Calibration of a water vapour Raman lidar with a kite-based ...
13
HAL Id: hal-01587346 https://hal.archives-ouvertes.fr/hal-01587346 Submitted on 27 Oct 2020 HAL is a multi-disciplinary open access archive for the deposit and dissemination of sci- entific research documents, whether they are pub- lished or not. The documents may come from teaching and research institutions in France or abroad, or from public or private research centers. L’archive ouverte pluridisciplinaire HAL, est destinée au dépôt et à la diffusion de documents scientifiques de niveau recherche, publiés ou non, émanant des établissements d’enseignement et de recherche français ou étrangers, des laboratoires publics ou privés. Calibration of a water vapour Raman lidar with a kite-based humidity sensor Julien Totems, Patrick Chazette To cite this version: Julien Totems, Patrick Chazette. Calibration of a water vapour Raman lidar with a kite-based humid- ity sensor. Atmospheric Measurement Techniques, European Geosciences Union, 2016, 9 (3), pp.1083 - 1094. 10.5194/amt-9-1083-2016. hal-01587346
-
Upload
khangminh22 -
Category
Documents
-
view
4 -
download
0
Transcript of Calibration of a water vapour Raman lidar with a kite-based ...
HAL Id: hal-01587346https://hal.archives-ouvertes.fr/hal-01587346
Submitted on 27 Oct 2020
HAL is a multi-disciplinary open accessarchive for the deposit and dissemination of sci-entific research documents, whether they are pub-lished or not. The documents may come fromteaching and research institutions in France orabroad, or from public or private research centers.
L’archive ouverte pluridisciplinaire HAL, estdestinée au dépôt et à la diffusion de documentsscientifiques de niveau recherche, publiés ou non,émanant des établissements d’enseignement et derecherche français ou étrangers, des laboratoirespublics ou privés.
Calibration of a water vapour Raman lidar with akite-based humidity sensor
Julien Totems, Patrick Chazette
To cite this version:Julien Totems, Patrick Chazette. Calibration of a water vapour Raman lidar with a kite-based humid-ity sensor. Atmospheric Measurement Techniques, European Geosciences Union, 2016, 9 (3), pp.1083- 1094. �10.5194/amt-9-1083-2016�. �hal-01587346�
Atmos. Meas. Tech., 9, 1083–1094, 2016
www.atmos-meas-tech.net/9/1083/2016/
doi:10.5194/amt-9-1083-2016
© Author(s) 2016. CC Attribution 3.0 License.
Calibration of a water vapour Raman lidar with a kite-based
humidity sensor
Julien Totems and Patrick Chazette
Laboratoire des Sciences du Climat et de l’Environnement, CEA, Gif-sur-Yvette, France
Correspondence to: Julien Totems ([email protected])
Received: 6 August 2015 – Published in Atmos. Meas. Tech. Discuss.: 15 October 2015
Revised: 3 February 2016 – Accepted: 24 February 2016 – Published: 15 March 2016
Abstract. We present a calibration method for a water vapour
Raman lidar using a meteorological probe lifted by a kite,
flown steadily above the lidar site, within the framework
of the Hydrological Cycle in the Mediterranean Experi-
ment (HyMeX) and Chemistry-Aerosol Mediterranean Ex-
periment (ChArMEx) campaigns. The experiment was car-
ried out in Menorca (Spain) during June 2013, using the mo-
bile water vapour and aerosol lidar WALI. Calibration us-
ing a kite demonstrated a much better degree of co-location
with the lidar system than that which could be achieved
with radiosondes, and it allowed us to determine the overlap
function and calibration factor simultaneously. The range-
dependent water vapour lidar calibration was thus deter-
mined with an uncertainty of 2 % in the 90–8000 m altitude
range. Lidar water vapour measurements are further com-
pared with radiosondes, showing very good agreement in
the lower troposphere (1–5 km) and a relative difference and
standard deviation of 5 and 9 % respectively. Moreover, a
reasonable agreement with MODIS-integrated water vapour
content is found, with a relative mean and standard deviation
of 3 and 16 % respectively. However, a discrepancy is found
with AERONET retrievals, showing the latter to be underes-
timated by 28 %. Reanalyses by the ECMWF/IFS numerical
weather prediction model also agree with the temporal evo-
lution highlighted with the lidar, with no measurable drift in
integrated water vapour content over the period.
1 Introduction
Because of its role in the energy balance of the atmosphere,
water vapour content is an essential parameter that drives
atmospheric dynamics in and above the planetary boundary
layer (PBL), as well as the hydrological cycle and of course
cloud formation (Kulmala, 1993; Melfi et al., 1989). Due to
the hygroscopic properties of airborne particles (e.g. Rood et
al., 1987; Randriamiarisoa et al., 2006), it also acts on the
radiative balance at a global scale (Haywood et al., 1997)
by enhancing the extinction power of plumes containing hy-
drophilic aerosols. This is one of the reasons why aerosols
remain a major source of uncertainty in long-term forecasts
of radiative forcing on the climate (IPCC, 2014). For the past
3 years, within the French MISTRALS (Mediterranean In-
tegrated Studies at RegionAL Scales) research program, the
western Mediterranean basin has been the focus of both wa-
ter cycle (Hydrological Cycle in the Mediterranean Exper-
iment (HyMeX); Drobinski et al., 2014) and aerosol radia-
tive forcing studies (Chemistry-Aerosol Mediterranean Ex-
periment (ChArMEx); Mallet et al., 2015) because of the
important societal impact of climate change in this densely
populated region as well as its complex atmospheric circula-
tion which makes both weather and chemical transport mod-
els fail to deliver reliable forecasts.
In this context, the range-resolved profiles of aerosol ex-
tinction and water vapour mixing ratio (WVMR) obtained
by lidar remote sensing are a powerful tool. Raman lidars
can measure WVMR through the calibrated ratio of water
vapour and nitrogen inelastic backscatter signals (Whiteman
et al., 1992). During the International H2O Project IHOP
(Weckwerth et al., 2004) in the American Great Plains, a
radiosonde-calibrated system (Whiteman et al., 2006a) en-
abled the first study of water-vapour-driven convective pro-
cesses in the PBL through the diurnal cycle (Whiteman et
al., 2006b). The European Convective Orographic Precipi-
tation Study COPS (Wulfmeyer et al., 2011) undertaken in
2007 in the Rhine Valley showed among other findings that
Published by Copernicus Publications on behalf of the European Geosciences Union.
1084 Julien Totems and Patrick Chazette: Calibration of a water vapour Raman lidar
biases between several Raman and DIAL (DIfferential Ab-
sorption Lidar) water vapour lidars and passive remote sens-
ing measurements remained below 5 % (Bhawar et al., 2011).
Such systems still operational in Europe include the Raman
lidars of BASIL (Di Girolamo and Summa, 2009) and IGN
(Bock et al., 2013) institutes, the upper tropospheric/lower
stratospheric Raman lidars at the Haute-Provence (Sherlock
et al., 1999a) and Réunion (Dionisi et al., 2015) observato-
ries and the scanning DIAL of the University of Hohenheim
(Behrendt et al., 2009).
The water vapour and aerosol lidar WALI (Chazette et al.,
2014a) is a portable and versatile system originally designed
to meet the scientific goals of the first special observation
period of HyMeX (Ducrocq et al., 2014) in autumn 2012.
HyMeX is dedicated to the study of the water cycle and the
role of water vapour and aerosols in cloud formation, lead-
ing specifically to the intense precipitation in the western
basin during the autumn season, using multiple instruments
in synergy and coupling their measurements to mesoscale
models. Its overarching goal is to improve forecasts of ex-
treme precipitation events on the orography of the western
basin. WALI was also implemented as part of the Menorca
Island (Spain) Cap d’en Font ground-based station during
the June 2013 special observation period of the ADRIMED
(Aerosol Direct Radiative Impact of the regional climate in
the Mediterranean region; Mallet et al., 2015) segment of
ChArMEx. ChArMEx aims to assess the present and future
state of the atmosphere (gaseous reactive species and aerosol
particles) in the Mediterranean basin, while its ADRIMED
segment focuses on how the Mediterranean climate is im-
pacted by direct aerosol forcing and may evolve in the next
50 years due to climate change and growing anthropic pres-
sure. It involved ground and airborne instruments to study
among others water vapour and aerosol coupling during sum-
mertime dust and pollution events in the western basin.
The proper absolute calibration of the WVMR derived by
a Raman lidar, with less than 0.4 g kg−1 total uncertainty
as demanded by meteorological and climate applications
(NCAR/NOAA; Weckwerth et al., 1999), remains a criti-
cal issue. Indeed, several studies have shown that a purely
photometric calibration performed on a laboratory optical
bench to determine the gain ratio of the H2O and N2 paths
lacks precision and leads to significant bias on the retrieved
WVMR (a few g kg−1, ∼ 10 % in the lower troposphere;
Leblanc and McDermid, 2008; Whiteman et al., 2011). This
calibration method also requires a common optical path be-
fore the field diaphragm of the lidar, which was dismissed
for WALI in favour of modularity. A more precise yet practi-
cal approach using the sky background as a standard light
source (Sherlock et al., 1999b) requires radiative transfer
models and elimination of all parasitic light sources. This
was impossible in the set-up of this field experiment, where
an anti-dust blowing funnel was necessary above the lidar
windows, which scattered some sunlight onto the receptor.
Raman lidars can also be calibrated using water vapour pro-
files given by a multi-channel microwave radiometer, as was
done recently in the framework of the HD(CP)2 campaign
in Germany, in an automated fashion (Foth et al., 2015).
However, this instrument is still unavailable commercially.
In the end, co-located vertical sounding to deduce WVMR
from temperature and relative humidity (RH) measurements
up to the stratosphere is the most precise method available,
albeit limited by the accuracy of the meteorological probe.
Radiosoundings are, however, rather heavy, with costly ap-
paratus and a flight exclusion area needed to be granted by
air traffic control. Moreover, they may drift and not always
be well co-located with the lidar. Whereas the spatial homo-
geneity of WVMR is generally good in the free troposphere,
it is less so in the PBL, especially in a coastal area or close
to orography.
Incidentally, there is a long history of kite atmospheric
sounding, which started with the “meteorographs” of Teis-
serenc de Bort at Trappes, France, in 1898. Despite an im-
pressive altitude range (up to 9800 m in 1916), this technique
was lost during the 20th century in favour of weather bal-
loons. Due to the specific advantages of kites the team of
Balsley et al. (1992, 1998) at CIRES reinstated their use and
improved the technique for profiling the atmosphere. Indeed,
materials and fabrics have evolved making kites lighter, less
expensive and easier to handle. They also offer the possibility
of sounding the same layer for a longer time and remaining
stationary, like tethered balloons. They have been applied to
low-altitude water vapour sounding (Davidson et al., 2003)
or used for aerosol profiling (Reiche et al., 2012). Willitsford
and Philbrick (2005) used the data of Davidson et al. (2003)
in synergy with a ground-based Raman lidar to describe the
evaporation duct over the ocean. Generally, the use of kites
is only limited by adverse wind conditions and strict local
regulations due to ever-increasing air traffic.
In this article, we present an original calibration process of
a mobile water vapour Raman lidar using a kite-borne Vaisala
pressure/temperature/RH probe, flying at low altitude where
the lidar signal is strongest and biases due to temperature and
aerosols transmission remain limited. This calibration is vali-
dated by comparisons to balloon profiling, remote sensing of
integrated water content, and outputs from a meteorological
model.
In Sect. 2 we will describe the set-up of the kite payload
and WALI lidar, along with the location of the experiment
and the exogenous measurements used in this study. Sec-
tion 3 will present the calibration method and the assess-
ment of the associated uncertainties. The cross-validation is
presented in Sect. 4, where the lidar-derived WVMR profile
and integrated water vapour content are compared with ra-
diosoundings, satellite measurements (Moderate-resolution
Imaging Spectroradiometer, MODIS), ground-based sun
photometer measurements and reanalyses by the numerical
weather prediction model ECMWF/IFS (European Centre
for Medium-range Weather Forecasts/integrated forecast sys-
tem). Section 5 will summarise and conclude.
Atmos. Meas. Tech., 9, 1083–1094, 2016 www.atmos-meas-tech.net/9/1083/2016/
Julien Totems and Patrick Chazette: Calibration of a water vapour Raman lidar 1085
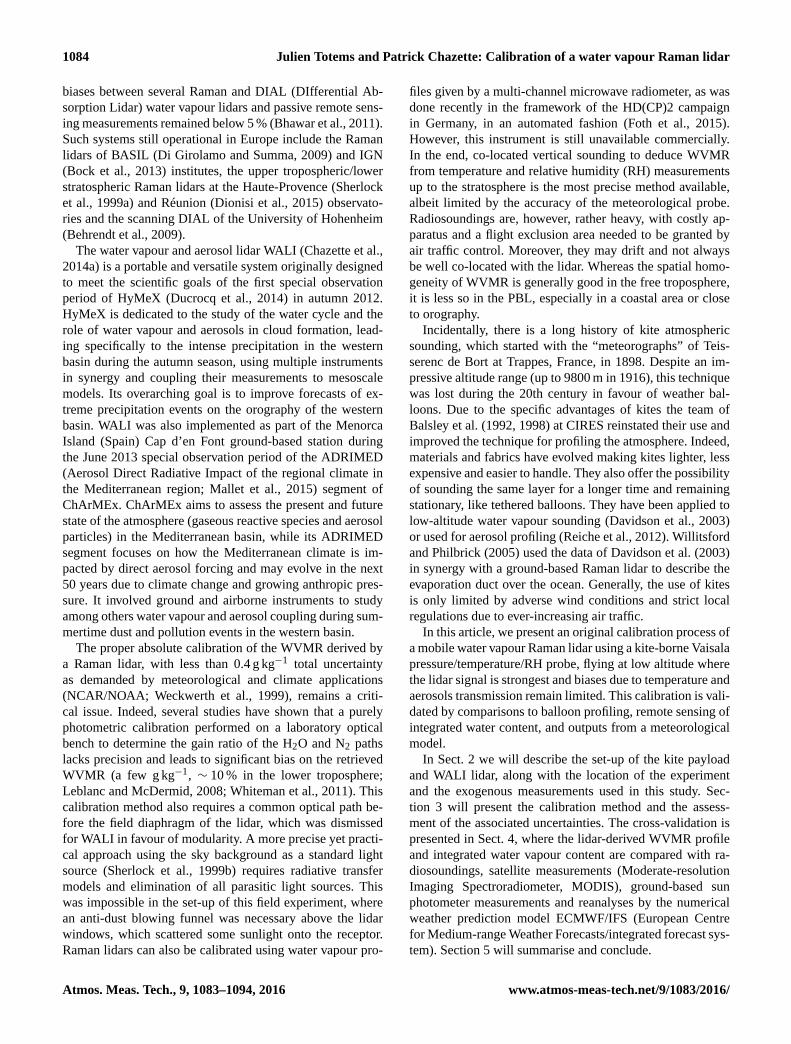
Figure 1. Situation map of the Menorca/Cap d’en Font station (red
cross). The launch site of radiosoundings on Menorca island is
shown as a blue square within the insert. Origins of air masses on the
dates of lidar/radiosonde intercomparisons are noted as coloured ar-
rows (Menorca digital elevation model courtesy of NASA/ASTER
GDEM).
2 Experimental set-up
2.1 Location of the experiment
During the ADRIMED SOP-1 campaign in June to
July 2013, a background station was deployed near the
centre of the western Mediterranean, at Cap d’en Font
(39◦49′33′′ N, 4◦12′29′′ E), a cape on the southern coast of
the island of Menorca (Fig. 1). This site was chosen to
stay clear of local pollution sources in the dominant south-
westerly winds. It provides the opportunity to sample various
air masses with contrasted water vapour amounts within the
lower and middle troposphere. Moreover, the windy southern
coast of Menorca is a very suitable environment to use a light
instrumented kite.
2.2 Raman lidar WALI
The WALI is a transportable lidar instrument mainly ded-
icated to atmospheric research activities (Chazette et al.,
2014a, b, 2015a). Emitting at a wavelength of 354.7 nm, it
is designed to fulfil eye safety conditions. Its emitter is a
pulsed Nd:YAG (Quantel Brilliant) laser. The UV pulse en-
ergy is ∼ 60 mJ and the pulse repetition frequency is 20 Hz.
Its wide field of view of ∼ 2.3 mrad ensures a full overlap of
the transmitter and receiver paths beyond ∼ 200–300 m.
The system has three receivers and a total of four chan-
nels. On each channel, optical detection is performed by a
photomultiplier tube (PMT) placed behind interferential fil-
ters (0.2 nm bandwidth) manufactured by Materion/Barr and
a focusing lens. The amplification gain of the PMT between
its anode and cathode is directly linked to the input high volt-
age (HV) chosen by the lidar acquisition software. Automatic
HV variation allows optimisation of the detection dynamic
range for both night-time and daytime measurements (with
strong sky background light). In the following, gain variation
is corrected after calibration of gain versus HV as in Chazette
et al. (2014a), and water vapour calibration is given for fixed
night-time values of HVs. The acquisition system is based on
PXI technology with 12 bit digitisers running at 200 MS s−1
(mega sampling per second), manufactured by National In-
struments. Throughout the experiment acquisition was per-
formed for mean profiles of 1000 laser shots, leading to a
temporal sampling close to 1 min.
The first receiver, with two channels (co- and cross-
polarised), is dedicated to the detection of the elastic molecu-
lar, aerosols and cloud backscatter from the atmosphere. The
second and third receivers are dedicated to the measurements
of the inelastic nitrogen (N2 channel, ∼ 387 nm) and water
vapour (H2O channel, ∼ 407 nm) Raman backscattered sig-
nals respectively. They are identical to the elastic receiver
except for interference filters centred at the respective wave-
lengths of the first Stokes vibrational lines for the two gases
(386.65± 0.10 and 407.45± 0.15 nm filter bandpass respec-
tively) and an extra dichroic beam splitter on the H2O chan-
nel for better rejection of the elastic returns (complete details
are given in Chazette et al., 2014a).
The WVMR is obtained as the ratio between the signals
recorded by the H2O and N2 Raman channels. In previous
experiments with a properly calibrated WALI (Chazette et
al., 2014a), the uncertainty on the WVMR reached 11 %
in the marine boundary layer and decreased to 7 % be-
low the 5 km range, with temporal averaging over 20 min
and a nominal vertical resolution of 15 m. Precision deteri-
orated quickly above 5 km above mean sea level (a.m.s.l.)
due to the decreasing signal-to-noise ratio (SNR), which we
compensate here with larger averaging. The determination
of the water vapour profile is more difficult during day-
time due to low SNR, but the measurements have been per-
formed with sufficient precision for altitude ranges below
∼ 1 km a.m.s.l. using temporal averaging over ∼ 30 min. A
low-altitude WVMR calibration directly above the lidar is
especially interesting considering that the progressive over-
lap of the lidar emission and reception paths biases WVMR
up to 300 m, as noticed in the previous deployment of the
lidar.
2.3 Water vapour sounding
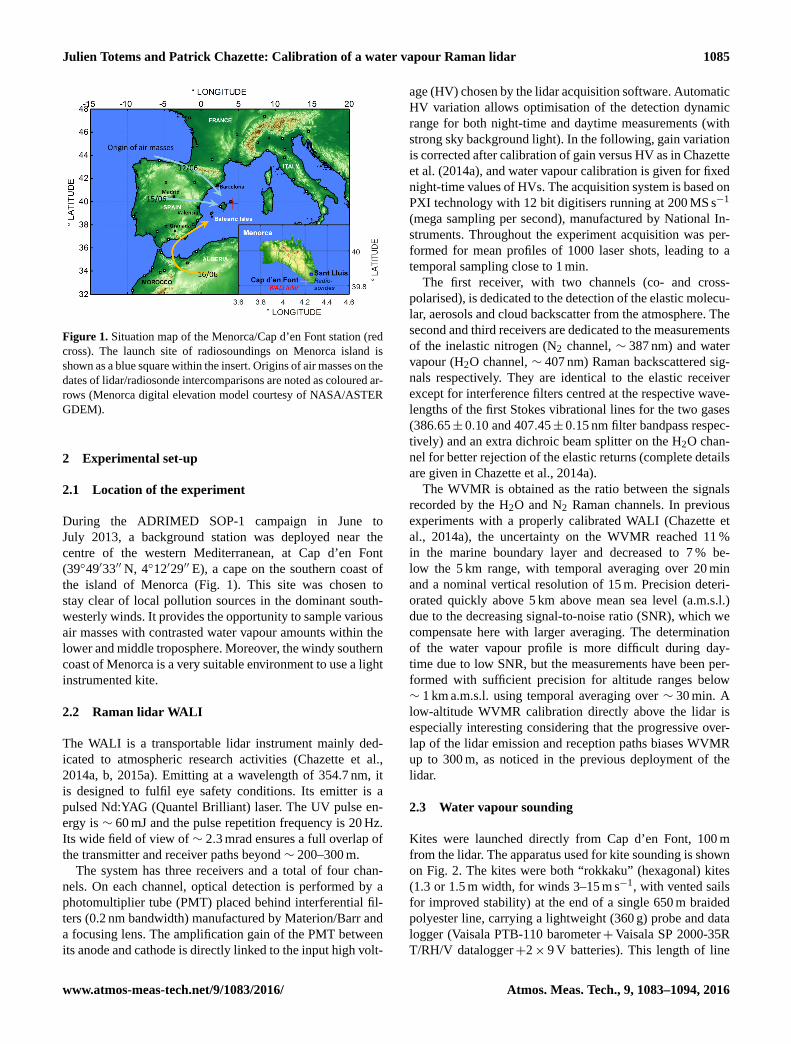
Kites were launched directly from Cap d’en Font, 100 m
from the lidar. The apparatus used for kite sounding is shown
on Fig. 2. The kites were both “rokkaku” (hexagonal) kites
(1.3 or 1.5 m width, for winds 3–15 m s−1, with vented sails
for improved stability) at the end of a single 650 m braided
polyester line, carrying a lightweight (360 g) probe and data
logger (Vaisala PTB-110 barometer+Vaisala SP 2000-35R
T/RH/V datalogger+2× 9 V batteries). This length of line
www.atmos-meas-tech.net/9/1083/2016/ Atmos. Meas. Tech., 9, 1083–1094, 2016
1086 Julien Totems and Patrick Chazette: Calibration of a water vapour Raman lidar
Figure 2. View of the rokkaku kite and lightweight sonde and data
logger assembly used for lidar calibration.
allowed for an approximate maximum sounding altitude of
450 m given the payload and wind conditions encountered in
Menorca. Data were recorded every 10 s and retrieved after
the flight. Given the specifications in Table 1, the expected
absolute accuracy on each WVMR sample is 0.6 g kg−1.
A CNES team led by N. Verdier launched radiosondes on
weather balloons, along with particle and ozone counters, at
the Sant-Lluís air field (39◦51′56′′ N, 4◦15′17′′ E), located
8 km northeast of the WALI lidar at Cap d’en Font. This air-
field was the only site where radiosounding could be organ-
ised, authorised and made compatible with air traffic to and
from the nearby Mahon airport, whereas the aerosol/lidar sta-
tion had to stay on the coast. The characteristics of the Mo-
dem M10 GPSondes used are also given in Table 1. From
these data, an absolute uncertainty of 1.2 g kg−1 is expected
near the ground (mostly due to the inaccuracy of the GPS
altitude), which goes down to 0.04 g kg−1 at 10 km a.m.s.l.
At ground level, a Vaisala PTU-300, set on a 6 m mast
protruding from the mobile laboratory where WALI was em-
bedded, yielded WVMR measurements with an accuracy of
0.3 g kg−1.
The Cap d’en Font station was also equipped with a Cimel
sun photometer as part of the Aerosol RObotic NETwork
(AERONET, http://http://aeronet.gsfc.nasa.gov/) for the du-
ration of the campaign. It provided regular measurements of
precipitable water vapour in the atmospheric column, simul-
taneously with aerosol optical thickness and Angström expo-
nent.
2.4 Spaceborne measurements and numerical weather
prediction model
On board the Aqua and Terra satellite, launched in the
early 2000s as part of the Earth Observing System, MODIS
captures images in 36 spectral bands to provide measure-
ments of large-scale global dynamics, including in the
lower atmosphere. MODIS level 3 data sets are avail-
Table 1. Characteristics of the WVMR in situ sounding apparatus.
Kite PTU sonde (LSCE), Vaisala modules and recorder (360g)
Altitude range 5–400 m
Measurements Temperature, RH, pressure
Meas. period 10 s
Temp. uncertainty ±0.15 ◦C
RH uncertainty ±2 %
Pressure uncertainty ±0.6 hPa
→WVMR error ±0.6 gkg−1 (below 500 m)
Balloon rawinsounding (CNES), Modem GPSonde M10 (150g)
Altitude range 100 m–36 kma.m.s.l.
Measurements Temperature, RH, GPS altitude
Meas. period 1 s
Temp. uncertainty ±0.5 ◦C
RH uncertainty ±5 %
Altitude uncertainty ±10 m (±1 hPa down to 0.4 hPa
at 10 kma.m.s.l.)
→WVMR error ±1.2 gkg−1 down to ±0.04 gkg−1
at 10 kma.m.s.l.
able online from NASA (https://earthdata.nasa.gov/labs/
worldview/). They include daily precipitable water vapour
data given on a 1◦ grid on both land and sea, with sufficient
accuracy to allow comparison with ground-based measure-
ments of water vapour (Gao and Kaufman, 2003).
Modelled synoptic-scale meteorological fields (geopoten-
tial height, temperature, moisture) have been obtained over
a large domain around the western Mediterranean from the
IFS of the ECMWF (http://www.ecmwf.int). The 3-D fields,
available on the ESPRI/IPSL data server, are 6-hourly re-
analyses with a horizontal resolution of 0.5◦. The ECMWF
model produces a good representation of the low-resolution
moisture field as demonstrated in previous works (Chazette
et al., 2014b).
3 Lidar calibration
With the WALI lidar, the WVMR profile is obtained as
rH2O,lidar(z)=KWVMR
SH2O(z)/ξH2O(z)
SN2(z)/ξN2
(z)exp(1τ(z)), (1)
where KWVMR is a constant to be calibrated, SH2O(z) and
SN2(z) are the lidar signals in the indexed channels, ex-
pressed as a function of altitude z, and ξH2O(z) and ξN2(z)
are the lidar overlap factors of the indexed channels (both
reach 1 above 400 m). Correction factor 1τ(z) is the differ-
ence of total optical thickness between wavelengths 387 and
407 nm, which has to be estimated from the aerosol chan-
nel and the Angström exponent of the aerosols obtained by
the AERONET sun photometer, as explained in Chazette
et al. (2014a) (thus avoiding a bias of up to 10 % above
4 km a.m.s.l., as estimated from our uncorrected signals). We
Atmos. Meas. Tech., 9, 1083–1094, 2016 www.atmos-meas-tech.net/9/1083/2016/
Julien Totems and Patrick Chazette: Calibration of a water vapour Raman lidar 1087
do not consider temperature dependence of the Raman lines,
as the H2O Raman interference filter is chosen at an insensi-
tive wavelength following Whiteman et al. (2006a). The re-
ceiver channels of the lidar were left confined and untouched
during the entire campaign to limit variations of the calibra-
tion parameters such as was reported by Bock et al. (2014).
We trust that this protocol allowed the complete stability
found between two calibrations of the WALI, 3 months apart,
in its previous involvement (Chazette et al., 2014a).
The overlap function ξN2(z) of the N2 Raman channel is
estimated in a homogeneous atmosphere, as provided by a
profile with the lidar set up horizontally. In order to assess the
missingKWVMR and ξH2O(z) in Eq. (1), we performed simul-
taneous measurements of water vapour by kite (rH2O,kite(z))
and lidar and computed the following calibration function:
C(z)=SH2O(z)
SN2(z)/ξN2
(z)
1
rH2O,kite(z)exp(1τ(z)) (2)
=1
KWVMR
ξH2O(z),
the shape of which is that of the overlap factor ξH2O(z), and
the value at high altitude yields the calibration coefficient
KWVMR.
Three flights were performed to assess calibration func-
tion C(z), during which the kite remained at a horizontal dis-
tance between 60 and 300 m from the laser beam. An impor-
tant practical constraint was that these flights had to be done
in daylight conditions, under which the lidar profiles are af-
fected by sky background noise. Indeed, kite flight is more
risky and often restricted in the absence of light. After an
initial flight up to 140 m on the afternoon of 22 June, it was
determined that the full overlap zone had not been reached.
A subsequent flight up to 390 m on the morning of 25 June
passed the required altitude to estimate the calibration co-
efficient. Finally, a third flight was performed during sunset
on 25 June when the sky background light was low, to bet-
ter assess the lowest values of the overlap function, from 0
to 115 m. Note that while this forms the best conditions for
lidar calibration, one must anticipate that wind strength can
fall quickly at dusk (as experienced on 23 and 24 June). The
kite was launched slightly beforehand.
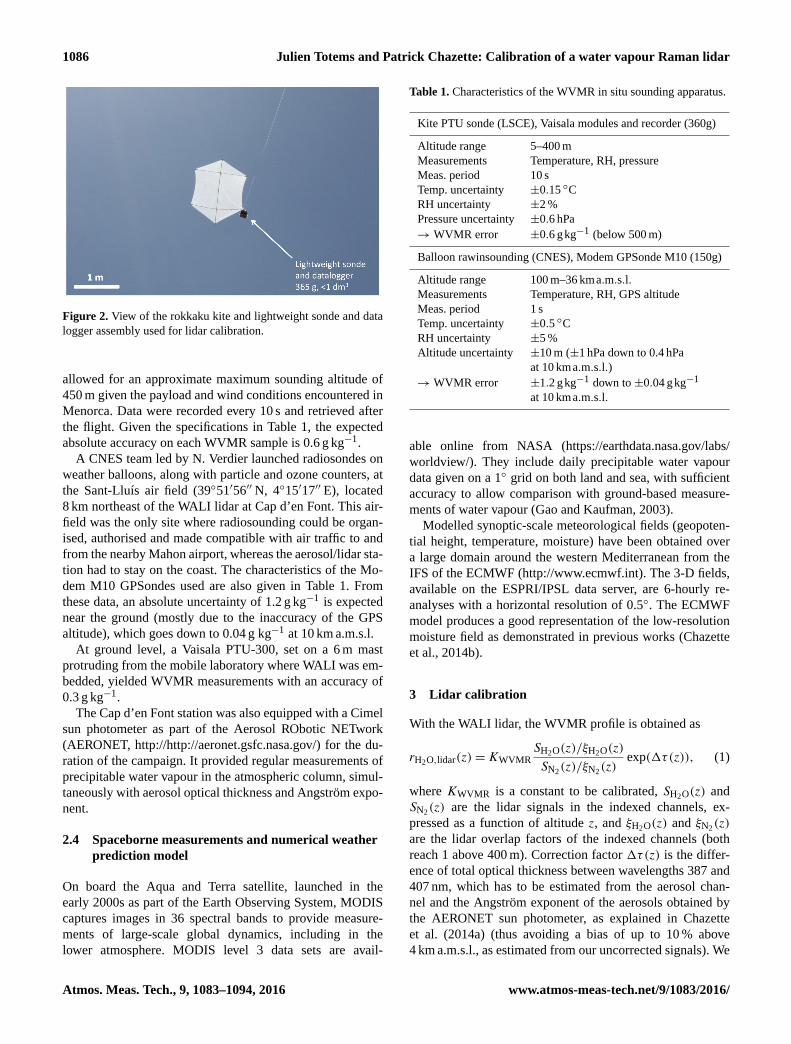
The computed C(z) are given in Fig. 3. The resulting as-
sessment of KWVMR is 94.8±2.0 g kg−1, as a mean over the
three flights (note that even if the first flight could not reach
the full overlap altitude, as the overlap function remains the
same, KWVMR can be evaluated on each flight by dividing
C(z) by this function). The uncertainty, estimated between
0.4 and 1.7 g kg−1 for each individual flight assuming ran-
domly distributed error with altitude, is predominantly due
to lidar noise above 100 m during daytime and to sounding
errors at lower altitude or at dusk. Residual standard devi-
ation on the final result will be due to fluctuating bias on
either one of the instrument. Full overlap is obtained at 150
m and 50 % overlap is obtained at ∼ 90 m; in the following
Figure 3. Results of lidar calibration by kite-carried PTU, in terms
of calibration function C(z)= ξH2O(z)/KWVMR (dots) as mea-
sured during three separate flights: on 22 June afternoon up to
140 m, on 25 June morning up to 390 m and on 25 June at sun-
set up to 115 m, the latter providing less noisy estimations of the
overlap function at low altitude. The RMSE combining lidar signal
noise and sounding errors is shown as horizontal bars. The assessed
KWVMR is 95± 2 g kg−1.
WVMR profile retrievals, we corrected the overlap function
down to the latter altitude and discarded the lower profile. We
note an unusual shape of the overlap function with a plateau
around 50–70 m. Rather than pointing towards a wrong esti-
mation of the N2 overlap function, verified on five separate
occurrences, this effect has already been seen on the elastic
channel of other lidars with the same design and has been
associated with a bad re-collimation of the received beam
on the spectral filtering components. The response of the
dichroic beam splitter and interference filter (see Chazette
et al., 2014a) to close object points with even more inclined
rays is highly variable and may explain this effect. Better fo-
cusing of the system on an optical bench should attenuate
this phenomenon in future implementations.
4 Validation
In order to validate the kite-calibrated WVMR profile pro-
vided by WALI, we first compare it to the radiosoundings
carried out at Sant Lluís airfield during the beginning of the
ADRIMED campaign (12–17 June 2013), a period charac-
terized by several pollution transport events, followed by
a Saharan dust event. We then study the correlation of li-
dar WVMR profiles with reanalyses of the ECMWF/IFS
weather prediction model, over a longer period. Finally, we
compare the integrated profile in terms of precipitable water
vapour to the retrievals of the AERONET sun photometer,
www.atmos-meas-tech.net/9/1083/2016/ Atmos. Meas. Tech., 9, 1083–1094, 2016
1088 Julien Totems and Patrick Chazette: Calibration of a water vapour Raman lidar
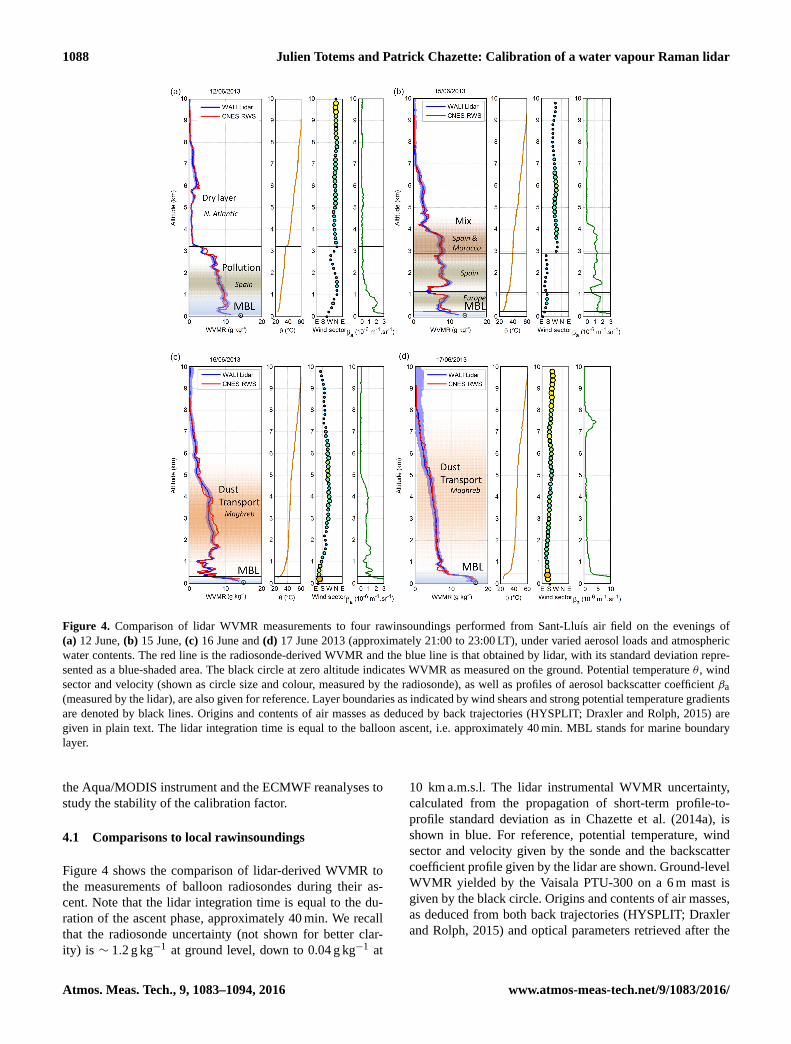
Figure 4. Comparison of lidar WVMR measurements to four rawinsoundings performed from Sant-Lluís air field on the evenings of
(a) 12 June, (b) 15 June, (c) 16 June and (d) 17 June 2013 (approximately 21:00 to 23:00 LT), under varied aerosol loads and atmospheric
water contents. The red line is the radiosonde-derived WVMR and the blue line is that obtained by lidar, with its standard deviation repre-
sented as a blue-shaded area. The black circle at zero altitude indicates WVMR as measured on the ground. Potential temperature θ , wind
sector and velocity (shown as circle size and colour, measured by the radiosonde), as well as profiles of aerosol backscatter coefficient βa
(measured by the lidar), are also given for reference. Layer boundaries as indicated by wind shears and strong potential temperature gradients
are denoted by black lines. Origins and contents of air masses as deduced by back trajectories (HYSPLIT; Draxler and Rolph, 2015) are
given in plain text. The lidar integration time is equal to the balloon ascent, i.e. approximately 40 min. MBL stands for marine boundary
layer.
the Aqua/MODIS instrument and the ECMWF reanalyses to
study the stability of the calibration factor.
4.1 Comparisons to local rawinsoundings
Figure 4 shows the comparison of lidar-derived WVMR to
the measurements of balloon radiosondes during their as-
cent. Note that the lidar integration time is equal to the du-
ration of the ascent phase, approximately 40 min. We recall
that the radiosonde uncertainty (not shown for better clar-
ity) is ∼ 1.2 g kg−1 at ground level, down to 0.04 g kg−1 at
10 km a.m.s.l. The lidar instrumental WVMR uncertainty,
calculated from the propagation of short-term profile-to-
profile standard deviation as in Chazette et al. (2014a), is
shown in blue. For reference, potential temperature, wind
sector and velocity given by the sonde and the backscatter
coefficient profile given by the lidar are shown. Ground-level
WVMR yielded by the Vaisala PTU-300 on a 6 m mast is
given by the black circle. Origins and contents of air masses,
as deduced from both back trajectories (HYSPLIT; Draxler
and Rolph, 2015) and optical parameters retrieved after the
Atmos. Meas. Tech., 9, 1083–1094, 2016 www.atmos-meas-tech.net/9/1083/2016/
Julien Totems and Patrick Chazette: Calibration of a water vapour Raman lidar 1089
inversion of the other channels of WALI (lidar ratio, particle
depolarisation ratio), are given in plain text.
Overall very good agreement is observed in all the com-
parisons, except at sharp transitions. The altitude of transi-
tions is sometimes shifted and absolute values of WVMR can
differ in thin layers. The largest discrepancies occur near the
ground, making these non-collocated radiosoundings unsuit-
able for the measurement of the overlap factor. Moreover,
strong deviations are seen in a dust layer on the evening of
16 June. Such an effect remains unexplained, as the most im-
portant inhomogeneity, corresponding to a change in circula-
tion, occurred 24 h earlier with little impact.
We assess the calibration factor KWVMR that would have
been obtained by using the ratio between radiosounding and
lidar, averaged between 1 km and 6 km a.m.s.l. and over
all profiles: KWVMR = 95.7± 3.5 g kg−1. This is compatible
with the result of calibration by kite: no drift of the calibra-
tion factor is measured during the span of 13 days covered
by these comparisons. Note that the above standard devia-
tion, computed using the lidar profile error and the specifi-
cations of Table 2, shows a higher value than with the kite,
which seems due to the horizontal inhomogeneity of WVMR
and maybe also to the shorter averaging time available with
balloons quickly ascending through the troposphere.
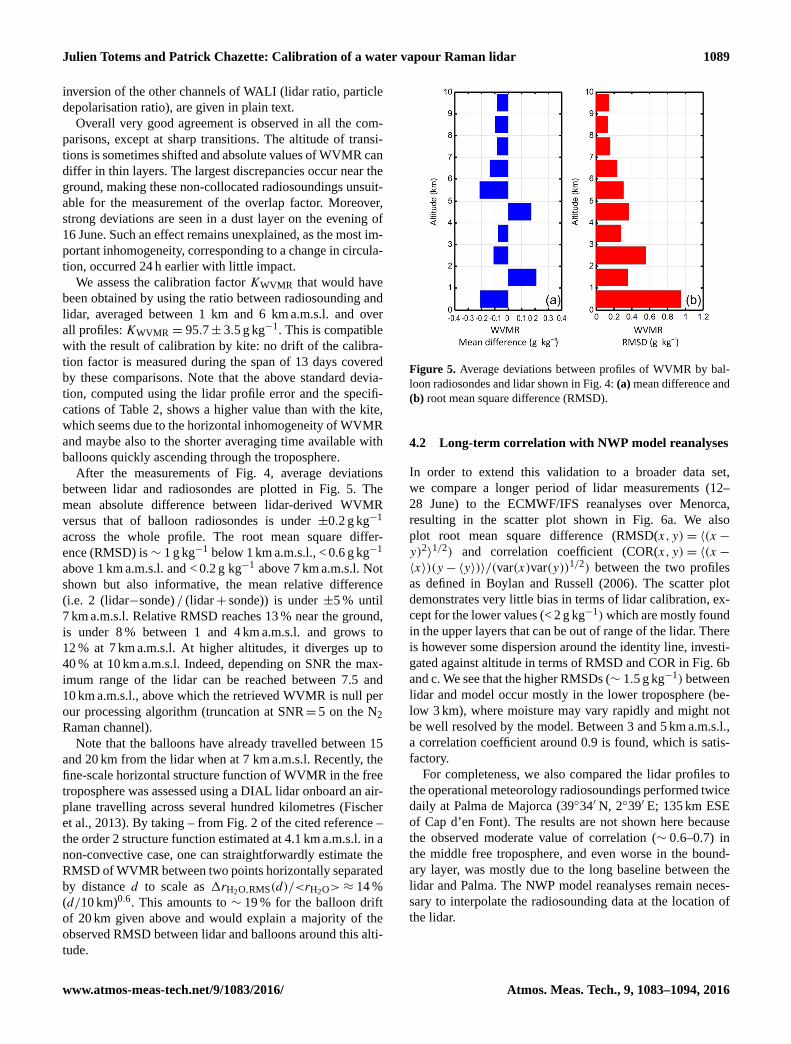
After the measurements of Fig. 4, average deviations
between lidar and radiosondes are plotted in Fig. 5. The
mean absolute difference between lidar-derived WVMR
versus that of balloon radiosondes is under ±0.2 g kg−1
across the whole profile. The root mean square differ-
ence (RMSD) is∼ 1 g kg−1 below 1 km a.m.s.l., < 0.6 g kg−1
above 1 km a.m.s.l. and < 0.2 g kg−1 above 7 km a.m.s.l. Not
shown but also informative, the mean relative difference
(i.e. 2 (lidar−sonde) / (lidar+ sonde)) is under ±5 % until
7 km a.m.s.l. Relative RMSD reaches 13 % near the ground,
is under 8 % between 1 and 4 km a.m.s.l. and grows to
12 % at 7 km a.m.s.l. At higher altitudes, it diverges up to
40 % at 10 km a.m.s.l. Indeed, depending on SNR the max-
imum range of the lidar can be reached between 7.5 and
10 km a.m.s.l., above which the retrieved WVMR is null per
our processing algorithm (truncation at SNR= 5 on the N2
Raman channel).
Note that the balloons have already travelled between 15
and 20 km from the lidar when at 7 km a.m.s.l. Recently, the
fine-scale horizontal structure function of WVMR in the free
troposphere was assessed using a DIAL lidar onboard an air-
plane travelling across several hundred kilometres (Fischer
et al., 2013). By taking – from Fig. 2 of the cited reference –
the order 2 structure function estimated at 4.1 km a.m.s.l. in a
non-convective case, one can straightforwardly estimate the
RMSD of WVMR between two points horizontally separated
by distance d to scale as 1rH2O,RMS(d)/<rH2O>≈ 14 %
(d/10 km)0.6. This amounts to ∼ 19 % for the balloon drift
of 20 km given above and would explain a majority of the
observed RMSD between lidar and balloons around this alti-
tude.
Figure 5. Average deviations between profiles of WVMR by bal-
loon radiosondes and lidar shown in Fig. 4: (a) mean difference and
(b) root mean square difference (RMSD).
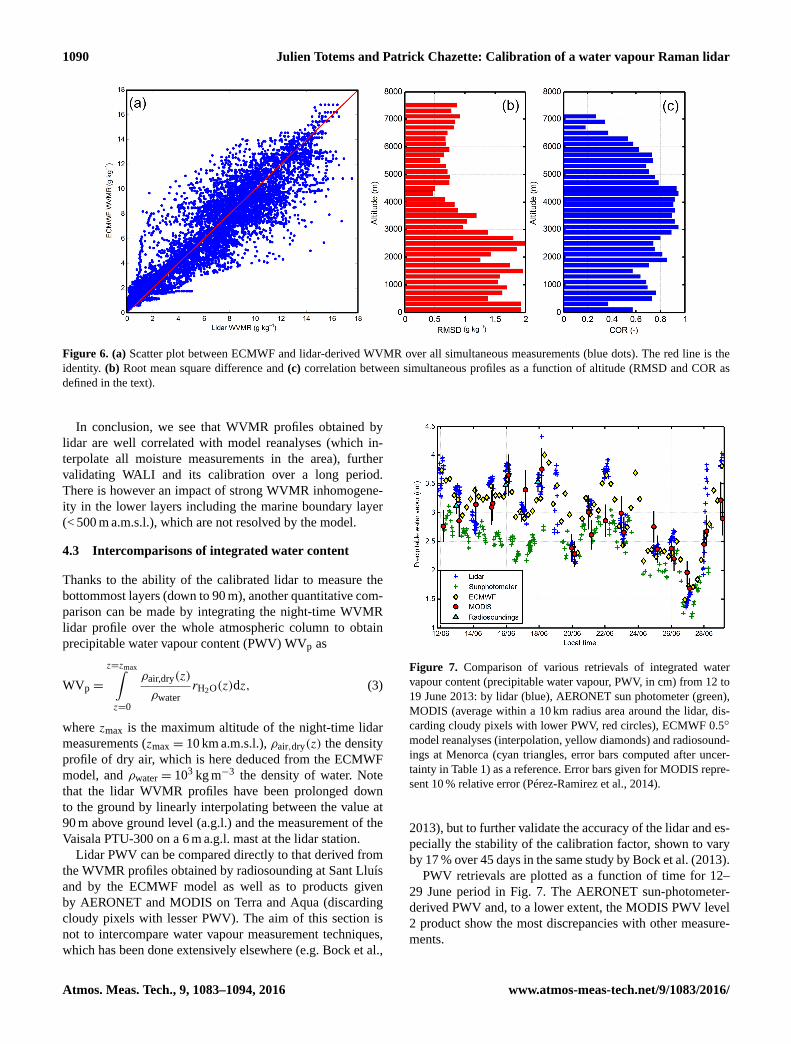
4.2 Long-term correlation with NWP model reanalyses
In order to extend this validation to a broader data set,
we compare a longer period of lidar measurements (12–
28 June) to the ECMWF/IFS reanalyses over Menorca,
resulting in the scatter plot shown in Fig. 6a. We also
plot root mean square difference (RMSD(x,y)= 〈(x−
y)2〉1/2) and correlation coefficient (COR(x,y)= 〈(x−
〈x〉)(y−〈y〉)〉/(var(x)var(y))1/2) between the two profiles
as defined in Boylan and Russell (2006). The scatter plot
demonstrates very little bias in terms of lidar calibration, ex-
cept for the lower values (< 2 g kg−1)which are mostly found
in the upper layers that can be out of range of the lidar. There
is however some dispersion around the identity line, investi-
gated against altitude in terms of RMSD and COR in Fig. 6b
and c. We see that the higher RMSDs (∼ 1.5 g kg−1) between
lidar and model occur mostly in the lower troposphere (be-
low 3 km), where moisture may vary rapidly and might not
be well resolved by the model. Between 3 and 5 km a.m.s.l.,
a correlation coefficient around 0.9 is found, which is satis-
factory.
For completeness, we also compared the lidar profiles to
the operational meteorology radiosoundings performed twice
daily at Palma de Majorca (39◦34′ N, 2◦39′ E; 135 km ESE
of Cap d’en Font). The results are not shown here because
the observed moderate value of correlation (∼ 0.6–0.7) in
the middle free troposphere, and even worse in the bound-
ary layer, was mostly due to the long baseline between the
lidar and Palma. The NWP model reanalyses remain neces-
sary to interpolate the radiosounding data at the location of
the lidar.
www.atmos-meas-tech.net/9/1083/2016/ Atmos. Meas. Tech., 9, 1083–1094, 2016
1090 Julien Totems and Patrick Chazette: Calibration of a water vapour Raman lidar
Figure 6. (a) Scatter plot between ECMWF and lidar-derived WVMR over all simultaneous measurements (blue dots). The red line is the
identity. (b) Root mean square difference and (c) correlation between simultaneous profiles as a function of altitude (RMSD and COR as
defined in the text).
In conclusion, we see that WVMR profiles obtained by
lidar are well correlated with model reanalyses (which in-
terpolate all moisture measurements in the area), further
validating WALI and its calibration over a long period.
There is however an impact of strong WVMR inhomogene-
ity in the lower layers including the marine boundary layer
(< 500 m a.m.s.l.), which are not resolved by the model.
4.3 Intercomparisons of integrated water content
Thanks to the ability of the calibrated lidar to measure the
bottommost layers (down to 90 m), another quantitative com-
parison can be made by integrating the night-time WVMR
lidar profile over the whole atmospheric column to obtain
precipitable water vapour content (PWV) WVp as
WVp =
z=zmax∫z=0
ρair,dry(z)
ρwater
rH2O(z)dz, (3)
where zmax is the maximum altitude of the night-time lidar
measurements (zmax = 10 km a.m.s.l.), ρair,dry(z) the density
profile of dry air, which is here deduced from the ECMWF
model, and ρwater = 103 kg m−3 the density of water. Note
that the lidar WVMR profiles have been prolonged down
to the ground by linearly interpolating between the value at
90 m above ground level (a.g.l.) and the measurement of the
Vaisala PTU-300 on a 6 m a.g.l. mast at the lidar station.
Lidar PWV can be compared directly to that derived from
the WVMR profiles obtained by radiosounding at Sant Lluís
and by the ECMWF model as well as to products given
by AERONET and MODIS on Terra and Aqua (discarding
cloudy pixels with lesser PWV). The aim of this section is
not to intercompare water vapour measurement techniques,
which has been done extensively elsewhere (e.g. Bock et al.,
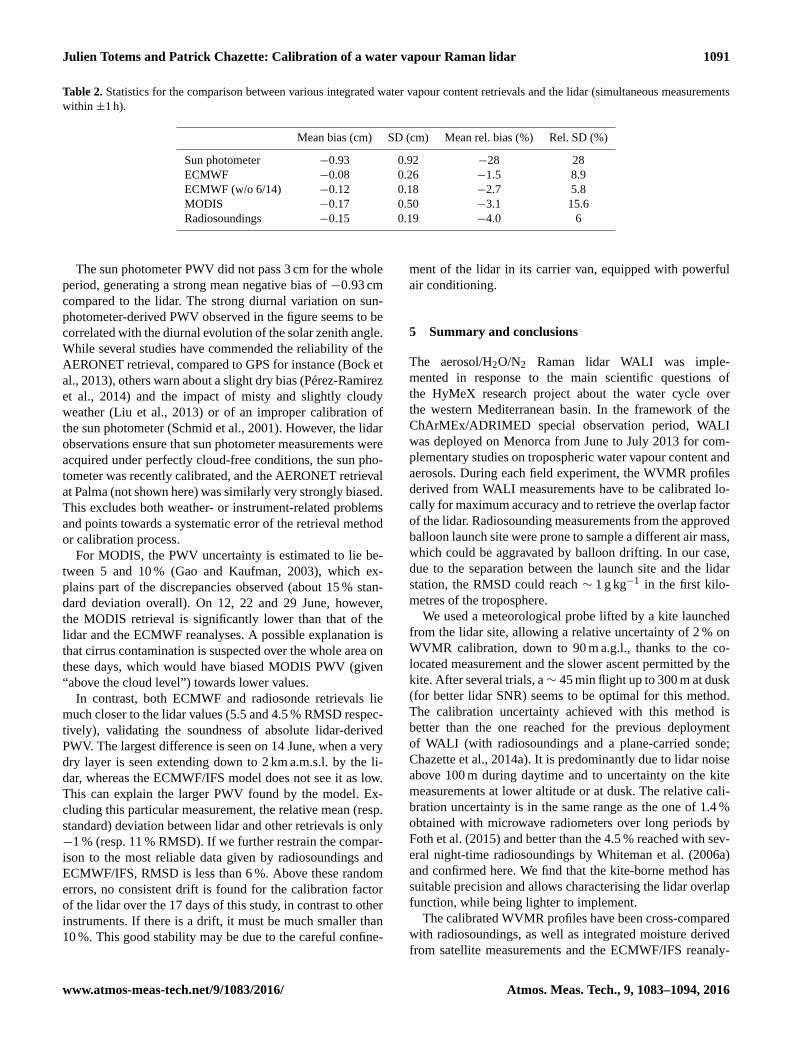
Figure 7. Comparison of various retrievals of integrated water
vapour content (precipitable water vapour, PWV, in cm) from 12 to
19 June 2013: by lidar (blue), AERONET sun photometer (green),
MODIS (average within a 10 km radius area around the lidar, dis-
carding cloudy pixels with lower PWV, red circles), ECMWF 0.5◦
model reanalyses (interpolation, yellow diamonds) and radiosound-
ings at Menorca (cyan triangles, error bars computed after uncer-
tainty in Table 1) as a reference. Error bars given for MODIS repre-
sent 10 % relative error (Pérez-Ramirez et al., 2014).
2013), but to further validate the accuracy of the lidar and es-
pecially the stability of the calibration factor, shown to vary
by 17 % over 45 days in the same study by Bock et al. (2013).
PWV retrievals are plotted as a function of time for 12–
29 June period in Fig. 7. The AERONET sun-photometer-
derived PWV and, to a lower extent, the MODIS PWV level
2 product show the most discrepancies with other measure-
ments.
Atmos. Meas. Tech., 9, 1083–1094, 2016 www.atmos-meas-tech.net/9/1083/2016/
Julien Totems and Patrick Chazette: Calibration of a water vapour Raman lidar 1091
Table 2. Statistics for the comparison between various integrated water vapour content retrievals and the lidar (simultaneous measurements
within ±1 h).
Mean bias (cm) SD (cm) Mean rel. bias (%) Rel. SD (%)
Sun photometer −0.93 0.92 −28 28
ECMWF −0.08 0.26 −1.5 8.9
ECMWF (w/o 6/14) −0.12 0.18 −2.7 5.8
MODIS −0.17 0.50 −3.1 15.6
Radiosoundings −0.15 0.19 −4.0 6
The sun photometer PWV did not pass 3 cm for the whole
period, generating a strong mean negative bias of −0.93 cm
compared to the lidar. The strong diurnal variation on sun-
photometer-derived PWV observed in the figure seems to be
correlated with the diurnal evolution of the solar zenith angle.
While several studies have commended the reliability of the
AERONET retrieval, compared to GPS for instance (Bock et
al., 2013), others warn about a slight dry bias (Pérez-Ramirez
et al., 2014) and the impact of misty and slightly cloudy
weather (Liu et al., 2013) or of an improper calibration of
the sun photometer (Schmid et al., 2001). However, the lidar
observations ensure that sun photometer measurements were
acquired under perfectly cloud-free conditions, the sun pho-
tometer was recently calibrated, and the AERONET retrieval
at Palma (not shown here) was similarly very strongly biased.
This excludes both weather- or instrument-related problems
and points towards a systematic error of the retrieval method
or calibration process.
For MODIS, the PWV uncertainty is estimated to lie be-
tween 5 and 10 % (Gao and Kaufman, 2003), which ex-
plains part of the discrepancies observed (about 15 % stan-
dard deviation overall). On 12, 22 and 29 June, however,
the MODIS retrieval is significantly lower than that of the
lidar and the ECMWF reanalyses. A possible explanation is
that cirrus contamination is suspected over the whole area on
these days, which would have biased MODIS PWV (given
“above the cloud level”) towards lower values.
In contrast, both ECMWF and radiosonde retrievals lie
much closer to the lidar values (5.5 and 4.5 % RMSD respec-
tively), validating the soundness of absolute lidar-derived
PWV. The largest difference is seen on 14 June, when a very
dry layer is seen extending down to 2 km a.m.s.l. by the li-
dar, whereas the ECMWF/IFS model does not see it as low.
This can explain the larger PWV found by the model. Ex-
cluding this particular measurement, the relative mean (resp.
standard) deviation between lidar and other retrievals is only
−1 % (resp. 11 % RMSD). If we further restrain the compar-
ison to the most reliable data given by radiosoundings and
ECMWF/IFS, RMSD is less than 6 %. Above these random
errors, no consistent drift is found for the calibration factor
of the lidar over the 17 days of this study, in contrast to other
instruments. If there is a drift, it must be much smaller than
10 %. This good stability may be due to the careful confine-
ment of the lidar in its carrier van, equipped with powerful
air conditioning.
5 Summary and conclusions
The aerosol/H2O/N2 Raman lidar WALI was imple-
mented in response to the main scientific questions of
the HyMeX research project about the water cycle over
the western Mediterranean basin. In the framework of the
ChArMEx/ADRIMED special observation period, WALI
was deployed on Menorca from June to July 2013 for com-
plementary studies on tropospheric water vapour content and
aerosols. During each field experiment, the WVMR profiles
derived from WALI measurements have to be calibrated lo-
cally for maximum accuracy and to retrieve the overlap factor
of the lidar. Radiosounding measurements from the approved
balloon launch site were prone to sample a different air mass,
which could be aggravated by balloon drifting. In our case,
due to the separation between the launch site and the lidar
station, the RMSD could reach ∼ 1 g kg−1 in the first kilo-
metres of the troposphere.
We used a meteorological probe lifted by a kite launched
from the lidar site, allowing a relative uncertainty of 2 % on
WVMR calibration, down to 90 m a.g.l., thanks to the co-
located measurement and the slower ascent permitted by the
kite. After several trials, a∼ 45 min flight up to 300 m at dusk
(for better lidar SNR) seems to be optimal for this method.
The calibration uncertainty achieved with this method is
better than the one reached for the previous deployment
of WALI (with radiosoundings and a plane-carried sonde;
Chazette et al., 2014a). It is predominantly due to lidar noise
above 100 m during daytime and to uncertainty on the kite
measurements at lower altitude or at dusk. The relative cali-
bration uncertainty is in the same range as the one of 1.4 %
obtained with microwave radiometers over long periods by
Foth et al. (2015) and better than the 4.5 % reached with sev-
eral night-time radiosoundings by Whiteman et al. (2006a)
and confirmed here. We find that the kite-borne method has
suitable precision and allows characterising the lidar overlap
function, while being lighter to implement.
The calibrated WVMR profiles have been cross-compared
with radiosoundings, as well as integrated moisture derived
from satellite measurements and the ECMWF/IFS reanaly-
www.atmos-meas-tech.net/9/1083/2016/ Atmos. Meas. Tech., 9, 1083–1094, 2016

1092 Julien Totems and Patrick Chazette: Calibration of a water vapour Raman lidar
ses. The profiles are shown to be in very good agreement
in the free troposphere (1–5 km a.m.s.l., mean absolute devi-
ations within 0.2 g kg−1, ±5 % relative), less so in the ma-
rine boundary layer due to inhomogeneity, and above 7–
8 km a.m.s.l. due to the range limitation of the lidar. Devi-
ations between integrated water vapour contents appear to be
within 6 % RMSE (compared to model reanalyses and local
radiosoundings), and no drift is reported over the measure-
ment period of ∼ 3 weeks. The MODIS level 2 data of PWV
do not agree as well, with a RMSD ∼ 15 % comparatively
with the PWV derived from WALI. Finally, large discrep-
ancies (more than −1 cm bias) are observed when consider-
ing the sun-photometer-derived PWV. The fact that sun pho-
tometer measurements were acquired in verifiably cloud-free
conditions, that the sun photometer was recently calibrated,
and that the AERONET retrievals at Palma were similarly
very strongly biased excludes both weather- or instrument-
related problems and points towards a systematic error of the
retrieval method or calibration process. It may still be spe-
cific to the conditions experienced in the Balearic sea dur-
ing this period. While several previous studies have warned
about a slight dry bias (Pérez-Ramirez et al., 2014) or wet/dry
biases and drifts below 0.3 cm depending on the Cimel sun
photometer used (Torres et al., 2009), this much stronger ef-
fect (up to 1 cm) has not been reported elsewhere, to our
knowledge, despite multiple works on the subject (Estellés
et al., 2007; Martinez-Lozano et al., 2007; Mavromatakis et
al., 2007; Ortiz de Galisteo et al., 2010). It should be inves-
tigated further, by comparison to GPS network retrievals for
instance, in similar conditions. However, overall the lidar cal-
ibration is found to be accurate and stable over the period.
Assuming full lidar overlap at the maximum sounding al-
titude and no bias at higher altitude, kite sounding therefore
appears to be a practical and reliable way to calibrate both
the water vapour retrieval and overlap factor of a H2O Ra-
man lidar, thanks to maximum SNR, longer sounding and
immediate proximity to the lidar beam. Limitations include
the need for good wind conditions, although only a couple of
knots are enough and frequent in many open sites, and regu-
lations due to air traffic control, which vary geographically.
This technique could be extended to any physical parameter
measurable both by a lidar and a probe weighting less than a
kilogram, such as temperature, aerosol size distribution, con-
centration or optical properties.
This calibration method may be considered within the con-
text of medium-term prospects such as the operational use of
H2O Raman lidar systems for monitoring water vapour con-
tent in the low and middle troposphere. Such monitoring will
provide the necessary constraints to forecast extreme precip-
itation events, like those encountered during autumn 2015 on
the orography of the western Mediterranean basin. Indeed,
during the upstream phase of HyMeX, a good coherence was
found between the water vapour mixing ratio profiles mea-
sured by WALI and those estimated by mesoscale model re-
analyses of AROME-WMED and ECMWF/IFS (Chazette et
al., 2015a, b).
Acknowledgements. The authors thank P. Fabre for providing the
kites, as well as S. Hassanzadeh, S. Bertolin and M. Jeannot for
their precious help during the kite sounding. The lidar station at
Menorca was set up and maintained with the help of F. Dulac,
F. Marnas and X. Shang from LSCE and M. Sicard, C. Munoz and
D. Lange from Universitat de Catanlunya. Balloon radiosoundings
were performed by N. Verdier from CNES. AERONET, NASA
(MODIS) and ECMWF are acknowledged for graciously making
their data sets available for this work. We finally thank Z. Harris
for her precious help in correcting the manuscript. This work
was funded by the HyMeX and ChArMEx components of the
MISTRALS program, the MUSIC grant ANR-14–CE01-01 and by
the Commissariat à l’Energie Atomique.
Edited by: O. Dubovik
References
Behrendt, A., Wulfmeyer, V., Riede, A., Wagner, G., Pal, S.,
Bauer, H., Radlach, M., and Späth, F.: 3-Dimensional ob-
servations of atmospheric humidity with a scanning differen-
tial absorption lidar, in: Proc. SPIE Vol. 7475, Remote Sens-
ing of Clouds and the Atmosphere XIV, edited by R. H. Pi-
card, K. Schäfer, A. Comeron, and M. van Weele, 74750L,
doi:10.1117/12.835143, 2009.
Bhawar, R., Di Girolamo, P., Summa, D., Flamant, C., Al-
thausen, D., Behrendt, A., Kiemle, C., Bosser, P., Cacciani, M.,
Champollion, C., Di Iorio, T., Engelmann, R., Herold, C.,
Müller, D., Pal, S., Wirth, M., and Wulfmeyer, V.: The water
vapour intercomparison effort in the framework of the convec-
tive and orographically-induced precipitation study: airborne-to-
ground-based and airborne-to-airborne lidar systems, Q. J. Roy.
Meteor. Soc., 137, 345–348, doi:10.1002/qj.697, 2011.
Bock, O., Bosser, P., Bourcy, T., David, L., Goutail, F., Hoareau, C.,
Keckhut, P., Legain, D., Pazmino, A., Pelon, J., Pipis, K., Pou-
jol, G., Sarkissian, A., Thom, C., Tournois, G., and Tzanos, D.:
Accuracy assessment of water vapour measurements from in
situ and remote sensing techniques during the DEMEVAP
2011 campaign at OHP, Atmos. Meas. Tech., 6, 2777–2802,
doi:10.5194/amt-6-2777-2013, 2013.
Boylan, J. W. and Russell, A. G.: PM and light extinction
model performance metrics, goals, and criteria for three-
dimensional air quality models, Atmos. Environ., 40, 4946–
4959, doi:10.1016/j.atmosenv.2005.09.087, 2006.
Chazette, P., Marnas, F., and Totems, J.: The mobile Water vapor
Aerosol Raman LIdar and its implication in the framework of the
HyMeX and ChArMEx programs: application to a dust transport
process, Atmos. Meas. Tech., 7, 1629–1647, doi:10.5194/amt-7-
1629-2014, 2014a.
Chazette, P., Marnas, F., Totems, J., and Shang, X.: Comparison of
IASI water vapor retrieval with H2O-Raman lidar in the frame-
work of the Mediterranean HyMeX and ChArMEx programs,
Atmos. Chem. Phys., 14, 9583–9596, doi:10.5194/acp-14-9583-
2014, 2014b.
Chazette, P., Flamant, C., Raut, J.-C., Totems, J., and Shang, X.:
Tropical moisture enriched storm tracks over the Mediterranean
Atmos. Meas. Tech., 9, 1083–1094, 2016 www.atmos-meas-tech.net/9/1083/2016/
Julien Totems and Patrick Chazette: Calibration of a water vapour Raman lidar 1093
and their link with intense rainfall in the Cevennes-Vivarais area
during HyMeX, Q. J. Roz. Meteor. Soc., doi:10.1002/qj.2674,
online first, 2015a.
Chazette, P., Flamant, C., Shang, X., Totems, J., Raut, J.-C., Do-
erenbecher, A., Ducrocq, V., Fourrié, N., Bock, O. and Cloché,
S.: A multi-instrument and multi-model assessment of atmo-
spheric moisture variability over the Western Mediterranean dur-
ing HyMeX, Q. J. Roz. Meteor. Soc., doi:10.1002/qj.2671, online
first, 2015b.
Davidson, K. L., Guest, P. S., Mabey, D. L., Frederickson, P. A.,
Anderson, K. D., Doss-Hammel, S. M., and Tsintikidis, D.: The
use of kite observations to study air–sea interaction-controlled
atmospheric surface layer profiles during the RED experiment,
in: 12th Conference on Interactions of the Sea and Atmosphere,
vol. 1, available at: http://calhoun.nps.edu/public/handle/10945/
41312 (last access: 19 September 2014), 2003.
Di Girolamo, P., Summa, D., Lin, R.-F., Maestri, T., Rizzi, R., and
Masiello, G.: UV Raman lidar measurements of relative humid-
ity for the characterization of cirrus cloud microphysical prop-
erties, Atmos. Chem. Phys., 9, 8799–8811, doi:10.5194/acp-9-
8799-2009, 2009.
Dionisi, D., Keckhut, P., Courcoux, Y., Hauchecorne, A.,
Porteneuve, J., Baray, J. L., Leclair de Bellevue, J., Vérèmes, H.,
Gabarrot, F., Payen, G., Decoupes, R., and Cammas, J. P.: Wa-
ter vapor observations up to the lower stratosphere through the
Raman lidar during the Maïdo Lidar Calibration Campaign, At-
mos. Meas. Tech., 8, 1425–1445, doi:10.5194/amt-8-1425-2015,
2015.
Draxler, R. R. and Rolph, G. D.: HYSPLIT (HYbrid Single-Particle
Lagrangian Integrated Trajectory) Model access via NOAA ARL
READY Website, NOAA Air Resour. Lab. Silver Spring, MD,
available at: http://ready.arl.noaa.gov/HYSPLIT.php, last access:
20 August, 2015.
Drobinski, P., Ducrocq, V., Alpert, P., Anagnostou, E., Béranger, K.,
Borga, M., Braud, I., Chanzy, A., Davolio, S., Delrieu, G., Es-
tournel, C., Boubrahmi, N. F., Font, J., Grubišic, V., Gualdi, S.,
Homar, V., Ivancan-Picek, B., Kottmeier, C., Kotroni, V., Lagou-
vardos, K., Lionello, P., Llasat, M. C., Ludwig, W., Lutoff, C.,
Mariotti, A., Richard, E., Romero, R., Rotunno, R., Roussot, O.,
Ruin, I., Somot, S., Taupier-Letage, I., Tintore, J., Uijlenhoet, R.,
and Wernli, H.: HyMeX: A 10-year multidisciplinary program
on the mediterranean water cycle, B. Am. Meteorol. Soc., 95,
1063–1082, doi:10.1175/BAMS-D-12-00242.1, 2014.
Ducrocq, V., Braud, I., Davolio, S., Ferretti, R., Flamant, C.,
Jansa, A., Kalthoff, N., Richard, E., Taupier-Letage, I., Ayral, P.-
A., Belamari, S., Berne, A., Borga, M., Boudevillain, B.,
Bock, O., Boichard, J.-L., Bouin, M.-N., Bousquet, O., Bou-
vier, C., Chiggiato, J., Cimini, D., Corsmeier, U., Coppola, L.,
Cocquerez, P., Defer, E., Delanoë, J., Di Girolamo, P., Do-
erenbecher, A., Drobinski, P., Dufournet, Y., Fourrié, N., Gour-
ley, J. J., Labatut, L., Lambert, D., Le Coz, J., Marzano, F. S.,
Molinié, G., Montani, A., Nord, G., Nuret, M., Ramage, K.,
Risøn, W., Roussot, O., Said, F., Schwarzenboeck, A., Testor, P.,
Van Baelen, J., Vincendon, B., Aran, M., and Tamayo, J.:
HyMeX-SOP1: the field campaign dedicated to heavy precipi-
tation and flash flooding in the northwestern Mediterranean, B.
Am. Meteorol. Soc., 95, 1083–1100, doi:10.1175/BAMS-D-12-
00244.1, 2014.
Estellés, V., Martínez-Lozano, J. A., Utrillas, M. P., and Campan-
elli, M.: Columnar aerosol properties in Valencia (Spain) by
ground-based Sun photometry, J. Geophys. Res., 112, D11201,
doi:10.1029/2006JD008167, 2007.
Fischer, L., Craig, G. C., and Kiemle, C.: Horizontal structure func-
tion and vertical correlation analysis of mesoscale water vapour
variability observed by airborne lidar, J. Geophys. Res. Atmos.,
118, 7579–7590, doi:10.1002/jgrd.50588, 2013.
Foth, A., Baars, H., Di Girolamo, P., and Pospichal, B.: Water
vapour profiles from Raman lidar automatically calibrated by mi-
crowave radiometer data during HOPE, Atmos. Chem. Phys., 15,
7753–7763, doi:10.5194/acp-15-7753-2015, 2015.
Gao, B.-C. and Kaufman, Y. J.: Water vapour retrievals using
Moderate Resolution Imaging Spectroradiometer (MODIS)
near-infrared channels, J. Geophys. Res., 108, 4389,
doi:10.1029/2002JD003023, 2003.
Haywood, J. M., Roberts, D. L., Slingo, A., Edwards, J. M., and
Shine, K. P.: General Circulation Model Calculations of the Di-
rect Radiative Forcing by Anthropogenic Sulfate and Fossil-Fuel
Soot Aerosol, J. Climate, 10, 1562–1577, doi:10.1175/1520-
0442(1997)010<1562:GCMCOT>2.0.CO;2, 1997.
IPCC: Climate Change 2014: Impacts, Adaptation, and Vulnerabil-
ity. Part A: Global and Sectoral Aspects, Contribution of Work-
ing Group II to the Fifth Assessment Report of the Intergov-
ernmental Panel on Climate Change, edited by: C. B. Field,
V. R. Barros, D. J. Dokken, K. J. Mach, M. D. Mastrandrea,
T. E. Bili, M. Chatterjee, K. L. Ebi, Y. O. Estrada, R. C. Genova,
B. Girma, E. S. Kissel, A. N. Levy, S. MacCracken, P. R. Mas-
trandrea, and L. L. White, Cambridge University Press, Cam-
bridge, UK and New York, NY, USA, 2014.
Kulmala, M.: Condensational Growth and Evaporation in the
Transition Regime, Aerosol Sci. Technol., 19, 381–388,
doi:10.1080/02786829308959645, 1993.
Leblanc, T. and McDermid, I. S.: Accuracy of Raman lidar water
vapour calibration and its applicability to long-term measure-
ments., Appl. Optics, 47, 5592–603, 2008.
Liu, Z., Li, M., Zhong, W., and Wong, M. S.: An approach to eval-
uate the absolute accuracy of WVR water vapour measurements
inferred from multiple water vapour techniques, J. Geodyn., 72,
86–94, doi:10.1016/j.jog.2013.09.002, 2013.
Mallet, M., Dulac, F., Formenti, P., Nabat, P., Sciare, J., Roberts,
G., Pelon, J., Ancellet, G., Tanré, D., Parol, F., Denjean, C.,
Brogniez, G., di Sarra, A., Alados-Arboledas, L., Arndt, J., Au-
riol, F., Blarel, L., Bourrianne, T., Chazette, P., Chevaillier, S.,
Claeys, M., D’Anna, B., Derimian, Y., Desboeufs, K., Di Iorio,
T., Doussin, J.-F., Durand, P., Féron, A., Freney, E., Gaimoz, C.,
Goloub, P., Gómez-Amo, J. L., Granados-Muñoz, M. J., Grand,
N., Hamonou, E., Jankowiak, I., Jeannot, M., Léon, J.-F., Maillé,
M., Mailler, S., Meloni, D., Menut, L., Momboisse, G., Nico-
las, J., Podvin, T., Pont, V., Rea, G., Renard, J.-B., Roblou,
L., Schepanski, K., Schwarzenboeck, A., Sellegri, K., Sicard,
M., Solmon, F., Somot, S., Torres, B, Totems, J., Triquet, S.,
Verdier, N., Verwaerde, C., Waquet, F., Wenger, J., and Zapf,
P.: Overview of the Chemistry-Aerosol Mediterranean Exper-
iment/Aerosol Direct Radiative Forcing on the Mediterranean
Climate (ChArMEx/ADRIMED) summer 2013 campaign, At-
mos. Chem. Phys., 16, 455–504, doi:10.5194/acp-16-455-2016,
2016.
www.atmos-meas-tech.net/9/1083/2016/ Atmos. Meas. Tech., 9, 1083–1094, 2016

1094 Julien Totems and Patrick Chazette: Calibration of a water vapour Raman lidar
Martinez-Lozano, J. A., Estelles, V., Molero, F., Gomez-Amo, J. L.,
Utrillas, M. P., Pujadas, M., Fortea, J. C., and Guanter, L.: Atmo-
spheric Components Determination From Ground-Level Mea-
surements During the Spectra Barax Campaigns (SPARC) Field
Campaigns, IEEE Trans. Geosci. Remote Sens., 45, 2778–2793,
doi:10.1109/TGRS.2007.902295, 2007.
Mavromatakis, F., Gueymard, C. A., and Franghiadakis, Y.: Tech-
nical Note: Improved total atmospheric water vapour amount de-
termination from near-infrared filter measurements with sun pho-
tometers, Atmos. Chem. Phys., 7, 4613–4623, doi:10.5194/acp-
7-4613-2007, 2007.
Melfi, S. H., Whiteman, D., and Ferrare, R.: Observation of
Atmospheric Fronts Using Raman Lidar Moisture Measure-
ments, J. Appl. Meteorol., 28, 789–806, doi:10.1175/1520-
0450(1989)028<0789:OOAFUR>2.0.CO;2, 1989.
Ortiz de Galisteo, J. P., Toledano, C., Cachorro, V., and Torres, B.:
Improvement in PWV estimation from GPS due to the absolute
calibration of antenna phase center variations, GPS Solut., 14,
389–395, doi:10.1007/s10291-010-0163-y, 2010.
Pérez-Ramirez, D., Whiteman, D. N., Smirnov, A., Lyamani, H.,
Holben, B. N., Pinker, R., Andrade, M., and Alados-
Arboledas, L.: Evaluation of AERONET precipitable wa-
ter vapour vs. micro-wave radiometry, GPS, and radioson-
des at ARM sites, J. Geophys. Res. Atmos., 119, 9596–9613,
doi:10.1002/2014JD021730, 2014.
Randriamiarisoa, H., Chazette, P., Couvert, P., Sanak, J., and
Mégie, G.: Relative humidity impact on aerosol parameters in
a Paris suburban area, Atmos. Chem. Phys., 6, 1389–1407,
doi:10.5194/acp-6-1389-2006, 2006.
Reiche, M., Funk, R., Zhang, Z., and Hoffmann, C.: Using a parafoil
kite for measurement of variations in particulate matter – a kite-
based dust profiling approach, Atmos. Clim. Sci., 2, 41–51,
doi:10.4236/acs.2012.21006, 2012.
Rood, M. J., Covert, D. S., and Larson, T. V.: Hygroscopic proper-
ties of atmospheric aerosol in Riverside, California, Tellus B, 39,
383–397, doi:10.1111/j.1600-0889.1987.tb00201.x, 1987.
Schmid, B., Michalsky, J. J., Slater, D. W., Barnard, J. C.,
Halthore, R. N., Liljegren, J. C., Holben, B. N., Eck, T. F., Liv-
ingston, J. M., Russell, P. B., Ingold, T., and Slutsker, I.:
Comparison of columnar water-vapour measurements
from solar transmittance methods, Appl. Optics, 40, 1886,
doi:10.1364/AO.40.001886, 2001.
Sherlock, V., Garnier, A., Hauchecorne, A., and Keckhut, P.: Im-
plementation and validation of a Raman lidar measurement of
middle and upper tropospheric water vapour, Appl. Optics, 38,
5838, doi:10.1364/AO.38.005838, 1999a.
Sherlock, V., Hauchecorne, A., and Lenoble, J.: Methodol-
ogy for the independent calibration of Raman backscat-
ter water-vapour lidar systems., Appl. Optics, 38, 5816–37,
doi:10.1364/AO.38.005838, 1999b.
Torres, B., Cachorro, V. E., Toledano, C., Ortiz de Galisteo, J.
P., Berjón, A., de Frutos, A. M., Bennouna, Y., and Laulainen,
N.: Precipitable water vapor characterization in the Gulf of
Cadiz region (southwestern Spain) based on Sun photometer,
GPS, and radiosonde data, J. Geophys. Res., 115, D18103,
doi:10.1029/2009JD012724, 2009.
Turner, D. D., Whiteman, D. N., Evans, K. D., Melfi, S. H., Gold-
smith, J. E. M., and Schwemmer, G. K.: Water vapour measure-
ments by Raman lidar during the ARM 1997 Water Vapour In-
tensive Observation Period, in: IGARSS’98. Sensing and Man-
aging the Environment, 1998 IEEE International Geoscience and
Remote Sensing, Symposium Proceedings, vol. 4, 2155–2157,
1998.
Weckwerth, T. M., Wulfmeyer, V., Wakimoto, R. M., Hard-
esty, R. M., Wilson, J. W., and Banta, R. M.: NCAR–
NOAA lower-tropospheric water vapour workshop, B.
Am. Meteorol. Soc., 80, 2339–2357, doi:10.1175/1520-
0477(1999)080<2339:NNLTWV>2.0.CO;2, 1999.
Weckwerth, T. M., Parsons, D. B., Koch, S. E., Moore, J. a.,
LeMone, M. a., Demoz, B. B., Flamant, C., Geerts, B., Wang, J.,
and Feltz, W. F.: An overview of the international H2O project
(IHOP_2002) and some preliminary highlights, B. Am. Meteo-
rol. Soc., 85, 253–277, doi:10.1175/BAMS-85-2-253, 2004.
Whiteman, D. N., Melfi, S., and Ferrare, R.: Raman lidar
system for the measurement of water vapour and aerosols
in the Earth’s atmosphere, Appl. Optics, 31, 3068–82,
doi:10.1364/AO.31.003068, 1992.
Whiteman, D. N., Demoz, B., Schwemmer, G., Gentry, B., Di Giro-
lamo, P., Sabatino, D., Comer, J., Veselovskii, I., Evans, K.,
Lin, R.-F., Wang, Z., Behrendt, A., Wulfmeyer, V., Browell, E.,
Ferrare, R., Ismail, S., and Wang, J.: Raman lidar measurements
during the international H2O project. Part I: Instrumentation
and analysis techniques, J. Atmos. Ocean. Tech., 23, 157–169,
doi:10.1175/JTECH1839.1, 2006a.
Whiteman, D. N., Demoz, B., Schwemmer, G., Gentry, B., Di Giro-
lamo, P., Sabatino, D., Comer, J., Veselovskii, I., Evans, K.,
Lin, R.-F., Wang, Z., Behrendt, A., Wulfmeyer, V., Browell, E.,
Ferrare, R., Ismail, S., and Wang, J.: Raman lidar measurements
during the international H2O project. Part II: Case studies, J.
Atmos. Ocean. Tech., 23, 170–183, doi:10.1175/JTECH1839.1,
2006b.
Whiteman, D. N., Venable, D., and Landulfo, E.: Comments on
“Accuracy of Raman lidar water vapour calibration and its ap-
plicability to long-term measurements,” Appl. Optics, 50, 2170–
2176 (author reply 2177–2178), doi:10.1364/AO.50.002170,
2011.
Willitsford, A. and Philbrick, C. R.: Lidar description of the evap-
ourative duct in ocean environments, in: Proc. SPIE Vol. 5885,
Remote Sensing of the Coastal Oceanic Environment, edited
by: R. J. Frouin, M. Babin, and S. Sathyendranath, 58850G,
doi:10.1117/12.620948, 2005.
Wulfmeyer, V., Behrendt, A., Kottmeier, C., Corsmeier, U.,
Barthlott, C., Craig, G. C., Hagen, M., Althausen, D.,
Aoshima, F., Arpagaus, M., Bauer, H.-S., Bennett, L., Blyth, A.,
Brandau, C., Champollion, C., Crewell, S., Dick, G., Di Giro-
lamo, P., Dorninger, M., Dufournet, Y., Eigenmann, R., Engel-
mann, R., Flamant, C., Foken, T., Gorgas, T., Grzeschik, M.,
Handwerker, J., Hauck, C., Höller, H., Junkermann, W.,
Kalthoff, N., Kiemle, C., Klink, S., König, M., Krauss, L.,
Long, C. N., Madonna, F., Mobbs, S., Neininger, B., Pal, S.,
Peters, G., Pigeon, G., Richard, E., Rotach, M. W., Russchen-
berg, H., Schwitalla, T., Smith, V., Steinacker, R., Trentmann, J.,
Turner, D. D., van Baelen, J., Vogt, S., Volkert, H., Weckw-
erth, T., Wernli, H., Wieser, A., and Wirth, M.: The convective
and orographically-induced precipitation study (COPS): the sci-
entific strategy, the field phase, and research highlights, Q. J. Roy.
Meteor. Soc., 137, 3–30, doi:10.1002/qj.752, 2011.
Atmos. Meas. Tech., 9, 1083–1094, 2016 www.atmos-meas-tech.net/9/1083/2016/
![[The Stellar Ensemble com] The Kite Runner - Khaled Hosseini](https://static.fdokumen.com/doc/165x107/6345cb7c03a48733920b865d/the-stellar-ensemble-com-the-kite-runner-khaled-hosseini.jpg)