LiDAR Surveys and Flood Mapping of Iraan River
149
-
Upload
khangminh22 -
Category
Documents
-
view
0 -
download
0
Transcript of LiDAR Surveys and Flood Mapping of Iraan River

1
LiDAR Surveys and Flood Mapping of Iraan River

2
Hazard Mapping of the Philippines Using LIDAR (Phil-LIDAR 1)

LiDAR Surveys and Flood Mapping of Iraan River
© University of the Philippines Diliman and University of the Philippines Los Baños 2017
Published by the UP Training Center for Applied Geodesy and Photogrammetry (TCAGP) College of Engineering University of the Philippines – Diliman Quezon City 1101 PHILIPPINES
This research project is supported by the Department of Science and Technology (DOST) as part of its Grants-in-Aid Program and is to be cited as:
E.C. Paringit and E.R. Abucay (eds.) (2017), LiDAR Surveys and Flood Mapping of Iraan River, Quezon City: University of the Philippines Training Center for Applied Geodesy and Photogrammetry — 148pp
The text of this information may be copied and distributed for research and educational purposes with proper acknowledgement. While every care is taken to ensure the accuracy of this publication, the UP TCAGP disclaims all responsibility and all liability (including without limitation, liability in negligence) and costs which might incur as a result of the materials in this publication being inaccurate or incomplete in any way and for any reason.
For questions/queries regarding this report, contact:
Asst. Prof. Edwin R. Abucay Project Leader, Phil-LiDAR 1 ProgramUniversity of the Philippines, Los BanosLos Banos, Laguna, Philippines 4031E-mail: [email protected]
Enrico C. Paringit, Dr. Eng. Program Leader, Phil-LIDAR 1 Program University of the Philippines Diliman Quezon City, Philippines 1101 E-mail: [email protected]
National Library of the PhilippinesISBN: 978-621-430-138-6
i

Hazard Mapping of the Philippines Using LIDAR (Phil-LIDAR 1)
ii

LiDAR Surveys and Flood Mapping of Iraan River
LIST OF TABLES.....................................................................................................................................vLIST OF FIGURES.................................................................................................................................viiLIST OF ACRONYMS AND ABBREVIATIONS.........................................................................................x
CHAPTER 1: OVERVIEW OF THE PROGRAM AND IRAAN RIVER..........................................................11.1 Background of the Phil-LiDAR 1 Program.......................................................................................11.2 Overview of the Iraan River Basin..................................................................................................1
CHAPTER 2: LIDAR DATA ACQUISITION OF THE IRAAN FLOODPLAIN.................................................32.1 Flight Plans.....................................................................................................................................32.2 Ground Base Stations.....................................................................................................................52.3 Flight Missions.............................................................................................................................102.4 Survey Coverage...........................................................................................................................11
CHAPTER 3: LIDAR DATA PROCESSING OF THE IRAAN FLOODPLAIN................................................133.1 Overview of the LiDAR Data Pre-Processing................................................................................133.2 Transmittal of Acquired LiDAR Data.............................................................................................143.3 Trajectory Computation...............................................................................................................143.4 LiDAR Point Cloud Computation..................................................................................................163.5 LiDAR Data Quality Checking.......................................................................................................173.6 LiDAR Point Cloud Classification and Rasterization......................................................................213.7 LiDAR Image Processing and Orthophotograph Rectification......................................................233.8 DEM Editing and Hydro-Correction..............................................................................................253.9 Mosaicking of Blocks....................................................................................................................273.10 Calibration and Validation of Mosaicked LiDAR Digital Elevation Model (DEM)........................293.11 Integration of Bathymetric Data into the LiDAR Digital Terrain Model......................................33
CHAPTER 4: LIDAR VALIDATION SURVEY AND MEASUREMENTS OF THE IRAAN RIVER BASIN.......344.1 Summary of Activities..................................................................................................................344.2 Control Survey..............................................................................................................................364.3 Baseline Processing......................................................................................................................414.5 Cross-section and Bridge As-Built survey and Water Level Marking............................................454.6 Validation Points Acquisition Survey............................................................................................524.7 River Bathymetric Survey.............................................................................................................54
CHAPTER 5: FLOOD MODELING AND MAPPING................................................................................585.1 Data Used for Hydrologic Modeling.............................................................................................58 5.1.1 Hydrometry and Rating Curves........................................................................................58 5.1.2 Precipitation.....................................................................................................................58 5.1.3 Rating Curves and River Outflow......................................................................................595.2 RIDF Station.................................................................................................................................605.3 HMS Model..................................................................................................................................625.4 Cross-section Data.......................................................................................................................675.5 Flo 2D Model...............................................................................................................................685.6 Results of HMS Calibration..........................................................................................................695.7 Calculated outflow hydrographs and discharge values for different rainfall return periods........71
5.7.1 Hydrograph using the Rainfall Runoff Model ................................................................ 715.8 River Analysis (RAS) Model Simulation........................................................................................725.9 Flow Depth and Flood Hazard......................................................................................................735.10 Inventory of Areas Exposed to Flooding....................................................................................805.11 Flood Validation.........................................................................................................................83
REFERENCES.......................................................................................................................................85
ANNEXES............................................................................................................................................86Annex 1. Technical Specification of the Pegasus Sensor ...................................................................86Annex 2. NAMRIA Certificates of Reference Points Used..................................................................87Annex 3. Baseline Processing Reports of Reference Points Used......................................................89Annex 4. LiDAR Survey Team Composition........................................................................................95Annex 5. Data Transfer Sheet for Iraan Floodplain Flights.................................................................96
TABLE OF CONTENTS
iii

Hazard Mapping of the Philippines Using LIDAR (Phil-LIDAR 1)
Annex 6. Flight Logs for the Flight Missions .................................................................................... .97Annex 7. Flight Status Reports.........................................................................................................102Annex 8. Mission Summary Reports................................................................................................108Annex 9. Iraan Model Basin Parameters ................................................................................ 128Annex 10. Iraan Model Reach Parameters ..................................................................................... 130Annex 11. Iraan Field Validation Points............................................................................................132Annex 12. Phil-LiDAR 1 UPLB Team Composition.............................................................................137
iv
LiDAR Surveys and Flood Mapping of Iraan River
LIST OF TABLES
Table 1. Parameters used in Pegasus LiDAR System during Flight Acquisition...............................................3
Table 2. Details of the recovered NAMRIA horizontal control point PLW-121 used as base station for the LiDAR Acquisition...............................................................................6
Table 3. Details of the recovered NAMRIA horizontal control point PLW-137 used as base station for the LiDAR Acquisition...............................................................................7
Table 4. Details of the established horizontal control point BLLM-1A used as base station for the LiDAR Acquisition...............................................................................8
Table 5. Details of the established horizontal control point QZT-1 used as base station for the LiDAR Acquisition...............................................................................8
Table 6. Details of established horizontal control point QZT-2 used as base station for the LiDAR Acquisition...............................................................................9
Table 7. Ground control points that were used during the LiDAR data acquisition.......................................9
Table 8. Flight missions for the LiDAR data acquisition of the Iraan Floodplain...........................................10
Table 9. Actual parameters used during the LiDAR data acquisition of the Iraan Floodplain......................10
Table 10. List of municipalities and cities surveyed during Iraan Floodplain LiDAR survey..........................11
Table 11. Self-Calibration Results values for Iraan flights.............................................................................16
Table 12. List of LiDAR blocks for Iraan Floodplain.......................................................................................17
Table 13. Iraan classification results in TerraScan.........................................................................................21
Table 14. LiDAR blocks with its corresponding areas...................................................................................25
Table 15. Shift values of each LiDAR block of Iraan Floodplain....................................................................27
Table 16. Calibration Statistical Measures....................................................................................................31
Table 17. Validation Statistical Measures.....................................................................................................32
Table 18. List of Reference and Control Points occupied for Iraan River Survey..........................................37
Table 19. Baseline Processing Report for Iraan River Static Survey .............................................................41
Table 20. Constraints applied to the adjustment of the control points.......................................................42
Table 21. Adjusted grid coordinates for the control points used in the Iraan River Floodplain survey........42
Table 22. Adjusted geodetic coordinates for control points used in the Iraan River Floodplain validation.43
Table 23. The reference and control points utilized in the Iraan River Static Survey, with their corresponding locations.............................................................................................44
Table 24. RIDF values for Puerto Princesa Rain Gauge computed by PAGASA.............................................60
Table 25. Range of Calibrated Values for Iraan River Basin..........................................................................69
Table 26. Summary of the Efficiency Test of the Iraan HMS Model.............................................................70
Table 27. Peak values of the Iraan HECHMS Model outflow using the Puerto Princesa RIDF......................72
Table 28. Municipalities affected in Iraan Floodplain...................................................................................73
Table 29. Affected Areas in Rizal, Palawan during 5-Year Rainfall Return Period.........................................80
Table 30. Affected Areas in Rizal, Palawan during 25-Year Rainfall Return Period.......................................81
Table 31. Affected Areas in Rizal, Palawan during 100-Year Rainfall Return Period.....................................82
Table 32. Actual flood vs simulated flood depth at different levels in the Iraan River Basin.......................84
Table 33. The summary of the Accuracy Assessment in the Iraan River Basin Survey.................................84
v

Hazard Mapping of the Philippines Using LIDAR (Phil-LIDAR 1)
vi
LiDAR Surveys and Flood Mapping of Iraan River
LIST OF FIGURES
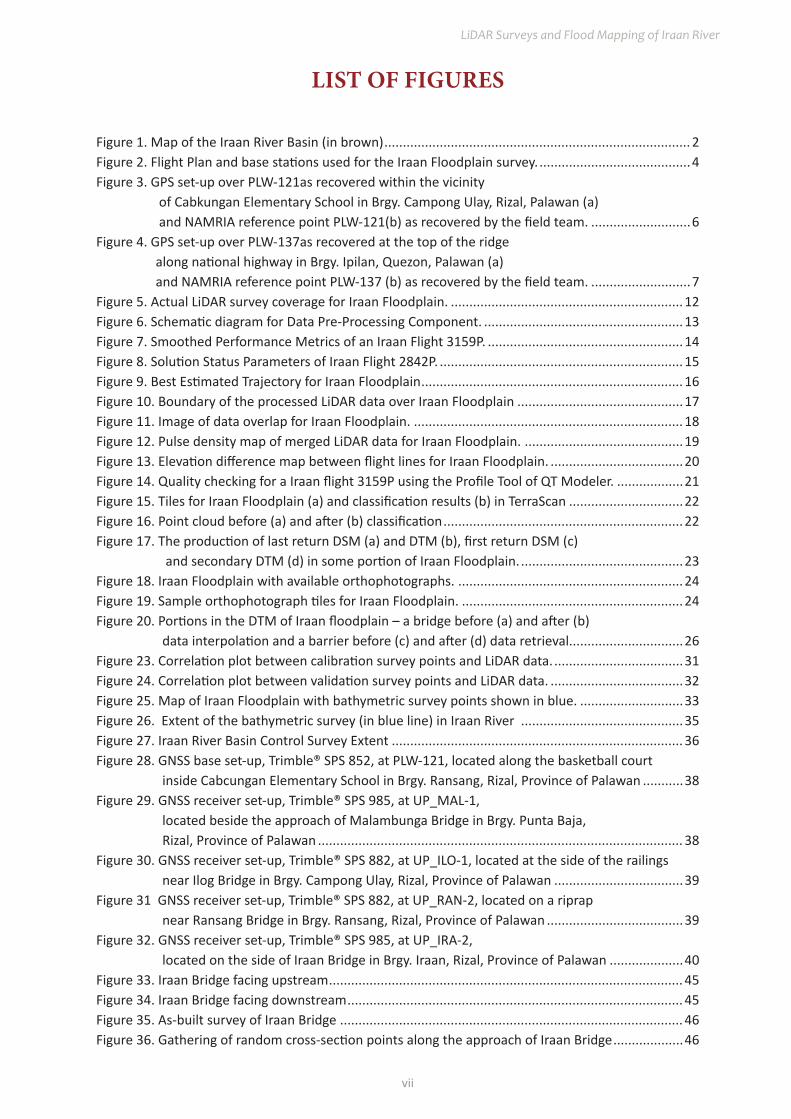
Figure 1. Map of the Iraan River Basin (in brown) ................................................................................... 2Figure 2. Flight Plan and base stations used for the Iraan Floodplain survey. .........................................4Figure 3. GPS set-up over PLW-121as recovered within the vicinity of Cabkungan Elementary School in Brgy. Campong Ulay, Rizal, Palawan (a) and NAMRIA reference point PLW-121(b) as recovered by the field team. ...........................6Figure 4. GPS set-up over PLW-137as recovered at the top of the ridge along national highway in Brgy. Ipilan, Quezon, Palawan (a) and NAMRIA reference point PLW-137 (b) as recovered by the field team. ...........................7Figure 5. Actual LiDAR survey coverage for Iraan Floodplain. ...............................................................12Figure 6. Schematic diagram for Data Pre-Processing Component. ......................................................13Figure 7. Smoothed Performance Metrics of an Iraan Flight 3159P. .....................................................14Figure 8. Solution Status Parameters of Iraan Flight 2842P. ..................................................................15Figure 9. Best Estimated Trajectory for Iraan Floodplain .......................................................................16Figure 10. Boundary of the processed LiDAR data over Iraan Floodplain .............................................17Figure 11. Image of data overlap for Iraan Floodplain. .........................................................................18Figure 12. Pulse density map of merged LiDAR data for Iraan Floodplain. ...........................................19Figure 13. Elevation difference map between flight lines for Iraan Floodplain. ....................................20Figure 14. Quality checking for a Iraan flight 3159P using the Profile Tool of QT Modeler. ..................21Figure 15. Tiles for Iraan Floodplain (a) and classification results (b) in TerraScan ...............................22Figure 16. Point cloud before (a) and after (b) classification .................................................................22Figure 17. The production of last return DSM (a) and DTM (b), first return DSM (c) and secondary DTM (d) in some portion of Iraan Floodplain. ............................................23Figure 18. Iraan Floodplain with available orthophotographs. .............................................................24Figure 19. Sample orthophotograph tiles for Iraan Floodplain. ............................................................24Figure 20. Portions in the DTM of Iraan floodplain – a bridge before (a) and after (b) data interpolation and a barrier before (c) and after (d) data retrieval...............................26Figure 23. Correlation plot between calibration survey points and LiDAR data. ...................................31Figure 24. Correlation plot between validation survey points and LiDAR data. ....................................32Figure 25. Map of Iraan Floodplain with bathymetric survey points shown in blue. ............................33Figure 26. Extent of the bathymetric survey (in blue line) in Iraan River ............................................35Figure 27. Iraan River Basin Control Survey Extent ............................................................................... 36Figure 28. GNSS base set-up, Trimble® SPS 852, at PLW-121, located along the basketball court inside Cabcungan Elementary School in Brgy. Ransang, Rizal, Province of Palawan ...........38Figure 29. GNSS receiver set-up, Trimble® SPS 985, at UP_MAL-1, located beside the approach of Malambunga Bridge in Brgy. Punta Baja, Rizal, Province of Palawan ................................................................................................... 38Figure 30. GNSS receiver set-up, Trimble® SPS 882, at UP_ILO-1, located at the side of the railings near Ilog Bridge in Brgy. Campong Ulay, Rizal, Province of Palawan ...................................39Figure 31 GNSS receiver set-up, Trimble® SPS 882, at UP_RAN-2, located on a riprap near Ransang Bridge in Brgy. Ransang, Rizal, Province of Palawan .....................................39Figure 32. GNSS receiver set-up, Trimble® SPS 985, at UP_IRA-2, located on the side of Iraan Bridge in Brgy. Iraan, Rizal, Province of Palawan ....................40Figure 33. Iraan Bridge facing upstream ................................................................................................ 45Figure 34. Iraan Bridge facing downstream ........................................................................................... 45Figure 35. As-built survey of Iraan Bridge ............................................................................................. 46Figure 36. Gathering of random cross-section points along the approach of Iraan Bridge ...................46
vii
Hazard Mapping of the Philippines Using LIDAR (Phil-LIDAR 1)
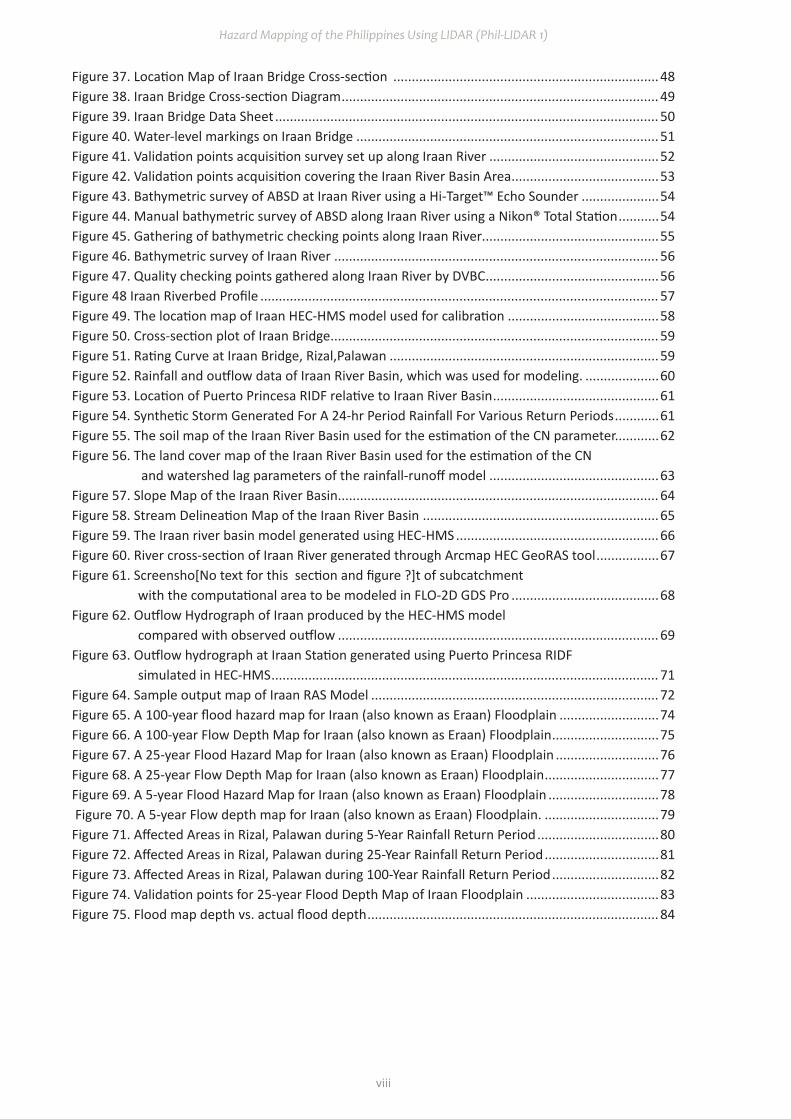
Figure 37. Location Map of Iraan Bridge Cross-section ........................................................................48Figure 38. Iraan Bridge Cross-section Diagram ...................................................................................... 49Figure 39. Iraan Bridge Data Sheet ........................................................................................................ 50Figure 40. Water-level markings on Iraan Bridge .................................................................................. 51Figure 41. Validation points acquisition survey set up along Iraan River ..............................................52Figure 42. Validation points acquisition covering the Iraan River Basin Area ........................................53Figure 43. Bathymetric survey of ABSD at Iraan River using a Hi-Target™ Echo Sounder .....................54Figure 44. Manual bathymetric survey of ABSD along Iraan River using a Nikon® Total Station ...........54Figure 45. Gathering of bathymetric checking points along Iraan River................................................55Figure 46. Bathymetric survey of Iraan River ........................................................................................ 56Figure 47. Quality checking points gathered along Iraan River by DVBC ...............................................56Figure 48 Iraan Riverbed Profile ............................................................................................................ 57Figure 49. The location map of Iraan HEC-HMS model used for calibration .........................................58Figure 50. Cross-section plot of Iraan Bridge ......................................................................................... 59Figure 51. Rating Curve at Iraan Bridge, Rizal,Palawan .........................................................................59Figure 52. Rainfall and outflow data of Iraan River Basin, which was used for modeling. ....................60Figure 53. Location of Puerto Princesa RIDF relative to Iraan River Basin .............................................61Figure 54. Synthetic Storm Generated For A 24-hr Period Rainfall For Various Return Periods ............61Figure 55. The soil map of the Iraan River Basin used for the estimation of the CN parameter............62Figure 56. The land cover map of the Iraan River Basin used for the estimation of the CN and watershed lag parameters of the rainfall-runoff model ..............................................63Figure 57. Slope Map of the Iraan River Basin ....................................................................................... 64Figure 58. Stream Delineation Map of the Iraan River Basin ................................................................65Figure 59. The Iraan river basin model generated using HEC-HMS .......................................................66Figure 60. River cross-section of Iraan River generated through Arcmap HEC GeoRAS tool .................67Figure 61. Screensho[No text for this section and figure ?]t of subcatchment with the computational area to be modeled in FLO-2D GDS Pro ........................................68Figure 62. Outflow Hydrograph of Iraan produced by the HEC-HMS model compared with observed outflow ....................................................................................... 69Figure 63. Outflow hydrograph at Iraan Station generated using Puerto Princesa RIDF simulated in HEC-HMS ......................................................................................................... 71Figure 64. Sample output map of Iraan RAS Model .............................................................................. 72Figure 65. A 100-year flood hazard map for Iraan (also known as Eraan) Floodplain ...........................74Figure 66. A 100-year Flow Depth Map for Iraan (also known as Eraan) Floodplain .............................75Figure 67. A 25-year Flood Hazard Map for Iraan (also known as Eraan) Floodplain ............................76Figure 68. A 25-year Flow Depth Map for Iraan (also known as Eraan) Floodplain ...............................77Figure 69. A 5-year Flood Hazard Map for Iraan (also known as Eraan) Floodplain ..............................78 Figure 70. A 5-year Flow depth map for Iraan (also known as Eraan) Floodplain. ...............................79Figure 71. Affected Areas in Rizal, Palawan during 5-Year Rainfall Return Period .................................80Figure 72. Affected Areas in Rizal, Palawan during 25-Year Rainfall Return Period ...............................81Figure 73. Affected Areas in Rizal, Palawan during 100-Year Rainfall Return Period .............................82Figure 74. Validation points for 25-year Flood Depth Map of Iraan Floodplain ....................................83Figure 75. Flood map depth vs. actual flood depth ............................................................................... 84
viii

LiDAR Surveys and Flood Mapping of Iraan River
ix
Hazard Mapping of the Philippines Using LIDAR (Phil-LIDAR 1)
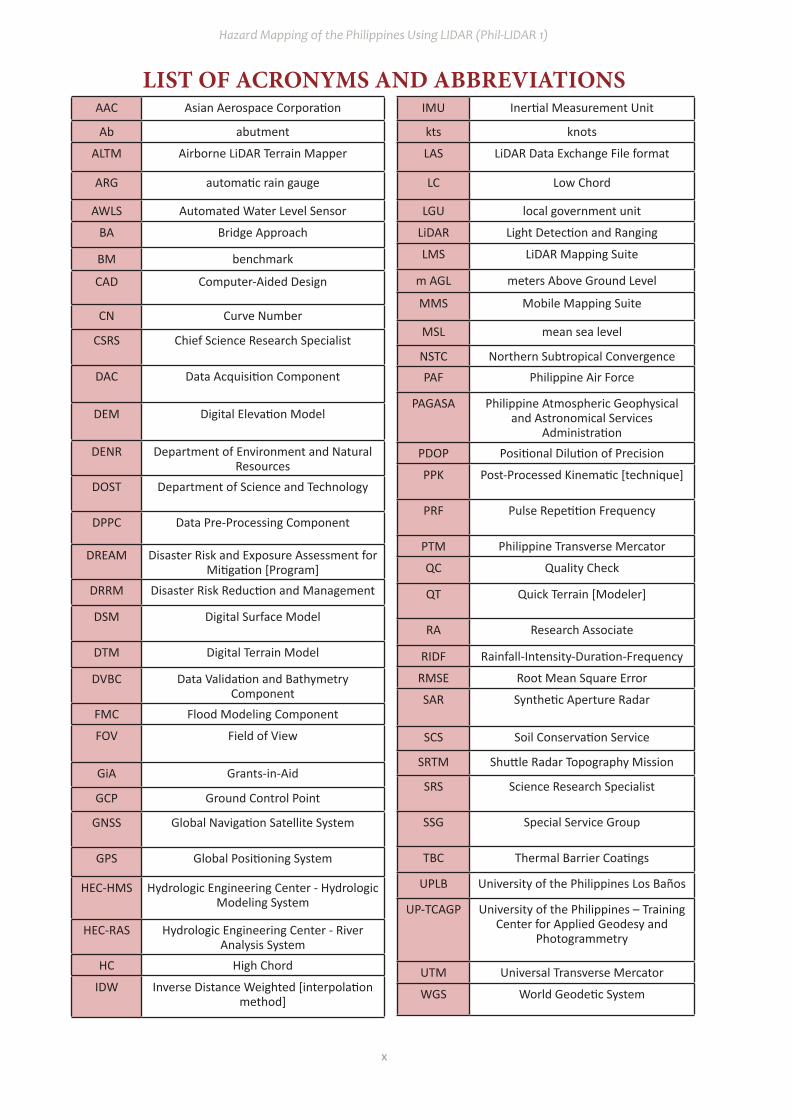
LIST OF ACRONYMS AND ABBREVIATIONSAAC Asian Aerospace Corporation
Ab abutment
ALTM Airborne LiDAR Terrain Mapper
ARG automatic rain gauge
AWLS Automated Water Level Sensor
BA Bridge Approach
BM benchmark
CAD Computer-Aided Design
CN Curve Number
CSRS Chief Science Research Specialist
DAC Data Acquisition Component
DEM Digital Elevation Model
DENR Department of Environment and Natural Resources
DOST Department of Science and Technology
DPPC Data Pre-Processing Component
DREAM Disaster Risk and Exposure Assessment for Mitigation [Program]
DRRM Disaster Risk Reduction and Management
DSM Digital Surface Model
DTM Digital Terrain Model
DVBC Data Validation and Bathymetry Component
FMC Flood Modeling Component
FOV Field of View
GiA Grants-in-Aid
GCP Ground Control Point
GNSS Global Navigation Satellite System
GPS Global Positioning System
HEC-HMS Hydrologic Engineering Center - Hydrologic Modeling System
HEC-RAS Hydrologic Engineering Center - River Analysis System
HC High Chord
IDW Inverse Distance Weighted [interpolation method]
IMU Inertial Measurement Unit
kts knots
LAS LiDAR Data Exchange File format
LC Low Chord
LGU local government unit
LiDAR Light Detection and Ranging
LMS LiDAR Mapping Suite
m AGL meters Above Ground Level
MMS Mobile Mapping Suite
MSL mean sea level
NSTC Northern Subtropical ConvergencePAF Philippine Air Force
PAGASA Philippine Atmospheric Geophysical and Astronomical Services
AdministrationPDOP Positional Dilution of Precision
PPK Post-Processed Kinematic [technique]
PRF Pulse Repetition Frequency
PTM Philippine Transverse Mercator
QC Quality Check
QT Quick Terrain [Modeler]
RA Research Associate
RIDF Rainfall-Intensity-Duration-Frequency
RMSE Root Mean Square Error
SAR Synthetic Aperture Radar
SCS Soil Conservation Service
SRTM Shuttle Radar Topography Mission
SRS Science Research Specialist
SSG Special Service Group
TBC Thermal Barrier Coatings
UPLB University of the Philippines Los Baños
UP-TCAGP University of the Philippines – Training Center for Applied Geodesy and
Photogrammetry
UTM Universal Transverse Mercator
WGS World Geodetic System
x

1
LiDAR Surveys and Flood Mapping of Iraan River
CHAPTER 1: OVERVIEW OF THE PROGRAM AND IRAAN RIVER
Enrico C. Paringit, Dr. Eng., Asst. Prof. Edwin R. Abucay, and Ms. Sandra S. Samantela
1.1 Background of the Phil-LiDAR 1 Program
The University of the Philippines Training Center for Applied Geodesy and Photogrammetry (UP-TCAGP) launched a research program entitled “Nationwide Hazard Mapping using LiDAR” or Phil-LiDAR 1, supported by the Department of Science and Technology (DOST) Grant-in-Aid (GiA) Program. The program was primarily aimed at acquiring a national elevation and resource dataset at sufficient resolution to produce information necessary to support the different phases of disaster management. Particularly, it targeted to operationalize the development of flood hazard models that would produce updated and detailed flood hazard maps for the major river systems in the country.
Also, the program was aimed at producing an up-to-date and detailed national elevation dataset suitable for 1:5,000 scale mapping, with 50 cm and 20 cm horizontal and vertical accuracies, respectively. These accuracies were achieved through the use of the state-of-the-art Light Detection and Ranging (LiDAR) airborne technology procured by the project through DOST.
The implementing partner university for the Phil-LiDAR 1 Program is the University of the Phiippines Los Baños (UPLB). UPLB is in charge of processing LiDAR data and conducting data validation reconnaissance, cross section, bathymetric survey, validation, river flow measurements, flood height and extent data gathering, flood modeling, and flood map generation for the 45 river basins in the MIMAROPA region. The university is located in the municipality of Los Baños in the province of Laguna.
1.2 Overview of the Iraan River Basin
The Iraan River Basin covers two (2) municipalities in Palawan; namely, the municipalities of Rizal and Brooke’s Point. The DENR River Basin Control Office (RBCO) states that the Iraan River Basin has a drainage area of 183 km² and an estimated 293 cubic meter (MCM) annual run-off (RBCO, 2015).
Iraan River Basin is a 157,400-hectare watershed located in Palawan. It covers the barangays of Aribungos, Mainit, Mambalot and Tubtub in the municipality of Brooke’s Point; and Bunog, Iraan and Punta Baja in Rizal. The river basin is generally characterized by >50% slope. Iraan River Basin is comprised of two soil classes. Sibul clay soil type covers the river basin although unclassified area (rough mountainous land) can also be found. The river basin still has good forest cover of closed canopy (mature trees covering >50%). Other land cover types include cultivated area mixed with brushland/ grassland, cropland mixed with coconut plantation, mossy forest and open canopy (mature trees covering <50%).
Its main stem, Iraan River, is part of the forty-five (45) river systems under the PHIL-LIDAR 1 Program partner HEI, University of the Philippines Los Baños. The Iraan River passes through Aribungos, Mainit, Mambalot and Tubtub in Brooke’s Point municipality; and, bunog, Iraan and Punta Baja in Rizal. According to the 2015 national census of PSA, a total of 6,780 persons reside in Brgy. Iraan in the Municipality of Rizal, which is within the immediate vicinity of the river. The economy of Palawan largely rests on agriculture particularly fishing, tourism, trade, commerce, and mineral extraction (Palawan Knowledge Platform for Biodiversity and Sustainable Development, 2007).
Based on the studies conducted by the Mines and Geosciences Bureau, only Iraan has a flood susceptibility range of low to high while other barangays have none. The field surveys conducted by the PHIL-LiDAR 1 validation team showed that a rainfall event in January 2013 caused flooding affecting barangay Iraan. In terms of landslide susceptibility, Punta Baja and and Iraan have a range of low to high risk while other barangays have a range of moderate to high risk. On August 22, 2016, an approximately 1-meter deep flooding incident was reported in Brgy. Iraan in the Municipality of Rizal due to heavy rains as per NDRRMC report (National Disaster Risk Reduction and Management Council, 2016).

2
Hazard Mapping of the Philippines Using LIDAR (Phil-LIDAR 1)
Figure 1. Map of the Iraan River Basin (in brown)
Climate Type I and III prevails in MIMAROPA and Laguna based on the Modified Corona Classification of climate. Type I has two pronounced seasons, dry from November to April, and wet the rest of the year with maximum rain period from June to September. On the other hand, Type III has no very pronounced maximum rain period and with short dry season lasting only from one to three months, during the period from December to February or from March to May.

3
LiDAR Surveys and Flood Mapping of Iraan River
CHAPTER 2: LIDAR DATA ACQUISITION OF THE IRAAN FLOODPLAIN
Engr. Louie P. Balicanta, Engr. Christopher Cruz, Lovely Gracia Acuña, Engr. Gerome Hipolito, Engr. Iro Niel D. Roxas, and Ms. Rowena M. Gabua
The methods applied in this Chapter were based on the DREAM methods manual (Sarmiento, et al., 2014) and further enhanced and updated in Paringit, et al. (2017).
2.1 Flight Plans
Plans were made to acquire LiDAR data within the delineated priority area for Iraan Floodplain in Palawan. These missions were planned for 21 lines and ran for at most four and a half (4.5) hours including take-off, landing and turning time. The flight planning parameters for the LiDAR system is found in Table 1. Figure 1 shows the flight plan for Iraan Floodplain.
Table 1. Parameters used in Pegasus LiDAR System during Flight Acquisition.
1 The explanation of the parameters used are in the volume “LiDAR Surveys and Flood Mapping in the Philippines: Methods.”
Block Name
Flying Height
(m AGL)
Overlap (%)
Field of view (ø)
Pulse Repetition Frequency (PRF)
(kHz)
Scan Frequency
(Hz)
Average Speed (kts)
Average Turn Time
(Minutes)
BLK42J 1200 30 50 200 30 130 5
BLK42L 1200 30 50 200 30 130 5
BLK42M 1200 30 50 200 30 130 5
BLK42N 1200 30 50 200 30 130 5
BLK42O 1200 30 50 200 30 130 5
BLK42P 1200 30 50 200 30 130 5
BLK42S 1200 30 50 200 30 130 5

4
Hazard Mapping of the Philippines Using LIDAR (Phil-LIDAR 1)
Figure 2. Flight Plan and base stations used for the Iraan Floodplain survey.

5
LiDAR Surveys and Flood Mapping of Iraan River
2.2 Ground Base Stations
The project team was able to recover two (2) NAMRIA ground control points: PLW-121 and PLW-137which are of second (2nd) order accuracy order accuracy. The project team also established three (3) ground control points: BLLM-1A, QZT-1 and QZT-2. The certifications for the NAMRIA reference points are found in Annex 2, while the processing reports for the established ground control points are found in Annex 3. These were used as base stations during flight operations for the entire duration of the survey (May 25 to July, 2015). Base stations were observed using dual frequency GPS receivers, TRIMBLE SPS 852 and SPS R8. Flight plans and location of base stations used during the aerial LiDAR acquisition in Iraan Floodplain are shown in Figure 2.
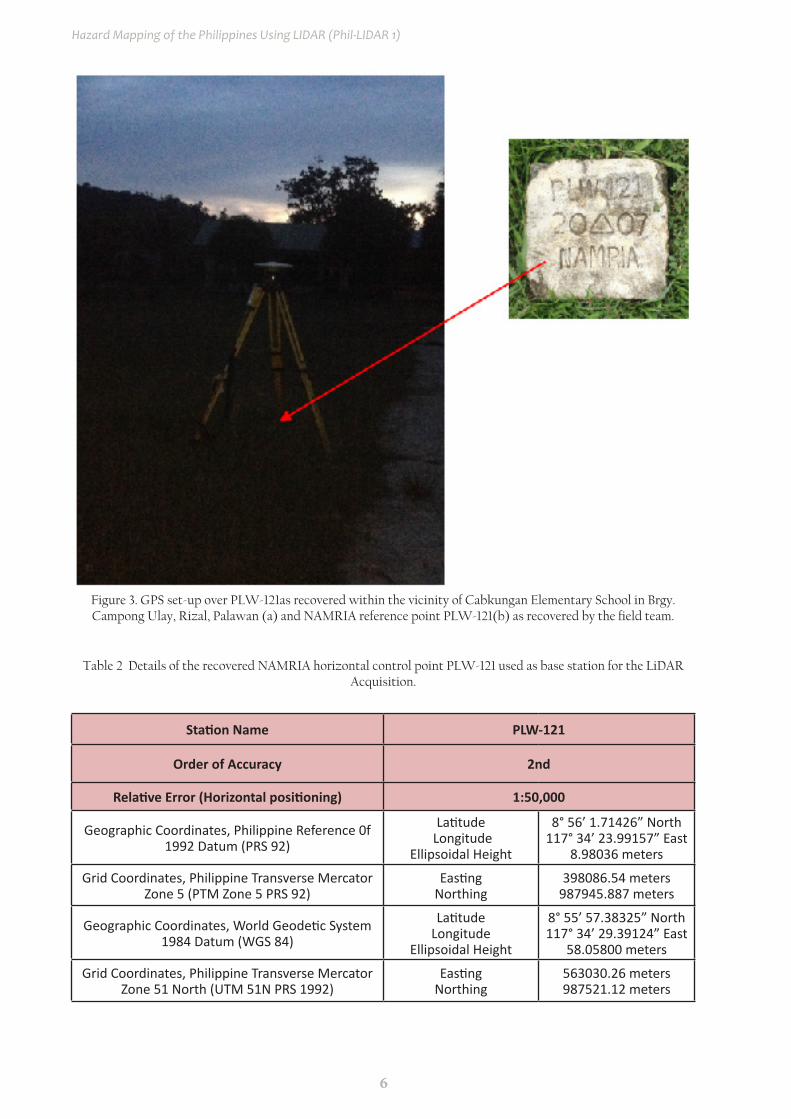
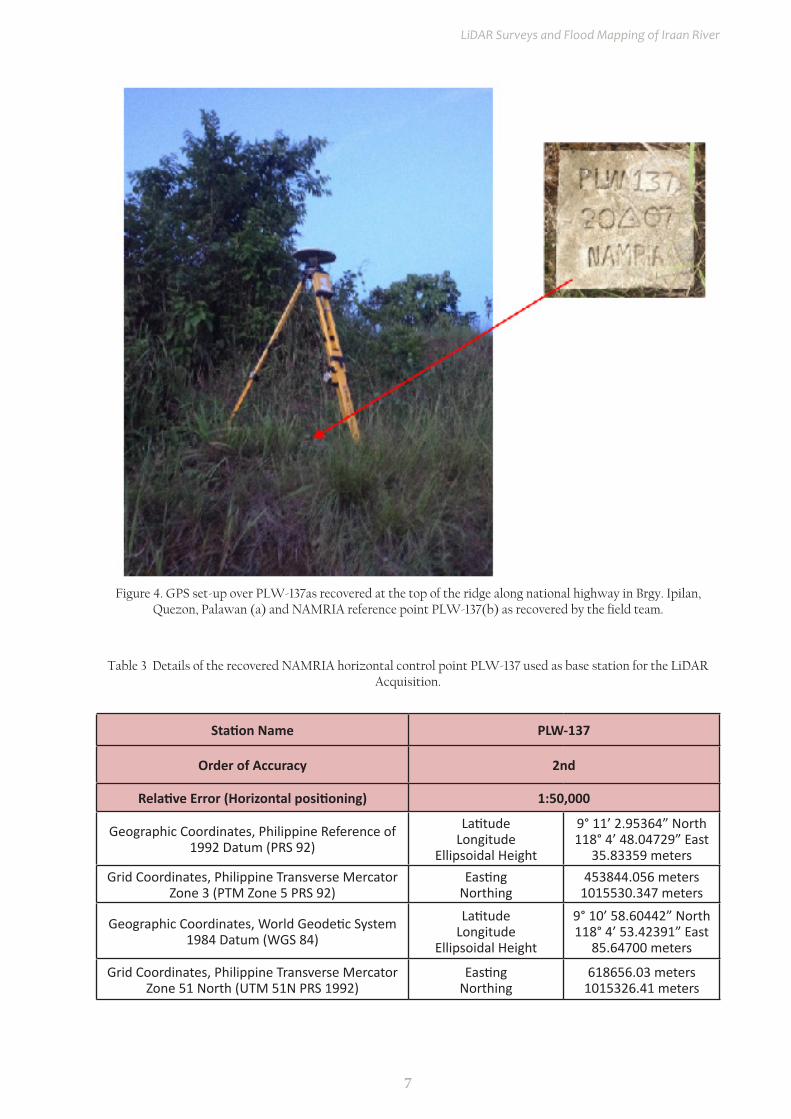
Figure 3 to Figure 4 show the recovered NAMRIA reference points within the area. In addition, Table 2 to Table 6 show the details about the following NAMRIA control stations and established points while Table 7 shows the list of all ground control points occupied during the acquisition together with the corresponding dates of utilization.
6
Hazard Mapping of the Philippines Using LIDAR (Phil-LIDAR 1)
Figure 3. GPS set-up over APA-13 located at the edge of the PCCP, 70m NE of a waiting shed near the barangay hall in Tumog, Municipaity of Luna.
Station Name PLW-121
Order of Accuracy 2nd
Relative Error (Horizontal positioning) 1:50,000
Geographic Coordinates, Philippine Reference 0f 1992 Datum (PRS 92)
Latitude Longitude
Ellipsoidal Height
8° 56’ 1.71426” North117° 34’ 23.99157” East
8.98036 meters
Grid Coordinates, Philippine Transverse Mercator Zone 5 (PTM Zone 5 PRS 92)
EastingNorthing
398086.54 meters987945.887 meters
Geographic Coordinates, World Geodetic System 1984 Datum (WGS 84)
LatitudeLongitude
Ellipsoidal Height
8° 55’ 57.38325” North117° 34’ 29.39124” East
58.05800 meters
Grid Coordinates, Philippine Transverse Mercator Zone 51 North (UTM 51N PRS 1992)
EastingNorthing
563030.26 meters987521.12 meters
Table 2 Details of the recovered NAMRIA horizontal control point PLW-121 used as base station for the LiDAR Acquisition.
Figure 3. GPS set-up over PLW-121as recovered within the vicinity of Cabkungan Elementary School in Brgy. Campong Ulay, Rizal, Palawan (a) and NAMRIA reference point PLW-121(b) as recovered by the field team.
7
LiDAR Surveys and Flood Mapping of Iraan River
Figure 4. GPS set-up over CGY-87 located on a solar dryer at Brgy. Cabayabasan, fronting the barangay hall, in municipality of Lal-lo.
Station Name PLW-137
Order of Accuracy 2nd
Relative Error (Horizontal positioning) 1:50,000
Geographic Coordinates, Philippine Reference of 1992 Datum (PRS 92)
LatitudeLongitude
Ellipsoidal Height
9° 11’ 2.95364” North118° 4’ 48.04729” East
35.83359 metersGrid Coordinates, Philippine Transverse Mercator
Zone 3 (PTM Zone 5 PRS 92)Easting
Northing453844.056 meters
1015530.347 meters
Geographic Coordinates, World Geodetic System 1984 Datum (WGS 84)
LatitudeLongitude
Ellipsoidal Height
9° 10’ 58.60442” North118° 4’ 53.42391” East
85.64700 meters
Grid Coordinates, Philippine Transverse Mercator Zone 51 North (UTM 51N PRS 1992)
EastingNorthing
618656.03 meters1015326.41 meters
Table 3 Details of the recovered NAMRIA horizontal control point PLW-137 used as base station for the LiDAR Acquisition.
Figure 4. GPS set-up over PLW-137as recovered at the top of the ridge along national highway in Brgy. Ipilan, Quezon, Palawan (a) and NAMRIA reference point PLW-137(b) as recovered by the field team.

8
Hazard Mapping of the Philippines Using LIDAR (Phil-LIDAR 1)
Table 5. Details of the established horizontal control point QZT-1 used as base station for the LiDAR Acquisition.
Station Name QZT-1
Order of Accuracy 2nd
Relative Error (horizontal positioning) 1:50,000
Geographic Coordinates, Philippine Reference of 1992 Datum (PRS 92)
LatitudeLongitude
Ellipsoidal Height
9° 10’ 58.89071” North117° 53’ 13.01663” East
9.33800 meters
Geographic Coordinates, World Geodetic System 1984 Datum (WGS 84)
LatitudeLongitude
Ellipsoidal Height
9° 10’ 54.52473” North117° 53’ 18.39361” East
85.64700 metersGrid Coordinates, Universal Transverse Mercator
Zone 51 North (UTM 51N PRS 1992)
EastingNorthing
597443.484 meters1015143.507 meters
Table 4. Details of the established horizontal control point BLLM-1A used as base station for the LiDAR Acquisition.
Station Name BLLM-1A
Order of Accuracy 2nd
Relative Error (horizontal positioning) 1:50,000
Geographic Coordinates, Philippine Reference of 1992 Datum (PRS 92)
LatitudeLongitude
Ellipsoidal Height
9° 02’ 07.68639” North117° 38’ 28.10618” East
-2.0700 meters
Geographic Coordinates, World Geodetic System 1984 Datum (WGS 84)
LatitudeLongitude
Ellipsoidal Height
9° 02’ 03.33580” North117° 38’ 33.49665” East
46.965 meters
Grid Coordinates, Universal Transverse Mercator Zone 51 North
(UTM 51N PRS 1992)
EastingNorthing
570465.682 meters998772.489 meters

9
LiDAR Surveys and Flood Mapping of Iraan River
Table 7. Ground control points that were used during the LiDAR data acquisition.
Date Surveyed Flight Number Mission Name Ground Control Points
11-Jul-15 3157P 1BLK42PO192A PLW-121, BLLM-1A
11-Jul-15 3159P 1BLK42PO192B PLW-121, BLLM-1A
12-Jul-15 3161P 1BLK42LMN193A QZT-1, QZT-2
13-Jul-15 3165P 1BLK42KLM194A PLW-137, QZT-1, QZT-2
13-Jul-15 3167P 1BLK42KLM194B PLW-137, QZT-1, QZT-2
Table 6. Details of established horizontal control point QZT-2 used as base station for the LiDAR Acquisition.
Station Name QZT-2
Order of Accuracy 2nd
Relative Error (horizontal positioning) 1 in 50,000
Geographic Coordinates, Philippine Reference of 1992 Datum (PRS 92)
LatitudeLongitude
Ellipsoidal Height
9° 10’ 57.93286” North117° 53’ 13.25970” East
6.86400 meters
Geographic Coordinates, World Geodetic System 1984 Datum (WGS 84)
LatitudeLongitude
Ellipsoidal Height
9° 10’ 53.56696” North117° 53’ 18.63670” East
56.200 meters
Grid Coordinates, Universal Transverse Mercator Zone 51 North
(UTM 51N PRS 1992)
EastingNorthing
597450.975 meters1015114.108 meters

10
Hazard Mapping of the Philippines Using LIDAR (Phil-LIDAR 1)
Table 9. Actual parameters used during the LiDAR data acquisition of the Iraan Floodplain.
Flight Number
Flying Height (m AGL)
Overlap (%)
FOV (θ)
PRF(khz)
Scan Frequency
(Hz)
Average Speed(kts)
Average Turn Time (Minutes)
3157P 1200 30 50 200 25 130 5
3159P 1200 30 50 200 25 130 5
3161P 1200, 1000 30 50 200 25 130 5
3165P 1200, 800 30 50 200 25 130 5
3167P 1200 30 50 200 25 130 5
2.3 Flight Missions
Five (5) missions were conducted to complete the LiDAR Data Acquisition in Iraan Floodplain, for a total of seventeen hours and forty minutes (17+40) of flying time for RP-C9022. All missions were acquired using the Pegasus LiDAR system. Table 8 shows the total area of actual coverage and the corresponding flying hours per mission, while Table 9 presents the actual parameters used during the LiDAR data acquisition.
Table 8. Flight missions for the LiDAR data acquisition of the Iraan Floodplain.
Date Surveyed
Flight Number
Flight Plan Area
(km2)
Surveyed Area
(km2)
Area Surveyed within the Floodplain
(km2)
Area Surveyed Outside the Floodplain
(km2)
No. of Images
(Frames)
Flying Hours
Hr Min
11-Jul-15 3157P 546.67 447.70 38.05 409.65 536 4 23
11-Jul-15 3159P 385.73 231.17 47.19 183.98 1 3 12
12-Jul-15 3161P 347.69 291.21 1.86 289.35 710 3 33
13-Jul-15 3165P 347.69 251.76 NA 251.76 583 4 14
13-Jul-15 3167P 28.55 79.92 NA 79.92 103 2 18
TOTAL 1656.34 1301.76 87.1 1214.66 1933 17 40

11
LiDAR Surveys and Flood Mapping of Iraan River
2.4 Survey Coverage
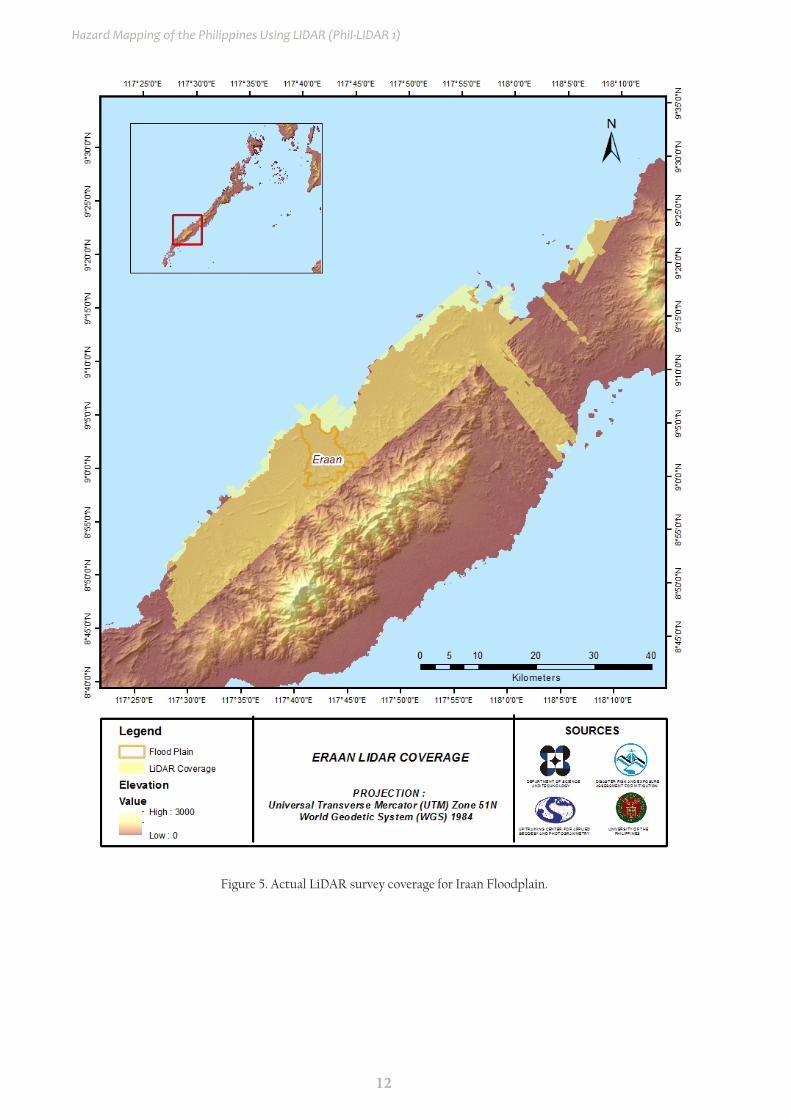
Iraan Floodplain is located in the province of Palawan with majority of the floodplain situated within the municipality of Rizal. Municipalities of Rizal and Quezon were mostly covered by the survey. The list of municipalities and cities surveyed with at least one (1) square kilometer coverage, is shown in Table 10. The actual coverage of the LiDAR acquisition for Iraan Floodplain is presented in Figure 5.
Table 10. List of municipalities and cities surveyed during Iraan Floodplain LiDAR survey.
Province Municipality/City
Area of Municipality/City
(km2)
Total Area Surveyed
(km2)
Percentage of Area Surveyed
Palawan
Narra 831.19 1.84 0.22%
Quezon 917.97 360.75 39.30%
Rizal 980.59 480.86 49.04%
Sofronio Espanola 477.50 84.93 17.79%
Total 3207.25 928.38 26.59%
12
Hazard Mapping of the Philippines Using LIDAR (Phil-LIDAR 1)
Figure 5. Actual LiDAR survey coverage for Iraan Floodplain.
13
LiDAR Surveys and Flood Mapping of Iraan River
CHAPTER 3: LIDAR DATA PROCESSING OF THE IRAAN FLOODPLAIN
Engr. Ma. Rosario Concepcion O. Ang, Engr. John Louie D. Fabila, Engr. Sarah Jane D. Samalburo , Engr. Harmond F. Santos , Engr. Angelo Carlo B. Bongat , Engr. Ma. Ailyn L. Olanda, Engr. Jovelle Anjeanette S. Canlas, Engr. Krishia Marie Bautista , Engr. Regis R. Guhiting, Engr. Merven Matthew D. Natino, Gillian
Katherine L. Inciong, Gemmalyn E. Magnaye, Leendel Jane D. Punzalan, Sarah Joy A. Acepcion, Ivan Marc H. Escamos, Allen Roy C. Roberto, and Jan Martin C. Magcale
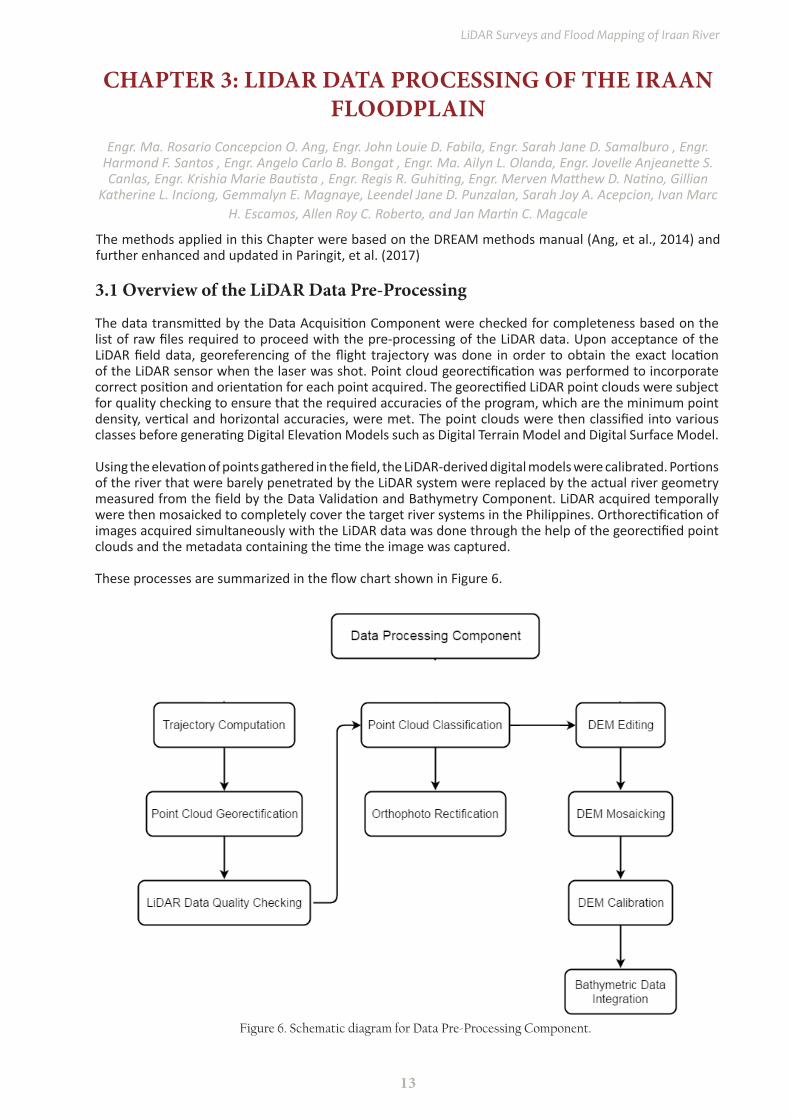
3.1 Overview of the LiDAR Data Pre-Processing
The data transmitted by the Data Acquisition Component were checked for completeness based on the list of raw files required to proceed with the pre-processing of the LiDAR data. Upon acceptance of the LiDAR field data, georeferencing of the flight trajectory was done in order to obtain the exact location of the LiDAR sensor when the laser was shot. Point cloud georectification was performed to incorporate correct position and orientation for each point acquired. The georectified LiDAR point clouds were subject for quality checking to ensure that the required accuracies of the program, which are the minimum point density, vertical and horizontal accuracies, were met. The point clouds were then classified into various classes before generating Digital Elevation Models such as Digital Terrain Model and Digital Surface Model.
Using the elevation of points gathered in the field, the LiDAR-derived digital models were calibrated. Portions of the river that were barely penetrated by the LiDAR system were replaced by the actual river geometry measured from the field by the Data Validation and Bathymetry Component. LiDAR acquired temporally were then mosaicked to completely cover the target river systems in the Philippines. Orthorectification of images acquired simultaneously with the LiDAR data was done through the help of the georectified point clouds and the metadata containing the time the image was captured.
These processes are summarized in the flow chart shown in Figure 6.
Figure 6. Schematic diagram for Data Pre-Processing Component.
The methods applied in this Chapter were based on the DREAM methods manual (Ang, et al., 2014) and further enhanced and updated in Paringit, et al. (2017)
14
Hazard Mapping of the Philippines Using LIDAR (Phil-LIDAR 1)
3.2 Transmittal of Acquired LiDAR Data
Data transfer sheets for all the LiDAR missions for Iraan Floodplain can be found in Annex 5. Missions flown during the first survey conducted on July 2015 used the Airborne LiDAR Terrain Mapper (ALTM™ Optech Inc.) Pegasus system over Rizal, Palawan.
The Data Acquisition Component (DAC) transferred a total of 129.96 Gigabytes of Range data, 1.05 Giga-bytes of POS data, 68.49 Megabytes of GPS base station data, and 173.73 Gigabytes of raw image data to the data server on July 13, 2015. The Data Pre-processing Component (DPPC) verified the completeness of the transferred data. The whole dataset for Iraan was fully transferred on August 5, 2015, as indicated on the Data Transfer Sheets for Iraan Floodplain.
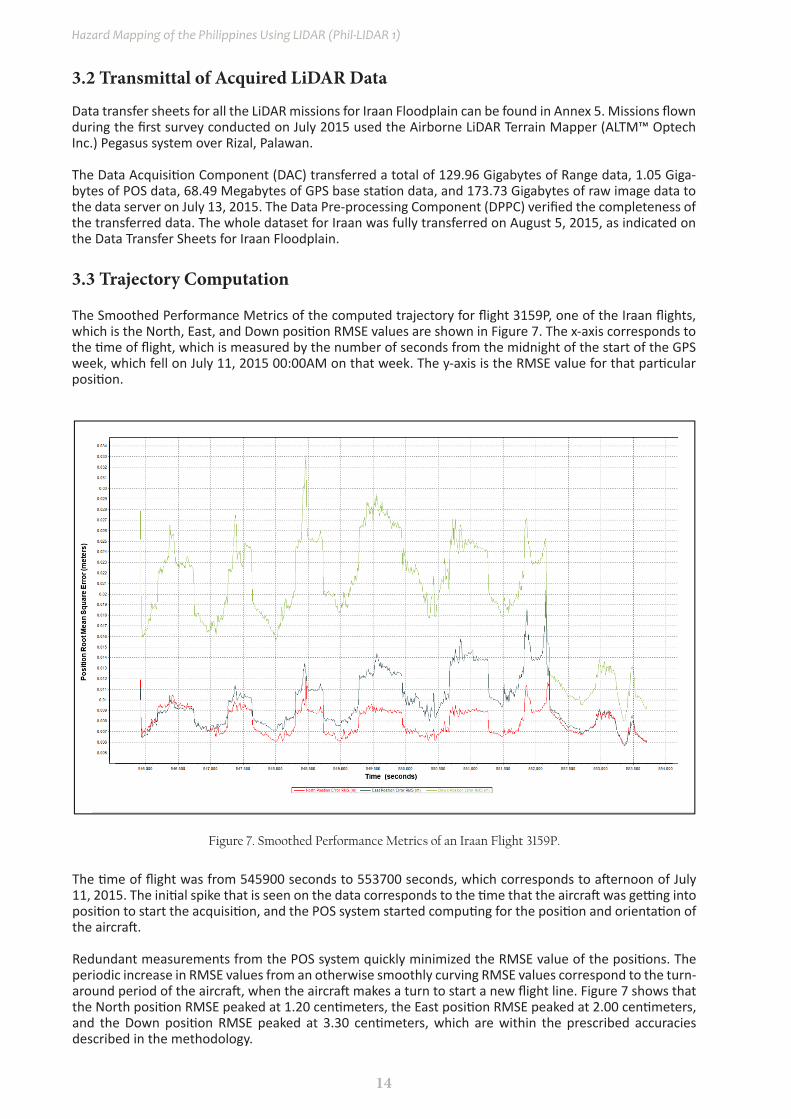
3.3 Trajectory Computation
The Smoothed Performance Metrics of the computed trajectory for flight 3159P, one of the Iraan flights, which is the North, East, and Down position RMSE values are shown in Figure 7. The x-axis corresponds to the time of flight, which is measured by the number of seconds from the midnight of the start of the GPS week, which fell on July 11, 2015 00:00AM on that week. The y-axis is the RMSE value for that particular position.
The time of flight was from 545900 seconds to 553700 seconds, which corresponds to afternoon of July 11, 2015. The initial spike that is seen on the data corresponds to the time that the aircraft was getting into position to start the acquisition, and the POS system started computing for the position and orientation of the aircraft.
Redundant measurements from the POS system quickly minimized the RMSE value of the positions. The periodic increase in RMSE values from an otherwise smoothly curving RMSE values correspond to the turn-around period of the aircraft, when the aircraft makes a turn to start a new flight line. Figure 7 shows that the North position RMSE peaked at 1.20 centimeters, the East position RMSE peaked at 2.00 centimeters, and the Down position RMSE peaked at 3.30 centimeters, which are within the prescribed accuracies described in the methodology.
Figure 7. Smoothed Performance Metrics of an Iraan Flight 3159P.
15
LiDAR Surveys and Flood Mapping of Iraan River
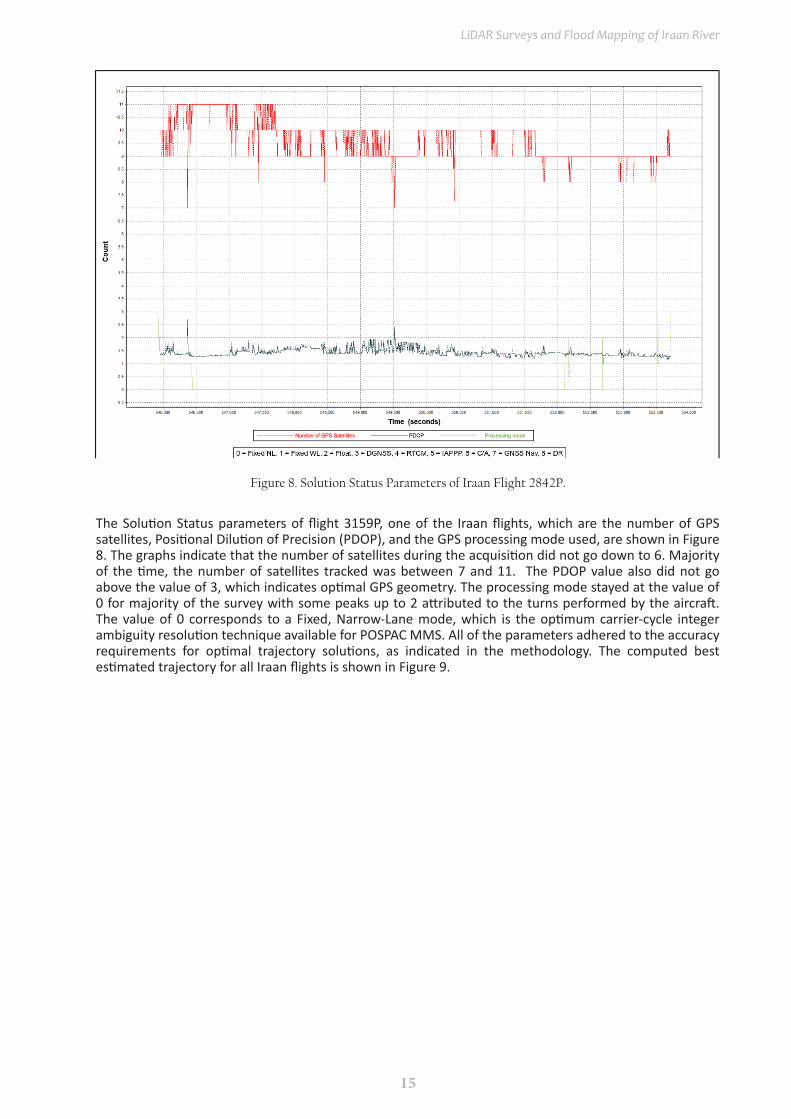
The Solution Status parameters of flight 3159P, one of the Iraan flights, which are the number of GPS satellites, Positional Dilution of Precision (PDOP), and the GPS processing mode used, are shown in Figure 8. The graphs indicate that the number of satellites during the acquisition did not go down to 6. Majority of the time, the number of satellites tracked was between 7 and 11. The PDOP value also did not go above the value of 3, which indicates optimal GPS geometry. The processing mode stayed at the value of 0 for majority of the survey with some peaks up to 2 attributed to the turns performed by the aircraft. The value of 0 corresponds to a Fixed, Narrow-Lane mode, which is the optimum carrier-cycle integer ambiguity resolution technique available for POSPAC MMS. All of the parameters adhered to the accuracy requirements for optimal trajectory solutions, as indicated in the methodology. The computed best estimated trajectory for all Iraan flights is shown in Figure 9.
Figure 8. Solution Status Parameters of Iraan Flight 2842P.

16
Hazard Mapping of the Philippines Using LIDAR (Phil-LIDAR 1)
3.4 LiDAR Point Cloud Computation
The produced LAS data contains 44 flight lines, with each flight line containing one channel, since the Pegasus system contains two channels. The summary of the self-calibration results obtained from LiDAR processing in LiDAR Mapping Suite (LMS) software for all flights over Iraan floodplain are given in Table 11.
The optimum accuracy was obtained for all Iraan flights based on the computed standard deviations of the corrections of the orientation parameters. Standard deviation values for individual blocks are available in the Annex 8. Mission Summary Reports.
Figure 9. Best Estimated Trajectory for Iraan Floodplain
Table 11 Self-Calibration Results values for Iraan flights.
Parameter Acceptable Value Computed Value
Boresight Correction stdev <0.001degrees 0.000562
IMU Attitude Correction Roll and Pitch Correction stdev <0.001degrees 0.000941
GPS Position Z-correction stdev <0.01meters 0.0098
17
LiDAR Surveys and Flood Mapping of Iraan River
3.5 LiDAR Data Quality Checking
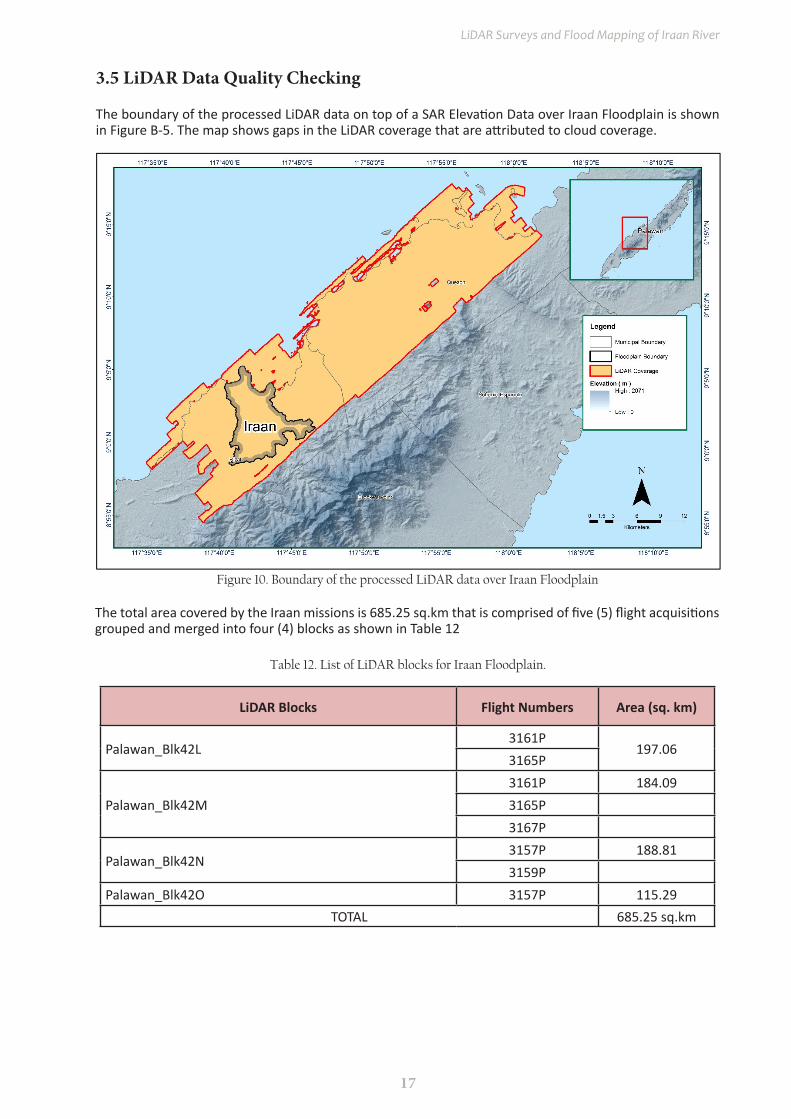
The boundary of the processed LiDAR data on top of a SAR Elevation Data over Iraan Floodplain is shown in Figure B-5. The map shows gaps in the LiDAR coverage that are attributed to cloud coverage.
Figure 10. Boundary of the processed LiDAR data over Iraan Floodplain
Table 12. List of LiDAR blocks for Iraan Floodplain.
The total area covered by the Iraan missions is 685.25 sq.km that is comprised of five (5) flight acquisitions grouped and merged into four (4) blocks as shown in Table 12
LiDAR Blocks Flight Numbers Area (sq. km)
Palawan_Blk42L3161P
197.063165P
Palawan_Blk42M3161P 184.093165P3167P
Palawan_Blk42N3157P 188.813159P
Palawan_Blk42O 3157P 115.29TOTAL 685.25 sq.km
18
Hazard Mapping of the Philippines Using LIDAR (Phil-LIDAR 1)
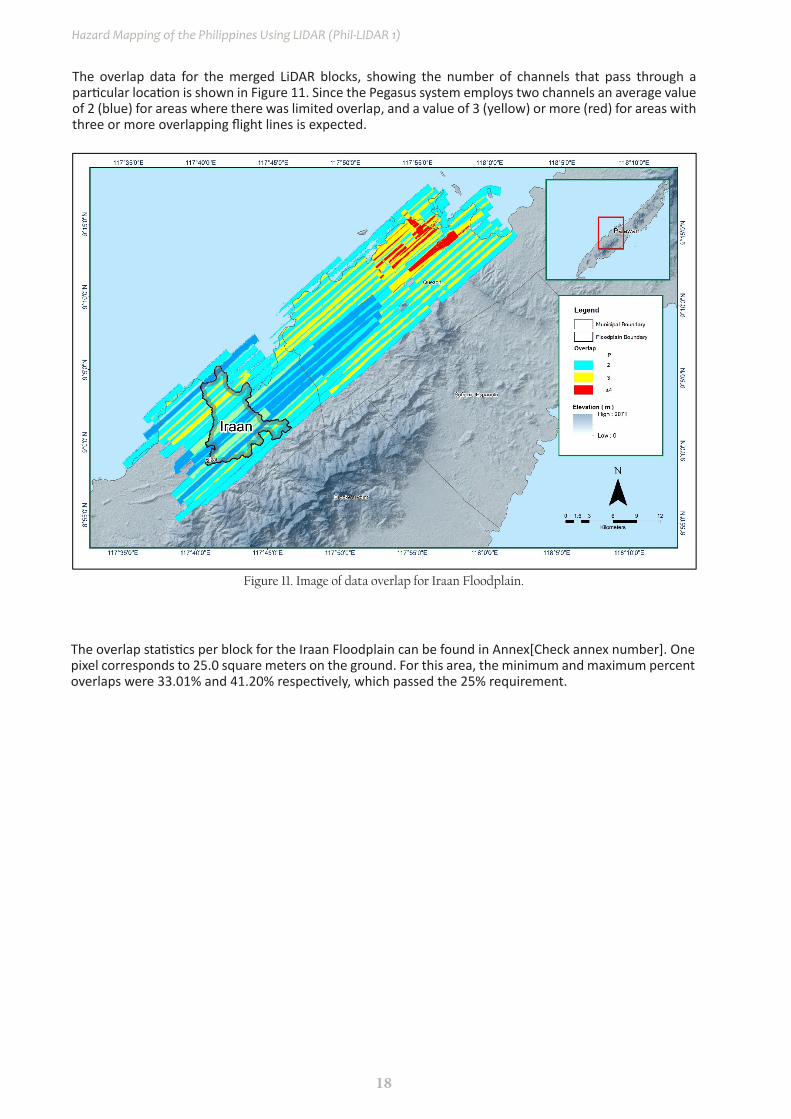
The overlap data for the merged LiDAR blocks, showing the number of channels that pass through a particular location is shown in Figure 11. Since the Pegasus system employs two channels an average value of 2 (blue) for areas where there was limited overlap, and a value of 3 (yellow) or more (red) for areas with three or more overlapping flight lines is expected.
The overlap statistics per block for the Iraan Floodplain can be found in Annex[Check annex number]. One pixel corresponds to 25.0 square meters on the ground. For this area, the minimum and maximum percent overlaps were 33.01% and 41.20% respectively, which passed the 25% requirement.
Figure 11. Image of data overlap for Iraan Floodplain.

19
LiDAR Surveys and Flood Mapping of Iraan River
The pulse density map for the merged LiDAR data, with the red parts showing the portions of the data that satisfy the 2 points per square meter criterion is shown in Figure 12. It was determined that all LiDAR data for Iraan Foodplain satisfy the point density requirement, and the average density for the entire survey area is 2.57 points per square meter.
Figure 12. Pulse density map of merged LiDAR data for Iraan Floodplain.
20
Hazard Mapping of the Philippines Using LIDAR (Phil-LIDAR 1)
The elevation difference between overlaps of adjacent flight lines is shown in Figure 13. The default color range is from blue to red, where bright blue areas correspond to portions where elevations of a previous flight line, identified by its acquisition time, were higher by more than 0.20m relative to elevations of its adjacent flight line. Bright red areas indicate portions where elevations of a previous flight line were lower by more than 0.20m relative to elevations of its adjacent flight line. Areas with bright red or bright blue need to be investigated further using Quick Terrain Modeler software.
Figure 13. Elevation difference map between flight lines for Iraan Floodplain.
21
LiDAR Surveys and Flood Mapping of Iraan River
Table 13. Iraan classification results in TerraScan
The tile system that TerraScan employed for the LiDAR data and the final classification image for a block in Iraan Floodplain is shown in Figure 15. A total of 984 1km by 1km tiles were produced. The number of points classified to the pertinent categories is illustrated in Table 13. The point cloud has a maximum and minimum height of 658.32 meters and 35.92 meters respectively.
3.6 LiDAR Point Cloud Classification and Rasterization
Figure 14. Quality checking for a Iraan flight 3159P using the Profile Tool of QT Modeler.
Pertinent Class Total Number of Points
Ground 477,956,084Low Vegetation 354,589,122Medium Vegetation 585,031,437High Vegetation 1,922,330,728Building 31,537,795
A screen capture of the processed LAS data from an Iraan flight 3159P loaded in QT Modeler is shown in Figure 14. The upper left image shows the elevations of the points from two overlapping flight strips traversed by the profile, illustrated by a dashed red line. The x-axis corresponds to the length of the profile. It is evident that there were differences in elevation, but the differences did not exceed the 20-centimeter mark. This profiling was repeated until the quality of the LiDAR data became satisfactory. No reprocessing was done for this LiDAR dataset.
22
Hazard Mapping of the Philippines Using LIDAR (Phil-LIDAR 1)
An isometric view of an area before and after running the classification routines is shown in Figure 16. The ground points are in orange, the vegetation is in different shades of green, and the buildings are in cyan. It can be seen that residential structures adjacent or even below canopy are classified correctly, due to the density of the LiDAR data.
Figure 15. Tiles for Iraan Floodplain (a) and classification results (b) in TerraScan
Figure 16. Point cloud before (a) and after (b) classification
23
LiDAR Surveys and Flood Mapping of Iraan River
The 96 1km by 1km tiles area covered by Iraan Floodplain is shown in Figure 18. After tie point selection to fix photo misalignments, color points were added to smoothen out visual inconsistencies along the seamlines where photos overlap. The Iraan Floodplain has a total of 41.16 sq.km orthophotogaph coverage comprised of 86 images. A zoomed in version of sample orthophotographs named in reference to its tile number is shown in Figure 19.
Figure 17. The production of last return DSM (a) and DTM (b), first return DSM (c) and secondary DTM (d) in some portion of Iraan Floodplain.
3.7 LiDAR Image Processing and Orthophotograph Rectification
The production of last return (V_ASCII) and the secondary (T_ ASCII) DTM, first (S_ ASCII) and last (D_ ASCII) return DSM of the area in top view display are shown in Figure 17. It shows that DTMs are the representation of the bare earth while on the DSMs, all features are present such as buildings and vegetation.

24
Hazard Mapping of the Philippines Using LIDAR (Phil-LIDAR 1)
Figure 18. Iraan Floodplain with available orthophotographs.
Figure 19. Sample orthophotograph tiles for Iraan Floodplain.
25
LiDAR Surveys and Flood Mapping of Iraan River
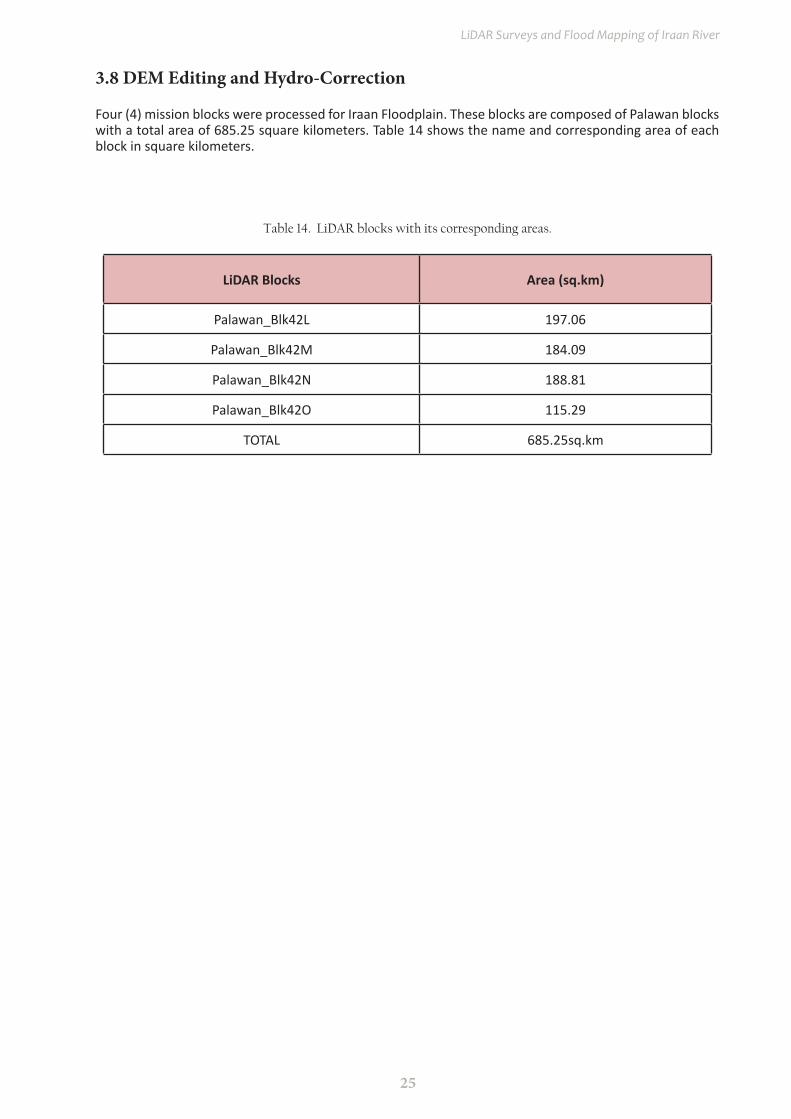
3.8 DEM Editing and Hydro-Correction
Four (4) mission blocks were processed for Iraan Floodplain. These blocks are composed of Palawan blocks with a total area of 685.25 square kilometers. Table 14 shows the name and corresponding area of each block in square kilometers.
Table 14. LiDAR blocks with its corresponding areas.
LiDAR Blocks Area (sq.km)
Palawan_Blk42L 197.06
Palawan_Blk42M 184.09
Palawan_Blk42N 188.81
Palawan_Blk42O 115.29
TOTAL 685.25sq.km
26
Hazard Mapping of the Philippines Using LIDAR (Phil-LIDAR 1)
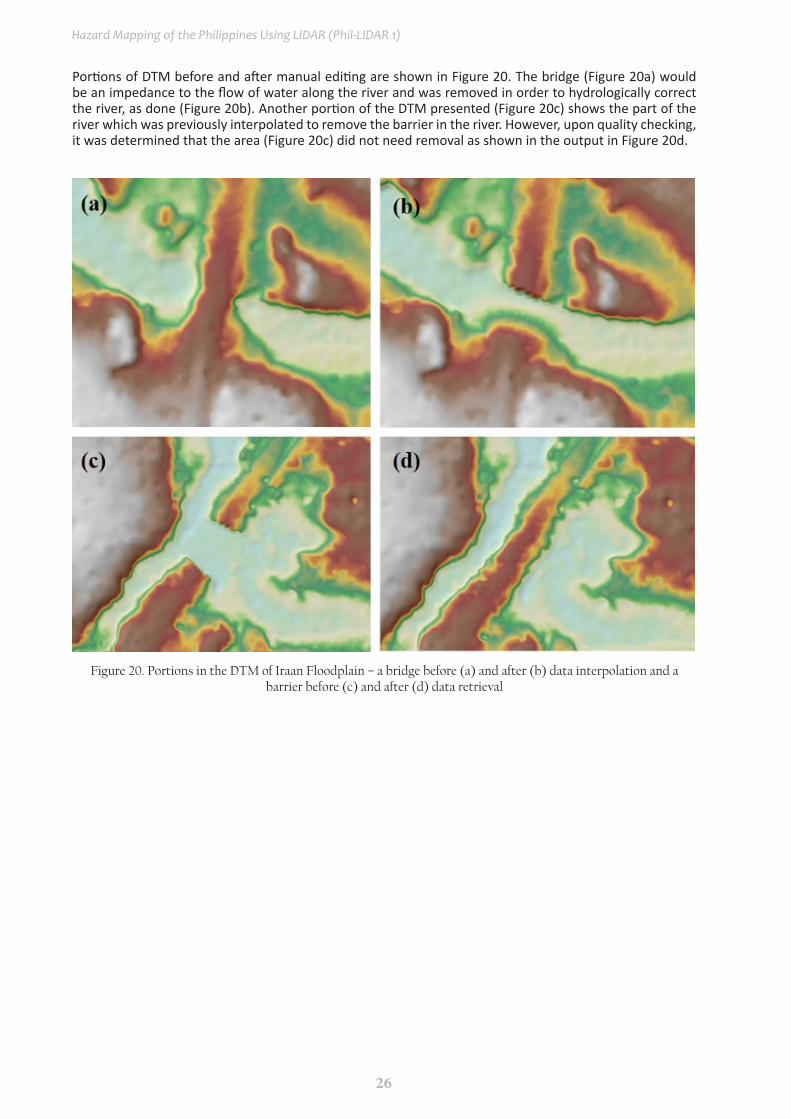
Portions of DTM before and after manual editing are shown in Figure 20. The bridge (Figure 20a) would be an impedance to the flow of water along the river and was removed in order to hydrologically correct the river, as done (Figure 20b). Another portion of the DTM presented (Figure 20c) shows the part of the river which was previously interpolated to remove the barrier in the river. However, upon quality checking, it was determined that the area (Figure 20c) did not need removal as shown in the output in Figure 20d.
Figure 20. Portions in the DTM of Iraan Floodplain – a bridge before (a) and after (b) data interpolation and a barrier before (c) and after (d) data retrieval

27
LiDAR Surveys and Flood Mapping of Iraan River
Table 15. Shift values of each LiDAR block of Iraan Floodplain.
Mission BlocksShift Values (meters)
x y z
Palawan_Blk42L 0.00 0.00 7.01
Palawan_Blk42M 0.00 0.00 6.88
Palawan_Blk42N 0.00 0.00 6.55
Palawan_Blk42O 0.00 0.00 6.52
3.9 Mosaicking of Blocks
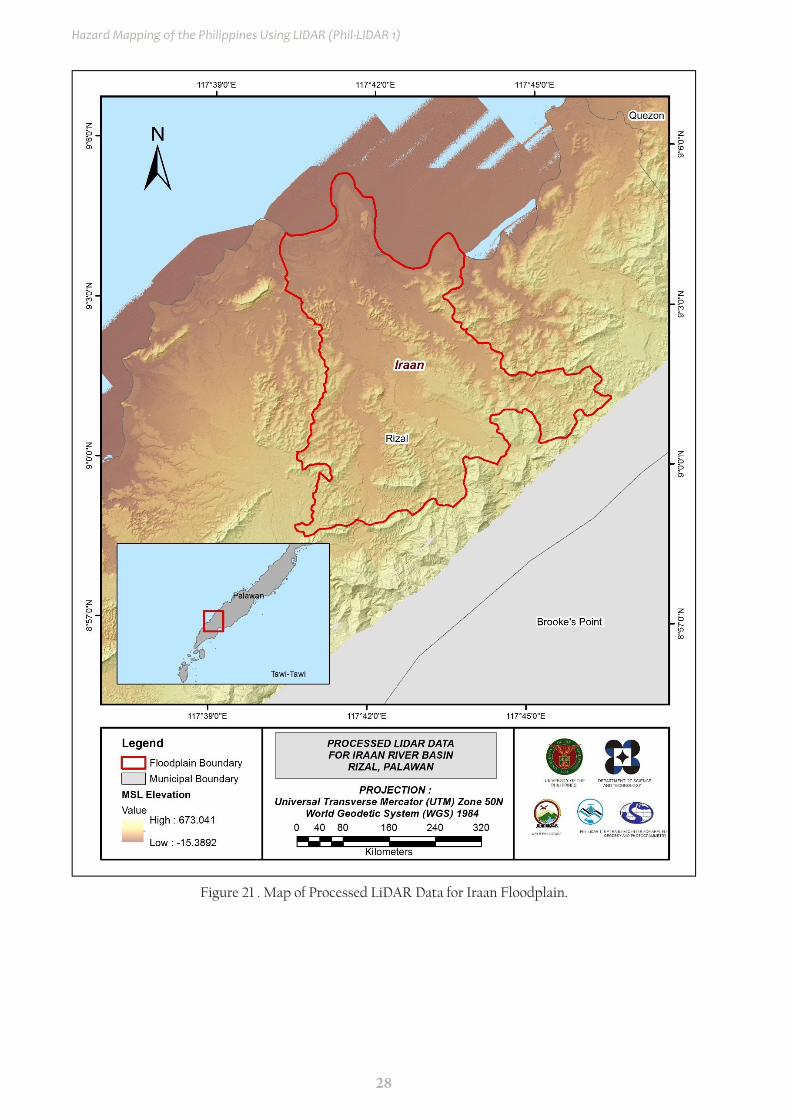
Palawan_Blk42M was used as the reference block at the start of mosaicking because it was the first block mosaicked to the larger DTM of West Coast Palawan. This was followed by PWN42N, PWN42L and PWN42O, respectively. Given that Palawan block 42M was mosaicked to the other blocks of West Coast Palawan, the block was also inspected for elevation shifts that it might need. Table 15 shows the area of each LiDAR block and the shift values applied during mosaicking.
Mosaicked LiDAR DTM for Iraan floodplain is shown in Figure 21. It can be seen that the entire Iraan Floodplain is 100% covered by LiDAR data.
28
Hazard Mapping of the Philippines Using LIDAR (Phil-LIDAR 1)
Figure 21 . Map of Processed LiDAR Data for Iraan Floodplain.

29
LiDAR Surveys and Flood Mapping of Iraan River
3.10 Calibration and Validation of Mosaicked LiDAR Digital Elevation Model (DEM)
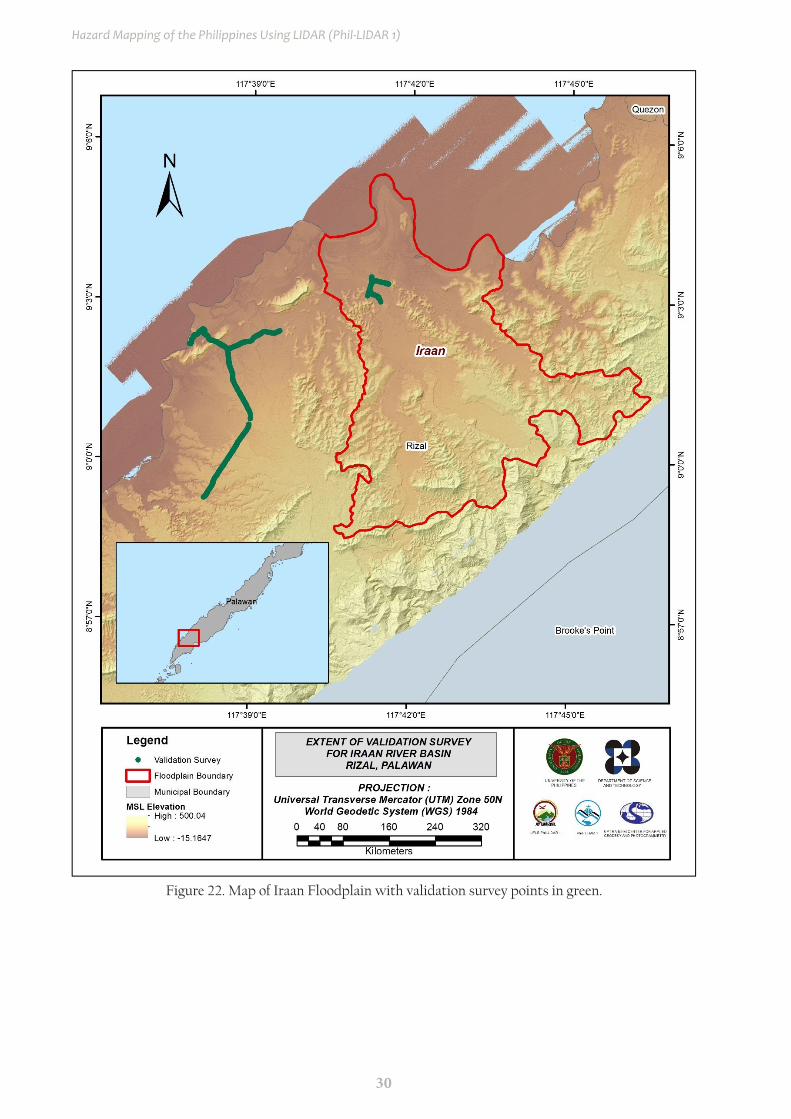
The extent of the validation survey done by the Data Validation and Bathymetry Component (DVBC) in Iraan to collect points with which the LiDAR dataset was validated is shown in Figure 22. A total of 2,533 survey points were used for calibration and validation of Iraan LiDAR data. Random selection of 80% of the survey points, resulting to 2,027 points, were used for calibration.
A good correlation between the uncalibrated mosaicked LiDAR elevation values and the ground survey elevation values is shown in Figure 23. Statistical values were computed from extracted LiDAR values using the selected points to assess the quality of data and obtain the value for vertical adjustment. The computed height difference between the LiDAR DTM and calibration elevation values is 0.20 meters with a standard deviation of 0.20 meters. Calibration of Iraan LiDAR data was done by adding the height difference value, 0.20 meters, to Iraan mosaicked LiDAR data. Table 16 shows the statistical values of the compared elevation values between LiDAR data and calibration data.
30
Hazard Mapping of the Philippines Using LIDAR (Phil-LIDAR 1)
Figure 22. Map of Iraan Floodplain with validation survey points in green.

31
LiDAR Surveys and Flood Mapping of Iraan River
Table 16. Calibration Statistical Measures
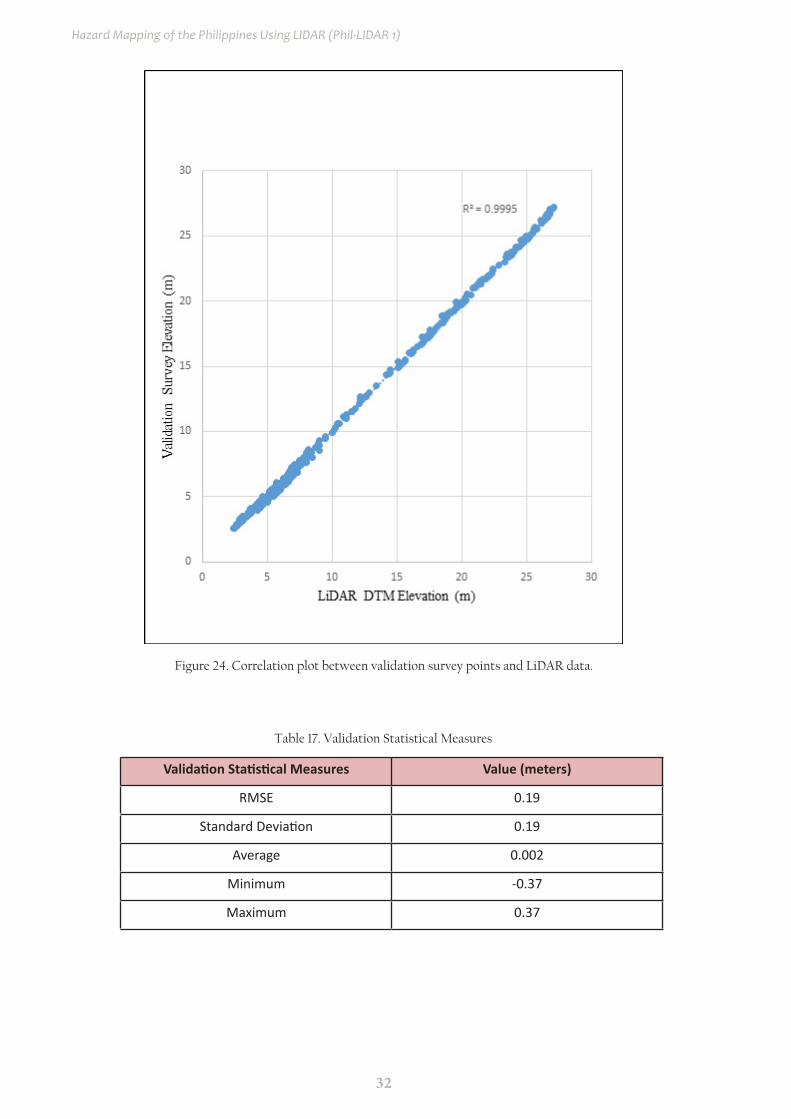
The remaining 20% of the total survey points, which was 506 points, were used for the validation of the calibrated Iraan DTM. A good correlation between the calibrated mosaicked LiDAR elevation values and the ground survey elevation, which reflects the quality of the LiDAR DTM is shown in Figure 24. The computed RMSE between the calibrated LiDAR DTM and elevation values is 0.29 meters with a standard deviation of 0.19 meters, as shown in Table 17.
Figure 23. Correlation plot between calibration survey points and LiDAR data.
Calibration Statistical Measures Value (meters)
Height Difference 14.31
Standard Deviation 0.23
Average 14.31Minimum 13.84Maximum 14.78
32
Hazard Mapping of the Philippines Using LIDAR (Phil-LIDAR 1)
Table 17. Validation Statistical Measures
Figure 24. Correlation plot between validation survey points and LiDAR data.
Validation Statistical Measures Value (meters)
RMSE 0.19
Standard Deviation 0.19
Average 0.002
Minimum -0.37
Maximum 0.37
33
LiDAR Surveys and Flood Mapping of Iraan River
3.11 Integration of Bathymetric Data into the LiDAR Digital Terrain Model
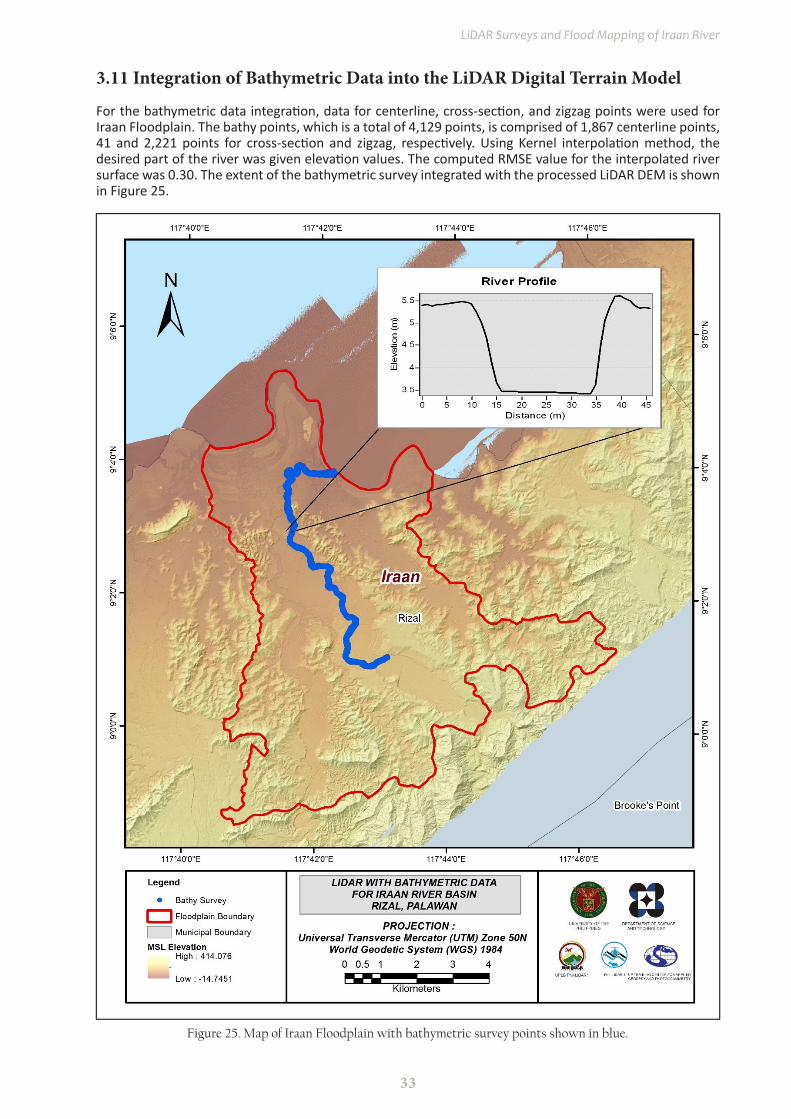
For the bathymetric data integration, data for centerline, cross-section, and zigzag points were used for Iraan Floodplain. The bathy points, which is a total of 4,129 points, is comprised of 1,867 centerline points, 41 and 2,221 points for cross-section and zigzag, respectively. Using Kernel interpolation method, the desired part of the river was given elevation values. The computed RMSE value for the interpolated river surface was 0.30. The extent of the bathymetric survey integrated with the processed LiDAR DEM is shown in Figure 25.
Figure 25. Map of Iraan Floodplain with bathymetric survey points shown in blue.
34
Hazard Mapping of the Philippines Using LIDAR (Phil-LIDAR 1)
CHAPTER 4: LIDAR VALIDATION SURVEY AND MEASUREMENTS OF THE IRAAN RIVER BASIN
Engr. Louie P. Balicanta, Engr. Joemarie S. Caballero, Ms. Patrizcia Mae. P. dela Cruz, Engr. Kristine Ailene B. Borromeo Ms. Jeline M. Amante, Marie Angelique R. Estipona, Charie Mae V. Manliguez, Engr. Janina
Jupiter, and Vie Marie Paola M. Rivera
The methods applied in this Chapter were based on the DREAM methods manual (Balicanta, et al., 2014) and further enhanced and updated in Paringit, et al. (2017).
4.1 Summary of Activities
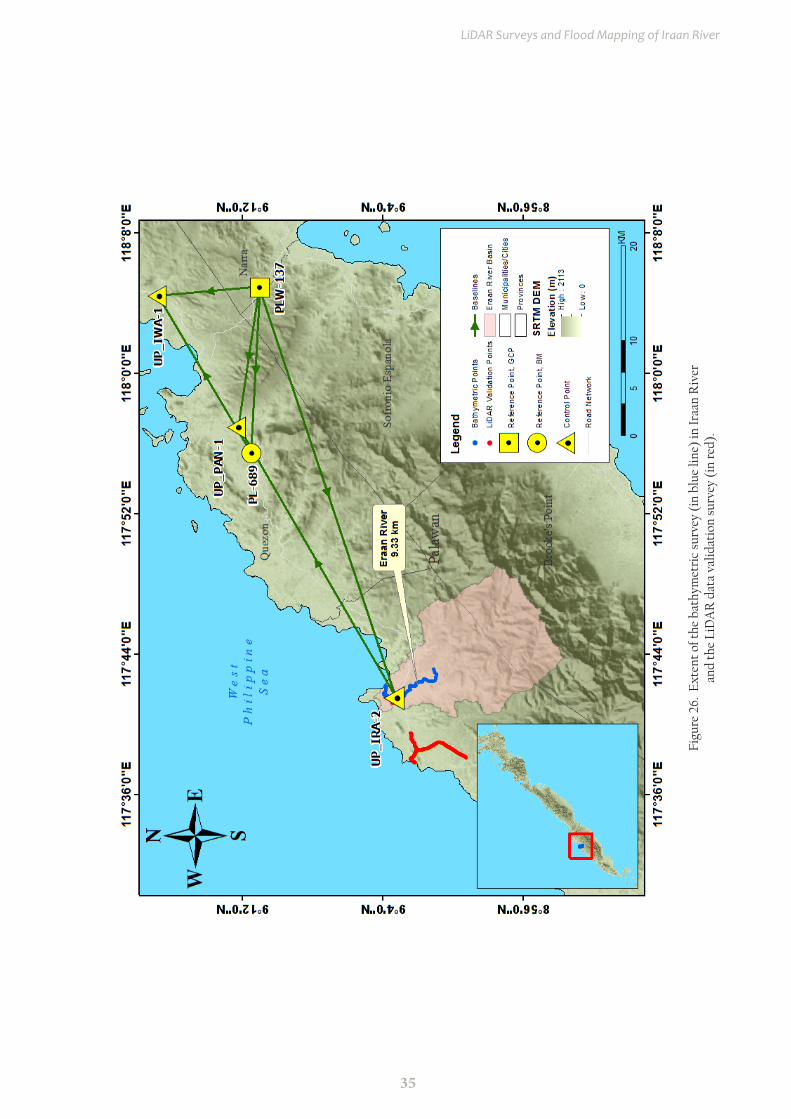
AB Surveying and Development (ABSD) conducted a field survey in Iraan River on December 3-4, 2015 and January 22-26, 2016 with the following scope: reconnaissance; control survey; and cross-section and as-built survey at Iraan Bridge in Brgy. Iraan, Municipality of Rizal, Palawan. Random checking points for the contractor’s cross-section and bathymetry data were gathered by DVBC on August 16-28, 2016 using an Ohmex™ Single Beam Echo Sounder and Trimble® SPS 882 GNSS PPK survey technique. In addition to this, validation points acquisition survey was conducted covering the Iraan River Basin area. The entire survey extent is illustrated in Figure 26.
35
LiDAR Surveys and Flood Mapping of Iraan River
Figu
re 2
6. E
xten
t of
the
bat
hym
etri
c su
rvey
(in
blu
e lin
e) in
Iraa
n R
iver
an
d th
e Li
DA
R d
ata
valid
atio
n su
rvey
(in
red
).
36
Hazard Mapping of the Philippines Using LIDAR (Phil-LIDAR 1)
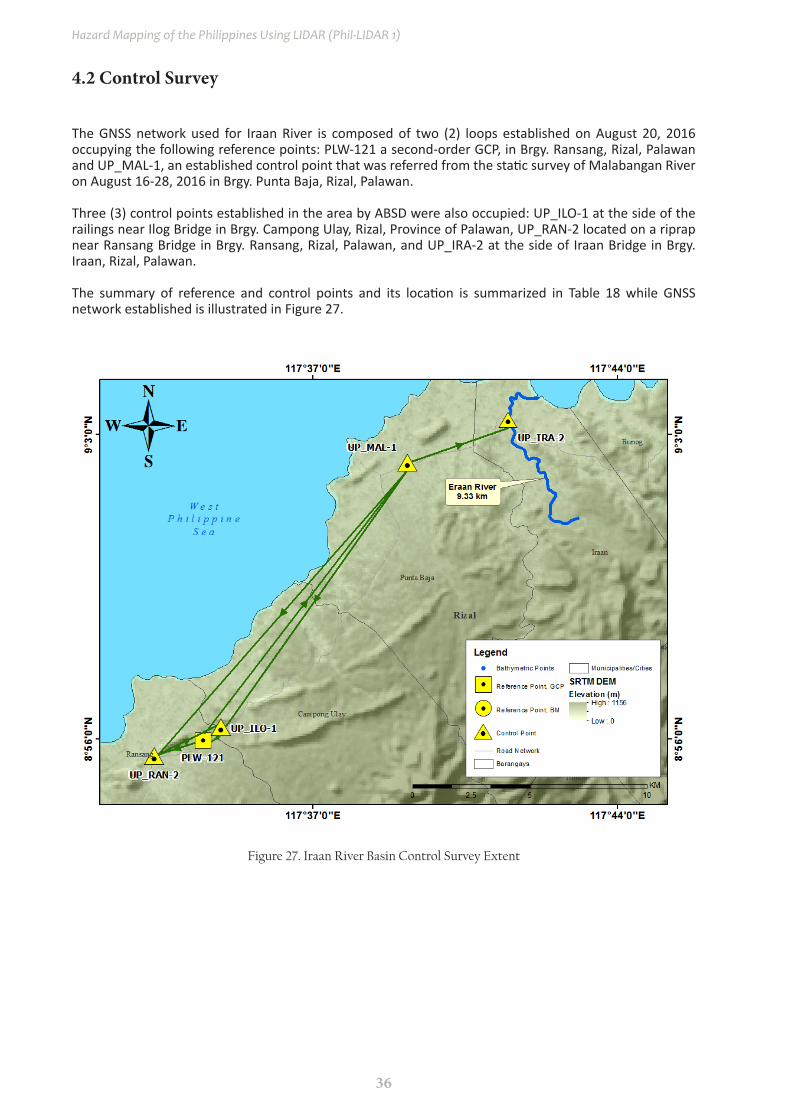
4.2 Control Survey
The GNSS network used for Iraan River is composed of two (2) loops established on August 20, 2016 occupying the following reference points: PLW-121 a second-order GCP, in Brgy. Ransang, Rizal, Palawan and UP_MAL-1, an established control point that was referred from the static survey of Malabangan River on August 16-28, 2016 in Brgy. Punta Baja, Rizal, Palawan.
Three (3) control points established in the area by ABSD were also occupied: UP_ILO-1 at the side of the railings near Ilog Bridge in Brgy. Campong Ulay, Rizal, Province of Palawan, UP_RAN-2 located on a riprap near Ransang Bridge in Brgy. Ransang, Rizal, Palawan, and UP_IRA-2 at the side of Iraan Bridge in Brgy. Iraan, Rizal, Palawan.
The summary of reference and control points and its location is summarized in Table 18 while GNSS network established is illustrated in Figure 27.
Figure 27. Iraan River Basin Control Survey Extent
37
LiDAR Surveys and Flood Mapping of Iraan River
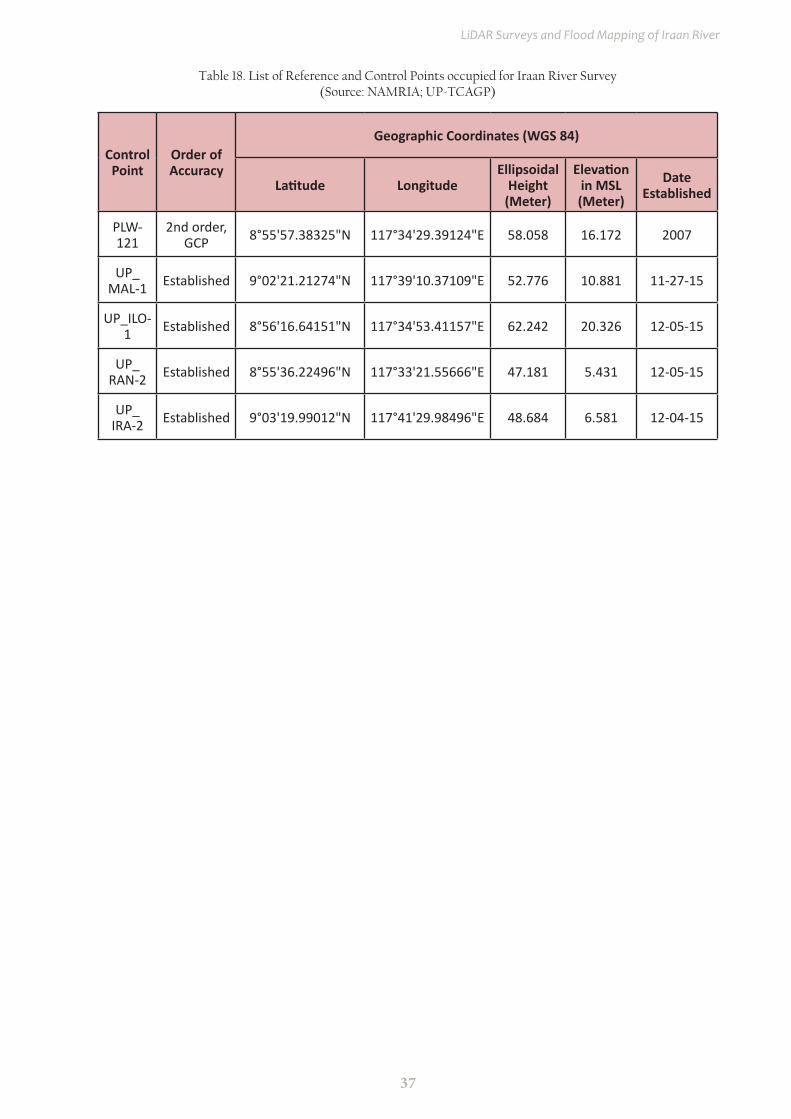
Table 18. List of Reference and Control Points occupied for Iraan River Survey (Source: NAMRIA; UP-TCAGP)
Control Point
Order of Accuracy
Geographic Coordinates (WGS 84)
Latitude LongitudeEllipsoidal
Height (Meter)
Elevation in MSL (Meter)
Date Established
PLW-121
2nd order, GCP 8°55'57.38325"N 117°34'29.39124"E 58.058 16.172 2007
UP_MAL-1 Established 9°02'21.21274"N 117°39'10.37109"E 52.776 10.881 11-27-15
UP_ILO-1 Established 8°56'16.64151"N 117°34'53.41157"E 62.242 20.326 12-05-15
UP_RAN-2 Established 8°55'36.22496"N 117°33'21.55666"E 47.181 5.431 12-05-15
UP_IRA-2 Established 9°03'19.99012"N 117°41'29.98496"E 48.684 6.581 12-04-15

38
Hazard Mapping of the Philippines Using LIDAR (Phil-LIDAR 1)
Figure 29. GNSS receiver set-up, Trimble® SPS 985, at UP_MAL-1, located beside the approach of Malambunga Bridge in Brgy. Punta Baja, Rizal, Province of Palawan
Figure 28. GNSS base set-up, Trimble® SPS 852, at PLW-121, located along the basketball court inside Cabcungan Elementary School in Brgy. Ransang, Rizal, Province of Palawan
The GNSS set-ups on recovered reference points and established control points in Iraan River are shown from Figure 28 to Figure 32.

39
LiDAR Surveys and Flood Mapping of Iraan River
Figure 31 GNSS receiver set-up, Trimble® SPS 882, at UP_RAN-2, located on a riprap near Ransang Bridge in Brgy. Ransang, Rizal, Province of Palawan
Figure 30. GNSS receiver set-up, Trimble® SPS 882, at UP_ILO-1, located at the side of the railings near Ilog Bridge in Brgy. Campong Ulay, Rizal, Province of Palawan

40
Hazard Mapping of the Philippines Using LIDAR (Phil-LIDAR 1)
Figure 32. GNSS receiver set-up, Trimble® SPS 985, at UP_IRA-2, located on the side of Iraan Bridge in Brgy. Iraan, Rizal, Province of Palawan

41
LiDAR Surveys and Flood Mapping of Iraan River
4.3 Baseline Processing
GNSS Baselines were processed simultaneously in TBC by observing that all baselines have fixed solutions with horizontal and vertical precisions within +/- 20 cm and +/- 10 cm requirement, respectively. In case where one or more baselines did not meet all of these criteria, masking is performed. Masking is done by removing/masking portions of these baseline data using the same processing software. It is repeatedly processed until all baseline requirements are met. If the reiteration yields out of the required accuracy, resurvey is initiated. Baseline processing result of control points in Iraan River Basin is summarized in Table 19 generated by TBC software.
Table 19. Baseline Processing Report for Iraan River Static Survey
Observation Date of Observation
Solution Type
H. Prec.(Meter)
V. Prec.(Meter) Geodetic
Az.
Ellipsoid Dist.
(Meter)ΔHeight(Meter)
UP_ILO-1 --- UP_MAL-1 8-20-2016 Fixed 0.004 0.013 215°01'35" 13676.838 9.465
UP_MAL-1 --- UP_IRA-2 8-20-2016 Fixed 0.009 0.023 67°02'36" 4630.420 -4.093
PLW-121 --- UP_ILO-1 8-20-2016 Fixed 0.002 0.002 231°07'17" 942.619 -4.184
PLW-121 --- UP_RAN-2 8-20-2016 Fixed 0.005 0.013 252°35'10" 2171.885 -10.878
PLW-121 --- UP_MAL-1 8-20-2016 Fixed 0.004 0.013 36°02'29" 14584.805 -5.289
UP_RAN-2 --- UP_ILO-1 8-20-2016 Fixed 0.005 0.015 66°07'44" 3068.568 15.065
UP_RAN-2 ---UP_MAL-1 8-20-2016 Fixed 0.005 0.018 40°34'00" 16380.815 5.587
As shown Table 23 a total of seven (7) baselines were processed with coordinates and ellipsoidal height values of PLW-121 and UP_MAL-1 held fixed. All of them passed the required accuracy.
42
Hazard Mapping of the Philippines Using LIDAR (Phil-LIDAR 1)
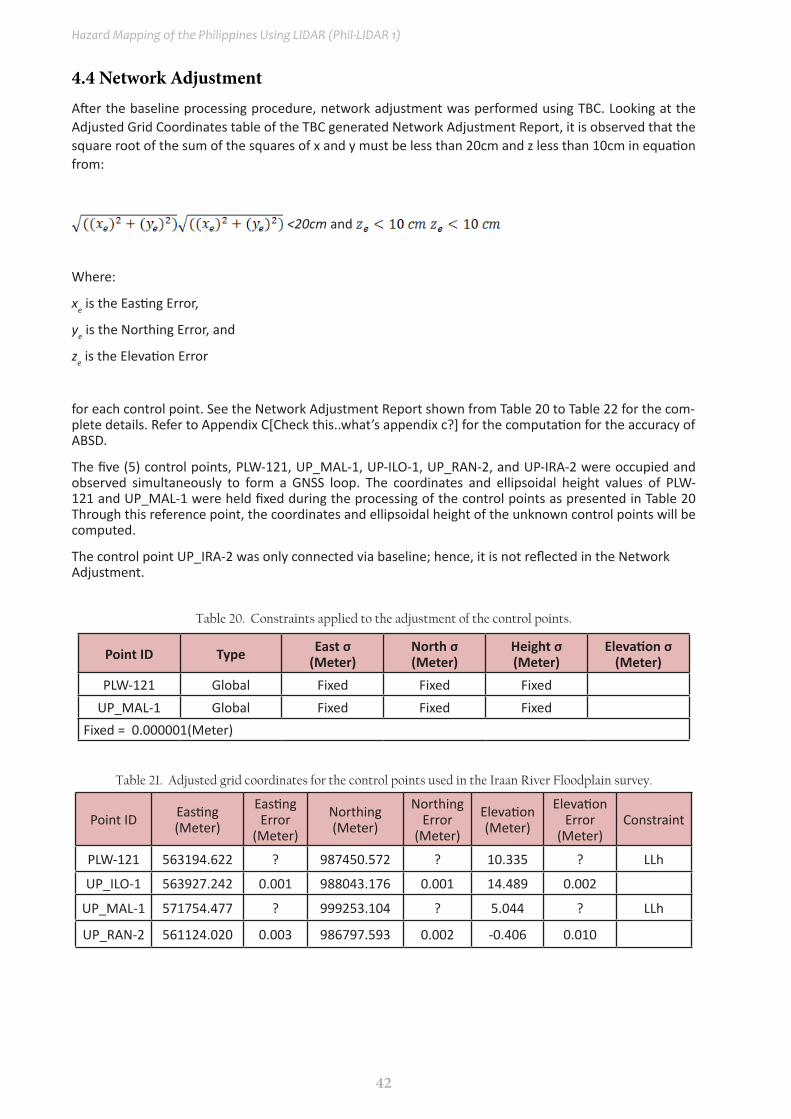
Table 20. Constraints applied to the adjustment of the control points.
Table 21. Adjusted grid coordinates for the control points used in the Iraan River Floodplain survey.
Point ID Type East σ(Meter)
North σ(Meter)
Height σ(Meter)
Elevation σ(Meter)
PLW-121 Global Fixed Fixed Fixed UP_MAL-1 Global Fixed Fixed Fixed
Fixed = 0.000001(Meter)
Point ID Easting(Meter)
EastingError
(Meter)
Northing(Meter)
NorthingError
(Meter)
Elevation(Meter)
ElevationError
(Meter)Constraint
PLW-121 563194.622 ? 987450.572 ? 10.335 ? LLh
UP_ILO-1 563927.242 0.001 988043.176 0.001 14.489 0.002
UP_MAL-1 571754.477 ? 999253.104 ? 5.044 ? LLh
UP_RAN-2 561124.020 0.003 986797.593 0.002 -0.406 0.010
4.4 Network AdjustmentAfter the baseline processing procedure, network adjustment was performed using TBC. Looking at the Adjusted Grid Coordinates table of the TBC generated Network Adjustment Report, it is observed that the square root of the sum of the squares of x and y must be less than 20cm and z less than 10cm in equation from:
<20cm and
Where:
xe is the Easting Error,
ye is the Northing Error, and
ze is the Elevation Error
for each control point. See the Network Adjustment Report shown from Table 20 to Table 22 for the com-plete details. Refer to Appendix C[Check this..what’s appendix c?] for the computation for the accuracy of ABSD.
The five (5) control points, PLW-121, UP_MAL-1, UP-ILO-1, UP_RAN-2, and UP-IRA-2 were occupied and observed simultaneously to form a GNSS loop. The coordinates and ellipsoidal height values of PLW-121 and UP_MAL-1 were held fixed during the processing of the control points as presented in Table 20 Through this reference point, the coordinates and ellipsoidal height of the unknown control points will be computed.
The control point UP_IRA-2 was only connected via baseline; hence, it is not reflected in the Network Adjustment.
43
LiDAR Surveys and Flood Mapping of Iraan River
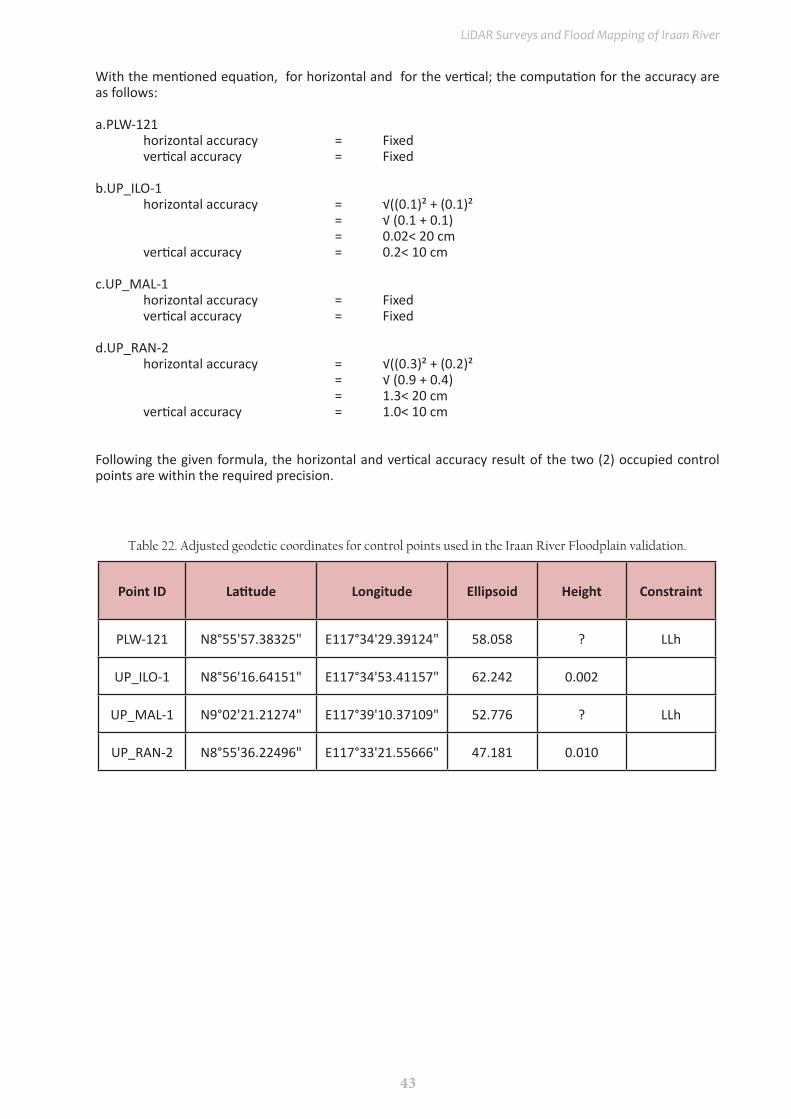
With the mentioned equation, for horizontal and for the vertical; the computation for the accuracy are as follows:
a.PLW-121 horizontal accuracy = Fixed vertical accuracy = Fixed
b.UP_ILO-1 horizontal accuracy = √((0.1)² + (0.1)² = √ (0.1 + 0.1) = 0.02< 20 cm vertical accuracy = 0.2< 10 cm
c.UP_MAL-1 horizontal accuracy = Fixed vertical accuracy = Fixed
d.UP_RAN-2 horizontal accuracy = √((0.3)² + (0.2)² = √ (0.9 + 0.4) = 1.3< 20 cm vertical accuracy = 1.0< 10 cm
Following the given formula, the horizontal and vertical accuracy result of the two (2) occupied control points are within the required precision.
Table 22. Adjusted geodetic coordinates for control points used in the Iraan River Floodplain validation.
Point ID Latitude Longitude Ellipsoid Height Constraint
PLW-121 N8°55'57.38325" E117°34'29.39124" 58.058 ? LLh
UP_ILO-1 N8°56'16.64151" E117°34'53.41157" 62.242 0.002
UP_MAL-1 N9°02'21.21274" E117°39'10.37109" 52.776 ? LLh
UP_RAN-2 N8°55'36.22496" E117°33'21.55666" 47.181 0.010

44
Hazard Mapping of the Philippines Using LIDAR (Phil-LIDAR 1)
The corresponding geodetic coordinates of the observed points are within the required accuracy as shown inTable 26. Based on the result of the computation, the equation is satisfied; hence, the required accuracy for the program was met.
The summary of reference control points used is indicated in Table 23.
Table 23. The reference and control points utilized in the Iraan River Static Survey, with their corresponding locations (Source: NAMRIA, UP-TCAGP)
Control Point
Order of Accuracy
Geographic Coordinates (WGS 84) UTM ZONE 51 N
Latitude LongitudeEllipsoidal
Height (m)
Northing (m) Easting (m)
BM Ortho
(m)
PLW-121 2nd order, GCP 8°55'57.38325"N 117°34'29.39124"E 58.058 987450.572 563194.622 16.172
UP_MAL-1 Established 9°02'21.21274"N 117°39'10.37109"E 52.776 999253.104 571754.477 10.881
UP_ILO-1 Established 8°56'16.64151"N 117°34'53.41157"E 62.242 988043.176 563927.242 20.326
UP_RAN-2 Established 8°55'36.22496"N 117°33'21.55666"E 47.181 986797.593 561124.02 5.431
UP_IRA-2 Established 9°03'19.99012"N 117°41'29.98496"E 48.684 1001066.17 576013.515 6.581

45
LiDAR Surveys and Flood Mapping of Iraan River
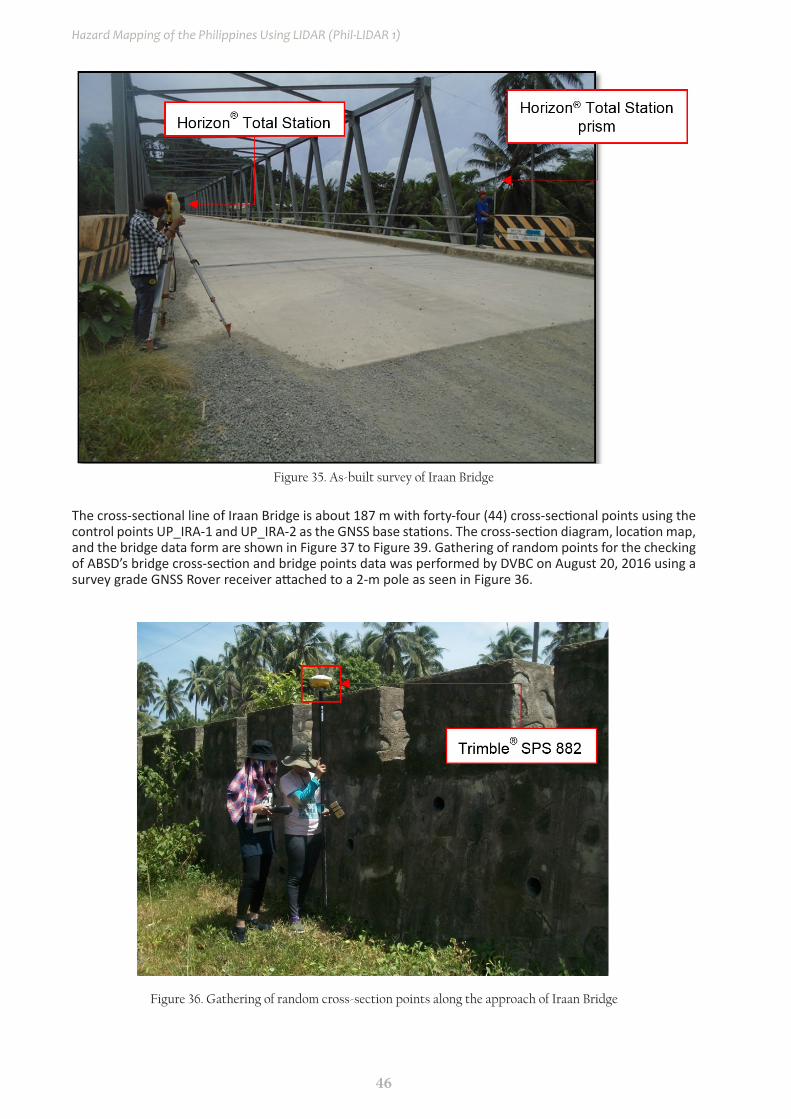
4.5 Cross-section and Bridge As-Built survey and Water Level Marking
Cross-section and as-built surveys were conducted on December 3, 2015 at the downstream side of Iraan Bridge in Brgy. Iraan, Municipality of Rizal as shown in Figure 33 and Figure 34. A Horizon®Total Station was utilized for this survey as shown in Figure 35.
Figure 33. Iraan Bridge facing upstream
Figure 34. Iraan Bridge facing downstream
46
Hazard Mapping of the Philippines Using LIDAR (Phil-LIDAR 1)
The cross-sectional line of Iraan Bridge is about 187 m with forty-four (44) cross-sectional points using the control points UP_IRA-1 and UP_IRA-2 as the GNSS base stations. The cross-section diagram, location map, and the bridge data form are shown in Figure 37 to Figure 39. Gathering of random points for the checking of ABSD’s bridge cross-section and bridge points data was performed by DVBC on August 20, 2016 using a survey grade GNSS Rover receiver attached to a 2-m pole as seen in Figure 36.
Figure 36. Gathering of random cross-section points along the approach of Iraan Bridge
Figure 35. As-built survey of Iraan Bridge

47
LiDAR Surveys and Flood Mapping of Iraan River
Linear square correlation (R2) and RMSE analysis were performed on the two (2) datasets. The linear square coefficient range was determined to ensure that the submitted data of the contractor is within the accuracy standard of the project which is ±20 cm and ±10 cm for horizontal and vertical, respectively. The R2 value must be within 0.85 to 1. An R2 approaching 1 signifies a strong correlation between the vertical (elevation values) of the two datasets. The computed R2values of 0.958 and 0.922 for the cross-section data via manual topographic survey and cross-section data via validation, respectively, were obtained by comparing the data of the contractor and DVBC; signifying a strong correlation between the two (2) datasets. Additionally, a computed R2 value of 0.879 for the bridge points data of Iraan Bridge was also obtained.
In addition to the Linear Square Correlation, Root Mean Square (RMSE) analysis was also performed in order to assess the difference in elevation between the DVBC checking points and the contractor’s. The RMSE value should only have a maximum radial distance of 5 m and the difference in elevation within the radius of 5 meters should not be beyond 0.50 m. For the cross-section data via manual topographic survey and cross-section data via validation, the computed values were0.135 and 0.188, respectively. The computed RMSE value for the bridge points data was 0.174. The computed R2 and RMSE values are within the accuracy requirement of the program.

48
Hazard Mapping of the Philippines Using LIDAR (Phil-LIDAR 1)
Fi
gure
37.
Loc
atio
n M
ap o
f Ira
an B
ridg
e C
ross
-sec
tion

49
LiDAR Surveys and Flood Mapping of Iraan River
Figu
re 3
8. Ir
aan
Brid
ge C
ross
-sec
tion
Dia
gram

50
Hazard Mapping of the Philippines Using LIDAR (Phil-LIDAR 1)
Figure 39. Iraan Bridge Data Sheet

51
LiDAR Surveys and Flood Mapping of Iraan River
Water surface elevation of Iraan River was determined by a Horizon® Total Station on December 3, 2015 at 1:16 PM at Iraan Bridge area with a value of 1.708 m in MSL as shown inFigure 38. This was translated into marking on the bridge’s pier as shown in Figure 40. The marking served [Pls check if this should be past tense or future tense. Will serve or served ]as reference for flow data gathering and depth gauge deployment of the partner HEI responsible for Iraan River, the University of the Philippines Los Baños.
Figure 40. Water-level markings on Iraan Bridge
52
Hazard Mapping of the Philippines Using LIDAR (Phil-LIDAR 1)
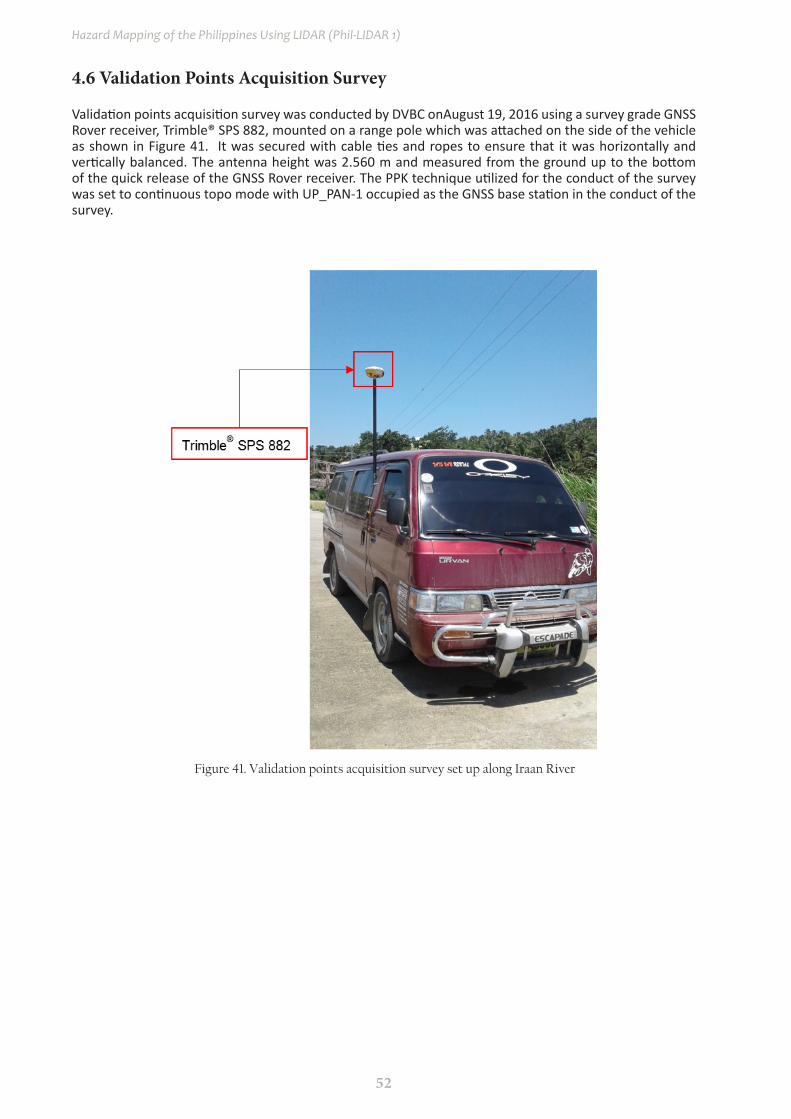
4.6 Validation Points Acquisition Survey
Validation points acquisition survey was conducted by DVBC onAugust 19, 2016 using a survey grade GNSS Rover receiver, Trimble® SPS 882, mounted on a range pole which was attached on the side of the vehicle as shown in Figure 41. It was secured with cable ties and ropes to ensure that it was horizontally and vertically balanced. The antenna height was 2.560 m and measured from the ground up to the bottom of the quick release of the GNSS Rover receiver. The PPK technique utilized for the conduct of the survey was set to continuous topo mode with UP_PAN-1 occupied as the GNSS base station in the conduct of the survey.
Figure 41. Validation points acquisition survey set up along Iraan River

53
LiDAR Surveys and Flood Mapping of Iraan River
The survey started from Brgy. Iraan, Municipality of Rizal, Palawan going south west along national highway and ended in Brgy. Punta Baja, Municipality of Rizal, Palawan. The survey gathered a total of 346 points with approximate length of 15.71 km using UP_MAL-1 as GNSS base station for the entire extent of validation points acquisition survey as illustrated in the map in Figure 42. Approximately 50% of roads traversed are unpaved, hence no data was acquired along it.
Figure 42. Validation points acquisition covering the Iraan River Basin Area
54
Hazard Mapping of the Philippines Using LIDAR (Phil-LIDAR 1)
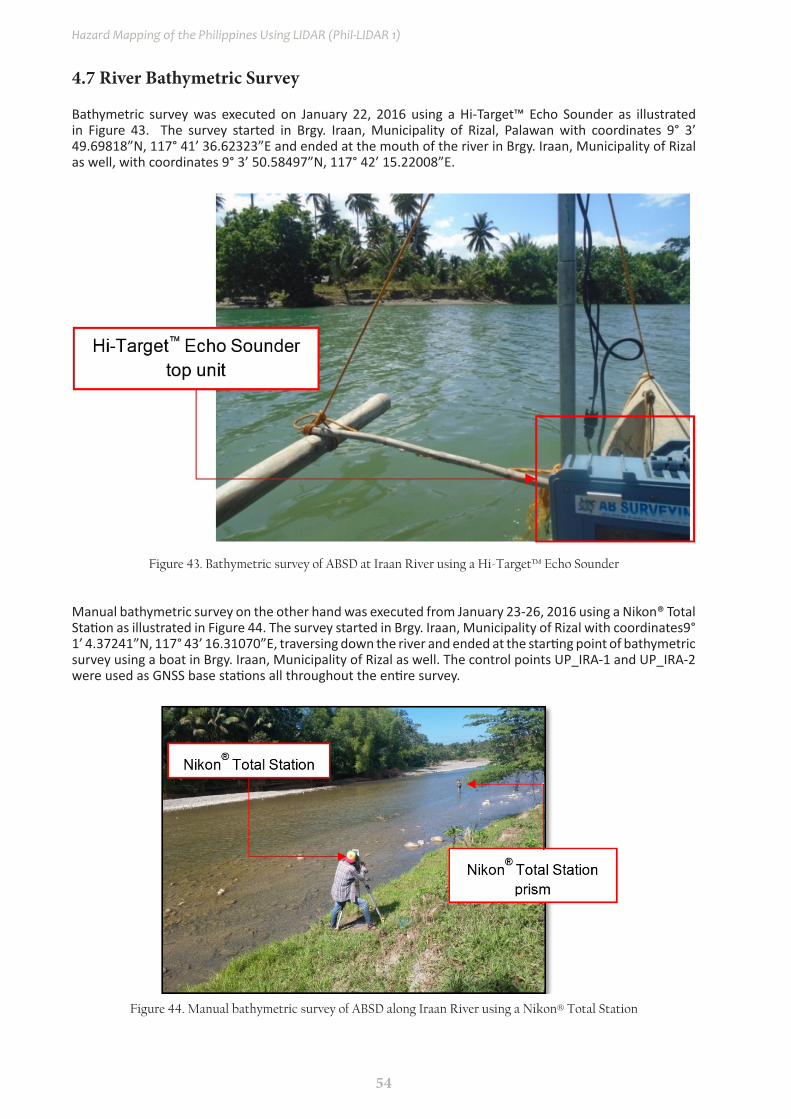
4.7 River Bathymetric Survey
Bathymetric survey was executed on January 22, 2016 using a Hi-Target™ Echo Sounder as illustrated in Figure 43. The survey started in Brgy. Iraan, Municipality of Rizal, Palawan with coordinates 9° 3’ 49.69818”N, 117° 41’ 36.62323”E and ended at the mouth of the river in Brgy. Iraan, Municipality of Rizal as well, with coordinates 9° 3’ 50.58497”N, 117° 42’ 15.22008”E.
Figure 43. Bathymetric survey of ABSD at Iraan River using a Hi-Target™ Echo Sounder
Figure 44. Manual bathymetric survey of ABSD along Iraan River using a Nikon® Total Station
Manual bathymetric survey on the other hand was executed from January 23-26, 2016 using a Nikon® Total Station as illustrated in Figure 44. The survey started in Brgy. Iraan, Municipality of Rizal with coordinates9° 1’ 4.37241”N, 117° 43’ 16.31070”E, traversing down the river and ended at the starting point of bathymetric survey using a boat in Brgy. Iraan, Municipality of Rizal as well. The control points UP_IRA-1 and UP_IRA-2 were used as GNSS base stations all throughout the entire survey.

55
LiDAR Surveys and Flood Mapping of Iraan River
Gathering of random points for the checking of ABSD’s bathymetric data was performed by DVBC on August 20, 2016 using a GNSS Rover receiver, Trimble® SPS 882 attached to a 2-m pole (see Figure 45). A map showing the DVBC bathymetric checking points is shown in Figure 47.
Figure 45. Gathering of bathymetric checking points along Iraan River
Linear square correlation (R2) and RMSE analysis were also performed on the two (2) datasets and a computed R2value of 0.927 is within the required range for R2, which is 0.85 to 1. Additionally, an RMSE value of 0.218 was obtained. Both the computed R2 and RMSE values are within the accuracy required by the program.
The bathymetric survey for Iraan River gathered a total of 6,424 points covering 9.33 km of the river traversing Brgy. Iraan in the Municipality of Rizal, as illustrated in Figure 46. A CAD drawing was also produced to illustrate the riverbed profile of Iraan River. As shown in Figure 48, the highest and lowest elevation has a 35-m difference. The highest elevation observed was 30.242 m below MSL while the lowest was -5.142 m below MSL, both located in Brgy. Iraan, Municipality of Rizal.
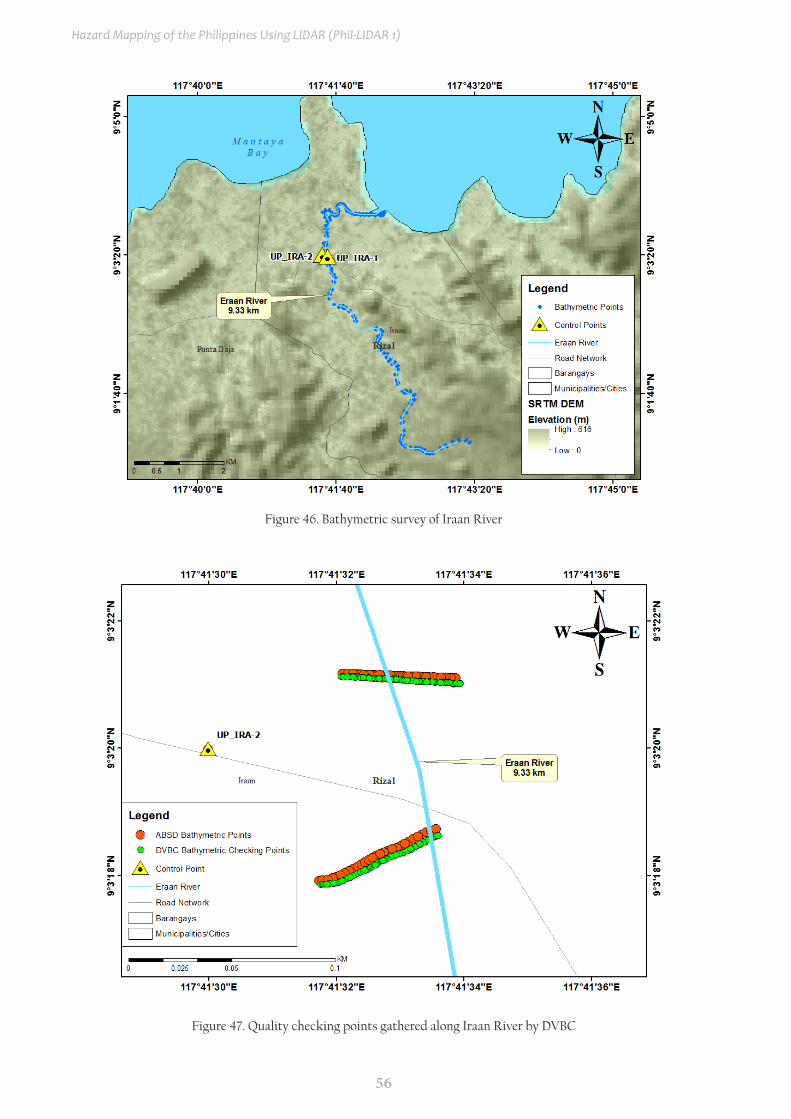
56
Hazard Mapping of the Philippines Using LIDAR (Phil-LIDAR 1)
Figure 47. Quality checking points gathered along Iraan River by DVBC
Figure 46. Bathymetric survey of Iraan River
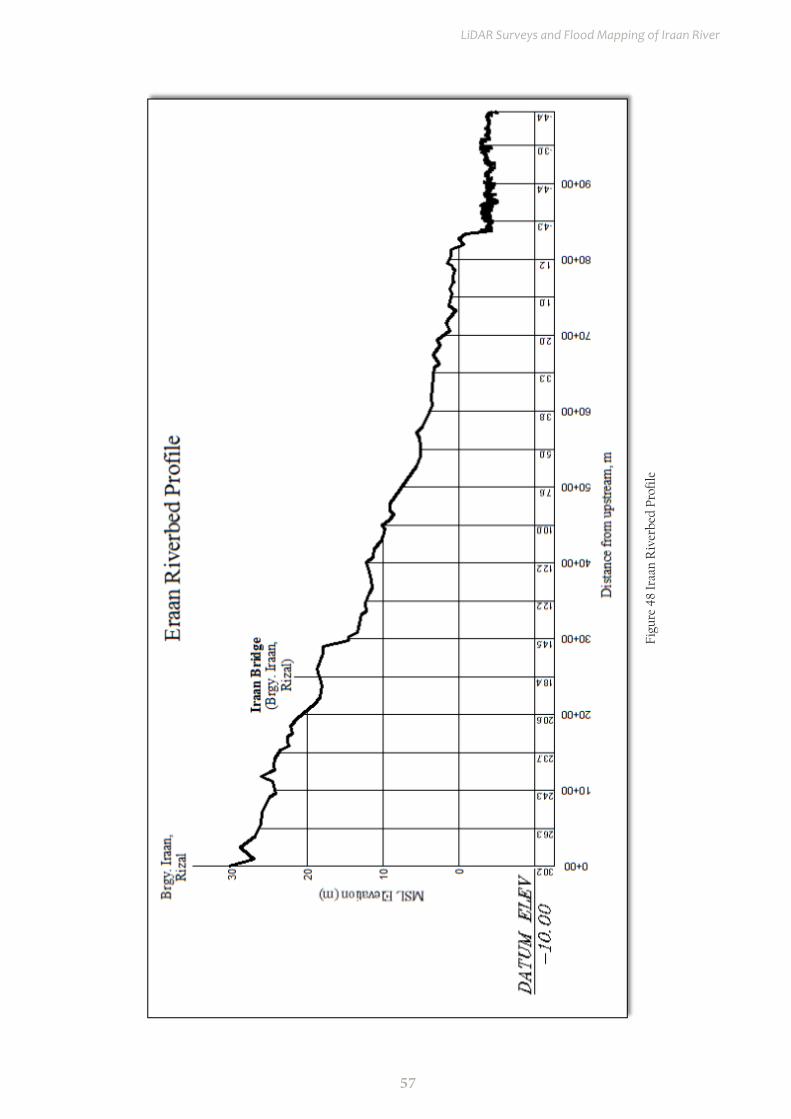
57
LiDAR Surveys and Flood Mapping of Iraan River
Figu
re 4
8 Ir
aan
Riv
erbe
d Pr
ofile

58
Hazard Mapping of the Philippines Using LIDAR (Phil-LIDAR 1)
CHAPTER 5: FLOOD MODELING AND MAPPINGDr. Alfredo Mahar Lagmay, Christopher Uichanco, Sylvia Sueno, Marc Moises, Hale Ines, Miguel del
Rosario, Kenneth Punay, Neil Tingin, Khristoffer Quinton, and John Alvin B. Reyes, Alfi Lorenz B. Cura, Angelica T. Magpantay, Maria Michaela A. Gonzales Paulo Joshua U. Quilao, Jayson L. Arizapa, and Kevin
M. Manalo
The methods applied in this Chapter were based on the DREAM methods manual (Lagmay, et al., 2014) and further enhanced and updated in Paringit, et al. (2017)
5.1 Data Used for Hydrologic Modeling
5.1.1 Hydrometry and Rating Curves
All data that affect the hydrologic cycle of the Iraan River Basin were monitored, collected, and analyzed. Rainfall, water level, and flow in a certain period of time, which may affect the hydrologic cycle of the Iraan River Basin were monitored, collected, and analyzed.
5.1.2 Precipitation
Precipitation data was taken from a portable rain gauge deployed on a strategic location within the river basin (9.056689˚ N, 117.678720˚ E). The location of the rain gauge is seen in Figure 49.
The total precipitation for this event was 144.0 mm. It had a peak rainfall of 8.60 mm on January 11, 2017 at 2:10 am. The lag time between the peak rainfall and discharge was 5 hour and 20 minutes, as seen in Figure 52.
Figure 49. The location map of Iraan HEC-HMS model used for calibration

59
LiDAR Surveys and Flood Mapping of Iraan River
Figure 50. Cross-section plot of Iraan Bridge
Figure 51. Rating Curve at Iraan Bridge, Rizal,Palawan
5.1.3 Rating Curves and River Outflow
A rating curve was developed at Iraan Bridge, Rizal, Palawan (9.055361° N, 117.692553° E). It gives the relationship between the observed water levels from the Iraan Bridge and outflow of the watershed at this location using Bankfull Method in Manning’s Equation.
For Iraan Bridge, the rating curve is expressed as Q = 1.88350.8369x as shown in Figure 51.
y = 1.8835e0.8369x
R2 = 0.9361
0
500
1000
1500
2000
2500
0.000 2.000 4.000 6.000 8.000 10.000
Flow
Dis
char
ge (m
3/s)
Stage (mMSL)
IRAAN BRIDGE RATING CURVE
Field Data PointsExpon (Field Data Points)

60
Hazard Mapping of the Philippines Using LIDAR (Phil-LIDAR 1)
For the calibration of the HEC-HMS model, shown in Figure 52, actual flow discharge during a rainfall event was collected in the Iraan bridge. Peak discharge was 12.670 cu.m/s on January 11, 2017 at 7:30 am.
Figure 52. Rainfall and outflow data of Iraan River Basin, which was used for modeling.
5.2 RIDF Station
The Philippines Atmospheric Geophysical and Astronomical Services Administration (PAGASA) computed Rainfall Intensity Duration Frequency (RIDF) values for the Puerto Princesa Rain Gauge. The RIDF rainfall amount for 24 hours was converted to a synthetic storm by interpolating and re-arranging the values in such a way a certain peak value is attained at a certain time. This station chosen based on its proximity to the Iraan watershed. The extreme values for this watershed were computed based on a 58-year record.
Table 24. RIDF values for Puerto Princesa Rain Gauge computed by PAGASA
COMPUTED EXTREME VALUES (in mm) OF PRECIPITATION
T (yrs) 10 mins 20 mins 30 mins 1 hr 2 hrs 3 hrs 6 hrs 12 hrs 24 hrs
2 14.8 22 27.3 36.2 49.8 58.8 75.1 88 104.1
5 21.3 31.9 39.7 52.3 73 86.9 112.8 135.4 156.4
10 25.6 38.5 48 63 88.4 105.5 137.8 166.8 191.1
15 28.1 42.2 52.6 69 97 116 151.9 184.5 210.6
20 29.8 44.7 55.9 73.3 103.1 123.4 161.7 196.8 224.3
25 31.1 46.7 58.4 76.5 107.8 129.1 169.3 206.4 234.9
50 35.2 52.9 66.1 86.5 122.2 146.5 192.7 235.8 267.3
100 39.2 59 73.7 96.4 136.5 163.8 216 265 299.6
024681012141618200
2468
101214161820
17:3
0
6:00
18:3
0
7:00
19:3
0
8:00
20:3
0
9:00
8-Jan-16 9-Jan-16 9-Jan-16 10-Jan-16 10-Jan-16 11-Jan-16 11-Jan-16 12-Jan-16
Rainfall Depth (m
m)
Flow
Dis
char
ge (m
3/s)
IRAAN HYDROMETRY
Rainfall Observed Discharge

61
LiDAR Surveys and Flood Mapping of Iraan River
Figure 53. Location of Puerto Princesa RIDF relative to Iraan River Basin
Figure 54. Synthetic Storm Generated For A 24-hr Period Rainfall For Various Return Periods
0
5
10
15
20
25
30
35
40
45
0:00 4:00 8:00 12:00 16:00 20:00 0:00
Rea
rran
ged
Incr
emen
tal P
reci
pita
tion
, mm
Time, min
Puerto Princesa Rainfall Intensity Duration Frequency
5 YEARS10 YEARS25 YEARS50 YEARS100 YEARS
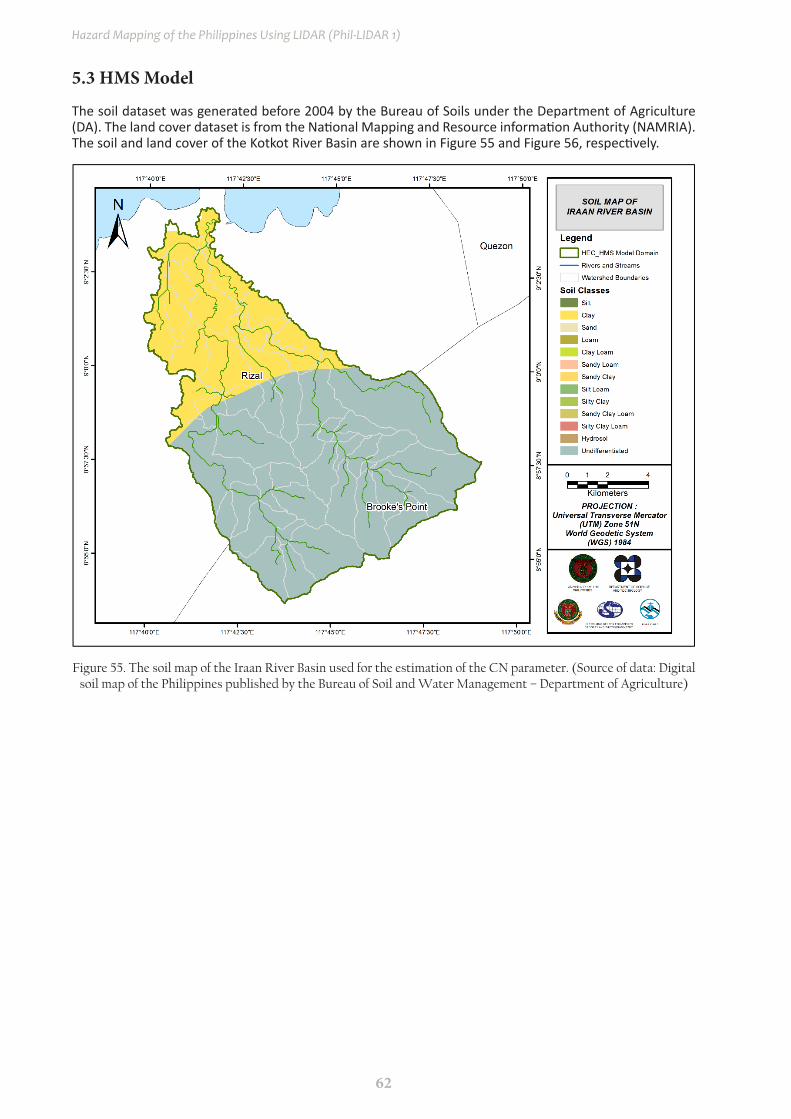
62
Hazard Mapping of the Philippines Using LIDAR (Phil-LIDAR 1)
5.3 HMS Model
The soil dataset was generated before 2004 by the Bureau of Soils under the Department of Agriculture (DA). The land cover dataset is from the National Mapping and Resource information Authority (NAMRIA). The soil and land cover of the Kotkot River Basin are shown in Figure 55 and Figure 56, respectively.
Figure 55. The soil map of the Iraan River Basin used for the estimation of the CN parameter. (Source of data: Digital soil map of the Philippines published by the Bureau of Soil and Water Management – Department of Agriculture)

63
LiDAR Surveys and Flood Mapping of Iraan River
Figure 56. The land cover map of the Iraan River Basin used for the estimation of the CN and watershed lag parameters of the rainfall-runoff model. (Source of data: Digital soil map of the Philippines published by the Bureau
of Soil and Water Management – Department of Agriculture)
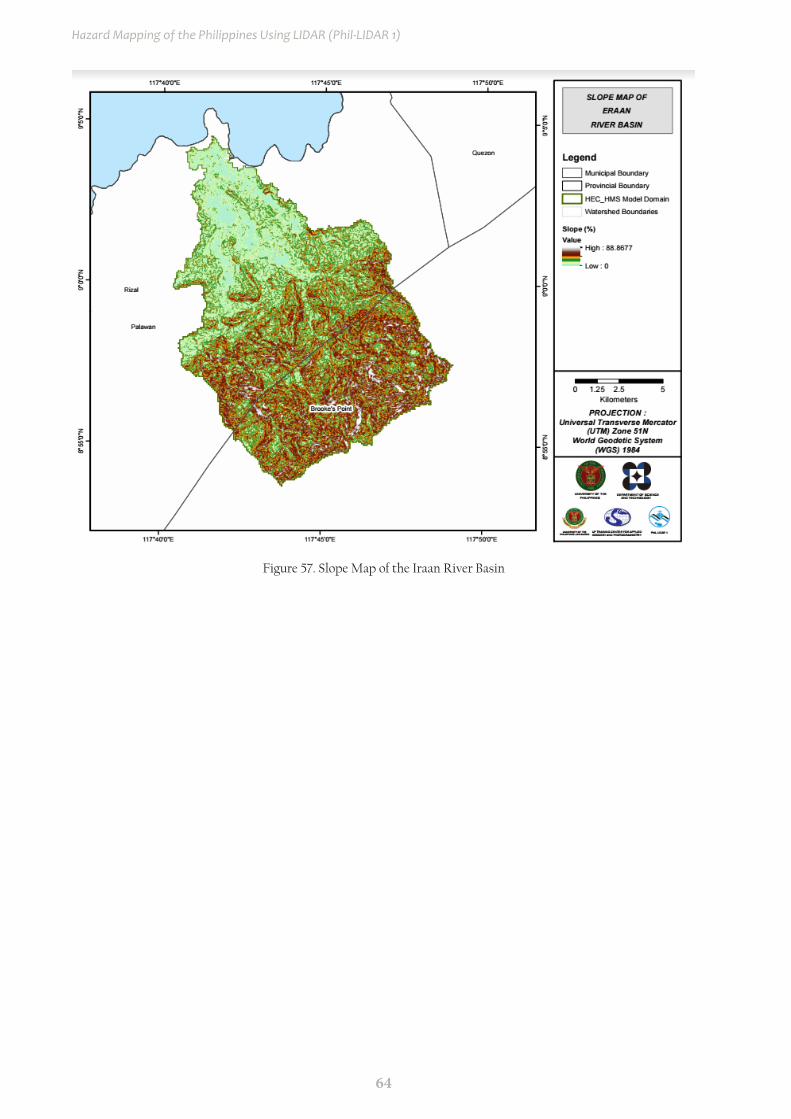
64
Hazard Mapping of the Philippines Using LIDAR (Phil-LIDAR 1)
Figure 57. Slope Map of the Iraan River Basin
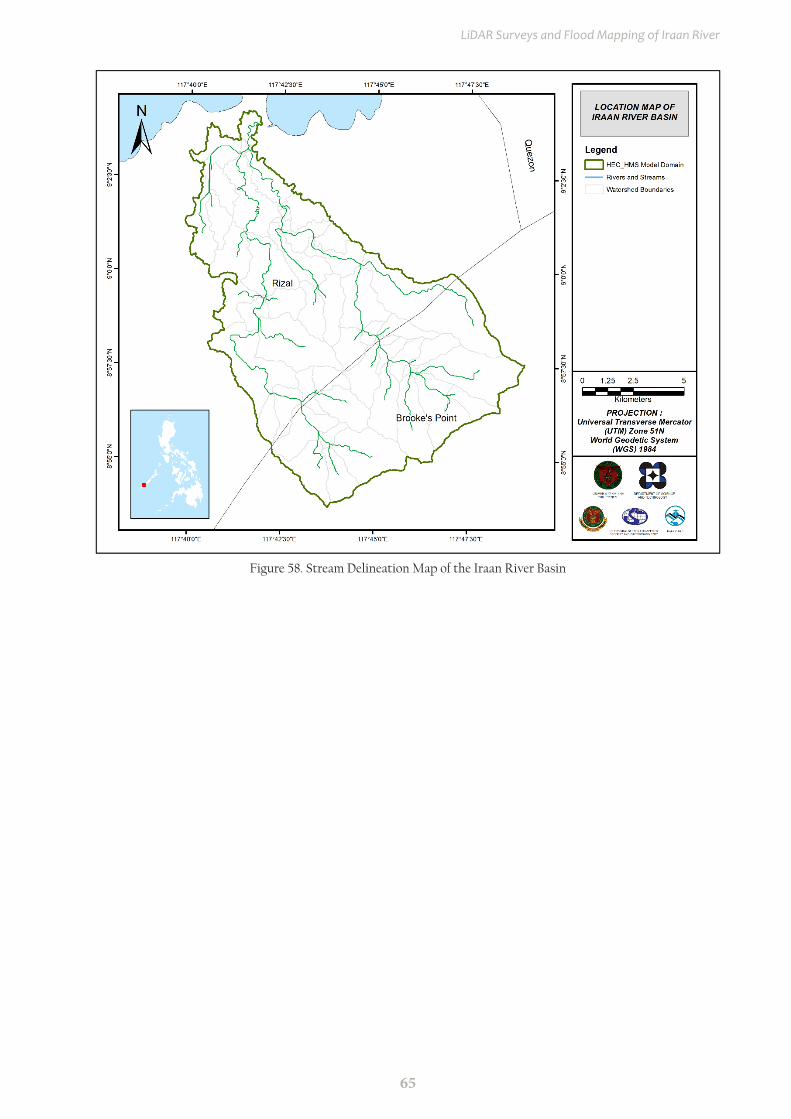
65
LiDAR Surveys and Flood Mapping of Iraan River
Figure 58. Stream Delineation Map of the Iraan River Basin

66
Hazard Mapping of the Philippines Using LIDAR (Phil-LIDAR 1)
Figure 59. The Iraan river basin model generated using HEC-HMS
Using SAR-based DEM, the Iraan basin was delineated and further subdivided into subbasins. The model consists of 56 sub basins, 29 reaches, and 29 junctions. The main outlet is at Iraan Bridge.
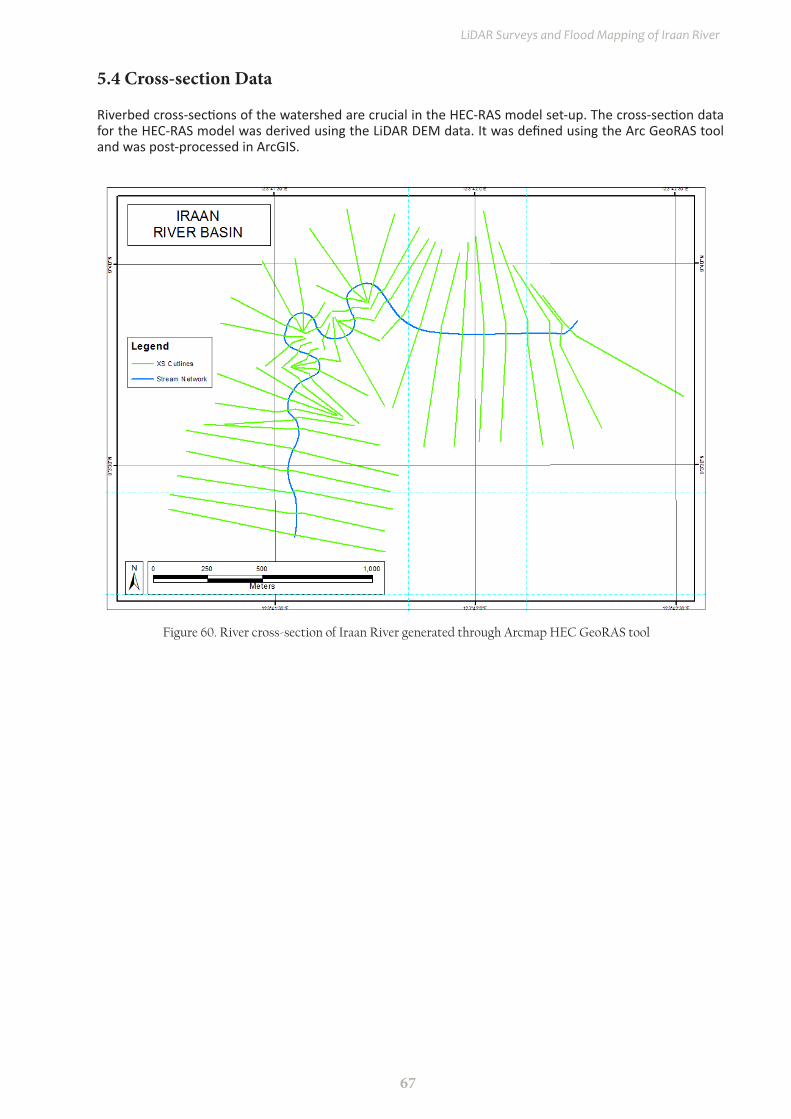
67
LiDAR Surveys and Flood Mapping of Iraan River
Figure 60. River cross-section of Iraan River generated through Arcmap HEC GeoRAS tool
5.4 Cross-section Data
Riverbed cross-sections of the watershed are crucial in the HEC-RAS model set-up. The cross-section data for the HEC-RAS model was derived using the LiDAR DEM data. It was defined using the Arc GeoRAS tool and was post-processed in ArcGIS.

68
Hazard Mapping of the Philippines Using LIDAR (Phil-LIDAR 1)
Figure 61. Screensho[No text for this section and figure ?]t of subcatchment with the computational area to be modeled in FLO-2D GDS Pro
5.5 Flo 2D Model
The automated modelling process allows for the creation of a model with boundaries that are almost exactly coincidental with that of the catchment area. As such, they have approximately the same land area and location. The entire area is divided into square grid elements, 10 meter by 10 meter in size. Each element is assigned a unique grid element number which serves as its identifier, then attributed with the parameters required for modelling such as x-and y-coordinate of centroid, names of adjacent grid elements, Manning coefficient of roughness, infiltration, and elevation value. The elements are arranged spatially to form the model, allowing the software to simulate the flow of water across the grid elements and in eight directions (north, south, east, west, northeast, northwest, southeast, southwest). Based on the elevation and flow direction, it is seen that the water will generally flow from the south of the model to the north, following the main channel. As such, boundary elements in those particular regions of the model are assigned as inflow and outflow elements respectively.
The simulation is then run through FLO-2D GDS Pro. This particular model had a computer run time of 31.95605 hours. After the simulation, FLO-2D Mapper Pro is used to transform the simulation results into spatial data that shows flood hazard levels, as well as the extent and inundation of the flood. Assigning the appropriate flood depth and velocity values for Low, Medium, and High creates the following food hazard map. Most of the default values given by FLO-2D Mapper Pro are used, except for those in the Low hazard level. For this particular level, the minimum h (Maximum depth) is set at 0.2 m while the minimum vh (Product of maximum velocity (v) times maximum depth (h)) is set at 0 m2/s.
The creation of a flood hazard map from the model also automatically creates a flow depth map depicting the maximum amount of inundation for every grid element. The legend used by default in Flo-2D Mapper is not a good representation of the range of flood inundation values, so a different legend is used for the layout. In this particular model, the inundated parts cover a maximum land area of 80 183 700.00 m2.
There is a total of 36 447 348.62 m3 of water entering the model. Of this amount, 22 918 238.06 m3 is due to rainfall while 13 529 110.56 m3 is inflow from other areas outside the model. 7 005 949.50 m3 of this water is lost to infiltration and interception, while 4 475 535.98 m3 is stored by the flood plain. The rest, amounting up to 24 965 868.70 m3, is outflow.
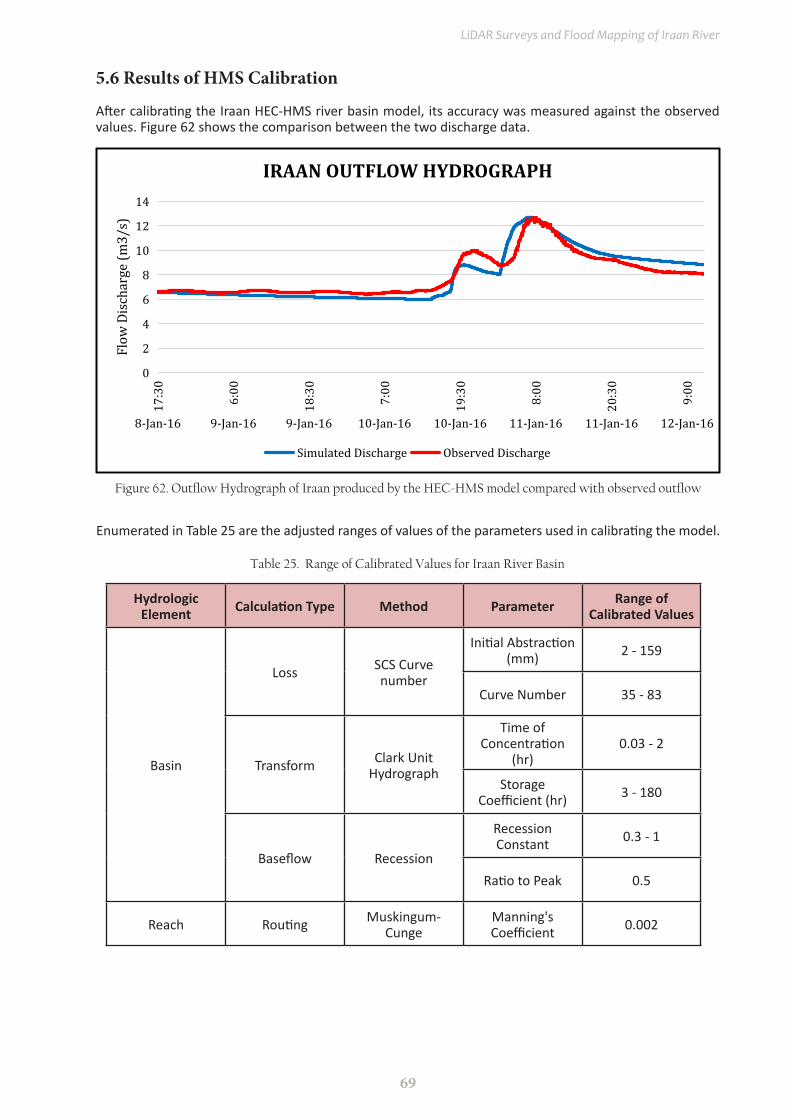
69
LiDAR Surveys and Flood Mapping of Iraan River
5.6 Results of HMS Calibration
After calibrating the Iraan HEC-HMS river basin model, its accuracy was measured against the observed values. Figure 62 shows the comparison between the two discharge data.
Table 25. Range of Calibrated Values for Iraan River Basin
Figure 62. Outflow Hydrograph of Iraan produced by the HEC-HMS model compared with observed outflow
Hydrologic Element Calculation Type Method Parameter Range of
Calibrated Values
Basin
Loss SCS Curve number
Initial Abstraction (mm) 2 - 159
Curve Number 35 - 83
Transform Clark Unit Hydrograph
Time of Concentration
(hr)0.03 - 2
Storage Coefficient (hr) 3 - 180
Baseflow Recession
Recession Constant 0.3 - 1
Ratio to Peak 0.5
Reach Routing Muskingum-Cunge
Manning's Coefficient 0.002
Enumerated in Table 25 are the adjusted ranges of values of the parameters used in calibrating the model.
0
2
4
6
8
10
12
14
17:3
0
6:00
18:3
0
7:00
19:3
0
8:00
20:3
0
9:00
8-Jan-16 9-Jan-16 9-Jan-16 10-Jan-16 10-Jan-16 11-Jan-16 11-Jan-16 12-Jan-16
Flow
Dis
char
ge (m
3/s)
IRAAN OUTFLOW HYDROGRAPH
Simulated Discharge Observed Discharge
70
Hazard Mapping of the Philippines Using LIDAR (Phil-LIDAR 1)
Table 26. Summary of the Efficiency Test of the Iraan HMS Model
The Root Mean Square Error (RMSE) method aggregates the individual differences of these two measurements. It was identified at 0.650.
The Pearson correlation coefficient (r2) assesses the strength of the linear relationship between the observations and the model. This value being close to 1 corresponds to an almost perfect match of the observed discharge and the resulting discharge from the HEC HMS model. Here, it measured 0.954.
The Nash-Sutcliffe (E) method was also used to assess the predictive power of the model. Here the optimal value is 1. The model attained an efficiency coefficient of 0.851.
A positive Percent Bias (PBIAS) indicates a model’s propensity towards under-prediction. Negative values indicate bias towards over-prediction. Again, the optimal value is 0. In the model, the PBIAS is 0.689.
The Observation Standard Deviation Ratio, RSR, is an error index. A perfect model attains a value of 0 when the error in the units of the valuable a quantified. The model has an RSR value of 0.386.
Initial abstraction defines the amount of precipitation that must fall before surface runoff. The magnitude of the outflow hydrograph increases as initial abstraction decreases. The range of values from 2 to 159 mm means that there is high amount of infiltration or rainfall interception by vegetation.
Curve number is the estimate of the precipitation excess of soil cover, land use, and antecedent moisture. The magnitude of the outflow hydrograph increases as curve number increases. The range of 39 to 99 for curve number means that there is a diverse characteristic for this watershed depending on its subbasin.
Time of concentration and storage coefficient are the travel time and index of temporary storage of runoff in a watershed. The range of calibrated values from 0.03 hours to 180 hours determines the reaction time of the model with respect to the rainfall. The peak magnitude of the hydrograph also decreases when these parameters are increased.
Recession constant is the rate at which baseflow recedes between storm events and ratio to peak is the ratio of the baseflow discharge to the peak discharge. Same as the curve number, the characteristics of this watershed differs per reach.
Manning’s roughness coefficient of 0.002 is relatively low compared to the common roughness of watersheds (Brunner, 2010).
Accuracy measure ValueRMSE 0.650
r2 0.954NSE 0.851
PBIAS 0.689RSR 0.386

71
LiDAR Surveys and Flood Mapping of Iraan River
5.7 Calculated outflow hydrographs and discharge values for different rainfall return periods
5.7.1 Hydrograph using the Rainfall Runoff Model
The summary graph (Figure 63) shows the Iraan outflow using the Puerto Princesa Rainfail Intensity-Duration-Frequency curves (RIDF) in 5 different return periods (5-year, 10-year, 25-year, 50-year, and 100-year rainfall time series) based on the Philippine Atmospheric Geophysical and Astronomical Services Administration (PAGASA) data. The simulation results reveal significant increase in outflow magnitude as the rainfall intensity increases for a range of durations and return periods.
0
10
20
30
40
50
60
70
80
90
1000
10
20
30
40
50
60
70
80
90
100
-0:0
01:
002:
003:
004:
005:
006:
007:
008:
009:
0010
:00
11:0
012
:00
13:0
014
:00
15:0
016
:00
17:0
018
:00
19:0
020
:00
21:0
022
:00
23:0
00:
00
Rain
fall
(mm
)
Dis
char
ge (m
3/s)
Time (min)
Iraan Outflow using Puerto Princesa Rainfall Intensity Duration Frequency
Q (5 yrs)
Q (10 yrs)
Q (25 yrs)
Q (50 yrs)
Q (100 yrs)
Rainfall (5 yrs)
Rainfall (10 yrs)
Rainfall (25 yrs)
Rainfall (50 yrs)
Rainfall (100 yrs)
Figure 63. Outflow hydrograph at Iraan Station generated using Puerto Princesa RIDF simulated in HEC-HMS
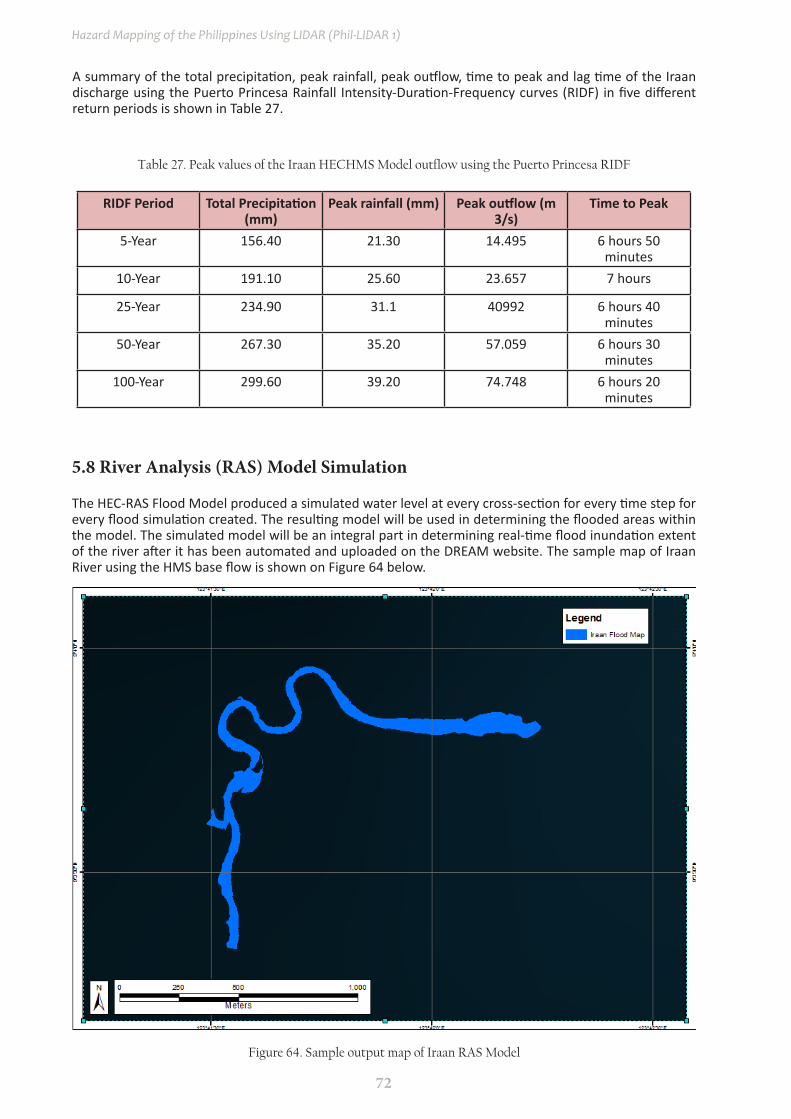
72
Hazard Mapping of the Philippines Using LIDAR (Phil-LIDAR 1)
Figure 64. Sample output map of Iraan RAS Model
5.8 River Analysis (RAS) Model Simulation
The HEC-RAS Flood Model produced a simulated water level at every cross-section for every time step for every flood simulation created. The resulting model will be used in determining the flooded areas within the model. The simulated model will be an integral part in determining real-time flood inundation extent of the river after it has been automated and uploaded on the DREAM website. The sample map of Iraan River using the HMS base flow is shown on Figure 64 below.
A summary of the total precipitation, peak rainfall, peak outflow, time to peak and lag time of the Iraan discharge using the Puerto Princesa Rainfall Intensity-Duration-Frequency curves (RIDF) in five different return periods is shown in Table 27.
Table 27. Peak values of the Iraan HECHMS Model outflow using the Puerto Princesa RIDF
RIDF Period Total Precipitation (mm)
Peak rainfall (mm) Peak outflow (m 3/s)
Time to Peak
5-Year 156.40 21.30 14.495 6 hours 50 minutes
10-Year 191.10 25.60 23.657 7 hours
25-Year 234.90 31.1 40992 6 hours 40 minutes
50-Year 267.30 35.20 57.059 6 hours 30 minutes
100-Year 299.60 39.20 74.748 6 hours 20 minutes
73
LiDAR Surveys and Flood Mapping of Iraan River
5.9 Flow Depth and Flood Hazard
The resulting hazard and flow depth maps for 5-, 25-, and 100-year rain return scenarios of the Iraan Floodplain are shown in Figure 65 to 70. The floodplain, with an area of 79.82 sq. km., covers one municipality namely Rizal. Table 28 shows the percentage of area affected by flooding per municipality.
Table 28. Municipalities affected in Iraan Floodplain
Municipality Total Area Area Flooded % Flooded
Rizal 980.59 79.76 8.13

74
Hazard Mapping of the Philippines Using LIDAR (Phil-LIDAR 1)
Figure 65. A 100-year flood hazard map for Iraan (also known as Eraan) Floodplain

75
LiDAR Surveys and Flood Mapping of Iraan River
Figure 66. A 100-year Flow Depth Map for Iraan (also known as Eraan) Floodplain
76
Hazard Mapping of the Philippines Using LIDAR (Phil-LIDAR 1)
Figure 67. A 25-year Flood Hazard Map for Iraan (also known as Eraan) Floodplain
77
LiDAR Surveys and Flood Mapping of Iraan River
Figure 68. A 25-year Flow Depth Map for Iraan (also known as Eraan) Floodplain

78
Hazard Mapping of the Philippines Using LIDAR (Phil-LIDAR 1)
Figure 69. A 5-year Flood Hazard Map for Iraan (also known as Eraan) Floodplain

79
LiDAR Surveys and Flood Mapping of Iraan River
Figure 70. A 5-year Flow depth map for Iraan (also known as Eraan) Floodplain.

80
Hazard Mapping of the Philippines Using LIDAR (Phil-LIDAR 1)
5.10 Inventory of Areas Exposed to Flooding
Affected barangays in Iraan river basin, grouped by municipality, are listed below. For the said basin, one municipality consisting of 3 barangays are expected to experience flooding when subjected to 5-yr rainfall return period.
For the 5-year return period, 5.51% of the municipality of Rizal with an area of 980.59 sq. km. will experience flood levels of less 0.20 meters. 0.39% of the area will experience flood levels of 0.21 to 0.50 meters while 0.66%, 1.01%, 0.53%, and 0.00004% of the area will experience flood depths of 0.51 to 1 meter, 1.01 to 2 meters, 2.01 to 5 meters and more than 5 meters, respectively. Listed in Table 29 are the affected areas in square kilometers by flood depth per barangay.
Table 29. Affected Areas in Rizal, Palawan during 5-Year Rainfall Return Period
Figure 71. Affected Areas in Rizal, Palawan during 5-Year Rainfall Return Period
Affected area (sq. km.) by flood
depth (in m.)
Affected Barangays in Rizal
Bunog Iraan Punta Baja
0.03-0.20 20.26 25.91 7.87
0.21-0.50 1.095 2.41 0.36
0.51-1.00 1.21 4.85 0.43
1.01-2.00 1.84 7.19 0.91
2.01-5.00 0.44 3.68 1.13
> 5.00 0.0004 0 0
0
2
4
6
8
10
12
14
16
18
20
Bunog Iraan Punta Baja
Affe
cted
Are
a (s
q. k
m.)
Barangays
Affected Areas in Rizal, Palawan(5-Year Rainfall Return Period)
> 5.002.01-5.001.01-2.000.51-1.000.21-0.50
81
LiDAR Surveys and Flood Mapping of Iraan River
For the 25-year return period, 5.67% of the municipality of Rizal with an area of 980.59 sq. km. will experience flood levels of less 0.20 meters. 0.49% of the area will experience flood levels of 0.21 to 0.50 meters while 0.77%, 0.83%, 0.36%, and 0.008% of the area will experience flood depths of 0.51 to 1 meter, 1.01 to 2 meters, 2.01 to 5 meters, and more than 5 meter, respectively. Listed in Table 30 are the affected areas in square kilometers by flood depth per barangay.
Table 30. Affected Areas in Rizal, Palawan during 25-Year Rainfall Return Period
Figure 72. Affected Areas in Rizal, Palawan during 25-Year Rainfall Return Period
Affected area (sq. km.) by flood
depth (in m.)
Affected Barangays in Rizal
Bunog Iraan Punta Baja
0.03-0.20 20.63 26.92 8.0
0.21-0.50 1.080 3.30 0.38
0.51-1.00 1.31 5.706 0.52
1.01-2.00 1.55 5.70 0.99
2.01-5.00 0.28 2.50 0.82
> 5.00 0.0002 0.079 0.0037
0
2
4
6
8
10
12
14
16
18
20
Bunog Iraan Punta Baja
Affe
cted
Are
a (s
q. k
m.)
Barangays
Affected Areas in Rizal, Palawan(25-Year Rainfall Return Period)
> 5.002.01-5.001.01-2.000.51-1.000.21-0.50
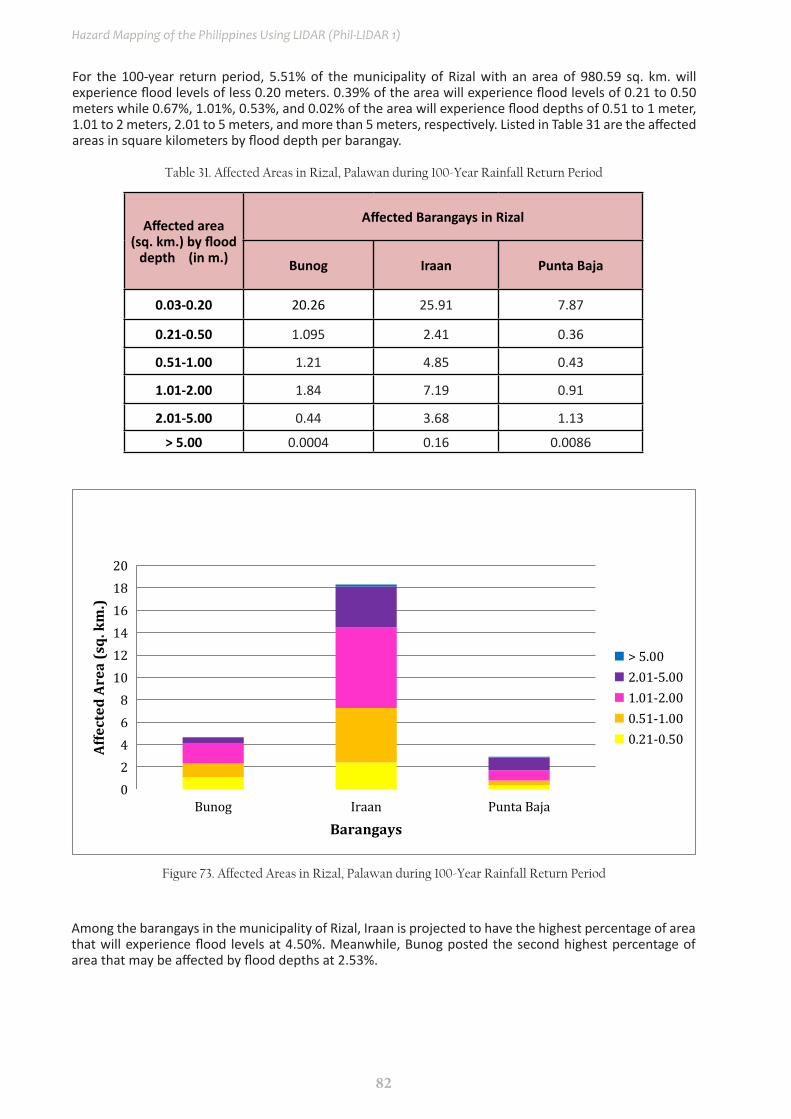
82
Hazard Mapping of the Philippines Using LIDAR (Phil-LIDAR 1)
Among the barangays in the municipality of Rizal, Iraan is projected to have the highest percentage of area that will experience flood levels at 4.50%. Meanwhile, Bunog posted the second highest percentage of area that may be affected by flood depths at 2.53%.
For the 100-year return period, 5.51% of the municipality of Rizal with an area of 980.59 sq. km. will experience flood levels of less 0.20 meters. 0.39% of the area will experience flood levels of 0.21 to 0.50 meters while 0.67%, 1.01%, 0.53%, and 0.02% of the area will experience flood depths of 0.51 to 1 meter, 1.01 to 2 meters, 2.01 to 5 meters, and more than 5 meters, respectively. Listed in Table 31 are the affected areas in square kilometers by flood depth per barangay.
Table 31. Affected Areas in Rizal, Palawan during 100-Year Rainfall Return Period
Figure 73. Affected Areas in Rizal, Palawan during 100-Year Rainfall Return Period
Affected area (sq. km.) by flood
depth (in m.)
Affected Barangays in Rizal
Bunog Iraan Punta Baja
0.03-0.20 20.26 25.91 7.87
0.21-0.50 1.095 2.41 0.36
0.51-1.00 1.21 4.85 0.43
1.01-2.00 1.84 7.19 0.91
2.01-5.00 0.44 3.68 1.13
> 5.00 0.0004 0.16 0.0086
02468
101214161820
Bunog Iraan Punta Baja
Affe
cted
Are
a (s
q. k
m.)
Barangays
Affected Areas in Rizal, Palawan(100-Year Rainfall Return Period)
> 5.002.01-5.001.01-2.000.51-1.000.21-0.50
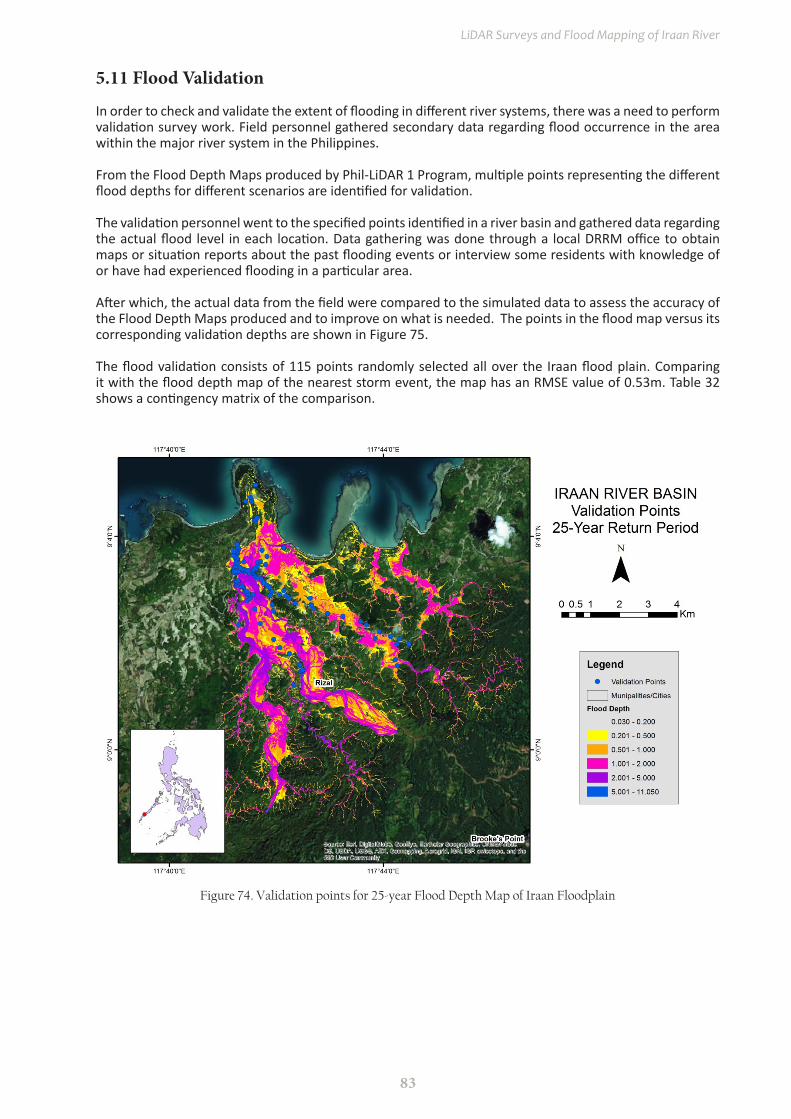
83
LiDAR Surveys and Flood Mapping of Iraan River
5.11 Flood Validation
In order to check and validate the extent of flooding in different river systems, there was a need to perform validation survey work. Field personnel gathered secondary data regarding flood occurrence in the area within the major river system in the Philippines.
From the Flood Depth Maps produced by Phil-LiDAR 1 Program, multiple points representing the different flood depths for different scenarios are identified for validation.
The validation personnel went to the specified points identified in a river basin and gathered data regarding the actual flood level in each location. Data gathering was done through a local DRRM office to obtain maps or situation reports about the past flooding events or interview some residents with knowledge of or have had experienced flooding in a particular area.
After which, the actual data from the field were compared to the simulated data to assess the accuracy of the Flood Depth Maps produced and to improve on what is needed. The points in the flood map versus its corresponding validation depths are shown in Figure 75.
The flood validation consists of 115 points randomly selected all over the Iraan flood plain. Comparing it with the flood depth map of the nearest storm event, the map has an RMSE value of 0.53m. Table 32 shows a contingency matrix of the comparison.
Figure 74. Validation points for 25-year Flood Depth Map of Iraan Floodplain
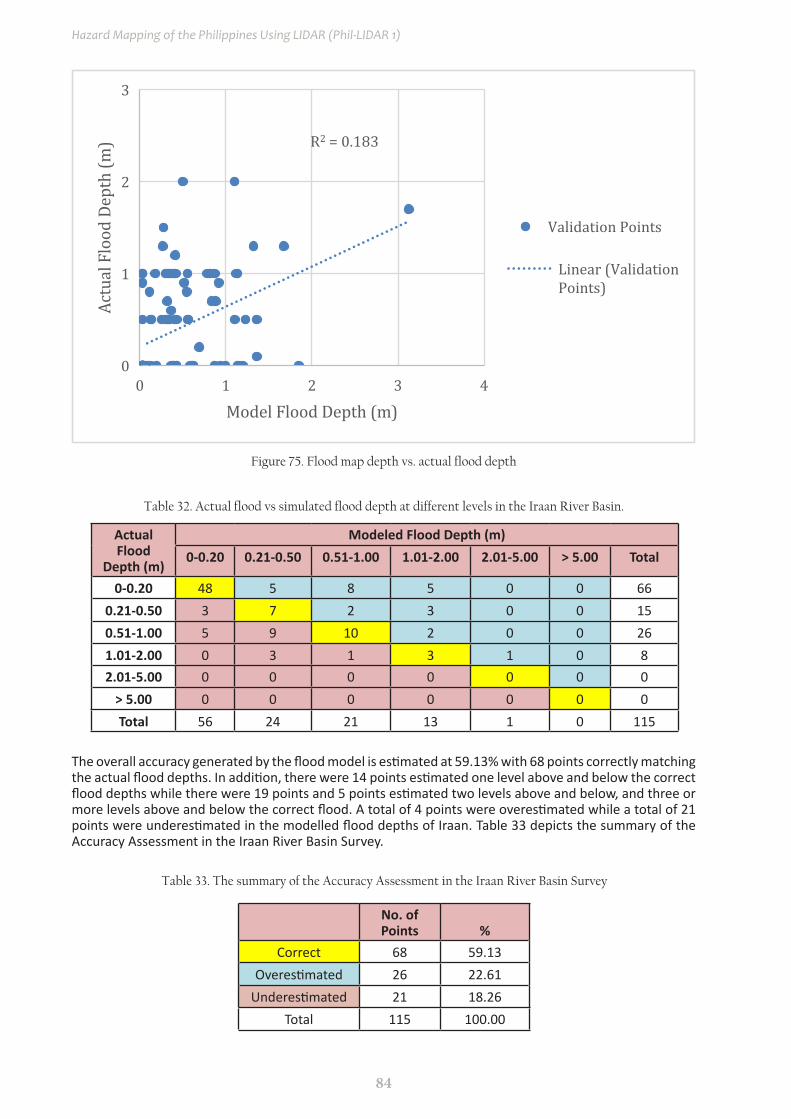
84
Hazard Mapping of the Philippines Using LIDAR (Phil-LIDAR 1)
Figure 75. Flood map depth vs. actual flood depth
Table 32. Actual flood vs simulated flood depth at different levels in the Iraan River Basin.
The overall accuracy generated by the flood model is estimated at 59.13% with 68 points correctly matching the actual flood depths. In addition, there were 14 points estimated one level above and below the correct flood depths while there were 19 points and 5 points estimated two levels above and below, and three or more levels above and below the correct flood. A total of 4 points were overestimated while a total of 21 points were underestimated in the modelled flood depths of Iraan. Table 33 depicts the summary of the Accuracy Assessment in the Iraan River Basin Survey.
Table 33. The summary of the Accuracy Assessment in the Iraan River Basin Survey
Actual Flood
Depth (m)
Modeled Flood Depth (m)0-0.20 0.21-0.50 0.51-1.00 1.01-2.00 2.01-5.00 > 5.00 Total
0-0.20 48 5 8 5 0 0 660.21-0.50 3 7 2 3 0 0 150.51-1.00 5 9 10 2 0 0 261.01-2.00 0 3 1 3 1 0 82.01-5.00 0 0 0 0 0 0 0
> 5.00 0 0 0 0 0 0 0Total 56 24 21 13 1 0 115
No. of Points %
Correct 68 59.13Overestimated 26 22.61
Underestimated 21 18.26Total 115 100.00
R2 = 0.183
0
1
2
3
0 1 2 3 4
Actu
al F
lood
Dep
th (m
)
Model Flood Depth (m)
Validation Points
Linear (Validation Points)
85
LiDAR Surveys and Flood Mapping of Iraan River
REFERENCES
Ang M.O., Paringit E.C., et al. 2014. DREAM Data Processing Component Manual. Quezon City, Philippines: UP Training Center for Applied Geodesy and Photogrammetry.
Balicanta L.P., Paringit E.C., et al. 2014. DREAM Data Validation Component Manual. Quezon City, Philippines: UP Training Center for Applied Geodesy and Photogrammetry.
Brunner, G. H. 2010a. HEC-RAS River Analysis System Hydraulic Reference Manual. Davis, CA: U.S. Army Corps of Engineers, Institute for Water Resources, Hydrologic Engineering Center.
Lagmay A.F., Paringit E.C., et al. 2014. DREAM Flood Modeling Component Manual. Quezon City, Philippines: UP Training Center for Applied Geodesy and Photogrammetry.
Paringit E.C, Balicanta L.P., Ang, M.O., Sarmiento, C. 2017. Flood Mapping of Rivers in the Philippines Using Airborne Lidar: Methods. Quezon City, Philippines: UP Training Center for Applied Geodesy and Photogrammetry.
Sarmiento C., Paringit E.C., et al. 2014. DREAM Data Acquisition Component Manual. Quezon City, Philippines: UP Training Center for Applied Geodesy and Photogrammetry.
UP TCAGP 2016, Acceptance and Evaluation of Synthetic Aperture Radar Digital Surface Model (SAR DSM) and Ground Control Points (GCP). Quezon City, Philippines: UP Training Center for Applied Geodesy and Photogrammetry.

86
Hazard Mapping of the Philippines Using LIDAR (Phil-LIDAR 1)
ANNEXES
Annex 1. Technical Specification of the Pegasus Sensor
Table A-1.1 Parameters and Specifications of the Pegasus Sensor
Parameter SpecificationOperational envelope (1,2,3,4) 150-4000 m AGL, nominal
Laser wavelength 1064 nmHorizontal accuracy (2) 1/5,500 x altitude, (m AGL)Elevation accuracy (2) <5-35 cm, 1 σ
Effective laser repetition rate Programmable, 33-167 kHz
Position and orientation systemPOS AV™ AP50 (OEM);
220-channel dual frequency GPS/GNSS/Galileo/L-Band receiver
Scan width (WOV) Programmable, 0-50˚Scan frequency (5) Programmable, 0-70 Hz (effective)
Sensor scan product 1000 maximum
Beam divergence Dual divergence: 0.25 mrad (1/e) and 0.8 mrad (1/e), nom-inal
Roll compensation Programmable, ±5˚ (FOV dependent)
Range capture Up to 4 range measurements, including 1st, 2nd, 3rd, and last returns
Intensity capture Up to 4 intensity returns for each pulse, including last (12 bit)
Video Camera Internal video camera (NTSC or PAL)Image capture Compatible with full Optech camera line (optional)
Full waveform capture 12-bit Optech IWD-2 Intelligent Waveform Digitizer (option-al)
Data storage Removable solid state disk SSD (SATA II)Power requirements 28 V; 900 W;35 A(peak)
Dimensions and weight Sensor: 260 mm (w) x 190 mm (l) x 570 mm (h); 23 kgControl rack: 650 mm (w) x 590 mm (l) x 530 mm (h); 53 kg
Operating temperature -10˚C to +35˚C (with insulating jacket)Relative humidity 0-95% no-condensing
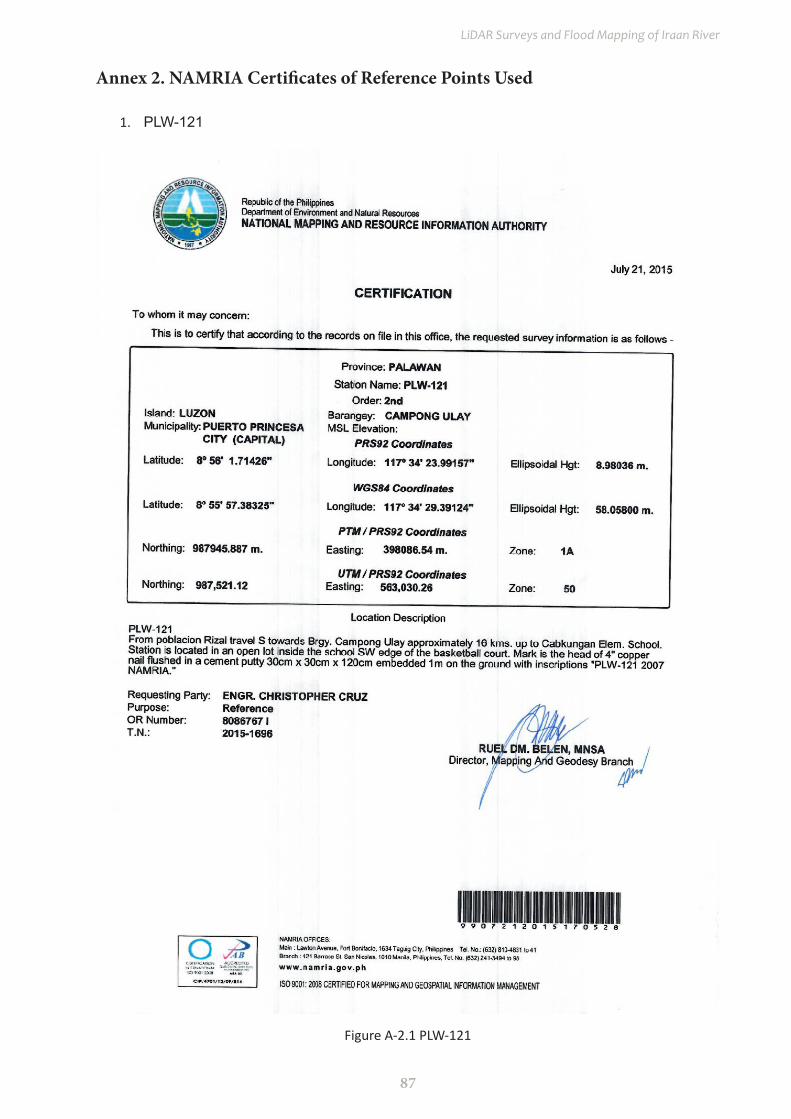
87
LiDAR Surveys and Flood Mapping of Iraan River
Annex 2. NAMRIA Certificates of Reference Points Used
1. PLW-121
Figure A-2.1 PLW-121

88
Hazard Mapping of the Philippines Using LIDAR (Phil-LIDAR 1)
2. PLW-137
Figure A-2.2 PLW-137
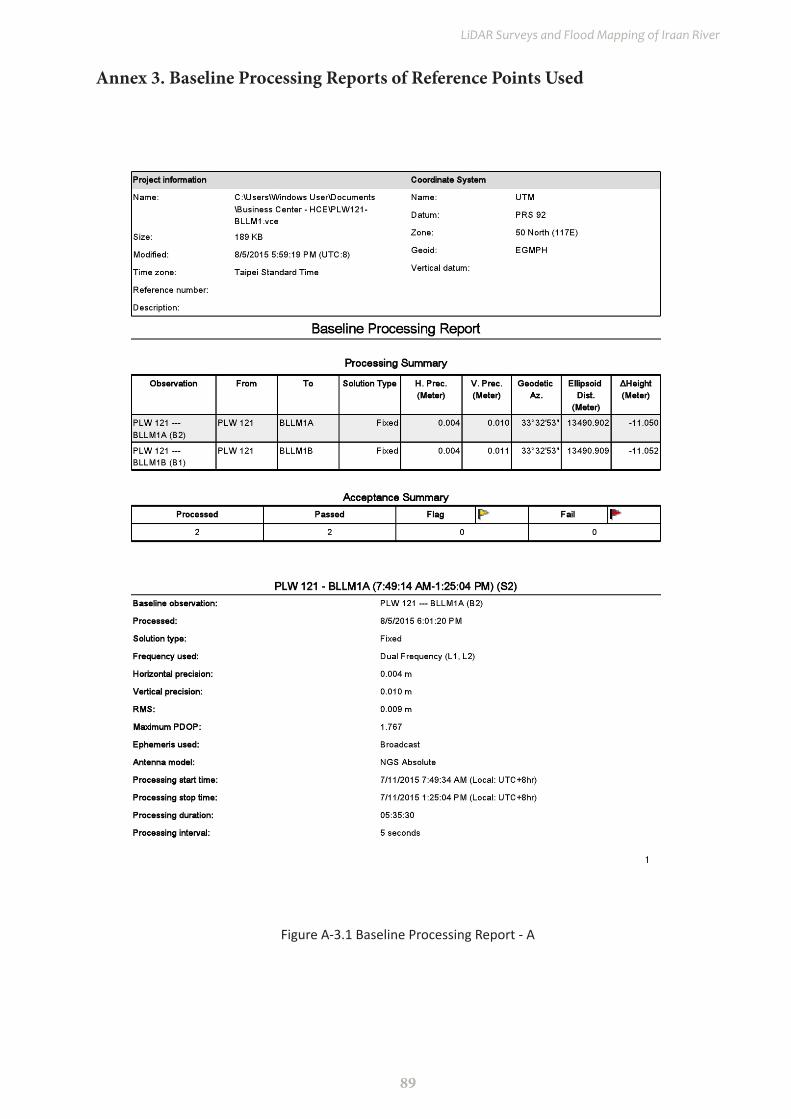
89
LiDAR Surveys and Flood Mapping of Iraan River
Annex 3. Baseline Processing Reports of Reference Points Used
Figure A-3.1 Baseline Processing Report - A
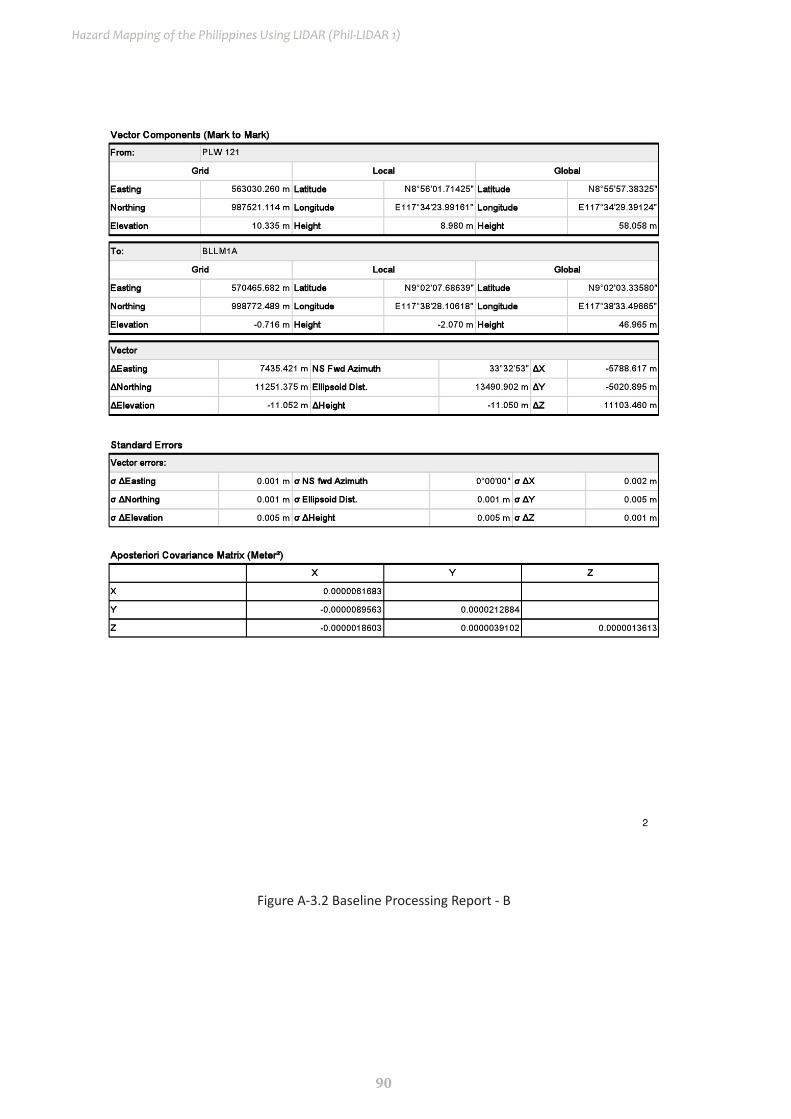
90
Hazard Mapping of the Philippines Using LIDAR (Phil-LIDAR 1)
Figure A-3.2 Baseline Processing Report - B

91
LiDAR Surveys and Flood Mapping of Iraan River
Figure A-3.3 Baseline Processing Report - C

92
Hazard Mapping of the Philippines Using LIDAR (Phil-LIDAR 1)
Figure A-3.4 Baseline Processing Report - D

93
LiDAR Surveys and Flood Mapping of Iraan River
Figure A-3.5 Baseline Processing Report - E

94
Hazard Mapping of the Philippines Using LIDAR (Phil-LIDAR 1)
Figure A-3.6 Baseline Processing Report - F
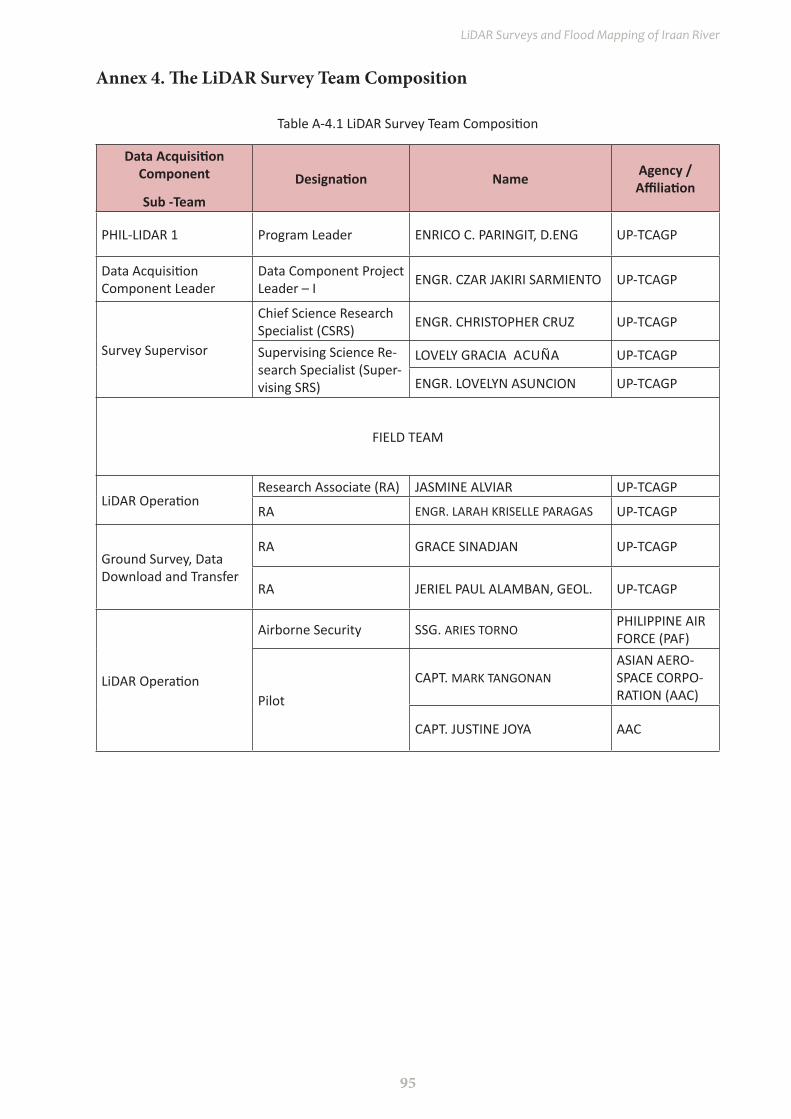
95
LiDAR Surveys and Flood Mapping of Iraan River
Annex 4. The LiDAR Survey Team Composition
Table A-4.1 LiDAR Survey Team Composition
Data Acquisition Component
Sub -TeamDesignation Name Agency /
Affiliation
PHIL-LIDAR 1 Program Leader ENRICO C. PARINGIT, D.ENG UP-TCAGP
Data Acquisition Component Leader
Data Component Project Leader – I ENGR. CZAR JAKIRI SARMIENTO UP-TCAGP
Survey Supervisor
Chief Science Research Specialist (CSRS) ENGR. CHRISTOPHER CRUZ UP-TCAGP
Supervising Science Re-search Specialist (Super-vising SRS)
LOVELY GRACIA ACUÑA UP-TCAGP
ENGR. LOVELYN ASUNCION UP-TCAGP
FIELD TEAM
LiDAR OperationResearch Associate (RA) JASMINE ALVIAR UP-TCAGP
RA ENGR. LARAH KRISELLE PARAGAS UP-TCAGP
Ground Survey, Data Download and Transfer
RA GRACE SINADJAN UP-TCAGP
RA JERIEL PAUL ALAMBAN, GEOL. UP-TCAGP
LiDAR Operation
Airborne Security SSG. ARIES TORNOPHILIPPINE AIR FORCE (PAF)
PilotCAPT. MARK TANGONAN
ASIAN AERO-SPACE CORPO-RATION (AAC)
CAPT. JUSTINE JOYA AAC
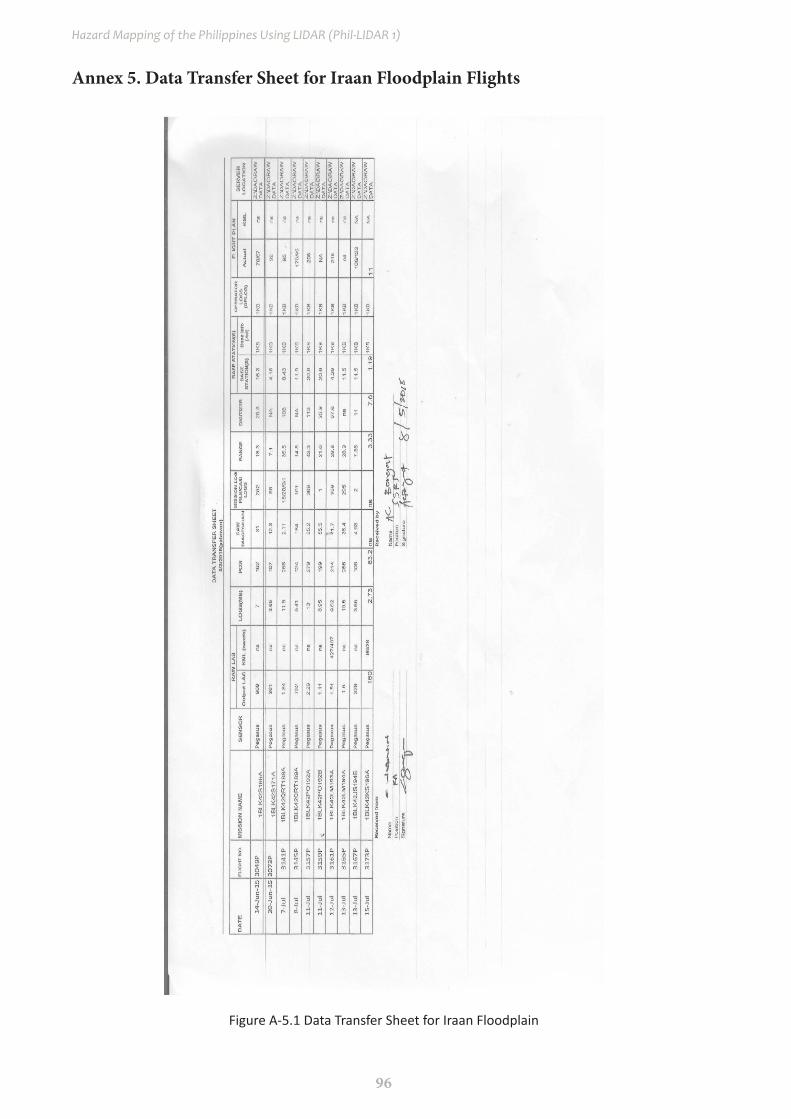
96
Hazard Mapping of the Philippines Using LIDAR (Phil-LIDAR 1)
Annex 5. Data Transfer Sheet for Iraan Floodplain Flights
Figure A-5.1 Data Transfer Sheet for Iraan Floodplain
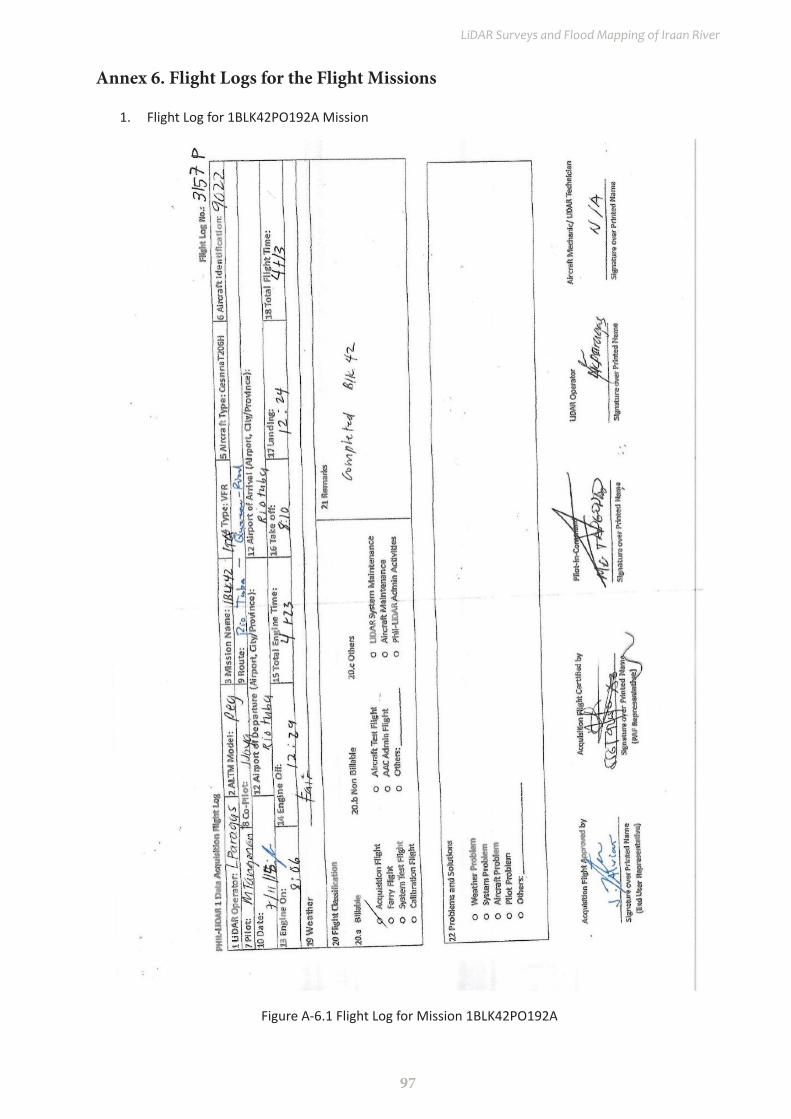
97
LiDAR Surveys and Flood Mapping of Iraan River
Annex 6. Flight Logs for the Flight Missions
1. Flight Log for 1BLK42PO192A Mission
Figure A-6.1 Flight Log for Mission 1BLK42PO192A
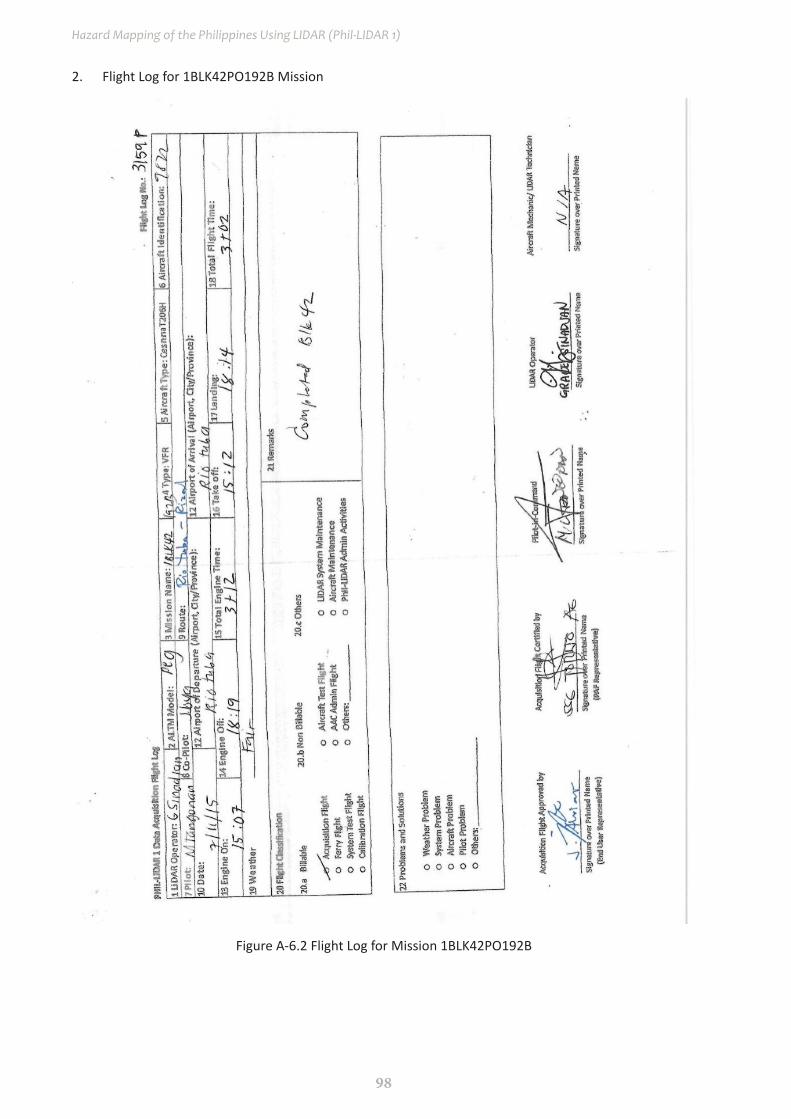
98
Hazard Mapping of the Philippines Using LIDAR (Phil-LIDAR 1)
2. Flight Log for 1BLK42PO192B Mission
Figure A-6.2 Flight Log for Mission 1BLK42PO192B
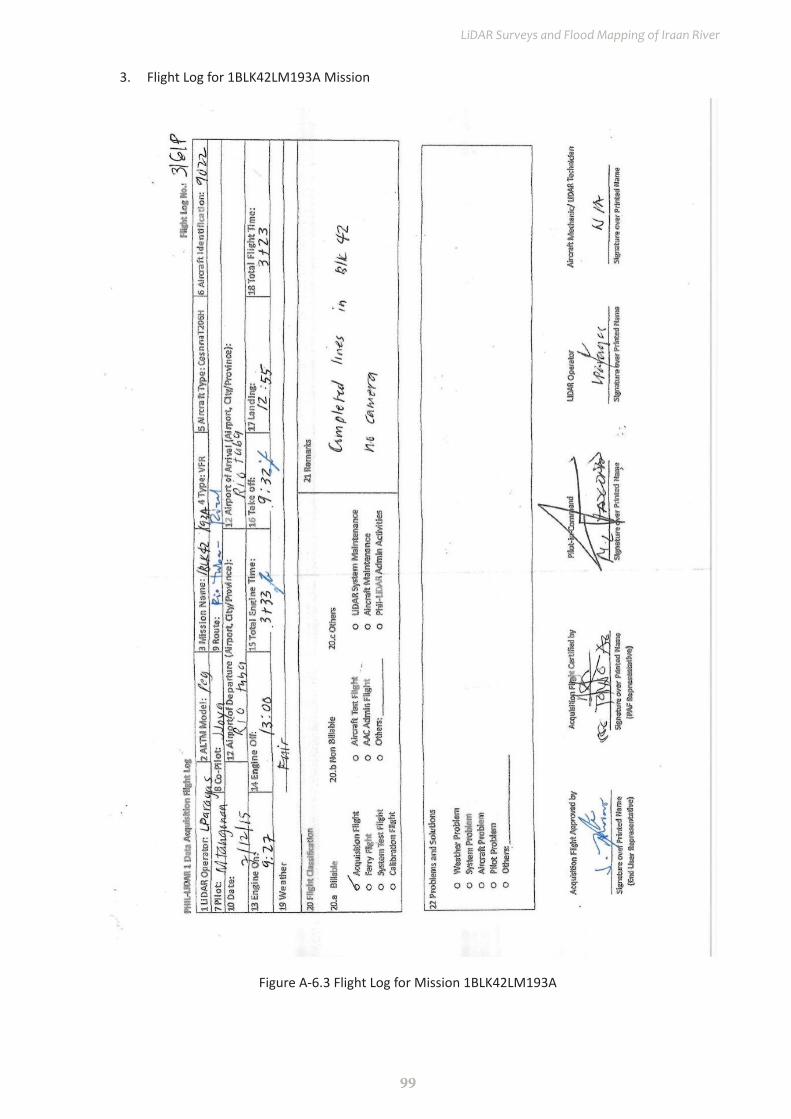
99
LiDAR Surveys and Flood Mapping of Iraan River
3. Flight Log for 1BLK42LM193A Mission
Figure A-6.3 Flight Log for Mission 1BLK42LM193A
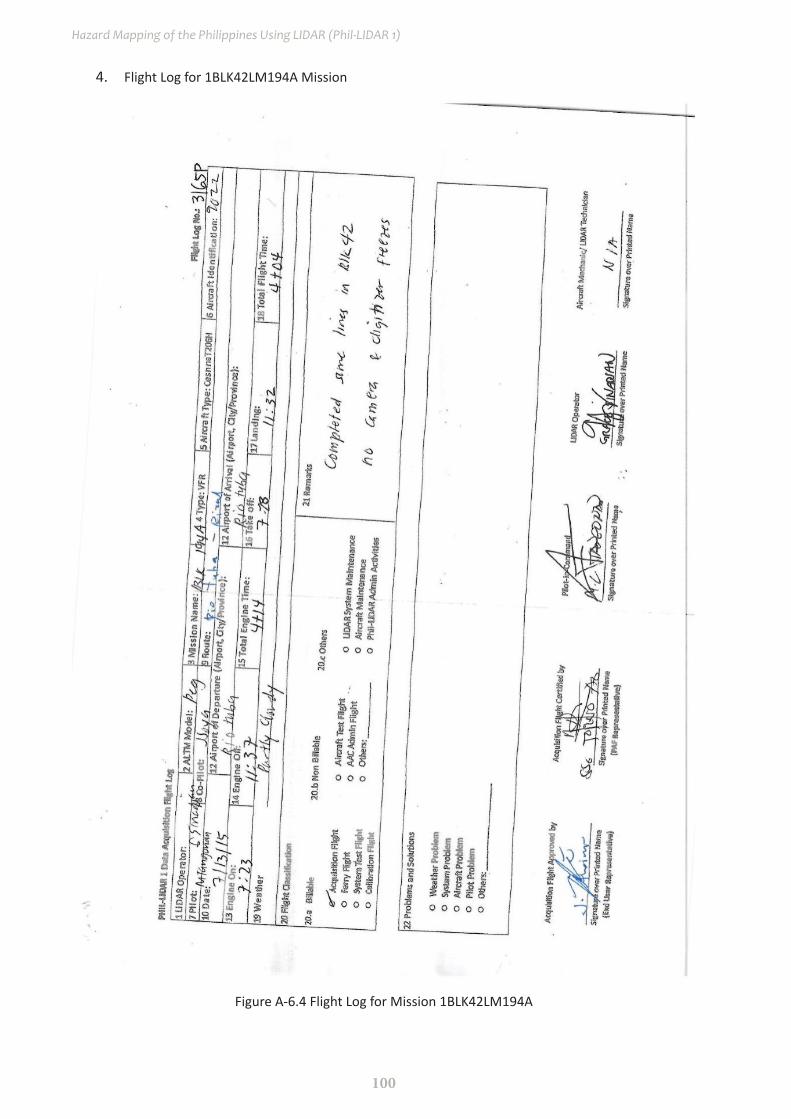
100
Hazard Mapping of the Philippines Using LIDAR (Phil-LIDAR 1)
4. Flight Log for 1BLK42LM194A Mission
Figure A-6.4 Flight Log for Mission 1BLK42LM194A

101
LiDAR Surveys and Flood Mapping of Iraan River
5. Flight Log for 1BLK42JS194B Mission
Figure A-6.5 Flight Log for Mission 1BLK42JS194B
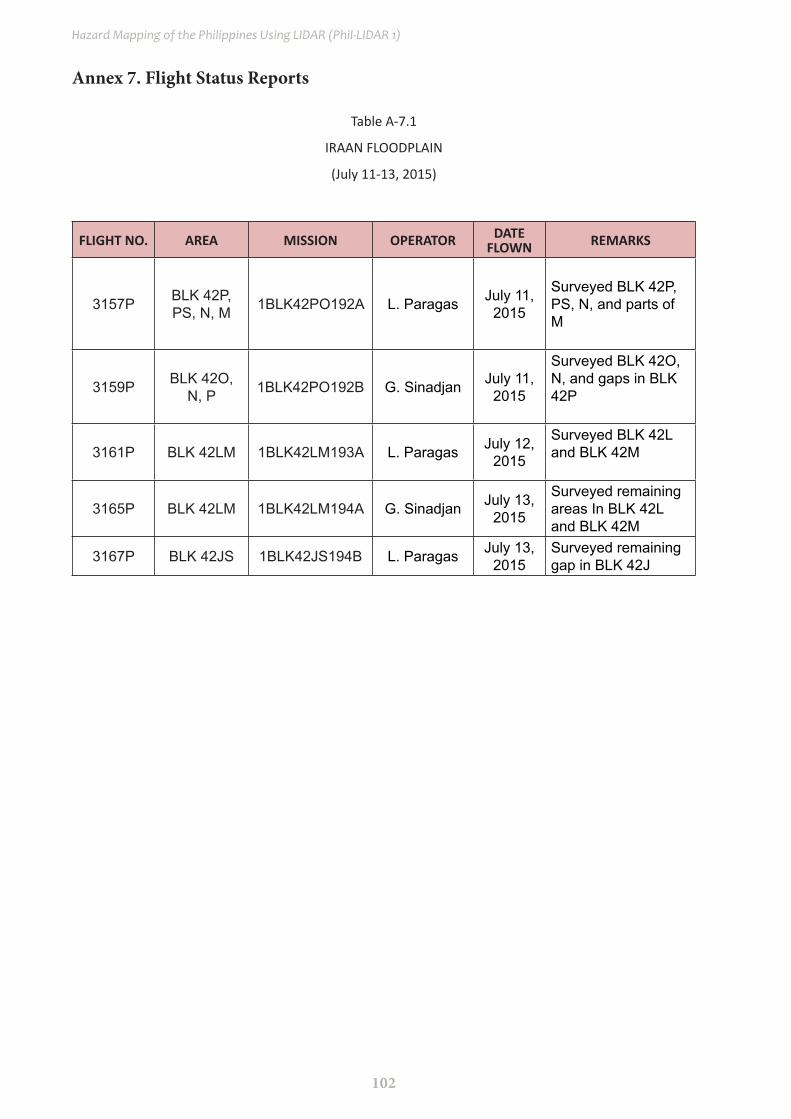
102
Hazard Mapping of the Philippines Using LIDAR (Phil-LIDAR 1)
Annex 7. Flight Status Reports
Table A-7.1
IRAAN FLOODPLAIN
(July 11-13, 2015)
FLIGHT NO. AREA MISSION OPERATOR DATE FLOWN REMARKS
3157P BLK 42P, PS, N, M 1BLK42PO192A L. Paragas July 11,
2015
Surveyed BLK 42P, PS, N, and parts of M
3159P BLK 42O, N, P 1BLK42PO192B G. Sinadjan July 11,
2015
Surveyed BLK 42O, N, and gaps in BLK 42P
3161P BLK 42LM 1BLK42LM193A L. Paragas July 12, 2015
Surveyed BLK 42L and BLK 42M
3165P BLK 42LM 1BLK42LM194A G. Sinadjan July 13, 2015
Surveyed remaining areas In BLK 42L and BLK 42M
3167P BLK 42JS 1BLK42JS194B L. Paragas July 13, 2015
Surveyed remaining gap in BLK 42J
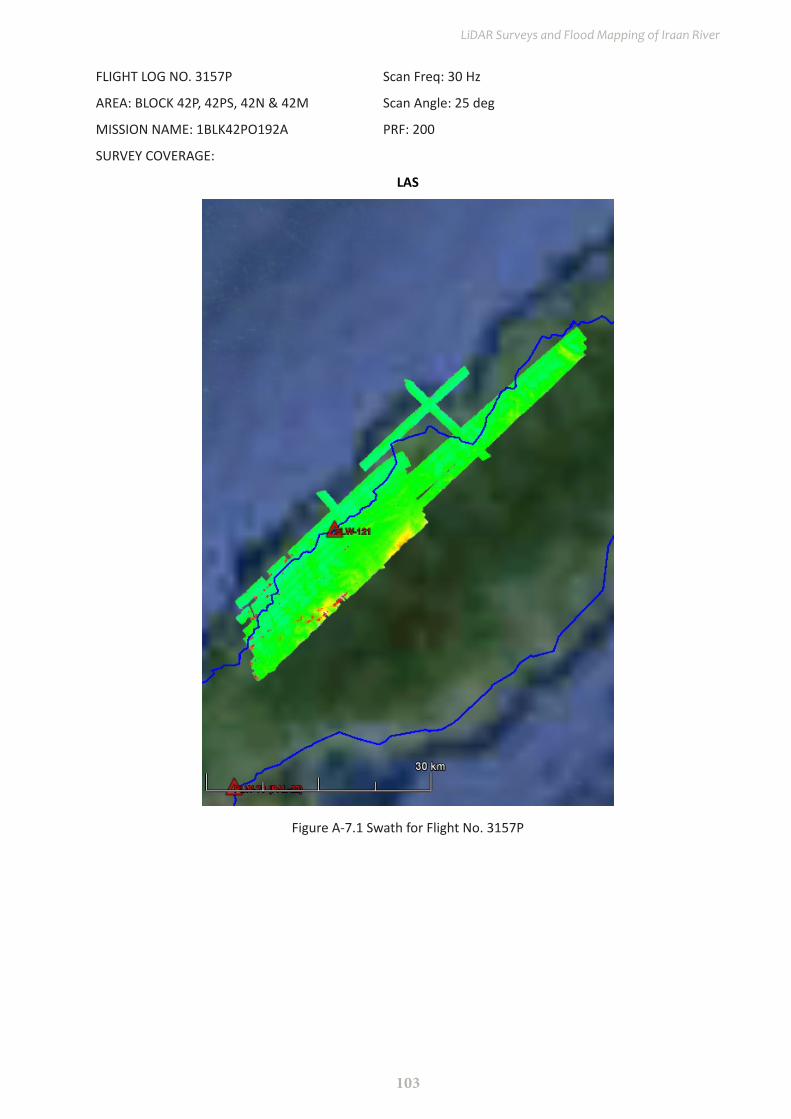
103
LiDAR Surveys and Flood Mapping of Iraan River
FLIGHT LOG NO. 3157P Scan Freq: 30 Hz
AREA: BLOCK 42P, 42PS, 42N & 42M Scan Angle: 25 deg
MISSION NAME: 1BLK42PO192A PRF: 200
SURVEY COVERAGE:
LAS
Figure A-7.1 Swath for Flight No. 3157P
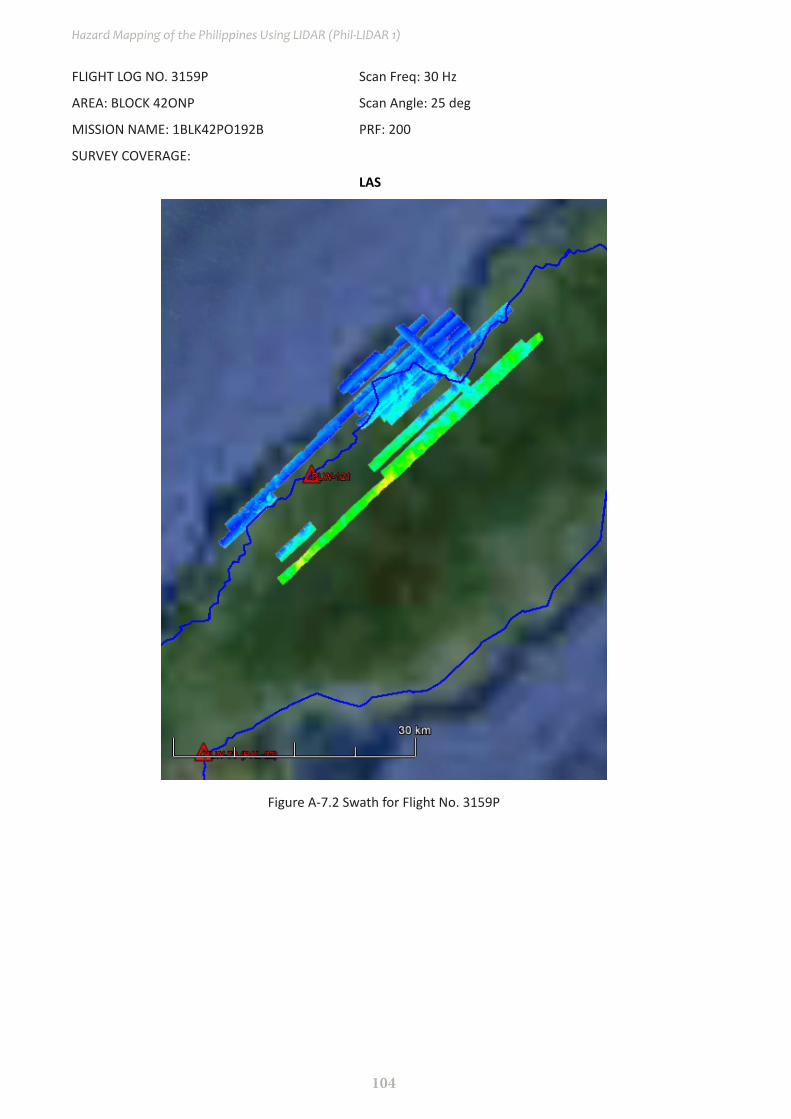
104
Hazard Mapping of the Philippines Using LIDAR (Phil-LIDAR 1)
FLIGHT LOG NO. 3159P Scan Freq: 30 Hz
AREA: BLOCK 42ONP Scan Angle: 25 deg
MISSION NAME: 1BLK42PO192B PRF: 200
SURVEY COVERAGE:
LAS
Figure A-7.2 Swath for Flight No. 3159P

105
LiDAR Surveys and Flood Mapping of Iraan River
FLIGHT LOG NO. 3161P Scan Freq: 30 Hz
AREA: BLOCK 42LM Scan Angle: 25 deg
MISSION NAME: 1BLK42LM193A PRF: 200
SURVEY COVERAGE:
LAS
Figure A-7.3 Swath for Flight No. 3161P

106
Hazard Mapping of the Philippines Using LIDAR (Phil-LIDAR 1)
FLIGHT LOG NO. 3165P Scan Freq: 30 Hz
AREA: BLOCK 42LM Scan Angle: 25 deg
MISSION NAME: 1BLK42LM194A PRF: 200
SURVEY COVERAGE:
LAS
Figure A-7.4 Swath for Flight No. 3165P
107
LiDAR Surveys and Flood Mapping of Iraan River
FLIGHT LOG NO. 3167P Scan Freq: 30 Hz
AREA: BLOCK 42JS Scan Angle: 25 deg
MISSION NAME: 1BLK42JS194B PRF: 200
SURVEY COVERAGE:
LAS
Figure A-7.5 Swath for Flight No. 3167P
108
Hazard Mapping of the Philippines Using LIDAR (Phil-LIDAR 1)
Annex 8. Mission Summary Reports
Table A-8.1 Mission Summary Report for Mission Block 42L
Flight Area West PalawanMission Name Block 42L
Inclusive Flights 3161P & 3165PRange data size 57.70 GB
POS 469 MBImage 78.10 GB
Transfer date August 5, 2015
Solution StatusNumber of Satellites (>6) Yes
PDOP (<3) YesBaseline Length (<30km) NoProcessing Mode (<=1) Yes
Smoothed Performance Metrics (in cm)RMSE for North Position (<4.0 cm) 1.80RMSE for East Position (<4.0 cm) 2.60
RMSE for Down Position (<8.0 cm) 1.35
Boresight correction stdev (<0.001deg) 0.000188IMU attitude correction stdev (<0.001deg) 0.000512
GPS position stdev (<0.01m) 0.0015
Minimum % overlap (>25) 41.20Ave point cloud density per sq.m. (>2.0) 2.92
Elevation difference between strips (<0.20 m) Yes
Number of 1km x 1km blocks 286Maximum Height 330.22Minimum Height 35.92
Classification (# of points)Ground 156485701
Low vegetation 131781027Medium vegetation 193453766
High vegetation 471929280Building 7313285
Orthophoto No

109
LiDAR Surveys and Flood Mapping of Iraan River
Figure A-8.1 Solution Status
Figure A-8.2 Smoothed Performance Metric Parameters
110
Hazard Mapping of the Philippines Using LIDAR (Phil-LIDAR 1)
Figure A-8.3 Best Estimated Trajectory
Figure A-8.4 Coverage of LiDAR data

111
LiDAR Surveys and Flood Mapping of Iraan River
Figure A-8.5 Image of data overlap
Figure A-8.6 Density map of merged LiDAR data
112
Hazard Mapping of the Philippines Using LIDAR (Phil-LIDAR 1)
Figure A-8.7 Elevation difference between flight lines
113
LiDAR Surveys and Flood Mapping of Iraan River
Table A-8.2 Mission Summary Report for Mission Block 42M
Flight Area West PalawanMission Name Block 42M
Inclusive Flights 3161P, 3165P & 3167PRange data size 65.06 GB
POS 575 MBImage 83.03 GB
Transfer date August 5, 2015
Solution StatusNumber of Satellites (>6) Yes
PDOP (<3) YesBaseline Length (<30km) NoProcessing Mode (<=1) Yes
Smoothed Performance Metrics (in cm)RMSE for North Position (<4.0 cm) 4.00RMSE for East Position (<4.0 cm) 4.60
RMSE for Down Position (<8.0 cm) 6.40
Boresight correction stdev (<0.001deg) 0.000283IMU attitude correction stdev (<0.001deg) 0.000320
GPS position stdev (<0.01m) 0.0020
Minimum % overlap (>25) 33.01Ave point cloud density per sq.m. (>2.0) 2.99
Elevation difference between strips (<0.20 m) Yes
Number of 1km x 1km blocks 287Maximum Height 577.26Minimum Height 41
Classification (# of points)Ground 125649379
Low vegetation 76720115Medium vegetation 157777193
High vegetation 708301440Building 9606648
Orthophoto No

114
Hazard Mapping of the Philippines Using LIDAR (Phil-LIDAR 1)
Figure A-8.8 . Solution Status
Figure A-8.9 Smoothed Performance Metric Parameters

115
LiDAR Surveys and Flood Mapping of Iraan River
Figure A-8.10 Best Estimated Trajectory
Figure A-8.11 Coverage of LiDAR data

116
Hazard Mapping of the Philippines Using LIDAR (Phil-LIDAR 1)
Figure A-8.12 Image of data overlap
Figure A-8.13 Density map of merged LiDAR data
117
LiDAR Surveys and Flood Mapping of Iraan River
Figure A-8.14 Elevation difference between flight lines

118
Hazard Mapping of the Philippines Using LIDAR (Phil-LIDAR 1)
Table A-8.3 Mission Summary Report for Mission Block 42N
Flight Area West PalawanMission Name Block 42N
Inclusive Flights 3157P and 3159PRange data size 64.90 GB
POS 478 MBImage 90.70 GB
Transfer date August 5, 2015
Solution StatusNumber of Satellites (>6) Yes
PDOP (<3) YesBaseline Length (<30km) NoProcessing Mode (<=1) Yes
Smoothed Performance Metrics (in cm)RMSE for North Position (<4.0 cm) 1.22RMSE for East Position (<4.0 cm) 2.10
RMSE for Down Position (<8.0 cm) 3.40
Boresight correction stdev (<0.001deg) 0.000370IMU attitude correction stdev (<0.001deg) 0.000558
GPS position stdev (<0.01m) 0.0026
Minimum % overlap (>25) 18.19Ave point cloud density per sq.m. (>2.0) 2.43
Elevation difference between strips (<0.20 m) Yes
Number of 1km x 1km blocks 251Maximum Height 658.32Minimum Height 42.09
Classification (# of points)Ground 83015160
Low vegetation 50176090Medium vegetation 153087772
High vegetation 599974416Building 9903936
Orthophoto No

119
LiDAR Surveys and Flood Mapping of Iraan River
Figure A-8.15 Solution Status
Figure A-8.16 Smoothed Performance Metric Parameters

120
Hazard Mapping of the Philippines Using LIDAR (Phil-LIDAR 1)
Figure A-8.17 Best Estimated Trajectory
Figure A-8.18 Coverage of LiDAR data

121
LiDAR Surveys and Flood Mapping of Iraan River
Figure A-8.19 Image of data overlap
Figure A-8.20 Density map of merged LiDAR data

122
Hazard Mapping of the Philippines Using LIDAR (Phil-LIDAR 1)
Figure A-8.21 Elevation difference between flight lines

123
LiDAR Surveys and Flood Mapping of Iraan River
Table A-8.4 Mission Summary Report for Mission Block 42O
Flight Area West PalawanMission Name Block 42O
Inclusive Flights 3157P and 3159PRange data size 64.90 GB
POS 478 MBImage 90.70 GB
Transfer date August 5, 2015
Solution StatusNumber of Satellites (>6) Yes
PDOP (<3) YesBaseline Length (<30km) NoProcessing Mode (<=1) Yes
Smoothed Performance Metrics (in cm)RMSE for North Position (<4.0 cm) 1.22RMSE for East Position (<4.0 cm) 2.10
RMSE for Down Position (<8.0 cm) 3.40
Boresight correction stdev (<0.001deg) 0.000370IMU attitude correction stdev (<0.001deg) 0.000558
GPS position stdev (<0.01m) 0.0026
Minimum % overlap (>25) 21.33Ave point cloud density per sq.m. (>2.0) 1.96
Elevation difference between strips (<0.20 m) Yes
Number of 1km x 1km blocks 160Maximum Height 178.72Minimum Height 40.13
Classification (# of points)Ground 112805844
Low vegetation 95911890Medium vegetation 80712706
High vegetation 142125592Building 4713926
Orthophoto Yes

124
Hazard Mapping of the Philippines Using LIDAR (Phil-LIDAR 1)
Figure A-8.22 Solution Status
Figure A-8.23 Smoothed Performance Metric Parameters

125
LiDAR Surveys and Flood Mapping of Iraan River
Figure A-8.24 Best Estimated Trajectory
Figure A-8.25 Coverage of LiDAR data
126
Hazard Mapping of the Philippines Using LIDAR (Phil-LIDAR 1)
Figure A-8.26 Image of data overlap
Figure A-8.27 Density map of merged LiDAR data

127
LiDAR Surveys and Flood Mapping of Iraan River
Figure A-8.28 Elevation difference between flight lines
128
Hazard Mapping of the Philippines Using LIDAR (Phil-LIDAR 1)
Ann
ex 9
. Ira
an M
odel
Bas
in P
aram
eter
s
Tabl
e A-
9.1
Iraan
Mod
el B
asin
Par
amet
ers
Subb
asin
SCS
CURV
E N
UM
BER
LOSS
CLAR
K U
NIT
HYD
ROG
RAPH
TRA
NSF
ORM
RECE
SSIO
N B
ASEF
LOW
Initi
al A
bstr
actio
n (M
M)
Curv
e N
umbe
rIm
perv
ious
ness
(%)
Tim
e of
Con
cent
ratio
n (H
R)St
orag
e Co
effici
ent (
HR)
Initi
al D
isch
arge
(C
U.M
/S)
Rece
ssio
n Co
nsta
ntRa
tio to
Pe
ak
W10
0013
7.03
0037
.601
00.
00.
0925
36.6
430
0.07
7070
20.
9693
0.50
00
W10
1012
9.40
0037
.537
00.
00.
0720
8.84
870.
1090
755
0.65
990.
4778
W10
2015
5.25
0041
.451
00.
00.
2819
22.7
840
0.17
588
0.98
460.
5000
W10
3015
5.25
0040
.425
00.
00.
0801
49.4
770
0.03
4342
10.
6371
0.50
00
W10
4014
0.44
0037
.646
00.
00.
1928
91.5
190
0.11
470
0.96
980.
5000
W10
5014
0.85
0051
.690
00.
00.
0722
2.91
220.
2748
80.
9800
0.50
00
W10
6015
2.64
0041
.841
00.
00.
3773
91.3
500
0.16
259
1.00
000.
5000
W10
802.
6000
83.0
000
0.0
1.45
4117
3.57
000.
0535
763
1.00
000.
5000
W10
9088
.384
055
.143
00.
00.
0333
58.9
830
.000
5183
720.
9861
0.50
00
W11
3023
.718
040
.225
00.
00.
0333
17.3
940
5.01
65E-
50.
9865
0.49
00
W11
4031
.833
035
.022
00.
00.
0926
12.1
870
0.23
675
1.00
000.
4706
W11
8015
.779
040
.225
00.
00.
0745
15.7
410
0.01
1420
90.
9925
0.49
00
W11
9073
.703
056
.813
00.
00.
0650
28.0
450
0.01
6157
30.
9928
0.50
00
W55
020
.242
035
.202
00.
00.
0779
15.5
990
0.11
183
0.99
920.
4900
W56
07.
2892
36.4
500
0.0
0.04
127.
3220
0.00
8774
71.
0000
0.47
06
W57
023
.595
041
.045
00.
00.
0828
15.6
340
0.01
5133
11.
0000
0.49
00
W58
018
.787
037
.833
00.
00.
0728
15.5
920
0.08
1179
60.
9987
0.49
00
W60
061
.443
035
.879
00.
00.
1102
38.8
930
0.14
147
0.99
870.
5000
W61
010
1.20
0035
.059
00.
00.
1911
93.4
070
0.08
5899
31.
0000
0.50
00
W62
020
.887
035
.223
00.
00.
0965
52.7
270
0.12
627
1.00
000.
5000
W63
099
.764
035
.871
00.
00.
1416
85.0
060
0.09
9004
91.
0000
0.50
00
W65
053
.688
035
.239
00.
00.
1335
39.5
290
0.14
572
1.00
000.
5000
W66
026
.386
035
.034
00.
00.
0769
8.77
560.
0768
486
1.00
000.
4706
W67
054
.315
035
.100
00.
00.
1305
23.4
980
0.14
921
1.00
000.
4900
W68
090
.089
036
.694
00.
00.
1397
87.2
630
0.06
6192
81.
0000
0.50
00

129
LiDAR Surveys and Flood Mapping of Iraan River
W69
044
.259
036
.108
00.
00.
1395
180.
0400
0.22
548
1.00
000.
5000
W70
010
4.79
0035
.691
00.
00.
1323
82.2
680
0.11
595
1.00
000.
5000
W71
099
.340
035
.378
00.
00.
1567
59.7
400
0.20
390
1.00
000.
5000
W72
010
0.43
0038
.324
00.
00.
3800
68.3
560
0.62
228
1.00
000.
5000
W73
013
7.95
0039
.677
00.
00.
0702
46.6
800
0.10
703
1.00
000.
5000
W74
014
2.42
0040
.305
00.
00.
0984
34.6
390
0.13
137
1.00
000.
5000
W75
012
5.15
0035
.771
00.
00.
0721
122.
4200
0.10
959
1.00
000.
5000
W76
016
.015
035
.116
00.
00.
0333
21.8
860
0.00
1576
00.
6533
0.47
06
W77
011
0.34
0046
.133
00.
00.
2413
65.4
960
0.09
7763
30.
9605
0.50
00
W78
014
7.56
0044
.514
00.
00.
1508
25.0
400
0.06
8333
11.
0000
0.50
00
W79
013
7.74
0037
.029
00.
00.
2210
90.8
910
0.34
649
0.93
820.
5000
W80
015
8.20
0052
.950
00.
00.
1301
14.8
470
0.08
0740
60.
9451
0.49
00
W81
015
7.48
0052
.950
00.
00.
1074
50.3
020
0.10
075
0.94
130.
5000
W82
014
7.27
0040
.962
00.
00.
7056
95.1
950
0.30
877
0.92
240.
5000
W83
010
6.38
0035
.300
00.
00.
0613
5.86
830.
0356
255
0.98
500.
4706
W84
015
5.25
0041
.305
00.
00.
0415
32.9
650
0.01
8021
80.
9734
0.50
00
W85
010
3.95
0038
.704
00.
00.
1483
30.2
930
0.13
344
0.66
210.
4802
W86
014
1.47
0083
.362
00.
00.
0587
16.7
280
0.04
7054
80.
9645
0.50
00
W87
013
4.96
0036
.787
00.
00.
3898
51.6
150
0.16
534
1.00
000.
5000
W88
010
2.51
0038
.000
00.
00.
1545
52.3
670
0.08
2166
10.
6489
0.50
00
W89
013
6.71
0039
.836
00.
00.
0934
61.6
060
0.07
0481
90.
6495
0.50
00
W90
025
.390
040
.676
00.
00.
0333
35.5
270
0.01
0622
40.
9751
0.50
00
W91
010
1.99
0038
.046
00.
00.
2059
40.2
890
0.34
171
0.94
550.
4900
W92
012
9.69
0040
.676
00.
00.
2468
70.7
250
0.21
664
1.00
000.
5000
W93
012
8.42
0040
.676
00.
00.
0333
66.6
730
0.00
3436
31.
0000
0.50
00
W94
037
.343
037
.356
00.
00.
1332
46.6
240
0.12
121
1.00
000.
5000
W95
015
6.01
0040
.425
00.
00.
4041
39.7
280
0.07
3391
40.
9702
0.50
00
W96
015
8.89
0037
.182
00.
00.
1573
63.3
600
0.06
7028
80.
9000
0.50
00
W97
010
5.79
0040
.627
00.
00.
1350
9.91
980.
0991
512
0.95
090.
4706
W98
015
6.00
0040
.425
00.
00.
1408
82.3
400
0.06
7559
80.
2978
0.50
00
W99
015
6.00
0041
.456
00.
00.
3685
24.2
090
0.15
256
0.65
340.
5000
130
Hazard Mapping of the Philippines Using LIDAR (Phil-LIDAR 1)
Ann
ex 1
0. Ir
aan
Mod
el R
each
Par
amet
ers
Tabl
e A-
10.1
Iraa
n M
odel
Rea
ch P
aram
eter
s
REAC
H
MU
SKIN
GU
M C
UN
GE
CHAN
NEL
RO
UTI
NG
Tim
e St
ep M
etho
dLe
ngth
(M)
Slop
e(M
/M)
Man
ning
’s n
Shap
eW
idth
(M)
Side
Slo
pe (x
H:1V
)
R10
Auto
mati
c Fi
xed
Inte
rval
1988
.40.
0590
421
0.04
Trap
ezoi
d30
1R1
00Au
tom
atic
Fixe
d In
terv
al30
0.05
9042
10.
002
Trap
ezoi
d30
1R1
100
Auto
mati
c Fi
xed
Inte
rval
112.
430.
0257
604
0.00
2Tr
apez
oid
301
R116
0Au
tom
atic
Fixe
d In
terv
al64
35.8
0.00
0800
650.
002
Trap
ezoi
d30
1R1
20Au
tom
atic
Fixe
d In
terv
al21
54.1
0.00
6037
00.
002
Trap
ezoi
d30
1R1
200
Auto
mati
c Fi
xed
Inte
rval
704.
560.
0103
780
0.00
2Tr
apez
oid
301
R150
Auto
mati
c Fi
xed
Inte
rval
3356
.30.
0088
544
0.00
2Tr
apez
oid
301
R160
Auto
mati
c Fi
xed
Inte
rval
4153
.60.
0074
102
0.00
2Tr
apez
oid
301
R170
Auto
mati
c Fi
xed
Inte
rval
4807
.90.
0031
992
0.00
2Tr
apez
oid
301
R20
Auto
mati
c Fi
xed
Inte
rval
489.
410.
0031
107
0.00
2Tr
apez
oid
301
R200
Auto
mati
c Fi
xed
Inte
rval
178.
990.
0204
617
0.00
2Tr
apez
oid
301
R230
Auto
mati
c Fi
xed
Inte
rval
1557
.80.
0183
512
0.00
2Tr
apez
oid
301
R250
Auto
mati
c Fi
xed
Inte
rval
3811
.50.
0155
435
0.00
2Tr
apez
oid
301
R260
Auto
mati
c Fi
xed
Inte
rval
882.
550.
0328
508
0.00
2Tr
apez
oid
301
R290
Auto
mati
c Fi
xed
Inte
rval
510.
420.
0098
523
0.00
2Tr
apez
oid
301
R30
Auto
mati
c Fi
xed
Inte
rval
1897
.90.
0017
829
0.00
2Tr
apez
oid
301
R310
Auto
mati
c Fi
xed
Inte
rval
905.
690.
0224
553
0.00
2Tr
apez
oid
301
R320
Auto
mati
c Fi
xed
Inte
rval
1139
.10.
0348
926
0.00
2Tr
apez
oid
301
R350
Auto
mati
c Fi
xed
Inte
rval
463.
140.
0678
961
0.00
2Tr
apez
oid
301
R360
Auto
mati
c Fi
xed
Inte
rval
271.
420.
1360
00.
002
Trap
ezoi
d30
1R3
90Au
tom
atic
Fixe
d In
terv
al69
34.8
0.02
2524
30.
002
Trap
ezoi
d30
1R4
10Au
tom
atic
Fixe
d In
terv
al22
11.4
0.08
2730
10.
002
Trap
ezoi
d30
1

131
LiDAR Surveys and Flood Mapping of Iraan River
R440
Auto
mati
c Fi
xed
Inte
rval
1718
.10.
0387
095
0.00
2Tr
apez
oid
301
R450
Auto
mati
c Fi
xed
Inte
rval
901.
540.
0647
780
0.00
2Tr
apez
oid
301
R490
Auto
mati
c Fi
xed
Inte
rval
1860
.70.
0611
930
0.00
2Tr
apez
oid
301
R50
Auto
mati
c Fi
xed
Inte
rval
1223
.10.
0004
2213
0.00
2Tr
apez
oid
301
R500
Auto
mati
c Fi
xed
Inte
rval
946.
400.
0350
357
0.00
2Tr
apez
oid
301
R70
Auto
mati
c Fi
xed
Inte
rval
4612
.70.
0025
940
0.00
2Tr
apez
oid
301
R90
Auto
mati
c Fi
xed
Inte
rval
740.
120.
0003
8635
0.00
2Tr
apez
oid
301
132
Hazard Mapping of the Philippines Using LIDAR (Phil-LIDAR 1)
Ann
ex 1
1. Ir
aan
Fiel
d Va
lidat
ion
Poin
ts
Tabl
e A-
11.1
IIra
an F
ield
Val
idati
on P
oint
s
Poin
t N
umbe
r
Valid
ation
Coo
rdin
ates
Mod
el V
ar
(m)
Valid
ation
Po
ints
(m)
Erro
rEv
ent
Date
Rain
Ret
urn
/
Sc
enar
ioLa
titud
eLo
ngitu
de
19.
0202
5413
000
117.
7054
2960
000
0.03
00.
000
-0.0
3025
-Yea
r2
9.02
4514
1900
011
7.70
7644
8000
00.
031
0.00
0-0
.031
25-Y
ear
39.
0249
2414
000
117.
7082
0190
000
0.07
40.
000
-0.0
7425
-Yea
r4
9.02
6291
9400
011
7.73
7633
1000
00.
030
1.00
00.
970
13-Ja
n-17
25-Y
ear
59.
0265
8105
000
117.
7073
2610
000
0.03
00.
000
-0.0
3025
-Yea
r6
9.02
8082
1100
011
7.73
7037
3000
00.
420
1.00
00.
580
13-Ja
n-17
25-Y
ear
79.
0300
2103
000
117.
7040
9050
000
0.17
81.
000
0.82
213
-Jan-
1725
-Yea
r8
9.03
1939
8700
011
7.70
1132
2000
00.
351
1.00
00.
649
13-Ja
n-17
25-Y
ear
99.
0330
1862
000
117.
7413
2120
000
0.03
00.
000
-0.0
3025
-Yea
r10
9.03
2997
1700
011
7.73
7525
8000
00.
030
0.00
0-0
.030
25-Y
ear
119.
0346
4844
000
117.
7385
1040
000
0.03
10.
000
-0.0
3125
-Yea
r12
9.03
4766
3700
011
7.73
0816
5000
00.
919
0.90
0-0
.019
13-Ja
n-17
25-Y
ear
139.
0344
5816
000
117.
6991
9230
000
0.32
21.
000
0.67
813
-Jan-
1725
-Yea
r14
9.03
5404
9100
011
7.73
5616
7000
00.
365
0.00
0-0
.365
25-Y
ear
159.
0368
1707
000
117.
7319
9460
000
0.42
30.
000
-0.4
2325
-Yea
r16
9.03
8960
9000
011
7.72
8091
7000
00.
031
0.00
0-0
.031
25-Y
ear
179.
0390
7079
000
117.
6882
7560
000
1.67
51.
300
-0.3
7513
-Jan-
1725
-Yea
r18
9.03
9425
8400
011
7.69
4982
9000
00.
883
0.70
0-0
.183
13-Ja
n-17
25-Y
ear
199.
0400
8744
000
117.
7262
5010
000
0.03
00.
000
-0.0
3025
-Yea
r20
9.04
1677
7400
011
7.72
0747
9000
00.
400
1.00
00.
600
13-Ja
n-17
25-Y
ear
219.
0425
5986
000
117.
7159
6760
000
0.03
00.
000
-0.0
3025
-Yea
r

133
LiDAR Surveys and Flood Mapping of Iraan River
229.
0433
7892
000
117.
6990
7710
000
0.03
00.
900
0.87
013
-Jan-
1725
-Yea
r23
9.04
4261
7800
011
7.71
1493
3000
00.
060
0.00
0-0
.060
25-Y
ear
249.
0440
4154
000
117.
6933
0590
000
1.35
90.
500
-0.8
5913
-Jan-
1725
-Yea
r25
9.04
5145
0800
011
7.71
0950
7000
00.
031
0.00
0-0
.031
25-Y
ear
269.
0453
6063
000
117.
6987
5500
000
0.03
10.
000
-0.0
3125
-Yea
r27
9.04
5778
3300
011
7.70
5871
9000
00.
030
0.00
0-0
.030
25-Y
ear
289.
0465
3806
000
117.
6909
6380
000
0.86
80.
000
-0.8
6825
-Yea
r29
9.04
7305
3400
011
7.71
0578
9000
00.
030
0.50
00.
470
13-Ja
n-17
25-Y
ear
309.
0472
6079
000
117.
7040
1570
000
0.03
10.
000
-0.0
3125
-Yea
r31
9.04
7262
4300
011
7.69
1860
0000
00.
030
0.00
0-0
.030
25-Y
ear
329.
0480
9796
000
117.
7029
3590
000
0.03
10.
000
-0.0
3125
-Yea
r33
9.04
8281
0600
011
7.69
8193
3000
00.
030
0.00
0-0
.030
25-Y
ear
349.
0482
2600
000
117.
6914
6440
000
0.03
00.
000
-0.0
3025
-Yea
r35
9.04
8507
4600
011
7.70
1129
8000
00.
030
0.00
0-0
.030
25-Y
ear
369.
0485
0924
000
117.
6909
6000
000
0.03
00.
000
-0.0
3025
-Yea
r37
9.04
8564
5700
011
7.69
2740
0000
00.
030
0.00
0-0
.030
25-Y
ear
389.
0486
6011
000
117.
6912
2830
000
0.03
00.
000
-0.0
3025
-Yea
r39
9.04
9270
5200
011
7.69
0321
4000
00.
030
0.00
0-0
.030
25-Y
ear
409.
0494
0566
000
117.
6986
1980
000
0.03
10.
000
-0.0
3125
-Yea
r41
9.04
9532
3500
011
7.69
0796
2000
00.
030
0.00
0-0
.030
25-Y
ear
429.
0497
1664
000
117.
7023
2290
000
0.03
10.
000
-0.0
3125
-Yea
r43
9.05
0630
7400
011
7.68
9827
2000
00.
030
0.00
0-0
.030
25-Y
ear
449.
0507
6894
000
117.
6978
1860
000
0.03
70.
000
-0.0
3725
-Yea
r45
9.05
0776
4100
011
7.68
9536
8000
00.
030
0.00
0-0
.030
25-Y
ear
469.
0510
2218
000
117.
6893
3670
000
0.62
50.
000
-0.6
2525
-Yea
r47
9.05
1200
3000
011
7.68
7677
2000
03.
126
1.70
0-1
.426
13-Ja
n-17
25-Y
ear
489.
0514
5093
000
117.
6970
5790
000
0.03
10.
000
-0.0
3125
-Yea
r49
9.05
2141
7000
011
7.69
6098
8000
00.
031
0.00
0-0
.031
25-Y
ear
134
Hazard Mapping of the Philippines Using LIDAR (Phil-LIDAR 1)
509.
0520
9974
000
117.
6875
1620
000
0.58
50.
000
-0.5
8525
-Yea
r51
9.05
2357
7400
011
7.68
8087
0000
00.
396
0.00
0-0
.396
25-Y
ear
529.
0525
2969
000
117.
6873
1160
000
1.14
80.
000
-1.1
4825
-Yea
r53
9.05
2567
3400
011
7.68
7698
8000
00.
428
0.00
0-0
.428
25-Y
ear
549.
0529
2437
000
117.
6881
4700
000
0.87
00.
000
-0.8
7025
-Yea
r55
9.05
3407
0200
011
7.69
5277
7000
00.
030
0.00
0-0
.030
25-Y
ear
569.
0536
3336
000
117.
6939
6990
000
0.03
10.
000
-0.0
3125
-Yea
r57
9.05
4490
3800
011
7.69
3161
0000
00.
031
0.00
0-0
.031
25-Y
ear
589.
0550
9440
000
117.
6928
3810
000
0.03
00.
000
-0.0
3025
-Yea
r59
9.05
5226
3400
011
7.69
1503
2000
01.
197
0.00
0-1
.197
25-Y
ear
609.
0552
3177
000
117.
6871
6360
000
0.03
00.
000
-0.0
3025
-Yea
r61
9.05
5253
7900
011
7.68
7490
6000
00.
410
1.20
00.
790
Jana
ury
2013
25-Y
ear
629.
0555
3461
000
117.
6928
1620
000
0.99
40.
000
-0.9
9425
-Yea
r63
9.05
5514
9300
011
7.69
0369
0000
00.
390
1.00
00.
610
13-Ja
n-17
25-Y
ear
649.
0556
1874
000
117.
6868
8910
000
0.03
00.
000
-0.0
3025
-Yea
r65
9.05
5640
5100
011
7.68
7684
7000
01.
105
0.50
0-0
.605
13-Ja
n-17
25-Y
ear
669.
0557
2086
000
117.
6929
6330
000
1.36
10.
100
-1.2
6113
-Jan-
1725
-Yea
r67
9.05
5751
3100
011
7.68
8287
9000
01.
227
0.50
0-0
.727
13-Ja
n-17
25-Y
ear
689.
0558
7396
000
117.
6898
5480
000
0.56
70.
500
-0.0
6713
-Jan-
1725
-Yea
r69
9.05
5859
2700
011
7.68
7382
0000
01.
140
0.00
0-1
.140
25-Y
ear
709.
0559
8990
000
117.
6912
0130
000
0.27
71.
500
1.22
313
-Jan-
1725
-Yea
r71
9.05
6068
3200
011
7.69
3075
4000
00.
932
0.00
0-0
.932
25-Y
ear
729.
0563
0693
000
117.
6937
1770
000
0.32
50.
500
0.17
513
-Jan-
1725
-Yea
r73
9.05
6345
8900
011
7.68
9943
1000
00.
294
0.50
00.
206
13-Ja
n-17
25-Y
ear
749.
0563
6040
000
117.
6894
4790
000
0.33
20.
500
0.16
813
-Jan-
1725
-Yea
r75
9.05
6719
3000
011
7.69
3392
8000
00.
133
0.50
00.
367
13-Ja
n-17
25-Y
ear
769.
0568
2178
000
117.
6888
8520
000
0.55
60.
500
-0.0
5613
-Jan-
1725
-Yea
r77
9.05
6962
3800
011
7.68
6865
4000
01.
102
2.00
00.
898
13-Ja
n-17
25-Y
ear

135
LiDAR Surveys and Flood Mapping of Iraan River
789.
0571
0887
000
117.
6875
4030
000
1.84
90.
000
-1.8
4925
-Yea
r79
9.05
7265
8400
011
7.68
7213
6000
00.
827
1.00
00.
173
13-Ja
n-17
25-Y
ear
809.
0576
0226
000
117.
6943
2770
000
0.25
50.
500
0.24
513
-Jan-
1725
-Yea
r81
9.05
7853
1100
011
7.69
6701
6000
00.
408
0.50
00.
092
13-Ja
n-17
25-Y
ear
829.
0582
0863
000
117.
6874
3990
000
1.13
01.
000
-0.1
3013
-Jan-
1725
-Yea
r83
9.05
8505
3811
7.69
4196
30.
343
0.50
00.
157
13-Ja
n-17
25-Y
ear
849.
0584
4915
117.
6877
743
1.32
11.
300
-0.0
2113
-Jan-
1725
-Yea
r85
9.05
8467
6711
7.68
8182
90.
691
0.20
0-0
.491
13-Ja
n-17
25-Y
ear
869.
0586
637
117.
6898
358
0.87
21.
000
0.12
813
-Jan-
1725
-Yea
r87
9.05
8835
4711
7.69
5026
60.
113
0.8
0.68
713
-Jan-
1725
-Yea
r88
9.05
9309
1111
7.68
7797
40.
808
10.
192
13-Ja
n-17
25-Y
ear
899.
0593
5305
117.
6874
922
0.61
50
-0.6
1525
-Yea
r90
9.05
9765
0411
7.68
7832
40.
502
21.
498
13-Ja
n-17
25-Y
ear
919.
0601
6157
117.
6872
530.
358
10.
642
13-Ja
n-17
25-Y
ear
929.
0603
6862
117.
6970
852
0.38
70
-0.3
8725
-Yea
r93
9.06
0568
6611
7.68
6645
20.
268
1.3
1.03
213
-Jan-
1725
-Yea
r94
9.06
1285
811
7.68
7902
91.
118
1-0
.118
13-Ja
n-17
25-Y
ear
959.
0614
6456
117.
6876
079
0.78
41
0.21
613
-Jan-
1725
-Yea
r96
9.06
1743
4611
7.68
7277
50.
431
0.5
0.06
913
-Jan-
1725
-Yea
r97
9.06
1766
611
7.68
6938
30.
363
0.6
0.23
713
-Jan-
1725
-Yea
r98
9.06
1825
811
7.68
7902
10.
838
0.7
-0.1
3813
-Jan-
1725
-Yea
r99
9.06
1971
7811
7.68
7638
50.
514
0.9
0.38
613
-Jan-
1725
-Yea
r10
09.
0620
1644
117.
6867
291
0.12
50.
50.
375
13-Ja
n-17
25-Y
ear
101
9.06
2267
4611
7.69
5563
60.
555
10.
445
13-Ja
n-17
25-Y
ear
102
9.06
2498
611
7.68
7982
50.
545
0.8
0.25
513
-Jan-
1725
-Yea
r10
39.
0628
2166
117.
6883
80.
319
0.7
0.38
113
-Jan-
1725
-Yea
r10
49.
0631
521
117.
7022
630.
030
-0.0
325
-Yea
r10
59.
0633
125
117.
6880
642
0.30
21
0.69
813
-Jan-
1725
-Yea
r
136
Hazard Mapping of the Philippines Using LIDAR (Phil-LIDAR 1)
106
9.06
4095
2211
7.68
7827
50.
031
0.97
13-Ja
n-17
25-Y
ear
107
9.07
1170
6411
7.69
3535
30.
129
0-0
.129
25-Y
ear
108
9.07
1742
3811
7.69
3237
20.
191
0-0
.191
25-Y
ear
109
9.07
1925
0511
7.69
3682
30.
090
-0.0
925
-Yea
r11
09.
0723
718
117.
6940
579
0.03
80
-0.0
3825
-Yea
r11
19.
0774
4538
117.
6922
681
0.03
0-0
.03
25-Y
ear
112
9.07
7588
4511
7.69
0491
30.
071
0-0
.071
25-Y
ear
113
9.07
8036
5311
7.69
2255
30.
032
0-0
.032
25-Y
ear
114
9.07
8834
3311
7.69
1960
30.
030
-0.0
325
-Yea
r11
59.
0826
344
117.
6935
845
0.04
10
-0.0
4125
-Yea
r

137
LiDAR Surveys and Flood Mapping of Iraan River
Annex 12. Phil-LiDAR 1 UPLB Team Composition
Project Leader Asst. Prof. Edwin R. Abucay (CHE, UPLB)
Project Staffs/Study Leaders Asst. Prof. Efraim D. Roxas (CHE, UPLB) Asst. Prof. Joan Pauline P. Talubo (CHE, UPLB) Ms. Sandra Samantela (CHE, UPLB) Dr. Cristino L. Tiburan (CFNR, UPLB) Engr. Ariel U. Glorioso (CEAT, UPLB) Ms. Miyah D. Queliste (CAS, UPLB) Mr. Dante Gideon K. Vergara (SESAM, UPLB)
Sr. Science Research Specialists Gillian Katherine L. Inciong For. John Alvin B. Reyes
Research Associates Alfi Lorenz B. Cura Angelica T. Magpantay Gemmalyn E. Magnaye Jayson L. Arizapa Kevin M. Manalo Leendel Jane D. Punzalan Maria Michaela A. Gonzales Paulo Joshua U. Quilao Sarah Joy A. Acepcion Ralphael P. Gonzales
Computer Programmers Ivan Marc H. Escamos Allen Roy C. Roberto
Information Systems Analyst Jan Martin C. Magcale
Project Assistants Daisili Ann V. Pelegrina Athena Mercado Kaye Anne A. Matre Randy P. Porciocula


![.Noah's Flood WTJ2004[1]](https://static.fdokumen.com/doc/165x107/631c39e73e8acd997705cf6b/noahs-flood-wtj20041.jpg)