Project Report LIDAR Data Collection and Processing for the ...
30
Project Report LIDAR Data Collection and Processing for the Central Coast of California, 2010 Prepared by: Digital Mapping, Inc. 21062 Brookhurst St., Suite 101 Huntington Beach, CA 92646
-
Upload
khangminh22 -
Category
Documents
-
view
1 -
download
0
Transcript of Project Report LIDAR Data Collection and Processing for the ...
Project Report
LIDAR Data Collection and Processing for the
Central Coast of California, 2010
Prepared by:
Digital Mapping, Inc.
21062 Brookhurst St., Suite 101 Huntington Beach, CA 92646
1
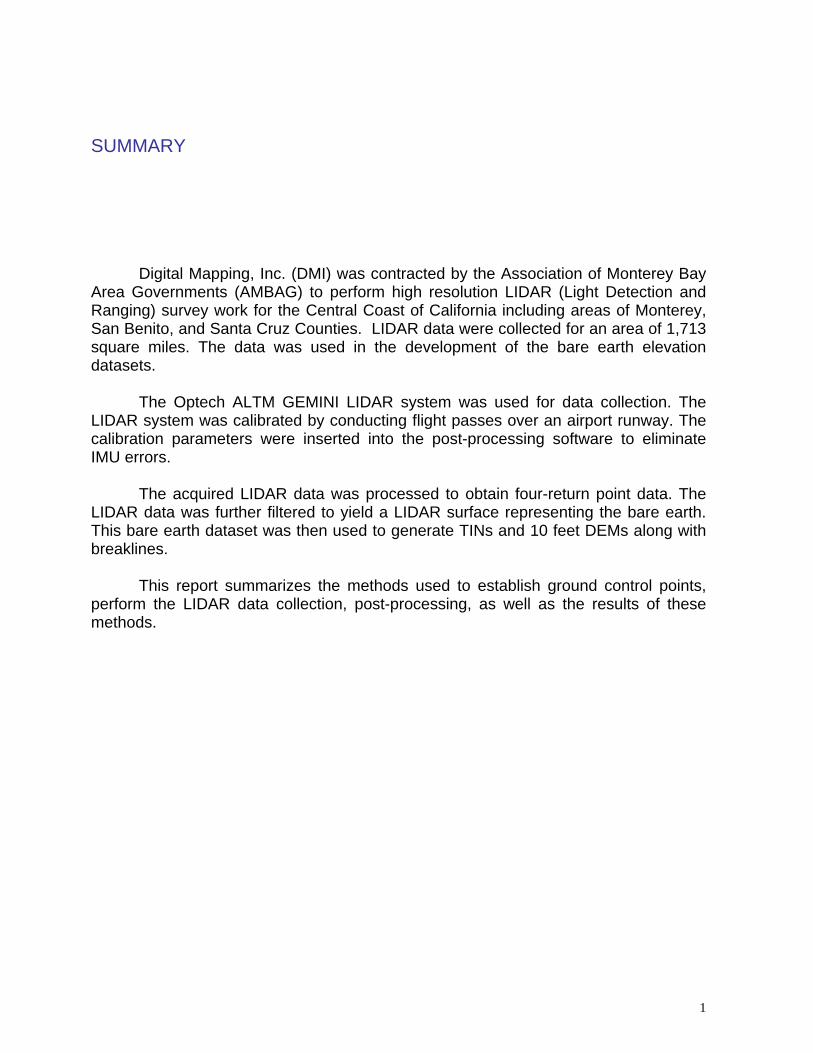
SUMMARY
Digital Mapping, Inc. (DMI) was contracted by the Association of Monterey Bay
Area Governments (AMBAG) to perform high resolution LIDAR (Light Detection and Ranging) survey work for the Central Coast of California including areas of Monterey, San Benito, and Santa Cruz Counties. LIDAR data were collected for an area of 1,713 square miles. The data was used in the development of the bare earth elevation datasets.
The Optech ALTM GEMINI LIDAR system was used for data collection. The
LIDAR system was calibrated by conducting flight passes over an airport runway. The calibration parameters were inserted into the post-processing software to eliminate IMU errors.
The acquired LIDAR data was processed to obtain four-return point data. The
LIDAR data was further filtered to yield a LIDAR surface representing the bare earth. This bare earth dataset was then used to generate TINs and 10 feet DEMs along with breaklines.
This report summarizes the methods used to establish ground control points,
perform the LIDAR data collection, post-processing, as well as the results of these methods.

2
Table of Contents
1. Table of Contents 2-4
i. Contents 2
ii. List of Tables 3
iii. List of Figures 4
2. Introduction 5
i. Contact Information 5
ii. Purpose of the LIDAR Acquisition 5
iii. Project Location 5
iv. Project Scope and Specifications 5
3. Survey Report 6
4. LIDAR REPORT 10-21
i. Flight Mission 10
5. LIDAR Calibration 22
i. Calibration Procedures 22
6. Data Processing 22
7. LIDAR Checkpoint Vertical Accuracy Assessment 23-28
8. Deliverables 29

3
List of Tables
Table 1 – Projection Specifications 6
Table 2 - Control Points in California Zone 4 8-9
Table 3 - Control Points in California Zone 3 9
Table 4 – Flight Dates and Acquisition Parameters 21
Table 5 – LIDAR Point Classes 23
Table 6 – Consolidated Vertical Accuracy (CVA) Result for Zone 4 24
Table 7 – Fundamental Vertical Accuracy (FVA) Result for Zone 4 24
Table 8 – Supplemental Vertical Accuracy (SVA) Result for Zone 4 24
Table 9 – Surveyed Checkpoint List for Zone 4 24-26
Table 10 –Consolidated Vertical Accuracy (CVA) Result for Zone 3 27
Table 11 –Fundamental Vertical Accuracy (FVA) Result for Zone 3 27
Table 12 – Supplemental Vertical Accuracy (SVA) Result for Zone 3 27
Table 13 – Surveyed Checkpoint List for Zone 3 28

4
List of Figures
Figure 1 Project Limit and Control Layout 7
Figure 2 Block Layout 11
Figure 3 Block 1—Santa Cruz 12
Figure 4 Block 2—Monterey – Salinas 13
Figure 5 Block 3—Carmel 14
Figure 6 Block 4— Lower Salinas River - King City 15
Figure 7 Block 5—Pinnacles National Monument 16
Figure 8 Block 6—Upper Salinas River - Camp Roberts 17
Figure 9 Block 7—Big Sur 18
Figure 10 Block 8—St. Lucia - Plaskett 19
Figure 11 Block 9—Ventana - Silver Peak 20

5
INTRODUCTION
This document is the technical write-up of the Central Coast of California LIDAR mission. It includes LIDAR system calibration techniques, the establishment of the control points, and the collection and post-processing of the LIDAR data. Contact Information Questions regarding this report should be addressed to: Digital Mapping Inc. 21062 Brookhurst St., Suite 101 Huntington Beach, CA 92646 Attention: Gencaga Aliyazicioglu (Project Manager) Telephone: 1-714-968-5459 Fax: 1-714-968-2429 Email: [email protected] Purpose of the LIDAR Acquisition
The LIDAR operation was designed to provide a highly detailed ground surface dataset to be used for the development of topographic, contour mapping, and hydraulic modeling. Oceanographic, agricultural, and atmospheric research facilities, etc. will directly benefit from the LIDAR and elevation data sets produced from this project. Project Location
Central Coast of California including areas of Monterey, San Benito and Santa Cruz Counties. Figure 1 shows the project area’s extent. Project Scope and Specifications
The LIDAR mission required the collection of 1,713 square miles of data. The project was flown in multiple dates. The final LIDAR product is within vertical accuracy of +/- 1.2 foot at the 95% confidence level which meets base LIDAR specification for projects funded under the American Recovery and Reinvestment Act of 2009 U.S. Geological Survey Program Announcement 10HQPA0014.
6
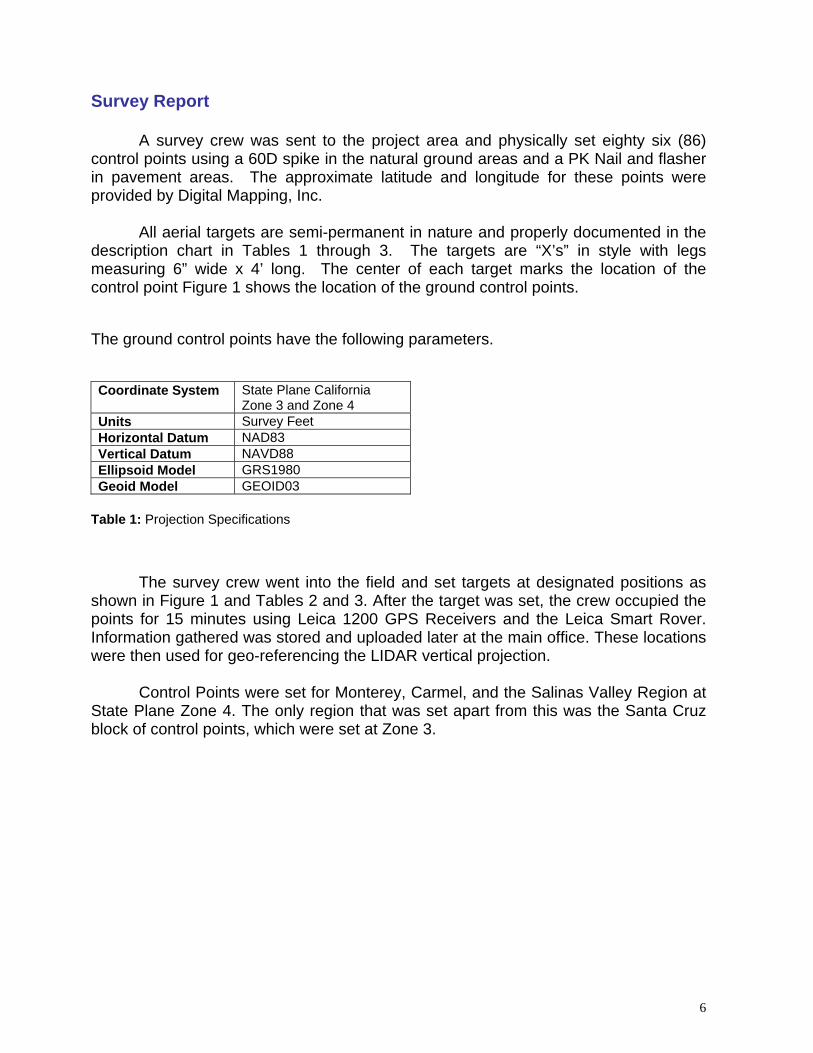
Survey Report
A survey crew was sent to the project area and physically set eighty six (86) control points using a 60D spike in the natural ground areas and a PK Nail and flasher in pavement areas. The approximate latitude and longitude for these points were provided by Digital Mapping, Inc.
All aerial targets are semi-permanent in nature and properly documented in the
description chart in Tables 1 through 3. The targets are “X’s” in style with legs measuring 6” wide x 4’ long. The center of each target marks the location of the control point Figure 1 shows the location of the ground control points. The ground control points have the following parameters. Coordinate System State Plane California
Zone 3 and Zone 4 Units Survey Feet Horizontal Datum NAD83 Vertical Datum NAVD88 Ellipsoid Model GRS1980 Geoid Model GEOID03
Table 1: Projection Specifications
The survey crew went into the field and set targets at designated positions as shown in Figure 1 and Tables 2 and 3. After the target was set, the crew occupied the points for 15 minutes using Leica 1200 GPS Receivers and the Leica Smart Rover. Information gathered was stored and uploaded later at the main office. These locations were then used for geo-referencing the LIDAR vertical projection.
Control Points were set for Monterey, Carmel, and the Salinas Valley Region at
State Plane Zone 4. The only region that was set apart from this was the Santa Cruz block of control points, which were set at Zone 3.
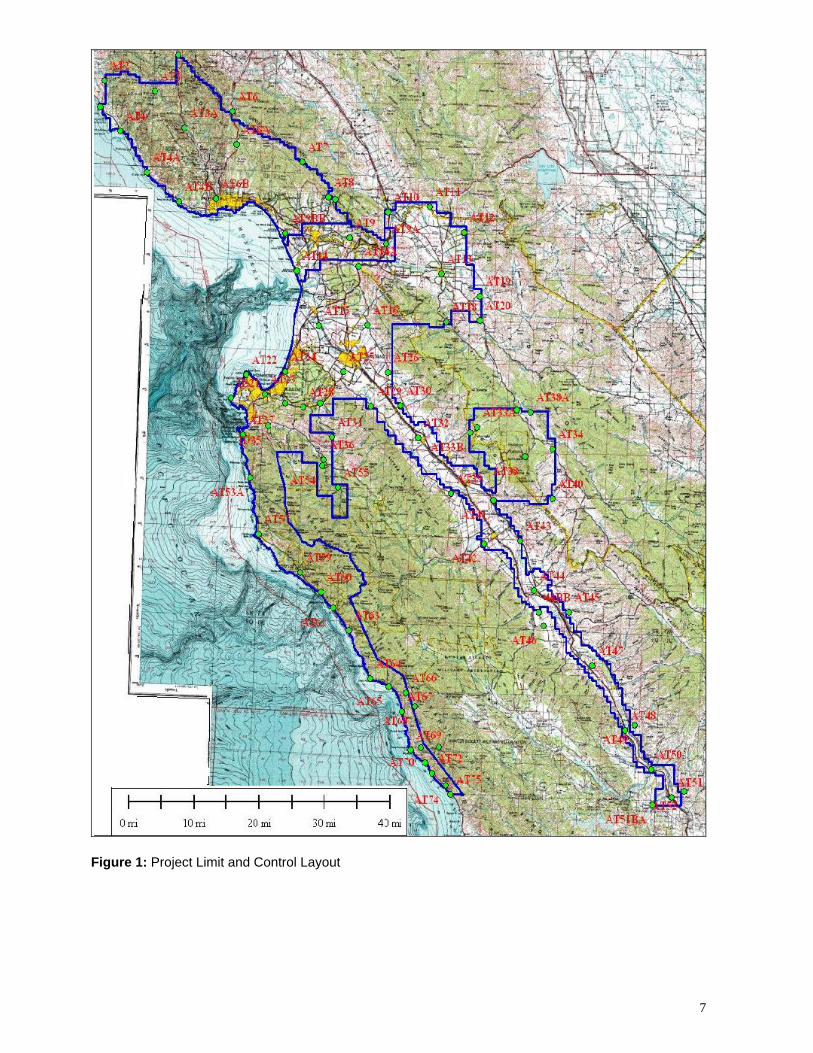
Figure 1: Project Limit and Control Layout
7
8
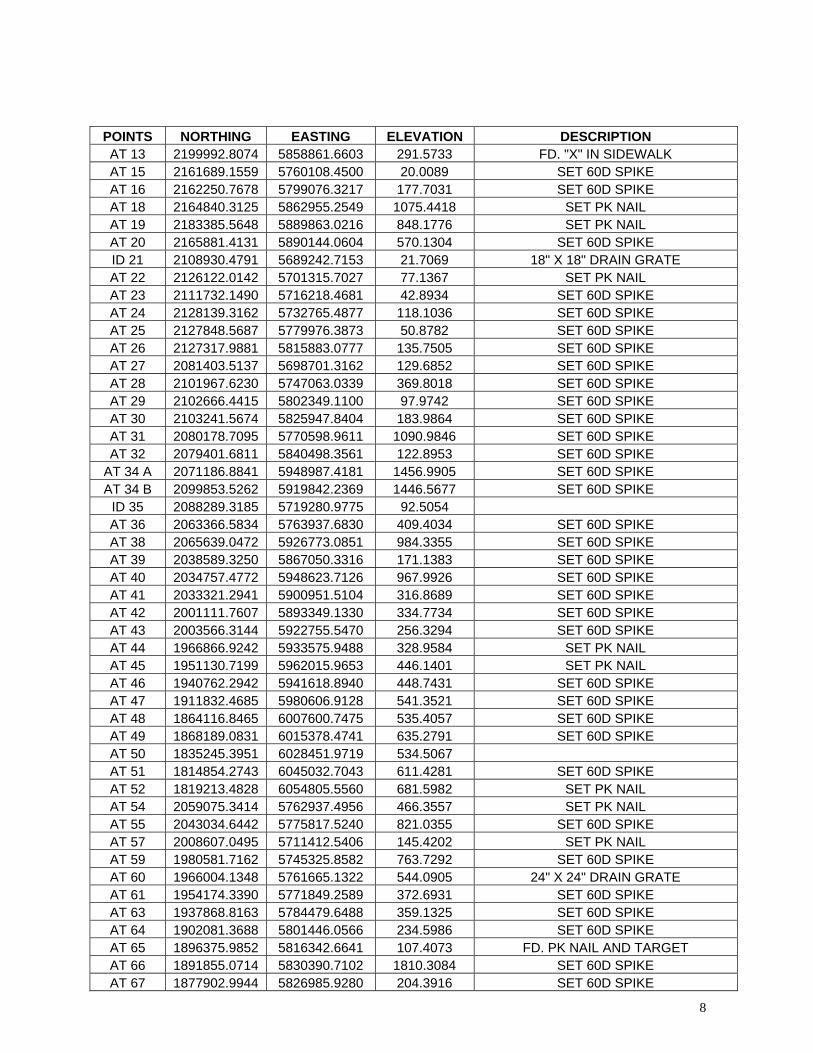
POINTS NORTHING EASTING ELEVATION DESCRIPTION AT 13 2199992.8074 5858861.6603 291.5733 FD. "X" IN SIDEWALK AT 15 2161689.1559 5760108.4500 20.0089 SET 60D SPIKE AT 16 2162250.7678 5799076.3217 177.7031 SET 60D SPIKE AT 18 2164840.3125 5862955.2549 1075.4418 SET PK NAIL AT 19 2183385.5648 5889863.0216 848.1776 SET PK NAIL AT 20 2165881.4131 5890144.0604 570.1304 SET 60D SPIKE ID 21 2108930.4791 5689242.7153 21.7069 18" X 18" DRAIN GRATE AT 22 2126122.0142 5701315.7027 77.1367 SET PK NAIL AT 23 2111732.1490 5716218.4681 42.8934 SET 60D SPIKE AT 24 2128139.3162 5732765.4877 118.1036 SET 60D SPIKE AT 25 2127848.5687 5779976.3873 50.8782 SET 60D SPIKE AT 26 2127317.9881 5815883.0777 135.7505 SET 60D SPIKE AT 27 2081403.5137 5698701.3162 129.6852 SET 60D SPIKE AT 28 2101967.6230 5747063.0339 369.8018 SET 60D SPIKE AT 29 2102666.4415 5802349.1100 97.9742 SET 60D SPIKE AT 30 2103241.5674 5825947.8404 183.9864 SET 60D SPIKE AT 31 2080178.7095 5770598.9611 1090.9846 SET 60D SPIKE AT 32 2079401.6811 5840498.3561 122.8953 SET 60D SPIKE
AT 34 A 2071186.8841 5948987.4181 1456.9905 SET 60D SPIKE AT 34 B 2099853.5262 5919842.2369 1446.5677 SET 60D SPIKE
ID 35 2088289.3185 5719280.9775 92.5054 AT 36 2063366.5834 5763937.6830 409.4034 SET 60D SPIKE AT 38 2065639.0472 5926773.0851 984.3355 SET 60D SPIKE AT 39 2038589.3250 5867050.3316 171.1383 SET 60D SPIKE AT 40 2034757.4772 5948623.7126 967.9926 SET 60D SPIKE AT 41 2033321.2941 5900951.5104 316.8689 SET 60D SPIKE AT 42 2001111.7607 5893349.1330 334.7734 SET 60D SPIKE AT 43 2003566.3144 5922755.5470 256.3294 SET 60D SPIKE AT 44 1966866.9242 5933575.9488 328.9584 SET PK NAIL AT 45 1951130.7199 5962015.9653 446.1401 SET PK NAIL AT 46 1940762.2942 5941618.8940 448.7431 SET 60D SPIKE AT 47 1911832.4685 5980606.9128 541.3521 SET 60D SPIKE AT 48 1864116.8465 6007600.7475 535.4057 SET 60D SPIKE AT 49 1868189.0831 6015378.4741 635.2791 SET 60D SPIKE AT 50 1835245.3951 6028451.9719 534.5067 AT 51 1814854.2743 6045032.7043 611.4281 SET 60D SPIKE AT 52 1819213.4828 6054805.5560 681.5982 SET PK NAIL AT 54 2059075.3414 5762937.4956 466.3557 SET PK NAIL AT 55 2043034.6442 5775817.5240 821.0355 SET 60D SPIKE AT 57 2008607.0495 5711412.5406 145.4202 SET PK NAIL AT 59 1980581.7162 5745325.8582 763.7292 SET 60D SPIKE AT 60 1966004.1348 5761665.1322 544.0905 24" X 24" DRAIN GRATE AT 61 1954174.3390 5771849.2589 372.6931 SET 60D SPIKE AT 63 1937868.8163 5784479.6488 359.1325 SET 60D SPIKE AT 64 1902081.3688 5801446.0566 234.5986 SET 60D SPIKE AT 65 1896375.9852 5816342.6641 107.4073 FD. PK NAIL AND TARGET AT 66 1891855.0714 5830390.7102 1810.3084 SET 60D SPIKE AT 67 1877902.9944 5826985.9280 204.3916 SET 60D SPIKE

9
AT 68 1881557.7372 5837393.0779 3324.4866 SET 60D SPIKE AT 69 1849644.1563 5834399.1604 294.8938 SET 60D SPIKE
POINTS NORTHING EASTING ELEVATION DESCRIPTION AT 70 1851360.2954 5842321.4935 2016.3277 SET 60D SPIKE AT 71 1840475.7393 5845706.1485 57.6277 SET 60D SPIKE AT 72 1832513.5908 5851399.0748 487.8411 SET 60D SPIKE AT 74 1823487.7956 5862275.7428 349.4572 SET 60D SPIKE AT 75 1817311.3863 5866086.9012 501.3924 SET 60D SPIKE
AT 28AA 2105060.1500 5761223.6610 290.7212 SET 60D SPIKE AT 28BB 2104883.8580 5732934.0460 138.4938 FOUND GEAR SPIKE AND TARGET AT 53A 2049986.3360 5704955.1580 109.5536 SET PK NAIL AT 73A 1852107.2540 5856770.5470 3233.878 SET 60D SPIKE 44BB 1950867.7880 5937639.4900 383.4146 SET 60D SPIKE
AT 14A 2205548.2100 5792269.4330 160.5837 SET PK NAIL AT 33A 2087385.0080 5887974.0020 2305.8484 SET 60D SPIKE AT 33B 2083032.4910 5882640.6330 1694.6817 SET 60D SPIKE AT 38A 2097972.2710 5930895.5430 1132.4288 SET 60D SPIKE AT 51 B 1809269.6280 6029735.6480 565.4321 SET 60D SPIKE AT 9A 2222424.4220 5814132.6030 179.7746 FOUND VERTICAL CONTROL G1236
Table 2: Control Points in California Zone 4
POINT NORTHING EASTING ELEVATION DESCRIPTION AT 1 1886680.5789 6020218.1353 50.4591 SET 60D SPIKE AT 2 1905847.3735 6023735.8991 132.2452 SET PK NAIL AT 3 1898850.7148 6064455.3640 1617.0356 SET 60D SPIKE AT 4 1869089.0604 6036510.9433 98.6204 SET PK NAIL AT 5 1925589.3086 6082801.3511 2558.2396 SET 60D SPIKE AT 6 1885002.6208 6127159.7993 1186.1125 SET PK NAIL AT 7 1848351.7207 6184421.0196 2704.8345 SET 60D SPIKE AT 8 1822774.6114 6205805.0475 1316.8949 SET PK NAIL AT 9 1793425.8549 6223433.2290 72.8551 SET PK NAIL
AT 10 1812810.5489 6254059.1454 179.4433 SET 60D SPIKE AT 11 1817044.6179 6287500.1384 163.6716 SET 60D SPIKE AT 12 1798299.7109 6315723.8196 442.5504 SET 60D SPIKE AT 14 1768017.8435 6181052.8169 9.4954 SET 60D SPIKE AT 3A 1872287.1610 6088696.6580 493.0011 SET PK NAIL AT 4A 1839032.3100 6058735.2780 102.2669 SET PK NAIL AT 4B 1817551.1220 6085168.3250 107.7852 SET PK NAIL AT 6A 1860491.9190 6131034.2310 1276.3787 CENTER BRICK PAVINGS AT 6B 1820598.4750 6115228.8680 34.8553 SET PK NAIL
AT 9BB 1795598.6780 6171478.5660 176.0628 SET PK NAIL AT 6C 1821294.3920 6211043.5590 929.5027 SET PK NAIL
Table 3: Control Points in California Zone 3

10
LIDAR REPORT Flight Mission Due to irregular shape of the project area and the changing terrain heights, the project is divided into 9 blocks. All the blocks except Block1 are in State Plane Coordinate System California Zone 4. Block 1 is in State Plane Coordinate System California Zone 3 (Figure 2). The data capture campaign required an unobstructed view of the ground from the flying height (i.e. no fog or clouds) and relatively smooth air in which to fly. Pre-flight checks such as cleaning the sensor head glass were performed. A five minute INS initialization was conducted on the ground, with the engines running, prior to flight, to establish fine-alignment of the INS. The Optech “ALTM NAV” software was used to plan and navigate the aircraft in real time. The LIDAR system operator uses this comprehensive flight management system to see, among other things, real-time swath coverage so that any gaps or GPS quality issues can be resolved before landing or leaving the site. A careful record of every flight line, or strip, is taken on the airborne log sheets in a digital form. Start and stop time, system parameters, and system observables represent some of the information recorded in these logs. During the data collection, the operator also recorded information on paper log sheets, which include weather conditions and flight line statistics. Following every flight, the LIDAR and GPS data were downloaded and initial post-processing began immediately. The mission was flown in multiple days. Two base stations were set up for each mission. Both of them were within the project area.

Figure 2: Block Layout
11

Figure 3: Block 1—Santa Cruz 12
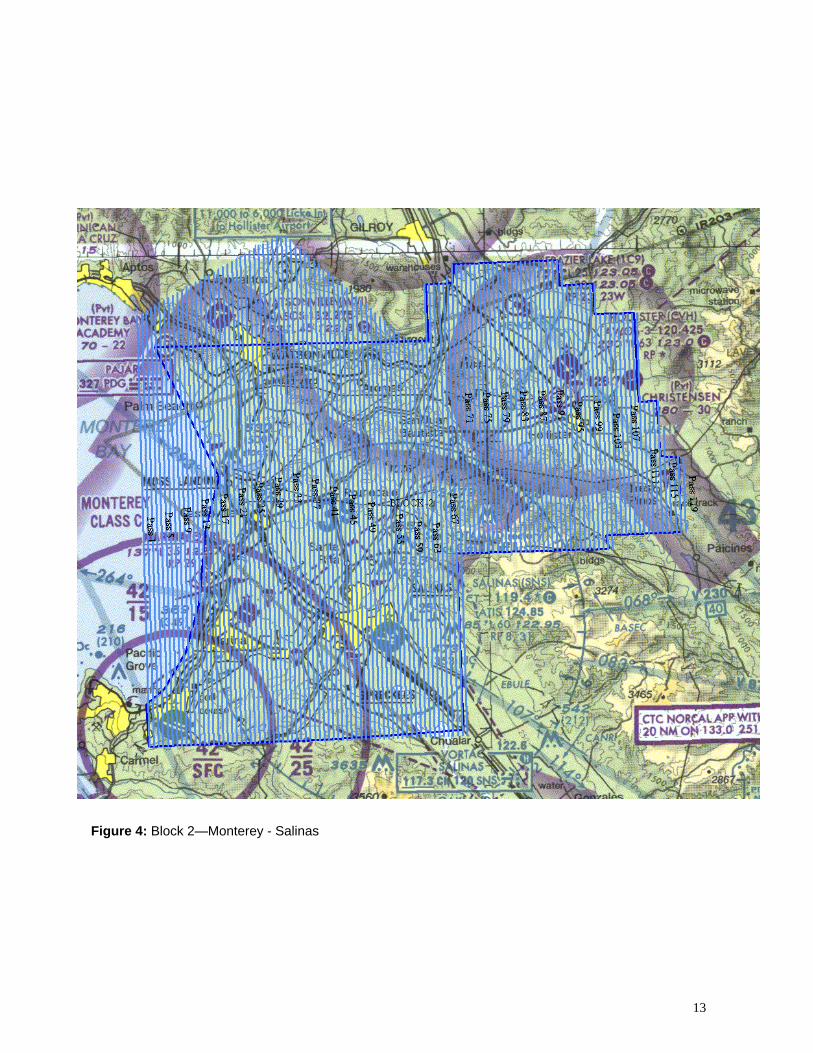
Figure 4: Block 2—Monterey - Salinas
13

Figure 5: Block 3–Carmel
14
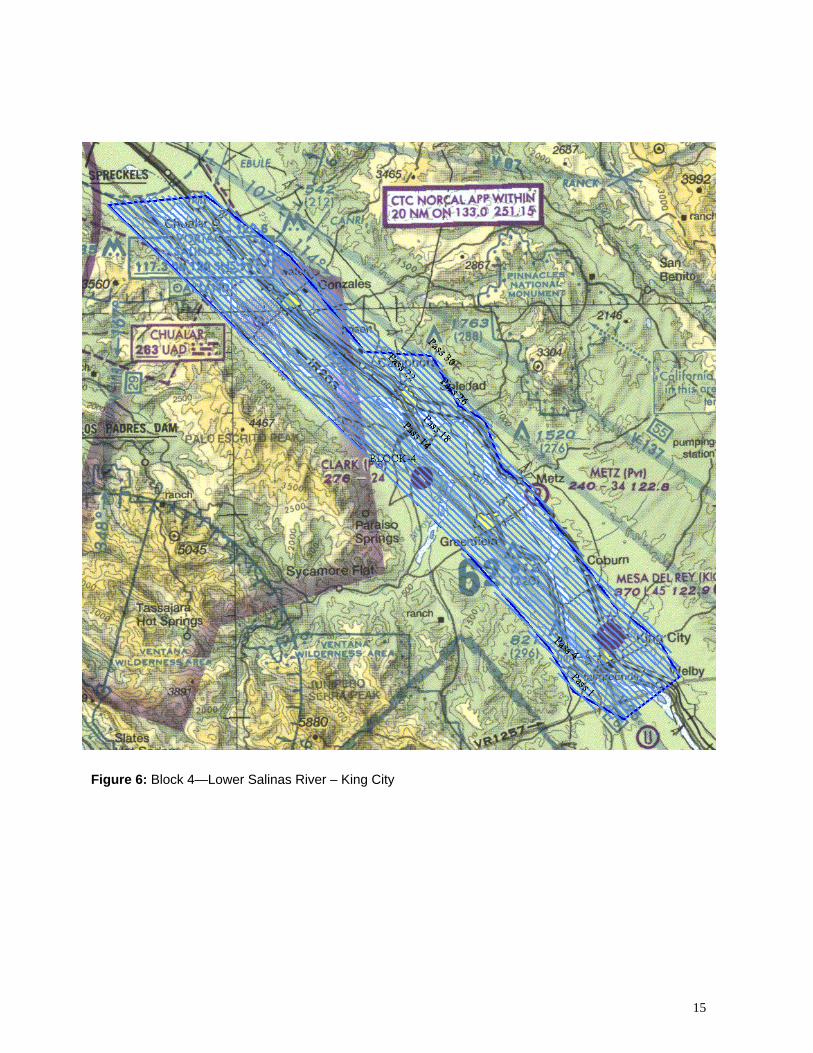
Figure 6: Block 4—Lower Salinas River – King City
15

Figure 7: Block 5—Pinnacles National Monument
16
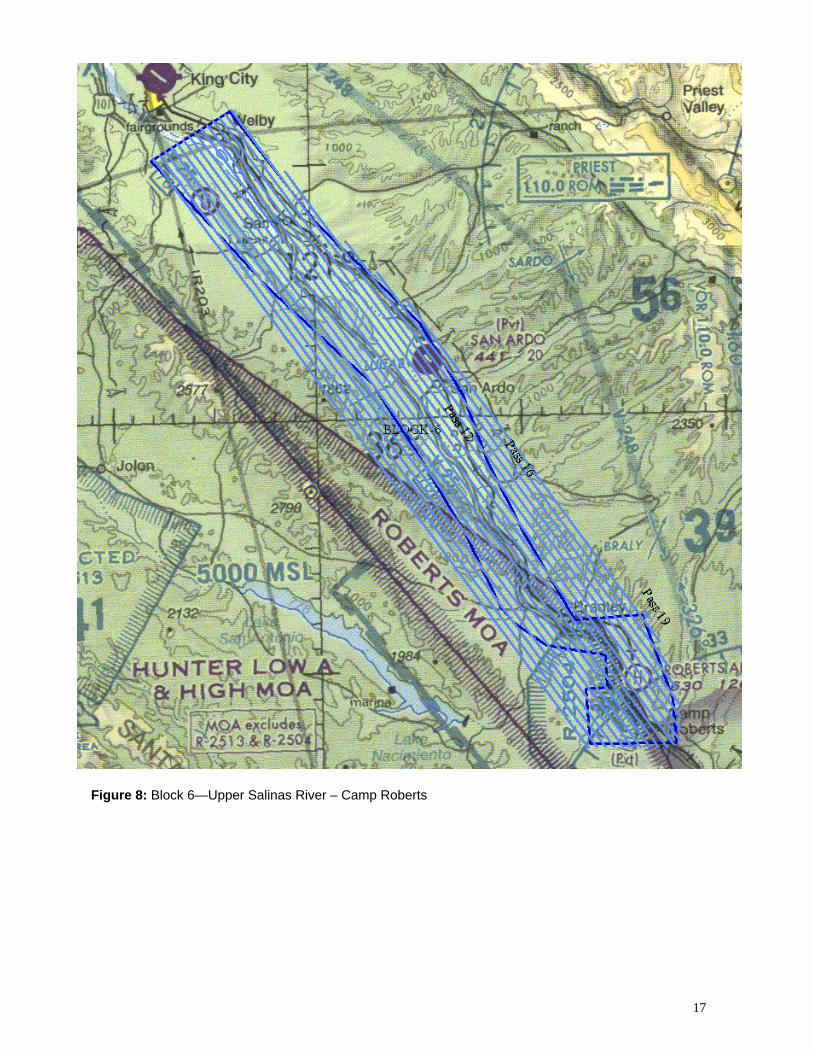
Figure 8: Block 6—Upper Salinas River – Camp Roberts
17
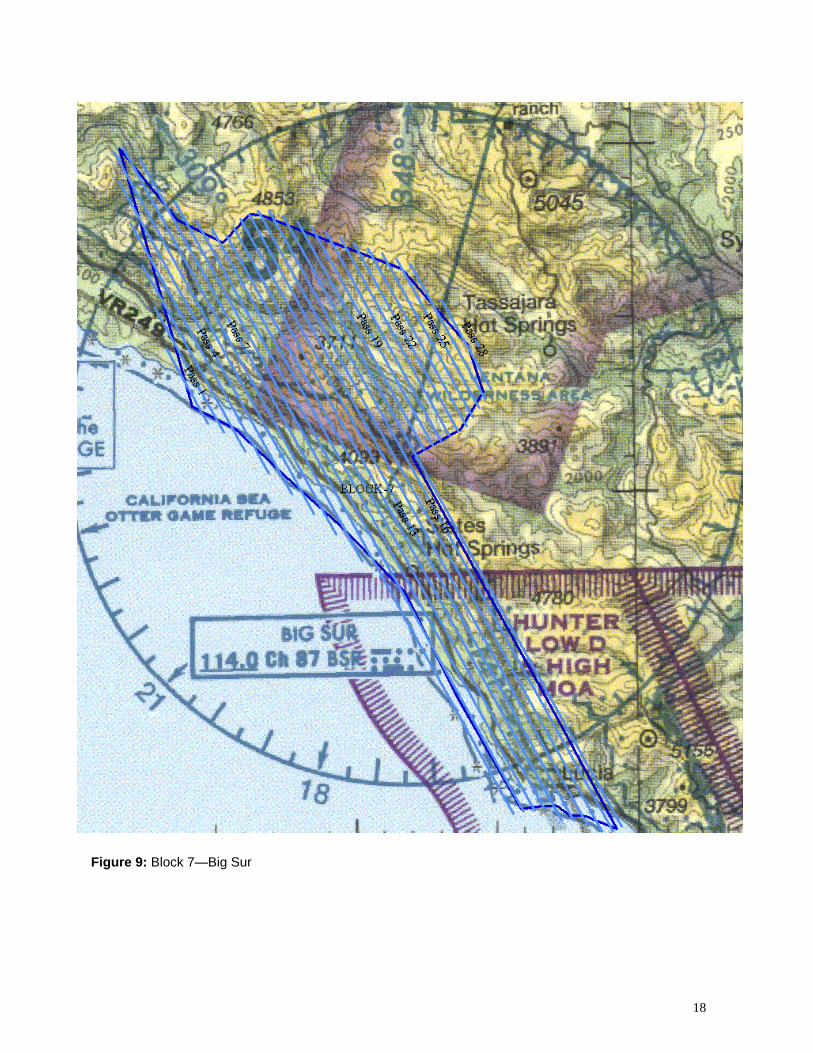
Figure 9: Block 7—Big Sur
18
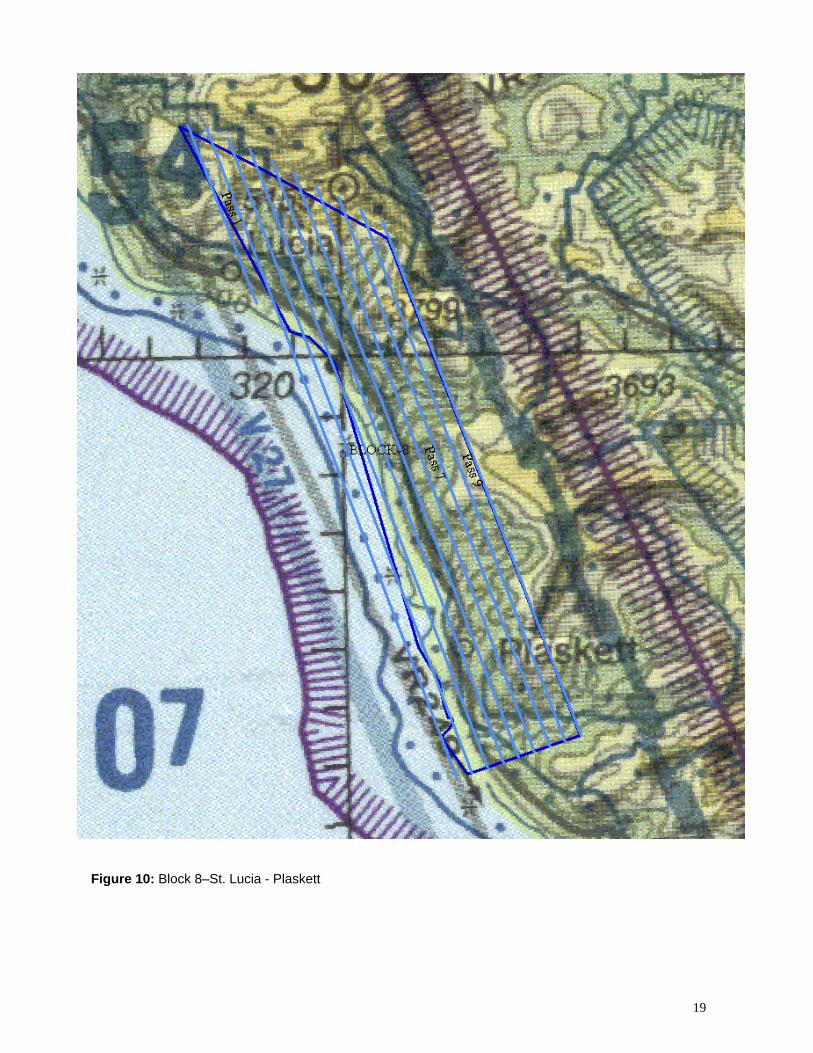
Figure 10: Block 8–St. Lucia - Plaskett
19

Figure 11: Block 9—Ventana – Silver Peak
20

21
mission flight_date Job # block #
system
_prf
Scan Freq
Scan Angle
Scan Cutoff
Flight Height
(sf)
Aircraft Speed
0817 8/17/2010 dmi10075 6 100 kHz 40 Hz +\- 25° 5° 4000 120 kts 0818am 8/18/2010 dmi10075 6 100 kHz 40 Hz +\- 25° 5° 4000 120 kts 0818pm 8/18/2010 dmi10075 4 100 kHz 40 Hz +\- 25° 5° 4000 120 kts 0819am 8/19/2010 dmi10075 4 100 kHz 40 Hz +\- 25° 5° 4000 120 kts 0819pm 8/19/2010 dmi10075 4&5 100 kHz 40 Hz +\- 25° 5° 4000 120 kts 0820am 8/20/2010 dmi10075 5 100 kHz 40 Hz +\- 25° 5° 4000 120 kts 0820pm 8/20/2010 dmi10075 5 100 kHz 40 Hz +\- 25° 5° 4000 120 kts
0821 8/21/2010 dmi10075 2 100 kHz 40 Hz +\- 25° 5° 4000 120 kts 0823 8/23/2010 dmi10075 2 100 kHz 40 Hz +\- 25° 5° 4000 120 kts
0824am 8/24/2010 dmi10075 2 100 kHz 40 Hz +\- 25° 5° 4000 120 kts 0824pm 8/24/2010 dmi10075 2 100 kHz 40 Hz +\- 25° 5° 4000 120 kts 0825am 8/25/2010 dmi10075 3 100 kHz 40 Hz +\- 25° 5° 4000 120 kts 0825pm 8/25/2010 dmi10075 3 100 kHz 40 Hz +\- 25° 5° 4000 120 kts
0826 8/26/2010 dmi10075 2 100 kHz 40 Hz +\- 25° 5° 4000 120 kts 0827am 8/27/2010 dmi10075 2 100 kHz 40 Hz +\- 25° 5° 4000 120 kts 0827pm 8/27/2010 dmi10075 2 100 kHz 40 Hz +\- 25° 5° 4000 120 kts 0831am 8/31/2010 dmi10075 2 100 kHz 40 Hz +\- 25° 5° 4000 120 kts 0831pm 8/31/2010 dmi10075 2 100 kHz 40 Hz +\- 25° 5° 4000 120 kts 0901am 9/1/2010 dmi10075 3 100 kHz 40 Hz +\- 25° 5° 4000 120 kts 0901pm 9/1/2010 dmi10075 1 100 kHz 40 Hz +\- 25° 5° 4000 120 kts 0901pm2 9/1/2010 dmi10075 1 100 kHz 40 Hz +\- 25° 5° 4000 120 kts 0902am 9/2/2010 dmi10075 3 100 kHz 40 Hz +\- 25° 5° 4000 120 kts 0902pm 9/2/2010 dmi10075 1 100 kHz 40 Hz +\- 25° 5° 4000 120 kts
0903 9/3/2010 dmi10075 2 100 kHz 40 Hz +\- 25° 5° 4000 120 kts 0912 9/12/2010 dmi10075 1 100 kHz 40 Hz +\- 25° 5° 4000 120 kts 0913 9/13/2010 dmi10075 7 100 kHz 40 Hz +\- 25° 5° 4000 120 kts
0914am 9/14/2010 dmi10075 7 100 kHz 40 Hz +\- 25° 5° 4000 120 kts 0914pm 9/14/2010 dmi10075 8&9 100 kHz 40 Hz +\- 25° 5° 4000 120 kts 0915am 9/15/2010 dmi10075 1 100 kHz 40 Hz +\- 25° 5° 4000 120 kts 0915pm 9/15/2010 dmi10075 1 100 kHz 40 Hz +\- 25° 5° 4000 120 kts 0916am 9/16/2010 dmi10075 1 100 kHz 40 Hz +\- 25° 5° 4000 120 kts 0916pm 9/16/2010 dmi10075 1 100 kHz 40 Hz +\- 25° 5° 4000 120 kts 1117pm 11/17/2010 dmi10075 8 100 kHz 40 Hz +\- 25° 5° 5000 120 kts 0117pm 01/17/2011 dmi10075 7 100 kHz 40 Hz +\- 25° 5° 5000 120 kts 0119pm 01/19/2011 dmi10075 1 100 kHz 40 Hz +\- 25° 5° 5000 120 kts 0120am 01/20/2011 dmi10075 2,3,7,8,9 100 kHz 40 Hz +\- 25° 5° 5000 120 kts
Table 4: Flight Dates and Acquisition Parameters
22
LIDAR Calibration LIDAR calibration is performed to determine and eliminate systematic biases that occur within the hardware of the OPTECH GEMINI system. Once the biases are determined, they can be modeled out. The corrected systematic biases include scale, roll, pitch, and heading error. Calibration procedures are intended to prevent operational errors in the field and office work and are designed to detect inconsistencies. Calibration Procedures Three passes were flown over the airport runway. Calibration parameters were computed with previous calibration runs. If there was any change, the new values were entered into the LIDAR post-processing software before the final data post-processing was completed. Data Processing The range files, flight logs, raw airborne and ground GPS files were taken to the office for data processing. Real time GPS data from the aircraft were used to check for coverage throughout the project area. The airborne GPS data was processed from two base stations using POSGPS from Applanix, Inc. The inertial data was processed using POSProc from Applanix, Inc. This software produces an SBET (Smooth Best Estimate of Trajectory) using the GPS trajectory from POSGPS and the roll, pitch, and heading information recorded by the POS (Position Orientation System). DASHMAP uses the SBET to generate a set of data points for each laser return in the LAS file format. Each data point is assigned an echo value so it can be segregated based on the first and last pulse information. This project’s data was processed in strip form, meaning each flight line was processed independently. Processing the lines individually provides the data analyst with the ability to QC the overlap between flight lines. After the LIDAR data was outputted to the LAS files per strip, the LIDAR processing steps were organized using GeoCue software. In GeoCue the coordinate and datum transformations were applied to the data set to reflect the required deliverable projection, coordinate, and datum systems as provided in the contract. LIDAR filtering was accomplished using TerraScan software. The filtering process reclassifies all the data into classes within the LAS formatted file based scheme using the LAS format 1.2 specifications. Table 5 lists the classification used for this project.

23
Code Description 1 Processed, but unclassified 2 Bare-earth ground 7 Noise (low or high, manually identified, if needed) 9 Water 10 Ignored Ground (Breakline Proximity)
Table 5: LIDAR Point Classes After the classification, the entire dataset was reviewed and manually edited for anomalies that were outside the required guidelines of the product specifications. Man-made structures were removed from bare earth data including bridges. The final bare earth product was verified to meet the accuracy requirements for the job. LIDAR Checkpoint Vertical Accuracy Assessment
The vertical accuracy of the LIDAR data for this project was evaluated by a set of 124 surveyed check points. In Zone 4, there were 104 check points set in six various ground cover categories. In Zone 3, there were 20 check points set in four categories.
This vertical accuracy was tested using the GPS results from the checkpoints
with the LIDAR results to find the distance of Z score. This is the average level of error present in the dataset in survey feet.
The results of a consolidated RMSEz came out to a 0.232 for Zone 3. Zone 4
had a consolidated RMSEz of 0.278. All other surface cover groupings for FVA and SVA were within the 0.492 margin of error in survey feet, or as NSSDA RMSEz = 15 cm. All check points showed a vertical accuracy level well within the 95th percentile margin of error. The NSSDA Accuracyz mark of RMSEz x 1.96 for the Zone 4 Monterey area and southern hinterland showed a Consolidated Score of 0.545. This comes to about 16.6 cm, which goes above the project requirement of a minimum of 30 cm by a fair margin. The NSSDA Accuracyz mark for the Zone 3 Santa Cruz area showed a Consolidated Score of 0.455, which is about 14 cm; also well beyond the project requirement for 95% vertical accuracy.

24
Average dz 0.098 Root Mean Square Error 0.278
minimum dz -0.683 maximum dz 0.648
Standard Deviation 0.261 Table 6: Consolidated Vertical Accuracy (CVA) Result for Zone 4
Average dz 0.233 Root Mean Square Error 0.305
Minimum dz -0.258 Maximum dz 0.479 Std deviation 0.201
Table 7: Fundamental Vertical Accuracy (FVA) Result for Zone 4
Average dz 0.051 Root Mean Square Error 0.268
Minimum dz -0.683 Maximum dz 0.648 Std deviation 0.265
Table 8: Supplemental Vertical Accuracy (SVA) Result for Zone 4 Number Easting Northing KnownZ LaserZ Dz Surface Type
z4-1 5747261 2103059 399.582 400.23 0.648 BRUSHLAND z4-2 5804532 2132567 94.141 94.62 0.479 BARE GROUND z4-3 5803364 2131893 91.061 91.54 0.479 BARE GROUND z4-4 5747236 2102948 395.622 396.08 0.458 BRUSHLAND z4-5 5803655 2131987 90.771 91.19 0.419 BARE GROUND z4-6 5803183 2132158 92.121 92.51 0.389 BARE GROUND z4-7 5804098 2132278 92.431 92.79 0.359 BARE GROUND z4-8 5803243 2132067 91.831 92.19 0.359 BARE GROUND z4-9 5803118 2132254 92.601 92.96 0.359 BARE GROUND
z4-10 5804449 2132511 93.791 94.14 0.349 BARE GROUND z4-11 5803925 2132163 91.621 91.97 0.349 BARE GROUND z4-12 5803304 2131978 91.531 91.87 0.339 BARE GROUND z4-13 5803840 2132107 91.291 91.62 0.329 BARE GROUND
Number Easting Northing KnownZ LaserZ Dz Surface Type z4-14 5803005 2132423 93.151 93.48 0.329 BARE GROUND z4-15 5803595 2131949 91.401 91.72 0.319 BARE GROUND z4-16 5746703 2102497 384.072 384.38 0.308 BRUSHLAND

25
z4-17 5747299 2102587 386.722 387.02 0.298 TREE z4-18 5804186 2132337 92.641 92.91 0.269 BARE GROUND z4-19 5804274 2132395 93.391 93.65 0.259 BARE GROUND z4-20 5746990 2102431 388.972 389.21 0.238 LOW GRASS z4-21 5747090 2102783 391.152 391.39 0.238 LOW GRASS z4-22 5804011 2132220 92.091 92.32 0.229 BARE GROUND z4-23 5804704 2132680 95.521 95.75 0.229 BARE GROUND z4-24 5803746 2132046 91.181 91.41 0.229 BARE GROUND z4-25 5746957 2102347 391.242 391.45 0.208 LOW GRASS z4-26 5746952 2102646 388.922 389.11 0.188 LOW GRASS z4-27 5802945 2132507 93.571 93.74 0.169 BARE GROUND z4-28 5747038 2102696 389.822 389.97 0.148 LOW GRASS z4-29 5747200 2102840 394.692 394.82 0.128 LOW GRASS z4-30 5802943 2132536 94.098 94.22 0.122 BARE GROUND z4-31 5747023 2102381 391.282 391.39 0.108 LOW GRASS z4-32 5747028 2102597 389.212 389.32 0.108 LOW GRASS z4-33 5746874 2102296 391.902 392.01 0.108 LOW GRASS z4-34 5804618 2132623 94.871 94.97 0.099 BARE GROUND z4-35 5746958 2102501 388.642 388.71 0.068 LOW GRASS z4-36 5747110 2102373 380.132 380.2 0.068 PAVEMENT z4-37 5747150 2102741 392.122 392.18 0.058 LOW GRASS z4-38 5746847 2102440 387.082 387.11 0.028 LOW GRASS z4-39 5747172 2102445 382.842 382.87 0.028 PAVEMENT z4-40 5746919 2102229 375.272 375.3 0.028 PAVEMENT z4-41 5746787 2102241 388.292 388.31 0.018 LOW GRASS z4-42 5747137 2102642 392.122 392.14 0.018 LOW GRASS z4-43 5746761 2102400 381.112 381.13 0.018 LOW GRASS z4-44 5746599 2102453 380.122 380.11 -0.012 BRUSHLAND z4-45 5747023 2102295 377.072 377.06 -0.012 PAVEMENT z4-46 5804364 2132453 93.481 93.43 -0.051 BARE GROUND z4-47 5747072 2102559 392.242 392.19 -0.052 LOW GRASS z4-48 5746629 2102379 374.442 374.39 -0.052 LOW GRASS z4-49 5746806 2102535 398.612 398.55 -0.062 LOW GRASS z4-50 5746853 2102602 396.982 396.9 -0.082 LOW GRASS z4-51 5746651 2102319 374.412 374.22 -0.192 LOW GRASS z4-52 5746810 2102162 372.355 372.12 -0.235 BARE GROUND z4-53 5747047 2102879 398.272 398.02 -0.252 TREE z4-54 5934209 1964484 319.704 319.99 0.286 BARE GROUND z4-55 5933794 1964202 316.561 316.84 0.279 BARE GROUND z4-56 5934568 1964706 321.044 321.49 0.446 PAVEMENT URBAN AREA z4-57 5934485 1964655 320.164 320.43 0.266 PAVEMENT URBAN AREA z4-58 5934406 1964606 320.204 320.69 0.486 PAVEMENT URBAN AREA z4-59 5934328 1964556 320.084 320.49 0.406 PAVEMENT URBAN AREA z4-60 5934254 1964510 319.914 320.28 0.366 PAVEMENT URBAN AREA z4-61 5934114 1964638 320.054 320.2 0.146 TREE z4-62 5934234 1964463 320.324 320.87 0.546 PAVEMENT URBAN AREA
Number Easting Northing KnownZ LaserZ Dz Surface Type z4-63 5934287 1964379 319.954 319.95 -0.004 PAVEMENT URBAN AREA
26
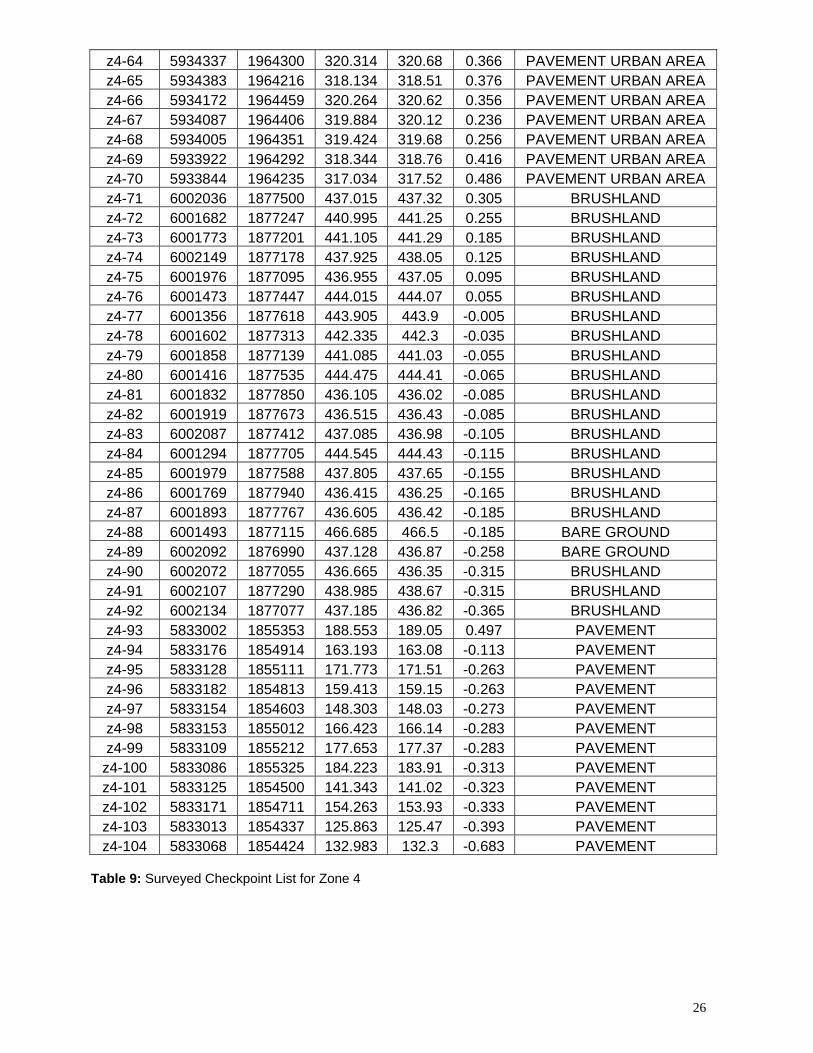
z4-64 5934337 1964300 320.314 320.68 0.366 PAVEMENT URBAN AREA z4-65 5934383 1964216 318.134 318.51 0.376 PAVEMENT URBAN AREA z4-66 5934172 1964459 320.264 320.62 0.356 PAVEMENT URBAN AREA z4-67 5934087 1964406 319.884 320.12 0.236 PAVEMENT URBAN AREA z4-68 5934005 1964351 319.424 319.68 0.256 PAVEMENT URBAN AREA z4-69 5933922 1964292 318.344 318.76 0.416 PAVEMENT URBAN AREA z4-70 5933844 1964235 317.034 317.52 0.486 PAVEMENT URBAN AREA z4-71 6002036 1877500 437.015 437.32 0.305 BRUSHLAND z4-72 6001682 1877247 440.995 441.25 0.255 BRUSHLAND z4-73 6001773 1877201 441.105 441.29 0.185 BRUSHLAND z4-74 6002149 1877178 437.925 438.05 0.125 BRUSHLAND z4-75 6001976 1877095 436.955 437.05 0.095 BRUSHLAND z4-76 6001473 1877447 444.015 444.07 0.055 BRUSHLAND z4-77 6001356 1877618 443.905 443.9 -0.005 BRUSHLAND z4-78 6001602 1877313 442.335 442.3 -0.035 BRUSHLAND z4-79 6001858 1877139 441.085 441.03 -0.055 BRUSHLAND z4-80 6001416 1877535 444.475 444.41 -0.065 BRUSHLAND z4-81 6001832 1877850 436.105 436.02 -0.085 BRUSHLAND z4-82 6001919 1877673 436.515 436.43 -0.085 BRUSHLAND z4-83 6002087 1877412 437.085 436.98 -0.105 BRUSHLAND z4-84 6001294 1877705 444.545 444.43 -0.115 BRUSHLAND z4-85 6001979 1877588 437.805 437.65 -0.155 BRUSHLAND z4-86 6001769 1877940 436.415 436.25 -0.165 BRUSHLAND z4-87 6001893 1877767 436.605 436.42 -0.185 BRUSHLAND z4-88 6001493 1877115 466.685 466.5 -0.185 BARE GROUND z4-89 6002092 1876990 437.128 436.87 -0.258 BARE GROUND z4-90 6002072 1877055 436.665 436.35 -0.315 BRUSHLAND z4-91 6002107 1877290 438.985 438.67 -0.315 BRUSHLAND z4-92 6002134 1877077 437.185 436.82 -0.365 BRUSHLAND z4-93 5833002 1855353 188.553 189.05 0.497 PAVEMENT z4-94 5833176 1854914 163.193 163.08 -0.113 PAVEMENT z4-95 5833128 1855111 171.773 171.51 -0.263 PAVEMENT z4-96 5833182 1854813 159.413 159.15 -0.263 PAVEMENT z4-97 5833154 1854603 148.303 148.03 -0.273 PAVEMENT z4-98 5833153 1855012 166.423 166.14 -0.283 PAVEMENT z4-99 5833109 1855212 177.653 177.37 -0.283 PAVEMENT
z4-100 5833086 1855325 184.223 183.91 -0.313 PAVEMENT z4-101 5833125 1854500 141.343 141.02 -0.323 PAVEMENT z4-102 5833171 1854711 154.263 153.93 -0.333 PAVEMENT z4-103 5833013 1854337 125.863 125.47 -0.393 PAVEMENT z4-104 5833068 1854424 132.983 132.3 -0.683 PAVEMENT
Table 9: Surveyed Checkpoint List for Zone 4

Average dz -0.032
Root mean square 0.232 Minimum dz -0.595 Maximum dz 0.315 Std deviation 0.236
Table 10: Consolidated Vertical Accuracy (CVA) Result for Zone 3
Average dz 0.205 Root mean square 0.205
Minimum dz 0.205 Maximum dz 0.205 Std deviation 0.000
Table 11: Fundamental Vertical Accuracy (FVA) Result for Zone 3
Average dz -0.044 Root mean square 0.233
Minimum dz -0.595 Maximum dz 0.315 Std deviation 0.235
Table 12: Supplemental Vertical Accuracy (SVA) Result for Zone 3 27
28
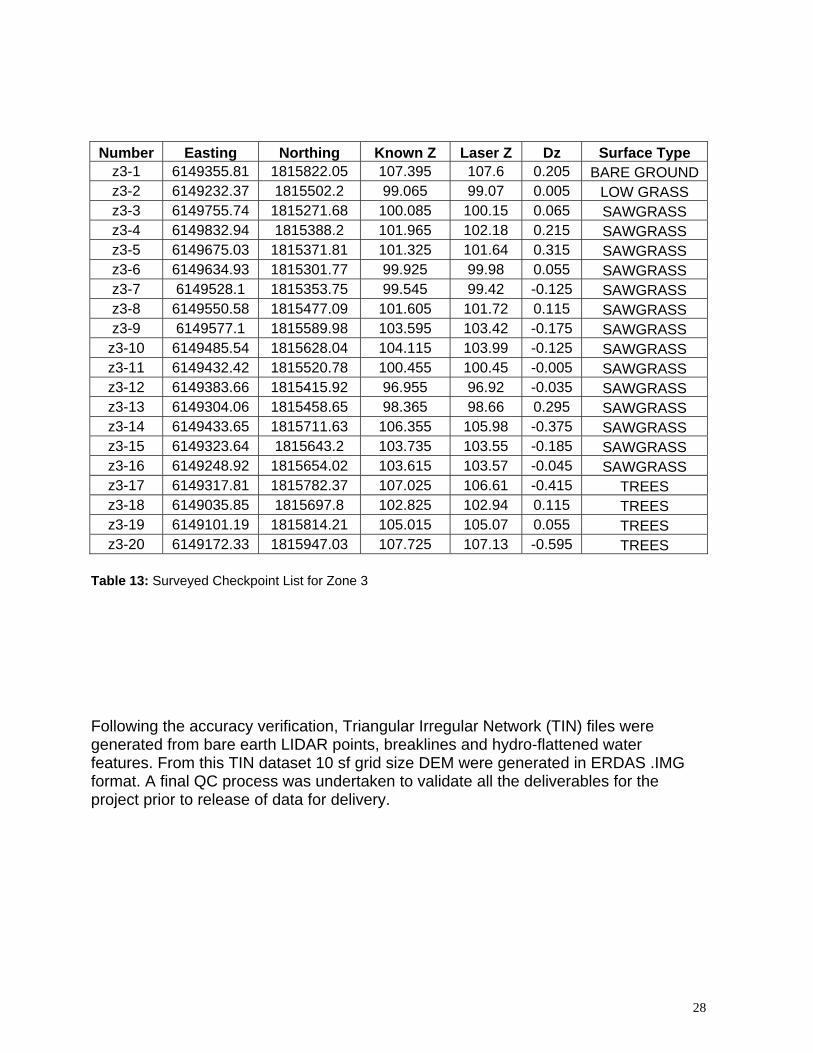
Number Easting Northing Known Z Laser Z Dz Surface Type
z3-1 6149355.81 1815822.05 107.395 107.6 0.205 BARE GROUND z3-2 6149232.37 1815502.2 99.065 99.07 0.005 LOW GRASS z3-3 6149755.74 1815271.68 100.085 100.15 0.065 SAWGRASS z3-4 6149832.94 1815388.2 101.965 102.18 0.215 SAWGRASS z3-5 6149675.03 1815371.81 101.325 101.64 0.315 SAWGRASS z3-6 6149634.93 1815301.77 99.925 99.98 0.055 SAWGRASS z3-7 6149528.1 1815353.75 99.545 99.42 -0.125 SAWGRASS z3-8 6149550.58 1815477.09 101.605 101.72 0.115 SAWGRASS z3-9 6149577.1 1815589.98 103.595 103.42 -0.175 SAWGRASS
z3-10 6149485.54 1815628.04 104.115 103.99 -0.125 SAWGRASS z3-11 6149432.42 1815520.78 100.455 100.45 -0.005 SAWGRASS z3-12 6149383.66 1815415.92 96.955 96.92 -0.035 SAWGRASS z3-13 6149304.06 1815458.65 98.365 98.66 0.295 SAWGRASS z3-14 6149433.65 1815711.63 106.355 105.98 -0.375 SAWGRASS z3-15 6149323.64 1815643.2 103.735 103.55 -0.185 SAWGRASS z3-16 6149248.92 1815654.02 103.615 103.57 -0.045 SAWGRASS z3-17 6149317.81 1815782.37 107.025 106.61 -0.415 TREES z3-18 6149035.85 1815697.8 102.825 102.94 0.115 TREES z3-19 6149101.19 1815814.21 105.015 105.07 0.055 TREES z3-20 6149172.33 1815947.03 107.725 107.13 -0.595 TREES
Table 13: Surveyed Checkpoint List for Zone 3 Following the accuracy verification, Triangular Irregular Network (TIN) files were generated from bare earth LIDAR points, breaklines and hydro-flattened water features. From this TIN dataset 10 sf grid size DEM were generated in ERDAS .IMG format. A final QC process was undertaken to validate all the deliverables for the project prior to release of data for delivery.

29
Deliverables DMI is submitting following deliverables to AMBAG. 1-Raw LIDAR Raw data in LAS 1.2, point format 1 with 4 returns. All the LAS files have geo-reference information. GPS times are recorded as Adjusted GPS Time. The LAS files have 8-bit intensity values for each point. Each file consists of one flight line. The flight lines which exceed 2 GB in size are split. All the collected points are included. 2-Classified Point Data Classified point data in LAS 1.2, point format 1. All the LAS files have geo-reference information. GPS times are recorded as Adjusted GPS Time. The LAS files have 8-bit intensity values for each point. Classified point data are delivered as tiles without overlap. The tiling scheme is provided by AMBAG. Each tile is 12000sf by 8000sf. 3-Bare Earth Surface (Raster DEM) DEM cell size is 10 survey feet. The DEM files are delivered as 32-bit floating point raster format as Erdas .IMG. Geo-reference information is included. The DEM data are tiled without overlap. Areas outside the project boundary but within the tiling scheme are coded as NODATA. 4-Breaklines Breaklines are provided as a continuous shapefile. 5-Hydro flattening water bodies All breaklines developed for use in hydro-flattening are delivered as a feature class in shapefile format in PolylineZ format. Water bodies (ponds and lakes), wide streams and rivers ("double-line"), and other non-tidal water bodies are hydro-flattened within the DEM. 6-DTM The DTM is delivered in ESRI TIN format. TIN data are tiled. 7-Metadata Project information, flight maps, ground control information and LIDAR data QA/QC report are provided. Product metadata (FGDC compliant, XML format metadata) will be provided separately for Zone 3 and Zone 4. 8-Raster DEM in MrSID DEM files will be a mosaic, using MrSID compression format. This will be the final delivery after all the DEMs are generated.