Dissolved organic carbon characteristics in boreal streams in ...
Upload
independentCategory
view
0download
0
07) xxx–xxx
+ model
GEODER-09619; No of Pages: 10
www.elsevier.com/locate/geoderma
ARTICLE IN PRESS
Geoderma xx (20
Comparison of different isotherm models for dissolved organic carbon(DOC) and nitrogen (DON) sorption to mineral soil
Jeroen Vandenbruwane a,⁎, Stefaan De Neve a, Robert G. Qualls b,Steven Sleutel a, Georges Hofman a
a Department of Soil Management and Soil Care, Division of Soil Fertility and Nutrient Management, Ghent University, Coupure Links 653, 9000 Ghent, Belgiumb Department of Natural Resources and Environmental Sciences, University of Nevada, Reno, NV 89557, USA
Received 2 October 2006; received in revised form 10 January 2007; accepted 25 January 2007
Abstract
The concentration of dissolved organic matter (DOM) in the soil solution is predominantly determined by sorption processes to mineralsurfaces. We compared four models describing DOM sorption isotherms to mineral soil material using the results of batch experiments fordissolved organic carbon (DOC) and nitrogen (DON) sorption to different horizons of a podsol. The Initial Mass and modified Langmuirisotherms could be fit to the data points in all cases. The three curvilinear models (Langmuir, Freundlich and exponential models) were found toresult in similar goodness-of-fit and parameter estimates. We found that the most widely used, linear model (the Initial Mass isotherm) could beused for horizons with very small sorption capacity and horizons almost saturated with DOM, but failed to describe sorption in the deeper, DOM-unsaturated horizons characterized by a curvilinear shape of the sorption isotherm. The modified Langmuir isotherm was found to describe DOMsorption to mineral soil best and gave realistic parameter estimates, including a measure for maximum sorption capacity of the soil. Comparing theresults of the sorption experiments with DOM concentrations in soil solution in the field indicated that the sorption isotherms can serve as a basisfor larger DOM leaching models.© 2007 Elsevier B.V. All rights reserved.
Keywords: Dissolved organic carbon; Dissolved organic matter; Dissolved organic nitrogen; Sorption isotherm; Soil solution
1. Introduction
The reactivity and mobility of most chemical elements in soilis determined by the fraction in the dissolved phase, namely itsconcentration in the soil solution. A number of microbial,chemical and physical processes control the DOM concentrationin the soil solution and thus the leaching to ground and surfacewaters. Sorption onto the mineral soil material has been reportedto be the predominant factor in DOM removal from thepercolating soil solution (Qualls, 2000; Guggenberger andKaiser, 2003).
Jardine et al. (1989) elucidated the mechanisms operatingduring dissolved organic carbon adsorption on mineral soil. Aportion of the DOC seemed to be electrostatically bound to the
⁎ Corresponding author. Tel.: +32 9 264 60 55; fax: +32 9 264 62 47.E-mail address: [email protected] (J. Vandenbruwane).
0016-7061/$ - see front matter © 2007 Elsevier B.V. All rights reserved.doi:10.1016/j.geoderma.2007.01.012
Please cite this article as: Vandenbruwane, J. et al. Comparison of different isothermmineral soil. Geoderma (2007), doi:10.1016/j.geoderma.2007.01.012
soil via anion exchange, but physical adsorption driven byfavourable entropy changes was found to be the predominantmechanism of DOC retention by the soil. Gu et al. (1994)investigated the interactions involved in sorption of naturalorganic matter on iron oxide. Their results indicated thatligand exchange between carboxyl/hydroxyl functional groupsof DOM and iron oxide surfaces was the dominant interactionmechanism, especially under acidic or slightly acidicconditions.
The general method used to obtain sorption characteristics ofa certain chemical involves the equilibration of different soluteconcentrations with the sorbent under investigation andmeasuring the amount of adsorbed solute. Basically, there aretwo main methods to generate adsorption isotherms, batchexperiments and flow (miscible displacement) techniques. Theflow systems seem to more closely approximate field conditionsby maintaining narrow solid/solution ratios and by allowing thesolid phase to be at rest relative to a mobile fluid phase
models for dissolved organic carbon (DOC) and nitrogen (DON) sorption to
2 J. Vandenbruwane et al. / Geoderma xx (2007) xxx–xxx
ARTICLE IN PRESS
containing a constant, low concentration of sorbate. Miller et al.(1989) compared batch- and flow-generated anion adsorptionisotherms and found that the shapes of the isotherms generatedby the two methods were very similar although the flow-generated isotherms were displaced slightly upward relative tothe batch experiments. Qualls and Haines (1992) measuredDOC adsorption isotherms using continuous, unsaturated flowthrough intact soil cores and compared these results with thoseof the batch experiments. They found a lower sorption affinityof the soil for DOC in the batch experiments compared to theflow-through technique. Guggenberger and Zech (1992) foundhigher affinities of the soil for DOC with batch experimentscompared to the miscible displacement method. Because thedifferences between the sorption isotherm parameters obtainedby the flow system and batch experiments seem not to beconsistent, we used the more simple and rapid batch experi-ments to produce sorption isotherms for this study.
2. Theory: Adsorption isotherm models
Travis and Etnier (1981) reviewed the existing isothermmodels describing sorption of reactive solutes to soil in general.Different linear and non-linear models are currently used todescribe the adsorption isotherms for natural DOM sorption tomineral soil. The most common model based on simplepartitioning is called the initial mass (IM) isotherm (Eq. (1))and was first used for DOC adsorption to soil by Nodvin et al.(1986). This model is based on the linear adsorption isotherm(Travis and Etnier, 1981), but additionally accounts forsubstances initially present within the soil:
RE ¼ mdXi−b ð1Þ
with RE the release (negative value) or removal (positive value)of DOM (mg kg−1 soil), m the regression coefficient similar tothe partition coefficient, Xi the initial concentration of DOC insolution (mg kg−1 soil) and b the intercept (mg kg−1 soil). Theregression coefficient (m) can be used to calculate thedistribution coefficient (Kd) (Nodvin et al., 1986):
Kd ¼ m1−m
dVM
ð2Þ
with V the volume of solution and M the mass of soil. Thedistribution coefficient, Kd, like the partition coefficient, m, is ameasure for the affinity of the substance under investigation forthe soil. The intercept and slope values of the regression can beused to calculate the reactive soil pool (RSP) of DOM (Nodvin etal., 1986):
RSP ¼ b1−m
ð3Þ
Nodvin et al. (1986) defined this RSP as “the amount ofreactive substance present in the soil with respect to the mass ofsoil”. Because for adsorption isotherms, the mass of DOMadsorbed per mass of dry soil (qe) is generally plotted againstthe equilibrium DOM concentration in solution (Ce), Eq. (1) canbe written using the above defined parameters Kd (Eq. (2)) and
Please cite this article as: Vandenbruwane, J. et al. Comparison of different isothermmineral soil. Geoderma (2007), doi:10.1016/j.geoderma.2007.01.012
RSP (Eq. (3)) and the general relationship between qe and Ce
(Eq. (4)):
qe ¼ ðCi−CeÞd VM ð4Þ
with qe representing the amount of a substance removed from orreleased to the solution with respect to the mass of soil (mgkg−1), Ci the initial DOM concentration (mg L−1), Ce theequilibrium DOM concentration (mg L−1). This results in thefollowing form of Eq. (1):
qe ¼ KddCe−RSP ð5ÞThe major advantage of this linear model is its ease of use
(linear regression) and also the ability to fit this model in allcircumstances. The major disadvantage is the lack of anadsorption maximum and thus its applicability is limited tolower adsorbate concentrations (Nodvin et al., 1986).
A second model used to describe DOM sorption to mineralsoil is the Langmuir equation:
qe ¼ Qod bdCe
1þ bdCeð6Þ
with Qo the Langmuir parameter related to maximum adsorptioncapacity (mg kg−1) and b the Langmuir parameter related toenergy of adsorption (Langmuir, 1918). Harter and Baker (1977)reviewed the applicability of this equation to soil sorptionphenomena. Gu et al. (1994) implemented the Langmuir modelto describe DOC sorption on iron-oxide and adapted the modelto describe desorption reactions. The major advantage of theLangmuir equation is the fact that it provides an estimate for theadsorption maximum of the adsorbent and a coefficient that is ameasure of the adsorbate–adsorbent bonding energy.
Because the original form of this equation does not take intoaccount the presence of native adsorbed organic matter,Lilienfein et al. (2004a) proposed to add a parameter a to theLangmuir equation:
qe ¼ Qod bdCe
1þ bdCe−a ð7Þ
where a represents the y intercept which describes the DOMreleased at low initial DOM concentrations. The principaldrawback of the above modification (Eq. (7)) is the fact that it isno longer possible to transform the equation into the linear formas is commonly done to solve the Langmuir equation and thatiterative non-linear methodsmust be used. Kumar and Sivanesan(2005) found, however, that the non-linear methods may be astatistically better way to obtain the adsorption parameters fromadsorption data because of the effect of transformation on thedistribution of error.
The third model used to describe dissolved organic mattersorption to soil is based on the empirical Freundlich isotherm:
qe ¼ kdC1=ne ð8Þ
with k the Freundlich parameter related to adsorption capacityand n the Freundlich parameter related to adsorption intensity.The advantage of this model is the ease of solving the equation
models for dissolved organic carbon (DOC) and nitrogen (DON) sorption to
Table 1Chemical composition of the litter leachate used as stock solution for theadsorption experiments (n=3)
pH 4.37±0.02†
EC (μS cm−1) 96.67±1.53DOC (mg C L−1) 134.1±3.2DON (mg N L−1) 5.47±0.08NO3
−–N (mg N L−1) 1.95±0.03NH4
+–N (mg N L−1) 2.89±0.03K+ (mg L−1) 5.77±0.06Na+ (mg L−1) 5.07±0.08Ca2+ (mg L−1) 4.80±0.10Mg2+ (mg L−1) 1.28±0.11Fe3+ (mg L−1) 0.19±0.02Al3+ (mg L−1) 0.52±0.03Cl− (mg L−1) 2.02±0.05SO4
2− (mg L−1) 3.72±0.05PO4
3− (mg L−1) 3.77±0.06†Standard deviation.
3J. Vandenbruwane et al. / Geoderma xx (2007) xxx–xxx
ARTICLE IN PRESS
(the logarithmic form is a linear function), but the lack of anadsorption maximum is its major drawback. As for theLangmuir equation, the original form of the Freundlich equationdoes not take into account the presence of native adsorbedorganic matter. Therefore, we propose to add a parameter a tothe Freundlich equation:
qe ¼ kdC1=ne −a ð9Þ
Another possible empirical model that we propose for theadsorption of dissolved organic matter to mineral soil is theasymptotic negative exponential curve:
qe ¼ bdð1−e−kd CeÞ−a ð10Þwith b the parameter related to maximum adsorption capacity(mg kg−1), k the parameter related to energy of adsorption anda the parameter (mg kg−1) accounting for the presence of nativeadsorbed substances (mg kg−1).
In most adsorption studies, the IM model has been used todescribe DOM sorption to mineral soil even for curvilinearisotherms. This has resulted from the apparent inability to fit theconventional Freundlich or Langmuir isotherms to data with anegative intercept caused by the presence of indigenous DOM(Nodvin et al., 1986; Vance and David, 1992; Kaiser and Zech,1997; Ussiri and Johnson, 2004). In models describing DOCtransport in terrestrial ecosystems, the simple Initial Massisotherm has been used to describe DOC sorption (Neff andAsner, 2001; Michalzik et al., 2003).
This comparative study was performed to determine whichof the proposed models best describes DOM sorption reactionsin mineral soil. The specific objective of this study was toevaluate which of the four models (1) is most suitable todescribe DOC and DON sorption to mineral soil and (2) yieldsrelevant parameters with a physical meaning.
3. Materials and methods
3.1. Study site
The comparative study was performed on soil samplesoriginating from the National Forest Reserve of Ravels, about12 km northeast of Turnhout in Northern Belgium. The soil underinvestigation was a podsol developed on sand deposits, classifiedas a Typic Haplorthod according to USDA Soil Taxonomy. Theaverage annual precipitation in the study area is about 748mmandthe average annual temperature amounts to 9.5 °C.
3.2. Laboratory experiments
Tomimic the field situation where the humus percolate entersthe mineral soil, an artificial forest floor leachate was used asDOM stock solution for the adsorption experiments (Lilienfeinet al., 2004a,b). The entire organic layer (Oi (1 cm)+Oe (3 cm)+Oa (1 cm)) originating from a homogeneous Silver Birch (Betulapendula Roth.) stand from the study site, was placed on nettingand was percolated every 2 h with 1 L deionized water till a finalsolid:solution ratio of 1/10 was reached. This percolate was
Please cite this article as: Vandenbruwane, J. et al. Comparison of different isothermmineral soil. Geoderma (2007), doi:10.1016/j.geoderma.2007.01.012
filtered through 0.45 μm polyethersulfone (PES) membrane discfilters (Pall Supor®-450, Gelman Laboratory) and was stored at−18 °C until used in the adsorption experiments. The chemicalcomposition of this stock solution is given in Table 1. The stockDOM solution was diluted to six DOM concentrations between0 and 100 mg DOC L−1 in order to cover the complete range ofsorption reactions (from desorption to saturation) (Table 2). Toexclude a possible influence of different ion concentrationsbetween dilutions, the original stock DOM solution was dilutedwith a solution having an identical inorganic ion compositionand pH as the stock solution (Table 1).
Field moist soil samples were taken from the differentmineral horizons of the podsol soil. Samples were homo-genized, sieved over a 2 mm mesh to remove most fine rootsand kept field moist at 4 °C until used in the experiment.Subsamples were air dried for chemical analysis (Table 3). ThepH was measured potentiometrically in a 1/2.5 soil/KCl extract(pH-KCl) and in a 1/5 soil/water extract (pH-H2O). Organiccarbon and total nitrogen were measured by dry combustion at850 °C using an elemental analyzer (Vario MAX CNS,Elementar, Germany). The NH4
+–acetate method was used todetermine the cation-exchange capacity (CEC) of the soils(Cottenie et al., 1982). Particle-size distribution was determinedby the pipette method (Gee and Bauder, 1986). Ammoniumoxalate-extractable iron and aluminum (Feox and Alox) weredetermined using the method of Jackson et al. (1986). Theamounts of Fe and Al in the extracts were measured with anatomic absorption spectrophotometer (SpectrAA, Varian, Bel-gium) at 248 nm and 309 nm, respectively.
To generate the sorption isotherm data, an amount of fieldmoist soil corresponding with 4 g dry material was weighed in acentrifuge tube in three replicates and 40 mL of the solutionswith different concentrations was added (Table 2). Thecentrifuge tubes were shaken for 24 h at room temperature(20–22 °C) on a rotary shaker (1 rpm) and afterwardscentrifuged for 15 min at 3000 rpm (1000 g). The supernatantwas filtered through 0.45μm polyethersulfone (PES) membranedisc filters (Pall Supor®-450, Gelman Laboratory) and thesamples were stored at −18 °C until analysis.
models for dissolved organic carbon (DOC) and nitrogen (DON) sorption to

Table 2The six DOM concentrations used to measure the adsorption isotherms and theiranticipated sorption reactions
DOC concentration DON concentration Expected reaction
mg C L−1 mg N L−1
1 0.91±0.21† 0.10±0.06 DOM-release2 2.04±0.14 0.15±0.07 Little reaction3 4.92±0.31 0.39±0.35 Little reaction4 22.05±0.61 0.86±0.09 DOM-sorption5 44.17±1.20 1.55±0.06 DOM-sorption6 88.93±3.63 3.27±0.11 Sorption maximum†Standard deviation.
4 J. Vandenbruwane et al. / Geoderma xx (2007) xxx–xxx
ARTICLE IN PRESS
To evaluate the model parameter accounting for the initiallyadsorbed DOC and DON present in the soil, a sequentialextraction procedure (Qualls, 2000) was performed. Therefore, anamount of field moist soil corresponding with 4 g dry materialwas weighed in a centrifuge tube in triplicate and 50 mL ofdeionized water was added. The centrifuge tubes were shaken for24 h at room temperature (20–22 °C) on a rotary shaker (1 rpm)and afterwards centrifuged for 15min at 7000 rpm (5500 g). Fortymilliliters of the supernatant was aspirated using a glass pipetteand filtered through 0.45 μm polyethersulfone (PES) membranedisc filters (Pall Supor®-450, Gelman Laboratory). The sampleswere stored at −18 °C until analysis. Again 40 mL of deionizedwater was added to the centrifuge tubes and the proceduredescribed above was repeated 15 times. An exponential curve(Eq. (11)) was fitted to the cumulative amounts of DOC and DONreleased from the soil as a function of the number of extractionsby omitting the first extraction to obtain a better fit (Qualls, 2000).
R ¼ C þ Rmaxd ð1−e−kdðN−1ÞÞ ð11ÞWith R the cumulative amount of DOC/DON released after Nextractions (mg kg−1), C the amount of DOC/DON releasedduring the first extraction (mg kg−1), (Rmax+C) the total amountof DOC/DON that can be released from the soil (mg kg−1), k therelease coefficient and N the number of extractions.
Table 3Soil properties of the different horizons of the podsol profile
Properties E Bh
Depth (cm) 10–19 19–22USDA Soil Taxonomy Albic horizon SMoisture content (w/w %) 6.27±0.19† 26.7±0.3pH-H2O 3.73±0.05 3.66±0.02pH-KCl 3.26±0.04 3.18±0.01C-content (g kg−1) 5.98±0.03 61.2±1.7N-content (mg kg−1) 0.20±0.00 2.29±0.02CEC (meq kg−1) 1.1±0.0 21.1±0.8% sand (50–200 μm) 94.8 93% silt (2–50 μm) 5.1 5.7% clay (0–2 μm) 0.1 1.3Alox (g kg−1) 0.0958±0.0091 3.66±0.12Feox (g kg−1) 0.111±0.001 0.742±0.046†Standard deviation.
Please cite this article as: Vandenbruwane, J. et al. Comparison of different isothermmineral soil. Geoderma (2007), doi:10.1016/j.geoderma.2007.01.012
3.3. Chemical analyses
All samples were analyzed for DOC, TN, NO3− and NH4
+-content. Total dissolved carbon (TDC) and dissolved inorganiccarbon (DIC) were determined on a Shimadzu TOC-V CPN-analyzer (Shimadzu Corp., Tokyo, Japan) with IR detectionfollowing thermal oxidation. Dissolved organic carbon (DOC)was calculated as the difference between TDC and DIC. Totaldissolved nitrogen (TDN) was determined after alkalinepersulfate oxidation (Koroleff, 1983) as NO3
− with a continuousflow auto analyzer. Samples were analyzed for dissolvedinorganic nitrogen (DIN) (NO3
−–N and NH4+–N) and DON
was calculated as the difference between TDN and DIN.
3.4. Statistical analysis
The four models were fit to the data points by non-linearcurve fitting using the Levenberg–Marquardt algorithm (SPSS12.0). The model performance was evaluated using followingcriteria: the relative mean error (ME),
ME ¼ 100d
1ndXni¼1
ðPi−OiÞ !
PO
ð12Þ
the root mean square error (RMSE) (Bernoux et al., 1998),
RMSE ¼ 1n
Xni¼1
ðPi−OiÞ2 !
12 ð13Þ
the coefficient of residual mass (CRM) (Loague and Green,1991)
CRM ¼Xni¼1
Oi−Xni¼1
Pi
!=Xni¼1
Oi ð14Þ
Soil horizon
Bs BC C
22–32 32–59 59–/podic horizon Parent material
11.6±0.1 6.05±0.28 12.1±0.14.11±0.03 4.47±0.06 4.66±0.044.56±0.02 4.18±0.01 4.52±0.0113.9±0.1 1.40±0.10 0.46±0.020.53±0.03 0.06±0.03 0.04±0.009.0±0.1 1.8±0.1 1.0±0.193.7 95.6 95.75.2 3.4 4.11.1 1.0 0.24.58±0.08 1.28±0.06 0.376±0.0192.32±0.14 1.39±0.08 0.148±0.008
models for dissolved organic carbon (DOC) and nitrogen (DON) sorption to
5J. Vandenbruwane et al. / Geoderma xx (2007) xxx–xxx
ARTICLE IN PRESS
and the modeling efficiency (EF) (Loague and Green,1991),
EF ¼Xni¼1
ðOi−PO Þ2−
Xni¼1
ðPi−OiÞ2 !
=Xni¼1
ðOi−PO Þ2 ð15Þ
where Pi is the amount of DOC/DON released or adsorbedpredicted by the model;Oi is the average DOC/DON released oradsorbed as found in the experiment, n is the number of samplesand Ō is the mean of all Oi values.
3.5. Field validation
To compare the results of the laboratory sorption experi-ments with the field soil solution concentrations, acid washedceramic suction cup lysimeters (Model 1900 Soil WaterSampler (with B02M2 cup), Soilmoisture Equipment Corp.,Santa Barbara, USA) were installed at three depths in threereplicates at the study site. The three depths were chosen so thatthe seepage water directly under the E (19 cm), Bs (32 cm) andBC (59 cm) horizon was collected. Zero-tension lysimetersmade of polyvinylchloride (PVC) were placed in nine replicatesunder the litter layer to collect the seepage water entering themineral soil. Soil solution samples were collected fortnightly for1 year and stored at −18 °C until analysis.
4. Results and discussion
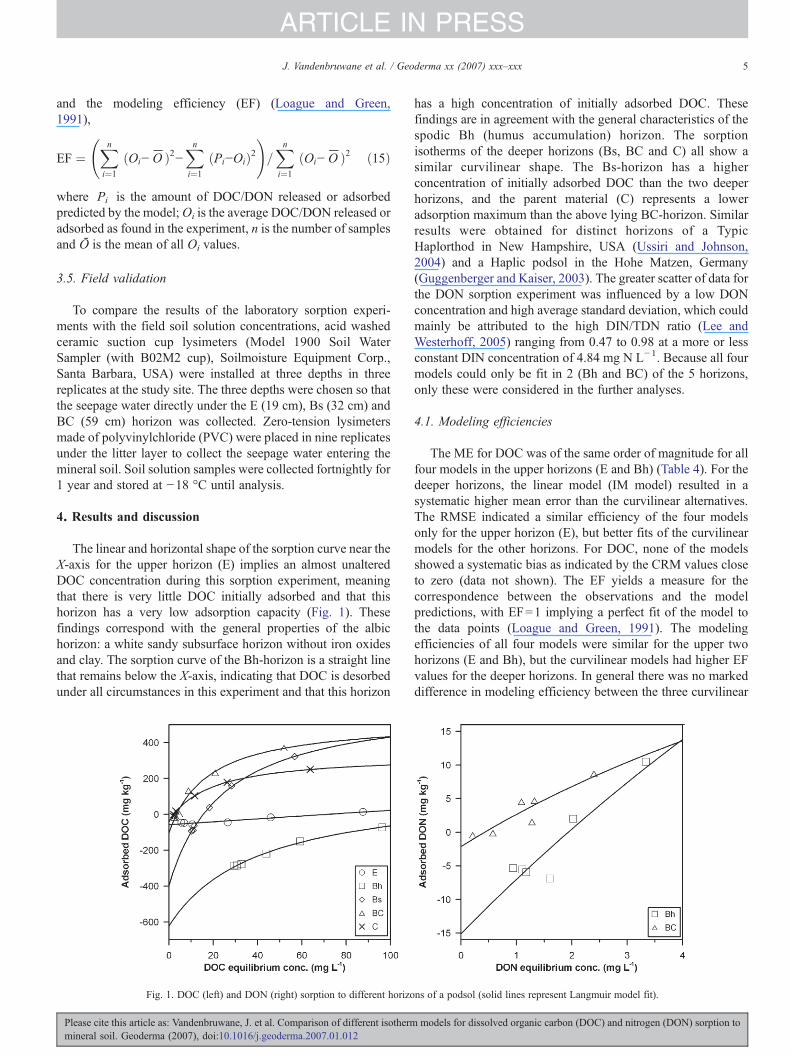
The linear and horizontal shape of the sorption curve near theX-axis for the upper horizon (E) implies an almost unalteredDOC concentration during this sorption experiment, meaningthat there is very little DOC initially adsorbed and that thishorizon has a very low adsorption capacity (Fig. 1). Thesefindings correspond with the general properties of the albichorizon: a white sandy subsurface horizon without iron oxidesand clay. The sorption curve of the Bh-horizon is a straight linethat remains below the X-axis, indicating that DOC is desorbedunder all circumstances in this experiment and that this horizon
Fig. 1. DOC (left) and DON (right) sorption to different horizo
Please cite this article as: Vandenbruwane, J. et al. Comparison of different isothermmineral soil. Geoderma (2007), doi:10.1016/j.geoderma.2007.01.012
has a high concentration of initially adsorbed DOC. Thesefindings are in agreement with the general characteristics of thespodic Bh (humus accumulation) horizon. The sorptionisotherms of the deeper horizons (Bs, BC and C) all show asimilar curvilinear shape. The Bs-horizon has a higherconcentration of initially adsorbed DOC than the two deeperhorizons, and the parent material (C) represents a loweradsorption maximum than the above lying BC-horizon. Similarresults were obtained for distinct horizons of a TypicHaplorthod in New Hampshire, USA (Ussiri and Johnson,2004) and a Haplic podsol in the Hohe Matzen, Germany(Guggenberger and Kaiser, 2003). The greater scatter of data forthe DON sorption experiment was influenced by a low DONconcentration and high average standard deviation, which couldmainly be attributed to the high DIN/TDN ratio (Lee andWesterhoff, 2005) ranging from 0.47 to 0.98 at a more or lessconstant DIN concentration of 4.84 mg N L−1. Because all fourmodels could only be fit in 2 (Bh and BC) of the 5 horizons,only these were considered in the further analyses.
4.1. Modeling efficiencies
The ME for DOC was of the same order of magnitude for allfour models in the upper horizons (E and Bh) (Table 4). For thedeeper horizons, the linear model (IM model) resulted in asystematic higher mean error than the curvilinear alternatives.The RMSE indicated a similar efficiency of the four modelsonly for the upper horizon (E), but better fits of the curvilinearmodels for the other horizons. For DOC, none of the modelsshowed a systematic bias as indicated by the CRM values closeto zero (data not shown). The EF yields a measure for thecorrespondence between the observations and the modelpredictions, with EF=1 implying a perfect fit of the model tothe data points (Loague and Green, 1991). The modelingefficiencies of all four models were similar for the upper twohorizons (E and Bh), but the curvilinear models had higher EFvalues for the deeper horizons. In general there was no markeddifference in modeling efficiency between the three curvilinear
ns of a podsol (solid lines represent Langmuir model fit).
models for dissolved organic carbon (DOC) and nitrogen (DON) sorption to
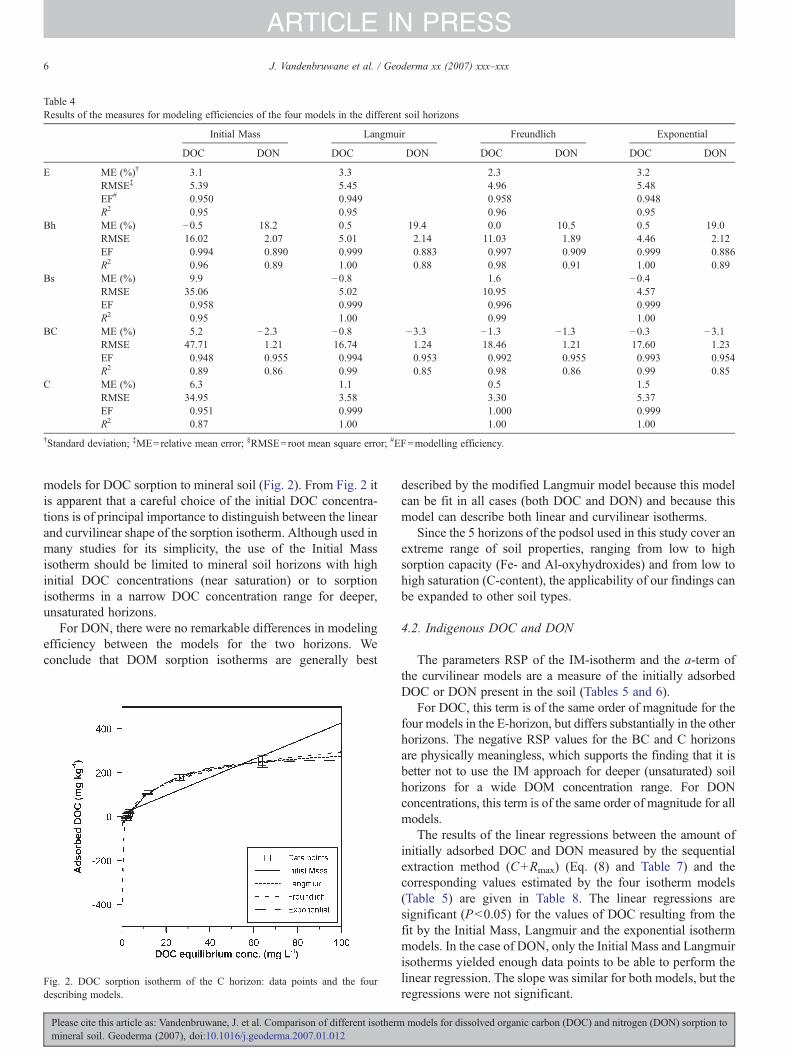
Table 4Results of the measures for modeling efficiencies of the four models in the different soil horizons
Initial Mass Langmuir Freundlich Exponential
DOC DON DOC DON DOC DON DOC DON
E ME (%)† 3.1 3.3 2.3 3.2RMSE‡ 5.39 5.45 4.96 5.48EF# 0.950 0.949 0.958 0.948R2 0.95 0.95 0.96 0.95
Bh ME (%) −0.5 18.2 0.5 19.4 0.0 10.5 0.5 19.0RMSE 16.02 2.07 5.01 2.14 11.03 1.89 4.46 2.12EF 0.994 0.890 0.999 0.883 0.997 0.909 0.999 0.886R2 0.96 0.89 1.00 0.88 0.98 0.91 1.00 0.89
Bs ME (%) 9.9 −0.8 1.6 −0.4RMSE 35.06 5.02 10.95 4.57EF 0.958 0.999 0.996 0.999R2 0.95 1.00 0.99 1.00
BC ME (%) 5.2 −2.3 −0.8 −3.3 −1.3 −1.3 −0.3 −3.1RMSE 47.71 1.21 16.74 1.24 18.46 1.21 17.60 1.23EF 0.948 0.955 0.994 0.953 0.992 0.955 0.993 0.954R2 0.89 0.86 0.99 0.85 0.98 0.86 0.99 0.85
C ME (%) 6.3 1.1 0.5 1.5RMSE 34.95 3.58 3.30 5.37EF 0.951 0.999 1.000 0.999R2 0.87 1.00 1.00 1.00
†Standard deviation; ‡ME=relative mean error; §RMSE=root mean square error; #EF=modelling efficiency.
6 J. Vandenbruwane et al. / Geoderma xx (2007) xxx–xxx
ARTICLE IN PRESS
models for DOC sorption to mineral soil (Fig. 2). From Fig. 2 itis apparent that a careful choice of the initial DOC concentra-tions is of principal importance to distinguish between the linearand curvilinear shape of the sorption isotherm. Although used inmany studies for its simplicity, the use of the Initial Massisotherm should be limited to mineral soil horizons with highinitial DOC concentrations (near saturation) or to sorptionisotherms in a narrow DOC concentration range for deeper,unsaturated horizons.
For DON, there were no remarkable differences in modelingefficiency between the models for the two horizons. Weconclude that DOM sorption isotherms are generally best
Fig. 2. DOC sorption isotherm of the C horizon: data points and the fourdescribing models.
Please cite this article as: Vandenbruwane, J. et al. Comparison of different isothermmineral soil. Geoderma (2007), doi:10.1016/j.geoderma.2007.01.012
described by the modified Langmuir model because this modelcan be fit in all cases (both DOC and DON) and because thismodel can describe both linear and curvilinear isotherms.
Since the 5 horizons of the podsol used in this study cover anextreme range of soil properties, ranging from low to highsorption capacity (Fe- and Al-oxyhydroxides) and from low tohigh saturation (C-content), the applicability of our findings canbe expanded to other soil types.
4.2. Indigenous DOC and DON
The parameters RSP of the IM-isotherm and the a-term ofthe curvilinear models are a measure of the initially adsorbedDOC or DON present in the soil (Tables 5 and 6).
For DOC, this term is of the same order of magnitude for thefour models in the E-horizon, but differs substantially in the otherhorizons. The negative RSP values for the BC and C horizonsare physically meaningless, which supports the finding that it isbetter not to use the IM approach for deeper (unsaturated) soilhorizons for a wide DOM concentration range. For DONconcentrations, this term is of the same order of magnitude for allmodels.
The results of the linear regressions between the amount ofinitially adsorbed DOC and DON measured by the sequentialextraction method (C+Rmax) (Eq. (8) and Table 7) and thecorresponding values estimated by the four isotherm models(Table 5) are given in Table 8. The linear regressions aresignificant (P<0.05) for the values of DOC resulting from thefit by the Initial Mass, Langmuir and the exponential isothermmodels. In the case of DON, only the Initial Mass and Langmuirisotherms yielded enough data points to be able to perform thelinear regression. The slope was similar for both models, but theregressions were not significant.
models for dissolved organic carbon (DOC) and nitrogen (DON) sorption to

Table 5Sorption isotherm parameters of the four models for DOC sorption to the different soil horizons
Initial Mass Langmuir Freundlich Exponential
E Kd 0.81 Qo 2600.92 k 0.23 b 807.90RSP 57.49 a 57.93 a 53.4 a 57.90
b 0.32×10⁻³ n 0.79 k 1.04×10⁻³
DOCnp 71.33 DOCnp 71.54 DOCnp 72.04 DOCnp 71.40Bh Kd 3.32 Qo 783.40 k 33.38 b 545.48
RSP 377.14 a 623.12 a 516.27 a 547.67b 24.82×10⁻³ n 1.75 k 21.44×10⁻³
DOCnp 113.49 DOCnp 156.61 DOCnp 120.62 DOCnp /Bs Kd 8.96 Qo 1032.95 k 427.66 b 739.71
RSP 156.92 a 398.08 a 856.14 a 335.82b 40.79×10⁻³ n 3.97 k 38.91×10⁻³
DOCnp 17.51 DOCnp 15.37 DOCnp 15.69 DOCnp 15.55BC Kd 7.77 (n.m.)† Qo 630.72 k 492.12 b 476.39
RSP −0.05 (n.m.) a 104.15 a 606.42 a 83.72b 57.88×10⁻³ n 5.73 k 56.55×10⁻³
DOCnp −0.01 (n.m.) DOCnp 3.42 DOCnp 3.31 DOCnp 3.42C Kd 4.13 (n.m.) Qo 374.99 k 384.16 b 291.20
RSP −15.01 (n.m.) a 41.77 a 431.03 a 31.10b 55.04×10⁻³ n 7.21 k 51.16×10⁻³
DOCnp −3.63 (n.m.) DOCnp 2.28 DOCnp 2.29 DOCnp 2.21†(n.m.)=no physical meaning.
7J. Vandenbruwane et al. / Geoderma xx (2007) xxx–xxx
ARTICLE IN PRESS
Although the model estimates for the amount of initiallyadsorbed DOC and DON are simply extrapolations of the datapoints (y-intercept), the above findings indicate that theseestimates are correlated with the analytical measures, especiallyfor the Initial Mass, Langmuir and exponential models, andhence have practical use and importance. Despite the correlationbetween the estimated values of the amount of indigenous DOCand DON and the analytically measured values (C+Rmax), theabsolute values differ substantially. This difference is a result ofthe contrasting methods of determination. The method used todetermine the amount of indigenous DOC and DON analyticallyis based on the sequential extraction till the soil is exhausted. Onthe other hand, the estimated value of the amount of indigenousDOC and DON is based on the results of one single extraction.
4.3. Sorption affinity
The distribution coefficient (Kd) of the Initial Mass, theLangmuir parameter (b) related to the energy of adsorption, theFreundlich parameter (n) related to adsorption intensity and theexponent (k) of the exponential function all represent a measurefor the bonding energy between DOC or DON and the mineral
Table 6Sorption isotherm parameters of the four models for DON sorption to the different
Initial Mass Langmuir
Bh Kd 7.23 Qo 201.54RSP 14.13 a 15.11
b 41.89×10⁻³
DONnp 1.95 DONnp 1.93BC Kd 4.31 Qo 67.11
RSP 1.77 a 2.12b 76.63×10⁻³
DONnp 0.41 DONnp 0.42
Please cite this article as: Vandenbruwane, J. et al. Comparison of different isothermmineral soil. Geoderma (2007), doi:10.1016/j.geoderma.2007.01.012
soil material (Tables 5 and 6). A comparison of the absolutevalues of the different models has little meaning since they areobtained in a different way and have other units, though theestimates for the different horizons can be compared with eachother.
In the case of quasi-linear isotherms, the use of the curvi-linear models gives rise to non-realistic estimates for the sorptionparameters, despite overall good fit of the models. For examplein the E horizon data, the maximum adsorption capacity isoverestimated and the bonding energy underestimated.
4.4. Maximum adsorption capacity and degree of saturation
Only the Langmuir and exponential isotherms yield anestimate for the maximum adsorption capacity of the soil,namely Qo and b respectively. The DOC adsorption capacitiesof these sandy soils seemed to be highly correlated with theamounts of oxalate-extractable iron and aluminum present inthe soil (data not shown). This corresponds with the generalknowledge of DOM sorption to soils with low clay contentand with iron and aluminum oxy-hydroxides (Kaiser et al.,2001). The slope of the linear regression provides a measure
soil horizons
Freundlich Exponential
k 2.09 b 159.35a 8.34 a 14.76n 0.54 k 50.16×10⁻³
DONnp 2.12 DONnp 1.94k 3.79 b 50.66a 1.35 a 2.03n 0.90 k 95.58×10⁻³
DONnp 0.40 DONnp 0.43
models for dissolved organic carbon (DOC) and nitrogen (DON) sorption to

Table 7Parameters resulting from the fit of the exponential function (Eq. (11)) to the 15data points of the sequential extraction procedure
C† § Rmax§ k# R2
DOC E 65.3±2.9 141.5±3.7 0.187±0.014 0.994Bh 391.9±16.1 2313.0±44.6 0.118±0.005 0.999Bs 82.3±2.9 455.3±10.8 0.102±0.005 0.999BC 12.1±1.0 210.9±303.7 0.012±0.188 0.985C 7.7±0.7 173.1±369.7 0.009±0.021 0.981
DON E 7.31±0.36 17.52±8.18 0.043±0.028 0.967Bh 18.89±1.07 138.89±5.42 0.088±0.007 0.998Bs 7.65±0.87 117.35±20.39 0.043±0.010 0.996BC 5.33±0.69 336.15±831.24 0.006±0.016 0.989C 1.82±0.33 29.40±10.75 0.037±0.018 0.987
†C=the amount of DOC/DON released during the first extraction (mg kgsoil−1); §Rmax+C=the total amount of DOC/DON that can be released from thesoil (mg kg soil−1); #k=release coefficient.
Table 8Results of the linear regression between measured and estimated values for theamount of indigenous DOC based on the data points of the 5 horizons
Slope Intercept R2 Sig. (F)
Initial Mass 0.141±0.026 6.96±32.59 0.906 0.013⁎
Langmuir 0.210±0.061 83.46±75.94 0.797 0.041⁎
Freundlich 0.038±0.153 463.08±190.52 0.020 0.818Exponential 0.186±0.051 68.13±63.04 0.817 0.035⁎
Measured values are the results of the fit to the data points of the sequentialextraction (C+Rmax). Estimated values are the y-intercepts of the different models.
8 J. Vandenbruwane et al. / Geoderma xx (2007) xxx–xxx
ARTICLE IN PRESS
for the amount of DOC and DON that can be adsorbed perunit of oxalate-extractable iron and aluminum present in thesoil: 266 and 176 mmol DOC per mol oxalate-extractable ironplus aluminum for the Langmuir and exponential isothermmodel respectively. These results lie in the range of thefindings of other studies. Gu et al. (1994) found a maximumDOC sorption onto hematite at pH 4.1 of 22.2 mmol C permol Fe. Kaiser and Zech (1997) reported a maximumadsorption of 756 mmol C per mol Fe onto goethite at pH3.95. The DON adsorption capacities of these sandy soilsseemed not to be correlated with the amounts of oxalate-extractable iron and aluminum present in the soil (data notshown).
As the fit of the Langmuir and exponential isotherm modelsresults in estimates for the amount of initially adsorbed DOCand for the maximum adsorption capacity, the ratio of bothvalues could be used to calculate a measure for the degree ofsaturation of the potential binding sites. The degree of saturationwas 80 and 100% for the Bh-horizon, 39 and 45% for the Bs-horizon, 16 and 18% for the BC-horizon and 11 and 11% for theC-horizon for the Langmuir and exponential models, respec-tively. The high degree of saturation of the Bh-horizoncorresponds with desorption of DOC under all circumstancesin this sorption experiment.
4.5. Null-point concentration
The null-point concentration of DOC (DOCnp) or DON(DONnp) is the equilibrium DOC or DON concentration atwhich there is no net removal (adsorption) or release(desorption) of DOC or DON from the solution, i.e. the xintercept of the fitted model curves (Mendoza and Barrow,1987). This means that the equilibrium DOM concentration (Ce)equals the initial DOM concentration (Ci) at this point. If theinitial concentration is lower than the null-point concentration,desorption of DOM will take place; if the initial concentration ishigher than the null-point concentration, adsorption will takeplace:
DOCnp ¼ Ce ¼ Cif qe ¼ 0
Please cite this article as: Vandenbruwane, J. et al. Comparison of different isothermmineral soil. Geoderma (2007), doi:10.1016/j.geoderma.2007.01.012
The fit of the four models to the DOC and DON valuesresults in similar null-point concentrations obtained by thedifferent isotherm models for each horizon (Tables 5 and 6). TheInitial Mass isotherm yielded realistic results for the upperhorizons (E, Bh and Bs), but gave inconsistent outcomes forDOC sorption to deeper soil layers (negative DOCnp) as a resultof the negative RSP values. The three curvilinear models(Langmuir, Freundlich and the exponential isotherm) yieldedalmost identical null-point concentrations for the E, Bs, BC andC horizons.
4.6. Correlation with soil solution concentrations
As a final analysis, we tested whether the results of the batchadsorption experiments could be related to soil solutionconcentrations in the field. The soil solutions sampled in thefield are considered to be in equilibrium with the surroundingmineral soil.
To predict the equilibrium DOC and DON concentrations inthe soil solution at different depths, the mineral soil is consideredto be a succession of different layers (horizons). The annualaverage DOC and DON concentration of the humus percolate ascollected using the zero-tension lysimeters (CHP, measured) is theonly given boundary condition of this layered system. This DOCand DON concentration was assumed to be the initialconcentration (Ci) of the E-horizon (Eq. (16)), and the calculatedequilibrium concentration of this horizon was, in turn, used asthe initial concentration of the underlying horizon. Thisprocedure was repeated for all lower horizons (Eqs. (17)–(20)).
Ci;E ¼ CHP;measured ð16Þ
Ci;Bh ¼ Ce;E ð17Þ
Ci;Bs ¼ Ce;Bh ð18Þ
Ci;BC ¼ Ce;Bs ð19Þ
Ci;C ¼ Ce;BC ð20ÞTo solve these equations, the equilibrium concentrations (Ce)
should be expressed as a function of initial concentrations (Ci).Therefore, Eq. (4) was substituted into either Eqs. (5), (7), (9),or (10) and the resulting equation was solved for Ce for thegiven Ci using the calculated adsorption parameters for eachmodel, derived from the adsorption experiments (Table 5)), foreach horizon. The V /M term (Eq. (4)) was kept the same as in
models for dissolved organic carbon (DOC) and nitrogen (DON) sorption to
9J. Vandenbruwane et al. / Geoderma xx (2007) xxx–xxx
ARTICLE IN PRESS
the batch experiments. The method of trial and error was used tosolve the equation for Ce in the case of the non-linear equations.
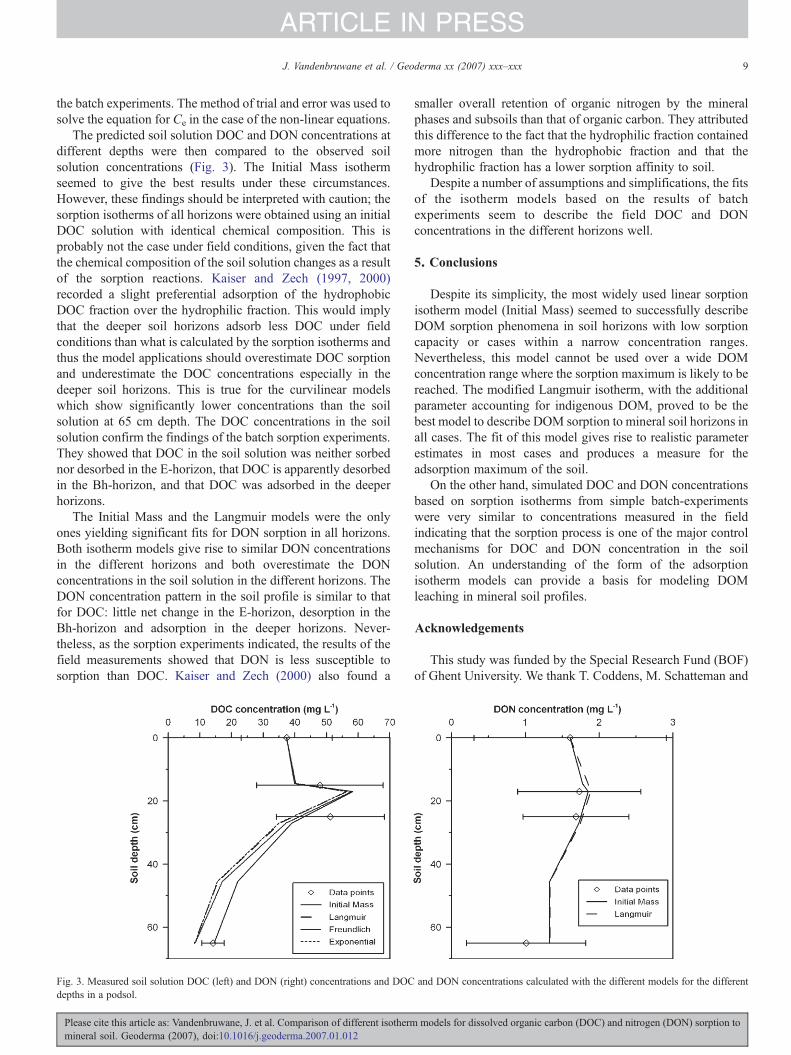
The predicted soil solution DOC and DON concentrations atdifferent depths were then compared to the observed soilsolution concentrations (Fig. 3). The Initial Mass isothermseemed to give the best results under these circumstances.However, these findings should be interpreted with caution; thesorption isotherms of all horizons were obtained using an initialDOC solution with identical chemical composition. This isprobably not the case under field conditions, given the fact thatthe chemical composition of the soil solution changes as a resultof the sorption reactions. Kaiser and Zech (1997, 2000)recorded a slight preferential adsorption of the hydrophobicDOC fraction over the hydrophilic fraction. This would implythat the deeper soil horizons adsorb less DOC under fieldconditions than what is calculated by the sorption isotherms andthus the model applications should overestimate DOC sorptionand underestimate the DOC concentrations especially in thedeeper soil horizons. This is true for the curvilinear modelswhich show significantly lower concentrations than the soilsolution at 65 cm depth. The DOC concentrations in the soilsolution confirm the findings of the batch sorption experiments.They showed that DOC in the soil solution was neither sorbednor desorbed in the E-horizon, that DOC is apparently desorbedin the Bh-horizon, and that DOC was adsorbed in the deeperhorizons.
The Initial Mass and the Langmuir models were the onlyones yielding significant fits for DON sorption in all horizons.Both isotherm models give rise to similar DON concentrationsin the different horizons and both overestimate the DONconcentrations in the soil solution in the different horizons. TheDON concentration pattern in the soil profile is similar to thatfor DOC: little net change in the E-horizon, desorption in theBh-horizon and adsorption in the deeper horizons. Never-theless, as the sorption experiments indicated, the results of thefield measurements showed that DON is less susceptible tosorption than DOC. Kaiser and Zech (2000) also found a
Fig. 3. Measured soil solution DOC (left) and DON (right) concentrations and DOCdepths in a podsol.
Please cite this article as: Vandenbruwane, J. et al. Comparison of different isothermmineral soil. Geoderma (2007), doi:10.1016/j.geoderma.2007.01.012
smaller overall retention of organic nitrogen by the mineralphases and subsoils than that of organic carbon. They attributedthis difference to the fact that the hydrophilic fraction containedmore nitrogen than the hydrophobic fraction and that thehydrophilic fraction has a lower sorption affinity to soil.
Despite a number of assumptions and simplifications, the fitsof the isotherm models based on the results of batchexperiments seem to describe the field DOC and DONconcentrations in the different horizons well.
5. Conclusions
Despite its simplicity, the most widely used linear sorptionisotherm model (Initial Mass) seemed to successfully describeDOM sorption phenomena in soil horizons with low sorptioncapacity or cases within a narrow concentration ranges.Nevertheless, this model cannot be used over a wide DOMconcentration range where the sorption maximum is likely to bereached. The modified Langmuir isotherm, with the additionalparameter accounting for indigenous DOM, proved to be thebest model to describe DOM sorption to mineral soil horizons inall cases. The fit of this model gives rise to realistic parameterestimates in most cases and produces a measure for theadsorption maximum of the soil.
On the other hand, simulated DOC and DON concentrationsbased on sorption isotherms from simple batch-experimentswere very similar to concentrations measured in the fieldindicating that the sorption process is one of the major controlmechanisms for DOC and DON concentration in the soilsolution. An understanding of the form of the adsorptionisotherm models can provide a basis for modeling DOMleaching in mineral soil profiles.
Acknowledgements
This study was funded by the Special Research Fund (BOF)of Ghent University. We thank T. Coddens, M. Schatteman and
and DON concentrations calculated with the different models for the different
models for dissolved organic carbon (DOC) and nitrogen (DON) sorption to
10 J. Vandenbruwane et al. / Geoderma xx (2007) xxx–xxx
ARTICLE IN PRESS
S. Schepens for the chemical analyses, Shauna Uselman andJuliane Lilienfein for help with the experimental set-ups andVerónica Martínez Campderà for the practical work.
References
Bernoux, M., Arrouays, D., Cerri, C.C., Bourennane, H., 1998. Modeling thevertical distribution of carbon in oxisols of the western Brazilian Amazon(Rondonia). Soil Sci. 163, 941–951.
Cottenie, A., Verloo, M., Kiekens, L., Velghe, G., Camerlynck, R., 1982. CationExchange Capacity. Chemical Analysis of Plants and Soils, Ghent, Belgium,pp. 38–39.
Gee, G.W., Bauder, J.W., 1986. Particle-size analysis, In: Klute, A. (Ed.),Methods of Soil Analysis, Part I: Physical and mineralogical methods, 2nded. ASA & SSSA, Madison WI USA, pp. 283–411.
Gu, B.H., Schmitt, J., Chen, Z.H., Liang, L.Y., McCarthy, J.F., 1994. Adsorptionand desorption of natural organic matter on iron-oxide — mechanisms andmodels. Environ. Sci. Technol. 28, 38–46.
Guggenberger, G., Kaiser, K., 2003. Dissolved organic matter in soil:challenging the paradigm of sorptive preservation. Geoderma 113, 293–310.
Guggenberger, G., Zech, W., 1992. Retention of dissolved organic carbon andsulfate in aggregated forest soils. J. Environ. Qual. 21, 643–653.
Harter, R.D., Baker, D.E., 1977. Applications and misapplications of Langmuirequation to soil adsorption phenomena. Soil Sci. Soc. Am. J. 41, 1077–1080.
Jackson, M.L., Lim, C.H., Zelazny, L.W., 1986. Oxides, hydroxides, andaluminosilicates, In: Klute, A. (Ed.), Methods of Soil Analysis, Part I:Physical and mineralogical methods, 2nd ed. ASA & SSSA, Madison WIUSA, pp. 101–150.
Jardine, P.M., Weber, N.L., McCarthy, J.F., 1989. Mechanisms of dissolvedorganic carbon adsorption on soil. Soil Sci. Soc. Am. J. 53, 1378–1385.
Kaiser, K., Zech, W., 1997. Competitive sorption of dissolved organic matterfractions to soils and related mineral phases. Soil Sci. Soc. Am. J. 61, 64–69.
Kaiser, K., Zech, W., 2000. Sorption of dissolved organic nitrogen by acidsubsoil horizons and individual mineral phases. Eur. J. Soil Sci. 51, 403–411.
Kaiser, K., Kaupenjohann, M., Zech, W., 2001. Sorption of dissolved organiccarbon in soils: effects of soil sample storage, soil-to-solution ratio, andtemperature. Geoderma 99, 317–328.
Koroleff, F., 1983. Simultaneous oxidation of nitrogen and phosphoruscompounds by persulfate, In: Grasshoff, K., Eberhardt, M., Kremling, K.(Eds.), Methods of Seawater Analysis, 2nd ed. Verlag Chemie, Weinheim,FRG.
Please cite this article as: Vandenbruwane, J. et al. Comparison of different isothermmineral soil. Geoderma (2007), doi:10.1016/j.geoderma.2007.01.012
Kumar, K.V., Sivanesan, S., 2005. Comparison of linear and non-linear methodin estimating the sorption isotherm parameters for safranin onto activatedcarbon. J. Hazard. Mater. B123, 288–292.
Langmuir, I., 1918. The adsorption of gasses on plane surfaces of glass, micaand platinum. J. Am. Chem. Soc. 40, 1361–1382.
Lee, W., Westerhoff, P., 2005. Dissolved organic nitrogen measurement usingdialysis pretreatment. Environ. Sci. Technol. 39, 879–884.
Lilienfein, J., Qualls, R.G., Uselman, S.M., Bridgham, S.D., 2004a. Adsorptionof dissolved organic carbon and nitrogen in soils of a weatheringchronosequence. Soil Sci. Soc. Am. J. 68, 292–305.
Lilienfein, J., Qualls, R.G., Uselman, S.M., Bridgham, S.D., 2004b. Adsorptionof dissolved organic and inorganic phosphorus in soils of a weatheringchronosequence. Soil Sci. Soc. Am. J. 68, 620–628.
Loague, K., Green, R.E., 1991. Statistical and graphical methods for evaluatingsolute transport models: overview and application. J. Contam. Hydrol. 7,51–73.
Mendoza, R.E., Barrow, N.J., 1987. Characterizing the rate of reaction of someArgentinian soils with phosphate. Soil Sci. 143, 105–112.
Michalzik, B., Tipping, E., Mulder, J., Gallardo, J.F., Lancho, E., Matzner, E.,Bryant, C.L., Clarke, N., Lofts, S., Vicente Esteban, M.A., 2003. Modellingthe production and transport of dissolved organic carbon in forest soils.Biogeochemistry 66, 241–264.
Miller, D.M., Summer, M.E., Miller, W.P., 1989. A comparison of batch- andflow-generated anion adsorption isotherms. Soil Sci. Soc. Am. J. 53,373–380.
Neff, J.C., Asner, G.P., 2001. Dissolved organic carbon in terrestrial ecosystems:synthesis and a model. Ecosystems 4, 29–48.
Nodvin, S.C., Driscoll, C.T., Likens, G.E., 1986. Simple partitioning of anionsand dissolved organic carbon in a forest soil. Soil Sci. 142, 27–35.
Qualls, R.G., 2000. Comparison of the behavior of soluble organic andinorganic nutrients in forest soils. For. Ecol. Manag. 138, 29–50.
Qualls, R.G., Haines, B.L., 1992. Measuring adsorption isotherms usingcontinuous, unsaturated flow through intact soil cores. Soil Sci. Soc. Am. J.56, 456–460.
Travis, C.C., Etnier, E.L., 1981. A survey of sorption relationships for reactivesolutes in soil. J. Environ. Qual. 10, 8–17.
Ussiri, D.A.N., Johnson, C.E., 2004. Sorption of organic carbon fractions byspodosol mineral horizons. Soil Sci. Soc. Am. J. 68, 253–262.
Vance, G.F., David, M.B., 1992. Dissolved organic carbon and sulfate sorptionby spodosol mineral horizons. Soil Sci. 154, 136–144.
models for dissolved organic carbon (DOC) and nitrogen (DON) sorption to
Copyright © 2022 FDOKUMEN