Stream isotherm shifts from climate change and implications ...
12
Stream isotherm shifts from climate change and implications for distributions of ectothermic organisms DANIEL J. ISAAK* andBRUCE E. RIEMAN † *U.S. Forest Service, Rocky Mountain Research Station, Boise Aquatic Sciences Laboratory, 322 E. Front St., Suite 401, Boise, ID, USA, †U.S. Forest Service, Rocky Mountain Research Station (retired), P.O. Box 1541, Seeley Lake, MT, USA Abstract Stream ecosystems are especially vulnerable to climate warming because most aquatic organisms are ectothermic and live in dendritic networks that are easily fragmented. Many bioclimatic models predict significant range contractions in stream biotas, but subsequent biological assessments have rarely been done to determine the accuracy of these pre- dictions. Assessments are difficult because model predictions are either untestable or so imprecise that definitive answers may not be obtained within timespans relevant for effective conservation. Here, we develop the equations for calculating isotherm shift rates (ISRs) in streams that can be used to represent historic or future warming scenarios and be calibrated to individual streams using local measurements of stream temperature and slope. A set of reference equations and formulas are provided for application to most streams. Example calculations for streams with lapse rates of 0.8 °C/100 m and long-term warming rates of 0.1–0.2 °C decade 1 indicate that isotherms shift upstream at 0.13–1.3 km decade 1 in steep streams (2–10% slope) and 1.3–25 km decade 1 in flat streams (0.1–1% slope). Used more generally with global scenarios, the equations predict isotherms shifted 1.5–43 km in many streams during the 20th Century as air temperatures increased by 0.6 °C and would shift another 5–143 km in the first half of the 21st Century if midrange projections of a 2 °C air temperature increase occur. Variability analysis suggests that short-term variation associated with interannual stream temperature changes will mask long-term isotherm shifts for several decades in most locations, so extended biological monitoring efforts are required to document anticipated distribu- tion shifts. Resampling of historical sites could yield estimates of biological responses in the short term and should be prioritized to validate bioclimatic models and develop a better understanding about the effects of temperature increases on stream biotas. Keywords: climate change, climate velocity, distribution shift, fish, global warming, isotherm, monitoring, range contraction, stream temperature Received 2 June 2012; revised version received 25 September 2012 and accepted 23 October 2012 Introduction Freshwater environments cover <1% of the Earth’s surface, yet contain 6% of all described species (Dud- geon et al., 2006). Despite well-recognized social and ecological values, these environments are being rapidly degraded and experiencing declines in biodiversity and functionality that often exceed losses in terrestrial systems (Malmqvist et al., 2008; Vorosmarty et al., 2010; Burkhead, 2012). Global warming is predicted to accel- erate losses of biodiversity this century as environmen- tal trends associated with a warming climate interact with other forms of anthropogenic habitat degradation (Thomas et al., 2004; Xenopoulos et al., 2005; Lawler et al., 2009a; Lawler et al., 2009b). As the climate warms, species are forced to shift their distributions in space (poleward or toward higher elevations) and time (phenologic adaptations) to track thermally suitable habitats. Some populations will encounter barriers (e.g., land/water interface, watershed divides, instream dis- continuities from dams, or warm temperatures), run out of habitat (i.e., mountaintop islands, ephemeral headwater streams), or be overtaken and simply perish (Jump et al., 2009; Loarie et al., 2009). Stream biotas are expected to be particularly vulnerable to thermal altera- tions associated with climate change given ectothermic physiologies (P€ ortner & Farrell, 2008), strong thermal regulation of growth and survival (Magnuson et al., 1979; Elliott & Hurley, 2001; McMahon et al., 2007), lim- ited evolutionary potential in thermal tolerances (Cro- zier et al., 2008; McCullough et al., 2009), and constraint to river and stream networks that are often heavily fragmented by natural and anthropogenic factors (Zwick, 1992; Graf, 1999). Species and population extinctions have been linked to climate change (e.g., Pounds et al., 2006; Beever et al., 2010), but for now, distribution shifts are more commonly documented. Case histories are sufficiently common that reviews encompassing dozens of Correspondence: Daniel J. Isaak, tel. +208 373 4385, fax +208 373 4391, e-mail: [email protected] 742 Published 2012. This article is a U.S. Government work and is in the public domain in the USA. Global Change Biology (2013) 19, 742–751, doi: 10.1111/gcb.12073
-
Upload
khangminh22 -
Category
Documents
-
view
0 -
download
0
Transcript of Stream isotherm shifts from climate change and implications ...

Stream isotherm shifts from climate change andimplications for distributions of ectothermic organismsDANIEL J . I SAAK * and BRUCE E. RIEMAN†
*U.S. Forest Service, Rocky Mountain Research Station, Boise Aquatic Sciences Laboratory, 322 E. Front St., Suite 401, Boise, ID,
USA, †U.S. Forest Service, Rocky Mountain Research Station (retired), P.O. Box 1541, Seeley Lake, MT, USA
Abstract
Stream ecosystems are especially vulnerable to climate warming because most aquatic organisms are ectothermic and
live in dendritic networks that are easily fragmented. Many bioclimatic models predict significant range contractions
in stream biotas, but subsequent biological assessments have rarely been done to determine the accuracy of these pre-
dictions. Assessments are difficult because model predictions are either untestable or so imprecise that definitive
answers may not be obtained within timespans relevant for effective conservation. Here, we develop the equations
for calculating isotherm shift rates (ISRs) in streams that can be used to represent historic or future warming scenarios
and be calibrated to individual streams using local measurements of stream temperature and slope. A set of reference
equations and formulas are provided for application to most streams. Example calculations for streams with lapse
rates of 0.8 °C/100 m and long-term warming rates of 0.1–0.2 °C decade�1 indicate that isotherms shift upstream at
0.13–1.3 km decade�1 in steep streams (2–10% slope) and 1.3–25 km decade�1 in flat streams (0.1–1% slope). Used
more generally with global scenarios, the equations predict isotherms shifted 1.5–43 km in many streams during the
20th Century as air temperatures increased by 0.6 °C and would shift another 5–143 km in the first half of the 21st
Century if midrange projections of a 2 °C air temperature increase occur. Variability analysis suggests that short-term
variation associated with interannual stream temperature changes will mask long-term isotherm shifts for several
decades in most locations, so extended biological monitoring efforts are required to document anticipated distribu-
tion shifts. Resampling of historical sites could yield estimates of biological responses in the short term and should be
prioritized to validate bioclimatic models and develop a better understanding about the effects of temperature
increases on stream biotas.
Keywords: climate change, climate velocity, distribution shift, fish, global warming, isotherm, monitoring, range contraction,
stream temperature
Received 2 June 2012; revised version received 25 September 2012 and accepted 23 October 2012
Introduction
Freshwater environments cover <1% of the Earth’s
surface, yet contain 6% of all described species (Dud-
geon et al., 2006). Despite well-recognized social and
ecological values, these environments are being rapidly
degraded and experiencing declines in biodiversity and
functionality that often exceed losses in terrestrial
systems (Malmqvist et al., 2008; Vorosmarty et al., 2010;
Burkhead, 2012). Global warming is predicted to accel-
erate losses of biodiversity this century as environmen-
tal trends associated with a warming climate interact
with other forms of anthropogenic habitat degradation
(Thomas et al., 2004; Xenopoulos et al., 2005; Lawler
et al., 2009a; Lawler et al., 2009b). As the climate warms,
species are forced to shift their distributions in space
(poleward or toward higher elevations) and time
(phenologic adaptations) to track thermally suitable
habitats. Some populations will encounter barriers (e.g.,
land/water interface, watershed divides, instream dis-
continuities from dams, or warm temperatures), run
out of habitat (i.e., mountaintop islands, ephemeral
headwater streams), or be overtaken and simply perish
(Jump et al., 2009; Loarie et al., 2009). Stream biotas are
expected to be particularly vulnerable to thermal altera-
tions associated with climate change given ectothermic
physiologies (P€ortner & Farrell, 2008), strong thermal
regulation of growth and survival (Magnuson et al.,
1979; Elliott & Hurley, 2001; McMahon et al., 2007), lim-
ited evolutionary potential in thermal tolerances (Cro-
zier et al., 2008; McCullough et al., 2009), and constraint
to river and stream networks that are often heavily
fragmented by natural and anthropogenic factors
(Zwick, 1992; Graf, 1999).
Species and population extinctions have been linked
to climate change (e.g., Pounds et al., 2006; Beever et al.,
2010), but for now, distribution shifts are more
commonly documented. Case histories are sufficiently
common that reviews encompassing dozens ofCorrespondence: Daniel J. Isaak, tel. +208 373 4385,
fax +208 373 4391, e-mail: [email protected]
742 Published 2012. This article is a U.S. Government work and is in the public domain in the USA.
Global Change Biology (2013) 19, 742–751, doi: 10.1111/gcb.12073
terrestrial plant and animal taxa and hundreds of indi-
vidual species have been published (Root et al. 2003;
Parmesan & Yohe, 2003; Hickling et al., 2006; Sunday
et al., 2012). For stream biotas, empirical evidence exists
for shifts in the timing of migrations and spawning
(Heino et al., 2009; Wedekind & Kung, 2010; Crozier
et al., 2011), as well as poleward and upstream range
expansions (Babaluk et al., 2000; Hickling et al., 2005;
Milner et al., 2011). However, little evidence exists of
broadscale range contractions, which is troubling given
the extensive and often dramatic changes predicted
with numerous bioclimatic models in recent decades
(Meisner, 1990; Eaton & Schaller, 1996; Keleher & Ra-
hel, 1996; Rahel et al., 1996; Mohseni et al., 2003; Chu
et al., 2005; Xenopoulos et al., 2005; Flebbe et al., 2006;
Battin et al., 2007; Rieman et al., 2007; Sharma & Jack-
son, 2008; Buisson & Grenouillet, 2009; Kennedy et al.,
2009; Williams et al., 2009; Lyons et al., 2010; Al-
mod�ovar et al., 2012; Wenger et al., 2011; Ruesch et al.,
2012; Tisseuil et al., 2012). A lack of supporting biologi-
cal evidence could contribute to an ‘inertia of inaction’
regarding difficult conservation choices or the misallo-
cation of resources if decisions are based on inaccurate
model projections (Dormann, 2006; Lawler et al., 2009a;
Lawler et al., 2009b).
Several factors are responsible for the limited evi-
dence regarding range contractions in stream organ-
isms. First and most simply, few monitoring efforts of
sufficient duration have been undertaken to assess the
issue in meaningful ways. Shifts associated with cli-
mate change are likely to be relatively slow, easily
masked by short-term (i.e., interannual or decadal) var-
iation in climate or fish distributions (e.g., Durance &
Ormerod, 2009; Copeland & Meyer, 2011), will interact
with other global change stressors (Xenopoulos et al.,
2005; Vorosmarty et al., 2010; Wenger et al., 2011), and
could require decades to describe accurately (Thomas
et al., 2006; Jackson et al., 2009; Sunday et al., 2012). Sec-
ond, changes will typically occur near the historical
boundaries of distributions, in habitats that are of mar-
ginal quality, and which are rarely monitored in ways
that accurately describe the location of these bound-
aries (e.g., Rieman et al., 2006; Tingley & Beissinger,
2009). Third, most bioclimatic model forecasts are based
on predictions that are either untestable or imprecise
(Wiens & Bachelet, 2009). In the former case, some
models predict the locations of temperature isotherms
and use these as surrogates for biological distributions
(e.g., Meisner, 1990; Keleher & Rahel, 1996; Williams
et al., 2009). These models do not incorporate geograph-
ically referenced biological surveys that can later be
resampled to assess possible changes. When biological
data are used in bioclimatic models, a general lack of
empirical stream temperature measurements usually
requires the use of surrogates like elevation or air tem-
perature that are only correlates of the thermal condi-
tions experienced by stream biotas. This may contribute
to considerable error at fine scales, especially in com-
plex mountainous terrain, where factors affecting
stream heat budgets often change considerably across
short distances (Johnson, 1971; Isaak & Hubert, 2001).
As an example of the precision associated with these
models, we recently estimated the lower elevation limit
of juvenile bull trout across 74 stream populations in
the Northwest United States to be 1567 m with a 95%
confidence interval of 172 m (Rieman et al., 2007).
Assuming a long-term air temperature warming rate of
0.2 °C decade�1 and perfect fidelity of bull trout to the
isotherm associated with the historic distribution, it
would take approximately 50 years before a compara-
ble distribution estimate differed statistically from the
current distribution (Calculations S1).
Clearly, better approaches are needed to document
the response of stream biotas to climate change if
conservation efforts are to be directed most effectively
this century. Fundamental to understanding these
responses are accurate predictions of the rate at which
isotherms are shifting to higher elevations or latitudes
near thermally mediated species boundaries. Such
predictions set the a priori expectations against which
biological patterns should be assessed to test a key
assumption in most bioclimatic models – that species
distributions are delimited by, and will track through
time, a critical temperature isotherm. Previously, Loarie
et al. (2009) developed an approach for mapping the
‘velocity’ at which isotherms shift across the Earth’s
land surfaces in response to climate warming that con-
sists of the ratio between temporal and spatial tempera-
ture gradients (i.e., °C yr�1/°C km�1 = km yr�1). Here,
we generalize Loarie et al. (2009) to provide a frame-
work for predicting isotherm shift rates (ISRs) in the
Earth’s streams and rivers by modifying the calcula-
tions to accommodate the distinct properties of these
systems, including: (i) more variable spatial tempera-
ture gradients, (ii) smaller long-term warming rates,
(iii) channel patterns that vary from straight to highly
sinuous, and (iv) restrictions on the topographic steep-
ness of streams that most aquatic organisms can access.
A set of reference curves and equations are developed
that facilitate specific application to many types of
streams. Lastly, we also describe the length of time for
statistically significant isotherm shifts to occur given
that short-term temperature variability will mask
warming trends from biotas for extended periods.
Implementing the ISR framework on a stream or river
requires only easily obtained measurements of temper-
ature and slope and yields several valuable applica-
tions that are subsequently discussed.
Published 2012. This article is a U.S. Government work and is in the public domain in the USA., Global Change Biology, 19, 742–751
STREAM ISOTHERM SHIFTS FROM CLIMATE CHANGE 743

Materials and methods
ISR calculations
The calculations made by Loarie et al. (2009) for terrestrial sys-
tems used global climate model representations of contempo-
rary spatial gradients in near surface air temperatures and
projections of future warming. By dividing the warming rate
(°C yr�1) by the spatial temperature gradient (°C km�1), the
quotient is the rate at which an isotherm moves (km yr�1) at a
specific location for a given climate scenario. Global datasets
of these input parameters are not available for the Earth’s
streams and rivers, but can be easily obtained or estimated for
individual streams. Four basic measurements are required,
the: (i) spatial temperature gradient (i.e., lapse rate) within a
stream; (ii) long-term warming rate; (iii) stream slope; and (iv)
stream sinuosity, which is relevant in flat streams that have
meandering channel patterns.
Deriving an estimate of a stream’s lapse rate requires
measuring temperatures concurrently at multiple sites along
the profile of a stream such that a sufficient elevation (or lat-
itude) range is covered and the spatial temperature gradient
is apparent. These measurements are easily obtained using
modern temperature sensors (Isaak et al., 2010a; Isaak & Ho-
ran, 2011) and Fig. 1a shows example temperature gradients
from mountain streams in central Idaho, USA. Measure-
ments often need to be spaced over several miles in steep
streams and longer distances in flatter streams to observe
meaningful temperature differences. The duration of mea-
surements at individual sites should encompass at least
1 month during that part of the year which is thermally lim-
iting, but longer term measurements (up to 12 months) may
also be useful for calculating annual averages if the limiting
period is unknown. Measurement periods longer than 1 year
are not necessary because lapse rates remain relatively con-
stant across years as temperatures change (Fig. 1b). Lacking
direct measurements for estimating the lapse rate in a
stream, data from nearby streams or the global average air
temperature lapse rate of 0.6 °C/100 m elevation (Dodson &
Marks, 1997; Rolland, 2003) might be used as first approxi-
mations.
The second measurement required is the long-term warm-
ing rate of a stream. These estimates may sometimes be
obtained from monitoring records, but those long enough to
describe anthropogenic climate change (i.e., 30–50 years) are
rare because streams have been poorly monitored compared
with terrestrial systems. Where long-term records are avail-
able, they are often associated with flow alterations (e.g., dams,
water diversions) or urban environments that confound warm-
ing trends associated with climate change (e.g., Kaushal et al.,
2010). To estimate warming rates at less impacted sites, it may
be necessary to use published values (e.g., Webb & Nobilis,
2007; Isaak et al., 2012a) or to reconstruct trends by linking
short-term stream temperature records to long-term air tem-
perature and flow data available near many stream locations
(e.g., Moatar & Gailhard, 2006; Isaak et al., 2010b; van Vliet
et al., 2010). A last option would be the use of long-term air
temperature trends as surrogates for stream temperature
trends after applying a scaling factor of 0.4–0.8 °C/°C to
account for the slower warming rates typical of streams (Mor-
rill et al., 2005; Hari et al., 2006; Isaak et al., 2012a).
The last two measurements needed for a stream ISR calcula-
tion, stream slope and sinuosity, may be measured in the field
(Isaak et al., 1999), obtained from digital elevation models in a
geographic information system (Neeson et al., 2008), or values
used from existing hydrocoverage sources like the US Geolog-
ical Survey 1 : 100 000-scale National Hydrologic Coverage
(Cooter et al., 2010). The latter two options are sufficiently pre-
cise and enable calculations to be made rapidly across an
extended length of stream or river network as may often be
desired.
The first step in a stream ISR calculation determines the
vertical displacement (a) of an isotherm associated with a
long-term warming rate (Fig. 2) by dividing the stream lapse
rate into the warming rate as:
a ¼�C=decade�C=100m
� 100 ð1Þ
Equation (1) yields values in vertical meters per decade
(Table S1 summarizes values across ranges of lapse rates and
warming rates) and the calculation is equivalent to Loarie
et al. (2009) except that stream temperatures are used rather
than air temperatures and the temperature gradient occurs
relative to elevation rather than latitude or horizontal distance
(e.g., Jump et al., 2009). We focus on elevational gradients
because these are readily discernible in steeper streams and
these streams are often less altered by other anthropogenic
factors that may confound climate assessments. However, ISR
predictions can be made in very flat streams (i.e., <0.1% slope)
(a)
(b)
Fig. 1 Examples of temperature gradients in mountain streams
from central Idaho, USA. Heterogeneity among streams is
apparent because heat budget parameters change along the
length of streams in association with riparian shade conditions,
groundwater contributions, and other factors (a). Lapse rates
within streams are relatively constant across years and changes
in temperature because sites experience common changes in
climatic conditions (b).
Published 2012. This article is a U.S. Government work and is in the public domain in the USA., Global Change Biology, 19, 742–751
744 D. J . ISAAK AND B. E . RIEMAN

using spatial temperature gradients expressed in horizontal
distance or latitude as the denominator in Eqn (1).
The second step in the ISR calculation translates a to
the distance in meters per decade along a stream using
the trigonometric relationship for a right triangle, wherein
the short side of the triangle is a, the hypotenuse repre-
sents the stream distance c, and stream slope (A) is
expressed in degrees as (Fig. 2):
c ¼ a
sin A� ð2Þ
Stream ecologists usually express stream slope as % (rise
over run times 100) rather than degrees. This conversion is
made as:
A� ¼ tan�1 slope%
100
� �ð3Þ
ISR variability analysis
Short-term variation in stream temperatures at interannual
and decadal timescales is large relative to the small tempera-
ture increases associated with climate change over short
periods. This variability will partially mask isotherm shifts
and cause population responses to lag temperature trends in
ways that depend on species generation times and climate
sensitivities (Araujo & Pearson, 2005; Jackson et al., 2009).
Therefore, understanding how short-term variability scales
relative to long-term climate trends is necessary for design-
ing biological monitoring efforts that conclusively test ISR
predictions and climate warming effects on species distribu-
tions. Reasoning that a distribution shift would not occur
before an isotherm had moved a statistically significant dis-
tance, we developed a series of curves that described the
time required for such a movement as a function of the ISR
and the amount of interannual variability in temperature.
The first step in these calculations estimated how far an iso-
therm must move before it was in a statistically different
location. This was done by calculating 95% confidence inter-
vals in °C based on the standard deviation (SD) of interan-
nual temperature variation observed in monitoring records
(e.g., Kaushal et al., 2010; Isaak et al., 2012a). Confidence
interval widths were translated to distances along streams
varying in slope and lapse rates using Eqns (1) and (2).
These distances were then divided by ISR values to describe
the time required for significant isotherm shifts to occur.
Results
ISR characteristics
Simple power curves describing the relationship
between ISR values calculated from Eqns (1)–(3) and
stream slope are summarized in Table 1 (an example
ISR calculation is provided in the supplementary mate-
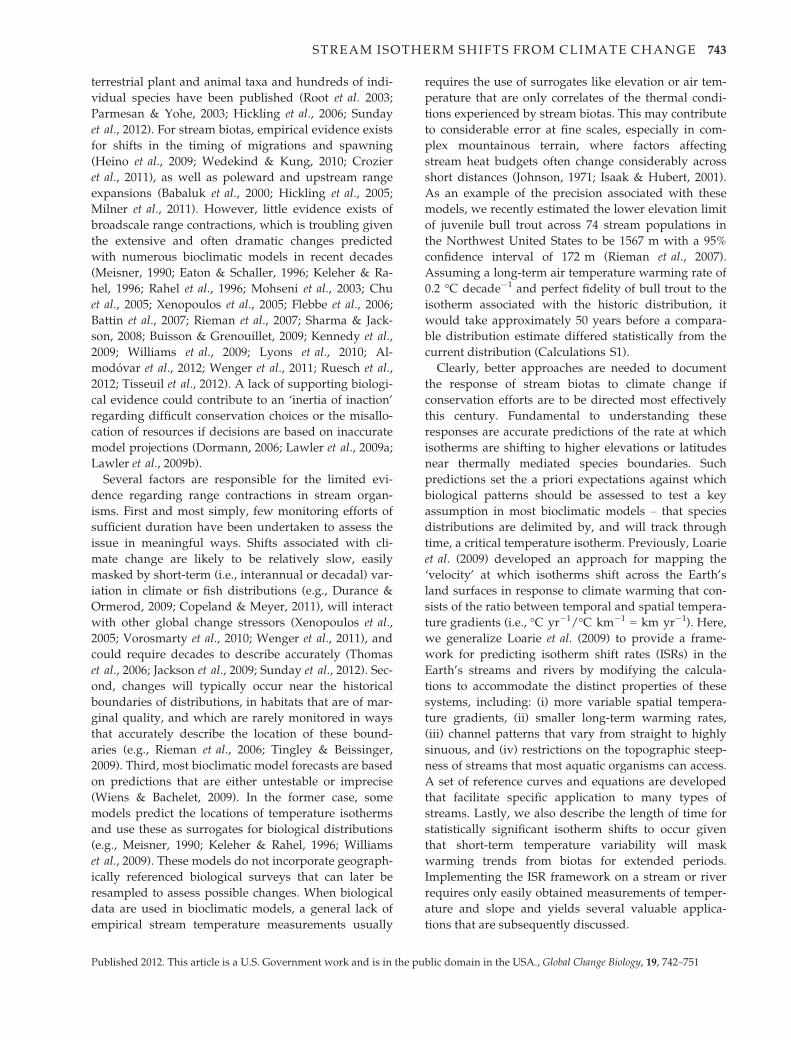
rials, Calculations S2). Figure 3 plots two sets of these
Table 1 Reference equations for predicting stream ISRs (km decade�1) from slope (x) for different combinations of lapse rates and
long-term warming rates. Slope values are entered as %’s. In streams with meandering channel patterns, ISRs should be multiplied
by the sinuosity ratio (thalweg length/straight line length) for greater accuracy
Stream lapse rate (°C/100 m)
Stream warming rate (°C decade�1)
0.1 0.2 0.3 0.4 0.5
0.1 y = 10.0x�1 y = 20.0x�1 y = 30.0x�1 y = 40.0x�1 y = 50.0x�1
0.2 y = 5.00x�1 y = 10.0x�1 y = 15.0x�1 y = 20.0x�1 y = 25.0x�1
0.3 y = 3.30x�1 y = 6.61x�1 y = 10.0x�1 y = 13.2x�1 y = 16.5x�1
0.4 y = 2.50x�1 y = 5.00x�1 y = 7.50x�1 y = 10.0x�1 y = 12.5x�1
0.5 y = 2.00x�1 y = 4.00x�1 y = 6.00x�1 y = 8.00x�1 y = 10.0x�1
0.6 y = 1.67x�1 y = 3.34x�1 y = 5.00x�1 y = 6.67x�1 y = 8.34x�1
0.7 y = 1.43x�1 y = 2.86x�1 y = 4.29x�1 y = 5.73x�1 y = 7.16x�1
0.8 y = 1.25x�1 y = 2.50x�1 y = 3.75x�1 y = 5.00x�1 y = 6.25x�1
0.9 y = 1.11x�1 y = 2.22x�1 y = 3.33x�1 y = 4.44x�1 y = 5.55x�1
1.0 y = 1.00x�1 y = 2.00x�1 y = 3.00x�1 y = 4.00x�1 y = 5.00x�1
Fig. 2 Schematic representing a stream isotherm shift as parts
of a right triangle. The short side of the triangle (a) represents
the vertical elevation displacement of an isotherm from a tem-
perature increase. The hypotenuse (c) represents the stream dis-
tance, an isotherm travels in association with a temperature
increase and is calculated using the trigonometric relationship
for a right triangle based on measurements of stream slope (A),
lapse rate, and long-term warming rate. See text for more
details.
Published 2012. This article is a U.S. Government work and is in the public domain in the USA., Global Change Biology, 19, 742–751
STREAM ISOTHERM SHIFTS FROM CLIMATE CHANGE 745

power curves on log scales for streams with lapse
rates of 0.4 °C/100 m and 0.8 °C/100 m across a range
of long-term warming rates. Several things about the
ISR values depicted in these curves are noteworthy.
First, stream slope has a dominant effect on ISRs, which
vary by almost two orders of magnitude across a slope
range from 0.1 to 13% that encompasses most streams
accessible to fish and amphibians. Second, the long-
term warming rate has an important effect on ISRs, but
it scales linearly so that a doubling of the warming rate
translates to a doubling of the ISR. Third, lapse rate is
inversely related to ISR as evidenced by the systematic
shift lower in the set of curves for streams with lapse
rates of 0.8 °C/100 m (Fig. 3b).
The curves indicate that isotherm shifts would occur at
0.13–1.3 km decade�1 in steep streams (2–10% slope)
and 1.3–25 km decade�1 in flat streams (0.1–1% slope)
for lapse rates of 0.8 °C/100 m and long-term warming
rates of 0.1–0.2 °C decade�1. Isothermshiftswouldoccur
at twice these rates in streams with lapse rates of 0.4 °C/100 m subject to similar warming. These predictions are
conservative in streamswhere channel patternsmeander
and ISRs need to be multiplied by the sinuosity ratio
(stream distance/straight line distance between stream
endpoints) to account for the additional streamdistance.
ISR applications
One use of the ISR calculations is to estimate the total
distance isotherms shift in association with historic or
future warming scenarios. These estimates can be made
at many scales, including individual streams, river net-
works, or even more broadly. It is, for example, straight-
forward to translate the often cited global average air
temperature increase of 0.6 °C during the 20th Century
(i.e., 0.06 °C decade�1; IPCC, 2007) to a stream isotherm
shift with some basic assumptions. If we apply the scal-
ing factor of 0.6 °C/°C of air temperature increase to
account for the slower warming rates of streams, and
assume a consistent lapse rate among streams of 0.8 °C/100 m, the general prediction can be made that iso-
therms shifted 1.5–43 km during the previous century in
streams ranging in slope from 0.1 to 3%. Under the same
assumptions, but using a projected air temperature
increase of 2 °C (i.e., a midrange IPCC (2007) warming
scenario), isotherms can be predicted to shift another 5–143 km during the first five decades of the 21st Century.
Another use of the ISR calculations is mapping the
velocity of isotherms (sensu Loarie et al., 2009) within
streams across river networks to portray spatial differ-
ences in shift rates. To illustrate, we map velocities
across a 2500 km river network in a mountainous area
of central Idaho, USA using the stream slope values
associated with the US Geological Survey 1 : 100 000-
scale National Hydrologic Coverage. The simplifying
assumption was made that all streams in the basin had
lapse rates of 0.4 °C/100 m and long-term warming
rates of 0.2 °C decade�1; values which approximate
published estimates for streams in the region. The aver-
age ISR for streams in this network under these condi-
tions was predicted to be 4.2 km decade�1, but values
varied by more than an order of magnitude (<1 to
>16 km decade�1; Fig. 4). Mainstem rivers and other
streams with low slopes were predicted to have higher
ISRs than steeper headwater streams, which will be a
common pattern due to the concavity of most longitu-
dinal stream profiles.
ISR variability analysis
The time required for a significant isotherm shift to
occur was negatively related to ISR and positively
related to interannual temperature variability (Fig. 5,
Calculations S3). Moreover, streams with smaller lapse
rates or lower slopes required longer periods for signifi-
cant isotherm shifts. These differences were largely
negated, however, if realistic ISR values associated with
long-term warming rates of 0.1–0.3 °C decade�1
(shaded area of Fig. 5) were used to constrain the range
of values considered. A minimum time for a statistically
significant isotherm shift to occur then is one decade
under the best conditions of low interannual variability
(SD = 0.5) and steep slope (Fig. 5b and d). However,
greater thermal variability is typical of most streams, so
two to four decades is a more general result.
(a)
(b)
Fig. 3 Stream ISRs relative to slope for different long-term
warming rates in streams with lapse rates of (a) 0.4 °C/100 m
and (b) 0.8 °C/100 m. In streams with meandering channel pat-
terns, ISR values should be multiplied by the sinuosity ratio
(thalweg length/straight line length) for greater accuracy.
Published 2012. This article is a U.S. Government work and is in the public domain in the USA., Global Change Biology, 19, 742–751
746 D. J . ISAAK AND B. E . RIEMAN

Discussion
A variety of useful predictions can be made with the
ISR framework to better anticipate, describe, and study
how warming from climate change may affect stream
thermal conditions and biotas this century. Most sober-
ing of these predictions are that the isotherm shifts
which occurred during the entirety of the 20th Century
will easily be exceeded in the first half of the 21st
Century under current midrange projections for global
Fig. 4 Climate velocity map for the Boise River network in central Idaho. Isotherm shift rates were calculated assuming a long-term
warming rate of 0.2 °C decade�1 and stream lapse rate of 0.4 °C/100 m. The histogram summarizes the number of stream segments
within each ISR category.
(a) (c)
(b) (d)
Fig. 5 Time required for a statistically significant isotherm shift to occur based on ISR values and interannual temperature variation.
Curves depict relationships for streams with lapse rates and slopes of: (a) 0.4 °C/100 m and 1%; (b) 0.4 °C/100 m and 4%; (c) 0.8 °C/
100 m and 1%; and (d) 0.8 °C/100 m and 4%. Shaded portions of the curves highlight ranges for realistic ISRs based on long-term
warming rates of 0.1 °C–0.3 °C decade�1.
Published 2012. This article is a U.S. Government work and is in the public domain in the USA., Global Change Biology, 19, 742–751
STREAM ISOTHERM SHIFTS FROM CLIMATE CHANGE 747

warming. Changes of this magnitude imply ISRs that
are sixfold faster than the average 20th-Century ISR
and populations near current distributional boundaries
must adjust accordingly. Of course, a range of future
warming scenarios exists for streams that is as wide as
the range for air temperatures (IPCC, 2007), but recent
warming trends and greenhouse gas emissions increas-
ingly suggest that the Earth’s climate is on a high-end
warming trajectory (Pittock, 2006; Raupach et al., 2007).
Moreover, warming from climate change will be exacer-
bated in many streams by warming from urbanization
and water development as human populations con-
tinue to expand (Xenopoulos et al., 2005; Kaushal et al.,
2010; Vorosmarty et al., 2010), so major thermal disrup-
tions of stream communities appear likely this century.
The greatest thermal threats to biodiversity may be
in the flattest streams, which generally include the larg-
est and most biodiverse rivers within a region and
globally. Also highly vulnerable are biotas in heavily
fragmented streams with east-west orientations and
those species with limited mobility and restricted
ranges (sensu Angermeier, 1995). The dominant effect
of slope on ISRs means that biotas in steeper streams
will be less susceptible to thermal habitat shifts associ-
ated with temperature increases, although other aspects
of climate change related to hydrology and disturbance
regimes may still affect these populations (Stewart,
2009; Rieman & Isaak, 2010). One exception regarding
thermal effects in steep streams occurs where small
populations are already constrained by warm tempera-
tures and lack elevational refugia due to upstream lim-
its imposed by small stream size or steep slopes that
preclude dispersal. These headwater populations are
often already of conservation concern (Rieman et al.,
2007; Fausch et al., 2009; Almod�ovar et al. 2012) and
those with less than 5 km of habitat could be particu-
larly vulnerable to extirpation by midcentury.
Our work makes the general assumption that distri-
butions of ectothermic stream organisms will track crit-
ical isotherms, but is based largely on observed spatial
patterns rather than biological shifts. Metabolic theory
(Brown et al., 2004; P€ortner & Farrell, 2008) provides a
strong mechanistic basis for why such shifts are antici-
pated, but predictions ultimately need to be tested with
empirical data. Biological and stream temperature mon-
itoring will be required to better understand how grad-
ual warming trends are integrated by populations and
translated to range or distribution shifts (Araujo &
Pearson, 2005; Jackson et al., 2009). Time lags between
environmental trends and biological responses are
likely (Morris et al., 2008; Sunday et al., 2012) and iso-
therm shifts may ultimately differ from the rates at
which distributions change because multiple factors
mediate population boundaries (Guo et al., 2005; Weng-
er et al., 2011). Nonetheless, Loarie et al.’s (2009) esti-
mate that isotherms in Earth’s terrestrial systems will
shift 4.2 km decade�1 under the A1B warming scenario
(IPCC, 2007) is close to Parmesan & Yohe (2003) esti-
mate that distributions of many terrestrial species are
shifting poleward at 6.1 km decade�1. More recent
studies also find concordance between long-term ISRs
and biological responses (e.g., Wilson et al., 2005;
Moritz et al., 2008; Sunday et al., 2012), but the details
for streams have yet to be resolved.
A strength of the ISR framework is that it can be used
to make precise local predictions that are paired with
biological surveys to test these predictions. Ideally,
such efforts would consist of dense temperature and
biological survey sites spread along stream profiles
with obvious temperature gradients that encompassed
thermally mediated population boundaries (e.g., Rieman
et al., 2006). A series of these ‘sentinel streams’ might
be replicated across a river network (e.g., Isaak et al.,
2009; Clews et al., 2010) to increase the statistical power
for trend detection, ensure patterns detected in one
stream were not idiosyncratic to that location, and
refine understanding of interacting and potentially con-
founding factors (e.g., Durance & Ormerod, 2009). Once
consistent sets of baseline data were established, quan-
tifying shifts in biological distributions, thermal associ-
ations, or measures of population performance would
only require periodic site resurveys and comparisons
(Tingley & Beissinger, 2009). If standardized sampling
protocols were developed, various conservation inter-
ests and concerned stakeholders might even be
engaged in formalized, distributed monitoring net-
works that tracked the status and trends of species
throughout their ranges
(e.g., Craine et al., 2007).
Results of the variability analysis suggest that the
best streams to detect climate-related trends have large
ISRs and small interannual thermal variability. Even
under ideal conditions, however, it would take at least
a decade and usually much longer for isotherms to shift
statistically significant distances at current rates of
warming (e.g., Webb & Nobilis, 2007; Kaushal et al.,
2010; Isaak et al., 2012a). Moreover, biological shifts
would be expected to lag any discernible temperature
trends, so new monitoring efforts are unlikely to yield
estimates of spatial shifts in time for near-term conser-
vation planning. Monitoring efforts that built on preex-
isting data, however, by resurveying historical sites
along stream profiles with thermally mediated popula-
tion boundaries, could be especially useful (e.g., Adams
et al., 2002; Hitt & Roberts, 2012). Many early stream
profile studies meet these criteria (e.g., Vincent &
Miller, 1969; Gard & Flittner, 1974; Platts, 1979) and
provide fertile grounds for reexamination now that sev-
Published 2012. This article is a U.S. Government work and is in the public domain in the USA., Global Change Biology, 19, 742–751
748 D. J . ISAAK AND B. E . RIEMAN

eral decades have elapsed during which species distri-
butions may have shifted. Another option is to resam-
ple large numbers of historic sites (i.e., 100’s) across
many streams within a region and to then examine
changes in a species’ site occupancy relative to local cli-
matic conditions (e.g., Beever et al., 2010). If climate
change is causing range contractions in some species,
site extirpation should exceed colonizations and be
skewed toward warm sites within a species’ thermal
niche. Large databases composed of 1000’s of fish,
macroinvertebrate, and amphibian surveys exist and
could be used in these assessments (e.g., Buisson &
Grenouillet, 2009; Wenger et al., 2011). Monitoring that
involves historical resurveys has to address issues of
imprecise spatial locations, differences in sampling
techniques, and changes caused by nonclimate factors
(e.g., invasive species, habitat degradation; Magurran
et al., 2010), but also has the potential to yield estimates
of biological shifts within a few years.
As empirical estimates of temperature effects on
stream biotas become more common, this information
can be used to validate and improve the predictions
from bioclimatic models. Better accuracy would in turn
improve the quality of climate vulnerability assessments
and should lend itself to highlighting specific popula-
tions at risk and areas within stream networks that
might warrant prioritization. This level of resolution is
ultimately needed to design effective conservation net-
works for sensitive species within landscapes and river
basins (Vos et al., 2008; Williams et al., 2011; Isaak et al.,
2012b). Moreover, when bioclimatic models are under-
pinned by observed biological changes, rather than
being simple extrapolations of static historical patterns,
it could strengthen resolve for implementing conserva-
tion actions. For species and populations confined to lin-
ear networks, removal of barriers or assisted migrations
are two obvious options (Peterson et al., 2008; Kostyack
et al., 2011), but many other actions are possible (Rieman
& Isaak, 2010; Wilby et al., 2010). Key to effective conser-
vation this century will be choosing among these actions
and implementing them in the best places because con-
servation needs will greatly exceed available resources
(Wiens & Bachelet, 2009; Isaak et al., 2012b).
In our view, the question is not whether, but how
fast, stream biotas are shifting and sometimes being
extirpated, by temperature increases associated with
global climate change. Other anthropogenic and natu-
ral factors will contribute to, or ameliorate, these
trends, but for ectotherms constrained to linear net-
works, temperature is destiny in a warming world.
Several studies have recently documented multideca-
dal decreases in trout abundance in warm streams or
lakes near species’ southern range margins (Hari et al.,
2006; Winfield et al., 2010; Almod�ovar et al., 2012).
Other studies have implicated factors associated with
climate change in the extirpation of stream macroin-
vertebrate populations (Durance & Ormerod, 2010)
and amphibians (Pounds et al., 2006). These case histo-
ries are likely only the initial phase of a much broader
global phenomenon that will be documented for the
Earth’s aquatic ecosystems as climate change continues
and monitoring records improve. However, even with
the best long-term monitoring efforts, or where seem-
ingly obvious climate-related mass mortality ‘events’
occur (e.g., Cooke et al., 2004; Doremus & Tarlock,
2008), direct attribution of biological outcomes to tem-
perature increases will be difficult (Durance & Orm-
erod, 2010; Parmesan et al., 2011). Temperature may be
the ultimate cause, but will often interact with other
factors like disease, invasive species, or altered trophic
ecology to exact its toll (Rahel & Olden, 2008; Wood-
ward et al., 2010). It will be important to develop
clearly testable hypotheses, effective monitoring proto-
cols, and rigorous analyses that clarify the role of tem-
perature in alteration of stream communities (e.g.,
Harper & Peckarsky, 2006; Coleman & Fausch, 2007)
and provide insight regarding how effects are trans-
lated across biophysical and spatiotemporal scales. The
ISR framework presented here is a useful tool for mak-
ing better predictions at scales relevant to conservation
efforts and can help focus research and monitoring to
resolve these questions.
Acknowledgements
This research was supported by the US Forest Service, RockyMountain Research Station, and the Washington Office ofResearch and Development. An earlier draft of this manuscriptwas improved by comments from Mike Young, Seth Wenger,Frank Rahel, Dan Gibson-Reinemer, and two anonymousreviewers. Thanks go to Dona Horan for her preparation ofFig. 4 and Dan Evans for his high school trigonometry class.
References
Adams SB, Frissell CA, Rieman BE (2002) Changes in distribution of nonnative brook
trout in an Idaho drainage over two decades. Transactions of the American Fisheries
Society, 131, 561–568.
Almod�ovar A, Nicola GG, Ayllon D, Elvira B (2012) Global warming threatens the
persistence of Mediterranean brown trout. Global Change Biology, 18, 1549–1560.
Angermeier P (1995) Ecological attributes of extinction-prone species: loss of freshwa-
ter fishes of Virginia. Conservation Biology, 9, 143–158.
Araujo MB, Pearson RG (2005) Equilibrium of species’ distributions with climate.
Ecography, 28, 693–695.
Babaluk JA, Reist JD, Johnson JD, Johnson L (2000) First records of sockeye
(Oncorhynchus nerka) and pink salmon (O. gorbuscha) from Banks Island and other
records of Pacific salmon inNorthwest Territories, Canada.Arctic, 53, 161–164.
Battin J, Wiley MW, Ruckelshaus MH, Palmer RN, Korb E, Bartz KK, Imaki H (2007)
Projected impacts of climate change on salmon habitat restoration. Proceedings of
the National Academy of Sciences (USA), 104, 6720–6725.
Beever EA, Ray C, Mote PW, Wilkening JL (2010) Testing alternative models of
climate-mediated extirpations. Ecological Applications, 20, 164–178.
Brown JH, Gillooly JF, Allen AP, Savage VM, West GB (2004) Toward a metabolic
theory of ecology. Ecology, 85, 1771–1789.
Published 2012. This article is a U.S. Government work and is in the public domain in the USA., Global Change Biology, 19, 742–751
STREAM ISOTHERM SHIFTS FROM CLIMATE CHANGE 749

Buisson L, Grenouillet G (2009) Contrasted impacts of climate change on stream fish
assemblages along an environmental gradient. Diversity and Distributions, 15, 613–626.
Burkhead NM (2012) Extinction rates in North American freshwater fishes,
1900–2010. BioScience, 62, 798–808.
Chu C, Mandrak NE, Minns CK (2005) Potential impacts of climate change on the
distributions of several common and rare freshwater fishes in Canada. Diversity
and Distributions, 11, 299–310.
Clews E, Durance I, Vaughan IP, Ormerod SJ (2010) Juvenile salmonid populations in
a temperate river system track synoptic trends in climate. Global Change Biology,
16, 3271–3283.
Coleman MA, Fausch KD (2007) Cold summer temperature limits recruitment of age-
0 cutthroat trout in high-elevation Colorado streams. Transactions of the American
Fisheries Society, 136, 1231–1244.
Cooke SJ, Hinch SG, Farrell AP et al. (2004) Abnormal migration timing and high en route
mortality of sockeye salmon in the Fraser River, British Columbia. Fisheries, 29, 22–33.
Cooter W, Rineer J, Bergenroth B (2010) A nationally consistent NHDPlus framework
for identifying interstate waters: implications for integrated assessments and inter-
jurisdictional TMDLs. Environmental Management, 46, 510–524.
Copeland T, Meyer KA (2011) Interspecies synchrony in salmonid densities associ-
ated with large-scale bioclimatic conditions in central Idaho. Transactions of the
American Fisheries Society, 140, 928–942.
Craine JM, Battersby J, Elmore AJ, Jones AW (2007) Building EDENs: the rise of envi-
ronmentally distributed ecological networks. BioScience, 57, 45–54.
Crozier LG, Hendry AP, Lawson PW et al. (2008) Potential responses to climate
change in organisms with complex life histories: evolution and plasticity in Pacific
salmon. Evolutionary Applications, 1, 252–270.
Crozier LG, Scheuerell MD, Zabel RW (2011) Using time series analysis to characterize
evolutionary and plastic responses to environmental change: a case study of a shift
toward earlier migration date in sockeye salmon. The American Naturalist, 178, 755–773.
Dodson R, Marks D (1997) Daily air temperature interpolated at high spatial resolu-
tion over a large mountainous region. Climate Research, 8, 1–20.
Doremus H, Tarlock AD (2008) Water War in the Klamath Basin. Macho Law, Combat
Biology, and Dirty Politics. Island Press, Washington.
Dormann CF (2006) Promising the future? Global change projections of species distri-
butions. Basic and Applied Ecology, 8, 387–397.
Dudgeon D, Arthington AH, Gessner MO et al. (2006) Freshwater biodiversity: impor-
tance, threats, status and conservation challenges. Biological Reviews, 81, 163–182.
Durance I, Ormerod SJ (2009) Trends in water quality and discharge confound long-
term warming effects on river macroinvertebrates. Freshwater Biology, 54, 388–405.
Durance I, Ormerod SJ (2010) Evidence for the role of climate in the local extinction of a
cool-water triclad. Journal of the North American Benthological Society, 29, 1367–1378.
Eaton JG, Schaller RM (1996) Effects of climate warming on fish thermal habitat in
streams of the United States. Limnology and Oceanography, 41, 1109–1115.
Elliott JM, Hurley MA (2001) Modeling growth of brown trout, Salmo trutta, in terms
of weight and energy units. Freshwater Biology, 46, 679–692.
Fausch KD, Rieman BE, Dunham JB, Young MK, Peterson DP (2009) Invasion versus
isolation: trade-offs in managing native salmonids with barriers to upstream
movement. Conservation Biology, 23, 859–870.
Flebbe PA, Roghair LD, Bruggink JL (2006) Spatial modeling to project southern
Appalachian trout distribution in a warmer climate. Transactions of the American
Fisheries Society, 135, 1371–1382.
Gard R, Flittner GA (1974) Distribution and abundance of fishes in Sagehen Creek,
California. Journal of Wildlife Management, 38, 347–358.
Graf WL (1999) Dam nation: a geographic census of American dams and their large-
scale hydrologic impacts. Water Resources Research, 35, 1305–1311.
Guo Q, Taper M, Schoenberger M, Brandle J (2005) Spatial-temporal population
dynamics across species range: from centre to margin. Oikos, 108, 47–57.
Hari RE, Livingstone DM, Siber R, Burkhardt-Holm P, Guttinger H (2006) Conse-
quences of climatic change for water temperature and brown trout populations in
alpine rivers and streams. Global Change Biology, 12, 10–26.
Harper MP, Peckarsky BL (2006) Emergence cues of a mayfly in a high-altitude stream
ecosystem: potential response to climate change. Ecological Applications, 16, 612–621.
Heino J, Virkkala R, Toivonen H (2009) Climate change and freshwater biodiversity:
detected patterns, future trends and adaptations in northern regions. Biological
Reviews, 84, 39–54.
Hickling R, Roy DB, Hill JK, Thomas CD (2005) A northward shift of range margins
in British Odonata. Global Change Biology, 11, 502–506.
Hickling R, Roy DB, Hill JK, Thomas CD (2006) The distributions of a wide range of
taxonomic groups are expanding polewards. Global Change Biology, 12, 450–455.
Hitt NP, Roberts JH (2012) Hierarchical spatial structure of stream fish colonization
and extinction. Oikos, 121, 127–137.
IPCC (Intergovernmental Panel on Climate Change) (2007) Climate change 2007: the
physical science basis. [Online]. Available: http://www.ipcc.ch/ (accessed 9
September 2012).
Isaak DJ, Horan DL (2011) An evaluation of underwater epoxies to permanently
install temperature sensors in mountain streams. North American Journal of Fisheries
Management, 31, 134–137.
Isaak DJ, Hubert WA (2001) A hypothesis about factors that affect maximum summer
stream temperatures across montane landscapes. Journal of the American Water
Resources Association, 37, 351–366.
Isaak DJ, Hubert WA, Krueger KL (1999) Accuracy and precision of stream reach
water surface slopes estimated in the field and from maps. North American Journal
of Fisheries Management, 19, 141–148.
Isaak DJ, Rieman BE, Horan D (2009) A watershed-scale monitoring protocol for bull
trout. General Technical Report. GTR-RMRS-224. U.S. Department of Agriculture,
Forest Service, Rocky Mountain Research Station, Fort Collins, CO. 25 p.
Isaak DJ, Horan DL, Wollrab S (2010a) A simple method using underwater epoxy to
permanently install temperature sensors in mountain streams. [Online]. Available
at: http://www.fs.fed.us/rm/boise/AWAE/projects/stream_temperature.shtml
(accessed 9 September 2012).
Isaak DJ, Luce CH, Rieman BE et al. (2010b) Effects of climate change and recent wild-
fires on stream temperature and thermal habitat for two salmonids in a mountain
river network. Ecological Applications, 20, 1350–1371.
Isaak DJ, Wollrab S, Horan D, Chandler G (2012a) Climate change effects on stream
and river temperatures across the northwest U.S. from 1980–2009 and implications
for salmonid fishes. Climatic Change, 113, 499–524.
Isaak DJ, Muhlfeld CC, Todd AS et al. (2012b) The past as prelude to the future for under-
standing 21st Century climate effects on Rocky Mountain trout. Fisheries, 37, 542–556.
Jackson ST, Betancourt JL, Booth RK, Gray ST (2009) Ecology and the ratchet of
events: climate variability, niche dimensions, and species distributions. Proceedings
of the National Academy of Sciences, 106, 19685–19692.
Johnson FA (1971) Stream temperatures in an alpine area. Journal of Hydrology, 14,
322–336.
Jump AS, Matyas C, Penuelas J (2009) The altitude-for-latitude disparity in the
range retractions of woody species. Trends in Ecology and Evolution, 24,
694–701.
Kaushal SS, Likens GE, Jaworski NA et al. (2010) Rising stream and river tem-
peratures in the US. Frontiers in Ecology and the Environment, 8, 461–466.
Keleher CJ, Rahel FJ (1996) Thermal limits to salmonid distributions in the Rocky Moun-
tain region and potential habitat loss due to global warming: a geographic informa-
tion system (GIS) approach. Transactions of the American Fisheries Society, 125, 1–13.
Kennedy TL, Gutzler DS, Leung RL (2009) Predicting future threats to the long-term
survival of Gila trout using a high-resolution simulation of climate change.
Climatic Change, 94, 503–515.
Kostyack J, Lawler JJ, Goble DD, Olden JD, Scott JM (2011) Beyond reserves and
corridors: policy solutions to facilitate the movement of plants and animals in a
changing climate. BioScience, 61, 713–719.
Lawler JJ, Tear TH, Pyke C et al. (2009a) Resource management in a changing and
uncertain climate. Frontiers in Ecology and the Environment, doi: 10.1890/070146.
Lawler JJ, Shafer SL, White D, Kareiva P, Paurer EP, Blaustein AR, Bartlein PJ (2009b) Pro-
jected climate-induced faunal change in the Western Hemisphere. Ecology, 90, 588–597.
Loarie SR, Duffy PB, Hamilton HH, Asner GP, Field CB, Ackerly DD (2009) The
velocity of climate change. Nature, 462, 1052–1055.
Lyons J, Stewart JS, Mitro M (2010) Predicted effects of climate warming on the distri-
bution of 50 stream fishes in Wisconsin, U.S.A. Journal of Fish Biology, 77,
1867–1898.
Magnuson JJ, Crowder LB, Medvick PA (1979) Temperature as an ecological resource.
American Zoologist, 19, 331–343.
Magurran AE, Baillie SR, Buckland ST et al. (2010) Long-term datasets in biodiversity
research and monitoring: assessing change in ecological communities through
time. Trends in Ecology and Evolution, 25, 574–582.
Malmqvist B, Rundle SD, Covich AP, Hildrew AG, Robinson CT, Townsend CR
(2008) Prospects for streams and rivers: an ecological perspective. In: Aquatic
Systems: Trends and Global Perspectives (ed Polunin N), pp. 19–29. Cambridge
University Press, Cambridge, UK.
McCullough DA, Bartholow JM, Jager HI et al. (2009) Research in thermal biology: burn-
ing questions for coldwater stream fishes. Reviews in Fisheries Science, 17, 90–115.
McMahon TE, Zale AV, Barrows FT, Selong JH, Danehy RJ (2007) Temperature and
competition between bull trout and brook trout: a test of the elevation refuge
hypothesis. Transactions of the American Fisheries Society, 136, 1313–1326.
Meisner JD (1990) Effect of climatic warming on the southern margins of the native
range of brook trout. Canadian Journal of Fisheries and Aquatic Sciences, 47, 1065–1070.
Published 2012. This article is a U.S. Government work and is in the public domain in the USA., Global Change Biology, 19, 742–751
750 D. J . ISAAK AND B. E . RIEMAN

Milner AM, Robertson AL, Brown LE, Sonderland SH (2011) Evolution of a stream
ecosystem in recently deglaciated terrain. Ecology, 92, 1924–1935.
Moatar F, Gailhard J (2006) Water temperature behaviour in the River Loire since
1976 and 1881. Comptes Rendus Geoscience, 338, 319–328.
Mohseni O, Stefan HG, Eaton JG (2003) Global warming and potential changes in fish
habitat in U.S. streams. Climatic Change, 59, 389–409.
Moritz C, Patton JL, Conroy CJ, Parra JL, White GC, Beissinger SR (2008) Impact of a
century of climate change on small-mammal communities in Yosemite National
Park, USA. Science, 322, 261–264.
Morrill JC, Bales RC, Asce M, Conklin MH (2005) Estimating stream temperature
from air temperature: implications for future water quality. Journal of Environmen-
tal Engineering, 131, 139–146.
Morris WF, Pfister CA, Tuljapurkar S et al. (2008) Longevity can buffer plant and ani-
mal populations against changing climatic variability. Ecology, 89, 19–25.
Neeson TM, Gorman AM, Whiting PJ, Koonce JF (2008) Factors affecting accuracy of
stream channel slope estimates derived from geographical information systems.
North American Journal of Fisheries Management, 28, 722–732.
Parmesan C, Yohe G (2003) A globally coherent fingerprint of climate change impacts
across natural systems. Nature, 421, 37–42.
Parmesan C, Duarte C, Poloczanska E, Richardson AJ, Singer MC (2011) Overstret-
ching attribution. Nature Climate Change, 1, 2–4.
Peterson DP, Rieman BE, Dunham JB, Fausch KD, Young MK (2008) Analysis of
trade-offs between threats of invasion by nonnative brook trout (Salvelinus fontinal-
is) and intentional isolation for native westslope cutthroat trout (Oncorhynchus clar-
kia lewisi). Canadian Journal of Fisheries and Aquatic Sciences, 65, 557–573.
Pittock AB (2006) Are scientists underestimating climate change? Eos, 87, 340–341.
Platts WS (1979) Relationships among stream order, fish populations, and aquatic
geomorphology in an Idaho river drainage. Fisheries, 2, 5–9.
P€ortner HO, Farrell AP (2008) Physiology and climate change. Science, 322,
690–692.
Pounds JA, Bustamante MR, Coloma LA et al. (2006) Widespread amphibian extinc-
tions from epidemic disease driven by global warming. Nature, 439, 161–167.
Rahel FJ, Olden JD (2008) Assessing the effects of climate change on aquatic invasive
species. Conservation Biology, 22, 521–533.
Rahel FJ, Keleher CJ, Anderson JL (1996) Potential habitat loss and population
fragmentation for cold water fish in the North Platte River drainage of the Rocky
Mountains: response to climate warming. Limnology and Oceanography, 41, 1116–1123.
Raupach MR, Marland G, Ciais P, Le Quere C, Canadell JG, Klepper G, Field CB
(2007) Global and regional drivers of accelerating CO2 emissions. Proceedings of the
National Academy of Sciences, 104, 10288–10293.
Rieman BE, Isaak DJ (2010) Climate change, aquatic ecosystems and fishes in the
Rocky Mountain West: implications and alternatives for management. USDA For-
est Service, Rocky Mountain Research Station, GTR-RMRS-250, Fort Collins, CO.
Rieman BE, Peterson JT, Myers DL (2006) Have brook trout displaced bull trout along
longitudinal gradients in central Idaho streams? Canadian Journal of Fisheries and
Aquatic Sciences, 63, 63–78.
Rieman BE, Isaak D, Adams S, Horan D, Nagel D, Luce C, Myers D (2007) Antici-
pated climate warming effects on bull trout habitats and populations across the
interior Columbia River Basin. Transactions of the American Fisheries Society, 136,
1552–1565.
Root TL, Price JT, Hall KR, Schneider SH, Rosenweig C, Pounds JA (2003) Finger-
prints of global warming on wild animals and plants. Nature, 421, 57–60.
Rolland C (2003) Spatial and seasonal variations of air temperature lapse rates in
alpine regions. Journal of Climate, 16, 1032–1046.
Ruesch AS, Torgersen CE, Lawler JJ, Olden JD, Peterson EE, Volk CJ, Lawrence DJ
(2012) Projected climate-induced habitat loss for salmonids in the John Day River
Network, Oregon, U.S.A. Conservation Biology, 26, 873–882.
Sharma S, Jackson DA (2008) Predicting smallmouth bass Micropterus dolomieu occur-
rence across North America under climatic change: a comparison of statistical
approaches. Canadian Journal of Fisheries and Aquatic Sciences, 65, 471–481.
Stewart IT (2009) Changes in snowpack and snowmelt runoff for key mountain
regions. Hydrological Processes, 23, 78–94.
Sunday JM, Bates AE, Dulvy NK (2012) Thermal tolerance and the global redistribu-
tion of animals. Nature Climate Change, 2, 686–690.
Thomas CD, Cameron A, Green RE et al. (2004) Extinction risk from climate change.
Nature, 427, 145–148.
Thomas CD, Franco A, Hill J (2006) Range retractions and extinction in the face of
climate warming. Trends in Ecology and Evolution, 21, 415–416.
Tingley MW, Beissinger SR (2009) Detecting range shifts from historical species
occurrences: new perspectives on old data. Trends in Ecology and Evolution, 24,
625–633.
Tisseuil C, Vrac M, Grenouillet G et al. (2012) Strengthening the link between climate,
hydrological and species distribution modeling to assess the impacts of climate
change on freshwater biodiversity. Science of the Total Environment, 424, 193–201.
Vincent RE, Miller WH (1969) Altitudinal distribution of brown trout and other
fishes in a headwater tributary of the South Platt River, Colorado. Ecology, 50,
464–466.
van Vliet MTH, Ludwig F, Zwolsman JJG, Weedon GP, Kabat P (2010) Global river
temperatures and sensitivity to atmospheric warming and changes in river flow.
Water Resources Research, 47, W02544. doi: 10.1029/2010WR009198.
Vorosmarty CJ, McIntyre PB, Gessner MO et al. (2010) Global threats to human water
scarcity and river biodiversity. Nature, 467, 555–561.
Vos CC, Berry P, Opdam P et al. (2008) Adapting landscapes to climate change: exam-
ples of climate-proof ecosystem networks and priority adaptation zones. Journal of
Applied Ecology, 45, 1722–1731.
Webb BW, Nobilis F (2007) Long-term changes in river temperature and the
influence of climatic and hydrological factors. Hydrological Sciences Journal, 52,
74–85.
Wedekind C, Kung C (2010) Shift in spawning season and effects of climate warming
on developmental stages of a grayling Salmonidae. Conservation Biology, 24,
1418–1423.
Wenger SJ, Isaak DJ, Luce CH et al. (2011) Flow regime, temperature, and biotic inter-
actions drive differential declines of trout species under climate change. Proceed-
ings of the National Academy of Sciences, 108, 1475–14180.
Wiens JA, Bachelet D (2009) Matching the multiple scales of conservation with the
multiple scales of climate change. Conservation Biology, 24, 51–62.
Wilby RL, Orr H, Watts G et al. (2010) Evidence needed to manage freshwater ecosys-
tems in a changing climate: turning adaptation principles into practice. Science of
the Total Environment, 408, 4150–4164.
Williams JE, Haak AL, Neville HM, Colyer WT (2009) Potential consequences of
climate change to persistence of cutthroat trout populations. North American
Journal of Fisheries Management, 29, 533–548.
Williams JE, Williams RN, Thurow RF et al. (2011) Native fish conservation areas: a
vision for large-scale conservation of native fish communities. Fisheries, 36,
267–277.
Wilson RJ, Gutierrez D, Gutierrez J, Martinez D, Agudo R, Monserrat VJ (2005)
Changes to the elevational limits and extent of species ranges associated with
climate change. Ecology Letters, 8, 1138–1146.
Winfield IJ, Hateley J, Fletcher JM, James JB, Bean CW, Clabburn P (2010) Popula-
tion trends of Arctic charr Salvelinus alpines in the UK: assessing the evidence
for a widespread decline in response to climate change. Hydrobiologia, 650,
55–65.
Woodward G, Perkins DM, Brown LE (2010) Climate change and freshwater ecosys-
tems: impacts across multiple levels of organization. Philosophical Transactions of
the Royal Society B, 365, 2093–2106.
Xenopoulos MA, Lodge DM, Alcamo J, Marker M, Schulze K, Van Vuuren DP (2005)
Scenarios of freshwater fish extinctions from climate change and water with-
drawal. Global Change Biology, 11, 1557–1564.
Zwick P (1992) Stream habitat fragmentation—a threat to biodiversity. Biodiversity
Conservation, 1, 80–97.
Supporting Information
Additional Supporting Information may be found in theonline version of this article:
Calculations S1. Estimation of the time required for aregional bull trout distribution to shift a statistically signifi-cant elevation due to climate warming.Calculations S2. Example ISR calculation for a stream with2% slope, a lapse rate of 0.8 °C/100 m, long-term warmingrate of 0.1 °C decade�1, and no sinuosity adjustment.Calculations S3. Example variability calculation to deter-mine the number of decades for a statistically significantisotherm shift to occur.Table S1. Vertical elevation displacement rate(m decade�1) for isotherms associated with different lapserates and long-term warming rates.
Published 2012. This article is a U.S. Government work and is in the public domain in the USA., Global Change Biology, 19, 742–751
STREAM ISOTHERM SHIFTS FROM CLIMATE CHANGE 751

12
Calculations S1. Estimation of the time required for the regional bull trout distribution as described in Rieman
et al. (2007) to shift a statistically significant elevation due to climate warming. A statistically significant shift is
defined as that elevational distance wherein the 95% confidence interval (172 m in this case) associated with the
historic estimate of the bull trout elevation boundary would no longer overlap the future elevation boundary. It
was assumed that the future boundary would be estimated with a similar amount of precision as the historic
boundary. The time required for this shift was calculated using a regional air temperature lapse rate of 0.6 ˚C /
100 m (estimated in Rieman et al. 2007) and assuming a long-term air temperature warming rate of 0.2 ˚C /
decade.
Step 1. Calculate the vertical elevation displacement rate (a) of a temperature isotherm using Equation 1:
a = x 100 = 33 m / decade as summarized in Table S1.
Step 2. Divide the 95% confidence interval for the bull trout elevation boundary by the isotherm displacement
rate to determine the time required for a statistically significant shift.
Time for significant shift = = 5.2 decades.
Calculations S2. Example ISR calculation for a stream with 2% slope, a lapse rate of 0.8 ˚C / 100 m, long-term
warming rate of 0.1 ˚C / decade, and no sinuosity adjustment.
Step 1. Calculate the vertical displacement (a) of a temperature isotherm using Equation 1:
a = x 100 = 12.5 m / decade as summarized in Table S1.
If necessary, convert stream slope % to degrees using Equation 3:
A = = 1.15˚
Step 2. Translate vertical displacement in Step 1 to distance along stream (c) using Equation 2:
c = = 623 m / decade. Divide by 1,000 to convert to km / decade as summarized in Fig. 3
curves.

13
Calculations S3. Example variability calculation to determine the number of decades for a statistically
significant isotherm shift to occur. Values are for a stream with an ISR of 5 km/decade, standard deviation (SD)
of 1.0 ˚C based on inter-annual temperature variation, 1% stream slope, and a lapse rate of 0.8 ˚C / 100 m.
Step 1. Convert stream temperature SD to a 95% confidence interval (here, we assume n = 10 years of
monitoring effort):
95% confidence interval = + 1.96 ( = + 1.96 = + 0.62 ˚C. Double 0.62 ˚C to obtain the
confidence interval width of 1.24 ˚C.
Step 2. Convert 95% confidence interval to elevation displacement within a stream (a in Fig. 2) based on the
lapse rate:
a = 1.24 ˚C ÷ = 155 m
Step 3. Translate elevation displacement to distance along a stream (c in Fig. 2) of 1% slope using Equation 2:
c = = 15,500 m. Divide by 1,000 to convert to 15.5 kilometers.
Step 4. Convert distance along stream to the number of decades for a statistically significant shift by dividing
with the ISR.
Time for significant shift = 15.5 km = 3.1 decades as summarized in Fig. 5 curves.
Table S1. Vertical elevation displacement rate (m / decade) for isotherms associated with different lapse rates
and long-term warming rates. Values correspond to a in Equation 1 and Fig. 2.
Warming rate (°C/decade)
Lapse rate
(°C/100 m) 0.1 0.2 0.3 0.4 0.5
0.1 100 200 300 400 500
0.2 50 100 150 200 250
0.3 33 67 100 133 167
0.4 25 50 75 100 125
0.5 20 40 60 80 100
0.6 17 33 50 67 83
0.7 14 29 43 57 71
0.8 13 25 38 50 63
0.9 11 22 33 44 56
1.0 10 20 30 40 50