Process Intensification of Hydrogen Plants and Naphtha Crackers
Upload
michiganstateCategory
view
1download
0
1
Determination of Equilibrium Sorption Isotherm of Crackers by Using
GAB Model
By
Kirtiraj Kundlik Gaikwad
MS: Packaging
School of Packaging
Michigan State University, East Lansing USA

2
Determination of Equilibrium Sorption Isotherm of Crackers by Using
GAB Model
Kirtiraj K Gaikwad, Maria Rubino
School of Packaging, Michigan State University, East Lansing 48825 MI USA
ABSTRACT
Crackers are highly sensitive to moisture. Due to moisture shelf life of crackers is decreases. Sorption
isotherms give information about the sorption mechanism and the interaction of food with water. In this
study moisture sorption isotherms of crackers were determined using Licl, Mgcl, kno2, NaNo2,
(NH4)2So4, KNo3 with RH 12%, 33.20%, 48%, 64.20%, 80.30%, and 92% respectively. It is shown
that, increasing equilibrium moisture content with increase in relative humidity RH. The Guggenheim-
Anderson-de Boer (GAB) models were applied to fit the predicted data. The criteria used to evaluate the
goodness of fit of model were the percentage root mean square (RMS) which is 3.10. The GAB model
is considered suitable to predict the moisture sorption isotherm of crackers since it gave RMS value
Key Words: Crackers, sorption isotherms, GAB model.

3
1 INTRODUCTION
Shelf-life determination is of great importance for the food industry to ensure that the consumer will
obtain a high-quality product for a certain period of time after purchase. For the delivery of a product
with maximum quality, the shelf-life of the packaged food product should be determined. (Ubonrat
Sirpatrawan2009) The quality of crackers is strictly related to their water content. Usually, when this
product is packaged, the water activity inside the package is generally as low as possible. During the
distribution and storage of the product, due to the difference between the water activity inside and
outside the package, water molecules permeate through the package leading to an increase of the internal
water activity. This causes an increase of the water content of the packed product and consequently a
decrease of its quality. The quality decay kinetics of these types of foods depends on several factors, the
most important being the characteristic of the packed product. (M.A. Del et al 2003). Moisture sorption
isotherms of these products are useful to determine their storage stability as well as to predict their shelf-
life since they give information about the equilibrium relationship between product moisture content and
water activity, at a given temperature and relative humidity.
An important role of packaging film is to reduce exchange of water between the product and the
environment the barrier property of packaging films depends on both molecule diffusion coefficient and
solubility of water in the matrix (R.S. Jagadish et. Al. 2011). Water activity (aw) is the most important
factor, affecting the durability of the packaging material. Water activity has the basic controlling factor
in the preservation of moisture sensitive material for food applications against microbiological,
chemical, and physical deterioration. Equations for modeling water-sorption isotherms are of special
interest in many aspects of food preservation by dehydration By the sorption isotherms which will
obtain from experimental data is necessary to predict the hygroscopic properties of the film. The
equilibrium moisture content is an important quantitative measure in the practice of food storage,
packaging. (Baldev Raj et al 2001) The GAB model is considered to be the most versatile sorption
model available in the literature. GAB models have been adopted as equations by the American Society

4
of Agricultural Engineers for describing sorption isotherms. These models have been widely used in the
literature (U. Siripatrawan and P. Jantawat)
The objectives of this study is to determine the experimentally the equilibrium sorption isotherm and
and to model the sorption characteristics of crackers using GAB equations on the basis of moisture
adsorb by crackers. This product usually encounters loss of crispness due to moisture gain during
storage and distribution, with subsequent deterioration in product quality.
.
2 Materials and Methods
2.1 Materials:
Electronic weighing balance, Crackers, Buckets (to create Humidity Environment contains salt),
Vacuum oven, different salt like Licl, Mgcl, kno2, NaNo2, (NH4)2So4, KNo3 with RH 12%, 33.20%,
48%, 64.20%, 80.30%, 92% respectively, Aluminum dish etc.
2.2 Methods
2.2.1 Determination of Initial moisture content (IMC or Mi):
Aluminum dishes were taken (3 dishes) and weighed empty dish to get dish weight on electronic
weighing balance. 3.2124 +-2 gm Crushed crackers weighed on electronic balance to get initial weight
of crackers (Wi). Measured crackers were taken in aluminum dish and. Crackers were dried on 98-1000C
under 30 inches Hg in vacuum oven till weight of crackers not changing (about 5 hours). After certain
time weight of crackers were not change and this at this point, reweighed dishes to get final product
crackers (WD) or loss of moisture from crackers. Equation for calculation of initial moisture content (Mi)
is as follow
Mi =(Wi−WD)
WD (1)
Where, Wi is the initial weight of product and WD is the final weigh of product
2.2.2 Determination of Equilibrium moisture content (Me):

5
Aluminum dishes were taken (18 dishes) and weighed empty dish to get dish weight on electronic
weighing balance. 3.2124 +-2 gm Crushed crackers weighed on electronic balance to get initial weight
of crackers. All weighed crackers were taken in keep in dish and reweighed to get sample +dish weight.
Applying same procedure each sample is weighed and recorded data. These dishes then placed in 6
different buckets witch contain different salt Licl, Mgcl, kno2, NaNo2, (NH4)2So4, KNo3 with RH
12%, 33.20%, 48%, 64.20%, 80.30%, 92% respectively. Total 18 samples used. i.e., in each salt solution
Bucket contains 3 samples. These samples are weighed initially 7 days period until no further change
in increase or decrease weight is observed. At this stage since no further weight gain or loss of
moisture is observed, it is assumed equilibrium has been reached. The equilibrium moisture content at
each specific relative humidity is determined based on following equation.
Me=We
Wi*(Mi + 1) − 1 (2)
Where, Wi is the initial weight of product, We is the final weigh of product, Mi is initial moisture content
and Me is equilibrium moisture content. Average the equilibrium moisture content value of replicate
samples for at specific relative humidity
Then using Me value plot the graph Me vs. Aw (RH/100). Other Graph were plotted for aw/Me vs Aw
by applying 2nd-polynomoal to get the value of α,β, γ. After getting values of α,β,γ. From equation k,
C, and Wm values were calculated by applying there formula
T = β 2/ (-α γ) +4 (3)
C = T√𝑇2 − 4𝑇/2 (4)
2.2.3 GAB model:
By using moisture sorption isotherm with the experimental data, we will successfully calculate three
constants in GAB model,k, C, and Wm and establish the equation for GAB model
The GAB equation was used to model water sorption of crackers as follows
6
Wm
Me=
(1−kaw)∗(1−kaw+C∗kaw)
C∗kaw (5)
Where, Me - equilibrium moisture content of the product (dry basis), Aw - water activity (RH%/100).
Wm- the water content in the mono-layer in BET theory, C - Guggenheim constant, k- factor correcting
properties of the multi-layer molecules, with respect to the bulk liquid.
Predicted equilibrium moisture content were calculated by using GAB model and graph plotted the
moisture sorption isotherm by predicted moisture sorption isotherm
2.2.4 Data comparison:
Predicted data (GAB model) and experimental data were compared the by using following equation
RMS-√∑(
Mexp−Mcalc
Mexp)^2
N⁄ *100 (6)
Where Mexp: Experimental moisture content, Mcalc: Calculated moisture content, N: Number of
experimental unit. This RMS equation is fit in Mexp and Mcal by which we can compare both data with
each other
3 RESULTS AND DISCUSSIONS
3.1 Experimental Data:

7
Calculation of the Initial Moisture Content (Mi):
Sample Initial weight of the
Crackers
Before Drying
Final weight of the
Crackers
After Drying
1 3.2758 3.0357
2 3.3477 3.1109
3 3.3957 3.1618
Salt (Chemical) RH (%) Sample
weight of Empty
dish (gm)
sample
(gm)
sample+dish
1/11/13 (Wi)
sample+ dish
(1/22/13) (gm)
samle + dish
1/29/13
sample
+dish 2/5/13
sample+dish
2/12/13
Licl 12% 5.4 1.3097 3.2124 4.5221 4.5317 4.5322 4.531 4.5306
5.5 1.3102 3.2413 4.5515 4.5581 4.5582 4.5586 4.5576
5.6 1.3151 3.2334 4.5485 4.5562 4.5567 4.5545 4.5502
Mgcl 33.20% 5.7 1.3205 3.2389 4.5594 4.6323 4.6327 4.633 4.6324
5.8 1.3258 3.2809 4.6067 4.6796 4.6803 4.6822 4.6801
5.9 1.3192 3.2744 4.5936 4.6666 4.668 4.6676 4.6671
kno2 48% 5.1 1.3219 3.2597 4.5816 4.6971 4.6974 4.6971 4.6962
5.11 1.3053 3.2624 4.5677 4.696 4.6968 4.6972 4.696
5.12 1.3201 3.2307 4.5508 4.6751 4.6753 4.6745 4.6737
NaNo2 64.20% 5.13 1.3095 3.2457 4.5552 4.771 4.7716 4.7738 4.7729
5.14 1.3351 3.2249 4.56 4.7729 4.7731 4.7753 4.7744
5.15 1.3247 3.2216 4.5463 4.7574 4.7576 4.7567 4.7589
(NH4)2So4 80.30% 5.16 1.2995 3.2725 4.572 5.9524 4.9583 4.9569 4.9571
5.17 1.3025 3.2726 4.5751 4.9505 4.9559 4.9543 4.9548
5.18 1.3027 3.2504 4.5531 4.9318 4.9361 4.93444 4.9334
KNo3 92% 5.19 1.3202 3.26 4.5802 5.2731 5.2642 5.2333 52001
5.2 1.288 3.2202 4.5082 5.1996 5.1865 5.13 5.1144
5.21 1.3166 3.2802 4.5968 5.2432 5.2401 5.199 5.1728
8
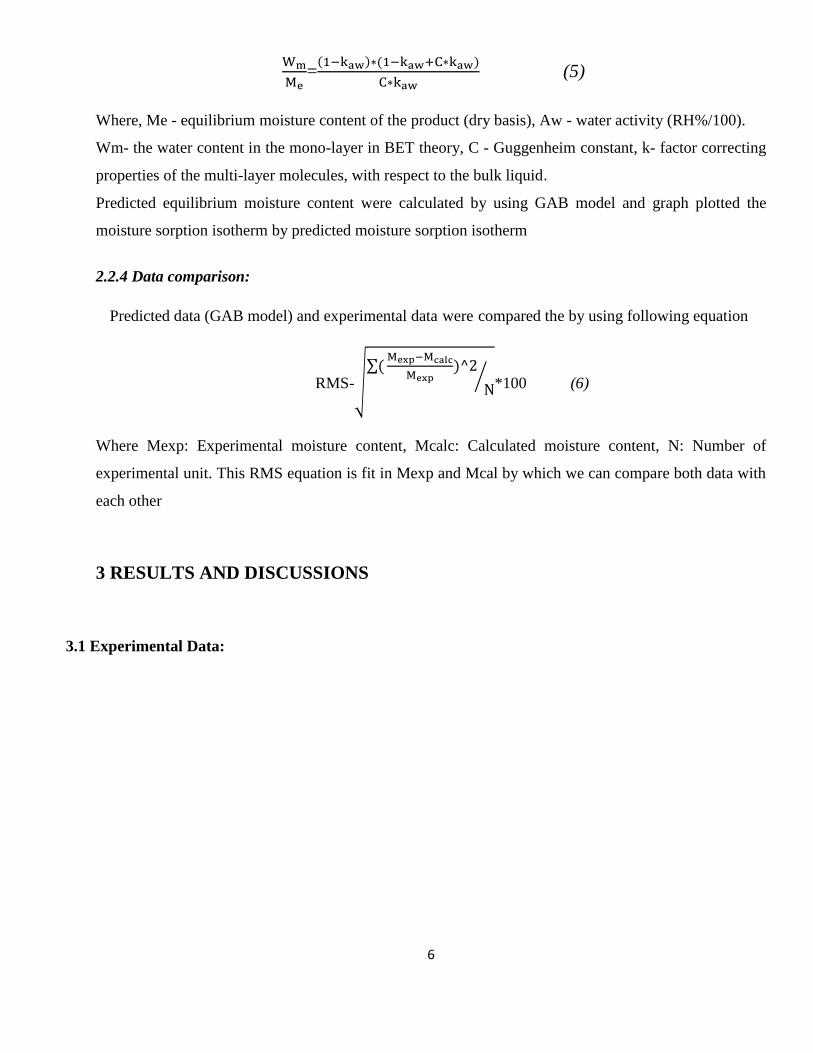
Equation for Mi:
𝑀𝑖 = 𝑊𝑖−𝑊𝐷
𝑊𝐷
Where,
Wi – Initial Weight of the product
WD- Final Weight of the product
For Sample No 1: 𝑀𝑖 = 3.2758−3.0357
3.0357 = 0.079092gm
For Sample No 2 𝑀𝑖 = 3.3477−3.1109
3.1109 = 0.076119gm
For Sample No 3 𝑀𝑖 = 3.3957−3.1618
3.1618 = 0.073976gm
Average Mi = 0.076396 gm
3.2 Tabulated 𝐖𝐢 𝐖𝐞 and 𝐌𝐞 under different RH%:
Me= 𝑊𝑒
𝑊𝑖 (𝑀𝑖 + 1) − 1
Where,
Wi – Initial Weight of the product, Mi- Initial Moisture Content
Me - Equilibrium Moisture content We – final weight of product
Calculation For 12%RH (sample 5.4): Me= 4.5306
4.5515 (0.0763 + 1) − 1
= 0.078514 gm

9
From above calculation we get following table for Wi, We and Me
Salt
(Chemical)
RH (%) Sample Initial Wt
(Wi)
Final wt
(We)
Equilibrium
Moisture Content
Me (Dry Basis)
Me Avg
Licl 12% 5.4 4.5221 4.5306 0.078514 0.078515
5.5 4.5515 4.5576 0.078075
5.6 4.5485 4.5502 0.077816
Mgcl 33.20% 5.7 4.5594 4.6324 0.093771 0.093772
5.8 4.6067 4.6801 0.094037
5.9 4.5936 4.6671 0.093736
kno2 48% 5.1 4.5816 4.6962 0.10353 0.103532
5.11 4.5677 4.696 0.10691
5.12 4.5508 4.6737 0.10565
NaNo2 64.20% 5.13 4.5552 4.7729 0.12805 0.128051
5.14 4.56 4.7744 0.12721
5.15 4.5463 4.7589 0.12621
(NH4)2So4 80.30% 5.16 4.572 4.9571 0.16701 0.167014
5.17 4.5751 4.9548 0.16561
5.18 4.5531 4.9334 0.16654
KNo3 92% 5.19 4.5802 52001 0.22988 0.229882
5.2 4.5082 5.1144 0.22485
5.21 4.5968 5.1728 0.21740
3.3 Moisture isotherm based on experimental data
Salt (Chemical) RH (%) Sample Equilibrium
Moisture Content
Me (Dry Basis)
Me Avg
(Exp)
Licl 12% 5.4 0.078514 0.078515

10
5.5 0.078075
5.6 0.077816
Mgcl 33.20% 5.7 0.093771 0.093772
5.8 0.094037
5.9 0.093736
kno2 48% 5.1 0.103531 0.103532
5.11 0.106913
5.12 0.105654
NaNo2 64.20% 5.13 0.128051 0.128051
5.14 0.127218
5.15 0.126211
(NH4)2So4 80.30% 5.16 0.167014 0.167014
5.17 0.165611
5.18 0.166548
KNo3 92% 5.19 0.229881 0.229882
5.2 0.224859
5.21 0.217408
Graph:

11
Fig 1: Moisture isotherm Me vs. RH%
3.4 Plot of 2nd-polynomoal version of GAB model and corresponding equation, including the
converted data.
Salt (Chemical) RH (%) Me Avg (Exp) Aw Aw/Me
(gm moisture /
100gm dry
product)
Licl 12% 0.078515 0.120 1.52
Mgcl 33.20% 0.093772 0.332 3.54
kno2 48% 0.10353 0.481 4.63
NaNo2 64.20% 0.12805 0.642 5.01
(NH4)2So4 80.30% 0.16701 0.803 4.80
KNo3 92% 0.22988 0.920 4.00
0
5
10
15
20
25
0% 20% 40% 60% 80% 100%
Me
(gm
)
RH %
Me/ RH%
Series1

12
Graph:
Fig 2: 2nd-polynomoal version of GAB model, Aw/Me vs Aw
3.5 Calculation of GAB parameter:
From above graph by 2nd-polynomoal equation we got the value of α, β, γ Values -12.363, 16.152 &
-0.3006 respectively
So first, Aw/Me = α(aw) 2 βaw γ
-12.363) + 16.152+ (-0.3006)
= 3.488
T= β 2/ (-α γ) +4
= ((16.152)2 /- ((-12.363)*(-0.3006)) +4)
= - 66.20
y = -12.363x2 + 16.152x - 0.3006
0
1
2
3
4
5
6
0 0.2 0.4 0.6 0.8 1
Aw
/Me
Aw
aw /Me VS aw
Series1
Poly. (Series1)
13
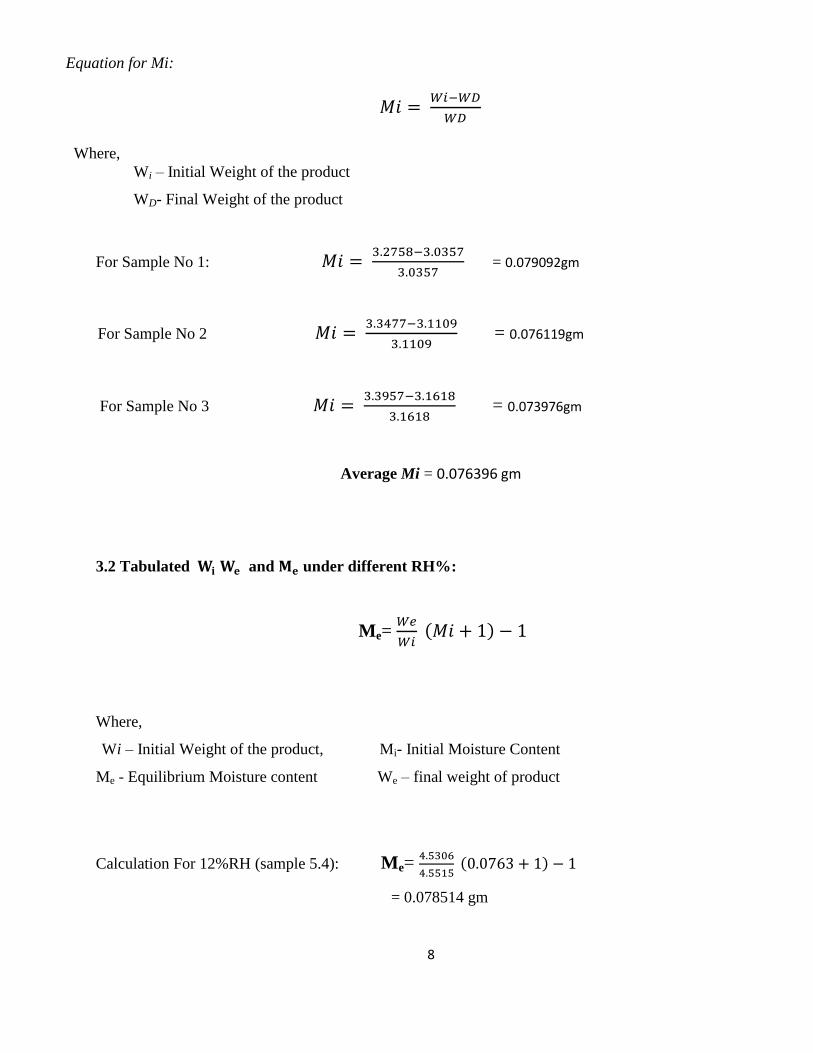
C = T√𝑇2 − 4𝑇/2
= −66.2004 √(−66.20)2 − 4 ∗ (−66.2004)/2
= 0.9853
β =1
Wm(1 −
2
C)
𝑾𝒎 =1
16152(1 −
2
0.985334)
= -0.06375
γ = 1
𝑊𝑚𝐶𝑘
k = 1
−0.06375∗0.9853∗(−0.3006)
= 52.95
α -12.363 T -66.20
β 16.152 C 0.9853
γ -0.3006 K 52.95
Wm -0.06375
3.6 Predicted data and experimental moisture isotherm
Calculation for Me by GAB Model
𝑊𝑚
𝑀𝑒=
(1 − 𝑘𝑎𝑤) ∗ (1 − 𝑘𝑎𝑤 + 𝐶𝑘𝑎𝑤)
𝐶𝑘𝑎𝑤
For Licl 12%
Rearranging above equation and putting values so we get,

14
−0.06375
𝑀𝑒=
(1 − 52.95 ∗ 0.120) ∗ (1 − 52.95.∗ 0.12 + 0.9853 ∗ 52.95 ∗ 0.120)
0.9853 ∗ 52.95 ∗ 0.120
Me= 0.0822 gm moisture)/gm dry product
By applying above equation we get
Salt (Chemical) RH (%) Exp (Me) (gm
moisture/100 gm
dry product
Me by GAB
Model (gm
moisture)/(gm
dry product)
Licl 12% 0.078515 0.0822
Mgcl 33.20% 0.093772 0.089
kno2 48% 0.103532 0.104
NaNo2 64.20% 0.128051 0.129
(NH4)2So4 80.30% 0.167014 0.170
KNo3 92% 0.229882 0.224
15
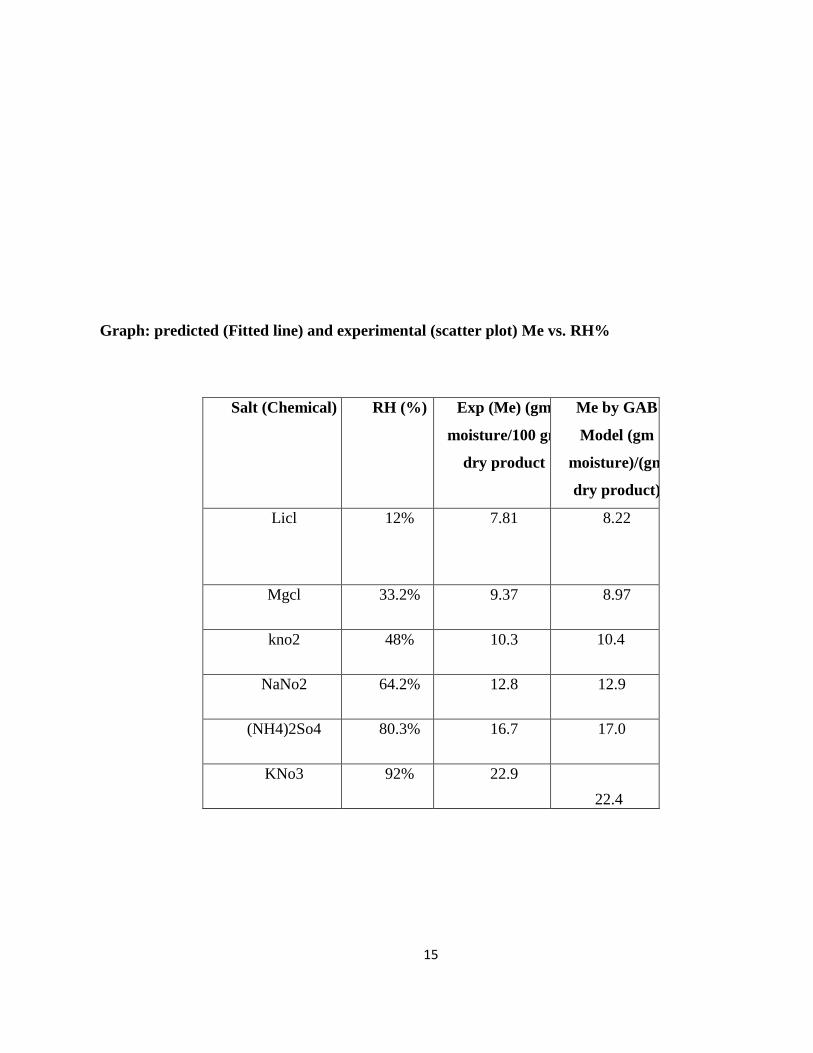
Graph: predicted (Fitted line) and experimental (scatter plot) Me vs. RH%
Salt (Chemical) RH (%) Exp (Me) (gm
moisture/100 gm
dry product
Me by GAB
Model (gm
moisture)/(gm
dry product)
Licl 12% 7.81 8.22
Mgcl 33.2% 9.37 8.97
kno2 48% 10.3 10.4
NaNo2 64.2% 12.8 12.9
(NH4)2So4 80.3% 16.7 17.0
KNo3 92% 22.9
22.4

16
Fig 3: Predicted data and experimental moisture isotherm Me exp & Me GAB VS RH%
3.7 Calculation for RMS:
Predicted data (GAB model) and experimental data were compared the by using following equation
RMS-√∑(
Mexp−Mcalc
Mexp)^2
N⁄ *100
Where,
Mexp : Experimental moisture content
Mcalc : Calculated moisture content
N: Number of experimental unit
We have Mexp , Mcal and N value so by putting values in above formula we get.
0
5
10
15
20
25
0% 10% 20% 30% 40% 50% 60% 70% 80% 90% 100%
Me
(gm
)
RH%
Me exp & Me GAB vs RH%
Me exp
Me GAB

17
RMS = 3.10
DISCUSSION
Moisture sorption isotherms describe the relationship between the equilibrium moisture content and the
water activity at constant temperatures and pressures. For food materials these isotherms give
information about the sorption mechanism and the interaction of food biopolymers with water. The
moisture sorption isotherms are extremely important in modeling the drying process, in design and
optimization of drying equipment, in predicting shelf-life stability, in calculating moisture changes
which may occur during storage and in selecting appropriate packaging material. Moisture sorption
isotherms are an important tool when formulating food to achieve specific qualities and attributes (Bell
and Labuza, 2000). Despite their value, traditional isotherms have been limited by their low resolution.
It is very helpful in making shelf life calculations, developing mixing models, modeling temperature
abuse, determining the integrity of a protective coating or layer, determining monolayer values, and
making accurate packaging calculations. GAB (Guggenheim- Anderson-de Boer) equation has been
applied successfully for the correlation of the equilibrium moisture content with the water activity of
food products and it is recommended by the european project COST 90 on Physical Properties of Foods.
(Z. B. Maroulis, 1988) The simplicity and physical meaning of the GAB model makes it very useful for
describing and interpreting water sorption isotherms for Food Application of the GAB model to food
isotherms has shown a good fit up to aw = 0.9 (Piotr P. Lewicki 1977) It has been shown that the GAB
equation fits food isotherms in that range as well as or better than other equations with four or more
terms The GAB equation can also describe water activity variation with temperature since W,, C and K
are exponential functions of inverse absolute It has become the standard sorption isotherm equation used
in Europe and is being established in US laboratories (Christine M. 1991) In this study we analyzed data
by two different way one is Me that is from experimental value and Me predicted from GAB model
from this data were compared with RMS 3.106875657 which is which is below 25%. It proves that the
18
GAB model can successfully predict the moisture content under different RH. Guggenheim- Anderson-
de Boer (GAB model ) could use for establish sorption isotherm, providing the relationship between aw
and water content over a wide range of food products with different shapes of isotherms, under widely
varying conditions of temperature, moisture and water activity Water activity is a measure of the water
in a food (or other substance) available to organisms. Water activity is defined as the equilibrium
relative humidity (ERH) of this air divided by 100. The relationship between water activity and moisture
content at a given temperature is called the moisture sorption isotherm. This relationship is complex and
unique for each product due to different interactions between the water and the solid components at
different moisture contents. In conclusion, different products at different temperature have their certain
moisture isotherm, and the increase tendency of water activity always accompanied by an increase of
water content in the certain product.
4 CONCLUSIONS
It is shown that, increasing equilibrium moisture content with increase in relative humidity RH. The
GAB isotherm model was found to be adequate for the description of the isotherms of the crackers at the
different percent RH Moisture content control. It is show that moisture sorption isotherms have an
important role to play in the quantitative approach to the prediction of the shelf life of crackers or any
dried foods due to their sensitivity to moisture changes. The GAB isotherm model was found to
represent the predictable data satisfactorily for crackers. The analysis of the GAB equation proves that
the GAB model can successfully predict the moisture content under different RH.
ERROR ANALYSIS
1) Every time we analyze the weight of sample there is a chances of error while recording of data

19
2) When we take sample out of salt solution bucket at that time there is change of relative humidity
percentage and it disturb the RH % around the sample.
3) We need to take precaution while handling sample during measurements. While taking sample dish
out of bucket we need to take precaution because sample dish are very light in weight so there is chance
of fall of sample in bucket while handling.
4) Bucket closure should be properly packed. If closure open then outside humidity affect the inside
humidity and it will not create expected humidity inside the bucket.
5) Due to high humidity like 90% there is chances of mold growth on the sample so it will also increase
the weight of sample if mold growth in large quantity
5 REFERENCES
1) U. Siripatrawan and P. Jantawat (2006) Determination of Moisture Sorption Isotherms of Jasmine Rice
Crackers Using BET and GAB Models Food Science and Technology International December 2006 vol. 12
no. 6 459-465
2) M.A. Del Nobile et al (2003) shelf life prediction of cereal-based dry foods packed in moisture-sensitive
films Journal Of Food Science—Vol. 68, Nr. 4, 2003.
3) R.S. Jagadish et al (2011) Properties and sorption studies of polyethylene oxide–starch blended films
Food Hydrocolloids Volume 25, Issue 6, August 2011, Pages 1572–1580.
4) Baldev Raj et al (2001) Moisture-sorption characteristics of starch/low-density polyethylene films.
Journal of Applied Polymer Science Volume 84, Issue 6, pages 1193–1202, 9 May 2002

20
5) Bell Leonard N., Labuza (2001) Moisture sorption: practical aspects of isotherm measurement and use
(2nd Ed.)
6) Z. B. Maroulis, et al (1988) Application of the GAB Model to the Moisture Sorption Isotherms for Dried
Fruits Journal ofFood Engineering 7 (1988) 63-78
7) Piotr P. Lewicki ( 1977) The applicability of the GAB model to food water sorption isotherms
International Journal of Food Science and Technology 1997, 32, 553-557 55
8) Christine M. (1991) Comparison of Regression Methods for Fitting the GAB Model to the Moisture
Isotherms of some Dried Fruit and Vegetables Journal of Food Engineering 13 ( 199 1) 115 - 13 3
Copyright © 2022 FDOKUMEN