
Taxing Reality: Rethinking Partnership Distributions - LMU ...
Upload
independentCategory
view
2download
0
Journal of Chromatography A, 849 (1999) 45–60
Estimation of the adsorption energy distributions for the Jovanovic–Freundlich isotherm model with Jovanovic local behavior
a,c d b,c ,*˜Igor Quinones , Brett Stanley , Georges GuiochonaDepartment of Chemical Engineering, The University of Tennessee, Knoxville, TN 37996-1600, USA
bDepartment of Chemistry, The University of Tennessee, Knoxville, TN 37996-1600, USAcDivision of Chemical and Analytical Sciences, Oak Ridge National Laboratory, Oak Ridge, TN 37831-6120, USA
dDepartment of Chemistry, California State University, San Bernardino, CA 92407-2397, USA
Received 27 November 1998; received in revised form 9 April 1999; accepted 9 April 1999
Abstract
The successful design of many modern separation processes as the overloaded chromatographic separations require anaccurate knowledge of the associated adsorption equilibria. It is well known that the characterization of the adsorbentheterogeneity plays an important role in the understanding of the adsorption equilibria. In a previous paper, a newJovanovic–Freundlich isotherm model for single-component adsorption on heterogeneous surfaces was proposed. Also, theadsorption energy distributions (AEDs) corresponding to the new model for Langmuir local behavior were derived andevaluated for the specific case of the adsorption of a series of chlorinated hydrocarbons on silica gel. In the present study, theadsorption energy distributions corresponding to the Jovanovic–Freundlich model with Jovanovic local behavior areevaluated for the same set of experimental data. In order to provide a basis for comparison, adsorption energy distributionswere also estimated for the given set of data via an established expectation–maximization procedure which does not assumeany particular model for the overall isotherm. The results presented in these paper complement the previous findings andprovide new insights into the features of the Jovanovic–Freundlich isotherm model, which could be useful both in thecorrelation of single-component adsorption data and in the prediction of multicomponent equilibria. 1999 ElsevierScience B.V. All rights reserved.
Keywords: Adsorption isotherms; Jovanovic–Freundlich isotherms; Adsorption energy distributions; Thermodynamicparameters; Organochlorine compounds
1. Introduction the knowledge of the adsorption equilibria of thespecies involved in the separation [2]. The ex-
The application of adsorption-based processes like perimental determination of competitive equilibriumindustrial-scale preparative chromatography is data is costly and time-consuming. There are meth-becoming common in industry [1]. The design and ods that allow estimation of the multicomponentoptimization of an adsorption-based process require equilibria from the analysis of single component data
[3]. Most of the adsorbents employed in industrialapplications exhibit surface and structural*Corresponding author. Tel.: 11-423-974-0733; fax: 11-423-heterogeneities [4]. Thus, the assessment of the974-2667.
E-mail address: [email protected] (G. Guiochon) adsorbent heterogeneity from the analysis of single
0021-9673/99/$ – see front matter 1999 Elsevier Science B.V. All rights reserved.PI I : S0021-9673( 99 )00509-9

˜46 I. Quinones et al. / J. Chromatogr. A 849 (1999) 45 –60
`component data is an important part of the existing q]models for the prediction of multicomponent ad- Q(P) 5 5E u(P,e) l(e) de (1)qssorption equilibria [4–6]. The adsorbent heterogene- 0
ity can be formally described by a distribution ofwhere Q(P) is the overall fractional coverage, a
homogeneous sites with different energies, known asfunction of the partial pressure P of the adsorbate, q
the adsorption energy distribution (AED). The ad-is the specific amount adsorbed, q is the saturationssorption on the sites with the same energy isor monolayer capacity of the adsorbent, u(P, e) is the
characterized using an isotherm model valid for anlocal fractional coverage on sites of energy e and
homogeneous surface, known as the local isotherml(e) is the AED.
model. In a previous publication [7], a Jovanovic–The Jovanovic–Freundlich model is described by
Freundlich (JF) isotherm model for single compo-the expression [7]
nent adsorption on heterogeneous surfaces was pro-n2 a Ps dposed. The model was applied to the analysis of Q(P) 5 1 2 e (2)
published adsorption data of several chlorinatedwhere n is the heterogeneity parameter and a is ahydrocarbons on silica gel [8,9] in order to derive bytemperature-dependent parameter described by theregression the corresponding isotherm parameters.equation [7]Also, an analytical expression for the AED corre-
esponding to the JF model for Langmuir local be- a]0RTa 5 K e (3)havior was derived following the procedure proposed0by Sips [8]. where K is a preexponential parameter, e is theaThe aim of this paper is to provide the calculated characteristic energy of the distribution, R the ideal
AED corresponding to the JF model for Jovanovic gas constant, and T the absolute temperature. The0local behavior, taking into account that the former values of the parameters K and e can be de-areduces to the latter for the particular case of an termined from a linear plot of Eq. (3) provided that
homogeneous surface. Also, AEDs were calculated isotherm data is available at different temperaturesfrom the experimental adsorption data using an [7]. The Jovanovic–Freundlich model described byestablished expectation maximization (EM) proce- Eq. (2) reduces, for the particular case of andure [11,12] which does not require prior knowledge homogeneous surface (n 5 1) to the well knownof the overall adsorption isotherm. The EM method Jovanovic model [13]requires the assumption of a local isotherm model
2 K Ps dand in the particular case of this study, the AEDs u(P,e) 5 1 2 e (4)were calculated for both Jovanovic and Langmuir
where the Henry law constant K is described by thelocal behavior. Therefore, a comparison between theexpression [4]AEDs calculated from the JF model and from other
ereported procedures is carried out. This comparison ]RTK 5 K e (5)0is important in order to check the consistency of the
AEDs generated by the new model. In the previous expression, K is a preexponential0
factor dependent on the molecular partition functionsof the adsorbate in both the bulk and adsorbed
2. Theory phases. In this study we used an expression for K0
proposed by Jaroniec [14]The overall (or experimental) isotherm is the result
Hvap]2of the summation of the adsorption taking place over
RTe]]all the homogeneous sites of different energies. This K 5 (6)0 Pssum can be replaced by an integral provided that
there exists a continuous AED. Then the overall where P is the vapor pressure and H is the heat ofs vap
isotherm on the heterogeneous surface can be de- vaporization of the adsorbate, both values evaluatedscribed by the following integral equation [4] at temperature T.

˜I. Quinones et al. / J. Chromatogr. A 849 (1999) 45 –60 47
To estimate the energy distributions corresponding points. Eq. (1) is evaluated using the expressionto the Jovanovic–Freundlich model for the Jovanovic [11,12]local behavior, let introduce the variable Z, defined emax
as [15] q (P ) 5O l(e )u(P ,e ) De (12)cal j i j iemine
]RTZ 5 e 2 1 (7) for i 5 1,2, . . . ,N, j 5 1,2, . . . , M and where De is
the energy grid spacing. In the previous expression,Combining Eqs. (1), (4), (5) and (7) and consideringe and e correspond to the lower and uppermin maxthe normalization condition [4]boundaries of the evaluated AED, respectively. The
`
AED is updated at the k iteration using the expres-E l(e) de 5 1 (8) sion [11,12]0
Pmax q (P )exp jk11 kwe obtain [15] ]]]l (e ) 5 l (e )O u(P ,e ) De (13)i i j i q (P )` P cal jmin
2K P 2K PZ0 0Q(P) 5 1 2 RT e E l(Z) e dZ (9) where q is the experimental value of solid-phaseexp
0 concentration. The usual initial guess of the AED inl(e ) Eq. (12) is the uniform distribution [11,12]. This]where l(Z) 5 and obviously e 5 RT ln(Z 1 1)1 1 Z initial estimate introduces the minimum bias into the(Eq. (7)). Note that the integrand in the right-hand-
calculated AED. The EM method applied in thisside of Eq. (9) has the form of the Laplace transformstudy employed as local models either the Jovanovic[16]model represented by Eq. (4) or the Langmuir model
`
[19], namely2sZF(s) 5E l(Z) e dZ (10)
KP0 ]]u(P, e) 5 (14)1 1 KP
where F(s) is a function of the complex argumentThe EM procedure is a reasonable choice whichs 5 K P. Combining Eqs. (2), (9), and (10), we0
protects better than most other methods against thederive the function F(s) corresponding to theconsequences of possible experimental artifactsJovanovic–Freundlich model aswhich can be incorporated in the calculation of AEDas1 n]2( ) 1s
K] or against the effect of modeling the experimentalF(s) 5 e (11)0RTdata or the AED [12].
Knowing the function F(s) defined by Eq. (11)permits the inversion of the Laplace transform (Eq.10), the derivation of the functional relationship 3. Resultsl(Z), and from there, that of the AED, i.e. l(e). TheAED can also be obtained by direct inversion of Eq. The values of the parameters q , a and n ats
(1). Both Eqs. (1) and (10) belong to the class of different temperatures were derived and reportedlinear Fredholm integral equations of the first kind. previously (see Table 3 from Ref. [7]), as a result ofTheir numerical inversion is usually a mathematical- the regression analysis of the experimental data ofly ill-posed problem. The EM method is an iterative chlorinated hydrocarbons obtained by Hines et al.maximum-likelihood procedure which has the advan- [9,10]. The values of these parameters were used intages of permitting the derivation of a statistically Eq. (11) in order to invert numerically the Laplacerobust estimate of the AED and of requiring no transform and derive the corresponding AEDs. Thesmoothing of the isotherm data but of operating value of the preexponential factor required in Eq.directly on the raw isotherm data. In the solution of (11) was calculated from Eq. (6) using reportedEq. (1), the AED is directly evaluated from M values of P and H at the desired temperaturess vap
experimental adsorption data points at N energy grid [17]. The numerical inversion was accomplished
˜48 I. Quinones et al. / J. Chromatogr. A 849 (1999) 45 –60
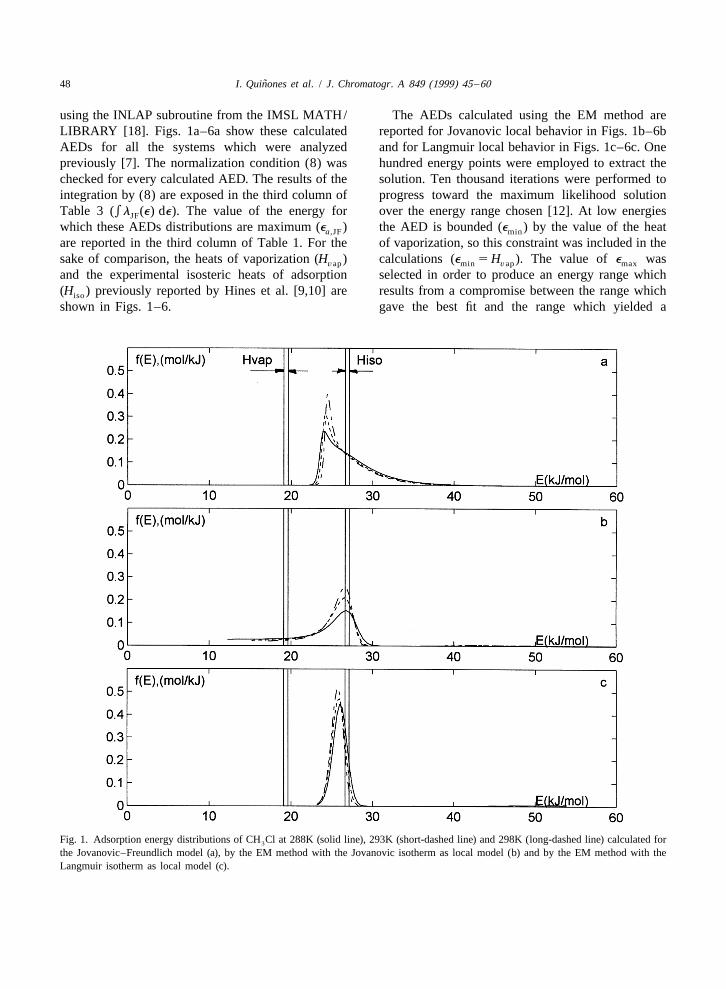
using the INLAP subroutine from the IMSL MATH/ The AEDs calculated using the EM method areLIBRARY [18]. Figs. 1a–6a show these calculated reported for Jovanovic local behavior in Figs. 1b–6bAEDs for all the systems which were analyzed and for Langmuir local behavior in Figs. 1c–6c. Onepreviously [7]. The normalization condition (8) was hundred energy points were employed to extract thechecked for every calculated AED. The results of the solution. Ten thousand iterations were performed tointegration by (8) are exposed in the third column of progress toward the maximum likelihood solutionTable 3 (el (e) de). The value of the energy for over the energy range chosen [12]. At low energiesJF
which these AEDs distributions are maximum (e ) the AED is bounded (e ) by the value of the heata,JF min
are reported in the third column of Table 1. For the of vaporization, so this constraint was included in thesake of comparison, the heats of vaporization (H ) calculations (e 5 H ). The value of e wasvap min vap max
and the experimental isosteric heats of adsorption selected in order to produce an energy range which(H ) previously reported by Hines et al. [9,10] are results from a compromise between the range whichiso
shown in Figs. 1–6. gave the best fit and the range which yielded a
Fig. 1. Adsorption energy distributions of CH Cl at 288K (solid line), 293K (short-dashed line) and 298K (long-dashed line) calculated for3
the Jovanovic–Freundlich model (a), by the EM method with the Jovanovic isotherm as local model (b) and by the EM method with theLangmuir isotherm as local model (c).

˜I. Quinones et al. / J. Chromatogr. A 849 (1999) 45 –60 49
Fig. 2. Adsorption energy distributions of CH Cl at 288K (solid line), 293K (short-dashed line) and 298K (long-dashed line) calculated for2 2
the Jovanovic–Freundlich model (a), by the EM method with the Jovanovic isotherm as local model (b) and by the EM method with theLangmuir isotherm as local model (c).
well-characterized peak. The upper value for every energy values of the main energy peak, calculated asspecific case corresponds to the highest value dis- the first moment of this peak are given in columns 4played in Figs. 1–6. The check of the normalization and 7 of Table 2 for Langmuir (e ) andmean,L
condition (8) is exposed in columns 4 and 5 of Table Jovanovic (e ) local behavior, respectively. Themean,J
3 for the Jovanovic (el (e) de) and Langmuir root-square-mean-deviation (d ) was calculated asJ
(el (e) de) local behavior, respectively. The valuesL ]]]]]2q 2 qof the saturation capacity were obtained by inte- exp cal]]]d 5 O (15)S Dgrating the calculated AEDs. The values of the qexpœ
monolayer capacity extracted from the AEDs in thecase of Langmuir local behavior (q ) are reported It is reported for the overall Jovanovic–Freundlichs,L
in column 3 of Table 2. The values of the saturation model (d ) in column 4 of Table 1. The AEDsJF
capacities corresponding to Jovanovic local behavior derived from the JF model were then used in Eq. (1)(q ) are reported in column 6 of Table 2. The mean together with Eqs. (4)–(6) in order to recover thes,J

˜50 I. Quinones et al. / J. Chromatogr. A 849 (1999) 45 –60
Fig. 3. Adsorption energy distributions of CHCl at 288K (solid line), 293K (short-dashed line) and 298K (long-dashed line) calculated for3
the Jovanovic–Freundlich model (a), by the EM method with the Jovanovic isotherm as local model (b) and by the EM method with theLangmuir isotherm as local model (c).
corresponding amount adsorbed at the given pres- tion values are reported for the EM models forsure. These latter q values were then used in Eq. Langmuir (d ) and Jovanovic local behavior (d ) incal L J
(15) to produce the corresponding root-square-mean- columns 5 and 8 of Table 2, respectively. For thedeviation (d ). The values of d are exposed particular case of chloromethane, the calculatedJF,l(e ) JF,l(e )
in column 5 of Table 1. This calculation permits to adsorption isotherms obtained within the frameworkcheck if any information is lost during the inversion of the EM method (using Eq. (12)) are shown forof Eq. (11). The numerical inversion was carried out Jovanovic (Fig. 7a) and for Langmuir (Fig. 7b) localusing a precision which assured on one hand a behavior, respectively, along with the experimentalreasonable match between the values of (d ) and data points.JF
(d ) and on the other hand a good approximation We can also define an experimental root-square-JF,l(e )
of the normalization condition (8). mean-deviation for each set (constant temperature) ofAlso, the corresponding root-square-mean-devia- data as

˜I. Quinones et al. / J. Chromatogr. A 849 (1999) 45 –60 51
Fig. 4. Adsorption energy distributions of CCl at 288K (solid line), 293K (short-dashed line) and 298K (long-dashed line) calculated for the4
Jovanovic–Freundlich model (a), by the EM method with the Jovanovic isotherm as local model (b) and by the EM method with theLangmuir isotherm as local model (c).
]]]]2 where N is the number of experimental points for theDqexp]]d 5 O (16) given isotherm. The values of d calculated forS Dexp expqexpœ each experimental isotherm are reported in the last
column of Table 1.Dqexp]]where is the relative error of the experimentalqexp
data. The data is reported to have an average error4. Discussionless than 1% over the entire adsorption range [9,10].
Dqexp]]So a maximum value of can be set equal to Figs. 1a–6a show that the AEDs corresponding toqexp
the JF model with Jovanovic local behavior are0.01. Then, a rough estimate of d can be done asexpsingle-peak quasi-Gaussian functions, more or less
]Œd 5 0.01 N (17) skewed in the direction of the high adsorptionexp

˜52 I. Quinones et al. / J. Chromatogr. A 849 (1999) 45 –60
Fig. 5. Adsorption energy distributions of C H Cl at 288K (solid line), 293K (short-dashed line) and 298K (long-dashed line) calculated2 3 3
for the Jovanovic–Freundlich model (a), by the EM method with the Jovanovic isotherm as local model (b) and by the EM method with theLangmuir isotherm as local model (c).
energies. In some cases, the distributions are only homogeneous. Note also that both the Jovanovic–mildly unsymmetrical, showing the highest degree of Freundlich and the Langmuir–Freundlich modelsasymmetry near the base of the peak. It is worth reduce to the monolayer at high pressures but do notnoting at this point that this behavior reminds the reduce to the Henry law at low coverages [4,7].behavior of the AEDs corresponding to the Lang- Figs. 1a–6a show that the adsorption energymuir–Freundlich [4] model for Langmuir local be- distributions calculated for the analyzed species athavior, which are quasi-Gaussian symmetrical func- three different temperatures are very similar in termstions [4]. The parallelism between the behavior of of shape and location on the energy axis. Similarthe two models is somehow related to the fact that results were obtained previously at different tempera-the Jovanovic–Freundlich model reduces to the tures for the same set of experimental data withJovanovic model when the surface becomes homoge- energy distribution functions represented either by aneous while the Langmuir–Freundlich model reduces Morse-type [9] or exponential decay [7] functions.to the Langmuir model when the surface becomes These facts indicate that for the Jovanovic–Freund-

˜I. Quinones et al. / J. Chromatogr. A 849 (1999) 45 –60 53
Fig. 6. Adsorption energy distributions of C Cl at 288K (solid line), 293K (short-dashed line) and 298K (long-dashed line) calculated for2 4
the Jovanovic–Freundlich model (a), by the EM method with the Jovanovic isotherm as local model (b) and by the EM method with theLangmuir isotherm as local model (c).
lich model the energy distribution functions are are close for the different compounds. The highestalmost temperature independent. In this sense, the value obtained was for chloromethane (n ¯ 0.8), thusmodel behaves in the same fashion as other models producing the narrowest energy distribution (Fig.do, as suggested elsewhere [4]. This situation is 1a). The lowest value was for tetrachloroethylenepossibly related to the fact that there are only small (n ¯ 0.4), which gives the broadest energy distribu-differences between the values of the heterogeneity tion (Fig. 6a). Note that dichloromethane and carbonparameter for the same compound at different tem- tetrachloride (n ¯ 0.7) and trichloromethane andperatures (See Table 3 from Ref. [7]). Also, the 1,1,1-trichloroethane (n ¯ 0.6) give energy distribu-temperature range in which the original data was tions which exhibit a similar dispersion (see Figs.obtained is relatively small (108C) and it is reason- 2a–5a). These findings confirm that for theable to think that big differences should not be Jovanovic–Freundlich model the AEDs narrow withexpected for the specific case under study. Moreover, the increase in the value of the heterogeneity param-the numerical values of the heterogeneity parameter eter. Also in this sense, the model behaves in the

˜54 I. Quinones et al. / J. Chromatogr. A 849 (1999) 45 –60
Table 1Results derived from the analysis of the experimental data for the JF model
Adsorbate T e d d da,JF JF JF, f(e) exp
(K) (kJ /mol)
CH Cl 288 24.7 0.2601 0.2633 0.03743
CH Cl 293 24.7 0.4492 0.4530 0.03873
CH Cl 298 24.8 0.5802 0.5840 0.04363
CH Cl 288 32.9 0.1501 0.1532 0.03742 2
CH Cl 293 32.9 0.2297 0.2332 0.03872 2
CH Cl 298 32.6 0.3062 0.3103 0.03742 2
CHCl 288 36.3 0.1018 0.0978 0.03323
CHCl 293 36.3 0.1121 0.1080 0.03323
CHCl 298 36.2 0.1755 0.1822 0.03163
CCl 288 36.9 0.0978 0.1037 0.03324
CCl 293 37.1 0.1715 0.1807 0.03324
C H Cl 288 39.8 0.0504 0.0505 0.03742 3 3
C H Cl 293 38.9 0.1109 0.1109 0.04002 3 3
C H Cl 298 38.0 0.1093 0.1140 0.04122 3 3
C Cl 288 46.3 0.0313 0.1147 0.03742 4
C Cl 293 46.1 0.0315 0.0861 0.03742 4
C Cl 288 45.8 0.1472 0.1609 0.04122 4
same fashion as other reported well known models along the energy axis produced as a consequence of[4]. the different values of the characteristic energy e ,a
Another interesting finding is that the JF model which characterizes the position of the maximum ofpredicts a similar degree of adsorbent heterogeneity the energy distributions. This result is also similar tofor all the systems analyzed, all the AEDs derived other ones previously reported [7,9]. From the resultshaving a similar shape, as reported previously [7,9]. reported in Table 1 and Figs. 1–6 it is clear that theThere is, of course, a shift of the density functions order of decreasing adsorption strength of the ana-
Table 2Results derived from the analysis of the experimental data for the EM models
Adsorbate T q e d q e ds,L mean,L L s,J mean,J J
(K) (mmol /g) (kJ /mol) (mmol /g) (kJ /mol)
CH Cl 288 7.03 26.0 0.0101 6.54 25.1 0.00203
CH Cl 293 7.05 25.8 0.0171 6.14 25.2 0.00723
CH Cl 298 6.88 35.6 0.0329 5.82 25.3 0.02233
CH Cl 288 5.93 34.4 0.0184 4.99 34.0 0.00692 2
CH Cl 293 5.98 34.2 0.0244 4.89 33.9 0.01142 2
CH Cl 298 5.84 33.8 0.0333 4.81 33.6 0.01582 2
CH Cl 288 3.97 37.8 0.0159 3.55 36.9 0.00492 3
CHCl 293 3.93 37.9 0.0222 3.47 37.1 0.00752
CHCl 298 3.87 377.8 0.0244 3.41 37.0 0.00733
CCl 288 3.17 38.6 0.0168 2.97 37.6 0.00864
CCl 293 3.10 38.8 0.0330 2.84 37.9 0.02214
CCl 298 3.00 38.8 0.0214 2.81 37.8 0.01294
C H Cl 288 3.46 42.8 0.01118 3.54 41.1 0.00502 3 3
C H Cl 293 3.48 40.9 0.0256 3.57 40.2 0.01522 3 3
CC H Cl 298 3.51 39.9 0.0187 3.51 39.6 0.00922 3 3
C Cl 288 3.00 52.6 0.0085 2.87 44.2 0.00712 4
C Cl 293 2.94 477.2 0.0053 2.82 46.6 0.00254 4
C Cl 298 2.87 46.8 0.0247 2.72 45.8 0.01482 4

˜I. Quinones et al. / J. Chromatogr. A 849 (1999) 45 –60 55
Fig. 7. Fit of the adsorption isotherm data of CH Cl at 288 K (solid line), 293 K (short-dashed line) and 298 K (long-dashed line) by the EM3
method with the Jovanovic isotherm as local model (a) and by the EM method with the Langmuir isotherm as local model (b). Experimentaldata points also represented by 288 K (s), 293 K (1) and 298 K (3).
lyzed species is given as follows: C Cl . T5293 K and T5288 K there is not a good match2 4
C H Cl .CCl .CHCl .CH Cl .CH Cl. Note between the values of d and d for C Cl . This2 3 3 4 3 2 2 3 JF JF,l(e ) 2 4
that the same order roughly holds for the values of fact indicates that the numerical inversion of thethe corresponding heats of vaporization [17], which Laplace transform in Eq. (11) is not efficient in thesedefine the lowest boundary on the energy axis for the cases. Note that there exist a reasonable agreementAEDs. Accordingly, the AEDs derived using the JF between the values of d and d for the rest ofJF JF,l(e )
model (Figs. 1a–5a) show that the calculated ad- the systems exposed in Table 1. So, the numericalsorption energies are as a rule equal to or higher than inversion of the Laplace transform is adequate forthe heats of vaporization. In the case of C Cl , there the majority of the systems. Note also that for C Cl2 4 2 4
is a small part of the AED at energies less than the at T5293 K and T5288 K the values of d are lessJF
heat of vaporization. The effect is more pronounced than d . So the model errors are less than theexp
for T5293 K and T5288 K while at T5298 K the estimated experimental errors, thus the possibility ofproblem is barely existent. Note from Table 1 that at some ‘‘modeling’’ of the experimental errors is

˜56 I. Quinones et al. / J. Chromatogr. A 849 (1999) 45 –60
Table 3Check of the normalization condition for the different models
Adsorbate T (K) e l (´) d´ e l (´) d´ e l (´) d´JF J L
CH Cl 288 0.9997 0.8100 0.99783
CH Cl 293 0.997 0.9047 0.99823
CH Cl 298 0.9998 0.9620 0.99853
CH Cl 288 0.9994 0.9987 0.99902 2
CH Cl 293 0.9994 0.9987 0.99832 2
CH Cl 298 0.9994 0.9988 0.99952 2
CHGl 288 1.0018 0.996 0.99773
CHCl 293 1.0018 0.9992 0.99843
CHCl 298 0.9981 0.9986 0.99923
CCl 288 0.9976 0.9629 1.00024
CCl 293 0.9983 0.9671 0.99844
CCl 298 0.9983 0.9281 1.00064
C H Cl 288 0.9978 0.6576 1.00112 3 3
C H Cl 293 0.9994 0.6428 0.99962 3 3
C H Cl 298 0.9967 0.9448 0.99752 3 3
C Cl 288 0.9593 0.9914 0.99812 4
C Cl 293 0.9758 0.9842 0.99592 4
C Cl 298 0.9892 0.9686 0.99782 4
possible for these cases. For the remaining systems tained in the low-energy first peak and can bed . d . From column 3 of Table 3 it is additional- ‘‘diluted’’ as the energy scale is expanded to higherJF exp
ly evident that there is a satisfactory compliance with energies. This is indicative of insufficient experimen-the normalization condition for all the systems with tal data to characterize the low pressure (highthe exception of C Cl at T5293 K and T5288 K. energy) region of adsorption. The energies of ad-2 4
This situation results from the fact that the dis- sorption for the AEDs derived for Langmuir localtributions are slightly truncated at the low energy behavior are always greater than the correspondingend. So, the fact that the inversion produces some heats of vaporization. These AEDs are almostvalues of energies less than the heat of vaporization symmetrical for the majority of the systems (seecan be just an artifact. It is possible that the situation Figs. 1c–6c) with the sole exception of C Cl at 2882 4
is somehow related to the ‘‘overfiting’’ of the K. Note that the EM method with Langmuir localexperimental data by the model. Recall that the behavior produce errors d as a rule less than theL
inversion of Eq. (11) is an ill posed problem difficult experimental errors d . The order of both types ofexp
to circumvent in every situation. errors seems to be the same. Moreover, because theThe results obtained with the EM method using values of d are just approximate, maximum esti-exp
the Langmuir local behavior are reasonably con- mates it is reasonable to think that there is asistent. They are illustrated in Figs. 1c–6c. There is reasonable agreement between the model errors andoften a small amount of adsorption at energies higher experimental errors for the case of the EM methodthan those of the main peak. This high adsorption with Langmuir local behavior. The lowest modelenergy was not well characterized and could corre- errors are again the values corresponding to C Cl at2 4
spond to a second type of high energy sites. How- T5293 K and T5288 K. The normalization con-ever, there was insufficient data at very low dition holds very well for this model, as seen frompressures to allow the derivation of numerical esti- column 5 of Table 3. The results obtained with themates in this region. The energy range was expanded EM algorithm for the case of Jovanovic localin the direction of high energies in order to better behavior are different than those obtained for avisualize the main, low energy peak, which was Langmuir local model. They are illustrated in Figs.present no matter the width of the range used. The 1b–6b. A better fit was obtained with the Jovanovicadsorption at high energy, however, was not con- than with the Langmuir isotherm as the local model,

˜I. Quinones et al. / J. Chromatogr. A 849 (1999) 45 –60 57
as shown by the fact that d , d for all the systems. JF model to the EM model with Jovanovic localJ L
Note also that d , d for all systems. The AEDs behavior. So, the result of a ‘‘too good’’ fitting of theJ exp
corresponding to the Jovanovic local behavior are experimental data is possibly the appearance ofnot symmetrical for several systems and in some artifacts. Despite the artifacts present in some AEDs,cases possess a multipeak character (see Figs. 2b, 3b, it is noteworthy that the AEDs calculated by the4b, 6b). In some cases (Figs. 1b, 4b, 6b and three different methods applied in this study occupyespecially 5b) the low energy region was not repre- the very same range of the energy axis. Note thesented as well with the Jovanovic model as it was similarities among the values of e ; e andmean,L mean,Jwith the Langmuir model. As seen from the figures, e shown in Tables 1 and 2. This is a consistenta,JFthe values of the AEDs do not approach to a low result. Moreover, for the majority of the systems, thisvalue when the value of the energy approaches the range also contains the values determined ex-value of the heat of vaporization. Basically, the perimentally for the isosteric heats of adsorptiondistributions are truncated at the e endpoint. Thismin [9,10], as shown in Figs. 1–6. The agreementfact is reflected in the value of the normalization obtained is quite reasonable if one considers that theintegral (column 4 of Table 3). The obtained mul- experimental isosteric heats of adsorption were de-tipeak distributions and energies of adsorption less termined using the intermediate region of the ad-than the corresponding heats of vaporization are sorption isotherm [9,10]. Thus, values of the isostericpossibly not real physicochemical features of the heats below and above the reported range arestudied systems but most likely artifacts arising from possible. The only exception is the AED of C H Cl2 3 3the fact that the Jovanovic local model forces its for which the AEDs calculated by the three differentassociated AED to sample such low values of energy methods used here do not contain the range ofthat improve the fit of the experimental data. So, the experimental values of the isosteric heat of adsorp-EM method simply tries to fit the data as best as tion (Fig. 5). It is difficult to supply at this time anpossible in accordance with the model chosen, and unbiased explanation to this fact. However, it ispossibly overfits it, modeling also the experimental worth noting that a previous identification procedure,errors. These artifacts are very common. It is applying a linearized version of Eq. 3, providednoteworthy to recall at this point that the parameters values of the characteristic energies lower or close toobtained from the fit of the given experimental data the energies of vaporization for all the compoundsto the Hines model [9] also produced AEDs sam- with the exception of C H Cl (Table 8 from Ref.2 3 3pling energies of adsorption less than the heat of [7]). This Table shows also that the values of e wereavaporization [9]. The majority of the AEDs derived determined with an important error, possibly becausefrom the EM method for both Langmuir and the three temperatures at which the isotherms wereJovanovic local behavior are similar for different obtained were too close (288 K, 293 K and 298 K).temperatures. The major exception are the distribu- Thus, the linear plots of ln a versus 1 /RT weretions calculated for C Cl (Figs. 6b and 6c). Note2 4 almost horizontal (see Fig. 2 from ref. [7]). Thefrom Table 2 that model errors are very small for value of e for C H Cl is the highest (ca. 80a 2 3 3these cases. The problem is more serious for the EM kJ/mol) and was determined with the smallest errormethod for Jovanovic local behavior. The drawback (see Table 8 from Ref. [7]). If we use this latterin using a direct technique to obtain AEDs like the value of the characteristic energy in Eq. (11) in order
eaEM procedure is that any inconsistencies or sys- a ]RT]to approximate the value of as e , we obtain thetematic errors present in the data, even if they are K0
small also get modeled. Artifacts are problematic AEDs displayed in Fig. 8a, which contains the rangewhen solving ill-posed problems and it is the price in which the isosteric heats of adsorption wereusually paid. Note that the Jovanovic–Freundlich reported. The AEDs calculated by the three methodsmodel (Fig. 6a) produces AEDs very similar at applied in this study are of course different, asdifferent temperatures. Note that an overall analysis should be expected given the different nature of theof the model errors shows that d . d . d and that three models compared. All of them are just approxi-JF L J
the appearance of artifacts increases going from the mations of the actual AEDs. Yet, all the distributions

˜58 I. Quinones et al. / J. Chromatogr. A 849 (1999) 45 –60
Fig. 8. Adsorption energy distributions of C H Cl at 288 K (solid line), 293 K (short-dashed line) and 298 K (long-dashed line) calculated2 3 3
for the Jovanovic–Freundlich model (a), by the EM method with the Jovanovic isotherm as local model (b) and by the EM method with theLangmuir isotherm as local model (c).
occupy the same range of values on the energy axis, reported recently [20] both for systems without andwhich coincides with the range where the isosteric with lateral interactions on the surface. The modelsheats of adsorption were experimentally determined. were applied with satisfactory results to competitiveThe fact that the JF model, which is simpler, gives adsorption data of phenyl alcohols on a C-18 re-results similar to the ones derived from more com- versed-phase from methanol /water solutions [20].plex models (the EM approach) encourages the The aforementioned study also compared the per-possible use of this model in the correlation of single formance of the JF model with other global iso-component data and as a tool to extract information therms for heterogeneous surfaces. The parametersregarding adsorbent heterogeneity, that could be present in the competitive global isotherm wereuseful in the prediction of multicomponent equilib- directly related to the single component Jovanovic–ria. As a matter of fact, the multicomponent exten- Freundlich model which accounts for the hetero-sion of the Jovanovic–Freundlich model (2) was geneity of the surface. These multicomponent

˜I. Quinones et al. / J. Chromatogr. A 849 (1999) 45 –60 59
equilibrium models can be used in the calculation of adsorption experimentally determined by Hines et al.overloaded chromatographic band profiles [2]. Final- [9,10] (Figs. 1–6), this correlation suggests that ourly, it is interesting to correlate the heterogeneity results are consistent with the experimental data andparameter, n, and some experimental parameter reasonable.characterizing the adsorption systems studied (seeTable 4). The dipole moments (m) and the Van derWaals volumes (V ) of the solutes [17] cannot be 5. Conclusionsvdw
expected to correlate well with the surface hetero-geneity, especially in the case of a series of light The adsorption energy distributions correspondingchlorinated hydrocarbons. For these compounds, the to the Jovanovic–Freundlich model with JovanovicVan der Waals volume depends essentially on the local behavior were determined from the adsorptionnumber of chlorine atoms (Table 4) while the data of a series of chlorinated hydrocarbons on silicaisosteric heat of adsorption (DH ) depends on the gel. These AEDs were derived from the best iso-iso
number of atoms which can interact with the surface therms using a numerical inversion of the Laplaceat a given time. The dipole moment depends on the transform. The AED are single-peak functionsgeometrical structure of the molecule and its symme- skewed in the direction of high energies. They aretry. It is very different for CHCl and CCl while the nearly temperature independent and the values calcu-3 4
adsorption energies are close, as expected (Table 4). lated for the adsorption energies are higher than theThe ratio DH /Dq of the difference between the heats of vaporization of the corresponding compoundiso iso
minimum and the maximum value of the isosteric at the same temperature. It was established that theheat of adsorption to the corresponding difference dispersion of the distribution decreases with increas-between the amounts adsorbed (i.e., q ) or change ing value of the heterogeneity parameter of theiso
of the isosteric heat of adsorption per unit increase of Jovanovic–Freundlich model. All this results areloading gives an approximate idea of the dispersion consistent with the behavior of other models reportedof the energy distribution in the range investigated. for single component adsorption on heterogenousTable 4 compares this ratio and the average values of surfaces [4]. On the other hand, the results presented
]the heterogeneity parameter, n, identified from the fit here and in a previous study [7] show that theof the Jovanovic–Freundlich model [7], at the differ- calculation of the AEDs is biased by the selection ofent temperatures studied. The last two columns of the local isotherm model. This fact complicates thethe Table correlate nicely. As explained earlier, the assessment of the true energy distribution.dispersion of the AED increases with decreasing It is worth noting that the AEDs corresponding tovalue of n while the ratio DH /Dq is zero for a the JF model occupies a range of adsorption energiesiso iso
homogeneous surface and increases with increasing which is the same as the one occupied by the AEDsheterogeneity. Together with the excellent agreement calculated from the raw adsorption data using otherbetween the range of energies occupied by the reported procedures like the EM method, whichcalculated AEDs and the range of isosteric heats of makes no assumption regarding the nature of the
Table 4Some properties of the adsorbate and the adsorption system
Adsorbate m V H q DH /Dq nVdW iso iso iso iso3 2(D) (m /kmol) (kJ /mol) (mmol /g) (kJ?g/mol )
CH Cl 1.87 0.02529 26.63–27.13 2.0–4.5 200.00 0.773
CH Cl 1.60 0.03471 38.77–43.17 2.0–4.5 1760.00 0.692 2
CHCl 1.01 0.04350 34.63–46.89 1.4–3.3 6452.63 0.623
CCl 0.00 0.0523 35.30–43.29 0.9–2.4 5326.67 0.694
C H Cl 1.78 0.05372 71.60–133.15 1.2–2.4 51291.67 0.582 3 3
C Cl 0.00 0.05898 47.31–97.14 1.6–2.4 62287.50 0.422 4

˜60 I. Quinones et al. / J. Chromatogr. A 849 (1999) 45 –60
overall isotherm. Additionally, this range also over- Referenceslaps with the range of probable values derived fromthe experimental results for the isosteric heats of [1] S.C. Stinson, Chem. Eng. News 73 (1995) 44.
[2] G. Guiochon, S.G. Shirazi, A.M. Katti, Fundamentals ofadsorption. Thus, the JF model being a rather simpleNonlinear and Preparative Chromatography, Academic Press,analytical model gives a meaningful interpretation ofBoston, 1994.
the energy distribution. It also could be a useful [3] D.P. Valenzuela, A.L. Myers, Adsorption Equilibrium Datachoice for the correlation of single component data Handbook, Prentice Hall, Englewood Cliffs, 1989.and subsequent prediction of multicomponent ad- [4] M. Jaroniec, R. Madey, Physical Adsorption On Heteroge-
neous Solids, Elsevier, Amsterdam, 1998.sorption data within the framework of existing[5] D.P. Valenzuela, A.L. Myers, O. Talu, I. Zwiebel, AIChE J.models which incorporate the effect of surface
34 (1988) 397.heterogeneity [5,6,20]. These multicomponent [6] F. Karavias, A.L. Myers, Chem. Eng. Sci. 47 (1992) 1441.equilibrium adsorption data can then be used in ˜[7] I. Quinones, G. Guiochon, J. Colloid and Interf. Sci. 183connection with appropriate models of chromatog- (1996) 57.
[8] R. Sips, J. Chem. Phys. 16 (1948) 490.raphy to calculate overloaded multicomponent band[9] S.–L. Kuo, A.L. Hines, N.H. Dural, Separat. Sci. Technol.profiles in preparative and industrial chromatography
26 (1991) 1077.[2]. Although the results of this study are directly [10] S.–L. Kuo, A.L. Hines, J. Chem. Eng. Data 37 (1992) 1.applicable for gas or vapor phase separations only, it [11] B. Stanley, G. Guiochon, Langmuir 10 (1994) 4279.is possible that a careful extrapolation of the formal- [12] B. Stanley, G. Guiochon, J. Phys. Chem. 97 (1993) 8098.
[13] D.S. Jovanovic, Kolloid–Z. Z. Polym. 235 (1969) 1203.ism can be accomplished for liquid phase sepa-[14] M. Jaroniec, Surf. Sci. 50 (1975) 553.rations.[15] S. Sircar, A.L. Myers, Surf. Sci. 205 (1988) 353.[16] E.C. Titchmarsh, Introduction To the Theory of Fourier
Integrals, Oxford Univ. Press, London, 1959.Acknowledgements [17] T.E. Daubert, R.P. Danner, Physical and Thermodynamic
Properties of Pure Chemicals, Hemisphere Publishing Com-pany, New York, 1989.This work has been supported in part by Grant
[18] Anon., IMSL Inc., ‘‘FORTRAN subroutines for mathemati-CHE-97-01680 of the National Science Foundation cal applications V2.0: User’s Manual’’, MATH/LIBRARY,and by the cooperative agreement between the Houston, 1991.University of Tennessee and the Oak Ridge National [19] I. Langmuir, J. Am. Chem. Soc. 40 (1918) 1361.
˜[20] I. Quinones, G. Guiochon, J. Chromatogr. A 796 (1998) 15.Laboratory. We acknowledge the support of MaureenS. Smith in solving our computational problems.
Copyright © 2022 FDOKUMEN