Comparing knee joint kinematics, kinetics and cumulative load ...
214
Comparing knee joint kinematics, kinetics and cumulative load between healthyweight and obese young adults by Kathleen MacLean A thesis presented to the University of Waterloo in fulfillment of the thesis requirement for the degree of Master of Science in Kinesiology Waterloo, Ontario, Canada, 2011 © Kathleen MacLean 2011
-
Upload
khangminh22 -
Category
Documents
-
view
3 -
download
0
Transcript of Comparing knee joint kinematics, kinetics and cumulative load ...

Comparing knee joint kinematics, kinetics and cumulative load between
healthy-weight and obese young adults
by
Kathleen MacLean
A thesis presented to the University of Waterloo
in fulfillment of the thesis requirement for the degree of
Master of Science in
Kinesiology
Waterloo, Ontario, Canada, 2011 © Kathleen MacLean 2011

ii
Author’s Declaration
I hereby declare that I am the sole author of this thesis. This is a true copy of the
thesis, including any required final revisions, as accepted by my examiners.
I understand that my thesis may be made electronically available to the public.

iii
Abstract
Obesity has been identified as a worldwide epidemic. While there are many co-‐
morbidities associated with the condition, one of the most poorly understood is the
pathway to musculoskeletal diseases such as osteoarthritis of the knee. To
implement appropriate preventative strategies, it is important to explore how
excess body weight is a causal factor for osteoarthritis. The present research
compared the kinematics and kinetics of a group of young obese, but otherwise
healthy, adults to a group of young, healthy-‐weight adults, in an attempt to identify
mechanical abnormalities at the knee during walking that may predispose the obese
to osteoarthritis of the knee.
Three-‐dimensional Optotrak motion capture (Northern Digital Inc. Waterloo,
Ontario) and a forceplate (AMTI OR6-‐7, Advanced Mechanical Technology Inc,
Watertown, MA) were used to measure ground reaction forces and moments of 16
participants – 8 obese and 8 sex-‐, age-‐ and height-‐matched healthy-‐weight – to
analyze knee joint kinematics and kinetics at three walking speeds of fast, natural
and slow. Healthy-‐weight participants walked at an additional speed that matched
the normal speed of the obese participants. Participants wore an accelerometer
(ActiGraph GT3X, Fort Walton Beach, USA) for seven days to measure physical
activity levels through daily steps counts. A series of dependent t-‐tests were
performed to determine group differences in the maximum, minimum and range of
ground reaction forces, knee angles and knee moments, as well as knee adduction
moment impulse and cumulative knee adductor load (CKAL). A multiple regression

iv
analysis was used to determine the effect of dynamic knee alignment on peak knee
adduction moment and knee adduction moment impulse.
The obese group walked at a significantly slower self-‐selected speed
compared to the matched controls (p=0.013). While not statistically significant, the
obese group did present with a more valgus mean dynamic knee alignment than the
health-‐weight group. Two obese participants presented with atypical frontal plane
moments. They were removed from the data set and analyzed separately as case
studies. A significantly greater maximum abduction angle (p=0.009) and smaller
minimum knee flexion angle at heel contact (p=0.001) was found in the obese group.
There were no significant group differences in the frontal or sagittal moment peaks.
A significant difference was found in the peak medial rotation moment in the
transverse plane (p=0.003). All of these significant group differences were
neutralized when walking speed was matched between obese and healthy-‐weight
groups, however similar kinematic and kinetic trends were still observed at the
matched speed. A greater stance duration lead to a significantly greater knee
adduction moment impulse (p=0.049) in the obese group. While significant group
differences were not found in the steps per day, the obese group had a significantly
greater CKAL (p=0.025). Dynamic knee alignment was strongly related to peak knee
adduction moment (r=0.705, p=0.011) and knee adduction impulse (r=0.600,
p=0.054).
In conclusion, young adults with healthy knees who are obese demonstrated
a gait pattern of reduced medial knee joint compartment loading through greater
knee abduction, medial knee rotation and a slower walking speed compared to
v
matched controls, but still exposed their knees to a greater daily cumulative load.
The ramifications of gait modifications on long-‐term musculoskeletal health remain
unknown. These compensations, which could place undue stress on joint structures
that were not built to endure such loading, may lead to increased risk of
osteoarthritis of the knee.

vi
Acknowledgements
I would like to start by thanking my (unintentionally!) numerous supervisors. To Dr. Jennifer Durkin, while we parted ways a year into my degree, I appreciated your guidance during our brief collaboration. Thank you to my current supervisors, Dr. Jack Callaghan and Dr. Monica Maly, for scooping up a stray, wet behind the ears student caught in an unlikely transition period. Your steady mentorship, encouragement in trying times and patience when I stumbled has been invaluable to my personal and academic development.
A sincere thank you to Dr. Steve Prentice for sitting on my committee and taking the time to endure my lengthy thesis.
To fellow graduate students, thank you for being a sounding board, a brain to pick, a helping hand in the lab, or a slap in the face when a reality check was desperately needed. Special thank you to Tyson Beach for his patience and time in the lab, the life lessons and not always being a crotchety old PhD student when I spammed his e-‐mail inbox. I may have stolen a piece of your sanity, so for that I am (a little) sorry.
My greatest blessing has been the unconditional, unwavering love and support of family. You are the link to my past and the bridge to my future. Thank you Stu and Chris for the wisecracks and wisdom, a coach to crash on and for always scaring away the bad guys.
Most affectionate thank you mom and dad for being my rock, my compass, my comfort when I falter, my inspiration to achieve beyond my own imagination, my greatest mentors. Amidst my greatest doubts and hardships, it is you I called at ungodly hours for a strong, patient heart. Your remarkable love and devotion have, and always will serve as the example by which I live my life. And if I ever make something of myself, I’ll try to pay you back for the long-‐distance phone bills.

vii
Table of Contents
Author’s Declaration .................................................................................................................. ii
Abstract .......................................................................................................................................iii
Acknowledgements ................................................................................................................... vi
List of Tables ................................................................................................................................ x
List of Figures .............................................................................................................................xii
List of Equations ..................................................................................................................... xvii
I. Introduction.............................................................................................................................. 1 1.1 Investigative Purpose ....................................................................................................................5
1.1.1 Study I – Kinematics and Kinetics at the Knee Joint During Walking ................................... 5 1.1.2 Study II – Cumulative Knee Joint Loading ...................................................................................... 5
1.2 Hypotheses......................................................................................................................................6 1.2.1 Study I – Kinematics and Kinetics at the Knee Joint During Walking ................................... 6 1.2.2 Study II – Cumulative Knee Joint Loading ...................................................................................... 7
II. Review of Literature .............................................................................................................. 8 2.1 Obesity .............................................................................................................................................8
2.1.1 Incidence and Prevalence of Obesity .............................................................................................. 9 2.1.2 Co-‐morbidities Associated with Obesity ..................................................................................... 12 2.1.3 Prevention of Obesity-‐Related Osteoarthritis of the Knee and Intervention in Already Established Cases ........................................................................................................................................... 13
2.2 The Knee Joint ............................................................................................................................. 15 2.2.1 Anatomy and Function of the Tibiofemoral (Knee) Joint ...................................................... 15 2.2.2 Pathologies of the Knee Joint ......................................................................................................... 17 2.2.3 Osteoarthritis of the Knee................................................................................................................ 18
2.3 Effect of Obesity on Knee Joint Structure and Integrity ....................................................... 21 2.3.1 Muscular Strength and the Adverse Effect of Obesity on Strength and Power ............ 25
2.4 The Knee Adduction Moment and its Application to Joint Loading ................................... 28 2.5 Knee Alignment and its Effect on Joint Load Distribution.................................................... 30 2.6 Functional Consequences of Obesity ....................................................................................... 34
2.6.1 Clinical Measures of Functional Status (LEFS) ........................................................................... 36 2.6.2 Walking in the Obese State ............................................................................................................. 37 2.6.3 Cumulative Loading at the Knee Joint During Walking .......................................................... 42 2.6.4 Physical Activity Levels and Accelerometry Measures of Activity...................................... 44 2.6.5 Gait speed .............................................................................................................................................. 47
III. Methodology........................................................................................................................49 3. 1 Participants ................................................................................................................................. 49
3.1.1 Inclusion Criteria ................................................................................................................................. 50 3.1.2 Exclusion Criteria ................................................................................................................................. 50 3.1.3 Recruitment of Participants and Preliminary Screening........................................................ 51
3.2 Equipment and Protocol ............................................................................................................ 52 3.2.1 Equipment and Setup ........................................................................................................................ 52 3.2.2. Calibration of Equipment ................................................................................................................ 54

viii
3.2.3 Subject Measurements ..................................................................................................................... 55 3.2.4 Walking ................................................................................................................................................... 56 3.2.5 Maximal Voluntary Knee Extensor Torque................................................................................. 57 3.2.6 Accelerometry ...................................................................................................................................... 58
3.3 Data Processing ........................................................................................................................... 58 3.3.1 Processing of Collected Measures................................................................................................. 58 3.3.2 Processing of Kinematics and Kinetics ......................................................................................... 60
3.4 Data Analysis ............................................................................................................................... 62 3.4.1 Analysis of Walking Speed ............................................................................................................... 63 3.4.2 Removal of the Factor of Walking Speed.................................................................................... 64 3.4.3 Analysis for Study I – Kinematics and Kinetics at the Knee Joint During Walking ........ 66 3.4.4 Analysis for Study II – Cumulative Knee Joint Loading ........................................................... 68
IV. Results...................................................................................................................................71 4.1 Anthropometric Results ............................................................................................................. 72 4.2 Clinical and Mechanical Outcomes .......................................................................................... 73
4.3 Effect of Walking Speed ...................................................................................................................... 74 4.4 Reduced Frontal Data Set Analysis .......................................................................................... 77
4.4.1 Case Studies of S01 and S04 ............................................................................................................ 78 4.5 Study I Kinematic and Kinetic Data Analysis .......................................................................... 82
4.5.1 Ground Reaction Forces Analysis .................................................................................................. 82 4.5.2 Knee Angles Analysis.......................................................................................................................... 85 4.5.3 Knee Moments Analysis.................................................................................................................... 89 4.5.4 Matched Walking Speed Kinematic and Kinetic Analysis ...................................................... 94
4.6 Study II CKAL Analysis ..............................................................................................................102 4.6.1 Accelerometer Physical Activity Analysis..................................................................................102 4.6.2 Cumulative Knee Adductor Load Analysis ................................................................................103
4.7 Regression Analysis of Frontal Moment Variables and Knee Alignment ........................106 4.7.1 Correlation between Peak Adduction Moment and Adduction Moment impulse ....106 4.7.2 Relationship of Knee Alignment with Peak Moment and with Impulse ........................107 4.7.3 Relationship of Knee Alignment, Participant Group and Normalized Maximum Extensor Torque with Peak Moment and with Impulse .................................................................111
V. Discussion ...........................................................................................................................113 5.1 Anomalies in the Frontal Plane Moment ..............................................................................116
5.1.1 Biomechanical Explanation of Frontal Moment Anomalies ...............................................116 5.1.2 Reducing the Frontal Plane of the Data Set .............................................................................122
5.2 Walking Speed Analysis ...........................................................................................................123 5.2.1 Matched Walking Speed .................................................................................................................123 5.2.2 Within Participants Differences at the Three Self-‐Selected Walking Speeds ...............125
5.3 Study I Kinematic and Kinetic Outcomes ..............................................................................126 5.3.1 Knee Joint Kinematics......................................................................................................................126 5.3.2 Knee Joint Kinetics ............................................................................................................................131
5.4 Knee Alignment .........................................................................................................................139 5.5 Lateral OA of the Knee .............................................................................................................143 5.4 Study II Cumulative Knee Adduction Load Outcomes ........................................................147
5.4.1 Physical Activity Levels ....................................................................................................................148 5.4.2 Knee Adduction Moment Impulse ..............................................................................................149 5.4.3 Interpreting the Cumulative Knee Load ....................................................................................151

ix
5.5 Obesity Interventions and Physical Rehabilitation .............................................................154 5.6 Limitations..................................................................................................................................158
5.6.1 Sample Size..........................................................................................................................................158 5.6.2 Skin Artifact and Palpation of Anatomical Landmarks .........................................................158 5.6.3 Walking Speed....................................................................................................................................160 5.6.4 Transverse Plane ...............................................................................................................................161 5.6.5 Accelerometers..................................................................................................................................162
5.7 Future Directions.......................................................................................................................163
VI. Conclusions .......................................................................................................................166
References...............................................................................................................................168
Appendix .................................................................................................................................184 Appendix A .......................................................................................................................................184 Appendix B........................................................................................................................................187 Appendix C........................................................................................................................................196
x
List of Tables
Table 1: Baseline variables analyzed between groups using dependent t-‐tests. Anthropometrics were determined manually. Mass (kg) and height (m) were used to determine BMI. Dynamic knee alignment was determined from the walking trials using motion capture, while the extensor torque was measured from the Cybex Dynamometer. Steps per day were averaged from seven days of accelerometer data. .......................................... 63
Table 2: GRF variables to be analyzed between subject groups by each of the walking speed conditions in Study I.............................................................................................................................................. 67
Table 3: Variables to be analyzed between subject groups by each of the walking speed conditions in Study I.............................................................................................................................................. 67
Tables 4: A summary of variables, hypotheses and statistical tests to be performed on baseline anthropometric, clinical and walking speed (fast, natural and slow) variables. ...... 69
Tables 5: A summary of Variables, Hypotheses and Statistical Tests to be performed in Study I. The walking speeds of fast, natural and slow were analyzed together as levels within a single factor, between participant groups. The matched speed condition analysis between groups was performed separately from the other speeds................................................. 69
Table 6: A summary of the variables, hypotheses and statistical tests to be performed in Study II. ....................................................................................................................................................................... 70
Table 7: Anthropometric means, standard deviations (SD) for both participant groups. The terms waist, thigh and shank refer to the circumference of each of these segments. Significant mean differences in dependent t-‐tests are denoted with an asterisk, *, at p<0.05.......................................................................................................................................................................................... 73
Table 8: Group means, standard deviations (SD) and mean difference from dependent t-‐tests for clinical and mechanical outcomes. The LEFS is scored out of 80. Torque and Norm. Torque refers to maximal knee extensor torque and torque normalized to body mass. Significant mean differences are denoted with an asterisk, *, at p<0.05........................................ 73
Table 9: Mean, standard deviation (SD) and mean difference between participant groups in self-‐selected, natural walking speed. Mean difference is significant at p<0.05, denoted by an asterisk, *. ................................................................................................................................................................... 75
Table 10: Difference between three walking speeds of fast, natural and slow with the natural speed confidence interval (CI) included. The two participant groups were combined together for the analysis. ..................................................................................................................................... 75
Table 11: Walking speed results from a two-‐way ANOVA performed to test the effect of walking speed and group on maximal joint angle and moment. The results for the factor level of walking speed are shown. Significance at p<0.05 is denoted by an asterisk, *. .......... 76
Table 12: A two-‐way ANOVA with the factors of group and walking speed was performed to determine the effect on impulse. The factor level of speed is shown. Significance level at p<0.05 is denoted by an asterisk, *. ................................................................................................................ 76
xi
Table 13: Individual results for the two case study participants, S01 and S04, for various anthropometric and clinical variables........................................................................................................... 79
Table 14: Results for the two case study participants, S01 and S04 for the medial-‐lateral GRF (N), frontal angle (degrees) and frontal moment (Nm). The mean is an average of the three walking speeds ............................................................................................................................................ 80
Table 15: Means, standard deviations (SD) and mean group differences in peaks and ranges of GRF (N) in all three axes. Significant mean differences are denoted by an asterisk, *, at p<0.05. ......................................................................................................................................................................... 83
Table 16: Means, standard deviations (SD) and mean group differences of peaks and ranges in three-‐dimensional knee angles (degrees). An asterisk *, denotes a significant mean difference between groups at p<0.05. ........................................................................................................... 86
Table 17: Means, standard deviations (SD) and mean group differences of peaks and ranges in three-‐dimensional knee moments. Moments are expressed in Newton-‐meters (Nm). Significant mean differences are denoted by an asterisk, *, at p<0.05............................................ 90
Table 18: Comparison of the three healthy average walking speeds to the healthy-‐weight group’s average matched (i.e. obese normal) walking speed.............................................................. 94
Table 19: Mean, standard deviation (SD) and mean group differences in GRF (N) comparison across participant groups at a matched walking speed in all three axes. Significant mean differences are denoted by an asterisk, *, at p<0.05............................................ 95
Table 20: Mean, standard deviation (SD) and mean group differences in knee angles (degrees) between participant groups at a matched walking speed in all three axes. Significant mean differences are denoted by an asterisk, *, at p<0.05............................................ 97
Table 21: Means, standard deviation (SD) and mean group differences in knee moments in Newton-‐meters (Nm) between participant groups at a matched walking speed in all three axes. Significant differences are denoted by an asterisk, *, at p<0.05. ..........................................100
Table 22: Physical activity levels, measured as steps taken from the accelerometer data for both participant groups. Significant group differences are denoted by an asterisk, *, at p<0.05. .......................................................................................................................................................................103
Table 23: Group differences in stance duration (s), moment impulse (Nm*s) and cumulative load (kNm*s). Significant group differences are denoted by an asterisk, *, at p<0.05. ..........104
xii
List of Figures
Figure 1: Representative Knee Adduction Moment, as time normalized to 100% of the gait cycle and amplitude normalized to body mass, during stance phase (Newell et al., 2008)...... 2
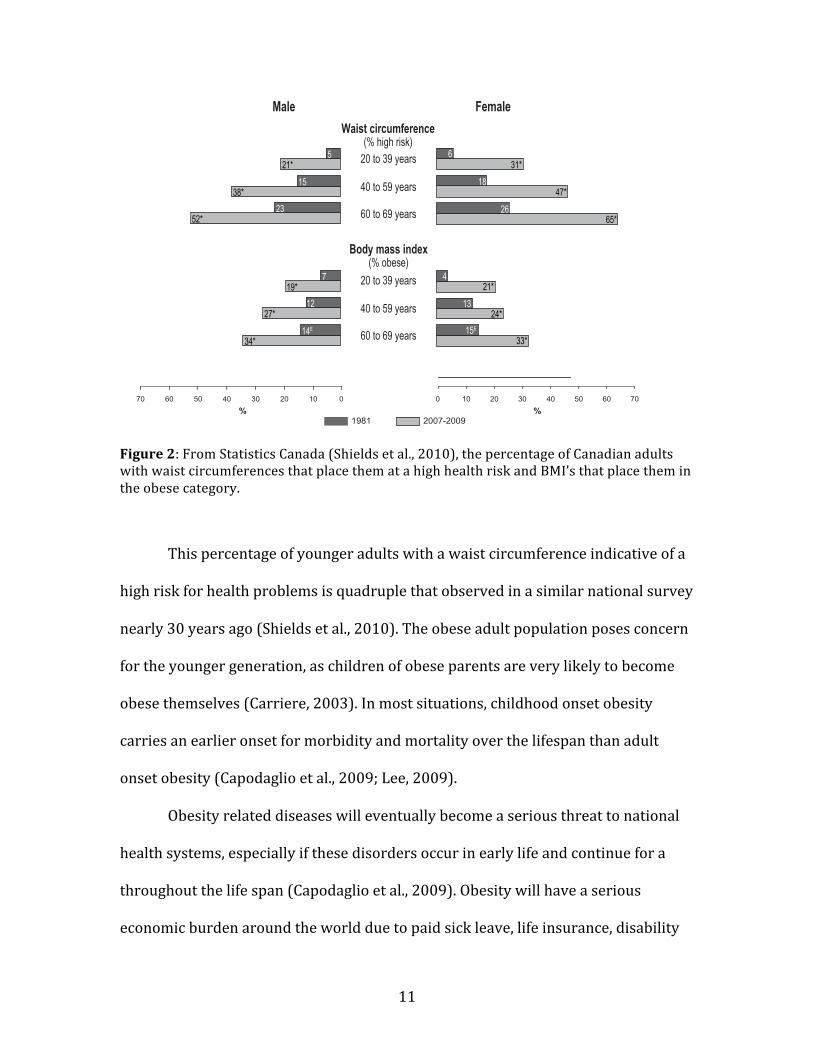
Figure 2: From Statistics Canada (Shields et al., 2010), the percentage of Canadian adults with waist circumferences that place them at a high health risk and BMI’s that place them in the obese category.................................................................................................................................................. 11
Figure 3: Flow chart showing the effect of obesity as a factor that can cause and progression OA (Sharma & Chang, 2007) .............................................................................................................................. 20
Figure 4: A varus knee alignment (a) causes the GRF to pass through the medial compartment of the knee, causing a knee adduction moment. A valgus knee alignment (b) causes the GRF to pass through the lateral compartment of the knee, resulting in a reduced knee adduction moment and, in some extreme cases, a knee abduction moment (Wearing et al., 2006a)................................................................................................................................................................... 31
Figure 5: Schematic for the individual and rigid body tracking marker placement from lateral side view and posterior view. The one hollow marker on the foot represents the marker on the distal end of first metatarsal on the medial side of the foot. ................................. 53
Figure 5: Graphical comparison of the frontal moment waveform from the reduced obese (N=6) and healthy (N=6) groups with the case studies of S01 and S04. The obese and healthy frontal moments represent the expected waveform, as seen in previous literature.......................................................................................................................................................................................... 77
Figure 6: Average Medial-‐Lateral GRF waveform for the case study participants, S01 and S04................................................................................................................................................................................. 80
Figure 7: Average frontal knee angle waveform for the case study participants, S01 and S04. A positive value on the vertical axis represents an adduction angle. .............................................. 81
Figure 8: Average frontal knee moment waveform for the case study participants, S01 and S04. It is in this waveform that these two participants differ from all other participants, both obese and healthy. A positive value on the vertical axis represents an adduction moment. 82
Figure 9: Average Medial-‐Lateral GRF for obese and healthy participant groups. Significant differences between groups were found in the maximal value and range (p<0.001).............. 84
Figure 10: Average Anterior-‐Posterior GRF for obese and healthy participant groups. Significant differences between groups were found in the minimum value (p=0.007) and range (p=0.023)....................................................................................................................................................... 84
Figure 11: Average vertical GRF for obese and healthy participant groups. Significant differences between groups were found in the maximum value and range (p<0.001)........... 85
Figure 12: Average frontal knee angle for obese and healthy participant groups. A positive value on the vertical axis represents adduction. Significant differences between groups were found in the maximum (p=0.002) and minimum value (p=0.003). ...................................... 87

xiii
Figure 13: Average sagittal knee angle for obese and healthy participant groups. A positive value on the vertical axis represents flexion. Significant differences between groups were found in the minimum value at heel contact (p=0.001) and range (p=0.001)............................. 88
Figure 14: Average transverse knee angle for obese and healthy participant groups. A positive value on the vertical axis represents medial rotation. No significant differences between groups were found. ............................................................................................................................. 89
Figure 15: Average frontal moment waveform for participant groups. A positive value on the vertical axis represents an adduction moment. No significant mean difference was found between groups in the minimum maximum or range values.............................................................. 91
Figure 16: Average sagittal waveform for participant groups. A positive value on the vertical axis represents a flexion moment. A significant mean difference between groups was found in the minimum value at heel contact (p=0.014). .............................................................. 92
Figure 17: Average transverse plane waveform for participant groups. A positive value on the vertical axis represents a medial rotation moment. A significant mean difference was found in the minimum at approximately 40 percent of the gait cycle (p=0.003),...................... 93
Figure 19: Average medial-‐lateral GRF waveform, expressed in Newtons, for participant groups at a matched walking speed. Significant group differences were found in the maximum value (p=0.004) and range (p=0.003). .................................................................................... 96
Figure 20: Average anterior-‐posterior GRF waveform, expressed in Newtons, for participant groups at a matched walking speed. Significant group differences were found in the maximum (p=0.025), minimum value (p=0.031) and range (p=0.018). ................................ 96
Figure 21: Average vertical GRF waveform, expressed in Newtons, for participant groups at a matched walking speed. Significant group differences were found in the maximum value (p=0.003) and range (p=0.003)........................................................................................................................ 97
Figure 22: Average frontal angle waveform, expressed in degrees, for participant groups at a matched walking speed. A positive value on the vertical axis represents an adduction angle. No significant mean group differences were found in the frontal angle peaks or range, but the maximum value was very close to being significant (p=0.054). ........................................ 98
Figure 23: Average sagittal angle waveform, expressed in degrees, for both participant groups at a matched walking speed. A positive value on the vertical axis represents a flexion angle. No significant differences were found between the groups in the peaks or range. ..... 99
Figure 24: Average transverse angle waveform, expressed in degrees, for both participant groups at a matched walking speed. A positive value on the vertical axis represents a medial rotation angle. No significant differences were found between the groups in the peaks or range............................................................................................................................................................................. 99
Figure 25: Average frontal moment waveform for participant groups at a matched walking speed. A positive value on the vertical axis represents an adduction moment. No significant differences were found between the groups in the peaks or range. ..............................................101
xiv
Figure 26: Average sagittal Moment waveform for participant groups at a matched walking speed. A positive value on the vertical axis represents a flexion moment. No significant differences were found between the groups in the peaks or range. ..............................................101
Figure 27: Average transverse moment waveform for participant groups at a matched walking speed. A positive value on the vertical axis represents a medial rotation moment. No significant differences were found between the groups in the peaks or range..................102
Figure 28: Example of an obese and healthy participant’s non time-‐normalized frontal moment used to compute adduction moment impulse. Only the positive part of the waveform was integrated to determine adduction moment impulse. ..........................................104
Figure 29: Comparison of reduced data set group and case study means in the frontal adduction moment impulse, expressed in Nm*s. The standard error bars are calculated from between participant group differences in the obese and healthy-‐weight means, and between walking speed differences in S01 and S04. A significant mean difference between the obese and healthy group is denoted by an asterisk, *, at p<0.05. ............................................105
Figure 30: Comparison of reduced data set group and case study means in the CKAL, expressed in kNm*s. The standard error bars are calculated from between participant group differences in the obese and healthy-‐weight means, and between three walking speed differences in S01 and S04. A significant mean difference between the obese and healthy group is denoted by an asterisk, *, at p<0.05............................................................................................105
Figure 31: Correlation between frontal moment peak and frontal moment adduction impulse. The correlation had an r-‐value of 0.835...................................................................................107
Figure 32: Comparison of the relationship between dynamic knee alignment and peak frontal moment in each participant group. A positive value on the horizontal axis represents a varus alignment. A lot of overlap is seen between groups in knee alignment. ......................108
Figure 33: Regression analysis of the knee alignment and peak adduction moment. The regression analysis was significant at p=0.011, with an r-‐squared= 0.497. ...............................109
Figure 34: Regression analysis of the knee alignment and adduction moment impulse.....110
Figure 35: From Hurwitz et al., (2002). This relationship shows the strong ability of the mechanical axis (knee alignment) to predict the second peak of the knee adduction moment. As the knee alignment becomes more valgus, the peak adduction moment decreases. .......118
Figure 36: From Lynn et al. (2008). An adduction moment from normal gait (solid black line) is contrasted with a toe-‐out gait (dotted black line) and toe-‐in gait (dashed black line). A toe-‐out gait of approximately 30 degrees significantly reduced the magnitude of the second peak of the adduction moment. ......................................................................................................120
Figure 37: From Lin et al., 2001, normal gait is represented by the solid black line, toe-‐out gait by the dashed black line and toe-‐in by the dotted black line. The toe-‐out gait waveform (dashed-‐line) is very similar to the two case studies in the present study, particularly S04........................................................................................................................................................................................120
xv
Figure 38: The average frontal angle as calculated relative to vertical for both the obese and healthy-‐weight groups. The obese have an abducted knee position that persists through stance despite adduction motions up to midstance. .............................................................................127
Figure 39: From Lynn et al. (2007). Displayed are individual knee adduction moments for 28 participants in the study from their first visit and the second follow-‐up visit. The lateral OA participant in signified by LOA and a dark dashed line, whereas MOA and a dark solid line signify the medial OA participant. All other participants, without OA, are the grey lines........................................................................................................................................................................................146
Figure 40: Obese group frontal angle throughout the stance phase at all three walking speeds. .......................................................................................................................................................................187
Figure 41: Healthy-‐weight group frontal angle throughout the stance phase at all four walking speeds.......................................................................................................................................................188
Figure 42: Obese group sagittal angle throughout the stance phase at all three walking speeds. .......................................................................................................................................................................188
Figure 43: Healthy-‐weight group sagittal knee angle throughout the stance phase at all four walking speeds.......................................................................................................................................................189
Figure 44: Obese group transverse knee angle throughout the stance phase at all four walking speeds.......................................................................................................................................................190
Figure 45: Healthy-‐weight group transverse knee angle throughout the stance phase at all four walking speeds.............................................................................................................................................190
Figure 46: Obese group frontal knee moment across the stance phase at all three walking speeds. .......................................................................................................................................................................191
Figure 47: Healthy-‐weight group frontal knee moment across the stance phase at all four walking speeds.......................................................................................................................................................192
Figure 48: Obese group sagittal knee moment across the stance phase at all three walking speeds. .......................................................................................................................................................................193
Figure 49: Healthy-‐weight group sagittal knee moment across the stance phase at all four walking speeds.......................................................................................................................................................193
Figure 50: Obese group transverse knee moment across the stance phase at all three walking speeds.......................................................................................................................................................194
Figure 51: Healthy-‐weight group transverse knee moment across the stance phase at all four wal7ing speeds.............................................................................................................................................194
Figure 52: Changes in knee adduction moment impulse as walking speed increases for both participant groups................................................................................................................................................195
Figure 53: The frontal moment waveform for each individual participant in the obese group at the self-‐selected walking speed. All eight participants are listed by a three-‐digit code name in the legend, including the two case studies of S01 and S04...............................................196
xvi
Figure 54: The frontal moment waveform for each individual participant in the healthy-‐weight participant group. All eight participants are listed by a three-‐digit code name in the legend.........................................................................................................................................................................197

xvii
List of Equations
Equation 1: CKAL ...................................................................................................................................................43
Equation 2: Peak Frontal Moment Prediction Equation ....................................................................109
Equation 3: Adduction Impulse Prediction Equation..........................................................................110
Equation 4: Peak Frontal Moment Prediction Equation 2.................................................................111
Equation 5: Adduction Moment Prediction Equation 2 .....................................................................112

1
I. Introduction
Obesity has been identified as an increasingly significant public health concern in
Canada and around the world. By 2009, nearly one quarter of Canadians over the
age of 18 were obese (Shields et al., 2010). Between 1981 and 1996, rates of obesity
rose to 17 and 15 percent for boys and girls, respectively, among children and
adolescents (Carriere, 2003). Childhood obesity is especially problematic, as obese
children are more likely to become obese adults (Perez, 2003). Among younger
adults, aged 20-‐39, obesity rates have risen over the last 30 years from 7 and 4
percent, to 19 and 21 percent for males and females (Shields et al., 2010). Obesity
has many associated co-‐morbidities including cardiovascular disease, type 2
diabetes, psychosocial problems and musculoskeletal disorders such as
osteoarthritis (OA) and premature mortality (Orpana et al., 2007). The increasing
rates of obesity and the younger ages at which it is occurring make preventing this
condition a health priority. Of biomechanical interest is the potential increase in
cases of OA of the knee as a consequence of obesity.
According to Newtonian Laws of Motion, the greater body mass that defines
obesity concurrently increase the force on joints, especially those of the lower
extremity (Hills et al., 2002). Over time, this high stress could theoretically promote
degeneration of the joint structures, particularly at the knee (Andriacchi et al.,
2004). A commonly used in vivo calculation of lateral to medial load distribution
within the knee joint is the knee adduction moment during the stance phase
(Andriacchi et al., 2009; Maly, 2008). Under normal knee joint loading, the
alignment of the lower limb causes the line of action of the ground reaction force to
2
pass through the medial compartment of the knee, allocating a greater percentage of
the joint load toward this compartment (Hunter et al., 2009). This bias toward
medial loading adducts the knee joint (Hurwitz et al., 1998; Jackson et al., 2004).
Under pathological conditions such as OA of the knee, the knee adduction moment
during stance phase has been successfully used to characterize abnormal joint
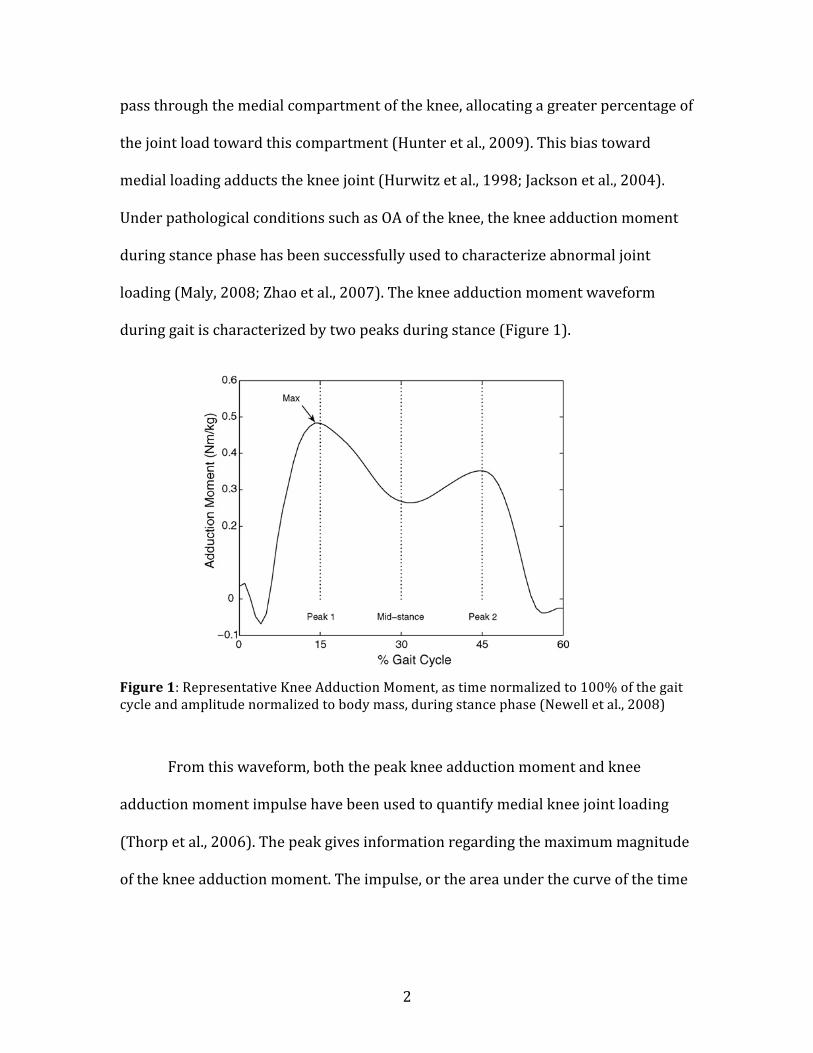
loading (Maly, 2008; Zhao et al., 2007). The knee adduction moment waveform
during gait is characterized by two peaks during stance (Figure 1).
Figure 1: Representative Knee Adduction Moment, as time normalized to 100% of the gait cycle and amplitude normalized to body mass, during stance phase (Newell et al., 2008)
From this waveform, both the peak knee adduction moment and knee
adduction moment impulse have been used to quantify medial knee joint loading
(Thorp et al., 2006). The peak gives information regarding the maximum magnitude
of the knee adduction moment. The impulse, or the area under the curve of the time
(peak 1), the second peak (peak 2), the mid-stance trough(mid-stance) and the overall maximum value (max).Asymptomatic and osteoarthritic subject groups have beencompared using the maximum adduction moment value[1,3–6,15], peak values [2] and the mid-stance value [4].Reporting group differences in terms of discrete measures iscomplicated by the fact that interventions have been found toreduce the adduction moment at certain portions of the gaitcycle. Toe-out gait has been shown to lower the kneeadduction moment in late stance [12], whereas a medialunloading knee brace has been shown to reduce theadduction moment during early stance [9].
Discrete features, although commonly reported in theliterature, are difficult to identify in many subject waveformsand cause group comparisons to be problematic and rathersubjective. An alternative to describing waveforms withdiscrete measures, principal component analysis (PCA) hasbeen shown to be an effective technique for capturingdifferences in the shape (both amplitude and temporalcharacteristics) of gait waveforms [19,20]. Landry et al. [14]demonstrated that differences in the adduction momentbetween moderate osteoarthritic and control subjects can becaptured with principal component analysis. Their studydemonstrated the importance of both the magnitude andshape of the adduction moment waveform in describingosteoarthritic gait.
To our knowledge no study has tried to determine theeffects of different knee coordinate systems in both anasymptomatic and moderate osteoarthritic group. Moreover,no studyhasexaminedhowchanging theknee joint coordinatesystem can influence adduction moment differences betweenthese two groups. It was hypothesized that: (i) changing thebiomechanical model of the knee alters the magnitude andshape of the adduction moment waveform for both asympto-matic and osteoarthritic subjects; (ii) changing the modelaffects the interpretation of differences between the groups.
2. Methods
2.1. Subjects
The subject groups consisted of 44 asymptomatic and 44osteoarthritic subjects. Subjects from both groups were 35years of age or older. The asymptomatic subjects had nohistory of knee pain and were recruited through postings onthe Dalhousie University campus. Subjects with moderateosteoarthritis were recruited from the Orthopaedic andSports Medicine Clinic of Nova Scotia. All moderate OAsubjects were diagnosed clinically and radiographically.Subjects were excluded from the study if they had otherforms of arthritis, gout, neuromuscular disorders, trauma ormajor surgery to the lower limb, or a history of stroke orcardiovascular disease.
2.2. Gait
Gait data were collected for five walking trials for eachsubject.Each subjectwas instructed towalk in a straight line ata self-selected speed.The three-dimensional orientation of thelower limb of interest was tracked using the Optotrak 3Dmotion analysis system operating at 100 Hz (NorthernDigitalInc.,Waterloo,ON). Themarkerswere placedover the greatertrochanter, lateral epicondyle, and lateralmalleolusalongwitha cluster of threemarkers on each of the foot, shank and femur.Virtual points were digitized to identify bony land-marks,including: medial epicondyle, fibular head, tibial tuberosity,medial malleolus, secondmetatarsal head and calcaneus [21].Ground reaction forces and moments (collected at 1000 Hz)were recorded from an AMTI force platform (AdvancedMechanical Technology Inc., Watertown, MA).
2.3. Kinetics
The adduction moment at the knee was calculated usingthe kinematic and kinetic data gathered during the walkingtrials. Ground reaction forces and moments, along withsegment weights and inertial properties were used tocalculate the resultant external joint moment at the knee [22]using custom software written in MatlabTM.
Moments were amplitude normalized to body mass(Nm/kg), as is commonly reported [3,14,19,23,24]. Inaddition the moments were reported for the stance phaseonly and were time normalized from heel strike to toe-off(0–60% gait cycle). The external knee joint moment wasinitially calculated in the 3D global coordinate system of thelab. To describe the adduction moment in an anatomicallyrelevant frame of reference, the moment was described inthree different coordinate systems in the lower limb. Thesecoordinate systems correspond to the three models regularlyused in the literature. The three models that were used tocalculate the adduction moment included a 2D model andtwo 3D model (a floating axis model and a tibial axis model)representations (Fig. 1).
R.S. Newell et al. / Gait & Posture 27 (2008) 485–492 487
Fig. 2. Representative knee adduction moment waveform. Peak 1 occurs at
15% gait cycle, mid-stance occurs at 30% gait cycle and peak 2 occurs at
45% gait cycle. Max is the maximum value over the whole adduction
moment waveform. (Note: in the figure the max value coincides with peak 1,but this is not always the case.)
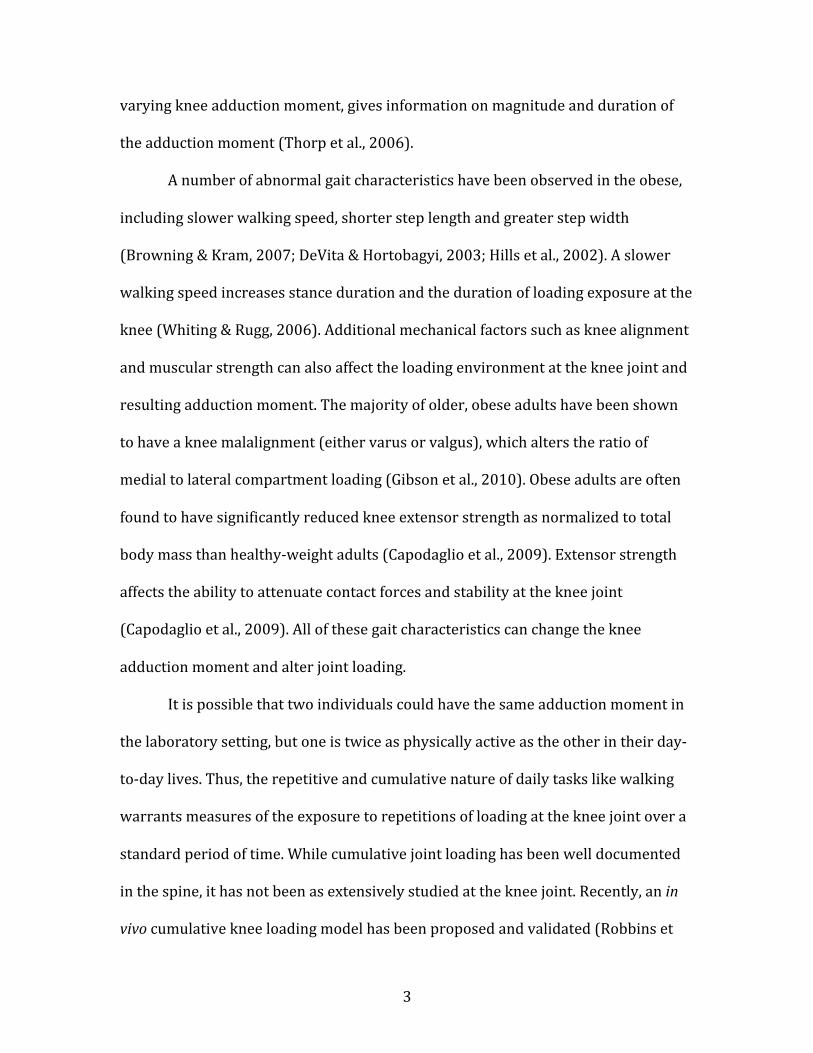
3
varying knee adduction moment, gives information on magnitude and duration of
the adduction moment (Thorp et al., 2006).
A number of abnormal gait characteristics have been observed in the obese,
including slower walking speed, shorter step length and greater step width
(Browning & Kram, 2007; DeVita & Hortobagyi, 2003; Hills et al., 2002). A slower
walking speed increases stance duration and the duration of loading exposure at the
knee (Whiting & Rugg, 2006). Additional mechanical factors such as knee alignment
and muscular strength can also affect the loading environment at the knee joint and
resulting adduction moment. The majority of older, obese adults have been shown
to have a knee malalignment (either varus or valgus), which alters the ratio of
medial to lateral compartment loading (Gibson et al., 2010). Obese adults are often
found to have significantly reduced knee extensor strength as normalized to total
body mass than healthy-‐weight adults (Capodaglio et al., 2009). Extensor strength
affects the ability to attenuate contact forces and stability at the knee joint
(Capodaglio et al., 2009). All of these gait characteristics can change the knee
adduction moment and alter joint loading.
It is possible that two individuals could have the same adduction moment in
the laboratory setting, but one is twice as physically active as the other in their day-‐
to-‐day lives. Thus, the repetitive and cumulative nature of daily tasks like walking
warrants measures of the exposure to repetitions of loading at the knee joint over a
standard period of time. While cumulative joint loading has been well documented
in the spine, it has not been as extensively studied at the knee joint. Recently, an in
vivo cumulative knee loading model has been proposed and validated (Robbins et

4
al., 2009a). Cumulative knee adductor loading has been measured using average
daily steps taken, as measured by an accelerometer, and the load and duration of the
average knee adduction moment angular impulse per step documented in a gait
laboratory. Considering the slower natural walking speed often selected by obese
subjects, the knee adduction moment impulse is a more logical choice for examining
knee joint loading over the peak knee adduction moment as it accounts for the
longer duration of loading exposure at the knee (Hills et al., 2002; Thorp et al.,
2006). This cumulative knee adductor load parameter has the potential to be useful
in the understanding of the mechanisms behind musculoskeletal disorders in people
with obesity. As the most common physical activity done repetitively on a daily
basis, walking may highlight the biomechanical link that predisposes the obese to
musculoskeletal disorders such as OA later in life.
Methods that identify mechanical factors that predispose obese individuals
to musculoskeletal disorders before irreversible joint damage has occurred need to
be studied. Young adults are theoretically in the prime of their musculoskeletal
conditioning (Lynch et al., 1999; Petrella et al., 2005), however obesity may
undermine this development and predispose young adults to OA of the knee. The
goal of this project is to identify biomechanical abnormalities associated with
obesity that may serve as risk factors for the development of OA. The results of this
research could lay the foundation for developing specific preventative measures to
address these abnormalities. This includes prioritizing weight loss before the onset
of musculoskeletal pathology, understanding the biomechanical gait factors
associated with obesity that go beyond increased body mass and identifying the

5
most prominent and problematic biomechanical abnormalities resulting from
obesity.
1.1 Investigative Purpose
The purpose of this study was to identify kinematic, kinetic and cumulative loading
differences at the knee joint between an obese sample of young adults and an age,
height and sex matched sample of healthy-‐weight adults during walking. Secondary
objectives were to relate abnormal kinematics and kinetics to dynamic knee
alignment and knee extensor torque.
1.1.1 Study I – Kinematics and Kinetics at the Knee Joint During Walking
Study I aimed to identify differences in kinematics and kinetics between a healthy
obese and matched healthy-‐weight young adult population in the performance of
walking at three different speeds – self-‐selected natural, 15% faster and 15% slower
speed. In addition, this study aimed to identify differences between groups at
matched walking speeds – the natural walking speed of the obese participants for
both groups -‐ thus eliminating the effect self-‐selected differences in walking speed
may have had on kinematic and kinetic outcomes. Finally, Study I aimed to
determine the effect of knee alignment and knee extensor torque on the peak knee
adduction moment in each group.
1.1.2 Study II – Cumulative Knee Joint Loading
Study II aimed to identify the cumulative knee adductor load (CKAL) between
healthy-‐weight and obese participants by applying a CKAL model using the
6
measured knee adduction moment impulse during walking at three different gait
speeds and daily physical activity as measured by an accelerometer. As well, this
study aimed to analyze the contribution of the separate components of knee
adduction moment impulse and daily physical activity to the resulting CKAL in both
participant groups. Finally, Study II aimed to determine the effect of knee alignment
and knee extensor torque on the knee adduction moment impulse in each group.
1.2 Hypotheses
1.2.1 Study I – Kinematics and Kinetics at the Knee Joint During Walking
It was hypothesized that the obese group would have a slower self-‐selected walking
speed than the healthy-‐weight group. The obese cohort would also demonstrate
greater dynamic knee malalignment, reduced maximal knee extensor torque as
normalized to total body mass and reduced self-‐reported physical function
compared to the healthy-‐weight controls.
It was hypothesized that participants who were obese would display reduced
knee joint range of motion in the sagittal plane and greater knee joint range of
motion in the frontal and transverse planes compared to the age-‐, height-‐ and sex-‐
matched controls at all three walking speeds. Despite a slower walking speed, the
obese participants would produce greater absolute maximal ground reaction forces
and knee moment peaks than their healthy-‐weight matches. In the anterior-‐
posterior ground reaction force and the sagittal plane knee moment, a significantly
greater minimum peak is also hypothesized to occur.
It was hypothesized that these same directional group differences would still
be observed at the matched walking speeds. The reduced ranged of motion in the

7
sagittal plane and greater range of motion in the frontal and transverse planes
would persist in the obese group when compared to the healthy-‐weight group.
However, due to the healthy-‐weight group walking at a slower speed, the magnitude
of the group differences in GRF and knee moments would increase at the matched
speed.
It was hypothesized that the peak knee adduction moment would be affected
by the clinical outcome variable of self-‐reported physical function and mechanical
outcomes of dynamic knee alignment and maximal knee extensor torque.
1.2.2 Study II – Cumulative Knee Joint Loading
It was hypothesized that the obese group would have a greater knee adduction
moment impulse than the sex-‐, age-‐ and height-‐matched healthy-‐weight group. This
will be due to a greater magnitude of the knee adduction moment waveform and a
longer stance phase in the obese group. Compared to the healthy-‐weight group, it
was hypothesized that the obese group would demonstrate lower levels of daily
physical activity as measured in steps per day by an accelerometer. Despite lower
activity levels, the obese group would show a CKAL that is greater than the healthy-‐
weight group because of higher medial knee loads.
It was hypothesized that the knee adduction moment impulse would be
affected by the clinical outcome variable of self-‐reported physical function and
mechanical outcomes of dynamic knee alignment and maximal knee extensor
torque.

8
II. Review of Literature
2.1 Obesity
Obesity has reached epidemic proportions around the world. It is a condition that
does not discriminate. It effects every population and is on the rise, especially in
children (Holm et al., 2001; Catenacci et al., 2009). The International Obesity Task
Force estimates that over 300 million people worldwide are obese (Cannon et al.,
2009). The wide spread, multi-‐factorial nature of overweight and obesity makes it
one of the most difficult public health issues to face our society in recent history.
Obesity is defined by excess weight on the body. It generally occurs when
energy intake exceeds energy expenditure (Palou et al., 2000). It has many potential
causal factors, such as genetics, endocrine and central nervous system diseases such
as Prader-‐Willi syndrome, diet and physical inactivity (Canadian Task Force on the
Periodic Health Examination, 1994). The majority of cases of overweight and
obesity are due to lifestyle factors such as diet and inactivity (Cannon et al., 2009;
Hill et al., 2008)
Obesity is typically defined using the body mass index (BMI), which is
calculated as whole body mass divided by the square of stature in meters (Xu et al,
2008). A BMI of 30-‐40 kg/m2 is considered obese. Above 40kg/m2 is considered
extremely/morbidly obese (Xu et al, 2008). However, obese has also defined as 30-‐
35 kg/m2, with a BMI over 35k kg/m2 being morbidly obese (Holm et al., 2001).
Childhood obesity is also defined using BMI, however the cutoffs change with age of
the developing child (Lee, 2009).

9
While BMI is the easiest to administer, other measures such as skinfolds,
waist circumference and hip-‐to-‐waist ratio are also used to define obesity (Lee,
2009). BMI does not reflect physical fitness. A high BMI can be found in a person
with high percent body fat or a lot of muscle mass (Jackson et al., 2009; Xu et al.,
2008). This can be misleading as one can be characterized as overweight or obese
by the BMI, but in fact be healthy, strong and fit. Use of only BMI to characterize the
overweight or obese subject in scientific research may result in otherwise healthy,
muscularly strong or highly functioning individuals being characterized as
overweight, or even obese. This could, and possibly has, confounded experimental
research, such as the sometimes, poor correlation between BMI and low back pain
in epidemiological literature (Xu et al., 2008). When possible, functional measures of
obesity such as strength-‐to-‐body mass measures, waist circumference or self-‐
reported physical function should be used in addition to BMI to characterize the out-‐
of-‐shape or mobility-‐limited individual (Xu et al., 2008).
2.1.1 Incidence and Prevalence of Obesity
The prevalence of obesity has been rising worldwide (Orpana et al, 2007). The
World Health Organization recognizes obesity as a global epidemic (Holm et al.,
2001). Based on the 2004 Canadian Community Health Survey: Nutrition, nearly
two-‐thirds of Canadian adults are either overweight or obese. According to most
recent survey results, approximately 25 percent of these overweight and obese
Canadian adults fall into the obese category (Shields et al., 2010).
What is even more alarming is that a third of Canadians who were within a
healthy-‐weight range from mid 1994 to 1995 became overweight in the following
10
eight years. Approximately one quarter of those who had been overweight became
obese in that time period (La Petit & Berthelot, 2006). This suggests that a healthy
weight throughout adolescence and young adulthood does not necessarily protect
against obesity later in life, and as we age more of us will join the proportion of
Canadians with an unhealthily excessive body mass. Annual trends of weight gain
are continuing in adult Canadians, shifting the distribution of an already overweight
and obese population toward even greater body masses (Orpana et al., 2007). This
trend will eventually increase the incidence of diseases and disorders associated
with overweight and obesity.
Among young adults in Canada, the rate of obesity is also increasing. From
1986 to 2004, the prevalence of obesity for 18-‐24 year old men and women rose
from 6 to 11 percent and 7 to 12 percent, respectively. Over the same 18-‐year time
period, the rates of obesity for 25-‐34 year old men jumped from 9 to 24 percent. For
women in the same age group, obesity rose from 9 to 17 percent (Shields &
Tjepkema, 2006a). In a recently completed Canadian Health Measures Survey, 19
and 21 percent of Canadian men and women between the ages of 20 and 39 had a
BMI over 30 in 2009. From the same survey, waist circumference measures of
Canadian adults between the ages of 20 and 39 placed 21 and 31 percent of
Canadian men and women in a category of high risk for health problems (Shields et
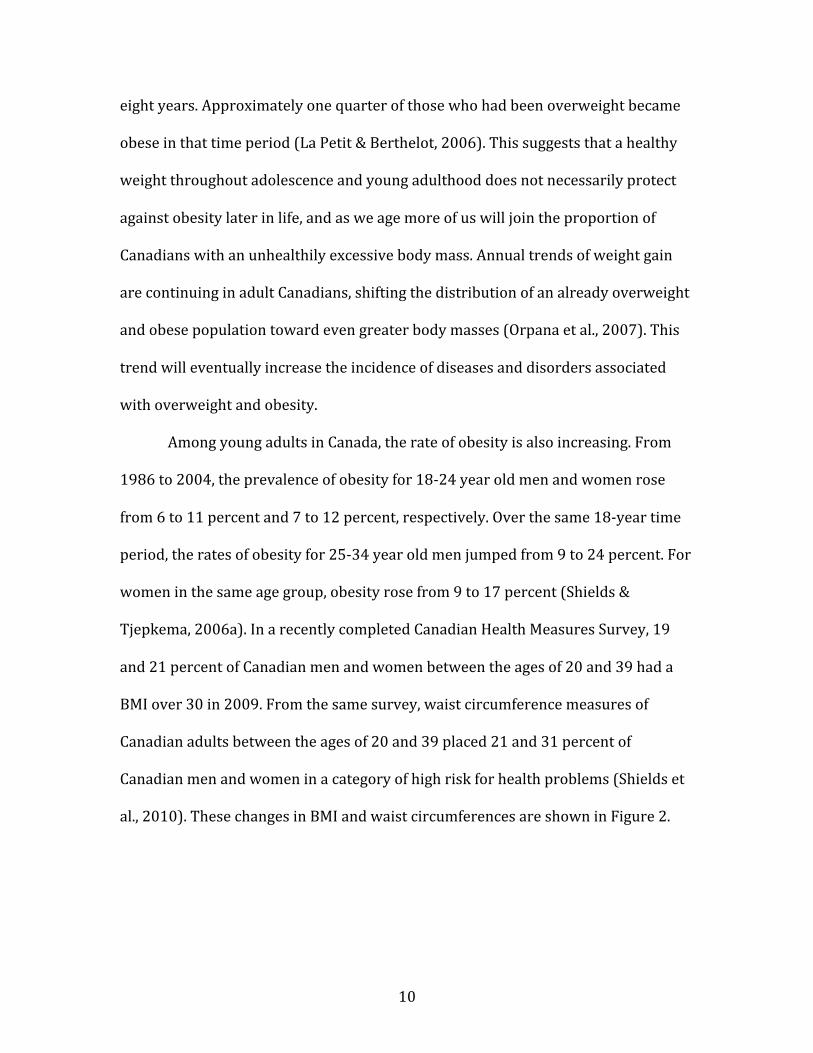
al., 2010). These changes in BMI and waist circumferences are shown in Figure 2.
11
Figure 2: From Statistics Canada (Shields et al., 2010), the percentage of Canadian adults with waist circumferences that place them at a high health risk and BMI’s that place them in the obese category.
This percentage of younger adults with a waist circumference indicative of a
high risk for health problems is quadruple that observed in a similar national survey
nearly 30 years ago (Shields et al., 2010). The obese adult population poses concern
for the younger generation, as children of obese parents are very likely to become
obese themselves (Carriere, 2003). In most situations, childhood onset obesity
carries an earlier onset for morbidity and mortality over the lifespan than adult
onset obesity (Capodaglio et al., 2009; Lee, 2009).
Obesity related diseases will eventually become a serious threat to national
health systems, especially if these disorders occur in early life and continue for a
throughout the life span (Capodaglio et al., 2009). Obesity will have a serious
economic burden around the world due to paid sick leave, life insurance, disability
!Statistics Canada, Catalogue no. 82-003-XPE • Health Reports, Vol. 21, no. 1, March 2010!"#$%&&'()'*+$+,"+$'+,-.#&'/'0%&%+123'+1#"2.%
!"##$%&'()*&+$*,-$#,.$*/01*&2*341($,#12'5*6,%*,%5*726,%*,#$*2-$#7$8.+&*,%5*+,-$*&+$*9,6$*:25(*;26<298&82%*<#2!*'$*,9* &+29$* 7+2* 7$#$* ,.$5* =0* ($,#9* 2#*2'5$#* 8%* >4?>@* * AB* &+$9$* &#$%59* ;2%&8%"$*B2#* ,%2&+$#* /C*($,#9)* +,'B* 2B*6,'$9* ,%5*B$6,'$9* 2-$#* &+$* ,.$* 2B* =0* ($,#9* 78''*:$*2:$9$*DEFA*30*G.H6/*2#*62#$I)*78&+*;266$%9"#,&$* 8%;#$,9$9* 8%* &+$*<$#92%,'*,%5*$;2%268;*:"#5$%*2B*,-285,:'$*%2%1;266"%8;,:'$*589$,9$@**J8BB$#$%;$9*8%*&+$*,$#2:8;*!*&%$99*&$9&*
<#2&2;2'9* "9$5* 8%* &+$* !KL* ,%5* !MFL*6,G$* 58#$;&* ;26<,#892%9* 58B!*;"'&)* ,%5*B2#*&+89*#$,92%)*#$9"'&9*7$#$*%2&*;26<,#$5*8%*&+89*9&"5(@**N+89*7,9*%2&*&+$*;,9$*B2#*&+$* "*$O8:8'8&(* ,%5* 6"9;"',#* 9&#$%.&+*&$9&9@* * K'$O8:8'8&(* D98&1,%51#$,;+I* ,62%.*6,'$9* ,%5* B$6,'$9* ,.$5*/0* &2* 34*($,#9*,%5* 6"9;"',#* 9&#$%.&+* D.#8<* 9&#$%.&+I*B2#*6,'$9* ,%5* B$6,'$9* 8%* &+$* /01&21C41($,#*,.$* #,%.$*5$;#$,9$5@* * A%*>4?>)* &+$*&(<8;,'*=C1($,#12'5*6,%*,%5*726,%*+,5*.#8<*9&#$%.&+*-,'"$9*2B*>0=*G.*,%5*P/*G.)*#$9<$;&8-$'(@**N+$9$*-,'"$9*,#$*>0*G.*,%5*P*G.* D,#2"%5*>0QI* '27$#* 8%* &+$* &(<8;,'*=C1($,#12'5*2B*&25,(@**N$6<2#,'*;+,%.$9*8%*.#8<*9&#$%.&+*2B*&+89*6,.%8&"5$*,&*&+$*<2<"',&82%*'$-$'*,#$*6$,%8%.B"'@**N2*<"&*&+89*8%&2*;2%&$O&)*&+$*#$9"'&9*2B*,*/C1($,#*<#29<$;&8-$*;2+2#&*9&"5(*2B*.#8<*9&#$%.&+*,%5*<+(98;,'*589,:8'8&(*#89G*D9";+*,9*9'27*7,'G8%.* 9<$$5)* "%,:'$* &2* 9&,%5* B#26*;+,8#I* 8%* 6855'$1,.$5* 6,'$9/R* B2"%5*&+,&* :$&7$$%1.#2"<* 58BB$#$%;$9* 8%* .#8<*9&#$%.&+* &+,&* 7$#$* ;26<,#,:'$* &2* &+$*&$6<2#,'*;+,%.$9*:$&7$$%* &+$*!KL*,%5*&+$* !MFL* 7$#$* ,992;8,&$5* 78&+* ,:2"&*,* &72B2'5* 8%;#$,9$5* #89G* 2B* 5$-$'2<8%.*<+(98;,'* 589,:8'8&(* 2-$#* &+$* B2''271"<*<$#825@**
"#$#%&%#'()N+$* &72* 629&* 86<2#&,%&* '868&,&82%9* 2B*&+89* 9&"5(* 7$#$* &+$* 9;#$$%8%.* ;#8&$#8,*"9$5*B2#*&+$*-,#82"9*!MFL*!*&%$99*&$9&9*,%5*&+$*%2%1#$9<2%9$*#,&$@*N+$* $O;'"982%9* 86<29$5* &2* $%9"#$*
#$9<2%5$%&*9,B$&(*;2"'5*+,-$*:8,9$5*&+$*9,6<'$@* * A%* <,#&8;"',#)* :$;,"9$* 2B* &+$*9;#$$%8%.*S"$9&82%9*2%*+$,'&+*;2%58&82%9)*"%!*&*8%58-85",'9*72"'5*:$*62#$*'8G$'(*&2*+,-$*:$$%*9;#$$%$5*2"&@* *!2%9$S"$%&'()*&+$*!*&%$99*5,&,*6,(*:$*62#$*B,-2"#,:'$*
*#+,-./01.-2.(%&+./3#%4/),5'6%#$&7/4.&7%4/5.(.!/%/-&%#(+)/8'-/).7.2%.9/&(%4-'6'$.%-#2/$.&),-.):/5;/).</&(9/&+./+-',6:/4',).4'79/6'6,7&%#'(/&+.9/0=/%'/>!/;.&-):/?&(&9&:/@!A@/&(9/0==BC0==!
* signifi cantly higher than estimate for 1981 (p<0.05) E use with caution (coeffi cient of variation 16.6% to 33.3%)!"#$%&'( 1981 Canada Fitness Survey; 2007-2009 Canadian Health Measures Survey.
9";+*,9*,*5$;#$,9$*8%*6,O86,'*+$,#&*#,&$*,%5*6"9;'$*6,99)* ,'92* '8G$'(* ;2%:"&$*&2*&+$*,.$*58BB$#$%;$*8%*,$#2:8;*!*&%$99@CR**T,&82%,''(*#$<#$9$%&,&8-$*5,&,*2%*,$#2:8;*!*&%$99* +,-$* :$$%* 2:&,8%$5* 8%* 2&+$#*;2"%$9)* 9";+* ,9* &+$* U%8&$5* L&,&$9)C3**:"&* 58BB$#$%;$9* 8%* 9&"5(* <#2&2;2'9* DB2#*$O,6<'$)* $O;'"982%* ;#8&$#8,)* !*&%$99* &$9&*$6<'2($5)*'27*!*&%$99*;"&1<28%&9I*6,G$*8&*58B!*;"'&* &2*;26<,#$*!MFL*#$9"'&9*78&+*&+$9$*2&+$#*;2"%$9@K2#* $,;+* 2B* &+$* &+#$$* ,.$* .#2"<9*
$O,68%$5)* 6$,%* "*$O8:8'8&(* D98&1,%51#$,;+I*-,'"$9*7$#$*+8.+$#*,62%.*B$6,'$9)*7+8'$* 6"9;"',#* 9&#$%.&+* D.#8<* 9&#$%.&+I*,%5* 6"9;"',#* $%5"#,%;$* D<,#&8,'* ;"#'1"<9I* 9;2#$9*7$#$* :$&&$#* 8%*6,'$9@* * N+89*<,&&$#%* 89*;2%989&$%&*78&+*$,#'8$#* 9&"58$9*8%*!,%,5,C0*,%5*$'9$7+$#$@C>1C3**N+$* !MFL* 5,&,* 2%* 6"9;"'29G$'$&,'*
!*&%$99)*,&*'$,9&*B2#*.#8<*9&#$%.&+)*,<<$,#*&2*:$*;26<,#,:'$*&2*&+29$*2:&,8%$5*8%*2&+$#*;2"%$9@* * K2#* 8%9&,%;$)* 8%* ,* %,&82%,''(*#$<#$9$%&,&8-$* ;2+2#&* 2B* C31($,#12'5*
E#8&89+*,5"'&9)*6$,%*.#8<*9&#$%.&+*-,'"$9*D9%.$9&*+,%5*2%'(I*7$#$*=?*G.*8%*6,'$9*,%5* /R* G.* 8%* B$6,'$9@C?* * K2#* C31($,#12'5* !MFL* <,#&8;8<,%&9)* &+$* 6$,%* .#8<*9&#$%.&+* -,'"$9* B2#* &+$* 9%.$9&* +,%5*7$#$*=R*G.*8%*6,'$9*,%5*/P*G.*8%*B$6,'$9@**V''* B2"#* 6$,9"#$9* 2B* ,58<298&(* ,%5*
B,&* 589:"&82%* 8%;#$,9$5* ;2%985$#,:'(*98%;$* >4?>@* * V-$#,.$* EFA* #29$* :(*,<<#2O86,&$'(* /* "%8&9* B2#* 6,'$9* ,;#299*,''* ,.$* .#2"<9@* * N+$* 8%;#$,9$* 7,9*9868',#* B2#* 6855'$1,.$5* B$6,'$9)* :"&* ,*',#.$#* 8%;#$,9$* 2B* 3* "%8&9*7,9* 2:9$#-$5*B2#*(2"%.$#* ,%5*2'5$#* B$6,'$9@* *F,'$9W*,-$#,.$* 7,89&* ;8#;"6B$#$%;$* 8%;#$,9$5*:(*C*;6*2#*62#$)*,%5*B$6,'$9W)*:(*>0*;6*2#*62#$@**N+$*,<<,#$%&*9$O*58BB$#$%;$*8%*;+,%.$9* 8%* 7,89&* ;8#;"6B$#$%;$* ,62%.*!,%,58,%*,5"'&9*52$9*%2&*68##2#*&#$%59*8%*&+$*U%8&$5*L&,&$9)*7+$#$*;+,%.$9*8%*7,89&*;8#;"6B$#$%;$*98%;$*&+$*',&$*>4?09*7$#$*9868',#*8%*6,'$9*,%5*B$6,'$9*D=@=*-$#9"9*C@0*;6I@C=***
!"#$%&'#(')*+,(,-',(% high risk)
."/, 0,*"/,
20 to 39 years
40 to 59 years
60 to 69 years
1234&*"$$&#-3,5(% obese)
20 to 39 years
40 to 59 years
60 to 69 years
1234&'2*62$#%#2-(% fair/needs improvement)
20 to 39 years
40 to 59 years
60 to 69 years
010203040506070 0 10 20 30 40 50 60 70
1981 2007-20097 7
33*
24*
21*
65*
47*
31*
17E
13
4
15E
13
4
26
18
6
29*
36*
47*40*
33*
20*
34*
27*
19*
52*
38*
21*
15E
11
5
14E
12
7
23
15
5

12
insurance, obesity related physician visits and hospital stays (Holm et al., 2001).
Addressing overweight and obesity should be a health and socioeconomic priority.
2.1.2 Co-‐morbidities Associated with Obesity
Among the most commonly reported co-‐morbidities associated with
overweight/obesity are cardiovascular diseases, elevated cholesterol and type-‐2
diabetes (Holm et al., 2001; Guh et al., 2009). Obesity also increases risk for most
cancers, gallbladder disease, asthma and obstructive sleep apnea (Guh et al., 2009).
Excess body weight also appears to alter the immune system, making obese people
more susceptible to infections and disease (Holm et al., 2001). The obese are more
likely to suffer from psychosocial problems such as negative self-‐image, problems
with social acceptance and poorer quality of life, decision-‐making abilities and
interactions with peers (Carriere, 2003; Lee, 2009; Whitaker et al., 1997). All of
these risks become even greater and occur at younger stages of adulthood for obese
children and adolescents, including earlier adult mortality (Carriere, 2003; Holm et
al., 2001; Lee, 2009).
Of particular interest to the present project are a number of musculoskeletal
disorders can develop from obesity. Two of the most common are OA of the knee
and chronic back pain (Guh et al., 2009; Shiri et al., 2008). The relationship between
obesity and musculoskeletal disorders and the pathways that lead to muscular and
skeletal disease is still not well understood (Hills et al., 2002). Obesity has been
indicated as a causal factor for OA and possibly even plays a role in the speed of
progression of the disease after onset (Issa & Sharma, 2006; Jackson et al., 2004).
Obesity may lead to OA of the knee by greater loading on the joint from excess body
13
mass, abnormal gait mechanics or both (Andriacchi et al., 2004; Issa & Sharma,
2006; Murphy et al., 2006).
2.1.3 Prevention of Obesity-‐Related Osteoarthritis of the Knee and Intervention in Already Established Cases
Two of the primary and modifiable contributors to weight gain are poor nutrition
and physical inactivity (Shields, 2006). With respect to the risk of developing OA of
the knee, weight loss interventions improve the loading environment at the knee
joint and can reduce the likelihood of developing the disease. While examining 142
overweight or obese adults over an 18-‐month trial period, Messier et al., (2005)
demonstrated that, for every pound of body mass lost, there was a four-‐pound
reduction in the load at the knee joint per step. Weight loss has also been associated
with a decrease in the chance of developing osteoarthritis and improvements in
physical function (Christensen et al., 2005; Miller et al., 2006). A weight loss of
approximately 5kg of body mass over a ten-‐year period can reduce the chance of
developing OA in the knee by 50% (Felson et al., 1992). Weight loss results in a
reduction of the mechanical stress on the joints of the lower extremity.
Use of a pedometer has been shown to increase the likelihood of physical
activity and subsequent weight loss (Bravata et al., 2007). However, in obese people
undertaking or beginning an exercise program, caution must be taken, as there is
the possibility that even light physical activity such as walking may be too
exhausting and cumbersome for obese individuals (Mattsson et al., 1997).
While the effect of weight loss on preventing incident OA has been verified
repeatedly, the relationship is less clear in already established cases of OA in the

14
obese. Of the research studying the effect of obesity on the progression of already
established OA, the results have been contradictory (Dieppe et al., 1997; Niu et al.,
2009; Reijman et al., 2007). A number of research papers have purported that the
relationship may be negated by alignment of the knee joint. Obesity may only
negatively affect OA progression in malaligned knees (Felson et al., 2004; Messier et
al., 2009; Sharma et al., 2001). Despite this, weight loss does improve physical
functioning in adults with OA of the knee (Messier et al., 2004; Miller et al., 2006;
Sevick et al., 2009). This stresses the magnitude of the effect of weight loss on
mechanical outcomes. It is highly important to identify obese individuals who
display characteristics that place them at high risk for OA of the knee and implement
weight loss interventions prior to the onset of the disease.
Muscle strengthening is another method to prevent and intervene in obesity
and OA. Muscle weakness is a mediating factor in difficulty performing daily
activities and eventual disability (Stenholm et al., 2009). Sartorio and colleagues
(2004b) showed that older, obese individuals with lower muscle power outputs per
kilogram displayed greater functional declines. Decreased functional ability is
associated with obesity (Rejeski et al., 2008). Not only can improving muscular
strength promote a healthy lifestyle and prevent the onset of obesity, but it can also
prevent decreasing functional status in those who are already obese. However,
weight loss may need to occur first, as obesity can present biomechanical limitations
to muscle power development in some physical activities (Lafortuna et al., 2005).
Of particular concern to the present project is the increase in OA of the knee
due to obesity. Obesity has been strongly linked to the development of OA of the

15
knee (Felson et al., 1992). Reducing the occurrence of overweight and obesity, as
well as reversing the effects of weight gain prior to the onset of biomechanical knee
pathology is paramount to diminishing the prevalence of new cases of OA of the
knee. Even after the development of OA, weight loss can still provide symptomatic
relief from OA and possibly slow the progression of the disease (Messier et al., 2009;
Sharma et al., 2001). Weight loss is rarely recommended to persons suffering from
OA, despite the possible benefits in physical function and pain management (Ganz et
al., 2006). Weight loss and its associated outcomes for individuals living with OA
have high economic efficacy (Hurley et al., 2007; Sevick et al., 2009). Unfortunately,
older adults with OA are more likely to be placed on medications for pain and
inflammation or referred to an orthopedic surgeon than provided with a supervised
exercise program (Ganz et al., 2006; Messier et al., 2004; Messier et al., 2009;
Reijman et al., 2007).
2.2 The Knee Joint
2.2.1 Anatomy and Function of the Tibiofemoral (Knee) Joint
The knee joint is known as the tibiofemoral joint. The proximal bone of the knee
joint is the femur. At its distal end, the femur becomes broadened where the medial
and lateral epicondyles are formed. The other bone that forms the tibiofemoral joint
is the distal tibia. At the proximal end of the tibia are two plateaus, one medial, and
one lateral. The medial and lateral condyles of the femur and the medial and lateral
plateaus of the tibia form two articulating surfaces at the knee joint. The medial
tibial plateau is approximately 50% larger than the lateral. This accommodates the
longer medial femoral condyle (Anderson, 2003; Whiting & Rugg, 2006).

16
The third articulation at the knee joint comes from the patellofemoral joint.
The patella is a triangular shaped bone, commonly called the kneecap. The patella
articulates with the patellofemoral groove, located between the two femoral
condyles. The patella protects the anterior surface of the knee and improves the
leverage of the quadriceps muscles by increasing the angle of pull of the patellar
tendon on the tibia (Anderson, 2003; Whiting & Rugg, 2006).
The knee is a synovial joint, and is the most complex of the major synovial
joints. Synovial joints have a synovial joint cavity encapsulated by a fibrous joint
capsule that is filled with synovial fluid. A smooth layer of hyaline type cartilage
covers the articulating surfaces of the knee joint, which allows the joint to move
smoothly and freely (Whiting & Rugg, 2006). One major purpose of cartilage is to
absorb shock due to the weight bearing activities we perform every day – from
walking to running to jumping to squatting. The synovial fluid, which is produced by
the synovial membrane, lubricates the knee joint and reduces friction between
articular surfaces and assists with the absorption of compressive loads (Whiting &
Rugg, 2006).
The articulation between the femoral condyles and tibial plateaus is
enhanced by the presence of the menisci. The menisci are two discs of fibrocartilage,
one medial and one lateral that deepen the articular surface. They assist in the
absorption and dissipation of force, lubrication and nourishment of the joint
structures, improve boney fit and help stabilize the knee joint (Anderson, 2003;
Whiting & Rugg, 2006).

17
The knee is classified as a hinge joint. The main movements at the knee joint
are flexion and extension and a limited amount of medial and lateral rotation
(Whiting & Rugg, 2006). Four important ligaments help to stabilize the knee joint
during these motions. Two ligaments, the anterior and posterior cruciate ligaments,
restrict anterior and posterior sliding of the femur with respect to the tibia. The
medial collateral ligament resists medially directed shear and rotational forces
acting on the knee. Similarly, the lateral collateral ligament resists laterally directed
shear forces and contributes to lateral stability of the knee (Anderson, 2003).
The prime muscles involved in knee flexion are the hamstrings:
semimembranosus, semitendinosus and biceps femoris. Gastrocnemius, popliteus,
gracilis and sartorius assist in knee flexion as well. Knee extension is performed
primarily by the four muscles that make up the quadriceps: vastus medialis, vastus
lateralis, vastus intermedius and rectus femoris. Medial rotation is done by the
similar muscle groups that perform knee flexion, while lateral rotation is performed
by biceps femoris (Anderson, 2003; Whiting & Rugg, 2006).
2.2.2 Pathologies of the Knee Joint
The knee joint is susceptible to a number of pathological conditions. Due to its
placement between the two longest bones in the body, coupled with minimal boney
stability, the knee joint is subjected to large and potentially injurious torques
(Anderson, 2003). Under high stress, such as during sporting activities, the knee
joint can undergo acute injuries such as dislocation, fractures, meniscal tears or
ligament rupture. Repetitive strain or age-‐related injuries also occur such as
patellofemoral stress syndrome, patellar tendinitis and osteoarthritis. Chronic
18
injuries become more likely when the joint loading environment is pathological.
This can include varus or valgus alignment, laxity or obesity (Anderson, 2003;
Sharma & Chang, 2009).
Studies of anterior cruciate ligament (ACL) deficient knees and knees
following ACL reconstruction have shown alterations in the ability of the knee joint
to restore normal rotational alignment, leading to an abnormal mechanical loading
environment in the joint. This causes repetitive loading exposures to the knee to be
shifted to a new location. In turn, changes in cartilage thickness and volume have
been observed in this clinical population, which in fact are at high risk for the
development of OA (Andriacchi et al., 2004; Andriacchi et al., 2009).
Overweight and obesity create a pathogenic environment for the knee joint.
Excess body weight increases the absolute load on the knee joint (Browning &
Kram, 2007; McGraw et al., 2000) and alters kinematics and kinetics of daily
activities (Lai et al., 2008; McGraw et al., 2000; Spyropoulos et al., 1991). The
repetitive strain and pathomechanics of this excess weight can be one of the leading
factors in the development of OA of the knee.
2.2.3 Osteoarthritis of the Knee
Osteoarthritis (OA) is a degenerative joint disease. The disease occurs when the
normal repair process in the joint fails to regenerate cartilage properly.
Osteoarthritis is the most common form of arthritis, being present in most people
over the age of 70 and 10% of Canadians (Health Canada, 2003; Murphy et al.,
2006). Women are more likely than men to suffer from OA of the knee. In fact,
women have up to a 1.8 greater chance of developing OA than men. This increased

19
rate of affliction for women is present in all age groups, but the gap increases with
age (Health Canada, 2003; Kaufman et al., 2001). The prevalence of OA also
increases with age. Compared to 13% of women between the ages of 45 and 49,
55% of women 80 years and older have OA (Issa & Sharma, 2006). Internationally,
osteoarthritis has been identified as a growing burden on public health as the global
population becomes older and life expectancy increases. By 2020 osteoarthritis is
expected to become the fourth leading cause of disability (Brooks, 2006; Woolf &
Pfleger, 2003). For this reason, research into the prevention and treatment of
osteoarthritis are urgently needed (Brooks, 2006).
Degeneration is thought to begin as a result of acute trauma or repetitive
strain. There are a number of risk factors for developing OA, including age, sex, joint
injury, repetitive pathological loading. Once OA has developed, nutritional status,
knee alignment and quadriceps strength are among the factors that affect the
progression of the disease (Issa & Sharma, 2006; Jackson et al., 2004; Woolf &
Pfleger, 2006).
Mechanically, OA is thought to be initiated by an alteration and shift in the
normal load bearing sequence at the joint. Different compartments of the knee are
functionally built to bear the stress associated with physical activity in a healthy
joint. However, a shift transfers physical loads to other compartments within the
knee joint. Repetitive stress on the joint in compartments that were never intended
to bear such loads leads to a pathological local weight-‐bearing environment,
including articular surface damage, increased fibrillation of the collagen network

20
and increased friction. Eventually this altered loading is theorized to accelerate the
process of degeneration within the joint (Andriacchi et al., 2004).
One of the most commonly cited risk factors for onset and possibly the
progression of knee OA is overweight and obesity (Figure 3). Excess body weight
increases the stress on the weight-‐bearing joints of the lower extremity (Messier et
al., 2009; Murphy et al., 2006). This appears to be especially true at the knee joint
(Felson et al., 2004; Reijman et al., 2006; Sharma & Chang, 2009; Sturmer et al.,
2000). By increasing the absolute mechanical load at the knee joint and altering gait
kinematics and kinetics, excess weight can deteriorate the internal structures of the
knee joint (Browning & Kram, 2007; Messier et al., 2009).
Figure 3: Flow chart showing the effect of obesity as a factor that can cause and progression OA (Sharma & Chang, 2007)
A number of systemic factors have also been implicated in the role of obesity
in the development and progression of OA, including at the knee (Figure 3). Obesity
has been associated with OA at non-‐weight-‐bearing joints such as the hand (Sharma
paradigm we had previously developed12
(fig 1), greater BMI may amplify and/oraccelerate a cycle of medial tibiofemoralcompartment cartilage loss and varusmalalignment in progressive knee osteo-arthritis, or accelerate a vicious cyclebetween a local factor other than or inaddition to malalignment and kneeosteoarthritis progression.12 This paradigmdescribes why any BMI effect could begreater at the knee than the more generaleffect of a systemic pathway through theleptin route on the hip and other joints.The study by Reijman et al introduces
some fascinating questions. This studyused established and widely applieddefinitions of incident and progressiveosteoarthritis. In their discussion, theauthors rightly note that these defini-tions, although they have been exten-sively validated, are somewhat arbitraryin the continuum that is the naturalcourse of osteoarthritis. Might the resultshave differed if what constitutes incidentosteoarthritis and progressive osteoarthri-tis had been defined using other points inthe radiographic steps between thehealthy joint and the end-stage joint?Might the results have differed if incidentosteoarthritis and progressive osteoarthri-tis had been defined using specialisedmagnetic resonance imaging protocols toassess the joint globally or joint tissuesspecifically, or to quantify cartilage? Suchprotocols have been developed for theknee, but have not been refined for thehip. There is uncertainty about whetherincident and progressive osteoarthritis atthe hip should be defined identically tothe outcomes defined at the knee.Although the approach taken by theauthors is reasonable, do the anatomy,mechanics and function of the hip require
unique radiographic definitions of inci-dent osteoarthritis and osteoarthritis pro-gression? The authors’ ability to look atthe effect of a BMI in the obese range waslimited by the small number of indivi-duals in the population whose weight fellinto this category. Might obesity (ie, BMI.30) increase the risk of incident orprogressive osteoarthritis at the hip? Thestudy’s findings are compelling for over-weight. Will the results differ for obesity?Might there be a subset of people inwhom BMI has a stronger effect at thehip than when the population is consid-ered as a whole?Is it safe for people with hip osteoar-
thritis to gain weight? Of course, no.Reijman et al deliberately examinedimportant questions relating to jointstructure outcomes. There is little in theliterature about the effect of overweightand obesity in the setting of hip arthritison person-relevant outcomes, but reasonsfor people with hip osteoarthritis to avoidexcess body weight are abundant.Overweight and obesity are associatedwith substantial morbidity to other organsystems. Also, excess body weight in thesetting of hip osteoarthritis may increasethe likelihood of incident disability ordisability progression possibly because ofdirect effects, interaction between excessweight and arthritis symptoms and lim-itations, and interaction between excessweight and medical comorbidities.The study by Reijman et al is an
outstanding advance. In the next step,epidemiological investigators should con-sider applying magnetic resonance imagetechniques to assess specific tissue effectstowards an overall goal of further enrich-ing our knowledge of what greater BMIdoes to the hip and the knee, and should
consider studies to elucidate the role ofgreater BMI in disability in people withosteoarthritis in these crucial joints.
Ann Rheum Dis 2007;66:141–142.doi: 10.1136/ard.2006.059931
Authors’ affiliations. . . . . . . . . . . . . . . . . . . . . . .
Leena Sharma, Department of Medicine,Feinberg School of Medicine, NorthwesternUniversity, Chicago, Illinois, USAAlison Chang, Department of Physical Therapyand Human Movement Sciences, FeinbergSchool of Medicine, Northwestern University,Chicago, Illinois, USA
Correspondence to: Dr Leena Sharma, Divisionof Rheumatology, Feinberg School of Medicine,Northwestern University, 240 E Huron, SuiteM300, Chicago, IL 60611, USA; [email protected]
Accepted 29 October 2006
Competing interests: None declared.
REFERENCES1 Reijman M, Pols HAP, Bergink AP, Hazes JMW,
Belo JN, Lievense AM, et al. Body mass indexassociated with onset and progression of osteoarthritisof the knee but not of the hip. The Rotterdam Study.Ann Rheum Dis 2006;66:158–62.
2 Hart DJ, Doyle DV, Spector TD. Incidence and riskfactors for radiographic knee osteoarthritis inmiddle-aged women, the Chingford Study. ArthritisRheum 1999;42:17–24.
3 Felson DT, Zhang Y, Hannan MT, Naimark A,Weissman B, Aliabadi P, et al. Risk factors forincident radiographic knee osteoarthritis in theelderly. Arthritis Rheum, 1997;40, 728–33.
4 Reijman M, Hazes JM, Pols HA, Bernsen RM,Koes BW, Bierma-Zeinstra SM. Role of radiographyin predicting progression of osteoarthritis of the hip:prospective cohort study. BMJ 2005;330:1183.
5 Lane NE, Nevitt MC, Hochberg MC, Hung YY,Palermo L. Progression of radiographic hiposteoarthritis over eight years in a communitysample of elderly white women. Arthritis Rheum2004;50:1477–86.
6 Ledingham J, Dawson S, Preston B, Milligan G,Doherty M. Radiographic progression of hospitalreferred osteoarthritis of the hip. Ann Rheum Dis1993;52:263–7.
7 Hart DJ, Doyle DV, Spector TD. Associationbetween metabolic factors and knee osteoarthritis inwomen: the Chingford Study. J Rheumatol1995;22:1118–23.
8 Davis MA, Neuhaus JM, Ettinger WH, Mueller WH.Body fat distribution and osteoarthritis.Am J Epidemiol 1990;132:701–7.
9 Davis MA, Ettinger WH, Neuhaus JM. The role ofmetabolic factors and blood pressure in theassociation of obesity with osteoarthritis of the knee.J Rheumatol 1988;15:1827–32.
10 Hochberg MC, Lethbridge-Cejku M, Scott WW,Reichle R, Plato CC, Tobin JD. The association ofbody weight, body fatness and body fat distributionwith osteoarthritis of the knee: data from theBaltimore Longitudinal Study of Aging. J Rheumatol1995;22:488–93.
11 Bagge E, Bjelle A, Eden S, Svanborg A. Factorsassociated with radiographic osteoarthritis: resultsfrom the population study 70-year-old people inGoteborg. J Rheumatol 1991;18:1218–22.
12 Sharma L, Lou C, Cahue S, Dunlop DD. Themechanism of effect of obesity in knee osteoarthritis:the mediating role of malalignment. Arthritis Rheum2000;43:568–75.
13 Felson DT, Goggins J, Niu J, Zhang Y, Hunter DJ.The effect of body weight on progression of kneeosteoarthritis is dependent on alignment. ArthritisRheum 2004;50:3904–9.
Obesity
Systemicfactor(s)
Increasedaxial forces
Increasedmedial load
Hand OA Hip OAMedialtibiofemoralOA
Varus malalignment(+other local factors)
Figure 1 Paradigm showing possible relationships 55 between obesity and osteoarthritis at variousjoint sites.
142 EDITORIAL
www.annrheumdis.com
on 23 July 2009 ard.bmj.comDownloaded from
21
et al., 2001). If there is a relationship between obesity and hand OA as has been
suggested in some research, then another factor other than increased axial forces
must be at play. This systemic factor within the joint environment may be derived
from a number of sources, including hormonal (estrogen levels) or biochemical
(serum lipid or uric acid levels) or external (smoking) (Sharma et al., 2001). If it
does exist, then it is likely that it affects all joints that are susceptible to OA,
including the knee. Given that both systemic and increased axial forces may
influence the effect of obesity on knee OA – and that local factors such as alignment
also affect OA in only this joint -‐ the paradigm shown in Figure 3 explains the higher
rates of OA at the knee than other joints.
2.3 Effect of Obesity on Knee Joint Structure and Integrity
Each additional kilogram of body mass increases the compressive load on the knee
joint by approximately 4 kilograms during activity (Messier et al., 2005). Obesity not
only places greater weight on the joints of the lower extremity, but it alters gait
kinematics and kinetics (Browning & Kram, 2007; Lai et al., 2007). Obese children
and adults have flatter feet, possibly caused by a collapse of the longitudinal arch
due to excess body mass (Hills et al., 2002). Obese children have higher rates of
fractures, musculoskeletal discomfort and malalignment in the lower extremity
(Taylor et al., 2006).
Obesity has been associated with greater bone mineral density (Taylor et al.,
2006). Research suggests that increased body mass and increased bone mass may
protect against osteoporosis (MacInnis et al., 2003; Reid, 2002), although this belief
has recently been challenged (Janicka et al., 2007; Taes et al., 2009). Bone
22
remodeling is dependent on exposure to mechanical stress and strain. A positive
relationship exists between lean body mass and bone mass, as bone adapts to the
dynamic load inflicted by muscle forces (Taes et al., 2009). Increased dynamic stress
and strain increases bone turnover and results in increased bone mass. Obesity
increases the stress on a joint through increased passive loads. If a positive
relationship between fat mass and bone mass does exist, it is likely due to increased
mechanical stress on bone contributed by excess whole body mass (Janicka et al.,
2007; Taes et al., 2009). However, other metabolic and hormonal factors may thwart
this relationship (Taes et al., 2009).
Cartilage in the knee joint adapts to the cyclic loading exposure during
physical activity. The thickest cartilage is located in the load bearing areas of the
tibiofemoral articulation, which are in contact during walking and running
(Andriacchi et al., 2009). Typically, the medial compartment of the knee has thicker
cartilage. This is because in a healthy, neutrally aligned knee, the medial
compartment bears a greater proportion of the load (Andriacchi et al., 2004).
Cartilage volume is usually related to body mass and body height (Wearing et
al., 2006b). Theoretically, cartilage should adapt to the amount of stress exposure at
a joint. Therefore, reduced physical activity levels -‐ a casual factor of obesity -‐ can
reduce cartilage thickness. However clinical studies have shown greater cartilage
degeneration at the knee joint when it is exposed to excessive mechanical stress as
well. Therefore, not only does the total magnitude of the stress on the joint affect
cartilage formation and maintenance, so does health and local environment of the
joint (Andriacchi et al., 2004). Issues such as joint age, laxity and alignment all alter

23
the degeneration and synthesis process of cartilage by altering the loading
environment of the knee joint (Andriacchi et al., 2004).
Obesity affects the health of cartilage through a number of possible pathways
that can eventually lead to OA of the knee. Increased knee joint stress due to excess
body mass, as well as altered gait mechanics that shift the knee load to a new
location within the joint capsule, may have a degenerative effect on cartilage. A BMI
over 30kg/m2 has been associated with an increase in knee cartilage defects and
tibial bone enlargement (Ding et al., 2005). Disuse of the knee joint through
inactivity can lead to cartilage degeneration as well (Andriacchi et al., 2009). Indeed,
when physical activity levels were increased in a cohort at high risk for
osteoarthritis of the knee, cartilage metabolism improved, suggesting ability for
cartilage to adapt, even in pathological joint conditions (Roos & Dahlberg, 2005).
Reduced physical activity causes increases in intermuscular adipose tissue
and significant strength losses in thigh musculature, both of which are associated
with physical limitations and reduced strength in older adults (Manini et al., 2007).
Overweight and obese children have been shown to have an impeded lower limb
strength and power in their performance of vertical and standing long jumps
(Riddiford et al., 1998). Overweight and obese children have to move a greater body
mass against gravity, impeding lower limb strength and power scores (Hills et al.,
2002). These differences may effect the development of neuromuscular abilities and
lead obese children to adopt modified neuromuscular programs. In the long-‐term,
muscular problems could develop from performing daily physical tasks using
altered neuromuscular programs (Hills et al., 2002; Riddiford et al., 1998).

24
Obesity may also lead to OA by altering the metabolic environment of the
knee joint. A number of metabolic factors have been implicated in cartilage
degeneration and the development of OA, including serum lipids, glucose, body fat
distribution or blood pressure (Hart et al., 1995). Adipokines are cytokines secreted
by adipose tissue. Of the most widely studied is leptin, which may share a link with
connective tissue and play a role as a regulator in cartilage chondrocyte anabolism
(Dumond et al., 2003; Gabay et al., 2008; Ku et al., 2009). Furthermore,
concentrations of leptin in synovial fluid have been found to correlate with BMI in
individuals with OA (Dumond et al., 2003). To date, evidence is limited and some of
it conflicting (Sharma & Chang, 2009), but there appears to be a role for metabolic
factors, such as cytokines, as mediators in the development of OA from obesity.
However, it does not diminish the importance of mechanical stress and abnormal
gait characteristics from obesity in the pathology of OA.
Recent evidence suggests that, of all the body’s joints, the effect of obesity on
incidence and progression of OA is strongest at the knee (Hart et al., 1999; Felson et
al., 1997; Reijman et al., 2006; Sturmer et al., 2000). The odds of developing OA of
the knee decrease by 50 percent with every 2-‐point decrease in BMI scores (Felson
et al., 1988) Mechanical factors as well as metabolic factors have been implicated in
this relationship. Adaptations to the internal joint structures of the knee, whether
through metabolic or mechanical pathways, that lead to OA may be caused primarily
by obesity.
25
2.3.1 Muscular Strength and the Adverse Effect of Obesity on Strength and Power
Lower muscle mass and muscle strength has been associated with greater functional
decline and problems with mobility in the elderly (Visser et al., 2005). Age-‐
associated losses in muscle strength are especially magnified in the quadriceps
muscles (Lynch et al., 1999). It has been suggested that these greater losses are due
to greater disuse of the lower extremity throughout the lifespan. Physical activities
that are engaged later in life are less likely to use the lower extremity. This
underscores the importance of lower extremity strength to disability status.
As shown by Rejeski et al. (2008), a greater BMI was correlated with a
greater disability and reduced probability of remaining in healthy among older
adults. This relationship emphasizes a possible vicious circle. Obese individuals are
more likely to decline toward disability, in which they will be less likely to perform
physical tasks that use the lower extremity. In this state, they will suffer from
greater muscle atrophy and strength losses. This will deepen the state of disability
and ensure the likelihood of remaining disabled with age (Rejeski et al., 2008).
Muscle strength peaks around the ages of 20-‐30 years and in healthy
individuals is maintained into the 50th decade. Therefore, young adults should be in
the healthiest state of their lifespan. After the 50th year, muscle strength typically
declines due to losses in muscle mass (Lynch et al., 1999; Petrella et al., 2005; Visser
et al, 2005). While this has been the observed trend for healthy individuals, it is not
clear whether this strength profile is found in obese individuals. Obesity is a risk
factor for many disabilities and diseases, including musculoskeletal disorders such
as OA. Strength of the knee flexors and extensors play a crucial role in functional

26
capacity. However, the pathomechanics of obesity-‐related disabilities, in particular
the role that muscle strength and atrophy play in the obese, is poorly understood
(Capodaglio et al., 2009, Wearing et al., 2006b).
Strength in the quadriceps muscles improves joint stability, shock absorption
and attenuates ground reaction forces at the knee joint during gait (Mikesky et al.,
2000) In the obese, reduced muscle strength relative to body weight has been
hypothesized to cause early fatigue of the quadriceps muscles during physical tasks.
In turn, this can increase the loading rate and variability at the knee joint by
reducing shock attenuation (Syed & Davis, 2000). Quadriceps strength has been
linked to the onset of OA of the knee. Women who went on to develop OA of the
knee had nearly 20% less quadriceps strength at baseline than those who did not
develop OA (Slemenda et al., 1998). A more recent study has found that, although
knee extensor strength was not related to radiographical findings of OA of the knee,
it was highly related to symptomatic OA of the knee (i.e. radiographic OA with knee
symptoms) in both sexes (Segal et al., 2009). Knee extensor strength remains as a
possible protective factor against the development of OA of the knee. Development
and maintenance of quadriceps strength from young adulthood could have a role in
the prevention of OA, while quadriceps weakness may place an individual at greater
risk of developing OA.
In a study on young adults between the ages of 19 and 28, reduced physical
activity was associated with increases in intermuscular adipose tissue and
significant strength losses in the lower limb (Manini et al., 2007). After a 4-‐week
control period, participants completed a 4-‐week period of unilateral lower limb
27
suspension, using crutches and wearing a shoe with an elevated sole. Strength
losses, as measured by maximum voluntary isometric contractions, were greatest in
the thigh and partially correlated with increases in intermuscular adipose tissue, as
measured by magnetic resonance imaging (MRI). Muscle lipid concentrations are
associated with physical limitations and reduced strength in older adults (Manini et
al., 2007). In otherwise healthy, obese individuals, absolute knee extensor strength
is usually greater when compared to their leaner peers, most likely due to greater
absolute fat-‐free mass in individuals with higher BMI. But when normalized to body
weight, obese individuals show significantly lower knee extensor strength
(Capodaglio et al., 2009; Hulens et al., 2001; Slemenda et al., 1998). Larger absolute
values may be a result of a training effect due to carrying around a larger body mass.
From these results, it would seem reasonable to hypothesize that obese young
adults, who are most likely less physically active than non-‐obese, would have
reduced lower extremity strength when normalized to body mass.
Lower extremity strength is integral to the individual capacity to perform
daily functional activities. Lifting from a squatting position has been shown to be
highly dependent on the knee extensor strength (Schipplein et al., 1990). The knee
extensor moment during stance while ascending stairs without handrails is nearly
double that seen during level walking. This strong action of the knee extensors
implicates their importance during stair climbing (Nadeau et al., 2003).
Reduced muscle strength is associated with high functional declines and the
ability to perform activities of daily living in the obese (Sartorio et al., 2004b). While
functional declines are expected with age, greater declines are seen in those who are
28
also obese. Obesity may be a greater factor in functional decline than age in elderly
populations, with reduced quadriceps strength as a mediating factor. Reduced
quadriceps strength may contribute to the difficulty performing daily activities in
the obese (Sartorio et al., 2004b; Stenholm et al., 2009; Zoico et al., 2004).
2.4 The Knee Adduction Moment and its Application to Joint Loading
One of the most commonly used measures of loading on the knee joint when
evaluating risk for knee OA is the external knee adduction moment, as determined
from three-‐dimensional motion analysis. External moments are created about the
joint center from ground reaction and distal segment inertial forces. Internal
moments are created by the action of muscle, soft tissue and contact forces
(Baliunas et al., 2002). Direct measure of contact forces within the joint is difficult
(Maly, 2008). Indirect measures include measuring the external moments about the
knee joint. The external knee adduction moment reflects the ratio of the medial to
lateral joint reaction force. As the alignment of the lower limb causes the line of
action of the ground reaction force to typically pass through the medial
compartment of the knee, it bears the greater load and an adduction moment is
created (Hunter et al., 2009). As the magnitude of the knee adduction moment
increases, the ratio of total joint loading becomes greater in the medial
compartment of the knee (Lim et al., 2009). The use of the knee adduction moment
as an indirect measure of knee joint reaction forces has been validated through
correlation to direct measures of knee forces (Zhao et al., 2007), cartilage thickness
measures (Koo et al., 2007) and tibial bone mineral content distribution (Hurwitz et
al., 1998). The knee adduction moment is considered a reliable and valid method for

29
measuring medial compartment loading of the knee in populations displaying both
healthy and pathological joint mechanics (Birmingham et al., 2007).
When determining the medial compartment knee load, the peak knee
adduction moment has been the most commonly reported parameter from the
adduction moment waveform. The peak adduction moment gives information about
the maximum magnitude of the moment at the knee joint and is highly correlated
with medial compartment forces (Miyazaki et al., 2002; Zhao et al., 2007). The peak
knee adduction moment has been linked to severity, as well as progression of OA of
the knee (Miyazaki et al., 2002; Sharma et al., 1998).
While the peak magnitude of the knee adduction moment is important, it
gives no information regarding the duration of the stance moment. The peak knee
adduction moment only reflects a single point in time of the stance phase (Thorp et
al., 2006). In healthy populations, the stance phase is approximately 60% of the gait
cycle (Whiting & Rugg, 2006). The time spent in the stance phase is lengthened
those with pathological states such as obesity (Lai et al., 2007; McGraw et al., 2000)
and osteoarthritis of the knee (Astephen et al., 2008; Baliunas et al., 2002; Kaufman
et al., 2001). An appropriate measure when conducting research on pathological gait
populations would include the duration of the knee adduction moment in addition
to the magnitude. The knee adduction moment impulse takes into account both the
magnitude and duration of the moment and may be a more appropriate measure for
studying obese groups (Maly et al., 2008; Robbins et al., 2009a; Thorp et al., 2006).
Robbins et al., (2009b) showed that the knee adduction moment impulse was
more sensitive to changes in gait speed than the peak knee adduction moment. As

30
walking speed decreased, the knee adduction impulse increased due to an increased
duration of stance phase. As obese populations walk at a slower speed than healthy-‐
weight populations and potentially have greater magnitudes of forces at their knee
joint (Browning & Kram, 2007), the knee adduction moment impulse is a much
more appropriate measure of knee loading than the peak knee adduction moment.
2.5 Knee Alignment and its Effect on Joint Load Distribution
Knee alignment is a strong determinant of load distribution across the joint (Hunter
et al., 2009; Lim et al., 2008). A shift away from a neutral alignment at the hip, knee
or ankle affects the medial-‐lateral load distribution at the knee (Sharma et al., 2001).
The load-‐bearing “mechanical” axis of the knee joint is determined by drawing a line
from the mid-‐femoral head to middle of the talus at the ankle (Hunter et al., 2009).
Under neutral static alignment, this line passes slightly medial to the middle of the
knee joint creating about 0-‐2 degrees of varus alignment (Andriacchi, 1994; Hunter
et al., 2009; Sharma et al., 2001). When this line passes more medially to the knee
during stance phase, the knee has a varus alignment (Figure 4). A moment arm is
created, increasing force across the medial compartment of the knee. In contrast, a
valgus alignment is created when the moment arm passes laterally to the knee
(Figure 4). The moment arm that is created in this scenario increases forces across
the lateral compartment of the knee (Sharma et al., 2001). The most commonly seen
malalignment is a varus alignment that creates an adduction moment during stance
phase.
A static measure of knee alignment can give information about the uniplanar
medial-‐to-‐lateral loading environment of the joint. However it does not give much

31
information about the loading at the knee joint during dynamic activities such as
walking, lifting and stair climbing, where the knee comes under multiplanar forces
(Hunter et al., 2009). Nevertheless, static alignment is still a measure that has
correlated with altered dynamic gait kinetics (Hurwitz et al., 2002). Static knee
alignment was a strong predictor of the external knee adduction moment in a group
of 62 participants with osteoarthritic knees. Knee alignment accounted for
approximately 50 percent of the variability in peak moment (r=0.74). Subjects with
greater static varus alignment had greater knee adduction moments. Knee
alignment was more strongly correlated with the adduction moment than toe-‐out
angle, disease severity, the Kellgren and Lawrence grade and pain (Hurwitz et al.,
2002).
Figure 4: A varus knee alignment (a) causes the GRF to pass through the medial compartment of the knee, causing a knee adduction moment. A valgus knee alignment (b) causes the GRF to pass through the lateral compartment of the knee, resulting in a reduced knee adduction moment and, in some extreme cases, a knee abduction moment (Wearing et al., 2006a).
242
Obesity: biomechanics and injury
S. C. Wearing
et al.
obesity
reviews
© 2006 The International Association for the Study of Obesity.
obesity
reviews
7
, 239–250
Obesity, skeletal alignment and knee-joint osteoarthritis
While obesity may increase the magnitude of joint loading,joint position and alignment are also known to influenceknee-joint forces and have been theorized to play a vitalrole in the progression of OA in the obese by altering stressdistribution within the joint (43,82,119–124). In particular,varus malalignment of the knee has been suggested topotentiate the effects of obesity by focusing even greaterload upon the medial compartment of the knee (Fig. 1)(125). In a cross-sectional study involving 300 cases of OAof the knee, Sharma
et al
. (126) found that BMI was pos-itively associated with the severity of joint-space narrowingin individuals with varus alignment of the knee, but not in
those with valgus alignment when determined by full-limbradiographs. Quasistatic testing on cadavers has revealedthat varus alignment of the knee joint results in increasedmedial compartment loading (127) while studies employingdynamic measures of knee-joint loading have indicated thatmild valgus deformity of the knee results in a more equita-ble distribution of load during gait (57,58). Increasedmedial joint loading, as evidenced by a greater knee-jointadduction moment, has also been frequently noted in indi-viduals with OA (120,128–133). However, given the cross-sectional nature of the study (126), it is unclear if theobserved varus malalignment of the knee and increasedBMI represent a prelude to, or consequence of, OA ormerely parallel changes in the severity of the condition.While there is indirect evidence that obesity may precedethe development of OA and advance its progression(43,46,134,135), longitudinal studies are required, toascertain the temporal relationships, if any, between obe-sity, varus alignment and OA of the knee. Moreover, ashighlighted by Astephen and Deluzio (120), the importanceof BMI in the progression of OA may lie in its interactionand combination with other concurrent risk factors(Table 1), suggesting that multivariate research designs mayprovide a greater insight into the potentially interactiveeffect of obesity in the development and progression of OAof the knee.
Obesity and plantar heel pain
Synonymous with terms such as heel spur syndrome, enthe-sopathy and plantar fasciitis, plantar heel pain is a commondisorder of the foot that is typically characterized by paininvolving the insertion of the plantar fascia into the calca-neus. Although the pain is commonly exacerbated follow-ing periods of non-weight-bearing (136), the developmentof plantar heel pain is thought to be of mechanical origin(137), with prolonged weight bearing and obesity com-monly implicated (16,138–141). Riddle
et al
. (16), in eval-uating potential risk factors in plantar heel pain, reportedthat obese individuals (BMI
>
30 kg m
!
2
) were five timesmore likely to present with heel pain than those with a BMIbelow 25 kg m
!
2
. Although the link between obesity andplantar heel pain is poorly understood, research to date hasfocused on the impact of adiposity on the subcalcaneal fatpad and the function of the medial longitudinal arch.
Obesity, arch function and heel pain
The plantar fascia has been cited as the primary structurestabilizing the medial longitudinal arch of the foot (142–144). As such, both abnormal arch structure and move-ment have been implicated in the development of plantarfasciitis and subsequent plantar heel pain. In particular, pesplanus foot types or lower-limb biomechanics that result in
Figure 1
The effect of joint alignment on vertical loading of the knee. The external knee adduction moment is generated by the combination of ground reaction force (indicated by the dashed line), and the perpendic-ular distance of this force from the knee joint centre. In the congruous knee joint, ground reaction force typically passes somewhat medial to the joint centre resulting in a small adduction moment during gait. (a) Varus alignment of the knee results in a greater knee adduction moment (arrow) and heightened compressive force within the medial compartment. (b) Valgus alignment, in contrast, results in a reduced knee adduction moment and, in extreme cases, may result in an abduction moment as depicted (arrow). The reduced knee adduction moment results in a redis-tribution of compressive force towards the lateral compartment of the knee. Note, for simplicity, horizontal reaction forces have not been depicted.
(a) (b)
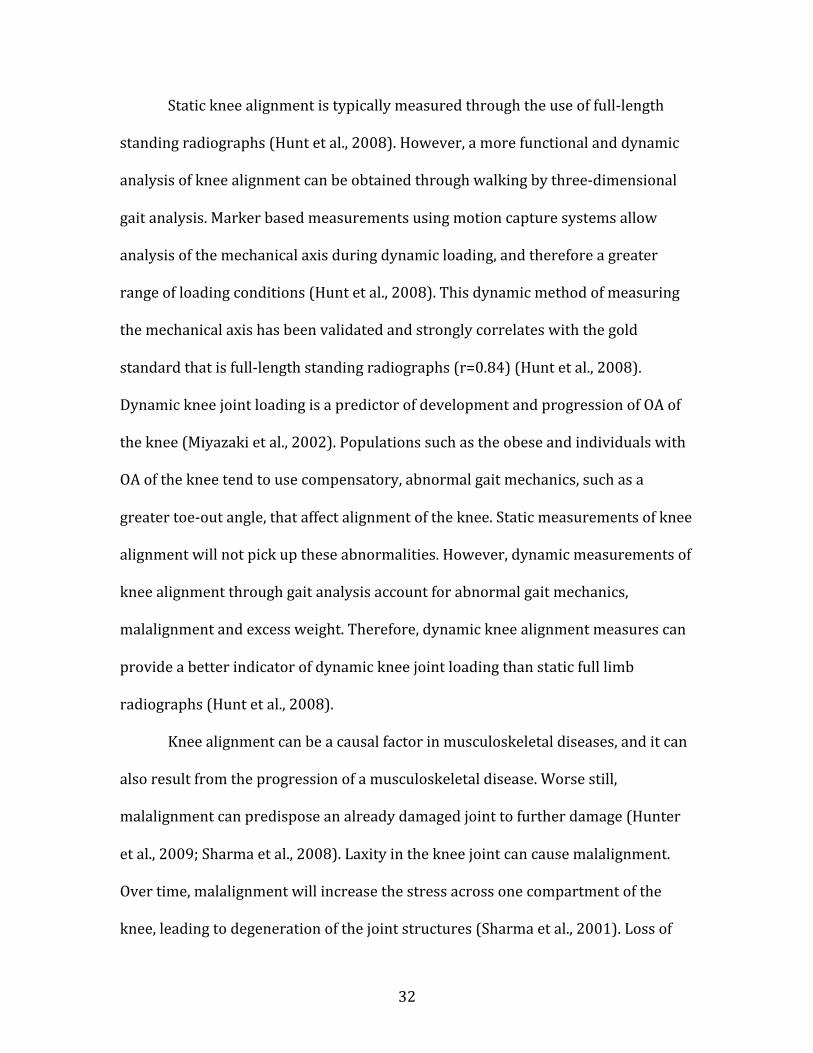
32
Static knee alignment is typically measured through the use of full-‐length
standing radiographs (Hunt et al., 2008). However, a more functional and dynamic
analysis of knee alignment can be obtained through walking by three-‐dimensional
gait analysis. Marker based measurements using motion capture systems allow
analysis of the mechanical axis during dynamic loading, and therefore a greater
range of loading conditions (Hunt et al., 2008). This dynamic method of measuring
the mechanical axis has been validated and strongly correlates with the gold
standard that is full-‐length standing radiographs (r=0.84) (Hunt et al., 2008).
Dynamic knee joint loading is a predictor of development and progression of OA of
the knee (Miyazaki et al., 2002). Populations such as the obese and individuals with
OA of the knee tend to use compensatory, abnormal gait mechanics, such as a
greater toe-‐out angle, that affect alignment of the knee. Static measurements of knee
alignment will not pick up these abnormalities. However, dynamic measurements of
knee alignment through gait analysis account for abnormal gait mechanics,
malalignment and excess weight. Therefore, dynamic knee alignment measures can
provide a better indicator of dynamic knee joint loading than static full limb
radiographs (Hunt et al., 2008).
Knee alignment can be a causal factor in musculoskeletal diseases, and it can
also result from the progression of a musculoskeletal disease. Worse still,
malalignment can predispose an already damaged joint to further damage (Hunter
et al., 2009; Sharma et al., 2008). Laxity in the knee joint can cause malalignment.
Over time, malalignment will increase the stress across one compartment of the
knee, leading to degeneration of the joint structures (Sharma et al., 2001). Loss of

33
cartilage and bone height due to osteoarthritis can cause knee malalignment
(Sharma et al., 2001). Knee alignment can also affect the outcome of a rehabilitation
program. A strengthening protocol, focused on the quadriceps, is often prescribed to
prevent or slow the progression of OA. However, strengthening of the quadriceps
muscles may have a negative effect on patient outcomes in knees that are
malaligned (Lim et al., 2008).
Whether or not knee alignment is a risk factor to musculoskeletal disorders
of the knee is still in question. Although, theoretically a varus alignment at baseline
should increase medial loading on the knee joint and predispose a joint to future
cartilage degeneration, there is inconsistent support for this theory (Hunter et al.,
2007). However, a relationship between varus knee alignment and the incidence
and progression of OA in overweight and obese individuals has been demonstrated
(Brouwer et al., 2007). Conversely, a valgus malalignment shifts a greater
proportion of stress to the lateral compartment of the knee. The result is often a
more even distribution of load between the medial and lateral compartments,
although a severe valgus malalignment can lead to the majority of the joint load
being bore by the lateral compartment (Brouwer et al., 2007; Sharma et al., 2000).
Reduced tibial and femoral cartilage volume has been linked to varus and valgus
knee alignments in the medial and lateral knee compartments, respectively. For
every one-‐degree increase of varus or valgus alignment over a two-‐year period, a
coupled loss in cartilage volume was observed in the medial or lateral knee
compartment (Cicuttini et al., 2004). Additionally, obesity is linked to increased
severity of OA of the knee in varus malaligned knees in a cohort of osteoarthritic
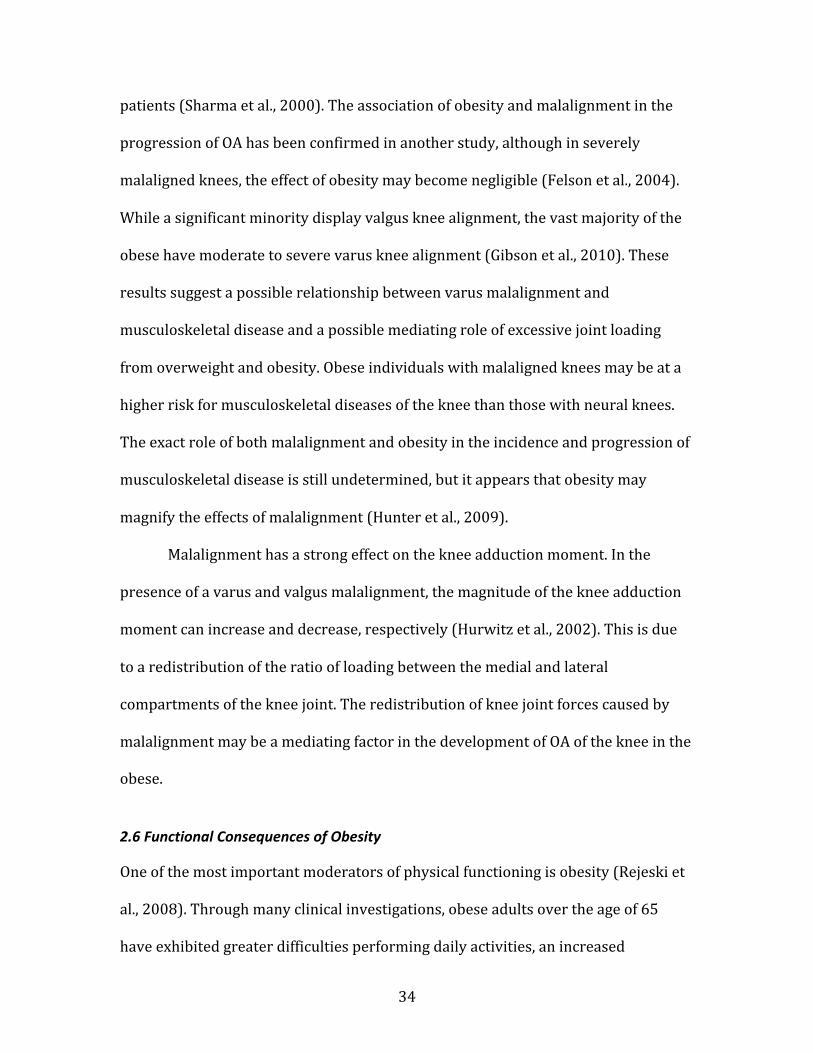
34
patients (Sharma et al., 2000). The association of obesity and malalignment in the
progression of OA has been confirmed in another study, although in severely
malaligned knees, the effect of obesity may become negligible (Felson et al., 2004).
While a significant minority display valgus knee alignment, the vast majority of the
obese have moderate to severe varus knee alignment (Gibson et al., 2010). These
results suggest a possible relationship between varus malalignment and
musculoskeletal disease and a possible mediating role of excessive joint loading
from overweight and obesity. Obese individuals with malaligned knees may be at a
higher risk for musculoskeletal diseases of the knee than those with neural knees.
The exact role of both malalignment and obesity in the incidence and progression of
musculoskeletal disease is still undetermined, but it appears that obesity may
magnify the effects of malalignment (Hunter et al., 2009).
Malalignment has a strong effect on the knee adduction moment. In the
presence of a varus and valgus malalignment, the magnitude of the knee adduction
moment can increase and decrease, respectively (Hurwitz et al., 2002). This is due
to a redistribution of the ratio of loading between the medial and lateral
compartments of the knee joint. The redistribution of knee joint forces caused by
malalignment may be a mediating factor in the development of OA of the knee in the
obese.
2.6 Functional Consequences of Obesity
One of the most important moderators of physical functioning is obesity (Rejeski et
al., 2008). Through many clinical investigations, obese adults over the age of 65
have exhibited greater difficulties performing daily activities, an increased
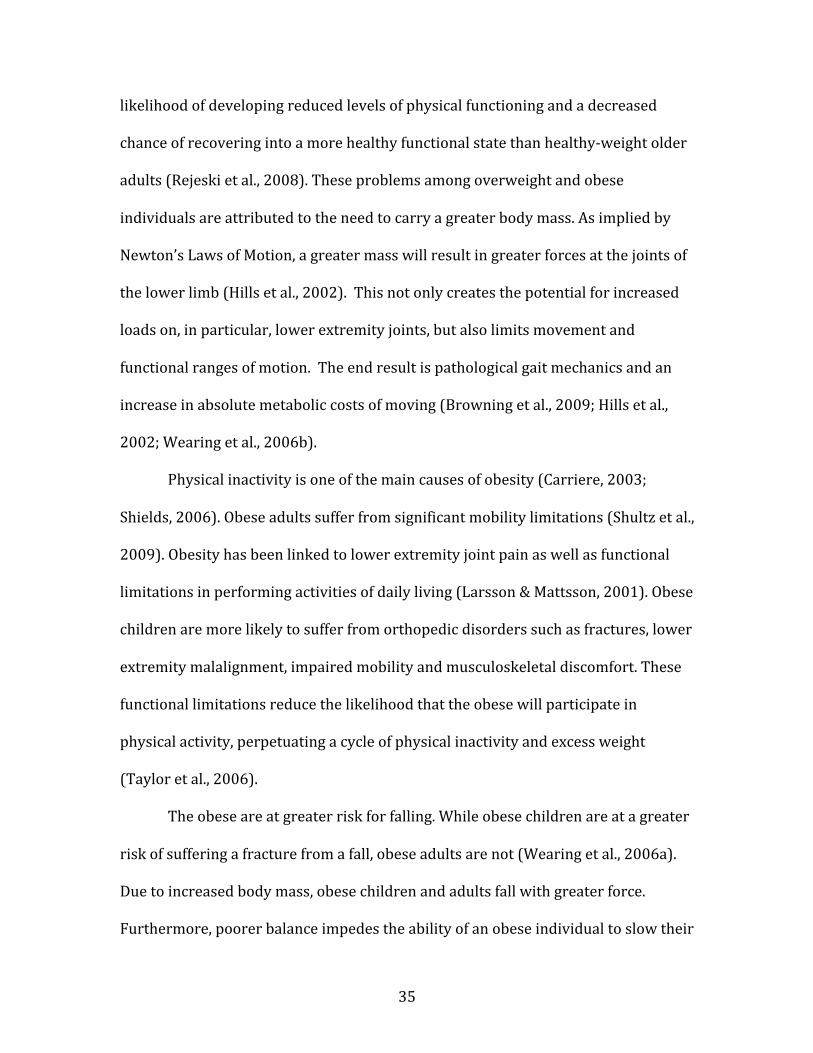
35
likelihood of developing reduced levels of physical functioning and a decreased
chance of recovering into a more healthy functional state than healthy-‐weight older
adults (Rejeski et al., 2008). These problems among overweight and obese
individuals are attributed to the need to carry a greater body mass. As implied by
Newton’s Laws of Motion, a greater mass will result in greater forces at the joints of
the lower limb (Hills et al., 2002). This not only creates the potential for increased
loads on, in particular, lower extremity joints, but also limits movement and
functional ranges of motion. The end result is pathological gait mechanics and an
increase in absolute metabolic costs of moving (Browning et al., 2009; Hills et al.,
2002; Wearing et al., 2006b).
Physical inactivity is one of the main causes of obesity (Carriere, 2003;
Shields, 2006). Obese adults suffer from significant mobility limitations (Shultz et al.,
2009). Obesity has been linked to lower extremity joint pain as well as functional
limitations in performing activities of daily living (Larsson & Mattsson, 2001). Obese
children are more likely to suffer from orthopedic disorders such as fractures, lower
extremity malalignment, impaired mobility and musculoskeletal discomfort. These
functional limitations reduce the likelihood that the obese will participate in
physical activity, perpetuating a cycle of physical inactivity and excess weight
(Taylor et al., 2006).
The obese are at greater risk for falling. While obese children are at a greater
risk of suffering a fracture from a fall, obese adults are not (Wearing et al., 2006a).
Due to increased body mass, obese children and adults fall with greater force.
Furthermore, poorer balance impedes the ability of an obese individual to slow their

36
forward progress once they begin to fall (Taylor et al., 2006). In adults, excess
adipose tissue appears to cushion a fall, providing protection from fracture. Why
this same phenomena does not exist in children is unknown. It is possible that
higher rates of fracture in children are the result of immature bone growth and
quality, lower bone mineral density, poorer coordination and muscle strength or a
lifestyle (e.g. playtime) that is more susceptible to falls (Shultz et al., 2009; Wearing
et al., 2006a). Research appears to be pointing to obese children being poorly
equipped to partake in many forms of physical activity (Shultz et al., 2009).
2.6.1 Clinical Measures of Functional Status (LEFS)
The Lower Extremity Functional Scale (LEFS) consists of 20 questions on physical
function over a range of activities specific to the lower extremity. Each question is
scored out of 5 points -‐ 0 points for extreme difficulty or inability to performing the
activity, 4 points for no difficulty. The total score can range from 0-‐80, with a higher
score indicating greater functional status (Stratford et al., 2004). In terms of
rehabilitation, a change in a LEFS score of at least 7 points is deemed a statistically
reliable change. Furthermore, the LEFS can be used to classify individuals into
percentile ranks or into hierarchical levels of functional stage (Wang et al., 2009).
Compared to the disease-‐specific Western Ontario McMaster Osteoarthritis Index
(WOMAC), the generic measure of the LEFS has been found to be as good, if not
better, indicator of disability and functional status in the lower limbs (Binkley et al.,
1999; Pua et al., 2009; Stratford et al., 2004).
Clinicians need an easy-‐to-‐administer and readily available method of
indentifying young, obese individuals who may be at high risk for developing

37
musculoskeletal disorders. If LEFS scores correlate with pathological kinematic and
kinetic characteristics in young, obese individuals observed in laboratory
experimentation, then the LEFS could provide an appropriate methodological link
between experimental subject observations and clinical patient diagnosis (see
appendix for LEFS questionnaire).
2.6.2 Walking in the Obese State
To date, surprisingly limited research has been done to characterize gait in obese
individuals who are otherwise healthy. Even fewer attempts have been made to
connect obese gait kinematics and kinetics to musculoskeletal disorders (Wearing et
al., 2006a). The research that has been completed can be categorized into three
areas: kinematics, kinetics and energetics. During walking, the tibiofemoral joint of a
healthy individual endures a load that is approximately 2.8 times body weight
(Taylor et al., 2004). This load is bore quite well by non-‐pathological tibiofemoral
joints in healthy-‐weight individuals. However, in the obese, greater body weight
multiplied by this 2.8 increased load may contribute to greater absolute joint stress
and overload. As theorized, obesity has been found to increase absolute ground
reaction forces (Browning & Kram, 2007; Browning et al., 2009; DeVita &
Hortobagyi, 2003; McGraw et al., 2000; Wearing et al., 2006b).
Of the research into the effect of obesity on gait parameters, a few common
trends in gait modifications have been observed. These include a number of
temporal-‐spatial kinematic modifications in obese gait. Among the commonly noted
is a reduced walking speed (DeVita & Hortobagyi, 2003; Lai et al., 2007; McGraw et
al., 2000). A decreased walking speed reduces the ground reaction force, and thus

38
the load on the knee joint, while walking. Other spatiotemporal alterations due to
obesity include a shorter stride length, increased step width, longer stance phase
and a shorter swing phase while walking (Browning & Kram, 2007; DeVita &
Hortobagyi, 2003; Hills et al., 2002; Hills & Parker, 1991; McGraw et al., 2000). The
obese also spend a longer time in double support phase compared to healthy-‐weight
adults (McGraw et al., 2000; Nantel et al., 2006). Obese adults achieve a slower
walking velocity by decreasing their step length and reducing their stride length.
Increased step width causes greater hip abduction during mid-‐swing phase
(Spyropoulos et al., 1991). This gait modification may increase the base of support,
but may also be a consequence of increased mass on the lower extremities
(particularly the inner thigh), prohibiting a smaller step width. Increased step width
can also contribute to increased metabolic costs of walking by increasing step-‐to-‐
step transition costs (Donelan et al., 2001; Peyrot et al., 2009). Step length
adjustments may be made as an attempt to reduce knee torque in obese populations
(DeVita & Hortobagyi, 2003). Another reason for all these gait modifications may be
an attempt to increase stability, by reducing the time spent in an unbalanced, single
support phase (DeVita & Hortobagyi, 2003; Nantel et al., 2006).
Overweight and obese children have displayed greater asymmetry and
difficulty adjusting to changes in walking speeds in gait than healthy-‐weight
children (Hills et al., 2002). Overweight and obese children also exhibit a longer
stance phase, lower cadence and lower relative velocity. All these changes are
characteristic of a slower, more tentative walking style relative to children of
healthy weight (Hills et al., 2002; Nantel et al., 2006).
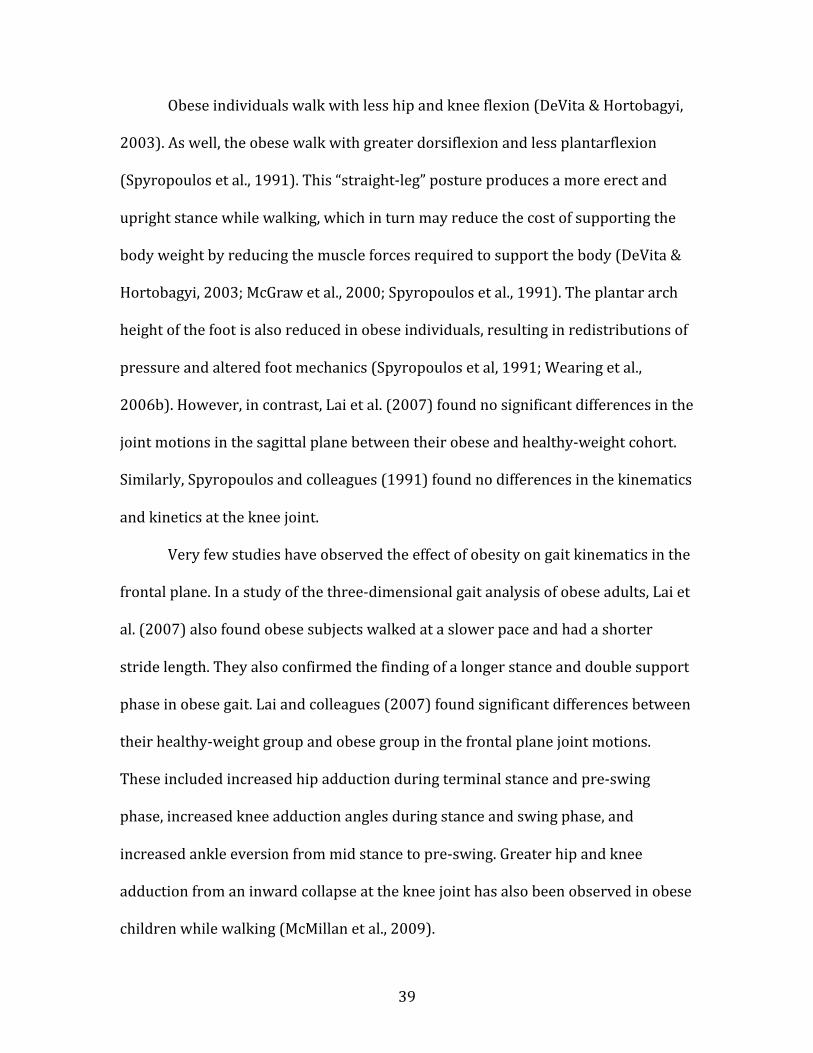
39
Obese individuals walk with less hip and knee flexion (DeVita & Hortobagyi,
2003). As well, the obese walk with greater dorsiflexion and less plantarflexion
(Spyropoulos et al., 1991). This “straight-‐leg” posture produces a more erect and
upright stance while walking, which in turn may reduce the cost of supporting the
body weight by reducing the muscle forces required to support the body (DeVita &
Hortobagyi, 2003; McGraw et al., 2000; Spyropoulos et al., 1991). The plantar arch
height of the foot is also reduced in obese individuals, resulting in redistributions of
pressure and altered foot mechanics (Spyropoulos et al, 1991; Wearing et al.,
2006b). However, in contrast, Lai et al. (2007) found no significant differences in the
joint motions in the sagittal plane between their obese and healthy-‐weight cohort.
Similarly, Spyropoulos and colleagues (1991) found no differences in the kinematics
and kinetics at the knee joint.
Very few studies have observed the effect of obesity on gait kinematics in the
frontal plane. In a study of the three-‐dimensional gait analysis of obese adults, Lai et
al. (2007) also found obese subjects walked at a slower pace and had a shorter
stride length. They also confirmed the finding of a longer stance and double support
phase in obese gait. Lai and colleagues (2007) found significant differences between
their healthy-‐weight group and obese group in the frontal plane joint motions.
These included increased hip adduction during terminal stance and pre-‐swing
phase, increased knee adduction angles during stance and swing phase, and
increased ankle eversion from mid stance to pre-‐swing. Greater hip and knee
adduction from an inward collapse at the knee joint has also been observed in obese
children while walking (McMillan et al., 2009).

40
Alterations in frontal plane motions may be an attempt to reduce frontal
sway. Postural instability has been a well-‐documented characteristic of obese gait. A
number of researchers have found greater medial-‐lateral displacement of center of
mass and instability in obese individuals (McGraw et al, 2000; Peyrot et al., 2009;
Wearing et al., 2006b). Others have also found obesity makes controlling balance
and vertical stability difficult (Colne et al, 2008; Hue et al., 2007). After a weight-‐loss
intervention, postural stability and balance both improved in a cohort of obese men
(Teasdale et al., 2007) Changes in the frontal plane ranges of motion could provide
control of body sway and maintenance upright stability (Lai et al., 2007). They may
also be a result of the greater step width (Peyrot et al., 2009).
Lai and colleagues (2007) found no differences between groups in external
knee adduction and extension moments. However, these moments were normalized
to body weight. A common procedure, normalization of moments removes the factor
of differing body weights to allow comparison of joint moments between subjects.
When observing cohorts of individuals of similar weights, normalization removes a
potentially confounding variable from the observation of the magnitude of joint
moments. However, body weight is a significant factor in the understanding of
obesity. Normalization of moments to body weight does not allow the analysis of the
absolute magnitude of the joint moments between a healthy-‐weight individual and
an individual carrying excess body weight. The actual effect of excess body mass on
joint loading is maintained when the moments are not normalized to body weight
(Browning & Kram, 2007). It is likely that the absolute magnitude of the knee joint
moments in the study by Lai and colleagues (2007) were drastically different

41
between the healthy-‐weight group and obese group due to body mass differences
between the two groups. In not normalizing moments to body mass, a more recent
study comparing obese and healthy-‐weight walking kinematics and kinetics found
much greater absolute peak knee moments in all three planes in the obese
participant group (Shultz et al., 2009).
Another consequence of obesity is the possibility of increased energy
expenditure while walking. While walking at the same velocity as healthy-‐weight
individuals, the obese have a greater metabolic rate during a walking exercise
(Browning et al., 2006; LaFortuna et al., 2008; Peyrot et al., 2009). When normalized
to kilogram of body mass, Browning and colleagues (2009) found no difference in
metabolic rates of walking at the same speed between obese and healthy-‐weight
individuals. The majority of the metabolic cost of walking is due to the generation of
muscular force during that stance phase, which is increased when there is excess
weight on the body (Griffin et al, 2003). However, even when accounting for extra
mass by normalizing to body mass, obesity impairs energy expenditure, as an
increased metabolic cost is still present (LaFourtuna et al., 2008; Peyrot et al.,
2009). It is likely that obesity related alterations to gait, such as a greater step
width, account for an increased absolute metabolic rate (Browning et al., 2009;
LaFortuna et al., 2008). Increases in step width concurrently increase metabolic
costs by about 10% (Donelan et al., 2001)
There are many observed kinematic and kinetic gait modifications made by
the obese. Some are an attempt to reduce loading on the lower extremity, increase
stability and reduce energy expenditure. Others may be a result of limited range of

42
motion and reduced functional state. By decreasing ranges of motion in the sagittal
plane, the obese attempt to improve stability and reduce energy expenditure.
Although limited research has been done on frontal plane kinematics, there are
alterations made my obese walkers in the frontal plane with the same goal in mind
(Wearing et al, 2006b). However, there may be adverse effects of these
modifications over the long-‐term to the integrity of the knee joint. As stated
previously, alterations within the joint to an abnormal loading environment places
stress on structures that were not intended to endure such stress. Done repetitively
over time, the cumulative loading the knee joint under these altered mechanics may
lead to musculoskeletal diseases.
2.6.3 Cumulative Loading at the Knee Joint During Walking
Obesity is a known factor in the pathogenesis of OA, either through greater stress on
the knee joint from excess weight or altered kinematics and kinetics. However, even
if two individuals display similar obese gait characteristics, only one may eventually
develop OA of the knee. Previous research has only considered altered walking gait
over a single testing session. To fully understand the mechanisms behind knee
pathology requires measurement of repetitions of loading on the knee joint.
Therefore, daily physical activity levels of the obese need to be considered to
develop a more complete picture of what characteristics predispose certain
individuals to OA.
An area that has only recently been explored is the cumulative knee adductor
joint load (CKAL). Cumulative loading measures the exposure to joint loading by
taking into account the repetitive load on the knee joint with every step taken by
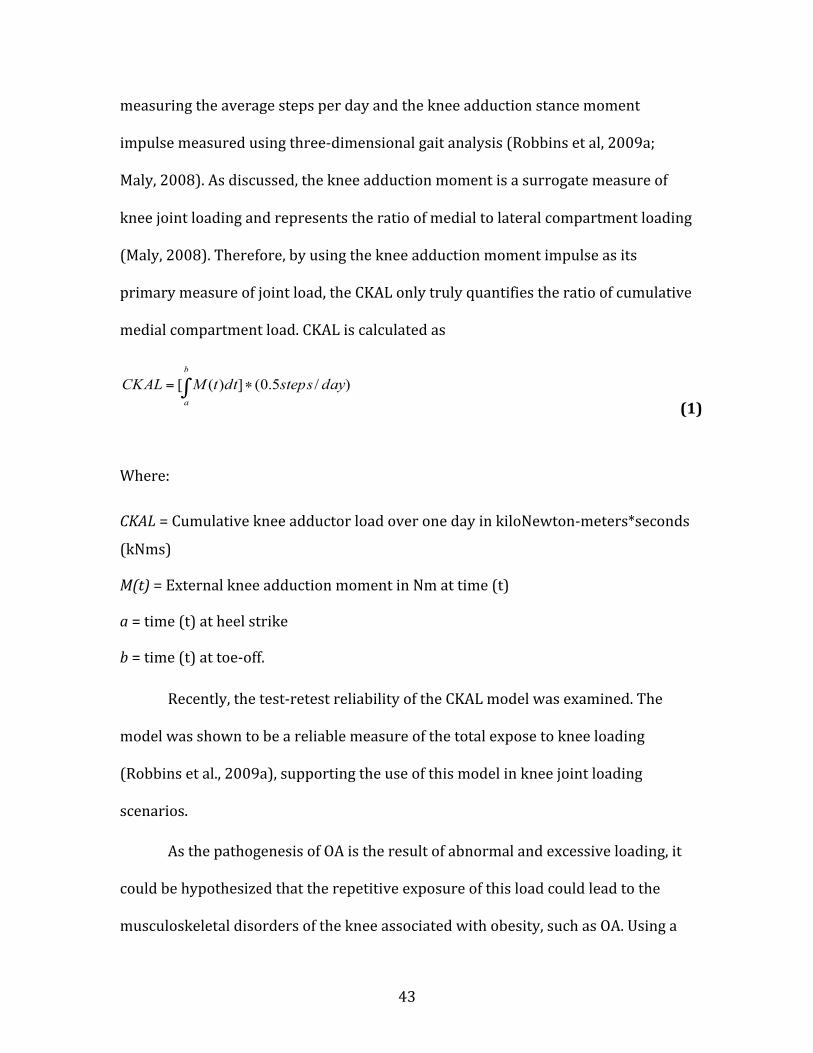
43
measuring the average steps per day and the knee adduction stance moment
impulse measured using three-‐dimensional gait analysis (Robbins et al, 2009a;
Maly, 2008). As discussed, the knee adduction moment is a surrogate measure of
knee joint loading and represents the ratio of medial to lateral compartment loading
(Maly, 2008). Therefore, by using the knee adduction moment impulse as its
primary measure of joint load, the CKAL only truly quantifies the ratio of cumulative
medial compartment load. CKAL is calculated as
Where:
CKAL = Cumulative knee adductor load over one day in kiloNewton-‐meters*seconds
(kNms)
M(t) = External knee adduction moment in Nm at time (t)
a = time (t) at heel strike
b = time (t) at toe-‐off.
Recently, the test-‐retest reliability of the CKAL model was examined. The
model was shown to be a reliable measure of the total expose to knee loading
(Robbins et al., 2009a), supporting the use of this model in knee joint loading
scenarios.
As the pathogenesis of OA is the result of abnormal and excessive loading, it
could be hypothesized that the repetitive exposure of this load could lead to the
musculoskeletal disorders of the knee associated with obesity, such as OA. Using a
(1)
44
measure such as the cumulative knee joint load could allow the observation of such
a phenomena. That being said, it has been shown repeatedly that obesity often
results from a sedentary lifestyle (Hu, 2003; Page et al., 2005). Reduced levels of
physical activity may play a role in the etiology of obesity and its associated
musculoskeletal disorders. As obese individuals are less likely to be active, they will
most likely take fewer steps per day. This inactivity could ultimately reduce the
CKAL per day, making it comparable to healthy-‐weight individuals. Nevertheless,
this is an important avenue to explore that may link obesity-‐related musculoskeletal
disorders to joint load exposure and abnormal loading. The absolute loads on the
knee in obese individuals may be so high that they will still produce higher CKAL
values, despite a lower step count.
2.6.4 Physical Activity Levels and Accelerometry Measures of Activity
Rising rates of obesity have increased the interest in an understanding of physical
activity in free-‐living conditions. To measure the cumulative load on the knee joint
in the present study, a measure of average daily activity needs to be utilized. A
number of methods have been developed to measure physical activity under free-‐
living conditions outside research laboratories. These methods allow a test subject
to engage in normal activities with minimal hindrance from a measurement device.
Measurement in these normal living environments can give a more accurate view of
daily physical activity over a long-‐term observation period than the short-‐term
scenarios simulated in the research environment. These methods allow a better
understanding of the effect of daily physical activity on health, and more specifically,
knee joint health.

45
The most basic forms of measuring physical activity are self-‐reports,
questionnaires and interviews (Murphy, 2009; Westerterp, 2009). While easy to
conduct and cost-‐effective, these methods are subjected to recall bias, as well as
under and over-‐estimation of physical activity. Furthermore, cognitive ability, mood,
depression, anxiety and health status of the individuals can alter self-‐reported
measures of physical activity (Murphy, 2009). Objective measures of physical
activity have proven to be more reliable and valid for scientific research.
Accelerometers have been chosen over many other devices for their non-‐
invasiveness, small size, low cost and high reproducibility (Zhang et al., 2003).
Accelerometers are even able to determine the amount, duration and frequency of
the physical activities being performed. This makes an accelerometer a more
optimal choice over pedometers, which are not sensitive enough to determine these
parameters (Murphy, 2009; Zhang et al., 2003). Accelerometers are a better choice
for the present study, as pedometers have been shown to be less reliable at slower
walking speeds and on obese individuals (McClung et al., 2000; Murphy, 2009).
Accelerometers are limited in their ability to identify the form of physical
activity being performed. For this reason, researchers need to ensure that the
physical activity performed by the individuals being observed is kept as normal and
regular as possible, and even monitored through another, secondary form, such as a
journal. Accelerometers, like most forms of measurement of physical activity, are
subjected to compliance issues. Attempts to overcome the problem of compliance
include having participants completing a daily monitoring log, reminder phone calls
and educating participants about the accelerometer (Trost et al., 2005).

46
Other methods for measuring physical activity have been employed less
often. These include physiological markers like heart rate, more sophisticated
accelerometers, calorimetry and motion sensors (Westertrep, 2009; Zhang et al.,
2003). Some of these are more sophisticated than accelerometers, allowing
identification of types of physical activity (Zhang et al., 2003). However, some of
these more sophisticated methods and their devices have inherent problems and
difficulties, including specific placement on the body that is integral to identification
of the physical activities being performed. Some even require the placement of
numerous sensors on the body, diminishing wearing comfort, or multi-‐day
measures performed by subjects independent of research involvement (Plasqui &
Westerterp, 2007). None have been proven to be superior to the simple
accelerometer. The results of these devices have been shown to be much less
reliable and valid than accelerometers in populations of differing anatomical and
body compositions (Zhang et al., 2003). Placement of a number of these devices is
difficult on overweight and obese populations, making them inadequate for the
present study. Accelerometers have been utilized successfully in previous research
on overweight and obese participants (Davis et al., 2006; Farr et al., 2008; Jacobi et
al., 2007; Page et al., 2005; Trost et al., 2001).
The number of days that a test subject wears an accelerometer has varied
across studies. Accelerometers are typically worn anywhere from three to seven
consecutive days, depending on the type of data being collected and the required
outcome (Murphy, 2009; Trost et al., 2005). Both weekdays and weekends should

47
be sampled to account for variability of physical activity across all days of the week
(Murphy, 2009). Therefore, seven days is deemed the most appropriate duration.
2.6.5 Gait speed
The speed at which an individual walks can greatly influence both the mechanics of
gait and the loading exposure at the knee joint. It has been well documented that a
slower walking speed is preferred in obese persons (Browning & Kram, 2007;
DeVita & Hortobagyi, 2003; Lai et al., 2007; McGraw et al., 2000).
Through excess body mass, obesity should increase the ground reaction
forces, and thus the loading environment on the knee joint while walking. While
excess body weight will produce greater loads on the knee, the chosen gait speed of
obese individuals may act to reduce the load on the knee. Browning and Kram
(2007) observed the sagittal plane kinematics and kinetics of an obese and healthy-‐
weight group at six different walking speeds. The sagittal plane net moments at the
hip, knee and ankle were all greater in the obese adults and were reduced by
walking at a slower pace. At all speeds of walking, the knee adduction moment was
greater in the obese group. DeVita and Hortobagyi (2003) examined the gait of
obese subjects at a self-‐selected, slower speed and a standard speed of walking, and
compared them to the standard walking speed of a healthy-‐weight group. Unlike
Browning and Kram (2007), the obese group displayed magnitudes of joint
moments comparable to the healthy-‐weight group when walking at similar speeds.
Overall, the knee forces were comparable to those of the leaner participants. These
contrasting results are likely due to differences between the knee kinematics of the
obese cohort. DeVita and Hortobagyi (2003) found less knee flexion in their obese

48
participants, which reduced their knee load. Additionally, the average BMI in the
obese group for DeVita and Hortobagyi (2003) was significantly higher than that of
Browning & Kram’s (2007) moderately obese group. The 21 obese subjects in the
DeVita and Hortobagyi study had an average BMI of 42.3 kg/m2, while the average
BMI for the 10 obese subjects was 35.5 kg/m2 in the Browning and Kram study.
As stated, obese individuals prefer a slower self-‐selected walking speed. This
results in a greater time spent in the stance phase. When forced to walk at a faster
pace, obese subjects have shown a tendency to adapt their gait, producing moderate
reductions in the duration of the stance phase (Browning et al., 2009; DeVita &
Hortobagyi, 2003). A reduced stance time will decrease the time over which the
knee adduction moment is present, in turn decreasing the knee adduction moment
impulse (Landry et al., 2007). However, ground reaction forces increase as a result
of a faster walking speed (Browning & Kram, 2007; DeVita & Hortobagyi, 2003). A
slower gait speed will increase the duration of the knee adduction moment, but
decrease the magnitude, while the opposite is true of a faster gait speed (Landry et
al., 2007; Robbins et al., 2009b). While the peak knee adduction moment is greater
at faster walking paces, the knee adduction moment impulse, which reflects
duration of loading, has been found to be greater at slower speeds (Robbins et al.,
2009b). This potentially implicates the slower walking speed of the obese as a factor
in the pathology of musculoskeletal disorders such as OA.
49
III. Methodology
The purpose of this study was to assess the three-‐dimensional kinematics, kinetics
and cumulative load at the knee joint in young adults who are obese and compare
them to matched healthy-‐weight young adults. Eight obese and eight sex-‐, age-‐ and
height-‐matched healthy-‐weight participants, for a total of 16, were recruited. All
testing involved two laboratory visits and one week wearing an accelerometer. A
preliminary screening session allowed the measurement of participant
anthropometrics and maximal knee extensor torque. A second testing session had
participants complete a kinematic and kinetic walking assessment. Knee alignment
and self-‐reported physical functional status was also measured at this time. Finally,
participants wore an accelerometer for a week to determine physical activity levels.
This data was used in a cumulative knee adductor load model. Kinematic, kinetic,
cumulative knee adductor load, walking speed, knee alignment, maximal knee
extensor torque, physical functional status and steps per day were compared
between participant groups using dependent t-‐tests and multiple regression
analysis.
3. 1 Participants
A total of 16 young adult participants between the ages of 19 and 28 years of age,
eight obese (four men, four women) and eight healthy-‐weight (four men, four
women), were recruited from the university student population. Both participant
groups were age-‐matched, height-‐matched and sex-‐matched. The experimental
protocol was approved by the University of Waterloo Office of Research Ethics.
50
3.1.1 Inclusion Criteria
A subject was defined as obese if they have a BMI greater than 30 kg/m2 and a waist
circumference of greater than 88cm and 102cm for women and men, respectively
(Price et al., 2006). A BMI between 18 and 25 kg/m2 was required to be considered
a healthy-‐weight participant as well as a waist circumference of less than 80cm and
94cm for women and men, respectively (Janssen et al., 2003; Lean et al., 1995).
Waist circumference was measured midway between the iliac crest and the lower
rib margin while the subject is at minimal respiration (Janssen et al., 2003; Price et
al., 2006). Subjects were asked to wear a “tight fitting” t-‐shirt and shorts to perform
laboratory tasks. All tasks were performed barefoot, therefore there were no
footwear requirements.
3.1.2 Exclusion Criteria
Subjects were excluded if they had any health problems that influenced their
performance or prevented them from completing the required tasks. This included
past or present cardiovascular or neurological illnesses or problems that affected
their gait, a history of lower extremity injury or surgery. All subjects had to be able
to walk without use of a gait aide. There was a high probability that the obese
subjects would have some history of knee pain. This was acceptable, so long as the
pain did not require management through daily medication. All subjects were given
informed consent prior to any experimentation, as stipulated by University of
Waterloo Research Ethics Board.
51
3.1.3 Recruitment of Participants and Preliminary Screening
All participants were recruited through the university student population. This was
done by word of mouth, posters placed in the academic buildings and gyms on the
University of Waterloo campus and by setting up a recruitment booth in the student
centre on the University of Waterloo campus.
Potential participants were asked to come into the lab briefly for a
preliminary screening to ensure they met the BMI and waist circumference
requirements. At this time, potential participants also filled out the Physical Activity
Readiness Questionnaire. (PAR-‐Q). This seven-‐question survey was designed as a
screening tool to detect individuals who are at high health risk when increasing
their physical activity (Adams, 1999). In order to participate in the present study,
participants had to answer no to all questions. This ensured that no participants
presented with any serious health problems that would limit their ability to
complete all required laboratory activities (see Appendix A for the PAR-‐Q).
During this same preliminary screening session, participants who fit the
experiment criteria and were deemed able to partake in all lab tasks performed a
maximal knee extensor torque as part of the experiment protocol. By having
participants perform this task on a day that was separate from all other lab tasks,
the confounding factor of muscle fatigue was avoided in the knee extensor torque
data. See section 3.2.5 for the maximal knee extensor torque protocol.

52
3.2 Equipment and Protocol
3.2.1 Equipment and Setup
Unilateral knee joint kinematics were measured using an eighteen-‐camera (six
bank) 3D Optotrak Motion Analysis System (Northern Digital Inc. Waterloo,
Ontario) and wireless smart markers at a collection rate of 64Hz. Of the six camera
bank sensors, two were 3020 sensors. The remaining four were Certus sensors.
Ground reaction forces (GRF) were measured using a force platform (AMTI
OR6-‐7, Advanced Mechanical Technology Inc, Watertown, MA) mounted to the floor
for walking tasks. The force platform data were sampled at a collection rate of
1024Hz and synchronized with the motion analysis system.
Calibration of the Optotrak Motion Capture sensors was done using a
calibrated cube equipped with 16 infrared emitting diode (iRED) markers (Northern
Digital Instruments, Inc., Waterloo, ON, Canada). Digitization of the force platform
corners and virtual anatomical landmarks were done using a calibrated digitizing
probe (Northern Digital Instruments, Inc., Waterloo, ON, Canada). The probe is
instrumented with four infrared emitting diode (iRED) markers on its body and a
probe at the base.
To track body segments, 37 Optotrak tracking smart markers were used.
Four separate rigid plates each with six markers were placed bilaterally on the
proximal lateral left and right mid thigh and shank. Five markers were placed on
one rigid body placed posteriorly on the sacrum. The rigid bodies were secured to
the body using Tuff skin, double-‐sided tape and elasticized bands wrapped around
the segment. Four individual markers were placed bilaterally on the bare feet at the

53
lateral base of the heel, lateral dorsum, and distal end of the fifth and first
metatarsals (Figure 5).
Figure 5: Schematic for the individual and rigid body tracking marker placement from lateral side view and posterior view. The one hollow marker on the foot represents the marker on the distal end of first metatarsal on the medial side of the foot.
All data collection was done through the NDI First Principles Software
(Version 1.22 Northern Digital Instruments, Inc., Waterloo, ON, Canada). Signals
from the force platform were acquired through the Data Acquisition Unit (ODAU II,
Northern Digital Instruments, Inc., Waterloo, ON, Canada) and synchronized with
the motion capture system through the System Control Unit.
54
3.2.2. Calibration of Equipment
Prior to each participant’s arrival to the lab for the second session, equipment was
switched on and allowed to warm up for one hour prior to being calibrated to avoid
electronic drift.
The Global Coordinate System was defined using the NDI calibration cube.
The cube was used to first register all the Optotrak camera sensors used in the
collection to a Global Coordinate System within the collection volume using a
dynamic calibration procedure. The collection volume was defined within the area
over and surrounding the force platform. A Global Coordinate System origin was
then defined statically by aligning the calibration cube at the corner of the force
platform for a 5 second trial. The Global Coordinate System was aligned with the
positive z-‐axis up, and the positive x-‐axis toward the right side of the participant and
negative y-‐axis pointing in the line of forward progression for the walking tasks.
The location of the force platform in the Global Coordinate System was
determined by digitizing the four corners of the force platforms using the digitizing
probe. The location of these corners was saved and input into Visual 3D software.
The joint coordinate system was established from anatomical landmarks,
defined with respect to the rigid body marker clusters using the NDI digitizing
probe. The following anatomical landmarks were identified bilaterally: anterior
superior iliac spine, posterior superior iliac spine, iliac crest, greater trochanter,
medial and lateral femoral condyles, head of the fibula, medial tibial plateau, tibial
tuberosity, and medial and lateral malleolus.

55
3.2.3 Subject Measurements
Upon arrival to the lab, subjects filled out a consent form and the Lower Extremity
Functional Scale (LEFS). Mass, height, and waist, thigh and shank circumference
were measured using a tape measure. Pelvic depth and foot width were also
measured for use in the modeling of body segment parameters to determine joint
kinematics and kinetics. Measurements were taken on the dominant leg for all
tasks. To determine the dominant leg, subjects were asked the question “which leg
would you use to kick a ball?”.
Before placement of body markers, the self-‐selected natural walking time
was determined to prevent confounding of the true natural cadence by
instrumentation. Subjects were asked to walk along a straight runway in an empty
hallway of 15 meters length. The distance to be walked was marked with tape on the
floor. After at least two practice trials, self-‐selected natural walking speed was
measured from the time taken to complete the full length of the 15 m walkway using
a stopwatch. A total of three trials were measured. The mean speed of these three
trials was deemed the “natural” walking speed, in meters per second, for the
participants. This natural walking speed was used to establish the time range of the
walking speed conditions for the shorter walkway distance in the lab. From the
natural walking speed, a 15% slower and 15% faster gait speed was determined. A
walking speed range of +/-‐2.5 percent for the three speeds was deemed acceptable.
For the healthy participants, the speed and range for the matched walking speed
was also noted from the natural speed and range of the obese participant with
whom they were matched.
56
Once markers had been placed and secured on the participant’s body and
virtual anatomical landmarks had been digitized, participants were asked to stand
quietly in the anatomical position with feet pointing forward, approximately
shoulder width apart and the axis for knee flexion-‐extension in the frontal plane for
5 seconds while a static trial was taken to determine a reference frame. While still in
the anatomical position, another trial was collected while the participants were
asked to create a hula-‐hoop motion with their hips to determine the functional hip
joint center. Following this, functional knee joint centers were determined by having
the participants actively flex and extend their right knee ten times and then their left
knee ten times for two separate trials.
Prior to the commencement of each of the three walking tasks, subjects were
given the opportunity to practice each task at least twice to orient themselves to the
speed requirements of the task. All trials were performed barefoot.
3.2.4 Walking
Five successful walking trials at three different gait speeds of fast, natural and slow
were performed, for a total of 15 trials for obese participants. The healthy
participants completed five extra trials at their matched obese participant’s walking
speed for a total of 20 trials. Each participant walked at the self-‐selected natural
pace and a gait speed that was 15% slower and 15% faster than this pace (Robbins
et al., 2009b). For each trial, participants walked 4 meters in a straight line on a level
walkway across the camera capture area. Due to space constraints, the walkway in
the lab could not be made longer than 4 meters. Walking speed was controlled using
infrared sensor gates linked to a timer placed at the start and finish of the lab

57
walkway. The distance between the start and finish sensor gates was measured
before the start of each collection. Using this distance, and the self-‐selected natural
walking speed from the 15-‐metre walkway, walking times for each of the three
speed conditions was determined in lab. For each walking trial, the pre-‐determined
walking time ranges were compared to the walking time detected from the timer
box to deem whether the appropriate walking speed has been obtained. After each
walking trial, verbal feedback was given immediately to ensure the participants
walked at an appropriate gait speed. The order of completion of the walking speeds
was block randomized, such that participants completed the five trials at one
walking speed before moving onto the next randomly selected speed.
A trial was deemed successful when the appropriate gait speed attained
was within +/-‐ 2.5 percent of the target time from the sensor gates (Robbins et al.,
2009b), the dominant foot was placed completely on the force platform during
stance phase and the participant did not make any visually obvious alterations to
stride to ensure contact with the force platform by the dominant foot.
3.2.5 Maximal Voluntary Knee Extensor Torque
Maximum knee extensor torque was completed during the preliminary screening
session. The knee extensor torque was measured on the dominant leg using a Cybex
Dynamometer. Participants performed a maximal voluntary isometric knee
extension in a seated position, with the hip at 90 degrees with respect to the torso
and the thigh horizontal. The shank was positioned at 60 degrees below the
horizontal (Perotto et al., 2005).
58
Participants performed five second trials where they were asked to ramp up
to maximum exertion in the first two seconds by attempting to extend their knee
and held this maximal exertion for approximately three seconds. A minimum of one
practice trial followed by two collected trials was completed. Two minutes of rest
was given between each trial to allow muscle adequate recovery (Rohmert, 1973).
3.2.6 Accelerometry
Following all lab procedures, each participant was given an accelerometer
(ActiGraph GT3X, Fort Walton Beach, USA) to be worn for seven consecutive days
(i.e. one week). Set with an epoch of 60 seconds which logs acquired data every 60
seconds, the unidimensional accelerometer determined the number of steps taken
per day by measuring and recording time varying accelerations during physical
activity. The accelerometer was to be worn anteriorly, below the waist over the
thigh midline of the dominant leg. Equipped with a clip on the back, the
accelerometer was securely clipped onto a lower body article of clothing while it
was worn. Participants were instructed to wear the accelerometer at all times
during waking hours, except when bathing or swimming. The accelerometer was not
to be worn while sleeping. Twice during the week, an e-‐mail was sent to the
participants to encourage compliance.
3.3 Data Processing
3.3.1 Processing of Collected Measures
All filtering and kinematic and kinetic data processing was done using Visual 3D
software (Version 4.29.75, C-‐Motion, Maryland, USA). A residual analysis was

59
performed to determine the appropriate cut-‐off frequency for the kinematic and
kinetic data.
Using inverse dynamics, moments were determined at the knee joint in each
of the three walking conditions. Lower extremity body segment masses, location of
mass centers and moments of inertia were established using the default body
segment parameters employed by Visual 3D. This approach is based on Dempster’s
equations (Dempster, 1955). Although the body anthropometrics in the obese
subject group would likely be significantly different from those reported in Visual
3D, to the knowledge of this researcher, there is currently no set of anthropometric
data to represent overweight and obese individuals.
Knee alignment was determined by using the position of ankle, knee and hip
joint centers in the frontal plane at terminal stance during walking trials (Hunt et al.,
2008). The dynamic peak magnitude of the marker-‐based lower limb alignment up
to terminal stance was identified. Unlike all other knee angle data, the dynamic
alignment was calculated in an absolute reference frame of the tibia relative to the
vertical, not relative to the quiet standing trial knee alignment. This was done to
observe the absolute range of frontal plane deviation and malalignment at the knee.
The peak amplitude of the marker-‐based lower limb alignment was averaged across
the five walking trials of the natural gait speed (Hunt et al., 2008).
Maximal knee extensor torque was determined by extrapolating the
maximum value from the two recorded trials, as measured by the Cybex
Dynamometer over the last three seconds of the two extensor torque trials. These
two maximum values were averaged to determine an absolute maximal knee

60
extensor torque. This value was also normalized to body mass to determine a
maximal knee extensor torque relative to body weight.
Accelerometer data were averaged for the seven collection days to find a
daily average step count. An average weekday (Monday to Friday) and weekend
(Saturday to Sunday) step count was also determined.
3.3.2 Processing of Kinematics and Kinetics
Three dimensional knee angles and net external moments were analyzed over the
stance phase of walking, while the foot was in contact with the force platform:
flexion-‐extension in the sagittal plane, abduction-‐adduction in the frontal plane and
medial-‐lateral rotation in the transverse plane.
The amplitude of the knee angles were calculated in a reference frame
relative to the joint alignment in all three axes during the quiet standing static
calibration trial taken prior to the walking trials. This set the quiet standing
orientation as the neutral, zero position. Analyzing walking knee angles relative to
the quiet standing trial orientation allowed observation of the relative angular
excursions at the knee. Angles were time-‐normalized to 100 percent of gait cycle,
with analyses performed over the stance phase (0-‐60 percent) only. Alternatively,
the dynamic knee alignment measure was not calculated relative to the quiet
standing alignment, but in an absolute reference frame of the tibia relative to
vertical – the vertical was deemed zero and the maximum deviation away from
vertical up to terminal stance dictated knee alignment. This showcased the full
range of differences in absolute alignment between the two participant groups
without zeroing orientation to standing posture alignment.
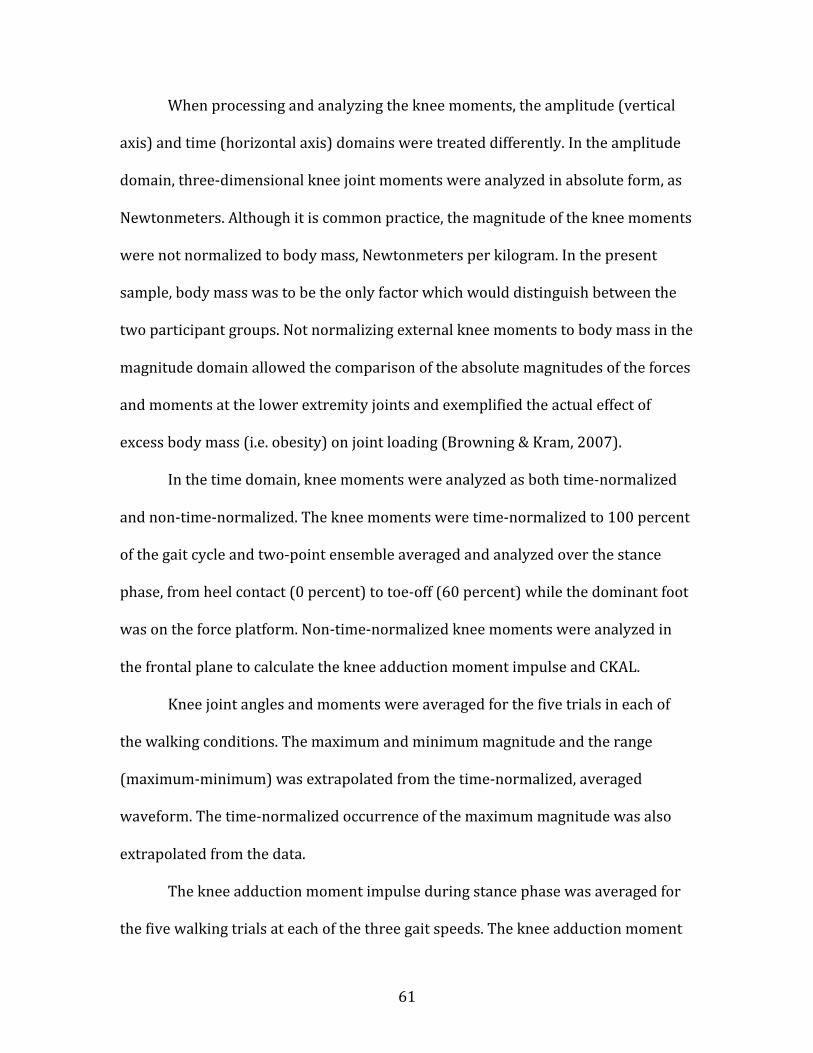
61
When processing and analyzing the knee moments, the amplitude (vertical
axis) and time (horizontal axis) domains were treated differently. In the amplitude
domain, three-‐dimensional knee joint moments were analyzed in absolute form, as
Newtonmeters. Although it is common practice, the magnitude of the knee moments
were not normalized to body mass, Newtonmeters per kilogram. In the present
sample, body mass was to be the only factor which would distinguish between the
two participant groups. Not normalizing external knee moments to body mass in the
magnitude domain allowed the comparison of the absolute magnitudes of the forces
and moments at the lower extremity joints and exemplified the actual effect of
excess body mass (i.e. obesity) on joint loading (Browning & Kram, 2007).
In the time domain, knee moments were analyzed as both time-‐normalized
and non-‐time-‐normalized. The knee moments were time-‐normalized to 100 percent
of the gait cycle and two-‐point ensemble averaged and analyzed over the stance
phase, from heel contact (0 percent) to toe-‐off (60 percent) while the dominant foot
was on the force platform. Non-‐time-‐normalized knee moments were analyzed in
the frontal plane to calculate the knee adduction moment impulse and CKAL.
Knee joint angles and moments were averaged for the five trials in each of
the walking conditions. The maximum and minimum magnitude and the range
(maximum-‐minimum) was extrapolated from the time-‐normalized, averaged
waveform. The time-‐normalized occurrence of the maximum magnitude was also
extrapolated from the data.
The knee adduction moment impulse during stance phase was averaged for
the five walking trials at each of the three gait speeds. The knee adduction moment
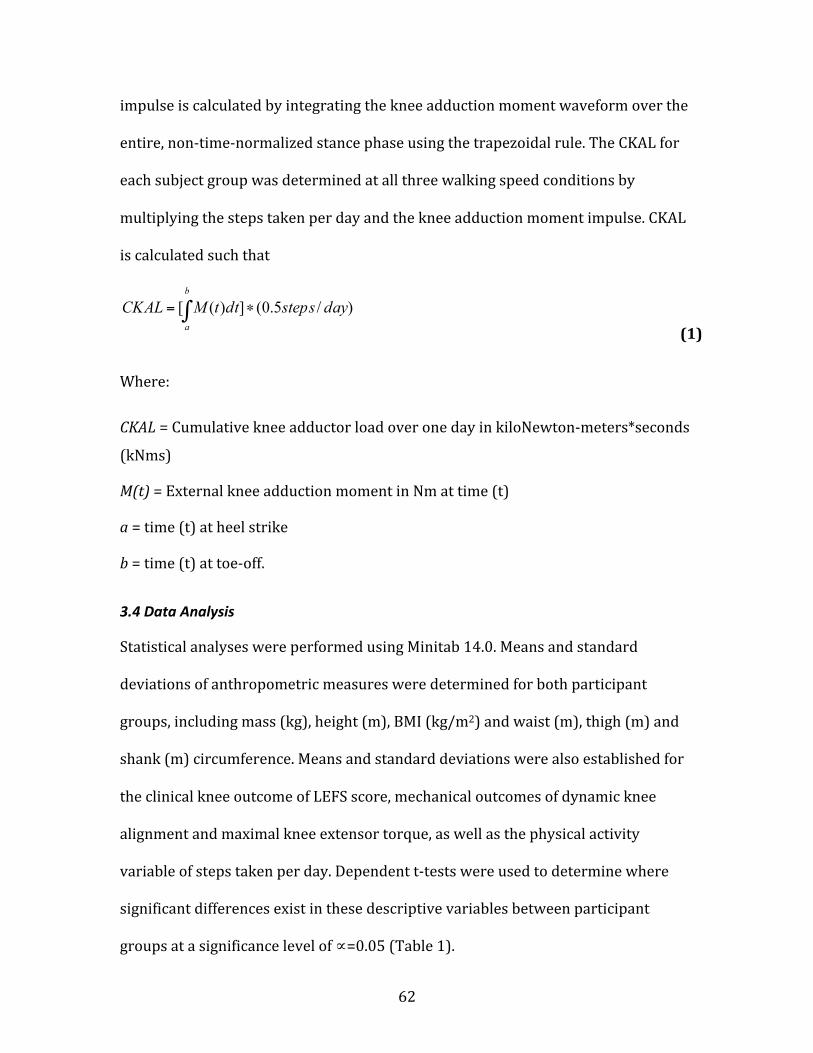
62
impulse is calculated by integrating the knee adduction moment waveform over the
entire, non-‐time-‐normalized stance phase using the trapezoidal rule. The CKAL for
each subject group was determined at all three walking speed conditions by
multiplying the steps taken per day and the knee adduction moment impulse. CKAL
is calculated such that
Where:
CKAL = Cumulative knee adductor load over one day in kiloNewton-‐meters*seconds
(kNms)
M(t) = External knee adduction moment in Nm at time (t)
a = time (t) at heel strike
b = time (t) at toe-‐off.
3.4 Data Analysis
Statistical analyses were performed using Minitab 14.0. Means and standard
deviations of anthropometric measures were determined for both participant
groups, including mass (kg), height (m), BMI (kg/m2) and waist (m), thigh (m) and
shank (m) circumference. Means and standard deviations were also established for
the clinical knee outcome of LEFS score, mechanical outcomes of dynamic knee
alignment and maximal knee extensor torque, as well as the physical activity
variable of steps taken per day. Dependent t-‐tests were used to determine where
significant differences exist in these descriptive variables between participant
groups at a significance level of ∝=0.05 (Table 1).
(1)

63
Table 1: Baseline variables analyzed between groups using dependent t-‐tests. Anthropometrics were determined manually. Mass (kg) and height (m) were used to determine BMI. Dynamic knee alignment was determined from the walking trials using motion capture, while the extensor torque was measured from the Cybex Dynamometer. Steps per day were averaged from seven days of accelerometer data.
Variables
Anthropometrics
Clinical and Mechanical Outcomes
Physical Activity Level
• Mass (kg) • Height (m) • BMI (kg/m2) • Waist circumference (cm) • Thigh circumference (cm) • Shank circumference (cm)
• Dynamic knee alignment (degrees)
• Maximum isometric knee extensor torque (Nm)
• LEFS score (out of 80)
• Steps taken per day
3.4.1 Analysis of Walking Speed
An analysis was performed to identify whether significant differences exist between
the self-‐selected walking speeds of fast, natural and slow. The first analysis was
done to determine if the three walking speeds were significantly different from each
other. The fast and slow walking speeds depend on the natural speed, as they were
calculated from the self-‐selected natural walking speed. As such, using an Analysis of
Variance (ANOVA) to test speed differences would violate the assumption of
independence between variables. To quantify whether the walking speeds
significantly differed from each other, a 95 percent confidence interval for the
natural walking speed mean was determined. If the mean fast and slow walking
speeds fell outside the lower and upper bounds of this confidence interval, then they
were considered to be significantly different from the natural walking speed.
Following this, a dependent t-‐test determined whether significant differences
existed between participant groups in the natural walking speed at a significance
level of ∝=0.05. If the fast and slow speeds were a calculated interval away from the
64
natural walking speed for both groups, the results of this between-‐group analysis
was inferred to the fast and slow walking speeds.
3.4.2 Removal of the Factor of Walking Speed
Subsequent analyses examined knee joint kinematics, kinetics between participant
groups at the three self-‐selected walking speeds. A separate analysis was conducted
between participant groups at the matched speed, where walking speed was not a
factor to be analyzed. Analyses were also performed to examine the stance duration,
knee adduction moment impulse and CKAL between groups at the three self-‐
selected walking speeds. Initially, these analyses would have required the
employment of a two-‐way ANOVA, with participant group (two levels) and walking
speed (three levels) as the two factors. If differences were found, a post-‐hoc test was
to be performed to identify the factor levels that accounted for the differences
between subject groups in joint angles and moments in each walking condition.
When two-‐way ANOVA’s (with group and walking speed as factors) were
done to determine if walking speed (3 levels) had a significant effect on peak
kinematics, peak kinetics and adduction impulse, it was observed that walking
speed did not significantly affect these variables (section 4.3). A decision was made
to remove walking speed as a three-‐level factor in the analysis and use it as pseudo-‐
replicates within each participant. This decision resulted in participant group being
the only factor analyzed. Where a two-‐way ANOVA and post-‐hoc test was originally
proposed, a dependent t-‐test (one-‐way randomized blocks ANOVA) was performed
to determine were differences existed between participant groups.

65
Removing the walking speed factor resulted in the sum of squares associated
with that factor being pooled with the error sum of squares in the statistical
analyses. In doing so, the error sum of squares increased, but the degrees of freedom
used to calculate the mean squared error also increased (Casella & Roger, 1990).
Increasing the degrees of freedom associated with the mean squared error reduces
the critical (tabulated) test statistic, improving the ability of the test to detect
significant differences. As the factor of walking speed did not have a significant
effect on outcome variables, the sum of squares associated with the factor was very
small. Pooling the sum of squares for walking speed did increase the error sum of
squares, but the gains made in degrees of freedom outweigh this increase. Had the
factor of walking speed been significant, the choice to pool the sum of squares would
have caused a substantial increase in the error sum of squares. The result would
have been a decrease in the calculated test statistic. This would make it much harder
to obtain a level of significance when running the statistical tests.
Pooling the sum of squares of a factor with the error sum of squares is only
effective when the factor being pooled is not significant, and in fact the statistical
evidence is strongly in favor of the null hypothesis (no effect). Therefore, this
method of pooling should only be employed when the degrees of freedom
associated with the mean square error are small and the p-‐value associated with the
factor in question is large (Neter & Wasserman, 1974). In the present case, both
conditions were met. First, the small sample size in the present study resulted in
limited degrees of freedom associated with the mean square error. Second, the p-‐
66
values for speed on the kinematic, kinetic and adduction moment impulse factors
were large. These p-‐values will be presented in the results section 4.
3.4.3 Analysis for Study I – Kinematics and Kinetics at the Knee Joint During Walking
All trials within each of the task conditions -‐ walking speeds of fast, natural, slow
and matched -‐ were averaged so that there was a single averaged trial for each of
the three walking conditions. The analysis of the matched walking speeds – obese
natural walking speed results compared to the matched healthy participant results
walking at this same speed -‐ were analyzed separately.
The averaged trial for each of the self-‐selected walking speeds of fast, natural
and slow was analyzed to determine peak and range of knee joint angles and
moments between groups in all three planes of motion. The three walking speeds
were then used as pseudo-‐replicates within each participant. For the factor of
participant group (two levels), means and standard deviation for the outcomes
variables of knee joint angles and moments were calculated for each of the levels of
the factor of participant group. Dependent t-‐tests were used to determine if
differences exist between groups in GRF, knee joint angles and moments at the three
self-‐selected walking speeds. This was done at a significance level of ∝=0.05.
A similar analysis was run for the matched walking speeds. Walking speed
was not a factor in the matched speed condition analysis. Therefore, dependent t-‐
tests were performed to determine participant group differences in all kinematic
and kinetic outcome variables at the matched speed condition at a significance level

67
of ∝=0.05. These results were compared to those found at the self-‐selected walking
speed condition to determine if walking speed was a factor in group differences.
The GRF, kinematic and kinetic variables that will be analyzed in all the
walking speed conditions – natural, fast, slow and matched – as part of Study I are
summarized in Tables 2 and 3. Analyses were performed in all three planes of
motion. All statistical procedures were tested at a significance level of ∝=0.05.
Table 2: GRF variables to be analyzed between subject groups by each of the walking speed conditions in Study I.
GRF
Variable
Medial-Lateral Maximum Force
Minimum Force Range of Force
Anterior-Posterior Maximum Force Minimum Force Range of Force
Vertical Maximum Force Minimum Force Range of Force
Table 3: Variables to be analyzed between subject groups by each of the walking speed conditions in Study I.
Variable
Plane Kinematic
Kinetic
Frontal Maximum Angle Minimum Angle Angle Range
Maximum Moment Minimum Moment Moment Range
Sagittal Maximum Angle
Minimum Angle Angle Range
Maximum Moment Minimum Moment Moment Range
Transverse Maximum Angle
Minimum Angle Angle Range
Maximum Moment Minimum Moment Moment Range

68
A multiple regression was used to analyze the relationship between peak
knee adduction moment with participant group and each of the mechanical outcome
variables of dynamic knee alignment and maximal knee extensor torque for the two
participant groups.
3.4.4 Analysis for Study II – Cumulative Knee Joint Loading
The variables of steps taken per day and knee adductor moment impulse at each of
the three walking speeds were used in the CKAL model to determine average daily
cumulative knee load. Knee joint moment impulse was used in absolute form in both
the time and amplitude domain.
As in Study I, the three walking speeds of fast, natural and slow were used as
pseudo-‐replicates within each participant to analyze between group differences in
the adduction moment impulse and CKAL. A dependent t-‐test was used to determine
statistically significant differences between participant groups in the average CKAL
at a significance level of ∝=0.05. In addition to testing the composite measure of
CKAL, the separate components of knee adductor moment impulse and steps taken
per day were tested for significant differences between participant groups and
walking speed at ∝=0.05. Finally, a multiple regression analysis was used to analyze
the relationship between knee adduction moment impulse with participant group
and each of the mechanical outcome variables of dynamic knee alignment and
maximal knee extensor torque.
Tables 3, 4 and 5 summarize all the variables analyzed, associated
hypotheses and statistical tests performed for Study I and Study II respectively.

69
Tables 4: A summary of variables, hypotheses and statistical tests to be performed on baseline anthropometric, clinical and walking speed (fast, natural and slow) variables.
Outcome Variables
Research Hypotheses
Statistical Procedure
Anthropometrics
Statistically significant differences will be tested between participant groups
Dependent T-‐test
Clinical Knee Outcomes • Alignment • Extensor Torque • LEFS
Statistically significant differences will be tested between participant groups
Dependent T-‐test
Walking speed
Statistically significant differences will be tested between three walking speed levels of fast, natural, slow
95% Confidence Interval
*Significance at ∝=0.05
Tables 5: A summary of Variables, Hypotheses and Statistical Tests to be performed in Study I. The walking speeds of fast, natural and slow were analyzed together as levels within a single factor, between participant groups. The matched speed condition analysis between groups was performed separately from the other speeds.
Statistical Procedure at Select
Walking Speed
Outcome Variables
Research Hypotheses Fast, Natural, Slow Matched
GRF
Statistically significant differences will be tested between participant groups
Dependent T-‐test Dependent T-‐test
Three-‐dimensional Knee Joint Angles
Statistically significant differences will be tested between participant groups
Dependent T-‐test Dependent T-‐test
Three-‐dimensional Knee Joint Moments
Statistically significant differences will be tested between participant groups
Dependent T-‐test Dependent T-‐test
Peak (maximum) Knee Moment
Peak adduction moment was statistically correlated with knee alignment, knee extensor torque and group
Multiple Regression Analysis
N/A
*Significance at ∝=0.05

70
Table 6: A summary of the variables, hypotheses and statistical tests to be performed in Study II.
Outcome Variables
Research Hypotheses
Statistical Procedure
CKAL Statistically significant differences will be tested between participant groups
Dependent T-‐test
Knee Adduction Moment Impulse
Statistically significant differences will be tested between participant groups
Dependent T-‐test
Accelerometry • Steps taken per Day
Statistically significant differences will be tested between participant groups
Dependent T-‐test
Knee Adduction Moment Impulse
Moment impulse was statistically correlated with knee alignment, knee extensor torque and group
Multiple Regression Analysis
*Significance at ∝=0.05
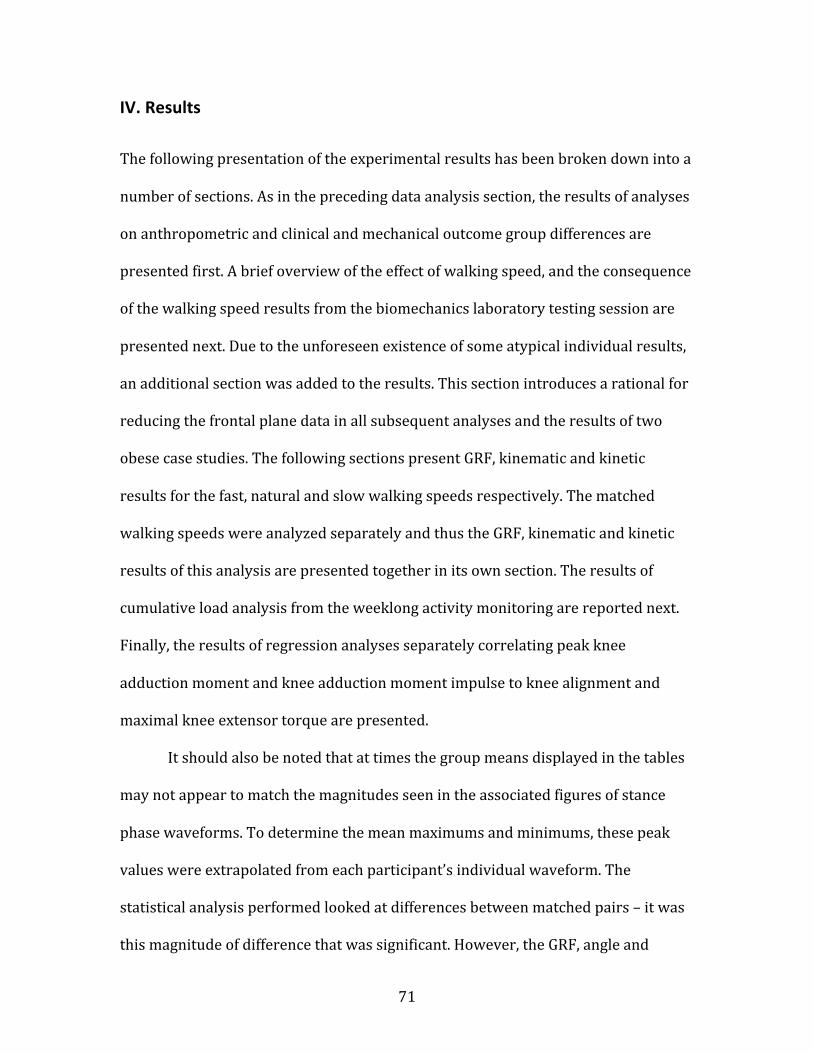
71
IV. Results
The following presentation of the experimental results has been broken down into a
number of sections. As in the preceding data analysis section, the results of analyses
on anthropometric and clinical and mechanical outcome group differences are
presented first. A brief overview of the effect of walking speed, and the consequence
of the walking speed results from the biomechanics laboratory testing session are
presented next. Due to the unforeseen existence of some atypical individual results,
an additional section was added to the results. This section introduces a rational for
reducing the frontal plane data in all subsequent analyses and the results of two
obese case studies. The following sections present GRF, kinematic and kinetic
results for the fast, natural and slow walking speeds respectively. The matched
walking speeds were analyzed separately and thus the GRF, kinematic and kinetic
results of this analysis are presented together in its own section. The results of
cumulative load analysis from the weeklong activity monitoring are reported next.
Finally, the results of regression analyses separately correlating peak knee
adduction moment and knee adduction moment impulse to knee alignment and
maximal knee extensor torque are presented.
It should also be noted that at times the group means displayed in the tables
may not appear to match the magnitudes seen in the associated figures of stance
phase waveforms. To determine the mean maximums and minimums, these peak
values were extrapolated from each participant’s individual waveform. The
statistical analysis performed looked at differences between matched pairs – it was
this magnitude of difference that was significant. However, the GRF, angle and

72
moment waveforms were the result of a point-‐by-‐point average of the time-‐
normalized variables within the participant groups. While the peak values occurred
within a very small time range, they did not necessary occur at the same time-‐
normalized point. This means that in performing the group averaging to produce the
waveforms, maximum and minimum values were averaged down by non-‐peak
values from other participants within a group. The waveforms still provide
advantageous information and a revealing visual presentation of the GRF, angles
and moments.
4.1 Anthropometric Results
A total of N=16 participants were recruited for this study – 8 obese (4 men, 4
women) and 8 healthy-‐weight (4 men, 4 women). Originally the intent was to
recruit a total of 20 participants. However, due to difficulties obtaining obese
participants and time constraints, the study recruitment process was concluded
when a total of 16 gender-‐, age-‐ and height-‐matched participants were recruited.
Dependent t-‐tests were performed to determine significant differences
between groups in anthropometric measures. Group differences were found in all
variables except for those which participants were matched on – age, gender and
height (Table 7). The largest group differences are seen in body mass, BMI and waist
circumference.
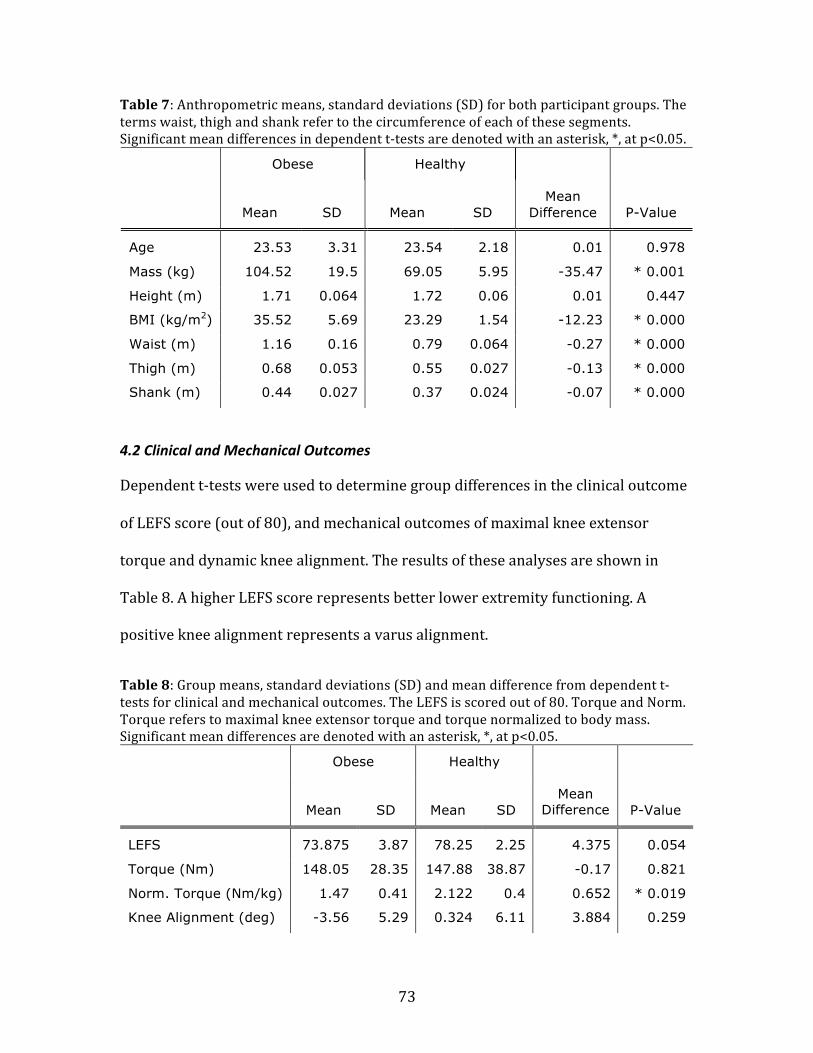
73
Table 7: Anthropometric means, standard deviations (SD) for both participant groups. The terms waist, thigh and shank refer to the circumference of each of these segments. Significant mean differences in dependent t-‐tests are denoted with an asterisk, *, at p<0.05.
Obese Healthy
Mean SD Mean SD Mean
Difference P-Value
Age 23.53 3.31 23.54 2.18 0.01 0.978
Mass (kg) 104.52 19.5 69.05 5.95 -35.47 * 0.001
Height (m) 1.71 0.064 1.72 0.06 0.01 0.447
BMI (kg/m2) 35.52 5.69 23.29 1.54 -12.23 * 0.000
Waist (m) 1.16 0.16 0.79 0.064 -0.27 * 0.000
Thigh (m) 0.68 0.053 0.55 0.027 -0.13 * 0.000
Shank (m) 0.44 0.027 0.37 0.024 -0.07 * 0.000
4.2 Clinical and Mechanical Outcomes
Dependent t-‐tests were used to determine group differences in the clinical outcome
of LEFS score (out of 80), and mechanical outcomes of maximal knee extensor
torque and dynamic knee alignment. The results of these analyses are shown in
Table 8. A higher LEFS score represents better lower extremity functioning. A
positive knee alignment represents a varus alignment.
Table 8: Group means, standard deviations (SD) and mean difference from dependent t-‐tests for clinical and mechanical outcomes. The LEFS is scored out of 80. Torque and Norm. Torque refers to maximal knee extensor torque and torque normalized to body mass. Significant mean differences are denoted with an asterisk, *, at p<0.05.
Obese Healthy
Mean SD Mean SD Mean
Difference P-Value
LEFS 73.875 3.87 78.25 2.25 4.375 0.054
Torque (Nm) 148.05 28.35 147.88 38.87 -0.17 0.821
Norm. Torque (Nm/kg) 1.47 0.41 2.122 0.4 0.652 * 0.019
Knee Alignment (deg) -3.56 5.29 0.324 6.11 3.884 0.259

74
While not statistically significant, the obese group had a lower mean LEFS
score and therefore marginally reduced lower extremity functional ability. As
reported in Wang et al. (2009), differences in LEFS scores of at least 7 points can be
considered clinically significant, or representative of different percentile ranks.
Based on the mean group results for LEFS score in Table 8, both participant groups
fall into the highest functioning percentile rank. Significant group differences were
only found in the maximal knee extensor torque when normalized to body mass.
This mean difference equals the difference in means displayed in Table 8. The
healthy participants were significantly stronger per kilogram body mass.
While no significant differences were found in the knee alignment, the obese
participant group had more negatively aligned knees, denoting valgus knee
alignment (Table 8).
4.3 Effect of Walking Speed
A dependent t-‐test was used to determine if natural, self-‐selected walking speed was
significantly different between groups. Healthy participants walked at a faster self-‐
selected speed than obese participants (p=0.013, Table 9). As the fast and slow
walking speeds were calculated as a percentage of natural speed – 15 percent faster
and slower, respectively – a significant group difference would also be found at
these two speeds.

75
Table 9: Mean, standard deviation (SD) and mean difference between participant groups in self-‐selected, natural walking speed. Mean difference is significant at p<0.05, denoted by an asterisk, *.
Obese Healthy
Mean SD Mean SD Mean
Difference P-Value
Natural Speed (m/s) 1.25 0.156 1.55 0.182 0.3 * 0.013
To quantify whether the walking speeds differed beyond the range of normal
variation from each other, a 95 percent confidence interval (CI) for the natural
walking speed mean was determined. The confidence interval for natural walking
speed is presented in Table 10. Both the mean fast and mean slow speeds fall
beyond the upper and lower limits of the mean natural speed 95 percent CI.
Table 10: Difference between three walking speeds of fast, natural and slow with the natural speed confidence interval (CI) included. The two participant groups were combined together for the analysis.
Group Slow
Speed (m/s)
Natural Fast Natural 95% CI
Obese 1.066 1.255 1.443 (1.117, 1.392)
Healthy 1.321 1.555 1.788 (1.394, 1.715)
Knee joint angles and moments were tested for significant differences by
walking speed. A series of two-‐way ANOVA’s, with the factors of group and walking
speed, showed no significant differences in means for angles and moments across
the three walking speeds in all three planes (p>0.05, Table 11). Due to this result, all
three walking speeds were treated as replicates within a subject in subsequent
kinematic and kinetic statistical analyses. Analyses that were to be performed using

76
a two-‐way ANOVA, with walking speed as a three level factor as indicated in the
Methods, were analyzed using a one-‐way ANOVA or dependent t-‐test.
Table 11: Walking speed results from a two-‐way ANOVA performed to test the effect of walking speed and group on maximal joint angle and moment. The results for the factor level of walking speed are shown. Significance at p<0.05 is denoted by an asterisk, *.
P-Value
Angle Moment
Maximum Frontal 0.911 0.718
Sagittal 0.595 0.106
Transverse 0.894 0.937
Minimum Frontal 0.966 0.712
Sagittal 0.999 0.525
Transverse 0.828 0.929
Range Frontal 0.982 0.655
Sagittal 0.653 0.059
Transverse 0.891 0.855
Adduction moment impulse was also tested for differences at the three
walking speeds using a two-‐way ANOVA with the factors of group and walking
speed. This analysis also showed no significant differences between walking speeds
(p=0.549, Table 12). Based on these results, within a participant, the three walking
speeds were used as replicates for Impulse and CKAL calculations as well.
Table 12: A two-‐way ANOVA with the factors of group and walking speed was performed to determine the effect on impulse. The factor level of speed is shown. Significance level at p<0.05 is denoted by an asterisk, *.
Fast Natural Slow
Mean SD Mean SD Mean SD P-Value
Impulse 7.88 4.90 9.09 5.09 9.80 4.93 0.549
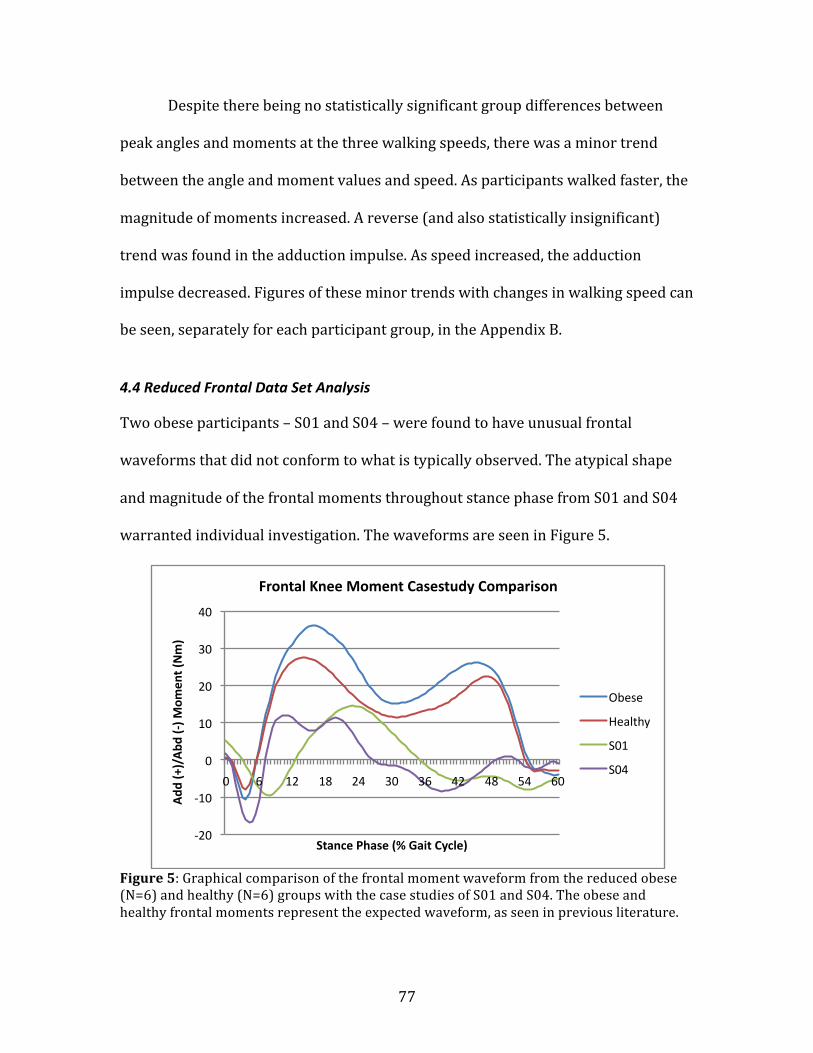
77
Despite there being no statistically significant group differences between
peak angles and moments at the three walking speeds, there was a minor trend
between the angle and moment values and speed. As participants walked faster, the
magnitude of moments increased. A reverse (and also statistically insignificant)
trend was found in the adduction impulse. As speed increased, the adduction
impulse decreased. Figures of these minor trends with changes in walking speed can
be seen, separately for each participant group, in the Appendix B.
4.4 Reduced Frontal Data Set Analysis
Two obese participants – S01 and S04 – were found to have unusual frontal
waveforms that did not conform to what is typically observed. The atypical shape
and magnitude of the frontal moments throughout stance phase from S01 and S04
warranted individual investigation. The waveforms are seen in Figure 5.
Figure 5: Graphical comparison of the frontal moment waveform from the reduced obese (N=6) and healthy (N=6) groups with the case studies of S01 and S04. The obese and healthy frontal moments represent the expected waveform, as seen in previous literature.
-‐20
-‐10
0
10
20
30
40
0 6 12 18 24 30 36 42 48 54 60
Add
(+)/Abd
(-‐) M
omen
t (Nm)
Stance Phase (% Gait Cycle)
Frontal Knee Moment Casestudy Comparison
Obese
Healthy
S01
S04

78
Both participants had peak frontal moments and adduction impulses that
were much smaller than all other participants. These unusual observations were
only seen in the frontal plane – sagittal and transverse plane data for S01 and S04
were as expected. Neither participant was deemed a statistical outlier – both fell
within two standard deviations of the obese group mean frontal moment peak.
However, the S01 and S04 frontal moments were uniquely different from all other
participants. Due to uncertainty in the origin of these unusual frontal moments and
concern that these participants may skew the statistical analyses, they, along with
their healthy matches, were removed from the data. The subsequent kinematic,
kinetic and cumulative load analyses of frontal plane data only were performed as a
reduced data set of N=12 (6 obese, 6 healthy). All other analyses include data from
all 16 participants, including the regression analyses. It was thought that removal of
these two participants (and their matches) from the frontal plane kinematic, kinetic
and cumulative load data would strengthen the results of the group analyses on
maximum frontal knee angle, moment, adduction impulse and resulting CKAL. The
results of these analyses are presented along with full data set of the sagittal and
transverse plane. The individual case study data for S01 and S04 are presented
separately, below.
4.4.1 Case Studies of S01 and S04
Due to the unusual frontal moments of S01 and S04, there individual participant
data is present below. Table 13 displays the anthropometric, clinical and walking
speed results for both S01 and S04. Most of these variables are comparable to the
results from all other obese participants. The most noteworthy result from this table

79
is the knee alignment for both participants. It is only in this variable that both
participants deviated significantly from the obese group mean.
Table 13: Individual results for the two case study participants, S01 and S04, for various anthropometric and clinical variables.
S01 S04
Gender Male Female
Weight (kg) 132.45 88.4
BMI 44.25 33.42
Waist Circumference (m) 1.47 1.05
LEFS 73 78
Torque (Nm) 139.36 170.8
Normalized Torque (Nm/kg) 1.05 1.93
Normal Walking Speed (m/s) 1.28 1.09
Average Steps/Day 6985 5072.1
Knee Alignment (deg) -9.459 -10.297
The means and standard deviations of the knee angle and moment in the
frontal plane for S01 and S04 are in Table 14. Means and standard deviations were
derived by using the three walking speeds of fast, natural and slow for each
participant as replicates. The results for the GRF and angles are similar to group
means in the full data set. However, the moments are quite a bit smaller than those
seen in other participants.
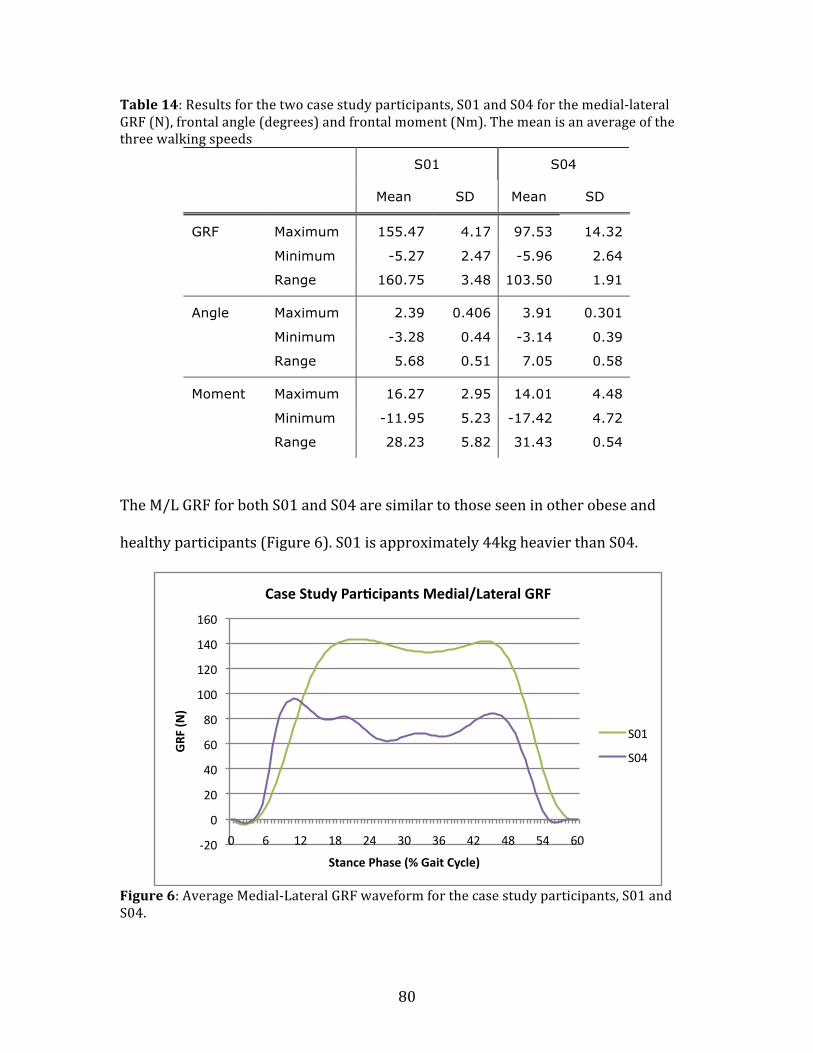
80
Table 14: Results for the two case study participants, S01 and S04 for the medial-‐lateral GRF (N), frontal angle (degrees) and frontal moment (Nm). The mean is an average of the three walking speeds
S01 S04
Mean SD Mean SD
GRF Maximum 155.47 4.17 97.53 14.32
Minimum -5.27 2.47 -5.96 2.64
Range 160.75 3.48 103.50 1.91
Angle Maximum 2.39 0.406 3.91 0.301
Minimum -3.28 0.44 -3.14 0.39
Range 5.68 0.51 7.05 0.58
Moment Maximum 16.27 2.95 14.01 4.48
Minimum -11.95 5.23 -17.42 4.72
Range 28.23 5.82 31.43 0.54
The M/L GRF for both S01 and S04 are similar to those seen in other obese and
healthy participants (Figure 6). S01 is approximately 44kg heavier than S04.
Figure 6: Average Medial-‐Lateral GRF waveform for the case study participants, S01 and S04.
-‐20
0
20
40
60
80
100
120
140
160
0 6 12 18 24 30 36 42 48 54 60
GRF
(N)
Stance Phase (% Gait Cycle)
Case Study Par^cipants Medial/Lateral GRF
S01
S04
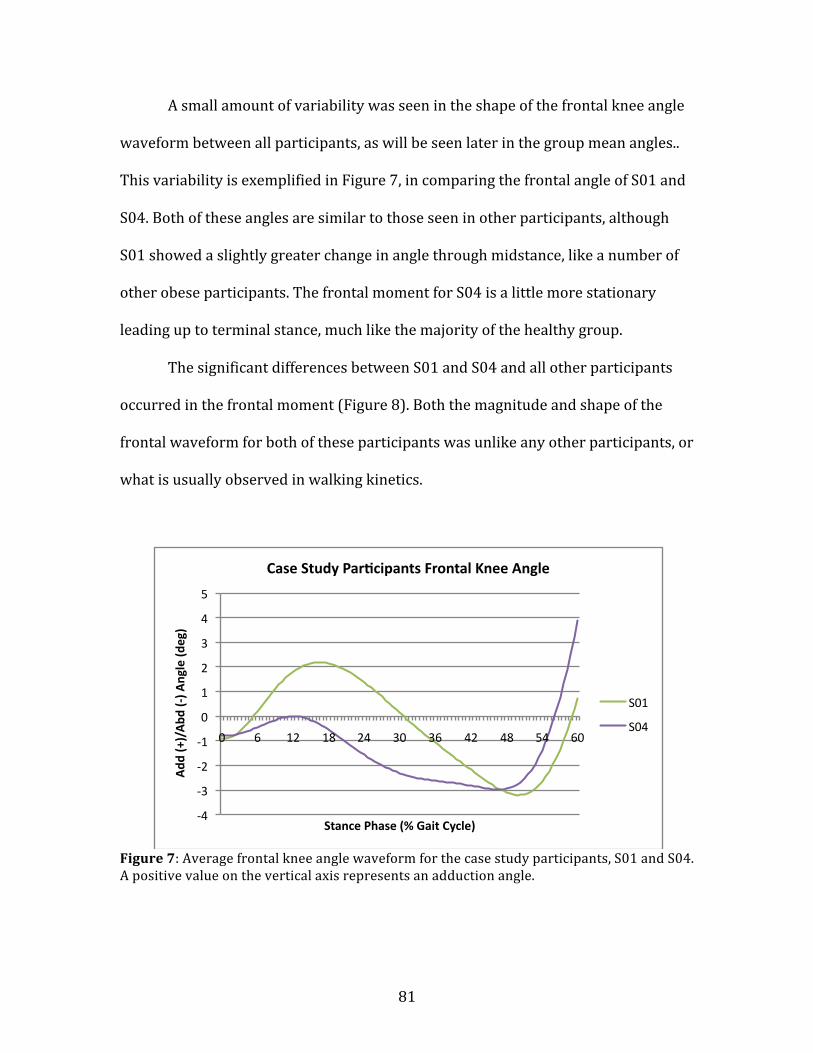
81
A small amount of variability was seen in the shape of the frontal knee angle
waveform between all participants, as will be seen later in the group mean angles..
This variability is exemplified in Figure 7, in comparing the frontal angle of S01 and
S04. Both of these angles are similar to those seen in other participants, although
S01 showed a slightly greater change in angle through midstance, like a number of
other obese participants. The frontal moment for S04 is a little more stationary
leading up to terminal stance, much like the majority of the healthy group.
The significant differences between S01 and S04 and all other participants
occurred in the frontal moment (Figure 8). Both the magnitude and shape of the
frontal waveform for both of these participants was unlike any other participants, or
what is usually observed in walking kinetics.
Figure 7: Average frontal knee angle waveform for the case study participants, S01 and S04. A positive value on the vertical axis represents an adduction angle.
-‐4
-‐3
-‐2
-‐1
0
1
2
3
4
5
0 6 12 18 24 30 36 42 48 54 60
Add
(+)/Abd
(-‐) A
ngle (d
eg)
Stance Phase (% Gait Cycle)
Case Study Par^cipants Frontal Knee Angle
S01
S04

82
Figure 8: Average frontal knee moment waveform for the case study participants, S01 and S04. It is in this waveform that these two participants differ from all other participants, both obese and healthy. A positive value on the vertical axis represents an adduction moment.
4.5 Study I Kinematic and Kinetic Data Analysis
4.5.1 Ground Reaction Forces Analysis
Ground Reaction Forces were tested for significant group differences in the
maximum, minimum values and range in all three planes – medial-‐lateral (M/L),
anterior-‐posterior (A/P) and vertical axes – using dependent t-‐tests. Fast, natural
and slow walking speeds were used as replicates within each of the eight
participants in both groups, making N=18 in the medial/lateral direction, and N=24
for each group in the anterior/posterior, and vertical direction. Results are shown in
Table 15, with group means and standard deviations (SD) and p-‐values. GRF are
expressed in Newtons (N). Significant group differences were found in all these axes.
-‐20
-‐15
-‐10
-‐5
0
5
10
15
20
0 6 12 18 24 30 36 42 48 54 60
Add
(+)/Abd
(-‐) M
omen
t (Nm)
Stance Phase (% Gait Cycle)
Case Study Par^cipants Frontal Knee Angle
S01
S04

83
Table 15: Means, standard deviations (SD) and mean group differences in peaks and ranges of GRF (N) in all three axes. Significant mean differences are denoted by an asterisk, *, at p<0.05.
Obese Healthy
Mean SD Mean SD Mean
Difference P-Value
M/L Maximum 107.23 33.13 71.06 14.62 -36.17 * 0.000
Minimum -22.59 18.77 -21.10 10.36 1.49 0.709
Range 129.82 36.54 92.17 14.62 -37.65 * 0.000
A/P Maximum 200.63 58.66 179.09 40.87 -21.54 0.125
Minimum -220.14 67.15 -182.82 28.33 37.32 * 0.007
Range 420.78 120.07 361.92 61.77 -58.86 * 0.023
Vertical Maximum 1197.35 254.76 949.44 153.44 -247.91 * 0.000
Minimum -0.46 0.31 -0.41 0.28 0.05 0.564
Range 1197.81 254.74 949.86 153.50 -247.95 * 0.000
Graphical comparisons of the GRF for both groups, time normalized to stance
phase of walking, are seen in Figures 9 to 11. These figures give a better
representation of the significantly large difference in peak values, and throughout
the waveform, between the groups. Obese participants had a significantly greater
maximal value and range for the M/L and vertical GRF’s. Obese participants also had
significantly greater terminal stance minimum value and range in the A/P GRF.
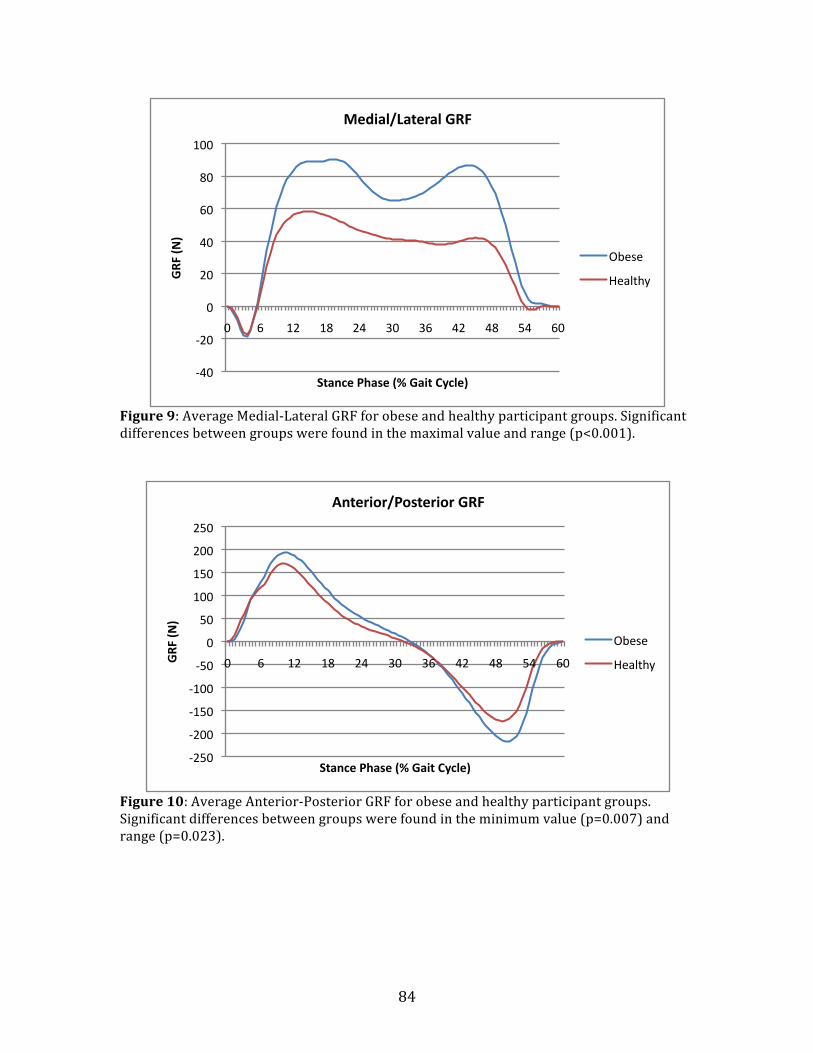
84
Figure 9: Average Medial-‐Lateral GRF for obese and healthy participant groups. Significant differences between groups were found in the maximal value and range (p<0.001).
Figure 10: Average Anterior-‐Posterior GRF for obese and healthy participant groups. Significant differences between groups were found in the minimum value (p=0.007) and range (p=0.023).
-‐40
-‐20
0
20
40
60
80
100
0 6 12 18 24 30 36 42 48 54 60
GRF
(N)
Stance Phase (% Gait Cycle)
Medial/Lateral GRF
Obese
Healthy
-‐250
-‐200
-‐150
-‐100
-‐50
0
50
100
150
200
250
0 6 12 18 24 30 36 42 48 54 60 GRF
(N)
Stance Phase (% Gait Cycle)
Anterior/Posterior GRF
Obese
Healthy

85
Figure 11: Average vertical GRF for obese and healthy participant groups. Significant differences between groups were found in the maximum value and range (p<0.001).
4.5.2 Knee Angles Analysis
Dependent t-‐tests were run to analyze differences between groups in knee joint
angles. All knee angles were zeroed to a quiet standing posture. Since fast, natural
and slow speeds were used as replicates for each of the eight participants in both
groups, each group had an N=18 in the frontal plane, and N=24 in the sagittal and
transverse planes for the following knee angle analysis. Table 16 summarizes the
results of this analysis, including separate means and standard deviations (SD) and
displays significant differences. Knee angles are expressed in degrees. Significant
group differences were found in the frontal and sagittal planes.
0
200
400
600
800
1000
1200
1400
0 6 12 18 24 30 36 42 48 54 60
GRF
(N)
Stance Phase (% Gait Cycle)
Ver^cal GRF
Obese
Healthy

86
Table 16: Means, standard deviations (SD) and mean group differences of peaks and ranges in three-‐dimensional knee angles (degrees). An asterisk *, denotes a significant mean difference between groups at p<0.05.
Obese Healthy
Mean SD Mean SD Mean
Difference P-Value
Frontal Maximum 3.51 2.58 -0.069 2.43 -3.579 * 0.002
Minimum -4.001 3.14 -8.32 3.54 -4.319 * 0.003
Range 7.51 2.57 8.25 3.601 0.74 0.510
Sagittal Maximum 46.36 4.31 48.71 6.34 2.35 0.065
Minimum -0.15 3.51 7.37 9.6 7.52 * 0.001
Range 46.52 5.63 41.34 5.92 -5.18 * 0.001
Transverse Maximum 4.34 8.07 5.62 3.53 1.28 0.537
Minimum -7.21 8.96 -5.19 6.03 2.02 0.412
Range 11.55 4.15 10.81 4.81 -0.74 0.599
Figures 12 to 14 show the averaged group knee angle for all three planes
while walking, time normalized to stance phase. These give a graphical
representation of group differences in knee angle throughout the stance phase of
walking. In the Figures for the frontal, sagittal and transverse plane knee angles, a
positive value on the vertical axis indicates adduction, flexion and medial rotation,
respectively.
The frontal knee angle between all participants – both obese and healthy -‐
had a bit of variability in their waveform shape. This variability, while constrained
within an angle range of approximately five degrees – occurred throughout the
stance phase of the gait cycle. There was a group pattern to this variability, and the
majority of it occurred in the obese participant group. The obese participants had a
significantly greater maximal frontal angle, while the healthy participants had a

87
significantly greater minimum frontal angle at toe-‐off (Table 16). There is one
between group pattern difference which is not communicated in the results from
Table 16 – the variability in the average group frontal angle from heel contact to the
beginning of terminal stance (45 percent of the gait cycle). The healthy participants
had a fairly stable (less than 2 degrees of variation) average frontal angle waveform
until terminal stance, akin to what is typically observed. The obese participants had
a less stable average frontal angle, with greater than 2 degrees of variability leading
up to terminal stance (Figure 12). Another graphical comparison of this variability
can also be seen in the Appendix B, where two separate figures showcase the frontal
angle waveform over stance phase for each group at all walking speeds (Appendix B,
Figures 42 and 43).
Figure 12: Average frontal knee angle for obese and healthy participant groups. A positive value on the vertical axis represents adduction. Significant differences between groups were found in the maximum (p=0.002) and minimum value (p=0.003).
-‐8
-‐6
-‐4
-‐2
0
2
4
0 6 12 18 24 30 36 42 48 54 60
Add
(+)/ Abd
(-‐) A
ngle (d
eg)
Stance Phase (% Gait Cycle)
Frontal Knee Angle
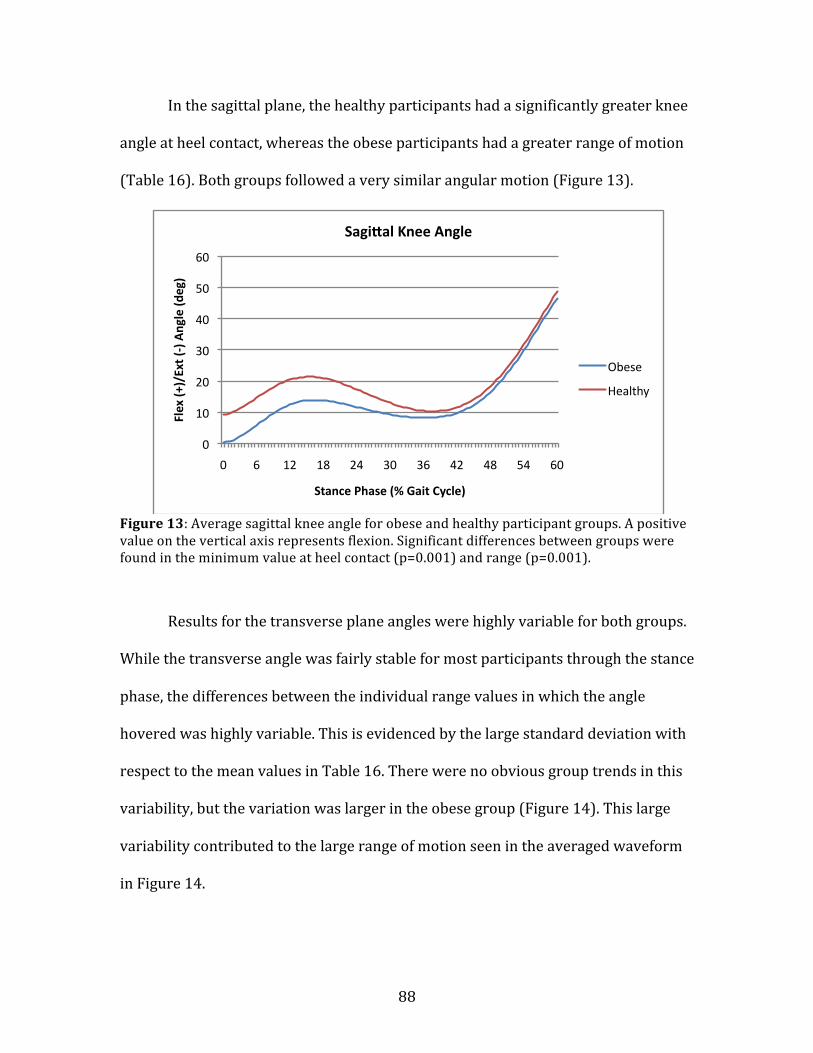
88
In the sagittal plane, the healthy participants had a significantly greater knee
angle at heel contact, whereas the obese participants had a greater range of motion
(Table 16). Both groups followed a very similar angular motion (Figure 13).
Figure 13: Average sagittal knee angle for obese and healthy participant groups. A positive value on the vertical axis represents flexion. Significant differences between groups were found in the minimum value at heel contact (p=0.001) and range (p=0.001).
Results for the transverse plane angles were highly variable for both groups.
While the transverse angle was fairly stable for most participants through the stance
phase, the differences between the individual range values in which the angle
hovered was highly variable. This is evidenced by the large standard deviation with
respect to the mean values in Table 16. There were no obvious group trends in this
variability, but the variation was larger in the obese group (Figure 14). This large
variability contributed to the large range of motion seen in the averaged waveform
in Figure 14.
0
10
20
30
40
50
60
0 6 12 18 24 30 36 42 48 54 60
Flex (+
)/Ext (-‐) Angle (d
eg)
Stance Phase (% Gait Cycle)
Sagi_al Knee Angle
Obese
Healthy
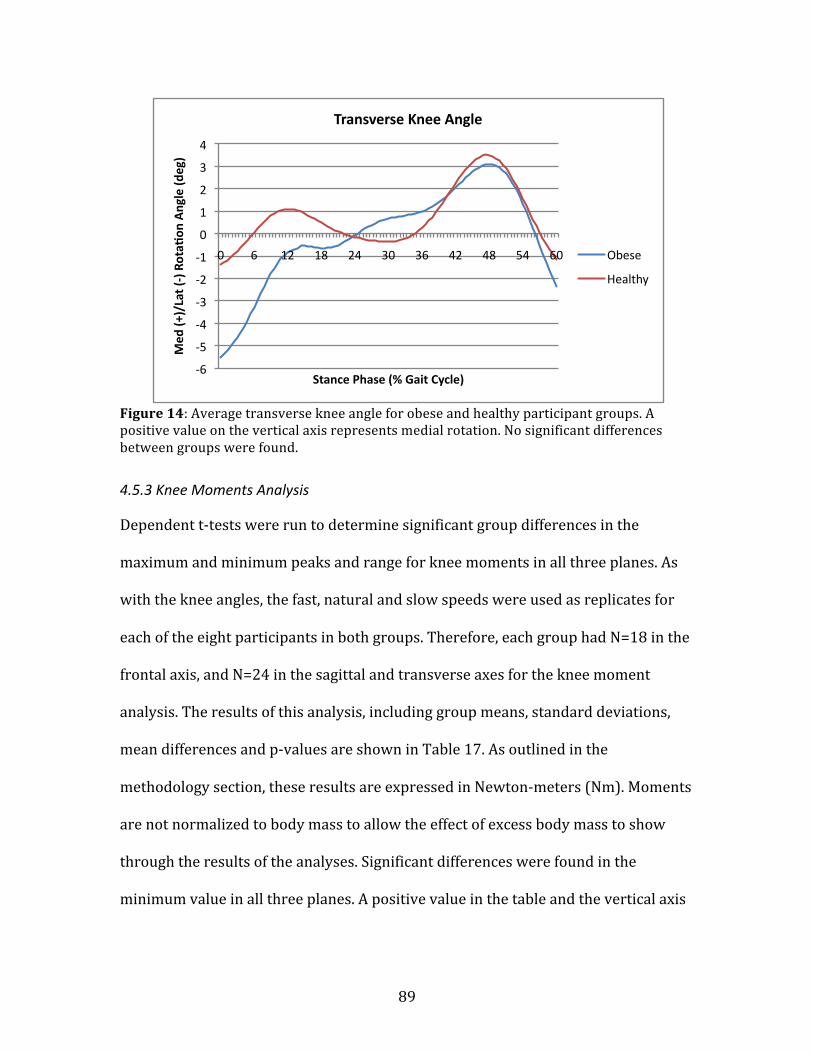
89
Figure 14: Average transverse knee angle for obese and healthy participant groups. A positive value on the vertical axis represents medial rotation. No significant differences between groups were found.
4.5.3 Knee Moments Analysis
Dependent t-‐tests were run to determine significant group differences in the
maximum and minimum peaks and range for knee moments in all three planes. As
with the knee angles, the fast, natural and slow speeds were used as replicates for
each of the eight participants in both groups. Therefore, each group had N=18 in the
frontal axis, and N=24 in the sagittal and transverse axes for the knee moment
analysis. The results of this analysis, including group means, standard deviations,
mean differences and p-‐values are shown in Table 17. As outlined in the
methodology section, these results are expressed in Newton-‐meters (Nm). Moments
are not normalized to body mass to allow the effect of excess body mass to show
through the results of the analyses. Significant differences were found in the
minimum value in all three planes. A positive value in the table and the vertical axis
-‐6
-‐5
-‐4
-‐3
-‐2
-‐1
0
1
2
3
4
0 6 12 18 24 30 36 42 48 54 60
Med
(+)/Lat (-‐) Rota^
on Angle (d
eg)
Stance Phase (% Gait Cycle)
Transverse Knee Angle
Obese
Healthy

90
of following figures represent an adduction, flexion and medial rotation moments in
the frontal, sagittal and transverse planes, respectively.
Table 17: Means, standard deviations (SD) and mean group differences of peaks and ranges in three-‐dimensional knee moments. Moments are expressed in Newton-‐meters (Nm). Significant mean differences are denoted by an asterisk, *, at p<0.05.
Obese Healthy
Mean SD Mean SD Mean
Difference P-Value
Frontal Maximum 40.2 23.31 29.99 6.49 -10.21 0.115
Minimum -13.69 10.08 -9.69 5.21 4.00 0.129
Range 53.89 31.94 39.68 5.63 -14.21 0.072
Sagittal Maximum 65.62 39.52 59.11 20.26 -6.51 0.485
Minimum -39.46 20.75 -26.94 8.24 12.52 * 0.014
Range 105.08 43.31 86.06 26.24 -19.02 0.074
Transverse Maximum -6.21 4.7 -2.33 1.57 3.88 * 0.003
Minimum 7.78 5.65 10.01 4.003 2.23 0.209
Range 13.99 6.47 11.98 3.91 -2.01 0.161
The averaged group knee moment waveforms, time normalized to the stance
phase of gait cycle, are shown below. In the frontal plane, similar trends in shape
and magnitude were found in both the averaged obese and healthy participant
groups through the stance phase. A fairly large difference is visible between the
participant groups in the maximum magnitude of the frontal moment (Figure 15).
However, this difference was not statistically significant (p=0.115). The magnitude
of the moments did vary considerably between all participants. This variability was
greatest in the obese group, as can be seen from the standard deviation in Table 17.
Two figures of all individual frontal moment waveforms – one for the obese group,
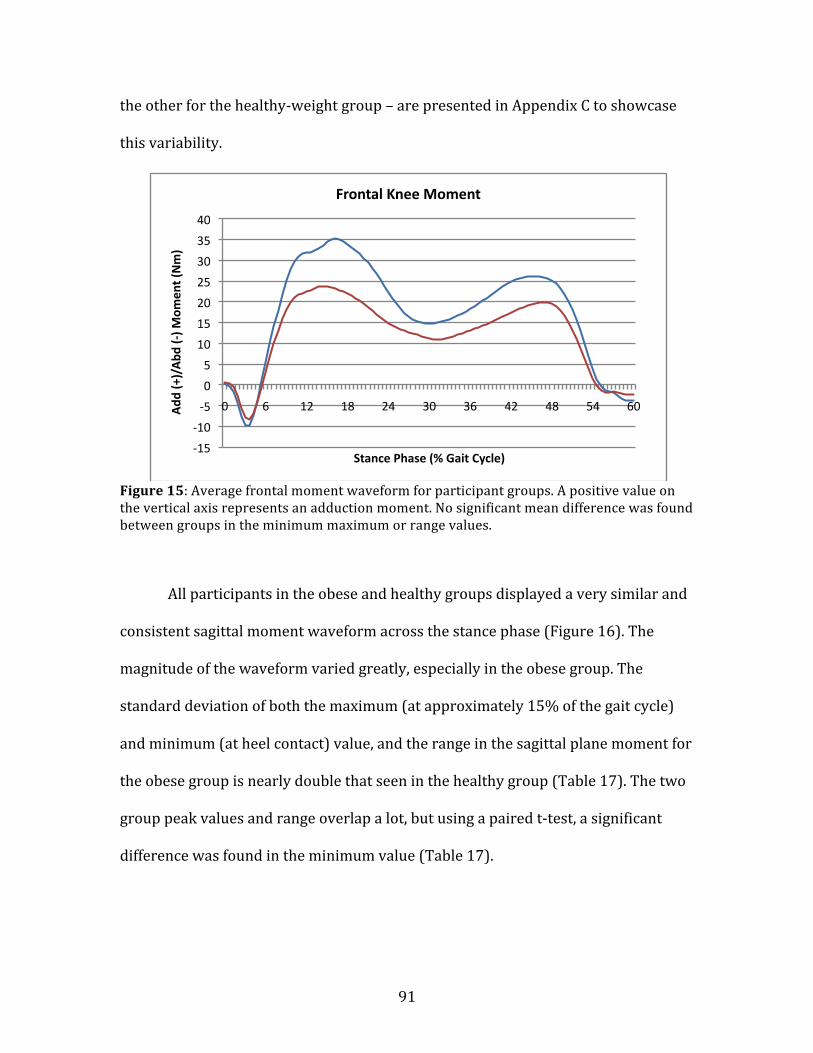
91
the other for the healthy-‐weight group – are presented in Appendix C to showcase
this variability.
Figure 15: Average frontal moment waveform for participant groups. A positive value on the vertical axis represents an adduction moment. No significant mean difference was found between groups in the minimum maximum or range values.
All participants in the obese and healthy groups displayed a very similar and
consistent sagittal moment waveform across the stance phase (Figure 16). The
magnitude of the waveform varied greatly, especially in the obese group. The
standard deviation of both the maximum (at approximately 15% of the gait cycle)
and minimum (at heel contact) value, and the range in the sagittal plane moment for
the obese group is nearly double that seen in the healthy group (Table 17). The two
group peak values and range overlap a lot, but using a paired t-‐test, a significant
difference was found in the minimum value (Table 17).
-‐15
-‐10
-‐5
0
5
10
15
20
25
30
35
40
0 6 12 18 24 30 36 42 48 54 60 Add
(+)/Abd
(-‐) M
omen
t (Nm)
Stance Phase (% Gait Cycle)
Frontal Knee Moment
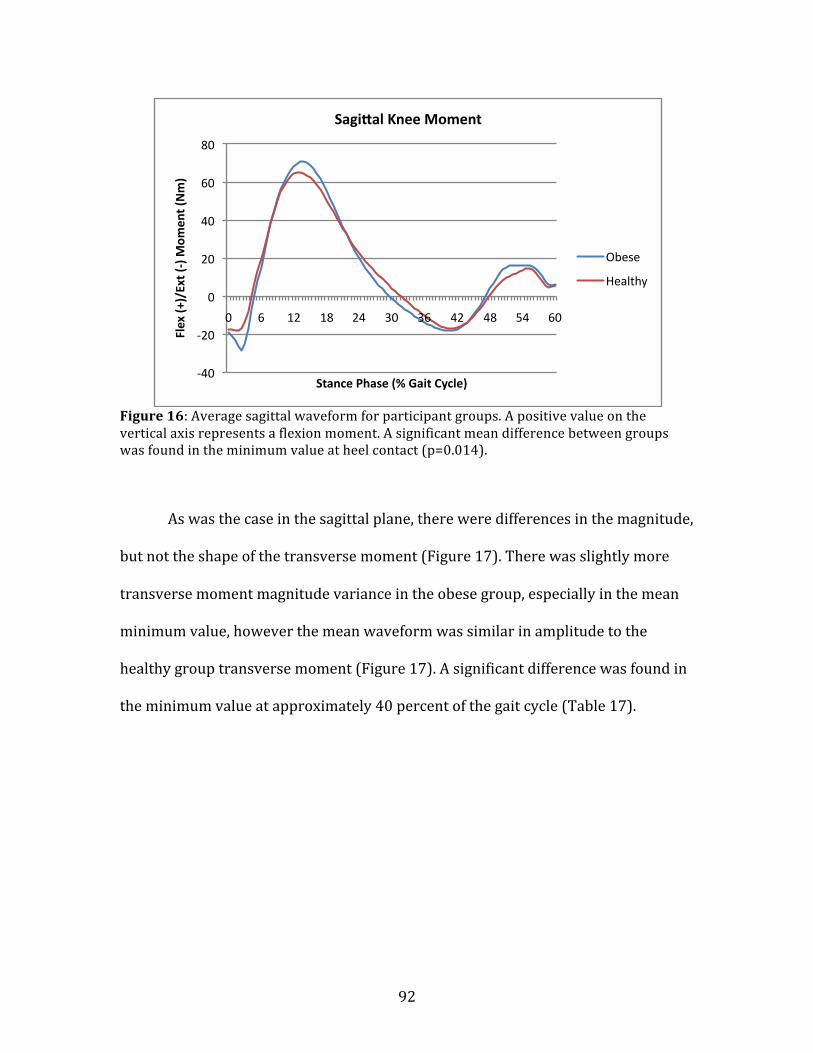
92
Figure 16: Average sagittal waveform for participant groups. A positive value on the vertical axis represents a flexion moment. A significant mean difference between groups was found in the minimum value at heel contact (p=0.014).
As was the case in the sagittal plane, there were differences in the magnitude,
but not the shape of the transverse moment (Figure 17). There was slightly more
transverse moment magnitude variance in the obese group, especially in the mean
minimum value, however the mean waveform was similar in amplitude to the
healthy group transverse moment (Figure 17). A significant difference was found in
the minimum value at approximately 40 percent of the gait cycle (Table 17).
-‐40
-‐20
0
20
40
60
80
0 6 12 18 24 30 36 42 48 54 60
Flex (+
)/Ext (-‐) M
omen
t (Nm)
Stance Phase (% Gait Cycle)
Sagi_al Knee Moment
Obese
Healthy
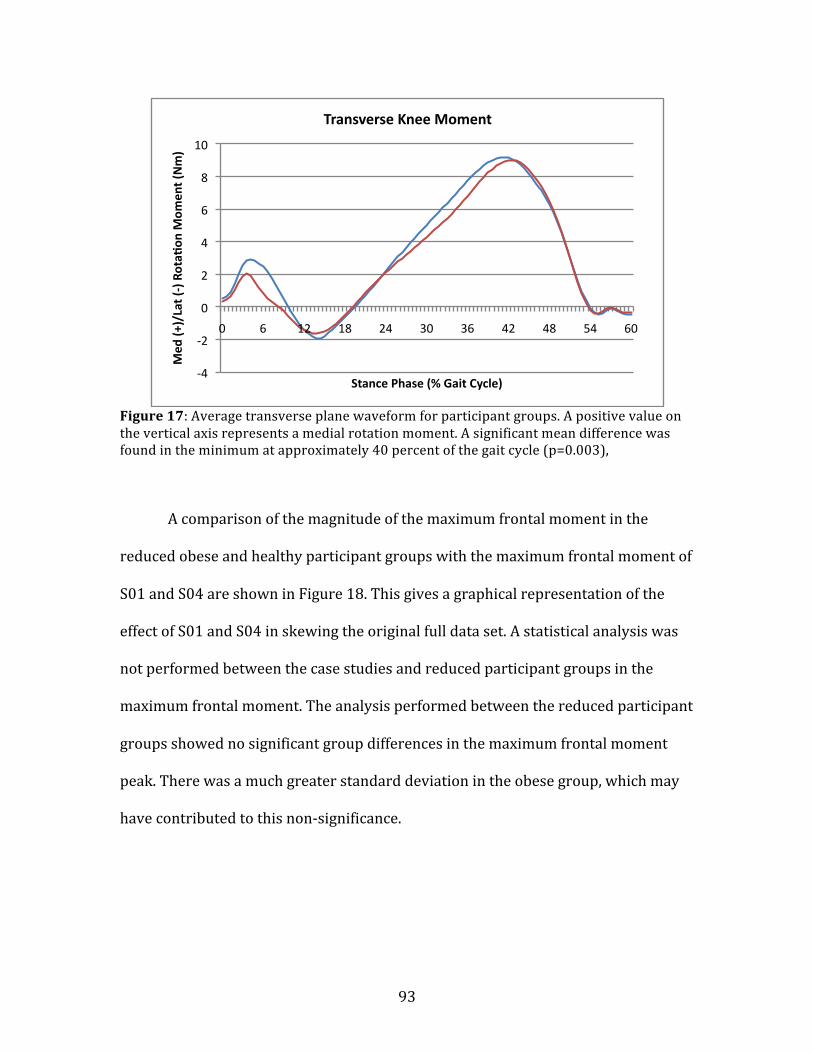
93
Figure 17: Average transverse plane waveform for participant groups. A positive value on the vertical axis represents a medial rotation moment. A significant mean difference was found in the minimum at approximately 40 percent of the gait cycle (p=0.003),
A comparison of the magnitude of the maximum frontal moment in the
reduced obese and healthy participant groups with the maximum frontal moment of
S01 and S04 are shown in Figure 18. This gives a graphical representation of the
effect of S01 and S04 in skewing the original full data set. A statistical analysis was
not performed between the case studies and reduced participant groups in the
maximum frontal moment. The analysis performed between the reduced participant
groups showed no significant group differences in the maximum frontal moment
peak. There was a much greater standard deviation in the obese group, which may
have contributed to this non-‐significance.
-‐4
-‐2
0
2
4
6
8
10
0 6 12 18 24 30 36 42 48 54 60
Med
(+)/Lat (-‐) Rota^
on M
omen
t (Nm)
Stance Phase (% Gait Cycle)
Transverse Knee Moment
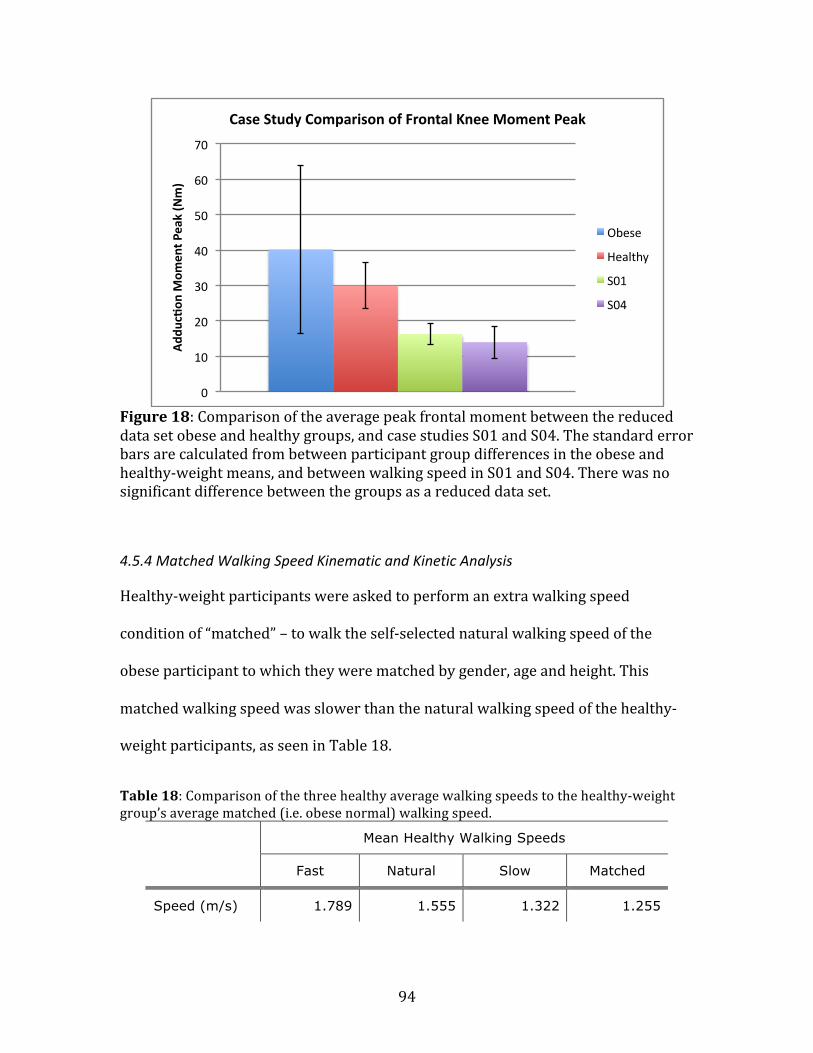
94
Figure 18: Comparison of the average peak frontal moment between the reduced data set obese and healthy groups, and case studies S01 and S04. The standard error bars are calculated from between participant group differences in the obese and healthy-‐weight means, and between walking speed in S01 and S04. There was no significant difference between the groups as a reduced data set.
4.5.4 Matched Walking Speed Kinematic and Kinetic Analysis
Healthy-‐weight participants were asked to perform an extra walking speed
condition of “matched” – to walk the self-‐selected natural walking speed of the
obese participant to which they were matched by gender, age and height. This
matched walking speed was slower than the natural walking speed of the healthy-‐
weight participants, as seen in Table 18.
Table 18: Comparison of the three healthy average walking speeds to the healthy-‐weight group’s average matched (i.e. obese normal) walking speed.
Mean Healthy Walking Speeds
Fast Natural Slow Matched
Speed (m/s) 1.789 1.555 1.322 1.255
0
10
20
30
40
50
60
70
Add
uc^on
Mom
ent P
eak (Nm)
Case Study Comparison of Frontal Knee Moment Peak
Obese
Healthy
S01
S04
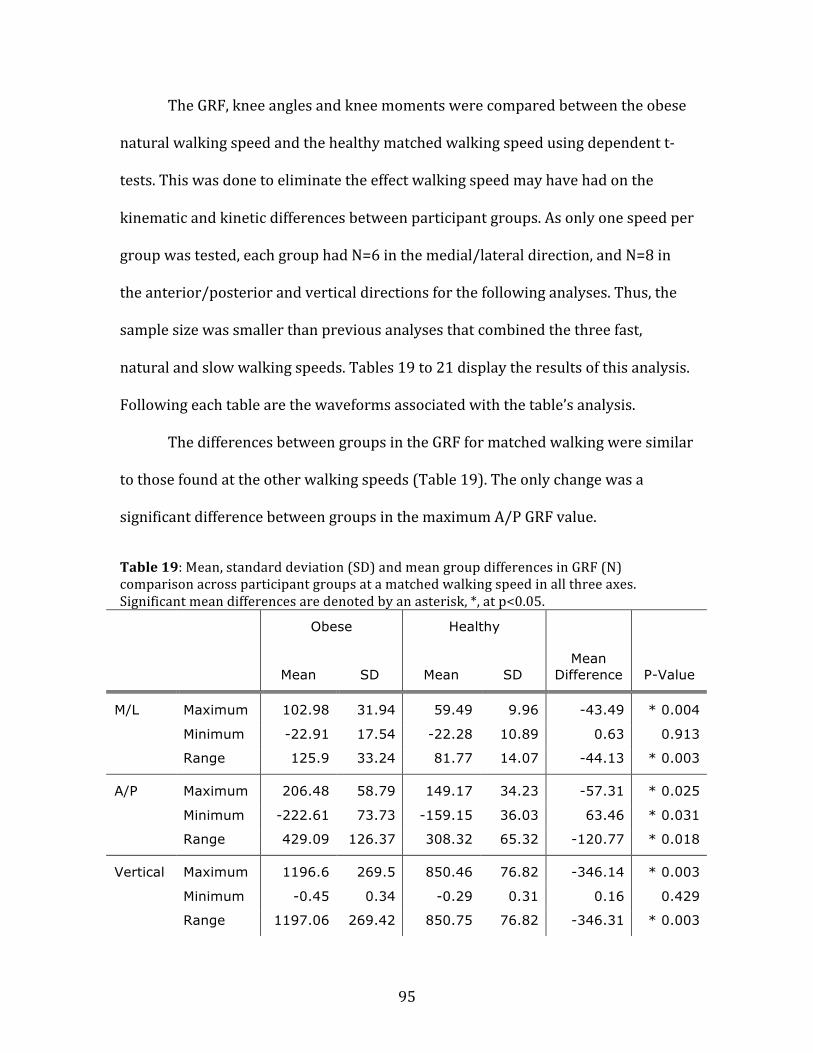
95
The GRF, knee angles and knee moments were compared between the obese
natural walking speed and the healthy matched walking speed using dependent t-‐
tests. This was done to eliminate the effect walking speed may have had on the
kinematic and kinetic differences between participant groups. As only one speed per
group was tested, each group had N=6 in the medial/lateral direction, and N=8 in
the anterior/posterior and vertical directions for the following analyses. Thus, the
sample size was smaller than previous analyses that combined the three fast,
natural and slow walking speeds. Tables 19 to 21 display the results of this analysis.
Following each table are the waveforms associated with the table’s analysis.
The differences between groups in the GRF for matched walking were similar
to those found at the other walking speeds (Table 19). The only change was a
significant difference between groups in the maximum A/P GRF value.
Table 19: Mean, standard deviation (SD) and mean group differences in GRF (N) comparison across participant groups at a matched walking speed in all three axes. Significant mean differences are denoted by an asterisk, *, at p<0.05.
Obese Healthy
Mean SD Mean SD Mean
Difference P-Value
M/L Maximum 102.98 31.94 59.49 9.96 -43.49 * 0.004
Minimum -22.91 17.54 -22.28 10.89 0.63 0.913
Range 125.9 33.24 81.77 14.07 -44.13 * 0.003
A/P Maximum 206.48 58.79 149.17 34.23 -57.31 * 0.025
Minimum -222.61 73.73 -159.15 36.03 63.46 * 0.031
Range 429.09 126.37 308.32 65.32 -120.77 * 0.018
Vertical Maximum 1196.6 269.5 850.46 76.82 -346.14 * 0.003
Minimum -0.45 0.34 -0.29 0.31 0.16 0.429
Range 1197.06 269.42 850.75 76.82 -346.31 * 0.003
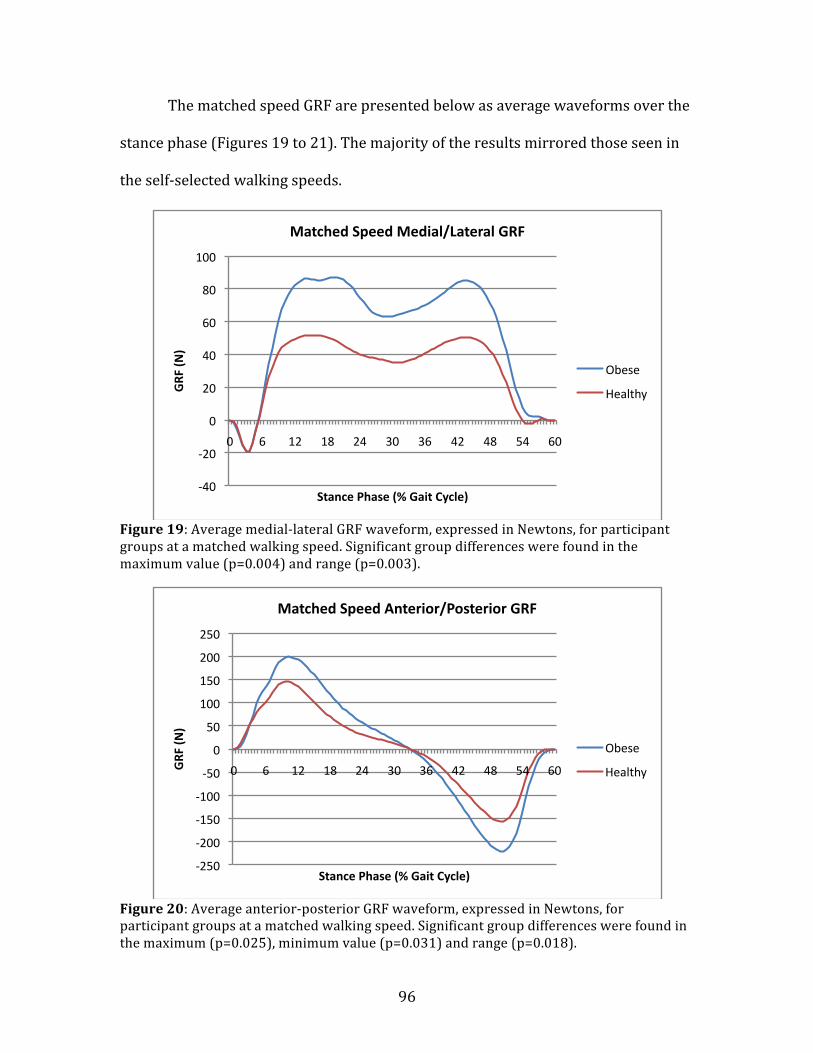
96
The matched speed GRF are presented below as average waveforms over the
stance phase (Figures 19 to 21). The majority of the results mirrored those seen in
the self-‐selected walking speeds.
Figure 19: Average medial-‐lateral GRF waveform, expressed in Newtons, for participant groups at a matched walking speed. Significant group differences were found in the maximum value (p=0.004) and range (p=0.003).
Figure 20: Average anterior-‐posterior GRF waveform, expressed in Newtons, for participant groups at a matched walking speed. Significant group differences were found in the maximum (p=0.025), minimum value (p=0.031) and range (p=0.018).
-‐40
-‐20
0
20
40
60
80
100
0 6 12 18 24 30 36 42 48 54 60
GRF
(N)
Stance Phase (% Gait Cycle)
Matched Speed Medial/Lateral GRF
Obese
Healthy
-‐250
-‐200
-‐150
-‐100
-‐50
0
50
100
150
200
250
0 6 12 18 24 30 36 42 48 54 60 GRF
(N)
Stance Phase (% Gait Cycle)
Matched Speed Anterior/Posterior GRF
Obese
Healthy

97
Figure 21: Average vertical GRF waveform, expressed in Newtons, for participant groups at a matched walking speed. Significant group differences were found in the maximum value (p=0.003) and range (p=0.003).
No knee angle differences were found between groups at the matched
walking speed in any of the three planes (Table 20).
Table 20: Mean, standard deviation (SD) and mean group differences in knee angles (degrees) between participant groups at a matched walking speed in all three axes. Significant mean differences are denoted by an asterisk, *, at p<0.05.
Obese Healthy
Mean SD Mean SD Mean
Difference P-Value
Frontal Maximum 3.69 2.76 -0.353 2.09 -4.043 0.052
Minimum -3.93 3.12 -7.50 3.31 -3.57 0.148
Range 7.62 2.88 7.14 3.40 -0.48 0.828
Sagittal Maximum 46.08 4.32 48.68 7.76 2.6 0.315
Minimum -0.66 3.04 4.11 5.6 4.77 0.084
Range 46.75 6.08 44.56 44.56 -2.19 0.354
Transverse Maximum 4.44 7.64 5.45 4.15 1.01 0.793
Minimum -6.79 8.63 -5.78 7.13 1.01 0.818
Range 11.23 3.88 11.23 4.63 0.00 0.999
-‐200
0
200
400
600
800
1000
1200
1400
0 6 12 18 24 30 36 42 48 54 60
GRF
(N)
Stance Phase (% Gait Cycle)
Matched Speed Ver^cal GRF
Obese
Healthy
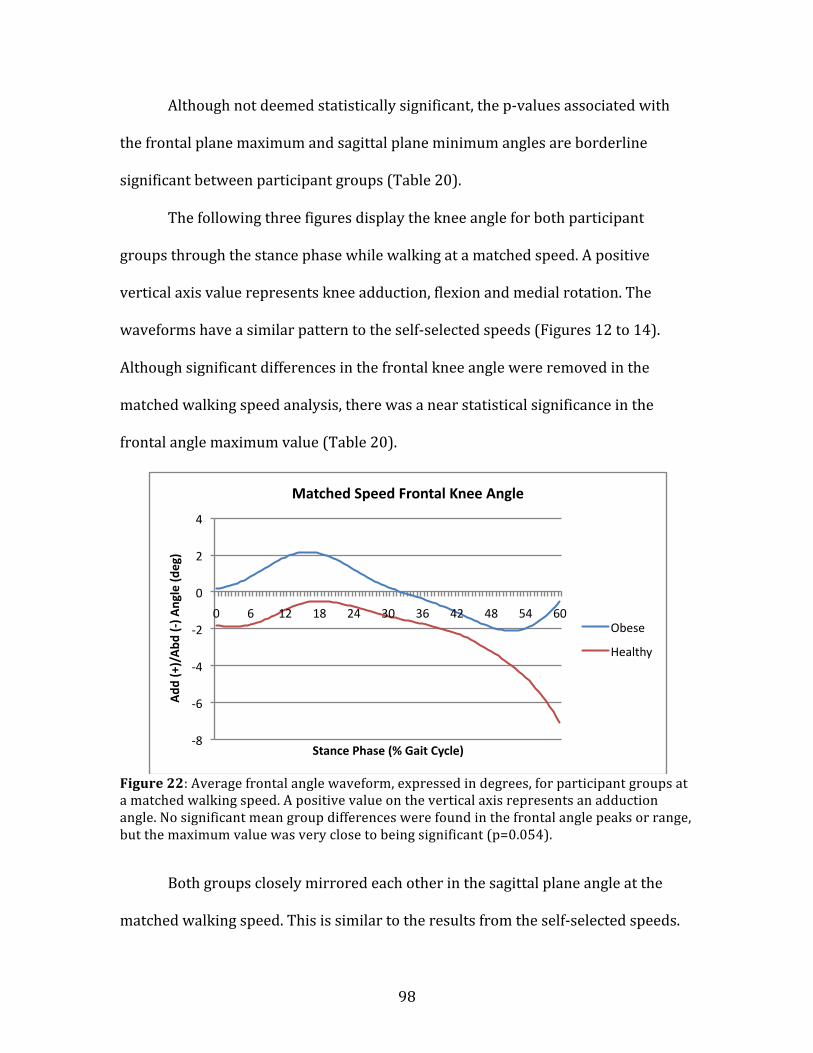
98
Although not deemed statistically significant, the p-‐values associated with
the frontal plane maximum and sagittal plane minimum angles are borderline
significant between participant groups (Table 20).
The following three figures display the knee angle for both participant
groups through the stance phase while walking at a matched speed. A positive
vertical axis value represents knee adduction, flexion and medial rotation. The
waveforms have a similar pattern to the self-‐selected speeds (Figures 12 to 14).
Although significant differences in the frontal knee angle were removed in the
matched walking speed analysis, there was a near statistical significance in the
frontal angle maximum value (Table 20).
Figure 22: Average frontal angle waveform, expressed in degrees, for participant groups at a matched walking speed. A positive value on the vertical axis represents an adduction angle. No significant mean group differences were found in the frontal angle peaks or range, but the maximum value was very close to being significant (p=0.054).
Both groups closely mirrored each other in the sagittal plane angle at the
matched walking speed. This is similar to the results from the self-‐selected speeds.
-‐8
-‐6
-‐4
-‐2
0
2
4
0 6 12 18 24 30 36 42 48 54 60
Add
(+)/Abd
(-‐) A
ngle (d
eg)
Stance Phase (% Gait Cycle)
Matched Speed Frontal Knee Angle
Obese
Healthy
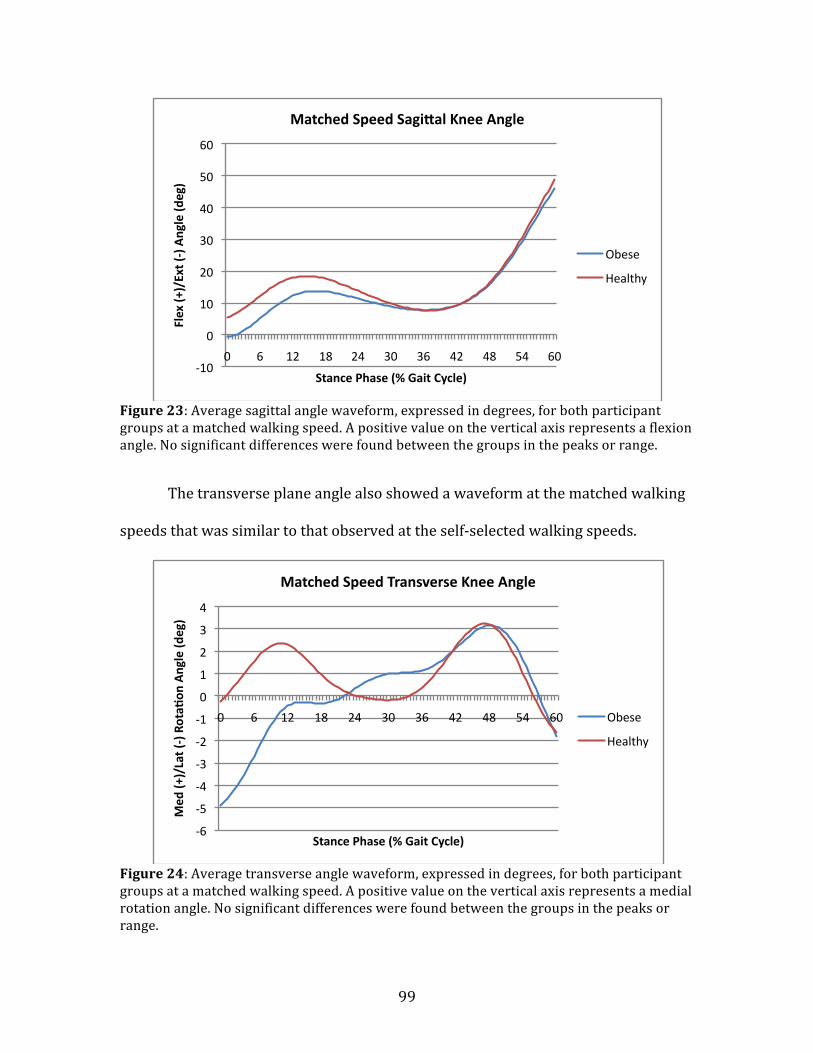
99
Figure 23: Average sagittal angle waveform, expressed in degrees, for both participant groups at a matched walking speed. A positive value on the vertical axis represents a flexion angle. No significant differences were found between the groups in the peaks or range.
The transverse plane angle also showed a waveform at the matched walking
speeds that was similar to that observed at the self-‐selected walking speeds.
Figure 24: Average transverse angle waveform, expressed in degrees, for both participant groups at a matched walking speed. A positive value on the vertical axis represents a medial rotation angle. No significant differences were found between the groups in the peaks or range.
-‐10
0
10
20
30
40
50
60
0 6 12 18 24 30 36 42 48 54 60
Flex (+
)/Ext (-‐) Angle (d
eg)
Stance Phase (% Gait Cycle)
Matched Speed Sagi_al Knee Angle
Obese
Healthy
-‐6
-‐5
-‐4
-‐3
-‐2
-‐1
0
1
2
3
4
0 6 12 18 24 30 36 42 48 54 60
Med
(+)/Lat (-‐) Rota^
on Angle (d
eg)
Stance Phase (% Gait Cycle)
Matched Speed Transverse Knee Angle
Obese
Healthy

100
Table 21 displays the knee moment results at the matched walking speed. A
positive value on the vertical axis represents an adduction, flexion and medial
rotation moment in the frontal, sagittal and transverse planes, respectively. No
significant differences in knee moments were found between groups in any plane
while walking at a matched speed (Table 21). A nearly significant difference was
found between groups in the maximum medial rotation peak in the transverse plane
(p=0.069) at the matched speed (Table 21).
Table 21: Means, standard deviation (SD) and mean group differences in knee moments in Newton-‐meters (Nm) between participant groups at a matched walking speed in all three axes. Significant differences are denoted by an asterisk, *, at p<0.05.
Obese Healthy
Mean SD Mean SD Mean
Difference P-Value
Frontal Maximum 39.58 21.95 25.93 7.67 -13.65 0.183
Minimum -13.03 9.29 -9.07 5.05 3.96 0.338
Range 52.62 29.54 35.009 8.13 -17.611 0.166
Sagittal Maximum 62.55 36.32 43.69 13.2 -18.86 0.193
Minimum -39.16 20.39 -26.22 6.67 12.94 0.142
Range 101.72 38.06 69.92 19.09 -31.8 0.056
Transverse Maximum -6.87 5.49 -2.3 0.77 4.57 0.069
Minimum 7.56 5.58 9.33 4.28 1.77 0.471
Range 14.44 7.68 11.63 4.29 -2.81 0.317
Figures 25 to 27 showcase differences in the knee moment at a matched
walking speed. A slightly greater difference between group means – especially in the
frontal and sagittal planes –is observed in the matched speed moments (Figures 25
to 27) than the self-‐selected speeds (Figures 15 to 17). The obese participants have
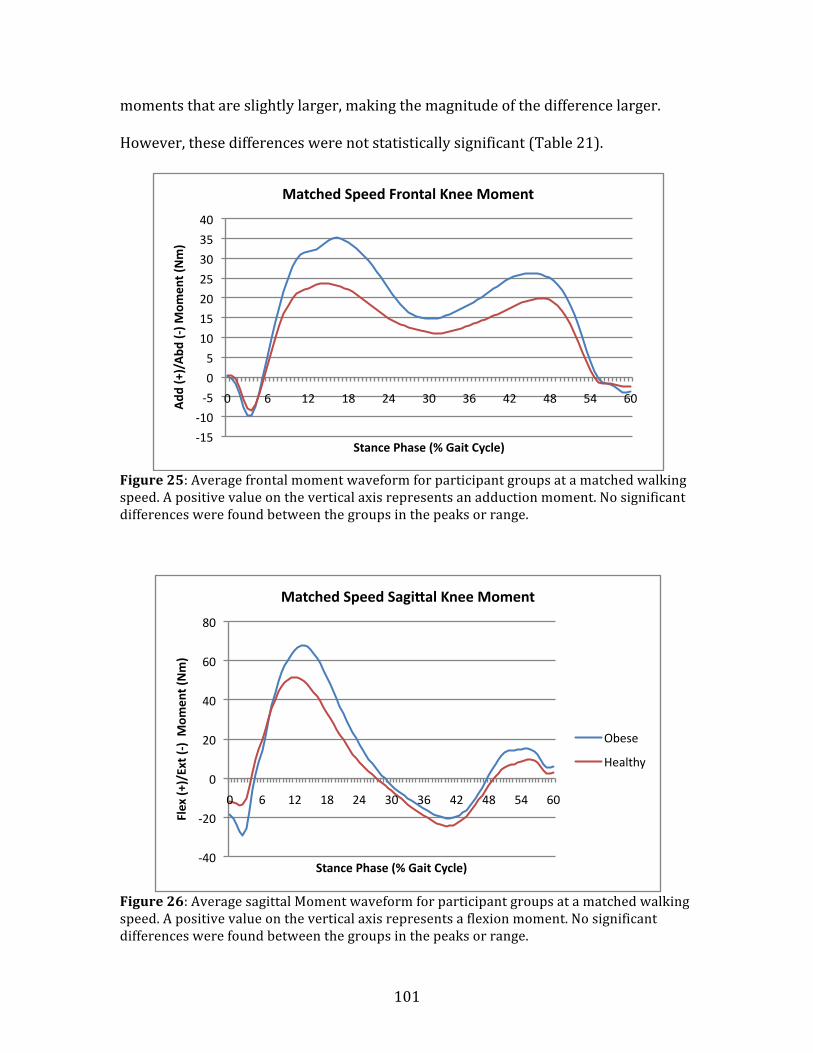
101
moments that are slightly larger, making the magnitude of the difference larger.
However, these differences were not statistically significant (Table 21).
Figure 25: Average frontal moment waveform for participant groups at a matched walking speed. A positive value on the vertical axis represents an adduction moment. No significant differences were found between the groups in the peaks or range.
Figure 26: Average sagittal Moment waveform for participant groups at a matched walking speed. A positive value on the vertical axis represents a flexion moment. No significant differences were found between the groups in the peaks or range.
-‐15
-‐10
-‐5
0
5
10
15
20
25
30
35
40
0 6 12 18 24 30 36 42 48 54 60 Add
(+)/Abd
(-‐) M
omen
t (Nm)
Stance Phase (% Gait Cycle)
Matched Speed Frontal Knee Moment
-‐40
-‐20
0
20
40
60
80
0 6 12 18 24 30 36 42 48 54 60
Flex (+
)/Ext (-‐) M
omen
t (Nm)
Stance Phase (% Gait Cycle)
Matched Speed Sagi_al Knee Moment
Obese
Healthy

102
Figure 27: Average transverse moment waveform for participant groups at a matched walking speed. A positive value on the vertical axis represents a medial rotation moment. No significant differences were found between the groups in the peaks or range.
4.6 Study II CKAL Analysis
4.6.1 Accelerometer Physical Activity Analysis
The CKAL is calculated from the physical activity data measured from the
accelerometer and the frontal moment. This includes analyses of the steps taken by
participants, adduction impulse, stance duration, and the calculated cumulative
knee adduction load.
Table 22 shows group differences in the steps taken per day measured from
the accelerometer, which were also used in the calculation of the CKAL. It also
breaks down the daily steps counts into average steps per weekday and weekend.
Dependent t-‐tests were run to determine if significant group differences existed
(Table 22).
-‐4
-‐2
0
2
4
6
8
10
0 6 12 18 24 30 36 42 48 54 60
Med
(+)/Lat (-‐) Rota^
on M
omen
t (Nm)
Stance Phase (% Gait Cycle)
Matched Speed Transverse Knee Moment
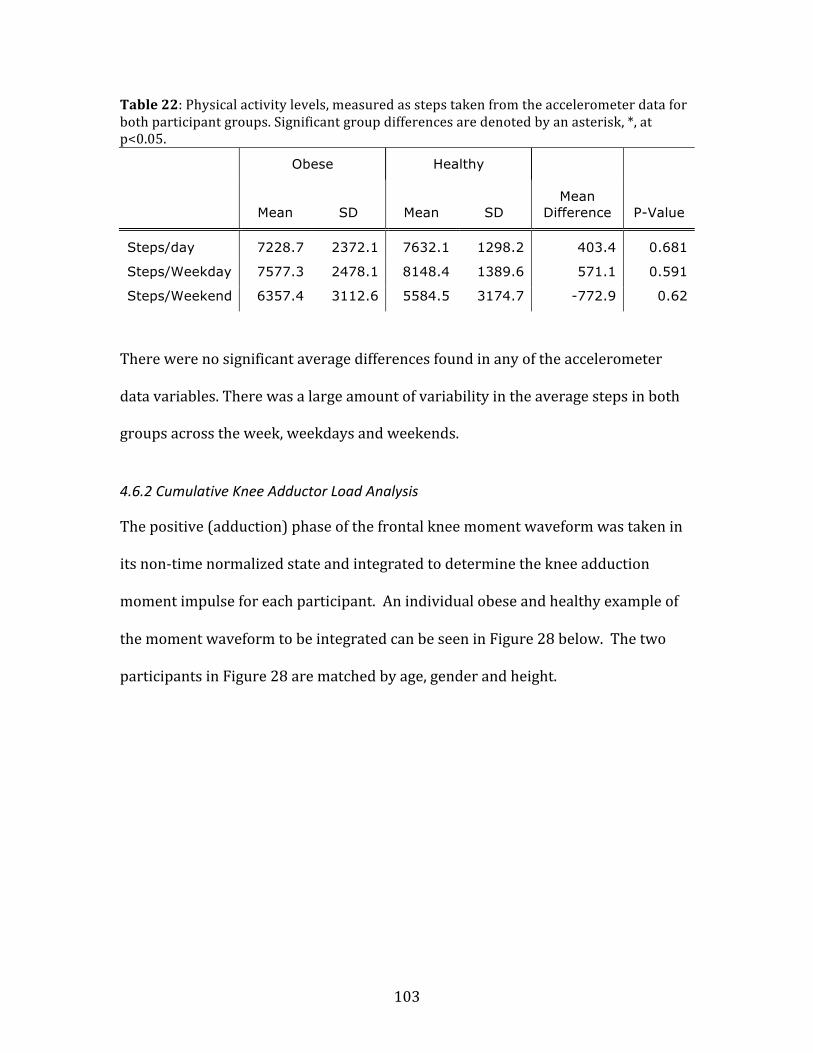
103
Table 22: Physical activity levels, measured as steps taken from the accelerometer data for both participant groups. Significant group differences are denoted by an asterisk, *, at p<0.05.
Obese Healthy
Mean SD Mean SD Mean
Difference P-Value
Steps/day 7228.7 2372.1 7632.1 1298.2 403.4 0.681
Steps/Weekday 7577.3 2478.1 8148.4 1389.6 571.1 0.591
Steps/Weekend 6357.4 3112.6 5584.5 3174.7 -772.9 0.62
There were no significant average differences found in any of the accelerometer
data variables. There was a large amount of variability in the average steps in both
groups across the week, weekdays and weekends.
4.6.2 Cumulative Knee Adductor Load Analysis
The positive (adduction) phase of the frontal knee moment waveform was taken in
its non-‐time normalized state and integrated to determine the knee adduction
moment impulse for each participant. An individual obese and healthy example of
the moment waveform to be integrated can be seen in Figure 28 below. The two
participants in Figure 28 are matched by age, gender and height.

104
Figure 28: Example of an obese and healthy participant’s non time-‐normalized frontal moment used to compute adduction moment impulse. Only the positive part of the waveform was integrated to determine adduction moment impulse.
Table 23 shows the group differences in stance duration, impulse and CKAL. A
significant group difference was found in all three variables using the dependent t-‐
test, with obese subjects having a longer stance phase, and greater knee adduction
moment and CKAL.
Table 23: Group differences in stance duration (s), moment impulse (Nm*s) and cumulative load (kNm*s). Significant group differences are denoted by an asterisk, *, at p<0.05.
Obese Healthy
Mean SD Mean SD Mean
Difference P-Value
Stance Duration 0.67 0.064 0.61 0.069 -0.06 * 0.003
Moment Impulse 11.93 5.84 8.45 2.64 -3.48 * 0.049
CKAL 43.61 20.88 30.65 13.38 -12.96 * 0.025
Figures 29 and 30 graphically present the mean adduction moment impulse
and mean CKAL, respectively, for the obese and healthy-‐weight groups, as well as
for S01 and S04.
-‐20
-‐10
0
10
20
30
40
0
0.125
0.25
0.375
0.5
0.65
0.75
0.875 1
Add
(+)/Abd
(-‐) M
omen
t (Nm)
Time (s)
CKAL Example -‐ Natural Speed Frontal Moment
S05 (Obese)
S15 (Healthy)
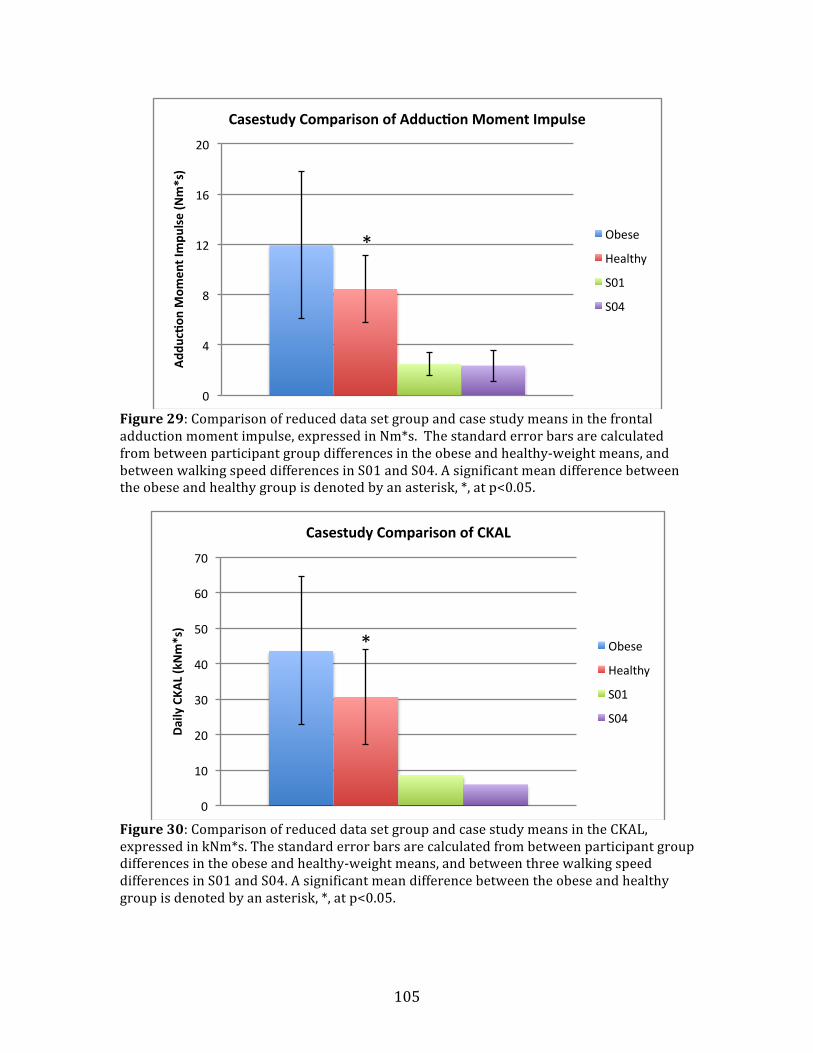
105
Figure 29: Comparison of reduced data set group and case study means in the frontal adduction moment impulse, expressed in Nm*s. The standard error bars are calculated from between participant group differences in the obese and healthy-‐weight means, and between walking speed differences in S01 and S04. A significant mean difference between the obese and healthy group is denoted by an asterisk, *, at p<0.05.
Figure 30: Comparison of reduced data set group and case study means in the CKAL, expressed in kNm*s. The standard error bars are calculated from between participant group differences in the obese and healthy-‐weight means, and between three walking speed differences in S01 and S04. A significant mean difference between the obese and healthy group is denoted by an asterisk, *, at p<0.05.
*
0
4
8
12
16
20
Add
uc^on
Mom
ent Impu
lse (Nm*s)
Casestudy Comparison of Adduc^on Moment Impulse
Obese
Healthy
S01
S04
*
0
10
20
30
40
50
60
70
Daily CKA
L (kNm*s)
Casestudy Comparison of CKAL
Obese
Healthy
S01
S04
106
The data from S01 and S04 in Figures 29 and 30 are presented to serve as a
comparison and highlight the differences from the obese and healthy-weight group means
in knee adduction moment and CKAL. Means and standard deviations for S01 and S04
were obtained by averaging results from the three walking speeds
4.7 Regression Analysis of Frontal Moment Variables and Knee Alignment
For the following regression analyses, the data from case studies S01 and S04, as
well as their healthy matches, are included. This allowed the correlation of their
peak frontal knee moment and knee adduction moment impulse to mechanical
outcomes of knee alignment and extensor torque.
4.7.1 Correlation between Peak Adduction Moment and Adduction Moment impulse
As both the peak (maximum) frontal moment and the adduction moment impulse
are used to infer knee joint loading and explore pathology of the knee, it was worth
exploring the correlation between the frontal moment peak and frontal moment
adduction impulse. Figure 31 shows the results of this analysis. The two variables
were strongly correlated, with an r-‐value of 0.835.

107
Figure 31: Correlation between frontal moment peak and frontal moment adduction impulse. The correlation had an r-‐value of 0.835.
4.7.2 Relationship of Knee Alignment with Peak Moment and with Impulse
To better understand the effect knee alignment may have on the frontal knee
moment, regression analyses were performed to determine the effect alignment has
on each of peak frontal moment and adduction moment impulse. In all of the
following figures, a positive knee alignment indicates varus (bow-‐legged) alignment,
whereas a negative alignment indicates a valgus (knock-‐kneed) alignment. Figure
32 displays the dispersion of knee alignment scores with peak frontal moment
values by group. From this graph, a fair amount of overlap in alignment can be seen.
Participants in both the healthy-‐weight and obese groups appear to have varus and
valgus knee alignments.
0
5
10
15
20
25
30
0 10 20 30 40 50 60 70 80 90 Add
uc^on
Mom
ent Impu
lse (Nm*s)
Adduc^on Moment Peak (Nm)
Correla^on of Adduc^on Moment Peak and Impulse

108
Figure 32: Comparison of the relationship between dynamic knee alignment and peak frontal moment in each participant group. A positive value on the horizontal axis represents a varus alignment. A lot of overlap is seen between groups in knee alignment.
As there was a lot of overlap in knee alignment between participant groups,
the two groups were combined to perform the regression analyses between peak
frontal moment and alignment, as well as adduction impulse and alignment. Figure
33 shows the linear regression that explains the relationship between peak frontal
moment and knee alignment.
0
10
20
30
40
50
60
70
80
90
-‐15 -‐10 -‐5 0 5 10 15
Add
uc^on
Mom
ent P
eak (Nm)
Dynamic Knee Alignment (deg)
Moment Peak by Knee Alignment and Group
Obese
Heathy
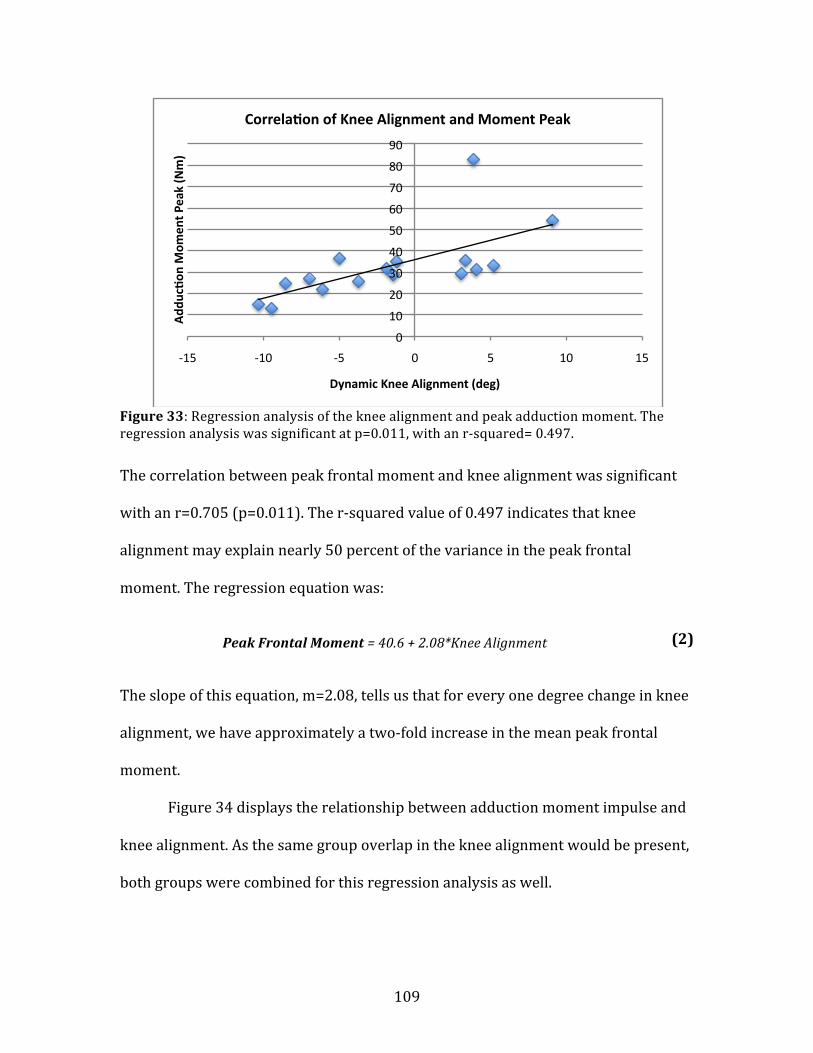
109
Figure 33: Regression analysis of the knee alignment and peak adduction moment. The regression analysis was significant at p=0.011, with an r-‐squared= 0.497.
The correlation between peak frontal moment and knee alignment was significant
with an r=0.705 (p=0.011). The r-‐squared value of 0.497 indicates that knee
alignment may explain nearly 50 percent of the variance in the peak frontal
moment. The regression equation was:
Peak Frontal Moment = 40.6 + 2.08*Knee Alignment
The slope of this equation, m=2.08, tells us that for every one degree change in knee
alignment, we have approximately a two-‐fold increase in the mean peak frontal
moment.
Figure 34 displays the relationship between adduction moment impulse and
knee alignment. As the same group overlap in the knee alignment would be present,
both groups were combined for this regression analysis as well.
0
10
20
30
40
50
60
70
80
90
-‐15 -‐10 -‐5 0 5 10 15
Add
uc^on
Mom
ent P
eak (Nm)
Dynamic Knee Alignment (deg)
Correla^on of Knee Alignment and Moment Peak
(2)

110
Figure 34: Regression analysis of the knee alignment and adduction moment impulse.
The regression analysis showed the relationship between the knee alignment and
adduction moment impulse to be a little less significant, with an r=0.601 and r-‐
squared value of 0.361 (p=0.054), suggesting that knee alignment may explain 36
percent of the variance in knee adduction moment impulse. The regression equation
for this relationship was as follows:
Adduction Impulse = 11.6 + 0.544*Knee Alignment
From the slope of m=0.544 in this relationship, for every one degree change in knee
alignment, a half point change in mean adduction impulse would be observed.
Based on both these regression analyses, knee alignment is a strong predictor of
peak frontal moment and adduction impulse for both groups.
0
5
10
15
20
25
30
-‐15 -‐10 -‐5 0 5 10 15
Add
uc^on
Mom
ent Impu
lse (Nm*s)
Dynamic Knee Alignment (deg)
Correla^on of Knee Alignment and Moment Impulse
(3)
111
4.7.3 Relationship of Knee Alignment, Participant Group and Normalized Maximum Extensor Torque with Peak Moment and with Impulse
The following regression analyses were performed to determine relationship
between participant group (Group), normalized maximum knee extensor torque
(normalized MVC) and knee alignment to either peak frontal knee moment or knee
adduction moment impulse. These differ from the previous section’s regression
analysis, as participant group and normalized maximal knee extensor torque were
included as factors. Normalized maximal knee extensor torque was found to be
significantly different between participant groups – the healthy-‐weight group had a
greater mean extensor torque than the obese group (Table 8).
For the peak frontal knee moment, the following regression equation was
produced:
Peak Frontal Moment = 37.7 + 2.04(Normalized MVC) + 2.11(Knee alignment) –
10.7(Group)
This regression equation had an r=0.709. Therefore, with an r-‐squared value of
0.503, this equation can explain 50.3 percent of the variance in the peak frontal knee
moment. While this high, most of it is attributable to the factor of knee alignment.
Dynamic knee alignment was a highly significant factor (p=0.007), but both group
(p=0.288) and normalized maximal knee extensor torque (p=0.827) were found to
be poor predictors of peak frontal knee moment.
For the variable of knee adduction moment impulse, the following regression
equation was generated:
(4)

112
Adduction Impulse = 11.6 + 0.08(Normalized MVC) + 0.562(Knee Alignment) -
3.86(Group)
The r-‐value associated with this relationship was r=0.624, with an r-‐squared value
of 0.39. This means that 39% of the variance in the knee adduction moment impulse
is explained by this regression equation. Again, the majority of explained variance
can be attributed to the dynamic knee alignment, which was the only significant
factor included in the analysis (p=0.026). Participant group (p=0.268) and
normalized knee extensor torque (p=0.981) were non-‐significant factors.
Participant group was not a statistically significant predictor of either frontal
moment variable. Therefore, weight-‐status (i.e. healthy-‐weight or obese) does not
determine peak frontal knee moment or knee adduction moment impulse outcome.
Normalized maximal knee extensor torque was found to be an non-‐significant factor
in predicting peak frontal knee moment and knee adduction moment impulse as
well. There fore, both of these factors were removed from the final regression
analyses.
(5)
113
V. Discussion
While both mechanical and metabolic factors have been implicated in the role of
obesity in the development and progression of knee OA, an increasing amount of
research is indicating that local mechanical factors at the knee joint may play the
greatest role in OA development (Hunter et al., 2009; Sharma et al., 2001). The
purpose of this study was to gain a better understanding of the local, biomechanical
factors acting at the knee joint in a group of young adults at high risk of developing
OA of the knee. A cohort of obese young adults and an age-‐, gender-‐ and height-‐
matched cohort of healthy-‐weight young adults were recruited and participated in
this study. Differences in outcomes between the two participant groups, as a direct
result of obesity, would indentify potential indicators of risk for the development of
OA of the knee.
In Study I it was hypothesized that the obese group would walk at a slower
self-‐selected natural speed and have a greater stance duration. Despite a slower
walking speed, the obese group was expected to also have greater peak ground
reaction forces (GRF) in all three planes. All these hypotheses were accepted. While
it was hypothesized that a reduced range of knee motion would be found in the
sagittal plane and a greater range of motion would be found in the frontal and
transverse planes in the obese group, all of these hypotheses were rejected. A
greater range of motion was found in the obese sagittal angle and no group
differences were found in the frontal and transverse range of motion. However, the
obese group had a greater peak knee adduction angle and smaller knee peak flexion
angle at heel contact.
114
The obese group was only found to have a greater peak medial rotation
moment in the transverse axis. This finding confirmed the hypothesized greater
peak in the transverse plane moment, but forced the rejection of the hypothesized
differences in the frontal and sagittal axis moments. In particular, the hypothesis
that the knee adduction moment peak would be greater in the obese group was
rejected. This was surprising, as the peak knee adduction moment is used as a
surrogate measure of knee joint load and a primary outcome measure in the
prediction of the development of OA of the knee (Wada et al., 2001). Reducing the
data set through elimination of two obese participants with atypical frontal
moments and their healthy-‐weight matches, revealed greater differences between
groups in the peak knee adduction moment in the frontal plane. However this
difference remained statistically non-‐significant and thus, still did not support the
original hypothesis.
It was hypothesized that the peak knee adduction moment would correlate
with knee alignment and maximal knee extensor torque . While there were no
statistically significant differences detected between participant groups in knee
alignment, the obese group did have a more valgus mean knee alignment. Both
participant groups scored highly on the LEFS and no group differences were
detected in this score. While this did force the rejection of the LEFS hypothesis, the
finding suggests that both participant groups exhibited no activity limiting knee
pathology. The hypothesis that the obese group would have a lower maximal knee
extensor torque when normalized to body mass was supported, but this variable did
not correlate with the peak knee adduction moment. The peak knee adduction

115
moment was strongly correlated with knee alignment (r=0.705), as was
hypothesized. This finding helped to explain the lack of differences between groups
in the peak knee adduction moment. The valgus knee alignment observed in the
obese group shortened the moment arm, which likely shifted more knee load
toward the lateral compartment of the joint. This reduced the knee adduction
moment in the obese group and reduced the magnitude of difference between
participant groups in the peak adduction moment.
For the matched walking speed condition, a difference between groups in the
GRF persisted, with the obese participants having even greater GRF over the
healthy-‐weight group in this condition. The hypothesized difference between
groups in peak knee angles and moments was rejected. But, it should be noted that a
greater magnitude of differences was observed between groups in the peak knee
moments at the matched speed analysis compared to the self-‐selected speed
analysis. A small sample size is likely responsible for these non-‐significant results at
the matched speed.
While a greater stance duration was found in the obese compared to the
healthy-‐weight group, in Study II no group differences were found in the knee
adduction moment impulse or CKAL, although the obese group did have a slightly
greater magnitude for both variables. Therefore the hypothesized statistically
greater moment impulse and CKAL in the obese group was rejected. When the data
set was reduced, the obese group had a greater knee adduction moment impulse
and CKAL. In the case of the reduced data set, the hypotheses were confirmed. The
116
knee adduction moment impulse was correlated with knee alignment (r=0.601), but
this relationship was not as strong as seen in the peak knee adduction moment.
Some of the between group results in the present study were not statistically
significant when a clear difference appeared to exist between the obese and healthy-‐
weight groups. Additionally, two individual participant results were deemed to
require a separate case study analysis. In some select cases of between group
statistical non-‐significance, as well as the two case study participants, the
relationships are worth discussing as some valuable preliminary information that
can be investigated further in future studies may be contained in the data.
Furthermore, some differences may be clinically significant – that is, these may be
indicative of emerging group differences that will contribute to future knee
pathology in the obese. A few limiting factors were also encountered that hindered
the conclusions made from the results. These will be discussed later under
limitations and will warrant future investigation.
5.1 Anomalies in the Frontal Plane Moment
5.1.1 Biomechanical Explanation of Frontal Moment Anomalies
One significant finding in the current research was the unusual frontal moment
observations in two participants, S01 (male) and S04 (female) (Figure 5). The two
participants had anthropometric and clinical outcomes, and frontal knee angle and
moments that are distinct from each other (Table 13). It is possible that the root
causes of the unusual frontal moments were very different or were the result of
experimental error. A very thorough investigation of the data for these two
participants was undertaken and there was no evidence that there were any
117
unusual error or data collection factors that contributed to the aberrant results.
Rigorous lab procedures were adhered to while collecting all participant data, as
outlined in the methodology section. Data processing was standardized to ensure all
participant data underwent the same sequence of processing events in Visual 3D
software. All of these procedures were performed to ensure testing reliability and
validity. Therefore, the frontal moment changes in S01 and S04 may be a display of
compensatory gait mechanisms as a consequence of excess body weight . Two
specific biomechanical factors may be responsible for the frontal moment anomalies
– knee malalignment and a toe-‐out gait pattern.
Both participants had valgus knee alignment values that were well beyond
neutral. Knee alignment can have a very large effect of the loading of the knee joint
(Sharma et al., 2001). This valgus knee alignment is likely a strong contributor to the
uniquely small knee adduction moments in S01 and S04. A regression analysis
relating peak knee adduction moment and adduction moment impulse to knee
alignment showed both to be strongly linked to alignment. The more valgus
(negative) knee alignment, the lower the peak adduction moment and adduction
moment impulse.
While a varus alignment increases the magnitude of the knee adduction
moment, the opposite relationship exists between a valgus knee and the adduction
moment. As a greater valgus alignment is observed, the knee adduction moment
decreases. This is the result of the load-‐bearing axis shifting away from the medial
compartment of the knee in a valgus knee alignment (Sharma et al., 2007). Hurwitz

118
et al. (2002) found that the knee adduction moment peak magnitude decreased with
increasingly valgus knee alignment (Figure 35).
Figure 35: From Hurwitz et al., (2002). This relationship shows the strong ability of the mechanical axis (knee alignment) to predict the second peak of the knee adduction moment. As the knee alignment becomes more valgus, the peak adduction moment decreases.
This relationship has also been found in similar studies assessing the effect of
knee alignment on peak moments (Andrews et al., 1996; Brouwer et al., 2007).
Additionally, in a sample of 18 obese adolescents (mean age 15 years), McMillian et
al., (2010) found a much more valgus knee posture during walking than in 18 age-‐
and sex-‐matched healthy-‐weight adolescents. This was associated with a significant
reduction in the frontal knee moment magnitude in the obese adolescents
(McMillian et al., 2010). These studies support the theory that the valgus knee
alignment observed in the two obese case study participants in the present study
reduced the magnitude of their frontal moments. As the valgus alignment shifts
I 04
E .- o) a,
I
E 5 - rn ._
2
D.E. Hurwitz et ul. I Journul of Orrhopaedic Reseurch 20 (2002) I01 107
R=-0.452 p =< 0.001
p = 0.027
I = OASubJects 0 Asymptomatic
Normal Subjects
p = 0.391 T
First Peak Second Peak Adduction Adduction Moment Moment
Fig. 2. The subjects with knee OA had a significantly greater than
normal peak adduction moment early in stance, while the peak ad-
duction moment later in stance was not significantly different between
the two groups.
sum of the subscales were negatively correlated with the
first peak adduction moment ( R = -0.34 to -0.26; p =: 0.007 to p = 0.047) indicating that subjects with
OA with worse clinical symptoms had lower first peak
adduction moments.
The three next best single predictors for the second
peak adduction moment also included the radiographic
measures of disease severity in the medial compartment ( R = 0.44, p < 0.001 medial joint space narrowing
grade; R = 0.47, p < 0.001 medial sclerosis grade) as
well as the toe out angle (R = -0.45, p < 0.001, Fig. 3). The negative correlation between toe out angle and the
second peak adduction moment indicated that subjects
with OA with an increased toe out angle had a lower
second peak adduction moment. Similar to the first peak
Table 2
Correlation coefficients and the significance levels"
R = 0.751 p < 0.001
I
4 -
3 -
2 -
1 ,
.
. 0. x U
O 4 1 : ..: m
-10 -5 0 5 10 15
Valgus Mechanical Axis
(Degrees)
0 10 20 30
varus Toe OutAngle
(Degrees)
Fig. 3. (Left) The best predictor of the second peak adduction moment
was the mechanical axis. (Right) The toe out angle was negatively
correlated with the second peak adduction moment, indicating that an
increased toe out angle decreases the adduction moment.
adduction moment, the WOMAC function and sum of the subscales were negatively correlated with the second
peak adduction moment ( R = - 0 . 3 3 , ~ = 0.010;R =
- 0 . 3 1 , ~ = 0.016, respectively).
After accounting for the effects of mechanical axis, only the osteophyte grade (R = 0.42, p < 0.001, partial
correlation coefficient) and the WOMAC function sub-
scale ( R = -0.27, p = 0.042, partial correlation coeffi-
cient) were significantly correlated with the first peak
adduction moment. The osteophyte grade and WO-
MAC function subscale only accounted for an addi-
tional 8% and 3% of the variation in the first peak
adduction moment, respectively, when used in con-
First peak adduction moment Second peak adduction moment
Mechanical axis
Toe otil angle
Radiogrupliic meusures of diseuse seuerity
K-L grade
Medial joint space narrowing
Lateral joint space narrowing
Medial sclerosis
Lateral sclerosis
Osteophytes
R = 0.735, p < 0.001
R = -.206, p = 0.108
R=0.751,p<0.001
R = -0.452, p C 0.001
R = 0.301, p = 0.01 7
R = 0.481, p 0.001
R = 0.429, p <: 0.001
R = -0.170, p = 0.186
R=0.357,p=0.004
R = 0.266, p = 0.036
R = 0.436, p < 0.001
R=0.467,p<0.001
R = -0.071, p 7 0.518
R = 0.205, p = 0.109
R = -0.178, p = 0.165 R = -0.113, p = 0.382
WOMAC scores
Paill R = -0.210, p = 0.104
Stiffness R = -0.224, p = 0.083
Function R = -0.326, p = 0.01 0
S uni R = -0.330, p 10.009 R=-0.306, p=0.016
R = -0.250, p z= 0.052
R = -0.343. p = 0.047
R = -0.343, p = 0.007
'I The values in italic are statistically significant.
119
loading away from the medial compartment, it is possible that the valgus alignment
noted in both S01 and S04 concomitantly reduced medial loading of their knee.
However, valgus knee alignment has only been shown to reduce the
magnitude of the frontal moment, and not necessarily alter the shape, as seen in S01
and S04. Another factor that may play a role in the frontal knee moments of S01 and
S04 is the toe-‐out angle. While not quantitatively measured in the present study,
toe-‐out gait may have factored into the results of the knee kinematics and kinetics.
By increasing toe-‐out angle, the ankle inversion moment decreases, which decreases
the knee adduction moment (Guo et al., 2007; Jenkyn et al., 2008). This reduces the
load on the medial compartment of the knee joint, much like a valgus knee
alignment (Rutherford et al., 2008).
Specifically, a greater toe-‐out angle has been shown to significantly decrease
the late stance peak of the frontal knee moment (Guo et al., 2007; Jenkyn et al.,
2008; Rutherford et al., 2008). While both S01 and S04 had greatly reduced frontal
moment magnitude in the second half of the stance phase of the gait cycle, it was
much lower than seen in most studies on toe-‐out gait. S01 and S04 also experienced
lower frontal moment magnitude throughout the entire stance phase. This included
the early stance phase where the maximum frontal moment of all participants
occurred.
A couple of previous studies by Lin et al. (2001) and the Lynn et al. (2008)
found that having participants walk with a toe-‐out gait almost completely removed
all magnitude of the frontal moment in late stance. This is similar to the observed
frontal moment in S01 and S04. The following Figures 36 and 37 are taken from
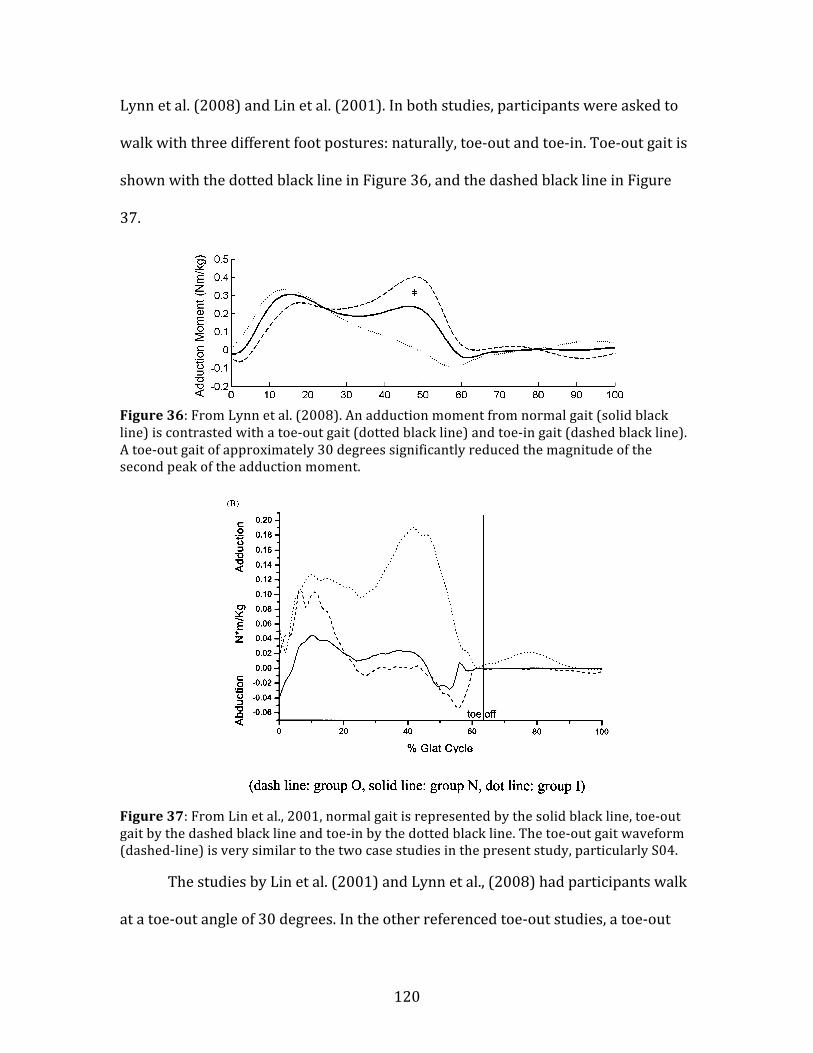
120
Lynn et al. (2008) and Lin et al. (2001). In both studies, participants were asked to
walk with three different foot postures: naturally, toe-‐out and toe-‐in. Toe-‐out gait is
shown with the dotted black line in Figure 36, and the dashed black line in Figure
37.
Figure 36: From Lynn et al. (2008). An adduction moment from normal gait (solid black line) is contrasted with a toe-‐out gait (dotted black line) and toe-‐in gait (dashed black line). A toe-‐out gait of approximately 30 degrees significantly reduced the magnitude of the second peak of the adduction moment.
Figure 37: From Lin et al., 2001, normal gait is represented by the solid black line, toe-‐out gait by the dashed black line and toe-‐in by the dotted black line. The toe-‐out gait waveform (dashed-‐line) is very similar to the two case studies in the present study, particularly S04.
The studies by Lin et al. (2001) and Lynn et al., (2008) had participants walk
at a toe-‐out angle of 30 degrees. In the other referenced toe-‐out studies, a toe-‐out
448 S.K. Lynn et al.
Figure 1 Average adduction moment and lateral—medial shear force gait curves (n = 11) for all three foot rotationconditions. Note: (*) significant main effect for foot rotation at p < 0.01.
Table 1 All outcome variables presented for all three foot rotation conditions
Foot position Velocity(m/s)
Foot rotationangle* (deg)
Adduction moment (Nm/kg) Lateral—medial force (N/kg)
Early stance Late stance* Early stance Late stance*
Normal 1.10 (0.12) 18.52a (8.15) 0.31 (0.16) 0.25a (0.16) !1.02 (0.33) !1.25a (0.30)Internal 1.08 (0.16) !9.10b (7.91) 0.28 (0.16) 0.41b (0.14) !0.97 (0.29) !1.45b (0.31)External 1.12 (0.15) 40.24c (8.74) 0.35 (0.18) 0.02c (0.16) !1.08 (0.36) !0.91c (0.39)
Different letters represent significant contrasts at p < 0.01 with appropriate Bonferroni corrections.* Significant main effect at p < 0.01 with appropriate Bonferroni corrections.
load on the diseased medial compartment.16,14,17
These results support such a mechanism and sug-gest that perhaps those with lateral compartmentdisease may want to internally rotate their footto decrease the load on the lateral compartment.The results from recent longitudinal4 and cross-sectional8 studies suggest that a high adductionmoment is associated with medial OA while a lowadduction moment is associated with lateral OA.Therefore, using the appropriate foot rotation dur-
ing gait to normalise this moment and shift the loadon to the non-diseased compartment may slow dis-ease progression.
This study quantified the magnitude of change inthe adduction moment associated with a change infoot progression angle. It should be noted that thisrelationship is stronger when both the foot rotationand adduction moment measurement are rela-tive to the subject’s ‘normal’ gait. Therefore, themagnitude of change in the adduction moment is
Table 2 Results of the attempt to predict corrected adduction moment peaks from data collected on knee OAsubjects with regression equations calculated on a normal population
Corrected footrotation angle (deg)
Corrected adductionmoment (Nm/kg)
Predicted adductionmoment (Nm/kg)
Difference (timesstandard error ofregression)
Using data from Guo et al.18
Early stance 16.6 0.02 0.031 <1Late stance 16.6 !0.53 !0.19 9.6
Corrected values are calculated by subtracting the external rotation condition from the normal rotation condition. Predictedadduction moment values are calculated using regression equations presented in Fig. 1.
C.-J. Lin et al. / Gait and Posture 14 (2001) 85–9186
Fig. 1. (A) Mean joint angle of the knee in the frontal plane for the three walking postures. The adduction/abduction angles of the knee in threedifferent postures were similar. (B) Mean joint moment of the knee in the frontal plane for the three walking postures. Posture I had greaterKAM, and a more pronounced second peak than the other two postures throughout stance. (C) Mean joint power of the knee in the frontal planefor the three walking postures. There were great variations for these three different postures. Posture O had increased power absorption in earlystance and increased power generation in mid-stance. Posture I had the greatest power generation in late stance.
121
angle of 15 degrees or less was observed or enforced. Based on the results of those
studies, the two case studies in the present study may have walked with a toe-‐out
angle closer to 30 degrees. It is particularly interesting that the dashed-‐line
waveform for the toe-‐out gait from Lin et al. (2001) in Figure 37 is similar to the
waveform of S04 (Figure 8). Both displayed a double adduction peak in the early
stance phase, followed by a very low magnitude abduction moment in late stance.
A toe-‐out gait may also alter the observed frontal knee adduction moment by
causing greater crosstalk between axes. It is possible that a great enough toe-‐out
angle will rotate part of the anterior segment of the tibia out of the frontal axis of the
local coordinate system of the knee. When the kinematic and kinetic data is
processed, this can cause a portion of the frontal data to be attributed to the sagittal
axis and flexion-‐extension moment.
No quantitative ankle data was analyzed to confirm the presence of toe-‐out
gait in these two, or any other participants. The possibility of toe-‐out being a causal
factor behind the unusual frontal moments of these two case studies is speculative.
Based on the observations in the frontal plane, previous research and the
performance of rigorous lab testing procedures to avoid measurement error, it is
strongly suggested that a valgus knee alignment and toe-‐out gait are partially, if not
mostly, behind these unusual frontal plane observations. These two biomechanical
characteristics have typically been adopted to reduce loading on the medial
compartment of the knee joint.

122
5.1.2 Reducing the Frontal Plane of the Data Set
Based on analyses of discrete data points taken from gait waveforms, neither S01
nor S04 were deemed to be statistical outliers, which would be defined as having a
frontal moment peak more than two standard deviations away from the group
mean. But when the frontal moment data from the two case study participants were
identified, a decision was made to run the analyses on the frontal plane outcomes
without these two participants and their healthy-‐weight matches.
It could be argued that removing the case study data from the kinematic and
kinetic group analysis restricted the applicable populations of obese and healthy-‐
weight participants. The full data set may be more representative of the possible
biomechanical features and knee joint measures in young adults who are obese. But
a future study with a much larger sample size would be needed to demonstrate
whether the results of the case studies are anomalies or representative of a
significant portion of the obese population. In the present study they have been
treated as anomalies. Therefore, the frontal moments from S01 and S04 needed to
be analyzed in a separate lens than the other participants to formulate a
biomechanical foundation for their unusual frontal moments.
If the data from S01 and S04 are representative of true joint loading, the
CKAL measure as it is presently interpreted may not be a useful tool in the case of
these two participants. One of the two inputs of the CKAL – the frontal moment
impulse – would skew the individual CKAL of S01 and S04 and possibly
misrepresent the loading environment of their knees. The CKAL values from these
two participants suggest minimal daily cumulative joint loading. This cumulative
123
load result is problematic. As the primary measure of joint loading in the CKAL is the
knee adduction moment, it only truly represents the ratio of loading in the medial
compartment. Less medial compartment loading, by way of a decreased adduction
moment, equates to a smaller CKAL, but not to less total knee joint loading. It only
represents a changed ratio of medial to lateral loading. Therefore, considering the
reduced data set as the more reliable analysis in the CKAL measure only is justified.
5.2 Walking Speed Analysis
Obese people choose a slower, self-‐selected normal walking speed (DeVita &
Hortobagyi, 2003; Lai et al., 2007). As expected, in this study, self-‐selected natural
speed was significantly slower in the obese group compared to the healthy-‐weight
group, confirming previous research. The choice to walk at a slower speed may be a
protective mechanism that reduces ground reaction forces and magnitude of joint
moments (Winter, 1991). But a slower walking speed also means contact forces are
experienced through the joint for a longer time period for every step.
5.2.1 Matched Walking Speed
In a pre-‐emptive attempt to remove the possible effect of different average self-‐
selected walking speeds between groups, the healthy-‐weight participants were
asked to walk an additional speed at the self-‐selected natural speed of their matched
obese participant. This required all healthy-‐weight participants to walk at a slower
walking speed than their own self-‐selected speed and 15 percent slower speed.
Some significant kinematic differences were found at the self-‐selected
walking speeds, but not at the matched speed. On the surface, this may suggest that
124
kinematic and kinetic differences between participant groups were due to walking
speed differences, and not directly to differences in body mass. But previous
research has shown no significant changes in knee kinematics with changing
walking speed, except mild reductions in knee flexion with decreasing walking
speed (Lelas et al, 2003; Winter, 1991). As shown in Table 20, the mean difference
between groups in knee angles at the matched speed remained similar to those at
the self-‐selected walking speed. There was a clear trend (p=0.054) in the group
differences of the frontal knee angle, with the obese group maintaining greater knee
adduction (Table 20). The minimal knee flexion angle also exhibited a clear trend
(p=0.084) at the matched speed condition, suggesting that the healthy-‐weight group
continued to make heel contact with slightly more knee flexion than the obese
group. Considering this, it seems unlikely that the non-‐significant results in the
matched speed knee angles were due to the healthy-‐weight group reducing their
walking speed. Mean group differences suggest that gait speed is not likely to be the
most important reason for group differences in kinematics.
The magnitude of knee kinetics has been observed to only become
marginally larger with increasing walking speed, much like a gain factor (Lelas et al.,
2003; Winter, 1991). The healthy-‐weight group demonstrated decreased peak knee
moments at the matched speed condition (walking at the slower, self-‐selected speed
of the obese participants) than the self-‐selected walking speed. Since the obese
participant group had the same peak knee moments at the matched speed analysis
as the self-‐selected speed analysis (Tables 17 and 21), the mean difference between
the two groups was greater in the matched speed. Waveforms of the matched speed

125
knee moments also showed greater magnitude of difference between groups – this
was especially true in the frontal and sagittal planes (Figure 25 and Figure 26). A
clearer trend between groups could be seen, as the obese frontal and sagittal
moment maximums were larger than the healthy-‐weight moments at the matched
speed. However, the difference between groups in peaks and ranges of the moment
was not statistically significant (Table 21). Reduced statistical power is the most
likely reason that no significant differences were detected between groups in the
peak knee moments of the matched walking speed condition.
Therefore, by matching their walking speed to the much slower, obese group
self-‐selected walking speed, the healthy-‐weight participants did not change their
knee angles to match those seen in the obese participants. But their knee moments
did decrease slightly, as previous literature would suggest, increasing the magnitude
of difference between participant groups. This lends support to the obese
kinematics being a result of carrying around excess body mass and not walking
speed.
5.2.2 Within Participants Differences at the Three Self-‐Selected Walking Speeds
A confidence interval for natural speed showed that the selected speeds of fast and
slow were outside the normal range of and distinct from the natural speed.
However, there were no significant differences in kinematics and kinetics outcomes
between the three walking speed conditions. Based on the results of the matched
speed condition, and previous literature, changes in walking speed seem to only
moderately affect the magnitude of knee joint kinetics (Browning & Kram, 2007;
Lelas et al., 2003; Winter, 1991). As the literature suggests, no differences were

126
found in peak knee angles between the three walking speeds of fast, natural and
slow in either group (Table 11). Surprisingly, magnitude differences in the peak
knee moments or adduction moment impulse did not manifest themselves within
participant groups between the fast, natural and slow walking speeds either (Tables
11 and 12). Due to these non-‐significant results, speed was removed as a three-‐level
factor in the statistical analyses. The sum of squares of the speed factor was pooled
with the error sum of squares, turning walking speed a pseudo-‐replicate measure
within each participant.
5.3 Study I Kinematic and Kinetic Outcomes
5.3.1 Knee Joint Kinematics
In the frontal plane, the obese participant group had a mean angle waveform that
was shifted toward more adduction throughout the entire stance phase (Figure 9).
However, the interpretation of the frontal plane knee angle has to be approached
with caution. For those reported in the results section, the reported angles are in a
reference frame that is relative to the quiet standing alignment. This ensured that
the knee angle values represented only the changes in orientation that occurred
with walking motions, not orientation plus the standing posture deviation away
from a neutral alignment. From these results, it was observed that the obese
adducted their knees more while walking. But when the frontal angle is calculated in
an absolute reference frame with respect to the tibia relative to vertical, this
adduction motion cannot be equated to a knee that is in an adducted posture. In the
results section, the obese participants had a greater positive, adduction peak (Figure
12). However in Figure 39 below, the same frontal angle waveforms are presented
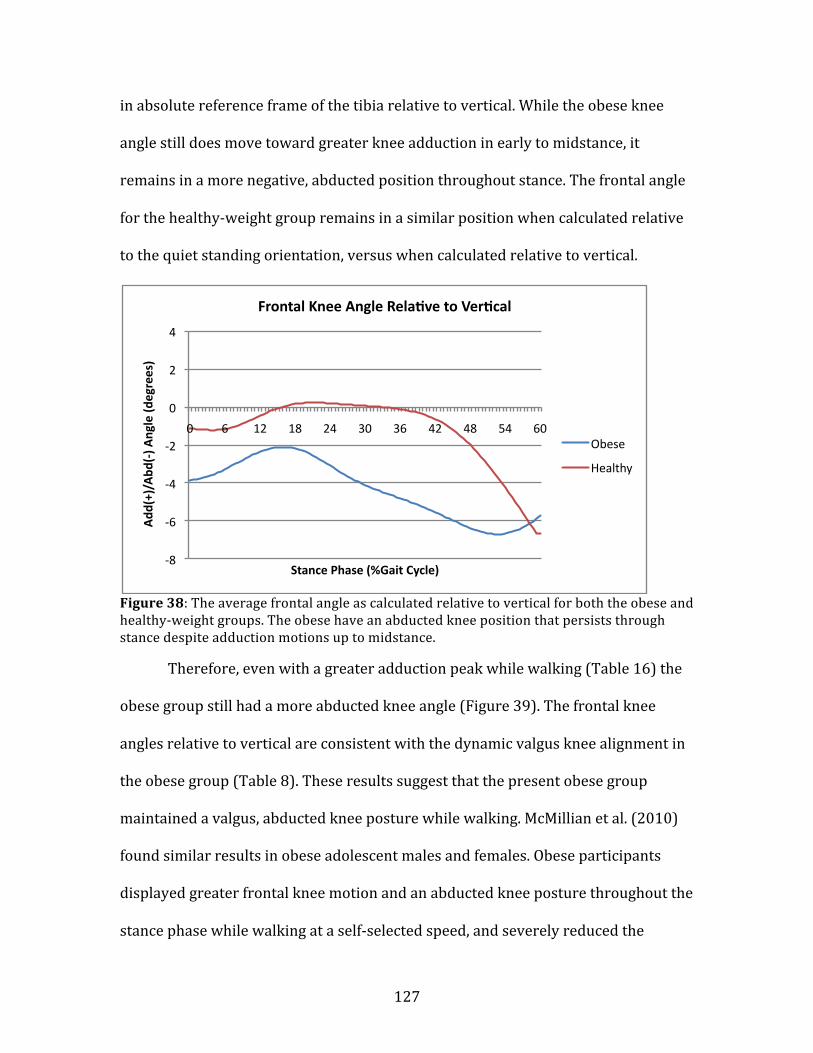
127
in absolute reference frame of the tibia relative to vertical. While the obese knee
angle still does move toward greater knee adduction in early to midstance, it
remains in a more negative, abducted position throughout stance. The frontal angle
for the healthy-‐weight group remains in a similar position when calculated relative
to the quiet standing orientation, versus when calculated relative to vertical.
Figure 38: The average frontal angle as calculated relative to vertical for both the obese and healthy-‐weight groups. The obese have an abducted knee position that persists through stance despite adduction motions up to midstance.
Therefore, even with a greater adduction peak while walking (Table 16) the
obese group still had a more abducted knee angle (Figure 39). The frontal knee
angles relative to vertical are consistent with the dynamic valgus knee alignment in
the obese group (Table 8). These results suggest that the present obese group
maintained a valgus, abducted knee posture while walking. McMillian et al. (2010)
found similar results in obese adolescent males and females. Obese participants
displayed greater frontal knee motion and an abducted knee posture throughout the
stance phase while walking at a self-‐selected speed, and severely reduced the
-‐8
-‐6
-‐4
-‐2
0
2
4
0 6 12 18 24 30 36 42 48 54 60
Add
(+)/Abd
(-‐) A
ngle (d
egrees)
Stance Phase (%Gait Cycle)
Frontal Knee Angle Rela^ve to Ver^cal
Obese
Healthy

128
magnitude of the frontal adduction moment (McMillian et al., 2010). While the
participant cohort were adolescents, the vast majority were in their mid to late
teens, making them only a few years younger than the participants of the present
study. Previous research on the frontal plane kinematics of the obese are
inconsistent – showing both abducted and adducted knee positions – but there
appears to be a subset of the younger obese population that abducts the knee,
possibly in an effort to reduce medial compartment loading (McMillian et al., 2010).
Greater knee joint instability and imbalance is often associated with obesity
(McGraw et al., 2000; Wearing et al., 2006b). However, it is usually observed in
populations that are older than the current one and have a pathological condition,
such as early stage OA of the knee (Andriacchi et al., 2004; Sharma et al., 2003). But,
the beginning stages of knee joint instability may be apparent in obese young adults.
Despite there being no statistical difference in the range of motion of the frontal
plane knee angle, Figure 12 shows the obese participant group to have a more
variable mean frontal angle up to late stance compared to the healthy-‐weight group.
The obese group experienced double the range of motion in the frontal plane –
about four degrees – leading up to late stance. This suggests that the obese young
adults may have experienced more varus-‐valgus joint instability.
Knee joint instability is defined as an abnormally large range of displacement
of the tibia with respect to the femur. Stability at the knee is provided by soft tissues
such as ligaments, proprioceptive muscular reflexes, and contact forces generated
from muscle activity and gravitational forces (Sharma, 2003). Greater muscle
strength contributes to dynamic joint stability through increased co-‐contraction and
129
greater control over the stop and start of knee motions and compensations for
gravity (Sharma et al., 2003). The obese group was found to have reduced maximal
knee extensor torque normalized to total body mass, which could have served as a
mechanism behind the greater instability of the frontal knee angle through stance.
Obesity can lead to imbalance by increasing inertial properties through
increased body mass, causing greater deviations in the centre of mass, reduced
postural control and greater postural sway (Corbeil et al., 2001; McGraw et al., 2000;
Wearing et al, 2006b). The resultant postural sway causes greater joint movement,
but it also places greater strain on ligaments and requires greater joint torque to
stabilize the body (Corbeil et al., 2001). Over time, high strain on the ligaments can
lead to chronic stretching of the tissue and joint laxity (Andriacchi, 1994). The
valgus knee alignment adopted by many of the participants in the obese group may
place strain on the medial collateral ligament and may be contributing to the greater
varus-‐valgus knee instability in the obese group.
Consistent with results in DeVita & Hortobagyi (2003) and McMillan et al.,
(2010), the obese participants made heel contact with significantly less knee flexion
in the sagittal plane than the healthy-‐weight participants in the present study. This
meant a more straight leg posture at heel contact. The obese participants did enter
the swing phase in late stance with a knee flexion angle mirroring that seen in the
healthy-‐weight group. This caused the obese group to have a significantly greater
range of motion in the sagittal plane. Much like the research on the frontal plane,
previous work has been inconsistent on the effect of obesity on sagittal plane
kinematics. Obesity has been associated with reduced knee flexion in early stance

130
when compared to the healthy-‐weight, including at a matched, standard speed
condition (DeVita & Hortobagyi, 2003; McMillian et al., 2010). However, these
findings are in contrast to those by Browning & Kram (2007) and Spyropoulos and
colleagues (1991), who found no differences in knee flexion at heel contact between
healthy-‐weight and obese adults. Results have been inconsistent in obese children
as well. Gushue et al. (2005) found reduced early stance knee flexion in obese
children while walking. But a different research group did not support this finding in
a later paper. Obese children in this more recent study had similar kinematics in all
three planes to healthy-‐weight children (Shultz et al., 2009).
The straight leg posture observed in the present study has been
hypothesized to reduce the moment about the sagittal plane. By maintaining a
straighter leg at heel contact, the obese group decreased the moment arm about the
knee joint in the sagittal plane. A shorter moment arm decreases the magnitude of
resultant moment. The extended knee angle could also be a consequence of knee
extensor weakness or compromised knee extensor activity resulting from the more
abducted position in the frontal plane (McMillian et al., 2010).
In the transverse plane, the knee angles for both groups overlapped a fair
amount, except in early stance as was seen in Figure 14. There is very little research
on transverse plane knee kinematics, due to difficulties tracking this plane.
Therefore, it is difficult to make strong conclusions based on the two very distinct
and variable, but small, group transverse plane knee angle waveforms reported in
the Results. In the only other three-‐dimensional gait analysis study on obese adults
with healthy knee joints, no differences were found between healthy-‐weight adults

131
and obese adults in the peak transverse plane knee angles (Lai et al., 2008). The
results from Lai et al. (2008) are similar to those of the present study. But in early
stance the two participant groups in the present study displayed different trends in
the transverse plane knee angle. Although it was not statistically significant, the
obese group made heel contact with a much more laterally rotated knee than the
healthy-‐weight group. As discussed in section 5.1.1, toe-‐out gait can decrease the
adduction moment. A lateral rotation at the knee could produce or be a
consequential product of toe-‐out gait. It is possible that a laterally rotated knee in
early stance is associated with greater toe-‐out gait in the present obese group and
reduced the adduction moment and medial knee joint loading during weight
acceptance while walking (Rutherford et al., 2008).
5.3.2 Knee Joint Kinetics
The ground reaction forces (GRF) of the obese participant group were significantly
greater at the self-‐selected walking speed, even though they walked at a slower self-‐
selected speed. This slower walking speed served to reduce their GRF (Browning &
Kram, 2007). Consequently, the magnitude of the difference in GRF between
participant groups increased at the matched speed. Greater GRF in the obese,
despite a slower walking speed, has been well documented (Browning & Kram,
2007; Browning et al., 2009; DeVita & Hortobagyi, 2003). The significantly greater
body mass of the obese group caused them to contact the ground with much greater
force, and increase the GRF in all three planes accordingly.
It was hypothesized that the greater GRF in the obese group would increase
the moments about the knee. As obesity is linked to OA of the knee, it was
132
speculated that obesity causes a greater knee joint load through greater GRF.
Greater joint loads would directly increase the risk for repetitive load wear and tear
in the joint and development of OA of the knee (DeVita & Hortobagyi, 2003). To
attenuate greater GRF, greater joint torque could be required. Therefore, it was
surprising to find very little difference in the three-‐dimensional moments about the
knee between the obese and healthy-‐weight participants. It was even more
surprising as knee moments in the present study were not normalized to body
weight. This allowed the effect of excess mass (obesity) on the knee moments to
remain in the reported results.
The obese adopt gait characteristics that can act to reduce GRF and resulting
knee moments, such as a slower walking speed, increased double support time and
shorter step (DeVita & Hortobagyi, 2003). These adaptations serve to lessen contact
forces and increase stability (Wearing et al., 2006b). Of these compensations, only a
slower walking speed was quantitatively measured in the present study. However,
this slower walking speed was coupled with a longer stance duration and it stands
to reason that a longer stance duration lengthened the time spent in double support
(Whitting & Rugg, 2003). Even with these adaptations, it seemed plausible that the
increased body mass from obesity would increase knee joint moments. However,
mechanical adaptations, such as knee angles, can also affect the magnitude of knee
moments. As will be discussed later, the mean valgus alignment in the obese group
served to reduce force through the medial compartment of the knee joint and the
frontal knee adduction moment.

133
A difference between groups was found in the peak minimum moment value
in the sagittal axis, representing an extension moment (Figure 16). This peak value
occurred at heel contact, at approximately 5 percent of the gait cycle. It was
expected that the peak extensor moment in the sagittal axis moment would occur in
the late stance peak. However, the value of the late stance peak did not surpass the
one at heel contact. The moments at heel contact represent the joint loading
response to weight acceptance, in which initial contact is made with the ground. It is
at this point in the stance phase that joint moments represent an attempt at
decelerating the lower limb, shock absorption to attenuate contact forces and
stabilization of the knee joint (Whiting & Rugg, 2006). The external extensor
moment in the sagittal axis represent muscle activity to control and prevent excess
knee flexion.
Due to their greater body mass, the obese group would have a greater peak
moment in the sagittal axis at heel contact to decelerate a heavier lower limb and to
allow acceptance of their greater body weight. Additionally, the greater peak
extension moment at heel contact may help to stabilize a joint that may be
experiencing more instability.
At the self-‐selected walking speeds, a significantly greater transverse
maximum peak was observed in the obese group (Figure 17). This point represents
the peak external medial rotation moment occurring in late stance. The obese
participant group experienced a greater external medial rotational peak than the
healthy group. This greater medial rotation moment will go hand in hand with the
valgus knee alignment and significantly different frontal angles. Subtalar

134
overpronation, which leads to a fallen arch in the foot, is common in obese
populations (Messier et al., 1994). While necessary for shock absorption during
walking, excessive subtalar pronation throughout stance leads to flattened feet and
a medial rotation of the tibia (Messier et al., 1994). Excessive subtalar pronation is
likely the root cause of the greater medial rotation moment peak in the obese group.
No differences were found between groups in the peak maximum value of
the frontal (external adduction) and sagittal (external flexion) moment, or range in
any of the three axes. Combined with the mentioned temporal-‐spatial gait
adaptations, the abducted (valgus) knee orientation reduced the peak adduction
moment throughout stance and the straight leg posture in early stance reduced the
peak flexion moment that occurred in early to midstance.
The obese group displayed a more obvious greater mean absolute peak
adduction moment that was nearly 50 percent greater than the healthy-‐weight
mean absolute peak adduction moment (Figure 15). While not statistically
significant, this is a clinically significant trend between groups. However, the
magnitude of the peak adduction moment was highly variable in the individual
obese participants as well. It will be discussed in greater detail in the limitations, but
a sample size effect is at play in the statistical non-‐significance.
Similar to the literature examining kinematics, there is a fair amount of
inconsistency in the few reports of obesity and knee moments. Obesity in children
causes greater absolute (not normalized to body mass) knee moments about the
frontal, sagittal and transverse axes (Shultz et al., 2009). Gushue and colleagues
(2005) also found greater internal knee abduction (external adduction) moments in

135
obese children compared to healthy-‐weight children, but no differences in sagittal
moments (Gushue et al., 2005). The Shultz et al. (2009) and Gushue et al. (2005)
studies are difficult to compare to the present one, as they both examined children
under the age of twelve. Childhood and adolescence is a period of great physical and
biomechanical development (Whitting & Rugg, 2006). Gait patterns in children are
difficult to compare to adults due to significant physical differences between the two
populations. However the gait patterns of children may be able to give insight into
the future adaptations in adulthood. Gushue and colleagues (2005) hypothesized
that obese children were able to control and adjust sagittal moments better than
frontal moments. This enabled the children to reduce only the magnitude of the
sagittal moments. Obese children were not able to compensate for large forces in the
frontal plane. The larger moments in the frontal plane could carry over into
adulthood, lead to varus-‐valgus deformities or laxity and increase medial
compartment loading and risk for OA of the knee in adults. Given the results of the
obese group in the present study – a sagittal moment consistent with the healthy-‐
weight group coupled with high variability in the frontal moment – it is possible that
a similar compensatory mechanism is behind the kinetics observed in obese young
adults. The results of this study show large variability in frontal moments in the
obese young adults (Appendix C), but much less variable sagittal moments. The
obese young adults in the present study may be displaying a long-‐term control (and
reduction) of sagittal moments, but an inability to compensate for frontal moment
magnitudes. The result is the observed varus -‐valgus irregularities and variability.
136
McMillian and colleagues (2010) studied walking in obese adolescents and
found frontal axis results quite similar to the present study. Obese adolescents
walked with much more knee abduction, which reduced the adduction moment
throughout stance (McMillian et al., 2010). Knee moments were normalized to body
mass in the study and as a result the obese peak frontal moment was significantly
smaller than the healthy-‐weight peak (McMillian et al., 2010). When not normalized
to body mass, the peak frontal moments would probably be more similar in
magnitude between groups, making the results of McMillian and colleagues (2010)
similar to the findings of this study. In the same study, the obese adolescents also
had significantly smaller (normalized to body mass) peak knee flexion moment.
Again, when considered as not normalized to body mass, the sagittal plane moments
are likely to mirror the non-‐significant between group differences in sagittal plane
moment of the present study.
In adult populations, there is limited research on obese gait. DeVita &
Hortobagyi (2003) and Browning & Kram (2007) have both examined sagittal plane
biomechanics of obese walking. DeVita & Hortobagyi found no differences in the
magnitude of the sagittal moment between obese and healthy-‐weight adults. The
results of the present study support the findings in DeVita & Hortobagyi (2003).
However, Browning & Kram (2007) found a significantly greater knee flexion
moment in obese adults compared to healthy-‐weight adults. The root of the
difference between studies is likely in the sagittal plane angle, as Browning & Kram
(2007) found no differences between obese and healthy-‐weight adults in the knee
flexion angle and DeVita & Hortobagyi (2003) did find a difference.
137
Browning & Kram (2007) also hypothesized that the difference between
sagittal plane mechanics of their study and DeVita & Hortobagyi (2003) was due to
the greater BMI of the DeVita & Hortobagyi (2003) study participants. However, this
hypothesis may not be true for the current study. The obese group in DeVita &
Hortobagyi (2003) had a mean BMI over 40kg/m2, which categorizes them as
morbidly obese. The range of BMI’s in the present study was wide (29.8-‐44.2kg/m2),
but averaged to a mean BMI and standard deviation similar to that in Browning &
Kram’s (2007) work. However the results of the present study were more
comparable to those seen in morbidly obese group of DeVita & Hortobagyi (2003).
Two methodological differences may affect between study comparisons with
Browning & Kram (2007). First, Browning & Kram (2007) measured kinematics and
GRF using a treadmill equipped with a forceplate. Treadmill walking, and forces
measured on a treadmill, may not closely reflect those of overground walking.
Second, both participant groups in Browning & Kram (2007) walked at the same six,
predetermined speeds. However, even at the matched walking speed condition, the
sagittal plane results of the present study do not compare to those from Browning &
Kram (2007).
To the knowledge of this researcher, the only paper to date to analyze the
three-‐dimensional knee kinematics and kinetics of obese gait was performed by Lai
and colleagues (2007). Lai et al. (2007) found no significant differences between the
knee moments of 14 obese and 14 healthy-‐weight individuals. Unfortunately, only
peak kinetic values that were significantly different between healthy-‐weight and
obese groups were reported in the paper – no knee moment values were reported

138
as no differences were found. However, the obese group did have a significantly
greater knee adduction angle during stance. Unlike the present study, Lai et al.
(2007) normalized joint moments to body mass. It can be speculated that since the
obese group in that study had a significantly greater adduction (varus) angle than
the healthy-‐weight control group, the obese group in Lai et al. (2008) probably
experienced greater medial compartment forces. Had the moments not been
normalized to body mass, differences may have been found in the peak values of the
knee moments. Given that no differences were found between the healthy-‐weight
and obese knee flexion angles, the obese participant group probably experienced a
greater, non-‐normalized to body mass sagittal moment – much like the obese group
in Browning & Kram (2007), but in contrast to the findings of this study.
An outcome that was of particular interest in this study was the peak knee
adduction moment. The knee adduction moment, which reflects the medial to lateral
compartment ratio of force distribution, is considered a surrogate measure of knee
joint loading (Maly, 2008). This outcome variable was presumed to be larger in the
obese group because a greater body mass would command greater forces through
the joint. Messier and colleagues (2005) found that weight-‐loss of one kilogram
resulted in a slight reduction in internal abduction (external adduction) moment,
which reduced knee loads. It stands to reason that the opposite could be true;
weight gain (i.e. obesity) could result in increases in the knee adduction moment. If
the knee adduction moment had been larger in the obese group, it would be an
indicator of greater medial knee joint loading due to excess body weight. As obese
individuals have been shown to have a much higher risk for developing OA of the
139
knee (Felson et al., 1998; Sharma & Chang, 2007), a greater knee adduction moment
could have been a predictor of greater medial compartment loading and increased
risk for medial OA of the knee. This hypothesis did not turn out to be true in this
study. However, it also does not account for gait adaptations that factor into the
magnitude of the knee adduction moment peak.
The comparable knee adduction moments between groups does not
necessarily mean that the obese participants in the present study – or the general
obese population – are not at a high risk of other knee pathologies. The greater
abducted, valgus frontal alignment in the obese group that distributes more joint
load to the lateral compartment may actually place them at a much higher risk for
the development of the less observed lateral OA of the knee (Brouwer et al., 2007).
5.4 Knee Alignment
The dynamic knee alignment derived from the frontal angle while walking was
probably a strong contributor to the non-‐significant difference in the frontal
moment peaks between participant groups. The obese participant group had a
greater peak valgus dynamic knee alignment (Table 8). This outcome altered the
knee joint loading from the more medial loading environment to a greater lateral
compartment loading.
While research has shown that malalignment is very common among obese
populations with OA of the knee, the vast majority have a varus knee alignment
(Gibson et al., 2010). While the finding of significantly greater varus alignment in the
obese with OA by Gibson et al. (2010) is indicative of the knee environment and
alignment of the obese with knee OA, it cannot necessarily be generalized to the

140
whole obese population. Not all those who are obese will eventually have OA of the
knee, and those that have developed it may have knee mechanics and an alignment
much different than those that have not or will not develop OA of the knee.
While the mean obese knee alignment was valgus, knee alignment did vary
between both extremes greatly (Figure 32). When looked at individually, some
obese participants had much more varus knee alignment and these participants had
matching greater knee adduction moments. Considering the variation between
individuals, some of the present obese participants may be representative of those
with a varus knee alignment and at a greater risk for medial OA of the knee, as the
literature suggests. However, there is clearly a subset of obese individuals who do
not fall into the typically seen varus knee alignment and greater medial
compartment loading. It is unlikely that these people are, or will be at risk for
medial compartment OA of the knee.
Why a mean valgus knee alignment was detected in an obese population that
is more commonly noted as having a varus knee alignment is unknown. However,
there are a number of possible reasons. Although the present study focused on the
knee joint, the joints of the body work in synergy. The ankle and hip may play a role
in biomechanical characteristics seen in the knee joint. A significantly greater medial
rotation moment was found in the obese participant group. Excessive subtalar
pronation occurs in obese populations (Messier et al., 1994). This overpronation at
the foot can cause flat feet, medial rotation of the tibia and an increase in the medial
rotation moment about the knee (Messier et al., 1994). While increasing the medial
141
rotation moment about the knee, subtalar pronation may also contribute to a valgus
knee alignment. The dropped arch of the foot may also abduct the tibia too.
While a valgus knee alignment can occur through knee abduction (distal tibia
moves laterally), a valgus knee alignment can also be a result of altered frontal plane
hip mechanics. In the frontal plane, hip adduction can cause the distal end of the
femur to shift medially (Weidow et al., 2005). This abducts the knee and contributes
to a valgus knee alignment. A number of anatomical factors can cause increased hip
adduction. When the lever arm from the medial border of the acetabulum to the
centre of the femoral head is shortened, decreasing the femoral offset (Weidow et
al., 2005). Pelvic width and pelvic tilt may also increase hip adduction and the
resulting knee abduction. A greater pelvic width, measured as the distance between
the medial borders of the left and right acetebulum, can alter the angle of the
longitudinal axis of the femur, and has been associated with lateral OA of the knee
and a valgus knee alignment (Weidow et al., 2005: Weidow et al., 2006). These
anatomical factors inhibit and weaken the hip abductor muscles through reduced
the mechanical efficiency. The result is greater hip adduction and a greater
possibility of a valgus knee alignment (Weidow et al., 2006).
While only theoretical, it may even be that the onset of obesity at a younger
age alters the typical musculoskeletal pathologies associated with adult onset
obesity. Recent statistics show that obesity rates in the youngest categories of the
Canadian population are rising at an unprecedented rate (Shields et al., 2010).
Similar to the present study on obese young adults, McMillian and colleagues (2010)
noted a valgus knee orientation in their cohort of obese adolescents. The
142
musculoskeletal pathologies of excess body weight in a young, still developing body
may be different than those in a grown adult body. While a varus knee alignment
has been more commonly reported in older adults who are obese, their weight gain
may be a recent, potentially age-‐related matter, and not demonstrative of a lifelong
struggle to maintain a healthy weight since childhood or adolescence. Perhaps, as a
consequence of excess body weight, a valgus knee alignment is more characteristic
of obesity onset during peak physical development, whereas a varus knee alignment
is characteristic of later-‐onset obesity. Obesity at a young age is known to carry
musculoskeletal problems that manifest themselves in the anatomy and
biomechanics in the joints of a developing body. Childhood obesity can
pathologically alter the musculoskeletal structure and function of any of the joints of
the lower limb (Hills et al., 2002). A knee alignment that is the result of development
issues related to obesity in childhood and adolescence, would have a different
pathological pathway that begins while the musculoskeletal system is still growing.
Based on the results of this study, there may be a significant subset of the
obese young adult population with a valgus knee alignment. It is possible that valgus
alignment is a phenomenon unique to the particular obese group that participated
in this study, but it has also been observed in obese adolescents (McMillian et al.,
2010). Very little research has been done on healthy young adults who are obese,
but it may be that valgus alignment is a characteristic associated with obesity in
younger populations and increases the susceptibility of their knee joints to
musculoskeletal pathology.

143
5.5 Lateral OA of the Knee
The observed malalignment in this study likely predates the presence of OA of the
knee or any other knee pathology. Although medical imaging would be required to
prove a lack of degeneration in the knee joint, none of the obese participants in the
present study scored below the highest percentile ranking in the LEFS questionnaire
(Wang et al., 2009). Given this outcome, the obese young adult participants in this
study exhibited little to no difficulty or pain while performing daily tasks and should
have a relatively healthy joint. Thus, the present malalignment of the knee is not
believed to be a consequence of a joint pathology. It remains to be explored whether
the observed valgus knee alignment and reduced adduction moments in the obese
group will increase the risk for knee pathology and musculoskeletal disease.
Among the risk factors for OA of the knee, overweight and obesity have been
strongly correlated with incident OA of the knee (Issa & Sharma, 2007). At age 37,
body weight predicted the development of OA of the knee approximately 35 years
later (Felson et al., 1988). Knee alignment is a strong predictor for the progression
of OA of the knee, but whether it affects incident OA of the knee is not known (Issa &
Sharma et al., 2007). While there is disagreement as to whether knee malalignment
– either varus or valgus – plays a role in the incidence of OA of the knee, there is
strong support for a role of malalignment when coupled with obesity (Brouwer et
al., 2007; Sharma et al., 2007). Malalignment produces greater stress on specific
compartments of the knee joint, and excess body mass will multiply this stress,
magnifying the risk for OA of the knee (Hunter et al., 2009). A longitudinal study by
Brouwer et al. (2007) found evidence for the role of malalignment in both the

144
incidence and progression of OA of the knee. Brouwer et al. (2007) found that the
effect of varus alignment on the incidence of OA of the knee was magnified in those
who were overweight and obese. Interestingly, in valgus knees, this mediating role
was only present for those who were obese (BMI greater than 30). Indeed, the
mediating role of obesity may be the missing factor in understanding the
relationship between knee alignment and incident OA of the knee.
Obesity has been more strongly related to a varus alignment and medial
compartment OA of the knee (Sharma et al., 2000; Issa & Sharma, 2007). In their
paper examining obesity and knee alignment, Sharma and colleagues (2000)
hypothesized that a valgus knee alignment would reduce the effect of obesity in
predisposing people to OA of the knee. The reason being that a valgus alignment
increases force through the lateral compartment, reducing the force through the
medial compartment and creating a more even distribution of load through the knee
joint (Sharma et al., 2000). This may be the case, and the present cohort of obese
participants may experience protection from medial compartment knee OA through
altered knee alignment.
However, a valgus knee alignment may also carry a risk for OA of the knee.
Specifically, the valgus alignment seen in the present obese cohort may increase risk
for knee OA in the lateral compartment. Hunter et al. (2007) found that baseline
measures of static valgus knee alignment in a moderately overweight population did
not predict the incidence of OA of the knee in a large cohort of adults. However, in
another longitudinal study, Brouwer and colleagues (2007) found a significant
increase in risk for incident OA of the knee in obese participants with valgus knee

145
alignment. The risk for the incident OA of the knee in malaligned knees appears
much stronger in obese populations over healthy-‐weight, and even overweight
populations (Brouwer et al., 2007). Therefore, a valgus alignment, coupled with
obesity, can likely place enough stress on the lateral compartment to induce a
pathogenic environment and lateral knee OA.
In comparing the lower limb joint kinematics and kinetics between persons
with medial OA of the knee and lateral OA of the knee, further support has been
found for knee abduction (valgus alignment) being linked to lateral OA. When lateral
OA of the knee was present, the knee adduction moment was severely reduced
(Weidow et al., 2006). This contrasted the much greater knee adduction moment in
those with medial OA of the knee. The minuscule frontal moment in lateral OA
participants was partnered with a much greater valgus knee angle through stance.
This suggests that, unlike medial OA of the knee, lateral OA of the knee occurs
through a different pathway of valgus knee alignment (Weidow et al., 2006).
This finding was supported by a case study report by Lynn and colleagues
(2007). In a longitudinal follow-‐up study, participants were analyzed over a 5-‐11
year period to assess the effect of the development and progression of OA of the
knee on gait patterns. In the follow-‐up analysis, two participants had developed OA
– one in the medial compartment, one in the lateral compartment. In initial testing,
the participant who eventually developed lateral OA had a knee adduction moment
of minimal magnitude. This moment was further reduced in the follow-‐up analysis.
The adduction moment from both visits are displayed in Figure 39. The dark dashed
line represents the participant with lateral OA of the knee. The individual knee

146
adduction moment waveforms for all 26 other participants who did not have OA of
the knee are also reported (Figure 39).
Figure 39: From Lynn et al. (2007). Displayed are individual knee adduction moments for 28 participants in the study from their first visit and the second follow-‐up visit. The lateral OA participant in signified by LOA and a dark dashed line, whereas MOA and a dark solid line signify the medial OA participant. All other participants, without OA, are the grey lines.
All participants who did not develop OA of the knee had knee adduction
moments that fell somewhere between the lateral OA and medial OA participants. Of
these participants who did not develop lateral or medial OA, some had extremely
small adduction moments, but did not develop lateral OA of the knee (Figure 41).
Therefore, while a small knee adduction moment was an indicator of risk for lateral
OA of the knee is the study by Lynn et al. (2007) and one by Weidow et al. (2006), it
may not always be the case. It remains to be seen if some of these other participants
from the study by Lynn and colleagues (2007), who currently do not have OA, would
eventually develop OA of the knee.
From the present study it is clear that the obese group had a mean dynamic
knee alignment that was more valgus than the healthy-‐weight group and remained
resultant curve (3 forces and moments) during the stance phase wascalculated as a measure of the load experienced by the knee.
Standard time–distance gait parameters were also calculated for eachparticipant. These included gait velocity, step length, cadence, time percycle, percent of time spent in stance phase and time spent in stance phase.
2.6. Statistical analysis
Two particularly interesting subjects with large joint space loss duringtheir second visit (score of 2 or 3), were removed from the rest of the groupcreating a normal elderly (NE) group of subjects (n=26). These subjects willbe examined further in a case study format. Paired Student t-tests were thenrun on NE subject data to determine if there were differences between visitsin gait velocity and frontal plane knee alignment. A non-parametricWilcoxen Signed Rank Test was also used to determine if there weredifferences in radiographic scores between visits in the control subjects.Pearson correlation coefficients were calculated for the stance phase
magnitude of the adduction moment and lateral-medial (LM) shear forcefor all subjects (n=28) and for only the NE subjects (n=26) to determine ifthere is any relationship between these two gait measures and if the casestudy subjects were driving this relationship.
3. Results
After initial examination of the knee radiographs and WOMAC®scores upon subsequent testing, two of our 28 returning participantsdeveloped both symptomatic and radiographic evidence of OA. Ofthese two participants, one had developed signs of medial com-partment OA (MOA) while another had signs of lateral compartmentOA (LOA) in the intervening years since their initial testing. Becauseof this finding, the relevant knee loads (adduction moment andlateral–medial (LM) shear force) and clinical information for thesetwo participants were examined more closely in a case study format.Along with other radiographic signs of OA, one had medial jointspace narrowing (MOA, Fig. 1) while the other had lateral joint spacenarrowing (LOA, Fig. 2). Other clinical and gait variables that werecollected are also presented as individual scores for the MOA andLOA subject and as means for the NE subjects (n=26) in Table 2.
It was also observed that these two subjects were also extremesfor both the adduction moment and LM shear force measuredduring both initial and follow-up gait testing. Fig. 3 (Fig. 3A=Visit1, Fig. 3B=Visit 2) shows the gait curves of both subjects alongwith the curves of the other 26 NE subjects. Note that theseindividual curves are mostly outside and on opposite sides of thespectrum of NE subject curves for both measures.
The results of a correlation analysis for the average stance phasemagnitudes of the adduction moment and the lateral–medial shearforce for the entire group (n=28) revealed that they were significantlycorrelated at visit one (r=!0.834, pb0.01) and visit two (r=!0.763,pb0.01). If theMOA and LOA subjects were removed the correlations
Table 2Other clinical and gait variables presented as individual scores for the medialand lateral case study subjects, and as mean (sd) for the control subjects(n=26)
WOMAC RadiographicOA score
Frontal kneealignment (deg)
Gait velocity(m/s)
Visit 2 Visit 1 Visit 2 Visit 1 Visit 2 Visit 1 Visit 2
MOA 9.5 0 6 0 6 1.14 0.75LOA 9.0 5 9 !11 !10 1.30 0.81Controls 2.2 1.6! 2.4! !3.0 !4.1 1.16 1.08
(4.1) (1.7) (2.2) (3.4) (2.8) (0.18) (0.25)
Note: - !=Significant difference (p=0.001) usingWilcoxen Signed Rank Test.- No other significant differences using Paired Student t-tests.- For frontal knee alignment: positive score=varus alignment,negative score=valgus alignment.
Fig. 3. The average net external knee adduction moment and lateral–medial (LM) shear force for the medial and lateral OA case study subjects— visit 1 (A) andvisit 2 (B). The elderly normal group's gait curves are also shown for each of these measures in the lighter grey. Note: LOA (lateral compartment OA case studyparticipant) — dotted line; MOA (medial compartment OA case study participant) — solid line.
25S.K. Lynn et al. / The Knee 14 (2007) 22–28

147
in an abduction knee position despite a greater adduction peak relative to a
standing quiet trial. The exact origin of the valgus alignment is unknown but it could
be the result of developmental adaptations to obesity, or altered kinematics and
kinetics at the neighbouring ankle and hip joints. Whether or not this increases their
risk for developing OA of the knee is undetermined and would require longitudinal
study. But a clear difference exists between the two participant groups that will
affect the loading environment of the knee joint. A valgus knee alignment, while
reducing the medial compartment load, may increase the risk for incident and
progressive lateral OA of the knee (Weidow et al., 2006).
5.4 Study II Cumulative Knee Adduction Load Outcomes
Given the non-‐significant difference between groups in the peak knee adduction
moment, could the knee adduction moment impulse, which takes into account the
duration and magnitude of the adduction moment, reveal group differences where
the peak could not? The moment impulse is affected by magnitude and duration of
the frontal moment and the obese group had a significantly greater stance duration
(Table 23). Even without a greater moment magnitude, it would be presumed that
the obese group would have a greater impulse because of the longer stance period.
The knee adduction moment impulse and CKAL were found to be significantly
greater in the obese group. But in order to have a full understanding of the CKAL,
the components of the measure need to analyzed individually.
148
5.4.1 Physical Activity Levels
Based on the accelerometer data, both participant groups had comparable mean
steps per day (Table 22). In fact, both groups averaged at approximately 7,000
steps per day, which is below the recommended 10, 000 steps per day (Bravata et
al., 2007). There was a large amount of variation between participants in both
groups. A select few individual participants met the recommended steps per day,
while others fell extremely short of the recommendation. The similar group results
for physical activity was unexpected, as obesity has been linked to physical
inactivity (Cannon et al., 2009). In a similar train of thought, a common assumption
is that healthy-‐weight individuals maintain their weight through high levels of
physical activity. But the results of this study challenge both assumptions. Healthy-‐
weight young adult participants did not meet physical activity requirements. To
lessen the rates of obesity, prevention must be a primary approach. This means
preventing weight gain in healthy-‐weight individuals. Healthy-‐weight in young
adulthood does not prevent obesity later in life. A significant portion of younger
healthy-‐weight Canadians will eventually become obese as they age (La Petit &
Berthelot, 2006). Optimal healthy lifestyle factors need to be promoted, encouraged
and maintained in healthy-‐weight young adults to prevent future weight gain. If the
results of the present physical activity levels are to be taken at face value, this may
also include bettering of current physical activity choices of young adults so that
they meet physical activity guidelines.
Adequate physical exercise is one of the most important components to the
management of a healthy-‐weight (Cannon et al., 2009). There is the possibility that

149
the healthy-‐weight participants in the present study did obtain sufficient levels of
physical activity, but the chosen measure of physical activity –steps per day – was
not capable of capturing a difference between participant groups. While steps per
day have been shown to be a good measure of activity, intensity of activity and
activities that do not incorporate accelerations of the lower body were not
quantified in the accelerometer outcomes of the present study. Davis and colleagues
(2006) found that intensity of exercise had a strong association with weight status,
with obese adults engaging in much less daily activity of moderate to high intensity.
Additionally, healthy-‐weight adults have also been found to stand on average two
hours more per day than obese adults (Levine et al., 2005). Although standing is a
low intensity activity, it is requires more energy expenditure than sitting. Upper
body physical activities – from deskwork and cooking, to weight training – may not
have been adequately measured by the accelerometer (Davis et al., 2006). It can be
speculated that there were group differences in some of the above-‐mentioned
activities. If they were lower in the obese group, as would be speculated, then the
result would be less movement and lower energy expenditure per day in the obese.
However, there is no method of confirming them at this time.
5.4.2 Knee Adduction Moment Impulse
The obese group had a significantly larger knee adduction moment impulse and
CKAL. The peak frontal moment is less sensitive to changes in walking speed than
the knee adduction moment impulse. Significantly large changes, up to a 30 percent
increase or decrease, in walking speed are often needed to induce a change in the
peak magnitude of the frontal moment (Robbins et al., 2009b). In the present study,

150
the peak frontal moment led to the conclusion that healthy-‐weight and obese young
adults experience similar levels of medial knee joint loading. But by including the
time domain of the frontal moment, this conclusion changed and a distinction was
made between participant groups. First, this provides further evidence that the peak
frontal moment may not be an optimal measure to use when comparing and
distinguishing between populations that have different self-‐selected walking speeds,
such as the obese and healthy-‐weight. Second, it appears as though the important
factor that distinguished between groups in the knee adduction moment impulse in
the present study was likely not in the amplitude domain, but in the time domain.
Therefore, when attempting to distinguish between healthy-‐weight and obese
young adults through gait characteristics at the knee, the stance duration may be the
best biomechanical gait indicator of weight status.
The peak knee adduction moment and knee adduction moment impulse were
highly correlated (Figure 31), but only one – the knee adduction moment impulse –
showed a significant group difference. Previous research on the knee adduction
moment impulse has found it to be larger at slower walking speeds (Robbins et al.,
2009b). This is in opposition to the trend seen in the peak frontal moment, where
the peak is smaller at slower walking speeds (Robbins et al., 2009b). This highlights
how the knee adduction moment impulse can account for more kinetic changes at a
slower self-‐selected speed than the peak frontal moment.
A slower self-‐selected walking speed is very common in obese populations
(Browning & Kram, 2007; DeVita & Hortobagyi, 2003; McMillian et al., 2010). While
used as a compensatory mechanism to reduce GRF and consequently the magnitude
151
of joint moments, a longer stance phase has a drawback. The longer the foot is in
contact with the floor over stance phase, the longer the exposure of knee joint
loading. The result serves to increase the knee adduction moment impulse (Robbins
et al., 2009b). Based on these results, a longer stance duration is a more
distinguishing feature of obesity – and greater knee joint loading – than a greater
peak frontal moment.
Therefoe, as the moment impulse is sensitive to both magnitude and duration
of the moment, it may be a better indicator of altered knee joint loading over the
peak adduction moment in obese populations.
5.4.3 Interpreting the Cumulative Knee Load
The results of the CKAL measures between groups suggest that obese young adults
are incurring greater daily cumulative stress in the medial compartment of their
knee joint. It has been shown to be a highly repeatable measure of daily repetitive
knee load and a useful measure for detecting loading environments in different
populations and walking conditions (Robbins et al., 2009a). The results of this study
show that the cumulative knee adductor load was able to detect differences in a
loading environment between two distinctly different populations of young adults
where the peak moment could not detect a difference. In future, this could be used
as a better predictor of risk for knee pathology and specifically OA of the knee
(Robbins et al., 2009a).
A longitudinal study would be required to establish whether a greater CKAL
would lead to OA of the knee. A greater adduction moment from a one-‐stride gait
analysis is a strong risk factor for developing and progressing OA of the knee (Issa &

152
Sharma, 2007). Since the CKAL uses the impulse of the knee adduction moment as
one of its primary components, then a similar risk level for OA of the knee can be
inferred. The added incentive of the CKAL is the measure of repetitive loading.
Exposure to physical activity over time may contribute to development and
progression of OA of the knee (Vignon et al., 2006). An abnormal knee joint loading
environment may not lead to OA of the knee under low daily physical activity levels.
Similarly, normal loading combined with extremely high physical activity levels may
or may not lead to OA of the knee. Knowing the cumulative exposure levels of knee
loading throughout a day provides an understanding of the interplay between
abnormal and repetitive loading at the knee (Robbins et al., 2009a). And it is this
interplay that may be more telling of risk level for OA of the knee.
Assuming that the frontal knee moments observed in the case study
participants S01 and S04 are true knee moments (and not the result of
measurement error) then the moment impulse and CKAL are not variables that can
provide a valid measure of knee loading in such cases. The CKAL is primarily a
measure of medial compartment loading, as the knee adduction moment impulse
does not measure the total load experienced in the knee joint, but the ratio of medial
to lateral compartment loading (Maly, 2008). Greater lateral loading, like that seen
in S01 and S04, does not indicate less total load in the knee joint. It only alters the
ratio of medial to lateral loading. The resultant CKAL can be deceiving.
Judging from the CKAL measure alone, S01 and S04 – despite their obesity –
have produced an ideal knee loading environment that has reduced the medial
loading and risk for OA of the knee because of a valgus knee alignment (Figure 30).
153
It is not known what the ramifications of the gait characteristics seen in S01 and S04
will be on cumulative knee joint loading. These altered knee kinematics and kinetics
may produce a cumulative loading environment in the knee that is more optimal
that what is normally observed, by shifting some overloading away from the medial
compartment (Sharma et al., 2000). Alternatively, it could create an internal
environment in the lateral compartment of the knee that is just as problematic as a
large CKAL or worse. An abnormal shift toward lateral compartment loading, will
incur a greater burden on tissues that were never meant to endure such a load.
Breakdown in these tissues may happen at a fast rate, and a less repetitive and
cumulative load may be needed to cause lateral compartment joint degradation. The
obesity and altered kinematics and kinetics of S01 and S04 may lead to knee
pathologies in the future such as lateral OA of the knee. However, this would not be
indicated by the CKAL measure, as it is best used to indicate and predict pathology
in the medial compartment, including medial OA of the knee.
Therefore, it is questionable as to whether the CKAL, or the knee adduction
moment, is a useful measure in some special populations. One population may be
those with a valgus knee alignment. Several participants in the current research
showed a severe valgus knee alignment. If the study obese sample is representative
of the obese population, there is a chance that this unusual moment feature is more
common among the overweight and obese. It may be wise in future to categorize
individual CKAL measures based on knee alignment. This may allow a more
complete analysis of the interpretation of the cumulative load that is obtained. It
will also give a more in depth meaning to the value behind a particular CKAL.

154
Whether or not a significant portion of the obese population, or any other
special population, display anomalies in the frontal moment, the CKAL must be used
cautiously. In every case there is a need to analyze the two components of CKAL
separately to gain a complete understanding of whether kinetics or physical activity
is the greater influence on the outcome. Two people can have a similar cumulative
load as the result of greater sway from opposite components of the CKAL – large
knee adduction moment impulse combined with low steps per day, versus a small
knee adduction moment combined with high steps per day. Furthermore, a person
with an abnormal knee adduction moment who has infrequent steps per day can
have the similar cumulative load as a person with a normal knee adduction moment
with frequent steps per day. While on the surface these cases would appear similar,
they represent very different joint profiles and risk levels for medial OA of the knee.
High physical activity levels in a knee with healthy biomechanics may not be as
much of a concern as any physical activity in the knee with abnormal biomechanics
(Robbins et al., 2009a).
5.5 Obesity Interventions and Physical Rehabilitation
Given the many health benefits associated with weight loss, it is commonly
prescribed to overweight and obese people. While weight loss through better
nutrition and physical activity has been shown to reduce the risk of cardiovascular
disease, diabetes and some cancers, relatively little is known about how it reduces, if
it actually does, the risk of musculoskeletal disease. Every additional kilogram of
body mass has been shown to increase the compressive load at the knee joint by
four times during activity (Messier et al., 2005). This positive association with
155
weight loss was coupled with small reductions in the knee adduction moment
(Messier et al., 2005). Furthermore, a significant relationship was found between
weight loss and the medial rotation moment about the knee. Considering a greater
medial rotation moment as been associated with subtalar overpronation and
flattened arch, weight loss in the obese will also reduce the medial rotation moment
and reduce stress on the arches of the foot (Messier et al., 2004). Theoretically,
weight loss will significantly reduce the heightened compressive force at the knee
joint present in the obese state. By reducing the knee adduction moment, weight
loss lessens the compressive load through the medial compartment of the knee
(Messier et al., 2005). Considered as part of the repetitive load in the CKAL, this can
greatly reduce the daily load on the knee joint.
Considering the compensations of obesity, weight loss is not the only factor
that requires change to remove the risk of OA of the knee. Abnormal gait mechanics
as a result of obesity may also need intervention to completely remove the
heightened risk for degenerative changes in the cartilage of the knee joint
(Andriacchi et al., 2004).
Practically, it makes sense that weight loss would reduce the direct load on
the knee joint. However, a reduction of high knee joint load does not automatically
infer a decreased risk for OA of the knee. The profile of the contact areas that
experience loading and the health of the joint in question are what create a risk for
pathology. In healthy knees that are regularly exposed to high load, regions that
bear the bulk of contact force have thicker cartilage with enhanced mechanics
(Andriacchi et al., 2004). Unfortunately, in knees with abnormal loading profiles

156
where infrequently loaded areas of the knee are forced to bear a significantly
amount of contact force, degraded properties are found in the joint cartilage
(Andriacchi et al., 2004).
This study and a few previous ones have shown that obesity also brings
abnormal kinematic gait alterations to the joints of the lower limbs, such as a valgus
knee alignment. Such a shift of load toward less frequently loaded regions of the
knee joint could produce degenerative changes in the cartilage (Andriacchi et al.,
2004). While removing obesity from this equation through weight loss removes a
magnifying factor, it may not remove the abnormal mechanics. The potential risk of
degenerative change and OA of the knee will, to a lesser degree, still persist. With
weight loss interventions in young adults, clinicians have to consider the
implications of persistent compensatory gait mechanisms and how to alleviate
them. This may include things such as gait retraining, muscular strengthening and
flexibility training.
Another rehabilitative area of concern is muscular strengthening. In the
present study, the obese had reduced strength per kilogram of body mass.
Strengthening programs are commonly and universally prescribed to maintain
weight, improve weight loss, physical function and reduce possible joint pain and
discomfort. Increasing muscular strength has been used to prevent disability, which
may include protection against the development of OA of the knee (Sharma, 2003;
Slemenda et al., 1998). Quadriceps strengthening programs can serve to improve
weight loss interventions in the obese, as well as potentially increase physical
function and prevent disability.

157
However, the local loading environment of a joint mediates the effect of
quadriceps strengthening (Sharma et al., 2003). In malaligned and lax knees, generic
strengthening programs have the potential to negatively affect knee joint loading. In
malaligned knees, increased muscle forces from increased quadriceps strength can
increase the abnormal compressive load being experienced by compartments of the
joint that are not equipped to handle such contact forces. This could initiate the path
to cartilage degradation and OA of the knee (Andriacchi et al., 2004). Generic
strengthening programs will not adequately address the abnormal loading
environment at the knee of obese, or formally obese individuals. To have a positive
impact, strength maintenance and strengthening programs need to be tailored to
the specific, individual joint loading environment (Sharma et al., 2003). This may
include agonist-‐antagonist (quadriceps-‐hamstring) exercise, targeting separate
components of the quadriceps, gait training, and improving muscle endurance and
proprioceptive accuracy (Sharma et al., 2003).
The knee kinematics that were observed in the present obese group are
likely the direct result of long-‐term biomechanical adaptations. Long-‐term obesity
carries greater biomechanical and neuromuscular modifications that may have
more enduring consequences (Wearing et al., 2006a). This is especially true if
obesity is present in childhood (Hills et al., 1991; Wearing et al., 2006b). Tissue
adaptations made during this critical time of growth have a high likelihood of
becoming a permanent characteristic and will be extremely difficult to reverse.
Therefore, weight loss and physical rehabilitation need to be prescribed early in life.
158
5.6 Limitations
5.6.1 Sample Size
A few limitations presented themselves in the completion of this research. First, the
participant sample size was small. When anomalies were detected in two obese
participants, and the participant groups were each reduced to six, this made the
sample size even smaller. A small sample size increases the variability of statistics,
as was seen particularly in the obese group. This reduced the power associated with
a statistical test. In a number of cases, large group differences were not statistically
significant. Part of this non-‐significance is attributable to the small sample size.
Recruitment of obese young adults was difficult in the present study. In the interest
of time, the decision was made to progress toward data analysis with a small sample
of obese and healthy-‐weight young adults. However, there were consequences of
this decision in regard to the statistical analyses and outcomes.
The variability in the outcome measures in the obese participant group was
especially large. This was due to the greater within group differences in kinematic
and kinetic outcomes, as exemplified in Appendix C. In some outcomes, the obese
participant group had a standard deviation that was as much as double that seen in
the healthy participant group. This was manifested in the standard deviation of the
mean differences and inversely affected the test statistics.
5.6.2 Skin Artifact and Palpation of Anatomical Landmarks
The second limitation concerns skin artifact and its effect on motion capture
equipment, lab protocol and inverse dynamics calculations. There are inherent
errors in using motion capture to determine joint kinematics and kinetics. These
159
revolve around assumptions including segment rigidity and segment mass
determination from mass proportioning approaches. All lower limb segments are
assumed to be rigid. Skin movement with respect to the bone is ignored, or assumed
to be negligible. Healthy, young adults can be considered an ideal population to
study under motion capture as relatively little subcutaneous tissue would be
expected to lie between the skin markers and underlying bone. And as walking is
not a fast, explosive or aggressive movement, little skin artifact error would be
expected to alter the results of a motion capture analysis on healthy, young adults.
However, obesity accentuates this relationship. The obese have much greater
subcutaneous adipose tissue. This tissue is subject to greater displacement during
movement, even slow walking. Using skin markers to determine position and
motion of the joint becomes problematic as large errors are likely to occur as a
result of skin movement and the assumption of rigidity is broken. It is highly
possible that skin artifact has manifested itself into the results of the obese
participant group in the present study. To date, the error associated with skin
movement and bone in motion capture analysis using skin-‐mounted markers in the
obese has not been established. Therefore, quantifying this error is difficult.
Greater subcutaneous tissue between the skin and bone made palpating
boney anatomical landmarks more difficult with the obese participants. The
possibility exists that there were greater errors in the location of anatomical
landmarks in the obese participant group due to excess adipose tissue. These errors
in the position of the landmarks would affect the location of joint centers and
calculations of joint kinematics.
160
Finally, the masses of the lower limb segments were determined through
anthropometric databases using cadavers that may not have been
anthropometrically appropriate. The subjects used in these databases are often slim,
older males. The present study participants were male and female young adults of
varying body mass. The percentage of body mass attributed to the lower limb
segments by the present anthropometric databases may not be applicable to obese
populations. However, to date, there is no obese anthropometric database, therefore
there are no better alternatives without employing the use of medical imaging.
5.6.3 Walking Speed
The non-‐significant differences in knee kinematics or kinetics at the three different
walking speeds agrees with previous research on the effect of walking speed on
kinematics and kinetics at the knee (Lelas et al., 2003). But it may also be attributed
to the magnitude of differences between the three speeds – fast and slow being 15
percent faster and slower than the natural, self-‐selected speed –not being great
enough.
The walking speeds may also have been confounded by the confined
walkway or the method for monitoring speed. To perform the walking tasks,
participants walked along a four-‐meter walkway. This is a very confined length and
does not allow much space or time for acceleration and deceleration while walking.
Due to this short length, some participants had difficulty meeting the required
walking times. This could have forced them into a faster than necessary walking
speed or more unsteady walking pace. The recorded step and associated stance
phase may not accurately reflect the desired walking speed.

161
Timing gaits, one at the beginning of the walkway and one at the end, were
used to monitor walking pace. Considering decelerations and accelerations at the
start and end of the confined walkway, it is possible that the speed at the instant
which the participants made heel contact with the force plate were not a true
manifestation of the required walking speed.
Lastly, asking the healthy participants to reduce their walking speed to that
of the obese population in the matched walking speed condition had implications on
the findings. It forced the healthy-‐weight participants out of their normal walking
speed comfort zone, without imposing the same condition on the obese participants.
Alternatively the obese participants could walk at the natural walking speed of the
healthy participants, thus asking the obese participants to walk at a faster speed
outside their normal walking speed.
5.6.4 Transverse Plane
The data from the transverse plane has to be considered with some caution. The
kinematics and kinetics of the transverse plane at the knee joint are not commonly
reported in biomechanical knee research. As motions in this plane are so small,
detecting true motions – separate of skin motion artifact – can be a very difficult
task. The results from this plane are often unreliable and possibly invalid, hence
why they are often not reported. In the current study there was a large amount of
participant-‐to-‐participant variability in the transverse knee kinematics and kinetics.
This resulted in some different shapes and magnitudes of angle and moment
waveforms. This also caused the point in the gait cycle where maximum and
minimum value occurred to much more variable than in the other two planes. In
162
Tables 16 and 17 of the results section, the standard deviation associated with each
participant group for transverse knee angles and moments serve as a warning sign.
Similarly in the matched walking condition, a large standard deviation is
noted again in Tables 20 and 21 of the results section.
5.6.5 Accelerometers
In determining steps per day through an accelerometer, possible issues are
compliance, reliability and sensitivity of the device. First, participants were asked to
wear the accelerometer for seven consecutive days during all waking hours, from
the moment they woke up in the morning until they went to bed that night. In every
participant, data was collected throughout the day for all 7 days in every participant,
but there is the possibility that there were occurrences of non-‐compliance. It is
difficult to determine if the accelerometer is being worn on the anterior hip as
instructed, as opposed to being held in the hand or thrown in a bag. What is
measured as a step may not be attributable to actual body movements. The
accelerometer is highly sensitive to any movement or acceleration. Vibrations, or
movement of clothing and adipose tissue could have an affect on the recordings of
the accelerometer. Therefore, some steps could be categorized as phantom steps
that never really occurred. If adipose tissue alters the detected accelerations, this
issue may be magnified in the obese group. Lastly, some physical activities do not
require steps to be taken or any lower body accelerations to occur. Such activities
could range greatly in their intensity level and could be significantly effective means
of high intensity exercise. Unfortunately, these activities would not have been
accounted for by the accelerometer in either participant group.
163
5.7 Future Directions
To give more statistical power to the results, future research on young adults who
are obese should include a larger sample size. This will also aid in quantifying the
percentage of obese individuals that have frontal moments similar to the two case
studies of S01 and S04 in the present study. Along the same lines, with a larger
sample size, participants could be separated out by knee alignment – varus, neutral
and valgus. This would allow discrete analyses of each specific alignment scenario.
Along a similar train of thought, stricter categorization of obesity may be
helpful in detecting and associating gait adaptations with excess weight. There are
many inconsistencies in the biomechanical literature on obesity. This may be in part
due to differences in obese populations selected in separate studies. Obesity is a
highly variable and complex physical condition. The degree of obesity, how long an
individual has been obese and where they carry excess body mass on their body will
likely be strong predictors of the degree of biomechanical compensations that occur
while walking. To obtain a clearer, consistent picture of obese gait, further sub-‐
categorizations of obesity may be needed in biomechanical research.
A three-‐dimensional analysis of the hip and ankle joint would also add
weight to the results. Under the current analysis scheme, there is no way to confirm
hypothesized changes occurring at the hip, ankle and foot. Assumptions were made
based on results from previous research and biomechanical gait theory. A
quantitative approach would include a close examination of three-‐dimensional
ankle kinematics and kinetics to prove, or disprove, the hypothesized toe-‐out gait.

164
Including the hip and ankle joints will also be essential to completing a picture of
obese gait.
Few significant differences were found between the obese and healthy-‐
weight groups in the peak maximum or minimum moments. Based on a visual
analysis of the kinematic and kinetic waveforms, a more complete analysis could
have included group differences at additional points of the stance phase. While the
frontal moment impulse provided a more complete investigative parameter, there
are other points of the frontal, sagittal and transverse moments that have been
explored in the dimension of moment magnitude. Some commonly extrapolated
points of the stance phase have been at 15, 30 and 45 percent of the gait cycle
(Newell et al., 2008). These points of the gait cycle usually correspond to the first
(15 percent) and second (45 percent) peak – one of which will most likely be the
maximum value – and the midstance (30 percent) dip in magnitude or inflexion
point in all three-‐dimensions. In future, it may be more insightful to analyze these
three points of the waveform.
A greater range of tasks could also be included to gain a more complete
understanding of gait compensations made by the obese young adults in daily life.
These could include occupational tasks, stair climbing, obstacle clearance, sit to
stands and even running, and balance and agility tests.
The CKAL is a composite measure – a function of several quantities. At
present it is difficult to suggest alterations to the CKAL to make it more complete
and improve its use in future study without introducing more complex measures. As
the knee adduction moment – and thus CKAL – represents the ratio of medial

165
compartment loading in the knee, caution must be used to ensure that individual
CKAL results are not equated to total joint loading. The CKAL is limited to
quatifiying medial compartment loading. The CKAL is also limited by the
technological ability to distinguish and measure human physical activity over an
entire day. But as technology advances, new opportunities to improve measures of
long-‐term physical activity and time-‐dependent knee loading exposure will arise.
And these will improve future studies that employ the CKAL.
As mentioned, weight loss can present new complications to obese
individuals. While weight loss should infer reduced compressive load on the knee
joint, it does not necessarily imply the implementation of good biomechanical
strategies at the knee. It would be interesting to examine the three-‐dimensional
kinematics and kinetics in the lower limb of the obese at pre-‐ and post-‐weight loss.
This would give new insight into proper clinical and rehabilitative interventions
post-‐weight loss to ensure good musculoskeletal health over the long term.
166
VI. Conclusions
It is clear that even as young adults, the obese display compensatory gait
mechanisms to reduce stress at the knee joint. Heavier individuals walk at a slower
self-‐selected speed to reduce ground reaction forces, but expose the knee joint to
loading over a longer period due to a longer stance duration. As a group, the obese
displayed greater knee abduction and less knee flexion in early stance. A more
valgus knee alignment in the obese group altered the frontal plane moments. These
characteristics reduced the peak knee adduction moment, knee adduction moment
impulse and the cumulative knee adduction load (CKAL). However, the obese group
was still shown to have a significantly greater knee adduction moment impulse and
significantly greater CKAL, despite having similar physical activity levels (steps per
day) to the healthy-‐weight group.
Obesity carries two biomechanical risk factors for knee pathology. First,
obese individuals altered their knee kinematics by adopting a more valgus knee
alignment throughout stance phase and more knee flexion at heel contact. These
likely serve as compensations for their excess body weight. Second, obesity serves
to increase the compressive and cumulative load experienced at the joint. This
increase in knee joint loading magnifies the effect of abnormal kinematics on the
knee joint. On the surface, the kinematic compensation observed in the present
study appear beneficial, as they reduce medial compartment stress and
theoretically, the resulting risk for medial OA of the knee. However, they also shift
force away from normal load bearing contact areas of the knee joint toward
infrequently loaded contact areas. This places undue stress on other structures in

167
the knee joint that were not intended to bear such loads. Increased load on
articulating surfaces that infrequently bear high loads has the potential to initiate
degradation of cartilage and increase risk for lateral OA of the knee. Therefore
observed altered gait in the obese group may carry with it an increased risk for
musculoskeletal disorders of the knee, which could include OA of the knee. It is also
not known whether these altered gait mechanisms, including knee malalignment,
will persist with weight loss. As weight loss is often prescribed, obese individuals
may be in dire need of gait retraining, supervised muscle strengthening and
flexibility training to optimize the biomechanics of their lower limbs. This is only
speculation at present – future research will be needed to confirm the possible risk
associated with the observed gait changes in the obese state.

168
References
Adams, R. (1999). Revised Physical Activity Readiness Questionnaire. Canadian Family Physician, 992, 1004-‐1005.
Anderson, M.K. (2003). Fundamentals of Sports Injury Management (2nd Ed). Philadelphia, PA: Lippincott Williams & Williams.
Andrews, M., Noyes, F. R., Hewett, T. E., Andriacchi, T. P. (1996). Lower limb alignment and foot angle and related to stance phase knee adduction in normal subjects: a critical analysis of the reliability of gait analysis data. Journal of Orthopedic Research, 14, 289-‐295.
Andriacchi, T. P. (1994). Dynamics of knee malalignment. Orthopedic Clinics of North America, 25, 395–403.
Andriacchi, T. P., Mundermann, A., Smith, R. L., Alexander, E. J., Dyrby, C. O., & Koo, S. (2004). A Framework for the in Vivo Pathomechanics of Osteoarthritis at the Knee. Annals of Biomedical Engineering, 32, 448-‐457.
Andriacchi, T. P., Koo, S., & Scanlan, S. F. (2009).Gait Mechanics Influence Healthy Cartilage Morphology and Osteoarthritis of the Knee. The Journal of Bone & Joint Surgery, 91, 95-‐101.
Astephen, J. L., Deluzio, K. J., Caldwell, G. E., Dunbar, M. J., & Hubley-‐ Kozey, C. L. (2008). Gait and neuromuscular pattern changes are associated with differences in knee osteoarthritis severity levels. Journal of Biomechanics, 41, 868–876.
Baliunas, A. J., Hurwitz, D. E., Ryals, A. B., Karrar, A., Case, J. P., Block, J. A, et al. (2002). Increased knee joint loads during walking are present in subjects with knee osteoarthritis. Osteoarthritis & Cartilage, 10, 573-‐579.
Binkley, J. M., Stratford, P. W., Lott, S. A., & Riddle, D. L. (1999). The Lower Extremity Functional Scale (LEFS): scale development, measurement properties, and clinical application. Physical Therapy, 79, 371-‐383.
Birmingham, T. B., Hunt, M. A., Jones, I. C., Jenkyn, T. R., & Giffin, J. R. (2007). Test-‐retest reliability of the peak knee adduction moment during walking in patients with medial compartment knee osteoarthritis. Arthritis & Rheumatism, 57, 1012-‐1017.
Bravata, D. M., Smith-‐Spangler, C., Sundaram, V., Gienger, A. L., Lin, N., Lewis, R., et al. (2007). Using pedometers to increase physical activity and improve health: a systematic review. Journal of the American Medical Association, 298, 2296-‐2304.
Brooks, P. M. (2006). The burden of musculoskeletal disease—a global perspective. Clinical Rheumatology, 25, 778-‐781.
169
Brouwer, R. W., van Raaij, T. M., Verhaar, J. A. N., Coene, L. N. J. E. M., Bierma-‐Zeinstra, S. M. A. (2006). Brace treatment for osteoarthritis of the knee: a prospective randomized multi-‐centre trial. Osteoarthritis & Cartilage, 14, 777-‐783.
Brouwer, G. M., van Tol, A. W., Bergink, A. P., Belo, J. N., Bernsen, R. M. D., Reijman,
M., et al. (2007). Association between valgus and varus alignment and the development and progression of radiographic osteoarthritis of the knee. Arthritis & Rheumatism, 56, 1204-‐1211.
Browning, R. C., Baker, E. A., Herron, J. A., & Kram, R. (2006). Effects of obesity and sex on the energetic cost and preferred speed of walking. Jounal of Applied Physiology, 100, 390-‐398.
Browning, R. C., & Kram, R. (2007). Effects of obesity on the biomechanics of walking at different speeds. Medicine & Science in Sports & Exercise, 39, 1632-‐1641.
Browning, R. C., McGowan, C. P., & Kram, R. (2009). Obesity does not increase external mechanical work per kilogram body mass during walking. Journal of Biomechanics, 42, 2273-2278.
Canadian Task Force on the Periodic Health Examination (1994). Periodic health examination, 1994 update: 1. Obesity in childhood. Canadian Medical Association Journal, 150, 871-‐879.
Cannon, C. P., & Kumar, A. (2009). Treatment of overweight and obesity: lifestyle, pharmacologic, and surgical options. Clinical Cornerstone, 9, 55-‐68.
Capodaglio, P., Vismara, L., Menegoni, F., Baccalaro, G., Galli, M., & Grugni, G. (2009). Strength characterization of knee flexor and extensor muscles in Prader-‐Willi and obese patients. BioMed Central Musculoskeletal Disorders, 10(47).
Carriere, G. (2003). Parent and child factors associated with youth obesity. Statistics Canada: Supplement to Health Reports, 29-‐39.
Casella, G., Roger, B. (1990). Statistical Inference (1st Ed.). Pacific Grove, CA, USA: Brooks/Cole Publishing.
Catenacci, V. A., Hill, J. O., & Wyatt, H. R. (2009). The obesity epidemic. Clinics in Chest Medicine, 30, 415-‐444.
Christensen, R., Astrup, A., & Bliddal, H. (2005). Weight loss: the treatment of choice for knee osteoarthritis? A randomized trial. Osteoarthritis & Cartilage, 13, 20-‐27.
Cincuttini, F., Wluka, A., Hankin, J., Wang, Y. (2004). Longitudinal study of the relationship between knee angle and tibiofemoral cartilage volume in subjects with knee osteoarthritis. Rheumatology, 43, 321-‐324.

170
Colne, P., Frelut, M. L., Peres, G., & Thoumie, P. (2008). Postural control in obese adolescents assessed by lmiits of stability and gait initiation. Gait & Posture, 28, 164-‐169.
Corbeil, P. Simoneau, M., Rancourt, S., Trembley, A., Teasdale, N. (2001). Increased risk for falling associated with obesity: mathematical modeling of postural control. IEEE Neural Systems and Rehabilitation Engineering, 9, 126-‐136.
Davis, J. N., Hodges, V. A., & Gillham, M. B. (2006). Physical activity compliance: differences between overweight/obese and normal-‐weight adults. Obesity, 14, 2259-‐2265.
Dempster, W. T. (1955). Space requirements for the seated operator. Wright-‐Patterson Air Force Base, Ohio, WADC Technical Report: 55-‐159.
DeVita, P., & Hortobagyi, T. (2003). Obesity is not associated with increased knee joint torque and power during level walking. Journal of Biomechanics, 36, 1355-‐1362.
Dieppe, P. A., Cushnaghan, J., & Shepstone, L. (1997). The Bristol ‘OA500’ Study: progression of osteoarthritis (OA) over 3 years and the relationship between clinical and radiographic changes at the knee joint. Osteoarthritis & Cartilage, 5, 87-‐97.
Dietz W.H. (1998) Health consequences of obesity in youth: childhood predictors of adult disease. Pediatrics, 101, 518-‐525.
Ding, C., Cucuttini, F., Scott, F., Cooley, H., & Jones, G. (2005). Knee structural alteration and BMI: a cross-‐sectional study. Obesity Research, 13, 350-‐361.
Donelan, J. M., Kram, R., & Kuo, A. D. (2001). Mechanical and metabolic determinants of the preferred step width in human walking. Proceedings of the Royal Society London B Biological Science, 268, 1985–1992.
Dumond, H., Presle, N., Terlain, B., Mainard, D., Loeuille, D., Netter, P., et al. (2003).
Evidence for a key role of leptin in osteoarthritis. Arthritis & Rheumatism, 48, 3118-‐3129.
Eckstein, F., Hudelmaier, M., Cahue, S., Marshall, M., Sharma, L. (2009). Medial-‐to-‐
Lateral Ratio of Tibiofemoral Subchondral Bone Area is Adapted to Alignment and Mechanical Load. Calcified Tissue International, 84, 186–194.
Farr, J. N., Going, S. B., Lohman, T. G., Rankin, L., Kasle, S., Cornett, M., et al. (2008). Physical activity levels in early knee osteoarthritis patients measured by accelerometry. Arthritis & Rheumatism, 59, 1229-‐1236.

171
Felson, D. T., Anderson, J. J., Naimark, A., Walker, A. M., & Meenan, R. F. (1988). Obesity and knee osteoarthritis. The Framingham study, Annals of Internal Medicine, 109, 18–24.
Felson, D. T., Zhang, Y., Anthony, J. M., Naimark, A., & Anderson, J. J. (1992). Weight loss reduces the risk for symptomatic knee osteoarthritis in women: The Framingham Study. Annals of Internal Medicine, 116, 535-‐539.
Felson, D. T., Zhang, Y., Hannan, M. T., Naimark, A., Weissman, B., Aliabadi, P., et al. (1997). Risk factors for incident radiographic knee osteoarthritis in the elderly. Arthritis & Rheumatism, 40, 728-‐733.
Felson, D. T., Goggins, J., Niu, J., Zhang, Y., & Hunter, D. J. (2004). The effect of body weight on progression of knee osteoarthritis is dependent on alignment. Arthritis & Rheumatism, 50, 3904-‐3909.
Flynn, M. A. T., McNeil, D. A., Maloff, B., Mutasingwa, D., Wu, M. Ford, C., et al. (2005). Reducing obesity and related chronic disease risk in children and youth: a synthesis of evidence with ‘best practice’ recommendations. Obesity Reviews, 7, 7-‐66.
Gabay, O., Hall, D. J., Berenbaum, F., Henrotin, Y., & Sanchez, C. (2008). Osteoarthritis and obesity: experimental models. Joint Bone Spine, 75, 675-‐679.
Ganz, D. A., Chang, J. T., Roth, C. P., Guan, M., Kamberg, C. J., Reuben, D. B. et al. (2006). Quality of osteoarthritis care for community-‐dwelling older adults. Arthritis & Rheumatism, 55, 241-‐247.
Gibson, K., Sayers, S. P., Minor, M. A. (2010). Measurement of varus/valgus alignment in obese individuals with knee osteoarthritis. Arthritis Care & Research, 62(5), 690-‐696.
Griffin, T. M., Roberts, T. J., & Kram, R. (2003). Metabolic cost of generating muscular force in human walking: insights from load-‐carrying and speed experiments. Journal of Applied Physiology, 95, 172-‐183.
Guh, D. P., Zhang, W., Bansback, N., Amarsi, Z., Brimingham, C. L., & Anis, A. H. (2009). The incidence of co-‐morbidities related to obesity and overweight: a systematic review and meta-‐analysis. BioMed Central Public Health, 9(88).
Guo, M., Axe, M. J., Manal, K. (2007). The influence of foot progression angle on the knee adduction moment during walking and stair climbing in pain free individuals with knee osteoarthritis. Gait & Posture, 26, 436–441.
Gushue, D. L., Houck, J., Lerner, A. L. (2005). Effects of childhood obesity on three-‐dimensional knee joint biomechanics while walking. Journal of Pediatric Orthopaedics, 25(6), 763-‐768.

172
Hart, D. J., Doyle, D. V., & Spector, T. D. (1995). Association between metabolic factors and knee osteoarthritis in women: the Chingford Study. Journal of Rheumatology, 22, 1118–1123.
Hart, D. J., Doyle, D. V., & Spector, T. D. (1999). Incidence and risk factors for radiographic knee osteoarthritis in middle-‐aged women, the Chingford Study. Arthritis & Rheumatism, 42, 17–24.
Health Canada (2003). Arthritis in Canada. An ongoing challenge. Ottawa, ON: Health Canada.
Hill, J. O., Peters, J. C., Catenacci, V. A., & Wyatt, H. R. (2008). International strategies to address obesity. Obesity Reviews, 9 (Suppl 1), 41-‐47.
Hills, A. P., Hennig, E. M., Byrne, N. M., & Steele, J. R. (2002). The biomechanics of adiposity – structural and functional limitations of obesity and implications for movement. Obesity Reviews, 3, 35-‐43.
Hills, A. P., & Parker, A. W. (1991). Gait characteristics of obese children. Archives of Physical Medicine and Rehabilitation, 72, 403–407.
Holm, K., Li, S., Spector, N., Hicks, F., Carlson, E., & Lanuza, D. (2001). Obesity in adults and children: a call for action. Journal of Advanced Nursing. 36, 266-‐269.
Hu, F. B. (2003). Sedentary lifestyle and risk of obesity and type 2 diabetes. Lipids, 38, 103-‐108.
Hue, O., Simoneau, M., Marcotte, J., Berrigan, F., Dore, J., Marceau, P., et al. (2007). Body weight is a strong predictor of postural stability. Gait & Posture, 26, 32-‐38.
Hulens, M., Vansant, G., Lysens, R., Claessens, A. L., Muls, E., & Brumagne, S. (2001). Study of differences in peripheral muscle strength of lean versus obese women: an allometric approach. International Journal of Obesity, 25, 676-‐681.
Hunt, M. A., Birmingham, T. B., Jenkyn, T. R., Giffin, J. R., & Jones, I. C. (2008). Measures of frontal plane lower limb alignment obtained from static radiographs and dynamic gait analysis. Gait & Posture, 27, 635-‐640.
Hunter, D. J., Niu, J., Felson, D. T., Harvey, W. F., Gross, K. D., McCree, P., et al. (2007). Knee alignment does not predict incident osteoarthritis: the Framingham Osteoarthritis Study. Arthritis & Rheumatism, 56, 1212– 1218.
Hunter, D. J., Sharma, L., & Skaife, T. (2009). Alignment and osteoarthritis of the knee. The Journal of Bone & Joint Surgery, 91, 85-‐89.
173
Hurley, M. V., Walsh, N. E., Mitchell, H. L., Pimm, T. J., Williamson, E., Jones, R. H., et al. (2007). Economic evaluation of a rehabilitation program integrating exercise, self-‐management, and active coping strategies for chronic knee pain. Arthritis Care & Research, 57, 1220-‐1229
Hurwitz, D. E., Sumner, D. R., Andriacchi, T. P., & Sugar, D. A. (1998). Dynamic knee loads during gait predict proximal tibial bone distribution. Journal of Biomechanics, 31, 423-‐430.
Hurwitz, D. E., Ryals, A. B., Case, J. P., Block, J. A., & Andriacchi, T. P. (2002). The knee adduction moment during gait in subjects with knee osteoarthritis is more closely correlated with static alignment than radiographic disease severity, toe out angle and pain. Journal of Orthopaedic Research, 20, 101-‐107.
Issa, S. N., & Sharma, L. (2006). Epidemiology of Osteoarthritis: an update. Current Rheumatology Reports, 8, 7-‐15.
Jackson, B. D., Teichtahl, A. J., Morris, M. E., Wluka, A. E., Davis, S. R., & Cicuttini, F. M. (2004). The effect of the knee adduction moment on tibial cartilage volume and bone size in healthy women. Rheumatology, 43, 311-‐314.
Jackson, A. S., Ellis, K. J., McFarlin, B. K., Sailors, M. H., & Bray, M. S. (2009). Body mass index bias in defining obesity of diverse young adults: the Training Intervention and Genetics of Exercise Response (TIGER) study. British Journal of Nutrition, 102, 1084-‐1090.
Jacobi, D., Perrin, A. E., Grosman, N., Dore, M. F., Normand, S., Oppert, J. M., et al. (2007). Physical activity-‐related energy expenditure with the RT3 and TriTrac accelerometers in overweight adults. Obesity, 15, 950-‐956.
Janicka, A., Wren, T. A. L., Sanchez, M. M., Dorey, F., Kim, P., Mittelman, S. D. et al. (2007). Fat mass is not beneficial to bone in adolescents and young adults. The Journal of Clinical Endocrinology & Metabolism, 92, 143-‐147.
Janssen, I., Katzmarzyk, P. T., & Ross, R. (2003). Waist circumference and not body mass index explains obesity-‐related health risk. The American Journal of Clinical Nutrition, 79, 379-‐384.
Jenkyn, T. R., Hunt, M. A., Ian C. Jones, I. C., Giffin, J. R., Birmingham, T. B. (2008). Toe-‐out gait in patients with knee osteoarthritis partially transforms external knee adduction moment into flexion moment during early stance phase of gait: A tri-‐planar kinetic mechanism. Journal of Biomechanics, 41, 276–283.
Kaufman, K. R., Hughes, C., Morrey, B. F., Morrey, M., & An, K. N. (2001). Gait
characteristics of patients with knee osteoarthritis. Journal of Biomechanics, 34, 907-‐915.
174
Koo, S., & Andriacchi, T. P. (2007). A comparison of the influence of global functional loads vs. local contact anatomy on articular cartilage thickness at the knee. Journal of Biomechanics, 40, 2961-‐2966.
Ku, J. H., Lee, C. K., Joo, B. S., An, B. M., Choi, S. H., Wang, T. H., et al. (in press). Correlation of synovial fluid leptin concentrations with the severity of osteoarthritis. Clinical Rheumatology.
La Petit, C., & Berthelot, J. M. (2006). Obesity-‐a growing issue. Statistics Canada: Health Reports, 17, 43-‐50.
Lafortuna, C. L., Maffiuletti, N. A., Agosti, F., & Sartorio, A. (2005). Gender variations of body composition, muscle strength and power output in morbid obesity. International Journal of Obesity, 29, 833-‐841.
LaFortuna, C. L., Agosti, F., Galli, R., Busti, C., Lazzer, S., & Sartorio, A. (2008). The energetic and cardiovascular response to treadmill walking and cycle ergometer exercise in obese women, European Journal of Applied Physiology, 103, 707-‐717.
Lai, P. P. K., Leung, A. K. L., Li, A. N. M., & Zhang, M. (2008). Three-‐dimensional gait analysis of obese adults. Clinical Biomechanics, 23 (Suppl), S2-‐S6.
Landry, S. C., McKean, K. A., Hubley-‐Kozey, C. L., Stanish, W., & Deluzio, K. (2007). Knee biomechanics of moderate OA patients measured during gait at a self-‐selected and fast walking speed. Journal of Biomechanics, 40, 1754-‐1761.
Larsson, U. E., & Mattsson, E. (2001). Functional limitations linked to high body mass index, age and current pain in obese women. International Journal of Obesity, 25, 893-‐899.
Lean, M. E., Han, T. S., & Morrison, C. E. (1995). Waist circumference as a measure for indicating need for weight management. BMJ, 311, 158-‐161.
Lee, Y. S. (2009). Consequences of Childhood Obesity. Annals Academy of Medicine Singapore, 38, 75-‐77
Lelas, J. L., Merriman, G. J., Riley, P. O., Kerrigan, D. C. (2003). Predicting peak kinematic and kinetic parameters from gait speed. Gait & Posture, 17, 106-‐112.
Levine, J. A., Lanningham-‐Foster, L. M., McCrady, S. K. Krizan, A. C., Olson, L.R., Kane, P. H., Jensen, M. D., Clark, M. M. (2005). Interindividual variation in posture allocation: possible role in human obesity. Science, 307, 551-‐556.
Lim, B. W., Hinman, R. S., Wrigley, T. V., & Bennell, K. L. (2008). Varus malalignment and its association with impairments and functional limitations in medial knee osteoarthritis. Arthritis & Rheumatism, 59, 935-‐942.

175
Lim, B. W., Kemp, G., Metcalf, B., Wrigley, T. V., Bennell, K. L., Crossley, K. M., et al. (2009). The Association of Quadriceps Strength With the Knee Adduction Moment in Medial Knee Osteoarthritis. Arthritis & Rheumatism, 61, 451-‐458.
Lin, C.J., Lai, K.A., Chou, Y.L., Ho, C.S., 2001. The effect of changing the foot progression angle on the knee adduction moment in normal teenagers. Gait & Posture, 14 (2), 85–91.
Lynch, N. A., Metter, E. J., Lindle, R. S., Fozard, J. L., Tobin, J. D., Roy, T. A., et al. (1999). Muscle quality. I. Age-‐associated differences between arm and leg muscle groups. Journal of Applied Physiology. 86 (1), 188-‐194.
Lynn, S K., Reid, S. M., Costigan, P. A. (2007). The influence of gait pattern on signs of knee osteoarthritis in older adults over a 5-‐11 year follow-‐up period: A case study analysis. The Knee, 14, 22-‐28.
Lynn, S. K., Costigan, P. A. (2008). Effect of foot rotation on knee kinetics and hamstring activation in older adults with and without signs of knee osteoarthritis. Clinical Biomechanics, 23, 779-‐786.
MacInnis, R. J., Cassar, C., Nowson, C. A., Paton, L. M., Flicker, L., Hopper, J. L. et al. (2003). Determinants of bone desity in 30-‐ to 65-‐year old women: a co-‐twin study. Journal of Bone and Mineral Research, 18, 1650-‐1656.
Maly, M. R. (2008). Abnormal and cumulative loading in knee osteoarthritis. Current Opinion in Rheumatology. 20 (5), 547-‐552.
Maly, M. R., Costigan, P. A., & Olney, S. J. (2008). Mechanical factors relate to pain in knee osteoarthritis. Clinical Biomechanics, 23, 796-‐805.
Manini, T. M., Clark, B. C., Nalls, M. A., Goodpaster, B. H., Ploutz-‐Snyder, L. L., & Harris, T. B. (2007). Reduced physical activity increases intermuscular adipose tissue in healthy young adults. The American Journal of Clinical Nutrition, 85, 377-‐384.
Mattsson, E., Larsson, U. E., & Rössner, S. (1997). Is walking for exercise too exhausting for obese women? International Journal of Obesity Related Metabolic Disorders, 21, 380–386.
McClung, C. D., Zahiri, C. A., Higa, J. K., Amstutz, H. C., & Schmalzried, T. P. (2000). Relationship between body mass index and activity in hip or knee arthroplasty patients. Journal of Orthopedic Research, 18, 35–39.
McGraw, B., McClenaghan, B. A., Williams, H. G., Dickerson, J., & Ward, D. S. (2000).
Gait and postural stability in obese and nonobese prepubertal boys, Archives of Physical Medicine and Rehabilitation, 81, 484-‐489.
176
McMillian, A. G., Auman, N. L., Collier, D. N., Blaise Williams, D. S. (2009). Frontal plane lower extremity biomechanics during walking in boys who are overweight and healthy weight. Pediatric Physical Therapy, 21(2), 187-‐193.
McMillian, A. G., Pulver, A. M.E., Collier, D. N., Williams, D. S. B. (2010). Sagittal and frontal plane joint mechanics throughout the stance phase of walking in adolescents who are obese. Gait & Posture, 32, 263-‐268.
Messier, S. P., Loeser, R. F., Miller, G. D., Morgan, T. M., Rejeski, W. J., Sevick, M. A., et al. (2004). Exercise and dietary weight loss in overweight and obese older adults with knee osteoarthritis: the Arthritis Diet, and Activity Promotion Trial. Arthritis & Rheumatism, 50, 1501-‐1510.
Messier, S. P., Davies, A. B., Moore, D. T., Davis, S. E., Pack, R. J., Kazmar, S. C. (1004). Severe obesity: effects o foot mechanics during walking. Foot & Ankle International, 15(1), 29-‐34.
Messier, S. P., Gutekunst, D. J., Davis, C., & DeVita, P. (2005). Weight loss reduces knee-‐joint loads in overweight and obese older adults with knee osteoarthritis. Arthritis & Rheumatism, 57, 2026-‐2032.
Messier, S. P. (2009). Obesity and osteoarthritis: disease genesis and nonpharmacological weight management. Medcine & Science in Sports & Exercise, 93, 145-‐159.
Miller, G. D., Nicklas, B. J., Davis, C., Loeser, R. F., Lenchik, L., & Messier, S. P. (2006). Intensive weight loss program improves physical function in older obese adults with knee osteoarthritis. Obesity, 14, 1219-‐1230.
Mikesky, A. E., Meyer, A., & Thompson, K. L. (2000). Relationship between quadriceps strength and rate of loading during gait in women. Journal of Orthopaedic Research, 18, 171–175.
Miyazaki, T., Wada, M., Kawahara, H., Sato, M., Baba, H., & Shimada, S. (2002). Dynamic load at baseline can predict radiographic disease progression in medial compartment knee osteoarthritis. Annals of the Rheumatic Diseases, 61, 617–622.
Murphy, K. A., Spence, S. T., McIntosh, C. N., & Gorber, S. K. C. (2006). Health state descriptions for Canadians: musculoskeletal diseases. Statistics Canada Health Analysis and Measurement Group. (no. 82-‐619-‐MIE2006-‐003)
Murphy, S. L. (2009). Review of physical activity measurement using accelerometers in older adults: Considerations for research design and conduct. Preventative Medicine, 48, 108-‐114.
Nantel, J., Brochu, M., & Prince, F. (2006). Locomotor strategies in obese and non-‐obese children. Obesity, 14, 1789-‐1794.

177
Nester, J., Wasserman, W. (1974). Applied Linear Statistical Models. Homewood, Ill, USA: Richard D. Irwin, Inc.
Newell, R. S., Hubley-‐Kozey, C. L., Stanish, W., & Deluzio, K. L. (2008). Detecting differences between asymptomatic and osteoarthritic gait is influenced by changing the knee adduction moment model. Gait & Posture, 27, 485-‐492.
Niu, J., Zhang, Y. Q., Torner, J., Nevitt, M., Lewis, C. E., Aliabadi, P., et al. (2009). Is obesity a risk factor for progressive radiographic knee osteoarthritis? Arthritis & Rheumatism, 61, 329-‐335.
Orpana, H. M., Trembley, M. S., & Fines, P. (2007). Trends in weight change among Canadian adults. Statistics Canada: Health Reports, 18, 9-‐16.
Pagani, C. H. F., Potthast, W., Brüggemann , G. P.(2010). The effect of valgus bracing on the knee adduction moment during gait and running in male subjects with varus alignment Clinical Biomechanics, 25, 70–76.
Page, A., Cooper, A. R., Stamatakis, E., Foster, L. J., Crowne, E. C., Sabin, M., et al. (2005). Physical activity patterns in nonobese and obese children assessed using minute-‐by-‐minute accelerometry. International Journal of Obesity, 29, 1070-‐1076.
Palou, A., Serra, F., Bonet, M. L., & Pico, C. (2000). Obesity: molecular bases of a multifactorial problem. European Journal of Nutrition, 39, 127-‐144.
Pua, Y-‐H., Cowan, S. M., Wrigley, T. V., & Bennell, K. L. (2009). The Lower Extremity Functional Scale could be an alternative to the Western Ontario and McMaster Universities Osteoarthritis Index physical function scale. Journal of Clinical Epidemiology, 62, 1103-‐1111.
Perez, C. (2003). Children who become active. Statistics Canada: Supplement to Health Reports, 17-‐28.
Perotto, A. O., Delagi, E. F., Iazzetti, J., & Morrison, D., (2005). Anatomical Guide for the Electromyographer: The Limbs and Trunk. Charles C. Thomas: Publisher Ltd., Springfield, Illinois.
Petrella, J. K., Kim, J. S., Tuggle, S. C., Hall, S. R., & Bamman, M. M. (2005). Age differences in knee extension power, contractile velocity and fatigability. Journal of Applied Physiology, 98, 211-‐220.
Peyrot, N., Thivel, D., Isacco, L., Morin, J. B., Duche, P., & Belli, A. (2009). Do mechanical gait parameters explain the higher metabolic cost of walking in obese adolescents? Journal of Applied Physiology, 106, 1763-‐1770.
Plasqui, G., & Westerterp, K. R. (2007). Physical activity assessment with accelerometers; an evaluation against doubly labeled water. Obesity, 15, 2371-‐2379.
178
Price, G. M., Uauy, R., Breeze, E., Bulpitt, C. J., & Fletcher, A. E. (2006). Weight, shape, and mortality risk in older persons: elevated waist-‐hip ratio, not high body mass index, is associated with a greater risk of death. The American Journal of Clinical Nutrition, 84, 449-‐460.
Reid, I. R. (2002). Relationship among body mass, its components, and bone. Bone, 31, 547-‐555.
Reijman, M., Pols, H. A. P., Bergink, A. P., Hazes, J. M. W., Belo, J. N., Lievense, A. M., et al. (2007). Body mass index associated with onset and progression of osteoarthritis of the knee but not of the hip: The Rotterdam Study. Annals of the Rheumatic Diseases, 66, 158-‐162.
Rejeski, W. J., Ip, E. H., Marsh, A. P., Zhang, Q., & Miller, M. E. (2008). Obesity influences transitional states of disability in older adults with knee pain. Archives of Physical Medicine and Rehabilitation, 89, 2102-‐2107.
Riddiford, D. L., Steele, J. R., & Storlien, L. H. (1998). Does obesity affect explosive strength of prepubescent children? Seventh Scientific Meeting of the Australasian Society for the Study of Obesity. Queensland: Gold Coast.
Robbins, S. M., Birmingham, T. B., Jones, G. R., Callaghan, J. P., & Maly, M. R. (2009a). Developing an estimate of daily cumulative loading for the knee: examining test-‐retest reliability. Gait & Posture, 30, 497-‐501.
Robbins, S. M., & Maly, M. R. (2009b). The effect of gait speed on the knee adduction moment depends on waveform summary measures. Gait & Posture, 30, 543-‐546.
Rohmert, W. (1973). Problems of determination of rest allowances. Part 2: Determining rest allowances in different human tasks. Applied Ergonomics, 4, 158-‐162.
Roos, E. M., & Dahlberg, L. (2005). Positive effects of moderate exercise on glycosaminoglycan content in knee cartilage: a four-‐month randomized, controlled trial in patients at risk of osteoarthritis. Arthritis & Rheumatism, 52, 3507-‐3514.
Rutherford, D. J., Hubley-‐Kozey, C. L., Deluzio, J., Stanish, W. D., Dunbar, M. (2008). Foot progression angle and the knee adduction moment: a cross-‐sectional investigation in knee osteoarthritis. Osteoarthritis & Cartilage, 16, 883-‐889.
Sartorio, A., Proietti, M., Agnosti, F., Adorni, F., & Lafortuna, C. L. (2004). Influence of
gender, age and BMI on lower limb muscular power output in a large population of obese men and women. International Journal of Obesity, 28, 91-‐98.

179
Seidler, A., Bolm-‐Audorff, U., Abolmaali, N., & Elsner, G. (2008). The role of cumulative physical work load in symptomatic knee osteoarthritis – a case-‐control study in Germany. BioMed Central Journal of Occupational Medicine and Toxology, 3(14).
Segal, N. A., Torner, J. C., Felson, D., Niu, J., Sharma, L., Lewis, C. E., et al. (2009). Effect of thigh strength on incident radiographic and symptomatic knee osteoarthritis in a longitudinal cohort. Arthritis & Rheumatism, 61, 1210-‐1217.
Sevick, M. A., Miller, G. D., Loeser, R. F., Williamson, J. D., & Messier, S. P. (2009). Cost-‐effectiveness of exercise and diet in overweight and obese adults with knee osteoarthritis. Medicine & Science in Sports & Exercise, 41, 1167-‐1174.
Sharma, L., Hurwitz, D. E., Thonar, E., Sum, J. A., Lenz, M. E., Dunlop, D. D., et al., (1998). Knee adduction moment, serum hyaluronan level, and disease severity in medial tibiofemoral osteoarthritis. Arthritis & Rheumatism, 41, 1233–1240.
Sharma, L., Lou, C., Cahue, S., & Dunlop, D. D. (2000). The mechanism of the effect of obesity in knee osteoarthritis: the mediating role of malalignment. Arthritis & Rheumatism, 43, 568-‐575.
Sharma, L., Song, J., Felson, D. T., Cahue, S., Shamiyeh, E., & Dunlop, D. D. (2001). The role of knee alignment in disease progression and functional decline in knee osteoarthritis. The Journal of the American Medical Association, 286, 188-‐195.
Sharma, L. (2003). Examination of exercise effects on knee osteoarthritis outcomes; why should the local mechanical environment be considered? Arthritis & Rheumatism, 49(2), 255-‐260.
Sharma, L., Dunlop, D. D., Cahue, S., Song, J., Hayes, K. W. (2003). Quadriceps strength and osteoarthritis progression in malaligned and lax knees. Annals of Internal Medicine, 138(8), 613-‐620.
Sharma, L., & Chang, A. (2007). Overweight: advancing out understanding of its impact on the knee and the hip. Annals of the Rheumatic Diseases, 66, 141-‐142.
Sharma, L., Eckstein, F., Song, J., Guermazi, A., Prasad, P., Kapoor, D., et al. (2008). Relationship of meniscal damage, meniscal extrusion, malalignment, and joint laxity to subsequent cartilage loss in osteoarthritic knees. Arthritis & Rheumatism, 58, 1716-‐1726.
Shields, M. (2006). Overweight and obesity among children and youth. Statistics Canada: Health Reports, 17, 27-‐42.

180
Shields, M., & Tjepkema, M. (2006a). Trends in adult obesity. Statistics Canada: Health Reports, 17, 53-‐59.
Shields, M., & Tjepkema, M. (2006b). Regional differences in obesity. Statistics Canada: Health Reports, 17, 61-‐67.
Shields, M., Tremblay, M. S., Laviolette, M., Craig, C. L., Jenssen, I., Gorber, S. C. (2010). Fitness of Canadian adults: Results from the 2007-‐2009 Canadian Health Measures Survey. Statistics Canada: Health Reports, 21(1), Catalogue no. 82-‐003-‐XPE
Shultz, S. P., Anner, J., & Hills, A. P. (2009). Paediatric obesity, physical activity and the musculoskeletal system. Obesity Reviews, 10, 576-‐582.
Shultz, S. P., Sitler, M. R., Tierney, R> T., Hillstrom, H. J., Song, J. (2009). Effects of pediatric obesity on joint kinematics and kinetics during two walking cadences. Archives of Physical Medicine and Rehabilitation, 90(12), 2146-‐2154.
Shiri, R., Solovieva, S., Husgafvel-‐Pursiainen, K., Taimela, S., Saarikoski, L. A., Huupponen, R., et al. (2008). The association between obesity and the prevalence of low back pain in young adults. American Journal of Epidemiology, 167, 1110-‐1119.
Slemenda, C., Heilman, D. K., Brandt, K. D., Katz, B. P., Mazzuca, S. A., Braustein, E. M., et al., (1998). Reduced quadriceps strength relative to body weight. A risk factor for knee osteoarthritis in women? Arthritis & Rheumatism, 41, 1951-‐1959.
Snook, S. H., & Ciriello, V. M. (1991). The design of manual handling tasks: revised tables of maximum acceptable weights and forces. Ergonomics, 34, 1197-‐1213.
Spyropoulos, P., Pisciotta, J.C., Pavlou, K.N., Cairns, M.A., & Simon, S.R., (1991). Biomechanics gait analysis in obese men. Archives of Physical Medicine and Rehabilitation, 72, 1065–1070.
Stenholm, S., Alley, D., Bandinelli, S., Griswold, M. E., Koskinen, S., Rantanen, T., et al.
(2009). The effect of obesity combined with lower muscle strength on decline in mobility in older persons: results from the InCHIANTI study. International Journal of Obesity, 33, 635-‐644.
Stratford, P. W., Kennedy, D. M., & Hanna, S. E. (2004). Condition-‐specific Western Ontario McMaster Osteoarthritis Index was not superior to region-‐specific Lower Extremity Functional Scale at detecting change. Journal of Clinical Epidemiology, 57, 1025-‐1032.
181
Sturmer, T., Gunther, K. P., & Brenner, H. (2000). Obesity, overweight and patterns of osteoarthritis: the Ulm Osteoarthritis Study. Journal of Clinical Epidemiology, 53, 307-‐313.
Syed, I. Y., & Davis, B. L. (2000). Obesity and osteoarthritis of the knee: hypotheses concerning the relationship between ground reaction forces and quadriceps fatigue in long-‐duration walking. Medical Hypotheses, 54, 182-‐185.
Taes, Y. E. C., Lapauw, B., Vanbillemont, G., Bogaert, V., De Bacquer, D., Zmierczak, H., et al. (2009). Fat mass is negatively associated with cortical bone size in young healthy male siblings. The Journal of Endocrinology & Metabolism, 94, 2325-‐2331.
Taylor, E. D., Theim, K. R., Mirch, M. C., Ghorbani, S., Tanofsky-‐Kraff, M., Adler-‐Wailes, D. C., et al. (2006). Orthopedic complications of overweight in children and adolescents. Pediatrics, 117, 2167-‐2174.
Teasdale, N., Hue, O., Marcotte, J., Berrigan, F., Simoneau, M., Dore, J., et al. (2007). Reducing weight increases postural stability in obese and morbid obese men. International Journal of Obesity, 31, 153-‐160.
Thorp, L. E., Sumner, D. R., Block, J. A., Moisio, K. C., Shott, S., & Wimmer, M. A. (2006). Knee joint loading differs in individuals with mild compared with moderate medial knee osteoarthritis. Arthritis & Rheumatism, 54, 3842-‐3849.
Trost, S. G., Kerr, L. M., Ward, D. S., & Pate, R. R. (2001). Physical activity and determinants of physical activity in obese and non-‐obese children. International Journal of Obesity Related Metabolic Disorders, 25, 822–829.
Trost, S. G., McIver, K. L., & Pate, R. R. (2005). Conducting accelerometer-‐based
activity assessments in field-‐based research. Medicine & Science in Sports & Exercise, 37, S531–S543.
Vignon, E., Valat, J. P., Rossignol., M., Avouac, B., Rozenberg, S., Thoumie, P., Avouac, J., Nordin, M., Hilliquin, P. (2006). Osteoarthritis of the knee and hip and activity: a systemic international review and sysnthesis (OASIS). Joint Bone Spine, 73(4), 442-‐455.
Visser, M., Goodpaster, B. H., Kritchevsky, S. B., Newman, A. B., Nevitt, M., Rubin, S. M., et al. (2005). Muscle Mass, Muscle Strength, and Muscle Fat Infiltration as Predictors of Incident Mobility Limitations in Well-‐Functioning Older Persons. Journal of Gerontology, 60A, 324-‐333.
Wada, M., Maezawa, Y., Baba, H., Shimada, S., Sasaki, S., Nose, Y. (2001). Relationships among bone mineral densities, static alignment and dynamic load in patients with medial compartment knee osteoarthritis. Journal of Rheumatology, 40, 499-‐505.

182
Wang, Y. C., Hart, D. L., Stratford, P. W., & Mioduski, J. E. (2009). Clinical interpretation of a Lower-‐Extremity Functional Scale-‐derived computerized adaptive test. Physical Therapy, 89, 957-‐968.
Waters, T. R., Putz-‐Anderson, V., Garg, A., & Fine, L. J. (1993. Revised NIOSH equation for the design and evaluation of manual lifting tasks. Ergonomics, 36, 749-‐776.
Wearing, S. C., Hennig, E. M., Byrne, N. M., Steele, J. R., & Hills, A. P. (2006a). Musculoskeletal disorders associated with obesity: a biomechanical perspective. Obesity Reviews, 7, 239-‐250.
Wearing, S. C., Hennig, E. M., Byrne, N. M., Steele, J. R., & Hills, A. P. (2006b). Biomechanics of restricted movement in adult obesity. Obesity Reviews, 7, 13-‐24.
Weidow, J., Mars, I., Karrholm, J. (2005). Medial and lateral osteoarthritis of the knee is related to variations of hip and pelvic anatomy. OsteoArthritis & Cartilage, 13, 471-‐477.
Weidow, J., Tranberg, R., Saari, T., Karrholm, J. (2006). Hip and knee joint rotations differ between patients with medial and lateral knee osteoarthritis: gait analysis of 30 patients and 15 controls. Journal of Orthopaedic Research, 24(9), 1890-‐1899.
Westerterp, K. R. (2009). Assessment of physical activity: a critical appraisal. European Journal of Applied Physiology, 105, 823-‐828.
Whitaker R.C., Wright J.A., Pepe M.S., Seidel K.D., & Dietz W.H. (1997) Predicting obesity in young adulthood from childhood and parental obesity. New England Journal of Medicine, 337, 869-‐873.
Whiting, W. C. & Rugg, S. (2006). Dynatomy: Dynamics of Human Movement (1st Ed). Windsor, ON: Human Kinetics.
Winter, D. A., (1990). Biomechanics and Motor Control of Human Movement (3rd Ed). John Wiley & Sons Inc.: New York.
Winter, D. A. (1991). The Biomechanics and Motor Control of Human Gait: Normal, Elderly and Pathological (2nd Ed). Waterloo, ON: University of Waterloo Press.
Woolf, A. D. & Pfleger, B. (2003). Burden of major musculoskeletal conditions. Bulletin of the World Health Organization, 81, 646-‐656.
Xu, X., Mirka, G. A., & Hsiang, S. M. (2008). The effects of obesity on lifting performance. Applied Ergonomics, 39, 93-‐98.
Zhang, K., Werner, P., Sun, M., Pi-‐Sunyer, X., & Boozer, C. N. (2003). Measurement of human daily physical activity. Obesity Research, 11, 33-‐40.
183
Zhao, D., Banks, S. A., Mitchell, K. H., D’Lima, D. D., Colwell, C. W. Jr., & Fregly, B. J. (2007). Correlation between the knee adduction torque and medial contact force for a variety of gait patterns. Journal of Orthopaedic Research, 25, 789-‐797.
Zoico, E., Di Francesco, V., Guralnik, J. M., Mazzali, G., Bortolani, A., Guariento, S., et al. (2004). Physical disability and muscular strength in relation to obesity and different body composition indexes in a sample of healthy elderly women. International Journal of Obesity, 28, 234-‐241.

184
Appendix
Appendix A
Lower Extremity Functional Scale (LEFS) Questionnaire
!"#$%&'#($#)!(#*
+!,$-./0!+&/1%$201%#$
!"#$%"#&'("%")("*#&'#+',-&'.#-/"(/"%#0,1#$%"#/$2&'.#$'0#*&33&415(0#$(#$55#-&(/#(/"#$4(&2&(&")#5&)("*#6"5,-#6"4$1)"#,3#0,1%#5,-"%#5&7
68%,65"7#3,%#-/&4/#0,1#$%"#41%%"'(50#)""+&'.#$(("'(&,'9##85"$)"#:%,2&*"#$'#$')-"%#3,%#!"#$#$4(&2&(09#
%&'"()*'&*(&+*&,*-&+.'*(&+*$"/!*"0(*'1221#+.3(*"3*"..*-13$4*
5#31/131!6
783,!9!
:1221#+.3(*&,*
;0"<.!*3&*
=!,2&,9*5#31/13(*
>+13!*"*?13*
&2*:1221#+.3(*
@&'!,"3!
:1221#+.3(*
5*A133.!*?13*
&2:1221#+.3(*
B&:1221#+.3(*
;#<'0#,3#0,1%#1)1$5#-,%+=#/,1)"-,%+=#,%#)4/,,5#$4(&2&(&")9#
>#;#
?#@#
A#?#
B,1%#1)1$5#/,66&")=#%"#4%"$(&,'$5#,%#):,%(&'.#$4(&2&(&")9#
>#;#
?#@#
A#@#
C"((&'.#&'(,#,%#,1(#,3#(/"#6$(/9#
>#;#
?#@#
A#A#
!$5+&'.#6"(-""'#%,,7)9#
>#;#
?#@#
A#D#
81((&'.#,'#0,1%#)/,")#,%#),4+)9#
>#;#
?#@#
A#E#
FG1$((&'.9#
>#;#
?#@#
A#H#
I&3(&'.#$'#,6J"4(=#5&+"#$#6$.#,3#.%,4"%&")#3%,7#(/"#35,,%9#
>#;#
?#@#
A#K#
8"%3,%7&'.#5&./(#$4(&2&(&")#$%,1'*#0,1%#/,7"9#
>#;#
?#@#
A#L#
8"%3,%7&'.#/"$20#$4(&2&(&")#$%,1'*#0,1%#/,7"9#
>#;#
?#@#
A#;>#C"((&'.#&'(,#,%#,1(#,3#$#4$%9#
>#;#
?#@#
A#;;#!$5+&'.#?#65,4+)9#
>#;#
?#@#
A#;?#!$5+&'.#$#7&5"9#
>#;#
?#@#
A#;@#C,&'.#1:#,%#*,-'#;>#)($&%)#M$6,1(#;#35&./(#,3#)($&%)N9#
>#;#
?#@#
A#;A#F($'*&'.#3,%#;#/,1%9#
>#;#
?#@#
A#;D#F&((&'.#3,%#;#/,1%9#
>#;#
?#@#
A#;E#O1''&'.#,'#"2"'#.%,1'*9#
>#;#
?#@#
A#;H#O1''&'.#,'#1'"2"'#.%,1'*9#
>#;#
?#@#
A#;K#P$+&'.#)/$%:#(1%')#-/&5"#%1''&'.#3$)(9#
>#;#
?#@#
A#;L#Q,::&'.9#
>#;#
?#@#
A#?>#O,55&'.#,2"%#&'#6"*9#
>#;#
?#@#
A#*
C&.+90*%&3".64*
**
**
*
@1019+9
*A!/!.*&2*:!3!#3"<.!*C$"0D!*EFGH
C&021'!0#!I4*F*J&1036*
KCLM74*NNNNNO*PG*
!"#$%&'"()*$+,-%&./"01)231)4'$5'*+$(1631)7+''1)431)!%((/"1)831)9):;")<+$';)=,"$%>5&)?$';+#5"(%>)!";5@%/%'5'%+&)!"A"5$>;)<"'B+$.1):;")7+B"$)CD'$",%'0
EF&>'%+&5/)4>5/"G)4>5/")("H"/+#,"&'1),"5AF$","&')#$+#"$'%"A1)5&()>/%&%>5/)5##/%>5'%+&1)6;0A%>5/):;"$5#01)IJJJ1)KJ1)LMKINMOM1)B%';)#"$,%AA%+&)+*)';")
=,"$%>5&)6;0A%>5/):;"$5#0)=AA+>%5'%+&3)))
!"#$%#&%'()*+&+,#&%')&-.&/#%0-1%#%2

185
Physical Activity Readiness Questionnaire (PAR-‐Q)

186
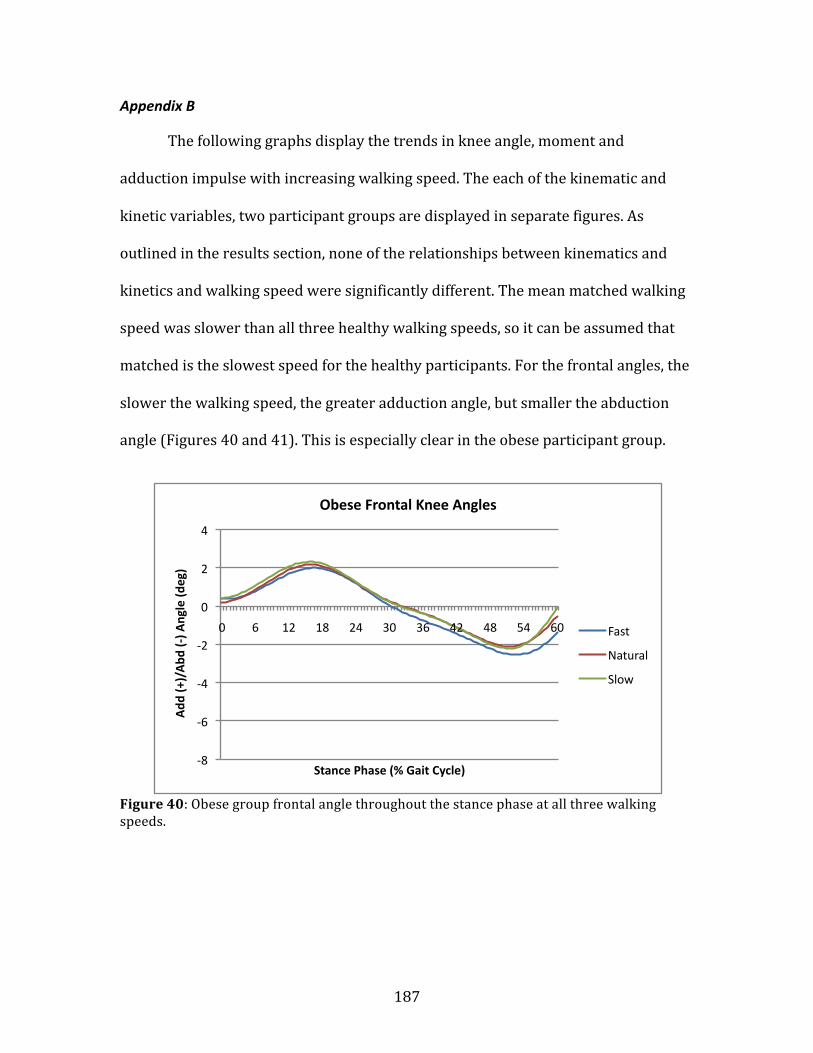
187
Appendix B
The following graphs display the trends in knee angle, moment and
adduction impulse with increasing walking speed. The each of the kinematic and
kinetic variables, two participant groups are displayed in separate figures. As
outlined in the results section, none of the relationships between kinematics and
kinetics and walking speed were significantly different. The mean matched walking
speed was slower than all three healthy walking speeds, so it can be assumed that
matched is the slowest speed for the healthy participants. For the frontal angles, the
slower the walking speed, the greater adduction angle, but smaller the abduction
angle (Figures 40 and 41). This is especially clear in the obese participant group.
Figure 40: Obese group frontal angle throughout the stance phase at all three walking speeds.
-‐8
-‐6
-‐4
-‐2
0
2
4
0 6 12 18 24 30 36 42 48 54 60
Add
(+)/Abd
(-‐) A
ngle (d
eg)
Stance Phase (% Gait Cycle)
Obese Frontal Knee Angles
Fast
Natural
Slow

188
Figure 41: Healthy-‐weight group frontal angle throughout the stance phase at all four walking speeds.
In the sagittal plane, knee flexion angle increased with increasing speed for
both participant groups (Figures 42 and 43).
Figure 42: Obese group sagittal angle throughout the stance phase at all three walking speeds.
-‐8
-‐6
-‐4
-‐2
0
2
4
0 6 12 18 24 30 36 42 48 54 60
Add
(+)/Abd
(-‐) A
ngle (d
eg)
Stance Phase (% Gait Cycle)
Healthy-‐weight Frontal Knee Angles
Fast
Natural
Slow
Matched
-‐10
0
10
20
30
40
50
60
0 6 12 18 24 30 36 42 48 54 60
Flex (+
)/Ext (-‐) Angle (d
eg)
Stance Phase (% Gait Cycle)
Obese Sagi_al Knee Angles
Fast
Natural
Slow

189
Figure 43: Healthy-‐weight group sagittal knee angle throughout the stance phase at all four walking speeds.
There was a less clear trend between knee angle and walking speed in the
transverse plane. This goes hand in hand with the high variability noted between all
participants in the transverse angle waveform throughout the stance phase. There
did appear to be more medial rotation with increased walking speed in the obese
participant group (Figure 44).
-‐10
0
10
20
30
40
50
60
0 6 12 18 24 30 36 42 48 54 60
Flex (+
)/Ext (-‐) Angle (d
eg)
Stance Phase (% Gait Cycle)
Healthy-‐weight Sagi_al Knee Angles
Fast
Natural
Slow
Matched
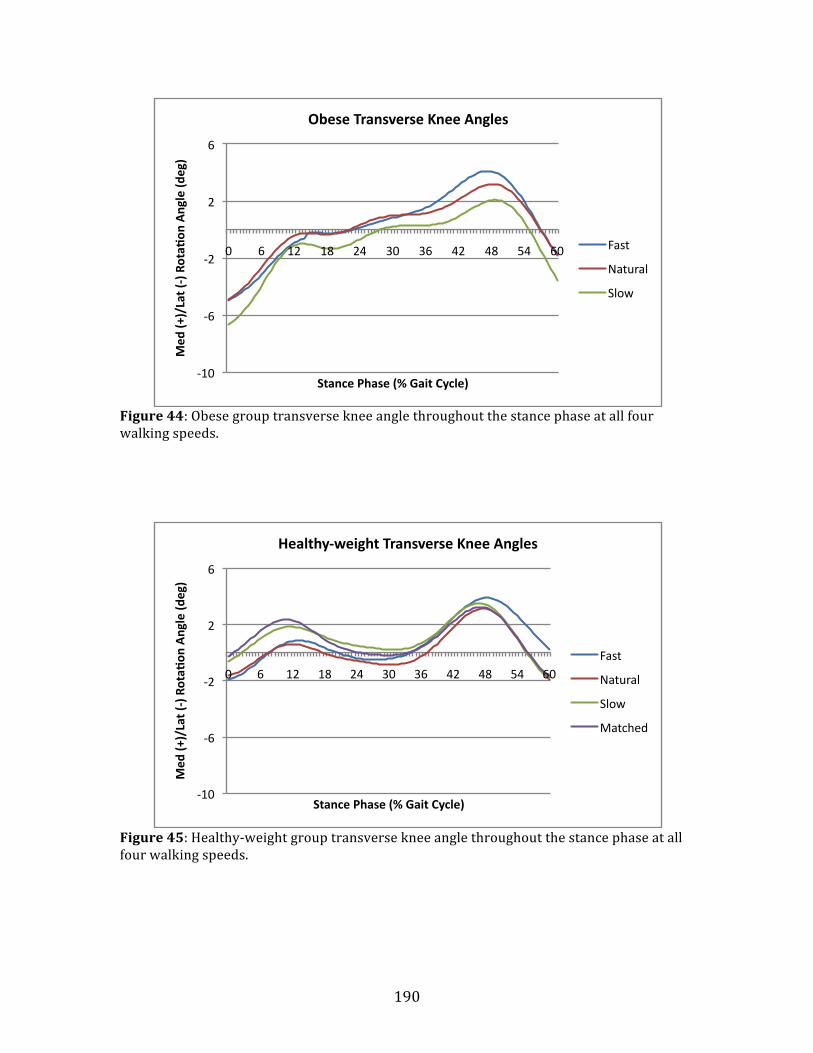
190
Figure 44: Obese group transverse knee angle throughout the stance phase at all four walking speeds.
Figure 45: Healthy-‐weight group transverse knee angle throughout the stance phase at all four walking speeds.
-‐10
-‐6
-‐2
2
6
0 6 12 18 24 30 36 42 48 54 60
Med
(+)/Lat (-‐) Rota^
on Angle (d
eg)
Stance Phase (% Gait Cycle)
Obese Transverse Knee Angles
Fast
Natural
Slow
-‐10
-‐6
-‐2
2
6
0 6 12 18 24 30 36 42 48 54 60
Med
(+)/Lat (-‐) Rota^
on Angle (d
eg)
Stance Phase (% Gait Cycle)
Healthy-‐weight Transverse Knee Angles
Fast
Natural
Slow
Matched

191
It is difficult to discern a trend with walking speed in the obese frontal
moments. While the greatest peak is from the fast walking speed, the smallest is in
the natural walking speed, with the slow speed being between these two (Figure
46). However in the healthy participant group, the peak (maximum) frontal moment
did increase with increased walking speed (Figure 47).
Figure 46: Obese group frontal knee moment across the stance phase at all three walking speeds.
-‐15
-‐10
-‐5
0
5
10
15
20
25
30
35
0 6 12 18 24 30 36 42 48 54 60
Add
(+)/Abd
(-‐) M
omen
t (Nm)
Stance Phase (% Gait Cycle)
Obese Frontal Knee Moments
Fast
Natural
Slow

192
Figure 47: Healthy-‐weight group frontal knee moment across the stance phase at all four walking speeds.
There is a very obvious trend in the sagittal plane moments (Figures 48 and
49). As walking speed increased from slow (or matched) to fast, the peak (maximum
flexor moment increased. While this increase seems large in Figures 48 and 49 for
both participant groups, a statistical analysis showed no significant differences in
the sagittal moment with walking speed.
-‐20
-‐10
0
10
20
30
40
0 6 12 18 24 30 36 42 48 54 60
Add
(+)/Abd
(-‐) M
omen
t (Nm)
Stance Phase (% Gait Cycle)
Healthy-‐weight Frontal Knee Moments
Fast
Natural
Slow
Matched
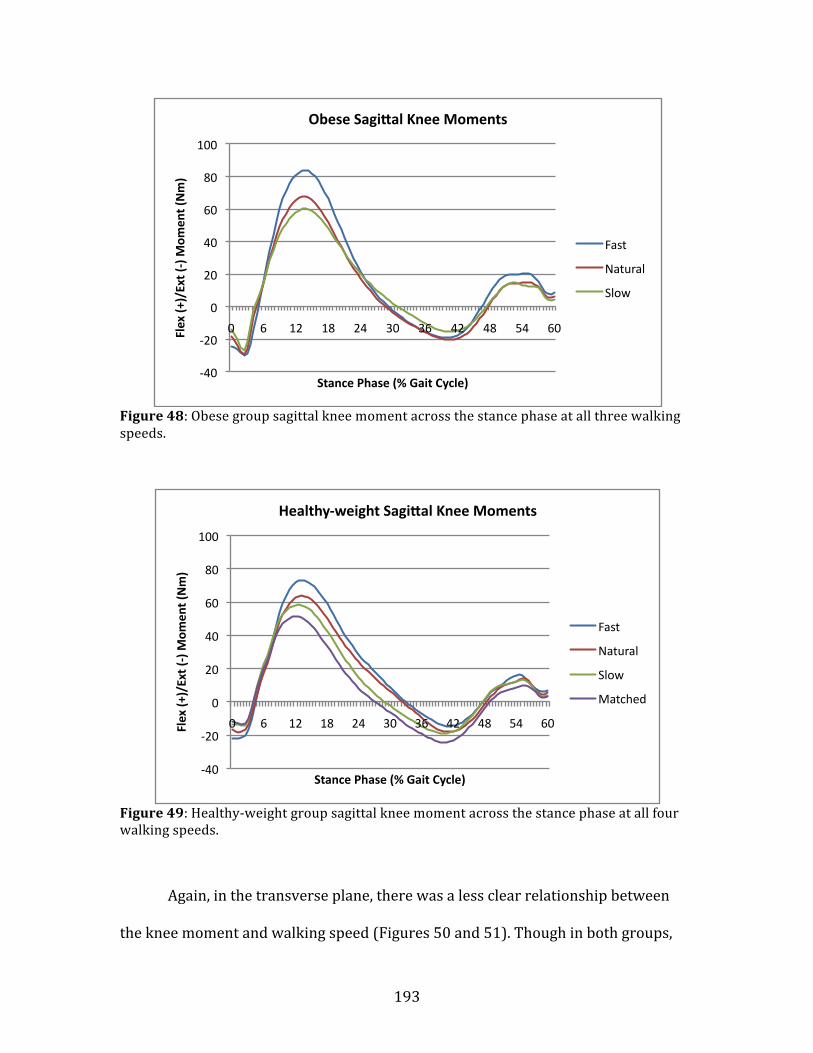
193
Figure 48: Obese group sagittal knee moment across the stance phase at all three walking speeds.
Figure 49: Healthy-‐weight group sagittal knee moment across the stance phase at all four walking speeds.
Again, in the transverse plane, there was a less clear relationship between
the knee moment and walking speed (Figures 50 and 51). Though in both groups,
-‐40
-‐20
0
20
40
60
80
100
0 6 12 18 24 30 36 42 48 54 60 Flex (+
)/Ext (-‐) M
omen
t (Nm)
Stance Phase (% Gait Cycle)
Obese Sagi_al Knee Moments
Fast
Natural
Slow
-‐40
-‐20
0
20
40
60
80
100
0 6 12 18 24 30 36 42 48 54 60 Flex (+
)/Ext (-‐) M
omen
t (Nm)
Stance Phase (% Gait Cycle)
Healthy-‐weight Sagi_al Knee Moments
Fast
Natural
Slow
Matched
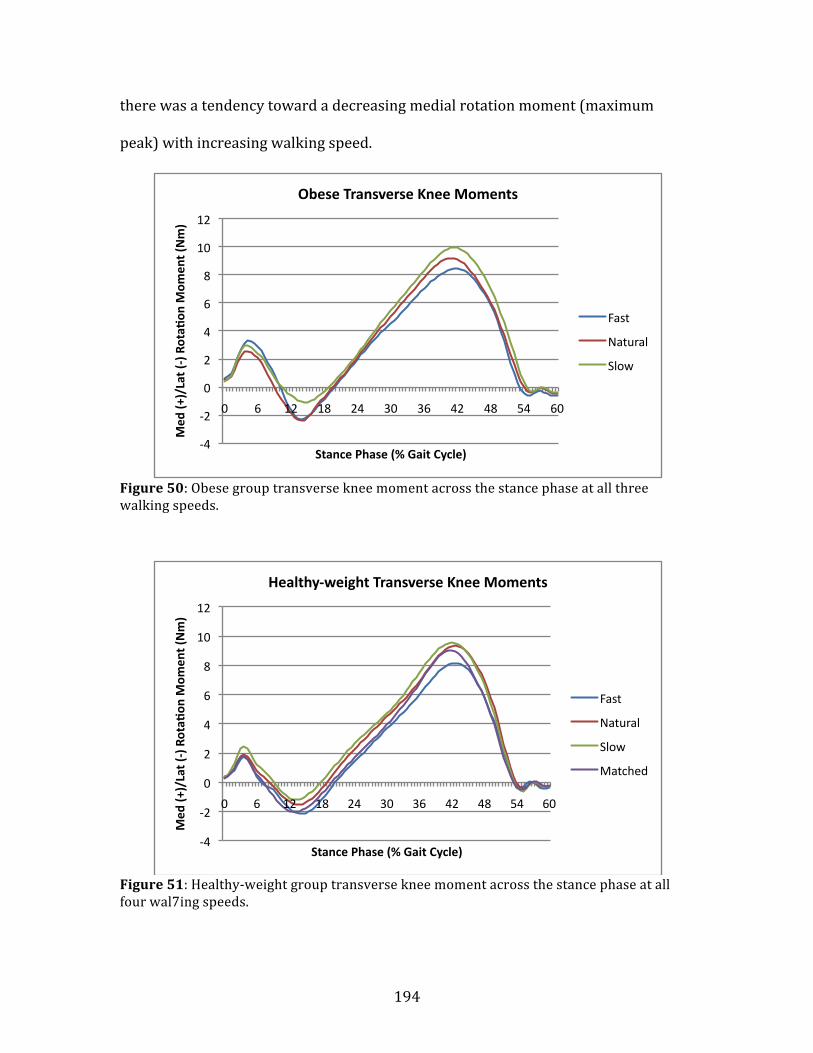
194
there was a tendency toward a decreasing medial rotation moment (maximum
peak) with increasing walking speed.
Figure 50: Obese group transverse knee moment across the stance phase at all three walking speeds.
Figure 51: Healthy-‐weight group transverse knee moment across the stance phase at all four wal7ing speeds.
-‐4
-‐2
0
2
4
6
8
10
12
0 6 12 18 24 30 36 42 48 54 60
Med
(+)/Lat (-‐) Rota^
on M
omen
t (Nm)
Stance Phase (% Gait Cycle)
Obese Transverse Knee Moments
Fast
Natural
Slow
-‐4
-‐2
0
2
4
6
8
10
12
0 6 12 18 24 30 36 42 48 54 60
Med
(+)/Lat (-‐) Rota^
on M
omen
t (Nm)
Stance Phase (% Gait Cycle)
Healthy-‐weight Transverse Knee Moments
Fast
Natural
Slow
Matched

195
Finally, the relationship between walking speed the mean knee adduction
moment impulse is displayed in Figure 52. There was no significant difference in
moment impulse between the three walking speeds. Figure 52 does show a trend by
speed though. In the obese participant group there is a clear trend for the adduction
moment impulse to increase as speed decreases. This trend is also seen in the
healthy participant group although it is less clear as the mean moment impulse at
the normal and slow speeds are very similar.
Figure 52: Changes in knee adduction moment impulse as walking speed increases for both participant groups.
0
4
8
12
16
20
Fast Natural Slow
Impu
lse (Nm*s)
Knee Adduc^on Moment Impulse by Speed
Obese
Healthy
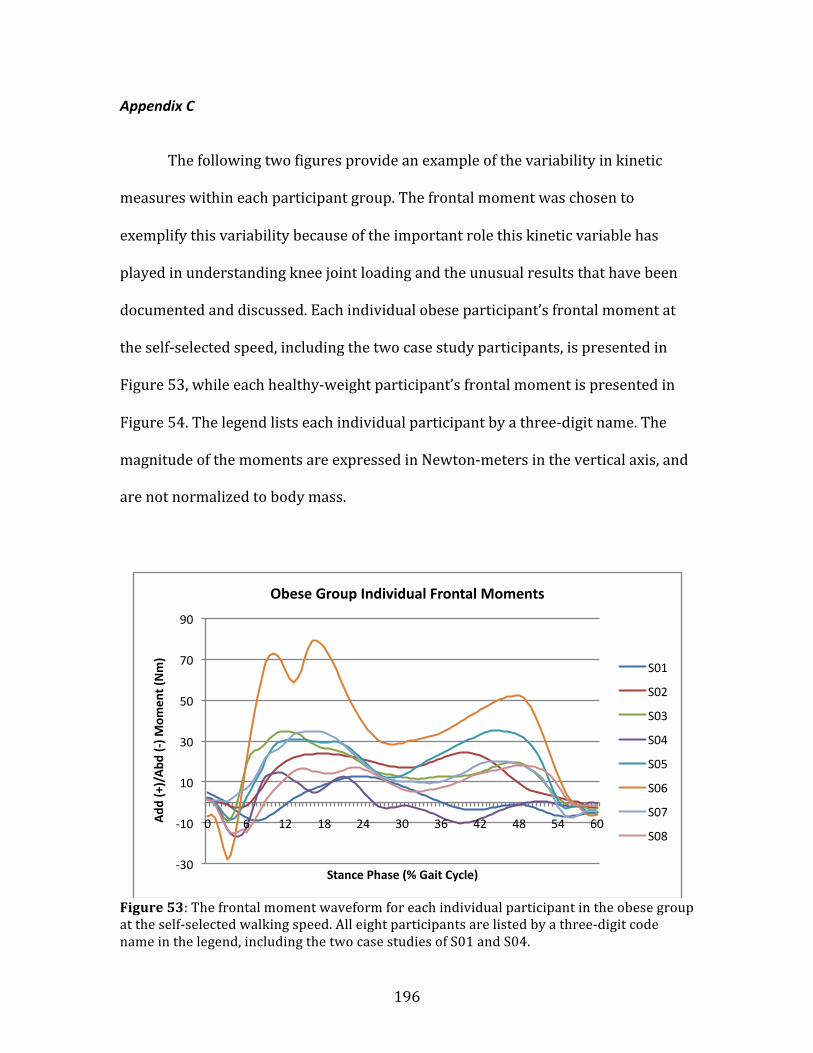
196
Appendix C
The following two figures provide an example of the variability in kinetic
measures within each participant group. The frontal moment was chosen to
exemplify this variability because of the important role this kinetic variable has
played in understanding knee joint loading and the unusual results that have been
documented and discussed. Each individual obese participant’s frontal moment at
the self-‐selected speed, including the two case study participants, is presented in
Figure 53, while each healthy-‐weight participant’s frontal moment is presented in
Figure 54. The legend lists each individual participant by a three-‐digit name. The
magnitude of the moments are expressed in Newton-‐meters in the vertical axis, and
are not normalized to body mass.
Figure 53: The frontal moment waveform for each individual participant in the obese group at the self-‐selected walking speed. All eight participants are listed by a three-‐digit code name in the legend, including the two case studies of S01 and S04.
-‐30
-‐10
10
30
50
70
90
0 6 12 18 24 30 36 42 48 54 60 Add
(+)/Abd
(-‐) M
omen
t (Nm)
Stance Phase (% Gait Cycle)
Obese Group Individual Frontal Moments
S01
S02
S03
S04
S05
S06
S07
S08

197
Figure 54: The frontal moment waveform for each individual participant in the healthy-‐weight participant group. All eight participants are listed by a three-‐digit code name in the legend.
Figures 53 and 54 express how variable that the frontal moment waveform
magnitude and shape was in the obese group, but not in the healthy-‐weight group.
There was an extremely high amount of inter-‐individual variability in the obese
participant group, with peaks in the frontal plane moment ranging from
approximately 15 to 80 Nm (Figure 53). Conversely, inter-‐individual differences in
the magnitude frontal moment in the healthy-‐weight group was very tight, with
peaks ranging from approximately 20-‐40 Nm (Figure 54)
The differences in variability between these two groups suggest the
possibility that much more versatile biomechanical strategies are being adopted in
the obese young adults in the present study compared to the healthy-‐weight young
adults. It also showcases that the obese participant group was a much less
homogeneous than the healthy-‐weight participant group.
-‐30
-‐10
10
30
50
70
90
0 6 12 18 24 30 36 42 48 54 60 Add
(+)/Abd
(-‐) M
omen
t (Nm)
Stance Phase (% Gait Cycle)
Healthy Group Individual Frontal Moments
S11
S12
S13
S14
S15
S16
S17
S18