Comparative proteome analysis of alkaliphilic Bacillus sp. N16-5 ...
11
SCIENCE CHINA Life Sciences © The Author(s) 2011. This article is published with open access at Springerlink.com life.scichina.com www.springer.com/scp *Corresponding author (email: [email protected]) • RESEARCH PAPERS • January 2011 Vol.54 No.1: 90–100 doi: 10.1007/s11427-010-4106-1 Comparative proteome analysis of alkaliphilic Bacillus sp. N16-5 grown on different carbon sources LI Gang 1,2 , SONG YaJian 1,2 , XUE YanFen 1 , RAO Lang 1,2 , ZHOU Chen 1,2 , WANG QuanHui 3 & MA YanHe 1* 1 State Key Laboratory of Microbial Resources, Institute of Microbiology, Chinese Academy of Sciences, Beijing 100101, China; 2 Graduate University of Chinese Academy of Sciences, Beijing 100049, China; 3 Beijing Proteomics Institute, Beijing 101318, China Received March 24, 2010; accepted April 26, 2010 To determine the impact of carbohydrates on the metabolic pathway in alkaliphiles, proteomes were obtained from cultures containing different carbohydrates and were resolved on two-dimensional gel electrophoresis (2-DE). The proteomes were compared to determine differentially expressed proteins. A novel alkaliphilic bacterium (alkaliphilic Bacillus sp. N16-5 iso- lated from Wudunur Soda Lake, China) was isolated in media with five different carbon sources (glucose, mannose, galactose, arabinose, and xylose). Comparative proteome analysis identified 61 differentially expressed proteins, which were mainly in- volved in carbohydrate metabolism, amino acid transport, and metabolism, as well as energy production and conversion. The comparison was based on the draft genome sequence of strain N16-5. The abundance of enzymes involved in central metabo- lism was significantly changed when exposed to various carbohydrates. Notably, catabolite control protein A (CcpA) was up-regulated under all carbon sources compared with glucose. In addition, pentose exhibited a stronger effect than hexose in CcpA-mediated carbon catabolite repression. These results provided a fundamental understanding of carbohydrate metabolism in alkaliphiles. Bacillus sp. N16-5, alkaliphile, cytoplasmic protein, 2-DE Citation: Li G, Song Y J, Xue Y F, et al. Comparative proteome analysis of alkaliphilic Bacillus sp. N16-5 grown on different carbon sources. Sci China Life Sci, 2011, 54: 90 – 100, doi: 10.1007/s11427-010-4106-1 Alkaliphiles, an important physiological group of microor- ganisms, are microorganisms that grow optimally or very well at pH levels >9, and often between 10 and 12. How- ever, alkaliphiles do not grow, or grow slowly, at a near- neutral pH value of 6.5 [1]. Because alkaliphiles can survive in alkaline environments, they likely contain potentially valuable functional genes and proteins that are not yet ex- plored. Over the past two decades, studies focusing on alka- liphiles have focused on two aspects: (i) adaptation mecha- nisms of alkaliphiles in an alkaline environment [2–4], and (ii) cloning, expression, and characterization of alkaliphilic proteins that are stable under alkaline conditions. Enzymes produced by alkaliphiles, such as alkaline protease, alkaline amylase, alkaline pectinase, and alkaline cellulase, have been used as novel biocatalysts on an industrial scale [5–14], be- cause these extremozymes are catalytically faster, more specific, and environmentally friendly. Bacteria use a variety of substances as nutritional sources of carbon and nitrogen. When grown in an abundance of nutrients, bacteria prefer to utilize the most favorable nutri- ent source that allows for maximal growth rates. However, under natural conditions, bacteria often encounter nutrient starvation. The ability to rapidly adapt to altered environ- mental conditions is essential for cell survival, and complex
-
Upload
khangminh22 -
Category
Documents
-
view
1 -
download
0
Transcript of Comparative proteome analysis of alkaliphilic Bacillus sp. N16-5 ...

SCIENCE CHINA Life Sciences
© The Author(s) 2011. This article is published with open access at Springerlink.com life.scichina.com www.springer.com/scp
*Corresponding author (email: [email protected])
• RESEARCH PAPERS • January 2011 Vol.54 No.1: 90–100
doi: 10.1007/s11427-010-4106-1
Comparative proteome analysis of alkaliphilic Bacillus sp. N16-5 grown on different carbon sources
LI Gang1,2, SONG YaJian1,2, XUE YanFen1, RAO Lang1,2, ZHOU Chen1,2, WANG QuanHui3 & MA YanHe1*
1State Key Laboratory of Microbial Resources, Institute of Microbiology, Chinese Academy of Sciences, Beijing 100101, China; 2Graduate University of Chinese Academy of Sciences, Beijing 100049, China;
3Beijing Proteomics Institute, Beijing 101318, China
Received March 24, 2010; accepted April 26, 2010
To determine the impact of carbohydrates on the metabolic pathway in alkaliphiles, proteomes were obtained from cultures containing different carbohydrates and were resolved on two-dimensional gel electrophoresis (2-DE). The proteomes were compared to determine differentially expressed proteins. A novel alkaliphilic bacterium (alkaliphilic Bacillus sp. N16-5 iso-lated from Wudunur Soda Lake, China) was isolated in media with five different carbon sources (glucose, mannose, galactose, arabinose, and xylose). Comparative proteome analysis identified 61 differentially expressed proteins, which were mainly in-volved in carbohydrate metabolism, amino acid transport, and metabolism, as well as energy production and conversion. The comparison was based on the draft genome sequence of strain N16-5. The abundance of enzymes involved in central metabo-lism was significantly changed when exposed to various carbohydrates. Notably, catabolite control protein A (CcpA) was up-regulated under all carbon sources compared with glucose. In addition, pentose exhibited a stronger effect than hexose in CcpA-mediated carbon catabolite repression. These results provided a fundamental understanding of carbohydrate metabolism in alkaliphiles.
Bacillus sp. N16-5, alkaliphile, cytoplasmic protein, 2-DE
Citation: Li G, Song Y J, Xue Y F, et al. Comparative proteome analysis of alkaliphilic Bacillus sp. N16-5 grown on different carbon sources. Sci China Life Sci, 2011, 54: 90–100, doi: 10.1007/s11427-010-4106-1
Alkaliphiles, an important physiological group of microor-ganisms, are microorganisms that grow optimally or very well at pH levels >9, and often between 10 and 12. How-ever, alkaliphiles do not grow, or grow slowly, at a near- neutral pH value of 6.5 [1]. Because alkaliphiles can survive in alkaline environments, they likely contain potentially valuable functional genes and proteins that are not yet ex-plored. Over the past two decades, studies focusing on alka-liphiles have focused on two aspects: (i) adaptation mecha-nisms of alkaliphiles in an alkaline environment [2–4], and (ii) cloning, expression, and characterization of alkaliphilic
proteins that are stable under alkaline conditions. Enzymes produced by alkaliphiles, such as alkaline protease, alkaline amylase, alkaline pectinase, and alkaline cellulase, have been used as novel biocatalysts on an industrial scale [5–14], be-cause these extremozymes are catalytically faster, more specific, and environmentally friendly.
Bacteria use a variety of substances as nutritional sources of carbon and nitrogen. When grown in an abundance of nutrients, bacteria prefer to utilize the most favorable nutri-ent source that allows for maximal growth rates. However, under natural conditions, bacteria often encounter nutrient starvation. The ability to rapidly adapt to altered environ-mental conditions is essential for cell survival, and complex

Li G, et al. Sci China Life Sci January (2011) Vol.54 No.1 91
regulatory networks are required to allow such adaptations [15].
2-DE analysis of pH-dependent proteins in Bacillus pseudofirmus OF4, an extremely alkaliphilic bacterium, has been reported [16]. Although a limited number of proteins have been identified, a novel surface layer protein exhibited a role in alkaliphilicity. A previous study [17] focused on the use of a variety of gel-based and gel-free proteomic techniques to elucidate regulation of metabolic pathways (e.g., glycolysis and TCA cycle) in a variety of Bacillus species under changing environment and physiological con-ditions (stress and starvation). Proteomic signatures were identified, which were correlated with specific physiologi-cal states of Bacillus. Under natural conditions, nutrients are present in extremely dilute concentrations, are inaccessible due to water paucity, or are only transiently available. Moreover, the quality of the available nutrients is highly variable. As a result, bacteria have evolved sophisticated adaptation systems to take advantage of the wide range of sources of essential elements, such as carbon, nitrogen, phosphorus, and sulfur [18]. Many studies have reported that the presence of preferred carbon sources prevents ex-pression, as well as activity, of catabolic systems that enable the use of secondary substrates, which is referred to as car-bon catabolite repression (CCR). In the firmicute Bacillus subtilis model [19], the pleiotropic transcriptional factor CcpA (catabolite control protein A) is the major factor. Acetate kinase (ackA) is responsible for regulation of the pta-ack pathway (acetyl-CoA-to-acetate) for acetate excre-tion, which results in synthesis of one ATP molecule [20]. This step in the overflow pathway is due to cell growth in the medium containing excess glucose; it enables the cell to generate ATP without utilizing the cytochrome system. In Bacillus, CcpA activates expression of genes required for acetate synthesis. Compared with neutraphilic bacteria, alka-liphiles survive in a much higher pH environment. However, it remains to be determined whether the two kinds of bacteria follow a similar metabolic pathway for different carbon sources, as well as protein expression of alkaliphilic bacte-ria under different carbon source conditions.
Alkaliphilic Bacillus sp. N16-5 was previously isolated from sediment of Wudunur Soda Lake in Inner Mongolia, China [21]; it is a facultative anaerobic, gram-positive bac-terium with peritrichous flagella and grows well over a pH range of 8.5–11.5, and is optimal at pH 10. The NaCl con-centration growth range is 0%–15%, with an optimal NaCl concentration of 8%, and the bacteria produce and secrete numerous hydrolytic enzymes that enable the cells to de-grade different substrates and grow on a wide variety of nutrient sources. This makes Bacillus sp. N16-5 an interest-ing organism for industrial biorefinery. The draft genome sequence of Bacillus sp. N16-5 provides a basis for proteo-mic studies of the bacterium, and to fully exploit its poten-tial for metabolic engineering, a deeper understanding of the central energy and precursor generating pathways is neces-
sary [22]. In the present study, a 2-DE map was created to provide a global overview of protein expression under a glucose-positive condition. This map was then used to measure the relative abundance of proteins involved in sugar metabolism for the purpose of identifying cellular responses to different carbon sources. To the best of our knowledge, this study was the first to report global proteo-mic profiles in response to different carbohydrates in alka-liphilic microorganisms, which could provide a useful re-source for further studying the physiology of alkaliphiles.
1 Materials and methods
1.1 Bacterial strain and growth condition
Bacillus sp. N16-5 (CGMCC No. 0369) was previously isolated from sediment of Wudunur Soda Lake in Inner Mongolia, China [21]. Bacillus sp. N16-5 was grown in modified alkaline Horikoshi-II medium [23] under aerobic conditions at 37°C in round-bottom flasks, which included 0.5% (w/v) sole carbon sources (glucose, mannose, galac-tose, arabinose, and xylose). The growth curve was deter-mined in triplicate. For each growth condition, bacterial cell samples were harvested at the mid-exponential growth phase by centrifugation at 8000×g at 4°C for 20 min and washed three times with Tris-HCl (pH 7.8) and then stored at −80°C until use.
1.2 Preparation of cytoplasmic proteins
Cell pellets were resuspended in Tris-HCl (pH 7.8) buffer with 1 mmol L−1 PMSF and disrupted by sonication for 30 min on ice (300 W, 3 s vs. 5 s break). The suspension was centrifuged at 12000×g for 20 min at 4°C to remove unbro-ken cells and large cellular debris. The supernatant was pre-cipitated by incubating with 10% trichloroacetic acid and acetone cooled to −20°C for 30 min. The insoluble pellets were washed three times with cold acetone, vacuum-dehy- drated, and stored at −80°C until further use. For 2D gel electrophoresis, protein pellets were resuspended in lysis buffer (7 mol L−1 urea, 2 mol L−1 thiourea, 50 mmol L−1 Tris-HCl pH 8.0, 2% (w/v) ASB-14, 10 mmol L−1 DTT and 2 mmol L−1 EDTA, 0.5% (v/v) Pharmalytes 4–7 (Amer-sham Pharmacia Biosciences)). Protein concentrations were measured using the Bradford method with a Bio-Rad pro-tein assay kit. Bovine serum albumin served as the standard. Two independent experiments were performed for each condition.
1.3 2D-PAGE proteomic analysis
Cytoplasmic protein aliquots (100 μg protein) were mixed with rehydration solution (8 mol L−1 urea, 4% CHAPS, 65 mmol L−1 DTT, 0.5% (v/v) Pharmalytes) at a final volume

92 Li G, et al. Sci China Life Sci January (2011) Vol.54 No.1
of 450 μL. The aliquots were evenly loaded onto IPG strips (linear; 24 cm in length; pH 4–7; GE Healthcare, USA) by overnight rehydration. Isoelectric focusing (IEF) was per-formed in five steps (200 V for 1 h, 500 V for 1 h, and 1 000 V for 1 h, followed by a gradient switch of 1000–10000 V for 1 h and 10000 V, continuing until the total volt-hours reached 80 kVh) at 20°C following manufacture instruc-tions (GE Healthcare). Prior to the second dimension, the IPG strips were equilibrated with two equilibration steps. The strips were first incubated for 15 min in a solution con-taining 6 mol L−1 urea, 2% (w/v) SDS, 50 mmol L−1 Tris-HCl (pH 8.8), 30% (w/v) glycerol, and 1.0% (w/v) DTT. Subse-quently, the solutions were discarded, and the strips were incubated in a solution containing 6 mol L−1 urea, 2% (w/v) SDS, 50 mmol L−1 Tris-HCl (pH 8.8), 30% (w/v) glycerol, and 2.5% (w/v) iodoacetamide. Following equilibration, the strips were placed on 12.5% SDS-PAGE gels using the Ettan DALTsix apparatus (GE Healthcare). Electrophoresis was performed using a constant current of 10 mA/gel for 30 min. Subsequently, the current was increased to 25 mA/gel for another 7 h. The gels were visualized by silver staining. Each sample set was performed in triplicate.
1.4 Gel image analysis
2D-PAGE protein patterns were recorded as digitized im-ages with Labscan3 (GE Healthcare). Profile analyses and statistical analyses of protein spot data were performed us-ing software properties supplied with the ImageMaster 2D Platinum 6.0 (GE Healthcare). To correct for differences in sample loading or staining intensity between gels, the ‘total quantity in valid spot’ normalization method was used. Du-plicated gels from the same sample were grouped together using the ‘replicate groups’ function, which allows the av-erage quantity of protein spots to be determined. The rela-tive volume of each protein spot was the fraction of that spot volume to the total volume of all spots in a gel. The fold was calculated from the averages of relative volumes in two biological samples. Significant changes in protein lev-els were defined by at least a two-fold difference.
1.5 In-gel digestion
Separated protein spots were picked with a 1.5-mm Spot Picker and transferred to 1.5-mL tubes. Gel pieces were destained by incubating in 30 mmol L−1 potassium ferricya-nide and 65 mmol L−1 sodium thiosulfate and were washed in Milli-Q water until they were colorless and transparent. After drying with a SpeedVac concentrator, gel pieces were incubated for 1 h at 56°C in 20 μL of 10 mmol L−1 DTT plus 25 mmol L−1 ammonium bicarbonate for reduction, and were subsequently alkylated for 30 min at room temperature in 20 μL of 100 mmol L−1 iodoacetamide plus 50 mmol L−1 ammonium bicarbonate in the dark. The gel pieces were washed with ACN/25 mmol L−1 NH4HCO3 (1:1) and dehy-
drated with ACN and dried in a SpeedVac concentrator. Dried gel pieces were rehydrated in 4−7 μL of trypsin solu-tion (10 mg mL−1; proteomics grade, Sigma, in 25 mmol L−1 ammonium bicarbonate) at 4°C for at least 40 min. The gel pieces were then covered with 25 mmol L−1 ammonium bicarbonate and incubated at 37°C for 12–16 h. Peptides were subsequently extracted twice with 50 μL 50% ACN/5% TFA, and the extracted solutions were combined and dried using a SpeedVac concentrator.
1.6 Protein identification
For MALDI-TOF-MS identification, the protein spots of interest were excised, and in-gel protein digestions were performed as previously described [24]. Dried tryptic pep-tide mixtures were dissolved in 0.7 μL saturated CHCA ma-trix solution (5 mg mL−1 CHCA in 50% ACN/0.1% TFA) and spotted onto a freshly cleaned target plate. After air drying, the crystallized spots were processed with a MALDI-TOF-MS mass spectrometer (4700 Proteomics Analyzer, Applied Biosystems, USA). All mass spectra were recorded in a reflector mode, with a mass range of 900−3700 Da using a 200-Hz laser at a repetition rate and wavelength of 355 nm. The accelerated voltage was 2 kV. Conversion of time-of-flight (TOF) to mass (Da) for the monoisotopic ions [M+H]+ was based on calibration with a peptide standard kit (Applied Biosystems) containing des-Arg1-bradykinin (m/z 904), angiotensin I (m/z 1296), Glu1-fibrinopeptide B (m/z 1570), ACTH (1–17, m/z 2093), ACTH (18–39, m/z 2465), and ACTH (7–38, m/z 3657). The resulting MS (PMF) and MS2 spectra were searched using MASCOT software incorporated in the Applied Bio-systems GPS v3.5 Explorer against the protein sequence database of Bacillus sp. N16-5 (trypsin constraint of one missed cleavage and a static modification of +57 Da on Cysteine residue, as well as +16 Da on Methionine residue). All amino acid sequences of differential proteins were sub-mitted to the PSORTb database to predict subcellular loca-tion [25]. In addition, proteins were grouped into categories according to functions by comparing to NCBI COG data-bases [26].
1.7 Real-time PCR
Total RNA in Bacillus sp. N16-5, which was cultured in different carbon sources, was extracted using the Trizol reagent kit (TaKaRa) according to manufacture instructions. The extraction was repeated from two independent cultures. Extracted RNA was dissolved in 50 μL water. Genomic contamination in total RNA was carefully removed by DNase (Promega) treatment for 30 min at 37°C. To obtain cDNA, the above preparation (500 ng RNA) was mixed with reagents provided in the PrimeScriptTM RT Reagent kit (TaKaRa). The mixture was incubated for 15 min at 37°C, and the reaction was terminated by incubation at 70°C for 5

Li G, et al. Sci China Life Sci January (2011) Vol.54 No.1 93
s. The cDNA was mixed with reagents provided in the SYBR® Premix Ex Taq kit (TaKaRa) at a final volume of 20 μL. Quantification of PCR reactions was conducted in Mastercycler® ep realplex system with programmed pa-rameters: 95°C for 15 s followed by 40 cycles of 2-stage temperature profile of 95°C for 5 s and 60°C for 35 s. The melting curves for each PCR reaction were carefully ana-lyzed to avoid non-specific amplifications of PCR products. Relative gene expression was calculated using the 2−ΔΔCt formula, which was normalized to 16s rRNA levels. Each sample was tested in triplicate.
2 Results
2.1 Growth curves of Bacillus sp. N16-5 using different carbon sources
Bacillus sp. N16-5 grew well in the media containing glu-cose, mannose, galactose, arabinose, and xylose as sole carbon sources, respectively. When cultured in the medium containing two of these carbon sources, the bacteria exhib-ited diauxic growth. The effectiveness of carbon sources could be ranked as glucose, galactose, mannose, arabinose, and xylose (data not shown). The growth curves of Bacillus sp. N16-5 with different carbon sources (Figure 1) show that it had different growth rates with different carbon sources. Strain N16-5 reached a mid-exponential growth phase after 10 h when grown on hexose (glucose, galactose, and mannose), compared with 12 h on pentose (arabinose and xylose). According to the growth curves, the cells were harvested during the mid-exponential growth phase.
2.2 Comparative analyses of proteomes from Bacillus sp. N16-5 grown on various hexoses
To identify proteins induced by different carbohydrates in Bacillus sp. N16-5, analysis of the cytoplasmic proteome was performed using 2-DE. The 2-DE map of the cytoplas-mic proteome of glucose-cultured Bacillus sp. N16-5 cells was used as a reference map (Figure 2A) and compared with cytoplasmic proteomes of Bacillus sp. N16-5 grown on mannose and galactose. Differentially expressed protein spots were analyzed by MALDI-TOF-MS to obtain a pep-tide mass fingerprint (PMF). Proteins were identified by matching PMF of identified proteins with a local database established, based on the draft genome sequence of Bacillus sp. N16-5. Similar to the growth phenotype at mid-log phase, proteomic analysis of two hexose-cultured (mannose and galactose) cells showed similar protein patterns with glucose on 2-DE gels. However, results demonstrated that mannose as the sole carbon source resulted in the identifica-tion of 22 differentially expressed protein spots (Figure 2B). Of these differentially expressed proteins, eight were down-regulated, seven were up-regulated, three were newly synthesized, and four were not expressed. With galactose as the sole carbon source, 34 differentially expressed proteins were identified (Figure 2C). Among them, 10 were down- regulated, 16 were up-regulated, four were newly synthe-sized, and 16 were not expressed. Most differentially ex- pressed proteins were enzymes involved in carbohydrate metabolism, amino acid transport, and metabolism, as well as energy production and conversion. Several differentially expressed proteins (spot 7, 24, 26, 37, 41, and 50) exhibited similar trends. Table 1 summarizes identification results of
Figure 1 Growth curves of Bacillus sp. N16-5 with different carbon sources.

94 Li G, et al. Sci China Life Sci January (2011) Vol.54 No.1
Figure 2 2-DE maps of cytoplasmic Bacillus sp. N16-5 proteins grown on hexose and pentose. A, Glucose; B, mannose; C, galactose; D, arabinose; E, xylose. Soluble proteins from crude cellular lysate (100 μg) were separated on IPG strips (24 cm in length, pH 4–7), followed by 12.5% SDS-PAGE gels.
Proteins in the 2-DE gels were visualized by silver nitrate staining.
Li G, et al. Sci China Life Sci January (2011) Vol.54 No.1 95
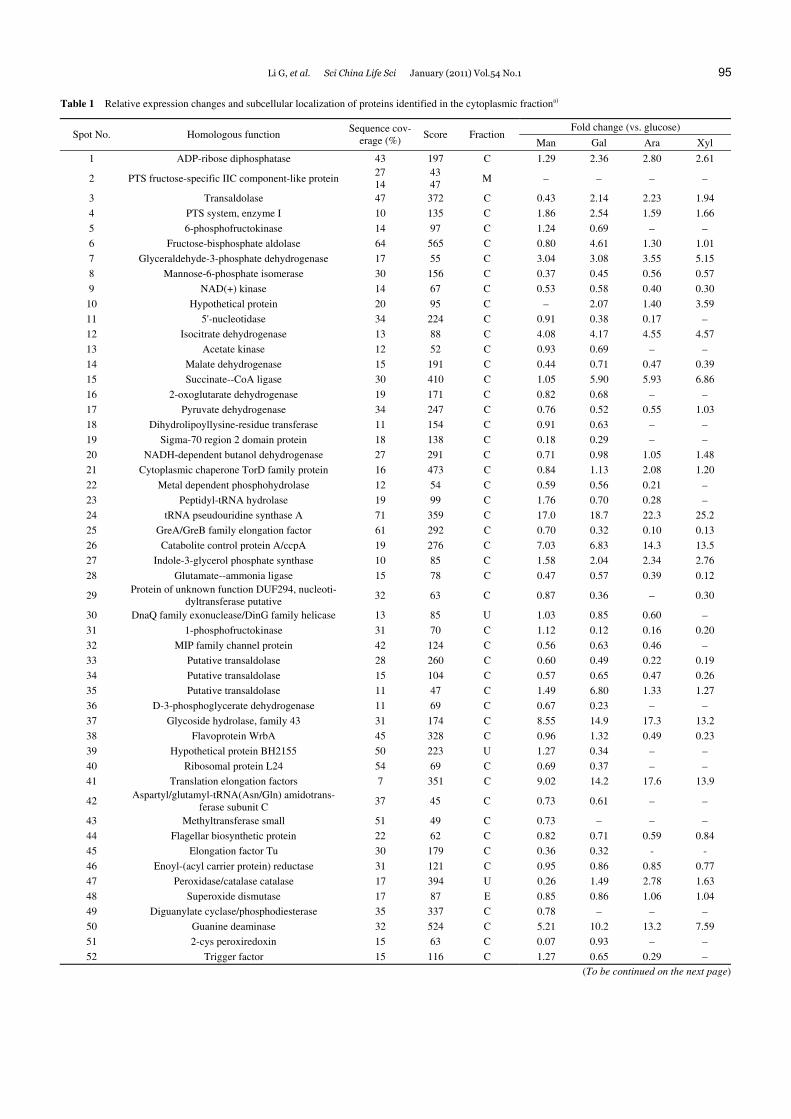
Table 1 Relative expression changes and subcellular localization of proteins identified in the cytoplasmic fractiona)
Fold change (vs. glucose) Spot No. Homologous function
Sequence cov-erage (%)
Score Fraction Man Gal Ara Xyl
1 ADP-ribose diphosphatase 43 197 C 1.29 2.36 2.80 2.61
2 PTS fructose-specific IIC component-like protein 27 14
43 47
M − − − −
3 Transaldolase 47 372 C 0.43 2.14 2.23 1.94
4 PTS system, enzyme I 10 135 C 1.86 2.54 1.59 1.66
5 6-phosphofructokinase 14 97 C 1.24 0.69 − − 6 Fructose-bisphosphate aldolase 64 565 C 0.80 4.61 1.30 1.01
7 Glyceraldehyde-3-phosphate dehydrogenase 17 55 C 3.04 3.08 3.55 5.15
8 Mannose-6-phosphate isomerase 30 156 C 0.37 0.45 0.56 0.57
9 NAD(+) kinase 14 67 C 0.53 0.58 0.40 0.30
10 Hypothetical protein 20 95 C − 2.07 1.40 3.59
11 5'-nucleotidase 34 224 C 0.91 0.38 0.17 − 12 Isocitrate dehydrogenase 13 88 C 4.08 4.17 4.55 4.57
13 Acetate kinase 12 52 C 0.93 0.69 − − 14 Malate dehydrogenase 15 191 C 0.44 0.71 0.47 0.39
15 Succinate--CoA ligase 30 410 C 1.05 5.90 5.93 6.86
16 2-oxoglutarate dehydrogenase 19 171 C 0.82 0.68 − − 17 Pyruvate dehydrogenase 34 247 C 0.76 0.52 0.55 1.03
18 Dihydrolipoyllysine-residue transferase 11 154 C 0.91 0.63 − − 19 Sigma-70 region 2 domain protein 18 138 C 0.18 0.29 − − 20 NADH-dependent butanol dehydrogenase 27 291 C 0.71 0.98 1.05 1.48
21 Cytoplasmic chaperone TorD family protein 16 473 C 0.84 1.13 2.08 1.20
22 Metal dependent phosphohydrolase 12 54 C 0.59 0.56 0.21 − 23 Peptidyl-tRNA hydrolase 19 99 C 1.76 0.70 0.28 − 24 tRNA pseudouridine synthase A 71 359 C 17.0 18.7 22.3 25.2
25 GreA/GreB family elongation factor 61 292 C 0.70 0.32 0.10 0.13
26 Catabolite control protein A/ccpA 19 276 C 7.03 6.83 14.3 13.5
27 Indole-3-glycerol phosphate synthase 10 85 C 1.58 2.04 2.34 2.76
28 Glutamate--ammonia ligase 15 78 C 0.47 0.57 0.39 0.12
29 Protein of unknown function DUF294, nucleoti-
dyltransferase putative 32 63 C 0.87 0.36 − 0.30
30 DnaQ family exonuclease/DinG family helicase 13 85 U 1.03 0.85 0.60 − 31 1-phosphofructokinase 31 70 C 1.12 0.12 0.16 0.20
32 MIP family channel protein 42 124 C 0.56 0.63 0.46 − 33 Putative transaldolase 28 260 C 0.60 0.49 0.22 0.19
34 Putative transaldolase 15 104 C 0.57 0.65 0.47 0.26
35 Putative transaldolase 11 47 C 1.49 6.80 1.33 1.27
36 D-3-phosphoglycerate dehydrogenase 11 69 C 0.67 0.23 − − 37 Glycoside hydrolase, family 43 31 174 C 8.55 14.9 17.3 13.2
38 Flavoprotein WrbA 45 328 C 0.96 1.32 0.49 0.23
39 Hypothetical protein BH2155 50 223 U 1.27 0.34 − − 40 Ribosomal protein L24 54 69 C 0.69 0.37 − − 41 Translation elongation factors 7 351 C 9.02 14.2 17.6 13.9
42 Aspartyl/glutamyl-tRNA(Asn/Gln) amidotrans-
ferase subunit C 37 45 C 0.73 0.61 − −
43 Methyltransferase small 51 49 C 0.73 − − − 44 Flagellar biosynthetic protein 22 62 C 0.82 0.71 0.59 0.84
45 Elongation factor Tu 30 179 C 0.36 0.32 - -
46 Enoyl-(acyl carrier protein) reductase 31 121 C 0.95 0.86 0.85 0.77
47 Peroxidase/catalase catalase 17 394 U 0.26 1.49 2.78 1.63
48 Superoxide dismutase 17 87 E 0.85 0.86 1.06 1.04
49 Diguanylate cyclase/phosphodiesterase 35 337 C 0.78 − − − 50 Guanine deaminase 32 524 C 5.21 10.2 13.2 7.59
51 2-cys peroxiredoxin 15 63 C 0.07 0.93 − − 52 Trigger factor 15 116 C 1.27 0.65 0.29 −
(To be continued on the next page)

96 Li G, et al. Sci China Life Sci January (2011) Vol.54 No.1
(Continued) Fold change (vs. glucose)
Spot No. Homologous function Sequence cov-
erage (%) Score Fraction
Man Gal Ara Xyl
53 ABC transporter 3 63 C 0.90 3.97 4.31 2.57
54 Xylose isomerase 22 149 C 0.15*
55 L-arabinose isomerase 8 74 C 0.02*
56 L-ribulokinase 23 290 C 0.23*
57 Catalase/peroxidase HPI 10 79 C 0.06* 0.07* 0.1* 0.1*
58 Protein of unknown function 34 190 U − 0.30* 0.35* 0.33*
59 Amino-acid N-acetyltransferase 9 75 C − − 3.02 1.82
60 Glutamate synthase small subunit 11 48 C 0.04* 0.04* 0.06* 0.04*
61 General stress protein 17M 49 262 U 0.07* 0.13* 0.05* 0.04*
a) C, cytoplasm fraction; M, membrane fraction; E, extracellular; U, unknown; *, newly synthesized protein; Man, mannose; Gal, galactose; Ara, arabi-nose; Xyl, xylose. “>2” and “<0.5” represent increased protein and reduced protein levels, respectively.
differential enzymes involved in carbon source metabolism from all forms of hexose (mannose and galactose).
2.3 Comparative analyses of Bacillus sp. N16-5 pro-teomes grown on different pentoses
Cytoplasmic Bacillus sp. N16-5 proteomes grown on ara-binose and xylose were compared to proteomes of cells grown on glucose (Figure 2A). Results demonstrate that when arabinose was used as the sole carbon source, 48 dif-ferentially expressed protein spots were identified (Figure 2D). Of these differentially expressed proteins, 13 were down-regulated, 15 were up-regulated, 14 were not ex-pressed, and six were newly synthesized. Interestingly, of these newly synthesized spots, two were induced exclu-sively when grown on arabinose. When xylose was used as the sole carbon source, 46 differentially expressed proteins were identified (Figure 2E); 12 were up-regulated, 20 were down-regulated, five proteins were newly synthesized, and nine were not expressed. Of these newly synthesized pro-teins, one was unique when grown on xylose. Similarly, most differentially expressed proteins were involved in carbohydrate metabolism, amino acid transport, and me-tabolism, as well as energy production and conversion. Ta-ble 1 summarizes identification results from differential enzymes involved in carbon source metabolism from all forms of pentose (arabinose and xylose).
2.4 Comparative analyses of proteomes of Bacillus sp. N16-5 grown on hexose and pentose
Bacillus sp. N16-5 grew slowly on pentose compared with hexose-cultured conditions. When cytoplasmic proteomes from cells grown on hexose were compared to cells grown on pentose, 11 up-regulated proteins and 23 down-regulated proteins were identified. Among the down-regulated pro-teins, 11 were attenuated in a hexose condition, but not ex-pressed in a pentose condition. These proteins were in-volved in carbohydrate metabolism (spot 5, 13, 16, and 36), ribosome synthesis (spot 40), amino acid metabolism (spot 18 and 42), transcription and translation process (spot 19
and 45), anti-oxide mechanism (spot 51), and an unknown function (spot 39). Among these proteins, 6-phosphofruc- tokinase was shown to be directly involved in glycolysis. Acetate kinase (ackA) was responsible for the overflow pathway in cells cultured in the medium with excess glu-cose. In addition, three proteins (spot 54, 55, and 56), which were not detected under hexose conditions, were newly synthesized. MS identification showed that all were involved in pentose metabolism. In addition, some common changes were observed. The present results demonstrated that hexose and pentose exerted carbon catabolite repression (CCR), which was regulated by CcpA. However, mannose and ga-lactose gave rise to six-fold CcpA abundance changes, and pentose resulted in >13-fold changes. tRNA pseudouridine synthase (spot 24) and guanine deaminase (spot 50) were up-regulated and play roles in post-translation modification of tRNA synthesis and GTP generation, respectively.
2.5 Central carbon metabolic pathways in Bacillus sp. N16-5 grown on different carbon sources
Genomic analysis indicated that Bacillus sp. N16-5 con-tained complete enzymes for the central carbon metabolic pathway. Comparative proteomic analysis revealed a total of 10 proteins in the glycolysis pathway (1-phosphofruc- tokinase, 6-phosphofructokinase, fructose-bisphosphate aldo-lase, glyceraldehydes-3-phosphate dehydrogenase), pentose phosphate pathway (transaldolase, L-ribulokinase), and TCA cycle (isocitrate dehydrogenase, malate dehydrogenase, 2-oxoglutarate dehydrogenase, pyruvate dehydrogenase), which were identified from proteomes from five carbohy-drates. Protein expression changes are listed in Table 1. Among the four proteins that were involved in the glycoly-sis pathway, 6-phosphofructokinase was reduced or absent with galactose, arabinose, and xylose, but increased with mannose. By contrast, fructose-bisphosphate aldolase was increased with galactose, arabinose, and xylose, but reduced with mannose. However, 1-phosphofructokinase was de-creased with mannose, galactose, arabinose, and xylose. Glyceraldehyde-3-phosphate dehydrogenase expression increased with mannose, galactose, arabinose, and xylose,
Li G, et al. Sci China Life Sci January (2011) Vol.54 No.1 97
and TCA cycle enzyme levels were also changed. For ex-ample, malate dehydrogenase and pyruvate dehydrogenase levels decreased with all carbohydrates compared to glucose. In addition, isocitrate dehydrogenase levels increased with galactose, arabinose, and xylose, but decreased with man-nose. In the pentose phosphate pathway, two enzymes were detected. Transaldolase expression increased with galactose, arabinose, and xylose, but decreased with mannose. How-ever, L-ribulokinase was uniquely synthesized with arabi-nose. Some newly synthesized proteins, such as xylose isomerase, L-arabinose isomerase, and L-ribulokinase, were also detected with pentose. These proteins were involved in transformation prior to entering the central carbon meta-bolic pathway.
To summarize these results, the carbohydrates (metabolic intermediates) might enter central carbon metabolism at multiple steps: (i) For mannose, phosphorylated mannose was isomerized to fructose-6-phosphate by mannose-6- phosphate isomerase and then incorporated into the glyco-lysis pathway. (ii) For arabinose and xylose, three unique proteins were detected under pentose, respectively. Xylose isomerase transformed from D-xylose to D-xylulose, and L-arabinose isomerase transformed from L-arabinose to L-ribulose. In addition, L-ribulose was phosphorylated to
L-ribulose 5-phosphate by L-ribulokinase. These two sub-strates entered the pentose-phosphate pathway for further catabolism following transformation to xylulose.
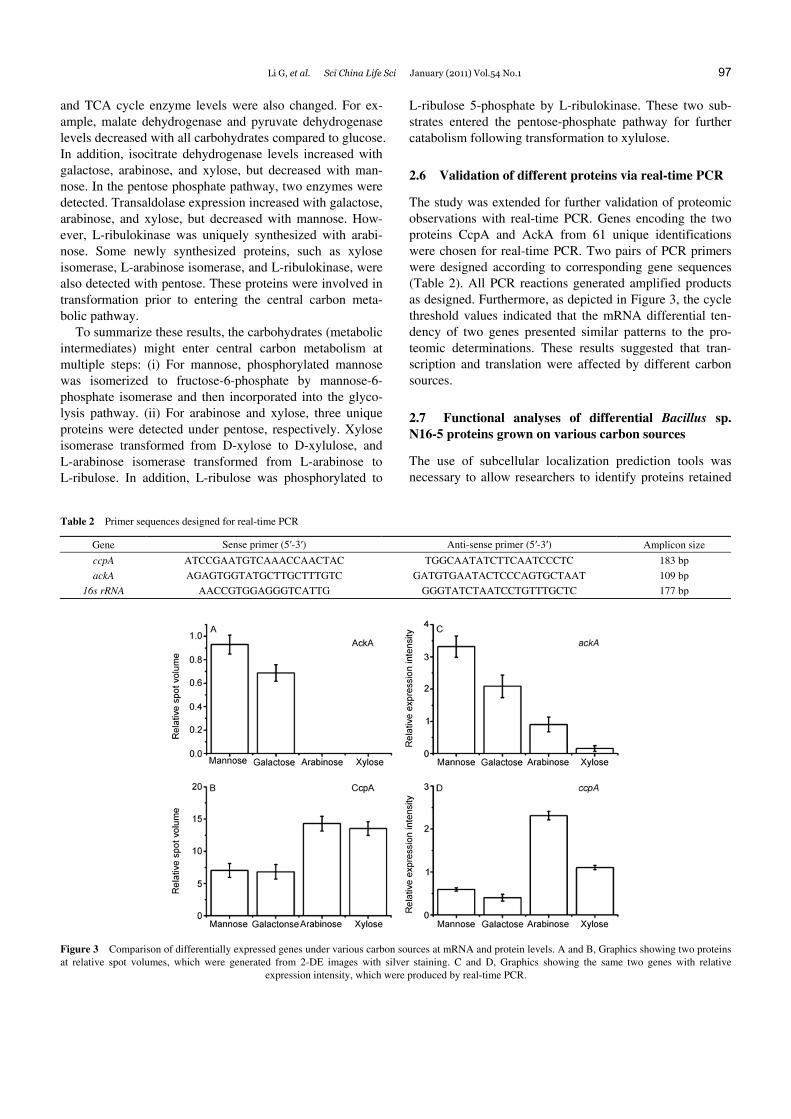
2.6 Validation of different proteins via real-time PCR
The study was extended for further validation of proteomic observations with real-time PCR. Genes encoding the two proteins CcpA and AckA from 61 unique identifications were chosen for real-time PCR. Two pairs of PCR primers were designed according to corresponding gene sequences (Table 2). All PCR reactions generated amplified products as designed. Furthermore, as depicted in Figure 3, the cycle threshold values indicated that the mRNA differential ten-dency of two genes presented similar patterns to the pro-teomic determinations. These results suggested that tran-scription and translation were affected by different carbon sources.
2.7 Functional analyses of differential Bacillus sp. N16-5 proteins grown on various carbon sources
The use of subcellular localization prediction tools was necessary to allow researchers to identify proteins retained
Table 2 Primer sequences designed for real-time PCR
Gene Sense primer (5′-3′) Anti-sense primer (5′-3′) Amplicon size
ccpA ATCCGAATGTCAAACCAACTAC TGGCAATATCTTCAATCCCTC 183 bp
ackA AGAGTGGTATGCTTGCTTTGTC GATGTGAATACTCCCAGTGCTAAT 109 bp
16s rRNA AACCGTGGAGGGTCATTG GGGTATCTAATCCTGTTTGCTC 177 bp
Figure 3 Comparison of differentially expressed genes under various carbon sources at mRNA and protein levels. A and B, Graphics showing two proteins at relative spot volumes, which were generated from 2-DE images with silver staining. C and D, Graphics showing the same two genes with relative
expression intensity, which were produced by real-time PCR.

98 Li G, et al. Sci China Life Sci January (2011) Vol.54 No.1
Figure 4 Functional analysis of cytoplasmic differential proteins of Bacillus sp. N16-5. The differential proteins were grouped into categories according to
functions from NCBI COG databases.
and exported from cells [27]. In the current study, PSORTb was utilized to predict cellular locations of identified pro-teins. The differential Bacillus sp. N16-5 proteins respond-ing to various carbon sources in the cytoplasm fraction were broadly divided into nine functional groups according to results from the NCBI COG database (Figure 4): (i) transla-tion, ribosomal structure, and biogenesis, (ii) transcription, (iii) post-translational modification, protein turnover, and chaperones, (iv) energy production and conversion, (v) general function prediction only, (vi) metabolism, (vii) de-fense mechanisms, (viii) signal transduction mechanisms, and (ix) cell envelope biogenesis and outer membrane. Re-sults indicated that differential strain N16-5 proteins in cy-toplasmic regions were mainly involved in metabolism, as well as energy production and conversion.
3 Discussion
The utilization of highly sensitive 2-DE marked the dawn of the field of proteomics. Soon after its emergence, the tech-nique was adapted for microbiology by the pioneering work of Neidhardt and van Bogelen for Escherichia coli [28,29]. 2-DE also provided the chance to gain deeper insight into alkaliphiles. Proteomic approaches using 2-DE could re-solve hundreds of proteins in a single gel, and it was a pow-erful method for detecting novel enzymes or pathways, as well as discovering carbohydrate metabolism-related stimu-lons or regulons [30]. Therefore, proteomic information
provided clues for a comprehensive understanding of bacte-rial cellular physiology when imposed by various environ-mental stimuli [17]. The prevalence of genomic information for Bacillus and related organisms allowed researchers to undertake a systems biology approach for understanding how certain bacteria adapt to specific environments [27].
Comparative proteomic analysis of Bacillus sp. N16-5 grown on hexose and pentose revealed that CcpA expres-sion consistently increased by 6–13 folds on various carbo-hydrate compounds, compared with growth on glucose. Recent proteomic and transcriptome studies in Bacillus sub-tilis demonstrated that approximately 250 genes are subject to CcpA-dependent repression. The genes repressed by CcpA encoded enzymes are required for utilization of sec-ondary carbon sources [31], which might be responsible for the disappearance of some proteins on various carbon sources, when compared with glucose conditions. In particular, there were larger expressional changes under pentose conditions, when compared with hexose, and some absent proteins were responsible for this growth. This could also result in slow growth under pentose conditions. In addition, in gram- negative E. coli, a large number of carbohydrates, in addi-tion to glucose, exert CCR. However, CCR exerted by car-bon sources other than glucose have not been systematically studied in B. subtilis [32]. Results from the present study showed that CcpA-mediated CCR was exerted by a variety of carbon sources in alkaliphilic Bacillus sp. N16-5, and pentose acted as a stronger effector than hexose in alka-liphilic Bacillus sp. N16-5. In addition, acetate kinase was
Li G, et al. Sci China Life Sci January (2011) Vol.54 No.1 99
repressed compared with high CcpA expression, when Ba-cillus sp. N16-5 was grown in pentose conditions, which was not consistent with results from general Bacillus spe-cies [20].
By contrast, among the 10 proteins involved in central carbon metabolism, 6-phosphofructokinase was absent un-der pentose conditions. In addition, 6-phosphofructokinase is a key enzyme in glycolysis and correlates with formation of signal metabolites (fructose-1,6-biophosphate) for CCR. Therefore, it is possible that other alternative signal mole-cules activated CcpA in pentose conditions and could exist in alkaliphiles. Two other global regulators, TnrA and CodY, of Bacillus subtilis [33], which provide a top layer of general nutritional regulation that determines expression rate of central metabolism, were not detected in the present study. However, guanine deaminase, which is involved in formation of the effector molecule GTP, was detected and plays a role in regulation of cellular GTP and the guanylate nucleotide pool under certain circumstances [34]. The pre-sent results suggested that these might contribute to me-tabolism in pentose conditions, although there was no direct evidence to support this [35]. Some isomerases, which were involved in transformation of various hexose and pentose, were exclusively expressed under respective conditions. These isomerases isomerized carbohydrate and then entered the central carbon metabolism cycle. In addition, some pro-teins were observed in more than one spot (spot 33, 34, and 35), which could be explained by several factors: (i) Iso-forms or post-translationally modified versions of the pro-tein might be present in the cell; (ii) the protein was modi-fied during protein extraction or 2-DE; (iii) the protein did not resolve well on the gel and, therefore, ‘smeared’ out over a large pH or mass range; (iv) the denaturizing condi-tions were not sufficient to completely break protein asso-ciations [22].
The complete enzyme system for central carbon metabo-lism of Bacillus sp. N16-5 enabled the metabolism of many carbohydrates, but CcpA-regulated CCR selected for the most easily utilized substrate, so that nutrients from a mix-ture of various carbon sources were efficient and achieved the fastest growth. Differential expression of CcpA, which was induced by hexose and pentose, exerted different re-pression activities on metabolic enzymes relative to the non-preferred carbon source. This phenomenon resulted in various growth rates. The present study investigated the effect of five carbon sources on the Bacillus sp. N16-5 pro-teome. Gene expression in these metabolic pathways was analyzed by measuring the relative abundance of proteins under various sugar-cultured conditions. The obtained pro-teomic data were interpreted according to central carbon metabolism, and expression levels of some key enzymes were altered in glycolysis and the TCA cycle. In addition, some hypothetical proteins with differential expression were detected, and these functions were not clear. Although the proteomic results suggested certain protein responses to
various carbon sources, more details are needed to deter-mine how these Bacillus sp. N16-5 molecules worked to-gether to adapt to the external nutritional environment. In addition to measuring expression levels, transcriptome studies currently focus on activity modulation using mi-croarray techniques. These studies could provide additional clues to better understand regulation of metabolism in alka-liphilic Bacillus sp. N16-5.
This work was supported by the National Basic Research Program of China, Ministry of Science and Technology of China (Grant Nos. 2007CB707801 and 2003CB716001) and the National High Technology Research and Development Program of China (Grant Nos. 2006AA020201 and 2007AA021306).
1 Horikoshi K. Alkaliphiles: Some applications of their products for biotechnology. Microbiol Mol Biol Rev, 1999, 63: 735–750
2 Rothschild L J, Mancinelli R L. Life in extreme environments. Na-ture, 2001, 409: 1092–1101
3 Padan E, Bibi E, Ito M, et al. Alkaline pH homeostasis in bacteria: New insights. Biochim Biophys Acta, 2005, 1717: 67–88
4 Gomes J, Steiner W. The biocatalytic potential of extremophiles and extremozymes. Food Technol Biotech, 2004, 42: 223–235
5 Coolbear T, Daniel R M, Morgan H W. The enzymes from extreme thermophiles: Bacterial sources, thermostabilities and industrial rele-vance. Adv Biochem Eng Biotechnol, 1992, 45: 57–98
6 Adams M W, Perler F B, Kelly R M. Extremozymes: Expanding the limits of biocatalysis. Biotechnol (NY), 1995, 13: 662–668
7 Eisenberg H. Life in unusual environments: Progress in understand-ing the structure and function of enzymes from extreme halophilic bacteria. Arch Biochem Biophys, 1995, 318: 1–5
8 Ishida M, Yoshida M, Oshima T. Highly efficient production of en-zymes of an extreme thermophile, Thermus thermophilus: A practical method to overexpress GC-rich genes in Escherichia coli. Extremo-philes, 1997, 1: 157–162
9 Hough D W, Danson M J. Extremozymes. Curr Opin Chem Biol, 1999, 3: 39–46
10 Breithaupt H. The hunt for living gold. The search for organisms in extreme environments yields useful enzymes for industry. EMBO Rep, 2001, 2: 968–971
11 Hoondal G S, Tiwari R P, Tewari R, et al. Microbial alkaline pecti-nases and their industrial applications: A review. Appl Microbiol Biotechnol, 2002, 59: 409–418
12 Marhuenda-Egea F C, Bonete M J. Extreme halophilic enzymes in organic solvents. Curr Opin Biotechnol, 2002, 13: 385–389
13 Schiraldi C, De Rosa M. The production of biocatalysts and bio-molecules from extremophiles. Trends Biotechnol, 2002, 20: 515–521
14 Ferrer M, Golyshina O, Beloqui A, et al. Mining enzymes from ex-treme environments. Curr Opin Microbiol, 2007, 10: 207–214
15 Voigt B, Hoi le T, Jurgen B, et al. The glucose and nitrogen starva-tion response of Bacillus licheniformis. Proteomics, 2007, 7: 413–423
16 Gilmour R, Messner P, Guffanti A A, et al. Two-dimensional gel electrophoresis analyses of pH-dependent protein expression in fac-ultatively alkaliphilic Bacillus pseudofirmus OF4 lead to characteri-zation of an S-layer protein with a role in alkaliphily. J Bacteriol, 2000, 182: 5969–5981
17 Hecker M, Volker U. Towards a comprehensive understanding of Bacillus subtilis cell physiology by physiological proteomics. Pro-teomics, 2004, 4: 3727–3750
18 Sonenshein A L. Control of key metabolic intersections in Bacillus subtilis. Nat Rev Microbiol, 2007, 5: 917–927
19 Gorke B, Stulke J. Carbon catabolite repression in bacteria: Many ways to make the most out of nutrients. Nat Rev Microbiol, 2008, 6: 613–624
20 Grundy F J, Waters D A, Allen S H, et al. Regulation of the Bacillus subtilis acetate kinase gene by CcpA. J Bacteriol, 1993, 175: 7348–

100 Li G, et al. Sci China Life Sci January (2011) Vol.54 No.1
7355 21 Ma Y T X, Zhou P, Wang D. Production and some properties of al-
kaline β-mannanase (in Chinese). Acta Microbiol Sin, 1991, 31: 443–448
22 Snijders A P, Walther J, Peter S, et al. Reconstruction of central car-bon metabolism in Sulfolobus solfataricus using a two-dimensional gel electrophoresis map, stable isotope labelling and DNA microarray analysis. Proteomics, 2006, 6: 1518–1529
23 Horikoshi K. Production of alkaline enzymes by alkalophilic micro-organisms. Agric Biol Chem, 1971, 36: 1407–1414
24 Shevchenko A, Wilm M, Vorm O, et al. Mass spectrometric se-quencing of proteins silver-stained polyacrylamide gels. Anal Chem, 1996, 68: 850–858
25 Gardy J L, Laird M R, Chen F, et al. PSORTb v.2.0: Expanded pre-diction of bacterial protein subcellular localization and insights gained from comparative proteome analysis. Bioinformatics, 2005, 21: 617–623
26 Tatusov R L, Galperin M Y, Natale D A, et al. The COG database: A tool for genome-scale analysis of protein functions and evolution. Nucleic Acids Res, 2000, 28: 33–36
27 Graham R L, Pollock C E, O’Loughlin S N, et al. Multidimensional analysis of the insoluble sub-proteome of Oceanobacillus iheyensis HTE831, an alkaliphilic and halotolerant deep-sea bacterium isolated from the Iheya ridge. Proteomics, 2007, 7: 82–91
28 Pedersen S, Bloch P L, Reeh S, et al. Patterns of protein synthesis in E. coli: A catalog of the amount of 140 individual proteins at differ-
ent growth rates. Cell, 1978, 14: 179–190 29 VanBogelen R A, Schiller E E, Thomas J D, et al. Diagnosis of cel-
lular states of microbial organisms using proteomics. Electrophoresis, 1999, 20: 2149–2159
30 Qi S W, Chaudhry M T, Zhang Y, et al. Comparative proteomes of Corynebacterium glutamicum grown on aromatic compounds re-vealed novel proteins involved in aromatic degradation and a clear link between aromatic catabolism and gluconeogenesis via fruc-tose-1,6-bisphosphatase. Proteomics, 2007, 7: 3775–3787
31 Wacker I, Ludwig H, Reif I, et al. The regulatory link between car-bon and nitrogen metabolism in Bacillus subtilis: Regulation of the gltAB operon by the catabolite control protein CcpA. Microbiology, 2003, 149: 3001–3009
32 Singh K D, Schmalisch M H, Stulke J, et al. Carbon catabolite re-pression in Bacillus subtilis: Quantitative analysis of repression ex-erted by different carbon sources. J Bacteriol, 2008, 190: 7275–7284
33 Commichau F M, Gunka K, Landmann J J, et al. Glutamate metabo-lism in Bacillus subtilis: Gene expression and enzyme activities evolved to avoid futile cycles and to allow rapid responses to pertur-bations of the system. J Bacteriol, 2008, 190: 3557–3564
34 Maynes J T, Yuan R G, Snyder F F. Identification, expression, and characterization of Escherichia coli guanine deaminase. J Bacteriol, 2000, 182: 4658–4660
35 Petranovic D, Guedon E, Sperandio B, et al. Intracellular effectors regulating the activity of the Lactococcus lactis CodY pleiotropic transcription regulator. Mol Microbiol, 2004, 53: 613–621
Open Access This article is distributed under the terms of the Creative Commons Attribution License which permits any use, distribution, and reproduction
in any medium, provided the original author(s) and source are credited.