Comparative investigation on the mechanical behavior of ...
8
Vol.:(0123456789) 1 3 Journal of Rubber Research https://doi.org/10.1007/s42464-021-00092-w ORIGINAL PAPER Comparative investigation on the mechanical behavior of injection molded and 3D‑printed thermoplastic polyurethane Erik Oelsch 1 · Ralf Landgraf 1 · Lysander Jankowsky 2,3 · Martin Kausch 2 · Stefan Hoyer 4 · Welf‑Guntram Drossel 2,3 · Jörn Ihlemann 1 Received: 25 September 2020 / Accepted: 3 March 2021 © The Author(s) 2021 Abstract 3D printing opens up new possibilities for the production of polymeric structures that would not be possible with injec- tion molding. However, it is known that the manufacturing method might have an impact on the mechanical properties of manufactured components. To this end, the mechanical behavior of test specimens made of thermoplastic polyurethane is compared for two different manufacturing methods. In particular, the SEAM technology (screw extrusion additive manufac- turing) is compared to a conventional injection molding process. Uniaxial tension test specimens from both manufacturing methods are analyzed in two testing sequences (multi-hysteresis tests to analyze inelastic properties and uniaxial tension until rupture). To get as less perturbation as possible, the 3D-printed samples are printed with only one strand per layer. Moreover, a correction approach based on optical measurements is applied to determine the true cross-sectional area of the test specimens. The mechanical tests reveal that the inelastic material behavior is the same for both manufacturing methods. Instead, 3D-printed specimens show lower maximal stretch values at rupture and an increased variance in the results, which is related to the surface structure of 3D-printed specimens. Keywords 3D printing · TPU · Build orientation · Material testing · SEAM · MORPH Introduction Injection molding is an established manufacturing proce- dure that has been continuously developed over many years of research. Nevertheless, there are limits to this process that are difficult or impossible to overcome. These are, for example, restrictions on the manufacturability of complex structures and the choice of the internal structure of a volu- metric component. In contrast, 3D printing is a comparably slow process, but it can solve both of these problems better than injection molding. With this technology, the production of more complex geometries is feasible and the inner struc- ture can easily be controlled by the help of infill strategies. However, the resulting material and component properties of 3D-printed and injection molded structures can differ, due to the different manufacturing methods. This results in a versatile field of research. The printing process is controlled by numerous param- eters, all of which have a significant impact on the result- ing quality of printed parts, in terms of print quality and mechanical behavior. Some of these control parameters are: printing speed, printing temperature, bed adhesion and cooling. Investigations on the impact of printing parame- ters on the properties of manufactured parts are for example described in [2, 7, 8, 16]. In contrast to injection molding, where produced parts are always completely filled with material, 3D print- ing enables the use of infill strategies. This means that the interior of the parts does not necessarily have to be * Erik Oelsch [email protected] 1 Chair of Solid Mechanics, Chemnitz University of Technology, Reichenhainer Straße 70, 09126 Chemnitz, Germany 2 Systems and Technologies for textile Structures STEX, Fraunhofer Institute for Machine Tools and Forming Technology IWU, Reichenhainer Straße 88, 09126 Chemnitz, Germany 3 Adaptronics and Lightweight Design in Production, Chemnitz University of Technology, Reichenhainer Straße 70, 09126 Chemnitz, Germany 4 Department of Lightweight Structures and Polymer Technology, Chemnitz University of Technology, Reichenhainer Straße 31/33, 09126 Chemnitz, Germany
-
Upload
khangminh22 -
Category
Documents
-
view
3 -
download
0
Transcript of Comparative investigation on the mechanical behavior of ...
Vol.:(0123456789)1 3
Journal of Rubber Research https://doi.org/10.1007/s42464-021-00092-w
ORIGINAL PAPER
Comparative investigation on the mechanical behavior of injection molded and 3D‑printed thermoplastic polyurethane
Erik Oelsch1 · Ralf Landgraf1 · Lysander Jankowsky2,3 · Martin Kausch2 · Stefan Hoyer4 · Welf‑Guntram Drossel2,3 · Jörn Ihlemann1
Received: 25 September 2020 / Accepted: 3 March 2021 © The Author(s) 2021
Abstract3D printing opens up new possibilities for the production of polymeric structures that would not be possible with injec-tion molding. However, it is known that the manufacturing method might have an impact on the mechanical properties of manufactured components. To this end, the mechanical behavior of test specimens made of thermoplastic polyurethane is compared for two different manufacturing methods. In particular, the SEAM technology (screw extrusion additive manufac-turing) is compared to a conventional injection molding process. Uniaxial tension test specimens from both manufacturing methods are analyzed in two testing sequences (multi-hysteresis tests to analyze inelastic properties and uniaxial tension until rupture). To get as less perturbation as possible, the 3D-printed samples are printed with only one strand per layer. Moreover, a correction approach based on optical measurements is applied to determine the true cross-sectional area of the test specimens. The mechanical tests reveal that the inelastic material behavior is the same for both manufacturing methods. Instead, 3D-printed specimens show lower maximal stretch values at rupture and an increased variance in the results, which is related to the surface structure of 3D-printed specimens.
Keywords 3D printing · TPU · Build orientation · Material testing · SEAM · MORPH
Introduction
Injection molding is an established manufacturing proce-dure that has been continuously developed over many years of research. Nevertheless, there are limits to this process that are difficult or impossible to overcome. These are, for example, restrictions on the manufacturability of complex
structures and the choice of the internal structure of a volu-metric component. In contrast, 3D printing is a comparably slow process, but it can solve both of these problems better than injection molding. With this technology, the production of more complex geometries is feasible and the inner struc-ture can easily be controlled by the help of infill strategies. However, the resulting material and component properties of 3D-printed and injection molded structures can differ, due to the different manufacturing methods. This results in a versatile field of research.
The printing process is controlled by numerous param-eters, all of which have a significant impact on the result-ing quality of printed parts, in terms of print quality and mechanical behavior. Some of these control parameters are: printing speed, printing temperature, bed adhesion and cooling. Investigations on the impact of printing parame-ters on the properties of manufactured parts are for example described in [2, 7, 8, 16].
In contrast to injection molding, where produced parts are always completely filled with material, 3D print-ing enables the use of infill strategies. This means that the interior of the parts does not necessarily have to be
* Erik Oelsch [email protected]
1 Chair of Solid Mechanics, Chemnitz University of Technology, Reichenhainer Straße 70, 09126 Chemnitz, Germany
2 Systems and Technologies for textile Structures STEX, Fraunhofer Institute for Machine Tools and Forming Technology IWU, Reichenhainer Straße 88, 09126 Chemnitz, Germany
3 Adaptronics and Lightweight Design in Production, Chemnitz University of Technology, Reichenhainer Straße 70, 09126 Chemnitz, Germany
4 Department of Lightweight Structures and Polymer Technology, Chemnitz University of Technology, Reichenhainer Straße 31/33, 09126 Chemnitz, Germany

E. Oelsch et al.
1 3
completely filled with material. Such a strategy saves material and contributes to the concept of lightweight con-struction. However, it also weakens the product against mechanical loading. The influences of infill strategies and percentages of infill volumes were for example investi-gated in [10] and [13]. But even a perfect 3D-printed part will always be different to an injection molded one because of the impact of build orientations resulting from layer-wise printing [1, 6, 14, 19].
There is a wide spectrum of printable materials, such as metals, ceramics and polymers, which can be printed by a variety of different additive manufacturing methods. This paper focuses on a polymeric material processed by an additive manufacturing process similar to FDM (fused deposition modeling). More specifically, a thermoplastic polyurethane (TPU) with a shore hardness of 86A is con-sidered, which is a challenging material for 3D printing. Similar materials and their behavior have for example been investigated in [15, 17] and [18]. However, conventional 3D printers with a slicing software are used in those works. This results in samples that are thicker than one strand per layer. To reduce the directional dependencies of mechanical properties, a slicing software varies the building orientation from layer to layer. Thus, it is not possible to get unbiased information about directional influences of the material. To overcome this problem, 3D printing with the SEAM (screw extrusion additive manufacturing) technology is employed in this study. With this technology, it is possible to print big single-layer parts, from which samples can be cut out for mechanical tests in different directions with respect to the building direction. Thus, it is possible to obtain information about the material itself and the influence of build orienta-tion resulting from the SEAM process.
Main objective of this study is the evaluation and com-parison of mechanical properties of TPU samples produced by injection molding and by the SEAM technology. Here, special attention is paid to inelastic properties and direc-tional dependencies due to the building process in additive manufacturing. To this end, “Manufacturing methods” gives an overview on the employed material and manufacturing methods. The “Experiments” then describes the experi-ments for mechanical testing. This includes uniaxial tension tests with two different loading sequences. First, a multi-hysteresis loading sequence up to moderate stretch levels is used to analyze the dependencies of the inelastic behavior on building direction. Second, monotonic uniaxial tension until rupture is used to analyse maximum strains at break as a first indication for adhesion properties between the lay-ers. Beyond that, a correction procedure for determining the true cross-sectional area area is presented, which takes into account non-planar sample surfaces (resulting from the processes of printing and cutting). Finally, the results
of multi-hysteresis and monotonic loading tests are sum-marized in the “Evaluation of the experiments”.
Materials and methods
Material
The investigated material is the TPU DesmopanⓇ 487 from Covestro AG, Germany [9]. The material is delivered in form of pellets that can be processed within extrusion-based manufacturing methods like injection molding. The final material shows rubber-like material behavior, has a shore hardness of 86 A and a glass temperature of approximately −35 ◦C [5]. Moreover, beneficial properties are grease and oil-resistance, low compression set and a good heat resist-ance [9].
Manufacturing methods
Two different extrusion-based manufacturing methods are applied to produce test specimens for mechanical testing. The next section gives a general overview of the SEAM process for 3D printing and explains the applied approach to produce test specimens. The second manufacturing method is conventional injection molding, which is regarded in the next following section.
SEAM process for 3D printing
The SEAM process is a very fast 3D-printing process with printing speeds up to 1 m/s (this exceeds most standard FDM printers up to 8 times) and a volume flow controlled output rate of up to 7 kg/h (see for example [4, 11]). The processing space allows to build pieces up to 1100 × 800 × 600mm3 . It is, therefore, well suited for printing large-scale objects. This is only possible because of an extrusion based feed-ing system where pre-dried thermoplastic pellets are auto-matically fed into an extruder. Due to the applicable melting temperature of up to 400 ◦C , nearly all thermoplastics with and without fiber-reinforcement, high-performance thermo-plastics and thermoplastic elastomers can be used. Due to the swivel angle range of ±45◦ and torsion angle range of ±20◦ , it is possible to print with real 5 axes. This allows the production of load path adapted component structures as well the integration of an endless fiber in the process.
In the current study, the part depicted in Fig. 1 was manu-factured. The outer dimensions are 262.50 × 90mm2 and the outer radius is 22.50mm . The part was printed with two different thicknesses (2 and 3 mm). Both versions can be printed with only one strand per layer. Thereby, printing

Comparative investigation on the mechanical behavior of injection molded and 3D-printed…
1 3
layers were added in z-direction up to a total height of 150mm.
During production, the building platform moved in three different spatial directions while the printing head remained fixed. The molten polymer comes out of the printing noz-zle and is deposited on the platform continuously layer by layer. As cooling system, two nozzles with compressed air are installed. Thereby, cooling can be controlled by the air flow rate.
The investigated TPU was dried before printing, so that the material had residual moisture content of about 0.13% . The printing temperature of the material was 220 ◦C and the melt pressure ranged between 50 and 60 bar. The screw speed was set to 20 rpm and the layer height was 0.7mm . The table speed to achieve 2mm and 3mm thick walls was 112 and 70mm/s , respectively. The air flow rate was set to 18m/s.
The printed parts were then used to cut out S2 tension test specimens (total length 75mm ) by the help of a die cutter. Thereby, specimens were cut from the part in three different orientations ( 0◦, 45◦ and 90◦ ) with respect to the building direction to investigate the impact of printing direction on the mechanical properties. Figure 1 depicts three different tension test specimens with varying cutting angles as well as the corresponding cutting orientation on the printed part. The cross-section of the specimens does not show a perfect rectangular shape. This is due to printing (grooves on the outer surfaces, see Fig. 1, right) and the cutting process. An approach to evaluate the true cross-sectional area is intro-duced in “Correction of cross-sectional area”.
Injection molding
Injection molding was used to produce further uniaxial test specimens that can be compared to those resulting from the 3D-printing process presented in the previous section. To this end, plates with dimensions 150 × 100mm2 and thicknesses of 2 and 3 mm were produced on a Battenfeld
injection molding machine (model HM 110/525). Before injection molding, the granulate was dried (residual moisture content 0.08% ). The screw speed was set to 100 rpm and the production was 25mm3∕s . Further production parameters are listed in Table 1.
In accordance with the procedure described in the previ-ous section, S2 tension test specimens were cut from the injection molded plates by die cutting. Due to the cutting process, the cross-sectional shape of the specimens was not perfectly rectangular, what is regarded in “Correction of cross-sectional area”.
Experiments
From the experimental point of view, the main goal of this study is the investigation of the impact of different manu-facturing processes on the mechanical behavior. In addi-tion, differences that might arise from different orientations of 3D printing and loading are investigated. To this end, 3D-printed specimens with three different cutting angles with respect to the building direction ( 0◦, 45◦, 90◦ ) are regarded and compared with injection molded S2 samples. This procedure is applied to specimens with two different thicknesses (2 and 3 mm). Thus, altogether eight different specimen groups are analyzed. Mechanical tests include two different testing sequences in uniaxial tension. The first
Fig. 1 3D-printed specimen and definition of the cutting angles for the experiments
Table 1 Production parameters for injection molding
Plate thickness 2mm 3mm
Injection time 1.54 s 1.8 s
Holding pressure 450 bar 600 bar
Holding time 7 s 10 s
Plastication time 11 s 20 s
Residual cooling time 25 s 25 s

E. Oelsch et al.
1 3
sequence is a multi-hysteresis test with stretch amplitudes up to 2. Second, uniaxial tension until rupture of the samples is regarded. In the following, first the experimental setup is introduced in the next section. Next, the mentioned issue of non-perfect rectangular cross-sectional shapes is regarded in the next following section. The results of the test are pro-vided in the fourth section.
Experimental setup
Uniaxial tension tests were carried out at room temperature ( 23◦C ) on a uniaxial testing machine from Zwick/Roell with a maximal load of 20 kN . A 1 kN load cell was installed to measure the comparably small force resulting from the soft TPU. The applied methods for strain measurement depend on the specific testing sequence.
The testing machine has a built-in clamping device (Mul-tiXtens) for strain measurement, which is used for the multi-hysteresis tests. At the start of the test, two clamps are placed on the sample at a pre-defined distance from each other. The strain is calculated from the change of the distance divided by the original distance. The benefit of this method is the possible actuation of the strain, which is used to load the specimens to specific strain levels. To avoid buckling of the specimens, unloading stops at zero force, which is not at zero strain because of permanent set.
The strain measurement device MultiXtens cannot be used for the tension tests until rupture. This is due to a limited measurement range and to secure the device, since a snap back due to rupture could possibly damage it. Therefore, a contact free method is used. Thereby, white marker points on the specimens are tracked by the help of a camera. Sub-sequently, the distances of the points are evaluated by image processing in MATLAB. The method to calculate strains from the distances remains the same as for the MultiXtens.
Correction of cross‑sectional area
Engineering stress in uniaxial tension is not measured directly, but calculated by the quotient from tensile force and the initial cross-sectional area of the specimen in the measuring zone. Measuring the exact cross-section turns out to be difficult due to two reasons: first, the layer-wise 3D-printing process generates corrugated surfaces, i.e., sur-faces with semicircles representing the different layers (see Fig. 2, left). And second, a trapezium shape on the left and right edges results from the cutting process. This appears in samples of both manufacturing methods (see Fig. 2).
The most common way to measure the initial cross-sec-tional area of S2 samples is to use a caliper gauge, which can only measure parallel edges. With this method, width
b and height h can be determined as given in Fig. 2 and the cross-sectional area can be calculated by
However, it can be seen that this measuring method would not be sufficient to gather the true cross-sectional area. To regard both mentioned reasons for deviations from a perfect rectangular shape, two different correction factors �t and �s are introduced and determined by the help of microscope images of the cross-sections as given in Fig. 2. Note that this precise evaluation of the cross-section area would not be feasible for the specimens to be tested in experiments, since a destruction of them would be needed. A measure-ment after the tests would also be insufficient, because of inelastic deformation and the corresponding permanent set.
The first correction factor �t only regards the trapezium shape. Based on the dimensions depicted in Fig. 2, it is cal-culated by
Therein, Ac is the area measured by the caliper gauge accord-
ing to 1 and At is the area of the trapezium. The width bt is evaluated for the different specimen groups (i.e., different print orientations and thicknesses) by the help of microscope images. The second correction factor �s regards deviations resulting from the semicircles in the 3D-printed specimens. It is calculated by
(1)Ac= h ⋅ b .
(2)�t =At
Ac
with At =h
2(bt + b) .
(3)�s =Ar
At
,
Fig. 2 Cross-section of a 3D-printed specimen with cutting angle 0◦ (left) and an injection molded specimen (right). In addition, length measures for the calculation of the cross-sectional area are provided
Comparative investigation on the mechanical behavior of injection molded and 3D-printed…
1 3
with Ar being the true surface area that is measured by microscope images.
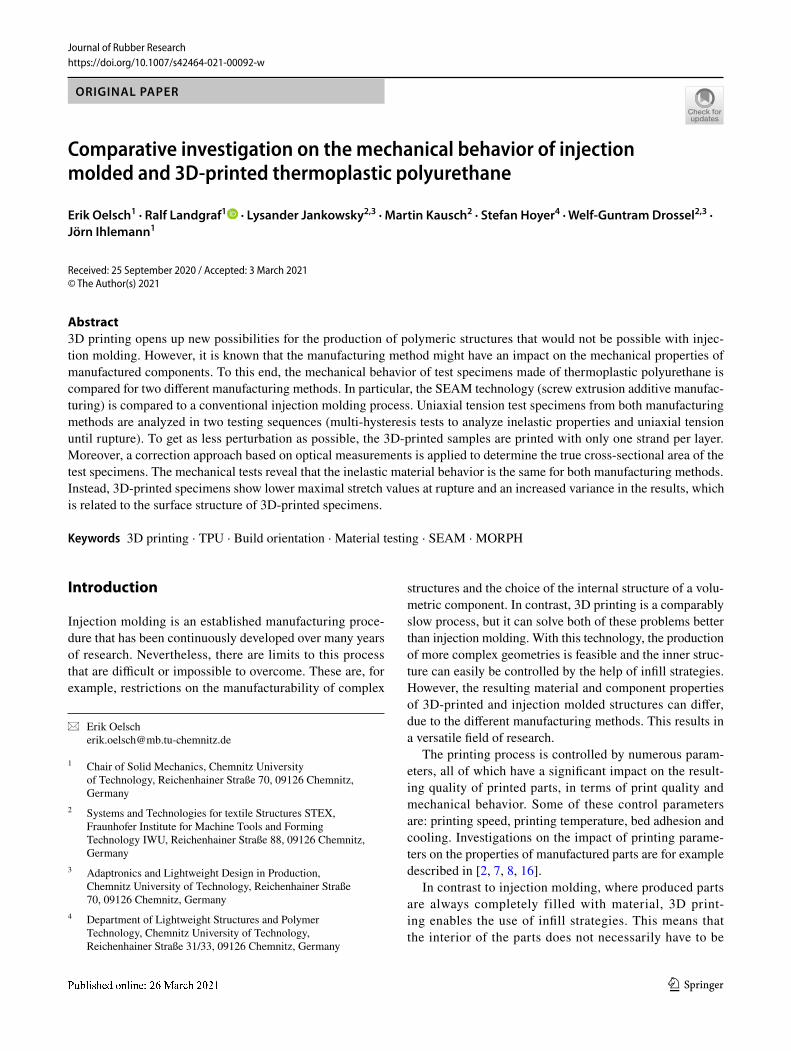
The results of the cross-section evaluation are summa-rized in Table 2. It can be seen that neither the trapezium nor the semicircle correction factor is constant for both thick-nesses. This can be explained with the different height to width proportions. Smaller specimens are less influenced by the cutting process, but higher affected from the 3D-printed semicircles, which have nearly the same radius for 2 mm and 3 mm thick samples. A correction due to semicircles is not necessary for injection molded samples. Thus, �s = 1 for the corresponding groups.
Based on the evaluated correction factors, the procedure to calculate the cross-sectional area of specimens to be mechanically tested is as follows. First, the outer dimen-sions are determined by a caliper gauge. Next, the virtual rectangular surface is calculated by Eq. (1) and the correc-tion factors of Table 2 are applied to calculate the true sur-face area A0 via
Evaluation of the experiments
Multi‑hysteresis tests
Multi-hysteresis tests were conducted on multiple samples of each specimen group (eight samples for each 0◦, 45◦ and 90◦ group; three samples for each injection molded group). The test sequence includes loading up to pre-defined stretch levels (1.2, 1.4, 1.6, 1.8, 2.0) with intermediate unloading to zero force. All amplitude levels were approached three times in a row before the next strain amplitude was set. The tests were carried out at a constant absolute value for the cross-head speed of 50mm/min.
One example for the resulting engineering stress vs. stretch curves can be seen in Fig. 3. The picture shows injection molded samples (black lines) and 3D-printed sam-ples with 90◦ cutting angle (gray lines) with a thickness of 2 mm. The stress–stretch curves clearly show all common rubber-like properties, such as Mullins effect, hysteresis and
(4)A0 = Ac⋅ �t ⋅ �s .
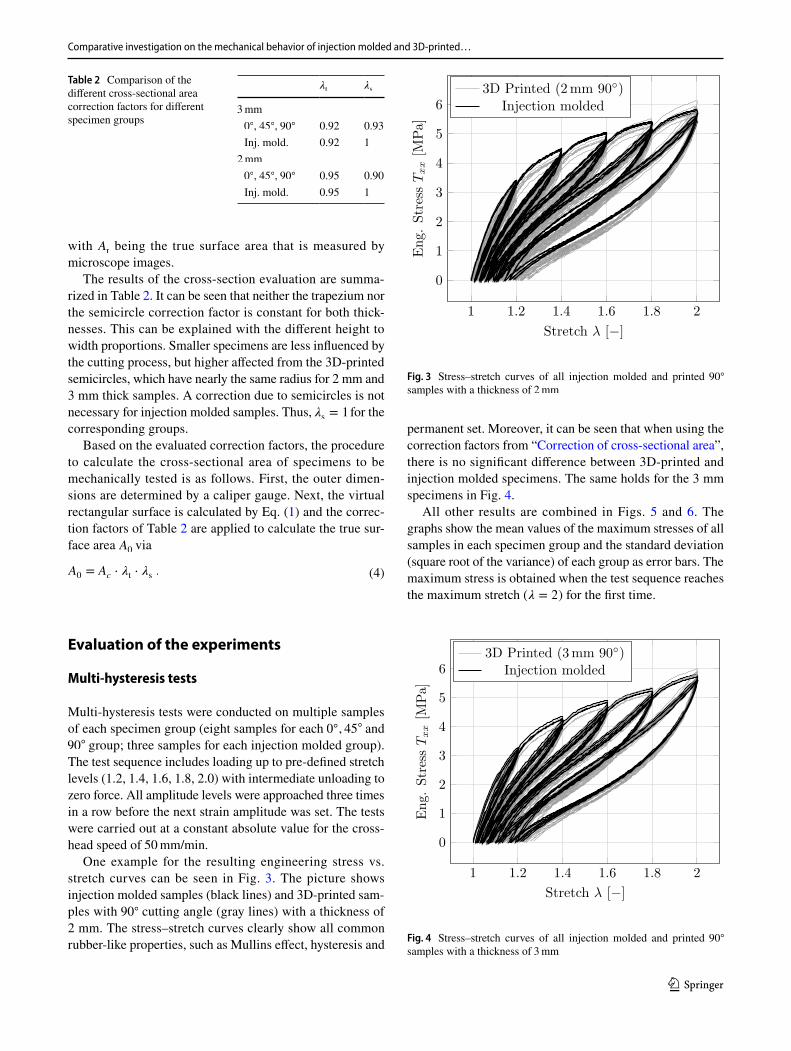
permanent set. Moreover, it can be seen that when using the correction factors from “Correction of cross-sectional area”, there is no significant difference between 3D-printed and injection molded specimens. The same holds for the 3 mm specimens in Fig. 4.
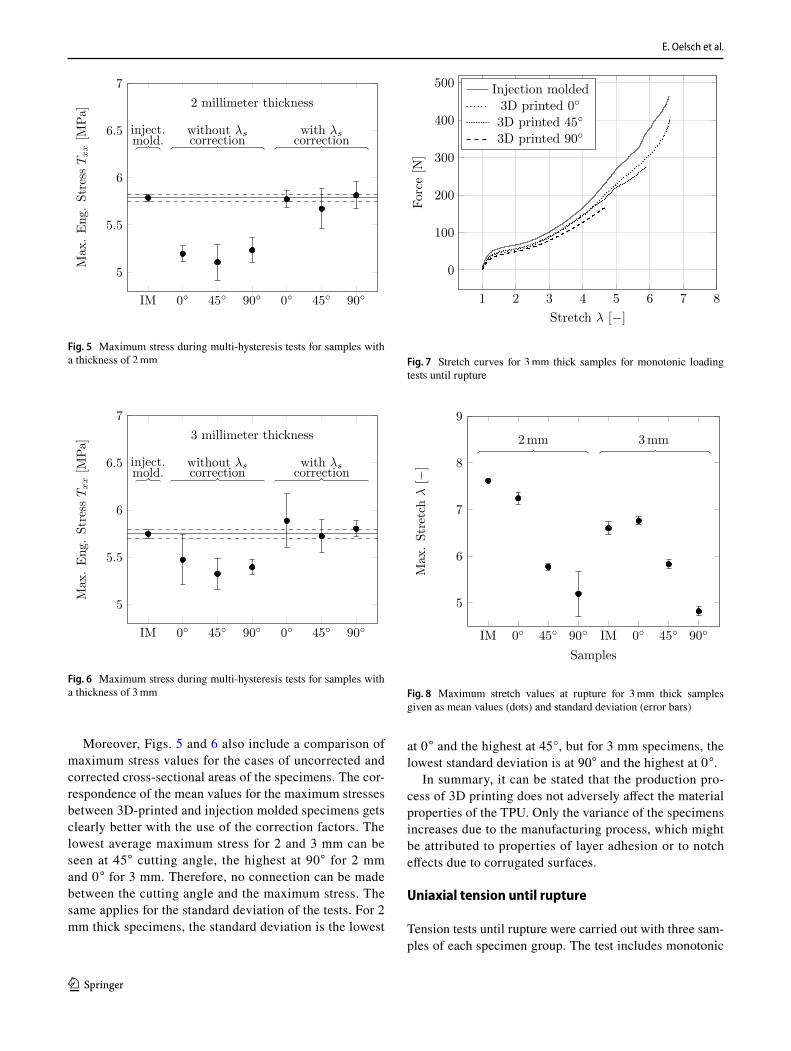
All other results are combined in Figs. 5 and 6. The graphs show the mean values of the maximum stresses of all samples in each specimen group and the standard deviation (square root of the variance) of each group as error bars. The maximum stress is obtained when the test sequence reaches the maximum stretch ( � = 2 ) for the first time.
Table 2 Comparison of the different cross-sectional area correction factors for different specimen groups
�t
�s
3mm
0◦ , 45◦ , 90◦ 0.92 0.93 Inj. mold. 0.92 12mm
0◦ , 45◦ , 90◦ 0.95 0.90 Inj. mold. 0.95 1
1 1.2 1.4 1.6 1.8 2
0
2
4
6
1
3
5
Stretch λ [−]
Eng
.Stress
Txx[M
Pa]
3D Printed (2mm 90◦)Injection molded
Fig. 3 Stress–stretch curves of all injection molded and printed 90◦ samples with a thickness of 2mm
1 1.2 1.4 1.6 1.8 2
0
2
4
6
1
3
5
Eng
.Stress
Txx[M
Pa]
3D Printed (3mm 90◦)Injection molded
Stretch λ [−]
Fig. 4 Stress–stretch curves of all injection molded and printed 90◦ samples with a thickness of 3mm
E. Oelsch et al.
1 3
Moreover, Figs. 5 and 6 also include a comparison of maximum stress values for the cases of uncorrected and corrected cross-sectional areas of the specimens. The cor-respondence of the mean values for the maximum stresses between 3D-printed and injection molded specimens gets clearly better with the use of the correction factors. The lowest average maximum stress for 2 and 3 mm can be seen at 45◦ cutting angle, the highest at 90◦ for 2 mm and 0 ◦ for 3 mm. Therefore, no connection can be made between the cutting angle and the maximum stress. The same applies for the standard deviation of the tests. For 2 mm thick specimens, the standard deviation is the lowest
at 0 ◦ and the highest at 45°, but for 3 mm specimens, the lowest standard deviation is at 90◦ and the highest at 0 ◦.
In summary, it can be stated that the production pro-cess of 3D printing does not adversely affect the material properties of the TPU. Only the variance of the specimens increases due to the manufacturing process, which might be attributed to properties of layer adhesion or to notch effects due to corrugated surfaces.
Uniaxial tension until rupture
Tension tests until rupture were carried out with three sam-ples of each specimen group. The test includes monotonic
IM 0◦ 45◦ 90◦ 0◦ 45◦ 90◦
5
5.5
6
6.5
7
inject.mold.
without λscorrection
with λscorrection
2 millimeter thickness
Max
.Eng
.Stress
Txx[M
Pa]
Fig. 5 Maximum stress during multi-hysteresis tests for samples with a thickness of 2mm
IM 0◦ 45◦ 90◦ 0◦ 45◦ 90◦
5
5.5
6
6.5
7
inject.mold.
without λscorrection
with λscorrection
3 millimeter thickness
Max
.Eng
.Stress
Txx[M
Pa]
Fig. 6 Maximum stress during multi-hysteresis tests for samples with a thickness of 3mm
1 2 3 4 5 6 7 8
0
100
200
300
400
500
Stretch λ [−]
Force[N
]
Injection molded3D printed 0◦
3D printed 45◦
3D printed 90◦
Fig. 7 Stretch curves for 3mm thick samples for monotonic loading tests until rupture
IM 0◦ 45◦ 90◦ IM 0◦ 45◦ 90◦
5
6
7
8
9
2mm 3mm
Samples
Max
.Stretchλ[−
]
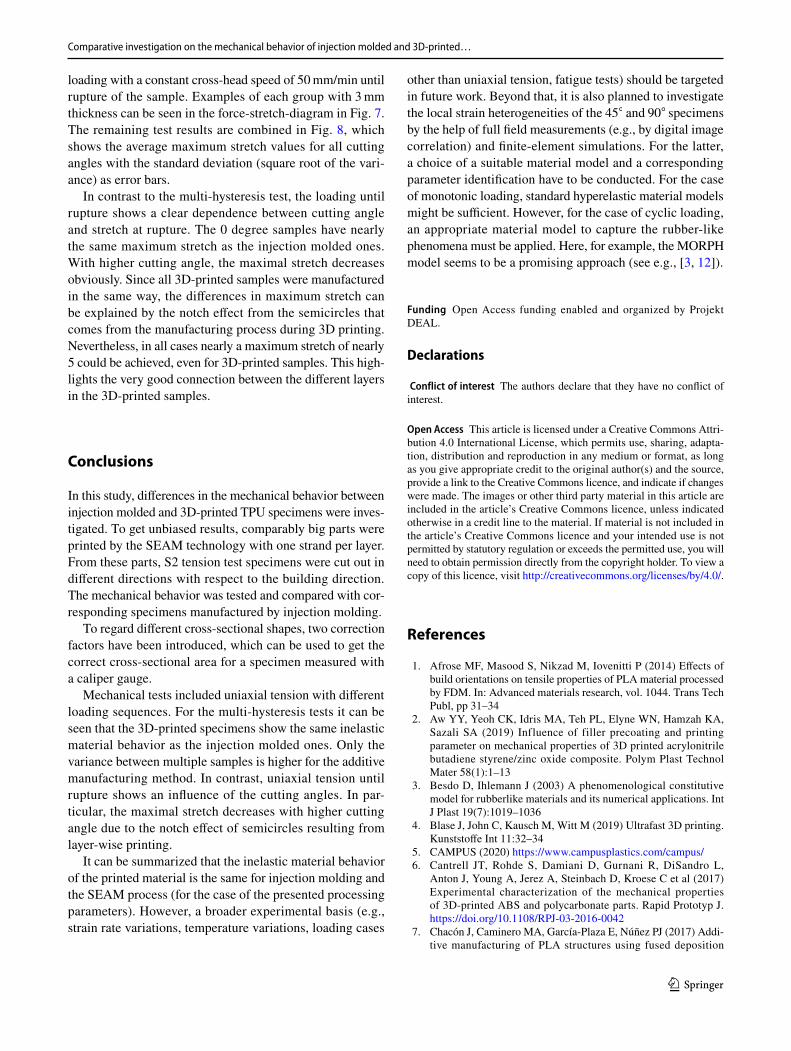
Fig. 8 Maximum stretch values at rupture for 3mm thick samples given as mean values (dots) and standard deviation (error bars)
Comparative investigation on the mechanical behavior of injection molded and 3D-printed…
1 3
loading with a constant cross-head speed of 50mm/min until rupture of the sample. Examples of each group with 3mm thickness can be seen in the force-stretch-diagram in Fig. 7. The remaining test results are combined in Fig. 8, which shows the average maximum stretch values for all cutting angles with the standard deviation (square root of the vari-ance) as error bars.
In contrast to the multi-hysteresis test, the loading until rupture shows a clear dependence between cutting angle and stretch at rupture. The 0 degree samples have nearly the same maximum stretch as the injection molded ones. With higher cutting angle, the maximal stretch decreases obviously. Since all 3D-printed samples were manufactured in the same way, the differences in maximum stretch can be explained by the notch effect from the semicircles that comes from the manufacturing process during 3D printing. Nevertheless, in all cases nearly a maximum stretch of nearly 5 could be achieved, even for 3D-printed samples. This high-lights the very good connection between the different layers in the 3D-printed samples.
Conclusions
In this study, differences in the mechanical behavior between injection molded and 3D-printed TPU specimens were inves-tigated. To get unbiased results, comparably big parts were printed by the SEAM technology with one strand per layer. From these parts, S2 tension test specimens were cut out in different directions with respect to the building direction. The mechanical behavior was tested and compared with cor-responding specimens manufactured by injection molding.
To regard different cross-sectional shapes, two correction factors have been introduced, which can be used to get the correct cross-sectional area for a specimen measured with a caliper gauge.
Mechanical tests included uniaxial tension with different loading sequences. For the multi-hysteresis tests it can be seen that the 3D-printed specimens show the same inelastic material behavior as the injection molded ones. Only the variance between multiple samples is higher for the additive manufacturing method. In contrast, uniaxial tension until rupture shows an influence of the cutting angles. In par-ticular, the maximal stretch decreases with higher cutting angle due to the notch effect of semicircles resulting from layer-wise printing.
It can be summarized that the inelastic material behavior of the printed material is the same for injection molding and the SEAM process (for the case of the presented processing parameters). However, a broader experimental basis (e.g., strain rate variations, temperature variations, loading cases
other than uniaxial tension, fatigue tests) should be targeted in future work. Beyond that, it is also planned to investigate the local strain heterogeneities of the 45◦ and 90◦ specimens by the help of full field measurements (e.g., by digital image correlation) and finite-element simulations. For the latter, a choice of a suitable material model and a corresponding parameter identification have to be conducted. For the case of monotonic loading, standard hyperelastic material models might be sufficient. However, for the case of cyclic loading, an appropriate material model to capture the rubber-like phenomena must be applied. Here, for example, the MORPH model seems to be a promising approach (see e.g., [3, 12]).
Funding Open Access funding enabled and organized by Projekt DEAL.
Declarations
Conflict of interest The authors declare that they have no conflict of interest.
Open Access This article is licensed under a Creative Commons Attri-bution 4.0 International License, which permits use, sharing, adapta-tion, distribution and reproduction in any medium or format, as long as you give appropriate credit to the original author(s) and the source, provide a link to the Creative Commons licence, and indicate if changes were made. The images or other third party material in this article are included in the article’s Creative Commons licence, unless indicated otherwise in a credit line to the material. If material is not included in the article’s Creative Commons licence and your intended use is not permitted by statutory regulation or exceeds the permitted use, you will need to obtain permission directly from the copyright holder. To view a copy of this licence, visit http:// creat iveco mmons. org/ licen ses/ by/4. 0/.
References
1. Afrose MF, Masood S, Nikzad M, Iovenitti P (2014) Effects of build orientations on tensile properties of PLA material processed by FDM. In: Advanced materials research, vol. 1044. Trans Tech Publ, pp 31–34
2. Aw YY, Yeoh CK, Idris MA, Teh PL, Elyne WN, Hamzah KA, Sazali SA (2019) Influence of filler precoating and printing parameter on mechanical properties of 3D printed acrylonitrile butadiene styrene/zinc oxide composite. Polym Plast Technol Mater 58(1):1–13
3. Besdo D, Ihlemann J (2003) A phenomenological constitutive model for rubberlike materials and its numerical applications. Int J Plast 19(7):1019–1036
4. Blase J, John C, Kausch M, Witt M (2019) Ultrafast 3D printing. Kunststoffe Int 11:32–34
5. CAMPUS (2020) https:// www. campu splas tics. com/ campus/ 6. Cantrell JT, Rohde S, Damiani D, Gurnani R, DiSandro L,
Anton J, Young A, Jerez A, Steinbach D, Kroese C et al (2017) Experimental characterization of the mechanical properties of 3D-printed ABS and polycarbonate parts. Rapid Prototyp J. https:// doi. org/ 10. 1108/ RPJ- 03- 2016- 0042
7. Chacón J, Caminero MA, García-Plaza E, Núñez PJ (2017) Addi-tive manufacturing of PLA structures using fused deposition

E. Oelsch et al.
1 3
modelling: effect of process parameters on mechanical properties and their optimal selection. Mater Design 124:143–157
8. Christiyan KJ, Chandrasekhar U, Venkateswarlu K (2016) A study on the influence of process parameters on the mechanical prop-erties of 3D printed ABS composite. In: IOP conference series: materials science and engineering, vol 114. IOP Publishing, p 012109
9. Covestro AG (2015) Technical data sheet Desmopan 487 10. Fernandez-Vicente M, Calle W, Ferrandiz S, Conejero A (2016)
Effect of infill parameters on tensile mechanical behavior in desk-top 3D printing. 3D Print Addit Manuf 3(3):183–192
11. Holzinger M, Blase J, Reinhardt A, Kroll L (2018) New additive manufacturing technology for fibre-reinforced plastics in skeleton structure. J Reinf Plast Compos 37(20):1246–1254
12. Landgraf R, Ihlemann J (2017) Application and extension of the MORPH model to represent curing phenomena in a PU based adhesive. In: Lion A, Johlitz M (eds) Constitutive models for Rub-ber X. CRC Press, Boca Raton, pp 137–143
13. Naranjo-Lozada J, Ahuett-Garza H, Orta-Castañón P, Verbeeten WM, Sáiz-González D (2019) Tensile properties and failure behavior of chopped and continuous carbon fiber composites produced by additive manufacturing. Addit Manuf 26:227–241
14. Puigoriol-Forcada JM, Alsina A, Salazar-Martín AG, Gomez-Gras G, Pérez MA (2018) Flexural fatigue properties of poly-carbonate fused-deposition modelling specimens. Mater Design 155:414–421
15. Reppel T, Weinberg K (2018) Experimental determination of elastic and rupture properties of printed ninjaflex. Technische Mechanik 38(1):104–112
16. Rodríguez-Panes A, Claver J, Camacho AM (2018) The influence of manufacturing parameters on the mechanical behaviour of PLA and ABS pieces manufactured by FDM: a comparative analysis. Materials 11(8):1333
17. Tanikella NG, Wittbrodt B, Pearce JM (2017) Tensile strength of commercial polymer materials for fused filament fabrication 3D printing. Addit Manuf 15:40–47
18. Yarwindran M, Sa’aban NA, Ibrahim M, Periyasamy R (2016) Thermoplastic elastomer infill pattern impact on mechanical prop-erties 3D printed customized orthotic insole. ARPN J Eng Appl Sci 11(10):6519–6524
19. Zaldivar R, Witkin D, McLouth T, Patel D, Schmitt K, Nokes J (2017) Influence of processing and orientation print effects on the mechanical and thermal behavior of 3D-printed ULTEMⓇ 9085 material. Addit Manuf 13:71–80
Publisher’s Note Springer Nature remains neutral with regard to jurisdictional claims in published maps and institutional affiliations.