Electrochemical Investigation of Corrosion Behavior of Epoxy ...
15
coatings Article Electrochemical Investigation of Corrosion Behavior of Epoxy Modified Silicate Zinc-Rich Coatings in 3.5% NaCl Solution Jingtao Wang , Yuhong Qi *, Xu Zhao and Zhanping Zhang Department of Materials Science and Engineering, Dalian Maritime University, Dalian 116026, China; [email protected] (J.W.); [email protected] (X.Z.); [email protected] (Z.Z.) * Correspondence: [email protected] Received: 20 March 2020; Accepted: 28 April 2020; Published: 30 April 2020 Abstract: In order to develop waterborne silicate anticorrosive coatings to replace solvent-based anticorrosive coatings used widely in the shipping industry, epoxy modified silicate emulsions were synthesized with different contents of epoxy resin, then aqueous silicate zinc-rich coatings were prepared with the synthesized silicate emulsion, triethylamine, and zinc powder. The influence of the content of epoxy on the properties and chemical structure of the modified emulsion, mechanical properties of the silicate coatings, and corrosion behavior of the silicate zinc-rich coatings in 3.5% NaCl solution were investigated. The coating samples on steel were measured by the immersion test, Tafel polarization test, and electrochemical impedance spectroscopy (EIS) test with different immersion times. The results showed that epoxy modified silicate emulsions were successfully synthesized. With the increase in epoxy content, the viscosity and solid content of the modified emulsion increased, the impact resistance of the silicate coating rose, the pencil hardness decreased, but the adhesion was not affected. Epoxy modification can reduce, to a certain extent, the corrosion driving force of the zinc rich coating and increase the impedance of the zinc-rich coating, which decreases with the increase of immersion time in 3.5% NaCl solution. With the increase in the epoxy content, the impedance value of the zinc-rich coating increases, indicating that the ability of the coating to resist corrosive media is enhanced. Keywords: anticorrosive; zinc-rich; coating; epoxy; silicate emulsion 1. Introduction To prevent the seawater corrosion of a ship’s hull during its navigation, anticorrosive coatings have always been used worldwide. The mechanism of the anti-corrosion coating is realized through the insulating effect, passivation and corrosion inhibition, and the sacrificial anode protection cathode effect [1,2]. However, most of the anticorrosive coatings are still solvent-based [3]. Epoxy zinc-rich coatings are usually used as a primer coating and have good corrosion resistance [4,5], which is very important for steel anticorrosion in atmosphere and water environments [6]. By using zinc powder as sacrificial anode type filler in a zinc rich coating, which has more negative corrosion potential than the protected substrate, it plays a cathodic protection role on the substrate. However, such coatings will release a large amount of toxic volatile organic compounds (VOCs) during its application [7]. This organic substance will produce photochemical smog and acid rain under ultraviolet radiation, causing serious pollution and damage to people’s lives and the environment. Therefore, with the improvement in people’s quality of life and the enhancement of environmental awareness, countries around the world have formulated laws and regulations to limit VOC emissions, so anticorrosive coatings will inevitably develop in the direction of energy saving, low pollution, and high performance. Coatings 2020, 10, 444; doi:10.3390/coatings10050444 www.mdpi.com/journal/coatings
-
Upload
khangminh22 -
Category
Documents
-
view
1 -
download
0
Transcript of Electrochemical Investigation of Corrosion Behavior of Epoxy ...

coatings
Article
Electrochemical Investigation of Corrosion Behaviorof Epoxy Modified Silicate Zinc-Rich Coatings in 3.5%NaCl Solution
Jingtao Wang , Yuhong Qi *, Xu Zhao and Zhanping Zhang
Department of Materials Science and Engineering, Dalian Maritime University, Dalian 116026, China;[email protected] (J.W.); [email protected] (X.Z.); [email protected] (Z.Z.)* Correspondence: [email protected]
Received: 20 March 2020; Accepted: 28 April 2020; Published: 30 April 2020
Abstract: In order to develop waterborne silicate anticorrosive coatings to replace solvent-basedanticorrosive coatings used widely in the shipping industry, epoxy modified silicate emulsions weresynthesized with different contents of epoxy resin, then aqueous silicate zinc-rich coatings wereprepared with the synthesized silicate emulsion, triethylamine, and zinc powder. The influence ofthe content of epoxy on the properties and chemical structure of the modified emulsion, mechanicalproperties of the silicate coatings, and corrosion behavior of the silicate zinc-rich coatings in 3.5% NaClsolution were investigated. The coating samples on steel were measured by the immersion test, Tafelpolarization test, and electrochemical impedance spectroscopy (EIS) test with different immersiontimes. The results showed that epoxy modified silicate emulsions were successfully synthesized.With the increase in epoxy content, the viscosity and solid content of the modified emulsion increased,the impact resistance of the silicate coating rose, the pencil hardness decreased, but the adhesion wasnot affected. Epoxy modification can reduce, to a certain extent, the corrosion driving force of the zincrich coating and increase the impedance of the zinc-rich coating, which decreases with the increase ofimmersion time in 3.5% NaCl solution. With the increase in the epoxy content, the impedance valueof the zinc-rich coating increases, indicating that the ability of the coating to resist corrosive mediais enhanced.
Keywords: anticorrosive; zinc-rich; coating; epoxy; silicate emulsion
1. Introduction
To prevent the seawater corrosion of a ship’s hull during its navigation, anticorrosive coatingshave always been used worldwide. The mechanism of the anti-corrosion coating is realized throughthe insulating effect, passivation and corrosion inhibition, and the sacrificial anode protection cathodeeffect [1,2]. However, most of the anticorrosive coatings are still solvent-based [3]. Epoxy zinc-richcoatings are usually used as a primer coating and have good corrosion resistance [4,5], which is veryimportant for steel anticorrosion in atmosphere and water environments [6]. By using zinc powder assacrificial anode type filler in a zinc rich coating, which has more negative corrosion potential thanthe protected substrate, it plays a cathodic protection role on the substrate. However, such coatingswill release a large amount of toxic volatile organic compounds (VOCs) during its application [7].This organic substance will produce photochemical smog and acid rain under ultraviolet radiation,causing serious pollution and damage to people’s lives and the environment. Therefore, with theimprovement in people’s quality of life and the enhancement of environmental awareness, countriesaround the world have formulated laws and regulations to limit VOC emissions, so anticorrosivecoatings will inevitably develop in the direction of energy saving, low pollution, and high performance.
Coatings 2020, 10, 444; doi:10.3390/coatings10050444 www.mdpi.com/journal/coatings

Coatings 2020, 10, 444 2 of 15
Based on this, water-based coatings will become the focus of future development in anticorrosivecoatings. This is because water is used as the solvent in water-based anticorrosive coatings, and theintroduction and emission of VOCs are avoided directly from the pollution source. There are manytypes of water-based anticorrosive coatings that mainly include epoxy, acrylic, and inorganic zinc silicatecoatings, among them, water-based epoxy and inorganic zinc-rich coatings have been successfullyindustrialized [8]. Water-based inorganic zinc-rich coatings are mainly composed of film-formingbase materials (including inorganic polymers such as silicates, phosphates, and dichromate) andzinc powder. It has excellent performance in terms of conductivity, weather resistance, and solventresistance [9,10]. The current research is mainly focused on the silicate series, but water-based silicateshave disadvantages such as having more pores on the surface, poor insulating effect, and worsebrittleness of the coating [11–13]. In the process of dehydration polycondensation, the adhesiondecreases with the increase in film thickness, so it is easy for the coating to crack or even fall off in alarge area. To overcome these issues, two technical approaches can be taken. One is to modify thesilicate emulsion, and the other is to decrease the content of zinc powder and enhance the electricalconductivity of coatings with a lower amount of conductive fillers such as polyaniline [11], modifiedzinc particle [12], graphene oxide [13], etc. Nevertheless, the dispersion of the conductive filler andthe contact between the conductive filler and the zinc particles still need to be improved. Epoxy resinhas good flexibility and excellent corrosion resistance [14], and its high permeability can make up forthe porosity defects of water silicate coatings [15,16]. Therefore, epoxy resin was used to modify thesilicate emulsion to decrease the brittleness, improve the impact resistance, and the corrosion resistanceof the water-based silicate coating in this paper.
2. Materials and Methods
2.1. Materials
3-aminopropyltriethoxysilane (LT-550) was obtained from Hubei BlueSky New Material Inc.(Xiantao, China). Its purity specification was analytically pure. E777-2 (nano-modified waterborneinorganic zinc-rich resin) was purchased from Wuhan Modern Industrial Technology Research Institute(Wuhan, China) and its purity specification was chemically pure. Epoxy resin 618 (E51) was obtainedfrom Nantong Xingchen Synthetic Material Co., Ltd. (Nantong, China), and its purity was chemicallypure. Zinc powder was purchased from Jiangsu Kechuang Metal New Material Co., Ltd. (Taizhou,China) and its specification was 500 meshes.
2.2. Preparation Process and Reaction Principle
2.2.1. Synthesis of Epoxy Modified Silicate Emulsion
The content of epoxy resin was controlled to be 10%, 20%, 30%, 40%, and 50% to prepare fiveepoxy modified silicate emulsions (Component A), respectively. The content of epoxy resin refers tothe ratio of the mass of epoxy resin to the sum of the mass of epoxy resin and water-based silicate resin.Their formulations are listed in Table 1.
Table 1. Formulation of the epoxy modified silicate emulsion.
Raw Materials/wt.% G10 G20 G30 G40 G50
E51 9.5 18.1 26 33.3 40LT550 5.0 9.5 13 16.7 20E777-2 85.5 72.4 61 50 40
The first stage is to use LT550 to modify the epoxy resin; the second stage is the reaction betweenthe hydroxyl group produced by the hydrolysis of LT550 and the aqueous silicate. The reactionprinciples of the epoxy modified silicate emulsion can be found in [17]. The specific process was as

Coatings 2020, 10, 444 3 of 15
follows: first, pour LT550 and E51 into a 500 mL metal mixing tank at a certain ratio and stir with aBGD750 sand mill dispersing and mixing multi-purpose machine (Guangzhou Biuged LaboratoryInstrument Supplies Co., Ltd., Guangzhou, China) for 5 min. After it is evenly dispersed, add E777-2,and finally disperse at a speed of 1000 rpm for 15 min. After the dispersion is completed, the mixtureis then poured into a clean white plastic box.
2.2.2. Formulation and Preparation of the Zinc-Rich Coating
To ensure good electrical contact between the zinc particles and cathodic protection for the steelsubstrate, a high pigment concentration of 92 wt.% zinc powders is required in the dry film [18].The anticorrosive zinc-rich paint was prepared with the following composition and consisted of threecomponents: Component A is the silicate emulsion E777-2 or epoxy modified silicate emulsion preparedas above-mentioned; Component B is triethylamine; and Component C is the zinc powders. The massratio of the three components was Component A: Component B:Component C = 100:1.25:233. They weremixed and then coated and cured on a steel plate for 60 µm dry film thick (DFT). The preparationprocess of the coating was performed with a BGD 750 multifunction high speed dispersing machine(Guangzhou Biuged Laboratory Instrument Supplies Co., Ltd., Guangzhou, China). ComponentsA and B were added to a 500 mL metal stirring tank at a speed of 500 pm before zinc powder wasadded to the stirring tank, according to the amount in the formula. The speed was then increased to1500 rpm and stirred for 15 min. Finally, the prepared coating was brushed on the surface of a steelplate with a size of 150 mm × 70 mm × 1 mm, which was polished with 100-grit sandpaper and washedwith absolute ethanol. N0 represents the water-based silicate zinc-rich coatings, and the coatingsprepared with the epoxy modified silicate emulsions listed in Table 1 are denoted by G10, G20, G30,G40, and G50.
2.3. Measurement and Characterization
2.3.1. Fourier Transform Infrared Spectroscopy
The emulsion samples were tested by the attenuation total reflection (ATR) method with Fouriertransform infrared spectroscopy (FTIR) from PERKINELMER (Waltham, MA, USA). The scanningrange was 4000–650 cm−1, the resolution was 2 cm−1, and the number of scans was 32 times.
2.3.2. Determination of Solid Content
The aluminum foil box was dried in a 140 C vacuum drying box for 20 min and cooled to roomtemperature, then the box was weighed and its mass was recorded as m1. Then, the modified emulsionwas added to the box, weighed, and the mass recorded as m2, and then placed in a 140 C vacuumdrying box, dried for 1 h, and then cooled again to room temperature, Finally, weigh the box with thedried modified emulsion, record it as m3, then the solid content = 100% × (m3 − m1)/(m2 − m1).
2.3.3. Basic Mechanical Properties
According to GB/T 1720-89 [19], the adhesion of the anticorrosion coatings was evaluated by thespiral scoring method and the film adhesion tester (QFZ-II, manufacturer, city, China). According toGB/T6379-2006 [20] and GB/T1732-93 [21], the pencil hardness and impact strength of anticorrosioncoatings were evaluated by the pencil-scratch hardness tester (QHQ-A) (Tianjin Yonglida MaterialTesting Machine Co., Ltd., Tianjin, China) and paint film impactor (QCJ) (Tianjin Yonglida MaterialTesting Machine Co., Ltd., Tianjin, China), respectively.
2.3.4. Film Thickness Measurement
The thickness of each sample was measured using a QuaNix 7500 coating meter (AUTOMATIONDR.NIX GmbH KÖLN, Köln, Germany), and each sample was tested at five points; the mean wasreported in this paper.
Coatings 2020, 10, 444 4 of 15
2.3.5. Immersion Test in 3.5% NaCl Solution
The surface of the steel plate with a size of 150 mm × 70 mm × 1 mm was polished with 100-gritsandpaper and washed with absolute ethanol, then painted with the prepared aqueous silicate zinc-richcoating and edge-sealed with epoxy resin. Then, the sample was immersed in 3.5% NaCl solution andthe test temperature was 23 ± 2 C. On the third day, the seventh day, the tenth day, and the fourteenthday, the samples were taken for observation and electrochemical measurement.
2.3.6. Electrochemical Test
The polarization curve and electrochemical impedance spectroscopy (EIS) were performed using aZAHNER IM6ex electrochemical workstation (ZAHNER-elektrik GmbH & Co. KG, Kronach, Germany)with a Coating & Laminate Tester (COLT) (ZAHNER-elektrik GmbH & Co. KG, Kronach, Germany)module under a two-electrode system. The sample plate is the working electrode and the shieldedcylinder copper electrode is the counter. The detailed test operation can be found in [22]. The contactarea between the coating and the corrosive medium (3.5% NaCl solution) was 19.625 cm2, and themeasurement range of the polarization curve was −200 to 200 mV, scanning speed was 1 mV/s, EIS witha perturbation potential of 10 mV, and a frequency range of 100 mHz to 100 kHz. The test results weretreated using Z2.03 USB software and then analyzed using ZSimp Win3.2.1 software. The impedanceat 100 mHz was compared in this investigation.
3. Results
3.1. Emulsion Properties
Their viscosity was measured by a NDJ-1 rotational viscometer (Shanghai Hengping ScientificInstruments Co., Ltd., Shanghai, China). The viscosity of the silicate emulsion purchased was 10 mPa·s,and the viscosity of the epoxy modified silicate emulsion with 10%, 20%, 30%, 40%, and 50% epoxycontent was 19.5, 40.5, 54, 60, and 70 mPa·s, respectively. It clearly shows that the viscosity of themodified emulsion increased due to the introduction of the epoxy resin. The pH value before and aftermodification was measured with a pH-10 m (Shanghai LICHEN-BX Instruments Technology Co., Ltd.,Shanghai, China). The results showed that the pH value was 12.5, which did not change before andafter the modification, and both were shown to be strongly alkaline. In addition, the solid content ofthe modified emulsion increased linearly with epoxy content and was higher than that of the silicateemulsion. The solid content of the silicate emulsion was above 27%. While the solid content of themodified emulsion with epoxy content of 10%, 20%, 30%, 40%, and 50% was more than 28%, 33%, 37%,40%, and 43%, respectively.
3.2. Chemical Structure
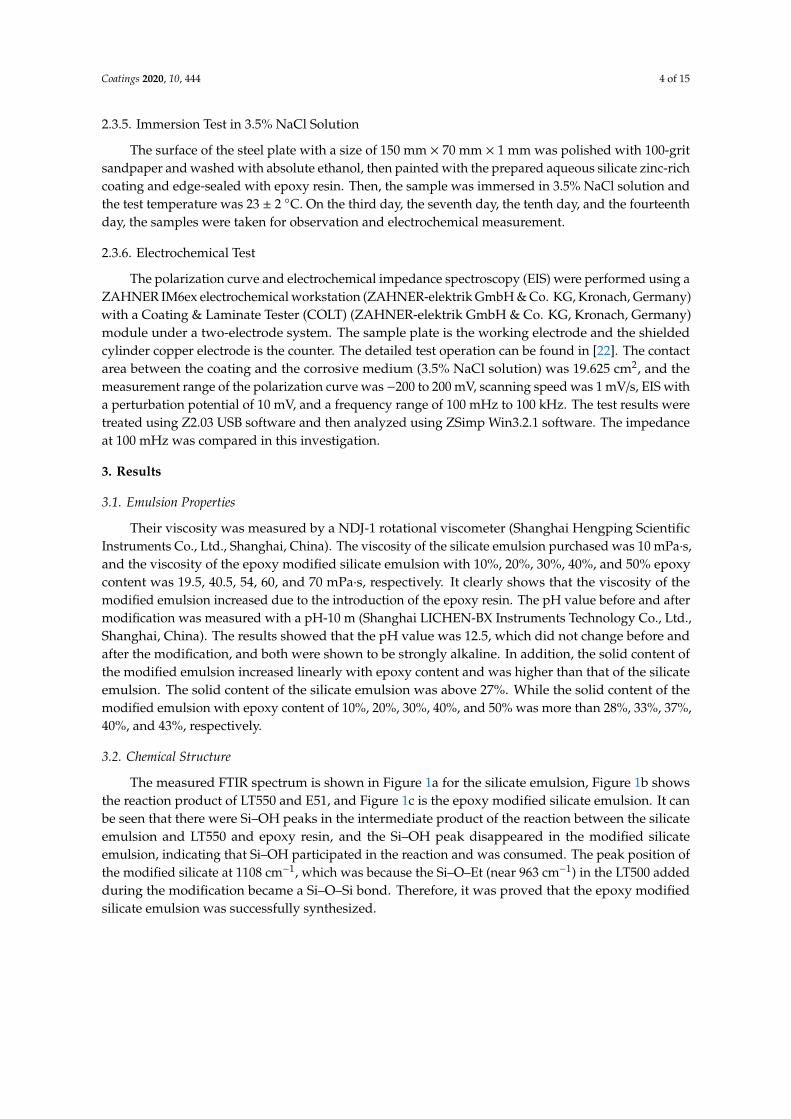
The measured FTIR spectrum is shown in Figure 1a for the silicate emulsion, Figure 1b showsthe reaction product of LT550 and E51, and Figure 1c is the epoxy modified silicate emulsion. It canbe seen that there were Si–OH peaks in the intermediate product of the reaction between the silicateemulsion and LT550 and epoxy resin, and the Si–OH peak disappeared in the modified silicateemulsion, indicating that Si–OH participated in the reaction and was consumed. The peak position ofthe modified silicate at 1108 cm−1, which was because the Si–O–Et (near 963 cm−1) in the LT500 addedduring the modification became a Si–O–Si bond. Therefore, it was proved that the epoxy modifiedsilicate emulsion was successfully synthesized.
Coatings 2020, 10, 444 5 of 15Coatings 2020, 10, x FOR PEER REVIEW 5 of 15
4000 3500 3000 2500 2000 1500 1000 500-0.2
0.0
0.2
0.4
0.6
0.8
1.0
1.2
(a)
Si-OH1022
C=C1644
3348
2326
-OH in H2O
Abs
orba
nce
Wavenumber / cm-1
4000 3500 3000 2500 2000 1500 1000 500
0.0
0.2
0.4
0.6
0.8
1.0
(b)
779.5Si-C
953 Si-O-Et1025 Si-OH
1258.5 C-O
1402 C-H stretching vibration
C-H in plane bending2972.5
3200 -OH in H2O
Abs
orba
nce
Wavenumber / cm-1
4000 3500 3000 2500 2000 1500 1000 500
0.0
0.2
0.4
0.6
0.8
C-O
C-H stretching vibration
(c)
Abs
orba
nce
Wavenumber / cm-1
1108
1310
1454
804
Si-O-Si
Si-C
Figure 1. Fourier transform infrared (FTIR) spectrum. (a) Silicate emulsion E777-2; (b) Product of LT550 modified E51; (c) Modified silicate emulsion with 20% epoxy
3.3. Basic Properties of the Silicate Coatings
Measured results showed that the average dry film thickness of each coating was between 58–65 μm, all coatings showed the best adhesion (grade 1). With the increase in epoxy content from 10% to 50%, the hardness decreased from 6H to 4H. The impact resistance of the epoxy modified silicate coating was higher than that of the silicate coating (30 kg⋅cm) and it increased with epoxy content. Once the epoxy content reached 20%, as shown in Figure 2, the impact resistance of the epoxy
Figure 1. Fourier transform infrared (FTIR) spectrum. (a) Silicate emulsion E777-2; (b) Product ofLT550 modified E51; (c) Modified silicate emulsion with 20% epoxy.
3.3. Basic Properties of the Silicate Coatings
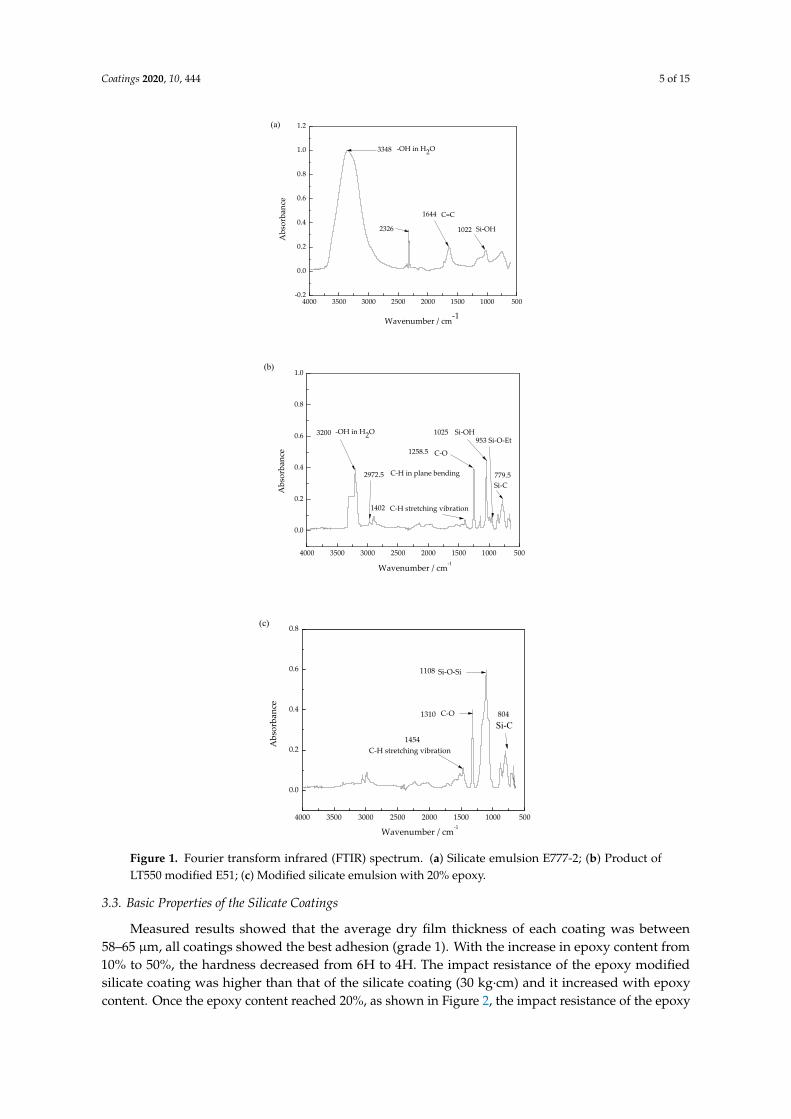
Measured results showed that the average dry film thickness of each coating was between58–65 µm, all coatings showed the best adhesion (grade 1). With the increase in epoxy content from10% to 50%, the hardness decreased from 6H to 4H. The impact resistance of the epoxy modifiedsilicate coating was higher than that of the silicate coating (30 kg·cm) and it increased with epoxycontent. Once the epoxy content reached 20%, as shown in Figure 2, the impact resistance of the epoxy
Coatings 2020, 10, 444 6 of 15
modified silicate coating could reach the maximum measurement value (50 kg·cm). This shows thatthe introduction of epoxy resin can improve the impact resistance of a silicate coating.
Coatings 2020, 10, x FOR PEER REVIEW 6 of 15
modified silicate coating could reach the maximum measurement value (50 kg⋅cm). This shows that the introduction of epoxy resin can improve the impact resistance of a silicate coating.
0 10 20 30 40 502
3
4
5
6
7
Content of epoxy / wt %
Penc
il ha
rdne
ss /
H
25
35
45
55
20
30
40
50
60
Impa
ct re
sist
ance
/ kg
⋅cm
Figure 2. Hardness and impact resistance of the studied coatings with epoxy content.
3.4. Corrosion Performance of the Coatings
3.4.1. Effect of Epoxy Content on Corrosive Performance
Figure 3 shows the photos of the six coatings before immersion in the 3.5% NaCl solution. The results of the Tafel polarization curves are shown in Figure 4a. The open circuit potential (OCP) for the silicate zinc-rich coating was −0.427 V. The open circuit potential for the modified coating G50 was about −0.4 V. As the epoxy content increased, the open circuit potential for the modified coating showed an increasing trend overall (Figure 4b), which is because the surface of the silicate coating is porous and adding epoxy resin results in increasing the solid content of the modified emulsion and a denser coating. This makes it less hollow in the modified coating. With the increase in the epoxy content, more and more micropores are covered by epoxy resin, which increases the open circuit potential of the coating. It also leads to an increase in the impedance of the modified coating, as shown in Figure 5. With the increase in the epoxy content, the impedance value of the modified coating showed an overall upward trend, ZG50 > ZG40 > ZG30 > ZG20 > ZG10 > ZN0, indicating that the ability of the coating to resist corrosive media is enhanced. The reason is that the solid content of the modified emulsion increased with the epoxy content and was higher than that of the silicate emulsion, so the compactness and barrier effect of the coating was improved. The measured solid content of the silicate emulsion was above 27%, while the solid content of the modified emulsion with epoxy contents of 10%, 20%, 30%, 40%, and 50% was more than 28%, 33%, 37%, 40%, and 43%, respectively. However, the impedance of the coating was only about 2.1 × 10⁵ Ω⋅cm2, which indicates that the zinc rich coating did not have good insulating performance, and had good conductivity characteristics, that is to say, the zinc powder had good contact conductivity and acted as a sacrificial anode. As shown in Figure 6, two time constants appeared immediately in the Bode and Nyquist diagrams of the zinc-rich coatings after the immersion test for 0.5 h. It indicates that once the coating is immersed in the 3.5% NaCl solution, the anodic dissolution reaction immediately occurs in zinc powder on the surface of the zinc-rich coating, which plays the role of sacrificial anode to protect the steel. The radius of the capacitive arc of the N0 coating in the Nyquist diagram was the smallest, which indicates that the impedance of the coating was the lowest and that the barrier effect on the medium as the worst. The radius of the capacitive arc and the impedance of the epoxy modified coating became larger with the increase in epoxy content, which indicates that the barrier effect of the G50 coating was best on the 3.5% NaCl solution.
Figure 2. Hardness and impact resistance of the studied coatings with epoxy content.
3.4. Corrosion Performance of the Coatings
3.4.1. Effect of Epoxy Content on Corrosive Performance
Figure 3 shows the photos of the six coatings before immersion in the 3.5% NaCl solution.The results of the Tafel polarization curves are shown in Figure 4a. The open circuit potential (OCP)for the silicate zinc-rich coating was −0.427 V. The open circuit potential for the modified coating G50was about −0.4 V. As the epoxy content increased, the open circuit potential for the modified coatingshowed an increasing trend overall (Figure 4b), which is because the surface of the silicate coatingis porous and adding epoxy resin results in increasing the solid content of the modified emulsionand a denser coating. This makes it less hollow in the modified coating. With the increase in theepoxy content, more and more micropores are covered by epoxy resin, which increases the opencircuit potential of the coating. It also leads to an increase in the impedance of the modified coating,as shown in Figure 5. With the increase in the epoxy content, the impedance value of the modifiedcoating showed an overall upward trend, ZG50 > ZG40 > ZG30 > ZG20 > ZG10 > ZN0, indicating that theability of the coating to resist corrosive media is enhanced. The reason is that the solid content of themodified emulsion increased with the epoxy content and was higher than that of the silicate emulsion,so the compactness and barrier effect of the coating was improved. The measured solid content ofthe silicate emulsion was above 27%, while the solid content of the modified emulsion with epoxycontents of 10%, 20%, 30%, 40%, and 50% was more than 28%, 33%, 37%, 40%, and 43%, respectively.However, the impedance of the coating was only about 2.1 × 10⁵ Ω·cm2, which indicates that the zincrich coating did not have good insulating performance, and had good conductivity characteristics, thatis to say, the zinc powder had good contact conductivity and acted as a sacrificial anode. As shown inFigure 6, two time constants appeared immediately in the Bode and Nyquist diagrams of the zinc-richcoatings after the immersion test for 0.5 h. It indicates that once the coating is immersed in the 3.5%NaCl solution, the anodic dissolution reaction immediately occurs in zinc powder on the surface ofthe zinc-rich coating, which plays the role of sacrificial anode to protect the steel. The radius of thecapacitive arc of the N0 coating in the Nyquist diagram was the smallest, which indicates that theimpedance of the coating was the lowest and that the barrier effect on the medium as the worst. Theradius of the capacitive arc and the impedance of the epoxy modified coating became larger with theincrease in epoxy content, which indicates that the barrier effect of the G50 coating was best on the3.5% NaCl solution.

Coatings 2020, 10, 444 7 of 15Coatings 2020, 10, x FOR PEER REVIEW 7 of 15
Figure 3. The photos of the coatings before the immersion test.
Figure 4. Polarization test results of the zinc-rich coatings. (a) Tafel curves, (b) Open circuit potential.
0 10 20 30 40 500
5x10⁴
1x10⁵
2x10⁵
2x10⁵
3x10⁵
|Z| /
Ω⋅cm
2
Content of epoxy / %
Figure 5. Impedance of the zinc-rich coatings with epoxy content.
Figure 3. The photos of the coatings before the immersion test.
Coatings 2020, 10, x; doi: FOR PEER REVIEW www.mdpi.com/journal/coatings
-0.7 -0.6 -0.5 -0.4 -0.3 -0.2 -0.110-8
10-7
10-6
10-5
10-4
Potential vs.Cu / V
N0 G10 G20
C
urre
nt /
A/c
m2
G30 G40 G50
(a)
Coating
0 10 20 30 40 50-0.45
-0.44
-0.43
-0.42
-0.41
-0.40
-0.39
-0.38
Content of epoxy / %
Ope
n ci
rcui
t pot
entia
l VS.
Cu /
V
(b)
Figure 4. Polarization test results of the zinc-rich coatings. (a) Tafel curves, (b) Open circuit potential.
Coatings 2020, 10, x FOR PEER REVIEW 7 of 15
Figure 3. The photos of the coatings before the immersion test.
Figure 4. Polarization test results of the zinc-rich coatings. (a) Tafel curves, (b) Open circuit potential.
0 10 20 30 40 500
5x10⁴
1x10⁵
2x10⁵
2x10⁵
3x10⁵
|Z| /
Ω⋅cm
2
Content of epoxy / %
Figure 5. Impedance of the zinc-rich coatings with epoxy content. Figure 5. Impedance of the zinc-rich coatings with epoxy content.
Coatings 2020, 10, x FOR PEER REVIEW 8 of 15
100m 1 10 100 1k 10k 100k1x100
1x101
1x10²
1x10³
1x10⁴
1x10⁵
1x10⁶
|Z
| / Ω
·cm
2
Frequency / Hz
N0 G10 G20
0
10
20
30
40
50
60
70
80
90 G30 G40 G50
-Pha
se a
ngle
/ °
(a)
0.0 5.0x10⁴ 1.0x10⁵ 1.5x10⁵ 2.0x1050.0
2.0x10⁴
4.0x10⁴
6.0x10⁴
8.0x10⁴
1.0x10⁵
0.0 5.0x10³ 1.0x10⁴ 1.5x10⁴ 2.0x1040.0
5.0x10³
1.0x10⁴
1.5x10⁴
2.0x10⁴
G30 G40 G50
Z″
/ Ω
·cm
2
Z′ / Ω·cm2
N0 G10 G20
(b)
Z″
/ Ω
·cm
2
Z′ / Ω·cm2
N0 G10 G20
Figure 6. EIS plots of the coatings at 0.5 h immersion. (a) Bode, (b) Nyquist diagrams.
3.4.2. Corrosive Performance of Coatings with Immersion Time
The pictures of the six samples immersed in 3.5% NaCl solution for 336 h are shown in Figure 7. Some red-brown rust spots began to appear on the surface of the silicate coating N0 and G10, while there was no visible change on the surface of other coatings. A confocal laser scanning microscope (CLSM) OLS4000 (OLYMPUS (China) Co. Ltd., Beijing, China) was used to observe the surface of the coatings. The CLSM morphology of these coatings before immersion is as shown in Figure 8a, in which the silver balls are zinc particles. The morphology of rust zone in coating N0 was showed in Figure 8b, in which there are some white and red-brown corrosion products together. The rust zone in coating G10 presented a similar morphology, as shown in Figure 8c, but with much less white and brown corrosion products. As the introduction of epoxy resin increased the insulating effect of the coating, the corrosion of the steel substrate was delayed with increasing epoxy content.
Figure 7. Photos of the coatings immersed in the 3.5% NaCl solution for 336 h.
Figure 8. CLSM morphology of the coatings immersed in the 3.5% NaCl solution for 336 h. (a) Coating G30, (b) rust zone in coating N0, (c) coating G10.
Figure 6. EIS plots of the coatings at 0.5 h immersion. (a) Bode, (b) Nyquist diagrams.

Coatings 2020, 10, 444 8 of 15
3.4.2. Corrosive Performance of Coatings with Immersion Time
The pictures of the six samples immersed in 3.5% NaCl solution for 336 h are shown in Figure 7.Some red-brown rust spots began to appear on the surface of the silicate coating N0 and G10, whilethere was no visible change on the surface of other coatings. A confocal laser scanning microscope(CLSM) OLS4000 (OLYMPUS (China) Co. Ltd., Beijing, China) was used to observe the surface ofthe coatings. The CLSM morphology of these coatings before immersion is as shown in Figure 8a, inwhich the silver balls are zinc particles. The morphology of rust zone in coating N0 was showed inFigure 8b, in which there are some white and red-brown corrosion products together. The rust zone incoating G10 presented a similar morphology, as shown in Figure 8c, but with much less white andbrown corrosion products. As the introduction of epoxy resin increased the insulating effect of thecoating, the corrosion of the steel substrate was delayed with increasing epoxy content.
Coatings 2020, 10, x FOR PEER REVIEW 8 of 15
100m 1 10 100 1k 10k 100k1x100
1x101
1x10²
1x10³
1x10⁴
1x10⁵
1x10⁶
|Z
| / Ω
·cm
2
Frequency / Hz
N0 G10 G20
0
10
20
30
40
50
60
70
80
90 G30 G40 G50
-Pha
se a
ngle
/ °
(a)
0.0 5.0x10⁴ 1.0x10⁵ 1.5x10⁵ 2.0x1050.0
2.0x10⁴
4.0x10⁴
6.0x10⁴
8.0x10⁴
1.0x10⁵
0.0 5.0x10³ 1.0x10⁴ 1.5x10⁴ 2.0x1040.0
5.0x10³
1.0x10⁴
1.5x10⁴
2.0x10⁴
G30 G40 G50
Z″
/ Ω
·cm
2
Z′ / Ω·cm2
N0 G10 G20
(b)
Z″
/ Ω
·cm
2
Z′ / Ω·cm2
N0 G10 G20
Figure 6. EIS plots of the coatings at 0.5 h immersion. (a) Bode, (b) Nyquist diagrams.
3.4.2. Corrosive Performance of Coatings with Immersion Time
The pictures of the six samples immersed in 3.5% NaCl solution for 336 h are shown in Figure 7. Some red-brown rust spots began to appear on the surface of the silicate coating N0 and G10, while there was no visible change on the surface of other coatings. A confocal laser scanning microscope (CLSM) OLS4000 (OLYMPUS (China) Co. Ltd., Beijing, China) was used to observe the surface of the coatings. The CLSM morphology of these coatings before immersion is as shown in Figure 8a, in which the silver balls are zinc particles. The morphology of rust zone in coating N0 was showed in Figure 8b, in which there are some white and red-brown corrosion products together. The rust zone in coating G10 presented a similar morphology, as shown in Figure 8c, but with much less white and brown corrosion products. As the introduction of epoxy resin increased the insulating effect of the coating, the corrosion of the steel substrate was delayed with increasing epoxy content.
Figure 7. Photos of the coatings immersed in the 3.5% NaCl solution for 336 h.
Figure 8. CLSM morphology of the coatings immersed in the 3.5% NaCl solution for 336 h. (a) Coating G30, (b) rust zone in coating N0, (c) coating G10.
Figure 7. Photos of the coatings immersed in the 3.5% NaCl solution for 336 h.
Coatings 2020, 10, x FOR PEER REVIEW 8 of 15
100m 1 10 100 1k 10k 100k1x100
1x101
1x10²
1x10³
1x10⁴
1x10⁵
1x10⁶
|Z
| / Ω
·cm
2
Frequency / Hz
N0 G10 G20
0
10
20
30
40
50
60
70
80
90 G30 G40 G50
-Pha
se a
ngle
/ °
(a)
0.0 5.0x10⁴ 1.0x10⁵ 1.5x10⁵ 2.0x1050.0
2.0x10⁴
4.0x10⁴
6.0x10⁴
8.0x10⁴
1.0x10⁵
0.0 5.0x10³ 1.0x10⁴ 1.5x10⁴ 2.0x1040.0
5.0x10³
1.0x10⁴
1.5x10⁴
2.0x10⁴
G30 G40 G50
Z″
/ Ω
·cm
2
Z′ / Ω·cm2
N0 G10 G20
(b)
Z″
/ Ω
·cm
2
Z′ / Ω·cm2
N0 G10 G20
Figure 6. EIS plots of the coatings at 0.5 h immersion. (a) Bode, (b) Nyquist diagrams.
3.4.2. Corrosive Performance of Coatings with Immersion Time
The pictures of the six samples immersed in 3.5% NaCl solution for 336 h are shown in Figure 7. Some red-brown rust spots began to appear on the surface of the silicate coating N0 and G10, while there was no visible change on the surface of other coatings. A confocal laser scanning microscope (CLSM) OLS4000 (OLYMPUS (China) Co. Ltd., Beijing, China) was used to observe the surface of the coatings. The CLSM morphology of these coatings before immersion is as shown in Figure 8a, in which the silver balls are zinc particles. The morphology of rust zone in coating N0 was showed in Figure 8b, in which there are some white and red-brown corrosion products together. The rust zone in coating G10 presented a similar morphology, as shown in Figure 8c, but with much less white and brown corrosion products. As the introduction of epoxy resin increased the insulating effect of the coating, the corrosion of the steel substrate was delayed with increasing epoxy content.
Figure 7. Photos of the coatings immersed in the 3.5% NaCl solution for 336 h.
Figure 8. CLSM morphology of the coatings immersed in the 3.5% NaCl solution for 336 h. (a) Coating G30, (b) rust zone in coating N0, (c) coating G10. Figure 8. CLSM morphology of the coatings immersed in the 3.5% NaCl solution for 336 h. (a) CoatingG30, (b) rust zone in coating N0, (c) coating G10.
The evolution of the self-corrosion potential of each coating sample with immersion time is shownin Figure 9. For the unmodified silicate coating N0, its open circuit potential increased with immersiontime. However, the open circuit potential of the epoxy modified silicate coating decreased during 72h, then increased continuously. The increase of the potential decreased with the increase in epoxycontent. This shows that epoxy modification can reduce, to a certain extent, the corrosion drivingforce of the zinc rich coating. Similarly, as shown in Figure 10, the impedance of the unmodifiedsilicate coating N0 hardly decreased, however, the impedance of the epoxy modified coating obviouslydecreased with the increase in immersion time. For example, the impedance of unmodified silicatecoating N0 decreased from 2.6 × 10⁴ Ω·cm2 at the beginning of 0.5 h to 1.8 × 10⁴ Ω·cm2 after 72 hof immersion; the impedance of the G30 coating decreased from 9.8 × 10⁴ Ω·cm2 at the beginningof 0.5 h to 6.3 × 10⁴ Ω·cm2 after 72 h of immersion. The impedance of the G50 coating decreasedfrom 2.1 × 10⁵ Ω·cm2 at the beginning of 0.5 h to 105 Ω·cm2 after 72 h of immersion. The coating’simpedance decreased rapidly at the beginning of immersion test and then slowed down. The extent of

Coatings 2020, 10, 444 9 of 15
the decline increased with the increase in epoxy content. With the further prolongation of immersiontime, the impedance of the coating gradually decreased. After 168 h, the impedance of the G30 coatingwas maintained at 4.8 × 10⁴ Ω·cm2. The impedance of the G50 coating decreased continuously from5.4 × 104 Ω·cm2 after 168 h of immersion to 3.7 × 10⁴ Ω·cm2 after 240 h of immersion, and thenremained unchanged. This shows that the epoxy modification can increase the insulation effect of azinc rich coating on a corrosion medium to a certain extent.
Coatings 2020, 10, x FOR PEER REVIEW 9 of 15
The evolution of the self-corrosion potential of each coating sample with immersion time is shown in Figure 9. For the unmodified silicate coating N0, its open circuit potential increased with immersion time. However, the open circuit potential of the epoxy modified silicate coating decreased during 72 h, then increased continuously. The increase of the potential decreased with the increase in epoxy content. This shows that epoxy modification can reduce, to a certain extent, the corrosion driving force of the zinc rich coating. Similarly, as shown in Figure 10, the impedance of the unmodified silicate coating N0 hardly decreased, however, the impedance of the epoxy modified coating obviously decreased with the increase in immersion time. For example, the impedance of unmodified silicate coating N0 decreased from 2.6 × 10⁴ Ω·cm2 at the beginning of 0.5 h to 1.8 × 10⁴ Ω·cm2 after 72 h of immersion; the impedance of the G30 coating decreased from 9.8 × 10⁴ Ω·cm2 at the beginning of 0.5 h to 6.3 × 10⁴ Ω·cm2 after 72 h of immersion. The impedance of the G50 coating decreased from 2.1 × 10⁵ Ω·cm2 at the beginning of 0.5 h to 105 Ω·cm2 after 72 h of immersion. The coating’s impedance decreased rapidly at the beginning of immersion test and then slowed down. The extent of the decline increased with the increase in epoxy content. With the further prolongation of immersion time, the impedance of the coating gradually decreased. After 168 h, the impedance of the G30 coating was maintained at 4.8 × 10⁴ Ω·cm2. The impedance of the G50 coating decreased continuously from 5.4 × 10⁴ Ω·cm2 after 168 h of immersion to 3.7 × 10⁴ Ω·cm2 after 240 h of immersion, and then remained unchanged. This shows that the epoxy modification can increase the insulation effect of a zinc rich coating on a corrosion medium to a certain extent.
Bode and Nyquist diagrams of all coatings with different immersion time are shown in Figures 11 and 12, respectively. From the beginning of the immersion test to 168 h, the Nyquist diagram of each coating showed two time constants, the zinc powder in the coating started to react with the NaCl solution and provided cathodic protection for the steel. The semicircle in the high frequency domain represents the impedance and capacitance of the coating, and the semicircle in the low frequency domain represents the impedance and capacitance of the zinc dissolution reaction. The radius of the impedance arc for each coating decreased rapidly with the increase in immersion time.
0 48 96 144 192 240 288 336-0.50
-0.48
-0.46
-0.44
-0.42
-0.40
-0.38
-0.36
-0.34
-0.32
-0.30Immersion in 3.5% NaCl solution
Ope
n ci
rcui
t pot
entia
l vs.C
u / V
Time / h
N0 G10 G20 G30 G40 G50
Coating
0 48 96 144 192 240 288 3360.0
5.0x10⁴
1.0x10⁵
1.5x10⁵
2.0x10⁵
2.5x10⁵
G30 G40 G50
|Z
| / Ω
·cm
2
Time / h
N0 G10 G20
Immersion in 3.5% NaCl solution
Figure 9. Evolution of the coating sample open circuit potential with immersion time in 3.5% NaCl solution.
Figure 10. Impedance change of the coatings immersed in 3.5% NaCl solution.
Figure 9. Evolution of the coating sample open circuit potential with immersion time in 3.5%NaCl solution.
Coatings 2020, 10, x FOR PEER REVIEW 9 of 15
The evolution of the self-corrosion potential of each coating sample with immersion time is shown in Figure 9. For the unmodified silicate coating N0, its open circuit potential increased with immersion time. However, the open circuit potential of the epoxy modified silicate coating decreased during 72 h, then increased continuously. The increase of the potential decreased with the increase in epoxy content. This shows that epoxy modification can reduce, to a certain extent, the corrosion driving force of the zinc rich coating. Similarly, as shown in Figure 10, the impedance of the unmodified silicate coating N0 hardly decreased, however, the impedance of the epoxy modified coating obviously decreased with the increase in immersion time. For example, the impedance of unmodified silicate coating N0 decreased from 2.6 × 10⁴ Ω·cm2 at the beginning of 0.5 h to 1.8 × 10⁴ Ω·cm2 after 72 h of immersion; the impedance of the G30 coating decreased from 9.8 × 10⁴ Ω·cm2 at the beginning of 0.5 h to 6.3 × 10⁴ Ω·cm2 after 72 h of immersion. The impedance of the G50 coating decreased from 2.1 × 10⁵ Ω·cm2 at the beginning of 0.5 h to 105 Ω·cm2 after 72 h of immersion. The coating’s impedance decreased rapidly at the beginning of immersion test and then slowed down. The extent of the decline increased with the increase in epoxy content. With the further prolongation of immersion time, the impedance of the coating gradually decreased. After 168 h, the impedance of the G30 coating was maintained at 4.8 × 10⁴ Ω·cm2. The impedance of the G50 coating decreased continuously from 5.4 × 10⁴ Ω·cm2 after 168 h of immersion to 3.7 × 10⁴ Ω·cm2 after 240 h of immersion, and then remained unchanged. This shows that the epoxy modification can increase the insulation effect of a zinc rich coating on a corrosion medium to a certain extent.
Bode and Nyquist diagrams of all coatings with different immersion time are shown in Figures 11 and 12, respectively. From the beginning of the immersion test to 168 h, the Nyquist diagram of each coating showed two time constants, the zinc powder in the coating started to react with the NaCl solution and provided cathodic protection for the steel. The semicircle in the high frequency domain represents the impedance and capacitance of the coating, and the semicircle in the low frequency domain represents the impedance and capacitance of the zinc dissolution reaction. The radius of the impedance arc for each coating decreased rapidly with the increase in immersion time.
0 48 96 144 192 240 288 336-0.50
-0.48
-0.46
-0.44
-0.42
-0.40
-0.38
-0.36
-0.34
-0.32
-0.30Immersion in 3.5% NaCl solution
Ope
n ci
rcui
t pot
entia
l vs.C
u / V
Time / h
N0 G10 G20 G30 G40 G50
Coating
0 48 96 144 192 240 288 3360.0
5.0x10⁴
1.0x10⁵
1.5x10⁵
2.0x10⁵
2.5x10⁵
G30 G40 G50
|Z
| / Ω
·cm
2
Time / h
N0 G10 G20
Immersion in 3.5% NaCl solution
Figure 9. Evolution of the coating sample open circuit potential with immersion time in 3.5% NaCl solution.
Figure 10. Impedance change of the coatings immersed in 3.5% NaCl solution.
Figure 10. Impedance change of the coatings immersed in 3.5% NaCl solution.
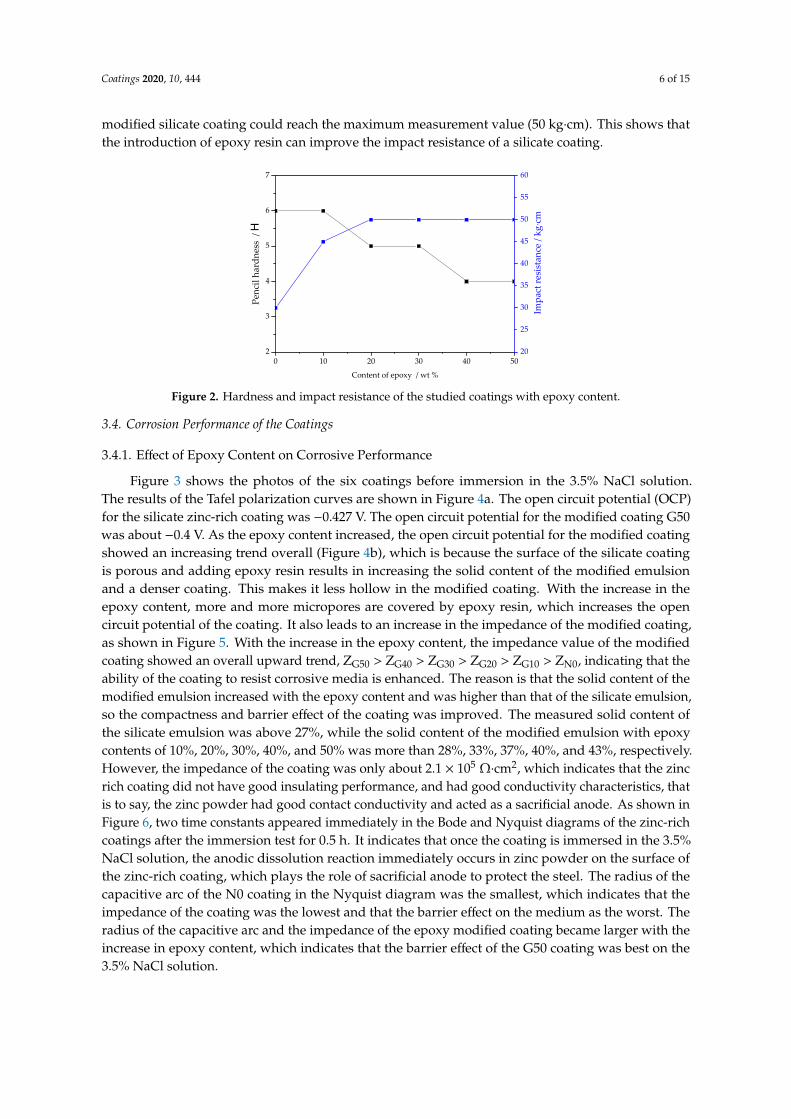
Bode and Nyquist diagrams of all coatings with different immersion time are shown inFigures 11 and 12, respectively. From the beginning of the immersion test to 168 h, the Nyquistdiagram of each coating showed two time constants, the zinc powder in the coating started to reactwith the NaCl solution and provided cathodic protection for the steel. The semicircle in the highfrequency domain represents the impedance and capacitance of the coating, and the semicircle inthe low frequency domain represents the impedance and capacitance of the zinc dissolution reaction.The radius of the impedance arc for each coating decreased rapidly with the increase in immersion time.
3.4.3. Analysis of Electrochemical Parameters of Coating Equivalent Circuit
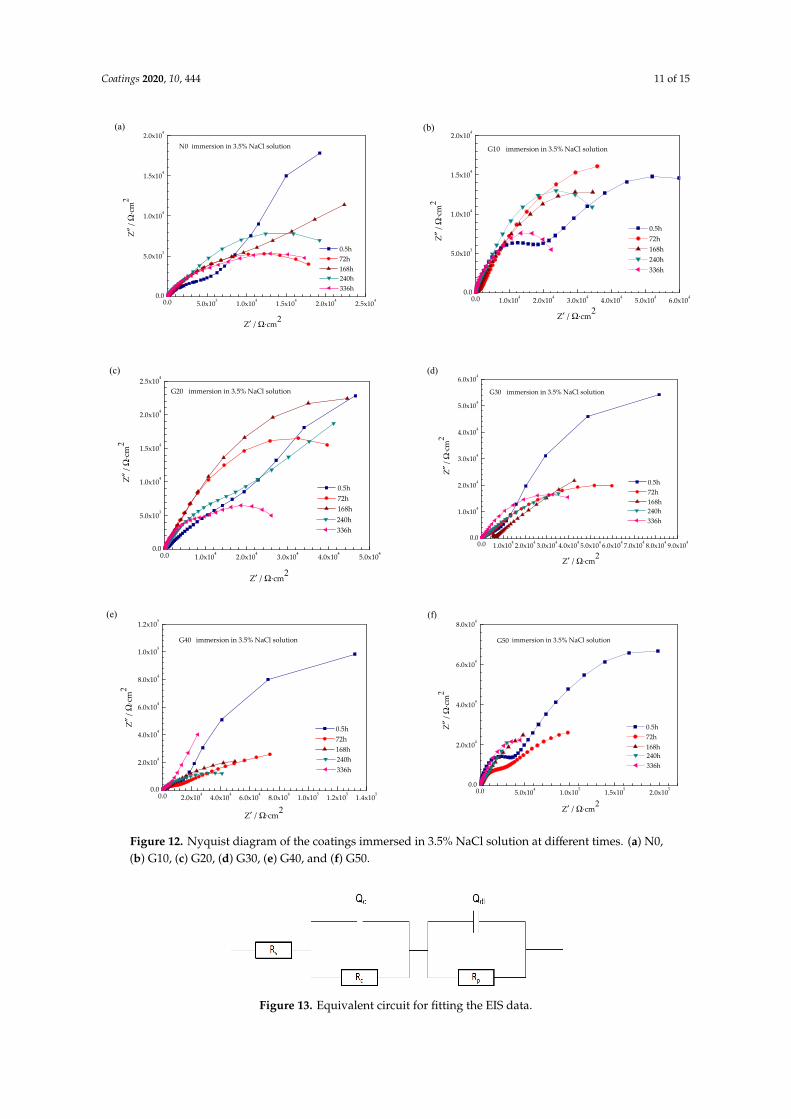
With the prolongation of immersion time, as shown in Figures 11 and 12, the impedance ofthe coatings continued to decrease. There were two time constants in the Nyquist diagram at thebeginning of the 0.5 h immersion, one is related to the resistance (Rc) and capacitance (Qc) of the coatingappeared at the high frequency end; the other is related to the corrosion reaction resistance (Rp) and thecapacitance (Qdl) of the electric double layer on zinc, which appeared at the low frequency end, and n1
and n2 are constant phase angle indexes, which indicate the degree of dispersion effect [23]. In orderto better explain the corrosion process of the coating, this paper used the R (QR) (QR) (Figure 13)equivalent circuit diagram to fit the electrochemical impedance data until the steel begins to corrode.

Coatings 2020, 10, 444 10 of 15
Typical fitting results are shown in Figure 14. The results show that the equivalent circuit can reproducethe measurement results and capacitive reactance characteristics of EIS. Figure 15 is the change curveof coating resistance, coating capacitance, and product resistance and capacitance of the Zn powderreaction with immersion time. Both Rc in Figure 15a and Rp in Figure 15b of the coating decreasedwith the increase of immersion time, which showed that on one hand, the substrate steel was always atthe state of cathodic protection by zinc powder, and on the other hand, the corrosion products of thezinc reaction failed to form a compact and continuous passivation layer and so would not block thepassage of the corrosive medium into the zinc rich coating during the immersion test.
Coatings 2020, 10, x FOR PEER REVIEW 10 of 15
100m 1 10 100 1k 10k 100k1.0x100
1.0x101
1.0x10²
1.0x10³
1.0x10⁴
1.0x10⁵
1.0x10⁶
|Z
| / Ω
·cm2
Frequency / Hz
0.5h 72h 168h
0
10
20
30
40
50
60
70
80
90
240h 336h
immersion in 3.5% NaCl solution
−Pha
se an
gle / °
(a)
N0
100m 1 10 100 1k 10k 100k1.0x100
1.0x101
1.0x10²
1.0x10³
1.0x10⁴
1.0x10⁵
1.0x10⁶
240 h 336 h
immersion in 3.5% NaCl solution
0.5 h 72 h 168 h
|Z| /
Ω·cm
2
Frequency / Hz
0
10
20
30
40
50
60
70
80
90
−P
hase
angle
/ °
G10
(b)
100m 1 10 100 1k 10k 100k1.0x100
1.0x101
1.0x10²
1.0x10³
1.0x10⁴
1.0x10⁵
1.0x10⁶
0.5h 72h 168h
immersion in 3.5% NaCl solution
G20
|Z| /
Ω·cm
2
Frequency / Hz
(c)
0
10
20
30
40
50
60
70
80
90
240h 336h
−Pha
se an
gle / °
100m 1 10 100 1k 10k 100k1.0x100
1.0x101
1.0x10²
1.0x10³
1.0x10⁴
1.0x10⁵
1.0x10⁶
0.5h 72h 168h
immersion in 3.5% NaCl solution
|Z
| / Ω
·cm2
Frequency / Hz
240h 336h
0
10
20
30
40
50
60
70
80
90
−Pha
se an
gle / °
G30
(d)
100m 1 10 100 1k 10k 100k1.0x100
1.0x101
1.0x10²
1.0x10³
1.0x10⁴
1.0x10⁵
1.0x10⁶
240h 336h
(e)
0
10
20
30
40
50
60
70
80
90 0.5h 72h 168h
immersion in 3.5% NaCl solution
−Pha
se an
gle / °
G40
Frequency / Hz
|Z| /
Ω·cm
2
100m 1 10 100 1k 10k 100k1.0x100
1.0x101
1.0x10²
1.0x10³
1.0x10⁴
1.0x10⁵
1.0x10⁶
240h 336h
immersion in 3.5% NaCl solution
−Pha
se an
gle / °
|Z
| / Ω
·cm2
Frequency / Hz
0.5h 72h 168h
(f)
10
20
30
40
50
60
70
80
90G50
Figure 11. Bode diagram of the coating immersed in 3.5% NaCl solution at different times. (a) N0, (b) G10, (c) G20, (d) G30, (e) G40, and (f) G50.
Figure 11. Bode diagram of the coating immersed in 3.5% NaCl solution at different times. (a) N0, (b)G10, (c) G20, (d) G30, (e) G40, and (f) G50.
Coatings 2020, 10, 444 11 of 15Coatings 2020, 10, x FOR PEER REVIEW 11 of 15
0.0 5.0x10³ 1.0x10⁴ 1.5x10⁴ 2.0x10⁴ 2.5x1040.0
5.0x10³
1.0x10⁴
1.5x10⁴
2.0x10⁴
0.5h 72h 168h
immersion in 3.5% NaCl solutionN0
Z″
/ Ω·c
m2
Z′ / Ω·cm2
240h 336h
(a)
0.0 1.0x10⁴ 2.0x10⁴ 3.0x10⁴ 4.0x10⁴ 5.0x10⁴ 6.0x1040.0
5.0x10³
1.0x10⁴
1.5x10⁴
2.0x10⁴
0.5h 72h 168h
immersion in 3.5% NaCl solutionG10
Z′ / Ω·cm2
Z″ /
Ω·c
m2
240h 336h
(b)
0.0 1.0x10⁴ 2.0x10⁴ 3.0x10⁴ 4.0x10⁴ 5.0x1040.0
5.0x10³
1.0x10⁴
1.5x10⁴
2.0x10⁴
2.5x10⁴
0.5h 72h 168h
immersion in 3.5% NaCl solutionG20
Z″ /
Ω·c
m2
Z′ / Ω·cm2
240h 336h
(c)
0.0 1.0x10⁴ 2.0x10⁴ 3.0x10⁴ 4.0x10⁴ 5.0x10⁴ 6.0x10⁴ 7.0x10⁴ 8.0x10⁴ 9.0x1040.0
1.0x10⁴
2.0x10⁴
3.0x10⁴
4.0x10⁴
5.0x10⁴
6.0x10⁴
0.5h 72h 168h
immersion in 3.5% NaCl solutionG30
Z′ / Ω·cm2
Z″ /
Ω·c
m2
240h 336h
(d)
0.0 2.0x10⁴ 4.0x10⁴ 6.0x10⁴ 8.0x10⁴ 1.0x10⁵ 1.2x10⁵ 1.4x1050.0
2.0x10⁴
4.0x10⁴
6.0x10⁴
8.0x10⁴
1.0x10⁵
1.2x10⁵
240h 336h
immersion in 3.5% NaCl solutionG40
Z′ / Ω·cm2
Z″ /
Ω·c
m2
0.5h 72h 168h
(e)
0.0 5.0x10⁴ 1.0x10⁵ 1.5x10⁵ 2.0x1050.0
2.0x10⁴
4.0x10⁴
6.0x10⁴
8.0x10⁴
0.5h 72h 168h
immersion in 3.5% NaCl solutionG50
Z″
/ Ω·c
m2
Z′ / Ω·cm2
240h 336h
(f)
Figure 12. Nyquist diagram of the coatings immersed in 3.5% NaCl solution at different times. (a) N0, (b) G10, (c) G20, (d) G30, (e) G40, and (f) G50.
3.4.3. Analysis of Electrochemical Parameters of Coating Equivalent Circuit
With the prolongation of immersion time, as shown in Figures 11 and 12, the impedance of the coatings continued to decrease. There were two time constants in the Nyquist diagram at the beginning of the 0.5 h immersion, one is related to the resistance (Rc) and capacitance (Qc) of the coating appeared at the high frequency end; the other is related to the corrosion reaction resistance (Rp) and the capacitance (Qdl) of the electric double layer on zinc, which appeared at the low frequency end, and n1 and n2 are constant phase angle indexes, which indicate the degree of dispersion effect
Figure 12. Nyquist diagram of the coatings immersed in 3.5% NaCl solution at different times. (a) N0,(b) G10, (c) G20, (d) G30, (e) G40, and (f) G50.
Coatings 2020, 10, x FOR PEER REVIEW 12 of 15
[23]. In order to better explain the corrosion process of the coating, this paper used the R (QR) (QR) (Figure 13) equivalent circuit diagram to fit the electrochemical impedance data until the steel begins to corrode. Typical fitting results are shown in Figure 14. The results show that the equivalent circuit can reproduce the measurement results and capacitive reactance characteristics of EIS. Figure 15 is the change curve of coating resistance, coating capacitance, and product resistance and capacitance of the Zn powder reaction with immersion time. Both Rc in Figure 15a and Rp in Figure 15b of the coating decreased with the increase of immersion time, which showed that on one hand, the substrate steel was always at the state of cathodic protection by zinc powder, and on the other hand, the corrosion products of the zinc reaction failed to form a compact and continuous passivation layer and so would not block the passage of the corrosive medium into the zinc rich coating during the immersion test.
According to [24], the double layer capacitance (Qdl) can reflect the degree of zinc reaction in the coating and the coating’s capacitance (Qc) can reflect the water absorption of the coating. The larger the degree of zinc reaction, the greater the double layer capacitance. Figure 15c shows that the degree of zinc reaction increased during immersion. Compared with the N0 silicate coating, the epoxy modified coatings had a lower Qdl (i.e., a lower zinc reaction) and Qdl of the epoxy modified coatings decreased with epoxy content. The larger the water absorption of the coating, the greater the coating capacitance, and the worse the protective performance of the coating. Figure 15d shows that the water absorption of the coating increased during immersion. Compared with the N0 silicate coating, the epoxy modified coatings had a lower Qc that decreased with epoxy content (i.e., epoxy modified coatings have a lower water absorption and better insulating effect).
Figure 13. Equivalent circuit for fitting the EIS data.
100m 1 10 100 1k 10k 100k1.0x100
1.0x101
1.0x10²
1.0x10³
1.0x10⁴
1.0x10⁵
1.0x10⁶
|Z
| / W
·cm
2
Frequency / Hz
Fitting Measured Fitting Measured
0
10
20
30
40
50
60
70
Immersion test 336 h
−Pha
se a
ngle
/ °
N0
(a)
0.0 4.0x10³ 8.0x10³ 1.2x10⁴ 1.6x10⁴ 2.0x10⁴ 2.4x1040.0
1.0x10³
2.0x10³
3.0x10³
4.0x10³
5.0x10³
6.0x10³
7.0x10³
8.0x10³
Z″
/ Ω
·cm
2
Z′ / Ω·cm2
Immersion test 336 h
Fitting data Original data
N0
(b)
Figure 13. Equivalent circuit for fitting the EIS data.
Coatings 2020, 10, 444 12 of 15
Coatings 2020, 10, x FOR PEER REVIEW 12 of 15
[23]. In order to better explain the corrosion process of the coating, this paper used the R (QR) (QR) (Figure 13) equivalent circuit diagram to fit the electrochemical impedance data until the steel begins to corrode. Typical fitting results are shown in Figure 14. The results show that the equivalent circuit can reproduce the measurement results and capacitive reactance characteristics of EIS. Figure 15 is the change curve of coating resistance, coating capacitance, and product resistance and capacitance of the Zn powder reaction with immersion time. Both Rc in Figure 15a and Rp in Figure 15b of the coating decreased with the increase of immersion time, which showed that on one hand, the substrate steel was always at the state of cathodic protection by zinc powder, and on the other hand, the corrosion products of the zinc reaction failed to form a compact and continuous passivation layer and so would not block the passage of the corrosive medium into the zinc rich coating during the immersion test.
According to [24], the double layer capacitance (Qdl) can reflect the degree of zinc reaction in the coating and the coating’s capacitance (Qc) can reflect the water absorption of the coating. The larger the degree of zinc reaction, the greater the double layer capacitance. Figure 15c shows that the degree of zinc reaction increased during immersion. Compared with the N0 silicate coating, the epoxy modified coatings had a lower Qdl (i.e., a lower zinc reaction) and Qdl of the epoxy modified coatings decreased with epoxy content. The larger the water absorption of the coating, the greater the coating capacitance, and the worse the protective performance of the coating. Figure 15d shows that the water absorption of the coating increased during immersion. Compared with the N0 silicate coating, the epoxy modified coatings had a lower Qc that decreased with epoxy content (i.e., epoxy modified coatings have a lower water absorption and better insulating effect).
Figure 13. Equivalent circuit for fitting the EIS data.
100m 1 10 100 1k 10k 100k1.0x100
1.0x101
1.0x10²
1.0x10³
1.0x10⁴
1.0x10⁵
1.0x10⁶
|Z
| / W
·cm
2
Frequency / Hz
Fitting Measured Fitting Measured
0
10
20
30
40
50
60
70
Immersion test 336 h
−Pha
se a
ngle
/ °
N0
(a)
0.0 4.0x10³ 8.0x10³ 1.2x10⁴ 1.6x10⁴ 2.0x10⁴ 2.4x1040.0
1.0x10³
2.0x10³
3.0x10³
4.0x10³
5.0x10³
6.0x10³
7.0x10³
8.0x10³
Z″
/ Ω
·cm
2
Z′ / Ω·cm2
Immersion test 336 h
Fitting data Original data
N0
(b)
Coatings 2020, 10, x FOR PEER REVIEW 13 of 15
100m 1 10 100 1k 10k 100k1.0x100
1.0x101
1.0x10²
1.0x10³
1.0x10⁴
1.0x10⁵
1.0x10⁶
0
10
20
30
40
50
60
70
80
Immersion test 336 h
-Pha
se a
ngle
/ °
|Z|
/ Ω·c
m2
Frequency / Hz
Fitting Measured Fitting Measured
G40
(c)
0.0 5.0x10³ 1.0x10⁴ 1.5x10⁴ 2.0x10⁴ 2.5x10⁴ 3.0x1040.0
1.0x10⁴
2.0x10⁴
3.0x10⁴
4.0x10⁴
5.0x10⁴
Fitting Measured
Z″
/ Ω·c
m2
Z′ / Ω·cm2
Immersion test 336 h
G40
(d)
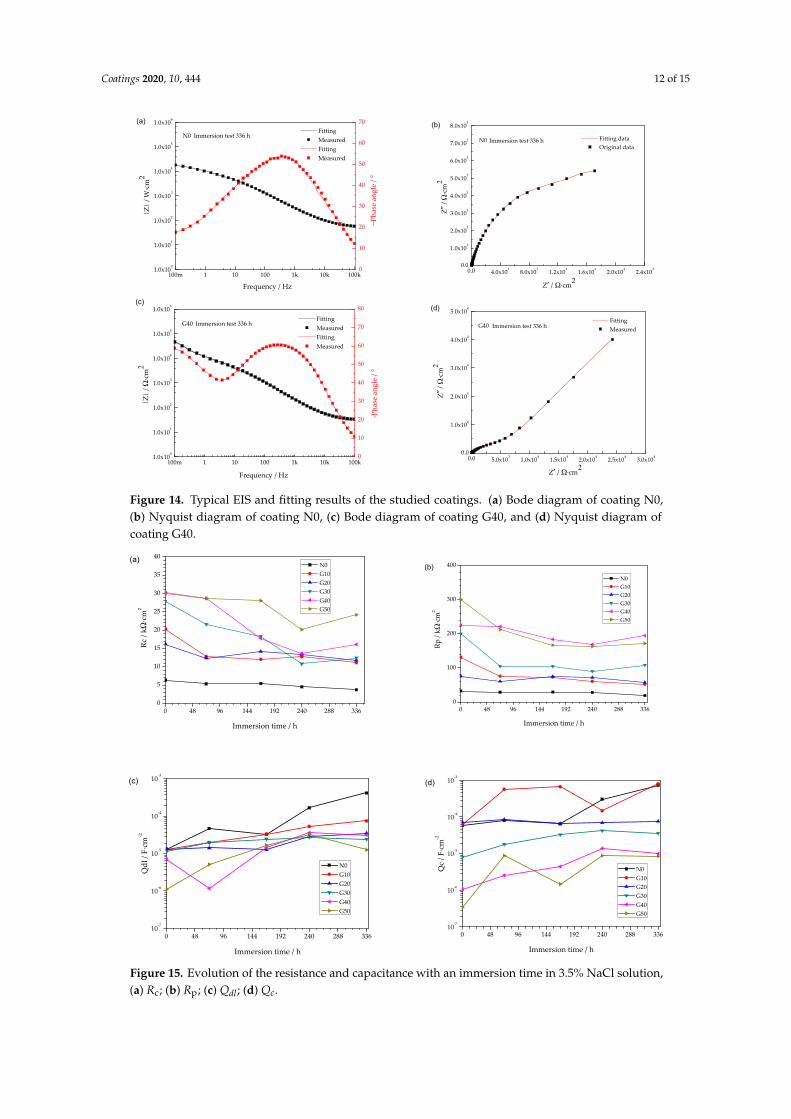
Figure 14. Typical EIS and fitting results of the studied coatings. (a) Bode diagram of coating N0, (b) Nyquist diagram of coating N0, (c) Bode diagram of coating G40, and (d) Nyquist diagram of coating G40.
0 48 96 144 192 240 288 3360
5
10
15
20
25
30
35
40
Rc
/ kΩ
⋅cm
2
Immersion time / h
N0 G10 G20 G30 G40 G50
(a)
0 48 96 144 192 240 288 3360
100
200
300
400
Rp /
kΩ⋅c
m2
Immersion time / h
N0 G10 G20 G30 G40 G50
(b)
0 48 96 144 192 240 288 33610-7
10-6
10-5
10-4
10-3
Qdl
/ F⋅
cm-2
Immersion time / h
N0 G10 G20 G30 G40 G50
(c)
0 48 96 144 192 240 288 33610-7
10-6
10-5
10-4
10-3
Qc
/ F⋅c
m-2
Immersion time / h
N0 G10 G20 G30 G40 G50
(d)
Figure 15. Evolution of the resistance and capacitance with an immersion time in 3.5% NaCl solution, (a) Rc; (b) Rp; (c) Qdl; (d) Qc.
3.5. Anticorrosive Mechanism of Zinc Rich Coatings
The data from the static immersion and electrochemical tests showed that compared to the silicate zinc-rich coating N0, epoxy-modified silicate coatings had good compactness, long cathodic protection time to the steel, and good corrosion resistance.
Different coatings yielded a similar corrosion process, time of medium arriving at steel substrate, and its corrosion was delayed with the increase in epoxy content. The corrosion failure process of the N0 coating was as follows: during early immersion to 72 h, the corrosive medium quickly entered the
Figure 14. Typical EIS and fitting results of the studied coatings. (a) Bode diagram of coating N0,(b) Nyquist diagram of coating N0, (c) Bode diagram of coating G40, and (d) Nyquist diagram ofcoating G40.
Coatings 2020, 10, x FOR PEER REVIEW 13 of 15
100m 1 10 100 1k 10k 100k1.0x100
1.0x101
1.0x10²
1.0x10³
1.0x10⁴
1.0x10⁵
1.0x10⁶
0
10
20
30
40
50
60
70
80
Immersion test 336 h
-Pha
se a
ngle
/ °
|Z|
/ Ω·c
m2
Frequency / Hz
Fitting Measured Fitting Measured
G40
(c)
0.0 5.0x10³ 1.0x10⁴ 1.5x10⁴ 2.0x10⁴ 2.5x10⁴ 3.0x1040.0
1.0x10⁴
2.0x10⁴
3.0x10⁴
4.0x10⁴
5.0x10⁴
Fitting Measured
Z″
/ Ω·c
m2
Z′ / Ω·cm2
Immersion test 336 h
G40
(d)
Figure 14. Typical EIS and fitting results of the studied coatings. (a) Bode diagram of coating N0, (b) Nyquist diagram of coating N0, (c) Bode diagram of coating G40, and (d) Nyquist diagram of coating G40.
0 48 96 144 192 240 288 3360
5
10
15
20
25
30
35
40
Rc
/ kΩ
⋅cm
2
Immersion time / h
N0 G10 G20 G30 G40 G50
(a)
0 48 96 144 192 240 288 3360
100
200
300
400
Rp /
kΩ⋅c
m2
Immersion time / h
N0 G10 G20 G30 G40 G50
(b)
0 48 96 144 192 240 288 33610-7
10-6
10-5
10-4
10-3
Qdl
/ F⋅
cm-2
Immersion time / h
N0 G10 G20 G30 G40 G50
(c)
0 48 96 144 192 240 288 33610-7
10-6
10-5
10-4
10-3
Qc
/ F⋅c
m-2
Immersion time / h
N0 G10 G20 G30 G40 G50
(d)
Figure 15. Evolution of the resistance and capacitance with an immersion time in 3.5% NaCl solution, (a) Rc; (b) Rp; (c) Qdl; (d) Qc.
3.5. Anticorrosive Mechanism of Zinc Rich Coatings
The data from the static immersion and electrochemical tests showed that compared to the silicate zinc-rich coating N0, epoxy-modified silicate coatings had good compactness, long cathodic protection time to the steel, and good corrosion resistance.
Different coatings yielded a similar corrosion process, time of medium arriving at steel substrate, and its corrosion was delayed with the increase in epoxy content. The corrosion failure process of the N0 coating was as follows: during early immersion to 72 h, the corrosive medium quickly entered the
Figure 15. Evolution of the resistance and capacitance with an immersion time in 3.5% NaCl solution,(a) Rc; (b) Rp; (c) Qdl; (d) Qc.

Coatings 2020, 10, 444 13 of 15
According to [24], the double layer capacitance (Qdl) can reflect the degree of zinc reaction in thecoating and the coating’s capacitance (Qc) can reflect the water absorption of the coating. The larger thedegree of zinc reaction, the greater the double layer capacitance. Figure 15c shows that the degree ofzinc reaction increased during immersion. Compared with the N0 silicate coating, the epoxy modifiedcoatings had a lower Qdl (i.e., a lower zinc reaction) and Qdl of the epoxy modified coatings decreasedwith epoxy content. The larger the water absorption of the coating, the greater the coating capacitance,and the worse the protective performance of the coating. Figure 15d shows that the water absorptionof the coating increased during immersion. Compared with the N0 silicate coating, the epoxy modifiedcoatings had a lower Qc that decreased with epoxy content (i.e., epoxy modified coatings have a lowerwater absorption and better insulating effect).
3.5. Anticorrosive Mechanism of Zinc Rich Coatings
The data from the static immersion and electrochemical tests showed that compared to the silicatezinc-rich coating N0, epoxy-modified silicate coatings had good compactness, long cathodic protectiontime to the steel, and good corrosion resistance.
Different coatings yielded a similar corrosion process, time of medium arriving at steel substrate,and its corrosion was delayed with the increase in epoxy content. The corrosion failure process of theN0 coating was as follows: during early immersion to 72 h, the corrosive medium quickly entered thecoating and reached the surface of the steel. The steel obtained mainly cathodic protection by the zincpowders. With the increase of immersion time, the corrosion products of the zinc powder blockedthe medium into the channel. At this time, the cathodic protection and the insulating effect of thecoating corrosion products together protected the substrate effect [18]. The presence of an appropriateamount of epoxy resin can delay the process of corrosive media penetrating the zinc rich coating andto the interface between the coating and steel substrate, and prolong the cathodic protection time ofzinc-rich coatings. Compared with silicate zinc-rich coating, epoxy-modified silicate zinc-rich coatingshave better compactness, more significant insulating effects and cathodic protection effects, and betterprotection against corrosive media.
4. Conclusions
In this paper, epoxy modified silicate anticorrosive coatings were prepared and their propertieswere studied. The conclusions were summarized as follows:
• Epoxy modified silicate emulsions were successfully synthesized. The viscosity and solid contentof the modified emulsion increased with epoxy content.
• Compared with the silicate coating, epoxy modified silicate coatings had the best adhesion (grade 1),lower hardness and higher impact resistance, were more compact and had better durability.
• The impedance of the silicate zinc-rich coating was 3 × 10⁴ Ω·cm2 and increased with theepoxy content in the modified silicate zinc-rich coating, so that the G50 coating was only about2 × 105 Ω·cm2. Modification with epoxy did not harm the sacrificial anode effect of zinc powderin the coating.
• Epoxy modified silicate zinc-rich coatings had a lower capacitance of the coating (i.e., lower waterabsorption and better insulating effect than those of the silicate coatings). Thus, they can providelonger lifetime protection than silicate ones.
Author Contributions: Conceptualization, J.W., Y.Q., X.Z., and Z.Z.; Methodology, J.W., Y.Q., and Z.Z.; Software,J.W.; Validation, J.W.; Formal analysis, J.W., X.Z., and Y.Q.; Investigation, J.W. and X.Z.; Resources, Y.Q. and Z.Z.;Data curation, J.W.; Writing—original draft preparation, J.W.; Writing—review and editing, J.W., X.Z., Y.Q., andZ.Z.; Visualization, J.W.; Supervision, Z.Z. and Y.Q.; Project administration, Z.Z. and Y.Q.; Funding acquisition,Z.Z. and Y.Q. All authors have read and agreed to the published version of the manuscript.
Funding: This research was funded by the Project of Equipment Pre-research Field Fund, grant number 61409220304and Equipment Pre-research Sharing Technology Project, grant numbers 41404010306 and 41423060314.
Coatings 2020, 10, 444 14 of 15
Conflicts of Interest: The authors declare no conflicts of interest.
References
1. Munger, C.G.; Vincent, L.D. Corrosion Prevention by Protective Coatings, 2nd ed.; NACE Publishing: Houston,TX, USA, 1999.
2. Shreepathi, S.; Bajaj, P.; Mallik, B.P. Electrochemical impedance spectroscopy investigations of epoxy zincrich coatings: Role of Zn content on corrosion protection mechanism. Electrochim. Acta. 2010, 55, 5129–5134.[CrossRef]
3. Merlatti, C.; Perrin, F.X.; Aragon, E.; Margaillan, A. Evaluation of physico-chemical changes in sub-layers ofmulti-layer anticorrosive marine paint systems: Plasticizer and solvent release. Prog. Org. Coat. 2008, 61,53–62. [CrossRef]
4. Schaefer, K.; Miszczyk, A. Improvement of electrochemical action of zinc-rich paints by addition ofnanoparticulate zinc. Corros. Sci. 2013, 66, 380. [CrossRef]
5. Marchebois, H.; Savall, C.; Bernard, J.; Touzain, S. Electrochemical behavior of zinc-rich powder coatings inartificial sea water. Electrochim. Acta 2004, 49, 2945. [CrossRef]
6. Zeng, D.F.; Tao, N.W.; Jiang, S.W.; Wang, J.N. NORSOK M-501 test method for heavy-duty anticorrosivemarine coatings. Coat. Ind. 2015, 45, 51.
7. Del Amo, B.; Romagnoli, R.; Deyá, C.; González, J.A. High performance water-based paints with non-toxicanticorrosive pigments. Prog. Org. Coat. 2002, 45, 389–397. [CrossRef]
8. Chen, L.; Wang, Z.Q.; Wei, T.; Xiao, C.J. Research status and prospects of water-based anticorrosive coatings.Shanghai Coat. 2012, 50, 37–41.
9. Chen, L.; Wang, Z.Q.; Wei, T.; Xiao, C.J. Research on the modification of water-borne inorganic zinc-richcoatings and its performances. Adv. Mater. Res. 2015, 1095, 626–630. [CrossRef]
10. Izquierdo, M.; Novoa, X.R.; Pena, G.; Espada, L. The mechanism of protection of zinc-rich inorganic coatings.A study based on electrochemical impedance spectroscopy (EIS). Mater. Sci. Forum 1992, 111–112, 257–268.[CrossRef]
11. Akbarinezhad, E.; Ebrahimi, M.; Sharif, F.; Attar, M.M.; Faridi, H.R. Synthesis and evaluating corrosionprotection effects of emeraldine base PAni/clay nanocomposite as a barrier pigment in zinc-rich ethyl silicateprimer. Prog. Org. Coat. 2011, 70, 39–44. [CrossRef]
12. Yun, T.H.; Park, J.H.; Kim, J.S.; Park, J.M. Effect of the surface modification of zinc powders with organosilaneson the corrosion resistance of a zinc pigmented organic coating. Prog. Org. Coat. 2014, 77, 1780–1788.[CrossRef]
13. Teng, S.; Gao, Y.; Cao, F.; Kong, D.; Zheng, X.; Ma, X.; Zhi, L. Zinc-reduced graphene oxide for enhancedcorrosion protection of zinc-rich epoxy coatings. Prog. Org. Coat. 2018, 123, 185–189. [CrossRef]
14. Feng, Y.; Keyao, Z. Development and Construction of New Waterborne Zinc-rich Coatings. Shanghai Coatings2006, 44, 4–8.
15. Wu, G.M.; Kong, Z.W.; Chen, J.; Huo, S.P.; Liu, G.F. Preparation and properties of waterbornepolyurethane/epoxy resin composite coating from anionic terpene-based polyol dispersion. Prog. Org. Coat.2014, 77, 315–321. [CrossRef]
16. Shengchuang, S. Study on Preparation and Performance of Waterborne Silicate Inorganic Zinc-RichAnticorrosive Coatings. Master’s Thesis, Southwest Petroleum University, Chengdu, China, 2017.
17. Yanyun, L. Research on Water-Based Inorganic Zinc-Rich Coatings. Master’s Thesis, Kunming University ofScience and Technology, Kunming, China, 2008.
18. Ross, T.K.; Wolstenholme, J. Anti-corrosion properties of zinc dust paints. Corros. Sci. 1977, 17, 341–351.[CrossRef]
19. GB/T 1720-1979 Method of Test for Adhesion of Paint Films; China Petroleum and Chemical Industry Federation:Beijing, China, 1980.
20. GB/T 6739-2006 Paints and Varnishes-Determination of Film Hardness by Pencil Test; China Petroleum andChemical Industry Federation: Beijing, China, 2007.
21. GB/T 1732-1993 Determination of Impact Resistance of Film; China Petroleum and Chemical Industry Federation:Beijing, China, 1993.

Coatings 2020, 10, 444 15 of 15
22. Qi, Y.H.; Zhang, Z.P.; Miao, M.; Zhang, X.Z. Studies on estimating methods of polarization performance forcoated steel in seawater. Mater. Sci. Forum 2010, 654–656, 2418–2421. [CrossRef]
23. Zhao, X.; Liu, S.; Wang, X.T.; Hou, B.R. Surface modification of nano-ZrO2 nanoparticles with styrenecoupling agent and its effect on the corrosion behaviour of epoxy coating. Chin. J. Oceanol. Limnol. 2014, 32,1163–1171. [CrossRef]
24. Shuyan, Z.H.; Xinhong, T.O.; Fuchun, L.I.; Jinyu, W.E.; En-Hou, H.A.; Xiaohui, L.I.; Lin, Y.A. CorrosionResistance of Three Zinc-rich Epoxy Coatings. J. Chin. Soc. Corros. Prot. 2019, 39, 563–570.
© 2020 by the authors. Licensee MDPI, Basel, Switzerland. This article is an open accessarticle distributed under the terms and conditions of the Creative Commons Attribution(CC BY) license (http://creativecommons.org/licenses/by/4.0/).