Endovascular stent graft repair for aneurysms on the descending thoracic aorta
Upload
independentCategory
view
3download
0
This article appeared in a journal published by Elsevier. The attachedcopy is furnished to the author for internal non-commercial researchand education use, including for instruction at the authors institution
and sharing with colleagues.
Other uses, including reproduction and distribution, or selling orlicensing copies, or posting to personal, institutional or third party
websites are prohibited.
In most cases authors are permitted to post their version of thearticle (e.g. in Word or Tex form) to their personal website orinstitutional repository. Authors requiring further information
regarding Elsevier’s archiving and manuscript policies areencouraged to visit:
http://www.elsevier.com/copyright
Author's personal copy
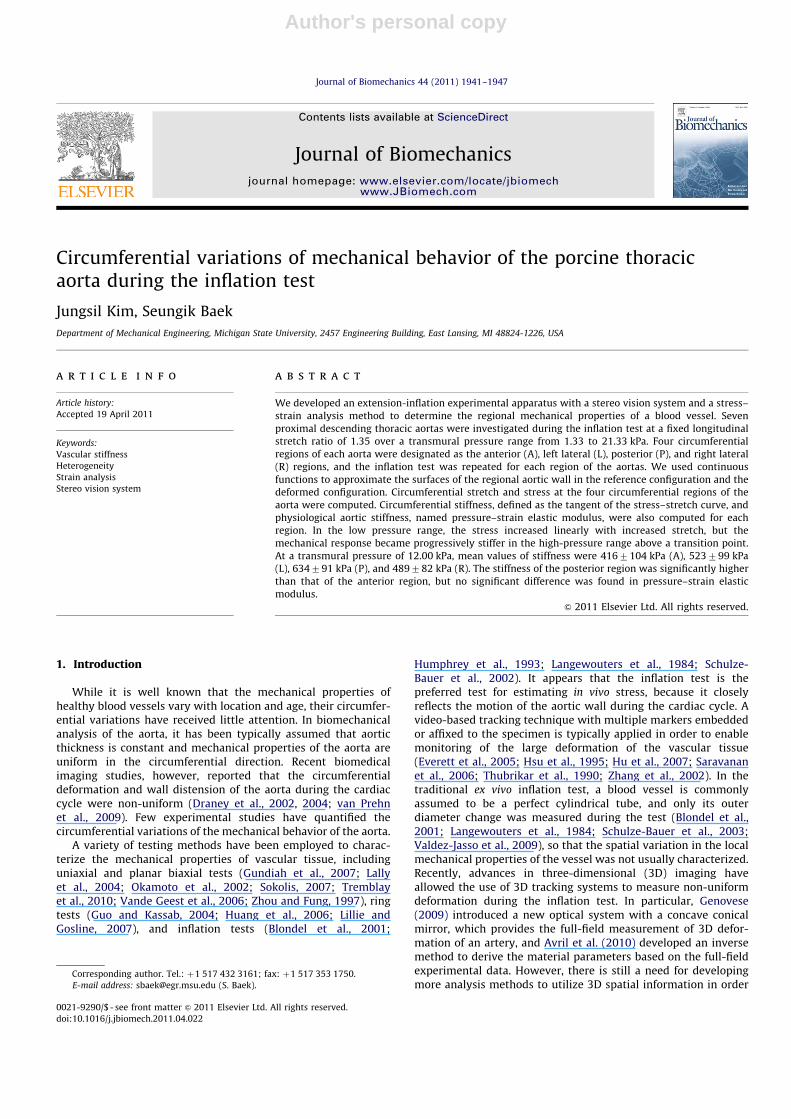
Circumferential variations of mechanical behavior of the porcine thoracicaorta during the inflation test
Jungsil Kim, Seungik Baek �
Department of Mechanical Engineering, Michigan State University, 2457 Engineering Building, East Lansing, MI 48824-1226, USA
a r t i c l e i n f o
Article history:
Accepted 19 April 2011
Keywords:
Vascular stiffness
Heterogeneity
Strain analysis
Stereo vision system
a b s t r a c t
We developed an extension-inflation experimental apparatus with a stereo vision system and a stress–
strain analysis method to determine the regional mechanical properties of a blood vessel. Seven
proximal descending thoracic aortas were investigated during the inflation test at a fixed longitudinal
stretch ratio of 1.35 over a transmural pressure range from 1.33 to 21.33 kPa. Four circumferential
regions of each aorta were designated as the anterior (A), left lateral (L), posterior (P), and right lateral
(R) regions, and the inflation test was repeated for each region of the aortas. We used continuous
functions to approximate the surfaces of the regional aortic wall in the reference configuration and the
deformed configuration. Circumferential stretch and stress at the four circumferential regions of the
aorta were computed. Circumferential stiffness, defined as the tangent of the stress–stretch curve, and
physiological aortic stiffness, named pressure–strain elastic modulus, were also computed for each
region. In the low pressure range, the stress increased linearly with increased stretch, but the
mechanical response became progressively stiffer in the high-pressure range above a transition point.
At a transmural pressure of 12.00 kPa, mean values of stiffness were 4167104 kPa (A), 523799 kPa
(L), 634791 kPa (P), and 489782 kPa (R). The stiffness of the posterior region was significantly higher
than that of the anterior region, but no significant difference was found in pressure–strain elastic
modulus.
& 2011 Elsevier Ltd. All rights reserved.
1. Introduction
While it is well known that the mechanical properties ofhealthy blood vessels vary with location and age, their circumfer-ential variations have received little attention. In biomechanicalanalysis of the aorta, it has been typically assumed that aorticthickness is constant and mechanical properties of the aorta areuniform in the circumferential direction. Recent biomedicalimaging studies, however, reported that the circumferentialdeformation and wall distension of the aorta during the cardiaccycle were non-uniform (Draney et al., 2002, 2004; van Prehnet al., 2009). Few experimental studies have quantified thecircumferential variations of the mechanical behavior of the aorta.
A variety of testing methods have been employed to charac-terize the mechanical properties of vascular tissue, includinguniaxial and planar biaxial tests (Gundiah et al., 2007; Lallyet al., 2004; Okamoto et al., 2002; Sokolis, 2007; Tremblayet al., 2010; Vande Geest et al., 2006; Zhou and Fung, 1997), ringtests (Guo and Kassab, 2004; Huang et al., 2006; Lillie andGosline, 2007), and inflation tests (Blondel et al., 2001;
Humphrey et al., 1993; Langewouters et al., 1984; Schulze-Bauer et al., 2002). It appears that the inflation test is thepreferred test for estimating in vivo stress, because it closelyreflects the motion of the aortic wall during the cardiac cycle. Avideo-based tracking technique with multiple markers embeddedor affixed to the specimen is typically applied in order to enablemonitoring of the large deformation of the vascular tissue(Everett et al., 2005; Hsu et al., 1995; Hu et al., 2007; Saravananet al., 2006; Thubrikar et al., 1990; Zhang et al., 2002). In thetraditional ex vivo inflation test, a blood vessel is commonlyassumed to be a perfect cylindrical tube, and only its outerdiameter change was measured during the test (Blondel et al.,2001; Langewouters et al., 1984; Schulze-Bauer et al., 2003;Valdez-Jasso et al., 2009), so that the spatial variation in the localmechanical properties of the vessel was not usually characterized.Recently, advances in three-dimensional (3D) imaging haveallowed the use of 3D tracking systems to measure non-uniformdeformation during the inflation test. In particular, Genovese(2009) introduced a new optical system with a concave conicalmirror, which provides the full-field measurement of 3D defor-mation of an artery, and Avril et al. (2010) developed an inversemethod to derive the material parameters based on the full-fieldexperimental data. However, there is still a need for developingmore analysis methods to utilize 3D spatial information in order
Contents lists available at ScienceDirect
journal homepage: www.elsevier.com/locate/jbiomechwww.JBiomech.com
Journal of Biomechanics
0021-9290/$ - see front matter & 2011 Elsevier Ltd. All rights reserved.
doi:10.1016/j.jbiomech.2011.04.022
� Corresponding author. Tel.: þ1 517 432 3161; fax: þ1 517 353 1750.
E-mail address: [email protected] (S. Baek).
Journal of Biomechanics 44 (2011) 1941–1947
Author's personal copy
to characterize the heterogeneity in the mechanical properties ofa blood vessel.
In the present study, we developed an extension-inflationexperimental apparatus with a stereo vision system and a newstress–strain analysis method, and used them to investigate thecircumferential variations in mechanical properties of the porcinethoracic aorta.
2. Methods
2.1. Experimental system
A computer-controlled system (Fig. 1) was developed to measure the biaxial
deformation of a blood vessel during the inflation test. It consists of three main
parts: motion, data acquisition, and vision systems.
A polycarbonate test chamber was placed on the lower crosshead in the center
of the test device. Two moving crossheads were driven by a stepper motor in
opposite directions, while the center of the device remained fixed. The specimen
was connected to a syringe pump (KDS 210, KD Scientific, MA, USA) by a tube.
Continuous bidirectional infusion-withdrawal motion of the syringe pump cyclically
inflated and deflated the specimen.
A 34.47 kPa (5 psi) gauge pressure transducer (FPG2AT, Honeywell-Sensotec,
OH, USA) was affixed to the tube connected to the specimen. The transmural
pressure was defined as the difference in pressure between the inside and outside
of the specimen in the test chamber. The axial load applied to the specimen was
measured using a 4.54 kg (10 lb) load cell (Model 34, Tension/Compression,
Honeywell-Sensotec, OH, USA) attached to the upper connector of the specimen,
although the data on axial load were not used in this paper. The measurements
were collected in a computer by a data acquisition board at a 100 Hz sampling
rate.
The stereo vision system, consisting of two CCD monochrome cameras
(KPM2A, 768H�494V, Hitachi, Japan) with fixed focal length lenses (HF25HA-
1B, Fujinon, Japan), allowed 3D marker tracking during the inflation test. Two
cameras were placed at different positions but at the same height, focusing on the
central region of the device where the specimen was mounted. The distance from
the cameras to the specimen was approximately 30 cm and the included angle
between the two cameras and the specimen was approximately 301. The frame
grabber obtained images of the specimen using the two cameras alternately at five
frames per 2 s.
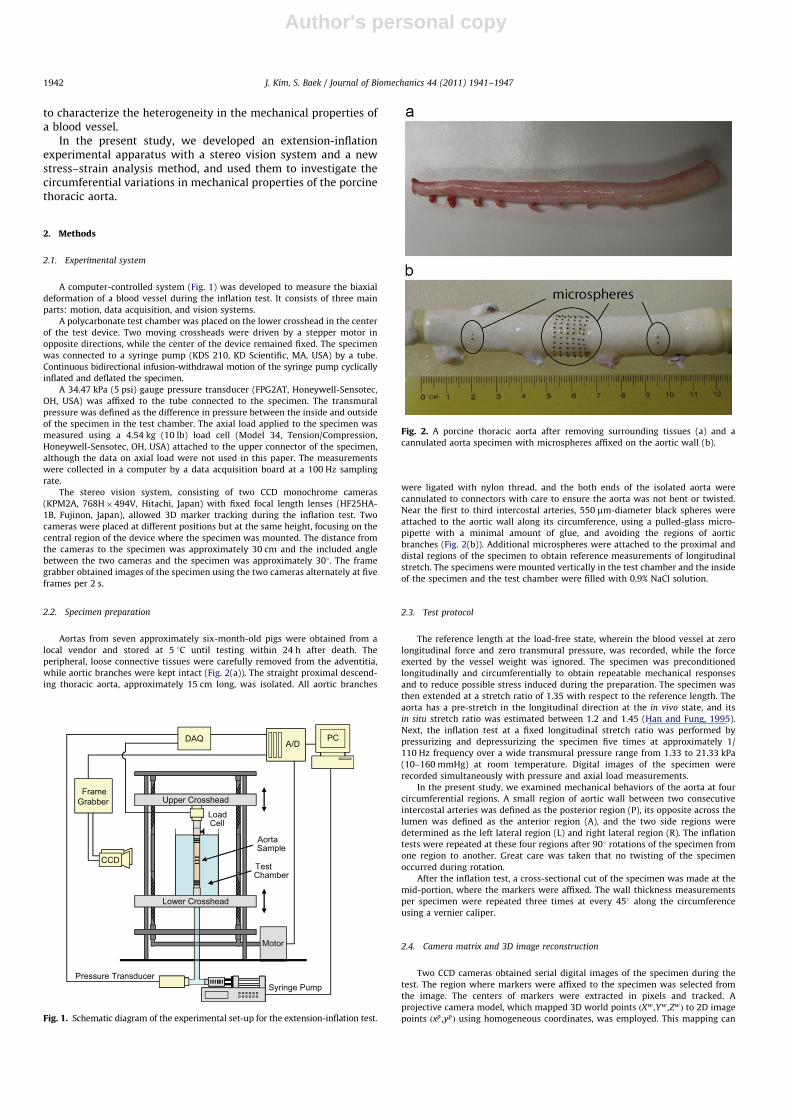
2.2. Specimen preparation
Aortas from seven approximately six-month-old pigs were obtained from a
local vendor and stored at 5 1C until testing within 24 h after death. The
peripheral, loose connective tissues were carefully removed from the adventitia,
while aortic branches were kept intact (Fig. 2(a)). The straight proximal descend-
ing thoracic aorta, approximately 15 cm long, was isolated. All aortic branches
were ligated with nylon thread, and the both ends of the isolated aorta were
cannulated to connectors with care to ensure the aorta was not bent or twisted.
Near the first to third intercostal arteries, 550 mm-diameter black spheres were
attached to the aortic wall along its circumference, using a pulled-glass micro-
pipette with a minimal amount of glue, and avoiding the regions of aortic
branches (Fig. 2(b)). Additional microspheres were attached to the proximal and
distal regions of the specimen to obtain reference measurements of longitudinal
stretch. The specimens were mounted vertically in the test chamber and the inside
of the specimen and the test chamber were filled with 0.9% NaCl solution.
2.3. Test protocol
The reference length at the load-free state, wherein the blood vessel at zero
longitudinal force and zero transmural pressure, was recorded, while the force
exerted by the vessel weight was ignored. The specimen was preconditioned
longitudinally and circumferentially to obtain repeatable mechanical responses
and to reduce possible stress induced during the preparation. The specimen was
then extended at a stretch ratio of 1.35 with respect to the reference length. The
aorta has a pre-stretch in the longitudinal direction at the in vivo state, and its
in situ stretch ratio was estimated between 1.2 and 1.45 (Han and Fung, 1995).
Next, the inflation test at a fixed longitudinal stretch ratio was performed by
pressurizing and depressurizing the specimen five times at approximately 1/
110 Hz frequency over a wide transmural pressure range from 1.33 to 21.33 kPa
(10–160 mmHg) at room temperature. Digital images of the specimen were
recorded simultaneously with pressure and axial load measurements.
In the present study, we examined mechanical behaviors of the aorta at four
circumferential regions. A small region of aortic wall between two consecutive
intercostal arteries was defined as the posterior region (P), its opposite across the
lumen was defined as the anterior region (A), and the two side regions were
determined as the left lateral region (L) and right lateral region (R). The inflation
tests were repeated at these four regions after 901 rotations of the specimen from
one region to another. Great care was taken that no twisting of the specimen
occurred during rotation.
After the inflation test, a cross-sectional cut of the specimen was made at the
mid-portion, where the markers were affixed. The wall thickness measurements
per specimen were repeated three times at every 451 along the circumference
using a vernier caliper.
2.4. Camera matrix and 3D image reconstruction
Two CCD cameras obtained serial digital images of the specimen during the
test. The region where markers were affixed to the specimen was selected from
the image. The centers of markers were extracted in pixels and tracked. A
projective camera model, which mapped 3D world points ðXw ,Yw ,ZwÞ to 2D image
points ðxp ,ypÞ using homogeneous coordinates, was employed. This mapping can
Aorta Sample
Upper Crosshead
Motor
FrameGrabber
CCD
Pressure TransducerSyringe Pump
LoadCell
PCDAQA/D
Lower Crosshead
Test Chamber
Upper Crosshead
Motor
FrameGrabber
CCDCCD
PCDAQ A/D
Lower Crosshead
Fig. 1. Schematic diagram of the experimental set-up for the extension-inflation test.
Fig. 2. A porcine thoracic aorta after removing surrounding tissues (a) and a
cannulated aorta specimen with microspheres affixed on the aortic wall (b).
J. Kim, S. Baek / Journal of Biomechanics 44 (2011) 1941–19471942
Author's personal copy
be written as
sxp
syp
s
8><>:
9>=>;¼
M11 M12 M13 M14
M21 M22 M23 M24
M31 M32 M33 1
264
375
Xw
Yw
Zw
1
8>>><>>>:
9>>>=>>>;
, ð1Þ
where s is a scale factor (Shapiro and Stockman, 2001). The 3�4 camera matrix Min Eq. (1), which describes how a point in the world projects onto an image in
pixels, was determined by 3D world points on a calibration jig and their
corresponding 2D images using the pseudoinverse (least squares) method. Once
the matrices of both cameras were determined, the 3D positions of markers were
obtained by linear mapping equations derived from Eq. (1) for each cameras using
pairs of 2D stereo images taken by both cameras.
3. Stress–strain analysis
The surface of each of the four circumferential regions in thereference and deformed configurations was approximated bycontinuous functions. The approximation and parameter estima-tion using stereo images are explained in the Appendix A. Here, Xand x denote the 3D positions of markers in the reference anddeformed configurations, respectively.
3.1. Deformation gradient, thickness, and curvature
The covariant base vectors Gi and gi of the surface in thereference and deformed configurations, respectively, are definedas
Gi ¼@X
@Si, gi ¼
@x
@Si, ð2Þ
where the two convected variables are S1 ¼Y and S2 ¼ S. Thecontravariant base vectors Gj in the reference configuration aredetermined to satisfy the relation
Gi � Gj¼ dj
i, ð3Þ
where dji ¼ 1 if i¼ j, and dj
i ¼ 0 if ia j for i, j¼1, 2.In a convected curvilinear coordinate system, the 2D deforma-
tion gradient F of the surface is given by
F¼ gi � Gi, ð4Þ
where � denotes the tensor product. Since the covariant andcontravariant base vectors are generally not orthonormal,local orthonormal base vectors Ei in the reference configurationand ei in the current configuration are determined at eachpoint by
E1 ¼G1
j G1 j, E2 ¼
G2�ðG2 � E1ÞE1
j G2�ðG2 � E1ÞE1 j, ð5Þ
e1 ¼g1
j g1 j, e2 ¼
g2�ðg2 � e1Þe1
j g2�ðg2 � e1Þe1 j, ð6Þ
where the subscripts 1 and 2 represent the circumferential andlongitudinal directions, respectively. Finally, the 2D deformationgradient F with respect to the local orthonormal base vectors canbe written as Fpq ¼ ep � FEq.
In the load-free state, the aortic wall thickness H0 at a givenposition along the circumference is approximated by a curve fit tothe measurements of aortic wall thickness, using Fourier series
H0ðyÞ ¼ a0þa1cosðyÞþa2sinðyÞþa3cosð2yÞþa4sinð2yÞ: ð7Þ
The deformed wall thickness h during the inflation test iscalculated by using the incompressibility assumption ððh=H0Þ detF¼1) (Carew et al., 1968), therefore
h¼H0
F11F22�F12F21: ð8Þ
The principal curvature of the aortic wall is obtained bythe first and second fundamental forms of a surface in differen-tial geometry. The normal curvatures kn of a surface are (Struik,1988)
kn ¼L dY
2þ2M dY dSþN dS
2
E dY2þ2F dY dSþG dS
2,
ð9Þ
where
E¼ g1 � g1, F ¼ g1 � g2, G¼ g2 � g2, ð10Þ
L¼ g1,1 � N , M¼ g1,2 � N , N¼ g2,2 � N : ð11Þ
Here gi,j denotes @gi=@Sj and the unit surface normal vector N isgiven by
N ¼g1 � g2
jg1 � g2j: ð12Þ
The two extreme values of kn in Eq. (9) are the two principalcurvatures k1 and k2. The outer radii of curvatures of the aorticwall are calculated by ri ¼ 1=ki for i¼1, 2.
-1.6X X
1.6
1.2
0.8
1.6
1.2
0.8
Z
(cm)
(cm)
1.07
1.05
1.03
-1.4 -1.2 -1.6 -1.4 -1.2
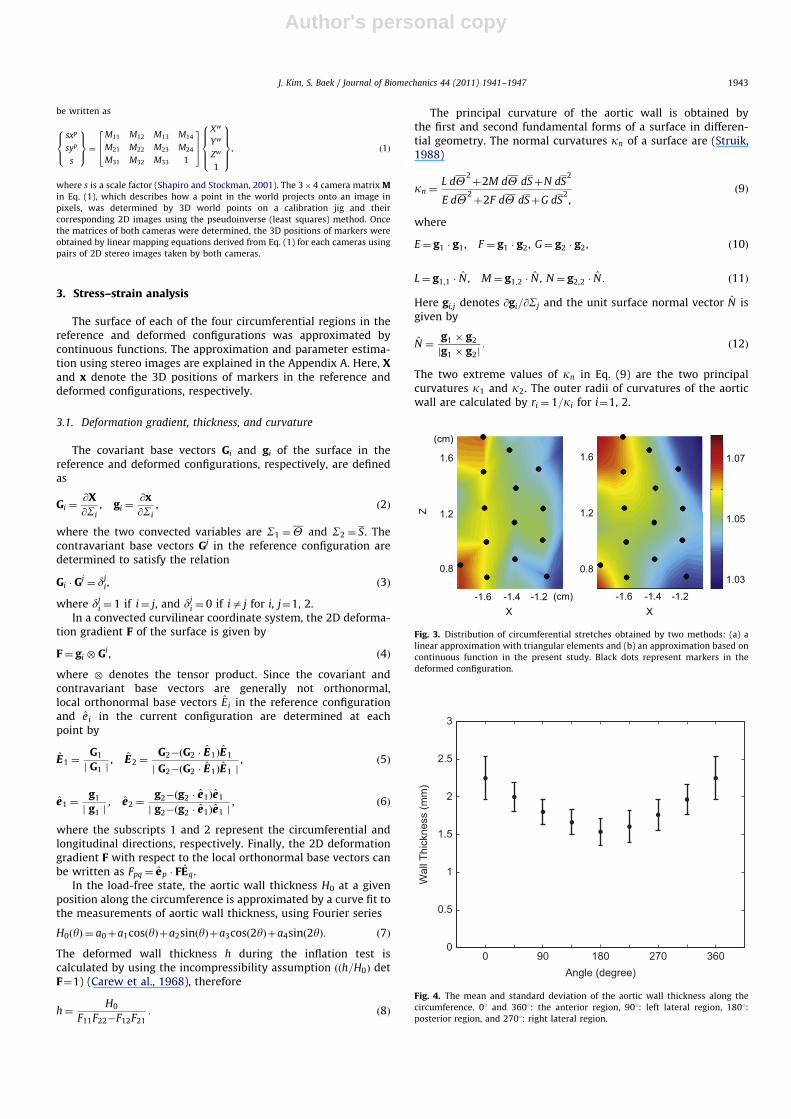
Fig. 3. Distribution of circumferential stretches obtained by two methods: (a) a
linear approximation with triangular elements and (b) an approximation based on
continuous function in the present study. Black dots represent markers in the
deformed configuration.
0 90 180 270 3600
0.5
1
1.5
2
2.5
3
Angle (degree)
Wal
l Thi
ckne
ss (m
m)
Fig. 4. The mean and standard deviation of the aortic wall thickness along the
circumference. 01 and 3601: the anterior region, 901: left lateral region, 1801:
posterior region, and 2701: right lateral region.
J. Kim, S. Baek / Journal of Biomechanics 44 (2011) 1941–1947 1943
Author's personal copy
3.2. Stretch, stress, and stiffness
The circumferential stretch l is calculated at each point by
l¼ffiffiffiffiffiffiffiffiffiffiffiffiffiffiffiffiffiffiffiffiffiffiffiffiffiffiE1 � ðF
T FÞE1
q: ð13Þ
Since the mean radius of the curvature in the longitudinaldirection is much larger than that in the circumferential directionðr2br1Þ, the circumferential Cauchy stress s is estimated by
s¼ Pðr1�hÞ
h: ð14Þ
The circumferential stiffness kðPiÞ, which is defined as thetangent of the mean stress–stretch curve, is obtained at atransmural pressure of Pi by
kðPiÞ ¼@s@l
����lðPiÞ
¼sðlþDlÞ�sðl�DlÞ
2Dl: ð15Þ
To estimate the structural stiffness during the cardiac cycle,the pressure–strain elastic modulus Ep (Feigl et al., 1963; Petersonet al., 1960) is calculated by
Ep ¼Psys�Pdia
ðlsys�ldiaÞ=ldia, ð16Þ
where subscripts sys and dia denote the systolic and diastoliccondition, respectively. We assumed Psys ¼ 15:20 kPa (114 mmHg)and Pdia ¼ 10:13 kPa (76 mmHg).
3.3. Statistical analysis
Stiffness for each circumferential region of each specimen wasused for statistical analysis. The significance of the differenceamong the four circumferential regions and each pair of regionswas evaluated by using one-way repeated measures ANOVA with
0.9 1 1.1 1.2 1.3 1.4−5
0
5
10
15
20
25
Circumferential Stretch
Tran
smur
al P
ress
ure
(kP
a)
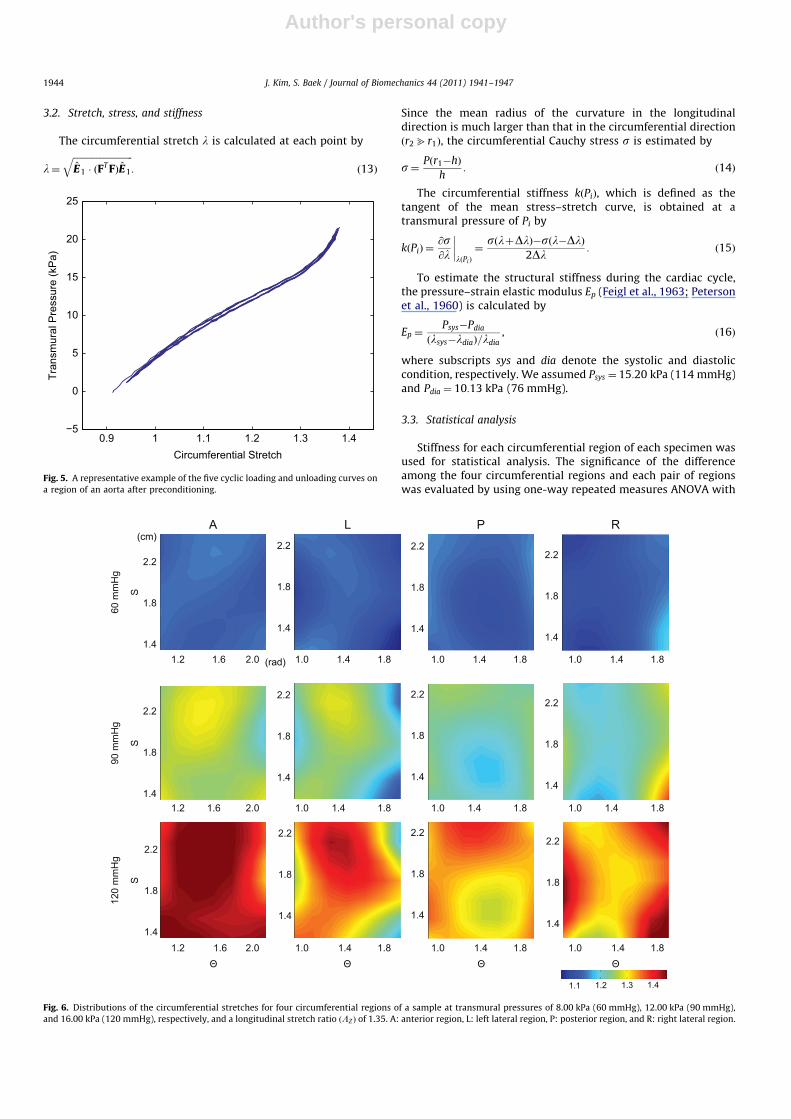
Fig. 5. A representative example of the five cyclic loading and unloading curves on
a region of an aorta after preconditioning.
A
60 m
mH
g
2.2
1.8
1.4
2.2
1.8
1.4
2.2
1.8
1.4
2.2
1.8
1.4
2.2
1.8
1.4
2.2
1.8
1.4
2.2
1.8
1.4
2.2
1.8
1.4
2.2
1.8
1.4
2.2
1.8
1.4
2.2
1.8
1.4
2.2
1.8
1.4
1.2
1.1
Θ Θ Θ Θ
(cm)
(rad)1.6 2.0 1.0 1.4 1.8 1.0 1.4 1.8 1.0 1.4 1.8
1.2 1.6 2.0 1.0 1.4 1.8 1.0 1.4 1.8 1.0 1.4 1.8
1.2 1.6 2.0 1.0 1.4 1.8 1.0 1.4 1.8 1.0 1.4 1.8
120
mm
Hg
90 m
mH
g
SS
S
L P R
1.2 1.3 1.4
Fig. 6. Distributions of the circumferential stretches for four circumferential regions of a sample at transmural pressures of 8.00 kPa (60 mmHg), 12.00 kPa (90 mmHg),
and 16.00 kPa (120 mmHg), respectively, and a longitudinal stretch ratio ðLZ Þ of 1.35. A: anterior region, L: left lateral region, P: posterior region, and R: right lateral region.
J. Kim, S. Baek / Journal of Biomechanics 44 (2011) 1941–19471944
Author's personal copy
post-hoc tests based on Sidak adjustment. The difference wasconsidered significant when po0:05.
4. Results
4.1. Validation of the method
In our pilot study, the inflation test of the same region of theaorta was repeated under the same experimental conditions afterrotating the specimen in order to ensure the reproducibility ofresults. There was little difference between the two stress–stretchresponses before and after rotation.
A flexible silicone tube was used to compare the circumfer-ential stretch distributions obtained by two approximations: onewas based on the continuous functions explained in the previoussection, and the other was based on a linear polynomial approx-imation with triangular elements, which is a typical method usedin finite element analysis and previous experimental studies (Huet al., 2007; Saravanan et al., 2006). Although the stretch dis-tributions appeared similar, the stretch distribution obtained bythe continuous function approximation showed smoother andslightly higher variation than that obtained by the linear approx-imation (Fig. 3). In addition to the circumferential stretch, theouter radii of the silicone tube obtained by the continuousfunction approximation and by the least squares method, assum-ing the tube to be an ideal cylinder with a constant radius, werecompared. The radius difference between the two methods wasless than 2%.
4.2. Wall thickness and curvature
Aortic wall thickness changed gradually along the circumfer-ence (Fig. 4). In all aorta samples, the anterior region was thethickest (2.270.3 mm) and the posterior region was the thinnest(1.570.2 mm).
The outer radius of the aorta changed in response to pressurechanges. In the load-free state, the radius of curvature of theposterior region was slightly smaller than that of other regions.During inflation, the radii of the four regions became nearlyuniform as pressure was increased. At a transmural pressure of12.00 kPa, the mean and standard deviation of the radius for eachregion were 10.070.7 mm (A), 10.170.7 mm (L), 10.270.7 mm(P), and 10.170.8 mm (R).
4.3. Mechanical response of the aorta
In a cyclic loading condition, loading and unloading curvesexhibited small hysteresis (i.e., pseudo-elastic behavior, Fig. 5).Therefore, the last loading curve was used for stress–strainanalysis.
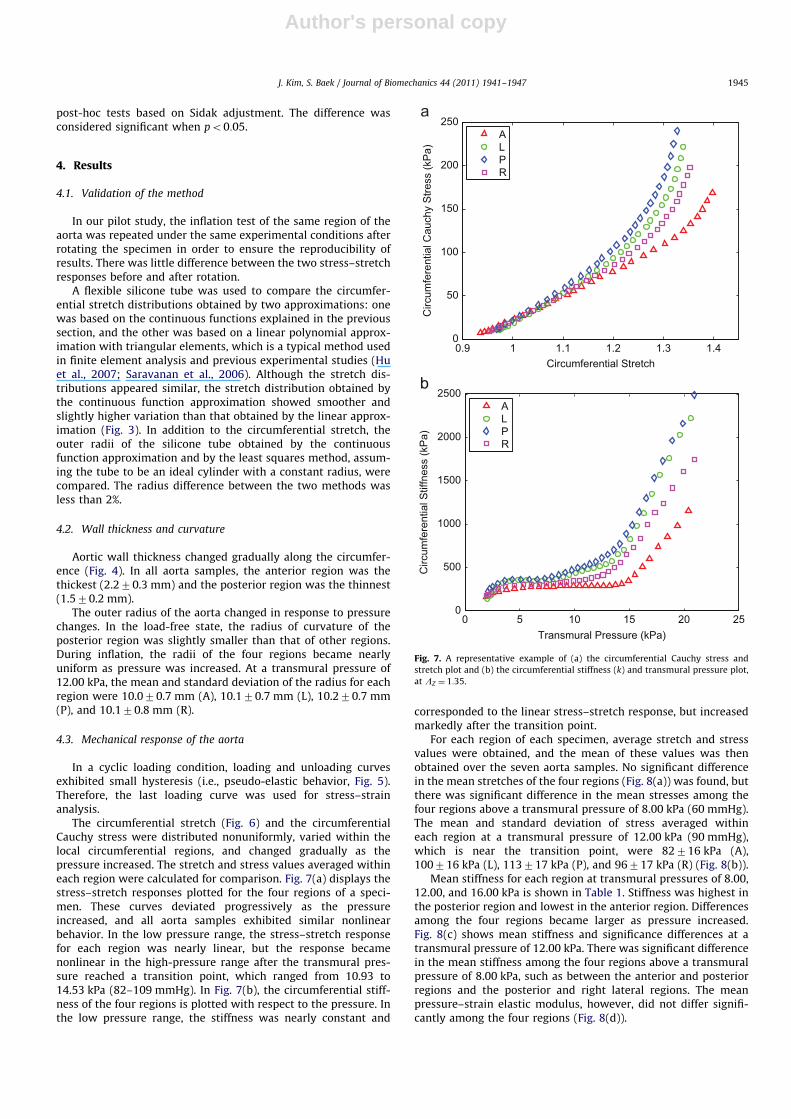
The circumferential stretch (Fig. 6) and the circumferentialCauchy stress were distributed nonuniformly, varied within thelocal circumferential regions, and changed gradually as thepressure increased. The stretch and stress values averaged withineach region were calculated for comparison. Fig. 7(a) displays thestress–stretch responses plotted for the four regions of a speci-men. These curves deviated progressively as the pressureincreased, and all aorta samples exhibited similar nonlinearbehavior. In the low pressure range, the stress–stretch responsefor each region was nearly linear, but the response becamenonlinear in the high-pressure range after the transmural pres-sure reached a transition point, which ranged from 10.93 to14.53 kPa (82–109 mmHg). In Fig. 7(b), the circumferential stiff-ness of the four regions is plotted with respect to the pressure. Inthe low pressure range, the stiffness was nearly constant and
corresponded to the linear stress–stretch response, but increasedmarkedly after the transition point.
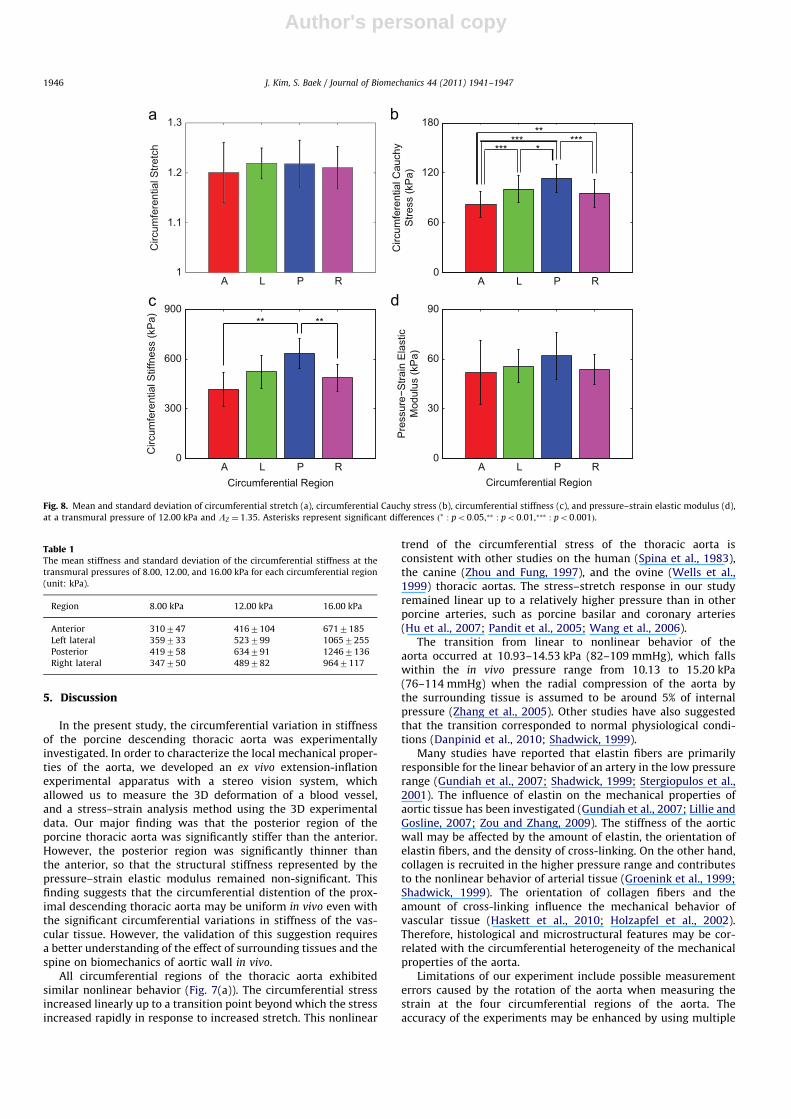
For each region of each specimen, average stretch and stressvalues were obtained, and the mean of these values was thenobtained over the seven aorta samples. No significant differencein the mean stretches of the four regions (Fig. 8(a)) was found, butthere was significant difference in the mean stresses among thefour regions above a transmural pressure of 8.00 kPa (60 mmHg).The mean and standard deviation of stress averaged withineach region at a transmural pressure of 12.00 kPa (90 mmHg),which is near the transition point, were 82716 kPa (A),100716 kPa (L), 113717 kPa (P), and 96717 kPa (R) (Fig. 8(b)).
Mean stiffness for each region at transmural pressures of 8.00,12.00, and 16.00 kPa is shown in Table 1. Stiffness was highest inthe posterior region and lowest in the anterior region. Differencesamong the four regions became larger as pressure increased.Fig. 8(c) shows mean stiffness and significance differences at atransmural pressure of 12.00 kPa. There was significant differencein the mean stiffness among the four regions above a transmuralpressure of 8.00 kPa, such as between the anterior and posteriorregions and the posterior and right lateral regions. The meanpressure–strain elastic modulus, however, did not differ signifi-cantly among the four regions (Fig. 8(d)).
0.9 1 1.1 1.2 1.3 1.40
50
100
150
200
250
Circumferential Stretch
Circ
umfe
rent
ial C
auch
y S
tress
(kP
a)
ALPR
0 5 10 15 20 250
500
1000
1500
2000
2500
Transmural Pressure (kPa)
Circ
umfe
rent
ial S
tiffn
ess
(kP
a)ALPR
Fig. 7. A representative example of (a) the circumferential Cauchy stress and
stretch plot and (b) the circumferential stiffness (k) and transmural pressure plot,
at LZ ¼ 1:35.
J. Kim, S. Baek / Journal of Biomechanics 44 (2011) 1941–1947 1945
Author's personal copy
5. Discussion
In the present study, the circumferential variation in stiffnessof the porcine descending thoracic aorta was experimentallyinvestigated. In order to characterize the local mechanical proper-ties of the aorta, we developed an ex vivo extension-inflationexperimental apparatus with a stereo vision system, whichallowed us to measure the 3D deformation of a blood vessel,and a stress–strain analysis method using the 3D experimentaldata. Our major finding was that the posterior region of theporcine thoracic aorta was significantly stiffer than the anterior.However, the posterior region was significantly thinner thanthe anterior, so that the structural stiffness represented by thepressure–strain elastic modulus remained non-significant. Thisfinding suggests that the circumferential distention of the prox-imal descending thoracic aorta may be uniform in vivo even withthe significant circumferential variations in stiffness of the vas-cular tissue. However, the validation of this suggestion requiresa better understanding of the effect of surrounding tissues and thespine on biomechanics of aortic wall in vivo.
All circumferential regions of the thoracic aorta exhibitedsimilar nonlinear behavior (Fig. 7(a)). The circumferential stressincreased linearly up to a transition point beyond which the stressincreased rapidly in response to increased stretch. This nonlinear
trend of the circumferential stress of the thoracic aorta isconsistent with other studies on the human (Spina et al., 1983),the canine (Zhou and Fung, 1997), and the ovine (Wells et al.,1999) thoracic aortas. The stress–stretch response in our studyremained linear up to a relatively higher pressure than in otherporcine arteries, such as porcine basilar and coronary arteries(Hu et al., 2007; Pandit et al., 2005; Wang et al., 2006).
The transition from linear to nonlinear behavior of theaorta occurred at 10.93–14.53 kPa (82–109 mmHg), which fallswithin the in vivo pressure range from 10.13 to 15.20 kPa(76–114 mmHg) when the radial compression of the aorta bythe surrounding tissue is assumed to be around 5% of internalpressure (Zhang et al., 2005). Other studies have also suggestedthat the transition corresponded to normal physiological condi-tions (Danpinid et al., 2010; Shadwick, 1999).
Many studies have reported that elastin fibers are primarilyresponsible for the linear behavior of an artery in the low pressurerange (Gundiah et al., 2007; Shadwick, 1999; Stergiopulos et al.,2001). The influence of elastin on the mechanical properties ofaortic tissue has been investigated (Gundiah et al., 2007; Lillie andGosline, 2007; Zou and Zhang, 2009). The stiffness of the aorticwall may be affected by the amount of elastin, the orientation ofelastin fibers, and the density of cross-linking. On the other hand,collagen is recruited in the higher pressure range and contributesto the nonlinear behavior of arterial tissue (Groenink et al., 1999;Shadwick, 1999). The orientation of collagen fibers and theamount of cross-linking influence the mechanical behavior ofvascular tissue (Haskett et al., 2010; Holzapfel et al., 2002).Therefore, histological and microstructural features may be cor-related with the circumferential heterogeneity of the mechanicalproperties of the aorta.
Limitations of our experiment include possible measurementerrors caused by the rotation of the aorta when measuring thestrain at the four circumferential regions of the aorta. Theaccuracy of the experiments may be enhanced by using multiple
A L P R1
1.1
1.2
1.3
Circ
umfe
rent
ial S
tretc
h
A L P R0
60
120
180
Circ
umfe
rent
ial C
auch
yS
tress
(kP
a)
**
*** **** ***
A L P R0
300
600
900
Circumferential Region
Circ
umfe
rent
ial S
tiffn
ess
(kP
a) ** **
A L P R0
30
60
90
Pre
ssur
e−S
train
Ela
stic
Mod
ulus
(kP
a)
Circumferential Region
Fig. 8. Mean and standard deviation of circumferential stretch (a), circumferential Cauchy stress (b), circumferential stiffness (c), and pressure–strain elastic modulus (d),
at a transmural pressure of 12.00 kPa and LZ ¼ 1:35. Asterisks represent significant differences ð� : po0:05,�� : po0:01,��� : po0:001Þ.
Table 1The mean stiffness and standard deviation of the circumferential stiffness at the
transmural pressures of 8.00, 12.00, and 16.00 kPa for each circumferential region
(unit: kPa).
Region 8.00 kPa 12.00 kPa 16.00 kPa
Anterior 310747 4167104 6717185
Left lateral 359733 523799 10657255
Posterior 419758 634791 12467136
Right lateral 347750 489782 9647117
J. Kim, S. Baek / Journal of Biomechanics 44 (2011) 1941–19471946
Author's personal copy
cameras simultaneously around the specimen or using a concaveconical mirror (Genovese, 2009). Another shortcoming of thisstudy is that we used only the circumferential stress and stretchfor estimating the stiffness. Hence, there is a need for anenhanced method for accurately analyzing the regional biaxialmechanical behavior of the vessel wall.
Finally, we suggest that the experimental method and analysispresented in this paper can be used in the study of vascularadaptation during the progression of vascular diseases, which willeventually increase our understanding of the role of biomechanicson vascular diseases or vice versa.
Conflict of interest
We do not have a conflict of interest with anyone ororganization.
Appendix A. Supplementary data
Supplementary data associated with this article can be foundin the online version at doi:10.1016/j.jbiomech.2011.04.022.
References
Avril, S., Badel, P., Duprey, A., 2010. Anisotropic and hyperelastic identification ofin vitro human arteries from full-field optical measurements. Journal ofBiomechanics 43, 2978–2985.
Blondel, W.C.P.M., Didelon, J., Maurice, G., Carteaux, J.P., Wang, X., Stoltz, J.F., 2001.Investigation of 3-D mechanical properties of blood vessels using a newin vitro tests system: results on sheep common carotid arteries. IEEE Transac-tions on Biomedical Engineering 48, 442–451.
Carew, T.E., Vaishnav, R.N., Patel, D.J., 1968. Compressibility of the arterial wall.Circulation Research 23, 61–68.
Danpinid, A., Luo, J., Vappou, J., Terdtoon, P., Konofagou, E.E., 2010. In vivocharacterization of the aortic wall stress–strain relationship. Ultrasonics 50,654–665.
Draney, M.T., Arko, F.R., Alley, M.T., Markl, M., Herfkens, R.J., Pelc, N.J., Zarins, C.K.,Taylor, C.A., 2004. Quantification of vessel wall motion and cyclic strain usingcine phase contrast MRI: in vivo validation in the porcine aorta. MagneticResonance in Medicine 52, 286–295.
Draney, M.T., Herfkens, R.J., Hughes, T.J.R., Pelc, N.J., Wedding, K.L., Zarins, C.K.,Taylor, C.A., 2002. Quantification of vessel wall cyclic strain using cine phasecontrast magnetic resonance imaging. Annals of Biomedical Engineering 30,1033–1045.
Everett, W.N., Shih, P., Humphrey, J.D., 2005. A bi-plane video-based system forstudying the mechanics of arterial bifurcations. Experimental Mechanics 45,377–382.
Feigl, E.O., Peterson, L.H., Jones, A.W., 1963. Mechanical and chemical properties ofarteries in experimental hypertension. Journal of Clinical Investigation 42,1640–1647.
Genovese, K., 2009. A video-optical system for time-resolved whole-body mea-surement on vascular segments. Optics and Lasers in Engineering 47,995–1008.
Groenink, M., Langerak, S.E., Vanbavel, E., van der Wall, E.E., Mulder, B.J.M.,van der Wal, A.C., Spaan, J.A.E., 1999. The influence of aging and aortic stiffnesson permanent dilation and breaking stress of the thoracic descending aorta.Cardiovascular Research 43, 471–480.
Gundiah, N., Ratcliffe, M.B., Pruitt, L.A., 2007. Determination of strain energyfunction for arterial elastin: experiments using histology and mechanical tests.Journal of Biomechanics 40, 586–594.
Guo, X., Kassab, G.S., 2004. Distribution of stress and strain along the porcine aortaand coronary arterial tree. American Journal of Physiology - Heart andCirculatory Physiology 286, H2361–H2368.
Han, H.C., Fung, Y.C., 1995. Longitudinal strain of canine and porcine aortas.Journal of Biomechanics 28, 637–641.
Haskett, D., Johnson, G., Zhou, A., Utzinger, U., Vande Geest, J., 2010. Microstruc-tural and biomechanical alterations of the human aorta as a function of ageand location. Biomechanics and Modeling in Mechanobiology 9, 725–736.
Holzapfel, G.A., Gasser, T.C., Stadler, M., 2002. A structural model for theviscoelastic behavior of arterial walls: continuum formulation and finiteelement analysis. European Journal of Mechanics-A/Solids 21, 441–463.
Hsu, F.P.K., Liu, A.M.C., Downs, J., Rigamonti, D., Humphrey, J.D., 1995. A triplanevideo-based experimental system for studying axisymmetrically inflatedbiomembranes. IEEE Transactions on Biomedical Engineering 42, 442–450.
Hu, J.J., Fossum, T.W., Miller, M.W., Xu, H., Liu, J.C., Humphrey, J.D., 2007.Biomechanics of the porcine basilar artery in hypertension. Annals of Biome-dical Engineering 35, 19–29.
Huang, Y., Guo, X., Kassab, G.S., 2006. Axial nonuniformity of geometric andmechanical properties of mouse aorta is increased during postnatal growth.American Journal of Physiology- Heart and Circulatory Physiology 290,H657–H664.
Humphrey, J.D., Kang, T., Sakarda, P., Anjanappa, M., 1993. Computer-aidedvascular experimentation: a new electromechanical test system. Annals ofBiomedical Engineering 21, 33–43.
Lally, C., Reid, A.J., Prendergast, P.J., 2004. Elastic behavior of porcine coronaryartery tissue under uniaxial and equibiaxial tension. Annals of BiomedicalEngineering 32, 1355–1364.
Langewouters, G.J., Wesseling, K.H., Goedhard, W.J.A., 1984. The static elasticproperties of 45 human thoracic and 20 abdominal aortas in vitroand theparameters of a new model. Journal of Biomechanics 17, 425–435.
Lillie, M.A., Gosline, J.M., 2007. Mechanical properties of elastin along the thoracicaorta in the pig. Journal of Biomechanics 40, 2214–2221.
Okamoto, R.J., Wagenseil, J.E., DeLong, W.R., Peterson, S.J., Kouchoukos, N.T.,Sundt III, T.M., 2002. Mechanical properties of dilated human ascending aorta.Annals of Biomedical Engineering 30, 624–635.
Pandit, A., Lu, X., Wang, C., Kassab, G.S., 2005. Biaxial elastic material properties ofporcine coronary media and adventitia. American Journal of Physiology - Heartand Circulatory Physiology 288, H2581–H2587.
Peterson, L.H., Jensen, R.E., Parnell, J., 1960. Mechanical properties of arteriesin vivo. Circulation Research 8, 622–639.
van Prehn, J., Vincken, K.L., Sprinkhuizen, S.M., Viergever, M.A., van Keulen, J.W.,van Herwaarden, J.A., Moll, F.L., Bartels, L.W., 2009. Aortic pulsatile distentionin young healthy volunteers is asymmetric: analysis with ECG-gated MRI.European Journal of Vascular and Endovascular Surgery 37, 168–174.
Saravanan, U., Baek, S., Rajagopal, K.R., Humphrey, J.D., 2006. On the deformationof the circumflex coronary artery during inflation tests at constant length.Experimental Mechanics 46, 647–656.
Schulze-Bauer, C.A.J., Morth, C., Holzapfel, G.A., 2003. Passive biaxial mechanicalresponse of aged human iliac arteries. ASME Journal of BiomechanicalEngineering 125, 395–406.
Schulze-Bauer, C.A.J., Regitnig, P., Holzapfel, G.A., 2002. Mechanics of the humanfemoral adventitia including the high-pressure response. American Journal ofPhysiology - Heart and Circulatory Physiology 282, H2427–H2440.
Shadwick, R.E., 1999. Mechanical design in arteries. Journal of ExperimentalBiology 202, 3305–3313.
Shapiro, L.G., Stockman, G.C., 2001. Computer Vision. Prentice Hall, New Jersey.Sokolis, D.P., 2007. Passive mechanical properties and structure of the aorta:
segmental analysis. Acta Physiologica 190, 277–289.Spina, M., Garbisa, S., Hinnie, J., Hunter, J.C., Serafini-Fracassini, A., 1983. Age-
related changes in composition and mechanical properties of the tunica mediaof the upper thoracic human aorta. Arteriosclerosis, Thrombosis, and VascularBiology 3, 64–76.
Stergiopulos, N., Vulliemoz, S., Rachev, A., Meister, J.J., Greenwald, S.E., 2001.Assessing the homogeneity of the elastic properties and composition of the pigaortic media. Journal of Vascular Research 38, 237–246.
Struik, D.J., 1988. Lectures on Classical Differential Geometry, second ed. DoverPublications, Inc., New York.
Thubrikar, M.J., Roskelley, S., Eppink, R., 1990. Study of stress concentration in thewalls of the bovine coronary arterial branch. Journal of Biomechanics 23,15–17.
Tremblay, D., Cartier, R., Mongrain, R., Leask, R.L., 2010. Regional dependency ofthe vascular smooth muscle cell contribution to the mechanical properties ofthe pig ascending aortic tissue. Journal of Biomechanics 43, 2448–2451.
Valdez-Jasso, D., Haider, M.A., Banks, H.T., Bia Santana, D., German, Y.Z., Armen-tano, R.L., Olufsen, M.S., 2009. Analysis of viscoelastic wall properties in ovinearteries. IEEE Transaction on Biomedical Engineering 56, 210–219.
Vande Geest, J.P., Sacks, M.S., Vorp, D.A., 2006. The effects of aneurysm on thebiaxial mechanical behavior of human abdominal aorta. Journal of Biomecha-nics 39, 1324–1334.
Wang, C., Garcia, M., Lu, X., Lanir, Y., Kassab, G.S., 2006. Three-dimensionalmechanical properties of porcine coronary arteries: a validated two-layermodel. American Journal of Physiology - Heart and Circulatory Physiology 291,H1200–H1209.
Wells, S.M., Langille, B.L., Lee, J.M., Adamson, S.L., 1999. Determinants of mechan-ical properties in the developing ovine thoracic aorta. American Journal ofPhysiology - Heart and Circulatory Physiology 277, H1385–H1391.
Zhang, D., Eggleton, C.D., Arola, D.D., 2002. Evaluating the mechanical behavior ofarterial tissue using digital image correlation. Experimental Mechanics 42,409–416.
Zhang, W., Herrera, C., Atluri, S.N., Kassab, G.S., 2005. The effect of longitudinalpre-stretch and radial constraint on the stress distribution in the vessel wall: anew hypothesis. Mechanics and Chemistry of Biosystems 2, 41–52.
Zhou, J., Fung, Y.C., 1997. The degree of nonlinearity and anisotropy of blood vesselelasticity. Proceedings of the National Academy of Sciences 94, 14255–14260.
Zou, Y., Zhang, Y., 2009. An experimental and theoretical study on the anisotropyof elastin network. Annals of Biomedical Engineering 37, 1572–1583.
J. Kim, S. Baek / Journal of Biomechanics 44 (2011) 1941–1947 1947
Copyright © 2022 FDOKUMEN