Mechanical Behavior Characterization of Knitted Textiles A ...
103
Mechanical Behavior Characterization of Knitted Textiles A Thesis Submitted to the Faculty of Drexel University by Mustafa Oncul in partial fulfillment of the requirements for the degree of Master of Science in Mechanical Engineering December 2017
-
Upload
khangminh22 -
Category
Documents
-
view
1 -
download
0
Transcript of Mechanical Behavior Characterization of Knitted Textiles A ...

Mechanical Behavior Characterization of Knitted Textiles
A Thesis
Submitted to the Faculty
of Drexel University
by
Mustafa Oncul
in partial fulfillment of the
requirements for the degree
of
Master of Science in Mechanical Engineering
December 2017

© Copyright 2017
Mustafa Oncul. All Rights Reserved.

ii
In the Name of Allah, the Entirely Merciful, the Especially Merciful

iii
TABLE OF CONTENTS
LIST OF TABLES .......................................................................................................... v
LIST OF FIGURES ........................................................................................................ vi
ABSTRACT .................................................................................................................... x
CHAPTER 1: INTRODUCTION ................................................................................... 1
1.1 An Overview ............................................................................................................. 1
1.1.1 Knitted Textiles .................................................................................................. 3
1.2 Testing and Characterization of Textiles .................................................................. 7
1.3 Nonlinear Mechanics of Knitted Textiles ................................................................. 9
1.4 Thesis Structure ....................................................................................................... 12
CHAPTER 2: BACKGROUND AND STATE-OF-THE-ART IN MECHANICAL BEHAVIOR CHARACTERIZATION AND TESTING OF KNITTED TEXTILES . 14
2.1 Bulk Measurements ................................................................................................. 14
2.2 Local Level Measurements ..................................................................................... 18
2.3 Textile Testing Standards ........................................................................................ 22
2.4 Three-dimensional Geometry Extraction ................................................................ 25
2.5 Modeling ................................................................................................................. 26
CHAPTER 3: THESIS OBJECTIVE AND APPROACH ............................................ 31
3.1 Research Motivation ............................................................................................... 31
3.2 Hypothesis and Objective ........................................................................................ 33
3.3 Proposed Approach ................................................................................................. 34
CHAPTER 4: EXPERIMENTAL SETUP AND PROCEDURE ................................. 37
4.1 Manufacturing of Specimens .................................................................................. 37
4.2 Mechanical Testing Setups ...................................................................................... 41
4.2.1 Micro-scale ....................................................................................................... 42
4.2.2 Lab-scale........................................................................................................... 43
4.3 Strain and Apparent Stiffness Calculations ............................................................. 45
4.3.1 Strain Calculation ............................................................................................. 45
4.3.2 Apparent Stiffness Calculation ......................................................................... 46
4.4 Speckle Pattern Creation for Digital Image Correlation ......................................... 47
4.5 Image Acquisition Setup ......................................................................................... 50

iv
CHAPTER 5: MECHANICAL BEHAVIOR CHARACTERIZATION OF KNITTED TEXTILES .................................................................................................................... 52
5.1 Global Measurements .............................................................................................. 52
5.1.1 Deformation ...................................................................................................... 52
5.1.2 Anisotropy ........................................................................................................ 55
5.1.3 Cyclic Loading ................................................................................................. 61
5.1.3 Stress Relaxation .............................................................................................. 63
5.2 Local Measurements ............................................................................................... 65
5.2.1 Yarn-level measurement results ....................................................................... 69
5.3 Correlation of Global and Local Measurements ..................................................... 72
CHAPTER 6: 3D GEOMETRY EXTRACTION ......................................................... 77
6.1 Material Geometry Characterization ....................................................................... 77
6.2 Data Extraction and Connection to Modeling ......................................................... 78
CHAPTER 7: CONCLUDING REMARKS AND FUTURE PROSPECTS ................ 82
LIST OF REFERENCES .............................................................................................. 83

v
LIST OF TABLES
Table 1: Deformation mechanisms of fabrics: a) Knitted, b) Woven, c) Nonwoven [14] ......................................................................................................................................... 8
Table 2: Measurement types and ASTM Standards ...................................................... 23
Table 3: Geometrical parameters and gauges of the manufactured specimens ............. 39
Table 4: GATAN load stage characteristics .................................................................. 42
Table 5: Mark-10 tensile tester characteristics .............................................................. 44
Table 6: Average speckle length values ........................................................................ 50
Table 7: Facet field characteristics ................................................................................ 51
Table 8: Average apparent stiffness values (N/mm) ..................................................... 58
Table 9: Areas of the load-strain curves ........................................................................ 62

vi
LIST OF FIGURES
Figure 1: Common textile structures: a) Knitted, b) Woven, c) Nonwoven, and d) Braided [2, 3] ................................................................................................................... 2
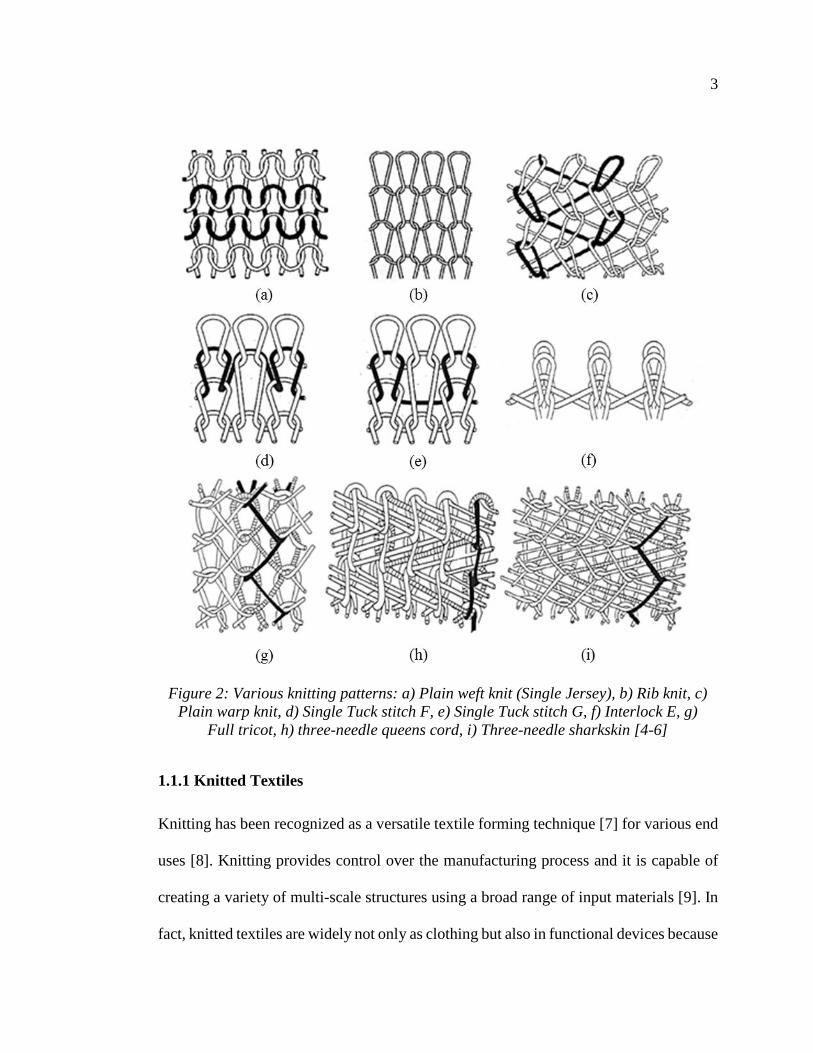
Figure 2: Various knitting patterns: a) Plain weft knit (Single Jersey), b) Rib knit, c) Plain warp knit, d) Single Tuck stitch F, e) Single Tuck stitch G, f) Interlock E, g) Full tricot, h) three-needle queens cord, i) Three-needle sharkskin [4-6] .............................. 3
Figure 3: Schematic representation of the hierarchical knit architecture; a) knitted loop, b) knit patterns, c) grid pattern, d) restructured grid [11] ............................................... 4
Figure 4: a) plain weft knit, b) weft knitting process, c) warp knit, d) warp knitting process [4, 5] ................................................................................................................... 5
Figure 5: The mechanism of a latch needle; a) running, b) clearing, c) feeding, d) loop pulling, e) knock over [8] ................................................................................................ 6
Figure 6: Some of the textile testing and characterization methods [1] .......................... 9
Figure 7: Load-displacement curves for woven and knitted fabrics [16]...................... 10
Figure 8: Structure of the thesis .................................................................................... 13
Figure 9: Macro-level deformation modes: a) transverse compression, b) in-plane tension, c) in-plane shear, d) out-of-plane bending [16] ............................................... 14
Figure 10: (a) Structure of the co-woven-knitted fabric, (b) Tension stress-strain and (c) tear displacement-load curves, along various directions ............................................... 16
Figure 11: Tensile test setup with non-crimp fabric structure....................................... 17
Figure 12: Stress-strain curves of the spacer fabrics: a) not glued, and b) glued to platens surfaces ............................................................................................................. 18
Figure 13: Micro-level deformation modes: a) inter-yarn slip, b) inter-yarn shear, c) yarn bending, d) yarn buckling, e) intra-yarn slip (inter-fiber friction), f) yarn stretching, g) yarn compression, h) yarn twist [16] ....................................................... 19
Figure 14: Displacement fields; a) at macroscale, b) at mesoscale (within the yarn) ... 21
Figure 15: a) Test apparatus; tensile tester and image acquisition, b) Displacement field within a woven yarn with 1.92 mm warp width and 2.21 mm weft width ................... 21
Figure 16: Picture frame test: (a) ‘Small Square’ setup in the reference state (ROI and subset window is indicated), (b) Fabric deformation for the ‘Small Square’ setup, (c) Fabric deformation for the ‘Large Cross’ setup ............................................................ 22
Figure 17: a) jaw faces, b) specimen, c) illustration of specimen placement................ 24
Figure 18: a) Hanger assembly, b) Loop specimen in place on pins............................. 25
Figure 19: a) Optical microscopy image of the sample, b) CT image from cross-section with fitted to threshold area, c) Reconstructed volume of the sample, d) Geometrical model of the loop [85] ................................................................................................... 26

vii
Figure 20: a) Model of the plain weave structure, b) Model of the plain weft knitted fabric with unit structure ............................................................................................... 28
Figure 21: a) Photograph of fabric sample and customized clamps during a uniaxial tensile test and finite element model for uniaxial tensile test utilizing symmetry, b) Axial stress vs strain curves, c) Transverse strain vs axial strain curves ...................... 29
Figure 22: a) Photos and schematics of rib and Milano knitted fabrics, b) Load-strain curve for rib knit in wale direction, c) Experimental results vs model prediction for rib knit ................................................................................................................................. 30
Figure 23: Results from modeling [23]; a) size effect, b) sliding and stretching, c) anisotropy, d) out-of-plane deformation, e) yarn interactions....................................... 33
Figure 24: Experimental methods; a) Micro Scale Tensile Tester, b) Lab Scale Tensile Tester, c) Digital Microscopy, d) X-ray micro CT ....................................................... 35
Figure 25: Manufactured specimen with border and interior regions ........................... 37
Figure 26: Interior region and border materials: (a) Monofilament yarn, (b) Digital microscopy image of the monofilament yarn, (c) Multifilament yarn .......................... 38
Figure 27: Single jersey knitted specimen with its components ................................... 40
Figure 28: Specimen manufacturing procedure: a) Designing, b) Shima Seiki SSG122SV machine, c) Knitting process, d) Final product .......................................... 40
Figure 29: Manufactured specimens with structure images: a & b are the specimens and c & d are the structure images of the single jersey and Rib knits respectively ............. 41
Figure 30: Microscale testing setup: 1. GATAN stage, 2. Load Cell controller, 3. Grips, 4. Digital microscope, 5. Load cell and microscope monitor, 6. Coupon, 7. Rubber pieces, 8. Black carbon piece, 9. Deben Microtest and MicroCapture software........... 43
Figure 31: Lab-scale testing setup: 1. Force gauge (50 N), 2. Mark-10 controller, 3. Grips (G1015-1), 4. Digital microscope, 5. Mark-10 and microscope monitor, 6. Coupon, 7. Rubber pieces, 8. Black carbon piece, 9. MeasurGauge and MicroCapture software ......................................................................................................................... 44
Figure 32: Gauge lengths: a) initial position (L0) and b) deformed position (L) .......... 45
Figure 33: Length differences in y-direction vs load data from machine and images .. 46
Figure 34: A sample of the apparent stiffness calculation [100] method in this study . 47
Figure 35: Speckle patterned coupon with single loop deformation: a) Field of view (FoV), b) Initial position (relaxed state), S, c) deformed position (stretched state), SI. 48
Figure 36: Speckle creation methods from a to c; spray paint, marker, and airbrushing; and speckled monofilament yarns are from d to f painted with these methods correspondingly ............................................................................................................. 49
Figure 37: Load-displacement curves for three identical specimens ............................ 53
Figure 38: Load-displacement curve for single jersey knit specimen with 4 different regions A-to-D and critical stretch point ....................................................................... 54

viii
Figure 39: 4 different regions from load-displacement curve with specimen images; a) sliding (oscillation), b)sliding and interlocking, c) sliding and stretching, d)stretching (linear) ........................................................................................................................... 55
Figure 40: Wale and course direction of a standard single jersey knitted specimen..... 56
Figure 41: Load-displacement curve divided 5 different regions ................................. 57
Figure 42: Anisotropy results for both single jersey and rib knit structures ................. 59
Figure 43: Gauge length difference results from J02C specimen ................................. 59
Figure 44: Load-strain curves: a) Modeling data [23], b) Experimental data ............... 60
Figure 45: Loading and unloading one deformation cycle in the load-strain curve for 3 coupons (J01B, J03B, and J04B). Dashed line OA represents perfect linear elasticity 61
Figure 46: The effects of gauge length (40 and 50 mm) on load-strain response for single jersey knitted specimen ....................................................................................... 62
Figure 47: Stress relaxation for 5 different applied load ............................................... 64
Figure 48: Stress relaxation in three steps with pre-load .............................................. 65
Figure 49: Optical image acquisition system for 2D DIC method ................................ 66
Figure 50: From coupon level to single yarn. a) Coupon level, b) Field of View (FoV), c) Region of Interest (RoI), d) Single loop with course spacing (C), wale spacing (W) and diameter (D) ............................................................................................................ 67
Figure 51: a) Field of view from Figure 50c, b) Line gauge measurements, c) Rotation measurements ................................................................................................................ 68
Figure 52: Deformation behavior of the architecture in microscale tensile testing. a) Relaxed state, b) Sliding and stretching region; elongation in y-direction and constriction in x-direction, c) Stretched region ............................................................. 69
Figure 53: Yarn level length difference in x-direction .................................................. 70
Figure 54: Yarn level length difference in y-direction .................................................. 70
Figure 55: Angle changes of the single yarns ............................................................... 71
Figure 56: Strain-time curve with load ......................................................................... 72
Figure 57: Load vs displacement curve with focusing region....................................... 73
Figure 58: Line-gage measurement results in the yarn level......................................... 74
Figure 59: Load vs displacement curve with focusing region....................................... 75
Figure 60: Line-gage measurement results in the yarn level......................................... 76
Figure 61: a) obtaining slices from the sample, b) applying image processing, c) extracting yarn path ....................................................................................................... 78
Figure 62: a) The specimen prepared for volumetric measurement, b) Region of Interest for yarn path analysis ....................................................................................... 79

ix
Figure 63: The method used to detect and characterize the yarn centerlines: a) A sample binary image, b) The slice with the centers of mass of the cross sections, c) Illustration of parallel slices with yarn path .................................................................. 80
Figure 64: Extracted loop geometries ........................................................................... 81
Figure 65: Process flow schematic ................................................................................ 81

x
ABSTRACT
Mechanical Behavior Characterization of Knitted Textiles
Mustafa Oncul
Antonios Kontsos, Ph.D.
Knitted textiles are flexible and geometrically hierarchical 3D materials dominated by
complex microstructure-property-behavior relations. From the microscale (fiber level)
to the macroscale (fabric level) these relations are influenced by a number of factors
including material properties, geometry, topological arrangements of yarns, yarn-to-yarn
interactions etc. Generally, the experimentation methodologies currently used to
characterize the mechanical behavior of knitted textiles are performed to investigate their
performance at the global/bulk level. In this context, the research presented in this thesis
attempts to provide a multiscale framework suitable for quantitative characterization of
the mechanical behavior of this class of materials. To achieve this goal, mechanical
testing at two different scales was coupled with full-field deformation mapping. To
demonstrate the approach two types of knit architectures were investigated including
specimens of single jersey and rib knits. Each of the two knit architectures was tested
using specimens having two different sizes. The experimental findings of this research
validated previously reported simulation results that predicted anisotropic, nonlinear and
multiscale-dependent mechanical behavior of knitted textiles, while they provide a
testing framework that can be expanded to other classes of 3D architectured materials.

This page intentionally left blank

1
CHAPTER 1: INTRODUCTION
1.1 An Overview
Textiles is one of the oldest and most versatile class of materials, generally conceived to
provide humans protection from the natural elements. Textiles manufacturing involves
methods that transform fibers into fabrics. Up to the present, numerous fabric types and
manufacturing techniques have emerged to fulfill continuous and increasing demands.
There are four main textile structures known as knitting, woven, nonwoven and braid as
shown in Figure 1. In the case of knitting, weaving, and braiding, fibers are first made
into yarns, which are then used in manufacturing, whereas nonwovens are produced
directly from fibers.
Knitted textiles, which constitute the target class of textiles in this thesis, are fabricated
by interlacing loops in several patterns as shown in Figure 2. In general, knitted textiles
can be extended by large amounts, while they are characterized by highly anisotropic
directional mechanical performance. In contrast to knitted textiles, woven textiles are
produced by interlacing warp weft yarns according to regular patterns as shown in Figure
1b. As a result, woven textiles are generally stronger but less stretchable compared with
other textile structures [1]. Nonwovens are produced by disposing fibers in a more or
less random manner to form 3D structures, similar to those shown in Figure 1c. Finally,
braids are formed by interlacing three or more yarns to yield long and narrow products,
as shown in Figure 1d. These four structures are the most commonly seen and used
textiles, but the variations within each category are numerous. As an example of such

2
diversity, Figure 2 shows various knit patterns. Note that the patterns shown in Figure
2a and Figure 2b are the ones used in this thesis.
Figure 1: Common textile structures: a) Knitted, b) Woven, c) Nonwoven, and d) Braided [2, 3]
Knitted fabrics differ depending on the shape of the final product and/or the architecture
of the knitting pattern both of which are directly linked to the manufacturing process. It
is important to note that the differences in complexity between these architectures, as
demonstrated by comparing, for example, the plain knits in Figure 2a with the three
needle sharkskin in Figure 2i. Since the mechanical behavior from each structure is
expected to be quite different, a high degree of design flexibility is possible when knitted
fabrics are used in functional fabric devices.
3
Figure 2: Various knitting patterns: a) Plain weft knit (Single Jersey), b) Rib knit, c) Plain warp knit, d) Single Tuck stitch F, e) Single Tuck stitch G, f) Interlock E, g)
Full tricot, h) three-needle queens cord, i) Three-needle sharkskin [4-6]
1.1.1 Knitted Textiles
Knitting has been recognized as a versatile textile forming technique [7] for various end
uses [8]. Knitting provides control over the manufacturing process and it is capable of
creating a variety of multi-scale structures using a broad range of input materials [9]. In
fact, knitted textiles are widely not only as clothing but also in functional devices because
4
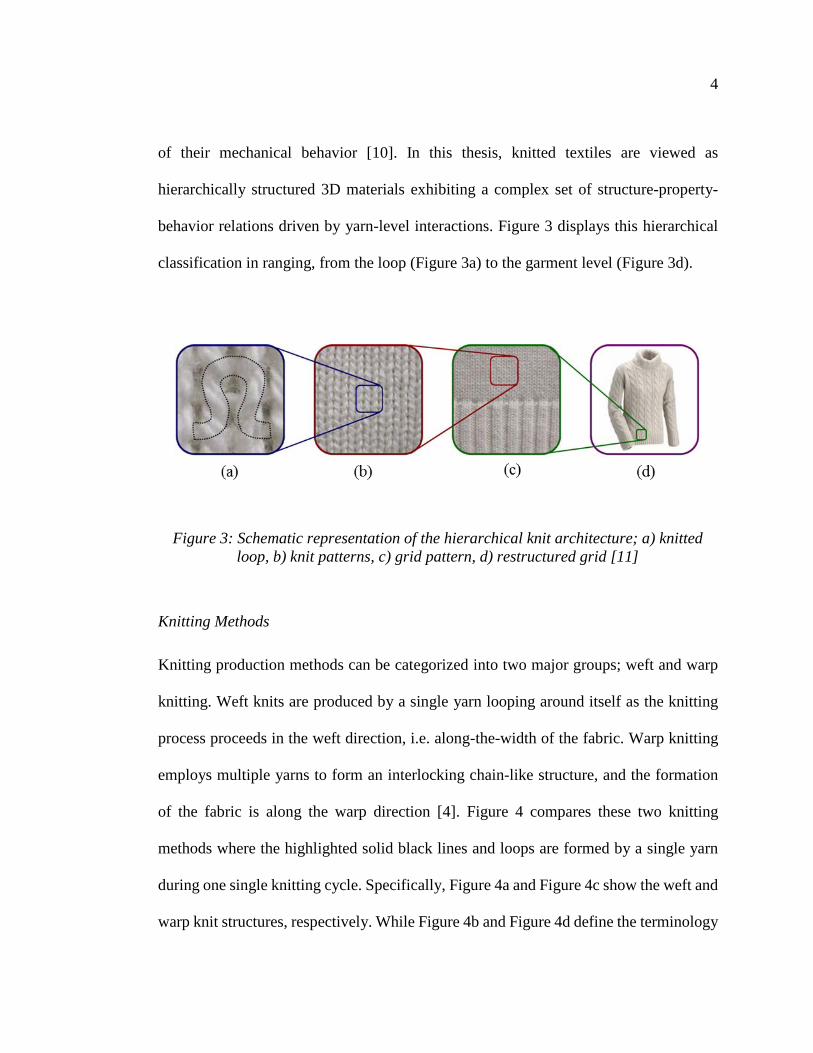
of their mechanical behavior [10]. In this thesis, knitted textiles are viewed as
hierarchically structured 3D materials exhibiting a complex set of structure-property-
behavior relations driven by yarn-level interactions. Figure 3 displays this hierarchical
classification in ranging, from the loop (Figure 3a) to the garment level (Figure 3d).
Figure 3: Schematic representation of the hierarchical knit architecture; a) knitted loop, b) knit patterns, c) grid pattern, d) restructured grid [11]
Knitting Methods
Knitting production methods can be categorized into two major groups; weft and warp
knitting. Weft knits are produced by a single yarn looping around itself as the knitting
process proceeds in the weft direction, i.e. along-the-width of the fabric. Warp knitting
employs multiple yarns to form an interlocking chain-like structure, and the formation
of the fabric is along the warp direction [4]. Figure 4 compares these two knitting
methods where the highlighted solid black lines and loops are formed by a single yarn
during one single knitting cycle. Specifically, Figure 4a and Figure 4c show the weft and
warp knit structures, respectively. While Figure 4b and Figure 4d define the terminology

5
used with respect to the knitted fabric directions; a column of loops along the length is
called a wale, and a row is named as a course.
Figure 4: a) plain weft knit, b) weft knitting process, c) warp knit, d) warp knitting process [4, 5]
In this thesis, single jersey and rib knit structures were examined. Since these two knit
architectures are manufactured with the weft knitting method, this method is presented
next in more detail. In weft knitting, special knitting needles are placed along the course
direction at regular intervals with respect to each other. A yarn is fed by making a loop
around these needles. The latch mechanism of the needles attaches a new course to a

6
previously formed course by an alternating up and down motion [4]. In this simple
motion displayed in Figure 5, the latch needle is placed inside the formed loop and moves
upwards first. Then, the hook at the top of the latch needle catches the new yarn to feed,
and a new loop is formed when this yarn is carried through the hole with a downwards
motion of the needle. The process repeats until a desired number of loops are formed
along the specified length of the fabric. Even though the knit geometries appear to be
rather complex knitting machines have been in existence since the mid-1500s. The
distance between the parallel needles affects the tightness of the final product. Other
factors that affect the produced knits include the diameter of the yarn and of the needles.
Figure 5: The mechanism of a latch needle; a) running, b) clearing, c) feeding, d)
loop pulling, e) knock over [8]

7
The mechanical properties of knits are fundamentally affected by the nonlinear, three-
dimensional kinematics of the long and interlooped yarns. Despite significant advances
in measuring tools, the mechanical behavior of knitted textiles has still not been
adequately described as compared to other materials used in engineering applications
[12].
1.2 Testing and Characterization of Textiles
Understanding textile mechanics has been a research topic for approximately a century
due to the complex geometries and various nonlinear effects involved while investigating
their behavior and performance.
Textile testing can be defined as applying engineering knowledge and science to detect
the criteria and properties of textile materials or their components including fiber, yarn,
and fabric [13]. The primary objective of textile testing is to measure properties and
quantify the performance of textiles. The information obtained may be used for the
following; research and development, selection of raw materials/inputs, process
development, process control, quality control, product testing, product failure analysis,
comparative testing and benchmarking etc. [1]. In terms of mechanical behavior, the
known deformation mechanisms of fabrics -included knitted, woven and nonwoven- are
summarized in Table 1. Additional information related to these deformations are given
in Chapter 2.
8
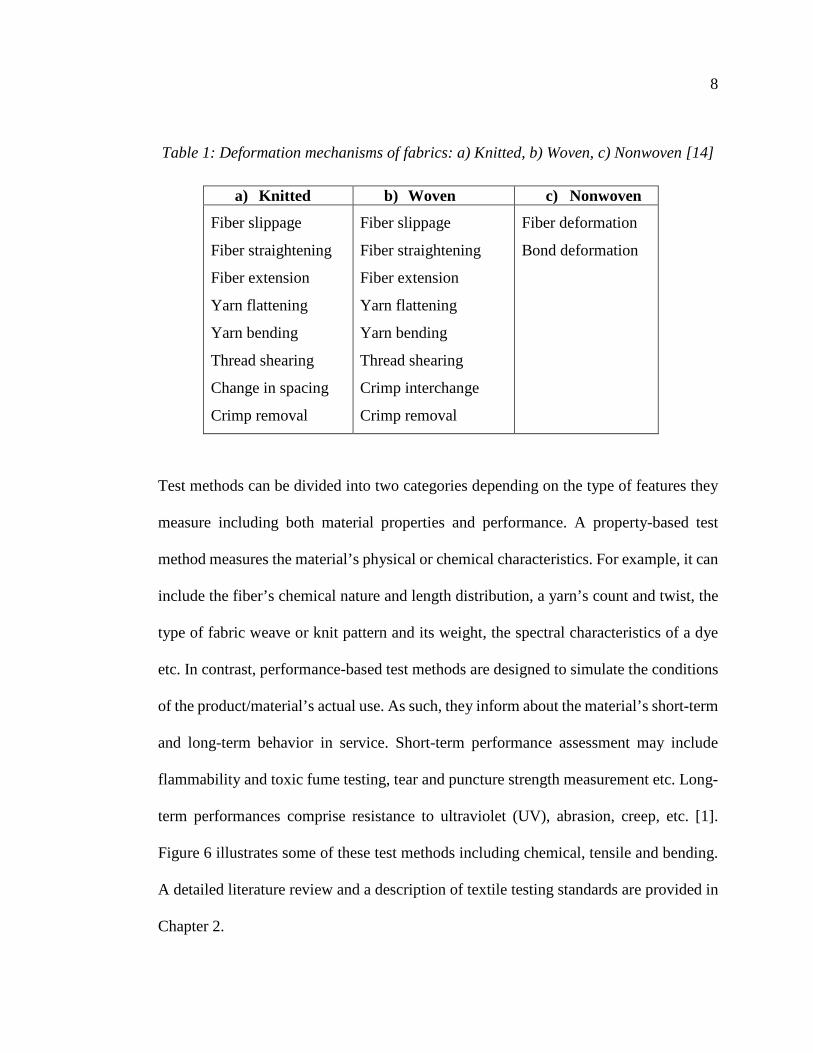
Table 1: Deformation mechanisms of fabrics: a) Knitted, b) Woven, c) Nonwoven [14]
a) Knitted b) Woven c) Nonwoven
Fiber slippage
Fiber straightening
Fiber extension
Yarn flattening
Yarn bending
Thread shearing
Change in spacing
Crimp removal
Fiber slippage
Fiber straightening
Fiber extension
Yarn flattening
Yarn bending
Thread shearing
Crimp interchange
Crimp removal
Fiber deformation
Bond deformation
Test methods can be divided into two categories depending on the type of features they
measure including both material properties and performance. A property-based test
method measures the material’s physical or chemical characteristics. For example, it can
include the fiber’s chemical nature and length distribution, a yarn’s count and twist, the
type of fabric weave or knit pattern and its weight, the spectral characteristics of a dye
etc. In contrast, performance-based test methods are designed to simulate the conditions
of the product/material’s actual use. As such, they inform about the material’s short-term
and long-term behavior in service. Short-term performance assessment may include
flammability and toxic fume testing, tear and puncture strength measurement etc. Long-
term performances comprise resistance to ultraviolet (UV), abrasion, creep, etc. [1].
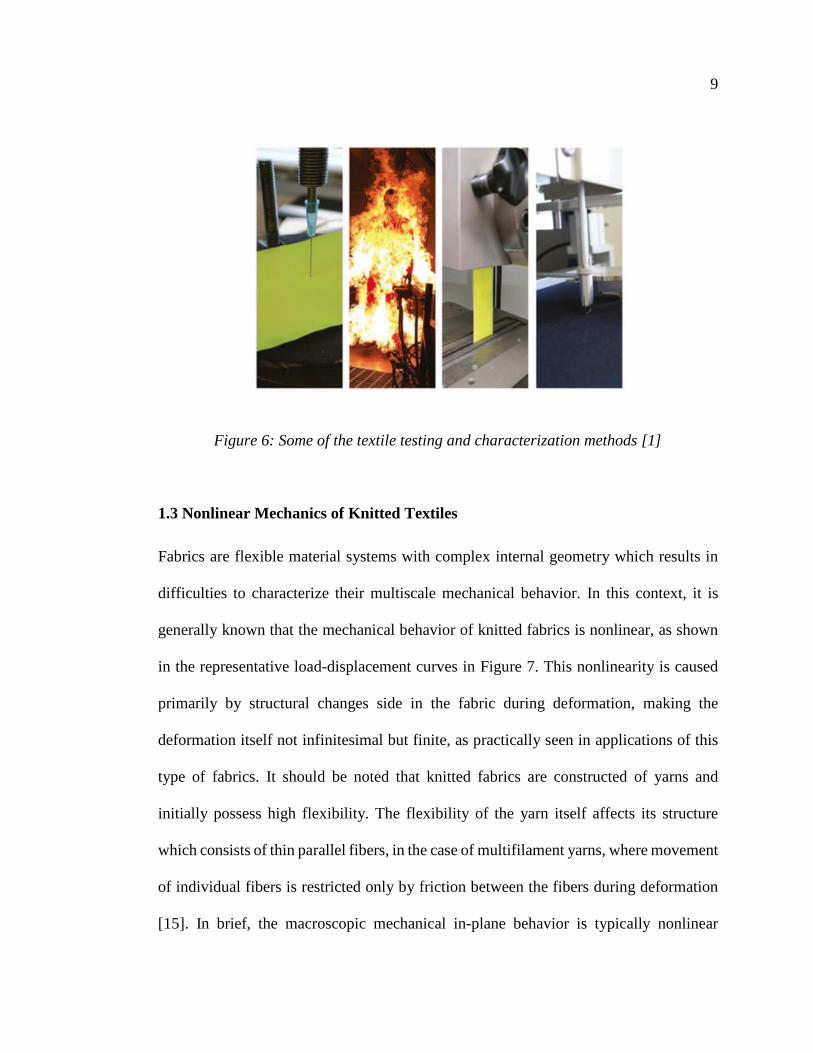
Figure 6 illustrates some of these test methods including chemical, tensile and bending.
A detailed literature review and a description of textile testing standards are provided in
Chapter 2.
9
Figure 6: Some of the textile testing and characterization methods [1]
1.3 Nonlinear Mechanics of Knitted Textiles
Fabrics are flexible material systems with complex internal geometry which results in
difficulties to characterize their multiscale mechanical behavior. In this context, it is
generally known that the mechanical behavior of knitted fabrics is nonlinear, as shown
in the representative load-displacement curves in Figure 7. This nonlinearity is caused
primarily by structural changes side in the fabric during deformation, making the
deformation itself not infinitesimal but finite, as practically seen in applications of this
type of fabrics. It should be noted that knitted fabrics are constructed of yarns and
initially possess high flexibility. The flexibility of the yarn itself affects its structure
which consists of thin parallel fibers, in the case of multifilament yarns, where movement
of individual fibers is restricted only by friction between the fibers during deformation
[15]. In brief, the macroscopic mechanical in-plane behavior is typically nonlinear
10
because the textile is geometrically heterogeneous while deformation at small scales (i.e.
at the yarn level) affects the macroscale behavior.
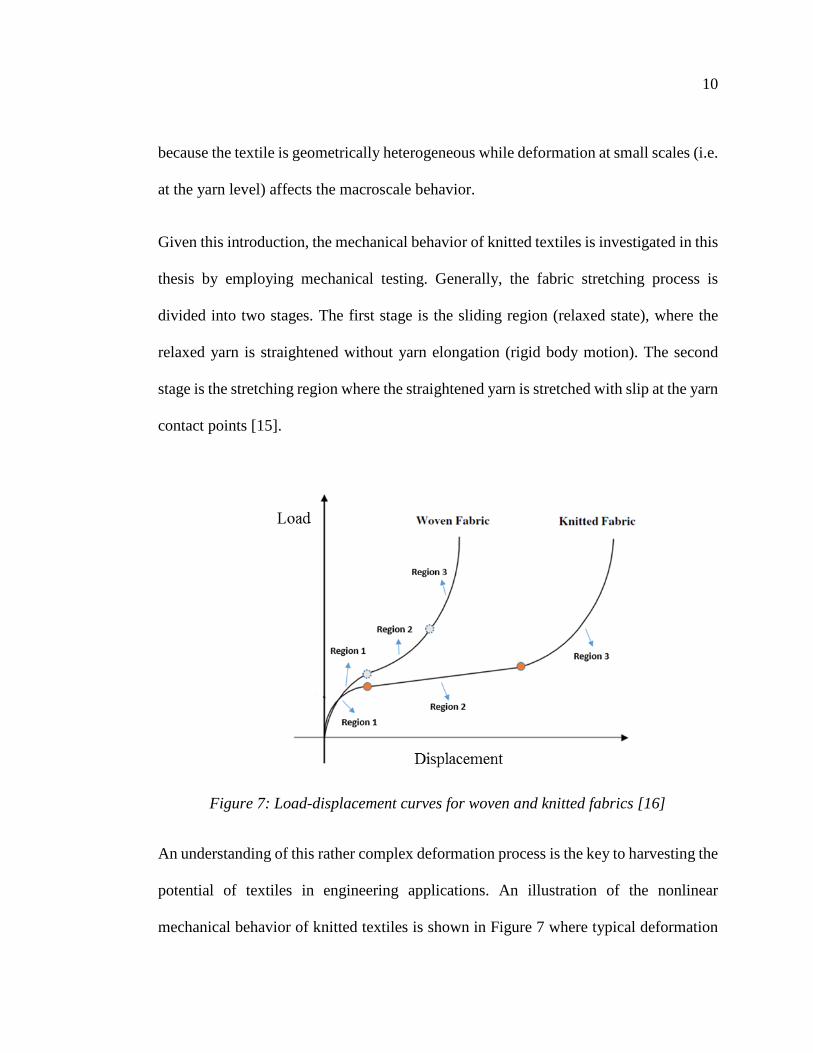
Given this introduction, the mechanical behavior of knitted textiles is investigated in this
thesis by employing mechanical testing. Generally, the fabric stretching process is
divided into two stages. The first stage is the sliding region (relaxed state), where the
relaxed yarn is straightened without yarn elongation (rigid body motion). The second
stage is the stretching region where the straightened yarn is stretched with slip at the yarn
contact points [15].
Figure 7: Load-displacement curves for woven and knitted fabrics [16]
An understanding of this rather complex deformation process is the key to harvesting the
potential of textiles in engineering applications. An illustration of the nonlinear
mechanical behavior of knitted textiles is shown in Figure 7 where typical deformation

11
curves of fabrics are compared. For the tensile loading case, three distinct phases are
expected to dominate the deformation range for both fabrics. Region 1 is dominated by
the static friction developed in between the yarns that are in contact (inter-yarn) and also
between the fibers inside the yarn (intra-yarn). Most experimental studies [10, 15-17]
suggest a very small, sometimes completely unrecognizable range in this region. When
this frictional resistance is overcome, Region 2 starts. This region gives fabrics the
uniqueness in terms of deformation behavior. Initially, curved yarns glide over each
other and are bent until they are as straight as their internal architecture allows in the
load direction. In this region, knitted fabrics may experience a range of stretching under
small loads. A woven fabric will also have somewhat a similar deformation region, as
its initially wavy yarns will straighten, and yarns will rotate over each other under tensile
loads. Extensions of over a few hundred percent are possible with knitted fabrics. Since
these properties will be dependent on the knitting pattern, i.e. knitting parameters set
during production, the designer has some control over the overall deformability of the
fabric or can additionally tailor different regions of the material to have different
mechanical properties. Finally, Region 3 is mainly related to fiber extension and
depending on the type of the fiber, a very high tensile modulus can be obtained in this
region. Despite extensive straightening of the yarns in the previous stages, some
curvature will always reside due to geometrical constraints. Thus, the tensile modulus
will never be equal to that of the straight fiber. Moreover, the contact forces between the
yarns increase as deformation occurs, triggering another deformation mechanism, that
of transverse compression of yarns. This effect is especially important for the overall

12
strength of the fabric, as any kinking in the tightened loops will cause stress
concentrations which ultimately result in fiber failure [5, 18].
In general, textiles are highly anisotropic material systems. In the sliding region,
however, textiles are almost isotropic with a relatively low stiffness values in every
direction. The straightening of the yarns in the load direction stiffens the yarns and
therefore textiles become anisotropic.
1.4 Thesis Structure
In this thesis, chapters organized as follows: introduction, background & state of the art,
thesis objective and approach, experimental setups, results and conclusion. The structure
of the thesis is summarized in Figure 8. Chapter 1 introduces textiles as well as their
properties of textiles. Chapter 2 provides the state of the art on mechanical testing of
textiles along with background information on the available experimental techniques.
Chapter 3 presents the objective and hypothesis of the research as well as the
experimental approach adopted in this thesis. Chapter 4 provides information on the
experimental setup used in this thesis work. Specifically, the material specifications,
manufacturing of coupons and speckle pattern characterization are discussed in detail.
Chapter 5 presents the results of the experimental study that specifies the anisotropic,
nonlinear and multi-scale dependent behavior of knitted textiles. Chapter 6 presents the
results of a volumetric investigation of knitted geometry. Chapter 7 concludes the thesis
by summarizing the results obtained relating to both global and local behavior of knitted
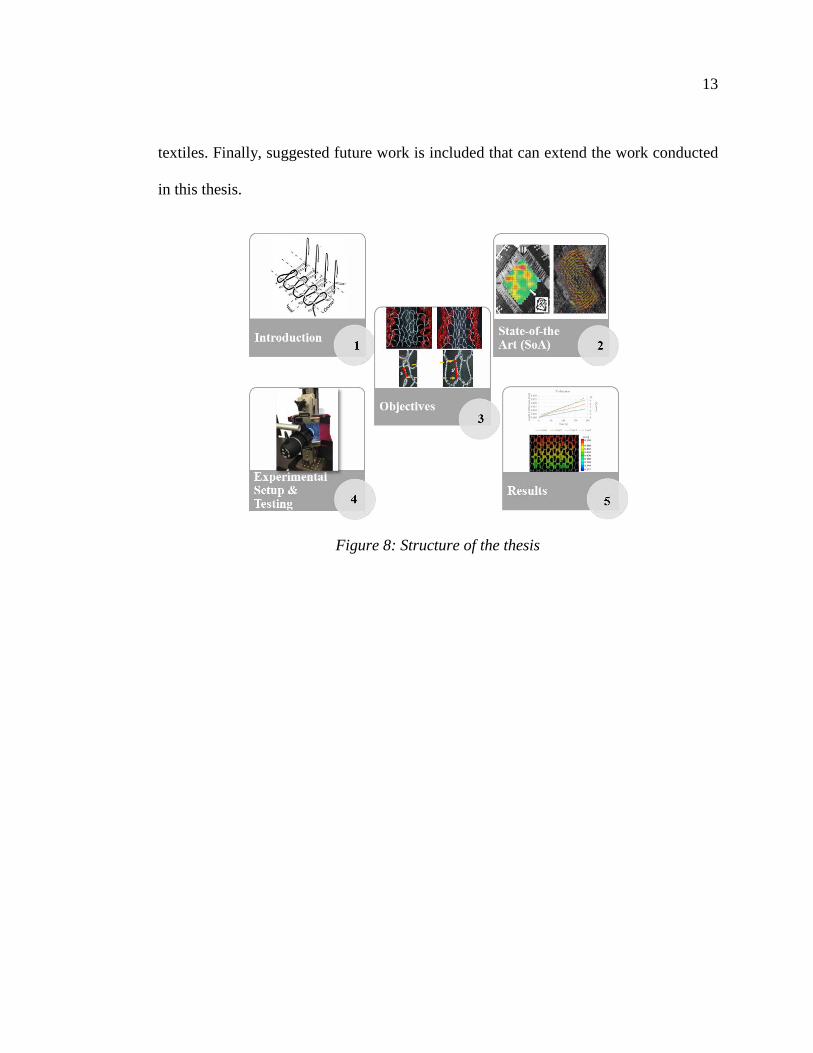
13
textiles. Finally, suggested future work is included that can extend the work conducted
in this thesis.
Figure 8: Structure of the thesis

14
CHAPTER 2: BACKGROUND AND STATE-OF-THE-ART IN MECHANICAL
BEHAVIOR CHARACTERIZATION AND TESTING OF KNITTED
TEXTILES
This chapter presents the current state of the art related to the mechanical behavior
characterization and testing of knitted textiles. Related testing standards are reviewed as
well. In addition, investigation related to reconstruction and visualization of the loop
geometry of knitted structures are reviewed since they relate to their mechanical
behavior. Lastly, computational modeling methods that are motivated and in some cases
validated by experimental results are presented in relation to the objectives of this thesis.
2.1 Bulk Measurements
Macro-level fabric deformation modes
The four types of macro-level fabric deformation modes, as shown in Figure 9, describe
the deformations observed in global scale [16]. However, the way in which each fabric
complies with these modes is different which can be attributed to the deformations
occurring within the textile structure itself.
Figure 9: Macro-level deformation modes: a) transverse compression, b) in-plane
tension, c) in-plane shear, d) out-of-plane bending [16]

15
The investigation of the bulk mechanical properties of textiles has been a subject of
several studies by using different approaches. Particularly, these investigations can be
grouped into three main methodologies: analytical [18-22], computational modeling [5,
23-31], and experimental [20, 27, 32-36]. Based on the available literature, textile testing
measurements can be summarized as follows: tensile properties [35, 37-43], stretch
properties [44-47], stiffness [48-51], yarn distortion [52-54], tearing strength [39, 55-
57], abrasion resistance [58-60], linear density [61], bursting strength [62-64], elongation
[65-67], and drape-ability [34, 68]. Measurements of tensile properties are the most
common mechanical measurements on textiles. They are used to determine the behavior
of a specimen while under axial and/or biaxial stretching loads. From such test results,
the elongation at breakage and the breaking load values can be obtained. The outcomes
depend on specimen geometry, fiber type and yarn pattern, as well as the fabric structure
[69], as discussed in Chapter 1.
The tensile properties of the single jersey knit structures which are also investigated in
this thesis were examined extensively. In this context, Bini et al. [21] presented a study
on the tensile properties of plain weft-knitted Kevlar fiber fabric reinforced epoxy matrix
composites to investigate the anisotropy. In other related work, the authors in [70]
described a method for testing the elastic knitted fabric Poisson ratio and modulus based
on orthotropic theory and strip biaxial tensile tests. Furthermore, the article published by
Islam [62] was focused on the bursting strength of various derivatives of single jersey
knitted fabrics in both gray and finished state. They found that the presence of tuck and
miss loops in the wale direction affects their bursting strength. Ma et al. [39] studied

16
experimentally the tension and tear behaviors of Co-woven-knitted fabric which are a
type of structural fabrics that combine the woven and knitted structures together shown
in Figure 10a. The tension stress-strain and tear displacement-load curves obtained along
various directions are depicted in Figure 10a and Figure 10b, respectively. It can be
concluded that the stress-strain curves in Figure 10a are different for 0°, 45°, and 90°
direction where the 90° shows higher stiffness. In the tear properties results, in Figure
10b, it can be seen that 0° direction has the weakest load, while the peak value of 900 test
reaches nearly triple of the one along 0°.
Figure 10: (a) Structure of the co-woven-knitted fabric, (b) Tension stress-strain and (c) tear displacement-load curves, along various directions
Kong et al. [71] investigated tensile properties and deformation mechanism of multiaxial
non-crimp fabrics shown in Figure 11. They determined that this kind of fabrics have
good mechanical properties. Luo et al. [32] researched the textiles behavior under biaxial
tension of rib and Milano weft knitted fabrics. They indicated deformation along the
wale and course directions at different displacement ratios.

17
Figure 11: Tensile test setup with non-crimp fabric structure
Hou et al. [72] studied the tensile behaviors of 3D angle-interlock woven carbon fabric
under high strain rate tension from the viewpoints of experimental and finite element
analyses. The obtained results from this study indicated that variety of failure
morphologies exist at the different layers in the 3D angle-interlock woven carbon fabric.
Compression behavior of a typical warp-knitted spacer fabric which has a highly
anisotropic structure was studied by Liu et al. [73]. The researcher modified ASTM D575
[74] test standard since there was no test standard specially developed for testing the
compression behavior of warp knitted spacer fabrics. They considered two cases in this
experimental study; keeping the width constant and changing the length of the
specimens, and vice versa. Different test boundary conditions which are glued and not
glued and different sample sizes were used in tests. The experimental test results are
summarized in Figure 12.

18
Figure 12: Stress-strain curves of the spacer fabrics: a) not glued, and b) glued to platens surfaces
As seen from the Figure 12a, the samples not glued to the plate have slight fluctuations
in the plateau stage. However, the results from glued samples in Figure 12b shows
similar trends without any oscillation. The reason is that different boundary conditions
can result in different actions.
2.2 Local Level Measurements
Micro-level fabric deformation modes
Micro-level fabric deformation modes exist through the interaction of structured yarns
within the textiles. Duhovic and Bhattacharyya [16] identified eight micro-level
deformation modes for knitted textile fabrics, as shown in Figure 13.

19
Figure 13: Micro-level deformation modes: a) inter-yarn slip, b) inter-yarn shear, c) yarn bending, d) yarn buckling, e) intra-yarn slip (inter-fiber friction), f) yarn
stretching, g) yarn compression, h) yarn twist [16]
Inter-yarn slip deformation mode is shown in Figure 13a. This mode happens when the
yarns move over each other. This deformation mode occurs mostly in knitted fabrics
where the friction between the yarns becomes important since it determines when and
where the onset of buckling will be as well as the magnitudes of the forming forces
required. In the Inter-yarn shear deformation shown in Figure 13b, the yarns rotate about
their crossover points to accommodate the required deformation. Yarn bending
(straightening) is shown in Figure 13c. It can be considered the most significant
deformation mode in knitted textiles because of the knit loop geometry. In-plane
buckling in Figure 13d can also occur but is less likely due to the geometric constraints
present in-plane. Intra-yarn slip shown in Figure 13e is the most dominant deformation
mode which effects a textile load-displacement curve. In this type of deformation, the
continuous fibers within the yarn slide past one another along the length of the fiber

20
because of changes in fiber curvature during bending and unbending. Yarn stretching as
shown in Figure 13f is present and becomes a significant contributor to the deformation
at larger strains. Another fabric deformation mechanism to consider is yarn compression
shown Figure 13g, where forces at yarn crossover points compress the filaments in the
yarn and cause them to flatten out and conform to the curvature of perpendicular yarns.
Finally, yarn twist, which arises from bundling of fibers into a yarn during manufacturing
(Figure 13h) causes a fabric to resist increases in yarn curvature during deformation [16].
After explaining fiber/yarn deformation modes, the studies related to local level
measurements from the literature will be reviewed. To measure and characterize the
deformation of specimens conventional strain gages are routinely used. However, there
are intrinsic deficiencies associated with strain gages when used on textile materials.
Komeili [75] addressed this issue in his thesis and explained why using traditional strain
gages creates measurement challenges when applied to fabrics. It is for these reasons that
only recently the Digital Image Correlation (DIC) method has been used to characterize
textile deformations [10, 76-78].
Boisse et al. [5] examined the phenomena at the basic woven cell level and designed a
model to simulate the fabric sheet forming method. The obtained results revealed a good
agreement between experiments and simulations. The measured displacement fields at
macroscale and mesoscale are shown in Figure 14.

21
Figure 14: Displacement fields; a) at macroscale, b) at mesoscale (within the yarn)
Full-field strain measurements during textile deformation tests were also reported by
Lomov et al. [10]. The authors claim that optical full-field strain techniques are desirable
to declare correct deformation measurements during tensile or shear tests of textiles. The
related test setup system with a coupon between the grips of a tensile tester is shown in
Figure 15a. The obtained displacement field within a woven yarn is demonstrated in
Figure 15b. This has been the smallest window observation (warp width: 1.92 mm and
weft width: 2.21 mm) in the literature so far including textile reinforced composites.
Figure 15: a) Test apparatus; tensile tester and image acquisition, b) Displacement
field within a woven yarn with 1.92 mm warp width and 2.21 mm weft width

22
Deformability tests on textile reinforcements subjected to biaxial tension and shear using
DIC were performed by Willems at al. [78]. It was concluded from the study that full-
field optical techniques are essential to reliably assess the textile deformation and
homogeneity of loading in textile testing. Two shear test methods were presented: a bias
tensile test (i.e. a uniaxial tensile test with principal directions at ±450 with regard to the
tensile load) and a dedicated test in a shear fixture, called picture frame test which is
depicted in Figure 16. The region of interest and subset size are indicated in Figure 16a.
Fabric deformation for the small and large square setups are presented in Figure 16a and
Figure 16b, respectively.
Figure 16: Picture frame test: (a) ‘Small Square’ setup in the reference state (ROI and subset window is indicated), (b) Fabric deformation for the ‘Small Square’
setup, (c) Fabric deformation for the ‘Large Cross’ setup
2.3 Textile Testing Standards
Textile testing standards provide the specifications and test methods for the physical,
mechanical, and chemical properties of textiles, fabrics, and clothes, as well as the

23
natural and artificial fibers that constitute them [79]. Some of the organizations involved
in developing textile testing standards are American Society for Testing and Materials
(ASTM), American National Standards Institute (ANSI), American Association of
Textile Chemist and Colorist (AATCC), International Organization for Standardization
(ISO), British Standards (BS) and German Standards (DIN). ASTM Standards
commonly used for textile testing are summarized in Table 2.
Table 2: Measurement types and ASTM Standards
MEASUREMENT ASTM STANDARDS
Yarn Distortion ASTM D1336 Stiffness ASTM D1388; ASTM D4032 Tearing Strength ASTM D1424; ASTM D2261; ASTM D5587 Tensile Properties ASTM D3822; ASTM D2256 Bursting Strength ASTM D3786; ASTM D3787 Abrasion Resistance ASTM D3884; ASTM D4158; ASTM D4966 Elongation ASTM D4964; ASTM D5278; ASTM D5034; ASTM
D5035 Linear Density ASTM D1577 Stretch Properties ASTM D2594; ASTM D6614
ASTM Standardized Testing Capabilities
ASTM D2256 [43] standard test method covers the determination of tensile properties
of monofilament, multifilament, and spun yarns with the measurement of breaking force
and elongation of yarns and includes directions for the calculation of breaking tenacity,
initial modulus, chord modulus and breaking toughness. ASTM D5034 [65] standard test
method covers the grab and modified grab test procedures for determining the breaking
strength and elongation of textile fabrics. The grab test procedure is applicable to woven,

24
nonwoven, and felted fabrics while it is not recommended for glass fabrics, or for knitted
fabrics and other textile fabrics which have high stretch (more than 11 %). Schematic
illustration of jaw faces, specimen geometry and specimen placement for modified grab
test method are shown in Figure 17.
Figure 17: a) jaw faces, b) specimen, c) illustration of specimen placement
ASTM D2594 [46] standard test method covers the measurement of fabric stretch and
fabric growth of knitted fabrics intended for applications requiring low-power stretch
properties while it is not applicable to fabrics intended for support or other applications
requiring high-power stretch properties. ASTM D4964 [80] standard test method covers
the measurement of tension and elongation of wide or narrow elastic fabrics made from
natural or man-made elastomers, either alone or in combination with other textile yarns.
Figure 18 displays the hanger assembly and loop specimen in place on pins. In general,
current textile testing standards focus primarily on the durability of the material at the
bulk level.

25
Figure 18: a) Hanger assembly, b) Loop specimen in place on pins
2.4 Three-dimensional Geometry Extraction
The use of X-ray micro-CT in textiles is being used due to the ability to extract geometry
of the manufactured architecture which is essential to obtain yarn interactions that are
contact, friction, and sliding. Many publications have shown the advantages of X-ray
micro-CT technique for textiles studies, especially for woven fabrics [81-84], whereas
only a few study [84-86] was made regarding knitted fabric geometry analysis with X-
ray micro-CT.
Shinohara et al. [84] reported yarn positional information extraction for the plain knitted
fabric structure, from X-ray micro-CT images. In this paper, trans-axial slices were
analyzed, and yarn middle line coordinates were obtained; cross-sections were assumed
circular, and the yarn was modeled as a trajectory of a circle (yarn cross-section) moved
along an arbitrary continuous curve (centerline of the yarn). Another work done by
Harjkova et al. [85] demonstrated usage of the X-ray micro-CT technique for structural

26
analysis of weft knitted fabrics and propose a data processing technique for
reconstruction and visualization of the loop geometry. This technique produces a full
description of the loop geometry, namely yarn middle line, cross-section areas and
orientation along the yarn. The geometry identification process for glass knitted fabric
sample is displayed in Figure 19. Furthermore, knitted fabric reinforced composites were
analyzed by Pandita [86] where the tensile stiffness of glass weft knitted fabric (namely
rib and Milano) reinforced composites was predicted using X-ray micro-CT for fabric
microstructure characterization. The yarn was considered as consisting of small straight
segments; orientations of these segments were determined experimentally by
tomography techniques.
Figure 19: a) Optical microscopy image of the sample, b) CT image from cross-section with fitted to threshold area, c) Reconstructed volume of the sample, d)
Geometrical model of the loop [85]
2.5 Modeling
Knitted fabrics are known as hyper-elastic materials, with high deformations at small
forces. Their mechanical behavior is important, especially in functional applications
where the strain level is higher and there is a need to control the fabric strength.

27
Therefore, it is essential to know how these fabrics behave when subjected to mechanical
strain. Experimental data also represent the base for modeling the mechanical behavior
of knitted fabrics.
The factors affecting the way knitted fabrics respond to strain are different in nature and
influence. From the micro level to macro level, they refer to the characteristics of the
raw material - fiber and yarn, the fabric structure and structural parameters. Their
diversity and complex interactions make it difficult to model the fabric response to strain.
Therefore, experimental study of the mechanical behavior that highlights the significant
influence factors is substantial. All models concerning the mechanical behavior of both
weft and warp knitted fabrics with different structures are based on experimental data
for definition of the fabric geometry, as well as for the accuracy of the model response
under a certain type of strain [37].
Prior theoretical studies of knitted textile geometry focused on characterizing the shape
of the loop. In geometrical models [31, 87-89], first, the loop shape was assumed then
geometrical parameters were set to fit the experimental results. Kawabata et al. [18, 22]
introduced a set of mechanical models describing the nonlinear stress-strain relations for
woven and knitted fabrics and later they suggested comprehensive tests on fabrics called
Kawabata Evaluation System (KES) which enabled an accurate and reproducible
measurement of fabric low-stress mechanical properties [90]. Kawabata fabric model
includes a set of truss elements representing yarns and stiffness elements for interaction
between yarns which are displayed in Figure 20 for woven and knitted structures

28
respectively. According to Hu [90], this model is a simplification of the geometrical and
mechanical system of the total fabric and also the full characterization of its parameters urges
the high cost of experimental setups.
Figure 20: a) Model of the plain weave structure, b) Model of the plain weft knitted fabric with unit structure
A constitutive model for the warp-weft coupled nonlinear behavior of knitted biomedical
textiles studied by Yeoman et al [49]. The authors concluded that the non-linear
anisotropic elastic strain energy function proved feasible to accurately describe the
coupled warp-weft mechanics of a variety of knit structures which are basic warp knit,
warp knit with Lycra, coarse warp knit and monofilament warp knit. Photograph of fabric
sample and customized clamps during a uniaxial tensile test and finite element model for
uniaxial tensile test utilizing symmetry is shown in Figure 21a. Nominal stress and
engineering strain data of physical tensile tests and model predictions for the warp and
weft direction of fabrics obtained by the researcher. The results for the monofilament
warp knitted sample are uniaxial tensile stress versus axial strain and transverse strain
versus axial strain graphs presented in Figure 21b and 21c, correspondingly.

29
Figure 21: a) Photograph of fabric sample and customized clamps during a uniaxial tensile test and finite element model for uniaxial tensile test utilizing symmetry, b)
Axial stress vs strain curves, c) Transverse strain vs axial strain curves
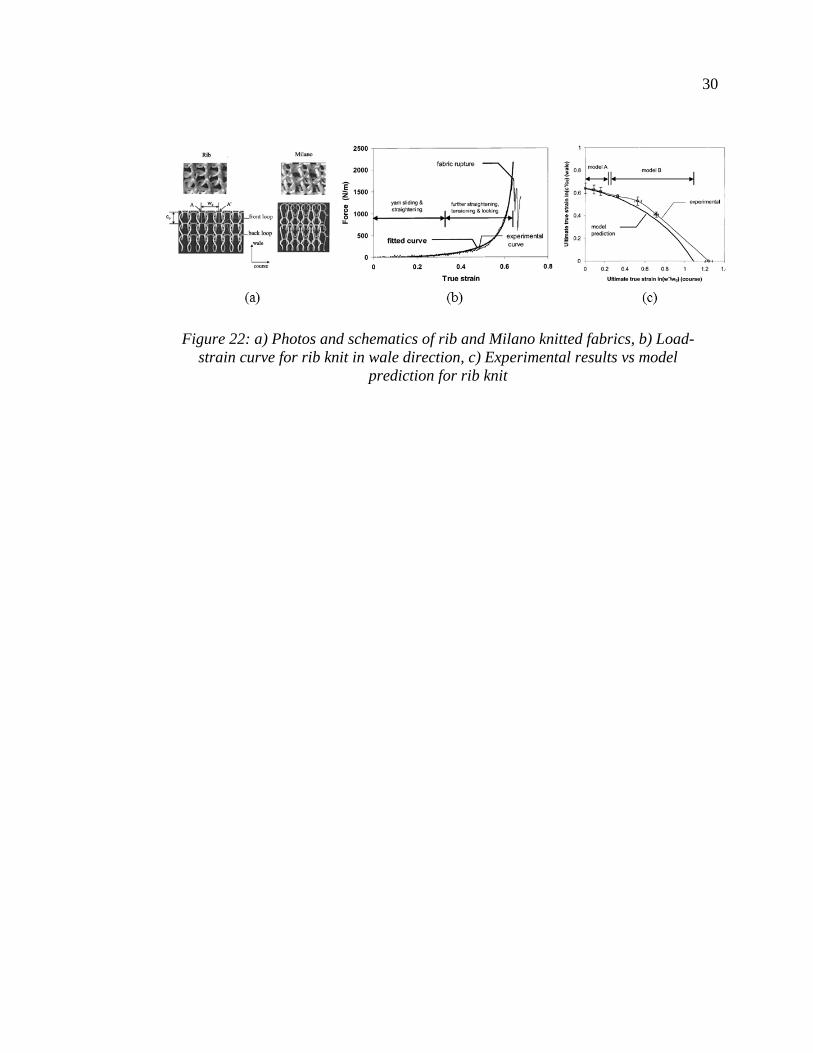
Luo et al. [32] studied biaxial tensile properties of two types of glass knitted fabrics. The
specimen structures which are rib and Milano knits are displayed in Figure 22a. They
observed a load-strain curve as shown in Figure 22b for rib knit in wale direction where
the curve divided into two parts which are sliding and locking. Furthermore, the authors
developed geometrical models for rib knit to predict deformation of this structure. Figure
22c presents the comparison between experimental results and model prediction.
Liu et al. [6], investigated the role of material architecture in the mechanical behavior of
knitted textiles by direct numerical simulations using finite element analysis. The results
indicated the anisotropic, nonlinear and multiscale-dependent mechanical behavior of
knitted textiles. These results will be analyzed in motivation part of this thesis, Chapter
3, in detail.
30
Figure 22: a) Photos and schematics of rib and Milano knitted fabrics, b) Load-strain curve for rib knit in wale direction, c) Experimental results vs model
prediction for rib knit

31
CHAPTER 3: THESIS OBJECTIVE AND APPROACH
To understand how to test and characterize knitted textiles involves different mechanical
and physical tests combined with multi-disciplinary monitoring techniques in order to
capture the textiles performance. As seen from summarized related standards in Section
2.3, they apply outdated technology and techniques that are no longer sufficient for
producing the required results to advance the development of functional fabrics. This is
a significant obstacle to innovation in textiles because there is no way to confidently
benchmark and compare different material architectures without standard procedures.
Moreover, nowadays, there is a gap of standardized characterization, testing and
manufacturing methods for functional fabric devices. Existing standards are inadequate
to capture the behavior of emerging functional fabric devices.
The relationship between the global behavior and local behavior of knitted textiles has
not been experimentally analyzed in the literature. In this study, not only overall
performance of the specimen but also the performance of the individual yarn interested
to characterize knitted textiles. While global deformation curve was obtained from the
monotonic tensile tester, local measurements completed via image processing. Since
there are no test standards for local yarn measurements, the tests completed in this
research can be a base for future local level measurement test standards in textiles.
3.1 Research Motivation
The motivation of the experimental and characterization approach in this thesis was to
validate previously reported [23] simulation results that indicated pronounced

32
anisotropic, nonlinear and multiscale mechanical behavior of knitted textiles. The
experimental findings in this research can, therefore, supply key inputs to computational
modeling and hence assist in efforts to predict the deformation of knitted textiles with a
goal to provide quantitative feedback to manufacturing. In this thesis, the emphasis is
placed on two knitting structures, namely, the single jersey and rib knit both comprised
of monofilament yarns because of their relatively simple structure that could allow the
observation of both local and global effects. Specifically, yarn-to-yarn interactions,
sliding and stretching, size effects, and structural anisotropy can all influence the
response of knitted fabrics and are the focal points of this investigation.
The previously obtained results from computational modeling work are summarized in
Figure 23. In Figure 23b, the sliding vs stretching behavior of single plain knitted textile
is presented where the tensile load was applied in course direction up to 5% strain. The
linear region after 0.5% strain indicates that the textile exhibits a stiffening behavior. In
addition, Figure 23c shows that the knitted model respond differently to tensile loads
applied in the course and wale directions; a more stiff behavior in the wale direction was
measured which proves the anisotropy of the material. The interactions between yarns,
including sliding, compression of one yarn to another and rotation represent intricate
features of the deformation and motion of a knitted material are shown in Figure 23e.
Relative normal and tangential movement of the yarn interfaces results from contact and
friction, which also contribute to their observed nonlinear behavior. Furthermore, the
flexural motion of the internal structure of knitted textiles adds nonlinearity into the
overall mechanical behavior. Lastly, the size effect of the knitted model was also

33
demonstrated for different material domain sizes including a 3 x 3, 6 x 6 and 8 x 8 models
where 3 by 3 yarn structure is displayed in Figure 23a. The out-of-plane
motion/deformation (Figure 23d) which needs to be analyzed in three-dimensional
measurement was not investigated in this work. It is, however, a part of future work.
Figure 23: Results from modeling [23]; a) size effect, b) sliding and stretching, c) anisotropy, d) out-of-plane deformation, e) yarn interactions
3.2 Hypothesis and Objective
There is a growing interest in functional fabrics that are a developing class of
architectured/hybrid material systems [91-93] used in wide-ranging industrial
applications including defense [94, 95], biomedical [96, 97], and flexible electronics [98,
34
99], among others. However, the design of functional fabric devices is primarily rooted
in iterative trial and error methodologies. The optimal design of knitted textile
architectures requires the knowledge of the mechanical performance of knitted
structures. The hypothesis is that understanding the mechanical behavior of these
materials through a combination of experimental and computational methods will
improve the design and compress time-to-market. From the available literature related
to textiles testing and reviewed in Chapter 2 for both global and local behavior, it can be
concluded that only limited research has been reported to determine the influence of local
on the mechanical behavior of knitted materials.
To this effect, the objective of this thesis is to examine, in particular, the mechanical
behavior of knitted textiles by using experimental mechanics methods capable to
evaluate both local and global deformation and motion of knitted textiles. The main parts
of the testing and characterization process followed include the manufacturing of proper
specimen geometries, the development of appropriate & mechanical testing and use of
in-situ monitoring techniques.
3.3 Proposed Approach
In this study, the deformation and motion characteristics of the knitted monofilament
yarns as well as their multiscale behavior were examined. Understanding how to test and
characterize these structures involves different mechanical and physical tests combined
with multi-disciplinary monitoring techniques in order to capture the behavior of textiles.
The testing procedures include mechanical testing combined with various imaging

35
techniques. This is accomplished by leveraging a suite of Non-Destructive Evaluation
(NDE) methods including Digital Image Correlation (DIC) and X-ray Micro-Computed
Tomography (X-ray micro-CT) in parallel with multiscale mechanical testing to gain
both a qualitative and quantitative understanding of knitted textiles behavior. The
experimental methods are shown in Figure 24. Both microscale and lab scale tensile
testers (Figure 24a and 24b) coupled with digital microscopy (Figure 24c) were carried
out in-house, while the X-ray micro-CT (Figure 24d) was outsourced.
Load-displacement curves were extracted from both microscale and lab scale testing
equipment by monotonic tensile testing. Once the images were acquired while loading,
the image correlation was performed using a commercial software. The results are
processed and analyzed to investigate deformation of the multiscale knitted textile
behavior.
Figure 24: Experimental methods; a) Micro Scale Tensile Tester, b) Lab Scale
Tensile Tester, c) Digital Microscopy, d) X-ray micro CT

36
For surface measurements, two types of knit architectures were investigated including
the single jersey and rib knits. Different size specimens were used to indicate the size
effect on the performance of the materials. For the purpose of geometry extraction of the
structure, only single jersey knitted specimen was used.

37
CHAPTER 4: EXPERIMENTAL SETUP AND PROCEDURE
4.1 Manufacturing of Specimens
In this thesis, knitted textile specimens composed of monofilament yarns with two
different types of architectures namely single jersey and rib knit were used to investigate
their mechanical performance. The reason for choosing these two particular knit pattern
is their relative simplicity when compared to other types of knitted structures, as for
example shown in Figure 2 in Section 1.1. Furthermore, it should be noted that there is
no standard specification for preparing such specimens at the scale and for the purposes
of testing with the objective to observe both local and global effects.
The manufactured specimens include two regions which are called border and interior
regions as shown in Figure 25. Borders are required for testing specimens because of
two main reasons; the structure of the knitted textiles and fabrication capabilities of the
knitting machine. Moreover, borders help to prevent damaging the specimen while
applying loading since knitted structures deform and damage easily. Second, borders
assist to observe the edge effects of the specimens.
Figure 25: Manufactured specimen with border and interior regions

38
The border region material is a multifilament jaguar yarn which comprised of 85% modal
and 15% nylon fiber. The color of the multifilament yarn is red and its diameter 0.60
mm. For the interior region, a monofilament yarn was chosen with 0.15 mm diameter.
The reason for this choice relates to the need to elucidate yarn-to-yarn effects, without
the added complication of intrafiber interactions. Specifically, the monofilament yarn
used was Nylon 6 which is commercially known as “fishing line”. For testing purposes,
specimens were manufactured with two different types of yarns in two different regions.
The materials before manufacturing are shown in Figure 26 with the microscopy image
of the monofilament yarn (Figure 26b).
Figure 26: Interior region and border materials: (a) Monofilament yarn, (b) Digital microscopy image of the monofilament yarn, (c) Multifilament yarn
The size of the specimens was selected based on two main restrictions. The first one was
the gripping issue of the mechanical testing equipment used. The other one was the travel
distance of the load gauges of both scales. The technical details will be explained in
section 4.3 in detail. Size A specimen was fabricated for micro-scale tester, while sizes

39
B and C was manufactured for lab scale tester. The size of the specimens is shown in
Table 3.
Table 3: Geometrical parameters and gauges of the manufactured specimens
Interior region Border Overall dimension
Size
Wale direction
Course direction
Wale direction
Course direction Wale
direction (cm)
Course direction (cm)
Leng
th
(cm
)
Gau
ge
Leng
th
(cm
)
Gau
ge
Leng
th
(cm
)
Gau
ge
Leng
th
(cm
)
Gau
ge
A 1 5 0.9 8 2 21 2.5 22 3 3.4
B 3.5 32 4 31 3 21 3.5 29 6.5 7.5
C 9 48 9 63 3.5 36 4 29 12.5 13
The simplest weft knitted fabric is a plain knitted fabric i.e. single jersey as displayed in
Figure 27 with its geometrical parameters. Its basic repeat unit is a loop of yarn pushed
through a previously made loop. The point at which a yarn in a neighboring loop crosses
over another loop is known as the interlock. The vertical columns of loops are known as
wales while the horizontal rows are known as courses. The density of the fabric is
expressed in terms of courses and wales per unit length. The gauge is the linear spacing
of the needles, expressed as a density i.e. number of needles per unit length.

40
Figure 27: Single jersey knitted specimen with its components
In this work, the size of the border areas was chosen based on the minimum value of the
machine capability. Figure 28 shows the knitting procedure steps. The manufacturing
process begins with programming each specimen by using Shima Seiki SDS-Apex
Design System knit programming (Figure28a). Then the model is inputted the machine
for manufacturing by the manufacturer (Figure 28b). Then, the fabrication process
begins with the slowest carriage speed rate, 0.03 meter per second (Figure 28c). The last
part of the manufacturing process is obtaining the finished product which is named
specimen (Figure 28d).
Figure 28: Specimen manufacturing procedure: a) Designing, b) Shima Seiki
SSG122SV machine, c) Knitting process, d) Final product

41
The manufactured specimens are displayed in Figure 29 with their structure images.
They were named in a specific way where the first letter represents the architecture type;
J stands for Jersey and R stands for rib. Next two numbers represent the specimen
number and the last letter represents the size of the specimen, labeled with A, B, and C
from smaller to larger size respectively.
Figure 29: Manufactured specimens with structure images: a & b are the specimens and c & d are the structure images of the single jersey and Rib knits respectively
4.2 Mechanical Testing Setups
Deformation of knitted textiles was investigated experimentally at multiple scales in this
thesis. This section explains the testing setups for both micro- and lab-scales, as well as
the patterning methods used to obtain displacement and strain measurements. Lab scale

42
allows different initial gage length which helps to investigate size effects, while micro
scale allows for investigation of a single loop.
4.2.1 Micro-scale
The goal of the micro-scale investigation is to examine yarn-to-yarn interaction in knits.
The individual loops and nearest neighbors can be investigated that result from global
loading. The micro-scale testing setup is shown in Figure 30. The micro tensile tester is
a screw-driven GATAN MTEST with a load cell capability of 2100 N. The slowest and
fastest speeds are 0.1 mm/min and 0.4 mm/min, respectively. The load is applied equally
to both sides of the specimen. Other characteristics such as sample size limitations and
extension range summarized in Table 4.
Table 4: GATAN load stage characteristics
Load 2.1 KN Load-cell. Resolution 5 N
Length and Extension 10 mm between clamps with 10 mm extension
Speed Range 0.1 mm/min to 0.4 mm/min
Max sample size 29x27x5 (L,B,H mm) for EBSD sample grips
Module dimensions 196x96x53 (L,B,H mm);
The specimens were gripped by hand. Rubber pieces were used to eliminate slipping and
damaging of specimens within the grips in both front and back surfaces. A black carbon
paper piece was placed in the background of the specimen while taking images.

43
Figure 30: Microscale testing setup: 1. GATAN stage, 2. Load Cell controller, 3. Grips, 4. Digital microscope, 5. Load cell and microscope monitor, 6. Coupon, 7.
Rubber pieces, 8. Black carbon piece, 9. Deben Microtest and MicroCapture software
4.2.2 Lab-scale
Figure 31 shows the experimental setup used for the lab-scale monotonic tensile test.
The tensile tester is Mark-10 ESM 301 with 1500 N maximum load and 292 mm
maximum travel. The travel speed range of load frame is between 0.5 mm/min and 330
mm/min. The displacement is applied only longitudinal with upper grip where the
bottom grip is fixed. Two different force gauges which are for tension and compression
force testing were used in testing, model M5-10 with 50 N and model M5-500 with 2500
N by 0.01 N and 0.5 N load sensitivity respectively. These characteristics are
summarized in Table 5.

44
Figure 31: Lab-scale testing setup: 1. Force gauge (50 N), 2. Mark-10 controller, 3. Grips (G1015-1), 4. Digital microscope, 5. Mark-10 and microscope monitor, 6.
Coupon, 7. Rubber pieces, 8. Black carbon piece, 9. MeasurGauge and MicroCapture software
The specimens were gripped by hand. Rubber pieces were glued to the specimen borders
to prevent damage to material and ensure effective load transfer during the tensile test.
Due to lack of a standardized test method, various sample configurations and gripping
conditions were being used for both setups.
Table 5: Mark-10 tensile tester characteristics
Load Frame Force Gauge: 2500 N
Maximum Load 1500 N Load Accuracy ± 0.1% of full scale
Maximum Travel 292 mm Load Sensitivity 0.5 N
Travel Speed 10-300 mm/min Force Gauge: 50 N
Travel Accuracy ± 0.05 mm Load Accuracy ± 0.1% of full scale
Travel Sensitivity 0.02 mm Load Sensitivity 0.01 N

45
4.3 Strain and Apparent Stiffness Calculations
4.3.1 Strain Calculation
The applied strain in the wale direction was measured at the global level, and therefore
it was defined herein as the ratio between the applied displacement and the total wale
length. The engineering longitudinal strain was calculated by using the initial position
gage length as L0 and the deformed gage length L as seen in Figure 32. The engineering
strain calculation formula is defined in Equation 4.1:
∈𝐸𝐸𝐸𝐸𝐸𝐸≡ΔL𝐿𝐿0
=L − 𝐿𝐿0𝐿𝐿0
(4.1)
The initial position of gage length means that the specimen is in the relaxed state between
grips before start testing in Figure 32a. The deformed specimen after applied
displacement is shown in Figure 32b.
Figure 32: Gauge lengths: a) initial position (L0) and b) deformed position (L)

46
4.3.2 Apparent Stiffness Calculation
In many cases, especially when testing in tension a material consisting of different
geometry as seen in knitted textiles, it is usually difficult to calculate the cross-sectional
area and hence the stress values. Stiffness is defined as load divided by extension and
has (SI) units of N*m-1. It is the slope of a load/extension curve [100]. Before explaining
apparent stiffness calculation and results from anisotropy tests, machine compliance has
been investigated. To check the error, the tensile test data and the data from image
processing are compared as seen in Figure 33. The tensile testing machine Mark-10 has
a potential compliance that can affect the load-displacement. To correct for this a series
of images of virtual line gages were applied where Line 1 represents the largest possible
gage and can be considered to be the “true” displacement for the load-displacement
curve. In addition, by reducing the size of the line gage it is possible to probe the more
local behavior of the material and investigate size effects. As shown in Figure 33, Line
1 and Line 2 have similar linear trends while the smallest size Line 3 shows a different
trend.
Figure 33: Length differences in y-direction vs load data from machine and images

47
Instantaneous apparent stiffness is defined as the slope in the linear region of the load-
displacement response which is illustrated in Figure 34 which is the Region 5 data from
Figure 41.
Figure 34: A sample of the apparent stiffness calculation [100] method in this study
The formula of the stiffness calculation is shown in Equation 4.2:
𝑆𝑆𝑆𝑆𝑆𝑆𝑆𝑆𝑆𝑆𝑆𝑆𝑆𝑆𝑆𝑆𝑆𝑆 =𝛥𝛥𝐹𝐹𝛥𝛥𝑙𝑙
(4.2)
The unit of the apparent stiffness is N/mm.
4.4 Speckle Pattern Creation for Digital Image Correlation
Digital Image Correlation (DIC) measurements were performed to capture point-wise
measurements of the evolution of strain. The DIC procedure begins with the specimen
surface preparation which involves the application of a random speckle pattern that
creates a unique gray-scale distribution. This pattern can be created through different

48
methods depending on the length scale of the analysis, such as particle deposition, rubber
stamping, and spray paint [101].
The single loop geometry is shown in Figure 35b where the straight line of the loop is
approximately 1 mm in length in a relaxed state which is also referenced as “S” in Figure
35b. In this experimental approach, one of the targeted results from speckle pattern
creation was to obtain two speckles in that straight region, S, with the aim to be capable
to measure local yarn deformation accurately. The next issue was that, since the yarn
rotates during loading, speckles should cover all around the yarn in terms of tracking the
deformation.
Figure 35: Speckle patterned coupon with single loop deformation: a) Field of view (FoV), b) Initial position (relaxed state), S, c) deformed position (stretched state), SI
For this experimental study, three different methods were examined to create appropriate
speckles on the knitted specimens. These are black spray paint, extra fine black marker,
and airbrushing techniques display in Figure 36 from a to c, respectively.

49
To compare these methods, after measuring each speckle length values through image
analysis in 10 cm length yarn via Fiji software, the average values of speckle lengths
were calculated, the results shown in Table 6. The images are resolved at 1600 x 1200
pixels with a spatial resolution of 0.007 mm/pixel. Characterizing these methods, spray
paint gave the best result with regards to speckle length and needs to cover all around of
the yarn. To prepare the specimens for DIC measurements, speckles was applied to the
specimen interior region with black spray paint.
Figure 36: Speckle creation methods from a to c; spray paint, marker, and airbrushing; and speckled monofilament yarns are from d to f painted with these
methods correspondingly
Creating speckles for knitted textiles before manufacturing cause problems during the
fabrication process and for the speckle quality on the yarn. For instance, it is not suitable
to run a spray-painted yarn through the knitting machines because the spray paint will

50
likely flake off during the knitting process. A knitted yarn rubs against machinery at
several different points, which would cause any applied spray paint to flake off,
potentially damaging the machine and the speckle pattern on the yarn. Due to these
reasons, speckle pattern process was applied to the manufactured specimen.
Table 6: Average speckle length values
Number Method Speckle Length Average Value [mm]
1 Spray Paint (Black) 0.634
2 Marker (Ultra-Fine Point) 0.265
3 Airbrushing No Value
4.5 Image Acquisition Setup
The DIC equipment setups for Micro-scale and Lab-scale tensile testers was shown in
Figure 30 and Figure 31 in Section 4.3. Images were analyzed with the ARAMIS
deformation analysis software, manufactured by GOM Optical Measuring Techniques.
The images were stored in the memory of the computer attached. Once the images were
acquired, the image correlation was performed in ARAMIS software. The facet field
characteristics used for the cross-correlation algorithm in the post-processing of tensile
test is shown in Table 7. Facet size, step, and overlap were always the same, whereas the
facet field varied by a few pixels due to the speckle pattern, lighting, etc.
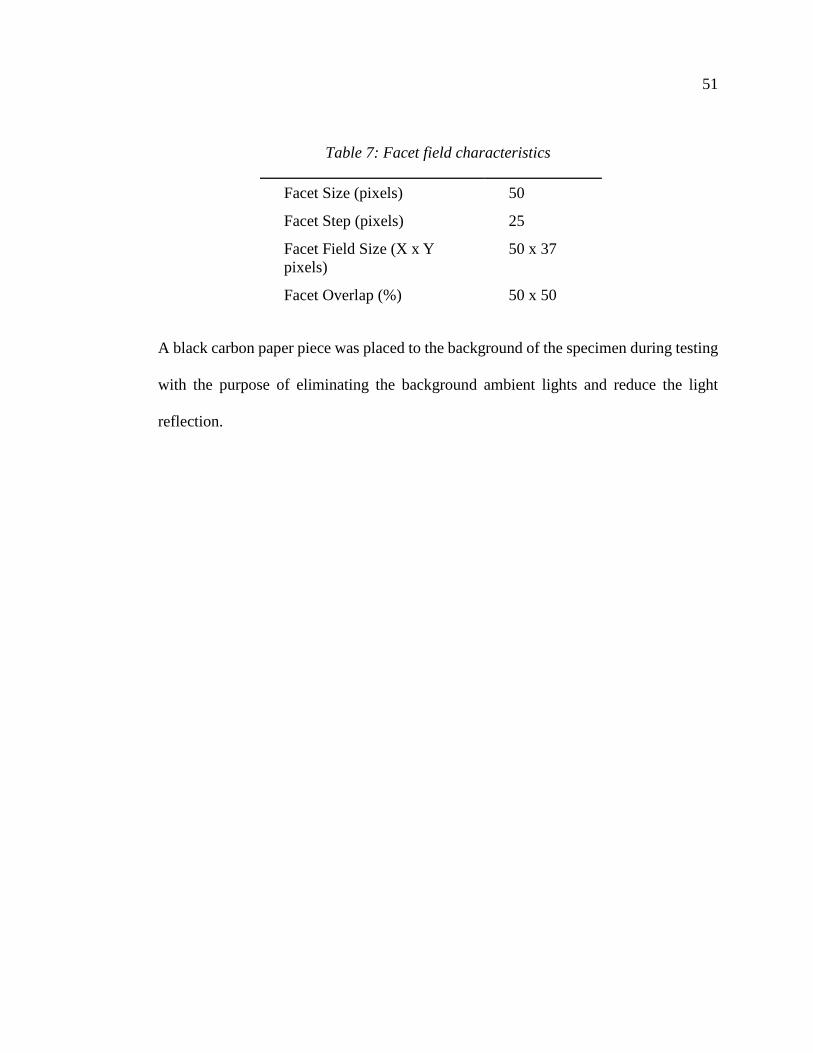
51
Table 7: Facet field characteristics
Facet Size (pixels) 50
Facet Step (pixels) 25
Facet Field Size (X x Y pixels)
50 x 37
Facet Overlap (%) 50 x 50
A black carbon paper piece was placed to the background of the specimen during testing
with the purpose of eliminating the background ambient lights and reduce the light
reflection.

52
CHAPTER 5: MECHANICAL BEHAVIOR CHARACTERIZATION OF
KNITTED TEXTILES
The aim of the thesis is to characterize the mechanical behavior of knitted textiles. For
this purpose, results from monotonic tensile tests are presented in this chapter.
Deformation measurements were performed at two different length scales to investigate
both specimen and local effects.
5.1 Global Measurements
Global level measurements analysis are defined as the ones obtained at the specimen
scale and they are expected to be influenced by size, manufacturing process, knit pattern
etc. However, such measurements in this thesis are definitely different than
measurements at the knit loop level which depend on yarn-to-yarn interactions and are
called therefore local. The deformation of knitted textiles in this section was investigated
using cyclic loading also. Next, the anisotropy of knitted textiles was studied
experimentally and the results were compared with computational work [23] for single
jersey knit with monofilament yarn. Thirdly, stress relaxation phenomenon was
examined as a result of the nonlinear behavior of knitted textiles.
5.1.1 Deformation
In this experimental study, the deformation of knitted textiles was studied under
monotonic tensile loading. The displacement was applied in the wale direction on the
Lab scale tensile tester. The way different parameters affect the behavior of the knitted
textiles such as the structure of knits (single jersey and rib knit), size of the specimens,

53
applied displacement speed, and gauge length differences are investigated. Firstly, load-
displacement curves are obtained. The test was repeated three times with three identical
single jersey knitted specimens J01B, J03B, and J05B. The raw data shown in Figure 37
indicates that the results are repeatable.
Figure 37: Load-displacement curves for three identical specimens
Figure 38 shows the experimental load-displacement curve for the single jersey knitted
specimen, J01B. The corresponding stretch amount that is required to switch the fabric
from the relaxed state to the stiff state is called the critical stretch [15], displayed with
an arrow Figure 38. This parameter is one of the main characteristics of a knitted textiles
that dependents on the geometry of the fabric, therefore, it dependents on three
parameters; wale count, course count, and the diameter of the yarn.
0123456789
10
0 10 20 30
Load
[N]
Displacement [mm]
J01BJ03BJ05B

54
Figure 38: Load-displacement curve for single jersey knit specimen with 4 different regions A-to-D and critical stretch point
Distinct stages of the deformation corresponding to specific regions of the obtained load-
displacement curve are illustrated as well. These specific points are investigated in detail
in Figure 39. Initially, the relaxed fabric is shown in Stage A. In the earlier stages of the
deformation, the specimen experiences large amounts of the overall stretch under a very
small amount of load. This is related to the free translation or easy gliding of relaxed
yarns over each other as shown in Stage B. However, after some amount of such
stretching, further translation of yarns results in major bending deformation that can
instill new properties into yarns themselves in Stage C as shown trends change in Figure
38 and diminish of oscillation shown in Figure 39c when compared to previous stages A
and B. Throughout this process, bending continues until the very end of the curve.
However, when the yarns are as straight as possible, stretching becomes more dominant.
Due to the stretching of stiff yarns, a quite linear final segment on the load-deformation
curve appears and continues until the failure of the specimen, as shown in illustration for
Stage D.

55
Figure 39: 4 different regions from load-displacement curve with specimen images; a) sliding (oscillation), b)sliding and interlocking, c) sliding and stretching,
d)stretching (linear)
5.1.2 Anisotropy
Anisotropy is a general term meaning that a property depends on direction. In other
words, anisotropy is the property of being directionally dependent, which implies
different properties in different directions. As the knitted textiles is anisotropic, different
behavior is expected by applying a load in the wale and course directions. In this
experimental study, measurements were carried out on the single jersey and rib knit
specimens, in order to assess the structural anisotropy. In Figure 40, a digital image of
the jersey structure is used to define wale and course axis in accordance with the
definitions provided in Chapter 1.

56
Figure 40: Wale and course direction of a standard single jersey knitted specimen
Prior computational modeling work [23] indicated that knitted textiles are highly
anisotropic materials systems, which motivated the experimental work performed herein.
Figure 41 indicates that the knitted architecture responds differently to the monotonic
tensile load applied in the wale and course directions. The results were obtained from
testing the single jersey specimen, named J03C, in both wale and course directions with
10 mm/min speed. 50 N force gauge was used for testing because of high load sensitivity,
0.01 N. Higher sensitivity load gauge gives more accurate results since knitted textiles
can deform even under a small amount of load. The specimen was in the relaxed state at
the beginning of the test. The obtained results after applied displacement until 10 N for
both directions were presented by the load-displacement curve.
The plot is divided into 5 regions; Region 1 (R1) represents yarn-to-yarn sliding where
the anisotropic effects are not apparent; Region 2 (R2) represents the onset of anisotropic
effects as the yarns become loaded; Region 3 (R3) shows a linear response in the course
direction; Region 4 (R4) displays the linear response in the course and wale; the course
& wale response again diverges in Region 5 (R5) where the course direction still shows
a linear response since R3 while the wale direction has not been in the linear region yet.

57
Figure 41: Load-displacement curve divided 5 different regions
Apparent structural stiffness was characterized in this five different regions. Computed
instantaneous apparent stiffness values presented in Table 8 that shows the regions’ wale
and course values from two different tests with error margins. Instantaneous structural
stiffness was defined as the slope in the linear region of the load-displacement response.
A stiffness contrast was apparent in the course and wale directions for most of the test,
with the exception of Region 4.

58
Table 8: Average apparent stiffness values (N/mm)
Region Wale Course
Test 1 Test 2 Error margin Test 1 Test 2 Error margin
1 0.026 0.029 0.003 0.011 0.010 0.001
2 0.114 0.118 0.005 0.016 0.025 0.008
3 0.125 0.124 0.002 0.165 0.204 0.039
4 0.274 0.254 0.020 0.287 0.262 0.025
5 0.600 0.555 0.045 0.307 0.265 0.042
The effects of knit architecture (single jersey vs. rib knit) in the mechanical behavior of
textile were probed herein. The load was applied with 10 mm/min force gauge speed and
50 mm gauge length for the tests. Figure 42 shows the load-strain curves for a jersey
(Figure 42a) and a rib (Figure 42b) knit specimens of the same overall dimensions and
Nylon 6 material, as well as the response in the wale and course directions for each
specimen. In the single jersey knit specimen results, the course direction displays a far
stiffer response, however, the opposite is true in rib knits. It can be clearly seen from that
results the architecture of the material has a significant effect on the behavior of the
materials. The digital microscopy images were displayed for both structures in Figure 29
in Section 4.2.

59
Figure 42: Anisotropy results for both single jersey and rib knit structures
The effect of starting conditions on fabric relaxation is performed with single jersey knit
on both wale and course loading direction as shown in Figure 43. The tests were done
with the lab-scale tensile tester by using J02C specimen. Two different gauge lengths
which are and 60 mm 50 mm were applied. The results indicate that gage length
difference is an effective factor to explain the mechanical behavior of textiles.
Figure 43: Gauge length difference results from J02C specimen

60
Validation with modeling
In the computational work, researcher applied the load in course direction with free
borders in the wale direction to get a load-strain curve at the global level. Tensile load
was applied to the single jersey knit architecture with monofilament yarn. In the
experimental work, the monotonic tensile load applied in course direction to compare
the previously reported simulation result. Load-strain curves from simulation and
experimental results are presented in Figure 44. At the beginning of the displacement, in
the sliding region, the material behaves softer while it becomes stiffer with stretching.
As seen from the plots, there is a good agreement between the modeling (Figure 44a)
and the experimental (Figure 44b) study results in terms of trends of the load-strain
curves.
Figure 44: Load-strain curves: a) Modeling data [23], b) Experimental data

61
5.1.3 Cyclic Loading
Cyclic loading described by the load-strain curve shown in Figure 45. Firstly, the
specimen is extended from zero load to the desired load which is 10 N in this experiment,
using the Mark-10 tensile tester. The unloading process follows the loading, which
releases the load from the applied distance (deformed position) to zero (initial position).
The load-strain curve derived using the lab scale tensile tester is shown in Figure 45
where three identical single jersey specimens were tested to indicate that the results are
repeatable. As textile materials are viscoelastic in nature, deform in the loading process,
the residual strain is observed in the tensile recovery load-strain curve when the applied
load has been completely removed. The perfect linear elasticity line is presented by
dashed line OA.
Figure 45: Loading and unloading one deformation cycle in the load-strain curve for 3 coupons (J01B, J03B, and J04B). Dashed line OA represents perfect linear
elasticity

62
Gauge length differences
The effect of gauge length was investigated by the standard monotonic testing on the lab
scale tensile tester. One of the advantages of the lab-scale tester, when compared the
micro-scale, is that it is possible to change gauge length in large scale. In this study, for
instance, the specimen placed with 10 mm difference, 40 mm and 50 mm gauge lengths,
respectively. Then, the displacement was applied to the specimen with same testing
parameters for both measurements. The obtained load-strain curves are shown in Figure
46.
Figure 46: The effects of gauge length (40 and 50 mm) on load-strain response for
single jersey knitted specimen
The area under the load-strain curve for the 50 mm gauge length is 217 N*mm, whereas
the 40 mm gauge length has an area of 476 N*mm, as shown in Table 9. It can be seen
that gauge length affects energy dissipation.
Table 9: Areas of the load-strain curves
Gauge length (mm) 50 40
Area (N*mm) 217.2 476.2

63
5.1.3 Stress Relaxation
Textiles can be treated as a 2D viscoelastic body and the corresponding principle
between elasticity and viscoelasticity is used to analyze stress relaxation effects. The
loops that make up knitted textile can be substantially deformed by the application of a
small force. Initially, the main cause of loop deformation is the slipping of yarns with
respect to each other at the interlocks. During the deformation, energy is stored in the
fabric as bending potential energy. Unless the yarns have poor bending elasticity, the
fabric most probably recovers from the deformation once the applied force is removed.
In this study, two different single jersey knitted specimens were used to analyze stress
relaxation phenomenon of the knitted textiles. The uniaxial tensile test was applied with
the lab-scale tensile tester. The specimens were tested using a gauge length of 50 mm
and speed of 5 mm/min. Load-extension data were extracted from the system software
and used to create load-extension curves. Therefore, the results are presented here in
terms of load-time since relaxation is related to time and load.
The graphs illustrate stress relaxation phenomena are shown in Figure 44 and Figure 45.
Firstly, five different specimens are tested and the tests are repeated 5 times for each
specimen to validate the results. The specimen is extended by a given load and held at
that position. While the length is stable, the load slowly decreases with time. The
outcomes are summarized in Figure 47.

64
Figure 47: Stress relaxation for 5 different applied load
When the load is applied up to 1 N, the displacement is fixed at this load. While the
displacement is stationary, the load value diminish with time and gets stable at 0.8 N.
The difference is illustrated by A that is equal to 0.2 N. Once the load is applied up to 5
N and the displacement is fixed, the load gets stable at 3.70 N. The difference value 1.3
N which is demonstrated by B. This comparison shows that the energy dissipation value
increases when the applied load is higher.
Another test was applied to investigate the stress relaxation, in which the fabric was
loaded to a given point and held for some time to allow for stress relaxation to occur. As
shown in Figure 48, the stress relaxation effects manifest in the fabric as it is loaded step-
wise to 4 points and held for some time to observe stress relaxation. Pre-load was applied
until 5 N from the relaxed state of the specimen, firstly, then, the displacement was fixed
and the load was slowly decreased until getting stable. The process was repeated 3 times
until 10 N to observe stress relaxation.

65
Figure 48: Stress relaxation in three steps with pre-load
The dissipation of energy is presented as A, B and C as seen in Figure 48. Note that even
though the process was repeated 3 times until 10 N and the waiting times between the
tests are equal, the energy dissipations A, B, and C are different where these values are
1.42 N, 0.81 N and 0.54 N, respectively. It shows that the extent of relaxation reduces
because of the successively loading.
5.2 Local Measurements
One of the objectives of this study is to quantify the yarn kinematics in order to monitor
local behavior in knit fabric under uniaxial tensile loading. Local deformation of loops
was quantified by use of image processing combined with optical metrology. 2D DIC
method was applied to extract yarn-level interactions with using line gage displacement
and line in-place rotation as parameters to further indicate the transition between sliding
and stretching. Speckle pattern creation has an important role to characterize the

66
deformation of the knitted textiles. If it is not the desired properties which explained in
Section 4.4, it is not possible to track the motion and deformation of the yarns.
Optical image acquisition system for the 2D DIC method which used in this experimental
study is shown in Figure 49. The usage of 2D DIC in surface measurements, specifically
in textiles, and testing setup were explained in Chapter 2 in detail.
Figure 49: Optical image acquisition system for 2D DIC method
In this study, DIC measurements were used in conjunction with mechanical testing to
observe local mechanical effects in knitted textiles. The image acquisition setup and
post-processing characteristics were explained in Section 4.5.
Figure 50 demonstrates pictures from global specimen level to local yarn level. In Figure
50a, the whole specimen is shown between grips arranged for testing. 12 by 12 mm field
of view (FoV) in the center of the specimen is displayed in Figure 50b. In Figure 50c
region of interest (RoI) is shown where the focusing 3 by 3 loops matrix for post-

67
processing. Lastly, a single loop is presented with geometrical parameters that are course
and wale spacing and diameter of the monofilament yarn in Figure 50d.
Figure 50: From coupon level to single yarn. a) Coupon level, b) Field of View (FoV), c) Region of Interest (RoI), d) Single loop with course spacing (C), wale
spacing (W) and diameter (D)
As summarized in the background section, full-field strain measurements have done
successfully for woven reinforced textiles in the literature [10, 78]. However, for knitted
textiles, full-field strain measurements could not be computed due to porosity in the
imaging regards to the natural characteristics of knitted textiles. In this thesis work, line
gage measurement was performed in a single loop. Lines were chosen manually on each
yarn straight region as shown in Figure 51b and to define orientation change, in Figure

68
51c. As opposed the full-field strain measurements, line gage measurements allow to
calculate strain for each loop in the yarn level.
Figure 51: a) Field of view from Figure 50c, b) Line gauge measurements, c) Rotation measurements
The shape change of the whole specimen and single yarns under tensile load can be
observed clearly in Figure 52. Figure 52a displays the initial position of the specimen
where the specimen is in the relaxed state before any load applied. Figure 52b
demonstrates the sliding vs stretching region where the load is being applied to the
specimen. The deformed specimen which is in the stretching region is shown in Figure
52c.
It can be clearly seen that the knits are complex structures in overall and each individual
yarns behave differently from each other. Moreover, defining this complex behavior and
interactions of yarns between each other is a very complicated work and needs more
effort and time.

69
Figure 52: Deformation behavior of the architecture in microscale tensile testing. a) Relaxed state, b) Sliding and stretching region; elongation in y-direction and
constriction in x-direction, c) Stretched region
5.2.1 Yarn-level measurement results
X and y coordinates are chosen at every point in the grid and their motion tracked over
the duration of the test in the x and y-directions and the length changes of the lines in the
stretching region plotted in Figure 53 and Figure 54, respectively. As understood from
these figures, yarns stretch in the y-direction (wale) and constrict in the x-direction
(course). The reason is that the monotonic tensile test was applied in wale direction of
the specimen. Figure 53 demonstrated this behavior in whole specimen level which is in
parallel with these results. Yarn to yarn friction directly influences the loading of yarn
loops and therefore influences the loop sets associated with a knit. These yarn-to-yarn
frictions are directly influenced by irregular relaxation of loops and loop sets.

70
Figure 53: Yarn level length difference in x-direction
Figure 54: Yarn level length difference in y-direction

71
Moreover, the macroscopic mechanical in-plane behavior is typically nonlinear because
the deformation mechanisms at smaller scales affect the macroscale behavior. In other
words, the mechanical response is directly connected to local geometry.
Under monotonic tensile load, the angle changes with normalized data with time
obtained as shown in Figure 55. The rotation calculation method was displayed in Figure
52c. While applying a tensile load, stretching obtained in the wale direction. Related to
this behavior, the decrease in the angle is expected on a single yarn. Figure 55
demonstrates this phenomenon by 3 different lines from three different loops.
Figure 55: Angle changes of the single yarns
The local strain was calculated for each line 1, line 3 and line 8 from three different loops
in the region of interest. The strain values are presented in Figure 56 with respect to time
and the applied load.

72
Figure 56: Strain-time curve with load
The differences in results indicate that the overall behavior of the structure depends on
the local behavior (yarn-to-yarn interactions). The differences in slope are due to
irregular relaxation of fabric. Yarn-to-yarn friction is highly dependent on relaxation.
5.3 Correlation of Global and Local Measurements
In this section, the obtained monotonic tensile test results for both global (Figure 1) and
local (Figure 53-54) level measurements are compared. The relationship between these
two scales is investigated in two different regions. The first investigated region is the
beginning of the test called the sliding region (relaxed state) where the yarn is
straightened without yarn elongation (rigid body motion). The second stage is the
stretching region where the straightened yarn is stretched with slip at the yarn contact
points. Figure 57 shows the overall load-displacement curve with the focused Region A
curve, explained in detail in Section 1.

73
Figure 57: Load vs displacement curve with focusing region
Local measurement results in the Region A was obtained from image processing for both
y- and x- directions are shown in Figure 58. In the x-direction, the lengths decrease as
expected because of the geometry change of the specimen under monotonic tensile load
which referenced in Figure 52.When the length changes analyzed in the y-direction
which is the same direction with applied load, two different regions were obtained. At
the very beginning of the curve called Region 1, a linear increase is shown first 30
seconds in terms of y- length differences. This linear curve does not occur since
stretching but the reason for this the results of straightening/vertical positioning of the
loops the loops in the relaxed state. After some time, with the applied displacement,
when the loops straight enough, the Region 2 starts which include rigid body motion and
gives constant line. It means there is sliding between yarns, and loops show rigid body
motion. This behavior continues until interlocking of the loops.

74
Figure 58: Line-gage measurement results in the yarn level
Stretching behavior from the global measurement is shown in Figure 59 with the overall
load-displacement curve. The linear curve after critical stretch point indicates that the
loops are interlocked fully and becomes a stretch.

75
Figure 59: Load vs displacement curve with focusing region
The length change in the x-direction shows contraction by contrast with y-direction. The
results presented in Figure 60 shows that the length change in x-direction decreases,
while the length change in y-direction increase linearly. This is exactly the observed
behavior obtained from global measurements. The images of this behavior were
displayed in Figure 52.
As a result, it was investigated that how yarns behave under given global deformation.
The obtained results from both scales were compared. It was found out that the overall
behavior depends on the local behavior of the knitted textiles.

76
Figure 60: Line-gage measurement results in the yarn level

77
CHAPTER 6: 3D GEOMETRY EXTRACTION
6.1 Material Geometry Characterization
Knitted textiles are three-dimensional and hierarchically structured materials exhibiting
a complex set of structure-property-behavior relations. Their behavior involves both
geometrical and material nonlinearities. Moreover, the complex geometry of knitted
textiles can be the reason for the lack of robust and widely accepted methodology for
design and analysis of these structures [85]. To assist the understanding of the
mechanical behavior of knitted structures it should be essential to have a model based
on 3D data. This work was completed for the purpose of extracting real specimen
geometry that could be used for computational modeling. The process will be explained
in three steps which are the characterization of material geometry with volume
measurement technique, extraction of data via computer vision algorithm, and
connection to modeling by data visualization. The schematic diagram of the process is
shown in Figure 61. The aim of this work is to establish a reliable, efficient, and non-
destructive way to characterize the internal geometry of the single jersey knit architecture
with monofilament yarn material.
To understand the mechanisms of knitted textiles, it is important to figure out the
structure geometry itself. Volumetric conceptualization of yarn-to-yarn interactions is
also important to acquire input for modeling of knitted textiles by defining contact points,
friction, and sliding of yarns. The geometry of knitted textiles can be experimentally
determined using a variety of imaging techniques. X-ray micro-CT technique is one of

78
them for imaging 3D yarn architecture. X-ray micro-CT is a non-destructive evaluation
technique which provides 3D visualization of the internal geometry of a structure without
destructing the sample.
Figure 61: a) obtaining slices from the sample, b) applying image processing, c) extracting yarn path
The aim of this study is to analyze knitted textiles structures by using X-ray micro-CT
technique. The geometrical parameters can be summarized as the yarn positional
information, shape and dimensions of cross-sections and contact points. This volume
measurement technique, three-dimensional visualization of the structure of the materials,
has been used to characterize the microstructure of jersey knits.
6.2 Data Extraction and Connection to Modeling
The image of the specimen prepared for X-ray micro-CT scanning is shown in Figure
62a with the coordinate systems where wale is z-direction and course is x-direction.
Furthermore, interested loops in this study for 3D reconstruction are displayed in Figure
62b. The specimen was manufactured with 0.15 mm diameter monofilament nylon yarn.

79
Single jersey knit was chosen as the specimen structure since its basic architecture. The
images were obtained using a Skyscan-1272 micro-CT scanner. The resolution per pixel
was 3.2 micron for the scanning.
Figure 62: a) The specimen prepared for volumetric measurement, b) Region of Interest for yarn path analysis
It should be noted that the relative positional information of each yarn is necessary to
reconstruct the fabric structure [84]. From this purpose, the yarn center points are
accordingly regarded as the positional information of the yarn in terms of reconstruction
and visualization of loop geometry in this study.
During the X-ray inspection, the collimator movement of the tomography machine was
set up to be equal to one pixel, 3.2 microns, which corresponds slice thickness. The X-
ray inspections on the knitted structure result in 817 CT images which called slices.
These slices were converted into binary images before applying image processing. Yarn
cross sections were identified by using image processing toolbox in Matlab software.
The centroids of the yarn cross sections were acquired by using Matlab region-props

80
function. X and y centroid coordinates were extracted from slices manually where z
coordinate was presented by the slice numbers which calculated from slice thickness.
Computer vision algorithm is applied in Matlab to identify yarn cross-sections as seen
in Figure 63. A sample CT image converted to binary is shown in Figure 63a. The
horizontal direction of the slice was defined as the x-axis, the vertical direction was
defined as the y-axis and the depth direction was defined as the z-axis. Figure 63b
displays the same slice from Figure 63a identified blobs with the centers of the cross
sections after applied image processing. An example of the parallel slices is depicted
Figure 63c with yarn path.
Figure 63: The method used to detect and characterize the yarn centerlines: a) A sample binary image, b) The slice with the centers of mass of the cross sections, c)
Illustration of parallel slices with yarn path
It can be concluded that a description of the loop geometry, namely yarn middle line,
cross-section areas and orientation along the yarn were produced to obtain real sample
data through input modeling. The 3D reconstruction of the focused three loops in relaxed
state shown in Figure 64 was executed with Autodesk fusion software.

81
Figure 64: Extracted loop geometries
Ultimately, the completed 3D geometry extraction process in this work can be
summarized as seen in Figure 65. The first step is the preparation of the specimen (Figure
65a). Then, X-ray micro-CT is applied to obtain CT images of the structure called slices
(Figure 65b). 3D yarn reconstruction and visualization are completed after image
processing (Figure 65c). The final step which is also the aim of all of the previous steps
is input obtained data to modeling (Figure 65d).
Figure 65: Process flow schematic

82
CHAPTER 7: CONCLUDING REMARKS AND FUTURE PROSPECTS
This work attempted to provide a multiscale framework suitable for quantitative
characterization of the mechanical behavior of this knitted textiles. To achieve this goal,
mechanical testing at two different scales was coupled with full-field deformation
mapping. In this study, optical metrology method was used to define the structural
behavior of monofilament yarns such as length changes and angle changes. The
properties of plain weft-knitted textiles are studied experimentally by employing multi-
purpose material tensile testers and digital microscopy is utilized to observe and
investigate the meso- and micro-scale mechanism of knitted textiles. X-Ray micro-CT
was used to determine yarn path geometry for the purpose of geometry extraction to
modeling. Two types of knit architectures were investigated including the single jersey
and rib knits. The experimental findings of this research validated previously reported
[23] simulation results that indicated the anisotropic, nonlinear and multiscale-dependent
mechanical behavior of knitted textiles.
In future investigations, different types of architecture, materials, and geometries can be
investigated with the specimens comprised of multifilament yarns. With the purpose of
investigating edge effects, different region of interest from the center of the specimen
can be analyzed with image processing. Furthermore, digital image correlation technique
requires better speckle pattern on the specimen. For this purpose, an improvement to
speckle pattern characterization can be done for better local measurements. Besides, in
terms of investigating contact area between yarns dynamic test on the X-Ray micro-CT
should be done for extracting sliding, friction, and contact region volume measurements.

83
LIST OF REFERENCES
[1] O. V. Patricia Dolez, and Valerio Izquierdo, Advanced Characterization and Testing of Textiles: Elsevier Ltd., 2018.
[2] L.-M. Zhu, P. Schuster, and U. Klinge, "Mesh implants: An overview of crucial mesh parameters," World journal of gastrointestinal surgery, vol. 7, p. 226, 2015.
[3] C. W. Rogers and S. R. Crist, "Braided preform for composite bodies," ed: Google Patents, 1997.
[4] A. R. Horrocks and S. C. Anand, Handbook of technical textiles: Elsevier, 2000.
[5] S. Ramakrishna, "Characterization and modeling of the tensile properties of plain weft-knit fabric-reinforced composites," Composites Science and Technology, vol. 57, pp. 1-22, 1997.
[6] N. V. Padaki, R. Alagirusamy, and B. Sugun, "Knitted preforms for composite applications," Journal of Industrial Textiles, vol. 35, pp. 295-321, 2006.
[7] R. Sinclair, Textiles and fashion: materials, design and technology: Elsevier, 2014.
[8] N. C. S. University. (2011). Weft Knitting. Available: https://www.aatcc.org/evnt/online/fundamentals/online-textile-fundamentals-demos/weft-knitting/
[9] S. Daggumati, E. Voet, W. Van Paepegem, J. Degrieck, T. Praet, B. Verhegghe, et al., "Influence of the internal yarn nesting (shifting) on the local structural response of a satin weave composite–an experimental and numerical overview," in 10th International conference on Textile Composites (TEXCOMP 10), 2010, pp. 238-247.
[10] S. V. Lomov, P. Boisse, E. Deluycker, F. Morestin, K. Vanclooster, D. Vandepitte, et al., "Full-field strain measurements in textile deformability studies," Composites Part A: Applied Science and Manufacturing, vol. 39, pp. 1232-1244, 8// 2008.
[11] J. Abel, J. Luntz, and D. Brei, "Hierarchical architecture of active knits," Smart Materials and Structures, vol. 22, p. 125001, 2013.
[12] J. M. Kaldor, D. L. James, and S. Marschner, "Simulating knitted cloth at the yarn level," in ACM Transactions on Graphics (TOG), 2008, p. 65.
[13] A. K., "Introduction (Amutha K.)," in A Practical Guide to Textile Testing, ed: WPI Publishing, 2016, pp. 9-22.
[14] P. Schwartz, Structure and mechanics of textile fibre assemblies: Elsevier, 2008.
[15] S. Kawabata, "Nonlinear mechanics of woven and knitted materials," Elsevier Science Publishers, Textile Structural Composites, pp. 67-116, 1989.

84
[16] M. Duhovic and D. Bhattacharyya, "Simulating the deformation mechanisms of knitted fabric composites," Composites Part A: Applied Science and Manufacturing, vol. 37, pp. 1897-1915, 2006.
[17] A. C. Long, Design and manufacture of textile composites: Elsevier, 2005.
[18] S. Kawabata, M. Niwa, and H. Kawai, "The finite-deformation theory of plain-weave fabrics part II: the uniaxial-deformation theory," Journal of the textile institute, vol. 64, pp. 47-61, 1973.
[19] S. V. Lomov and I. Verpoest, "Modelling of the internal structure and deformability of textile reinforcements: WiseTex software," in Proc. ECCM-10, 10th European Conference on Composite Materials, 2002, pp. 1-9.
[20] A. Gasser, P. Boisse, and S. Hanklar, "Mechanical behaviour of dry fabric reinforcements. 3D simulations versus biaxial tests," Computational materials science, vol. 17, pp. 7-20, 2000.
[21] T. Bini, S. Ramakrishna, Z. M. Huang, and C. Lim, "Structure–tensile property relationship of knitted fabric composites," Polymer composites, vol. 22, pp. 11-21, 2001.
[22] S. Kawabata, M. Niwa, and H. Kawai, "The finite-deformation theory of plain-weave fabrics part I: the biaxial-deformation theory," Journal of the textile institute, vol. 64, pp. 21-46, 1973.
[23] D. Liu, D. Christe, B. Shakibajahromi, C. Knittel, N. Castaneda, D. Breen, et al., "On the Role of Material Architecture in the Mechanical Behavior of Knitted Textiles," International Journal of Solids and Structures, 2017.
[24] B. Gommers, I. Verpoest, and P. Van Houtte, "Modelling the elastic properties of knitted-fabric-reinforced composites," Composites science and technology, vol. 56, pp. 685-694, 1996.
[25] A. Loginov, S. Grishanov, and R. Harwood, "Modelling the Load–Extension Behaviour of Plain-knitted Fabric: Part I: A Unit-cell Approach towards Knitted-fabric Mechanics," Journal of the Textile Institute, vol. 93, pp. 218-238, 2002.
[26] V. Carvelli, C. Corazza, and C. Poggi, "Mechanical modelling of monofilament technical textiles," Computational Materials Science, vol. 42, pp. 679-691, 2008.
[27] T.-L. Chu, C. Ha-Minh, and A. Imad, "Analysis of local and global localizations on the failure phenomenon of 3D interlock woven fabrics under ballistic impact," Composite Structures, vol. 159, pp. 267-277, 1/1/ 2017.
[28] C. Tephany, D. Soulat, J. Gillibert, and P. Ouagne, "Influence of the non-linearity of fabric tensile behavior for preforming modeling of a woven flax fabric," Textile Research Journal, p. 0040517515595030, 2015.
[29] B. Hepworth and G. Leaf, "The mechanics of an idealized weft-knitted structure," Journal of the Textile Institute, vol. 67, pp. 241-248, 1976.

85
[30] B. Hepworth, "The biaxial load-extension behaviour of a model of plain weft-knitting—part I," Journal of the Textile Institute, vol. 69, pp. 101-107, 1978.
[31] Y. Kyosev, "Survey over the Mechanical Modelling of Weft Knitted Structures," in II International Technical Textiles Congress, 2015, pp. 13-15.
[32] Y. Luo and I. Verpoest, "Biaxial tension and ultimate deformation of knitted fabric reinforcements," Composites Part A: Applied Science and Manufacturing, vol. 33, pp. 197-203, 2// 2002.
[33] J. Cao, R. Akkerman, P. Boisse, J. Chen, H. Cheng, E. De Graaf, et al., "Characterization of mechanical behavior of woven fabrics: experimental methods and benchmark results," Composites Part A: Applied Science and Manufacturing, vol. 39, pp. 1037-1053, 2008.
[34] K. Vanclooster, M. Barburski, S. V. Lomov, I. Verpoest, F. Deridder, and F. Lanckmans, "Experimental characterization of steel fibre knitted fabrics deformability," Experimental Techniques, vol. 39, pp. 16-22, 2015.
[35] R. Brad and M. Dinu, "Experimental Investigation on Tensile Strength of Jacquard Knitted Fabrics," arXiv preprint arXiv:1510.07619, 2015.
[36] H. Stumpf, T. Lenz, K. Schulte, and C.-H. Andersson, "The Mechanical Behaviour of Single-tricot Warp-knitted Fabrics Part I: An Experimental Investigation of Knitted Fabrics of Varying Loop Geometry under Tensile Stress with Special Attention Given to Inter-yarn Friction," Journal of the Textile Institute, vol. 90, pp. 209-224, 1999.
[37] L. Ciobanu and F. Filipescu, "Experimental Study on the Mechanic Behaviour of Weft Knitted Fabrics," PNA, vol. 11, pp. 11-13, 2012.
[38] Y.-P. Zhang and H.-R. Long, "The biaxial tensile elastic properties of plain knitted fabrics," Journal of Fiber Bioengineering and Informatics, vol. 3, pp. 27-31, 2010.
[39] P. Ma, G. Jiang, Z. Gao, Q. Zhang, and D. Xia, "Tension and tear behaviors of co-woven-knitted fabric with photograph investigation," Fibers and Polymers, vol. 15, pp. 382-389, 2014.
[40] O. Tokmak, O. B. Berkalp, and J. Gersak, "Investigation of the mechanics and performance of woven fabrics using objective evaluation techniques. Part I: The relationship between FAST, KES-F and Cusick’s drape-meter parameters," Fibres & Textiles in Eastern Europe, vol. 18, p. 79, 2010.
[41] D. Vlad and L.-I. Cioca, "Research Regarding the Influence of Raw Material and Knitted Fabric Geometry on the Tensile Strength and Breaking Elongation," Procedia Technology, vol. 22, pp. 60-67, 2016.
[42] ASTM, "Standard Test Method for Tensile Properties of Single Textile Fibers," ed, 2014.

86
[43] ASTM, "Standard Test Method for Tensile Properties of Yarns by the Single-Strand Method," ed, 2015.
[44] M. Maqsood, Y. Nawab, J. Umar, M. Umair, and K. Shaker, "Comparison of compression properties of stretchable knitted fabrics and bi-stretch woven fabrics for compression garments," The Journal of The Textile Institute, pp. 1-8, 2016.
[45] D. Semnani, "Mechanical properties of weft knitted fabrics in fully stretched status along courses direction: Geometrical model aspect," Universal Journal of Mechanical Engineering, vol. 1, pp. 62-67, 2013.
[46] ASTM, "Standard Test Method for Stretch Properties of Knitted Fabrics Having Low Power," ed, 2016.
[47] ASTM, "Standard Test Method for Stretch Properties of Textile Fabrics-CRE Method," ed, 2015.
[48] A. H. Mohamad, T. Cassidy, A. Brydon, and D. Halley, "The measurement of plain weft-knitted fabric stiffness," Measurement Science and Technology, vol. 23, p. 055602, 2012.
[49] M. S. Yeoman, D. Reddy, H. C. Bowles, D. Bezuidenhout, P. Zilla, and T. Franz, "A constitutive model for the warp-weft coupled non-linear behavior of knitted biomedical textiles," Biomaterials, vol. 31, pp. 8484-8493, 11// 2010.
[50] ASTM, "Standard Test Method for Stiffness of Fabric by the Circular Bend Procedure," ed, 2016.
[51] ASTM, "Standard Test Method for Stiffness of Fabrics," ed, 2014.
[52] M. UÇAR, "Mechanical Behavior of Knitted Fabrics under Bending and Shear Deformation," Turkish Journal of Engineering and Environmental Sciences, vol. 27, pp. 177-182, 2003.
[53] H. Kang, Z. Shan, Y. Zang, and F. Liu, "Effect of Yarn Distortion on the Mechanical Properties of Fiber-Bar Composites Reinforced by Three-Dimensional Weaving," Applied Composite Materials, vol. 23, pp. 119-138, 2016.
[54] ASTM, "Standard Test Method for Distortion of Yarn in Woven Fabrics," ed, 2015.
[55] ASTM, "Standard Test Method for Tearing Strength of Fabrics by Falling-Pendulum (Elmendorf-Type) Apparatus," ed, 2013.
[56] ASTM, "Standard Test Method for Tearing Strength of Fabrics by the Tongue (Single Rip) Procedure (Constant-Rate-of-Extension Tensile Testing Machine)," ed, 2017.
[57] ASTM, "Standard Test Method for Tearing Strength of Fabrics by Trapezoid Procedure," ed, 2015.

87
[58] ASTM, "Standard Guide for Abrasion Resistance of Textile Fabrics (Rotary Platform, Double-Head Method)," ed, 2017.
[59] ASTM, "Standard Guide for Abrasion Resistance of Textile Fabrics (Uniform Abrasion)," ed, 2016.
[60] ASTM, "Standard Test Method for Abrasion Resistance of Textile Fabrics (Martindale Abrasion Tester Method)," ed, 2016.
[61] ASTM, "Standard Test Methods for Linear Density of Textile Fibers," ed, 2012.
[62] M. A. Islam, "Effect Of Wale Wise Increasing Of Tuck And Miss Loops On Bursting Strength Of Single Jersey Fabric At Grey And Finish State," ed: JRET: International Journal of Research in Engineering and Technology, 2014.
[63] ASTM, "Standard Test Method for Bursting Strength of Textile Fabrics—Diaphragm Bursting Strength Tester Method," ed, 2013.
[64] ASTM, "Standard Test Method for Bursting Strength of Textiles—Constant-Rate-of-Traverse (CRT) Ball Burst Test," ed, 2016.
[65] ASTM, "Standard Test Method for Breaking Strength and Elongation of Textile Fabrics (Grab Test)," ed, 2017.
[66] ASTM, "Standard Test Method for Breaking Force and Elongation of Textile Fabrics (Strip Method)," ed, 2015.
[67] ASTM, "Standard Test Method for Elongation of Narrow Elastic Fabrics (Static-Load Testing)," ed, 2017.
[68] A. Willems, S. V. Lomov, I. Verpoest, and D. Vandepitte, "Drape-ability characterization of textile composite reinforcements using digital image correlation," Optics and Lasers in Engineering, vol. 47, pp. 343-351, 2009.
[69] X. Wang, X. Liu, and C. Hurren, "Physical and mechanical testing of textiles," Fabric testing, pp. 90-123, 2008.
[70] Z. Jinyun, L. Yi, J. Lam, and C. Xuyong, "The Poisson ratio and modulus of elastic knitted fabrics," Textile Research Journal, vol. 80, pp. 1965-1969, 2010.
[71] H. Kong, A. Mouritz, and R. Paton, "Tensile extension properties and deformation mechanisms of multiaxial non-crimp fabrics," Composite Structures, vol. 66, pp. 249-259, 2004.
[72] Y. Hou, H. Hu, B. Sun, and B. Gu, "Strain rate effects on tensile failure of 3-D angle-interlock woven carbon fabric," Materials & Design, vol. 46, pp. 857-866, 2013.
[73] Y. Liu and H. Hu, "An Experimental Study of Compression Behavior of Warp-knitted Spacer Fabric," Journal of Engineered Fabrics & Fibers (JEFF), vol. 9, 2014.

88
[74] ASTM, "Standard Test Methods for Rubber Properties in Compression," ed, 2012.
[75] M. Komeili, "Multi-scale characterization and modeling of shear-tension interaction in woven fabrics for composite forming and structural applications," 2014.
[76] E. E. Swery, T. Allen, and P. Kelly, "Automated tool to determine geometric measurements of woven textiles using digital image analysis techniques," Textile Research Journal, p. 0040517515595031, 2015.
[77] R. S. Pierce, B. G. Falzon, M. C. Thompson, and R. Boman, "A Low-Cost Digital Image Correlation Technique for Characterising the Shear Deformation of Fabrics for Draping Studies," Strain, vol. 51, pp. 180-189, 2015.
[78] A. Willems, S. V. Lomov, I. Verpoest, and D. Vandepitte, "Optical strain fields in shear and tensile testing of textile reinforcements," Composites Science and Technology, vol. 68, pp. 807-819, 3// 2008.
[79] ASTM. Textile Standards. Available: https://www.astm.org/Standards/textile-standards.html
[80] ASTM, "Standard Test Method for Tension and Elongation of Elastic Fabrics (Constant-Rate-of-Extension Type Tensile Testing Machine)," ed, 2016.
[81] F. Desplentere, S. V. Lomov, D. Woerdeman, I. Verpoest, M. Wevers, and A. Bogdanovich, "Micro-CT characterization of variability in 3D textile architecture," Composites Science and Technology, vol. 65, pp. 1920-1930, 2005.
[82] L. P. Djukic, I. Herszberg, W. R. Walsh, G. A. Schoeppner, B. G. Prusty, and D. W. Kelly, "Contrast enhancement in visualisation of woven composite tow architecture using a MicroCT Scanner. Part 1: Fabric coating and resin additives," Composites Part A: Applied Science and Manufacturing, vol. 40, pp. 553-565, 2009.
[83] L. P. Djukic, I. Herszberg, W. R. Walsh, G. A. Schoeppner, and B. G. Prusty, "Contrast enhancement in visualisation of woven composite architecture using a MicroCT Scanner. Part 2: Tow and preform coatings," Composites Part A: Applied Science and Manufacturing, vol. 40, pp. 1870-1879, 2009.
[84] T. Shinohara, J.-y. Takayama, S. Ohyama, and A. Kobayashi, "Extraction of Yarn Positional Information From Three-Dimensional ct Image of Textile Fabric Using Yarn Tracing With Filament Model for Structure Analysis," Textile Research Journal, 2009.
[85] G. Harjkova, M. Barburski, S. V. Lomov, O. Kononova, and I. Verpoest, "Weft knitted loop geometry of glass and steel fiber fabrics measured with X-ray micro-computer tomography," Textile Research Journal, vol. 84, pp. 500-512, 2014.

89
[86] S. D. Pandita and I. Verpoest, "Prediction of the tensile stiffness of weft knitted fabric composites based on X-ray tomography images," Composites science and technology, vol. 63, pp. 311-325, 2003.
[87] G. Leaf and A. Glaskin, "The geometry of a plain knitted loop," Journal of the Textile Institute Transactions, vol. 46, pp. T587-T605, 1955.
[88] F. T. Peirce, "Geometrical principles applicable to the design of functional fabrics," Textile Research Journal, vol. 17, pp. 123-147, 1947.
[89] M. W. Suh, "A study of the shrinkage of plain knitted cotton fabric, based on the structural changes of the loop geometry due to yarn swelling and deswelling," Textile Research Journal, vol. 37, pp. 417-431, 1967.
[90] J. Hu, Structure and mechanics of woven fabrics: Elsevier, 2004.
[91] M. Ashby, "Designing architectured materials," Scripta Materialia, vol. 68, pp. 4-7, 2013.
[92] F. Barthelat, "Architectured materials in engineering and biology: fabrication, structure, mechanics and performance," International Materials Reviews, vol. 60, pp. 413-430, 2015.
[93] O. Bouaziz, Y. Bréchet, and J. D. Embury, "Heterogeneous and Architectured Materials: A Possible Strategy for Design of Structural Materials," Advanced Engineering Materials, vol. 10, pp. 24-36, 2008.
[94] P. Kiekens and S. Jayaraman, Intelligent textiles and clothing for ballistic and NBC protection: technology at the cutting edge: Springer Science & Business Media, 2012.
[95] B. Sun, H. Pan, and B. Gu, "Tensile impact damage behaviors of co-woven-knitted composite materials with a simplified microstructure model," Textile Research Journal, vol. 84, pp. 1742-1760, 2014.
[96] R. Chapman, Smart textiles for protection: Elsevier, 2012.
[97] M. Struszczyk, K. Kostanek, M. Puchalski, and I. Krucińska, "Design aspects of fibrous, implantable medical devices," in Proceedings of EGE MEDITEX-2012 International Congress on Healthcare and Medical Textiles, 2012, pp. 17-18.
[98] F. Lorussi, S. Galatolo, R. Bartalesi, and D. De Rossi, "Modeling and characterization of extensible wearable textile-based electrogoniometers," IEEE Sensors Journal, vol. 13, pp. 217-228, 2013.
[99] S. Park and S. Jayaraman, "Smart textiles: Wearable electronic systems," MRS bulletin, vol. 28, pp. 585-591, 2003.
[100] B. D. Stemper, D. Board, N. Yoganandan, and C. E. Wolfla, "Biomechanical properties of human thoracic spine disc segments," Journal of Craniovertebral Junction and Spine, vol. 1, p. 18, 2010.

90
[101] P. Reu, "Speckles and their relationship to the digital camera," Experimental Techniques, vol. 38, pp. 1-2, 2014.

This page intentionally left blank