Coding and adaptation during mechanical stimulation in the leech nervous system
16
The nervous system of the leech consists of a head ganglion, a chain of 21 ganglia and a tail ganglion. Each segmental ganglion innervates a specific segment of the animal (Nicholls & Baylor, 1968; Yau, 1976) and is composed of about 400 neurones, including inter- neurones, secretory neurones, motoneurones or sensory neurones (Macagno, 1981; Muller et al. 1981). The skin of each body segment is composed of five annuli, providing landmarks for a map of the entire skin. Coding of mechanical stimulation of the skin is primarily carried out by three kinds of mechanosensory neurones, touch (T), pressure (P) and noxious (N) cells (Nicholls & Baylor, 1968). T cells transduce light touch of the skin and each ganglion has three T cells on the left and right side. On each side of a ganglion there are two P and N cells tuned to progressively stronger stimulation of the skin (Nicholls & Baylor, 1968; Lewis & Kristan, 1998b). Mechanosensory neurones of a given ganglion innervate not only the skin Coding and adaptation during mechanical stimulation in the leech nervous system G. Pinato and V. Torre Scuola Internazionale Superiore di Studi Avanzati, Via Beirut 2, Trieste and INFM, Unita’ di Trieste, Via Beirut 2, Trieste, Italy (Received 26 June 2000; accepted after revision 27 July 2000) 1. The experiments described here were designed to characterise sensory coding and adaptation during mechanical stimulation in the leech (Hirudo medicinalis). A chain of three ganglia and a segment of the body wall connected to the central ganglion were used. Eight extracellular suction pipettes and one or two intracellular electrodes were used to record action potentials from all mechanosensory neurones of the three ganglia. 2. When the skin of the body wall was briefly touched with a filament exerting a force of about 2 mN, touch (T) cells in the central ganglion, but also those in adjacent ganglia (i.e. anterior and posterior), fired one or two action potentials. However, the threshold for action potential initiation was lower for T cells in the central ganglion than for those in adjacent ganglia. 3. The timing of the first evoked action potential in a T cell was very reproducible with a jitter often lower than 100 µs. Action potentials in T cells were not significantly correlated. 4. When the force exerted by the filament was increased above 20 mN, pressure (P) cells in the central and neighbouring ganglia fired action potentials. Action potentials in P cells usually followed those evoked in T cells with a delay of about 20 ms and had a larger jitter of 0.5–10 ms. 5. With stronger stimulations exceeding 50 mN, noxious (N) cells also fired action potentials. With such stimulations the majority of mechanosensory neurones in the three ganglia fired action potentials. 6. The spatial properties of the whole receptive field of the mechanosensory neurones were explored by touching different parts of the skin. 7. When the mechanical stimulation was applied for a longer time, i.e. 1 s, only P cells in the central ganglion continued to fire action potentials. P cells in neighbouring ganglia fully adapted after firing two or three action potentials. 8. P cells in adjacent ganglia, having fully adapted to a steady mechanical stimulation of one part of the skin, fired action potentials following stimulation of a different region of the skin. 9. These results indicate that a brief and localised stimulation of the skin can activate more than a dozen different mechanosensory neurones in the three ganglia and after 100 ms of steady stimulation many of these mechanosensory neurones stop firing action potentials and fully adapt. Adaptation occurs primarily at the nerve endings and mechanosensory neurones can quickly respond to mechanical stimulation at a different location on the skin. Journal of Physiology (2000), 529.3, pp.747–762 11325 747 ) by guest on May 31, 2013 jp.physoc.org Downloaded from J Physiol (
-
Upload
independent -
Category
Documents
-
view
1 -
download
0
Transcript of Coding and adaptation during mechanical stimulation in the leech nervous system

The nervous system of the leech consists of a headganglion, a chain of 21 ganglia and a tail ganglion. Eachsegmental ganglion innervates a specific segment of theanimal (Nicholls & Baylor, 1968; Yau, 1976) and iscomposed of about 400 neurones, including inter-neurones, secretory neurones, motoneurones or sensoryneurones (Macagno, 1981; Muller et al. 1981). The skin ofeach body segment is composed of five annuli, providinglandmarks for a map of the entire skin. Coding of
mechanical stimulation of the skin is primarily carriedout by three kinds of mechanosensory neurones, touch(T), pressure (P) and noxious (N) cells (Nicholls & Baylor,1968). T cells transduce light touch of the skin and eachganglion has three T cells on the left and right side. Oneach side of a ganglion there are two P and N cells tunedto progressively stronger stimulation of the skin (Nicholls& Baylor, 1968; Lewis & Kristan, 1998b). Mechanosensoryneurones of a given ganglion innervate not only the skin
Coding and adaptation during mechanical stimulation inthe leech nervous system
G. Pinato and V. Torre
Scuola Internazionale Superiore di Studi Avanzati, Via Beirut 2, Trieste and INFM,Unita’ di Trieste, Via Beirut 2, Trieste, Italy
(Received 26 June 2000; accepted after revision 27 July 2000)
1. The experiments described here were designed to characterise sensory coding and adaptationduring mechanical stimulation in the leech (Hirudo medicinalis). A chain of three ganglia anda segment of the body wall connected to the central ganglion were used. Eight extracellularsuction pipettes and one or two intracellular electrodes were used to record action potentialsfrom all mechanosensory neurones of the three ganglia.
2. When the skin of the body wall was briefly touched with a filament exerting a force of about2 mN, touch (T) cells in the central ganglion, but also those in adjacent ganglia (i.e. anterior andposterior), fired one or two action potentials. However, the threshold for action potentialinitiation was lower for T cells in the central ganglion than for those in adjacent ganglia.
3. The timing of the first evoked action potential in a T cell was very reproducible with a jitteroften lower than 100 µs. Action potentials in T cells were not significantly correlated.
4. When the force exerted by the filament was increased above 20 mN, pressure (P) cells in thecentral and neighbouring ganglia fired action potentials. Action potentials in P cells usuallyfollowed those evoked in T cells with a delay of about 20 ms and had a larger jitter of0.5–10 ms.
5. With stronger stimulations exceeding 50 mN, noxious (N) cells also fired action potentials.With such stimulations the majority of mechanosensory neurones in the three ganglia firedaction potentials.
6. The spatial properties of the whole receptive field of the mechanosensory neurones wereexplored by touching different parts of the skin.
7. When the mechanical stimulation was applied for a longer time, i.e. 1 s, only P cells in thecentral ganglion continued to fire action potentials. P cells in neighbouring ganglia fullyadapted after firing two or three action potentials.
8. P cells in adjacent ganglia, having fully adapted to a steady mechanical stimulation of one partof the skin, fired action potentials following stimulation of a different region of the skin.
9. These results indicate that a brief and localised stimulation of the skin can activate more thana dozen different mechanosensory neurones in the three ganglia and after 100 ms of steadystimulation many of these mechanosensory neurones stop firing action potentials and fullyadapt. Adaptation occurs primarily at the nerve endings and mechanosensory neurones canquickly respond to mechanical stimulation at a different location on the skin.
Journal of Physiology (2000), 529.3, pp.747–76211325 747
) by guest on May 31, 2013jp.physoc.orgDownloaded from J Physiol (

of its body segment, but also that of the adjacent ganglia(Yau, 1976).
The sensitivity (Gascoigne & McVean, 1991; Carlton &McVean, 1995), receptive field characteristics (Nicholls &Baylor, 1968; Yau, 1976) and biophysical properties(Jansen & Nicholls, 1973; Van Essen, 1973; Blackshaw,1981; Blackshaw et al. 1982; Mar & Drapeau, 1996; Pastoret al. 1996) of mechanosensory neurones have beenextensively studied at a single cell level. T cells respondtransiently to skin stimulation and are considered to bedetectors of the mechanical environment, while P cellsshow tonic responses to prolonged stimulation of higherthreshold and are considered responsible for triggeringbehaviour (Carlton & McVean, 1995). N cells are lessfrequently activated and have functional propertiessimilar to the polymodal nociceptive neurones inmammals (Pastor et al. 1996). Morphological studies of theperipheral endings of these cells have established acorrelation between the distribution of mechanoreceptorsand the physiological properties of their receptive fields(Blackshaw, 1981; Blackshaw et al. 1982). Horseradishperoxidase injection has shown that T cell endings are themost superficial ones, being located among epithelial cells,while P and N cell endings lie deeper in the skin.
Understanding the coding of mechanical stimulationrequires the characterisation of the firing pattern of allsensory neurones evoked by a given stimulus. The aim ofthis study was to obtain a detailed and quantitativedescription of sensory coding in the leech skin;in particular we want to address the following questions.(1) How many mechanosensory neurones are activated bytouching the skin in a given location? (2) Howreproducible and correlated is their electrical activity?(3) How does the global firing pattern change withstimulus intensity and location? (4) Is this global firingpattern dynamical? And how does it change duringadaptation? In order to answer these questions it isnecessary to record action potentials simultaneously fromall the sensory neurones of the leech nervous systemresponding to a touch stimulus.
In this paper we describe experiments performed using aleech preparation that consisted of three ganglia, with apiece of body wall connected to the central ganglion. Thispiece of body wall consisted of five annuli, forming asingle segment, and these were stimulated withappropriate devices (see Methods). Eight suction pipettesand two intracellular electrodes were used to monitor thesimultaneous electrical activity of all mechanosensoryneurones on the left or right side of the three ganglia.With this experimental set-up it was possible to recordsimultaneously the electrical activity of almost allmechanosensory neurones activated by touching the skin.
Our results indicate the basic properties of sensory codingof mechanical stimulation in the leech nervous system.When the skin is touched with a moderate tactile
stimulus, i.e. exerting a force of about 20 mN, manymechanosensory neurones (T and P cells) of the threeganglia fire action potentials. If the stimulation isprolonged, many of these sensory neurones rapidly andfully adapt and only P cells in the central ganglioncontinue to respond. Thus sensory coding is dynamic andadaptation tunes the receptive field properties ofmechanosensory neurones.
METHODS
Animals and preparation
Leeches (Hirudo medicinalis) were obtained from Ricarimpex(Eysines, France) and were kept at 5ºC in tap water dechlorinated byaeration for 24 h. A semi-intact preparation was used, consisting of achain of three segmental ganglia. The central ganglion innervatedthe skin of either the left or right part of its body segment (seeFig. 1A). The left or right posterior and anterior roots were gentlycleaned of all connective tissue, so as to allow a good en passantrecording with a suction pipette with a diameter of about 80 µm. Thechain of ganglia and the piece of skin were pinned in a Sylgard-coated dish at room temperature (20–24°C). During dissection, thepreparation was bathed in a Ringer solution with the followingcomposition (mM): 115.0 NaCl, 1.8 CaCl2, 4.0 KCl, 12.0 glucose, 10Tris maleate, buffered to pH 7.4 with NaOH. If a vigorousspontaneous electrical activity was recorded from all suction pipettesand if the mechanical stimulation evoked a clear electrical response inthe roots and connectives, the preparation was perfused with amodified Ringer solution in which 15 mM MgCl2 replaced 15 mM
NaCl, so as to block chemically mediated synaptic transmission.
Electrophysiological recording
Extracellular recordings. Eight suction pipettes were used toperform extracellular recordings as shown in Fig. 1A. Two pipetteswere applied en passant onto the anterior and posterior connectivesof the central ganglion. If the left (or right) part of the skin wasattached to the central ganglion, two en passant suction pipettes wereused to record from the left (or right) anterior and posterior rootsinnervating the skin. The remaining four suction pipettes wereapplied to the left (or right) anterior and posterior roots of adjacentganglia.
Intracellular recordings. The electrical activity of mechanosensoryneurones was also monitored by intracellular recordings (Muller et al.1981) using sharp electrodes (input resistance around 30 MΩ filledwith 4 M potassium acetate) and Axoclamp-2b amplifiers (AxonInstruments, Foster City, CA, USA). The extracellular voltagesignals were recorded with standard analog amplifiers with a gain of2 w 104 and a bandwidth of 200–3000 Hz. Voltage recordings weredigitised at 10 kHz, stored on a personal computer and analysed withthe program pCLAMP8 (Axon Instruments). Voltage signals, eitherintracellular or extracellular, were also stored on an 8-channel digitalaudio recorder (DA-88 TASCAM).
Stimulation protocol. One brief (50–80 ms) or long lasting (0.5–1 s)mechanical stimulation was delivered every 50 s to the skin byrapidly pressing nylon filaments driven by a solenoid (347-652, RScomponents), as described by Lewis & Kristan (1998a). Differentstimulus intensities were achieved by changing the diameter andlength of the filaments (Levin et al. 1978). The filament was initiallyplaced very close to the skin so that its rapid displacement, caused bythe solenoid, induced a buckling stress. The force exerted by eachfilament was measured by a force transducer (Honeywell FSG-15N1A) and was independent of its total buckling stress to within15%. A stronger buckling, obtained by moving the filament closer to
G. Pinato and V. Torre748 J. Physiol 529.3
) by guest on May 31, 2013jp.physoc.orgDownloaded from J Physiol (

Mechanosensory coding 749J. Physiol 529.3
Figure 1. The preparation
A, a photograph of three leech ganglia with a piece of skin (SKIN) connected to the central ganglion (GC).Eight suction electrodes are used to obtain en passant extracellular recordings from the anterior andposterior roots (C.G. A.R. and C.G. P.R.) and the two connectives. (P.C. and A.C.) of the central ganglionand recordings from the posterior (P.G. P.R. anD A.G. P.R.) and anterior roots (P.G. A.R. and A.G. A.R.)of the anterior (GA) and posterior (GP) ganglia. B, schematic representation of the preparation. A chain ofthree ganglia and the branching pattern are schematised in red, producing a typical extracellularrecording. The skin is depicted by the box with graduated shading.
) by guest on May 31, 2013jp.physoc.orgDownloaded from J Physiol (

the skin, caused a slightly greater force. The small dependence of theforce on the filament buckling was used in the experiments todetermine the relative threshold of T cells in the central and adjacentganglia.
A set of six filaments delivering stimulus intensities of about 1, 2.2,6, 22, 50 and 100 mN was calibrated.
Neurone identification
Either at the beginning or end of the experiment all left (or right)mechanosensory neurones of the three ganglia were successivelyimpaled with sharp intracellular electrodes. For each mechano-sensory neurone, action potentials were directly evoked by passing adepolarising current pulse and by touching the skin. With thisprocedure it was possible to obtain a clear signature of extracellularvoltage signals evoked by the action potentials in eachmechanosensory neurone. These neurones have extensive branching,as shown in Fig. 1B, and extracellular voltage signals associated withaction potentials can be measured by suction pipettes placed atdifferent locations, with the amplitude of the signal depending onthe size of the branch at that location. Large extracellular signalswere measured from the roots branching from the ganglion in whichthe recording was obtained. Clear and measurable extracellularvoltage signals from the connectives were recorded only from T cells;signals from P and N cells could be seen only by averaging differenttrials and were very small. Dorsal T and P cells (Td and Pd) producedextracellular signals only in posterior roots, while other T and P cells(Tl, Tv and Pv; v, ventral; l, lateral) had signals in both roots. Actionpotentials in N cells (Nm and Nl; m, medial) produced smaller voltagesignals in both roots. The shapes of the extracellular signalsgenerated by the action potentials evoked by touching the skin andby passing depolarising current into the soma were almost identical.The extracellular signals generated by an action potential from a Pv
cell in the central ganglion were almost simultaneous on the anteriorand posterior roots when the action potential was evoked by passingdepolarising current into the cell body. However, when the actionpotential was evoked by touching the skin, it was first detected in theanterior root, then in the cell body after a delay of about 2 ms (see‘Intracellular recordings’) and finally in the posterior root afterapproximately 4 ms. This difference in detection time reflects thepropagation of the action potential from the endings of the anteriorbranch to the cell body and on to the posterior root. In someexperiments when the skin near the midline was touched it waspossible to observe an inversion of the detection time of signals in thetwo roots: sometimes the action potential wave on the anterior rootpreceded that on the posterior root and at other times the signalswere reversed. This inversion is an indication of the variability of thelocus of initiation of the action potential.
Action potentials elicited in T, P and N cell bodies by passing a briefdepolarising current were detected by the suction pipette recordingen passant from the nearest root after an average delay of 2.3 ± 0.3,2.6 ± 0.5 and 2.8 ± 0.8 ms, respectively. This delay corresponds tothe time necessary for the action potential to travel from the soma tothe recording site in the root. When the skin was touched, it waspossible to measure the time necessary for the action potential totravel from the roots to the cell body. This delay was on average2.4 ± 0.4, 2.9 ± 0.6 and 3.5 ± 0.8 ms for T, P and N cells,respectively. Thus the action potentials in T, P and N cells propagatealong the dendrites with similar (to within 1 ms) delays in bothdirections. In the case of mechanosensory neurones belonging toadjacent ganglia activated by the stimulation of their minorreceptive fields, the first action potential is detected in theconnective (anterior or posterior), then in the cell body (see‘Intracellular recordings’) and, finally, in the roots of the anterior orposterior ganglion simultaneously.
Neurone identification was done in a semi-automatic way: differentshapes of action potentials were classified as described in Pinato et al.(2000) and pairs or triplets of extracellular action potentials weredetected. When different T and P cells were simultaneously activereliable neurone identification was not possible from extracellularrecordings. In these cases the statistics for each neurone wererecovered from intracellular recordings from visually identifiedmechanosensory neurones.
Receptive field characterisation
The receptive field properties of different mechanosensory neuroneswere analysed with brief (50 or 80 ms) or prolonged (0.5–1 s)stimulations of the skin. The piece of skin attached to the centralganglion was mapped in 12 or 20 distinct areas. This piececorresponded to the right or left hemisegment and was mapped intofour regions from the dorsal to the ventral side (D, DL, VL, V) andinto five regions from anterior to posterior, corresponding to the fiveannuli of the body segment. Each distinct area of the skin wastouched with the filament at least 5 times and action potentialsoriginating from identified mechanosensory neurones were countedand averaged in a time window of 100 ms following the stimulusonset. The receptive field was also mapped on a coarser grid withonly three different regions from anterior to posterior. The receptivefield profiles obtained by stimulating 12 or 20 distinct areas were thesame, and therefore only 12 areas were tested in the majority of theexperiments. The receptive field for a brief stimulation wasconstructed by counting the average number of action potentialsoccurring in a time window of 100 ms following the onset of themechanical stimulation. The receptive field for a prolongedstimulation was constructed by computing the average firingfrequency during the steady stimulation.
Latency and jitter
Latency of the action potentials evoked by mechanical stimulationwas computed as the delay between the onset of the mechanicalstimulation and the peak of the action potential, measured eitherintracellularly or extracellularly. The onset of the mechanicalstimulation was taken as the onset of the voltage pulse to the solenoiddriving the filament displacement. The jitter of the first evokedaction potential is the standard deviation of latency as definedabove.
RESULTSThe present analysis of sensory coding and adaptation inmechanosensory neurones of the leech is based on parallelelectrical recordings obtained with eight suction pipettesand two intracellular microelectrodes. To resolve actionpotentials in mechanosensory neurones from extra-cellular recordings, the preparation was perfused with aRinger solution (Baylor & Nicholls, 1969b; Stuart, 1970).In this medium most chemical synapses were blocked andit was easy to identify action potentials originating frommechanosensory neurones.
Parallel recordings from mechanosensory neurones
Figure 2 illustrates a set of extracellular recordingsobtained with eight suction pipettes when the skin wastouched with a filament exerting a force of about 50 mN.Action potentials in identified mechanosensory neuronesare indicated by different symbols (see key on the left ofthe figure) and colours (blue, red and green formechanosensory neurones in the central, posterior and
G. Pinato and V. Torre750 J. Physiol 529.3
) by guest on May 31, 2013jp.physoc.orgDownloaded from J Physiol (

Mechanosensory coding 751J. Physiol 529.3
Figure 2. Eight intracellular and two simultaneous intracellular recordings from a Pv and a Tv cell
The two lowest traces are five superimposed traces from the two intracellular electrodes. Stimulation ofthe skin with a filament exerting a force of 50 mN for 80 ms (indicated by the top stimulus trace). Extra-cellular recordings as in Fig. 1A. Action potentials from identified mechanosensory neurones are indicatedby different symbols (see key on the left) and colours (blue, red and green for mechanosensory neuronesin the central, posterior and anterior gangla, respectively). Abbreviations defined in legend to Fig. 1.
) by guest on May 31, 2013jp.physoc.orgDownloaded from J Physiol (

anterior ganglia, respectively). The two lowest traces arefive superimposed intracellular recordings from a Pv anda Tv cell in the central ganglion. The mechanicalstimulation evoked action potentials both in the centraland adjacent ganglia and in T and P cells.
T cells are the first to respond to stimulation, and actionpotentials in these cells precede those from P and N cellsby about 20 and 50 ms, respectively. These differences inlatency are significantly larger than the differences inthe conduction delays of T, P and N cells along thedendrites, which are similar to within 1 ms (see Methods).
The degree of correlation of the activation of T cells wasanalysed in experiments in which action potentials indifferent T cells in the central and adjacent ganglia wererecorded and analysed. Figure 3A illustrates threesuperimposed sets of extracellular recordings from thetwo roots of the central, posterior and anterior ganglia,respectively, when the ventral skin was briefly touchedwith a filament exerting a force of about 2 mN. The skinwas touched every 50 s for 47 different trials. With these
experimental conditions, only action potentials from Tcells were evoked and it was possible to identify a fixednumber of action potentials produced by Tv cells in eachtrial. For instance Tv and Tl cells in the central ganglionfired five and three action potentials, respectively, inevery trial and it was possible to compute the jitter ofeach of these action potentials. Figure 3B illustrates asingle recording in which action potentials are labelledand assigned to specific T cells. The number below eachidentified action potential is the computed jitter inmicroseconds. The first three action potentials occurred atvery reproducible times with a jitter of less than 100 µs.All the action potentials in the Tv cell in the centralganglion had a very small jitter, always lower than140 µs. In contrast, the action potentials in the Tl cell inthe central ganglion had a much larger jitter, whichprogressively increased with consecutive evoked actionpotentials. In the experiment shown in Fig. 3, the actionpotentials in T cells had jitters varying from just 60 µs toabout 1.5 ms. A similar range of jitter was observed inanother seven experiments in which the occurrence of
G. Pinato and V. Torre752 J. Physiol 529.3
Figure 3. Jitter of action potentials in T cells
A, three superimposed extracellular recordings from the anterior and posterior roots of the centralganglion (two upper traces), the posterior ganglion (two middle traces) and the anterior ganglion (twolowest traces) when the skin was touched on the ventral side with a filament exerting a force equivalentto about 2 mN for 80 ms. The stimulus onset was 20 ms before the start of the trace. Forty-seven differenttrials were repeated every 50 s. The Tv and Tl cells in the central ganglion fired five and three actionpotentials, respectively, at every trial. The Tv cell in the posterior ganglion fired two action potentials andthe Tv and Tl cells in the anterior ganglion fired two action potentials at every trial, of which only the firstwas analysed. B, one representative set of extracellular recordings showing each action potential from theT cells. Ti indicates the ith evoked action potential in the T cell. The number below each action potentialis the jitter of that action potential in microseconds.
) by guest on May 31, 2013jp.physoc.orgDownloaded from J Physiol (

action potentials in T cells was analysed. In the greatmajority of the experiments analysed, a small drift of theaction potential latency, of less than or about 100 µs pertrial, was observed. This drift was not the same for allmechanosensory neurones as one T cell could have apositive drift and another a negative one. This effect isunlikely to be caused by a drift in the stimulatingapparatus, which would lead to a similar artifact in allneurones, and is probably caused by small deformationsof the skin.
The correlation of action potentials in T cells wasevaluated by computing the correlation matrix of thelatencies of all identified action potentials. This matrixhad positive and negative entries with absolute valuesusually lower than 0.5 and only occasionally entries above0.5. While pairs of specific action potentials occasionallyhad a correlation around 0.7, trains of action potentials inpairs of T cells never had a correlation exceeding 0.4.These results indicate the existence of a rather smallcorrelation between the firing of action potentials indifferent T cells, thus supporting the notion that the
firing of action potentials in mechanosensory neurones isalmost independent (see Lewis & Kristan, 1998b)
Receptive field properties with a brief mechanical
stimulation
The receptive field properties of different mechano-sensory neurones were analysed with brief stimulationsof the skin in nine different preparations (see Methods).The piece of skin attached to the central ganglion wasmapped in 12 distinct areas. This piece corresponded tothe right or left hemisegment and was mapped into fourregions from the dorsal to the ventral side (D, DL, VL, V)and into three regions from anterior to posterior.
Each of these areas was repeatedly stimulated and thenumber of action potentials occurring in a time window of100 ms following the stimulus onset was counted andaveraged over all trials. In this way a receptive field wasobtained for each mechanosensory neurone from all threeganglia in the same experiment. These receptive fields,obtained with a stimulus of 100 mN, are shown inFig. 4A–C for single T, P and N cells in central and either
Mechanosensory coding 753J. Physiol 529.3
Figure 4. Receptive fields for a brief stimulation of different mechanosensory neurones
T (A), P (B) and N (C) cells in the central and posterior or anterior ganglia for stimulation correspondingto 100 mN. Receptive fields were obtained by computing the average number of actio potentials in a timewindow of 100 ms after the onset of the stimulation. Each stimulation was repeated at least 8 times.
) by guest on May 31, 2013jp.physoc.orgDownloaded from J Physiol (

G. Pinato and V. Torre754 J. Physiol 529.3
Figure 5. Reponse to stimuli of increasing strength
A–D, recordings from suction pipettes with stimuli exerting 1, 2.2, 6 and 22 mN, respectively. Stimulusduration was 80 ms (indicated by the top stimulus trace). Extracellular recordings as in Fig. 1A. Actionpotentials from identified mechanosensory neurones are labelled as in Fig. 2.
) by guest on May 31, 2013jp.physoc.orgDownloaded from J Physiol (

posterior or anterior ganglia. The receptive fields shownin Fig. 4 were obtained from a single experiment, buttheir spatial profiles were very similar to those obtainedin all preparations analysed from nine different leeches.
In all experiments aimed at mapping receptive fields, theneurones from adjacent ganglia contributed significantlyto the overall evoked electrical activity. During the initial100 ms of stimulation, the numbers of action potentials inT cells in the anterior and posterior ganglia were onaverage 23 ± 5 and 32 ± 7%, respectively, of thoserecorded from the central ganglion. For P cells thesevalues were 16 ± 5 and 18 ± 7%. As a consequence theratio between the number of action potentials frommechanosensory neurones in adjacent ganglia and that inthe central ganglion was on average 0.55 for T cells and0.34 for P cells.
The spatial profile of the receptive field of mechano-sensory neurones from adjacent ganglia was not assmooth as that of neurones from the central ganglion andit was often possible to find a region with a very lowsensitivity, surrounded by regions with appreciablesensitivities. While the receptive fields of mechano-sensory neurones from the central ganglion wereremarkably reproducible in different experiments, thoseof neurones from adjacent ganglia were variable.
Receptive fields obtained with the two stimulationstrengths of about 22 and 100 mN were very similar.Therefore the spatial profile of the receptive field doesnot depend significantly on the intensity of the stimulusused to map it.
Threshold of action potential initiation for T cells in
the central and adjacent ganglia
We have shown that the number of action potentials in Tcells in adjacent ganglia is about half of that produced byT cells in the central ganglion for mechanical stimulationsabove 2 mN. This observation, however, was made in thepresence of mechanical stimulations well above thethreshold, when many action potentials were evoked. IfT cells in the central ganglion and from adjacent gangliahave different thresholds, there may be mechanicalstimulations for which only T cells in the central ganglionfire action potentials. In order to establish the relativethreshold of T cells in the central and adjacent ganglia,the skin was touched with a filament exerting a force ofabout 1 mN. This force could be slightly increased ordecreased by small vertical displacements of the filament,inducing different filament buckling (see Methods), so asto evoke just one action potential in a T cell in the centralganglion and/or in adjacent ganglia. The relativethreshold for T cells in the central and adjacent gangliawas analysed in four preparations, in which 20 differentareas were analysed.
The threshold for the activation of action potentials inT cells in the central ganglion was always smaller than
that for T cells in adjacent ganglia. In 8% of cases thethreshold in the posterior and anterior ganglia was thesame and in 43% of cases it was lower in the anteriorganglion.
Dependence on stimulus strength with a brief
mechanical stimulation
When the skin was touched with filaments exertingforces of increasing strength, different mechanosensoryneurones were activated. As shown in Fig. 5A, when theskin was lightly touched with a filament exerting a forceof about 1 mN on the ventral side, two action potentialsin a Tv cell and one action potential in a Tl cell in thecentral ganglion were observed, and an action potentialfrom a Tv cell in the anterior ganglion also appeared.
Increasing the stimulus intensity to about 2.2 mN evokeda larger number of action potentials from T cells in thecentral ganglion (see Fig. 5B), and with a stimulus ofabout 6 mN a Tv cell in the posterior ganglion was alsoactivated (see Fig. 5C). When the stimulus intensity wasincreased to about 22 mN, Pv cells in the three gangliastarted to fire action potentials and T cells fired morevigorously (see Fig. 5D). The dependence of the evokedactivity on the stimulus intensity was analysed in ninepreparations from different leeches and is shown in moredetail in Fig. 6.
Figure 6A reproduces the average (7 experiments) numberof action potentials, in a time window of 100 ms followingthe stimulus onset, as a function of stimulus intensity, fora ventral T cell (∆), a ventral P cell (*) and a medial N cell(ª) of the central (top) and posterior (bottom) ganglia.Panels B and C reproduce the latency and jitter,respectively, of the first evoked action potential. Datashown in Fig. 6 were averaged over seven differentexperiments in which the central area of the skin wastouched. The threshold for activation of mechanosensoryneurones in the central ganglion was very similar to thatalready reported (Nicholls & Baylor, 1968; Lewis &Kristan, 1998b) and was below 2 mN for T cells, about20 mN for P cells and about 50 mN for N cells (Nicholls &Baylor, 1968). The threshold for activation of mechano-sensory neurones of adjacent ganglia was slightly higherthan that for neurones of the central ganglion.
The average latency of the first evoked action potentialin T cells was about 50 ms for the weakest stimulation inthe central ganglion and about 80 ms in the posteriorganglion, and decreased by about 30 ms when thestimulus intensity was increased from 1 to about 20 mN(see Figs 5 and 6). In one experiment, however, thelatency of the first evoked action potential in a T cell inthe central ganglion was always between 20 and 30 msand did not change significantly with stimulus intensity.The first action potential evoked in P cells usuallyfollowed, by about 20 ms, the first action potentialevoked in T cells and its latency did not changeappreciably when the stimulus intensity was increased
Mechanosensory coding 755J. Physiol 529.3
) by guest on May 31, 2013jp.physoc.orgDownloaded from J Physiol (
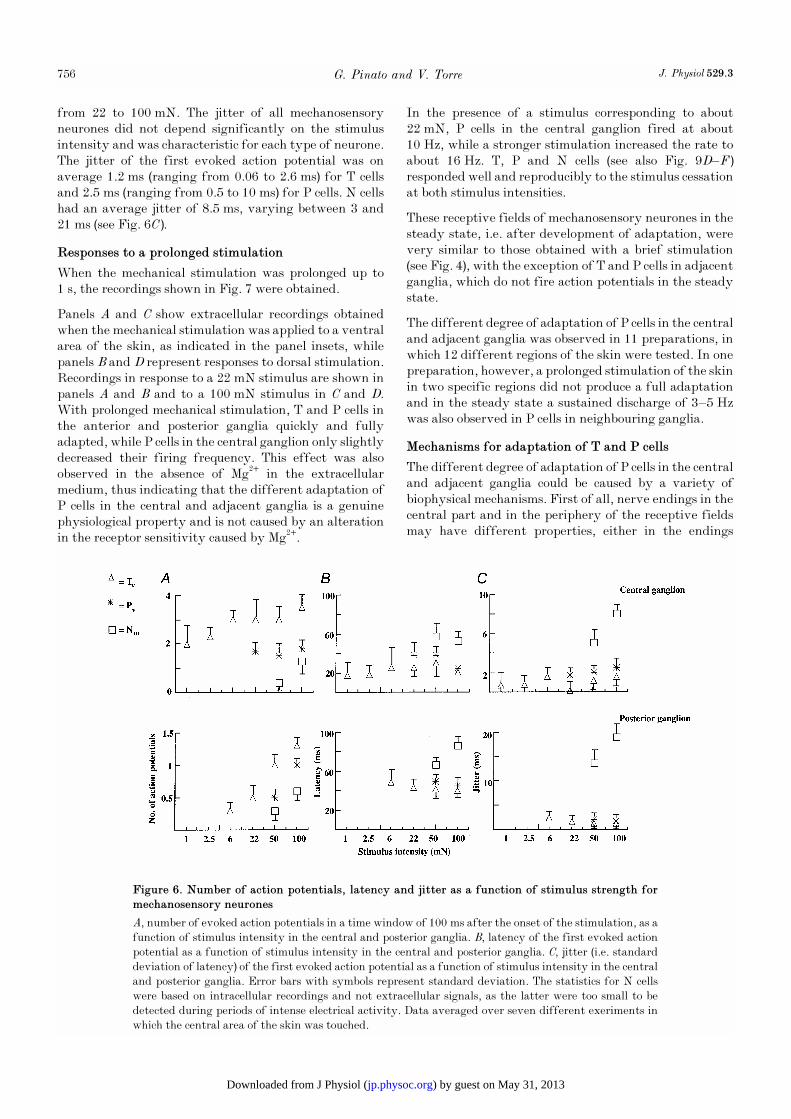
from 22 to 100 mN. The jitter of all mechanosensoryneurones did not depend significantly on the stimulusintensity and was characteristic for each type of neurone.The jitter of the first evoked action potential was onaverage 1.2 ms (ranging from 0.06 to 2.6 ms) for T cellsand 2.5 ms (ranging from 0.5 to 10 ms) for P cells. N cellshad an average jitter of 8.5 ms, varying between 3 and21 ms (see Fig. 6C).
Responses to a prolonged stimulation
When the mechanical stimulation was prolonged up to1 s, the recordings shown in Fig. 7 were obtained.
Panels A and C show extracellular recordings obtainedwhen the mechanical stimulation was applied to a ventralarea of the skin, as indicated in the panel insets, whilepanels B and D represent responses to dorsal stimulation.Recordings in response to a 22 mN stimulus are shown inpanels A and B and to a 100 mN stimulus in C and D.With prolonged mechanical stimulation, T and P cells inthe anterior and posterior ganglia quickly and fullyadapted, while P cells in the central ganglion only slightlydecreased their firing frequency. This effect was alsoobserved in the absence of Mg2+ in the extracellularmedium, thus indicating that the different adaptation ofP cells in the central and adjacent ganglia is a genuinephysiological property and is not caused by an alterationin the receptor sensitivity caused by Mg2+.
In the presence of a stimulus corresponding to about22 mN, P cells in the central ganglion fired at about10 Hz, while a stronger stimulation increased the rate toabout 16 Hz. T, P and N cells (see also Fig. 9D–F)responded well and reproducibly to the stimulus cessationat both stimulus intensities.
These receptive fields of mechanosensory neurones in thesteady state, i.e. after development of adaptation, werevery similar to those obtained with a brief stimulation(see Fig. 4), with the exception of T and P cells in adjacentganglia, which do not fire action potentials in the steadystate.
The different degree of adaptation of P cells in the centraland adjacent ganglia was observed in 11 preparations, inwhich 12 different regions of the skin were tested. In onepreparation, however, a prolonged stimulation of the skinin two specific regions did not produce a full adaptationand in the steady state a sustained discharge of 3–5 Hzwas also observed in P cells in neighbouring ganglia.
Mechanisms for adaptation of T and P cells
The different degree of adaptation of P cells in the centraland adjacent ganglia could be caused by a variety ofbiophysical mechanisms. First of all, nerve endings in thecentral part and in the periphery of the receptive fieldsmay have different properties, either in the endings
G. Pinato and V. Torre756 J. Physiol 529.3
Figure 6. Number of action potentials, latency and jitter as a function of stimulus strength formechanosensory neurones
A, number of evoked action potentials in a time window of 100 ms after the onset of the stimulation, as afunction of stimulus intensity in the central and posterior ganglia. B, latency of the first evoked actionpotential as a function of stimulus intensity in the central and posterior ganglia. C, jitter (i.e. standarddeviation of latency) of the first evoked action potential as a function of stimulus intensity in the centraland posterior ganglia. Error bars with symbols represent standard deviation. The statistics for N cellswere based on intracellular recordings and not extracellular signals, as the latter were too small to bedetected during periods of intense electrical activity. Data averaged over seven different exeriments inwhich the central area of the skin was touched.
) by guest on May 31, 2013jp.physoc.orgDownloaded from J Physiol (

Mechanosensory coding 757J. Physiol 529.3
Figure 7. Responses to a prolonged stimulation in two different areas and with two stimulationintensities
The two location where the stimulus was applied are indicated in the panel insets and the stimulusintensity was 22 mN in A and B and 100 mN in C and D. Stimulus duration was 1 s (indicated by the topstimulus trace). Extracellular recordings as in Fig. 1A. Action potentials from identified mechanosensoryneurones are labelled as in Fig. 2.
) by guest on May 31, 2013jp.physoc.orgDownloaded from J Physiol (

themselves or in the mechanical milieu. Anotherpossibility is that action potentials do not reach the cellbody of P cells in adjacent ganglia because of conductionblock or reflection (Van Essen, 1973; Yau, 1976; Macagnoet al. 1987; Mar & Drapeau, 1996; Baccus, 1998). In orderto distinguish between these possibilities, intracellularrecordings from P and N cells in the central ganglion andadjacent ganglia were performed during a prolongedstimulation.
Panels A and B of Fig. 8 reproduce intracellularrecordings from the cell bodies of a Pv cell and an Nm cell,respectively, in the central ganglion during a prolongedstimulation. The Pv and Nm cells adapt to some extent andin the steady state they fire action potentials at a rate ofabout 16 and 6 Hz, respectively. Intracellular recordingsfrom a Pv cell and an Nm cell of adjacent ganglia are shownin panels C and D, respectively. The Pv cell fired fouraction potentials and then fully adapted and stoppedfiring action potentials. The membrane potential of thePv cell did not show any sign of hyperpolarisation (seeFig. 8C), typical of conduction block (Van Essen, 1973;Yau, 1976). The intracellular recording from the Nm cellshows an initial large action potential, followed by aslight membrane hyperpolarisation with some smallerdepolarising deflections superimposed (see Fig. 8D),typical of conduction block (Van Essen, 1973; Macagno etal. 1987). A block occurs when the action potentialsconducted by fine axons of mechanosensory neurones failto invade large axons and the soma because of thehyperpolarisation of the cell. This behaviour wassometimes observed in N cells in adjacent ganglia, butnever in P cells during a mechanical stimulation lasting1 s, during which P cells fired at most four action
potentials (see Figs 8 and 9). When a P cell in an adjacentganglion was repeatedly stimulated with a briefmechanical stimulation, a conduction block was observedafter some seconds as previously described (Gu, 1991; Mar& Drapeau, 1996). As a consequence, central conductionblock does not seem to be the major biophysicalmechanism underlying full adaptation in P cells inadjacent ganglia.
Responses to two stimuli
Biophysical mechanisms underlying full adaptation ofadjacent P cells were investigated in experiments usingtwo mechanical stimuli. Stimuli 1 and 2 were applied totwo different locations of the skin, L1 and L2, so that theyactivated different sets of nerve endings from the sameP cell in an adjacent ganglion. The two locations L1 and L2
were approximately 2–3 mm apart so that the twomechanical stimulations were applied to nerve endings ofthe same main branch. Stimulus 1 was applied for 1 s in L1
so as to induce a full and rapid adaptation of the P cell.When adaptation was fully reached, stimulus 2 wasapplied in L2, so as to test the P cell sensitivity. Theresults of this experiment are shown in Fig. 9.
Panels A and B show extracellular recordings obtained bystimulating the two areas indicated in the insets. P cells inthe central ganglion did not fully adapt, while those ofadjacent ganglia fired very few action potentials andquickly and fully adapted. When the two stimuli weredelivered during the same trial, the second mechanicalstimulation was also able to induce action potentials inthose neurones which had fully adapted to the previousstimulation, as shown in Fig. 9C. Intracellular recordingsfor the three stimulations used in A, B and C are shown
G. Pinato and V. Torre758 J. Physiol 529.3
Figure 8. Intracellular recordings during a prolonged mechanical stimulation
A and B, recordings from a Pv cell and an Nm cell, respectively, from the central ganglion. C andD, recordings from a Pv cell (anterior ganglion) and an Nm cell (posterior ganglion), respectively, during asteady stimulation lasting 1 s (indicated by the top stimulus trace). Stimulus intensity was 100 ms.
) by guest on May 31, 2013jp.physoc.orgDownloaded from J Physiol (

Mechanosensory coding 759J. Physiol 529.3
Figure 9. Responses to two stimulations in different areas and at different times
A and B, extracellular recordings showing responses to a mechanical stimulation of 1 s (A) and 0.5 s (B).C, extracellular recordings obtained when the two stimulations used in A and B were deliveredsimultaneously. Extracellular recordings are labelled as in Fig. 1A. D–F, intracellular recordings obtainedduring the same stimulation used in A–C. from a Pd cell and an Nl cell in the posterior ganglion and froma Tl cell in the central ganglion. Stimulus intensity was 100 mN. Stimulus duration indicated by top trace.Action potentials from identified mechanosensory neurones are labelled as in Fig. 2.
) by guest on May 31, 2013jp.physoc.orgDownloaded from J Physiol (

in panels D, E and F, respectively. These recordings wereobtained from Pd , Nl and Tl cells, from top to bottom, ofthe posterior ganglion (top and middle traces) and thecentral ganglion (bottom trace). In all three cells thesecond stimulation was able to produce action potentials.This result indicates that the full and rapid adaptationobserved in mechanosensory neurones of adjacent gangliaand in T cells in the central ganglion is likely to originatefrom properties of nerve endings and not fromconduction block or membrane properties of the cell body.
DISCUSSIONThe results presented in this paper shed a new light on thecoding of mechanical stimulation in the leech nervoussystem, by providing the first simultaneous analysis ofthe electrical activity evoked in mechanosensoryneurones by mechanical stimulation. Several of theproperties of mechanosensory neurones described herecould be inferred from previous single neurone recordings(Nicholls & Baylor, 1968; Yau, 1976), but the nature ofsensory coding, i.e. the relative timing, sensitivity,variability, correlation and adaptation of differentmechanosensory neurones, can be firmly established onlyon the basis of simultaneous recordings, such as thosedescribed here.
Coding and sensitivity
When the skin was briefly touched with a thin filamentexerting a weak force (above 2 mN), several T cells in thecentral and neighbouring ganglia fired action potentials(see Fig. 5). During the initial 100 ms, the number ofaction potentials in T cells in the anterior and posteriorganglia were 23 ± 5 and 32 ± 7% of those recorded fromthe central ganglion. T cells are able to respond to lightmechanical touches exerting a force of less than or about1 mN. Such a high sensitivity is also observed in othermechanosensitive neurones, such as those innervatinghairy skin of the mouse (Koltzenburg et al. 1997). T cellsin the central ganglion have a lower threshold than thatof T cells in adjacent ganglia.
In agreement with previous studies (Nicholls & Baylor,1968) when the mechanical stimulation was increased above20 mN, P cells in the three ganglia were also stimulated.For P cells, the numbers of action potentials from theanterior and posterior ganglia were 16 ± 5 and 18 ± 7%,respectively, of those recorded from the central ganglion.The ratio between the number of action potentials frommechanosensory neurones in adjacent ganglia and that inthe central ganglion was about 0.55 for T cells and 0.34for P cells. Thus the electrical activity of adjacent gangliais not negligible and is comparable to that of the centralganglion in terms of number of evoked action potentials.The onset of a mechanical stimulation of medium strength,i.e. about 20 mN, is signalled in the leech nervous systemby T and P cells in three ganglia and by the activation ofbetween six and twelve different mechanosensory
neurones. With even stronger stimulations, correspondingto about 50 mN, N cells also respond to the stimulation(Nicholls & Baylor, 1968) and under these conditionsbetween ten and twenty mechanosensory neurones codethe mechanical stimulation.
The different sensitivity of T, P and N cells may berelated to the density and architecture of their peripheralendings: indeed T cell endings are the most superficialones (Blackshaw, 1981; Blackshaw et al. 1982) and it is notsurprising that they are the most sensitive mechano-sensory neurones and the first to be activated.
Timing
For any mechanical stimulation T cells are the firstmechanosensory neurones to be activated. After a delayvarying between 15 and 20 ms P cells also fire actionpotentials. Action potentials in N cells are produced witha longer delay than in T cells, varying between 40 and80 ms. This different delay in producing action potentialsis likely to originate from different mechanisms. First ofall the nerve endings of T cells are the most superficialand are the first to be stimulated when the skin istouched. In addition the transduction machinery may nothave the same kinetics in different mechanosensoryneurones. Action potentials evoked by a mechanicalstimulation occur with a delay that does not dependsignificantly on the stimulus strength (see Fig. 6). Thisbehaviour is different from what is observed ininvertebrate photoreceptors (Fuortes & Yeandle, 1964;Yeandle, 1985) and olfactory sensory neurones (Reisert &Matthews, 1999), where the response latency is reduced inthe presence of a stronger stimulation.
Variability and correlation
Action potentials evoked in mechanosensory neurones canoccur with remarkable precision and reproducibility. Actionpotentials evoked in T cells by a brief mechanicalstimulation have a jitter varying from as low as 0.06 ms to1 or 2 ms (see Fig. 3). Action potentials in other mechano-sensory neurones have a slightly larger jitter, in the orderof some milliseconds. This very low variability is not seenin invertebrate photoreceptors and olfactory sensoryneurones, where highly variable bumps and events areobserved (Fuortes & Yeandle, 1964; Yeandle, 1985; Meniniet al. 1995), but is observed in other mechanosensoryneurones in the skin of the cat and and of the monkey(Werner & Mountcastle, 1965; Vega-Bermudez & Johnson,1999). Action potentials in T cells do not show anysignificant and consistent correlation in their firingpattern, despite the presence of electrical junctions amongthem (Baylor & Nicholls, 1969b). These results indicate thatneuronal coding of mechanical stimulation has a veryprecise initial timing and is based on independent units.
Adaptation
In the presence of a continuous mechanical pressure,T cells in the three ganglia and P cells in neighbouring
G. Pinato and V. Torre760 J. Physiol 529.3
) by guest on May 31, 2013jp.physoc.orgDownloaded from J Physiol (

ganglia usually stop firing action potentials 200 ms afterthe stimulus onset (see Fig. 7) showing a rapid and fulladaptation. This behaviour is reminiscent of rapidlyadapting cutaneous mechanosensory neurons (Werner &Mountcastle, 1965; Burgess et al. 1983). Therefore in thepresence of a weak or moderate mechanical stimulation,only P cells in the central ganglion fire action potentials.In the presence of a stronger stimulation N cells in allthree ganglia also fire action potentials.
Mechanisms underlying adaptation
Different mechanisms can produce the full and completeadaptation observed in P cells in adjacent ganglia.Adaptation can occur because of the intrinsic propertiesof the voltage-activated conductances responsible foraction potential initiation. This mechanism, however, isvery unlikely to operate in our conditions, because P cellsdo not fully adapt when stimulated in the receptive fieldof their body segment (see Fig. 7). Another possiblemechanism leading to adaptation of action potentialsinitiated in the accessory receptive fields is conductionblock (Baylor & Nicholls, 1969a; Van Essen, 1973;Macagno et al. 1987). This mechanism was sometimesclearly observed in N cells (see Fig. 8D), where the firstaction potential initiated in the accessory fieldpropagates into the cell body, but those following it donot. In this case the long-lasting hyperpolarisationfollowing the somatic action potential in an N cell leads tothe conduction block of action potentials arriving fromdistant branches (see Fig. 8D). This behaviour, however,was never observed in P cells (see Figs 8C and 9D and E),where the first somatic action potential is not followedby a membrane hyperpolarisation with superimposedsmaller depolarising waves, typical of conduction block(Yau, 1976; Gu, 1991; Mar & Drapeau, 1996; Baccus,1998).
The experiments described in Fig. 9 show that a P cell ina neighbouring ganglion, which has completely and fullyadapted to a prolonged mechanical stimulation of a givenarea of its receptive field, is able to fire action potentialsin response to the stimulation of a different, but adjacentarea of the receptive field. Therefore the mechanismleading to adaptation is likely to be confined to the nerveendings. The density of nerve endings in the central bodysegment is larger than those in the adjacent bodysegments (Blackshaw, 1981) and this may lead todifferent responses to prolonged stimulation in the centreand periphery of the receptive field. According to thisview, the generator current produced during mechano-transduction at each nerve ending adapts to some extent,but the much larger density of nerve endings in thecentral body segment is able to induce a sustaineddischarge of action potentials. The lower density of nerveendings of adjacent ganglia is sufficient to produce theaction potentials in the cell body at the start of thestimulus, but not after adaptation takes place at thenerve endings.
General properties of mechanical coding in the leech
nervous system
The present analysis of the responses of mechanosensoryneurones to stimulation of the skin shows some new basicproperties of sensory coding in the leech skin. At theonset of the stimulation many mechanosensory neuronesfrom at least three adjacent ganglia fire action potentialsand a massive electrical signal is produced, without anyclear coding of the stimulated area of the skin. Afterabout 200 ms, this massive electrical discharge stops anda good localisation of the stimulated area is achieved bythe precise coding of P cells in the central ganglion (Lewis& Kristan, 1998b). Therefore sensory coding in the leechskin is designed so as to have an initial high sensitivitybut poor localisation, but within 200 ms a good degree oflocalisation is achieved by an appropriate gain controlmechanism.
This time-dependent contraction of the receptive fieldproperties is reminiscent of lateral inhibition observed inthe eye of many invertebrate species (Coleman &Renninger, 1974; Coleman, 1975) and in the vertebrateretina (Dowling & Werblin, 1971; Werblin, 1974; Cook &McRaynolds, 1998), and of similar mechanisms observedin the cochlea (Brownell et al. 1985; Zhao & Santos-Sacchi,1999). This dynamic control of sensitivity and localisationseems to be a basic property of sensory transductionpresent across species and sensory modalities.
BACCUS, D. A. (1998). Synaptic facilitation by reflected actionpotentials: enhancement of transmission when nerve impulsesreverse direction at axon branch points. Proceedings of theNational Academy of Sciences of the USA 95, 8345–8350.
BAYLOR, D. A. & NICHOLLS, J. G. (1969a). After-effects of nerveimpulses on signalling in the central nervous system of the leech.Journal of Physiology 203, 571–589.
BAYLOR, D. A. & NICHOLLS, J. G. (1969b). Chemical and electricalsynaptic connexions between cutaneous mechanoreceptorneurones in the central nervous system of the leech. Journal ofPhysiology 203, 591–609.
BLACKSHAW, S. E. (1981). Morphology and distribution of touch cellterminals in the skin of the leech. Journal of Physiology 320,219–228.
BLACKSHAW, S. E., NICHOLLS, J. G. & PARNAS, I. (1982).Physiological responses, receptive fields and terminalarborizations of nociceptive cells in the leech. Journal ofPhysiology 326, 251–260.
BROWNELL, W. E., BADER, C. R., BERTRAND, D. & DE RIBAUPIERRE,Y. (1985). Evoked mechanical responses of isolated cochlear outerhair cells. Science 227, 194–196.
BURGESS, P. R., MEI, J., TUCKETT, R. P., HORCH, K. W., BALLINGER,C. M. & POULOS, D. A. (1983). The neural signal for skinindentation depth. I. Changing indentations. Journal ofNeuroscience 3, 1572–1585.
CARLTON, T. & MCKEAN, A. (1995). The role of touch, pressure andnociceptive mechanoreceptors of the leech in unrestrainedbehaviour. Journal of Comparative Physiology A 177, 781–791.
Mechanosensory coding 761J. Physiol 529.3
) by guest on May 31, 2013jp.physoc.orgDownloaded from J Physiol (
COLEMAN, B. D. (1975). Consequences of delayed lateral inhibition inthe retina of Limulus. II. Theory of spatially uniform fields,assuming the four-point property. Journal of Theoretical Biology51, 267–291.
COLEMAN, B. D. & RENNINGER, G. H. (1974). Theory of delayedlateral inhibition in the compound eye of limulus. Proceedings ofthe National Academy of Sciences of the USA 71, 2887–2891.
COOK, P. B. & MCREYNOLDS, J. S. (1998). Lateral inhibition in theinner retina is important for spatial tuning of ganglion cells.Nature Neuroscience 1, 714–719.
DOWLING, J. E. & WERBLIN, F. S. (1971). Synaptic organization ofthe vertebrate retina. Vision Research 3, 1–15.
FUORTES, M. G. F. & YEANDLE, S. (1964). Probability of occurrenceof discrete potential waves in the eye of limulus. Journal ofGeneral Physiology 47, 443–463.
GASCOIGNE, L. & MCVEAN, A. (1991). Neuromodulatory effects ofacetylcholine and serotonin on the sensitivity of leechmechanoreceptors. Comparative Biochemistry and Physiology C 99,369–374.
GU X. (1991). Effect of conduction block at axon bifurcations onsynaptic transmission to different postsynaptic neurones in theleech. Journal of Physiology 441, 755–778.
JANSEN, J. K. S. & NICHOLLS, J. G. (1973). Conductance changes, anelectrogenic pump and the hyperpolarization of the leechneurones following impulses. Journal of Physiology 229, 635–655.
KOLTZENBURG, M., STUCKY, C. L. & LEWIN, G. R. (1997). Receptiveproperties of mouse sensory neurons innervating hairy skin.Journal of Neurophysiology 78, 1841–1850.
LEVIN, S., PEARSALL, G. & RUDERMAN, R. J. (1978). Von Frey’smethod of measuring pressure sensibility in the hand: anengineering analysis of the Weinstein–Semmes pressureaesthesiometer. Journal of Hand Surgery (American) 3, 211–216.
LEWIS, J. E. & KRISTAN, W. B. JR (1998a). Quantitative analysis ofa directed behavior in the medicinal leech: implications fororganizing motor output. Journal of Neuroscience 18, 1571–1582.
LEWIS, J. E. & KRISTAN, W. B. JR (1998b). Representation of touchlocation by a population of leech sensory neurons. Journal ofNeurophysiology 80, 2584–2592.
MACAGNO, E. R. (1981). Number and distribution of neurons in leechsegmental ganglia Journal of Comparative Neurology 190,283–302.
MACAGNO, E. R., MULLER, K. J. & PITMAN, R. M. (1987). Conductionblock silences parts of a chemical synapse in the leech centralnervous system. Journal of Physiology 387, 649–664.
MAR, A. & DRAPEAU, P. (1996). Modulation of conduction block inleech mechanosensory neurons. Journal of Neuroscience 16,4335–4343.
MENINI, A., PICCO, C. & FIRESTEIN, S. (1995). Quantal-like currentfluctuations induced by odorants in olfactory receptor cells.Nature 373, 435–437.
MULLER, K. J., NICHOLLS, J. G. & STENT, G. S. (1981). Neurobiologyof the Leech. Cold Spring Harbor Laboratory, New York, USA.
NICHOLLS, J. G. & BAYLOR, D. A. (1968). Specific modalities andreceptive fields of sensory neurones in CNS of the leech. Journalof Neurophysiology 31, 740–756.
PASTOR, J., SORIA, B. & BELMONTE, C. (1996). Properties of thenociceptive neurons of the leech segmental ganglion. Journal ofNeurophysiology 75, 2268–2279.
PINATO, G., BATTISTON, S. & TORRE, V. (2000). Statisticalindependence and neural computation in the leech. BiologicalCybernetics 83, 119–130.
REISERT, J. & MATTHEWS, H. R. (1999). Adaptation of the odour-induced response in frog olfactory receptor cells. Journal ofPhysiology 519, 801–813.
STUART, A. (1970). Physiological and morphological properties ofmotoneurones in the central nervous system of the leech. Journalof Physiology 209, 627–646.
VAN ESSEN, D. C. (1973). The contribution of membranehyperpolarization to adaptation and conduction block in sensoryneurones of the leech. Journal of Physiology 230, 509–534.
VEGA-BERMUDEZ, F. & JOHNSON, K. O. (1999). SA1 and RA receptivefields, response variability, and population responses mappedwith a probe array. Journal of Neurophysiology 81, 2701–2710.
WERBLIN, F. S. (1974). Control of retinal sensitivity. II. Lateralinteractions at the outer plexi form layer. Journal of GeneralPhysiology 63, 62–87.
WERNER, G. & MOUNTCASTLE, V. B. (1965). Neural activity inmechanoreceptive cutaneous afferents: stimulus-responserelations, Weber functions and information transmission. Journalof Neurophysiology 28, 359–397.
YAU, K. W. (1976). Receptive fields, geometry and conductionblock of sensory neurones in the central nervous system of theleech. Journal of Physiology 263, 513–538.
YEANDLE, S. (1985). Statistics and quantum bumps in arthropodphotoreceptors. Federation Proceedings 44, 2947–2949.
ZHAO, H. B. & SANTOS-SACCHI, J. (1999). Auditory collusion and acoupled couple of outer hair cells. Nature 399, 359–362.
Acknowledgements
We wish to thank Professors John Nicholls and Kenneth Muller forreading the manuscript and for useful suggestions and comments.Laura Giovanelli did the artwork. This work was supported by E.C.Project Biotech PARALLEL 960211.
Corresponding author
V. Torre: SISSA, Via Beirut 2, 34014 Trieste, Italy.
Email: [email protected]
G. Pinato and V. Torre762 J. Physiol 529.3
) by guest on May 31, 2013jp.physoc.orgDownloaded from J Physiol (