Linear and nonlinear measures predict swimming in the leech
11
Bryn Mawr College Scholarship, Research, and Creative Work at Bryn Mawr College Biology Faculty Research and Scholarship Biology 2000 Linear and Nonlinear Measures Predict Swimming in the Leech C. J. Cellucci Peter Brodfuehrer Bryn Mawr College, [email protected] H. Acera-Pozzi E. Dobrovolny J. Engler See next page for additional authors Let us know how access to this document benefits you. Follow this and additional works at: hp://repository.brynmawr.edu/bio_pubs Part of the Biology, general Commons is paper is posted at Scholarship, Research, and Creative Work at Bryn Mawr College. hp://repository.brynmawr.edu/bio_pubs/2 For more information, please contact [email protected]. Recommended Citation C. J. Cellucci, P. D. Brodfuehrer, R. Acera-Pozzi, H. Dobrovolny, E. Engler, J. Los, R. ompson, and A. M. Albano. Physical Review E 62, 4826 (2000).
Transcript of Linear and nonlinear measures predict swimming in the leech
Bryn Mawr CollegeScholarship, Research, and Creative Work at Bryn MawrCollege
Biology Faculty Research and Scholarship Biology
2000
Linear and Nonlinear Measures Predict Swimmingin the LeechC. J. Cellucci
Peter BrodfuehrerBryn Mawr College, [email protected]
H. Acera-Pozzi
E. Dobrovolny
J. Engler
See next page for additional authors
Let us know how access to this document benefits you.
Follow this and additional works at: http://repository.brynmawr.edu/bio_pubsPart of the Biology, general Commons
This paper is posted at Scholarship, Research, and Creative Work at Bryn Mawr College. http://repository.brynmawr.edu/bio_pubs/2
For more information, please contact [email protected].
Recommended CitationC. J. Cellucci, P. D. Brodfuehrer, R. Acera-Pozzi, H. Dobrovolny, E. Engler, J. Los, R. Thompson, and A. M. Albano. Physical Review E62, 4826 (2000).

AuthorsC. J. Cellucci, Peter Brodfuehrer, H. Acera-Pozzi, E. Dobrovolny, J. Engler, R. Los, R. Thompson, and AlfonsoM. Albano
This article is available at Scholarship, Research, and Creative Work at Bryn Mawr College: http://repository.brynmawr.edu/bio_pubs/2
Linear and nonlinear measures predict swimming in the leech
C. J. Cellucci,1,3 P. D. Brodfuehrer,2 R. Acera-Pozzi,1 H. Dobrovolny,1 E. Engler,1 J. Los,1 R. Thompson,1
and A. M. Albano11Department of Physics, Bryn Mawr College, Bryn Mawr, Pennsylvania 190102Department of Biology, Bryn Mawr College, Bryn Mawr, Pennsylvania 19010
3Department of Physics, Ursinus College, Collegeville, Pennsylvania 19426and The Arthur P. Noyes Clinical Research Center, Norristown, Pennsylvania 19401
~Received 6 March 2000!
Stimulation of a trigger interneuron of an isolated nerve cord preparation of the medicinal leech,Hirudomedicinalis, sometimes leads to swimming; sometimes it does not. We investigate signals transmitted in theventral cord of the leech after stimulation and seek quantitative measures that would make it possible todistinguish signals that predict swimming from those that do not. We find that a number of linear as well asnonlinear measures provide statistically significant distinctions between the two kinds of signals. The linearmeasures are the time dependence of~i! the standard deviation and~ii ! the autocorrelation function at a smalltime delay. The nonlinear measures are~i! a measure of nonlinear predictability and~ii ! the time dependenceof a measure of the size of the embedded signal trajectory. Calculations using surrogate data suggest that thedifferences between the two classes of signals are dynamical as well as statistical.
PACS number~s!: 05.45.2a, 87.10.1e, 87.19.Nn
I. INTRODUCTION
In the medicinal leech,Hirudo medicinalis, the initiationof swimming following body wall stimulation can be traced,neuron to neuron, from the mechanosensory neurons thatperceive the stimulus to motor neurons that produce theswimming movements@1–3#. In this swim-initiating path-way, neuronal information flows sequentially from mecha-nosensory neurons to trigger interneurons~cells Tr1!, to seg-mental swim-gating interneurons, to oscillator interneurons.The output connections of the swim oscillator network drivemotor neurons in each segmental ganglion that produce theundulatory body wall movements of swimming@1–3#. How-ever, the synaptic interactions described in the swim-initiating pathway do not adequately explain the behavioralvariability observed in the isolated leech nervous system fol-lowing activation of this pathway. For example, stimulationof cell Tr1 can elicit swimming in one trial, but may not inthe next trial, even though the strength of cell Tr1 stimula-tion is constant in both trials@3#. Similar behavioral variabil-ity also occurs in intact leeches in response to body wallstimulation@4#.
Recent attempts to understand why stimulation of cell Tr1does not reliably trigger swimming has led to the hypothesisthat the control of swimming involves two parallel systemsoriginating in the head ganglion that have opposite effects onthe segmental swim-generating network, a swim-activatingsystem that excites the segmental swim-generating networkand a swim-inactivating system that inhibits or suppresses it@5#. In order for a given stimulus to initiate swimming, theswim-activating system must be turned on and the inactivat-ing system turned off. Attempts to identify neurons in thehead ganglion that comprise the swim-activating and-inactivating systems and are directly involved with deter-mining whether a leech swims in response to a given stimu-lus have been largely unsuccessful@6#. The inability tophysiologically identify individual neurons that strongly af-
fect the probability of eliciting swimming is consistent withthe control of swimming being a function of the coordinatedactivity of large populations of neurons in the leech nervoussystem. Individual neurons may only make a small contribu-tion to the net output of the system, and could easily bemissed during physiological searches. Support for a distrib-uted process controlling swimming is clearly revealed in ex-tracellular records of neuronal spiking activity descendingfrom the head ganglion in the lateral connectives prior toswimming. These recordings show a complex pattern ofspiking activity that is coincident with the onset of swim-ming @5#. Collectively, these observations suggest that nosingle neuron or even a small group of neurons determinesabsolutely whether swimming will occur in response to agiven input. Under these circumstances, a computationalanalysis of neuronal activity is most likely necessary to de-cipher how the leech nervous system encodes the initiationof swimming
One of the simplest things expected of the computationalanalysis of biological data is to provide some quantitativemeasures that would make it possible to distinguish distinctstates of the system that produced the data. These statescould be associated with different behaviors either as precur-sors or correlates of these behaviors. It is, however, not quiteso easy to live up to these expectations. In recent years, forinstance, various linear and nonlinear measures have beenused to study human electroencephalograms~EEGs!. Someof these studies have been attempts to forecast epileptic sei-zures~@7# and references therein,@8,9#!. Although these haveshown varying levels of promise there is, as yet, no reliablepredictor of the onset of epilepsy@11,12#.
Here, we explore the use of some linear and nonlineartechniques in the analysis of data from a simpler behavior ina much simpler system. We simply ask whether we can findquantitative measures that would make it possible to distin-guish signals propagating in the leech ventral nerve cord thatlead to swimming from those that do not. Specifically, weanalyze two sets of time series measured from signals propa-gating along the ventral nerve cord following Tr1 stimula-
PHYSICAL REVIEW E OCTOBER 2000VOLUME 62, NUMBER 4
PRE 621063-651X/2000/62~4!/4826~9!/$15.00 4826 ©2000 The American Physical Society

tion. One signal propagates toward the rear while the othersignal propagates toward the head~ACN and PCN, respec-tively, in Fig. 1!. These signals are clearly nonstationary~seeFig. 2!, so rather than using a single set of measures to de-scribe an entire time series, or treating the signal’s trajectoryin a reconstructed state or phase space as an attractor, wepartition it into successive nonoverlapping epochs and thenuse the time evolution of the properties of the epochs tocharacterize the time series.
We find that analysis of the ventral chord signals providesstatistically significant discriminations between signals thatlead to swimming and those that do not, and that these areachieved using both linear and nonlinear measures. The lin-ear measures are the time dependence of the standard devia-tion and that of the autocorrelation function at some smalltime delay. The nonlinear measures are two that are rela-tively robust against noise and the limitations imposed bysmall data sets:~1! nonlinear predictablity@10,11#, and ~2!the time dependence of the mean distance between points inmultidimensional time-delay embeddings of the data. In ad-dition, we compare the patterns of spiking activity for swim-ming elicited by intracellular stimulation of cell Tr1 andswimming episodes that occur spontaneously.
II. NEURAL CORRELATES OF SWIMMING
1. Leech nervous system
The leech central nervous system consists of head and tailganglia connected by the ventral nerve cord, a chain of 21segmental ganglia and their intersegmental connectives. Thesegmental ganglia are numbered sequentially, from 1–21,beginning with the ganglion posterior to the head ganglion~Fig. 1!. Each segmental ganglion is joined by connectivescomposed of two large lateral bundles of nerve fibers~2800axons each! and a thin bundle called Faivre’s nerve~97 ax-ons! @13#!. A pair of nerve roots arises from each segmentalganglion to innervate the body wall surrounding that seg-ment. In isolated nerve cords, swimming activity is indicatedby rhythmic bursts of action potentials in the dorsal posterior~DP! nerve, a branch of a segmental peripheral nerve@12#.
2. Experimental setup
In an isolated leech nerve cord extending from the headganglion to the tail ganglion, we recorded extracellularly
FIG. 1. Diagram of the experimental preparation. Preparationconsists of the isolated leech ventral nerve cord extending from thehead ganglion~HG! to the tail ganglion~TG!. Extracellular record-ing of multiunit spiking activity in the lateral connectives weremade at two locations: ACN, posterior to the segmental ganglion 2;PCN, anterior to segmental ganglion 17. Extracellular recordingfrom a peripheral nerve~dorsal posterior, DP! was used to monitorthe occurrence of swimming in the isolated nerve cord. Swimmingwas initiated by intracellular stimulation of cel Tr1.
FIG. 2. Neuronal activity patterns in the lateral connectives as-sociated with swimming and nonswimming trials.~a! and ~c! Inboth triggered and spontaneous swim episodes, neuronal activity inACN increases and decreases in PCN approximately 3 s before theinitiation of swimming. ~b! In nonswimming trials, no consistentchange was evident in the activcity pattern in ACN or PCN.
PRE 62 4827LINEAR AND NONLINEAR MEASURES PREDICT . . .
neural signals propagating in a lateral connective prior to andfollowing stimulation of cell Tr1~Fig. 1!. Neuronal activityin the connectives and DP nerve was recorded using extra-cellular suction electrodes, while the electrical potential ofcell Tr1 was recorded and stimulated using an Axoclamp 2B~Axon Instruments, Foster City, CA! amplifier in bridgemode. One extracellular recording location was from the cutend of one lateral connective posterior to segmental ganglion2, ~referred to as the anterior connective, ACN! while theother recording location was from the contralateral connec-tive anterior to segmental ganglion 17~posterior connective,PCN!. Since the leech nervous system is bilaterally sym-metrical, it is likely that the neural activity patterns recordedin one lateral connective reflect the spike activity patternsoccurring in the other connective. The only noticeable differ-ence between isolated preparations with intact lateral con-nectives and those with one lateral connective severed wasan increase in the latency between Tr1 stimulation and thebeginning of swimming in the latter group.
3. Physiological data
In the preparation described above, seven Tr1 stimulationtrials triggered swimming and seven ‘‘spontaneous’’ swimepisodes occurred. In all seven trials where stimulation ofcell Tr1 triggered swimming, we observed two consistentchanges in the neuronal activity pattern recorded from theanterior and posterior connective recording sites, ACN andPCN, respectively. First, several seconds prior to swimming,the amount and amplitude of neural signals in ACN in-creased and remained elevated throughout the duration of theswim episode. Second, coincident with the increase in ACNactivity, large amplitude signals ceased and there was anoverall decrease in neural activity in PCN that gradually in-creased before the onset of swimming@Fig. 2~a!#. An almostidentical change in ACN and PCN activity patterns occurredbefore the onset of all seven spontaneous swim episodes: anincrease in ACN activity and a simultaneous decrease inPCN activity @Fig. 2~c!#. On the other hand, in 13 trials
where Tr1 stimulation did not lead to swimming, no consis-tent change was evident in ACN and PCN activity patterns@Fig. 2~b!#.
III. ANALYSIS
All analyses were performed on a time series consistingof a segment of ACN and PCN recorded data. For Tr1, trig-gered swim episodes this segment, referred to as the post-stimulus segment, consisted of the portion of the time seriesstarting at the end of spiking activity in cell Tr1 to the onsetof swimming, which is indicated by the first burst of actionpotentials in the DP nerve~see Fig. 2!. In trials where Tr1stimulation did not elicit swimming, the end of the post-stimulus period occurred approximately 6 s after stimulationof cell Tr1, which corresponded to the average swim latencyin trials where swimming occurred following stimulation ofcell Tr1. Data segments starting approximately 6 s before theonset of swimming were used in the analyses of spontaneousswim episodes.
A. Statistical and spectral measures
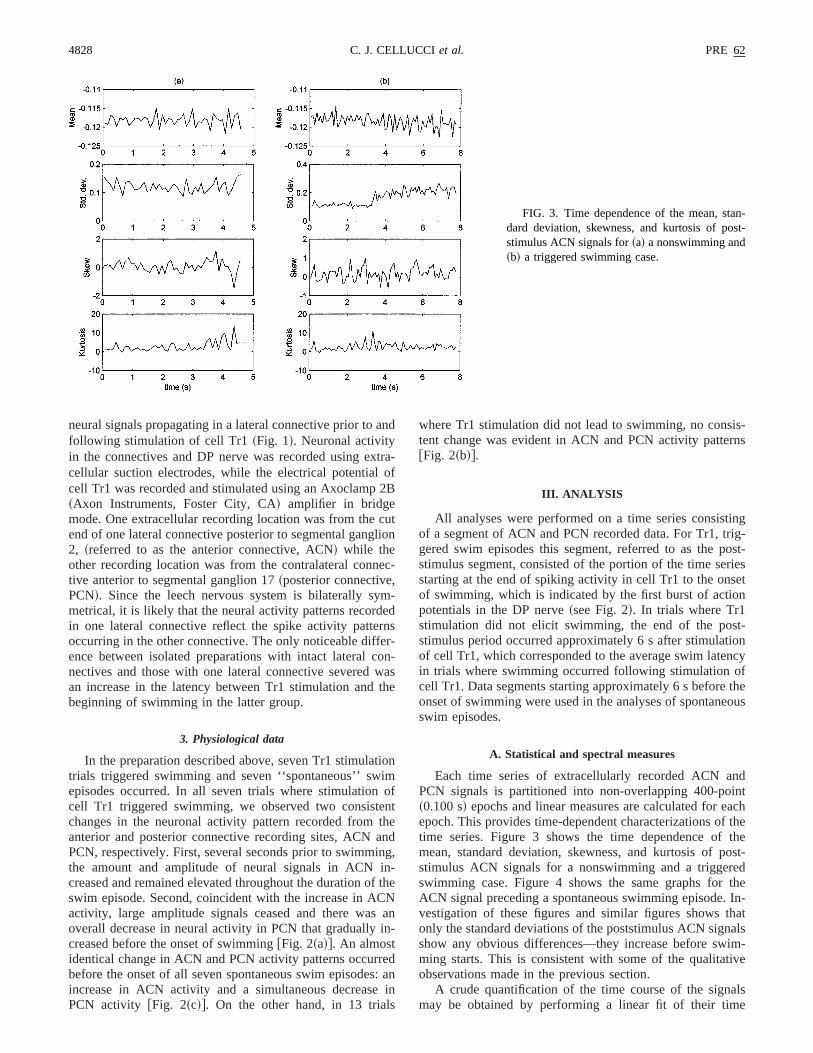
Each time series of extracellularly recorded ACN andPCN signals is partitioned into non-overlapping 400-point~0.100 s! epochs and linear measures are calculated for eachepoch. This provides time-dependent characterizations of thetime series. Figure 3 shows the time dependence of themean, standard deviation, skewness, and kurtosis of post-stimulus ACN signals for a nonswimming and a triggeredswimming case. Figure 4 shows the same graphs for theACN signal preceding a spontaneous swimming episode. In-vestigation of these figures and similar figures shows thatonly the standard deviations of the poststimulus ACN signalsshow any obvious differences—they increase before swim-ming starts. This is consistent with some of the qualitativeobservations made in the previous section.
A crude quantification of the time course of the signalsmay be obtained by performing a linear fit of their time
FIG. 3. Time dependence of the mean, stan-dard deviation, skewness, and kurtosis of post-stimulus ACN signals for~a! a nonswimming and~b! a triggered swimming case.
4828 PRE 62C. J. CELLUCCIet al.

dependence, and using the slopes of these fits to characterizethe data. Figures 5 and 6 show the standard deviations vs.time, and the linear fits, for post-stimulus ACN signals cor-responding to nonswimming and triggered swimming. Figure7 shows the corresponding values for an ACN signal preced-ing spontaneous swimming. Figure 8 shows the slopes ofthese fits for all cases of each condition. The linear fits of allsignals preceding swimming, triggered as well as spontane-ous, have positive slopes. Eight of the 13 nonswimmingcases do not.
Using a t test to compare the slopes, we find that theprobability p that the post-stimulus nonswimming and trig-gered swimming ACN signals come from the same popula-tion is 9.331027. A similar comparison of the triggeredswimming and spontaneous swimming signals givesp50.015; nonswimming vs spontaneous swimming givesp52.231027. In contrast, a comparison of the poststimulusPCN nonswimming and triggered swimming signals givesp50.51. Although the slope does not give an unambiguousclassification of each individual signal, it clearly provides a
FIG. 4. Time dependence of the mean, standard deviation,skewness, and kurtosis of poststimulus ACN signals for a sponta-neous swim episode.
FIG. 5. Time dependence and linear fit~dashed line! of thestandard deviation of a nonswimming case.
FIG. 6. Time dependence and linear fit~dashed line! of thestandard deviation of a triggered swimming case.
FIG. 7. Time dependence and linear fit~dashed line! of thestandard deviation of a spontaneous swimming case.
PRE 62 4829LINEAR AND NONLINEAR MEASURES PREDICT . . .

statistically significant distinction between the two classes ofsignals.
Figure 9 shows the time dependence of the power spectraldensities~the Gabor transforms, see@14#! of an ACN signalafter stimulation in~a! a case that did not lead to swimmingand~b! one that led to swimming. Investigation of these andsimilar figures for the other data sets shows no obvious dif-ferences that could be used to distinguish one condition fromthe other. The autocorrelation function~Fig. 10! is the Fou-rier transform of the power spectral density~Wiener-Khinchin theorem, see, e.g., Ref.@15#!, so one should conveythe same information~or lack thereof! as the other. Never-theless, despite the lack of easily identifiable global featuresthat may be used to distinguish the signals, there are usableconsistent differences in the time dependence of the autocor-relation function at small delays. Figure 11~a! shows the timedependence of the autocorrelation at a delay of 6 points~1.5ms! for a poststimulus time signal that did not lead to swim-
ming; Figure 11~b! shows the time dependence of the auto-correlation for one that did.
As was done for the standard deviation, we show in Fig.12 the slopes of linear fits of graphs such as Fig. 11 for allthree conditions.t test comparisons of these values givep58.831025 for nonswimming vs triggered swimming,p52.131025 for nonswimming vs spontaneous swimming,andp50.15 for triggered vs spontaneous swimming.
B. Nonlinear measures
The standard deviation, like other measures based on sta-tistical moments, depends only on the distribution of valuesand not on their time sequence. It is insensitive to dynamics.Some time sequence-dependent information is provided byspectra or autocorrelation functions, but this information canbe mimicked by appropriately filtered noise@see,e.g., Ref.@16# and Sec. III B 3 below#. In this section we investigatetwo nonlinear measures that are capable of eliciting somedynamical information from the data.
Traditional analyses of scalar time series such as thosedone in the preceding section focus their attention on onemeasured variable at a time. A system characterized by manycoupled variables is more appropriately described by the si-multaneous values of all the variables. These are representedby a point in the multidimensional state space spanned by thesystem’s variables, and the system’s dynamics is describedby the trajectory of this representative state space point.
In situations when only values of a scalar quantity$x1 ,x2 , . . . ,xN% are measured, the state space trajectory maybe reconstructed in anm -dimensional state space by meansof embedding vectors of the form@17–21#,
X~n!5~xn ,xn11 , . . . ,xn1m21!. ~3.1!
Theorems by Takens@17# and Mane @18# show that for asufficiently large number of clean data, and ifm is suffi-ciently large, the trajectory in the embedding space has thesame geometric and topological properties as that in theoriginal state space. In the following, we use the method of
FIG. 8. Slopes of the linear fits of the time dependence of thestandard deviation for all non-swimming, triggered swimming, andspontaneous swimming cases.
FIG. 9. Time dependence of the power spec-tral density~Gabor transform! of the poststimulusACN signal for~a! a nonswimming case and~b! atriggered swimming case.
4830 PRE 62C. J. CELLUCCIet al.

global false nearest neighbors and mutual information to de-termine embedding parameters@22#.
1. Predictability
If a time series comes from a deterministic system then, inprinciple, it is possible to predict its future values from pastones. One technique that has been particularly effective is theuse of local approximation@11#. In its simplest form, to pre-dict X(n1t) from X(n), we look for that past stateX(n8),with n8,n, that is closest toX(n). We then determine whereX(n8) is t time units later and use that state@X(n81t)# asthe prediction forX(n1t).
Our use of predictability differs from our use of the othermeasures in that we calculate a value that characterizes anentire time series rather than a sequence of values that tracksits time dependence. We take nonstationarity into account byusing a moving window for the prediction. That is, to predict
X(n11), we start by locatingX(n)’s nearest neighborX(n8) from among the previous 2500 vectors,X(n22500), X(n22499),. . . ,X(n21). We then take as ourprediction, Xp(n11)5X(n811)5(xn8 ,xn811 , . . . ,xn81m21). This is done forn52501 until the end of the timeseries.
As a measure of the predictability, we use the root-mean-square~RMS! difference between the predicted and actualvalues scaled to the signal standard deviation. We used themedian value of the RMS errors to compare time series sinceit is much less sensitive to outliers. In Fig. 13 we see a largedifference between the predictability of ACN and PCN sig-nals in the cases that did not lead to swimming. This differ-ence is not as pronounced in the triggered and spontaneousswimming cases~Fig. 14!. Since we cannot ascribe a signifi-cance to isolated values of the median prediction error for theindividual signals, we use the differences between the ACN
FIG. 10. Time dependence of the autocorrela-tion function of the poststimulus ACN signal for~top! a nonswimming case and~bottom! a trig-gered swimming case.
FIG. 11. Time dependence of the autocorrelation function for atime delay of 6 time units~1.5 ms! for ~a! a nonswimming case and~b! a triggered swimming case.
FIG. 12. Slopes of the linear fits of the time dependence of theautocorrelation function for a time delay of 6 time units~1.5 ms! forall nonswimming, triggered swimming, and spontaneous swimmingcases.
PRE 62 4831LINEAR AND NONLINEAR MEASURES PREDICT . . .

and PCN values to compare the different cases. Using apairedt test, we find that the probability that the poststimulusnonswimming ACN and PCN are equally predictable isp59.331023. The corresponding probabilities for the trig-gered swimming and spontaneous swimming cases are 0.75and 0.16, respectively. In the nonswimming case, the concur-rent ACN and PCN signals differ significantly in predictabil-ity; in the swimming cases, they do not.
2. Mean interpoint distance
For this measure we use a very simple characterization ofthe embedded trajectory, namely the average distance^r &,between embedded vectors. We use^r & to investigate thetime evolution of the ACN and PCN signals individually asseparate univariate data, as well as together as elements of abivariate data set. In the former case, we formm-dimensionalembeddings using each signal separately; in the latter case,we use values of both ACN and PCN in the embedding.
Figure 15~a! shows the^r & vs time graph for an ACN
signal embedded in two dimensions in a nonswimming case.Figure 15~b! shows a triggered swimming case. Slopes of thelinear fits of the time dependence of^r & for all data sets areshown in Fig. 16. All signals that preceded swimming,whether triggered or spontaneous, are characterized by posi-tive slopes. All but 3 of the 13 nonswimming signals havenegative slopes.t -test comparisons show that the probabil-ity, p, that the 13 nonswimming and the 7 triggered swim-ming ACN signals come from the same population is 1.531024. The distinction is even sharper in higher embeddingdimensions ~a five-dimensional calculation givesp53.231026).
To compare the time evolution of the ACN and PCN sig-nals as separate univariate data with their behavior as ele-ments of a bivariate data set, we combine the first sevennonswimming trials with the seven swimming trials. Figure
FIG. 13. Median prediction errors for poststimulus nonswim-ming ~nacn and npcn! and triggered~tacn and tpcn! swimming sig-nals.
FIG. 14. Median prediction errors for poststimulus triggered~tacn and tpcn! and spontaneous~sacn and spcn! swimming signals.
FIG. 15. Mean interpoint distancer &, vs time for ~a! a non-swimming and~b! a triggered swimming ACN signal embedded intwo dimensions.
FIG. 16. Slopes of the linear fits of the time dependence of^r &for all non-swimming, triggered swimming, and spontaneous swim-ming cases for embedding dimension5 2 ~top!, and embeddingdimension5 5 ~bottom!.
4832 PRE 62C. J. CELLUCCIet al.
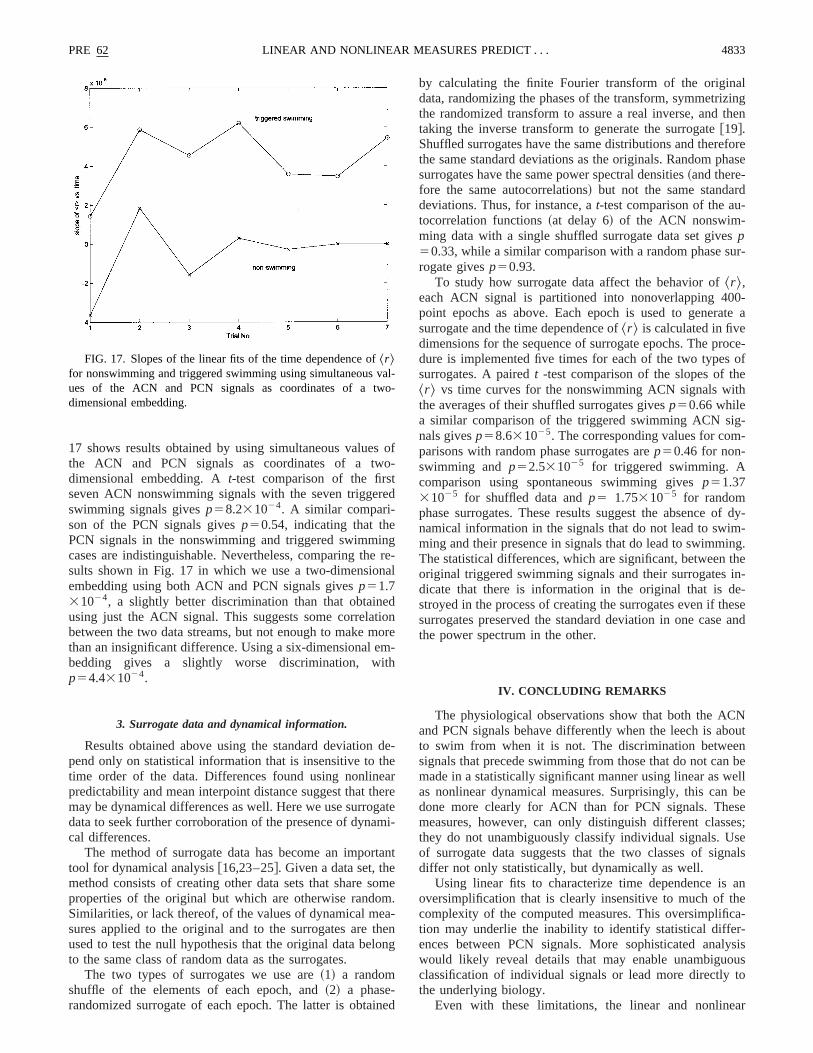
17 shows results obtained by using simultaneous values ofthe ACN and PCN signals as coordinates of a two-dimensional embedding. At-test comparison of the firstseven ACN nonswimming signals with the seven triggeredswimming signals givesp58.231024. A similar compari-son of the PCN signals givesp50.54, indicating that thePCN signals in the nonswimming and triggered swimmingcases are indistinguishable. Nevertheless, comparing the re-sults shown in Fig. 17 in which we use a two-dimensionalembedding using both ACN and PCN signals givesp51.731024, a slightly better discrimination than that obtainedusing just the ACN signal. This suggests some correlationbetween the two data streams, but not enough to make morethan an insignificant difference. Using a six-dimensional em-bedding gives a slightly worse discrimination, withp54.431024.
3. Surrogate data and dynamical information.
Results obtained above using the standard deviation de-pend only on statistical information that is insensitive to thetime order of the data. Differences found using nonlinearpredictability and mean interpoint distance suggest that theremay be dynamical differences as well. Here we use surrogatedata to seek further corroboration of the presence of dynami-cal differences.
The method of surrogate data has become an importanttool for dynamical analysis@16,23–25#. Given a data set, themethod consists of creating other data sets that share someproperties of the original but which are otherwise random.Similarities, or lack thereof, of the values of dynamical mea-sures applied to the original and to the surrogates are thenused to test the null hypothesis that the original data belongto the same class of random data as the surrogates.
The two types of surrogates we use are~1! a randomshuffle of the elements of each epoch, and~2! a phase-randomized surrogate of each epoch. The latter is obtained
by calculating the finite Fourier transform of the originaldata, randomizing the phases of the transform, symmetrizingthe randomized transform to assure a real inverse, and thentaking the inverse transform to generate the surrogate@19#.Shuffled surrogates have the same distributions and thereforethe same standard deviations as the originals. Random phasesurrogates have the same power spectral densities~and there-fore the same autocorrelations! but not the same standarddeviations. Thus, for instance, at-test comparison of the au-tocorrelation functions~at delay 6! of the ACN nonswim-ming data with a single shuffled surrogate data set givesp50.33, while a similar comparison with a random phase sur-rogate givesp50.93.
To study how surrogate data affect the behavior of^r &,each ACN signal is partitioned into nonoverlapping 400-point epochs as above. Each epoch is used to generate asurrogate and the time dependence of^r & is calculated in fivedimensions for the sequence of surrogate epochs. The proce-dure is implemented five times for each of the two types ofsurrogates. A pairedt -test comparison of the slopes of the^r & vs time curves for the nonswimming ACN signals withthe averages of their shuffled surrogates givesp50.66 whilea similar comparison of the triggered swimming ACN sig-nals givesp58.631025. The corresponding values for com-parisons with random phase surrogates arep50.46 for non-swimming andp52.531025 for triggered swimming. Acomparison using spontaneous swimming givesp51.3731025 for shuffled data andp5 1.7531025 for randomphase surrogates. These results suggest the absence of dy-namical information in the signals that do not lead to swim-ming and their presence in signals that do lead to swimming.The statistical differences, which are significant, between theoriginal triggered swimming signals and their surrogates in-dicate that there is information in the original that is de-stroyed in the process of creating the surrogates even if thesesurrogates preserved the standard deviation in one case andthe power spectrum in the other.
IV. CONCLUDING REMARKS
The physiological observations show that both the ACNand PCN signals behave differently when the leech is aboutto swim from when it is not. The discrimination betweensignals that precede swimming from those that do not can bemade in a statistically significant manner using linear as wellas nonlinear dynamical measures. Surprisingly, this can bedone more clearly for ACN than for PCN signals. Thesemeasures, however, can only distinguish different classes;they do not unambiguously classify individual signals. Useof surrogate data suggests that the two classes of signalsdiffer not only statistically, but dynamically as well.
Using linear fits to characterize time dependence is anoversimplification that is clearly insensitive to much of thecomplexity of the computed measures. This oversimplifica-tion may underlie the inability to identify statistical differ-ences between PCN signals. More sophisticated analysiswould likely reveal details that may enable unambiguousclassification of individual signals or lead more directly tothe underlying biology.
Even with these limitations, the linear and nonlinear
FIG. 17. Slopes of the linear fits of the time dependence of^r &for nonswimming and triggered swimming using simultaneous val-ues of the ACN and PCN signals as coordinates of a two-dimensional embedding.
PRE 62 4833LINEAR AND NONLINEAR MEASURES PREDICT . . .
analyses, along with the analysis of surrogate data, highlightthe importance of understanding the temporal characteristicsof neuronal activity in the leech ventral nerve cord to deter-mine the underlying physiology controlling swim initiation.
Changes in the total amount of activity in the nerve cord,although important, clearly do not adequately describe thepattern of neuronal activity in the leech nerve cord that pre-dicts whether a given stimulus will initiate swimming.
@1# P. D. Brodfuehrer and W. O. Friesen, Science234, 1002~1986!.
@2# W. O. Friesen, inNeuronal and Cellular Oscillators, edited byJ. W. Jacklet~Dekker, New York, 1989!.
@3# P. D. Brodfuehrer, E. A. Debski, B. A. O’Gara, and W. O.Friesen, J. Neurobiol.27, 403 ~1995!.
@4# W. B. Kristan, Jr., S. J. McGirr, and G. V. Simpson, J. Exp.Biol. 96, 143 ~1982!.
@5# P. D. Brodfuehrer and A. Burns, Neurobiol. Learn Mem.63,192 ~1995!.
@6# P. D. Brodfuehrer~unpublished!.@7# K. Lehnertz and E. E. Elger, Phys. Rev. Lett.80, 5019~1998!.@8# A. M. Albano, C. Bedonie, C. J. Cellucci, D.Halkides, V.
Miller, J. Ree, A. Torruella, R. Harner, and P. E. Rapp, inNonlinear Dynamics and Brain Functioning, edited by R.Sreenivasan, N. Pradhan, and P. E. Rapp~Nova Science, NewYork, 1999!.
@9# M. Le Van Quyen, J. Martinerie, C. Adam, and F. J. Varela,Physica D127, 250 ~1999!.
@10# G. Sugihara and R. M. May, Nature~London! 344, 734~1994!.@11# J. D. Farmer and J. J. Sidorowich, Phys. Rev. Lett.59, 845
~1987!.@12# K. J. Muller, J. G. Nicholls, and G. S. Stent,Neurobiology of
the Leech~Cold Spring Harbor Laboratory, Cold Spring Har-bor, NY, 1981!.
@13# J. M. Wilkinson and R. E. Coggeshall, J. Comp. Neurol.162,387 ~1975!.
@14# D. Gabor, J. Inst. Electr. Eng., Part III93, 429 ~1946!.@15# W. H. Press, B. P. Flannery, S. A. Teukolsky, and W. T. Vet-
terling, Numerical Recipes: The Art of Scientific Computing,2nd ed. ~Cambridge University Press, Cambridge, England,1998!.
@16# J. Theiler, J. Galdrikian, A. Longtin, S. Eubank, and J. D.Farmer, inNonlinear Modeling and Forecasting, edited by M.Casdagli and S. Eubank~Addison-Wesley, Reading, MA,1992!.
@17# F. Takens, inDynamical Systems and Turbulence, Warwick,1980, edited by D. A. Rand and L. S. Young~Springer-Verlag,New York, 1981!.
@18# R. Mane, in Dynamical Systems and Turbulence, Warwick1980 ~Ref. @17#!.
@19# N. H. Packard, J. P. Crutchfield, J. D. Farmer, and R. S. Shaw,Phys. Rev. Lett.45, 712 ~1980!.
@20# J.-P. Eckmann and D. Ruelle, Rev. Mod. Phys.57, 617~1985!.@21# T. Sauer, J. A. Yorke, and M. Casdagli, J. Stat. Phys.65, 579
~1991!.@22# M. Kennel, R. Brown, and H. D. I. Abarbanel, Phys. Rev. A
45, 3403~1992!.@23# J. Theiler and P. E. Rapp, Electromyogr. Clin. Neurophysiol.
98, 213 ~1996!.@24# P. E. Rapp, A. M. Albano, I. D. Zimmerman, and M. A.
Jimenez-Montan˜o, Phys. Lett. A192, 27 ~1994!.@25# T. Schreiber and A. Schmitz, Phys. Rev. Lett.77, 635 ~1996!
4834 PRE 62C. J. CELLUCCIet al.