classification changes - DTIC
261
UNCLASSIFIED AD NUMBER AD357974 CLASSIFICATION CHANGES TO: unclassified FROM: confidential LIMITATION CHANGES TO: Approved for public release, distribution unlimited FROM: Distribution authorized to DoD only; Administrative/Operational Use; Mar 1965. Other requests shall be referred to Director, Atomic Support Agency, Washington, DC 20301. AUTHORITY HQ DNA/IMTI ltr dtd 8 Jun 1994; HQ DNA/IMTI ltr dtd 8 Jun 1994 THIS PAGE IS UNCLASSIFIED
-
Upload
khangminh22 -
Category
Documents
-
view
0 -
download
0
Transcript of classification changes - DTIC

UNCLASSIFIED
AD NUMBERAD357974
CLASSIFICATION CHANGES
TO: unclassified
FROM: confidential
LIMITATION CHANGES
TO:Approved for public release, distributionunlimited
FROM:
Distribution authorized to DoD only;Administrative/Operational Use; Mar 1965.Other requests shall be referred toDirector, Atomic Support Agency,Washington, DC 20301.
AUTHORITYHQ DNA/IMTI ltr dtd 8 Jun 1994; HQDNA/IMTI ltr dtd 8 Jun 1994
THIS PAGE IS UNCLASSIFIED

CONFIDENTIALFORMERLY RESTRICTED DATA
AD 35197 4L
DEFENSE DOCUMENTATION CENTERFORP
SCIENTIFIC AND TECHNICAL INFORMATION
CAMERON STATION. ALEXANDRIA, VIdG:NIA
FORMERLY RESTRICTED DATA
CONFIDENTIAL

NOTICE: When government or other drawings, speci-fications or other data are used for any purposeother than in connection with a definitely relatedgovernment pro•:urement operation, the U. S.Government thereby incurs no responsibility, nor anyobligation whatsoever; and the fact that the Govern-merit may have formilated, furnished, or in any waysupplied the said drawings, specifications, or otherdata is not to be regarded by implication or other-wise as in any manner licensing the holder or anyother person or corporation, or conveying any rightsor permission to manufacture, use or sell anypatented invention that may in any way be relatedthereto.
NOTICE:
THIS DOCUMENT CONTAINS INFORMATION
AFFECTING TIM NA1TONAL DEFENSE OF
THE UNITED STATES WITHIN THY MEAN-
1NG OF TIE ESPIONAGE LAWS, TITLE 18,
U.S.C., SECTIONS 703 and 794. THE
TRANSKISSION OR THE REVELATION OF
ITS CONTENTS IN ANY MANNER TO AN
UNAUTHORIZED PERSON IS PROHIBITED
BY LAW.

Tk~A ATIQN'~
V NEAD A P ROV I NG GROU N DSCIAI 5pri dunp, 1952
LU--roc tL .1. and 1,5~
TRSSR MEA8UPEWE(N'I8
f R I t D
11 11 1 11, t~ij t f I.III IIk
A', I.' . I

4if 4 I
U'MI
E AD, pt N D S
fnLA Ip ri' -Jn ,15
-. rjc-.. andr 1.5)
XREE~~~~~ -Ap ADO--~jWLEE
.1:ESUR.MAMUERET~A
~REEBest ANDlbl Copy-LVE

CONF sIB I ,;
IA* US't Sj AOLVJ. $IN C OT14R Q irectaTO 01,o)Io
This documern t contains information aff('Cti,,g
the naticnal defense of the United States withie
the meaning of the Espionage Laws, Title l0
U. S. C. Sections 793 and 794. Thv trans:uis-
sion or the revelation of its contents in any
manner to anunauthorized person is prohibited
by law.
D D
FORMERLY RESTPiUCTED DATA
" I'S. ' ESTE TED DAA IN
SZXi•N 14,4b, A'iC1C LNF..RGY ACT 1954
¾,rVA
23I

This d~o -ernint consistas of 261 omges
No. ,,:_of 305 copies, Series A
OPERATION TUMBLER,
Projets 1.3 and 1.5
FREE-AIR AND GROUND-LEVEL
PRESSURE MEASUREMENTS
"-REPORT TO THE TEST DIRECTOR
I C. T. Aronson1. F. Moulton, Jr.,3. PetesE. 3. CullingE. R. Walthall
/Novemasbr 14952)
4MAWVLORDNANCE L&BORAI•'ijY " .;* I' cJ] l :Ein! :•• RVTc1r DAT .
"E ... . E,,; ,,C IID D ffIAi' •; 8.:';{;1• ] ',I' IL ]. , A' Wli CJ LN1•ay AC2' 1orI
II IIT 1
t.•.'Naval Ordnance Labe" ,White Oak, S ve,4 , M

Reproduced Direct from Manuscript Copy byAEC Technical Information Service
Oak Ridge, Tennessee
Inquiries relative to this report may be made to
Chief, Armed Forces Special Weapons ProtectP. 0. Box 2610
Washington, D. C.

SECRETSecurity Information
ABSTRACT
The Naval Ordnance Laboratory participated in all four air burstshots of Operation TtQ(BIER at the Nevada Proving Grounds by me~asuring
free-air peak pressures and pressure variation with time by means ofrocket smoke-trail photograpby and by measuring pressure-time data atground level by means of Bendix inductance gages using an FgM trans-mission system.
As the free-air data scaled well, a reliable composite free-airpressure-distance curve from 6 to 800 psi has been obtained in terms
of I XT (Va4iochamical) at e&a level. Efficiencies in free-air wereestimated to be of the order of 45 per cent compared ro cast VTspheres at about the 20 psi level.
Data from the gages in t ground show that the first three shiotsfell between the so-called ir" and "Good" height-of-burst curveswhile data from the last s t fell between the "Poor" and "Fair" curves.The optimum hoight of b for the test conditions was found to bezero for pressure leve3 greater than 12 psi and to follow the empiri-cal relation 1 between 12 and 3 psi vhere p is the over-
Sres /i. i" It teH.7 + Ppressure in psi / is in ft for I IT(RC) at sea level.
Long risg/times vcie encounrtered on the fourth shot except at lowpressure ranges, and rounding or chopping-off of the peak shock occurredon all shots/in the regular region in varying amounts. Shots 2 and 3which vere,/bt nearly scaled heights gave ground level data which scaledwell.
Decay constants and impulses calculated from particle displacementmeasurements scaled well with high explosives results; but the free-airpressure-time curves themselves were arrived at by such smoothingprocesses that no fine structure of the pressure-time history could bedetermined from them.•
Comparisons with high explosives data indicated the importance ofthe height of the measuring system above the ground level. Calcula-tions based on the free-air pressure curve and ideal reflection theoryshoved that in the regular region on Shots 1 and 2 the ground levelpressures could aave been reasonably well predicted, but that predic-tions fcr the Shot 4 results would have been too high. This factWhoved up in other phases of the analysis the most outstanding of whichwas the direct evidence of a precursor shock, ahead of the incidentshock, on TMiLER 4. This phenomenon is shown to be similar to certainun~en-iteor explosion effects and to have been predictable on the basisof acoustic theory if a heated layr of air near the ground were as-s.t'ced to e tYIst.
3
SECRET RESTRICTED DATA3! 1 rlATC'MYIC EIFIRGY ACT 1946

SECRETSecurity Informatign
PREFACE
This report on the work of the Naval Ordnance Laboratory groupon Operation TMBLER (Projects 1.3 and 1.5) presents all the data thusfar extracted frcm the records. Most of the information has beenchecked at least once, and it is not planned to re-examine it unlessquestions are raised on specific points. There are, perticularly onthe particle-displacement motion picture records, some data which havenot been completely analyzed; however, it is not believed that suchdata will alter the conclusions of this report.
It should be noted that enough of the data presented in the pre-liminary reports, Annexes II and XXI to the Oporation TUMBLER Prelim-inary Report of 15 May 1952, have been revised for presentation inthis report to make both of these preliminary annexes of questionablevalue as references; and it is strongly recommended that existingccies of them be destroyed. These revisions are not expected tomodify the basic conclusions previously presented, but they are im-portant in any consideration where the data are to be compared indetail with data from other projects or from other operations.
This report wa.s prepared as Naval Ordnance Laboratory Report 1166for publication and distribution by the Armed Forces Special WeaponsProject as W]-513.
SECRET RESTRICTED DATASe:,iiy Informatio, ATCMIC ENERGY ACT 1946
Preceding Page Blank

SECRETSecurity Informati•r
ACMNOWLEDGOETrS
Planning for the Naval Ordinncce Laboratory's P- rticipation wasdone by Dr. G. K. Hartmann, Dr. P. H. Fye, Dr. J. E. Ablard,Dr. W. E. Morris, Mr. C. J. Aronson, Mr. J. F. Moulton, Jr., andMr. Joselph Petes. Administrative details were capably handled byLCIR J. D. McClendon with advice and assirstance in planning byCIO P. E. Somers and Mr. Joseph Shisko. Mr. J. R. Mitchell success-fully met the difficult problems imposed on logistics by thestringent time scale of the operation. He was aided in this by theSupply and Fiscal Department of the Naval Ordnance Laboratory andby Major C. W. Burns of the J_4 Division of the Test Command.
Appreciation is sincerely expressed to the Military EffectsTests Group and the office of Program One which spared no pains tosmooth out the udinistrative and technical difficulties ericounteredin the field by Projects 1.3 and 1.5. In particular the work ofLt. Col. G. B. Page, Dr. H. Scoville, Jr., and CDR D. C. CampbellZaUs this well-run operation a pleasant, and it is believed a mostworth while experience. Appreeciation is also expressed to Edgerton,Germeshausen, and Grier, Inc., whose excellent photography was thesource of all Project 1.5 data. Their cooperation made the resultsavai-able rapidly and simplified the work of the NOL group appreci-ably.
The authors are indebted to the following persons who competentlyaided in the analysis of the data for this report:
LCDF J. D. McClendon LT(jg) C. C. LittleP. Hanlon F. J. OlivorF. Theilheimer C. L. KIarmelT. A. Flynn C. A. DixonR. L. Varwig
Preparation of material in form for publication was done by:
M. M. Case J. W. CulbertsonJ. R. Mitchel3 R. B. GranetM. M. Fox E. L. RankinS. Woolston M. SimonR. Q. Riser V. SorrellL. A. Grymes E. Zdanis
SECRETRESTRICTED DATABest Available CopY ATOMiC £NEWCY ACT 1A4h
Preceding Page Blank

SECRETSecurty Infoanuion
ABSTRACT . . . . . . . . . . 3
I:::WACE ..PRKFOE....................................... ....
4ACIMOWLIDa~MM8 . 7
fLUTSTRATIONS . . . . . . . .. . . . . . . . 13
TABLES . . . . . . . . . . . . . . . . . . 19
CHAPTER 1 ITROXTION... ........... ............ 23
1.1 General Objectives I... ........ .. 231.2 Objectives )f Projects i.3 and 1.5 ..... 231.3 Methods . ................ 241.4 Test Conditions ......... ........... 24
1.4.1 Inductance Gages .... ........ 241.4.2 Rocket Lines ....... ........ 25
1.5 Susary of Instrument Performance ..... 251.6 Conversion Factors and Scaling .. ..... 251.7 Personnel and Responsibilities..... . . 281.8 Costs of Projects 1.3 and 1.5 . . .......... 29
CKRAFER 2 GROUND LEVEL PRESSURE-TIME MEASUREENJTS(PROJECT 1.3) ........ ........... .... 31
2.1 Instrvuentation. ........... ........ 312.1.1 General .......... ....... 312.1.2 Gages .............. ....... 312.1.3 Oscillator-Amplifier ... ...... 392.1.4 Recording System .... ......... ..2.1.5 Power ..... .............. 422.1.6 Peback and Data Reduction ... ..... 422.1.7 System Errors ........ .......... . 62.1.8 Recommendations for Instrumentation . 47
2.2 Results ............... ............ 49
2.2.1 TUMBLER 1 ........... ...... 522.2.2 TUMBLER 2. . . . . .. 602.2.3 TUMBLER 3 . . . . . . . . . . . 612.2.4 TuaBIn. 4 ........ ........ 762.2.5 Conpamison of Data ..... ....... A8
9SECRET RESTRICTED DATA
Seturity Information ATOMIC L Z,;ERGY ACT 1946
preceding Page Blank

3.1.1 Th - hock- Velocity Method oQT Peak. •• :,:Pressure Determination . . n ,
3.1.2 The Particle Displ~keeent Method ofPressure-Time Determination . .. 91 i
I
3.2 nstrmen on ...... 923.2.1 The Smoke Rocket Detection Grid 92
3.2.2 Phouo&ýNhla Instru-0eDtation . .. 933.3 Results . D.t.e.. t. ........... ... 933.3.1 Pressure-Distance Results - TMeBt R 1 .o 953.3.2 Pressure-Distance Results - TBLER 2 . .102
3.3.3 Pressure-Distance Results - ENIBLER 3 ..1063.3.4 Pressure-Distance Results - TEMBLER 4 . •1093.3.5 Free-air Pressure-Time Results-TUMBLER 1 .1p3.3.6 Free-air Pressure-Time Results-TUMBLER 4 .1133.3.7 Determination of the Decay Parameter, 0 .1.253.3.8 Accuracy of Results ..... ........ 126
CHAPTER 4 REDmEED RESULTS. ........ .............. 132
4.1 Ground Level Data . .......... ........ 1324.2 Photo-Optical Data in Free Air ..... .... 133
4.2.1 Arrival Time of the Shock Wave inFree Air ....................... 133
4.2.2 Pressure-Distance in Free Air ......... 1464.2.3 Pressure-Time in Free Air ..... ..... 1464.2.4 Reduced Decay Parameter, 0 ..... .... 150
CHAPTER 5 DISCUSSION OF RESULTS ...... ............ 151
5..L Height-of-Burst Comparisons .... ........ 1515.1.1 Height-of-Burst, TU43LER and High
Explosives .. .... ... ... . 1515.1.2 Height-of-Burat, TUMBLER vs Previous
Operational Instructions ..... ..... 1555.2 The Precursor of TUMBLER 4 ........ I161
S.P.] Description of the Phenomenon ........ 1-5.2.2 Arrival Time of the Precursor Along
tbh Ground ...... ........ ... 1645.2.3 Analysis of Results. ....... ..... 1655.2.4 Discussion and Conclusion . . . ... 168
5.3 Comparison with Regular Reflection Theory . 1715.3.1 Method ........ ........... 1715.3.2 Results in Regular Region ..... ..... 172
10
RESTRICTED DATA SECRET,kTOMI• ENERGY ACT 19 scurIy Information
S M 3

SECRETSecurity Inforiation
CONEENTS (cor.)
5.- TNT Efficiencies of TUMBLER Weapons ..... 1735.4.1 C vparison of Free-air Data with
TNT . . . . . . . . . . . . . . 1735.4.2 TM Efficiencies at Ground Level . . . . 173
5.5 Positive Impulse in Free Air Compared with TNT . . 179
alPER 6 COCIcsIoNs AND RECo NDATIONS .. ........ .. 182
6.1 Conclusions on Systems Used ....... ... . 1826.1.1 Pressure-Time Measurements on the
Ground . ....... ........... . 1826,1.2 Peak Pressure Measurements in Free Air
by the Shock Velocity Method 182. 186.1.3 Pressure-Time Measurements in Free Air
by the Particle Displacement Method . . 1826.2 Conclusions on Experiments ..... .... .. 1836.3 Recomndations ............. ..... 185
APPENDIX A H OF PEAK PRESSURE BY INDENTER GAGES DAMPEDWITH SILICONE AND JITH BAFFLE CHAMME(By F. J. Oliver) ........ ............. 186
A.1 FieldExperiments . ..... . . . . 186A.2 Analysis ... ...... . ........... 189A.3 Conclusion .......... .............. 189
APPENDIX B DI-EI WINATION OF PRESSURE-T-0 CURVES FROM OBSERVEDPARTICLE MOTION IN BLAST WAVES (By F. Theilheimer) . 191
B.1 Introduction ......... ............. 191B.2 Analysis of Photographic Records .. ..... 191B.3 Determination of Pressure-Time Curves .... .. 193B.4 Derivation of Equation (B.3) ... ....... 195B.5 Check on the Accuracy of the Procedure . . . . 197
LIST OF REFERENCES . . ............................ 199
TAM1JLAR DATA . .................................. 202
SECRET RESTRICTED DATAS!arLy Information ATOMIC ENERGY ACT 1946

SECRETSecurity Information
* ~ILLUSTRMTONS
1.1 Area F - Test layout, Project 1.5a and 1.5b,TUMBIER 1 ................. 26
1.2 Area T-7 - Test Layout, Project l.5a and 1.5b,TULBIER 2-4 ... . ............. . . . . . 27
2.1 Blast Line Layouts for Operation TUMBLER ... ....... 322.2 Cable Laying ..... . .................. 332.3 Bend•ix Gage and its Construction .... .......... 332.4 Transieet Response of Bendix Gages . . . ............ 352.5 Gage Calibration Set-up....... ..... ... ..... ..... ...... 362.6 Top Viev of Cover Plate Baffle ................... 372.7 Oscillator Amplifier Chassis and Gage on Cover Plate
Baffle .................... 372.8 Oscillator-Amplifier and Cable Schematic..... 382.9 Instruent Trailer in Revetment ..... ....... . .. 392.10 Inside View of Instrumentation Trailer ........ ..... 402.11 Block Diagram Shoving Signal Paths and Interlaced
Station Hookup . .................... 412.12 Timing and Fiducial Marker System 43......32.13 Pover System and Remote Control Relay Utilization . 442.11 Magnetic Tape Playback Block Diagram ....... ..... 452.15 Non-Linearity Correction for Impulse ......... ..... 482.16 Symbols for Characteristic Waveforms ...... 512.17 Records, TUMBLER 1, Stations F-200 through F-203 . . 532.18 Records, TUMBLER 1, Stations F-204 through F-208 . . 52.19 Records, TUMBLER 1, Stations 7-209 through F-211 . .2.20 Peak Positive Overpressure, Pc, Ground Level, TUMBLER 1 562.21 Peak Negative Pressure, Pe, Ground Level.., TUMLER 1 ... 572.22 Positive Implse, Ground Level, TUMBLR 1i .......... 582.23 Positive Phase Duration, t4, Ground Level, TUMBLER 1 592.24 Negative Phase Duration, t8, Ground Level, TUMBLER 1 . 592.25 Arrival Time of Initial Disturbance, tl, Ground Level,
TUEBLER 1 .............. ... .. .............. 602.26 Records, TUMBLER 2, Stations 7-200 through 7-201T . . 622.27 Records, TUMBLER 2, Stations 7-213 through 7-204 . ... 632.28 Records, TUMBLER 2, Stations 7-205 through 7-20'T .... 642.29 Peak Positive Overpressure, Pc, Ground Level, TUMBLER 2 . 652.30 Peak Negative Pressure, Pe, Ground Level, TUMBLER 2 • 652.31 Positive Imlulse, Ground Level, TUMBLER 2 . ... . 662.32 Positive Phase Duration, t4, Ground Level, TUMBLER 2 . . . 662.33 Negative Phase Duration, t 8 , Ground Level, TUMBLER 2 . . . 662.34 Arrival Time of Initial Disturbance, tl, Ground Level,
TUMBLER 2 ............... ............... 672.35 Records, TUMB1LM 3, Stations 7-200 through 7-201T . . . . 682.36 Records, TUMBLER 3, Stations 7-213 through 7-205 . . . . 69
13
SECRET RESTRICTED DATASecurity Information ATOMIC ENERGY ACT 1946
Preceding Page Blank

SECRET
Security Infrmatioq.
niL arTmms (conT.)
2.37 Records, TUMBLER 3, Stations 7-206T through 7-209 .... 702.38 Records, TUMBLE 3, Stations 7-210 through 7-Q2 . ... 712.39 Peak Positive Overpressure, P.2 Ground Level,
T• BIER 3 . . . . . . . . . . . . ... 722.10 Peak Negative Pressure, Pe, Ground Level, TLMBLER* 3 *.. 732.41 Positive Impulse, Ground Level., TUMBIER 3 . . . . 742.42 Arrival Time of Initial Disturbance, tl, Ground
Level, TUMBLER 3 . . . .. . .. . . .. 752.43 Positive Phase Duration, t 4 ., Ground Level, TUMBLER 3 • • 752.44 Negative Phase Duration, t 8 , Ground Level, TUMBLER 3 . . . 762.45 Records, TamBiR 4., Stations 7-200 through 7-213 . . . . 782.46 Records, Tu¶BiLR 4, Stations 7-202 through 7-205 . . . . 792.47 Records, TUKBL2R 4, Stations 7-206T through 7-209 .. . 802.48 Records, TUMBLER 4, Stations 7-210 through 7-Q2 .. ... 812.49 Peak Positive Overpressure, Pc, Ground Level,
Tw)inE 4 . . . . . . ............... .2.50 Peak Negative Pressure, Pe, Ground Level,
T•I•.3R 4 . . . . . . . .•..... .... . . 832.51 Positive Iqmulse, Ground Level., TUM(BLER 4 . . . . . 842.52 Positive Phase Duration, t4 , Ground 1evel, TL14BLER 4 . . . 852.53 Arrival Times, tl, t 2 , t 3 , and t 9 , Ground Level,
TUKBLKR 4 . . . . .... . . . ........ 862.54 Expended Scale of Arrival Times, tl, t 2 , and t
Ground Level, TtUBLER4 .. .............. 87
3.1 Rocket Launcher with 850 Firing Angle . . . . . . . . . 943.2 Assembled Ske Rockets with Nk 3 Motor (Left), Nk 4Motor (Rigt), TUMBLER 1-4 .. .. . .... . .. 94,3.3 Planes of Measurent used in Free-air Pressure-Distance
Analyses . * . . . . . .0. . . . .. .. .. 963.4 Free-air Shock Wave Time-of-Arrival Curve, TUMBIER 1 • 973.5 Shock Wave Time-of-Arrival Curve Along the Ground,
TUMLBIR 1 . . . . . . 0 . . ........... 983.6 Height of Mach Stem vs Distance from Ground Zero,
TUKBLER 1 . . . . . . . .. 0.. . . . . .. . 993.7 Atmospheric Pressure, Po, and Sound Velocity, -o,
vs Altitude, TMBLER . . . . . . . . .. . . .1003.8 Peak Shock Overpressure in Free Air ve Distance,
TIMBLER 1 ........ ............... .... .. 1013.9 Free-air Shock Wave Time-of-Arrival Curve, TUMBLER 2 . . .1033.10 Atmospheric Pressure Po, and Sound Velocity, C0o, vs
Altitude, TUMBLER 2. . . . . . . . . .... .1043.11 Peak Shock Overpressure in Free Air vs Distance,
TLMIER 2 ......... .............. ........ 1053.12 Free-air Shock Wave Ti;me-or-Arrival Curve, TUIBLER 7 • . 107
114.RESI RICTED DATA SECRETATO!41C E.NERY ACT 1946
Security Inforra!t n

SECRETSeturty Informtion
nlIZZOM IONs (coNT.)
3.13 Atmospheric Pressure, Po, and Sound. Velocity, Co,vs Altitude, TUBLERR3 . . . A . . . . . . . 108
3.14 Peak Shock Overpresvare in free Air vs Distance,T•MBLMR 3 .. .. .. .. .. .. .. . .. ii0
3.15 Free -air Shock Wave Tim -of-Arrival Curve,T iUM d,. .. ............... . Ill
vz Altitude., TUKLER 4 ..... . . .. .ll1
3.17 *Peak Shock Overpressure in Free Air vs Distance,TUMBLER . . .. .. ..... . 115
3.18 Particle Displacent Layout, T.KBLER 1.63.19 Particle Dixlacement Layout, TMMBLKR . ............ 163.20 Particle Displacement vs Time, T•MBLER 1 ......... 1173.21 Particle Disptwcement vs Time, TUMBLER 4 ......... . 1183.22 K and Z at Constant Times, T IMBLE 1 .. ........ 1193.23 K and Z at Constant Times, TtMBLER 4 ... ........ 1203.24 Pnm v X, TMBLER 1 . . . ............. 1213.25 Pnu ve X, TMBLHR 4 . . . . ............ 1203.26 Pressure-Tim in Free Air, TUMBLER 1 ... ....... 1233.27 Pressure-Time in Free Air, TUMBLER 4 . . ......... .124
3.28 Effect of a Nearby Surface on Smoke Trail Particle3 otion . .p. . . . . .t. ... Trais fo Sc A 130
3.29 Particle Displacement Smoke Trails Before Shock Arrival,3.30 Par-ticle Displacemen Smk Tril After Shock Arrival,
TtWULMR 1 .... ............. !........ ... .. 131
.. 1 Peak Positive Overpressure vs Ground Range, DataReduced to 1 XT at Sea Level. . . ............ 134
4.2 Positive Impulse vs Ground Range, Deta Rednced to 1 KV4t Sea Level . . . . ..... . . . 135
4.3 Peak Negative Pressure vs Ground Range, Data Reducedto 1 K2 at Sea Level .. . . .. . .16
4.. Arrival Times, tI and t2 vs Ground Range, Data Reducedto 1 KT at Sea Level .................... 137
4.5 Positive Duration vs Ground Range, Data Reduced to I KTat Sea level . . ............... 138
4.6 Peak Positive Overpressure vs Slant Range, DataReduced to 1 KT at 6ea Leve" ......... 139
4.7 Positive Impulse vs Slant Range, Data Reduced to 1 &Tat Sea 1evel . . ................. ... 140
o.8 Peak Negative Pressure vs Slant Range, Data Roeducedto 1 KT at Sea Level ... .................... .. 14l
4.9 Arrival Times, t aend t 2 vs Slant Range, Data Reducedto 1 fO at Sea.ývel ........... ............ .. 142
15
SECRET RESTRICTED DATASez.,ýiy i~fnrmanon ATOMIC ENERGY ACT 1946

.10 Positive Duratio vp Slant Range, Data- Reduci-d to :1.
41.11 Composite -Reduced- Free-eli' A*rIva:L-TIv~e Curvet~
1I.32 Composite Reduced (1 1Kr(Rc') at sea Le-vel) Free-airPressure-Distance Curve, N'EBUIR 1-4 . . . . . . . . .. l-7
4 -13 Refteed p vs. t for TumBLER I and. 4 at a ReducedDistance of 541 ft for 1 KT(RC) at Sea Leve ............ 8
4.14 Q vs Distance, Reduced to I Kr-IRC) aL Sea Lev-•l,TumBLER 1 and 4 (Free Air) .... ........... 149
5.1 Heigk.t of Burst vs Horizontal Distance for 1 KT(RC)Bomb, Curves Based on TINBLER Data .. ......... .... 152
5.2 Height of Buxrst vs Horiwnutaj. Distance for 1 KT(Rc)Bomb, Comparison with High Explosives and Effectof Gage Height .. . . .. 153
5.3 Height uZ Bwrstv vs Horizontal Distance for 1. KYT(RC) atSea Level for 50-15-5 Psi ............. ...... 156
5.l4 Height of Burst vs Horizontal Distance for 1 KT(RC) atSea Level for 40-12-4poi...... . . .. .* ...... 157
5.5 Height of Burst vs Horizontal Distance for 1 iKr(RC) atSea Level for 30-1O-3 psi ...... .... .... .158
5.6 Height of Burast vs Horizontal Distance for 1 1V3(RC) atSea Level for 25-8 pai. ............... ....... 159
5.7 Height of burst vs Horizontal Distance for I KT(RC) atSea Level for 20-6 psi ................ ....... 16o
5.8 Precuraor Sequence, 0.2512 see, TUMBLER . ......... 1625.9 Precursor Sequence, 0.2906 sec, TUKBLER . ....... . 1625.10 Precursor Sequence, 0.4189 sec, TUMBLER 4 . a .. . . . 1635.11 Precursor Sequence, 0.5867 seec, TUMBLER 4 . . . ........ 1635.12 Sketch Showing Construction of Reference Frame for
Precursor Measuenets ......... ..... 166~.13 T~--~-~ii~n of Pcusrand Reflected Shock Wave,
TMwLR. 4 . '............... ... 1675.14 Reflection of a Spheric.1 Wave by a Medium of Higher
Wave Velocity ..... ........... 1705.15 One of the Family of Curves Showing Pf vs P for
Ideal, Reflection of Shocks from a Rigid Surface . . ... 174I r- zro .... +11- Th,,urlar Reflection Region, TUMBLER. 1,
2, ani 4 . ................... 175.17 Frea-mir iftssure Reduced to I IU of II at Sea Level •. . 765.1.8 Free-aiM Poaitiv Impulse (Reduced to I K!P(RC) at Sea
Level) - Paxticlo Displacement Method Compared with TIT . • 180
16RESTRIU 110 FiATA •;i{A I )MIC ENLUIC,Y SECRET •
Security Infk{malion

SECRETSecunty I109=60@
ILIm"R&TON (coNT.)
A.1 Arrangement of Indenter Gage vith Baffle Chamber . . . . . 187
A.2 C~aparison of Indu~ctance and Indenter Gages.,TUMBLEP 3 and I. ..........
B.1 Soke Trails Before Passing of Shock . . . . . . . . . 192
3.2 Tables Requifred for Ccuplete Pressure-~Tim Aia3.Ysis . . . . 1.94
17
SECRET RESTRICTED DATASecurty informlatior ATOMIC ENERGY ACI 1946

SECRETSecurtty Iuformolu
TABI.,L
1.1 Characteristics of T2 MShots 1 through 4. . . . . 2o2
2.1 Carbon .Papr Distribuion ..... . . . .-. -".". . 203
2.2 TUMBLER 1 - Phase Durations,. Positive lipulses., and.Pressuren (Ground Level) . . . . . . .204
2.3 TUMBU 1 - Distances and, Times (Ground Level) . . . . . 2052.4 TUMBLER 2 - Phase Durations, Positive Impulses, and
Pressures (Ground Level) . . .. . . . . . . . .2062.5 TUMBLER 2 - Distances and Tim (Ground Level) . . . . . 2062.6 TUMBLER 3 - Phase Durations, Positive Impulses, and
Pressures (Ground Level) . . . . . . . . . . . .2072.7 TUMBLER 3 - Distances and. Times (Ground level) . . . . . 2082.8 TUMLER 4 - Distance and Arrival Times (Ground Level) . . . 2092.9 TUMBER 4 - Positive Impulses and Pressures (Ground Level) . 2102.10 TUMBLER 4 - Phase Durations and Rise Times (Ground Level). . 23-1
3.1 Photogapjhic Details . . . . . '. 2123.2 Absolute Tivme-of-Arrival of Shock in Free Air and Mach
Region, TMBLER 1 .. . ..... .. . .. . .2133.3 Peak Overpressure - Shock Velocity - Distance, TUMBLER 1 . . 2143.4 Absolute Time-of-Arrival of Shock in Free Air, TUMBLER 2 . . 2153.5 Peak Oerpressure - Shock Velocity - Distance, T L3ER 2 . . 2143.6 Absolute Time-of-Arrival of Shock in Free Air, TWMBLER 3 • . 2163.7 Peak Overpressare-Shock Velocity-Distance, TUMBLER 3 . • . 2173.8 Absolute Time-of-Arrival of Shock in Free Air, TUMBLER 4 . . 2183.9 Peak Overpressure-Shock Velocity-Distance, TUMBLER 4 . . . 2193.10 X's mad Z's in Feet (Film 13083) TUMBLER 1 . * . . . 2203.1.1 X's and Z's in Feet (7i~n. 3383) TLUiBIER 4 . . . . . . .2203.12 zn - Zj, Xn - X lin Feet, TUMBLER . . . . .2213.13 Zn - zj, Xn - Xjin Feet, TUBLER 4. . . . . . . . .2213.114 Calculated, (K.), i . .T 1 .222
3.15 Calculated K, (") ,TUeI~14 . . . . . . . . . 222Ht
3.16 Calculated Pressure, Pn,m, and Distance, X, TUMBLER 1 . . . 2233.17 Calculated Pressure, Pnmw and Distance, X -, TUBLER 4 • . 2243.18 Free-air Pressure-Tim, TfUfMLE 1 . . . . . . . . . 2253.19 Free-air Pressure-Time, TUMBLER 4 . . . . . . . . * 2253.20 Decay Parameter, e, for TUMBLER 1 and "4 . . .. ... 226
4.1 TUMBLER I - Ground Level Data Reduced to 1 KT at Sea Level • 2274n.2 TUMBLER 2 - Ground Level Data Reduced to 1 KT at Sea Level . 228
4-3 TUMBLER 3 - Ground Level Data Reduced to 1 KT at Sea Level . 2294.4 TUMBLER 4 - Ground Level Data Reduced to 1 KT at Sea Level • 230
19
SECRET RESTRICTED DATASecurity Information ATOMIC EN4ERG-Y ACT 1946
Preceding Page Blank

SECRE•
TAL (oooe.)
4.5 Reduced Time-of-Arrival of Shock in Free Air and MachR.gIon- T•J *T_ - ._R 1 .231
4.6 Reduced Ti .e-of -Arrival of Sh ck in Free Air,TUMBLER 2 .. .. . . . . .232
4.7 Redaced Time-of-Arrival of Shock in Free Air,TUMBLER 3 ........ . . . . . . . . . .233
4.8 Reduced Time-of-Arrival of Shock in Free Air,Trmu 4 ..... ....... .... . . . . . . . . 2314
4.9 Reduced Time-of-Arrival of Shock in Free Air,
4.10 Reduced Time-of-Arrival of Shock in Free Air,GRedNOUSE (EASY).. ... .. ................ . . . . .235
4.11 Reduced Free-air Overpressure vs Distance, TUMBLER 1 . . .2364..12 Reduced Free-air Overpressure vs Distance, TUMBLER 2 .23614.13 Reduced Free-air Overpressure vs Distance, TUMBLER 3 ... 2374.14 Reduced Free-air Overpressure vs Distance, TUMBLER 4 . . .2384.15 Composite Free-air Peak Overpressures vs Distance
Eleduced to 1. KT(RC) al Sea Level . . .. .. . -2394.16 Pressures at Reduced Distances, GRIMHOW (DýG); (EASY) . .2404.17 Free-nir Pressure-Time Roducede to 1 KI(RC) at Sea Level
TUMBIR1 i and . . ................. ... .. 241w.18 Values of 1ecay Parameter, 0, Reduced to I KRi
at Sea Lev.l ............... ................ 242
5.1 Distances at which Pressures Occur-Reduced to 1 KT(RC)at Sea Level. ............ 213
5.2 Optimuu Height of Burst for'1 K'T at Sea Level. .P2.. 2435.3 Data for Figure 5.-2 .. .. 415.14. Arrival Tim~ of Precursor and Reflected Shock, TUMBLER 4 : 21455.5 Overlap of Ground Level and Free-air Measurements .. . 2455.6 TUMBLEF .1 - Calculated vs Experimental Values of
Reflected Pressures in the Regular Region ........ 2465.7 TU{BIER 2 - Calculated vs abperimenLal Values of
Reflected Pressures in the Regular Region . . . . ... 2465.P TjBgL'R 14 - Calculated vs Experimntal Values of
Reflected Pie ssures in che Regular Region.................2465.9 Psp (Po -1) for TU TR , . .. ...... .2475.10 Pq "p0 ( -- -l o~BE2 . .......... 247
5.11 Pf o (" ,o -1) for TUMBLER 12 .... ........... 2475- (P0 1) for . .M 4 ... ... 2485.13 Pf - o 1, . . .• . .n
5.14 Pf (- - o,-l) for TmLm 4 ..... ......... 248
20RESTRICTE[I flATA T AFA CrfiviC " ',' ACT, E_.__ RF
Security Information

SECRETSecurity Infomatiu
TABI•ZS (co.)
5.15 Distances at Vhich Pressure Levels occur in Free Air for1 KT(TNT) at sea T•le .. .. .. .. V0.... 2495.16 Comparison of TWMBIER Data with TWT in Free Air . ... 2505.17 Ccmwison of TW'iER Data with TuT for Reflected
Piressures . . . . . . . 2515.18 Coarison of Free-aJi Imullse Iata for Scaled Nuclear
and T Charges . . . . . . . . . . . . . . . 252
6.1 Siunary of Free-air THT Equivalents for TtILER . . . . 252
A.1 TMBLER 3 - Peak Pressure (Ground level) . . . . . . 253A.2 TI•MABR 4 - Peak Pressure (Ground Level) . . . . . . 254
21
SECRET RESTRICTED DATASecurity Information ATOMIC ENERGY ACT 1946

SECRETSourdty Infiwaiti
CRAPTER 1
INTRODUCTION
1.1 GENERAL OBJECTIVES
As the result of blast measurements made on Operation BUSTER inthe fall of 1951, questions arose as 1o the reliability of the height-of-burst curves presented in IA-743Rý! because the pressures measuredwere considerably less than expected and the rise times to the meas-ured maximum pressures were much longer than would be expected frompure shock waves. These height-of-burst curves which were based ontheory, shock-tube experiments, small-charge (HE) experiments, and asmall amount of nuclear bomb data were used by military operationalagencies to select the proper heights for detonating atomic weapons,the proper yield of weapon to achieve particular military objectives,and the criteria for the design of fuzes. The proper height-of-burstinformation we,, therefore, considered essential to the national de-fense; and it was iecided to conduct a series of atomic bomb tests todetermine (a) if the BUSTER results were reproducible, (b) if thecurrent scaling laws could be considered reliable, (c) whether theorigin of the effects noted on BUSTER might be attributed to the ab-sorption of thermal radiation by the ground, to ground shock, or toother phenomena, and (d) whether nuclear bombs at hiah heights of burstgave results comparable with predictions.
1.2 OBJECTIVES OF PROJECTS 1.3 AND 1.5
As part of this operation the Naval Ordnance Laboratory was askedto make two types of measurements (a) free-air peak pressures to serveas a basis for judging the blast effectiveness of the test weapons in-dependent of ground conditions, i.e., to obtain knowledge of theweapons' characteristics so that they could be isolated from the char-acteristics introduced by the geometry and terrain (Project 1.5a); and(b) independent pressure-time measurements on the ground to check othermethods of instrumentation for measuring the actual blast of the weaponsat locations where military targets might exist (Project 1.3). Earlyin the preparation period a feasibility experiment (Project 1.5b), wasadded at the request of the NOL to use a photo-optical method for meas-uring pressure-time in the free air from the motion of rocket trailswhich were hit by the shock wave. The importance of this technique isthat it might provide pressure-time data in e region where it wouldbe almost impossible to locate gages by conventional methods. Suchdata would be most useful for an understanding of the blast char-
i/ See references, page 199
23
SECRET RESTRICTED DATASecurity Information ATOMIC ENERGY ACT 1q46Preceding Page Blank

.0
-SECRIET.
act-e4istie of atomic weakpons. The methods esiployed in theme p~rojedotwill be described in brief below a~nd in detail in Chapters 2 and3.
1.3 METHOIIDS
Because of the limited preparation time for this operation, abouxttwo months, existing instrumnertation and proven methods were employedwith as little modification as possible. The shock-velocity methodfor memb"uInC free-air pealk pressures from photographs of rocket smoketrails as seen through the shock,'4sve bad "been previously used on Op-erat ions GMEMqflUSE2./ and JA1NGIY,21. The Bendix inductance gage systemto obtain pressure-time data emrployed a cooination of to,_91niques manayof vihi94 were used on Operations SANDSTONE21, GFJ=OUSWh2, andJANqGLEJ/. Although it was not part of the original plan, the firingof Shots 3 and 4~ provided suitable -test conditions for indenter aewhich are being developed. by the ROL to measure peak pressureV§1fly/
* These slhots were, therefore, instrumenr..d by a limited numiber of in-denter gages mounted near the Bendix pressure-time installations. Dis-cussion of this work is limited to Appendix A.
1.4~ TEST CONDr]ýIONS
* ~All boabs were dropped from aircraft at the Nevada Proving Groundsduring April and. Mayj, 1952. The first shot was fired on I April 1952over Frenchman F),it whiich was light colored., flat, smooth, and a rel-
J.. atively stable tar~ct area. Th~e other three shots were fired on 15and. 22 April and 1 May over area. T-7, near the siLte of the BUSTER shots,which was, in general, rougher, darker, and dustiLer than the FrenchmanFlot "rea. Details of the location of the bursts, the size of theweapons as used for scaling data, and similar parameters of the shotsare listed. in Table 1.1.
1.4.1 inductance Gages
Ali- inductance gages vere mounted flush with the ground35 ft to one side of the blast-line towers, except that on Shots 3and 4 two addltlional stations were installed in a region severalhunidred feet to the side of the blast line where the sage brush wasless disturbed than that on the main blaot line. The purpose of theseadditional stations~ (7-Ul and 7-Q2) was to get data from terrain mnoresimilar to thiat of the BUSTER tesLv Lbuai the blast, line terrain. Theexact locationv of all Instruments relative to each burst (ground andblant ranges) were calculated on the basis of ir-formation given inTable. 1.1 and arc tabulated in the appropriate tables of results givenin Chapter 2. (Although ditstances are given to the nearest 0.1 footý%
RESTRICTED nATA t~tRETSecurity Information

-SECRETSecurity information
in the tables, the precision is only about t 1.0 foot; hence Such data
may be rounded off.)
1.4.2 Rocket Lines
Two rocket lines were employed on each shot - one for theshock-velocity measurements and one for the particle motion measure-ments. The layovt of thaa 19pneher linen relative to the blAst linesnthe 200 stations, and the cameras are shown in Figs. 1.1 and 1.2.
1.5 SM94ARY OF INSTRUMENT FE1FOR AZMCE
Projects 1.3 and 1.5 were exceptionally successful in that allinductance gages worked on all shots &ud all required film records ofrocket trails were readable. Actually thare were a few rockets on thefirst two shots which failed to smoke but this in no way reduced thereliability nor amount of significant data. Film broke on one cameraused in Shot 2 but there was adequate coverage from a back-up camera.In general the results of the inductance gages checked those of otherpressure time gages, as indicated in the preliminary reports of othergroupl=_/. Free-air pressure distance curves were obtained from shock-velocity records on all shots so that a generalized reliable free-aircurve was made. Free-air pressure-time curves were calculated fromthe particle motion films from two shots, and data are available forccmputing such information from the other two shots when and if theexpenditure of the effort seems warranted. The indenter gage trialsdemonstrated a successful baffle for protecting the gage from sandblast,radiation, and other mechanical disturbances; it also demonstrated thatadditional laboratory work was needed for a complete understanding ofthe use of these gages.
1.6 CONVERSION FACTORS AnD SCALim
To scale effects from one weight charge to another and from chargesfired at different altitudes to sea level a certain number of almostarbitrary decisions have to be made as to the exact method to use. Themethod of scaling for altitud& and kilotonnage usee in this report isthe one reccmmended by paragraph 7 of referencs 16 which states thatpressures at high altitude targets can be converte4 to those at sealevel by multiplying the high altitude values by 164-- and that dis-tances for a one XT bomb at sea level can be calcuMted from those atthe target for a bomb of weight Wo by multiplying the distanceby ([po.) 1/3 where po is the atmospheric pressure at burst
\T4-.7 Wo /height. There has been some informal discussion as to whether po should
25
SECRET RESTRICTED DATASecurity Infoufnation ATOMIC ENERGV ACT 1940

sicurity inkrmation ,""S-C...T...'
STA 231 (SHOOK VEL)
PSTA 200
746,250 FT3,O/ " E 714,000 FT
"hbe/ 002, 3,078 FTr
v Co
STA 2 30o A
v- 0STA 232 o
(PARTICLE .NOTION) -U. -
7,920 FT STA 3614z~ G AMERA
0- MN738,351 FTE 710,987 FTZ 3,143 FT
0 N ----C4
00
U-
0
STA 362
CAMERAN 745,860 FTE 703,948 FTZ 3,098 FT
IVOTE; (I) STA 231, LAUNGHERS AT 250 FT INTERVALS
(2) STA 232, LAUNCHERS AT 400 Fl INTERVALS
(3) A,EBASE POINT 70 FT, S80-44-46W FROM STA 200
(4) COORDINATES ARE THOSE OF NPG, MERCURY, NEVADA
Fig. 1.1 Area "F" Test Layout, Project 1L.5a and 1.5b, TLWBIER 1
26
RESTRICTED DATA %SECEDTATOMIC LNFRGY A;T 1946 lScur'ty Information

-SECRET..Security Information
LINE OF FIRE m \ STA 7-231 (SHOCK VEL)
0 -STA 7-200ý/L IE OF -1 IN850,424l FT
/FIRE t SHOT E 688, 685 FT5TA 7.230-1k 121 . 4,19 3 FT.
SHOT 4 "q j4-SHOT 3 -- 7-232 (PARTICLE MOTION)
0.0wO0zo
LL.
0. (3,200 FT0' N \ STA 7-361
N a- CAMERA< • N 839,274 FT
E700,113 FT0-. Z 4,267.8 FT
001 U- STA 7- 362
CAMERAN 833,910 FT
E 686,838 FTZ 4,024.7FT
,NOTrEc (I) STA 7-231 SHOT 2, 3,000 FT LONG, LAUNCHERS AT 250 FT INTERVALS.SHOTS 3 6 4; 4,800 FT LONG, LAUNCHERS AT 400 FT INTERVALS.
(2) STA 7.,232 SHOT 2; 1,200 FT LONG, 500 FT FROM POINT B TO Ist LAUNCHER.ISt 4 LAUNCHERS AT 200 I-T INTERVALS. LAST 2 AT 400 FTINTERVALS. SHOT 4; 2,850 FT LONG, 600 FT FROM POINT"B" TOISt LAUNCHER. ISt 4 LAUNCHERS AT 285 FT INTERVALS, LAST4 AT 570 FT INTERVALS. SHOT 3, 2,280 FT LONG,600 FT FROMPOINT A TO I St LAUNCHER. I St 4 LAUNCHERS 265 I-1 INTERVALS.LAST 3 AT 570 FT INTERVALS.
(3) A 306 FT SO-46-41 E FROM STA 7-200B 92 FT SO-46-41 E FROM STA 7-200
(4) COORDINATES ARE THOSE OF NPG, MERCURY, NEVADA
Fig. 1.2 Area T-7 Test Layout, Projoct 1.5a and 1.5b, TUMBLER 2-4f
27
SECRET RESTRICTED DATASýuuity Informahtior ATC?.IC INL-RGY ACT 194G

SECRET
be the atmospheric pressure at burst height, Itarget height, or somecompromise value. Although the latter is probably most-realistic, .for..
method of reference 16 is being used. No mention is made in reference16 of methods of scaling time and impulse so that the following rela-tions, based on methods similar to those discussed in references 17and 19 are being used in this report (Table 1.1). (in all cases thetatmospheric pressure at burst height is considered the suitable valueto use.)
If iand Yi prevail at a distance R1 , for certain values of pI,
Cl, and W1 , and it is desired to convert them for other atmosphericconditions and charg~e weights P2 , c2 , end W2 at R2, then
I (wJ 1/3(p\Z 2/3 (1.1)
RR 2 (W,\ 1/3 (p2 1/3 (1.2)
.l .- R,:? /!2 1/ 13
1(1.4.)
where I - Impulse"- - Time
R - Distancec - Velocity of soundW - Weight of chargep - Atmospheric pressureT - Temperature, °C
It should be noted that the radio-chemical kilotonnages used are thoseprovided by the Armed Forces Special Weapons Project on 31 July 1952and do not agree with those based on fire-ball measurements which weregiven in the prelimInary reports. For conversion to sea 'Level the at-mospheric presture at sea level was assumed to be 14.7 psi, and thetemperature was assumed to be 293°K (i.e. 200C).
1.7 PERSONNEL AND RESPONSIBILTIES
To execute these projects the field party was sent out to Nevada
28
RESTRICTED DATA SFCRETAlOMIC LNI-RGY ACT 1946 Security Informalion

SECRETSecurity Information
in three stages - an advance party to lay cable and receive shipping .the main party to set-up and conduct the 'tMI' e- n -d a hippingparty to pack equipment for return to the NOL. The advance party ofH. W. Baggott, C. L. Karze1, and E. G. Nacke was under the directionof LT G. W. Robinson, USN. The main party, under the direction ofC. J. Aronson, was as follows:
C. J. Ar'onson Project Officer (1.3 and 1.5)J. F. Moulton, Jr. Group Leader (1.5)J. Pates Group Leader (1.3)H. W. Baggott Cable and Power (1.3)E. E. Burk Electronic Technician (1.3)E. J. Culling Associate Group Leader (1.3)P. Hanlon Analysis (1.5)C. L. Karmal Instrumentation and Cabling (1.5)C. C. Little (T1JGf•UN) Instrumentation and Analysis (1.3)B. M. Loring (LT, USN) Instrumentation (1.5)J. D. McClendon(LCDR,USN) Administration and Analysis (1.3 and 1.5)J. R. Mitchell Logistics (1.3 and 1.5)E. G. Nacke Cable and Power (1.3 and 1.5)F. J. Olimr Instrwmentation ard Ana.3sis (1.3)G. W. Robir. ,on (LT, USN) Cable and Power (1.3)E. R. Walthall Associate Group Leader (1.5)
The shipping party sent out by the Supply Department of the NOL com-prised two packers, Curtis Beacks and H. L. Terry, to prepare apparatusfor tne returL shipnext.
1.8 COSTS OF FROJECTS 1.3 AND 1.5
As a guide for the planning of future tests of this nature thefollowing costs of this operation are listed.
Labor and Material $39,208Capital Equipment 1,783Communications Fiscal 174Shipping and Packing 31952 18,759Travel 12,754Clerical, Supervisory, Maintenance _44,900Reports, Analysis and Close-out work -
Fiscal 1953 30,000 (est.)TOTAL CIAJGES AT THE NOL $147,578
Trailer Shelters (2) 56,221Rocket Control Shelters (2) 10,368
29
SECRET RESTRICTED DATASecurity Information ATOMIC ENERGY ACT 1046

-SECRET•---•Smeurity lintrmatiun
CAbling and Trenching F-Area 9,319Ce•bllng w-d Trenching 7-Area 15,384Rocket Lines 1,600Cameret Stations (2) 15,615Support Job Orders 10 000
TOTAL CHAIGES AT THE MP $'118,507TOT~AL $2660q8
30
RESTRICTED DATA SECREiATOMIC ENERGY ACT 19415 Security Murmation

SEC.RETSecurity information
GRODUND LEV3T, PMESMR-TIM~ WOZSUREHMS(PROn . .1. 3 ...
2A1 INSTRUENTATION
2.1.1 General
The instrumentation system used by the Naval Ordnance Lab-oratorgon Operation TUMBLER was the system developed for OperationJAJAGLEU_ with minor modifications. The JA4CLE system was an outgrowthof the system used on Operation GRFWMOUSU2/ and used many of the samebasic components. The system featured the use of frequency modulationfor tranmnission of page signRls over long lengths of cable to a re-mote position where these signals were recorded on multi-channel mag-netic tape recorders. The blast line layouts are shown in Figs. 2.1and 2.2. The system has proved itself to be highly reliable andfairly free from the effects peculiar to atomic explosions.
2.1.2 Gages
The pressure gages used were modified Bendix Type TTP-3Avariable reluctance pressure pickups (Fig. 2.3). The modificationwhich was found advantageous for use on Operation GREEMOUSE was ac-cepted and no further improvenrents were attempted. This modificationconsisted of adding a suitably restricted inlet tube to reduce aircolumn and diaphragm ringing. These gages produtced an oscillator fre-quency shift of approximately 7.5 per cent when ncmina.1 rated pressurewan applied. Gages were used having nominal ratings of 5,10,15,2O,30,60, and 100 psi. In general, these gages were used and calibrated forpressures up to 150 per cent of the nominal rating.
Sample gages of each pressure range, except 100 psi, weretested in the NOL shock tube, and the resulting transient character-istics observed. The gages exhibited ring frequencies from about 700cps for a 5 psi gage to 1330 cps for a 60 psi gage. The diaphragm wasessentially undamped an& would ring for several cycles, but the anpli-tude of this oscillation was reduced materially by the choice of thesuitably small inlet tube diameter.
Foa the 5, 10, and 15 psi gages this ring amplitude had apeak value not exceeding 10 per cent of the applied step of pressure.For pressures which had rise times longer than 2 to 3 msec this ringamplitude was considerably reduced. The higher range gages had greater
31.
SECRET RESTRICTED DATASecurily Inlormation ATOMIC ENERGY ACT 1946

SECRETWSu0uity Inot•mation
TRUE GROUND TRUE GROUND
ZERO--- 7ERO ---
STATION DISTANCE (FT) y STATION DISTANCE (FT)
F-200 0 0 7-200
TARGET7 - F-201 250 TARGET •75
ZERO {6 F -202 500 ZER0O 1 2' F-203 750 7 LT-20T 750
F-204 1.000 0 7-213 1,125* F-205 1,250 1
F-206 1,500 * 7-202 1,500
*F-207 1,750S-208 2,000
.. Fr-' 208~ 2,500 * 7-203 2,250fF- 209 '2,50IF-o209 TJ I
41 "1 30 7-QI 2,916F- 210 3,000 7-204 3,000
0 7-02 3,686
* 7-205 3,750
0 F- 211 4,000
6b FT ;-t• .m2o7-2 o0
TRAILER 57000
REVETMENT 5,000 7-207 5,250
BLAST LINE, TUMBLER I
* 7-208 6,000
7TEST X I(FT) - (FT)
1 122 67
2 -107,4 -126.3 * 7-209 7,500l
3 108.3 - 100, 24 126.6 -164.3
a 7-210 9,000
35 FT
7-211 12,000TRAILER 12,050REVETMENT
BLAST LINE, TUMBLER 2,3, 0 4
Fig. 2.1 Blast Line Leyouts for operation TUMBLER
32
RESTRICTED DATA SECRETATOMIC ENERGY ACT 1946 Security Inlrnmation

SECRE[
Sa~uij IitmaSah
FU. 2.2 Cable LoyIng
GASE 846K th INLET TUBE
PIAPHRAG.M Sk PAD)
(W-A~E BODY
0 --R ING
CLAMPING RING---#
ASSEMBLED GAGE
Fig. 2.3 D~endlx G~eV and~ ItS Conztruc~t iOA
33
SECRET RESTRICTED DATASecurity Informition ATOMIC ENERGY ACT 1946

-SECRETSeciiiv-fJhf0 imtlon . ....
ring amplitudes, more diaplragm damping, eand exhibited some inlet tubeL1ringing Vulich produced a coupled resonance effect. ý(fig. 200.)
All gages were factory calibrated for a particular ambientteaerature and pressure which were noted. Field calibrations, how-ever, were taken and used for all masurements. This was thought ad-visable since the gages had a built-in air cavity, sealed at the timeof manufacture, providing the reference pressure. This sealed aircwvlty made the gages •eusltive to both ambient Lmqzperature and barom-etric pressure, so that the center frequency of each oscillator had tobe set at the time of field calibration. Those changes in center fre-quency which resulted from variations in barometric pressure and tem-perature were used to locate the new pre-shock reference point on thenon-linear gage calibration curve. The pressure standards used forfield calibration were a mercury manometer up to 15 psi levels and a"dead-weight calibrated Bourdon tube dial gage above 15 psi. A sketchof the cailibration set-up 1.s ihown in Fig. 2.5.
The gage inlet tube was mounted flMsh with the surface ofa steel cover plate (Fig. 2.6). A short length of rubber hose com-pleted the seal and provided some shock mounting for the gage. Gageinlets were kept sealed until a few hours before the test. In loca-tions where burning was assured, carbon paper was fastened over theinlet to be burnt off by the thermal energy before blast arrival. Toincrease Lbe assurance uif burnimg, the carbon paper was humped overthe inlet tube providing a small area at least, with decreased angleof incidence (i.e. more nearly normal) to the thermal energy. Thisseemed to be an excellent way to protect the gages against dirt andsand entering the inlet tube before shot time. Although there was nooperational evidence of sand causing gage malfunctioning, it was con-sidered to be a ba.TrArd. The carbon Paper protection proved to besatisfactory, and no disturbance of the pressure signal on the recordscould be attributed to the presence of the carbon paper or its residualnsh. Table 2.1 gives the stations at which carbon paper was placedover the gage inlets for protection or on the cover plate as a control;the thermal results are also given. (In reference 26 for Operation1IUTMR, Table C.3 shows that carbon paper was totally destroyed for araormally incident thermal energy of 2.9 cal/cm2 and Ihat laboratorytests indicated the critical value to be 0.78 cal/cm:. On OperationTWKBLER in locations where normal incidence was assured, burning wasfound for thermal energies as low as 1.45 caa/cm:2; however, for atest patch of carbon paper with an angle of incidence that could havebeen as high as 820 from normal in an area of 9.0 cal/cm2 , no burningoccurred. The computed normally incident energy for this station
3kRESTRICTED DATA SECRETATOMIC7 ENERGY ACT 196t i
Secuity Information

SECRETSecurity Information
GaW N36 Out~put with 9.2 psi Step Applied for5 awec by NOL Shock Tube *1000 cps Ti"I "St Trace
Gage N59 Ouitput With198piSoAplefr5 msec by ?WOL Shock Tube. 1000 cps Timing Trace
Fig. 2.4 Troxisierxt Responsae or Bendix Gages
35SECRET RESTRICTED DATA
Security Information ATOMIC ENERGY ACT 194,

SECRETSecurity Information
Ir00
I0.
z.w
WfLL LIJ
Z
ww C
w.~
w
44 0 /
wk
M -j 36RETIC E DAA SEREATOMI CNLYAT14 o~rt nomto

SECRETSecurity leformtloo
LIII
00
00
LuW
w
37
SECRET RESTRICTED DATASecurity Intomimtion ATOMIC ENERGY ACT 1940

SECRETSecurity Informiation
00
w4w I I I "
U38RESTRICTLD WAASCE
ATMI ENRG ACT -4 SeuiyInomt

Sedly Iitlufuatiw
Fig. 2.9 Instrment Trailer in Revetment
vas 1.26 cal/c:2. Thermal data were taken from reference 11.)
2.1.3 Oscillastor-AMplifier
In the field a one tube, shunt-feed, Hartley oscillatorccmprised the signal source, the tapped inductance of the gage pro-viding the entire inductance for the 14, 500 cps frequency-determiningcircuit. A triode amplifier was incorporated to insure adequatepower for simgal transmission. This oscillator-amplifier unit, exceptfor simplified transmission line coupling and the addition of a by-pass condenser to insure vigorous oscillations at the expense of in-creased carrier distortion, was identical to the oscillator-anplifiersystem used and carefully studied for Operation JABGM. A schematicliagru of the oscillator-mplifier shoving cable utilization isshown in Fig. 2.8, and a photograph shoving the oscillator-amplifierand gage mounted on the baffle cover-plate is given in Fig. 2.7.
Standard MCcS-6 cable was used except for two lines ofunshielded 'WD- twisted pair telephone wires. The telephone wire wasused experimntally to determine the feasibility of using it exten-sively in future tests. Its use would reduce cable costs materially.All cables were laid in trenches and covered to a depth of 18 in. to
39
SECRET RESTRICTED DATASecurity Information ATOMIC ENERGY ACT 1946

SECRETSecurity Information
I e
W.,,
Fig. 2.10 Inside View of Instrumentation Trailer
afford mechanical and thermal protection (see Fig. 2.2).
2.1.4 Recordixg System
The system and equipmnb for recording the signals re-ceived over cables ;rcom the gage stations wmre the sams as those usedon Operation JA1GLrJ. The system was built around the Model 8-3041Ampex multichannel magnetic tape recorder. Eight of these recorderswere assembled in a single inatr, ment trailer, along with associatedpower, time base, fiducial marker, remote control, and other support-ing equipmient. (See Fig. 2.10). To protect the trailers from blastand radiation hazards, they were housed in urdergrou&A revetmentshaving inside dimensions 35 ft long, 11 ft wide, and 12.5 ft high(Fig. 2.9). Figure 2.1L is a block diagram showing the use of alter-nate recorders for back-up, and the interlaced station hookup to pre-vent loss of data f.rom alacent measuring stations in case of failure.The intelligence bandvi&th of the recording system was 0 to 1500 cps,
k0
RESTRICTED DATA ,.,-,,'-ATOMIC ENFRGy ACT 1946 S;rilly Irnfomnation

SECRETSecrMt Isfourutim
IRECORDING SYSTEM NO. I
RECORDER[ IA 0I RECORDER______I lB.
VRECORDING SYSTEM NO. 2
fRECORDER P______202
I 203I RECORDER <
21 20B
---------- ----IRECORDING SYSTEM NO. 3
I IRECORDER _____
3A m- 0
I RECORDER ____n__
31320
VRECORDING SYSTEM NO. 420
I RECORDER 0214A I4B
-- J TYPICAL GAGE
GAGE SIGNAL PATHS STATION HOOKUP
Fig. 2.11. Block Diagru Sbwving Signal Paths and Interlaced. StationHookup
141
SECRET RESTRICTED DATASecurity II"formabon ATOMIC ENERGY ACT 1946

SECRETSecurty/ Iuflmtian
leaving the pressure gage as the limiting factor in determining over-all system response.
The time base equipment consisted of 400 cps and 1000 cpstuning forks, the outputs of which were recorded simultaneously onall tapes. Similarly, signals from two photo-electric circuits (BlueBoxes) generating zero-time marks and two signals derived from a minus2.5 second relay signal were recorded on all tapes to furnish c nfiducial marks. This timing and fiducial marker system is shown inthe block diagra. of Fig. 2.12.
2.1.5 Power
Storage batteries provided power for all equilnent duringthe tests giving complete independence from outside power sources. Toreduce data loss i. case of failure, four independent power systemssupplied power to four coplete recording systems. Except for fidu-cial and timing signals, each system could provide complete function-ing of one quarter of the data channels. A block diagram showing thepower system and utilization of the remote control relays is shown inFig. 2.13.
2.1.6 Playuack and Data Reduction
The magnetic tape records recovered from the instrumenttrailer were returned to the base cs~m where the reproducing equip-ment was set-up. (See Fig. 2.14). By use of an Ampex Model S-30142Reproducer, the frequency modulated signals from individual datachannels and the fiducial marker channel were recovered and fedsimultaneously into two discriminators. The discriminator outputswere fed into separate galvanometers of a Century Oscillograph,Model W08, which provided continuous timing lines from a 100 cpstuning fork. During playback the magnetic tape reproducer speedwas manually controlled, keeping the recorded 400 cps or 1000 cpstime-base signals in step with a similar fork-generated sigaal inthe playback equipment. In this way proper playback speed vasassured, thus compensating for any tape shrinkage or variation inrecorder speed.
The records we:- -Il1ved back with an oscillograph paperspeed of approximately 7 in. per sec for studying gross effects,measuring arrival times, positive durations, negative durations, andnegative peak pressures. A paper speed of about 60 in. per sec wasused to obtain better time-base resolution xwar the peak so that ajudicious choice of the short duration positive peak could be made and
42RESTRICTED DATAATOMeIC ENERG ACT 1946S RT
Security !rtgor-aticn

SECRETSecurity Information
I I
SECRET RESTRICTED DATASecurity Information ATOMIC ENEHiGY ACT W94e

SECRETSecurity Information
F]F
J 0
RESTRICTED DATA SECRETATOMIC ENERGY ACT 19465 Security Information
I I II If

SECRETSecurity Information
14.5; KC
2.3 OR 3.9 xcFIDUCIAL MARK
DISC. 0-
OSCILLOGRAPHSTRING SELECTOR
STRIANMI FOROCSILLO{IRAPH I ý
WIEN SCOPE
LINE VOLTAGE
AMPEXSTABILIZERMIFEX FOR T)ISC.
TAPE REPRODUCER ,,MO)EL S-3042 AUTMATI-CSTAFnT AND I.. FREQUENCY
CALIBRATIONo. -- CONTROL -- STANDARD
FREQUENCY STEPCALl BRATI ONOSCILLATOR
400BP AUTOMATIC START
ITAND CALIBRATION
OSCILLATOR
POWER SUPPLY
12 VOLT 12 VOLTBATTERY BATTERY BATTE•"Y
L4 CHAROM*
Fig. 2.14 Magnetic Tape Playback Block Diag=
45
SECRET RESTRICTED DATASecurity Information ATOMIC ENERGY ACT 1946

SECRETscurty Inormatim
the rise times measured.
Amplitude calibrations were provided automatically at thebegimni of each oscillograph record by a step calibration generator.This unit produced eight equal sB.eps of 290 cps each, covering thefrequencies from 12,470 to 111.,790 cps. To obtain pressure values fromthe reccrds, the amplitude of the trace was measured, converted into afrequency value by means of simple ratios from the calibration sienals,and then this frequency was converted into a pressure value by meansof the gage calibration curve which plotted pressure versus oscillatorfrequency.
2.1.7 System Errors
It is estimated that an amplitude on the record could beconverted to a pressure with an accuracy of t 2.6 per cent of thepressure input or t 1.4 per cent of nominal gage rating whicheverwas larger. Choice of the points to be read were subject to consid-erably greater variation because of the extraneous signals introducedby the instrumentation system and the irregularities in the pressurewave. The points read on all records obtained on this operation werepoints believed to be the most significant as selected by methodsconsistent with previous practices used at the NOL, which were basedon known characteristics cf the overall system as determined by lab-oratory and shock tube tests.
Measurement of the frequency of all vacuum-tube tuningfork. used in controlling the time base was made with a crystal con-trolled oscillator with an accuracy of 1 part in 105. The short timestability of the three forks was sufficient to maintain an overallcorrected time base accuracy of t 0.1 per cent. The measurable cor-rection was -0.392 per cent and was applied to all time mea~arements.The time base resolution on high-speed records was 0.2 msec and onlow-speed records, 2 msec.
In the impulse calculations it was recessary to considerthe fact that the oscillograms of the pressure wvires were distortedsomewhat because of thc non-linearity of the gages. This resulted inthe area under the p-t oscillograms being smaller than the areaswoulu uavc been '- the pressures had acted on Wges with linear char-acteristics. The actual pressure-time nistcries could be recuns-ructedonly by a teious replotting of the records point by point. This re-plotting was avoided by assumin that the actual pressure-time func-tions were triangular and determi.-ng exact corrections for theseassumed p-t curves, a, shown in Fig. 2.15. These corrections werethen applied to the area measuremen+t T thie - ,- i-t oniýi1r-
246
RESTRICTED DATA SECRETATOMIC ENEF,Y ACT 11 Security Information

SECRETSecurity Informalion
The difference in the correction factor required for the triangularwave shape sa the actual p-t curve was only a second order effect.A :ev records plotted point to point to check the validity of theassumption and procedure resulted in good agreement. The ma~xmiumcorrection ior any record increased the area (and impulse) measuredon the oscillogram by 15.7 per cent, while the average correctionwan about 7 per cent. The average of at least two readings was usedfor each record area measurement; the error in area measurement wasestimated to be 3.6 per cent. Since the area was multiplied by thepeak pressure, which had an accuracy of 2.6 per cent, the final im-pulse accuracy was approximately 4.5 per cent, i.e., 96 per cent ofthe impulse values had an accuracy of t 4.5 per cent or better.
2.1.8 Recomendations for Instrumentation Improvement
Although the NOL system used for measuring pressure asa function of time on Operation TUMBLER had a high degree of reli-ability, several features are subject to improvement.
The signal-to-noise ratio should be increased by usingwider frequency deviation, an improved tape recorder, or a fluttercmensation scheme. This would increase the dynamic range of thesystem, a vital factor when amplitude predictions are uncertain.
A reduction in the number of conductors necessary tooperate a gage station and the use of an inexpensive unshieldedcable would reduce coats materially. Although the experimentalchannels operated on TUMBLER using unshielded cable showed no illeffects, there are unanswered questions about the possible effectsof cross-talk when such cable is used on more than tvo channels.
Automatic control of the tape speed during playback in-stead of the present manual control would offer improved base linedad time base stability.
More extensive use of automatic start, calibration, andrecord length control In playback would be desirable.
The gage is subject to considerable improvement. Itwould be desirable to use a gage with Improved frequency response,better damping, better linearity, and one capable of producing widefrequency deviation. Since all known gages that fit into an FMsystem leave much to be desired, it would seem that vork on thistype gage might prove rewarding.
The data reduction for TUMBLFR has all been done manually.
h7
SECRET RESTRICTED DATASecurity Information ATOMIC LNERGr Y ACT 1946

SECRETSac~r't
Stcrq 11~ 0
0.
M w~ <
U' a. <iw~ <~z
Io I
w 0 r f0 -JLLW
>-cra:wi
o ? Is_ ___
n'-3fS~- 000 w C0
ZD U'X
icr)
IM-
o-e--8fSS38id-
RESTRICTED DATA SCEATOMIC ENERGY ACT I.1"6 Security Information

SECRETSecurity Information
For a large program isom mechanization should be attempted. The useof a Tele-reader to transfer data to IM cards is one approach. Theburden of rapid data reduction in the field could be relieved somvewhatby the use of an electronic integrator for impulse values and possiblyby an electronic means of locating and computing peak pressure andtime duration.
The complete instrumentation system functioned satisfactorily onthis operatiog resulting in 59 records produced by the 59 gages used.These recor4s are reproduced throughout this chapter. Complete sboakdata were obtained from all records but one. The oscillator-amnlifierat Station 7-201 on TUMBLER 3 behaved erratically approximately 50milliseconds after the arrival of the shock wave producing spurioussignals (Fig. 2.35), so that no determinations of positive phase dur-ation and impulse, and negative phase duration and pressure were madefrom this record. However, no information was lost at this distancesince the back-up station, 7-201 T, functioned properly.
The cable experiment described in Sec 2.1.. proved to be highlysuccessful. The stations using telephone wire for signal transmission(T appended to station designation) showed no difference in pick-upcharacteristics when compared to the stations using shielded MCOS-6cable (see Fig. 2.26). Any extraneous signal which may have beenpicked up on TUiBIZR 1, 2, and 3 had no effect on the PH signal; onTWEBLIR 4, the telephone wire circuits were affected to the some de-gree as the MCOS-6 circuits.
* To show the camplete press-rne-time history at each station in aform suitable for publication the magnetic tape records werf re-runusing a low-speed paper feed on the string oscillograph thus coress-ing the time scale. The amplitude scale remained the same as on theoscillograph records used for data analysis. The high-speed recordinserts of the initial peaks are photographic reproductions of ceae-ful tracings of the original high-speed records used for analysis andhave approximately the same wmplitude scale as the low-speed records.The reader io cautioned against scaling any of these reproduced re-cords for quantitative values since gage calibration curves andcorrection values are not included in this report. The original datawith all necessary curvew and correction factors are available forstudy at the Naval Ordnance Laboratory.
149
SECRU RESTRICTED DATASecuritY Ilformation ATOMIC ENERGY ACT 1946

SECRETSecurity Information
To read the records obtained in this operation, considerableJudgment bad to be exercised in the choice of the points to be read soas to distinguish among background noise in the system, gage ringing,and true signals. In. general, the procedures used in reading therecords were as follows:
(a) Where there appeared to be a clean shock as shown in the re-cords for TU1MBLEB 2, Stations 7-203 and 7-204 (Fig. 2.27), the peakpressure vas considered to occur at the time and have the v&lue in-dicated by smoothing a line through the center of the decaying signalfrom right to left until it intersected the initial signal rise. Thisdecaying signal was due to gage ringing, and it was superimposed onthe forcing function. The smoothing process was the attempt to ex-tract the forcing function - in this case, the pressure signal - fromthe composite signa3.
(b) Where thare appeared to be excessive overshoot as in TUMBLER 2,Stations 7-205 and 7-206 (Fig. 2.28), the smoothing process was alsoused; however, the first upswing was weighted more heavily than in theabove case. There was justification for this in terms of the systembehavior and therefore the initial high amplitude spikes were consider-ed to be a composite of gage ring and high short duration peaks ofpressure. Indeed, high peaks of short duration had been recorded byother instrumentation systems at the onset of such records.
(c) Where there was a pecularity about the initial rise partic-ularly careful judgnent had to be used in establishing a smoothedline. On some records, such as on TUMBLER 1, Station F-202 (Fig.2.17), moothing was necessary to filter out the recorder and play-back flutter; on other records, such as TUMBLER 4, Station 7-201(Fig. 2.45) for instance, the smoothing was done only to establishthe significant peak-pressure wave shape - the individual short dur-ation peaks and oscillations were considered to be real pressure in-duced signals.
(d) In reading phase durations, some difficulty was experiencedin determining the exact point where the signal trace intersected thebase line. This was particularly true for negative phase durationswhere the intersection of the two traces took place at a very smallangle because of the long durations and small aiplitudes. Because ofthis lck of resoltion, neeative duration times may be in error byas much as 0.1 to 0.2 second. This may account for the large degreeof scatter evident in the negative phase duration plots in Figs. 2.24,2.33, and 2.44.
It must be re-emphasized that considerable Judgment was required
50
RESTRICTED DA"T"A L nLTATOMIC ENERGY ACT l146 Security Information

SECRETSecuity Information
4-
015
0
4-T
SECRET RESTRICTED DATASecurity Information ATOftIIC IENIEIAGy ACT 1946•

SECRETSecanty Inforr.ation
to interpret the records. The values read on all records obtained onthis operation were read at points believed to be the most eignificantas selected by methods consistant with previous practices used at theNOL. This selection was based on known characteristics of the overallsystem as determined by laboratory and shock tube tests.
To assist in the interpretatiou of the tabulated and plotteddata, the various points of interest read off the records are labeledand pictorially defined in Fig. 2.16.
2.2.1 TUMBLER 1
The high and lov-speed records for TUMBLER 1 are shown inFigs. 2.17, 2.18, and 2.19; the numerical results obtained from theanalysis of these records are smmarized in Tables 2.2 and 2.3 andplotted in Figs. 2.20 through 2.25. A study of the high-speed re-cords indicates that there was a definite difference between the risetime characteristics of the close-in and farther-out stations. Theearly stations, F-200 through F-203, showed a relatively long risetime to the maximn- pressure value, averaging approximately 8.5 milli-seconds. Within the resolution capabilities of the instrumentation,this rise appeared to take place with a double step in a manner verysimilar to that encountered at the close-in stations on TUMBLER 4.This suggests that these initial steps may have arisen in a similarfashion to the precursor pe n noted in TUI4BLER 4 and discussedin Sec. 5.2. It should be noted that there was some corroborativephotographic evidence of such a precursor in the results of Project1.5 for TUKLER 1. (See Sec. 5.2).
Stations F-205 through F-211 gave pressure-time recordsof the conventional variety with short rise times, averaging 1.3milliseconds (which is about the response time of the system), andsmooth decays. The oscillations at the early portions of these re-cords were due to gage ringing caused by the rapid application of thepressure wave on the air column aud the diaphragm of the gage. Theseoscillations, although undesirable, indicated the shock nature of theforcing function. Most of the smaller irregular variations iA thetrace arose from characteristic flutter or noise produced by thetape recorders and reproducers.
It will be noted on the plot of peak positive pressuresversus distance (Fig. 2.20) that there is an apparent shift in thecurve occurring between Stations F-203 and F-204. This is interest-ing in view of the fact that according to data from the rocket photo-graphy of Project 1.5, the Mach stem rose from the ground at about
52
REST "iuiru ODATA S['RETATQW,•C ENER@GY AC7 1946 S_

SECRETSecurity Information
30 1_20 2 STATION F - 200
I DISTANCE: 170.7 FT.
S0.5 1.0 1.5 .0 2.5TIME (SECONDS)
20 r• - - - - •220.22 PSI STATION F - 201
10 )isiANLuE: 353.1 FT.
0 0.5 1.0 1.5 2.0 2.5TIME (SECONDS)
15.85 PSI STATION F-202
TIME (SECONDS)
15 r-.1 PSI1-- STATION F -202-
O2 DISTANCE: 588.3 FT.
O 0. 1.0 1.5 2.0 2.5TIME (SECONDS)
15.15 PSI STATION F-2203SECR ET DISTANCE: 588.9 FT.
O 0.5 1 I0 1.5 2.0 2.5
TIME (SECONDS)
Fig. 2.17 Records, TWIBIZR 1, Stations~ F-20 'through 7-203
53
SECRET RESTRICTED DATASecurity Informaio~in ATO(mic ENERGY ACT 194e

SECRETSecurity iormationu
1 2 r 1.91PSISTATION F-2048 DISTANCE: 1078.4 FT.
0.5 1.0 1.5 2.0 2.5 3.0
10.24 PSI
l 4,.* '--**tl I --- STATION F-205
"FrI .o, oDISTANCE: 1326.3 FT.jSEC ..- . .
0.5 1.0 1.5 2.0 2.5 3.0
TIME (SECONDS)
t-.8PSI
9-_____ -. w STATION F -2066 DISTANCE: 1574.6 FT
(fLC• o3
L. ._._.
0.5 1.0 1!5 2.0 2.5TIME (SECONDS)
7.05 PSI
6 ISTATION F-207DISTANCE: 1823.7 FT.
0.5 1.0 1.5 2.0 2.5 3.0TIME (SECONDS)
J.5.63 PSI
STATION F-208
DISTANCE: 2073.0 FT.
-- '2 -
0.5 .0 1.5 2.0 2.5 3.0TIME (SECONDS)
Fig. 2.18 Records, TIILBLER 1, Stations F-204 through F-208
RESTRICTED DATA S, EL.CR E TATOMIC ENE'C_- 194f, Security ,,rrmatiuil

SECRETSacurlty Informa~toiI
4ISTATION F -209
vi DISTANCE: 2571.7 FT.
20 2553 4.0 5
TIME (SECONDS)
i7PSI
4 STATION - 209 T_3 .0DISTANCE: 2571.7 FT.
,,- 1.5 2.0.5 . 40r 5.0TIME (SECONDS)
2.0 2.5 3.0 3.5 4.0 4.,5 5 .0)
0. 2.96 PSI
TIME (SECONDS)
STATION F-211
n IDISTANCE: 4070,0 FT.
......................................... _ l,,,i, __,,..........
1.5 2.0 2.5 3.0 3.5 4.0 4,5 5.0TIME (SECONDS)
Fig. 2.19 Records, TtMBLER 1, Blttions F-209 trou&P -23.11
55
SECRET RESTRICTED DATASecurity Informition ATOMIC ENERGY ACT 1946

SECRETSecafity Infonuatiw'
30 ____ ___ -r
20 T i
TI:101'
77.
a -1:
10 0 0010 ,0050
GRUDRNE(W
>i.22 ez oiie0epe~f~ rudLvl MIF
80 .t. o.js.eodStto..0. Th nras f rsuefo
Mac re-ecio wa-vdne-b-hscre paeet
Th>eod fTALR1soe.a neetn etr
n0 ..ually .eto.e.rosevdi.arbat.tde . .he negativphae o te soc wae as olowe by~.secndpostie pas hain
arL slow------ .....e ..n.. ... m ltd~, a~ rxi ntl e en fte m ishock~~~~~~~~~~.... stegh.n.f.. uainitemdaebtee h nta
positive ~ ~ ~ ~ ~ ~ ~ ~ ~ ~ ~ ... .n.ea.epass.oissovn ntdslaeeto h
Wrtd also ini.e t.sscn...tv hse lhuh hs hr
RESTRCTEDDATA ECRE0- . ' ....... ......

SECRIFT
wout Inorato
I-I H
>A U1 0
SECRET RETRCTD-AT
Secuity Inurmatan ATMIC EERGY ACT14L

SECRETSecuriy Inlannation
2.0-'iii ...I1.0
0. 5
0.2 .....100 200 500 1,000 2,000 5,000
GROUND RANGE (FT)
Fig. 2.22 Positive Impu~lse, Ground Level, TUM4BLER I.
58
RESTRICTED UATA SECRET

SECRETSecurity Information
I~ it .1 i I
ILI N. ii
lit i~100 200 500 1,000 2.000 6,000
GROUND RANGE (FT)
Fig. 2.23 Positive Phase Duration, t4, Ground Level, T§UMBLER 1.
U) lV: 1 i'il
M I ! 1: 1 ;
:.. . . . . . . .. q......1
100 200 500 1,000 2, 000 6.000GROUND RANGE (FT)
Fig. 2.24 Negative Phase Duration, t 8 , Ground. Level, TUMBLER 1
59
SECRET RESTRICTED DATASecurity Informnation ATOMIC ENERGY ACT 1946

SECRETSecurity Inilrmatrnu
1 M , l il IH i l 1 1 1 ; 1 1 i l t : I I
4--,
- 1 1 ;i ,
4 .! : ; 1
20ipooi illo 3I0 40000
GRUDHAGE(T
Fig. .25 ArivalTime f Intial isturancet 1 , GoundLelThBR1
actersticswere imilr to hose ssocitedfithtebbleprepnoeo nudrm1.0xlso., h rgno hi eodpstv
phase111 is1 11ot1 HIown aild its Jtuly isy beo1yfcosdeaion
2.2.2 TULH 21!!
Figs. 2.265 2.27ivald 2.8;thmret of theia Daaaayistubne ar run eel sTIML-
macriedin abc were siianr 2.5 ands raphoialypented int Figbbbe us. 2.29
nomenoles inhunerwaert ysemnosise, thargn toe recors seobined fromiivTtIbase 1. nthiso aros from sthdy fayt tha the presosidresteiountee
onthesecond gho ware clowsper tocthe o epti oducagtirngs tr hawn thnsongs th26 pre2iou shot2.28 this results in lare dreauanalysdeviationsumberingzued inTbyltes prss.4gnl and 2. ndgapialyprsntedte inhFrent 2re-
qonc dhevistiondsho peroducloer bltteoo the rpli aerdange tand pthosc
machines, i.e., a good signal-to-~noise ratio wns obtained.
The preasure-time records indicated smaller irregularities
60RESTRICTED DATA SECRETATO:MIC ENERGY ACT 1946 12uiyInomtn

SECRETSecurity Inforntion
in the wave r-hapes for this shot than for TUBLEIR 1. There was somerounding or flattening of the peaks for the stations in the regularreflection region; however, this distortion of the typical shock formwas continuous and smooth and unlike the step discontinuities encounter-ed in the TLWLER 1 records if data taken extremely close to groundzero (Stations F-200 and 7-2W) are -not ___ a.A T.P 4 -- tc; •.2
continuities of TUMLBLR 1 arose from a weak precursor, it is reason-able to believe they would not exist on TUMBLER 2 where no precursorwas observed, probably because of the higher burst height of thelatter shot. In the Mach reflection region, Station 7-203 and beyond,typical shocks were evidenced with their characteristic short risetimes to the maximum value. The plot of pea,& positive overpressureversus distance, Fig. 2.29, showed a slight flattening between Stations7-202 and 7-203. As in TMBOLER 1, this plateau occurred in the areaof the Mach stem formation as determined by Project 1.4 and reportedin reference 27.
A second positive phase of small amplitude and averaging0.3-0.4 sec in duration was also observed on TUMBLER 2.
2.2.3 TUMUM 3
The reproductions of records for TUMBLER 3 are shown inFigs. 2.35 through 2.38 with s' arized data given in Tables 2.6 and2.7 and plotted in Figs. 2.39 tLrough 2.44. In general, the char-acteristic features of these records were similar to those on TUMBLER2. The close-in stations, 7-200 through 7-204, showed a sharp risewith gradual rounding to the peak value; Stations 7-205 and 7-206Texhibited a sharp initial rise with flattened peaks; and Stations7-207 through 7-211 showed typical shock forms. The plateau in thepressure-distance curve, Fig. 2.39, indicated that the Mach stemformed in the region around Station 7-206T to 7-208. This was con-sistent with data from Project 1. 2A, which showed that the Mach stemwas at least 10 ft high at Station 7-209, i.e., that it was formed ata distance closer to ground zero than Station 7-209. As on the pre-vious shots, typical shock-wave features were encountered in thelater portion of the pressure distance curve which coincided withthe Mach reflection region, and irregular shock characteristics wereevident in the regular reflection region or the early part of thepressure-distance curve. Stations 7-205 and 7-206T appeared to bein a tranniticn o "th the sh' " Lng from a rounded peak througha flattened stage and then to the typical shock form.
Two stations, 7-Q-1 and 7-Q2, were added to TUBLEIR 3 toinvestigate the effect of terrain on shock form. These stations werelocated approximately 800 ft off the right side of the main blast line
SECRET RESTRICTED DATASec'rity I!fCrmat2on ATOMIC ENERGY ACT 1946

SECRETSecurity Intormation
-I4.06 PSI
A STATION 7- Z.0
4 DISTANCE: 4.5.6 FT.
-101. SE C
II,, , , , i i i i I i I I i i i i !
0 0.5 1.0 1.5 2,0 2.571ME (SECONDS)
/ 1J2.0o6 Ips i
SSTATION 7-212
I2r DISTANCE: 259.0 FT.
U, 0 0.5 1.0 1.5 2.0 2.5w TIME (SECONDS)
a--
1210.59 PSI STATION 7-201
8 [ DISTANCE: 627.9 FT.
0 - -
m mi 1 i i I I I I i i [ i I II • _L ! i I 1 i
0 0.5 1.0 1.5 2.0 2.5TIME (SECONDS)
2
F STATION 7-201 T8 \ DISTANCE: 627.9 FT.
L • I I J _I _ I _I I I J I Ii I I .L .J I • l _ - _
0 0.5 1,0 1.5 2,0 2.5TIME (SECONDS)
Fig. 2.26 Records, TMUZLR 2, Stations 7-2W0 tbxough 7-201T
62
RESTRICTED DATA SECRETATOMIC ENERGY ACT 1946
Siecurity Informtion

SECRETSecurity Informntion
8 7 77-PSI STATION 7- 21368 4E 1 DISTANCE: 1001.3 FT.
- SEC,20
1.0 1.5 2.0 2.5 3.0 3,5 4.0TIME (SECONDS)
J6 .3 63 rSi
6 STATION 7-202
[ DISTANCE: 1375.6 FT.
0
.J IO 1!5 2.0 2.5 3.0 .5 4.0TIME (SECONDS)
,., -f4 t 5.32 psil
6f STATION 7-203
4- DISTANCE: 2124.9 FT.
t.J....... -L.. L.A .__l- IA --- J....J.. - l I -- L 1 LJ__L I Ll l [- - - 1 L 1 L.A
1.0 1.5 2.0 2.5 3.0 3.5 4.0TIME (SECONDS)
3.59 PSI
4 -STATION 7-204DISTANCE: 2874.6 FT.
0-
10 1.5 I 5 3.0 3,tTIME (SECONDS)
Fig. 2.27 Records, TIMfLER 2, StatLons 7-213 through 7-204
63
SECRET RESTRICTED DATASecurily Information ATOMIC ENERGY ACT 1946

SECRETSecurity Iniornmation
J tLJ
o 4 10t> e
cn to 4
IIL) .pZL
.1) 0
LOi
Ui UO
IL-
LJ C '.)cdd
a--
OD _ _,_ _
rO- 0I-LI~r4 I12S
~flSS~t.U
Security Inlrmh

SECRET
w +O-AI+
5 ALUj>~ ~ . .. ..
0
-0 20 50 -00 -~0 ---- ---GRUN RANGE (...
CLi
10j0 0 1000 _PO 45P
(n 0 1,000 Ti05,0GFUORAG F
z 065SECRE RESRICTE DAT
ATOMIC ENEI~la: T~4

SECRETSecurity Information
2.l0
+77 -7--±I.
F I
I: !QW 1I F 5,;q:[ I I :i :1 I :idl III:, IFlFF f~
F F t :L- 'i
Fn .11 i :1 !! N, Fl H ! !!iiIF0~~
Mj i
0.20g,0
t00 200 500 1,000 2,000 00GROUND RANGE (FT)
Fig. 2.3 1 Pooiive ivae Imulsioe j, Ground Level, TUMBLLER 2
471 11 U.~H0 F
:
4W
I I T
2 0 - -iiij Vi ii - 1
06D
100 200 500 1,000 2,000 5,000GROUND RANGE (FT)
Fig. 2.32 Posative Phase Duration, t4, Ground Level, TUMLER 2
w6REIICF DAASCE
(TMCL EG irI4~Scrt numto

SECRETSecur, Iufoeamthm
- _• , : .... ........ . ....
S..... .. • ....- ... .. . . .. . .. . .... .. ,.. . .. .. .., ..o.1
S2 1 + .. ..
_j 44~ U- - 4 . 4
4~ _P :.:: ' . ,
(facing zero) and 2917 ft and. 3686 ft respectively from Station 7-200(Fig. 2.1). Here the ground was relatively undisturbed as comparedto the main blast line anud consequently it was rougbh, dusty, andcovered with a considerable amount of sage brush. The gross char-acteristics of the records from these stations were very simlar tothe records from the stations at comparable distances in the traus,..ition and Mach reflection regions which showed shock features, i.e.*,short initia~l rise times. The first 10-20 milliseconds off thepressure records, however, contained a considerable number of sharpirregularities which, it is believed, were the signals resulting fromthe combination of gage ringing and irre gular, possibly spiked,pres•"''- sij--ds. (It "-"' 'e noted in Fig. 2.38 that the signal-to-noise ratio for these records weas quite high, and therefore few ofthe irregularities could have been contributed by tape. flutter). Ithas been suggested by Dr. C. W. Iampson of' the Bae.listic ResearchLaboratories that these pressure spikes may have been caused by localturbulences induced and abetted by the sage brush, surface diseontinu-
67
SECRET RESTRICTED DATASez 1•. l-or ,• o• ATOMIC ENERGY .•CT t946
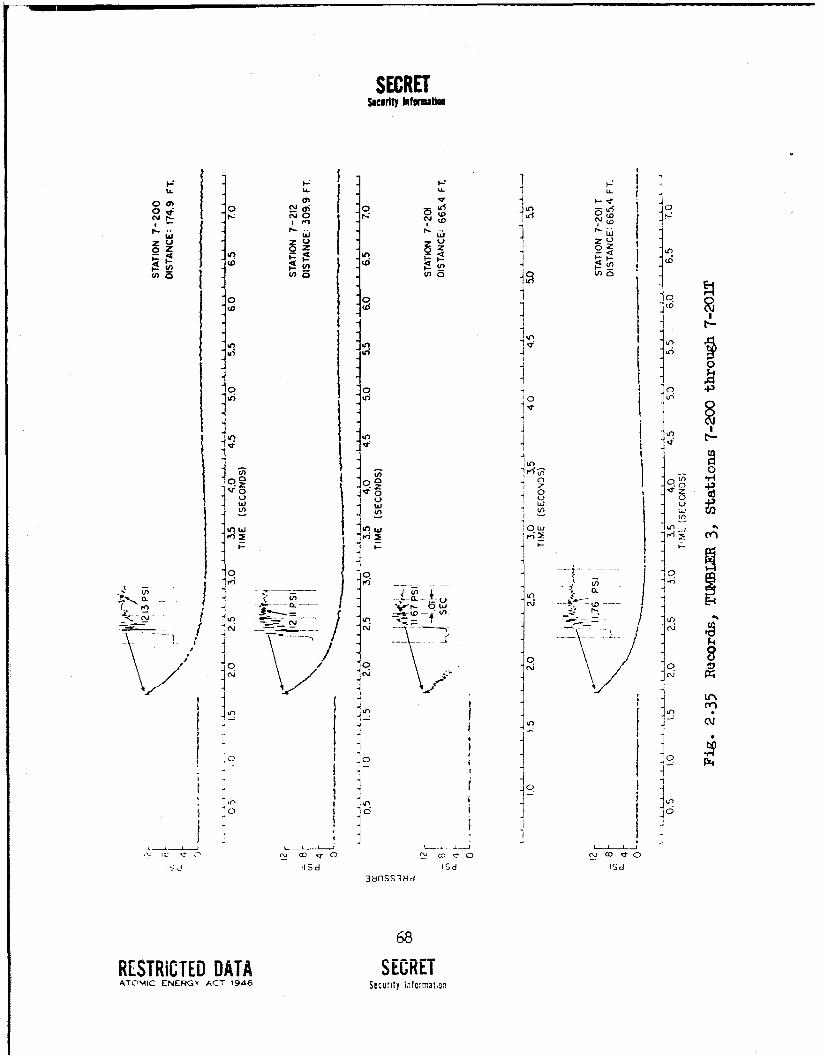
SECRE[SecuIty lutsuabe
0- .0 i 1v uq 0 r Q
to.. w I
(n! 1, (nO (0o(
odc(n Ln 4
.0 0.
l~c'J
0 0 0\ 40
0 0
fnjr-LL WJ
Sd i~ Sd(D3Ui S3l
68
RET0CE DAASCEATCMICj EN R Y A T 196Scrtyltint

SECRETSocurity Infornialsa
000
Ui to P4I10L
SERE RETICE DATsocullty ~ ~ ~ [Omto T- C NRYAT14

SECRETSecart lutmwfumabo
0
'co,
.10
P- t• .N 4' '-I - '- \,
1 1 4•
I- in0 inI
-,o !o
o i0
70
RESTRICTED DAT A SECRETATOMIC ENE: rf A,: 1.46z

SECRETSecurity Information
! F:
Ln
a co
Inen
19d ISd -Sd 16d
71
SECRET RESTRICTED DATASacurity Information ATOhj E:NERGY ACT 1046

SECRETSecurity Information
0
AI i it I
' I IIIR1IiI III I
.4I
CU
p;p.
l11ii ii i H: II N
TT F ill I I I I il I1 0t0
N (ISd) 3UflSS3Nldk1AO 3AIJ.ISOd )IV3d
72
RESTRICTED DATA SEGREIATOMIC ENERGY ACT 1946 Security Information

SECRETSecgrdt1 Inismatiu
7- L
0
-6 .... . .
0 L.. ~~1 ..-. .N
0i
0 z
.~o. 0
dcU,
.*i
0* 0
6 6 0(ISd) 38flSG3Ud 3A!1XV093N )4V~d
73SECRET RESTRiCT"IED DATA
Se nrity ATOMIC ENERGY ACT

SECRETSecurity Information
~~0
I I 0
- -
0
00
II 0
0
.1 IL1
('36- IS d) 3Sild~i 3A1.LIS0d
74RESTRICTED DATA SECRETATOMIC ENERGY ACT 1946 %
Security Wolrniation

SECRETSecurity Infoirmition
60.0
II li l I
00 6,00 i1 I
2 .0
4 .0 1-.1 MIgt
11 0-T;fI fl
at
0.L. 2000 4,000 6,000 2,000 10,000 120,001400
GROUND RANGE (F T)
Fig. 2.423 Arrial i fIiti al Diase hwatio , t lp Ground Level, TIBE
TUMBLER RETITDDT
S1uiyI.rnto T0CENRYAT14

SECRETSecuifty Information
-o- _,_ _ . ., . . l i I t l :: • 4 -
1 725q - __I I
- - i 7 • ' .. . . .... . . _.-_
o al
PT _ I*
tOO 200 500 1,000 2,000 5,000 F0,000
GROUND RANGE (FT'
Fig. 2.44 Negative Phase Duration, t 8 , Ground Level, TUMBLER 3
Ities, and dust peculiar to the imediate vicinity of the gages. Itvill be noted that the 7-Q stations had higher pcak pressure valuesthan the stations on the main blast line which were at comparable dis-tances, 7-204 and 7-205. These high readings were probably due to theinfluence of the high, sharp spikes occurring in the first 10-20milliseconds. After this time, however, the pressure levels forStations 7-01Q and 7-20o4, and Stations 7-Q2 and 7-205 were comparableat corresponding times. This indicated that the shocks at the 7-Qstations, regardless of the vastly different terrain, were basicallythe same as the shocks produced on the main blast line; the spikesand high peak values seem to be extremely local and other stationsin the I-dite vicinity might well have given quite different re-sults.
A second pocitive phase did not appear on the records ofTI{MBZR 3.
2.2.4 TmLERu .
The photographic reproductions of the records cbtainedfor TTmBLE2R 4 are shown in Figs. 2.4 5 through 2.4,8; the results ofthe data analysis are presented in Tables 2.8, 2.9, and 2.10 andplotted in Figs. 2.49 through 2.5k.
For the first time in this operation, the instrumentationsysrem at the close-in stations picked up so sort of extraneoussignal at zero time. This signal, which appeared on all stationsup to and including 7-204, seemed to short-circuit the gage-oscillator
76RESTRILCTI LU SAT AATOC ENERGY ACT 1946SCR
Securtly Informmamc,

SECRETSecurity Inevmation
combination for approximately 50 milliseconds, after which time the os-cillator recovered and oscillated at a slightly lower frequency. Thecause for these signals is unknown. However, it is likely that the in-tense ionization which occurred at zero time effectively short-circuitedthe field circuits (gage, oscillator-amplifier, cable) for a short timeand also produced changes in the dielectric and/or magnetic propertiesof the capacitors and inductors of these circuits, which in turn changedthe osr!!!•tr frequency. As the ionization decreased in intensity,the short circuit ceased, the capacitors and inductors tended to returnto their original state, and the frequency of the oscillators shiftedtowards their pre-zero-time value, or as at some stations, to a newcenter frequency.
The smooth exponential return of the trace to its finalpre-shock arrival position possibly can be interpreted in another way,this time in terms of a pressure signal. The high thermal output ofthe weapon may have in some way created a high intensity thermal pulsein the air effectively trapped by its own inertia in the iUediatevicinity of the surface giving the effect of a pressure pulse. How-ever, with the lack of conclusive evidence to bolster either the ion-ization or the thermal pressure hypothesis, the signal at zero-timeis considered extraneous and discussed only in the interest of present-ing a complete picture of the results. Where a permanent base-linesh±it occurred, the new base line was used for record analysis purposessiace it was to this shifted frequency that the oscillator returnedWhen steady atmospheric conditions prevailed after shock passage.
As is evident from the records, even aside from the zero-time disturbance, the gross characteristics for the close-in stationsof TUII.R 4 were markedly different from the corresponding stations ofthe previous shots (with the possible exceptions of Stations F-230through 7-203 of TtNBLlH 1). For Stations 7-200 through 7-203, thepressure increased to its peak value in a double step-wise fashion andin a relatively long time. For Stations 7-212 through 7-202 this staireffect was quite obvious. For Station 7-203, the second step was lessprominent; however, it appeared to occur at approximately 50 milli-seconds after the iniLial distuebance. For Station 7T2300, th-e initi-'lstep, Pal was higher than the second step, P,, and less sharply defined.(Because Pa was of only short duration coepared to Pe, the later peakwas considered to bc the significant one and its vmlue was the oneplotted for peak pressure at this station in Fig. 2.49).
It can be seen that at these close-in stations, the firststep, Pa, attenuated rapidly and lengthened in duration with distancefrom ground zero. The pressure pulse associated with Pa has been
77
SECRET RESTRICTED DATASecurity Information ATOMIC ENERGY ACT 1946

IV
SECRETSicurity ICformation
1.50 -150 ~7~V'STATION 7-200
TIME (SECONDS)
iI 16.9S PS!
DISTANCE: 265.5 FT.
80
in
5 -
40
.5 .0 .1.5 2.0 2.5TIME (SECONDS)
10[20iK STATION 7-212
60• 82.7 PSI DISTANCE: 607.6 FT.
0.5 1.0 1.5 2.0 2.5 3.0TIME (SECONDS)
~- ~8-211 STATION 7- 201T
260 PDISTANCE: 607.6 FT.
0-J
O 0.5 .. 0 1.5 2.0 2.5 3.0TIME (SECONDS)
40 STATION 7-213L0 82'44.6 PS DISTANCE: 974.2 FT.
320-
O L I_._.. ,_._._.
0 0.5 1.0 1.5 2.0 2.5 3.0TIME (SECONDS)
Fi. 2.-5 Records T L .4, Stations 7-200 troSTAT h 7-213
78RESTRICTED DATA SECRET
ATO0MIC ENER.Y ACT 1943Secwrty Information

SECRETSecurity Information
0 a)
U.!j
oU - e- 0'z 7
mo°
0 o 00)
I~.I NIS II
LL N'- Fz
Seuiy nomtinAO ICEEG AT14
Li
0
nIn
in -R to
0 ~ mII 0 -o0o
00 0 oiI'IiLL.~0) (n~ w N
CU Sd d Ed E'No (n Ud
L9SERE RETICEZDT
Seuit ot ranAOI NRYAT14
Ljf

SECRETSecurity Infemation
LLo
w
cuo
004
ZU-C> N
0 Q
w 0 w*0 .
N ~-~N
ChCOC')~Lr Q)N~1 '
oz to~0 cu0
00
4 4
0g
U.)In
c ITS.
ItI
d. Izd3Hf';,;S 8
80
RESRITE DAT.x-oAic :NEF- Y11,C 19.t, S CRE

SECRETSocurity Inform~ation
Inti ~ 0L
NjCR c
0*
ii
'V1
Li f
j. j;--~~~-*C 0 0W -
rn I~ uIN
1() in
N - 0 N 0 to 0 to 0IJ
Isd ISd Is ld
SECRET RESTRICTED DATASicurity Information ATOMIC ENERGY ACT 1940

SECRETSeartty Informatbii
200
100
~504. t:t
w
U)20 +44 4:z-4
_
I0fT
5 T
til0050lO0 ,0 11-0 J0,00 2 00GR0N RANE FT
Fig 2I4 ;eV ...tiv Qvrrsue run eeTLR
82RESRIii DAT SECRET~i-
ATOMI ENERY ~-~Ta49-

SECRETSecurity Inforination
IW i lh1 i i
It 0HH " ii t1
!IItil-9 1 I 0-
t~~' I I_1 --
-H- 11 1:.t. C)1
I II If I It :111,
Wi 1 ItC
M 1' .1 H V --- 1
I ;i ,-O I 14 ~
o z
1_1 F-. I T N Ilii-1 1 1 1 - i I m i" l 1 1 1 11 -
M ul wilit 11 1111J--- - 0l 0 I 0 11& I 111
IId 3 O 6Id AII-11N )I11 V11d
Ill U I I-K hi 183
SECRE RESRITE DATA,111Secrit tnor~tiii TOIICIH HNRYATlA

SECRETSecurity Iafomibon
00
4- ~ i--
__ 0
41- ---- -. J~tttt 0
0170
LA.
100-IL-
-4-4
74)
0 0 0 to W
(03 - ,~ ' 8WI3II~
840RETICT E DAIASEREA l-O,C 194
. cu '- 0

SECRETSecurity Information
1. It; li L 11 i T tll i IH IM11 HI 11111 J1IIliiii 1iil I i
Il I II III iit I I I 7 il! 1f
114
o.2 ill '
--
200 500 1,00n 2,0 5,00 1000 20, H0
Fig. 2.52 Positive Phase Du~ration, t41 , Ground Level, TUMBLER 4
identified as a precursor and its origin and significanice eare discussedin See. 5.2. The precursor nature of P. is evident in the plot ofarrival times in Fig. 2.54i with the ti curve f alling below the tpoints for the sixc stations where the precursor was evident. (Beforethe initial disturbance was recogniz.ed as a precur~sor,, the arrivaltime of all initial disturbances was designated as t3.0 and thearrival time of the pressure pulse associated with P. was designatedas t 2 . It is for this reason that the arriival time nomaenclature forthe main shock on TUM(BLER 4 is t2 for Stations 7-200 through 7-203 andt1 for Stations 7-2041 and beyond).
The records from Stations 7-204, 7-205, and 7-206 ex-hibited the nov familiar, sharp initial rise with a rounding or flatten-ing to the peak value. N ot until Station 7-207 at 5088 ft did a shockform appear; the stations following also shoved shocks. Stations7-Q1 and 7-Q2 showed pressure-time rec~ords which were siailn~ to therecords obtained from stations 7-204 and 7-205, the stations on theratin blast line located at corresponding distances; however, there wasmore rounding of the peaks on the 7-Q records and the peak values weresomewhlat lover. The significance of this is not known; probablly itcan be attributed to the purely locall peculiarities in the terrain inthe immuediate vicinity of the gages. Certainly, as on TUJABLE 3, thegeneral features of the record~s for 7-204 and 7-Qi, and 7-205 and7-0.2 were similar and general terrain conditions seemed to have little
SECRET RESTRICTED DATASecuity Intormation ATOMIC ENERGY ACT 1946

SECRET
- I
.. ...:.. .-1 1+ . .. .. ... . .. s e
4_04u
1- 77414-o
cc:J
0 0
4.: cr2::

SECRETSecurity Information
0
IffT
TITI
Iil v r I- 0
N 0
~3S ~ I .. 10AI jpli U4, all.
I IN:! 8lSECRE RETITDDT
SeuiyTrmto TMCENRVAT14

SECRETSecurity 1Ifomatien
effect on either wave form or peak pressure values.
The peak positive overpressure versus distance curve,Fig. 2.49., has a plateau at Stations 7-203 to 7-204. Indicationsfrm other sources indicated that the Mach reflection region startedbefore Station 7-203; therefore, for TU1MBJR 4 there appeared to beno correlation between Mach stem formation and plateau in the curve.Further, whereas in the previous shots only shocks occurred in theMach region, on this shot slow rise times and rounded peaks alsoappeared in thiP region.
TUMBLER 4 gave rise to other interesting results besidesthe aforementioned ones. Two additional pressure pulses were appar-ent on the records: one occurring usually during the positive phase,(designated Pd with arrival time of t ) and the other occurring duringthe negative phase (designated Pf witz corresponding arrival time oft 9 ). The appearance of Pd was that of a shock wave with short risetime while Pf showed a longer rise time. Both pulses had an amplitudeapproximately 1/10 to 1/20 of the main shock, Pc. A plot of the ar-rival times t 3 and tg, Fig. 2.53, shows the orderly fashion of prop-agation for Pd and fp indicating the coon origin of all Pd pulsesand the common origin of all Pf pulses. It is not known wha-t thissource is.
The presence of Pf bad the effect of considerably shorten-ing the duration and diminishing the impulse of the negative phaseassociated with Pe. This effectively distorted the true nature of thenegative phase associated with the main shock and made the applicationof scaling laws inapplicable to this feature of the main shock. Inaddition this distortion made even the reasonable determination ofnegative time duration very questionable because of the gradual returnof the pressure trace to the base line. For these reasons, onlylimited quantitative data are provided for negative phase duration andno data for negative impulse for TUMBLER 4.
As on TUMBLER 3, no second positive phase was apparent onthe records after the completion of the negative phase. It might benoted that this second positive phase occurred only on the small(approximately 1 KT) bombs used on TU!4BLER 1 and 2.
2.2.5 Comparison of Data
A comparison was made between the final NOL ground stationdata for Operation TUMBLER and the preliminary data presented in ref-erences 13, 23, and 28. (It w-s realized that this comparison may besomewhat premature since the data presented in aforementioned refer-
88
RESTRICTED DATA SECRET

SECRETSecurity Information
ences are preliminary and subject to change. However, it was assumedthat these changes, if any, would be small, and ccparisons and con-clusions arrived at herein would hold true for final figures too.)It should be noted that both Stanford Research Institute and SandiaCorporation used similar instrumentation - basically the Wiancko gagecircuit - while the ROL utilized the Bendix gage - FM system describedin this report and the David Taylor Model Basin used a capacitancegage circuit. The overall response of the Wiancko and Bendix-FMsystems was such as to indicate rise times of 1-2 milliseconds forapplied step pulses; the response of the David Taylor Model Basincapacitance gage was considerably better, requiring approximately 5microseconds to rise to full anplitude.
The NOL data for peak pressures for all stations on allshots averaged 7 per cent higher than both the Stanford Research In-stitute data (Project 1.2) and the Sandia Coxporation data (Project19.1). The IOL data averaged I per cent lower than the David TaylorModel Basin data (Project 1.13).
The agreement between NOL and 11 results vas good butonly three readings could be compared. However, the indications "ethat extremely high frequency response is not required for A-weapontests if high frequency detail such as provided by the DMhB apaci-tance system can be sacrificed. For effects tests this seems to bea reasonable sacrifice especially if simplifled field instrumenta-tion and installation result. The 7 per cent discrepancy between NOLand SRI - Sandia, although probably not significant in terms of mil-itary effects, was perplexing particularly since the NOL figures wereconsistently higher than botb the SRI and Sandia values. A randomdifference could be accounted for by the approximate stated errorsof each system. The consistently higher difference would be accountedfor only in terms of a constant comon factor such as gage calibrationor choice of points read on the record.
A conparison of the positive durations reported by thevarious activities also showed a consistent difference. Here, theNOL final values were consistently lower than the preliminary valuesof SRI, Sandia and IM4B by approximately 7, 4, and 8 per cent respec-tively. (It my be of interest to note that although TMBLER 4 pro-duced the greatest distortions of shouck form and disturbances ininstrumentation, this shot produced data which showed best overallagreement between SRI and NOL. The NOL pressures were only 3 per centhigher, on the average, than SRIn, and the NOL positive durationswere only 4 per cent less). Final values from these other activitiesmay resolve the problem; certainly, additional data on imnalle andnegative peaks may provide some information which could intelligentlyconpromise the differences.
89SECRET RESTRICTED DATA
Security Information ATOMIC ENERGY ACT 194a

SECRET
Secunity Infom,15ou
CE.AMEM 3
.HO.O-OFI.ICAL PFESSM MEASMMWTS (PRoJE•T 1.51)
3.1 BAMMO•D AND BASIC THEORY
3.1.1 The Shock Velocity Method of Peak Pressure Determination
The photo-optical technique and smoke rocket grids employedin Operation TUMBLER to obtain measurements of shock velocity leadingto determinations of peak shock pressure as a function of distance infree air havne been fully described in reports on Operations G 1EEEOFt0E&/and JARiLi /. Briefly, the method consists of establishing a smokerocket trail grid behind the air burst and taking high speed motionpicture photographs which show the locus of the shock front as a func-tion of time. The shock front is rendered visible as the result oflight refraction phenomena caused by the shock wave which interceptsthe light from the grid and scattered light on its way to the camera.Time of arrival of the shock at measured distances from the explosioncenter can thus be found. One or more equations representing curvesfitting these data are calculated using the method of least squares.The fitted equations describing the curves are of the form
t - A.+ A1 R+ A 2 + (3.1)
where t is the time at which the shock wave has reached a distance Rfrom the explosion center or some other fixed point. Differentiationof equation 3.1 gives
dt 2.id A + 2A R + 3AR (3.2)
where U is the instantaneous shock velocity. The peak preserne in theshock wave is shown to be a function of the instantaneous shock veloc-ity by the Rankine-Hugoniot relation:
Ps = 2• Po l(o2ý -2 (33)
where Ps is the peak shock overpressurePO is the absolute atmospheric pressure ahead of the shock
' is the ratio of specific heats for air = 1.403Co is the velocity of sound in the medium ahead of the qAock.
90RESTRICTED DATA SECRET.

SECRETSecurmty Information
Po and the temperature, To, can be measured directly, andc0 =1089 l+T/273, To in 00, Co in ft/Bec (3-4)
3.1.2 The Particle Disulacment Method of Pressure-TimeDetermination
In the shock velocity method described above it will berecalled that in obtaining the desired measurements the shock waveis not called upon to do any work other than to refract rays of light;.The particle displacement method to be described depends upon theshook wave to move mass, however small. Measurements of the displace-ment of zinute particles of fuming sulfuric and hydrochloric acidscompising the rocket smoke trails provide data which, when properlytreated, lead to values of the pressure existing within the shockwave as a function of time an observed &t a fixed point.
To obtain particle displacement data the moke trail gridwas located in a nearly vertical plane passing through the burst.Motion picture photographs of the radial motion of the trails, afterbeing struck by the shock wave, provided a record of the time historyof the forces acting on the particles of smoke. Figures 3.29 and 3.30show the trail nearest the burst before and after being struck by thgshock wave on TU(LER 1.
The procedure for translating the measurements of particledisplacament into a pressuro-time history of the shock wave that wouldbe observed at a fixed. dstance from the burst was ably developed byDr. F. Theilheimor of the Naval Ordnance Laboratory and is presentedin detail in Appendix B. In this analysis no attempt is made to obtaina peak shock pressure. The peek pressure is taken froa the shockvelocity data. (These pressures can be determined with a degree ofaccuracy significantly higher than that for corresponding peak pressurevalues based on meaurezts of particle velocity as recorded withthe particular instrumentation employd which was designed to providesufficient space-time resolution to obtain reliable data for theparticle displacement method. The resolution would have had to bebetter if it were desired to measure particle velocity with a suf-ficient degree of accuracy. See Sec. 3.3.8.) The lower pressuresfolloving the peak of the wave are obteined using the particle dis-placement data. They are determined as functions of the peak pressureand density as shown in Appendix B, and do not rely on a knowledge ofthe paxricle velocity.
The principal advantages of the p•ticle di.placement
9j1
SECRET RESTRICTED DATASecunity Informalion ATOMIC ENERGY ACT 1946
I.

SECRETS•ecfity Infuomatie
pressure-time method are its si1licity and its relatively low cost,since it circumvents the problem of placing a gage in free air to re-cord directly the pressure-time cumve. When the system is used inconjunction with the smoke rocket shock velocity system a nearly ccc-plete analysis of the free-air blast phenc..ne should be possible.The two experiments can be coordinated well in the field and the nec-essary apparatus for both systems is interchangeable.
A prime disadvantage of the technique is that all datamut be grnphically fitted with smooth continuous curves and any dis-continuity or irregularity, unless its magnitude is large, is lost inthis smoothing process. No such large irregularities occurred duringthe present experiment (see Fig. 3.20 and Fig. 3.21) in the free-airregion and the pressure-time curves are probably very representativeof the actual shock wave in free air.
3.2 ITRWMATION
3.2.1 The Smoke Rocket Detection Grid
The rocket smoke trails established in the form of a ver-tical line grid Just prior to the time of burst were prodneed using5"0 spin-stabilized rockets. For a complete description and detailsconcerning the rockets and the method of launching, the reader isreferred to references 2 and 3.
Two innovations introduced on this Operation to establishthe smoke trail grids were (1) the use of a different, more powerfulrocket motor (5.'0 Spin-Stabilized Motor MK3) and (2) an increase inthe angle of launching the rocket. See Figs. 3.1 and 3.2. Bothmeasures increased the overall height of the grid from 6000 to about13,000 ft and permitted a decrease in the time interval between fir-ing the rockets and the time of burst. The latter is especiallyadvantageous, for if the wind is strong it is capable of destroyingthe continuity of the trails before they have served their purpose.
The spacing of trails, location of grid planes and camerapositions, and other data pertinent to the experimental layout aregiven in Figs. 1.1 and 1.2.
Due to the dissipation of the smoke trails at the closerparticle displacement stations after passage of the shock wave andthe inaccuracies at the lower pressure levels, it is recomnended thatin future tests the trails be placed between the 10 and 50 psi levelsonly and at closer intervals than used on Operation TUMBILR. Inter-
92
RESTRICTED DATA SECRETAT('MIC ENERGY ACT 1946
Security Intormition

SECRET
v&ss of qproimately 50 ft would. be desirable to obtain more reliabledata.
3.2.2 Photoraphie Mstrmmentation
The pbotographi• records were obtained. by Edgerton,Germeahnsen, and Grier, Inc. and submitted to the NOL for ana1yBsiswithin three days of the shot, together with pertinent space and timecalibrations. Four Mitchell high-speed camera were used to dbtainthe desired records for each test. Throughout the operation, "East-man Ere ntal Microfile" film was used with excellent results.Table 3.1 gives a comlete listing of cameras, exposures, frame rate,and other photographic details.
Yidnciall markers were placed in the field of view of thecinras to provide for horizontal space calibration. The markerswere spbherical gazing globes mounted on poles at a given height soas to lie in a true horizontal line, as seen from the camera station.
In addition to the space fiducial markers, an accuratespace calibration rose was put on each film so that no matter how thefilm might shrink or expand during processing or storage the calibra-tion would not change. The calibration rose, together with an accuratemesure of the focal length of the lens used. is sufficient informa-tion with which to calculate a vertical and horizontal scale in anygiven object plane in the field of view.
Timing marks for calibrating the record were placed on theedge of each film at the rate of 100 marks per sec. A master oscil-lator controlled these marks to t 50 5, sec.
3.3 SULTS
To avoid confusion, the pressure-distance results based on theshock velocity method are presented first for all four shots. Follov-ing this, the pressure-time results based on particle displacementanalyses are given for Shots 1 and 4. Only two shots vere analyzedbecause the time required to reduce the remaining data would undulydelay publication of this report. Shots 1 and 4 were chosen so thata comarison of the results could be xade to indicate the usefulnessof the technique under the most favorable conditions. Shot 4., inparticular, was of interest because it was desired to know if thedisparity between the results of Shot 4 and the other shots at theground level could have been predicted from the free-air pressare-time curve.
93SECRET RESTRICTED DATA
Security Information ATOMC ENERGY ACT 19445

SECRETSeurity laf abuu
Fig- 3.1 Rocket Laimclier vith 850 Firing Angle
Fig- 3.2 Assembled Smke Rockets, vith M4K 3 Motor (Left), MK 43 Motor
94
RIESTRICTED DATA S3ECRE TA~n.ICENE',A'CT 1946

SECRETSecurity Information
Only the motion of one trail on each of Shots 1 and 4 was ana-lyzed. Some of the reasons why this was done are: (1) some trailswere too close to the burst and disappeared for a considerable timeduring the period of interest, (2) acne trails were in regions oflow pressure where no corresponding data from the shock velocity ex-periment were available, and (3) most of the remaining trails weredistorted by the arrival of the reflected wave too soon after thearrival of the incident wave, as shovn in Fig. 3.28.
3.3.1 Presxsure-Distance Results - TWMIR 1
The free-air shock wave time-of-arrival data for TU(BLER Iwere taken from film No. 13082. On the enlarged image, distancescould be measured accurately to t 1.0 ft in the plane of measurement(see Fig. 3.3).* From the timing marks on the film it was evidentthat the camera was in the process of slowing down slightly duringthe period of interest. At zero time the frame rwte was 110.005frames per see while at 0.9 sec the frame rate dropped to 108.215fraens per see. The small corrections dictated by this unusual cir-euastance have been included in the time-of-arrival data given inTable 3.2. The ti.e values listed in this table and in similar tablesfor subsequent shots are given in absolute time after zero time ofburst. Absolute time wvas determined on all shots by fitting the earlytime-of-arrival data to highly accurate fireball growth data.
On this particular shot it was found possible to measureshock tis-of-arrival along the ground extending into the Mach re-gion. These data are included in Table 3.2.
Graphs of the data appearing in Table 3.2 are given inFigs. 3.- and 3.5. Included in these graphs are calculated pointsbased on the equations fitted to the data by the method of leantsquares. For the shock wave in free air the time-of-arrival curve isrepresented by
t 0.0158 - 0.1513B + 0.9354R2 - 0.3426R3 (200 ft to 8oo ft)(3.5)
t -- 0.1919 + 0.5955H + 0.o446i2 + o.0120F 3 (800 ft to 1200 ft)(3.6)
where t is in seconds and R is in thousands o. Xt frou the explosioncenter.
Along the ground the time-of-arrival curve is representedby
t - 0.2966 + o.1i46R + 0.2201R? + 0.0079R3 (200 ft to 1200 ft)(3.7)
"*Data were tabulated to higher precision for coisputational purposes.
SE•RET RESTRICTED DATASecurity Information ATOMIC ENERGY ACT I948

SECRETSncurit Infotf in
SHOT I SHOT 2
4 31j, /P 27.91'
AZ
BLAST LINE NN zz
I AZ
STA 361 Z GROUND ZEROSTA 200
AZ=ACTUAL GROUND STA 7-361ZERO
SHOT 3 SHOT 4
d<N N
33 ,.
Z I IZZ
AZI
1-J
STA 7- 361
STA 7-361
Fig. 3.3 Planes or Measurement used in Frve-air z-essure-Dib B.UcAnalysis, TUTMBILR 1-4
96
RESTRICTED DATA SECRETA1L_•LC ENERGY AC- 194S
Seurity ¶nfornatio

SECRETSecurity Informration
ISO ,1ITFI'j~T 11I1 it h I r
1,300
1900ifII
0
o 700
3000 0.1 0.2 0.3 0.4 0.5 0.6 0.7 0le 0.9
ARRIVAL TIME (SEC)
Fig. 3.11 Free-air Bhock Wave Time-of-Arrival Curve, TLU4BLR 1
ivaere t and R are given in the same units as above.
Film No. 13082 yielded unexpected data concerning the for-mation and height of the Mach stem. The height of the Mach stem as afunction of distance from ground zero (GZ) directly beneath the burstpoint is given :In Fig- 3.6. The point at 10 ft stem height was takenfrom prliminary resu~lts reported by the Stanford Research Institute
ion-N141 A -. r__ A.4 .-U ... 21 -0 ..-FA%h~.i. ~~~~.. . CaWAkU hLL U M~f bfl ve n d5U1ata pvunle in-dicates that the Mach stem began to form at about 860 ft from OZ.
The -values of atmospheric pressure, PO, and temperature,To,, vere measured on the ground and at burst height just prior toshot tine. Theme values are given in Table 1.1 for all shots. Valuesor the sound. velocity, Ce,, were computed using Eq. 3.ly.
The variations of P0 and C0 with altitude above groundwere assumed to be linear for lack of more complete data. See Fig.3.7. The values read from these curves were used in calculating
97
S ECIR ET RESTRICTED DATASecurily Information ATOMIC IENERGY ACT 1946

SECRETSecurity Iufwiuati
)1$00
Ii.7
- 7I
Nj
UL
400F
200
Sooi0.. ... .. .. ii
ATOM... .... .....

* SECRETSecurity Information
ii
IT
IT t
w90 iIiIiiMil11i 11, 00 1, 00 1,0 1,i300DITAC 4RMGOUDZRO(T
1i. . Heighlflc tmv itnefrmGon eo U~BE
peak shock overpresau11.11s inlreal a afnto f itnefo
the b4 s 1 InfL0ftevreyo ~soemgtuetevle fP n
C0 as functious of altitude, the foIAwn a hsns htcm
anBtousof 100 ft er0c00e arbtr1ily 1If0 v1uo0P0
Fauaion. the Hecght of McSthemv prseDistance cfrve Grould bero lightly
greate thank iovicatessre in thee airahs shownbelow. of dfistnite quan-
titativ te valu rnb iveny of this oemghete dcybause vit vausov.arid
waithn vach shotand ethe ox~tng thetorolo mgica beomditon. Vale were.lchek whic inteluded aln proer corretioalne fror the geoejtr itolved
graerta idcae n ih raphs shfowian AIOMvi No N deiite quan-~4

SECRETSecurity Isfawomat
SOUND VELOCITY, GO (FT/SEC)1,114 1,115 1,116 1 117
8 00
44-
700
6 00 : ::
.................................... ....
I~t;- -;:: :::: :2 :. :- ' :~
IH I.... .
Altitt:: tit;BLR
4100RSRCTEo AASCE
AT+I 14.Ul, V ~ tit: ...... ..."IH

I SECRETSicurity Iniormition
50 20 PEA0 SHOC 0 2,000ESUR
SECRE ASE RETICE:DTSLut nc~InAOI NRYAT¶4

SECRETS.curiat lnformabo
showed that within the precision of measurement of the films, all in-itial shock waves were symetrical around the burst point.
The peak shock overpressures in free air at v-ariou dis-tances from weapon zero were calculated using shock velocities, asobtained from the differentiation of the time-of-arrival equations,substituted in Eq. 3.3. Values for shock velocity and peak over-pressure at various distances from weapon zero are given in Table 3.3.The pressures are plotted as a function of distance in Fig. 3.8.
As mentioned above, shock arrival times at distances alongthe ground ranging from 105 to 1231 ft from GZ were obtained. Thevalidity of the shock pressures calculated from these data via theshock velocity method (3q. 3-3) depends significantly on the valuesof sound velocity, Co, (or temperature, TO) in the medium ahead ofthe shock. On TUMBLER 1, To was measured as a function of time atseveral distances from GZ. No measurements were obtained, however,between GZ and 1024 ft. The authors are of the opinion that an extrap-olation of the temperature data based on a few widely separated pointsbeyond 1024 ft in an attempt to obtain reliable values of sound vel-ocity, C., at distances closer to GZ is unjustified. Shock pressuresin the limited portion of the Mach region for which time-of-arrivaldata were obtained have, therefore, not been calculated.
3.3.2 Pressure-Distance Results - TUMBLER 2
The free air, shock wave, time-of-arrival data for TUMBLER2 were taken from film No. 13182. The vertical plane through zero inwhich measurements were made is shown in Fig. 3.3. Timing marks onthe film showed the camera to be running at constant speed throughoutthe region of interest. The frame rate was 75.586 frames per sec cor-responding to a time per frame of 0.01323005 sec. (The last three dec-imal places are held for computational purposes only.) On the enlargedimage, distance could be measured accurately to t 1.0 ft. The absolutstimes of arrival of the shock wave in free air are given in Table 3.4.In Fig. 3.9 the tabular values are plotted together with calculatedpoints based on the equations fitted to the data by the method ofleast squares. For the shock wave in free air the time-of-arrivalcurve is represented by
t " -0.0h12 + n n'l5ý - 0.63114R2 - 0.1708R3 (400 ft to 700 ft) (3.8)
t -O.0651 + 0.1970R + 0.4316Ri - 0.1075R3 (6e t to 1200 _t) (3,9,
where t is in seconds and R is in thousands of feet f rom the burstpoint.
102
RESTRICTED DATA SECRETAT IC ENERGKIY A.:-T 1946
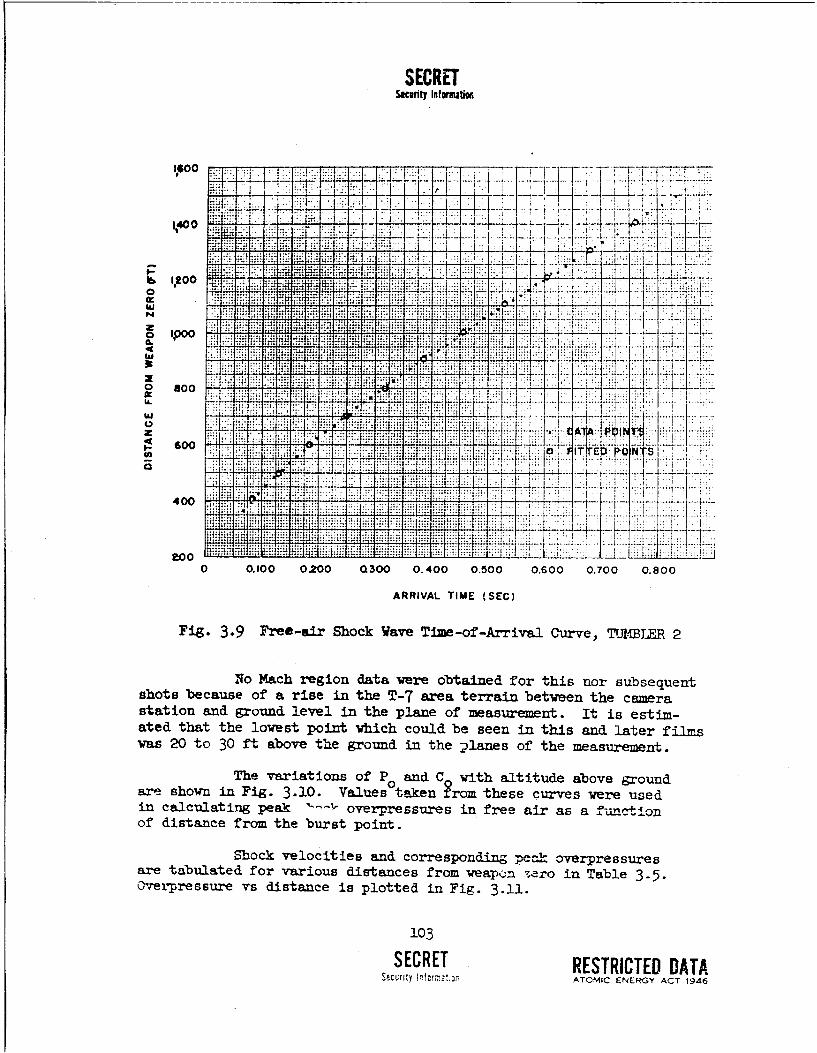
SECRET
s~dt 0mtilt
4600 1
ARIA TIM (EC
Fig. 3.9 Free~~~~-..I! ShcMa!Tm-fAria uvTJBE
No Mahrgo at eeotindfrti nrsbeunshots because o a~ rise inte#jae erinbtentecmr
stto0n rudlvli h laeo esrmn.I setma.ed that the .lowes point .. ic coul be. seniJti ndltr7im
was 0 t 30 t aovethe roud inthe~1aes o th meaureent
of distac frmteIuMpit
Shock ~ ~ ~ ~ ~ ~ ~ ~ ~ 7, veoiien1orepndn:7-~oeprsue
ar tRuaeoooaiusdsacsfo ep~ r nTbe35
SERE RETRICTED DATA14.: fft"2~ TMCENRYAT14
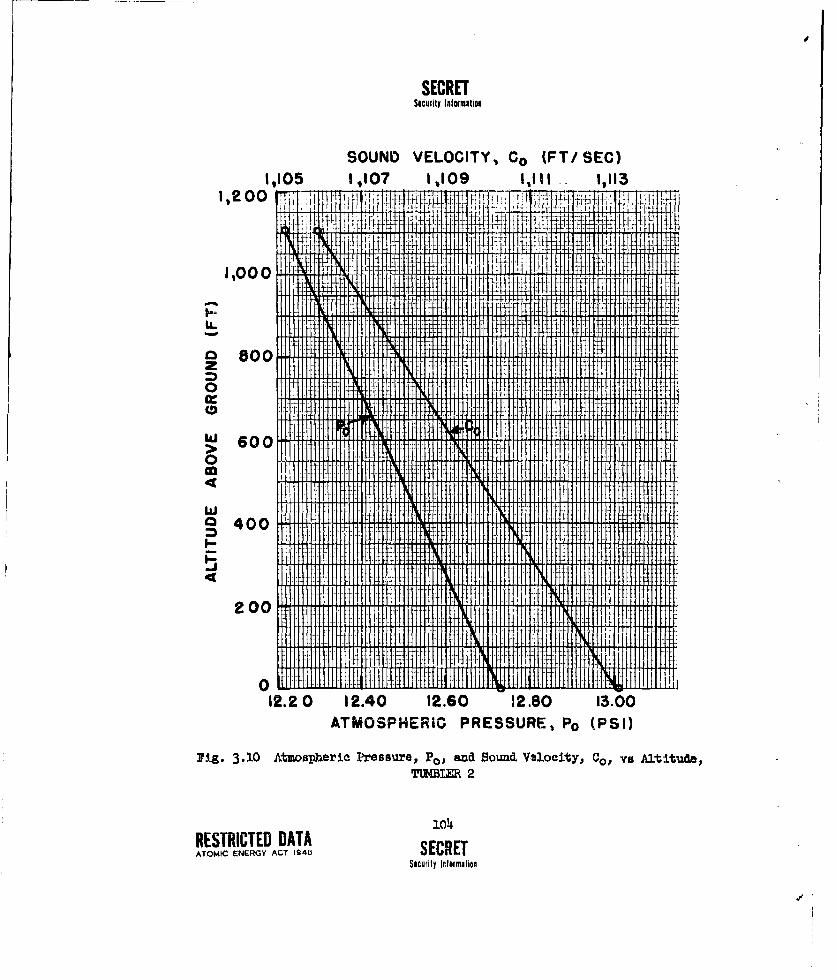
SECRETSacurityIuom of
SOUND VELOCITY, C0 (FT/ SEC)1,105 1,1107 1,109 1,111 1,113
81,00
hiI0 -t , , .1 -1 i
11000I +
0L12110 12.4 126 -20, 13.0
ATOMIC0 ENRG ACT 19
-0 1 X1 11 Sec-it I foraloni1 1:1 _t~jI'_t1.MI ,
600 - 1H-11111m -_I 10 1 kl I: It H-111 R. ftll-.1

SECRETsoCUrity I~ftsiiation
50
It 'HEiii
It
10 i
I.1 Ili1- :7 L
PIT2 0 w0 ,0
0 ~ T'C FO WE PONZEO1,T
1~ig .1 ea hoflfrpesueinreAr sDtne, 1 dLR2
105 -
SECRET1 RESTRICTED DATAlSecurity111111-f-M 1 1,1111 Ifraion . ATO4I ENER1 ACT 194

SECRETSecurity Information
3.33 Pre.ssure-Distance R~esults - TUMBLER 3
The free air shock wave time-of-arrival data for TUMBLER 3were taken from film No. 13281. The vertical plane through zero inwhich measurements were made is shown in Fig. 3.3. Timing marks onthe film showed the camera to be running at constant speed throughoutthe region of interest. The frame rate was 104.644 frames per see cor-responding to a time per frame of 0.0095562 see. (The last two decimalplaces are held for ccmpntational purposes only.) On the enlargedimage, distances could be measured accurately to t 2.0 ft. The ab-solute times of arrival of the shock wave in free air are given inTable 3.6. In Fig. 3.12 the tabular values are plotted together withcalculated points using the equations fitted to the data by the methodof least squares. For the shock wave in free air the time-of-arrivalcurve is represented by
t - - o.1a519 + o.846oR - l.I614R2 + 1.0213R3 (500 ft to 650 ft) (3.10)
t - - 0.0370 + o.0861R + 0.0723R2 + 0.0398R3 (650 ft to 1100 ft)(3.11)
t - - 0.1107 + 0.15l42 + o.11o0R 2 + o.o007R3 (1I4 ft to 1700 ft) (3.12)
and
t - 0.2286 - o..623R + 0.48281t - 0.0701R3 (1700 ft to 2000 ft)(3.13)
where t is in seconds and R is in thousands of feet from the burstpoint.
It should be mentioned that the image of the shock wave didnot appear symetrical. on the film record, but with the proper geo-metrical corrections applied it was found to be symmetrical within theaccuracy of measurement. The apparent nonsphericity is due only to thegeometry involved. The burst occurred at the greatest elevation yetrecorded for such a test, (i.e., 3447 ft). The camera was located atground level and measurements were made in the vertical plane throughthe burst. A sphere when projected through angles ranging from 5 to19 degrees into this vertical plane from a point, should not appearspherical. The only true radii appearing on the record, therefore,are those which are measured at the level of burst. The results re-ported here are based on these shock radii. It will be noted inFig. 3.12 that a peculiar irregularity appears in the curve near 1250ft. In this region the shock did not intercept light from the smoketrails at burst height within reasonable limits and the precision ofthe data declines. Results based on them have been omitted in this
RESTRICTED DATA ,CRFTATOMIC; ENERGY AU:T N44'5 .E RE
Security aiftgrwhiin

SECRETsecurily Infolmation
4
111 IH M-111141 MR li- H i ti H I H
_1 ITIC-11- fl Il' I m - I IV, A fifl:: f PI I H: -1 1 1-1 14fltl 11-41iffit V M tw 4-flt'l I M cn
IL 47 m111-1 11f 4 1 W A ll 1: 1 mm I fl
f t 1111 -111111 t t 111111 MR it! 1IN : -4: 1 Ilt 'I'll I
M I T I t4t It TRto- .m--- 4, T O f 1-1:-- _4 4: ýI_
M. I c;
m x
flitt- -:-t ý - - ý
4 Wt:3H34-Ti :01 -Itt flil t-0 I Rm A fl-t
Wtlt 11 Hd4 1111, 111
11 H I t :%11111 Ht VIR 11:141- -11111
IT I - : ý , :11 _j4111,111 ItI11 I IN -- V IA I R 11111 H 11 IN t I 11111 Rt ý It :411-W11:11
- -i 1 1111. -_ 1 , T1-1 TH il I i i I - T!11 H _J:: I 1 1 1 -- t -- H [4aft
Al-1 1 0 4-H 11:11711, -1 ýITH fl I H
HII- IIII dill I lit] I kVIfilit 1.i I tl-1 4 11A
14' 11] !M [11 i'_ 05 1 1 -1 HIM i 11:11:1 1 i I I i I ITHI I ::: . -1-11 : 11.1 11 H 111' -1TIP I c*jillildlill . , w M I-1 titl flit-:11 fl-11il-WIll t1l IS
i RIV A tH11,11 -to : 111111 11111 -1ii I i Hii 11111 'Hill- _111M, M11 H[
if H c;Z
Llit11! 1 1-1 11 f HALLL - 1 .1 11H I it 0
0 0 0 0 00 0 0 00 ej QD V
IDS;
(1-4) OU3Z NOdV3M WOU4 3ONVISIa
SECRET RESTRICTED DATASocurity informition ATOMIC ENERGY ACT 1946

SECRETSecurity Information
SOUND VELOCITY, Cc (FT/SEC)
fa
44
2,00a X
A mOSHEI PRSUE P P
Fig 313 tmsphri Pessre F0 ad Sun Vlocty C0 v A~itdtTUk LR
2,400 1 ---- 108ARESTRICED DAT-SECRE
ATOMIC ------ ACT mm .. E6 SsuIl InX m otiunff
P '0 0 - - -- -- -- - ............. ------- ....... .... ý ..W i 1 11

SECRETSocurity Information
region without great loss in the final analysis.
The variations of P0 and CO with altitude above groundare shown in Fig. 3.13. Values taken from these curves were used incalculating peek shock overpressures in free air as a function ofdistance from the burst point.
Shock velocities and corresponding peak overpressuresare tabulated for various distances from weapon zero in Table 3.7.Overpressure vs distance is plotted in Fig. 3.1k. Data points areomitted between -100-1400 ft for the reasons mentioned above.
3.3.4 Pressure-Distance Results - TUM, 4.
The free-air shock wave time-of-arrival data for TUMLER4 were taken from films No. 13381 and 13382. The vertical planethrough zero in Vhich measurements were made is shown in Fig. 3.3.Timing mark" on the film- shoved the camras to be running at con-stant speed throughout the region of interest. The respective rateswere 101.337 and 102.869 frames per sec corresponding to times perframe of 0.00986800 and 0.00972107 sec. (The last three decimalplaces are held for computational purposes only.) On the enlargedimage, distances could be measured accurately to t 1.0 and t 1.25ft respectively. The absolute times of arrival of the shock wavein free air are given in Table 3.8. In Fig. 3.15 the tabular valuesare plotted together with points calculated using the equationsfitted to the data by the method of least squares. For the shock wavein free air the time-of-arrival curve is represented by
t - o.0-57 - 0.1584R + 0.4319R2 - o.11o3R3 (0oo ft to 650 ft) (3.14)
t - 0.1891 - 0.7711R + 1.1727R? - 0.396613 (650 ft to 900 ft) (3.15)
t - 0.0537 - O.2296R + 0.4523R2 - 0.0837R3 (900 ft to 1300 ft) (3.16)
t - 0.0o19 - 0.16321 + 0.3748R2 - 0.0581R3 (1300 ft to 1900 ft)(3.17)
where t is in seconds and R is in thousands of feet from the burstpoint.
The variations of Po and Co with altitude above ground areshown in Fig. 3.16. Values taken from these curves were used in cal-culating peak shock overpressures in free air as a function of distancefrom the burst point.
Shock velocities and corresponding peak overpressures are
109
SECRET RESTRICTED DATASerity Information ATOMIC ENERG• ACT 1946

SECRETSecurity Information
40
200-
(L
U) =VU) z_ ýUKHI
50
1.1
ATOMICH ENRG ACT- I-4 SIurl HIoat

SECRETWeuittiy liflomation
'7,7- 7000
IA.T
I.: -
16000P
0~i Ilk 0!0!04 0i0i0EllARRVA I;ME llSEC)-,T
Fi. .5 re ir Shoc Wav ..m .... .ria uvTMI
Tit JL
SECRE RETICEDT1,u600nomtinAOICEEG AT1A
I.H

SECRETSecurity Information
tabulated for various distances from weapon zero in Table 3.9. Over-
pressure vs distance is plotted in Fig. 3.17.
3.3.5 Free-air Pressure-Time Results - TI4BLER 1
The data for Shot 1 were taken from filmt No. 13063. Theframe rate was 93.49 frames per see, and it was constant over the re-gion of interest. Figure 3.18 shows the vertical plane of measure-ment through bomb zero. On the enlarged image, distances cou'.d bemeasured to t 1.0 ft.
The intersections of the smoke trail as a function of timealong different radii (see Fig. B.1) are tabulated in Table 3.10. Aplot of these data is shown in Fig. 3.20. From Fig. 3.20, smoothedvalues of Zn - Zj, and Xn - X were obtained and are given in Table
3.12. (A value Zn corresponds to the distance from the burst point toa fixed point on the smoke trail chosen before shock arrival. A valueXn represents the distance from the burst to a particle, originally atZn, after s-hock vrrivnl. The values of Zn,,, once chosen, remain fixed,while the values of Xn change with time.) The values of K, or'MX , 'required for the solution of P, wera calculated byU )t
K XnXat Z n-.L 1 (See App. B, Eq. B.2)zn - zj 2
and are plotted in Fig. 3.22. These data may be found tabulated inTable 3.14. Values of K were chosen from Fig. 3.22 for several Z'sand the pressures as a function of distance at constant times werecalculated by
w 6Po + Pn Zn2 '1.4Pn,m Pn 6 Pn + Po .m j (SeeIAw .B,Eq.3.3)
where P. is the total peak pressure at the distance Zn, obtained fromthe shock velocity data, and Po is the atmospheric pressure at burstheight. These data are given in Table 3.16 and Fig. 3.24.
The pressure-time curves for 590 ft and 690 ft were takenfrom Fig. 3.24 and are given in Table 3.18 and shown in Fig. 3.26.
The pressure-time curve at 575 ft was reduced to I KT(RC)
112
RESTRICTED DATA SECRETATOMIC ENERGY ACT 1946
Security Information

SECRETSecurity Information
at sea level and is included in Table 4.17 awid Fig. 4.13.
In Sec 3.1.2 it was pointed out that the particle displace-ment instrumentation, as employed, was not designed to have sufficientspace-time resolution to give reliable peak shock overpressure resultsbased on particle velocity measurements. However, since the particlevelocity could be determined easily during the course of the pressure-time analysis,a few specific values were found. At 408.7, 130.8, and449.2 ft the particle velocity was measured to be 1377.2, 1205.1, and1067.7 ft/sec, respectively. The equation used to convert from par-ticle velocity to peak shock overpressure is
PO 2 3.57 Ps2 (3.18)c 6 Ps + 7 Po
where u particle velocity (ft/sec)Co - sound velocity ahead of shock wave Cft/sec)P0 atmospheric pressure ahead of shock wave (psi)Ps I peak shock overpressure (psi)
Compwison of these results wvtn those obtained by the moreaccurate shock velocity method showed that the particle velocity methodproduced low results in each case:
44.1 psi vs 46.0 psi35.7 vs 41.029.6 vs 36.5
These values have been plotted in Fig. 3.8. The evident disagreement
is discussed further in See 3.3.8.
3.3.6 Free-air Pressure-Time Results - TUMBLER .
The data from Shot 4 were taken from film No. 13383. Theframe rate was 82.46 frames per sec and it was constant over the re-gion of interest. Figure 3.19 shows the vertical plane of measurementthrough bomb zero. On the enlarged image, distances could be measuredto t 1.0 ft.
The intersections of the smoke trail as a function of timealong different radii (see Fig. B.i) are tabulated in Table 3.11. Aplot of these data is shown in Fig. 3.21. From Fig. 3.21, smoothed
113
SECRET RESTRICTED DATASecurity Information ATOMIC ENERGY ACT 1946
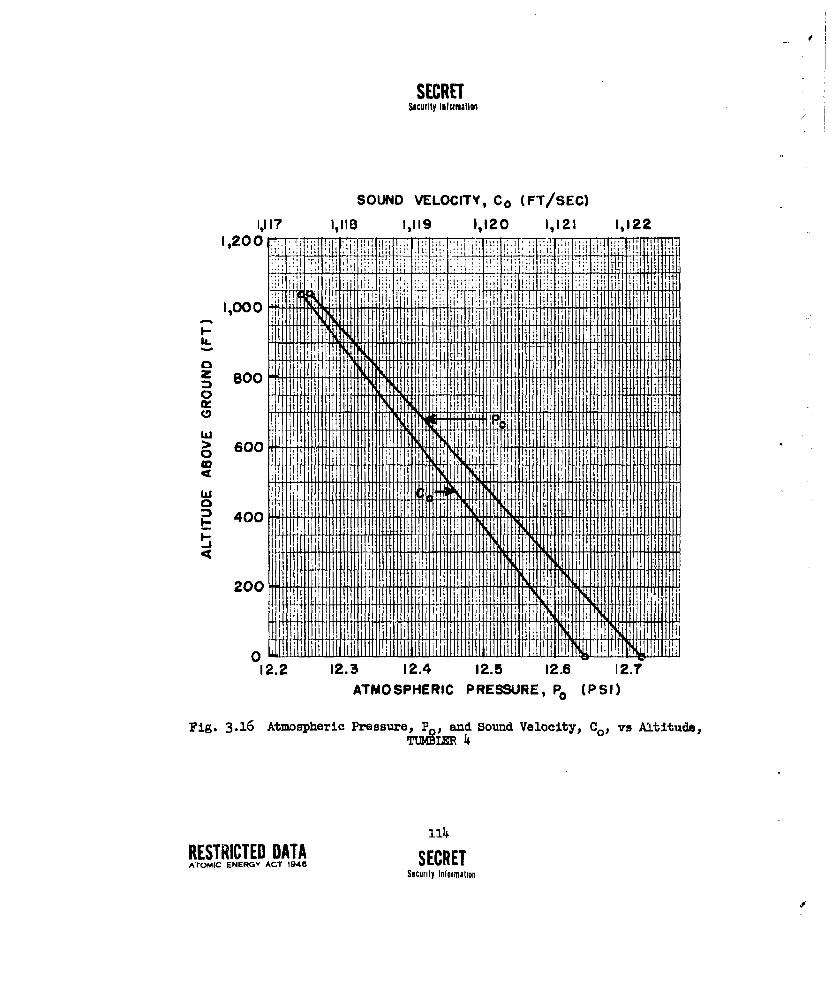
SECRETSicurity Intormstion
SOUND VELOCITY, C0 (FT/SEC)
11117 11108 113119 1,120 11121 1,122
14-4
1,8000~ LMD .
It, [J I K 1 I H iII "I I f ilj I8 00 V 1M 1 1
~ 0
20 DI I i
2i2 2.3 12. 12. I 1 2.11116 1-111 12.71
Fig. 3.16 tmpHei Preesui e Pl k n on eoiy 0 sAttd
, El
RETICE0 DT0SCEATOMC ENRGYACT 948 gcuitn nforatA

SECRETSecurity Information
S000it PEAK SHOCK OVkRPRESSUREBASED ON
0 SHOCK VELOCITYX PARTICL V LOCITY
500T U--10ii iii! k'Il J Illt11 1111
j I [.-,- ; ii I'lI I~h
900 . ~ IIi
Jc I
100 500II! 1000I,1I 2000I
INDITAC FIO W EAPO ZER -1 FT) 11.Il
1111VTIT t
SERE RESTRICTED1 DATA1:- -I: 1 lScRit In1: ti11OICEEG AT14
IRT] I ff

SECRETSecurity Information
N -.,.
BOMB ZERO
0 39'~ STA.
FIRST TRAIL 200-~
600 I.
MOTION OF PPART ICLES -
0
C.
CAMERAS7A. 362!
Fig- 3.18 Particle Displacmnt Layout -TUIBLEE 1
3 RD 2 ND I ST TRAILe3 e2- a PLANE OF MEASUREMENT
-P
STA 200BOMB wZERO N
CAMERASTA 362
Fig. 3.19 Particle Displacement Layout TWI 4Li~LR
U6
RESTRICTED DATA SECRETATOMIC ENERGY ACT 1946 Security Infor.iffitlon

SECRETSocuritv Informition
-M-7'-+++0
V.1. .. ... .. .M 1.1 -F
X.0 .V11-1fl] - --- Iff 111,
(.X~ TX'~ZW~ N3VdI41 :11,117
SERE RETICE DATIt ~ IyIloiiiinAOI EEG C 9(

-'frRan
Security Information
Wil
K IN
Lfll
iti
Al IMI ENRG INc.T 1 194.1 Veuill HInoMationI 1 1

SECRETkc~urity Iflicrmation
I AL
.1 IIrIj I- L
* 0 1.iO vo d 0 0
""4rU90
SERE RESRITE DATAillrit Inomt1 ATtI 11RG ACT I19I46 1

SECRETSecurity Information
0 id0
7-47
A: .L11.
1)44
120;RETICE DAA ECEATOMIC~~~~~~ H:ERG AC!I6SCiiy ftIllIf

SECRETS c urity Inform~ation
(340
. 10
IL t'
SECRET~~ RETRITDDTSeuity nor91 o TOI E11G CT14

SECRETSecurity Information
I IT* iii -4-- n
Jr~* 0 !'
::7: ki
ILIno 0 0 0 0 T0 w NA!
707 It w
(I~d)W'Ud 3~If6S3&7&I7t
is'.RETITEDAASCTATOMC ENR~y CT 148 ecurty Iformtho

SECRETSecurity Informlition
fiPli7, q :I~iII I '
U l- L I . . 1 -I l, . :: : w
"T 4 it I. ,1i
I~ wd
II TIK :: Iii I I, Il :;
!:1 i W li ' ' till ,
Nj I
1:;: till ~d :11 '3d lSS 3idl !1 1"M RH123 ..... .
SERE RESRITE DATA11 USecurity~~ Inoiito ATOMIC2 2 N G ACT ý19

SECRETSecurity Information
0
i I i!vi..W
7- h-"ji"0
.. I. : 1 .W ,H it k' 1s:I
fi[I l Ii : ll I !!If..IiI iiIi~irI~I~~,!:!V.
(I~d 'd 3&IAS3&i~i30
RETICE DAT SECRET 1i iATMLENRYAT 96Scu~yIlHmto

SECRETSecurity Informalion
values of Zn - Zj, and Xn - Xj wer obtained and are given in Table3.13. The values of K are plotted inFig. 3.23. These data may befound in Table 3.15. Values of K were chosen from Fig. 3.23 for sev-eral Z's and the pressures as a function of distance at constant timeswere calculated. These data are given in Table 3.17 and Fig. 3.25.
The pressure-time curves for 1350 ft and 1iO ft weretaken from Fig. 3.25 and are given in Table 3.19 and shown in Fig.3.27.
The pressure-time curve at 1550 ft was reduced to 1 KT(RC)at sea level and Is included in Table 4.17 and Fig. 4.13.
As in Sec 3.3.5 for Shot 1, a few measurements of the par-ticle velocity were also recorded for Shot 4. At 1461.0, 1488.3,1500.2, and 1520.3 ft from the burst poirit the particle velocity wasmeasured to be 1279.7, 981.1, 639.8, and 1237.0 ft/see, respectively.Equation 3.18 was used to convert these values to the correspondingpeak shock overpressures. Comparison of these results with thoseobtained by the more accurate shock velocity method showed that theparticle velocity method produced high results in three of the fourcases:
37.5 psi vs 23.0 psl25.1 vs 22.2
13.8 vs 21.735.6 vs 21.3
These values have been plotted in Fig. 3.17. The evident disagreementis discussed further in Sec 3.3.8.
3.3.7 Determination of the Decay Parmter, 6
In reference 24 an equation is given which was developed byTheilheimer and modified by Hartmann correlating the decay parameter, 9,of the pressure-time curve with the pressure-distance curve. Re-arrangement of this equation leads to the form
[Coj,~ 1, d I [21J4Q 7)-
+ 1LrfrWLT +#7) J] (3.1-9)
where IV * .PPo , C0 is the ambient velocity of sound in ft/sec, R isro (ppo%,.the distance in ft, and e in 4 1 evaluated at the shock's peak.
Ft-
125
SECRET RESTRICTED DATA-OurIty Infmmltiop ATOMIC ENERGY ACT i946

SECRETISecurity Information
Since 'P0 -if 1.167 'U(R) 1 ,from Eq. 3.3,
p0 -.=67L
then d -f . 2.334 U3 (2AP + 6MAAR), where the A's are the coefficients
dR cor
of the polynomial fitted to the arrival time data as in Eqs. 3.1 and3.2.
Assuming the theory leading to Eq. 3.19 to be correct, itcan bo used as a check on the pressure-time curves determined by theparticle displacement technique. Values of e were determined as above,based on the shock velocity pressure-distance curves. These valueswere compared with time values at (P-Po)max as read from the
pressure-time curves given in Figs. 3.26 and 3.27. (If one assumes the
pressure-time curve to be of the form P-P o - (-Po)max et/, then
t - 0 when (P-Po) - (P- o)max ). The results are given in Table 3.20.e
The average discrepancy between 9., (based on shock velocity) and Opd(based on particle displacement) for TUMBLER I is found to be 14.7per cent while for TUMBLER 4 the average discrepancy is 1.5 per cent.If the sensitivity of these results to such things as small errors inthe measurement of slopes is considered, it appears that the correla-tion is reasonably good and hence the pressure-time curves obtained bythe particle displacement measurement are satisfactory.
3•.3.8 Accuracy of Results
The sources of possible errors and the procedures for com-puting their magnitudes in the methods employed to find pressure as afunction of distance by the smoke rocket shock velocity technique havebeen covered extensively in references (2) and (24). The six maJoxsources of error stem (1) from the static and dynamic resolution um..certainties associated with film measurements under optimum conditiruin,S2) from failing to correct for foreshortening in the image plane,3 from imroper scaling of distance on the film, (k) from improper
time calibration, (5) from improper curve fitting, and (6) from %meof improper values of the atmospheric -re-eu.e, P., and so=rn- refeocity,C0 , for the region in front of the shock in pressure ccumutaticas.
The value of J , the ratio of specific heats for air, isa function of the shock strength. At overpressures above 75 psi, where
126RESTRICTED DATAATOMIC ENERGY AC,14 SECRET
Security Informition

4 SECRETi• Security Inlolmattn
the variation in starts to became significant, the correct valuefor Y' bha been used in the calculations by referring to the Hirsch-felder and Curtiss Tablesa2/. In these tables, values of P/Po arelisted for values of U/Co. The desired values include corrections forvariation in ' and for changes in the equation of state.
Throughout the analyses of the data presented in Sec 3.3.1through 3.3.4 care was taken to hold the above-linted errors to aminim%=. In all cases the distance measurements were found to fallwithin a maxium, uncertainty of t 2.0 ft and measurements of time perfraew to Z =&a maximum uncertainty of t 0.00005 nec. In most casesthese values were I-i0ft and t 0.00001 see, respectively. Fittingthe measured time-distance data with a polynomial by the method ofleast squares has been shown to be a reliable method of smoothing ex-perimental data to obtain the most Probable valuesm2J. Since the datapoints form quite a smooth curve when plotted directly, each pointhaving a maximum daviation from the mean of less than 5 per cent, thefitted polyncmial is estimated to be accurate to t 1 per cent in theregion of best fit. The errors in calculated pressures, therefore,are considered to be accurate to 4 per cent at the 5 psi level, 2.5per cent at the 10 psi level, and decreasingly less than 2.5 per centat a o.ger pressure levels within the range of pressures deter-mine d..
The determination of the free-air pressure-time curve bymeans of the particle displacement method is at best a coupromise.The procedure of differentiation by difference methods is in itselfan approximation rontaining certaiu inherent errors. Moreover, thediffearoes, (X, -Xj) and (Zn -Z.j),wnust be taken greater than a Pre-aetermineI value ;.n order to assure yressure errors less than 10 percent. The minimu value can be found by differenti-ting Eq. B.2which gives a maxinum percentage error in K of
r 1 1m 2 AR L X- + InA' (3.20)
KK 4 PZ1.4.(' 2 - Al
are. BIM11wrly zrr • . Hence the maximum per-centage error in Pn,m is
A. ZF 2.8 . ___ + 7 (3.21)
where A R is the error in reading on the enlarged image.
127
SECRET RESTRICTED DATASlurity Information ATOMIC ENERGY ACT 1946

SECRETSecurity Iliormnatlon
Now if .Ž..P = 0.1 and L R - 0.1 mm on the enlarged film ImageP
thenO.l - 0.28 1 I
Then since Xn - X >ý- 2.9 um is of the order of magnitude for Xn - X
at the earlier times, Za - Zj must be greater than 10 mm. On the two
shots analyzed to obtain Zn - Zj 1 10 mm, - bad to be greater than10 degrees. On the other hand, ac was kept less than 20 degrees tokeep the 6 X and A Z intervals used in the differentiation by dif-ferences process reasonably sm-ll.
Determination of the projected position of the particlefor each frame was accurate to t 1 ft. The maximum correction factorfor distance due to the displacement of the bomb from the plane ofmeasurement (Fig. 3.18 and Fig. 3.19) was 6 per cent for Shot 1 (firsttrail) and 1 per cent for Shot 4 (third trail).
Finally, to obtain the pressure-distance curve at constanttimes the system depended ,pon the peak pressure-distance measurementsfrom the shock velocity data. Thus, the error in this data, althoughit is small, is carried over an& will add to an uncertainty in thepressure-time results.
The pressures obtained using this particle displacementtechnique have a maximum error of approximately 10 per cent. Sincethe highest pressure on each curve in Fig. 3.24 and Fig. 3.25 wastaken from the shock velocity data, the first part of any of thepressure-time curves determined is much more accurate than the 10per cent figure quoted and is accurate to 2-3 per cent.
Although there are no other free-air pressure-time mas-uiemenos with which to check the particle displacement data, thepressure-time curves of Shots 1 and 4 have been scaled and comparedto give some indication of their overall validity. Figure 4.13 showsthat the agreement between the curves for the two shots is quite good.
The &inagreerent betveen the peak shock overpressure re-sults based on measured particle velocities as compared with thosebased on shock velocity measurements (see Sees 3.3.5 and 3.3.6) canbe readily understooca in view of the facts that the measurement ofdistance from the burst to a point contained a maximum uncertainty ofvery nearly 2 ft and that the speed of the camera system used was too
128RESTRICTED DATATOIC ENY ACT 1946SECRET
Security information

SECRETSecurity Informatin
slow to obtain an adequate number of measurements to permit statisticalsmoothing of rand= errors in the particle velocity determination. Inthe shock velocity method rand=m er-rors are minimized by the smoothingprocess involved in fitting a polyncmial to the data. The time resolu-tion of the system has been found adequate for the shock velocitymeasurements.
On the other hand, Eq. 3.18, correlating particle velocitywith pressure, in based on the Rankine-Hugoniot shock conditions andapplies only to the peak,instantaneous particle velocity i~mdiatelybehind the shock front. A system having better time resolution,therefore, would be necessary to obtain adequate data in a sufficient-ly short period of time so that a smoothing technique could be applied.Without smoothing, as in the case at hand, the maximm uncertainty of2 ft in the distance moved by a particle in the time elapsed betweentwo successive frames of the film leads to a maximum uncertainty inthe measured particle velocity of 10 per cent. An error of this mag-nituds in turn could leand to an error in calculated--peak overpressureof as much as 70 per cent.
A film exposure rate of 1000 frames per second with a spaceresolution of t 1 ft is estimated to be just adequate to obtain rea-sonably reliable peak shock overpressures based on particle velocitymeasurements. The term "reasonably reliable" is used because with thehigh space-time resolution afforded by the system proposed, it is be-lieved that it would be possible to discern the effect on accelerationwhich would arise from the mass of the wwk particles being greaterthan that of air molecules, to which Eq. 3.18 applies. Only a "rea-sonably reliable" measure of the desired particle velocity could,therefore, be obtained.
129
SECRET RESTRICTED DATASocurlty Information ATOMIC ENERGY ACT 1946

SECRETSecurity I0Iomation
2
TRAIL POS. TRAIL POSITIVEPHASE T PHASF
SHOCK SHOCKFRONT NEG. F RONT 14 PHA
3 4
TRAIL POS. TRAILPHAS
N-GATIVEPHASE
SHOOK NEG. SHOOKFRONT PHASE FRONT
PHASEREFLECTED
REFLECTED WAVEWAVE
1: TRAIL JUST BEFORE ARRIVAL OF SHOCK2: TRAIL JUST AFTER ARRIVAL OF SHOCK3: BEGINNING OF REFLECTED WAVE4: NEG. PHASE ARRIVAL AT TRAIL AND INTERFERENCE
OF REFLECTED SHOCK AT BOTTOM OF TRAIL
Fig. 3.28 Effect of a Nearby Surface on Smoke TrailParticle Motion
RESTRICTED DATA 130
ATOMIC ENERGY ACT 19A6 SECRETSecurity luformition

SECRETSea"ft 111fumt
Fig. 3.29 Parti.cle Displacement Smke Trails Bef ore Shock Arrival',TUMBIXR 1
1250 FT
Fig. 3.30 Particle Displacement Smke Trails After Shock Arrival,TUMBLER 1
131.SECRET RESTRICTED DATA
Security Intonnation ATOM C ENERGY ACT 1946

SECRETSecurity Intormatiw'
CHAPTER 4~
REDLUED ESIULTS
To get an overall picture cf tV-, results obtained on this opera-tion and to facilitate the comparison of these results with those ob-tained on other nuclear weapon operations, the significant dats for allT3MBLER shots were normalized to 1 Kr(RC) at sen l.0•vel. The normaliz-ing factors, weapon yields, and other pertinent test data are givenin Table 1.1 and discussed in Sec 1.6.
4.1 GROUND ILVEL DATA
The normalized data obtained from the ground level measurementsof ProJect 1.3 are presented in Tables 4.1 through 4.4 and shown ingraphical form in Figs. 4.1 through 4.10. The blast phenomena wereplotted against reduced ground range in Figs. 4.1 through 4.5 andagainst reduced slant range in Figs. 4.6 through 4.10.
It will be observed that in many of these figures a single curvewas drawn through the data points of TUMBIJT. 2 -ad 3; this curve wasthe best fit that could be made by eye for bota sets of data for thephenomena plotted. The identity of the normalized data for these twoshots indicates the siuilarity of TUMBLER 2 and 3. It also confirmsthe validity of the model law since these two shots were fired underconditions designed to check directly the applicability of normalcube-root blast scaling laws to nuclear explosions, i.e., both TUMBLER2 and 3 were fired in the saei test area under similar ground condi-tions and at nearly the same scaled height, 995 and 1012 ft for 1 KT(RC).In Fig. 4.4 where reduced arrival times were plotted against reducedground ranges the percentage accuracy in measuring time was sufficientto resolve the differences in times of arrival of the shocks becauseof the slight difference in heights of burst for TUMBLER 2 and 3;hence in this and some other figures, the general spread in the dataresulted in separate curves being drawn for TUMBLER 2 and 3.
Inspection of Figs. 4.1, 4.2 and 4.3, in which no account of theheights of burst has been taken, shows that the TUMBLER 1 scaled datayield higher pressures and impulses than TUMBLER 2 and 3 except inthe far Mach region where they all agree reasonably well. The curvefor TUMBLER 4, as would be expected from its low height and high yield,falls well above the curves of the other shots at the high pressureand impulse levels and below the others at the far distances. Figure4.4 shows the differences in shock-arrival times as measured from de-tonation with the shot at the lowest normalized height of burst,TII4BLER 4, showing the shortest times of arrival, and the highestburst shot, TUMBLER 3, giving the longest times. The relative heights
132
RESTRICTED DATA SECRETATOMIC ENEFRGY ACT 1946 Security Information

SECRETSecurity information
of the four shots again are indicated in Fig. wh5, here TUMBLER l nthe shortest reduced positive durations at the close-in distances andthe longest durations in the far region.
In Figs. 4.6 tbrotwh 4.10 heights of burst for the four TNBLIRshots were taken into account to some extent by plotting the blastphenomena against reduced slant range (i.e., reduced radial distmncefrom the bomb) instead of ground range. The results are interestingin that on all plots except that of arrival time (Fig. 4 ..9), the datapoints for the first three shots tend to group themselves around asingle curve while the points for TLI&LER 4 form a separate curve.The pressures and impulses for TUMBLER 4 are definitely lower thanfor TIMILER 1, 2, and 3 indicating that if the given weapon yieldsare correct, TUNLER 4 produced blast effects of lower mantude thanthe preceding three shots. This decrease probably can be attributedto the influence of the low burst height with its attendant greaterground and thermal effects.
It is not clear why the reduced jositive durations, Fig. 1.10,for TtMBLER 4 were greater than for the other three shots at corres-ponding reduced slant ranges. The time contribution of neither theprecursor at the early stations nor the secondary peak, Pd, kt thelater stations could account entirely for the longer durations. InFig. 4.9 it is interesting to note that although reduced arrivaltimes were plotted against reduced radial distances, four curvesresulted; the curves once again so positioned, one with respect tothe other, as to indicate the differences in burst heights for 'FuMBEIR1, 2, 3, and 4. It is obyious from these curves that ground measure-ments, even when presented in the same maa.ar-r as ftme-air measurements,are different from free-air results throughout the whole range ofmeasurements from regular reflection region through Mach reflectionregion. In addition to effects which might be predicted from idealreflection theory the presence of the ground influences the blast bysuch effects as energy absorption of the ground, thermal and dusteffects, and localized effects from a11 peculiarities in the ter-rain.
4.2 PHOTO-OPTICAL DATA IN FME AIR
The data obtained in free air have been reduced using the samescaling factors given in Table 1.1 that were used to reduce the groundlevel data of Sec. 4.1 to 1 KT(RC) at sea level.
4.2.1 Arrival Time of the Shock Wave in Free Air
The arrival time data tabulated in Tables 3.2, 3.4, 3.6,
133
SECRET RESTRICTED DATASecurity Information ATOMIC ENERGY ACT 1946
oV

SECRETSecurity Information
It~ I It
41
I 1 1 iI W I I - if
4
to 1 H~I atVa e
132- - ] 11-f 111 1RETIC5 DAT SECRE
ATMI ENRG AC7 1
,.7rit InTrmaT

SECRETSecurity Intormnation
I0
U'
0
I J : ......
41
~0
0 0 *0
0 ~N1
(IGd) 3S-fld V41 BALLISOd
1-35SECRET RESTRICTED DATA
Security Informration ATOMIC ENERGY ACT 1946

SECRETSecurity Information
I- 1,111 il 11.J i w
I,H I IT 1 F - -T ll-i 1
0 c
Willil 11( : I4dlil ;t1 I'
ill w11T H l HV 14 11 1* 11 1 -11,111:
-1iI dil_ iH iiii I I i, I n:-
ot 0
o 1 Ill 1
(ISd) ed 3unIfSS3~d 3AIIV03N )4V3c
136
RESTRICTED DATA SECRETATOMIC ENERGY ACT 1946 $ecurity Information

SECRETsocurity Intermation
0
7 '7! 7 i 0
I ~j~i~ti~ii0
IQ 6 iii 1 N Jilli VA~
[1 HOW Ili!137SERTilTRCEDDT
Security Informatrun ATO iClNRGl CT1

SECRETSecurity Informition
11,14
11 H-
A. I IlII
, H'1I 0a2.1-I I H M I J -- 111
I0 1 - 0 I
1 1 i 0l11 11
(03G) NOIJ.Lvanf 3A1.LISOd
RESTRICTED DATA SECREAWIUIK. iLNERGV ACT 1946 SCE
Security Iniormation

SECRETSic ,urity Information
500
100
toN 1 1 at Sea Level-
_T''

SECRETSecuuity Information
U :11 :1 -1 4 1 11 ti-
MlI, I
I ill, 1! iiN
Till 500 1,000 w,0 5,000!j
0.54
Sacurity nomto

SECRETSecurity Information
100
to 111 j! ;tSe;Lve
111E.SERTRSRITDDT
Sg-, t 71omtinAOICEEG AT14
U) i U

SECRETSecurity Informationl
0%
1111-4
1w Ai4. 'NE`V ACT19
Sslitt;tr ato
I MIM I MMME 1111

SECRETSecurity Informaition
0~
W 111f-H _RRM L-4:
IT _111
Ct 0
N 433
SE1E RESTRICED DATSecriy nfrmtin TOICENRG AT 94

SECRETSecurity Information
and 3.8 have been reduced to correspond to values that would be ob-tained using a weapon of 1 KT(RC) at sea level. The reduced valuesare given in Tables 4.5, 4.6, 4.7, and 4.8 flr TIMBLMR 1, 2, 3, and 4,respectively.
If it were assumed that all of the original data were equal-34 accurate and that the radiochemical equivalents were correct, thenone would expect to find that the original data, after reduction ornormalization, would all fit a single smooth curve perhaps represent-ing from henceforth the arrival time of the shock wave in free air foran air burst atomic weapon.
The reduced data appearing in the tables mentioned abovehave been plotted in Fig. 4.11, no attem•pt being made to identify anypoint as to shot number. Also plotted in this graph are calculatedpoints taken from polynomials fitted to all these data. The polyncmi-als fitting the data over the ranges indicated axe:
t a 0.0079 - 0.1303R + 1.0153R2 - 0.446103 (From 100 to 550 ft) (4.1)
t - - 0.0504 + 0.1745R + 0.4804R2 - 0.1314R3 (From 550 to 1200 ft)(4.2)
where t is in seconds for a 1 10 bomb and R is in thousands of feetfor a 1 XT bomb at sea level (see Table 1.1).
As can be seen from Fig. 4..1 all four TUMBLER shote scalerather well. The maximum uncertainty exists at the larger distancesand later times - as would be expected since timing errors are accu-mulative in the representation of the data in this form. The maximumuncertainty in time was found to be 1 per cent while that for distanceis slightly less than 0.1 per cent. Out to a reduced distance ofabout 582 ft (i.e. for 1 IT(RC) at sea level) all four shots are repre-sented and the very small unnertainty existing is not evident. Beyonda reduced distance of 735 ft only T .,BI. 1 and 2 are represented andthe uncertainty is observ•ble in this region. It is interesting tonote that although all the data of TLUBLR 2 consistently fall belowthose of TUMBLER 1, they agree within the range of uncertainty givenabove. These uncertainties are much smaller than the uncertainty of10 per cent (2.15 per cent reduced) which was given to the assignedradiochemical kilotonnages.
It should be emphasized that the error or uncertainty pointedout above is not a simple error in fitting to absolute time or zerodistance. It is a compound error caused by errors in time calibration,space calibration, and reduction factors. Fortunately they are small(see Sec 3.3.8).
144RESTRICTED DATA SECRETATOMIC ENERGY ACT 194SC
Security Informatio,
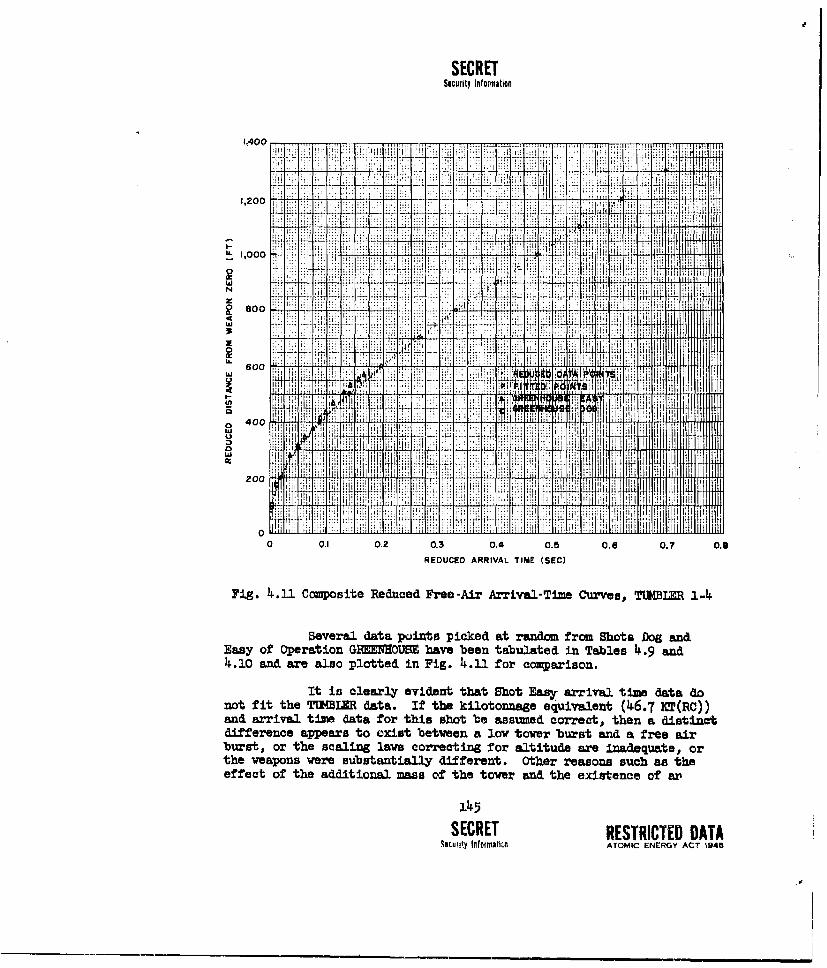
SECRETSicurity ~Inormationl
~1,4000
11200
44IJ!,
00W i
00
0 ~ ~ ~ ~ 1: 01 0 0i4 OB 0 0!.REDC. ANilA TI4 1SEC1
Fi.600oieReue roArAria-ieCwes ~~E ~4
Seea aapclzspce a aJ rm ht o nEaay of Operat~~IonL NOS aebe auae nTbe i. n14.10~~~~~ and. ar al. plotte i.......1 Po cuais
It i clarl evden tht Sot Esy rrial imedat df
effet o th ad itioa 1ass of' the toe andI th exsec of a
1145; 11 1111 11 1
SERE RETICE DTj.uft Tnomt~ TMC NRYAT14
0'

SECRETSacurity Information
Additional aliab•ati pulse ma an explanation of GIMMOUCSE have beendiscussed to some extent in references (24) and (2). The authors waeof the opinion that the Eaey arrival time data are nearly as reliableas those obtained on Operation TUMBLER. They feel that the scalinglaws are trustworthy, especially in view of the TUMBE.R results, andfail to understand how the proximity of the burst to the ground mighthave such a significant effect on the arrival time data in the free-air region.
4.2.2 Pressure-Distance in Free Air
The pressures and corresponding distances found in Tables3.3, 3.5, 3.7, and 3.9 have been scaled to 1 1T(RC) at sea level andare presented in Tables 4.11, 4.12, 4.13, and 4.14. Pressure vs dis-tancs reduced to 1 XT at sea level is plotted for all four TUMBLERshots in Fig. 4.12.
On the same graph, pressures calculated from the compositefree-air arrival time equations (See 4.2.1) are plotted as given inTable 4.15. This pressure-distance curve my be considered as a stand-ard for air dropped weapons representing the best available measure-ments to date for the free-air region down to the 10 psi pressurelevel. Uncertainties in the data upon vhich the curve is based wereminimized in all respects and a figure of accuracy of 2 per cent isjudiciously assigned. This figure contains a "safety factor" ofapproximately 1/3 and is considered by the authors to be highly reli-able. Values of pressure below 10 psi are considered to be less re-liable and should be used with caution.
In agreement with the trend shown in the composite arrivaltime curve, Fig. 24.11, the GREMMOUSE pressure data given in Table4.16 and plotted in Fig. 4.12 diverge from TUBLER data towards thelow pressure end of the curve. Reasons for thin divergence are notreadily forthcoming, as wars discussed in Sec 4.2.1.
In the region between 300 and 600 psi on the reduced com-posite pressure-distance curve it was found that the overpressure P3is related to the radial distance from the burst, R, by P c0 R-3. 1 interms of psi and thousauds of feet. The values of the exponent forGREMEOUSE, Shots Dog and Rasy, ven -2.82 (1,500 -150 Psi) and -3.15(10,000 -1,500 psi), reupectively• /. Thus at high pressures theslopes agree fairly well, as shown in Fig. 4.12.
4.2.3 Pressure-Time in Free Air
Pressure-time measurements based on the particle displace-
146RESTRICTED DATA SECRETATOMKI ENERGY ACT 1946
Seureiry Information

dlSECRET
Sicurity Information
I T 0Oly T ii. i
00 500 4~O 5,000REDUCED DISTANCE FROM WEAPON ZERO (F7)
7k
SECRE RETRE DATSeu100nomtinAOICEEG ATl4

SECRETSecurity Infermaugen
28T
244-
-. 20im
E+ 2... ---
I _ 11 - - -- - m
20X----
H8- --------- 7 M
4.. -
0.....- --------0 0.- -----------
ATOM...... ENERG A......
Seurt Xnlr2aiu

SECRETSecurity Infofmatirn
200.0_
300.0 _-- -- i
70 0 i600
40.0_
Lot CIH~liI K
0~~~~~~~~~~~~~ V0 20 0 0 0 6070 80901,0 ,0 ,0
R r 1T-
Fig.~ ~~~~~~~~~~~~T111 F1.12 e sDsac euu.t TCC t -sLvl(reA
10.09SECRET R~~ESTITDDT
SeurC InomtinAOICEEG AT14

SECRETSecurity Information
ment method were obtained in particular at 575 ft on Shot 1 and at1550 ft on Shot 4 so that when rediiced to 1 KT(RC) at sea level, acomparison between the two might be made. On the reduced scale, boththe above distances correspond to a distance of 541.1 ft. The pressuresfor corresponding reduced times for Shots 1 and 4 are given in Table4.17. Data from both tables are plotted in Fig. 4.13 for comparison
purposes.
The superposed curves shown in Fig. 4.13 can be used as ameans for determining a qualitative estimate of the accuracy of theparticle displacement method. It is encouraging to note the agree-ment with regard to reduced decay parameter (41.5 vs 46.5 msec) andthe general similarities of the curves. It should be pointed out,nevertheless, that the uncertainties (not necessarily errors) mustfor the present remain of the order of 10 per cent, as indicated inSec 3.3.8. The agreement observed in Fig. 4.13 im not accepted bythe authors as proof that the accuracy of the method is equivalentto, say, that of the smoke rocket shock velocity method. More ex-perience using the particle displacement method may change this opinion.
An additional note of interest which may or may not affectthe argument in the preceding paragraph is that in Fig. 4.13 the curvefor Shot 4 indicates a longer reduced positive duration than for thatof Shot 1. Similar indications were observed in the ground levelmeasurements (Sec 4.1, Fig. 4.10) and may be significant.
4.2.4 Reduced Decay Parameter, e
The values of e have been computed by use of the methodoutlined in Sec 3.3.7 as applied to the composite reduced pressure-distance data from all four TI3BLER shots as given in Table 4.15.These values of e are given in Table 4.18 and are plotted as a fumc-tion of reduced distance in Fig. 4.14. The pentolite curve in Fig.4.14 was taken from the G~IM U• Sumary Report (Fig. 4.14, reference(24)) as scaled to 1 Kr(RC) at sea level. The curve, as calculated bythe method in Sec 3.3.7, is in good agreement with the pentolite curveconsidering that the method involves the second derivative of the shockarrival time curve, which leads to large erroru in 0 for wall dis-crepancies in peak pressure.
Also given in Table 4.18 and Fig. 4.134 are the values of 0reduced to 1 KT at sea level for TUMBLER 1 and 4 ans obtained from thefree-air pressure-time curve by the particle displacement method andfrom the individual pressure-distance curves obtained by the shockvelocity method. (See Sec 3.3.7). These points are in good agrementwith the pentolite curve considering the limits of accuracy.
150
RESTRICTED DATA SECRETATOMIC ENERGY ACT 1946 Security Information
SECRETSecurity Informatio
CHAPTER 5
DISCUSSION OF 1•-I.ULTS
5.1 H'IGET-OF-BMWST COMPARISONS
Height-of-burst data for TUMBLER were obtained from Fig. 4.1, astabulated in Table 5.1. From such data height-of-burst charts, i.e.,plots showing the distance along the ground at which certain pressurelevels occurred, can be presented in several ways, three of Which aregiven in this report:
(a) Drawing height-of-burst curves based principally on the dataobtained on TUBLER plus data obtained from a surface shot (Operation
(1) Plotting TUMBLER data on cuav s calculated from recent highexplosive (small-charge) experimentsV (Fig. 5.2), and
(c) Plotting TUMBLER data on curves traced from reference (16)which gave the official values up to the time of this operation(Figs. 5.3 through 5.7).
5.1.1 Height-of-Burst, TU1BLER and High Explosive
Figure 5.1, cw4 is based almost entirely on TUMBLER dataas extended by JANGLE data.-/, shows that down to the 12 psi pressurelevel the optimmn height of burst over the Nevada Proving Grounds iszero (ground level) if the effect of shadowing by structures and Ir-regular terrain is ignored. As the pressure level decreases, the em-pirical optimum height of burst for 1 X(RC) sea level, Hp, can becharacterized by the relation
N .m • (5.1)
where 3 < P < 12 if H61 is in reduced feet and p is the desired over-pressure level in pounds per square inch. For coparison, thb la-tion and another, based on one given by Hartmann and Kalavskyj- forthe optimum height of burst of pentolite over concrete, are also plot-ted on Fig. 5.1 and tabulated in Table 5.2. Although casual inspectionof these two optimum height-of-burst relations, as superposed on theconventional height-of-burst curves, shows a higher optimum height ofburst for nuclear weapons, this difference is likely to be misleading.To see this more clearly, Fig. 5.2, Vhich gives height-of-burst curves
151
SECRET RESTRICTED DATASecurity Information ATOMIC ENERGY ACT 1946

SECRETSecurity Information
it 8f10
4-
0 in 0
0 a W
Seuity ramt
l~il 11 til 1. il I I II. 1, . II h

SECRET ISecurity Information
00
17'.1
INI
o 00
153
SECRET RESTRICTED DATASecurity Informaliun ATOMIC ENERGY ACT 1948

SECRETSecurity Informtion
for pentolitel5_/, should be consulted. On these high explosive height-of-burst curves are plotted the TEMMBLE data collected at ground levelby the NOL (Project 1.3) and the ýLWBIH preliminary data collected ontowers by the SRI (Project 1.2)13/ (See also Table 5.3). As waspointed out in reference (15), the high explosive data were measuredwith gages close-to but not flush-with the ground. When the meanheight of the sensitive area of these gages is scaled to 1 KT(RC), itindicazes that the resulting BE data should be compared with measure-ments made 16.4 ft above the ground. The SHI data used for comparisonwere measured at 10 ft above the ground on Shots 1 and 2, vhich scaledto 9.4 and 9.0 ft, and at 50 ft on Shots 3 and 4, which scaled to 14.7and 17.4 ft. It can be seen from this figure that the appropriatetower data* check the EM data much more closely than the ground leveldata, except on Shot 14 where they are similar or where the ground levelchecks a little closer, such as at the 10 psi level. The conclusion,therefore, is that the two relations for HeO plotted on Fig. 5.1 rep-resent the optimum height-of-buret in one case for gages flush withthe ground (Eq. 5.1) and the other for gages at a reduced height of16.4 ft. Furthermore it indicates that, except under the conditionsof Shot 4 vhere the precursor disturbed the blast appreciably, the Exand nuclear height-of-burst data scale satisfactorily.
One serious difference in the shapes of the high explosiveand nuclear height-of-ourst charts arises from the tie-in points usedfor the zero height-of-burst. It can be seen from the Operation
The reader may justifiably object to using NOL ground data withSRI tower data, since as is mentioned elsewhere in this report, theSRI data differed from the NOL data on the ground by about 7 per cent.However, the SRI data available at this writing were only preliminary,and it was desired to use as much final data as possible in this pre-Sentation. As a check, SRI preliminary data on the ground level re-duced in the same manner as the other data on Fig. 5.2, were alsoplotted but not published. These data also indicated that pressureson the ground level occurred farther away from ground zero than thesame pressures measured on the towers. The differences, however, werenot so striking. It is suggested that when final SRI data becmeavailable, Fig. 5.2 be revised using only SRI and high explosive data.
1L54
RESTRICTED DATA 15EATOMIC ENERGY ACT 1940 SECRET
Security Information

SECRETSecurity Informstion
JANGLE air blast resultsR/ that the blast efficiency of nuclear weas-aus fired on the ground. is nearer 80 per cent than the 45 per centwhich was used to convert the remaining HE data. Therefore if highexplosive height-of-burst data are used for nuclear prediction, thisfact should be taken into account. (To scale the blast effect of one-pound charges of pentolite to 1 kiloton of THT(RC), it was assumedthat 45 per cent of the radiochemical energy (weight) went into blastand that 1.2 pounds of TNT were necessary to equal one pound of pento-lite. Hence dista ces for tn% one pound pentolite charges, were mul-tiplied by (2 X 10° x 0.45) 173 - 91. Additional discussion of nuclear
blast coapared with that from high explosives blast is in Sec 5.4.)
5.1.2 Height-of-Burst, TUMBLER vs Previous Operational Instruc-tions
As an additional way to view the height-of-burst data, theTUMBLER results from the ground level gages were plotted on qurvestraced from the guide to be used in firing nuclear weaponsl_. Thisreference, which was based on all height-of-burst data previous toOperation TUMBLER, gave for each pressure level three curves designatedas Good, Fair, or Poor. Which cumve should be used in each instancewas to depend on the nature of the target surface. Inspection of thisinformation as shown on Figs. 5.3 through 5.7 shows that the TUMBLERpoints fall on the Good-Fair-Poor curves as follows:
Pressure TUMBLER TUMBLER TUMBLER TUMBLERPSI__1_2_3 14
50 - - -•40- F-P30 G-F - - P25 F - - F-P20 F - - P15 F F F P12 G F P P10 G+ F F P8 G+ F F F6 G+ G+ G+ F5 G+ G+ G+ F4 G+ G+ G+ 0-P3 G+ G+ G+ G-P
The above list shows that, in general, Shots 1, 2, and 3 can be consid-ered to be between Good and Fair and Shot 4 is between Fair and Poor.Inspection of the pressure-time records reveals them to be consistent
155
SECRET RESTRICTED DATAScurity Informilaon ATOMIC ENEI4GY ACT 1948

SECRETSecurity Information
10,000FOR OTHER TONNAGES: MULTIPLY EACH 015TANCEBY W FOR EXAMPLE: 8 KT MULTIPLY BY 2
27 KT MULTIPLY BY 3
5,000 - 64 KT MULTIPLY BY 4125 KT MULTIPLY BY 5
U.
1,000
0
'~ . . . .S I"; 7 o T U M B L E R I
w 500_ * TUMBLER 2l, ATUMBLER3
"MA ;* + TUMBLER 4
__ __ _GOOD FAIR.
FAIR100POO-R I R
100 200 500 1000 2,000 5,000 10,000HORIZONTAL DISTANCE FROM GROUND ZERO (FT)
Fig. 5.3 Height of Burst vs Horizontal. Distance for 1 IC(RC) at BeaLeIel for 50, 15, and 5 psi
Shaded Curves from Sunw. 1 m 23-200, 8 Feb 1952
RESTRICTED DATA SECRETATOMIC CNrrGY ACT 1g40
Security Inlotmation

SECRETSecurity Inormmation
10,000FOR OTHER TONP/A6ES: MULTIPLY EACH DISTANCE
gy W rk, FOR EXAMPLE- 8 KT MULTIPLY BY 2-_--'- - 27 KT MULTIPLY BY 3
5,000 64 KT MULTIPLY BY 412 5 KT MULTIPLY BY 5
S~POOR,
1,00U-
" ' 12 PS • /4
4 PSI-I500 6
GOOD - *-GOOD o TUMBLER I
FAIR - FAIR • TUMBLER 2
POOR . POOR A TUMBLER 310 0 , 1 _ _ _ ., + T U M B L E R 4
100 200 500 1,000 2,000 5,000HORIZONTAL DISTANCE FROM GROUND ZERO (FT)
Fig. 5.-4 Height of Burst vo Norizontal Distazce for 1 X. (tc)at Sea Level for 140, 12, ad 4 p•iShaded. C="ZsB from Bipp. 1 ¶fl-23-200, 8 Feb i95P
157SECRET RESTRICTED DATA
Security Information ATOMIC ENERGY ACT 1I46

SECRIFTSecurity Information
10,000FOR OTHER TONNAGES: MULTIPLY EACH DISTANCEBY W P, FOR EXAMPLE: 8 KT MULTIPLY BY 2
2 I-- 4 KT MULTIPLY BY 3
,O000 84 KT MULTIPLY BY 4125 KT MULTIPLY BY 5
, ,
Ui.. 0
S1,000 - I.. .. I
-I-- -
w
"OTUMBLER I___ _--- *TUMBLER2
A TUMBLER 3GOOD GOOD + TUMBLER 4
" FAIR FAIR
I0 POOR POOR
100 - __
500 200 500 1,000 2,000 5,000 I4000HORIZONTAL DISTANCE FROM GROUND ZERO (FT)
Fig. 5.5 Height of Burst vs Horizontal Distance for 1 K(RC) atSea Level for 30, 10, and. 3 psi ShvAded Curvoe fromSupp. 1 T1-23-200, 8 February 1952
158
RESTRICTED DATA SECRETATOMIC ENERGY ACT 1I46
Security information

SECRETSecurity Intormstion
10,000 OTEI O"FOR TER TONNA6ES: MULTIPLY EACH' DISTANCEBY W "s, FOR EXAMPLE: 1 KT MULTIPLY BY 2
-- __27 KT MULTIPLY BY 3
5,000 - , 64 KT MULTIPLY BY 4
125 KT MULTIPLY BY 5
I33=Ii.
I-
0
I-
"11" ..... -•,;•o TUMBLER I_ 500, * TUMBLER 2
ATUMBLER 3
+ TUMBLER4
1OOD-3 , 8eD 1S... . FAIR FA %I R
POOR -- POOR"i
10,o 1 1 / 1 I .10(0 200 500 IOOO 2000 5),000 1400oe
HORIZONTAL DISTANCE; FROM GROUND ZERO (FT)
rig. 5.6 Height of Burst vs Horizontal Distance for 1 la (RC)at Sea Level for 25 and 8 pox Shaded Curves fromSupy. 1 TK-23-200, 8 February 1952
159
SECRET RESTRICTED DATASecurity Infornmtion ATOMIC ENE"RGY ACT 1941

SECRET% ornIv Itf1 mtstiml
10,000 - _ _ _ _ _ _ _ _ _ _ _ _ _ _ _ _ _ _ _ _ _
FOR OTHER TONNA6ES MUL TIPLY EACH DIS ,TANCE
BY W'p FOR EXAMPLE. 8 KT MULTIPLY BY 2-_ 27 KT MULTIPLY BY 3
000 I 64 KT MULTIPLY BY 4
125 KT MULTIPLY BY 5
SPS
S1,000 IN
00
zI o TUMBLER I
Boo * TUMBLER 2A TUMBLER 3+ TUMBLER 4
"100 200 500 1000 2,000 5,000 10,000
HIORIZONTAL DISTANCE FROM GROUND ZERO (FT)
Fig. 5.7 Height of Burst vs Horizonal Distance for 1 KT(RC) atSea Level for 20 and 6 pi - S/ad d Curves from BIup. 1TK-23-200, 8 FebruarY 1952
160
RESTRICTED DATA SECRETATOMIC rNCJRGY ACT 1046 Security Informaiwn
SECRET
with this conclusion. The traces on the first three shots show sharpinitial rises at all •istances, though traces in the regular regionshow a rounding off or break at the peak. On Shot h,, however, therewere several stations where no shaxp rise was visible at all; and thestations on this shot which had sharp rises with rounded peaks werelocated as far as 4339 ft from ground zero, i.e., beyond the theoret-ical regular region.
5.2 TS PRECURSOR 0? TWUL .
5.2.1 Description of the Phenomenon
In addition to the usual incident and reflected shockwaves intersecting at the ground level on TUMBLER 4, there vs alsoa third wave visible which appeared to extend frm the ground aheadof the incident and reflected waves back through the incident waveto connect nearly tangentially with the reflected wave. This thirdwave, or "precursor," is shown in Figs. 5.8, 5.9, 5.10, and 5.11taken from photographs (EGG 13381) in time sequence. This is be-lieved to be the first time that such a phenomenon was observedand analyzed; though after attention was called to it, others havenoted its presence in photographs taken of BUBTER Shots Charlie,Dog,and Easy. There is even some slight indication that a meagerprecursor was formed on TUMBLER 1.
The precursor was formed a short, but undetermined timeafter the incident wave struck the ground at 210 asec after burst,as best as could be determined from the photographs of TI3BIR 4.It was visible in the films out to their limit of view of 1765 ftin the plane of measurement containing GZ. Close-up photographs ex-posed primarily for mortar and Jato particle motion studies (Project19.2a) showed the precursor passing Station 7-202 (1345 ft from GZ),while at Station 7-203 it was no longer visible. (At Station 7-203,2092 ft from OZ, the NOL pressure-time records gave a s11 barelyperceptible indication of a precnarsor; none was evident at Station"7-204 at 280o4 ft (See See 2.2.4).
Especially in the close-up mortar and Jato photographs ofStation 7-202, it was observed that ahead of the precusor the groundwas clearly visible and the air above it was not dust-laden. Ined-iately behind the precursor the dust rose rapidfy. After the arrivalof the precursor but before the arrival of the incident and reflectedwaves this dust appeared to be rolling outward radially from GZ ingreat billows.
161
SECRET RESTRICTED DATASecurity InformrtIn ATOMIC ENERGY ACT 1046

SECRET
Fig. 5.8 Precursor Seqwueno, 0.2512 xec, TU4BMZ I4
600 FT
Fig. 5.9 Precursor Sequence, 0.2906 see, TI/BLE1 i
RESTRICTED DATA SECRETATOMAIC ENERGY ACT 1946 S-l"ty Inllmtw

SECRET! Sacuty tatnatbe
Fig. 5.10 Precursor Sequence, 0.4189 sece, TUSuLW 4
I IeOO FT
Fig. 5.11 Precursor Sequence, 0.5W7 sec, TIBLE 4
163SECRET RESTRICTED DATA
Smutty JainatATOMIC ENERGY ACT 1046
i r ........ ..............

SECRETSecurity Informaiqu
At the ground in the vicinity of Station 7-202 the pre-cursor appeared nearly vertical but in less than 20 ft above theground it slanted sharply forming an angle of roughly 450 with thehorizontal. It curved gradually back until it joined with the re-flected wave, at which point it made an angle with the horizontalof about 200. Also, as the wave progressed outwardly there wassome indication of a sudden change of slope, although very slight,at approximately 150 ft above the ground.
Measurements of the mortar and Jato photographs of Sta-tion 7-202 revealed that smoke particles originating at the top ofthe 50 ft instrument tower were first struck by the precursor andmoved away from the pole at an angle of approximately 450, i.e., ina path normal to the front of the precursor. Following the arrivalof the incident wave, which was nearly normal to the precursor, thesmoke particles changed their course to follow in the direction ofmotion of the incident wave. An attempt to determine with certaintythe direction in whIch dust left the ground was fruitless, becausethe dust appeared as a cloud not as small groups of particles whichcould be identified from frame to frame.
The mortar puff appearing in these photographs was firststrunk by the incident wave causing the smoke particles to move to-ward the ground radially from zero. The puff was struck soon there-after by the reflected wave and the direction of motion of theparticles changed to that of the reflected wave. The mortar puffwas sufficiently high so that at no time was it observed to be struckby the precursor.
5.2.2 Arrival Time of the Precursor Along the Ground
On TUMBLER 4 the pressure-time gages mounted at the groundsurface and on towers indicated that possibly a low pressure wavearrived at the station before one of higher pressure, i.e., thepressure-time curves, as far out as Station 7-202, exhibited a longflat step between arrival of the initial disturbance and the peak(see Fig. 2.46). To determine whether or not this effect was assoc-iated with the precursor, thae times of arrival of the precursor andthe reflected wave at points along the ground were measured and com-pared with shock arrival times taken from the NCL pressure-timerecords.
A small rise in the level of the ground between the cameraand ground zero made it impossible to see the ground level near GZ inthe rocket trail photographs. In the analysis, therefore, it was nec-
RESTRICTED DATA 164
ATOMIC ENFFWIY ACT 1946 SECRETSecurity Inlormation

SECRETSecurity Information
essary to establish some frame of reference in order to establish theposition of the precursor and the reflected shock wave. This was doneas follows:
From rocket smoke trail data (Sec 3.3.4) the incident shockwave was observed to be spherical, and the locus of the center, 0, andthe shock radius, R, (Fig. 5.12) were known. The reflected shock wavewas assumed to be spherical for a short time after its formation, andfurthermore its radius was assumed to be the same as that of the in-cident wave. This latter asoumrtion was checked in the first fewframes after the formation of the reflected wave and was found to bereasonable. (The frame of reference was established in these frames.In later frames the reflected wave became distorted at the center fromheating in the region immediately below the burst). The reflectedshock wave's center, 0', was found by using the visible ends of thereflected wave, points BE and SW, as base points and striking arcs ofradius R from these points. The point at which these arcs intersectis the center (0'). With this center as the base, an arc of radius Rintersected the incident wave at two points, C and D. A straight linethrough these points forms a datum level the slope of which approxi-mates that of the terrain behind the rise. A perpendicular was droppedfrom bomb zero (0) to the line (CD) in order to establish a zero posi-tion, m, at this level. Perpendiculars were droned from the visibleends of the precursor, PE and PW, and the reflected wave, SE and BWto datum level. The points of intersection were then measured. Thismethod of establishing a frame of reference was proved to be internal-ly consistant as follows:
The position of the datum zero (m), which was transferredafter its initial establishment from frame-to-frame by use of the fi-ducial markers, was checked in some of the later frames by using theends of the reflected wave as reference points. Within the precisionof the measurements both methods agreed well.
The plane of measurement is shown in Fig. 3.3 (Shot 4) andwas roughly at an augle of 300 with the blast line. The results of theanalysis are given in Table 5.4 and are shown graphically in Fig. 5.13.The scatter in the points is due to the method of determining theirradial distances and cannot be improved under the circumstances.
5.2.3 Analysis of Results
The data, as presented, show primarily the qualitative dif-ference in arrival times of the precursor and incident shock at a point.As can be seen, the precursor advanced with a velocity along the groundexceeding that of the reflected wave. (The slope of the curve for theprecirsor, Fig. 5.13, is always greater than that for the reflectedwave within the range of measurements.) A glance at the photographs.
165
SECRET RESTRICTED DATASecutity Information ATOMIC ENERGY ACT 1946

SECRETSecurity Information
INCIDENT SHOCKWAVE ESTABLISHEDBY SMOKE TRAILS
R 0
PE' PW' EXTREME VISIBLE ENDS MARKERS
OP PRECURSOR5 E' Sw• EXTREME VISIBLE ENDSOF REFLECTED SHOCK
WAVEE
Fig, 5.32 Sketch Shoin Construction of Reference Fraeni for PreouisorMe~ur•mnt s
RESTRICTED DATA SECRETATOMIC ENERGY ACT 1946
Security Infrmation la'
RESTICTE DAT
ATOMC ENRGY CT 146 SCRE

SECRETSecurity Information
1,600 Iti
I.-
2,00
1ITI 11 i I M UM
01,000,0 0.00.0 0.0 0.0 070
ITI BLER11:1
w 1111111 11 H ll II1 111 IIIIIHI167 IlSERtRSRITDDT
0Secilhlur, 111 il1 1 I ty47 Iri~mt~ ATII ENERG IC 194HI
z'

SECRETSecurity Information
Figs. 5.8 through 5.11, can leave no dQubt that at a given instant thereflected wave lags behind the precursor. The incident wave, madeapparent by the breaks and hooks in the rocket smoke trails, clearlypasses through the upper portion of the precursor apparently to Joinwith the reflected wave at the ground (when extended through the dustlayer).
The curves drawn through the data points in Fig. 5.13 donot represent a least squares fit to the data but were simply drawnin by eye. The time-of-arrival of the incident wave at ground zerois plotted in the same figure to show that the formation of the pre-cursor was nearly coincident with that of the reflected wave.
Also shown in Fig. 5.13 are the arrival-time data recordedby NOL inductance gages. The sketch in the upper left corner of thegraph shows the points on the pressure-time curves for which arrivaltimes were plotted. All possible errors considered, it is difficultto deny that the precursor was responsible for the "front porch"effect on the pressure-time curves, as it has been aptly named bvE. B. Doll of the Stanford Research Institute. The gages respondedupon the arrival of the precursor, indicating an increase in pressure.Upon the arrival of the reflected wave the pressure Jumped to a highervalue. At Station 7-204 and beyond, the NOL pressure-time gages in-dicated that the precursor had completely dissipated itself or thatit coincided with the Mach wave which had apparently formed beforereaching this station. The mortar and Jato photographs showed no dustbillows and only a single shock at this station.
5.2.4 Discussion and Conclusions
Acoustic theory has predicted that a sound wave can forma "precursor" having similar characteristics to the one formed fromthe shock wave on TL4BLER 4. The basic theory' from which its origincan be deduced was presented by Rayleigh 2, and has since beenapplied to qip41" problems met in the study of underwater explosionpbenomena 77/. It is also interesting to note that shadow photo-graphs of this phenomenon were recently displayed by Dr. H. Schardinat the International Symposium on High-Speed Photography. Dr.Schardin attributed the work to a German investigator at about theturn of the century.
The attention of the authors was called by lr. G. K.Ea rtmann to a David Taylor Model Basin summary repor tUr5 . Thisreference from which Fig. 5.14 has been taken, clearly states howa precursor is formed at the critical angle, ec, When a spherical
168RESTRICTED DATA SECRETATOMIC ENERGY ACT 1946
Security Information

SECRETSecurity lfommtion
acoustic wave, having its origin at 0, is reflected and refracted atan interface separating two media of different sound wave velocities,CI and C2, where in the present instance, the medium containing thesource of theewve is one of lover sourA velocity, CI.
From reference (25): "When a symmetrical spherical wavefalls on a plane interface of infinite lateral extent, the angle ofincidence increases progressively from 00 to 900 as the wave spreadsoutward. According to awalytical results, each part of the wave isreflected nearly like a plane wave incident at the same angle. Asillustrated in Fig. (5.14), the reflected wave is spherical in formbut centered at a point 0' which is the mirror image in the interfaceof the center 0 of the incident wave. The ratio of the reflectedpressure to the incident pressure is least at the point P which isreflected first. The refracted wave is likewise variable in strengthbut its form is spherical only if 02 - CI.
"If O2 > C1 , a remarkable change occurs as the angle o0,incidence of the enlarging incident wave passes the critical anglee 2 .At the critical angle itself, the refracted wave stands perpendicularlyon the surface, as at C in Fig. ( 5 .14), in which the various waves areshown at three successive times. Beyond C, the refracted wave remainsperpendicular to the surface but runs ahead of the counon intersectionof the incident and reflected waves with the interface; it is connectedwith the reflected wave by a fourth wave AB which is conical in form,tangent to the reflected wave at A, and inclined to the interface atthe constant critical angle 00. This connecting wave (precursor)draws its energy from the refracted wave, which rapidl.y diminishes inintensity. The intensity of the connecting wave (precursor) decreasesfrom A to B. At a point in space such as Q the connecting wave (pre-cursor) will arrive ahead of the incident wave.
"The curves drawn in the figure may represent the front ofa pulse of pressure together with the associated reflected and refractedfronts. They may also be taken to represent related fronts in a pro-longed train of waves, but in this case the train of connecting wavesis superpose& upon the ordinary reflected train and may not be dis-tinguishable as separate waves."
Jacobs and Liddiard1/, of NOL, conducted sae experimentsin which very small charges were inmersed and fired in water suspendedabove a layer of carbon tetrachloride. The velocity of sound for thetwo media were sufficiently different so that some excellent picturesresembling the precursor on TUMBLER 4 were obtained.
On TUHBLER 4, energy coupling considerations make it dif-
169
SECRET RESTRICTED DATASecurity Information ATOMIC ENERGY ACT 19ig

SECRETSecurity lInformation
~-5..
SID / PRECURSOR
St0 ,, C SURFACE
R40TED \0%1Pý
Fig. 5.1 Reflection of a Spherical Wave by a Medium of HigherWave Velocity (Reference (25))
ficult to accept the theory that ground shook, or upward surface dis-placement, as has been proposedp could have given rise to Such highpressures as were measured before the arrival of the reflected wave.As stated above, the precursor draws its energy from the refractedwave, so another explanation must be sought if the acoustic theoryapplies.
The therml layer hypothesis appears as though it mightsatisfy all the basic requirement. for an adequate explaaation of theorigin of the precursor. Furthermore, it is supported scrmewhat by ob-servations made on the photographs. If it can be assmed that up tosome level above the ground the air was sufficiently heated and inwhich the velocity of sound was sufficiently greater than that in theundisturbed air above it, then the interface separating the sufficient-ly heated layer from the air above it could serve as the surface layershown in Fig. 5.1. Energy would be fed to the precursor from the re-fracted wave in the heated lay•r rather than from the ground, and theobstacle encountered in the ground shock theory would be overcome.
In Sec 5.2.1 it was stated that in the mortar and Jatophotographs the front of the precursor was nearly vertical up to some
RESTRICTED DATA SCTATOI ENERGY ACT 1946 SECRET
Security Information

SECRETSocurity Iofumatio
20 ft above the ground at Station 7-202. Assuming this to be in thesufficiently heated layer, the vertical portion of the precursor asobserved would correspond to the vertical portion of the refractedwave shown in Fig. 5.14. In that figure the precursor above the inter-face, or surface as it is marked, is shown as a straight line. Nowit is known from temperature measurements that the air was heated sig-nificantly as high as 50 ft above the ground. Some measurements atStation 7-202 indicated a rise o0,q4 much as 6000C above anbient airtemperature before shock arriv =l/. Measurements at this station atgrade level indicated a rise of as high as 13500C. The temperaturegradient and resultant gradient in sound velocity in the mdiwum couldaccount for the observed curvature of the precursor almost withoutquestion. Closer to ground zero the temperatures must have been evengreater but no suitable masurements were obtained. At more distantstations such as 7-204 the temperature increase at the 50 ft level wasonly 50 C before shock arrival. As mentioned above, the precursor dis-sipated itself comevtnere in the vicinity of Station 7-203 in whichregion the Mach stem apparently began to form.
The theory for the origin and formation of the precursormight well be applied in considerations of the formation of Jets fromthe fireball along M cables as has been observed on tower shots. Itshould be considered also in connection with the slow rise times inpressure-time measurements made on past tower shots on OperationsSAIWTONE, GREENHOUSE, and others.
5.3 CC14PARISON WITH REGULAR EFLECTION THEORY
5.3.1 Method
It was thought that there might be some interest in seeinghow much the pressure values on the ground differed from values cal-culated from ideal reflection theory, as given by Polachek and SeegerL./.As a basis for such a calculation, the appropriate free-air curve asmeasured by smoke-rocket photography was used with Fig. 5(b) of ref-erence (18) which plots f' vs f for various angles of incidence, PCfor an ideal gas of 1( 1.41.. In references (18) and (i) these termsare defined so that:
P5ps .-j- PC) _ and (5.2)
P PC-1 (5.3)
where Ps equals excess pressure behind the incident shock, Pf equals
171
SECRET RESTRICTED DATASicurity Information ATOMIC ENERGY ACT 1946

SECRETSecurity Information
excess pressure behind the reflected shock, and p0 equals the ambientpressure. The quantity AY is the usuel ratio of specific heats and
c( is the angle between the normal to the wave front and the normalto the ground.
It was not possible to make these calculations over a widerange of values since the ground-level gages could be no closer to theburst than the height of burst and the rocket moke-trail measurementscould not be mmde farther away than the limitation of motion pictureframe size and illumination level permitted. A samary of these con-ditions is given in Tablle 5.5.
Further inspection showed that even the entire range ofoverlap given in this table cannot be investigated in this manner be-cause it extends beyond the theoretical origin of the Mach stem.
Tables 5.6, 5.7, and 5.8 show a comarison between thecalculated and measured values of Pf on Shots 1, 2, and 4.
To arrive at these comparisons the calculations indicatedin Tables 5.9, 5.10, an& 5.fl were necessary to determine the properranges of I in terms of P. and po. With these tables and Fig. 5(b)of reference (18) various values of Pf ran be found for each value of0C and po. These are given in Tables 5.32, 5.13, and 5.14; a sample
plot of sUCh data is given in Fig. 5.15. (All sixteen of the P vsPs graphs required for this evaluation arA not reproduced in this re-port as it was the opinion or the authors that publication of suchdetail was not varranted. If other members of this family of graphsare desired they may be plotted from the tables.) These plots ofPf vs ps were used with the measured values of P. from the rocketmake-trail experiment to find the ideal reflected pressures. Plotsof these results a•re given in Fig. 5.16 together with the valuesmeasured by ground-mounted gages of the 1OL, EIRI, and SandiaCorporatic.
5.3.2 Results in Regular Region
Inspection of Fig. 5.16 reveals that Shot 1 gave pressuresin the regular region which were substantially those predicted bytheory. Shot 2 pressures were about 12 per cent lower at one pointand about as predicted at 'the other point where comarison could bemade. As might be expected from inspection of the pressure-time re-cords, Shot 4 gave results which were 25 to 30 per cent lower thanpredicted from free-air measuramnts and regular reflection theory.It is interesting to see that the scatter of experimental results isabout the sa as the scatter from theory, though it is necessary to
172
RESTRICTED DATA SECRETATOMIC ENERGY ACT 1946
Security Information

SECRETSecurity IntOm•tioo•
re ember that the SRI and Sandia values were from their preliminauryreports.
5.4 TNT EFICIENCIES OF TOOLER WE•0NS
5.4.1 Com rison of Free-air Data with TI
A curve, Fig. 5.17, representing pressure-distance from1 X Mi free air, was constr•cted from information given by
and Kirkwood-BrSnkleyE.V. TUMBLER pressure-distancecurves corrected to sea level were made up from Tables 3.3, 3.5, 3.7,and 3.9 by adjusting the appropriate values for pressure and distanceby the scaling factors of Table 1.1. These were plottedý the valuesof particular pressure levels were read off, and are presented to-gether with Kirkwood-Brinkley values in the left side of Table 5.15.The ratios of these distances to the distance at which the TT curvegave the same pressure were then obtained and cubed to give XT(TWT)equivalents at each pressure level from 2W0 to 7 psi. These Ki(T!)values and their averages for each shot are tabulated on the leftside of Table 5.16. On the right side of Table 5.16 the TUMBLERvalues of Ia(THT) have been multiplied by 100 and divided by the=(RC) value to obtain blast efficiencies at each pressure level.In addition averages for each shot and each pressure level are pre-sented. On the right side of Table 5.15 the sea liml distances forTUMBLER have been divided by the average (ln(TIT))'/ and the resultsare plotted on Fig. 5.17.
It can be seen from this figure that the average IE(THT)values used represent the data best over the range from 30 to 200 psiand give an efficiency of about 14 per cent under these conditions.Elsewhere in this report the value of 45 per cent was used to scaleto high explosives, but it is believed this differenme is insignificantdepending somewhat on how averages are taken. The vation of effi-ciency with pressure level was observed on GUNEE0uf.TJ, where it wassuggested that a second wave added to blast effectiveness in the lowerpressure regions.
5.4.2 TNT Efficiencies at Ground Level
A sizaple direct measure of the TNT efficiency as measuredat ground level is harder to achieve than in the free-air region; how-ever, an estimate of it can be made by a series of a; proximations orby at least two graphical methods. The difficulty in these processeslies in the lack of good reflection factor data from TM under the ex-act conditions that the TUMBLER shots were fired; therefore, this es-timate was based on the height-of-burst curves presented by Hartmann
173
SECRET RESTRICTED DATASe.ndrity Ifitormatiop ATOMIC ENERGY A(. r 1946

1 SECRETI Security lnformition
I2
A_
10_0 -
20.
IV A : I I
1, 0 5 02
.174
RETICTE DATAATOICEEGAC196SRT
Secrit inomto

SECRETSecurity Information
200
L -Ai
:. ii IIII
w IH-
IA. OAI !
!+1 41 : II~o *4
510SERTRSRITDDT
SeuiyrorainAO ICtAl14
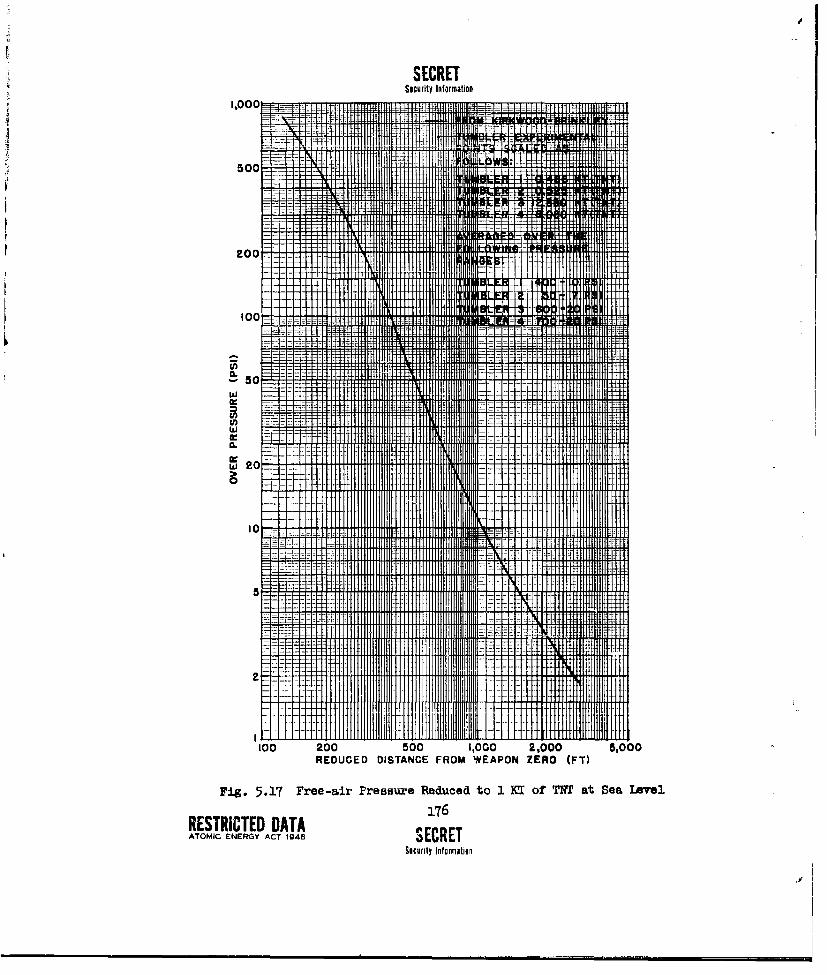
SECRETSecurity Information
500
too 20050 1,00 ,00 500REDUED DSTANE FRM WEAPONZER imiT
Fi. .1 Feeai Pe~ur Rdicd o 1 o T~ t eaIae
z Ml mm76RETRCTDDAA ECEATOMIC EN.....ACT.1..
10c0it . n.r...t..

SECRETSecurity Information
and KallavskiK/. It is realized, as discussed in Sec 5.-1 that thesecurves represent gages well above ground level and that pentolite(taken as 1.2 times as effective as TNT), not TNT, charges were used.Since no adjustment was made in this estimate for the error intro-duced by the higher gage position, the resulting efficiencies willbe somewhat in error. The methods used were as follows:
The first method is applied by assuming an efficiency andcalculating from this a reduced height, . This reduced height isthen used with Fig. 19 of reference (151* to get a reduced distance,
S, which can then be scaled up using the sere efficiency factor.A plot of these scaled distances is made vs the assumed efficiencyand the proper efficiency is read off where this curve crosses themeasured distance. A sample calculation for an assumed efficiency of50 per cent on Shot 2 at the 10 psi level is as follows:
Ab -13 (4 x 2 x 100) .Ln -?T -105W \.i/.2
where h and W are the values of height-of-burst and charge weight re-duced to 1 R(OC). This gives a X 7.9 Pt I1/3 or a distance of
7.9 x 94.i - 743 ft which can be ccomared with the measured value of850 ft. By assuning other values of efficiency and plotting the re-sults, one arrives at an efficiency of 57.1 per cent for this method.The second approach, which is somewhat simpler, is also based on theidea that the ýAl of the height-of-burst curves for high explosiveswill scale to atomi± weapons. This method is shown by the sample cal-culation given below for the 10 psi level on Shot 2:
h 1.171 where h and R are the height-of-burst and
distance from ground zero where the 10 psi level occurs - all reducedto I KXT(RC). A line having this slope, plotted through the origin ofFig. 19 of reference (15), crosses the 10 psi curve at a /e4- 10.0.Rence the scale ratio is h , 9 -9.5ad ~0-985x 106 is
the equivalent weight of the charge of Shot 2 in pounds of pentolite.
-Data from FiP. 19 of reference 15 is plotted in Fig. 5.2 after cor-rection to 1 K(RC) by the method shown in Table 5.3 and Sec 5.1.1.
177
SECRET RESTRICTED DATASecurity Information ATOMIC ENERGY ACT 1946

SECRETSecurity Information
(Shot 2 is still in terms of 1 KI(RC)). To convert 0.985 x 10⁶ toper cent of 1 KT(TNT) it is multiplied by 1.2 (pentolite to IMT), by
I (pounds to kilotons), and by 100 to get the percentage2 x 106-value, which in this example is found to be 59.1 per cent.
A third method of determining the efficiencies of theTUMBLER shots in terms of TNT equivalents was also a graphical one.It involved the determination of the weights of TNT which when firedunder the same conditions as the TIUMBLER shots would give the samepressure results at the sene distances. These TNT weights were thencompared to RC weights given for the four TUMBLER shots, the result-ing ratio being the efficiency of the TLIBINX weapons in terms of thestandard TNT. The steps required to do this were as follows:
The height-of-burst curve for pentolite (from Fig. 19 ofreference (15)) at the 10 psi level was redrawn on a log-log scalewith ordinate and abscissa in terms of actual height-of-burst andgroimn range for a 1-pound charge. A curve for ary different weightof pentolite would be displaced along a 45 degree line from thiscurve. The normalized values (for 1 XTP at sea level) of TUMBLERdata for height-of-burst and ground ranges at the 10 psi level wereplotted on the same sheet of log-log paper and 450 lines drawnthrough these points. The points of intersection between the 1-poundpentolite curve and the 1150 lines gave values of ground range R1 whichscaled to the reduce TUMBLER equivalent R, and therefore the relation-ship R could be used to determine W, the weight of
pentolite required to give 10 psi at the distance R when fired at thescaled height (Rl and WI are associated with the 1-pound pentolitecharge). These calculaied values of W for pentolite were then mul-tiplied by 1.2 to obtain the TNT equivalents. The TIT values werethen finally compared to the W(RC) of the TUMBLER shots. As an ex-ample for the 10 psi level of TUMBLER 2, the 450 line through . - 850ft and h - 995 ft (as normalized for 1 KI(RC) at sea level) inter-sected the 1-pound pentolite curve at R1 - 8.5 ft. Then the ratio
WIR 1/3 . R__ 850 or W 106, i.e., 106 pounds of pentoliteur 1.2 x 10 pounds of TNT. This means that 1.2 x 10⁶ pounds of TIV
fired at a height of 995 ft would give a pressure of 10 psi at aground range of 850 ft. These height and distance values are thescaled .parameters for the TUMBLER 2 shot scaled to 1 KT(RC) or2 x 100 pounds RC. Therefore, the TNT efficiency of the shot was
178
RESTRICTED DATA SECRETATOMIC .Nhh...Y ACT 1946 Security Information

SECRETSecurity Informition
the ratio of these figures, i.e., 1.2 x 10⁶ or 0.60.k x 1(oe
Table 5.17 gives the average results as computed by thefirst two methods described. The differences which were averagedout were s-all and can be wholly attributed to the limits of pre-cision with which the height-of-burst curves can be read. The widevariation of efficiencies with pressure level arose from the follow-ing sources of error:
(i) The fact that the BE values used as a standard were measurednot at ground level but at a height of several feet above the ground.(See see 5.1.)
(2) The fact that the pressure-distance curves for pentolite,TNT, and nuclear explosives are not similar, i.e., their slopes varydifferently with pressure level.
(3) Small errors of measurement of the nuclear pressure-distancecurves occurred particularly at low pressure levels. (Errors aremore likely here than in the HE results which are average values froma series of six or more identical shots.)
(4) These calculations of TWT efficiencies are very sensitive tosmall errors because of the cube law for scaling.
(5) There may be important differences between the reflectingsurface at the Nevada Proving Grounds and the concrete slab used atthe NOL firing field.
(6) Effects of thermal layers created by radiation from the nu-clear explosion are known to be substantial.
As a result the tabular values only indicate the trendwhich can be seen in the other types of analysis, viz, that TUMBLER 1was most efficient, TUMBLER 4 least efficient, and TUMBLER 2 and 3were moderately efficient in the 10 psi region. It is felt that thepresent best-estImate of TRT efficiency should be obtained from free-air comparison as discussed in Sec 5.4.1 above.
5.5 POSITIVE nCUUMINE2 FM AIR CCIMARED WITH Tin
The free-air positive impulse curve shown in Fig. 5.18 was takenfrom reference (20), plate 7. It is the experimental curve for cast
179
SECRET RESTRICTED DATASecurity Information ATOMIC ENERGY ACT 1946

SECRETSecurity Information
00
t I 0
sI -V ~ -
IT,
I 'i i l ~ ~ ii **1***-**~ 0
j~.iIIt0LL FA
1~ ~ ~ ~ h -7;g
o~~~ o 0 -
T7iri
tpu
ýii! 4,3RESRITE DAAtEoEATMI ENRG La ICSausyInomt

SECRETSecurity Infumnation
TNT spheres as corrected for the effect of shock flow past the pressure-time gages and based on the dynamic calibration of these gages. Thiscurve was scaled to 1 MI(RC) at sea level using a blast efficiency of45 per ct. for TU1BLER 1. A caoparison of these data and data obtainedby the particle displacement method is shown in Fig. 5.18 and given inTable 5.18.
Positive impulse could be measured directly only on TUMBLIRI at 590 and 690 ft (see Fig. 3.26). No attempt was made to extrap-olate the pressure-time curves obtained for TUMBUKR 4 because they didnot cross the zero axis. The two points measured are in very goodagreement with the experimental curve for TNT indicating that the over-all free-air p-t curves for TiMLER 1 scale well and therefore are con-sidered to be reasonably accurate.
181
SECRET RESTRICTED DATASecurity Information ATOMIC ENERGY ACT 1946

SECRETSecurity Information
c'6
CONCLUSIONS AND REC~OENDAGIONS
6.1 CONCLUSIONS ON SYST!MS USED
6.1.1 Pressure-Time Measurements on the Ground
The frequency-modulation system used to record pressure-time measureernts made on the ground was reliable, accurate, and rea-sonably simple to operate. Furthermore the effects of radiationinduced in the system, while noticeable, did not cause any loss ofreliability nor of actual results. The Bendix diaphragm gages usedas end-instruments with this system were reliable and easy to use;however, they are not perfectly damped so that the resultant ringingmakes appreciable Judgment and experience in their use necessary toget consistent results in reading the records. Furthermore the sealedreference volume of air in these gages necessitates careful calibra-tion in the field to correct for the proper ambient conditions ofpressure and temperature. In spite of these difficulties the resultschecked those of other systems to within a few per cent.
6.1.2 Peak Pressure Measurements in Free Air by the ShookVelocity Method
This system once again showed itself to be reliable, simple,reproducible, and self-consistent. It suffers from its requiring along and careful analysis procedure which is subject to human errors;although much of this might be avoided by the use of machine calcula-tors such as the IBM type. The system has the further advantage ofshowing up asymmetries, if they exist, and special effects such as theprecursor on Shot 4 and the rise of the Mach stem on Shot 1.
6.1.3 Pressure-Time Measurements in Free Air by the ParticleD etnI Method
This experiment gave pressure-time curves which, when as-sociated with peak-pressures measured by the shock velocity method,gave time-decay rates and impulse values comparable with those fromhigh-explosives. It has the advantages of the shock velocity systemas far as simplicity and reliability are concerned and suffers fromthe same disadvantage of requiring a complicated analysis system. Asused for the first time, the system suffers from a low-frequency re-sponse which arises from the need to smooth the data, so that smallrapid changes in the pressure-time history cannot be detected. It
182RESTRICTED DATA SECRET4TOMiC ENERGY ACT 19Ma
Security Information

SECRETSecurity Informtion
probably is slow to react, i.e., the shock w be well pact the smoketrail before the motion of the particle has approached the velocity ofthe air with sufficient accuracy. This, it is believed, arises fromthe fact that the smoke particles have substantially greater mass thanthe air particles and a relatively low viscosity with the result thatthere is probably a nsml delay before their velocity approaches thatof the air stream. A result of this is that calculated peak-preossureswould probably be in error When particle velocities measured by thismethod are used in the Rankine-Hugoniot particle velocity equationsfor air; therefore, it is necessary to use the shock velocity methodto obtain the peak pressure for the initial portion of the pressure-time curve. The system at present is also limited to the 10 to 30psi region because lower pressure shocks do not give sufficient dis-placements to maintain accuracy requirements, and larger pressureshocks are hot enough to evaporate the trails during the initial partof their motion. Some of these disadvantages would be overcome ifthe smoke trail were made up of particles more nearly like air par-ticles and if the camera system had a better space-time resolutionthan the system used on TO]LER. To sum up, this method can, as aresult of fairly lengthy analysis, give pressure-time curves in free-air vhich have poor time resolution but reasonably accurate initialdecay and impulse values.
6.2 COnCLUImONS ON E RIMmTs
The following general conclusions are listed to summarize the maInresults:
(a) The cube law of scaling in free-air was confirmed for nuclearexplosions between 1 and 30 KD(RC). This enabled generalized free-airarrival-time and pressure-distance curves to be determined in terms of1 ia(RC) at sea level.
(b) Height-of-burst curves for four heights over the Nevada Prov-ing Grounds were determined in terms of 1 KT(RC). In general Shots1, 2, and 3 fell between the Good and Fair curves of the operationaldata available before TUMBLER and Shot 4 fell between the Fair andPoor curves.
(c) The optimum height-of-burst for the test conditions was foundto be zero for pressures down to 12 psi and to be 1 1 i8
for pressures between 3 and 12 psi where H& is in ft and p is theoverpressure in psi, both quantities reduce' to 1 KP(RC) at sea level.
1.83SECRET RESTRICTED DATA
Security Informition ATOMIC ENERGY ACT 1946

SECRETSecurity Information
(d) The cube law of scaling for pressures and impulses at theground level was confirmed for nuclear explosions between 1 and 30ET(RC) at a height-of-burst equivalent to 1,000 ft for 1 10(RC) atsea level.
(e) For the first time a detailed analysis was made of the effecton blast of the high radiation produced by a nuclear bomb close to theground. This effect, called the precursor in this report, had neverbeen so clearly observed and measured both by pressure-time gages andby photography.
(f) Whereas the pressure-time curves seem to be smooth in freeair, the effect of the ground (probably because the absorbed heatproduces a thermal layer near the surface) seems to cause the groundlevel pressure-time curves to be altered both during their initialrise and during their decay.
(g) Calculated reflected pressures based on regular reflectiontheory and the measured free-air pressure-distance curves gave rea-sonably close agreement with measured values from Shots 1 and 2. Shot3 could not be compared for lack of data. As might be expected, Shot4 data fell below the theoretical predictions for an ideal reflectingsurface.
(h) The summary of the TM equivalents for the TUMBLER shots isgiven in Table 6.1 which indicates that, over the regions measuredin free air, these efficiencies fell between 46 and 41 per cent.
(i) The ground level TNT equivalents for the TUMBLER shots at the10 psi level ranged between 42 and 84 per cent but these values arebased on data which may be so inappropriate that the results can notbe considered to be meaningful.
(J) A study made with TUMBLER and small charge data indicatedthat the optimu height-of-burst for a given pressure level is appreci-ably higher for gages placed on the ground than for gages placed ashort height above ground.
(k) There seems to be little difference in the blast reflectivityof the ground at Frenchman Flat and at the T-7 area for fairly highbursts.
(1) Typical shocks seen to have existed in the Mach region excepton Shot 4; and even there they existed at low pressure levels.
184
RESTRICTED DATA SECRETATOMIC ENERGY ACT 1946 Security Information

SECRETSecurity Information
(m) In the regular region, the shocks were always rounded off,had double-steps, or disappeared completely into slow rise times.
(n) Small secondary and tertiary pressure pulses were observedduring the main shock on T SBLER 4; a small second positive phaseoccurred on TUMBLER 1 and 2.
(o) The decay parameters and positive impulses of the free-air
shock waves compared favorably when scaled to HE data.
6.3 MCMEATIONS
(a) Insofar as possible, all atumic explosions should be instru-mented for measurement of free-air peak pressures and ground levelpressures vs time so that statistically reliable information can beobtained for free-air and height-of-burst effects.
(b) Pressure measurements at various heights above the groundfrom this and future operations should be used to deterine newheight-of-burst curves and some decision should be made, based onfurther investigations, as to whether such height-of-burst curvesare not a better basis for operational action than the present height-of-burst curves which are based on data measured at ground level.
(c) Use of the particle displacement method for measuring pressure-time in free air as described in this report should be limited to ex-periments where gross irregularities are expected, as the presentsystem does not have high resolution. Use of the particle velocitymethod to measure peak pressures in free air should probably be limitedto experiments where shock velocity measureients are impossible tomake.
(d) Photography of blast on future tests should be arranged toprovide direct pictures of the precursor, if formed, and the rise ofthe Mach stem.
(e) The system used on this operation of preparing preliminaryreports in the field was highly satisfactory and should be made stand-ard practice for future tests of similar size.
185SECRET RESTRICTED DATA
Security Information ATOMIC ENERGY ACT I94

SECRETSecurity Information
APPENDIX A
MEASUMNT OF PEAK PRESSURE BY INDENTER GAGESD*JXPED WTM SILICONE AND WITH BAFFLE CHAMBER
By: F. J. Oliver
A.1 FIELD EXPERIMENTS
On TtUBLER Shots 3 and 4 some indenter gages71 8a 9, 10/ wereplaced in the ground next to the NOL inductance gages at selectedstations. The indenter gages were damped to prevent overshoot andwere covered with a baffle as shown in Fig. Al. The baffle was pro-vided mainly to shield the rubber air seal from damage from radiationand sand blast. On GREENHOUSE, damage to the air seal prior to thearrival of the peak pressure was the most likely cause of low read-ing gages in the regions where the pressure was over 20 psi.
For TUMBLER 3, each baffle had a 1/8-in, orifice which alloweda slow rise to maximum pressure. In addition each gage was dampedwith 100,000 centistoke, DC 200 silicone fluid. All gage mounts werecoupled to the ground with a "Calseal" mix.
The results are shown in Fig. A2 and Table Al. All records weretoo low and there was much scatter.
In the time between TUMBLER 3 and TUMBLER 4 the baffle fill time,as measured with the inductance gage system, was found to be between20 and 30 Maec. It was found that if the rubber spacer (see Fig. Al)was loose and there was no clearance seal, this 20- to 30-msec filltime of the chamber was greatly increased. A clearance seal was addedfor TUJBLER 4 by increasing the gage diameter with tape and grease tomake a tight fit.
For TUMBLER 4, the orifice was increased to 3/8-in. diameter.This gave a fill time of 4 to 6 mrse. For comparison the orifice platewas omitted for half the gages, giving a fill time probably around1/4 msee depending on how tight the steel wool was packed. To obtainsome data on the effect of the oil, hal the gages were damped with100,000 centistoke silicone and the rest with 1,000,000 centistokesilicone. The "Calseal" cement was omitted on TUMBLER 4 to avoid thepossibility of a heavy blow being transmitted to the ground mount whenthe shock front passed, which might have caused the gage to bounce.
186
RESTRICTED DATAATOMIC ENERGY .4fT 19A6 SECRET
Security Information

SECRETSecurity hlereuaiminu
ORIFICEALUMINUM ORIFICE PLATE I 1/4" MESH STEEL WIRE
SOLDERED TO COVER
SURFACE OF GROUNDSll,-..•BRAG S COVER
1/4' MESH STEEL WIRESTEE.WOO
PUSHED N PLACE(PACKED THICK SO DRLIGHT CANNOT BE DR
RUBBER SPACER "•iSEEN THRU IT)
! •GLEARANCE SEAL
AIR REIE AIR SEAL FOR PISTONlb'
0 AIR RELIEF 0 0 o 0
HOLE SEAL -SILICONE DAMPING OIL
RUBBER WASHER CALSEALNICKED) TO PREVENT0
PRESSURE BUILD UP0 0 o 0 00 0 0 0 00
0 00 00
GROUND MOUNT
BACKING BAR
S OLT
pig. Al Arrangement of ITndonter Gage with Baffle Cembar
187
SECRET RESTRICTED DATASowufity Informatlon rAT(WMC. rNERY ACT 1946

SECRETSecurity information
Indenter gage preaoures shown tu
T11"eat 3 Each ga a damped wi1tb' 1 00ooistoke silicone ail,500 - with 1/ orifice pl ate. bal entran~ce.
- - Test 4i At each station gages were as follows:
&13gages 1 ,000,000 centistoks oil, no orifice plate on baffle.b ' 1,000,000 '3/1" "
c100,000 " no ' *
C)100,000)O 3/811
100 ! have indicated thia value of pak pressure.
is lu fo g!ýIii. 4b ) ......... ............ -11 Pa
La i I Peak preasure along blast line -TULG 4
-alonghiastline TWMDER3 J::~-
10 g A2Coato o nutneand.Ine te g agepek rss Hl 11"AlUfu ~ 3-q TUILd 3~
710588ERETICE DATA,011 SECREL Ht.....L 3ATOMIC ENERGY ACTH 194 scriyntrito

SECRETSecurity Inlomation
A.2 ANALYSIS
Results of indenter gages having no orifice plate on TUMBLER 4(Fig. A2 and Table A2) showed excellent agreement with inductance gagedata in the high pressure region. With the 3/8-in. orifice the re-sults were about 10 per ceut low, and the scatter seemed excessive.In the low pressure region results again were too low. All air sealswere intact although many baffles showed burning of steel wool downabout 1/l-in. There was no apparent effect of sand blast.
After the tests further work was done at the NOL to find an ex-planation for the scatter and.. the poor low pressure results. Viscositytests on the silicone at various rates of shear showed surprising re-sults, The viscosity, instead of being ca tant, was inversely pro-portional to some power of the shear ratevY. For instance the nDCinall1,000,000 centistoke oil shoved an effective viscosity of around 5,000centistokes when tested in the laboratory under high shear rates, e.g.,a rise to 35 psi in one msec.
A study of the GREENHOUSE damping procedure revealed that thecrater compound used. for damping had a viscosity of around 10,000centistokes and tests at high shear rate showed only a slight lower-Ing of viscosity. GYEFMI SE results were about 10 per cent low, in-dicating that the viscosity should have been less for better correlationwith inductance gage results.
These results furnish an explanation for the fact that both shocktube and field results were good at high pressures, but were poor atlow pressures. At high pressures, the breakdown of the oil producederratic damping, resulting In a variation of plus or minus 20 per centin the peak pressure records as compared to mean inductance gage values.Examination of inductance gage pressure-time records revealed that theresponse times of the indenter gages were between 1 and 12 maec approx-imately.
At low pressures, the large scatter indicates great variation indamping, but it Is significant that there were no values as high as theinductance gage values. This means that the dasping was much too high.Examination of pressure-time records in this region show that a responsetime of around 100 msec would have caused low values such as recorded.
A.3 CONCLUSION
Although investigation of the behavior of these gages under dif-ferent loadings is still being conducted, it. appears that the best way
189
SECRET RESTRICTED DATASecurity I4formation ATOMIC ENERGY ACT 1946

SECRETs$curlty Infifiuu
to use these gages to measure peak pressures from atcmic blasts is asfollows:
(a) Use a baffle chamber designed to give protection from thermalradiation and sand. blast.
(b) Mhape the baffle so that the ratio of volume to orifice areais 40 in. This gives a fill time of 4 msec at about 7 psi. (Seepage 37 of reference 8).
(a) Damp each gage so that the time of fall of the piston underits own weight, for a distance of 1/2 cm, is approximtely 1 sec.
The author is indebted to R. R. Caforek,, W. S. Filler, andLT B. M. Loring for their assistance in the laboratory worko toH. P. Feldman for manufacturing, and to J. H. Mitchell for assist-ance in obtaining material needed in the field.
RESTRICTED DATA 190T ENERGY SECRET
Scurity Informatieo

SECRETSecurity Inferetnalo
APPFMXX B
LUMM~(ATION OF PH3SSUR-TIME CURVES FRCI(OBSERVED PARTICLE MOTION IN BLAST WAVES
By: F. Theilbeimer
B.1 IITRODUCTION
The problem to be discussed here deals with the determination ofthe pressure due to an explosion. It is assumed. that it is possibleto observe and measure the displacement of certain particles, and frcmthese data the pressure field due to the explosion can be couputed.
The explosion is to take place high up in the air. On a horizon-tal radial line drawn frco ground zero a number of amoke-producingrockets are fired upward and the smoke trails thus generated can bephotographed by means of a motion picture camera. If these smoketrails are generated imediately before time zero, then the motionof these smoke trails will give information about the motion of theair particles due to the blast wave passing over them. It is assumedhere that the difference in velocity between smoke and air particlesis negligible soon after the passage of the shock.
The explosion is assumed to be spherically symmetric. Therefore,if two fremes were superposed correspondin points in the two framescould be identified by drawing radial lines through the center of theexplosion. It is of course understood that in this particular pro-cedure care had been taken that the images of some markers unaffected bythe explosion coincide exactly in the two frames.
The method to be discussed here can be used to find pneasure-timerelations for points that have been passed by the shock wave. Thepeak shock pressure itself is not to be found by this method. It isassumed that other better methods are available for that purpose andthe peak shock pressure can, therefore, be assumed as given.
B.2 ANALYSIS OF PHOTOGRAPHC RECORDS
The various points whose motion is to be studied can be chosen inthe following way: Draw lines through the center of the explosion,say every ten degrees, on a frame that was taken before the shook fronttouched the nearest trail. (See Fig. B.1). Choose a certain number,say N, of the intersections between the lines drawn and the various
191
SECRET RESTRICTED DATASecurity Information ATOMIC ENERGY ACT 194,

SECRETSecurity Information
Fig. B.1 Smoke Trails Before Passing of Shock
smoke trails. Measure the distances from the center of the explosionto these N points. For increased accuracy this measurement should becarried out for each point on the last frame before the point is reachedby the shock. Then the points snould be ordered according to distanceand their distances denoted by
z 1 , Z 2 1 Z 3 , ..., I -l , Z J "Let frame one be the frame in which at least the point Z1 has
changed position; the time when it was taken will be called tl. Letthere be M frames at times
tI, t2p ... , tH.
For each frame again draw lines through the center of the explo-sion and measure the new distances of each of the points which wereoriginally at distances z., z2 , ... ,
192RESTRICTED DATAATOMIC ENERGY ACT 194, SECRET
Security Information

SECRETSecuuity Inlormition
The following notation will be used: Xnm will be the distanceat time tm of the point which was originally at distance Zn. One can,therefore, set up M tables Am*, giving X versus Z. It is clear thatthe tables for the first frames will contain only a few entries, butas soon as the shock has reached 2N each table Am will have N entries.
Each table A.gives X as a function of Z at constant t. For thedetermination of the pressure it will be necessary to find the deriv-ative of X with respect to Z at constant t. Lot us write
K- (a X (B.1)
Then K for the midpoint between Zn and Zn+ can be found as a differ-ence quotient. If we denote by KXn-+/2,m tie value of K for
Z + 1/2 (Zn+l + Z.) and t - tm, then
K r4.l/2,m, Xa+lm - Xnm (B.2)Zn+l - Zn
Thus tables Bm can be set up giving K as function of Z at constant tat the midpoint l/2(Zm+i + Zn). If a graph of K versus Z is dravnfor every t then the values of K for Zn can be read from the graphand tables m can be constructed.
B.3 I=ME3flATION OF PRESSVBE-TRIE CURVES
To find the pressure for any point it is necessary to know thepeak pressure at the instant when the point was reached by the shook.It is assumed that the peak pressure as a function of distance isavailable through other observations. Let Pn denote the absolutepeak pressure - not the excess pressure - when the point at the dis-tance Zn is reached by the shock. Thus one can immediately set up atable P giving peak pressure as a function of distance.
The pressure prevailing at time tm at the point whose originaldistance was Zn is denoted by Pn,m' This pressure is found to be(See Sec B.4):
Pn,m - P'n (Po+n)Zn (B.3)
(6 Pn + Po) X2nm Knm
* Figure B.2 shows a number of tables useful in carrying out thepressure-time analysis.
193
SECRET RESTRICTED DATASacurity Information ATOMIC ENERGY ACT 1946

SECRETSocurity Information
TABLE Am TABLE BM TABLE C3 TABLE P
Z2 X2 ,3mZ K5/ 2,m Z2 K2 ,3m 72 P2
Z3 /2, Z Z3 "3)M Z3 '3
ZN XN,m M 11Kj/, Zx KN, ZN PN
ZN ____
TABLE q TABLE Din TABLE Fla TABLE Pi
73 Q3 Z3 P3 ,3M X3 i'(X3 , mt 3) P~Xj t3
Fig. B.2 Tables Required for Cmuplete Pressure - Time Ana:lysis
1924
RESTRICTED DATA SECRETATOMC ENRGYACT 946Sacurity informationi

SECRETSacurity Infermatia
where P0 is the pressure of the undisturbed air.
For computational reasons it will be advisable to combine thosefactors which do not depend on time into
Sapn [(6 Po + Pn) Zn 1"4S6 Pn +Po
and then
Now one can construct first a table Q, giving Q in terms of 2, andthen tables Em giving P In terms of Z.
As soon as tables DI us found, one knows the pressure at auytimo t e for ssU those points whose initl distances were Zi; thatmeans ehat at different times one knows the pressure for differentdistances. Thls is no a what one cuotca ily means by presoure-tiherelation or pressure-tme cr. Then one nnts to knou the paessureefor all times for one oT more faxed distances fral the explosione
Suppose we vaet to know the pressure at the distances
X11 7-, #..., Xj.
To fini the pressure at these points for time td a gaph is awann ofpressure P versus d ostance X at time tm by t ckin correspondi. valuesof P and X from Tables A. and til From the craph one reads the valueso at3. xz, p ..*., x. and esu a Table..
An soon as all these Tables Em, wre found for 9.U tin, one can col-lect all pressurTe values that occur at the distance Xj Fit the varioustimes and form J tables Fj which contain the data from which pressure-time curves can te drawn.
Finally one may consult the given peak-pressure data and enterthe peak-pressure in each of the pressure-time curves.
BA• MERIVATON OF EVU ON (B.31)
The distance of a particle from the center of the explosion "ba-
fore the particle was reached by the shock was denoted by Z. Thedistance of such a particle at any time after passage of the shock
195
SECRET RESTRICTED DATAsicurity IWformation ATOMIC ENERGY ACT IW46

SECRETSocurity Information
was called X, where X is a function of Z and t. This function X -X(Z,t) is tabulated in the Tables Am for the various times ti.
A relationship between Z, the Lagrangian coordinate, and X, theEulerian coordinate, can be found by observing that a sphere consist-ing of the same particles does not change its mass as time goes on,even if it changes its volume. Thus if e denotes the density atany time and e the density of the undisturbed medium then
4_V Z3 z 4ea f XC Z't)x2L x (B.6)
Differentiation with respect to Z yields
If we wTite as in equation (B.1)
-then a simple formula for the density is found:Z20 (B.8)
To derive a formula for the pressure it now becomes necessary tofind a relationship between pressure and density. If the mediumstudied is an ideal gas with constant ratio of specific heats vm- 1.4,then pressure and density change in such a way that
P IC - const. (B.9)
provided that there is no change in entropy. When a particle is passedby a shook it undergoes a change in entropy depending on the strengthof the shock; after the passage of the shock, however, no furtherchange in entropy takes place. Therefore, equation (B.9) holds foreach particle that has been passed by the shock. The pressure P(Z)at the shock front at the instant when the particle of coordinate Zis reached by the shock is considered a known quantity. If the
196
RESTRICTED DATA SECRETATOMIC ENERGY ACT 1946 Security Information

SECRETSecurity Informatioa
corresponding density is called es(Z), then equation (B.9) yields
-l.i (z.-0)P(z,t) C (Zlt) - P(Z) ( (B.(z)
Since p (Z,t) can be found from equation (B.8) it remains only toexpressC (Z) in terms of known quantities. This Is done by theRankine- uoniot relation
eo a 6 P + Po (B.11)C 0 6 Po÷ P
which is found from the general form of the Rankine-Hugoniot equationby applying it to an ideal gas with Y - 1.4.
Substituting equations (B,8) and (B.11) in equation (B.10) onefinds
fidP(Z,t) M P(z) (6 ro + PMz) z2 2(B.1.1. (3.12)
P(z) + Po) x(z,t) 2 K(Z,t)j
which is equivalent to equation (B.3).
B.5 CHECK ON THE ACCRAOCY OF THE PROCEDE
A check on the data found here can be based on one of the differ-ential equations of fluid dynamics, the one which expresses the con-servation of momentum. Considering that Z is the Legrazngian and Xthe Eulerian coordinate this differential equation assuaes the form
2 + 0. (B. 13)
The differential equation can be replaced by the following differ-ence equation:
Xn~ -2Xn,m + Xin,ll.i + X2U2 n1,3 - n0(.)
L1/2~ ~ ~ ~ (t~ a1 7 Oý ý+ - Zn-
197
SECRET RESTRICTED DATASecurity Informition ATOMIC ENERlGY ACT 19"4

SECRETStcurity Information
Then equation (B.14) provides a check on the accuracy of the procedureby comparing the n-th lines of Tables A_.I Am, and. A+ with the(n-l)-st and (n+l)-st lines of Table Dm.
198RESTRICTED DATA SECRETATOMIC ENERGY ACT 1946 Saurity Information

SECRETSecurity Infcumatior
1. Porzel and Reines, "Height of Burst for Atomic Bombs" IA-743Rdated 3 Aug 1949 (Seeret-RD)
2. Moulton and Simonds, Annex 1.6, Part I Sec I to the ScientificDirector's Report - Operation GFECM0SE, "Peak Pressure vsDistance in the Free Air and Mach Regions Using Smoke RocketPhotography" draft of I4 July 1951 in Publication (Secret-RD)
3. Moulton, Walthall, Hanlon, Project 1.3b Operation JANGLE, "PeakPressure vs Distance in Free Air Using Smoke Rocket Photograpby"June, 1952 (AFsw WT-389) (Secret-RD)
4. Redmond at al "SANDMTOIM Blast Telametering Report" SANDSTONENo. 22 Annex 5, Part III of the Scientific Director's Report,June 10ii8 (Secret-RD)
5. Price et al Annex 1.6 Part VI Sec la to the Scientific Director'sReport Operation GRENOUSE "Pressure-Time Measurements in theMaoh Region with Variable Inductance Diaphragm Gauge" draft of15 July 1951 in Publication (Secret-RD)
6. Morris at al, Project 1.1 Operation JANGIL, "Groun& AccelerationMeasurement" June, 1952 (AMW WT-388) (Secret-ED)
7. Shafer, "A Copper Indenter Gauge for Air Blast Measurement"SANDSTONE No. 21 Annex 5, Part II of the Scientific Director'sReport, Juoe, 191.8 (Secret-ED)
8. Shafer and Walthall, "A Copper Indenter Gauge for the Measurementof Air Blast Peak Pressure" NavOrd 2192, 10 Jay 1951 (Unclassi-fied)
9. Shafer, Annex 1.6, Part III, Sec 3 of the Scientific Di•ector'sReport - "Positive Peak Pressure Measurumnts in the Mach StemRegion by Means of Comer Indenter Gages" draft of .Tuly, 1951 inPublication (Secret-ED)
10. Caforek, "Evaluation of Copper-Disc Indenter Gage in Measurementof Peak Pressure and Pressure Ratios of Small Charges" Nvord Re-port 2170, 16 Saytember 1951 (Confidential sI)
11. Operation TWLER. Preliminary Report (Parts One and Two) APP15 May 1952 (Secret-RD)
199
SECRET RESTRICTED DATASecurity Informatio ATOMIC ENERGY ACT 1946

SECRETSocurity Information
RMMCES (coN.)
12. Eberhard et al, Project, 1.2u-1, yperation JANGLE, "Peak Air BimstPressure from Shock Velocity Measurements along the Ground"(APSWP WT-323) (Secret-ED)
13. Doll, "Air Pressure vs Time" Annex 1, Operation TMBLER Prelimin-ary Report (Project 1.2) 9 May 1952 (Secret-ED)
14. Aronson et al, "Free Air and Ground Level Pressure Measurements"Annex II, Operation TUMBLER, Prelimina Report - 6 May 1952(Secret -ED)
15. Hartmann and Kalavski, "The Optimum Height of Burst for High Ex-plosives", NavOrd Report 2451, July 1952 (Confidential SI)
16. ArMv, Navy, Air Force (JaS) IM 23-200/OPNAV-P-36-00100/APOAT385.2. Supplement No. 1 dated 8 February 1952 (Secret)
17. Pike and Bird, "The Reduction in Blast from Bare Charges at HighAltitudes" Armament Research Establishment Report No. 3/50,April, 1950 (Secret, Descreet)
18. Polacheck and Seeger, "Regular Reflection of Shocks in Ideal Gases"ERR No. 13 (Bureau of Ordnance) 12 February 1944 (Confidential)
19. Hartmann "The Effect of Ambient Conditions on Air Blast" NavOrdReport 2482, 20 June 1952 (Confidential 81)
20. Fisher, "Spherical Cast TNT Charges, Air Blast Measurements on"NOIN No. 10,780 of 23 January 1950 (Confidential)
21. Kirkwood and Brinkley "Theoretical Blast-Wave Curves for Cast TNT"OSHD No. 5481 of Agut 1915 (Unclassified)
22. Sokolnikoff, "Higher Mathematics for Engineers and Physicists"McGraw-Hill 1941
23. Murphey, "Pressure-time vs Distance Measurements" Annex XIV, Oper-ation TUMBLER Preliminary Report (Project 19.1) 11 May 1952(Secret-RD)
24. Hartmann, Lampoon, Aronson, "Stuary Report on Blast Measurementsat Enivetok 1951" Draft of Annex 1.6, Part I of the ScientificDirector's Report of Operation GREENOUSE - dated 1 May 1952(Secret-RD) (In publication)
200
RESTRICTED DATAATOWIC EN'RGY ACT 19AR SECRET
Scl ri!y Information

SECRETSecurity Infomation
HWEBENCES (co~R.)
25. Kennard, "Underwater Explosions, A Suwmary of Results" Report C-334,David Taylor Model Basin, February, 1951, (Confidential)
26. Monraban et al, "The Effect of Thermal Radiation on Materials"Operation BUSTER, October-November 1951, Project 2.4-2 (Secret-SI)
27. Clarke and Eberhard, "Time Shock Arrival" Operation TMMLER, Pre-liminary Report Annex III, Project 1.4, 8 May 1952 (Confidential S1)
28. Cook, "Air Blast Pressure Measurement" Operation TUMBLER, Prelimin-ary Report - Annex IX, Project 1.13, 8 May 1952 (Confidential SI)
29. Hirschfelder and Curtiss, "Thermodynamic Properties of Air", Vol.11,University of Wisconsin (NEL) 21 Dec 1948 (Unclassified)
30. Currie and Smith, "Flow Characteristics of Organopoly-siloxarneFluids and Greases" Industrial and Engineering Chemistry, Vol. 42,Page 2457, December, 1950 (Unclassified)
31. Arons and Yennle, "Long Range Shock Propagation in Underwater Ex-plosion Phenomena, I", NavOrd 42., 27 April 1919 (Unclassified)
32. Rayleigh, "Theory of Sound", Vol. II, Second Edition p.78-88,Dover Publications, 1945
33. Por the theory of the precursor beyond the critical angjle, seeOtt, Annalen der Ihysik, Vol. 41, 1942, p.4143; for observationssee Scbmidt, Zeits. fir tech. Phys. Vol. 19, p.554, and Physik.Zeits., Vol 39, 1938, p.8 68 .
34. Broida, Broido, and Willoughby, "Air Temperature in the Vicinityof a Nuclear Detonation", Operation TUMLER Preliminary Report,Annex Xl (Project 8.2), A may 1952 (Confidential SI)
35. "Effects of Atomic Weapons", Edited under supervision of LASL,Government Printing Office, September, 1950 (Unclassified)
36. Jacobs and Lidd~iard, "The Observation of Precursors Near theBoundary of Two Liquids", NavOrd 2602, now in publication(Unclassified)
37. Murphey, "Some Measurements of Overpressure - Time vs Distancefor Air Burst Bombs", Operation BUSTER-JANGLZ, (W]-304)4 March 1952 (Secret SI)
201
SECRET RESTRICTED DATASecurity Inftoraition ATCMC Emi"Gr ACA T iRA6

SECRETSecurity Information
TABLE 1.1
Characteristics of TTUBLER'Shots 1 tbrough
Charaoteristics Waol Shot 1 Shot 2 Shot 3 Shot 4
Looation -- FF Area T-7 T-7 T-7
Nowinal. Ground Zero -- F-200 7-200 7-200 7-200
Direction of Blast -- West from S 90561060 W from 7-200Line from Zero Tower F-200
Location of Bendix 35 feet to right of blast lineGages Relative to Blast (facing nero) except for stations
7Q1e and 7Q2*.
Actual Ground Zero OZ 122tN "313S 801 140iSfrom Station 200 671% 8413 1241W 2531W
Aotual Height in feet h 793 1109 3U?7 1040
Radio Chemical KT WRC 1.05 1.35 30.0 19.6
Pressure on OrovWz POO 914 b 878 873 877before Shot •13.26 psi 12.73 12.66 12.72
Pressure at Burst Po 888.5 ab 842 770 845Height before Shot 12.89 psi 1.2.21 11.17 12.26
Ground before Shot IS.OC 310Y1 1 MCCF I _Y6
Actual Temperature at To &6,5p 4 T s9g0Burst Height 060.3.0 91.0 7.6c 15.00
Factor to Multiplypresures to Correct Sp . 1.1140 1.204 1.316 1.199to Sea-Level
Pactor to Multiply . p. 1/3Distanoe to Correct
5d' - )0.957 0.940 0.913 0.941
to Sea-Level
Factor to Multiply Po 1/3Distance to Correct to ad "(- '~-) 0.942 0.897 u.2914 o.3491 KT at Sea-Level
Factor to Multiply Tie / T0.273 1/2 Po i1/3, 1 .l/3byto aorct to 1 KT 8
TWRC-~~- ~ -j I- 0.J3l 0.880 0.288 0.3146at Sea-Level
Factor to Multiply ~ #T0 273 112 /*.Z)2/3 (1~/Impuls• b, to Correct Sz " . 29 -- 1.061 1.060 0.379 0.415to 1 KT at Sea-Levl ' /
Roduced Height in feet T" ( o1/3 (Po) 1/3 74 995 1012 363
* Sta~ion 7Q14 and 7Q2 Vere used on Shots 3 and 4 only and were locatedrelative to Station 7-200 as follows:
7ql: 2917 feet; S 501010" E72: 3686 feet; 8 3031'30" E
202
RESTRICTED DATA SECRETATOMIC ENERGY ACT 1946 Security Information

SECRETSecurity Informaiton
A \0 \ \0 \0 \0 0 0
1A A ~ 4 no Cl uA A' 4 A 0
01 0~ 0 0 0 0C) Q a 0 0N~~~C % 0I\ 0'
0% .OkOs fn -: M 1I.- t~- Os .Zf -I H Is0 UN I^ Al C
A CAM Ry P. A~ s4N
00 * *
04
z H
A__ - VS 0~ 0 0S
U r'1-0
U H r'!
Ii -4rIICUrdC) .
203
SECRET RESTRICTED DATAsecurity information ATOMIC ENERGY ACT Iw4r

SECRETSecurity Information
TABLZ 2.2
TUMBIER 1 - Phase Durations, Positive Impulses, and Pressures(Ground Level)
Phase Durations Peak PressuresStation Pround Positive
Range Positive Negative Impulse Initial Positive Negative(t) t4 t 8 (psi-sec) Pb P Pee(ec) (sea) _) (psi)psi)
F-200 170. 7 0. 222 O.840 1. 98 25.08 27.65 3.48
F-201 353.7 0.213 o.936 1.57 16.18 20.22 3. 45
F-202 588.3 0.220 o.936 1.34 1O.63 15.85 2.60
F-202T 588.3 0.230 o.856 1.39 11.40 15.15 3.15
F-203 831.9 0. 231 0. 970 1. 07 9.74 12. 00 2.49
F-204 1078.4 0.243 0.972 o.86 11.91 2.10
F-205 1326. 3 0. 255 0.981 0. 74 10. 24 1.74
F-206 1574.8 0.277 0.975 o.68 8.08 1.37
F-207 1823.7 0.299 o.947 O.60 7.05 1.27
F-208 2073.0 0.309 0.975 0.50 5.63 1.01
F-209 2571.7 0. 337 0. 984 0. 42 3.92 0. 78
F-209T 2571.7 0.326 1.006 o.142 3.87 0.884
F-210 3071.0 0. 361 1.032 0. 35 2.96 0. 70
F-211 4070, 0. 390 1.033 0. 27 2.00 0.149
RESTRICTED DATA SECRETAIUMIL, ENERGY ACT 124C
Security Information

If
SECRETSecurity Information
TABLE 2.3
TUMBLER - Distances and TimaB(Ground Level)
"Range Arrival Rise TimesStation Distances Time Initial PeakNumber Ground Slant tl t5 tb
(ft) (ft) (sec) (•nec) (maec)
F-200 170.7 811.1 0.330 1.6 5.6
F-201 353.7 868.3 0.368 1.i7 6.9
F-202 588.3 987.4 O.448 1.7 12.9
F-202T 588.3 987.4 0.1453 1.6 10.9
F-203 831.9 1149.3 0.569 1.6 9.9
F-204 1078 .4 1338.7 0.718 1.5
F-205 1326.3 1545.3 0.882 1.3
F-206 1574.8 1763.2 1.053 1.6
F-207 1823.7 1988.7 1.232 1.3
F-208 2073.0 2219.4 1.-427 1.2
F-209 2571.7 2691.2 1.819 1.14
F-209T 2571.7 2691.2 1.821 1.6
F-210 3071.0 3171.7 2.227 1.14
F-211 4070.0 4146.5 3.066 1.1
205
SECRET RESTRICTED DATASecurity Information ATOMIC ENERGY ACT 1946

SECRETSecurity Information
TABLE 2.4
TUMLER 2 - Phase Durations, Positive Impulses, and Pressures
Ground Phase Durations Peak PressuresStation Range Positive Negative Positive Initial Positive NegativeNumber (Ft) t4 t8 Imulse Pb a Pe(see) (see) (psi-see) (psi) (psi) (psi)
7-200 145.6 0.250 1.296 1.22 9.14* 14.o6 2.377-212 259.0 0.259 1.314 1.18 10.91 12.o6 2.197-201 07.9 O.•54 0.986 1.06 9.59 10.59 1.997-201T 627.9 0.265 1.036 1.o2 9.89 10.814 1.917-213 1,001.3 0.267 1.060 0.802 7.62 7.77 1.717-202 1,375.6 0.283 0.998 o.644 6.o8 6.38 1.537-203 2,124.9 0.324 0.935 0.477 5.32 0.967-20o4. 2,874.6 0.345 0.936 0.365 3.59 0.707-205 3,624.4 0.371 0.962 0.296 2.78 0.577-206 4,374.3 0.363 0.959 0.250 2.o6 0.547-206T 4,374.3 0.390 0.895 0.244 1.86 0.47
* Initial peak of the form of
TABLE 2.5
TUMBLER 2 - Distances and Times (Ground Level)
Range Arrival Rise TimesDistances Times Initial Peak
Station Ground Slant tI t 2 t t(Ft)er (3t) (se (see) (msa) {mea)
7-200 15.b 1,118.5 0.551 0.554 1.5* 3.47-212 259.0 1,138.8 0.567 1.5 3.77-201 627.9 1,274.4 0.672 1.3 6.27-201T 627.9 1,274.4 0.671 1.5 5.97-213 1,001.3 1,494.2 0.842 1.4 5.67-202 1,375.6 1,767.0 1.066 1.3 6.67-203 2,124.9 2,396.9 1.584 1.77-204 2,874.6 3,081.1 2.163 1.47-205 3,264.4 3,790.3 2.773 1.47-206 4,374.3 4,512.6 3.399 1.47-206T 4,374.3 4,512.6 3.399 1.2
* Rise time to initial peak of 9.14 psi.
2o6RESTRICTED DATAATOMIC LNEIGY ACT 1946 SECRET
Security IfIcImation

SECRETSecurity Informatief
TABLE 2.6
TUMBLER 3 - Phase Durations, Positive Impulses, and Pressures(Ground Level)
Phase Durations Peak PrusiaresStation Ground Positivetu'aber Range Positive Negative Impulse Initial Positive Negative
(ft) 4 8 (psi-see) Pb PC Pe(sea) (sea) (psi) (psi) (psi)
7-200 174.9 0.753 4,.07 3.30 6.55 12.13 1.88
7-212 309.9 0.753 3.09 3.37 7.58 12.11 1.88
7-201 665.4 8.14 11.67
7-201T 665.4 0.738 3.24 3.21 6.22 11.76 1.96
7-213 1034.8 0.755 3,63 3.19 7.73 11.13 1.85
7-202 1407.1 0.781 3.71 2.95 8.83 10.19 1.71
7-203 2154.6 0.825 3.57 2.74 5,54 8.55 1.52
7-204 2903.3 0.780 3.13 2.20 6.51 7.73 1.61
7-205 3652.6 0.832 3.97 1.97 6.52 1.29
7-206T 44o2.1 0.879 3.51 1.76 5.87 1.11
7-207 5151.8 o.938 3.47 1.62 5.77 0.89
7-208 5901.5 0.968 3.85 1.53 5.72 0.90
7-209 74o1.2 1. 025 3.25 1.23 4.51 0.65
7-210 89o1.o 1.0o4l 5.05 1.05 3.26 o.6o
7-211 11900.7 1.1u5 3.25 0.809 2.55 0.49
7-Q1 2851.1 0.821 3.88 2.26 9.77 1.37
I-Q2 3616.0 0.855 3.56 2.13 7.19 1.24
207
SECRET RESTRICTED DATASecurity Information ATOMIC ENERGY A(_T 1946

SECRETSecurity Information
TABLE 2.7
TUIABLER 3 - Matmances and Times
(Ground Level)
Range Arrival Rise Times
Station Distances Time Initial PeakNumber Ground Slant tt 6
(ft) (ft) (sea) (mrec) (086c)
7-200 174. 9 3451.4 1. 705 1.8 27.2
7-212 309.9 3460.9 1.721 1.2 21.5
7-201 665.4 3510.6 1,760 1.2 12.5
7-201T 665.4 3510.6 1.758 1.2 16.4
7-213 1034.8 3599.0 1.832 1.3 7.5
7-202 1407.1 3723.1 1.926 1.5 11.2
7-203 2154.6 4065.0 2.200 1.7 7.8
7-204 2903.3 4506.8 2.566 1.5 8.5
7-205 3652.6 5022.3 2.987 1.4
7-206T 4402.1 5591.1 3.459 1.8
7-207 5151.8 6198.6 3.964 1.6
7-208 5901.5 6834,5 4 .502 1.4
7-209 7401.2 8164.5 5.630 1.6
7-210 8901.0 9545.1 6.822 5.5
7-211 n900. 7 12389.8 9.275 0.9
7-Ql 2851.1 4473.3 2.530 1.8
ý10QLo v 4Y±.u~~7 J- 2.953 5208
rESTrICTED DATA SECRETA M U IC ER AL ,,yATOMIC ENERGY ACT 1946 Scrt nomto
:Sec rit ,Iinformatio

SECRETSecurity Information
TABLE 2.8
TUMBLER 4 - Distances and Arrival Times(Ground Level)
Range Arrival Times
Station DistancesNumber Ground Slant 1 2 3 9
(ft) (ft) (see) (see) (seec) (se)
7-200 230.4 1065.2 0.224 0.234
7-212 265.5 1073.4 0.235 0.250
7-201 607.6 1204.6 0. 283 0. 301
7-201T 607.6 1204.6 0.284 0.303
7-213 974.2 1425. 0 0. 368 0. 420
7-202 1345.4 1700.5 0. 486 0.608 1.089
7-203 2091.9 2336.? 0.907 0.953 1.529
7-204 2804.3 3024.7 1.430 2.064 3.351
7-205 3589.3 3737. 0 1.973 2.631 4.056
7-206T 4338.7 4461.6 2.546 3.235 4.785
7-207 5088.3 5193.5 3.131 3.841 5.496
7-208 5837.9 5929.8 3.730 4.452 6.186
7-209 7337.5 7410.8 4.967 5.709 7.482
7-210 8837.2 8898.2 6.232 9.008
7-211 11836.8 11882.4 8.802 .628
7-Q. 2795.8 2983.0 1.377 1.074
7-Q2 3559.31 3708.1 11.936 1 12.602 14.0301209
SECRET RESTRICTED DATASecurity Infoiiation ATOMIC ENERGY ACT 1946

SECRETSecuriLy Information
TABIE 2.9
TU MLER 4 - Positive Impulses and Pressures(Ground Level)
Peak Pressures
Station Ground Posive Precursor Initial Positive Negative
(ft) (psi-sec) Pa PP P
___________ (psi) (psi) (psi) (paA)
7-200 230.4 9.30 151,0 140.2 7.4
7-212 265.5 8.67 1o0.4 116.9 6.3
7-201 607.6 6.99 27.5 82.7 5.9
7-201T 607.6 7.37 29.2 82.4 6.0
7-213 974.2 5.25 1O.6 43.6 5.47
7-202 1345.4 4.33 8.7 24.50 4.37
7-203 2091.9 3.27 9.84 2.65
7-204 2804.3 2.38 6.09 8.84 2.06
7-205 3589.3 2.00 5.47 6.39 1.50
7-206T 4338.7 1.71 4.24 4.80 1.23
7-207 5088.3 1.39 3.96 0.96
7-208 5837.9 1.25 3.24 0.95
7-209 7337.5 0.87 2.14i 0.65
7-210 8837.2 O.78 1.53 0.59
7-211 11836.8 o.64 1.21 0. 45
7-Ql. 2795.8 2.49 7.72 1.88
7-Q2 3559.3 2,06 1.69 6.20 1.71
210
RESTRICTED DATA SECRETATOMIC ENERGY ACT 1946 Security Information

SECRETSacurity Infornution
TABIE 2..10
TUMBLER 4 - Phase Durations and Rise Times(Ground Level)
Phase Rise Times
Station Cround Durations Precursor PeakNumbe Range Positive Negative ti Peak t
Nar£) (aeo) t7 (msec)(see) () (seeec (aseo)
7-200 230.4 0.281 1.08 9.3 18.2
7-212 265.5 0.279 1.02 8.3 22.2
7-201 607.6 0.300 0.807 1.14 34.6
7-201T 607.6 0.303 0.922 1.6 35.0
7-213 974.2 0.414 1.133 23.2 74.8
7-202 1345.4 0.539 20.5 161.8
7-203 2091.9 0.702 57.2
7-204 2804.3 0.748 1.9 15.5
7-205 3589.3 0.807 1.4 6.4
7-206T 4338.7 0.877 1.6 11.5
7-207 5088.3 0.942 1.7
7-208 5837.9 0.988 1.5
7-209 7337.5 1.085 1.5
7-210 8837.2 1.196 1.3
7-211 11836.8 1.284 1.5
7-01 2795.8 0.747 36.0
211
SECRET RESTRICTED DATASecurity Information ATOMIC ENERGY ACT 1946

SECRETSecurity Information
So o
H 0 0 0
0 ~ 00 ) It0 0 m
m0 13% tg: 9 j 11% . 89- r-4H
. l 0AU I, I
S i-
H0 c
00 1 4'-JC-J H H H HI H HC'i H r4f -
212RESTRICTED DATA SECRETATOMIC ENERGY ACT 1946 Security Information

SECRETSecurity Information
TABLU 3.2
Absolute Time-of-Arrival of Shock in Free Air and Mach Region -TUMBLER 1
Distance Distance Time Tbistance Distance TimeFrom Burst From GZ (sc) From Burst From GZ (Sec)
(Ft) (Ft) (Ft) (Ft)
123.216 0.0052490 850.130 281.464 0.3517802163.080 0.0143395 859.190 312.268 0.3609295229.218 0.0234318 877.310 335.220 0.3700802261.230 0.0325258 889.390 375.990 0.3792324289.618 0.0416213 913.550 435.182 u.jy'15419
317.100 0.0507183 940.126 489.844 0.4158576343,978 o.%058169 966.400 527.896 0.4341796368.138 0.0689169 990.560 579.236 0.4525078387.164 0.0780187 1,013.814 619.100 0.4708422411.928 0.0871221 1,040.390 661.380 0.14891829
431.256 0.0962269 1,063.946 700.036 0.5075298447.564 0.1053332 1,0890314 732,652 0.5258825467.496 0.1144409 1,101.394 755.000 0.5350612484.710 0.1235503 l,117.400 775.234 0.5442417497.998 0.1326610 1,126.158 789.730 0.5534236
519,440 0.1417730 1,138.540 809.360 0.5626073535.748 0.1508868 1,150.318 825.970 0.5717925550.848 0.1600020 1,162.700 844y.694 0.5809792566.552 0.1691188 1,175.082 860.700 o.5901675584.370 0.1782371 1,186.860 877.310 0.5993572
598.262 0.1873571 1,201.054 893.920 0.6085486613.060 0.1964786 1,208.906 906.000 0.6177418628.160 0.2056016 1,220.080 922.610 0,b269364643.260 0.2147262 1,236.086 939.220 0.6361324657.152 0.2238522 1,260.548 970.024 0.6545293673.460 0.2329799 1,286,218 1,002.640 0.6729324688.258 0.2421090 1,294.674 1,017.740 0.682136471.5.740 0.2603721 1,330.310 1,060.624 0.7097574741.108 0.2786415 1,356.584 1,094.750 0.7281791773.120 0.2969171 1,380.140 1,123.138 0.7466068
798.790 0.3151988 1,402.790 1,15o.016 0.7650411809.360 105.398 0.3243419 1,414.870 1,174.176 0.7834813819.326 173.650 0.3334866 1,449.600 1,208.000 0.8019278835.936 234.654 1. 3426328 1,469.834 1,230.650 0.8203804
213SECRET RESTRICTED DATA
Security Information ATOMIC ENERGY ACT 1946

SECRETSecurity Information
TABLE 3.3
Peak Overpressure - Shock Velocity -
Distance - TUMBLER 1
Distance Shock PeakFrom Burst Velocity Overpressure
(Ft) (Ft/Sec) (psi)
200 5,500.8 348.5300 3,149.7 106.0400 2,295.5 49.3500 1,896.7 28.9600 1,663.2 18.8
700 1,527.3 13.5800 1,,454.2 10.8900 1,4187. 9.5
1,000 1,387.7 8.41,100 1,356.6 7.4
TABI 3.5
Peak Overpressure - Shock Velocity -Distance - TUMBLER 2
Distance Shock PeakFrom Burst Velocity Overpressure
(Ft) (Ft/Sec) (psi)
400 2,278.8 46.6450 2,084.4 36.7500 1,926.9 29.3550 1,802.5 23.9600 1,698.1 19.5
650 1,614.1 16.3700 1,554.7 14.0800 1,L468.1 10.9900 1,403.1 8,7
1, 000 1,9355.5 7.2
1,100 1,322.1 6.1
2114
RESTRICTED DATA SECRETATOMIC ENERGY ACT 1946 Security Information

SECRETSecurity Information
TABLE 3.4
Absolute Time-of-Arrival of Shock :Lin Free AirTUMBLER 2
Distance Time Distance Distance TimeFrom Burst (see) From Burst (See) From Burst (See)
(Ft) (Ft) (c)(Ft)
368.4 1 0 0.0683803 787.788 0.3065203 1,119.080 0.5446603397.772 0.0816103 806.624 0.3197503 1,132.930 0.5578903427.134 0.0948403 828.230 0.3329803 1,152.320 0.5711203457.050 0.1080703 850.390 0.3462103 1,172.264 0.5843503481.980 0.1213003 865.902 0.3594403 1,185.560 0.5975803
510.234 0.1345303 886.400 0.3726703 1,207.166 0.6108103534.056 o.1477603 908.560 0.3859003 1i214.368 0.6240403559.540 0.1609903 920.748 0.3991303 1,238.744 0.6372703575.606 0.1742203 939.030 0.4123603 1#257.580 0.6505003603.860 0.1874503 958.420 0.4255903 1,289.158 0.6769603
624.358 O.2006803 976.702 0.4388203 1#310.764 0.6901903648.180 0.2139103 997.754 0.4520503 1,i328.492 0.7034203666.462 0.2271403 1,013.266 0.4b52803 1,358.962 0.7298803691.392 0.2403703 1,030.994 0.4785103 1,393.864 0.7563403708.012 0.2536003 1,049.830 0.491.7403 1,430.982 0.7828003
729.064 0.2668303 1,067.004 0.5049703 1,460.344 0.8092603750.116 0.2800603 1,080.300 0.5182003 1,493-030 0.8357203768.398 0.2932903 1,096.920 0.5314303
215
SECRET RESTRICTED DATASecurity Information ATOMIC ENERGY ACT I9463

SECRETSecurity Inforution
TABLE 3.6
Absolute Time-of-Arrival of Shock in Free AirTUMBLER 3
ce Time Distance DistanceFrom Burst Trom BurstTce From Burst Time
(Ft) (see) (Frm st) TiSe) (Ft) (Sec)
194.580 0.0028800 1,009.278 0.1653354 1,478.808 0.3755718342.630 0.00124362 1,044.810 0.1748916 1,519.416 0.39468142424.692 0.0219924 1,072.728 0.1844478 1,556.640 0.14137966485.604 0.0315486 1,095.570 0.1940040 1,591.326 0.4329090552.438 0.0411048 1,120.114 0.2035602 1,631.088 0.4520214
599.814 0.0506610 1,139.562 0.2131164 1,664.082 0.4711338b47.190 0.0602172 I,164.096 0.2226726 1a,690.308 0.4902462691.182 0.0697734 1,175.940 0.2322288 1,724.994 0.5093586730.098 0.0793296 1,201.320 0.2417850 1,763.910 0.5284710765.630 0.0888858 1,222.470 0.2513412 1,785.060 0.5475834
798.624 0.0984420 1,235.160 0.2608974 1,823.976 0.5666958835.002 0.1079982 1,258.848 0.2704536 1,853.586 0.5858082868.842 0.11755414 1,284.228 0.2800098 1,888.272 0.6049206899.298 0.1271106 1,323.990 0.2991222 1,920.420 0.6240330926.370 0.1366668 1,367.982 0.3182346 1,954.260 0.6431454
955.980 0.1462230 1,406.052 0.3373470 1,981.332 0.6622578989.820 011557792 1,450.890 0.3564594
216
RESTRICTED DATA SECRETATOMIC ENERGY ACT 1948 Security Information

.SECRETSacurltt I~fhrrntto"
TABLE 3.7
Peak Oveipressure - Shock Velocity -
Distance - TtXBiLhR 3
Distance Shock " PeakFrom Burst Velocity Overpressure
(Ft) (Ft/Sec) (psi)
525 6,385 337.0575 5,581 339.0650 4, 499 217.6700 4,066 177.8800 3,593 129.6
900 3,184 100.51,000 2,855 77.7i,100 2,565 59091,9400 2,039 32.41,500 1,936 27.9
1,550 1,891 26.11,600 1i842 26. 0
1,650 1,792 22.11,700 1,751 20.41,750 1,715 19.1
1,800 1,683 17.91,850 1,656 16.91,900 1, 632 16.01,950 1,612 15.32,000 19594 14.6
217
SECRET RESTRICTED DATASecurity kIformtilon ATOMIC ENERGY ACT 1946

SECRETSecufily Inforination
TABLE 3.8
Absolute Time-of-ArriVal of Shock in free Air - TUMBLER 4
Distance Distance Distance TimeFrom Burst From Burst From Burst
(Ft) (Sec) (Ft) (Sea) (Ft)
2o6.164 0.0044500 1,064.689 0.221546o 1,547.291 0.14682460
325.968 0.0143180 1,087.972 0.2314140 1,583.275 0.4879820
398.359 0.0241860 1#107.446 0.2412820 1,608.675 0.5077180
464.822 0.0340540 1,131.153 0.2511500 1,644.235 0.5274540
517.316 0.0439220 1,152.319 0.2610180 1,678.526 0.5471900
562.613 0.0537900 1,174.756 0,2708860 1,714.509 0.5669260
606.217 0.0636580 1,193.806 0.2807540 1,744.143 0.5866620643. 470 0.0735260 1,212.433 0.2906220 1,763.996 0.6002851
682.840 0.0833940 1, 230.213 0.3004900 1, 778.009 0.6063980
717.554 0.0932620 1,250.957 0.3103580 i,794.017 0.6197273
748.881 0.1031300 1,267.467 0. 3202260 1,807.643 0.6261340
782.324 0.1129980 1,286.940 0.3300940 1,829.749 0.6391694
811.534 0.1228660 1,309.377 0.3399620 1,853.556 0.6586116
839.474 0.1327340 1,331.390 0.3498300 1,883.031 0.6780537861.488 0.1426020 1,348.324 0.3596980 1,913.074 0.6974958
889.005 0.1524700 1,365.257 0.3695660 1,947.651 0.7169380
916.521 0.1623380 1,384.731 0.3794340 1,979.960 0.7363801
944.038 0.1722060 1,402.934 0.3893020 2,012.270 0.7558222
969.322 0.1820740 1,437.224 0.4090380 2,041.179 0.7752644
994.839 0.1919420 1,479.558 0.4287740 2,077.6456 0.7947065
1,020.239 0.2018100 1,509.191 0.4485100 2,108.632 0.5238697
1,041.405 0.2116780
218
RESTRICTED DATA SECRETATOMIC ENERGY ACT 1946 Seculity Information

SECRETSacurity InformitIno
TABLE 3.9
Peak Overpressure - Shock Velocity - DistanceTUMBLER 4
Distance Shock PeakPM Blurst Velocity Ove sours
(ft) (ftb/se) 2 psi)
4w0 74157 6.45o 61375w 521 319.5550 WE65 2145.0600 414a6 196.6
65o 3801 158.7700 3521 129.5750 3147 103.2800 2908 87.0850 2763 74-.8
900 2624 66.21000 2359 81050 2257r5*111W0 2166 4o.51150 2091 36.7
1200 2023 33-.41250 1966 30.71300 1916 28.41350 1874 26.514M 1830.6 24.7
1500 1757.5 21.61600 1pý.2 19.01700 A6.6 17.11800 1609.6 15.71900 1583.0 14.7
219
SECRET RESTRICTED DATAScurity Information ATOMIC ENERGY ACT 1R46

SECRETSocurity Information
TABLE 3.10
X's and Z's in Feet(Film 13083)- TUMBLER 1
Time (Seconds)Zn Zn 0.157h40.178810.21231 0.2337 0.265810.28721 0.319310,71o.3728
(Ft) x(Ft)
Z2 4,13.3 493.6 503.9 521.6 526.8 533.4 539.3 543.7 545.2 544.5
Z2 432.5 501.0 511.3 529.7 537.8 5L2.2 5L8.9 553.3 •5 3.3 553.3
Z3 449.4 509.1 520.1 540.0 548.1 552.6 559.9 564.3 567.3 565.1
Z4, 478.9 523.1 537.8 557.7 565.1 573.9 579.1 5 8 4.2 589.4 589.4
Z5 510.6 537.5 553.3 574.7 583.5 592.3 600.4 607.1 610.8 613.7
Z6 553.3 --- 575.4 601.9 611.5 622.5 630.6 638.8 646.1 6)48.3
Z7 604.1 ---- --- 629.9 641.0 655.7 666.0 677.1 683.7 688.1
Z8 677.5 ------------ 697.7 711.7 726.4 733.8 740.4
Z9 783.2 ------------ 797.2 806.7 820.0
TABLE 3.11
X's and Z's in Feet(Film 13383)- TUMBLER 4
Time (Seconds)
Z. ,,07.(Ft) 0.3587 0.38291 0.1193 0.1136j0.17;9T 4.061 0.770 0.6012 1 o.6376X(Ft)
Z4 1,090.1, 1,226.9 1,253.4 1,274.8 1,292.1 1,301h.1. 1,325.8 1,038.0 1,305.1 1,359-.Z5 1,135.2 1,28.3 1,271.7 1,2962. 1,310.5 1,323.7 1,350.2 1,363.5 1,37h.7 1,385.9
Zb 1 171.9 1,265.6 1,291.1. 1,312.5 1,332.9 1,347.2 1,37b.7 1,386.9 1,397.1 1, hl2. L
Z7 1,226.9 1,286.0 1,312.5 1,339.0 1,362.L. 1,377.7 I,1O8,3 1,022.6 1,032.8 1,1b47.0Z8 1,302.3A 1,320.7 1,352.3 1,378.7 ,1,00.1 1,1h11.41 1, h49.). 1,463.3 1,47h.5 1,192.9z 9 1,393.0 --- --- 1,20.5 1,h19.) 1,h61.3 1,0,9.0 1,513.3 1,529.6 1,553.0
220
RESTRICTED DATA SECRETATOMIC ENE•RY ICT 1946 SecurIly Information

SECRETStwuity linforazt:.n,
TABLE 3.-I.
Z7-zj, Xn-xj in Feet - TLWL*ER I
Time (Seconds)
zn. (A) 0.2123T0.2337 0°.25511 02765 0.297910.3193°0.34°110703728IAX(Ft)Zh-Z1 65.6 314.0 37.0 39.0 40.0 41.0 42.0 43.0 45.0Z5-Z 2 78.1 45.0 49.0 50.0 54.0 56.0 57.0 58.0 62.0Z5-z 3 61.2 3L.0 38.0 39.0 42.0 44.0 43.0 45.0 48.0Z6-Z3 103.9 58.0 65.0 68.0 72.0 74.0 75.0 78.0 82.0Z U-Z 4 74.4 42.0 46.0 48.0 51.0 52.0 55.0 56.0 5B.0
z7-Z4 125.2 68.0 71.0 78.0 84.0 87.0 92.0 95.0 99.0Z7-Z5 93.5, 50.0 55.0 59.0 63.0 65.0 69.0 72.0 75.0Z8=Z6 124.5 -- -- 70.0 76.0 82.0 86.0 89.0 93.0Z8-Z 7 73.7 .. .. 410.0 43.0 47.0 49.0 50.0 52.0
Z-Z7 179.1 .. .. .. . . .129.0 125.0 131.0
Z9-Z8 154.0 -. .... 70.0 75.0 79.0
TABLE 3.13
Zn-Zj, X-xi in Feet - 4UeLm If
Time (Seconds)
Z,-Zj AZ(Pt) 0.38291 0.39501 0.40721 0.o314 1 4436 0.1 0.7 01o678 o01.4799 0.5-406A x(Ft)
Z9-7 166.1 . -. . 85.6 89.7 91.7 93.8 94.8 94.8.A 221.3. - . .. . 111.1 115.2 119.2 123.3 125.3 120.4p 257.8 .. .. .. 131.11 135.5 140.6 143.7 115.7 151.8
Z b 302.6 .. .. .. 150.8 155.9 160.0 164.1 166.1 174.2Z8. 130. 58.1 60.1 62.2 66.2 67.2 68.3 71.3 71.3 74.4
a8-5 167.1 76.4 80.5 81.5 86.6 87.3 89.7 91.7 91.7 97.8Z8:4 212.0 96.8 99.9 i00.9 lo6.0 108.0 109.0 112.1 112.1 120.2L7 4 136.6 60.1 62.2 62.2 65.2 66.2 68.3 70.3 71.3 79.5
221
SECRET RESTRICTED DATASecurity information ATOMIC ENERGY ACT 1948

SECRETSecurity Intormation
TA3L3 3.14
Calculated K, - TtBLM 1
(-zt
Time (Seconds)
j (Ct) 0.2123 0.2337 o.2551 0.27651 02979o 03193 0.3407 0.3728K
Z ,-Z1 446.1 0.518 0.564 0.595 --- ... ... ... ...z5-Z2 471,5 0.576 0.627 0.640 0.691 0.717 0.730 0.743 0.794Z5 -Z31480.0 0.556 0.621 0.637 0.686 0.719 0.703 0.735 0.784Zb-Z 3 5oi.4 0.558 0.626 0.654 0.693 0.712 0.722 0.751 0.789Z6-Z4 516.1 0.5614 0.618 0.645 0.685 0.699 0.739 0.753 0.780
Z7-Z4 541.5 0.543 0.591 0.623 0.671 0.695 0.735 0.759 0.791zT.z 556.0 0.535 0.588 0.631 0.674 0.695 0.738 0.770 0.802a 6 615.5 --- - 0.562 0.610 0.659 0.691 0.715 0.747
Z8-Z7 640.9 . .. 0.543 0.583 0.638 0.665 0.673 0.706Z2-Z7 693,6 ... . ---.--- - - o,66), 0.698 0.731
Z9-Z8 730.5 -------------- 0.454 0.487 0.513
TABLE 3.15
Calculated IC - TUMLER4
Time (Seconds)7 (Ft) 0.3829 1 0.3950 0.1o72 0.141 0.14 o.15-7 0.1678 o0.479 0.540
K
Z9-Z7 1,31015 .. ..-. 0.5153 0.5399 0.5521 0.5644 .5705M 0.5705Z9-Zb 1,281.9 .. .. . 0.5023 0.5207 0.5392 0.5576 0.5668 0.5806
z 1,768.7 .. .. .. 0.5099 O.5257 0.1,4514 0.5573 0.5652 0.5889iE 1,241.2 .. 0.14983 0.5152 0.5286 0.5421 0.5488 0.5758
Z8-z 1 ,•288.0 o.%4145j 0.4609 0.4766 0.507b o. 556 o.523h 0.5469 0.51469 0.57031,118.8 0.4573 0.4817 0.4878 0.5183 0.521414 0.5366 0.5488 0.5488 0.5854Z8=Z 0 1,196.31 .567 0.4711 0.4760 0.5000 0.5096 0.5144 0.5288 0.5288 0.5673
Z7-=Z4 1,158.6 0.U403 0.4552 0.4552 0.4776 0.4851 0.5000 0.5149 0.5224 0.5821
222
RESTRICTED DATA SECRETATOMWC F-.NE Y ACT 1946 Security Information

SECRETSecurity Informaion
TABLE 3.16
Calculated Pressure, Pn,mB aBd Distance, X - T1I•LER 1
Pn Z 6F 0 p n (z n2 I5pp [0 0..Pk,) 23L . 6p+'j~ sI .4I 1 rise" - < -I , a ( - ) ( s a
zý 0.530 9.9 1449.14 0.4100 0.6900 0.5338 0. 1w 20.7 541.00.565 144.5 1478.9 0.14355 0.7392 o.5698 o.4555 20.3 557.0
5 0.56? 140. 510.6 0.0)635 0.7885 o.61446 0.5400 21.7 575.026 0.535 35.9 553.3 0.4963 0.8532 0.7915 0.7204 25.9 599.0 0.2123Z7 --- 31.6 6M•.1 0.5383 .. .......Z6 --- 27.7 677.8 0.5868 ---- ----..
23 0.578 .49.9 4,)9 .,104 6 0 -0.6726 o0.771 0,552 17.7 5i4,6Z4 o.616 U.5 478.14 0.-4355 0.7133 0.5043 0.3832 17.1 567.025 0.624 140.1 50o.6 0.14635 0.7592 0.5639 o.4485 1B.0 586.0Z6 0.602 35.9 553.3 0.14963 0.81147 0.6716 0.5730 20.6 613.0 0.23372 7 . 31.6 60b.1 0.5383 ----... ............
27.7 677.8 0.5868 ---- ...
Z3 0.-06 h99 h449.4 01100 0.6580 o.446 0.3260 16.3 55640h14 0.639 44.5 478.14 0.4355 0.6961 0.4714 o.3515 15.6 574.0
Z5 0.650 40.1 510.6 0.14635 0.714. 0.5267 0.409$ 16.L 593.026 0.6314 35.9 553.3 0.4963 0.7913 0.61914 0.5105 18.3 622.0 0.255127 0.585 31.6 6o0,. 0.5383 0.8584 0.7099 0.7190 22.7 A5?.]
--- 27.7 677.8 0.586 ........3 - 149.9 449.4 •o ........ .....zj 0.05 ,44.5 478.14 o0. 55 o.6841 0.14349 .3105 13.8 579.02Z5 0.688 Wo.1 510.6 0, 4635 0.721• O.h879 0.3655 14.7 600.06 0.665 35.9 553.3 0.o4963 0.7713 0.5756 o.1461o 16.5 630.0 0.2765
27 0.605 31.6 6014.1 0.5383 0.8302 0.7387 0.6548 20.7 663.0Z6 -.- 27.7 677.8 0.5868 .... ............
Z3 --- L9.9 449.14 0..4100 --.. - ..Z4 0.709 414.5 478.h 0.14355 0.6748 0.4W 0.2905 12.9 583.025 o.710 40.1 510.6 0.14635 0.7123 0.41650 0.3420 13.7 605•026 0.696 35.9 553.3 0.14963 0.7592 0.54114 0.14240 15.2 635.0 0.297927 0.665 31.6 604.1 0.5383 0.8129 O.658O 0.5560 17.6 670.0Z4 --- 27.7 677.8 0.5868 ... .....
z3 -.. 49.9 44 --.1 -. .... ............z4 o.734 U.5 1478.9 0 .4355 0.6701 0.3976 0.2745 12.2 585.0S0.738 40.1 510.6 0.14635 0.7053 0.4430 0.3205 12.9 608.o
0.731 35.9 553.3 0.4963 0o714714 0.50714 0.3870 13.9 640.0 0.319327 0.718 31.6 6o01.1 0.5383 07962 o.5969 O,.486o 15.14 677.028 0.656 27.7 677.8 0.5868 0.8716 0.7797 0.7059 19.6 726.073 --- 4.9 449. ..----------
Zh 0 .78 Wu5 4789 0.10355 0.6632 0"3861 o,261 11,8 588.0Z5 0:760 140.1 510.6 0.11635 0.6981L 0.4259 0.3021 12.1 611.0
0.786 35.9 553.3 0.A4963 0.7382 o.4661 0.3o40 12.3 64L.0 0.3107z 0.704h 31.6 6014.1 0.5383 0.7823 0.5660 0.4515 114.3 683.0z8 0.700 27.7 677.8 0.5868 0.8551 0.7168 0.6279 17.4 733.0
23 4-I9.9 W14 4.1----- -------0.791 h4.5 1478.9 o.4355 0o.6588 0.32"7 0.2,420 10.8 590.o
27 0.799 110.1 510.6 0.14635 0.6916 0.h4012 0.2781 11.2 6114.oq0.797 35.9 553.3 0.14963 0.7290 O.L514O 0:3315 11.9 648.0 0.3728Z7 0.778 31.6 604.1 0.5383 0.7688 0.5319 0 4130 13.0 66.90
0.734 27.7 677.8 0.5868 0.8367 0.6689 0.5690 15.8 1711.o0
* P0 = 12.9 PSI
223
SECRET RESTRICTED DATASecurity Information ATOMIC ENERGY ACT W946
r • I ,

SECRETSocurity Informati"
TABLE 3.17
Calculated Pressure, Pnm, ,and Distance, X, TUMBLER 4
2 61 a (p2i) =
K . 6P +P (Z\ 6p / i 0 . \ l Rý 2 2r 2 1.1
(psi) (Ft) 6P-n*P i 6) .KK Xi LbP6~o• ) I"n] (72.) 4
.. -- 40.14 1,3114 0.o. 47.4 --- i,335.9Z7 0. 448 44.2 1,238 0.4243 0.890 0.8133 0.7879 34.8 1,300.3 0.370Z 0.:450 47.2 1,183 0.o406 0.8383 0.7612 0.6825 32.2 1,279.9
14.--- 414 1,3114 0.41474 - - .. ..... 1,348.247 0.157 144.2 1,238 0.4243 0.8752 0.8126 0.7335 32.14 1,3U.5 0.3829
2 0.1454 147.2 1,18,3 0.4086 0.8252 0.7427 0.6590 31.1 1,290.1
1- 40.1 1,3114 0.144714 --.. . ........ 1,360.14Z7 0.o47oh 44.2 1,238 0.42143 0.66041 0.7715 0.6952 30.7 1,322.7 0.395026 0.1472 147.2 1,183 0.14086 0.8122 0.7031 0. 610 28.8 1,300.3
-- 1`o40.4 1,314 0."4 -714 -... 1,370.6"0.185 14.2 1,238 0.42h3 0.81486 0.71424 0.6595 29.1 1,331.9 0.14072
Z6 0.476 47.2 1,183 0.14086 0.8021 0.6885 0.5930 28.0 1,30.h
Ze o.1489 14o.14 1,3141 0.4474 0.8883 0.8121 0.7180 30.2 1,381.827 0.498 44.2 1,238 0.42143 0.8370 0.7131 0.6230 27.5 1,301.0 0.4193z 0.485 47.2 1,183 0.4086 0.7923 0.6675 0.5680 26.8 1,316.6
z2 0.505 40.14 1,314 0.1474 0.8765 0.7766 0.7019 28.14 1,391.0Z7 0.509 44.2 1,238 0.4243 0.8257 0.683 0.5930 26.2 1,350.2 0.4314z6 0.495 47.2 1,183 0.14066 0.7825 0.6459 0.5421 25.6 1,3214.7
z2 0.526 ho.1h 1,3114 0.4474 0.86614 0.7370 0.6521 26.3 1,399.1Z7 0.5214 U1.2 1,238 0.42143 0.8170 0.6616 o.56o2 214.8 1,3573 0.1443626 10.506 147.2 1,183 0.h086 0.77142 0.6252 0.5179 24.14 1,331.9
zo 0.542 o.14 1314 0.14474 0.8577 0.7081 0.6170 214.9 1,1406.3Z7 0.540 44.2 1,238 0.14243 0.8073 0.63143 0.5295 23.14 1,365.5 0.45572 0.521 47.2 1,183 0.14086 0.7670 0.6015 0.4910 23.2 1,33801
Z8 0.558 4o.4 1,3114 0.11474 0.81477 0.6797 0.5822 23.5 1,41.14S0.550 14.2 1238 0.4243 0.7989 0.6163 0.5082 22.5 1,372.6 0.4678
0.531 h7.Z 1,183 0.14086 0.7387 0.5684 0.514O 22.2 1,345.1
"z 0.567 40 .4 1,314 0.44714 0.81405 0.6633 0.5630 22.7 1,420.5Z7 0.556 h1.2 1,238 0.0243 0.7907 0.6034 0.14925 21.8 1,379.8 0.147992 0.537 147.2 1,183 0.14086 0.7545 0.5741 0.1565 21.5 1,3149.2
26 0.578 40.4 1,311h 0.447h 0.8077 0.6252 0.5180 20.9 1,1449.1z7 0.576 144.2 1,238 0.4243 0.7590 0.5591 0.44135 19.6 1,1408.3 0.5140626 0.570 47.2 1,183 0.4086 0.7268 0.5210 0.4010 18.9 1,37h.7
26 0.576 40.4 1,3141 0.4474 0.7767 0.6033 0.49214 19.9 1,477.6
27 0.616 44.2 1,238 0.142h3 0.7302 0.50)0 0.3825 16.9 1,435.8 0.6012o 0.626 147.2 1,183 0.4086 0.7026 0.4582 0.3357 15.0 1,398.1
z8 0.615 40.4 1,314 0.1 4714 0.7600 0.,5529 0.14362 17,2 1,,93.9
27 0.633 1a.2 1,238 0.4243 0.7200 0.14822 0.3600 15.9 1,4h6.0 0.637626o.637 47.2 1,1831 o.4o86 0.68914 0.4149 O.A2X) 15.1 1,141. 4
"w o - 12.25 PSI
224.
RESTRICTED DATA SECRETATOMIC ENERGY ACT 1046 Security Information

SECRETseurity leform0tl
TABLE 3.18
Free-eir Pressure-Time, TIRBLER 1
R = 590 Ft R = 690 Ft
P(psi) T(Sac) P(psi) T(Sec)
19.5# 0.0000 14.2# 0.000011.0 0.0323 11.1 0.01115.5 0.0537 8.2 0.03253.3 0.0751 5.3 0.05391.3 0.0965 3.2 0.0753
0.2 0.1179 1.4 0.0967-o.6 0.1393 0.2 0.1288-1.1 0.1607-2.1 0.1928
TABLE 3.19
Free-air Pressure-Time, TUMBLER 4
R - 1350 Ft R = 1410 Ft
P(psi) T(Sec) P(psi) T(Sec)
26.5# 0.0000 24.2# 0.000025.2 0.0088 21.5 0.012222.2 0.0204 19.6 0.024r119.8 0.0330 17.3 0.036417.9 0.o452 14.5 0.o486
16.0 0.0573 13.1 0.060714.2 0.0694 11.3 0.072812.6 0.0816 10.0 0.084911.0 0.0937 7.5 0.145610.0 0.1058 4.1 0.20659.2 0.1179 3.0 0.2426
# Taken from shock velocity data; arrival time
taken as zero time.
225
SECRET RESTRICTED DATASecurity Informatlin ATOMICC ENERGY ACT 1946

SECRETSecurity lfe0mation
TABLE 3.20
Decayv Parameter, e, for TUMBLER 1 and 4
TUMBLER 1 TUMBLER 4
Radial * * Radial *Distance 8V ed Distance Gov 9pd
(ft) (Meec) (msec) (ft) (28ec) (Meec)
575 39.2 44.9 1350 96.9 96.0
590 42.0 46.5 3410o no.04 108.0
690 64.5 53.0 1550 141.9 140.
a * v is based on shock velocity pressure-distance results.
• pd is based on particle displacement pressure-time results.
226
RESTRICTED DATA SECRETATOMIC ENERYr ACT 1946 Security Informition

SECRETSecurity Information
TABLE 4.1
TUMBLER 1 Data Reduced to I XT at Sea Level(Ground Level)
Pres Positive Negative Arrival Positive NegativeStation Range* Impulse pressure Time Duration Duration
( (t) (psi) (psi-see) (psi) te t4 t8
(see) (sea) (soe)- 6--
F-200 76& 31.52 2.10 3.97 0.307 0.207 0.782
1 -0 1.67 ,871554F-202 930 18.07 1.42 2.96 .022 0,205 0l871
F-202T 9 17.27 i.d0 3.59 o.U? 0.21h 0,797
F-203 1,083 13.68 1.14 2.84 0.530 0.215 0.903
F-204 1,261 13.58 _ 0.668 0.226 0.g0511,249F-205 1.4 11.67 0.79 0198 0.821 0.237 0,913
1 ,,4• 8 3 ..
F-206 1,661 9.21 0.72 1.56 0.980 0.258 0.908
F-207 1 873 8.04 0.64 .1.4 1.147 0..278 0.882I, 952F-208 2,091 6.42 0.53 1.15 1.329 0,288 0.9082,422F-209 2,535_ 4.47 o.k5. 0.89 1.693 0o. -0 o96E-2o02 .2.515 4.41 o.J04_ o.937
F-210 2,988 3.37 0.37 0.80 1 2.073 0.336 0961I, 3F-211 j3,906 2.28 J 0,?9 0.56 2.854 0.363 0.962
*iround RMe]
227
SECRET RESTRICTED DATASecurity Information ATOMiC ENERGY ACT t046

SECRETSacurity Information
TABLE 4.2
TUMBLER 2 DeIa Reduced to 1 la at Sea Level (Ground Level)
Positive Negative Arrival Positive Negative
Station Range* Pressure Impulse Pressure Time Duration Duration
(Ft) (psi) (psi-see) (psi) t( t4 t8(sec) (nec) (oe c)
7-200 1,003 16.93 1.28 2.85 0.485 0.220 1.1140
7-212 1.021 14.52 1.25 2.64 0.499 0.228 1.156563
7-201 1,143 12.75 1.12 2..t0 0.521 0.224 0,8685b3
7-201T 143 1340j 1,08 2.30 0.590 0.233 00912
7-213 1,340 9.36 0.650 2.06 0.741 0.235 .0.g21,23•
7-202 1,585 7.68 0.683 1.84 0.9_ 8 0.249 0.878'1,907
7-203 2,185 6.41 0.506 1.16 10394 0.285 0.52
7-204 2,763 4.32 0.387 0.84 1.903 0.304 0.8243,252
7-205 3,1i00 3.35 0.314 0.69 2.440 0.326 0.847
7-2o6 4 8 2.48 0.,265 0.65 2s991 0.319 0.54h
7-206T 4____o 2.24 0.259 0.57 2.991 0.343 0.788
iSlant R.• I
228
RESTRICTED DATA SECRETATOMIC ENERGY ACT 194"
Scurity Informatiton

SECRETScurity Infomation
TABiz 4 .3
TUIBLER 3 Data Reduced tv 1 NT at Sea Level(Ground Level)
PoArrival Positive NegativePressure Positive Negative Time Duration Duration
station Range* (psi) Impulse Pressureth t(Ft) (psi-sec) (psi) (see) (see) (geo)
51
7-200 1,015 15.96 1.25 2.07 0.491 0.217 1.172917-23.2 1,018 15.94 1.28 2.47 0.496 0.217 0.890
1957-201 1,032 15.36 ---- --- .507 ----- --
7-201T .1,032 15.148 1.22 2.58 0.506 0.213 -0.233304
7-213 1,058 14.65 1.21 2.43 0.528 0.217 1.025S4137-202 3,o95 13.41 1.12 2.25 0.555 0.225 3.0... .
7-203 11.25 1.04 2.00 0.634 0.2A 1.028853
7-204 1,32 10.17 0.83 2.12 0.739 0.225 0.901
7-205 1,073 8.58 0.75 1.70 0.860 0.240 1.143
7-206T i, 7.72 0.67 1.46 0.996 0.253 1.0111,513
7-207 1,822 7.59 0.61 1.17 1.142 0.270 0.9991,733
7-208 2,009 7.53 0.58 1.18 1.297 0.279 1.109
7-209 2,14o 5.94 0.47 0.86 1.621 0.295 0.936
7 2210 ,86 4.29 0.l40 0.79 10965 0.300 1.4524
7-211 3,6 3. 306 0.31 0.64 2.671 0.321 0.9361537
7-Ql 1.15 12.86 0.86 1.80 0.729 0.236 1.31171,062
7-Q2 :I,69 9.46 0.81 1.63 0.852 0.246 1.025
Slant EM,•; I
229SECRET RESTRICTED DATA
Security Ilrmation ATOMIC ENERGY ACT 192A

SECRETSecurity Information
TABLE 4.4-
TUMBLER 4 Data Reduced to 1 KT at, Sea Level(Ground Level)
Positive Negative Arrivel Positive NegativePresur Poitie NgatveTime Duration Duration
Station Range* Pressure Impulse Pressure Ti
(Ft) (psi) (psi-see) (psi) t( t4 ta(•ise) (ps) sec) (see) (seeo)
do
7-200 372 168.1 3.86 8.9 0.081 0.097 0.37493
7-212 375 140.2 3.60 7.6 _.0087 1. 097 0.353232
7-201 420 99.2 2990 7.1 0o,104 0.104 0.279212
7-202 1- 420 98J8 3.06 7.2 0.105 0.105 0.319340721_3 497 52.3 2.18 6.56 o.i145 0o.143 o.392
4707-202 594. 29.A8 1.80 5.24 0.210 0.186
7307-203 815 u1.80 1.36 3.18 0.330 o.2439797-204 1,056 10.60 0.99 2.47 0.495 0.259
7-205 1.304 7.66 0,83 1.80 o,683 0.279
7-2O6T 1,i52 5.76 0.71 1. 0,881 0.303
7-207 I1= 4.75 0.58 1.15 1.083 0.3262:03b7-208 2 . 3..88 ,U52 1.14 1.291 u. 322, 5017-209 2,586 2.57 0.36 o078 1.719 0.375
7-210 3.zo6 1.83 0o32 0.71 2.156 o.I4144,1327-211 ,147 l.... 0.27 0.54 3.045 o.444
9767- 1 0141 9.26 1.03 2.25 0. 476 0. 258i,243[
7-Q2 .,294 7.43 0.85 2.05 0.670.281
* RangeSlaut Range
230
RESTRICTED DATA SECRETATOMIC ENERGY ACT 1946 Socurity Information

SECRETSecurity Information
TABLE 1&.5
Reduced Time-of-Arrival of Shock in Free Air and Mach RegionTUMBLER 1
(For 1 KO(RC) at Sea Level)
Reduced Reduced Reduced Reduced Reduced ReducedDistance Distance Ted Distance Distance Time
From Burst From OZ (Sec) From Burst From OZ (Sec)
116.070 o.oo48868 800.823 265.139 0.3275074153.621 0.0133501 809.357 294.156 0.3360254215.923 0.0218150 826.426 315.777 0.33445447246.079 0.0302815 837.805 354.183 0.3530654272.820 0.0387494 860.564 409.941 0.3701115
298.708 O. 0472187 885.987 461.433 0.3871634324.027 0.0556895 910.349 497.278 0.L4042212346.786 O.06141616 933.108 545.640 0.4212848364.709 0.0726354 955.013 583.192 0.4383541388.0036 0.0811107 980.048 623.020 0.145654293
406.243 0.0895872 1,002.237 659.434 0.4725102421.605 0.0980052 1,026.134 690.1_58 0.4895966440. 381 0.106 5)445 1,037.513 711.210 0.14981420456.597 0.1150253 1,052.591 730.270 0.5066890469.114 0.12,35074 1,o60.841 743,926 0.5152374489,313 0..319907 1,072.5C5 762.417 0o5237874504.1420 o.1404756 1,083.600 778.064 0.5323388518.899 0.1489619 1,095.263 795.702 0.5408916533.692 0.1574496 1,1O6.927 810.779 0.5494459550.-07 0.1659387 1,118.022 826.426 0.5580016563.563 0.171,4295 1,131.313 842.073 0.5665588577.503 0.1829216 1,138.790 853.452 0.5751176591.727 0.1914.51 1,149.994 869.099 0.5836778605.951 0.1999101 1,164.393 884.745 0.5922393619.037 0.2084064 1,187.436 913.763 0.6093668
63 M.399 0.2169043 1,211.617 9414.1487 0.6265001648.339 0.2254035 1,219.583 958.711 0.6350690674.227 0.2424064 1,253.152 999.108 0.6607854698.0-24 0.259)1152 1,277.902 1,031.255 0.6779347728.279 0.2764298 1,300.092 1,057.996 O.6950909
752, tuu 0.293hL01 l, 321. h28 1,9083.315 0.7122533762.417 99.28 0.3019623 1,332.808 1,106.074 0.7294211771.805 154.158 '3.3104760 1,365.523 1,137.936 0.7465948787.L52 221.O44 0.3189911 1, 384.584 1,159.272 0.7637742
231
SECRET RESTRICTED DATASecurity Inf frl; tiofl ATOMIC ENERGY AC r i48

SECRET,aculity Information
TABm 4.6
Reduced Time-of-Arrival of Shock iu Free Air - TUMBLER 2(For 1 KT(RC) at Sea Level)
Reduced Reduced ReducedDisae Dist Reduced Reduced Distance ReducedFrom Burst TiSee From Burst Time) From Burst TiSe)
(F)(sc)() ( sac) (Ft)(e)
330&464 0.0601747 706.646 0.2697379 1,003.815 0.4793011356.8Ol 0.0718171 723.542 0.2813803 1,016.238 0.4909435383.139 0.0834595 742.922 0.2930227 1,033.631 0.5025859hOP9.974 0.0951019 762.800 o.3o46651 1,051.521 0.5142283432.336 0.1067443 776.714 0.3163075 1,063.447 0.5258707
457.680 0.1183867 795.1O0l 0.3279499 1,082.828 0.5375131479.048 0.1300291 814.978 0.3395923 1,089.288 0.51991555501.907 0.1416715 825.911 0.3512347 1,111.153 0.5607979516.319 0.1533139 842.310 0.3628771 1,128.049 0.5724403541.662 0.1649563 859.703 0.3745195 1,156.375 0.5957251
560.049 0.1765987 876.102 0.3861619 1,175.755 0.6073675581.1417 0.188241J. 894.985 0.3978043 1,191.657 0.6190099597.816 0.1998835 908.900 0.4094467 1,218.989 0.6422947620.179 0.2115259 924.802 0.14210891 1,250.296 O.6•55795635.087 0.2231683 941.698 0.4327315 1,283.591 0.6888643
653.970 0.2348107 957.103 0.4443739 1,309.929 0.7121491672.854 0.2464531 969.029 0.14560163 1,339.248 0.7354339689.253 0.2580955 983.937 0.14676587 11 1
232
RESTRICTED DATA SECRETATOMIC ENERGY ACT 1946 Siclrity Information

SECRETSocurity Inlwmtiot
TABiL 4 .7
Reduced Time-of-Arrival of Shock in Free Air - TUMBLER 3(For 1 KT(RC) at Sea Level)
Reduced Reduced ReducedDistance Reduced Distance Reduced Distance Reduced
From Burst Time From Burst Time From Burst Time(F) (sec) (F) (Sec) (t) (Sa)
57.207 o.0008294 296.728 0.0476166 434.770 o0.1O81647100.733 o.oo35816 307.174 o.o503688 446.708 0o.136690124.859 0.0063338 315.382 0.0531210 457.652 0.11917334142.768 0.0090860 322°098 0.0558732 467.850 0.1246778162.417 0.0118382 329.314 0.0586253 479.540 0.1301822
176.345 0.0145904 335.031 0.0613775 489.240 0.1356865190.274 0.0173426 34.2o44 0.0641297 496.951 0.1411909203,208 0.0200947 345.726 0.0668819 507.148 0.1466953214.649 0.0228469 353.188 0,0696841 518.590 0.1521996225.095 0.0255991 359.406 0.0723863 524.808 0.1577040
2364795 0.0283513 363.137 0.0751385 536.2149 0.1632084245.491 0.0311035 370.101 0.0778906 544.954 0.1687128255.440 0.0338557 377.563 0.0806428 555.152 0.1742171264.394 0.0366079 389.253 0.08611472 564.603 0.1797215272.353 0.0393600 402.187 0.0916516 574.552 0.1852259
281.058 0,0421122 4113,379 0,0971559 582,512 0,1907302291.007 1. 0.448644 426.562 0.1026603 11 1
233
SECRET RESTRICTED DATASecurity Information ATOMIC ENEJ•GY ACT 1946

SECRETSecurity Information
TABLE ..8
Reduced Time-of-Arrival of Shock in Free Air - TUMBLER 4(For 1 KP(RC) at Sea Level)
Reduced Reduced ReducedDistance Reduced Distance Reduced Dstance Reduced
From Burst Time From Burst Time From Burst Time(Ft) ( )(Ft) (Sec)(Ft)
71.951 0.0015397 371.576 0.0766549 540.005 0.1620131113.763 0.0049540 379.702 0.0800692 552.563 0.1688418139.027 0.0083684 386.499 0.0834836 561.428 0.1756704162.223 0.0117827 394.772 0.0868979 573.838 0.1824991180.543 0.0151970 402.159 0.0903122 585.805 0.1893277
196.352 0.0186113 409.990 0.0937266 598.364 0.1961564211.570 0.0220257 416.638 0.0971409 608.706 0.2029851224.571 0.0254400 423.139 0.1005552 615.634 0.2076986238.3131 0.0288543 429.344 O. 1039415 620.525 0.2098137250.426 0.0322687 436.584 0.1073839 626.112 0.2144256
261.359 0.0356830 442.346 0.1107982 630.867 0.2166424273.031 0.0390973 449.142 0.1142125 638.582 0.2211526283.225 0.0425116 456.973 0,1176269 646.891 0.2278796292.977 0.0459260 464.655 0.1210412 657.178 o.2346066300.659 0.0493403 470.565 0.1244555 667.663 0.2413335
310.263 0.0527546 476.0b75 0.1278698 679.730 0.2480605319.866 0.0661689 483.271 0.1312842 691.006 O.2547875329.,469 0.0595833 489.624 0.1346985 702.282 0.2615145338.293 0.0629976 501.591 0.1415271 712.371 0.2682380347.199 o.0664119 516.366 0.1483558 725.032 0.2749684
356.063 0.0698263 526.708 0.1551845 735.126 0.2850589363.451 0.0732406 11
234
RESTRICTED DATA SECRETA I uf , ENERGY AC•T 1940 Security Information

d
SECRETS•curity Infomitli
TABLE 4.9* TABLE 4.1o**Reduced Time-of-Arrival of Reduced Time-of-Arrival of
Shock in Free Air Shock in Free Air
GRMMMOUSE (DOG) ami~ot (EASY)
Reduced Reduced Reduced ReducedDistance Time Distance Time
From Burst (se) From Burst (sec)(Ft) (Ft)
14.60 0.0 79.585 0.00176531.75 0. 0001437 164.244 O p.01206241.61 0.0002915 229.561 0.02493445.62 0.0004358 271.414 0.03780552.56 0.0005778 315.805 0.050677
67.52 0.0012776 340.536 0.06354891.97 0.0019738 371.780 0.076 419
106.57 0.0032188 405.852 0.089291116.79 o.oo45926 4.35.659 0.099588128.10 0.0059579 462.926 0.112459140.15 0.0073147 507.317 0.1304 79151.10 0.0086617 530.780 0.-1433513157.67 0.0100009 556.145 o.156222175.92 0. 0126520 569. -464 0.166519
* Taken from Table 3.1, Ref. (2) and reduced to 1 KTRc.*a. "I " " 3#5 " " "f " " 1
235SECRET RESTRICTED DATA
Security Information ATOMIC ENERGY ACT 194,

SECRETSocurity information
TABLE 4. 11
Reduced Free-air Overpressure vs Distance, TUMBLER 1
Distance Reduced Distance Reduced Pressure Reducedto Sea Level to Sea Level and to Sea Level
(ft) 1 lKr(RC) (psi)(•t)
191 188 397.3287 283 120.8383 377 56.2479 471 32.9574 565 21..670 659 15.1766 754 12.3861 848 10.8957 942 9.6
1053 1036 8.4
TABLE )I.12
Reduced Free-air Overpressure vs Distance, TUMBLER 2
Distance Reduced Distance Reduced r Pressure Reducedto Sea Level to Sea Level anrd to Sea Level
(ft) 1 KT(RC) (pyi)_____ ____ ____(f~t)
376 35? 56.1423 4044.2".470 449 35.3517 493 28.8564 538 23.5611 583 19.6658 678 16.975 718 13.1
807 10o5940 897 8.71034 987 7.31128 3.076 6.5
236RESTRICTED DATAA,-*-DA- TA--Y ACT W4 SECRET
Socurity Information
.9
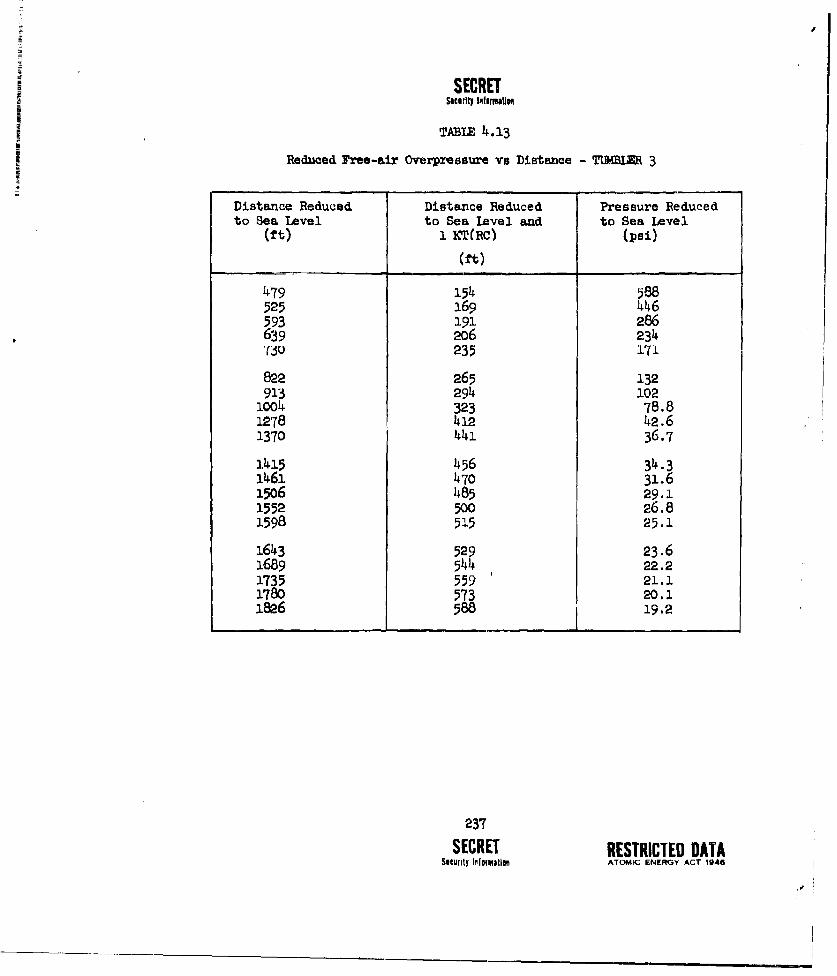
oo SECRETS~ Security I~, omtion
E TABLE 4.13
Reduced Free-air Overpiessure vs Distance - 3 3
Distance Reduced Distance Reduced Pressure Reducedto Sea Level to Sea Level and to Sea Level
(ft) i KT(RC) (psi)
(:'t)
479 154 588525 169 446593 191 286639 206 234• (F 235 171
822 265 132913 294 102
ioo4 323 78.81278 412 42.61370 441 36.7
1415 456 34.31461 470 31.615o6 485 29.11552 500 26.81598 515 25.1
1643 529 23.61689 544 22.21735 559 21.11780 573 20.11826 588 19.2
23'T
SECRET RESTRICTED DATASecurity Ilofmiatin ATOMIC ENERGY ACT 1946

SECRETSacurity Infotmatioo
TAi 4a
Reduced P1ee-air Overpressure vs Distance - TUMBLaR 4
Distance Reduced Distance Reduced Pressure Reducedto Sea level to Sea Level and to Sea Level
(ft) 1 XC(RC) (Pei)(rt)
376 14o 7871423 157 530
471 175 383518 192 294565 209 236
612 227 190659 24 155706 262 124753 279 1o4800 297 89.7
847 314 79.4910 349 60.9988 366 54.1
1035 384 48.6io82 4ol 44.o
1129 4119 4o0.01176 436 36.81223 454 34.11270 471 31.81317 489 29.6
1412 5214 25.915o6 558 22.816oo 593 20.51694 628 18.81788 663 17.6
238
RESTRICTED DATA SECRETATOMIC ENERGY ACT 1946 Scutily Information

SECRETSecurity lifffflua
TABiZ 14.15
CouWoite Yree-Air Peak Overpressure and Distance Reduced to
1 m(mc) at sea Level
Reduced Distance Overpressure(it) (psi)
150 632.5
200 256.2
300 88.0
400 44.6
500 27.4
600 19.3
700 14.3
800 11.1
900 8.9
1000 7.4
1100 6.6
239
SECRET RESTRICTED DATAS4curily Informtion ATOMIC ENERGY ACT IAe
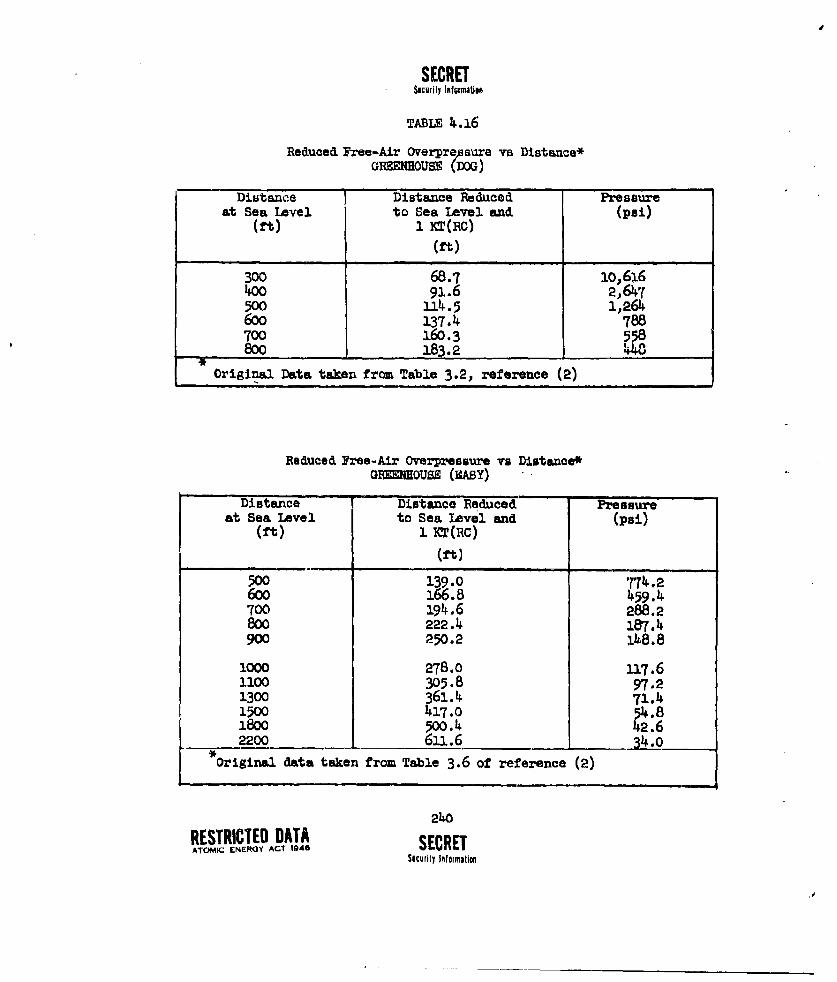
SECRETsocurity Informariot
Reduced Free-Air Overpre Yure vs Distance*G(mMOUSE rM0G)
Distance Distance Reduced Pressureat Sea Level to Sea Level and (psi)(ft) 1 la (Cc)
(ft)
300 68.7 .o,616400 91.6 2,647500 114.5 1,264600 137.4 788700 16o.3 558800 183.2 448
Original Data taken from Table 3.2, reference (2)
Reduced Free-Air Overpreusure vs Distance*GMMOUSE (FMAY)
Distance Distance Reduced - Pressureat Sea Level to Sea Level and (psi)
(ft) 1 W(Rc)
500 139.0 774.2600 166.8 459.4700 194.6 288.2800 222.4 187.4900 250.2 14,8.8
1000 278.0 317.61100 305.8 97.21300 361.4 71.41500 417.o01800 500.4 ý.2200 611.6 34.o
Original data taken from Table 3.6 of reference (2)
240
RESTRICTED DATA SECRETSecurity Information

SECRETSecurity InfofmitiM
TABLE 4.17
Free-Air Pressure-Time, Reduced to 1 KI(RC) at Sea Level
TUMBLER 1 and. 4
TUMBLER 1* TUMBLER 4**
P(pBei) T(Sec) P(psi) T(Sec)
23.9# 0.0000 24.4# 0.0000
10.5 0.0357 22.1 0.0034
'"2 0.0556 14.5 0.0244
3.2 0.0755 9.2 0.0454
0.9 0.0954 7.4 0.0580
# Taken from shock velocity data; arrival time taken as zero time.REDUCTION FACTORS: * Distance: 0.9417, Time: 0.931, Pressure: 1.140
* Distance: 0.3491, Time: 0.346, Pressure: 1.199
241
SECRET RESTRICTED DATASecurity Informition ATOMIC ENERGY ACT 1I46

SECRETSecurity Information
TABLE 4.18*
Values of Decay Parameter, e, Reduced to 1 KI(RC) at Sea Level
Pentolite Composite P-D P-t CurveCurve from Curve, Shock Particle P-D Curve
Fig. 4.14,Ref.(24) Velocity Displacement Shock Velocity
Zone 1 TULER 1 TUMBLER 1
R 0 R O R 9 R 0
91.0 1.64 200 3.69 541.4 41.67 541.4 36.50
182.0 4.91 300 11.82 555.1 43.13 555.1 39.10
273.0 10.56 400 23.45 649.7 49.23 649.7 60.05
364.0 18.66 500 39.37
455.0 31.4o
546.0 45.50 Zone 2 TUKBLER 4 TUMBLER 4
637.0 51.42 600 60.35 471.4 33.31 471.4 33.52
728.0 63.24 700 64.73 493.2 37.49 493.2 38.20
819.0 74.62 800 71.44 541.4 48.50 541.4 49.10
910.0 85.50 900 80.uj
1092.0 105.56
* All values reduced to 1 KeT(Rc) at sea levelR in (?b), e in (msec)
2142
RESTRICTED DATA SECRETATOMIC ENERGY ACT 1946 SCESecurity Information

SECRETSocurity Information
TABIZ 5.1
Distances at which Pressures OccurReduced to 1 KI(RC) at Sea Level
pressure 1 2_3LIL..angie "Si(psi) Height of Burst in 0
Feet for 1 T'(RC) (a)
747 995 1102 363
3 3,100 3,460 2,310 2,1504 2,530 2,800 1,960 1,8105 2,220 2,430 1,690 1,5806 2,000 2,160 1,500 1,4208 1,680 1,150 1,240 1,21010 1,410 850 1,060 1,08012 1,180 630 720 98515 710 220 620 8852U 44O --- 555 77525 280 505 7o530 180 4. 465 6504o 0-- 405 58050 ... 350 535
(a) Derived from Figure 3.3 of reference 12
TABLE 5.2
Optimum Height of Burst for 1 KT(RC) at Sea Level
]•eslz. Hop 80 7 Ho," 80 a
Presur OP +Um '7 4 _I 1. o4(psi) (t) (Ft)
3 1,1254 813 1,0665 780 1,0106 746 9638 678 878
10 622 80712 576 74615 518 67020 --- 575
Hop a From equation for Pentollte given inreference 15.
E*p = Empirical based on Figur-e 5.1
243
SECRET RESTRICTED DATASoculity Information ATOMIC ENERGY ACT I946

SECRE[Security Information
TABLE 5.3
Data for Figure 5.2
Heighte* Pressures vs Distances in Reduced FeetFt JH Ft 4 psi 6 Pei 10 psi 15 psi
/3.-- H -r I/ Lb Pent. 1 KT(RC) 1 Lb Pent. I KT(RC) I Lb Pent. 1 KT(RC) 1 Lb Pent. I KT(RC)
Ls (KTJ CX) )X 91 (X) x1 91 (X) X91 -) -x9
0.0 0 14.8 1,347 11.5 1,047 8.8 801 7.2 655
2.27 207 18.7 1,702 14.5 1,320 11.0 1,001 9.0 819
3.29 299 18.8 1,711 15.8 1,438 11.8 1,0Th 9. 4 855
4.44 40h 20.2 1,838 16.1 1i465 11.5 1,047 9.0 819
5.9? 543 22.5 2,048 17.3 1,620 12.2 1,110 10.2 928
7.40 673 23.8 2,166 18.2 1,656 12.6 1,147 7.5 683
9.20 837 26.0 2,366 17.2 1,565 10.2 928 4.7 428
9.88 899 26.0 2,366 17.2 1,565 9.2 837 0.0 0
11.80 1,00h 214.0 2,1811 15.5 1,1111 5.5 501 ---..
l4.50 1,320 22.5 2,0h48 12.5 1,137 0.0 0 ......
19.00 1,729 ... ... 0.0 0 .... ... ... ...
19.93 1,814 15.5 1,411 ... ... .... ... ... ...
25.0 2,275 0.0 0 ... ... ....
* All gages were at a height 0.18 (Ft/LbsI/3) or 16.4 (Ft/KTI/3).
N(Yrro Curves are from Figure 19 and Table II of Navord 2451 (Reference 15).
Points are from Tables I,(a), v(b),
IX(°), and X1i(d) of Annex I (SRI) of the Tumbler Preliminary
Report (Refecence 13) as corrected below to I KT(Rc) at Sea Level
TUMBLER
Preson 1 2 3 4(psi)
Reduced Gage Height
9.0(a) 9 . 0 (b) .14.7(Oc) 1 7 .4 (d)
h 2,370 2,410 2,530 1,850
6 i,i6u 1,470 1,60D 1,70O
10 1,11h0 815 655 810
15 565 ...... 595
244RESTRICTED DATAATOMIC ENERGY ACT 1946 SECRET
Security Information

SECRETSecurity Informtion
TABLE 5.4
Arrival Time of Precursor and Reflected Shook, TUMBLER 4
Reflected Reflected Precursor Precursor AbsoluteShock Shock (East) (West) Time
(East) (West)
(Ft) (Ft) (Ft) (Ft) (sec)
269.4 240.9 .2512329.1 324.0 -- .2610394.o 4014.6 532.1 506,5 .2709469.0o 455.8 614.4 577.3 .2808475.8 473.7 662.1 666.0 .2906520.5 538.5 675.8 726.5 .3005588.4 572.6 758.5 741.9 .3104655.7 652.8 840.8 840.4 .3301721.4 763.6 859.5 924.8 .3498823.7 819.9 1041,,2 1010.5 .3696865.9 891.9 1099.2 1078.7 .3893937.6 925.6 1171.6 1161.9 .14090965.7 976.8 1246.2 1191.3 .14288
1016.9 1030.5 1297.0 1285.5 .44851061.6 1055.2 1368.2 1317.9 .46821129.8 1126.9 1383.1 1364.3 .148801137.9 1159.3 1437.7 1409.1 .5077I184.4 1228.3 11485.8 1457.3 .52741221.1 1257.8 1513.1 15o8.14 .54721275.2 1294.9 1601.0 1558.3 .56691313.6 1317.9 1616.3 1608.6 .58671347.7 1355.4 167,49 1616.7 .60641398.0 14o44.5 1694.8 1649.2 .62611428.7 1467.1 172P,1 1707.6 .64591452.2 1423.6 1764,3 1738.7 .6656
TABLE 5.5
Overlap of Ground Level adn Free-air Measurame.ts
Region of Overa-'piTUMBLER slant lange Ground RangeShot No. (Ct) (ft)
1 811-1,200 171-9012 1,119-1,150 1146-2873 None None4 1,065-1,040 230-937
2145
SECRET RESTRICTED DATASocurity Information ATOMIC ENERGY ACT 1I46

SECRETSocufity IWlorrintio.1
TABLE 5.6
TUMBLER 1 - Calculated vs Experimental Valuer of ReflectedPressure in the Regular Region
Range (Ft) P3 (psi) Pf(Psi)Rocket a
Slant Ground Trails Measured Calculated
811 171 10.1 12010, 27,65 26.5832 250 9.7 17030' 23.5 25.0868 353 8.9 24 0 O' 20.22 22.2912 450 7.8 29034, 1810 18.5
"987 588 7.0 360331 15.85 16.21,058 700 6.2 410 26 ' 13.8 15.01,149 832 5.4 460 22' 12.0 13.8
TABLE 5.7
TUMBLER 2 - Calculated vs Experimental Values of ReflectedPressure in the Regular Region
Range (Ft) ]P@(P~si) T- Pf(si~
Slant Ground Trails Measured Calculated
1,118.6 145.6 6.0 70321 14.06 14.41,123 175.0 5.9 8058' 13.3 14.21,127 200.0 5.8 100131 12.9 13.81,132 225.0 5.8 110281 12.5 13.81,139 259.6 5.8 13010' 12.06 13.81,143 275.0 5.7 13056, 11.9 13.5
TABLE .5.8
q!UMBLKR 4 - Calculated vs Experimental Values of ReflectedPressure in the Regular Region
Range (Ft) P (psi) Pf(psi)- IRocket a
Slant Ground Trails Measured Calculated
1,065.2 23o.4 43.5 120301 14o0.2 1721,073.h 265.5 42.8 140201 116.9 1641,097 350 4l B136' 98.8 155.51,11) 400 39.8 210 2' 93 ]1.81,154 500 36.8 25`40' 87.0 1311,204.6 607.6 32.9 300181 82.4 111.51,20)4.6 607.6 32.9 300131 82.7 111.51,)425.0 974.2 24.3 430 8' 43.6 -----
RESTRICTED DATA 246
ATOMIC ENERY At- 1.94 SECRETSecurity Inlormition

SECRETSocurity Information
TABLE 5.9
FE p0 ( 14 ) for 1UBE where p. m 12.89ps
P 8 (Pai) P (psi)
0.05 244.9 0.50 12.890.10 116.0 0.60 8.600.20 51.56 0.70 5.530.30 30.07 0.80 3.220.40 19.33 0.90 1.13
TABLE 5.10
Ps P" "1 for TUMBLER 2 where po m 12.21 psi
P a(psi), P.(pai)
0.05 231.99 0.50 12.210.10 109.89 0.60 8.140.20 48.8I4 o.7 5.240.30 28.145 0.80 3.050.bO 18.32 0.90 1.36
TABLE 5.11
Ps " Po 1) " for TUMBLER 4 where po - 12.2 6 psi
C Pa(psi) P8(pai)
0.q5 232.9 0.50 12.260.10 110.3 0.60 8.180.20 49.0 0.70 5.260.30 28.6 0.80 3.070.140 18.39 0.90 1. 36
247
SECRET RESTRICTED DATASeclrity Inornmatfor ATOMIC ENERGY ACT 194a

SECRETSecurity 10f0(matien
TAB.Z 5.32
Pf- I for TLMBIER 1 here p.0 =289 psi
-P l o - a = ?hoof I -' ?9'3, 1 d 36o331 a = 410 261 a - 460?2,S(PSI) i t t' p r(p ) ' P api.) V' .•r u, s ')! V' r(paL) C , 1pr(p -i) t ' pfP sll) C pr( p:i)
19.33 0.12.22 58.65 2.19 $7.62 2.16 56.72 2.15 56.33 2.16 56.72 ..... ... ...... ...12.89 0.5 1.87 35.17 1.85 34.80 1.84 34.55 1.82 34.03 1.8h 34.55 1.95 37.38 ---- ---8.60 0.6 1.60 21.53 1.60 21.53 1.59 21.27 1.59 21.27 1.59 21.27 1.64 22.30 ----....5.53 0.7 1.40 12-89 1.40 12.89 1.39 12,76 1.38 12.50 1.40 12.89 1.b2 13*28 1. 48 1h. 313.22 0.8 1.2h 7.09 1.24 7.09 1.24 7.09 1.23 6.96 1.2h 7.09 1.25 7.22 1.27 7.61
l.113 0.9 1.12 3.15 1.12 3.15 1.12 3.15 1.11 3.00 1.14h 3.00 1.11 3.00 1.12 3.15
TABLE 5.13
Pf- (0 -P 1) for TUMBLER 2 where p. - 12.21 psi
a -a 70320* a- 130109*l
12.21 0.5 1.87 33.46 1.86 33.218.14 o.6 1.61 20.51 1.61 20.515.24 0.7 1.10 12.21 1.10 12.213.05 o .8 1.241 6.72 1.241 6.72
* and P£ under these oonditions are the saw, for a - 70321, 80581, I00131, 11028,e pf Of If " " a "130101, 13056,
TABLE 5.14~
-f p0 (. ) for TVMBLEH 4 whiere p0 31 2.26 psi
P, -1o'0 mW do 18036, a . n21e d = 25010oI a0 3001(31 a- 14(psi) t' lp vti•) V' PfI•ai)• C, Pf•-)l ;, Pr(PNI) C, lf(PA)! C, -Pf(P-vi- F •kl)
110.) 0.1 1.81 577 1.77 572.5 ----.---- .61 552.9 ----.---- 1.311 I .... ...19.0 0.2 3.118 201 3.36 193.7 3. 41 196.8 3.37 19h.3 3.30 190.0 3.22 185.1 .... ...28.6 0.3 2.71 98.1 2.70 98.1 2.67 91.85 2.65 96.00 2.61 94h,1 2.57 92.8 -..18.390.11 2.2b 56.6 2.20 55.2 ----.--- 2.17 54.56 ---- l---- 2.1 53.)12.26 0.5 1.87 3).6 1.86 33.3 ----.---- 1.81 32.86 ----.--- 1.83 32.68.18 0.6 1.60 20.47 1.60 20.07 ---. ---- 1.60 20.47 ----.--- 1.58 19.98 1.68 22.075.26 0.7 ----.---- .....-.-.----- ----- --------- .... .... .----- --- 1.4h 13.003.07 0.8 ----.-------- .....----- ---------.----.... ..----- --- 1.26 7.11
11.3510.9--------------------------------- ----- ------ ----- --. .. 1.11 2.82
248
RESTRICTED DATA SECRETATOMIC ENERGY ACT 1946 Security Inlormalion

SECRETsocurlty Inflrmitio
Hi - _zt Y- 1 ý H \fl 1ý O ra i CC) (y) cnj (j
ii +Lf\ co en CaV'u ra a1 a, a- m ena t
+' 41 arl 1- an a a*, in aI an a rrU \,arr (y) anI I Ijd 43 0 41f yc c -. \ U- D t-
H~r Ocs~' (Y) MfkX a:4 SI\ cI
4)
0 m _q5 out a-0 Lr\ -\\D o mr 4 r
AV M
4) c~j
P4 L
4,r
~ H H
2149
SECRET RESTRICTED DATASocuriiay fnformation ATOMIaC ENERGY ACT i94

SECRETSlcufity Information
TABLE 5.16
Comparison of TUMBLER Data with TT in Free Air
Over- KT x I00- Blast Efficiency
Pressure KT (TNT) X 100
(psi) T1i T2 T3 T4 Ti T2 T3 T4 Avg.
200 .526 - 12.0 8.12 50.1 - 40.0 41.4 43.8
150 .493 - 12.5 7.76 46.9 - 41.7 39.6 42.7
100 .473 - 1.2.8 7.•41 45.0 - 42.7 37,8 41.8
80 .460 - 12.6 7.41 43.8 - 42.0 37.8 41.2
70 .455 - 12.3 7.53 43.3 - 41.0 38.4 40.9
60 .465 - 12.6 7.76 44.3 - 42.0 39.6 42.0
50 .469 .469 13.0 8.00 44.6 4o.8 43.3 40.8 42.4
40 .464 .495 12.6 8.12 44.2 43.1 142.o 41.4 142.7
30 .476 .508 12.6 9.o0 45.3 44.2 42.o 45.9 44.3
20 .467 .504 12.5 9.73 44.4 43.8 41.7 49.6 44.9
15 .478 .520 - - 45.5 45.2 - - 45.3
10 .612 .543 - 58.3 47.2 - 52.7
8 - .584 - - 50.8 - - 50.8
7 - .601 - - - 52.2 - - 52.2
Avg. ,486 ,525 12.55 8.08 46.3 45.9 41.8 41.2 44.9
250
RESTRICTED DATA SECRETATOMIC ENERGY ACT 1941 Security Information
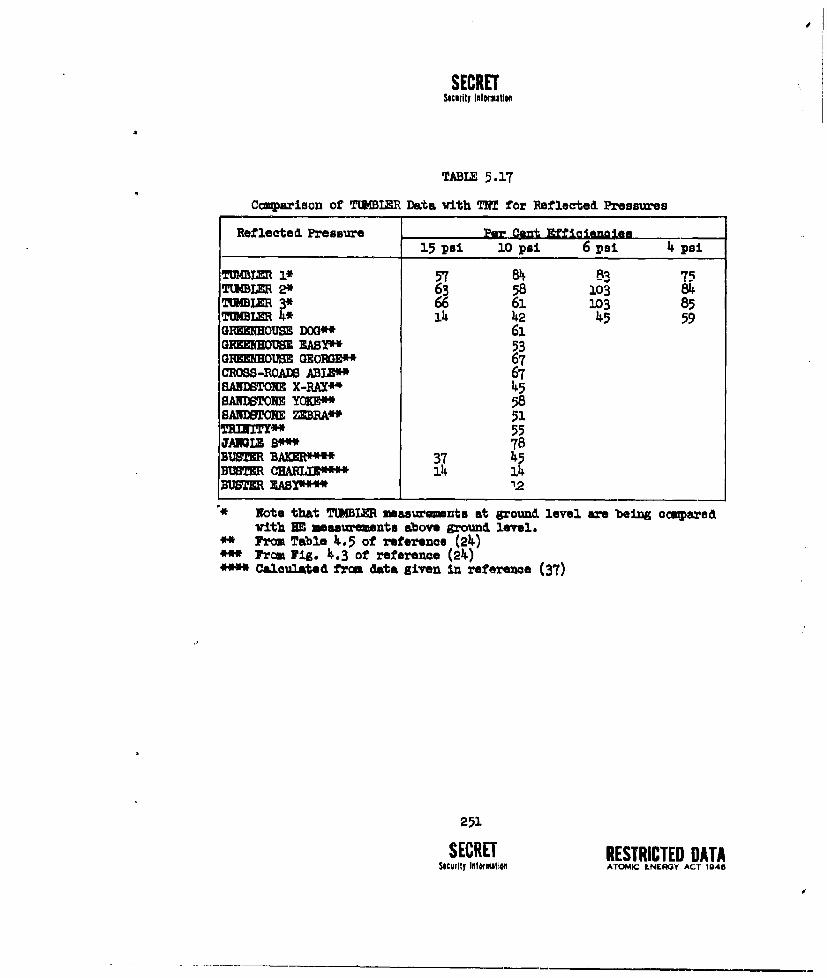
SECRETsocidty InfutUtIR
TABLE 5.17
Comparison of Tt•MBIR Data with TNT for Reflected Pressures
Reflected Pressure Per nt Eiciftnee15 psi l0 psi 6 psi I psi
TWMLER 1* 57 84 83 75TULMN R 2* 6 58 103 84
MIBLER 3* 61 103 85TMIBLER 4* 14 42 4 59GRHMHOUSE DOG** 610 lOOUSE 3ASY** 53GHMOMUSE GEORaE* 67CR06S-ROADS AB•"LU 67SANDSTONE X-RAY* 45SANDSTONE YOKE" 58SAND9TONE ZMRA* 51T1PJ3TrY** 55JAWLE S*m 78BUS= BAKR**** 37 45B CHAR1JLE*4I* 14 1BUSTER EASX**** '2
* Note that TtMBLER measurements at ground level are being ocaparedwith IM measurements above ground level.
*'Frro Table 4.5 of reference (24)SFrr Fig. 1.3 of reference (21)S1Calculated from data given in reference (37)
251
SECRET RESTRICTED DATAsoculity Infafmati0 ATOMIC LNERGY ACT 1946

SECRETSecurity loformation ;
TABLE 5.18
Comparison of Free-Air Positive Impulse Data for Scaled Nwule&--T andTNT Charges
TUMBLER I Reduced to Experimental Cuz-e forTUMBLER 1 1 iKD(HC) at Sea. l~v'e* TN Sealed. to 1 K(RC)
_________________ at Sea Level( f- QL0)R I RI R
(ft) (psi-mnec) (ft) (ps±-msec) (ft) (psL-Ssec)
590.0 797.3 555.8 846.7 555.8 M.8
690.0 644.8 650.0 684.8 65o.o T'13.5
See Table 1.1 for scaling factors.
TABLE 6.1
Sunnary of Free-air TNT Equivalents for TtMBLE11
Per CentShot lr(Rc) KC(Tyr) Efficiency AQ
T 1 1.05 0.49 46 200.X0 psi
T 2 1.15 0.53 46 50.- psi
T 3 30.0 12.6 42 200.0 jpsi
T 4 19.6 8.08 k3. 200.E0 psi
252
RESTRICTED DATA SECRETATOMIC ENERGiY A(-l I. 6 scullty Information
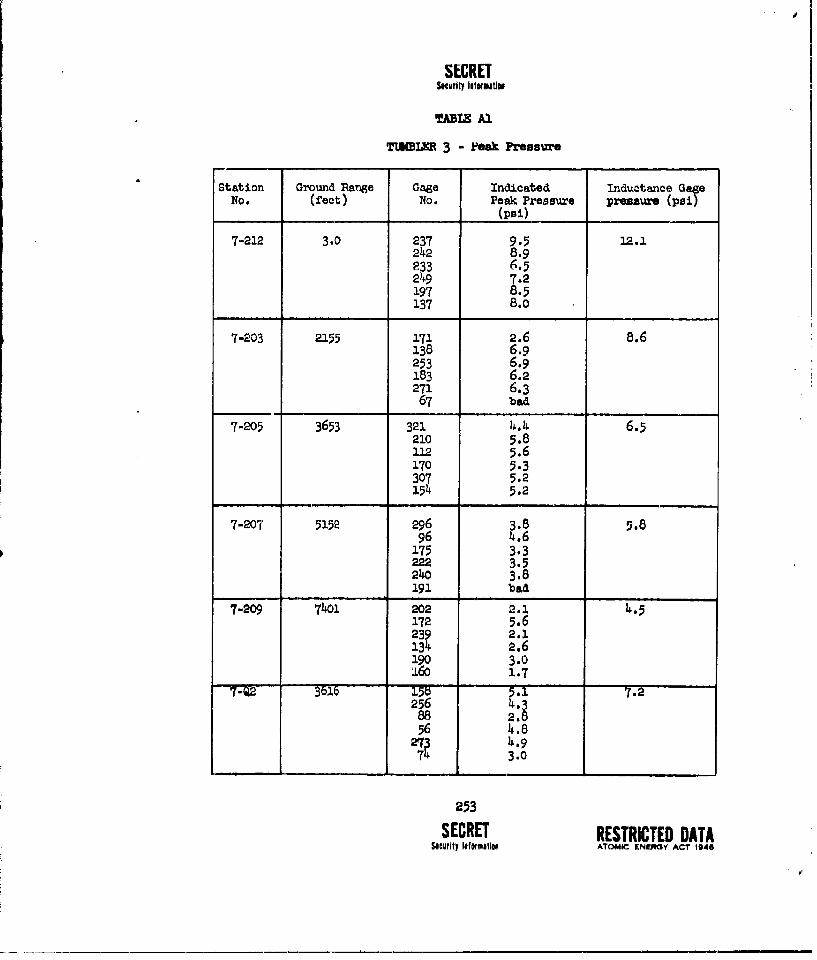
1 14
SECRETScmr•fl~ytntartim
TMLE(XR 3 -Peak Preesure
Station Ground Range Gage Indicated Inductance Ga0eNo. (feet) No. Peak Pressure premaure (psi)
(psi)
7-212 3.0 237 9.5 12.1242 8.9233 6.5249 7.2197 8.5137 8.0
7-203 2155 171 2.6 8.6138 6.9253 6.9183 6.2271 6.367 bad
7-205 3653 321 4•.4 6.5210 5.8112 5.6170 5.3307 5.2154 5.2
7-207' 5152 296 3.8 5.896 4.6
175 3.3222 3.5240 3.8
_______191 bad
7-209 7401 202 2.145172 5.623 2.1
13ý 2.6190 3.0±60 1.7
7 "- ?. 3616215613•• 7.2
275288 2.056 4.827? 4.9
3.0
253
SECRET RESTRICTED DATAsculnty Inftrmtll ATOMIC ENERGY ACT 1948

SECRETSecurtt Inf~ty ion
TABLE A2
TMI~EIR I4 - Peak Prssr
Station Grd Gage Damping Orifice Indicated Inductance GageNo. Range No. OilVis. Plate Peak Pressure PTessure (psi)
(ft) (Cent.) Dia.(in.) (psi)
7-212 266 185 1,000,000 None 104 117 (8 nsec duration)138 " 113137 it 121 125 (1 msec duration)a222 • 3/ 9996 3/B 96
249 "3/8 10261 100,000 None 104
154 .. 136253 .. 116172 " 3/8 103321 It3/8 102190 3/8 106
7-213 974 158 1,000,000 None 39.5233 It37 j (8 m=ea duration)256W .. 2.5 49 (1 maec dur4ution)
•6 -3/8 42.5112 3/0 36P73 "/8 3
M• i,0•000 None197 i 44210 " 46237 "3/.038307 " 3/8 52170 it 3/8 39
7-207 5oBB 296 1,000,000 None L.I 4.o202 " 1.7183 1.5"22 "3/0 3.213h& " 3/8 2.3210 it 3/0 0.5,271 0P None 1.5175 " 1.9239 I1 o.21)171 , -3113 1.o191 j 3/8 1.5zLQo--2 1___.o
254RESTRICTED DATA SECRETAT OMIC. ENE'RG Y, ACT 1946
Secur)ty InIfomation

DISTRIBUTION
Copy No.
ARM! ACTIVITIES
Asst. Chief of Staff, G-2, D/A, Washington 25, D. C. 1Asst. Chief of Staff, G-3, D/A, Washington 25, D. C.
ATTN: Dep. Asst. CofS, G-3, (IR&SW) 2Asst. Chief of Staff, G-4, D/A, Washington 25, D. C. 3Chief of Ordnance, D/A, Washington 25, D. C.
ATTN: ORDT=-AR4Chief Signal Officer, D/A, P&O Division, Washington 25,
D. C. ATTN: SIGOP 5- 7The Surgeon General, D/A, Washington 25, D. C.
ATTN: Chairman, Medical R&D Board 8Chief Chemical Officer, D/A, Washington 25, D. C. 9- 10Chief of Engineers, D/A, Military Construction Division,
Protective Construction Branch, Washington 25, D. C.ATTN: ENGEB U1
Chief of Engineers, D/A, Civil Works Division, Washington25, D. C. ATTN: Engineering Division, StructuralBranch 12
The Quartermaster General, CBR, Liaison Office, Researchand Development Division, D/A, Washington 25, 3). C. 13
Office, Chief of Transportation, D/A, Washington 25, D. C.ATTN: Military Planning and Intelligence 14
Chief, Army Field Forces Ft. Monroe, Va. 15- 17Army Field Forces Board ¶i, Ft. Bragg, N. C. 18Army Field Forces Board #2, Ft. Knox, Ky. 19Army Field Forces Board 4, Ft. Bliss, Tex. 20Commanding General, First Army, Governor's Island, Nov
York 4j N. T. ATTN: G-4, ACofS 21- 23Commanding General, Second Army, Ft. George 0. Meade, Md.
ATTN: AIABB 24Commanding General, Second Army, Ft. George 0. Meade, Md.
ATTN: AIAJ'0 25Cmmanding General, Second Army, Ft. George G. Meade, Md.
ATTN: AIACM 26Comwanding General, Third Army, Ft. McPherson, Ga.
ATTN: ACofS, G-3 27- 28Commanding General, Fourth Army, Ft. Sam Houston, Tea.
ATT'N: G-3 Section 29- 30Commanding General, Fifth Army, 1660 Hyde Park Blvd.,
Chicago 15, Ill. ATTN: ALIEN 31Commanding General, Fifth Army, 1660 Hyde Park Blvd.,
Chicago 15, Ill. ATTN: ALFOR 32Ccemandbig General, Fifth Army, 1660 Hyde Park Blvd.,
Chicago 15, Ill. ATTN: ALM-O 33- 36
255
SECRET RESTRICTED DATAS"Ity Infrmilef ATOMIC ENERGY ACT 1946

SECRETSeirty hItfomtlom
DISTRIBUTION (Continued) Copy No.
Commanding General, Sixth Army, Presidio of San Francisco,Calif. ATTN: AIGCT-4 J7
Commander-in-Chief, European Command, APO 403, c/o EM,New York, N. Y. 38
Commander-in-Chief, U. S. Army Europe, APO 403, 0/o FM,
New York, N. Y. AT'TN: OPOT Division, Com. De-v. Branch 39- 40Commander-in-Chief, Far East Command, APO 500, c/o 44,
San Francisco, Calif. ATTN: ACofS, G-3 41- 45Commanding General, U. S. Army Alaska, APO 942, c/o PM,
Seattle, Wash. 46Commanding General, U. S. Army Caribbean, APO 831, c/o
PM, New Orleans, La. ATTN: CG, UBARCARIB 47Commanding General, U. S. Army Caribbean, APO 83., C/o
PM, New Orleans, La. ATTN: CG, USARFANT 48Commanding General, U. S. Army Caribbean, APO 83ý., c/o
PM, New Orleans, La. A7.TN: Cml. Off., UBARCARIB 49Commanding General, U. S. Army Caribbean, APO 83ý, c/o
PM, New Orleans, La. ATTN: Surgeon, USARCAPJUB 50Commanding General, USAR Ptiulflu, APO 958, c/o H4, Can
Francisco, Calif. ATTN: Cml. Off. 51- 52Commanding General, Trieste U. S. Troops, APO 20?, c/o PM,
New York, N. Y. ATTN: ACofS, G-3 53Commandant, Command and General. Staff College, Ft. Leaven-
worth, Kan. ATTN: ALLIS(AS) 54- 55Commandant, The Infantry School, Ft. Benning, Ga.
ATTN: C.D.S. 56- 57Comumdant, The Artillery School, Ft. Sill, Okla. 58Commandant, The AA&GM Branch, The Artillery School,
Ft. Bliss, Tex. 59Commandant, The Armored School, Ft. Knox, Ky. A?=I•: Clas-
sified Document Section, Evaluation and Ron. IDivision 60- 61Commanding General, Medical Field Service School. Brooke
Army Medical Center, Ft. Bam Houston, Tex. 62Commandant, Army Medical Service School, Walter Reed Army
Medical Center, Washington 25, D. C. ATTN: Dept. ofBiophysics 63
The Superintendent, United States Military Acadenry, WestPoint, N. Y. ATTN: Professor of Ordnance 64- 65
Commanding General, The Transportation Corps Center and Ft.Eustis, Ft. Runtis, Va. ATTN: Aust. Ccumandant)Military Sciences and Tactics 66
Commandant, Chemical Corps School, Chemical Corps TrainingCommand, Ft. McClellan. Ala. 67
Commanding General, Research and Engineering Cxmeand, ArmyChemical Center, Md. ATTN: Special Projects OffIcer 68
RD Control Officer, Aberdeen Proving Ground, Md.ATTN: Director, Ballistics Research Laborator-y 69- 70
RESTRICTED DATA SECRETATOMIV ENERGY ACT 1946 SIerty I0fhMitA1i4

SECRETSKwrtty Iftlvoi,
DISTRIBUTION (Continued) Copy No.
Commanding General, The Engineer Centor, Ft. Belvoir, Va.ATTN: Asst. Commandant, The Engineer School 71- 73
Chief of Research and Development, D/A, Washington 25, D. C. 74Commanding Officer, Engineer Research and Development
Laboratory, Ft. Belvoir, Va. ATTN: Chief, TechnicalIntelligence Branch 75
Commanding Officer, Picatinny Arsenal, Dover, N. J.ATTN: ORUBB-TX 76
Commanding Officer, Army Medical Research Laboratory,Ft. Khox, Ky. 77
Commanding Officer, Chemical Corps Chemical and Radio-logical Laboratory, Army Chemical Center, Md.ATTN: Technical Library 78- 79
Comanmding Officer, Transportation R&D Station, Ft.Eustis, Va. 80
Commanding Officer, Psychological Warfare Center, Ft.Bragg, N. C. ATTN: Library 81
Asst. Chief, Military Plans Division, Rm 516, Bldg. 7,Army Map Services, 6500 Brooks Lane, Washing-on 25,D. C. ATTN: Operations Plans Branch 82
Director, Technical Documents Center, Evans Signal Labora-tory, Belmar, N. J. 83
Director, Waturways Experiment Station, PO Box 631, Vicks-burg, Miss. ATTN: Library 84
Director, Operations Research Office, Johns Hopkins Uni-versity, 6410 Connecticut Ave., Chevy Chase, Md.ATTN: Library 85
NAVY ACTITIES
Chief of Naval Operations, D/N, Washington 25, D. C.ATTN: OP-36 86- 87
Chief of Naval Operations, D/N, Washington 25, D. C.ATTN: OP-5i 88
Chief of Naval Operations, D/N, Washington 25, D. C.ATTN: OP-53 89
Chief of Naval Operations, D/N, Washington 25, D. C.ATTN: OP-374 (ORG) 90
Chief, Bureau of Medicine and Surgery, D/N, Washington25, D. C. ATTN- Special Weapons Defense Division 91- 92
Chief, Bureau of Ordnance, DIN, WarhingLwi 25, D. C. 93Chief, Bureau of Personnel, D/N, Washington 25, D. C.
ATTN: Pere 15 94Chief, Bureau of Personnel, D/N, Washington 25, D. C.
ATTN: Pars C 95Chief, Bureau of Ships, DIN, Washington 25, D. C.
ATTN: Code 348 96
27
SECRET RESTRICTED DATAh11ty INfImtlp ATOMIC ENERGY ACT 1946

SECRETerSH1ty InfomaUn
DISTRIBUTION (Continued) Copy No.
Chief, Bureau of Supplies and Accounts, D/N, Washingtor.25, D. C. 97
Chief, Buoreau of Yards and Docks, D/N, Washington 25,D. C. ATTN: P-312 98
Chief, Bureau of Aeronautics, D/N, Washington 25, D. C. 99-100Office of Naval Research, Code 219, Rm 1807, Bldg. T-3,
Washington 25, D. C. ATTN: RD Control Officer 101Commander-in-Chief, U. S. Atlantic Fleet, Fleet Post
Office, New York, N. Y. 102-103Comumnder-in-Chief, U. S. Pacific Fleet, Fleet Fost Office,
San Francisco, Calif. 104-105Commander, Operation Development Force, U. S. Atlantic
Fleet, U. S. Naval Base, Norfolk 11, Va. A11J: Tac-tical Development Group 106
Commander, Operation Development Force, U. S. AtlanticFleet, U. S. Naval Base, Norfolk 11, Va. ATTN: AirDepartment 107
Commandant, U. S. Marine Corps, Headquarters, UBM,Washington 25, D. C. ATTN: (A03H) 108-111
President, U. S. Naval War College, Newport, Rhode Island 112Superintendent, U. S. Naval Postgraduate School, Monterey,
Calif. 113Commanding Officer, U. S. Naval Schools Command, Naval Sta.,
tion, Treasure Island, San Francisco, Calif. 114-115Director, USMC Development Center, USMC Schools, Quan-
tico, Va. ATTN: Marine Corps Tactics Board 116Director, USMC Development Center, USWE Schools, Quan-
tico, Va. ATTN: Marine Corps Equipment Board 117Commanding Officer, Fleet Training Center, Naval Base,
Norfolk 11, Va. ATTN: Special Weapons School 118-119Commanding Officer, Fleet Training Center, (SPWP School),
Naval Station, Ban Diego 36, Calif. 120-121Communder, Air Force, U. S. Pacific Fleet, Naval Air Sta-
tion, San Diego, Calif. 122Commander, Training Command, U. S. Pacific Fleet, c/o Fleet
Sonar School, San Diego 47, Calif. 123Commanding Officer, Air Development Squadron 5, UJSN Air
Station, Moffett Field, Calif. 124Commanding Officer, Naval Damage Control Training Center,
U. S. Naval Base, Philadelphia 12, Pa. ATTN: ABCDefense Course 125
Conmuidbig Officer, Naval Unit, Chemical Corpa School,Ft. McClellan, Ala. 126
Joint Landing Force Board, Marine Barracks, Camp Lejeune,N.C. 127
258
RESTRICTED DATA SECRETATOMIC ENERGY ACT 19•6 S.cvrity Informallen

SECRETScurity Iift al m
DISTRIBUTION (Continued) Copy No.
Commander, U. S. Naval Ordnazce Laboratory, Silver Spring19, Md. ATTN: EE 128
Commander, U. S. Naval Ordnance Laboratory, Silver Spring19, Md. ATTN: Alias 129
Commander, U. S. Naval Ordnance Laborat ry1 , Silver Spring19, Md. ATTN: Aliex 130
Commander, U. S. Naval Ordnance Test Station, Inyokern,China Lake, Calif. 131
Officer-in-Charge, U. S. Naval Civil Engineering Researchand Evaluation Laboratory, Construction BattalionCenter, Port Hueneme, Calif. ATTN: Code 753 132-133
Commanding Officer, UBN Medical Research Institute, Nation-al Naval Medical Center, Bethesda 14, Md. 134
Director, U. S. Naval Research Lbboratory, Washington 25,D. C. 135
Commanding Officer and Director, USN Electronics Laboratory,San Diego 52, Calif. ATTN: Code 210 136
Commanding Officer, USN Radiological Defense Laboratory,San Francisco, Calif. ATTN: Technical InformationDivision 137-138
Commanding Officer and Director, David W. Taylor ModelBasin, Washington 7, D. C. ATrN: Library 139
Commander, Naval Air Development Center, Johnsville, Pa. 140Commanding Officer, Office of Naval Research Branch Of-
fice, 1000 Geary St., San Francisco, Calif. 141-142
AIR FORCE ACTIVITIES
Special Asst. to Chief of Staff, Headquarters, USAF,Rm 5E1019, Pentagon, Washington 25, D. C. 143
Asst. for Atomic Energy, Headquarters, USAF, Washington25, D. C. ATTN: DCS/O 144
Asst. for Development Planning, Headquarters, UMAY, Wash-ington 25, D. C. 145-146
Director of Operations, Headquarters, USAF, Washington 25,D. C. 147-148
Director of Plans, Headquarters, USAF, Washington 25,D. C. ATTN: War Plans DiVision 149
Directorate of Requirements, Headquarters, USAF, Washington25, D. C. ATTN: AFDRQ-8A/M 150
Diroctorate of Research and Development, Armament Division,DCS/D, Headquarters, USAF, Washington 25, D. C. 151
Directorate of Intelligence, Headquarters, USA?, Washing-ton 25, D. C. 152-153
The Surgeon General, Headquarters, USAF, Washington 25,D. C. 154-155
259
SECRET RESTRICTED DATAsacurt)y In"ofmtwle ATOAIC •KNUMG ACT 1946
• • .u m u n ii m • | m I • u mn in

CONFIDENTIAL
DISTRIBUTION (Continued) copy No.
Commanding General, U. S. Air Forces Europe, APO 633, c/oFM, New York, N. Y. 156
Commanding General, Far East Air Forces, APO 925, c/o PM,San Francisco, Calif. 157
Commanding General, Alaskan Air Command, APO 942, c/o PM,Seattle, Wash. AiTTN: AAOTN 158-159
Commanding General, Northeast Air Command, APO 862, c/oPM, Nev York, N. Y. 160
Commanding General, Strategic Air Command, Offutt AFB,Omaha, Neb. ATTN: Chief, Operations Analysis 161
Commanding General, Tactical Air "ommand, Langley AFB, Va.ATTN: Documents Security Branch 162-164
Commanding General, Air Defense Command, Ent AFB, Colo. 165-166
Commanding General, Air Materiel Command, Wright-PattersonAFB, Dayton, Ohio 167-169
Commanding General, Air Training Command, Scott AFB,Belleville, Ill. 170-171
Commanding General, Air Research and Development Command,PO Box 1393, Baltimore 3, Md. ATTN: RDDN 172-174
Commanding General, Air Proving Ground Ccrmand, Eglin AFB,Fla., ATTN: AG/TRB 175
Commanding General, Air University, Maxwell AFB, Ala. 176-180Commandant, Air Command and Staff School, Maxwell APB, Ala. 181-182Commandant, Air Force School of Aviation Medicine, Randolph
AFB, Tax. 183-184Commanding General, Wright Air Development Center, Wright-
Patterson APB, Dayton, Ohio. ATTN: WCOESP 185-190Commanding General, Air Force Cambridge Research Center,
230 Albany St., Cambridge 39, Mass. ATTN: AtomicWarfare Directorate 191
Commanding General, Air Force Cambridge Research Center,230 Albany Bt., Cambridge 39, Masn. ATT1N: CRTSL-2 192
Comminding General, AF Special Weapons Center, Kirtland AFB,N. Max. ATTN: Chief, Technical Library Branch 193-195
Commandant, USAF Institute of Technology, Wright-PattersonAFP, Dayton, Ohio. ATTN: o.•sident College 196
Commanding General, Lowry AVR, Denver, Colo. A'•NN: Dept.of Armament Training 197-198
Commanding General, 1009th Special Weapons Squadron,1712 G St., NW, Washington 25, D. C, 199-201
The RAND Corporntion, 1500-4th St., Santa Monica, (alif.ATTN: Nucleoar Enrgy Division 202-203
OrM DEFT. OF DKENSE ACTIVTTIEO
Executive Secretary, Joint Chiefs of Staff, Washington25, D. C. ATTN: Joint Strategic Plano Committee 204
260 F-C)hiMtMi'Y RESTRICTED DATAAS.; hAi..:TAIC'iJ'.1 DATA IN
It DN N sk'C IION 1441), ATOMIC I NZRGY ACT 1054
_NFI_ _ N_

COHFiB[E fI L
DISTRIBUTION (Continued) Copy No.
Director, Weapons Systems Evaluation Group, OSD, Rm 2E1006,
Pentagon, Washington 25, D. C. 205Asst. for Civil Defense, OSD, Washington 25, D. C. 206Chairman Armed Services Explosives Safety Board, D/D,
Rm 2403, Barton Hall, Washington 25, D. C. 207Chairman, Research and Development Board, D/D, Washington
25, D. C. ATTN: Technical Library 208Executive Secretary, Committee on Atomic Energy, Research
and Development Board, Em 3E1075, Pentagon, WashingtonP5, D. C. 209-210
Executive Secretary, Military Liaison Co22ittee, PO Box1814, Washington 25, D. C. 211
Commandant, National War College, Washington 25, D. C.ATTN: Classified Records Section, Library 212
Commandant, Armed Forces Staff College, Norfolk 11, Va.ATTN: Secretary 213
Comanding General, Field Command, AFSWP, PO Box 5100,Albuquerque, N. Rex. 214-219
Chief, AFSWP, PO Box 2610, Washington 13, D. C. 220-228
University of California Radiation Laboratory, P0
Box 808, Livermore Calif. ATTN: Margaret Folden 229Division of Military Application, U. S. Atomic Energy
Commission, 1901 Constitution Ave., Washington 25,D.C. 230-232
Los Alamos Scientific Laboratory, Report Library, PoBox 1663, Los Alamos, N. Mex. ATTN: Helen Redman 233-235
Sandia Corporation, Classified Document Division, SandiaBase, Albuquerque, N. Mex. ATTN: Wynne K. Cox 236-255 :
Weapon Test Reports Group, TIS 256
Surplus in TISOR for AVSWP 257-305
CONFIDENTIAL -
2U1
ABC, Ok R [,ISe, Tenn.,, A.A 1i 4