Chile Energy Sector Review - World Bank Documents & Reports
201
Report No. 7129-CH Chile Energy Sector Review Augut 1, 1908 Energy Efficiency andStrategy Unit Industry and Energy Department FOR OFFICIAL USE ONLY H Document of the World Bank This document has a restricted distribution and maybe used by recipients only inthe performance of their official duties. Itscontents maynot otherwise bedisclosed without World Bank authorization. Public Disclosure Authorized Public Disclosure Authorized Public Disclosure Authorized Public Disclosure Authorized
-
Upload
khangminh22 -
Category
Documents
-
view
2 -
download
0
Transcript of Chile Energy Sector Review - World Bank Documents & Reports
Report No. 7129-CH
ChileEnergy Sector ReviewAugut 1, 1908
Energy Efficiency and Strategy UnitIndustry and Energy Department
FOR OFFICIAL USE ONLY
H
Document of the World Bank
This document has a restricted distribution and may be used by recipientsonly in the performance of their official duties. Its contents may not otherwisebe disclosed without World Bank authorization.
Pub
lic D
iscl
osur
e A
utho
rized
Pub
lic D
iscl
osur
e A
utho
rized
Pub
lic D
iscl
osur
e A
utho
rized
Pub
lic D
iscl
osur
e A
utho
rized
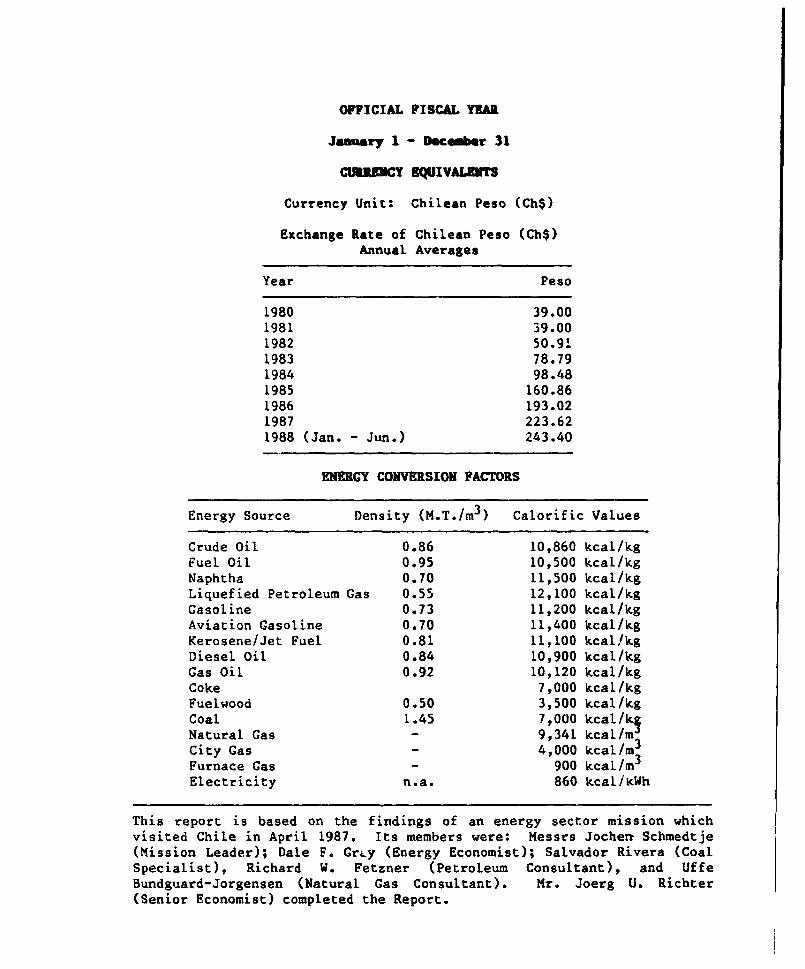
OFFICIAL FISCAL YAIL
January 1 - Doc e r 31
CUUk!CY 0QUIVALEYTs
Currency Unit: Chilean Peso (Ch$)
Exchange Rate of Chilean Peso (Ch$)Annual Averages
Year Peso
1980 39.001981 39.001982 50.911983 78.791984 98.481985 160.861986 193.021987 223.621988 (Jan. - Jun.) 243.40
ENERGY CONVERSION FACTORS
Energy Source Density (M.T./m3) Calorific Values
Crude Oil 0.86 10,860 kcal/kgFuel Oil 0.95 10,500 kcal/kgNaphtha 0.70 11,500 kcal/kgLiquefied Petroleum Gas 0.55 12,100 kcal/kgGasoline 0.73 11,200 kcal/kgAviation Gasoline 0.70 11,400 kcal/kgKerosene/Jet Fuel 0.81 11,100 kcal!kgDiesel Oil 0.84 10,900 kcal/kgGas Oil 0.92 10,120 kcal/kgCoke 7,000 kcal/kgFuelwood 0.50 3,500 kcal/kgCoal 1.45 7,000 kcal/k Natural Gas - 9,341 kcal/mCity Gas 4,000 kcal/m3
Furnace Gas 900 kcal/m3
Electricity n.a. 860 kcaliKWh
This report is based on the findings of an energy sector mission whichvisited Chile in April 1987. Its members were: Messrs Jochenr Schmedtje(Mission Leader); Dale F. GrLy (Energy Economist); Salvador Rivera (CoalSpecialist), Richard W. Fetzner (Petroleum Consultant), and UffeBundguard-Jorgensen (Natural Gas Consultant). Mr. Joerg U. Richter(Senior Economist) completed the Report.
FOR OMCUL Use ONLY
ABSTRACT
Chile's energy resources are significant but are concentratedin remote areas distant from the major energy consumption centears,involving high cost of energy production and transmission. Final energyconsumption in Chile, 7.8 million tons of oil equivalent or 0.65 toe percapita in 1986, is moderate compared to other Latin American countries ata similar stage of economic development. Declining output of crude oilis bound to result in increasing petroleum imports to meet future energyrequirements. This will exert a growing yet manageable burden on thebalance of payments as the Covernment's strategy of pricing energyaccording to economic cost and shifting demand towards non-petroleumenergy sources should keep future petroleum requirements in check.
As agreed with tne Government, the present report focuses onselected priority issues in the energy sector. These are, in the hydro-carbon subsector, the rapid decline in domestic petroleum production andconcomitant needs for energy imports, accelerated exploration, utiliza-tion of natural gas, improving petroleum product pricing and refinerymanagement; in the coal subsector, the high cost of production and themarketing policy of the national coal enterprise ENACAR; and in theforestry subsector, the role of voodfuels within the overal energy sectorstrategy. The report makes recommendations on the development andproduction of remaining crude oil reserves, domestic exploration strategyand joint ventures envisaged by SNAP with foreign oil companies.Regarding natural gas, various supply and utilization options areidentified. The report emphasizes the importance of addressing eRACAR'srehabilitation needs. The report further recommends that a fuelvoodstrategy be prepared and more emphasis be given to reconciling energysector development with environmental conservation. The implications ofthe report's findtngs for the medium-term investment requirements of thehydrocarbon and coal subsectors are briefly discussed.
This document has a restrictod distribution and may be used by recipaets only In the performanceof their official duties. Its contents may not otherwise be disclosed without World Rank authorization.
COKPENDIO
Los recureos de Chile an onorgia son significantes poro so*ncuentran concentradoo an Areas remotas de los controo de consumo, loquo involucra altos costo. de produccion y transports. El consumo finalde enorgia on 1986, 7,8 millones do toneladas de petr6leo equivalente, o0,65 top. por habitante, *s moderado en comparaci6n con otro. paises deAm6rica Latina at mismo nivel de desarrollo econ6mico. La calda en laproduccion nacional de petr6leo traerA consigo incrementos de gran escalaon las importaciones de petr6leo para cubrir los requerimientosonergeticos futuros. Esto ejercera una carga creciente, aunquemanejable, sobre la balanza de pagos, ya que la estrategia del Cobiernobasadt en precios de energia segun costos econ6micos y cambios en laostructura de la demanda hacia fuentes energ4ticas, fuera de lac depetr6leo, limitaria los requerimientos futuros de petr6leo.
De acuerdo a lo convenido con el Gobierno, este informe enfocaaspectoc prioritarios del sector energetico. Estos son, en el subsectorde hidrocarburos, la disminuci6n acelorada del petr6leo nacional y Losrequerimientoo concomitantes para importaciones y para la aceleraci6n dela exploraci6n, la utilizaci6n del gas natural, mejoras en la fijaci6n deprecios de productos petroliferos y requerimientoo de modificaci6n de Lasrefinerias; en el subsoector carbonifero, los altos costos de producci6n yla politica comercial de ENACAR; y en el subsector forestal, el papel decombustibles lefiosos dentro de la estrategia global para el sectoronergetico. El informe presente recomendaciones con respecto aldesarrollo y la producci6n de las reservas restantes de petr6leo, laestrategia para la exploraci6n nacional y proyectos de operaci6n conjuntacon compafias internacionales de petr6leo contempladas por ENAP. Conreospecto at gas natural, el informe identifica distintas opciones desuministro y de utilizaci6n. El informe enfatiza la importancia deoncarar las necesidades de rehabilitaci6n de ENACAR. El informerecomienda la preparaci6n de una estrategia de uso de recursos forestaleospara fines energAticos y un enfoque mas pronunciado sobre .a necesidad dereconciliar el desarrollo del sector energetico con la rinservaci6n delmedio ambiento. Las implicaciones de las recomendaciones del informesobre los requerimientos de inversi6n a mediano plazo en los subsectoresde hidrocarburos y carb6n son brevemente analizados.
API American Petroleum Institute(crude gravity measurement)
bbl barrelB/3 barrel per dayco cubic centimeterft3 cubic footha hectarein inch (2.4 cm)kg4o kilogram of oil equivalentkm kilometer1 literLPG Liquefied Petroleum Gasm2 meter
square meterm cubic meterMcf thousand cubic feet (natural gas)M.T. metric tonNCL Natural Gas LiquidsRON Research Octane NumberSCF Standard Cubic Feet (natural gas)sec. secondTcals Teracaloriestoe ton of oil equivalenttpy metric ton per year
ACRONYMS
CHILELECTRA Empresa Chilena de ElectricidadCNE Comisi6n Nacional de EnergiaCOCAR Compafiia de Carbones de ChileCODELCO Corporaci6n del CobreCONAF Corporaci6n Nacional ForestalCOPEC Compadia de Petroleos de Chile S.A.coaro Corporacion de Fomento de la ProduccionSNACAR Empresa Nacional del CarbonFNAP Empresa Nacional del PetroleoENDESA Empresa Nacional de Electricidad S.A.GASCO Compafiia de Consumidores de Gas de SantiagoIDB inter-American Development BankINFOR Instituto ForestalODEPLAN Oficina de PlanificacionsIC Central Interconnected SystemSOFREGAZ Soci6t& Francaise d'Etudes et de R6alisations
d'Equipments GaziersYPF Yacimientos Petroliferos Fiscales (Argentina)
TABLR OF COUTTM
RESUMEN Y CONCLUSIONES ........................ ............ i-xv
SU?OAIY AND CONCLUSIONS .. ..... .............. Xvi-* -. * . * * * *-.-. ... xVii
I. ENERGY AND THE ECONOMOY..................... IBackground*.....I 1Energy Resources, Supply and Deo a n d 2Energy Resources....... ............. 0.. . ....... 2Energy Supply and Conversion ve.....e...e.. on.. ... e..e 4Energy Deeand*.**.... 6Energy End-Use for Major Economic Activities..o...... 12
Sector Policies and Institutions....................... 13Sector Objectives and Policies ....... . .... 13Institutional Structure..... 14
II. ENERGY PRICING AND TAXATION .......... 17Introduction ........ o... **..* ... oe ... 17Prices of Petroleum Productso d u ct........ .... 17
Structure and Levels..*l... ..... ...................... 17Economic Implications of Petroleum Products Pricing... 20Adjusting to Petroleum Price Volatility....6......6 22
Electricity Priigi......... i....... 23Principles of Tariff Setting..t.i..........g 23Regulated Tariffs......... #......... .... .... 24Negotiated Tariffs for Major Consumers.***.**.... 25
Comparative Energy Prices and Costs... ss.........so.* 25Economic Cost of Natural Gasas......e..............9 29Conclusions and Recomendationsc ...... 31
III. ISSUES IN THE HYDROCARBONS SUBSECTOR.................. 32Introduction ...... *.* .............. 32Alternative Production Strategies forDeclining Crude Oil Reserves.............. 33Reserves and Production Dec1ines.....cl.i...9e.. 33Planned Production From Undeveloped Reserves...'***::: 34Prospects for Secondary and Enhanced Oil Recovery..... 37
Petroleum Exploration Strategy.*.**.*.*.**...*...... 38Hydrocarbon Potential .............. .... 38Domestic Exploration Strategy..***..*.* ..... 40International Exploration Strategy....rat... **ee y 43Conclusion and Recom mendations..............ee ...... 45
Natural Gas Utilization.., . .... ... . 45Intoutio r......u ct.......i o n0 .. 45Natural Gas Utilization in Magallanes............... 47Natural Gas Utilization in Central Chile..i l e.9..... 48
Petroleum Rfni n i n g 52Introduction ..... S009... 2Hydrocracker Opt i on......*........... ........... . 54Delayer Coker Opt ion eao.n.. 59Refinery Ownership Consieaions.....tions06" 59
IV. COAL SUBSECTOR ............................................ 60Introduction........ ...... .. ..................... 60Main Issues9.......... .......... o. .........e . 60Cost of Co*l Supplies .... 9 .. .. *... ..............*** 60Coal Market Outlook................................... 65Finances *eeoe...............................*............ 66
Rehabilitation Plan ........ *........................... 67
V. FORESTRY AND WOODFUELS .................................... 69Supply-Demand Balance ............ ... ............ ..... 69Policy and Institutional Issues ................... 71Cost and Price Structure....*.*.*.* ...............o 71Institutional Requirements............................e 72
VI. ENERGY AND ENVIRONMENT ............................... 73Present Situation ... ..... ................................ 73Government Policies.o...........*...... *000000-0009400* 73General ......sees...............-..... sees............. *ee.... .... 73Requirements for Environmental Management ... .*.**..o* 74Recommendations . ..... ........... ... .................. 74
VII. ENERGY SECTOR OUTLOOK, 1988-97... ................. 76Constraints and Strategy Requirementsu........m........s 76Subsector Projections and Projection Methodology..lo.... 77
Petr"leum Products .o-u........ . s 77Natural. Gaase..***......... . ...... ................ 9* 79Electricity .................... o................. o.o.. 79
World Bank Projections, 1988-97 ....................... 80Energy Imports and Exports p o.............. o.oooort s. 83
Energy Sector Investment Strategyo..ae...... 84
ANNUES
1 Energy Balance, 1986 (Teracalories)2 Energy Balance, 1986 (Physical Units)3 Consumption of Petroleum Products, 1976-864 Projected Summary Energy Balances, 1990; 1992; 1995; 19975 Projected Final Energy Consumption, 1990; 1992; 1995; 19976 Projected Energy Foreign Trade, 1990; 1992; 1995; 19977 Energy Demand Projections, 1987-97 - Assumptions Used8 Criteria for Crude Oil and Natural Gas Reserve Estimates9 Crude Oil and Natural Gas Projections, 1987-9610 Formula for Estimating Optimal Petroleum Depletion11 Risk and Association Contracts for Oil Exploration and Production12 Geologic Framework for Hydrocarbon Deposits in Chile13 Estimated Income and Price Elasticities of Demand
for Petroleum Products14 Comparative Delivered Prices of Coal, 198615 Electricitv Demand Forecasts and Pricing for the
Public Sector in the Central Interconnected System16 Long Run Marginal Costs for Selected Coal Mines17 ENACAR Financial Indicators, 1981-87
18 Projected Coal Demand for Electricity Generation in theCentral Interconnected System, 1987-91
19 Puelvood Prices and Costs20 Forecast Demand for Petroleum Products Used in ENAP
Refinery Analysis21 Suary of Economic Calculations of the Combined
Valdivia/Maipo Valley Natural Gas Scheme22 Economic Cost of Natural Gas for Electricity Generation23 Projected Pnergy Sector Investment, 1987-91
1.1 Primary Energy Reserves, 1986 ............................... 31.2 Energ y Indicators, 1976; 1986 .......................... 51.3 Fuelwood Consumption, 1976-86 ......................... ........ 61.4 Coal and Coke Consumption, 1976-86 .......................... 71.5 Consumption of Petroleum Products, 1976-86........... ....... 81.6 Consumption of Natural Gas, Furnace Gas,
and Town Gas, 1976-86..... . .... ... ..... ......... 101.7 Electricity Consumption by Sector, 1975-86 .e............. 111.8 Residential Electricity Consumption Indicators, 1960-86 ..... 121.9 Energy and the Balance of Payments, 1976-86 ................. 142.1 Structure of Prices of Petroleum Products, 1986; 1988....0... 182.2 Structure of Specific Taxes on Gasoline
and Automotive Diesel, 1987-88 ............................ 192.3 Fiscal Revenue From the Petroleum Subsector, 1984-878....... 202.4 Prices to Consumers of Various Forms of Energy,
Santiago, April 198..988.. .. . 262.5 Economic Cost of Various Forms of Energy,
Santiago, April 19888. 283.1 Production and Imports of Crude Oil and
Petroleum Products, 1985-87 and 1988 (Pro ected)ed... .... 333.2 Projected Crude Oil and Condensates Produsion
from the Springhill Area.................................. 343.3 Actual and Potential Demand for Natural Gas, 195; 1990;
199500.0.00e............... W ............... 463.4 Comparative Fuel Prices in the Santiago Metropolitan Region 483.5 Preliminary Estimates of Competitive Prices for
Natural Gas, Various Industries and Locations.*.**.****** 493.6 Petroleum Refining Configuration, 1986 ...................... 533.7 Net Present Value and Internal Rates of Return
of Alternative Petroleum Refining Projectsjects.***.. .* 573.8 Exportable Surpluses of Refined Products 584.1 Projected Coal Mining Capacity and Demand, 1987-95-......00. 614.2 Average Mine-Mouth Costs, 1987 ........ .0..0. 624.3 Representative Delivered Prices for Steam Coal, May 1988.... 634.4 ENACAR--Performance Indicators..e.........e.............. 675.1 Fuelwood Supply/Demand Balance, 1985.9.8....5 705.2 Internal Rates of Return on Plantation Projects*.est..**** 727.1 ENAP Projections of Demand and Pricea for
Petroleum Products, 1988-2000 .......... 78
7.2 Projected Energy Indicators, 1990; 1995..................... 827.3 Projected Energy Imports, 1990; 1992; 1995; 1997. 9.......... 837.4 Projected Public Investment in the Energy Sector, 1987-91... 84
PAP$
IBRD 20548: Electric Generating and Transmission System!BRD 20549: Hydrocarbons, Coal, and Supporting InfrastructureIBRD 20550: Forestry and Vegetation
RESUMEN Y CONCLUSIONES
1. La economia chilena depende en grado considerable de Lasimportaciones de energeticos, principalmente petr6leo. Estasimportaciones menos reexportaciones de energ6ticos, ascendieron en 1986 aun costo de US$354 millones, o sea el 6,4% de las exportaciones de bienesy servicios no atribuibles a factores. Ante la disminuci6n de le.producci6n .nterna de petr6leo crudo, el Cobierno enfrenta decisionesdificiles para asegurar la disponibilidad a largo plazo de energia pa-ael crecimiento econ6mico. La tarea principal en el sector consistiri encontrabalancear, en el mediano a largo plazo. la disminuci6n dn laproducci6n del petr6leo. La base de recursos energeticos de Chile esdiversificada, pero las alternativas viables a petr6leo crudo, mayormentehidroelectricidad y gas natural, se encuentran a gran distancia de loscentros de consumo de energia. Su desarrollo es costoso --incluyendoaltas inversiones en transporte de energia-- y requiere de un tiempoconsiderable de preparacion. Carbon de algunas minas nacionales no escompetitivo con importaciones. Despues de haber alcanzado unasustituci6n notable de productos del petr6leo por carb6n, la sustituci6necon6mica del petr6len por gas natural en la regi6n central de Chile esviable pero tendria que basarse en su mayor parte en importaciones. Aunsuponiendo progresos adicionales en conservaci6n de energia, lasimportaciones de energeticos inevitablemente aumentaran en formasustancial en el curso del proximo decenio. Se estima que podrianabsorber hasta un 9% de los ingresos de exportacion de bienes y serviciosde no-facteres a principio de los afios 90, siempre y cuando que sematerialice un auge razonable de las exportaciones.
2. Chile estA bien preparado para enfrentar los desafios que sepresenten er. el sector energetico. Los objetivos del Cobierno estanclaramente definidos y guardan armonia con las exigencias del desarrollodel sector. Tales objetivos estan dirigidos a: a) asegurar la asignaci6neficiente de los recursos e intensificar la eficiencia del uso final dela energia; b) alentar la competencia y la mayor participaci6n del sectorprivado; y c) satisfacer las necesidades de energia principalmentemediante recursos aut6ctonos. Un marco juridico coherente y estructurasinstitucionales efectivas han sido establecidos. En el centro de laformulaci6n de politicas, la Comisi6n Nacional de Energia (CNE) tiene asu cargo la preparaci6n y coordinaci6n de los planes del sector y elasesoramiento al Gobierno sobre politicas y reglamentaciones en materiade energia. La Oficina de Planificacion Nacional (ODEPLAN) coordinalas actividades de las entidades y empresas estatales dentro del ProgramaNacional de Desarrollo. El Ministerio de Economia aprueba las tarifas deelectric-dad sobre la base de recomendaciones de la CNE. Al Ministeriode Mineria le compete la representaci6n del Estado para concertar ysupervisar contratos con empresas para la exploraci6n y producci6n dehidrocarburos. El Ministerio de Hacienda tiene u(ltima autoridad en las
decisiones sobre inversiones y el financiamiento de las mismes en lasempresas del Estado. Las politicas do *nergia basadas en la fija:i6n deprecios de acuordo a crstos econ6micos y la aplicaci6n de mecanismos de*ercado pare la asigiiaci6n de recursos han sido medidas claves par&asegurar abastecimientos suficientes y aumentar la eficiencia del usofinal.
3. A nivel operativo, la estrategia del Cobierno es aplicada atrav6s de e*presas estatales ! privadas, las cuales tienen plan&autonomia y responsabilidad adm;inistrativa. La Empresa Naciorial dePetr6leo (ENAP) tiene a au cargo la exploraci6n, producci6n y refinaci6nde petr6leo y gas natural, y esta facultada para asociarse con empresasextranjeras a fines de desarrollar reservas petr6liferas tanto en Chilecomo en el exterior. Cuatro corporaciones de energia electrica estinencargadas de generaci6n: Empresa Nacional de Electricidad, S.A.(ENDESA), Compafiia Chilena de Generaci6n Electrica, S.A. (CHILECTRA-GENERACION), Empresa Elictrica Colbun S.A. (COLBUN, S.A.) y EmpresaElectrica Pehuenche S.A. (PEHUENCHE, S.A.) la transmisi6r, estaprincipalmente bajo la responsabilidad de ENDESA. La distribuci6n deelectricidad se efectua mayoritariamente por empresas privadas. LaEmpresa Nacional del Carb6n (ENACAR) es el productor mas importante decarb6n, mientras que COCAR y Schwager son los productores principales delsector privado. La Corporaci6n Nacional Forestal (CONAF) reguia lasactividades relacionadas con la lefia que son dominadas por el sectorprivado. El Gobierno ha iniciado un programa de desregularizaci6n ydescentralizaci6n de las empresas de energia estatales mas importantes,con miras a su privatizaci6n gradual. Una presencia vigorosa del sectorprivado ha sido asegurada en la comercializaci6n del petr6leo, lageneraci6n y distribuci6n de electricidad, y la producci6n ycomercializaci6n de carb6n. Mas reciente, el Gobierno ha tenido exito enatreer companias privadas extranjeras para la exploraci6n dehidrocarburos. El Gobierno continuara desempeniando una funci6n clavevigilando los precios de la energia y las inversiones en ese campo,evaluando los recursos y necesidades de energia, asegurando latransparencia del mercado, y fomentando el uso eficiente de la energia.
4. A fin de asegurar la capacidad productiva y manejo eficientedel sector de energia, y ante la disminuci6n de las reservas de crudo,es preciso, mantener una estrategia coheve ite cuyos elementos principales,en gran medida, ya se estan llevando a cabo. Estos incluyen loxsiguie tes:
(a) A corto plazo:
(i) eliminar las distorsiones menores que subsistan en laformaci6n de precios en la energia y robustecar elmanejo de la demanda de energia a traves de medidasenfocadas a incentivar la transparencia del mercado, ya su vez, aumentar la eficiencia de las inversiones ydel uso final de la energia;
- iii -
(ii) mojorar la oficiencia de los abastecisiontos de energtamodianto la raducci6n do desgastas on la producci6n, yde p6rdidas en la tranformaci6n y distribuci6n,especialmnte de electricidad;
(iii) asegurar un esfuerzo sostenido para promover laexploraci6n petrolifera por compaMias foraneas en todaslas ireas promisorias;
(iv) evaluar el potencial y las opciones para la utilizaci6nde gas natural, incluyendo la generaci6n de energiatermoelectrica, y las opciones para la importaci6n degas y el trueque de gas con Argentina;
(v) desarrollar una estrategia con miras a optimizar elabastecimiento y uso de combustibles a base de madera;
(vi) identificar los requerimientos immediatos y lasopciones disponibles para la conservaci6n del medioambiente;
(b) De mediano a largo plazo:
(vii) expandir la participaci6n de inversionistas privadosnacionales y extranjeros en todas las etapas de lasactividades de energia, aplicando modalidadesapropiadas de financiamiento incluyendo la conversi6nde la deuda en capital accionario en la medida posible;
(viii) explotar e-n forma econ6micamente (vs. t6cnicamente)6ptima las reservas de petroleo crudo, y aprovechar lasnuevas reservas dentro del pais como en el exterior;
(ix) aprovechar el potencial hidroelectrico como componenteclave del programa de expansi6n de electricidad a costominimo;
(x) rehabilitar y desarrollar aquellas minas de carb6n quetienen el potencial de ser competitivas con lasimportaciones;
(xi) desarrollar la utilizaci6n de gas natural en la regi6ncentral de Chile en aquellas actividades en que elcombustible es de costo minimo; y
(nii) reconciliar los objetivos del desarroilo del sector deenergia con aquellos de la preservaci6n del medioambiente.
- Iv -
Kolorando .1 ilutoma do Droc$tLn .~a onera
s. En general, la politics do procios do onosgta esti biondosarrollada y so administra sticamonto, prowcviondo Ia faiiAnci do Isasilgnaci6n do rocurso an la oconomia, too objetivos fiscalo. y Isviabilidad financiora do Las emprosas de onorgia. bos prci;os de ltoproductos dtl potr6loo y do carb6n so basan on los prncios do frontora.Los procioc do osoctricidad co dotoruinan par noeociacift ontre c-m=ftiasgoneradoras y dietribiidorse ajustados por lce cobros do traramisi6n, yaquolloo para usuarioa do monoc do 2,000 kW do potoncia, 0o beast? oo lofcoctos marginalso a largo plaso como aproximaci6n de procios domorcado. Aunquo Loa procios ox-rofinoria do loc productos del pvtr6loosatin ajuetadc3 rogularmonto par lo abasteocodoro., han surgido algunasdistorsionos on loo procios &I consumidor, como rosultado do diforonciason la tributaci6n. Si bion ostas distorsionos plantoan consocuonciasnegativas do monor Indolo, dobon abordarso sin embargo on .l intor6s domojorar la utiltizacin oficient deo loc rocursos. Tambi6n as monosteorquo so considoren Las exigencias ospocificas quo onvuelve la fijaci8n deproclo do Los productot del petr6leo on el medio actual caracterizadopar la inostaoilidad de los procios internacionalto de petr6leo.
6. Precios de las Productos del petr6oleo. Debido a Las marcadasdiforoncias on los impuestos oepocificos, los procios dol dieselautomotrie son mus bajos quo aquolloo de la gasotina, lo quo ha creado unincentivo para eL uso del diesel y la orientaci6n dol parquo automotorhacia los vehiculos impuleados con sos tipo do combustible. Mientrasquo el impuesto sobro el diesel en au nivtl actual cubre adecuadaments elcar;o variable por e1 uso do carreteram, el impuesto sobre la gasolina eamucho mis aLto quo ose cargo. steo problema podria resolverse elevandoel impuosto ospocifico sobro el diesol, a bajando el impuesto sobre lagasolina, o con una combinaci6n do las doe medidas, a fin do reflejar deuna manora mojor loe costos relativos pars too usuarios de carreoeras ycolocar loc procios relativos do La gasolina y el diesel mis en armontacon sus procios rolativoa on frontora. La cuoeti6n quo so plantoa os siel costo ocondmico vinculado a la distorsi6n de los procios relativos delos combustibles os mayor quo el costo *con6mico do rocaudar el mismoingroso a travis de impuestos diforentes, por ejemplo, sabre losvahiculos. La juatificaci6n para oetas diferencias on loa procios deborianalisarso mis a fondo a fin do detorminar los modios 6ptimos par& lograrlos cbjotivos de ias mismas.
7. Un probLoma potoncial as causado por el procio mis alto deldiosol automotris fronto at diesel industrial ya quo ol impuestoospocifico so recauda solamonto sobre el primoro. Mientras Laocamionoros indepondientes pagan un procio mis alto por eL diesolautomotris, las industrias con fltees de camiones tienen la posibilidaddo usar oL diesel industrial de procio mis baja coma combustible pars eltransporto, afectando &as los mirgenes de utilidad do los camionorosindependientoe. Sin embargo, el fisco otorga la exenci6n de impuestospars el diosel industrial solamonto ex-post, con verificaci6n adecuadaquo el carburanto ostuvo usado pars prop6sitas industriales. El procio
- v -
al consumidor del kerosine es apreciablemente inferior al del gas licuadode petr6leo. La factibilidad de corregir estas relaciones de losprecios mediante el ajuste del impuesto sobre el kerosine debe serevaluada.
8. El ajuste a la inestabilidad de los precios del petr6leo. Losprecios internacionales dei petr6leo en los ultimos anios han sidoparticularmente inestables, y la probabilidad es alta que permanezcan asien el corto a mediano plazo. Surge la pregunta si las variaciones deprecios a corto plazo deberin ser trasladados a los consumidores en sutotalidad, o si los precios al consumidor deberin ser estabilizados pormedio de mecanismos compensatorios, aunque esto podria afectar en formanegativa la competibilidad internacional de la economia. A veces sepresenta el argumento seg;n el cual los problemas de tipo fiscal y debalanza de pagos mis la necesidad de mantener el empuje de conservaci6nde energia, requieran que los precios internos de productos petroliferossean establecidos en forma fija, dada la rigidez del proceso deinversi6n, las repuntes de los precios internacionales de petr6leoesperados a mediano y largo plazo, la disminuci6n de reservas en crudo deChile y la fragilidad resultante de la posici6n externa de la economia.Sin embargo, por razones de eficiencia de la economia, es necesario quelos precios internos de productos petroliferos stan establecidos enconformidad con las condiciones que rigen a los mercados internacionalespara que se tomen las decisiones basadas sobre estas condiciones. Por lotanto, los precios internos deben moverse paralelamente con losmovimientos en los mercados internacionales tanto en el corto como en ellargo plazo, reflejando asi auges como bajas. Esto tambien es laposici6n del Gobierno. En el supuesto de que el Gobierno evaluara unavez la conveniencia de imponer un "impuesto para la conservaci6n", unamedida de esta indole deberia basarse en un anilisis cuidadoso delpotencial de ahorros de energia en la economia y de los costos ybeneficios para realizar este potencial. Sin embargo, un impuesto deeste tipo deberia ser aplicado a todos los productos petroliferos y atodos los consumidores a traves de una tasa fija, preferiblementeidentica, para asegurar que los consumidores sean sujetos en forma iguala la incidencia de movimientos de precios internacionales.
9. Precios y costos comparativos de la energia. La comparaci6n delos precios de mercado de los energeticos (ajustados en funci6n de laeficiencia del uso final a los consumidores) indica que en los sectoresresidencial, comercial y administrativo la lenia es el combustibles decocina de mis bajo costo, seguidos del gas licuado de petr6leo, kerosene,y gas de caneria mientras que la electricidad es la fuente de energia miscara. En los sectores industrial y minero, carb6n y fuel oil son loscombustibles de mis bajo costo para calderas, seguido del diesel, lefia yelectricidad. El kerosene y el gas licuado de petr6leo son loscombustibles mis caros pero se usan poco. En el sector transporte, eldiesel es el combustible de menor costo dado su precio mas bajo y su misalta eficiencia en comparaci6n con la gasolina.
- vi -
10. El anilisis de los precios de mercado es util par& explicar losfactores relacionados con la demanda afectando la corservaci6n ysustituci6n de la energia. Sin embargo, es preciso que se analicentambi6n los costos econ6micos relativos de varias formas de energia,incluyendo los costos de equipo para conclusiones propias acerca de lafactibilidad de usar o sustituir distintas fuentes de energia. Sobreesta base, en los sectores residencial, comercial y administrativo, elgas licuado de petr6leo sigue siendo el combustible de costo miniso,seguido del kerosene y la letia. El gas de canieria y la electricidad sonmucho mis costosos. En los sectores industrial y minero, salvo eladvenimiento del gas natural, la lefia, el carb6n y el fuel oil son loscombustibles mis baratos, seguidos del diesel y el kerosine. Laelectricidad continua siendo la fuente de energia mis cara a pesar de lamis alta eficiencia de las calderas de electrodos.
11. Algunas conclusiones importantes surgen de este anilisis. Seminimizaria el costo de la energia mediante un esquema enfatizando el usode lenia en los sectores residencial, comercial y administrativo, y el usode lenia, carb6n y fuel oil en los sectores industrial y minero. Esrecomendable fortalecer la capacidad para producir y comercializar estosenergeticos en la manera factible. La electricidad (en los sectoresresidencial, comercial y administrativo, asi como en los sectoresindustrial y minero), y el diesel, kerosene y gas licuado de petr6leo (enlos sectores industrial y minero) son fuentes costosas de energia, aunquepuede requerirse de electricidad por razones vinculadas a tecnologias deprocesamiento (por ejemplo, en la refinaci6n del cobre). En el sectortransporte, el costo econ6mico del diesel y el de la gasolina seaproximan en tal grado que no se puede llegar a una conclusi6n definitivarespecto de su preferencia relativa sobre esa base solamente. Los costosde la energia en la regi6n central de Chile serian notablemente influidassi llega a disponerse de gas natural en esa regi6n. Es probable que elgas natural sea el combustible de costo minimo para la generaci6n deenergia termoelectrica y muchos usos industriales aunque la conversi6ndel equipo existente para adaptarlo al uso del gas podria ser noviable. Con el fin de promover la transferencia del mercado y de obteneruna base firme para proyecciones de demanda, es preciso que se lleven acabo estudios de costos econ6micos detallados y que se les actualicecontinuamente. Estos estudios deben incluir una evaluaci6n a fondo deexternalidades relacionadas a las distintas formas de energia, tal comosu impacto sobre el medio ambiente.
Fortalecimiento del subsector del petr6leo
12. Producci6n y exploraci6n. La producci6n nacional de petr6leocrudo suministra actualmente cerca del 33% de las necesidades de Chile.Sin embargo, este porcentaje podria descender a 5% pare mediados de 1990,ya que las reservas probadas y la producci6n interna estin disminuyendopronunciadamente y la producci6n se vuelve mis costosa. Incluso en basea supuestos optimistas en cuanto al aumento de reservas en areas dondetodavia no se ha descuibierto dep6sitos comerciales, la producci6nincremental de esas areas no seria suficiente para estabilizar la tasa de
- vii -
declinaci6n, a la que se pronostica un aceleramiento ripido a partir delprincipios de los aiios 90. Una cuesti6n importante es determinar e1nivel y la tasa con que se debe producir el petr6leo de alto costotodavia existente, lo que afectaria directamente la envergadura de lasactividades de la ENAP. Una cuesti6n conexa es la estrategia deexploraci6n de la ENAP, es decir, a) si en ausencia de inversionesextranjeras se debe seguir realizando exploraciones riesgosas en laszonas geologicamente dificiles, y b) cuil debe ser el grado y la indolede su nuevo enfasis en las operaciones internacionales. Los pr6ximosafios pueden ofrecer a la ENAP una oportunidad singular para adquirir porlo menos una participaci6n limitada en las reservas de petr6leo de costorelativamente bajo en el exterior, pero su falta de experiencia en lasoperaciones fuera de Chile y las graves limitaciones de divisas de laeconomia podrian restringir tal opci6n.
13. La estrategia del Gobierno de aprovechamiento de los recursos,que tiene por meta reducir los gastos piblicos y los riesgos tanto parael Gobierno como para la ENAP, es apropiada y se debe aplicarvigorosamente. Debe hacer hincapie en los siguientes aspectos:
(a) Producci6n
i) enfocar el desarrollo y la explotaci6n a corto plazo delas reservas restantes de petr6leo crudo a las "reservasbasicas" que se puede producir a costos mas bajos;
(ii) ofrecer las propiedades restantes, asi como las zonascon potencial de recuperacion secundaria, a empresas delsector privado en virtud de contratos de expLotaci6n; y
(iii) continuar asegurandose que las decisiones sobreexplotaci6n sean basadas sobre costos marginales deproducci6n de cada yacimiento incluyendo tasas dedeclinacion susceptible de maximizar el rendimientoecon6mico mis bien que la producci6n fisica;
(b) Exploraci6n nacional
(i) asegurar la promoci6n continua de las nuevas zonasofrecidas, a fin de superar la percepci6n negativa delas empresas internacionales acerca del potencial dehidrocarburos de Chile, y atraer a aquellas empresas quetengan los conocimientos tecnieos y el respaldofinanciero requeridos;
(ii) poner en marcha ia decisi6n del Gobierno de abrir todaslas areas a los inversionistas; y
(iii) realizar esfuerzos suplementarios de bajo costo paramejorar la base de datos sobre las zonas geol6gicast6cnicamente dificiles y complejas. Aunque cierta
- viii -
actividad de perforaci6n por la ENAP podria estarjustificada, se deben evitar gastos de gran magnitud enla exploraci6n de esas zonas;
(c) Inversiones en el exterior
(i) fijar objetivos claros para la EMAP con respecto algrado y tipo de riesgo y a la magnitud de susinversiones, y
(ii) mejorar la capacidad de la ENAP para evaluar lasoportunidades en 1 exterior, particularmente lasinversiones de bajo riesgo por realizar conjuntamentecun empresas internacionales.
14. Utilizaci6n del gas natural. Actualmente el gas natural seproduce y utiliza solamente en la zona de Magallanes. En el periodoactual son reinyectadas casi tres cuartas partes de la producci6n brutaprincipalmente para mantener la presi6n del reservorios, mejorar elrecubrimiento del pett6leo y eventualmente, producir de nuevo el gasreinyectado. El resto es usado en las operaciones de yacimientos,venteado o consumido en el pequefio mercado residencial. El gas producidoen Magallanes no se puede transportar econ6micamente a las otras regionesdel pais, de modo que se ha decidido usarlo localmente para producirmetanol y amoniaco/urea para exportaci6n. Asi, gas asQciado al crudo,que anteriormente estaba reinyectado o venteado, sera vendido por la ENAPa empresas privadas para la producci6n de metanol y de ammonia urea, a unprecio de base suficiente para cubrir costos, mas un precio suplementariopara obtener un margen adecuado.
15. Aunque la demanda de energia en el centro de Chile esconsiderable, el abastecimiento de gas tendria que provenir de Argentinamediante la importaci6n o el trueque con el gas de Magallanes o,potencialmente, de los yacimientos costa afuera de Valdivia que todaviatienen que explorarse mas a fondo. De las dos opciones de imporcaci6n,la del proyecto del valle de Maipo parece superior y seria marginalmenteecon6mica, a un precio en frontera del gas de alrededor de US$2 pormill.6n de BTU. El plan de los yacimientos maritimos costa afuera deValdivia no parece viable actualmente porque las posibles reservas talvez no sean suficientes para justificar este proyecto de al.to costo comouna operaci6n aut6noma. No obstante, un enfoque de dos etapas podria serconsiderado, es decir, importar primero el gas a trav4s del valle deMaipo, y mas tarde, aprovechar los recursos costa afuera de Valdivia silas reservas disponibles fueran suficientes y si el mercado del gas sedesarrolla. Ademas, el proyecto combinado podria reforzar la posici6nnegociadora del pais en que existiria otra fuente para el abastecimientofuturo.
16. Como una variante de la opci6n de la importaci6n, el gas deMagallanes se podria proveer a Argentina a cambio del suministro de gasargentino a la regi6n central de Chile. Esta alternativa reduciriaconsiderablemente el costo de suministro de gas a Chile central. Su
- ix
viabilidad dependeria, entre otras cosas, de los costos de oportunidaddel gas de Magallanes y de los costos del transporte (y la disponibilidadde capacidad) por el gasoducto sur de la Argentina, en comparacion con elcosto de las importaciones lisa y llanas de gas argentino. La SNAPjugaria un papel importante en este esquema. El Cobierno ha indicado aArgentina su interes para iniciar negociaciones sobre importaciones talcomo trueque de gas. Potencialmente, volumenes importantes de gaspodrian tambien existir en el solar de Atacama cuyo desarrollo podriaabrir una alternativa importante de energia para Chile central. Dada lacomplejidad de las cuestiones involucradas, se recomienda: a) que seactualicen los estudios ya hechos de optimizaci6n del suministro de gasal centro de Chile, basado en evaluaciones actualizadas del mercado ynueva informaci6n sobre las reservas de la cuenca maritima de Valdivia, yteniendo en cuenta la posibilidad de usar el gas para generarelectricidad, por una parte, y la opci6n del trueque de gas conArgentina, por la otra, y b) en la manera que el resultado de estaevaluaci6n lo aconseje, buscar acuerdos con Argentina sobre la ejecuci6nde proyectos conjuntos como materia de alta prioridad.
1?. Refinaci6n del petr6leo. Debido a la reorientaci6n de lademanda de productos del petr6leo hacia el uso mayor de diesel, elGobierno enfrenta la decisi6n de si se justifica aumentar las; istalaciones de craqueo o si se pueden atender los cambios en lacomposici6n de demanda mas economicamente aumentando el. volcimen de laproducci6n de la refineria, modificando los insumos del crudo mediante unuso mayor de crudos mAs livianos o de crudos mezclados con destilados("spiked crude"), importando los productos en posici6n deficitaria, o conuna combinaci6n de estas opciones. La modificaci6n actualmente siendoconsiderada es un hidrocraquer moderado, muy probablemente en larefineria de Conc6n, con un costo estimado de US$22 millones, y uncoquizador retardado en la refineria de Concepci6n para mejorar laproducci6n de gasolina y diesel y reducir la producci6n de fuel oilconvirtiendolo en coque de petr6leo, a un costo que se estima en formapreliminar a US$45 millones.
18. Aprovechando plenamente la capacidad refinadora existente de laENAP, podria ser suficiente para cubrir la demanda nacional de casi todoslos productos sin necesidad de inversi6n adicional. Sin embargo, serequeriria usar cantidades mas grandes de crudo que en el caso deinstalaci6n de un hidrocraquer moderado y se deberia exportar volumenesconsiderables de fuel oil a precios relativamente bajos. Un hidrocraquermoderado tambien contribuiria en aumentar la cualidad de productos ycumplir con los requerimientos de conservaci6n del medio ambiente, perolos costos de capital. y operacionales de refinaci6n aumentarian en formasustancial. Mientras que el hidrocraquer moderado contribuiria poco areducir la producci6n de fuel oil; esto se alcanzaria a travez de uncoquizador retardado que co -Aerte los residuos casi totalmente en coquede petr6leo. Sin embargo, -a viabilidad de la segunda alternativa quedapor establecer. El aralisis hecho por la ENAP sobre las diversasopciones de inversi6n se basaba inicialmente en varias restricciones, lascuales tendran una gran influencia en los resultados del analisis,
especialmente las relativas a restringir la exportaci6n de productos depetr6leo en exceso y a limitar la proporci6n de crudo liviano de losinsumos de la refineria. Aunque la eliminaci6n de algunas de estasrestricciones podria indicar que la instalaci6n de un hidrocriquermoderado en Conc6n sea econ6micamente factible, los beneficiosincrementales de este proyecto disminuyen significativamente una vez quese considere exportar productos en exceso. En el caso que los preciosrelativos de crudos livianos y pesados prevalezcan hacia los anios 1990-91, se justificaria postergar el proyecto del hidrocriquer moderado porunos dos afios incluso si despues de esa 6poca los precios de crudoslivianos aumentaran mAs ripidamente que aquellos de crudos pesados. ElGobierno ha postergado la decisi6n correspondiente hasta fines de 1988.En vista de la complejidad de los problemas asociados,se deben evaluarmas a fondo los costos y beneficios de las opciones del hidrocriquermoderado y coquizador retardado, conjuntamente con la opci6n de seguir lapauta actual. La armonia de las inversiones propuestas, con losrequerimientos a largo plazo deben ser claramente establecidas antes detomar una decisi6n al respecto. Este anilisis tendria que clarificar lacompatibilidad o, contrariamente, la competividad de estas dosopciones. Mientras tanto, se deberia considerar las siguientesmodificaciones en la evaluaci6n de los proyectos de 'las refinerias;algunas de las cuales tendrian un impacto directo sobre mejoras deoperaciones:
(a) reducir el diferencial entre eL precio de crudos livianos y decrudos pesados;
(b) optimizar Los insumos de crudos, particularmente mediante el"spiking" de insumos con diesel;
(c) eliminar la asignaci6n fija (50% y 50%) de crudo nacional a lasrefinerias ; y
(d) eliminar la asignaci6n fija de mercado para las refinerias, einiciar la venta de productos en la Regi6n I.
19. El Gobierno esta en el proceso de evaluar la factibilidad deprivatizar las dos refinerias o en forma alternativa, la ENAP en sutotalidad. Las perspectivas financieras de refinaci6n en Chile serin deprimordial importancia para que estos esfuerzos sean exitosos. Cualquiermedida de privatizaci6n se escogera, la misma debe ser expuesta enestricta conformidad con un enfoque basado en la competencia de precios ymercados.
Reestructuraci6n del subsector carbonifero
20. Chile esti dotado de recursos carboniferos moderados, decalidad relativamente baja. La producci6n en Chile central se basatotalmente en la mineria subterrinea, en condiciones geol6gicasdificiles, realizada principalmente por la Empresa Nacional del Carb6n(ENACAR), la entidad mas grande del sector. Las importaciones son
reducidas y consisten basicamente en carbon coquizable. El Gobierno hadado apoyo al desarrollo del subsector carbonifero mediante actividadesde exploraci6n, expansi6n de capacidad de las minas estatales ysustituci6n del carb6n por productos del potr6leo en los sectores deelectricidad e industrial. Una nueva m presa privada, COCAR, comenz6 laexplotaci6n de una mina a cielo abierto de 600.000 toneladas anuales enMagallanes a fines de 1987.
21. Costos del suministro. El problems fundamental en elsubsector es determinar en que proporci6n Ia capacidad minera nacional eso puede volverse competitiva con las importaciones. ENACAR esta afectadapor costos altos especialmente costos fijos de mano de obra encomparacion con aquellos de importaciones y suministros de otrosproductores nacionales. Aunque ENACAR ha hecho grandes esfuerzos deracionalizar sus operaciones y de reducir la mano de obra ociosa, durantelos anios 1981-87, los costos operativos por unidad de produccionaumentaron y la producci6n por empleado estaba virtualmente estancada porlo que la produccion declin6. El precio en boca-mina que oscila entreUS$43 y US$64 por tonelada m6trica (de carb6n lavado), es superior alcosto de paridad de las importaciones, de alrededor de US$40 por toneladametrica, y los precios de entrega para la mayor parte de la producci6n deENACAR variai entre US$56 y US$75 por tonelada metrica. Un indicadormejor del precio econ6mico del carb6n es el costo marginal a corto plazode la producci6n actual y el costo marginal a largo plazo de laproducci6n futura. En algunas minas estos costos podrian aproximarse alcosto de paridad de importaci6n, sobre el supuesto de la reducci6n de lamano de obra y el aumento de. grado de mecanizaci6n. Esto indica que laproducci6n nacional de carb6n podria ser marginalmente econ6mica.
22. Por lo tanto, se plantea la pregunta si es aconsejablecontinuar la producci6n de las minas no econ6micas. Hay varios factoresque considerar a este respecto. Primero, una proporci6n importante delos costos no son recuperables, y en la medida en que los costosmonetarios de los despidos, las jubilaciones, cargas financieras, etc.,sean mayores que la diferencia entre los costos monetarios de producci6ny de importaci6n, no se obtendria ningun ahorro reemplazando laproducci6n nacional por las importaciones. Segundo, no obstante de sertecnicamente dificil y costoso reponer en operaci6n las minas cerradas,continuando la produccion se justificaria solamente en la medida que hayaun margen suficiente de reducci6n de costos para que la producci6n seamas competitiva. En caso contrario, el cierre de las minas seria lasoluci6n econ6micamente 6ptima. Tercero, una gran parte de los costosfijos se relaciona con el exceso de mano de obra, cuyo precio sombraprobablemente sea relativamente bajo siempre y cuando exista falta deotras fuentes de trabajo. Los costos de mano de obra relativamentebajos, tienden a reducir el coito de bienestar de operaciones minerascontinuas (o a la inversa, resultan en costos de bienestar significativosen caso de cierre de las minas). El exceso de mano de obra en las minasde carb6n podria ser el resultado, a lo menos en parte, de presiones dellado de autoridades regionales y locales de preservar el nivel deempleo. Este costo deberia ser hecho explicito. En un sentido masamplio, se deberian estudiar medidas para aumentar la movilidad de Lamano de obra en la manera que surjan otras fuentes de trabajo en laszonas afectadas.
- xii -
23. Las consideraciones anteriormente mencionadas subrayan laurgencia de racionalizar las minas de costos elevados y de reestructurarEMACAR. Todas las opciones factibles, incluyendo la privatizaci6n,deberian ser evaluadas. Antes de considerar cualquier expansi6n de laproducci6n es preciso reducir los altos costos fijos de sue minas,particularmente la de Lota, a trav6s de mejoras de la eficienciaoperativa. ENACAR ha contratado consultores para evaluar a fondo lasopciones para aumentar la eficiencia, incluso por reducir la fuerzalaboral. Cualquier consejo tecnico a ENACAR deberia enfocarse en lassiguientes esferas:
(a) Reducci6n de los costos de operaci6n: Se deberan evaluar lasoperaciones de cada mina con miras a determinar lasposibilidades de reducir costos, especialmente los costosfijos, incluyendo mejoras en el manejo de inventarios y stocks,la reducci6n de los servicios en el exterior de la mina, elcierre de las minas o secciones de minas no rentables, y lareasignaci6n o reducci6n de la fuerza de trabajo. Estaevaluaci6n deberia incluir las opciones para reorientar laproducci6n de minas con costos elevados hacia aquellas concostos relativamente bajos;
(b) Examen del programa de inversiones: Se debe determinar si elprograma de inversiones de ENAP es consistente con supuestosrealistas acerca del alcance de las mejoras en eficiencia y ely el crecimiento del mercado futuro;
(c) Finanzas y la planificaci6n: ENACAR debera determinar:
(i) el nivel de producci6n financieramente 6ptimo --en vezde ser tecnicamente factible-- de cada mina, y
(ii) el mejoramiento de la posici6n financiera que se puedeobtener de la descentralizaci6n de las operacionesmineras, la contrataci6n externa de serviciosauxiliares y otras medidas aptas a reducir los costosde operaci6n y los gastos generales;
(d) Estrategia de desarrollo: Se debera preparar un planempresarial a mediano plazo que abarque la producci6n, lasinversiones, las ventas y las finanzas. En la medida en queENACAR no pueda competir eficazmente con otros productoresnacionales o con importaciones, se debe formular una estrategiaque le permita reducir la escala de sus operaciones y volversecompetitiva en un plazo de cinco afos. El plan empresarialdeberia incluir una propuesta detallada para establecer unsistema de informaci6n para la gesti6n que ayude a integrar atodas las actividades de la entidad.
- xlii -
Fortaleciendo el rol de los combustibles leiiosos
24. El crecimiento natural forestal se encuentra muy por enci-a dela demanda nacional combinada de lefia y madora de construcci6n y cerca deun mill6n de hectareas de plantaciones de arboles han sido establecidosen los ultimos diez afos. Sin embargo, estas plantaciones en su mayoriahan sido par& prop6sitos industriales mientras que plantacionesestablecidas por CONAP para prop6sitos dentroenergeticos no eransuficientes para prevenir una escasez regional y de determinadas especiesforestales, especialmente de eucalipto en la Regi6n Metropolitana dondela demanda de lenia es elevada y donde en anos anteriores la deforestaci6nya ha causado problemas de erosion y ordenaci6n de vertientes. Por ende,es necesario tomar medidas preventivas antes que la deforestaci6n localalcance proporciones serias. La determinaci6n de las necesidadesconcomitantes de reforestaci6n requiere una evaluaci6n detallada desuministro y demanda en cada regi6n y para las especies especificas, parala cual es preciso ampliar la base estadistica. Las zonas forestales quedeben ser protejidas y aquellas aptas para uso intensivo deben sercuidadosamente demarcadas. Tambi6n se deben evaluar las opciones ynecesidades con respecto a la participaci6n de pequefnos agricultores enla plantaci6n de arboles, y de las necesidades financieras asociadas. Envista del potencial forestal de gran escala en de Chile, es convenienteestablecer una estrategia para aumentar el rol de recursos forestalespara enfrentar los requerimientos de energia. Eso debera incluirfortalecer el marco institucional para poder controlar con mas eficaciala evoluci6o de la oferta, la demanda y la comercializaci6n de lenia.C*omo un paso positivo en esta direcci6n, CONAF estableci6 en 1986 la RedNacional de Dendroenergia con el objetivo de a) facilitar la diseminacionen el campo tecnico y la acci6n conjunta de las institucionespertinentes, b) formular recomendaciones sobre politicas, y c) prepararuna base de informaci6n para facilitar el financiamiento de proyectos.La Red tiene programada procurar la participaci6n activa de los grupos depoblaci6n directamente afectados. Se recomienda que se incorpore a laRed aquellas entidades del sector privado que actuan en el campc. delmanejo forestal, las plantaciones y la comercializaci6n de la lenia.
Encarando aspectos del medio ambiente
25. Existen conflictos, tal como complementaridades, entre losobjetivos de desarrollo energetico y la conservaci6n del medioambiente. Por encima de deforestaci6n causada por el uso de leba, laproducci6n, mercadeo y uso de carb6n y de productos petroliferoscontribuyen a la contaminaci6n atmosferica y terrestre. Este problematiene particular seriedad en la Regi6n Metropolitana donde el impacto dela alta concentraci6n de poblaci6n y de actividades econ6micas aumentadebido a las condiciones topograficas y climatol6gicas locales.
26. El Gobierno esta conciente de la necesidad de manejo ambientalen el sector energetico y la CNE ha tomado la iniciativa de prepararmedidas correctivas. Proyectos recientes de hidroelectricidad incluyencomponentes dirigidos a aminorar los efectos negativos sobre el medio
- xiv -
ambiente. El Gobierno esti en el proceso de preparar un manual paramedir el impacto ambiental sobre proyectos de electricidad como parte delproyecto de gesti6n del sector publico financiado por el Banco Mundial.Un proyecto de descontaminaci6n ambiental esti siendo llevado a cabo enSantiago financiado en parte por un prestamo del BID.
27. Los aspectos ambientales, a menudo complejos, deben ser mejorentendidos y los costos de degradaci6n del medio ambiente y de lareducci6n de los mismos deben ser determinados mis a fondo, par& poderevaluar en que forma estos problemas deben ser encarados. Entre lasopciones para mejorar y prevenir los efectos negativos sobre el medioambiente, las mis eficaces en funci6n de costos deben ser evaluados afondo. El manejo de recursos naturales debe dar enfasis a laconservaci6n y sostaner la base de esos recursos. El impacto ambientalde las distintes formas de energia debe ser evaluado, considerandodebidamente aquellas formas que son mis compatibles con la meta deconservaci6n del medio ambiente. El anilisis de proyectos de energiadebe incluir una evaluaci6n de posibilidades para reducir los efectosnegativos sobre el medio amb.ente, especialmente en zonas susceptibles ala degradaci6n ecol6gica. Se debe establecer claramente el principio decobrar los costos de dafios ambientales a aquellos que los causan. LaCNE y otras instituciones gubernamentales iugarin un papel importantepara lograr un mejor entendimiento sobre las complementariedades einconsistencias entre energia y preocupaci6n ambiental y para definirconceptos de la politica a seguir y proyectos aptos que reconcilien losobjetivos de desarrollo de energia, protecci6n del medio ambiente ycrecimiento econ6mico. La CNE y ODEPLAN deberian guiar la integraci6n deinformac.6n sobre el uso de recursos con datos macroecon6micos, y evaluarlos costos y beneficios de ameliorar y prevenir la degradaci6n ambientalcomo resultado de operaciones de energia.
Inversiones previstas en el sector energetico, 1987-91
28. De acuerdo con la informaci6n suministrada por las empresas delsector, las inversiones en el sector de la energia para l987-91 podrianalcanzar el equivalente de US$2.700 millones (a precios y tipos de cambiode 1986), el 75Z del cual corresponde al sector publico. La mayorproporci6n de estas inversiones sigue siendo asignada al subsector de laelectricidad. Hay cuestiones fundamentales con respecto a lasinversiones en los subsectores de los hidrocarburos y del carb6n. Seplantea la cuesti6n de si el programa de inversiones de ENAP, que preveun volumen en el rango de US$460-675 millones, se justifica o si no sepodria reducir este programa por medio de una selecci6n de proyectos enforma mis rigorosa, mayor eficiencia de los proyectos en funci6n de loscostos y mayor participaci6n del sector privado. Los rubros que mispreocupan son las exploraciones de petr6leo y gas, pero tambien lasinversiones en refineria, para los cuales las prioridades aun deben deser definidas en forma mis clara basindose en soluciones a costominimo. Por tanto, las inversiones en el subsector de hidrocarburosquedan por ser definidos mis claramente, lo que incluye la intervenci6nrespectiva de los sectores publico y privado.
xv
29. En el subsector carbonifero, el programa de inversiones deEXACAR para 1987-91 asciende a casi US$47 millones. En vista del margenrestringido de ENACAR para ampliar la producci6n y de mus dificultadesfinancieras actuales, la magnitud y composici6n de este programa planteanpreguntas con respecto a en que medida las inversiones previstas lepermitiran realizar las mejoras necesarias para poder competir con elcarb6n importado (cuyo precio esta previsto de aumentar muy poco durantelos pr6ximos diez anos). El programa de inversiones de ENACAR se deberiareexaminar basandose en una evaluaci6n de todas las alternativas alalcance para reducir los costos de producci6n, desglosados mina por mina,proponiendo a la vez medidas especificas para reforzar la capacidad enmateria de planificaci6n, finanzas y comercializaci6n de la empresa.Inversiones en mejoras de la infraestructura deberian ser orientadashacia una reducci6n de costos de suministro y un apoyo a las operacionesde minas de costos relativamente bajos.
- Xvi -
SUMMARY AND CONCLUSIONS
1. Chile's economy depends to a considerable degree on energyimports, mainly petroleum, which in 1986 *mounted to US$354 million (netof energy reexports) equivalent to 6.42 of exports of goods and non-factor services. Witn domestic production of crude oil declining, thedecision makers face difficult choices to secure the long-termavailability of energy for economic growth. Counterbalancing the declinein crude production will therefore be the principal task in the energysector. Chile's energy resources are diversified but viable alternativesto crude oil, largely hydropower and natural gas, are located distantfrom the centers of energy consumption. Their development will becostly--including considerable investment in transport--and will involvelong lead times. Coal from some domestic mines may not be competitiv'with imports. Significant substitution of woodfuels for petroleurnproducts has been achieved in industry but a clear Government strategy *sneeded to utilize this potential more fully. Following significantconversion from fuel oil to coal, economic substitution of natural gasfor petroleum in central Chile is feasible but may have to be basedmainly on imports. Even assuming further gains in energy conservation,energy imports are bound to increase substantially over the nextdecade. They might absorb 7-91 of earnings from exports of goods andnon-factor services by the early 1990s, provided that the export growthof the ecoromy remains reasonably buoyant.
2. Chile is well-prepared to meet the challenges in the energysector. The Government's objectives are clearly defined and inaccordance with development requirements. They aim at (a) ensuringefficient resource allocation, and enhancing the efficiency of energyend-use; (b) encouraging competition and greater private sectorinvolvement; and (c) meeting energy requirements primarily throughindigenous resources. A coherent legal framework and effective organiza-tional structures have been established. At the apex of policyformulation, the autonomous National Energy Commission (CNE) isresponsible for preparing and coordinating sector planst and for advisingthe Government on energy policies and regulations. The National PlanningOffice (ODEPLAN) coordinates the actions of state entities within theNational Development Program. The Ministry of Economy approveselectricity tariffs based on CNE's recommendations. The Ministry ofMining represents the State in concluding and supervising contracts withcompanies on hydrocarbon exploration and production. The FinanceMinistry has ultimate authority in decisions on investment and thefinancing of investment in state-owned corporations. Energy policiesbased on pricing according to economic costs and the application ofmarket mechanisms for resource allocation have been instrumental insecuring adequate supplies, and in enhancing the efficiency of end-use.
3. At the operational level, the Government's strategy isimplemented through state-owned and private companies which have fullmanagerial autonomy and accountability. The National Petroleum Company
- xvii -
(ENAP) is charged with oil and gas exploration, production and refining,and is empowered to enter into partnership with foreign firms to develophydrocarbon reserves both in Chile and abroad. Four major electricitycorporations are in charge of generation, i.e. ENDESA, CHILECTRA-GENERACION, COLBUN, and PEHUENCHE. Transmission is primarily theresponsibility of ENDESA. Electricity distribution is carried out mainlyby private companies. The National Coal Company (ENACAR) is the majorproducer of coal whereas COCAR and Schwager are the principal privateproducers. The National Forestry Corporation (COWA?) monitors fuelwood-related activities dominated by the private sector. The Government hasinitiated a program of deregulating and decentralizing the major stateenergy corporations, in preparation for their gradual privatization. Astrong private sector presence has been secured in petroleum marketing,electricity generation and distribution, and coal production andmarketing. The Government has recently succeeded in attracting privateforeign firms to hydrocarbon exploration. The Government will continueto have a key role in the energy sector through monitoring pricing andinvestment, evaluating resources and requirements, ensuring markettransparency, and promoting efficient energy use.
4. To strengthen the productive capacity and management of theenergy sector, in the face of declining crude reserves, a coherentstrategy is called for whose main components to an important extent arealready being implemented. They include:
(a) over the short term:
(i; removing the remaining minor distortions in energypricing, and reinforcing energy demand management throughmeasures to increase market transparency, to improve theefficiency of investment and energy use;
(ii) enhancing the efficiency of energy supplies throughreducing wastage in production and losses intransformation and distribution, especially forelectricity;
(iii) ensuring a determined effort to promote petroleumexploration by outside companies in all promising areas;
(iv) assessing the potential for natural gas utilizationincluding for thermal power generation, and evaluatingoptions for gas imports from, and gas swaps withArgentina;
(v) developing a strategy for optimizirg the use of woodfuels;
(vi) identifying the immediate requi-ements and specificoptions for environmental conservation;
- xviii -
(b) over the medium to longer term:
(vii) expanding private sector involvement by means ofparticipation by national and foreign investors in allstages of energy operations, applying suitable financingmechanisms including debt-equity conversion to thefeasible ex-ent;
(viii) exploiting crude oil rsc-rves to the economically optimal(vs. technically feasik,Y) degree, and developing newreserves both domestcaliv ind abroad;
(ix) developing the hydro potential as the key component of theleast-cost electricity expansion program;
(x) rehabilitating and developing those coal mines that havethe scope to become competitive with imports;
(xi) utilizing natural gas in cental Chile for those uses whereit is the least-cost fuel; and
(xii) reconciling longer-term energy development strategies withenvironmental concerns.
Improving Energy Pricing
5. In general, energy pricing is well-developed and effectivelyadministered, furthering allocative efficiency, fiscal objectives, andthe financial viability of energy enterprises. Prices of petroleumproducts and coal are based on border prices. Electricity prices arebased on negotiations between generating and distributing companiesadjusted by transmission charges and those for consumers with less than2,000 kW installed capacity, on long-run marginal costs of supply as aproxy of market prices. Although ex-refinery prices of petroleumproducts are regularly adjusted by the suppliers, some distortions inconsumer prices have emerged. While of relatively limited negativeconsequences, these distortions should be addressed in the interest ofallocative efficiency. Also, the specific requirements involving thepricing of petroleum products in the current environment of internationalpetroleum price volatility need to be addressed.
6. Pricing of Petroleum Products. Marked differentials inspecific taxes result in lower prices of automotive diesel relative togasoline, which has created an incentive to use diesel and to shift thefleet toward diesel-powered vehicles. While the tax on diesel at itscurrent level covers adequately the variable element of road user costs,the tax on gasoline is much higher than an appropriate road usercharge. This problem could be resolved through raising the specific taxon diesel, or lowering the tax on gasoline, or a combination of the two,to better reflect the relative road user costs and to bring the relativeprices of gasoline and diesel closer in line with their relative border
- xis -
prices. The issue is whether any sub-optimal resource allocationresulting from the distortion in the relative fuel prices involves agreater economic cost than that of raising the same revenue through adifferent tax, e.g. on vehicles. The justification for these pricedifferentials should be analyzed in more detail to determine optimalmeans for achieving their objectives.
7. A potential problem relates to the price differential betweenautomotive and industrial diesel as the specific tax is levied only onthe former. While independent truckers pay the higher price of automotivediesel, industries with truck fleets might have the possibility to uselower-priced industrial diesel as transport fuel, thus squeezing profitmargins of independent truckers. However, the tax exemption forindustrial diesel is granted ex-post only on proof that the fuel has beenused for industrial purposes. The retail price of kerosene is substan-tially below thaL of LPG. The feasibility of correcting this throughadjusting the taxation of kerosene should be evaluated.
8. Adjusting to Petroleum Price Volatility. Internationalpetroleum prices have been highly volatile in recent years and are likelyto be so in the short-to medium term. This raises the issue whethershort-term as well as long-term price variations should be passed on toconsumers, or if consumer prices should be stabilized through somecompensatory mechanism, even if this may impact adversely on theinternational competitiveness of the economy. It is sometimes arguedthat fiscal and balance of payments concerns and the need to maintain themomentum for energy conservation may call for stabilizing petroleumprices, in view of investment rigidities, the expected increases ininternational petroleum prices over the medium-to longer term, thedecline in Chile's crude oil reserves, and the resulting fragility of theexternal position of the economy. However, on economic efficiencygrounds, it is necessary that domestic prices of petroleum products arein conformity with international market conditions so that economicdecisions are based on these conditions. Therefore, domestic petroleumprices need to fully reflect international price movements, short-term aswell as long-term, upswings as well as down-swings. The Governmentshares this position. Should some form of "conservation tax" onpetroleum products ever be considered, this would need to be based on acareful analysis of the energy savings potential in the economy and ofthe costs and benefits of mobilizing this potential. Such a tax wouldneed to be levied on all petroleum products and all consumers, at a fixedpreferably identical rate, so that the impact of international pricemovements is felt fully and equally by all consumers.
9. Comparative Energy Prices and Costs. The comparison of marketprices of useful energy to consumers indicates that in the residential/commercial/administrative sectors, fuelwood is the cheapest cooking fuel,followed by LPG, kerosene, and town gas, whereas electricity is the mostexpensive energy source. In the industrial/ mining sectors, coal andfuel oil remain the cheapest boiler fuels followed by diesel, fuelwood,and electricity. Kerosene and LPG are the most expensive fuels but are
- xx -
little used. In the transport sector, diesel is lower-cost on account ofits lower price and higher combustion efficiency compared to gasoline.
10. The analysis of market prices is useful for explaining thedemand-related factors in energy conservation and substitution. However,the relative economic costs of the various energy options including equi-pment costs also need to be analyzed to draw correct conclusions on thefeasibility of using or substituting various energy sources. On thatbasis, in the residential/co mmercial/ administrative sectors, LPG remainsthe cheapest fuel, followed by kerosene and fuelvood. Towrn gas and elec-tricity are much more costly. In the industrial/mining sectors, barringthe advent of natural gas, fuelwood, coal, and fuel oil are the cheapestfuels, followed by diesel and kerosene. Electricity remains the most ex-pensive energy source despite the higher efficiency of electrode boilers.
11. Some important conclusions can be drawn from this analysis.Energy costs would be minimized through a use pattern emphasizing fuel-wood in the residential/commercial/administrative sectors and fuelwood,coal and fuel oil in the industrial/mining sectors. The capacity forproducing and marketing these fuels should be expanded to the feasibleextent. Electricity (in the residential/ commercial/ administrativesectors and in the industry/mining sectors), and diesel,' kerosene, andLPG (in the industrial/mining sectors) are expensive sources of energy,even though electricity may be required for reasons related to processtechnology (e.g. for copper smelting). In the transport sector, theeconomic cost of diesel vs. gasoline approximate each other closely sothat no definitive conclusion on their relative preferability can bereached on that basis alone. Energy costs in central Chile would besignificantly influenced if natural gas becomes available. Natural gasmight be the least-cost fuel for thermal power generation and manyindustrial uses although it may not be economic to convert existingequipment to gas use. In order to improve market transparency and toprovide a firmer basis for energy demand projections, detailed economiccost studies need to be carried out and be continously updated. Thisshould include a careful evaluation of the environmental impact ofdifferent energy sources.
Strengthening the Petroleum Subsector
12. Production and Exploration. Crude oil production presentlymeets about 33% of Chile's requirements. However, this may fall to about5% by the mid-1990s, as proven reserves and production decline sharplyand production is becoming increasingly expensive. Even under optimisticassumptions regarding reserve additions from areas where no commercialdeposits have as yet been discovered, incremental production from theseareas would not be sufficient to stabilize the decline rate which isprojected to sharply accelerate from the early 1990s onwards. A majorissue is determining the most economic level and rate at which theremaining high-cost oil should be produced, which has a direct bearing onthe size of ENAP's future operations. A related issue is the explorationstrategy of ENAP, i.e. (a) whether it should go ahead with costly and
- xxi -
risky exploration in domestic marginal areas in the absence of foreigninvestment; and (b) what should be the level and nature of its new thrustinto international operations. The next few years may offer a uniqueopportunity for ENAP to acquire at least a limited stake in relativelylow-cost crude oil reserves abroad but its inexperience in operationsoutside Chile and foreign exchange constraints of the economy mayrestrict this option.
13. The Government's resource development strategy, which aims atreducing fiscal expenditures and risk for both the Government and ENAP,is appropriate and should be actively pursued. It should emphasize thefollowing elements:
(a) Production: (i) limit the near-term development andexploitation of the remaining crude oil reserves to coreproperties whose production costs are lowest; (ii) offer theremaining properties, along with areas with secondary recoverypotential, to private sector operators under exploitationcontracts; and (iii) assure that decisions on developmentinvestments continue to be based on long-run marginal cost ofproduction by field, with depletion rates consistent withmaximizing economic return rather than physical output;
(b) Domestic exploration: (i) ensure a persistent effort topromote the newly offered areas, to overcome the negativeperception among international companies about Chile'shydrocarbon potential, and to attract those companies with therequired technical expertise and financial backing; (ii)implement the Government's decision to open all areas tooutside investors; and (iii) undertake supplementary low-costefforts to improve the information base on technicallydifficult and complex geological areas. While some limiteddrilling by ENAP may be justified, large expenditure forexploring frontier areas should be avoided;
(c) International ventures: (i) establish clear objectives forENAP regarding the degree and type of risk and the extent ofits investment; and (ii) improve ENAP's ability to evaluateintprnational opportunities, particularly lower-risk jointventures with international companies.
14. Natural Gas Utilization. At present, natural gas is producedand used only in Magallanes. Nearly three-quarters of total output isreinjected, mainly to maintain reservoir pressure, to improve oilrecovery, and eventually, recover the reinjected gas. The remainder isused in field operations, flared or consumed in the small residentialmarket. Gas produced in Magallanes cannot be economically transported toother parts of the country so plans are to use it locally to producemethanol and ammonia/urea for exports. Therefore, natural gas associatedwith crude, which previously was reinjected or flared, will be sold byENAP to private firms for the production of methanol 1-d ammonia/urea, at
- xxii -
a floor price sufficient to cover costs and a supplementary price toachieve an adequate margin. While a basic assumption of these projectsis that gas has low opportunity cost, it needs to be ensured that gas-related investment is least cost and viable on its own, irrespective ofany associated oil development.
15. While there is considerable energy demand in central Chile, gassupplies would have to be provided from Argentina either through importsor swaps with Magallanes gas or, potentially, from deposits offshoreValdivia yet to be more fully explored. Of the import alternatives, theMaipo valley scheme appears to be superior and would be marginallyeconomic at a border price of about US$2/BTU million. The Valdiviaoffshore scheme does not appear viable at this time as the reserveslikely to exist miglt not be large enough to support this high-costscheme as a free-standing project. However, a two-stage supply approachmight be considered, i.e. first importing gas via the Maipo valley andlater, tapping the Valdivia offshore resources once sufficient reservesare proven and the market for natural gas develops. The combined projectalso would improve the country's bargaining position in that a futuredomestic supply alternative would exist.
16. As a variation to the importation option, gas from Magallanescould be supplied to Argentina in exchange for Argentine supplies tocentral Chile. This option could considerably reduce the cost of gas tocentral Chile. Its viability among others would depend on the oppor-tunity costs for Magallanes gas, and transmission costs (and capacity) onthe Argentine southern trunk pipeline, compared to the cost of straightgas imports from Argentina. While GASCO has taken the lead in discus-sions with Gas del Estado of Argentina, ENAP would have an important roleto play in this venture. The Government has indicated to Argentina theirinterest in initiating negotiations on gas imports as well as gas swaps.Potentially, the Salar de Atacama structure could hold significant gasreserves whose development might provide an important energy supplyoption to central Chile. Given the complexity of the issues involved, itis recommended that (8) existing gas optimization studies for centralChile be updated, based on updated market evaluations and new informationon domestic reserves, thereby taking into account the use of gas forpower generation, on the one hand, and the option of gas swaps withArgentina, on the other; and (b) provided the outcome of this evaluationmakes it advisable, agreements with Argentina on joint projects be soughtas a matter of priority.
17. Petroleum Refining. Because of the changing pattern ofpetroleum product demand towards more diesel use, the Government facesthe decision whether additional cracking facilities should be installed,or whether this increased demand should be accomodated by increases inrefinery throughput, changes in the crude input mix through increasingthe use of lighter or spiked crudes, importation of products in shortsupply, or a combination of these options. Under consideration are theinstallation of a mild hydrocracker at the Concon refinery to improvediesel runs, estimated by ENAP to cost US$22 million, and a delayed cokerat the Concepcion refinery to improve gasoline and diesel output and
- xxiii -
reduce the output of fuel oil by converting it into petroleum coke, whosecost are preliminarily estimated at US$45 million.
18. Used fully, ENAP's existing capacity would be sufficient tomeet domestic demand for virtually all products without any additionalinvestment. However, larger volumes of crude would be necessary than ifa mild hydrocracker were to be installed, and considerable volumes offuel oil would need to be exported at relatively low prices. A mildhydrocracker also would contribute to improving product quality andmeeting environmental requirements, but the capital and operating cost ofrefining would considerably increase. While the mild hydrocracker woulddo little to reduce the surplus of fuel oil, this could be achievedthrough a delayed coker which converts virtually all residual fuel intopetroleum coke. However, the economic viability of the latter option hasyet to be established. ENAP's analysis of investment options initiallywas based on a number of constraints which were bound to have a strongimpact on the results of the analysis, especially those restrictingexports of refined products in excess supply, and restricting the lightcrude portion of refinery inputs. While the removal of some of theseconstraints may make a mild hydrocracker at Concon economically viable,the incremental benefits of this scheme decline significantly onceexports of surplus products are assumed to take place. Should thepresent relative prices of light vs. heavy crude prevail until 1990-91,postponing the investment in the mild hydrocracker by about two yearswould be justified even if the prices of light crude would afterwardsincrease faster than those of heavy crude. The Government has postponeda decision until end-1988. Given the complexity of the issues involved,the comparative costs and benefits of the mild hydrocracker and delayedcoker options, together with those of continuing present arrangements,need to be evaluated in more detail, and the consistency of these inves-tments with longer-term optimization of refining operations clearlyestablished before a decision can be taken. This analysis also wouldneed to clarify the compatibility or competitiveness of the twooptions. In the meantime, the following modifications of the refininganalysis should be considered, some of which would have a direct bearingon operational improvements:
(a) reducing the differential in the price of light vs. heavycrudes;
(b) optimizing the crude slate, particularly through increasingdiesel spike inputs;
(c) eliminating the 50-50 allocation of domestic crude to therefineries; and
(d) eliminating fixed market allocations for the refineries, andinitiating product sales to Region I.
19. The Government is evaluating the feasibility of privatizingENAP's refining operations or alternatively, ENAP in its entirety. The
- xxiv -
financial prospects of refining in Chile will be crucial for this effortto be successful. Whichever form of privatization would in the end bechosen, it would need to be in strict conformity with price and marketcompetition.
Restructuring the Coal Subsector
20. Chile's coal resources are moderate and of relatively poorquality. Mining in central Chile is entirely underground, carried outunder difficult geological conditions mainly by the state-owned companyENACAR, the largest enterprise. Imports are minor and essentiallyconsist of coking coal. The Government has supported the development ofthe coal subsector through exploration, capacity expansion at the state-owned mines, and substituting coal for petroleum products in theelectricity and industrial sectors. A new private company, COCAR, hasstarted a 0.8 million tpy open pit mine in Magallanes in late 1987.
21. Costs of Supplies. The central issue facing the coal subsectoris how much of domestic mining capacity is competitive with imports orlikely to become so. ENACAR is affected by high costs especially fixedlabor costs relative to those of coal imports and of other domesticproducers. While ENACAR has taken strides to rationalize operations andto reduce excess labor, during the 1981-87 period operating costs perunit of output increased and output per employee remained virtuallyunchanged as output dropped. Mine-mouth costs varying between US$43-64/M.T. (washed coal) are above import parity cost of about US$40/M.T.and its delivery prices range from US$56-75/M.T. A better measure of theeconomic viability of coal production is given by the short-run marginalcost of existing production and the long-run marginal cost of futureproduction. These costs in some mines come close to, or below, theimport parity cost, assuming reduced manning levels combined with highermechanization. This indicates that local coal production could beeconomic at the margin.
22. The question arises if production from uneconomic mine3 shouldbe continued. There are various considerations to this. First, asignificant proportion of costs are sunk and to the extent that the cashcosts of lay-offs, pensions, financial charges, etc. exceed thedifferential between cash production costs and import costs, no savingsmaterialize from replacing domestic production through imports. Second,even though the recommissioning of closed mines is technically difficultand costly, continuing production would be justifiable only if there issufficient scope for reducing costs to make production competitive.Otherwise, mine closure would be economically superior. Third, a largeshare of fixed costs is related to excess labor whose shadow price may berelatively low as long as employment alternatives are lacking.Relatively low labor cost would tend to reduce the welfare cost ofcontinuing mining operations (or, conversely, result in significantwelfare cost in the case of mine closures). Excessive labor in coalmining may, at least in part, be the outcome of pressures from regionaland local authorities to preserve employment and these related costs
- xxv -
should be made explicit. In a wider context, measures should beevaluated to increase labor mobility as employment alternatives in theaffected areas are being developed.
23. The above considerations stress the urgency for furtherrationalizing high-cost mines and restructuring ENACAR. All feasibleoptions, including privatization, should be evaluated. The high fixedcosts of ENACAR, particularly Lota, need to be addressed through improve-ments in operational efficiency before any expansion is pursued. ENACARhas contracted consultants to conduct an in-depth evaluation of the scopefor efficiency improvements including reductions in the labor force. Anytechnical advice to ENACAR should focus on the following areas:
(a) Reducing Operating Costs: Operations should be evaluated mine-by-mine with a view to determining the scope for reducing costsespecially fixed costs, including through improvedinventory/stocks management, reducing above-ground services,closure of non-profitable mines or mine sections, andredeployment or reduction of the labor force. This evaluationshould include the options for shifting production from high-cost Lo lower-cost mines;
(b) Review of Investment Program: It needs to bi determinedwhether ENACAR's proposed investment program is consistent withrealistic assumptions about efficiency improvements and thegrowth of future markets;
(c) Finance and Planning: ENACAR should determine and pursue (i)financially optimal -- rather than technically feasible --production levels for invidividual mines and (ii) the financialimprovements attainable from decentralizing mining operations,out-contracting supporting services, and other measuresconducive to reducing operating costs and overheads;
(d) Development Strategy: A consistent medium-term corporate planshould be prepared comprising production, investment, sales,and finances. To the extent that ENACAR is unable to competeeffectively with other domestic producers or imports, astrategy enabling ENACAR to downsize operations and to becomecompetitive over a five-year period should be prepared. Thecorporate plan should include detailed proposals for improvingthe management information system linking all activities of theentity.
Enhancing the Role of Woodfuels
24. Natural growth of forests exceeds considerably the combinedfuelwood and timber demand country-wide, and nearly 1 million ha of treeplantations have been established over the past 10 years or so. However,most of these have been for industrial purposes whereas plantations forfuelvood established by CONAF have failed to prevent the emergence of
-xxvi-
regional and species-specific shortages, especially for eucalyptus in theMetropolitan Region where fuelwood demand is heavy and where deforesta-tion in the past has led to erosion and watershed management problemns.It therefore is necessary to take preventive action before localdeforestation reaches serious proportions. The concomitant reforestationneeds should be determined by detailed regional and species-specificsupply and demand evaluations, for which the data base needs to beconsiderably improved. Forested areas to be protected and those open forintensive use should be clearly demarcated. The options for involvingsmall-scale farmers more widely in tree planting and the relatedinstitutional and financing requirements also need be evaluated.
25. Given Chile's substantial forestry potential, a strategy toenhance the role of woodfuels in meeting energy requirements is appro-priate and should be developed. This should include strengthening theinstitutional framework to monitor more closely the supply, demand, andmarketing of fuelwood. As a positive step in this direction, CONAF in1986 created the National Dendroenergy Network, aimed at (a) facilitatingtechnical dissemination and joint action among the relevant institutions,(b) preparing policy recommendations, and (c) preparing an informationbase to facilitate project financing. The active participation of thedirectly affected population groups is being sought. It is recommendedto incorporate into the Network those private sector entities which areactive in forest management, plantations, and fuelwood marketing.
Addressing Environmental Concerns
26. There are trade-offs, as well as complementarities, between theobjectives of energy development and environmental conservation. Inaddition to deforestation as a result of fuelwood use, the production,marketing and use of coal and petroleum products contribute toatmospheric and soil pollution. This problem is especially serious inthe Metropolitan Region where the effects of heavy concentration ofpopulation and of economic activities is aggravated by local topographicand climatological conditions.
27. The Government is aware of the need for environmental manage-ment in the energy sector, and CNE has taken the initiative to preparecorrective action. Recent hydro projects have included components aimedat ameliorating adverse environmental effects. The Government is prepar-ing a manual for measuring the environmental impact of electric powerprojects, as part of the World Bank financed Public Sector Managementproject. A US$4 million air pollution monitoring and diagnostic programis being implemented in Santiago supported through an IDB loan.
28. Requirements and Recommendations. The often complexenvironment-related _ssues need to be better understood and the costs ofenvironmental damage and its abatement determined, to assess how theseissues can best be addressed. Among the options to counter adverseenvironmental impacts, the most cost-effective ones should be moreclosely evaluated. In managing natural resources, a premium should be
- xxvi i -
put on efficiency, conservation and sustaining the resource base. Theenvironmental impact of different energy forms should be evaluated,giving due consideration to those which are environmentally morebenign. Energy project analysis should incorporate an evaluation ofoptions to reduce adverse environmental effects, especially in ecologi-cally sensitive zones. The principle of charging the pollutor for thecosts of environmental damage should be clearly established and applied.CNE and other public sector institutions have an important role to playin achieving a better understanding of the complementarities and trade-offs between energy and environmental concerns, and in formulating policyand project concepts that reconcile the objectives of energy development,environmental conservation, and economic growth. CNE and ODEPLAN shouldtake the lead in integrating information on resource use with macco-economic data, and evaluating costs and benefits of ameliorating andpreventing damage to the environment as a result of energy operations.
Future Energy Sector Investment, 1987-91
29. According to information provided by the energy enterprises,energy-related investment for the 1987-91 period could be about US$2.7billion (1986 prices and exchange rates), with the public sectoraccounting for more than three-quarters of the total. The largest shareof energy investment would continue to be allocated to electricity.Critical issues relate to the investment plans in the hydrocarbons andcoal subsectors. There are question as to whether ENAP's investmentprogram as envisaged -- ranging from US$460-675 million -- is justified,or whether it could be reduced through more discriminating projectselection, improved cost effectiveness of individual projects, and largerinvolvement by the private sector. This primarily concerns the largestinvestment items, i.e. petroleum and gas exploration, but also refiningwhere priorities still need to be more clearly defined based on least-cost solutions to meeting petroleum requirements. Future investment inhydrocarbons has yet to be more clearly defined, including the respectiveroles of the public and private sectors.
30. In the coal subsector, ENACAR's 1987-91 investment programamounts to nearly US$47 million. Given ENACAR's limited scope to expandproduction and its prevailing operational and financial difficulties, thesize and composition of this program raises questions as to what extentthe proposed investment will enable the entity to make needed improve-ments to become competitive with imported coal (whose price is expectedto increase very little over the next ten years or so). ENACAR'sinvestment program should be reviewed based on evaluating all feasibleoptions to reduce production costs, disaggregated mine-by-mine, whileproposing specific measures to enhance ENACAR's planning, financial andmarketing capabilities. Infrastructure-related investment should beplanned with a view towards reducing the costs of coal supplies andsupporting the operations of low-cost mines.
I. IYENEtY AND THE ECOUCK
Background
1.1 Structure of the Economy. With a per-capita GNP ef US$1,320 in1986, Chile is in the upper range of middle-income countries. Agriculturein 1986 generated 10% of GDP; industrv and mining combined, 321; andservices both modern and traditional accounted for 52% of GDP. Coppermining and refining continues to be a pillar of the economy, accountingfor about 82 of CDP and 50% of merchandise exports. Sharoly fluctuatinginternational prices of copper traditionally have subjected the overalleconomy to a high degree of instability.
1r2 Recent Economic Developments. Following the 1982-83 depres-sion, which was caused by both external events and inappropriate domestic.policies, the Chilean economy has entered a period of relatively steadygrowth. Led by a strong export expansion which produced trade surplisesof US$1.1 billion both in 1986 and 1987, GDP growth averaged 4.6% p.a.during 1984-85 and nearly 5.5% p.a. in 1986-87, with emplovmentgeneration more than twice as high, despite the persi.tence ofunfavorable terms of trade and high real international interest rates.The resolution of the financial crisis which had struck many highlyindebted firms and banks in 1982-83, has resulted in a significantincrease in private savings and an increase in gross domestic savings to18.42 of GDP by 1986. This recovery, severe fiscal austerity, andcontinued foreign capital inflows have permitted a strong investmentexpansion amounting to about 10% p.a. in 1986-87. Nevertheless, theeconomic and social costs of che recovery have been considerable eventhough they were mitigated by responsive social programs: unemploymentreached record levels and family incomes dropped almost one-third duringthe depths of the depression. Chile's interest payments on its publicforeign debt in 1985-86 amounted to one-tenth of GDP and one-half ofdomestic savings, leaving little room for expansionary programs ormarginal investments.
1.3 Government Policies. The Government is aware that thestructural problems of the economy require a sustained medium-termadjustment program. Such a program has been in place since 1985 and hasincluded measures to (a) strengthen incentives for non-copper exports;(b) increase public savings and the efficiency of public expenditures;(c) improve the mobilization and allocation of savings; and (d) improvepublic efforts in the social sectors. This program has been supported bythree Structural Adjustment Loans from the World Bank of US$250 millioneach, an Extended Fund Facility from the IMF of SDR 750 million, andreschedulUngs from commercial banks and creditor governments totallingUS$18.4 billion. Prudent management of the external debt has contributedto maintain a sustainable situation. This included a program of debt-equity swaps which by mid-1986 had facilitated conversions of US$1.9
billion of foreign debt, bringing about a decline in foreign debt -- byabout US$230 million -- in 1987.
1.4 Outlook. Continued fiscal prudence, growing investment, and astable if not improving international environment are necess*ry to enablethe economy to continue to grow despite its heavy debt burden. It willtake some years more of austerity in consumption and sustained investmentgrowtie if Chile is to both service its external debt and achieve satis-factory economic growth. Given the openness of the economy, Chile'slong-term economic prospects are linked to the performance of theindustrial economies, terms of trade, and international interest rates.In spite of the growth in non-traditional exports, copper still accountsfor almost half of export earnings and its price prospects arevolatile. The country's foreign debt is about equal to GDP. Debtservice ratios while declining will remain substantial throughout the1980s. However, over the 1988-92 period, under moderately optimisticassumptions--real copper prices increasing by 3% p.a. (from a base rfUSC72/lb), non-copper exports increasing by 6% p.a. in real terms, inter-national interest rates falling to 5%, and continued internationalfinancial support--GDP growth averaging 4.5-5.5% p.a. seems feasible.Such a continued recovery would improve Chile's external debt positionconsiderably and strengthen its creditworthiness. Over the 1986-92period, the ratio of total debt to GDP would decrease from over 98% to67% and the interest-to-exports ratio, from 33% to 16%. The benefits ofexport-led growth could be spread throughout the economy. Social outlayscould be increased to attend to social infrastructure needs deferred bythe adjustment program. The expected employment generation would likelylead to an improvement in income distribution and living conditions forthe majority of the population.
1.5 Nevertheless, there remain considerable risks centering on theGovernment's ability to generate the required domestic savings andinvestment, Chile's terms of trade, and access to foreign capital ataffordable interest rates. In the case of adverse external developments,domestic savings may be insufficient to permit satisfactory growth anddebt service payments. Uncertainty related to internal politicaldevelopments also may affect private savings and investment.
Energy Resources, Supply and Demand
Energy Resources
1.6 Chile has limited crude oil resources yet substantial resourcesof natural gas, coal, hydropow 5r, and forests. Proven reserves of crudeoil in 1986 were 9.6 million m , less than 10 years of production at the1986 rate, which implies that oil resources are dwindling and productionwill decline sharply during the next years until commercial deposits areexhausted. Proven aft developed reserves of natural gas are estimated atnearly 56 billion m (or 1.96 trillion SCF), equivalent to 35 years of
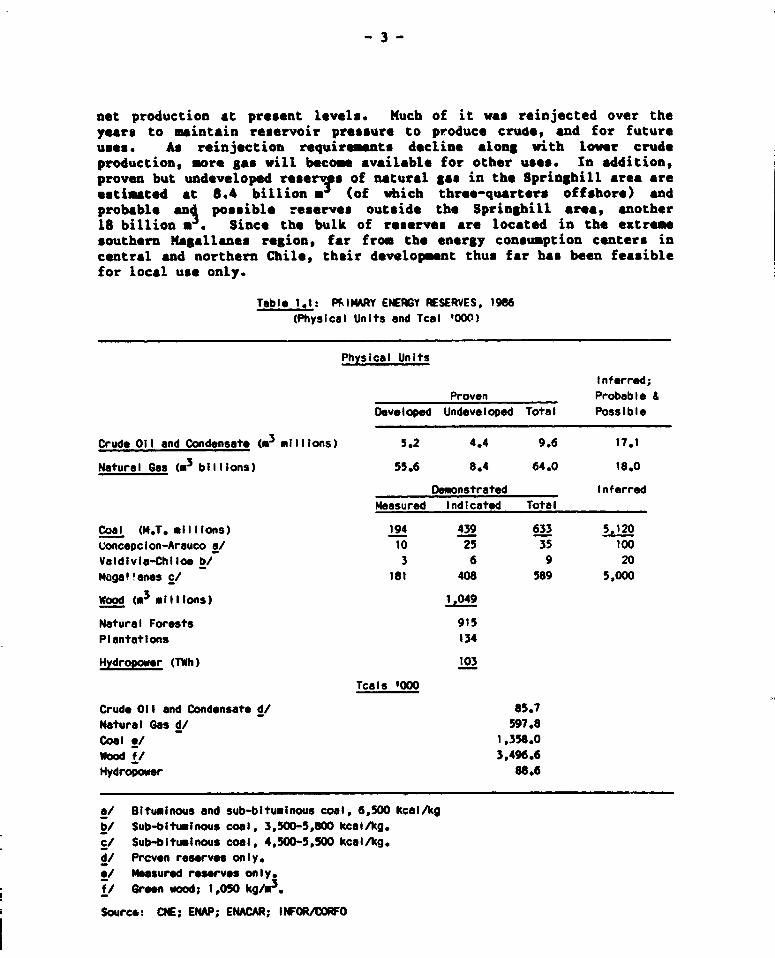
- 3 -
net production at present levels. Much of it was reinjected over theyears to maintain reservoir pressure to produce crude, and for futureuses. As reinjection requirements docline along with lower crudeproduction, more gas will becom available for other uses. In addition,proven but undeveloped resaerys of natural gas in the Springhill area areestimated at 8.4 billion a (of which three-quarters offshore) andprobable an4 possible reserves outside the Springhill area, another18 billion a S Since the bulk of reserves are located in the extremesouthern Magallanes region, far from the energy consumption centers incentral and northern Chile, their development thus far has been feasiblefor local use only.
Table 1.1: PFIMARY ENERGY FESERVES, 1986(Physical Units and Tcal '000)
Physical Units
Inferred;Proven Probable &
Developed Undeveloped Total Possible
Crude Oil and Condensate (m3 millions) 5.2 4.4 9.6 17.1
Natural Gas (*3 billions) 55.6 8.4 64.0 18.0
Demonstrated InferredMeasured Indicated Total
Coal (M.T. mIIIIons) 194 439 633 5 120Concepcion-Arauco a/ 10 25 35 100Valdivia-Chiloe b/ 3 6 9 20Maga!anes C/ 181 408 589 5,000
Wood Cm3 miliIons) 1.049
Natural Forests 915Plantations 134
Hydropow r (TWh) 103
Tcals '000
Crude Oil and Condensate d/ 85.7Natural Gas d/ 597.8Coal */ 1,358.0Wood f/ 3,496.6Hydropower 88.6
a/ Bituminous and sub-bituminous coal, 6,500 kcalAkgb/ Sub-bituminous coal, 3,500-5,800 kcal/kg.c/ Sub-bituminous coal, 4,500-5,500 kcal/kg.d/ Proven reserves only.*/ Measured reserves only.f/ Green wood; 1,050 kg/i3.
Sourc&: CNE; ENAP; ENACAR; IWFOR FOWO
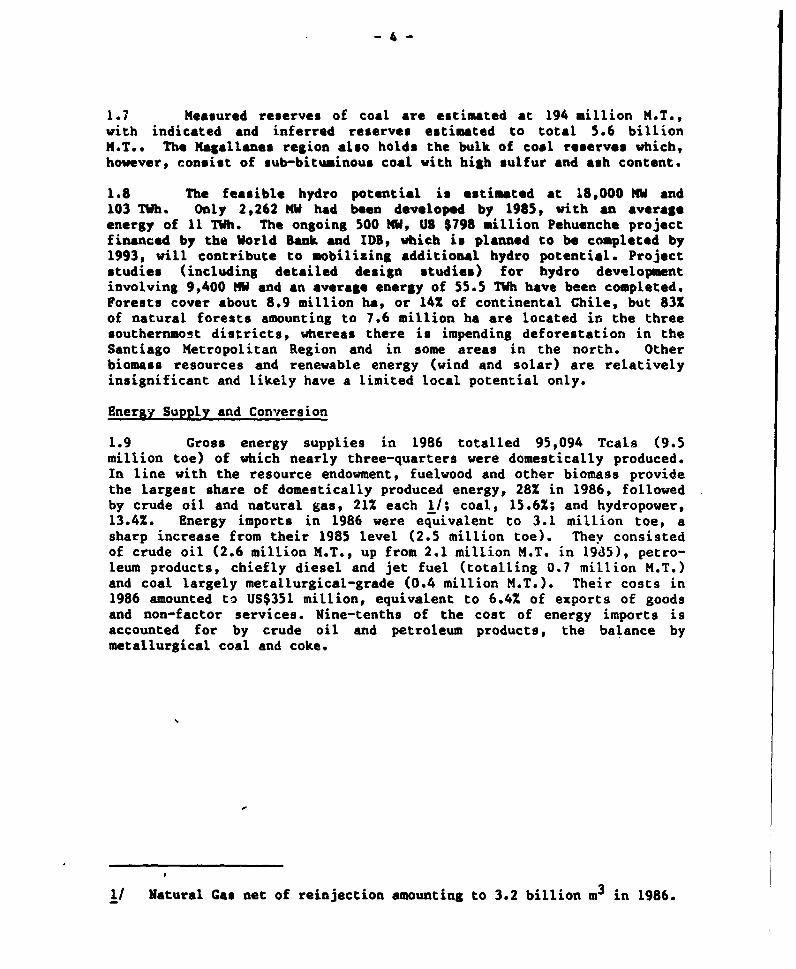
- 4 -
1.7 Measured reserves of coal are estimated at 194 million M.T.,with indicated and inferred reserves estimated to total 5.6 billionMT.. The Magallanes region also holds the bulk of cool reserves which,however, consist of sub-bituminous coal with high sulfur and ash content.
1.8 The feasible hydro potential is estimated at 18,000 MW and103 TWh. Only 2,262 NW had been developed by 1985, with an averageenergy of 11 TWh. The ongoing 500 NW, US $798 million Pehuenche projectfinanced by the World Bank and IDB, which is planned to be completed by1993, will contribute to mobilizing additional hydro potential. Projectstudies (including detailed design studies) for hydro developmentinvolving 9,400 MW and an average energy of 55.5 TWh have been completed.Forests cover about 8.9 million ha, or 14% of continental Chile, but 83Sof natural forests amounting to 7.6 million ha are located in the threesouthernmost districts, whereas there is impending deforestation in theSantiago Metropolitan Region and in some areas in the north. Otherbiomass resources and renewable energy (wind and solar) are relativelyinsignificant and likely have a limited local potential only.
Energy Supply and Conversion
1.9 Gross energy supplies in 1986 totalled 95,094 Tcals (9.5million toe) of which nearly three-quarters were domestically produced.In line with the resource endowment, fuelwood and other biomass providethe largest share of domestically produced energy, 28Z in 1986, followedby crude oil and natural gas, 21% each 1/; coal, 15.6%; and hydropower,13.4%. Energy imports in 1986 were equivalent to 3.1 million toe, asharp increase from their 1985 level (2.5 million toe). They consistedof crude oil (2.6 million M.T., up from 2.1 million M.T. in 19d5), petro-leum products, chiefly diesel and jet fuel (totalling 0.7 million M.T.)and coal largely metallurgical-grade (0.4 million M.T.). Their costs in1986 amounted to US$351 million, equivalent to 6.4% of exports of goodsand non-factor services. Nine-tenths of the cost of energy imports isaccounted for by crude oil and petroleum products, the balance bymetallurgical coal and coke.
1/ Natural Gas net of reinjection amounting to 3.2 billion m3 in 1986.
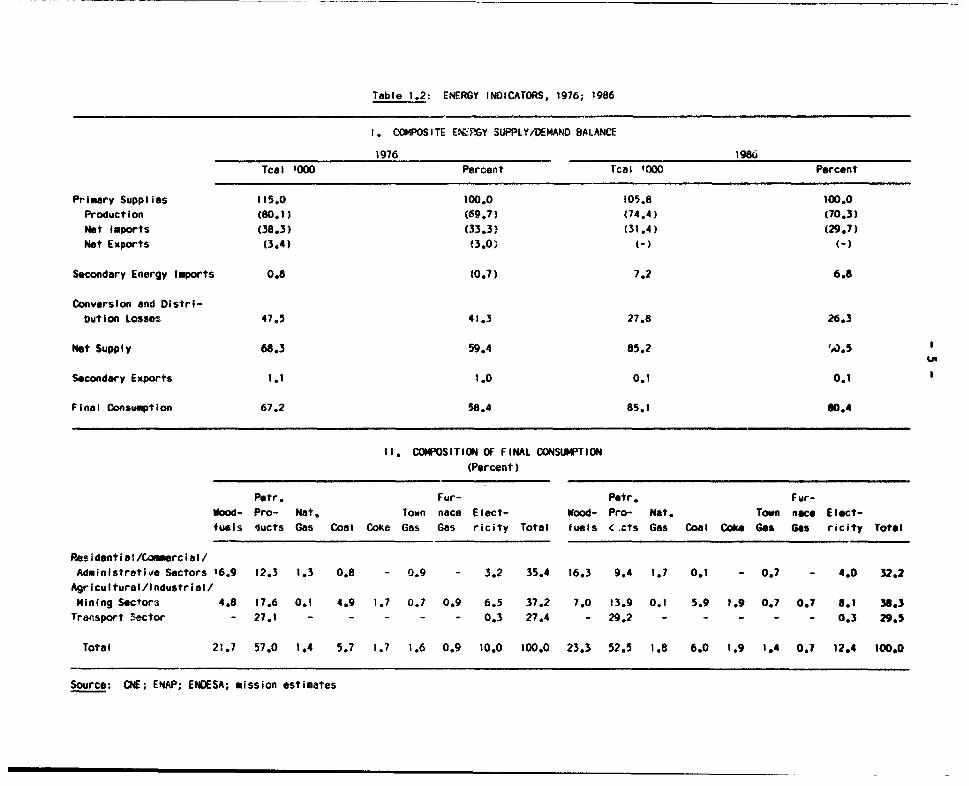
Table 1.2: ENERGY INDICATORS, 1976; 1986
I. COMPOSITE ENWRGY SUPPLY/DEMAND BALANCE
1976 1986
Tcal '000 Percent Tcal '040 Percent
Primary Supplies 115.0 100.0 105.8 100.0
Production (80.1) (69.7) (74.4) (70.3)
Net lmports (38.3) (33.3) (31.4) (29.7)
Net Exports (3.4) '3.0) ( (-)
Secondary Energy Imports 0.8 10.7) 7.2 6.8
Conversion and Distri-
bution Losses 47.5 41.3 27.8 26.3
Net Supply 68.3 59.4 85?2 '.,5
Secondary Exports 1.1 1.0 0.1 0.1
Final Consumption 67.2 58.4 85.1 80.4
I1. COMPOSITION OF FINAL CONSSUMPTION
(Percent)
P.tr. Fur- Petr. Fur-
Wood- Pro- Nat. Town nace Elect- Wood- Pro- Nat. Town naco Elect-
fuels 4ucts Gas Coal Coke Gas Gas ricity Total fuels C.cts Gas Coal Coke Gas Gas ricity Total
Res identiat/Commercial/
Administratlie Sectors '6.9 12.3 1.3 0.8 - 0.9 - 3.2 35.4 16.3 9.4 1.7 0.1 - 0.7 - 4.0 32.2
Agricultural/lndustrial/
Mining Sectors 4.8 17.6 0.1 4.9 1.7 0.7 0.9 6.5 37.2 7.0 13.9 0.1 5.9 1.9 0.7 0.7 8.1 38.3
Transport 5ector - 27.1 - - - - - 0.3 27.4 - 29.2 - - - - - 0.3 29.5
Total 21.7 57.0 1.4 5.7 1.7 1.6 0.9 10.0 100.0 23.3 52.5 1.8 6.0 1.9 1.4 0.7 12.4 100.0
Source: CNE; ENAP; ENDESA; mission estimates
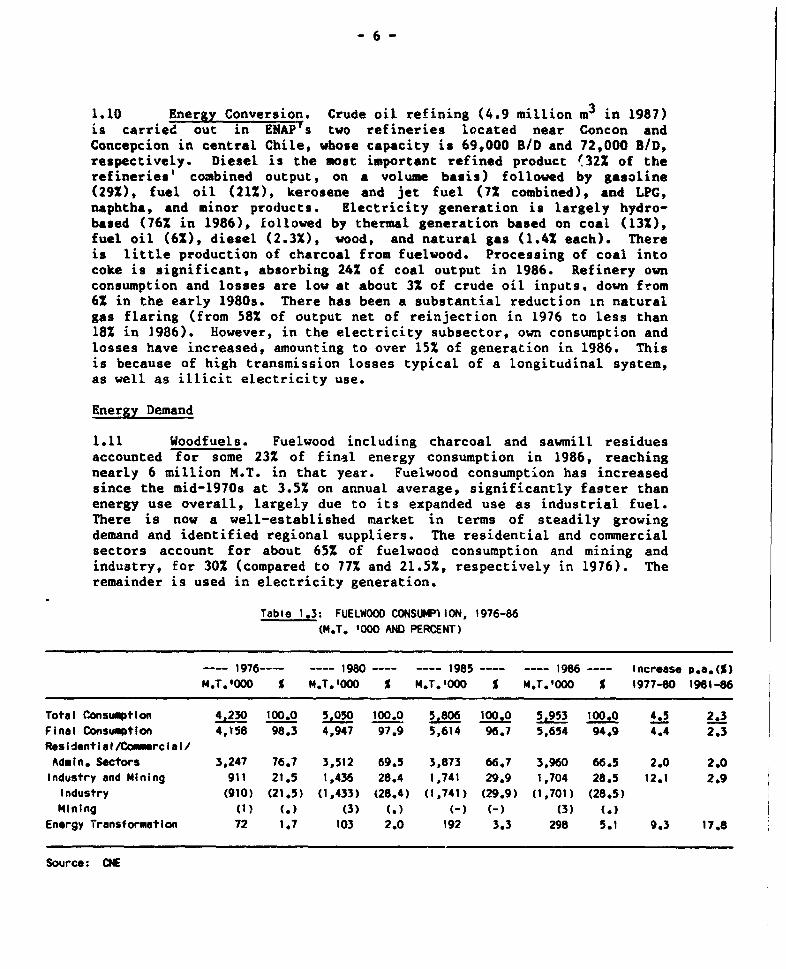
1.10 Energy Conversion. Crude oil refining (4.9 million m3 in 1987)is carried out in ENAP's two refineries located near Concon andConcepcion in central Chile, whose capacity is 69,000 B/D and 72,000 B/D,respectively. Diesel is the most important refined product {32% of therefineries' combined output, on a volume basis) followed by gasoline(29%), fuel oil (21O), kerosene and jet fuel (7% combined), and LPG,napbtha, and minor products. Electricity generation is largely hydro-based (76% in 1986), followed by thermal generation based on coal (13%),fuel oil (6%), diesel (2.3X), wood, and natural gas (1.4% each). Thereis little production of charcoal from fuelvood. Processing of coal intocoke is significant, absorbing 24% of coal output in 1986. Refinery ownconsumption and losses are low at about 3% of crude oil inputs. down from6Z in the early 1980s. There has been a substantial reduction in naturalgas flaring (from 58% of output net of reinjection in 1976 to less than18% in 1986). However, in the electricity subsector, own consumption andlosses have increased, amounting to over 15% of generation in 1986. Thisis because of high transmission losses typical of a longitudinal system,as well as illicit electricity use.
Energy Demand
1.11 Woodfuels. Fuelwood including charcoal and sawmill residuesaccounted for some 23% of final energy consumption in 1986, reachingnearly 6 million M.T. in that year. Fuelwood consumption has increasedsince the mid-1970s at 3.5% on annual average, significantly faster thanenergy use overall, largely due to its expanded use as industrial fuel.There is now a well-established market in terms of steadily growingdemand and identified regional suppliers. The residential and commercialsectors account for about 65% of fuelwood consumption and mining andindustry, for 30% (compared to 77% and 21.5%, respectively in 1976). Theremainder is used in electricity generation.
Table 1.3: FUELWOOD CONSUWitlON, 1976-86(M,T. '000 AND PERCENT)
---- 1976---- ---- 19801---- ---- 985 ---- ---- 1986 ---- Increase P.a.(%)M.T.0000 S M.T.000 S M.T.1000 S M.T.�000 S 1977-80 1981-86
Total Consumption 4,230 100.0 5.050 loo.o 5,806 100.0 5.953 100.0 4.5 2.3Final Consumption 4,158 98.3 4,947 97.9 5,614 96.7 5,654 94.9 4.4 2.3Residentalo/Comercial/Admin. Sectors 3,247 76.7 3,512 69.5 3,873 66.7 3,960 66.5 2.0 2.0Industry and Mining 911 21.5 1,436 28.4 1,741 29.9 1,704 28.5 12.1 2.9Industry (910) (21.5) (1,433) (28.4) (1,741) (29.9) (1,701) (28.5)Mining (1? . (3) .) () -)(3) (.
Energy Transformation 72 1.7 103 2.0 192 3.3 298 5.1 9.3 17.8
Source: CNE
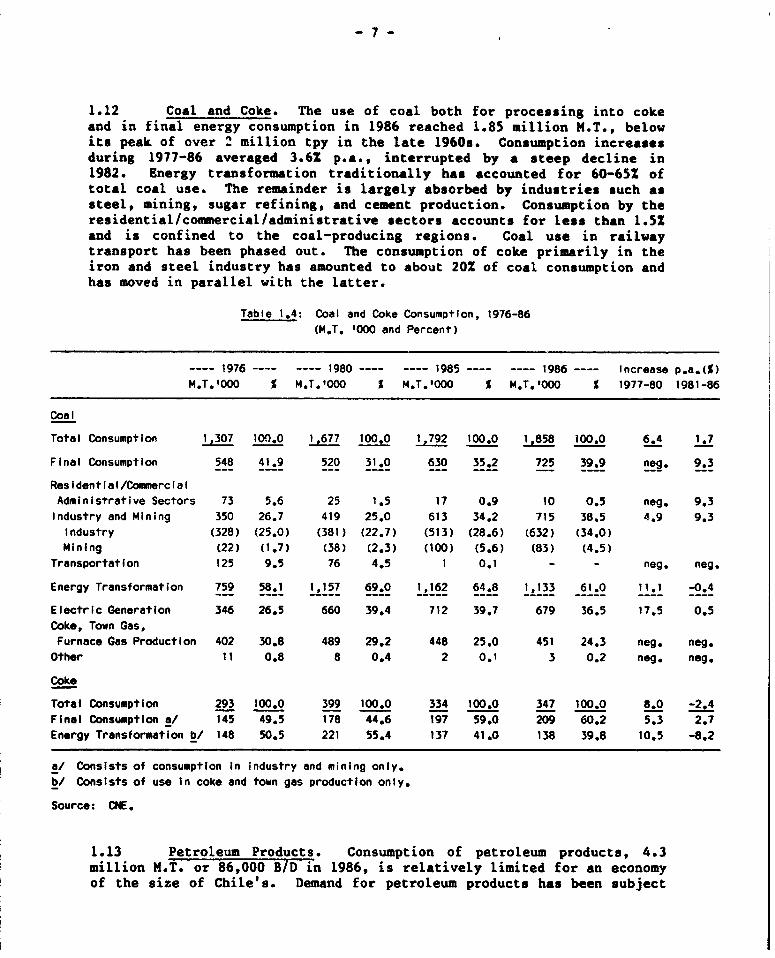
-7-
1.12 Coal and Coke. The use of coal both for processing into cokeand in final energy consumption in 1986 reached 1.85 million M.T., belowits peaik of over 2 million tpy in the late 1960s. Consumption increasesduring 1977-86 averaged 3.6% p.a., interrupted by a steep decline in1982. Energy transformation traditionally has accounted for 60-65% oftotal coal use. The remainder is largely absorbed by industries such assteel, mining, sugar refining, and cement production. Consumption by theresidential/commercial/administrative sectors accounts for less than 1.5%and is confined to the coal-producing regions. Coal use in railwaytransport has been phased out. The consumption of coke primarily in theiron and steel industry has amounted to about 20% of coal consumption andhas moved in parallel with the latter.
Table 1.4: Coal and Coke Consumption, 1976-86(M.T. '000 and Percent)
---- 1976 ---- ---- 1980 ---- ---- 1985 ---- ---- 1986 ---- Increase p.a.(%)M.T.1000 % M.T.'000 % M.T.1000 % M.T.oo00 % 1977-80 1981-86
Coal
Total Consumption 1,307 100.0 1,677 100.0 1,792 100.0 1.858 100.0 6.4 1.7
Final Consumption 548 41.9 520 31.0 630 35.2 725 39.9 neg. 9.3
Residential/CommercialAdministrative Sectors 73 5.6 25 1.5 17 0.9 10 0.5 neg. 9.3Industry and Mining 350 26.7 419 25.0 613 34.2 715 38.5 4.9 9.3Industry (328) (25.0) (381) (22.7) (513) (28.6) (632) (34.0)Mining (22) (1.7) (38) (2.3) (100) (5.6) (83) (4.5)
Transportation 125 9.5 76 4.5 1 0.1 - - neg. neg.
Energy Transformation 759 58.1 1,157 69.0 1,162 64.8 1,133 61.0 11.1 -0.4
Electric Generation 346 26.5 660 39.4 712 39.7 679 36.5 17.5 0.5Coke, Town Gas,Furnace Gas Production 402 30.8 489 29.2 448 25.0 451 24.3 neg. neg.Other 11 0.8 8 0.4 2 0.1 3 0.2 neg. neg.
Coke
Total Consumption 293 100.0 399 100.0 334 100.0 347 100.0 8.0 -2.4Final Consumption a/ 145 49.5 178 44.6 197 59.0 209 60.2 5.3 2.7Energy Transformation b/ 148 50.5 221 55.4 137 41.0 138 39.8 10.5 -8.2
a/ Consists of consumption In industry and mining only.b/ Consists of use In coke and town gas production only.
Source: CNE.
1.13 Petroleum Products. Consumption of petroleum products, 4.3million M.T. or 86,000 BID in 1986, is relatively limited for an economyof the size of Chile's. Demand for petroleum products has been subject
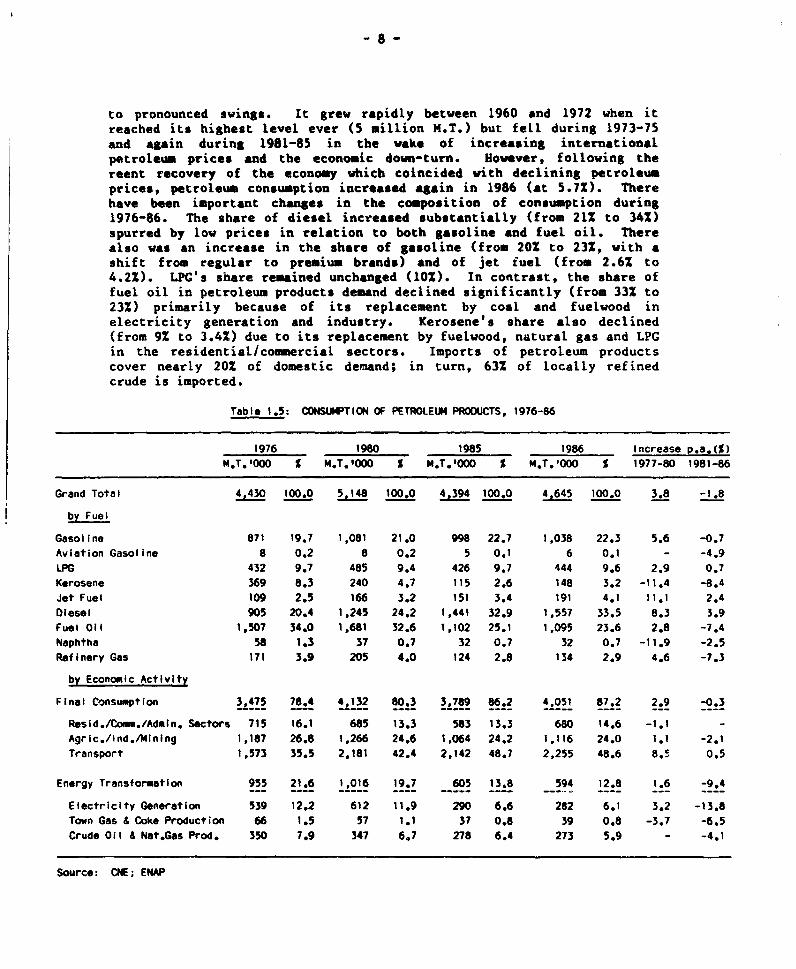
to pronounced swings. It grew rapidly between 1960 and 1972 when itreached its highest level ever (5 million M.T.) but fell during 1973-75and again during 1981-85 in the woke of increasing internationalpetroleum prices and the economic down-turn. However, following thereent recovery of the economy which coincided with declining petroleumprices, petroleum consumption incre"sed again in 1986 (at 5.7%). Therehave been important changes in the composition of consumption during1976-86. The share of diesel increased substantially (from 21% to 341)spurred by low prices in relation to both gasoline and fuel oil. Therealso was an increase in the share of gasoline (from 201 to 23%, with ashift from regular to premium brands) and of jet iuel (from 2.6% to4.2%). LPC's share remained unchanged (102). In contrast, the share offuel oil in petroleum products demand declined significantly (from 33% to231) primarily because of its replacement by coal and fuelwood inelectricity generation and industry. Kerosene's share also declined(from 9% to 3.4%) due to its replacement by fuelwood, natural gas and LPGin the residential/cosmercial sectors. Imports of petroleum productscover nearly 201 of domestic demand; in turn, 63% of locally refinedcrude is imported.
Table 1.5: CONSUMPTION OF PETROLEUM PROOUCTS, 1976-86
1976 1980 1985 1986 Increase p.a.(%)M.T.'0 s M.T.000 OO M.T.'OOO S 1977-80 1981-86
Grand Total 4,430 100.0 5,148 100.0 4,394 100.0 4,645 100.0 3.8 -1.8
by Fuel
Gasoline 871 19.7 1,081 21.0 998 22.7 1,038 22.3 5.6 -0.7Aviation Gasoline 8 0.2 8 0.2 5 0.1 6 0.1 - -4.9LPG 432 9.7 485 9.4 426 9.7 444 9.6 2.9 0.7Kerosene 369 8.3 240 4.7 115 2.6 148 3.2 -11.4 -8.4Jet Fuel 109 2.5 166 3.2 151 3.4 191 4.1 11.1 2.4Diesel 905 20.4 1,245 24.2 1,441 32.9 1,557 33.5 8.3 3.9Fuel Oil 1,507 34.0 1,681 32.6 1,102 25.1 1,095 23.6 2.8 -7.4Naphtha 58 1.3 37 0.7 32 0.7 32 0.7 -11.9 -2.5Refinery Gas 171 3.9 205 4.0 124 2.8 134 2.9 4.6 -7.3
by Economic Activity
Final Consumption 3,475 78.4 4,132 80.3 3,789 86.2 4,051 87.2 2.9 -0.3
Resid./Comm./Admin. Sectors 715 16.1 685 13.3 583 13.3 680 14.6 -1.1 -
Agric./lnd./lMining 1,187 26.8 1,266 24.6 1,064 24.2 1,116 24.0 1.1 -2.1Transport 1,573 35.5 2,181 42.4 2,142 48.7 2,255 48.6 8.' 0.5
Energy Transformation 955 21.6 1,016 19.7 605 13.8 594 12.8 1.6 -9.4
Electricity Generation 539 12.2 612 11.9 290 6.6 282 6.1 3.2 -13.8Town Gas & Coke Production 66 1.5 57 1.1 37 0.8 39 0.8 -3.7 -6.5Crude Oil & Nat.Gas Prod. 350 7.9 347 6.7 278 6.4 273 5.9 - -4.1
Source: CNE; ENAP
1.14 Natural Gas, Furnace Gas, and Town Cas. At present, the use ofnatural gas is restricted to the producing region of Magallanes, distantfrom major energy consumption center,%. A substantial share of the 1986psoduction amounting to 1.2 billion * (net of reinjection of 3.2 billionm ; was for ENAP's own use (640 million *3) or was burned (211 millionm3). Gas is mainly sold to the residential/co_ercial/administrativesectors and for electricity generation, whereas very little is consumedin industry. Consumption during 1977-86 increased at 1.8%, annualaverage, which is low given available resources and the energy substitu-tion potential in th e economy. Natural gas exports to Argentina hadreached 750 million m in 1978 but were discontinued after 1979 when thatcountry accelerated the development of its own resources. Theconsumption of low-calorific furnace gas and town gas has stagnated overthe past ten years.
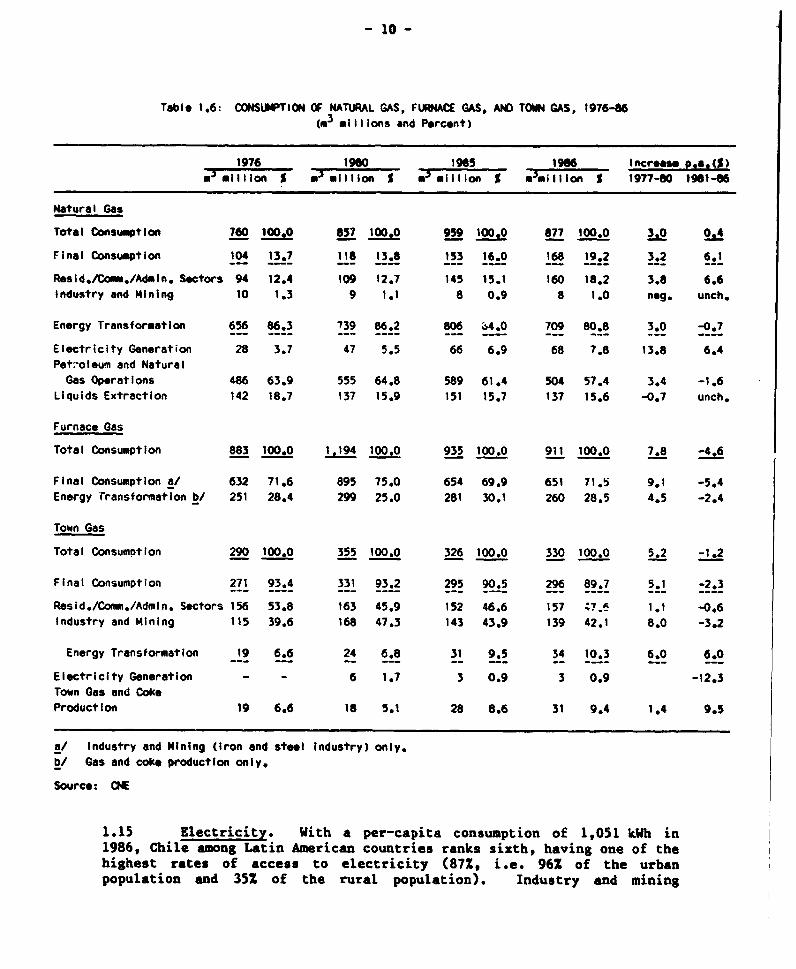
- 10 -
Table 1.6: CONSUMPTION OF NATURAL GAS, FURNACE GAS, ANO TOWN GAS, 1976-86(03 millions and Percent)
1976 19W 1965 1966 incres. p..&($)mJ miliIon w' million S m'million S *3million S 1977-80 1961-66
Natural Gas
Total Consumptlon 760 100.0 857 100.0 959 100.0 877 100.0 3.0 0.4
Final Consumption 104 13.7 118 13.8 153 16.0 168 19.2 3.2 6.1
Resid./Com./Admin. Sectors 94 12.4 109 12.7 145 15.1 160 18.2 3.8 6.6Industry and Mining 10 1.3 9 1.1 8 0.9 8 1.0 neg. unch.
Energy Transformation 656 86.3 739 86.2 806 84.0 709 80.8 3.0 -0.7
Electricity Generation 28 3.7 47 5.5 66 6.9 68 7.8 13.8 6.4Pot:oleum and NaturalGas Operations 486 63.9 555 64.8 589 61.4 504 57.4 3.4 -1.6
Liquids Extraction 142 18.7 137 15.9 151 15.7 137 15.6 -0.7 unch.
Furnace Gas
Total Consumption 883 100.0 1_194 100.0 935 100.0 911 100.0 7.8 -4.6
Final Consumption a/ 632 71.6 895 75.0 654 69.9 651 71.5 9.1 -5.4Energy Transformation b/ 251 28.4 299 25.0 281 30.1 260 28.5 4.5 -2.4
Town Gas
Total Consumption 290 100.0 355 100.0 326 100.0 330 100.0 5.2 -1.2
Final Consumption 271 93.4 331 93.2 295 90.5 296 89.7 5.1 -2.3
Resid./Comm./Admin. Sectors 156 53.8 163 45.9 152 46.6 157 ;7_6 1.1 -0.6Industry and Mining 115 39.6 168 47.3 143 43.9 139 42.1 8.0 -3.2
Energy Transformation 19 6.6 24 6.8 31 9.5 34 10.3 6.0 6.0
Electricity Generation - - 6 1.7 3 0.9 3 0.9 -12.3Town Gas and CokeProduction 19 6.6 18 5.1 28 8.6 31 9.4 1.4 9.5
a/ Industry and Mining (iron and steel industry) only.b/ Gas and coke production only.
Source: CNE
1.15 Electricity. With a per-capita consumption of 1,051 kWh in1986, Chile among Latin American countries ranks sixth, having one of thehighest rates of access to electricity (87%, i.e. 96% of the urbanpopulation and 35% of the rural population). Industry and mining
- 11 -
combined accounted for 61% of 1986 consumption followed by theresidential/commercial/administrative sectors '331), energy transforma-tion (4.31) and transport (1.71). Industry and mining are relativ(:yelectricity-intensive, due to the importance of copper and pulp and paperproduction. 2/ Given the relatively moderate growth of self-generation,the share of industrial consumption supplied by the public service hasbeen growing significantly faster than that of total industrial consump-tion, especially in the Central Interconnected System which accounts for741 of total installed capacity and 84X of generation and consumption.In the future, this difference should become less pronounced in view of
the continued reduction of the share of self-generation.
Table 1.7: ELECTRICITY CONSUMPTION BY SECTOR, 1975-86
(GWh and Percent)
Preliminary Change p.a. (W)
Consuming Sectors ----1975---- ----1980---- ----1985---- ----1986---- 1976-80 1981-86
(GWh) (S) (GWh) (S) (GWh) (S) (GWh) (S)
Total Consumption 7,962 100.0 10,526 100.0 12,262 100.0 12,795 100.0 5.9 3.7
Industry and Mining 5,129 64.4 6,954 66.1 8,101 66.0 8.407 65.7 5.8 3.2
Public Grid Supplied (2,817) (35.4) (4,076) (38.7) (5,103) (41.6) (5,380) (42.0) (7.7) (4.6)
Self Generation (2,312) (29.0) (2,878) (27.4) (2,998) (25.4) (3,027) (23.7) (4.5) (0.8)
Residential 1,393 17.5 1,805 17.1 1,996 16.3 2,109 16.5 5.3 2.6
Commercial and Others 1,264 15.9 1,569 14.9 1,945 15.9 2,056 16.1 4.4 7.2
Transport 176 2.2 198 1.9 220 1.8 223 1.7 2.4 2.0
Source: ENOESA.
1.16 Electricity growth was relatively high throughout the 1970s butslowed down during 1981-86 especially for residential consumption.Indeed, present consumption per customer is practically the same as thatof 1960. It seems that until 1970, the rapid pace of connections of newcustomers with below-average consumption outweighed the growth ofconsumption of existing customers. In contrast, the stagnation of per-customer consumption since 1980 cannot be explained by rapid growth of
the number of low-volume consumers: it probably is due to improvements inthe efficiency of appliances and other conservation efforts, as well as
the slight decline in disposable incomes. Neither can it be explained bya reduced competitiveness of electricity. In fact, the price of
2/ These two sectors in 1986 accounted for 401 and 13Z, respectively,of industrial electricity consumption. Further, they accounted for351 of the 1980-86 growth of total electricity consumption, and for621 of the growth of industrial consumption alone.
- 12 -
electricity during 1975-84 has increased by a factor of 1.77 compared to2.87 for kerosene and 3.91 for LPG.
Table 1.8: FESIDENTIAL ELECTRICITY CONSUMPTION INDICATORS, 1960e6
1960-65 1965-70 1970-75 1975-80 198044
Numbr of Connections p.a. 40,326 56,200 70,293 47,576 45,295Customer Growth (S) 7.7 7.3 6.8 3.7 3.0Growth of Consumptionper customer (%) -1.4 -1.1 1.7 1.8
1960 1965 1970 1975 1980 1984 1986
Consumption per Customer (kWh) 1,040 970 918 996 1,087 989 1,051
Source: ENDESA.
Energy End-Use for Major Economic Activities
1.17 Final energy consumption in 1986 totalled 8.5 million toe, or0.69 toe per capita. 3/ Its growth during 1977-86 has been slow, 2.4% onannual average, compared to GDP growth averaging 3.7% over the sameperiod, indicating that significant gains in energy efficiency have beenachieved. Primarily as a result df energy conservation and substitution,important structural changes have taken place. Petroleum products whilecontinuing to meet the largest share of final energy consumption havedeclined in 1976-86 from 57% to less than 53% whereas there werecorresponding increases in the shares of fuelwood (from 21.6% to 23.3Z)and electricity (from 10% to 12.4%). The use of wood has increasedparticularly in mining and the pulp and paper industries, where it hasbeen replacing fuel oil and coal in heat generation. The share of theother fuels (coal and coke; natural, town, and furnace gases) haveremained unchanged.
1.18 In the industrial sector, energy consumption during 1977-86increased at 2.7X on annual average. The share of petroleum productsover that period declined from 51% to 37%, with corresponding increasesin the shares of electricity (from 18% to 21%), fuelwood (from 13% to18%) and coal and coke (combined, from 14% to 17%). The shares of therema5aing fuels (mainly town and furnace gas) have changed little. Fueloil has remained the largest single energy source in industry (22.5X in
3/ This compares to per-capita energy consumption of 1.5 toe aorMexico, 1.3 toe for Brazil, and 0.7 toe for Colombia.
- 13 -
1986, down from 33% in 1976) which indicates that a substantial potentialfor fuel substitution still exists.
1.19 In the residential/com_ercial/administrative sectors, annualincreases in energy consumption during 1977-86 averaged just 1.4%.Fuelvood has met 50% of energy requirements in 1986 followed by LPG (182)and electricity (9%, vs. 13% in 1976). Town and natural gas increasedtheir combined share slightly (from 6.3% to 7.6%). There were sharpincreases in the use of fuelwood mirrored by declines in the use ofkerosene (from 12.6% to 4.5%) and coal (from 2% to less than 0.5%)despite low relative prices for both fuels.
1.20 ,n the transport sector, energy consumption grew at 3.1% p.a.in 1977-86. There was a substantial increase in the shares of diesel(from 29% to 43%) and high-octane gasoline (from 9% to 37%) as a resultof favorable relative prices of these fuels and concomitant shifts in thevehicle fleet. On the other hand, substantial declines occurred in theshares of low-octane gasoline (from 43% to 9%) and fuel oil for maritimeand rail transport (from 5.5% to less than 2%). The small share ofelectricity principally for the Santiago Metro system remained unchanged(about 0.5%). The share of air transport fuels remained steady at 7.5 -8.5% of energy use in transport.
Sector Policies and Institutions
Sector Objectives and Policies
1.21 The Government has set clear goals for the energy sector,consistent with its basic economic philosophy. These are: (a) ensuringefficient resource allocation to supply energy at least cost and enhancethe efficiency of energy end-use throughout the economy; (b) encouragingcompetition and private sector activity; and (c) to the feasible degree,meeting energy demand primarily through indigenous resources. Theapplication of economic cost principles to energy pricing and of marketmechanisms for resource allocation have been key elements in theGovernment's energy strategy. Primarily because of economic-cost basedpricing, important achievements have been made in energy conservationand substitution which have contributed to reducing gross energyrequirements per GDP by 32% during l176-86 4/ and energy imports by 18%(in energy terms) over the same period.
4/ Gross energy requirements fell from 0.44 Tcals/Ch$ million (1977constant prices) of GDP in 1976 to 0.30 Tcals/Ch$ million of GDP in1986. CODELO, the largest industrial corporation, reduced itsenergy requirements from

- 14 -
Table 1.9: ENERGY AND THE BALANCE OF PAYMENTS, 1976-86(USS milIlons and percent)
Prel im.1960 1982 1985 1986
(1) Energy lmports 911.2 589.0 491.5 351.3Crude Petroleum 810.4 277.3 445.7 266.2Petroleum Products 21.8 292.9 18.4 53.5
Coal 58.5 - 21.5 26.0
Coke 20.5 18.8 5.9 5.6(2) Energy Reexports a/ 60.3 69,3 34,3 31.5(3) Net Energy Imports 850.9 519.7 457.2 319.8
Goods and Non-factor Service Imports 7,122.0 5,134.0 3,984.0 4,328.0Goods and Non-factor Service Exports b/ 5,908.7 4,572.7 4,461.7 5,008.5
(3) as Percent of (4) 11.9 11.4 11.5 7.4(3) as Percent of (5) 14.4 10.1 10.2 6.4
a/ Mainly Petroleum Productsb/ Net of energy reexports and bunkers (mainly fuel oil and jet fuel).
Source: Central Bank of Chile.
1.22 The Government is carrying out a program to decentralize andderegulate the operations of the major state-owned energy companies, with
a view towards enhancing competition, increasing managerial autonomy andaccountability, and gradually transferring their ownership to the privatesector. A Government presence is to be maintained only in those areaswhere private entities cannot meet the sectorai objectives. A strong
private sector participation has been secured in petroleum productsmarketing, electricity generation and distribution, and coal production
and marketing. Progress is being made in attracting private foreignfirms to hydrocarbon exploration. Nevertheless, the Government continuesto have a key role in the energy sector through (a) setting and/ormonitoring energy prices; (b) deciding on the investment programs of the
state energy enterprises; (c) evaluating energy resources andrequirements; and (d) developing information systems to ensure markettransparency and efficient use of energy resources.
Institutional Structure
1.23 To implement its energy strategy, the Government hasestablished a coherent legal framework and effective organizationalstructures. At the apex of policy formulation is the National Energy
Commission (Comision Nacional de Energia; CNE), an autonomous agencycreated in 1978, which is responsible for preparing and coordinatingsector plans, policies and regulations, and for advising the Governmenton energy matters. CNE also is monitoring the electricity, hydrocarbons,
- 15 -
and coal subsectors and is responsible for preparing and updating theleast-cost electricity investment program. 5/ The entity reportsdirectly to the President of the Republic. A representative of thePresidency presides CNE and its Executive Board. This Board includes theMinisters of Defense, Economy, Finance, Mining, Planning, and the Chiefof the Presidential Staff. CNE's Executive Secretary is in charge of theadministrative and technical functions, assisted by a small but well-qualified staff. CNE also carries out energy studies for which itusually engages the services of consultants. The Ministry of Mining isresponsible for negotiating and executing operating contracts in thehydrocarbons subsector on behalf of the State, with technical advice fromCNE. (Contract signature requires the approval of CNE's Board.) TheMinistry of Finance has ultimate authority in decisions on investment andinvestment financing of state-owned corporations. The National PlanningOffice (ODEPLAN) has an important role in the energy sector throughcoordinating thie actions of state entities and enterprises within theNational Development Program. ODEPLAN makes recommendations on publicsector investment -- in close cooperation with CNE in matters pertainingto energy investment -- and through its handling the System of BasicStatistics for Investment, monitors Government-approved projects. TheMinistry of Economy approves electricity tariffs based on CNE'srecommendations, monitors the compliance with regulations and proceduresregarding installations and services (through the Superintendent ofElectricity and Fuels) , and attends to any customer complaints onmatters related to service and tariffs.
1.24 On the operational level, the Government's strategy isimplemented through state-owned or associated enterprises which areincorporated with the sole exception of ENAP, the National PetroleumCompany, which is constituted as state company. All state-owned orcontrolled enterprises have full managerial autonomy and accounta-bility. They operate strictly along market principles and are atdiffering stages of privatization. Corporation de Fomento de laProduction (CORFO), the Government's holding company, controls theincorporated companies, i.e. National Coal Enterprise (ENACAR; 99.9%CORFO participation), ENDESA (about 60%, the remainder being owned byother power companies, municipalities, and small private investors),COLBUN S.A. (98%) and PEHUENCHE S.A. (about 70%) and Compaiiia CarboniferaSchwager S.A. (about 50%). Fully privately owned are meanwhileCHILECTRA-GENERATION, CHILECTRA-METROPOLITANA, and CHILECTRA-QUINTAREGION.
1.25 In the hydrocarbons subsector, ENAP carries out exploration,production, and refining, and is empowered to enter into association withforeign firms to develop petroleum reserves in Chile or abroad. ENAP
5/ For preparing the investment program, CNE uses a dynamic programmingmodel taking into account hydrology factors and water storagesystems, and determines the cost of demand not met.
- 16 -
owns and operates two refineries which are located at Concon andConception in central Chile and which are operated as separate entities.The Covernment is studying the possible sale of these refineries toprivate investors such as EAP employees, pension funds, and others.
1.26 In response to the Government's desire to use the natural gasreserves of Magallanes, private firms have been invited to developprojects to accelerate the economic utilization of these reserves. Theseprojects are to be implemented without direct participation by publicsector entities, i.e. ENAP, which would be responsible only fordelivering gas to the respective plants.
1.27 In the electricity subsector, there are four major generatingcompanies, i.e. ENDESA, CHILECTRA-GENERATION, COLBUN S.A., and PEHUENCHES.A. (which will start operat5ng in 1991). Transmission is primarilycarried out by ENDESA, with other companies owning minor segments of thenetwork. Distribution is the responsibility primarily of privatecompanies which purchase electricity in bulk from the generatingcompanies. 6/ Electricity operations are coordinated by the EconomicDispatch Center for the Central Interconnected System (CDEC-SIC) wherethe most important generation/transmission companies are represented.Its responsibilities are to preserve reliability of supply, ensure least-cost operation, establish access, and set wheeling charges for the usersof this transmission system extending over 1,860 km. For these purposes,CDEC-SIC (a) determines energy dispatch and other operational parametersof the system on a daily basis and for the medium- and long-term;(b) calculates the marginal costs of the operation; (c) determines thetransfer of energy among the generating companies and sets prices; and(d) coordinates major preventive maintenance of generating units.
1.28 In the coal subsector, ENACAR, COCAR, and Schwager are the mainproducers. The National Forestry Corporation (Corporaci6n NacionalForestal; CONAF) monitors fuelwood-related activities dominated by theprivate sector.
6/ A number of electricity generation/distributior. companies such asEDELNOR, ELELAYSEN, and EDELMAG, are in the process of beingprivatized.
- 17 -
11. ENMMGY PRICING AND TAIATION
Introduction
2.1 The system of energy prices is well-developed and effectivelyadministered. Following a period during the mid-to late 1970s when theirincreases fell behind the increases in international energy prices anddomestic inflation, in 1978 they were liberalized and allowed to findtheir market levels (kerosene and LPG prices in 1982 when subsidies wereremoved). Domestic price of energy without exception meet theiropportunity cost, defined as border prices for tradeable goods, marginalcost for electricity and town gas, and replacement cost for fuelwood andnatural gas. Thus, in setting or monitoring energy prices, theGovernment has succeeded in exerting the right signals to consumers andproducers, furthering efficient allocation of energy resources, fiscalobjectives, and the financial viability of the energy enterprises.
2.2 Prices of tradeables such as crude oil and petroleum productsare based oa international prices and are being adjusted by the suppliersin line with international price changes. In the same way, prices offuelwood and coal are market-determined. For coal, large quantities aretraded directly between producers and users, and import parity prices areused as a reference point. Fiscal levies take the form of import duties,value-added tax, and special taxes on transport fuels. The 15 importduty 7/ provides a margin of protection for domestic energy production.Otherwise, the Government has eliminated subsidies and resisted pressuresto establish new ones. Nevertheless, some distortions in consumer priceshave emerged mainly as a result of specific taxes on transport fuels.While these distortions are of relatively limited negative consequences,they should be addressed in the interest of allocative efficiency. Also,managing petroleum products pricing -- with participation by ENAP -- inthe current environment of volatile international petroleum prices needsto be given careful attention.
Prices of Petroleum Products
Structure and Levels
2.3 Import parity prices are used by ENAP as a guide to set ex-refinery prices and there usually is only a small difference between thetwo. (Import parity prices for petroleum products are calculated weeklyor bi-weekly based on Caribbean f.o.b. prices to which insurance andfreight and the import duty are added.) As petroleum products can be
7/ This duty was reduced from 201 in early 1988.
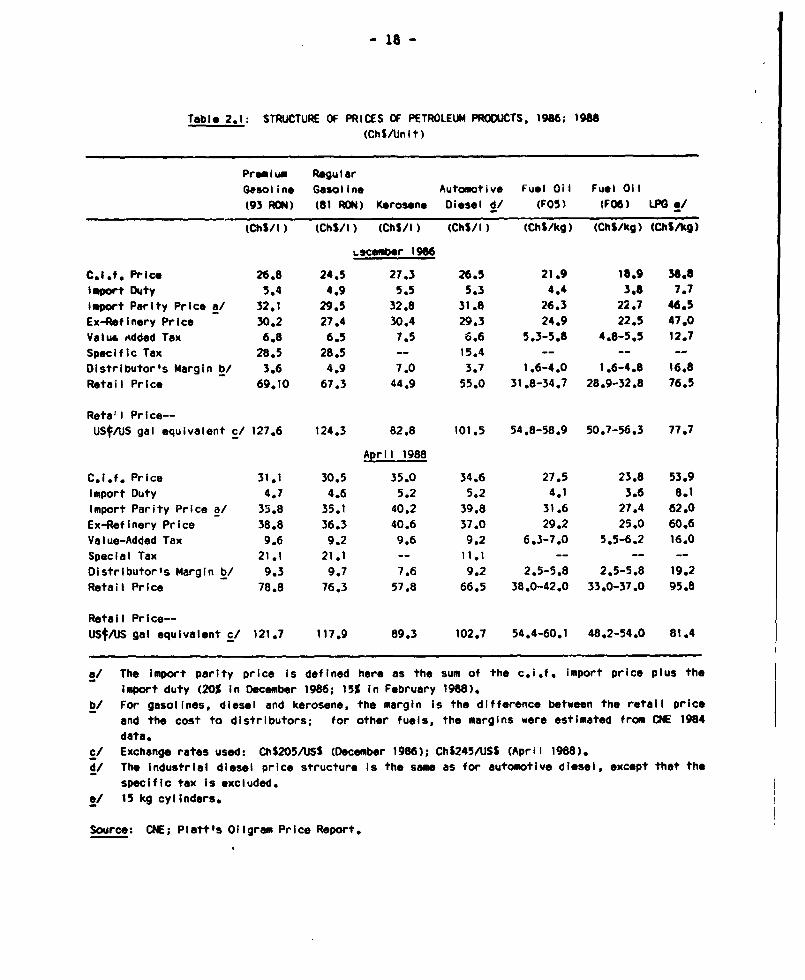
- 18 -
Table 2.1: STRUCTURE OF PRICES OF PETROLEUM PRODUCTS, 1986; 1988(ChS/Unit)
Premium RegularGesoline Gasoline Automotive Fu-l Oil Fuel Oil(93 RON) (81 RON) Kerosene Diesel d/ (FOS) (FOG) LPG a/
(ChS/I) (ChS/I) (ChS/I) (Chl/I) (ChS/kg) (ChS/kg) (ChS/kg)
L.cember 1966
C.I.f. Price 26.8 24.5 27.3 26.5 21.9 18.9 38.8lmport Duty 5.4 4.9 555 5.3 4.4 3.8 7.7lIport Parity Price a/ 32.1 29.5 32.8 31.8 26.3 22.7 46.5Ex-Refinery Price 30.2 27.4 30.4 29.3 24.9 22.5 47.0Value Added Tax 6.8 6.5 7.5 6.6 5.3-5.8 4.8-5.5 12.7Specific Tax 28.5 28.5 -- 15.4 -- -- --Distributor's Margin b/ 3.6 4.9 7.0 3.7 1.6-4.0 1.6-4.8 16.8Retail Price 69.10 67.3 44.9 55.0 31.8-34.7 28.9-52.8 76.5
Retall Price--USfAuS gal equivalent c/ 127.6 124.3 82.8 101.5 54.8-58.9 50.7-56.3 77.7
April 1988
C.i.f. Price 31.1 30.5 35.0 34.6 27.5 23.8 53.9Import Duty 4.7 4.6 5.2 5,2 4.1 3.6 8.1Import Parity Price a/ 35.8 35.1 40.2 39.8 31.6 27.4 62.0Ex-Refinery Price 38.8 36.3 40.6 37.0 29.2 25.0 60.6Value-Added Tax 9.6 9.2 9.6 9.2 6.3-7.0 5.5-6.2 16.0Special Tax 21.1 21.1 -- 11.1 -- -- --Distributor's Margin b/ 9.3 9.7 7.6 9.2 2.5-5.8 2.5-5.8 19.2Retail Price 78.8 76.3 57.8 66.5 38.0-42.0 33.0-37.0 95.8
Retail Price--USt/tJS gal equivalent cl 121.7 117.9 89.3 102.7 54.4-60.1 48.2-54.0 81.4
a/ The import parity price is defined here as the sum of the c.i.f. import price plus theImport duty (20% in December 1986; 15% In February 1968).
i/ For gasolines, diesel and kerosene, the margin Is the difference between the retail priceand the cost to distributors; for other fuels, the margins were estimated from CME 1984data.
c/ Exchange rates used: ChS205/USS (December 1986); ChS245/USS (April 1988).d/ The industrial diesel price structure Is the same as for automotive diesel, except that the
specific tax Is excluded._/ 15 kg cylinders.
Source: CNE; Platt's Oligram Price Report.
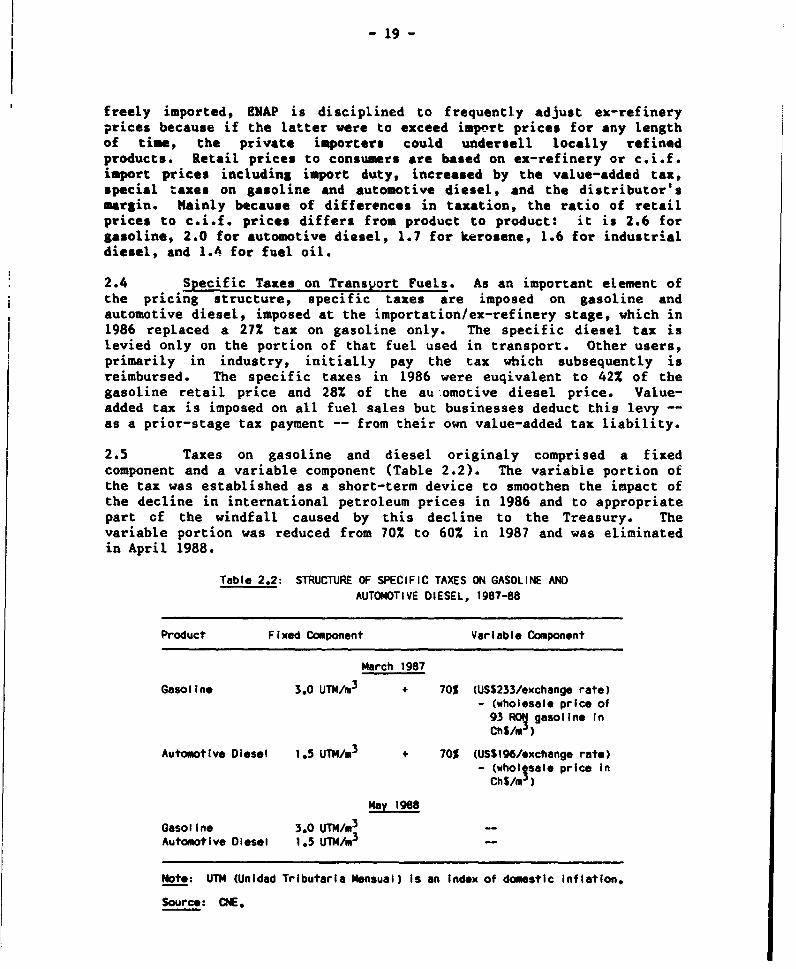
-19-
freely imported, ENAP is disciplined to frequently adjust ex-refineryprices because if the latter were to exceed import prices for any lengthof time, the private importers could undersell locally refinedproducts. Retail prices to consumers are based on ex-refinery or c.i.f.import prices including import duty, increased by the value-added tax,special taxes on gasoline and automotive diesel, and the distributor'smargin. Mainly because of differences in taxation, the ratio of retailprices to c.i.f. prices differs from product to product: it is 2.6 forgasoline, 2.0 for automotive diesel, 1.7 for kerosene, 1.6 for industrialdiesel, and 1.4 for fuel oil.
2.4 Specific Taxes on Transport Fuels. As an important element ofthe pricing structure, specific taxes are imposed on gasoline andautomotive diesel, imposed at the importation/ex-refinery stage, which in1986 replaced a 272 tax on gasoline only. The specific diesel tax islevied only on the portion of that fuel used in transport. Other users,primarily in industry, initially pay the tax which subsequently isreimbursed. The specific taxes in 1986 were euqivalent to 422 of thegasoline retail price and 28% of the au omotive diesel price. Value-added tax is imposed on all fuel sales but businesses deduct this levy --as a prior-stage tax payment -- from their own value-added tax liability.
2.5 Taxes on gasoline and diesel originaly comprised a fixedcomponent and a variable component (Table 2.2). The variable portion ofthe tax was established as a short-term device to smoothen the impact ofthe decline in international petroleum prices in 1986 and to appropriatepart cf the windfall caused by this decline to the Treasury. Thevariable portion was reduced from 70% to 60% in 1987 and was eliminatedin April 1988.
Table 2.2: STRUCTURE OF SPECIFIC TAXES ON GASOLINE ANDAUTOMOTIVE DIESEL, 1987-88
Product Fixed Component Variable Component
March 1987
Gasoline 3.0 UTM/M3 + 70% (USS233/exchange rate)- (wholesale price of93 RON gasoline InChS/m3 )
Automotive Diesel 1.5 UTh/m3 + 70% (USS196/*xchange rate)- (whoIssale price InChS/m )
May 1988
Gasoline 3.0 UTM/m3Automotive Diesel 1.5 UTM/m3
Note: UM (Unidad Tributaria Mensual) Is an Index of doestic inflation.
Source: CNE.
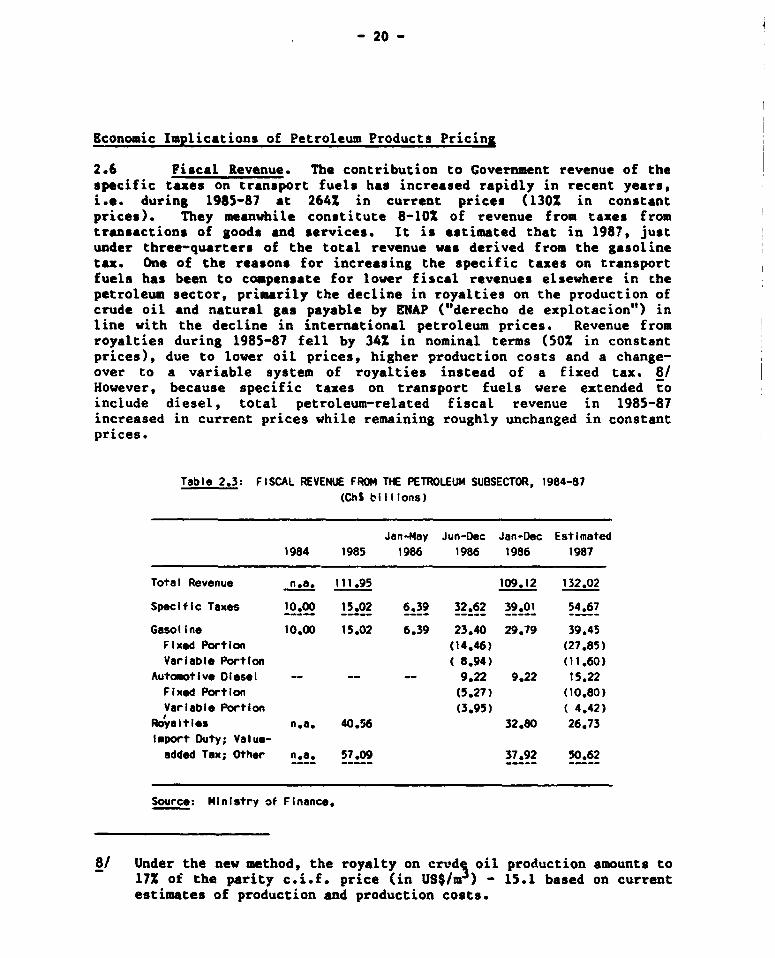
-20-
Economic Implications of Petroleum Products Pricing
2.6 Fiscal Revenue. The contribution to Government revenue of thespecific taxes on transport fuels has increased rapidly in recent years,i.e. during 1985-87 at 264S in current prices (1302 in constantprices). They meanwhile constitute 8-10 of revenue from taxes fromtransactions of goods and services. It is estimated that in 1987, justunder three-quarters of the total revenue was derived from the gasolinetax. One of the reasons for increasing the specific taxes on transportfuels has been to compensate for lower fiscal revenues elsewhere in thepetroleum sector, primarily the decline in royalties on the production ofcrude oil and natural gas payable by ENAP ("derecho de explotacion") inline with the decline in international petroleum prices. Revenue fromroyalties during 1985-87 fell by 342 in nominal terms (50X in constantprices), due to lower oil prices, higher production costs and a change-over to a variable system of royalties instead of a fixed tax. 8/However, because specific taxes on transport fuels were extended toinclude diesel, total petroleum-related fiscal revenue in 1985-87increased in current prices while remaining roughly unchanged in constantprices.
Table 2.3: FISCAL RtEVENUE FROM THE PETROLEUM SUBSECTOR, 1984-87(Ch$ billions)
Jan-May Jun-Dec Jan-Dec Estimated1984 1985 1986 1986 1986 1987
Total Revenue n.o. 111.95 109.12 132.02
Specific Taxes 10.00 15.02 6.39 32.62 39,01 54.67
Gasoline 10.00 15.02 6.39 23.40 29.79 39.45Fixed Portion (14.46) (27.85)Variable Portion ( 8.94) (11.60)
Automotive Diesel -- -- 9.22 9.22 15.22Fixed Portion (5.27) (10.80)Variable Portion (3.95) ( 4.42)
Royaltl*s nao. 40.56 32.80 26.73Import Duty; Value-added Tax; Other n.a. 57.09 37.92 50.62
Sourco: Ministry of Finance.
8/ Under the new method, the royalty on crvdi oil production amounts to172 of the parity c.i.f. price (in US$/m ) - 15.1 based on currentestimates of production and production costs.
- 21 -
2.7 Impact on Demand. The differentiation in taxation tends todistort relative prices to consumers of the various products, which thusdiffer from their relative c.i.f. prices adjusted for local marketingcosts. This is most important in the transport sector where the ratio ofretail prices of automotive diesel are about 15X below those of gasoline(81 RON) even though the c.i.f. price for diesel is close to and oftenexceeds that of gasoline. Lower taxes on automotive diesel have exertedan incentive to shift the public transport fleet toward diesel-poweredvehicles, especially for busses, small trucks, etc.. While this wouldcontribute to improving the efficiency of fuel use in the transportsector, 9/ the local refineries have been unable to meet the rapidlygrowing diesel demand and import requirements for diesel havesignificantly increased as a result. Also, since there are no specifictaxes on kerosene, LPG, and fuel oil, the retail prices of these productsare considerably lower than those of gasoline and diesel.
2.8 In many countries a road user charge is incorporated in thefuel price, normally in the form of specific taxes on transport fuels.In Chile, the specific tax on diesel is estimated to be in line with anappropriate road user charge whereas the specific tax on gasoline tendsto be much higher than such a charge. (Since the--generally heavier--diesel-powered vehi.les cause larger wear and te-r on roads thangasoline-powered vehicles, road user charges for the former should behigher, not lower, than for the latter.) On grounds of allocativeefficiency, it would seem to be advisable to either lower the specifictax on gasoline to more accurately reflect the road user charge, or toincrease the tax on automotive diesel to levels closer to that of thegasoline tax. 1O/ Either measure would bring the relative consumerprices of gasoline and diesel more closely in line with their relativeborder prices. However, fiscal and equity considerations might militateagainst a reduction of the gasoline tax, as the price elasticity ofdemand for gasoline is relativel; low and revenue from such a taxcorrespondingly high, and gasoline-powered vehicles are used mainly forindividual transport by higher income groups. On the other hand, anincrease in the diesel tax would widen the price differential betweenautomotive and industrial diesel (para 2.9). The issue is whether thedistortion in relative fuel prices exerts a greater economic cost, interms of affecting allocative efficiency and equity, than would resultfrom raising the same revenue through other taxes. Therefore, thejustification for the taxation-induced price differentials for transportfuels should be evaluated in more detail, possibly in the context of the
9/ Diesel engines are assumed to be at least 25% more efficient thangasoline engines.
10/ A third set of measures would consist of compensating for thedifference in fuel taxes through license fees, km-based taxes etc.
- 22 -
study on fuel taxation and road user charges planned by the Ministry ofTransport, to determine optimal means for achieving their objectives.
2.9 Another issue concerns the high price of automotive compared toindustrial diesel, as the specific tax is levied only on the former. Tothe extent that truck fleets of industrial firms use lower-pricedindustrial diesel, they would gain an advantage over independent truckerswho have access to higher-priced automotive diesel only. Any systemwhere different prices for virtually the same products are establishedinvites arbitrage. There is no easy solution to this problem, except, toa certain extent, stricter enforcement of the rules aimed at restrictingthe use of industrial diesel to industrial purposes, possibly by coloringthe different diesel fuels.
2.10 The use of low-priced kerosene in diesel engines, which is inevidence in some countries, does not appear to be a problem in Chile andprobably is limited to periods of the year/areas of the country with verylow cemperatures. However, the retail price of kerosene is well belowthat of diesel and LPG and does not reflect relative scarcities,considering that both these products need to be imported. The prevailingprice relationship between kerosene and LPG tends to give the wrongsignals to residential energy consumers and should be corrected throughincreasing the price of kerosene, in the interest of allocativeefficiency.
Adjusting to Petroleum Price Volatility
2.11 International petroleum prices in recent years have shown ahigh degree of volatility. F.o.b. prices for crude averaged US$26/bbl in1985, fell at times below US$10/bbl in 1986, and rose close to US$20/bblin mid-1987, to fall again to about US$15/bbl by early 1988. Relativelylow prices are projected for the period 1988-91 to be followed bysubstantial increases into the mid-1990s. The declining trend in Chile'scrude oil production means that the economy will be even more vulnerableto price shocks in the 1990s than during the 1970s and 1980s. Given theimportance of petroleum as the critical energy source, this raises theissue whether the short-term variations in international petroleum pricesshould be fully and promptly passed through to the consumers, or if partor all of these variations should be neutralized -- and prices bestabilized at relatively high levels -- through some compensatorymechanism, such as variable taxation, even if this impacts adversely onthe international competitiveness of some energy users. So far, thiscompensatory mechanism was only applied for gasoline and automotivediesel, in the form of the variable portion of the specific tax. It canbe argued that a variable tax applied evenly to all petroleum productswould be the most efficient means to smooth swings as the volatility ofall petroleum product prices is considered to be the problem.
2.12 It is sometimes argued that fiscal and balance of paymentsconcerns call for stabilizing prices at relatively high levels even insituations of declining international prices, in view of the expected
- 23 -
increases in international petroleum prices over the medium-to longerterm, the decline in Chile's crude oil reserves and the resultingfragility of the external position of the economy, which involve a highdegree of risk for macroeconomic management. Also, because of investmentrigidities, it might take relatively long to shift the productivestructure in response to unanticipated price changes.
2.13 Nevertheless, on economic efficiency grounds, it is necessarythat domestic prices of petroleum products -- like those of any othertradeables -- are set in conformity with international market conditions,to provide efficiency guideposts for the decisions of producers andconsumers. Therefore, domestic petroleum prices need to reflectinternational price movements, short-term as well as long-term,downswings as well as upswings. There is no convincing economic argumentwhy countercyclical tariff and taxation measures should be taken tocushion domestic consumers from international price movements.Considering that the price elasticity of demand for petroleum productstends to be low, any adverse effects of lowering prices on the incentiveto improve the efficiency of energy use probably are minor. In addition,problems of a global nature such as fiscal and balance of paymentsproblems would have to be addressed through global measures, e.g.exchange rate and fiscal reforms, and not just chrough changes in taxeson specific products. This also is the Government's position. Shouldthe Government ever consider a "conservation tax" -- in preparation forincreases in energy prices over the medium-to longer term -- this wouldneed to be based on careful analysis of the energy savings potential inthe economy and of the costs and benefits to mobilize this potential.Such a tax would need to be levied on all petroleum products and allconsumers, at a fixed preferably identical rate, so that the impact ofinternational price movements is felt fully and equally by all consumers.
Electricity Pricing
Principles of Tariff Setting
2.14 The Government's electricity pricing policy is in line with itseconomic philosophy of relying on market forces to establish prices ofgoods and services. Prices to major consumers and for exchanges amonggenerating companies are set through bargaining with electricitysuppliers who must compete for that portion of the market. Node pricesand tariffs at the distribution level, where a natural monopoly exists,are set and regulated by the Ministry of Economy based on the structureand levels of marginal costs -- a proxy of market prices -- as calculatedby CNE. This institutional separation combined with regular andautomatic adjustments ensures that no political pressures come to bear insetting electricity prices.
2.15 Criteria and procedures for calculating electricity tariffs arelaid down by the Electricity Law of 1982. The energy tariff reflects the
- 24 -
short-run marginal cost of energy and the capacity tariff, the long-runmarginal cost of new generating capacity required to cover peak demand,calculated on the basis of a least-cost investment program. Thelegislation allows consumers to choose freely among alternative tariffswithin their corresponding voltage range, and does not distinguishclasses of consumers for tariff purposes.
Regulated Tariffs
2.16 Regulated electricity prices are established at two stages:i.e. the generation-transmission level (node prices) and the distributionlevel (aggregate values of distribution). The sum of both is the maximumprice paid by the final consumer. The node prices are the prices of bulkelectricity sold by the generation/transmission companies to thedistribution companies. They are calculated for capacity and energy forthose locations where electricity is supplied to distribution systems,including marginal transmission losses as a proxy for marginal costs oftransmission and to account for locational differences. Node prices arerecalculated by CNE twice each year and modified if necessary, throughindexation formulae based on water reservoir levels 11/ and on costcomponents such as fuel (coal) and equipment. These formulae operateautomatically every time there is a variation of at least lOZ in theapcity oP e~nergy price. The average retail tariff in April 1988 wasabout USC8.1/kWh equivalent. 12/
2.17 The aggregate values of distribution have three basic costcomponents, i.e. (a) costs of investment, operation, and maintenance;(b) administration, billing and other consumer-related costs; and(c) losses for model distribution components, with the optimum size andoperational efficiency in concession areas classified according to theirconsumer density (high, medium and low). 13/ The aggregate values ofdistribution are calculated every four years and in the interim, areautomatically adjusted through formulae which incorporate cost variationssuch as for materials, equipment, and labor. Distribution companies areauthorized to adjust prices every time the node prices or the aggregatedistribution values change. There are various tariff options among which
11/ This in view of the importance of water reservoir levels for thegenerating capacity of Chile's largely hydro-based system.
12/ BT 1 tariff, i.e. combined fixed charge and energy charge calculatedfor consumption of 100 kWh/month (as average household consumption);the fixed charge amounts to about US$1 equivalent/connection/month.See Annex 15 for the structure of electricity tariffs.
13/ Distribution costs incorpoLated into the tariffs are composed of (a)the cost of distributing 1 kWh at peak; (b) the cost of distributing1 kWh off-peak; (c) costs of losses; and (d) fixed cost percustomer, independent of consumption.

- 25 -
the consumers can freely choose the one that fits closest theirparticular circumstances (with the sole limitation of an upper maximumcapacity for the simplest -- B1 -- tariff). By basing electricitytariffs on standard costs instead of actual costs, this system gives anincentive to distribution componies to achieve the highest possibleefficiency levels, through reducing costs of operations and improving theutilization of the network.
Negotiated Tariffs for Major Consumers
2.18 Consumers with an installed capacity above 2,000 kI may freelynegotiate electricity prices with any generation company. The resultingprices are within a range of the node prices and generally, do notdiverge more than 10 from the latter. To facilitate the access of anyelectricity producer to any electricity consumer, the transmission systemis freely accessible, by means of paying wheeling charges. 14/ Thesecharges are based on short-run marginal costs or average incrementalcosts of transmission (as established by CNE) as their maximum level andotherwise are negotiated between the transmission company and thegenerating companies. This policy aims at (a) promoting competition amongthe generation companies; (b) stimulating major consumers to seek theleast-cost sources of electricity including self-generation andcogeneration; (c) optimizing the use of transmission systems; and (1)utiiizing Lhe cunuumers~ cechnical and enzrepreIieuriai eap;t ;
establish an effective independent system of monitoring electricityprices.
Comparative Energy Prices and Costs
2.19 The comparative costs of energy alternatives have a stronginfluence on consumer choices. In addition to the price paid by theconsumers, the costs of these alternatives are determined by relativeend-use efficiencies which vary according to the type of energy and ofequipment used, specific applications, and the equipment's energyefficiency and power output. To provide appropriate signals toconsumers, prices should reflect the economic cost of the energy form inquestion. Proper analysis should include the investment costs of theenergy using equipment as these often are substantial and front-loadedand therefore can influence consumer decisions more than does the energyprice itself.
2.20 The comparison of energy prices to consumers (market prices)adjusted by the end-use efficiency of energy-consuming appliances offerssome important conclusions (Table 2.4). In the residential/commercial/
14/ In addition, there are no barriers to entry, and self-generation isencouraged, subject to certain technical regulations.
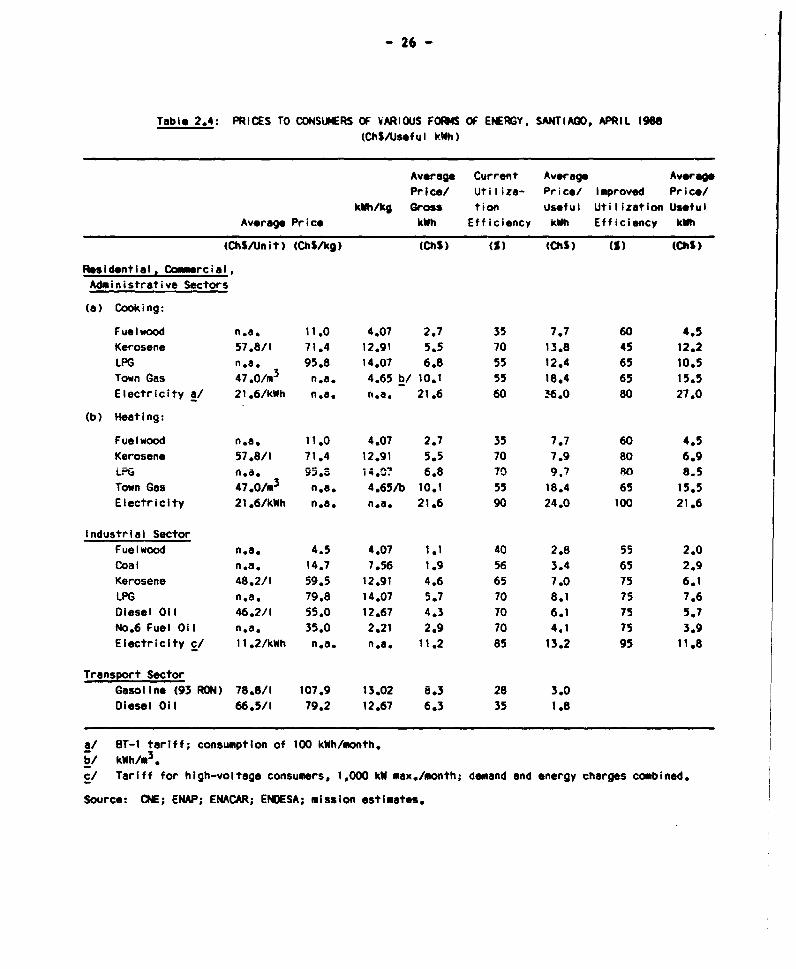
- 26 -
Table 2.4: PRICES TO CONSUMERS OF VARIOUS FORM4S OF ENERGY, SANTIAGO, APRIL 1968(ChS/Aseful kWh)
Average Current Averoage AveregePrice/ Utilize- Price/ Improved Price/
kWh/kg Gross tion Useful Utilization UsefulAverage Price kWh Efficiency kWh Efficiency kWh
(ChS/Unlt) (ChS/kg) (ChS) Ms (ChS) ()(Ch$)
Residential. Coercial,Administrative Sectors
(a) Cooking:
Fuelwood n.a. 11.0 4.07 2.7 35 7.7 60 4.5Kerosene 57.8/1 71.4 12.91 5.5 70 13.8 45 12.2LPG n.a. 95.8 14.07 6.8 55 12.4 65 10.5Town Gas 47.0/m3 n.a. 4.65 b/ 10.1 55 18.4 65 15.5Electricity a/ 21.6/kWh n.a. n.a. 21.6 60 36.0 80 27.0
(b) Heating:
Fuelwood n.a. 11.0 4.07 2.7 35 7.7 60 4.5Kerosene 57.8/1 71.4 12.91 5.5 70 7.9 80 6.9LF ~ ,,.. ;,.;i 14.07 6.8 70 - - RO 8 5Town Gas 47.0/03 n.e. 4.65/b 10.1 55 18.4 65 15.5Electricity 21.6/kWh n.e. n.a. 21.6 90 24.0 100 21.6
Industrial SectorFuelwood n.a. 4.5 4.07 1.1 40 2.8 55 2.0Coal n.e. 14.7 7.56 1.9 56 3.4 65 2.9Kerosene 48.2/1 59.5 12.91 4.6 65 7.0 75 6.1LPG n.a. 79.8 14.07 5.7 70 8.1 75 7.6Diesel Oil 46.2/1 55.0 12.67 4.3 70 6.1 75 5.7No.6 Fuel Oil n.e. 35.0 2.21 2.9 70 4.1 75 3.9Electricity e/ 11.2/kWh n.e. n.e. 11.2 85 13.2 95 11.8
Transport SectorGasoline (93 RON) 78.8/1 107.9 13.02 8.3 28 3.0Diesel Oil 66.5/1 79.2 12.67 6.3 35 1.8
a/ BT-1 tariff; consumption of 100 kWh/month.b/ kWh/n3 .c/ Tariff for high-voltage consumers, 1,000 kW max./month; demand and energy charges combined.
Source: CNE; ENAP; ENACAR; ENDESA; mission estimates.
- 27 -
administrative sectors, fuelwood is the cheapest cooking fuel despite therelatively low efficiency of wood-burning stoves, followed by LPG andkerosene due to the high efficiency of the respective appliances, andtown gas. Electricity is the most expensive energy source despite thehigh end-use efficiency of electrical appliances. In the industrial/mining sectors, fuelwood, coal and fuel oil are the cheapest boiler fuelsfollowed by diesel, kerosene, LPG, and electricity. For both theresidential/commercial and industrial sectors, these relationshipsprevail even if the comparison is based on the use of more energy-efficient equipment since the inherent price and efficiency differentialsare too large to be compensated through efficiency improvements.Finally, in the transport sector, diesel is lower-cost on account of itslower price and higher combustion efficiency compared to gasoline.
2.21 The analysis of comparative market prices is useful forexplaining the demand-related factors in energy conservation andsubstitution. However, to fully assess the efficiency of energy use, therelative economic costs of the various energy forms including equipmentcosts also need to be analyzed. On this bas.s, in theresidential/commercial/administrative sectors, fuelwood remains theleast-cost fuel, followed by kerosene and LPG. Town gas and especiallyelectricity are much more costly. In the industrial/mining sectors,fuelhood, coal and fuel Oil o a^^ t^ ^ pcst b-Cicr ---- ---approximate each other very closely, followed by diesel, kerosene, andLPG. Electricity remains the most expensive energy source despite thehigher efficiency of electrode boilers. Comparative costs would besignificantly influenced if the wider use of natural gas were to becomefeasible. In transport, the combined energy and capital cost of diesel-powered vehicles are virtually the same as those of gasoline-poweredvehicles as the formers' lower fuel costs are compensated by their higherequipment cost.
2.22 The foregoing analysis provides some important conclusions.First, relative prices to consumers of the various forms of energy arefairly closely in line with their relative economic costs (with theexception of transport fuels and to a lesser degree, kerosene and LPG)which indicates that in Chile, energy pricing according to economicefficiency principles has been largely accomplished. Second, costs ofenergy would be minimized through a use pattern emphasizing the use offuelwood in the residential/ commercial/ administrative sectors and offuelwood, coal, and fuel oil in the industrial/mining sectors. Thecapacity for producing and marketing these relatively cheaper fuelsshould be expanded, especially for fuelwood whose wider use might belimited by market imperfections, which should therefore be removed to thefeasible extent. Kerosene, diesel, LPG and electricity are relativelyexpensive sources of energy in both sectors (although electricity oftenis required for reasons of process technology, e.g. for coppersmelting). Third, in the transport sector, the economic cost ofdiesel vs. gasoline approximate each other closely so that no definitive
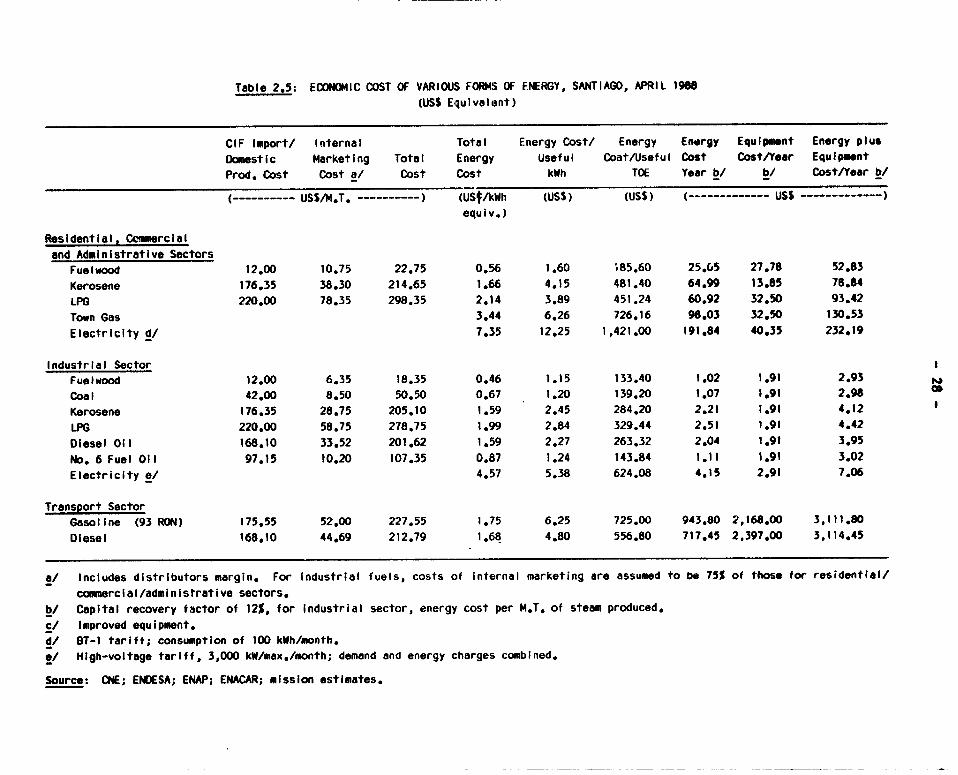
Table 2.5: ECONOMIC COST OF VARIOUS FORMS OF ENERGY, SANTIAGO, APRIL 1988
(USS Equivalent)
CIF Import/ Internal Total Energy Cost/ Energy En#rgy Equipment Enorgy plus
Domestic Marketing Total Energy Useful Coat/Useful Cost Cost/Year Equipment
Prod. Cost Cost a/ Cost Cost kWh TOE Year bl b/ Cost/Yeoar b/
---------- USS/M.T. ----------) (USf/kblh (USS) (USS) (------------- USS -------------)equiv,,)
Residential, Commercialand Administrative Sectors
Fuelwood 12.00 10.75 22.75 0.56 1.60 1'85.60 25.05 27.78 52.83
Kerosene 176.35 38.30 214.65 1.66 4.15 481.40 64.99 13.85 78.84
LPG 220.00 78.35 298.35 2.14 3.89 451.24 60.92 32.50 93.42
Town Gas 3.44 6.26 726.16 98.03 32.50 130.53
Electricity d/ 7.35 12.25 1,421.00 191.84 40.35 232.19
Industrial Sector
Fuelwood 12.00 6.35 18.35 0.46 1.15 133.40 1.02 1.91 2.93
Coal 42.00 8.50 50.50 0.67 1.20 139.20 1.07 1.91 2.98 as
Kerosene 176.35 28.75 205.10 1.59 2.45 284.20 2.21 1.91 4.12
LPG 220.00 58.75 278.75 1.99 2.84 329.44 2.51 1.91 4.42
Diesel Oil 168.10 33.52 201.62 1.59 2.27 263.32 2.04 1.91 3.95
No. 6 Fuel Oil 97.15 10.20 107.35 0.87 1.24 143.84 1.11 1.91 3.02
Electricity o/ 4.57 5.38 624.08 4.15 2.91 7.06
Transport Sector
Gasoline (93 RON) 175.55 52.00 227.55 1.75 6.25 725.00 943.80 2,168.00 3,111.80
Diesel 168.10 44.69 212.79 1.68 4.80 556.80 717.45 2,397.00 3,114.45
a/ Includes distributors margin. For industrial fuels, costs of internal marketing are assumed to be 75% of those for residential/
commercial/administrative sectors.
b/ Capital recovery factor of 12%, for industrial sector, energy cost per M.T. of steam produced.
c/ Improved equipment.d/ ST-) tariff; consumption of 100 kWh/month.
e/ High-voltage tariff, 3,000 kW/max./month; demand and energy charges combined.
Source: CNE; ENDESA; ENAP; ENACAR; mission estimates.
- 29 -
conclusion about their preferability can be reached on the basis ofcurrent economic costs alone. However, the future price relationship ofgasoline vs. diesel on international markets may be a potentiallyimportant consideration. Since the options for replacing middledistillates are relatively few, demand for diesel is likely to remainrelatively strong and consequently, international prices of diesel overthe medium term might increase relative to those of gasoline.
Economic Cost of Natural Gas
2.23 Natural gas, whose use presently is limited to Magallanes,could conceivably become available in central Chile by the early to mid-1990s (para 3.3). This fuel then would compete with town gas in theresidential/commercial/administrative sectors, and with fuel oil and coalin industry (and, possibly, mining).
2.24 A preliminary evaluation of the economic costs of natural gasin central Chile for thermal power generation and industrial use has beencarried out. This evaluation is based on the following assumptions:
(a) power generation in central Chile is to be expanded through thecommissioning of a 300 MW thermal plant, to be on line by 1995;
(b) for power plant conversions to natural gas, a payback period(on a discounted cashflow basis) of up to ten years would bepermissible but five years would be more desirable; and
(c) energy prices for 1995 are based on World Bank projections(September 1987).
2.25 For new installations of industrial boilers and boilerconversions to gas use, two cases have been analyzed, i.e. (i) large-sized high-pressure boilers (45 M.T./hr) and (ii) medium-sized lowpressure boilers (15 M.T./hr). The results of this evaluation show thatnatural gas would be the cheapest fuel for new installations in thermalpower generation and industries using at least medium-sized boilers.Conversion of existing installations from fuel oil to gas use also wouldbe economic whereas coal-to-gas conversion would involve long pay-backperiods which make this option largely uneconomic.
2.26 Specifically, the results of the evaluation are as follows:
(a) Electricity generation - central Chile: based on the 1995energy price projections, gas/combined cycle plant would becheaper than either fuel oil- or coal-fired steam plant at
- 30 -
virtually all plant factors. 15/ The border price of gas wouldhave to rise to US$3.50/BTU million by 1995 for gas to becomeuncompetitive with coal-fired steam plant.
(b) Electricity generation - Magallanes region: based on thecurrent opportunity cost for gas of US$0.60/BTU million, gasturbine plant would be the least-cost option but at higher gasprices, combined-cycle plant would be more attractive.
(e) Industrial boilers: for large-sized boilers, at 1987 fuelprices and US$2/BTU million for gas, the use of gas would becheaper than fuel oil for all load factors, and cheaper thancoal up to a 50% load factor. At 1995 prices, gas would becheaper than coal for load factors up to 65%. For medium-sizedboilers, gas is cheaper than coal up to 60% load factor (1987prices, and US$2/BTU million for gas) whereas at 1995 pricesand gas at US$2/BTU million, gas is cheaper than coal up to 90%load factor.
(d) Power plant conversion - central Chile: coal-to-gas conversionis not likely to be attractive for existing steam plant. Thecoal price would need to rise to US$70/M.T. with a gas price ofUS$2/BTU million or alternatively, the gas price should drop toUS$i.45/BKU miiiiuzX Wi Li -U0q_#VfL g* -a&
payback within ten years. However, a 50% reduction in capitalcost in the latter case would shorten the payback Deriod of theconversion to 3.5 years. In contrast, fuel oil-to-gas conver-sion appears feasible at current price levels and even more soat 1995 energy prices. At a gas price of US$2/BTU million andtne 1987 fuel oil price (US$100/M.T.), the payback would bewithin four years. Assuming a fuel oil price of US$115/M.T. by1995, the payback would be within 1.5 years. With US$100/tonfuel oil, the maximum gas price would be US$2.10/BTU millionfor a payback in ten years.
(e) Boiler conversions: coal-to-gas conversions are not feasibleregardless of boiler size at a gas price above US$1.-/BTUmillion. In contrast, fuel oil-to-gas conversion for bothmedium-sized and large-sized boilers is feasible for gas pricesin the range of US$2-2.20/BTU million and the cost of fuel oilat US$115/M.T.
15/ At a 70% load factor, the cost per kWh sent out would be USC3.5 forcombined cycle plant compared to US¢6.5/kWh for coal-fired steamplant and USC6.7/kWh for fuel oil-fired steam plant. The advantageof combined cycle plant results from high thermal efficiency andrelatively low capital cost per installed kW.
-31 -
Conclusion3 and Reco mmeendations
2.27 The results of this analysis have important implications forthe efficiency of energy supply and end-use in the economy. To evaluatethe specific requirements related to the optimal energy mix for thevarious sectors, more detailed studies of the economic costs of differentenergy forms need to be carried out and be continuously updated. Thisshould include a careful evaluation of externalities related to the useof different forms of energy, especially their environmental impact.
- 32 -
III. ISSUES IN TUB HYDROCAhUOS SUBSECTOR
Introduction
3.1 Crude oil and natural gas resources are almost entirely locatedin Magallanes, far from energy consumption centers. Crude oil wasdiscovered in Magallanes in 1945 but since 1983, proven reserves andproduction have been dwindling and are approaching the final stages ofdepletion. The degree of crude self-sufficiency, presently about 33X,thus may fall to about 5-10 by 1995. Also, crude production is becomingincreasingly expensive as reservoirs are being depleted. A major issuetherefore is determining the most economic level and rate at which theremaining high-cost oil should be produced, particularly in the presentenvironment of international price volatil'.ty, which has a direct bearingon the size of ENAP's future operations.
3.2 The Government actively pursues a policy of attracting foreignoil companies to explore in Chile. All previously reserved areas inMagallanes have been opened up except for the producing Springhill area,and new risk association contracts have been offered. Although thecoastal basins have been open to international exploration for a numberof years, and some companies were exploring at one stage, no foreigncompanies are active there at present. Also, the industry's response tooffering exploration areas in Magallanes thus far has been moderate butthe Salar de Atacama area in the North has attracted interest by a numberof companies. ENAP plans to explore in frontier areas on its own ifforeign investment is not forthcoming, and also envisages exploration anddevelopment ventures outside Chile. The key issue is (a) whether ENAPshould go ahead with costly and risky exploration in domestic frontierareas even in the absence of foreign participation, and (b) what shouldbe the level and nature of its new thrust into international operations.
3.3 Natural gas in Magallanes, which habitually has been reinjectedin large quantities or flared, is planned to be sold to private companiesfor production of methanol and ammonia/urea. These ventures are based onthe assumption that gas in Magallanes has very low production cost andlow opportunity cost in view of the absence of readily available optionsfor transporting gas to Chile's major energy consumption centers. Anumber of ott-r options exist to supply gas to the Santiago Metropolitanregion, including importation from Argentina, and the development ofoffshore deposits near Valdivia, and, possibly, the development of anydeposits to be found in the Salar de Atacama, but the viability of theseoptions depends on providing gas to industrial consumers at less thanUS$3.50/BTU million. For petroleum refining, the economic viability ofalternatives to meet supply-demand imbalances needs to be evaluatedcomprehensively and in more detail.
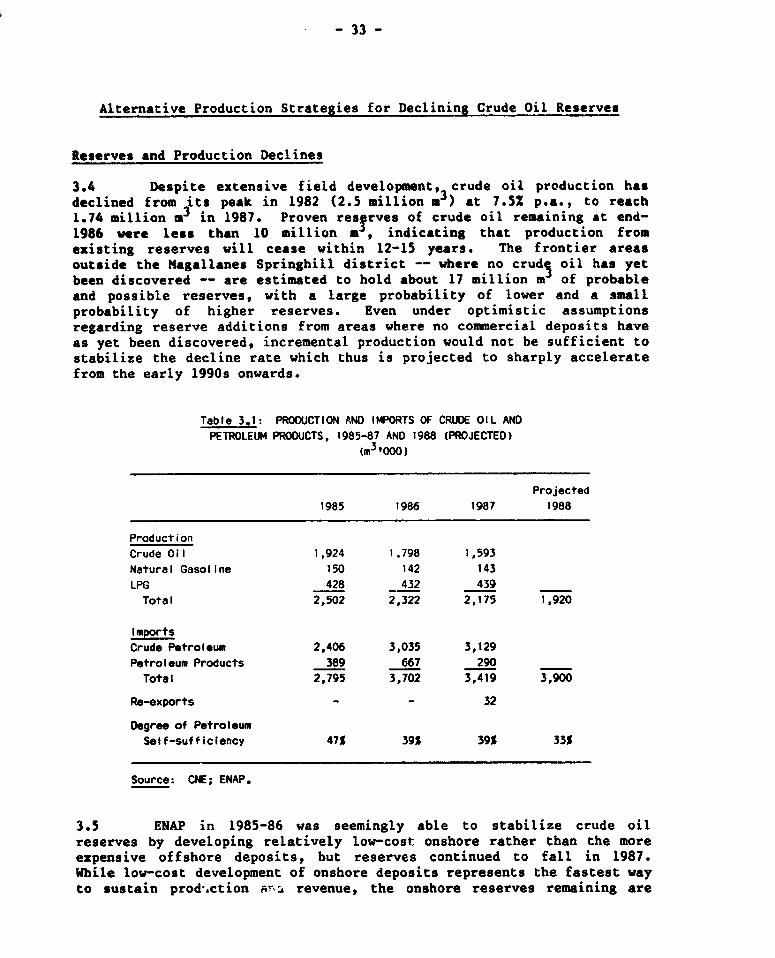
-33 -
Alternative Production Strategies for Declining Crude Oil Reserves
Reserves and Production Declines
3.4 Despite extensive field developmont, crude oil production hasdeclined from its peak in 1982 (2.5 million .3) at 7.5Z p.a., to reach1.74 million m3 in 1987. Proven resirves of crude oil remaining at end-1986 were less than 10 million * , indicating that production fromexisting reserves will cease within 12-15 years. The frontier areasoutside the Magallanes Springhill district -- where no cruds oil has yetbeen discovered -- are estimated to hold about 17 million m of probableand possible reserves, with a large probability of lower and a smallprobability of higher reserves. Even under optimistic assumptionsregarding reserve additions from areas where no commercial deposits haveas yet been discovered, incremental production would not be sufficient tostabilize the decline rate which thus is projected to sharply acceleratefrom the early 1990s onwards.
Table 3.1: PRODUCTION AND IMPORTS OF CRUDE OIL AND
PETROLEUM PRODUCTS, 1985-87 AND 1988 (PROJECTED)(m3 'OOO)
Projected1985 1986 1987 1988
Production
Crude Oil 1 ,924 1 ,798 1 ,593Natural Gasoline 150 142 143
LPG 428 432 439Total 2,502 2,322 2,175 1,920
Imports
Crude Petroleum 2,406 3,035 3,129Petroleum Products 389 667 290
Total 2,795 3,702 3,419 3,900
Re-exports - - 32
Degree of PetroleumSelf-sufficiency 47% 39% 39% 33%
Source: CNE; ENAP.
3.5 ENAP in 1985-86 was seemingly able to stabilize crude oilreserves by developing relatively low-cost onshore rather than the moreexpensive offshore deposits, but reserves continued to fall in 1987.While low-cost development of onshore deposits represents the fastest wayto sustain prod.ction Fiz, revenue, the onshore reserves remaining are
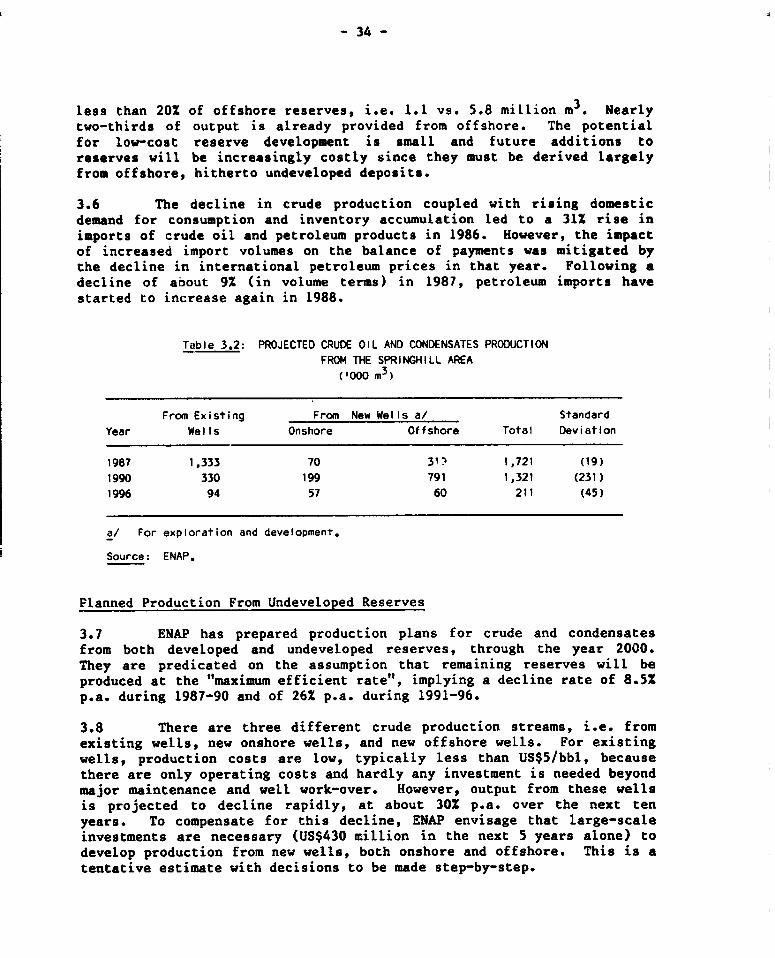
- 34 -
less than 20X of offshore reserves, i.e. 1.1 vs. 5.8 million m3. Nearlytwo-thirds of output is already provided from offshore. The potentialfor low-cost reserve development is small and future additions toreserves will be increasingly costly since they must be derived largelyfrom offshore, hitherto undeveloped deposits.
3.6 The decline in crude production coupled with rising domesticdemand for consumption and inventory accumulation led to a 31Z rise inimports of crude oil and petroleum products in 1986. However, the impactof increased import volumes on the balance of payments was mitigated bythe decline in international petroleum prices in that year. Following adecline of about 9Z (in volume terms) in 1987, petroleum imports havestarted to increase again in 1988.
Table 3.2: PROJECTED CRUDE OIL AND CONDENSATES PRODUCTIONFROM THE SPRINGHILL AREA
('000 m3 )
From Existing From New Wells a/ StandardYear Wells Onshore Offshore Total Deviation
1987 1,333 70 31'- 1,721 (19)1990 330 199 791 1,321 (231)1996 94 57 60 211 (45)
a/ For exploration and development.
Source: ENAP.
Planned Production From Undeveloped Reserves
3.7 ENAP has prepared production plans for crude and condensatesfrom both developed and undeveloped reserves, through the year 2000.They are predicated on the assumption that remaining reserves will beproduced at the "maximum efficient rate", implying a decline rate of 8.5Zp.a. during 1987-90 and of 26% p.a. during 1991-96.
3.8 There are three different crude production streams, i.e. fromexisting wells, new onshore wells, and new offshore wells. For existingwells, production costs are low, typically less than US$5/bbl, becausethere are only operating costs and hardly any investment is needed beyondmajor maintenance and well work-over. However, output from these wellsis projected to decline rapidly, at about 30% p.a. over the next tenyears. To compensate for this decline, ENAP envisage that large-scaleinvestments are necessary (US$430 million in the next 5 years alone) todevelop production from new wells, both onshore and offshore. This is atentative estimate with decisions to be made step-by-step.
- 35
3.9 Offshore Development. The largest portion of this investment,about US$360 million, is for developing offshore deposits. Offshorwelis are projected to achieve their peak around 1989 at 0.89 million mof crude and condensate (or 15,000 B/D). Howeve5, also this productionstream would decline sharply to 0.14 million m (2,400 B/D) by 1995.Production would be relatively high-cost: over the field production lifeestimated at 10-14 years, average incremental costs are calculated atUS$16.50/bbl, of which about US$2.50/bbl is operating cost (1986 pricesand exchange rates). This average cost may exceed internationalpetroleum prices in some years, although the marginal cost of crude frot"some reservoirs is likely to be lower. However, the marginal cost isexpected to increase sharply especially once cumulative of shoreproduction exceeds 3-4 million m for offshore and 1 million m foronshore, respectively.
3.10 Onshore Development. The output from new onshore wells isplanned to peak shortly after 1990 at 0.28 million m3 (4,700 B/D), afterwhich also this production stream would decline sharply. Associatedinvestment is projected to total about US$70 million in the next f,veyears, for an average incremental cost of production approxinawrtingUS$13/bbl. 16/
3.11 Project Evaluation Methodology. ENAP uses a sophisticatedproduction optimization model to evaluate rates of return for hydrocarbondevelopment, which is of particular relevance in situations when marginalcosts of productions are close to the international crude price. Theinternal rates of return and net present values are calculated based onindividual reservoirs and wells (onshore) and individual platforms(offshore). This analysis indicates high returns for onshore crude oildevelopment and offshore crude oil and gas develornent. Investmentdecisions are based on marginal cost of production. ENAP's projectanalysis is appropriate but could be further improved through thefollowing refinements:
(a) The application of marginal cost analysis for individualfields/platforms should be further refined. This would make itclear that some reservoirs (or producing units) may have highmarginal cost and that their development should be postponed orruled out. However, this analysis might be difficult ifreservoirs are "sandwiched" and/or use common facilities.
(b) There should be an analysis of the depletion rate at which thenet present value -- based on marginal cost -- is maximized.International experience in managing high-cost reservoirs has
16/ See Annex 9 for a breakdown of investment and resulting productionas projected by ENAP. The cost of LPG extraction is included in thecalculations as this is a by-product of gas compression required tomaintain reservoir pressure for crude production.
-36-
shown that optimal economic depletion may occur at a muchslower than the maximum technical rate. 17/ Through reducingcosts more than benefits, the net present value would bemaximized at lower production levels. This approach should betested to see if slower depletion may be optimal for some ofthe larger fields.
(c) There should be a clear separation of investment for crudeproduction and for production of natural gas as petrochemicalfeedstock. If planned expenditures are to result in gasproduction only, they should be allocated to the cost ofproducing gas, not oil.
(d) The analysis should incorporate the assumption of equipmentreuse to the feasible extent (which could possibly lowerinvestment costs by at least 10-15%).
3.12 The above refinements are important because (a) the marginalproduction cost should not exceed the costs of petroleum imports or ofother substitutable energy sources; (b) the optimal economic depletionmight be lower than planned depletion; and (c) in the Chilean context,investment should be geared to optimal development and production ofcrude whereas gas as a byproduct is of lesse- significance as energysource. The marginal production cost of crude oil can be reduced through(a) producing only those reservoirs in "core properties" whose cost arelowest, and/or (b) slowing down the composite depletion rate. However,the question of which reservoirs to produce, and how fast to produce themare inter-related. At the one extreme, a strategy of producing all, ornearly all, of the reservoirs at the fastest possible rate is likely tolead to high marginal cost of production. In contrast, producing allreservoirs at a slower rate may increase the net present value to theextent that marginal costs will be reduced more than marginal benefits.Nevertheless, during the final stages of depletion, the marginal costsneed to be carefully evaluated because per-barrel production costs thenare bound to rise sharply.
3.13 Risk Considera.ions. Planning petroleum operations contains anunusually high degree of risk, both in regard to technical (i.e. produc-tion) and cost/price risks. Standard deviations based on ENAP's offshoreproduction data indicate a one-third probability that crude and conden-sate production will be just three-quarters of the planned level. On aconservative basis, the average incremental cost of offshore oil could beabove US$21/bbl.
3.14 Price risk is particularly significant in planning high-costproduction, given the degree of volatility in international petroleumprices in recent years. According to World Bank projections, a supply
17/ See Annex 10 for details of the methodology to determine this rate.
- 37 -
overhang will likely result in relatively low petroleum prices during thelate 1980s but these prices would increase significantly after 1992 intothe mid-and late 1990s. There is, therefore, a distinct possibility thatENAP's marginal production cost exceed international petroleum prices inthe 1989-91 period (when production of high-cost crude from new ofishorewells is projected to peak). Rules of thumb in the oil industry are thatan internal rate of return of at least 15 should be achieved on the lowproduction/low price forecast. To the extent that ENAP's productioncosts for some offshore schemes are above US$20/bbl -- i.e. substantiallyabove conservative price forecasts of, say, US$15/bbl -- these schemeswould be unviable under those conditions. However, it is of particularconcern that the decline in Chile's crude production may gather momentumafter 1992 precisely at the time when increases in internationalpetroleum prices are projected to accelerate also.
3.15 This reinforces the conclusion that an appropriate strategy ofproducing crude would be to limit development to the least-cost "coreproperties" and deplete these properties at the optimal rate. Theremaining properties could be produced in later years (when internationalpetroleum prices are projected to be higher) or be offered to privateinvestors under exploitation contracts. Especially the latter appraochwould provide significant benefits to the public sector by reducingexpenditures for field development and shifting part of the price andproduction risk to the private sector. The "core properties" should bedefined based on conservative forecasts of international petroleum pricesand of domestic crude production, so as to minimize risk and avoidproducing excessively high-cost oil.
3.16 In the short run, lower depletion will have a positive effecton ENAP's investment requirements but through increasing petroleum importrequirements, it may affect negatively the balance of payments.Therefore, in addition to a conventional rate of return analysis, adetailed evaluation of optimal depletion is needed, based on marginalproduction cost by reservoir and production and price risk, to define theappropriate depletion profile. In deciding on a production strategy, ahigh premium should be placed on operational flexibility especially inregard to the cost structure, in order to respond quickly to changes inprices and other crucial parameters.
Prospects for Secondary and Enhanced Recovery
3.17 In addition to primary production, crude oil can be producedthrough secondary recovery (water and/or gas injection) or enhancedrecovery, depending on the geology and reservoir behavior. While nodetailed information was provided, ENAP consider the prospects forproducing additional oil reserves through secondary recovery in theSpringhill district to be non-economic in six out of the eight largest
-38-
fields because of insufficient remaining reserves and other technicalfactors. 18/
3.18 Both CNE and ENAP envisage secondary recovery as a prime areafor private service contractors, following the Argentine model, inparticular for relatively small fields. Two portions of Springhill areplanned to be opened to private service contractors to test theirsuitability for secondary recovery. Nevertheless, a firm conclusion onthe attendant potential cannot be made on the limited informationprovided. Therefore, it is recommended to complete an independent reviewof this potential before ENAP take firm investment and pr_iductiondecisions. In the meantime, efforts aimed at commissioning privatecontractors to produce primary and secondary oil under exploitationcontracts inside and outside the "core properties" should be pursued,possibly through joint ventures with ENAP, given the need to attractadditional capital and technological resources (new production conceptsetc.) for these complex operations.
Petroleum Exploration Strategy
Hydrocarbon Potential
3.19 General. Favorable geologic conditions for hydrocarbonformation are limited to the Magallanes region east of the Andes,essentially the Springhill District which is the only part of the countrywhere crude oil and natural gas has been found in commercial quantities.More than 90 oil, gas, and condensate fields have been developed inMagallanes since the mid-1940s. Most of the "easy discoveries" appear tohave been made, leaving only relatively high-risk areas unexplored.Thus, future hydrocarbon exploration and production will likely be morecostly and higher-risk than in the past.
3.20 Two groups of basins comprise the frontier areas where hydro-carbons might be discovered, i.e. Magallanes outside the producingSpringhill District, and the Pacific coast. Most of the Pacific coast isnot prospective for crude and only marginally favorable for naturalgas. Nevertheless, a number of prerequisites for hydrocarbonaccumulations are present in both basins. Adequate structures fortrapping hydrocarbons as well as sedimentary sequences sufficiently thickfor oil and gas development exist along the entire coast. The problemlies in identifying the right kind of sediments, and this should be the
18/ ENAP studied eight of the largest oil fields in the Springhilldistrict to determine their susceptibility to secondary recovery.Of these, only the Calafante and Catalina fields are consideredcandidates for secondary recovery, as represented in the operatingplan.
39M
focus of Chile's exploration effort. Noncommercial accumulations ofnatural gas have been found offshore Valdivia, which is important in thatit confirms that hydrocarbon source materials do exist, at least to someextent, in that area.
3.21 Given the extension of the sedimentary basins and the pastconcentration of the exploration effort on Magallanes, thile clearly isunderexplored. Of ENAP's 1980-84 exploration expenditures totallingUS$164 million (for 23,000 km of seismic lines and 15 exploratory wells)702 were allocated to the Magallanes Basin, with 90% of exploratorydrilling in the Magallanes Straits area. In the rtst of the country,within a period of approximately 30 years, only abtut 100 explorationwells have been drilled, and only 18 offshore wells along the 3,500-mile-long continental shelf. 19/ 1,200 mile, of the soutbarn shelf and 1,000miles of the northern shelf are totally undrilled'. ENAP in 1987 finished14 exploration wells (of which ten were dry), exclusively inMagallanes. However, ENAP envisage substantial exploration anddevelopment expenditures in frontier areas, tentatively in the order ofUS$80 million in 1988-91 and up to US$380 million in 1992-96 (1986 pricesand exchange rates), although a large part of this may in fact be carriedout by outside companies associated with ENAP.
3.22 Magallanes Basin. The mature producing Springhill district inthe eastern part has been thoroughly explored, and there appear to be fewprospects of finding significant further oil reserves. Half of theprospects lie below 2,500 m depth so that the general expectation ispredominantly for gas accumulations of reduced size. 20/ In the westernpart of Magallanes, which has been much less explored, three explorationobjectives are present, i.e. (a) the Western Springhill, (b) the TertiaryDistrict, and (c) the Pre-Cordillera (Foothills) District. In WesternSpringhill, target exploration objectives consistently occur at depthsgreater than 2,500 m. In the Tertiary District, multiple reservoirs oflower and upper tertiary age occur. Thus far, 89 wells have beendrilled, resulting in eight discoveries totalling 50 BCF of dry gas and7 million bbl of condensate. Additional gas reserves of 80 BCF have beenestimated, and there is a high probability that gas rather than crude oilwill be discovered. This is not considered a desirable explorationobjective in view of market constraints (para 3.39). ENAP has includedexploration expenditure for this area for the early period of its plan.The likelihood of this expenditure going ahead depends on favorableindications from geophysical surveys.
19/ Of these wells, 14 were drilled by ENAP, three by Atlantic Richfield(including the Valdivia offshore gas field) and one by Phillips.Total depth drilled was 36,500 meters.
20/ There is a relatively high geothermal gradient in the MagallanesStraits (5 degrees centigrade per 100 m.). The warmer the medium,the more likely it is that hydrocarbon deposits are gasiferous.
- 40 -
3.23 Pre-Cordillera District. This is an untested and complex areawith the presence of large tolded and faulted anticlinal structures thatcould provide traps for significant oil accumulations. Thirteenexploration wells drilled in this area proved up only minor oil shows.The main deficiency has been the lack of porous and permeable reservoirrocks within the structures. Technical problems are considerable instructural provinces of this nature. Given that this area holds severallarge structures, 21/ exploration carried out thus far falls short ofwhat is needed for a thorough evaluation of the potential. ENAP considerthat about 50 exploration wells and in case of discoveries, 100 develop-ment wells should be drilled in that area between 1989 and 2000, with theemphasis on the northern Ultima Esperanza sector. Obviously, any produc-tion after 1991 will depend on the outcome of the exploration effort.(Two other foothill areas, Central and Tierra del Fuego, are equally oilprospective, but are not included in ENAP's exploration program becauseof their structural complexity and difficult operating conditions.)
3.24 Pacific Coast. This area includes numerous offshore, onshoreand intra-montain sedimentary basins. For the most part, geologicconditions are not favorable for oil accumulations and only marginallyfavorable for natural gas. However, the Jurassic Norte Grande Basin(which may be an extension of the Argentine Cuyana Basin) containsgeologic criteria that should favor oil formation. Although nineexploration wells have been drilled without significant shows, ENAPconsider an extensive drilling program in this area appropriate,consisting of 37 exploration wells and 87 development wells to be drilledduring 1989-2000. The expected results of this drilling, and that inUltima Esperanza, are to account for 75% of crude production expected forthe second half of the plan period. These are very optimisticprojections for two areas that have had no exploration success to-date.The Arauco-Valdivia offshore basin might hold a favorable potential butis primarily gas-prone.
Domestic Exploration Strategy
3.25 In response to declining crude oil production, the Governmenthas aimed at accelerating exploration and reserve accumulationdomestically, and more recently, at initiating a thrust to explore anddevelop deposits outside Chile. The Government is aware that it cannotcommand the substantial resources required to mount an adequateexploration effort, and that the participation of oGl:side companies istherefore needed. The Government in 1981 opened all hydrocarbon-prospective areas, except the Magallanes Basin, to outside companies forexploration and exploitation under Petroleum Operations Contracts (RiskContracts). The Magallanes Basin then remained reserved for ENAP. TheGovernment in 1986 also opened up all prospective areas in the Magallanes
21/ The Parillar-1 structure covers an area of 70 kn2; the Vicuna-CaboNariz structure, 600 km2 .
- 41 -
region. Areas offered to date to risk contracts total 276,000 sq. km(Magallanes, 53,000 sq. km; prospective areas with improved geologicalinformation, 79,000 sq.km; other areas, 144,000 sq.ka.).
3.26 Exploration and exploitation of hydrocarbon resources in Chilerequire risk contracts between companies and the State and in the case ofactivities in Magallanes, additional association contracts betweenoutside companies and ENAP. In areas outside Magallanes, the contractorsare at liberty to decide to associate with ENAP in exploration orexploitation programs. The regulations of the petroleum law and modelcontract governing work commitments, production sharing, valuation ofoutput, taxation, and foreign exchange matters are at least as favorableas in other countries in the Region, and offer considerableflexibility. It is indeed important to offer conditions to internationalcompanies that allow Chile to compete successfully with other oilproducing countries for scarce exploration funds. This is especially soin view of the highly speculative and costly nature of exploration inChile's frontier areas, the relatively unfavorable geology which mightlimit the chances for discovering crude in significant quantities, thecomplex technological requirements, and the moderate success thus far inattracting foreign petroleum companies to Chile.
3.27 While the Government has engaged its best efforts to attractinvestment in exploration by international companies, the response thusfar has been relatively slow in coming. This may have been because ofthe timi'6 of these offers which coincided with the fall in internationalpetroleum prices in 1986 and a cutback in exploration world-wide.Especially the Pacific Basin is considered high-risk and expensive toevaluate, and the limited exploration to date in that area has notproduced any signifizant results. Although foreign companies have showninterest in the Magallanes area, and the coastal basins have been openfor years to foreign investors, at present no foreign companies areexploring in Chile. However, in early 1988, two companis werenegotiating risk contracts for exploration acreage in the Salar deAtacama, and a number of others have acquired the technical information.
3.28 Should there be no or not sufficient foreign investment, ENAPplans to carry out some exploration in frontier areas and field develop-ment in case of commercial discoveries. Based on probabilistic estimatesof oil discovery and development, ENAP estimates its investment expendi-tures for exploration and development to total US$430 million during1987-1996, which are expected to result in a production of 0.7 million mp.a. of crude by 1996 (±0.4 million m3). ENAP plans to approach anyinvestment incrementally, with continuous review of plans based on newinformation.
3.29 Evaluation of Exploration Strategy. In general, lack ofinterest by foreign companies may be attributable to one of the followingfactors: (a) the most prospective areas have not been offered;(b) contract terms are unattractive; (c) the hydrocarbon-related geologyis comparatively poor, and/or exploration is technically difficult; and
- 42 -
(d) petroleum price prospects are unfavorable. In the case of Chile, itappears that reasons (a) and (b) are not a problem but reasons (c) and(d) explain the lack of oil company interest.
3.30 Therefore, ENAP need to reassess their plans to go ahead withcostly and risky exploration in frontier areas, in the absence of foreigninvestment. Exploration of frontier areas and evaluation of resultsalmost always are technically difficult and foreign oil company expertiseand financial back-up is required. Instead of large-scale capitalexpenditures solely by ENAP, the Government's and ENAP's priority shouldbe to improve the information base and promote these areas to attractforeign companies. All feasible options should be pursued includingjoint exploration ventures with ENAP. Opening up the remainingMagallanes areas hitherto reserved for ENAP, possibly on condition ofexploring other areas as well, might help to stimulate interest byoutside investors. Even though ENAP has sufficient expertise andexperience to explore and develop the few remaining prospects, opening upthe hitherto reserved areas to outside companies would stimulate know-howtransfer and application of new technical concepts, with long-termbenefits for petroleum operations overall.
3.31 Certain clauses pertaining to taxation (i.e. the possibility ofchoice between corporate income tax and a fixed levy on gross revenues;provision for tax rebates) might need to be clarified to ensure theeligibility of U.S. based companies for the U.S. overseas tax credit. 22/This is recognized by the Government, and the contract framework offerssufficient flexibility to resolve any possible ambiguities, inconsultation with the affected companies. Also, there are specialprovisions with regard to production sharing for natural gas.Eliminating the mandatory association with ENAP in Magallanes probab.ywould help to attract additional investor's interest.
3.32 Exploration Promotion Needs. The prevailing perception amonginternational oil companies is that prospects for significant petroleumdiscoveries in Chile are relatively poor. It will be a major challengeto convince these companies to invest significant portions of theirexploration budgets in Chile. To achieve this, a strong technical caseneeds to be made that good prospects do exist in the areas beingoffered. Indeed, in the view of some exploration specialists, severalcomplex and relatively untested exploration plays hold good hydrocarbonpotential. However, few international companies command the necessarytechnology, experience, and financial resources to undertake specialized
22/ In order for a tax to meet U.S. Internal Revenue Service criteriafor creditability against U.S. income tax, it needs to (a) be leviedon income, not gross revenue (in which case it would be treated as a-- non-creditable -- royalty; (b) be generally applicable, i.e. notbe industry- or company-specific; and (c) remain unchanged duringthe period of its application.
- 43 -
exploration of this type. It is therefore recommended that explorationpromotion focuses on these plays, and on companies capable to undertakethe required specialized exploration. The promoted areas should be givenbroader international coverage than they have received to-date. To theextent that specialized advice for organizing this complex type ofexploration promotion is needed, ENAP and the Covernment at large shouldbe prepared to actively seek it.
3.33 Price Uncertainty. The fall in international petroleum pricesin 1986 and subsequent price uncertainty has contributed to the lack ofcompany interest in exploring in Chile. Prior to 1986, major oilcompanies were interested in operating in Magallanes but these areas werenct open to foreign investors at that time. Since then there has been amajor reduction in the companies' exploration budgets parcicularly formarginal and complex basins like those in Chile. This price uncertaintymakes an adequate legal framework for hydrocarbor. operations and a strongpromotional effort even more important, supplemented by relatively low-cost efforts to improve the information base. Any decision on large-scale investment by ENAP to explore risky and complex frontier areasshould be deferred until a clearer picture on price prospects and on theinvolvement of outside companies emerges.
International Exploration Strategy
3.34 In view of the limited hydrocarbon potential domestically, ENAPis interested in forming joint ventures for oil exploration and/orpurchase of reserves outside Chile, with .special focus on prospects inother Latin American countries. Two projects are under consideration.
3.35 ENAP has discussed with YPF of Argentina and Petrobras thepossibility to jointly operate in the Argentine Magallanes offshore afield holding recoverable reserves of 20-30 million bbls of recoverablecrude and 5 billion m3 of natural gas, and has recently submitted aproposal to YPF. 23/ ENAP's share of this oil could amount to 8-10 million bbls. If the field can be developed and produced economi-cally, there probably is no other reserve addition available to ENAPoutside Springhill at such a low risk. However, the Argentine Governmenthas yet to give the go-ahead for this arrangement. A second interna-tional project -- less advanced than the former -- involves a jointexploration venture wich PetroCanada and the state oil company of Uruguayin the Ecuadorian Oriente where a certain portion of exploration acreagehas been set aside by the Government of Ecuador for state-owned oil
23/ Petroleum Intelligence Weekly, July 11, 1988. The field wasdiscovered by Shell Oil Co. which considered it to be marginal andwhich elected not to develop it, so the field reverted to theState. Since the discovery is within 12 km of ENAP's own operatingarea, the economics for ENAP are more favorable than for Shell,which has no operations in the area.
- 44 -
companies. 24/ The contract calls for a seismic option followed by atwo-well work program in the range of US$10-20 million. The block inquestion is near producing fields holding reserves of at least 50 millionbbls.
3.36 Evaluation of Foreign Exploration Strategy. The option ofacquiring relatively low-cost, low-risk reserves outside Chile, inassociation with international companies, may indeed be superior to high-risk, low-return exploration ventures in the country. However, it needsto be established that production, or earnings from production, can befreely transferred to Chile under acceptable conditions (e.g. in the caseof countries that are net importers of petroleum, such as Argentina.)
3.37 An international exploration strategy also involves a number ofinstitutional issues. ENAP as a domestic company has little inter-national expertise, notwithstanding its recent exposure to foreign firmsin the context of negotiating association contracts for ventures inChile. To be successful internationally, ENAP has yet to develop thecapability to generate and exploit exploration prospects abroad,negotiate agreements with international companies and foreign govern-ments, and operate on international markets. Without it, ENAP wouldalways depend on someone else's venture, operated by others, for which itwill have to pay a premium and receive a relatively minor share. Theinternational strategy also raises the issue as to which extent ENAP as agovernment-owned company should spend public funds on foreign ventures.An alternative to ENAP's direct involvement would be to set up aprivately owned or mixed company to attract domestic private capital tointernational petroleum operations (even though up to now, nationalprivate firms have not indicated much interest in petroleum exploration,domestic as well as foreign). The purpose of exploration abroad, from anational perspective, is to ensure future pe -oleum supplies in the eventof international shortages. Therefore, a pr.vate or mixed company wouldneed to be structured in such a way that (a) the domestic private sectorconsiders it a worthwhile investment, and (b) the benefits ofinternational operations return to the national economy and not escapethrough leakages. Otherwise, the benefits of this international strategywould be lost.
3.38 Provided a satisfactory solution to these issues is found, theinternational strategy provides an excellent vehicle to develop a privateoil sector in Chile, which is an important Government objective. How-ever, the petroleum-related expertise in the country resides entirely inENAP. It needs to be determined how this expertise can be transferred tothe private sector, and how a privately-owned petroleum industry can bedeveloped. One option would be to follow the Argentine experience byopening up service opportunities to the private sector, e.g. in
24/ PetroCanada, the original bidder, has obtained permission to bringin partners.
- 45 -
Springhill, although there may be only few adequate opportunities remain-ing in producing areas. An international strategy as a means of securingand augmenting the country's future oil supply, whether by ENAP orprivate companies, is a worthwhile effort and should be encouraged. Howthis strategy can be best pursued to the maximum benefit of the nationaleconomy still requires considerable analysis and strategic planning.
Conclusion and Recommendations
3.39 The sector strategy aimed at reducing expenditures and risk forboth the Government and ENAP in hydrocarbon exploration and production isappropriate and should be maintained. Such a strategy should emphasizethe following elements:
(a) Production: The near-term development and production ofremaining oil reserves should be limited to the lowest-cost"core properties". Properties should be offered to privatesector operators under service contracts, along with areaswhich may have secondary recovery potential.
(b) Domestic Exploration: A sustained promotion effort should becarried out to attract those foreign companies which have therequired technical expertise and financial resources to exploretechnically difficult and complex geologic areas. This shouldbe supplemented by low-cost efforts by ENAP to improve therelevant information base. While it may be appropriate forENAP to carry out a limited amount of exploration drilling, theentity 3houlu avoid large-scale drill ng expenditure in complexand risky frontier areas.
c) International Ventures: The next five years or so may be auniquely favorable period to acquire a stake in relatively low-cost petroleum reserves abroad. However, clear objectives andguidelines for ENAP are needed regarding the acceptable typeand degree of risk and the size of the investment. ENAP'sability to assess international opportunities should beimproved, particularly options to lower the risk throughassociation with international companies. Options andrequirements for involving the domestic private sector in theseventures should be evaluated.
Natural Gas Utilization
Introduction
3.40 Natural gas is produced only in Magallanes. Of the grossoutput (about 4.35 billion m3 in 1987, or some 420 million CF/D), nearlythree-quarters are reinjected to maintain reservoir pressure, improve oilrecovery, and eventually, be utilized again. The remainder is used in
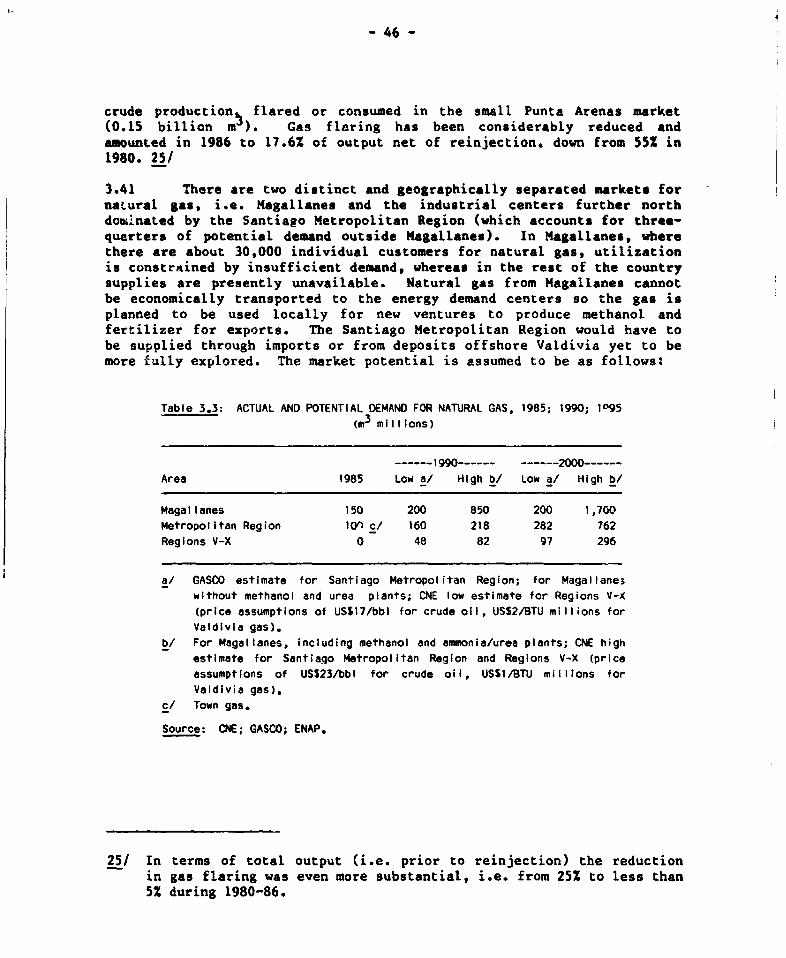
-46-
crude production flared or consumed in the small Punta Arenas market(0.15 billion m ). Gas flaring has been considerably reduced andamounted in 1986 to 17.6% of output net of reinjection, down from 55% in1980. 25/
3.41 There are two distinct and geographically separated markets fornatural gas, i.e. Magallanes and the industrial centers further northdominated by the Santiago Metropolitan Region (which accounts for three-quarters of potential demand outside Magallanes). In Magallanes, wherethere are about 30,000 individual customers for natural gas, utilizationis constrained by insufficient demand, whereas in the rest of the countrysupplies are presently unavailable. Natural gas from Magallanes cannotbe economically transported to the energy demand centers so the gas isplanned to be used locally for new ventures to produce methanol andfertilizer for exports. The Santiago Metropolitan Region would have tobe supplied through imports or from deposits offshore Valdivia yet to bemore fully explored. The market potential is assumed to be as follows:
Table 3.3: ACTUAL AND POTENTIAL DEMAND FOR NATURAL GAS, 1985; 1990; 1095
(m3 mIllions)
…-- 1990 … ------ 2000------Area 1985 Low a/ High b/ Low a/ High b/
Magallanes 150 200 850 200 1,700Metropolitan Region 10") c/ 160 218 282 762Regions V-X 0 48 82 97 296
a/ GASCO estimate for Santiago Metropolitan Region; for Magallaneswithout methanol and urea plants; CNE low estimate for Regions V-X(price assumptions of USS17/bbl for crude oil, USS2/BTU millions for
Valdivia gas).b/ For Magallanes, including methanol and ammonia/urea plants; CNE high
estimate for Santiago Metropolitan Region and Regions V-X (priceassumptions of USS23/bbl for crude oil, USSI/BTU millions forValdivia gas).
c/ Town gas.
Source: CNE; GASCO; ENAP.
25/ In terms of total output (i.e. prior to reinjection) the reductionin gas flaring was even more substantial, i.e. from 25% to less than5% during 1980-86.
- 47 -
Natural Gas Utilization in Magallanes
3.42 Twc petrochemical projects are being developed by privateinvestors, i.e. a 750,000 tpy methanol plant and a similar-sizedamfonia/urea plant. The output of both schemes is almost entirely forexports. The methanol plant is expected to come on strean by end-1988while the ammonia project is less advanced as financing has yet to bearranged. These schemes, whose gas requirements would total 1.5 billionam p.a., will make use of the area's abundant natural gas resources whichotherwise are of little economic value. ENAP will be the seller of thegas, with the major investment in a collection and delivery system. 26/The cost of this investment amounting to US$22 million is financed inpart through a loan from IDB.
3.43 Take-or-pay supply contracts guaranteed by the Government havebeen concluded between ENAP and the industrial purchasers. These broadlysimilar contracts are based on a minimum sales price sufficient for ENAPto recover investment and operating costs. The agreed base price coversENAP's costs of supplying the gas to the plant gate and is then escalatedusing an index of international inflation. The contract includes aprofit/risk sharing clause which is advantageous to ENAP. 27/ On theother hand, ENAP has a firm delivery commitment and the pipeline loadfactor is deemed to be close to 90Z (330 days/year).
3.44 The petrochemical schemes offer a market for natural gas inMagallanes nearly four times its present size and provide export outletsfor this resource. While there are no supply constraints, it needs to beensured that investments to supply gas to petrochemical plants are least-
26/ The Cabo Nego Methanol project is implemented by the Henley Group ofthe U.S. (the ammonia/urea plant would start operating by 1990-1991at the earliest). Capital costs of the methanol plant approximateUS$305 million, of which IFC is providing a US$50 million long-termloan and US$f million equity capital. ENAP's investment ma;nlyc3nsists of a 18 in, 178 km pipeline, with a capacity of 6 millionm /d to supply gas to the two petrochemical schemes and to iLs ownfields and oil terminals.
27/ This clause for the methanol plant works as follows: The standardcost of the methanol production is defined between the two partiesand is escalated according to the international price index.Differences between agreed standard costs and actual productioncosts are borne entirely by the methanol producer. The calculatedprofit from methanol sales (i.e. sales proceeds less standard costs)is divided between ENAP and the plant: for years 1-3, ENAP's shareis 33% and thereafter 50%. If the actual sales price exceeds 10% ofthe projected and escalated sales price, ENAP receives 80% of thisexcess profit.
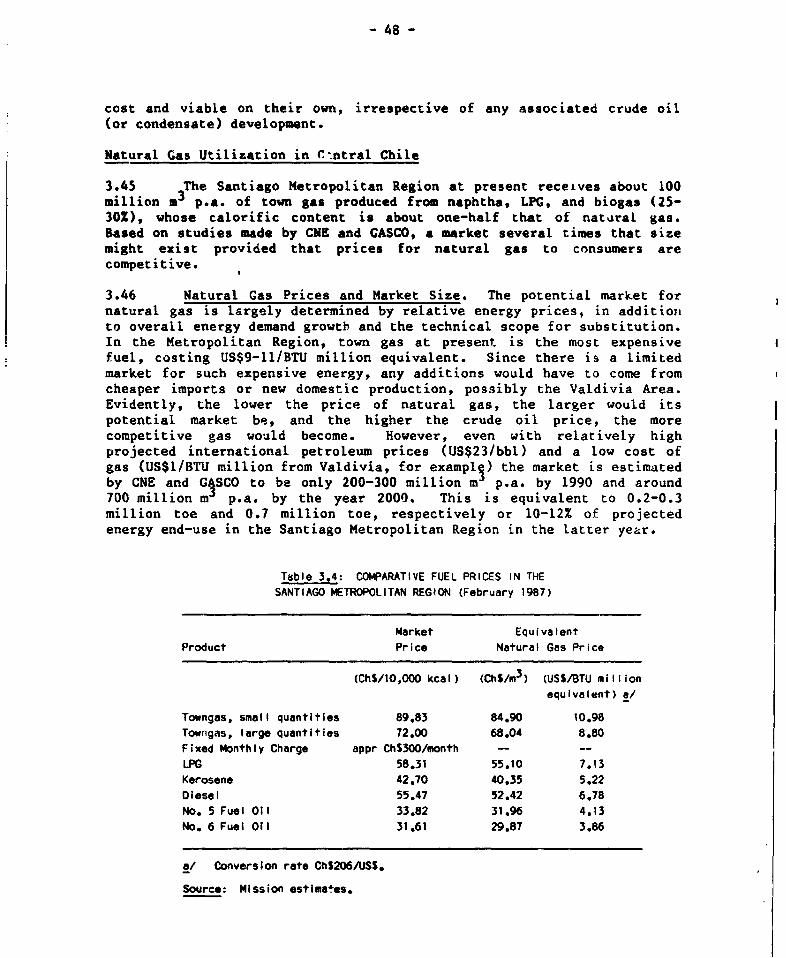
- 48 -
cost and viable on their own, irrespective of any associated crude oil(or condensate) development.
Natural Gas Utilization in C-ntral Chile
3.45 The Santiago Metropolitan Region at present receives about 100million a3 p.a. of town gas produced from naphtha, LPG, and biogas (25-30X), whose calorific content is about one-half that of natural gas.Based on studies made by CNE and GASCO, a market several times that sizemight exist provided that prices for natural gas to consumers arecompetitive.
3.46 Natural Gas Prices and Market Size. The potential market fornatural gas is largely determined by relative energy prices, in additionito overall energy demand growth and the technical scope for substitution.In the Metropolitan Region, town gas at present is the most expensivefuel, costing US$9-11/BTU million equivalent. Since there is a limitedmarket for such expensive energy, any additions would have to come fromcheaper imports or new domestic production, possibly the Valdivia Area.Evidently, the lower the price of natural gas, the larger would itspotential market be, and the higher the crude oil price, the morecompetitive gas would become. However, even with relatively highprojected international petroleum prices (US$23/bbl) and a low cost ofgas (US$1/BTU million from Valdivia, for exampl9) the market is estimatedby CNE and G SCO to be only 200-300 million m p.a. by 1990 and around700 million m p.a. by the year 2000. This is equivalent to 0.2-0.3million toe and 0.7 million toe, respectively or 10-12Z of projectedenergy end-use in the Santiago Metropolitan Region in the latter year.
Table 3.4: COWPARATIVE FUEL PRICES IN THESANTIAGO METROPOLITAN REGION (February 1987)
Market EquivalentProduct Price Natural Gas Price
(ChS/1O,OO0 kcal) (ChS/m3) (USS/BTU millionequivalent) a/
Towngas, small quantities 89.83 84.90 10.98Towngas, large quantities 72.00 68.04 8.80Fixed Monthly Charge appr ChS300/month
LPG 58.31 55.10 7.13Kerosene 42.70 40.35 5.22Diesel 55.47 52.42 6.78No. 5 Fuel Oil 33.82 31.96 4.13No. 6 Fuel Oil 31.61 29.87 3.86
o/ Conversion rate ChS206/USS.
Source: Mission estima4es.
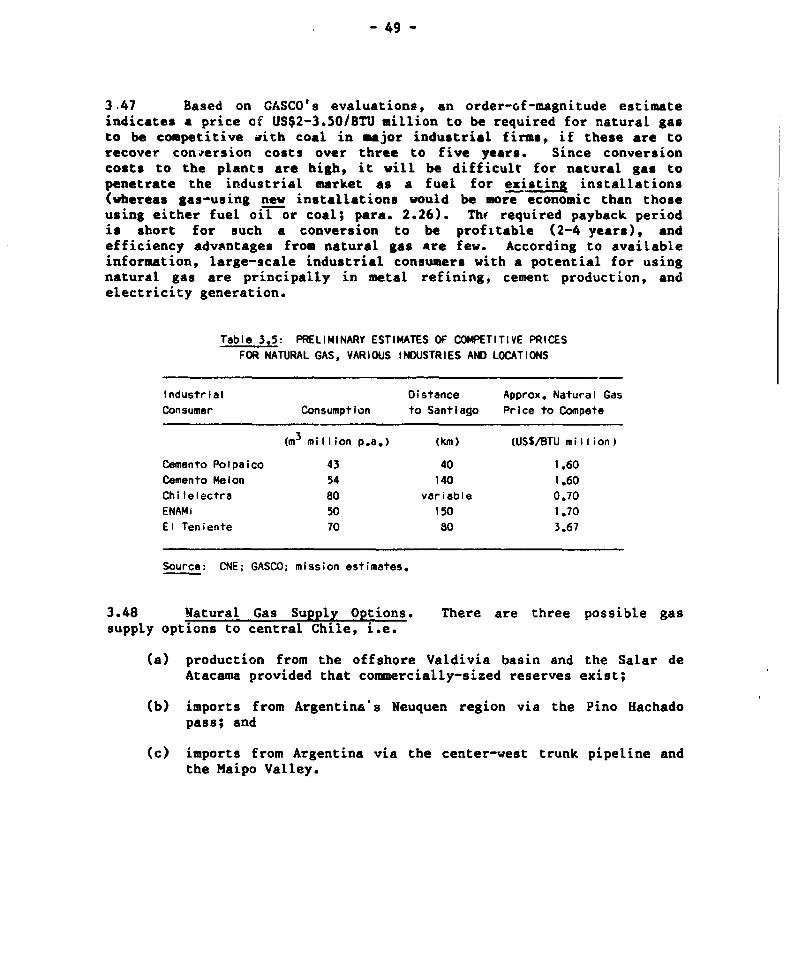
- 49 -
3 47 Based on GASCO's evaluations, an order-of-magnitude estimateindicates a price of US$2-3.50/BTU million to be required for natural gasto be competitive aith coal in major industrial firms, if these are torecover con-iersion costs over three to five years. Since conversioncosts to the plants are high, it will be difficult for natural gas topenetrate the industrial market as a fuel for existing installations(whereas gas-using new installations would be more economic than thoseusing either fuel oil or coal; para. 2.26). Thf required payback periodis short for such a conversion to be profitable (2-4 years), andefficiency advantages from natural gas are few. According to availableinformation, large-scale industrial consumers with a potential for usingnatural gas are principally in metal refining, cement production, andelectricity generation.
Table 3.5: PRELIMINARY ESTIMATES OF COMPETITIVE PRICESFOR NATURAL GAS, VARIOUS INDUSTRIES AND LOCATIONS
Industrial Distance Approx. Natural GasConsumer Consumption to Santiago Price to Compete
(m3 million p.a.) (km) (USS/BTU million)
Cemento Polpaico 43 40 1.60Cemento Melon 54 140 1.60Chitelectra 80 variable 0.70ENAMi 50 150 1.70El Teniente 70 80 3.67
Source: CNE; GASCO; mission estimates.
3.48 Natural Gas Supply Options. There are three possible gassupply options to central Chile, i.e.
(a) production from the offshore Valdivia basin and the Salar deAtacama provided that commercially-sized reserves exist;
(b) imports from Argentina's Neuquen region via the Pino Hachadopass; and
(c) imports from Argentina via the center-west trunk pipeline andthe Maipo Valley.
- so -
3.49 There are indications that the Valdivia offshore basin mightcontain gas in commercial quantities. 28/ ENAP and CNE are in theprocess of evaluating whether detailed exploration and, possibly, fielddevelopment is justified in view of the likely costs and the marketsize. In addition to the demand in the Metropolitan area, the marketwould consist of an estimated one-third of the potential energy demand inthe Valdivia-Santiago corridor. While detailed exploration and fielddevelopment costs are not yet available, those are roughly estimated tobe in the US$400-700 million range (for some 70 production wells), inaddition to about US$400 million for onshore facilities and a 800 kmtrunk pipeline. Resulting transmission costs alone might be in the orderof US$1.20-1.50/BTU million, assuming investment costs of US$200 millionand a 700 million m3 p.a. throughput.
3.50 Quite apart from its incipient nature, the scheme on is own isnot likely to be economically viable from several perspectives. First.any capital costs above US$300 million would be high, in view ofprojected gas demand and realistic oil price scenarios determiningsubstitution price levels. Second, for the price of natural gas to becompetitive with other fuels and for the project to achieve a reaso3ablereturn, gas reserves would have to be in the order of 24 billion m (ornearly one trillion CF), to produce 1 billion m3/year for some 20years. Such large reserves are not likely to exist. Third, with theexpected relatively small reserves and high investment costs for gasproduction and transmission, the unit cost would be very high.
3.51 The option of importing natural gas from Argentina via the PinoHachado pass has similarities to the Valdivia offshore scheme inasmuch asthe pipeline (110 km in Argentina and 830 km on the Chilean side) wouldtraverse the Temuco-Santiago corridor, thus reaching energy markets southof Santiago. Argentina's natural gas resources are very large and haveonly recently become more fully accessible. Their marginal opportunitycost is low. If the cost of imported gas does not exceed US$2-3/BTUmillion, the project is superior to the Valdivia offshore scheme.
3.52 The option of importing natural gas from Argentina via theMaipo Valley appears superior to the Pino Hachado scheme, assuming thesame border price. The Maipo Valley scheme requires a less costlypipeline investment, i.e. a 300 km pipeline on the Argentine side (whosecost are in the range of US$45-70 million) and a 150 km pipeline from theborder to Santiago, and, possibly, a branch to the El Teniente coppermining and processing center (costing about US$20-30 million). Based onCNE's market assumptions, the Maipo Valley scheme may be marginallyeconomic at a border price of US$2/BTU million (1986 prices and exchangerates). However, based on GASCO's demand projections (which are 20-50%
28/ This basin comprises 25 geologic structures, three of which couldcontain commercial accumulations of gas. They are located about50 km offshore, in water depths of 80-140 m.
- 51 -
lower than CNE's), this scheme would be commercial only at a border pricein the US$1.30-1.80/BTU million range, with a city-gate price ofUS$2-2.50/BTU million. It thus appears that gas imports via the MaipoValley would be an interesting option for the residential/commercialmarket vhere natural gas would substitute for higher-priced fuels, i.e.town gas, LPG, and kerosene, but also for thermal power generation andfor use at El Teniente, substituting for fuel oil. Supplying natural gasto central Chile might reduce the costs of energy imports byapproximately US$50-55 million p.a. by the mid-1990s, compared to US$85-120 million of investment and US$6 million p.a. of operating cost.Hovever, this scheme hinges on a realistic price agreement with Argentinaand a contractual framework which reduces the risk to the partiesinvolved to acceptable levels. Discussions have been held between thetwo Governments on the various possibilities for gas importation butlittle progress has been made so far. One of the problems is thatArgentina is reluctant to export gas at a lower price than it is payingfor gas imports from Bolivia. One way to resolve the pricing issue maybe through applying a combined base price/profit sharing or netbackarrangement.
3.53 As a variation of the Maipo Valley scheme, there might be amedium- to long-term option of adding supplies from future Valdiviaoffshore production if and when sufficient reserves are proven and themarket for natural gas develops. If these conditions were met, a two-stage supply approach could be envisaged: during the first stage, gaswould be imported via the Maipo Valley, and during the second stage,these supplies could be supplemented from the Valdivia offshore. Thisapproach would provide some important if unquantifiable benefits, i.e.
(a) developing domestic resources instead of exclusively relying ongas imports may be economically sound provided that the long-term cost of domestic supplies do not exceed those of gasimports;
(b) the decision on when, if at all, to incur the heavy front-endcosts of developing offshore gas deposits and constructing thetrunk pipeline could be postponed until a clearer picture ofthe offshore gas resources and of the gas market emerges; and
(c) a domestic supply alternative would improve Chile's bargainingposition.
3.54 Gas Swaps with Argentina. As another variat;on of theimportation option, natural gas from Magallanes could be supplied toArgentina and swapped with Argentine supplies to central Chile. Theviability of this option would depend on the ultimate reserves andopportunity cost of Magallanes gas, the existence of a market in southernArgentina for Magallanes gas, the transmission costs, and the avail-ability of spare capacity on the Argentine southern trunk pipeline toaccomodate sufficiently large volumes of Magallanes gas to make thescheme economic, compared to the cost of straight gas imports from
-52-
Argentina. While GASCO has taken the lead in discussions with Gas delEstado of Argentina, ENAP would have an important role to play in thisventure. In the past, Argentina has declined this option because (a)there is no spare capacity on the southern trunk pipeline, and (b) thereis no market in Argentina for dry or liquids-stripped gas from Magallanes(Argentina requires rich gas especially ethane for use at its BahiaBlanca petrochemical complex). These obstacles could be removed to theextent that the pipeline capacity is increased and Chile agrees toexporting gas rich in liquids to Argentina. 29/
3.55 Salar de Atacama Potential. Seismic results in that area about1,000 km north of Santiago indicate the existence of importantstructures, which will be the object of forthcoming exploration byforeign companies. Any commercial gas deposits could be used either incentral Chile for markets indicated above and in combination with gasimports, or in the northern mining centers both for mineral processingand power generation. No detailed evaluations can be undertaken beforemore is known about that area's gas potential.
3.56 Recommendations. In view of the complexity and wide-rangingimportance of the related issues, it is recommended that (a) existingstudies on optimizing natural gas supplies and utilization in centralChile be reviewed, based on updated market evaluations and explorationresults for the Valdivia and Salar de Atacama basins; and (b) providedthat the results of these updated evaluations make this advisable,agreements with Argentina on joint projects be pursued as a matter ofhigh priority.
Petroleum Refining
Introduction
3.57 Changes in petroleum product demand towards enlarging the shareof middle distillates and a declining share of fuel oil have requiredtechnical modifications in ENAP's two refineries located at Concon andConcepcion, primarily to produce more diesel from fuel oil (secondaryprocessing). These modifications were made during 1984-87 by (a) addinga 10,000 B/D visbreaker to the Concon refinery to convert fuel oil, and(b) modernizing a visbreaker and fluid catalytic cracking units at theConcepcion refinery. The costs of these modifications were about US$25million (US$14.5 million at Concon; US$9.5 million at Concepcion) ofwhich US$8 million were financed by IDB.
29/ There also is interest in Chile to acquire LPG (which is in shortsupply) from Argentina's Neuquen Province, in exchange for naturalgas rich in ethane. The feasibility of this scheme would depend onoptions to transport LPG economically to and within Chile.
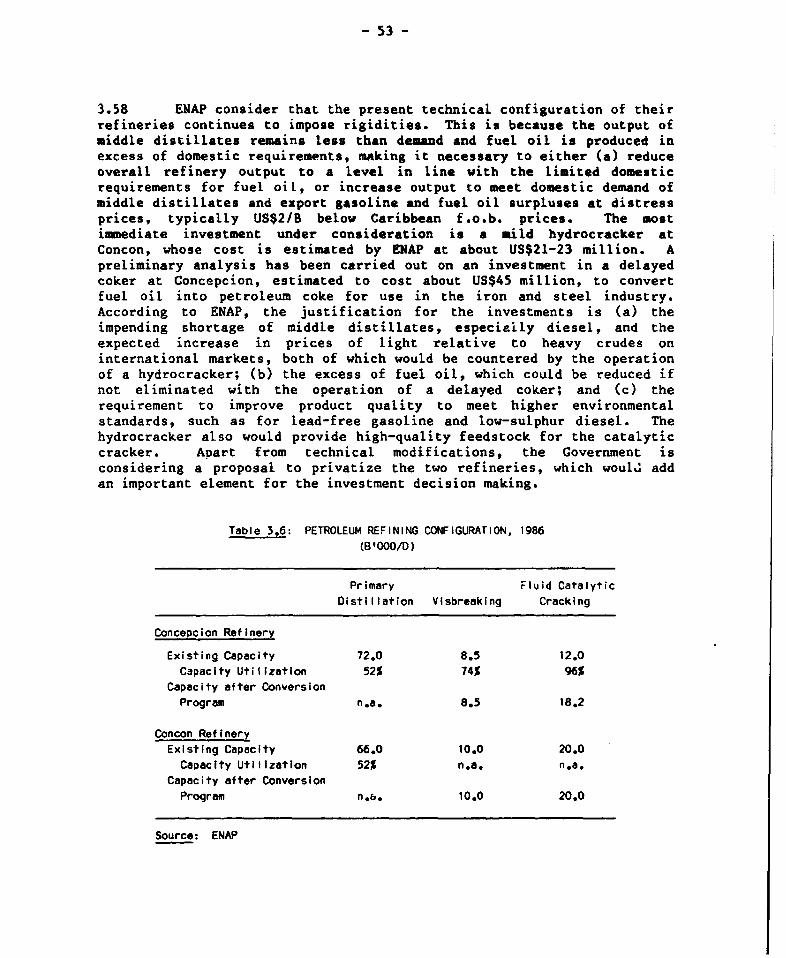
- 53 -
3.58 ENAP consider that the present technical configuration of theirrefineries continues to impose rigidities. This is because the output ofmiddle distillates remains less than demand and fuel oil is produced inexcess of domestic requirements, making it necessary to either (a) reduceoverall refinery output to a level in line with the limited domesticrequirements for fuel oit, or increase output to meet domestic demand ofmiddle distillates and export gasoline and fuel oil surpluses at distressprices, typically US$2/B below Caribbean f.o.b. prices. The mostimmediate investment under consideration is a mild hydrocracker atConcon, whose cost is estimated by ENAP at about US$21-23 million. Apreliminary analysis has been carried out on an investment in a delayedcoker at Concepcion, estimated to cost about US$45 million, to convertfuel oil into petroleum coke for use in the iron and steel industry.According to ENAP, the justification for the investments is (a) theimpending shortage of middle distillates, especiaily diesel, and theexpected increase in prices of light relative to heavy crudes oninternational markets, both of which would be countered by the operationof a hydrocracker; (b) the excess of fuel oil, which could be reduced ifnot eliminated with the operation of a delayed coker; and (c) therequirement to improve product quality to meet higher environmentalstandards, such as for lead-free gasoline and low-sulphur diesel. Thehydrocracker also would provide high-quality feedstock for the catalyticcracker. ADart from technical modifications, the Government isconsidering a proposal to privatize the two refineries, which would addan important element for the investment decision making.
Table 3.6: PETROLEUM REFINING CONFIGURATION, 1986(B'OOO/D)
Primary Fluid Catalytic
Distillation Visbreaking Cracking
Concepcion Refinery
Existing Capacity 72.0 8.5 12.0Capacity Utilization 52% 74% 96%
Capacity after ConversionProgram n.a. 8.5 18.2
Concon RefineryExisting Capacity 66.0 10.0 20.0Capacity Utilization 52% n.a. n.a.
Capacity after ConversionProgram n.a. 10.0 20.0
Source: ENAP
- 54 -
Hydrocracker Option
3.59 The question at this point is whether further investment inconversion facilities is justified or whether the changing pattern ofdemand can be met more economically through increases in refinerythroughput, changes in the refinery input mix through increasing the useof lighter or spiked crudes, importation of petroleum products in shortsupply, or a combination of the aforementioned options. There are anumber oi ways to improve the supply-demand balance for petroleumproducts. ENAP can maintain existing refining capacity and importproducts that cannot be produced economically, or add a mild hydrocrackerand/or a delayed coker and import products that still cannot be producedeconomically.
3.60 Initial Analysis. The determinants of the viability of themild hydrocracker are a) availability of domestically produced crude;(b) availability and prices of gas oil spike; (c) price differentialsbetween light and heavy crudes; (d) price differentials between crude andpetroleum products, in particular diesel and LPG; and (e) prices forpetroleum products in excess supply in Chile, i.e. gasoline and fueloil. ENAP analyzed each alternative listed above using a linearprogramming model to maximize the joint benefits from the Concon andConcepcion refineries subject to a number of constraints (paras 3.61-3.62). The model determined the type and amount of products that shouldbe produ_ed at Concon and Concepcion to maximize joint benefits in theyears 1990, 1995, 2000, and 2005. Demand projections were based onprojected consumer prices and various GDP growth scenarios. ENAP thencalculated both the economic and financial net present values of eachalternative based on its investment cost and the incremental netbenefits. The benefit and gross profit flows are identical in theeconomic analysis, adjusted by shadow-pricing of foreign exchange. Theresult of this analysis was that for the proposed project, the optionconsisting of the mild hydrocracker at Concon combined with an additionalvacuum unit at Concepcion had the highest net present value (Table 3.7).Concon emerged as the superior location for the mild hydrocracker because(a) it is slightly closer to the principal crude sources, i.e. imports,so its cost of raw materials is slightly lower; (b) it is closer to themajor markets, so transport costs are lower; and (c) it has a largerguaranteed supply of hydrogen and thus, can support a somewhat largerplant. 30/ Should the b-Irocracker be installed in Concepcion and novacuum unit be added, the hydrocracker would compete with the catalyticcracker for gas oil feedstock, and neither could operate at capacity. Itis worth noting that ENAP may consider adding a vacuum unit at Concepcion
30/ The Concon refinery has a vacuum unit to produce vacuum gas oil tofeed its catalytic cracker. In contrast, installing the mild hydro-cracker at Concepcion would necessitate the installation of a vacuumunit also, to increase the production of high-quality gas oilfeedstock.
- 55 -
even in the absence of a mild hydrocracker as the increased gas oil feedstock to the catalytic cracker would permit increasing the production ofpremium gasoline and diesel.
3.61 ENAP based this initial analysis on a number of importantassumptions. These included:
(a) a decline in indigenous crude (1.3 million m3 in 1990 and 0.7million m3 in 1995) reflecting a perceived lack of success offurther exploration; 31/
(b) Chilean crude is to be divided equally between the Concon andConcepcion refineries; 32/
(c) not more than 55% of refinery feedstock may be light crudes(i.e. above 34°API);
(d) only the Concepcion refinery can suoply the South, and only theConcon ref;.nery can supply Region V. The two refiaeries willcompete for the Santiago Metropolitan Region and the North;
(e) the refineries must operate at a capacity of at least 40X; and
(f) no exports of refined products are to take place.
3.62 Sensivity Analysis. The above assumptions were bouad to havean important effect on the results of the analysis, especially theexclusion of refined products exports and the restriction on the use oflight crude. These constraints, which were either poLicy-induced orrelated to economic factors such as limitations on exporLing surplus
31/ This assumption is significant for refining operations since Chileancrude is light and paraffinic and yields more diesel than mostimported crudes. It was, however, the direct outcome of ENAP'ssimulation model for evaluating field development projects. Theprojection horizon of these models is relativeLy short (i.e. notmore than seven years).
32/ The results of the model indicate that this is not an economicallyoptimal solution since delivery cost of crude from Magallanes toConcepcion would be lower than to Concon. In fact, the assumptionof free allocation of national crude would favor the mild hydro-cracker option. However, this parameter would become less signifi-cant for the results of refining as less domestic crude becomesavailable over time.
- 56 -
products 33/ made a correct decision on this project difficult. Also thesubstantial degree of risk of this project, mainly associated withprevailing price volatility, made it advisable that a number of pricescenarios were tested. On CNE's suggestion, ENAP in the followingmodified the analysis to incorporate the assumptions that (a) largervolumes of naiional crude would be available than originaly assumed, i.e.0.7 million m in 1995 and 0.5 million m in 2000; (b) the national crudewill be used by the refineries in the most economic way without fixedallocation; (c) sales to the Northern-most Region I will take place; (d)limiting supplies from one individual source will be determined in termsof overall petroleum requirements (i.e. crude plus products) instead ofcrude only; (e) gas oil spike will be available in sufficient quantitiesand at acceptable prices; and (f) the refineries are allowed to exportpart of their production 34/ and compete for each other's market.
3.63 To calculate the net present value of the investment, theincremental benefit flows for each project alternative were compared.When exports are permitted, the incremental benefits of the projectsdecrease substantially, as indicated by the lower net present values andinternal rates of return (Table 3.7). However, sales to Region I (whichhitherto has met its petroleum product requirements through imports)could allow disposing of most of the surpluses, at prices considerablyabove those obtainable at international markets. For the export case,Concon would remain the best location for the mild hydrocracker as longas a vacuum tower is installed at Concepcion.
33/ This is because regional surpluses prevail for fuel oil and low-octane gasoline, which are the principal excess products of Chileanrefineries. As these products are of relatively inferior quality,ENAP would have to sell these at distress prices.
34/ To estimate the attainable export price, ENAP (a) established thef.o.b. price of each product at Caribbean refineries; (b) discountedthat price by 3-1OX; (c) deducted the cost of freight, insurance,losses in transport, etc.; and (d) added back the import duty thatis levied on ENAP's crude imports. The discount is to reflectquality differentials and the fact that ENAP would not sell acomplete product line. For the price differential between light andheavy crude, US$0.15/B/API were assumed. The gas oil spike wasvalued at 90-95% of the price of diesel. For calculating the netpresent value of the project, a discount rate of 13% was used toreflect the relatively high risk of the investment.

- 57 -
Tabl, 3.7: NET PRESENT VALUE AND INTERNAL RATES OF RETURNOF ALTERNATIVE PETROLEUM REFINING PROJECTS a/
(1W!5 USS millions and Percent)
Constraints Binding Constraints Removed
Project Options NPV IRR NPV IRR
(1985 USS *n) (X) (1985 USS on) (S)
Mild Hydrocracker at Concon 14.21 26.3 0.60 13.7
Mild Hydrocracker at Concon and
Vacuum Unit at Concepcior 20.32 30.6 12.50 23.2
Mild Hydrocracker and Vacuum Unit
at Concepcion 19.77 27.6 8.60 20.4
Vacuum Unit at Concepcion only 5.92 83.2 11.90 -
a/ NPV was calculated with a discount rate of 13%.
Source: ENAP.
3.64 The results of this second-round sensitivity analysis alsoindicate that even in the exportation case, ENAP's present refiningcapacity is sufficient to meet domestic demand for all products exceptLPG without any additional investment. This is because the actualrestriction on exporting products prevents the refineries from operatingat full capacity and thus, producing diesel at (larger) quantitiescommensurate with existing capacity. Table 3.8 shows the quantity ofexportable surpluses in case diesel production were increased to levelsat which the domestic demand for this product can be met. However, inthat case, larger volumes of crude would be required than if a mildhydrocracker is installed, and surplus fuel oil would need to be exportedat prices below the cost of crude. If no exports were to take place,domestic consumption (plus storage capacity) of fuel oil would limitoverall refining operations. In the case of a mild hydrocracker, dieseloutput would be increased with given crude inputs and the quality ofproducts improved, but capital and operating costs of refining wouldincrease considerably. Also, higher output of diesel would beaccompanied by a decline in the output of LPG, which already is in shortsupply. Assuming that present price relationships continue until the
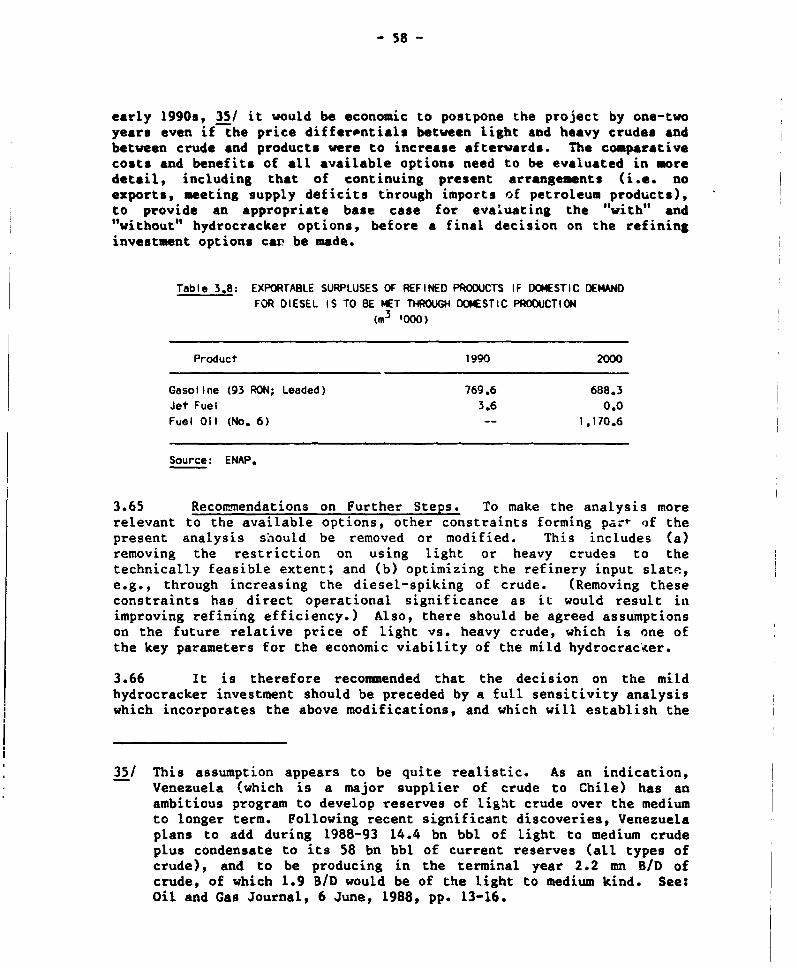
- 58 -
early 1990s, 35/ it would be economic to postpone the project by one-twoyears even if the price differentials between light and heavy crudes andbetween crude and products were to increase afterwards. The comparativecosts and benefits of all available options need to be evaluated in moredetail, including that of continuing present arrangements (i.e. noexports, meeting supply deficits through imports of petroleum products),to provide an appropriate base case for evaluating the "with" and"without" hydrocracker options, before a final decision on the refininginvestment options ca- be made.
Table 3.8: EXPORTABLE SURPLUSES OF REFINED PRODUCTS IF DOMESTIC DEMANDFOR DIESEL IS TO BE MET THROUGH DOMESTIC PRODUCTION
(,,3 '000)
Product 1990 2000
Gasoline (93 RON; Leaded) 769.6 688.3Jet Fuel 3.6 0.0Fuel Oil (No. 6) -- 1,170.6
Source: ENAP.
3.65 Recommendations on Further Steps. To make the analysis morerelevant to the available options, other constraints forming part of thepresent analysis shiould be removed or modified. This includes (a)removing the restriction on using light or heavy crudes to thetechnically feasible extent; and (b) optimizing the refinery input slate,e.g., through increasing the diesel-spiking of crude. (Removing theseconstraints has direct operational significance as it would result inimproving refining efficiency.) Also, there should be agreed assumptionson the future relative price of light vs. heavy crude, which is one ofthe key parameters for the economic viability of the mild hydrocracker.
3.66 It is therefore recommended that the decision on the mildhydrocracker investment should be preceded by a full sensitivity analysis
* which incorporates the above modifications, and which will establish the
35/ This assumption appears to be quite realistic. As an indication,Venezuela (which is a major supplier of crude to Chile) has anambitious program to develop reserves of light crude over the mediumto longer term. Following recent significant discoveries, Venezuelaplans to add during 1988-93 14.4 bn bbl of light to medium crudeplus condensate to its 58 bn bbl of current reserves (all types ofcrude), and to be producing in the terminal year 2.2 mn B/D ofcrude, of which 1.9 B/D would be of the light to medium kind. See:Oil and Gas Journal, 6 June, 1988, pp. 13-16.
- 59 -
consistency of the proposed investment with longer-term requirements.This analysis should take into account the risk related to the currentdegree of price volatility but also the probability that over the nextthree-four years (which is the critical period in terms of projecteconofics) the price differential between light and heavy crude is likelyto change little. CNE have proposed to postpone a decision on the mildhydrocracker for about one year until a clearer picture on the petroleumprice outlook emerges. The cost involved in postponing this decision islikely to be low.
Delayed Coker Option
3.67 ENAP also are evaluating the feasibility of installing adelayed coker at Conception, mainly to transform surplus fuel oil intopetroleum coke and to improve the quality of middle distillates. Aprefeasibility study analyzing the economic viability of this scheme,i.e. costs, markets, and attainable prices for petroleum coke, isexpected to be completed by end-1988. This investment would contributeto reducing fuel oil surpluses (the mild hydrocracker would addressmainly the problem of shortage of middle distillates). While the twoschemes may be complementary in certain aspects by allowing the Conconand Concepcion refineries to specialize in production processes andoutput patterns, they might be competitive in others. It therefore needsto be evaluated how these two investment options compare, and how theycould be jointly optimized. The production of petroleum coke may not beeconomic as substitute for fuel oil unless it is low sulphur, electrode-grade material. Also, the supply of hydrogen at the Concepcion refinery(which is needed for operating a delayed coke-) may pose a problem andmay have to be secured from outside.
Refinery Ownership Considerations
3.68 Future petroleum refining operations will be influencedconsiderably by a possible Government decision to transfer the refineriesto priv&te sector ownership. It seems that the Government does not wantto take a decision on refining modification before the ownership issue isresolved.
3.69 The viability of the proposed refining modifications and thefinancial prospects of refining overall will be important for any effortsto privatize the two refineries to be successful, and measures tostrengthen the economic viability of refining would be instrumental forimproving the financial position of the refineries as well. Thefinancial results of refining operations in Chile, as elsewhere, havebeen susceptible to changes in relative prices of crude vs. petroleumproducts, and are likely to remain so. At any rate, privatization wouldneed to be in strict conformity with a market-oriented approach, i.e. ncsubsidies nor price or market guarantees should be envisaged irrespectiveof refinery ownership.
- 60 -
IV. COAL SUBSECTOI
Introduction
4.1 In view of Chile's limited and declining reserves of crude oil,substituting petroleum use by coal has attained particularsignificance. The Government has supported the development of the coalsector through exploration particularly in Magallanes, expansion of theproductive capacity of the state-owned mining companies, and facilitatingsubstitution of coal for petroleum products, e.g. for power generation atCODELCO. However, Chile's coal resources are moderate, given the highsulphur content of Arauco coal and the high ash content of the sub-bituminous Magallanes coal, which limits their use. Only about 14% isgood-quality, low-cost coal with some coking properties, Located close toconsuming centers in the southern and central regions. Coal in cer.tralChile is mined entirely underground, under difficult geologicalconditions. The government-owned Empresa Nacional del Carbon S. A.(ENACAR), the largest coal producer, operates the Lota, Lebu, andColico/Trongol mines. Compantia Carbonifera Schwager S.A., a formerENACAR subsidiary and now owned 50% each by CORFO and private investors,operates the Schwager mine. ENACAR in 1986 met 54% of domestic coalconsumption (i.e. 1.5 million M.T.), the balance was provided bySchwaget, small mine operators (pirquineros), and imports, largely ofcoking coal. A new private company, COCAR, has started operating a 0.8million tpy open pit mine in Magallanes for sub-bituminous coal in late1987, representing an investment of about US$65 million. Its capacity isplanned to be eventually expanded to 1.4 million tpy. This venturebetween COPEC and Northern Strip Mining of the U.K. is partly financedthrough a US$16.5 million loan and US$2.2 million equity participationfrom IFC.
Main Issues
Costs of Coal Supplies
4.2 While the subsector's capacity is large enough to meet domesticcoal demand for the foreseeable future, the key issue is how much of thiscapacity is, or is likely to become, competitive with imports. ENACAR'scosts of operations are very high, which tends to raise energy coststhroughout the economy. COCAR's production costs are considerablylower -- in the order of US$35/M.T. -- but this advantage will be partlyoffset by the lower quality of the subbituminous Magallanes coal. Ittherefore needs to be evaluated (a) whether domestic coal production canbe made part of a least-cost program to meet energy demand especially ona local level, giving due consideration to energy alternatives primarilyimported coal and/or natural gas, and the need for thermal back-up in theelectricity system: and (b) whether there is scope for cost reductions atENACAR so that its production becomes more competitive with coal imports.
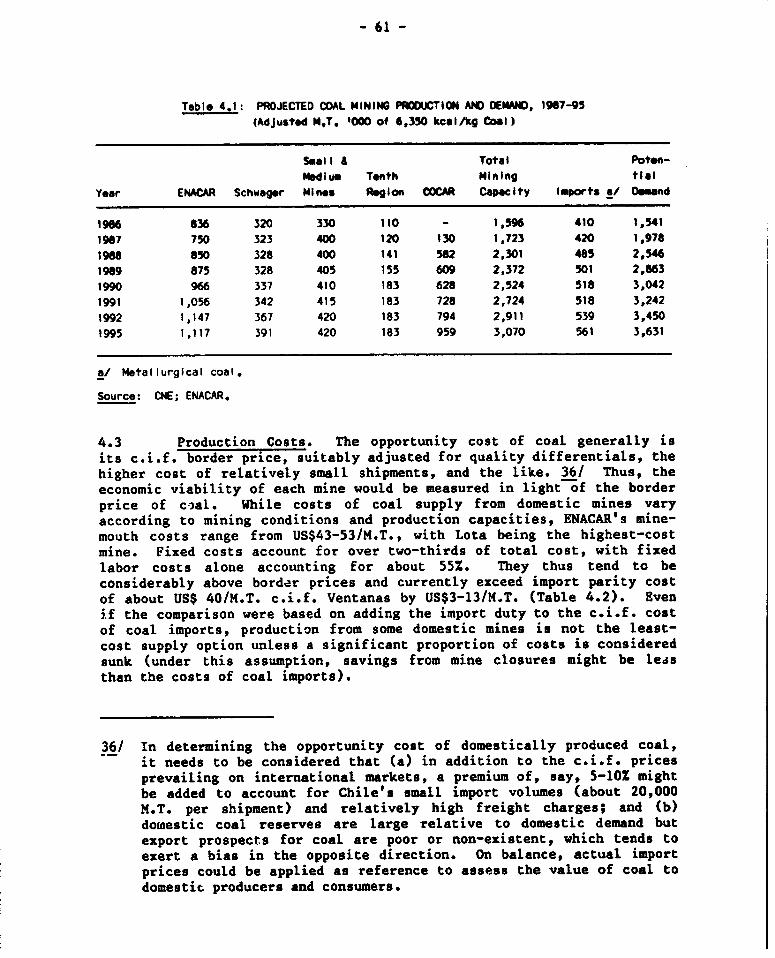
- 61 -
Table 4.11: PROJECTED COAL MINING PR0U0CTION AND DEMAND, 1967-95(Adjusted M.T. '000 of 6,350 kcal/kg Coal)
Smoll Total Poten-Modium T*nth mining tial
Year ENACAR Schwager Mines Reglon COCAR Capacity Imports a/ Demand
1986 836 320 330 110 - 1,596 410 1,5411987 750 323 400 120 130 1,723 420 1,978
1968 850 328 400 141 582 2,301 485 2,54619J9 875 328 405 155 609 2,372 501 2,8631990 966 337 410 183 628 2,524 518 3,042
1991 1,056 342 415 183 728 2,724 518 3,242
1992 1,147 367 420 183 794 2,911 539 3,4501995 1,117 391 420 183 959 3,070 561 3,631
a/ Metallurgical coal.
Source: CNE; ENACAR.
4.3 Production Costs. The opportunity cost of coal generally isits c.i.f. border price, suitably adjusted for quality differentials, thehigher cost of relatively small shipments, and the like. 36/ Thus, theeconomic viability of each mine would be measured in light of the borderprice of coal. While costs of coal supply from domestic mines varyaccording to mining conditions and production capacities, ENACAR's mine-mouth costs range from US$43-53/M.T., with Lota being the highest-costmine. Fixed costs account for over two-thirds of total cost, with fixedlabor costs alone accounting for about 551. They thus tend to beconsiderably above border prices and currently exceed import parity costof about US$ 40/M.T. c.i.f. Ventanas by US$3-13/H.T. (Table 4.2). Evenif the comparison were based on adding the import duty to the c.i.f. costof coal imports, production from some domestic mines is not the least-cost supply option unless a significant proportion of costs is consideredsunk (under this assumption, savings from mine closures might be leisthan the costs of coal imports).
36/ In determining the opportunity cost of domestically produced coal,it needs to be considered that (a) in addition to the c.i.f. pricesprevailing on international markets, a premium of, say, 5-10 mightbe added to account for Chile's small import volumes (about 20,000M.T. per shipment) and relatively high freight charges; and (b)domestic coal reserves are large relative to domestic demand butexport prospects for coal are poor or non-existent, which tends toexert a bias in the opposite direction. On balance, actual importprices could be applied as reference to assess the value of coal todomestic producers and consumers.
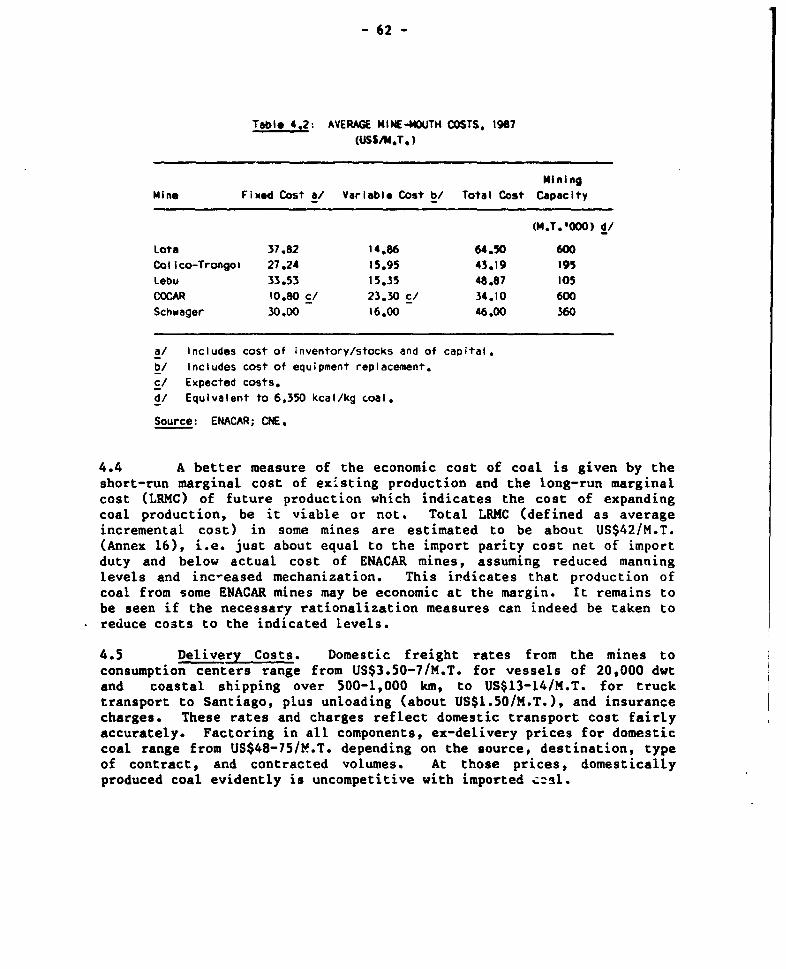
- 62 -
Table 4.2: AVERAGE MINE-MOUTH COSTS, 1987
(USS/M.T.)
MiningMine Fixed Cost a/ Variable Cost b/ Total Cost Capacity
(M.T.'000) d/
Lota 37.82 14.86 64.50 600Colico-Trongoa 27.24 15.95 43.19 195Lebu 33.53 15.35 48.87 105COCAR 10.80 C/ 23.30 c/ 34.10 600Schwager 30.00 16.00 46.00 360
a/ Includes cost of inventory/stocks and of capital.b/ Includes cost of equipment replacement.
c/ Expected costs.d/ Equivalent to 6.350 kcal/kg coal.
Source: ENACAR; CNE.
4.4 A better measure of the economic cost of coal is given by the
short-run marginal cost of existing production and the long-run marginalcost (LRMC) of future production which indicates the cost of expandingcoal production, be it viable or not. Total LRMC (defined as averageincremental cost) in some mines are estimated to be about US$42/M.T.(Annex 16), i.e. just about equal to the import parity cost net of importduty and below actual cost of ENACAR mines, assuming reduced manning
levels and inc-eased mechanization. This indicates that production ofcoal from some ENACAR mines may be economic at the margin. It remains tobe seen if the necessary rationalization measures can indeed be taken toreduce costs to the indicated levels.
4.5 Delivery Costs. Domestic freight rates from the mines toconsumption centers range from US$3.50-7/M.T. for vessels of 20,000 dwtand coastal shipping over 500-1,000 km, to US$13-14/M.T. for trucktransport to Santiago, plus unloading (about US$1.50/M.T.), and insurancecharges. These rates and charges reflect domestic transport cost fairlyaccurately. Factoring in all components, ex-delivery prices for domestic
coal range from US$48-75/tO.T. depending on the source, destination, typeof contract, and contracted volumes. At those prices, domesticallyproduced coal evidently is uncompetitive with imported .zil.
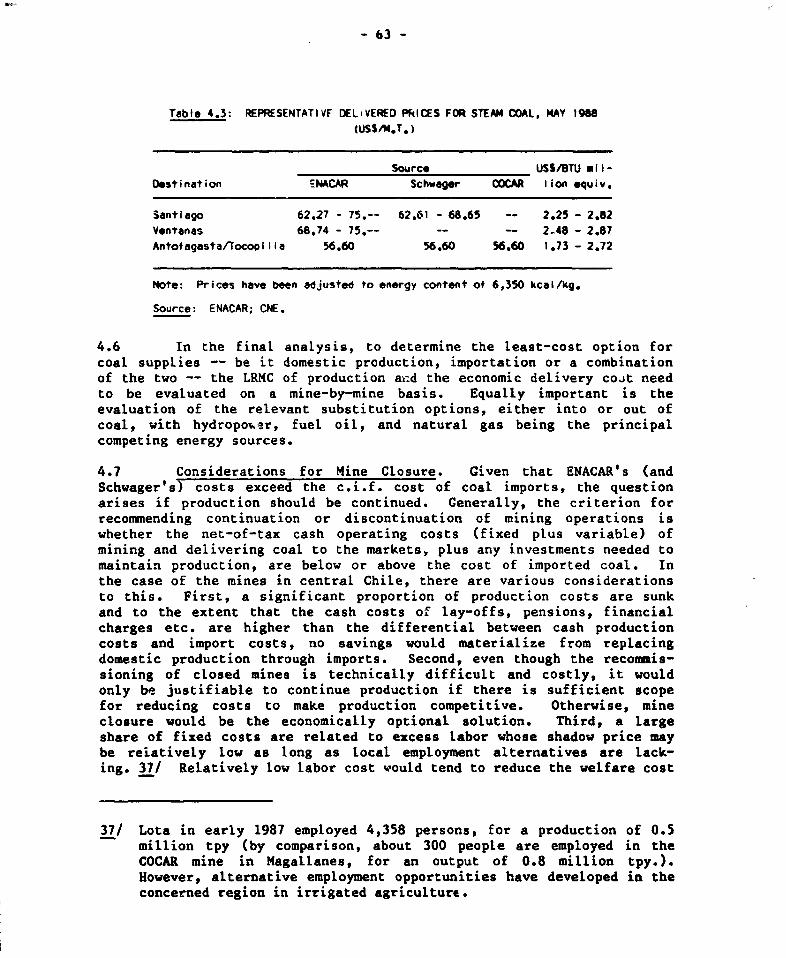
- 63 -
Table 4.3: REPRESENTATIVF DELOVERED PRICES FOR STEAM COAL, MAY 1908(tUSSM.T.)
Source USS/BTU L1m-Destination EMACAR Schwager COCAR lion *quiv.
Santiago 62.27 - 75.-- 62,61 - 68.65 -- 2.25 - 2.82Ventanas 68.74 - 75.-- -- -- 2 48 - 2.87
Antofagasta/Tocoollla 56,60 56.60 56.60 1.73 - 2,72
Note: Prices have been adjusted to energy contnt of 6,350 kcal/kg.
Source: ENACAR; CNE.
4.6 In the final analysis, to determine the least-cost option forcoal supplies -- be it domestic production, importation or a combinationof the two -- the LRMC of production and the economic delivery cost needto be evaluated on a mine-by-mine basis. Equally important is the
evaluation of the relevant substitution options, either into or out ofcoal, with hydropouer, fuel oil, and natural gas being the principalcompeting energy sources.
4.7 Considerations for Mine Closure. Given that ENACAR's (andSchwager's) costs exceed the c.i.f. cost of coal imports, the questionarises if production should be continued. Generally, the criterion forrecommending continuation or discontinuation of mining operations iswhether the net-of-tax cash operating costs (fixed plus variable) ofmining and delivering coal to the markets, plus any investments needed tomaintain production, are below or above the cost of imported coal. In
the case of the mines in central Chile, there are various considerationsto this. First, a significant proportion of production costs are sunkand to the extent that the cash costs of lay-offs, pensions, financialcharges etc. are higher than the differential between cash productioncosts and import costs, no savings would materialize from replacingdomestic production through imports. Second, even though the recomis-
sioning of closed mines is technically difficult and costly, it wouldonly be justifiable to continue production if there is sufficient scopefor reducing costs to make production competitive. Otherwise, mine
closure would be the economically optional solution. Third, a largeshare of fixed costs are related to excess labor whose shadow price maybe relatively low as long as local employment alternatives are lack-ing. 37/ Relatively low labor cost would tend to reduce the welfare cost
37/ Lota in early 1987 employed 4,358 persons, for a production of 0.5million tpy (by comparison, about 300 people are employed in theCOCAR mine in Magallanes, for an output of 0.8 million tpy.).However, alternative employment opportunities have developed in theconcerned region in irrigated agriculture.
- 64 -
of continued mining operations (or, conversely, result in significantwelfare cost ihf the case of mine closures). Also, excessive labor incoal mining at least in part is the outcome of pressures by local andprovincial authorities to preserve employment, causing ENACAR to sharethe cost of employment preservation. These costs should be made explicitand, if feasible, be reimbursed to the company. In a wider context,measures should be evaluated to increase labor mobility as alternativeemployment in the affected areas is being created, to address economicand social problems resulting from lay-offs by the mines.
4.8 Requirements for Efficiency Improvements. The aboveconsiderations stress the urgency for rationalizing high-cost mines andrestructuring ENACAR. The high fixed costs in ENACAR's mines,particularly Lota, need to be reduced through improvements in operationalefficiency before any expansion is undertaken. Efforts are ongoing atENACAR to lower production costs to more competitive levels primarilythrough mechanizing mining operations, such as the introduction oflongwall mining, for which during 1984-87 a total of nearly US$22 millionwere invested. While the enterprise made efforts to improve operatingefficiency and to reduce excess labor, over the 1981-87 period unitoperating costs have increased, and output per employee has remainedvirtually unchanged as output has dropped (Table 4.4). The entity hasstill a long way to go to achieve efficiency levels comparable to thoseof other domestic producers. Specifically, the following areas need tobe addressed as a matter of urgency:
(a) Operations: While current investment plans are aimed atmechanizing mine operations thus reducing variable productioncosts, fixed costs also need to be reduced, particularly atLota, through rationalization including improved inventory/stocks management, reducing above-ground services, closing non-profitable mines or mine sections, and redeploying or reducingthe labor force. An in-depth technical and financial evalua-tion of ENACAR's operations, by mine and mine section, isneeded tc determine the scope left for operational improvementsto reduce production costs, within the technical/geologicalconstraints.
(b) Investment: It needs to be determined that ENACAR's proposedinvestment program is consistent with realistic assumptionsabout the scope for efficiency improvements and the domesticmarket for coal over the medium-to-longer term, givencompetition from domestic and imported coal and, possibly,natural gas. The options for shifting production from high-cost to lower-cost mines should also be evaluated based on arefined analysis of LRMC and an examination mine-by-mine of thescope for cost reductions. More cost-effective technologiesshould be evaluated and introduced.
(c) Finance and Planning: ENACAR should determine (i) financiallyoptimal production levels for individual mines (vs. the current
- 65 -
policy of maximizing production by mine irrespective of costs)and (ii) the impact on costs of decentralizing miningoperations, out-contracting supporting services, and othermeasures conducive to reducing operating costs and overheads.
(d) Marketing: In order to obtain a realistic perception about theenergy needs in the economy which could be competitively metthrough coal, ENACAR should systematically monitor thedevelopments related to international coal markets andcompeting energy sources including coal from other domesticproducers, and their impact on the domestic market. EMACARalso should carry out more determined and better focusedselling efforts. These improvements could help to strengthenENACAR's market position, particularly vis-a-vis majorconsumers.
Coal Market Outlook
4.9 Coal demand will continue to be closely linked to the expansionof thermal electricity generation. COCAR has been awarded an eight-yearcontract to eventually supply 880,000 tpy of coal to CODELCO's thermalpower plant at Tocopilla (northern Chile), which represents about 80% ofthat plant's fuel needs (the remaining 20% will be supplied by ENACAR andothers). Also, CHILECTRA and ENACAR in 1987 concluded a one-year, renew-able contract based on a delivered price of US$51/M.T. (US$56.60 in 1988)c.i.f. Veiitanas, as CHILECTRA's coal demand is projected to increase to0.8 million M.T. by 1988. 38/ For thermal power generation, then, coalis likely to continue to play an important role especially in theNorthern Integrated System although imported coal would be an attractiveoption given ample supplies on international markets and limitedprospects for price increases over the medium-to longer term. Naturalgas also would be a serious competitor provided that its cost at theplant gate would not exceed US$3.50/BTU million, at a capital cost of
38/ Delivered volumes in 1988 amount to 0.4 million M.T. for ENACAR and60,000 M.T. each for Schwager and other coal supplies. CNE carriedout a sensitivity analysis to measure the impact on planned powerexpansion in the Central Interconnected System of alternative coalpricing scenarios (i.e. US$40/M.T.; US$45/M.T.; and US$48/M.T).According to this analysis, different coal prices would affect theexpansion of generation only slightly, i.e. through delaying the 325MW Cortaderal hydroplant by about one year (from 1996 to 1997) forUS$40/M.T. and US$45/M.T. prices. For all the three pricingscenarios, the need for a 300 MW thermal power plant in 1995 locatedin central Chile was confirmed.
- 66 -
$645/net kW installed (for combined-cycle plants). 39/ The industrialsector still offers scope for substitution towards coal, to the extentthat natural gas could not or not economically be supplied.
Finances
4.10 Financial issues in the subsector mainly concern DNMCAR and aredirectly related to the entity's cost structure and levels. In the past,MACAR has operated with losses but has managed to improve its financialposition considerably during 1981-86. Losses, which exceeded US$18 mil-lion in 1981, were reduced and for the first time in many years, EMACARin 1986 achieved after-tax profits of US$5 million equivalent. Sales peremployee, 135.5 M.T. in 1987, were 8% higher than in 1981. However, thiswas largely brought about by increasing purchases from independent smallmines as output per employee remained nearly unchanged at 114 M.T./yearduring this period. ENACAR in 1987 again sustained losses, of US$11.7million equivalent, largely on account of below-cost sales to CHILECTRA(at US$42/M.T. for nearly 0.25 million M.T.).
39/ Spot export prices (f.o.b.) for thermal coal in 1987 ranged fromUS$23/M.T. for South African coal (11,300 BTU/lb, 15% ash) toUS$37/M.T. for U.S. coal (12,000 BTU/lb, 12% ash). Increases ininternational coal prices during 1988-95 are projected to total 43%in current prices, and 22% in constant prices (World Bank, September1987). Natural gas when used with new electricty-generatingtechnology -- e.g. combined cycle generation -- can already competewith much cheaper coal. Basud on 1976-86 international prices (whenenergy-equivalent costs of natural gas averaged 34% more than thoseof coal) the cost of gas-produced electricity was estimated to be17% less than that produced from coal. Key attractions of combinedcycle plant include high thermal efficiency, smaller capital costs,shorter lead times, and environmental advantages. It thus couldpromote decentralized power generation among relatively smallproducers. Petroleum Intelligence Weekly, December 14, 1987.
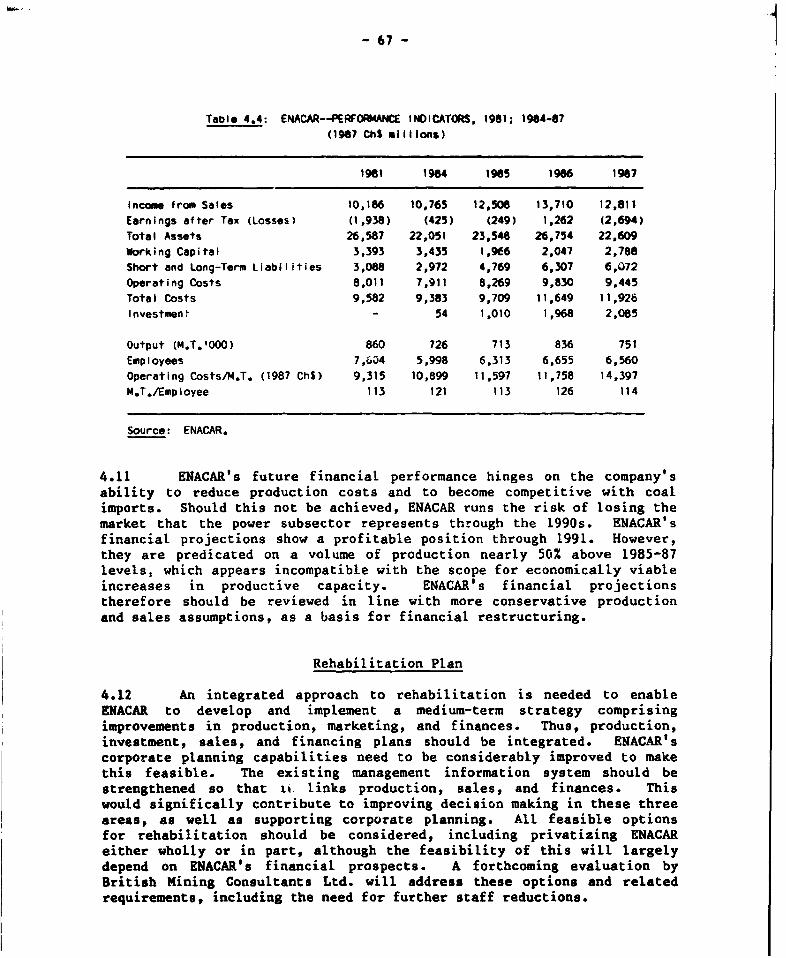
- 67 -
Table 4.4; ENACAR--PERfORMANCE INDICATORS, 1981; 1984-87(1987 ChI millions)
1961 1964 1965 1986 1967
Income from Sales 10,186 10,765 12,506 13,710 12,811
Earnings after Tax (Losses) (1,938) (425) (249) 1,262 (2,694)Total Assets 26,587 22,051 23,548 26,754 22,609Working Capital 3,393 3,435 1,9f6 2,047 2,788Short and Long-Term Liabilities 3,068 2,972 4,769 6,307 6,072
Operating Costs 8,011 7,911 8,269 9,830 9,445Total Costs 9,582 9,383 9,709 11,649 11,926Investment - 54 1,010 1,968 2,085
Output (M.T.'000) 860 726 713 836 751Employees 7,604 5,998 6,313 6,655 6,560Operating Costs/M.T. (1987 ChS) 9,315 10,899 11,597 11,758 14,397M.T./Employee 113 121 113 126 114
Source: ENACAR.
4.11 ENACAR's future financial performance hinges on the company's
ability to reduce production costs and to become competitive with coalimports. Should this not be achieved, ENACAR runs the risk of losing the
market that the power subsector represents through the 1990s. ENACAR'sfinancial projections show a profitable position through 1991. However,they are predicated on a volume of production nearly 50% above 1985-87levels, which appears incompatible with the scope for economically viableincreases in productive capacity. ENACAR's financial projectionstherefore should be reviewed in line with more conservative production
and sales assumptions, as a basis for financial restructuring.
Rehabilitation Plan
4.12 An integrated approach to rehabilitation is needed to enableENACAR to develop and implement a medium-term strategy comprising
improvements in production, marketing, and finances. Thus, production,investment, sales, and financing plans should be integrated. ENACAR's
corporate planning capabilities need to be considerably improved to make
this feasible. The existing management information system should be
strengthened so that ii. links production, sales, and finances. Thiswould significally contribute to improving decision making in these threeareas, as well as supporting corporate planning. All feasible optionsfor rehabilitation should be considered, including privatizing ENACAR
either wholly or in part, although the feasibility of this will largelydepend on ENACAR's financial prospects. A forthcoming evaluation byBritish Mining Consultants Ltd. will address these options and relatedrequirements, including the need for further staff reductions.
- 68 -
4.13 To the extent that these measures still prove insufficient forENACAR to compete effectively with coal imports or supplies from COCAR,an alternative strategy focusing on downsizing operations and financialrestructuring would need to be pursued.
- 69 -
V. FORSTtY AND WOODFULS
Supply-Demand Balance
5.1 Forest growth--,? measured by its mean annual increment--isestimated at 64 million m p.a., which is considerably higher than thecombined remand for fuelwood and industrial forest products of abojat 15.4million m p.a. (fuelvood demand amounts to about 6 million m p.a).Also, forest plantations have been substantially expanded, especially ofpinus radiata which reached about 1 million ha by the mid-1980s. 40/However, these have been mainly industrial plantations contributinglittle to meeting fuelwood requirements: those have to be met by naturalforests, which usually are distant from population centers, or fuelwoodplantations which are relatively small. 41/ Regional and species-specific imbalances of fuelwood have emerged especially in theMetropolitan Region where demand is heavy and which has to be supplied byother regions, over distances at up to 300 km, but also in northernChile, the Interior Secano, and around nearly all major cities of thecountry. The supply-dtemand balance is especially delicate for eucalyptuswhose natural growth just about meets demand. Areas subject todeforestation are already being affected by erosion and watershedmanagement problems.
5.2 While these problems are incipient, reforestation is requiredto bring them under control. The specific reforestation needs should bedetermined by det&iled regional and species-specific evaluations, forwhich the data base has to be substantially improved. This shouldinclude evaluating the options and requ_rements for involving small-scalefarmers more widely in tree planting, including the financingrequirements related to it. Forested areas in need of protection andthose to be opened for intensive use should be clearly demarcated.
5.3 Any pressures on natural forests also could be relieved throughintensified use of forest residues. On the demand side, improving the
40/ This was stimulated by subsidies (established through decree-law No.701, of 1974) amounting to 75X of the cost of establishingindustrial plantations. The Government plans to continue thesesubsidies through 1994.
41/ Fuelwood plantations established by CONAF in conjunction with small-and medium-scale farmers have totalled about 12,000 ha (at a cost ofUS$1.8 million equivalent) in three years.

Table 5.1: FUELWOQD SUPPLY/DEMAND BALANCE, 1985
--------------------Radiata Pine------------------- -----------------Eucalyptusa---------------- ------------ Native Forest------------
Avail- Fuel- Indus- Aail- Avail-
able Potentlal wood trial Net able Potential Net able Potential Not
Region MAI Area MAI Supply Demand Forest Balance MAI Area MAI Supply Demand Balance MAI Area MAI Supply Demand Balance
.m3/ha) (ha'000) ........... m3 million…........) . m3 /ha) (ha'000) (---- ----v3 million…------- (m3/haj (ha000I ------- m3 million…-------
Total 1,039,2 21,7 3.7 12.3 5.7 1.016 0.980 0.035 7,612.5 41.28 9, 31.5
IV 5 0.8 0.004
RM 14 3.6 0.054 2 2.7 0.005
V 12.4 23.4 0.3 16 17.8 0.285 -
vI 16.8 60,9 1.0 13 5.1 0.066 2.S 41.2 0.103
VIl 19.2 205.6 3.9 19 2.0 0.038 3.9 196.4 0.766
Vill 23.2 523.5 1.2 27 18.8 0.507 5.1 401.7 2,049
IX 18.0 167,3 3.0 27 2,0 0.053 5.3 632.9 3.354
X 22.0 58.4 1.3 13 0.8 0.10 6.2 3,592,6 22.274
Xi 5.0 1,686.0 S.450
X;I 4.0 1,059.0 4.236
MAI = Mean Annual Increment.
Source: CONAF.
- 71 -
efficiency of wood-burning stoves would help to a certain degree toreduce local pressures on supplies. 42/
Policy and Institutional Issues
Cost and Price Structure
5.4 In Chile, costs of wood are lower than almost anywhere else.COMAF's plantation establishment costs are in the US$150-210/ha range andlower i; voluntary labor particiates (i.e. about US$100/ha). With amean annual increment of 25-30 m /ha (15-18 M.T./ha), this would resultin stumpage (i.e. cost of establishing plantations and maintaining themuntil the time of harvesting) in the order of US$6.15/M.T.. Cost oflogging, storage and extraction to roadside may add US$6/M.T. andtransport to consumption centers, US$6.50/M.T. (for an average ofUSC10/M.T. and an average distance of 65 km). 43/ With additional costsof preparation, wholesale costs of firewood would be in the order ofUS$23/M.T.
5.5 Current fuelwood prices to residential consumers in Santiago,about Ch$10/kg in early 1988, are considerably above leng-run marginalcosts. They thus fully cover production and marketing costs and allowsatisfactory returns on fuelwood from plantations insasfar as yields forclear-felling are in the 150-200 M.T./ha range. Industrial usersnormally purchase directly from the fuelwood producers in largequantities and acquire fuelwood at prices only marginally above wholesalecost. To the extent that there are market imperfections, measures arerequired to remove any impedements so that fuelwood can play its fullpart in meeting energy requirements. This issue should be approached inthe context of a Government strategy to enhance the economic use offuelwood as energy source.
42/ In Region VIII (where reforestation with pinus radiata is centered)current consumption of forest residues for energy purposes amountsto over 0.4 million tpy. According to CNE, these consumptionvolumes could be doubled. Regarding the efficiency of woodstoves, astudy carried out by CNE and CONAF in 1985 concluded that fuelsavings in the order of 2-10% could be achieved: this, however, wasconsidered too small to justify a large-scale stove disseminationprogram.
43/ See Chile Forest Industries Sub-Sector Study, World Bank ReportNo. 6380-CH of August 8, 1986.
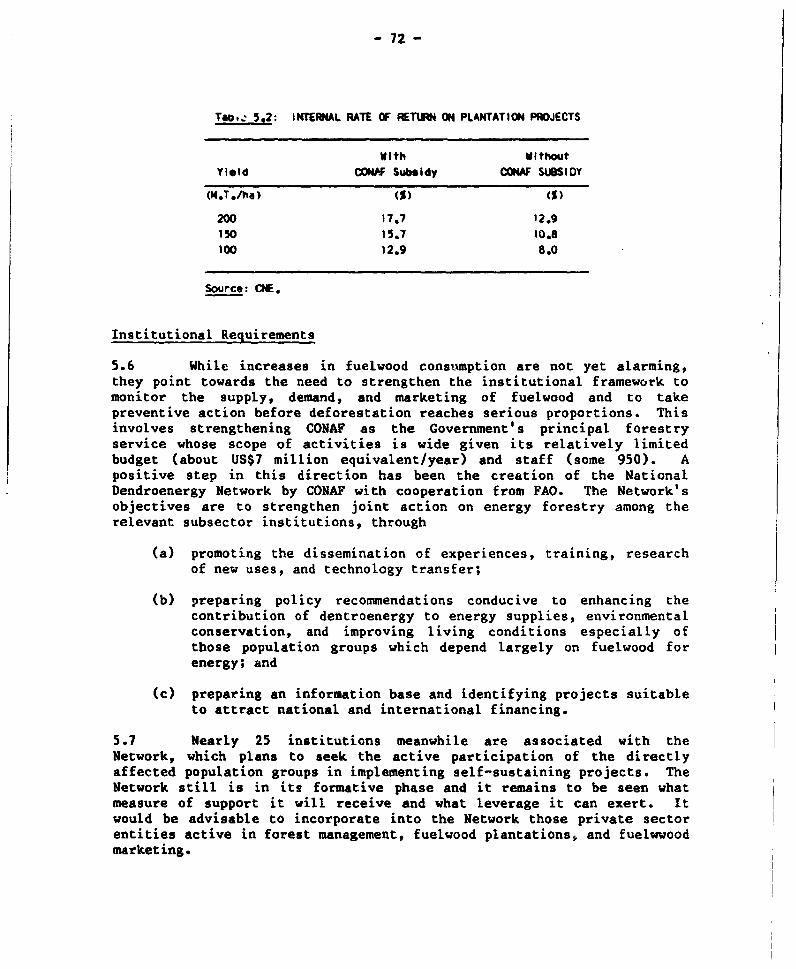
- 72 -
Tao,b 52: INERIAL RATE OF RETURN ON PLANTATION PROJECTS
With WithoutYi*ld CONAF Subsidy CONAF SUBSIDY
(M.T./ha) S) (1)
200 17,7 12.9150 15.7 10.8100 12.9 8.0
Source: CNE.
Institutional Requirements
5.6 While increases in fuelwood constmnption are not yet alarming,they point towards the need to strengthen the institutional framework tomonitor the supply, demand, and marketing of fuelwood and to takepreventive action before deforestation reaches serious proportions. Thisinvolves strengthening CONAF as the Government's principal forestryservice whose scope of activities is wide given its relatively limitedbudget (about US$7 million equivalent/year) and staff (some 950). Apositive step in this direction has been the creation of the NationalDendroenergy Network by CONAF with cooperation from FAO. The Network'sobjectives are to strengthen joint action on energy forestry among therelevant subsector institutions, through
(a) promoting the dissemination of experiences, training, researchof new uses, and technology transfer;
(b) preparing policy recommendations conducive to enhancing thecontribution of dentroenergy to energy supplies, environmentalconservation, and improving living conditions especially ofthose population groups which depend largely on fuelwood forenergy; and
(c) preparing an information base and identifying projects suitableto attract national and international financing.
5.7 Nearly 25 institutions meanwhile are associated with theNetwork, which plans to seek the active participation of the directlyaffected population groups in implementing self-sustaining projects. TheNetwork still is in its formative phase and it remains to be seen whatmeasure of support it will receive and what leverage it can exert. Itwould be advisable to incorporate into the Network those private sectorentities active in forest management, fuelwood plantations, and fuelwwoodmarketing.
- 73 -
VI * nc AND r OINmW
Present Situation
6.1 The energy sector as a major aser of natural resources has adirect impact on the environment and there are trade-offs, as well ascomplementaries, between the objectives of energy development andenvironmental conservation. Energy operations car have multiple adverseeffects: while damuge from deforestation in Chile is limited to certainareas and species (para 5.1), environmental problems may arise from theconstruction and operation of electric power installations, coal mines,and petroleum production and processing facilities. Through creatingeffluents and solid waste, energy production and use contribute toatmospheric, soil, and water pollution. The effects of environmentalcontamination often become discernible only after many years and in areasdistant from the source of pollution.
6.2 The Santiago Metropolitan Region with its heavy concentrationof population and economic activities might be the area in Chile worstaffected by pollution. There is substantial emission of contaminantsfrom vehicles, industries, and space heating, including the heavy use offuelwood and the associated creation of particle matter (i.e. polycyclicaromatic hydrocarbons). This is aggravated by the peculiar geographicand climatological conditions of this region. The Lower Aconcagua Valleyalso is being adversely affected by emissions of sulphur dioxyde from theVentanas thermal power plant and copper smelter.
Government Policies
General
6.3 The Government is aware of the need for environmental manage-ment in the energy sector. CNE has taken the initiative to preparecorrective and preventive action. The Pehuenche hydropower project hasincluded components aimed at ameliorating adverse impacts on fauna andflora. CNE have commissioned studies aimed at identifying measures toreduce sulphur and other contaminants contained in hydrocarbons, such asincreasing the use of filters in chimneys. Unde- the World Bank financedPublic Sector Management project, the Governmeit is preparing a manualfor measuring the environmental impact of electric power projects. AUS$4 million project is being implemented to (a) monitor atmospheric andwater pollution in Santiago, including the environmental impact ofdifferent fuels used by busses; (b) identify the pollution sources andtheir contribution; (c) model pollutants dispersion; and (d) devisestricter environmental safeguards. This project is under theresponsibility of the regional and local authorities and is supported bya US$2.5 million IDB loan. The National Ecological Coumission (which
- 74 -
reports to the Ministry of National Patrimony) has not been veryefiective, mainly for lack of resources, and should be strengthened.
Requirements for govironmental Management
6.4 To develop a coherent strategy, the environmental concerns needto be better understood and the costs of environmental damage and itsalleviation be more clearly identified. Only on this basis will it bepossible to determine at what speed and level environmental issues can beaddressed. There is normally a wide range of options to ameliorate andprevent adverse environmental impacts, and the most cost-effective onesshould be evaluated. The approach to natural resource management shouldbe one which puts a premium on efficiency, conservation, and sustainingthe resource base. Economic policy interventions to improve environ-mental management should be assessed with a view to their conformity withmarket principles. Thus, instead of offering subsidies for environment-supporting investment, the approach should be to charge the pollutor forthe environmental cost to the economy. It also needs to be consideredthat the beneficiaries of environmental actions often are not identicalto those who bear the costs of these actions. Building the capability inthe public and private sectors to handle complex environmental issues isitself a complex process for which specialists need to be trained,especially those capable to carry out integrated environmentalanalysis. Better coordination and political resolve among institutionshandling these matters are needed to strengthen environmental safeguards.
6.5 Chile is beginning to develop the capacity to identify optionsfor reducing adverse environmental effects of energy projects. Thisdevelopment should be strengthened. Reducing pollution from energyprocesses is important, especially in ecologically sensitive zones. Thewider environmental impact of different sources of energy also should beevaluated. Certain forms of energy are eavironmentally more benign, e.g.hydroelectricity and natural gas compared to fuel oil and coal,especially of the high-sulphur type. This should be given dueconsideration in deciding on ex'ergy development alternatives. Themanagement and disposal of waste from energy processes needs to beevaluated in more detail. Energy pricing should reflect theenvironmental cost of the use of different energy forms. This has beenlargely achieved for electricity but not for other forms of energy(especially fuelwood). Measures aimed at improving the efficiency ofenergy use -- which normAlly involve reducing emission of burned gases,heat, and rteam -- also have favorable environmental effects and shouldtherefore be pursued to achieve twin benefits.
Recomnendations
6.6 The Government institutions involved in environmental mattersi.e. CNE, CONADE, ODEPLAN, and CORFO should enhance their role inachieving a better understanding of the complementarities and trade-offsbetween energy and environmental concerns, and in a search for policy andproject concepts that reconcile the objectives of energy development,
- 75 -
environmental conservation, and economic growth. They should also aim atcloser cooperation with non-governmental organizations concerned aboutenvironmental issues. CUE and ODEPLAN should take the lead inintegrating the information on resource use with macroeconomic data, andin evaluating costs and benefits of ameliorating or preventingenvironmental damage caused by energy development.
- 76 -
VII. ENERGY SECTOR OUTLOOK, 1988-97
Constraints and Strategy Reuirements
7.1 Meeting future energy requirements will pose difficult choicesfor the country's decision makers. The development of energy rcsourceswill oe high-cost, technologically difficult in some cases, and willinvolve considerable lead time. The major energy corporations are highlyindebted so that increased reliance needs to be placed on the privatesector to carry out the necessary investments. 44/ Declines in crude oilproduction and constraints on expanding economically viable coal produc-tion are bound to limit the sector's productive capacity. The resultingincreases in energy imports will impose a growing though manageableburden on the foreign exchange position of the economy.
7.2 On the positive side, the sectoral institutions are well-suitedto analyze and implement policies and strategies, and prepare investmentprograms. The operating agencies are equally well-equipped and competentto meet their tasks. In order to make the energy sector more resilient,a coherent strategy is called for which should be formulated andimplemented in close consultation with the private sector. The maincomponents of such a strategy are as follows:
(a) developing the hydropower potential as the key component of theleast-cost expansion program for the electricity subsector;
(b) exploiting existing crude oil reserves to the economicallyoptimal (vs. technically feasible) degree, and developing newreserves both domestically and abroad;
(c) rehabilitating those coal mines that have the scope to becomecompetitive with imports, if necessary through down-sizingoperations;
(d) assessing the potential for natural gas use in central Chile,including for electricity generation, and determining theleast-cost options for gas supply, including imports from,and/or gas swaps with, Argentina;
(e) enhancing the efficiency of energy supplies through reductionof losses in production, transformation, and distribution;
44/ The end-1986 debt outstanding and disbursed of Chile's four largestenergy corporations (ENDESA, ENAP, ENACAR and CHILECTRA CENERACION)amounted to US$1.8 billion, with a debt service of some US$150million. See OLADE, The Foreign Debt and the Energy Sector of LatinAmerica and the Caribbean, 1987 (quoting national sources).
- 77 -
(f) expanding the involvement of the private sector in energyoperations;
(g) removing the remaining minor distortions in energy pricing,essentially those for petroleum products, and increase markettransparency, to ensure allocative efficiency;
(h) reinforcing energy pricing through non-pricing measures toimprove the efficiency of energy end-use, such as disseminationof energy-efficient technologies and train..ng in theirapplication; and
(i) reconciling energy sector development with the objective ofenvironmental conservation.
Subsector Projections and Projection Methodology
Petroleum Products
7.3 ENAP have developed demand forecasts for refined petroleumproducts which are based on econometric models for each product exceptfuel oil (the latter is based on individual information from therelatively few large-volume consumers). The explanatory variablesinclude GDP, population growth, lagged consumption, and the price of eachfuel and its closest substitute. ENAP's demand forecast is based on theassumption of GDP growth of 4.5% in 1988 and 3% p.a. thereafter, andtheir projections of international prices of crude and products(Table 6.1). ENAP tested a number of different lagged models andfunctional forms. The resulting models fit the data well. Themethodology used is appropriate and the resulting elasticity estimatesare robust. 45/
7.4 To forecast demand in the domestic market, it is necessary toconvert f.o.b. Caribbean prices into landed Chilean prices, by increasingthe f.o.b. price by the costs of transportation and handling, insurance,losses due to evaporation, a charge for working capital and the importduty on the c.i.f. price. On that basis, ENAP in early 1988 hasprojected domestic demand of petroleum products as follows:
45/ See Annex 13 for income and price elasticities of demand estimates.
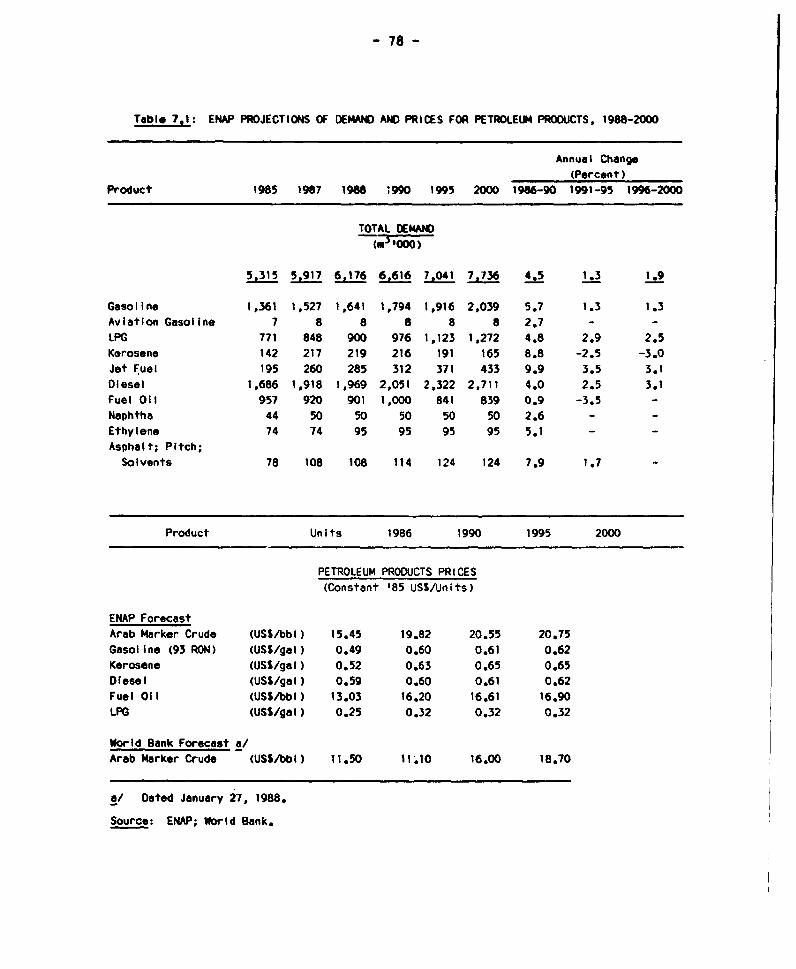
- 78 -
Table 7.1: ENAP PROJECTIONS OF DEMAND AND PRICES FOR PETROLEUM PRODUCTS, 1988-2000
Annual Change(Percent)
Product 1985 197 1988 7990 1995 2000 1986-90 1991-95 1996-2000
TOTAL DEMAND
5,315 5,917 6.176 6.616 7.041 7,736 4.5 1.3 1.9
Gasoline 1,361 1,527 1,641 1,794 1,916 2,039 5.7 1.3 1.3Aviation Gasoline 7 8 8 8 8 8 2.7 - -LPG 771 848 900 976 1,123 1,272 4.8 2.9 2.5Kerosene 142 217 219 216 191 165 8.8 -2.5 -3.0Jet Fuel 195 260 285 312 371 433 9.9 3.5 3.1Diesel 1,686 1,918 1,969 2,051 2,322 2,711 4.0 2.5 3.1Fuel Oil 957 920 901 1,000 841 839 0.9 -3.5 -Naphtha 44 50 50 50 50 50 2.6 - -
Ethylene 74 74 95 95 95 95 5.1 - -
Asphalt; Pitch;
Solvents 78 108 108 114 124 124 7.9 1.7 -
Product Units 1986 1990 1995 2000
PETROLEUM PRODUCTS PRICES
(Constant '85 USS/Units)
ENAP ForecastArab Marker Crude (USS/bbl) 15.45 19.82 20.55 20.75Gasoline (93 RON) (USS/gal) 0.49 0.60 0.61 0.62Kerosene (USS/gal) 0.52 0.63 0.65 0.65Diesel (USS/gal) 0.59 0.60 0.61 0.62Fuel Oil (USS/bbl) 13.03 16.20 16.61 16.90LPG (USS/gal) 0.25 0.32 0.32 0.32
World Bank Forecast a/Arab Marker Crude (USS/bbl) 11.50 11.10 16.00 18.70
a/ Dated January 27, 1988.
Source: ENAP; World Bank.
-79 -
Natural Gas
7.5 CNE use a computer model to simulate natural gas demand anddistribution costs under various price scenarios. This model is based onstudies by ENAP and SOFREGAZ of France, carried out to analyze the costfor establishing a pipeline network connecting and servicing fourconsumption centers (Santiago, Concepcion, Talca and Linares) correspond-ing to various demand scenarios. The assumptions about the substitabi-lity of natural gas for other fuels are based on conversion costs, pricedifferentials, and possible consumption volumes. Penetration rates (interms of number of customers and volume of consumption) for differentcost and price levels have been estimated based on a normal logdistribution for residential, commercial and public sector customers andon deterministic analysis for industrial customers. A demand curve wasconstructed based on these estimates, and corresponding prices andvolumes and distribution costs were iterated. Independently, GASCO havestudied the market potential for natural gas in the Santiago area,indicating demand levels substantially below those projected by CNE.(GASCO's primary interest in obtaining natural gas is to blend it withtown gas to reduce the cost of town gas.) While it has not been possibleto obtain all the detailed information on the CNE study, the methodologyapplied for estimating demand appears appropriate. However, in view ofthe proposed pricing policy for gas (i.e. substitution price) probably60-75Z only of the potential market might be attainable within eachdelimited area. These relatively lower average penetration rates areconsistent with market experiences in other countries. 46/
7.6 The potential demand for natural gas of large-volume industrialcustomers has been analyzed separately by both GASCO and CNE. Ofparticular interest is the El Teniente copper mining and processingcenter situated 80 km southetst of Santiago, whose consumption potentialis estimated at 70 million m /year. CODELCO is interested in convertingEl Teniente to natural gas use, provided the ex-delivery price is atleast 5% below the price of No. 6 fuel oil. (This assumption may beconservative given the efficiency advantages of natural gas, and providedthat the costs of converting to gas are amortized over a reasonableperiod, say 3-4 years).
Electricity
7.7 CNE's electricity demand forecast for the Interconnected Systemis based on econometric models, using sectoral and global approaches.Under the sectoral approach, projections of residential consumption arebased on exogenous parameters, i.e. population growth and electrificationratio, while per-customer consumption is related to household incomes,
46/ Only the Netherlands have a much higher penetration rate (close to95-98%), but natural gas in that country has been priced far belowcompeting fuels.
- 80 -
kerosene and electricity prices, and lagged consumpEion. The growth ofconsumption by small-scale industries and irrigation is related to thegrowth of industrial production (log-log model, with a good cowrelation)and of irrigated agriculture, respectively. The projections ofconsumption growth for large-scale industries and mining are based oncustomer surveys. The global approach is based on a classical log-logmodel, with lagged consumption and CDP as explanatory variables. Twomacroeconomic scenarios have been used, i.e. GDP growth of 3.5Z p.a. and52 p.a., respectively, over the 1986-95 period. For the grovth of self-generation, two alternative assumptions have been made in the globalmodel, i.e. (a) a growth of 12 p.a. (which corresponds to recent trends),and (b) a somewhat higher forecast based on customer surveys.
7.8 The results of the forecasts are shown in Annex 15 (Tablee 1and 2). Depending on the approach chosen and the projected GDP growth,annual average growth of electricity consumption through 1995 ranges from3.8Z to 5.32, accelerating significantly in the second half of theprojection period. Although these rates are in line with long-runtrends, the pattern and structure of electricity growth that result fromthe modeis are more debatable. For, within the framework of relativelysteady GDP growth, one would expect the rates of electricity growth to bedecreasing slightly over time rather than increasing. 47/ Also, in viewof the recent acceleration of electricity growth -- an increase of nearly92 is expected for the whole of 1988 -- ENDESA has revised upwards thegrowth of 'lectricity demand over the medium to longer term, to about 6%per year.
7.9 As regards the residential consumption growth, the twoapproaches result in differing growth rates, with the econometric modelforecasting a significant reduction of per-customer consumption. Ananalytical approach to residential consumption based on surveys ofappliance ownership as well as a detailed analysis of the evolution ofconsumption per customer -- i.e. evolution of the statisticaldistribution, and analysis by zone -- may prove useful to betterunderstand the recent evolution of consumption, as well as to complementthe econometric approach.
World Bank Projections, 1988-97
7.10 There are no comprehensive projections for the energy sector asa whole beyond the individual subsectoral forecasts discussed above.Therefore, sectoral and sub-sectoral energy supply/demand projectionshave been developed for the periods 1988-92 and 1993-97. They are based
47/ The pattern of increasing growth rates is a direct result of thestructure of the global model which gives a significant weight tolagged consumption, and a relatively low weight to GDP growth.
- 81 -
on the assumption that (a) economic growth will average 5% p.a. during1988-92, and 4% p.a. during 1993-97; (b) growth in the main productivesectors and in personal consumption vill be related to GDP growth basedon historical correlations; and (c) income elasticities of energy demandwill be lower than historically observed, thus resulting in lower energygrowth per given GDP and sectoral growth (Annex 7). Two scenarios areused to illustrate the possible impact of alternative strategies onfuture energy requirements. The scenarios differ in their assumptionsabout energy demand, management and the efficiency of energy production,transformation and use. The Action-Oriented Scenario indicates theimprovements in energy supply and demand that could result from thecontinuation of appropriate pricing policies, the intensification of non-pricing measures aimed at increasing the efficiency of energy end-use,the speedy implementation of energy production and transformationprojects and the reduction in energy conversion and distribution lossesespecially in electricity. It is assumed that natural gas will besupplied to central Chile by the early 1990s either through imports from,or gas swaps with, Argentina. Under the Trend-Based Scenario, few if anyof these measures are assumed to take place, and consequently, demandgrowth would be relatively faster and increases in energy supplieslower. While the two scenarios represent a range of possible outcomesrather than precise projections, they do indicate important structuralchanges in the energy sector likely to occur over the medium to longerterm, such as quantitative relationships and qualitative characteristics,capacity constraints, and changes in the efficiency of investments and ofenergy use.
7.11 It is assumed that by the mid-1990s, under the Action-OrientedScenario, (a) crude-oil production will still meet about 10% of domesticpetroleum requirements, through increases in production efficiency fromexisting fields and development of new discoveries; (b) coal productionwill be raised nearly 55% over its 1986 level; (c) natural gas lift andflaring combined will be reduced to 10% of production net of reinjection(compared to 17.6% in 1986); and (d) own consumption and losses inelectricity transmission will be reduced to 10% (13% in 1986). Under theTrend-Based Scenario, less progress is assumed to be made in these areas,resulting in correspondingly higher import requirements to meet energydemand. Increases in final energy consumption during 1987-97, projectedat 2.6% p.a. under the Action-Oriented Scenario, would be 3.0% p.a. underthe Trend-Based Scenario. Accordingly, energy end-use in 1997 would be1.1 million toe lower under the Action-Oriented than under the Trend-Based Scenario. This difference reflects the respective assumptions onconservation and substitution of petroleum products through natural gasin mining and industry (0.3 million toe), in the residential/commer-cial/administrative sectors (0.1 million toe), and in transport (0.6million toe), as well as differences in losses in natural gas production(0.6 bn CF) and in electricity transmission and distribution (1,350 GWh;all in respect of 1997). Final consumption of petroleum products in1987-97 is projected to increase at 2% p.a. under the Action-OrientedScenario and at about 3% p.a. under the Trend-Based Scenario. Petroleum
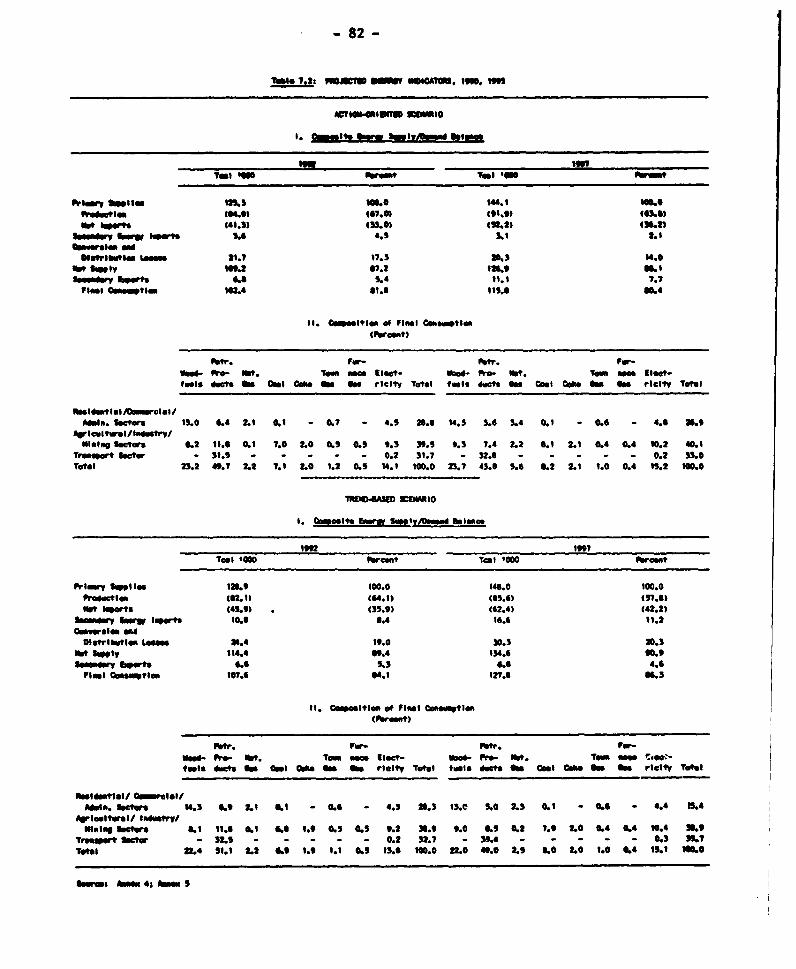
- 82 -
T11leb .2, JYW _ USCA?'*, l, u. 15
I. buselta bmw ~sl w~ blouse
.~~~~~~~~~, 1*
T^ 1 Om_l "1 _
Ptlmr~~~~ buSies ~~~129.3 10.014.1 6.ftedustlin (66.01 (._ (91.20
1 _ low 441.3) (37.0) 213.) (.1od- - 1_W S4.6 3^)4.1 K
_v bw _ s . 4.5 31 L
"wlSt 1_. 1.1 17.3 .3 14.*s? Ss 02 07.2 120.9 00.1
_eue _ots 6.6 3.4 II.) 2.711mma bseti 14.4 1. 115.0 0.4r1_1 ow1 _ti IG4 1 1144 sk4
I. Osltlum eq Plel Cs.sl.s
Ustr. For- Ustr. For-ed- fre. lat. Tom sea Elect- UEld- ft.- Us?. Tom ees Eleet-
foels dus en beg CCdG GM Gu1 rlClt1 TOtal fetls duct OM Omel Coke 0. Oe rlClty Totl
b nelbtulel_rcel/Admin. 5scors 15.0 14 Li 0.1 - 0.7 - 4.5 20.6 14.3 3.6 3.4 0.1 - 0.6 - 4.6 20.9
_rlITuelll"ul /N1.1mg Sectwe 0.2 111. 0.1 7.0 20 0.5 0.9 9.3 39.5 9.3 7.4 2.2 0.1 L1 0.4 0.4 10.2 40.1
Trwemrt etr - 31.5 - - - - - 0.2 31. - 32.6 - - - - - 0.2 33.0Tftal 23.2 49.7 2.2 7.1 2.0 1.2 0.5 14.1 100.0 23.1 43.6 .6 .2 2.1 1.0 0.4 15.2 110.0
IWIS-OASED 20EWIO
I. 0inos1t. EDaf SuetvjDmn.d Belene
19:2 19Tces OO Perewt Too t000 Peret
Frl_wy 115las 12.9 100.0 146.0 100.0fsetles (IL.1) (64.1) (65.6) (57.6)Us? loprts 145..°) (35.9) (42.4) (42.2)
,t fe 1 1es0.6 6.4 16.6 11.2COmsrles *Ld
Dlstriomelam Lease 24.4 19.0 30.3 20.3Not Sply 114.4 69.4 134.6 91.9-ea i I.ort 4.6 5.3 6.6 4.6
Froel beeatiom 107.6 04.1 121.6 6.3
1I. Co'*cltl.. @9 rFel b.autlen(Premn)
Pet. r tr. r_-_sed- ft.- Us?. T sem Elect- bd- Pr- Pwt. Tou oe 'eer-
fuels dwiu U 01 0e Om e r elctY Totel fuls dut Oe Cost Coke be On riellt Tot*l
_l_*1|1le/ am_etil/Ad.l. lo, 14.3 0.9 2.1 0.1 - 0.6 4.3 20.3 3.0e 9.0 2.3 0.1 - 0.6 - 4.4 B.4
AWiculturel/ l.dutrgy/E1m1p Sets 6.1 11. 0.1 I4. 1.9 0.5 0.5 9.2 36.9 9.0 LS 0.2 7.9 2.0 0.4 0.4 10.4 3.9
Truae rt -ter - - - - 0.2 32.1 - 3s.4 - - - 03 319.7TO"eI 2LM .1.1 .9 . I.1 0.5 3.0 100.0 2.0 49.0 . 0 0 2.0 1.0 0.4 15.11 0 .
buwmi Anson 4j loses. S
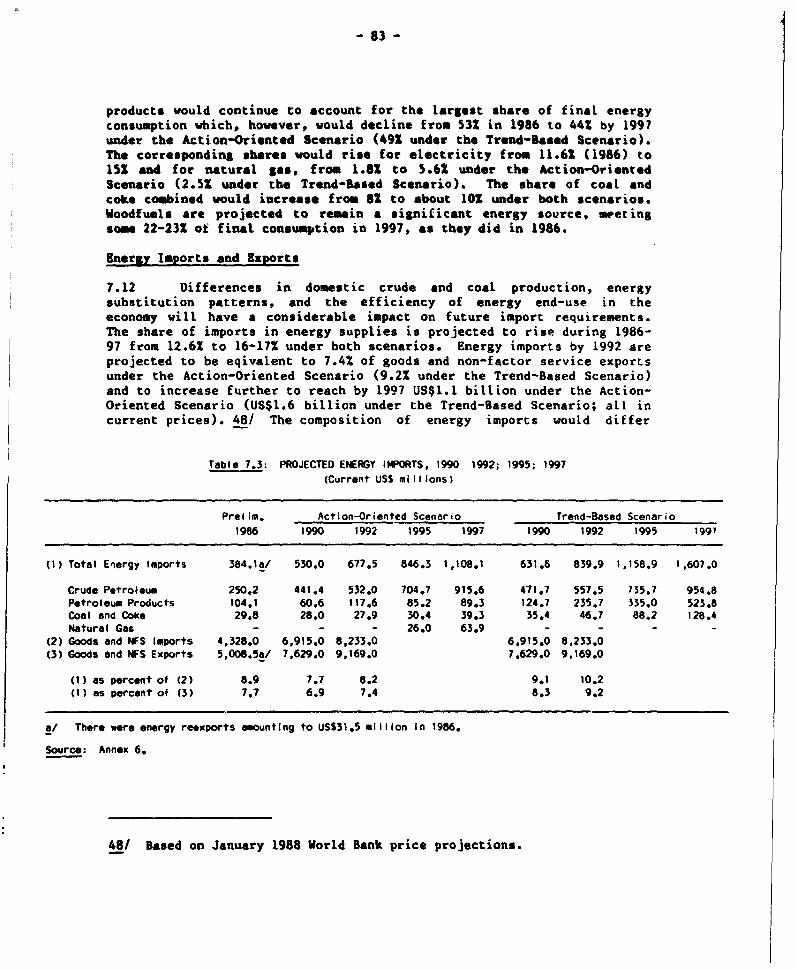
- 83 -
products would continue to account for the largest share of final energyconsumption which, however, would decline from 532 in 1986 to 44S by 1997under the Action-Oriented Scenario (49X under the Trend-Based Scenario).The corresponding shares would rise for electricity from 11.62 (1986) to15i and for natural gas, from 1.82 to 5.62 under the Action-OrientedScenario (2.52 under the Trend-Based Scenario). The share of coal andcoke combined would increase from 82 to about 102 under both scenarios.Woodfuels are projected to remain a significant energy source, meetingsome 22-232 of final consumption in 1997, as they did in 1986.
Energy Imports and Exports
7.12 Differences in domestic crude and coal production, energysubstitution patterns, and the efficiency of energy end-use in theeconomy will have a considerable impact on future import requirements.The share of imports in energy supplies is projected to rise during 1986-97 from 12.62 to 16-172 under both scenarios. Energy imports by 1992 areprojected to be eqivalent to 7.4% of goods and non-factor service exportsunder the Action-Oriented Scenario (9.2X under the Trend-Based Scenario)and to increase further to reach by 1997 US$1.1 billion under the Action-Oriented Scenario (US$1.6 billion under the Trend-Based Scenario; all incurrent prices). 48/ The composition of energy imports would differ
Table 7.3: PROJECTED ENERGY IMPORTS, 1990 1992; 1995; 1997(Current US$ mi mI ions)
Prelim. Action-Oriented Scenario Trend-Based Scenario1986 1990 1992 1995 1997 1990 1992 1995 1997
(1) Total Energy Imports 384.1a/ 530.0 677.5 846.3 1,108.1 631.6 839.9 1,158.9 1,607.0
Crude Petroleum 250.2 441.4 532.0 704.7 915.6 471.7 557.5 1S5.7 954.8Petroleum Products 104.1 60.6 117.6 85.2 89.3 124.7 235.7 535.0 523.8Coal and Coke 29.8 28.0 27.9 30.4 39.3 35.4 46.7 88.2 128.4Natural Gas - - - 26.0 63.9 - - - -
(2) Goods and NFS Imports 4,328.0 6,915.0 8,233.0 6,915.0 8,233.0(3) Goods end NFS Exports 5,008.5a/ 7,629.0 9,169.0 7,629.0 9,169.0
(1) as percent of (2) 8.9 7.7 8.2 9.1 10.2(1) as percent of (3) 7.7 6.9 7.4 8.3 9.2
a/ There were energy reexports amounting to USS31.5 million in 1986.
Source: Annex 6.
48/ Based on January 1988 World Bank price projections.
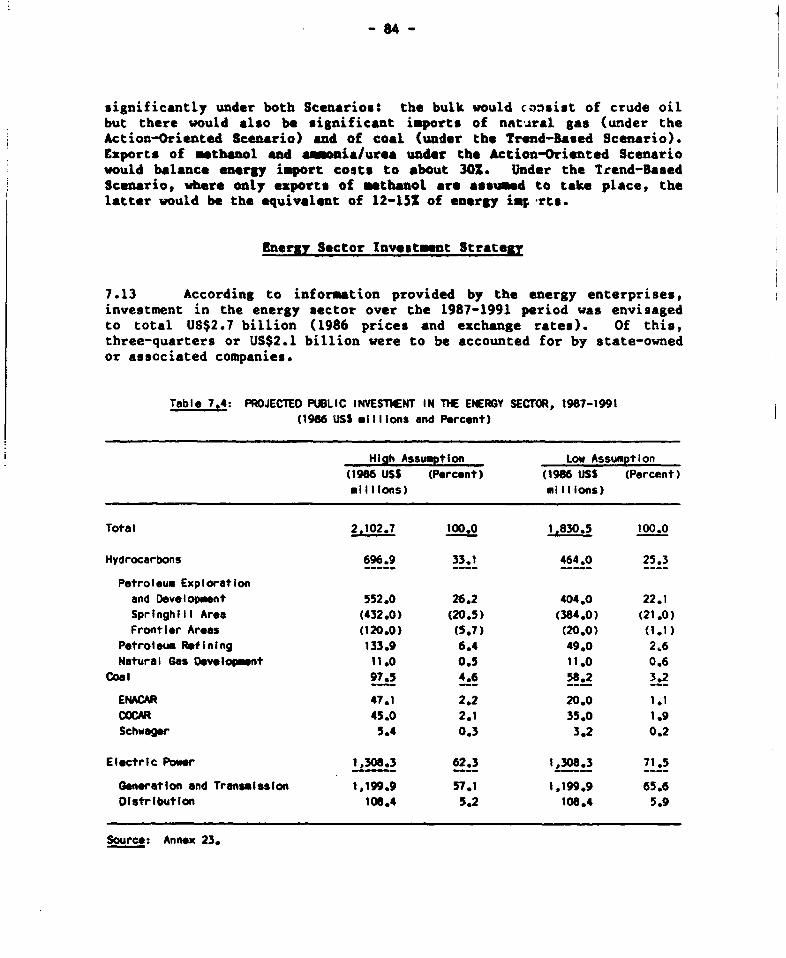
-84-
significantly under both Scenarios: the bulk would consist of crude oilbut there would also be significant imports of natural gas (under theAction-Oriented Scenario) and of coal (under the Trend-Based Scenario).Exports of methanol and monia/urea under the Action-Oriented Scenariowould balance energy import costs to *bout 30Z. Under the Trend-BasedScenario, where only exports of methanol are assumed to take place, thelatter would be the equivalent of 12-152 of energy i-; rts.
Energy Sector Investment Strategy
7.13 According to information provided by the energy enterprises,investment in the energy sector over the 1987-1991 period was envisagedto total US$2.7 billion (1986 prices and exchange rates). Of this,three-quarters or US$2.1 billion were to be accounted for by state-ownedor associated companies.
Table 7.4: PROJECTED PUBLIC INVESTMENT IN THE ENERGY SECTOR, 1967-1991(1986 USS millions and Percent)
High Assumption Low Assumption(1966 USS (Percent) (1986 USS (Percent)mIlitons) milions)
Total 2,102.7 100.0 1,830.5 100.0
Hydrocarbons 696.9 33.1 464.0 25.3
Petroleum Explorationand Development 552.0 26.2 404.0 22.1Springhill Area (432.0) (20.5) (384.0) (21.0)Frontier Areas (120.0) (5.7) (20.0) (1.1)
Petroleum Refining 133.9 6.4 49.0 2,6Natural Gas Development 11.0 0.5 11.0 0.6
Coal 97.5 4.6 58.2 3.2
ENACAR 47.1 2.2 20.0 1.1COCAR 45.0 2.1 35.0 1.9Schwager 5.4 0.3 3.2 0.2
Electric Power 1,308.3 62.3 1,308.3 71.5
Generation and Transmission 1,199.9 57.1 1,199.9 65.6Distribution 108.4 5.2 108.4 5.9
Source: Annex 23.
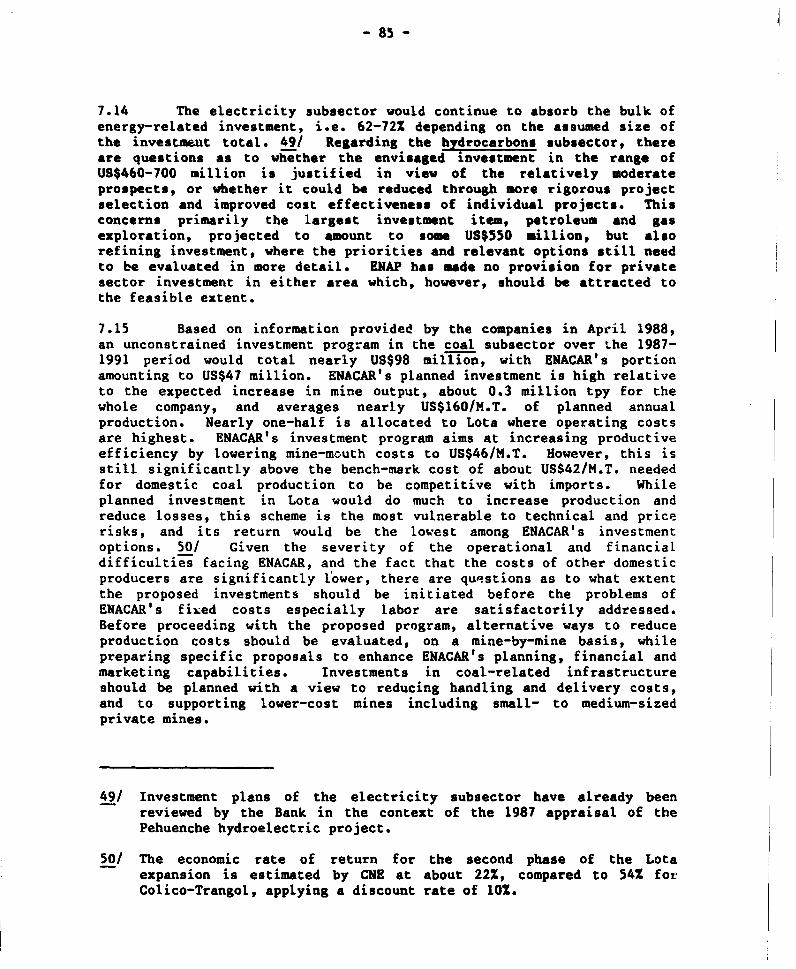
- 85 -
7.14 The electricity subsector would continue to absorb the bulk ofenergy-related investment, i.e. 62-72% depending on the assumed size ofthe investment total. 49/ Regarding the hydrocarbons subsector, thereare questions as to whether the envisaged investment in the range ofUS$460-700 million is justified in view of the relatively moderateprospects, or whether it could be reduced through more rigorous projectselection and improved cost effectiveness of individual projects. Thisconcerns primarily the largest investment item, petroleum and gasexploration, projected to amount to some US$550 sillion, but alsorefining investment, where the priorities and relevant options still needto be evaluated in more detail. ENAP has made no provision for privatesector investment in either area which, however, should be attracted tothe feasible extent.
7.15 Based on information provided by the companies in April 1988,an unconstrained investment program in the coal subsector over the 1987-1991 period would total nearly US$98 million, with ENACAR's portionamounting to US$47 million. ENACAR's planned investment is high relativeto the expected increase in mine output, about 0.3 million tpy for thewhole company, and averages nearly US$160/M.T. of planned annualproduction. Nearly one-half is allocated to Lota where operating costsare highest. ENACAR's investment program aims at increasing productiveefficiency by lowering mine-mouth costs to US$46/M.T. However, this isstill significantly above the bench-mark cost of about USS42/M.T. neededfor domestic coal production to be competitive with imports. Whileplanned investment in Lota would do much to increase production andreduce losses, this scheme is the most vulnerable to technical and pricerisks, and its return would be the lowest among ENACAR's investmentoptions. 50/ Given the severity of the operational and financialdifficulties facing ENACAR, and the fact that the costs of other domesticproducers are significantly lower, there are questions as to what extentthe proposed investments should be initiated before the problems ofENACAR's fixzed costs especially labor are satisfactorily addressed.Before proceeding with the proposed program, alternative ways to reduceproduction costs should be evaluated, on a mine-by-mine basis, whilepreparing specific proposals to enhance ENACAR's planning, financial andmarketing capabilities. Investments in coal-related infrastructureshould be planned with a view to reducing handling and delivery costs,and to supporting lower-cost mines including small- to medium-sizedprivate mines.
49/ Investment plans of the electricity subsector have already beenreviewed by the Bank in the context of the 1987 appraisal of thePehuenche hydroelectric project.
50/ The economic rate of return for the second phase of the Lotaexpansion is estimated by CNE at about 22X, compared to 54Z forColico-Trangol, applying a discount rate of 10.
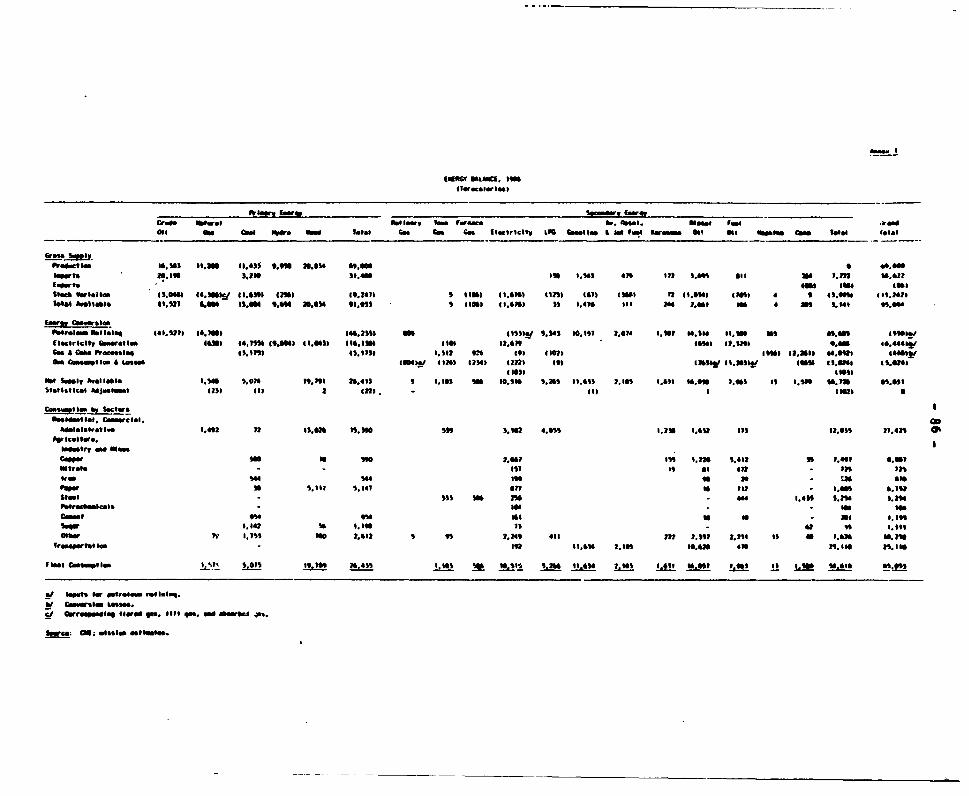
frIam ~ ~ ~ ~ ~ ~ {c bwe,E I_.4,E e _________
cr,. 394 M.l 1.wV T6 or' . .w* U4s" fool r"
01 C _ Gl _l* 1.1.1 1. Cm Cm I6mttIeI4 L b~4sC I.z 40 Jlos 93mm 00|4 006 _tt 0.6 4.1 3.4.
Gross uflt~
Pra4 t6m 16*,us 11.3? 11.463 9.93 3.034 ",6o a
.."
w ' .? 3.26 33.460 ISO $.4% 41 Its S.6 all 73 *.m 1.622
f_wt l 4 ,03 lbSl 446
Stock O34.06.9 IS.041 (4.bkl I I.G3S1 I4 4P.241 lob) 41.1)63 toM 1013 34 12 41.0341 11 P" 4 9 I S."" 6S3.2423
hotal 409 41.41 6.46 Islam 9.9 11.641 Ait."S ( (1 11.9) ) t.4176 oil 4" 7.43 a an S.14 II.*"
~S*r.l blbolag 441*423i 14.M1 t46,4 b on.2_SS141 S.543 to. 1 2 H.04 $.W,3 14.114 1.30 as 4 1* .1t 41,0"1
ElecIricIty 4w 1atl 463 14.16 449.011113 49.643b 416.131 It0" 12.019 1931 1 1. use 9.3 4*.4bGf
0.M a Cok Pt.COSS104 45.114 43.1141 I.S12 914 too 402 11401"1 42.21166 44.942 44 44
ft
am Cmm.93lob 0 "aMt" 1931.1 (243 12341 42223 493 12 3
65W 1.91. 1S MOSS4 41.931 41.824A
laostlitcel bdjustln.l (233 its 2 en21 . IllSa
Adi.lstr.tlm 1.492 12 63.92 is.30 S"4 3.32 4.944 6.28 I.&2 633 12.oo4 11.434
6e4.etry no IN"&.c.ww 90 le 46 2.4014 6.229 1.462 33 ?."93 6w0,
G traft * ^ C rslt s,Wna s,|ns ,|a S7 3 422 in4 .31*
trop "'I~~34 34 4 39 U6 939l
FewI 31 S.161 S.341 an 16 pit k. *s. 9.1 4
S1406 433 93 23A . 444.439 1.144 no
pbtecbbcbs laf
so we
COMt 9,1 954 60 at A to jet 6
saw 1.142 'A 1.064 is..e~ 4.$S1
039 ?n' II's T6o 2.912 4 9 2.249 4ll 222 2. "I 2.246 is 40 P.929 160.2
vr 346 642 I 33.63 2.164 69.93 an6 21. 169 24.6I6i
Feel s...t..s ,en nCY: 4, 09.4s Wl~h 4.21£ 11,64 Z.SOS !.04 is."? 1.40 is j -1 ".G* In."S
!Y lw.s Sm 6*s.99.
C_ rmr " d669 o4wee vs. 6833 46. me 0w46 P,.
Goge_ M£ .66ss6w 4,01040.
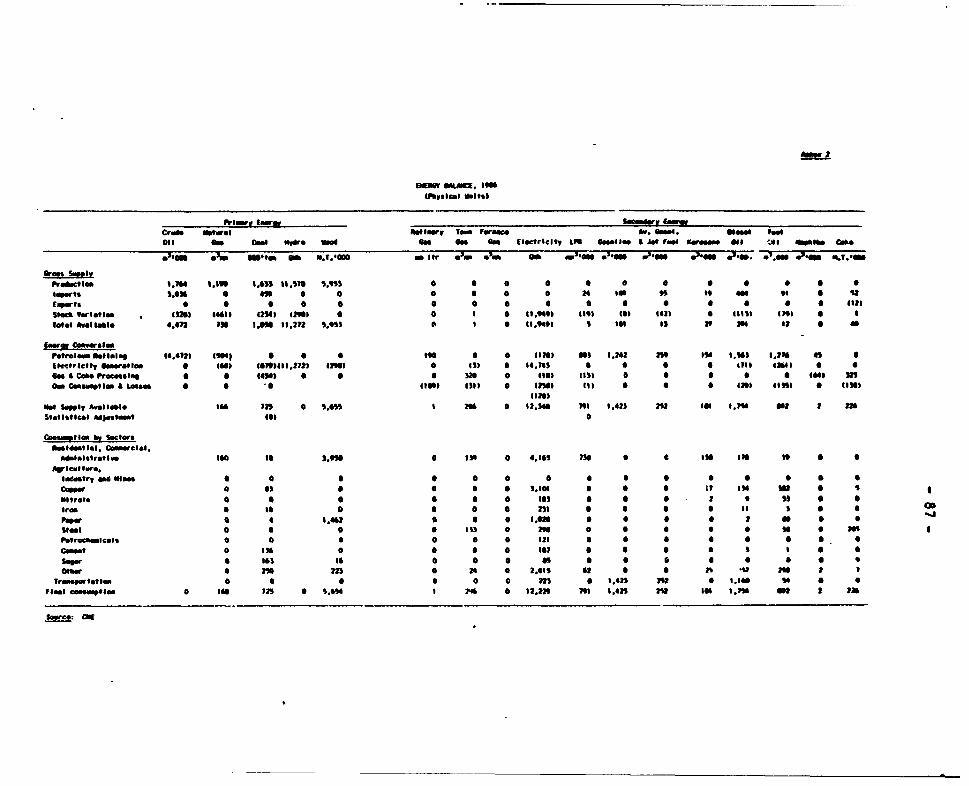
. ~ ~ ~ ~ ~ ~ ~ ~ ~ ~ ~ ~ m _. .
Pirlwrv saw.w Scmw, (awer
Croft Ntural 4 ltuar tewn Fwrame A. O6. so""l few
oil on cue "W. m ae am Of Eletricit- LP_ Oee.Ime f, Jd* Food uAmme ad 'Al l a"
e'S .'m Metm" Ui J.t00 m lItr im, *'. g M'om am _ '4_ 0*em *'tl, e".a_m W*" * .t.-_
Gran Sw l|Y
Prectlee 13.14 1.1 6 3,331 110 .") 0 0 0 * o 0 0 0 0 0 0
Sugets 36306 6 439 0 0 0 0 0 S 24 to W33 do 14 S 3
Ex_wl 0 0 S 0 0 a 0 a a 0 a 0 0 a * * 4il
Stk Wrletlm 43263 944 4l 42343 4t2"6 a a I 0 4 1.39) fill (St OH2 6 II%1 ("I 0 6
Tota ve $waIe, 4.412 7 .I53 33.212 3."3 0 I S 43.1411 l ot 3 Si n R 31 * 4
Emr CintvalemPetreim bible, 64.412) (lo4 St 6 5 I 0 (in) a1 1.242 2" Bd4 *i.- 1.23 as a
tluctrlclty Imwatim 0 4 4611 3 Ct 411.22) 626) 0 3) 5 * 4.74) S * 0 * 41*3 4363 4 a
GmS CAc.Preese 4 0 a 3* 0 tool Its) a 5 * 0 * * 4443 31
amC m.atir L a 0 0 0 4131 1II) O 4230 ) 0 a a * 463i") 0 141,
fls Suppl Awelleble IG0 712 0 S.SS3 I 290 a 12.346 396 6.42) 2 l4M I.M du 2 ?34
Statistiecl Mjustmet 46 0
CoemiAis by Sectorsmsoldoat$6l Cineclel,Aebmilstratius ISO IS I" 0 4.343 730 a 6 IIn I3 i 5 0
Apical lr.tITsutry m* OiWOme, S 0 0 0 0 6 6 4
Cupe 0 o 0 0 3.e 0 S e * 17i W t *
*Ntrate 0 0 0 0 663es a 6 0 2 6 33 0 0
Ir. a is 0 231 S 6 $6 S 6 a6
PeP- a 4 3.40 6 a 6.0S6 0 0 t 2 a 0 *
steel 0 a 0 S I61 0 ?1 S * S 0 is 0 ?f1
Ptfracsmie-l, a 0 ° 0 0 S 121 6 * a a a 6 5 0
cmet 0 I 0 0 0 t o a 0 0 5 * I 0 0
Sawr S 3) 16 a 0 0 0s 0 0 a a a a 0 9
mer* 0 23 2 0 14 * 2.66s 62 a 0 ?1 -W 1 I r
Trosaotte 0 0 S 0 0 a ns a 3,42) 24 * 6.3" S 6
FIeel I_meowtIm 0 I" 2 30 S 12 * 221 lot 3.42 ? 232 to I.1 on 2 123
Somrc. Cm
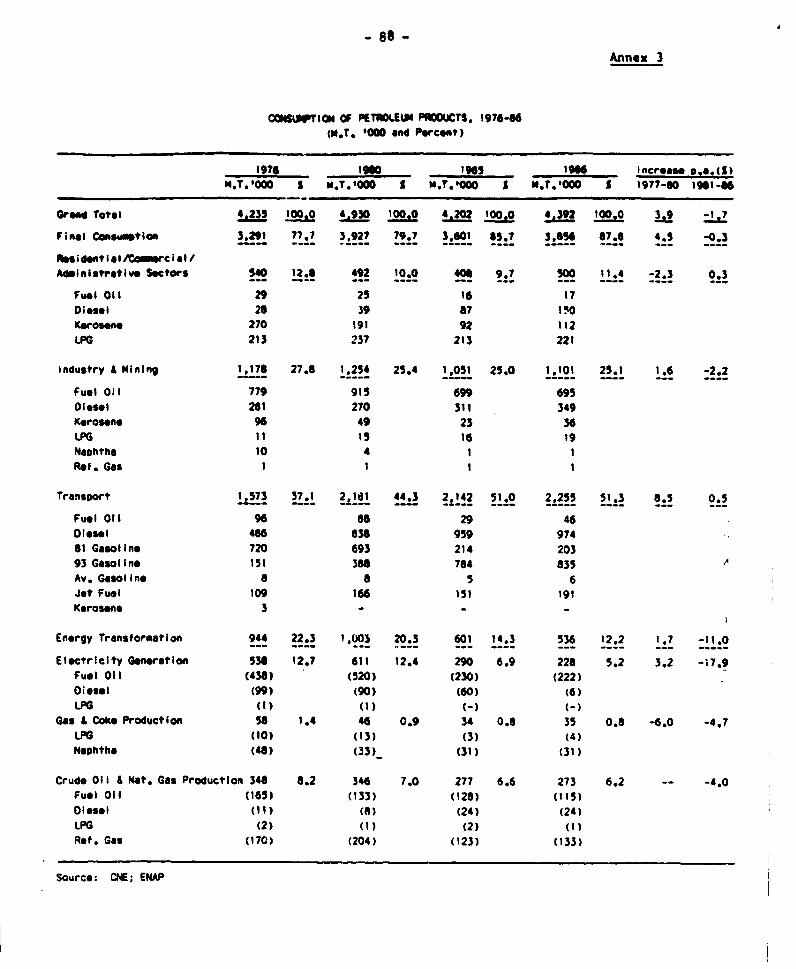
- 88 -Anne: 3
CONSUWION OF PETE UN POPUCTS * 1976-6(m.T. '000 and Pereot)
1976 19GO l965 1986 Increase D .*4.)m.T.ooo I m.T.000 t M.T.o000 S M.T.'000 S 1977-80 1961-46
Gre"d Total 4.235 100.0 4.930 100.0 4.202 100.0 4.392 100.0 3,9 -1. 7
Final Co4sumltlon 3.291 77.7 3.927 79.7 3,601 85.7 3'65 67.6 4.5 -0,3
pau ident Ia I Cinmrc ialIAdmlnlstrativ. Sectors 540 12.8 492 10.0 406 9. 500- 11,4 -2.3 0.3
Fm l Oil 29 25 16 17DIesel 28 39 87 140Keroseno 270 191 92 112LPG 213 237 213 221
Industry & Mining 1,178 27.8 1,254 25.4 1.051 25.0 1,10! 25.! 1.6 -2.2
Fuel Oil 779 915 699 695Oiesel 281 270 311 349Kerosene 96 49 23 36LPG 11 15 16 19Naphtha 10 4 1 1Rof. Gas I I I I
Transport 1,573 37,1 2,181 44.3 2X142 51.2 2.255 51.3 8.5 0.5
Fuel Oil 96 88 29 46Diesel 486 838 959 97481 Gasoline 720 693 214 20393 Gasoline 151 386 784 835 A
Av. Gasoline 8 a 5 6Jet Fuel 109 166 151 191Kerosese 3 - - -
Energy Transformation 944 22.3 1,003 20.3 601 14.3 536 12.2 1.7 -11.0
Electricity Gen ration 538 12.7 611 12.4 290 6.9 226 5.2 3.2 - 7.9Fuel Oil (438) (520) (230) (222)Diesel (99) (90) (60) (6)LPGi {(I ) (1) (-) (-)
Gas & Coke Production 58 1.4 46 0.9 34 0.6 35 0.8 -6.0 -4.7LPG (10) (13) (3) (4)Naphth& (46) (33)_ (31) (31)
Crude Oil & Not. Gas Production 348 8.2 346 7.0 277 6.6 273 6.2 -- -4.0Fuel Oil (165) (133) (128) (115)Oiesel (11) (a) (24) (24)LPG (2) (1) (2) (1)Ref. Gas (170) (204) (123) (133)
Source: CNE; ENAP
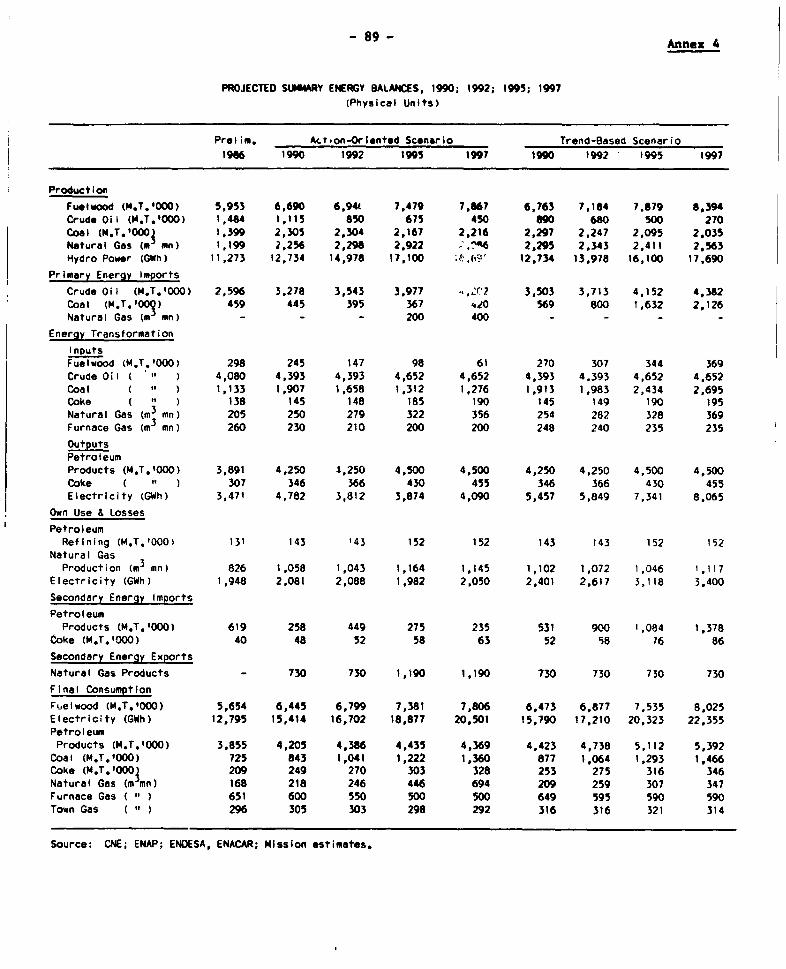
-89- Annex 4
PROJECTED SUMMARY ENERGY aALANCES, 1990. 1992; 1995; 1997(Physical Units)
Prelim, Action-Orl.nted Sconario Trend-Based Scenario1986 1990 1992 199S 1997 1990 1992 1995 1997
Production
Fuelwood (M.T.'000) 5,953 6,690 6,944 7.479 7,867 6,763 7,184 7,879 8,394Crude Oil (M.T.'000) 1,484 1,115 850 675 450 890 680 SOO 270Coal (M.T.'000 1,399 2,305 2,304 2,167 2,216 2,297 2,247 2,095 2.035Natural Gas (m an) 1,199 2,256 2,298 2.922 , 2,295 2,343 2,411 2,563Hydro Power (GWh) 11,273 12,734 14,978 17,100 ;49ti9 12,734 13,978 16,100 17,690
Primary Energy ImportS
Crude Oil (M.T.000) 2,596 3,278 3,543 3,977 ,2r7 3,503 3,713 4,152 4,382Coal (M.T'OO) 459 445 395 367 4.i0 569 800 1,632 2,126Natural Gas (m3 mn) - - - 200 400 - - - -
Energy Transformation
InputsFuelwood (M.T.000) 298 245 147 98 61 270 307 344 369Crude Oil ( '' ) 4,080 4,393 4,393 4,652 4,652 4,393 4,393 4,652 4,652Coal ( ) 1,133 1,907 1,658 1,312 1,276 1,913 1,983 2,434 2,695Coke ( i ) 138 145 148 185 190 145 149 190 195Natural Gas (m3 mn) 205 250 279 322 356 254 282 328 369Furnace Gas (m3 mn) 260 230 210 200 200 248 240 235 235
OutputsPetroleumProducts (M.T.1000) 3,891 4,250 *,250 4,500 4,500 4,250 4,250 4,500 4,500Coke ( ) 307 346 366 430 455 346 366 430 455Electricity (GWh) 3,471 4,782 3,812 3,874 4,090 5,457 5,849 7,341 8,065
Own Use & LossesPetroleumRefining (M.T.'000, 131 143 '43 152 152 143 143 152 152
Natural GasProduction (m3 mn) 826 1,058 1,043 1,164 1,145 1,102 1,072 1,046 1,117
Electricity (GWh) 1,948 2,081 2,088 1,982 2,050 2,401 2,617 3,118 3,400
Secondary Energy Imports
PetroleumProducts (M.T.000) 619 258 449 275 235 531 900 1,084 1,378
toke (M.T.'000) 40 48 52 58 63 52 S8 76 86
Secondary Energy Exports
Natural Gas Products - 730 730 1,190 1,190 730 730 730 730
Final Consumption
Faeiwood (M.T.'000) 5,654 6,445 6,799 7,381 7,806 6,473 6,877 7,535 8,025Electricity (GWh) 12,795 15,414 16,702 18,877 20,501 15,790 17,210 20,323 22,355PetroleumProducts (M.T.'000) 3,855 4,205 4,386 4,435 4,369 4,423 4,738 5,112 5,392Coal (M.T.'000) 725 843 1,041 1,222 1,360 877 1,064 1,293 1,466Coke (M.T.,0003 209 249 270 303 328 253 275 316 346Natural Gas (m mn) 168 218 246 446 694 209 259 307 347Furnace Gas ( ) 651 600 550 500 500 649 595 590 590Town Gas ( 296 305 303 298 292 316 316 321 314
Source: CNE; ENAP; ENDESA, ENACAR; Mission estimates.
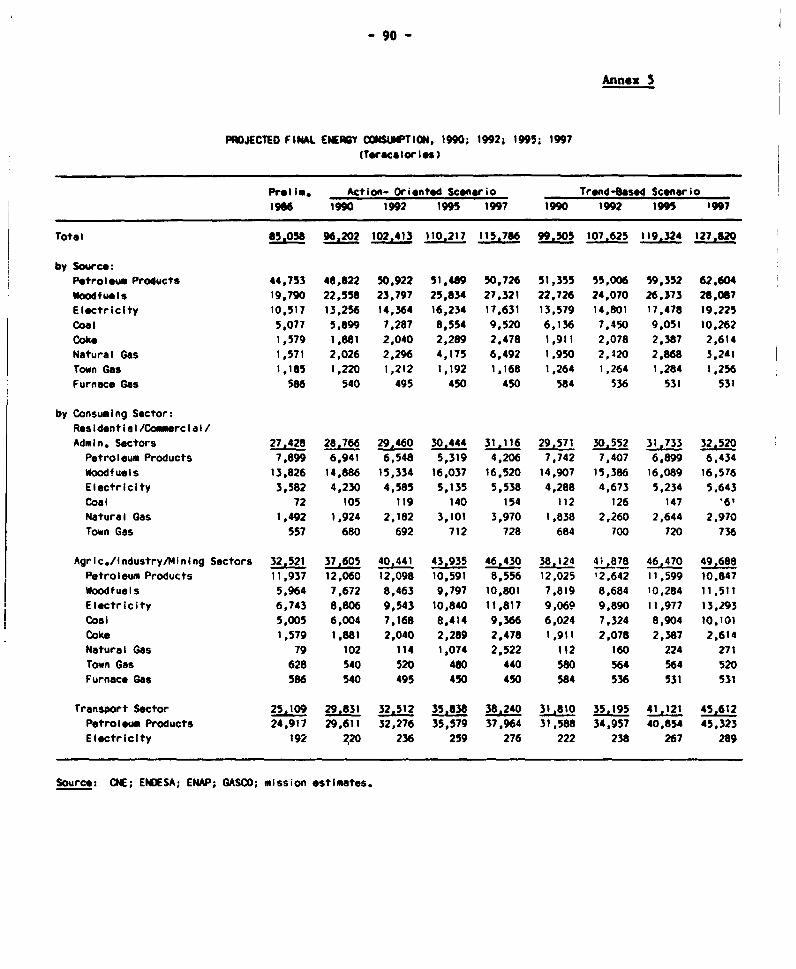
- 90 -
Annex 5
PROJECTED FINAL ENERGY COSMPTION, 1990; 1992; 1995; 1997(Teracaloris"1
Prel i. Action- Oriented Scenario Trend-ased Scenario1986 1990 1992 1995 1997 1990 1992 1995 '997
Total 85,058 96,202 102,41 110,217 15.76 99,505 107,625 119,324 127,i52
by Source:Petroleum Products 44,753 48,822 50,922 51,489 50,726 51,355 55,006 59,352 62.604Woodfueis 19,790 22,558 23,797 25,834 27,321 22,726 24,070 26,373 28,087Electricity 10,517 13,256 14,364 16,234 17,631 13,579 14,801 17,478 19,225Coal 5,077 5,899 7,287 8,554 9,520 6,136 7,450 9,051 10,262Coke 1,579 1,881 2,040 2,289 2,478 1,911 2,078 2,387 2,614Natural Gas 1,571 2,026 2,296 4,175 6,492 1,950 2,420 2,868 3,261Town Gas 1,185 1,220 1,212 1,192 1,168 1,264 1,264 1.284 1,256Furnace Gas 586 540 495 450 450 584 536 531 531
by Consuming Sector:Residential/Coimercial/Admn. Sectors 27,428 28,766 29,460 30,444 31,116 29571 30,552 31,733 32,520Petroleum Products 7,899 6,941 6,548 5,319 4,206 7,742 7,407 6,899 6.434Woodfuels 13,826 14,886 15,334 16,037 16,520 14,907 15,386 16,089 16,576Electricity 3,582 4,230 4,585 5,135 5,538 4,288 4,673 5,234 5.643Coal 72 105 119 140 154 112 126 147 '61Natural Gas 1,492 1,924 2,182 3,101 3,970 1,838 2,260 2,644 2,970Town Gas 557 680 692 712 728 684 700 720 736
Agric./lndustry/Mining Sectors 32,521 37,605 40,441 43,935 46,430 38,124 4L,_8' 46,470 49,688Petroleum Products 11,937 12,060 12,098 10,591 8,556 12,025 12,642 11,599 10.847Woodfuels 5,964 7,672 8,463 9,797 10,801 7,819 8,684 10,284 11,511Electricity 6,743 8,806 9,543 10,840 11,817 9,069 9,890 11,977 13,293Coal 5,005 6,004 7,168 8,414 9,366 6,024 7,324 8,904 10.101Coke 1,579 1,881 2,040 2,289 2,478 1,911 2,078 2,387 2,614Natural Gas 79 102 114 1,074 2,522 112 160 224 271Town Gas 628 540 520 480 440 580 564 564 520Furnace Gas 586 540 495 450 450 584 536 531 531
Transport Sector 25,109 29,831 32.512 35,838 38,240 31,810 35,195 41.121 45,612Petrolem Products 24,917 29,611 32,276 35,579 37,964 31,588 34,957 40,854 45,323Electricity 192 220 236 259 276 222 238 267 289
Source: CNE; ENDESA; ENAP; GASCO; mission estimates.
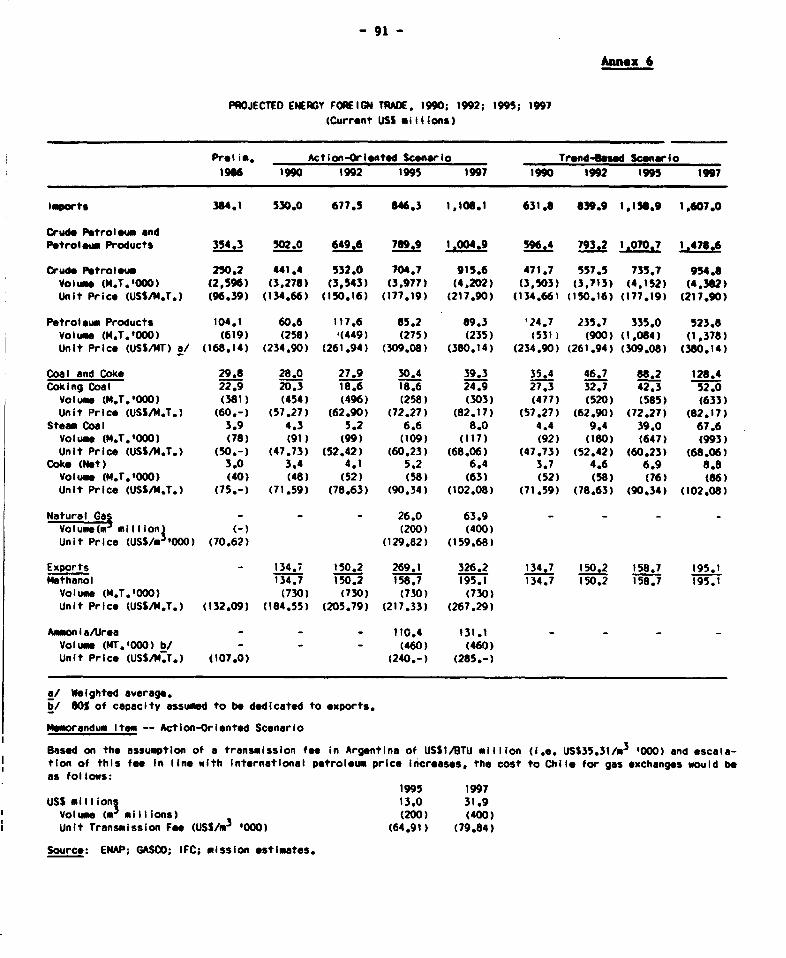
- 91 -
Aunex 6
PROJECTED ENERGY FOREIGN TRADE. 1990; 1992; 199S; 1997(Current USS millions)
Preli*. Action-Oriented Sconario Tro nd-sed Scenario1966 1990 1992 1995 1997 1990 1992 1995 1997
lmports 364.1 530.0 677.5 646.3 1,106.1 631.8 639.9 1,158.9 1,607.0
Crude Petroleum andPetroleum Products 354.3 502.0 649.6 789.9 1.004.9 596.4 793.2 1 070.7 1478.6
Crude Petroleu 250.2 441.4 532.0 704.7 915.6 471.7 557.5 735.7 954.6lVolume (M.T.000) (2,596) (3,278) (3,543) (3,977) (4,202) (3,503) (3,713) (4,152) (4,362)Unit Price (USs,N.T.) (96.39) (134.66) (150.16) (177.19) (217.90) (134.66) (150.16) (177,19) (217.90)
Petroleum Products 104.1 60.6 117.6 85.2 89.3 24.7 235.7 335.0 523.8Volume (M.T.0000) (619) (258) (449) (275) (235) (531) (900) (1,084) (1,378)Unit Price (USS/1T) a/ (168.14) (234.90) (261.94) (309.08) (380.14) (234.90) (261.94) (309.08) (380.14)
Coal and Coke 29.8 28.0 27.9 30.4 39.3 35.4 46.7 88.2 128.4Coking Coal 22.9 20.3 18.6 18.6 24.9 27.3 32.7 42.3 52.0
Volume (M.T.1000) (381) (454) (496) (258) (303) (477) (520) (585) (633)Unit Price (USS/M.T.) (60.-) (57.27) (62.90) (72.27) (82.17) (57.27) (62.90) (72.27) (82.17)
Steam Coal 3.9 4.3 5.2 6.6 8.0 4.4 9.4 39.0 67.6volume (H.T.'000) (78) (91) (99) (109) (117) (92) (180) (647) (993)Unit Price (USS/M.T.) (50.-) (47.73) (52.42) (60.23) (68.06) (47.73) (52.42) (60.23) (68.06)
Coke (Net) 3.0 3.4 4.1 5.2 6.4 3.7 4.6 6.9 8.8Volume (M.T.1000) (40) (48) (52) (58) (63) (52) (58) (76) (86)Unit Price (USS/M.T.) (75.-) (71.59) (78.63) (90.34) (102.08) (71.59) (78.63) (90.34) (102.08)
Natural Gai - - - 26.0 63.9 - - - -Volume(" million1 C-) (200) (400)Unit Price (USS/r '000) (70.62) (129.82) (159.68)
Exports - 134.7 150.2 269.1 326.2 134.7 150.2 158.7 195.1Methanol 134,7 150.2 158.7 195.1 134.7 150.2 158.7 195.1Volume (M.T.000) (730) (730) (730) (730)Unit Price (USS/M.T.) (132.09) (184.55) (205.79) (217.33) (267.29)
AmmonIa/Urea - - - 110.4 131.1 - - - -
Volume (MT.000) b/ - - - (460) (460)Unit Price (USS/M.T.) (107.0) (240.-) (285.-)
a/ Weighted average.b/ 80% of capacity assumed to be dedicated to exports.
Memorandum Item -- Action-Orlented Scenario
Based on the assumption of a transmlssion fee in Argentina of USSI/BTU million (I.e. USS35.31/m3 000) and escala-tion of this fee In line with International petroleum price Increases, the cost to Chile for gas exchanges would beas follows:
1995 1997USS millionr 13.0 31.9Volum (m millions) (200) (400)Unit Transmission Fee (USS/m3 000) (64.91) (79.84)
Source: ENAP; GASCO; IFC; mission estimates.
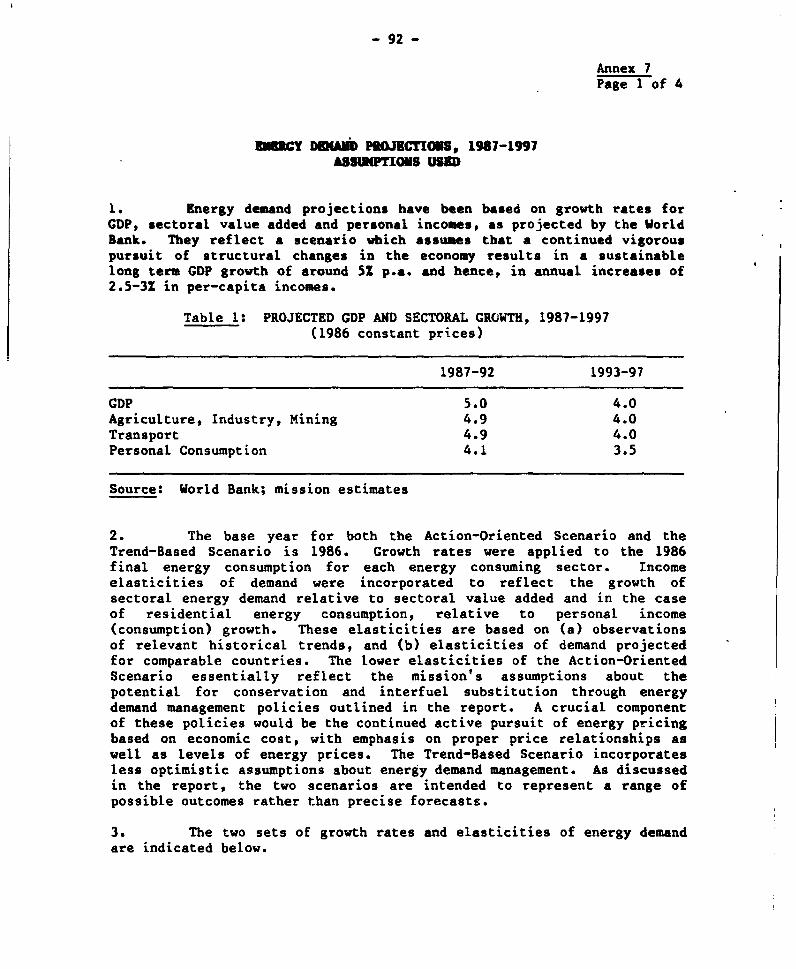
- 92 -
Annex 7Page 1 of 4
jCY DAD PROJECTIONS, 1987-1997ASSUMTONS USED
1. Energy demand projections have been based on growth rates forGDP, sectoral value added and personal incomes, as projected by the WorldBank. They reflect a scenario which assumes that a continued vigorouspursuit of structural changes in the economy results in a sustainablelong term GDP growth of around 5Z p.a. and hence, in annual increases of2.5-3Z in per-capita incomes.
Table 1: PROJECTED GDP AND SECTORAL GROWTH, 1987-1997(1986 constant prices)
1987-92 1993-97
GDP 5.0 4.0Agriculture, Industry, Mining 4.9 4.0Transport 4.9 4.0Personal Consumption 4.1 3.5
Source: World Bank; mission estimates
2. The base year for both the Action-Oriented Scenario and theTrend-Based Scenario is 1986. Growth rates were applied to the 1986final energy consumption for each energy consuming sector. Incomeelasticities of demand were incorporated to reflect the growth ofsectoral energy demand relative to sectoral value added and in the caseof residential energy consumption, relative to personal income(consumption) growth. These elasticities are based on (a) observationsof relevant historical trends, and (b) elasticities of demand projectedfor comparable countries. The lower elasticities of the Action-OrientedScenario essentially reflect the mission's assumptions about thepotential for conservation and interfuel substitution through energydemand management policies outlined in the report. A crucial componentof these policies would be the continued active pursuit of energy pricingbased on economic cost, with emphasis on proper price relationships aswell as levels of energy prices. The Trend-Based Scenario incorporatesless optimistic assumptions about energy demand management. As discussedin the report, the two scenarios are intended to represent a range ofpossible outcomes rather than precise forecasts.
3. The two sets of growth rates and elasticities of energy demandare indicated below.
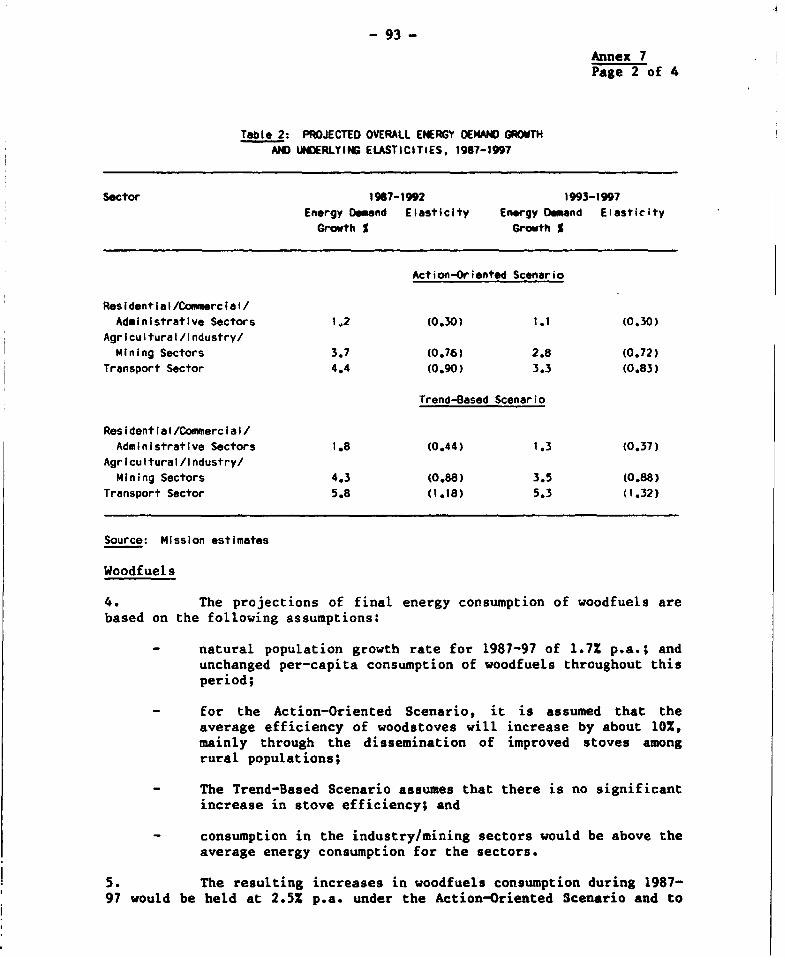
- 93 -
Annex 7Page 2 of 4
Table 2: PROJECTED OVERALL ENERGY DEMAND GROWTHAND UNDERLYING ELASTICITIES, 1967-1997
Sector 1987-1992 1993-1997
Energy OD and Elasticity Energy Demand ElasticityGrowth S Growth S
Action-Oriented Scenario
Res ident iA I/Coamerc i a/Administrative Sectors 1.2 (0.30) 1.1 (0.30)
Agricultural/industry/Mining Sectors 3.7 (0.76) 2.8 (0.72)
Transport Sector 4.4 (0.90) 3.3 (0.83)
Trend-Based Scenario
Residential/Commercial/Administrative Sectors 1.8 (0.44) 1.3 (0.37)
Agricultural/industry/
Mining Sectors 4.3 (0.88) 3.5 (0.88)Transport Sector 5.8 (1.18) 5.3 (1.32)
Source: Mission estimates
Woodfuels
4. The projections of final energy consumption of woodfuels arebased on the following assumptions:
- natural population growth rate for 1987-97 of 1.7% p.a.; andunchanged per-capita consumption of woodfuels throughout thisperiod;
- for the Action-Oriented Scenario, it is assumed that theaverage efficiency of woodstoves will increase by about 10%,mainly through the dissemination of improved stoves amongrural populations;
- The Trend-Based Scenario assumes that there is no significantincrease in stove efficiency; and
- consumption in the industry/mining sectors would be above theaverage energy consumption for the sectors.
5. The resulting increases in woodfuels consumption during 1987-97 would be held at 2.5% p.a. under the Action-Oriented Scenario and to
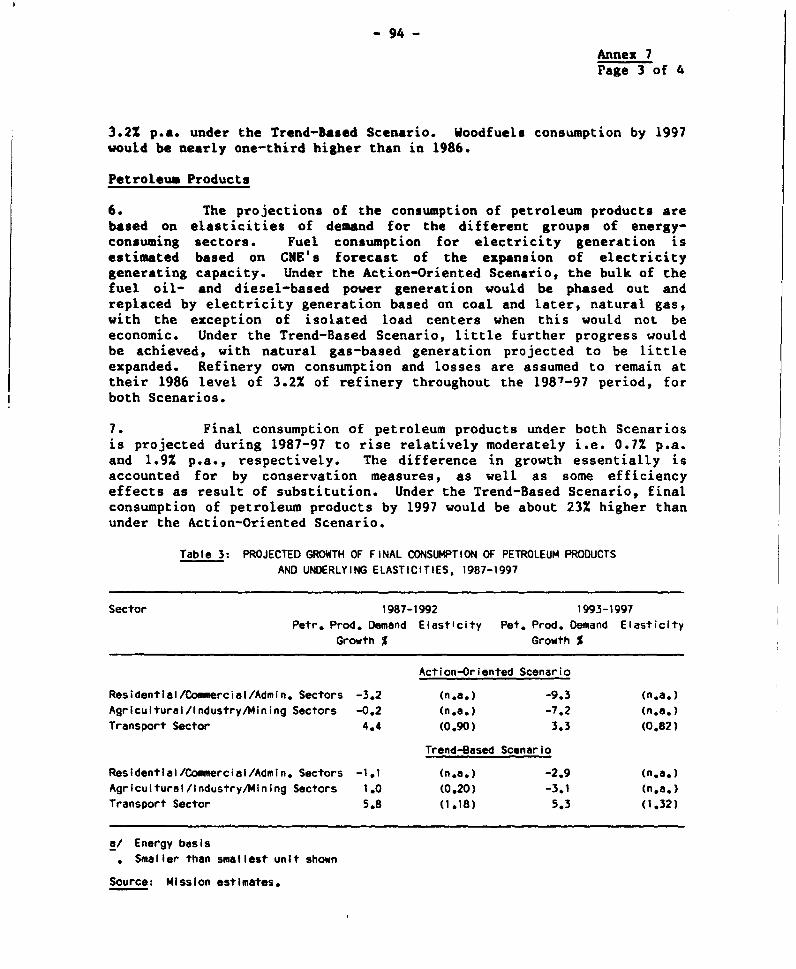
- 94 -
Annex 7Page 3 of 4
3.2% p.a. under the Trend-Based Scenario. Woodfuels consumption by 1997would be nearly one-third higher than in 1986.
Petroleum Products
6. The projections of the consumption of petroleum products arebased on elasticities of demand for the different groups of energy-consuming sectors. Fuel consumption for electricity generation isestimated based on CNE's forecast of the expansion of electricitygenerating capacity. Under the Action-Oriented Scenario, the bulk of thefuel oil- and diesel-based power generation would be phased out andreplaced by electricity generation based on coal and later, natural gas,with the exception of isolated load centers when this would not beeconomic. Under the Trend-Based Scenario, little further progress wouldbe achieved, with natural gas-based generation projected to be littleexpanded. Refinery own consumption and losses are assumed to remain attheir 1986 level of 3.2% of refinery throughout the 1987-97 period, forboth Scenarios.
7. Final consumption of petroleum products under both Scenariosis projected during 1987-97 to rise relatively moderately i.e. 0.7% p.a.and 1.9% p.a., respectively. The difference in growth essentially isaccounted for by conservation measures, as well as some efficiencyeffects as result of substitution. Under the Trend-Based Scenario, finalconsumption of petroleum products by 1997 would be about 23% higher thanunder the Action-Oriented Scenario.
Table 3: PROJECTED GROWTH OF FINAL CONSUMPTION OF PETROLEUM PRODUCTSAND UNDERLYING ELASTICITIES, 1987-1997
Sector 1987-1992 1993-1997Petr. Prod. Demand Elasticity Pet. Prod. Demand Elasticity
Growth % Growth %
Action-Oriented Scenario
Residential/Commercial/Admin. Sectors -3.2 (n.a.) -9.3 (n.a.)Agricultural/Industry/Mining Sectors -0.2 (n.a.) -7.2 (n.a.)Transport Sector 4.4 (0.90) 3.3 (0.82)
Trend-Based Scenario
Residential/Commercial/Admin. Sectors -1.1 (n.a.) -2.9 (n.a.)Agricultural/Industry/Mining Sectors 1.0 (0.20) -3.1 (n.a.)Transport Sector 5.8 (1.18) 5.3 (1.32)
a/ Energy basis. Smaller than smallest unit shown
Source: Mission estimates.
- 95 -
Annex 7Page 4 of 4
Natural Gas
8. Natural gas requirements under the Action-Oriented Scenarioare projected t3 be nearly 30% above those for the Trend-Based Scenario,i.e. 3.3 bn m vs. 2.6 bn m' in 1997. This is because (a) bothpetrochemical schemes (i.e. methanol and amonia/urea production) areprojected to be operating by then; (b) natural gas is projected to besupplied to central Ch le from the mid-19909 onwards which would accountfor 250-350 million m of additional demand for power generation andfinal consumption by the mid-to late 19909; and (c) higher requirementsfor NGL extraction would arise. In contrast, natural gas flaring isprojected to be reduced during 1986-97 from 27Z of output (net ofreinjection) to 15% under the Action-Oriented Scenario and to 20Z underthe Trend-Based Scenario.
Electricity
9. The electricity demand projections are those made by thePehuenche project appraisal mission 1/ as extended to 1997 andcomplemented by projections for self-generation. They incorporate thefollowing specific assumptions:
= a loss reduction program is instituted under the Action-Oriented Scenario such that transmission and distributionlosses as a proportion of generation decline from 13.2%estimated in 1986 to 10% from 1995 onwards. Under the Trend-Based Scenario, however, no such decline would be achieved;
- the load factor is assumed to remain unchanged.
10. Compared to past years, the growth of electricityconsumption projected over 1987-97 would be relatively fast, averaging4.8% p.a. under the Action-Oriented Scenario and 5.6% p.a. under theTrend-Based Scenario. Resulting electricity requirements by 1997 underthe latter would be about 10% higher than those under the Action-OrientedScenario (i.e. about 2,000 CWh). Under the Action-Oriented Scenario,electricity growth would be moderated through higher efficiency of end-use and in generation and distribution. Thus, electricity generationrequired to meet domestic demand by 1997 under the Action-OrientedScenario would be 13% lower than under the Trend-Based Scenario.
1/ SAR No. 6687-CH of May 15, 1987
-96 Annex 8Page 1 of 3
CIUAU FOM CIMQD OIL AND hATUtAL CGA DISERVE ESTIKTUS
Standard U.S. oil industry reserve categories are used in thisanalysis. Proved and developed reserves (I IIA) are those connected toproducing wells. Proved but undeveloped reserves (1IS) are adjacent andrequire another well to be drilled in order to be produced, but theirprobability of success is high (80-901). Such wells are calleddevelopment wells, and their costs are referred to as developmentcosts. The obvious fact in this data is that 861 of the IIB reservesstated are in offshore fields which are normally more costly to developand produce than are the onshore IIS reserves. Possible and probablereserves (III, IV) are speculative and must be viewed with caution.Class III reserves are those expected to be produced from secondaryrecovery operations, as well as reserves assigned to offshore discoveriesbefore the production platform is set. Both types could be present here,but in small amounts. Class IV refers to expected exploration reservesand is merely an indication of anticipated success. No differentiationis made in these figures between III and IV, but the mission's analysisindicated they are primarily Class IV exploration reserves. Therefore,they are not of significant value. All conventional methods of reserveappraisal emphasize only Class I and II reserves in their valuations andview Class III and IV reserves merely as indications of upside potential.
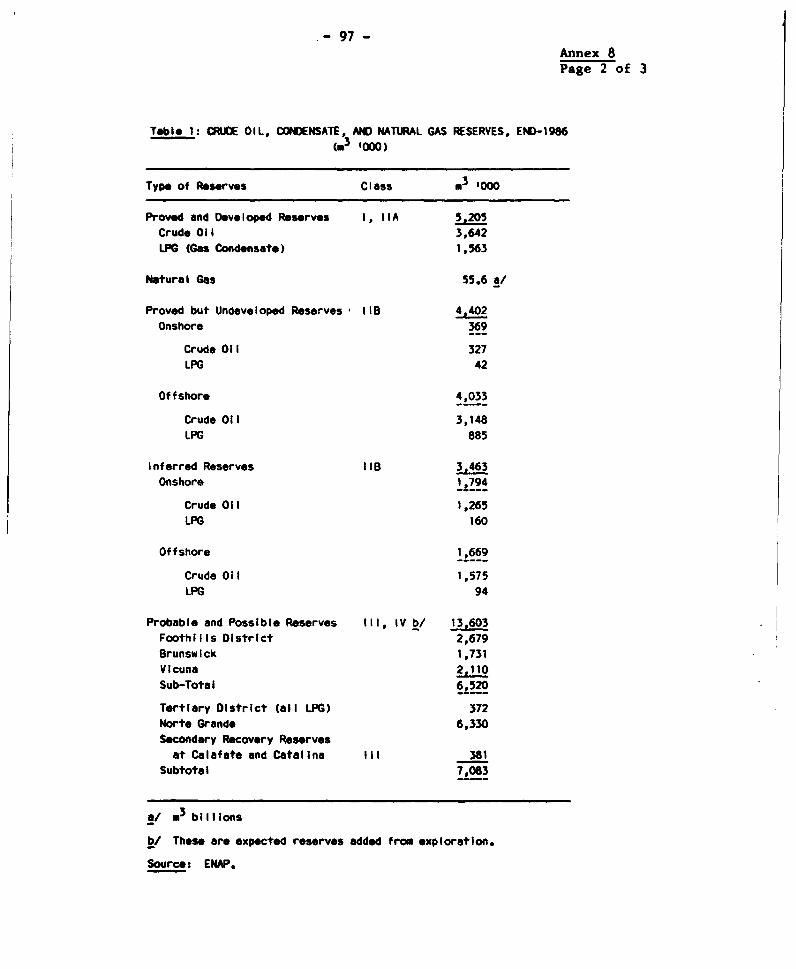
97 -
Annex 8Page 2 of 3
Table 1: CRUDE OIL, CONDENSATE, AND NATURAL GAS RESERVES, END-1986(M3 '000)
Type of Res rves Class .3 '000
Proved and Developed Reserves 1, IIA 5.205Crude 01i 3,642LPG (Gas Condensate) 1,563
Natural Gas 55.6 a/
Proved but Undeveloped Reserves IIB 4.402Onshore 369
Crude 011 327LPG 42
Offshore 4,033
Crude 011 3,148LPG 885
Inferred Reserves IIB 3.463Onshore 1 ,794
Crude Oil 1,265LPG 160
Offshore 1 ,669
Crude Oil 1,575LPG 94
Probable and Possible Reserves III, IV b/ 13,603Foothills District 2,679Brunswick 1,731Vicuna 2,110Sub-Total 6,520
Tertiary District (all LPG) 372Norte Grande 6,330Secondary Recovery Reserves
at Calafate and Catalina III 381Subtotal 7,083
a/ 3 billions
bl Thes are expected reserves added from exploration.
Sourc_: ENAP.
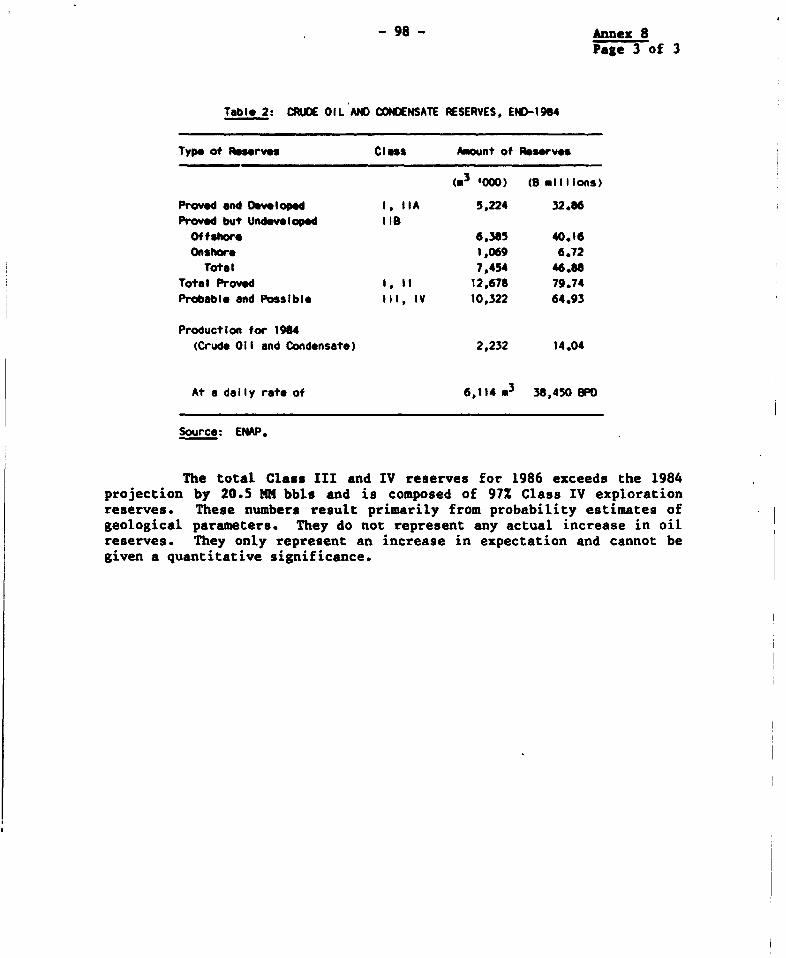
-98 - Annex 8Page 3 of 3
Table 2: CRUDE OIL AND CONDENSATE 9ESERVES, END-1984
Type of Resrves Class Amount of Reserves
(M3 '000) (8 millions)
Proved and Developed 1, IIA 5,224 32.86Proved but Undevloped IeB
Offshore 6,3U5 40.16Onshore 1,069 6.72
Total 7,454 46.88Total Proved I, if 12,678 79.74Probable and Possible Ill, IV 10,322 64.93
Production for 1964(Crude Oil and Condensate) 2,232 14.04
At a daily rate of 6,114 m3 38,450 BPO
Source: ENAP.
The total Class III and IV reserves for 1986 exceeds the 1984projection by 20.5 MM bbls and is composed of 97% Class IV explorationreserves. These numbers result primarily from probability estimates ofgeological parameters. They do not represent any actual increase in oilreserves. They only represent an increase in expectation and cannot begiven a quantitative significance.
-99-An9Page I of 4
UE OIL AND NATIPAL AS P"JECTIONS, 1917-96
Table 1: PPOJECTED IWfVSlMiT PRO6RM* Fo0 PET1RLEUM EVELOP AN D MO EIXLCTION,1967-1996
(1966 USS ml IIloes; Standrd Devlation In Pwenth.Ise)
Sarmnohll District Noe-Proolluelsg Au.Ye w nshor Offshor T.otIary Piedmont e/ Grnd Nout b/ Totul
1967 34 (6) 79 (9) 0 (0) 1 (0) 4 (0) 117 (10)196 24 (6) s0 (a) 4 (1) 6 (2) 5 (0) 122 (11)1969 9 (5) 65 (11) 2 (1) 11 (3) 10 (1) 116 (12)1990 4 (4) 75 (19) 0 (0) 17 (3) 15 (2) 110 (20)1991 1 (2) 41 (27) 0 (0) 24 (5) 19 (4) 65 (26)1992 1 (1) 12 (23) 3 (2) 27 (6) 23 (S) 65 (25)1993 1 (1) 2 (7) 13 (2) 29 (10) 27 (9) 72 (16)1994 0 (1) 0 (2) 17 (6) 26 (12) 24 (10) 6? (17)1995 2 (1) 0 (1) 5 (4) 24 (13) 21 (10) 53 (17)1996 4 (2) 0 (2) 2 (2) 21 (14) 20 (12) 47 (19)
a/ Ulti.e Espwranz Sector.b/ Soler de Ateee Sector.
Source: EIAP.
Annex 9?age 2 of 4
Tble 2: PETROLEi PROMUCTION FORECAST OURING THE PERIOD 197-1996-(3 '000; Staudard Oevlotloe In Pareathes i)
S!rMlhill DistrictDevelope RerWes Estimated EstImted Non-Prod"cle Arors
Year Presently ProducImg OmWeore *f Off sore / Tertirry Pledao4 t b/ Grand Nrth c/ Total
'967 1.333. 70 (15) 319 (11) 0 (0) 0 (0) 0 (0) 1.721 (19)
1966 621 172 (42) 617 (73) 0 (0) 0 10) 0 (0) 1,610 464)
1969 490 220 (49) 0S (123) 0 (0) 0 (0) 0 (0) 1.515 (132)
1990 330 199 (67) 791 (221) 0 (0) 0 (0) 0 (0) 1.321 (231)
1991 305 161 (76) 619 (279) 0 (0) 0 (0) 0 (0) 1.0I 5 (299)
1992 242 132 (76) 422 (235) 0 (0) 56 (60) 62 (63) 914 (2664)1993 196 107 (73) 261 (166) 62 (149) 164 (126) 1I" I167) 9W (325)
1994 157 .92 (71) IS0 (104) 63 (133) 214 (141) 278 (246) 954 (337)
1995 119 72 (53) 65 (48) 57 (110) 249 (163) 343 (210) 924 (342)
1996 94 57 (37) 60 (2s) 41 (64) 271 (164) 367 (263) 910 (350)
a/ Estimted productIon resulting from pianned exploration and development Investment.
bl Ultil- Esp.ranza Sector*
c/ Solar 4d Atacam Sector.
Sourco: ENAP.
Annex 9Page 3 of 4
Table 3: PROJECTED CONDENSATE PlIODUCTION FOR THE PERIOD 1987-1996(a tons, Stanndd Deviation In Parenthesis)
SprimobilI District
Oev loped Reserves Estimated Estimated Nos-Produciag ArosYear Presently Produclg ashore Offshore Tertiary Pied ont a/ Gr ad Nortb Total
1967 217 4 01) 5 11) 0 0 (0) 0 (0) 226 (1)
1968 197 20 (5) 26 (5) 0 0 (0) 0 (0) 243 (7)
1969 169 31 (a) 45 (9) 0 0 (0) 0 (0) 264 (12)
1990 175 29 (1) 40 (11) 0 0 (0) 0 (0) 252 (16)
1991 161 24 (13) 52 (12) 0 0 (0) 0 (0) 237 (17)1992 155 20 (14) 49 (13) 0 1 (2) 1 (3) 226 (19)1993 ISI IS (14) 44 (12) 0 7 (9) S (95 22? (22)1994 129 13 (14) 39 (11) 0 13 (13) 12 (I5) 206 (27)1995 130 10 (10) 32 (6) 0 19 (16) 19 (20) 211 (26)
1996 133 7 (6) 31 (3) 0 24 (1) 26 (23) m (30)
a/ Sector Ultiea Esperanza.
b/ Sector Salar de Atac am.
Source: ENAP.
- 102- Anexz 9Pane 4 of 4
Tablo 4: P^0JECTtO MATUML GAS PM WIJCTIAN D SALES. 1967-199k(M 1 Iionse Standard ceviotIf[ In Parenthesi)
SpIghIl OistrictMethwal wmn I Aks Dometic Prsetly Mn-PnoucIna Areas
Yea Project POJect Xi I q. Tertiy PIed-lnt u/ rnd Nort! b Total
1907 0 0 223 0 (0) 0 (0) 0 (0) 225 (0)19J 0 0 225 0 (0) 0 (0) 0 (0) 223 (0)19 9 550 0 215 0 (0) 0 (0) 0 (0) 765 (0)1990 732 174 215 0 (0) 0 (0) 0 (0) 1,121 (0)1991 732 436 215 0 (0) 0 (0) 0 (0) 1,383 (0)1992 732 457 215 0 (0) 0 (0) 0 (0) 1,404 (0)1993 732 457 215 0 (0) 0 (0) 0 (0) 1.404 (0)1994 732 457 215 0 (0) 0 (0) 0 (0) 1,404 (0)199 732 457 215 460 (201) 32 (67) 33 (93) 1,929 (231)1996 732 457 215 470 (192) 56 (C1) 61 (122) 1,991 (241)
a/ Sector Ultims Eswetaa.b/ Sector Salar de Atacme.
Source: ENAP.
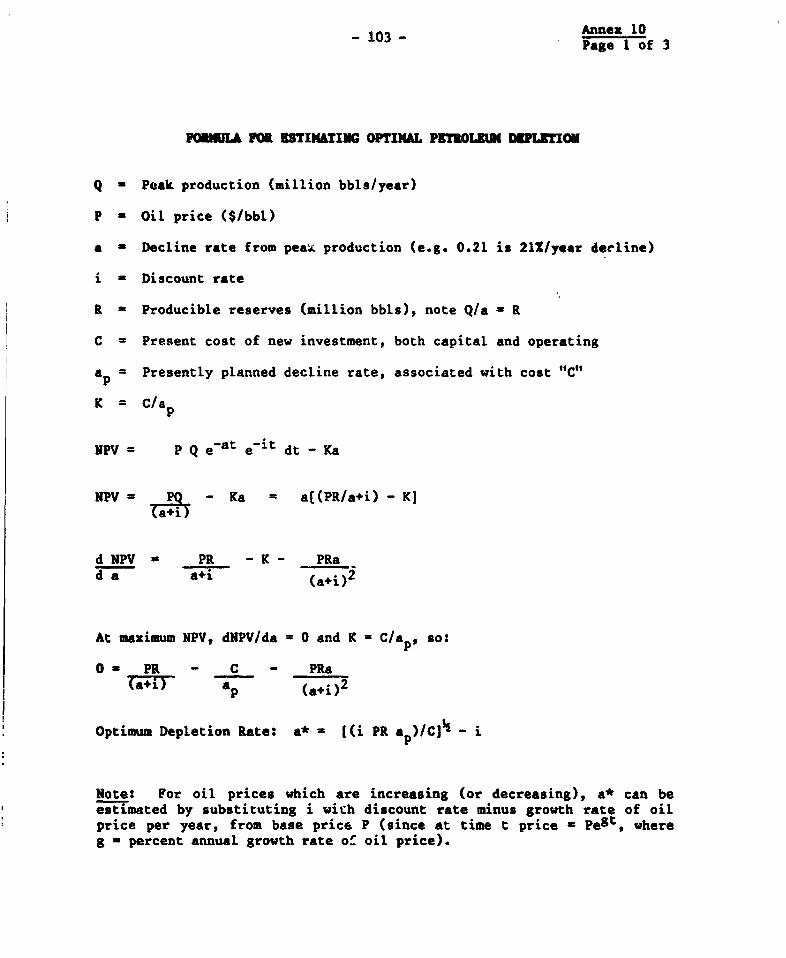
- 103 Annex 10Page 1 of 3
FOIRLA FMO EBTIMATING OPTIMAL PKThOL3U DRPLETION
Q - Peak production (million bbls/year)
P - Oil price ($/bbl)
a - Decline rate from peak production (e.g. 0.21 is 21X/year decline)
i - Discount rate
R - Producible reserves (million bbls), note Q/a - R
C = Present cost of new investment, both capital and operating
ap = Presently planned decline rate, associated with cost "C"
K = C/ap
NPV = P Q e-at e-it dt - Ka
NPV = PQ - Ka = a[(PR/a+i) - K]
d NPV = PR - K- PRad a a+i (a+i)2
At mazimum NPV, dNPV/da = 0 and K = C/ap, so:
0 PR - C - PRa
(a+i) ap (a+i)
Optimum Depletion Rate: a* - l(i PR a p)/C1 - i
Note: For oil prices which are increasing (or decreasing), a* can beestimated by substituting i wich discount rate minus growth rate of oilprice per year, from base price P (since at time t price - Pegt, whereg - percent annual growth rate of oil price).
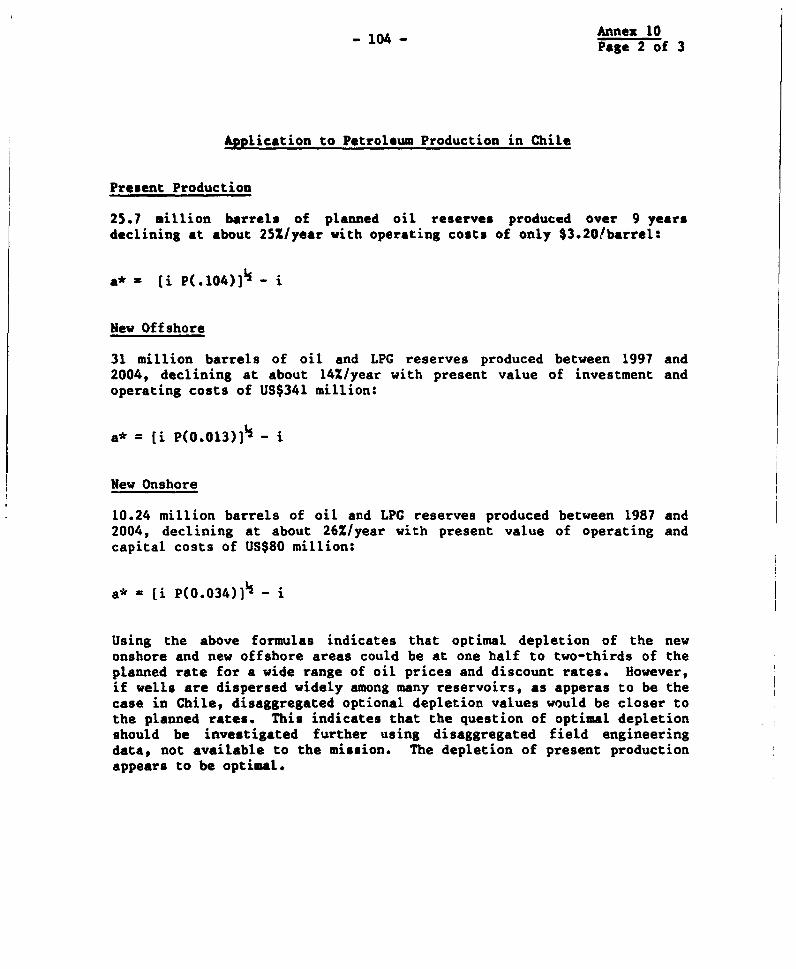
104 - ~~~~Annex 10- 104 - Page 2 of 3
Application to Petroleum Production in Chile
Present Production
25.7 million barrels of planned oil reserves produced over 9 yearsdeclining at about 25X/year with operating costs of only $3.20/barrel:
a* - [i P(.104)1 - i
New Offshore
31 million barrels of oil and LPG reserves produced between 1997 and2004, declining at about 14%/year with present value of investment andoperating costs of US$341 million:
a* = fi P(0.013)]½ - i
New Onshore
10.24 million barrels of oil and LPG reserves produced between 1987 and2004, declining at about 26%/year with present value of operating andcapital costs of US$80 million:
a* = [i P(0.034)]½ - i
Using the above formulas indicates that optimal depletion of the newonshore and new offshore areas could be at one half to two-thirds of theplanned rate for a wide range of oil prices and discount rates. However,if wells are dispersed widely among many reservoirs, as apperas to be thecase in Chile, disaggregated optional depletion values would be closer tothe planned rates. This indicates that the question of optimal depletionshould be investigated further using disaggregated field engineeringdata, not available to the mission. The depletion of present productionappears to be optimal.
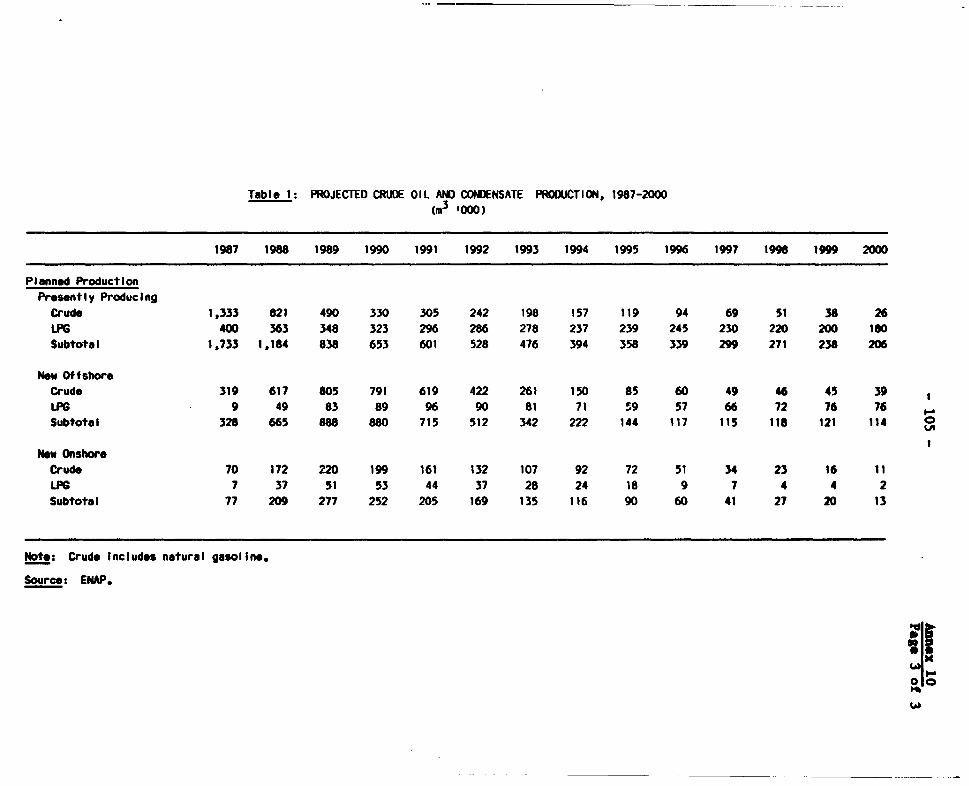
Table 1: PROJECTED CRUDE OIL AND CONDENSATE PROCOiCTION, 1987-2000
(m3 '000)
1987 1988 1989 1990 1991 1992 1993 1994 1995 1996 1997 1996 1999 2000
Planned Production
Presently Producing
Crude 1,333 821 490 330 305 242 198 157 119 94 69 51 38 26
iPG 400 363 348 323 296 286 278 237 239 245 230 220 200 180
Subtotal 1,733 1,184 838 653 601 528 476 394 358 339 299 271 238 206
Now OffshoreCrude 319 617 805 791 619 422 261 150 85 60 49 46 45 39
LPG 9 49 83 89 96 90 81 71 59 57 66 72 76 76
Subtotal 328 665 888 880 715 512 342 222 144 117 115 118 121 114 0
New OnshoreCrude 70 172 220 199 161 132 107 92 72 51 34 23 16 11
iPG 7 37 51 53 44 37 28 24 18 9 7 4 4 2
Subtotal 77 209 277 252 205 169 135 116 90 60 41 27 20 13
Note: Crude Includes natural gasoline.
Source: ENAP.
iiw
- 106 -
Annex 11Page 1 of 6
RISK A ASSOCInAT CaETACTnFOM OIL EXPLOIATIO0 AND PRODUCTION
Introduction
1. The Government in 1981 opened all hydrocarbon-prospectiveareas, except the Magallanes Basin, to outside companies for explorationand exploitation under Petroleum Operations Contracts (Risk Contracts).The Magallanes Basin then remained reserved for the state company ENAP.However, in 1986, the Government also opened up all prospective areas inthe Magallanes region, except the producing Springhill district. Explo-ration and exploitation of hydrocarbon resources in Chile require riskcontracts between companies and the State and in the case of activitiesin the Magallan, association contracts between outside companies andENAP. It is up to the contractors' decision whether they associate withENAP in exploration or exploitation programs outside Magallanes.
2. The stipulations of the petroleum law and model contractgoverning work commitments, production sharing, valuation of output,taxation, and foreign exchange matters are at least as favorable as inother countries in the Region, and offer considerable flexibility. It isimportant to offer conditions to international companies that allow Chileto compete successfully with established oil producing countries forscarce exploration funds, in a situation where the international irvest-ment is adversely affected by relatively depressed petroleum prices.This is especially so in view of the highly speculative and costly natureof exploration in Chile's frontier areas, the relatively unfavorable geo-logy which might limit the chances for discovering crude in significantquantities, the complex technological requirements, and the moderate suc-cess achieved thus far in attracting foreign petroleum companies to Chile.
3. As part of the generally favorable petroleum legislation, theclauses pertaining to taxation (i.e. the possibility of choice betweencorporate income tax and a fixed levy on gross revenues; provision fortax rebates) are sufficiently flexible to allow elegibility of U.S. basedcompanies of the U.S. overseas tax credit. l/ Also, no specialprovisions seem to exist with regard to production sharing for naturalgas. These issues should be resolved in consultation with affectedcompanies. Also, eliminating the mandatory association with ENAP in theMagallanes probably would help to attract additional investors'
1/ In order for a levy to meet U.S. Internal Revenue Service criteriafor creditability against U.S. income tax, it needs to (a) be leviedon income, not gross revenue (in which case it would be treated as a-- non-creditable -- royalty; (b) be generally applicable, i.e. notbe industry- or company-specific and (c) remain unchanged during theperiod of its application.
- 107 -
Annex 11Page 2 of 6
interest. While reserving the producing Springhill district for ENAP isnot considered to be a serious impediment to attracting foreigninvestment, know-how transfer and application of new technical conceptsby different companies would be stimulated through opening up this area,with long-term benefits for petroleum operations.
Contract Terms
4. The exploration/exploitation agreement is a modified servicecontract following the Colombian model. The Contractor assum s theentire exploration risk, unless ENAP agrees to join in the explorationprogram. The Contractor is paid in convertible currency or a percentageof production, at the Government's option. Should ENAP share in theexploitation and exploration risk, the agreement becomes an associationcontract between the outside company and ENAP. Almost all aspects of thecontract, including certain aspects of taxation, are negotiable, in partto make provisions for higher costs and more severe working conditions incertain areas. As a result, it is impossible to determine how favorablethis agreement is from its terms and conditions. To-date, no agreementshave been negotiated under this new law, and as a result, no goodunderstanding exists as to the range within which many of the contractterms can be negotiated.
S. In order to enter into a contract for any of the operationsareas in Chile, an interested party must pay a US$50,000 registrationfee. This entitles the party to receive th! technical informationpackage, which includes seismic surveys, well reports and logs,geological reports and maps, base maps and geological background data.By early 1987, 22 companies have expressed some interest and nine havepaid the registration fee. Five companies followed up by making specificproposals and/or visiting ENAP for discussions.
Exploration
6. The contract comprises two parts, exploration andexploitation. The size of explortion blocks onshore is not to exceed3,000 sq.km in Magallanes, or 5,000 sq.km elsewhere. The size ofoffshore blocks are not to exceed 10,000 sq.km.
7. Exploration Period. The exploration phase is for 10 years,i.e. initially for five years and extendable for five additional years,provided the Contractor has discovered hydrocarbons in sizeable quanti-ties and has fulfilled all contractural obligations. Exploration isbroken into eight contractual periods (three during the first five years,five during the following five years). The first is a two-year geologi-cal and geophysical work period, with a minimum expenditure commitment ofUS$1 million, exploratory drilling being optional. During the remainingseven contractual periods, at least one exploratory well per period needsto be drilled. A seismic option exists since the contractor can leave atthe end of any work period. The length of the periods, the amunt ofwork and even the length of the exploration phase are all negotiable.
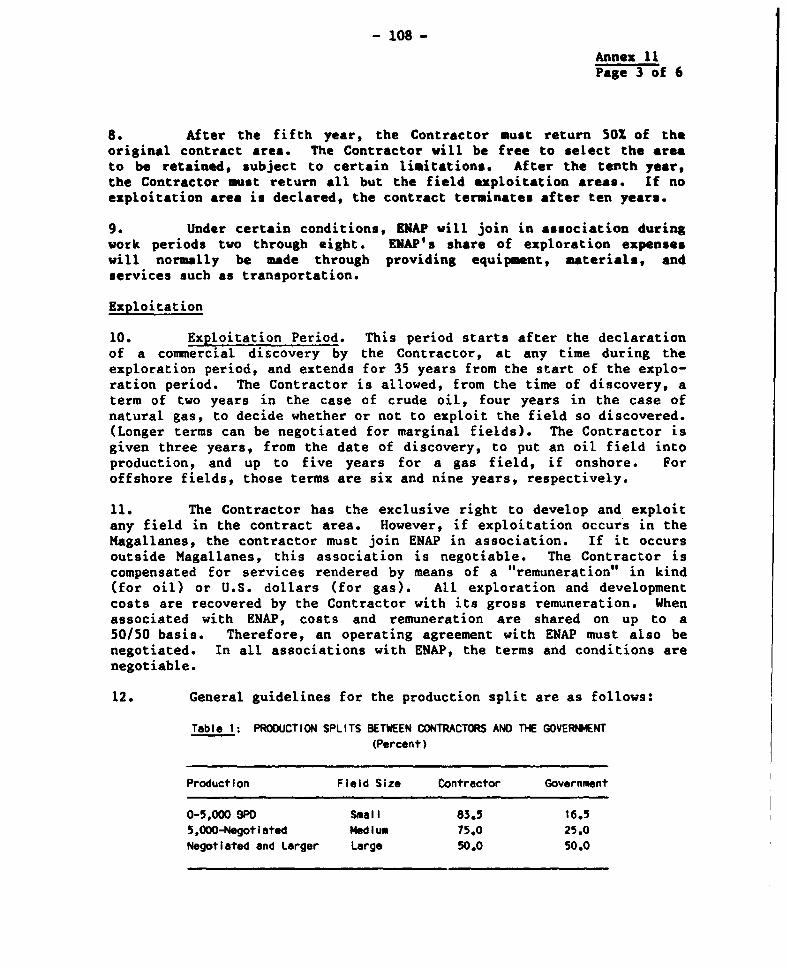
- 108 -
Annex 11Page 3 of 6
8 After the fifth year, the Contractor must return 50% of theoriginal contract area. The Contractor will be free to select the areato be retained, subject to certain limitations. After the teuith year,the Contractor must return all but the field exploitation areas. If noexploitation area is declared, the contract terminates after ten years.
9. Under certain conditions, ENAP will join in association duringwork periods two through eight. ENAP's share of exploration expenseswill normally be made through providing equipment, materials, andservices such as transportation.
Exploitation
10. Exploitation Period. This period starts after the declarationof a commercial discovery by the Contractor, at any time during theexploration period, and extends for 35 years from the start of the explo-ration period. The Contractor is allowed, from the time of discovery, aterm of two years in the case of crude oil, four years in the case ofnatural gas, to decide whether or not to exploit the field so discovered.(Longer terms can be negotiated for marginal fields). The Contractor isgiven three years, from the date of discovery, to put an oil field intoproduction, and up to five years for a gas field, if onshore. Foroffshore fields, those terms are six and nine years, respectively.
11. The Contractor has the exclusive right to develop and exploitany field in the contract area. However, if exploitation occurs in theMagallanes, the contractor must join ENAP in association. If it occursoutside Magallanes, this association is negotiable. The Contractor iscompensated for services rendered by means of a "remuneration" in kind(for oil) or U.S. dollars (for gas). All exploration and developmentcosts are recovered by the Contractor with its gross remuneration. Whenassociated with ENAP, costs and remuneration are shared on up to a50/50 basis. Therefore, an operating agreement with ENAP must also benegotiated. In all associations with ENAP, the terms and conditions arenegotiable.
12. General guidelines for the production split are as follows:
Table 1: PROOUCTION SPLITS BETWEEN CONTRACTORS AND THE GOVERNMENT(Percent)
Production Field Size Contractor Government
0-5,000 9PD Small 83.5 16.55,000-Negotiated Medium 75.0 25.0Negotiated and Larger Large 50.0 50.0
- 109 - Annex 11Page 4 of 6
13. Although this is not very useful for profitability calcula-tions, it does give an indication of how the Government views productionsplits. The contract is a negotiated agreement, and when signed, itbecomes a decree law.
14. Taxation. Should the Contrauttr elect to organize a singleagency or partnership in Chile, it shall be deemed a single taxpayer andtaxed on the basis of the consolidated balance sheet covering itsoperations in Chile. The Contractor will then be subject to taxationunder the prevailing income tax law and customs duties. (The incomn taxrate is currently 372 for corporations.) Alternatively, the Contractormay elect to be taxed at 50X on the remuneration. The tax rate soestablished will remain constant while the contract is in force, althoughthe Government can grant tax rebates under specific circumstances, e.g.difficult working conditions and costly operations.
15. Pt-icing of Crude Oil and Natural Gas. For purposes ofcalculating the Contractor's income tax liability, crude oil will bevalued at the price actually received for sales to third parties in thedomestic or export markets, or at the price calculated for reacquisitionof oil by the State, whichever is higher. (The latter price is theaverage of the basket composed of at least three crudes, f.o.b. originalport of shipment, from three countries, agreed by the Parties.) Fornatural gas, calculation of the tax liability will be based on the marketprice actually received. The State and the Contractor will agree to takeall steps necessary for the sale of the gas, with a view to attaining thebest possible price.
16. Domestic Market Supply ObLigations. The State will only beentitled to reacquire part of the Contractor's remuneration (and pay forit in cash) if domestic requirements for crude oil are not met by the
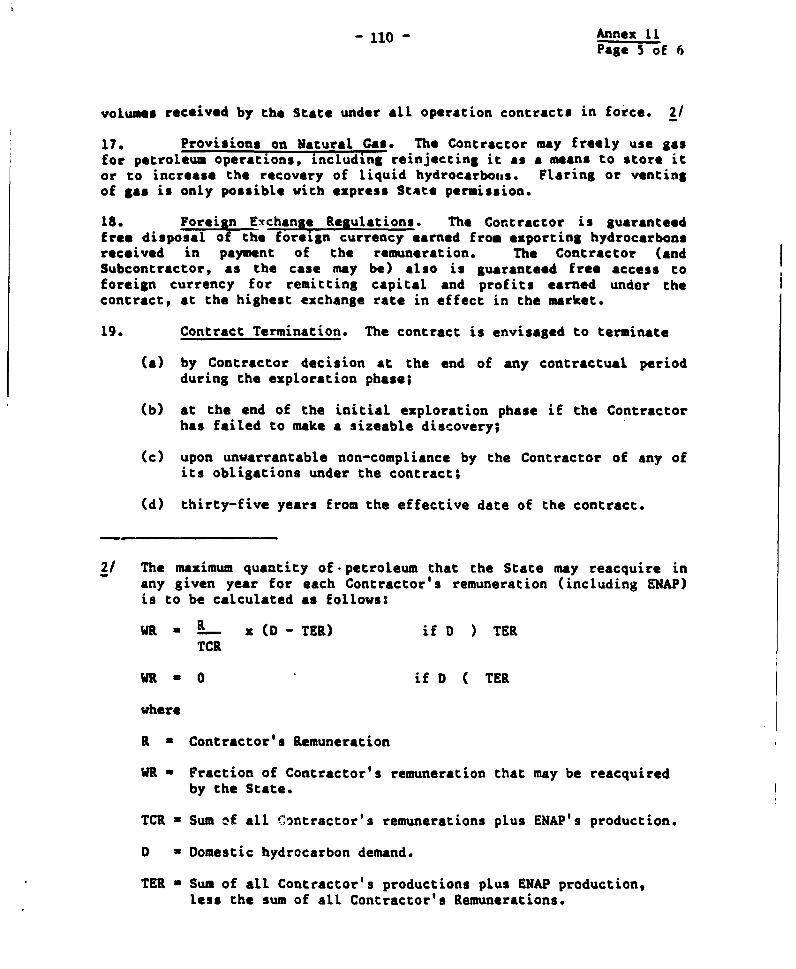
- 110 - Annex 11Page 5 of 6
volumes received by the State under all operation contracts in force. 2/
17. Provisions on Natural Gas. The Contractor may freely use gasfor petroleum operations, including reinjecting it as a means to store itor to increase the recovery of liquid hydrocarbotws. Flaring or ventingof gas is only possible vith express State permission.
l8. Foreign Exchange Regulations. The Contractor is guaranteedfree disposal of the foreign currency earned from exporting hydrocarbonsreceived in payment of the remuneration. The Contractor (andSubcontractor, as the case may be) also is guaranteed free access toforeign currency for remitting capital and profits earned under thecontract, at the highest exchange rate in effect in the market.
19. Contract Termination. The contract is envisaged to terminate
(a) by Contractor decision at the end of any contractual periodduring the exploration phase;
(b) at the end of the initial exploration phase if the Contractorhas failed to make a sizeable discovery;
(c) upon unwarrantable non-compliance by the Contractor of any ofits obligations under the contract;
(d) thirty-five years from the effective date of the contract.
2/ The maximum quantity of -petroleum that the State may reacquire inany given year for each Contractor's remuneration (including ENAP)is to be calculated as follows:
W = R sx (D -TER) if D ) TERTCR
WR * 0 if D ( TER
where
R a Contractor's Remuneration
WR - Fraction of Contractor's remuneration that may be reacquiredby the State.
TCR - Sum of all Contractor's remunerations plus ENAP's production.
D a Domestic hydrocarbon demand.
TER - Sum of all Contractor's productions plus ENAP production,less the sum of all Contractor's Remunerations.
- 111 - Annex 11
Page 6 of 6
20. Should the contract terminate during the exploration phase, theContractor is obliged to return to the State the entire contract area andshall be released from all rights and obligations except the contrac -ualobligations for the period in effect. The Contractor can dispose freelyof any equipment, materials, and facilities used for exploration. Shouldthe contract termiante after the start of the exploitation phase, theContractor shall transfer to the State, free of charge and in goodworking conditions, all wells and ancillary installations associated withfield exploitation.
Association Agreement with ENAP
21. For exploration and production in the Magallan area, it isobligatory for outside investors -- domestic as well as foreign -- toassociate with ENAP. ENAP and the outside investors -- the "Associate"-- will then jointly constitute the Contractor under a PetroleumOperation Contract with the State.
22. Exploration. In any contract area, exploration shall beperformed by the Associate(s) at own risk and expense, and under ownresponsibility. ENAP is to be kept informed of all explorationoperations.
23. Exploitation. Any commercial field discovered shall beexploited at the risk and expense of the Associate(s) and ENAP. To carryout field development and exploitation, ENAP and the Associate(s) shalldesignate an operator who shall determine the maximum production rate foreach field, among others. ENAP and the Associate(s) share 50X each inthe joint operation. Once ENAP has accepted a declaration by theAssociate(s) of commercial exploitability of a field. the join. operationto exploit such field will begin, and ENAP will reimburse theAssociate(s) for 50X of the costs of drilling and completing those wellsthat are put into production. (In the case of an offshore field, allpotentially productive wells will be treated as above, even if notcompleted as producing wells.) ENAP will reimburse the Associate(s) incrude oil from its share in the remuneration or in cash, at its option.Each party may freely and separately sell, or otherwise dispose of, anyoil received as its part of the remuneration.
_ 112 _
Annex 12Page 1 of 5
GEOLOGIC FPADIM1 FMOR HYDROCARBON DPOS ITS IN CHILE
Background
1. In order to comprehend the current level of oil development inChile, several basic geologic factors must be understood. The entirePacific coastal area is a subduction zone of convergent crustal plates.As a result, the sedimentary basins are characterized by sedimentarysequences comprised mainly of volcanic clastics, or fore arc facies.Such a geologic environment is not condusive to oil accumulations andonly marginally favorable for natural gas formation. It is only on theeast side of the main orogenic belt (Andean Cordillera) that favorablegeologic conditions for forming hydrocarbon accumulations exist. This isthe back arc facies in which almost all the oil fields of South andCentral America are found.
2. The Springhill district of the eantern Magallanes area,adjacent to Argentina and between the first an. second narrows of theMagallan Straights, is the only part of Chile where commercial oilaccumulations have been found. This is a maturely developed oil basinthat conprises ENAP's main exploration and production operations. Themain reason for these oil and gas fields is the presence of the basalCretaceous Springhill sandstone which forms the only oil reservoir in thearea. This reservoir is a transgressive marine sandstone that occurs inclose association with underlying granitic, bedrock, depositional highs,at depths between 2,000 and 3,000 meters. In no other conditions havecommercial oil accumulations been found in the country.
3. Going west and south of the shallow Springhill district, thisformation is found at increasing depths, and when it occurs below3,500 meters natural gas with contained condensate is the rule. Atdepths greater then 4,000 meters, only natural gas can be expected.Shallower sandstones in the Cretaceous and Tertiary sections offermoderate potential, but to date have only produced natural gas, very leanin condensate content. Because of these geological chracteristics,40 years of exploration operations have resulted in commercial oilproduction in only a very limited part of the country, i.e. northeastMagallanes. Except for the foothills and Norte Grande, it is not likelythat oil will be found elsewhere in Chile. With this background inplace, the following discussion of ENAP's exploration strategies foradding new oil reserves is presented.
Magallanes--Springhill District
4. ENAP is presently completing exploration of the shallowSpringhill district, where minimum new onshore fields remain and onlymoderate amounts of offshore oil are to be found. The operating planindicates that over the next four years, 22 and 24 exploratory wells willbe drilled onshore and offshore, respectively. Beyond 1990, no explor-
- 1133-
Annex 12Page 2 of 5
atory work is programmed on- or offshore in the Springhill district.Associated with these exploratory wells are 90 onshore development wells(approximatel) 4 well fields) and 200 offshore development wells (8 wellfields). Beyond 1991, almost all development drilling in the Springhilldistrict is expected to be terminated. The numbers of development wellsare based on the success of exploration wells and expected size of thefields to be found. Beyond 1992, no more exploration wells are plannedbecause by then all expected oil fields will have been discovered.Exploration in this basin will be completed within the first five yearsof the plan.
5. The plan expectations for the Springhill district should bevery realistic because the area is a mature oil basin, and ENAP has agood understanding of its content and what remains. Further explorationin the deep Springhill (below 3,000 meters) is likely to result primarilyin natural gas reserves. Additional natural gas is not desired becauseof market limitations.
Magallanes--Tertiary District
6. The Tertiary district comprises the area west and south of theSpringhill district and east of the folded Foothills district. This areais characterized by a deep basin filled with thick sequences ofCretaceous and Tertiary sediments. If the basal Cretaceous sandstone ispresent, it is deeply buried. Even if it is present, there is noknowledge that it occurs in the optimal situation that exists in theshallow Springhill; e.g., associated with underlying graniticdepositional highs. At depths greater than 3,500 meters, the Springhillreservoir produces mainly dry gas. In the younger sand reservoirs, onlydry gas has been found. Consequently, additional exploration in the deepSpringhill and Tertiary basin will only produce additional natural gasreserves. No oil has been found in this area. Thus, the area does notappear to be an appropriate exploration objective. However, ENAP's planincludes U.S.$6 million for exploration in 1988-89 (for aeromagneticsurveys and other geophysical studies to try to locate basal Cretaceousdepositional highs, similar to the Springhill district), and US$40million for 1992-96, for exploration wells. Because of the depthsinvolved, it is questionable that liquids will be present, even if thecorrect geological conditions can be found. Consequently, it is doubtfulthat the latter expenditures will be made.
Magallanes--Pre-Cordillera (Foothills) District
7. A long narrow area of folded structures occurs between theTertiary district and the east side of the Andean cordillera. Only a fewdrilling shows and one oil seep have been found in the area. However,because of the large structures present, the area has been of explorationinterest for the past decade. The foothills are divided into threesegments.
- 114 -
Annex 12Page 3 of 5
Ultima Esperanza (Northern Segment)
8. This area contains the least structural complexity of the threeareas, which makes it an easier area to explore. To date, fiveexploration wells have been drilled without success and withoutsignificant hydrocarbon shows. The main problem is the lack of favorablereservoir rocks. (Where the Springhill sandstone was encountered, it wasfound to be indurated, impermeable and not a favorable reservoir rock).The operations plan indicates that EHAP will undertake an extensiveexploration and development program in this area over the next decade.Forty-nine exploration and 100 development wells are programnedbetween 1989 and the year 2000. The majority of this drilling is plannedto occur during the second five years of the plan. The larger part ofpotential future oil production from 1992 on is expected to come fromthis area and Norte Grande. Three new seismic surveys have been com-pleted in 1986, and this exploration program is well underway.
9. This would appear to be a very optimistic expectation since noresults have been found to date. There are numerous geological reasonsto argue that the favorable Springhill conditions that exist further eastare not present in the Ultima Esperanza area. It is therefore question-able that all of these exploration funds can be usefully spent.
Central Area (Brunswick Peninsula)
10. This segment contains more complex structures than UltimaEsperanza and is a more difficult operating area due to fjords and ruggedtopography. Five exploration wells have been drilled without producinghydrocarbon shows. Again, the absence of adequate reservoir rocks wasthe biggest problem. Large anticlinal structures are present and thepotential for oil discoveries should be similar to Ultima Esperanza.However, no exploration program for the area is contained in the plan,probably because of the operating problems that would be encountered andthe lack of favorable results in the past five attempts.
Tierra Del Fuego (Southeastern Segment)
11. This is the southernmost section of the Foothills districtextending to the southeast into the Argentinian Magallanes. Threeexploration wells have been drilled without success, although an oil seepwas reported in one. The Vicuna well was drilled on an enormousstructure that could be 75 kilometers in length and contain 1,000 feet ofvertical closure.. Since the area is structurally complex, itsexploration will be difficult: not only has it been effected bycompressional folding from the Andean cordillera, but also from lateralwrench faulting that has displaced the southern tip of South America tothe east. Such intense folding and faulting tends to break up oil trapsand allow their contents to escape. However, the fracture volume thatmay result in such a regime can produce oil reservoirs. The biggestquestion here is whether the tectonics have been so great as to precludeoil accumulations.
- 113-
Annex 12Page 4 of 5
12. ENAP reports that AMOCO is interested in exploring this area.Furthermore, Occidental Oil Corporation has taken a similar explorationblock directly adjacent in Argentina. Obviously there is some interestby international oil companies in this part of the Foothills district.HEAP has not included funds for exploring this area in their operatingplan.
13. Of the three Foothills segments described, Ultima Esperanza isthe least complex and the mnst accessible. Whether it is the best areain which to find oil is uncertain, but it is the easiest of the three toexplore. Geophysical work is in progress and numerous exploration wellsare planned.
14. The Foothills district is attractive because it contains largestructures that theoretically could hold significant oil accumulations.The depositional environment shosld be favorable, back arc facies, andthe Springhill could be found at shallow enough depths to be oil ratherthan gas productive. However, ENAP is aware that this is a high riskarea where 13 dry holes have been drilled with minimal hydrocarbon showsand no reservoir rocks found.
Pacific Coast
15. This area, which is 2,500 miles in length, consists of numerousoffshore, onshore and intro-montaine sedimentary basins that have under-gone limited but unsuccessful oil exploration over the past 40 years.Aprpoximately 65 onshore and 18 offshore exploration wells have beendrilled, but no commercial oil fields have been discovered. This arealies on the west side of the Andean Cordillera, is dominated by a forearc depositional facies and for numerous geologic reasons is notfavorable for hydrocarbon formation. However, within this vast area, twobasins are considered to have relatively more poitential.
Norte Grande
16. This is the large onshore, intra-montaine area which occupiesthe northern coast, adjacent to Peru and Bolivia. The southern half,known as Las Salares, contains two basins, Salar de Atacama and Salar dePunta Negra. These basins are probably the most attractive oilexploration areas of the entire Pacific coastal area. This is becausethey contain many prerequisits for oil accumulation that are not known tobe present elsewhere on the coast. These factors include active oilseeps, marine source rocks, fractured limestone reservoirs and afavorable depositional history. The Jurassic age sediments of interestpre-date the fore arc facies development.
17. Broken Hills Py. is reported to be interested in an explorationcontract in Salar de Punta Negra in order to supply fuel for its nearbymining operations. To date, six exploration wells have been drilled inthe northern half and three exploration wells in the Salares area withoutsuccess.
- 116 -
Annex 12Page 5 of S
18E. SP h,ss designed an extensive exploration and developmentprogram in the Norte Crande. Between 1989 and 2000, 37 exploration wellsare planned, accompanied by at least a3 development wells within thatperiod. NAP assues extremely low exploration and development costs forthis area, projecting U.S.$1.76 per barrel well-head cost. This must beconsidered to be an extremely optimistic forecast in terms of oilproduction and associated cost. This area, along with Ultina Esperansa,plays a dominant role in MNAP's strategy. Seventy-five percent of crudeoil production during the second five-year period of the plan isprojected to come from these two areas, where no known oil accumulationsexist today.
Arauco-Valdivia Basins (offshore)
19. This is primarily a natural gas area that could containaccumulations of commercial size. Because of their offshore location,with high development costs, and remoteness from the main gas market,this area is not likely to be developed for at least another decade.
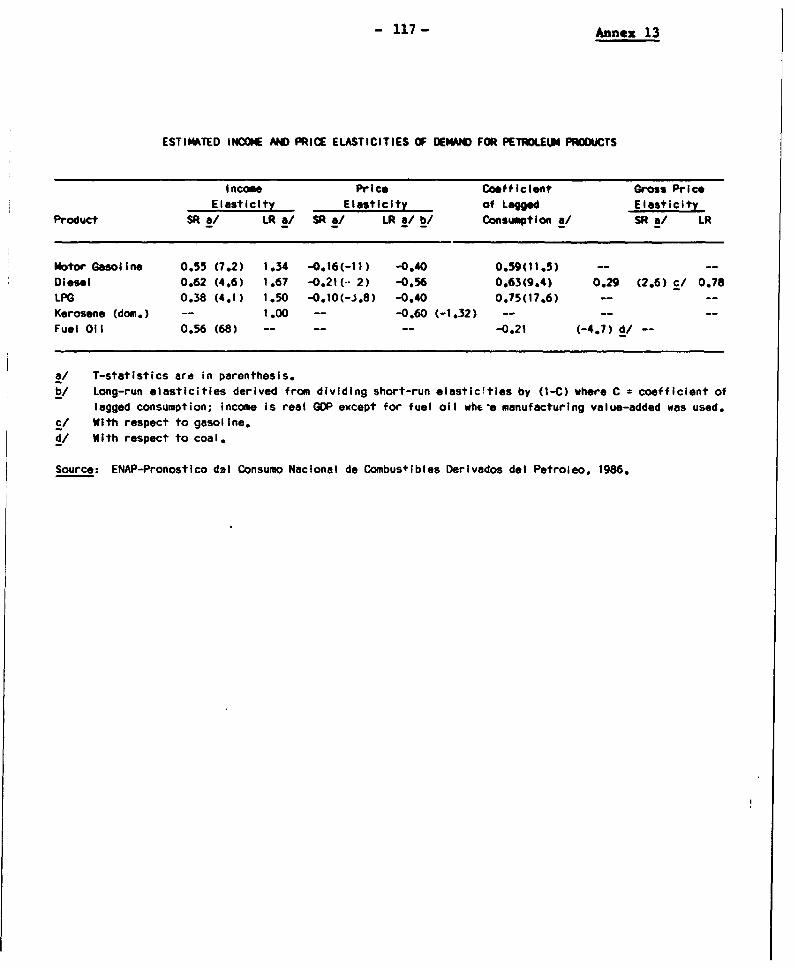
- 117 - Annex 13
ESTIMATED INCOME AND PRICE ELASTICITIES OF DEMWD FOR PETROLE-J PROOCUTS
Income Pr-ice Coefficient Gross PriceElasticity Elasticity of Lagged Elasticity
Product SR a/ LR a/ SR a/ LR a/ b/ Consumption a/ SR a/ LR
Motor Gasoline 0.55 (7.2) 1.34 -0.16(-11) -0.40 0.59(11.5) -- --
Diesel 0.62 (4.6) 1.67 -0.21(- 2) -0.56 0.63(9.4) 0.29 (2.6) c/ 0.78LPG 0.38 (4,1) 1.50 -0.10(-5.8) -0.40 0.75(17.6) -- --
Kerosene (dom.) -- 1.00 __ -0,60 (-1.32)Fuel Oil 0.56 (68) -- -- -- -0.21 (-4,7) d/ -_
a/ T-statistics are in parenthesis.b/ Long-run lIasticities derived from dividing short-run elasticities by (1-C) where C = coefficient of
lagged consumption; income is real GDP except for fuel oil whe-e manufacturing value-added was used.c/ With respect to gasoline.d/ ifWith respect to coal.
Source: ENAP-Pronostico dal Consumo Nacional de Combus+iblesi Derivados del Petroleo, 1986.
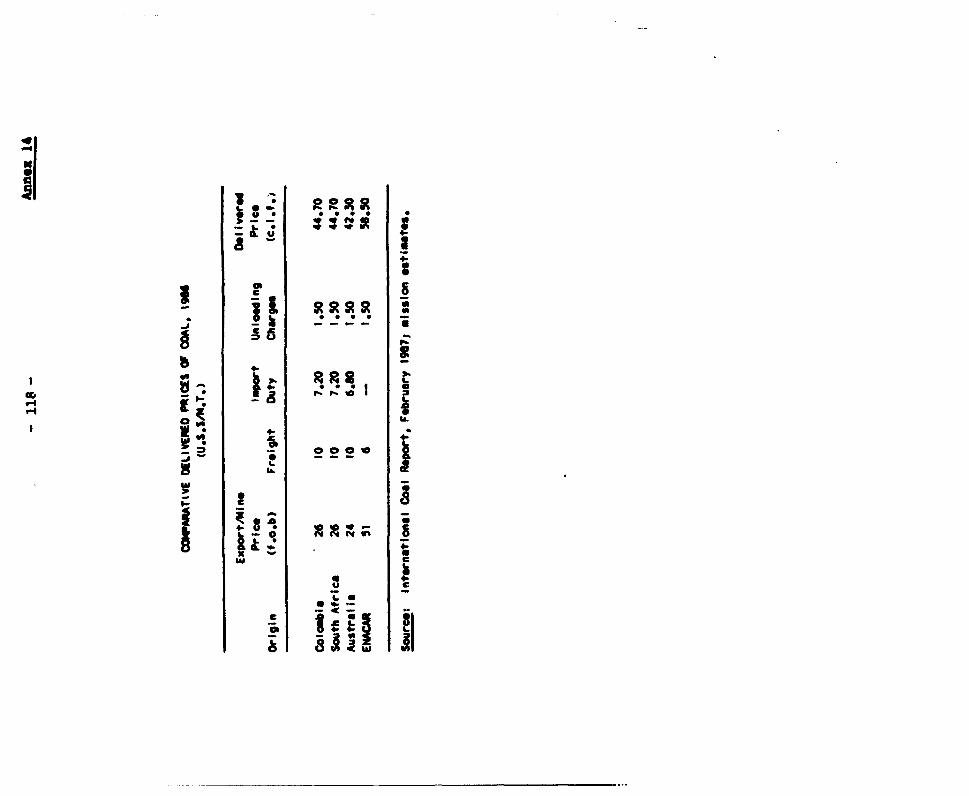
St St St StINg et... ooog !,~~
l : ooo s
, ,. j ij , , i}~~
| b&5 . t.
0~o8*}j
- 119 - Annex 15Paoge 1 of 3
5UCm3ITV DRUM P1 AUCS A MICIU KOa T PUC SICTOSIN in Corn"L DSTo1_- in 1313
Tablo 1: SeCTORAL FORCASTS
1965 1990 1995High Low High Low
Swll Industry & Irrigation 2,200 2,974 2,746 3,641 3,236Larg Industry A Transport 2,967 4,157 4,157 6,272 6,272
Sub-total Industry 5,187 7,131 6,925 9,913 9,506
RasIdeetial; 1,873 1,926 1,929 2,446 2,364Coaweial;
Public Lighting 1.565 1.617 1,620 2.145 2.0O0
Toatl Sa les 8625 10M674 12474 14.504 13.932
Own Use and Losses 1 .912 2,018 1,995 2,640 2.654
Total Geeeratlon 120m 126 12469 17,1441 16 5W
Soure: CNE: Proyaccion del consumo de el*ctrlcidad.
Table 2: GLOBAL FORECASTS a/(GUh)
1990 19951965 High Low High Low
Totel Sole SIC 1 8,625 10,165 9.926 14,845 13,267Total Salos SIC 2 8,625 9,854 8S815 14,116 12,536
Growt Rate" CS) 1966-90 1991-95Total Solos SIC 1 3.3 2.9 7.9 6.0Total Sales SIC 2 2.7 2.2 7.5 7.3
a/ The 'high- and low-growth scenarlos correspond to the two economIcforocasts; hypothosis I for the SIC corresponds to a IS growth ofself-gnration, hypothosis 2 corresponds to the growth of solf-geeation as given by the customer survey.
Source: CNE: Proyaccion del consumo do *Ieltricidad.
TYPICAL ELECTRICITY TARIFFS CHARGED BY DISTRIBUTION COhWANIES, 1986; 198 a/
EOELNOR (Regions I & 11) CHI LECTRA METIP0LITANA (SantIago)
(December 1986) (may 196)-__-_-_-_------------------------------------------------------------_-_---_-_----_-_-_-_-------------
Tariff Description Fixed Charge Deoand Charge Energy Charge Fixed Charge Domand Charge Energy Charge AdditionalEnergy Charge,
Wintor Months
(ChS/month) (ChS/kW/month) (ChS/kWh) (ChS/month) (ChSAWh) (ChS/kWh) (ChS/kh)
tri Metered Customrsup to 90 kWh/month 143.26 -- 17.17
over 90 kWh/month 210.67 -- 19.93 (212.40 -- 19.47 36.99
iT2 Monthly Contracted Demand
WIthout peak hour lImits 210.67 2,048.90 11.40 212.40 2,431.21 11.21 n.o.
Partly peak hour use 210.67 1,365.90 11.40 212.40 1,562.92 11.21
BT3 Monthly Maximum Deand Reading °
Without peak hour limits 335.30 2,048.90 11.40 390.69 2,431.21 11.21 n.a.
Partly peak hour use 335.30 1,365.90 11.40 390.69 1,562.92 11.21
AT2 High Voltoge Tariff with
Mtnthly Contracted Demand
Without Peak hour limits 210.67 1,314.90 10.00 212,40 1,477.26 9.64 n.o.
Pa,tly peak hour use 210.67 845.30 10.00 212.40 955.88 9.64
AT3 Montly Maximf m Demand Reading
Without peak hour limits 335.30 1,314.90 10.00 390.69 1,477.28 9.64 n.o.
Parly peak hour use 335.30 845.30 10.00 390.69 955.8 9.64
AT4 Off-Peak Tariff 491.09 -- 10,00 585.25 -- 9.64 n.a. * i'Plus off-peak demand -- 184.90 -- -- 185.79 -- M
Plus peak demand -- 1,130.00 -- -- 1,291.48 --
w
a/ Exchange rates: ChS195/USS (December 1986); ChS 243/USS (May 1988)
Source: CNE
_121 - Annex 15Page 3 of 3
Pm4j*NE 4YUotiECTRIC PR ECT AALTO JAHUEL-POLPAICO TRANSMISSION PROJECr
TYPICAL TMlFFS CHAROED BY EHOSA FOR H144 VOLTAGE CUST@KERS(As of December 1966; exchange rat: USSI-ChSI f /
Customer Type T 1f-
and Location Voltnge s tnd Charge Erergy Charg
(kV) (ChS/Wk max/mont") (ChS/kWh)
PubiIc Serv ic DistrIbutIon CompaniesTrl tal 110 965.50 4.78
Diego do Almgro 220 76S.70 5.40
San Isidro, Alto Jahuel 220 620.30 4,01
Rancogu 154 571.10 3.91Temuco 154 512.70 3.26
Voldivia 66 597.30 3.14
Osorno 66 592.70 3.15Puerto Elviar 23 1,537.30 6.97
Industries over 2,000 "U
Diego do Almagro 220 616.40 5.51
San Isidro, Alto Jahuel 220 620.30 4.09
Rancagua 154 571.10 3.99
Voldivia 66 557.30 3.21
Osorno 66 592.70 3.21
a/ Tariffs do not Include the value added tax of 20S.
Note: Delivery points are ENDESAo substations. For other dolivery points using
ENOESA's lines, other charges are added to cover use of the line and
transmission lossIs.
Note: Extra charges are added for reactive energy for power factors lower than
S5%; during peek hours, these charges are higher.
122 A hnnex 16Page 1 of 3
IM - NMIuAL COT PM S_ CT COAL HIM
The calculation of LURC is based on the average incrementalcost (AIC). The AIC method estimates LURC by discounting all incrementalcosts (capital and operating) that will be incurred in the future toprovide the additional amounts of coal produced over a specified period,and dividing that by the discounted incr e ntal output over that period:
Aye! - NPV of total costsNPV of production stream
LOTA EXPANSION PLANLRMC Calculation
INVW S51,289,336, i * 12S
Year Capital Cost Operating Cost Production Strom
WUSS) (USS) (M..T)
1 2,072,671 23,215,268 543,6002 17.066.583 24.606,753 600,0003 3,153,076 26,036,739 720,0004 2,776,217 26,757,232 720,0005 2,624,461 26,652,733 720.0006 2,616,859 26,537,234 720,0G07 2,292,689 26,427,235 720,000a 2,495,299 26,317,236 720,0009 2,346,705 26,201,737 720,000
10 2,381,331 26,097,239 720,00011 2,292,689 25,961.740 720,00012 2,292,689 25,671,741 720,00013 2,292,689 25,761,742 720,00014 2,292,689 25,646,243 720,00015 2,292,69 25,541,744 720,00016 0 25,541,744 720,00017 0 25,541,744 720,000la 0 25,541,744 720,00019 0 25,541.744 720,00020 0 25,541,744 720,00021 0 25,541,744 720,00022 0 25,541,744 720,00023 0 25,541,744 720,00024 0 25,541,744 720,00025 0 25,541,744 720,000.
NPV * USS26,598,445 USS201,17-,020 5,393,897AIC * USS42.60AM.T.
Source: Cost and production figures provided by ENACAR, March 1967.
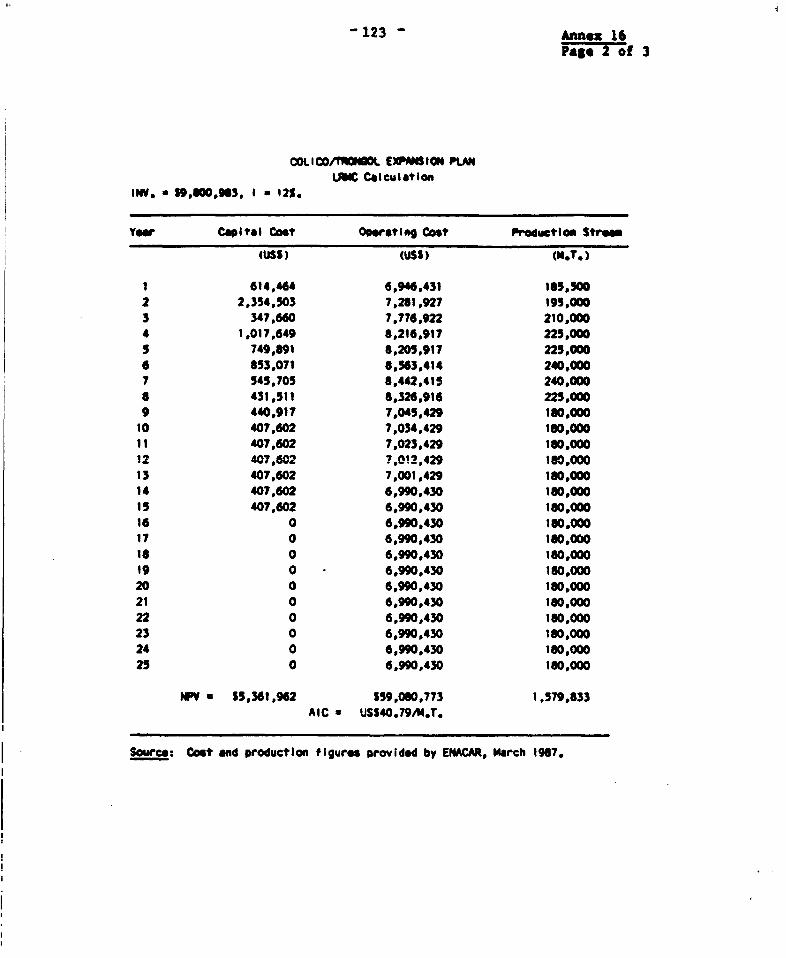
4
123 - Annex 16Page 2 of 3
Cotl I CO/TMOGO EXPES ION KmLALNC Clcml atIan
aIW $9,600,963, 1 a 12%.
Yew Cap I to I Coot OPet Ing Cost Production Stream
(USS) CUSS) (N.T.)
1 614,464 6,946,431 165,5002 2,354,503 7,281,927 195,0003 347,660 7,776,922 210,0004 1,017,649 8,216,917 225,0005 749,891 8,205,917 225,0006 853,071 8,563,414 240,0007 545,705 8,442,415 240,000a 431,511 8,326,916 225,0009 440,917 7,045,429 160,000
10 407,602 7,034,429 160,00011 407,602 7,023,429 160,00012 407,602 7,012,429 !60,o0013 407,602 7,001,429 160,00014 407,602 6,990,430 180,00015 407,602 6,990,430 180,00016 0 6,990,430 180,00017 0 6,990,430 160,00O18 0 6,990,430 180,00019 0 6,990,430 160,00020 0 6,990,430 180,00021 0 6,990,430 180,00022 0 6,990,430 180,00023 0 6,990,430 180,00024 0 6,990,430 180,00025 0 6,990,430 180,000
*W 55,361,962 S59.080,773 1,579,833AIC U USS40.79A4.T.
Source: Cost and production figuros provided by ENACAR, March 1967.
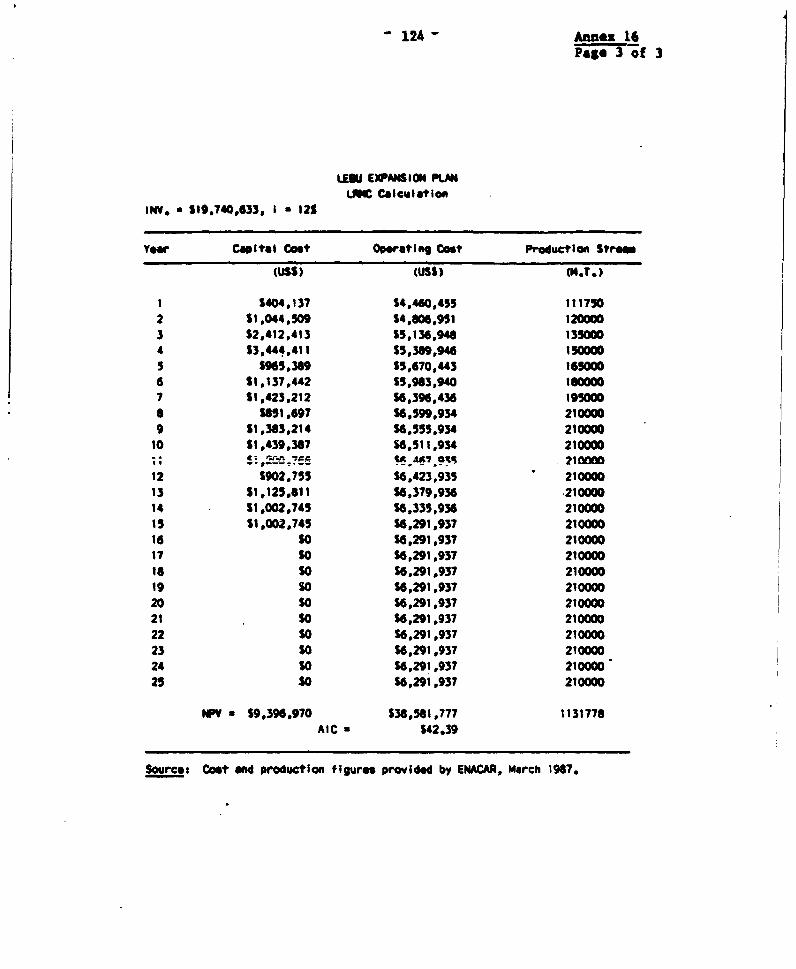
- 124 Annex 16Page 3 of 3
LEU EXPASIONPLIC Calculation
INV. S19,740,633, I * 12S
Yer Cap I tel Cost Operati n Cost Productio n Strom
(USS) CUSS) (1.T.)
1 1404,137 S4,460,455 1117502 S1,044,509 14,606,951 1200003 52,412,413 S5,136,94S 135904 13,444.411 15,389,946 1500005 1965,369 S5,670,443 G65006 11,137,442 S5,963,940 6S00007 S1,423,212 S6,396,436 19500a S651,697 S6,599,934 2100009 S1,363,214 S6,555,934 210000
10 S1,439,367 16,511,934 210000I,- . , -E 47. It
12 $902,755 S6,423,935 21000013 S11,125,6111 16,379,936 .21000014 S1,002,745 S6,335,936 210000I5 11,002,745 16,291,937 21000016 SO S6.291,937 21000017 SO 56,291,937 210000i so 16,291,937 21000019 s0 S6,291,937 21000020 SO S6,291,937 21000021 So S6,291,937 2100022 So S6,291,937 21000023 S0 16,291,937 21000024 S0 S6,291,937 21000025 So 16,291,937 210000
NPY S9,396,970 S36,561,777 1131778AIC * S42.39
Source: Cost and production figures provided by ENACAR, March 1967.
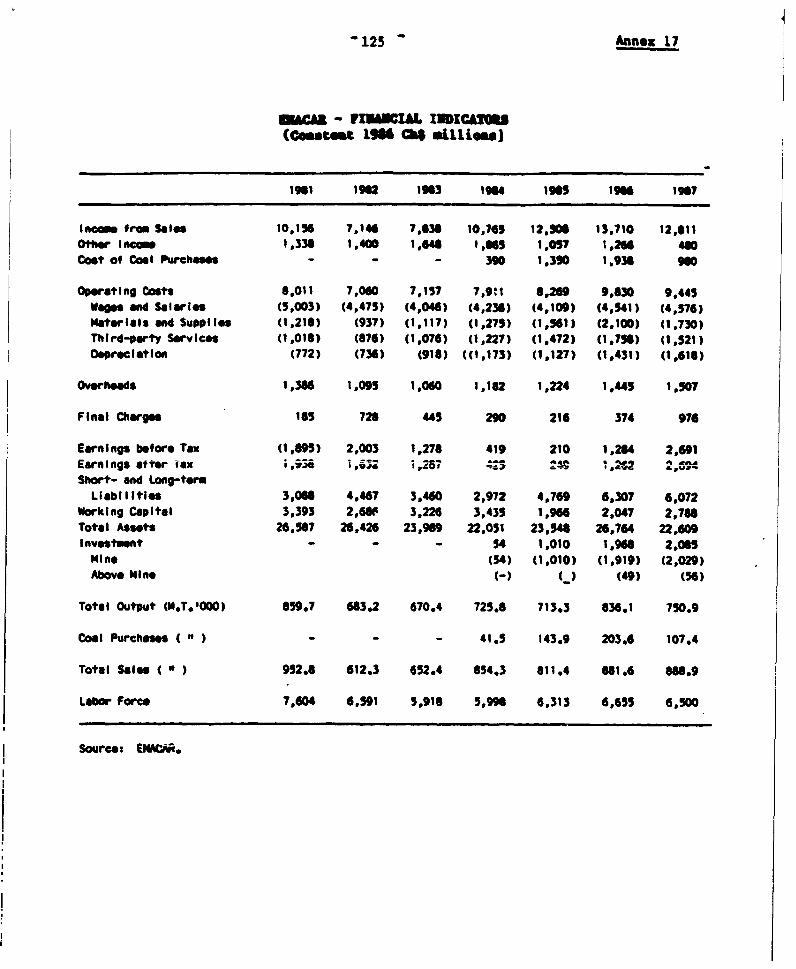
- 123 Annex 17
in&caa - V1 L ZICUM(coutest 19 CM milli
1961 1962 1963 1964 1965 1966 1967
Inoom f rom S los 10,156 7,146 7,636 10,745 12,906 13,710 12,611Other Ieos 1,336 1,400 1,64 1,65 1,057 1,26 460Cost of coal Purchab - - - 390 1,390 1,93 9g0
Operating Costs 6,011 7,060 7,157 7,9:1 6,269 9,60 9,445Wags and S l rIes (5,003) (4,475) (4,046) (4,236) (4,109) (4,541) (4,576)Moterials and SupplIes (1,216) (937) (1,117) (1,275) (1,561) (2,100) (1.730)Third-prty Services (1,016) (876) (1,076) (1,227) (1,472) (1,756) (1,521)OsrecIatian (772) (736) (916) ((1,173) (1,127) (1,431) (1,616)
Overheads 1,366 1.095 1,060 1,162 1,224 1,4S 1,0?
Final Chargps 1SS 728 4S 290 216 374 976
Earnings before Tax (1,95) 2,003 1,276 419 210 1,264 2,691Earnings att. rax iT,a 1x,v 1 42 - i !,8*4Short- and Long-term
Liabilities 3,066 4,467 3,460 2,972 4,769 6,307 6,072Working Capital 3,393 2,6S0 3,226 3,435 1,966 2,047 2,766Total Assets 26,567 26,426 23,969 22,051 23,541 26,764 22,609Investmnt - - - 54 1,010 1,966 2,065
MIne (54) (1,010) (1,919) (2,029)Above Min () () (49) (56)
Total Output (M.T.'000) 859.7 663.2 670.4 725,6 713.3 836.1 750.9
Coal Purches" - - - 41.5 143.9 203.6 107.4
Total Salo ( " ) 952.6 612.3 652.4 854.3 611.4 661.6 666.9
Labor Force 7,604 6,591 5,916 5,99 6,313 6,655 6,500
Source: EWC.
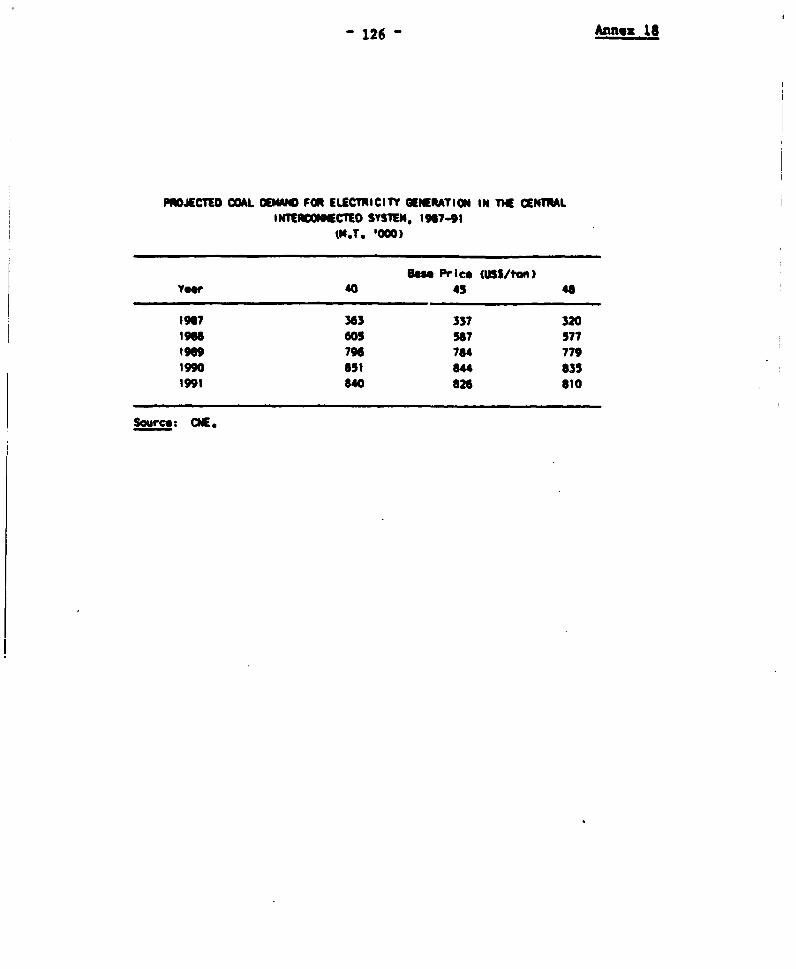
126 Annex 1S
PRECTED COAL OEWM FOR ELECTRICITY GEEtATION IN THE CENTRALINTIERIECTED SYSTM, 198741
1s1 PrlIe cUSS/ton)Yw 40 43 48
19P7 343 337 3201966 805 567 57719S9 79 164 7791990 631 64 6351991 640 626 810
Source: CNE.
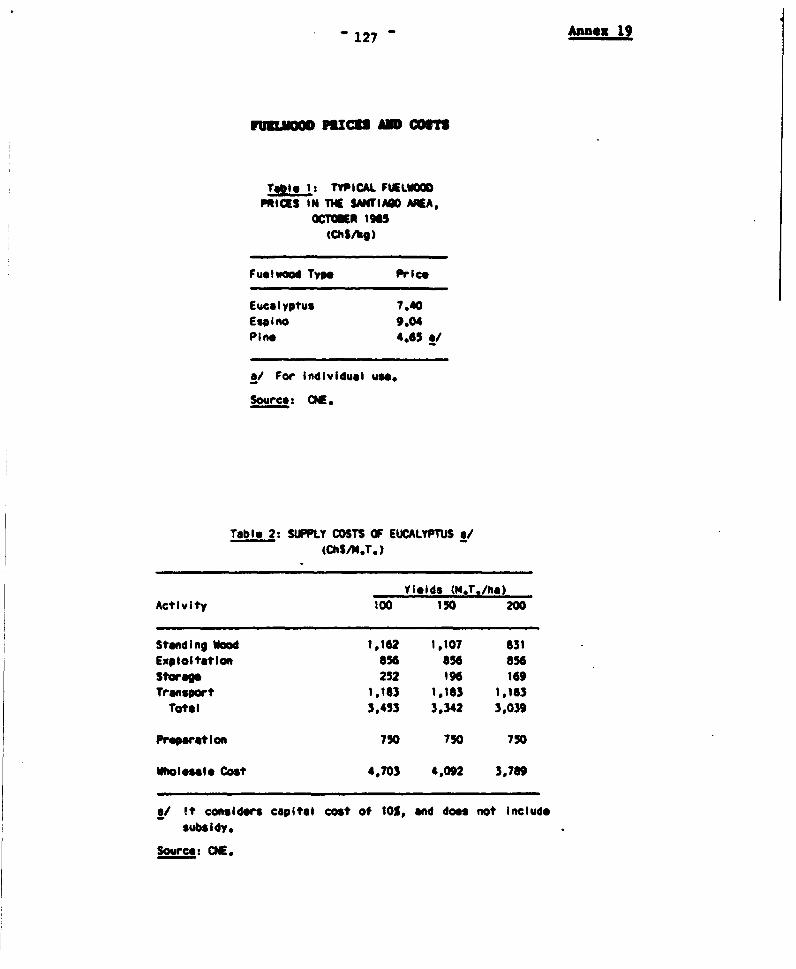
127 Annex 19
nuIOsD PICI D coST
Table 1: TYICAL FUELUOCPRICES IN THE SAOTIAGO AREA,
OCThMR 195(Chi/kg)
Fueluood Type Price
Eucalyptus 7.40Espino 9.04Pine 4.65 /
a/ For Individual use.
Source: CE.
Table 2: SUPPLY COSTS OF EUCALYPTUS .(ChsM.T.)
Yields (M.T./ho)Activity 100 150 200
Standing Wood 1.162 1.107 831
Exploitation 856 856 856Strae9 252 196 169Transport 1,183 1,163 1,183
Total 3,453 3,342 3,039
Prep r tion 750 750 750
Wholoesle Cost 4.703 4,092 3,789
a/ It considers capital cost of 10, and does not Include
subsidy.
Source: CNE.
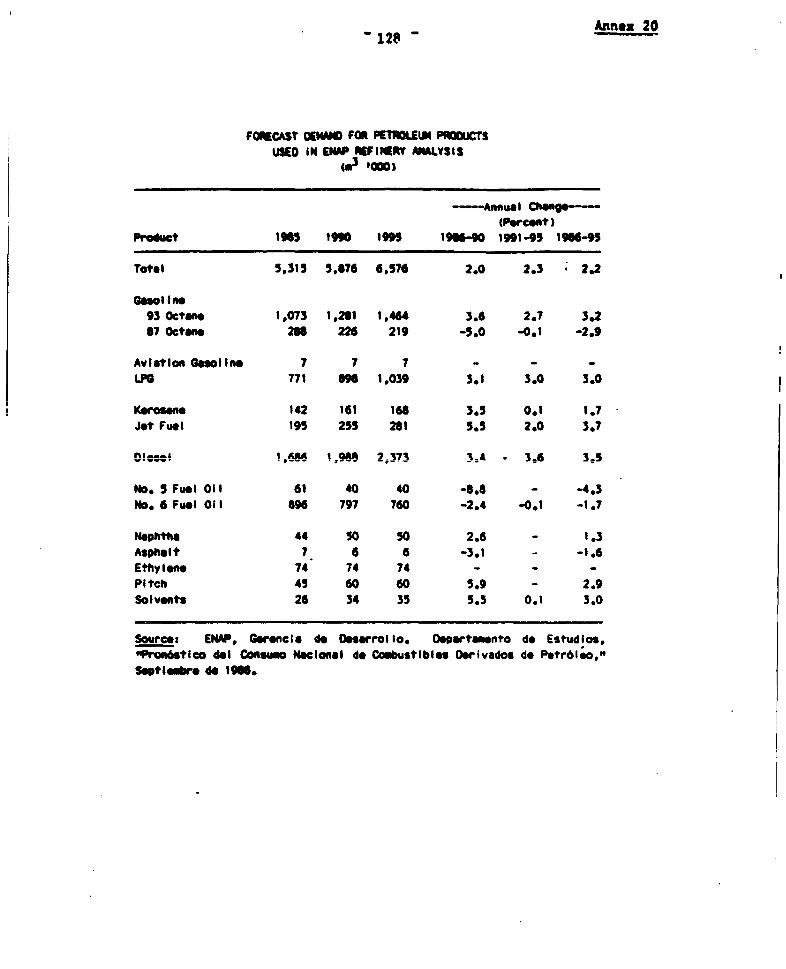
Annex 20128-
FORtCAST cEWC FOR PETRLEUU PROOUCTSUSED IN 11AP RWIVS?RY ANALYSIS
(M3 t00)
-Annual Change-(Percent)
Prodct 1965 1990 1995 191_-90 191-95 1911695
TOtcl 5,315 5,076 6,576 2.0 2.3 2.2
Gasolin93 Octan 1,073 1,281 1,464 3.6 2.7 3.2$7 Octane 266 226 219 -5.0 -0.1 -2.9
Aviation Gasoline 7 7 I - - -
LPG 771 696 1,039 3.1 3.0 3.0
Kerosen 142 161 166 3.5 0.1 1.7
Jot Fuel 195 255 261 5.5 2.0 3.7
Oi@ i 1 ,6M 19a" 2373 3& 3e6 3.5
No. 5 Fuel Oil 61 40 40 -8.0 - -4.3No. 6 Fuel Oil 496 797 760 -2.4 -0.1 -1.7
Nophth 44 50 50 2.6 - 1.3Asphalt 7 6 6 -3.1 - -1.6Ethylene 74 74 74 - - -
Pitch 45 60 60 5.9 - 2.9Solvents 26 34 35 5.5 0.1 3.0
Source: ENAP, Gerencla do OnsaIrol lo. Dpartmento d, Estudios,oPron6stico del Consumo Nalocnal de Combustibles ODrivados de Petr6l;o,"Sept lmbr& de 19".
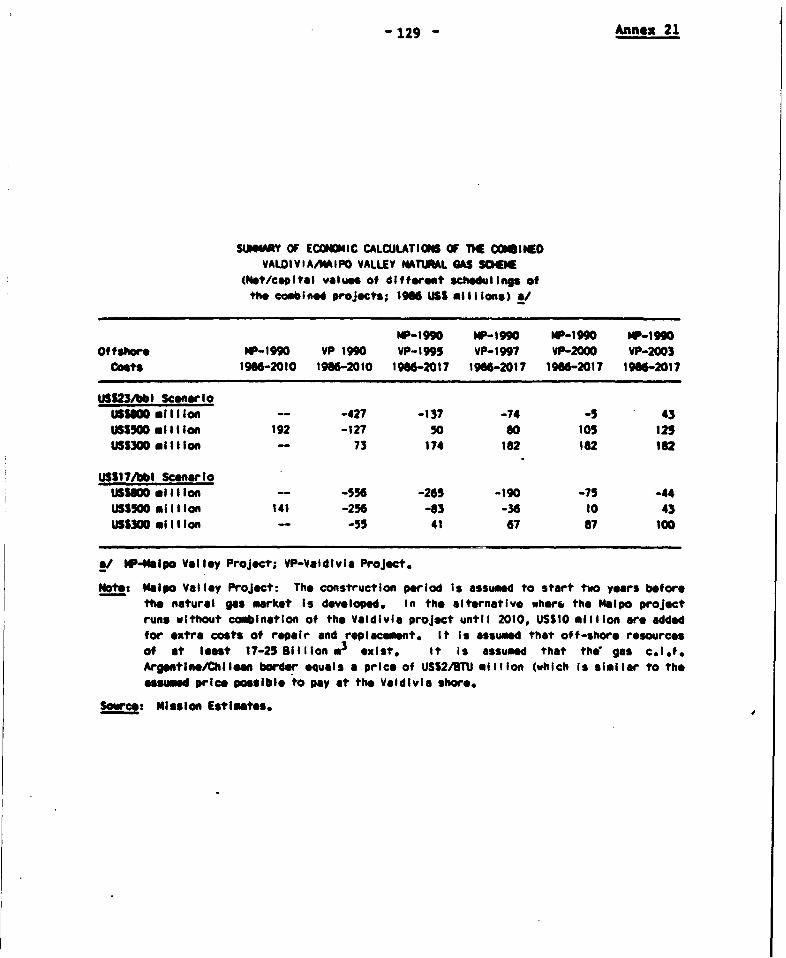
- 129 Annex 21
SU"WA OF ECONOMIC CALCULATIONS OF THE COINiEDVALDIVIAAMIPO VALLEY NATURAL GAS SCEI
(Net/capital value of different schedultlop ofthe coobin d projects; 1966 USS ofilions) *J
MP-1990 iSP-1990 i"P-1990 WP-1990
Offshor, P-1990 VP 1990 VP-1995 VP-lW7 VP-2000 VP-2003Costs 1966-2010 196I-2010 1966-2017 1966-2017 1966-2017 1966-2017
US323/bbI ScenarioUSS000 mlIlion - -427 -137 -74 -5 43
USS500 oIliIon 192 -127 50 S0 105 125USS300 mliloe - 73 174 182 162 162
USS17/bbl Scenario
USS000 million -- -556 -265 -190 -75 -44USSSOO mil*lon 141 -256 -63 -36 to 43USS300 million -- -55 41 6? 67 100
1/ s-Helpo Valley Project; VP-Valdivia Project.
Not: a Ipo Valley Project: The construction pWriod is assumed to start two years beforethe natural gas market Is developed. In tho alternative whers the Melpo projectruns vithout comb InotIon of the VaIdivia project untIl 2010, US$I0 mIIIIon are addedfor extra costs of repair and replacement. It is assumed that off-shore resourcesof at laost 17-25 OIlIion m3 *xist. It is assumed that the gas c.l.f.ArgentinoeChi laon border equals a prico of USS2/BTU mIIIIon (which Is sImilar to the
assumed price possible to pay at the Valdivia shore.
Source: Mission Estimates.
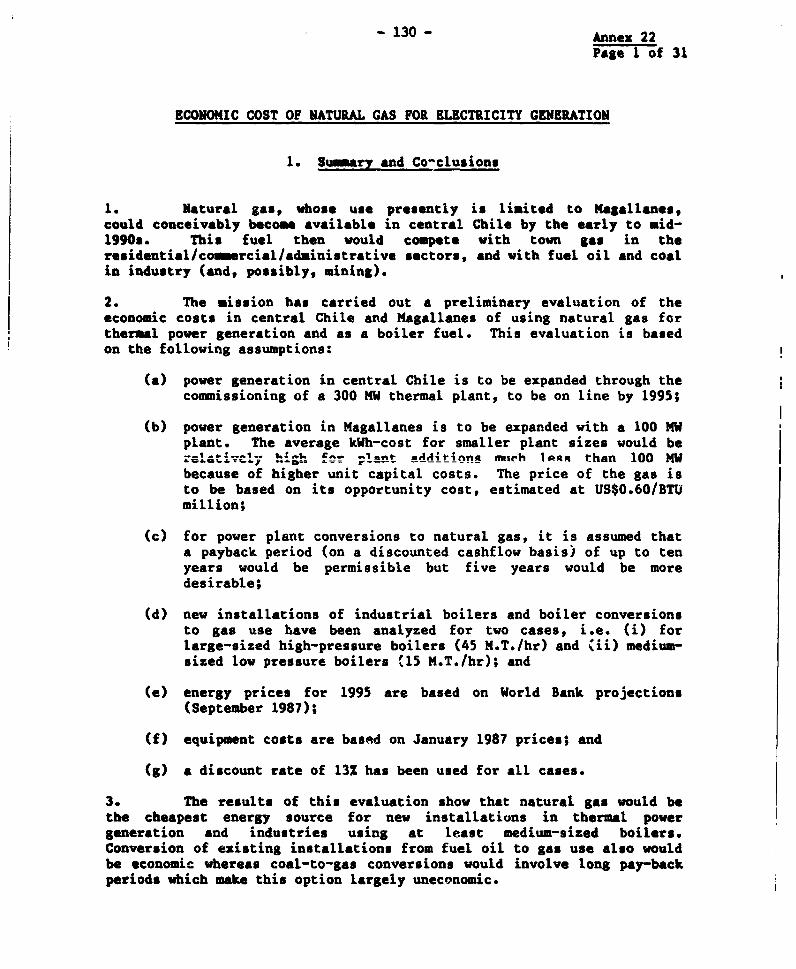
-130 - Annex 22
Page 1 of 31
ECONOMIC COST OF NATURAL GAS FOR ELECTRICITY GENERATION
1. Sumary and Co-clusions
1. Natural gas, whose use presently is limited to Magallanes,could conceivably become available in central Chile by the early to mid-1990s. This fuel then would compete with town gas in theresidential/comercial/adainistrative sectors, and with fuel oil and coalin industry (and, possibly, mining).
2. The mission has carried out a preliminary evaluation of theeconomic costs in central Chile and Magallanes of using natural gas forthermal power generation and as a boiler fuel. This evaluation is basedon the following assumptions:
(a) power generation in central Chile is to be expanded through thecommissioning of a 300 MW thermal plant, to be on line by 1995;
(b) power generation in Magallanes is to be expanded with a 100 MWplant. The average kWh-cost for smaller plant sizes would be.. i.,a:.;.1* Ct.^- -lent nAA4t-inna mnch lAiin than 100 MWbecause of higher unit capital costs. The price of the gas isto be based on its opportunity cost, estimated at US$0.60/BTUmillion;
(c) for power plant conversions to natural gas, it is assumed thata payback period (on a discounted cashflow basis) of up to tenyears would be permissible but five years would be moredesirable;
(d) new installations of industrial boilers and boiler conversionsto gas use have been analyzed for two cases, i.e. (i) forlarge-sized high-pressure boilers (45 M.T./hr) and (ii) medium-sized low pressure boilers '15 M.T./hr); and
(e) energy prices for 1995 are based on World Bank projections(September 1987);
(f) equipment costs are based on January 1987 prices; and
(g) a discount rate of 13% has been used for all cases.
3. The results of this evaluation show that natural gas would bethe cheapest energy source for new installations in thermal powergeneration and industries using at least medium-sized boilers.Conversion of existing installations from fuel oil to gas use also wouldbe economic whereas coal-to-gas conversions would involve long pay-backperiods which make this option largely uneconomic.
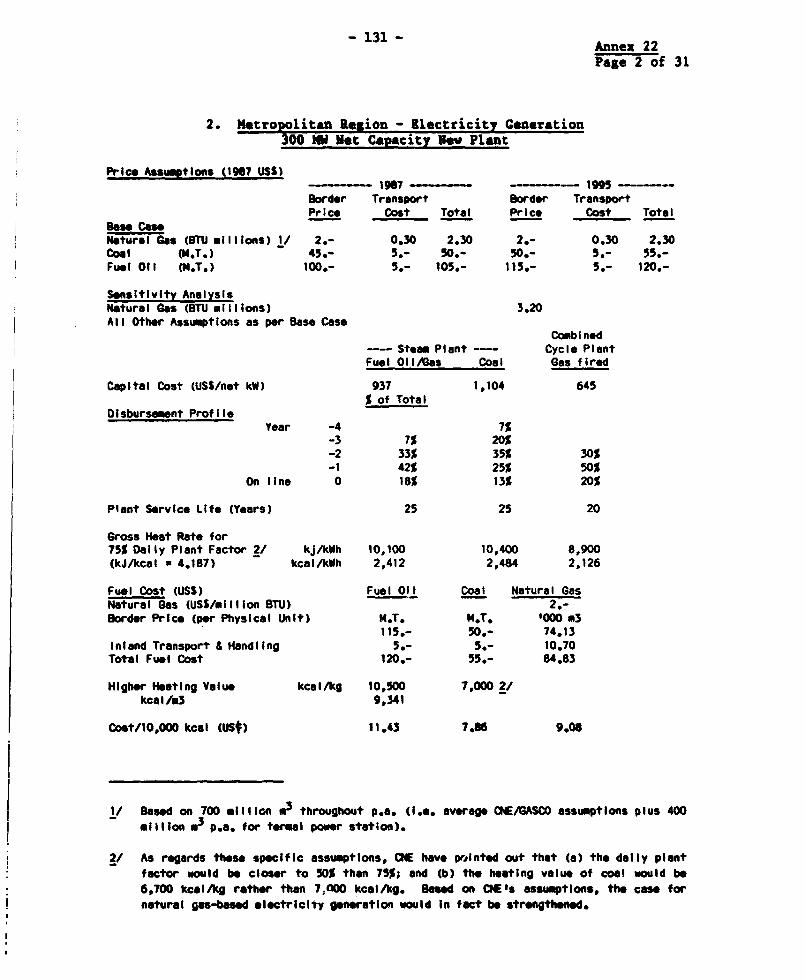
- 131 - Annex 22
Page 2 of 31
2. Metropolitan Region - Electricity Generation300 MM Net Capecity Now Plant
Price Assuwotions (1967 USS)- l~~967 1995
Border Transport Border TransportPrice Cost Total Price Cost Total
Bose Cas.Netural Gas (BTU millions) 1/ 2.- 0.30 2.30 2.- 0.30 2.30coal (H.T.) 45.- 5.- 50.- 50.- 5.- 55.-Fuel 011 (H.T.) 100.- 5.- 105.- 115.- 5.- 120.-
Sensitivity AnalysisNatural Gas (BTU millions) 3.20All Other Assueptlons as per Base Case
CombinedSteoam Plant - Cycle Plant
Fuel Oil/Gas Coal Gas fired
Capital Cost (USS/net kW) 937 1,104 645% of Total
Disbursement ProfileYear -4 7%
-3 7% 20%-2 33% 35% 30%-1 42% 25% 50%
On line 0 18% 13% 20%
Plant Service Life (Years) 25 25 20
Gross Heat Rate for75% Daily Plant Factor 2/ kJ/kWh 10,100 10,400 8,900(kJ/Acal a 4.187) kcal/kWh 2,412 2,484 2,126
Fuel Cost (USS) Fuel Oil Coal Natural GasNatural Gas (USS/million BTU) 2.-Border Price (per Physical Unit) M.T. M.T. '000 m3
115.- 50.- 74.13Inland Transport & Handling 5.- 5.- 10.70Total Fuel Cost 120.- 55.- 84.83
Higher Heating Value kcal/kg 10,500 7,000 2/kcal/A3 9,341
Cost/10,000 koal CuSO) 11.43 7.t6 9.06
1/ Based on 700 mil Ion m3 throughout p.a. (i.e. average CNE/GASCO assumptions plus 400million mi3 p.a. for te rmal power station).
2/ As regards thes specifle assumptions, CNE have posinted out that (a) the daily plantfactor would be closer to 50% than 75%; and (b) the heating value of coal would be6,700 kelAkg rather than 7?000 kcalAkg. Based on OE's assumptions, the cas fornatural gas-based electricity generation would In fact be strengthened.
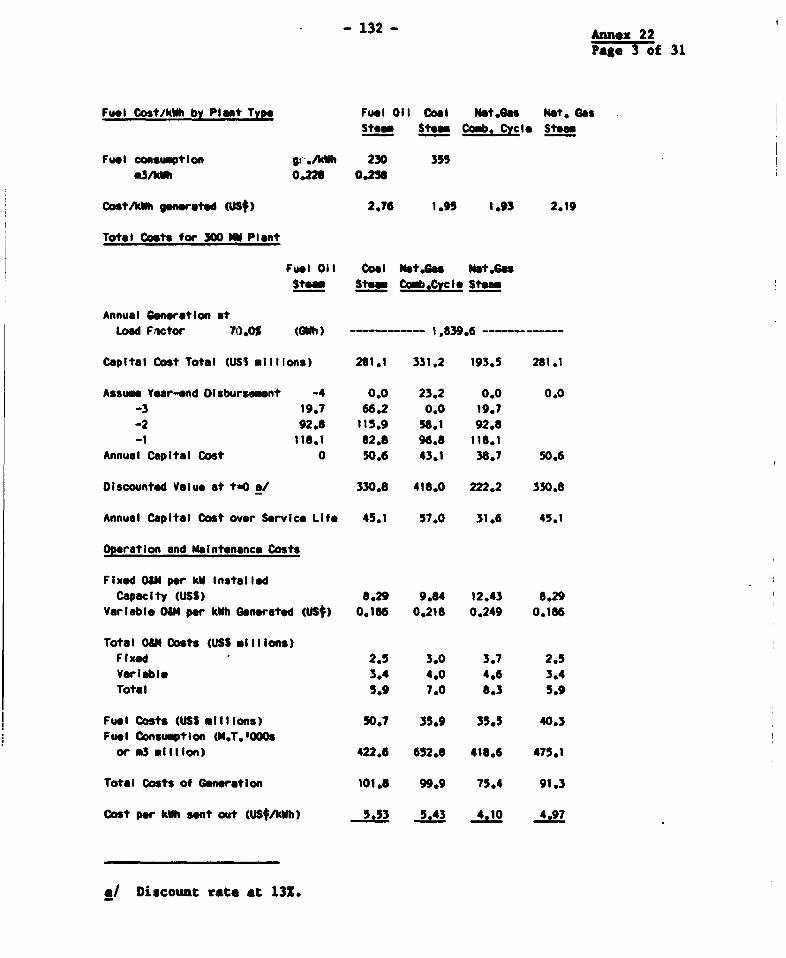
- 132 - Annex 22
Page 3 of 31
Fuel Cost/kWh by Plant Type Fuel Oil Coal Nbt.an Nat, Ga5Stam Stm Comb CyCle Steam
Fuel consumption g-i./kWh 230 3553/dkWh 0.225 0.25
CostAkWh gen rated (US¢) 2.76 1.95 1.93 2.19
Total Costs for 300 NW Plant
Fuel Oil coal tasG Nat.GbsStea Stem Comb,CyclI Steam
Annual Generation atLoad Factor 70.0S (GWh) 1,839.6 --- -
Capital Cost Total (USI IIIIons) 281.1 331.2 193.5 281.1
Assum Year-nd Disburseamnt -4 0.0 23.2 0.0 0.0-3 19.7 66.2 0.0 19.7-2 92.8 115.9 58.1 92.6-1 118.1 82.8 96.8 118.1
Annual Capital Cost 0 50.6 43.1 38.7 50.6
Discounted Value at taO a/ 330.8 418.0 222.2 330.8
Annual Capital Cost over Service Llfe 45.1 57.0 31.6 45.1
Operation and Maintenance Costs
Fixed O03 per kW InstalledCapacity (USS) 8.29 9.84 12.43 8.29
Variable OWM per kWh Generated (US¢) 0.186 0.218 0.249 0.186
Total O8U Costs (USS ilIlIons)Fixed 2.5 3.0 3.7 2.5Variable 3.4 4.0 4.6 3.4Tota I 5.9 7.0 8.3 5.9
Fuel Costs (USS millions) 50.7 35.9 35.5 40.3Fuel Consumption (M.T.1000sor *3 mililon) 422.6 652.8 418.6 475.1
Total Costs of GeneratIon 101.8 99.9 75.4 91.3
Cost per kWh sent out (USe/kWh) 5.53 5.43 4.10 4.97
a/ Discount rate at 132.
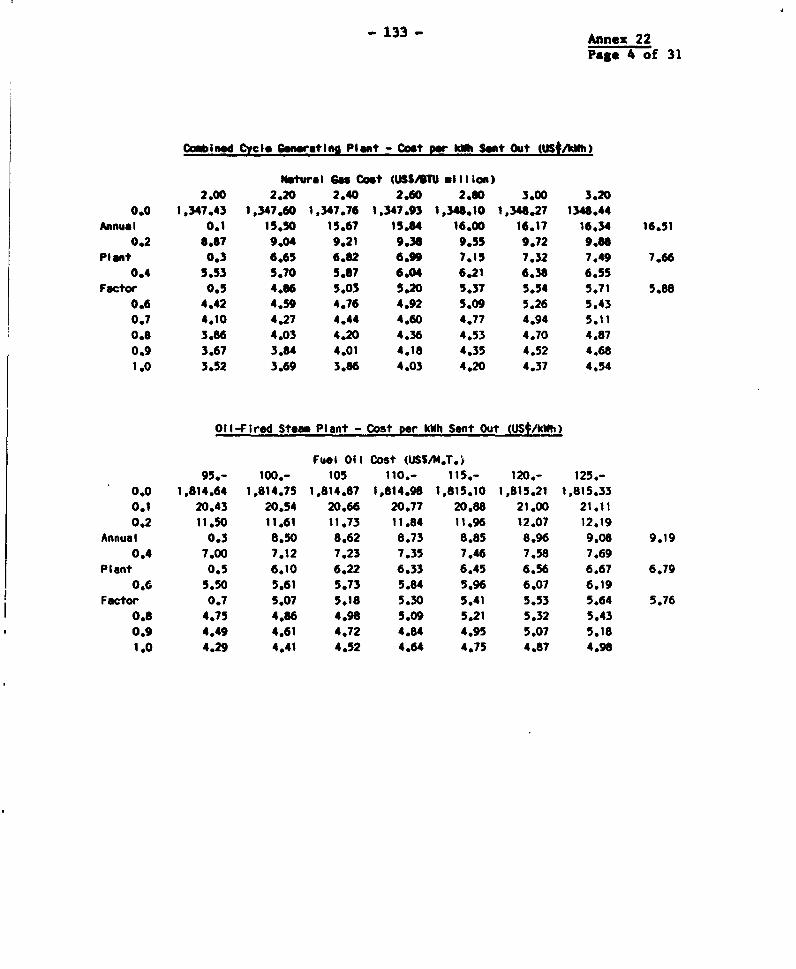
- 133 Annex 22
Page 4 of 31
CAomined Cycle Generating Plant - Cost we kWh Sent Out (uSt/kWh)
Natural ae Cost (USSA4TU mIl l ion)2.00 2.20 2.40 2.60 2.60 3.00 3.20
0.0 1,347.43 1,347.60 1,347.76 1,347.93 1,341.10 1,346.27 1348.44Annual 0.1 15.50 15.67 15.84 16,00 16.17 16.34 16.51
0.2 8.67 9.04 9.21 9.38 9.55 9.72 9.86Plant 0.3 6.65 6.82 6.99 7,15 7.32 7.49 7.66
0.4 5.53 5.70 5.67 6.04 6.21 6.38 6.55Factor 0.5 4.86 5.03 5.20 5.37 5.54 5.71 5.88
0.6 4.42 4.59 4.76 4.92 5.09 5.26 5.430.7 4.10 4.27 4.44 4.60 4.77 4.94 5.110.8 3.86 4.03 4.20 4.36 4.53 4.70 4.870.9 3.67 3.84 4.01 4.18 4.35 4.52 4.681.0 3.52 3.69 3.86 4.03 4.20 4.37 4.54
Oil-Fired Steam Plant - Cost per kWh Sent Out (US..AWh)
Fuel Oil Cost (USS/M.T.j95.- 100.- 105 110.- 115.- 120.- 125.-
0.0 1,814.64 1,814.75 1,814.87 1,814.98 1,815.10 1,815.21 1,815.330.1 20.43 20.54 20.66 20.77 20.88 21.00 21.110.2 11.50 11.61 11.73 11.84 11.96 12.07 12.19
Annual 0.3 8.50 8.62 8.73 8.85 8.96 9.08 9.190.4 7.00 7.12 7.23 7.35 7.46 7.58 7.69
Plant 0.5 6.10 6.22 6.33 6.45 6.56 6.67 6.790.6 5.50 5.61 5.73 5.84 5.96 6.07 6.19
Factor 0.7 5.07 5.18 5.30 5.41 5.53 5.64 5.760.8 4.75 4.86 4.98 5.09 5.21 5.32 5.430.9 4.49 4.61 4.72 4.84 4.95 5.07 5.181.0 4.29 4.41 4.52 4.64 4.75 4.87 4.98
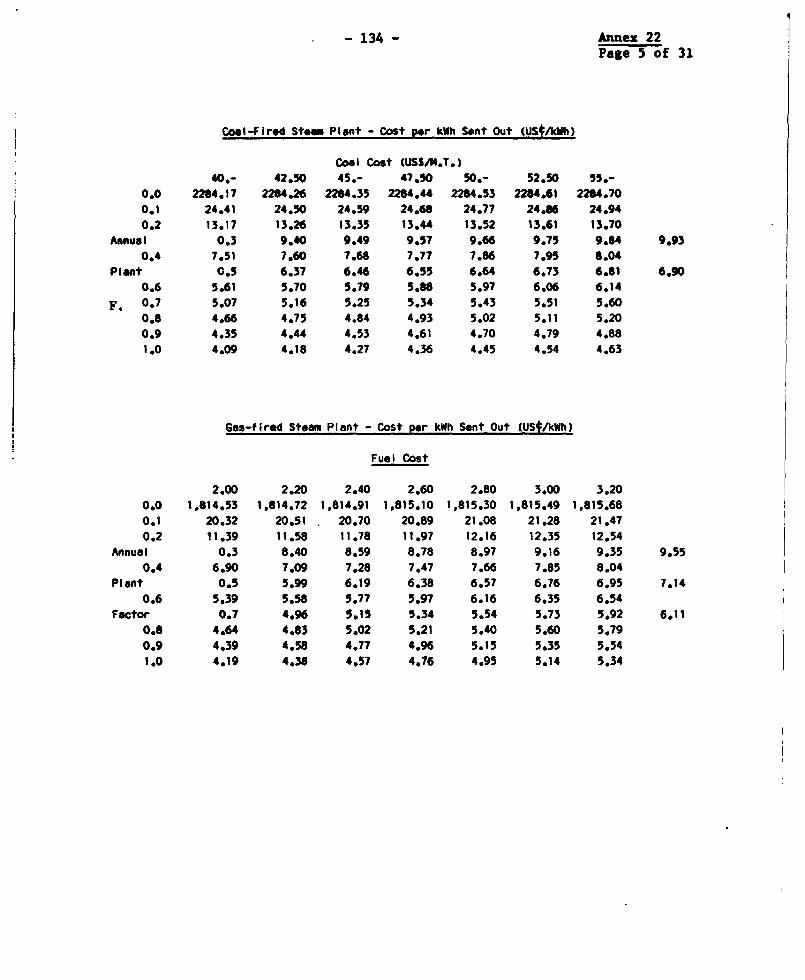
-134 - Annex 22Page 5 of 31
Coal-Fired Stem Plant - Cost g!r kWh Sent Out (USt/kWh)
Coal Cost (USSMi,.T.)40.- 42.50 45.- 47.50 50.- 52.50 55.-
0.0 2264.17 2284.26 2284.35 2264.44 2264.53 2264.61 2284.700.1 24.41 24.50 24.59 24.68 24.77 24.86 24.940.2 13.17 13.26 13.35 13.4 13.52 13.61 13.70
Annual 0.3 9.40 9.49 9.57 9.66 9.75 9.84 9.930.4 7.51 7.60 7.68 7.77 7.86 7.95 6.04
Plant 0.5 6.37 6.46 6.55 6.64 6.73 6.81 6.900.6 5.61 5.70 5.79 5.88 5.97 6.06 6.14
F. 0.7 5.07 5.16 5.25 5.34 5.43 5.51 5.600.8 4.66 4.75 4.84 4.93 5.02 5.11 5.200.9 4.35 4.44 4.53 4.61 4.70 4.79 4.881.0 4.09 4.18 4.27 4.36 4.45 4.54 4.63
Gas-fired Steam Plant - Cost pEr kWh Sent Out (US$Ath)
Fuel Cost
2.00 2.20 2.40 2.60 2.80 3.00 3.200.0 1,814.53 1,814.72 1,814.91 1,815.10 1,815.30 1,815.49 1,815.680.l 20.32 20.51 20.70 20.89 21.08 21.28 21.470.2 11.39 11.58 11.78 11.97 12.16 12.35 12.54
Annual 0,3 8.40 8.59 8.78 8.97 9.16 9.35 9.550.4 6.90 7.09 7.28 7.47 7.66 7.85 8.04
Plant 0.5 5.99 6.19 6.38 6.57 6.76 6.95 7.140.6 5.39 5.58 5.77 5.97 6.16 6.35 6.54
Factor 0.7 4.96 5.15 5.34 5.54 5.73 5.92 6.110.6 4.64 4.83 5.02 5.21 5.40 5.60 5.790.9 4.39 4.58 4.77 4.96 5.15 5.35 5.541.0 4.19 4.38 4.57 4.76 4.95 5.14 5.34

-135 - Annex 22
Page 6 of 31
3. Metropolitan Region - Electrlclty Generation Cost Comparison300 NW Net Capocity Plant
Coal-to-Natural Gas Conversion
Coal Steamto Not. Gas Net.ConversIon Coal Gas
Capital Cost (USS/net kW, 100 0 0Jan. 87 Prices)
S of totalDisbursement Profile
Year -4-3-2-1
Online 0 100%
Plant Service Life (Years) 2 25
Gross Heat Rate for75% daily Plant Factor kJ/kWh 10,100 10,400 8,900
kcaI/kAWh a/ 2,412 2,484 2,126
Fuel Cost Fuel Oil Coal Nat.Gas
Natural Gas (USS/BTU million) 1.60IBorder Price/Physical Unit (USS) M.T. M.T. m3000
120.- 45.- 59.30
Inland Transport & Handling (USS) 5.- 10.70
Total Fuel Cost 120.- 5_0- 70.
Higher Hoeting Value kcaI/kg 10,500 7,000kMOl/W3 9,341
Cost/10,000 kcal (USO) 11.43 7.14 7.49
a/ 4.187 kJ/kcal.
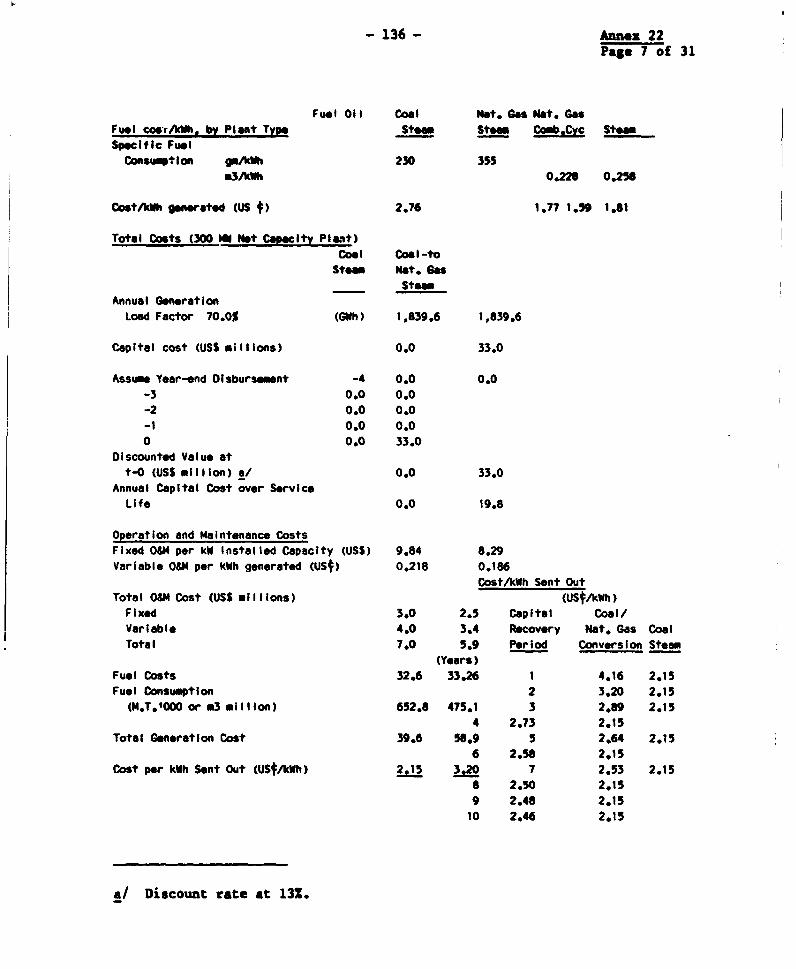
- 136 - Annex 22Page 7 of 31
Fuel 01I Coal Nat. Gas Net. GasFuel cowrAcWh, by Pl ant Typ Stem Steam Comb.Cyc Stem
SpecifIc FuelConsumption g9okWh 230 355
m3/kWh 0.226 0.258
Cost/kWh generated (US 0) 2.76 1.77 1.59 1.81
Total Costs (300 MN Not Capcity Plant)
Coal Coal-to
Stem Nat. Gas
Stem
Annual Generation
Load Factor 70.0% (GWh) 1,839.6 1,839.6
Capital cost (USS millions) 0.0 33.0
Assume Year-end Disbursement -4 0.0 0.0
-3 0.0 0.0-2 0.0 0.0
-1 0.0 0.0
0 0.0 33.0
Discounted Value at
t-0 (USS million) a/ 0.0 33.0
Annual Capital Cost over Service
Life 0.0 19.8
Operation and Maintenance Costs
Fixed 04 per kW Installed Capacity (USS) 9.84 8.29
Variable O&M per kWh generated (US0) 0.218 0.186
Cost/kWh Sent Out
Total OM Cost (USS millions) (USA/kWh)Fixed 3.0 2.5 Capital Coal/
Variable 4.0 3.4 Recovery Nat. Gas Coal
Total 7.0 5.9 Period Conversion Stem
(Yoars)
Fuel Costs 32.6 33.26 1 4.16 2.15
Fuel Consumption 2 3.20 2.15
(M.T.'OOO or m3 million) 652.8 475.1 3 2.89 2.15
4 2.73 2.15
Total Generation Cost 39.6 58.9 5 2.64 2.15
6 2.58 2.15
Cost per kWh Sent Out (UStAkWh) 2.15 3.20 7 2.53 2.15
8 2.50 2.15
9 2.48 2.15
10 2.46 2.15
a/ Discount rate at 131.
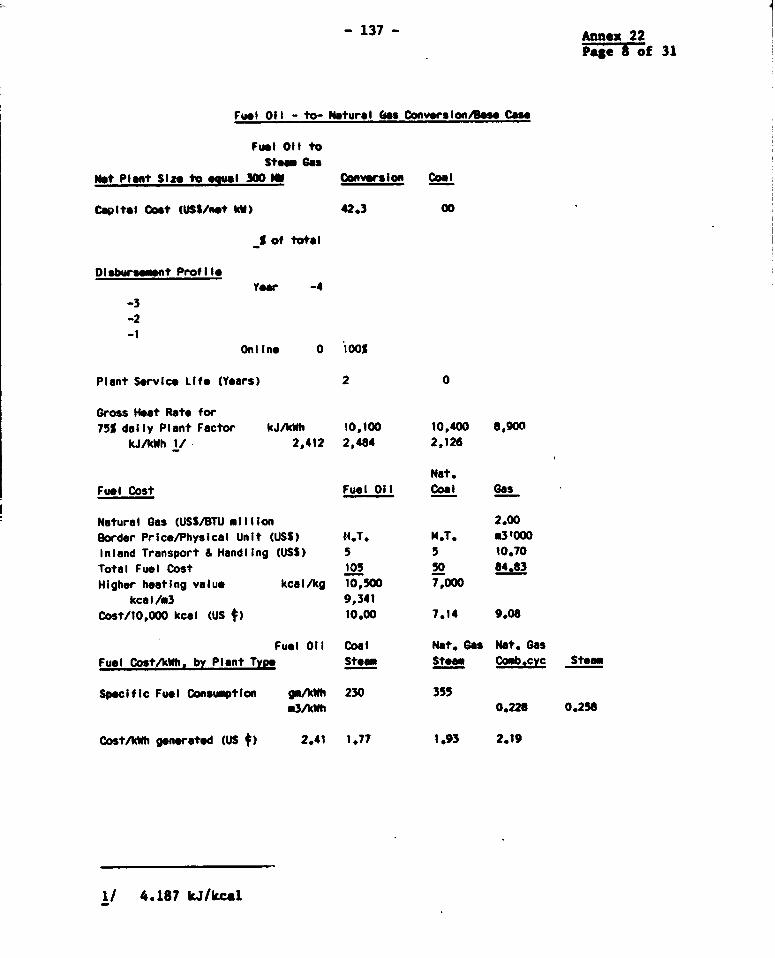
-137- Annex 22
Page 8 of 31
Fuel O1I - to- Natural 6as Conversion/Bse Cos
Fuel 01I toStem Ga
Net Plant Siz to !eual 300 M Conversion coal
Capital Cost (USS/net W) 42.3 00
S9 of tovtal
DIsbursement ProfileYer -4
-3-2-1
Onilne O 100%
Plant Service Life (Years) 2 0
Gross Heat Rate for75% daily Plant Factor kJ/kWh 10,100 10,400 8,900
kJ/kWh 1/ 2,412 2,484 2,126
Nat.Fuel Cost Fuel Oil Coal Gas
Natural Gas (USS/BTU mllilon 2.00Border Price/PhysIcal Unit (USS) Ni.T. M.T. .3'000Inland Transport & Handling (USS) 5 5 10.70Total Fuel Cost 105 50 84-J3Higher heating value kcalAkg 10,500 7,000
kcal/m3 9,341Cost/10,000 kcal (US 0) 10.00 7.14 9.08
Fuel Oil Coal Nat. Gas Nat. GasFuel Cost/kWh. by Plant Type Stem Steam Comb.cyc Steam
Specific Fuel Consumption g/kwh 230 355.3/kWh 0.228 0.258
Cost/kWh generated (US 0) 2.41 1.77 1.93 2.19
1/ 4.187 WJ/kcal
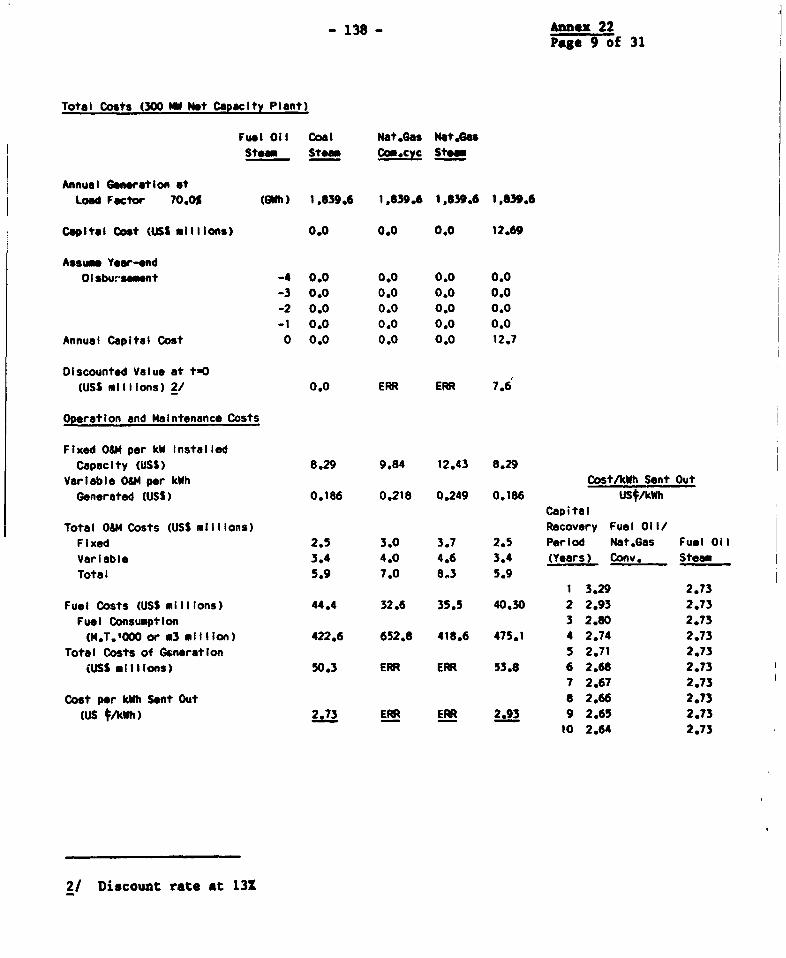
-138 - Annex 22Page 9 of 31
Total Costs (300 NW Net Capacity Plant)
Fuel Oil Coal Nat.Gas N4t.GasStew Stem Co .cyc Stoa
Annual Generation atLoad Factor 70.0% (GWh) 1,639.6 1,839.6 1,839.6 1,839.6
Capital Cost (USS millions) 0.0 0.0 0.0 12.69
Assum Year-endDlsbursament -4 0.0 0.0 0.0 0.0
-3 0.0 0.0 0.0 0.0-2 0.0 0.0 0.0 0.0
-1 0.0 0.0 0.0 0.0Annual Capital Cost 0 0.0 0.0 0.0 12.7
Discounted Value at t-O(USS millions) 2/ 0.0 ERR ERR 7.6
Operation and Maintenance Costs
Fixed O&M per kW Installed
Capacity (USS) 8.29 9.84 12.43 8.29Varlable O&M0 per kWh Cost/kWh Sent Out
Generated (USS) 0.186 0.218 0.249 0.186 USt/kWh
Capital
Total OM Costs (USS millions) Recovery Fuel Oil/Fixed 2.5 3.0 3.7 2.5 Period Nat.Gas Fuel Oil
Variable 3.4 4.0 4.6 3.4 (Years) Conv. Steam
Total 5.9 7.0 8.3 5.91 3.29 2.73
Fuel Costs (USS millions) 44.4 32.6 35.5 40.30 2 2.93 2.73
Fuel Consumption 3 2.80 2.73(M.T.'000 or m3 million) 422.6 652.8 418.6 475.1 4 2.74 2.73
Total Costs of Generation 5 2.71 2.73
(USS millions) 50.3 ERR ERR 53.8 6 2.68 2.737 2.67 2.73
Cost per kWh Sent Out 8 2.66 2.73(US ftWh) 2.73 ERR ERR 2.93 9 2.65 2.73
10 2.64 2.73
2/ Discount rate at 13Z
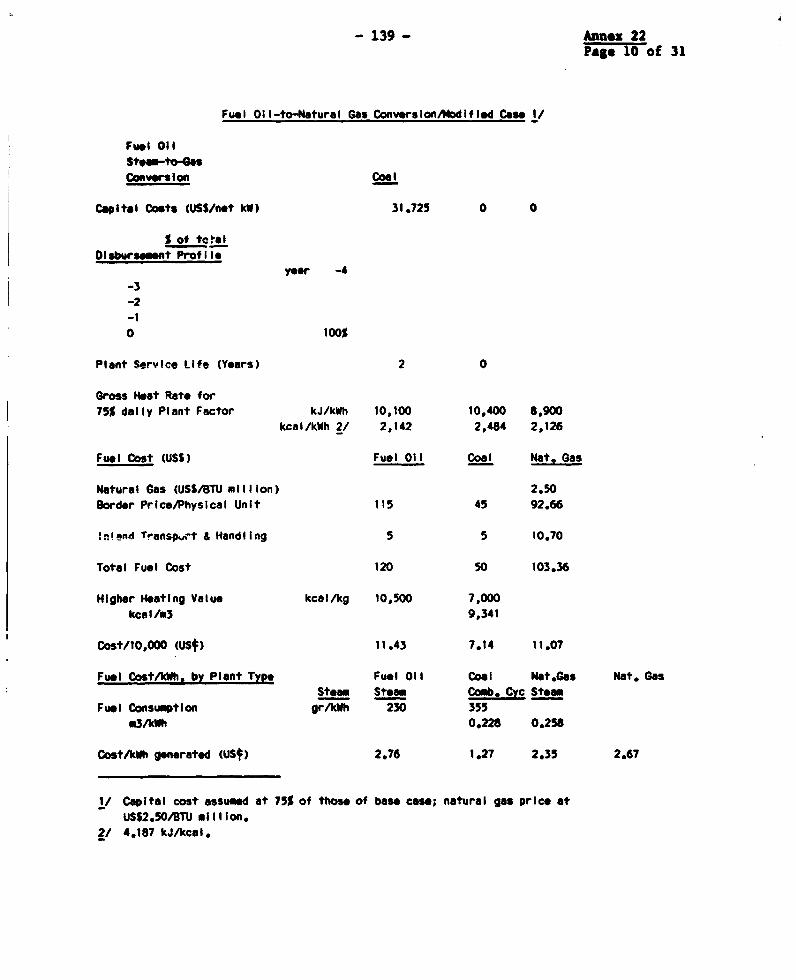
- 139- Annex 22Pege 10 of 31
Fuel 011-to-Natural Gas Conv*rsioniModifled Case 1/
Fuel OilSte-to-Ga|Convesion Coal
Capital Costs (USS/net kW) 31.725 0 0
S of tetoID sbursoment Prof i I.
year -4-3-2-10 100%
Plant Seryice Life (Years) 2 0
Gross Hest Rate for75% daily Plant Factor kJ/kWh 10,100 10,400 8,900
kcal/kWh 2/ 2,142 2,484 2,126
Fuel Cost (USS) Fuel Oil Coal Nat. Gas
Natural Gas (USS/BTU million) 2.50Border Price/Physical Unit 115 45 92.66
hW!end Transphn t & Handling 5 5 10.70
Total Fuel Cost 120 50 103.36
Higher Heating Value kcal/kg 10,500 7,000koal/.3 9,341
Cost/10,000 (ust) 11.43 7.14 11.07
Fuol Cost/kWh. by Plant Type Fuel Oil Coal Nat.Gas Nat. GasStem Stean Comb. Cyc Steam
Fuel ConsumPtion grAkWh 230 355m3/kWh 0.228 0.256
Cost/kWh generated (US¢) 2.76 1.27 2.35 2.67
1/ Capital cost assumed at 75% of those of bas caseo; natural gas price atUSS2.50/BTU million.
2/ 4.187 kJ/kcal.
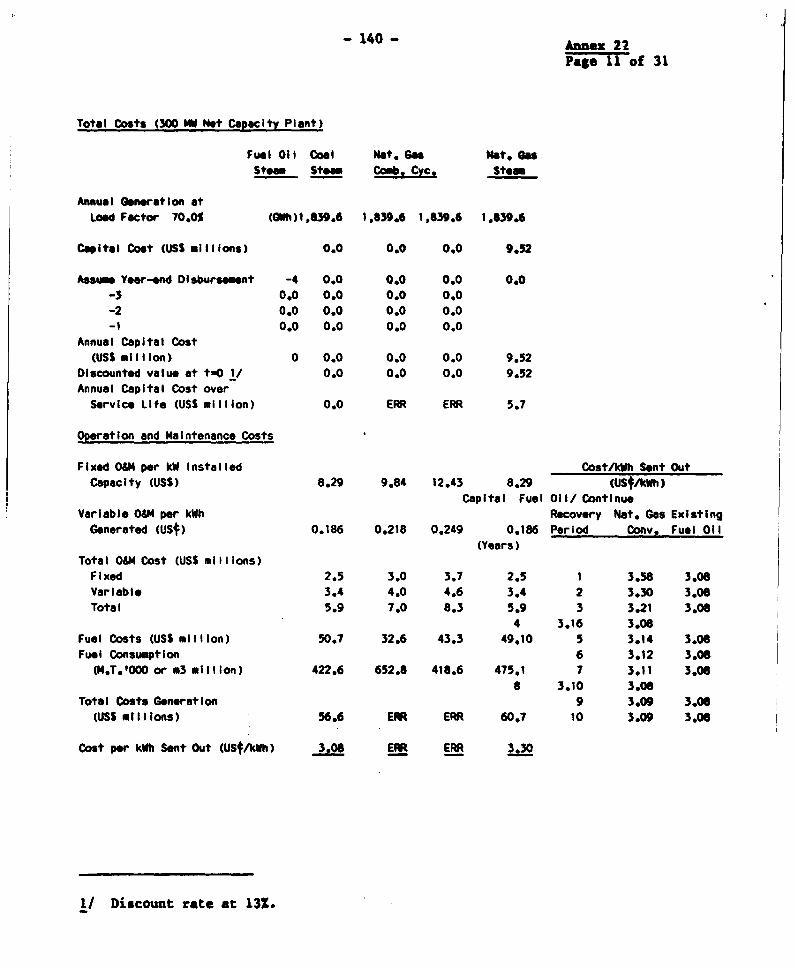
-140 - Annex22
Page 11 of 31
Total Costs (300 MN Net Capacity Plant)
Fuel Oil Coal Nat. I 4e Nte 6asSteam stow cob.^ Cyc. Stesm
Annual Generation atLoad Factor 70.0% (GWh)1,839.6 1,839.6 1,839.6 1,639.6
Capital Cost (USS millions) 0.0 0.0 0.0 9.52
Assumo Yer-end Disbursament -4 0.0 0.0 0.0 0.0-3 0.0 0.0 0.0 0.0-2 0.0 0.0 0.0 0.0-1 0.0 0.0 0.0 0.0
Annual Capital Cost(USS million) 0 0.0 0.0 0.0 9.52
Discounted value at t-0 1/ 0.0 0.0 0.0 9.52Annual Capital Cost overService Life (USS million) 0.0 ERR ERR 5.7
Operation and Maintenance Costs
Fixed O0M8 per kW Installed CostAkWh Sent OutCapacity (USS) 8.29 9.84 12.43 8.29 tSA/kWh)
Capital Fuel Oil/ ContinueVariable OM per kWh Recovery Nat. Gas ExistingGenerated (uMt) 0.186 0.218 0.249 0.186 Period Conv. Fuel Oil
(Years)Total O0M Cost (USS millions)Fixed 2.5 3.0 3.7 2.5 1 3.58 3.08Variable 3.4 4.0 4.6 3.4 2 3.30 3.08Total 5.9 7.0 8.3 5.9 3 3.21 3.08
4 3.16 3.08Fuel Costs (USS million) 50.7 32.6 43.3 49.10 5 3.14 3.06Fuel Consumption 6 3.12 3.06(M.T.1000 or m3 million) 422.6 652.8 416.6 475.1 7 3.11 3.06
8 3.10 3.06Total Costs Generation 9 3.09 3.06(USS millions) 56.6 ERR ERR 60.7 10 3.09 3.08
Cost per kWh Sent Out (UStkWh) 3.06 Eli ERR 3.30
1/ Discount rate at 13%.
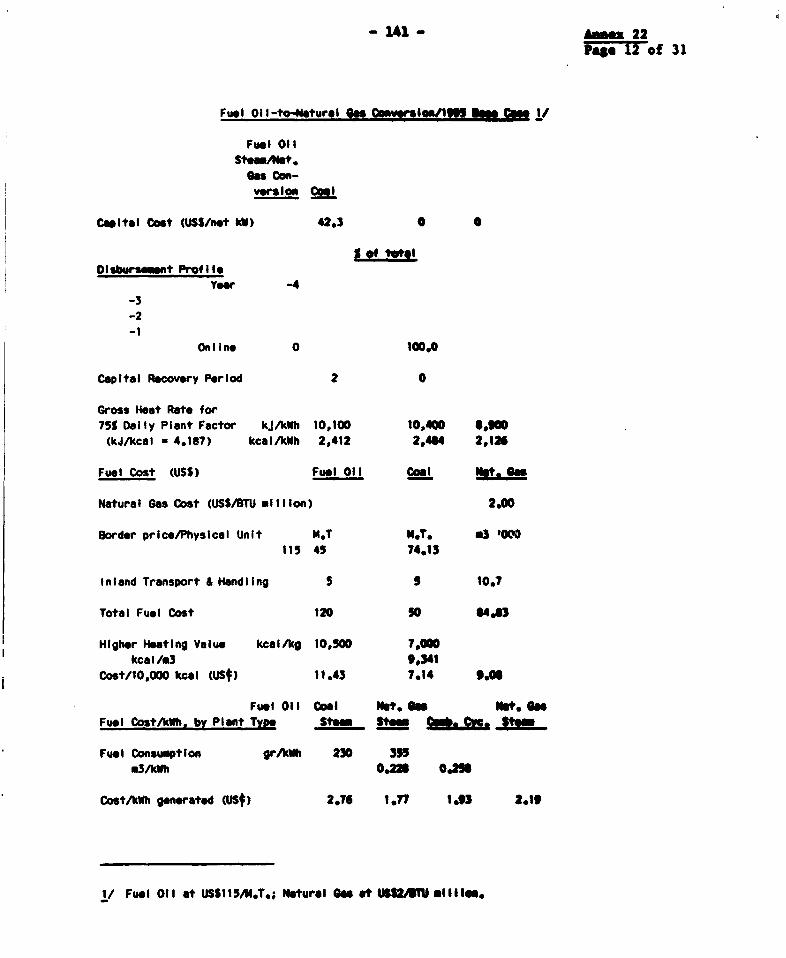
- A1 - Am.z22Pg 12 of 31
Fuel O1Il -to-Natural On. 2MMerIM!J19W fe coo V
Fuel O1IlSt eam/ t.
vsc Coal
Cwitel Cost (USS/net 1t) 42.3 0 0
s of tgtalDI sbursement ProfilI
Year -4-3-2
Onlinc 0 100.0
Capital Recovery Perlod 2 0
Gross Heat Rate for75% Daily Plant Factor kj/kWh 10,100 10,400 *,IN(kJ/kcal * 4.187) kcalIkWh 2,412 2,4S4 2,113
Fuel Cost (USS) Fuel 01I coal Nat, an
Natural Gas Cost (USS/BTU mIllIon) 2.00
Border price/Physical Unit M.t N.r. d3 000115 45 74.13
Inland Transport & HandlIng 5 5 10.7
Total Fuel Cost 120 SO S4J3
Higher Hesting Value kcalskg 10,500 7,000kcalA /3 9,341
Cost/10,00 kcal Must) 11.43 7.14 9go
Fuel 01l Coal Nat, an Note be
Fuel CostkWh. by Plant Type Ste Stel 0106h go.- H .
Fuel Consumption grAkWh 230 3553/kWh 0.22 0.21
Cost/kWh generated (USt) 2.76 1.77 1.93 2.19
1/ Fuel I01 at USSISM.T.e; Natural ee at USS2dTU of *I I I.
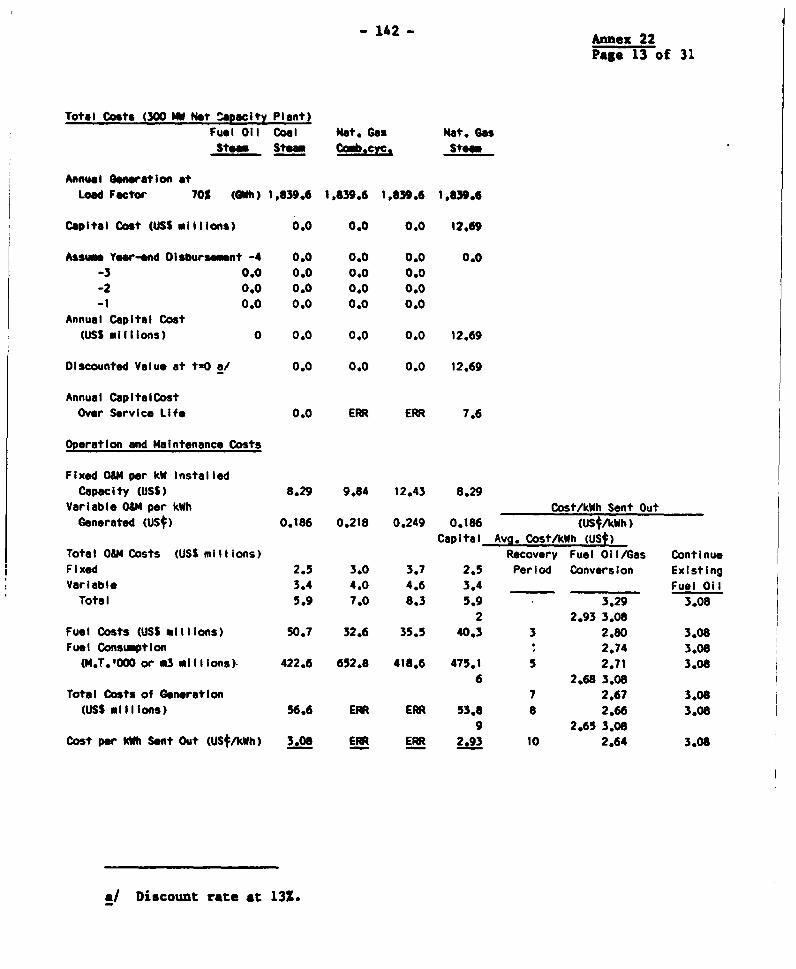
142 - Annex 22
Page 13 of 31
Total Costs (300 MW Net Sapecity Plant)Fuel Oil Coal Mat. Gas Mat. GasStea Stea mcy Ste
Annual GeneratIon atLoad Factor 70% (GWh) 1,639.6 1,839.6 1,639.6 1,639.6
Capital Cost (iUSS mIIlions) 0.0 0.0 0.0 12.69
AssMe Yerw-nd Disbursemnt -4 0.0 0.0 0.0 0.0-3 0.0 0.0 0.0 0.0-2 0.0 0.0 0.0 0.0-1 0.0 0.0 0.0 0.0
Annual Capital Cost(USS millions) 0 0.0 0.0 0.0 12.69
Discounted Value at tuO a/ 0.0 0.0 0.0 12.69
Annual CapitalCostOver Service Life 0.0 ERR ERR 7.6
Operation and Milntenance Costs
Fixed OM per kW InstalledCapacity (USS) 8.29 9.84 12.43 8.29
Variable 08r per kWh Cost/kWh Sent OutGenerated (USt) 0.186 0.218 0.249 0.186 (UStAkWh)
Capital Avg. Cost/kWh (USf)Total O0M Costs (USS millions) Recovery Fuel Oil/Gas ContinueFixed 2.5 3.0 3.7 2.5 Period Conversion ExistingVariable 3.4 4.0 4.6 3.4 Fuel Oil
Total 5.9 7.0 8.3 5.9 3.29 3.082 2.93 3.08
Fuel Costs (USS millions) 50.7 32.6 35.5 40.3 3 2.80 3.08Fuel Consumption 2.74 3.08
(M.T.'000 or m3 millions)- 422.6 652.8 416.6 475.1 5 2.71 3.086 2.68 3.08
Total Costs of Generation 7 2.67 3.08(USS millions) 56.6 ERR ERR 53.8 8 2.66 3.08
9 2.65 3.06Cost per kWh Sent Out (USt/kWh) 3.08 ERR ERR 2.93 10 2.64 3.08
a/ Discount rate at 13Z.
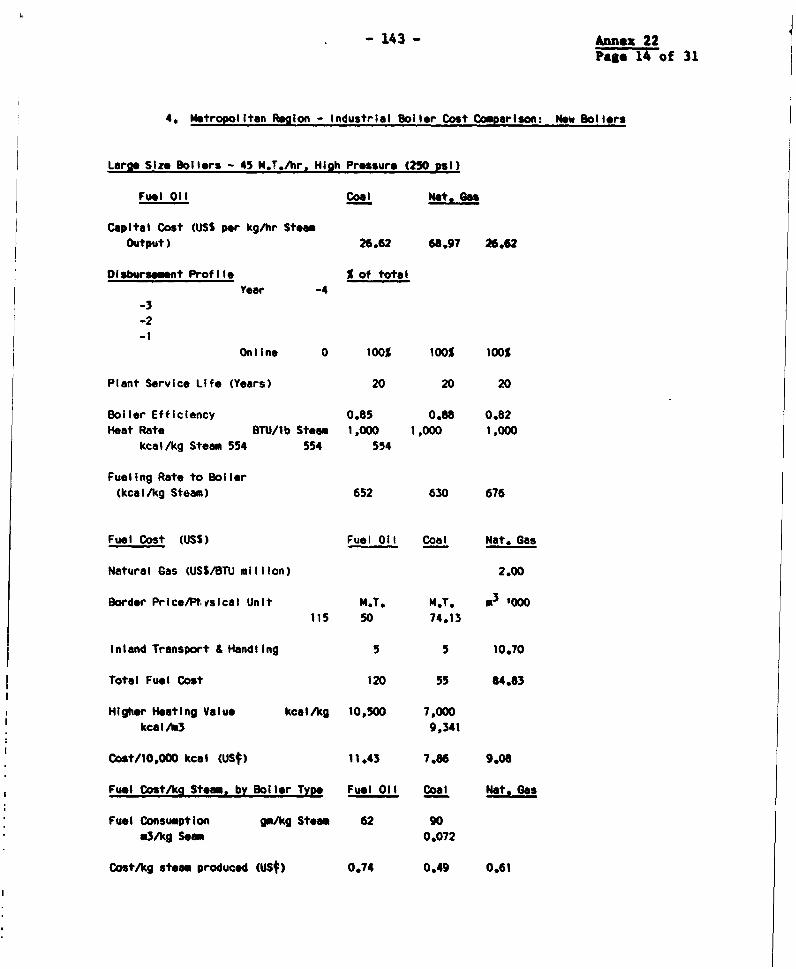
143 - Annex 22Page 14 of 31
4. Metropolltan Region - Industrial Boiller Cost Comparlon: New Sollers
Large Size Boilers - 45 M.T./hr Hlgh Pressure (250 psi)
Fuel Oil Co lmet, 6b
Capital Cost (USS per kg/hr SteamOutput) 26.62 68,97 26.62
Olsbursent Profile S of totalYear -4
-3-2-1
Online 0 100% 100% 100%
Plant Service Life (Years) 20 20 20
Boiler Efficiency 0.85 0.88 0.82Heat Rate BTU/lb Steam 1 000 1 000 1 000
kcal/kg Steam 554 554 554
Fueling Rate to Boller(kcal/kg Steam) 652 630 676
Fuel Cost (USS) Fuel Oil Coal Nat. Gas
Natural Gas (USS/BTU million) 2.00
Border Price/Ptysical Unit M.T. M.T. *3 000C115 50 74.13
Inland Transport & Handling 5 5 10.70
Total Fuel Cost 120 55 4.483
Higher Hoating Value kcalAkg 10,500 7,000kcal//3 9,341
Cost/10,000 kcal (US0) 11.43 7.86 9.06
Fuel Cost/kg Steam, by Boller Type Fuel Oil Coal Nat. Gas
Fuol Consumption g/kg Steam 62 90m3/kg Seam 0,072
Cost/kg steam produced (USt) 0.74 0.49 0.61
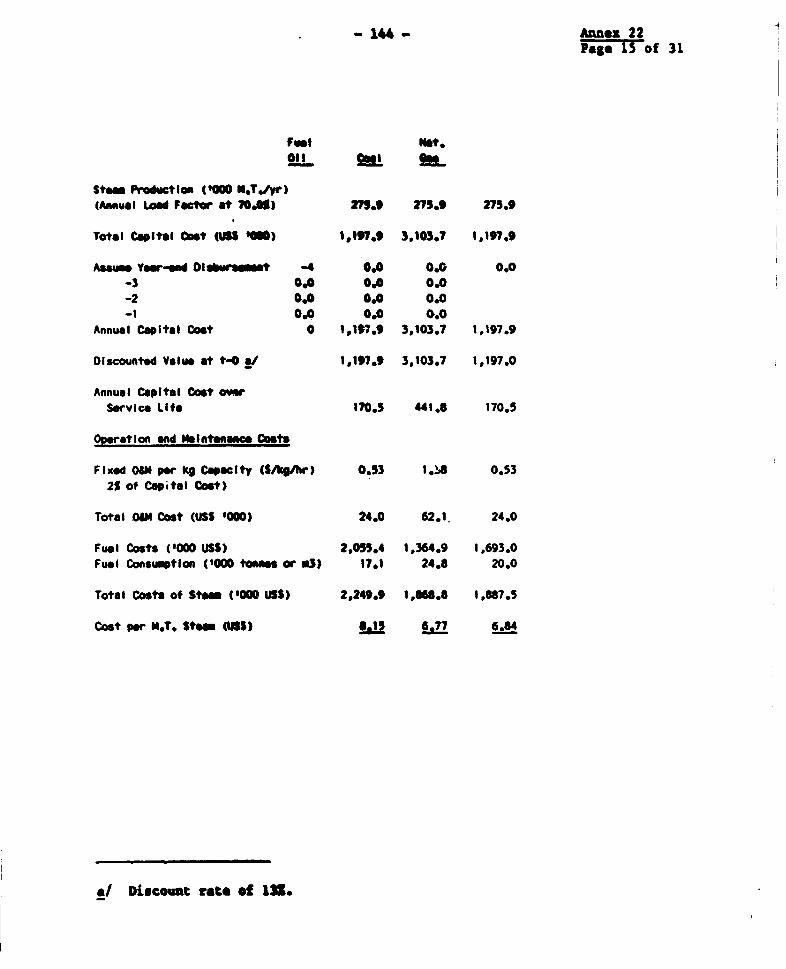
-144- Annex 22Page 1S of 31
Stem Proi ctlos ('000 .*To/yr)(Asesul Load Fector at 7J06) 2m5.9 27.9 275.9
Total Capital Ost (US1 '0M) 1,197.9 3,103.7 1,197.9
Ass Yea-md Dl buroina1t -4 0.0 0.0 0.0-3 0.0 0,0 0.0-2 .O0 0.0 0.0-1 0.0 0.0 0.0
Annual Capital Cost 0 1,197.9 3,103.7 1,197.9
DIscounted Value at t-0 s/ 1,197.9 3,103.7 1,197.0
Annual Capital Oost orService Life 170.5 441.6 170.5
Opation ad Nelntenaac Costs
Fixed OU pe kg Capacity CS/kg/br) 0.53 1.!M 0.532% of Capital Cost)
Total U0M Cost (USS '000) 24.0 62.1. 24.0
Fuel Costs ('000 USS) 2,055.4 1,364.9 1,693.0Fuel Consumptlon ('000 tomame or *3) 17.1 24.8 20.0
Total Costs of Stem (000 US5) 2,249.9 1,160.8 1,687.5
Cost per N.T. Stem (U1) 6.15 -G'7 6.64
*/ lDiscount rate of 13.
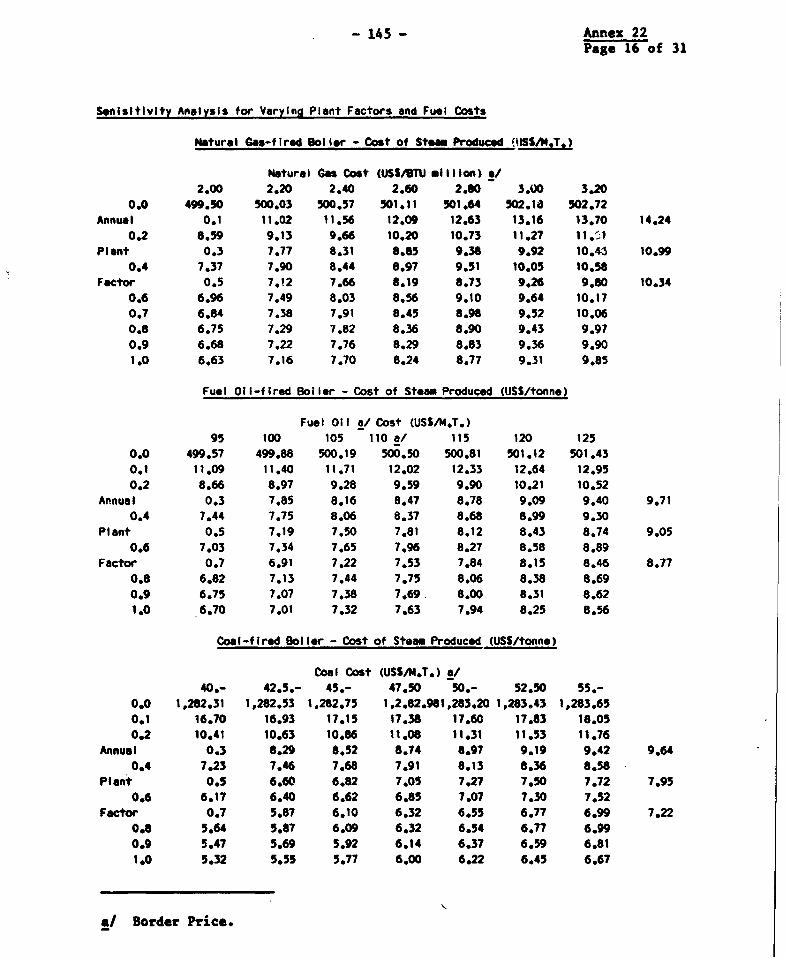
- 145 - Annex 22Page 16 of 31
Senisitlvity Analysis for Varying Plant Factors and Fuel Costs
Natural Gas-fired Boiler - Cost of Steam Produced "ISSiJ.T.)
Natural Gas Cost (USS4BTU million) at2.00 2.20 2.40 2.60 2.00 3.00 3.20
0.0 499.50 500.03 500.57 501.11 501.64 502.18 502.72Annual 0.1 11.02 11.56 12,09 12.63 13.16 13.70 14.24
0.2 8.59 9.13 9.66 10.20 10.73 11.27 11.s1Plant 0.3 7.77 8.31 8.85 9.38 9.92 10.45 10.99
0.4 7.37 7.90 8.44 8.97 9.51 10.05 10.58Factor 0.5 7.12 7.66 8.19 8.73 9.26 9.80 10.34
0.6 6.96 7.49 8.03 8.56 9.10 9.64 10.170.7 6.84 7.38 7.91 8.45 8.98 9.52 10.060.8 6.75 7.29 7.82 8.36 8.90 9.43 9.970.9 6.68 7.22 7.76 8.29 8.83 9.36 9.901.0 6.63 7.16 7.70 8.24 8.77 9.31 9.S5
Fuel 011-fIred Boiler - Cost of Steam Produced (USS/tonne)
Fuel Oil a/ Cost (USS/M.T.)95 100 105 110 a/ 115 120 125
0.0 499.57 499.88 500.19 500.50 500.81 501.12 501.430.1 11.09 11.40 11.71 12.02 12.33 12.64 12.950.2 8.66 8.97 9.28 9.59 9.90 10.21 10.52
Annual 0.3 7.85 8.16 8.47 8.78 9.09 9.40 9.710.4 7.44 7.75 8.06 8.37 8.68 8.99 9.30
Plant 0.5 7.19 7.50 7.81 8.12 8.43 8.74 9.050.6 7.03 7.34 7.65 7.96 8.27 8.58 8.89
Factor 0.7 6.91 7.22 7.53 7.84 8.15 8.46 8.770.8 6.82 7.13 7.44 7.75 8.06 8.38 8.690.9 6.75 7.07 7.38 7.69. 8.00 8.31 8.621.0 6.70 7.01 7.32 7.63 7.94 8.25 8.56
Coal-fired Boller - Cost of Steam Produced (USS/tonne)
Coal Cost (USS/M.T.) a/40.- 42.5.- 45.- 47.50 50.- 52.50 55.-
0.0 1,282.31 1,282.53 1,282.75 1,2.82.961,283.20 1,283.43 1,283.650.1 16.70 16.93 17.15 17.38 17.60 17.83 18.050.2 10.41 10.63 10.86 11.08 11.31 11.53 11.76
Annual 0.3 8.29 8.52 8.74 8.97 9.19 9.42 9.640.4 7.23 7.46 7.68 7.91 8.13 8.36 8.58
Plant 0.5 6.60 6.82 7.05 7.27 7.50 7.72 7.950.6 6.17 6.40 6.62 6.85 7.07 7.30 7.52
Factor 0.7 5.87 6.10 6.32 6.55 6.77 6.99 7.220.6 5.64 5.87 6.09 6.32 6.54 6.77 6.990.9 5.47 5.69 5.92 6.14 6.37 6.59 6.811.0 5.32 5.55 5.77 6.00 6.22 6.45 6.67
*/ Border Price.
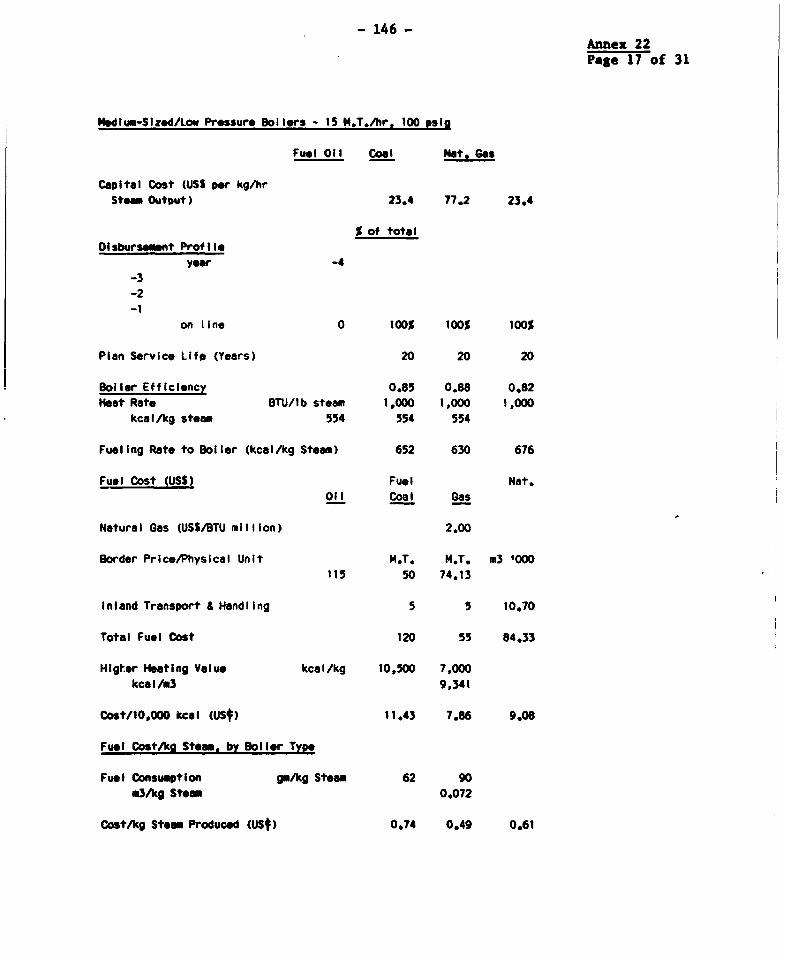
- 146 -Annex 22Page 17 of 31
Hediuo-Sized/Low Pressure Boilers - 15 M.T./hr, 100 psig
Fu*l Oil Coal Not, Gas
Capital Cost (US per kg/hrStea Output) 23.4 77.2 23.4
S of totalDlsburse_snt Profile
year -4-3-2-1
on line 0 100% 100% 100%
Plan Service Life (Years) 20 20 20
Boiler Efficiency 0.85 0.88 0.82Heat Rate BTU/lb steam 1,000 1,000 1,000
kca I/kg steam 554 554 554
Fueling Rate to Boiler (kcal/kg Steam) 652 630 676
Fuel Cost (USS) Fuel Nat.Oil Coal Gas
Natural Gas (US$/BTU million) 2.00
Border Price/Physical Unit M.T. M.T. m3 '000115 50 74.13
Inland Transport & Handling 5 5 10.70
Total Fuel Cost 120 55 84.33
Higter Heating Value kcal/kg 10,500 7,000kcal/.3 9,341
Cost/10,000 kcal (US0) 11.43 7.86 9.06
Fuel Cost/kg Steam, by oiI r Type
Fuel Consumption gm/kg Steam 62 90m3/kg Steam 0.072
Cost/kg Steam Produced (US0) 0.74 0.49 0.61
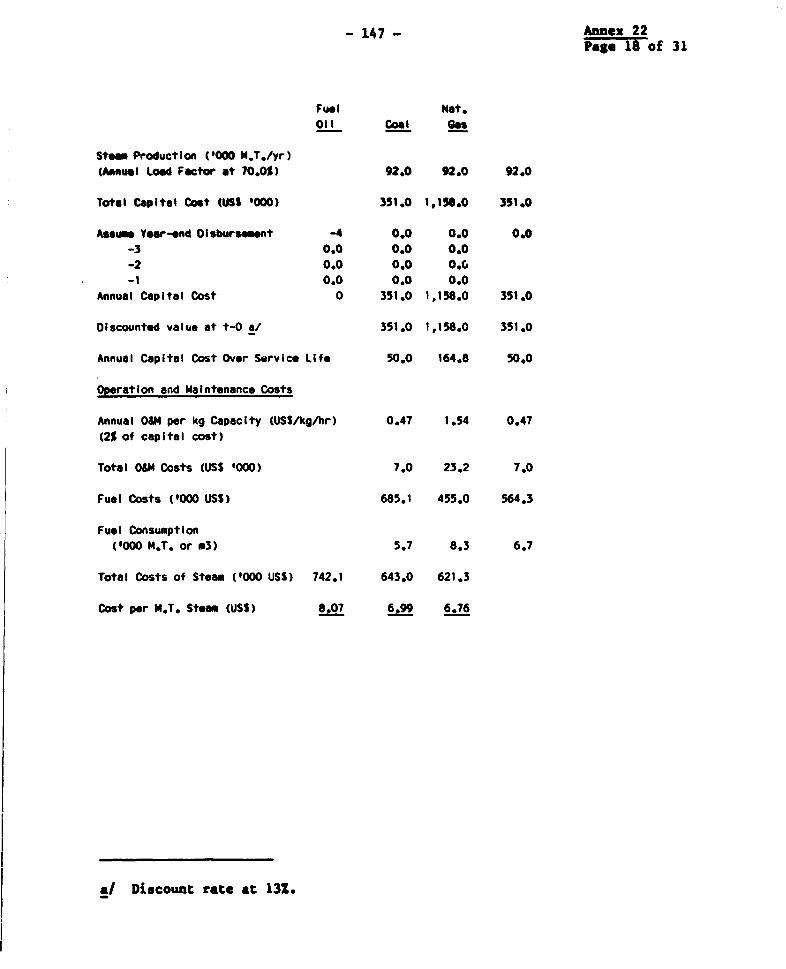
- 147- Anne 22Page 18 of 31
Fuel Nat.Oil Cooal 0
Stoe Production V'OOO M.T./yr)(Annual Load Factor at 70.0%) 92.0 92.0 92.0
Total Capital Cost (USS '000) 351.0 1,158.0 351.0
Assum_ Year-end Disbursement -4 0.0 0.0 0.0-3 0.0 0.0 0.0-2 0.0 0.0 0o.-1 0.0 0.0 0.0
Annual Capital Cost 0 351.0 1,150.0 351.0
Discounted value at t-O a/ 351.0 1,158.0 351.0
Annual Capital Cost Over Service Life 50.0 164.8 50.0
Operation and Maintenance Costs
Annual O&M per kg Capacity (USS/kg/hr) 0.47 1.54 0.47
(2% of capital cost)
Total O&M Costs CUSS '000) 7.0 23.2 7.0
Fuel Costs ('000 USS) 685.1 455.0 564.3
Fuel Consumption('000 M.T. or *3) 5.7 8.3 6.7
Total Costs of Steam ('000 USS) 742.1 643.0 621.3
Cost per M.T. Steam (USS) 0 6.99 6.76
. Discount rate at 13Z.
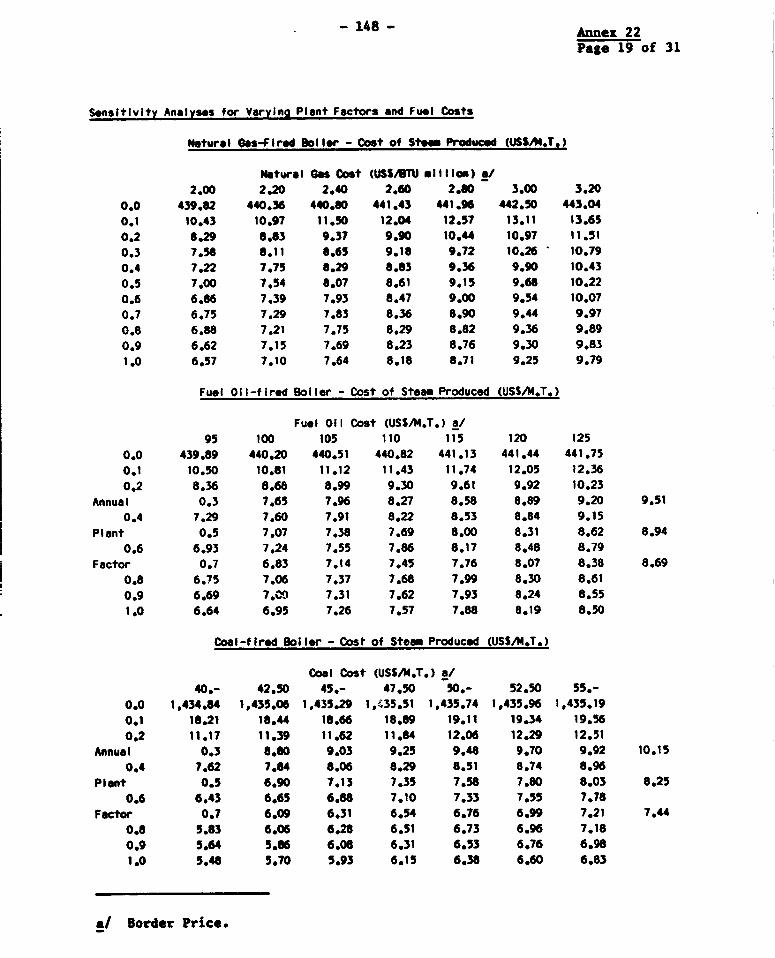
-148 - Annex 22
Page 19 of 31
Sensitivity Analyses for Varying Plant Factors and Fuel Costs
Natural Gas-Flred Boiler - Cost of Stem Produced (USShi.T.)
Natural G" Cost (USSBTU .1I IIe) a/2.00 2.20 2.40 2.60 2.80 3.00 3.20
0.0 439.62 440.36 440.60 441.43 441.96 442.50 443.040.1 10.43 10.97 11.50 12.04 12.57 13.11 13.650.2 8.29 8.83 9.37 9.90 10.44 10.97 11.510.3 7.58 8.11 8.65 9.16 9.72 10.26 10.790.4 7.22 7.75 8.29 8.63 9.36 9.90 10.430.5 7.00 7.54 8.07 8.61 9.15 9.68 10.220.6 6.86 7.39 7.93 8.47 9.00 9.54 10.070.7 6.75 7.29 7.83 8.36 8.90 9.44 9.970.8 6.88 7.21 7.75 8.29 8.82 9.36 9.890.9 6.62 7.15 7.69 8.23 8.76 9.30 9.831.0 6.57 7.10 7.64 8.18 8.71 9.25 9.79
Fuel Oil-fired Boller - Cost of Stean Produced (USSAM.T.)
Fuel Oil Cost (USsaM.T.) a/95 100 105 110 115 120 125
0.0 439.89 440.20 440.51 440.82 441.13 441.44 441.750.1 10.50 10.81 11.12 11.43 11.74 12.05 12.360.2 8.36 8.66 8.99 9.30 9.61 9.92 10.23
Annual 0.3 7.65 7.96 8.27 8.58 8.89 9.20 9.510.4 7.29 7.60 7.91 8.22 8.53 8.84 9.15
Plant 0.5 7.07 7.38 7.69 6.00 8.31 8.62 8.940.6 6.93 7.24 7.55 7.86 8.17 8.48 8.79
Factor 0.7 6.83 7.14 7.45 7.76 8.07 8.38 8.690.8 6.75 7.06 7.37 7.68 7.99 8.30 8.610.9 6.69 7.00 7.31 7.62 7.93 8.24 8.551.0 6.64 6.95 7.26 7.57 7.88 8.19 8.50
Coal-f Ired Boller - Cost of Steam Produced (USS/M.T.)
Coal Cost (USSAM.T.) a/40.- 42.50 45.- 47.50 50.- 52.50 55.-
0.0 1,434.84 1,435.06 1,435.29 1,$35.51 1,435.74 1,435.96 1,435.190.1 18.21 18.44 18.66 18.89 19.11 19.34 19.560.2 11.17 11.39 11.62 11.84 12.06 12.29 12.51
Annual 0.3 8.60 9.03 9.25 9.48 9.70 9.92 10.150.4 7.62 7.84 8.06 8.29 8.51 8.74 8.96
Plant 0.5 6.90 7.13 7.35 7.58 7.80 8.03 8.250.6 6.43 6.65 6.88 7.10 7.33 7.55 7.78
Factor 0.7 6.09 6.31 6.54 6.76 6.99 7.21 7.440.8 5.83 6.06 6.28 6.51 6.73 6.96 7.180.9 5.64 5.66 6.08 6.31 6.53 6.76 6.981.0 5.48 5.70 5.93 6.15 6.38 6.60 6.83
a/ Border Price.
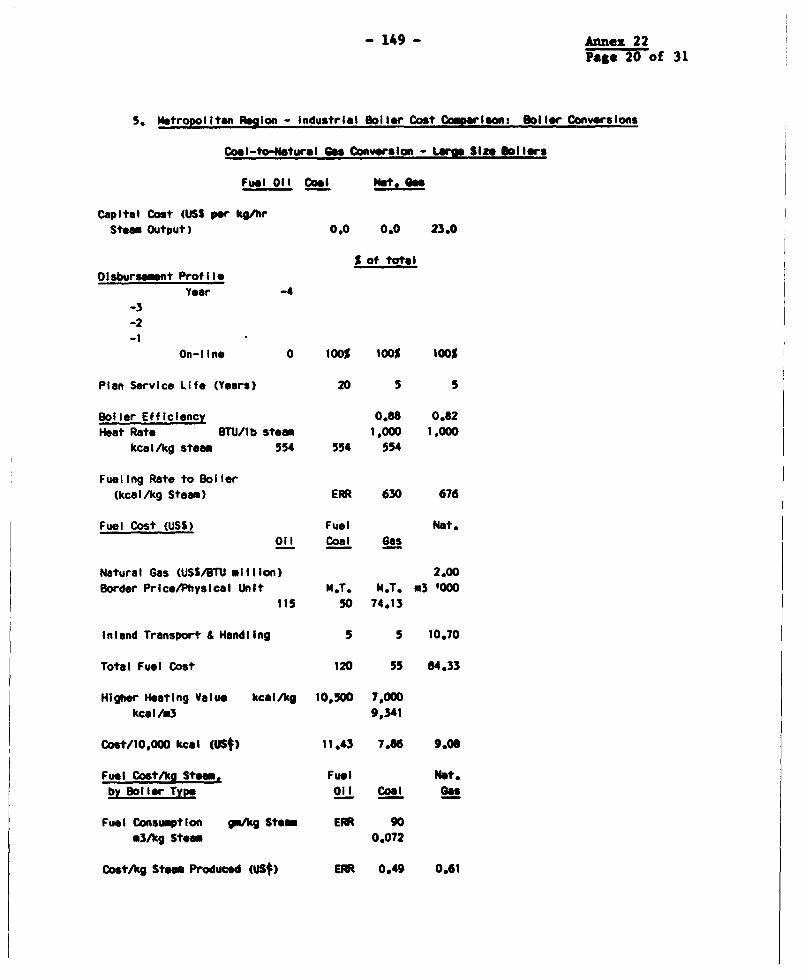
- 149 - Annex 22Page 20 of 31
5. Metropolltan PAgion - Industrial SoIlor Cost Carlson: Boiler Conversions
Cool-to-Ntural Gas Conversion - Lwr Size bilers
Fuel Oil Cool Not.
Capital Cost (USS pe kg/hrStea Output) 0.0 0.0 23.0
S of totaDlsburs_ent Profile
Year -4-3-2-1
On-line 0 100% 100% 100%
Plan Service Life (Years) 20 5 5
Boiler Efficiency 0.88 0.82Heat Rate BI/ b stem 1,000 1,000
kcaI/kg steam 554 554 554
Fueling Rate to Boiler(kcal/kg Steam) ERR 630 676
Fuel Cost (USS) Fuel Nat.Oil Coal Gas
Natural Gas (USS/BTU m IliIon) 2.00Border Price/Physical Unit M.T. Ml,.T. m3 '000
115 50 74.13
inland Transport & Handling 5 5 10.70
Total Fuel Cost 120 55 84.33
Hlgher Heoting Value kcal/kg 10,500 7,000kcal /.3 9,341
Cost/10,000 koal Cust) 11.43 7.86 9.06
Fuel Cost/kg Stow, Fuel Met.by i301er Type Oil Coal Gas
Fuel Consumption gmAg Stem EPR 90m3hg Steam 0.072
Cost/kg Stem Produced (USt) ERR 0.49 0.61
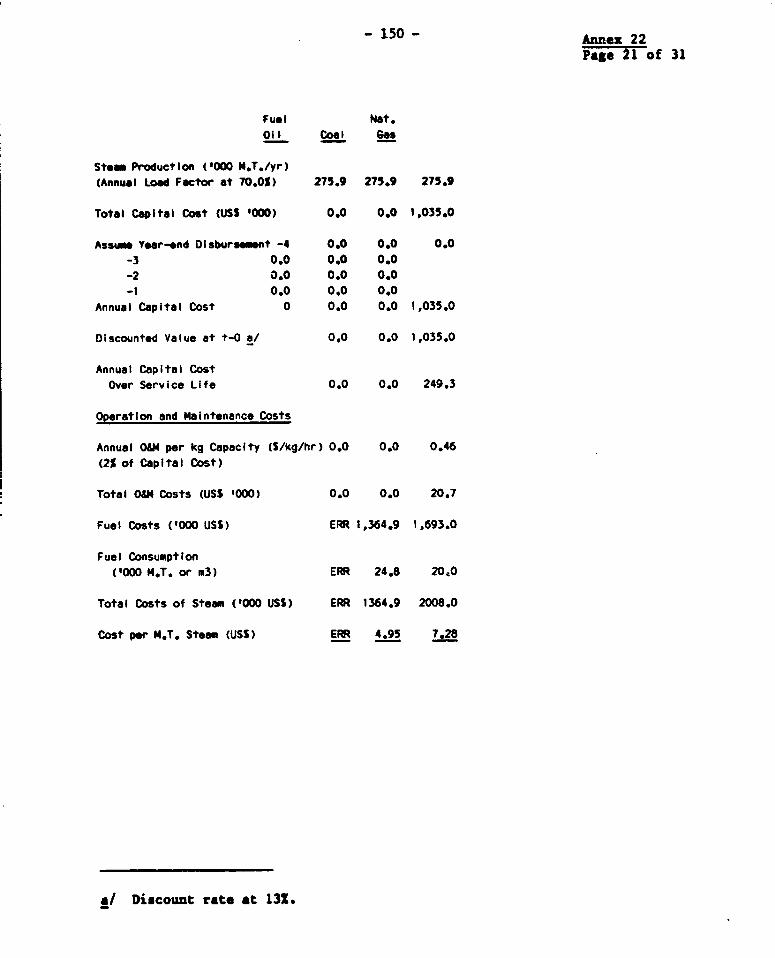
- 150 - Annex 22Page 21 of 31
Fuel Nat.Oil Coal Gea
Stem Production ('000 M.T./yr)
(Annual Load Factor at 70.0%) 275.9 275.9 275.9
Total Capital Cost (U5S '000) 0.0 0.0 1,035.0
Assume Year-end Disbursmnt -4 0.0 0.0 0.0
-3 0.0 0.0 0.0
-2 0.0 0.0 0.0
-1 0.0 0.0 0.0Annual Capital Cost 0 0.0 0.0 1,035.0
Discounted Value at t-O a/ 0.0 0.0 1,035.0
Annual Capital CostOver Service Life 0.0 0.0 249.3
Operation and Maintenance Costs
Annual O&M per kg Capacity (S/kg/hr) 0.0 0.0 0.46
(2% of Capital Cost)
Total OIM Costs (USS '000) 0.0 0.0 20.7
Fuel Costs ('000 USS) ERR 1,364.9 1,693.0
Fuel Consumption('000 M.T. or .3) ERR 24.8 20,0
Total Costs of Steam ('000 USS) ERR 1364.9 2008.0
Cost per M.T. Steam (USS) ERR 4.95 7.28
*/ Discount rate at 13%.
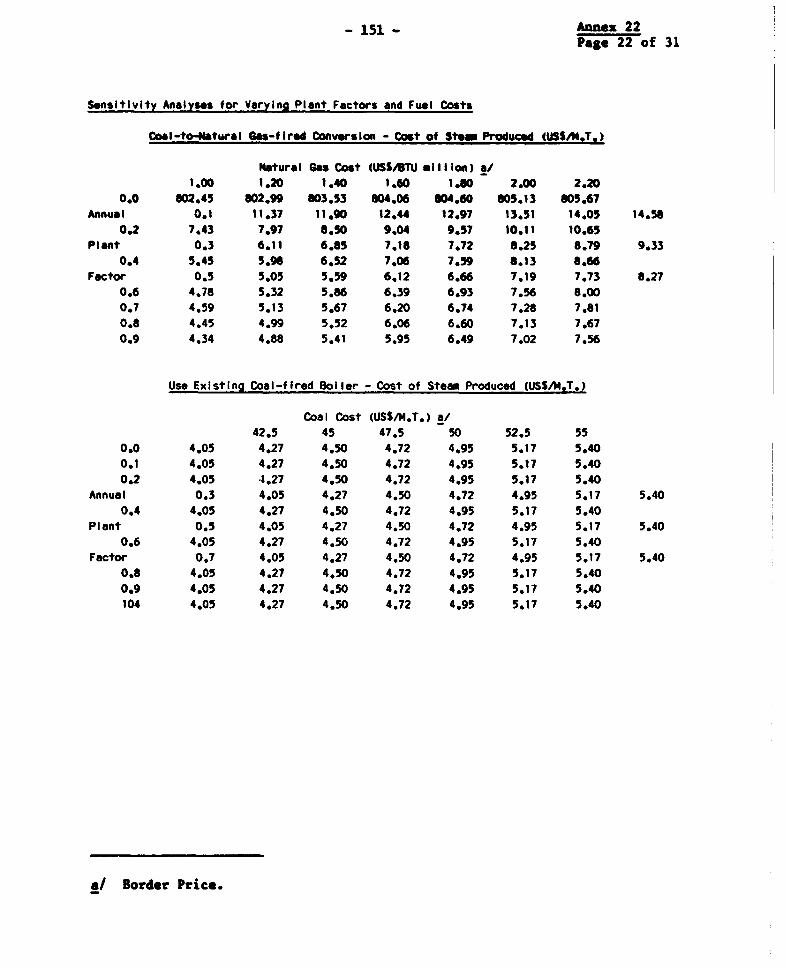
- 151 - Anne- 22Page 22 of 31
Sensitivity Analyses for Varying Plant Factors and Fuel Costs
Coal-to,Natural G.-fitrod Conversion - Cost of Steam Produced (iJSSM.T.)
Natural Gas Cost (US5STA million) SI1.00 1.20 1.40 1,60 1.60 2.00 2.20
0.0 802.45 802.99 803.53 604.06 604.60 6015.13 05.67Annual 0.1 11.37 11.90 12.4 12.97 13.51 14.05 14.58
0.2 7.43 7.97 8.50 9.04 9.57 10.11 10.65Plant 0.3 6.11 6.85 7.18 7.72 8.25 8.79 9.33
0.4 5.45 5.96 6.52 7.06 7.59 8.13 6.66Factor 0.5 5.05 5.59 6.12 6.66 7.19 7.73 8.27
0.6 4.78 5.32 5.86 6.39 6.93 7.56 8.000.7 4.59 5.13 5.67 6.20 6.74 7.28 7.810.8 4.45 4.99 5.52 6.06 6.60 7.13 7.670.9 4.34 4.88 5.41 5.95 6.49 7.02 7.56
Use Existing Coal-fired Boiler - Cost of Steam Produced (USS/MT.)
Coal Cost (USSJM.T.) a/42.5 45 47.5 50 52.5 55
0.0 4.05 4.27 4.50 4.72 4.95 5.17 5.400.1 4.05 4.27 4.50 4.72 4.95 5.17 5.400.2 4.05 4.27 4.50 4.72 4.95 5.17 5.40
Annual 0.3 4.05 4.27 4.50 4.72 4.95 5.17 5.400.4 4.05 4.27 4.50 4.72 4.95 5.17 5.40
Plant 0.5 4.05 4.27 4.50 4.72 4.95 5.17 5.400.6 4.05 4.27 4.50 4.72 4.95 5.17 5.40
Factor 0.7 4.05 4.27 4.50 4.72 4.95 5.17 5.400.8 4.05 4.27 4.50 4.72 4.95 5.17 5.400.9 4.05 4.27 4.50 4.72 4.95 5.17 5.40104 4.05 4.27 4.50 4.72 4.95 5.17 5.40
a/ Border Price.
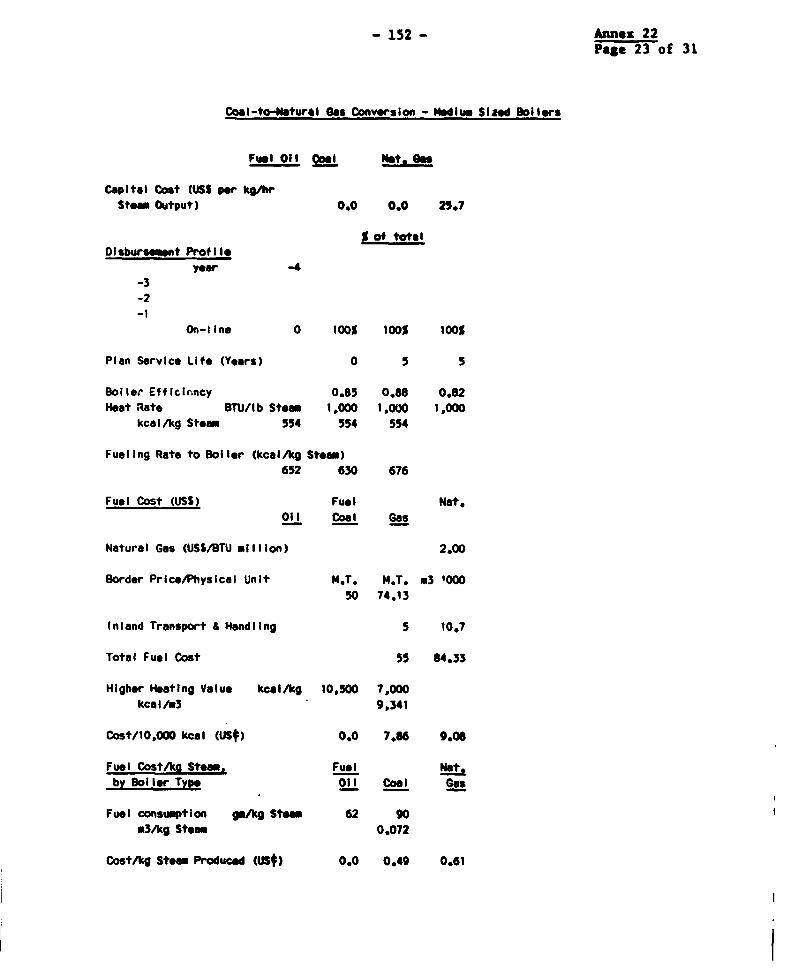
- 152 - Annex 22Pate 23 of 31
COal-to-Natural Gas Convwrsion - ModIum Sized Doilollrs
Fuel Oil Coa I I GM
Capital Cost (UMSS We kg/brStow Output) 0.0 0.0 25.7
S of totelDisbursement Prof i@I
yer -4-3-2-1
On-line 0 100% 100% 100S
Plan Service Life (Years) 0 5 5
Boiler Efficirncy 0.85 0.68 0.82Heat Rate BTU/lb Steoa 1,000 1.000 1,000
kcai I g Steam 554 554 554
Fueling Rate to Boller (kcal/kg Stem)652 630 676
Fuel Cost (USS) Fuel Nat.Oil Coal Gas
Natural Gas (USS/BTU million) 2.00
Border Price/Physical Unit M.T. M.T. m3 '00050 74.13
Inland Transport & Handling 5 10.7
Total Fuel Cost 55 84.33
Higher Heating Value kelskg 10,500 7,000kcal/63 9,341
Cost/10,000 kcal (USt) 0.0 7.86 9.06
Fuel Cost/kg Steam. Fuel Nat.by Bollor Type oli Coal Gas
Fuel consumption gpkg Stem 62 90m3/kg Stoea 0.072
Cost/kg Steam Produced (US0) 0.0 0.49 0.61
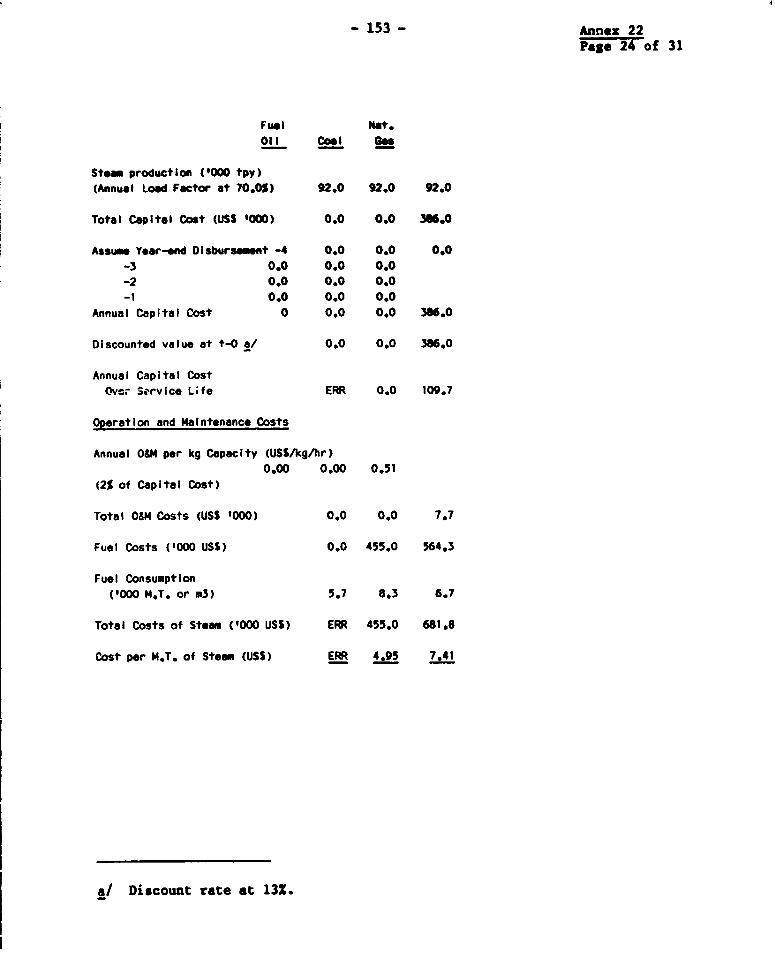
- 153- Annez 22Page 24 of 31
Fuel Net.Oil Coal e
Steam production ('000 tpy)(Annual Load Factor at 70.0%) 92.0 92.0 92.0
Total Capital Cost (USS '000) 0.0 0.0 366.0
Assume Year-end Disbursement -4 0.0 0.0 0.0-3 0.0 0.0 0.0-2 0.0 0.0 0.0-1 0.0 0.0 0.0
Annual Capital Cost 0 0.0 0.0 386.0
Discounted value at t-0 a/ 0.0 0.0 386.0
Annual Capital CostQvcr Service Life ERR 0.0 109.7
Operation and Maintenance Costs
Annual O&M per kg Capacity (USS/kg/hr)0.00 0.00 0.51
(2S of Capital Cost)
Total O04 Costs (USS '000) 0.0 0.0 7.7
Fuel Costs ('000 USS) 0.0 455.0 564.3
Fuel Consumption('000 M.T. or i3) 5.7 8.3 6.7
Total Costs of Steam ('000 USS) ERR 455.0 681.6
Cost per M.T. of Steam (USS) ERR 4.95 7.41
a/ Discount rate at 13%.
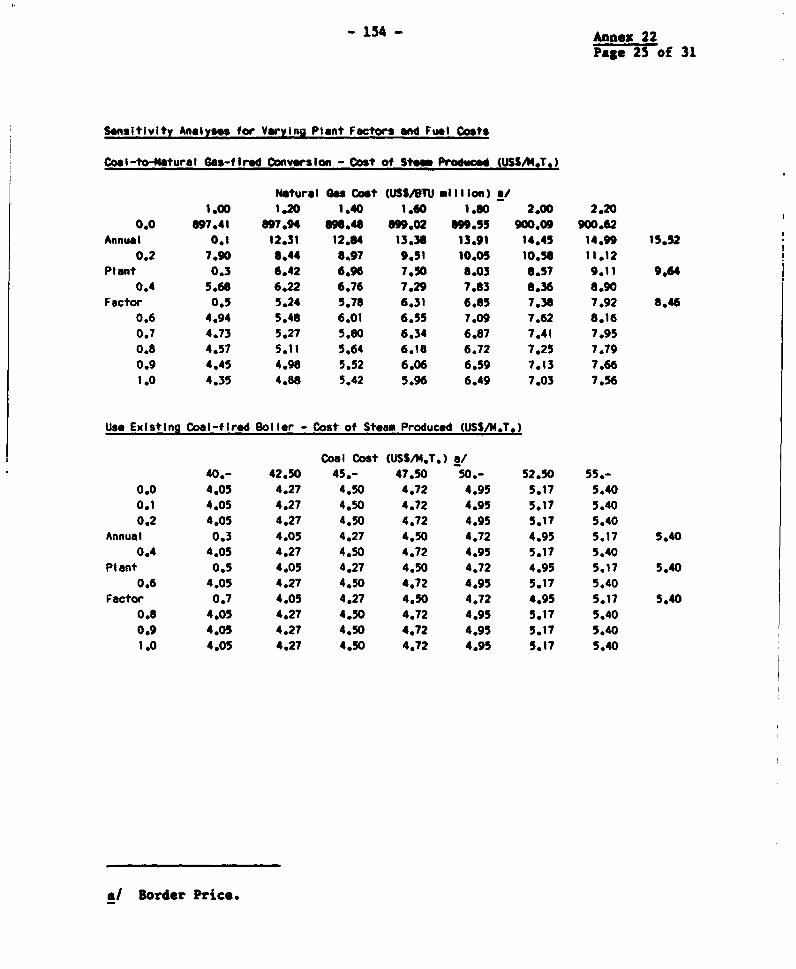
-154 - Annex 22Page 2S of 31
Sensitivity Analeys for Vwying Plant Factors and Fuel Coats
Coal-to-Natural 6as-f lred ConversIon - Cost of Stam Produced (USSM.T.)
Natural Ga Cost (USS/ mil IIon) a/1.00 1.20 1.40 1.60 1.60 2.00 2.20
0.0 697.41 897.94 96,46 69.02 99.55 900.09 900.62Annual 0.1 12.31 12.64 13.36 13.91 14,45 14.99 15.52
0.2 7.90 8.44 6.97 9.51 10.05 10.56 11.12Plant 0.3 6.42 6.96 7.50 8.03 8.57 9.11 9.64
0.4 5.60 6.22 6.76 7.29 7.83 8.36 8.90Factor 0.5 5.24 5.76 6.31 6.85 7.38 7.92 8.46
0.6 4.94 5.46 6.01 6.55 7.09 7.62 8.160.7 4.73 5.27 5.80 6.34 6.87 7.41 7.950.8 4.57 5.11 5.64 6.18 6.72 7.25 7.790.9 4.45 4.96 5.52 6.06 6.59 7.13 7.661.0 4.35 4.86 5.42 5.96 6.49 7.03 7.56
Use Existing Coal-fired Boiler - Cost of Steam Produced (USS/M,.T.)
Coal Cost (USSAM.T.) a/40.- 42.50 45.- 47.50 50.- 52.50 55.-
0.0 4.05 4.27 4.50 4.72 4.95 5.17 5.400.l 4.05 4.27 4.50 4.72 4.95 5.17 5.400.2 4.05 4.27 4.50 4.72 4.95 5.17 5.40
Annual 0.3 4.05 4.27 4.50 4.72 4.95 5.17 5.400.4 4.05 4.27 4.50 4.72 4.95 5.17 5.40
Plant 0.5 4.05 4.27 4.50 4.72 4.95 5.17 5.400.6 4.05 4.27 4.50 4.72 4.95 5.17 5.40
Factor 0.7 4.05 4.27 4.50 4.72 4.95 5.17 5.400.8 4.05 4.27 4.50 4.72 4.95 5.17 5.400.9 4.05 4.27 4.50 4.72 4.95 5.17 5.401.0 4.05 4.27 4.50 4.72 4.95 5.17 5.40
a/ Border Price.
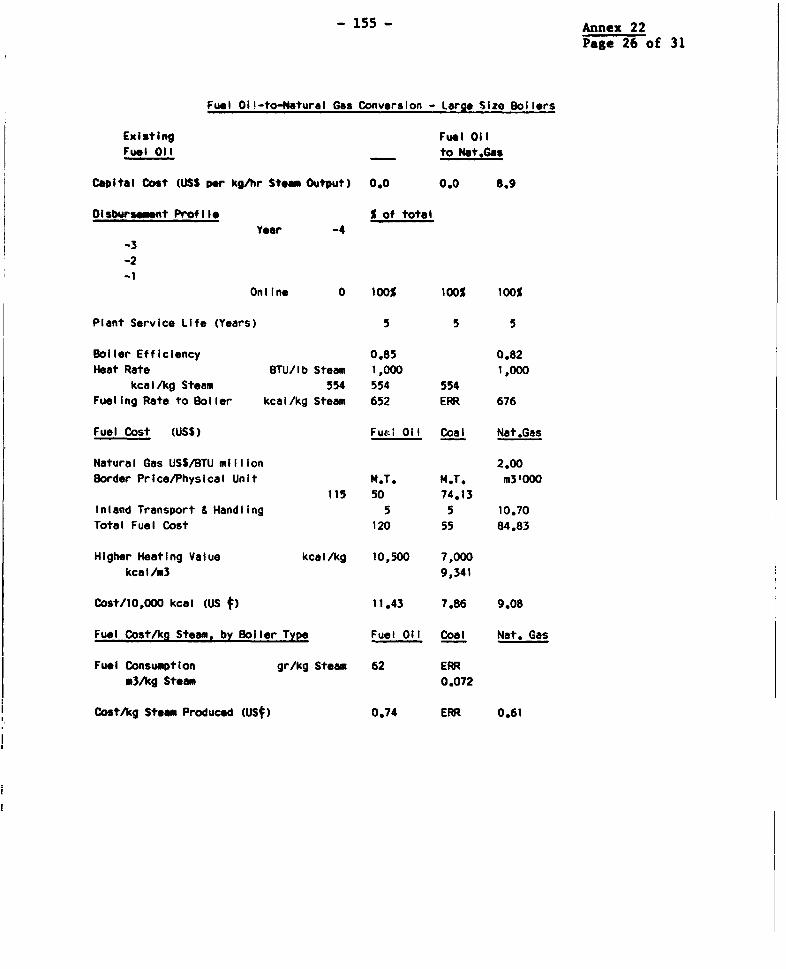
- 155 - Annex 22
Page 26 of 31
Fuel Oi!-to-Natural Gas Conversion - Large Size Boilers
Existing Fuel OilFuel Oil to Nat.Gas
Capital Cost (USS per kg/hr Steam Output) 0.0 0.0 8.9
Disbursement Profile S of totalYear -4
-3-2
-1Online 0 100% 100% 100%
Plant Service Life (Years) 5 5 5
Boiler Efficiency 0.85 0.82Heat Rate BTU/lb Steam 1,000 1,000
kcal/kg Steam 554 554 554Fueling Rate to Boiler kcal/kg Steam 652 ERR 676
Fuel Cost (USS) Fuel Oil Coal Nat.Gas
Natural Gas USS/BTU million 2.00Border Price/Physical Unit M.T. M.T. m3'000
115 50 74.13Inland Transport & Handling 5 5 10.70Total Fuel Cost 120 55 84.83
Higher Heating Value kcal/kg 10,500 7,000kcal/m3 9,341
Cost/10,000 kcal (US f) 11.43 7.86 9.08
Fuel Cost/kg Steam, by Boiler Type Fuel Oil Coal Nat. Gas
Fuel Consumption gr/kg Steam 62 ERRm3/hg Steam 0.072
Cost/kg Steam Produced (usM) 0.74 ERR 0.61

- 156 - Annex 22Page 27 of 31
Ful Oil Coat Nat.Gas
Steam Production ('000 tpy)(Annual Load Factor 70.0%) 275.9 275.9 275.9
Total Capital Cost (USSOOO) 0.0 0.0 399.0
Assume Year-end Disbursemnt -4 0.0 0.0 0.0-3 0.0 0.0 0.0-2 0.0 0.0 0.0-1 0.0 0.0 0.0
Annual Capital Cost 0 0.0 0.0 0.0
Discounted Value at tzO a/ 0.0 0.0 399.0
Annual Capital Cost over Service Life 0.0 0.0 113.4
Operation and Maintenance Costs
Annual O&M per kg Capacity (USS/kg/hr) 0.00 0.00 0.18(2% of Capital Cost)
Total OM Costs (USS '000) 0.0 0.0 8.0
Fuel Costs ('000 USS) 2,055.4 ERR 1,693.0Fuel Consumption('000 M.T. or m3) 17.1 ERR 20.0
Total Costs of Steam ('000 USS) 2,055.4 ERR 1,814.5
Cost per M.T. Steam (USS) 7.45 ERR 6.58
a/ Discount rate at 13Z.
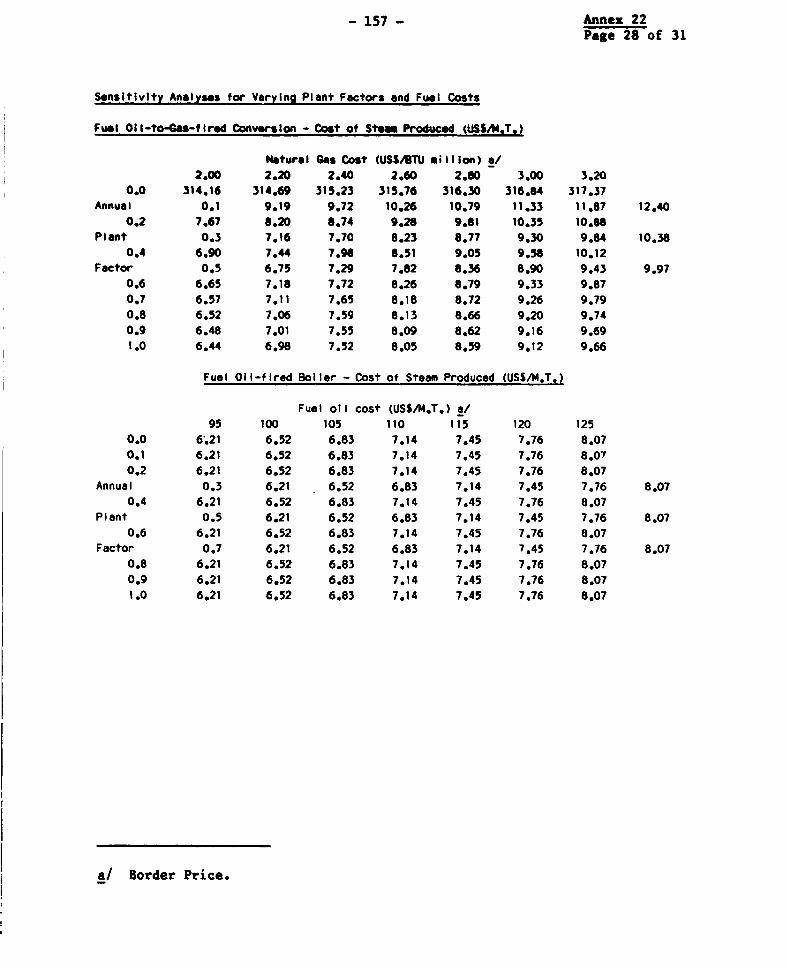
- 157 - Annex 22Page 28 of 31
Sensitivity Anolyss for Varying Plant Factors and Fuel Costs
Fuel Oll-to-Gas-fIred Conversion - Cost of Stem Produced (USSM.T.)
Natural Gas Cost (USS/BTU million) a/
2.00 2.20 2.40 2.60 2.80 3.00 3.20
0.0 314.16 314.69 315.23 315.76 316.30 316.84 317.37Annual 0.1 9.19 9.72 10.26 10.79 11.33 11.87 12.40
0.2 7.67 8.20 8.74 9.26 9.81 10.35 10.88
Plant 0.3 7.16 7.70 8.23 8.77 9.30 9.84 10.38
0.4 6.90 7.44 7.91 8.51 9.05 9.58 10.12
Factor 0.5 6.75 7.29 7.82 8.36 8.90 9.43 9.97
0.6 6.65 7.18 7.72 8.26 8.79 9.33 9.87
0.7 6.57 7.11 7.65 8.18 8.72 9.26 9.79
0.8 6.52 7.06 7.59 8.13 8.66 9.20 9.74
0.9 6.48 7.01 7.55 8.09 8.62 9.16 9.69
1.0 6.44 6.98 7.52 8.05 8.59 9.12 9.66
Fuel Oil-fired Boiler - Cost of Steam Produced (USS/M4.T.)
Fuel oil cost (USS/M.T.) a/
95 100 105 110 115 120 125
0.0 6.21 6.52 6.83 7.14 7.45 7.76 8.07
0.1 6.21 6.52 6.83 7.14 7.45 7.76 8.07
0.2 6.21 6.52 6.83 7.14 7.45 7.76 8.07
Annual 0.3 6.21 6.52 6.83 7.14 7.45 7.76 8.07
0.4 6.21 6.52 6.83 7.14 7.45 7.76 8.07
Plant 0.5 6.21 6.52 6.83 7.14 7.45 7.76 8.07
0.6 6.21 6.52 6.83 7.14 7.45 7.76 8.07
Factor 0.7 6.21 6.52 6.83 7.14 7.45 7.76 8.07
0.8 6.21 6.52 6.83 7.14 7.45 7.76 8.07
0.9 6.21 6.52 6.83 7.14 7.45 7.76 8.07
1.0 6.21 6.52 6.83 7.14 7.45 7.76 8.07
a/ Border Price.
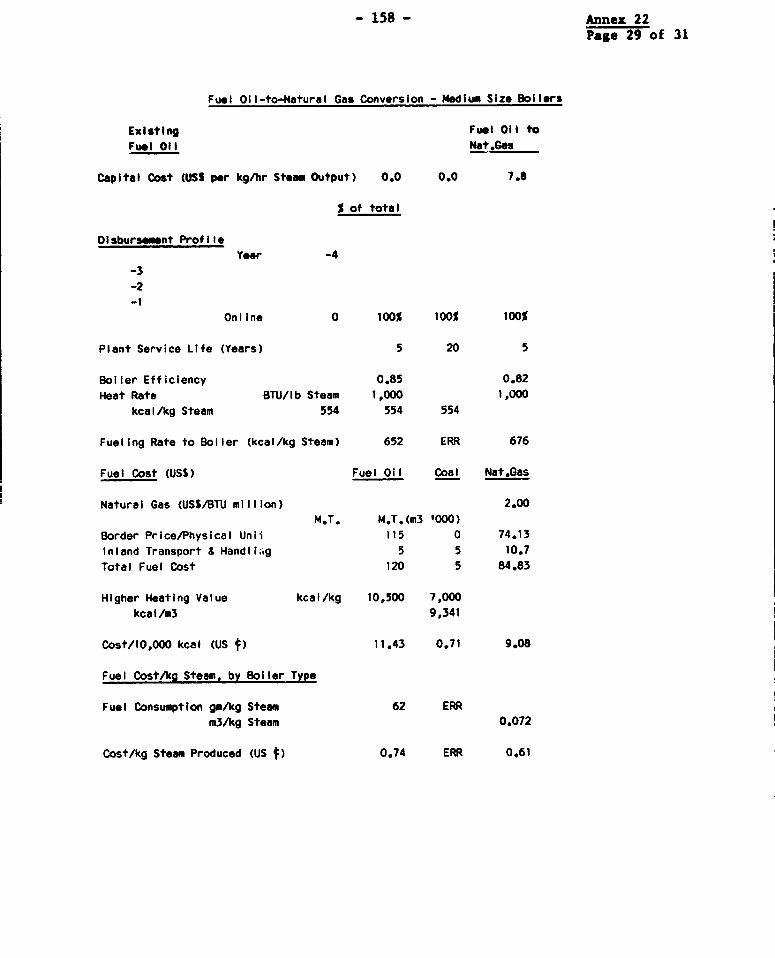
- 158 - Annex 22Page 29 of 31
Fuet Oil-to-Natural Gas Conversion - Medium Size Boilers
Existing Fuel Oil to
Fuel 01I Nat.Ges
Capital Cost (USS per kg/hr Steam Output) 0.0 0.0 7.8
% of total
Disbursemnt ProfileYear -4
-3
-2-1
Online 0 100% 100% 100%
Plant Service Life (Years) 5 20 5
Boiler Efficiency 0.85 0.82
Heat Rate BTU/lb Steam 1,000 1,000
kcal/kg Steam 554 554 554
Fueling Rate to Boiler (kcal/kg Steam) 652 ERR 676
Fuel Cost (USS) Fuel Oil Coal Nat.Gas
Natural Gas (USS/BTU million) 2.00M.T, M.T.(m3 '000)
Border Price/Physical Unii 715 0 74.13Inland Transport & Handli.g 5 5 10.7Total Fuel Cost 120 5 84.83
Higher Heating Value kcal/kg 10,500 7,000kcal/m3 9,341
Cost/10,000 kcal (US 1) 11.43 0.71 9.08
Fuel CostAkg Steam, by Boiler Type
Fuel Consumption gm/kg Steam 62 ERRm3/kg Steam 0.072
Cost/kg Steam Produced (US j) 0.74 ERR 0.61

- 159 - Annex 22Page 30 of 31
Fuel Oil Coal Nat.Gas
Steam Production i;'000 tpy)(Annual Load Factor 70.0%) 70.0 92.0 92.0
Total Capital Cost (USS '000) 0.0 0.0 117.0
Assume Year-end DIsbursement -4 0.0 0.0 0.0-3 0.0 0.0 0.0-2 0.0 0.0 0.0-1 0.0 0.0 0.0
Annual Capital Cost 0 0.0 0.0 117.0
Discounted Value at t*O a/ 0.0 0.0 117.0
Annual Capital Cost over Service Life n.a. n.a. 33.3
Operation and Maintenance Costs
Annual O&M per kg Capacity (USS/kg/hr) 0.00 0.00 0.16
(2% of Capital Cost)
Total O&M Costs (.SS '000) 0.00 0.0 2.3
Fuel Costs ('000 USS) 685.1 ERR 564.3Fuel Consumption ('000 M.T. or m3) 5.7 ERR 6.7
Total Costs of Steam ('000 USS) 685.1 ERR 600.0
Cost per M.T. Steam (USS) 7.45 ERR 5.52
a/ Discount rate at 13Z.
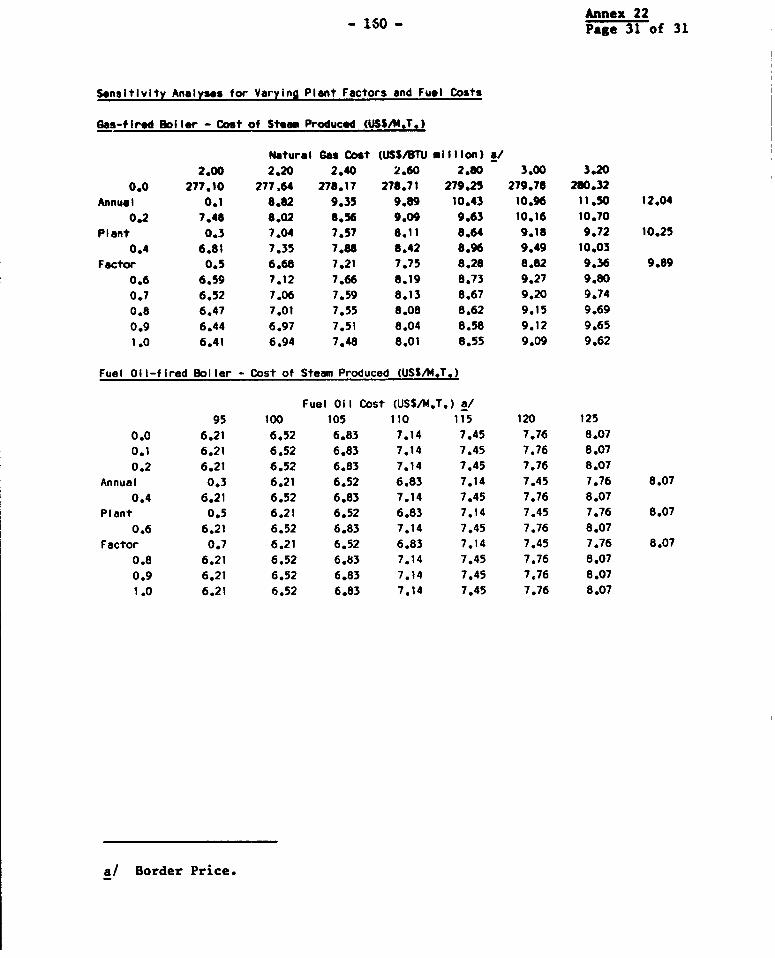
Annex 22- 160 - Page 31 of 31
Sensitivity Analyses for Varying Plant Factors and Fuel Costs
Gas-fI red El ler - Cost of Steam Produced (USSM.T.)
Natural Gas Cost (USS#UTU million) a/2.00 2.20 2.40 2.60 2.80 3.00 3.20
0.0 277.10 277.64 278.17 278.71 279.25 279.76 260.32Annual 0.1 8.82 9.35 9.89 10.43 10.96 11.50 12.04
0.2 7.48 8.02 8.56 9.09 9.63 10.16 10.70Plant 0.3 7.04 7.57 8.11 8.64 9.18 9.72 10.25
0.4 6.81 7.35 7.88 8.42 8.96 9.49 10.03Factor 0.5 6.68 7.21 7.75 8.28 8.82 9.36 9.89
0.6 6.59 7.12 7.66 8.19 8.73 9.27 9.800.7 6.52 7.06 7.59 8.13 8.67 9.20 9.740.8 6.47 7.01 7.55 8.08 8.62 9.15 9.690.9 6.44 6.97 7.51 8.04 8.58 9.12 9.65
1.0 6.41 6.94 7.48 8.01 8.55 9.09 9.62
Fuel Oil-fired Boiler - Cost of Steam Produced (USS/M.T.)
Fuel Oil Cost (USS/M.T.) a/
95 100 105 110 115 120 125
0.0 6.21 6.52 6.83 7.14 7.45 7.76 8.07
0.1 6.21 6.52 6.83 7.14 7.45 7.76 8.07
0.2 6.21 6.52 6.83 7.14 7.45 7.76 8.07
Annual 0.3 6.21 6.52 6.83 7.14 7.45 7.76 8.07
0.4 6.21 6.52 6.83 7.14 7.45 7.76 8.07Plant 0.5 6.21 6.52 6.83 7.14 7.45 7.76 8.07
0.6 6.21 6.52 6.83 7.14 7.45 7.76 8.07Factor 0.7 6.21 6.52 6.83 7.14 7.45 7.76 8.07
0.8 6.21 6.52 6.83 7.14 7.45 7.76 8.07
0.9 6.21 6.52 6.83 7.14 7.45 7.76 8.07
1.0 6.21 6.52 6.83 7.14 7.45 7.76 8.07
a/ Border Price.
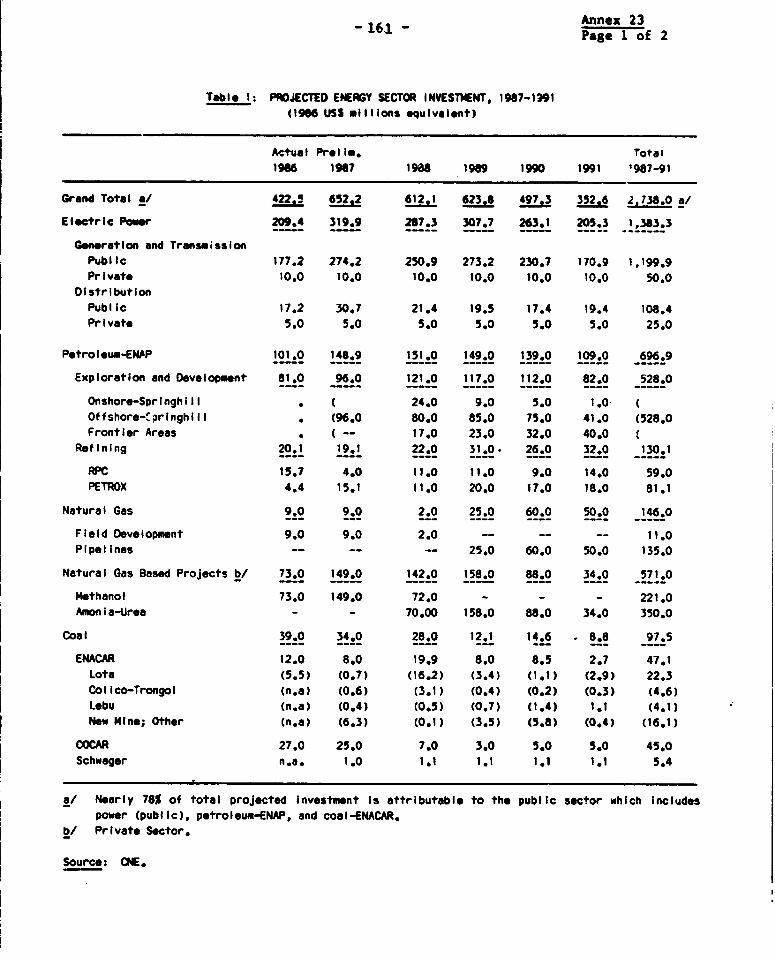
- 161 - Annex 23Page 1. of 2
Table 1: PROJECTED ENERGY SECTOR INVESTMENT, 1987-1991(1966 USS millions equivalent)
Actual Prel li. Total1966 1967 1988 1989 1990 1991 '987-91
Grand Total a/ 422.5 652.2 612.1 623.8 497.3 352.6 2,738.0 a/
Electric Pow 209.4 319.9 267.3 307.7 263.1 205.3 1,383.3
Generation and TransmissionPublic 177.2 274.2 250.9 273.2 230.7 170.9 1,199.9Private 10.0 10.0 10.0 10.0 10.0 10.0 50.0
DistributionPublic 17.2 30.7 21.4 19.5 17.4 19.4 108.4Private 5.0 5.0 5.0 5.0 5.0 5.0 25.0
Petroleum-EN4P 101.0 148.9 151.0 149.0 139.0 109.0 696.9
Exploration and Development 81.0 96.0 121.0 117.0 112.0 82.0 528.0
Onshore-Springhiil .l 24.0 9.0 5.0 1.0Offshore- pringhiil l (96.0 80.0 85.0 75.0 41.0 (528.0Frontier Areas . ( -- 17.0 23.0 32.0 40.0
Refining 20.1 19.1 22.0 31.0. 26.0 32.0 130.1
R{PC 15.7 4.0 11.0 11.0 9.0 14.0 59.0PETROX 4.4 15.1 11.0 20.0 17.0 18.0 81.1
Natural Gas 9.0 9.0 2.0 25.0 60.0 50.0 146.0
Field Development 9.0 9.0 2.0 - -- -- 11.0Pipelines -- -- -- 25.0 60.0 50.0 135.0
Natural Gas Based Projects b/ 73.0 149.0 142.0 158.0 88.0 34.0 571.0
Methanol 73.0 149.0 72.0 - - - 221.0Amonia-Urea - - 70.00 158.0 88.0 34.0 350.0
Coal 39.0 34.0 28.0 12.1 14.6 8.8 97.5
ENACAR 12.0 8.0 19.9 8.0 8.5 2.7 47.1Lota (5.5) (0.7) (16.2) (3.4) (1.1) (2.9) 22.3Colico-Trongol (n.a) (0.6) (3.1) (0.4) (0.2) (0.3) (4.6)Lebu (n.a) (0.4) (0.5) (0.7) (1.4) 1.1 (4.1)New Mine; Other (n.a) (6.3) (0.1) (3.5) (5.8) (0.4) (16.1)
COCAR 27.0 25.0 7.0 3.0 5.0 5.0 45.0Schwager n.a. 1.0 1.1 1.1 1.1 1.1 5.4
e/ Nearly 78% of total projected Investment Is attributable to the public sector which includespower (public), petroleum-ENAP, and coal-ENACAR.
b/ Private Sector.
Source: CNE.
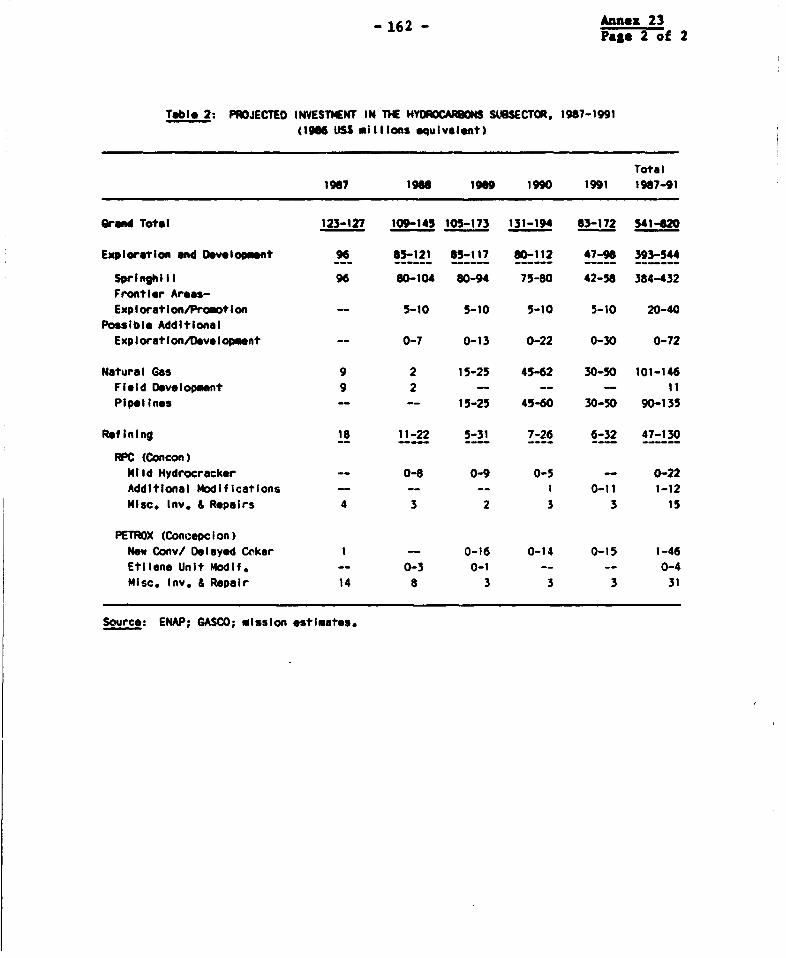
- 162 - Annex 23-162 - ~~~~Page 2 of 2
Table 2: PROJECTED INVESTiENT IN THE HYROCARONS SU9SECTOR, 1987-1991(196 USS millions equivalent)
Total1967 1966 1969 1990 1991 1967-91
Gred Total 123-127 109-145 105-173 131-194 63-172 541420
Exploration an Developmnt 96 85-121 65-117 0112 47-96 393-544
Springhl II 96 80-104 80-94 75-80 42-58 384-432Frontier Areas-Exploration/Promotion -- 5-10 5-10 5-10 5-10 20-40
Possible AdditionalExploration/Development -- 0-7 0-13 0-22 0-30 0-72
Natural Gas 9 2 15-25 45-62 30-50 101-146Field Development 9 2 - -- - 11Pipelines -- -- 15-25 45-60 30-50 90-135
Refining 18 11-22 5-31 7-26 6-32 47-130
RC (Concon)Mild Hydrocracker -- 0-8 0-9 0-5 - 0-22Additional Modifications -- -- -- I 0-11 1-12Misc. Inv. & Repairs 4 3 2 3 3 15
PETROX (Concepc ion)New Conv/ Delayed Ceker 1 -- 0-16 0-14 0-15 1-46Etilene Unit Modif. -- 0-3 0-1 -- -- 0-4Misc. Inv. & Repair 14 8 3 3 3 31
Source: ENAP; GASCO; mission estimates.
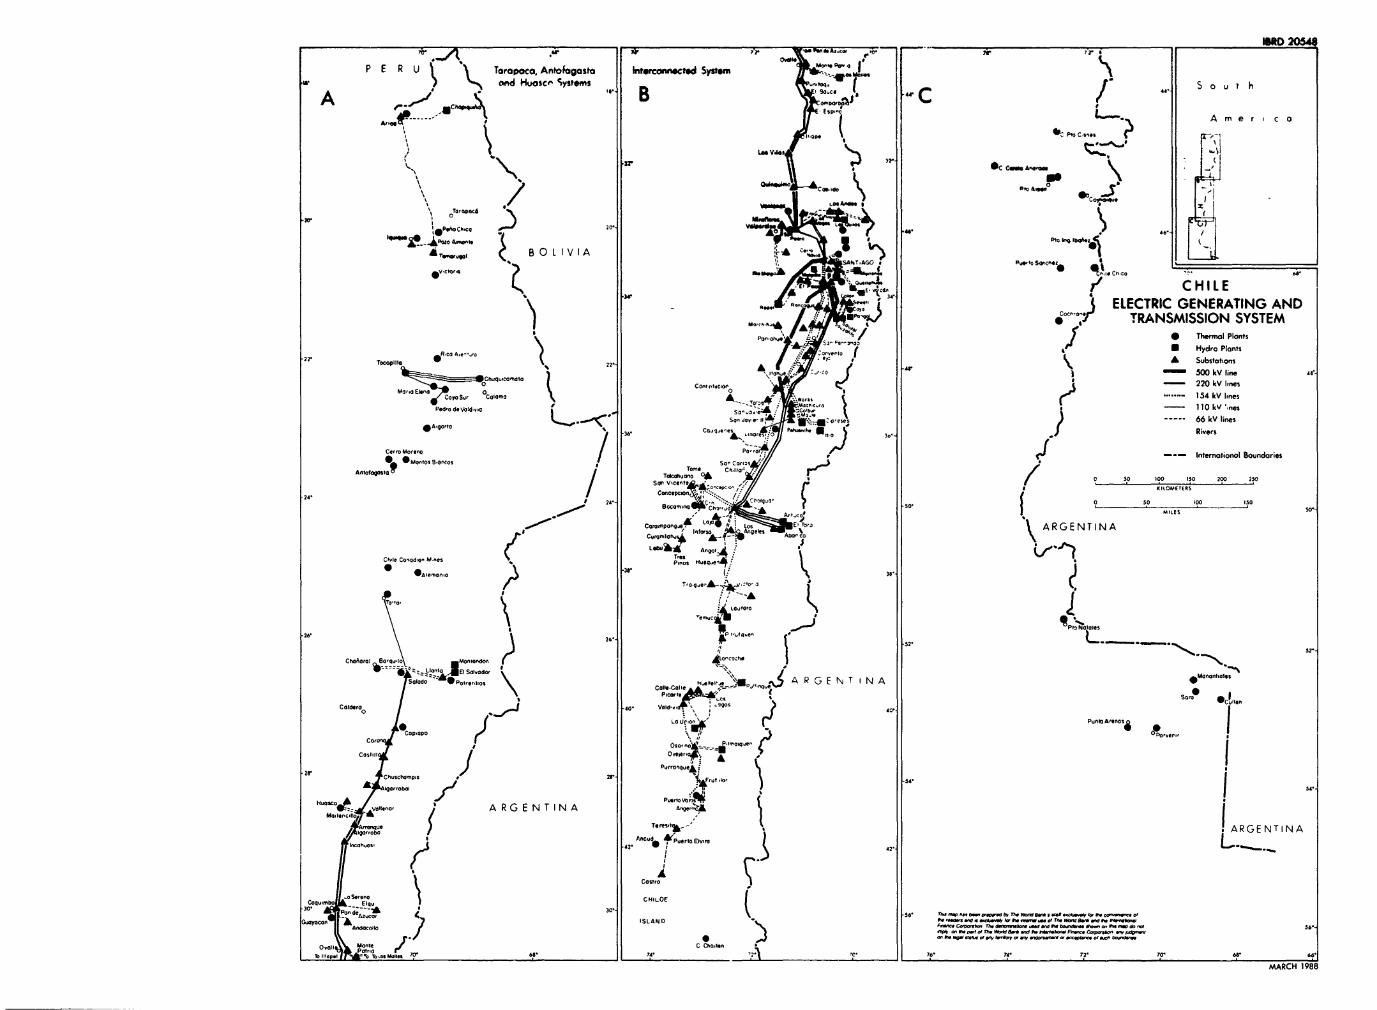
_ _ { > _ of etWt< ' ~44mror r ;0
P E R U Torapoco, Antofosasto 6 hco tn d System M o wW I) 1%%~~~~~~~~~~~~ dHuscec" Systems o I
| A ~ ~trS ":4 B n |C / " So| 5 u tA
It P~~~~~~~~~~~~~~~ta Ci.
\~~~~~~~~~~~~~~~~~~~,am coti:FE\ 11 ~ cooaa.e..!!; zI
r' C t4 2 _ 0f i < n.l¢ C h C o s^. itsWiT AGO p ~~~~~~~PuosrtoSeoO
~~~~~~~~1 .4.~~~~~~~~~~~~~~~~~~~~~~~~~~~~~~~~
.0.0.0(4 joot / ^ - liO+E.aeCHILE
\ S 0 .'R<-iQ,Fl' i t ELECTRIC GENERATING ANDl IA.t.Xe,, .;0bro ....... ) TRANSMISSION SYSTEM
Poroi,o& V / A * Thermal PlantsR.cT A.e-4 % 7 osW r rl { irt * Hydro Plemts~~~~~~~~~~~~~~~~~~~~~~~~~~~~HyroPlnt
-2r Toropilbc 22 Ar .,A e Substot,ons
CAt.vgComqto -Comf.t clor 2 7 e)8 4r ! = 500 kV line 44*
MorioEwenoW*0y0s, \ioiie t ti ..::oU Hyra. P *--- 5 VlantsPe"ro 2o20i.tio i- - jkV lines
COirplForero / Pooi>// t sJ --- Internedionos154kV Ines~~~~~qoOres, ~~~~~~~~~~~~~~~~~~~~~~~~66 kV lines*A.ssflo Joor ii,~~~~16 Rives
:-AA *ootso *Mo0ntos.oncos J CS0
3~*8i a I CI:ilYr/! . ~~~~~~~~~~~~~~~~~~~~~~~~~~. ---~~~~~~~~Internationol Boundaries
A.*fo0 so Igo ISBonin C.0o . 2/
24 , J 2ss * 5 50, f sItOMETERS ' *50~~~~~~~~~~~~~~~~~~~~~~~~~~~~~~~~~~~~~~~~~~~~~KIOEIR
24' 0 24'- 0~~~~~~~~~~~~~~~~~~~~~~~~~~~50 5~0 00 _iso
co,ainponga4 0 0El T, ARGENTINA
Ch.l C-ndon MS T,-s TI.-
040400.0o i. p,0
H (ot '\ 38t-.
---=a-. Llont<3 ,l4EISolvodor ~ ~ ~ ~ xx / '_
2~~~~ ~~* o4 SCol - tt^--Pl qp4RGENTSNA owt/ . Plcorle>;.bt'c, , sOW c I~~~~~~~~~~~~~~~~~~~~~~~~~~~~~~~~~~~~~~~~~~~~I,NcosIOM.Y JM __% '. I '%% sr
C2roa Bo'hisaTownl uw tno 2r 4orctdoeh ) 4
4tArenq ) Ter 'Iqi A R G E N T N Aoorbo AncudLioflt,UaSIoldo,L
Inc1h040 S orrio na 0 b 0 .
Coldero C0 o d0
cSerero X CHI~~~~~~~~~~~~~~~~LOE r;.o
C,C OscIspisp P*CtCc .A LS N_A_~ ot Ans
Cotii Cop
t Sfno. / ARGEN,INAA.'arq.iP ~ ~ ~ ~ ~ ~ ~ ~ ~~~~~~~~~0,,-.e,
igoioo MARGENTINAlosotioss. (1 I2 =d .e-E. 2
CasVro
oC2Q,no 1CHILOE '
Po 0 w..5. aaoatt.ts,nte .aa 4roc.of.0
Gooyooan ~~~~~~~~~~~~~~~~ 1 ~~~~ISLAND ft' -k-* .. e.. iw0...iin Th. -siastoa0 of
Osl Mn.C Cti.t.ii
.0 ila* .laSoo. B7''' 74*16 74* or0Y 46
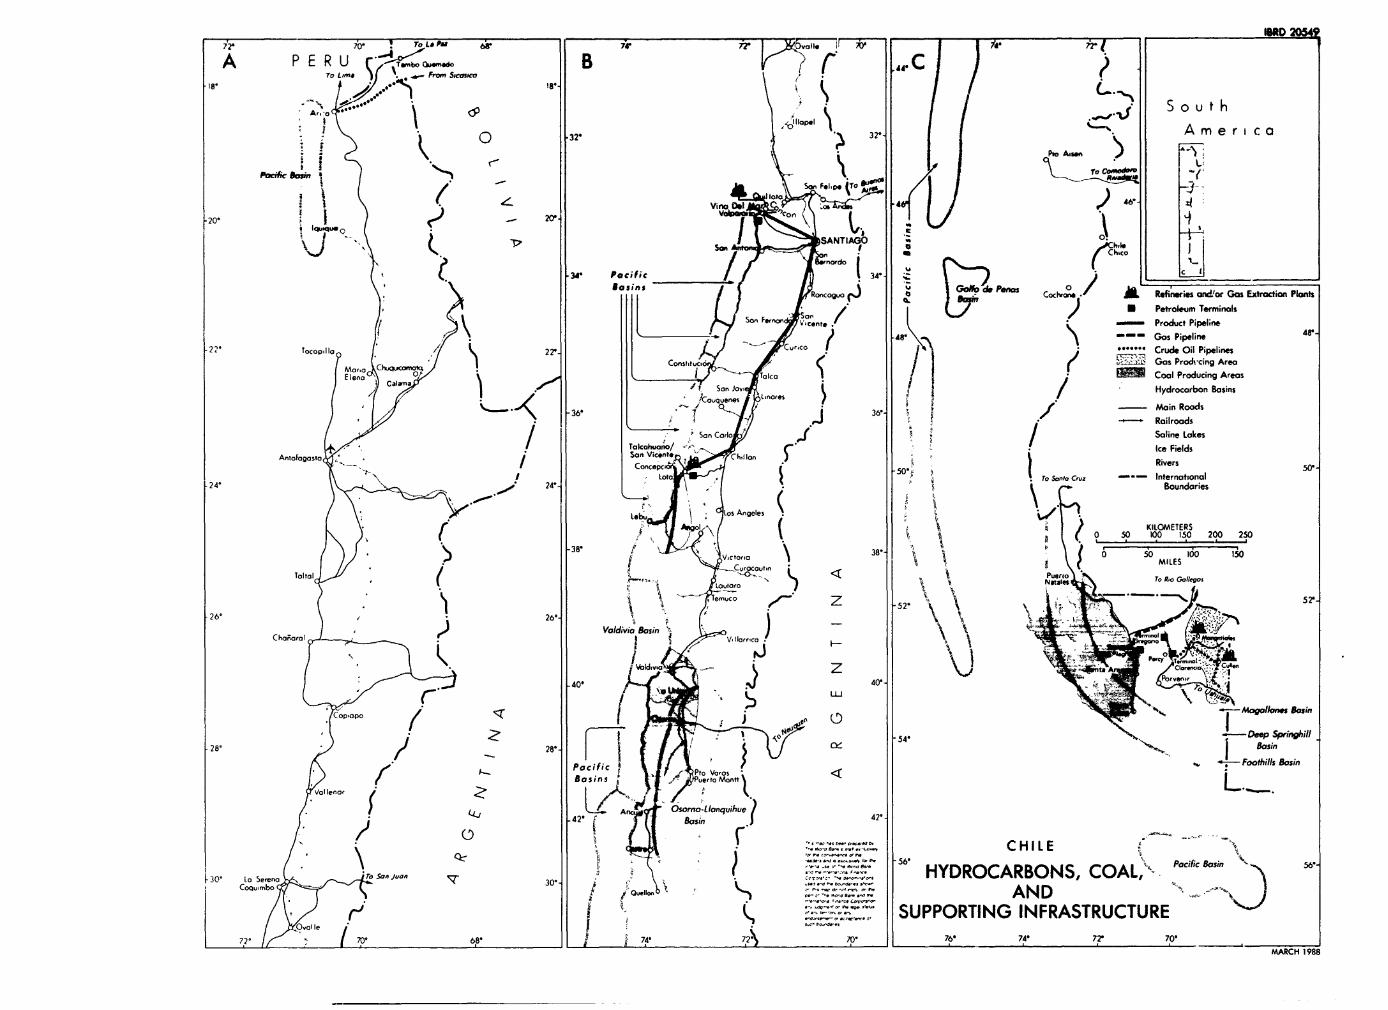
ir 70- ! ToLa Pa 7* -_
A P E R U c20' ,!, tx rS 1 3^ tv fi _Sou th
18 Q 32~~~~~~~~~~~~~~~~~~~~~~~~~~~~~~~~~~~~~~~~~~~~3'
PacIfic Basin - Son FeI pe -48 gG4
j ~ ~ 2 t8 ; t3ei.3w4 s3Sneeie
20' 0
} = '11 / ' >> U |^~i i IU (
|:> .t~~~~~~~~~~~~~~~~4 Pacific 34 '?p°oon 1s-,Fohlssi
Roiicog.,o ~~~~~~..J a ~~CocIv"e Refimanes and/or Gas Extraction Plants
So. F t Petroleum Term inalstocoi,IIa / 48* ~~~~~~~~~~~~~~~~~~~~~~~~~~I et.- Product Pipeline
2?- Crude Oil PipelinesMaro Co11 h-. Gas Prod.-cing Area
Eln Ican'I11Coal Producing Areas/ I f ~~~~~~~~~~~~~~~~~~~~/T a o~ .osHydrocarbon Basins
36 f - ~~~~~~~~~~~~~~~~~~~~~~~~~~~~Main Roads/ 36-i3-. Railroads
4'- / Takahuano! ~~~~~~~~~~~~~~~~~~~~~~~~~~~~~~~~~~~~~~~~~~~~~~~Salinte LakesAniofagasto / ~~~~~~~~~~~~ ~ ~~~~~~San Viceinte .Io Ice Fields
24> 5o*C on P Rivers N S Loto -50'~~~~~~~~~~~~~~~~~~ ~To Sameo C-o International
Boundaries
Le An gol ~~~~~~~~~~~~~~~~~~~KILOMETERS0 50 100 M50 200 250-38- 38', ~~~~~~~~~~~~~~~~~~~~~~~~0 ~~~~ i6o ISOMILES
Toltol Pu~~~~~~~~~~~~~~~~~~~~~~~~~~~~~~~~~~~~~~~~~~~~~~iaee To Ro Gollegoi
.26' 26 \ \ Chogora l Valdivia Basin V~ 7 \ >7
40. 40a Cor,o
.54. - Springhill.28' 28- j Jy Basin
Pacific - ~~~~~~~~~~~~~~~~~~~~~~~~~~~~~~~~~~~~~~~Foothills BasinBasins / Ppo V0,os
L~. A Osorno Llonquihue.42- Bas ~~~~~~~~~~~~~~~42-
La Sereno To ~~~~~~. 56 ~HYDROCARBONS, COAL,- aifcBai
~~ SUPPORTING INFRASTRUCTURE72. 701 68I j ~ 4* 2 7p 761 74- ?7 _____
MAARCH 1988
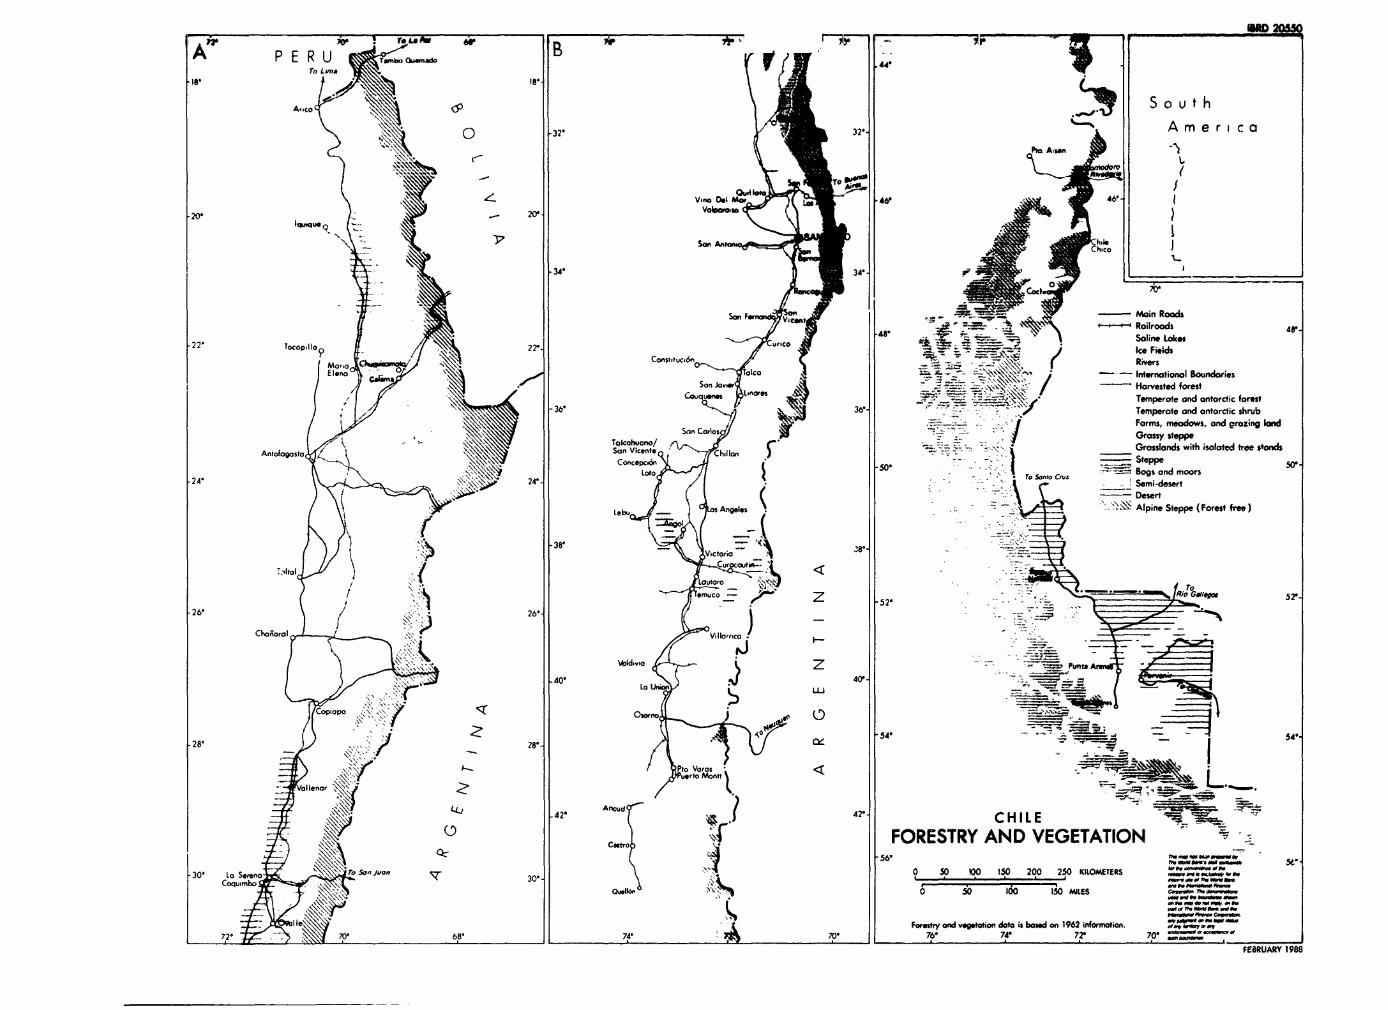
A7~P E R U
To
I.. ~~~Aoco Lmal~S
o ut h
C) 32' 32'-' Am er Ic aPia A.ie
V-na De MO, 4
34- 34* _ _ _ _ _ _ _ __ _ _ _ _ _ _ _ _
-4 11 Saline Lake s-22' Tocop.1o laRilra.22'. ~ ~ ~ ~ ~ vco/Ice
FieldsCornswvtc,6n oiolRK~ ~, nitvernsationl Boundaries
Elena [co~~~~~~~~~~~~~~i Z- A Harvested forest
7~~~~~~~~~~~6 36' Temperate and antarctic shrub
San Caries j ~~~~~~~~~~~~~~~~~~Farms, meadows, and grazing lkd
Talcatiuona/ ~~~~~~~~~~~~~~~~~~~~~~~Grassy steppeAnrofogasto ~~~~~~~~~~~~~~Son Vicente Grasslands with isalated tree stands
Coocepc.6~~~~~~~~~~~~~~~~ J - ~~~~~~~Steppe24' 24 ~~~~~~~~ ~~~~~~~~~~~~~Loto To Sa.Cv Bogs and moors
I I ~~~~~~~~~~~~~~~~~2 ~~~~Semi-desert( ~~~~~~~~~~~~~~~~~~~Desert
¶ ~ ~ ~ ~~ ~Alpine Steppe (Forest free)Lobs, ~~~Angeles
38' 78
- Vctori,
>.Atal
I emuco-~~~~~~~~ ~ ~~~ ~~~~~~ 52' .- ' *zRo 'eo26' /26'/ChoiRora I
lia'rrco F-
40-
40'40LaUnLr
7U
Co,opo O K , o
28' 28'-
PaVrosM
Qtj 42 ncdj HL
To LaoJuan Castro ~~~FORESTRY AND VEGETATIONSN'~~~~~~~~~~~~~~~~~~~~~~~~~~~~~~~~~~~~~~~~~~~~~~~~~~~~~~e
0 50 100 150 200 250 KILOMETERS-30' Lo Sero
___ ____Joan_ ___30_ ___
lie ~~~~~~~~~~~~~~~~~~~~~~~~~~~~~~~~~~~~~~~~Foresr and vegetation data is based on 1962 information. 0.rywe,.7PI ~~6I8' I74' 70 6' 7~4' 7.2' 0
FE8RUARY 1988