Children’s drawings about environmental phenomena: the use of visual codes
16
Volume 1, Number 1 Children’s Drawings about Environmental Phenomena: The Use of Visual Codes Vasilia Christidou, Vassilia Hatzinikita and Anastasia Dimitriou
-
Upload
independent -
Category
Documents
-
view
0 -
download
0
Transcript of Children’s drawings about environmental phenomena: the use of visual codes

Volume 1, Number 1
Children’s Drawings about EnvironmentalPhenomena: The Use of Visual Codes
Vasilia Christidou, Vassilia Hatzinikita and Anastasia Dimitriou

THE INTERNATIONAL JOURNAL OF SCIENCE IN SOCIETY http://science-society.com/journal/ First published in 2009 in Champaign, Illinois, USA by Common Ground Publishing LLC www.CommonGroundPublishing.com. © 2009 (individual papers), the author(s) © 2009 (selection and editorial matter) Common Ground Authors are responsible for the accuracy of citations, quotations, diagrams, tables and maps. All rights reserved. Apart from fair use for the purposes of study, research, criticism or review as permitted under the Copyright Act (Australia), no part of this work may be reproduced without written permission from the publisher. For permissions and other inquiries, please contact <[email protected]>. ISSN: 1836-6236 Publisher Site: http://science-society.com/journal/ THE INTERNATIONAL JOURNAL OF SCIENCE IN SOCIETY is peer-reviewed, supported by rigorous processes of criterion-referenced article ranking and qualitative commentary, ensuring that only intellectual work of the greatest substance and highest significance is published. Typeset in Common Ground Markup Language using CGCreator multichannel typesetting system http://www.commongroundpublishing.com/software/

Children’s Drawings about Environmental Phenomena:The Use of Visual CodesVasilia Christidou, University of Thessaly, Volos, GreeceVassilia Hatzinikita, Hellenic Open University, Patra, GreeceAnastasia Dimitriou, Democritus University of Thrace, Alexandroupolis,Greece
Abstract: Visual communication, i.e. the use of images in order to produce messages, constitutes anautonomous system of meaning – making, parallel to language, with its specialized codes and ‘gram-mar’. Visual representations play a central role in texts related to science, either these texts addressscientists, or the non-specialized, general public. Therefore, the ability of students to understand andexplain scientific phenomena depends – at least partly – on their ability to use the codes of scientificimagery. The present study aims at exploring the types of visual codes that the children use and atestimating their degree of compatibility with the codes normally used for the illustration of scientifictexts. The study presents an analysis of 50 drawings produced by Greek elementary school pupils (11-12 years old). The drawings concerned global environmental issues (namely ozone depletion andglobal warming), which involve complex scientific processes. The pupils’ drawings are analyzed alongthree dimensions: a) the type of representation, that is the degree to which the drawings follow theconventions of the scientific visual language; b) the function of the representation, i.e. if it mainlynarrates an event, analyses an entity to its constituent parts, or it classifies different entities accordingto specific criteria; c) the degree of abstraction and elaboration (formality) of the visual code. Theresults of the analysis indicate that at the time of leaving primary school children are already familiarwith the basic rules of ‘visual grammar’. They successfully use codes and conventions of the visuallanguage of science in order to describe and explain graphically complex mechanisms, even whentheir representations are inadequate in comparison with the scientific explanation of the depictedphenomena.
Keywords: Formality of Visual Representations, Function of Visual Representations, GlobalWarming,Ozone Depletion, Pupils’ Drawings, Type of Visual Representations, Visual Codes, Visual Commu-nication
Introduction
VISUALCOMMUNICATION, THAT is the use of images (visual representations)for the construction of messages, constitutes an autonomous system of meaningmaking, parallel to language, with its own specific conventions, codes and “gram-mar” (Kress & vanLeeuwen, 1996; Lister &Wells, 2006; Pintó & Ametller, 2002).
Specifically science-related texts use visual images as a central rhetoric means for analyzing,describing, and understanding scientific phenomena (Cifuentes & Hsieh, 2004; Mathewson,2005; Roth & Bowen, 2003), independent of the scientific specialization of the public theyaddress. Among the visual communication used in such texts are diagrams, tables, chains,pyramids, and circles (Mathewson, 2005). These conventions present different aspects of
The International Journal of Science in SocietyVolume 1, Number 1, 2009, http://science-society.com/journal/, ISSN 1836-6236© Common Ground, Vasilia Christidou, Vassilia Hatzinikita, Anastasia Dimitriou, All Rights Reserved,Permissions: [email protected]

information, highlighting or suppressing particular entities, and organizing individual elementsin space in a manner that represents their interrelations (Kress, Jewitt, Ogborn & Tsatsarelis,2001).The number of images and the space allocated to them in science texts addressed to students
(such as school textbooks, or leisure books) is constantly growing. Visual images are currentlyused as a primary source of information in these texts (Ametller & Pintó, 2002; Kress et al.,2001; Kress & vanLeeuwen, 1996; Testa, Monroy & Sassi, 2002) and are considered as animportant tool for understanding scientific concepts and phenomena (Kress et al., 2001;Pintó & Ametller, 2002). However, an image is valuable as a teaching and learning deviceonly if the students are familiar with the necessary codes for interpreting it and capable ofusing the available semiotic resources in order to understand signs and construct newmeanings about the represented facets of reality (Britsch, 2001).Despite the increasing importance and occurrence of visual images in science texts, the
skills involved in reading and producing visual representations are not taught in school(Pozzer-Ardenghi & Roth, 2004; Kress et al., 2001; Kress & van Leeuwen, 1996). Nonethe-less, the students from an early age, and with little or no systematic support, develop theability to recognize and use the codes of “visual grammar” in parallel with other availablemeans of communication (Britsch, 2001; Kress & van Leeuwen, 1996). When the studentsare asked to produce visual representations -like drawings- to convey a scientific conceptor phenomenon, the opportunity is capitalized to construct messages to convey ideas andmeanings that could not be expressed by other means of communication (Kress et al., 2001).Thus, a socio-semiotic analysis of students’ visual representations can reveal a lot about thesemiotic resources they use in their drawings for interpreting relationships between objects,concepts, and phenomena (Kress et al., 2001).Given the significance of images in the construction of meaning in learning science and
the lack of systematic training in understanding and producing visual representations, crucialpedagogical questions arise about the types of images that the students can interpret andproduce. Previous research has suggested that the students prefer narrative readings, i.e. theytend to attribute a story structure to images and mainly focus on certain elements such asvectors, or synthetic structures (Pintó & Ametller, 2002). Moreover, the students needguidance in order to produce visual representations of complex phenomena. In particular,while they seem to be capable of representing concepts, they face significant difficulties inrepresenting relationships between concepts, and hierarchic, antithetic, or causal structures.Therefore, it is suggested that science teaching should engage in familiarizing students withthe visual language of science, in order for them to develop the necessary skills for readingand producing visual images (Cifuentes &Hsieh, 2004;Mathewson, 2005; Pintó &Ametller,2002; Pozzer-Ardenghi & Roth, 2004; Testa et al., 2002). Researchers indeed agree thatmore research is required concerning the students’ use of visual language in an attempt toeducate future citizens for the information and knowledge society (Pintó & Ametller, 2002).Collectively, the discussion thus far highlights the importance of conducting research on thechildren usage of visual codes.The present study presents the results of a socio-semiotic analysis in a pedagogical per-
spective of primary pupils’ drawings about environmental issues. It aims at exploring thepupils’ readiness to use the visual language of science and its specialized codes when visuallyrepresenting the mechanisms involved in particularly important, topical and complex envir-
108
THE INTERNATIONAL JOURNAL OF SCIENCE IN SOCIETY

onmental phenomena, such as the stratospheric ozone depletion and global warming due tothe enhanced greenhouse effect.
MethodForty primary school children from 3 state urban primary schools in the city of Thessaloniki,Greece were interviewed in the research. Twenty-two of the pupils were boys and 18 weregirls. Thirteen of the 40 pupils were in the Fifth Grade (approximately 11 years old) whilethe remaining 27 were in the Sixth Grade (approximately 12 years old). The selected pupilswere average in terms of performance and abilities that had been identified by their teachers.The constitution of the sample is described in Table 1.
Table 1: Distribution of the Pupils Examined in Regards to Grade and Gender
TotalGirlsBoys1376Fifth grade271116Sixth grade401822Total
The pupils participated in individual, semi-structured interviews. After a preliminary discus-sion about ozone depletion and global warming, each pupil was asked to produce one ormore drawings representing their causes, mechanisms, and consequences. Pieces of A4 paper,pencils, and felt pens of different colours, were given to the pupils, who were invited to usethem as they felt most appropriate. After the completion of the task each pupil was asked toexplain his/her drawing. The interviewswere recorded and consequently transcribed verbatim.It should be noted that the pupils had received no formal teaching concerning the two envir-onmental issues prior to the study.The pupils’ drawings were analysed along three axes, which were based on a scheme
combining the socio-semiotic, epistemological and pedagogical perspectives developed byKoulaidis, Dimopoulos, Sklaveniti & Christidou (2002) and Dimopoulos, Koulaidis, & Sk-laveniti (2003). These axes include (see Figure 1):
1) The type, concerning the degree to which the drawings attempt to represent elementsof the environment according to the human visual perception, or adopt conventions ofthe scientific visual language. Thus, a drawing can be a) realistic, if it represents entitiesas perceived by the human eye (For example: sketches); b) conventional, if it involvescodified representations following specific conventions of the scientific visual language(For example: diagrams, maps, etc.); or c) hybrid if it includes both realistic and con-ventional elements.
2) The function, according to which drawings are distinguished as narrative, analytical,classificational, or metaphorical (Kress & van Leeuwen, 1996). Narrative representa-tions depict events, or processes of change evolving in time and/or space. They involveone or more vectors, i.e. distinct lines indicating the direction of evolution. Analyticalrepresentations emphasise the constant structure of an object or system, for instancethe constituent parts of a whole, by focusing on the relationships between the depicted
109
VASILIA CHRISTIDOU, VASSILIA HATZINIKITA, ANASTASIA DIMITRIOU

elements in terms of a part-whole structure. The meaning of an analytical image corres-ponds to linguistic expressions such as “this is” or “this consists of”. Classificationalrepresentations involve elements which are interconnected by relations of subordination,i.e. taxonomies. The subordinates constitute one category and their equivalence isvisually realised by their symmetrical allocation in the image. The use of classificationalimages in scientific texts emphasises hierarchical relationships, or unifies entities undera certain, common feature. Metaphorical representations imply a symbolic meaning,i.e. different from what is literally represented. The symbolism may refer either tospecific elements, or to the whole of the image. Moreover, often it is not possible toattribute a single function to pupils’ drawings, since they frequently integrate more thanone of the functions described above. Such drawings are recorded in the present analysisas combinations of functions.
3) The formality of the visual code, that is the degree of its elaboration and abstraction.The “visual grammar” employed in science texts generally uses a high formality code,which aims at downgrading the superficial variability of external features and at repres-enting precisely entities and processes, by eliminating multiple readings. Such aimscan be accomplished for instance by the use of symbols for chemical substances, or therestricted use of colour in diagrams. Formality can be estimated using different markerswhich record particular elements of the representations that contribute to their level ofabstraction. In pupils’ drawings the elimination of multiple readings is mainly accom-plished by controlling the followingmarkers: a) Introduction of elements of the scientificvisual code, such as symbols (letters or digits), or geometrical shapes. When bothsymbols and geometrical shapes are involved in a drawing, formality (according to thismarker) takes its maximum value. When no such element appears in a drawing, thismarker takes its minimum value. b) Colour differentiation: This marker is related tothe variety of colours used in a drawing. A broad variety of (3 or more different) colourstends to lower the formality, while a restricted use of colour (e.g. exclusive use ofpencil) raises the formality of an illustration. Each formality marker can take 3 differentvalues: 1 for low formality, 2 for moderate formality, or 3 for high formality. Accord-ingly, the overall formality of a drawing is estimated by adding the formality values ofthe two markers (elements of the scientific visual code and colour differentiation) andis considered as low if its value is 2 or 3, moderate if its value is equal to 4, or high ifits value is 5 or 6.
ResultsThe analysis of the conceptual content of the drawings reveals mental representations ofozone depletion and global warming similar to those documented in previous relevant researchbased on other techniques, such as questionnaires (Boyes& Stanisstreet, 1993) and interviews(Christidou &Koulaidis, 1996; Koulaidis & Christidou, 1999). The present analysis focuseson the characteristics of the visual code used in the pupils’ drawings and not on their concep-tual content reflecting their level of understanding of the two phenomena.Fifty drawings were collected in total, since the pupils had the opportunity to produce
more than one illustration each. However, the majority of the participants either confusedozone depletion with global warming, or considered the former as the primary cause of the
110
THE INTERNATIONAL JOURNAL OF SCIENCE IN SOCIETY

latter (Christidou & Koulaidis, 1996; Koulaidis & Christidou, 1999) and therefore chose torepresent both phenomena in one drawing. In the following paragraphs the results yieldedfrom the analysis of the drawings are presented, according to each of the three axes presentedin the previous section. The percentages appearing next to each category in Figure 1 corres-pond to the occurrence of the different types, functions and levels of formality in children’sdrawings.
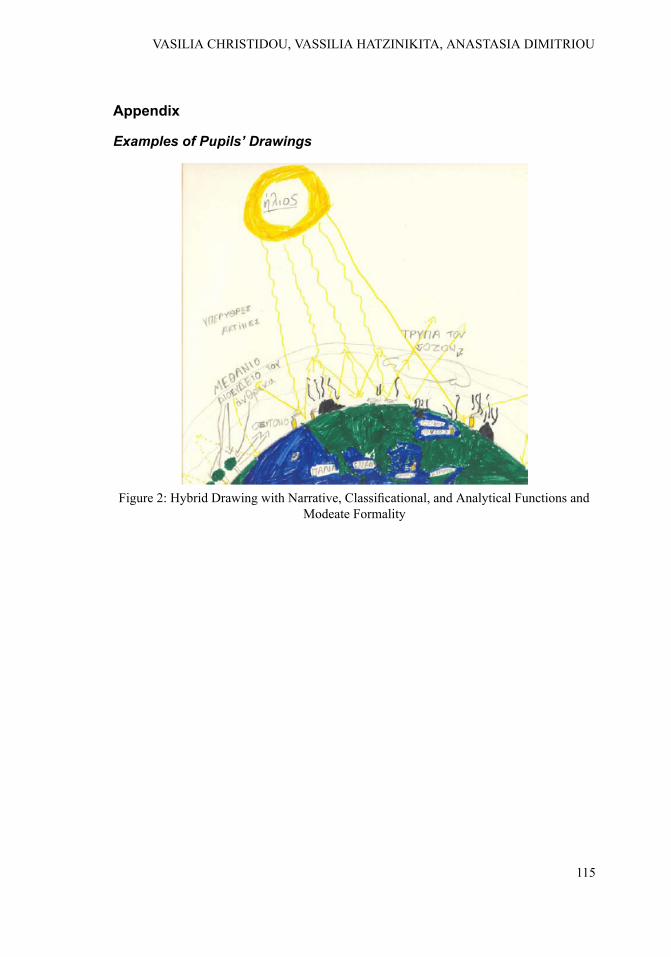
The Type of the Pupils’ DrawingsThe pupils’ drawings were in their vast majority hybrids (43 of 50, or 86%), that is they in-tegrate realistic and conventional representations of entities of the natural world (see Ap-pendix, Figures 2, 3 and 4). The realistic elements typically concern representations of livingthings (human beings, animals, or plants), objects of everyday life (For example: garbageas in Figure 2, or sprays as in Figure 3), or other elements of the natural or man-made envir-onment (For example: icebergs, clouds, industries). On the other hand, elements that areusually represented conventionally include solar radiation, the location and transportationof pollutant gases in the atmosphere, or the ozone layer and ozone hole(s). Solar radiationis usually depicted as downward vectors as is apparent in the drawings of the Appendix,while the two cloud-like layers in Figure 4 correspond to stratospheric ozone (top layer) andman-made harmful gases, or smog (lower layer). Seven drawings (14%) involve exclusivelyrealistic representations. No instance of purely conventional representation has been recorded.
Figure 1: The Axes of Analysis of Pupils’ Drawings and the Relevant Percentages
111
VASILIA CHRISTIDOU, VASSILIA HATZINIKITA, ANASTASIA DIMITRIOU

The Function of the Pupils’ DrawingsAs far as the function of the pupils’ drawings is concerned, the analysis has indicated thatin majority they tend to integrate a combination of different functions at the same time (36instances, 72%). All of these combinatorial drawings are primarily narrative, i.e. the pupilsrepresent the evolution of events in time and space (see Appendix, Figures 2, 3 and 4).Typical events that are depicted in pupils’ drawings include pollutant gases moving into theatmosphere, and solar radiation reaching the earth and being reradiated or reflected backtowards the atmosphere and space. A considerable number of drawings, apart from the nar-rative function incorporate the function of classification, which mainly refers to the juxtapos-ition of different sources of pollution, as is the case in Figures 2 (garbage, spray cans, andanimals) and 3 (industries, burning forests, and spray cans). When an analytical function isalso present, it largely concerns the representation of the globe as a whole composed bydifferent parts (see Appendix, Figure 2), or the depiction of the atmosphere as a mixture ofdifferent gases. Elements with a metaphorical function in pupils’ combinatorial drawingsinvolve monstrous figures representing gaseous pollutants, or magnifying glasses focusingon important components of illustrations.Thirteen drawings (26%) implemented a purely narrative function (as in Figure 4, see
Appendix), while in one instance a purely metaphorical function was recorded.
The Formality of the Pupils’ DrawingsIn their vast majority the pupils’ drawings presented an overall low (20 instances, or 40%),or moderate (24 instances, or 48%) formality in regards to the visual code employed. Thedrawings in figures 2 and 3 (see Appendix) involve symbols and geometrical shapes (highformality according to the marker corresponding to elements of the scientific visual code),and more than 3 different colors (i.e. low formality in relation to the marker concerningcolor differentiation). The overall formality is therefore moderate for both of them. Thiscombination of low and high formality along the different markers is a common trend in theparticipants’ drawings. The pupils typically introduced symbols (e.g. terms correspondingto pollutant gases, or digits), and/or geometrical shapes such as lines, or vectors that denotedirection. Thus, in regards to this marker, the pupils’ drawings exhibit a high or moderateformality. Conversely, the majority of the drawings include a variety of three or more differentcolors, hence lowering the overall formality of the visual code in respect to the relevantmarker.On the other hand, the number of drawings that systematically introduced an elaborated
visual code, presenting a high formality, was rather restricted (6 instances, 12%). This is thecase for Figure 4, where both geometrical shapes and symbols are present, while at the sametime only black color (pencil) is used.
Discussion and ConclusionsThe results of the analysis presented in the previous section suggest that even before gradu-ating primary school the pupils seem to be familiar with basic rules of the “visual grammar”to which scientific texts are amenable. Therefore, they use codes and conventions of thescientific visual language in order to graphically describe and explain the complex mechan-
112
THE INTERNATIONAL JOURNAL OF SCIENCE IN SOCIETY

isms underlying stratospheric ozone depletion and global warming. Interestingly, this obser-vation even includes the cases of representations which are not conceptually compatiblewith the scientific view.Images play a principal role in teaching and learning science. The present study implies
that it is important for science teaching to focus on the development of pupils’ relevantvisual skills. In this perspective, school science textbooks, which have an extensive influenceon teaching and learning science, can have an effective role in regards to the visual messagesthat they familiarise the pupils with in the school context. Therefore, introducing appropriatevisual representations in science textbooks can enhance and promote the pupils’ emergentability to use codes and conventions of the scientific visual language, hence to understandthe meanings expressed through its use.More particularly, the analysis of the drawings concerning the two environmental issues,
has revealed a remarkable readiness of the pupils to use visual and graphic conventionsnormally used by experts, although these conventions co-exist with realistic elements (inhybrid drawings). This tendency could be supported by enhancing the use of scientificvisual conventions in primary school science teaching material (textbooks, educationalsoftware, charts, graphs, maps, etc.), where realistic images dominate (93.3% in schooltextbooks, see Dimopoulos et al., 2003).Similarly, the pupils’ tendency to produce narrative images, which is parallel to their
preference to read images in a narrativemanner (Pintó &Ametller, 2002), could bemoderatedby decreasing the frequent use of narrative representations (24.5%, in Greek primary sciencetextbooks, see Dimopoulos et al., 2003) and by introducing more systematically classifica-tional and analytical images (8.7% and 64.4% correspondingly, see Dimopoulos et al., 2003)in science teaching. The pupils seem to be quite familiar with these functions, although theyuse them in combination with the narrative one. In fact, a greater emphasis could be givento more elaborated visual codes in the teaching material used, where a low formality codeis usually introduced (55.5% of the images in Greek school science textbooks, see Dimopouloset al., 2003), since a considerable number of pupils’ drawings introduced more specialisedvisual codes.In conclusion, visual literacy, and more particularly the skills related to the production
and interpretation of visual messages, emerges as a relevant and important challenge forscience education. However, more extensive and systematic research is needed in order todetermine the pupils’ readiness to use the scientific visual language in relation to a widerange of scientific concepts and phenomena. Such an insight would support crucial decisionsregarding the inclusion of teaching goals related to visual literacy in science curricula, ulti-mately aiming at familiarising the pupils with the rigorous, accurate, and abstract world ofscience. Consequently, such goals would guide the selection, design and implementation ofrelevant teaching activities and material for primary education, as well as teacher’s educationand training in order to meet the challenges and requirements of scientific visual literacy.
113
VASILIA CHRISTIDOU, VASSILIA HATZINIKITA, ANASTASIA DIMITRIOU
ReferencesAmetller, J., & Pintó, R. (2002). Students’ reading of innovative images of energy at secondary school
level. International Journal of Science Education 24: 285-312.Britsch, S. J. (2001). Emergent Environmental Literacy in theNonnarative Compositions of Kindergarten
Children. Early Childhood Education Journal 28: 153-159.Boyes, E., & Stanisstreet, M. (1993). The “Greenhouse Effect”: children’s perceptions of causes,
consequences and cures. International Journal of Science Education 5: 531-552.Christidou, V., & Koulaidis, V. (1996). Children’s models of the ozone layer and ozone depletion.
Research in Science Education, 26: 421-436.Cifuentes, L., & Hsieh, Y-C. J. (2004). Visualization for Middle School Students’ Engagement in
Science Learning. Journal of Computers in Mathematics and Science Education, 23: 109-137.
Dimopoulos, K., Koulaidis, V., & Sklaveniti, S. (2003). Towards an analysis of visual images in schoolsciences textbooks and press articles about science and technology. Research in ScienceEducation 33: 189-216.
Koulaidis, V., Dimopoulos, K., Sklaveniti, S., & Christidou, V. (2002). Texts of techno - sciencein the public domain. Athens: Metaixmio. [In Greek].
Koulaidis, V., & Christidou, V. (1999). Models of Students’ Thinking Concerning the GreenhouseEffect and Teaching Implications, Science Education 83: 559–576.
Kress, G., & van Leeuwen, T. (1996). Reading Images. The Grammar of Visual Design. London andNew York: Routledge.
Kress, G., Jewitt, C., Ogborn, J., & Tsatsarelis, C. (2001). Multimodal Teaching and Learning: TheRhetorics of the Science Classroom. London: Continuum.
Lister, M., & Wells, L. (2006). Seeing beyond belief: Cultural studies as an approach to analyzing thevisual. In: T. van Leeuwen and C. Jewitt (Eds.), Handbook of Visual Analysis (pp. 61-91).London: Sage Publications.
Mathewson, J. H. (2005). The Visual Core of Science: Definition and Applications to Education. In-ternational Journal of Science Education 27: 529-548.
Pintó, R., & Ametller, J.. (2002). Students’ difficulties in reading images. Comparing results from fournational research groups. International Journal of Science Eudcation 24: 333-341.
Pozzer-Ardenghi, L., & Roth, W. M. (2004). Making Sence of Photographs. Science Education 89:219-241.
Roth, W. M., & Bowen, G. M. (2003). When Are Graphs Worth Ten Thousand Words? An expert-expert study. Cognition and Instruction 21: 429-473.
Testa, I., Monroy, G., & Sassi, E. (2002). Students’ reading images in kinematics: the case of real-timegraphs. International Journal of Science Education 24: 235-256.
114
THE INTERNATIONAL JOURNAL OF SCIENCE IN SOCIETY
Appendix
Examples of Pupils’ Drawings
Figure 2: Hybrid Drawing with Narrative, Classificational, and Analytical Functions andModeate Formality
115
VASILIA CHRISTIDOU, VASSILIA HATZINIKITA, ANASTASIA DIMITRIOU
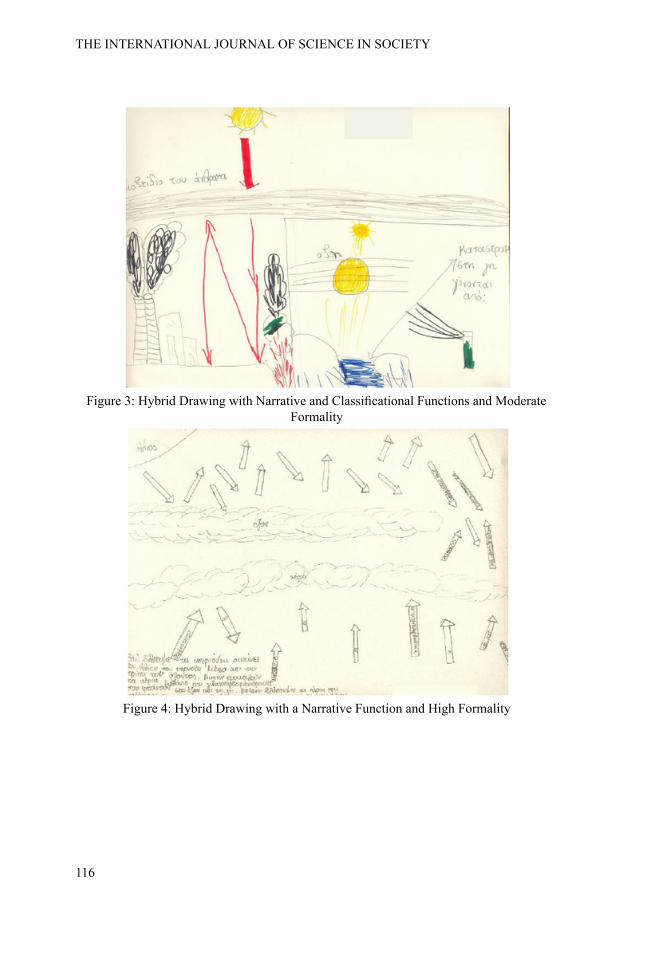
Figure 3: Hybrid Drawing with Narrative and Classificational Functions and ModerateFormality
Figure 4: Hybrid Drawing with a Narrative Function and High Formality
116
THE INTERNATIONAL JOURNAL OF SCIENCE IN SOCIETY
About the AuthorsDr. Vasilia ChristidouDr. Vasilia Christidou is an Associate Professor in Science Education at the Department ofPreschool Education, University of Thessaly, Greece. Her current research interests concernteaching and learning in science, children’s ideas in science, the promotion of Public Under-standing of Science, and the process of recontextualization of scientific texts addressed tonon-experts. She has coordinated and participated in a number of research projects relatedto teaching and learning science and has published numerous research articles and studiesin journals, books, and conference proceedings.
Dr. Vassilia HatzinikitaAssociate Professor Vassilia Hatzinikita is currently an academic coordinator of the Masterin Education in the Hellenic Open University and a coordinator of Educational Research inAction module. Her research interests concern science teaching and learning as well as theanalysis and development of educational materials. She has published a considerable numberof research papers in journals, books and conference proceedings and has developed educa-tional material for the Science Education module of the Hellenic Open University.
Dr. Anastasia DimitriouDr. Anastasia Dimitriou is an Assistant Professor of Science and Environmental Educationand director of the Labortory of Research and Communication for the Environment andEnvironmental Education at the Department of Education Sciences in Pre-School Age,Democritus University of Thrace, Greece. She has coordinated and participated in researchprojects relevant to teachers’ and students’ conceptions and development of teaching mater-ial regarding science, the environment and environmental education and has published re-search articles and studies in journals, books, and conference proceedings.
117
VASILIA CHRISTIDOU, VASSILIA HATZINIKITA, ANASTASIA DIMITRIOU


EDITORS Amareswar Galla, The University of Queensland, Brisbane, Australia. Bill Cope, University of Illinois, Urbana-Champaign, USA.
Please visit the Journal website at http://www.ScienceinSocietyJournal.com
for further information about the Journal or to subscribe.

THE UNIVERSITY PRESS JOURNALS
Creates a space for dialogue on innovative theories and practices in the arts, and their inter-relationships
with society. ISSN: 1833-1866
http://www.Arts-Journal.com
Explores the past, present and future of books,
publishing, libraries, information, literacy and learning in the information society.
ISSN: 1447-9567 http://www.Book-Journal.com
Examines the meaning and purpose of ‘design’ while also speaking in grounded ways about the task of design and the use of designed artefacts and
processes. ISSN: 1833-1874
http://www.Design-Journal.com
Provides a forum for discussion and builds a body of knowledge on the forms and dynamics of difference
and diversity. ISSN: 1447-9583
http://www.Diversity-Journal.com
Maps and interprets new trends and patterns in
globalisation. ISSN 1835-4432
http://www.GlobalStudiesJournal.com
Discusses the role of the humanities in contemplating the future and the human, in an era otherwise dominated by scientific, technical and economic
rationalisms. ISSN: 1447-9559
http://www.Humanities-Journal.com
Sets out to foster inquiry, invite dialogue and build a body of knowledge on the nature and future of
learning. ISSN: 1447-9540
http://www.Learning-Journal.com
Creates a space for discussion of the nature and future of organisations, in all their forms and
manifestations. ISSN: 1447-9575
http://www.Management-Journal.com
Addresses the key question: How can the institution
of the museum become more inclusive? ISSN 1835-2014
http://www.Museum-Journal.com
Discusses disciplinary and interdisciplinary approaches to knowledge creation within and across the various social sciences and between the social,
natural and applied sciences. ISSN: 1833-1882
http://www.Socialsciences-Journal.com
Draws from the various fields and perspectives through which we can address fundamental
questions of sustainability. ISSN: 1832-2077
http://www.Sustainability-Journal.com
Focuses on a range of critically important themes in the various fields that address the complex and
subtle relationships between technology, knowledge and society.
ISSN: 1832-3669 http://www.Technology-Journal.com
Investigates the affordances for learning in the digital
media, in school and throughout everyday life. ISSN 1835-2030
http://www.ULJournal.com
Explores the meaning and purpose of the academy in times of striking social transformation.
ISSN 1835-2030 http://www.Universities-Journal.com
FOR SUBSCRIPTION INFORMATION, PLEASE CONTACT
![DA190759 Original Architectural Drawings - [A6402145].pdf](https://static.fdokumen.com/doc/165x107/6327476b5c2c3bbfa8041923/da190759-original-architectural-drawings-a6402145pdf.jpg)