Integration of Computer-Aided Acquisition & Logistic Support ...
Computational Materials Science xxx (2013) xxx–xxx
Contents lists available at SciVerse ScienceDirect
Computational Materials Science
journal homepage: www.elsevier .com/locate /commatsci
Characterisation of microstructure and modelling of flow behaviourof bainite-aided dual-phase steel
0927-0256/$ - see front matter � 2013 Published by Elsevier B.V.http://dx.doi.org/10.1016/j.commatsci.2013.05.017
⇑ Corresponding author. Tel.: +49 241 80 95841; fax: +49 241 80 92253.E-mail address: [email protected] (A. Ramazani).
Please cite this article in press as: A. Ramazani et al., Comput. Mater. Sci. (2013), http://dx.doi.org/10.1016/j.commatsci.2013.05.017
A. Ramazani a,⇑, P.T. Pinard b, S. Richter b, A. Schwedt b, U. Prahl a
a Department of Ferrous Metallurgy, RWTH Aachen University, Germany.b Central Facility for Electron Microscopy, RWTH Aachen University, Germany
a r t i c l e i n f o a b s t r a c t
Article history:Received 14 December 2012Received in revised form 29 April 2013Accepted 17 May 2013Available online xxxx
Keywords:Bainite-aided dual-phase steelElectron backscatter diffractionElectron probe microanalysisKernel average misorientationMicromechanical modellingRepresentative volume elementDislocation-density-based hardening model
This study aims to characterise the microstructure and model the flow curve behaviour of bainite-aidedDP steel. First, combined electron backscatter diffraction (EBSD) and electron probe microanalysis (EPMA)measurements were applied to quantify the constituents (ferrite, martensite, and bainite) in the micro-structure. Then, the flow behaviour of the material was modelled using the microscale finite elementmethod by considering the effect of the microstructures using the representative volume element(RVE) approach based on real microstructure. The flow behaviour of single phases (ferrite, martensite,and bainite) was modelled using the dislocation-density-based work-hardening approach, whereas themodel parameters were identified using microstructural features. The flow curves predicted from the2D RVE calculations were correlated to 3D using a correlation factor. Good agreement between the 3Dcorrelated and experimental flow curves was only achieved when bainite was considered in the RVEmodelling. The presence of bainite reduces the internal stress gradients while increasing the overallstrength of the material.
� 2013 Published by Elsevier B.V.
1. Introduction
Dual-phase (DP) steels show attractive properties owing totheir microstructure, in which a hard martensitic phase is dis-persed in a soft ferrite phase [1–5]. As a result, these steels havegained interest from the viewpoint of applications in the auto-motive industry [6–11]. The flow behaviour of DP steel dependson the mechanical properties, volume fraction and morphologyof ferrite, martensite, and additional phases such as retainedaustenite and bainite [12–15]. In DP steels, the strength of ferritecan be estimated from its composition and grain size [16–18].The ferrite phase also derives additional strength from the initialdislocation density caused by the austenite to martensite trans-formation during cooling [19–21]. The strength of martensite de-pends primarily on its carbon content; martensite shows a linearincrease in yield strength with increasing (local) carbon content[12,22].
In thick DP steel sheet, bainite fractions might be formed whencontinuous cooling is not fast enough to fully suppress bainitictransformation. In this case, a fine lath structure of bainitic ferriteand retained austenite is formed [23]. This structure is character-ised by a higher number of dislocations and higher average carbon
concentration than ferrite. [24]. The effect of bainite content onferrite–bainite–martensite steels has been studied by Sudo et al.[25] and [26], Kim et al. [27] and Choi et al. [28]. Sudo and Iwai[25] indicated that reducing the bainite content in ferrite–bainite–martensite steels causes a decrease of the ratio betweenthe tensile and yield strength but an increase in the percentageelongation and strain hardening exponent. Kim et al. [27] sug-gested that small amounts of bainite in ferrite–martensite DPsteels lead to an increase in the yield strength and ductility but adecrease in the tensile strength.
Matlock et al. [29] investigated the effect of the microstruc-ture on the mechanical properties of micro-alloyed ferrite–bainite–martensite steels and reported inferior tensile propertiesand toughness for ferrite–bainite–martensite steels in compari-son to conventional steels. Kim et al. [27] reported the occur-rence of discontinuous yielding behaviour in ferrite–bainite–martensite steels, whereas Abdollah-Zade et al. [30] reportedcontinuous yielding behaviour in ferrite–bainite–martensitesteels.
Many researchers are currently focusing on building models topredict the flow behaviour of DP steels from their microstructure[31–33]. For modelling the microstructural properties of DP steels,the flow behaviours of ferrite and martensite can be quantifiedthrough dislocation-based modelling. However, to predict the flowbehaviour of DP steels, information about the constituent proper-ties is not sufficient. The partitioning of stress and strain between

Fig. 2.1. LOM image of DP steel consisting of ferrite (light areas) and martensite/bainite (dark areas).
2 A. Ramazani et al. / Computational Materials Science xxx (2013) xxx–xxx
the two phases during deformation also needs to be considered tomodel the flow behaviour of DP steels. Micromechanical modellingis used to predict the flow behaviour of DP steels from the flowbehaviour of the individual constituents. To realise this, the repre-sentative volume elements (RVEs) of DP steels are meshed in thecommercial finite element (FE) package ABAQUS. The stress-straindevelopment of the dual-phase structure is solved using FE solver[32–35].
For micromechanical modelling of the fraction, the spatial dis-tribution and chemical composition of the constituents are criticalinput parameters [36–38]. This requires a proper characterisationof ferrite, bainite, and martensite [39,40].
This study aims to model the flow behaviour of bainite-aidedDP steel. The microstructure was characterised by combininghigh-resolution electron microprobe (EPMA) and electron back-scatter diffraction (EBSD) acquisitions to properly identify andquantify ferrite, martensite, and bainite. The local composition ofmartensite and bainite was also obtained from EPMA measure-ments. A microstructure-based approach based on the use of RVEsis employed to evaluate the microstructure deformation and fail-ure initiation at the mesoscale. 2D RVEs were defined based on realmicrostructures. The flow behaviour of single phases was modelledusing a dislocation-based work-hardening approach. The flowcurves predicted from 2D RVE calculations were correlated to 3Dusing a correlation factor. Finally, the flow curve predicted fromRVE calculations was compared with the experimental one andthe influence of 5% bainite fraction was quantified.
2. Experimental
2.1. Material
The material used in this study is a commercial DP steel (DP-K34/60 + Z). It was cold-roll-annealed to a thickness of 1.5 mm. Thenominal chemical composition measured using a spark opticalemission spectrometer is presented in Table 1.
2.2. Characterisation and quantification of microstructure
Light optical microscope (LOM) images and image analysis of a3% nital etched sample show that the microstructure consists ofapproximately 65% ferrite (light areas) (Fig. 2.1). The dark areas(35%) correspond to martensite and possibly a small fraction ofbainite. It was not possible to unambiguously identify these twophases from the LOM images.
To determine the martensite and bainite fractions, EBSD andEPMA measurements were combined. EBSD mappings wereperformed on a JEOL JSM7000F (JEOL Corporation Ltd., Japan)field-emission SEM equipped with a Hikari camera and TSL OIMsoftware (AMETEK, Inc., Berwyn, PA, USA). The phase identificationwas improved and validated by measuring the spatial distributionof carbon using a JEOL JXA8530F (JEOL Corporation Ltd., Japan)field-emission electron microprobe. The acquisition conditionsand identification method are described in detail elsewhere [40].The identification method used to obtain the RVE is summarisedbelow.
EBSD indexes both ferrite and martensite to a body-centred cu-bic crystal structure. However, they can be differentiated based onthe quality of the diffraction as martensite inherently contains
Table 1Chemical composition in wt%.
C Si Mn P S Cr Mo Al
0.09 0.2 1.24 0.013 0.18 0.14 0.2 0.026
Please cite this article in press as: A. Ramazani et al., Comput. Mater. Sci. (201
more defects than ferrite and has lower-quality diffraction pat-terns. The grain average image quality was used to identify themartensite islands [41]. Fig. 2.2 shows the (a) grain average imagequality map and (b) the corresponding area fraction distribution ofa representative area of the sample. Grains with an average imagequality lower than 4000 were segmented as martensite.
Bainite is usually identified using the kernel average misorien-tation (KAM) (Fig. 2.3a) as it contains a higher amount of disloca-tions than ferrite while having similar image quality values [42].In the case of DP steel, the presence of transformation-inducedgeometrically necessary dislocation (GND) zones around martens-ite islands complicates the identification. Both bainite and GND re-gions are characterised by high misorientation values. Bycombining EBSD results with an EPMA carbon map (Fig. 2.3b), highmisorientation regions (>0.5�) containing carbon can be assignedto bainite. The final segmentation of the different phases is shownin Fig. 2.4. Consequently, from the combined EPMA and EBSD mea-surements of a representative area of the sample, it was deter-mined that martensite and bainite respectively cover 30% and 5%of the measured area.
To understand the substructure of bainite in the studied mate-rial, high-resolution secondary electron images were acquired afternital etching. From Fig. 2.5a, bainite consists of a two-phase sub-structure made of bainitic ferrite and small martensitic particles.The low carbon concentration inside the bainitic ferrite can be as-sessed by its similar etching behaviour to the surrounding ferritegrains. In this high-silicon-content steel, carbides cannot beformed. The distributed particles are therefore assumed to be mar-tensite with high carbon content. In a KAM map (Fig. 2.5b), the bai-nite region shows high dislocation density.
EPMA was also used to quantify the carbon and manganese con-centration inside martensite and the manganese concentration in-side bainite. The concentration was measured by performingquantitative line scans over the martensite and bainite regions.Fig. 2.6a shows the carbon and manganese concentration profileacross a bainite region (left) and two martensite islands (centreand right). The corresponding grain average image quality andKAM maps are shown in Fig. 2.6b and c, respectively. Owing tothe limited spatial resolution of this technique, the carbon concen-tration of the bainite constituents (bainitic ferrite and martensiteparticles) cannot be precisely measured. It can be found that car-bon clearly partitions between martensite and ferrite.
Based on four quantitative line scans, the average concentrationof carbon and manganese measured in martensite was 0.72 wt%and 1.56 wt%, respectively. The manganese concentration was
3), http://dx.doi.org/10.1016/j.commatsci.2013.05.017

Fig. 2.2. Identification of martensite using the grain average image quality measured by EBSD: (a) mapping of a representative area and (b) area fraction distribution of thisarea.
Fig. 2.3. (a) EBSD mapping showing the KAM (step size: 100 nm, kernel radius: 300 nm) without the identified martensite grains and (b) EPMA carbon intensity map (stepsize: 100 nm, dwell time: 100 ms) of the same representative area as that shown in Fig. 2a.
Fig. 2.4. Final segmentation of ferrite, martensite, and bainite phases.
A. Ramazani et al. / Computational Materials Science xxx (2013) xxx–xxx 3
Please cite this article in press as: A. Ramazani et al., Comput. Mater. Sci. (201
found to be similar in bainite (1.60 wt%). The carbon concentrationin ferrite was considered as 0.004 wt% from the carbon solubility iniron. The concentration of the other elements was found to behomogeneous in all phases; the nominal concentration was usedin the modelling.
2.3. Mechanical testing
The tensile samples were prepared from the sheet according toDIN EN 10002. The geometry of the samples used for mechanicaltesting is shown in Fig. 2.7. Three tensile tests were performed ata velocity of 4 mm/min on a Zwick 100. Samples were tested par-allel to the initial cold-rolling direction.
3. Micromechanical modelling procedure
To study the flow behaviour of DP steels, micromechanicalmodelling is a suitable procedure that provides a good descriptionof the deformation of the material at the microlevel. The DP micro-structure is embodied in the FEM framework of continuummechanics through a RVE. 2D plane strain conditions were used
3), http://dx.doi.org/10.1016/j.commatsci.2013.05.017

Fig. 2.5. Substructure of a bainite region characterised using (a) secondary electron image after nital etching and (b) KAM mapping (step size: 100 nm, kernel radius:300 nm).
Fig. 2.6. (a) Concentration profile of carbon and manganese across a bainite region(left) and two martensite islands (centre and right) as measured by EPMA. (b) Grainaverage image quality and (c) KAM maps obtained from EBSD mapping ofcorresponding area.
Fig. 2.7. Geometry of sample for mechanical testing (all dimensions are given inmm).
4 A. Ramazani et al. / Computational Materials Science xxx (2013) xxx–xxx
Please cite this article in press as: A. Ramazani et al., Comput. Mater. Sci. (201
for the numerical tensile tests. All phases were assumed to behomogeneous, and flow behaviour was modelled through an iso-tropic material model using dislocation density formulation. Theeffective macroscopic flow curves of multiphase composites werecomputed from the numerical tensile test result of RVE through afirst-order homogenisation strategy, as shown by Kouznetsova[43]. The following subsections discuss the premises and simula-tion methods that were used in this study.
3.1. Definition of RVEs for bainite-aided DP steels
In this study, the satisfactory dimension of the RVE was 24 lm,which should contain a minimum of 19 martensite particles as re-ported by Ramazani et al. [36]. To make the RVE from the EBSD/EPMA segmented microstructure (Fig. 2.4), the meshing programOOF, Version 2.4, 2007, was used [44]. Quadratic elements withparabolic form functions were used. The generated RVE based onthe real microstructures of the developed DP steel is shown inFig. 3.1. Periodic boundary conditions using a developed FOR-TRAN-based program were imposed on the RVE.
To study the influence of the bainite fraction, three RVEs weregenerated based on the following microstructures:
– Bainite was considered as a pseudo-single phase as determinedby EBSD/EPMA (Fig. 2.4) (30% martensite, 5% bainite, 65%ferrite).
Fig. 3.1. Generated RVE based on real microstructure.
3), http://dx.doi.org/10.1016/j.commatsci.2013.05.017
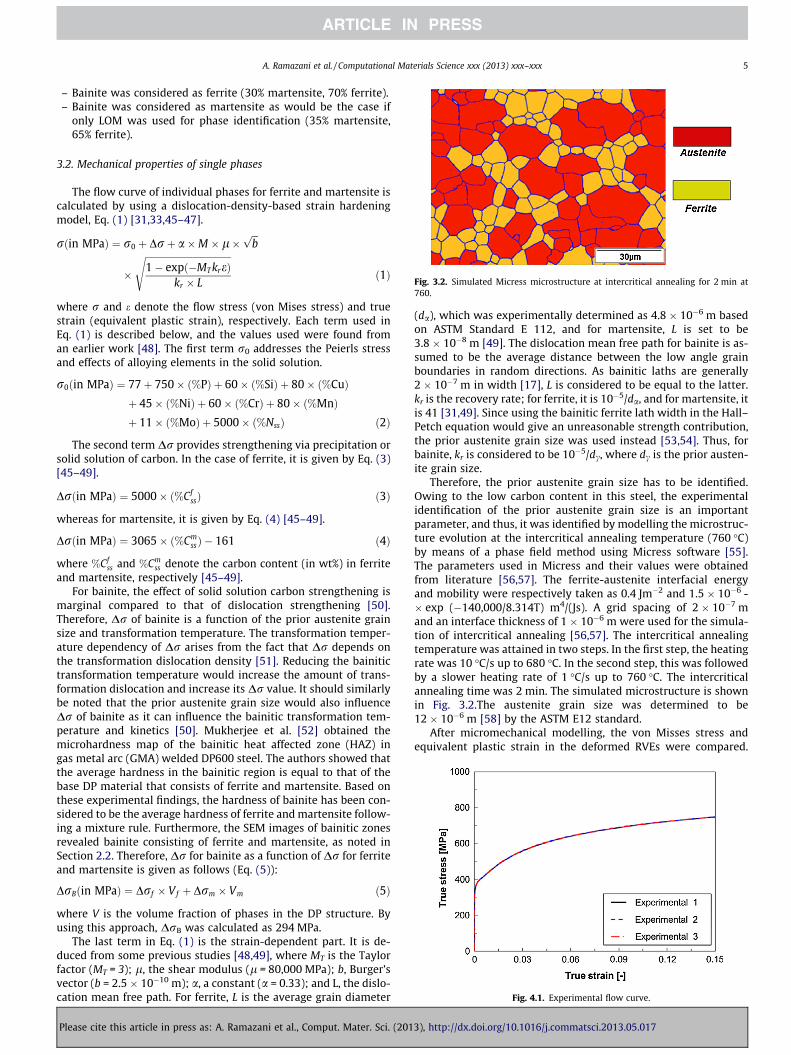
Fig. 3.2. Simulated Micress microstructure at intercritical annealing for 2 min at760.
Fig. 4.1. Experimental flow curve.
A. Ramazani et al. / Computational Materials Science xxx (2013) xxx–xxx 5
– Bainite was considered as ferrite (30% martensite, 70% ferrite).– Bainite was considered as martensite as would be the case if
only LOM was used for phase identification (35% martensite,65% ferrite).
3.2. Mechanical properties of single phases
The flow curve of individual phases for ferrite and martensite iscalculated by using a dislocation-density-based strain hardeningmodel, Eq. (1) [31,33,45–47].
rðin MPaÞ ¼ r0 þ Drþ a�M � l�ffiffiffibp
�
ffiffiffiffiffiffiffiffiffiffiffiffiffiffiffiffiffiffiffiffiffiffiffiffiffiffiffiffiffiffiffiffiffiffiffiffiffi1� expð�MT kreÞ
kr � L
sð1Þ
where r and e denote the flow stress (von Mises stress) and truestrain (equivalent plastic strain), respectively. Each term used inEq. (1) is described below, and the values used were found froman earlier work [48]. The first term r0 addresses the Peierls stressand effects of alloying elements in the solid solution.
r0ðin MPaÞ ¼ 77þ 750� ð%PÞ þ 60� ð%SiÞ þ 80� ð%CuÞþ 45� ð%NiÞ þ 60� ð%CrÞ þ 80� ð%MnÞþ 11� ð%MoÞ þ 5000� ð%NssÞ ð2Þ
The second term Dr provides strengthening via precipitation orsolid solution of carbon. In the case of ferrite, it is given by Eq. (3)[45–49].
Drðin MPaÞ ¼ 5000� ð%CfssÞ ð3Þ
whereas for martensite, it is given by Eq. (4) [45–49].
Drðin MPaÞ ¼ 3065� ð%CmssÞ � 161 ð4Þ
where %Cfss and %Cm
ss denote the carbon content (in wt%) in ferriteand martensite, respectively [45–49].
For bainite, the effect of solid solution carbon strengthening ismarginal compared to that of dislocation strengthening [50].Therefore, Dr of bainite is a function of the prior austenite grainsize and transformation temperature. The transformation temper-ature dependency of Dr arises from the fact that Dr depends onthe transformation dislocation density [51]. Reducing the bainitictransformation temperature would increase the amount of trans-formation dislocation and increase its Dr value. It should similarlybe noted that the prior austenite grain size would also influenceDr of bainite as it can influence the bainitic transformation tem-perature and kinetics [50]. Mukherjee et al. [52] obtained themicrohardness map of the bainitic heat affected zone (HAZ) ingas metal arc (GMA) welded DP600 steel. The authors showed thatthe average hardness in the bainitic region is equal to that of thebase DP material that consists of ferrite and martensite. Based onthese experimental findings, the hardness of bainite has been con-sidered to be the average hardness of ferrite and martensite follow-ing a mixture rule. Furthermore, the SEM images of bainitic zonesrevealed bainite consisting of ferrite and martensite, as noted inSection 2.2. Therefore, Dr for bainite as a function of Dr for ferriteand martensite is given as follows (Eq. (5)):
DrBðin MPaÞ ¼ Drf � Vf þ Drm � Vm ð5Þ
where V is the volume fraction of phases in the DP structure. Byusing this approach, DrB was calculated as 294 MPa.
The last term in Eq. (1) is the strain-dependent part. It is de-duced from some previous studies [48,49], where MT is the Taylorfactor (MT = 3); l, the shear modulus (l = 80,000 MPa); b, Burger’svector (b = 2.5 � 10�10 m); a, a constant (a = 0.33); and L, the dislo-cation mean free path. For ferrite, L is the average grain diameter
Please cite this article in press as: A. Ramazani et al., Comput. Mater. Sci. (201
(da), which was experimentally determined as 4.8 � 10�6 m basedon ASTM Standard E 112, and for martensite, L is set to be3.8 � 10�8 m [49]. The dislocation mean free path for bainite is as-sumed to be the average distance between the low angle grainboundaries in random directions. As bainitic laths are generally2 � 10�7 m in width [17], L is considered to be equal to the latter.kr is the recovery rate; for ferrite, it is 10�5/da, and for martensite, itis 41 [31,49]. Since using the bainitic ferrite lath width in the Hall–Petch equation would give an unreasonable strength contribution,the prior austenite grain size was used instead [53,54]. Thus, forbainite, kr is considered to be 10�5/dc, where dc is the prior austen-ite grain size.
Therefore, the prior austenite grain size has to be identified.Owing to the low carbon content in this steel, the experimentalidentification of the prior austenite grain size is an importantparameter, and thus, it was identified by modelling the microstruc-ture evolution at the intercritical annealing temperature (760 �C)by means of a phase field method using Micress software [55].The parameters used in Micress and their values were obtainedfrom literature [56,57]. The ferrite-austenite interfacial energyand mobility were respectively taken as 0.4 Jm�2 and 1.5 � 10�6 -� exp (�140,000/8.314T) m4/(Js). A grid spacing of 2 � 10�7 mand an interface thickness of 1 � 10�6 m were used for the simula-tion of intercritical annealing [56,57]. The intercritical annealingtemperature was attained in two steps. In the first step, the heatingrate was 10 �C/s up to 680 �C. In the second step, this was followedby a slower heating rate of 1 �C/s up to 760 �C. The intercriticalannealing time was 2 min. The simulated microstructure is shownin Fig. 3.2.The austenite grain size was determined to be12 � 10�6 m [58] by the ASTM E12 standard.
After micromechanical modelling, the von Misses stress andequivalent plastic strain in the deformed RVEs were compared.
3), http://dx.doi.org/10.1016/j.commatsci.2013.05.017
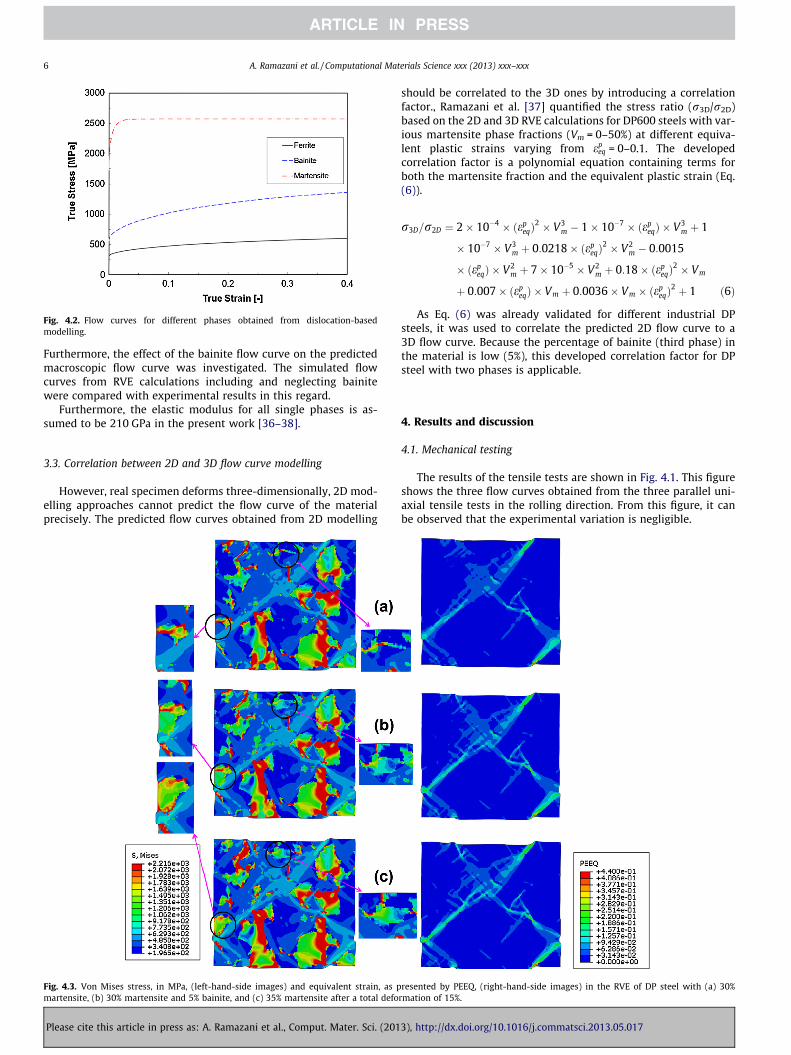
Fig. 4.2. Flow curves for different phases obtained from dislocation-basedmodelling.
6 A. Ramazani et al. / Computational Materials Science xxx (2013) xxx–xxx
Furthermore, the effect of the bainite flow curve on the predictedmacroscopic flow curve was investigated. The simulated flowcurves from RVE calculations including and neglecting bainitewere compared with experimental results in this regard.
Furthermore, the elastic modulus for all single phases is as-sumed to be 210 GPa in the present work [36–38].
3.3. Correlation between 2D and 3D flow curve modelling
However, real specimen deforms three-dimensionally, 2D mod-elling approaches cannot predict the flow curve of the materialprecisely. The predicted flow curves obtained from 2D modelling
Fig. 4.3. Von Mises stress, in MPa, (left-hand-side images) and equivalent strain, as pmartensite, (b) 30% martensite and 5% bainite, and (c) 35% martensite after a total defo
Please cite this article in press as: A. Ramazani et al., Comput. Mater. Sci. (201
should be correlated to the 3D ones by introducing a correlationfactor., Ramazani et al. [37] quantified the stress ratio (r3D/r2D)based on the 2D and 3D RVE calculations for DP600 steels with var-ious martensite phase fractions (Vm = 0–50%) at different equiva-lent plastic strains varying from ep
eq = 0–0.1. The developedcorrelation factor is a polynomial equation containing terms forboth the martensite fraction and the equivalent plastic strain (Eq.(6)).
r3D=r2D ¼ 2� 10�4 � ðepeqÞ
2 � V3m � 1� 10�7 � ðep
eqÞ � V3m þ 1
� 10�7 � V3m þ 0:0218� ðep
eqÞ2 � V2
m � 0:0015
� ðepeqÞ � V2
m þ 7� 10�5 � V2m þ 0:18� ðep
eqÞ2 � Vm
þ 0:007� ðepeqÞ � Vm þ 0:0036� Vm � ðep
eqÞ2 þ 1 ð6Þ
As Eq. (6) was already validated for different industrial DPsteels, it was used to correlate the predicted 2D flow curve to a3D flow curve. Because the percentage of bainite (third phase) inthe material is low (5%), this developed correlation factor for DPsteel with two phases is applicable.
4. Results and discussion
4.1. Mechanical testing
The results of the tensile tests are shown in Fig. 4.1. This figureshows the three flow curves obtained from the three parallel uni-axial tensile tests in the rolling direction. From this figure, it canbe observed that the experimental variation is negligible.
resented by PEEQ, (right-hand-side images) in the RVE of DP steel with (a) 30%rmation of 15%.
3), http://dx.doi.org/10.1016/j.commatsci.2013.05.017

A. Ramazani et al. / Computational Materials Science xxx (2013) xxx–xxx 7
4.2. Flow curve of single phases
Developed flow curves of ferrite, martensite, and bainite for thestudied DP steel, as discussed in Section 3.2, are shown in Fig. 4.2.Ferrite shows lowest strength while martensite presents the high-est strength. No work hardening can be seen in the martensite flowcurve after approximately 0.02 true strain. The flow curve of bai-nite is located in between those of ferrite and martensite. Bainitehas the highest work hardening in comparison to the other phases.
4.3. Numerical tensile tests
Numerical tensile tests were carried out on the generated 2DRVEs. The evolution of stress and strain in the RVEs can be obtainedfrom these numerical tensile tests. Fig. 4.3 shows the contour plot ofthe von Mises stress and the equivalent plastic strain on the micro-scale at e = 0.15 for DP steel containing 30% martensite, 30% mar-tensite plus 5% bainite, and 35% martensite. While the hardmartensite carries stresses of more than 2300 MPa, the ferrite showsmuch lower stresses. On the other hand, martensite undergoes onlysmall strains, and the development of shear bands is observed in fer-rite. These bands of localised plastic strain in ferrite are observed at45� to the tensile direction, and they might be overpredicted becauseof the plane strain condition. It is noteworthy that martensite under-goes finite plastic strains in all cases, which is in agreement withexperimental findings reported in the literature [59].
In the stress distribution figures, two regions were found wherethe various interpretations of bainite were active. It can be clearlyseen that these zones show low stress when interpreted as ferrite,high stress when interpreted as martensite, and intermediate
Fig. 4.4. Comparison of experimental and simulated true stress-true strain curvesfor (a) 2D and (b) 3D calculations.
Please cite this article in press as: A. Ramazani et al., Comput. Mater. Sci. (201
stress when interpreted as bainite. In both local zooms, it can beseen that considering the bainitic fraction smoothens the stressdistribution and even reduces the stress concentration by a smoothgradient. In addition to the general increase in strength, this mighthave a positive effect on the damage initiation behaviour as asmooth stress gradient is less prone to failure [61].
A comparison between the experimental and the predicted(from 2D RVE calculations) true stress-true strain curves is shownin Fig. 4.4a. 2D modelling approaches cannot precisely predict theflow curve of the material in all cases. It seems that the main rea-son for the deviation is the planar state of the strain adopted in thecalculations. During the experimental tensile test, the specimendeforms three-dimensionally; therefore, a deviation should appear.Using the correlation factor, as explained in Section 3.3 and shownin Fig. 4.4b, the correlated flow curve from 2D to 3D calculations isin excellent agreement with the experimental flow curve when 5%bainite is taken into account in the RVE. When bainite is consid-ered as ferrite or martensite in the RVE, the predicted flow curveshows small underestimation or overestimation compared to theexperimental flow curve. Therefore, considering bainite in theRVE calculations significantly improves the prediction of the flowcurve of bainite-aided DP steels.
It is noteworthy that in all cases, the onset of yielding is under-estimated during the simulation. As shown in a previous work, thispart of the flow curve can be better explained much more clearlywhen the transformation-induced GND effect is considered[38,60]. The latter should be considered in future work.
5. Conclusions
1. An effective flow curve has been established for bainite-aidedDP steels to describe the flow curve behaviour in a pseudo-sin-gle phase approach for bainitic phase fractions. Quantitativemodel parameters for the single-phase flow curve have beenderived from microstructural arguments by considering thesubstructure of bainitic fractions. By using this approach, theeffective flow properties of bainite-aided DP steels can becalculated.
2. Using a 2D–3D correlation factor, effective 3D-flow curves canbe derived based on the calculated 2D-RVE-based flow curves.The 3D corrected flow curve obtained from the 2D one showsgood agreement with the experimental flow curve for the inves-tigated microstructure when bainite was considered inside theRVE as an individual constituent phase.
3. In addition to increasing the overall strength level of the com-posite material, the bainitic region also shows much less parti-tioning of stress and strain in comparison to a pure martensite-ferrite structure. The influence of 5% bainite remarkably smoo-thens the internal stress gradients in the bainite-aided DP mac-rostructure; this might positively affect the damage behaviourat high strains.
Acknowledgements
This research was carried out under Project number MC2.07293in the framework of the Research Program of the Materials Innova-tion Institute M2i (www.m2i.nl).
References
[1] J.M. Rigsbee, P.J. Vander Arend, in: A.D. Davenport (Ed.), Formable HSLA andDual-phase Steels, The Metallurgical Society of AIME, New York, USA, 1979, pp.58–86.
[2] G.R. Speich, R.L. Miller, in: A.D. Davenport (Ed.), Formable HSLA and Dual-phase Steels, 1979, pp. 145–182.
[3] M.S. Rashid, Ann. Rev. Mater. Sci. 11 (1981) 245–266.
3), http://dx.doi.org/10.1016/j.commatsci.2013.05.017
8 A. Ramazani et al. / Computational Materials Science xxx (2013) xxx–xxx
[4] G.R. Speich, in: R.A. Kot, B.L. Bramfitt (Eds.), Fundamentals of Dual-PhaseSteels, The Metallurgical Society of AIME, New York, USA, 1981, pp. 3–45.
[5] N.K. Balliger, T. Gladman, Metal Sci. 15 (1981) 95–108.[6] WorldAutoSteel, <www.elsab.org>, Overview Report, January 2002.[7] M. Pfestorf, Great Designs in Steel Seminar, BMW Group, 2005.[8] H. Qu, Master Thesis, 2011.[9] ULSAB-AVC-PES Engineering Report, October 2001.
[10] B.K. Zuidema, S.G. Denner, B. Engl, J. Sperle, Soc. Automotive Eng. (2011) 984–992.[11] A. Ramazani, M. Abbasi, U. Prahl, W. Bleck, Comput. Mater. Sci. 64 (2012) 101–
105.[12] C.A.N. Lanzillotto, F.B. Pickering, Metal Sci. 16 (1982) 371–382.[13] J.Y. Koo, M.J. Young, G. Thomas, Metall. Trans. A 11 (1980) 852–854.[14] F.B. Pickering, Constitution and Properties of Steels, Germany, Weinheim,
1992. pp. 77–79.[15] T. Gladman, The physical metallurgy of microalloyed steels, The Institute of
Metals, London, 1997. pp. 325–336.[16] A. Bag, K.K. Ray, E.S. Dwarakadasa, Metall. Mater. Trans. A 30 (1999) 1193–
1202.[17] N.J. Kim, G. Thomas, Metall. Trans. A 12 (1981) 483–489.[18] F. B., Pickering, Advances in the Physical Metallurgy and Applications of Steels,
The Metals Society, 1981, pp. 5–25.[19] A.M. Sherman, R.G. Davies, Int. J. Fatigue 3 (4) (1981) 195–198.[20] D.L. Bourell, A. Rizk, Acta Metall. 31 (1983) 609–617.[21] U. Liedl, S. Traint, E.A. Werner, Comput. Mater. Sci. 25 (2002) 122–128.[22] W.C. Leslie, The Physical Metallurgy of Steels, McGraw-Hill, New York, 1981.
pp. 216–23.[23] B. Josefsson, H.O. Andren (Eds.) S.A. David, J. Vitek, OH: ASM, 1989, pp. 243–247.[24] S. Zaefferer, J. Ohlert, W. Bleck, Acta Mater. 52 (2004) 2765.[25] M. Sudo, T. Iwai, ISIJ Int. 23 (1983) 294–302.[26] M. Sudo, S. Hashimoto, S. Kambe, ISIJ Int. 23 (1983) 303–311.[27] I. Kim, S. Raiachel, W. Dahl, Steel Res. 58 (1987) 186–190.[28] B.Y. Choi, G. Krauss, D.K. Matlock, Scripta Metall. 22 (1988) 1575–1580.[29] D.K. Matlock, G. Krauss, Mater. Sci. Eng. A 165 (1995) 1–8.[30] A. Abdollah-Zadeh, A. Salemi, H. Assadi, Comput. Mater. Sci. 483–484 (2008)
325–328.[31] R.M. Rodriguez, I. Gutierrez, Mater. Sci. Forum 426–432 (2003) 4525–4530.[32] C. Thomser, U. Prahl, H. Vegter, W. Bleck, Comput. Methods Mater. Sci. 7 (1)
(2007) 42–46.[33] C. Thomser, V. Uthaisangsuk, W. Bleck, Steel Res. Int. 80 (8) (2010) 582–587.[34] U. Prahl, S. Papaefthymiou, V. Uthaisangsuk, W. Bleck, J. Sietsma, S. Van der
Zwaag, Comput. Mater. Sci. 39 (2007) 17–22.
Please cite this article in press as: A. Ramazani et al., Comput. Mater. Sci. (201
[35] V. Uthaisangsuk, U. Prahl, W. Bleck, Comput. Mater. Sci. 43 (2008) 27–35.[36] A. Ramazani, K. Mukherjee, U. Prahl, W. Bleck, Comput. Mater. Sci. 52 (2012)
46–54.[37] A. Ramazani, K. Mukherjee, H. Quade, U. Prahl, W. Bleck, Mater. Sci. Eng. A 560
(2013) 129–139.[38] A. Ramazani, K. Mukherjee, U. Prahl, W. Bleck, Metall. Mater. Trans. A 43 (10)
(2012) 3850–3869.[39] W. Bleck, F. Gerdemann, Mater. Manuf. Processes 26 (2011) 43–50.[40] P.T. Pinard, A. Schwedt, A. Ramazani, U. Prahl, S. Richter, Microstructure and
Microanalysis, 2013, http://dx.doi.org/10.1017/S1431927613001554.[41] L. Ryde, Mater. Sci. Technol. 22 (2006) 1297–1306.[42] S. Zaefferer, P. Romano, F. Friedel, J. Microscopy 230 (2008) 499–508.[43] V.G. Kouznetsova, PhD Thesis, Technical University Eindhoven, The
Netherlands, 2002.[44] http://www.ctcms.nist.gov/oof/.[45] Y. Bergström, Mater. Sci. Eng. 5 (4) (1970) 193–200.[46] Y. Estrin, H. Mecking, Acta Metall. 32 (1) (1984) 57–70.[47] J.G. Sevillano, Mater. Sci. Technol. 6 (1993).[48] O. Bouaziz, P. Buessler, La Revue de Metall.-CIT 99 (2002) 71–77.[49] C. Thomser, PhD Thesis, RWTH-Aachen, Germany, 2009.[50] H.K.D.H. Bhadeshia, Bainite in Steels, Second ed., IOM Communications Ltd.,
London, 2001.[51] J.L. Bocos, E. Novillo, M.M. Petite, A. Iza-Mendia, I. Gutierrez, Metall. Mater.
Trans. A 34 (3) (2003) 827–839.[52] K. Mukherjee, A. Ramazani, L. Yang, U. Prahl, W. Bleck, U. Reisgen, M. Schleser,
A. Abdurakhmanov, Steel Res. Int. 82 (12) (2010) 1408–1416.[53] T. Gladman, D. Dulieu, I. McIvor, Microalloying, 75, New York, 1977.[54] J.A. Whiteman, Inst. Metall. 3 (6) (1977) I–1.[55] www.micress.de.[56] J. Rudnizki, B. Böttger, U. Prahl, W. Bleck, Metall. Mater. Trans. A 42A (2011)
2516–2525.[57] A. Ramazani, Y. Li, U. Prahl, K. Mukherjee, W. Bleck, U. Reisgen, M. Schleser, A.
Abdurakhmanov, Comput. Mater. Sci. 68 (2013) 107–116.[58] K. Mukherjee, S.S. Hazra, M. Militzer, Metall. Mater. Trans. A 40 (9) (2009)
2145–2159.[59] M. Azuma, S. Goutianos, N. Hansen, G. Winther, X. Huang, Mater. Sci. Technol.
28 (9–10) (2012) 1092–1100.[60] A. Ramazani, K. Mukherjee, A. Schwedt, P. Goravanchi, U. Prahl, W. Bleck, Int. J.
Plasticity 43 (2013) 128–152.[61] A. Ramazani, A. Schwedt, A. Aretz, U. Prahl, W. Bleck, Comput. Mater. Sci. 75
(2013) 35–44.
3), http://dx.doi.org/10.1016/j.commatsci.2013.05.017
Copyright © 2022 FDOKUMEN