Chapter 2- literature review - OhioLINK ETD Center
82
Controlling the Production of Off-odor Guaiacol by Alicyclobacillus acidoterrestris in Apple juice or a Microbiological Medium Thesis Presented in Partial Fulfillment of the Requirements for the Degree Master of Science in the Graduate School of The Ohio State University By Xiaohuan Hu, B.S. Graduate Program in Food Science & Technology The Ohio State University 2016 Thesis Committee: Prof. Sheryl Barringer, Advisor Prof. Ahmed Yousef Asso. Prof. Monica Giusti
-
Upload
khangminh22 -
Category
Documents
-
view
1 -
download
0
Transcript of Chapter 2- literature review - OhioLINK ETD Center

Controlling the Production of Off-odor Guaiacol by
Alicyclobacillus acidoterrestris in Apple juice or a
Microbiological Medium
Thesis
Presented in Partial Fulfillment of the Requirements for the Degree Master of
Science in the Graduate School of The Ohio State University
By
Xiaohuan Hu, B.S.
Graduate Program in Food Science & Technology
The Ohio State University
2016
Thesis Committee:
Prof. Sheryl Barringer, Advisor
Prof. Ahmed Yousef
Asso. Prof. Monica Giusti

Copyright by
Xiaohuan Hu
2016

ii
Abstract
The presence of the off-odor compound guaiacol in juices spoiled by Alicyclobacillus
acidoterrestris, is one of the major causes for consumer complaints and product
rejection. This study tested how temperature, pH, substrate (vanillin) and antimicrobial
compounds (ɛ-polylysine and lauric arginate) effected bacterial growth and guaiacol
production in yeast starch glucose broth (YSG) and apple juice with new analytical
instrument Selected Ion Flow Tube Mass Spectrometery (SIFT-MS). Incubated
samples were held at 20-45°C and pH 2.7-6.7 with 10mg/L vanillin. Minimum
inhibitory concentrations (MICs) of ɛ-polylysine and lauric arginate were determined
at 37°C and pH 3.7. Guaiacol concentration was determined in the headspace by
selected ion flow tube mass spectrometry (SIFT-MS). Incubation temperature didn’t
influence the concentration of bacteria in the stationary phase or guaiacol produced, but
did influence bacterial growth rate which determined the time until guaiacol production
occurred. Bacterial growth was inhibited at 20 and 25°C in apple juice but not at 37 or
45°C either in YSG or apple juice. pH 6.7 completely inhibited bacteria and pH 2.7
delayed bacterial growth, thus influencing guaiacol production; but the bacterium grew
well at pH 3.7 and 4.7. Guaiacol was produced when the bacterial population reached
~105CFU/mL. MIC values for lauric arginate and ɛ-polylysine were 9.4 and 75ug/ml,
respectively. Both of these compounds inhibited vegetative cell multiplication and

iii
spore germination and no guaiacol was produced. However, Alicyclobacillus
acidoterrestris OSYE in YSG solution was not inhibited by lauric arginate. The
correlation of vanillin concentration (0.25-2 mg/L) to guaiacol production was highly
linear.

iv
Acknowledgements
I would first like to thank my father and my mother, who gave me this chance to study
in America and who always give me a lot of encouragement to explore new things.
I also would like to thank my advisor Dr. Sheryl Barringer. She gave me countless
advice relating to my research and classes. I also learned a lot from the way that she deals
with things. What is more, she is always so nice no matter what kinds of problems I
brought to her. She also taught me how to write thesis and how to manage my project
efficiently. I also want to thank Dr Yousef and En Huang, they came up with a great
project for me, I learned a lot by working with this project for about two years. En also
taught me all necessary lab skill of microbial research step by step and gave me various
great suggestions toward the troubles that I met in my project.
What is more, I would also like to thank my committee member Dr. Monica Giusti for
her supports to my research project. I also appreciate all the help from Dr. Yousef’s lab
such as the help from Xu Yang and Yang Song; the help from my lab mates, such as Yafei
Han and Hacer Akpolat who taught me a lot knowledge about SIFT-MS. It was a wonder
experience by working with all of you.

v
Vita
2014…………………………………….B.S. Food Science, Jilin University
2014 to present…………………………M.S. Food Science, The Ohio State
University
Fields of study
Major Field: Food Science and Technology.

vi
Table of Contents
Abstract .......................................................................................................................... ii
Acknowledgements ....................................................................................................... iv
Vita ................................................................................................................................. v
List of Figures ................................................................................................................ x
List of Tables ............................................................................................................... xii
Practical Application .................................................................................................. xiii
Chapter 1-Introduction ................................................................................................. 1
Chapter 2- literature review ......................................................................................... 4
2.1. Apple juice ............................................................................................ 4
2.1.1 Apple juice composition ..................................................................... 4
2.1.3 Method for microorganism control in apple juice .............................. 7
2.1.3.1 Physical treatment ............................................................................ 7
2.1.3.2 Heat Treatment................................................................................. 8
2.1.3.3 Antimicrobial compounds ................................................................ 8
2.1.3.4 Irradiation ......................................................................................... 9
2.2 Properties of Alicyclobacillus spp .......................................................... 9

vii
2.3 Reasons for survival of Alicyclobacillus spp in juice ........................ 10
2.4 Methods for the control of A. acidoterrestris .................................... 11
2.5 Off-flavor of juice .............................................................................. 14
2.6 Flavor properties of guaiacol ............................................................. 14
2.7 Formation pathway of guaiacol in drink ............................................ 15
2.8 The influence of substrates on guaiacol production .......................... 19
2.9 The sensory threshold of guaiacol ..................................................... 21
2.10 The influence factors on guaiacol production .................................. 21
2.10.1 The concentration of Alicyclobacillus spp. ................................... 21
2.10.2 Temperature of storage ................................................................. 22
2.10.3 Heat shock ..................................................................................... 23
2.11 Other off-flavor compounds ............................................................ 23
2.11.1 Chemical properties of 2, 6-dibromophenol and 2, 6-dichlorophenols
.................................................................................................................. 24
2.11.2 The synthetic pathway of 2, 6-dibromophenol (2, 6-DBP) and 2, 6-
dichlorophenols (2, 6-DCP) ..................................................................... 24
2.12 Detection method of guaiacol .......................................................... 26
2.12.1 Instrumental analysis of guaiacol.................................................. 26
a. Peroxidase enzyme colorimetric assay ................................................. 26
b. High performance liquid chromatography with UV-diode array detection
(HPLC-DAD) ........................................................................................... 26

viii
c. Headspace gas chromatography-mass spectrometry (HS GC-MS) ..... 27
2.12.2 Sensory analysis ............................................................................ 27
2.13 Selected Ion Flow Tube Mass Spectrometry (SIFT-MS) ................ 28
2.13.1 Principle of selected ion flow tube mass spectrometry (SIFT-MS) .. 2
8
2.13.2. Chemical characters of H3O+, NO+, and O2+ .............................. 29
Chapter 3 - Materials and Methods .......................................................................... 33
3.1 Yeast Starch and Glucose (YSG) solution ......................................... 33
3.2 YSG (Yeast, Starch and Glucose) broth preparation ......................... 33
3.3 YSG agar medium base ..................................................................... 33
3.4 Sporulation agar medium ................................................................... 34
3.5 Apple juice, 2-ethoxyphenol and vanillin .......................................... 34
3.6 Peptone water ..................................................................................... 34
3.7 Internal standard curve for YSG broth and apple juice samples ....... 34
3.8 Selected Ion Flow Tube Mass Spectrometry Detection of Guaiacol . 35
3.9 Culturing vegetative Alicycobacillus acidoterrestris......................... 35
3.10 Culturing Alicycobacillus acidoterrestris spores ............................. 36
3.11 The relationships of guaiacol and bacterial counts over time at different
temperatures in YSG broth or juice samples ........................................... 36
3.12. The relationship of guaiacol and bacterial counts over time at different
pH in YSG broth ...................................................................................... 37

ix
3.13 Antimicrobial compounds ................................................................ 38
3.14 Limitation of vanillin for guaiacol production................................. 39
3.15 Statistical Analysis ........................................................................... 39
Chapter 4- Results and Discussion .......................................................................... 40
4.1 The influence of temperature on bacterial growth and guaiacol
production ................................................................................................ 40
4.2 The influence of pH on guaiacol production and bacterial growth ... 45
4.3 Effect of antimicrobial compounds .................................................... 46
4.4 Limitation of substrate (vanillin) on guaiacol production ................. 51
Chapter 5-Conclusions ............................................................................................ 52
References ................................................................................................................ 53
Appendix: Tables and Figures ................................................................................. 62

x
List of Figures
Figure 1.The process of forming vanillin acid from ferulic acid ............................. 16
Figure 2.The process of forming guaiacol from vanillic acid .................................. 17
Figure 3.The process of ferulic acid degradation through the producing of 4-vinyl-
guaiacol .................................................................................................................... 18
Figure 4.The pathway of guaiacol production by A. acidoterrestris FB2 ................ 19
Figure 5. Bacterial counts influenced by temperature in YSG solution (above) and
apple juice (below) ameasurements with the same letter within the same sample have
no significant difference (p ≤ 0.05) .......................................................................... 43
Figure 6.Guaiacol production influenced by temperature in YSG solution (above) and
apple juice (below) ameasurements with the same letter within the same sample have
no significant difference (p ≤ 0.05) .......................................................................... 44
Figure 7.The influence of pH on guaiacol production and bacterial growth in YSG
ameasurements with the same letter within the same sample have no significant
difference (p ≤ 0.05) ................................................................................................ 46
Figure 8.The influence of antimicrobial compounds on vegetative cells (above) and
spores (below) of Alicycobacillus acidoterrestris OSYE in YSG ........................... 49

xi
Figure 9.Relationship between the amount of vanillin (mg/L) and guaiacol
concentration in the headspace (ppb) ....................................................................... 51
Figure 10.The influence of antimicrobial compounds on vegetative cell of
Alicycobacillus acidoterrestris ATCC in YSG ........................................................ 65
Figure 11.The influence of antimicrobial compounds on spores of Alicycobacillus
acidoterrestris ATCC in YSG .................................................................................. 65
Figure 12.The influence of antimicrobial compounds on vegetative cell of
Alicycobacillus acidoterrestris ATCC in juice ........................................................ 66
Figure 13.The influence of antimicrobial compounds on spore of Alicycobacillus
acidoterrestris ATCC in juice .................................................................................. 66
Figure 14.The influence of antimicrobial compounds on vegetative cell of
Alicycobacillus acidoterrestris OSYE in YSG ........................................................ 67
Figure 15.The influence of antimicrobial compounds on spore of Alicycobacillus
acidoterrestris OSYE in YSG .................................................................................. 67
Figure 16.The influence of antimicrobial compounds on vegetative cell of
Alicycobacillus acidoterrestris OSYE in Juice ........................................................ 68
Figure 17.The influence of antimicrobial compounds on spore of Alicycobacillus
acidoterrestris OSYE in Juice .................................................................................. 68

xii
List of Tables
Table 1. Vitamin Content of Fresh Apples per 100 Gram of Tissue ........................... 5
Table 2.Amino Acid Content (%) of Fresh Apples and Apple Products ..................... 5
Table 3. Mean, Standard Deviation (SO), Coefficient of Variation (CV), minimum
and maximum for apple juice mineral content ............................................................ 6
Table 4. Difference between the initial (0h) and final (48h for YSG and 72h for juice)
bacterial counts and guaiacol concentration ............................................................ 50
Table 5.Difference between the initial (0h) and final bacterial counts (48h for YSG or
72h for juice) among different conditions ............................................................... 62
Table 6. Difference between the initial (0h) and final (48h for YSG and 72h for juice)
guaiacol concentration among different conditions ................................................. 63
Table 7.Volatile Compounds Measured in Headspace Scan Volatile Compound ... 64
Table 8.The influence of storage time in water bath on volatilization .................... 64

xiii
Practical Application
Alicyclobacillus acidoterrestris growth and guaiacol production were inhibited by
storage at 20 or 25°C, pH 6.7 and addition of ɛ-polylysine or lauric arginate. Guaiacol
production can be decreased, but not prevented, by decreasing the substrate (vanillin)
concentration in food.
Therefore, storage apple juice at low temperatures (20 or 25°C) and adding ɛ-
polylysine or lauric arginate into apple juice products can be used in practical
processing of juice to prevent both vegetative cell growth and spore generation as
well as prevent guaiacol production. In ideal condition, adjusting juice to high pH
(6.7) or reduce vanillin concentration in it can help inhibit bacterial growth and
guaiacol production.

1
Chapter 1-Introduction
Alicyclobacillus acidoterrestris is a thermophilic, acidophilic, spore-forming
microorganism (Chang and Kang 2004). Because of its thermophilic properties, this
bacterium can survive in a large temperature range, from 20 to 70°C (Chang and
Kang 2004). 42-60°C is the optimal temperature range (Chang and Kang 2004). It can
survive commercial pasteurization of juice in the form of spores and spoil fresh or
processed fruit juice products by producing an off-odor when its count reaches
105CFU/mL (Chang and Kang 2004). Alicyclobacillus acidoterrestris can produce
guaiacol at 25 or 45°C, but bacterial grow more slowly at 25 than 45°C (Witthuhn and
others 2013). The bacteria can also grow in a wide range of pH, from 2.5-6.0 (Chang
and Kang 2004).
Guaiacol is a metabolite, which is the main factor that leads to the smoky or
medicinal off-flavor in juice associated with Alicyclobacillus. spp. Guaiacol is
produced by a biological conversion reaction from ferulic acid to vanillic acid and
then decarboxylation to guaiacol (Chang and Kang 2004). Vanillin, vanillic acid and
ferulic acid are three important precursors of guaiacol, but only vanillin or vanillic
acid can be decomposed by Alicyclobacillus. spp directly without participation of
other bacteria (Witthuhn and others 2012). Higher concentration of substrates
(vanillin or vanillic acid) tended to produce higher final amounts of guaiacol by

2
Alicyclobacillus acidoterrestris in Bacillus acidoterrestris (BAT) broth (Witthuhn and
others 2012).
Lauric arginate (LAE) is a new and natural cationic surface-active molecule which
has a large range of antimicrobial activity (Rinrada and others 2014). Lauric arginate
is a surfactant because of its polar cationic head group which is formed from L-
arginine, and nonpolar tail which comes from lauric acid, so it can attach to the oil-
water interface or biofilm (Rodríguez and others 2004; Loeffler and others, 2014). It
is mostly used in meat products and has not been used in juice against
Alicyclobacillus. spp. Lauric arginate is generally recognized as safe (GRAS) by the
US. Food and Drug Administration (FDA) (Food and Drug Administration 2005).
ε-Polylysine was reported to have antimicrobial activity against yeasts, fungi, gram-
positive and gram-negative bacteria, and bacteriophages (Chang and others 2010). It
is a GRAS additive and was approved by the FDA in 2004 (Food and Drug
Administration, 2004). ε-Polylysine can inhibit bacterial growth, mainly depending on
electrostatic adsorption to the bacterial cell surface and its cationic properties which
can destroy the outer membrane and finally lead to abnormal cytoplasmic distribution
(Shima and others 1984; Yoshida and Nagasawa 2003; Chang and others 2010). Both
ε-polylysine (300mg/L) and lauric arginate (200mg/L) have been reported to
effectively reduce the amount of Salmonella on inoculated chicken carcasses (Benli
and others 2011)
Alicyclobacillus acidoterrestris ATCC had been reported to produce the off-odor
guaiacol in juice (Gocmen and others 2005). Alicyclobacillus acidoterrestris OSYE is
an industrial strain isolated from commercial juice which it is considered to be the
most resistant strain found commercially. The objective of this study was to test how
different temperature and pH affects bacterial growth and guaiacol production by

3
Alicyclobacillus acidoterrestris ATCC and OSYE during storage. The minimum
inhibition concentrations (MICs) were determined for lauric arginate, and ε-
polylysine and they were tested for their ability to inhibit the growth of vegetative
cells and spore germination in YSG broth and apple juice. The relationship between
vanillin concentration and guaiacol production was also tested with Selected Ion Flow
Tube Mass Spectrometry (SIFT-MS).

4
Chapter 2- literature review
2.1. Apple juice
2.1.1 Apple juice composition
Apple juice is a high acid product (pH<4.6), it is treated with pasteurization
process. The contents of apple juice are mainly fiber, vitamin, pectin, amino acid,
mineral, organic acid. In the peel of apple, there are 0.7~0.8% higher of fiber content
than oranges, bananas or grapefruits (Downing 1995). Ascorbic acid is the highest
vitamin compound in apple which is about 5mg/100g (Downing 1995; Gebhardt and
others 1982). Other vitamins in apple with and without peels can been seen from the
table 1. Apple with skin usually have higher content of ascorbic acid than without
skin. For apple grew in America, the pectin content is constant during season until
apples become soft, and then the total pectin will be decrease. Amino acid is a minor
compound in apple. Protein in fresh apples with peel is about 0.19%. Aspartic and
glutamic acid are the predominant amino acid followed by lysine and leucine in fresh
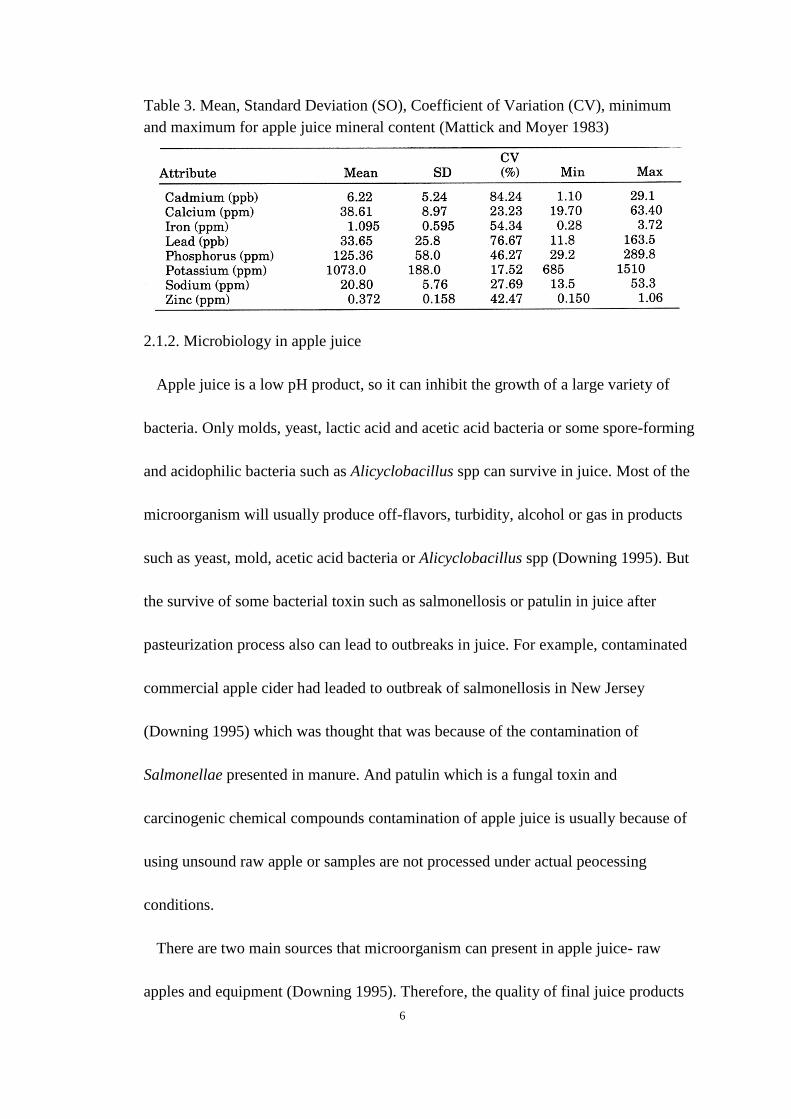
apple and apple products (Table 2). The average mineral content in apple juice is
about 0.207% among apple from different areas because of the various of soil content
(Mattick and Moyer 1983). Potassium contents are the main mineral compounds
followed by phosphorus and calcium (Table 3). Organic acid is one of important
contents in apple. Temperature condition and the length of growing season will

5
influence the organic acid content. Malic acid is the primary organic acid in fruit, but
citric acid, oxalic acid as well as lactic acid are also presented. The contents of acid in
fruit will influence flavor or eating quality (Downing 1995).
Table 1. Vitamin Content of Fresh Apples per 100 Gram of Tissue (Gebhardt and
others 1982)
RE*= Retinol equivalent
Table 2.Amino Acid Content (%) of Fresh Apples and Apple Products (Gebhardt and
others 1982)
6
Table 3. Mean, Standard Deviation (SO), Coefficient of Variation (CV), minimum
and maximum for apple juice mineral content (Mattick and Moyer 1983)
2.1.2. Microbiology in apple juice
Apple juice is a low pH product, so it can inhibit the growth of a large variety of
bacteria. Only molds, yeast, lactic acid and acetic acid bacteria or some spore-forming
and acidophilic bacteria such as Alicyclobacillus spp can survive in juice. Most of the
microorganism will usually produce off-flavors, turbidity, alcohol or gas in products
such as yeast, mold, acetic acid bacteria or Alicyclobacillus spp (Downing 1995). But
the survive of some bacterial toxin such as salmonellosis or patulin in juice after
pasteurization process also can lead to outbreaks in juice. For example, contaminated
commercial apple cider had leaded to outbreak of salmonellosis in New Jersey
(Downing 1995) which was thought that was because of the contamination of
Salmonellae presented in manure. And patulin which is a fungal toxin and
carcinogenic chemical compounds contamination of apple juice is usually because of
using unsound raw apple or samples are not processed under actual peocessing
conditions.
There are two main sources that microorganism can present in apple juice- raw
apples and equipment (Downing 1995). Therefore, the quality of final juice products

7
relying on the quality of raw apples and the sanitation of equipment. Microbial flora
of apples varies with the soundness of apple and seasons. The epiderm and core of
sound apple can inhibit the growth of bacteria, but for unsound apples, there ae high
microbial counts in the flesh (Marshall and Walkley 1951). What is more, hand-
picked apples also have lower bacterial counts than mechanically harvested apples
during storage (Davenport 1980)
Inadequately cleaned equipment can provide pools of residual fruit and juice which
usually bring the fasted growth strains of bacteria to apple products. Therefore,
routine daily cleaning of equipment is pretty important to keep the initial counts of
bacteria at a low level and prevent potential spoilage.
2.1.3 Method for microorganism control in apple juice
Methods used for preventing bacterial growth in juice varies with the different
nature of final products. If juice is processed with soundness raw apple and go
through with adequate sanitation, it can simplify the preservation procedures
(Downing 1995). The most commonly used preservation method are physical
treatments, heat treatment, irradiation and chemical antimicrobial compounds.
2.1.3.1 Physical treatment
Centrifugation apple juice at the speed of 9,000*g can reduce the population of
microbial by more than about 99.8% (Kosikowski and Moreno 1970). Filtration of
juice with diatomaceous earth can help reducing microbial counts (Swanson and
others 1985), but ultrafiltration can remove molds, yeast and bacteria (Heatherbell and
others 1977).

8
2.1.3.2 Heat Treatment
Heat treatment is the most commonly used method for removing bacteria from
apple product. For shelf-stable apple juice, usually samples are processed with heat
treatment at 71°C for 15-20min, 88°C for 1 or 2 min, or >121°C with treat time less
than 30 sec. The effective of heat treatment depending on the initial number of
microorganism (Downing 1995). However, heat treatment is not effective on
inhibiting heat resistance or spore-forming organisms such as Alicyclobacillus spp.
2.1.3.3 Antimicrobial compounds
Sorbic acid, sodium and potassium sorbate have been used in apple juice for a long
time. Research showed that sodium benzoate is more effective on controlling the
growth of yeasts and model than sorbic acid or sodium sorbate. But benzoate can
arouse off-flavor, so sorbate is wildly used antimicrobial compound in juice
(Downing 1995).
Sulfur Dioxide can reduce the bacterial population to a undetectable levels with the
concentration of 150 ppm (Downing 1995, Warth 1985). Only fermenting type of
yeast can survive in this condition, but its lag time will be extended (Warth 1985).
Other preservatives such as pimaricin which can inactivate Saccharomyces spp in
apple juice within twenty-five days with at 5ppm (Baerwald 1976);
dichlorofluoromethane or acetaldehyde also are used in apple juice for inhibiting
yeasts (Cousin and others 1997, Barkai-Colan and Aharoni 1976).

9
2.1.3.4 Irradiation
Different kinds of irradiation have been used in inactivation of bacteria in apple
juice (Downing 1995). Ultraviolet irradiation is used in pasteurization of apple juice
can achieve 99% reduction of microbial counts without any turbidity or off-flavor
production (Harrington and Hills 1968). Gamma-irradiation is used in freeze-
concentrated apple juice which can extend its shelf life to 10 months without any
other off-odor (Downing 1995, Kiss and Farkas 1968).
2.2 Properties of Alicyclobacillus spp
Alicyclobacillus spp. is a gram-positive, rod-shaped, spore-forming, thermophilic,
and acidophilic bacteria (Chang and Kang 2004). They can live in a large temperature
range from 20 to 70°C. The optimal range is 42-60°C. They also can grow in a wide
range of pH, from 2.5-6.0 (Chang and Kang 2004). The most special character of
Alicyclobacillus. spp is the membrane component of ω-alicyclic fatty acids, which can
provide them with ability of surviving in high temperature and acid environment
(Albuquerque and others 2000).
Alicyclobacillus spp is a major microorganism that can cause the spoilage of food.
However, it has no pathogenicity which was tested by directly injecting spores into
mice or indirectly adding spores to juice and then feeding spores to guinea pigs (Walls
and Chuyate 2000). No symptoms of disease were produced. However,
Alicyclobacillus spp is the main concern of fruit juice companies, because it can
survive in commercial pasteurized production and produce off-flavor guaiacol
(Splittstoesser and others 1994; Chang and Kang 2004). The appearance of this kind

10
of bacteria would not make people sick but it will influence the flavor of productions
and arouse consumer complaint.
2.3 Reasons for survival of Alicyclobacillus spp in juice
There are two main ways for juice to be contaminated by microorganism. Fruit can
contact with microorganism directly and then microorganisms can adhere to the peel
of fruit, after that the bacteria can enter the processing of juice leading to juice
contamination (Chang and Kang 2004). Other media, such as wind, rain, animal, etc.,
also can cause the accumulation of microorganisms on the surface of fruit (Chang and
Kang 2004). Therefore, if the fruit is not washed well, Alicyclobacillus spp can enter
the juice easily.
Most spore-forming bacteria can be killed or controlled by low pH (pH<4.6). What
is more, most juice industries attach great importance to other bacteria such as mold,
yeast, and under heat and acidic conditions, most of the growth of heat reliable
microorganism can be inhibited in juice (Change and Kang 2004). However, spore of
Alicyclobacillus spp. can survive in pasteurization temperature and high acid
environment. Thus, the processing of juice cannot control the survival or germination
of Alicyclobacillus spp. It is a leading microorganism can cause deterioration of juice
(Cerny and others 1984).
In juice samples, only sugar when its content is higher than 18 °Brix, or phenolic
compounds can inhibit the growth of Alicyclobacillus spp (Chang and Kang 2004).
Apple juice and tomato juice are also susceptible to this kind of bacteria, and normal

11
it cannot be detected until there are consumer complaints because of the off-odor of
juice (Chang and Kang 2004). Lower temperature (T<20°C) can inhibit the growth or
germination of spore, but most of the juice are shelf stable and stored at room
temperature, thus it is not an effective way to inhibit the spoilage of Alicyclobacillus
spp (Chang and Kang 2004). Therefore, with the growth in consumption of apple
juice, more attention should be given to control or detect the Alicyclobacillus spp.
2.4 Methods for the control of A. acidoterrestris
The optimization of heat treatment has been regarded as effective method to
inactive A. acidoterrestris. However, high temperature is not such an effective method
to inhibit spores of the bacteria, so during the storage period, spore of A.
acidoterrestris can still germinate in product. Moreover, heat can destroy lots of
nutritional compounds, so it is not ideal for inhibiting the growth of A. acidoterrestris
in food (Chang and Kang 2004).
High pressure processing is another effective method. A. acidoterrestris spores can
be inactivated at high pressure (200 to 600Mpa) with gentle temperatures (45 to
65°C). Compared to traditional thermal processing (85~95°C), this method can lower
process temperature which can provide a fresher and higher quality preserved food
(Silva and others 2012).
Excepting to these two main physical methods to control A. acidoterrestris, there
are lots of chemical compounds that also can inhibit the growth of bacteria. Natural
antimicrobial compounds or additives combine can reduce the amount of bacteria as

12
well as inhibit the germination of spores especially when samples are stored at high
temperature or low pH conditions (Bevilacqua and others 2009). Additive of cinnamic
aldehyde, and a moderate heat and low pH treatment is considered to be an effective
method to control the number of bacteria (Bevilacqua and others 2009). In this
method, cinnamaldehyde (40ppm-50ppm) works as inhibitor of the spore germination
and thermal (80 to 86°C) and lower pH (3.5 to 5.5) treatment can reduce the original
number of bacteria. Saponin extracts with a combination of heat-treatment can also
inactivate A. acidoterrestris and produce less influence on the quality of products than
high temperature treatment (Alberice and others 2012).
Bovicin HC5 make contribution to the effective of heat treatment by promote the
thermal sensitive of A. acidoterrestris (Carvalho and others 2008). When spores of A.
acidoterrestris was treated by heat, D-values can increase from 77% to 95% when
bovicin HC5 was added compared to no bovicin HC5 added (Carvalho and others
2008).
Grape seed extracts which contain a lot of polyphenols, such as catechin (49.8%)
and epicatechin (26.0%) were the major contents of the grape seed extracts, which are
followed by epicatechin gallate (9.3%), procyanidin B1 (5.8%) and B2 (5.1%),
epigallocatechin gallate (1.9%) and gallic acid (1.3%) (Guendez and others 2005), are
regarded as natural material that can effectively inhibit the growth of vegetative cells
and spore of A. acidoterrestris (Molva and Baysal 2015). Compared to control
samples, 2 to 3 log decrease of the count of bacteria can be achieved when grape seed

13
extracts with concentration from 0.06% to 1.80% was added to contaminated juice by
A. acidoterrestris (Molva and Baysal 2015).
Nisin is another natural antimicrobial compound which was produced by
Lactococcus lactis subsp. Lactis (Bevilacqua and others 2008). It can inhibit A.
acidoterrestris cell, and by working with chelating agents (such as EDTA) or at lower
pH and heat at high temperature (51°C), the ability of bacteriostatic can be improved
(Nguyen and Mittal 2007; Rosa and others 2009).
Supercritical carbon dioxide (SC-CO2) at temperature of 65 or 70 °C and pressure
of 80, 100, 120 bar with time from 10 to 40 min was proved that it can totally
inactivate the spore of A. acidoterrestris and reduce the amount of spores to an
undetectable level with less quality destruction (Bae and others 2009). In addition to
these methods, chemical disinfectants and chlorine dioxide are also effective
pathways to inactive A. acidoterrestris (Chang and Kang 2004).
ε-Polylysin and lauric arginate are widely used antimicrobial compounds and they
are both in the GRAS (generally recognized as safe) status. ε-Polylysine is edible and
water-soluble antimicrobial compound (Benli and others 2011)). It has been largely
used in different foods such as custard cream, potato salad, steamed cakes, fish, fish
slices, sushi, boiled rice, noodles, cooked vegetable as well as soups as antimicrobial
compounds (Hiraki and others 2003; Otsuka and others 1992; Chang and other 2010).
Lauric arginate is colorless and odorless with a large range of antimicrobial ability
which make it a very prospective food preservation (Becerril and others 2013). Gram-

14
negative as well as gram-positive pathogen, such as Salmonella and Listeria
monocytogenes, can be effectively inhibited by it (Martin and others, 2009; Stopforth
and others, 2010; Soni and others, 2010; Theinsathid and others, 2012). Because it
can destroy the cell membrane and influence the metabolic process of cells
(Rodríguez and others 2004; Loeffler and others, 2014).
2.5 Off-flavor of juice
Off-flavor is the most common cause that a product will be rejected by consumer.
Microorganisms can not only spoil products but also can produce off-odor which can
affect the quality of products (Barbara and Barbara, 2007). Spoilage of juice is caused
mainly by Alicyclobacillus spp by producing bad flavor. Usually, the metabolites of
bacteria in juice is the main pathway to form off-flavor after a period of storage in
room temperature. There are mainly two different kinds of compounds that can cause
the off-flavor in juice: guaiacol and halophenols (Jensen and Whitfield 2003; Chang
and Kang 2004). Halophenols include 2, 6-dibromophenol and 2, 6-dichlorophenol
(Jensen and Whitfield 2003; Chang and Kang 2004). However, guaiacol is the main
factor and most commonly focused compounds that can arouse the smoky or
medicinal off-odor in juice associated with Alicyclobacillus spp (Chang and Kang
2004).
2.6 Flavor properties of guaiacol
Guaiacol can produce sweet or burnt odor and smoky flavor, so it is always used as
flavoring in food (Wasserman 1966). It is well known by its smoky or phenolic flavor.
It can help promote the special flavor of roasted food products such as coffee or beef

15
(Mayer and others 1999). In another hand, the spoilage off-flavor in contaminated
acid products is the most widely known character of guaiacol. The spoilage off-flavor
of some products such as wine (Simpson and others 1986), fruit juice (Jensen 2000),
dairy products (Jensen and others 2001) as well as ice cream (Saxby 1993), are
proved to be guaiacol.
2.7 Formation pathway of guaiacol in drink
There are several ways that can lead to guaiacol production. It can be formed when
products go through heat treatment which can decompose the phenolic compounds to
produce guaiacol (Chang and Kang 2004). In fruit juice, guaiacol also can be
produced because of the microbial metabolism. Microorganisms that can produce
guaiacol include Alicyclobacillus acidoterrestris, Bacillus magaterium, Pseudomonas
acidovorans, Rhodotorula rubra and Streptomyces setonii (Chang and Kang 2004).
Alicyclobacillus acidoterrestris is the one that was first and wildly detected.
In fruit juice, vanillic acid is the direct precursor of guaiacol (Figure 1, 2).
Degradation of lignin which mainly comes from the plant polymer such as ferulic acid
or contamination of raw product all can bring vanillic acid or vanillin into juice
(Chang and Kang 2004). Lignin is one kind of cross-linked phenolic polymers which
is important compound in structural tissue such as cell walls (Martone and others
2009). Lignin can decompose to conlferyl alcohol and then convert into ferulic acid
during processing (Kumar and Pruthi 2014). The degradation of ferulic acid is a
common method to generating vanillic acid or vanillin in juice (Figure 3).

16
There are two ways of ferulic acid degradation. In one way, firstly ferulic acid is
hydrated and then the acetate moiety was removed through chemical reaction and then
produce the vanillin acid (Figure 1).
Figure 1.The process of forming vanillin acid from ferulic acid (Huang and others,
1993; Chang and Kang 2004)
When the vanillin acid is formed in samples, then it will be further decomposed into
guaiacol (Figure 2). Vanillin acid will change into a quinoid intermediate and then
break down into guaiacol (Huang and others 1993, Chang and Kang 2004) (Figure 2).

17
Figure 2.The process of forming guaiacol from vanillic acid (Huang and others, 1993;
Chang and Kang 2004)
Ferulic acid can also be degraded into 4-vinylguaiacol and then go further to
produce off-flavor guaiacol by decarboxylation (Chang and Kang 2004) or S. setonii
(Max and others 2012) (Figure 3). During this process, B. coagulans will involve in
this process to decompose ferulic acid into 4-vinylguaiacol and then convert 4-
vinylguaiacol into vanillin during a short time (Crawford and Olson 1978, Pometto
and others 1981, Huang and others 1993, Chang and Kang 2004) (Figure 3).

18
Figure 3.The process of ferulic acid degradation through the producing of 4-vinyl-
guaiacol (Huang and others, 1993; Chang and Kang 2004)
During the pathway of ferulic acid degradation to form guaiacol production, ferulic
acid can be decomposed by Rhodotorula rubra (Huang and others 1993),
Paecilomyces variotii (Rahouti and others 1989), and Sporotrichum thermophile
(Topakas and others 2003). But Alicyclobacillus acidoterrestris cannot decompose
ferulic acid into vanillin acid (Witthuhn and others 2012). It can only produce
guaiacol when there are substrates of vanillic acid or vanillin, and the speed of

19
converting vanillin acid into guaiacol is much faster than vanillin (Witthuhn and
others 2012) (Figure 4).
Figure 4.The pathway of guaiacol production by A. acidoterrestris FB2 (Witthuhn
and others 2012)
2.8 The influence of substrates on guaiacol production
The pathway of guaiacol production was tested by adding 100 or 1000mg/L vanillin
or vanillic acid and 5.67, 66.67 or 100 mg/L ferulic acid into BAT broth with
106CFU/mL final concentration of A. acidoterrestris FB2 (Witthuhn and others 2012).
Samples were stored at 45°C incubator for 7 days to test the guaiacol and bacterial
changes. During these 7 days, the number of bacteria have no significant difference
from the number on day 0. For samples with ferulic acid, no guaiacol was produced
during the storage, which proved that A. acidoterrestris FB2 cannot decompose
ferulic acid into guaiacol (Witthuhn and others 2012). In samples with 100mg/L

20
vanillin, there are significant increase of the guaiacol concentration from days 0 to 5,
and then keep stable (Witthuhn and others 2012). The 100mg/L vanillin was almost
used up at day 5 and the highest concentration of guaiacol is 61.7mg/L. In 1000mg/L
vanillin samples, the amount of guaiacol keep increase where the highest amount of
guaiacol is 170.8mg/L, but vanillin was not used up during 7days; it is possible that
guaiacol will increase until the vanillin is used up. For samples with 100mg/L vanillic
acid, guaiacol increased very fast at the first 24h and then kept stable from 1 to 7 days
and the highest amount of guaiacol was 67.4mg/L. In 1000mg/L vanillic acid sample,
guaiacol producing was delayed initially which may because of the decrease of the
amount of bacteria during the first 24h (Witthuhn and others 2012). Then the amount
of bacteria as well as guaiacol kept increasing. The highest amount of guaiacol
concentration for samples with 1000mg/L vanillic acid was higher than the sample
with 100mg/L vanillic acid. Therefore, in 100mg/L samples, vanillic acid was used up
very fast and produce a very high amount of guaiacol in a shorter time than vanillin.
However, very high concentration of vanillic acid can inhibited the growth of bacteria
(Witthuhn and others 2012).
In fact, tyrosine is also a precursor of guaiacol (Jensen 1999). However, the amount
of tyrosine in beverage is very small so the influence on juice is not obvious. The
amount of it in apple juice is usually about 4.1μg/mL and in orange juice is 3.4–13.5
μg/mL (Chang and Kang 2004). The synthetic way of guaiacol through tyrosine is not
clear.

21
2.9 The sensory threshold of guaiacol
The sensory thresholds for guaiacol are different in different conditions. The
sensory threshold of guaiacol was about 20 ppb in water (Wasserman 1966). It is not
very hard for olfactory evaluation to test it. Pettipher and others (1997) also find the
threshold of guaiacol is about 2 ppb in some noncarbonated juice such as apple,
orange juice. There were also other compounds that can produce off-odor in products
such as 2, 6-dibromophenol and 2, 6-dichlorophenols. The sensory thresholds of these
two compounds were low to ppt level (Chang and Kang 2004). Even though 2, 6-
dibromophenol and 2, 6-dichlorophenols have a lower threshold than guaiacol, most
research focus on guaiacol, which was regarded as the primary off-flavor compound.
There were two reasons which make guaiacol the main role of off-flavor: (1) guaiacol
has a high volatility (2) the concentration of guaiacol in juice is normal much higher
than other off-flavor compounds, about 1,000 times higher than halophenols (Chang
and Kang 2004).
2.10 The influence factors on guaiacol production
2.10.1 The concentration of Alicyclobacillus spp.
When fruit juice was contaminated by Alicyclobacillus spp, there would be guaiacol
production when the concentration of Alicyclobacillus spp. reach 105CFU/mL
(Pettipher and others 1997). Then with time goes by, guaiacol will kept increase and
then kept stable at a higher amount (Witthuhn and others 2012). Thus the number of
bacteria must reach 105CFU/mL in order to produce guaiacol.

22
2.10.2 Temperature of storage
Alicyclobacillus spp. growth at a range of temperature from 20 to 70°C. Depending
on different species, the optimal temperature various from 42 to 60°C (Chang and
Kang 2004). There is obvious difference of guaiacol between contaminated chocolate
milk when stored at 8-9°C, then there was 150-190 ppb; when stored at 4-5°C there
was 50-70 ppb guaiacol tested by GC-MS (Jensen and others 2001).
One of either Alicyclobacillus acidoterrestris FB2, FB38, DSM 3922T as well as
strains A. acidocaldarius FB19 and DSM 446T have been cultivated in Bacillus
acidoterrestris (BAT) broth with final cell concentration of 101-103cfu/mL and
supplement with 100mg/L vanillin (Witthuhn and others 2013). There were two sets
of samples for each bacterium. They were stored at temperature of 25 and 45°C
separately for 6d. All three strains of Alicyclobacillus acidoterrestris can produce
guaiacol, and A. acidoterrestris DSM 3922T and FB38 can even produce a higher
concentration of guaiacol in 25 than 45℃, therefore the degree of spoilage can be the
same, or even more serious at lower temperature (25℃) than at higher temperatures
(45℃) (Witthuhn and others 2013). However other two A. acidcaldarius strains were
unable to produce guaiacol at 25℃ (Witthuhn and others 2013).
Thus different temperatures will influence the amount of guaiacol in juice that is
produced by Alicyclobacillus spp. Lower temperature also cannot be ignored which
may provide a condition for more guaiacol production produced by A. acidoterrestris.

23
2.10.3 Heat shock
In fruit juice, the metabolite of guaiacol will be influenced by the status of
Alicyclobacillus spp. Only in vegetative status rather than dormant condition, can
metabolites be produced (Chang and Kang 2004). Thus, activation of dormant
bacteria is a process that can lead to spores germinate. Among lots of activation
methods, exposure bacteria to sub-lethal heat is the most frequently used. Different
temperatures of heat shocking, there would be different recovery speeds for bacteria
at low concentration (Chang and Kang 2004). When Alicyclobacillus spp. are
inoculated at low concentration, heat shocking at 80℃ for 10 min will lead to a higher
number of bacterial germination than heat shocking at 60℃ for 10 min or 100℃ for 5
min (Walls and Chuyate 2000). While, with high concentration of bacteria, heat shock
with different temperatures does not make any differences for germinating (Chang
and Kang 2004). For spores of Alicyclobacillus acidoterrestris which survived
pasteurization of juice, seems needs no heat shocking was needed to germinate it. It
can germinate in juice with time which may because of some natural compounds in
the juice that can induce them, but the speed of germinating is slower than heat
shocking (Pettipher and others 1997). Thus, heat shock will definitely help to activate
Alicyclobacillus spp and increase the speed of the present of guaiacol production.
2.11 Other off-flavor compounds
Excepting to guaiacol, halophenols: 2, 6-dibromophenol (2, 6-DBP) and 2,6-
dichlorophenols (2,6-DCP) are also regarded as the major cause of off-flavor in fruit
juices (Jensen 1999). Both 2, 6-DBP and 2, 6-DCP is detected in spoilage fruit juice

24
by Alicyclobacillus acidoterrestris (Baumgart and others 1997, Borlinghaus and
Engel 1997). But there is still no affirmative answer to whether these halogenated
phenolic compounds can be produced by Alicyclobacillus acidoterrestris or not. It is
also possible that these compounds are presented in juice just because of chemical
contamination.
2.11.1 Chemical properties of 2, 6-dibromophenol and 2, 6-dichlorophenols
2, 6-dibromophenol and 2, 6-dichlorophenols usually present a similar flavor as
guaiacol. Actually, most common way of halogenated phenolic compound
contamination was coming from disinfectant taints at a level below 1 ppb (Saxby
1993). In fact, even though at a very low level of 2, 6-DBP and 2, 6-DCP, they still
can produce off-odor and influence the quality of products, because they have much
lower threshold than guaiacol (Chang and Kang 2004).
2.11.2 The synthetic pathway of 2, 6-dibromophenol (2, 6-DBP) and 2, 6-
dichlorophenols (2, 6-DCP)
There are two ways that will lead to food contamination by 2, 6-DBP and 2, 6-DCP:
chemical contamination and microbial synthetic pathway (Chang and others 2004).
As for the chemical way, bromophenol and chlorophenol are easily formed by the
reaction of phenol with halogen solutions (Chang and others 2004). During the
process of fruit, disinfectants will be used to clean fresh fruits as well as in the process
of diluting the juice. Some recycled paper also contains high level of chlorophenolic
compounds, thus if these materials are used for packaging, it will also can bring
chlorophenolic compounds to products and then produce food contamination

25
(Mottram 1998). Thus during these steps, when phenols containing water contacts
with halogen solution, then a quick product of halophenols will be formed. If
halophenols were not removed from the system, then it will continue to pollute the
final products (Chang and others 2004). Even though phenol is important factors that
lead to halophenol contamination, it is not a necessary compound in this kind of
contamination. When there was no phenol in carrots, but if carrots were treated with
sodium hypochlorite and then heat them to 121°C, then 2, 6-DCP can also been
produced (Adams and others 1999). In fact, free phenol has not detected in fresh
vegetable
In the microbial synthetic pathway, the contaminations were produced because of
the bacterial biosynthesis, instead of external disinfection contamination. In the
process, some main reactants were the phenolic precursor, hydrogen peroxide, halide
ions and haloperoxidase (Neidleman and Geigert 1986). In the biosynthetic process,
microbial haloperoxidase can make contribution to promote the process, even without
metal ions or cofactors to speed up reactions (Picard and others 1997). From these
aspects, fruit juice should be a very suitable environment to form the off-odor
halophenol, because even though in the juice there are trace quantities of phenolic
compounds, hydrogen peroxide and halide ions, haloperoxidases produced by bacteria
can still promote the happen of this reaction (Chang and Kang 2004). Strains of A.
acidoterrestris are capable to produce halogenation. Therefore A. acidoterrestris

26
could be also one kind of microorganism that related to the generation of these two
off-odor compounds.
2.12 Detection method of guaiacol
There are two categories for the guaiacol detection: instrumental analysis and
sensory analysis. Instrumental analysis focuses on quantifying the amount of guaiacol.
The sensory analysis is usually applied to detect the presence or absence of guaiacol.
2.12.1 Instrumental analysis of guaiacol
a. Peroxidase enzyme colorimetric assay
Peroxidase enzyme colorimetric assay will show different colors which means
different concentrations of guaiacol (Sheu and Chen 1991, Bahçeci and Acar 2007).
UV/Vis spectrophotometer will be combined with it to measure the color changes at
420nm (Sheu and Chen 1991, Bahçeci and Acar 2007). Different colors will lead to
different signals. After that, the guaiacol concentration can be calculated depending
on the standard curve. But the disadvantage is that the high concentration of vanillic
acid can also influence the color of solution and then produce a discoloration of the
buffer. Thus, sometimes it just cannot gain an obvious color change or useful signal in
UV/Vis spectrophotometer (Witthuhn and others 2012). Therefore, most of the time,
this method will only be applied to detect the presence or absence of guaiacol.
b. High performance liquid chromatography with UV-diode array detection (HPLC-
DAD)
For this method, sample need to be filtered first and then injected it into HPLC with
a silica C18 column (Witthuhn and others 2012, Chang and Kang 2004). Since

27
different compounds will have different retention times, thus, the peak area of a
specific compound with a fixed retention time point can be calculated through
standard curve. This method is much accurate than peroxidase enzyme colorimetric
assay method, but tedious sample preparation is needed (Witthuhn and others 2012).
c. Headspace gas chromatography-mass spectrometry (HS GC-MS)
Headspace gas chromatography-mass spectrometry (HS GC-MS) has ever used to
detect guaiacol produced by Alicyclobacillus spp strains at different temperatures.
Though it is an expensive and time-consuming method, the advantage is that it is very
high accurate, sensitive detection method with relative less sample preparation
(Witthuhn and others 2013). The detection limit is 0.5ug/L (ppb) (Witthuhn and
others 2013).
2.12.2 Sensory analysis
The detection threshold for volatile compounds guaiacol are the level which the
different samples can be separated correctly by panel without being able to describe
the off-flavor as “disinfection” or “medicine” (Witthuhn and others 2012; Chang and
Kang 2004). The recognition threshold is the concentration of guaiacol at which the
different samples can be recognized correctly and the medicinal flavor of guaiacol
also can be described (Chang and Kang 2004).
The sensory threshold of guaiacol in juice is a little higher than guaiacol threshold
in water (20ppb). In fact, the special smell of guaiacol is very obvious thus most
consumers are able to detect the presence of guaiacol even without sensory training.

28
Thus this kind of sensory test worth nothing for qualification, and most of time,
sensory test can be utilized to confirm the presence of guaiacol (Chang and Kang
2004).
2.13 Selected Ion Flow Tube Mass Spectrometry (SIFT-MS)
2.13.1 Principle of selected ion flow tube mass spectrometry (SIFT-MS)
SIFT-MS is a new and fast analytical technique which are mainly used for real-time
quantification of the trace gases both in air and breath (Smith and Španěl 2005). Three
precursor ions: H3O+, NO+, or O2
+ in SIFT-MS are used to react with aimed trace
volatiles by chemical ionization reaction to test the concentration of volatile
compounds (Munch and Barringer 2014). When testing the sample, the three
precursor ions can react with volatiles in headspace in a fixed time, and then the
reaction can be detected and counted depending on the change of the concentration of
precursor ions by mass spectrometer, therefore, the concentration of volatiles can be
detected (Smith and Španěl 2005). Most of the time, only one of the ions, which
shows the lowest reaction, was used for calculating the concentration of one
compound. Absolute concentrations of volatile compounds in one sample can be
tested by SIFT-MS down to ppb levels (Smith and Španěl 2005).
In the SIFT, the three positive ions (H3O+, NO+, or O2
+) are generated from ion
mixtures. The information of mass-to-change ratio can be obtained by the detection of
quadrupole mass filter (Smith and Španěl 2005). The reaction ions will be injected
into the fast-flowing inert carrier gas (usually pure helium under a pressure of at most
100Pa) by a venturi-type orifice (diameter usually 1-2mm). They will be carried as a

29
cold ion current with carrier gas along the flow tube. The speed of ions follows the
Maxwellian velocity distribution related to the change of temperature (normally
300K) of carry gas (Smith and Španěl 2005). The ions for mass analysis are sampled
by the pinhole orifice from the flowing current (the diameter at most 0.3mm) into a
differentially-pumped quadrupole mass spectrometer (Smith and Španěl 2005). After
that they can be analyzed by channeltron multiplier/pulse counting system.
The rate of coefficient and ion products for the injected ions and trace volatile gas
can be determined according to the reduction of injected ion current and the increase
of the product ion which can be measured by the downstream mass spectrometer
system. Then the rate coefficient of the reaction can be calculated according to series
of procedures.
The main focus of SIFT-MS analyses is the ions change of precursor and the
produce of ion products by downstream mass spectrometry detection system.
Depending on these principles, SIFT-MS can achieve the real-time quantification of
trace gases in a complex circumstance (Smith and Španěl 2005).
2.13.2. Chemical characters of H3O+, NO+, and O2+
The most important principles to select appropriate ions is that the ions should
hardly react with major air molecules such as CO2,O2, N2, but they should be
easily to react with trace gases which will be tested (Smith and Španěl 2005). After a
long time’s study, it has been found that H3O+ (Španěl and Smith, 1995; Španěl and
others 1995; Smith and Španěl 1996b; Smith and Španěl 2005), NO+, O2+ (Smith and

30
Španěl 1996; Smith and Španěl 2005) are ideal ions for SIFT-MS. These ions do not
react with major air molecular such as N2, O2, H2O, CO2, or Ar; and only through
slow termolecular association so that can these ions react with these molecules (Smith
and Španěl,1996 a, c; Španěl and Smith, 1996b; Smith and Španěl 2005). Negative
ions are also tested for the possibility of being the precursors. As for OH-, it cannot
react with organic molecules as quickly as H3O+, and it is also does not have
sufficient amount of its molecular to form the current of negative ions (Smith and
Španěl 2005). Thus, the negative ions will decrease the accuracy of the instrumental
analysis (Smith and Španěl 2005). More information regarding the reaction properties
can be seen as follows:
A. H3O+ reaction
As for this ion, H3O+ reaction with molecules M will produce a stable product of
MH+. The main reaction of H3O+ ion is H3O
+ + M→ (M-H)+ + H2O according to the
function of][
2AkN
iDNi
dt
dNj
i
. But these compounds of MH+ also can
decompose or re-synthesize to form other compounds such as (M-OH)+, and (M-OR)+
( R is radical such as CH3 and C2H5). And (M-OH)+ comes from the reaction of MH+
with H2O. Tertiary alcohols (M-OH)+ can be produced when further react with H3O+
molecular (Španěl and Smith 1997; .Smith and Španěl 2005). There are also other
compounds that will be produced because of further complex reaction, such as the
ester reactions: H3O+ + C3H7COOCH3 →C3H7COOCH3H
++ H2O (90%) →C3H7CO+

31
+ H2O +CH3OH (10%) (Španěl and Smith 1998; Smith and Španěl 2005); and react
with aliphatic hydrocarbons or halocarbons such as H3O+ + C10H22 + He
→H3O+(C10H22)
+ He (Smith and Španěl 2005); when moisture gas currents- such as
human breath-was tested, there may form cluster because of too much water:
H3O++nH2O+ X→H3O
+ (H2O)n +X,
where X is a third media that can stabilize the cluster (Smith and Španěl 2005).
Sometimes there would be a further reaction in a humid environment which can
reaction with (M-H)+ or (M-OH)+ to form MH+(H2O)n.
B. NO+ reaction
As for NO+, there are several kinds of reactions, but usually they do not occur at the
same time. All kinds of reactions can be seen as follow:
(1) charge transfer, producing M+·
NO+ + C6H5CH3→C7H8+·+NO·
(2) H+ transfer
When NO+ ions react with aldehydes or ethers, (M-H) + can be produced (Španěl
and Smith 1997b; Španěl and Smith 1998b; Smith and Španěl 2005).
NO++CH3CHO→CH2CHO+ +HNO
(3) OH- transfer
NO+ + (CH3)3COH→ (CH3)3C++HNO2
(4) charge transfer, producing NO+M

32
In this kind of reaction, there would be transform of alkoxide ion simultaneously
which will form NO+M and (M-OH)+ ions in some of ester reactions (Španěl and
Smith 1998a, Smith and Španěl 2005).
NO+ +CH3COOCH3 +He→NO+CH3COOCH3 + He→CH3CO+ +CH3NO2 + (He)
C. O2+ reactions
The IE of O2 molecules is relative higher than most of organic compounds (Lias and
others 1988; Smith and Španěl 2005). Thus it is much easier for O2+·to react with
most of organic molecules. As for the reaction for O2+·, no-dissociative charge
transfer reaction and dissociative charge transfer reaction are two main kinds of
reactions:
O2+·+CH3COCH3→CH3COCH3
+·+O2 (60%)
O2+·+CH3COCH3→CH3CO++CH3
·+O2 (40%)
Some small molecules such as NO, NO2 and CS2 which can hardly react with NO+
or H3O+ can be tested by O2
+· (McIntosh and Smith 1988; Smith and Španěl 2005).
These reactions can be seen as follows:
O2+·+NO·→NO++O2
O2+·+NO2
·→NO2+ +O2
O2+·+CS2→CS2
+·+O2
According to the describing of all precursors’ reaction, it would be very important
to find the suitable ions which can accurately reflect the reaction with analysts
without or with less other molecules’ influence (Smith and Španěl 2005).

33
Chapter 3 - Materials and Methods
3.1 Yeast Starch and Glucose (YSG) solution
YSG solution was used to culture bacteria. YSG solution was prepared by mixing
0.2% yeast extract (MSDS, NJ, USA), 0.2% soluble starch (J. T. Barker, NJ, USA)
and 0.1% dextrose (Difco, MD, USA) in distilled water in a 900mL pyrex glass bottle
and adjusting the pH to 3.7. This solution was sterilized by autoclave (30min,
120.5°C) and then stored at 25°C.
3.2 YSG (Yeast, Starch and Glucose) broth preparation
YSG broth was prepared by mixing YSG solution with 8% sucrose (Difco, MD,
USA) with a final pH of 3.7. This solution was sterilized by autoclave (30min,
120.5°C) and then stored at 25°C. The YSG broth was used for sample preparation,
since it is a near ideal environment for bacterial growth.
3.3 YSG agar medium base
The YSG agar medium base was used for counting the number of bacteria and
culturing the bacterial colonies. This agar medium was prepared by adding 1.5% agar
(Difco, MD, USA) to YSG solution, sterilizing and cooling to about 55°C before
poured into Petri dishes and cooling until it solidified (Silva and others 1999).

34
3.4 Sporulation agar medium
Sporulation agar medium were prepared by mixing the following two solutions after
being sterilized separately then pouring in Petri dishes before it cooled down. The first
solution was prepared by mixing 1g yeast extract; 0.2 g (NH)2SO (Fisher Scientific
Fair Lawn, NJ, USA), 0.25 g CaCl2 (Fisher Scientific Fair Lawn, NJ, USA), 0.5 g
MgSO (Fisher Scientific Fair Lawn, NJ, USA), 1 g glucose; 0.6 g KH2PO (Fisher
Scientific Fair Lawn, NJ, USA) with 500 ml distilled water, and adjusting to pH 4.0
with 6mol/L HCl. The second solution was prepared by mixing 20 g agar with 500 ml
distilled water.
3.5 Apple juice, 2-ethoxyphenol and vanillin
Apple juice (Old Orchard, LLC Co, Sparta, MI, USA) was used for this research
with 1.068g/mL 2-ethoxyphenol (ACROS Organics, Fair Lawn NJ, USA) as an
internal standard. 10mg/L vanillin (Sigma-Aldrich, Louis MO, USA) was used as the
substrate which can be decomposed by bacteria to produce guaiacol.
3.6 Peptone water
0.1% peptone (HIMEDIA Laboratories Pvt. Ltd, Mumbai, India) was prepared with
distilled water and then sterilized. 0.1% peptone water was used for serial dilutions
before counting the number of bacteria.
3.7 Internal standard curve for YSG broth and apple juice samples
Guaiacol (Sigma-Aldrich, Louis MO, USA) was prepared at four different
concentrations: 0, 282, 1129, 5645 ppm in YSG broth or apple juice. One hundred

35
milliliters YSG broth or apple juice with five concentrations of guaiacol were placed
into 500mL-sterilized Pyrex glass bottles with 3 replicates for each group and sealed
well with open top screw cap with polytetrafluoroethylene (PTFE)-faced silicone
septa (Corning Life Sciences, Tewksbury, MA, USA). One-milliliter filtered and
diluted 2-ethoxyphenol (1.069ug/mL) (ACROS Organics, Fair Lawn NJ, USA) was
added into every sample as an internal standard and these samples were held in a
37°C water bath for 1h to volatilize guaiacol and 2-ethoxyphenol in the solution. The
concentration of guaiacol in the headspace were tested by SIFT-MS.
3.8 Selected Ion Flow Tube Mass Spectrometry Detection of Guaiacol
Selected Ion Flow Tube Mass Spectrometry (SIFT-MS) (Voice 200; Syft
Technologies Ltd., Christchurch, New Zealand) was used for guaiacol detection under
selected ion mode (SIM). Guaiacol reacted with precursor ion of NO+ with m/z of 124
to produce C7H8O2+. 2-ethoxyphenol was tested by precursor ion O2
+, with m/z of 138
to produce C8H10O2+. Volatiles had a 60 sec scan processing. The volatiles selected
for headspace measurement and SIFT-MS settings are listed in Appendix (Table 4)
3.9 Culturing vegetative Alicycobacillus acidoterrestris
Colonies of pure frozen Alicycobacillus acidoterrestris OSYE and ATCC were
aseptically removed and added to sterile YSG Agar Medium Base and cultured at
37°C for 2 d, then 1conly of bacteria was aseptically removed from YSG agar
medium base into a 50mL centrifuge tube with 30mL YSG solution. The two
centrifuge tubes were stored at 37°C for 2 days until there was turbidity. These
cultures were used to inoculate YSG broth and juice samples.

36
3.10 Culturing Alicycobacillus acidoterrestris spores
Solutions of Alicycobacillus acidoterrestris OSYE and ATCC were aseptically
spread on sterile spore agar medium base and cultured at 45°C for 4d, then aseptically
removed from medium base with a sterilized microscope slide into 2ml centrifuge
tube with sterilized water to a final volume of 1ml. The spore solution was
centrifuged (15 min, 16.1*1000rcf (relative centrifugal force), 4°C), the supernatant
was decanted and the sediment was re-suspended in 50% (v/v) aqueous ethanol for 30
min, to destroy any vegetative cells. The spore suspension was re-centrifuged, the
supernatant was discarded and the sediment was re-suspended in sterile water
(repeated three times). The final sediment was re-suspended in sterile distilled water
and heated 10 min at 80°C, and the number counted and then stored at 4°C for use.
3.11 The relationships of guaiacol and bacterial counts over time at different
temperatures in YSG broth or juice samples
Samples were prepared by adding 100mL YSG broth or apple juice, 1mL of
Alicycobacillus acidoterrestris OSYE, or Alicycobacillus acidoterrestris ATCC, and
10mg/L vanillin solution into a 500mL sterilized Pyrex glass bottle. Fifteen samples
were prepared and divided into five groups with 3 replicates in each group and stored
in an incubator. In order to test the influence of temperature, samples were stored at
20, 25, 37, 45°C in separate incubators. Before testing, 1mL 2-ethoxyphenol was
added into each bottle as the internal standard. These samples were placed into a 37°C
water bath for 1h to volatilize guaiacol and 2-ethoxyphenol, and the headspace was

37
tested by SIFT-MS. The guaiacol concentration in the headspace was determined by
dividing the concentration of 2-ethoxyphenol in headspace and then multiplying it by
the average 2-ethoxyphenol concentration in the headspace for all samples.
At every temperature, samples were tested at 5 different times (YSG broth: 20°C: 0,
211.5, 282.5, 304.5, 326.5h; 25°C:0, 70, 82, 101, 146h; 37°C: 0, 18, 26, 42, 56h;
45°C: 0, 18.5, 25.5, 42.5, 74h; Apple Juice: 20 :0, 22, 31, 33, 35d; 25°C:0, 35, 48, 57,
59d; 37°C: 0, 66, 90.5, 114.5h; 45°C: 0, 69, 76, 100, 119h) according to the bacterial
growth.
After sample testing by SIFT-MS, the number of bacteria in every bottle was
counted where the limitation is 10 CFU/ml. 100uL solution was taken from one
sample, and then diluted to 10-1, 10-2, 10-3, 10-4, 10-5 times of original concentration
with 0.1 % peptone water. 100uL from each diluted solution was spread onto YSG
agar plates. All plates were stored at 37°C for 2 d for bacterial growth and then plates
with 20 to 200 bacterial colonies were selected to count the average number of
bacteria.
3.12. The relationship of guaiacol and bacterial counts over time at different pH in
YSG broth
YSG solution was adjusted to different pH (2.7, 3.7, 4.7, 6.7) with 6M HCL.
Samples were stored at 37°C for bacterial growth. For every pH level, guaiacol
concentration in the headspace and bacterial counts were tested 7 times and there

38
were 3 replicates for every point at different times according to bacterial growth
speed.
3.13 Antimicrobial compounds
Lauric arginate and ɛ-polylysine were tested for their minimum inhibitory
concentrations (MICs) using the method of Clinical and Laboratory Standards
Institute (CLSI 2006). Lauric arginate was diluted to 4.7, 9.4, 18.8, 37.6, 75.2ug/mL
and then 100uL of these solutions were added to the cells of a 94 cells culture plate
with 1uL Alicycobacillus acidoterrestris ATCC or OSYE culture added. ɛ-Polylysine
was diluted to 37.5, 75,150, 300, 600 ug/mL and measured in the same way as lauric
arginate. The 96-cell cultural plate was stored at 37°C for 24h to check whether there
was bacterial growth with microtiter plate reader
Samples used to test the effect of antimicrobial compounds were prepared by
adding their MICs to 100 mL YSG broth or apple juice with 1mL of 10mg/L vanillin
solution and 1mL vegetative cells or 0.1ml spores (Alicycobacillus acidoterrestris
ATCC or OSYE) separately with final concentration ~103CFU/mL. In every batch,
there were three groups of samples: samples with ɛ-polylysine added, samples with
lauric arginate added as well as a control group (no antimicrobial compound was
added). During the test of every batch, guaiacol concentration in the headspace as
well as bacterial counts were recorded.

39
3.14 Limitation of vanillin for guaiacol production
Vanillin was added to samples at different concentrations (0.00, 0.25, 0.05, 1.00,
2.00mg/L). There were three replicates for samples of each concentration of vanillin.
Samples were stored at 37°C, and tested at 24h when guaiacol reached its highest
point according to preliminary tests. 95% confidence interval was used to determine
the minimum concentration of guaiacol in the headspace that is significantly different
from the background.
3.15 Statistical Analysis
One-way analysis of variance (ANOVA) and Tukey’s post hoc analysis (RStudio
Statistical Software, RStudio, Inc, Richmond Hill, ON, Canada) were used to
determine statistical difference. P value of 0.05 was used for indicating significant
difference.

40
Chapter 4- Results and Discussion
4.1 The influence of temperature on bacterial growth and guaiacol production
Research was conducted in YSG (yeast starch and glucose) broth and apple juice
samples with A. acidoterrestris ATCC and OSYE. A. acidoterrestris OSYE was
isolated from commercial juice samples. It is thermophilic and acidophilic bacteria,
therefore, it can survive the pasteurization process of juice in the form of spores and
then produce the off-odor guaiacol (Chang and Kang 2004). A. acidoterrestris ATCC
is a well-studied and has been reported to produce the off-odor guaiacol in juice
(Gocmen and others 2005). YSG broth is a media with ideal conditions for bacterial
growth.
Temperature did not influence the final concentration of bacteria when they reached
the stationary phase in the sample, but did influence the time for bacterial
concentration to reach its stationary phase (Figure 5). Bacterial growth curves were
very similar for samples at 37 and 45℃, however bacteria at 25 or 20℃ took longer to
reach the exponential phase in YSG broth. A. acidoterrestris is thermophilic and the
optimum temperature for its growth is from 42 to 60°C (Chang and Kang 2004).
There are ω-alicyclic fatty acids in the membrane of A. acidoterrestris, which protect
the bacteria from high temperature and low acid conditions (Chang and Kang 2004).

41
The higher temperatures (37 or 45℃) increase the speed of metabolism due to the
increased activity of enzymes, but it does not influence the final concentration of
bacteria in the stationary phase as long as there are enough nutrients (carbon source,
nitrogen source, minerals, growth factors), and water. Others also reported that A.
acidoterrestris strains grew slower at 25 than 45°C in yeast starch glucose (YSG)
broth (Witthuhn and others 2013). Alicyclobacillus acidoterrestris 2498 can live and
grow at 25, 35, and 44°C but it cannot grow at 4°C in apple juice or orange juice
(Pettipher and others 1997).
In apple juice, there was no bacterial growth at 20 and 25°C (Figure 5). Some
natural compounds such as polyphenols in juice can inhibit the growth of bacteria
(Brodbeck and others 2009). The yeast extract, glucose and starch in YSG broth are
important nutritions which support the growth of bacteria. Therefore, in a perfect
media (such as YSG broth), temperature can only delay bacterial growth, while in
nutrient limited media such as apple juice, storage at room temperature can inhibit the
growth of bacteria. At the same temperature, bacteria grew slower in apple juice than
in YSG solution (Figure 5, 6).
Temperature did not influence the maximum amount of guaiacol produced, but did
influence the time for guaiacol production to reach its highest concentration (Figure
6). Guaiacol production is highly related to the bacterial growth rate. Bacteria grew
faster at 37 or 45°C than 20 or 25°C, leading to different time (18, 18.5, 282.5, 70h)
until guaiacol production under different temperature conditions (Figure 5, 6). There

42
was guaiacol production at all temperatures which were tested in YSG broth.
Guaiacol production occurred at almost the same time (18, 18.5h) at 37 or 45°C, but
longer time (282.5, 70h) were needed for guaiacol production at 20 or 25°C. Guaiacol
formation accelerated when incubation temperature increased from 32 to 50°C
(Chang and others 2015). Others also reported that in YSG broth, Alicyclobacillus
acidoterrestris can produce guaiacol at 25 or 45°C, and longer time was needed to
produce guaiacol at 25 than 45°C (Witthuhn and others 2013). On the other hand, a
different researcher also found no guaiacol formation at 25°C, in K broth with
different strains (Alicyclobacillus isolates1016 and 1101) during 48h (Chang and
others 2015).
There was no significant difference in the maximum amount of guaiacol produced
in YSG or juice samples or at different temperatures (Figure 5, 6). The growth media
only influenced the growth rate of bacteria, therefore leading to longer time needed
for guaiacol to reach its maximum in juice compared to YSG. In apple juice, no
guaiacol production occurred at 20 and 25°C, because there was no bacterial growth.
But there was bacterial growth at 37 or 45°C in apple juice which lead to guaiacol
production in the samples.

43
Figure 5. Bacterial counts influenced by temperature in YSG solution (above) and
apple juice (below) ameasurements with the same letter within the same sample have
no significant difference (p ≤ 0.05)
0
1
2
3
4
5
6
7
8
0 50 100 150 200 250 300
Aver
age
nu
mb
er o
f b
act
eria
in
YS
G(l
og10C
FU
/mL
)
Time (h)
37℃
45℃
25℃
20℃
limit of detection
abde abef
bcdef
bcdefbde
bdebdebde
ff bcef
gg
hh h
defdef
a
0
1
2
3
4
5
6
7
8
0 50 100 150 200 250 300
Aver
age
nu
mb
er o
f b
act
eria
in
ju
ice
(Log10C
FU
/mL
)
Time (h)
37 ℃
45 ℃
25℃
20℃
limit of detectionc
b
b
c
b b
abaa
c
c

44
Figure 6.Guaiacol production influenced by temperature in YSG solution (above) and
apple juice (below) ameasurements with the same letter within the same sample have
no significant difference (p ≤ 0.05)
0
10
20
30
40
50
60
70
80
90
100
0 50 100 150 200 250 300
Ad
just
ed a
ver
age
gu
aia
col
con
cen
trati
on
in
hea
dsp
cace
of
YS
G
(pp
b)
Time (h)
37 ℃
45 ℃
25 ℃
20 ℃
h
bc
e
h
g
de
bce
h
f
bc
ab
h h
bc
a
abab
b bcbc
0
10
20
30
40
50
60
70
80
90
100
0 50 100 150 200 250 300
Ad
just
ed a
ver
age
gu
aia
col
con
cen
trati
on
in
hea
dsp
cace
of
juic
e
(pp
b)
Time (h)
37 ℃
45 ℃
25℃
20℃
f
d
bb
c
f
e
aba
ff

45
4.2 The influence of pH on guaiacol production and bacterial growth
Adjusting the pH to 2.7-6.7 did not influence the final microbial count in the
stationary phase or guaiacol concentration, but did influence the time for bacteria or
guaiacol to reach the stationary phase (Figure 7). Higher pH (6.7) inhibited bacterial
growth thus no guaiacol was produced. Lower pH (2.7) delayed bacterial growth and
guaiacol production was delayed. Bacterial growth in the exponential phase occurred
the fastest at pH 3.7 and 4.7 with corresponding guaiacol production. Others reported
that guaiacol can be produced by Alicyclobacillus isolate 1016 in a pH range of 3.5 to
4.5 and Alicyclobacillus isolate 1101 in a pH range of 3.5 to 5.0 (Chang and others
2015). The maximum concentration of guaiacol was the same but required different
time to reach their maximum at different pH (Chang and others 2015). Longer time
was needed at pH 3.5 than pH 4 or 4.5 for Alicyclobacillus isolate 1016 and 1101 to
produce guaiacol; and no guaiacol production occurred at pH 5 (Chang and others
2015).
Guaiacol production started when bacterial counts exceeded 104 (about 105) (Figure
7). It has been reported that only when the number of A. acidoterrestris reach about
105~106cfu/ml, can it produce guaiacol (Pettipher and others 1997).

46
Figure 7.The influence of pH on guaiacol production and bacterial growth in YSG ameasurements with the same letter within the same sample have no significant
difference (p ≤ 0.05)
4.3 Effect of antimicrobial compounds
Lauric arginate and ɛ-polylysine had bactericidal and bacteriostatic effects on the
vegetative cells and spores of Alicycobacillus acidoterrestris ATCC and
0
1
2
3
4
5
6
7
8
0 50 100 150 200 250 300 350
Bact
eria
nu
mb
er (
log c
fu/m
L)
Time (h)
pH 4.7
pH 3.7
pH 2.7
pH 6.7
Limit of detectionfgg
gg
a
g
ded
g
g gfg
ee
e
cd
abcd
bca
bcd
fg
g
abcd
0
10
20
30
40
50
60
70
80
90
100
0 50 100 150 200 250 300 350
Gu
aia
col
con
cen
trati
on
(p
pb
)
Time (h)
pH 4.7
pH 3.7
pH 2.7
pH 6.7
a abbcdc
cdc
abc dde
f ffff ff f f f ff
f
ff

47
Alicycobacillus acidoterrestris OSYE in YSG broth and apple juice (Table 4).
However, there were turbidity in lauric arginate YSG samples and ɛ-polylysine in
apple juice samples for all tree replicates, which may because of some chemical
reactions which lead to the sedimentation.
Lauric arginate has a cationic head from L-arginine and a nonpolar tail from lauric
acid. It adheres to oil-water interfaces and crosses the cell membrane into the
cytoplasm, where it breaks the inter cell environmental balance and inhibits metabolic
processes (Rodríguez and others 2004). ɛ-Polylysine has a positive charge in solution,
thus because of electrostatic adsorption and osmotic pressure between cell
membranes, cationic ɛ-polylysine enters the cell membrane and disrupts the balance
of neutral charge in the cytoplasm causing damage to the cell (Shima and others
1984).
In control samples, the increase in bacterial counts during storage showed few
differences between juice and YSG broth or for different strains with spores or
vegetative cells (Table 4). In control samples, bacterial counts increased to a high
level (106 CFU/ml) and produced guaiacol. Bacterial counts in many samples had an
initial decrease in the first 6h due to adaptation to the new environment. An example
graph is showed in Figure 8. However, after 6h, bacterial counts increased in the
control.
With added antimicrobial compounds at their MICs values (9.4ug/ml lauric
arginate, 75ug/ml ɛ-polylysine), bacterial counts decreased to the detection limit of

48
10CFU/mL, and no guaiacol was produced in the samples (Table 4). Only in the YSG
solution with lauric arginate added, did the spore count of Alicycobacillus
acidoterrestris OSYE increase (Figure 8, Table 4). YSG broth is an ideal growth
media for bacterial growth, and spores are resistant to stressful environments because
of the coat, cortex and dipicolinic acid in core that can protect the core. Since the MIC
value was determined on vegetative cells, it is clear that the MICs were not high
enough to inhibit spore germination in an ideal media.
Others reported that the more lauric arginate in the sample, the greater the reduction
of L. monocytogenes in the sample (Soni and others 2010). ɛ-Polylysine also been
reported to have a marginally better inhibition against L. monocytogenes at pH of 5.5
than 7 (Najjar and others 2007).

49
Figure 8.The influence of antimicrobial compounds on vegetative cells (above) and
spores (below) of Alicycobacillus acidoterrestris OSYE in YSG
0.0
1.0
2.0
3.0
4.0
5.0
6.0
7.0
8.0
0 10 20 30 40 50
nu
mb
er o
f b
act
eria
(lo
gcf
u/m
l)
Time (h)
Control
Polylysine
Lauric
arginatelimit of
detection
aa
bbbb
cce cecd
cdfe
0
10
20
30
40
50
60
70
80
90
100
0 10 20 30 40 50
Gu
aia
col
co
nce
ntr
ati
oin
(p
pb
)
Time (h)
Control
polylysine
lauric
arginate
b
ccc cc c c c c c
a
0.0
1.0
2.0
3.0
4.0
5.0
6.0
7.0
8.0
0 10 20 30 40 50
nu
mb
er o
f b
act
eria
(lo
gcf
u/m
l)
Time (h)
Control
Polylysine
Lauric
arginatelimit of
detection
ab
c
ddd de e
f g g
0102030405060708090
100
0 10 20 30 40 50Gu
aia
col
co
nce
ntr
ati
oin
(p
pb
)
Time (h)
Control
polylysine
lauric
arginate
a
bc
ddd ddd d d d

50
Table 4. Difference between the initial (0h) and final (48h for YSG and 72h for juice)
bacterial counts and guaiacol concentration
difference in bacterial count
(log cfu/ml)
difference in guaiacol
concentration (ppb)
Samples Control lauric
arginate
ε-
polysine Control
lauric
arginate ε-polysine
Juice with
spore of
ATCC
2.59 ab -2.10ed -2.08defgh 72.1AB 0.79D 0.88D
Juice with
spore of
OSYE
1.89bc -1.67defg -0.91d 90.0A 0.63D 0.63D
Juice with
vegetative
cell of
ATCC
1.55bc -1.83defg -1.58defgh 33.2C 1.38D -0.71D
Juice with
vegetative
cells of
OSYE
2.09abc -1.28defgh -1.10de 49.8C -0.71D -0.42D
YSG with
Spore of
ATCC
1.27c -1.03de -2.59gh 69.4B 0.57D 0.93D
YSG with
Spore of
OSYE
3.22a 2.28abc -2.37fgh 74.8AB 48.0C 0.17D
YSG with
Vegetative
cells of
ATCC
2.20abc -1.83defg -1.43defg 72.6AB 0.04D 0.54D
YSG with
Vegetative
cells of
OSYE
2.60ab -2.16efgh -3.13h 84.8AB 0.53D -0.08D
log population difference= Initial log cfu/ml– final log cfu/ml
ameasurements within a sample with the same letter are not significantly different

51
4.4 Limitation of substrate (vanillin) on guaiacol production
The correlation between the substrate (vanillin) concentration and guaiacol
production was highly linear in the range of 0.25-2mg/L vanillin (Figure 9). Others
have also reported that higher substrate concentration produced higher maximum
guaiacol: 100mg/L vanillin can produce about 61.7mg/L guaiacol while 1000mg/L
vanillin can produce about 170.8mg/L guaiacol (Witthuhn and others 2012).
Therefore, carefully controlling the amount of substrate can reduce the maximum
amount of guaiacol production in a sample. SIFT-MS was able to detect down to
0.1mg/L vanillin added or 3.6ppb of guaiacol in the headspace which produced a
significant difference from the background.
Figure 9.Relationship between the amount of vanillin (mg/L) and guaiacol
concentration in the headspace (ppb)
y = 7.7704x + 2.7935
R² = 0.9983
0
5
10
15
20
0 0.25 0.5 0.75 1 1.25 1.5 1.75 2
Gu
aia
col
con
cen
trati
on
(p
pb
)
Vanillin's concentration (mg/L)

52
Chapter 5-Conclusions
Temperature didn’t influence the final concentration of bacteria in the stationary
phase or concentration of guaiacol produced, but did influence bacterial growth rate
which determined the time until guaiacol production occurs. Temperature inhibited
bacterial growth at 25 and 20°C in apple juice but not at 37 and 45°C. pH 6.7
completely inhibited bacteria thus there is no guaiacol production; and pH 2.7 delayed
bacterial growth, thus leaded to delay on guaiacol production. However, bacteria grew
well at pH 3.7 and 4.7. Compared to apple juice, YSG broth is more ideal for bacterial
growth. Guaiacol was produced when the bacterial count reached about 105 CFU/mL.
9.4 and 75ug/ml were the minimal inhibitory concentrations for lauric arginate and
ɛ-polylysine respectively on Alicycobacillus acidoterrestris OSYE and ATCC. Lauric
arginate and ɛ-polylysine have bactericidal and bacteriostatic effect on Alicycobacillus
acidoterrestris vegetative cells and spores, except lauric arginate does not inhibit the
spores of Alicycobacillus acidoterrestris OSYE in YSG solution. When adding lauric
arginate to YSG samples and ɛ-polylysine to apple juice samples, there was turbidity,
which will influence the appearance of samples. Vanillin concentration was highly
related to guaiacol production, therefore carefully control the concentration of vanillin
can also reduce guaiacol production.

53
References
Adams B, Lock J, Toward R, Williams M. 1999. Bromophenol formation as a
potential cause of ‘disinfectant’ taint in foods. Food Chem 64 (3):377-381.
Alberice J, Funes-Huacca M, Guterres S, Carrilho E. 2012.Inactivation
of Alicyclobacillus acidoterrestris in orange juice by saponin extracts combined with
heat-treatment. Int J Food Microbiol 159 (2):130-135.
Albuquerque L, Rainey F, Chung P, Sunna A, Nobre M, Grote R, Antranikian G,
Costa M. 2000. Alicyclobacillus hesperidium sp. nov. and a related genomic species
from solfataric soils of São Miguel in the Azores. Int. J. Syst Evol. Microbiol 50 (2):
451-7.
Bae Y, Lee H, Kim S, Rhee M. 2009. Inactivation of Alicyclobacillus
acidoterrestris spores in apple juice by supercritical carbon dioxide. Int J Food
Microbiol 136 (1):95-100.
Baerwald, G. 1976. Cold sterilization of apple juice with the fungicide pimaricin (in
German). Ind. Obst Gemueseverwert. 61(3): 453-58.
Bahçeci K, Acar J. 2007. Determination of guaiacol produced by Alicyclobacillus
acidoterrestris in apple juice by using HPLC and spectrophotometric methods, and
mathematical modeling of guaiacol production. EUR FOOD RES TECHNOL
Journal, 225 (5-6): 873-878.
Barbara S, Barbara Z. 2007. Growth Behavior of Off-Flavor-Forming
Microorganisms in Apple Juice. Food Chem 55 (16):6692-6699.
Baumgart J, Husemann M, Schmidt C. 1997. Alicyclobacillus acidoterrestris:
occurrence, significance and detection in beverages and beverage base. Flussiges Obst
64 (61):78-180.

54
Becerrila R, Manso S, Nerina C, Gómez-Lusb R. 2013. Antimicrobial Activity of
Lauroyl Arginate Ethyl (LAE), against selected food-borne bacteria. Food Control 32
(2):404-408.
Benli H, Sanchez-Plata MX, Keeton JT. 2011. Efficacy of ε-polylysine, lauric
arginate, or acidic calcium sulfate applied sequentially for Salmonella reduction on
membrane filters and chicken carcasses. J Food Prot 74 (5):743-50.
Bevilacqua, A., Sinigaglia, M., Corbo, M. R. (2008). Alicyclobacillus acidoterrestris:
New methods for inhibiting spore germination. Int J Food Microbiol, 125 (2): 103-
110.
Bevilacqua A, Sinigaglia M, Corbo M. 2009. Effects of pH, cinnamaldehyde and
heat-treatment time on spore viability of Alicyclobacillus acidoterrestris. Int J Food
Sci Technol 44 (2):380-385.
Borlinghaus A, Engel R.1997. Alicyclobacillus incidence in commercial apple juice
concentrate (AJC) supplies-method development and validation. Fruit Processing, 7
(9): 262-266.
Brodbeck C, Hennlich W, Sandmeier D, Cerny G, Duong H-A. Influence of
processing related phenol components on growth of Alicyclobacillus acidoterrestris in
iced tea. Flüssiges Obst, http://www.cababstractsplus.org/abstracts, consulted June
19th 2009.
Carvalho A, Vanetti M, Mantovani M. 2008. Bovicin HC5 reduces thermal resistance
of Alicyclobacillus acidoterrestris in acidic mango pulp. J of Appl Microbiol 104 (6):
1685-91
Cerny G, Hennlich W, Poralla K. 1984. Fruchtsaftverderb durch Bacillen: isolierung
und charakterisierung des verderbserregers. Z. Lebensmitt. Unters. Forsch 179
(3):224-227.
Chang SS, Kang DH. 2004. Alicyclobacillus spp. in the fruit juice industry: history,
characteristics, and current isolation/detection procedures. CRIT REV MICROBIOL
30 (2):55-74.

55
Chang S, Lu WW, Park SH, Kang DH.2010. Control of foodborne pathogens on
ready-to-eat roast beef slurry by ε-polylysine. Int J Food Microbiol 141(3): 236-241.
Chang S, Park SH, Kang DH. 2015. Effect of Extrinsic Factors on the Production of
Guaiacol by Alicyclobacillus spp. Int J Food Prot 78 (4): 831-835.
CLSI -Clinical and Laboratory Standards Institute. 2006. Performance standards for
antimicrobial susceptibility testing. Sixteenth Informational Supplement. Document
M100-S16, Wayne, PA.
Cousin A, Marth H, Fennema O. 1977. Inactivation of Saccharomyces
bailii and Debaromyces hansenii by dichlorofluoromethane. Lebensm. Wiss. Technol.
10(4): 227-31.
Crawford L, Olson P. 1978. Microbial catabolism of vanillate: decarboxylation to
guaiacol. Appl. Environ. Microbiol. 36 (4): 539–543.
Davenport R. 1980. Microbiology in prospective. Progress in the field of fruit and
vegetable juices. Proc. Int. Fed. Fruit Juice Prod. 16 (2):155-73.
Downing D. 1995. Processed Apple Products. Boston, MA: Springer US. 314-316.
Food and Drug Administration. 2004. Agency response letter GRAS Notice No. GRN
000135.Website:http://www.fda.gov/Food/FoodIngredientsPackaging/GenerallyReco
gnizedasSafeGRAS/GRASListings/ucm153957.htm
Food and Drug Administration. 2005. Agency response letter GRAS Notice No. UCM
268847. Website:
http://www.fda.gov/downloads/Food/IngredientsPackagingLabeling/GRAS/NoticeInv
entory/UCM268847
Gebhardt, Cutrufelli, Matthews. 1982. Composition offoods: Fruitsand fruit juices.
Agric. U.S. Dept. of Agriculture.8-9.
Gocmen D, Elston A, Williams T, Parish M, Rouseff RL. 2005. Identification of
medicinal off-flavours generated by Alicyclobacillus species in orange juice using
GC–olfactometry and GC–MS. Letters in Appl Microbiol 40 (3):172-177.
Guendez R; Kallithraka S; Makris DP; Kefalas P.2005. An analytical survey of the
polyphenols of seeds of varieties of grape (Vitis vinifera) cultivated in Greece:

56
implications for exploitation as a source of value-added phytochemicals. Phytochem
Anal 16 (1):17-23
Harrington O, Hills C. 1968. Reduction of the microbial population of apple cider by
ultraviolet irradiation. Food Technol. 22: 1451-54.
Heatherbell D, Short J, Struebi P. 1977. Apple juice clarification by ultrafiltration.
Confructa, 22 (5-6): 157-69.
Huang Z, Dostal L, Rosazza J.1993. Mechanisms of ferulic acid conversions to
vanillic acid and guaiacol by Rhodotorula rubra. J of Biol Chem 268 (32): 23954 –8.
Jensen N. 1999. Alicyclobacillus: a new challenge for the food industry. Food Aust 51
(1-2):33-36.
Jensen N. 2000. Alicyclobacillus in Australia. Food Aust 52 (7):282-285.
Jensen N, Whitfield B. 2003. Role of Alicyclobacillus acidoterrestris in the
development of a disinfectant taint in shelf-stable fruit juice. Lett Appl Microbiol 36
(1):9-11.
Jensen N, Varelis P, Whitfield B. 2001. Formation of guaiacol in chocolate milk by
the psychrotrophic bacterium Rahnella aquatilis. Lett Appl Microbiol 33 (5): 339-43.
Hiraki J, Ichikawa T, Ninomiya S, Seki H, Uohama K, Seki H, Kimura S,
Yanagimoto Y, Barnett J. 2003. Use of ADME studies to confirm the safety of ε-
polylysine as a preservative in food. Regul Toxicol Pharmacol 37 (2): 328-340.
Kiss I, Farkas J.1968. Radiation sterilization of freeze-concentrated apple juice
(in Hungarian). Elelmiszertudomany 2 (1): 67-75.
Kosikowski, F. V., and V. Moreno. 1970. Removing microorganisms in fresh apple
juiceby bacterial centrifugation. J. Food Sci. 35 (4): 368-70.
Kumar N, Pruthi V.2014. Potential applications of ferulic acid from natural sources.
Biotechnol Rep. 4 (1): 86-93
Loeffler M, McClements D. McLandsborough L, Terjung N, Chang Y, Weiss J. 2014.
Electrostatic interactions of cationic lauric arginate with anionic polysaccharides

57
affect antimicrobial activity against spoilage yeasts. J of Appl Microbiol 117 (1):28-
39.
Marshall R, Walkley V. 1951. Some aspects of microbiology applied to commercial
apple juice production. I. Distribution of microorganisms on the fruit. Food Res 16 (1-
6): 448-56.
Martin EM, Griffis CL, Vaughn K.L, O'Bryan CA, Friedly EC, Marcy JA, Ricke SC,
Crandall PG, Lary RY Jr. 2009. Control of Listeria monocytogenes by lauric arginate
on frankfurters formulated with or without lactate/diacetate. J Food Sci 74(6): M237-
41.
Martone P, Estevez J, Lu F, Ruel K, Denny M, Somerville C, Ralph J. 2009.
Discovery of Lignin in Seaweed Reveals Convergent Evolution of Cell-Wall
Architecture. Current Biology 19 (2): 169–75.
Mattick R. 1983. Criteria for determining the adulteration of apple juice and
concentrate. N.Y. State Agric. Exp. Stn. Spec. Rep. 50.
Max B, Carballo J, Cortés S, Domínguez M. 2012. Decarboxylation of Ferulic Acid to
4-Vinyl Guaiacol by Streptomyces setonii. Appl Biochem Biotechnol 166 (2):289–
299.
Mayer F, Czerny M, Grosch W. 1999. Influence of provenance and roast degree on
the composition of potent odorants in Arabica coffees. Eur. Food Res. Technol 209
(3-4): 242-250.
McDaniel EW, Mason EA. 1973. The mobility and diffusion of ions in gases. New
York: Wiley. 372p.
McIntosh B, Adams N, Smith D. 1988. Determination of the proton affinities of
H2Oand CS2 relative to C2H4. Chem Phys Letters 148 (2-3):142–148.
Munch R, Barringer S. 2014. Deodorization of Garlic Breath Volatiles by Food and
Food Components. J. Food Sci 79 (4):526-533.
Molva C, Baysal A. 2015. Antimicrobial activity of grape seed extract on
Alicyclobacillus acidoterrestris DSM 3922 vegetative cells and spores in apple juice.
Food sci. technol 60 (1):238-245.

58
Mottram, D. 1998. Chemical tainting of foods. Int J Food Sci Technol 33 (1):19-29.
Najjar MB, Kashtanov D, Chikindas ML. 2007. Epsilonpolylysine and nisin A act
synergistically against Gram-positive food-borne pathogens Bacillus cereus and
Listeria monocytogenes. Lett Appl Microbiol. 45 (1):13-8.
Neidleman L, Geigert J. 1986. The halogenating enzymes (haloperoxidases): sources
and reactions in Biohalogenation: principles, basic roles and applications, New York:
E Horwood.46-84p.
Nguyen P, Mittal GS. 2007. Inactivation of naturally occurring microorganisms in
tomato juice using pulsed electric field (PEF) with and without antimicrobials. Chem
Eng Process 46 (4):360–5.
Otsuka N, Kuwahara Y, Manabe K.1992. Effect of ε-poly-lysine on preservation of
boiled noodles. Nippon Shokuhin Kogyo Gakkaishi 39 (4): 344-347.
Pettipher, G, Osmundson, M, Murphy J. 1997. Methods for the detection and
enumeration of Alicyclobacillus acidoterrestris and investigation of growth and
production of taint in fruit juice and fruit juice containing drinks. Lett. Appl.
Microbiol 24 (3):185-9.
Picard M, Gross J, Liibbert E, Tolzer S, Krauss S, Pee K, Berkessel A. 1997. Metal-
free bacterial haloperoxidases as unusual hydrolases: activation of H2O2 by the
formation of peracetic acid. ANGEW CHEM INT EDIT 36 (11):1196-1199.
Pometto R, Sutherland J, Crawford D. 1981. Streptomyces setonii: catabolism of
vanillic acid via guaiacol and catecol. Can. J Microbiol. 27 (6): 636-638
Pérez-Cacho P, Danyluk M, Rouseff R. 2011. GC–MS quantification and sensory
thresholds of guaiacol in orange juice and its correlation with Alicyclobacillus spp.
Food Chem.129 (1):45-50.
Rahouti M, Seigle M, Steiman R., Eriksson KE.1989. Metabolism of ferulic acid by
Paecilomyces variotii and Pestalotia palmarum. Appl Environ Microbiol 55 (9):2391–
2398.

59
Rinrada P, Aran H, Catherine C. 2014. Effect of lauric arginate, nisin Z, and a
combination against several food-related bacteria. Int J Food Microbiol 188 (1):135-
146.
Rodríguez E, Seguer J, Rocabayera X, Manresa A. 2004. Cellular effects of
monohydrochloride of l-arginine, Na-lauroyl ethylester (LAE) on exposure to
Salmonella typhimurium and Staphylococcus aureus. J Appl Microbiol 96 (5):903–
912.
Rosa M, Raybaudi M, Jonathan M, Robert S, Olga M.2009. Control of Pathogenic
and Spoilage Microorganisms in Fresh-cut Fruits and Fruit Juices by Traditional and
Alternative Natural antimicrobials. COMPR REV FOOD SCI F 8 (3):157-180.
Saxby M. 1993. A survey of chemicals causing taints and off-flavours in foods in
Food taints and off-flavors.1st edit, London, UK: Saxby, M.40p.
Sheu S, Chen A. 1991. Lipoxygenase as blanching index for frozen vegetable
soybeans. J of Food Sci 56 (2):448-451.
Shima S, Matsuoka H, Iwamoto T, Sakai H. 1984. Antimicrobial action of ε-
polylylsine. J of Antibiotics 37 (11): 1449-1455.
Silva FM, Gibbs P, Vieira MC, Silva CLM. 1999. Thermal inactivation of
Alicyclobacillus acidoterrestris spores under different temperatures, soluble solids
and pH conditions for the design of fruit processes. Int J Food Microbiol 51(2-3): 95-
103.
Silva FM, Tan EK, Farid M. 2012. Bacterial spore inactivation at 45–65 °C using
high pressure processing: Study of Alicyclobacillus acidoterrestris in orange juice.
Food Microbiol 32 (1):206-211.
Simpson R, Amon J, Daw A. 1986. Off-flavor in wine caused by guaiacol. Food
Technol 38 (1):31-33.
Španěl P, Pavlik M, Smith D.1995. Reactions of H3O+ and OH- ions with some
organic molecules; applications to trace gas analysis in air. Int J Mass Spectrom Ion
Processes 145 (3):177–186.

60
Splittstoesser DF, Churey JJ, Lee CY.1994. Growth characteristics of aciduric spore-
forming bacilli isolated from fruit juices. J Food Prot 57 (12):1080–3.
Smith D, Španěl P. 1996c. The novel selected ion flow tube approach trace gas
analysis of air and breath. Rapid Commun Mass Spectrom 10 (10):1183–1198.
Smith D, Adams N. 1988. The selected ion flow tube (SIFT): Studies of ion neutral
reactions. Adv Atom Mol Phys 24:1–49.
Smith D, Španěl P. 2005. Selected Ion Flow Tube Mass Spectrometry (SIFT-MS) for
On-line Trace Gas Analysis. Mass Spectrom. Rev. 24 (5): 661-700.
Soni KA, Nannapaneni R, Schilling MW, Jackson V. 2010. Bactericidal activity of
lauric arginate in milk and Queso Fresco cheese against Listeria monocytogenes cold
growth. J Dairy Sci 93 (10): 4518–4525
Španěl P, Smith D. 1996a. A selected ion flow tube study of the reactions of NO+
andO2+ ions with some organic molecules: The potential for trace gas analysis of air. J
Chem Phys 104 (5):1893–1899.
Španěl P, Smith D. 1996b. Selected ion flow tube: A technique for quantitative trace
gas analysis of air and breath. Med Biol Eng Comp 34 (6):409–419.
Španěl P, Smith D. 1997. SIFT studies of the reactions of H3O+, NO+ and O2
+ with a
series of alcohols. Int J Mass Spectrom Ion Processes 167 (168):375–388.
Španěl P, Smith D. 1998a. SIFT studies of the reactions of H3O+, NO+ and O+
2 with
several aliphatic and aromatic hydrocarbons. Int J Mass Spectrom 172 (1):137–147.
Španěl P, Smith D. 1998b. SIFT studies of the reactions of H3O+, NO+ and O+
2 with
several aliphatic and aromatic hydrocarbons. Int J Mass Spectrom 172 (1):239–247.
Španěl P, Smith D. 1998c. SIFT studies of the reactions of H3O+, NO+ and O+
2 with
several aliphatic and aromatic hydrocarbons. Int J Mass Spectrom 181(1):1–10.
Stopforth J, Visser D, Zumbrink R, Van Dijk L, Bontenbal E., 2010. Control of
Listeria monocytogenes on cooked cured ham by formulation with a lactate–
diacetateblend and surface treatment with lauric arginate. J Food Prot 73 (3):552–555.

61
Swanson K, Leasor S, Downing D. 1985. Aciduric and heat resistant microorganisms
in apple juice and cider processing operations. J. Food Sci. 50 (2):336-39.
Theinsathid P, Visessanguan W, Kruenate J, Kingcha Y, Keeratipibul S. 2012.
Antimicrobial Activity of Lauric Arginate-Coated Polylactic Acid Films against
Listeria monocytogenes and Salmonella Typhimurium on Cooked Sliced Ham. J Food
Sci 77 (2):M142-M149.
Topakas E, Kalogeris E, Kekos D, Macris B, Christakopoulos P. 2003. Bioconversion
of ferulic acid into vanillic acid by the thermophilic fungus Sporotrichum
thermophile. LWT-Food Sci and Technol 36 (6):561–565.
Walls I, Chuyate R. 2000. Isolation of Alicyclobacillus acidoterrestris from fruit
juices. J. AOAC Int 83 (5): 1115-20.
Warth D. 1985. Resistance of yeast species to benzoic and sorbic acids and to sulfur
dioxide. J. Food Protect. 48 (6): 564-69.
Wasserman AE. 1966. Organoleptic evaluation of three phenols present in wood
smoke. J. Food Sci 31 (6): 1005-1010.
Witthuhn R, Merwe E, Venter P, Cameron P. 2012.Guaiacol production from ferulic
acid, vanillin and vanillic acid by Alicyclobacillus acidoterrestris. Int J Food
Microbiol 157 (1): 113–117.
Witthuhn R, Smith Y, Cameron M, Venter P. 2013.Guaiacol production by
Alicyclobacillus and comparison of two guaiacol detection Methods. Food Control 30
(2):700-704.
Viehland LA, Mason EA. 1995. Transport properties of gaseous ions over a wide
energy range, IV. Atomic Data and Nuclear Data Tables 60 (1):37–95.
Yoshida T, Nagasawa T. 2003. ε-PolyLysine: microbial production, biodegradation
and application potential. Appl Microbiol Biotechnol 62 (1): 21–26.

62
Appendix: Tables and Figures
Table 5.Difference between the initial (0h) and final bacterial counts (48h for YSG or
72h for juice) among different conditions
Control
2.59ab Juice spore of ATCC
1.89bc Juice spore of OSYE
1.55bc Juice vegetative cell of ATCC
2.09abc Juice vegetative cells of OSYE
3.22a YSG Spore of OSYE
2.60ab YSG Vegetative cells of OSYE
2.20abc YSG Vegetative cells of ATCC
1.27c YSG Spore of ATCC
lauric
arginate
-2.10ed Juice spore of ATCC
-1.67defg Juice spore of OSYE
-1.83defg Juice vegetative cell of ATCC
-1.28defgh Juice vegetative cells of OSYE
2.28abc YSG Spore of OSYE
-2.16efgh YSG Vegetative cells of OSYE
-1.83defg YSG Vegetative cells of ATCC
-1.03de YSG Spore of ATCC
ε-polysine
-2.08defgh Juice spore of ATCC
-0.91d Juice spore of OSYE
-1.58defgh Juice vegetative cell of ATCC
-1.10de Juice vegetative cells of OSYE
-2.37fgh YSG Spore of OSYE
-3.13h YSG Vegetative cells of OSYE
-1.43defg YSG Vegetative cells of ATCC
-2.59gh YSG Spore of ATCC

63
Table 6. Difference between the initial (0h) and final (48h for YSG and 72h for juice)
guaiacol concentration among different conditions
Control
72.1AB Juice spore of ATCC
90.0A Juice spore of OSYE
33.2C Juice vegetative cell of ATCC
49.8C Juice vegetative cells of OSYE
74.8AB YSG Spore of OSYE
84.8AB YSG Vegetative cells of OSYE
72.6AB YSG Vegetative cells of ATCC
69.4B YSG Spore of ATCC
lauric
arginate
0.79D Juice spore of ATCC
0.63D Juice spore of OSYE
1.38D Juice vegetative cell of ATCC
-0.71D Juice vegetative cells of OSYE
48.0C YSG Spore of OSYE
0.53D YSG Vegetative cells of OSYE
0.04D YSG Vegetative cells of ATCC
0.57D YSG Spore of ATCC
ε-polysine
0.88D Juice spore of ATCC
0.63D Juice spore of OSYE
-0.71D Juice vegetative cell of ATCC
-0.42D Juice vegetative cells of OSYE
0.17D YSG Spore of OSYE
-0.08D YSG Vegetative cells of OSYE
0.54D YSG Vegetative cells of ATCC
0.93D YSG Spore of ATCC

64
Table 7.Volatile Compounds Measured in Headspace Scan Volatile Compound
Compound Reagent Reaction rate Mass
(m/z)
Produce
guaiacol NO+ 2.5E-9 124 C7H8O2+
2-ethoxyphenol O2+ 2.5E-9 138 C8H10O2
+
Table 8.The influence of storage time in water bath on volatilization
Time (h)
Guaiacol
in solution
(g/mL)
2-
ethoxyphenol
concentration in
solution (g/mL)
Guaiacol in
headspace (ppb)
2-ethoxyphenol
concentration in
headspace (ppb)
0.50 1.129 1.068 14.80 16.29
1.00 1.129 1.068 14.04 15.51
1.50 1.129 1.068 16.04 15.26

65
Figure 10.The influence of antimicrobial compounds on vegetative cell of
Alicycobacillus acidoterrestris ATCC in YSG
Figure 11.The influence of antimicrobial compounds on spores of Alicycobacillus
acidoterrestris ATCC in YSG
0.0
1.0
2.0
3.0
4.0
5.0
6.0
7.0
0 10 20 30 40 50
nu
mb
er o
f b
act
eria
(lo
gcf
u/m
l)
Time (h)
Control
Lauric
arginatePolylysine
limit of
detection
aa
bbbc
d d d
eff
0
10
20
30
40
50
60
70
80
90
0 10 20 30 40 50
Gu
aia
col
co
nce
ntr
ati
oin
(p
pb
)
Time (h)
Control
lauric
arginate
polylysine
a
b
cc cc cc
cc cc
0.0
1.0
2.0
3.0
4.0
5.0
6.0
7.0
0 10 20 30 40 50
nu
mb
er o
f b
act
eria
(lo
gcf
u/m
l)
Time (h)
Control
Polylysine
Lauric
arginate
limit of
detection
aa
bbbb
cdd
e e e
0
10
20
30
40
50
60
70
80
0 10 20 30 40 50
Gu
aia
col
co
nce
ntr
ati
oin
(p
pb
)
Time (h)
Control
polylysine
lauric
arginate
a
b
ccc
ccc c c cc

66
Figure 12.The influence of antimicrobial compounds on vegetative cell of
Alicycobacillus acidoterrestris ATCC in juice
Figure 13.The influence of antimicrobial compounds on spore of Alicycobacillus
acidoterrestris ATCC in juice
0.0
1.0
2.0
3.0
4.0
5.0
0 10 20 30 40 50 60 70 80
nu
mb
er o
f b
act
eria
(lo
gcf
u/m
l)
Time (h)
Control
Polylysine
Lauric
arginatelimit of
detection
a
bbbbb
c
dd d dd
0
10
20
30
40
50
0 10 20 30 40 50 60 70 80
Gu
aia
col
co
nce
ntr
ati
oin
(p
pb
)
Control
polylysine
lauric
arginate
bbb
bbb bbb bb
Time (h)
a
0.0
1.0
2.0
3.0
4.0
5.0
6.0
7.0
8.0
0 10 20 30 40 50 60 70 80
nu
mb
er o
f b
act
eria
(lo
gcf
u/m
l)
Time (h)
Control
Lauric
arginate
Polylysine
limit of
detection
a
bbcc
b dddf
c
e
0
10
20
30
40
50
60
70
80
90
0 10 20 30 40 50 60 70 80
Gu
aia
col
co
nce
ntr
ati
oin
(p
pb
)
Time (h)
Control
lauric
arginate
Polylysine
a
bbb bb
bbb
b b b

67
Figure 14.The influence of antimicrobial compounds on vegetative cell of
Alicycobacillus acidoterrestris OSYE in YSG
Figure 15.The influence of antimicrobial compounds on spore of Alicycobacillus
acidoterrestris OSYE in YSG
0.0
1.0
2.0
3.0
4.0
5.0
6.0
7.0
8.0
0 10 20 30 40 50nu
mb
er o
f b
act
eria
(lo
gcf
u/m
l)
Time (h)
Control
Polylysine
Lauric
arginatelimit of
detection
aa
bbbb
cce cecd
cde
0
10
20
30
40
50
60
70
80
90
100
0 10 20 30 40 50
Gu
aia
col
con
cen
tra
tio
in (
pp
b)
Time (h)
Control
polylysine
lauric
arginate
b
ccc cc c c c c c
a
0.0
1.0
2.0
3.0
4.0
5.0
6.0
7.0
8.0
0 10 20 30 40 50
nu
mb
er o
f b
act
eria
(lo
gcf
u/m
l)
Time (h)
Control
Lauric
arginatePolylysine
limit of
detection
ab
c
ddd de e
f g g
0102030405060708090
100
0 10 20 30 40 50
Gu
aia
col
co
nce
ntr
ati
oin
(p
pb
)
Time (h)
Control
lauric
arginatepolylysine a
bc
ddd d
dd
d d d

68
Figure 16.The influence of antimicrobial compounds on vegetative cell of
Alicycobacillus acidoterrestris OSYE in Juice
Figure 17.The influence of antimicrobial compounds on spore of Alicycobacillus
acidoterrestris OSYE in Juice
0.0
1.0
2.0
3.0
4.0
5.0
0 10 20 30 40 50 60 70 80
nu
mb
er o
f b
act
eria
(lo
gcf
u/m
l)
Time (h)
Control
Lauric
arginatePolylysine
limit of
detection
a
bbbb
bc
ccc
c c
0
10
20
30
40
50
60
70
80
0 10 20 30 40 50 60 70 80
Gu
aia
col
co
nce
ntr
ati
oin
(p
pb
)
Time (h)
Control
lauric
arginatepolylysine a
bb
b bbb
bb b b b
0.0
1.0
2.0
3.0
4.0
5.0
6.0
7.0
0 10 20 30 40 50 60 70 80
nu
mb
er o
f b
act
eria
(lo
gcf
u/m
l)
Time (h)
Control
Polylysine
Lauric
arginatelimit of
detection
a
dd d
bbcb
c
b b
bce
0102030405060708090
100
0 10 20 30 40 50 60 70 80
Gu
aia
col
co
nce
ntr
ati
oin
(p
pb
)
Time (h)
Control
polylysine
lauric
arginate
bbb bbb
bbb
a
b b