Changes in penetration resistance of Ultisols from southern China as affected by shearing
10
Changes in penetration resistance of Ultisols from southern China as affected by shearing B. Zhang a,* , R. Horn b , T. Baumgartl b a Institute of Soil Science, Chinese Academy of Sciences, Nanjing 210008, PR China b Institute of Plant Nutrition and Soil Science, University Kiel, Olshausenstr. 40, 24118 Kiel, Germany Received 14 March 2000; received in revised form 4 July 2000; accepted 10 August 2000 Abstract Shear stresses and soil properties modified due to stress play an important role during formation of seals in a series of rainfall events and during tillage. The objectives of the study were to evaluate the effects of the penetrometer geometry on the penetration resistance as affected by shearing under different initial soil conditions and to use the information on soil strength to elucidate shearing process. Nine homogenous air-dried soils (<2 mm) were sprayed and stored so as to obtain equilibrium soil water contents. The moist soils were sheared by horizontal displacement of layers of soil particles/aggregates in between hands in one direction. The soil cores were prepared with comparable bulk density before the measurement of maximum penetration resistance (P max ) with a small flat tip and a cone tip penetrometers. At a wide range from 0.05 to 6.2 MPa, P max was linearly correlated between the small flat tip and the cone tip penetrometers. The conversion ratio was higher under the saturation condition irrespective of the shearing effect. The penetrometer with the small flat tip was more sensitive for the weak soils. Shearing generally increased P max in most cases, but it decreased P max for some sandy soils under both saturated and unsaturated conditions and for a clayey soil under the saturated condition. The soil consisting of swelling clay exerted a decrease in P max . Rearrangement and/or sliding of particles/aggregates and increase in soil suction during shearing were attributed to the increase in P max . Increase in porosity due to the aggregation during shearing was ascribed to the decrease in P max . In addition, it was shown that agricultural cultivation resulted in a reduction in soil strength. # 2001 Elsevier Science B.V. All rights reserved. Keywords: Shearing process; Penetration resistance; Soil structure; Ultisols 1. Introduction Surface sealing induced by rainfall results in trans- formation of the surface of a structured soil into a layer with higher bulk density, lower porosity and lower hydraulic conductivity compared with the underlying soil (Moore, 1981). The process results in an increase of soil strength (Bradford and Huang, 1992). In addi- tion to the deleterious effects of reduced water infil- tration and increased runoff and erosion, it can lead to poor seedling emergence, drought stress, yield reduc- tion due to poor infiltration, off-site environmental problems and even threaten the sustainability of agri- culture (Sumner, 1995). Shear stress is an important property in formation of seals (Bryan et al., 1989). During rainfall the Soil & Tillage Research 57 (2001) 193–202 * Corresponding author. Permanent address: PO Box 821, Nanjing 210008, PR China. Tel.: 86-25-3369284; fax: 86-25-3353590. E-mail addresses: [email protected] (B. Zhang), [email protected] (R. Horn), [email protected] (T. Baumgartl). 0167-1987/01/$ – see front matter # 2001 Elsevier Science B.V. All rights reserved. PII:S0167-1987(00)00148-3
Transcript of Changes in penetration resistance of Ultisols from southern China as affected by shearing
Changes in penetration resistance of Ultisols fromsouthern China as affected by shearing
B. Zhanga,*, R. Hornb, T. Baumgartlb
aInstitute of Soil Science, Chinese Academy of Sciences, Nanjing 210008, PR ChinabInstitute of Plant Nutrition and Soil Science, University Kiel, Olshausenstr. 40, 24118 Kiel, Germany
Received 14 March 2000; received in revised form 4 July 2000; accepted 10 August 2000
Abstract
Shear stresses and soil properties modi®ed due to stress play an important role during formation of seals in a series of
rainfall events and during tillage. The objectives of the study were to evaluate the effects of the penetrometer geometry on the
penetration resistance as affected by shearing under different initial soil conditions and to use the information on soil strength
to elucidate shearing process. Nine homogenous air-dried soils (<2 mm) were sprayed and stored so as to obtain equilibrium
soil water contents. The moist soils were sheared by horizontal displacement of layers of soil particles/aggregates in between
hands in one direction. The soil cores were prepared with comparable bulk density before the measurement of maximum
penetration resistance (Pmax) with a small ¯at tip and a cone tip penetrometers. At a wide range from 0.05 to 6.2 MPa, Pmax
was linearly correlated between the small ¯at tip and the cone tip penetrometers. The conversion ratio was higher under the
saturation condition irrespective of the shearing effect. The penetrometer with the small ¯at tip was more sensitive for the
weak soils. Shearing generally increased Pmax in most cases, but it decreased Pmax for some sandy soils under both saturated
and unsaturated conditions and for a clayey soil under the saturated condition. The soil consisting of swelling clay exerted a
decrease in Pmax. Rearrangement and/or sliding of particles/aggregates and increase in soil suction during shearing were
attributed to the increase in Pmax. Increase in porosity due to the aggregation during shearing was ascribed to the decrease in
Pmax. In addition, it was shown that agricultural cultivation resulted in a reduction in soil strength. # 2001 Elsevier Science
B.V. All rights reserved.
Keywords: Shearing process; Penetration resistance; Soil structure; Ultisols
1. Introduction
Surface sealing induced by rainfall results in trans-
formation of the surface of a structured soil into a layer
with higher bulk density, lower porosity and lower
hydraulic conductivity compared with the underlying
soil (Moore, 1981). The process results in an increase
of soil strength (Bradford and Huang, 1992). In addi-
tion to the deleterious effects of reduced water in®l-
tration and increased runoff and erosion, it can lead to
poor seedling emergence, drought stress, yield reduc-
tion due to poor in®ltration, off-site environmental
problems and even threaten the sustainability of agri-
culture (Sumner, 1995).
Shear stress is an important property in formation
of seals (Bryan et al., 1989). During rainfall the
Soil & Tillage Research 57 (2001) 193±202
* Corresponding author. Permanent address: PO Box 821,
Nanjing 210008, PR China. Tel.: �86-25-3369284;
fax: �86-25-3353590.
E-mail addresses: [email protected] (B. Zhang),
[email protected] (R. Horn), [email protected]
(T. Baumgartl).
0167-1987/01/$ ± see front matter # 2001 Elsevier Science B.V. All rights reserved.
PII: S 0 1 6 7 - 1 9 8 7 ( 0 0 ) 0 0 1 4 8 - 3
dissipation of raindrop energy occurs in the surface
water ®lms as the soil surface ponds, resulting in high
shear stresses (Ghadiri and Payne, 1986). As a con-
sequence it can be assumed that soil compaction by
raindrops and soil shearing by water ®lms result in not
only an intensive local compaction in interrill erosion,
but also a compaction on rill wall or rill head cutting in
rill erosion (Rose et al., 1990). Shearing processes
are related to the structural issues such as compaction,
aggregate destruction, particle detachment, dispersion
and in-depth washing-in of the ®ne particles. Apart
from O'Sullivan et al. (1999) no reports are found
about the effects of shearing on soil structural proper-
ties, such as geometry, pore continuity and perme-
ability to water or air. In the past, soil shear strength
was only expressed as function of initial bulk density
and soil matric suction for modeling process of seal
formation (Cruse and Larson, 1977), implying that
shear strength may change in different pathways
due to different initial soil water content and bulk
density. Assouline and Mualem (1997) used this
function to model sealing processes, resulting in a
good agreement between in®ltration function and
measured data. Horn (1988) has summed up addi-
tional parameters such as soil texture, soil aggregate
stability, and soil organic matter and compression
history. Among the others, soil water content, bulk
density, and soil aggregate formation are time-
dependent (Roth, 1997) and may result in changes
in shear strength of soil (Le Bissonnais et al.,
1995).
There are several methods in the laboratory to
investigate the consequence of shearing deformation
on soil structure. In the triaixial test, the specimen is
not suitable to examine the behavior of thin layers of
soil and the testing is slow and laborious. In the normal
shear test a specimen is forced to fail along a single
plane. It is useful for determining the strength of the
soil but the nature of the deformation before failure
makes it less useful for investigating the effects of
shear deformation itself. O'Sullivan et al. (1999)
proposed an improved `̀ simple shear box'', which
caused a specimen to deform such that a cross-section
parallel to the direction of deformation was a paralle-
logram. The deformations within the specimens
were found fairly uniform when the normal stress
applied was not less than the maximum normal stress
that had been applied in the past. This, however,
made it dif®cult to obtain uniform specimens and
made it laborious to obtain a large number of
specimens.
Shear strength has been measured using fall cone
devices, vane testers and pocket penetrometers and
related to soil aggregate breakdown by a single rain-
drop (Al-Durrah and Bradford, 1981) to rain plash
(Bradford et al., 1992; Posen, 1981). Torri et al. (1987)
and Rauws and Govers (1988) related the soil shear
strength measured with a vane test apparatus to runoff
stress and erosion by ¯owing water. Truman and
Bradford (1990) measured soil penetration resistance
from a cone penetrometer before and after rainfall in
order to relate various measures of soil strength to soil
erodibility.
Since penetration resistance is essentially derived
from a point measurement, a set of measurements is
required to characterize this parameter for an overall
soil strength value. When tip and shaft are driven into a
soil, the soil re-expands into the cavity behind the tip
of the penetrometer. By pulling the penetrometer out
of the soil sample at the end of the measurement the
soil surrounding the penetrometer will be later loo-
sened and destroyed. When a soil column in a simula-
tion experiment on sealing processes is small, the
measurement area becomes a limitation if the in¯u-
ence is between measurement sites, and the destruc-
tion of the soil structure itself has to be avoided. Thus
care has to be taken not only to choose the measure-
ment site but also to select the diameter of the penet-
rometer.
To simulate the normal shearing under in situ
conditions, the moist soils in total 50 kg of materials
were sheared by horizontal displacement of layers of
soil particles/aggregates in between hands. This
method was not only very appropriate to the required
amount of soil, but also to enable us to obtain uni-
formly sheared materials. Although the way of pre-
paration does not allow us to quantify the normal shear
stress applied by hand, it was the only possibility to
prepare a sheared soil in one direction rather than a
homogenized soil, which results in a particle arrange-
ment at random.
The objectives of the study were to evaluate the
effects of the penetrometer geometry on the penetra-
tion resistance as affected by shearing under different
initial soil conditions and to use the information on
soil strength to elucidate shearing process.
194 B. Zhang et al. / Soil & Tillage Research 57 (2001) 193±202
2. Materials and methods
2.1. Soils
The soil samples were taken from tropical China,
with soil parent material covering quaternary red clay
(Q), sandstone (S), granite (G) and purple mudstone
(P). Soil samples were taken from the top layer (0±
15 cm). Soil properties determined by routine methods
(ISSAS, 1978) have been reported elsewhere (Zhang
and Horn, 2001) and selected physical properties are
given in Table 1. Particle size distribution was mea-
sured by the pipette method. The mean weight dia-
meter (MWD) was calculated by Eq. (1). Brie¯y, the
soils ranged from sandy loam, clayey loam, and silty
clay to silty loam. The subscript c, p and w represent
the soils for cultivation at least >5 years, parent
material and without cultivation, respectively. All soils
except the purple soils were strongly acidic. They are
very low in organic carbon content, ranging from 1.46
to 15.14 g kgÿ1. The purple soils had abundant smec-
tite and hydromica clay minerals, while others were
dominant in kaolinite and contain some additional
hydromica and vermiculite.
The sheared soils were sampled and dried in air for
determination of aggregate distribution by the sieving
method. The soil samples were sieved by hand on a
column of ®ve sieves: 2, 1, 0.63, 0.2, and 0.1 mm. The
mass percentage of each size fraction and the MWD
were calculated. The MWD was calculated as an index
of aggregation by
MWD �X �riÿ1 � ri�
2mi; i � 1 to n� 1 (1)
where MWD is the mean weight diameter in milli-
meter, ri the aperture of the ith mesh (millimeter) in
particle distribution analysis and aggregate distribu-
tion analysis, r0 � r1 and rn � rn�1, mi the mass
fraction of the soil remaining on the ith sieve, n the
number of the sieves.
2.2. Preparation of soil cores
The air-dried soils were ground and sieved through
2 mm mesh. Each soil was thereafter moistened by
adding distilled water up to a certain water content
(Table 2) in very ®ne droplets with a spray bottle. Soils
were remolded by hand, while about 10 g of the water
was sprayed on the soil. To obtain a homogenous soil
water content, the moist soil was kept in a plastic bag
at least for 2 weeks before use. Before the soils were
®lled into soil cylinders, they were remolded again and
a part of them was sheared by horizontal displacement
of layers of soil particles/aggregates in between hands
in one direction under constant speed. Only one person
completed shearing treatment for all soils, trying to
keep the force by hand the same, though it was
dif®cult to quantify the normal force by hand. The
sheared and unsheared soils were compacted without
layering in cylinders of 100 cm3 (40 mm high) to a
desired bulk density (Table 2). The ®lling techniques
gave reproducible results with small variations of bulk
density.
2.3. Measurements of soil penetration resistance
Soil cores were prepared in the above-mentioned
way. Each soil was packed to three levels of bulk
density: high (H-dB), moderate (M-dB) and low
(L-dB) (Table 2), repeated twice. Two tips, a cone
and a ¯at tip, were used as penetrometers. The cone of
the penetrometer had an apex angle of 608, base
diameter of 4.0 mm and a shaft diameter of
2.0 mm. The ¯at tip was a converse cone or taper
having an end diameter of 1.3 mm and a shaft diameter
of 1.0 mm. Penetration resistance was ®rst measured
immediately after the preparation of soil cores, which
was referred to as unsaturated condition. The second
measurement was conducted on the same soil core
after their saturation for 3 days, which was referred
to as saturated condition. Each time ®ve readings of
penetration force were recorded. Ten penetrometer
measurements from two soil cores with the same
bulk density and water content were then taken as
replicates.
The tips were mounted on a rack that allowed an
easy movement downward and upward. The soil core
was placed on an electronic digital balance of 1 g
resolution. The tip and shaft were driven manually
at a low speed. The maximum reading of the mass
component of a force M (g) was manually recorded
during the penetration distance of 10 mm into soil
core. Each value of M (g) was converted into a force F
(N). Maximum penetration resistance Pmax (MPa) was
then calculated dividing the force by the probe base
area.
B. Zhang et al. / Soil & Tillage Research 57 (2001) 193±202 195
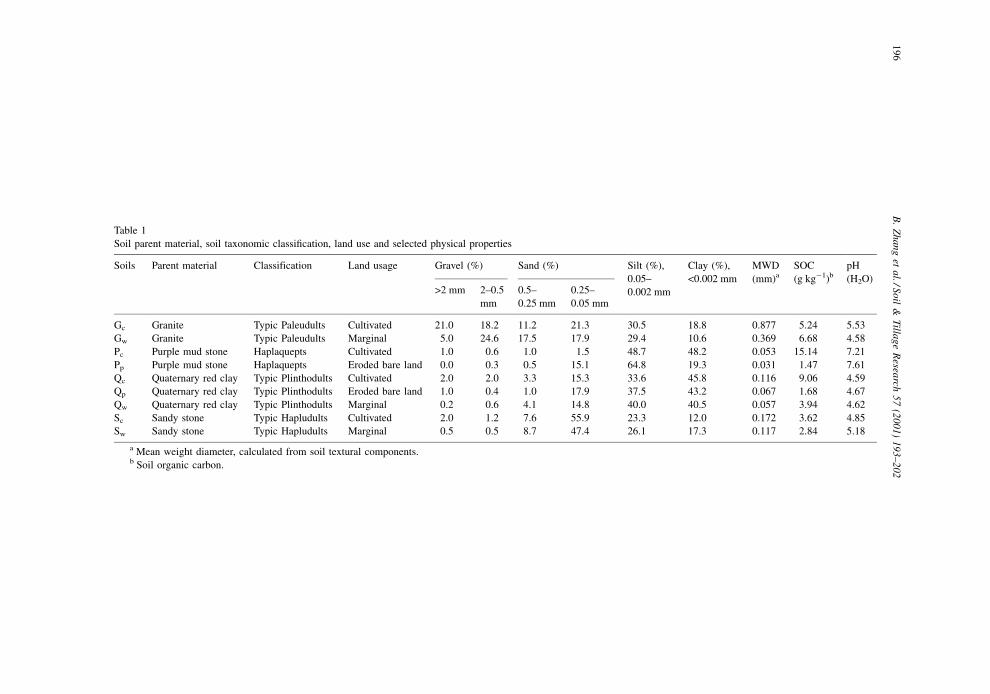
Table 1
Soil parent material, soil taxonomic classi®cation, land use and selected physical properties
Soils Parent material Classification Land usage Gravel (%) Sand (%) Silt (%),
0.05±
0.002 mm
Clay (%),
<0.002 mm
MWD
(mm)a
SOC
(g kgÿ1)b
pH
(H2O)>2 mm 2±0.5
mm
0.5±
0.25 mm
0.25±
0.05 mm
Gc Granite Typic Paleudults Cultivated 21.0 18.2 11.2 21.3 30.5 18.8 0.877 5.24 5.53
Gw Granite Typic Paleudults Marginal 5.0 24.6 17.5 17.9 29.4 10.6 0.369 6.68 4.58
Pc Purple mud stone Haplaquepts Cultivated 1.0 0.6 1.0 1.5 48.7 48.2 0.053 15.14 7.21
Pp Purple mud stone Haplaquepts Eroded bare land 0.0 0.3 0.5 15.1 64.8 19.3 0.031 1.47 7.61
Qc Quaternary red clay Typic Plinthodults Cultivated 2.0 2.0 3.3 15.3 33.6 45.8 0.116 9.06 4.59
Qp Quaternary red clay Typic Plinthodults Eroded bare land 1.0 0.4 1.0 17.9 37.5 43.2 0.067 1.68 4.67
Qw Quaternary red clay Typic Plinthodults Marginal 0.2 0.6 4.1 14.8 40.0 40.5 0.057 3.94 4.62
Sc Sandy stone Typic Hapludults Cultivated 2.0 1.2 7.6 55.9 23.3 12.0 0.172 3.62 4.85
Sw Sandy stone Typic Hapludults Marginal 0.5 0.5 8.7 47.4 26.1 17.3 0.117 2.84 5.18
a Mean weight diameter, calculated from soil textural components.b Soil organic carbon.
19
6B
.Z
ha
ng
eta
l./So
il&
Tilla
ge
Resea
rch57
(2001)
193±202
2.4. Statistical analysis
An analysis of variance (ANOVA) on ranks was
performed using SigmaStat when normal ANOVA
failed to determine the signi®cance of effects of
shearing, soil moisture, bulk density or soil type on
maximum penetration resistance. If the signi®cance
was evident multiple comparison among means or
medians was then performed using Student±New-
man±Keuls test procedures.
3. Results
3.1. Prepared soils and soil cores
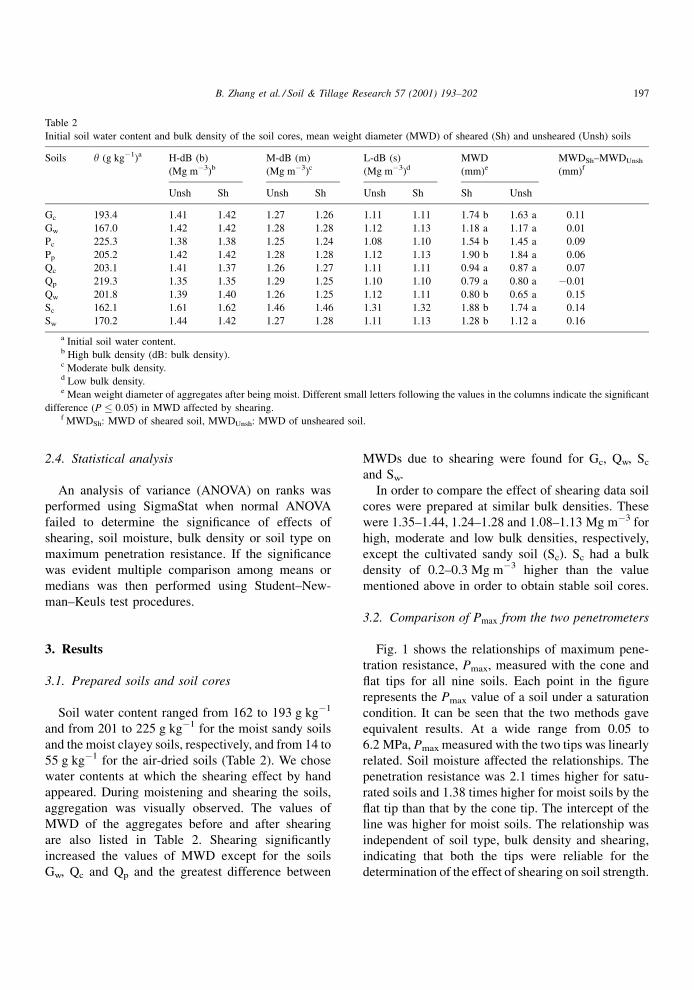
Soil water content ranged from 162 to 193 g kgÿ1
and from 201 to 225 g kgÿ1 for the moist sandy soils
and the moist clayey soils, respectively, and from 14 to
55 g kgÿ1 for the air-dried soils (Table 2). We chose
water contents at which the shearing effect by hand
appeared. During moistening and shearing the soils,
aggregation was visually observed. The values of
MWD of the aggregates before and after shearing
are also listed in Table 2. Shearing signi®cantly
increased the values of MWD except for the soils
Gw, Qc and Qp and the greatest difference between
MWDs due to shearing were found for Gc, Qw, Sc
and Sw.
In order to compare the effect of shearing data soil
cores were prepared at similar bulk densities. These
were 1.35±1.44, 1.24±1.28 and 1.08±1.13 Mg mÿ3 for
high, moderate and low bulk densities, respectively,
except the cultivated sandy soil (Sc). Sc had a bulk
density of 0.2±0.3 Mg mÿ3 higher than the value
mentioned above in order to obtain stable soil cores.
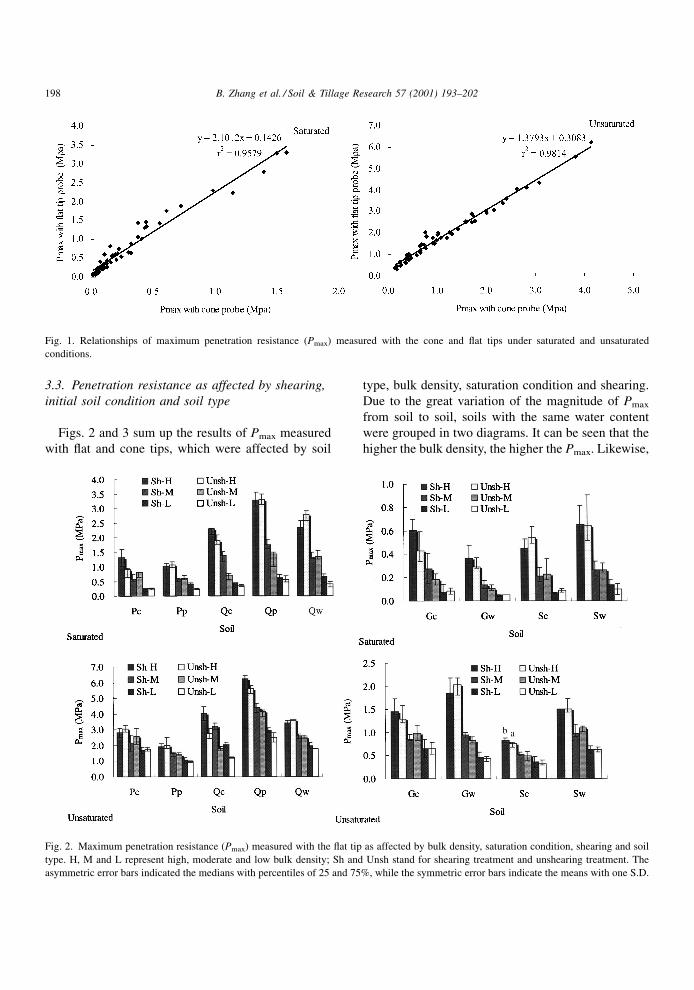
3.2. Comparison of Pmax from the two penetrometers
Fig. 1 shows the relationships of maximum pene-
tration resistance, Pmax, measured with the cone and
¯at tips for all nine soils. Each point in the ®gure
represents the Pmax value of a soil under a saturation
condition. It can be seen that the two methods gave
equivalent results. At a wide range from 0.05 to
6.2 MPa, Pmax measured with the two tips was linearly
related. Soil moisture affected the relationships. The
penetration resistance was 2.1 times higher for satu-
rated soils and 1.38 times higher for moist soils by the
¯at tip than that by the cone tip. The intercept of the
line was higher for moist soils. The relationship was
independent of soil type, bulk density and shearing,
indicating that both the tips were reliable for the
determination of the effect of shearing on soil strength.
Table 2
Initial soil water content and bulk density of the soil cores, mean weight diameter (MWD) of sheared (Sh) and unsheared (Unsh) soils
Soils y (g kgÿ1)a H-dB (b)
(Mg mÿ3)b
M-dB (m)
(Mg mÿ3)c
L-dB (s)
(Mg mÿ3)d
MWD
(mm)e
MWDSh±MWDUnsh
(mm)f
Unsh Sh Unsh Sh Unsh Sh Sh Unsh
Gc 193.4 1.41 1.42 1.27 1.26 1.11 1.11 1.74 b 1.63 a 0.11
Gw 167.0 1.42 1.42 1.28 1.28 1.12 1.13 1.18 a 1.17 a 0.01
Pc 225.3 1.38 1.38 1.25 1.24 1.08 1.10 1.54 b 1.45 a 0.09
Pp 205.2 1.42 1.42 1.28 1.28 1.12 1.13 1.90 b 1.84 a 0.06
Qc 203.1 1.41 1.37 1.26 1.27 1.11 1.11 0.94 a 0.87 a 0.07
Qp 219.3 1.35 1.35 1.29 1.25 1.10 1.10 0.79 a 0.80 a ÿ0.01
Qw 201.8 1.39 1.40 1.26 1.25 1.12 1.11 0.80 b 0.65 a 0.15
Sc 162.1 1.61 1.62 1.46 1.46 1.31 1.32 1.88 b 1.74 a 0.14
Sw 170.2 1.44 1.42 1.27 1.28 1.11 1.13 1.28 b 1.12 a 0.16
a Initial soil water content.b High bulk density (dB: bulk density).c Moderate bulk density.d Low bulk density.e Mean weight diameter of aggregates after being moist. Different small letters following the values in the columns indicate the signi®cant
difference (P � 0:05) in MWD affected by shearing.f MWDSh: MWD of sheared soil, MWDUnsh: MWD of unsheared soil.
B. Zhang et al. / Soil & Tillage Research 57 (2001) 193±202 197
3.3. Penetration resistance as affected by shearing,
initial soil condition and soil type
Figs. 2 and 3 sum up the results of Pmax measured
with ¯at and cone tips, which were affected by soil
type, bulk density, saturation condition and shearing.
Due to the great variation of the magnitude of Pmax
from soil to soil, soils with the same water content
were grouped in two diagrams. It can be seen that the
higher the bulk density, the higher the Pmax. Likewise,
Fig. 1. Relationships of maximum penetration resistance (Pmax) measured with the cone and ¯at tips under saturated and unsaturated
conditions.
Fig. 2. Maximum penetration resistance (Pmax) measured with the ¯at tip as affected by bulk density, saturation condition, shearing and soil
type. H, M and L represent high, moderate and low bulk density; Sh and Unsh stand for shearing treatment and unshearing treatment. The
asymmetric error bars indicated the medians with percentiles of 25 and 75%, while the symmetric error bars indicate the means with one S.D.
198 B. Zhang et al. / Soil & Tillage Research 57 (2001) 193±202
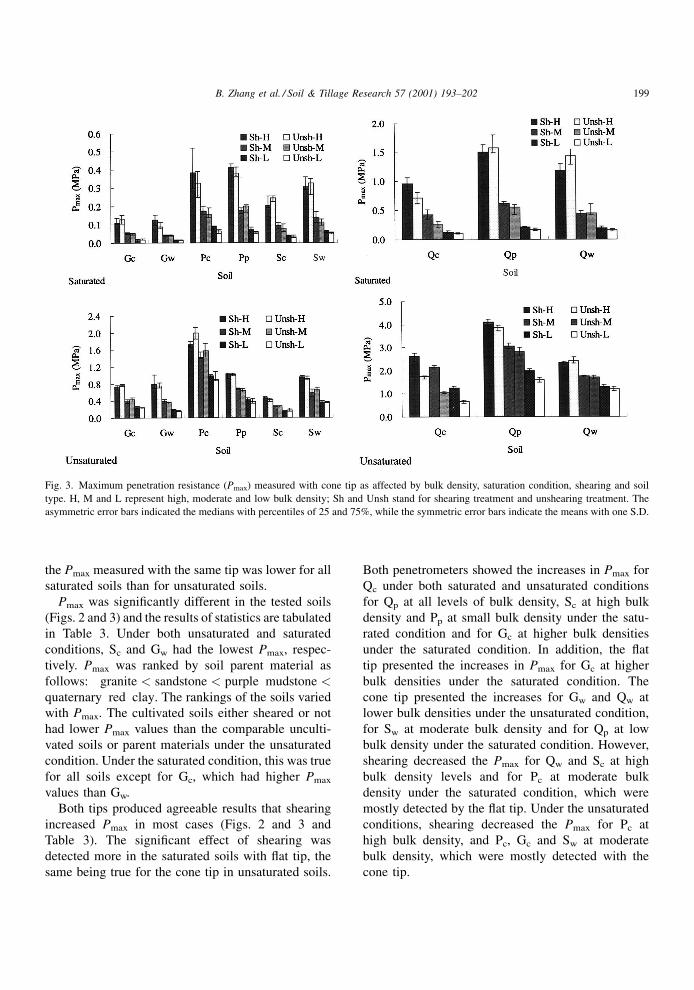
the Pmax measured with the same tip was lower for all
saturated soils than for unsaturated soils.
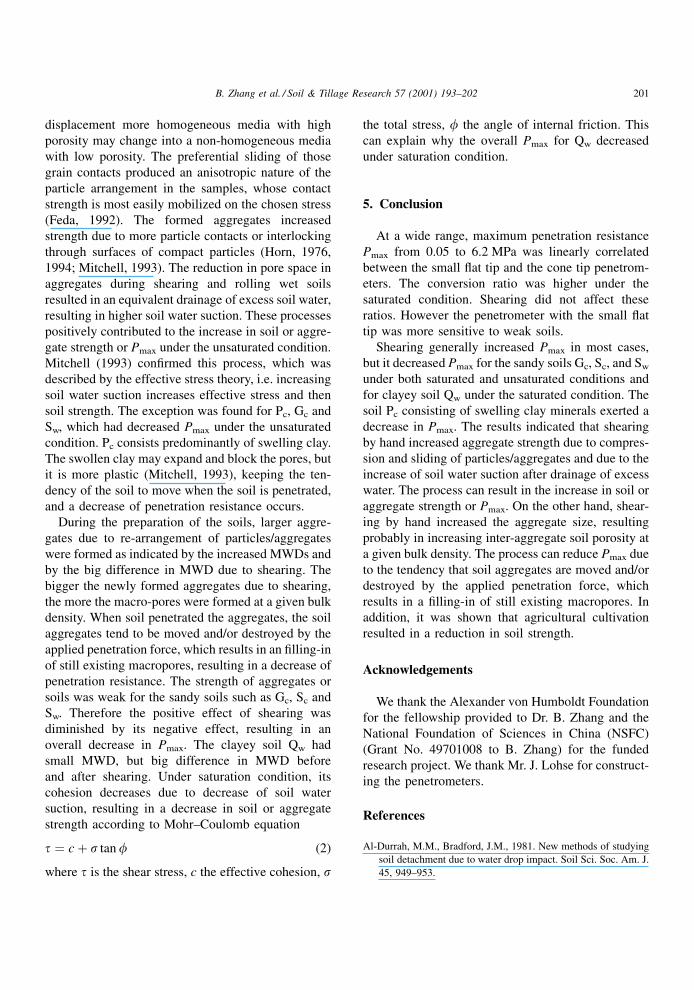
Pmax was signi®cantly different in the tested soils
(Figs. 2 and 3) and the results of statistics are tabulated
in Table 3. Under both unsaturated and saturated
conditions, Sc and Gw had the lowest Pmax, respec-
tively. Pmax was ranked by soil parent material as
follows: granite < sandstone < purple mudstone <quaternary red clay. The rankings of the soils varied
with Pmax. The cultivated soils either sheared or not
had lower Pmax values than the comparable unculti-
vated soils or parent materials under the unsaturated
condition. Under the saturated condition, this was true
for all soils except for Gc, which had higher Pmax
values than Gw.
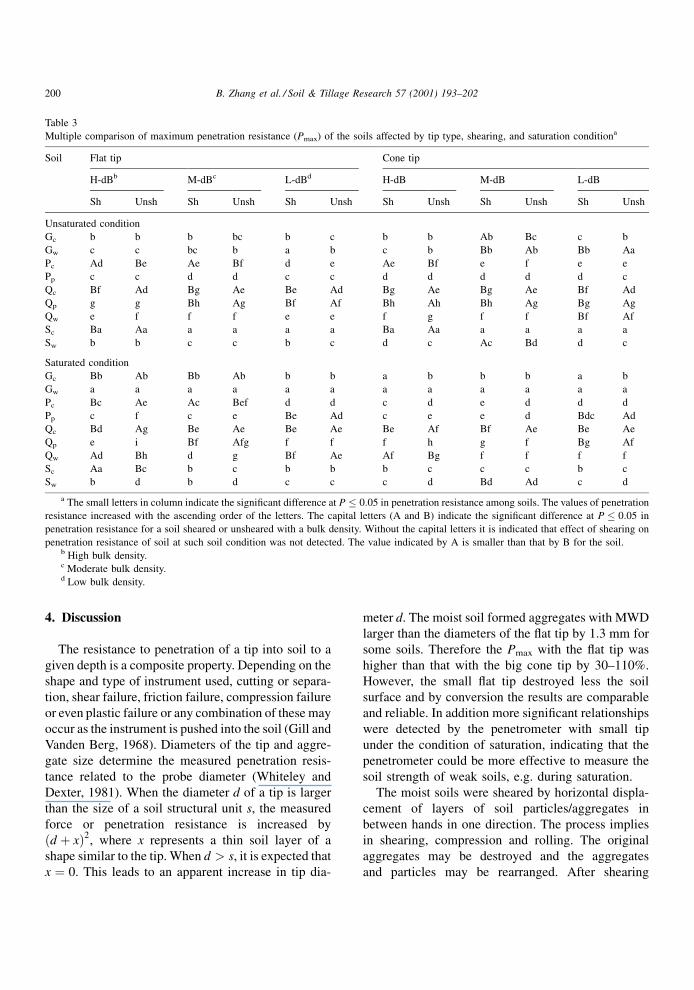
Both tips produced agreeable results that shearing
increased Pmax in most cases (Figs. 2 and 3 and
Table 3). The signi®cant effect of shearing was
detected more in the saturated soils with ¯at tip, the
same being true for the cone tip in unsaturated soils.
Both penetrometers showed the increases in Pmax for
Qc under both saturated and unsaturated conditions
for Qp at all levels of bulk density, Sc at high bulk
density and Pp at small bulk density under the satu-
rated condition and for Gc at higher bulk densities
under the saturated condition. In addition, the ¯at
tip presented the increases in Pmax for Gc at higher
bulk densities under the saturated condition. The
cone tip presented the increases for Gw and Qw at
lower bulk densities under the unsaturated condition,
for Sw at moderate bulk density and for Qp at low
bulk density under the saturated condition. However,
shearing decreased the Pmax for Qw and Sc at high
bulk density levels and for Pc at moderate bulk
density under the saturated condition, which were
mostly detected by the ¯at tip. Under the unsaturated
conditions, shearing decreased the Pmax for Pc at
high bulk density, and Pc, Gc and Sw at moderate
bulk density, which were mostly detected with the
cone tip.
Fig. 3. Maximum penetration resistance (Pmax) measured with cone tip as affected by bulk density, saturation condition, shearing and soil
type. H, M and L represent high, moderate and low bulk density; Sh and Unsh stand for shearing treatment and unshearing treatment. The
asymmetric error bars indicated the medians with percentiles of 25 and 75%, while the symmetric error bars indicate the means with one S.D.
B. Zhang et al. / Soil & Tillage Research 57 (2001) 193±202 199
4. Discussion
The resistance to penetration of a tip into soil to a
given depth is a composite property. Depending on the
shape and type of instrument used, cutting or separa-
tion, shear failure, friction failure, compression failure
or even plastic failure or any combination of these may
occur as the instrument is pushed into the soil (Gill and
Vanden Berg, 1968). Diameters of the tip and aggre-
gate size determine the measured penetration resis-
tance related to the probe diameter (Whiteley and
Dexter, 1981). When the diameter d of a tip is larger
than the size of a soil structural unit s, the measured
force or penetration resistance is increased by
�d � x�2, where x represents a thin soil layer of a
shape similar to the tip. When d > s, it is expected that
x � 0. This leads to an apparent increase in tip dia-
meter d. The moist soil formed aggregates with MWD
larger than the diameters of the ¯at tip by 1.3 mm for
some soils. Therefore the Pmax with the ¯at tip was
higher than that with the big cone tip by 30±110%.
However, the small ¯at tip destroyed less the soil
surface and by conversion the results are comparable
and reliable. In addition more signi®cant relationships
were detected by the penetrometer with small tip
under the condition of saturation, indicating that the
penetrometer could be more effective to measure the
soil strength of weak soils, e.g. during saturation.
The moist soils were sheared by horizontal displa-
cement of layers of soil particles/aggregates in
between hands in one direction. The process implies
in shearing, compression and rolling. The original
aggregates may be destroyed and the aggregates
and particles may be rearranged. After shearing
Table 3
Multiple comparison of maximum penetration resistance (Pmax) of the soils affected by tip type, shearing, and saturation conditiona
Soil Flat tip Cone tip
H-dBb M-dBc L-dBd H-dB M-dB L-dB
Sh Unsh Sh Unsh Sh Unsh Sh Unsh Sh Unsh Sh Unsh
Unsaturated condition
Gc b b b bc b c b b Ab Bc c b
Gw c c bc b a b c b Bb Ab Bb Aa
Pc Ad Be Ae Bf d e Ae Bf e f e e
Pp c c d d c c d d d d d c
Qc Bf Ad Bg Ae Be Ad Bg Ae Bg Ae Bf Ad
Qp g g Bh Ag Bf Af Bh Ah Bh Ag Bg Ag
Qw e f f f e e f g f f Bf Af
Sc Ba Aa a a a a Ba Aa a a a a
Sw b b c c b c d c Ac Bd d c
Saturated condition
Gc Bb Ab Bb Ab b b a b b b a b
Gw a a a a a a a a a a a a
Pc Bc Ae Ac Bef d d c d e d d d
Pp c f c e Be Ad c e e d Bdc Ad
Qc Bd Ag Be Ae Be Ae Be Af Bf Ae Be Ae
Qp e i Bf Afg f f f h g f Bg Af
Qw Ad Bh d g Bf Ae Af Bg f f f f
Sc Aa Bc b c b b b c c c b c
Sw b d b d c c c d Bd Ad c d
a The small letters in column indicate the signi®cant difference at P � 0:05 in penetration resistance among soils. The values of penetration
resistance increased with the ascending order of the letters. The capital letters (A and B) indicate the signi®cant difference at P � 0:05 in
penetration resistance for a soil sheared or unsheared with a bulk density. Without the capital letters it is indicated that effect of shearing on
penetration resistance of soil at such soil condition was not detected. The value indicated by A is smaller than that by B for the soil.b High bulk density.c Moderate bulk density.d Low bulk density.
200 B. Zhang et al. / Soil & Tillage Research 57 (2001) 193±202
displacement more homogeneous media with high
porosity may change into a non-homogeneous media
with low porosity. The preferential sliding of those
grain contacts produced an anisotropic nature of the
particle arrangement in the samples, whose contact
strength is most easily mobilized on the chosen stress
(Feda, 1992). The formed aggregates increased
strength due to more particle contacts or interlocking
through surfaces of compact particles (Horn, 1976,
1994; Mitchell, 1993). The reduction in pore space in
aggregates during shearing and rolling wet soils
resulted in an equivalent drainage of excess soil water,
resulting in higher soil water suction. These processes
positively contributed to the increase in soil or aggre-
gate strength or Pmax under the unsaturated condition.
Mitchell (1993) con®rmed this process, which was
described by the effective stress theory, i.e. increasing
soil water suction increases effective stress and then
soil strength. The exception was found for Pc, Gc and
Sw, which had decreased Pmax under the unsaturated
condition. Pc consists predominantly of swelling clay.
The swollen clay may expand and block the pores, but
it is more plastic (Mitchell, 1993), keeping the ten-
dency of the soil to move when the soil is penetrated,
and a decrease of penetration resistance occurs.
During the preparation of the soils, larger aggre-
gates due to re-arrangement of particles/aggregates
were formed as indicated by the increased MWDs and
by the big difference in MWD due to shearing. The
bigger the newly formed aggregates due to shearing,
the more the macro-pores were formed at a given bulk
density. When soil penetrated the aggregates, the soil
aggregates tend to be moved and/or destroyed by the
applied penetration force, which results in an ®lling-in
of still existing macropores, resulting in a decrease of
penetration resistance. The strength of aggregates or
soils was weak for the sandy soils such as Gc, Sc and
Sw. Therefore the positive effect of shearing was
diminished by its negative effect, resulting in an
overall decrease in Pmax. The clayey soil Qw had
small MWD, but big difference in MWD before
and after shearing. Under saturation condition, its
cohesion decreases due to decrease of soil water
suction, resulting in a decrease in soil or aggregate
strength according to Mohr±Coulomb equation
t � c� s tanf (2)
where t is the shear stress, c the effective cohesion, s
the total stress, f the angle of internal friction. This
can explain why the overall Pmax for Qw decreased
under saturation condition.
5. Conclusion
At a wide range, maximum penetration resistance
Pmax from 0.05 to 6.2 MPa was linearly correlated
between the small ¯at tip and the cone tip penetrom-
eters. The conversion ratio was higher under the
saturated condition. Shearing did not affect these
ratios. However the penetrometer with the small ¯at
tip was more sensitive to weak soils.
Shearing generally increased Pmax in most cases,
but it decreased Pmax for the sandy soils Gc, Sc, and Sw
under both saturated and unsaturated conditions and
for clayey soil Qw under the saturated condition. The
soil Pc consisting of swelling clay minerals exerted a
decrease in Pmax. The results indicated that shearing
by hand increased aggregate strength due to compres-
sion and sliding of particles/aggregates and due to the
increase of soil water suction after drainage of excess
water. The process can result in the increase in soil or
aggregate strength or Pmax. On the other hand, shear-
ing by hand increased the aggregate size, resulting
probably in increasing inter-aggregate soil porosity at
a given bulk density. The process can reduce Pmax due
to the tendency that soil aggregates are moved and/or
destroyed by the applied penetration force, which
results in a ®lling-in of still existing macropores. In
addition, it was shown that agricultural cultivation
resulted in a reduction in soil strength.
Acknowledgements
We thank the Alexander von Humboldt Foundation
for the fellowship provided to Dr. B. Zhang and the
National Foundation of Sciences in China (NSFC)
(Grant No. 49701008 to B. Zhang) for the funded
research project. We thank Mr. J. Lohse for construct-
ing the penetrometers.
References
Al-Durrah, M.M., Bradford, J.M., 1981. New methods of studying
soil detachment due to water drop impact. Soil Sci. Soc. Am. J.
45, 949±953.
B. Zhang et al. / Soil & Tillage Research 57 (2001) 193±202 201
Assouline, S., Mualem, Y., 1997. Modeling the dynamics of seal
formation and its effect on in®ltration as related to soil and
rainfall characteristics. Water Resour. Res. 33 (7), 1527±1536.
Bradford, J.M., Huang, C.C., 1992. Mechanisms of crust formation.
In: Summer, M.E., Stewart, B.A. (Eds.), Advances in Soil
Science: Soil Crusting Ð chemical and Physical Processes.
Lewis Publishers, Boca Raton, FL, pp. 55±72.
Bradford, J.M., Truman, C.C., Huang, C., 1992. Comparison of
three measures of resistance of soil surface seals to raindrop
splash. Soil Technol. 5, 47±56.
Bryan, R.B., Govers, G., Poesen, J., 1989. The concept of soil
erodibility and some problems of assessment and application.
Catena 16, 393±412.
Cruse, R.M., Larson, W.E., 1977. Effect of soil shear strength on
soil detachment due to raindrop impact. Soil Sci. Soc. Am. J.
41, 777±781.
Feda, J., 1992. Creep of soils and related phenomena. Develop-
ments in Geo-technical Engineering, Vol. 68. Elsevier,
Amsterdam, 422 pp.
Ghadiri, H., Payne, D., 1986. The risk of leaving the soil surface
unprotected against falling rain. Soil Till. Res. 8, 119±130.
Gill, W.R., Vanden Berg, G.E., 1968. Soil dynamics in tillage and
traction. Agriculture Handbook No. 316. US Government
Printing Of®ce, Washington, DC, 511 pp.
Horn, R., 1976. Fetigheitsaenderungen inforlge vone aggregier-
ungenprozessen eines mesozoischen tones. Ph.D. Thesis.
Hannover University, Hannover, 199 pp.
Horn, R., 1988. Impact of water and external forces on soil
structure. Catena (Suppl.) 11, 53±71.
Horn, R., 1994. Soils on water, gas, and heat transport. In: Schulze,
E.-D. (Ed.), Flux Control in Biological Systems, from Enzymes
to Populations and Ecosystems. Academic Press, London,
pp. 336±361.
ISSAS, 1978. Soil Physical and Chemical Analysis. Shanghai
Science and Technology Press, Shanghai, 532 pp.
Le Bissonnais, Y., Renaux, B., Delouche, H., 1995. Interactions
between soil properties and moisture content in crust formation,
runoff, and interrill erosion from tilled loess soils. Catena 25,
33±46.
Mitchell, J.K., 1993. Fundamentals of Soil Behavior. Wiley, New
York, 437 pp.
Moore, I.D., 1981. Effect of surface sealing on in®ltration. Trans.
ASAE 24, 1546±1552.
O'Sullivan, M.F., Robertson, E.A.G., Henshall, J.K., 1999. Shear
effects on gas transport in soil. Soil Till. Res. 50, 73±83.
Posen, J., 1981. Rainwash experiments on the erodibility of loose
sediments. Earth Surf. Process. Landforms 6, 285±307.
Rauws, G., Govers, G., 1988. Hydraulic and soil mechanical aspects
of rill generation on agricultural soils. J. Soil Sci. 39, 111±124.
Rose, C.W., Hairsine, P.B., Prof®tt, A.P.B., Misra, R.K., 1990.
Interpreting the role of soil strength in erosion process. Catena
(Suppl.) 17, 153±165.
Roth, C.H., 1997. Bulk density of surface crusts: depth functions
and relationships to texture. Catena 29, 223±237.
Sumner, M.E., 1995. Soil crusting: chemical and physical
processes. The view forward from Georgia, 1991. In: So,
H.B., Smith, G.D., Raine, S.R., Schafer, B.M., Loch, R.J.
(Eds.), Sealing, Crusting and Hardsetting Soils: Productivity
and Conservation. ASSSI Queensland Branch, Queensland,
pp. 1±14.
Torri, D., Sfalanga, M., Chisci, G., 1987. Threshold conditions for
incipient rilling. Catena (Suppl.) 8, 97±105.
Truman, C.C., Bradford, J.M., 1990. Effect of antecedent soil
moisture on splash detachment under simulated rainfall. Soil
Sci. 150, 787±798.
Whiteley, G.M., Dexter, A.R., 1981. The dependence of soil
penetrometer pressure on penetrometer size. J. Agric. Eng. Res.
26, 467±476.
Zhang, B., Horn, R., 2001. Mechanisms of aggregate stabilization
of Ultisols from Subtropical China. Geoderma 99, 123±145.
202 B. Zhang et al. / Soil & Tillage Research 57 (2001) 193±202