Flash Flooding at the Colorado National Monument 1921 – 2003
Upload
independentCategory
view
1download
0
ARTICLE IN PRESS
0038-0717/$ - se
doi:10.1016/j.so
�CorrespondE-mail addr
Soil Biology & Biochemistry 38 (2006) 2069–2080
www.elsevier.com/locate/soilbio
Changes in chemical and biological soil properties as induced byanthropogenic disturbance: A case study of an agricultural soil under
recurrent flooding by wastewaters
Antonio Gelsominoa,�, Luigi Badaluccob, Roberto Ambrosolic, Carmine Crecchiod,Edoardo Puglisie, Salvatore M. Melif
aDipartimento di Biotecnologie per il Monitoraggio Agroalimentare ed Ambientale, Universita Mediterranea di Reggio Calabria, Feo di Vito, I-89060 Reggio
Calabria, ItalybDipartimento di Ingegneria e Tecnologie Agro-Forestali, Universita di Palermo, V.le delle Scienze 13, I-90128 Palermo, Italy
cDipartimento di Valorizzazione e Protezione delle Risorse Agroforestali, Universita di Torino, Via Leonardo da Vinci 44, I-10095 Grugliasco (Torino), ItalydDipartimento di Biologia e Chimica Agroforestale ed Ambientale, Universita di Bari, Via Amendola 165/A, I-70126 Bari, Italy
eIstituto di Chimica Agraria ed Ambientale, Universita Cattolica del Sacro Cuore, Via Emilia Parmense 84, I-29100 Piacenza, ItalyfDipartimento di Scienze Agronomiche, Agrochimiche e delle Produzioni Animali, Universita di Catania, Via Santa Sofia 98, I-95123 Catania, Italy
Received 5 September 2005; received in revised form 27 December 2005; accepted 31 December 2005
Available online 13 March 2006
Abstract
Monitoring the environmental impact of anthropogenic disturbance on soil ecosystem is of great importance for optimizing strategies
for soil use, conservation and remediation. The aim of this study was to assess whether and to what extent a long-term, human-induced
disturbance could have affected main chemical and biological properties in an agricultural soil. The study site was a hazel (Corylus
avellana L.) orchard located in the area surrounding the volcanic apparatus of Somma-Vesuvius (Southern Italy). For the last two
decades, the site has been repeatedly subjected to floodings by wastewaters containing not only alluvial sediments but also potentially
hazardous compounds from illegally disposed wastes. Soil disturbance was assessed by a multitechnique approach, which combined
chemical, biochemical and physiological (Biologs) methods together with community fingerprinting by denaturing gradient gel
electrophoresis (DGGE) and amplified ribosomal DNA restriction analysis (ARDRA). A hazel site never subjected to flooding provided
the control soil. Soil sampling was repeated three times over a 1-year period. The effect of flooding by wastewaters, sampling time and
their interaction were statistically evaluated. Under wastewater flooding, soil pH and most organic matter-related pools, i.e. total organic
C, total N, and active soil C-resources such as basal (SBR) and substrate-induced respiration (SIR) and microbial biomass C (MBC)
were all increased; whereas sampling time mostly affected two active-N pools, namely K2SO4-extractable N (Extr-N) and potentially
mineralizable N that varied unconcurrently in tested soils. Also the electrical conductivity varied across samplings. Parameters related to
microbial maintenance energy (ATP and qCO2) were higher in the flooded soil, even though they were not statistically affected by
wastewater flooding or by sampling time. The Biologs method evidenced that under recurrent flooding, soil microbial populations
became functionally more uniform when compared to the control soil. Molecular fingerprinting of PCR-amplified 16S rDNA targets
revealed that, along with seasonal shifts, a marked change in the genetic structure of total bacterial community occurred in the flooded
soil. Furthermore, compositional shifts in the actinomycete community were less marked and mostly influenced by seasonal effects. Yet,
a decreased genetic diversity in the ammonia-oxidizing bacteria community was evidenced in the flooded soil by ARDRA. Thus both the
genetic and the functional structure of native soil bacterial populations were changed under repeated flooding by wastewaters. Repeated
sampling over a 1-year period allowed us to reveal soil disturbance effects beyond seasonal variations.
r 2006 Elsevier Ltd. All rights reserved.
Keywords: Anthropogenic disturbance; Microbial biomass; Soil biochemical variables; Biologs; DGGE; ARDRA
e front matter r 2006 Elsevier Ltd. All rights reserved.
ilbio.2005.12.025
ing author. Tel.: +390965 682781; fax: +39 0965 311092.
ess: [email protected] (A. Gelsomino).
ARTICLE IN PRESSA. Gelsomino et al. / Soil Biology & Biochemistry 38 (2006) 2069–20802070
1. Introduction
Measuring the environmental impact of anthropogenicactivities on soil microbial processes and diversity isnowadays considered of great importance for broadeningour knowledge of soil ecosystem functioning and forassessing human-induced changes in soil properties. Con-sequences of anthropogenic activities such as soil pollutionusually result in severe deterioration of agro-ecosystems, asthey may exert a significant direct effect on soil microbialactivities and growth, and hence on soil fertility and plantproductivity (Pierzynski et al., 1994; Doran and Zeiss,2000).
One of the major difficulties in monitoring the environ-mental impact of anthropogenic disturbance on soilproperties deals with the proper choice of a minimum dataset of physical, chemical and biological properties. Areliable soil indicator must be highly sensitive to dis-turbance but also stable enough to be scarcely influencedby seasonal fluctuations or crop development (Arshad andMartin, 2002). Since biological properties are highlysensitive to changes, they are being considered suitableindicators of environmental impact for properly comple-menting physical and chemical properties (Elliott et al.,1996; Bending et al., 2004). There is an increasing evidencethat measurements of size and activity of soil microbialcommunity hold considerable potential as early indicatorsof soil quality degradation or improvement (Anderson,2003). As new encouraging techniques for investigatingfunctional and genetic diversity of soil microbial commu-nities have been developed in recent decades (Hill et al.,2000; Kirk et al., 2004), investigating soil microbialdiversity appears nowadays to be essential in the assess-ment of the impact of anthropogenic disturbance on soilecosystem functioning (Ibekwe et al., 2002). Garland andMills (1991) developed a community-level redox technique(the Biologs approach) based on sole C-source utilizationfor estimating functional microbial community diversity.Since then, the community-level physiological profile(CLPP) approach has been increasingly used to differenti-ate microbial communities either from diverse habitats orsubjected to various stresses/disturbances (Mayr et al.,1999; Bundy et al., 2004). Moreover, molecular biologicaltechniques based on analysis of soil-extracted nucleic acidsare currently very popular in microbial ecology studies aspowerful tools able to broaden our understanding ofmicrobial interactions in soil (Akkermans et al., 1999). Inparticular, community fingerprinting by denaturing gradi-ent gel electrophoresis (DGGE) or amplified ribosomalDNA (rDNA) restriction analysis (ARDRA) of PCR-amplified 16S ribosomal RNA (rRNA) gene fragments arewidely used to profile complex microbial communities inmany diverse habitats (Muyzer and Smalla, 1998).
Our study case dealt with an agricultural (hazel-culti-vated) soil located in the area surrounding Naples (SouthernItaly) that has been repeatedly subjected for many yearsto periodical inundation due to stream overflowings of
potentially polluted wastewaters from a system of largedrainage ditches. The drainage system, named ‘‘RegiLagni’’, extends for about 60km over a large area of ca.1095km2 and it was made in the early 19th century in orderto prevent run-off after the frequent and intensive rainfallsoccurring in the region. In fact, as most soils in the areaoriginate from volcanic incoherent materials, the site isvulnerable to erosion. Unfortunately, for the last twodecades, regular maintenance and cleaning of the drainageditches have been neglected. The ditches have often beenused as an illegal disposal area of any sort of potentiallyharmful wastes (municipal and industrial sludges, alluvialsediments), containing oils together with industrial fats,heavy metals and other organic toxic compounds originat-ing from agricultural and industrial activities (Gianfredaet al., 2005). Thus, regular water flowing is heavilyhampered, if not blocked, and when heavy rainfall occurs,agricultural soils next to the drainage ditches are periodicallyflooded by wastewaters due to stream overflow. During arecent environmental monitoring programme in the sameperiodically flooded hazel soil, Puglisi et al. (2003) foundsignificant amounts of coprostanol, a sterol commonly usedas a biomarker of fecal contamination in water and soil.However, no evidence was given about possible alterationson soil biological processes. On this basis, the overall aim ofthe present study was to investigate whether and to whatextent changes in main soil chemical and biological proper-ties were influenced by repeated flooding by wastewaters. Tothis aim, a multitechnique approach, which combinestraditional biochemical methods with cultural (Biologs)and molecular (DGGE, ARDRA) techniques, was followedin order to (i) assess changes in various functionally relatedsoil active pools (microbial biomass C (MBC) and N (MBN),basal (SBR) and substrate-induced respiration (SIR), poten-tially mineralizable N (PMN), adenosine 50-triphosphate(ATP) content), and to (ii) reveal functional and composi-tional shifts in the structure of soil bacterial communities.Seasonal fluctuations were also monitored by a regularsampling at 4-month intervals over a 1-year period.
2. Materials and methods
2.1. Study site and soil sampling
The study site (named Palma Campania near Naples,50m a.s.l., Southern Italy) is a fertile volcanic areacharacterized by young, deep and well-drained soils, whichoriginated from pyroclastic sediments from the volcanicapparatus of Somma-Vesuvius. The soils show moderate tohigh andic properties and are classified as Typic Haplu-stand, according to USDA classification (Soil Survey Staff,1999). The parent material is constituted by fine and coarsevolcanic ashes. The area is flat facing a NW exposure. Soildepth is 4170 cm. The site has a mean annual rainfall of930mm and a mean annual temperature of 17 1C, with aminimum of 4 1C in January and a maximum of 39.5 1C inAugust (averages from observations over the last 50 years).
ARTICLE IN PRESSA. Gelsomino et al. / Soil Biology & Biochemistry 38 (2006) 2069–2080 2071
The climate is Mediterranean, and thermal and moistureregimes are mesic and ustic, respectively. The site is mainlyan intensive agricultural farmland, cultivated with hazel(Corylus avellana L.), densely overcrowded (4 500,000inhabitants), with varied small industry activities.
As seen before, agricultural soils in the area have beenperiodically affected by repeated flooding by wastewaterscarrying both alluvial sediments and potentially harmfulcompounds. The most recent stream overflowing occurredin 1998, less than 2 years before the sampling started. Hazelsites exposed to recurrent wastewater flooding wereselected for investigating soil disturbance (wastewater-flooded soil, WF). Hazel sites never subjected to floodingprovided the control soil (nonflooded, NF).
In each hazel site five composite soil samples, eachconsisting of five 3 kg sub-samples, were taken at a depth of5–15 cm (Ap horizon), following a W-shaped transect (vanElsas and Smalla, 1997). Soil sampling was repeated threetimes over 1 year on the following dates: 14 April 2000 (I),25 October 2000 (II), and 24 April 2001 (III). Field-moistsoils were partially air-dried, sieved to 2-mm particle sizeand stored at +4 1C before analysis.
2.2. Chemical and biochemical analyses
Main chemical soil properties (total organic C, TOC;total N, TN; pH in water, pHH2O
; pH in 1M KCl, pHKCl;electrical conductivity in 1:5, w/v, soil-to-water mixture,EC1:5) were determined using the standard methodsrecommended by SSSA (Sparks, 1996). Particle-sizeanalysis was carried out using the pipette method (Day,1965).
MBC and MBN were determined with the chloroformfumigation–extraction (CFE) method by fumigating analiquot of fresh soil (50 g dry weight, dw) at 60% waterholding capacity (WHC) under ethanol-free chloroform at2571 1C for 24 h, according to Vance et al. (1987) andBrookes et al. (1985), respectively. MBC was estimatedusing a conversion factor of KEC ¼ 0.45 (Wu et al., 1990;Joergensen, 1996) and MBN was estimated using aconversion factor of KEN ¼ 0.54 (Brookes et al., 1985;Joergensen and Mueller, 1996). K2SO4-extractable C(Extr-C) and K2SO4-extractable N (Extr-N) determinedin unfumigated samples were considered, respectively, as Cand N soluble pools.
Microbial ATP was extracted from fresh soil (0.5 g dw)according to Arnebrant and Baath (1991) and biolumino-metrically titrated with Lumac (The Netherlands) equip-ment and reagents. An internal standard procedure wasused (Ciardi and Nannipieri, 1990) in order to increase theaccuracy of the analytical method (Wen et al., 2005).
SBR was evaluated by measuring the total CO2-Cproduced by an amount of fresh soil (50 g dw) at 60%WHC during a 10-d incubation at 2571 1C (Dumontet andMathur, 1989). The metabolic quotient (qCO2) wascalculated as follows: [(mgCO2-C evolved in 1 d g�1 dwsoil)/(mgMBCg�1 dw soil)] ¼ (mgCO2-C mg�1MBCd�1).
To determine the SIR an amount of fresh soil (50 g dw)at 60% WHC was amended with glucose (4mg g�1 dw soil)(1:2.5 glucose-to-talcum ratio) according to Sparling(1995). After stabilizing for 30min, soil samples wereincubated at 2571 1C and the CO2 evolution wasdetermined over a 0.5–6.0 h period after glucose addition.SIR was expressed as mgCO2-C g�1 dw soil h�1.PMN was estimated by short-term incubation under
aerobic conditions according to Drinkwater et al. (1996),with slight modifications. Briefly, fresh soil (15 g dw) at60% WHC was incubated at 3071 1C in a polyethylenebottle not hermetically sealed for 0, 7, 14, 21 and 28 d.After the incubation, mineral N (comprising NO3
�-N andexchangeable NH4
+-N) was extracted with 0.5M K2SO4
(1:4, w/v, soil:solution) under agitation (120 rpm, 30min)at room temperature and then the soil slurry was filteredthrough Whatman No. 42 filter paper. Clean extracts werestored at �20 1C prior to mineral N determination viacolorimetric analysis. Soil PMN, resulting from netmineralization of active soil organic N, was estimated asnet cumulative mineral N after 28 d minus net cumulativemineral N at 0 d.
2.3. Microbial community metabolic (Biologs) profiles
Carbon source utilization patterns of soil microbialcommunities (CLPPs) were assessed by using Biologs 96-well Eco-Microplates (Biologs Inc., USA), which con-tained 31 different carbon sources (eight carbohydrates,eight carboxylic acids, four polymers, six amino acids, twoamines and three miscellaneous substrates) replicated threetimes on each microplate. Soil microorganisms were firstextracted according to Zak et al. (1994) and Crecchio et al.(2004), and then serially 10-fold diluted in sterile quarter-strength Ringer’s solution. Microplates were inoculatedwith 150 mL per well of the 10�3 dilution. Plates wereincubated in the dark at 30 1C. After 96-h incubation thecolour development was measured at 590 nm using aMicroplate E-Max Reader (Bio-Rad, USA).
2.4. Soil DNA analysis
2.4.1. Bacterial DNA extraction and purification
Bacterial community DNA was extracted from 4 g offresh-sampled soil by using the indirect DNA extractionmethod described by van Elsas et al. (1997) with slightmodifications as described by Crecchio et al. (2004). Yieldand quality of soil-extracted DNA were assessed by 0.8%(w/v) agarose gel electrophoresis followed by staining withethidium bromide (Sambrook et al., 1989).
2.4.2. PCR amplifications of 16S rDNA targets
PCR amplification was carried out with a thermal cyclerPCR Sprint (Hybaid, Ashford, UK). Amplification ofbacterial 16S rDNA targets was performed by using theprimer pair F984GC/R1378 (targeting the 968–1401positions, Escherichia coli numbering), which is suitable
ARTICLE IN PRESSA. Gelsomino et al. / Soil Biology & Biochemistry 38 (2006) 2069–20802072
for total community fingerprinting (Heuer et al., 1997).PCR conditions were: 3min at 95 1C, (20 s at 95 1C, 30 s at54 1C, 40 s at 72 1C)� 35 cycles and a final step of 10min at72 1C. Amplification of actinomycete 16S rDNA targetswas carried out using the primer system F243/R513GC(targeting the 226–528 positions) described by Heuer et al.(1997). PCR conditions were: 3min at 95 1C, (20 s at 95 1C,30 s at 63 1C, 40 s at 72 1C)� 35 cycles and a final step of10min at 72 1C. Bacterial and actinomycete 16S rDNAproducts were further analyzed by DGGE fingerprinting.A group-specific primer system F141/R1314 was used forthe amplification of ammonia-oxidizing bacteria (AOB)16S rDNA targets (Smit et al., 1997). PCR conditions were:3min at 95 1C, (20 s at 95 1C, 30 s at 55 1C, 3min at72 1C)� 35 cycles and a final step of 10min at 72 1C.Community fingerprinting of AOB was obtained byamplified rDNA restriction analysis (ARDRA). In allcases, the PCR reaction mixture contained: 20 ng oftemplate DNA, 1 mM each primer, 200 mM each dNTP,2.5mM MgCl2, 3.0Unit of EuroTaq DNA polymerase(EuroClone, Pero, Italy) in a buffered (Tris-HCl 10mM,pH 8.3) final volume of 50 ml. Bovine serum albumin (BSA)(Roche Diagnostics, Mannheim, D) was added (2 mg/50 ml)to the reaction mixture to prevent inhibition by co-extracted organic compounds. PCR products were ana-lysed by 1.5% (w/v) agarose gel electrophoresis beforefurther analysis (Sambrook et al., 1989).
2.4.3. Denaturing gradient gel electrophoresis (DGGE)
PCR-amplified 16S rDNA fragments were communityfingerprinted using a DCode
TM
Universal Mutation Detec-tion System (Bio-Rad Laboratories, Hercules, CA, USA).PCR products (10 ml) were loaded onto 6% (bacterialamplicons) or 8% (w/v) (actinomycete amplicons) acryla-mide gel containing a linear denaturing gradient (urea andformamide). Bacterial 16S rDNA fragments were separatedin a 40–60% denaturing gradient running in 1�TAEbuffer at 60 1C at a constant voltage of 100V for 16 h.Actinomycete 16S rDNA fragments were resolved in a40–70% denaturing gradient running in 1x TAE buffer at60 1C at a constant voltage of 90V for 16 h. Then gels werestained with SYBRs Green I nucleic acid gel stain(Molecular Probes, Eugene, OR, USA) and photographedunder UV light (l ¼ 254 nm) with a Bio-Rad Gel Doc 2000Documentation System (Bio-Rad Laboratories) equippedwith Quantity Ones Quantitation Software (Bio-RadLaboratories).
2.4.4. Amplified ribosomal DNA restriction analysis
(ARDRA)
Aliquots (20 ml) of PCR-amplified AOB 16S rDNAproducts were digested (37 1C, 2 h) with 5Unit of therestriction endonuclease Hinf I (Roche Diagnostics).Digested DNA was electrophoresed in 0.5� TBE bufferat a constant voltage of 150V for 4 h using a 16� 16 cmhigh-resolution 2% (w/v) agarose gel. Then the gel wasstained with ethidium bromide and photographed under
UV light (l ¼ 254 nm) with a Bio-Rad Gel Doc 2000Documentation System.
2.5. Data analysis and statistics
Chemical and biochemical data, reported as mean valuesfrom five replicates (n ¼ 5), were expressed on an oven dwsoil basis (105 1C, 24 h). A mixed model of analysis ofvariance (ANOVA) (PROC PRINCOMP, SAS Institute,1985) containing fixed and random classification variables(Sit, 1995) was applied. The main experimental factorswere wastewater flooding (flooding), sampling time (time)and their interaction. Flooding was set as a fixed factor,while time and time� flooding interaction were bothconsidered random factors. With the presence of fixed
and random effects, statistical tests become more restrictiveand presumably more realistic (Snedecor and Cochran,1989). All significant effects were confirmed by Tukey test(at Po0.05) for comparison of means in a fixed model.Chemical and biochemical data were also analysed byprincipal component analysis (PCA). A varimax rotationwas performed in order to maximize the correlationbetween the original variables and the axes (PROCFACTOR, SAS Institute, 1985). All the above statisticalanalyses were performed with a SAS software (SASInstitute, 1985).The Biologs data were analysed by cluster analysis with
a SPSS software. DGGE banding patterns were analysedby the Bio-Rad Quantity Ones Quantitation Software(Bio-Rad Laboratories) to generate similarity dendrograms(Dice coefficient of similarity) via the unweighted pair-group method using mathematical averages (UPGMA)(Rademaker et al., 1999).
3. Results
3.1. Soil chemical properties
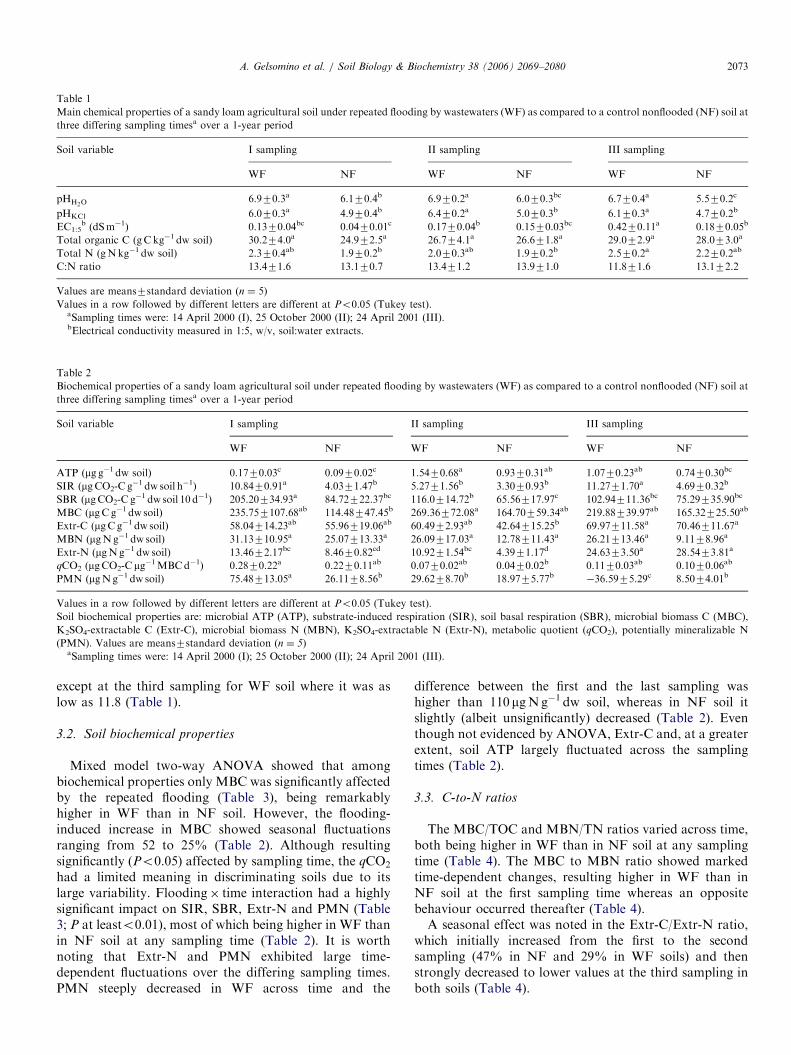
Sampled soils showed a sandy loam texture (WF: sand62%, silt 28%, clay 10%; NF: sand 73%, silt 20%, clay 7%).Mixed model two-way ANOVA revealed that at any
sampling flooding was the main factor influencing the pHin H2O and in KCl, which were both significantly higher inWF than in NF soil (Tables 1 and 3). The electricalconductivity (EC1:5) showed an increasing trend over time,with the highest values found at the third sampling (Table1). Yet, EC1:5 was significantly (Po0.01) affected by theflooding x time interaction (Table 3).TOC and TN were not significantly (P40.05) affected
by time, flooding or their interaction (Table 3). However, itis worth noting that, albeit not significantly, TOC and TNcontents were higher in WF than in NF soil at anysampling (Table 1), with the largest difference between WFand NF soil occurring at the first sampling (a ca. 21%increase in both TOC and TN). The soil C-to-N ratio wasrather constant in all cases (ranging from 13.1 to 13.9),
ARTICLE IN PRESS
Table 1
Main chemical properties of a sandy loam agricultural soil under repeated flooding by wastewaters (WF) as compared to a control nonflooded (NF) soil at
three differing sampling timesa over a 1-year period
Soil variable I sampling II sampling III sampling
WF NF WF NF WF NF
pHH2O6.970.3a 6.170.4b 6.970.2a 6.070.3bc 6.770.4a 5.570.2c
pHKCl 6.070.3a 4.970.4b 6.470.2a 5.070.3b 6.170.3a 4.770.2b
EC1:5b (dSm�1) 0.1370.04bc 0.0470.01c 0.1770.04b 0.1570.03bc 0.4270.11a 0.1870.05b
Total organic C (gCkg�1 dw soil) 30.274.0a 24.972.5a 26.774.1a 26.671.8a 29.072.9a 28.073.0a
Total N (gNkg�1 dw soil) 2.370.4ab 1.970.2b 2.070.3ab 1.970.2b 2.570.2a 2.270.2ab
C:N ratio 13.471.6 13.170.7 13.471.2 13.971.0 11.871.6 13.172.2
Values are means7standard deviation (n ¼ 5)
Values in a row followed by different letters are different at Po0.05 (Tukey test).aSampling times were: 14 April 2000 (I), 25 October 2000 (II); 24 April 2001 (III).bElectrical conductivity measured in 1:5, w/v, soil:water extracts.
Table 2
Biochemical properties of a sandy loam agricultural soil under repeated flooding by wastewaters (WF) as compared to a control nonflooded (NF) soil at
three differing sampling timesa over a 1-year period
Soil variable I sampling II sampling III sampling
WF NF WF NF WF NF
ATP (mg g�1 dw soil) 0.1770.03c 0.0970.02c 1.5470.68a 0.9370.31ab 1.0770.23ab 0.7470.30bc
SIR (mgCO2-C g�1 dw soil h�1) 10.8470.91a 4.0371.47b 5.2771.56b 3.3070.93b 11.2771.70a 4.6970.32b
SBR (mgCO2-C g�1 dw soil 10 d�1) 205.20734.93a 84.72722.37bc 116.0714.72b 65.56717.97c 102.94711.36bc 75.29735.90bc
MBC (mgCg�1 dw soil) 235.757107.68ab 114.48747.45b 269.36772.08a 164.70759.34ab 219.88739.97ab 165.32725.50ab
Extr-C (mgCg�1 dw soil) 58.04714.23ab 55.96719.06ab 60.4972.93ab 42.64715.25b 69.97711.58a 70.46711.67a
MBN (mgNg�1 dw soil) 31.13710.95a 25.07713.33a 26.09717.03a 12.78711.43a 26.21713.46a 9.1178.96a
Extr-N (mgNg�1 dw soil) 13.4672.17bc 8.4670.82cd 10.9271.54bc 4.3971.17d 24.6373.50a 28.5473.81a
qCO2 (mgCO2-Cmg�1MBCd�1) 0.2870.22a 0.2270.11ab 0.0770.02ab 0.0470.02b 0.1170.03ab 0.1070.06ab
PMN (mgNg�1 dw soil) 75.48713.05a 26.1178.56b 29.6278.70b 18.9775.77b �36.5975.29c 8.5074.01b
Values in a row followed by different letters are different at Po0.05 (Tukey test).
Soil biochemical properties are: microbial ATP (ATP), substrate-induced respiration (SIR), soil basal respiration (SBR), microbial biomass C (MBC),
K2SO4-extractable C (Extr-C), microbial biomass N (MBN), K2SO4-extractable N (Extr-N), metabolic quotient (qCO2), potentially mineralizable N
(PMN). Values are means7standard deviation (n ¼ 5)aSampling times were: 14 April 2000 (I); 25 October 2000 (II); 24 April 2001 (III).
A. Gelsomino et al. / Soil Biology & Biochemistry 38 (2006) 2069–2080 2073
except at the third sampling for WF soil where it was aslow as 11.8 (Table 1).
3.2. Soil biochemical properties
Mixed model two-way ANOVA showed that amongbiochemical properties only MBC was significantly affectedby the repeated flooding (Table 3), being remarkablyhigher in WF than in NF soil. However, the flooding-induced increase in MBC showed seasonal fluctuationsranging from 52 to 25% (Table 2). Although resultingsignificantly (Po0.05) affected by sampling time, the qCO2
had a limited meaning in discriminating soils due to itslarge variability. Flooding� time interaction had a highlysignificant impact on SIR, SBR, Extr-N and PMN (Table3; P at leasto0.01), most of which being higher in WF thanin NF soil at any sampling time (Table 2). It is worthnoting that Extr-N and PMN exhibited large time-dependent fluctuations over the differing sampling times.PMN steeply decreased in WF across time and the
difference between the first and the last sampling washigher than 110 mgNg�1 dw soil, whereas in NF soil itslightly (albeit unsignificantly) decreased (Table 2). Eventhough not evidenced by ANOVA, Extr-C and, at a greaterextent, soil ATP largely fluctuated across the samplingtimes (Table 2).
3.3. C-to-N ratios
The MBC/TOC and MBN/TN ratios varied across time,both being higher in WF than in NF soil at any samplingtime (Table 4). The MBC to MBN ratio showed markedtime-dependent changes, resulting higher in WF than inNF soil at the first sampling time whereas an oppositebehaviour occurred thereafter (Table 4).A seasonal effect was noted in the Extr-C/Extr-N ratio,
which initially increased from the first to the secondsampling (47% in NF and 29% in WF soils) and thenstrongly decreased to lower values at the third sampling inboth soils (Table 4).
ARTICLE IN PRESS
Table 3
Significant effects of flooding by wastewaters, time and their interaction (flooding� time) on chemical and biochemical properties in a sandy loam
agricultural soil
Main effect dfa pHH2OpHKCl TOC TN EC ATP SIR SBR MBC Extr-C MBN Extr-N qCO2 PMN
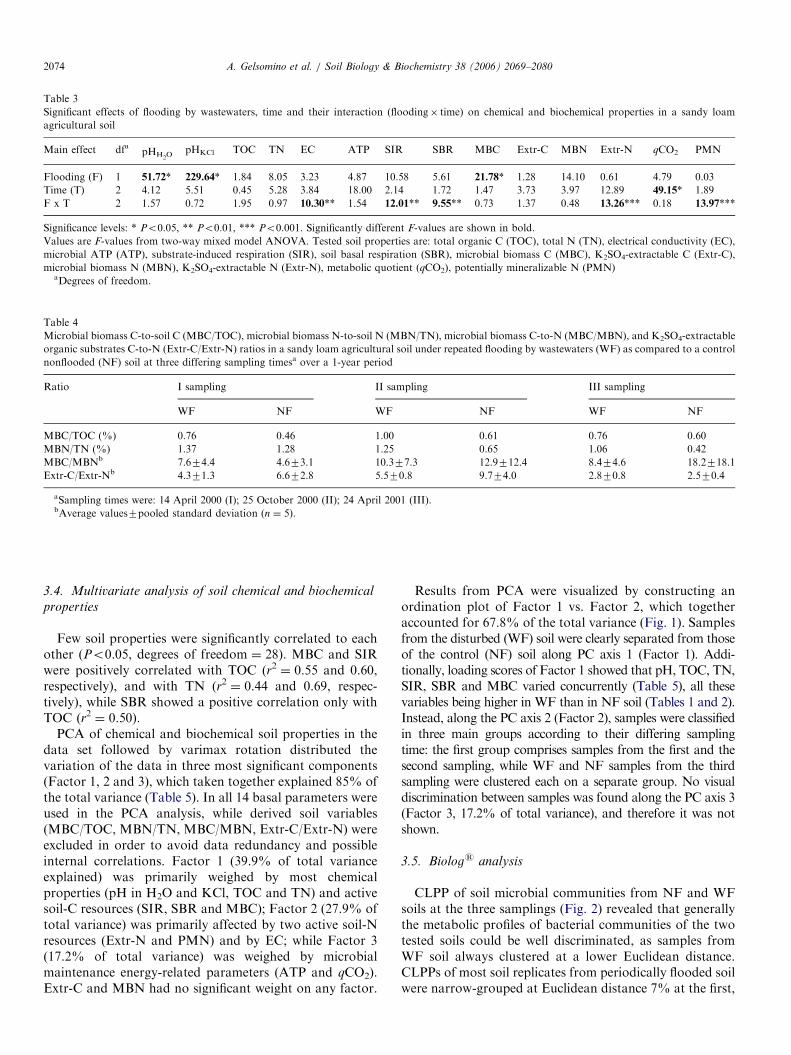
Flooding (F) 1 51.72* 229.64* 1.84 8.05 3.23 4.87 10.58 5.61 21.78* 1.28 14.10 0.61 4.79 0.03
Time (T) 2 4.12 5.51 0.45 5.28 3.84 18.00 2.14 1.72 1.47 3.73 3.97 12.89 49.15* 1.89
F x T 2 1.57 0.72 1.95 0.97 10.30** 1.54 12.01** 9.55** 0.73 1.37 0.48 13.26*** 0.18 13.97***
Significance levels: * Po0.05, ** Po0.01, *** Po0.001. Significantly different F-values are shown in bold.
Values are F-values from two-way mixed model ANOVA. Tested soil properties are: total organic C (TOC), total N (TN), electrical conductivity (EC),
microbial ATP (ATP), substrate-induced respiration (SIR), soil basal respiration (SBR), microbial biomass C (MBC), K2SO4-extractable C (Extr-C),
microbial biomass N (MBN), K2SO4-extractable N (Extr-N), metabolic quotient (qCO2), potentially mineralizable N (PMN)aDegrees of freedom.
Table 4
Microbial biomass C-to-soil C (MBC/TOC), microbial biomass N-to-soil N (MBN/TN), microbial biomass C-to-N (MBC/MBN), and K2SO4-extractable
organic substrates C-to-N (Extr-C/Extr-N) ratios in a sandy loam agricultural soil under repeated flooding by wastewaters (WF) as compared to a control
nonflooded (NF) soil at three differing sampling timesa over a 1-year period
Ratio I sampling II sampling III sampling
WF NF WF NF WF NF
MBC/TOC (%) 0.76 0.46 1.00 0.61 0.76 0.60
MBN/TN (%) 1.37 1.28 1.25 0.65 1.06 0.42
MBC/MBNb 7.674.4 4.673.1 10.377.3 12.9712.4 8.474.6 18.2718.1
Extr-C/Extr-Nb 4.371.3 6.672.8 5.570.8 9.774.0 2.870.8 2.570.4
aSampling times were: 14 April 2000 (I); 25 October 2000 (II); 24 April 2001 (III).bAverage values7pooled standard deviation (n ¼ 5).
A. Gelsomino et al. / Soil Biology & Biochemistry 38 (2006) 2069–20802074
3.4. Multivariate analysis of soil chemical and biochemical
properties
Few soil properties were significantly correlated to eachother (Po0.05, degrees of freedom ¼ 28). MBC and SIRwere positively correlated with TOC (r2 ¼ 0.55 and 0.60,respectively), and with TN (r2 ¼ 0.44 and 0.69, respec-tively), while SBR showed a positive correlation only withTOC (r2 ¼ 0.50).
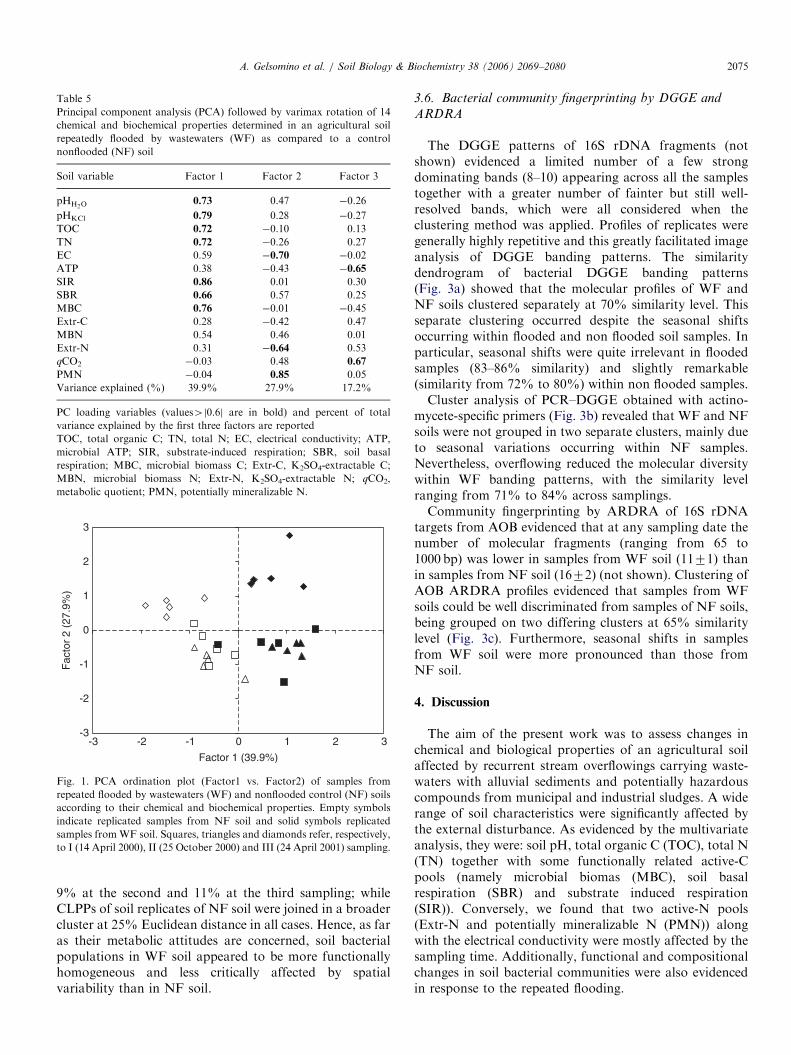
PCA of chemical and biochemical soil properties in thedata set followed by varimax rotation distributed thevariation of the data in three most significant components(Factor 1, 2 and 3), which taken together explained 85% ofthe total variance (Table 5). In all 14 basal parameters wereused in the PCA analysis, while derived soil variables(MBC/TOC, MBN/TN, MBC/MBN, Extr-C/Extr-N) wereexcluded in order to avoid data redundancy and possibleinternal correlations. Factor 1 (39.9% of total varianceexplained) was primarily weighed by most chemicalproperties (pH in H2O and KCl, TOC and TN) and activesoil-C resources (SIR, SBR and MBC); Factor 2 (27.9% oftotal variance) was primarily affected by two active soil-Nresources (Extr-N and PMN) and by EC; while Factor 3(17.2% of total variance) was weighed by microbialmaintenance energy-related parameters (ATP and qCO2).Extr-C and MBN had no significant weight on any factor.
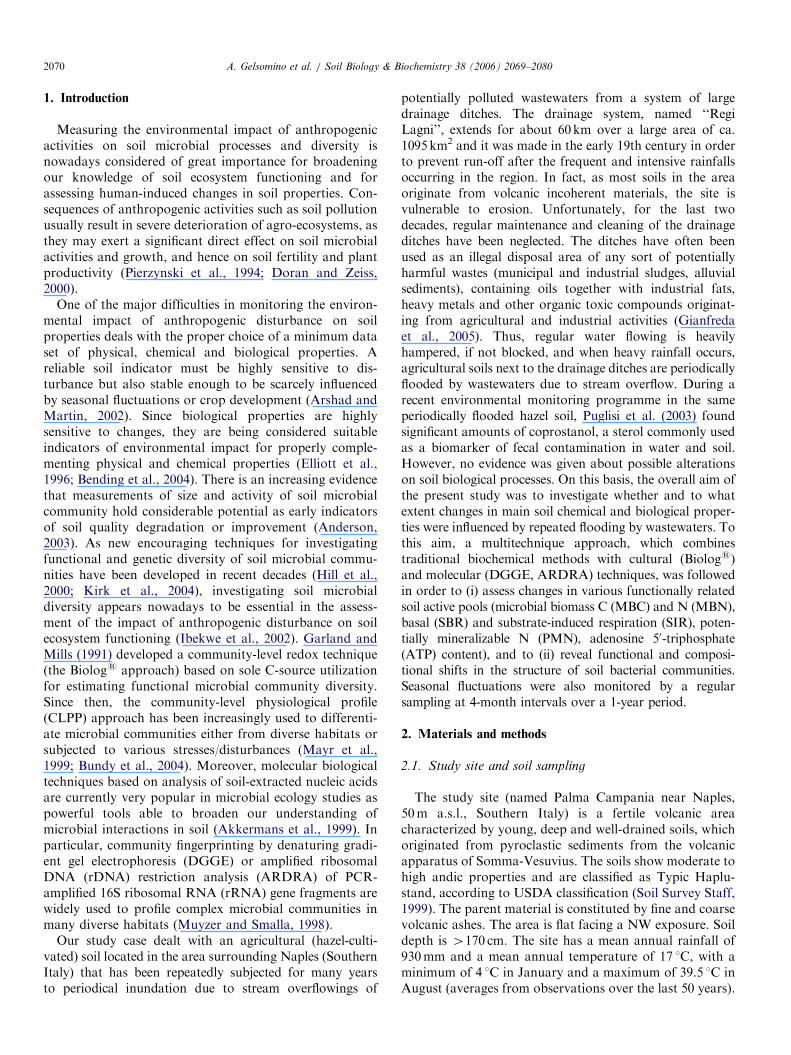
Results from PCA were visualized by constructing anordination plot of Factor 1 vs. Factor 2, which togetheraccounted for 67.8% of the total variance (Fig. 1). Samplesfrom the disturbed (WF) soil were clearly separated from thoseof the control (NF) soil along PC axis 1 (Factor 1). Addi-tionally, loading scores of Factor 1 showed that pH, TOC, TN,SIR, SBR and MBC varied concurrently (Table 5), all thesevariables being higher in WF than in NF soil (Tables 1 and 2).Instead, along the PC axis 2 (Factor 2), samples were classifiedin three main groups according to their differing samplingtime: the first group comprises samples from the first and thesecond sampling, while WF and NF samples from the thirdsampling were clustered each on a separate group. No visualdiscrimination between samples was found along the PC axis 3(Factor 3, 17.2% of total variance), and therefore it was notshown.
3.5. Biologs analysis
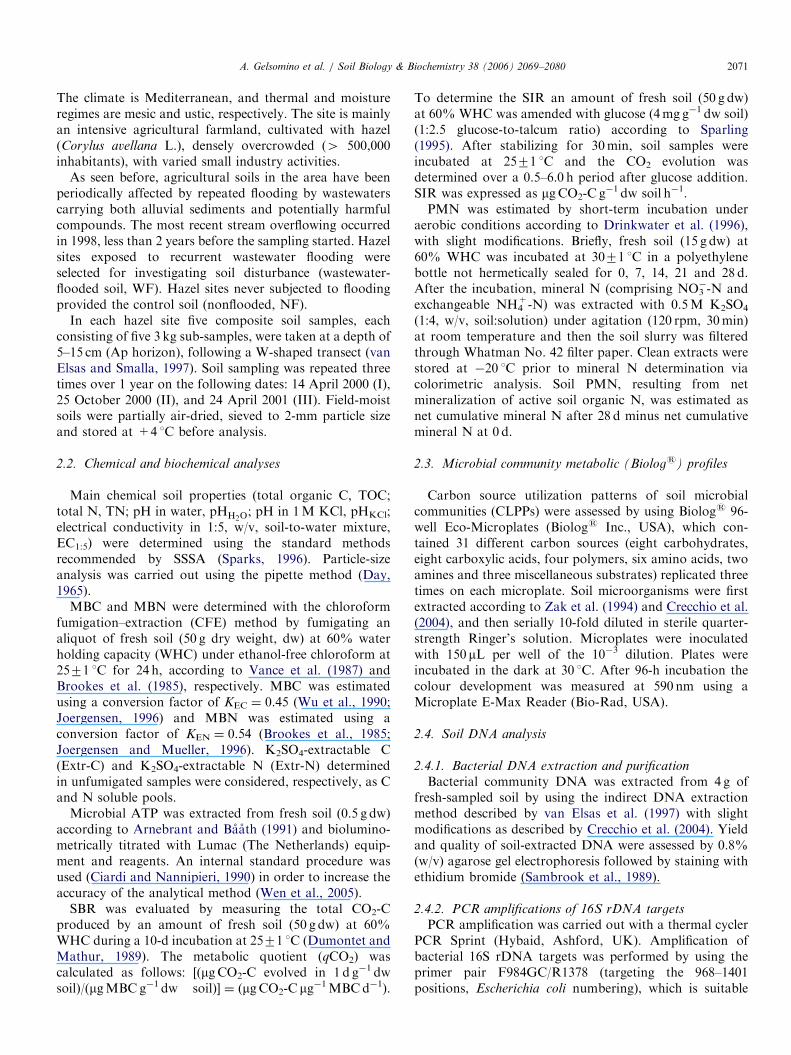
CLPP of soil microbial communities from NF and WFsoils at the three samplings (Fig. 2) revealed that generallythe metabolic profiles of bacterial communities of the twotested soils could be well discriminated, as samples fromWF soil always clustered at a lower Euclidean distance.CLPPs of most soil replicates from periodically flooded soilwere narrow-grouped at Euclidean distance 7% at the first,
ARTICLE IN PRESS
-3
-2
-1
0
1
2
3
-3 -2 -1 0 2
Factor 1 (39.9%)
Fac
tor
2 (2
7.9%
)
1 3
Fig. 1. PCA ordination plot (Factor1 vs. Factor2) of samples from
repeated flooded by wastewaters (WF) and nonflooded control (NF) soils
according to their chemical and biochemical properties. Empty symbols
indicate replicated samples from NF soil and solid symbols replicated
samples fromWF soil. Squares, triangles and diamonds refer, respectively,
to I (14 April 2000), II (25 October 2000) and III (24 April 2001) sampling.
Table 5
Principal component analysis (PCA) followed by varimax rotation of 14
chemical and biochemical properties determined in an agricultural soil
repeatedly flooded by wastewaters (WF) as compared to a control
nonflooded (NF) soil
Soil variable Factor 1 Factor 2 Factor 3
pHH2O0.73 0.47 �0.26
pHKCl 0.79 0.28 �0.27
TOC 0.72 �0.10 0.13
TN 0.72 �0.26 0.27
EC 0.59 �0.70 �0.02
ATP 0.38 �0.43 �0.65
SIR 0.86 0.01 0.30
SBR 0.66 0.57 0.25
MBC 0.76 �0.01 �0.45
Extr-C 0.28 �0.42 0.47
MBN 0.54 0.46 0.01
Extr-N 0.31 �0.64 0.53
qCO2 �0.03 0.48 0.67
PMN �0.04 0.85 0.05
Variance explained (%) 39.9% 27.9% 17.2%
PC loading variables (values4j0.6j are in bold) and percent of total
variance explained by the first three factors are reported
TOC, total organic C; TN, total N; EC, electrical conductivity; ATP,
microbial ATP; SIR, substrate-induced respiration; SBR, soil basal
respiration; MBC, microbial biomass C; Extr-C, K2SO4-extractable C;
MBN, microbial biomass N; Extr-N, K2SO4-extractable N; qCO2,
metabolic quotient; PMN, potentially mineralizable N.
A. Gelsomino et al. / Soil Biology & Biochemistry 38 (2006) 2069–2080 2075
9% at the second and 11% at the third sampling; whileCLPPs of soil replicates of NF soil were joined in a broadercluster at 25% Euclidean distance in all cases. Hence, as faras their metabolic attitudes are concerned, soil bacterialpopulations in WF soil appeared to be more functionallyhomogeneous and less critically affected by spatialvariability than in NF soil.
3.6. Bacterial community fingerprinting by DGGE and
ARDRA
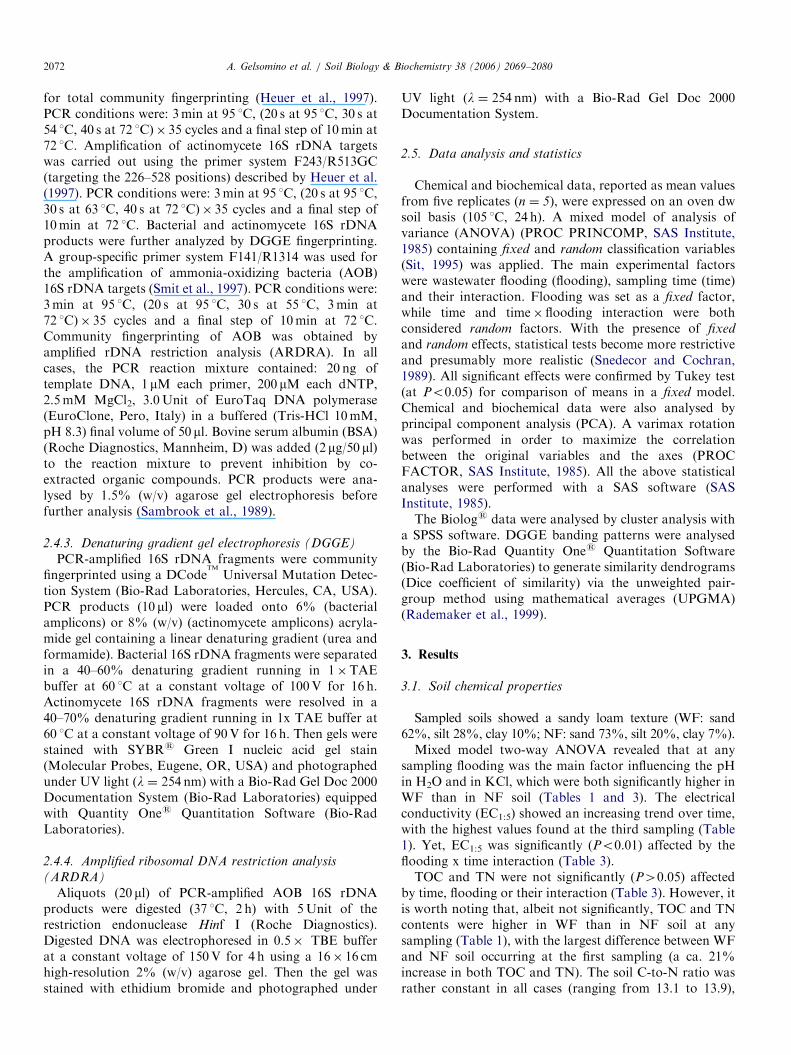
The DGGE patterns of 16S rDNA fragments (notshown) evidenced a limited number of a few strongdominating bands (8–10) appearing across all the samplestogether with a greater number of fainter but still well-resolved bands, which were all considered when theclustering method was applied. Profiles of replicates weregenerally highly repetitive and this greatly facilitated imageanalysis of DGGE banding patterns. The similaritydendrogram of bacterial DGGE banding patterns(Fig. 3a) showed that the molecular profiles of WF andNF soils clustered separately at 70% similarity level. Thisseparate clustering occurred despite the seasonal shiftsoccurring within flooded and non flooded soil samples. Inparticular, seasonal shifts were quite irrelevant in floodedsamples (83–86% similarity) and slightly remarkable(similarity from 72% to 80%) within non flooded samples.Cluster analysis of PCR–DGGE obtained with actino-
mycete-specific primers (Fig. 3b) revealed that WF and NFsoils were not grouped in two separate clusters, mainly dueto seasonal variations occurring within NF samples.Nevertheless, overflowing reduced the molecular diversitywithin WF banding patterns, with the similarity levelranging from 71% to 84% across samplings.Community fingerprinting by ARDRA of 16S rDNA
targets from AOB evidenced that at any sampling date thenumber of molecular fragments (ranging from 65 to1000 bp) was lower in samples from WF soil (1171) thanin samples from NF soil (1672) (not shown). Clustering ofAOB ARDRA profiles evidenced that samples from WFsoils could be well discriminated from samples of NF soils,being grouped on two differing clusters at 65% similaritylevel (Fig. 3c). Furthermore, seasonal shifts in samplesfrom WF soil were more pronounced than those fromNF soil.
4. Discussion
The aim of the present work was to assess changes inchemical and biological properties of an agricultural soilaffected by recurrent stream overflowings carrying waste-waters with alluvial sediments and potentially hazardouscompounds from municipal and industrial sludges. A widerange of soil characteristics were significantly affected bythe external disturbance. As evidenced by the multivariateanalysis, they were: soil pH, total organic C (TOC), total N(TN) together with some functionally related active-Cpools (namely microbial biomas (MBC), soil basalrespiration (SBR) and substrate induced respiration(SIR)). Conversely, we found that two active-N pools(Extr-N and potentially mineralizable N (PMN)) alongwith the electrical conductivity were mostly affected by thesampling time. Additionally, functional and compositionalchanges in soil bacterial communities were also evidencedin response to the repeated flooding.

ARTICLE IN PRESS
Fig. 2. Cluster analysis of Biologs profiles of NF and WF soil at three differing sampling times: (a) I sampling (14 April 2000); (b) II sampling (25
October 2000); (c) III sampling (24 April 2001). Each bar corresponds to a single field replicate. Scale (0–100) indicates Euclidean distance.
A. Gelsomino et al. / Soil Biology & Biochemistry 38 (2006) 2069–20802076
The significant increase in both active and potential pHvalues found in the flooded soil was accompanied by aconcomitant, albeit small, increase in the electricalconductivity. This finding is consistent with the possibilitythat stream overflowings were relatively high in Ca2+ andMg2+ ions, which then accumulated near or on the soilsurface thus giving a higher percentage base saturation inwastewater-flooded (WF) soil (Colombo et al., 2002).
Soil organic matter (SOM) is considered a key factor,because of its large influence on many soil properties andprocesses (Brady and Weil, 2002). However, SOM is otherthan a highly variable soil characteristic and it isdemonstrated that, unless large amendments are made tosoils, several years are generally required to detectsignificant changes resulting from anthropogenic distur-bance or management strategies (Sikora and Stott, 1996).It is also widely known that the whole of SOM can be
divided into a number of related pools of differing turnovertimes and functional roles in soil, many of which areactually used to provide an early and sensitive measure ofanthropogenic disturbance. However, in the present workboth gross pools of TOC and TN, and certain soil active-Cpools (MBC, SBR and SIR) were clearly increased in theperiodically flooded soil. As expected, the significantpositive correlations found between TOC and MBC(r2 ¼ 0.55), SIR (r2 ¼ 0.60) and SBR (r2 ¼ 0.50) wouldsubstantiate that these C pools are functionally inter-related. These findings may suggest that the additional Ccarried with wastewater overflowings increased the micro-bial growth and activity, since it probably consisted of asignificant fraction of soluble organic compounds readilyavailable to microbial immobilization and/or mineraliza-tion. An altered microbial ecology could also be inferred bythe change in kind and amount of soluble organic

ARTICLE IN PRESS
Fig. 3. Similarity dendrograms (UPGMA) of molecular banding patterns of samples from NF and WF soil at I (14 April 2000), II (25 October 2000) and
III (24 April 2001) sampling: (a) cluster analysis of eubacterial community fingerprinting by PCR–DGGE; (b) cluster analysis of actinomycete community
fingerprinting by PCR-DGGE; (c) cluster analysis of ammonia-oxidizing bacteria (AOB) community fingerprinting by ARDRA. Each bar averages five
field replicates. Values indicate the similarity level (Dice coefficient of similarity).
A. Gelsomino et al. / Soil Biology & Biochemistry 38 (2006) 2069–2080 2077
substrates extracted from WF soil, where the C-to-N ratioof K2SO4-extractable organic compounds decreased andthe size of Extr-C and Extr-N pool tended to increase.
A clear indication of an increased microbial activity asdue to wastewater flooding seems also to be confirmed bythe high values of both SBR and SIR; whereas microbialadenosine 50-triphosphate (ATP) did not significantlychange even though it was higher in the disturbed than inthe control soil. This could be regarded as a furtherindication that a higher metabolic activity was promoted insoil under human-induced disturbance. Needless to say,microbial ATP content has been recently shown to be asensitive indicator for differentiating soils under contrast-ing management strategies (Crecchio et al., 2004). In thisregard, it is also worth noting that within the frame of thesame monitoring programme, Gianfreda et al. (2005)recently found that soil enzyme activities involved in theC cycle (invertase, X-glucosidase, dehydrogenase) and inthe S cycle (arylsulfatase) were significantly increased inperiodically flooded soil as compared to nonflooded (NF)control soil. Then we may hypothesize that higher activitylevels in the flooded soil were reflecting an increasedamount of easily decomposable substrates, probablyoriginating from the organic matter fraction carried withalluvial sediments during the stream overflowing events. As
regards qCO2 it resulted altered in the flooded soil, eventhough it was not clearly responsive to any of the twoexperimental factors, i.e. repeated disturbance or samplingtime.Among soil variables, PMN did not clearly contribute to
the discrimination between tested soils. Nevertheless, theuse of N mineralization potential is generally less thansatisfactory as contrasting results were reported when itwas used as a reliable indicator of environmental impact(Wander and Bollero, 1999; Sparling and Schipper, 2002).Indeed, many factors, such as seasonal effects (i.e. soilmoisture and temperature variability), sample handlingand incubation procedures may strongly affect the measureof soil N mineralization capacity (Drinkwater et al., 1996;Wang et al., 2003). Additionally, the increased MBN/TNratio observed at the II and III sampling (Table 4) couldindicate that an increased microbial N immobilizationoccurred in WF soil as compared to NF soil, thus affectingan accurate estimate of net N mineralization.The Biologs method was able to discriminate between
WF and NF soil as microbial populations in WF soilresulted to be functionally more uniform. A further insightof this finding was provided by denaturing gradient gelelectrophoresis (DGGE) community fingerprinting ofbacterial 16S rDNA targets. The analysis revealed that
ARTICLE IN PRESSA. Gelsomino et al. / Soil Biology & Biochemistry 38 (2006) 2069–20802078
the molecular structure of bacterial populations in WF soilwas clearly changed when compared to that in NF soil, andthe two soils could be easily discriminated when dataclustering methods were applied. However, it is known thatthe eubacterial PCR–DGGE method may preferentiallytarget dominant bacterial types (Gelsomino et al., 1999)and it may not be able to adequately explore complex soilmicrobial communities (Nakatsu et al., 2000; Gomes et al.,2001). Thus, bacterial communities response to the externalstress was also assessed by using group-specific primerstargeting two less abundant components of soil microbiotathat are likely to play a key ecological role in maintainingsoil fertility and functioning. They are: (i) actinomycetes,widely distributed in soil and active in the decompositionof organic compounds occurring in agricultural and urbanwastes (McCarthy, 1987; Crawford, 1988); (ii) autotrophicammonia-oxidizing bacteria (AOB), responsible for theoxidation of ammonia to nitrite, the first step in thenitrification process (Prosser, 1989). DGGE fingerprintingevidenced marked differences between the molecularstructure of the actinomycete communities occurring inthe two tested areas. Regarding the DGGE molecularfingerprinting of soil bacterial community, Westergaard etal. (2001) have recently pointed that it is important to focuson community structure changes when evaluating the effectof external disturbance on native soil populations inrelation to system functioning. Yet, a change in geneticdiversity occurring in the flooded soil was also revealedafter amplified ribosomal DNA restriction analysis (AR-DRA) of AOB. Thus, both the genetic and the functionalstructure was changed in wastewater-treated soil.
Overall, seasonal fluctuations were also evidenced by thecommunity fingerprinting methods. Nonetheless, this find-ing agrees with the seasonal shifts in soil bacterialcommunities observed by Smit et al. (2001), who postu-lated that differences in environmental conditions (tem-perature, humidity, nutrient supply, etc.) could havefavoured certain populations of the whole bacterialcommunity. Additionally, Griffiths et al. (2003) who usedDGGE and Biologs methods over a 1-year soil samplingwent on to show that most pronounced bacterial commu-nity changes due to seasonal variations occurred in theuppermost soil horizon. In the present study, we observedthat temporal changes greatly affected the variability ofsome chemical and biochemical data. Needless to say, soilis a rather complex microbial habitat within which a widerange of physicochemical factors affect growth, survivaland activity of the indigenous microbiota (Stotzky, 1997).Thus, taken together our findings would further supportthe need in environmental studies to take into accountseasonal variations by monitoring soil biological propertiesover at least a 1-year period.
All these results may lead to the conclusion thatrecurrent floodings by wastewaters containing alluvialsediments and potentially hazardous compounds didmarkedly affect a wide range of soil characteristics rangingfrom chemical to biological properties. Repeated sampling
allowed to reveal soil disturbance effects beyond seasonalvariations. Among chemical properties pH, TOC, TN andEC were significantly varied. Most significant effectsinvolved an increased microbial size together with anenhanced metabolic activity. We also observed thatchanges in certain labile and functionally related fractionsof SOM were statistically linked and they were alsomirrored by changes in the molecular structure of selectedbacterial groups. It seemed that functionally milestonemicrobial groups such as AOB were more sensitive thanmore wide-spread and functionally redundant groups inevidencing a reduced genetic diversity in response to soildisturbance. Moreover, our work would substantiate theneed of a proper integration of parametric with non-parametric variables to gain a deeper understanding ofcomplex relationships between functional and geneticdiversity of soil microbial communities in response toenvironmental stresses.
Acknowledgements
The authors wish to express their gratitude to Prof. PacificoRuggiero, Universita di Bari, Italy, for his continuoussupport and for critically reviewing the manuscript, and toProf. Mara Gennari, Universita di Catania, Italy, for hervaluable suggestions given during the experimental work. Wealso thank Prof. Claudio Colombo, Universita del Molise,Italy, for providing site description and climatic data. SabrinaOliva and Patrizia Ricciuti are acknowledged for their skilfulassistance during soil DNA analysis.This work was funded by the MIUR (Ministero
dell’Istruzione, dell’Universita e della Ricerca) under theprogramme ‘‘Potential use of biological indicators inmonitoring soil quality for a sustainable environment’’,years 1999–2000.
References
Akkermans, A.D.L., van Elsas, J.D., de Bruijn, F.J., 1999. Molecular
Microbial Ecology Manual. Kluwer Academic Publishers, Dordrecht,
NL Section 1–8.
Anderson, T.-H., 2003. Microbial eco-physiological indicators to assess
soil quality. Agriculture, Ecosystems and Environment 98, 285–293.
Arnebrant, K., Baath, E., 1991. Measurement of ATP in forest humus.
Soil Biology & Biochemistry 23, 501–506.
Arshad, M.A., Martin, S., 2002. Identifying critical limits for soil quality
indicators in agro-ecosystems. Agriculture, Ecosystems and Environ-
ment 88, 153–160.
Bending, G.D., Turner, M.K., Rayns, F., Marx, M.-C., Wood, M., 2004.
Microbial and biochemical soil quality indicators and their potential
for differentiating areas under contrasting agricultural management
regimes. Soil Biology & Biochemistry 36, 1785–1792.
Brady, N.C., Weil, R.R., 2002. Soil organic matter. In: Brady, N.C., Weil,
R.R. (Eds.), The Nature and Properties of Soils, 13th ed. Prentice Hall,
Upper Saddle River, NJ, pp. 498–591.
Brookes, P.C., Landman, A., Pruden, G., Jenkinson, D.S., 1985.
Chloroform fumigation and the release of soil nitrogen: a rapid direct
extraction method to measure microbial biomass nitrogen in soil. Soil
Biology & Biochemistry 17, 837–842.
ARTICLE IN PRESSA. Gelsomino et al. / Soil Biology & Biochemistry 38 (2006) 2069–2080 2079
Bundy, J.G., Paton, G.I., Campbell, C.D., 2004. Combined microbial
community level and single species biosensor responses to monitor
recovery of oil polluted soil. Soil Biology & Biochemistry 36,
1149–1159.
Ciardi, C., Nannipieri, P., 1990. A comparison of methods for measuring
ATP in soil. Soil Biology & Biochemistry 22, 725–727.
Colombo, C., Palumbo, G., Sannino, F., Gianfreda, L., 2002. Chemical
and biochemical indicators of managed agricultural soils. In:
Proceedings of the 17th World Congress of Soil Science, vol. 1740,
14–21 August 2002, Bangkok, Thailand, pp. 1–9.
Crawford, D.L., 1988. Biodegradation of agricultural and urban wastes.
In: Goodfellow, M., Williams, S.T., Mordarski, M. (Eds.), Actinomy-
cetes in Biotechnology. Academic Press, London, pp. 433–439.
Crecchio, C., Gelsomino, A., Ambrosoli, R., Minati, J.L., Ruggiero, P.,
2004. Functional and molecular responses of soil microbial commu-
nities under differing soil management practices. Soil Biology &
Biochemistry 36, 1873–1883.
Day, P.R., 1965. Particle fractionation and particle-size analysis. In:
Black, C.A. (Ed.), Methods of Soil Analysis, Part 1. ASA, Madison,
WI, pp. 545–567.
Doran, J.W., Zeiss, M.R., 2000. Soil health and sustainability: managing
the biotic component of soil quality. Applied Soil Ecology 15, 3–11.
Drinkwater, L.E., Cambardella, C.A., Reeder, J.D., Rice, C.W., 1996.
Potentially mineralizable nitrogen as an indicator of biologically active
soil nitrogen. In: Doran, J.W., Jones, A.J. (Eds.), Methods for
Assessing Soil Quality. SSSA Special Publication No. 49. SSSA,
Madison, WI, pp. 217–229.
Dumontet, S., Mathur, S.P., 1989. Evaluation of respiration-based
methods for measuring microbial biomass in metal-contaminated
acidic mineral and organic soils. Soil Biology & Biochemistry 21,
431–436.
Elliott, L.F., Lynch, J.M., Papendick, R.I., 1996. The microbial
component of soil quality. In: Stotzky, G., Bollag, J.-M. (Eds.), Soil
Biochemistry, vol. 9. Marcel Dekker Inc., New York, pp. 1–21.
Garland, J.L., Mills, A.L., 1991. Classification and characterization of
heterotrophic microbial communities on the basis of patterns of
community-level sole-carbon-source utilization. Applied and Environ-
mental Microbiology 57, 2351–2359.
Gelsomino, A., Keijzer-Wolters, A.C., Cacco, G., van Elsas, J.D., 1999.
Assessment of bacterial community structure in soil by polymerase
chain reaction and denaturing gradient gel electrophoresis. Journal of
Microbiological Methods 38, 1–15.
Gianfreda, L., Rao, M.A., Piotrowska, A., Palumbo, G., Colombo, C.,
2005. Soil enzyme activities as affected by anthropogenic alterations:
intensive agricultural practices and organic pollution. Science of the
Total Environment 341, 265–279.
Gomes, N.C.M., Heuer, H., Schonfeld, J., Costa, R., Mendonc-a-Hagler,
L., Smalla, K., 2001. Bacterial diversity of the rhizosphere of maize
(Zea mays) grown in tropical soil studied by temperature gradient gel
electrophoresis. Plant and Soil 232, 167–180.
Griffiths, R.I., Whiteley, A.S., O’Donnel, A.G., Bailey, M.J., 2003.
Influence of depth and sampling time on bacterial community structure
in an upland grassland soil. FEMS Microbiology Ecology 43, 35–43.
Heuer, H., Krsek, M., Baker, P., Smalla, K., Wellington, E.M.H., 1997.
Analysis of actinomycete communities by specific amplification of
genes encoding 16S rRNA and gel-electrophoretic separation in
denaturing gradients. Applied and Environmental Microbiology 63,
3233–3241.
Hill, G.T., Mitkowski, N.A., Aldrich-Wolfe, L., Emele, L.R., Jurkonie,
D.D., Ficke, A., Maldonado-Ramirez, S., Lynch, S.T., Nelson, E.B.,
2000. Methods for assessing the composition and diversity of soil
microbial communities. Applied Soil Ecology 15, 25–36.
Ibekwe, A.M., Kennedy, A.C., Frohne, P.S., Papiernik, S.K., Yang, C.-
H., Crowley, D.E., 2002. Microbial diversity along a transect of
agronomic zones. FEMS Microbiology Ecology 39, 183–191.
Joergensen, R.G., 1996. The fumigation-extraction method to estimate
soil microbial biomass: calibration of the KEC value. Soil Biology &
Biochemistry 28, 25–31.
Joergensen, R.G., Mueller, T., 1996. The fumigation-extraction method to
estimate soil microbial biomass: calibration of the KEN value. Soil
Biology & Biochemistry 28, 33–37.
Kirk, J.L., Beaudette, L.A., Hart, M., Moutoglis, P., Klironomos, J.N.,
Lee, H., Trevors, J.T., 2004. Methods of studying soil microbial
diversity. Journal of Microbiological Methods 58, 169–188.
Mayr, C., Miller, M., Insam, H., 1999. Elevated CO2 alters community-
level physiological profiles and enzyme activities in alpine grassland.
Journal of Microbiological Methods 36, 35–43.
McCarthy, A.J., 1987. Lignocellulose-degrading actinomycetes. FEMS
Microbiology Review 46, 145–163.
Muyzer, G., Smalla, K., 1998. Application of denaturing gradient gel
electrophoresis (DGGE) and temperature gradient gel electrophoresis
(TGGE) in microbial ecology. Antonie van Leeuwenhoek 73, 127–141.
Nakatsu, C.H., Torsvik, V., Øvreas, L., 2000. Soil community analysis
using DGGE of 16S rDNA polymerase chain reaction products. Soil
Science Society of America Journal 64, 1382–1388.
Pierzynski, G.M., Sims, J.T., Vance, G.F., 1994. Soils and Environmental
Quality. CRC Press, Boca Raton, FL 313pp.
Prosser, J.I., 1989. Autotrophic nitrification in bacteria. Advances in
Microbial Physiology 30, 125–181.
Puglisi, E., Nicelli, M., Capri, E., Trevisan, M., Del Re, A.A.M., 2003.
Cholesterol, b-sitosterol, ergosterol, and coprostanol in agricultural
soils. Journal of Environmental Quality 32, 466–471.
Rademaker, J.L.W., Louws, F.J., Rossbach, U., Vinuesa, P., de Bruijn,
F.J., 1999. Computer-assisted pattern analysis of molecular
fingerprints and database construction. In: Akkermans, A.D.L., van
Elsas, J.D., de Bruijn, F.J. (Eds.), Molecular Microbial Ecology
Manual. Kluwer Academic Publishers, Dordrecht, NL, pp. 1–33
section 7.1.3.
Sambrook, J., Fritsch, E.F., Maniatis, T., 1989. Molecular Cloning: A
Laboratory Manual, second ed. Cold Spring Harbor Laboratory
Press, Cold Spring Harbor, New York Section 6.1–6.19.
SAS Institute, 1985. SAS User’s Guide: Statistics, Version fifth ed. SAS
Institute Inc., Cary.
Sikora, L.J., Stott, D.E., 1996. Soil organic carbon and nitrogen. In:
Doran, J.W., Jones, A.J. (Eds.), Methods for Assessing Soil
Quality. SSSA Special Publication No. 49. SSSA, Madison, WI,
pp. 157–167.
Sit, V., 1995. Analyzing ANOVA designs. Biometrics Information
Handbook No. 5. Research Branch, B.C. Ministry of Forestry,
Victoria, B.C., Working Paper No. 07.
Smit, E., Leeflang, P., Wernars, K., 1997. Detection of shifts in microbial
community structure and diversity in soil caused by copper contam-
ination using amplified ribosomal DNA restriction analysis. FEMS
Microbiology Ecology 23, 249–261.
Smit, E., Leeflang, P., Gommans, S., van den Broek, J., van Mil, S.,
Wernars, K., 2001. Diversity and seasonal fluctuations of the
dominant members of the bacterial soil community in a wheat field
as determined by cultivation and molecular methods. Applied and
Environmental Microbiology 67, 2284–2291.
Snedecor, G.W., Cochran, W.G., 1989. Statistical Methods, eighth ed.
Iowa State University Press, Ames, Iowa.
Soil Survey Staff, 1999. Soil taxonomy. Agricultural Handbook No. 436,
Second edition. USDA, Natural Resources Conservation Service, US
Gov. Print. Office, Washington, DC 869pp.
Sparks, D.L. (Ed.), 1996. Methods of Soil Analysis: Chemical Methods.
Part 3. No. 5 in the SSSA Book Series. SSSA-ASA, Madison, WI,
1390pp.
Sparling, G.P., 1995. The substrate-induced respiration method. In: Alef,
K., Nannipieri, P. (Eds.), Methods in Applied Soil Microbiology and
Biochemistry. Academic Press, London, pp. 397–404.
Sparling, G.P., Schipper, L.A., 2002. Soil quality at a national
scale in New Zealand. Journal of Environmental Quality 31,
1848–1857.
Stotzky, G., 1997. Soil as an environment for microbial life. In: van Elsas,
J.D., Trevors, J.T., Wellington, E.M.H. (Eds.), Modern Soil Micro-
biology. Marcel Dekker Inc., NY, pp. 1–20.
ARTICLE IN PRESSA. Gelsomino et al. / Soil Biology & Biochemistry 38 (2006) 2069–20802080
Vance, E.D., Brookes, P.C., Jenkinson, D.S., 1987. An extraction method
for measuring soil microbial biomass C. Soil Biology & Biochemistry
19, 703–707.
van Elsas, J.D., Smalla, K., 1997. Methods for sampling soil microbes. In:
Hurst, C.J., Knudsen, G.R., McInerney, M.J., Stetzenbach, L.D.,
Walter, M.V. (Eds.), Manual of Environmental Microbiology. ASM
Press, Washington, DC, pp. 383–390.
van Elsas, J.D., Mantynen, V., Wolters, A.C., 1997. Soil DNA extraction
and assessment of the fate of Mycobacterium chlorophenolicum strain
PCP-1 in different soils by 16S ribosomal RNA gene sequence based
most-probable-number PCR and immunofluorescence. Biology and
Fertility of Soils 24, 188–195.
Wander, M.M., Bollero, G.A., 1999. Soil quality assessment of tillage
impacts in Illinois. Soil Science Society of America Journal 63,
961–971.
Wang, W.J., Smith, C.J., Chen, D., 2003. Towards a standardised
procedure for determining the potentially mineralisable nitrogen of
soil. Biology and Fertility of Soils 37, 362–374.
Wen, G., Voroney, R.P., Curtin, D., Schoenau, J.J., Qian, P.Y., Inanaga,
S., 2005. Modification and application of a soil ATP determination
method. Soil Biology & Biochemistry 37, 1999–2006.
Westergaard, K., M +uller, A.K., Christensen, S., Bloem, J., Sørensen, S.J.,
2001. Effects of tylosin as a disturbance on the soil microbial
community. Soil Biology & Biochemistry 33, 2061–2071.
Wu, J., Joergensen, R.G., Pommerening, B., Chaussod, R., Brookes, P.C.,
1990. Measurement of soil microbial biomass-C by fumigation-extraction—
an automated procedure. Soil Biology & Biochemistry 22, 1167–1169.
Zak, J.C., Willig, M.R., Moorhead, D.L., Wildman, H.G., 1994.
Functional diversity of microbial communities: a quantitative
approach. Soil Biology & Biochemistry 26, 1101–1108.
Copyright © 2022 FDOKUMEN