Sulfate reduction at low pH in organic wastewaters - WUR ...
248
Sulfate reduction at low pH in organic wastewaters
-
Upload
khangminh22 -
Category
Documents
-
view
2 -
download
0
Transcript of Sulfate reduction at low pH in organic wastewaters - WUR ...
Sulfate reduction at low pH in
organic wastewaters

PROMOTOR
Prof. Dr. Ir. Cees Buisman
Hoogleraar in de anaerobe zuiveringstechnologie en hergebruik van afvalstoffen
CO-PROMOTOREN
Prof. Dr. Ir. Piet Lens
Hoogleraar in de Milieubiotechnologie, UNESCO-IHE, Delft
Dr. Maria Isabel Capela
University of Aveiro, Portugal
SAMENSTELLING PROMOTIECOMMISSIE
Prof. Dr. Ing. Karl-Heinz Rosenwinkel Leibniz Universität Hannover Prof. Dr. Ir. A. J. M. Stams Wageningen Universiteit Dr. G. Muyzer TU Delft Dr. Ir. A. Visser Haskoning Nederland B.V.
Dit onderzoek is uitgevoerd binnen de onderzoekschool SENSE (Socio-Economic and Natural
Sciences of the Environment)

Sulfate reduction at low pH in
organic wastewaters
Sónia Isabel de Castro Lopes
Proefschrift ter verkrijging van de graad van doctor
op gezag van de rector magnificus van Wageningen Universiteit
Prof. Dr. M. J. Kropff in het openbaar te verdedigen op dinsdag 23 oktober 2007
des namiddags te half twee in de Aula

Author: Lopes, S.I.C.
Title: Sulfate reduction at low pH in organic wastewaters
ISBN: 978-90-8504-763-6
Publication year: 2007
Subject headings: Sulfate reduction, acidification, low pH, anaerobic
Ph.D. Thesis Wageningen University, Wageningen, The Netherlands – with references – with
summaries in English and Dutch

Aos meus pais, Serafim e Lurdes
Ao meu irmão, Rui
Ao Tiago


ABSTRACT Lopes, S.I.C. (2007) Sulfate reduction at low pH in organic wastewaters. Doctoral Thesis, Wageningen University, Wageningen, The Netherlands, 248 pages. The objective of the research described in this thesis was to investigate the operational window of dissimilatory sulfate reduction at low pH (6, 5 and 4) during the acidification of organic wastewaters. High sulfate reduction efficiencies at low pH are desirable for a more sustainable operation of acidification reactors in a two-phase wastewater treatment system, as pH control requires less caustic and/or the effluent recirculation from the second (methanogenic) reactor can be skipped. The low pH would also facilitate the removal of sulfide by stripping, as the fraction of gaseous sulfide increases with decreasing pH. Sucrose was used as a model substrate at moderate loading rates (1-5 gCOD (lreactor d)-1 ) and the effect of low pH (6, 5 and 4) and different COD/SO4
2- ratios (9 to 1) was evaluated in terms of sulfate reduction and acidification efficiencies, acidification products and methanogenesis. The dynamics of micro and macronutrients were quantified and the effects of sulfide, VFA and trace metal concentrations on the treatment efficiency were studied as well. Most experiments were performed in thermophilic (55°C) UASB reactors. One experiment was also performed in mesophilic (30°C) CSTR and UASB reactors. Acidification was complete at all pH and COD/SO4
2- ratios tested in the thermophilic UASB reactors under the conditions investigated. The pH had a strong effect on the sulfate reduction efficiency and acidification products formed. Sulfate reduction was complete at pH 6 and a COD/SO4
2- ratio of 9. At pH 5, sulfate reduction efficiencies were 80-95% for both COD/SO4
2- ratios (9 and 3.5). At pH 4, sulfate reduction efficiencies further dropped to 55-65% at a COD/SO4
2- ratio of 9 and 30-40% at a COD/SO42-
ratio of 3.5. The pH decrease from 6 to 5 or 4 caused a shift in the acidification products from mainly acetate to butyrate, as well as a higher production of ethanol, mainly at pH 4. At pH 4, there was no propionate or methane formed and hydrogen concentrations in the biogas reached 50%, equivalent to a hydrogen yield of 1.3 mol H2 (mol glucose)-1. The pH had a strong effect on the micro and macronutrient retention in the sludge granules. Most metals leached from the sludge granules except for Co at pH 6, Al at pH 6 and 5 and Cu and Zn at all three pH values investigated. At the end of the UASB reactor runs at pH 5 and 4 (270 days), the sludge granules were almost completely deprived of Fe and Mn. The results obtained in this thesis showed the strong effect of sulfide on the sulfate reduction efficiency at low pH. At pH 6 and a COD/SO4
2- ratio of 1, the presence of sulfide at a concentration of approx. 200 mg l-1 caused the low sulfate reduction efficiencies obtained (35%). The stepwise decrease in sulfide by N2 stripping caused an immediate stepwise increase of the sulfate reduction efficiency, which indicated a reversible inhibition. At sulfide concentrations lower than 45 mg l-1, the sulfate reduction efficiency reached 96%. At pH 5 and a COD/SO4
2- ratio of 4, the decrease in sulfide concentration from 100 to 20 mg l-1 resulted in a fast increase in the sulfate reduction efficiency from approx. 70% to 91%. Nearly complete sulfate reduction efficiencies at a COD/SO4
2- ratio of 1 were achieved at a sulfide concentration below 50 mg l-1 and 25 mg l-1 at pH 5 and 4, respectively. The effect of trace metals (7.5 μM Fe and 0.5 μM for the other trace elements) on the sulfate reduction efficiency was studied at pH 5. The absence of trace metals in the influent of a UASB reactor did not affect its sulfate reducing or acidifying performance throughout a 305 day long reactor run. In contrast, the low concentrations of trace metals fed to a parallel UASB reactor were inhibitory for sulfate reduction. The UASB reactor design proved to be adequate for sulfate reducing acidification reactors, with superior performance than a CSTR, at the OLR applied in this study, provided that granular biomass is used as inoculum. A good sludge retention was observed in all the UASB reactor runs performed with anaerobic granular sludge as inoculum. In contrast, granulation was not observed when using a crushed granular sludge inoculum.

CONTENTS
1. General Introduction 11
2. Low pH (6, 5 and 4) sulfate reduction during the acidification of sucrose under thermophilic
(55oC) conditions 39
3. Influence of low pH (6, 5 and 4) on nutrient dynamics and characteristics of acidifying sulfate
reducing granular sludge 63
4. Effect of COD/SO42- ratio and sulfide on thermophilic (55oC) sulfate reduction during the
acidification of sucrose at pH 6 91
5. Trace metal dynamics during the acidification of sucrose at pH 5 under thermophilic (55oC)
conditions: effect on sulfate reduction 113
6. Thermophilic (55oC) sulfate reduction at pH 4 during the acidification of sucrose 155
7. Performance of mesophilic (30oC) UASB and CSTR reactors for the treatment of sulfate rich
wastewaters under acidifying conditions (pH 6 and 5) 179
8. Summary and General Discussion 197
References 215
Appendixes 233
Samenvatting (Dutch) 234
Acknowledgements 240
About the author 242
List of Publications 243
Training and Supervision Plan 245


Chapter
General Introduction
12
Cha
pter
1
1 INTRODUCTION
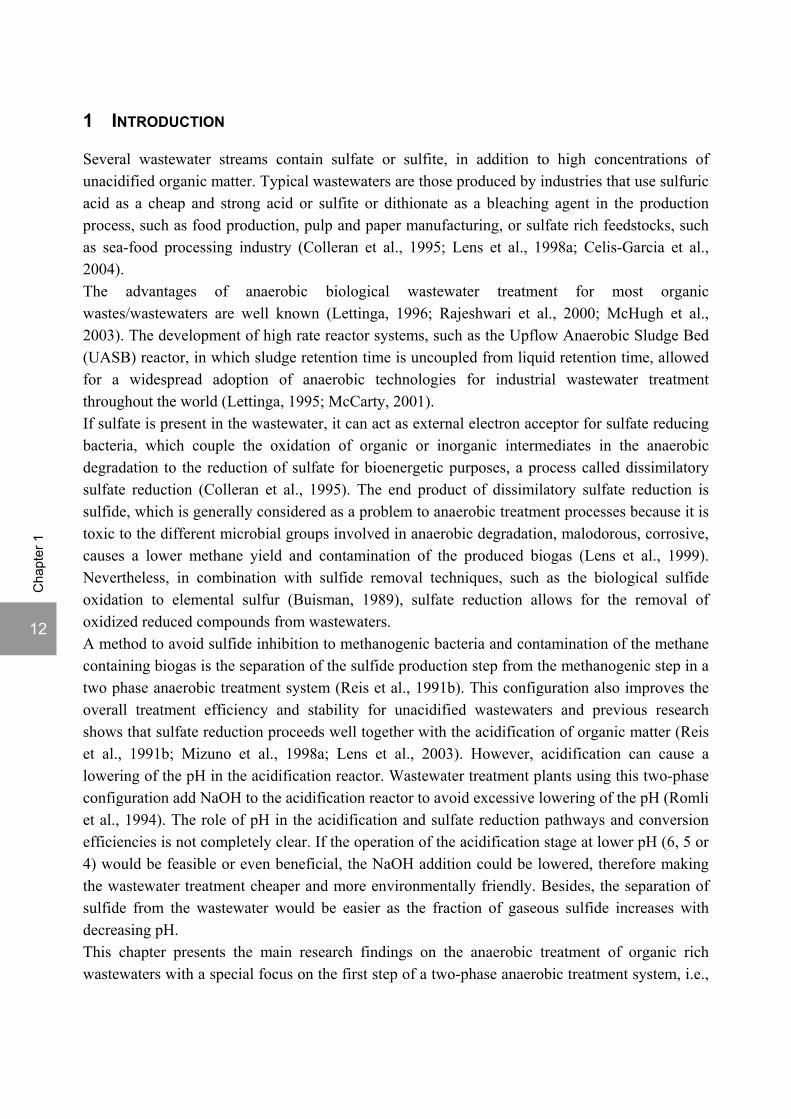
Several wastewater streams contain sulfate or sulfite, in addition to high concentrations of unacidified organic matter. Typical wastewaters are those produced by industries that use sulfuric acid as a cheap and strong acid or sulfite or dithionate as a bleaching agent in the production process, such as food production, pulp and paper manufacturing, or sulfate rich feedstocks, such as sea-food processing industry (Colleran et al., 1995; Lens et al., 1998a; Celis-Garcia et al., 2004). The advantages of anaerobic biological wastewater treatment for most organic wastes/wastewaters are well known (Lettinga, 1996; Rajeshwari et al., 2000; McHugh et al., 2003). The development of high rate reactor systems, such as the Upflow Anaerobic Sludge Bed (UASB) reactor, in which sludge retention time is uncoupled from liquid retention time, allowed for a widespread adoption of anaerobic technologies for industrial wastewater treatment throughout the world (Lettinga, 1995; McCarty, 2001). If sulfate is present in the wastewater, it can act as external electron acceptor for sulfate reducing bacteria, which couple the oxidation of organic or inorganic intermediates in the anaerobic degradation to the reduction of sulfate for bioenergetic purposes, a process called dissimilatory sulfate reduction (Colleran et al., 1995). The end product of dissimilatory sulfate reduction is sulfide, which is generally considered as a problem to anaerobic treatment processes because it is toxic to the different microbial groups involved in anaerobic degradation, malodorous, corrosive, causes a lower methane yield and contamination of the produced biogas (Lens et al., 1999). Nevertheless, in combination with sulfide removal techniques, such as the biological sulfide oxidation to elemental sulfur (Buisman, 1989), sulfate reduction allows for the removal of oxidized reduced compounds from wastewaters. A method to avoid sulfide inhibition to methanogenic bacteria and contamination of the methane containing biogas is the separation of the sulfide production step from the methanogenic step in a two phase anaerobic treatment system (Reis et al., 1991b). This configuration also improves the overall treatment efficiency and stability for unacidified wastewaters and previous research shows that sulfate reduction proceeds well together with the acidification of organic matter (Reis et al., 1991b; Mizuno et al., 1998a; Lens et al., 2003). However, acidification can cause a lowering of the pH in the acidification reactor. Wastewater treatment plants using this two-phase configuration add NaOH to the acidification reactor to avoid excessive lowering of the pH (Romli et al., 1994). The role of pH in the acidification and sulfate reduction pathways and conversion efficiencies is not completely clear. If the operation of the acidification stage at lower pH (6, 5 or 4) would be feasible or even beneficial, the NaOH addition could be lowered, therefore making the wastewater treatment cheaper and more environmentally friendly. Besides, the separation of sulfide from the wastewater would be easier as the fraction of gaseous sulfide increases with decreasing pH. This chapter presents the main research findings on the anaerobic treatment of organic rich wastewaters with a special focus on the first step of a two-phase anaerobic treatment system, i.e.,
General Introduction
13
Cha
pter
1
acidification, acetogenesis and sulfate reduction. Then, effects of a low pH and toxicity problems in this first step are discussed. Finally, the scope and organization of this thesis will be presented.
2 ANAEROBIC TREATMENT OF ORGANIC SULFATE RICH WASTEWATERS
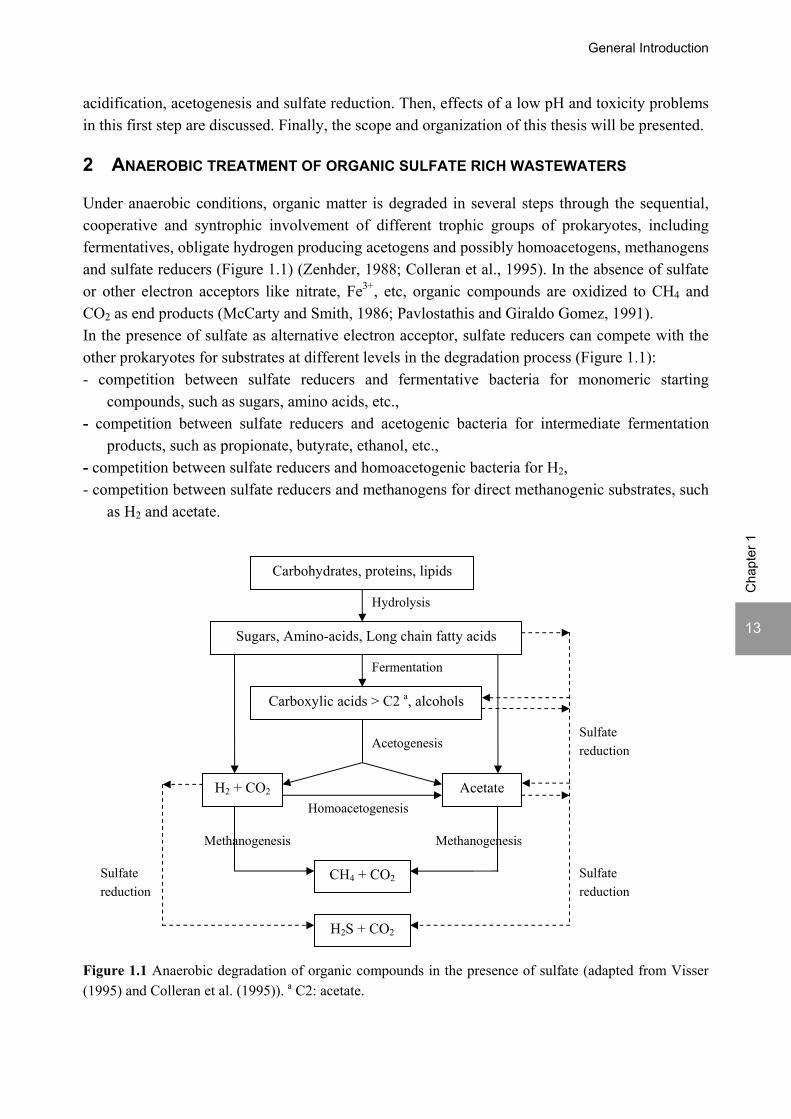
Under anaerobic conditions, organic matter is degraded in several steps through the sequential, cooperative and syntrophic involvement of different trophic groups of prokaryotes, including fermentatives, obligate hydrogen producing acetogens and possibly homoacetogens, methanogens and sulfate reducers (Figure 1.1) (Zenhder, 1988; Colleran et al., 1995). In the absence of sulfate or other electron acceptors like nitrate, Fe3+, etc, organic compounds are oxidized to CH4 and CO2 as end products (McCarty and Smith, 1986; Pavlostathis and Giraldo Gomez, 1991). In the presence of sulfate as alternative electron acceptor, sulfate reducers can compete with the other prokaryotes for substrates at different levels in the degradation process (Figure 1.1): - competition between sulfate reducers and fermentative bacteria for monomeric starting
compounds, such as sugars, amino acids, etc., - competition between sulfate reducers and acetogenic bacteria for intermediate fermentation
products, such as propionate, butyrate, ethanol, etc., - competition between sulfate reducers and homoacetogenic bacteria for H2, - competition between sulfate reducers and methanogens for direct methanogenic substrates, such
as H2 and acetate.
Figure 1.1 Anaerobic degradation of organic compounds in the presence of sulfate (adapted from Visser (1995) and Colleran et al. (1995)). a C2: acetate.
Carbohydrates, proteins, lipids
Sugars, Amino-acids, Long chain fatty acids
Carboxylic acids > C2 a, alcohols
H2 + CO2 Acetate
CH4 + CO2
Hydrolysis
Fermentation
Acetogenesis
Methanogenesis Methanogenesis
H2S + CO2
Sulfate reduction
Sulfate reduction
Sulfate reduction
Homoacetogenesis

14
Cha
pter
1
2.1 Sulfate reducing prokaryotes
Sulfate reducing prokaryotes are a heterogeneous group of bacteria and archaea characterized by the use of sulfate as terminal electron acceptor for anaerobic respiration, i.e., that are capable of dissimilatory sulfate reduction. To date, more than 120 species of 35 genera, belonging to 3 bacterial phyla and 1 archaeal phylum have been described and their metabolism elucidated (Thauer et al., 2007). Sulfate is unique among microbial electron acceptors because it must be activated to adenosine 5’- phosphosulfate (APS) by means of adenosine triphosphate (ATP) before it is reduced (Hamilton, 1998) (Figure 1.2). In addition to sulfate, reduction of sulfite and thiosulfate is very common among sulfate reducers (Widdel, 1988). Also elemental sulfur, fumarate, nitrate, dimethylsulfoxide, Mn(IV) and Fe(III) can be used as electron acceptor by sulfate reducers (Thauer et al., 2007).
Figure 1.2 Pathway of dissimilatory sulfate reduction (Hansen, 1994; Lampreia et al., 1994; Madigan et al., 2000). More than 125 compounds can be oxidized by the available pure cultures of sulfate reducers (Hansen, 1994). Direct utilization of biopolymers is very rare, with only one archaeal strain capable of using starch (Hansen, 1994). Most of the substrates for sulfate reducers include typical organic fermentation products and intermediates such as lactate, alcohols, fatty acids and hydrogen. Figure 1.3 shows how Desulfovibrio vulgaris Hildenborough couples the oxidation of lactate to acetate to the reduction of sulfate to sulfide for energy generation.
ATP + SO42- APS + PPi 2 Pi
HSO3-
ATP Sulfurylase Pyrophosphatase
APS Reductase
Bisulfite Reductase S3O6
-
S2O3-
S2-
General Introduction
15
Cha
pter
1
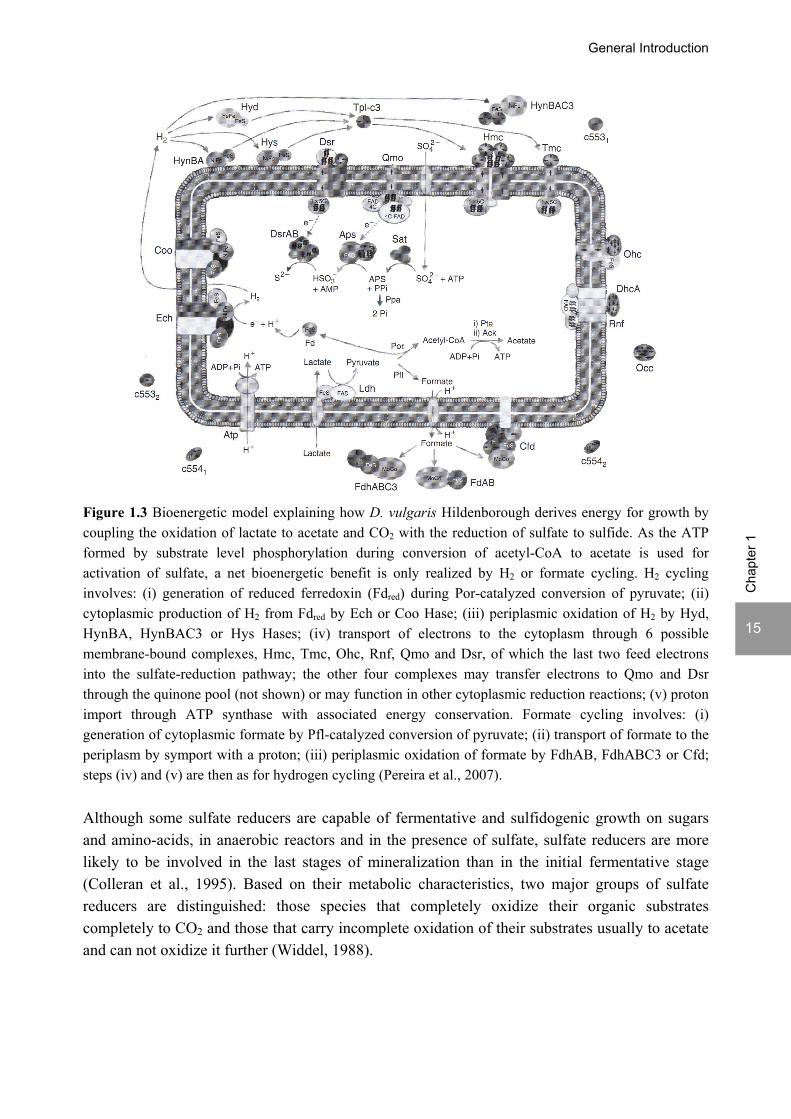
Figure 1.3 Bioenergetic model explaining how D. vulgaris Hildenborough derives energy for growth by coupling the oxidation of lactate to acetate and CO2 with the reduction of sulfate to sulfide. As the ATP formed by substrate level phosphorylation during conversion of acetyl-CoA to acetate is used for activation of sulfate, a net bioenergetic benefit is only realized by H2 or formate cycling. H2 cycling involves: (i) generation of reduced ferredoxin (Fdred) during Por-catalyzed conversion of pyruvate; (ii) cytoplasmic production of H2 from Fdred by Ech or Coo Hase; (iii) periplasmic oxidation of H2 by Hyd, HynBA, HynBAC3 or Hys Hases; (iv) transport of electrons to the cytoplasm through 6 possible membrane-bound complexes, Hmc, Tmc, Ohc, Rnf, Qmo and Dsr, of which the last two feed electrons into the sulfate-reduction pathway; the other four complexes may transfer electrons to Qmo and Dsr through the quinone pool (not shown) or may function in other cytoplasmic reduction reactions; (v) proton import through ATP synthase with associated energy conservation. Formate cycling involves: (i) generation of cytoplasmic formate by Pfl-catalyzed conversion of pyruvate; (ii) transport of formate to the periplasm by symport with a proton; (iii) periplasmic oxidation of formate by FdhAB, FdhABC3 or Cfd; steps (iv) and (v) are then as for hydrogen cycling (Pereira et al., 2007). Although some sulfate reducers are capable of fermentative and sulfidogenic growth on sugars and amino-acids, in anaerobic reactors and in the presence of sulfate, sulfate reducers are more likely to be involved in the last stages of mineralization than in the initial fermentative stage (Colleran et al., 1995). Based on their metabolic characteristics, two major groups of sulfate reducers are distinguished: those species that completely oxidize their organic substrates completely to CO2 and those that carry incomplete oxidation of their substrates usually to acetate and can not oxidize it further (Widdel, 1988).

16
Cha
pter
1
2.2 Competition between sulfate reducers with methanogens and acetogens
Although thermodynamic and kinetic considerations generally favour sulfate reducing bacteria (SRB) in the competition for the substrates available in anaerobic degradation (Colleran et al., 1995), in practice factors such as substrate composition and concentration, pH, temperature, type of reactor and biomass, sulfate concentration and chemical oxygen demand (COD)/SO4
2- ratio, differential sulfide toxicity, trace metals and other nutrients, etc, may significantly affect the outcome of the competition (Patidar and Tare, 2005). The COD/SO4
2- ratio of the wastewater is a very important parameter because it determines which part of the COD can be degraded via sulfate reduction. In theory, all COD can be degraded via sulfate reduction if the COD/SO4
2- (g g−1) ratio is below 0.67. The following paragraphs present research findings in the competition between sulfate reducers and methanogens for acetate and H2 and between sulfate reducers and acetogenic bacteria for propionate, butyrate and ethanol. Unless mentioned otherwise, the studies refer to near neutral pH values.
2.2.1 Hydrogen
Both thermodynamic and kinetic data predict an advantage of sulfate reduction in relation to methanogenesis from H2 (Robinson and Tiedje, 1984; Visser, 1995). Moreover, it is accepted that SRB maintain the concentration of H2 in the reactor below the threshold level for methanogens (Lovley and Tiedje, 1984). Consequently, if sufficient sulfate is available, hydrogenotrophic SRB should out-compete hydrogenotrophic methanogens. Under conditions of excess sulfate, Visser (1995) clearly showed that hydrogenotrophic methanogens were out-competed by the SRB in UASB reactors, which was observed both for mesophilic (30°C) and thermophilic (55°C) conditions. However, the hydrogenotrophic methanogens were not expelled from the biomass but remained present in relative high numbers. In mesophilic EGSB reactors, O’Reilly and Colleran (2006) observed a dominance of hydrogenotrophic methanogens at COD/SO4
2- ratios of 16 and 4, but SRB were dominant at a COD/SO4
2- of 2. Nevertheless, Maillacheruvu and Parkin (1996) found that methanogens were less inhibited by sulfide than SRB in batch tests with propionate, acetate and hydrogen at a COD/SO4
2- of 3. Thus, sulfide inhibition can favour methanogens over sulfate reducers.
2.2.2 Acetate
Although both thermodynamic and kinetic considerations favour sulfate reduction over methanogenesis, literature data on the outcome of competition for acetate in anaerobic reactors are contradictory. Several studies have found that acetate is completely converted into methane even in the presence of excess sulfate (Isa et al., 1986a; Isa et al., 1986b; Yoda et al., 1987; Parkin et al., 1990; Visser et al., 1993b) while others found that acetotrophic methanogens were out-competed by sulfate reducers (Stucki et al., 1993; Alphenaar, 1994; Uberoi and Bhattacharya, 1995). Several authors tried to explain this discrepancy based on the sulfate concentration and COD/SO4
2- ratio (Choi and Rim, 1991; Omil et al., 1998; Oude Elferink, 1998a; O'Reilly and

General Introduction
17
Cha
pter
1
Colleran, 2006), type of substrate (Maillacheruvu et al., 1993; Uberoi and Bhattacharya, 1995; Oude Elferink, 1998a) and concentration (Yoda et al., 1987), pH (Visser, 1995; De Smul et al., 1997), temperature (Visser, 1995; De Smul et al., 1999), the type of seed sludge (Oude Elferink et al., 1998b) and experimental operation time (Harada et al., 1994; Omil et al., 1998; Oude Elferink, 1998a), differences between immobilization properties (Isa et al., 1986a; Isa et al., 1986b; Visser, 1995; Omil et al., 1996; De Smul et al., 1997) and sensitivity to sulfide (Visser, 1995; Maillacheruvu and Parkin, 1996; De Smul et al., 1997) between acetotrophic sulfate reducers and methanogens.
2.2.3 Propionate
Several studies found that SRB play a significant role in the degradation of propionate (Qatibi et al., 1990; McCartney and Oleszkiewicz, 1991; Wu et al., 1991; Visser et al., 1993b; Harada et al., 1994; Oude Elferink et al., 1998b). Sulfate reducers can participate in the degradation of propionate by oxidizing propionate directly or by using hydrogen in syntrophy with the oxidation of propionate by acetogens. Moreover, sulfate reducers can oxidize propionate completely or incompletely. Incompletely oxidising SRB are thought to outcompete completely oxidising species due to the faster growth rate of the former on propionate (Widdel, 1988). Also O’Flaherty et al. (1999b) showed, in activity tests involving addition of sulfate plus bromoethane sulphonic acid (BES), that the SRB population established degraded propionate by an incomplete oxidation to acetate. Growth rates of propionate-degrading SRB are higher than of syntrophic propionate-degrading bacteria (Visser et al., 1993b; Maillacheruvu and Parkin, 1996). However, if sulfate is limiting, propionate-degrading SRB have to compete with other groups of SRB for the available sulfate (Visser et al., 1993b; Oude Elferink, 1998a). Under sulfate limiting conditions, propionate-degrading SRB are not very effective competitors for hydrogenotrophic SRB (Maillacheruvu and Parkin, 1996), which can enable propionate-degrading acetogens to compete with propionate-degrading SRB. If sulfate is present in excess, sulfate limitation and sulfate competition between different groups of SRB becomes unimportant and therefore propionate-degrading SRB are able to outcome acetogens for propionate (Visser et al., 1993b). Moreover, due to utilization of propionate by SRB, H2 production drops, channeling more sulfate to propionate-degrading SRB (Maillacheruvu and Parkin, 1996; Speece, 1996).
2.2.4 Butyrate
Few studies focus on the competition for butyrate between acetogenic bacteria and SRB in anaerobic reactors. Rinzema and Lettinga (1988) and Mulder (1984) reported that the reduced equivalents produced in the oxidation of butyrate were completely oxidized by SRB, but no distinction was made between direct incomplete oxidation of butyrate by SRB or a syntrophic degradation coupled to hydrogen utilization by SRB. Visser et al. (1993b) found that, in contrast to propionate oxidation, acetogenic bacteria were competitive with SRB for butyrate both at low and high COD/SO4
2- ratios in UASB reactors. However, in continuously stirred tank reactors (CSTR), Mizuno et al. (1994) reported that the degradation pathway of butyrate was dominated by the COD/SO4
2- ratio. At high COD/SO42- ratios, butyrate was degraded to methane via acetate
18
Cha
pter
1
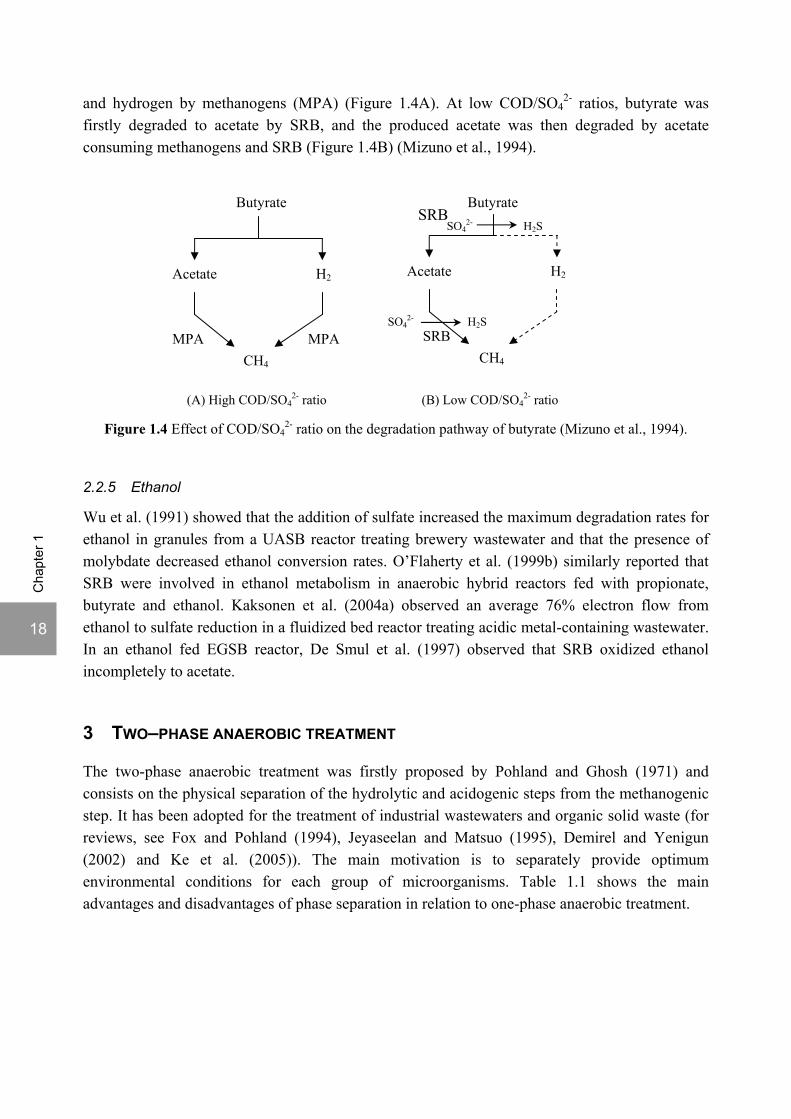
and hydrogen by methanogens (MPA) (Figure 1.4A). At low COD/SO42- ratios, butyrate was
firstly degraded to acetate by SRB, and the produced acetate was then degraded by acetate consuming methanogens and SRB (Figure 1.4B) (Mizuno et al., 1994).
Figure 1.4 Effect of COD/SO4
2- ratio on the degradation pathway of butyrate (Mizuno et al., 1994).
2.2.5 Ethanol
Wu et al. (1991) showed that the addition of sulfate increased the maximum degradation rates for ethanol in granules from a UASB reactor treating brewery wastewater and that the presence of molybdate decreased ethanol conversion rates. O’Flaherty et al. (1999b) similarly reported that SRB were involved in ethanol metabolism in anaerobic hybrid reactors fed with propionate, butyrate and ethanol. Kaksonen et al. (2004a) observed an average 76% electron flow from ethanol to sulfate reduction in a fluidized bed reactor treating acidic metal-containing wastewater. In an ethanol fed EGSB reactor, De Smul et al. (1997) observed that SRB oxidized ethanol incompletely to acetate.
3 TWO–PHASE ANAEROBIC TREATMENT
The two-phase anaerobic treatment was firstly proposed by Pohland and Ghosh (1971) and consists on the physical separation of the hydrolytic and acidogenic steps from the methanogenic step. It has been adopted for the treatment of industrial wastewaters and organic solid waste (for reviews, see Fox and Pohland (1994), Jeyaseelan and Matsuo (1995), Demirel and Yenigun (2002) and Ke et al. (2005)). The main motivation is to separately provide optimum environmental conditions for each group of microorganisms. Table 1.1 shows the main advantages and disadvantages of phase separation in relation to one-phase anaerobic treatment.
Butyrate
Acetate H2
MPA MPA
SRB
CH4
Acetate H2
CH4 SRB
SO42- H2S
SO42- H2S
(A) High COD/SO42- ratio (B) Low COD/SO4
2- ratio
Butyrate
General Introduction
19
Cha
pter
1
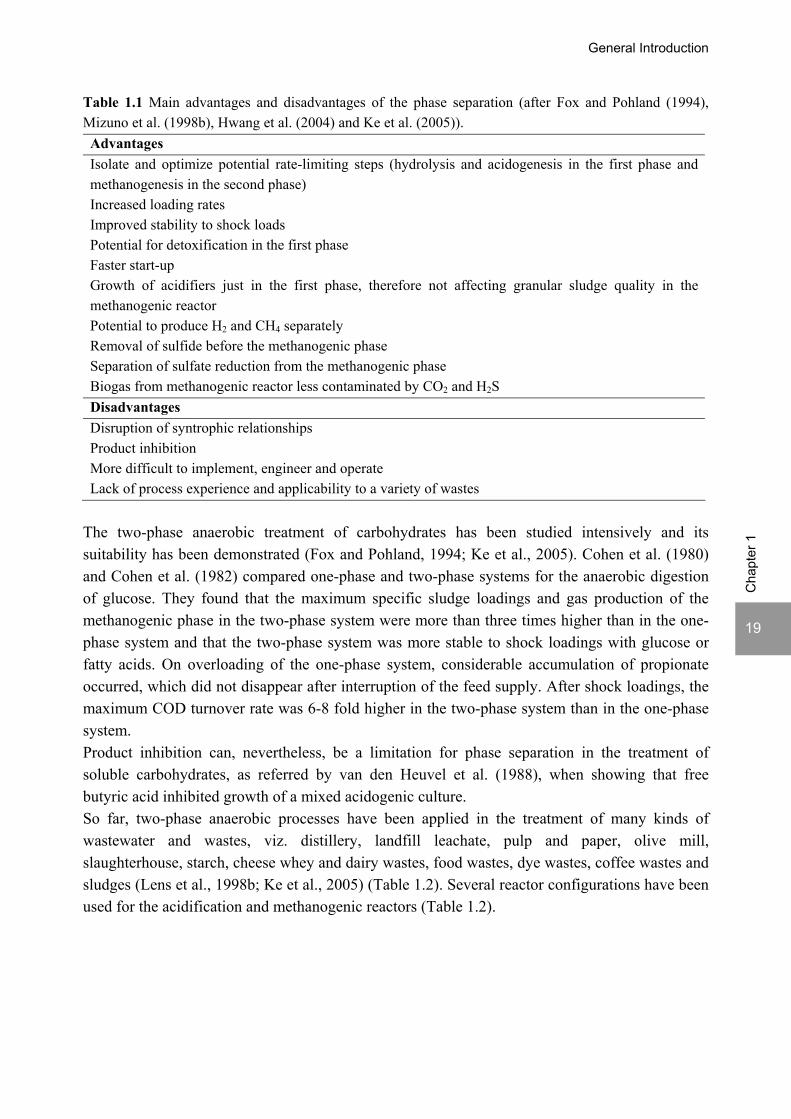
Table 1.1 Main advantages and disadvantages of the phase separation (after Fox and Pohland (1994), Mizuno et al. (1998b), Hwang et al. (2004) and Ke et al. (2005)). Advantages Isolate and optimize potential rate-limiting steps (hydrolysis and acidogenesis in the first phase and methanogenesis in the second phase) Increased loading rates Improved stability to shock loads Potential for detoxification in the first phase Faster start-up Growth of acidifiers just in the first phase, therefore not affecting granular sludge quality in the methanogenic reactor Potential to produce H2 and CH4 separately Removal of sulfide before the methanogenic phase Separation of sulfate reduction from the methanogenic phase Biogas from methanogenic reactor less contaminated by CO2 and H2S Disadvantages Disruption of syntrophic relationships Product inhibition More difficult to implement, engineer and operate Lack of process experience and applicability to a variety of wastes
The two-phase anaerobic treatment of carbohydrates has been studied intensively and its suitability has been demonstrated (Fox and Pohland, 1994; Ke et al., 2005). Cohen et al. (1980) and Cohen et al. (1982) compared one-phase and two-phase systems for the anaerobic digestion of glucose. They found that the maximum specific sludge loadings and gas production of the methanogenic phase in the two-phase system were more than three times higher than in the one-phase system and that the two-phase system was more stable to shock loadings with glucose or fatty acids. On overloading of the one-phase system, considerable accumulation of propionate occurred, which did not disappear after interruption of the feed supply. After shock loadings, the maximum COD turnover rate was 6-8 fold higher in the two-phase system than in the one-phase system. Product inhibition can, nevertheless, be a limitation for phase separation in the treatment of soluble carbohydrates, as referred by van den Heuvel et al. (1988), when showing that free butyric acid inhibited growth of a mixed acidogenic culture. So far, two-phase anaerobic processes have been applied in the treatment of many kinds of wastewater and wastes, viz. distillery, landfill leachate, pulp and paper, olive mill, slaughterhouse, starch, cheese whey and dairy wastes, food wastes, dye wastes, coffee wastes and sludges (Lens et al., 1998b; Ke et al., 2005) (Table 1.2). Several reactor configurations have been used for the acidification and methanogenic reactors (Table 1.2).
20
Cha
pter
1
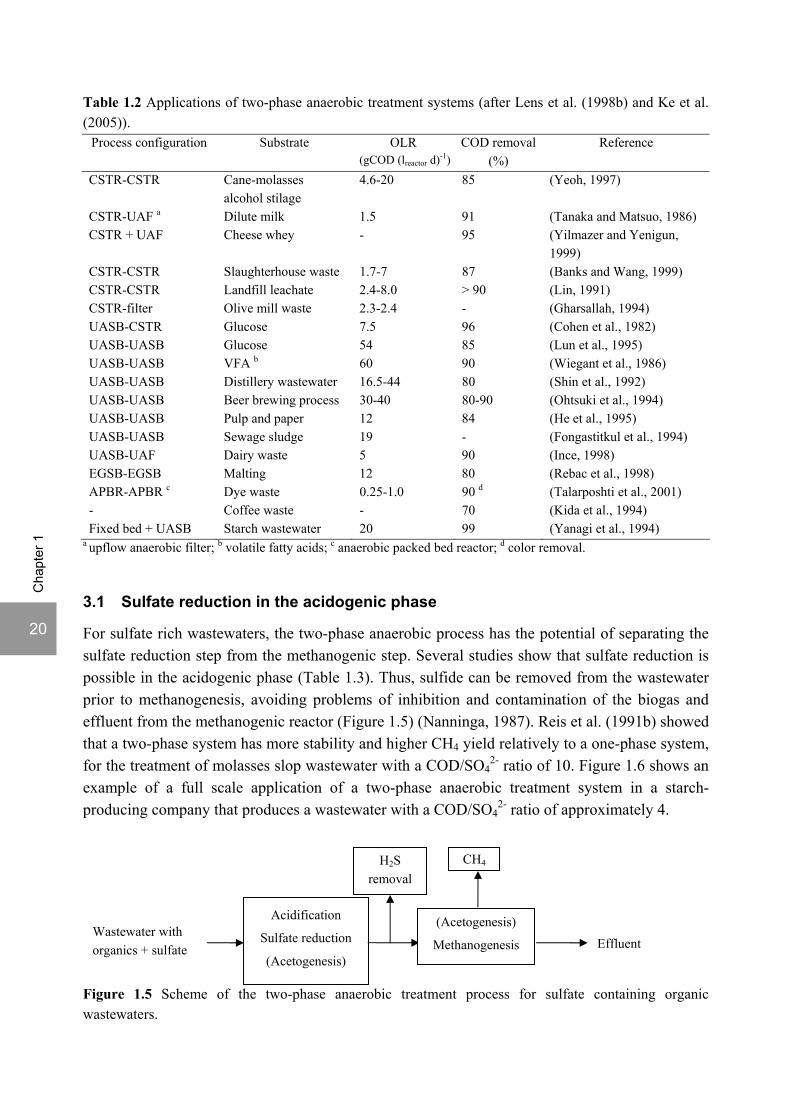
Table 1.2 Applications of two-phase anaerobic treatment systems (after Lens et al. (1998b) and Ke et al. (2005)).
Process configuration Substrate OLR (gCOD (lreactor d)-1)
COD removal (%)
Reference
CSTR-CSTR Cane-molasses alcohol stilage
4.6-20 85 (Yeoh, 1997)
CSTR-UAF a Dilute milk 1.5 91 (Tanaka and Matsuo, 1986) CSTR + UAF Cheese whey - 95 (Yilmazer and Yenigun,
1999) CSTR-CSTR Slaughterhouse waste 1.7-7 87 (Banks and Wang, 1999) CSTR-CSTR Landfill leachate 2.4-8.0 > 90 (Lin, 1991) CSTR-filter Olive mill waste 2.3-2.4 - (Gharsallah, 1994) UASB-CSTR Glucose 7.5 96 (Cohen et al., 1982) UASB-UASB Glucose 54 85 (Lun et al., 1995) UASB-UASB VFA b 60 90 (Wiegant et al., 1986) UASB-UASB Distillery wastewater 16.5-44 80 (Shin et al., 1992) UASB-UASB Beer brewing process 30-40 80-90 (Ohtsuki et al., 1994) UASB-UASB Pulp and paper 12 84 (He et al., 1995) UASB-UASB Sewage sludge 19 - (Fongastitkul et al., 1994) UASB-UAF Dairy waste 5 90 (Ince, 1998) EGSB-EGSB Malting 12 80 (Rebac et al., 1998) APBR-APBR c Dye waste 0.25-1.0 90 d (Talarposhti et al., 2001) - Coffee waste - 70 (Kida et al., 1994) Fixed bed + UASB Starch wastewater 20 99 (Yanagi et al., 1994)
a upflow anaerobic filter; b volatile fatty acids; c anaerobic packed bed reactor; d color removal.
3.1 Sulfate reduction in the acidogenic phase
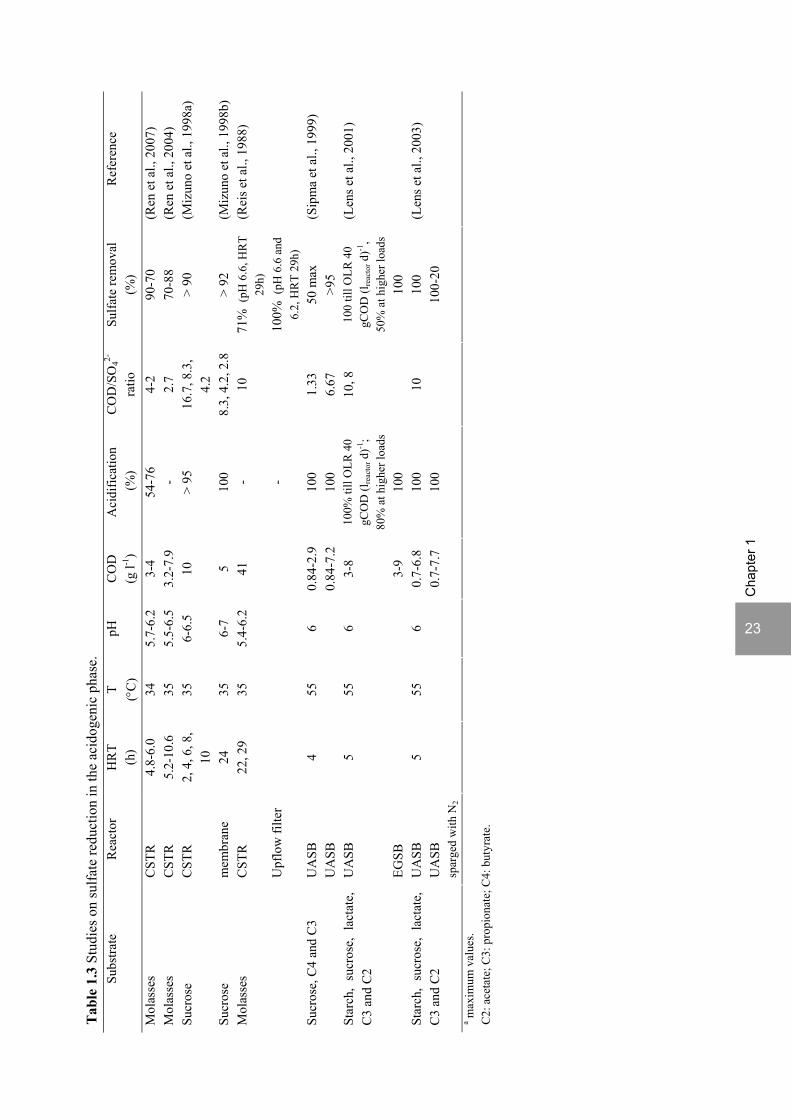
For sulfate rich wastewaters, the two-phase anaerobic process has the potential of separating the sulfate reduction step from the methanogenic step. Several studies show that sulfate reduction is possible in the acidogenic phase (Table 1.3). Thus, sulfide can be removed from the wastewater prior to methanogenesis, avoiding problems of inhibition and contamination of the biogas and effluent from the methanogenic reactor (Figure 1.5) (Nanninga, 1987). Reis et al. (1991b) showed that a two-phase system has more stability and higher CH4 yield relatively to a one-phase system, for the treatment of molasses slop wastewater with a COD/SO4
2- ratio of 10. Figure 1.6 shows an example of a full scale application of a two-phase anaerobic treatment system in a starch-producing company that produces a wastewater with a COD/SO4
2- ratio of approximately 4.
Figure 1.5 Scheme of the two-phase anaerobic treatment process for sulfate containing organic wastewaters.
Acidification
Sulfate reduction
(Acetogenesis)
(Acetogenesis)
Methanogenesis Effluent Wastewater with organics + sulfate
H2S removal
CH4
General Introduction
21
Cha
pter
1
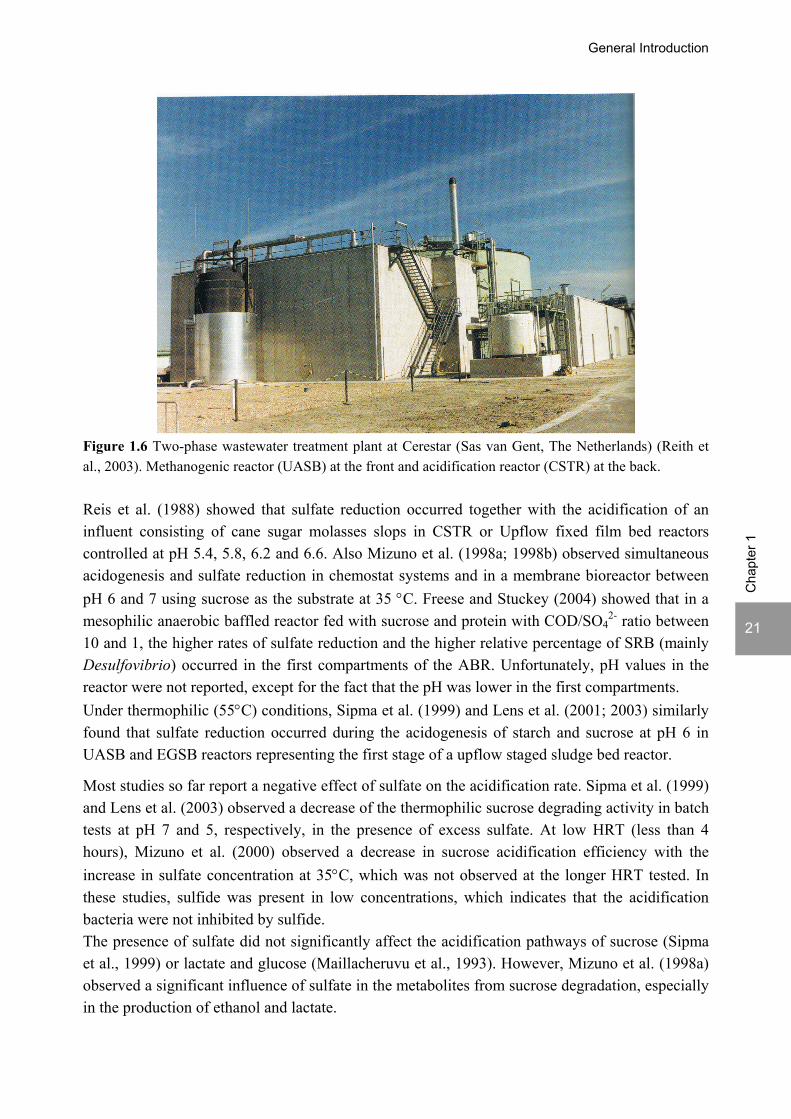
Figure 1.6 Two-phase wastewater treatment plant at Cerestar (Sas van Gent, The Netherlands) (Reith et al., 2003). Methanogenic reactor (UASB) at the front and acidification reactor (CSTR) at the back. Reis et al. (1988) showed that sulfate reduction occurred together with the acidification of an influent consisting of cane sugar molasses slops in CSTR or Upflow fixed film bed reactors controlled at pH 5.4, 5.8, 6.2 and 6.6. Also Mizuno et al. (1998a; 1998b) observed simultaneous acidogenesis and sulfate reduction in chemostat systems and in a membrane bioreactor between pH 6 and 7 using sucrose as the substrate at 35 °C. Freese and Stuckey (2004) showed that in a mesophilic anaerobic baffled reactor fed with sucrose and protein with COD/SO4
2- ratio between 10 and 1, the higher rates of sulfate reduction and the higher relative percentage of SRB (mainly Desulfovibrio) occurred in the first compartments of the ABR. Unfortunately, pH values in the reactor were not reported, except for the fact that the pH was lower in the first compartments. Under thermophilic (55°C) conditions, Sipma et al. (1999) and Lens et al. (2001; 2003) similarly found that sulfate reduction occurred during the acidogenesis of starch and sucrose at pH 6 in UASB and EGSB reactors representing the first stage of a upflow staged sludge bed reactor.
Most studies so far report a negative effect of sulfate on the acidification rate. Sipma et al. (1999) and Lens et al. (2003) observed a decrease of the thermophilic sucrose degrading activity in batch tests at pH 7 and 5, respectively, in the presence of excess sulfate. At low HRT (less than 4 hours), Mizuno et al. (2000) observed a decrease in sucrose acidification efficiency with the increase in sulfate concentration at 35°C, which was not observed at the longer HRT tested. In these studies, sulfide was present in low concentrations, which indicates that the acidification bacteria were not inhibited by sulfide. The presence of sulfate did not significantly affect the acidification pathways of sucrose (Sipma et al., 1999) or lactate and glucose (Maillacheruvu et al., 1993). However, Mizuno et al. (1998a) observed a significant influence of sulfate in the metabolites from sucrose degradation, especially in the production of ethanol and lactate.
22
Cha
pter
1
In the acidification phase, sulfate reducers mostly use hydrogen and VFA as substrates (Mizuno et al., 1998a; Mizuno et al., 1998b; Ren et al., 2007). By maintaining low levels of hydrogen partial pressure in the acidification reactor, SRB contribute to the stability of the system (Ren et al., 2007). Mendez et al. (1989) observed a 5 fold increase in propionate concentrations in sucrose acidification at a COD/SO4
2- of 100 compared to 5, which was attributed to H2 scavenging by the SRB at the lower COD/SO4
2- ratio. The presence of sulfate reduction was associated to increased production of acetic acid in the acidogenic reactor in several studies. Mizuno et al. (1998b) observed the decrease in n-butyrate and 3-pentanol and concomitant increase of acetate and 2-propanol with the increase in sulfate concentrations. Ren et al. (2007) reported that the metabolic activities of SRB resulted in 45-82% acetic acid in the terminal liquid products in the acidogenic reactor. Similarly, Reis et al. (1991b) showed a linear relationship between sulfate reduction and acetate production and that the decrease in SRB activity shifted the fermentation towards butyric acid production. Therefore, it is advantageous to operate the acidogenic phase in the presence of high SRB activities, as acetic acid is the main precursor for methanogenic bacteria (Reis et al., 1991b).
23
Cha
pter
1
Tab
le 1
.3 S
tudi
es o
n su
lfate
redu
ctio
n in
the
acid
ogen
ic p
hase
. Su
bstra
te
Rea
ctor
H
RT
(h
) T (°C
) pH
C
OD
(g
l-1)
Aci
dific
atio
n (%
) C
OD
/SO
42-
ratio
Su
lfate
rem
oval
(%
) R
efer
ence
Mol
asse
s C
STR
4.
8-6.
0 34
5.
7-6.
2 3-
4 54
-76
4-2
90-7
0 (R
en e
t al.,
200
7)
Mol
asse
s C
STR
5.
2-10
.6
35
5.5-
6.5
3.2-
7.9
- 2.
7 70
-88
(Ren
et a
l., 2
004)
Su
cros
e C
STR
2,
4, 6
, 8,
10
35
6-6.
5 10
>
95
16.7
, 8.3
, 4.
2 >
90
(Miz
uno
et a
l., 1
998a
)
Sucr
ose
mem
bran
e 24
35
6-
7 5
100
8.3,
4.2
, 2.8
>
92
(Miz
uno
et a
l., 1
998b
) C
STR
-
71%
(pH
6.6
, HR
T 29
h)
Mol
asse
s
Upf
low
filte
r
22, 2
9 35
5.
4-6.
2 41
-
10
100%
(pH
6.6
and
6.
2, H
RT
29h)
(Rei
s et a
l., 1
988)
UA
SB
0.84
-2.9
10
0 1.
33
50 m
ax
Sucr
ose,
C4
and
C3
UA
SB
4 55
6
0.84
-7.2
10
0 6.
67
>95
(Sip
ma
et a
l., 1
999)
UA
SB
3-8
100%
till
OLR
40
gCO
D (l
reac
tor d
)-1;
80%
at h
ighe
r loa
ds
100
till O
LR 4
0 gC
OD
(lre
acto
r d)-1
, 50
% a
t hig
her l
oads
Star
ch,
sucr
ose,
lac
tate
, C
3 an
d C
2
EGSB
5 55
6
3-9
100
10, 8
100
(Len
s et a
l., 2
001)
UA
SB
0.7-
6.8
100
100
Star
ch,
sucr
ose,
lac
tate
, C
3 an
d C
2 U
ASB
sp
arge
d w
ith N
2
5 55
6
0.7-
7.7
100
10
100-
20
(Len
s et a
l., 2
003)
a max
imum
val
ues.
C2:
ace
tate
; C3:
pro
pion
ate;
C4:
but
yrat
e.
24
Cha
pter
1
4 EFFECT OF LOW pH ON ANAEROBIC MICROBIAL CONVERSIONS
Microbial conversions are strongly affected by the pH. Different microorganisms have different pH-optima and pH ranges for growth. High concentrations of free intracellular protons can impair the functions of proteins and nucleic acids and therefore affect processes such as DNA transcription, protein synthesis and enzyme activity. The effect of pH may also be indirect by affecting the speciation of weak acids like sulfide, VFA or ammonia in dissociated or undissociated forms, which will determine their toxicity. Moreover, the pH determines the bioavailability of nutrients (e.g. trace metals), substrate ingredients (e.g. proteins) or the speciation of CO2. The following paragraphs will describe the effect of (low) pH values on sulfate reducers, acidogens and methanogens.
4.1 Sulfate reduction
Most known SRB have a pH optimum of around 7 and are inhibited at pH values below 6 or higher than 9 (Widdel, 1988). However, sulfate reduction has been found in natural or engineered ecosystems at lower pH values. Sulfate reduction has been proven to occur at pH ≤ 3 in the acidic sediments of an Argentinean lake influenced by volcanism (Koschorreck et al., 2003). Tuttle et al. (1969) observed sulfate reduction in incubations of water from acid mine drainage accumulated in a dam composed of wood dust at initial pH 3 with saw dust cellulose as the substrate. Gyure et al. (1990) reported sulfate reduction in incubations with sediments from an acid mine lake in Indiana at pH as low as 3.8 using several substrates. Other studies reported sulfate reduction in continuous packed bed column experiments at pH as low as 3 with enrichments of sulfate reducers from mine sites (Elliott et al., 1998; Kolmert and Johnson, 2001; Jong and Parry, 2006) or from horse manure (Tsukamoto et al., 2004). However, the effluent pH of these reactors was always higher, in general higher than 5.5 and it was not clear at what pH sulfate reduction occurred in the reactors.
The isolation of acid-tolerant or acidophilic SRB has not been very successful so far. Pure cultures isolated from mixed cultures capable of reducing sulfate at pH 3 were not capable of reducing sulfate below pH 5.5 (Tuttle et al., 1969). Also Gyure et al. (1990) reported that primary enrichments could be maintained and transferred at pH 3.8 but pure cultures growing at pH 3-5 were not obtained. It was therefore suggested that the SRB present in the acid environments occurred in microenvironments of a higher pH in the sediment or around wood or other suspended particles (Tuttle et al., 1969; Gyure et al., 1990). Koschorreck et al. (2003) attributed the lack of success in the isolation of acidophilic SRB from most acidic mining lakes to the lack of organic substrates and to competition with iron-reducing bacteria for electron donors, which leaves acidophilic SRB in competitive disadvantage in those habitats. Indeed, Kusel et al. (2001) reported the presence of SRB in lower deep slightly acidic sediment zones of coal-mining impacted sediments, whereas the reduction of Fe(III) occurred in the upper acidic sediment zone. From the sediment zone with maximum sulfate reduction activity, with an in situ pH of 5.2, the
General Introduction
25
Cha
pter
1
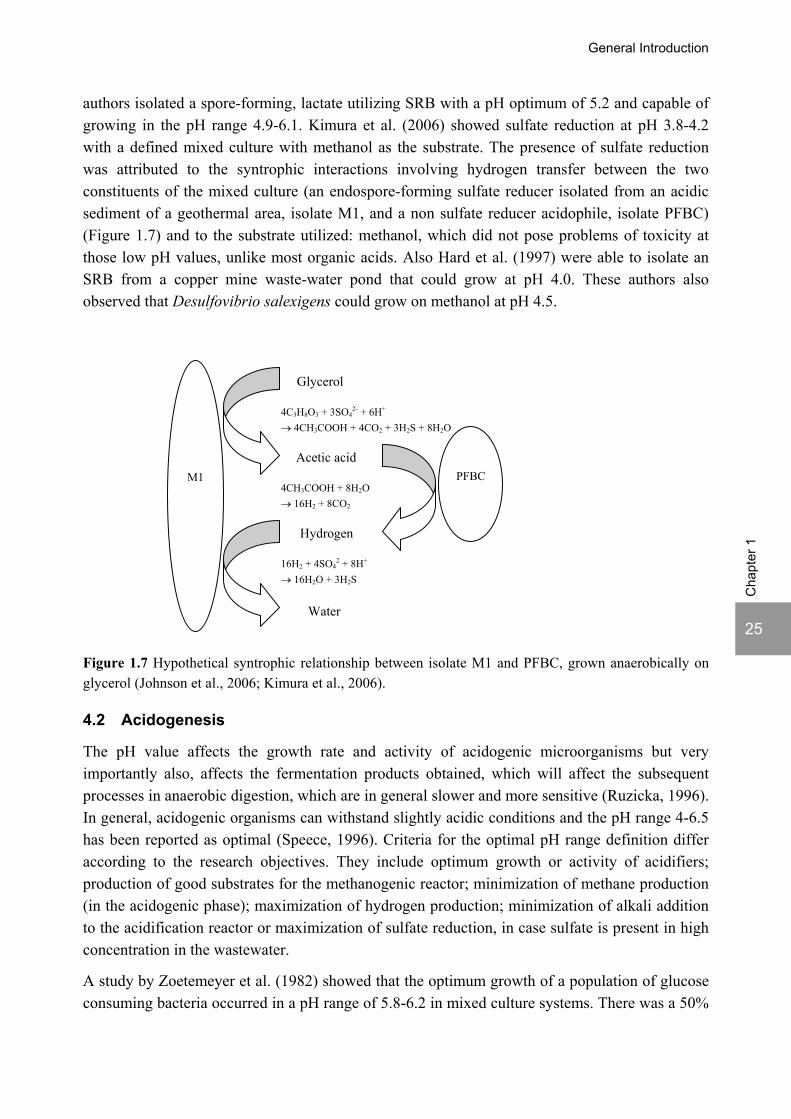
authors isolated a spore-forming, lactate utilizing SRB with a pH optimum of 5.2 and capable of growing in the pH range 4.9-6.1. Kimura et al. (2006) showed sulfate reduction at pH 3.8-4.2 with a defined mixed culture with methanol as the substrate. The presence of sulfate reduction was attributed to the syntrophic interactions involving hydrogen transfer between the two constituents of the mixed culture (an endospore-forming sulfate reducer isolated from an acidic sediment of a geothermal area, isolate M1, and a non sulfate reducer acidophile, isolate PFBC) (Figure 1.7) and to the substrate utilized: methanol, which did not pose problems of toxicity at those low pH values, unlike most organic acids. Also Hard et al. (1997) were able to isolate an SRB from a copper mine waste-water pond that could grow at pH 4.0. These authors also observed that Desulfovibrio salexigens could grow on methanol at pH 4.5.
Figure 1.7 Hypothetical syntrophic relationship between isolate M1 and PFBC, grown anaerobically on glycerol (Johnson et al., 2006; Kimura et al., 2006).
4.2 Acidogenesis
The pH value affects the growth rate and activity of acidogenic microorganisms but very importantly also, affects the fermentation products obtained, which will affect the subsequent processes in anaerobic digestion, which are in general slower and more sensitive (Ruzicka, 1996). In general, acidogenic organisms can withstand slightly acidic conditions and the pH range 4-6.5 has been reported as optimal (Speece, 1996). Criteria for the optimal pH range definition differ according to the research objectives. They include optimum growth or activity of acidifiers; production of good substrates for the methanogenic reactor; minimization of methane production (in the acidogenic phase); maximization of hydrogen production; minimization of alkali addition to the acidification reactor or maximization of sulfate reduction, in case sulfate is present in high concentration in the wastewater.
A study by Zoetemeyer et al. (1982) showed that the optimum growth of a population of glucose consuming bacteria occurred in a pH range of 5.8-6.2 in mixed culture systems. There was a 50%
PFBC
4C3H8O3 + 3SO42- + 6H+
→ 4CH3COOH + 4CO2 + 3H2S + 8H2O
Glycerol
4CH3COOH + 8H2O → 16H2 + 8CO2
16H2 + 4SO42 + 8H+
→ 16H2O + 3H2S
Acetic acid
Hydrogen
Water
M1

26
Cha
pter
1
decrease in the growth rate at pH 5, while for pH levels higher than 6.0, there was a gradual decrease in biological activity down to 25% at a pH of 8. A similar optimum pH range was found for an acidogenic population degrading a complex waste based on beef extract (Dinopoulou et al., 1988a). The optimum pH was 7 but significant acidification of the wastewater occurred within the tested range (pH 5.0 to 8.0).
4.2.1 Acidogenesis in two-phase anaerobic treatment
In a two-phase anaerobic treatment system, the fermentation products from the acidogenic reactor will determine the metabolic rates and operational stability to be expected in the methanogenic reactor. Acetic acid, butyric acid, lactate and ethanol are considered to be the best substrates for the methanogenic reactor (Ren et al., 1997; Yang et al., 2003), contrary to propionate (Reis et al., 1991b; Inanc et al., 1999). Kisaalita et al. (1987) suggested the pH range of 6.0 to 6.5 as optimum, in order to obtain butyrate and acetate in the acidification of lactose. However, the same authors stated that to maintain such a pH range, a high concentration of NaOH should be added. Romli et al. (1994) observed that lowering the pH from 6.0 to 5.3 in the acidification of molasses in a CSTR led to a reduction in the external alkali addition by 30% without any significant deterioration in the final effluent quality. For sulfate rich wastewaters, Reis et al. (1991b) suggested the operation of the acidogenic phase at pH 6.2 in order to achieve high sulfate removal efficiencies and acetic acid concentrations and to minimize methane production in the acidogenic phase.
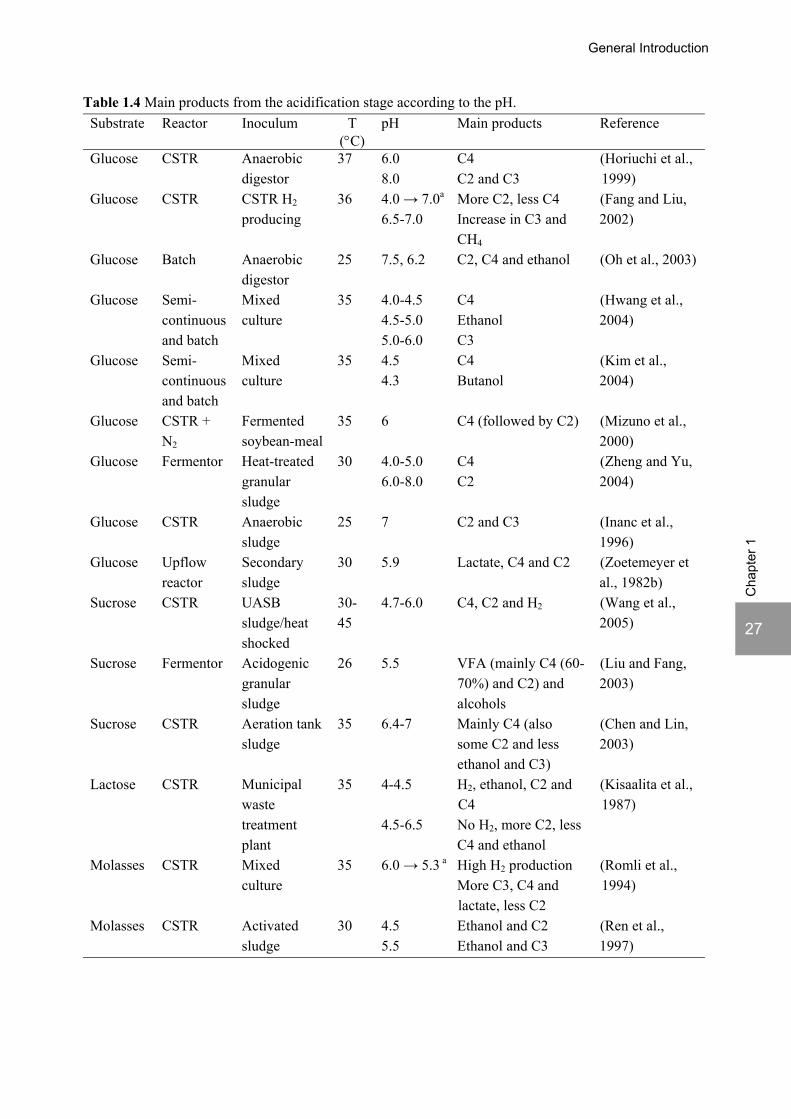
The strong effect of the pH on the acidification products was reported by several authors. Table 1.4 shows the main products obtained according to the pH. It should be noted the studies reviewed in this section use mixed cultures as inoculum, so besides acidogenesis, subsequent processes in the anaerobic digestion chain also take place, according to the inoculum and operational conditions. Therefore, also acetogenesis/homoacetogenesis, methanogenesis or sulfate reduction can occur in these ‘acidification’ reactors.
General Introduction
27
Cha
pter
1
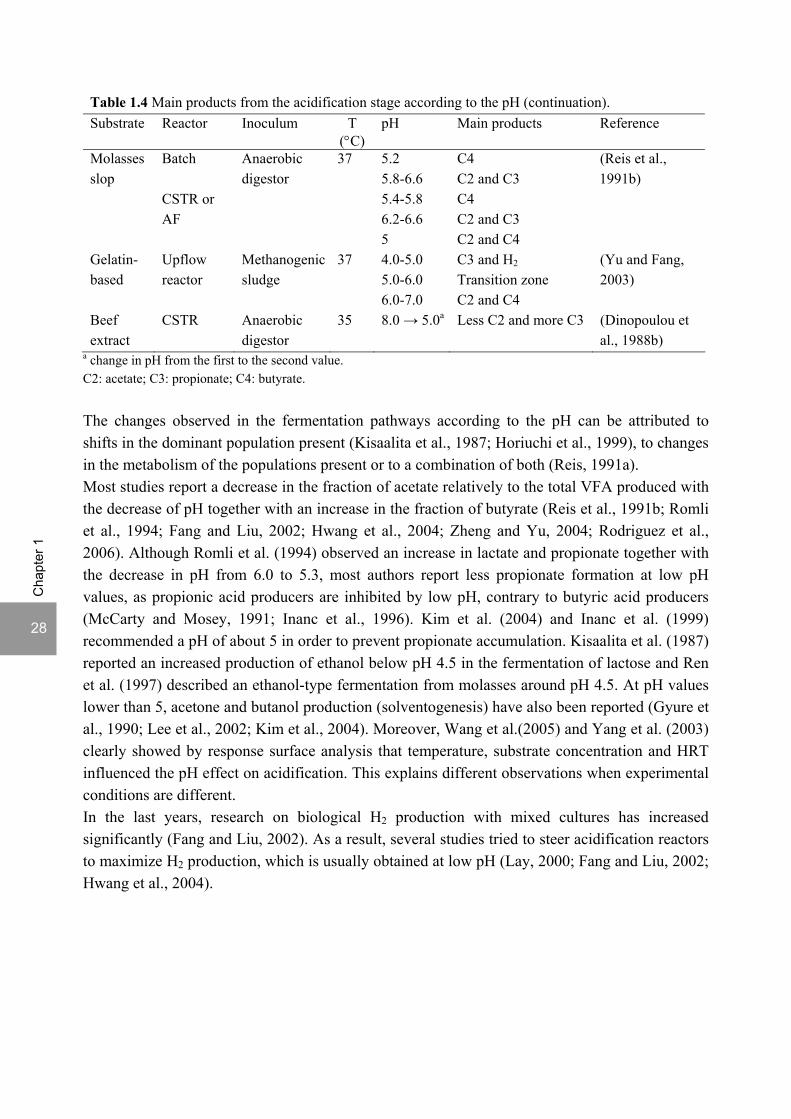
Table 1.4 Main products from the acidification stage according to the pH. Substrate Reactor Inoculum T
(°C) pH Main products Reference
6.0 C4 Glucose CSTR Anaerobic digestor
37 8.0 C2 and C3
(Horiuchi et al., 1999)
4.0 → 7.0a More C2, less C4 Glucose CSTR CSTR H2 producing
36 6.5-7.0 Increase in C3 and
CH4
(Fang and Liu, 2002)
Glucose Batch Anaerobic digestor
25 7.5, 6.2 C2, C4 and ethanol (Oh et al., 2003)
4.0-4.5 C4 4.5-5.0 Ethanol
Glucose Semi-continuous and batch
Mixed culture
35
5.0-6.0 C3
(Hwang et al., 2004)
4.5 C4 Glucose Semi-continuous and batch
Mixed culture
35 4.3 Butanol
(Kim et al., 2004)
Glucose CSTR + N2
Fermented soybean-meal
35 6 C4 (followed by C2) (Mizuno et al., 2000)
4.0-5.0 C4 Glucose Fermentor Heat-treated granular sludge
30 6.0-8.0 C2
(Zheng and Yu, 2004)
Glucose CSTR Anaerobic sludge
25 7 C2 and C3 (Inanc et al., 1996)
Glucose Upflow reactor
Secondary sludge
30 5.9 Lactate, C4 and C2 (Zoetemeyer et al., 1982b)
Sucrose CSTR UASB sludge/heat shocked
30-45
4.7-6.0 C4, C2 and H2 (Wang et al., 2005)
Sucrose Fermentor Acidogenic granular sludge
26 5.5 VFA (mainly C4 (60-70%) and C2) and alcohols
(Liu and Fang, 2003)
Sucrose CSTR Aeration tank sludge
35 6.4-7 Mainly C4 (also some C2 and less ethanol and C3)
(Chen and Lin, 2003)
Lactose CSTR 35 4-4.5 H2, ethanol, C2 and C4
(Kisaalita et al., 1987)
Municipal waste treatment plant
4.5-6.5 No H2, more C2, less C4 and ethanol
Molasses CSTR Mixed culture
35 6.0 → 5.3 a High H2 production More C3, C4 and lactate, less C2
(Romli et al., 1994)
4.5 Ethanol and C2 Molasses CSTR Activated sludge
30 5.5 Ethanol and C3
(Ren et al., 1997)
28
Cha
pter
1
Table 1.4 Main products from the acidification stage according to the pH (continuation). Substrate Reactor Inoculum T
(°C) pH Main products Reference
5.2 C4 Batch 5.8-6.6 C2 and C3 5.4-5.8 C4 6.2-6.6 C2 and C3
Molasses slop
CSTR or AF
Anaerobic digestor
37
5 C2 and C4
(Reis et al., 1991b)
4.0-5.0 C3 and H2 5.0-6.0 Transition zone
Gelatin-based
Upflow reactor
Methanogenic sludge
37
6.0-7.0 C2 and C4
(Yu and Fang, 2003)
Beef extract
CSTR Anaerobic digestor
35 8.0 → 5.0a Less C2 and more C3 (Dinopoulou et al., 1988b)
a change in pH from the first to the second value. C2: acetate; C3: propionate; C4: butyrate. The changes observed in the fermentation pathways according to the pH can be attributed to shifts in the dominant population present (Kisaalita et al., 1987; Horiuchi et al., 1999), to changes in the metabolism of the populations present or to a combination of both (Reis, 1991a). Most studies report a decrease in the fraction of acetate relatively to the total VFA produced with the decrease of pH together with an increase in the fraction of butyrate (Reis et al., 1991b; Romli et al., 1994; Fang and Liu, 2002; Hwang et al., 2004; Zheng and Yu, 2004; Rodriguez et al., 2006). Although Romli et al. (1994) observed an increase in lactate and propionate together with the decrease in pH from 6.0 to 5.3, most authors report less propionate formation at low pH values, as propionic acid producers are inhibited by low pH, contrary to butyric acid producers (McCarty and Mosey, 1991; Inanc et al., 1996). Kim et al. (2004) and Inanc et al. (1999) recommended a pH of about 5 in order to prevent propionate accumulation. Kisaalita et al. (1987) reported an increased production of ethanol below pH 4.5 in the fermentation of lactose and Ren et al. (1997) described an ethanol-type fermentation from molasses around pH 4.5. At pH values lower than 5, acetone and butanol production (solventogenesis) have also been reported (Gyure et al., 1990; Lee et al., 2002; Kim et al., 2004). Moreover, Wang et al.(2005) and Yang et al. (2003) clearly showed by response surface analysis that temperature, substrate concentration and HRT influenced the pH effect on acidification. This explains different observations when experimental conditions are different. In the last years, research on biological H2 production with mixed cultures has increased significantly (Fang and Liu, 2002). As a result, several studies tried to steer acidification reactors to maximize H2 production, which is usually obtained at low pH (Lay, 2000; Fang and Liu, 2002; Hwang et al., 2004).

General Introduction
29
Cha
pter
1
4.3 Methanogenesis
The pH range of approximately 6.5-8.2 is generally required for methanogenesis (Speece, 1996). The inhibition of methanogenesis has been reported under weak acidic conditions (Hwang et al., 2004). Under mesophilic conditions, although Fang and Liu (2002) observed a biogas free of methane at pH 5.5 or lower by a mixed culture fed glucose, Kim et al. (2004) reported that when the HRT of the reactor was long enough for the growth of methanogens, hydrogenotrophic methanogenesis was not completely inhibited at pH 4.5. Hwang et al. (2004) similarly concluded that the pH range 4.5-6 did not completely inhibit hydrogenotrophic methanogens. However, acetotrophic methanogenesis was inhibited at pH 4.5 (Kim et al., 2004). Similar observations were made by Paulo et al. (2003) at pH 4 and thermophilic (55°C) conditions. The authors operated a methanol fed UASB reactor at pH 4 for 160 days without detecting methane formation. However, at the end of reactor run, the sludge still showed significant hydrogenotrophic methanogenesis at neutral pH. On the contrary, the sludge did not show any acetotrophic methanogenesis, which confirmed that the hydrogen utilizing methanogens are more tolerant to the acidic conditions than acetate utilizing methanogens.
4.4 Mechanisms for pH homeostasis
Although neutrophiles and acidophilies have different pH optima, both require a circum-neutral intracellular pH (Baker-Austin and Dopson, 2007). Figure 1.8 illustrates the mechanisms used by acidophiles to maintain a pH gradient across the molecular membrane: (i) pumping out excess protons by potassium transport (a predominance of potassium-transporting ATPases is found in acidophile genomes). (ii) the presence of highly impermeable cell membranes to retard the influx of protons into the cell. (iii) active proton export by transporters. (iv) the sequencing of several acidophile genome sequences has indicated that there is a higher proportion of secondary transporters than in neutrophiles. Overall, they reduce the energy demands associated with pumping necessary solutes and nutrients into the cell. (v) the presence and availability of enzymes and/or chemicals capable of binding and sequestering protons. (vi) comparative genome analysis suggests that a larger proportion of DNA and protein repair systems might be present in acidophiles compared with neutrophiles. (vii) organic acids that function as uncouplers in acidophiles might be degraded by heterotrophic acidophiles.

30
Cha
pter
1
Figure 1.8 Processes associated with pH homeostasis in acidophiles (Baker-Austin and Dopson, 2007). See text for explanation.
5 TOXICITY
5.1 Sulfide
Sulfate reduction results in the production of sulfide, which is inhibitory at high concentrations to the different trophic groups involved in anaerobic digestion. Nevertheless, the presence of small amounts of sulfide is advantageous as it can maintain a low oxidation-reduction potential in the reactors, constitutes an important sulfur source for methanogens, the majority of which does not contain assimilatory sulfate reductases (Daniels et al., 1986) and decreases the bioavailability of some toxic metals by the production of insoluble metal sulfides (Mizuno et al., 1994). The inhibitory effect of sulfide has been associated to the formation of insoluble metal sulfides with essential trace metals for microorganisms (Bharathi et al., 1990) or to intrinsic toxicity to living systems (Postgate, 1979). Sulfide can cause denaturation of proteins due to the formation of cross-links between polypeptide chains and interfere with key metabolic enzymes in the cells (Postgate, 1979; Madigan et al., 2000). Sulfide can also interfere with the assimilation of sulfur and affect the intracellular pH (Visser, 1995). Thus, more energy is needed for cell maintenance, which uncouples growth from energy production (Okabe et al., 1995). The toxic form of sulfide and its relative toxicity to the different trophic groups will be discussed in the following paragraphs.
5.1.1 Toxic form of sulfide
The toxicity of sulfide is often associated with its undissociated form (H2S) due to the facilitated passage of neutral molecules across cell membranes and to its high reactivity with cellular components (Postgate, 1979; O'Flaherty et al., 1998). H2S concentrations are related to the pH and to its solubility in water:

General Introduction
31
Cha
pter
1
H2S (l) ↔ H+ + HS- H2S (l) ↔ H2S (g) The pKa of sulfide is 6.68 at 55°C and 6.99 at 25°C (Amend and Shock, 2001), which means that small pH variations around those values will significantly affect the H2S concentration, with higher concentrations at lower pH values. At 55°C and pH 7, 30% of the sulfide is in the undissociated form. At pH 6, the percentage increases to 80% and at pH 5 and 4, nearly all the sulfide is in the undissociated form. H2S has a relatively low solubility in water, which means that stripping by the biogas produced or other gases can significantly decrease the H2S concentration in the liquid phase. Reis et al. (1991c; 1992) indeed showed that the inhibitory form of sulfide to a sulfate reducing culture of the genus Desulfovibrio at pH 6.2 and 6.6 was the undissociated form of sulfide, by correcting bacterial growth rates for the pH effect and for the effect of acetic acid concentration. However, many studies conclude about the relative toxicity of total dissolved sulfide (TS) and undissociated sulfide based on comparisons between microbial growth or activity at different pH values, without correcting for the effect of the pH alone (Oleszkiewicz et al., 1989; De Smul et al., 1997). Nevertheless, several studies conclude that H2S is not always the most toxic form of sulfide, which seems to depend on the pH range (Koster et al., 1986; Visser, 1995; O'Flaherty et al., 1998), type of microorganism (Hilton and Oleszkiewicz, 1988; Okabe et al., 1992) and if growing in suspended or attached form (Visser, 1995).
5.1.2 Fermentatives
Fermentative bacteria are not very sensitive to sulfide toxicity. Studies by Maillacheruvu et al. (1993) showed that fermentatives are less susceptible to sulfide toxicity than methanogens or SRB. Shin et al. (1992) reported that glucose utilization was only retarded when the total dissolved sulfide concentration was higher than 800 mg l-1. Mizuno et al. (1998a; 1998b) observed no inhibition of sucrose utilization at a H2S concentration of 105 mg l-1. Under thermophilic conditions, Sipma et al. (1999) and Lens et al. (2001) found that sucrose degradation was not affected by H2S concentrations up to 300 mg l−1.
5.1.3 SRB
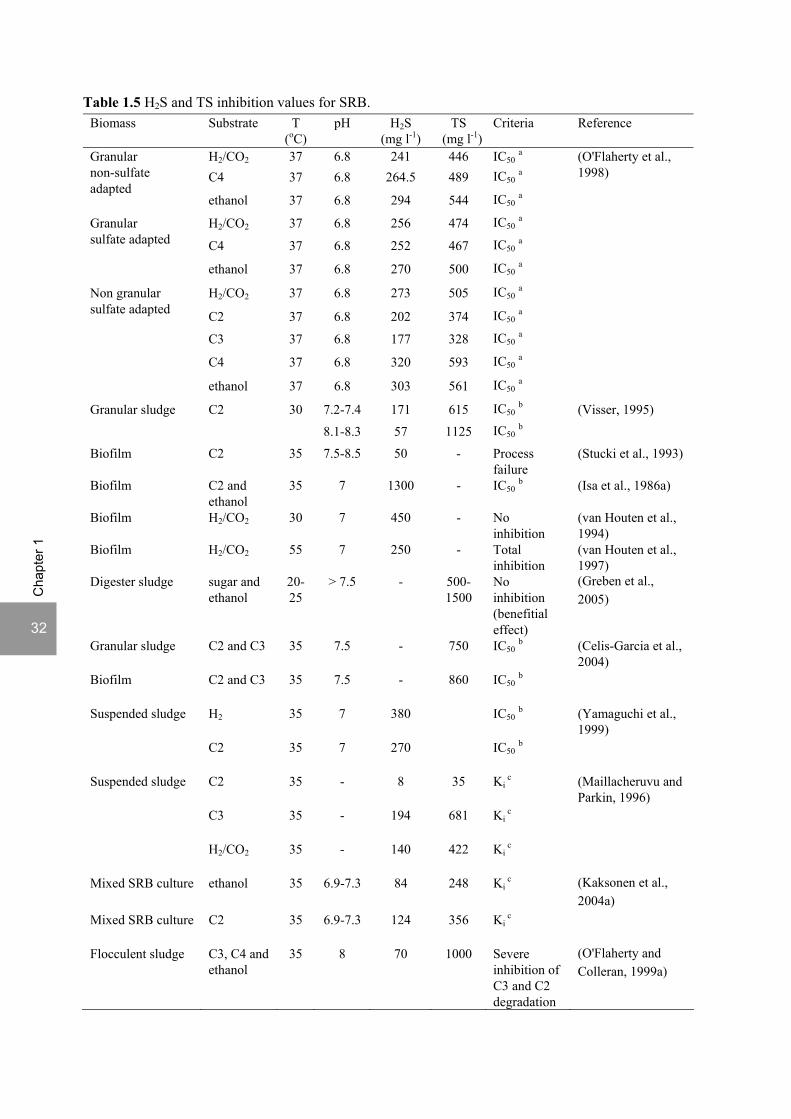
Literature data on the sensitivity of SRB to sulfide toxicity are contradictory. Isa et al. (1986a) reported that SRB growing on acetate and ethanol were not affected by high levels of sulfide (IC50 approx. 1300 mg l-1 H2S) and Greben et al. (2005) even observed increased sulfate removal rates on ethanol and sugar with increased total sulfide concentrations up to 1424 mg l-1. Most reports, however, state a negative effect of elevated sulfide concentrations on sulfate reduction but the concentration level at which inhibition occurs differs largely between studies (Table 1.5).
32
Cha
pter
1
Table 1.5 H2S and TS inhibition values for SRB. Biomass Substrate T
(oC) pH H2S
(mg l-1) TS
(mg l-1)Criteria Reference
H2/CO2 37 6.8 241 446 IC50 a C4 37 6.8 264.5 489 IC50 a
Granular non-sulfate adapted
ethanol 37 6.8 294 544 IC50 a H2/CO2 37 6.8 256 474 IC50 a C4 37 6.8 252 467 IC50 a
Granular sulfate adapted
ethanol 37 6.8 270 500 IC50 a
H2/CO2 37 6.8 273 505 IC50 a
C2 37 6.8 202 374 IC50 a C3 37 6.8 177 328 IC50 a C4 37 6.8 320 593 IC50 a
Non granular sulfate adapted
ethanol 37 6.8 303 561 IC50 a
(O'Flaherty et al., 1998)
7.2-7.4 171 615 IC50 b Granular sludge C2 30
8.1-8.3 57 1125 IC50 b (Visser, 1995)
Biofilm C2 35 7.5-8.5 50 - Process failure
(Stucki et al., 1993)
Biofilm C2 and ethanol
35 7 1300 - IC50 b (Isa et al., 1986a)
Biofilm H2/CO2 30 7 450 - No inhibition
(van Houten et al., 1994)
Biofilm H2/CO2 55 7 250 - Total inhibition
(van Houten et al., 1997)
Digester sludge sugar and ethanol
20-25
> 7.5 - 500-1500
No inhibition (benefitial effect)
(Greben et al., 2005)
Granular sludge C2 and C3 35 7.5 - 750 IC50 b (Celis-Garcia et al., 2004)
Biofilm C2 and C3 35 7.5 - 860 IC50 b
H2 35 7 380 IC50 b Suspended sludge
C2 35 7 270 IC50 b
(Yamaguchi et al., 1999)
C2 35 - 8 35 Ki c
C3 35 - 194 681 Ki c
Suspended sludge
H2/CO2 35 - 140 422 Ki c
(Maillacheruvu and Parkin, 1996)
Mixed SRB culture ethanol 35 6.9-7.3 84 248 Ki c (Kaksonen et al.,
2004a) Mixed SRB culture C2 35 6.9-7.3 124 356 Ki
c
Flocculent sludge C3, C4 and ethanol
35 8 70 1000 Severe inhibition of C3 and C2 degradation
(O'Flaherty and Colleran, 1999a)
General Introduction
33
Cha
pter
1
Table 1.5 H2S and TS inhibition values for SRB (continuation). Biomass Substrate T
(oC) pH H2S
(mg l-1) TS
(mg l-1)Criteria Reference
D. desulfuricans lactate 35 7 - 500 IC50 d (Okabe et al., 1992)
D. desulfuricans lactate 35 7 - 267 Ki c (Okabe et al., 1995)
D. magnum C2 30 6.8 239 443 IC50 growth (O'Flaherty et al., 1998)
D. acetoxidans C2 37 6.8 263 487 IC50 a
D. postgatei C2 30 6.8 315 583 IC50 a
D. vulgaris H2/CO2 37 6.8 299 554 IC50 a
D. propionicus C3 37 6.8 120.5 223 IC50 a
D. sapovorans C4 37 6.8 277 513 IC50 a
D. multivorans ethanol 37 6.8 269 498 IC50 a
Desulfovibrio sp. lactate 37 6.2, 6.6 547 - Complete inhibition of growth
(Reis et al., 1991c)
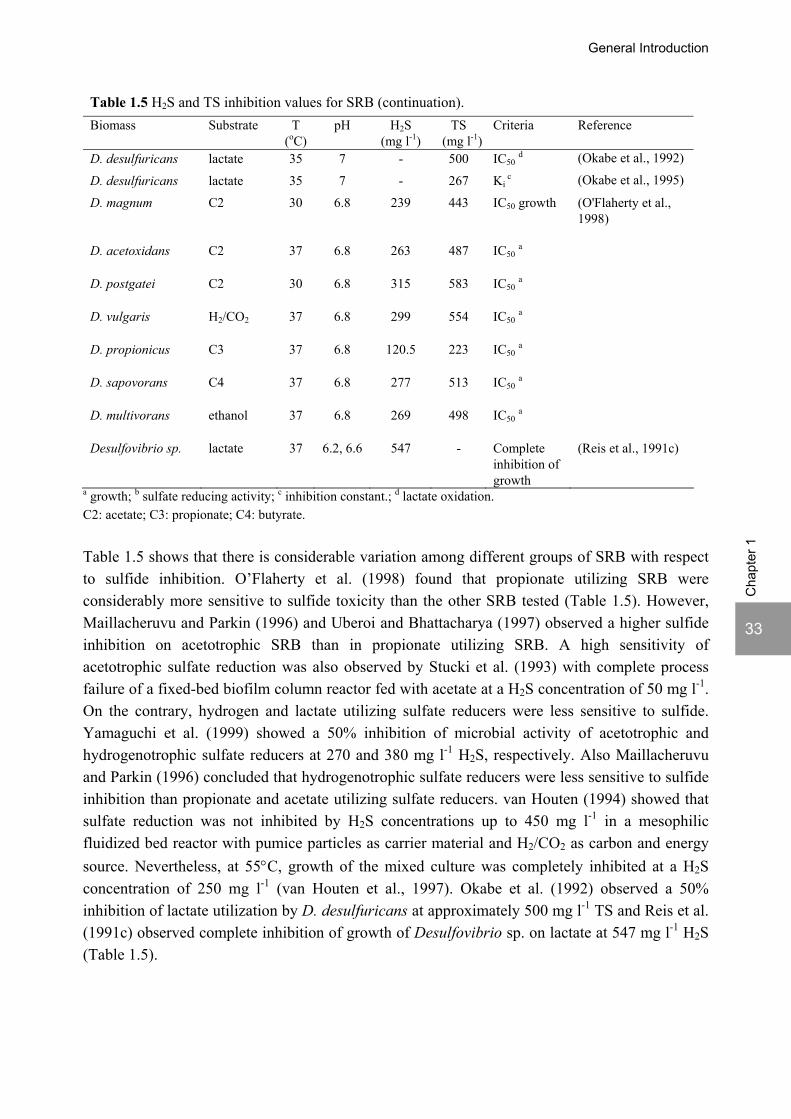
a growth; b sulfate reducing activity; c inhibition constant.; d lactate oxidation. C2: acetate; C3: propionate; C4: butyrate. Table 1.5 shows that there is considerable variation among different groups of SRB with respect to sulfide inhibition. O’Flaherty et al. (1998) found that propionate utilizing SRB were considerably more sensitive to sulfide toxicity than the other SRB tested (Table 1.5). However, Maillacheruvu and Parkin (1996) and Uberoi and Bhattacharya (1997) observed a higher sulfide inhibition on acetotrophic SRB than in propionate utilizing SRB. A high sensitivity of acetotrophic sulfate reduction was also observed by Stucki et al. (1993) with complete process failure of a fixed-bed biofilm column reactor fed with acetate at a H2S concentration of 50 mg l-1. On the contrary, hydrogen and lactate utilizing sulfate reducers were less sensitive to sulfide. Yamaguchi et al. (1999) showed a 50% inhibition of microbial activity of acetotrophic and hydrogenotrophic sulfate reducers at 270 and 380 mg l-1 H2S, respectively. Also Maillacheruvu and Parkin (1996) concluded that hydrogenotrophic sulfate reducers were less sensitive to sulfide inhibition than propionate and acetate utilizing sulfate reducers. van Houten (1994) showed that sulfate reduction was not inhibited by H2S concentrations up to 450 mg l-1 in a mesophilic fluidized bed reactor with pumice particles as carrier material and H2/CO2 as carbon and energy source. Nevertheless, at 55°C, growth of the mixed culture was completely inhibited at a H2S concentration of 250 mg l-1 (van Houten et al., 1997). Okabe et al. (1992) observed a 50% inhibition of lactate utilization by D. desulfuricans at approximately 500 mg l-1 TS and Reis et al. (1991c) observed complete inhibition of growth of Desulfovibrio sp. on lactate at 547 mg l-1 H2S (Table 1.5).

34
Cha
pter
1
5.1.4 Syntrophs
In a UASB reactor inoculated with a sludge adapted to low sulfate concentrations and fed with propionate and sulfate, Rinzema and Lettinga (1988b) observed a decrease in propionate degradation at H2S concentrations higher than 100 mg l-1. Also Oleszkiewicz et al. (1989) found that propionate utilization was more affected by H2S inhibition than lactate, butyrate and acetate utilization by a suspended sludge adapted to low sulfate concentration. This was confirmed by Maillacheruvu and Parkin (1996), who found that propionate utilizing acetogens were very sensitive to H2S and by O’Flaherty et al. (1999b), who reported that the propionate utilizing syntrophs present in the sludge appeared to be irreversibly inhibited by sulfide.
5.1.5 Methanogens
Several studies confirm the high susceptibility of acetotrophic methanogenesis to sulfide and the lower susceptibility of hydrogenotrophic methanogenesis. Yamaguchi et al. (1999) showed a 50 % inhibition of microbial activity of acetotrophic and hydrogenotrophic methanogens at 160 and 220 mg l-1 H2S, respectively. Maillacheruvu and Parkin (1996) also found that acetotrophic methanogens were much more inhibited by H2S than hydrogenotrophic methanogens. Toxicity tests carried out by O’Flaherty et al. (1999b) showed that acetoclastic methanogenesis was the most sensitive step in sulfide inhibition, with 50% inhibition observed at total sulfide concentrations of 220-980 mg l-1 (69-150 mg l-1 H2S) over the pH range 6.5-8.0. Koster et al. (1986) reported a 50% inhibition of maximum specific acetotrophic methanogenic activity at approximately 250 mg l-1 H2S in the pH range 6.4-7.2. At higher pH values, the inhibitory effect of a given H2S concentration increased significantly. Higher sensitivities were reported for acetotrophic methanogens under thermophilic conditions. Pender et al. (2004) demonstrated that the methanogenic conversion of acetate at 55°C was extremely sensitive to inhibition by sulfide (50% inhibition at 8-17 mg l-1 H2S at pH 7.6-8.0), while the methanogenic conversion of H2/CO2 was favored. Similarly, Visser et al. (1993c) reported 50% reduction in the acetotrophic methanogenic activity at H2S concentrations of 18-24 mg l-1 at pH levels 6.3-8.0 and 55°C.
5.1.6 Comparative toxicity between trophic groups
The different groups of organisms involved in anaerobic degradation have different susceptibilities to sulfide toxicity. As mentioned above, fermentative bacteria are considered less sensitive than sulfate reducers and methanogens to sulfide toxicity (Maillacheruvu et al., 1993). In a comprehensive study on effect of pH (6.8-7.5) and sulfide toxicity on methanogens, sulfate reducers and syntrophs by O’Flaherty et al. (1998), it was found that in the pH range 7.2-8.5, propionate utilizing SRB were the most sensitive of the bacterial groups, both in pure culture and in sludge samples, to high concentrations of total sulfide. Moreover, in the pH range 6.8-7.2, the levels of sulfide which resulted in 50% inhibition of the growth of the bacterial groups were similar (O'Flaherty et al., 1998). However, Maillacheruvu and Parkin (1996) showed that for the microbial groups involved in systems treating propionate and sulfate, sensitivity to sulfide increased in the following way: hydrogenotrophic methanogens < hydrogenotrophic SRB <
General Introduction
35
Cha
pter
1
incomplete propionate oxidizing SRB < acetotrophic methanogens < propionate utilizing syntrophs < acetotrophic SRB. Maillacheruvu and Parkin (1996) showed that both for hydrogen and acetate as substrates, sulfate reducers were more inhibited by sulfide than methanogens. Yamaguchi et al. (1999) reported the opposite conclusion, based on values of 50% inhibition of sulfate reduction and methanogenesis on hydrogen and acetate as substrates. However, the sludge used by Yamaguchi et al. (1999) for the assessment of sulfate reducing activities was taken from a sulfate rich reactor, whereas the sludge used for the assessment of methanogenic activities was taken from a sulfate poor reactor. Therefore, probably the adaptation of the sulfate reducers to higher sulfide concentrations in the former sludge caused its higher resistance to sulfide toxicity. Nevertheless, Visser (1995) found that acetate utilizing SRB and MPB have similar sensitivities to sulfide between pH 7.0 and 7.5 and at higher pH levels, SRB are considerably less sensitive to sulfide inhibition than MPB.
5.1.7 Type of biomass
The type of biomass immobilization is extremely important in determining its sensitivity to sulfide. Factors such as substrate transport inside the biofilm or granule/floc, location of sulfate reduction and its proximity to the location of methanogenesis, the diffusion of unionized H2S and total sulfide, pH gradients etc., can have significant effects on the toxicity of sulfide (Koster et al., 1986; Maillacheruvu et al., 1993; Speece, 1996). Maillacheruvu et al. (1993) clearly showed that sulfide toxicity was mediated at lower concentrations in suspended growth systems than in anaerobic filters. Levels of 64-80 mg l-1 H2S (150-200 mg l-1 TS) were found to cause stress in all suspended growth systems tested with acetate and propionate. By contrast, propionate-fed filters could withstand 213 mg l-1 H2S and total sulfide levels of 1060 mg l-1. With acetate fed filters, 133 mg l-1 H2S caused no inhibition and total sulfide concentration of 425 mg1-1 could be tolerated with no adverse effect (Maillacheruvu et al. 1993). Also Speece and Parkin (1983) found that total sulfide concentration up to 400 mg l-1 had no effect on methane production from a submerged anaerobic filter and that concentrations higher than 800 mg l-1 only reduced methane formation by about 30%. Similarly, O’Flaherty et al. (1998) observed a higher sulfide sensitivity in sludge samples than in pure cultures of methanogens, sulfate reducers and syntrophs. Celis-Garcia et al. (2004) found 50% inhibition of methanogenic activity at 800 mg l-1 TS for granular sludge and 1250 mg l-1 TS for attached biomass.
5.2 VFA toxicity
Acetic, propionic and butyric acids were reported to inhibit the growth of several microbial species (van den Heuvel et al., 1988). The undissociated forms of VFA are considered the toxic form, as they can diffuse across the cell membrane and dissociate intracellularly, thereby preventing the bacterial cell from maintaining a membrane potential and proton motive force (van den Heuvel et al., 1988; Gyure et al., 1990). As a consequence, less energy will be available for the synthesis of biomass and the attainable growth rate will be lowered (van den Heuvel et al., 1988). As the pKa of acetate, propionate and butyrate are in the range of 4.80-4.93 at 55°C (Amend and Shock, 2001), approximately 40% and 90% of those acids at, respectively, pH 5 and
36
Cha
pter
1
4, will be in the undissociated form. Therefore, at low pH values, VFA toxicity can become very important.
5.2.1 Fermentatives
Product inhibition in acidogenic bacteria by the acids formed is well known (Zoetemeyer et al., 1982a; van den Heuvel et al., 1988). Zoetemeyer et al. (1982a) reported that 4580 mg l-1 (52 mmol l-1) butyrate caused a 30% reduction on acidogenesis of glucose at pH 5.5 and a decrease in propionate and butyrate and increase in lactate, suggesting that the fermentation shifted in an attempt to reduce the levels of butyric acid in the reactor. In the presence of 18339 mg l-1 butyrate, acidification dropped to 70%, but the inhibition was reversible. van Heuvel et al. (1988) tested the effect of acetate or butyrate up to 200 mmol l-1 at different pH (5 to 6.5) values in the acidification of glucose and concluded that only the undissociated butyric acid inhibited growth of acidifiers, while the addition of acetate did not reduce the attainable growth rate. Bahl et al. (1982) reported similar results on a pure culture of Clostridium acetobutylicum: butyrate affected the fermentation while acetate did not. Nevertheless, Denac (1988) reported significant inhibition of propionic acid producing bacteria at 10 mmol l-1 acetic acid and significant inhibition of butyric acid producing bacteria at 26.7 mmol l-1 acetic acid.
5.2.2 SRB
Gyure et al. (1990) reported that SRB were inhibited at acetic acid concentrations higher than 2 mM and that organic acids concentrations greater than 5 mM completely inhibited SRB activity in sediments at pH 3.8. Inhibition of SRB by acetic acid has been described already by Ghose and Wiken (1955) in cultures of D. desulfuricans, suggesting that the inhibition was due to competition between the fatty acids and pyruvate for the sulfhydryl group of coenzyme A. Reis et al. (1990) reported 50% inhibition of SRB growth on lactate (pH 5.8 to 7.0) for undissociated acetic acid concentrations of approximately 54 mg l-1 and concluded that the inhibition of SRB growth was related to the undissociated form. According to James et al. (1998), SRB are generally more susceptible to elevated VFA concentrations than the methanogens.
5.2.3 Syntrophs
Acetogenic bacteria are in general more inhibited by acetic acid than the acetoclastic bacteria (Denac et al., 1988; Costello et al., 1991). O’Flaherty et al. (1999b) observed inhibition of propionate-utilizing syntrophs by acetate concentrations as low as 300 mg l-1. The addition of acetate to the influent of a methanogenic UASB reactor inhibited propionate degradation severely, while addition of equimolar butyrate concentrations did not affect propionate degradation (van Lier et al., 1993). Kaspar and Wuhrmann (1978) reported complete inhibition of propionate utilizing populations at 4800 mg l-1 (80 mmol l-1) acetate, while no inhibition was observed at half of that concentration. Acetate concentrations higher than 5000 mg l-1 completely inhibited butyrate oxidation in a fluidized bed reactor (Labib et al., 1992). High propionate concentrations inhibited butyrate consumption in a mesophilic methanogenic biofilm reactor (Yu and Pinder, 1993).

General Introduction
37
Cha
pter
1
5.2.4 Methanogens
High propionate concentrations have been reported as toxic for methanogens (Barredo and Evison, 1991; Otieno, 1996; Inanc et al., 1999). Both studies of Barredo and Evison (1991) and Otieno (1996) reported the inhibition of methanogenesis at propionate concentrations of 1760 mg l-1. Results from other studies indicated that methanogens were inhibited at 1000 mg l-1 propionate, while they could tolerate acetic and butyric acids up to 10000 mg l-1 (Inanc et al., 1999). Dogan et al. (2005) found 50% and 100% inhibition of acetoclastic methanogenesis in granular sludge at acetate concentrations of 13000 mg l-1 and 25000 mg l-1, butyrate concentrations of 15000 mg l-1 and 25000 mg l-1, and propionate concentrations of 3500 mg l-1 and 5000 mg l-1, respectively.
6 SCOPE AND ORGANIZATION OF THIS THESIS
The main goal of the research described in this thesis was to gain insight on sulfate reduction at low pH in organic wastewaters. For that, sucrose was used as substrate at moderate loading rates (1-5 gCOD (lreactor d)-1 ) and the effect of low pH (6, 5 and 4) and different COD/SO4
2- ratios was evaluated in terms of sulfate reduction and acidification efficiency, acidification products, methanogenesis and the dynamics of micro and macronutrients. The effects of sulfide, VFA and trace metal concentrations were studied as well. Chapters 2 to 6 describe experiments performed in thermophilic (55°C) UASB reactors, while Chapter 7 describes experiments performed in mesophilic (30°C) CSTR and UASB reactors. Chapters 2 and 3 studied the effect of pH 6, 5 and 4 and different COD/SO4
2- ratios (9 and 3.5) on the UASB reactor performance (sulfate reduction, acidification, acidification products and methanogenesis), sludge characteristics and metal dynamics. In Chapter 4, the effect of the COD/SO4
2- ratio (4 and 1) and the sulfide concentration on sulfate reduction were studied at pH 6. Chapter 5 describes the effect of trace metal concentrations, sulfide concentrations and COD/SO4
2- ratios (4 and 1) on the sulfate reduction efficiency at pH 5. In Chapter 6, sulfate reduction at pH 4 and COD/SO4
2- ratio of 1 was studied and the main microbial populations present in the sludge were analysed. In Chapter 7, the effect of lowering the pH from 6 to 5 in the sulfate reducing and acidification performance of a CSTR reactor with similar operating conditions as in a wastewater treatment plant from a starch-producing company was evaluated, and compared to the performance of a UASB reactor. Finally, in Chapter 8, the results of the work presented in this thesis are summarized and discussed.

Chapter
Low pH (6, 5 and 4) sulfate reduction during the acidification of sucrose under thermophilic
(55oC) conditions Abstract The effect of a low pH (6, 5 and 4) and different COD/SO4
2- ratios (9 and 3.5) on thermophilic (55°C) sulfate reduction and acidification of sucrose was investigated using three upflow anaerobic sludge bed reactors fed with sucrose at an organic loading rate of 3.5 gCOD (lreactor d)-1. The three reactors showed nearly 100% acidification of sucrose for all pH values and COD/SO4
2- ratios investigated. Sulfate reduction was complete at pH 6 and a COD/SO4
2- ratio of 9. At pH 5, sulfate reduction efficiencies were 80-95% for both COD/SO4
2- ratios (9 and 3.5). At pH 4, sulfate reduction efficiencies further dropped to 55-65% at a COD/SO4
2- ratio of 9 and 30-40% at a COD/SO4
2- ratio of 3.5. The pH decrease from 6 to 5 or 4 caused a shift in the acidification products from mainly acetate to butyrate, as well as a higher production of ethanol, mainly at pH 4. At pH 4, the effluent was free of propionate and hydrogen concentrations in the biogas reached 50%, equivalent to a hydrogen yield of 1.3 mol H2 (mol glucose)-1. This study shows that sulfate reduction is possible in the acidification phase of anaerobic wastewater treatment at pH values as low as 6 till 4 and that the pH strongly affects both the acidification pathways and the sulfate reduction efficiencies. A modified version of this chapter was published as: Lopes S.I.C, Sulistyawati I., Capela M.I. and Lens P.N.L. (2007) Low pH (6, 5 and 4) sulfate reduction during the acidification of sucrose under thermophilic (55 oC) conditions. Process Biochemistry 42, 580-591.

40
Cha
pter
2
1 INTRODUCTION
Many wastewaters that can be treated anaerobically contain sulfate, in addition to high concentrations of unacidified organic matter, e.g. fermentation, starch or pulp and paper industries (Omil et al., 1996; Lens et al., 2003). The fact that, in many cases, the wastewaters are discharged at high temperatures, in addition to the current interest in closing water-loops and reusing process waters, leads to thermophilic treatment as a desirable option, as it avoids energy investments for cooling and heating the wastewater prior and after the wastewater treatment step, respectively (Reis et al., 1995; Sipma et al., 1999; Yu et al., 2002; Lens et al., 2003). Under anaerobic conditions, the end product of dissimilatory sulfate reduction is sulfide, which can be toxic for the different trophic groups involved in the anaerobic treatment, particularly the methanogens (Mizuno et al., 1998a). Previous studies show that sulfate reduction occurs together with acidification in the acidification stage (Reis et al., 1995; Sipma et al., 1999; Lens et al., 2003). Therefore, in a two-phase anaerobic treatment process (Demirel and Yenigün, 2002), sulfide can be removed before the methanogenic reactor, resulting in higher methanogenic activities, as well as a biogas from the methanogenic reactor with less or no sulfide. Wastewater treatment plants using this two-phase configuration add NaOH to the acidification reactor to avoid excessive lowering of the pH (Romli et al., 1994). If operation would be feasible at lower pH (5 or 4), this NaOH addition could be lowered or completely omitted. Moreover, sulfide stripping would proceed more efficiently at a lower pH, as a higher percentage of the total dissolved sulfide is in the gaseous form (H2S). To our knowledge, there are no studies reported on sulfate reduction in the acidification stage for mixed liquor pH values lower than 5.4 (Reis et al., 1988). Therefore, this work studies the effect of a low pH (6, 5 and 4) of the reactor mixed liquor combined with different COD/SO4
2- ratios (9 and 3.5) on the sulfate reduction and acidification of a sucrose containing synthetic wastewater. For this purpose, three thermophilic anaerobic upflow sludge bed reactors (UASB) were operated and the acidification, sulfate reduction efficiencies and metabolite production were determined. The metabolic characteristics of the sludge were also assessed by batch experiments.
2 MATERIALS AND METHODS
2.1 Experimental Set-up
One UASB reactor with 6.5 l volume (R1) and two UASB reactors with 0.92 l each (R2 and R3) were used in this study (Figure 2.1). Throughout the experiment, the three reactors were operated at 55oC, a hydraulic retention time (HRT) of 10h and an organic loading rate (OLR) of 3.5 gCOD (lreactor d)-1. The pH in the reactors was measured with a pH electrode (Hamilton, Hilkomij BV, Rijswijk, The Netherlands) and was controlled by automatic pH controllers (Endress and Hauser, Naarden, The Netherlands) by 0.1 M NaOH or HCl addition. The influent was fed to the bottom of the reactors using peristaltic pumps (Gilson Minipuls 2) and in order to keep the upflow velocity at 1 m h-1, the effluent was recirculated using a peristaltic pump (Watson Marlow 503 S, Falmouth, Cornwall, UK).

Effect of low pH (6, 5 and 4) on sulfate reduction and acidification
41
Cha
pter
2
The conical bottom of the reactors was filled with glass marbles (5 mm diameter) in order to distribute the influent evenly over the sludge bed. The produced biogas was led through a waterlock filled with NaOH (1 M) and a column with soda lime pellets, in order to remove CO2 and H2S.
Figure 2.1 Schematic representation of the UASB reactors used in this study. 1: pH electrode; 2: pH controller; 3: NaOH; 4: HCl; 5: safety bottle; 6: NaOH; 7: soda lime pellets; 8: gas meter; 9: waterbath; 10: double wall. a in the 6.5 l reactor (R1), heated water was recirculated in a double wall, whereas the 0.92 l UASB reactors (R2 and R3) were submerged in a heated waterbath. b dilution water was just used in the 6.5 l UASB reactor (R1) due to the higher influent flows.
2.2 Inoculum
R1 was inoculated with approximately 2 kg wet granular Eerbeek sludge (Oude Elferink et al., 1998b) and after 120 days of operation, 600 g wet sludge was removed from R1 and used to inoculate R2 and R3 (300g wet sludge each).
2.3 Medium
The reactors were fed with a synthetic influent consisting of sucrose as a model carbohydrate (sole electron donor and carbon source), sulfate and nutrients, added to the reactors by peristaltic
Nutrients
Sucrose and sulfate (at 4°C)
Dilution water b
3 4
5 6
7 8
9 a
10 a
1
2
42
Cha
pter
2
pumps. The concentration of sulfate, added as sodium sulfate, depended on the applied COD/SO4
2- ratios (Table 2.1). The nutrient solution consisted of macro and micronutrients according to Vallero et al. (2003).
2.4 Experimental design
In order to investigate the effect of low pH in combination with two different COD/SO42- ratios,
the reactor runs were divided in the following phases. R1 was operated for 425 days at pH 6 and a COD/SO4
2- ratio of 9 throughout the experiment. R2 and R3 were run for 190 days, which was divided in 3 periods. After an initial start-up period of 12 days (Period I) operating at pH 6, R2 was operated at pH 5 and R3 at pH 4 (Period II and III). The COD/SO4
2- ratio was 9 (Period I and II) for both reactors and was decreased to 3.5 (by the increase in sulfate concentrations) after 114 and 134 days of operation for R2 and R3, respectively (Period III).
2.5 Batch activity tests
Batch activity tests were performed to compare the metabolic properties of the sludge developed in R2 (pH 5) and R3 (pH 4) and to see whether adaptation to the low pH values had occurred. Therefore, after 97 and 96 days of operation for R2 and R3 (Period II), respectively, sludge samples were harvested from both reactors in order to assess its activity on glucose, acetate and hydrogen (2 gCOD l-1) in the absence or presence of sulfate (COD/SO4
2- ratio of 0.5) and at different pH values (pH 6, 5 and 4). For R3 sludge, activity tests were also performed at pH 3, to investigate whether the sludge showed any metabolic activity at that pH value, and thus if reactor operation at such a low pH would still be feasible. The activity tests were performed in 117 ml vials (glucose or acetate) or in 243 ml vials (hydrogen) with 50 ml of basal medium containing (in g l-1): NH4Cl (0.3), CaCl2.2H2O (0.11), MgCl2.6H2O (0.10), NaCl (0.3), yeast extract (0.5) and 1 ml l-1 of an acid and an alkaline trace element solution according to Stams et al. (1993). Resazurine was used as redox indicator at a concentration of 0.5 μg l-1. The medium was buffered at the different pH with 6.8 g l-1 KH2PO4, 7.8 g l-1 NaH2PO4.2H2O and the necessary concentration of NaOH. The activity tests were performed in duplicate.
2.6 Analysis
Sugars (sucrose, glucose and fructose) and lactate were measured by High-Pressure Liquid Chromatography according to van Lier et al. (1997). Sulfate was measured by Ion Chromatography according to Sipma et al. (2004). Sulfide was fixed with zinc acetate and measured photometrically according to Trüpper and Schlegel (1964). Volatile fatty acids (VFA), alcohols and biogas composition were measured using Gas Chromatography, according to Weijma et al. (2000). VSS was analyzed according to standard methods (APHA, 1998). The volume of biogas produced in the reactors was measured using a wet-type precision gas meter (Schlumberger Industries, Dordrecht, The Netherlands).
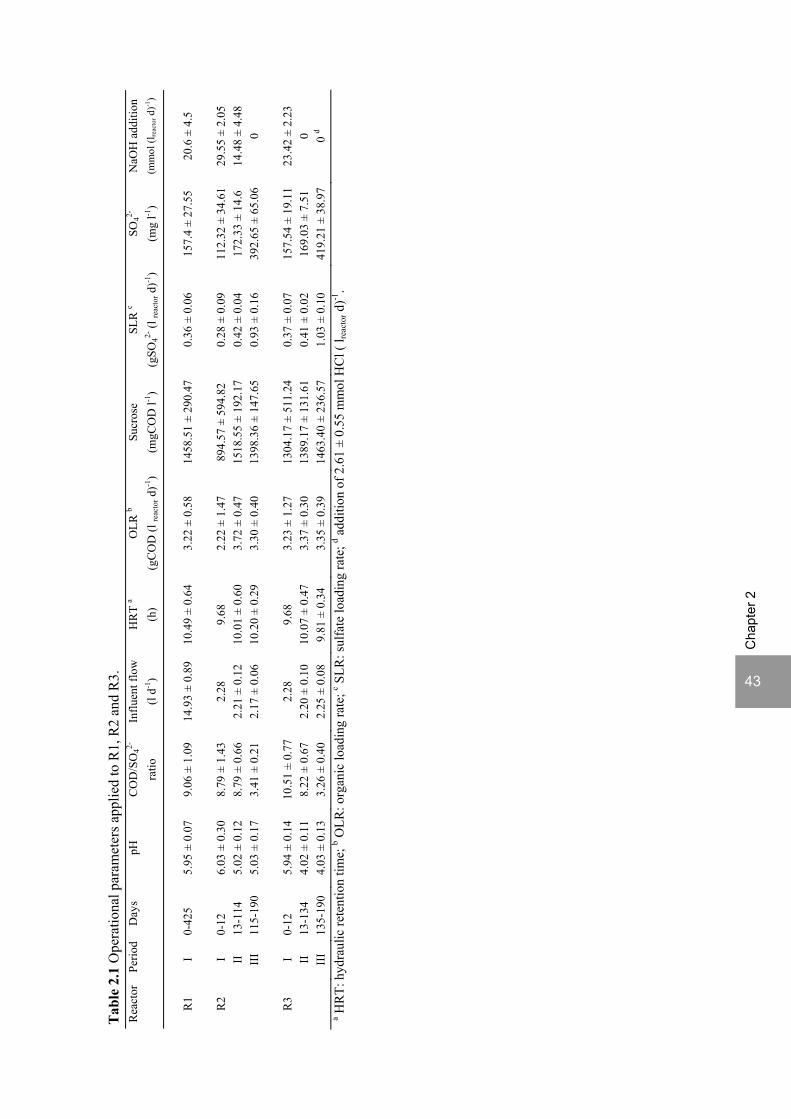
43
Cha
pter
2
Tab
le 2
.1 O
pera
tiona
l par
amet
ers a
pplie
d to
R1,
R2
and
R3.
R
eact
or
Perio
dD
ays
pH
CO
D/S
O42-
In
fluen
t flo
w
HR
T a
OLR
b Su
cros
e SL
R c
SO42-
N
aOH
add
ition
ra
tio
(l d-1
) (h
) (g
CO
D (l
reac
tor d
)-1)
(mgC
OD
l-1)
(gSO
42- (l
reac
tor d
)-1)
(mg
l-1)
(mm
ol (l
reac
tor d
)-1)
R1
I 0-
425
5.95
± 0
.07
9.06
± 1
.09
14.9
3 ±
0.89
10
.49
± 0.
64
3.22
± 0
.58
1458
.51
± 29
0.47
0.36
± 0
.06
157.
4 ±
27.5
5 20
.6 ±
4.5
R
2 I
0-12
6.
03 ±
0.3
0 8.
79 ±
1.4
3 2.
28
9.68
2.
22 ±
1.4
7 89
4.57
± 5
94.8
2 0.
28 ±
0.0
9 11
2.32
± 3
4.61
29.5
5 ±
2.05
II
13-1
14
5.02
± 0
.12
8.79
± 0
.66
2.21
± 0
.12
10.0
1 ±
0.60
3.
72 ±
0.4
7 15
18.5
5 ±
192.
170.
42 ±
0.0
4 17
2.33
± 1
4.6
14.4
8 ±
4.48
III
115-
190
5.03
± 0
.17
3.41
± 0
.21
2.17
± 0
.06
10.2
0 ±
0.29
3.
30 ±
0.4
0 13
98.3
6 ±
147.
650.
93 ±
0.1
6 39
2.65
± 6
5.06
0
R
3 I
0-12
5.
94 ±
0.1
4 10
.51
± 0.
77
2.28
9.
68
3.23
± 1
.27
1304
.17
± 51
1.24
0.37
± 0
.07
157.
54 ±
19.
1123
.42
± 2.
23
II
13
-134
4.
02 ±
0.1
1 8.
22 ±
0.6
7 2.
20 ±
0.1
0 10
.07
± 0.
47
3.37
± 0
.30
1389
.17
± 13
1.61
0.41
± 0
.02
169.
03 ±
7.5
1 0
II
I 13
5-19
0 4.
03 ±
0.1
3 3.
26 ±
0.4
0 2.
25 ±
0.0
8 9.
81 ±
0.3
4 3.
35 ±
0.3
9 14
63.4
0 ±
236.
571.
03 ±
0.1
0 41
9.21
± 3
8.97
0 d
a HR
T: h
ydra
ulic
rete
ntio
n tim
e; b O
LR: o
rgan
ic lo
adin
g ra
te; c S
LR: s
ulfa
te lo
adin
g ra
te; d a
dditi
on o
f 2.6
1 ±
0.55
mm
ol H
Cl (
l rea
ctor
d)-1
.

44
Cha
pter
2
3 RESULTS
3.1 Acidification
The three reactors showed nearly complete acidification. A 100% acidification is defined as the complete elimination of sucrose, glucose and fructose. Figure 2.2 shows that R1 (pH 6) showed 100% acidification throughout the experiment with the exception of day 35, after the reestablishment of the influent flow after a period with less influent flow due to a pump malfunctioning (day 21-35). R2 (pH 5) showed always complete acidification. R3 (pH 4) also showed acidification efficiencies close to 100%, occasionally reduced to around 80%, following 2 episodes without influent solution for a few hours, but with a fast recovery to complete acidification.
3.2 Sulfate reduction
R1 (pH 6) showed nearly complete sulfate reduction over the experimental run (Figure 2.3A). The drop in the period day 21-35 was due to lack of influent as a result of a peristaltic pump malfunction. Both R2 and R3 also showed complete sulfate reduction while operating at pH 6 (Period I). The decrease to pH 5 on day 12 (R2, Period II) resulted in an immediate drop in sulfate reduction efficiency, but with fast recovery to about 95%, followed by an unstable period with an average of 85% (Figure 2.3A). R3 also showed an immediate drop in sulfate reduction efficiency, when the pH was lowered to 4 (Period II). In this case, sulfate reduction dropped to below 10% and gradually increased up to 65% after approximately 90 days (Figure 2.3A). The increase in sulfate loading rate (Period III) caused a decrease in the sulfate reduction efficiency in R2, but a fast recovery occurred, first to an unstable period with sulfate reduction efficiencies of about 80% and then further to 95% (Figure 2.3A). R3 showed, in the corresponding period, a lowering in the sulfate reduction efficiency to approximately 35%, although with a short period with lower sulfate reduction efficiencies around day 163 (Figure 2.3A). However, it should be noted that, despite the lower sulfate reduction efficiencies at COD/SO4
2- ratio of 3.5 (Period III) compared to COD/SO42- ratio of 9 (Period II), R3 showed a
comparable sulfate reduction rate in both periods (0.26 ± 0.02 g (lreactor d)-1 in Period II and 0.32 ± 0.08 g (lreactor d)-1 in Period III). Figures 2.3B give the corresponding dissolved sulfide concentrations in the reactors effluents. R1 showed an average of 30 mg l-1 dissolved sulfide over the reactor run. R2 showed an average of 30 mg l-1 dissolved sulfide in Period II and 65 mg l-1 dissolved sulfide in Period III. R3 showed an average of 18 mg l-1 dissolved sulfide in Period II, which increased to an average of 25 mg l-1 dissolved sulfide in Period III.
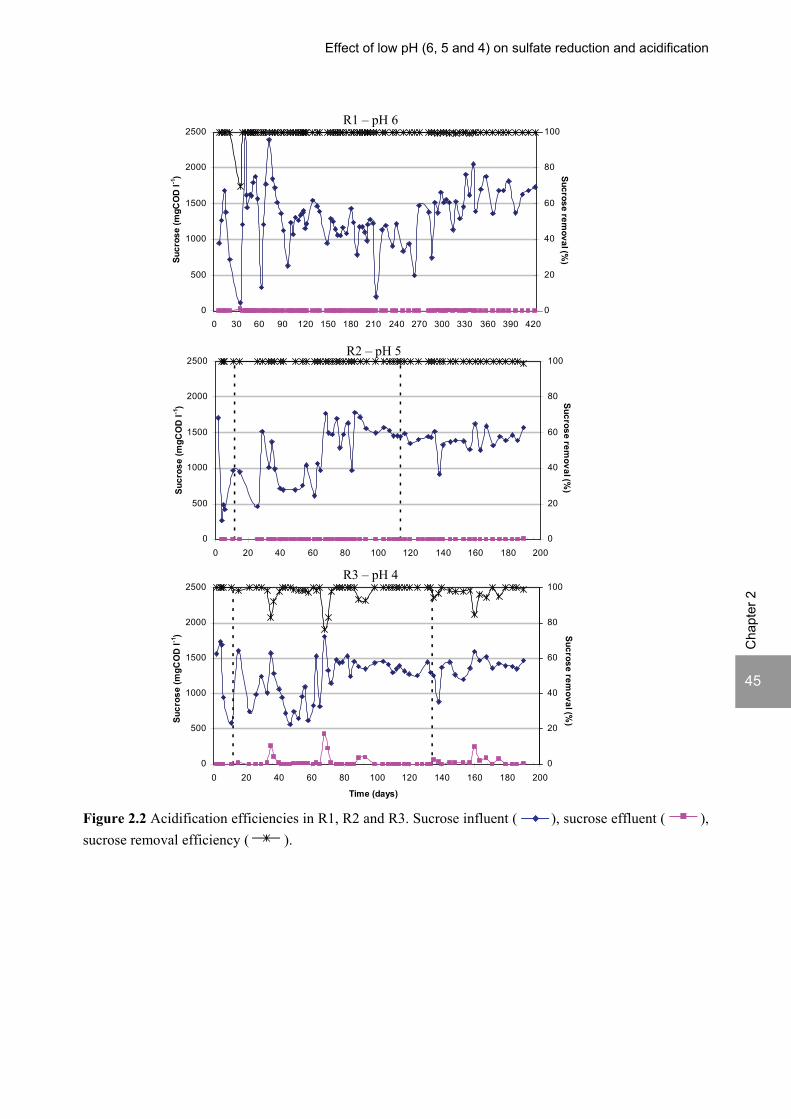
Effect of low pH (6, 5 and 4) on sulfate reduction and acidification
Cha
pter
2
45
0
500
1000
1500
2000
2500
0 20 40 60 80 100 120 140 160 180 200
Sucr
ose
(mgC
OD
l -1)
0
20
40
60
80
100
Sucrose removal (%
)_
0
500
1000
1500
2000
2500
0 30 60 90 120 150 180 210 240 270 300 330 360 390 420
Sucr
ose
(mgC
OD
l -1)
0
20
40
60
80
100
Sucrose removal (%
)_
R1 – pH 6
R2 – pH 5
0
500
1000
1500
2000
2500
0 20 40 60 80 100 120 140 160 180 200
Time (days)
Sucr
ose
(mgC
OD
l -1)
0
20
40
60
80
100
Sucrose removal (%
)_
R3 – pH 4
Figure 2.2 Acidification efficiencies in R1, R2 and R3. Sucrose influent ( ), sucrose effluent ( ), sucrose removal efficiency ( ).
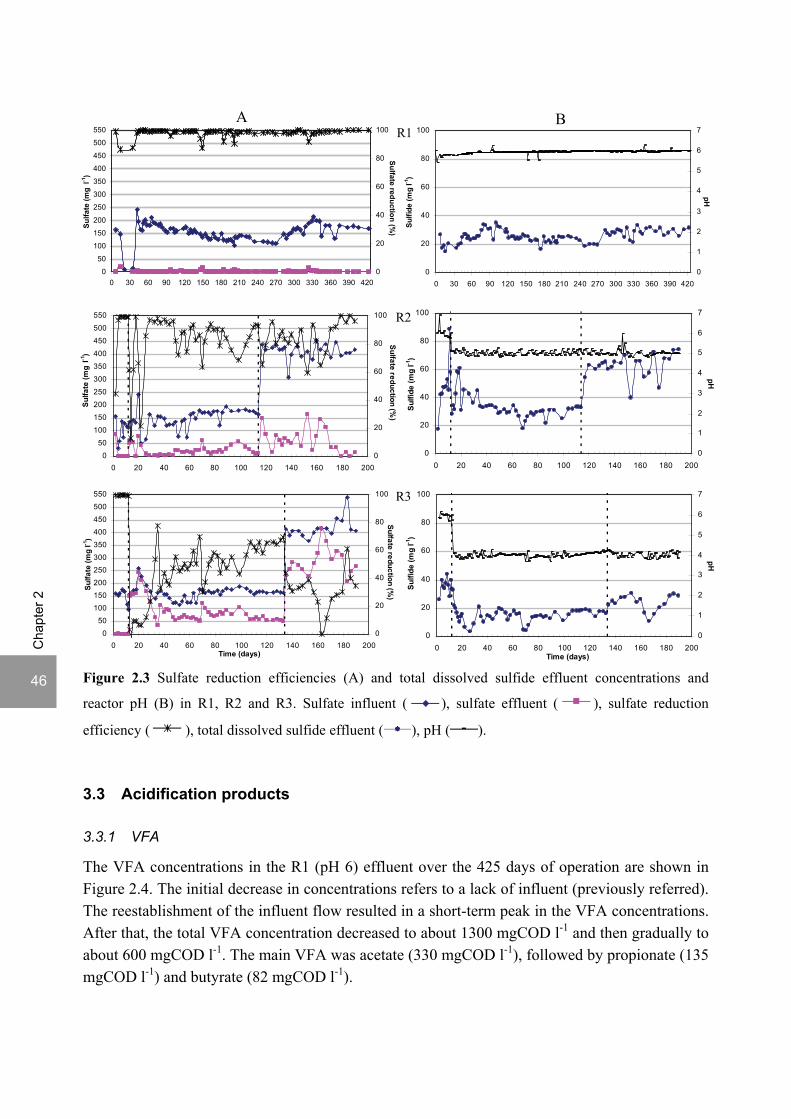
46
Cha
pter
2
0
20
40
60
80
100
0 30 60 90 120 150 180 210 240 270 300 330 360 390 420
Sulfi
de (m
g l-1
)
0
1
2
3
4
5
6
7
pH
0
50
100
150
200
250
300
350
400
450
500
550
0 30 60 90 120 150 180 210 240 270 300 330 360 390 420
Sulfa
te (m
g l-1
)
0
20
40
60
80
100
Sulfate reduction (%)_
B A
0
20
40
60
80
100
0 20 40 60 80 100 120 140 160 180 200
Sulfi
de (m
g l-1
)
0
1
2
3
4
5
6
7
pH
0
20
40
60
80
100
0 20 40 60 80 100 120 140 160 180 200Time (days)
Sulfi
de (m
g l-1
)
0
1
2
3
4
5
6
7
pH
0
50
100
150
200250
300
350
400
450
500
550
0 20 40 60 80 100 120 140 160 180 200
Sulfa
te (m
g l-1
)
0
20
40
60
80
100
Sulfate reduction (%)_
R2
0
50
100150
200
250300
350
400450
500
550
0 20 40 60 80 100 120 140 160 180 200Time (days)
Sulfa
te (m
g l-1
)
0
20
40
60
80
100
Sulfate reduction (%)_
R3
Figure 2.3 Sulfate reduction efficiencies (A) and total dissolved sulfide effluent concentrations and
reactor pH (B) in R1, R2 and R3. Sulfate influent ( ), sulfate effluent ( ), sulfate reduction
efficiency ( ), total dissolved sulfide effluent ( ), pH ( ).
3.3 Acidification products
3.3.1 VFA
The VFA concentrations in the R1 (pH 6) effluent over the 425 days of operation are shown in Figure 2.4. The initial decrease in concentrations refers to a lack of influent (previously referred). The reestablishment of the influent flow resulted in a short-term peak in the VFA concentrations. After that, the total VFA concentration decreased to about 1300 mgCOD l-1 and then gradually to about 600 mgCOD l-1. The main VFA was acetate (330 mgCOD l-1), followed by propionate (135 mgCOD l-1) and butyrate (82 mgCOD l-1).
R1
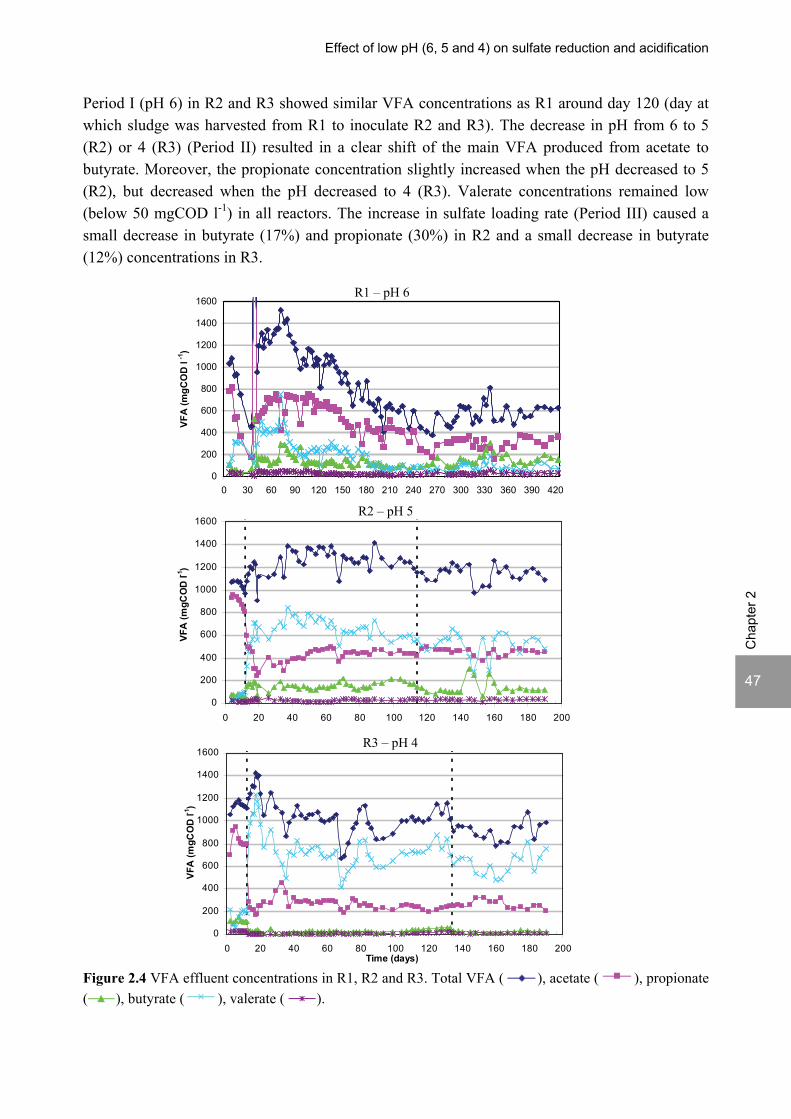
Effect of low pH (6, 5 and 4) on sulfate reduction and acidification
Cha
pter
2
47
0
200
400
600
800
1000
1200
1400
1600
0 20 40 60 80 100 120 140 160 180 200Time (days)
VFA
(mgC
OD
l -1)
0
200
400
600
800
1000
1200
1400
1600
0 30 60 90 120 150 180 210 240 270 300 330 360 390 420
VFA
(mgC
OD
l -1
)
0
200
400
600
800
1000
1200
1400
1600
0 20 40 60 80 100 120 140 160 180 200
VFA
(mgC
OD
l -1)
R1 – pH 6
R2 – pH 5
R3 – pH 4
Period I (pH 6) in R2 and R3 showed similar VFA concentrations as R1 around day 120 (day at which sludge was harvested from R1 to inoculate R2 and R3). The decrease in pH from 6 to 5 (R2) or 4 (R3) (Period II) resulted in a clear shift of the main VFA produced from acetate to butyrate. Moreover, the propionate concentration slightly increased when the pH decreased to 5 (R2), but decreased when the pH decreased to 4 (R3). Valerate concentrations remained low (below 50 mgCOD l-1) in all reactors. The increase in sulfate loading rate (Period III) caused a small decrease in butyrate (17%) and propionate (30%) in R2 and a small decrease in butyrate (12%) concentrations in R3. Figure 2.4 VFA effluent concentrations in R1, R2 and R3. Total VFA ( ), acetate ( ), propionate ( ), butyrate ( ), valerate ( ).
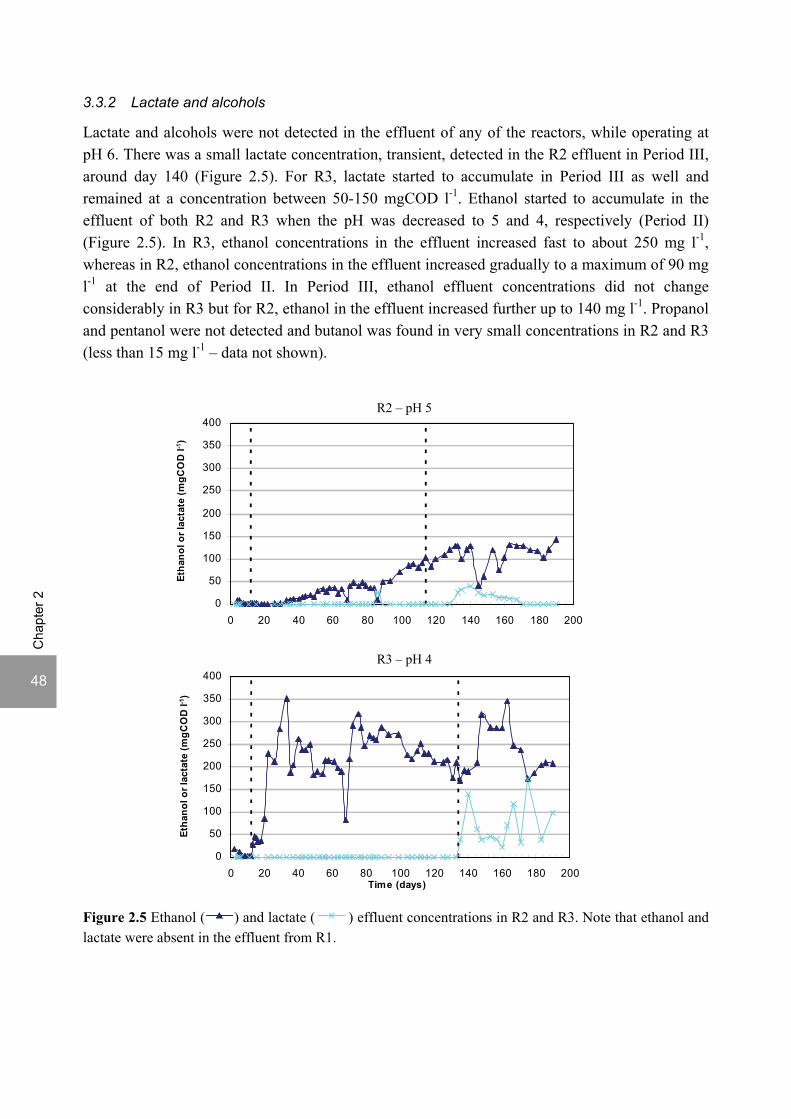
48
Cha
pter
2
0
50
100
150
200
250
300
350
400
0 20 40 60 80 100 120 140 160 180 200Time (days)
Etha
nol o
r lac
tate
(mgC
OD
l-1)
0
50
100
150
200
250
300
350
400
0 20 40 60 80 100 120 140 160 180 200
Etha
nol o
r lac
tate
(mgC
OD
l-1)
R2 – pH 5
R3 – pH 4
3.3.2 Lactate and alcohols
Lactate and alcohols were not detected in the effluent of any of the reactors, while operating at pH 6. There was a small lactate concentration, transient, detected in the R2 effluent in Period III, around day 140 (Figure 2.5). For R3, lactate started to accumulate in Period III as well and remained at a concentration between 50-150 mgCOD l-1. Ethanol started to accumulate in the effluent of both R2 and R3 when the pH was decreased to 5 and 4, respectively (Period II) (Figure 2.5). In R3, ethanol concentrations in the effluent increased fast to about 250 mg l-1, whereas in R2, ethanol concentrations in the effluent increased gradually to a maximum of 90 mg l-1 at the end of Period II. In Period III, ethanol effluent concentrations did not change considerably in R3 but for R2, ethanol in the effluent increased further up to 140 mg l-1. Propanol and pentanol were not detected and butanol was found in very small concentrations in R2 and R3 (less than 15 mg l-1 – data not shown). Figure 2.5 Ethanol ( ) and lactate ( ) effluent concentrations in R2 and R3. Note that ethanol and lactate were absent in the effluent from R1.
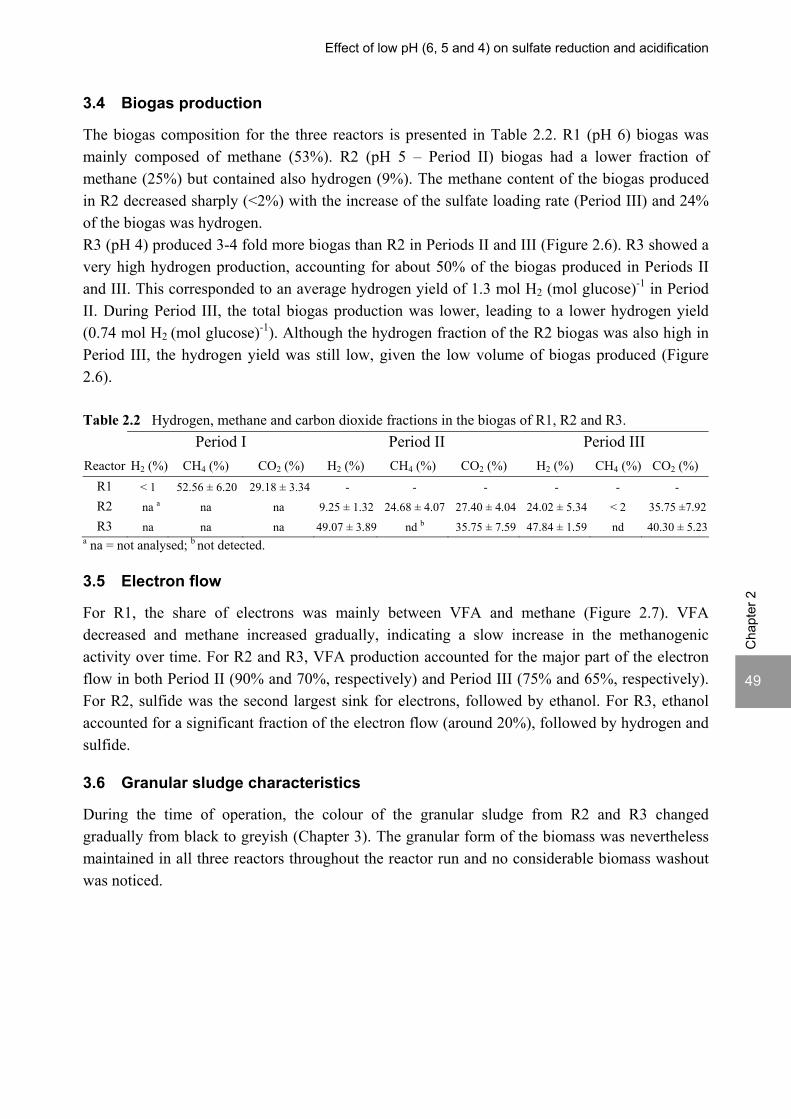
Effect of low pH (6, 5 and 4) on sulfate reduction and acidification
Cha
pter
2
49
3.4 Biogas production
The biogas composition for the three reactors is presented in Table 2.2. R1 (pH 6) biogas was mainly composed of methane (53%). R2 (pH 5 – Period II) biogas had a lower fraction of methane (25%) but contained also hydrogen (9%). The methane content of the biogas produced in R2 decreased sharply (<2%) with the increase of the sulfate loading rate (Period III) and 24% of the biogas was hydrogen. R3 (pH 4) produced 3-4 fold more biogas than R2 in Periods II and III (Figure 2.6). R3 showed a very high hydrogen production, accounting for about 50% of the biogas produced in Periods II and III. This corresponded to an average hydrogen yield of 1.3 mol H2 (mol glucose)-1 in Period II. During Period III, the total biogas production was lower, leading to a lower hydrogen yield (0.74 mol H2 (mol glucose)-1). Although the hydrogen fraction of the R2 biogas was also high in Period III, the hydrogen yield was still low, given the low volume of biogas produced (Figure 2.6). Table 2.2 Hydrogen, methane and carbon dioxide fractions in the biogas of R1, R2 and R3. Period I Period II Period III Reactor H2 (%) CH4 (%) CO2 (%) H2 (%) CH4 (%) CO2 (%) H2 (%) CH4 (%) CO2 (%)
R1 < 1 52.56 ± 6.20 29.18 ± 3.34 - - - - - - R2 na a na na 9.25 ± 1.32 24.68 ± 4.07 27.40 ± 4.04 24.02 ± 5.34 < 2 35.75 ±7.92R3 na na na 49.07 ± 3.89 nd b 35.75 ± 7.59 47.84 ± 1.59 nd 40.30 ± 5.23
a na = not analysed; b not detected.
3.5 Electron flow
For R1, the share of electrons was mainly between VFA and methane (Figure 2.7). VFA decreased and methane increased gradually, indicating a slow increase in the methanogenic activity over time. For R2 and R3, VFA production accounted for the major part of the electron flow in both Period II (90% and 70%, respectively) and Period III (75% and 65%, respectively). For R2, sulfide was the second largest sink for electrons, followed by ethanol. For R3, ethanol accounted for a significant fraction of the electron flow (around 20%), followed by hydrogen and sulfide.
3.6 Granular sludge characteristics
During the time of operation, the colour of the granular sludge from R2 and R3 changed gradually from black to greyish (Chapter 3). The granular form of the biomass was nevertheless maintained in all three reactors throughout the reactor run and no considerable biomass washout was noticed.

50
Cha
pter
2
0
0.2
0.4
0.6
0.8
1
0 30 60 90 120 150 180 210 240 270 300 330 360 390 420
Bio
gas
(l (l r
eact
or d
)-1)
0
0.2
0.4
0.6
0.8
1
0 20 40 60 80 100 120 140 160 180 200Time (days)
Bio
gas
(l (l r
eact
or d
)-1)
0
0.2
0.4
0.6
0.8
1
0 20 40 60 80 100 120 140 160 180 200
Bio
gas
(l (l r
eact
or d
)-1)
R2 – pH 5
R3 – pH 4
R1 – pH 6
Figure 2.6 Biogas production in R1, R2 and R3.
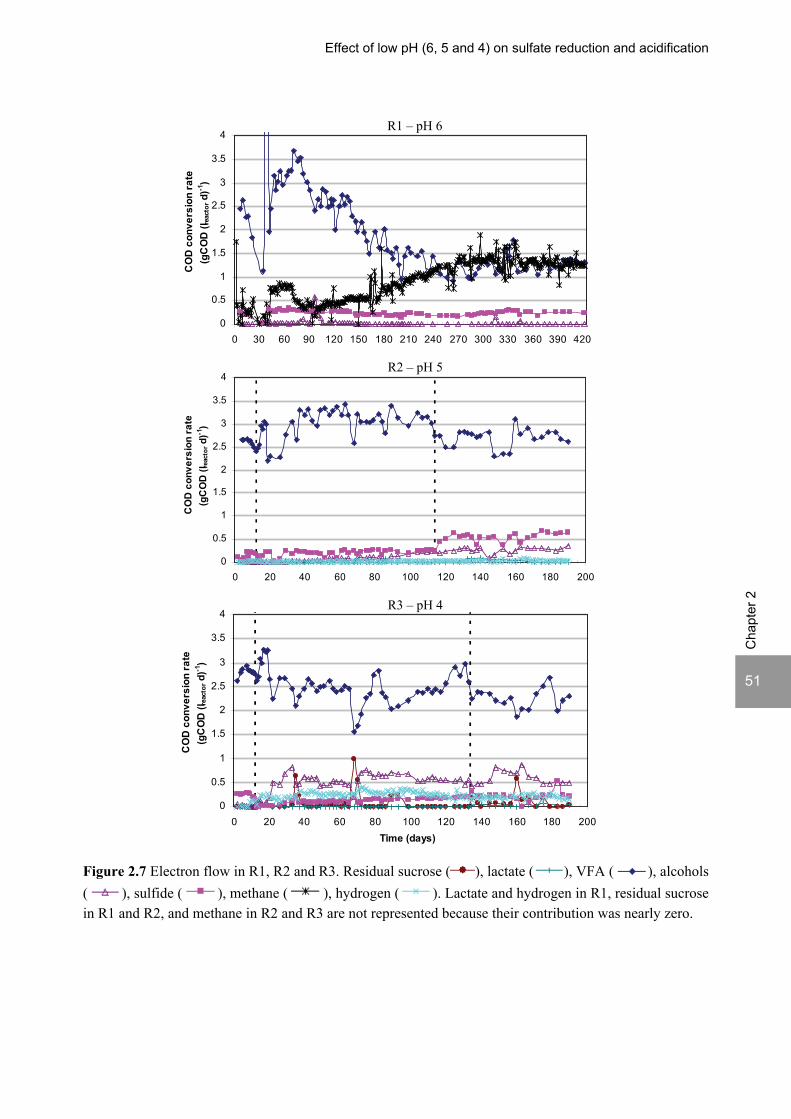
Effect of low pH (6, 5 and 4) on sulfate reduction and acidification
Cha
pter
2
51
0
0.5
1
1.5
2
2.5
3
3.5
4
0 30 60 90 120 150 180 210 240 270 300 330 360 390 420
CO
D c
onve
rsio
n ra
te(g
CO
D (l r
eact
or d
)-1)
0
0.5
1
1.5
2
2.5
3
3.5
4
0 20 40 60 80 100 120 140 160 180 200
CO
D c
onve
rsio
n ra
te(g
CO
D (l r
eact
or d
)-1)
0
0.5
1
1.5
2
2.5
3
3.5
4
0 20 40 60 80 100 120 140 160 180 200Time (days)
CO
D c
onve
rsio
n ra
te(g
CO
D (l r
eact
or d
)-1)
R2 – pH 5
R3 – pH 4
R1 – pH 6
Figure 2.7 Electron flow in R1, R2 and R3. Residual sucrose ( ), lactate ( ), VFA ( ), alcohols ( ), sulfide ( ), methane ( ), hydrogen ( ). Lactate and hydrogen in R1, residual sucrose in R1 and R2, and methane in R2 and R3 are not represented because their contribution was nearly zero.
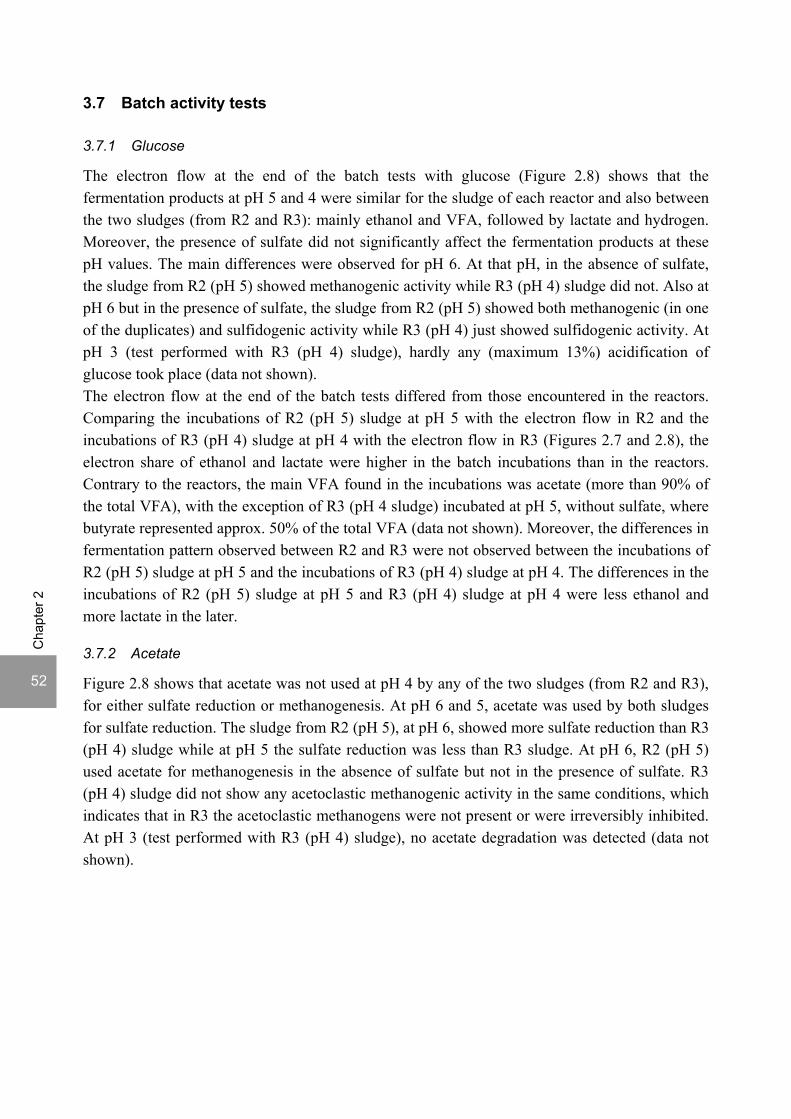
52
Cha
pter
2
3.7 Batch activity tests
3.7.1 Glucose
The electron flow at the end of the batch tests with glucose (Figure 2.8) shows that the fermentation products at pH 5 and 4 were similar for the sludge of each reactor and also between the two sludges (from R2 and R3): mainly ethanol and VFA, followed by lactate and hydrogen. Moreover, the presence of sulfate did not significantly affect the fermentation products at these pH values. The main differences were observed for pH 6. At that pH, in the absence of sulfate, the sludge from R2 (pH 5) showed methanogenic activity while R3 (pH 4) sludge did not. Also at pH 6 but in the presence of sulfate, the sludge from R2 (pH 5) showed both methanogenic (in one of the duplicates) and sulfidogenic activity while R3 (pH 4) just showed sulfidogenic activity. At pH 3 (test performed with R3 (pH 4) sludge), hardly any (maximum 13%) acidification of glucose took place (data not shown). The electron flow at the end of the batch tests differed from those encountered in the reactors. Comparing the incubations of R2 (pH 5) sludge at pH 5 with the electron flow in R2 and the incubations of R3 (pH 4) sludge at pH 4 with the electron flow in R3 (Figures 2.7 and 2.8), the electron share of ethanol and lactate were higher in the batch incubations than in the reactors. Contrary to the reactors, the main VFA found in the incubations was acetate (more than 90% of the total VFA), with the exception of R3 (pH 4 sludge) incubated at pH 5, without sulfate, where butyrate represented approx. 50% of the total VFA (data not shown). Moreover, the differences in fermentation pattern observed between R2 and R3 were not observed between the incubations of R2 (pH 5) sludge at pH 5 and the incubations of R3 (pH 4) sludge at pH 4. The differences in the incubations of R2 (pH 5) sludge at pH 5 and R3 (pH 4) sludge at pH 4 were less ethanol and more lactate in the later.
3.7.2 Acetate
Figure 2.8 shows that acetate was not used at pH 4 by any of the two sludges (from R2 and R3), for either sulfate reduction or methanogenesis. At pH 6 and 5, acetate was used by both sludges for sulfate reduction. The sludge from R2 (pH 5), at pH 6, showed more sulfate reduction than R3 (pH 4) sludge while at pH 5 the sulfate reduction was less than R3 sludge. At pH 6, R2 (pH 5) used acetate for methanogenesis in the absence of sulfate but not in the presence of sulfate. R3 (pH 4) sludge did not show any acetoclastic methanogenic activity in the same conditions, which indicates that in R3 the acetoclastic methanogens were not present or were irreversibly inhibited. At pH 3 (test performed with R3 (pH 4) sludge), no acetate degradation was detected (data not shown).
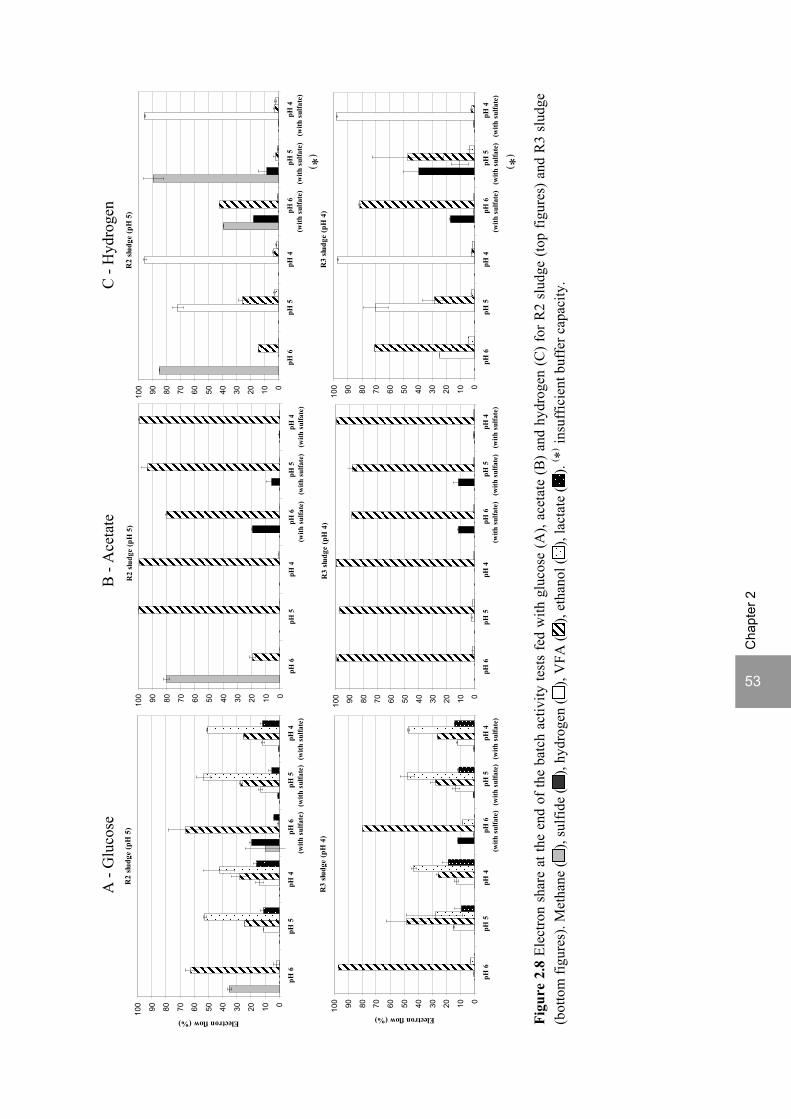
53
Cha
pter
2
R2
sludg
e (p
H 5
)
0102030405060708090100
pH 6
pH
5pH
4
pH
6
(w
ith s
ulfa
te)
p
H 5
(with
sul
fate
)
pH
4
(w
ith s
ulfa
te)
R3
sludg
e (p
H 4
)
0102030405060708090100
pH 6
pH
5pH
4
pH
6
(w
ith s
ulfa
te)
p
H 5
(with
sul
fate
)
pH
4
(w
ith s
ulfa
te)
R2
sludg
e (p
H 5
)
0102030405060708090100
pH 6
pH
5pH
4
pH
6
(w
ith s
ulfa
te)
p
H 5
(with
sul
fate
)
pH
4
(w
ith s
ulfa
te)
R3
sludg
e (p
H 4
)
0102030405060708090100
pH 6
pH
5pH
4
pH
6
(w
ith s
ulfa
te)
p
H 5
(with
sul
fate
)
pH
4
(w
ith s
ulfa
te)
R2
sludg
e (p
H 5
)
0102030405060708090100
pH 6
pH
5pH
4
pH
6
(w
ith s
ulfa
te)
p
H 5
(with
sul
fate
)
pH
4
(w
ith s
ulfa
te)
Electron flow (%)
R3
sludg
e (p
H 4
)
0102030405060708090100
pH 6
pH
5pH
4
pH
6
(w
ith s
ulfa
te)
p
H 5
(with
sul
fate
)
pH
4
(w
ith s
ulfa
te)
Electron flow (%) Figu
re 2
.8 E
lect
ron
shar
e at
the
end
of th
e ba
tch
activ
ity te
sts
fed
with
glu
cose
(A),
acet
ate
(B) a
nd h
ydro
gen
(C) f
or R
2 sl
udge
(top
figu
res)
and
R3
slud
ge
(bot
tom
figu
res)
. Met
hane
(),
sulfi
de (
), hy
drog
en (
), V
FA (
), et
hano
l (),
lact
ate
().
( *) in
suff
icie
nt b
uffe
r cap
acity
.
A -
Glu
cose
B
- A
ceta
te
C -
Hyd
roge
n
( *)
( *)
54
Cha
pter
2
3.7.3 Hydrogen
Figure 2.8 shows that hydrogen was not used at pH 4 by the two sludges, for either sulfate reduction or methanogenesis, but only a small amount for homoacetogenesis (less than 5%). At pH 5 (absence of sulfate), no hydrogenotrophic methanogenic activity was observed for both sludges, but hydrogen was utilized for homoacetogenesis. In the tests at pH 5 with sulfate, there was insufficient buffer capacity and the pH rose to 6.2-6.7 during the experiment for both sludges, due to sulfate reduction and methanogenesis. However, while sulfate reduction and homoacetogenesis took place with R3 (pH 4) sludge, R2 (pH 5) sludge produced mainly methane, although sulfidogenesis also occurred. At pH 6 and in the absence of sulfate, R2 (pH 5) sludge showed mainly methanogenic activity, besides homoacetogenesis, contrary to R3 (pH 4) sludge, that presented just homoacetogenesis, which confirms that hydrogenotrophic methanogens were not present in the sludge of this reactor or were irreversibly inhibited. At pH 6 and in the presence of sulfate, both sludges showed similar sulfate reduction (about 15% of electron flow). However, R2 (pH 5) sludge showed methanogenic activity (40%), contrary to R3 (pH 4) sludge. At pH 3 (test performed with R3 (pH 4) sludge), no hydrogen consumption was detected (data not shown).
4 DISCUSSION
4.1 Effect of pH on sulfate reduction
This study shows that thermophilic (55°C) sulfate reduction is possible in the acidification stage of a two-phase anaerobic treatment process at pH 6, 5 and 4 (Figure 2.3). To our knowledge, this is the first study reporting continuous sulfate reduction in a bioreactor with the reactor liquid controlled at pH 5 and 4. Decreasing the pH from 6 to 5 and 4 caused a decrease in the sulfate reduction efficiency, especially to pH 4 (Figure 2.3). However, the long reactor runs (R1-pH 6: 425 days; R2-pH 5 and R3-pH 4: 190 days) with significant sulfate reduction efficiencies open new perspectives in relation to sulfate reduction processes at low pH. Low pH values can have a direct effect on the sulfate reduction by affecting enzyme activity and, consequently, affecting the activity or even the growth of the neutrophilic microorganisms. Effects may also be indirect with changes in chemical equilibrium of the system related to e.g., toxicity of sulfide, VFA and heavy metals. The undissociated sulfide is considered to be the most toxic form of sulfide to microorganisms, because it can pass through the cell membrane (Postgate, 1979; O'Flaherty et al., 1998). The pKa of sulfide is 6.68 at 55°C (Amend and Shock, 2001), which means that at pH 6, 80% of the sulfide is in the undissociated form whereas at pH 5 and 4, nearly all the sulfide is in the undissociated form. Undissociated sulfide concentrations in R3 (pH 4) were always less than 30 mg l-1 (Figure 2.3). Although no sulfide toxicity data for sulfate reducing bacteria (SRB) are available for the low pH values investigated in this study, the lowest value reported in the literature is in the work of Stucki et al. (1993), where an undissociated sulfide below 40 to 50 mg l-1 was advised in order to achieve high sulfate reduction efficiencies with acetate, at pH 7.5-8.5. Therefore, the sulfide concentrations obtained at pH 4 in this study are expected to have not

Effect of low pH (6, 5 and 4) on sulfate reduction and acidification
Cha
pter
2
55
adversely affected sulfate reduction. At pH 5 and at COD/SO42- ratio of 3.5 (Period III),
undissociated sulfide concentrations reached 65 mg l-1 in R2, so sulfide toxicity can not be excluded in that reactor (Figure 2.3). VFA concentrations reached very high values (1-1.4 gCOD l-1) in the reactors (Figure 2.4). As the pKa of acetate, propionate and butyrate are in the range of 4.80-4.93 at 55°C (Amend and Shock, 2001), approximately 40% and 90% of those acids at, respectively, pH 5 and 4, will be in the undissociated form. The later form is, as with sulfide, considered the toxic form, as it can diffuse across the cell membrane and prevent the bacterial cell from maintaining a membrane potential and proton motive force (Gyure et al., 1990). Gyure et al. (1990) showed that concentrations of organic acids greater than 5 mM, which are lower than the values encountered in the present study (Figure 2.4), completely inhibited SRB activity in sediments at pH 3.8. Also Reis et al. (1990) reported 50% inhibition of SRB growth on lactate (pH 5.8 to 7.0) for undissociated acetic acid concentrations of approximately 54 mg l-1, so VFA toxicity was likely one of the causes of the lower sulfate reduction efficiencies observed in this study at pH 5 and 4.
4.2 Long term acidification and sulfate reduction at pH 6 and COD/SO42- ratio of 9
The results obtained in this study showed that complete acidification and sulfate reduction at pH 6 occurred over the whole 425 days run. This is in agreement with previous studies (Sipma et al., 1999; Lens et al., 2001; Lens et al., 2003). Lens et al. (2001) reported efficient acidification and sulfate reduction under the same environmental conditions (pH 6 and 55°C) at an OLR up to 40 gCOD (lreactor d)-1 and HRT of 5 hours over a period of 100 days, treating a synthetic cardboard wastewater containing starch, sucrose, lactate, propionate and acetate, at a COD/SO4
2- ratio of 10. The long time span during which sulfate reduction was observed in R1 suggests that SRB metabolize and grow at pH 6 and 55°C in the acidogenic phase of a two-phase anaerobic treatment. This study also showed that methanogens can slowly grow in such a system, given by the increase in methane production over approximately 150 days, up to a 50% utilization of the electron flow (Figure 2.7).
4.3 Effect of pH on the acidification efficiency and pathways
Acidification was complete at all the pH values tested, at the applied OLR (Figure 2.2). Besides the acidification efficiencies, the type of fermentation products obtained in the acidification reactor is very important for the overall treatment as it represents the substrate for the subsequent methanogenic reactor and therefore will determine the metabolic rates and operational stability to be expected. Acetic acid, butyric acid, lactate and ethanol are considered to be the best substrates for the methanogenic reactor (Ren et al., 1997; Yang et al., 2003). The present study showed that pH had a strong effect on the fermentation pathways (Figures 2.4 and 2.5). Decreasing the pH to 5 or 4 shifted the main fermentation products from mainly acetate at pH 6 to mainly butyrate at pH 5 and 4 (Figure 2.4). The least desirable substrate for methanogenesis, propionate (Wang et al., 2006), was minimum in the effluent of the reactor operating at pH 4, as compared with pH 5 and 6. Lactate, ethanol and hydrogen, absent in the effluent of the reactor at pH 6, accumulated in the reactors at pH 5 and pH 4, especially in the latter (Figure 2.5 and Table 2.2). At pH 4,

56
Cha
pter
2
hydrogen yield averaged 1.3 mol H2 (mol glucose)-1, which shows the potential of hydrogen production in the acidification stage of a two-phase treatment process (Liu and Fang, 2003; Hwang et al., 2004). Other studies on carbohydrate fermentation similarly show a decrease in the fraction of acetate relatively to the total VFA produced with the decrease of pH together with an increase in the fraction of butyrate (Reis et al., 1991b; Romli et al., 1994; Fang and Liu, 2002; Hwang et al., 2004; Zheng and Yu, 2004). Romli et al. (1994) also observed an increase in lactate and propionate together with the decrease in pH from 6.0 to 5.3. However, Kim et al. (2004) and Inanc et al. (1999), recommended a pH of about 5 in order to prevent propionate accumulation, which is not in agreement with the results obtained in this study (Figure 2.4). Kisaalita et al. (1987) reported an increased production of ethanol below pH 4.5 in the fermentation of lactose and Ren et al. (1997) described an ethanol-type fermentation from molasses around pH 4.5. The optimal pH value for hydrogen production was reported by Ren et al. (1995) to be in the pH range 4.0-4.5 for the continuous fermentation of sucrose, which is in agreement with the results of the present study. According to Romli et al. (1994), the lowering of the pH of the acidification reactor from 6.0 to 5.3 did not have any significant deterioration in the effluent quality of the two-phase treatment process and allowed a reduction in alkali addition of 30%. In this study, the operation at pH 5 as compared to pH 6 resulted in a significant decrease in NaOH addition of approximately 50% (Table 2.1) whereas at pH 4 no NaOH needed to be added for pH control (at pH 4 and COD/SO4
2- ratio of 3.5, even low amounts of HCl were needed to control the pH – Table 2.1). Moreover, although the overall efficiency of the two-phase treatment process was not addressed in this study, the metabolic pathways found in the acidification reactor at pH 4 seem to be more favourable to phase separation than operation at pH 6. The changes observed in the fermentation pathways according to the pH can be attributed to shifts in the dominant population present (Kisaalita et al., 1987; Horiuchi et al., 1999), to changes in the metabolism of the populations present or to a combination of both (Reis, 1991a). The relationship between fermentation products and hydrogen are given by the reaction stoichiometry: C6H12O6 + 2 H2O → 2 CH3COOH + 2CO2 + 4H2 (1)
C6H12O6 → CH3CH2CH2COOH + 2CO2 + 2H2 (2)
C6H12O6 + 2H2 → 2 CH3CH2COOH + 2H2O (3)
3 C6H12O6 → 4 CH3CH2COOH + 2 CH3COOH + 2CO2 +2 H2O (3’)
C6H12O6 → 2 CH3CH2OH + 2CO2 (4)
The shifting of glucose fermentation towards butyric acid (reaction 2) and ethanol (reaction 4) (Ren et al., 1997) at the lower pH is a way of counteracting the high proton concentration, in contrary to reactions (1), (3) and (3’), where more acid molecules are formed.
Effect of low pH (6, 5 and 4) on sulfate reduction and acidification
Cha
pter
2
57
Although reaction (1) is the one that yields more energy for the acidogenic bacteria (Thauer, 1982), reactions (2) to (4) become more favourable at elevated hydrogen concentration, as they are less sensitive (2), independent (3’ and 4) or even favoured (3) by high hydrogen concentration. However, reaction (3) was not considered to be important in anaerobic reactors (IWA, 2002). The higher hydrogen concentration at pH 5 and 4 relative to pH 6 (Table 2.2) would therefore lead to a decrease in the acetate concentration and a consequent increase in the butyrate, propionate and ethanol concentrations, which is in agreement with the results obtained in this study (Figures 2.4 and 2.5), except for propionate at pH 4. In fact, propionate accumulated in the reactor at pH 5, but not at pH 4 (Figure 2.4). This behaviour was described in previous studies (Inanc et al., 1996; Inanc et al., 1999; Wang et al., 2006). Propionate production can be inhibited at low pH as propionate-producing bacteria are suppressed at a low pH value (McCarty and Mosey, 1991; Inanc et al., 1999; Fang and Liu, 2002), contrary to the butyrate-producing bacteria, which are acid-tolerant bacteria (McCarty and Mosey, 1991). The accumulation of propionic and butyric acids could also be attributed to the pH inhibition of the acetogenic bacteria (Romli et al., 1994) and SRB (O'Flaherty et al., 1998) and to the fact that the correspondent syntrophic acetogenic reactions are also dependent on hydrogen concentration (Thauer et al., 1977). The accumulation of ethanol at pH 5 and 4 (Figure 2.5) can also be tentatively attributed to its production from acetic acid and hydrogen, which is a feasible reaction at high hydrogen partial pressures (Oh et al., 2003).The reason why hydrogen accumulates can be explained by the lower activity of the hydrogenotrophic methanogens (Kim et al., 2004) or SRB (van Houten, 1996) at low pH. The activity tests at pH 4 showed indeed the absence of sulfidogenic or methanogenic activity with hydrogen at that pH (Figure 2.8). At pH 5, the results were not clear, due to the insufficient buffering capacity of the batch medium (Figure 2.8).
4.4 Effect of sulfate reduction on the acidification efficiency and pathways
The acidification efficiency was complete in the reactors even with the increase in sulfate loading in R2 and R3 (Figure 2.2) and the fermentation pathways do not seem to have been affected by sulfate reduction, as the increase of sulfate loading in both R2 and R3 (Period III) did not significantly affect the fermentation products (Figures 2.4 and 2.5). The results of the activity tests with glucose as the substrate also did not show differences between the incubations with and without sulfate (Figure 2.8). Similarly, Sipma et al. (1999) found that the product patterns of the acidification of a synthetic wastewater composed of sucrose, propionate and butyrate in a thermophilic UASB reactor were not significantly affected by different sulfate concentrations (COD/SO4
2- ratios 1.33 and 6.67). Also Maillacheruvu et al. (1993) reported that the fermentation pathways of lactate and glucose did not change with different sulfate loading rates in chemostats fed with glucose. In contrast, Mizuno et al. (1998a) found a significant influence of the growth of SRB on the mesophilic degradation pathways of sucrose in a chemostat.
4.5 Substrates for sulfate reduction
Fermentation products from sucrose that SRB can use as substrates for sulfate reduction are VFA, hydrogen, lactate and alcohols (Mizuno et al., 1998a). SRB compete better than the hydrogen producing acetogens for the same substrates such as propionic acid and butyric acid (Mizuno et

58
Cha
pter
2
al., 1994). Oude Elferink et al. (1998b) reported that propionate is the preferred substrate for sulfate reduction in a sulfate limited reactor. Qatibi et al. (1990) showed that the oxidation of propionate was strongly dependent on sulfate reduction. It accelerated considerably in the presence of sulfate. The increase in sulfate concentration in Period III in R2 (pH 5) was accompanied by a decrease in butyrate and propionate (Figure 2.4), suggesting that these two substrates were also used by SRB at pH 5 to reduce the additional sulfate fed to the reactor. The same was observed for R3 (pH 4) in relation to butyrate. The non-preference for acetate is a nutritional characteristic of SRB (Oude Elferink et al., 1998b) and acetate utilizing SRB have a low growth rate (Widdel, 1988). Moreover, the inoculum sludge (Eerbeek sludge) contains only a small population of acetate degrading SRB (Oude Elferink et al., 1998b). The sludges of R2 and R3 show a poor sulfate reduction with acetate as the substrate at pH 6 and 5 and none at pH 4 (Figure 2.8). Besides, there was no change in the acetate concentration in the effluents of both R2 and R3 with the increase in sulfate concentration from Period II to III (Figure 2.4). So it is not likely that acetate was used as substrate for sulfate reduction in the reactors, as also reported by Mizuno et al. (1998a). Hydrogen was considered a key electron donor for SRB in the acidification phase at pH 6-6.5 and mesophilic conditions (Mizuno et al., 1998a) and at pH 6 and thermophilic conditions (Sipma et al., 1999; Lens et al., 2001; Lens et al., 2003). This is in agreement with this work, where both the sludge from R2 (pH 5) and R3 (pH 4) were capable of utilizing hydrogen for sulfate reduction at pH 6. In contrast, hydrogenotrophic sulfate reduction at pH 4 was absent in the sludge from reactors R2 (pH 5) and R3 (pH 4) (Figure 2.8). The fact that hydrogen was detected in the biogas from both R2 (pH 5) and R3 (pH 4) (Table 2.2 and Figure 2.7) and that sulfate reduction was not complete indicates that SRB are not capable of utilizing hydrogen for sulfate reduction at these lower pH values, at least within the HRT applied. Ethanol and lactate are reported in several studies as good substrates for SRB (Qatibi et al., 1990; Reis et al., 1992; Smul et al., 1997; Kaksonen et al., 2004b) and SRB are thought to outcompete lactate and ethanol oxidizers (Qatibi et al., 1990; Colleran et al., 1995). However, in the present study, ethanol accumulated in the effluent at pH 5 (R2) and even more at pH 4 (R3) (Figure 2.5). The increase in sulfate concentration from Period II to III did not cause a decrease in ethanol concentrations, suggesting that ethanol was not used for sulfate reduction. Lactate started to accumulate in the effluent of R2 and specially R3 with the increase in sulfate, suggesting as well that lactate was not a preferential substrate for sulfate reduction at these low pH values.
4.6 Effect of pH and sulfate concentration on methanogenesis
One of the most important parameters for the inhibition of the methanogenic activity in an acidogenic reactor is the pH (Kim et al., 2004). This study clearly shows the strong effect of pH on methanogenesis. At pH 6, methanogenesis represented up to 50% utilization of the electron flow, whereas at pH 5 it dropped to a maximum of 2% and at pH 4 methanogenesis was absent. This is in agreement with the findings of Hwang et al. (2004), where methanogenesis was completely inhibited below pH 4.5. On the other hand, Fang and Liu (2002) reported that the biogas was free of methane already at pH lower than 5.5. The activity tests performed in this study (Figure 2.8) confirmed that neither hydrogen nor acetate utilizing methanogens were
Effect of low pH (6, 5 and 4) on sulfate reduction and acidification
Cha
pter
2
59
present in the sludge of the reactor at pH 4, or were irreversibly inhibited. The nearly and complete suppression of methanogenesis at pH 5 and pH 4, respectively, has the advantage of avoiding methane losses in the acidification reactor which is desirable in a two-phase anaerobic treatment process (Demirel and Yenigün, 2002). Besides the direct effect of pH, the indirect effects of pH on sulfide and VFA toxicity are also important for methanogenesis, in a similar way as discussed for sulfate reduction, in the previous section. Pender et al. (2004) showed that the thermophilic acetotrophic methanogenesis was extremely sensitive to inhibition by sulfide (50% inhibition at 8-17 mg/l undissociated sulfide at pH 7.6-8.0) but that hydrogenotrophic methanogenesis was favoured. VFA toxicity does not seem to be relevant in the present study as reported values of inhibition are generally reported for much higher concentrations of VFA than the concentrations obtained in this study (McCarty and McKinney, 1961; Barredo and Evison, 1991; James et al., 1998). In R2 (pH 5), the decrease in the COD/SO4
2- ratio from 9 to 3.5 was followed by a suppression of the methanogenesis (Table 2.2). In a complex system involving acidogens, methanogens and SRB, competition between the bacteria/archaea for electron donors and inhibition by sulfide species will determine the outcome of the competition (Colleran et al., 1995; Maillacheruvu and Parkin, 1996). In the present study, hydrogen and acetate were still available as electron donors for methanogenesis, so probably the reason for the inhibition of methanogenesis was sulfide toxicity, given higher sulfide concentrations at the lower COD/SO4
2- ratio (Figure 2.3).
4.7 Characteristics of the acidifying granular sludge
The low pH (6, 5 and 4) and the presence of sulfate (COD/SO42- ratio of 9 and 3.5) did not
negatively affect the granular shape of the biomass. This is in agreement with previous studies which indicated that the granular sludge nature could be maintained at pH 6 during the acidification of a synthetic wastewater composed of starch, sucrose, lactate, propionate and acetate with a COD/SO4
2 ratio of 10 and HRT of 5 hours up to an OLR of 35 gCOD (lreactor d)-1 in UASB and EGSB reactors (Lens et al., 2001) and up to an OLR of 25 gCOD (lreactor d)-1 in a nitrogen sparged UASB reactor (Lens et al., 2003). At higher OLR flocculent sludge developed and in the absence of nitrogen sparging, slimy filaments deteriorated the sludge bed quality, which did not happen in a nitrogen sparged UASB (Lens et al., 2003). However, in the latter case a selective washout of SRB from the reactor or overgrowth of fermentatives was noticed (Lens et al., 2003). The poor attachment properties of SRB have been reported by several authors (Alphenaar, 1994; Omil et al., 1996; Shayegan et al., 2005). Sipma et al. (1999) observed good granular sludge at a COD/SO4
2 ratio of 6.67 (up to an OLR of 46 gCOD (lreactor d)-1) but higher sulfate loading rates (COD/SO4
2 ratio of 1.33) induced gelation of the sludge bed. It was not clear how the higher sulfate loading lead to the over-production of extracellular polymers (Sipma et al., 1999). The effect of low pH values on granulation is presently also poorly understood. Mulder (1990) reported granulation in mesophilic acidification in gas-lift reactors fed with glucose at pH values between 5.5 and 6.4 and concluded that the lower pH enhanced granulation. However, no studies were found for lower pH values. Further research is needed to elucidate the influence of sulfate reduction and low pH values on granulation and granule growth.
60
Cha
pter
2
5 CONCLUSIONS
• Thermophilic (55°C) sulfate reduction is possible in the acidification stage at pH 6, 5 and 4 at
an OLR of 3.5 gCOD (lreactor d)-1, although sulfate reduction efficiencies decreased with the
decrease in pH.
• Complete acidification of sucrose occurred at the pH values (6, 5 and 4) and COD/SO42- ratios
(9 and 3.5) investigated. The pH decrease caused a significant shift in the acidification
products.
• The granular form of the sludge was maintained throughout the reactors run (R1: 425 days;
R2/R3: 190 days).

61


63
Chapter
Influence of low pH (6, 5 and 4) on nutrient dynamics and characteristics of acidifying sulfate reducing
granular sludge Abstract The effect of a low pH (6, 5 and 4) on macro and micronutrient dynamics in anaerobic sludge granules was investigated in batch leaching experiments (48h) and thermophilic (55°C) Upflow Anaerobic Sludge Bed (UASB) reactors. The UASB reactors were fed with sucrose and sulfate at an organic loading rate of 3.5 gCOD (lreactor d)-1 and a COD/SO4
2- ratio of 9 or 3.5 over a period of 520 days at pH 6 and 270 days at pH 5 and 4. Decreasing the pH led to increased solubilisation of metals from the sludge in the leaching experiments within 48 hours. For many metals (Co, Ni, Fe, Zn and Al), the difference between pH 6 and 5 was very small. For the three pH values investigated, the degree of leaching was the highest for the macronutrients K, Ca and Mg while for the other micronutrients leaching decreased in the following order: Mn > Ni ≈ Co ≈ Fe > Al ≈ Zn ≈ Cu. In the continuously operating UASB reactors, most metals leached from the sludge granules except for Co at pH 6, Al at pH 6 and 5 and Cu and Zn at all three pH values investigated. At the end of the UASB reactor runs, the sludge granules were almost deprived of Fe and Mn both at pH 5 and 4. Despite the significant changes in the inorganic composition of the sludge granules, the granular form of the sludge was kept at the different pH values and sulfate loading rates applied, and no significant washout occurred, though the granules’ strength decreased at pH 5 and 4. The color of the granules changed gradually from black to grey during the operation at pH 6 and to a pale yellow during the operation at pH 5 and 4. Submitted
64
Cha
pter
3
1 INTRODUCTION
The anaerobic treatment of sulfate rich organic wastewaters involves interactions among various trophic groups of bacteria including acidogenic bacteria, acetogenic bacteria, methanogenic archaea and sulfate reducing bacteria. All these trophic groups require nutrients to sustain enzyme activity and for biomass growth (Zandvoort et al., 2006). Metals can be present as free ions or as different chemical species due to (bio)chemical processes such as precipitation, sorption onto minerals or extracellular polymers, ion exchange and chelation or complexation with both inorganic ions and organic ligands (Patidar and Tare, 2004b; van Hullebusch et al., 2005a). These processes can contribute to metal accumulation in biofilms and granular sludge, thus constituting a stock of trace metals. Depending on the speciation and thus the bioavailability, this stock can sustain the trace metal requirements of the microbial populations in granular sludge based bioreactors, like the Upflow Anaerobic Sludge Bed (UASB) reactor (Zandvoort et al., 2006). Not much is known about the effect of different operational conditions on the dynamics of the various macro and micronutrients in anaerobic granular sludge, i.e., under which conditions the nutrients are stored in or leached from the sludge granules. Such knowledge is important to allow for an efficient nutrient dosage to the bioreactors. The operational pH is an important parameter influencing the metal dynamics, as in general, metal solubility increases at lower pH values. Therefore, a decrease in the metal stock in the sludge granules is expected at lower pH values, which can lead to suboptimal reactor performance in case nutrient limitation develops. However, given the complexity of the granular sludge matrix, it is difficult to predict the extent of metal solubilisation and the changes in chemical speciation induced by the low pH values. This knowledge is important to assess the effects of unintended (pH shock) or intended (operation at acidophilic conditions) decreases in operational pH. Therefore, this work studied the effect of a low pH (6, 5 and 4) on the macro and micronutrients dynamics in granular sludge and on its characteristics. For this purpose, batch leaching experiments with granular sludge were performed and long-term continuous UASB reactors fed with sucrose and sulfate were operated under thermophilic (55°C) conditions. Macro and micronutrient retention was assessed by monitoring their concentrations in the sludge and in the liquid phase. In order to evaluate the distribution of the nutrients over different chemical fractions in the granular sludge, a sequential extraction scheme distinguishing 4 fractions of decreasing mobility/bioavailability was applied to the sludge. The UASB reactor sludges were observed by scanning electron microscopy (SEM) and their chemical composition was further quantified by the determination of soluble microbial products (SMP) and extracellular polymeric substances (EPS), as well as by energy dispersive X-ray (EDX) analysis.

Effect of low pH (6, 5 and 4) on nutrient dynamics and sludge characteristics
65 C
hapt
er 3
2 MATERIALS AND METHODS
2.1 Inoculum sludge
The inoculum of the batch leaching experiments and the continuous UASB reactor R1 was granular sludge harvested from a full-scale UASB treating papermill wastewater (Industriewater Eerbeek B.V., Eerbeek, The Netherlands) (Oude Elferink et al., 1998b). R1 was inoculated with approximately 2 kg wet granular Eerbeek sludge and after 120 days of operation, 600 g wet sludge was removed from R1 and used to inoculate two other UASB reactors, R2 and R3 (300 g wet sludge each).
2.2 Batch leaching experiments
The leaching of elements from the sludge granules at low pH under non-feeding conditions was studied in batch leaching experiments. 30 g wet granular Eerbeek sludge was added in 400 ml double-wall glass vessels containing 90 ml ultra-pure water (Milli-RO system, Millipore, Bedford, MA, USA). The pH was adjusted to the desired value with 1M HCl, the vessels were closed with butyl rubber stoppers and flushed with N2 to ensure anaerobic conditions. The vessels were placed in a rotative shaker at 100 rpm and kept at 55°C due to water heated in a thermostatic waterbath (Julabo, Seelbach, Germany) and recirculated in the double-wall of the vessels. The pH in the vessels was measured on-line with a pH electrode (Hamilton, Hilkomij BV, Rijswijk, The Netherlands) and controlled by automatic pH controllers (Endress and Hauser, Naarden, The Netherlands) by 0.1M NaOH or 0.1M HCl addition. Liquid samples were taken over time during 2 days in the experiments at pH 4 and 5 and 27 hours in the experiments at pH 6 and filtered through a 0.2 μm microfiber filter (Whatman FP 30, Germany) to determine dissolved element concentrations.
2.3 Continuous bioreactor experiments
In order to investigate the effect of low pH values on macro and micronutrients retention in granular sludge bioreactors treating unacidified sulfate rich wastewater, one UASB reactor with 6.5 l volume (R1) and two UASB reactors of 0.92 l each (R2 and R3) were used in this study. A detailed description of the experimental set-up and design as well as the performance of the three reactors, i.e., sulfate reduction, acidification and intermediate product formation was described in Chapter 2. The reactors were fed with a synthetic influent consisting of sucrose as a model carbohydrate (sole electron donor and carbon source), sulfate and nutrients, added to the reactors by peristaltic pumps. The concentration of sulfate, added as sodium sulfate, depended on the applied COD/SO4
2- ratios. The nutrient solution consisted of macro and micronutrients according to Table 3.1. In order to avoid precipitation in the storage vessels, the influent consisted of two different streams: 1. sucrose and sodium sulfate (kept at 4°C), and 2. macro and micronutrients. The medium was prepared with demineralised water.

66
Cha
pter
3
Table 3.1 Macro and micronutrients composition of the reactors influent.
Macronutrient Compound Influent (mg l-1)
N NH4Cl 8.72 K K2HPO4 4.19 P K2HPO4 1.66 S MgSO4.7H2O 0.87
Mg MgSO4.7H2O 0.66 Ca CaCl2.2H2O 0.36
Micronutrient (μg l-1) Fe FeCl2 . 4H2O 11.22 B H3BO3 0.17 Zn ZnCl2 0.48 Cu CuCl2 . 3H2O 0.26 Mn MnCl2 . 4H2O 2.77 Al AlCl3 . 6H2O 0.20 Co CoCl2 . 6H2O 9.90 Ni NiCl2 . 6H2O 0.45 Se Na2SeO3 . 5H2O 0.98 Mo (NH4)6Mo7O24 . 4H2O 0.08
Throughout the experiment, the three reactors were operated at 55oC, a hydraulic retention time of 10h, 1 m h-1 upflow velocity and an organic loading rate of 3.5 gCOD (lreactor d)-1. R1 was operated for 520 days at pH 6 and a COD/SO4
2- ratio of 9 throughout the experiment. R2 and R3 were run for 270 days, which was divided in three periods. After an initial start-up period of 12 days (Period I) operating at pH 6, R2 was operated at pH 5 and R3 at pH 4 (Period II and III). The COD/SO4
2- ratio was 9 (Period I and II) for both reactors and was decreased to 3.5 (by increasing the influent sulfate concentration) after 114 and 134 days of operation for R2 and R3, respectively (Period III). Effluent liquid samples were taken over time during the reactor runs to determine dissolved element concentrations in the same way as in the batch leaching experiments. Sludge samples were harvested from R1 after 210, 390 and 520 days of operation. From R2 and R3, sludge was harvested after 43, 90 and 270 days of operation (sludge samples named 163, 210 and 390 days, respectively, in order to refer to the start-up of R1, as R2 and R3 were inoculated with sludge harvested from R1 on day 120). Therefore, the first two sludge samples from R2 and R3 refer to a COD/SO4
2- ratio of 9 (Period II), whereas the last sludge samples from R2 and R3 refer to a COD/SO4
2- ratio of 3.5 (Period III).
2.4 Sequential extraction procedure and pseudo-total metal determination
The sequential extraction procedure applied to the sludge harvested from the continuous UASB reactor runs and at the end of the batch leaching experiments consisted of 4 steps and was based on Tessier et al. (1979) with some modifications (Osuna et al., 2004; van Hullebusch et al., 2005a) as described in Table 3.2. Extractants of increasing reactivity are used in each subsequent
Effect of low pH (6, 5 and 4) on nutrient dynamics and sludge characteristics
67 C
hapt
er 3
step, so that the fractions obtained correspond to metal species with lesser mobility. The pseudo-total metal content (TMC) was determined according to van Hullebusch et al. (2005a). The sequential extractions and the pseudo-total metal content were performed in triplicate on subsamples of about 1 g wet sludge. If the sum of the sequential extraction fractions and the TMC differed more than 25%, the sequential extraction results were not considered. All vessels used for metal analysis were previously cleaned in a 4 M HNO3 acid bath for at least 12 h. Table 3.2 Modified Tessier sequential extraction procedure. Fraction Extracting agent Extraction conditions Shaking timea Temperature (°C) 1. Exchangeable 10 ml NH4CH3COO
(1M, pH = 7) 1 h 20
2. Carbonates 10 ml CH3COOH (1M, pH = 5.5)
1 h 20
3. Organic matter/sulfides 5 ml H2O2 (30%, pH = 2)
3 h 35
4. Residual 10 ml Aqua regia (HCl:HNO3, 3:1)
26 min Microwave-ovenb
a Shaking was applied at 100 rpm. b Extraction of the residual fraction in the microwave was equal to the pseudo-total extraction method.
2.5 Microscopic analysis
At the end of the R2 and R3 run, samples were taken from these reactors and also from R1 (day 390) for scanning electron microscopy (SEM) and energy dispersive X-ray (EDX) analysis. Prior to electron microscopic analysis, intact and cross-sectioned granules were prepared as described by Alphenaar et al. (1994). SEM observations were performed with a scanning electron microscope (JSM 6300F; JEOL, Tokyo, Japan) at 10 keV as described by Gonzalez-Gil et al. (2001). Environmental Scanning Electron Microscopy (ESEM) examinations were performed in an Electroscan (Wilmington, MA) Type II LaB6gun microscope. The ESEM was operated at 30 keV using the environmental secondary detector. Qualitative elemental analysis of the granules (selected area of 20 µm × 20 µm in the ESEM) were performed by EDX.
2.6 SMP and EPS
Soluble microbial products (SMP) and extracellular polymeric substances (EPS) were extracted from the sludge samples harvested from R1 on days 390 and 520 and from R2 and R3 on days 210 and 390. The extraction procedure was based on Zhang et al. (1999). SMP were extracted by centrifuging 1 g wet sludge in 50 ml demineralised water for 5 minutes at 5000 rpm, followed by filtration of the supernatant through a 0.2 μm microfiber filter (Whatman FP 30, Germany). For EPS determination, 50 ml of demineralised water was added to the remaining sludge and heated for 60 minutes at 105°C. The samples were subsequently centrifuged for 5 minutes at 7500 rpm and the supernatant was filtered through a 0.2 μm microfiber filter. The carbohydrate and protein content were determined in the SMP and EPS extracts.
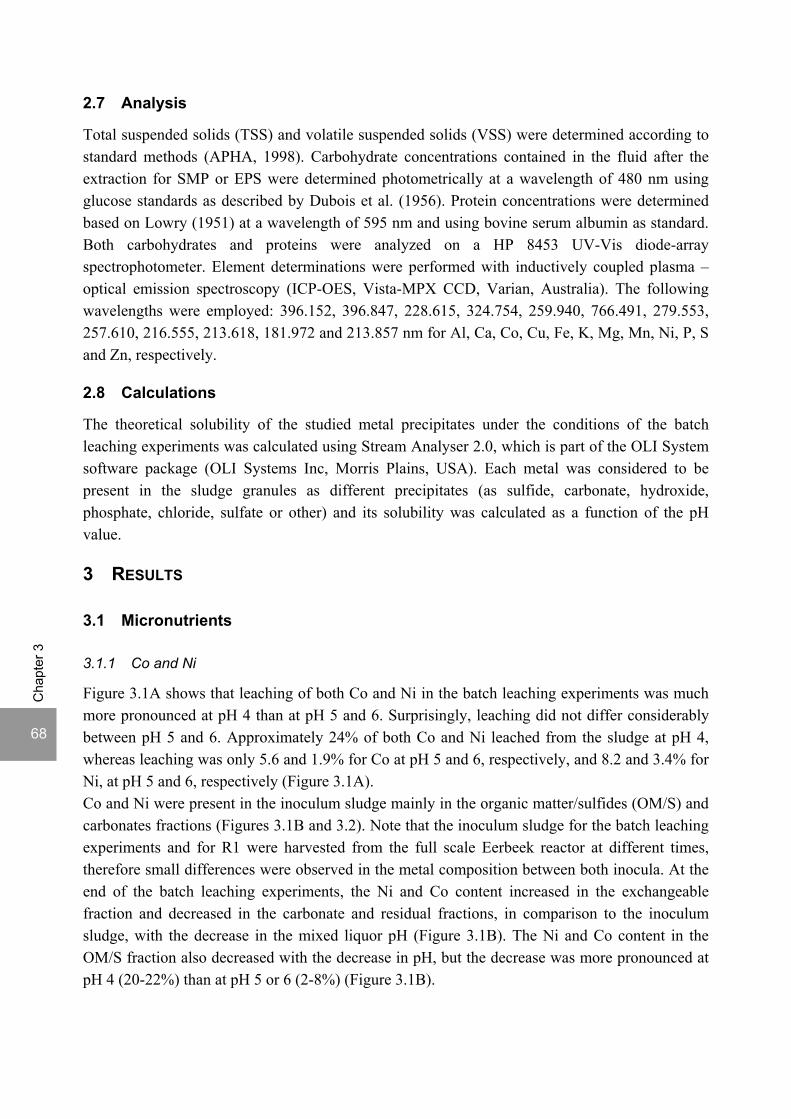
68
Cha
pter
3
2.7 Analysis
Total suspended solids (TSS) and volatile suspended solids (VSS) were determined according to standard methods (APHA, 1998). Carbohydrate concentrations contained in the fluid after the extraction for SMP or EPS were determined photometrically at a wavelength of 480 nm using glucose standards as described by Dubois et al. (1956). Protein concentrations were determined based on Lowry (1951) at a wavelength of 595 nm and using bovine serum albumin as standard. Both carbohydrates and proteins were analyzed on a HP 8453 UV-Vis diode-array spectrophotometer. Element determinations were performed with inductively coupled plasma – optical emission spectroscopy (ICP-OES, Vista-MPX CCD, Varian, Australia). The following wavelengths were employed: 396.152, 396.847, 228.615, 324.754, 259.940, 766.491, 279.553, 257.610, 216.555, 213.618, 181.972 and 213.857 nm for Al, Ca, Co, Cu, Fe, K, Mg, Mn, Ni, P, S and Zn, respectively.
2.8 Calculations
The theoretical solubility of the studied metal precipitates under the conditions of the batch leaching experiments was calculated using Stream Analyser 2.0, which is part of the OLI System software package (OLI Systems Inc, Morris Plains, USA). Each metal was considered to be present in the sludge granules as different precipitates (as sulfide, carbonate, hydroxide, phosphate, chloride, sulfate or other) and its solubility was calculated as a function of the pH value.
3 RESULTS
3.1 Micronutrients
3.1.1 Co and Ni
Figure 3.1A shows that leaching of both Co and Ni in the batch leaching experiments was much more pronounced at pH 4 than at pH 5 and 6. Surprisingly, leaching did not differ considerably between pH 5 and 6. Approximately 24% of both Co and Ni leached from the sludge at pH 4, whereas leaching was only 5.6 and 1.9% for Co at pH 5 and 6, respectively, and 8.2 and 3.4% for Ni, at pH 5 and 6, respectively (Figure 3.1A). Co and Ni were present in the inoculum sludge mainly in the organic matter/sulfides (OM/S) and carbonates fractions (Figures 3.1B and 3.2). Note that the inoculum sludge for the batch leaching experiments and for R1 were harvested from the full scale Eerbeek reactor at different times, therefore small differences were observed in the metal composition between both inocula. At the end of the batch leaching experiments, the Ni and Co content increased in the exchangeable fraction and decreased in the carbonate and residual fractions, in comparison to the inoculum sludge, with the decrease in the mixed liquor pH (Figure 3.1B). The Ni and Co content in the OM/S fraction also decreased with the decrease in pH, but the decrease was more pronounced at pH 4 (20-22%) than at pH 5 or 6 (2-8%) (Figure 3.1B).

Effect of low pH (6, 5 and 4) on nutrient dynamics and sludge characteristics
69 C
hapt
er 3
In the continuous UASB reactors, a more pronounced difference between leaching of Co and Ni from the sludge at pH 6 and 5 was observed (Figure 3.2). The total Co content of the sludge granules remained approximately constant during the run at pH 6, whereas the total Co content decreased gradually at pH 5 and 4. However, Co leaching was faster and to a higher extent at pH 4 than at pH 5 (49% and 6% decrease, respectively, relatively to the inoculum sludge, at day 210, and 67% and 27% decrease, respectively, at the end of the UASB reactor runs). The total Ni content decreased to similar values at the three pH values (Figure 3.2). At day 210, the sludge from the pH 6 UASB reactor showed a total Ni content slightly higher than the inoculum sludge, whereas the sludge at pH 5 and 4 showed a 40-49% decrease in the total Ni content. The decrease was nevertheless faster at pH 4 than 5, as the sludges at day 163 show. After 390 days, the total Ni content was higher at pH 5 and 4 than at pH 6, likely due to the lower COD/SO4
2- ratio applied in R2 and R3 (Table 3.3). The Co and Ni content in the carbonate fraction of the UASB reactor sludges decreased at all the pH values tested. The residual fraction increased initially at pH 6 relatively to the inoculum sludge but decreased afterwards. The decrease in residual fraction was also observed at pH 5 and 4. At the end of the three UASB reactor runs, both Co and Ni were mainly located in the OM/S fraction (51-79%). The decrease in COD/SO4
2- ratio from 9 to 3.5 at pH 5 and 4 increased the Co and Ni in the OM/S fraction, particularly at pH 5 (day 210 versus day 390, Figure 3.2).
Table 3.3 Total dissolved sulfide concentrations in the reactors according to the applied COD/SO42- ratio.
COD/SO42- ratio
Reactor 9 3.5 R1 (pH 6) 26.55 ± 3.61 - R2 (pH 5) 30.15 ± 3.89 63.22 ± 8.28 R3 (pH 4) 16.13 ± 4.23 23.73 ± 5.66
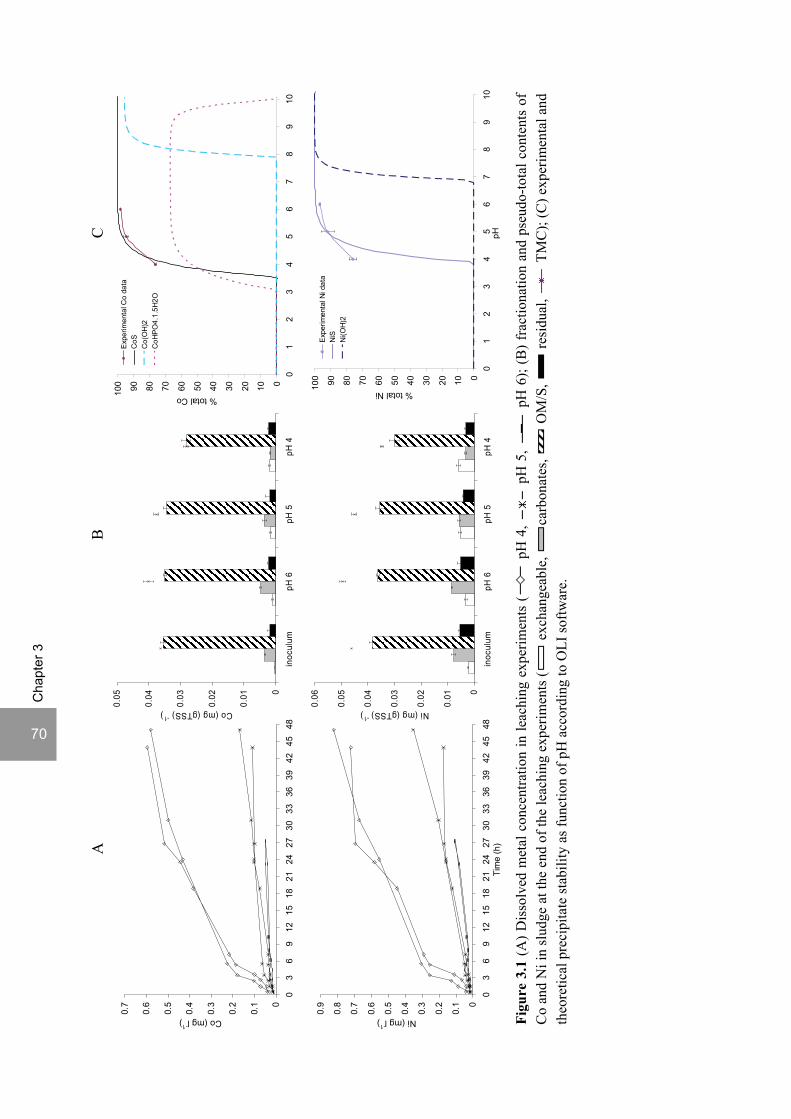
70
Cha
pter
3
Figu
re 3
.1 (A
) Dis
solv
ed m
etal
con
cent
ratio
n in
leac
hing
exp
erim
ents
( p
H 4
, p
H 5
, p
H 6
); (B
) fra
ctio
natio
n an
d ps
eudo
-tota
l con
tent
s of
C
o an
d N
i in
slud
ge a
t the
end
of t
he le
achi
ng e
xper
imen
ts (
exc
hang
eabl
e,
carb
onat
es,
OM
/S,
resi
dual
, T
MC
); (C
) exp
erim
enta
l and
th
eore
tical
pre
cipi
tate
stab
ility
as f
unct
ion
of p
H a
ccor
ding
to O
LI so
ftwar
e.
A
B
C
0
0.01
0.02
0.03
0.04
0.05
0.06
inoc
ulum
pH 6
pH 5
pH 4
Ni (mg (gTSS)-1)
0
0.1
0.2
0.3
0.4
0.5
0.6
0.7
0.8
0.9
03
69
1215
1821
2427
3033
3639
4245
48Ti
me
(h)
Ni (mg l-1
)
0
0.1
0.2
0.3
0.4
0.5
0.6
0.7
03
69
1215
1821
2427
3033
3639
4245
48
Co (mg l-1
)
0102030405060708090100
01
23
45
67
89
10
% total Co
Exp
erim
enta
l Co
data
CoS
Co(
OH
)2C
oHP
O4.
1.5H
2O
0102030405060708090100
01
23
45
67
89
10pH
% total Ni
Exp
erim
enta
l Ni d
ata
NiS
Ni(O
H)2
0
0.01
0.02
0.03
0.04
0.05
inoc
ulum
pH 6
pH 5
pH 4
Co (mg (gTSS)-1)

Effect of low pH (6, 5 and 4) on nutrient dynamics and sludge characteristics
71 C
hapt
er 3
0
0.01
0.02
0.03
0.04
0.05
0.06
0.07
0.08
0.09
0.1
0 210 390 520 163 210 390 163 210 390Time (days)
Ni (
mg
(gTS
S)-1
)
R1- pH 6 R2 - pH 5 R3 - pH 4
0
0.02
0.04
0.06
0.08
0.1
0.12
0 210 390 520 163 210 390 163 210 390
Co
(mg
(gTS
S)-1
)
R1- pH 6 R2 - pH 5 R3 - pH 4
Figure 3.2 Metal fractionation and pseudo-total contents of Co, Ni, Fe and Mn in sludge from R1, R2 and R3 ( exchangeable, carbonates, OM/S, residual, TMC).
3.1.2 Fe and Mn
In the batch leaching experiments, Fe leaching was higher at pH 4 than 5 or 6 (Figure 3.3A) and the difference observed between pH 5 and 4 was smaller than the difference observed between pH 6 and 5 (21.7, 3.3 and 0.2% leaching at pH 4, 5 and 6, respectively), similarly to Co and Ni. Mn leaching also increased with the decrease in pH but the difference observed between the three pH values was more linear (55.4, 28.1 and 4.7% leaching at pH 4, 5 and 6, respectively). Figures 3.2 and 3.3B show that the inoculum sludge contained Fe mainly in the residual fraction, whereas Mn was mainly present in the carbonates fraction. At the end of the batch leaching experiments, the Fe content decreased in all fractions at pH 4, except for the exchangeable fraction, which increased with the decrease in pH (Figure 3.3B). Mn leaching at pH 5 was mainly due to the decrease in the OM/S fraction (53%), whereas at pH 4, Mn leached from all fractions (Figure 3.3B).
0
10
20
30
40
50
60
70
80
0 210 390 520 163 210 390 163 210 390
Fe (m
g (g
TSS)
-1)
R1- pH 6 R2 - pH 5 R3 - pH 4
0
0.05
0.1
0.15
0.2
0.25
0.3
0.35
0.4
0.45
0.5
0 210 390 520 163 210 390 163 210 390Time (days)
Mn
(mg
(gTS
S)-1
)
R1- pH 6 R2 - pH 5 R3 - pH 4
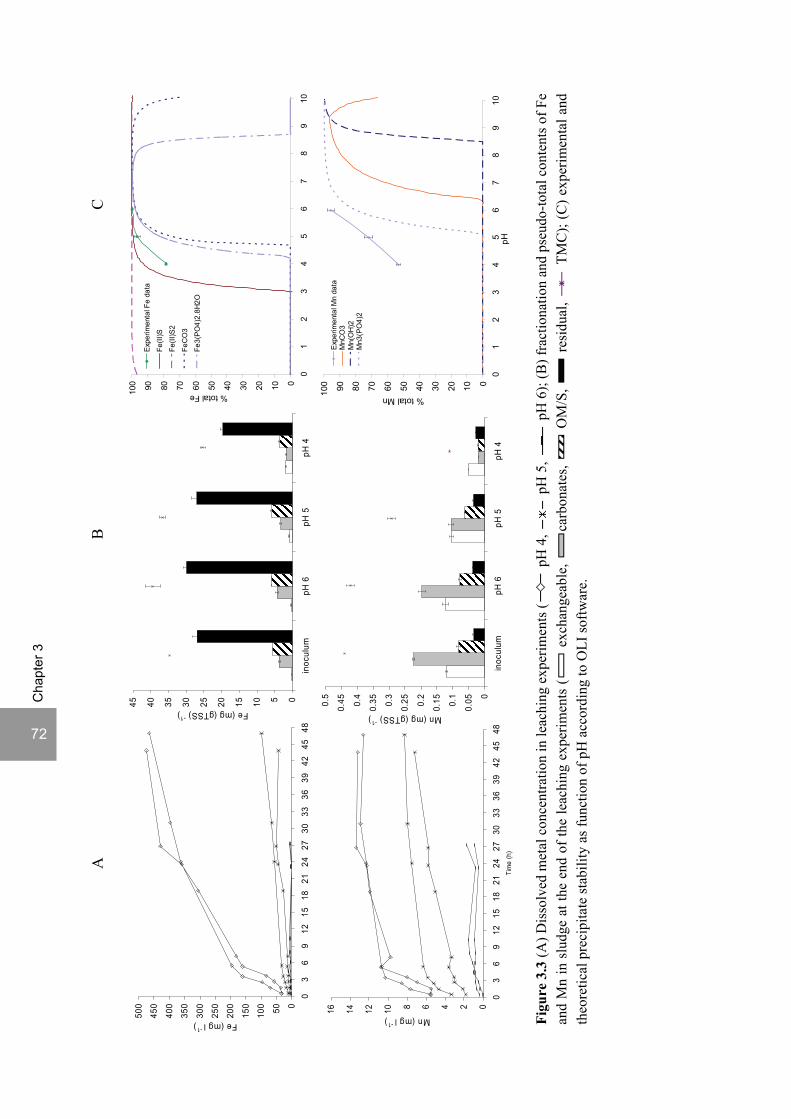
72
Cha
pter
3
Figu
re 3
.3 (A
) Dis
solv
ed m
etal
con
cent
ratio
n in
leac
hing
exp
erim
ents
( p
H 4
, p
H 5
, p
H 6
); (B
) fra
ctio
natio
n an
d ps
eudo
-tota
l con
tent
s of F
e an
d M
n in
slu
dge
at th
e en
d of
the
leac
hing
exp
erim
ents
( e
xcha
ngea
ble,
ca
rbon
ates
, O
M/S
, re
sidu
al,
TM
C);
(C) e
xper
imen
tal a
nd
theo
retic
al p
reci
pita
te st
abili
ty a
s fun
ctio
n of
pH
acc
ordi
ng to
OLI
softw
are.
050100
150
200
250
300
350
400
450
500
03
69
1215
1821
2427
3033
3639
4245
48
Fe (mg l-1)
051015202530354045
inoc
ulum
pH 6
pH 5
pH 4
Fe (mg (gTSS)-1)
0
0.050.
1
0.150.
2
0.250.
3
0.350.
4
0.450.
5
inoc
ulum
pH 6
pH 5
pH 4
Mn (mg (gTSS)-1)
0246810121416
03
69
1215
1821
2427
3033
3639
4245
48Ti
me
(h)
Mn (mg l-1)A
B
C
0102030405060708090100
01
23
45
67
89
10
% total Fe
Expe
rimen
tal F
e da
ta
Fe(II
)S
Fe(II
)S2
FeC
O3
Fe3(
PO4)
2.8H
2O
0102030405060708090100
01
23
45
67
89
10pH
% total Mn
Expe
rimen
tal M
n da
taM
nCO
3M
n(O
H)2
Mn3
(PO
4)2
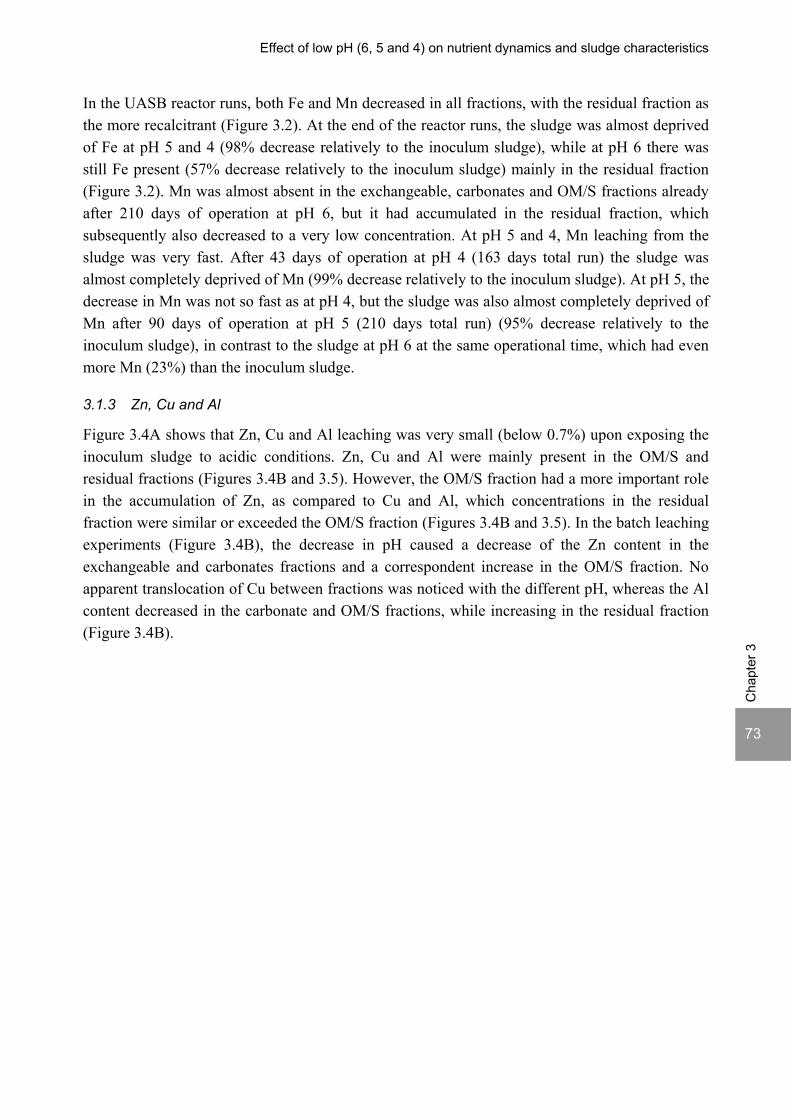
Effect of low pH (6, 5 and 4) on nutrient dynamics and sludge characteristics
73 C
hapt
er 3
In the UASB reactor runs, both Fe and Mn decreased in all fractions, with the residual fraction as the more recalcitrant (Figure 3.2). At the end of the reactor runs, the sludge was almost deprived of Fe at pH 5 and 4 (98% decrease relatively to the inoculum sludge), while at pH 6 there was still Fe present (57% decrease relatively to the inoculum sludge) mainly in the residual fraction (Figure 3.2). Mn was almost absent in the exchangeable, carbonates and OM/S fractions already after 210 days of operation at pH 6, but it had accumulated in the residual fraction, which subsequently also decreased to a very low concentration. At pH 5 and 4, Mn leaching from the sludge was very fast. After 43 days of operation at pH 4 (163 days total run) the sludge was almost completely deprived of Mn (99% decrease relatively to the inoculum sludge). At pH 5, the decrease in Mn was not so fast as at pH 4, but the sludge was also almost completely deprived of Mn after 90 days of operation at pH 5 (210 days total run) (95% decrease relatively to the inoculum sludge), in contrast to the sludge at pH 6 at the same operational time, which had even more Mn (23%) than the inoculum sludge.
3.1.3 Zn, Cu and Al
Figure 3.4A shows that Zn, Cu and Al leaching was very small (below 0.7%) upon exposing the inoculum sludge to acidic conditions. Zn, Cu and Al were mainly present in the OM/S and residual fractions (Figures 3.4B and 3.5). However, the OM/S fraction had a more important role in the accumulation of Zn, as compared to Cu and Al, which concentrations in the residual fraction were similar or exceeded the OM/S fraction (Figures 3.4B and 3.5). In the batch leaching experiments (Figure 3.4B), the decrease in pH caused a decrease of the Zn content in the exchangeable and carbonates fractions and a correspondent increase in the OM/S fraction. No apparent translocation of Cu between fractions was noticed with the different pH, whereas the Al content decreased in the carbonate and OM/S fractions, while increasing in the residual fraction (Figure 3.4B).
74
Cha
pter
3
Figu
re 3
.4 (A
) Dis
solv
ed m
etal
con
cent
ratio
n in
leac
hing
exp
erim
ents
( p
H 4
, p
H 5
, p
H 6
); (B
) fra
ctio
natio
n an
d ps
eudo
-tota
l con
tent
s of
Zn
, Cu
and
Al i
n sl
udge
at t
he e
nd o
f the
leac
hing
exp
erim
ents
( e
xcha
ngea
ble,
ca
rbon
ates
, O
M/S
, re
sidu
al,
TM
C);
(C) e
xper
imen
tal
and
theo
retic
al p
reci
pita
te st
abili
ty a
s fun
ctio
n of
pH
acc
ordi
ng to
OLI
softw
are.
0
0.050.
1
0.150.
2
0.250.
3
0.35
inoc
ulum
pH 6
pH 5
pH 4
Zn (mg (gTSS)-1)
0
0.02
0.04
0.06
0.080.
1
0.12
0.14
0.16
0.180.
2
inoc
ulum
pH 6
pH 5
pH 4
Cu (mg (gTSS)-1)
0246810121416
inoc
ulum
pH 6
pH 5
pH 4
Al (mg (gTSS)-1)
0
0.00
5
0.01
0.01
5
0.02
0.02
5
03
69
1215
1821
2427
3033
3639
4245
48
Cu (mg l-1)
0
0.51
1.52
2.53
3.54
4.5
03
69
1215
1821
2427
3033
3639
4245
48Ti
me
(h)
Al (mg l-1)0
0.050.
1
0.150.
2
0.250.
3
03
69
1215
1821
2427
3033
3639
4245
48
Zn (mg l-1)
0102030405060708090100
01
23
45
67
89
10
% total Zn
Exp
erim
enta
l Zn
data
ZnS
Zn3(
PO
4)2.
2H2O
0102030405060708090100
01
23
45
67
89
10
% total Cu
Exp
erim
enta
l Cu
data
Cu(
II)S
Cu(
I)2S
Cu3
(PO
4)2.
2H2O
Cu
0102030405060708090100
01
23
45
67
89
10pH
% total Al
Expe
rimen
tal A
l dat
aAl
(OH
)3Al
PO4
A
B
C

Effect of low pH (6, 5 and 4) on nutrient dynamics and sludge characteristics
75 C
hapt
er 3
Figure 3.5 Metal fractionation and pseudo-total contents of Zn, Cu and Al in sludge from R1, R2 and R3 ( exchangeable, carbonates, OM/S, residual, TMC).
The Zn and Cu contents of the UASB reactor sludges were kept similar during the reactor run at pH 6 (Figure 3.5), whereas at pH 5 and 4, Zn and Cu accumulated in the sludge, particularly when the COD/SO4
2- ratio was decreased from 9 to 3.5 (210 versus 390 days). The Al content in the sludge increased at pH 6 relatively to the inoculum sludge. The operation at pH 5 did not change significantly the Al content in the sludge whereas at pH 4, the Al content in the sludge decreased back to a similar concentration as in the inoculum sludge. In the UASB reactor runs (Figure 3.5), Zn accumulation at pH 5 and 4 occurred mainly in the OM/S fraction, but also additionally in the residual fraction with the increase in sulfate loading rate (day 210 versus day 390). Cu accumulation at pH 5 and 6 occurred mainly in the residual fraction but also additionally in the OM/S fraction with the increase in sulfate loading rate (day 210 versus day 390). In contrast, the Al content in the OM/S fraction decreased at pH 5 and 4 (Figure 3.5).
0
2.5
5
7.5
10
12.5
15
17.5
0 210 390 520 163 210 390 163 210 390
Time (days)
Al (m
g (g
TSS)
-1)
R2 - pH 5R1- pH 6 R3 - pH 4
0
0.05
0.10.15
0.2
0.25
0.3
0.350.4
0.45
0.5
0 210 390 520 163 210 390 163 210 390
Cu
(mg
(gTS
S)-1
)
R1- pH 6 R2 - pH 5 R3- pH 4
0
0.3
0.6
0.9
1.2
1.5
1.8
2.1
2.4
2.7
0 210 390 520 163 210 390 163 210 390
Zn (m
g (g
TSS
)-1)
R1- pH 6 R2 - pH 5 R3 - pH 4
76
Cha
pter
3
3.2 Macronutrients
3.2.1 Ca, Mg and K
Large amounts of Ca, Mg and K leached from the sludge in the batch leaching experiments at pH 4 (68, 40 and 82%, respectively), followed by pH 5 and 6 (Figure 3.6A). In the inoculum sludge, Ca, Mg and K were mainly present in the carbonates and exchangeable fractions (Figure 3.6B). The lowering of the mixed liquor pH provoked a loss of Ca, Mg and K from the three first fractions, while the residual fraction showed little change (Figure 3.6B). In the UASB reactor runs, the Mg, Ca and K contents in the sludge decreased to similar levels at the three pH values but at a faster leaching rate at pH 5 and 4 than for pH 6 (Figure 3.7). The data on the sequential extraction is not presented because the sum of the sequential extraction fractions and the TMC differed more than 25%.
3.2.2 P and S
Figure 3.8A shows that P leaching was similar at the three pH values investigated (3.3-7.6%), whereas S leaching was higher at pH 4 than at pH 5 and 6 and similar between the latter two pH values (10.5, 2.0 and 0.8% at pH 4, 5 and 6, respectively). In the inoculum sludge, P and S were mainly present in the residual fraction. In the case of S, approximately 40% was also present in the OM/S fraction. The lowering of the mixed liquor pH provoked a loss of P in the exchangeable and carbonates fractions and an increase in the OM/S and residual fractions. S was leached mainly from the carbonates and residual fractions (Figure 3.8B). In the UASB reactor runs, the P and S content in the sludge decreased at the three pH values investigated but the decrease of P and S was faster with decreasing pH value (Figure 3.7). At pH 6, leaching of both elements from the sludge occurred mainly from the residual fraction, whereas the concentration in the OM/S fraction remained similar. At pH 5 and 4, the same behaviour was found for P, but S also leached from the OM/S fraction. With the decrease in COD/SO4
2- ratio, P accumulated in the first three extraction fractions, especially at pH 4, particularly in the exchangeable and in the OM/S fractions. This contrasts with S, which concentration decreased in all the fractions upon increasing the sulfate concentration in the R2 and R3 influent.
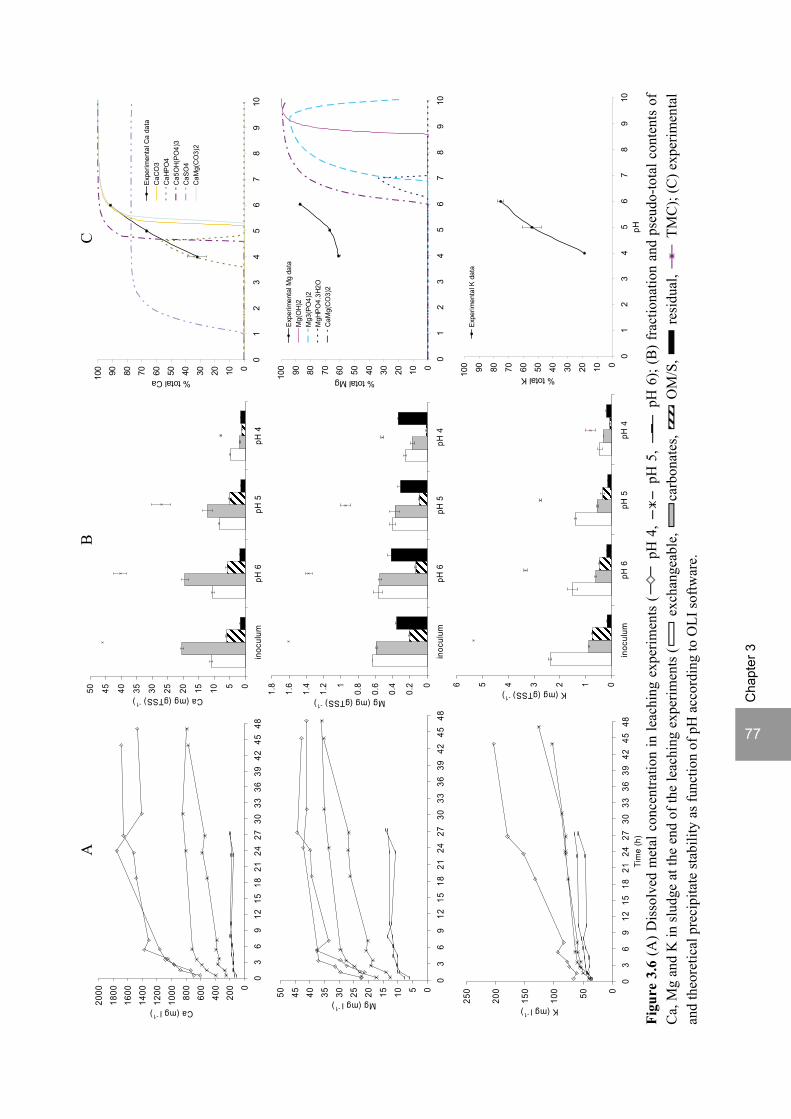
77 C
hapt
er 3
0102030405060708090100
01
23
45
67
89
10pH
% total K
Exp
erim
enta
l K d
ata
0
0.2
0.4
0.6
0.81
1.2
1.4
1.6
1.8
inoc
ulum
pH 6
pH 5
pH 4
Mg (mg (gTSS)-1)
05101520253035404550
inoc
ulum
pH 6
pH 5
pH 4
Ca (mg (gTSS)-1)
0123456
inoc
ulum
pH 6
pH 5
pH 4
K (mg (gTSS)-1)05101520253035404550
03
69
1215
1821
2427
3033
3639
4245
48
Mg (mg l-1)
050100
150
200
250
03
69
1215
1821
2427
3033
3639
4245
48Ti
me
(h)
K (mg l-1)
020
040
060
080
010
0012
0014
0016
0018
0020
00
03
69
1215
1821
2427
3033
3639
4245
48
Ca (mg l-1)
0102030405060708090100
01
23
45
67
89
10
% total Ca
Expe
rimen
tal C
a da
taC
aCO
3C
aHP
O4
Ca5
OH(
PO
4)3
CaS
O4
CaM
g(C
O3)
2
0102030405060708090100
01
23
45
67
89
10
% total Mg
Exp
erim
enta
l Mg
data
Mg(
OH
)2M
g3(P
O4)
2M
gHP
O4.
3H2O
CaM
g(C
O3)
2
Figu
re 3
.6 (A
) Dis
solv
ed m
etal
con
cent
ratio
n in
leac
hing
exp
erim
ents
( p
H 4
, p
H 5
, p
H 6
); (B
) fra
ctio
natio
n an
d ps
eudo
-tota
l con
tent
s of
C
a, M
g an
d K
in sl
udge
at t
he e
nd o
f the
leac
hing
exp
erim
ents
( e
xcha
ngea
ble,
ca
rbon
ates
, O
M/S
, re
sidu
al,
TM
C);
(C) e
xper
imen
tal
and
theo
retic
al p
reci
pita
te st
abili
ty a
s fun
ctio
n of
pH
acc
ordi
ng to
OLI
softw
are.
A
B
C
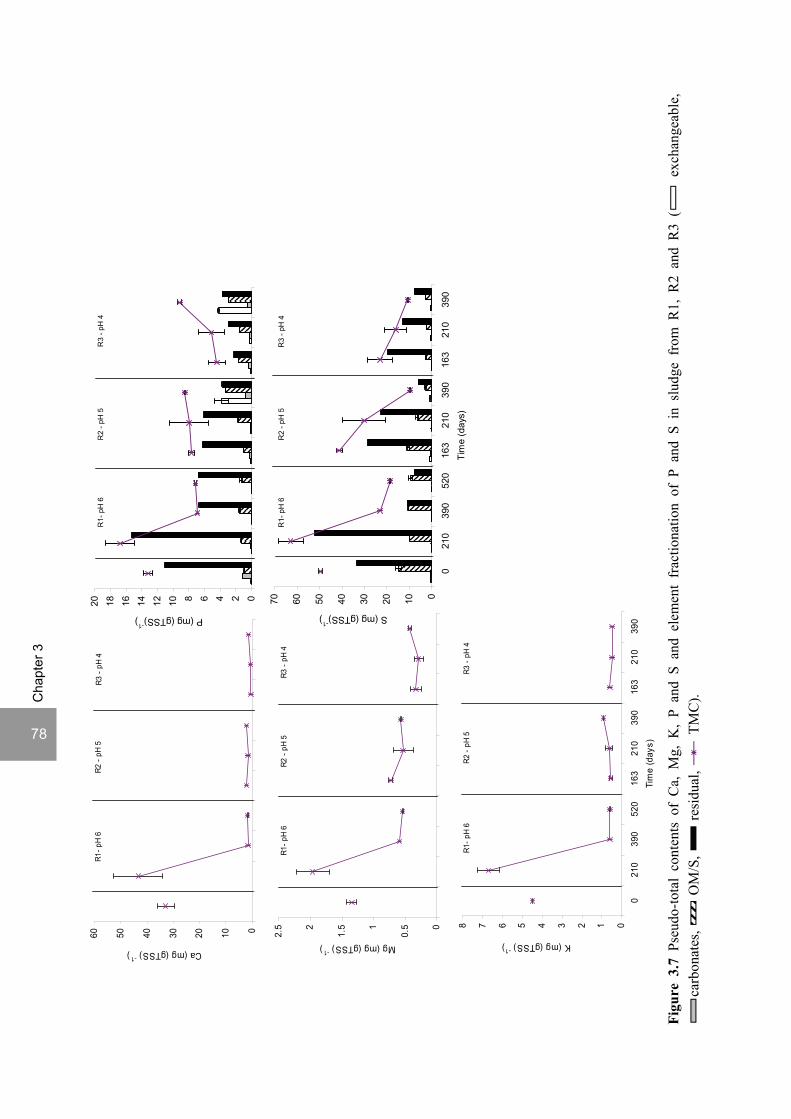
78
Cha
pter
3
010203040506070
021
039
052
016
321
039
016
321
039
0Ti
me
(day
s)
S (mg (gTSS)-1
)
R1-
pH
6R
2 - p
H 5
R3
- pH
4
Figu
re 3
.7 P
seud
o-to
tal
cont
ents
of
Ca,
Mg,
K,
P an
d S
and
elem
ent
frac
tiona
tion
of P
and
S i
n sl
udge
fro
m R
1, R
2 an
d R
3 (
exc
hang
eabl
e,
carb
onat
es,
OM
/S,
resi
dual
, T
MC
).
02468101214161820
021
039
052
016
321
039
016
321
039
0
P (mg (gTSS)-1
)
R1-
pH
6R
2 - p
H 5
R3
- pH
4
0102030405060
02
35
12
31
23
Ca (mg (gTSS)-1)
R1- p
H 6
R2 -
pH 5
R3 -
pH 4
012345678
021
039
052
016
321
039
016
321
039
0Ti
me
(day
s)
K (mg (gTSS)-1)
R1- p
H 6
R2 -
pH 5
R3 -
pH 4
0
0.51
1.52
2.5
021
039
052
016
321
039
016
321
039
0
Mg (mg (gTSS)-1)
R1- p
H 6
R2 -
pH 5
R3 -
pH 4
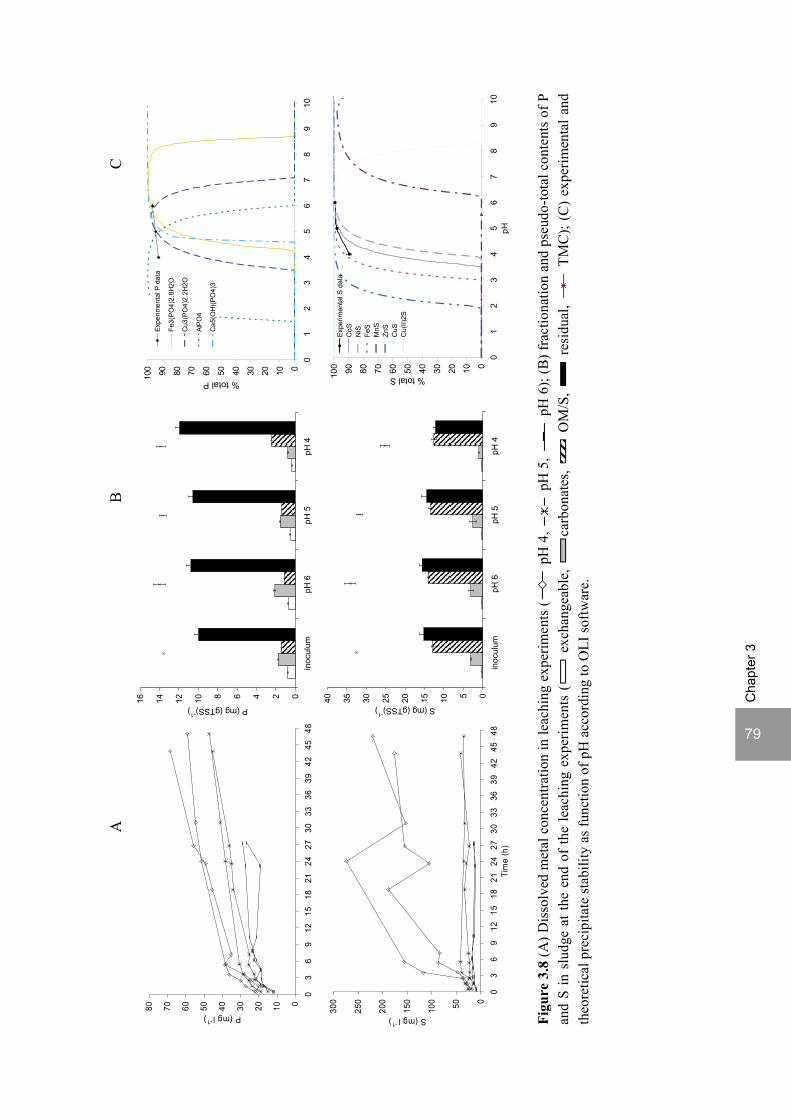
79 C
hapt
er 3
Figu
re 3
.8 (A
) Dis
solv
ed m
etal
con
cent
ratio
n in
leac
hing
exp
erim
ents
( p
H 4
, p
H 5
, p
H 6
); (B
) fra
ctio
natio
n an
d ps
eudo
-tota
l con
tent
s of
P
and
S in
slu
dge
at th
e en
d of
the
leac
hing
exp
erim
ents
( e
xcha
ngea
ble,
ca
rbon
ates
, O
M/S
, r
esid
ual,
TM
C);
(C)
expe
rimen
tal a
nd
theo
retic
al p
reci
pita
te st
abili
ty a
s fun
ctio
n of
pH
acc
ordi
ng to
OLI
softw
are.
0246810121416
inoc
ulum
pH 6
pH 5
pH 4
P (mg (gTSS)-1
)
0510152025303540
inoc
ulum
pH 6
pH 5
pH 4
S (mg (gTSS)-1
)
01020304050607080
03
69
1215
1821
2427
3033
3639
4245
48
P (mg l-1)
050100
150
200
250
300
03
69
1215
1821
2427
3033
3639
4245
48Ti
me
(h)
S (mg l-1)
0102030405060708090100
01
23
45
67
89
10
% total P
Expe
rimen
tal P
dat
a
Fe3(
PO
4)2.
8H2O
Cu3
(PO
4)2.
2H2O
AlPO
4
Ca5
(OH)
(PO
4)3
0102030405060708090100
01
23
45
67
89
10pH
% total S
Expe
rimen
tal S
dat
aC
oSN
iSFe
SM
nSZn
SC
uSC
u(II)
2S
A
B
C

80
Cha
pter
3
3.3 Sludge characteristics
3.3.1 VSS, SMP and EPS
The VSS fraction of the sludge increased during UASB reactor operation in the three reactors (Table 3.4). However, there was a small decrease in the VSS fraction in R2 and R3 with the decrease in the COD/SO4
2- ratio (day 210 versus day 390). The sludge at pH 4 (R3) showed the highest VSS fraction, followed by the sludge at pH 5 (R2). The sludge at the highest pH (R1 – pH 6) showed the lowest VSS fraction (Table 3.4). On day 210, the sludge growing at pH 5 (R2) contained more SMP and EPS, both proteins and carbohydrates, than the sludge growing at pH 4 (R3). However, at day 390 (lower COD/SO4
2- ratio), R3 sludge produced more SMP and EPS, while R2 sludge produced less. At this sampling date, both carbohydrate and protein fractions of SMP were not significantly different between the sludges of the three UASB reactors, whereas the EPS production was higher in the sludge at pH 6 than at pH 5 and 4. Both the carbohydrate and protein fractions of the SMP as well as the EPS decreased during reactor operation at pH 6 and increased at pH 4 (Table 3.4). Table 3.4 Total suspended solids (TSS), volatile suspended solids (VSS), soluble microbial products (SMP) and extracellular polymeric substances (EPS) of the inoculum sludge from R1 and of sludge sampled at different sampling times from R1, R2 and R3.
SMP (mg (gVSS)-1) EPS (mg (gVSS)-1) Sludge TSS (%)
VSS (%TSS) Carbohydrates Proteins Carbohydrates Proteins
Inoculum 16.00 ± 0.20 67.37 ± 0.32 4.60 ± 0.20 19.30 ± 2.70 11.70 ± 0.70 51.00 ± 17.30 R1 - 210 days 11.30 ± 0.10 85.61 ± 0.22 n.a. a n.a. n.a. n.a. R1 - 390 days 9.17 ± 0.18 87.76 ± 0.15 15.32 ± 1.57 42.01 ± 0.04 28.27 ± 0.85 104.29 ± 3.82 R1 - 520 days 10.75 ± 0.02 89.49 ± 0.12 10.83 ± 0.93 33.67 ± 3.15 20.93 ± 1.22 77.47 ± 3.06 R2 - 163 days 7.94 ± 0.13 82.72 ± 0.13 n.a. n.a. n.a. n.a. R2 - 210 days 8.66 ± 0.04 87.72 ± 0.15 14.37 ± 1.19 40.30 ± 7.87 28.77 ± 6.04 20.67 ± 5.35 R2 - 390 days 6.04 ± 0.09 87.09 ± 0.46 12.58 ± 1.89 21.52 ± 14.39 16.69 ± 2.14 29.03 ± 6.10 R3 - 163 days 9.49 ± 0.15 89.05 ± 0.22 n.a. n.a. n.a. n.a. R3 - 210 days 10.60 ± 0.13 91.56 ± 0.03 9.49 ± 0.65 16.06 ± 4.07 8.71 ± 1.38 1.17 ± 0.64 R3 - 390 days 7.30 ± 0.08 89.35 ± 0.26 15.76 ± 0.84 36.27 ± 7.37 17.67 ± 3.26 47.41 ± 6.21
a n.a.: not analyzed.
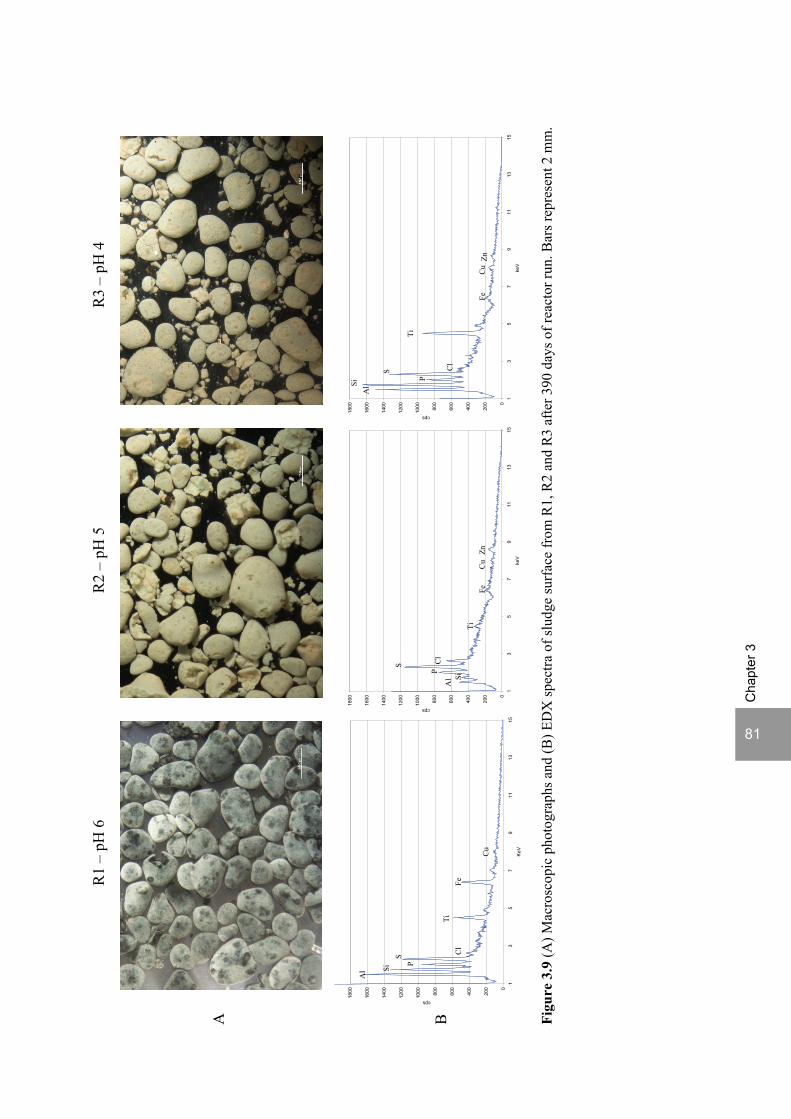
81 C
hapt
er 3
Figu
re 3
.9 (A
) Mac
rosc
opic
pho
togr
aphs
and
(B) E
DX
spec
tra o
f slu
dge
surf
ace
from
R1,
R2
and
R3
afte
r 390
day
s of r
eact
or ru
n. B
ars r
epre
sent
2 m
m.
A
B
R2
– pH
5
R1
– pH
6
R3
– pH
4
0
200
400
600
800
1000
1200
1400
1600
1800
13
57
911
1315
KeV
cps
Al S
i P S
Ti
Fe
Cl
Cu
0
200
400
600
800
1000
1200
1400
1600
1800
13
57
911
1315
keV
cps
Zn
Cu
Z
Al S
i P S
Ti
Fe
Cl
0
200
400
600
800
1000
1200
1400
1600
1800
13
57
911
1315
keV
cps
Al S
i P
S
Ti
Fe
Cl
Cu
Zn
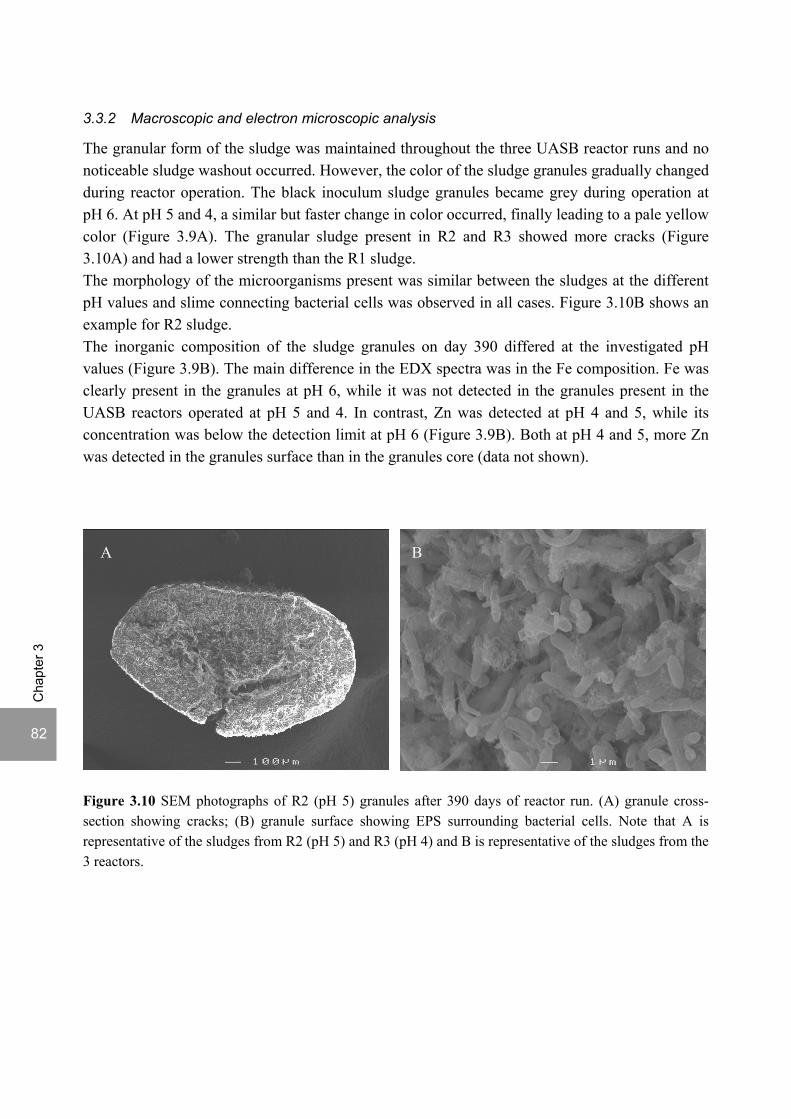
82
Cha
pter
3
3.3.2 Macroscopic and electron microscopic analysis
The granular form of the sludge was maintained throughout the three UASB reactor runs and no noticeable sludge washout occurred. However, the color of the sludge granules gradually changed during reactor operation. The black inoculum sludge granules became grey during operation at pH 6. At pH 5 and 4, a similar but faster change in color occurred, finally leading to a pale yellow color (Figure 3.9A). The granular sludge present in R2 and R3 showed more cracks (Figure 3.10A) and had a lower strength than the R1 sludge. The morphology of the microorganisms present was similar between the sludges at the different pH values and slime connecting bacterial cells was observed in all cases. Figure 3.10B shows an example for R2 sludge. The inorganic composition of the sludge granules on day 390 differed at the investigated pH values (Figure 3.9B). The main difference in the EDX spectra was in the Fe composition. Fe was clearly present in the granules at pH 6, while it was not detected in the granules present in the UASB reactors operated at pH 5 and 4. In contrast, Zn was detected at pH 4 and 5, while its concentration was below the detection limit at pH 6 (Figure 3.9B). Both at pH 4 and 5, more Zn was detected in the granules surface than in the granules core (data not shown). Figure 3.10 SEM photographs of R2 (pH 5) granules after 390 days of reactor run. (A) granule cross-section showing cracks; (B) granule surface showing EPS surrounding bacterial cells. Note that A is representative of the sludges from R2 (pH 5) and R3 (pH 4) and B is representative of the sludges from the 3 reactors.
B A
A B
Effect of low pH (6, 5 and 4) on nutrient dynamics and sludge characteristics
83 C
hapt
er 3
4 DISCUSSION
4.1 Effect of pH on micronutrient retention
4.1.1 Co and Ni
The leaching behaviour of Co and Ni from the sludge in the batch leaching experiments is in accordance with the simulations of CoS and NiS dissolution with OLI software under the conditions of the leaching experiments (Figure 3.1C). The theoretical dissolution edge for both CoS and NiS is close to pH 5 (Figure 3.1C). Therefore, Ni and Co leaching is limited at pH 6 and 5, in contrast to pH 4 (Figure 3.1A and 3.1C). This suggests that Co and Ni are present in the Eerbeek sludge mainly as CoS and NiS. Jong and Parry (2003) also suggested that NiS formation was the key process for Ni removal in an upflow anaerobic packed bed reactor fed with lactate, sulfate and metals at an OLR and SLR of, respectively, 7.43 and 3.71 g (lreactor d)-1. Additionally, the solubilisation of Co and Ni could also be associated with Fe sulfide solubilisation, as Co and Ni tend to adsorb or co-precipitate onto Fe sulfide minerals (Watson et al., 1995; Morse and Luther, 1999), which also have a dissolution edge close to pH 5 (see paragraph 4.1.2.). The decrease of Co and Ni in the carbonate fraction at the pH values tested (Figures 3.1B and 3.2) reflects the theoretical complete solubilisation of Co and Ni carbonates at these low pH values. Even at neutral pH, Zandvoort et al. (2005b) reported the loss of Co and Ni from the carbonate fraction of Eerbeek sludge in mesophilic (30°C) methanol fed UASB reactors. However, Co and Ni are present in forms other than only carbonates in the carbonate fraction of the Eerbeek sludge, otherwise a much higher leaching would have been observed at pH 5 and 4 (Figures 3.1B and 3.2). Van Hullebusch et al. (2005a) showed that, at neutral pH, the OM/S fraction has the highest sorption affinity for Ni and Co for Eerbeek sludge, followed by the residual fraction. This study confirms that Co and Ni also mainly accumulate in the OM/S and residual fractions at pH 6, 5 and 4. However, the Co and Ni accumulated in the residual fraction during the first 210 days of operation at pH 6, subsequently leached from the granules at the three pH values investigated (Figure 3.2). At pH 6, the decrease in Co from the residual and carbonate fraction coincided with the increase in Co in the OM/S fraction (Figure 3.2). The increase in Co and Ni in the OM/S fraction caused by the increase in sulfate loading rate (210 versus 390 days) (Figure 3.2) again reflects the high affinity of the OM/S fraction for Co and Ni (van Hullebusch et al., 2005a). A previous study of Zandvoort et al. (2005b) with methanol fed UASB reactors operating at pH 7 inoculated with Eerbeek sludge (the same sludge as the inoculum in the present study) or sludge from a full scale UASB reactor treating alcohol distillery wastewater also showed that a 30-hour pH shock to pH 5 provoked only a limited loss of Co and Ni from the granular sludge and mainly a translocation of Ni and Co from the residual to the OM/S fraction. A longer pH shock (4 days) to pH 5 induced a more pronounced loss of Co, due to its decrease from the OM/S fraction (Zandvoort et al., 2005b). This is in agreement with the decrease of Co and Ni present in the OM/S fraction during the operation at pH 5 (Figure 3.2).

84
Cha
pter
3
4.1.2 Fe and Mn
The dissolution edge of FeS is close to pH 5 while the dissolution edge of FeCO3 is close to pH 6 (Figure 3.3C) under the conditions of the leaching experiments. Figure 3.3C shows that the experimental Fe leaching data lies between the curves of FeS and FeCO3 and Fe3(PO4)2.8H2O (vivianite). Given the low amounts of phosphate expected in the granular sludge as compared to carbonates and sulfide, it is expected that Fe is present in the sludge as mainly Fe sulfide minerals and FeCO3. This is in agreement with Jong and Parry (2003), who also suggested that the removal of Fe in an upflow anaerobic packed bed reactor fed with lactate, sulfate and metals was associated to FeS formation. The observed behaviour of Mn in the batch experiments contrasts the theoretical prediction of Mn sulfides, carbonates, hydroxides and phosphates dissolution (Figure 3.3C). According to the theoretical dissolution of these minerals, all the Mn should be solubilised at pH 5. This clearly indicates that these are not the main Mn species in the granular sludge, in agreement with the findings of Maes et al. (2003) in leaching experiments with a sulfide-rich freshwater sediment (Gent-Terneuzen canal). These authors suggested that Mn was partially present in mixed FeS/FeCO3 precipitates, as Fe and Mn have similar atomic radii. The UASB reactor operation showed that both Mn and Fe were almost completely leached out from the sludge at pH 5 and 4 (approximately 98% decrease relatively to the inoculum sludge), constituting the nutrients with the most extensive leaching from the sludge, despite the relatively high concentrations of Fe provided with the reactors’ influent (Table 3.1). This is in agreement with the higher solubilities of Mn and Fe sulfides in relation to the other trace metals studied (Table 3.5). Table 3.5 Solubility products at 55°C with sulfide, carbonate, phosphate and hydroxide taken from OLI thermodynamic database. Ksp of sulfide Ksp of carbonate Ksp of phosphate Ksp of hydroxide Al - - 2.74 x 10⁻²² 3 x 10-34 Co 2.97 x 10⁻²¹ 2.02 x 10⁻¹¹ 1.14 x 10⁻²⁹ 1.16 x 10⁻¹⁵ Cu 1.93 x 10-43 Cu(I)
1.19 x 10⁻³⁴ Cu(II) 2.27 x 10⁻⁷
2.27 x 10-39 Cu(II)
3.87 x 10⁻¹⁹ Cu(II)
Fe 6.61 x 10⁻¹⁵ (FeS amorphous) 7.19 x 10⁻¹⁷ (FeS hexagonal) 1.43 x 10⁻¹⁵ (FeS tetragonal) 6.59 x 10⁻²⁵ (FeS2 isometric) 2.23 x 10⁻²⁴ (FeS2 orthorhombic)
1.80 x 10⁻¹¹
4.88 x 10⁻²⁷
2.39 x 10⁻¹⁴ Fe (II)
Mn 8.00 x 10⁻¹⁴ 1.94 x 10⁻¹¹ 7.39 x 10-36 2.20 x 10⁻¹³ Ni 2.55 x 10⁻²⁰ 3.83 x 10⁻⁹ 1.23 x 10⁻³⁴ 1.55 x 10⁻¹⁷ Zn 3.81 x 10⁻²³ (cubic)
4.95 x 10⁻²³ (hexagonal) 6.22 x 10⁻¹¹ 1.60 x 10⁻³⁰ 1.53 x 10⁻¹⁶
5.99 x 10⁻¹⁶ (amorphous) Ca - 3.14 x 10⁻⁹ (aragonite)
1.48 x 10⁻⁹ (calcite) 2.30 x 10⁻³¹ 1.67 x 10⁻⁶
Mg - 7.63 x 10⁻⁷ 2.01 x 10⁻²⁶ 3.46 x 10⁻¹² K - - - -
Effect of low pH (6, 5 and 4) on nutrient dynamics and sludge characteristics
85 C
hapt
er 3
4.1.3 Zn, Cu and Al
The very low dissolution of Zn, Cu and Al from the sludge in the batch leaching experiments (Figure 3.4A) is in agreement with the theoretical solubilities of Zn and Cu sulfides and Al hydroxide (Figure 3.4C). Zn, Cu and Al carbonates are not expected to be stable at the low pH values studied. The dissolution edge for ZnS and Al(OH)3 are close to pH 4 and 3.5, respectively (Figure 3.4C), which is in agreement with the small Zn and Al dissolution observed at pH 4 (0.7 and 0.5%, respectively, Figure 3.4A). CuS and Cu2S predominate above and below pH 8, respectively (Figure 3.4C), in agreement with the nearly absence of solubilisation at the three pH values investigated. The very low solubility of Zn and Cu was also reported for a sulfide-rich freshwater sediment (Maes et al., 2003). Moreover, the latter authors qualitatively showed that zinc was partly associated with iron sulfide/iron carbonate phases in addition to their presence as discrete metal sulfides. Quan et al. (2003) showed that Cu and Zn were mostly precipitated in the form of metal sulfides in a mesophilic (30°C) lab-scale UASB fed with cow manure. Also Jong and Parry (2003) reported that the removal of Zn and Cu was according to the solubility of their respective metal sulfides. The high Cu concentration in the residual fraction can still be attributed to Cu sulfide species. Van Hullebusch et al. (2005a), performing the same extraction procedure in Eerbeek sludge concluded that part of the Cu released in the residual fraction is present as sulfides due to the fact that Cu sulfide species are more refractory to the H2O2 oxidation step compared to Ni, Co and Zn sulfides. Zn and Cu accumulated in the UASB reactor sludges of R2 (pH 5) and R3 (pH 4), in contrast to R1 (pH 6), where Zn concentrations in the sludge were kept similar over the reactor run (Figure 3.5). Given the same operational conditions between the three reactors until days 234 and 254 for R2 and R3, respectively, it is surprising that Zn and Cu accumulated in the sludges with the decreasing pH. It is very likely that, similarly to the competition between Co, Ni and Fe for similar sites on the granular sludge described by van Hullebusch et al. (2005b), Zn and Cu can benefit from the solubilisation of other trace metals from the granular sludge, in particular Fe, which occurred in larger extent at pH 5 and 4. Zn and Cu mainly accumulated in the OM/S and residual fractions, which reflects the very low solubility of the correspondent metal sulfides. Zandvoort et al. (2005b) also showed that zinc accumulated mainly in the OM/S fraction of mesophilic methanol fed granular sludge at pH 7.
4.2 Effect of pH on macronutrient retention
4.2.1 Ca, Mg and K
The macronutrient storage in the sludge granules decreased considerably with the decrease in pH (Figure 3.6). The dissolution edge for calcium carbonate is close to pH 6 (Figure 3.6C), which agrees with the small extent of Ca leaching at pH 6. However, Ca carbonate should be solubilized at pH 5 and 4, which contrasts with the only 33 and 68% Ca leaching from the sludge granules at pH 5 and 4, respectively (Figure 3.6A). A similar discrepancy has been found by Buykx et al. (2002) and Maes et al. (2003) with sulfide-rich freshwater sediments. The latter authors hypothesized that the difference was due to ion exchange adsorption of dissolved Ca and from the

86
Cha
pter
3
presence of Ca in other mineral phases with less solubility. Hydroxyapatite (Ca5OH(PO4)3), Ca phosphate (Yu et al., 2001b) and Ca sulfate can accumulate in anaerobic granules. These compounds have dissolution edges of approximately pH 5, 4.5 (above that pH hydroxyapatite dominates) and 3, respectively, and thus likely contribute to the Ca retention at pH 5 and 4 in the sludge granules (Figure 3.6C). Sulfide, carbonate, phosphate and hydroxide minerals of Mg and K are all theoretically soluble within the pH range 4 to 6. Therefore, Mg and K are present in the sludge in the form of other less soluble mineral phases. Struvite (MgNH4PO4.6H2O) formation in anaerobic treatment plants is widely reported in the literature (Carliell and Wheatley, 1997). Calculations on struvite stability were not performed due to the absence of struvite in OLI’s database. However, struvite is unlikely to precipitate at the low pH values studied (Ueno and Fujii, 2001; Stratful et al., 2004; Wang et al., 2006).
4.2.2 P and S
Figure 3.8C shows several species that can contribute to P accumulation in the sludge and explain the small leaching from the granular sludge, namely Fe3(PO4)2.8H2O (vivianite), Cu3(PO4)2.2H2O, AlPO4 and Ca5OH(PO4)3 (hydroxyapatite). S leaching from the sludge (Figure 3.8A) shows the same trend as Co, Ni and Fe, i.e., limited leaching at pH 6 and 5 (0.8 and 2%, respectively) and higher leaching at pH 4 (10.5%), which supports the presence of the latter metals as precipitated, co-precipitated or adsorbed onto sulfur minerals (Figure 3.8C). The higher release of S in the residual fraction relatively to the OM/S fraction has been observed by van Hullebusch et al. (2005a) using the same sludge and extraction scheme used in this study. Dollar et al. (2001) showed that an increased contact time or amount of H2O2 added in the third extraction step allowed to extract the majority of S in that fraction.
4.3 Effect of pH on sludge characteristics
The low pH (6, 5 and 4) and the presence of sulfate (COD/SO42- ratio of 9 and 3.5) did not
negatively affect the granular shape of the biomass. Other studies on acidifying granules also reported good granular sludge quality at pH 6 and in the presence of sulfate under similar experimental conditions (Sipma et al., 1999; Lens et al., 2001; Lens et al., 2003). The differences in the color, strength and VSS fraction of the granular sludge at the different pH values tested reflect the significant changes in inorganic composition, namely the dissolution of sulfide and carbonate minerals at the lower pH values, leading to the release of the associated metals (see previous section). The importance of Ca2+, Mg2+, Fe2+ and Al3+ on anaerobic sludge granulation and stability is well known (Dubourgier et al., 1988; Grotenhuis, 1992; Schmidt and Ahring, 1993; Yu et al., 2000; Yu et al., 2001a; Yu et al., 2001b). Therefore, the considerable loss of these divalent and trivalent cations (93-96, 58-68, 98-99 and 0-17%, for Ca2+, Mg2+, Fe2+ and Al3+, respectively, at pH 4 and 5) and correspondent precipitates from the UASB sludges contributed to the decrease in granular strength observed at the lower pH values. The change in color of the sludge granules at the low pH values is likely due to the decrease in the FeS content, as the black color of the granules is generally related to FeS (Dolfing, 1987; Kosaric et al., 1990). The grey or yellowish granules observed at pH 5 and 4, where the granules were almost deprived

Effect of low pH (6, 5 and 4) on nutrient dynamics and sludge characteristics
87 C
hapt
er 3
of FeS (98-99% Fe loss from the granules), is in agreement with observations on granules fed with sucrose or glucose under neutral conditions without sulfate (Daffonchio et al., 1995; Thaveesri et al., 1995a; Ahn, 2000; Britz et al., 2002). EPS and SMP are mainly constituted by polysaccharides, proteins and in some cases lipids, with minor amounts of nucleic acids and other biopolymers (Flemming and Wingender, 2001). They are located on or outside the cell surface (Laspidou and Rittmann, 2002). EPS production by microorganisms is generally accepted as the main factor responsible for the phenomenon of anaerobic granulation (Dolfing, 1987; Jia et al., 1996). Another very important function of EPS is the accumulation of nutrients from the environment (Laspidou and Rittmann, 2002) by biosorption (van Hullebusch et al., 2005b). SMP are soluble cellular components secreted by cells, have moderate molecular weights (Laspidou and Rittmann, 2002) and have metal chelating properties (Kuo and Parkin, 1996; Aquino and Stuckey, 2007). This study showed that there is a larger difference between the EPS production than the SMP production of the sludges present in the UASB reactors at pH 4 and 5 compared to pH 6. The higher EPS content of the sludge at pH 6, in addition to its higher metal content, has likely contributed to its higher strength, as compared to pH 5 and pH 4 granules. SEM observations of the sludge did not show significant differences between the bacterial morphology. Nevertheless, it can not be excluded that the microbial populations present in the UASB reactors are different. Activity tests performed in Chapter 2 showed that populations with different metabolic properties developed in reactors R2 and R3. The data on reactor performance, activity tests and SEM observations do not allow concluding if different sludge populations developed at the different pH values or if a shift in the metabolic properties of the same, endogenous populations occurred. Molecular ecological tools such as fluorescence in situ hybridization (FISH) and denaturing gel gradient electrophoresis (DGGE) (Wilderer et al., 2002) are required to assess whether there was a shift in populations caused by the different reactor mixed liquor pH values.
4.4 Implications for bioavailability
This study clearly shows the strong effect of low pH values on macro and micronutrient leaching/accumulation dynamics and speciation in granular sludge. This is important for an efficient nutrient dosage to bioreactors. Besides knowing which nutrients are retained in the sludge or lost in the reactors’ effluent under the applied conditions, the fraction where the nutrients are stored in the sludge is an important tool in predicting their bioavailability to the microorganisms. This study showed that, except for Cu and Zn, the low pH caused a decrease in the nutrients’ storage in the sludge. The implications of these losses are yet difficult to determine, because although the decrease in the granules’ metal stock and losses of metals with the effluent are undesirable, a limited amount of metal dissolution can actually improve metal bioavailability. The fraction of the micronutrients in the more mobile fractions also decreased with the decrease in pH, which is an indication of the lower bioavailability of the micronutrients at lower pH values. Besides the different chemical speciation according to the pH, the microbial populations at the different pH values are possibly different or have adapted their metabolism, which could also affect their nutrient demand and surface binding properties (Wang et al., 1999). In addition,

88
Cha
pter
3
certain anaerobic microorganisms are known to excrete compounds that facilitate metal uptake. Co- and Ni-binding ligands were found in sulfidogenic reactors (Jansen et al., 2005) and Zn- and Cu-binding ligands in sulfate reducing bacterial cultures (Bridge et al., 1999). Also Beech and Cheung (1995) reported that the EPS of sulfate reducers was important in the complexation of Ni. Aquino and Stuckey (2007) reported the importance of Cu-chelating SMP for Cu uptake while Kuo and Parkin (1996) observed the production of Ni-chelating SMP in anaerobic microorganisms fed with glucose. If these strong complexes can be taken up by the microorganisms, metal bioavailability can be greatly increased. Therefore, further research is needed to evaluate whether microorganisms are limited by nutrient deficiency at low pH values and in what form the metals should be fed to the UASB reactor.
5 CONCLUSIONS
• Batch leaching experiments (48 hours) showed that the decrease in pH caused an increased
nutrient solubilisation from the sludge granules. The difference in solubilisation between pH 6
and pH 5 was, however, very small for Co, Ni, Fe, Zn and Al, contrary to the difference in
solubilisation between pH 5 and pH 4.
• Long-term UASB reactor runs (520 days at pH 6 and 270 days at pH 5 and 4) showed that
most nutrients leached from the sludge granules at the three pH values investigated. Fe and Mn
were the metals with the most extensive leaching.
• The predominant fractions involved in metal accumulation in the sludge changed with pH.
• Despite the long operation time at low pH, the granular form of the granules was kept and no
significant washout occurred at the applied operational conditions.
ACKNOWLEDGEMENT
Rossano Combes (Université Paris-Est) is acknowledged for the assistance in performing the ESEM-EDX analysis.

89


Chapter
Effect of COD/SO42- ratio and sulfide on
thermophilic (55oC) sulfate reduction during the acidification of sucrose at pH 6
Abstract This study investigated the effect of the COD/SO4
2- ratio (4 and 1) and the sulfide concentration on the performance of thermophilic (55°C) acidifying (pH 6) upflow anaerobic sludge bed reactors fed with sucrose at an organic loading rate of 4.5 gCOD (lreactor d)-1. Sulfate reduction efficiencies amounted to 65% and 25-35% for the COD/SO4
2- ratios of 4 and 1, respectively. Acidification was complete at all the tested conditions and the electron flow was similar at the two COD/SO4
2- ratios applied. The stepwise decrease of the sulfide concentrations in the reactors with a COD/SO4
2- ratio of 1 by N2 stripping caused an immediate stepwise increase in the sulfate reduction efficiencies, indicating a reversible inhibition by sulfide. The degree of reversibility was, however, strongly affected by the growth conditions of the sludge. Acidifying sludge pre-grown at pH 6, at a COD/SO4
2- ratio of 9 and exposed for 150 days to 115 mg l-1 sulfide showed a slower recovery from the sulfide inhibition than a freshly harvested sludge from a full scale treatment plant (pH 7 and COD/SO4
2- = 9.5) exposed for a 70 days to 200 mg l-1 sulfide. In the later case, the decrease of the sulfide concentration from 200 mg l-1 to 45 mg l-1 (35 mg l-1 undissociated sulfide) by N2 stripping caused an immediate increase of the sulfate reduction efficiency from 35% to 96%. A modified version of this chapter was published as: Lopes S.I.C, Wang X., Capela M.I. and Lens P.N.L. (2007) Effect of COD/SO4
2- ratio and sulfide on thermophilic (55oC) sulfate reduction during the acidification of sucrose at pH 6. Water Research 41(11), 2379-2392.

92
Cha
pter
4
1 INTRODUCTION
Wastewater streams such as those from fermentation, starch or pulp and paper industries (Omil et al., 1996; Lens et al., 2003) contain considerable amounts of sulfate, in addition to high concentrations of unacidified organic matter. When these wastewaters are discharged at high temperatures, thermophilic treatment is desirable, as it allows the reuse of the process waters without the need for cooling down before the wastewater treatment step (Reis et al., 1995; Sipma et al., 1999; Lens et al., 2003). For unacidified wastewaters, a two-phase anaerobic treatment process has a number of advantages, as optimum environmental conditions are provided for the acid-forming and methane-forming microorganisms (Pohland and Ghosh, 1971; Demirel and Yenigün, 2002). When sulfate is present in the wastewater, sulfate reduction will occur in the acidification stage (Reis et al., 1995; Sipma et al., 1999; Lens et al., 2003). Therefore, sulfide can be removed prior to the methanogenic reactor in a two-phase anaerobic treatment process, resulting in higher methanogenic activities (no sulfide inhibition) and a less (sulfide) contaminated biogas from the methanogenic reactor. The influent chemical oxygen demand (COD) to SO4
2- ratio is an important parameter affecting the competition between sulfate reducing bacteria (SRB) and the other anaerobic bacteria involved in anaerobic wastewater treatment, namely fermentative bacteria for monomeric starting compounds (e.g. sugars or amino acids), syntrophs for intermediate fermentation products (e.g. propionate, butyrate or ethanol), homoacetogens for H2 and methanogens for H2 or acetate (Colleran et al., 1995; Visser, 1995; Mizuno et al., 1998a). Besides the influent COD/SO4
2- ratio, sulfide concentrations will also affect the outcome of the competition, as the different trophic groups have different sensitivities to sulfide (Maillacheruvu and Parkin, 1996; Uberoi and Bhattacharya, 1997). Fermentative bacteria are generally reported to be relatively insensitive to sulfide concentrations (Maillacheruvu et al., 1993; Mizuno et al., 1998a). Literature data on the sensitivity of SRB to sulfide toxicity are quite contradictory. Isa et al. (1986a) reported that SRB growing on acetate and ethanol are not affected by high levels (IC50 approx. 1300 mg l-1) of hydrogen sulfide and Greben et al. (2005) even suggested that increased sulfide concentrations might improve biological sulfate reduction. Most reports, however, state a negative effect of elevated sulfide concentrations on sulfate reduction but the concentration level at which inhibition occurs is still debated. Reis et al. (1992) and Okabe et al. (1992) showed the reversibility of sulfide toxicity for a mesophilic SRB culture at pH 6.2 and 6.6 and for Desulfovibrio desulfuricans at pH 7, respectively, growing on lactate and sulfate. However, the former study used batch activity tests and the later study short term chemostats, which can result in an underestimation of the long term toxicity (Visser, 1995). Therefore, studies with longer exposure times to high sulfide concentrations are required in order to evaluate the type of toxicity. O’Flaherty and Colleran (1999a) suggested a reversible sulfide inhibition of SRB growing on volatile fatty acids and ethanol at pH 8 and a COD/SO4
2- ratio of 3, based on the observed oscillating pattern between sulfide and sulfate concentrations in the reactor effluent. However, the recovery of sulfate reduction after the decrease in sulfide concentrations took a

Effect of COD/SO4
2- ratio and sulfide on sulfate reduction at pH 6
93
Cha
pter
4
relatively long time, i.e., approximately 12.5 hydraulic retention times (O'Flaherty and Colleran, 1999a). The objective of this study was to investigate the effect of the COD/SO4
2- ratio and sulfide on thermophilic (55°C) sulfate reduction during the acidification of sucrose at pH 6. Therefore, Upflow Anaerobic Sludge Bed (UASB) reactors were operated at an organic loading rate (OLR) of 4.5 gCOD (lreactor d)-1 and a COD/SO4
2- ratio of 4 and 1. To assess the effect of the sulfide concentration on the acidifying UASB reactor performance, N2 stripping was applied at increasing loading rates. The effect of the inoculum on the performance of the bioreactor was evaluated as well.
2 MATERIALS AND METHODS
2.1 Experimental Set-up
Three cylindrical double wall UASB reactors (R1, R2 and R3) with a working volume of 2.8 l and an internal diameter of 0.1 m were used in this study. A schematic representation of the reactors is given in Chapter 2. The three reactors were operated at pH 6, a hydraulic retention time (HRT) of 10h, a superficial upflow velocity of 1 m h-1 (by applying effluent recirculation) and an OLR of 4.5 gCOD (lreactor d)-1 throughout the experiment. The reactors were kept at 55oC due to water heated in a thermostatic waterbath (Julabo, Seelbach, Germany) and recirculated in the double-wall of the UASB reactors. The pH in the reactors was measured with a pH electrode (Hamilton, Hilkomij BV, Rijswijk, The Netherlands) and was controlled by automatic pH controllers (Endress and Hauser, Naarden, The Netherlands) by 0.1 M NaOH or HCl addition. The produced biogas was led through two waterlocks filled with NaOH (1 M) and zinc acetate (0.5 M), respectively, in order to remove CO2 and H2S. In the experiments with sulfide stripping, N2 gas (purity 99.999%, Hoekloos, Dieren, The Netherlands) was introduced above the sludge bed and distributed homogeneously as small bubbles (0.1-0.3 mm diameter) by using a Teflon gas sparger. The gas flow was controlled using a Brocks microprocessor control and readout unit (SHO-rate, R-2-15-AAA, Fisher-Rosemount).
2.2 Inoculum
The three reactors were inoculated with approximately 750 g wet granular sludge each. The inoculum of R1 and R2 was grown in an UASB reactor operating under the same conditions as the reactors in this study but with a COD/SO4
2- ratio of 9 for 538 days (Chapter 2). It was inoculated with sludge from a full scale mesophilic reactor of Eerbeek, treating paper mill wastewater with COD/SO4
2- ratio of 9.5 and pH 7 at an OLR of 9 gCOD (lreactor d)-1 (Oude Elferink et al., 1998b). R3 was inoculated with sludge freshly sampled at the full scale Eerbeek reactor.
2.3 Medium
The reactors were fed a synthetic influent consisting of sucrose as model carbohydrate (sole electron donor and carbon source), sulfate and nutrients. The sulfate concentration, supplied as

94
Cha
pter
4
sodium sulfate, depended on the applied COD/SO42- ratio (Table 4.1). The nutrient solution
consisted of macro and micronutrients according to Vallero et al. (2003) except for the phosphate concentration, which was 1 g l-1 potassium hydrogen phosphate in the present study. In order to avoid precipitation in the storage vessels, the influent consisted of two different streams: 1. sucrose, sodium sulfate and potassium hydrogen phosphate; and 2. macronutrients (except for potassium hydrogen phosphate) and micronutrients. The medium was prepared with demineralised water and was flushed for 10 minutes with N2 gas (purity 99.999%, Hoekloos, Dieren, The Netherlands) prior to being connected to the reactor pumps, in order to assure anaerobic conditions. Storage vessel 1 was kept at 4°C to prevent acidification.
2.4 Experimental design
Table 4.1 summarizes the operational parameters applied to the 3 reactors. In order to investigate the effect of two different COD/SO4
2- ratios at pH 6, R1 and R2 were operated at a COD/SO42-
ratio of, respectively, 4 and 1. With the purpose of investigating the effect of the inoculum, R3 was operated similarly to R2 with the exception of being inoculated with freshly harvested Eerbeek sludge. To assess the effect of sulfide concentrations on the reactor performance, N2 stripping was applied in R2 and R3 from day 150 and 70 onwards, respectively, with increasing N2 loading rates as detailed in Table 4.1.
2.5 Batch activity tests
Batch activity tests were performed to compare the metabolic properties of the inoculum sludge of R1 and R2 and of the sludge developed in R1 (COD/SO4
2- = 4) and R2 (COD/SO42- = 1) after
62 and 64 days of operation, respectively. The tests were performed in duplicate at 55ºC with 2 gCOD l-1 and 1 gVSS l-1. For the inoculum sludge the tests were performed with glucose and hydrogen, both at pH 6 and 7 and both in the absence or presence (COD/SO4
2- = 0.5) of sulfate. For the sludge of R1 and R2, tests were performed at pH 6 with glucose, lactate, butyrate and ethanol as well as at both pH 6 and pH 7 for hydrogen, acetate and propionate, all in the presence (COD/SO4
2- = 0.5) of sulfate. The activity tests were performed in 117 ml vials (glucose, lactate, acetate, propionate, butyrate or ethanol) or in 243 ml vials (hydrogen) with 50 ml of basal medium containing (in g l-1): NH4Cl (0.3), CaCl2.2H2O (0.11), MgCl2.6H2O (0.10), NaCl (0.3), yeast extract (0.5), and 1 ml l-1 of an acid and an alkaline trace element solution according to Stams et al. (1993). Resazurine was used as redox indicator at a concentration of 0.5 μg l-1. The medium was buffered at the different pH values with 6.8 g l-1 KH2PO4 and 6.9 g l-1 NaH2PO4.H2O and the necessary concentration of NaOH.

95
Cha
pter
4
Tab
le 4
.1 O
pera
tiona
l par
amet
ers a
pplie
d to
R1,
R2
and
R3.
R
eact
or
Perio
d D
ays
CO
D/S
O42-
G
LR a
Influ
ent f
low
H
RT
b O
LR c
Sucr
ose
SLR
d SO
42-
pH
ra
tio
(m3 m
-2 d-1
)(l
d-1)
(h)
(gC
OD
(lre
acto
r d)-1
) (m
gCO
D l-1
) (g
SO42-
(lre
acto
r d)-1
)(m
g l-1
)
R1
I 0-
80
3.96
± 0
.77
0 6.
67 ±
0.1
1 10
.08
± 0.
11
4.20
± 0
.78
1765
.41
± 32
8.38
1.
08 ±
0.1
2 45
1.71
± 4
7.19
5.
95 ±
0.0
7
R
2 I
0-14
9 0.
94 ±
0.1
6 0
6.68
± 0
.18
10.0
7 ±
0.27
4.
23 ±
0.6
5 17
82.4
6 ±
250.
59
4.60
± 0
.49
1944
.17
± 17
4.75
5.
97 ±
0.0
8
II
150-
156
0.97
± 0
.23
2.5
6.70
± 0
.26
10.0
4 ±
0.37
4.
76 ±
1.0
1 19
86.8
1 ±
392.
66
4.89
± 0
.29
2042
.93
± 12
1.02
6.
04 ±
0.1
1
III
157-
166
0.96
± 0
.11
5 6.
76 ±
0.0
9 9.
94 ±
0.1
4 4.
74 ±
0.7
0 19
63.8
6 ±
296.
65
4.91
± 0
.29
2032
.45
± 12
1.17
6.
10 ±
0.0
0
IV
167-
174
1.04
± 0
.07
7.5
6.65
± 0
.07
10.1
1 ±
0.11
4.
58 ±
0.2
2 19
29.4
6 ±
75.1
6 4.
42 ±
0.0
4 18
54.6
0 ±
29.6
4 5.
95 ±
0.3
0
R
3 I
0-69
0.
92 ±
0.1
6 0
6.68
± 0
.17
10.0
7 ±
0.26
4.
05 ±
0.6
8
1709
.58
± 28
2.19
4.
50 ±
0.2
7 18
97.5
7 ±
115.
56
6.02
± 0
.04
II
70
-76
1.03
± 0
.15
2.5
6.23
± 0
.31
10.8
1 ±
0.57
4.
31 ±
0.7
7 19
29.4
4 ±
282.
41
4.22
± 0
.56
1891
.94
± 18
5.42
6.
12 ±
0.1
1
III
77-8
6 0.
96 ±
0.2
7 5
6.57
± 0
.16
10.2
4 ±
0.25
4.
17 ±
1.3
2 17
75.7
9 ±
544.
74
4.32
± 0
.31
1841
.97
± 12
2.18
6.
03 ±
0.0
5
IV
87-1
01
0.94
± 0
.15
7.5
6.62
± 0
.16
10.1
6 ±
0.25
4.
28 ±
0.4
6 18
31.3
3 ±
243.
03
4.61
± 0
.68
1969
.70
± 30
2.20
6.
05 ±
0.0
5
V
102-
116
0.96
± 0
.13
15
6.53
± 0
.21
10.3
0 ±
0.33
4.
49 ±
0.5
7 19
33.4
8 ±
299.
07
4.53
± 0
.22
1936
.65
± 11
4.97
6.
06 ±
0.1
3 a G
LR: N
2 loa
ding
rate
; b HR
T: h
ydra
ulic
rete
ntio
n tim
e; c O
LR: o
rgan
ic lo
adin
g ra
te; d S
LR: s
ulfa
te lo
adin
g ra
te.
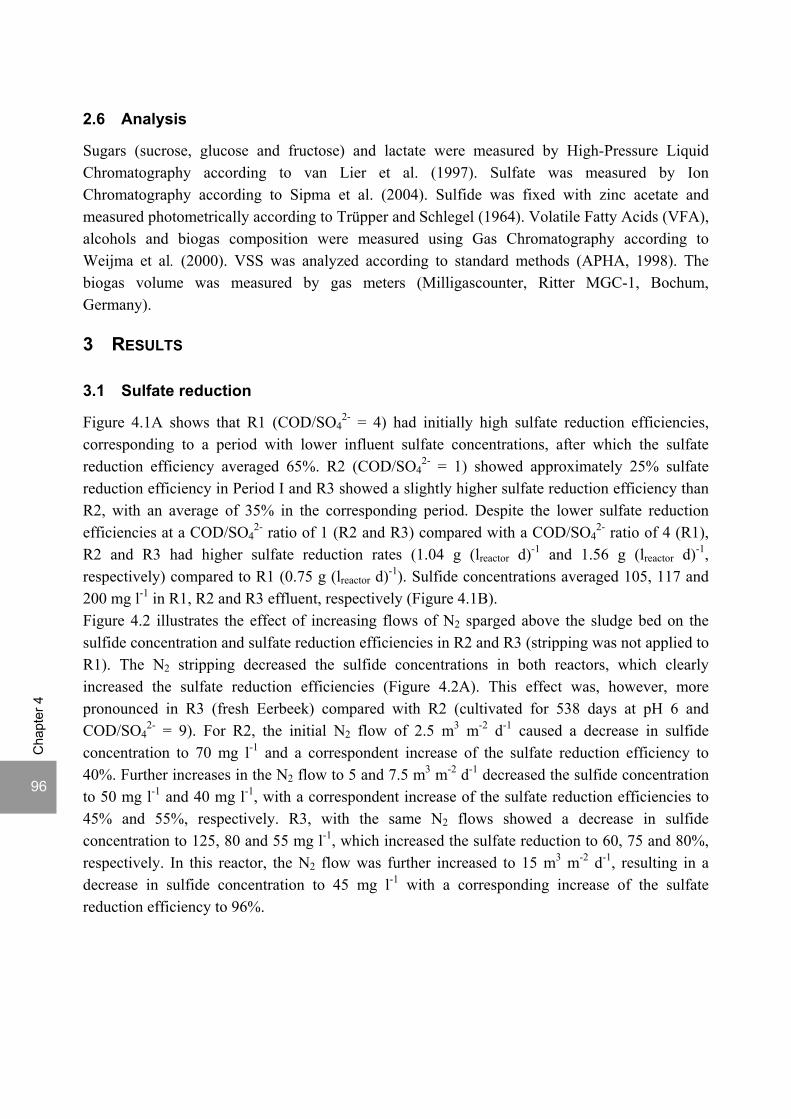
96
Cha
pter
4
2.6 Analysis
Sugars (sucrose, glucose and fructose) and lactate were measured by High-Pressure Liquid Chromatography according to van Lier et al. (1997). Sulfate was measured by Ion Chromatography according to Sipma et al. (2004). Sulfide was fixed with zinc acetate and measured photometrically according to Trüpper and Schlegel (1964). Volatile Fatty Acids (VFA), alcohols and biogas composition were measured using Gas Chromatography according to Weijma et al. (2000). VSS was analyzed according to standard methods (APHA, 1998). The biogas volume was measured by gas meters (Milligascounter, Ritter MGC-1, Bochum, Germany).
3 RESULTS
3.1 Sulfate reduction
Figure 4.1A shows that R1 (COD/SO42- = 4) had initially high sulfate reduction efficiencies,
corresponding to a period with lower influent sulfate concentrations, after which the sulfate reduction efficiency averaged 65%. R2 (COD/SO4
2- = 1) showed approximately 25% sulfate reduction efficiency in Period I and R3 showed a slightly higher sulfate reduction efficiency than R2, with an average of 35% in the corresponding period. Despite the lower sulfate reduction efficiencies at a COD/SO4
2- ratio of 1 (R2 and R3) compared with a COD/SO42- ratio of 4 (R1),
R2 and R3 had higher sulfate reduction rates (1.04 g (lreactor d)-1 and 1.56 g (lreactor d)-1, respectively) compared to R1 (0.75 g (lreactor d)-1). Sulfide concentrations averaged 105, 117 and 200 mg l-1 in R1, R2 and R3 effluent, respectively (Figure 4.1B). Figure 4.2 illustrates the effect of increasing flows of N2 sparged above the sludge bed on the sulfide concentration and sulfate reduction efficiencies in R2 and R3 (stripping was not applied to R1). The N2 stripping decreased the sulfide concentrations in both reactors, which clearly increased the sulfate reduction efficiencies (Figure 4.2A). This effect was, however, more pronounced in R3 (fresh Eerbeek) compared with R2 (cultivated for 538 days at pH 6 and COD/SO4
2- = 9). For R2, the initial N2 flow of 2.5 m3 m-2 d-1 caused a decrease in sulfide concentration to 70 mg l-1 and a correspondent increase of the sulfate reduction efficiency to 40%. Further increases in the N2 flow to 5 and 7.5 m3 m-2 d-1 decreased the sulfide concentration to 50 mg l-1 and 40 mg l-1, with a correspondent increase of the sulfate reduction efficiencies to 45% and 55%, respectively. R3, with the same N2 flows showed a decrease in sulfide concentration to 125, 80 and 55 mg l-1, which increased the sulfate reduction to 60, 75 and 80%, respectively. In this reactor, the N2 flow was further increased to 15 m3 m-2 d-1, resulting in a decrease in sulfide concentration to 45 mg l-1 with a corresponding increase of the sulfate reduction efficiency to 96%.
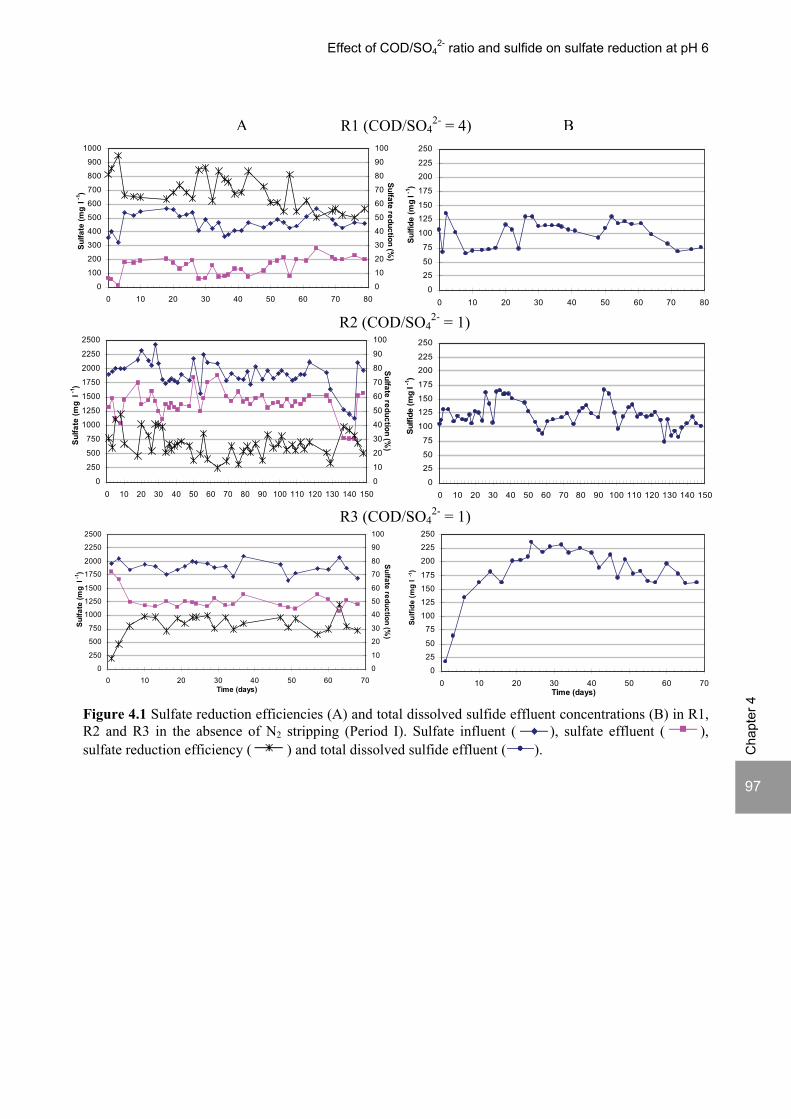
Effect of COD/SO4
2- ratio and sulfide on sulfate reduction at pH 6
97
Cha
pter
4
0
100
200
300
400
500
600
700
800
900
1000
0 10 20 30 40 50 60 70 80
Sulfa
te (m
g l -1
)
0
10
20
30
40
50
60
70
80
90
100
Sulfate reduction (%)_
0
2550
75100
125150
175
200
225250
0 10 20 30 40 50 60 70Time (days)
Sulfi
de (m
g l
-1)
0
25
50
75
100
125
150
175
200
225
250
0 10 20 30 40 50 60 70 80
Sulfi
de (m
g l -1
)
0
25
50
75
100
125
150
175
200
225
250
0 10 20 30 40 50 60 70 80 90 100 110 120 130 140 150
Sulfi
de (m
g l -1
)
Figure 4.1 Sulfate reduction efficiencies (A) and total dissolved sulfide effluent concentrations (B) in R1, R2 and R3 in the absence of N2 stripping (Period I). Sulfate influent ( ), sulfate effluent ( ), sulfate reduction efficiency ( ) and total dissolved sulfide effluent ( ).
0
250
500
750
1000
1250
1500
1750
2000
2250
2500
0 10 20 30 40 50 60 70Time (days)
Sulfa
te (m
g l
-1)
0
10
20
30
40
50
60
70
80
90
100
Sulfate reduction (%)_
0
250
500
750
1000
1250
1500
1750
2000
2250
2500
0 10 20 30 40 50 60 70 80 90 100 110 120 130 140 150
Sulfa
te (m
g l
-1)
0
10
20
30
40
50
60
70
80
90
100
Sulfate reduction (%)_
R1 (COD/SO42- = 4)
R2 (COD/SO42- = 1)
R3 (COD/SO42- = 1)
A B

98
Cha
pter
4
0
500
1000
1500
2000
2500
3000
3500
4000
110 120 130 140 150 160 170
Sulfa
te (m
gSO
42- l
-1)
0
500
1000
1500
2000
2500
3000
3500
4000
30 40 50 60 70 80 90 100 110
Sulfa
te (m
g l
-1)
020406080
100120140160180200220240
110 120 130 140 150 160 170
Sulfi
de (m
g l -1
)
0
10
20
30
40
50
60
70
80
90
100
Sulfate reduction (%)_
0
200
400
600
800
1000
1200
1400
1600
110 120 130 140 150 160 170Time (days)
VFA
(mgC
OD
l -1)
0
10
20
30
40
50
60
70
80
90
100
Sulfate reduction (%)_
020406080
100120140160180200220240
30 40 50 60 70 80 90 100 110
Sulfi
de (m
g l -1
)
0
10
20
30
40
50
60
70
80
90
100
Sulfate reduction (%)__
s
0
200
400
600
800
1000
1200
1400
1600
30 40 50 60 70 80 90 100 110Time (days)
VFA
(mgC
OD
l -1)
0
10
20
30
40
50
60
70
80
90
100
Sulfate reduction (%)__
Figure 4.2 Sulfate concentrations in influent and effluent (A), sulfate reduction efficiencies and total dissolved sulfide effluent (B) and VFA effluent concentrations (C) in R2 and R3, before and after N2 stripping (stripping was not applied in R1). Sulfate influent ( ), sulfate effluent ( ), sulfate reduction efficiency ( ), total dissolved sulfide effluent ( ), acetate ( ), propionate ( ) and butyrate ( ). Vertical dotted lines indicate periods of stripping with increasing N2 flows as in Table 4.2.
R3 (COD/SO42- = 1) R2 (COD/SO4
2- = 1) A
C
B
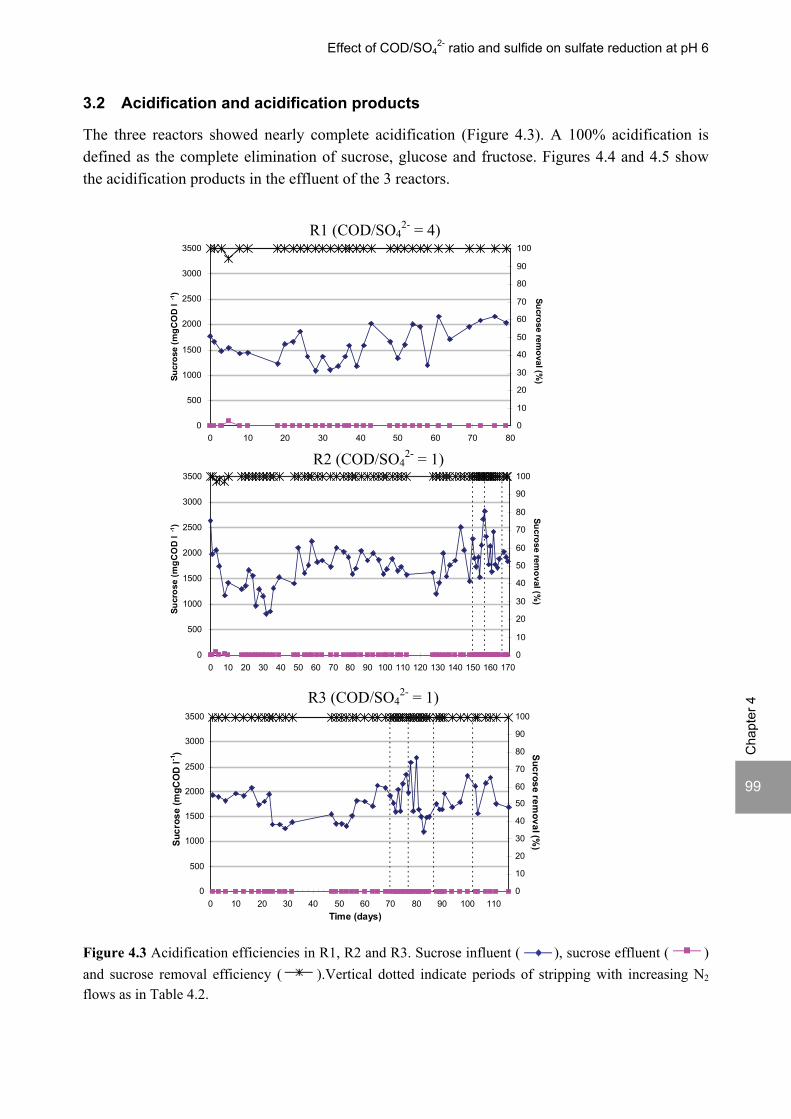
Effect of COD/SO4
2- ratio and sulfide on sulfate reduction at pH 6
99
Cha
pter
4
0
500
1000
1500
2000
2500
3000
3500
0 10 20 30 40 50 60 70 80 90 100 110Time (days)
Sucr
ose
(mgC
OD
l -1)
0
10
20
30
40
50
60
70
80
90
100
Sucrose removal (%
)_
0
500
1000
1500
2000
2500
3000
3500
0 10 20 30 40 50 60 70 80
Sucr
ose
(mgC
OD
l -1)
0
10
20
30
40
50
60
70
80
90
100Sucrose rem
oval (%)
_
0
500
1000
1500
2000
2500
3000
3500
0 10 20 30 40 50 60 70 80 90 100 110 120 130 140 150 160 170
Sucr
ose
(mgC
OD
l -1)
0
10
20
30
40
50
60
70
80
90
100
Sucrose removal (%
)_
3.2 Acidification and acidification products
The three reactors showed nearly complete acidification (Figure 4.3). A 100% acidification is defined as the complete elimination of sucrose, glucose and fructose. Figures 4.4 and 4.5 show the acidification products in the effluent of the 3 reactors. Figure 4.3 Acidification efficiencies in R1, R2 and R3. Sucrose influent ( ), sucrose effluent ( ) and sucrose removal efficiency ( ).Vertical dotted indicate periods of stripping with increasing N2 flows as in Table 4.2.
R1 (COD/SO42- = 4)
R2 (COD/SO42- = 1)
R3 (COD/SO42- = 1)

100
Cha
pter
4
0
200
400
600
800
1000
1200
1400
1600
0 10 20 30 40 50 60 70
Time (days)
VFA
(mgC
OD
l -1)
0
200
400
600
800
1000
1200
1400
1600
0 10 20 30 40 50 60 70 80 90 100 110 120 130 140 150
VFA
(mgC
OD
l -1)
0
200
400
600
800
1000
1200
1400
1600
0 10 20 30 40 50 60 70 80
VFA
(mgC
OD
l -1
)
Figure 4.4 VFA effluent concentrations in R1, R2 and R3 in the absence of N2 stripping (Period I). Total VFA ( ), acetate ( ), propionate ( ) and butyrate ( ).
R1 (COD/SO42- = 4)
R2 (COD/SO42- = 1)
R3 (COD/SO42- = 1)
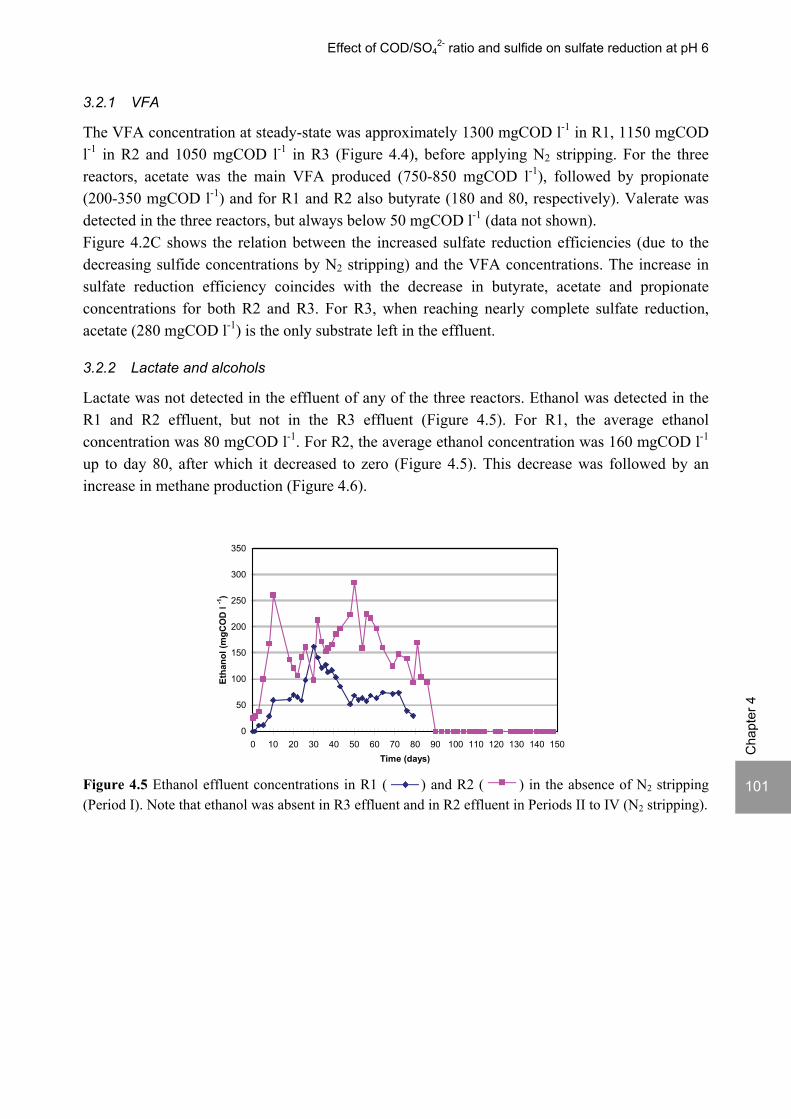
Effect of COD/SO4
2- ratio and sulfide on sulfate reduction at pH 6
101
Cha
pter
4
3.2.1 VFA
The VFA concentration at steady-state was approximately 1300 mgCOD l-1 in R1, 1150 mgCOD l-1 in R2 and 1050 mgCOD l-1 in R3 (Figure 4.4), before applying N2 stripping. For the three reactors, acetate was the main VFA produced (750-850 mgCOD l-1), followed by propionate (200-350 mgCOD l-1) and for R1 and R2 also butyrate (180 and 80, respectively). Valerate was detected in the three reactors, but always below 50 mgCOD l-1 (data not shown). Figure 4.2C shows the relation between the increased sulfate reduction efficiencies (due to the decreasing sulfide concentrations by N2 stripping) and the VFA concentrations. The increase in sulfate reduction efficiency coincides with the decrease in butyrate, acetate and propionate concentrations for both R2 and R3. For R3, when reaching nearly complete sulfate reduction, acetate (280 mgCOD l-1) is the only substrate left in the effluent.
3.2.2 Lactate and alcohols
Lactate was not detected in the effluent of any of the three reactors. Ethanol was detected in the R1 and R2 effluent, but not in the R3 effluent (Figure 4.5). For R1, the average ethanol concentration was 80 mgCOD l-1. For R2, the average ethanol concentration was 160 mgCOD l-1 up to day 80, after which it decreased to zero (Figure 4.5). This decrease was followed by an increase in methane production (Figure 4.6).
0
50
100
150
200
250
300
350
0 10 20 30 40 50 60 70 80 90 100 110 120 130 140 150Time (days)
Etha
nol (
mgC
OD
l -1
)
Figure 4.5 Ethanol effluent concentrations in R1 ( ) and R2 ( ) in the absence of N2 stripping (Period I). Note that ethanol was absent in R3 effluent and in R2 effluent in Periods II to IV (N2 stripping).
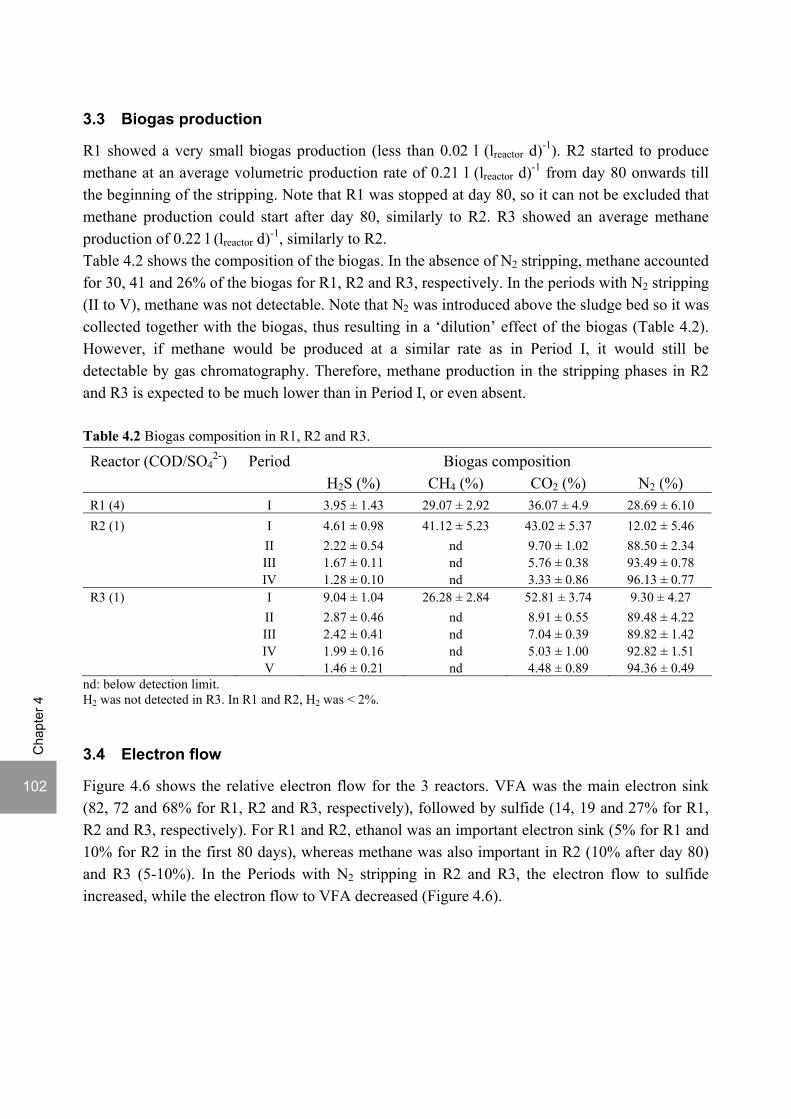
102
Cha
pter
4
3.3 Biogas production
R1 showed a very small biogas production (less than 0.02 l (lreactor d)-1). R2 started to produce methane at an average volumetric production rate of 0.21 l (lreactor d)-1 from day 80 onwards till the beginning of the stripping. Note that R1 was stopped at day 80, so it can not be excluded that methane production could start after day 80, similarly to R2. R3 showed an average methane production of 0.22 l (lreactor d)-1, similarly to R2. Table 4.2 shows the composition of the biogas. In the absence of N2 stripping, methane accounted for 30, 41 and 26% of the biogas for R1, R2 and R3, respectively. In the periods with N2 stripping (II to V), methane was not detectable. Note that N2 was introduced above the sludge bed so it was collected together with the biogas, thus resulting in a ‘dilution’ effect of the biogas (Table 4.2). However, if methane would be produced at a similar rate as in Period I, it would still be detectable by gas chromatography. Therefore, methane production in the stripping phases in R2 and R3 is expected to be much lower than in Period I, or even absent. Table 4.2 Biogas composition in R1, R2 and R3.
Reactor (COD/SO42-) Period Biogas composition
H2S (%) CH4 (%) CO2 (%) N2 (%) R1 (4) I 3.95 ± 1.43 29.07 ± 2.92 36.07 ± 4.9 28.69 ± 6.10 R2 (1) I 4.61 ± 0.98 41.12 ± 5.23 43.02 ± 5.37 12.02 ± 5.46 II 2.22 ± 0.54 nd 9.70 ± 1.02 88.50 ± 2.34 III 1.67 ± 0.11 nd 5.76 ± 0.38 93.49 ± 0.78 IV 1.28 ± 0.10 nd 3.33 ± 0.86 96.13 ± 0.77 R3 (1) I 9.04 ± 1.04 26.28 ± 2.84 52.81 ± 3.74 9.30 ± 4.27 II 2.87 ± 0.46 nd 8.91 ± 0.55 89.48 ± 4.22 III 2.42 ± 0.41 nd 7.04 ± 0.39 89.82 ± 1.42 IV 1.99 ± 0.16 nd 5.03 ± 1.00 92.82 ± 1.51 V 1.46 ± 0.21 nd 4.48 ± 0.89 94.36 ± 0.49
nd: below detection limit. H2 was not detected in R3. In R1 and R2, H2 was < 2%.
3.4 Electron flow
Figure 4.6 shows the relative electron flow for the 3 reactors. VFA was the main electron sink (82, 72 and 68% for R1, R2 and R3, respectively), followed by sulfide (14, 19 and 27% for R1, R2 and R3, respectively). For R1 and R2, ethanol was an important electron sink (5% for R1 and 10% for R2 in the first 80 days), whereas methane was also important in R2 (10% after day 80) and R3 (5-10%). In the Periods with N2 stripping in R2 and R3, the electron flow to sulfide increased, while the electron flow to VFA decreased (Figure 4.6).
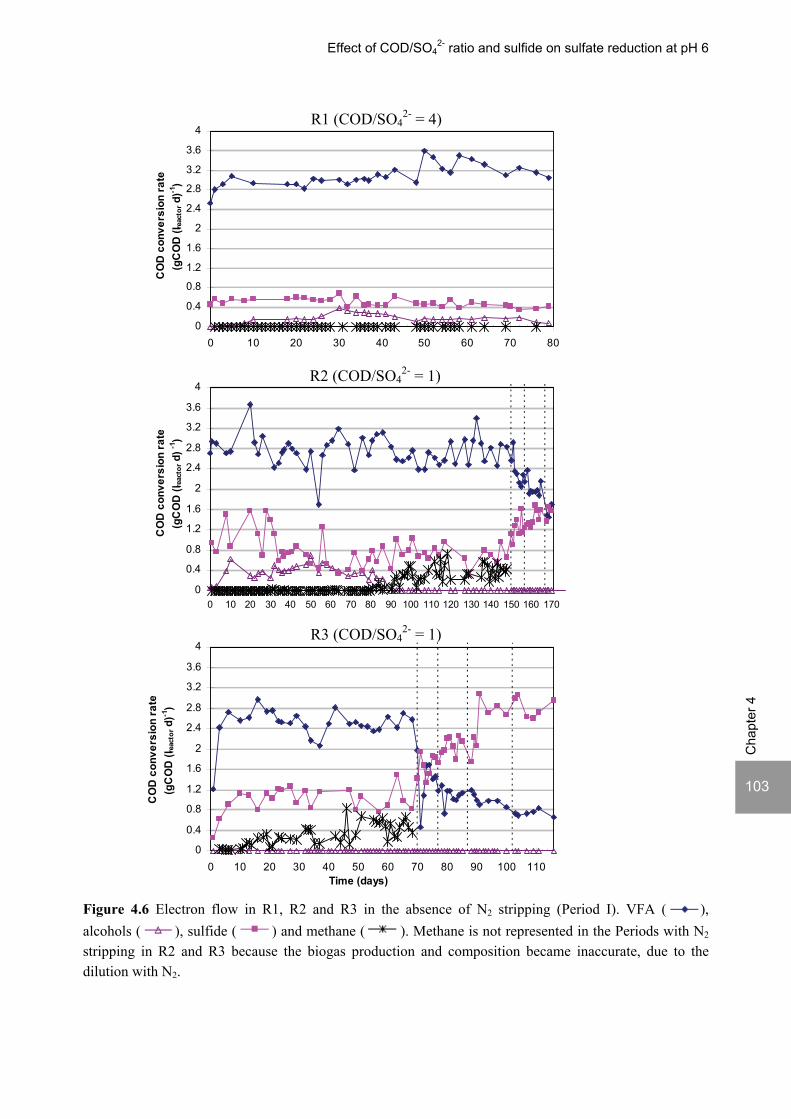
Effect of COD/SO4
2- ratio and sulfide on sulfate reduction at pH 6
103
Cha
pter
4
Figure 4.6 Electron flow in R1, R2 and R3 in the absence of N2 stripping (Period I). VFA ( ), alcohols ( ), sulfide ( ) and methane ( ). Methane is not represented in the Periods with N2 stripping in R2 and R3 because the biogas production and composition became inaccurate, due to the dilution with N2.
0
0.4
0.8
1.2
1.6
2
2.4
2.8
3.2
3.6
4
0 10 20 30 40 50 60 70 80
CO
D c
onve
rsio
n ra
te(g
CO
D (l r
eact
or d
)-1)
0
0.4
0.8
1.2
1.6
2
2.4
2.8
3.2
3.6
4
0 10 20 30 40 50 60 70 80 90 100 110 120 130 140 150 160 170
CO
D c
onve
rsio
n ra
te(g
CO
D (l r
eact
or d
) -1)
0
0.4
0.8
1.2
1.6
2
2.4
2.8
3.2
3.6
4
0 10 20 30 40 50 60 70 80 90 100 110Time (days)
CO
D c
onve
rsio
n ra
te(g
CO
D (l r
eact
or d
)-1)
R1 (COD/SO42- = 4)
R2 (COD/SO42- = 1)
R3 (COD/SO42- = 1)

104
Cha
pter
4
3.5 Batch activity tests
3.5.1 Glucose
Glucose was completely degraded in the batch tests, for all conditions tested (Table 4.3). Glucose was degraded to mainly acetate, for the inoculum sludge at pH 7, whereas at pH 6, glucose was degraded mainly to butyrate and acetate, both for the inoculum sludge and for the sludges developed in R1 and R2. For the sludges developed in R1 and R2, the formed butyrate is afterwards completely consumed, with concomitant increase in the acetate and sulfide concentrations. The inoculum sludge (COD/SO4
2- = 9) showed a shorter lag phase as well as a higher specific glucose depletion rate at pH 6 than at pH 7. Moreover, the inoculum sludge showed higher specific glucose depletion rates than the sludges developed in R1 and R2. The sludge developed in R1 (COD/SO4
2- = 4) presented a higher specific glucose depletion rate than the R2 sludge (COD/SO4
2- = 1) (Table 4.3). Nevertheless, the lag phase observed for sulfide production (coincident with butyrate consumption) was longer for R1 sludge than for R2 sludge (10 versus 3 days, respectively).
3.5.2 Lactate and ethanol
Both lactate and ethanol were completely degraded by both R1 and R2 sludges. Lactate consumption was followed by propionate and acetate production. Propionate was subsequently used for sulfate reduction whereas acetate accumulated. Ethanol degradation was accompanied by sulfide and acetate production (data not shown). Specific lactate depletion rates were higher with the sludge developed in R1 (COD/SO4
2- = 4) than with the sludge developed in R2 (COD/SO42- =
1) (Table 4.3). For ethanol, specific depletion rates were similar for the two sludges but the lag phase observed was longer for R1 sludge than for R2 sludge (8.5 versus 2 days, respectively) (Table 4.3). The sludge developed in R2 showed a higher specific sulfidogenic activity and more sulfide production than the sludge developed in R1 for both lactate and ethanol as the substrates. Moreover, the lag phase for sulfide production in R2 was significantly shorter than for R1 (5 versus 11 days for lactate and 2 versus 11 days, respectively, for ethanol).
3.5.3 VFA
Similarly to lactate and ethanol, the lag phase observed in the activity tests with R1 sludge (COD/SO4
2- = 4) was longer than in the tests with R2 sludge (COD/SO42- = 1) for acetate,
propionate and butyrate, at pH 6 (Table 4.3). This difference was particularly pronounced for propionate (32 versus 9 days). Substrate depletion rates at pH 6 were higher for R2 sludge than for R1 sludge. Specific sulfidogenic activities were very low with the three VFA tested and similar between the 2 reactor sludges investigated with acetate, but higher for R2 than R1 for propionate and butyrate at pH 6. The highest specific sulfidogenic activities were observed with butyrate (57 mg (gVSS d)-1). Sulfide production was similar for each substrate between the two reactor sludges, reaching the highest values with propionate (283 mg l-1) (Table 4.3). Similar findings were observed in tests at pH 7, performed with acetate and propionate as the substrates. Lag phases were similar at pH 7 and 6 for the tests with acetate for both reactor sludges and with propionate for R2 sludge. R1 sludge showed a much longer lag phase for

Effect of COD/SO4
2- ratio and sulfide on sulfate reduction at pH 6
105
Cha
pter
4
propionate degradation at pH 6 than at pH 7 (32 versus 11 days, respectively). Substrate depletion rates at pH 7 were higher than at pH 6, except for R1 with acetate. Sulfidogenic activities at pH 7 were higher than at pH 6, but sulfide production was not significantly different (Table 4.3). In contrast to butyrate, which was almost completely degraded (91%) at pH 6, propionate and specially acetate were only partially degraded by both R1 and R2 sludges, both at pH 7 and 6 (10-34% for acetate and 53-69% for propionate). Methanogenic activity was not observed with acetate as the substrate for any of the sludges. For propionate, methane was produced at pH 7 but not at pH 6, for both sludges. For butyrate, similar amount of methane was produced at pH 6, for both sludges.
3.5.4 Hydrogen
The sludge used to inoculate R1 and R2 (grown at a COD/SO42- = 9), as well as the sludge
developed in R1 (COD/SO42- = 4) and R2 (COD/SO4
2- = 1) produced more sulfide at pH 6 than at pH 7 with H2 as the substrate (Table 4.3). The inoculum sludge also showed higher specific sulfidogenic activity at pH 6 than at pH 7, whereas both the sludge from R1 and R2 showed similar values at pH 6 and pH 7. The inoculum sludge had higher specific sulfidogenic activities and produced more sulfide compared to the sludges of R1 (COD/SO4
2- = 4) and R2 (COD/SO42- = 1) at both pH 7 and pH 6.
Moreover, R1 sludge showed higher specific sulfidogenic activities than R2 sludge (Table 4.3). The inoculum sludge produced more methane at pH 7 than pH 6 in the presence of sulfate, whereas in the absence of sulfate the methane production was similar at pH 7 and pH 6. R1 and R2 sludges produced a similar amount of methane at pH 7 and pH 6 in the presence of sulfate. At pH 6, R1 and R2 sludges produced more methane than the inoculum sludge.
3.6 Characteristics of the acidifying granular sludge
The granular form of the biomass was maintained in all three reactors, throughout the reactor runs and no considerable washout was noticed, even with the addition of N2 stripping. The dark grey color of R1 and R2 inoculum sludge was kept during the run and the R3 sludge changed from black to dark grey. No visible differences were observed between the granular sludge of the three reactors at the end of the reactor runs.

106
Cha
pter
4
Tab
le 4
.3 M
axim
um sp
ecifi
c su
bstra
te d
eple
tion
rate
s and
max
imum
spec
ific
sulfi
doge
nic
activ
ities
of b
atch
act
ivity
test
s with
slud
ge fr
om R
1 an
d R
2.
Subs
trate
Sl
udge
(C
OD
/SO
42-)
pH
SO42-
ala
g ph
ase
(day
s) b
% su
bstra
te
degr
aded
subs
trate
dep
letio
n ra
te
(mgC
OD
(gV
SS d
-1))
su
lfido
geni
c ac
tivity
(m
g (g
VSS
d)-1
) pr
oduc
ed su
lfide
(m
g l-1
) pr
oduc
ed
C
H4
(%)
Inoc
ulum
(9)
7 -
0.
83
100
3594
-
-
10
.4 ±
0.0
6 -
0.
45
100
5797
-
-
6.
7 ±
0.2
7
+
0.8/
0.8
100
1765
33
.1 ±
0.3
12
2.5
± 13
.4
3.4
± 0.
3
6 +
0.
45/0
.8
100
6827
19
.0 ±
1.4
64
.0 ±
1.4
0.
5 ±
0.0
R1
(4)
6 +
1/
9.7
100
3450
± 4
04
13.8
± 2
.2
139
± 12
7.
1 ±
4.8
Glu
cose
R2
(1)
6 +
1/
2.8
100
2282
18
.0
165
± 2
15.8
In
ocul
um (9
) 7
-
0.4
100
nd
c -
-
21
.5
6
-
0.4
100
nd
-
-
23.9
7 +
0.
4/0.
4 10
0 nd
90
.3 ±
1.1
20
7 ±
1.4
19.7
± 1
.7
6
+
0.4/
0.4
100
nd
264.
1 ±
33.6
62
2.5
± 3.
5 4.
5 ±
1.0
R1
(4)
7 +
0.
6/0.
9 10
0 nd
16
.2
41 ±
13
19.3
± 1
.8
6
+
0.6/
8 10
0 nd
17
.5
136
± 0
16.5
± 0
.7
R2
(1)
7 +
0.
7/0.
7 10
0 nd
3.
2 11
9 ±
93
15.0
Hyd
roge
n
6
+
0.7/
0.7
100
nd
3.4
125
± 11
15
.0
R1
(4)
6 +
1
/11
100
3035
± 2
4 8
± 0
154
± 8
0.0
Lact
ate
R2
(1)
6 +
1/
5
100
1922
16
20
6 ±
19
15.8
R
1 (4
) 6
+
8.5
/11
100
297
± 13
1 14
.8
128
± 40
6.
1 ±
3.0
Etha
nol
R2
(1)
6 +
2
/2
100
317
± 52
17
.3
174
± 33
0.
0 R
1 (4
) 7
+
11/
11
10
107
13.2
± 1
.3
160
± 75
0.
0
6 +
1
1/11
34
81
9.
6 ±
1.5
172
± 85
0.
0 R
2 (1
) 7
+
9/9
23
74
19
.5
167
± 10
0.
0
Ace
tate
6
+
9/9
29
10
8 8.
2 20
0 ±
7 0.
0 R
1 (4
) 7
+
11/
19
61
80
21.3
19
7 ±5
4 8.
5
6 +
32
/32
53
33
5.1
± 0.
7
222
± 16
0.
0 R
2 (1
) 7
+
9/9
69
20
0 18
.0
258
± 89
5.
6
Prop
iona
te
6
+
9/7
65
81
13
.3
283
± 33
0.
0 R
1 (4
) 6
+
5/5
91
28
9 41
.8
167.
0 3.
0 ±
0.0
But
yrat
e R
2 (1
) 6
+
4/4
91
56
3 57
.1
174.
0 3.
0 ±
0.7
a pre
senc
e (+
) or a
bsen
ce (-
) of S
O42-
in th
e m
ediu
m; b se
cond
val
ue st
ands
for l
ag p
hase
for s
ulfid
ogen
esis
; c nd:
not
det
erm
ined
.

Effect of COD/SO4
2- ratio and sulfide on sulfate reduction at pH 6
107
Cha
pter
4
4 DISCUSSION
4.1 Sulfide inhibition
This study clearly shows the effect of sulfide inhibition on sulfate reduction at pH 6: decreasing the sulfide concentration by N2 stripping had a very fast stimulating effect on sulfate reduction (Figure 4.2A). The gradual increase in sulfate reduction efficiencies immediately following the decreased sulfide concentrations induced by N2 stripping clearly shows the reversible character of the sulfide inhibition. This is in agreement with previous studies that suggested the reversibility of sulfide inhibition of SRB (Okabe et al., 1992; Reis et al., 1992; O'Flaherty and Colleran, 1999a). However, this is the first study which demonstrates reversible sulfide inhibition at low pH, based on a continuous reactor run study over a considerable time span. Moreover, when reaching almost complete (ca. 96%) sulfate reduction in R3, sulfide toxicity was shown to be the factor dictating the low sulfate reduction efficiencies observed prior to N2 stripping in R3. Therefore, keeping the sulfide concentration below 50 mg l−1 (40 mg l−1 undissociated sulfide) could assure sulfate reduction efficiencies close to 100%. This contrasts the observations of Sipma et al. (1999), where the decrease in sulfide concentrations from approx. 200 to 50 mg l-1 did not increase the poor sulfate reduction efficiency (30%) during the thermophilic acidification of a mixture of sucrose, propionate and butyrate at pH 6, a COD/SO4
2- ratio of 1.33, OLR of 20 gCOD (lreactor d)-1 and HRT of 4 h. Probably the lower HRT and/or the higher VFA concentrations due to the higher OLR applied caused the low sulfate reduction efficiencies in the referred study. No inhibition of the sucrose acidification was observed for sulfide concentrations up to 225 mg l−1 (Figures 4.1 and 4.3). This confirms previous work in thermophilic UASB reactors operating under similar operational conditions (Sipma et al., 1999; Lens et al., 2001), where sucrose degradation was found to be unaffected by sulfide concentrations up to 375 mg l−1. Other studies also show that fermentative bacteria are less sensitive to sulfide than SRB and methanogens (Maillacheruvu et al., 1993; Mizuno et al., 1998a). The history of the inoculum sludge was an important factor determining the extent of sulfide toxicity. Sulfate reduction was only 55% in R2 even at sulfide concentrations below 40 mg l-1, in contrast to R3, where sulfide concentrations below 50 mg l-1 allowed nearly complete sulfate reduction (Figures 4.2 and 4.7). The long operation of the R2 inoculum at pH 6 and at low sulfate concentrations (COD/SO4
2- = 9) most likely decreased the SRB population size given the lower growth rates of SRB at low pH values (Reis et al., 1988). Despite the fact that the pre-grown sludge used to inoculate R1 and R2 was more active at pH 6 than pH 7, which was observed at least for the hydrogenotrophic SRB (Table 4.3), probably only a small population of specialized SRB was left from the initial SRB population in the Eerbeek sludge. Moreover, R2 was operated at COD/SO4
2- ratio of 1 and without N2 stripping for a longer period than R3 (150 days versus 70 days) resulting in a longer exposure time of R2 sludge to elevated sulfide concentrations (approx. 115 mg l-1) than R3 sludge. This means that the number of SRB in R2 was possibly further decreased compared to R3 given the lower growth yield as a result of higher maintenance energy requirements to counteract the inhibitory effect of sulfide (Okabe et al., 1992). In addition, the

108
Cha
pter
4
longer exposure time to sulfide might have changed the nature of the inhibition from a completely reversible inhibition (as observed in R3) to an inhibition with a lower degree of reversibility. Molecular ecological tools such as fluorescence in situ hybridization and denaturing gel gradient electrophoresis (Wilderer et al., 2002) would be useful to assess whether there was indeed a decreased number of SRB between the fresh Eerbeek sludge and the pre-grown sludge exposed for varying time intervals to high concentrations of sulfide. It is more difficult to investigate whether the degree of reversibility has changed with a longer exposure to sulfide, given the current poor understanding on the mechanisms underlying sulfide inhibition on SRB. This requires specific activity tests in situ, which could be done by e.g. microelectrodes (Wilderer et al., 2002).
0
10
20
30
40
50
60
70
8090
100
0 25 50 75 100 125 150 175 200 225 250
Sulfide (mg l-1)
Sulfa
te re
duct
ion
(%)
0.0
0.9
1.8
2.7
3.6
4.5 Sulfate reduction (g (lreactor d) -1)
Figure 4.7 Sulfate reduction efficiency as a function of total dissolved sulfide concentration for R2 (pre-grown sludge: ) and R3 (fresh sludge: ) (stripping was not applied in R1).
4.2 Effect of COD/SO42- ratio on sulfate reduction and methanogenesis
This study showed that the decrease in COD/SO42- ratio from 4 to 1 caused a decrease in sulfate
reduction efficiency (Figure 4.1, R1 versus R2 and R3). Nevertheless, there was more sulfate reduced at a COD/SO4
2- ratio of 1 (R2 and R3) than at a COD/SO42- ratio of 4 (R1), given the
higher influent sulfate concentration in the former (Figure 4.1). If R1 and R2 would have the same sulfate reduction rates, the sulfate reduction efficiency of R1 would be close to complete. It is thus remarkable that the biomass in R1 was not capable of reducing the residual sulfate (200 mg l-1), given the availability of sufficient residual COD as VFA and ethanol. A possible explanation might be related with sulfate limitation in the sludge granules, despite the relatively high sulfate concentrations in the bulk liquid. Visser (1995) reported that, in reactors fed with acetate and sulfate, SRB in sludge granules become sulfate limited at sulfate concentrations in the bulk liquid of about 230 mg l-1. Also Overmeire (1994) calculated that sludge granules become sulfate limited at bulk liquid sulfate concentrations below 300 mg l-1. However, the inoculum sludge of R1 and R2 was grown in a UASB reactor that completely

Effect of COD/SO4
2- ratio and sulfide on sulfate reduction at pH 6
109
Cha
pter
4
reduced the influent sulfate concentration of 150 mg l-1 (Chapter 2). Therefore, sulfate limitation due to mass transfer in the granules seems not to be the cause of the lower sulfate reduction rates in R1 compared to R2. The influent COD/SO4
2- ratio has been reported by several authors to significantly affect the metabolic pathways of SRB (Colleran et al., 1995; Visser, 1995; O'Reilly and Colleran, 2006). At lower COD/SO4
2- ratios (higher sulfate concentrations), VFA degrading SRB might become in competitive advantage with syntrophs, which is generally not the case for high COD/SO4
2- ratios (sulfate limitation) (Visser, 1995). Therefore higher sulfate reduction rates are possible at low COD/SO4
2- ratios. The metabolic properties of the populations developed in R1 and R2 after 2 months of operation were clearly different, as shown in the batch activity tests performed with different substrates (Table 4.3). The shorter sulfidogenic lag phases observed for R2 (COD/SO4
2- = 1) compared to R1 (COD/SO4
2- = 4) with lactate, ethanol and propionate and, although to a smaller extent, also acetate and butyrate, are a strong indication that a larger and/or more active SRB population growing on those substrates was present in the reactor with a lower COD/SO4
2- ratio (R2). The electron flow was similar for R1 and R2 (Figure 4.6), except for methanogenesis, which was observed in the later (COD/SO4
2- =1) but not in the former (COD/SO42- =4). Also in the batch
tests with glucose and lactate, R2 sludge showed more methane production than R1 sludge (Table 4.3). This means that the reactor fed with more sulfate shows more methanogenesis, which seems contrary to what would be expected from both thermodynamic and kinetic considerations on the competition between SRB and methanogens, which favor sulfate reduction over methanogenesis (Dries et al., 1998). However, according to Maillacheruvu and Parkin (1996), for both hydrogen and acetate as the substrates, methanogens are less susceptible to sulfide toxicity than SRB. Therefore, at high sulfide concentrations, methanogens are in competitive advantage in relation to SRB, which can explain the results obtained in this study.
4.3 Effect of COD/SO42- ratio on the acidification efficiency and pathways
Acidification was complete for both applied COD/SO42- ratios (Figure 4.3). However, Table 4.3
shows that acidification rates were approximately 30% lower for R2 sludge (COD/SO42- = 1) than
for R1 sludge (COD/SO42- = 4). The R1 and R2 inoculum sludge (COD/SO4
2- = 9) showed approximately 2-3 fold higher acidification rates than R1 or R2 sludge after approximately 2 months of operation (Table 4.3). Therefore, acidification rates decreased with the increase in influent sulfate concentration. Similar findings have been reported by Lens et al. (2003) and Sipma et al. (1999), who observed a decrease of the thermophilic sucrose degrading activity at pH 7 and 6, respectively, in the presence of excess sulfate. The acidification pathways did not change significantly with the different COD/SO4
2- ratios applied to R1 and R2/R3 (Figures 4.4 and 4.5). The main acidification products were VFA (mainly acetate, followed by propionate and butyrate) and ethanol. This is in agreement with Lens et al. (2003) and Sipma et al. (1999) who did not find an effect of different COD/SO4
2- ratios on the acidification products of starch, sucrose, lactate, propionate and acetate in the former and sucrose, butyrate, propionate in the latter, both in UASB reactors at pH 6 and 55°C.
110
Cha
pter
4
4.4 Effect of COD/SO42- ratio on granular sludge characteristics
This study showed that the higher sulfate loading rates (COD/SO42- of 4 and 1) did not have any
negative effect on the granular sludge bed characteristics relatively to the inoculum sludges at COD/SO4
2- of 9.5 and 9. This contrasts the findings of Sipma et al. (1999) where a good granular sludge was observed at a COD/SO4
2 ratio of 6.67 in a sucrose, butyrate and propionate fed thermophilic UASB reactor at pH 6 (up to an OLR of 46 gCOD (lreactor d)-1) but higher sulfate loading rates (COD/SO4
2 ratio of 1.33 and OLR of 5 up to 20 gCOD (lreactor d)-1) induced gelation of the sludge bed. The higher OLR and correspondingly higher sulfate loading rates applied in their study can explain the differences observed. Although poor attachment properties of SRB have been reported by several authors (Alphenaar, 1994; Omil et al., 1996; Shayegan et al., 2005), this study shows that SRB could effectively be retained in the sludge bed as evidenced in the fast increase in sulfate reduction efficiency when sulfide was removed with N2 stripping.
5 CONCLUSIONS
• Sulfide inhibition caused the low sulfate reduction efficiencies (25-35%) in the thermophilic
acidifying UASB reactors investigated (pH 6; COD/SO42- ratio of 1; OLR 4.5 gCOD(lreactord)-1;
55°C).
• The decrease in the sulfide concentration to below 50 mg l-1 (40 mg l-1 undissociated sulfide)
by N2 stripping allowed a rapid increase in the sulfate reduction efficiency up to 96%,
indicating that sulfide inhibition was reversible. The degree of reversibility was, however,
dependent on the growth conditions of the sludge.
• Sucrose acidification was complete and the acidification products were similar for both the
COD/SO42- ratios (4 and 1).

111

Chapter
Trace metal dynamics during the acidification of sucrose at pH 5 under thermophilic (55oC)
conditions: effect on sulfate reduction Abstract This work studied the effect of trace metal concentrations, sulfide concentrations and different COD/SO4
2- ratios (4 and 1) on sulfate reduction and acidification in thermophilic (55°C) UASB reactors fed with sucrose (4 gCOD (lreactor d)-1) operated at a mixed liquor controlled at pH 5. For that, trace metals were added to one UASB reactor and omitted in the influent of a second UASB reactor. Trace metal concentrations were monitored in the reactor effluent and in the sludge. The influence of different trace metal concentrations was further assessed in batch tests performed with the sludge from the reactor receiving no trace metals. Sulfate reduction efficiencies up to 95% (0.87 and 4.2 g (lreactor d)-1 at COD/SO4
2- ratios of 4 and 1, respectively) and complete acidification were achieved in the trace metal fed UASB reactor with N2 stripping. Sulfide was toxic to sulfate reduction at a total dissolved concentration of 100 mg l-1. The presence of low concentrations of trace metals (7.5 μM Fe and 0.5 μM for the other trace elements) was inhibitory to sulfate reduction, while the absence of trace metals in the influent did not affect the performance of the UASB reactor throughout the 305 day long reactor run. Despite the operation at pH 5, Co, Ni, Cu, Zn, B, Se and Mo added in the influent accumulated in the sludge.
114
Cha
pter
5
1 INTRODUCTION
The pH value is an important parameter in acidification bioreactors, influencing the microbial activities, metabolic pathways and the accumulation of trace metals in the sludge. In granular sludge based bioreactors, such as the Upflow Anaerobic Sludge Bed (UASB) reactor, trace metals can accumulate in the granular sludge due to (bio)chemical processes such as precipitation, sorption onto minerals or extracellular polymers and chelation or complexation (Patidar and Tare, 2004b). Decreasing pH values increase the solubility of most trace metals (Chapter 3). However, the consequences of metal solubilisation are difficult to predict. On the one hand, a decrease in the metal stock is undesirable leading to losses of metals with the reactor effluent and possibly leading to metal deprivation. This can be detrimental for the bioreactor performance because trace metals are present in many enzymes and co-factors involved in the microbial conversions (Madigan et al., 2000). On the other hand, metal solubilisation can improve metal bioavailability, which can be positive for microbial activity or become toxic if the concentrations are high enough. This work studied the effect of trace metal concentrations, sulfide concentrations and COD/SO4
2- ratio on the sulfate reduction and acidification in thermophilic UASB reactors fed with a sucrose containing synthetic wastewater at pH 5. The acidification, sulfate reduction efficiencies and metabolite production were evaluated. The influence of different trace metal concentrations was further assessed in batch tests performed with the sludge from the reactor receiving no trace metals. Trace metal retention in the reactors was assessed by monitoring their concentrations in the sludge and in the liquid phase and a sequential extraction procedure was applied to the sludges in order to evaluate the distribution of the metals over different chemical fractions.
2 MATERIALS AND METHODS
2.1 Inoculum sludge
The Upflow Anaerobic Sludge Bed (UASB) reactors were inoculated with granular sludge harvested from a full-scale UASB reactor treating papermill wastewater (Industriewater Eerbeek B.V., Eerbeek, The Netherlands) (Oude Elferink et al., 1998b). Each reactor was inoculated with 350 g wet sludge.
2.2 Medium
The UASB reactors were fed a synthetic influent consisting of sucrose as model carbohydrate (sole electron donor and carbon source), sulfate and nutrients. The sulfate concentration, supplied as sodium sulfate, depended on the applied COD/SO4
2- ratio (Table 5.1). The nutrient solution consisted of macronutrients as described in Table 5.2 and yeast extract at an influent concentration of 2.2 mg l-1. Micronutrients were also added to the influent of R1 at a concentration of 0.5 μM each except in the case of Fe, which had a concentration of 7.5 μM (Table 5.2). The other UASB reactor (R2) was not supplied with trace metals.
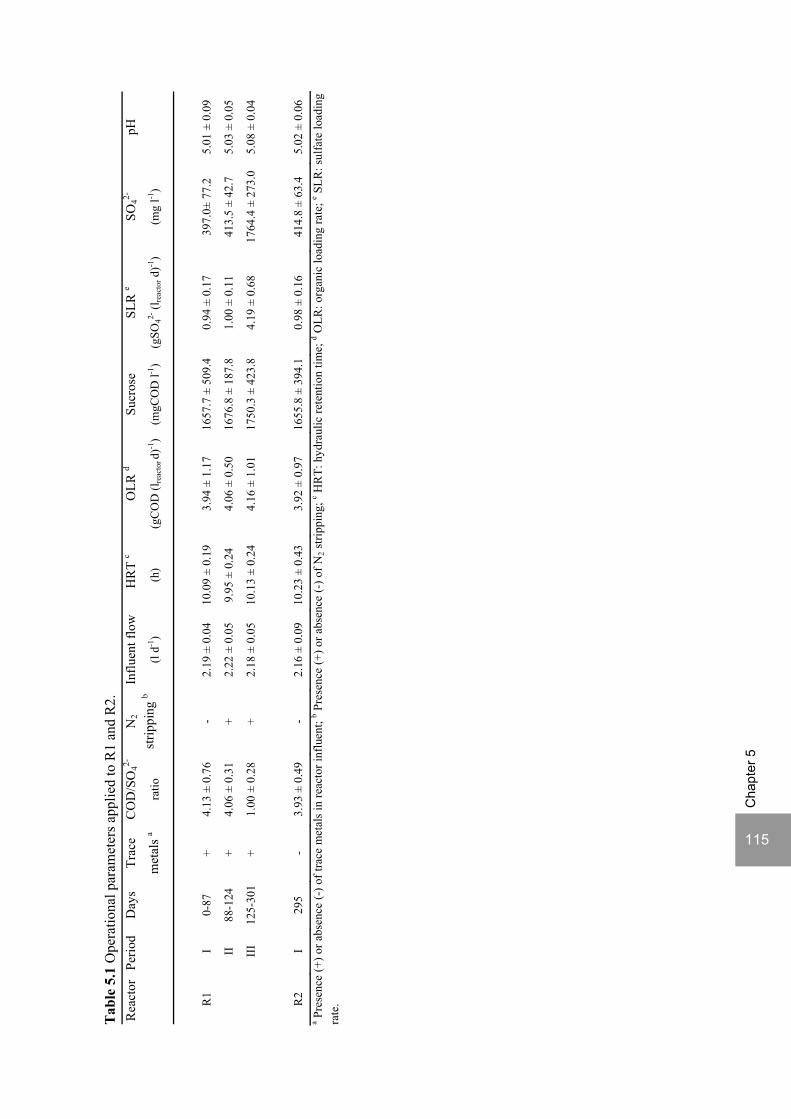
115
Cha
pter
5
Tab
le 5
.1 O
pera
tiona
l par
amet
ers a
pplie
d to
R1
and
R2.
R
eact
or
Perio
dD
ays
CO
D/S
O42-
Influ
ent f
low
HR
T c
OLR
d Su
cros
e SL
R e
SO42-
pH
Trac
e
met
als a
ratio
N2
strip
ping
b(l
d-1)
(h)
(gC
OD
(lre
acto
r d)-1
) (m
gCO
D l-1
) (g
SO42-
(lre
acto
r d)-1
)(m
g l-1
)
R1
I 0-
87
+ 4.
13 ±
0.7
6 -
2.19
± 0
.04
10.0
9 ±
0.19
3.
94 ±
1.1
7 16
57.7
± 5
09.4
0.94
± 0
.17
397.
0± 7
7.2
5.01
± 0
.09
II
88
-124
+
4.06
± 0
.31
+ 2.
22 ±
0.0
5 9.
95 ±
0.2
4 4.
06 ±
0.5
0 16
76.8
± 1
87.8
1.00
± 0
.11
413.
5 ±
42.7
5.
03 ±
0.0
5
II
I 12
5-30
1 +
1.00
± 0
.28
+ 2.
18 ±
0.0
5 10
.13
± 0.
24
4.16
± 1
.01
1750
.3 ±
423
.84.
19 ±
0.6
8 17
64.4
± 2
73.0
5.
08 ±
0.0
4
R2
I 29
5 -
3.93
± 0
.49
- 2.
16 ±
0.0
9 10
.23
± 0.
43
3.92
± 0
.97
1655
.8 ±
394
.10.
98 ±
0.1
6 41
4.8
± 63
.4
5.02
± 0
.06
a Pre
senc
e (+
) or a
bsen
ce (-
) of t
race
met
als
in re
acto
r inf
luen
t; b P
rese
nce
(+) o
r abs
ence
(-) o
f N2 s
tripp
ing;
c HR
T: h
ydra
ulic
rete
ntio
n tim
e; d O
LR: o
rgan
ic lo
adin
g ra
te; e S
LR: s
ulfa
te lo
adin
g ra
te.
116
Cha
pter
5
In order to avoid precipitation in the storage vessels, the influent consisted of two different streams: 1. sucrose, sodium sulfate and potassium hydrogen phosphate; and 2. macronutrients (except for potassium hydrogen phosphate) and micronutrients. Both solutions were prepared with demineralised water and flushed for 10 minutes with N2 gas (purity 99.999%, Hoekloos, Dieren, The Netherlands) prior to being connected to the reactor pumps, in order to assure anaerobic conditions. Storage vessel 1 was kept at 4°C to prevent acidification. Table 5.2 Macro and micronutrients composition of the reactors influent (micronutrients were not added in R2 influent).
2.3 Continuous bioreactor experiments
Two UASB reactors with 0.92 l each (R1 and R2) were used in this study. A detailed description of the experimental set-up is found in Chapter 2. Throughout the experiment, the two reactors were operated at 55oC, a hydraulic retention time (HRT) of 10 h, a superficial upflow velocity of 1 m h-1 (by applying effluent recirculation) and an organic loading rate (OLR) of 4 gCOD (lreactor d)-1. The pH in the reactors was measured with pH electrodes (Hamilton, Hilkomij BV, Rijswijk, The Netherlands) and was controlled by automatic pH controllers (Endress and Hauser, Naarden, The Netherlands) by 0.1 M NaOH or 0.1 M HCl addition. The produced biogas was led through two waterlocks filled with NaOH (1 M) and zinc acetate (0.5 M), respectively, in order to remove CO2 and H2S. In the experiments with sulfide stripping, N2 gas (purity 99.999%, Hoekloos, Dieren, The Netherlands) was introduced as small bubbles (0.1-0.3 mm diameter) by using a sintered glass gas sparger in a 20 ml stripping chamber located in the recirculation line. The N2 gas flow was
Macronutrient Compound Influent (mg l-1)
N NH4Cl 8.72 K K2HPO4 4.19 P K2HPO4 1.66 S MgSO4.7H2O 0.87
Mg MgSO4.7H2O 0.66 Ca CaCl2.2H2O 0.36
Micronutrient (μg l-1) Fe FeCl2 . 4H2O 436.3 B H3BO3 5.6 Zn ZnCl2 34.2 Cu CuCl2. 2H2O 33.3 Mn MnCl2. 4H2O 28.6 Co CoCl2. 6H2O 30.7 Ni NiCl2. 6H2O 30.6 Se Na2SeO3. 5H2O 41.1 W Na2WO4.2H2O 95.8 Mo Na2MoO4.2H2O 50.0
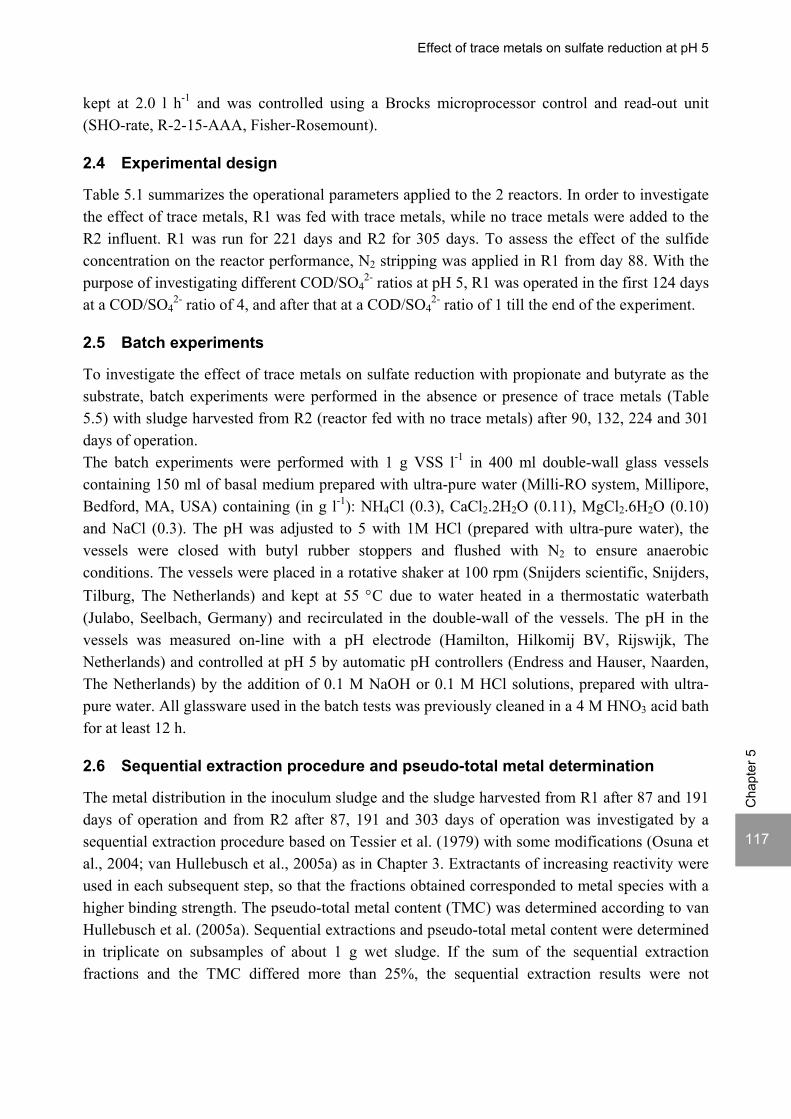
Effect of trace metals on sulfate reduction at pH 5
117
Cha
pter
5
kept at 2.0 l h-1 and was controlled using a Brocks microprocessor control and read-out unit (SHO-rate, R-2-15-AAA, Fisher-Rosemount).
2.4 Experimental design
Table 5.1 summarizes the operational parameters applied to the 2 reactors. In order to investigate the effect of trace metals, R1 was fed with trace metals, while no trace metals were added to the R2 influent. R1 was run for 221 days and R2 for 305 days. To assess the effect of the sulfide concentration on the reactor performance, N2 stripping was applied in R1 from day 88. With the purpose of investigating different COD/SO4
2- ratios at pH 5, R1 was operated in the first 124 days at a COD/SO4
2- ratio of 4, and after that at a COD/SO42- ratio of 1 till the end of the experiment.
2.5 Batch experiments
To investigate the effect of trace metals on sulfate reduction with propionate and butyrate as the substrate, batch experiments were performed in the absence or presence of trace metals (Table 5.5) with sludge harvested from R2 (reactor fed with no trace metals) after 90, 132, 224 and 301 days of operation. The batch experiments were performed with 1 g VSS l-1 in 400 ml double-wall glass vessels containing 150 ml of basal medium prepared with ultra-pure water (Milli-RO system, Millipore, Bedford, MA, USA) containing (in g l-1): NH4Cl (0.3), CaCl2.2H2O (0.11), MgCl2.6H2O (0.10) and NaCl (0.3). The pH was adjusted to 5 with 1M HCl (prepared with ultra-pure water), the vessels were closed with butyl rubber stoppers and flushed with N2 to ensure anaerobic conditions. The vessels were placed in a rotative shaker at 100 rpm (Snijders scientific, Snijders, Tilburg, The Netherlands) and kept at 55 °C due to water heated in a thermostatic waterbath (Julabo, Seelbach, Germany) and recirculated in the double-wall of the vessels. The pH in the vessels was measured on-line with a pH electrode (Hamilton, Hilkomij BV, Rijswijk, The Netherlands) and controlled at pH 5 by automatic pH controllers (Endress and Hauser, Naarden, The Netherlands) by the addition of 0.1 M NaOH or 0.1 M HCl solutions, prepared with ultra-pure water. All glassware used in the batch tests was previously cleaned in a 4 M HNO3 acid bath for at least 12 h.
2.6 Sequential extraction procedure and pseudo-total metal determination
The metal distribution in the inoculum sludge and the sludge harvested from R1 after 87 and 191 days of operation and from R2 after 87, 191 and 303 days of operation was investigated by a sequential extraction procedure based on Tessier et al. (1979) with some modifications (Osuna et al., 2004; van Hullebusch et al., 2005a) as in Chapter 3. Extractants of increasing reactivity were used in each subsequent step, so that the fractions obtained corresponded to metal species with a higher binding strength. The pseudo-total metal content (TMC) was determined according to van Hullebusch et al. (2005a). Sequential extractions and pseudo-total metal content were determined in triplicate on subsamples of about 1 g wet sludge. If the sum of the sequential extraction fractions and the TMC differed more than 25%, the sequential extraction results were not

118
Cha
pter
5
considered. All vessels used for metal analysis were previously cleaned in a 4 M HNO3 acid bath for at least 12 h.
2.7 Analysis
Sugars (sucrose, glucose and fructose) and lactate were measured by High-Pressure Liquid Chromatography according to van Lier et al. (1997). Sulfate was measured by Ion Chromatography according to Sipma et al. (2004). Sulfide was fixed with zinc acetate and measured photometrically using the Lange sulfide cuvette test LCK653 (Hach Lange, Düsseldorf, Germany). Volatile Fatty Acids (VFA), alcohols and biogas composition were measured using Gas Chromatography according to Weijma et al. (2000). Total suspended solids (TSS) and volatile suspended solids (VSS) were determined according to standard methods (APHA, 1998). The biogas volume was measured by gas meters (Milligascounter, Ritter MGC-1, Bochum, Germany). Metal samples were filtered through a 0.2 μm microfiber filter (Whatman FP 30, Germany) and element determinations were performed with inductively coupled plasma – optical emission spectroscopy (ICP-OES, Vista-MPX CCD, Varian, Australia). The following wavelengths were employed: 396.152, 249.772, 396.847, 228.615, 324.754, 259.940, 766.491, 279.553, 257.610, 202.032, 216.555, 213.618, 181.972, 196.026 and 213.857 nm for Al, B, Ca, Co, Cu, Fe, K, Mg, Mn, Mo, Ni, P, S, Se and Zn, respectively. Element determinations in the batch tests were performed with inductively coupled plasma – mass spectrometry (ICP-MS, XSeries, Thermo Scientific, USA). The following mass-to-charge ratios were used: 11, 59, 65, 56, 55, 95, 60, 82, 182 and 66 for B, Co, Cu, Fe, Mn, Mo, Ni, Se, W and Zn, respectively.
3 RESULTS
3.1 Reactor performance
3.1.1 Sulfate reduction
Figure 5.1A shows that sulfate reduction was very low in the first 20 days in both reactors (10-20%). This period coincided with the highest dissolved metal concentrations in the reactor (Figures 5.8 to 5.13). After this initial period, sulfate reduction increased promptly to approx. 35% in R1 (fed with trace metals) and 51% in R2 (no trace metals added). The sulfate reduction efficiencies decreased in the following 15 days, coinciding with a (unintentional) decrease in the influent sulfate concentrations in both reactors (Figure 5.2A). At about day 40, sulfate reduction efficiencies increased again in both reactors, up to 60%. The difference in sulfate reduction efficiencies between the two reactors was evident till at least day 49. Similar results had been obtained in a previous experiment (Figure 5.1B) performed under the same conditions as the present study but with a shorter duration. The UASB reactor fed an influent containing no trace metals also showed a higher sulfate reduction efficiency and correspondent higher sulfide production in comparison with the reactor with trace metal addition in the start-up phase.
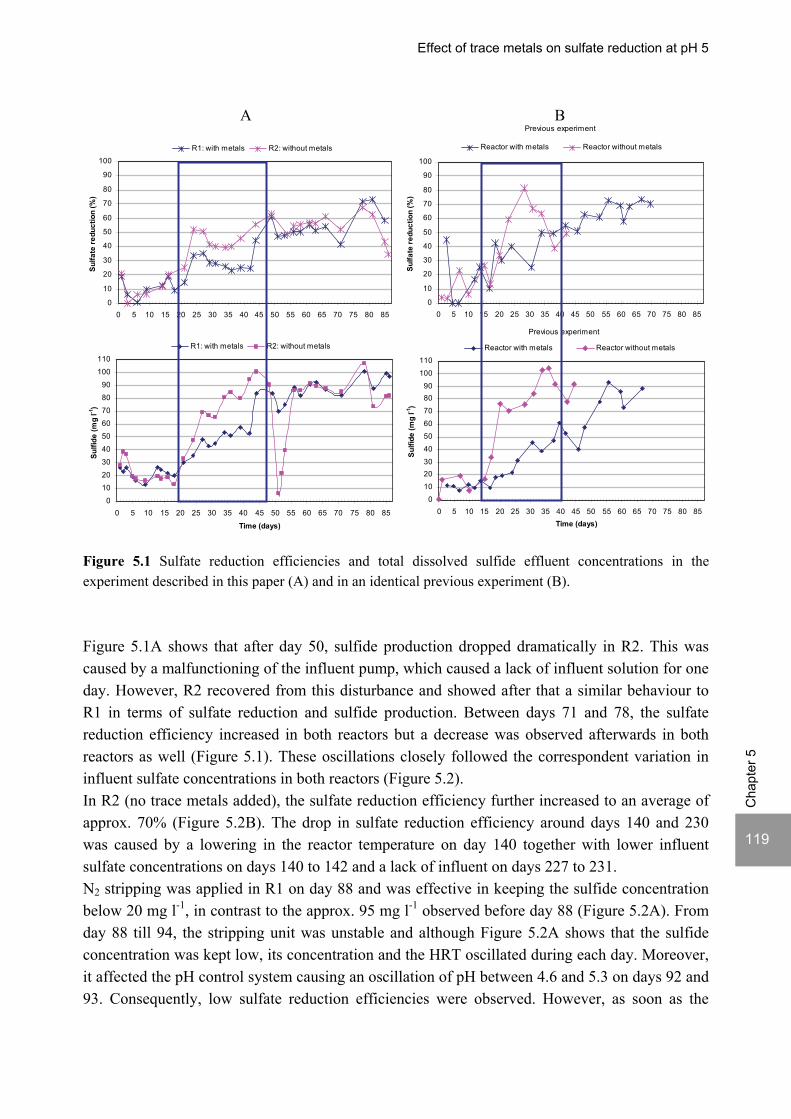
Effect of trace metals on sulfate reduction at pH 5
119
Cha
pter
5
Figure 5.1 Sulfate reduction efficiencies and total dissolved sulfide effluent concentrations in the experiment described in this paper (A) and in an identical previous experiment (B). Figure 5.1A shows that after day 50, sulfide production dropped dramatically in R2. This was caused by a malfunctioning of the influent pump, which caused a lack of influent solution for one day. However, R2 recovered from this disturbance and showed after that a similar behaviour to R1 in terms of sulfate reduction and sulfide production. Between days 71 and 78, the sulfate reduction efficiency increased in both reactors but a decrease was observed afterwards in both reactors as well (Figure 5.1). These oscillations closely followed the correspondent variation in influent sulfate concentrations in both reactors (Figure 5.2). In R2 (no trace metals added), the sulfate reduction efficiency further increased to an average of approx. 70% (Figure 5.2B). The drop in sulfate reduction efficiency around days 140 and 230 was caused by a lowering in the reactor temperature on day 140 together with lower influent sulfate concentrations on days 140 to 142 and a lack of influent on days 227 to 231. N2 stripping was applied in R1 on day 88 and was effective in keeping the sulfide concentration below 20 mg l-1, in contrast to the approx. 95 mg l-1 observed before day 88 (Figure 5.2A). From day 88 till 94, the stripping unit was unstable and although Figure 5.2A shows that the sulfide concentration was kept low, its concentration and the HRT oscillated during each day. Moreover, it affected the pH control system causing an oscillation of pH between 4.6 and 5.3 on days 92 and 93. Consequently, low sulfate reduction efficiencies were observed. However, as soon as the
0
1020
3040
506070
8090
100110
0 5 10 15 20 25 30 35 40 45 50 55 60 65 70 75 80 85
Time (days)
Sulfi
de (m
g l-1
)
R1: with metals R2: without metals
0
10
20
30
40
50
60
70
80
90
100
0 5 10 15 20 25 30 35 40 45 50 55 60 65 70 75 80 85
Sulfa
te re
duct
ion
(%)_
R1: with metals R2: without metals
Previous experiment
0
10
20
30
40
50
60
70
80
90
100
0 5 10 15 20 25 30 35 40 45 50 55 60 65 70 75 80 85
Sulfa
te re
duct
ion
(%)_
Reactor with metals Reactor without metals
Previous experiment
0
102030
40
5060
70
8090
100
110
0 5 10 15 20 25 30 35 40 45 50 55 60 65 70 75 80 85Time (days)
Sulfi
de (m
g l-1
)
Reactor with metals Reactor without metals
A B
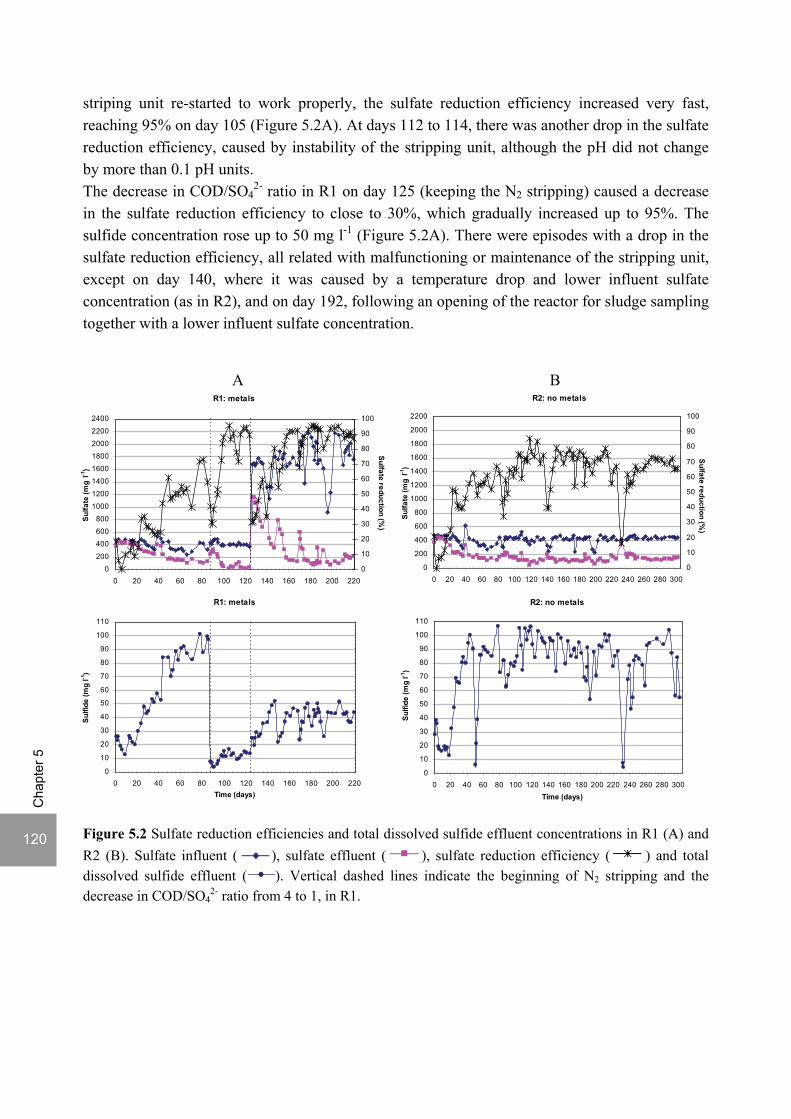
120
Cha
pter
5
striping unit re-started to work properly, the sulfate reduction efficiency increased very fast, reaching 95% on day 105 (Figure 5.2A). At days 112 to 114, there was another drop in the sulfate reduction efficiency, caused by instability of the stripping unit, although the pH did not change by more than 0.1 pH units. The decrease in COD/SO4
2- ratio in R1 on day 125 (keeping the N2 stripping) caused a decrease in the sulfate reduction efficiency to close to 30%, which gradually increased up to 95%. The sulfide concentration rose up to 50 mg l-1 (Figure 5.2A). There were episodes with a drop in the sulfate reduction efficiency, all related with malfunctioning or maintenance of the stripping unit, except on day 140, where it was caused by a temperature drop and lower influent sulfate concentration (as in R2), and on day 192, following an opening of the reactor for sludge sampling together with a lower influent sulfate concentration.
Figure 5.2 Sulfate reduction efficiencies and total dissolved sulfide effluent concentrations in R1 (A) and R2 (B). Sulfate influent ( ), sulfate effluent ( ), sulfate reduction efficiency ( ) and total dissolved sulfide effluent ( ). Vertical dashed lines indicate the beginning of N2 stripping and the decrease in COD/SO4
2- ratio from 4 to 1, in R1.
A B R1: metals
0
200
400
600
800
1000
1200
1400
1600
1800
2000
2200
2400
0 20 40 60 80 100 120 140 160 180 200 220
Sulfa
te (m
g l-1
)
0
10
20
30
40
50
60
70
80
90
100Sulfate reduction (%
)_R2: no metals
0
200
400
600
800
1000
1200
1400
1600
1800
2000
2200
0 20 40 60 80 100 120 140 160 180 200 220 240 260 280 300
Sulfa
te (m
g l-1
)
0
10
20
30
40
50
60
70
80
90
100
Sulfate reduction (%)_
R1: metals
0
10
20
30
40
50
60
70
80
90
100
110
0 20 40 60 80 100 120 140 160 180 200 220Time (days)
Sulfi
de (m
g l-1
)
R2: no metals
0
10
20
30
40
50
60
70
80
90
100
110
0 20 40 60 80 100 120 140 160 180 200 220 240 260 280 300Time (days)
Sulfi
de (m
g l-1
)
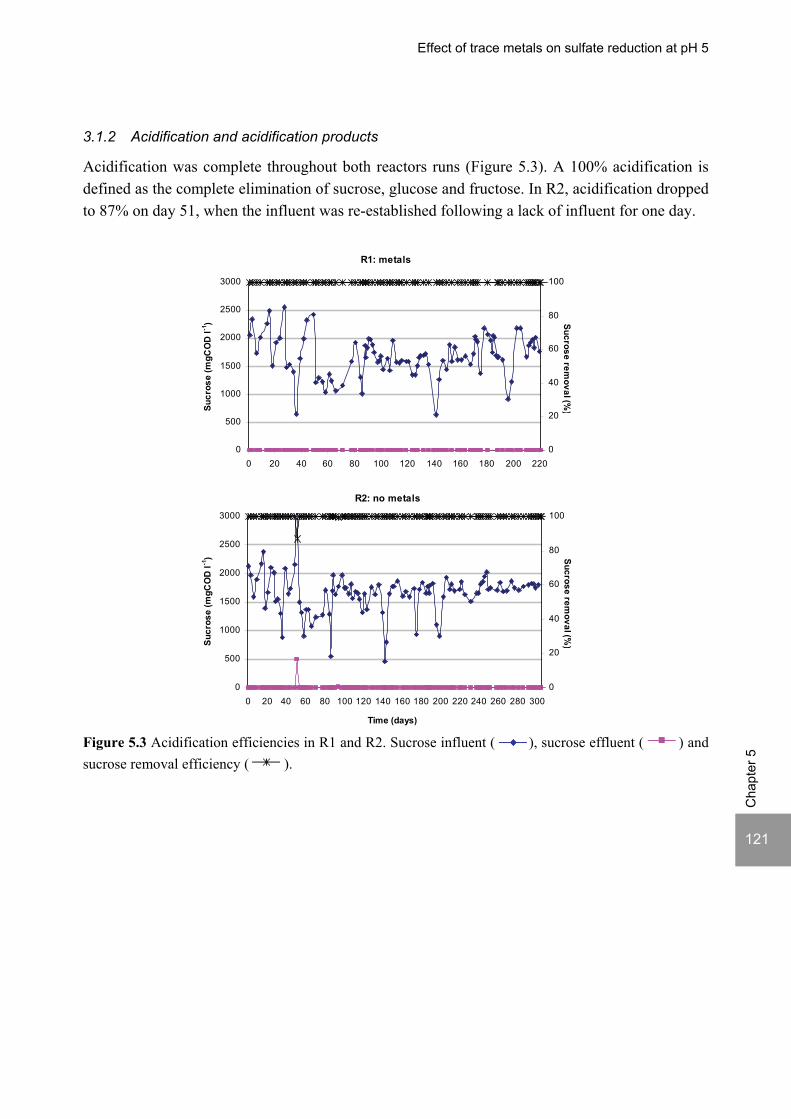
Effect of trace metals on sulfate reduction at pH 5
121
Cha
pter
5
3.1.2 Acidification and acidification products
Acidification was complete throughout both reactors runs (Figure 5.3). A 100% acidification is defined as the complete elimination of sucrose, glucose and fructose. In R2, acidification dropped to 87% on day 51, when the influent was re-established following a lack of influent for one day.
Figure 5.3 Acidification efficiencies in R1 and R2. Sucrose influent ( ), sucrose effluent ( ) and sucrose removal efficiency ( ).
R1: metals
0
500
1000
1500
2000
2500
3000
0 20 40 60 80 100 120 140 160 180 200 220
Sucr
ose
(mgC
OD
l -1)
0
20
40
60
80
100
Sucrose removal (%
)
R2: no metals
0
500
1000
1500
2000
2500
3000
0 20 40 60 80 100 120 140 160 180 200 220 240 260 280 300
Time (days)
Sucr
ose
(mgC
OD
l -1)
0
20
40
60
80
100
Sucrose removal (%
)

122
Cha
pter
5
3.1.2.1 VFA
Butyrate was the main VFA in both reactor effluents during the first 40 days in R1 and 30 days in R2, with levels of approx. 900 and 1000 mgCOD l-1, respectively (Figure 5.4), followed by acetate and propionate. After this initial period, butyrate concentrations decreased and acetate concentrations increased correspondingly, until both VFA had similar concentrations, approx. 750 and 650 mg l-1 in R1 and R2, respectively. This change in butyrate and acetate concentrations was coincident with a sharp increase in sulfate reduction in both reactors (Figure 5.4). In R1, this change was also accompanied by a decrease in propionate concentration, from approx. 300 to 170 mgCOD l-1. In R2, VFA concentrations did not change throughout the reactor run, after day 30. In R1, the decrease in sulfate reduction caused by the problems with the stripping unit on days 88 to 93 coincided with an increase in butyrate and decrease in acetate concentration, but previous concentrations were re-established when sulfate reduction increased again.
Figure 5.4 VFA effluent concentrations versus sulfate removed in R1 (Periods I and II: COD/SO42- = 4)
and R2. Acetate ( ), propionate ( ), butyrate ( ) and sulfate reduction ( ). Vertical dashed line indicates the beginning of N2 stripping in R1.
R1: metals
0
200
400
600
800
1000
1200
1400
1600
0 20 40 60 80 100 120
VFA
(mgC
OD
l-1)
0
50
100
150
200
250
300
350
400
Sulfate reduced (mg l -1)
R2: no metals
0
200
400
600
800
1000
1200
1400
1600
0 20 40 60 80 100 120 140 160 180 200 220 240 260 280 300Time (days)
VFA
(mgC
OD
l -1)
0
50
100
150
200
250
300
350
400
Sulfate reduced (mg l -1)
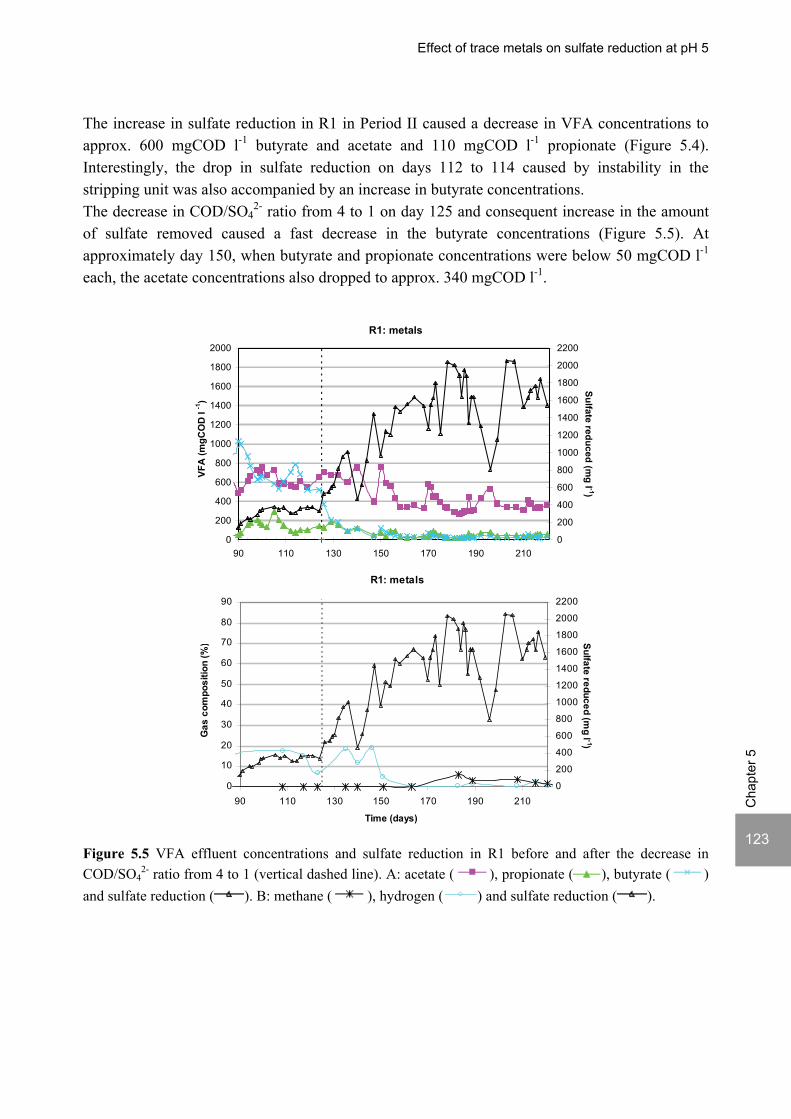
Effect of trace metals on sulfate reduction at pH 5
123
Cha
pter
5
The increase in sulfate reduction in R1 in Period II caused a decrease in VFA concentrations to approx. 600 mgCOD l-1 butyrate and acetate and 110 mgCOD l-1 propionate (Figure 5.4). Interestingly, the drop in sulfate reduction on days 112 to 114 caused by instability in the stripping unit was also accompanied by an increase in butyrate concentrations. The decrease in COD/SO4
2- ratio from 4 to 1 on day 125 and consequent increase in the amount of sulfate removed caused a fast decrease in the butyrate concentrations (Figure 5.5). At approximately day 150, when butyrate and propionate concentrations were below 50 mgCOD l-1 each, the acetate concentrations also dropped to approx. 340 mgCOD l-1.
R1: metals
0
200
400
600
800
1000
1200
1400
1600
1800
2000
90 110 130 150 170 190 210
VFA
(mgC
OD
l -1
)
0
200
400
600
800
1000
1200
1400
1600
1800
2000
2200
Sulfate reduced (mg l -1)
Figure 5.5 VFA effluent concentrations and sulfate reduction in R1 before and after the decrease in COD/SO4
2- ratio from 4 to 1 (vertical dashed line). A: acetate ( ), propionate ( ), butyrate ( ) and sulfate reduction ( ). B: methane ( ), hydrogen ( ) and sulfate reduction ( ).
R1: metals
0
10
20
30
40
50
60
70
80
90
90 110 130 150 170 190 210
Time (days)
Gas
com
posi
tion
(%)
0
200
400
600
800
1000
1200
1400
1600
1800
2000
2200
Sulfate reduced (mg l -1)
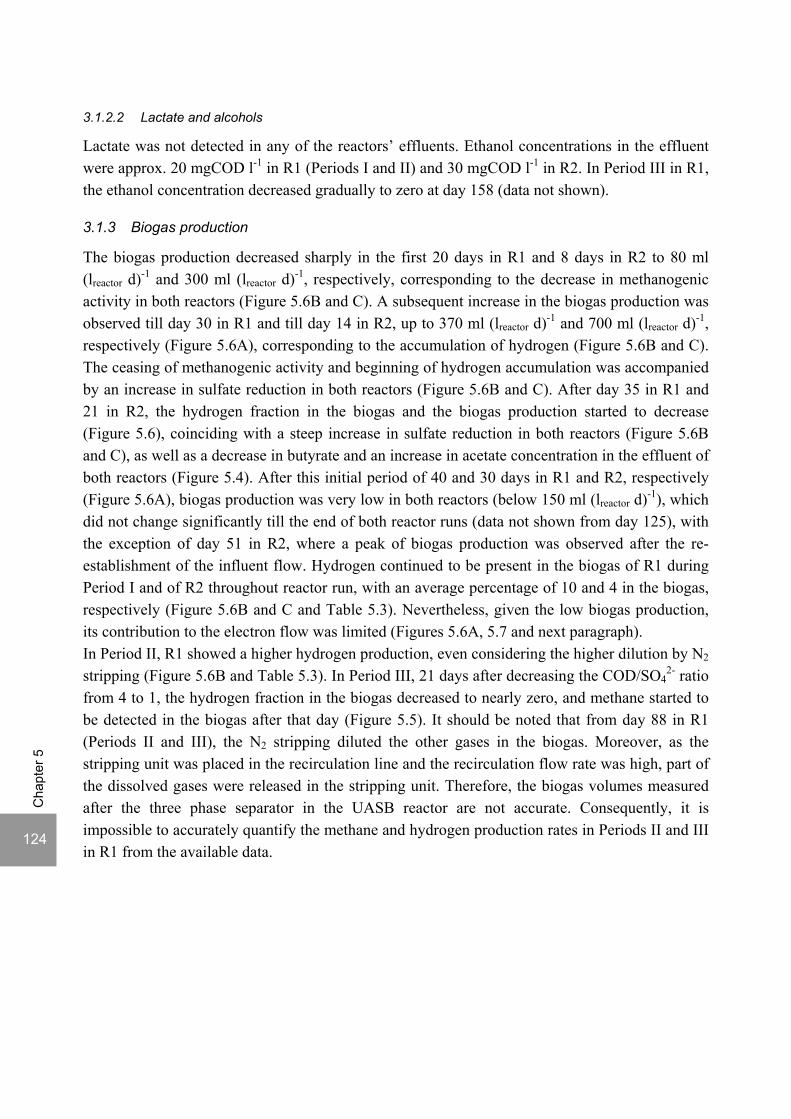
124
Cha
pter
5
3.1.2.2 Lactate and alcohols
Lactate was not detected in any of the reactors’ effluents. Ethanol concentrations in the effluent were approx. 20 mgCOD l-1 in R1 (Periods I and II) and 30 mgCOD l-1 in R2. In Period III in R1, the ethanol concentration decreased gradually to zero at day 158 (data not shown).
3.1.3 Biogas production
The biogas production decreased sharply in the first 20 days in R1 and 8 days in R2 to 80 ml (lreactor d)-1 and 300 ml (lreactor d)-1, respectively, corresponding to the decrease in methanogenic activity in both reactors (Figure 5.6B and C). A subsequent increase in the biogas production was observed till day 30 in R1 and till day 14 in R2, up to 370 ml (lreactor d)-1 and 700 ml (lreactor d)-1, respectively (Figure 5.6A), corresponding to the accumulation of hydrogen (Figure 5.6B and C). The ceasing of methanogenic activity and beginning of hydrogen accumulation was accompanied by an increase in sulfate reduction in both reactors (Figure 5.6B and C). After day 35 in R1 and 21 in R2, the hydrogen fraction in the biogas and the biogas production started to decrease (Figure 5.6), coinciding with a steep increase in sulfate reduction in both reactors (Figure 5.6B and C), as well as a decrease in butyrate and an increase in acetate concentration in the effluent of both reactors (Figure 5.4). After this initial period of 40 and 30 days in R1 and R2, respectively (Figure 5.6A), biogas production was very low in both reactors (below 150 ml (lreactor d)-1), which did not change significantly till the end of both reactor runs (data not shown from day 125), with the exception of day 51 in R2, where a peak of biogas production was observed after the re-establishment of the influent flow. Hydrogen continued to be present in the biogas of R1 during Period I and of R2 throughout reactor run, with an average percentage of 10 and 4 in the biogas, respectively (Figure 5.6B and C and Table 5.3). Nevertheless, given the low biogas production, its contribution to the electron flow was limited (Figures 5.6A, 5.7 and next paragraph). In Period II, R1 showed a higher hydrogen production, even considering the higher dilution by N2 stripping (Figure 5.6B and Table 5.3). In Period III, 21 days after decreasing the COD/SO4
2- ratio from 4 to 1, the hydrogen fraction in the biogas decreased to nearly zero, and methane started to be detected in the biogas after that day (Figure 5.5). It should be noted that from day 88 in R1 (Periods II and III), the N2 stripping diluted the other gases in the biogas. Moreover, as the stripping unit was placed in the recirculation line and the recirculation flow rate was high, part of the dissolved gases were released in the stripping unit. Therefore, the biogas volumes measured after the three phase separator in the UASB reactor are not accurate. Consequently, it is impossible to accurately quantify the methane and hydrogen production rates in Periods II and III in R1 from the available data.
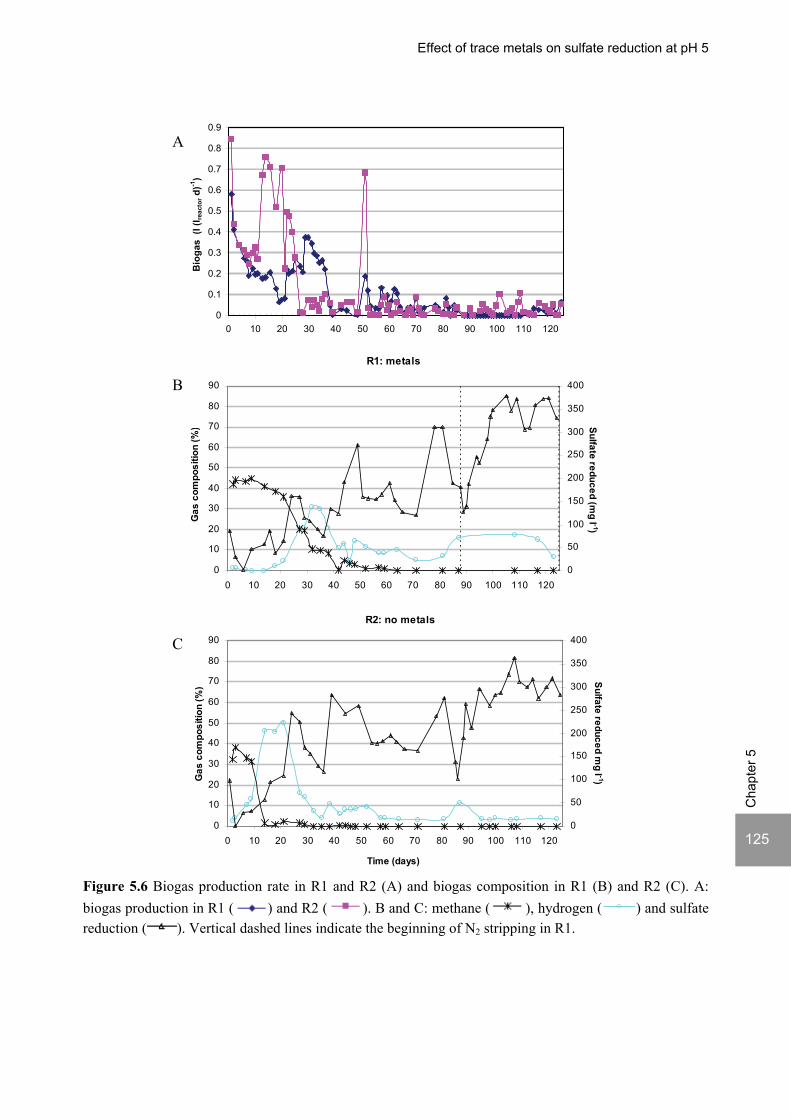
Effect of trace metals on sulfate reduction at pH 5
125
Cha
pter
5
0
0.1
0.2
0.3
0.4
0.5
0.6
0.7
0.8
0.9
0 10 20 30 40 50 60 70 80 90 100 110 120
Bio
gas
(l (l
reac
tor d
)-1)
Figure 5.6 Biogas production rate in R1 and R2 (A) and biogas composition in R1 (B) and R2 (C). A: biogas production in R1 ( ) and R2 ( ). B and C: methane ( ), hydrogen ( ) and sulfate reduction ( ). Vertical dashed lines indicate the beginning of N2 stripping in R1.
A
C R2: no metals
0
10
20
30
40
50
60
70
80
90
0 10 20 30 40 50 60 70 80 90 100 110 120
Time (days)
Gas
com
posi
tion
(%)_
0
50
100
150
200
250
300
350
400
Sulfate reduced mg l -1)
R1: metals
0
10
20
30
40
50
60
70
80
90
0 10 20 30 40 50 60 70 80 90 100 110 120
Gas
com
posi
tion
(%)
0
50
100
150
200
250
300
350
400
Sulfate reduced (mg l -1)
B
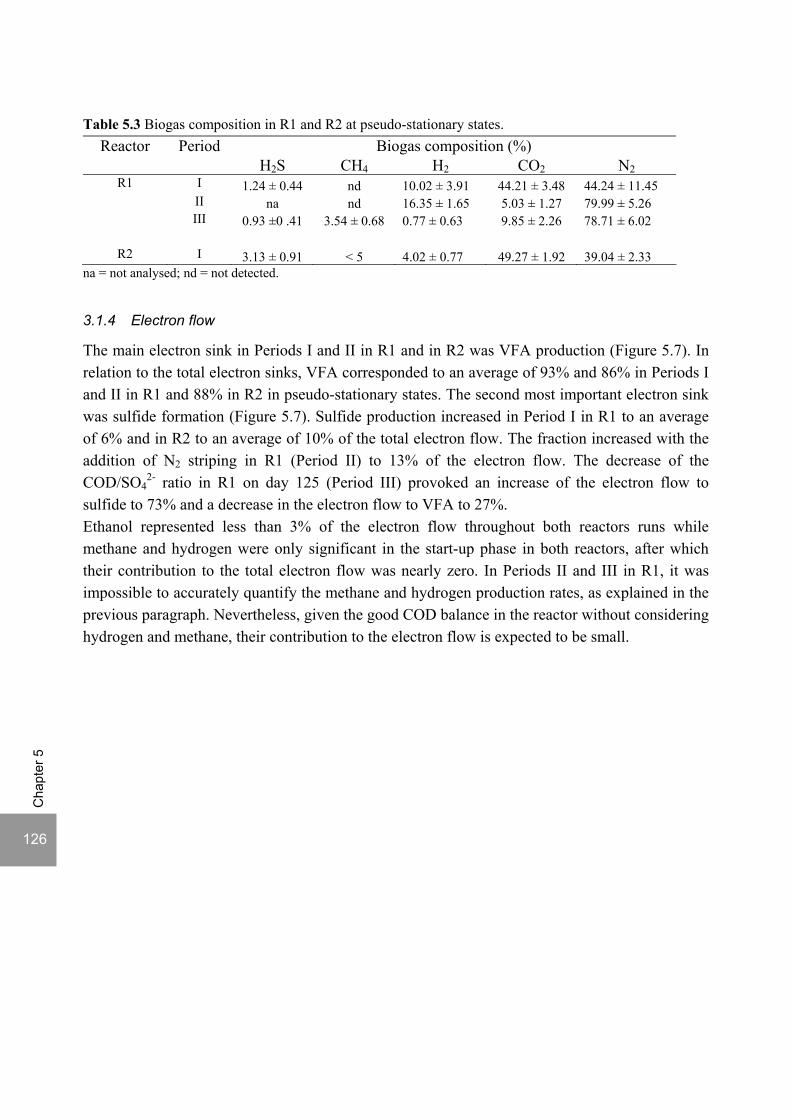
126
Cha
pter
5
Table 5.3 Biogas composition in R1 and R2 at pseudo-stationary states.
Reactor Period Biogas composition (%) H2S CH4 H2 CO2 N2
R1 I 1.24 ± 0.44 nd 10.02 ± 3.91 44.21 ± 3.48 44.24 ± 11.45 II na nd 16.35 ± 1.65 5.03 ± 1.27 79.99 ± 5.26 III 0.93 ±0 .41 3.54 ± 0.68 0.77 ± 0.63 9.85 ± 2.26 78.71 ± 6.02
R2 I 3.13 ± 0.91 < 5 4.02 ± 0.77 49.27 ± 1.92 39.04 ± 2.33 na = not analysed; nd = not detected.
3.1.4 Electron flow
The main electron sink in Periods I and II in R1 and in R2 was VFA production (Figure 5.7). In relation to the total electron sinks, VFA corresponded to an average of 93% and 86% in Periods I and II in R1 and 88% in R2 in pseudo-stationary states. The second most important electron sink was sulfide formation (Figure 5.7). Sulfide production increased in Period I in R1 to an average of 6% and in R2 to an average of 10% of the total electron flow. The fraction increased with the addition of N2 striping in R1 (Period II) to 13% of the electron flow. The decrease of the COD/SO4
2- ratio in R1 on day 125 (Period III) provoked an increase of the electron flow to sulfide to 73% and a decrease in the electron flow to VFA to 27%. Ethanol represented less than 3% of the electron flow throughout both reactors runs while methane and hydrogen were only significant in the start-up phase in both reactors, after which their contribution to the total electron flow was nearly zero. In Periods II and III in R1, it was impossible to accurately quantify the methane and hydrogen production rates, as explained in the previous paragraph. Nevertheless, given the good COD balance in the reactor without considering hydrogen and methane, their contribution to the electron flow is expected to be small.
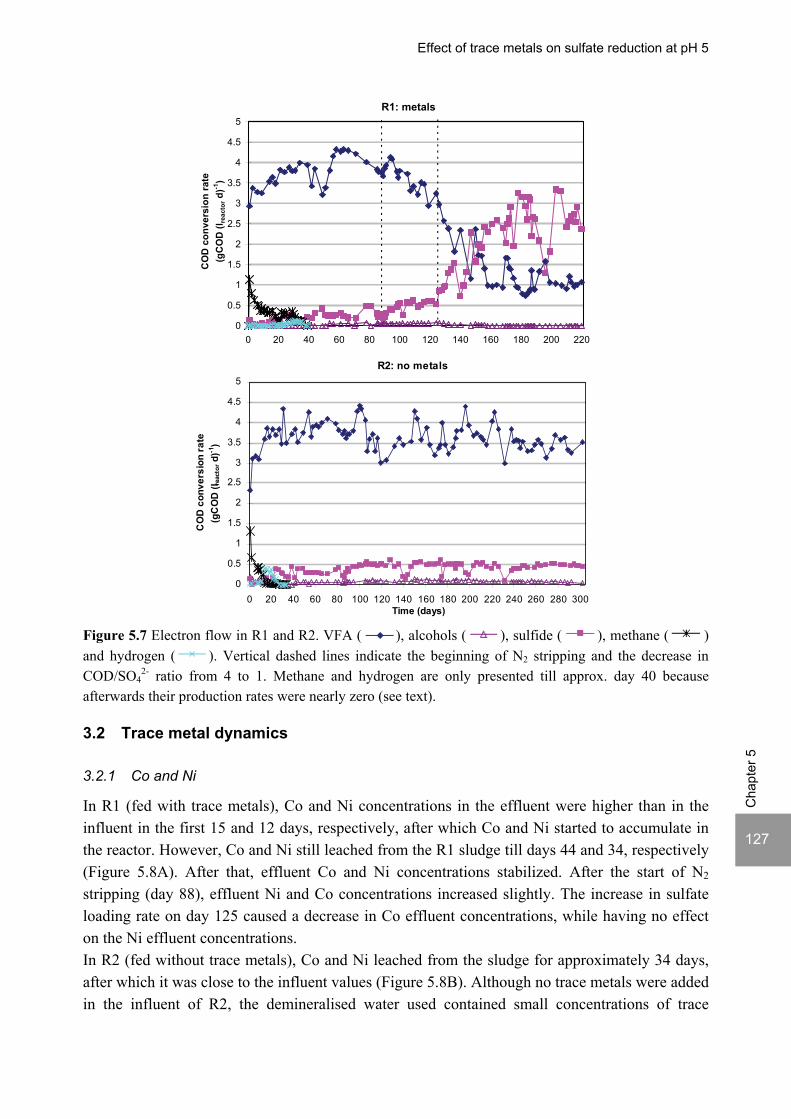
Effect of trace metals on sulfate reduction at pH 5
127
Cha
pter
5
R1: metals
0
0.5
1
1.5
2
2.5
3
3.5
4
4.5
5
0 20 40 60 80 100 120 140 160 180 200 220
CO
D c
onve
rsio
n ra
te
(gC
OD
(lre
acto
r d)-1
)
Figure 5.7 Electron flow in R1 and R2. VFA ( ), alcohols ( ), sulfide ( ), methane ( ) and hydrogen ( ). Vertical dashed lines indicate the beginning of N2 stripping and the decrease in COD/SO4
2- ratio from 4 to 1. Methane and hydrogen are only presented till approx. day 40 because afterwards their production rates were nearly zero (see text).
3.2 Trace metal dynamics
3.2.1 Co and Ni
In R1 (fed with trace metals), Co and Ni concentrations in the effluent were higher than in the influent in the first 15 and 12 days, respectively, after which Co and Ni started to accumulate in the reactor. However, Co and Ni still leached from the R1 sludge till days 44 and 34, respectively (Figure 5.8A). After that, effluent Co and Ni concentrations stabilized. After the start of N2 stripping (day 88), effluent Ni and Co concentrations increased slightly. The increase in sulfate loading rate on day 125 caused a decrease in Co effluent concentrations, while having no effect on the Ni effluent concentrations. In R2 (fed without trace metals), Co and Ni leached from the sludge for approximately 34 days, after which it was close to the influent values (Figure 5.8B). Although no trace metals were added in the influent of R2, the demineralised water used contained small concentrations of trace
R2: no metals
0
0.5
1
1.5
2
2.5
3
3.5
4
4.5
5
0 20 40 60 80 100 120 140 160 180 200 220 240 260 280 300Time (days)
CO
D c
onve
rsio
n ra
te(g
CO
D (l r
eact
or d
)-1)
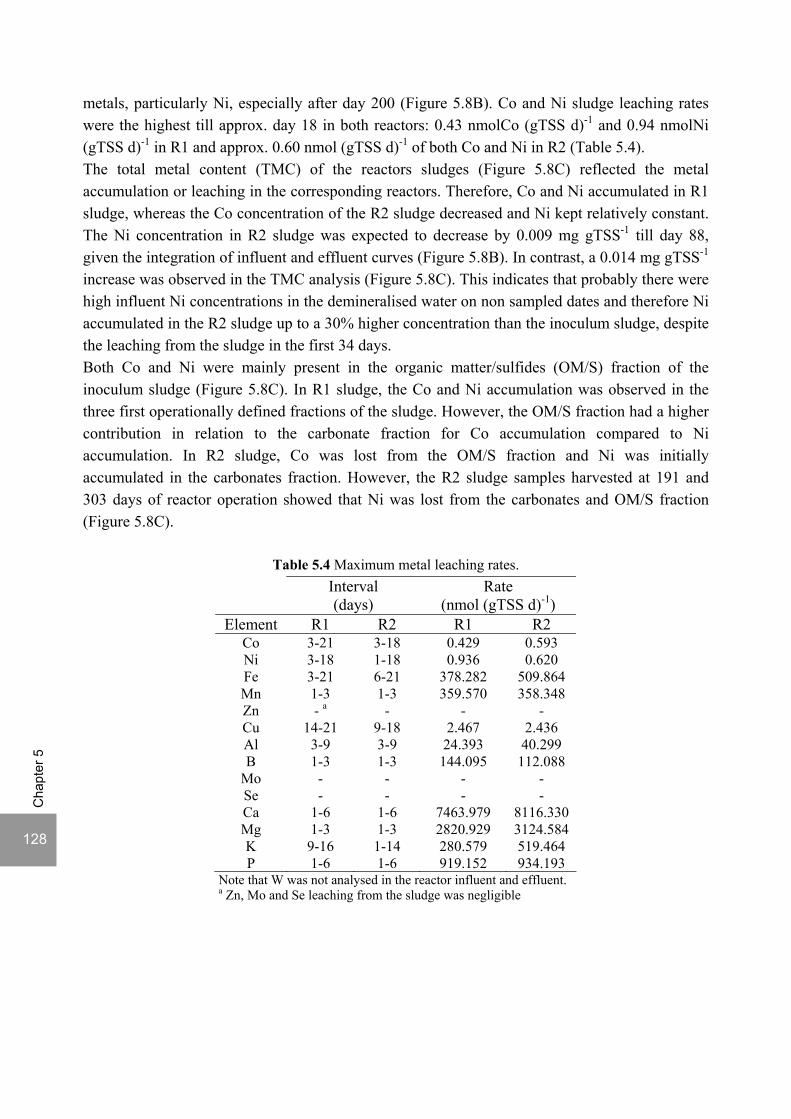
128
Cha
pter
5
metals, particularly Ni, especially after day 200 (Figure 5.8B). Co and Ni sludge leaching rates were the highest till approx. day 18 in both reactors: 0.43 nmolCo (gTSS d)-1 and 0.94 nmolNi (gTSS d)-1 in R1 and approx. 0.60 nmol (gTSS d)-1 of both Co and Ni in R2 (Table 5.4). The total metal content (TMC) of the reactors sludges (Figure 5.8C) reflected the metal accumulation or leaching in the corresponding reactors. Therefore, Co and Ni accumulated in R1 sludge, whereas the Co concentration of the R2 sludge decreased and Ni kept relatively constant. The Ni concentration in R2 sludge was expected to decrease by 0.009 mg gTSS-1 till day 88, given the integration of influent and effluent curves (Figure 5.8B). In contrast, a 0.014 mg gTSS-1 increase was observed in the TMC analysis (Figure 5.8C). This indicates that probably there were high influent Ni concentrations in the demineralised water on non sampled dates and therefore Ni accumulated in the R2 sludge up to a 30% higher concentration than the inoculum sludge, despite the leaching from the sludge in the first 34 days. Both Co and Ni were mainly present in the organic matter/sulfides (OM/S) fraction of the inoculum sludge (Figure 5.8C). In R1 sludge, the Co and Ni accumulation was observed in the three first operationally defined fractions of the sludge. However, the OM/S fraction had a higher contribution in relation to the carbonate fraction for Co accumulation compared to Ni accumulation. In R2 sludge, Co was lost from the OM/S fraction and Ni was initially accumulated in the carbonates fraction. However, the R2 sludge samples harvested at 191 and 303 days of reactor operation showed that Ni was lost from the carbonates and OM/S fraction (Figure 5.8C).
Table 5.4 Maximum metal leaching rates.
Interval (days)
Rate (nmol (gTSS d)-1)
Element R1 R2 R1 R2 Co 3-21 3-18 0.429 0.593 Ni 3-18 1-18 0.936 0.620 Fe 3-21 6-21 378.282 509.864 Mn 1-3 1-3 359.570 358.348 Zn - a - - - Cu 14-21 9-18 2.467 2.436 Al 3-9 3-9 24.393 40.299 B 1-3 1-3 144.095 112.088
Mo - - - - Se - - - - Ca 1-6 1-6 7463.979 8116.330 Mg 1-3 1-3 2820.929 3124.584 K 9-16 1-14 280.579 519.464 P 1-6 1-6 919.152 934.193
Note that W was not analysed in the reactor influent and effluent. a Zn, Mo and Se leaching from the sludge was negligible

129
Cha
pter
5
Figu
re 5
.8 D
isso
lved
Co
and
Ni
conc
entra
tion
in i
nflu
ent
and
efflu
ent
from
R1
(A)
and
R2
(B)
(influ
ent:
clos
ed s
ymbo
ls;
efflu
ent:
open
sym
bols
); fr
actio
natio
n an
d ps
eudo
-tota
l con
tent
s of
Co
and
Ni i
n sl
udge
fro
m R
1 an
d R
2 (C
) (
exc
hang
eabl
e,
carb
onat
es,
OM
/S,
res
idua
l,
TMC
).
R1: w
ith m
etal
s
00.
005
0.01
0.01
50.
020.
025
0.03
0.03
50.
040.
045
0.05
020
4060
8010
012
014
016
018
020
022
0
Co (mg l-1
)
R2: w
ithou
t met
als
00.
005
0.01
0.01
50.
020.
025
0.03
0.03
50.
04
0.04
50.
05
020
4060
8010
012
014
016
018
020
022
024
026
028
030
0
Co (mg l-1
)
R1: w
ith m
etal
s
0
0.01
0.02
0.03
0.04
0.05
0.06
0.07
020
4060
8010
012
014
016
018
020
022
0Ti
me
(day
s)
Ni (mg l-1
)
R2: w
ithou
t met
als
0
0.01
0.02
0.03
0.04
0.05
0.06
0.07
020
4060
8010
012
014
016
018
020
022
024
026
028
030
0
Tim
e (d
ays)
Ni (mg l-1
)
A
B
C
0
0.050.1
0.150.2
0.25
087
191
8719
130
3
Co (mg (gTSS)-1)
R1:
with
met
als
R2:
with
out m
etal
s
0
0.050.1
0.150.2
0.250.3
0.350.4
0.45
087
191
8719
130
3
Tim
e (d
ays)
Ni (mg (gTSS)-1)
R1:
with
met
als
R2:
with
out m
etal
s

130
Cha
pter
5
3.2.2 Fe and Mn
For both reactors, Fe concentrations in the effluent were higher than in the influent throughout the reactor runs, although reaching similar values at the end of the reactor runs (Figure 5.9A and B). Fe leaching from the sludge was very fast till day 21 in both reactors and at a higher rate in R2 (fed without trace metals) than in R1 (fed with trace metals), viz. 510 and 378 nmol (gTSS d)-1, respectively (Table 5.4). After the start of N2 stripping (day 88) in R1, effluent Fe concentration at least doubled, while the increase in sulfate loading rate on day 125 did not affect the Fe leaching behaviour. In R1, Mn concentrations were higher in the effluent than in the influent till day 32 and after that influent and effluent concentrations were similar (Figure 5.9A). In R2, Mn leached from the sludge till approximately day 82 (Figure 5.9B). Mn leaching from the sludge was the highest till day 3 with similar rates in both reactors (Figure 5.9 and Table 5.4). Fe and Mn were the trace metals with the fastest leaching from the trace metals studied (Table 5.4). In the inoculum sludge, Fe was mainly present in the residual and OM/S fractions (Figure 5.9C) and in the first 87 days, Fe leached mainly from these fractions in both reactors. After that, Fe also leached from the exchangeable and carbonates fractions. Mn was mainly present in the first three fractions in the inoculum sludge and the operation at pH 5 caused Mn leaching from all the fractions in both reactors sludges, with minor differences between R1 and R2 sludges.
3.2.3 Zn, Cu and Al
For both reactors, effluent Zn concentrations were lower than in the influent throughout the reactor runs (Figure 5.10A and B), except on day one in R1 and in the first 6 days in R2. The demiwater used in the influent preparation contained significant amounts of Zn, approx. 0.04 mg l-1, and even higher concentrations up to 0.2 mg l-1 were observed around day 6 and 60, resulting in Zn accumulation also in R2 sludge. Cu concentrations were higher in the effluent than in the influent during days 3 to 21 in R1 and from the beginning till day 32 in R2 (Figure 5.10A and B). Subsequently, Cu accumulated in R1 while in R2, effluent concentrations were similar to the (very low) influent concentrations. Interestingly, effluent Cu concentrations in both reactors increased in the first days of operation, contrary to the other trace metals studied. The maximum Cu leaching rate was similar in the two reactors (Table 5.4), approx. 2.5 nmol (gTSS.d)-1 for both R1 and R2, and occurred between days 14 and 21 for R1 and between days 9 and 18 for R2. Al was not added to the reactor influents, but its behaviour is presented because both the inoculum and the reactors sludges contain high concentrations of Al (Figure 5.10C). Al leached from both sludges throughout the reactor runs. Maximum leaching rates were observed between days 3 and 9 in both reactors, and were higher in R2 than in R1 (Table 5.4), viz. 40 and 24 nmol (gTSS d)-1, respectively. The introduction of N2 stripping in R1 caused a decrease in Al leaching (Figure 5.10A).
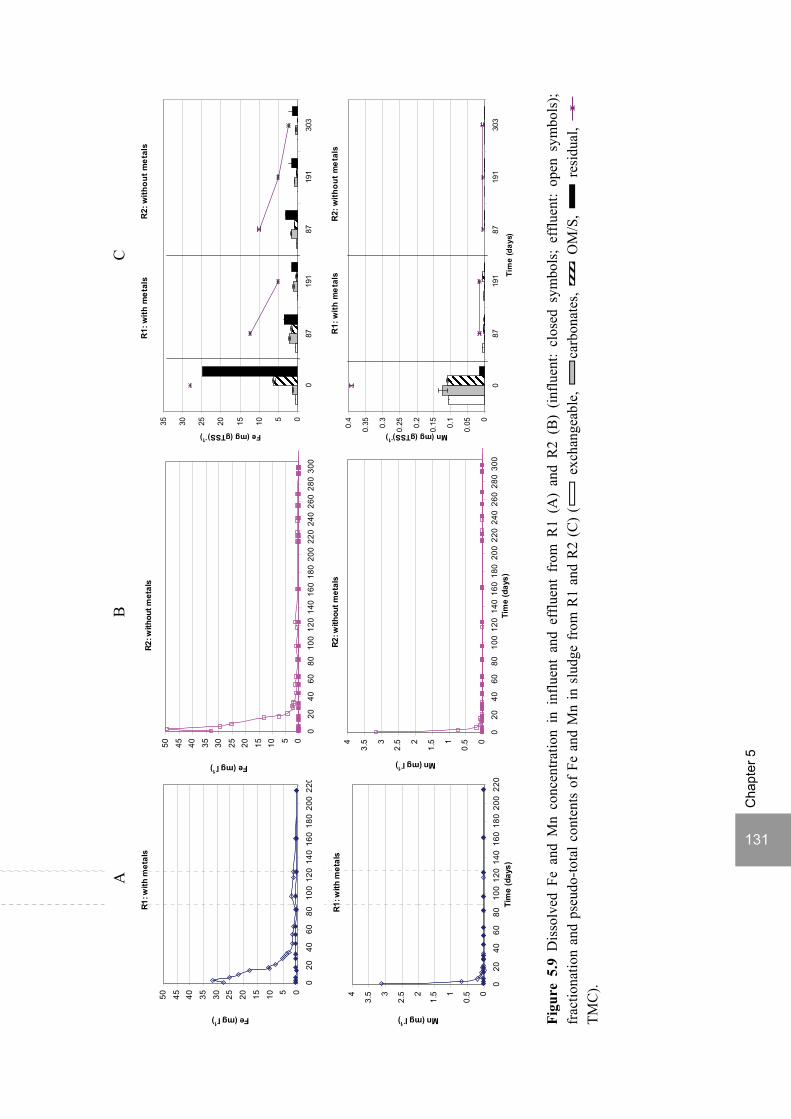
131
Cha
pter
5
Figu
re 5
.9 D
isso
lved
Fe
and
Mn
conc
entra
tion
in i
nflu
ent
and
efflu
ent
from
R1
(A)
and
R2
(B)
(influ
ent:
clos
ed s
ymbo
ls;
efflu
ent:
open
sym
bols
); fr
actio
natio
n an
d ps
eudo
-tota
l con
tent
s of
Fe
and
Mn
in s
ludg
e fr
om R
1 an
d R
2 (C
) (
exc
hang
eabl
e,
carb
onat
es,
OM
/S,
res
idua
l,
TMC
).
R1: w
ith m
etal
s
0
0.51
1.52
2.53
3.54
020
4060
8010
012
014
016
018
020
022
0Ti
me
(day
s)
Mn (mg l-1
)
R1: w
ith m
etal
s
05101520253035404550
020
4060
8010
012
014
016
018
020
022
0
Fe (mg l-1
)
A
B
C
R2: w
ithou
t met
als
05101520253035404550
020
4060
8010
012
014
016
018
020
022
024
026
028
030
0
Fe (mg l-1
)
05101520253035
087
191
8719
130
3
Fe (mg (gTSS)-1)
R1:
with
met
als
R2:
with
out m
etal
s
R2: w
ithou
t met
als
0
0.51
1.52
2.53
3.54
020
4060
8010
012
014
016
018
020
022
024
026
028
030
0Ti
me
(day
s)
Mn (mg l-1
)
0
0.050.1
0.150.2
0.250.3
0.350.4
087
191
8719
130
3
Tim
e (d
ays)
Mn (mg (gTSS)-1)
R1:
with
met
als
R2:
with
out m
etal
s
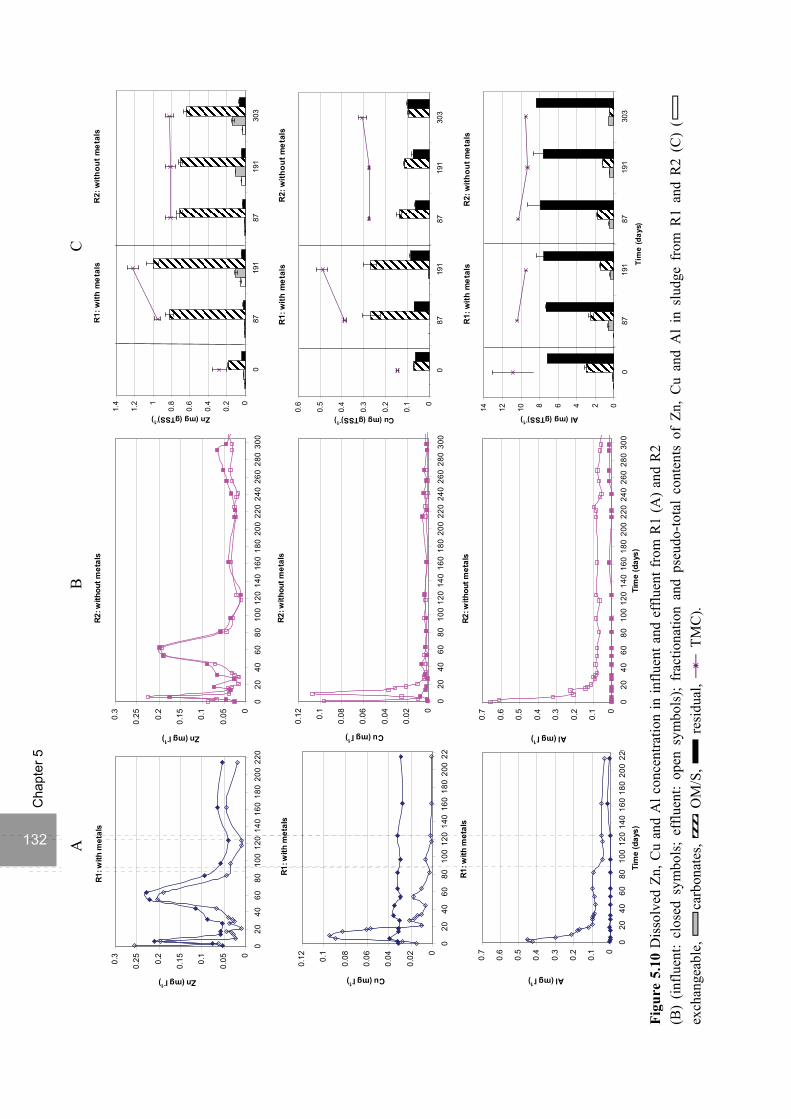
132
Cha
pter
5
Figu
re 5
.10
Dis
solv
ed Z
n, C
u an
d A
l con
cent
ratio
n in
influ
ent a
nd e
fflu
ent f
rom
R1
(A) a
nd R
2 (B
) (in
fluen
t: cl
osed
sym
bols
; ef
fluen
t: op
en s
ymbo
ls);
frac
tiona
tion
and
pseu
do-to
tal
cont
ents
of
Zn,
Cu
and
Al
in s
ludg
e fr
om R
1 an
d R
2 (C
) (
ex
chan
geab
le,
carb
onat
es,
OM
/S,
resi
dual
, T
MC
).
R1: w
ith m
etal
s
0
0.050.
1
0.150.
2
0.250.
3
020
4060
8010
012
014
016
018
020
022
0
Zn (mg l-1
)
R2: w
ithou
t met
als
0
0.050.
1
0.150.
2
0.250.
3
020
4060
8010
012
014
016
018
020
022
024
026
028
030
0
Zn (mg l-1
)
0
0.2
0.4
0.6
0.81
1.2
1.4
087
191
8719
130
3
Zn (mg (gTSS)-1)
R1:
with
met
als
R2:
with
out m
etal
s
R1: w
ith m
etal
s
0
0.02
0.04
0.06
0.080.
1
0.12
020
4060
8010
012
014
016
018
020
022
0
Cu (mg l-1
)
R2: w
ithou
t met
als
0
0.02
0.04
0.06
0.080.
1
0.12
020
4060
8010
012
014
016
018
020
022
024
026
028
030
0
Cu (mg l-1
)
R1: w
ith m
etal
s
0
0.1
0.2
0.3
0.4
0.5
0.6
0.7
020
4060
8010
012
014
016
018
020
022
0Ti
me
(day
s)
Al (mg l-1
)
R2: w
ithou
t met
als
0
0.1
0.2
0.3
0.4
0.5
0.6
0.7
020
4060
8010
012
014
016
018
020
022
024
026
028
030
0Ti
me
(day
s)
Al (mg l-1
)
A
B
C
0
0.1
0.2
0.3
0.4
0.5
0.6
087
191
8719
130
3
Cu (mg (gTSS)-1)
R1:
with
met
als
R2:
with
out m
etal
s
02468101214
087
191
8719
130
3
Tim
e (d
ays)
Al (mg (gTSS)-1)
R1:
with
met
als
R2:
with
out m
etal
s
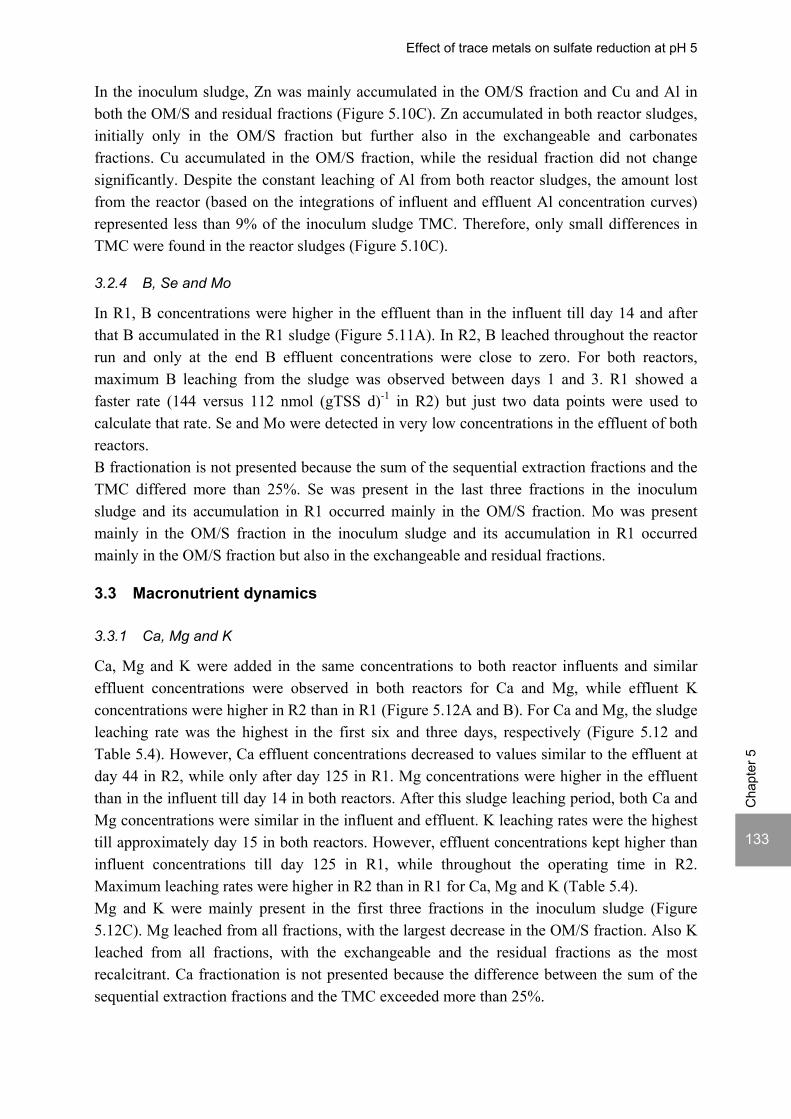
Effect of trace metals on sulfate reduction at pH 5
133
Cha
pter
5
In the inoculum sludge, Zn was mainly accumulated in the OM/S fraction and Cu and Al in both the OM/S and residual fractions (Figure 5.10C). Zn accumulated in both reactor sludges, initially only in the OM/S fraction but further also in the exchangeable and carbonates fractions. Cu accumulated in the OM/S fraction, while the residual fraction did not change significantly. Despite the constant leaching of Al from both reactor sludges, the amount lost from the reactor (based on the integrations of influent and effluent Al concentration curves) represented less than 9% of the inoculum sludge TMC. Therefore, only small differences in TMC were found in the reactor sludges (Figure 5.10C).
3.2.4 B, Se and Mo
In R1, B concentrations were higher in the effluent than in the influent till day 14 and after that B accumulated in the R1 sludge (Figure 5.11A). In R2, B leached throughout the reactor run and only at the end B effluent concentrations were close to zero. For both reactors, maximum B leaching from the sludge was observed between days 1 and 3. R1 showed a faster rate (144 versus 112 nmol (gTSS d)-1 in R2) but just two data points were used to calculate that rate. Se and Mo were detected in very low concentrations in the effluent of both reactors. B fractionation is not presented because the sum of the sequential extraction fractions and the TMC differed more than 25%. Se was present in the last three fractions in the inoculum sludge and its accumulation in R1 occurred mainly in the OM/S fraction. Mo was present mainly in the OM/S fraction in the inoculum sludge and its accumulation in R1 occurred mainly in the OM/S fraction but also in the exchangeable and residual fractions.
3.3 Macronutrient dynamics
3.3.1 Ca, Mg and K
Ca, Mg and K were added in the same concentrations to both reactor influents and similar effluent concentrations were observed in both reactors for Ca and Mg, while effluent K concentrations were higher in R2 than in R1 (Figure 5.12A and B). For Ca and Mg, the sludge leaching rate was the highest in the first six and three days, respectively (Figure 5.12 and Table 5.4). However, Ca effluent concentrations decreased to values similar to the effluent at day 44 in R2, while only after day 125 in R1. Mg concentrations were higher in the effluent than in the influent till day 14 in both reactors. After this sludge leaching period, both Ca and Mg concentrations were similar in the influent and effluent. K leaching rates were the highest till approximately day 15 in both reactors. However, effluent concentrations kept higher than influent concentrations till day 125 in R1, while throughout the operating time in R2. Maximum leaching rates were higher in R2 than in R1 for Ca, Mg and K (Table 5.4). Mg and K were mainly present in the first three fractions in the inoculum sludge (Figure 5.12C). Mg leached from all fractions, with the largest decrease in the OM/S fraction. Also K leached from all fractions, with the exchangeable and the residual fractions as the most recalcitrant. Ca fractionation is not presented because the difference between the sum of the sequential extraction fractions and the TMC exceeded more than 25%.

134
Cha
pter
5
3.3.2 P and S
P was added in the same concentrations to both reactor influents. P leached from the sludge till about day 30 with the highest leaching rates till day 6 and with similar values in both reactors (Figure 5.13A and B and Table 5.4). After day 30, P accumulated in the reactors (Figure 5.13A and B). However, this accumulation was not observed in the sludge analysis (Figure 5.13C). P was mainly present in the residual and OM/S fractions in the inoculum sludges. The reactor operation at pH 5 caused a decrease in the P content in the residual phase down to a relatively stable value, while its content firstly increased in the OM/S fraction and then decreased with operation time, particularly in R2 (Figure 5.13C). S was not analysed in the influent and effluent from the reactor, besides the sulfate and sulfide analysis described in the previous section. S was mainly present in the residual and OM/S fractions in the inoculum sludge and was lost from both fractions during both reactors operation (Figure 5.13C).

135
Cha
pter
5
Figu
re 5
.11
Dis
solv
ed B
, Se
and
Mo
conc
entra
tion
in in
fluen
t an
d ef
fluen
t fr
om R
1 (A
) an
d R
2 (B
) (in
fluen
t: cl
osed
sym
bols
; ef
fluen
t: op
en s
ymbo
ls);
frac
tiona
tion
and
pseu
do-to
tal c
onte
nts
of B
, Se
and
Mo
in s
ludg
e fr
om R
1 an
d R
2 (C
) ( e
xcha
ngea
ble,
ca
rbon
ates
, O
M/S
, re
sidu
al,
TM
C).
R1: w
ith m
etal
s
0
0.050.
1
0.150.
2
0.250.
3
0.35
020
4060
8010
012
014
016
018
020
022
0
B (mg l-1
)
R2: w
ithou
t met
als
0
0.050.
1
0.150.
2
0.250.
3
0.35
020
4060
8010
012
014
016
018
020
022
024
026
028
030
0
B (mg l-1
)
0
0.050.1
0.150.2
0.250.3
0.350.4
0.450.5
B (mg (gTSS)-1)
R1:
with
met
als
R2:
with
out m
etal
s
R1: w
ith m
etal
s
00.
005
0.01
0.01
5
0.02
0.02
50.
03
0.03
50.
04
0.04
5
0.05
020
4060
8010
012
014
016
018
020
022
0
Se (mg l-1
)
R2: w
ithou
t met
als
00.
005
0.01
0.01
50.
020.
025
0.03
0.03
50.
040.
045
0.05
020
4060
8010
012
014
016
018
020
022
024
026
028
030
0
Se (mg l-1
)
0
0.01
0.02
0.03
0.04
0.05
0.06
0.07
0.08
0.090.1
087
191
8719
130
3
Se (mg (gTSS)-1)
R1:
with
met
als
R2:
with
out m
etal
s
R1: w
ith m
etal
s
0
0.01
0.02
0.03
0.04
0.05
0.06
020
4060
8010
012
014
016
018
020
022
0
Tim
e (d
ays)
Mo (mg l-1
)
R2: w
ithou
t met
als
0
0.01
0.02
0.03
0.04
0.05
0.06
020
4060
8010
012
014
016
018
020
022
024
026
028
030
0
Tim
e (d
ays)
Mo (mg l-1
)
0
0.1
0.2
0.3
0.4
0.5
0.6
0.7
087
191
8719
130
3
Tim
e (d
ays)
Mo (mg (gTSS)-1)
R1:
with
met
als
R2:
with
out m
etal
s
A
B
C

136
Cha
pter
5
Figu
re 5
.12
Dis
solv
ed C
a, M
g an
d K
con
cent
ratio
n in
inf
luen
t an
d ef
fluen
t fro
m R
1 (A
) an
d R
2 (B
) (in
fluen
t: cl
osed
sym
bols
; eff
luen
t: op
en s
ymbo
ls);
frac
tiona
tion
and
pseu
do-to
tal c
onte
nts
of C
a, M
g an
d K
in s
ludg
e fr
om R
1 an
d R
2 (C
) ( e
xcha
ngea
ble,
ca
rbon
ates
, O
M/S
, re
sidu
al,
TM
C).
R1: w
ith m
etal
s
020406080100
120
020
4060
8010
012
014
016
018
020
022
0
Ca (mg l-1
)
R2: w
ithou
t met
als
020406080100
120
020
4060
8010
012
014
016
018
020
022
024
026
028
030
0
Ca (mg l-1
)
051015202530
Ca (mg (gTSS)-1)
R1:
with
met
als
R2:
with
out m
etal
s
R1: w
ith m
etal
s
024681012
020
4060
8010
012
014
016
018
020
022
0
Mg (mg l-1
)
R2: w
ithou
t met
als
024681012
020
4060
8010
012
014
016
018
020
022
024
026
028
030
0
Mg (mg l-1
)
0
0.2
0.4
0.6
0.81
1.2
1.4
087
191
8719
130
3
Mg (mg (gTSS)-1)
R1:
with
met
als
R2:
with
out m
etal
s
R1: w
ith m
etal
s
051015202530
020
4060
8010
012
014
016
018
020
022
0
Tim
e (d
ays)
K (mg l-1
)
R2: w
ithou
t met
als
051015202530
020
4060
8010
012
014
016
018
020
022
024
026
028
030
0
Tim
e (d
ays)
K (mg l-1
)
0123456
087
191
8719
130
3
Tim
e (d
ays)
K (mg (gTSS)-1)
R1:
with
met
als
R2:
with
out m
etal
s
A
B
C
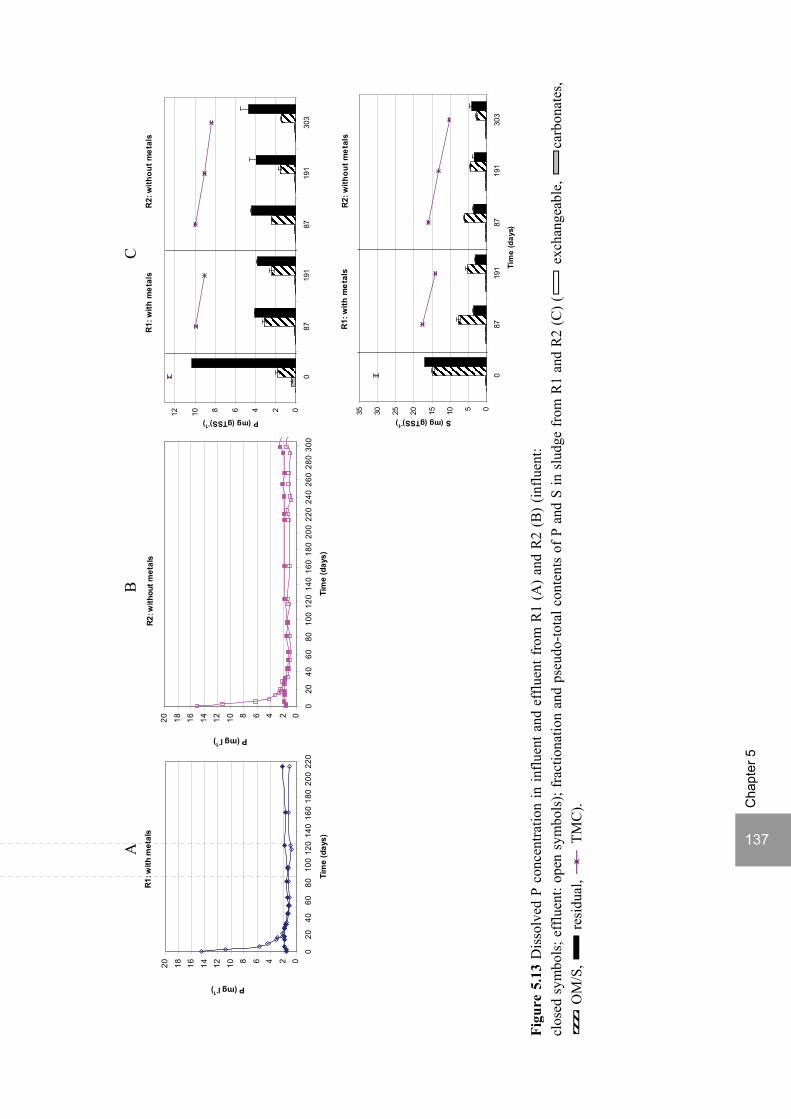
137
Cha
pter
5
Figu
re 5
.13
Dis
solv
ed P
con
cent
ratio
n in
influ
ent a
nd e
fflu
ent f
rom
R1
(A)
and
R2
(B)
(influ
ent:
clos
ed s
ymbo
ls; e
fflu
ent:
open
sym
bols
); fr
actio
natio
n an
d ps
eudo
-tota
l con
tent
s of
P a
nd S
in s
ludg
e fr
om R
1 an
d R
2 (C
) ( e
xcha
ngea
ble,
ca
rbon
ates
, O
M/S
, re
sidu
al,
TM
C).
R1: w
ith m
etal
s
02468101214161820
020
4060
8010
012
014
016
018
020
022
0
Tim
e (d
ays)
P (mg l-1
)
024681012
087
191
8719
130
3
P (mg (gTSS)-1)
R1:
with
met
als
R2:
with
out m
etal
sR2
: with
out m
etal
s
02468101214161820
020
4060
8010
012
014
016
018
020
022
024
026
028
030
0
Tim
e (d
ays)
P (mg l-1
)
A
B
C
05101520253035
087
191
8719
130
3
Tim
e (d
ays)
S (mg (gTSS)-1)
R1:
with
met
als
R2:
with
out m
etal
s
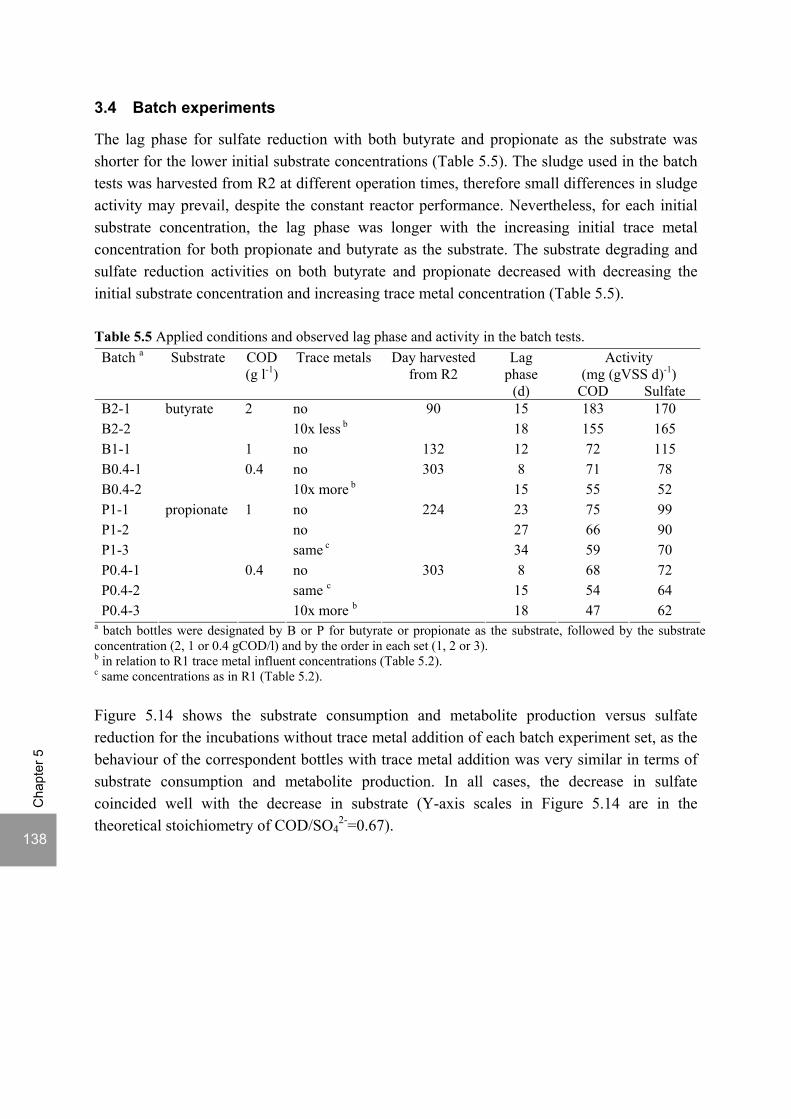
138
Cha
pter
5
3.4 Batch experiments
The lag phase for sulfate reduction with both butyrate and propionate as the substrate was shorter for the lower initial substrate concentrations (Table 5.5). The sludge used in the batch tests was harvested from R2 at different operation times, therefore small differences in sludge activity may prevail, despite the constant reactor performance. Nevertheless, for each initial substrate concentration, the lag phase was longer with the increasing initial trace metal concentration for both propionate and butyrate as the substrate. The substrate degrading and sulfate reduction activities on both butyrate and propionate decreased with decreasing the initial substrate concentration and increasing trace metal concentration (Table 5.5). Table 5.5 Applied conditions and observed lag phase and activity in the batch tests.
Activity (mg (gVSS d)-1)
Batch a Substrate COD (g l-1)
Trace metals Day harvested from R2
Lag phase
(d) COD Sulfate B2-1 no 15 183 170 B2-2
2 10x less b
90 18 155 165
B1-1 1 no 132 12 72 115 B0.4-1 no 8 71 78 B0.4-2
butyrate
0.4 10x more b
303 15 55 52
P1-1 no 23 75 99 P1-2 no 27 66 90 P1-3
1
same c
224
34 59 70 P0.4-1 no 8 68 72 P0.4-2 same c 15 54 64 P0.4-3
propionate
0.4
10x more b
303
18 47 62 a batch bottles were designated by B or P for butyrate or propionate as the substrate, followed by the substrate concentration (2, 1 or 0.4 gCOD/l) and by the order in each set (1, 2 or 3). b in relation to R1 trace metal influent concentrations (Table 5.2). c same concentrations as in R1 (Table 5.2). Figure 5.14 shows the substrate consumption and metabolite production versus sulfate reduction for the incubations without trace metal addition of each batch experiment set, as the behaviour of the correspondent bottles with trace metal addition was very similar in terms of substrate consumption and metabolite production. In all cases, the decrease in sulfate coincided well with the decrease in substrate (Y-axis scales in Figure 5.14 are in the theoretical stoichiometry of COD/SO4
2-=0.67).
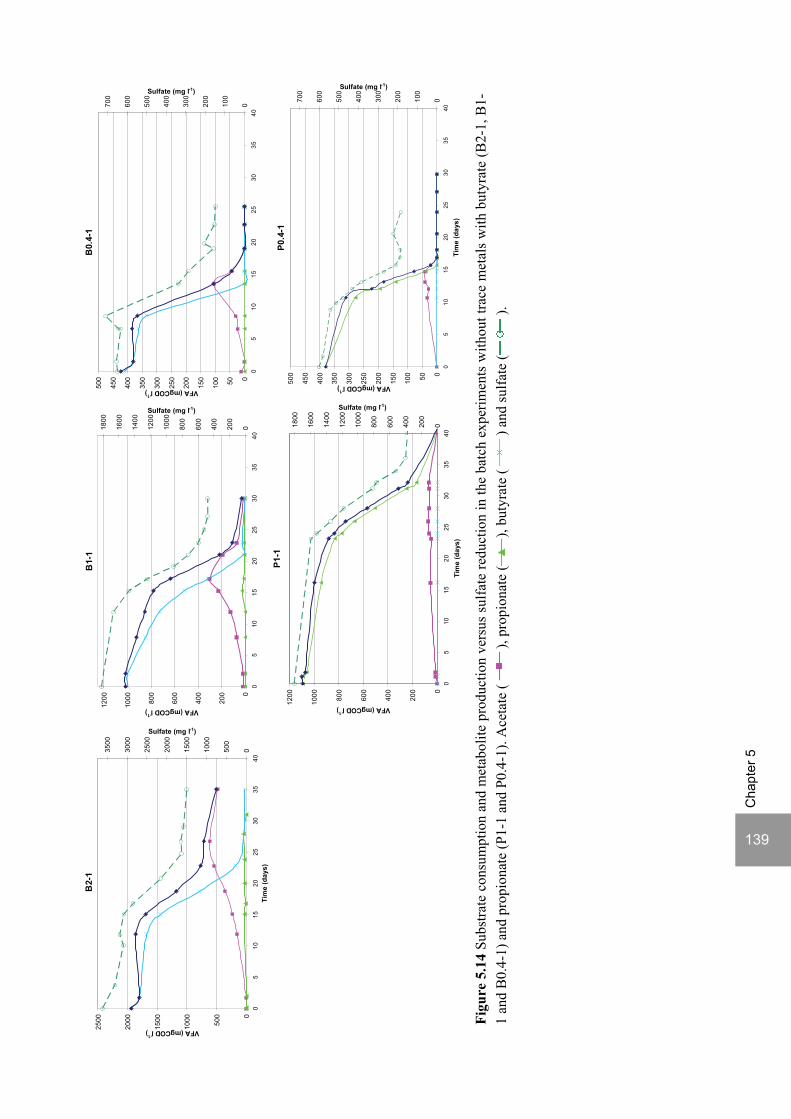
139
Cha
pter
5
Fi
gure
5.1
4 Su
bstra
te c
onsu
mpt
ion
and
met
abol
ite p
rodu
ctio
n ve
rsus
sul
fate
redu
ctio
n in
the
batc
h ex
perim
ents
with
out t
race
met
als
with
but
yrat
e (B
2-1,
B1-
1 an
d B
0.4-
1) a
nd p
ropi
onat
e (P
1-1
and
P0.4
-1).
Ace
tate
(),
prop
iona
te (
), bu
tyra
te (
) and
sulfa
te (
).
B2-
1
0
500
1000
1500
2000
2500
05
1015
2025
3035
40Ti
me
(day
s)
VFA (mgCOD l-1
)
0500
1000
1500
2000
2500
3000
3500
Sulfate (mg l-1)
B1-
1
0
200
400
600
800
1000
1200
05
1015
2025
3035
40
VFA (mgCOD l-1
)
0200
400
600
800
1000
1200
1400
1600
1800
Sulfate (mg l-1)
B0.
4-1
050100
150
200
250
300
350
400
450
500
05
1015
2025
3035
40
VFA (mgCOD l-1
)
0100
200
300
400
500
600
700
Sulfate (mg l-1)
P0.4
-1
050100
150
200
250
300
350
400
450
500
05
1015
2025
3035
40
Tim
e (d
ays)
VFA (mgCOD l-1
)
0100
200
300
400
500
600
700
Sulfate (mg l-1)
P1-1
0
200
400
600
800
1000
1200
05
1015
2025
3035
40
Tim
e (d
ays)
VFA (mgCOD l-1
)
0200
400
600
800
1000
1200
1400
1600
1800
Sulfate (mg l-1)
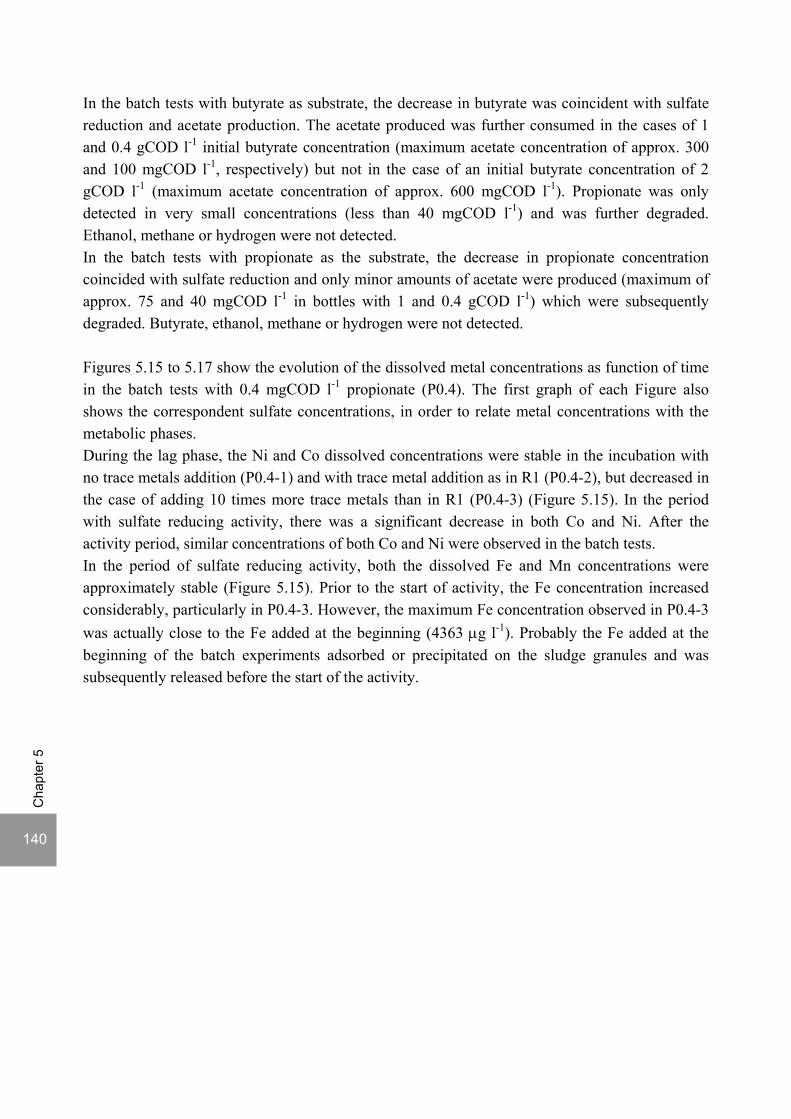
140
Cha
pter
5
In the batch tests with butyrate as substrate, the decrease in butyrate was coincident with sulfate reduction and acetate production. The acetate produced was further consumed in the cases of 1 and 0.4 gCOD l-1 initial butyrate concentration (maximum acetate concentration of approx. 300 and 100 mgCOD l-1, respectively) but not in the case of an initial butyrate concentration of 2 gCOD l-1 (maximum acetate concentration of approx. 600 mgCOD l-1). Propionate was only detected in very small concentrations (less than 40 mgCOD l-1) and was further degraded. Ethanol, methane or hydrogen were not detected. In the batch tests with propionate as the substrate, the decrease in propionate concentration coincided with sulfate reduction and only minor amounts of acetate were produced (maximum of approx. 75 and 40 mgCOD l-1 in bottles with 1 and 0.4 gCOD l-1) which were subsequently degraded. Butyrate, ethanol, methane or hydrogen were not detected.
Figures 5.15 to 5.17 show the evolution of the dissolved metal concentrations as function of time in the batch tests with 0.4 mgCOD l-1 propionate (P0.4). The first graph of each Figure also shows the correspondent sulfate concentrations, in order to relate metal concentrations with the metabolic phases. During the lag phase, the Ni and Co dissolved concentrations were stable in the incubation with no trace metals addition (P0.4-1) and with trace metal addition as in R1 (P0.4-2), but decreased in the case of adding 10 times more trace metals than in R1 (P0.4-3) (Figure 5.15). In the period with sulfate reducing activity, there was a significant decrease in both Co and Ni. After the activity period, similar concentrations of both Co and Ni were observed in the batch tests. In the period of sulfate reducing activity, both the dissolved Fe and Mn concentrations were approximately stable (Figure 5.15). Prior to the start of activity, the Fe concentration increased considerably, particularly in P0.4-3. However, the maximum Fe concentration observed in P0.4-3 was actually close to the Fe added at the beginning (4363 μg l-1). Probably the Fe added at the beginning of the batch experiments adsorbed or precipitated on the sludge granules and was subsequently released before the start of the activity.

Effect of trace metals on sulfate reduction at pH 5
141
Cha
pter
5
Figure 5.15 Metal versus sulfate concentrations in batch tests P0.4 (-1, 2 and 3) for Fe, Mn, Co and Ni ( sulfate P04-1, sulfate P0.4-2, sulfate P0.4-3, metal P0.4-1, metal P0.4-2, metal P0.4-3).
0
50
100
150
200
250
300
0 5 10 15 20 25 30
Co
( μg
l-1)
0
100
200
300
400
500
600
700
Sulfate (mg l -1)
0
50
100
150
200
250
0 5 10 15 20 25 30
Ni (μ
g l-1
)
0
500
1000
1500
2000
2500
3000
3500
4000
4500
0 5 10 15 20 25 30
Fe ( μ
g l-1
)
0
50
100
150
200
250
0 5 10 15 20 25 30
Time (days)
Mn
( μg
l-1)
0
5
10
15
20
25
30
35
0 5 10 15 20 25 30
Co
( μg
l-1)
0
100
200
300
400
500
600
700
Sulfate (mg l -1)
0
5
10
15
20
25
30
35
40
45
0 5 10 15 20 25 30
Ni (μ
g l-1
)
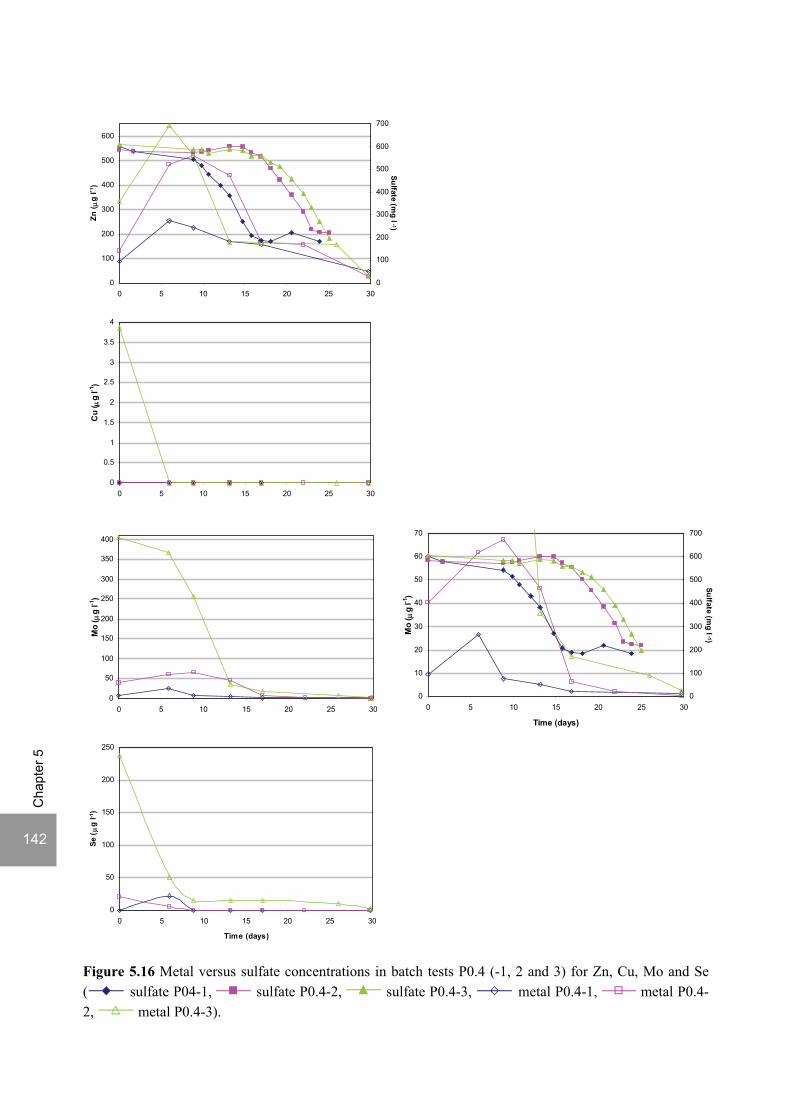
142
Cha
pter
5
Figure 5.16 Metal versus sulfate concentrations in batch tests P0.4 (-1, 2 and 3) for Zn, Cu, Mo and Se ( sulfate P04-1, sulfate P0.4-2, sulfate P0.4-3, metal P0.4-1, metal P0.4-2, metal P0.4-3).
0
100
200
300
400
500
600
0 5 10 15 20 25 30
Zn ( μ
g l*1
)
0
100
200
300
400
500
600
700
Sulfate (mg l
-1)
0
0.5
1
1.5
2
2.5
3
3.5
4
0 5 10 15 20 25 30
Cu
( μg
l-1)
0
50
100
150
200
250
300
350
400
0 5 10 15 20 25 30
Mo
( μg
l-1)
0
50
100
150
200
250
0 5 10 15 20 25 30
Time (days)
Se (μ
g l-1
)
0
10
20
30
40
50
60
70
0 5 10 15 20 25 30
Time (days)
Mo
( μg
l-1)
0
100
200
300
400
500
600
700
Sulfate (mg l
-1)

Effect of trace metals on sulfate reduction at pH 5
143
Cha
pter
5
0
200
400
600
800
1000
1200
1400
0 5 10 15 20 25 30
B ( μ
g l-1
)
0
100
200
300
400
500
600
700
Sulfate (mg l -1)
Dissolved Zn concentrations increased at the beginning of the batch experiments, but decreased very fast just before or at the start of the sulfate reducing activity (Figure 5.16). Interestingly, similar dissolved Zn concentrations (approx. 170 μg l-1) were reached at this phase in the three batch tests. Similar findings were found for Mo (Figure 5.16). After an initial increase in dissolved Mo concentrations in P0.4-2 and P0.4-3, dissolved Mo concentrations decreased prior to the start of activity, which started at Mo dissolved concentrations below 10 μg l-1. In P0.4-1, Mo decreased abruptly before activity started in the range 10-15 μg l-1. Dissolved concentrations of Cu and Se were already much lower at the beginning of the batch tests than the concentration supplied and decreased further to below detection limit much before the start in activity, except for Se in batch P0.4-3, which reached approx. 15 μg l-1 between days 6 and 9 and was stable before and during activity (Figure 5.16). B dissolved concentrations increased during the batch tests, particularly before the activity and were stable or increased slightly during the activity (Figure 5.17). Batch P0.4-1 showed the highest B dissolved concentration. W was below detection limit in P0.4-1 and showed similar initial dissolved concentrations in P0.4-2 and P0.4-3. However, the dissolved W concentration decreased in P0.4-2 till below the detection limit before the start in activity, while increasing in P0.4-3 before and during activity up to approx. 67 μg l-1.
Figure 5.17 Metal versus sulfate concentrations in batch tests P0.4 (-1, 2 and 3) for B and W ( sulfate P04-1, sulfate P0.4-2, sulfate P0.4-3, metal P0.4-1, metal P0.4-2, metal P0.4-3).
0
10
20
30
40
50
60
70
0 5 10 15 20 25 30
Time (days)
W ( μ
g l-1
)
144
Cha
pter
5
4 DISCUSSION
4.1 Effect of trace metals on sulfate reduction
This study shows that absence of trace metals in the reactor influent did not negatively affect the performance of R2 in terms of acidification or sulfate reduction. On the contrary, the presence of low concentrations of trace metals can be inhibitory to sulfate reduction. The lag phase of about 20 days in which sulfate reduction efficiencies below 20% were observed in both reactors coincides with the period with the highest trace metal concentrations in both reactors (Figure 5.2 versus Figures 5.8 till 5.13). The high initial trace metal concentrations were caused by the solubilisation of trace metals from the sludge, which largely exceeded the initial trace metal concentrations in R1 influent. Trace metal concentrations decreased by more than 70% compared to the initial concentrations in both reactors in this period. This suggests that the high trace metal concentrations observed were inhibiting sulfate reduction during the first 20 days of reactor operation. Moreover, during the subsequent 30 days, the sulfate reduction efficiency increased in both reactors, but the increase was faster in the reactor fed without trace metals than in the reactor fed with trace metals (Figure 5.1), which again suggests trace metal inhibition. This was confirmed in the batch tests performed with R2 sludge, in which the lag phases were longer in the bottles with trace metals compared to the bottles without trace metals, for both butyrate and propionate as substrates (Table 5.5).
4.1.1 Relation between dissolved trace metal concentrations and sulfate reducing activity
Figure 5.18 shows the trace metal concentrations in the reactors during the start-up period in which the sulfate reduction rate in R2 was higher than in R1. Most dissolved metal concentrations were lower in R2 than in R1, namely Co, Mn, Cu, Se and Mo. Nevertheless, in both reactors, all trace metals were present at concentrations below 0.12 mg l-1 (except for Fe, which was present in concentrations up to 8 mg l-1). These concentrations are much lower than reported toxic values. Toxic metal concentrations have been reported in the range of few mg l-1 to more than 100 mg l-1 at neutral pH (Hao, 2000; Utgikar et al., 2002). Nevertheless, several studies used media containing strong chelators, buffers or reductants which can greatly diminish the toxic effect of the metals. Sani et al. (2001), using an SRB metal toxicity medium to eliminate the formation of metal precipitates and minimize metal complexation, reported an IC50 of 16 μM for Cu in D. desulfuricans at pH 7.2, which was 100 times lower than previously reported values. Without chelators in the media, Poulson et al. (1997) reported a toxic Zn concentration of 198 μM as toxic to D. desulfuricans at pH 7.2 but also that a total activity of free Ni + Zn greater than approximately 25 μmolal was already toxic, meaning that the toxic effect of the binary mixture was substantially higher than the summation of the individual metal toxicity. The lower pH used in this study and synergetic or cumulative metal toxic effects have probably contributed to the inhibitory effect observed in the reactor fed with trace metals.

Effect of trace metals on sulfate reduction at pH 5
145
Cha
pter
5
0
0.02
0.04
0.06
0.08
0.1
0.12
0.14
CoR1
CoR2
Ni R1
NiR2
MnR1
MnR2
ZnR1
ZnR2
CuR1
CuR2
Al R1
AlR2
B R1
B R2
SeR1
SeR2
MoR1
MoR2
FeR1
FeR2
Trac
e m
etal
s (m
g l-1
)
0
1
2
3
4
5
6
7
8
9
Fe (mg l -1)
Figure 5.18 Trace metal concentration ranges in effluent during the period 21 to 44 days (bars) and influent concentrations (dots) in R1 and R2. Due to the production of sulfide and the very low solubility of most metal sulfides, sulfate reducers have the ability of detoxifying the medium by precipitating most toxic metals. The longer lag phases in the batch bottles with a higher trace metal concentration but with substrate depletion and sulfate reduction activities not significantly decreased by the higher trace metal concentrations (Table 5.5 and Figure 5.15) suggests a detoxification mechanism. Interestingly, Zn, Cu, Mo and Se concentrations in the batch media were decreased significantly before or just at the start of the sulfate reduction activity (Figure 5.16). Cu and Se concentrations decreased days before the start of activity, whereas Zn and Mo decreased at the start of activity. Moreover, similar concentrations of Zn and Mo were observed at the start of the activity in the incubations which had initially different Zn and Mo concentrations (Figure 5.16). Although this behaviour suggests that the decrease of Zn or Mo concentration to below 200 μg l-1 and 10 μg l-1, respectively, is the factor that triggers the start of activity, it can not be excluded that this is only a consequence of the start of the activity, e.g. by sulfide precipitation. Also the Co and Ni concentration decreased during the activity period in all the bottles (Figure 5.15). The decrease in Cu, Zn, Ni and Co concentration in the batch tests (Figures 5.15 and 5.16) is in agreement with the solubility products of their respective metal sulfides (1.19x10⁻³⁴, 3.81x10⁻²³, 2.55x10⁻²⁰ and 2.97x10⁻²¹, respectively). Therefore, Cu is the first metal to precipitate, already with small traces of sulfide produced in the lag phase and Zn precipitates as soon as sulfide production starts (Figure 5.16). Co and Ni precipitate during the sulfide production phase and with similar trends (Figure 5.15), as predicted by their similar solubility products. Se and Mo were added to the medium as oxyanions, which can be reduced once electrons from the substrate oxidation are available. Subsequently, insoluble metal selenides can be formed (Lenz et al., 2006) or selenite co-precipitates with sulfide to elemental selenium and sulfur (Hockin and Gadd, 2003). The reduction of molybdate in the presence of sulfide can result in the precipitation of the mineral molybdenite (MoS2(s)) (Tucker et al., 1997). Probably such mechanisms contributed to the decrease in dissolved Se and Mo concentrations in the batch tests.
146
Cha
pter
5
4.1.2 Pathways affected by trace metals
The start-up of sulfate reduction in both reactors was associated firstly with the ceasing of the methanogenic activity and concomitant hydrogen accumulation (Figure 5.6) and secondly with the simultaneous decrease in hydrogen and butyrate concentration and increase in acetate concentration (Figures 5.4 and 5.6). This suggests that sulfate reducers initially used the hydrogen accumulated by the ceasing of methanogenesis (equation 1). The stable acetate concentrations confirm that acetate was not used as substrate for sulfate reduction at this stage, as was also observed at pH 5 in Chapter 2. Moreover, acetate degrading SRB have a low growth rate (Widdel, 1988) and the inoculum sludge (Eerbeek sludge) contains only a small population of them (Oude Elferink et al., 1998b). Subsequently, at about day 40 in R2 and day 20 in R1, butyrate started to be consumed by sulfate reducers (Figure 5.4) according to equation 2 or, alternatively, the higher activity of sulfate reducers on hydrogen caused the decrease in hydrogen concentration, which favoured reaction 3. Similar considerations can be made with reactions 4 and 5 about the decrease of propionate in R1, coinciding with the changes in butyrate and propionate concentration. There is also the possibility that fermentation pathways were affected by trace metals and lower concentrations favoured reaction 6 to reaction 7. This would cause a higher hydrogen production which could be used for sulfate reduction. 4 H2 + SO4
2- + H+→ HS- + 4 H2O (1)
CH3CH2CH2COO- + 0.5 SO42 → 2 CH3COO- + 0.5 HS- + 0.5 H+ (2)
CH3CH2CH2COO- + 2 H2O → 2 CH3COO- + H+ + 2 H2 (3)
CH3CH2COO- + 0.75 SO42 → CH3COO- + HCO3
- + 0.75 HS- + 0.25 H+ (4)
CH3CH2COO- + 2 H2O → CH3COO- + CO2 + 3 H2 (5)
C12H22O11 + 5 H2O → 4 CH3COOH + 8 H2 + 4 CO2 (6)
C12H22O11 + H2O → 2 CH3CH2CH2COOH + 4 H2 + 4 CO2 (7)
The observed inhibition of sulfate reduction by trace metals can therefore be the result of trace metal inhibition of several pathways. The batch tests performed with butyrate and propionate with R2 sludge (Table 5.5) confirmed the trace metal inhibition in the degradation of both single substrates, indicating therefore that sulfate reducers and/or acetogens were inhibited by the higher trace metal concentrations. Batch tests with specific inhibitors for sulfate reducers, like molybdate, tungstate or anthraquinone derivatives (Oremland and Capone, 1988; Cooling et al., 1996) and using hydrogen or acetate as substrates would allow to determine which pathway is more affected by trace metal concentrations.

Effect of trace metals on sulfate reduction at pH 5
147
Cha
pter
5
4.2 Effect of absence of trace metals in the influent
The stationary performance of R2 over the long run of 305 days without trace metals supply indicates that the absence of trace metals in the influent did not have a negative effect on the performance of the reactor. Moreover, when exposing R2 sludge after different times of reactor operation to different trace metal concentrations in the batch tests, higher concentrations were actually prejudicial to the activity (Table 5.5). This confirms that R2 sludge was not metal deprived, despite the long operation without addition of trace metals. However, the demiwater used for medium preparation was not completely free of metals, as Figures 5.8 to 5.12 indicate, and contained particularly high concentrations of Ni and Zn (up to 0.02 and 0.2 mg l-1, respectively). Although yeast extract was added also in R2, its contribution to the trace metal concentration in the reactor influent was negligible (maximum 1.3, 0.6 and 0.01 nM of Fe, Zn and Se, respectively). Therefore, the very small concentrations of trace metals in the influent were sufficient to sustain the microbial activity, at least with the moderate organic loading rate applied in this study. Given the presence of a stock of trace metals in R2 sludge, despite the 305 day long run at pH 5, as Figures 5.8C to 5.13C show, it is possible that those trace metals can become available to the microorganisms by solubilisation and /or the production of strong complexes by the microorganisms (Bridge et al., 1999; Jansen et al., 2005).
4.3 Effect of sulfide
Fermentative bacteria are less sensitive to sulfide than SRB and methanogens (Maillacheruvu et al., 1993; Mizuno et al., 1998a). This study shows that no inhibition of the sucrose acidification was observed for sulfide concentrations up to 115 mg l−1 (Figures 5.1 and 5.3). This is in agreement with previous studies in thermophilic UASB reactors where sucrose degradation was found to be unaffected by sulfide concentrations up to 375 mg l−1 at pH 6 (Sipma et al., 1999; Lens et al., 2001) and up to 75 mg l-1 at pH 5 (Chapter 2). Sulfide concentrations of 100 mg l-1 were inhibitory to sulfate reduction at pH 5: lowering the sulfide concentrations to below 20 mg l-1 resulted in a fast increase in sulfate reduction efficiency in R1 from an average of 70% to 91% (Figure 5.2A). Moreover, the almost complete sulfate reduction efficiencies observed at a COD/SO4
2- ratio of 1, corresponding to a sulfate reduction rate of 4.19 g (lreactor d)-1, showed that sulfate reduction was not hampered by sulfide concentrations up to 50 mg l-1 (Figure 5.2A). Sulfide toxicity has been related with denaturation of proteins by acting as a cross-linking agent between polypeptide chains (Postgate 1984), with ceasing electron transport systems due to combination with the iron of the cytochrome and other essential iron-containing compounds in the cell (Madigan et al., 2000) or with precipitation of trace elements required as cofactors for enzyme systems (Postgate 1984). The latter hypothesis is not likely in this study, given the high dissolved concentrations of trace metals observed in R1. In Chapter 4, in a similar experiment with the same inoculum sludge as in the present study but performed at pH 6, it was shown that sulfide concentrations should be below 50 mg l-1 in order to get complete sulfate reduction at a COD/SO4
2- ratio of 1 with sucrose as the substrate. The present study also showed nearly complete sulfate reduction efficiencies with sulfide

148
Cha
pter
5
concentrations up to 50 mg l-1 (Figure 5.2). Moreover, higher concentrations of undissociated sulfide, considered the most toxic form of sulfide to SRB (Reis et al., 1991c), were present in the present study, given the difference in pH. The incomplete sulfate reduction observed in R2 (Figure 5.2) was very likely due to sulfide toxicity, as sulfide concentrations averaged 90 mg l-1 during the reactor run (Figure 5.2).
4.4 Effect of COD/SO42- ratio
Sulfate reduction efficiencies above 90% were observed at both COD/SO42- ratios of 4 and 1 in
R1, provided low sulfide concentrations were kept in the reactor (Figure 5.2). Given the same OLR, the electron flow to sulfide production was increased, while decreasing for VFA (Figure 5.7). The increase in the amount of sulfate reduced in Period III was accompanied first by a decrease in butyrate concentrations, followed by decrease in the propionate, hydrogen and finally acetate concentration (Figure 5.5). This confirms that butyrate was the preferred substrate and acetate the least preferred substrate for sulfate reduction at low COD/SO4
2- ratio. The fact that butyrate concentrations decreased much before the decrease in hydrogen accumulation suggests that butyrate was used directly by SRB. There are contradictory reports on the competition between acetogens and SRB for butyrate. Visser (1995) concluded that acetogens are competitive with SRB at both low and high COD/SO4
2- ratios while Mizuno et al. (1994) and Omil et al. (1996) reported that butyrate is degraded faster by SRB than acetogens. Nevertheless, it is clear from the present study that sulfate reduction steers butyrate consumption, which was already noticed in the start-up phase in both reactors (Figure 5.4 and section 4.1), when the increase in sulfate reduction was accompanied by a decrease in butyrate concentrations and increase in acetate concentrations. Moreover, in episodes with decreased sulfate reduction efficiencies due to instability of the stripping unit, namely after day 88 and day 114 in R1, butyrate concentrations increased and acetate decreased. This is in agreement with a previous study under similar conditions as this one, in which the increased amount of sulfate reduced upon decreasing the COD/SO4
2- ratio from 9 to 3.5 was accompanied by a decrease in butyrate concentrations (Chapter 2). Also Reis et al. (1991b) and Mizuno et al. (1994) reported a similar relationship between the sulfate reduction rate and butyrate and acetate concentration, under mesophilic conditions. The decrease in COD/SO4
2- ratio from 4 to 1 in R1 provoked the restart of methane production, although still in low amounts, but which production had decreased sharply at the beginning of the reactor runs and was suppressed since day 64 (Figure 5.6B). The restart of methane production was accompanied by a decrease in hydrogen concentration (Figure 5.5). It seems contradictory that methanogenesis restarted following an increase in sulfate reduction, given the competition of these trophic groups for the same substrates. It is, however, in agreement with the findings of Chapter 4, in UASB reactor experiments at pH 6, where the lower susceptibility of methanogens than SRB to sulfide toxicity with hydrogen and acetate as the substrates was given as a possible explanation (Maillacheruvu and Parkin, 1996). However, in the present study, sulfide concentrations were kept low due to N2 stripping and small amounts of hydrogen were accumulating in the biogas already before the decrease in COD/SO4
2- ratio. Therefore, further
Effect of trace metals on sulfate reduction at pH 5
149
Cha
pter
5
research is needed to understand the increase in methane production at higher sulfate loading rates.
4.5 Trace metal dynamics
This study shows that trace metal leaching from the inoculum sludge had an important contribution to the trace metal concentrations observed in both reactors at the beginning of the reactors runs. The inoculum sludge used in this study was harvested from a full scale UASB reactor operating at a pH of approx. 6.9 (Oude Elferink et al., 1998b). Therefore, given the important influence on the operational pH on trace metal dynamics, as in general metal solubility increases with decreasing pH, leaching from the granules’ trace metal stock is expected at pH 5. This study showed that the sludge was, nevertheless, still capable of accumulating several trace metals fed to the reactor at this pH value, namely Co, Ni, Cu, Zn, B, Se and Mo.
4.5.1 Co and Ni
Although Co and Ni leached from the inoculum sludge during the first 44 and 34 days in R1 and 82 and 34 days in R2, respectively, the addition of 0.5 μM Co and Ni in R1 influent lead to Co and Ni accumulation in R1 sludge (Figure 5.8). In Chapter 3, based on leaching tests with Eerbeek sludge at 55°C, it was suggested that Co and Ni were present in the sludge mainly as sulfide precipitates, which both have a theoretical dissolution edge close to pH 5. Therefore, some solubilisation of CoS and NiS is expected at pH 5. Moreover, as Co and Ni tend to adsorb or co-precipitate onto Fe sulfide minerals (Watson et al., 1995; Morse and Luther, 1999), their solubilisation can be associated with Fe sulfide solubilisation, which also has a theoretical dissolution edge close to pH 5. The latter hypothesis is supported by the similar leaching behaviours of Fe, Co and Ni, which show maximum leaching rates in the same period (Figures 5.8 and 5.9, Table 5.4). Co and Ni accumulated in R1 sludge mainly in the OM/S fraction (Figure 5.8C). This is in agreement with van Hullebusch et al. (2005a), which showed that the OM/S fraction has the highest sorption affinity for Ni and Co in Eerbeek sludge, under neutral conditions. However, in the latter study, the residual fraction shows the second highest affinity for Co and Ni, while in the present study, carbonate and exchangeable fractions accumulated more Ni and Co than the residual fraction. Ni and Co are, together with Mo, the only trace metals investigated accumulating in the exchangeable fraction.
4.5.2 Fe and Mn
Despite the higher Fe concentration fed to R1 (7.5 μM) in relation to the other trace metals, the R1 Fe stock decreased significantly and similarly to R2, to which no Fe was added (besides the 0.16 μM Fe concentrations in demiwater). Nevertheless, Fe was still the nutrient with the highest concentration in the sludge from both reactors, except for Al and P (Figures 5.8 to 5.11). Mn was also almost completely leached from both sludges (Figure 5.9). Fe and Mn were the trace metals with the most extensive leaching from sludge, and with the highest leaching rate (Table 5.4), which is in agreement with the higher solubilities of Mn and Fe sulfides (Chapter 3). However,

150
Cha
pter
5
given the very high Fe concentration in the inoculum sludge, Fe leaching from the sludge was observed throughout all R1 and R2 reactor runs, although at decreasing rates. Only at the end of both reactor runs Fe effluent concentrations were similar to the influent concentrations (Figure 5.9A and B). Table 5.4 shows that Fe and Mn have similar maximum molar leaching rates (378 and 359 nmol/(gTSS.d) in R1 and 510 and 358 μmol (gTSS d)-1 in R2, respectively), despite the fact that Mn leaching ceased faster. This is in agreement with Maes et al. (2003), who suggested that as Fe and Mn have similar atomic radii, Mn was partially present in mixed FeS/FeCO3 precipitates in a sulfide-rich freshwater sediment. The start of N2 stripping in R1 on day 88 caused a two-fold increase in effluent Fe concentrations (Figure 5.9A). This reflects the presence of Fe as sulfide precipitates in the sludge, which is in agreement with the findings of Chapter 3 and Jong and Parry (2003). Thus, the decrease in sulfide concentration caused by stripping with N2 (Figure 5.2A) provoked an increased Fe solubilisation. Co and Ni concentrations in the R1 effluent also increased with the start of N2 stripping (Figure 5.8A), which supports the hypothesis of Co and Ni adsorption or co-precipitation onto Fe sulfide minerals (Watson et al., 1995; Morse and Luther, 1999).
4.5.3 Zn, Cu and Al
Cu and Zn accumulated in both reactors (Figure 5.10). Cu and particularly Zn were present in the demiwater used for influent preparation (Figure 5.10B), which explains the accumulation of these metals also in R2, to which trace metals were not intentionally added. In Chapter 3, a very low leaching extent of Cu and Zn from Eerbeek sludge in leaching experiments at pH 5 was observed (0.4 and 0.14%, respectively), which was in the agreement with the very low solubilities of the correspondent metal sulfides (Chapter 3) and accumulation of Cu and Zn in a UASB operating under similar conditions as the reactors in this study. Surprisingly, Cu leached from the sludge in the period 9-20 days of operation in both reactors (Figure 5.10). Moreover, Cu concentrations increased in the first days in both reactors and the period of maximum leaching rate started later than the other trace metals studied, although ending at the same time as Co, Ni and Fe (Table 5.4). This suggests that Cu was associated to other minerals present in the sludge, besides its presence as discrete Cu sulfides. Al was not intentionally added in the influent of any reactor but was present in very high concentration in the inoculum sludge (Figure 5.10). Al leached from the reactors throughout the reactor runs, although corresponding to a small fraction of the Al stored in the granules (Figure 5.10). The introduction of N2 stripping in R1 caused a two-fold decrease in Al effluent concentration. Given the likely presence of Al mostly as Al(OH)3 in the inoculum sludge (Chapter 3), the decrease in CO2 due to stripping might have contributed to the lower Al(OH)3 solubilisation.
4.5.4 B, Se and Mo
Se and Mo were almost completely retained by the sludge in both reactors, while B leached from R2 sludge and in the first days of R1, accumulating in R1 sludge after that (Figure 5.11). B, Se and Mo were added to the medium as oxyanions. Zandvoort et al. (2005c) showed that the Se
Effect of trace metals on sulfate reduction at pH 5
151
Cha
pter
5
accumulation in a mesophilic UASB treating methanol was independent of the addition of a sulfur source, which indicated that other mechanisms were involved in the accumulation of Se besides the mechanisms referred in 4.1.1.. In the same study, Zandvoort et al. (2005c) showed that Mo did not accumulate in the absence of a sulfur source, which supported the hypothesis that Mo immobilization can be due to the precipitation as molybdenite, after the reduction of molybdate. Similarly to the present study, Zandvoort et al. (2005c) observed accumulation of Se mainly in the OM/S fraction and accumulation of Mo in the OM/S and exchangeable fractions, despite the different inoculum sludge, temperature and substrate as compared to the present study.
5 CONCLUSIONS
• The presence of low concentrations of trace metals (7.5 μM Fe and 0.5 μM for the other trace
elements) was inhibitory to sulfate reduction in thermophilic acidifying (pH 5) reactors (4
gCOD (lreactor d)-1).
• The absence of trace metals in the influent did not affect the performance of a thermophilic
acidifying UASB reactor throughout the reactor run (305 days).
• Sulfate reduction efficiencies up to 95% and complete acidification were achieved in the
thermophilic acidifying UASB reactor at pH 5 and fed with trace metals (0.87 and 4.2 g (lreactor
d)-1 at COD/SO42- ratios of 4 and 1, respectively) with N2 stripping.
• Sulfide was toxic to sulfate reduction at a total dissolved concentration of 100 mg l-1.
• At a COD/SO42- ratio of 1, acetate was the only substrate left in the reactor (only minor
amounts of propionate and butyrate) under the applied loading rates.
• Sulfate reduction was associated with butyrate consumption in both reactors.
• Leaching from the inoculum sludge had an important contribution to the trace metal
concentrations in the effluent of both reactors at the beginning of the reactors runs. Fe and Mn
leached the fastest from the inoculum sludge.
• Despite the operation at pH 5, Co, Ni, Cu, Zn, B, Se and Mo present in the influent
accumulated in the sludge, mainly in the OM/S fraction.
152
Cha
pter
5
ACKNOWLEDGEMENTS
Pieter Rowlette (University of Arizona, USA) and Ricardo Sampaio (Wageningen University, The Netherlands) are acknowledged for their contribution in the continuous bioreactors operation.

153

Chapter
Thermophilic (55°C) sulfate reduction at pH 4 during the acidification of sucrose
Abstract The feasibility of continuous sulfate reduction at pH 4.0 was investigated in a pH controlled thermophilic (55°C) upflow anaerobic sludge bed reactor fed with sucrose at a COD/SO4
2- ratio of 0.9 and an organic loading rate of 0.8 and 1.9 gCOD (lreactor d)-1 for a period of 78 days. A nearly complete sulfate reduction efficiency was achieved throughout the reactor run, corresponding to sulfate reduction rates of 0.91 and 1.92 g (lreactor d)-1 at sulfate loading rates of 0.94 and 2 g (lreactor d)-1, respectively. Acidification was always complete and acetate was the only substrate left in the effluent. Sulfide concentration was kept below 20 mg l-1 by stripping with nitrogen gas and volatile fatty acids concentrations did not exceed 180 mgCOD l-1 in pseudo-stationary states. The sludge was well retained in the reactor and kept its granular shape. Zn, Cu, Se, Mo and B accumulated in the sludge, while Co, Ni, Fe and Mn leached from the sludge, despite their continuous supply in the reactor influent. The bacterial diversity in the reactor sludge at the end of the reactor run was low and dominated by one acidifying species, resembling Thermoanaerobacterium sp., and one sulfate reducing species, resembling Desulfotomaculum sp..
156
Cha
pter
6
1 INTRODUCTION
Microbial dissimilatory sulfate reduction couples the oxidation of reduced organic or inorganic compounds to the reduction of sulfate or other oxidized sulfur compounds for energy gain, producing sulfide as metabolic product (Colleran et al., 1995). This process has been widely applied for the removal of oxidized sulfur compounds from wastewaters at circum-neutral pH conditions. For wastewaters with a low pH, caused either by the acidification of organic matter (Chapter 2) or by biogeochemical processes like in acid mine drainage (Neculita et al., 2007), its technological application becomes limited by the inhibition of biological sulfate reduction under acidic conditions, despite the absence of thermodynamic constraints. The lower pH limit of known pure cultures of sulfate reducing bacteria (SRB) is pH 4 (Hard et al., 1997). Nevertheless, sulfate reduction has been proven to occur at pH ≤ 3 in the acidic sediments of an Argentinean lake influenced by volcanism (Koschorreck et al., 2003). Sulfate reduction has also been observed in incubations of water from acid mine drainage accumulated in a dam composed of wood dust at initial pH 3 with saw dust cellulose as the substrate (Tuttle et al., 1969). Similarly, sulfate reduction occurred in incubations with sediments from an acid mine lake in Indiana at pH as low as 3.8 and different substrates (Gyure et al., 1990). Sulfate reduction was also observed in continuous packed bed column experiments inoculated with enrichments of sulfate reducers from mine sites (Elliott et al., 1998; Kolmert and Johnson, 2001; Jong and Parry, 2006) or from horse manure fed with an influent at pH 3 (Tsukamoto et al., 2004). It should, however, be noted that the effluent pH of these columns was always higher, in general higher than 5.5 and it is not clear at what pH the sulfate reduction occurred. Sen (2001) reported sulfate reduction in continuous reactors filled with glass beads fed with glycerol with the mixed liquor pH controlled at 2.5, 3.0, 3.5 and 4.0. The maximum sulfate reduction efficiency achieved was 38% at pH 4.0, decreasing further at the lower pH values investigated. The experiments lasted for 7 to 10 days and growth of SRB was not documented (Sen, 2001). For continuous reactor studies fed with non-acidified substrates, Reis et al. (1988) performed the reactor experiment with the lowest reactor mixed liquor pH. Continuously stirred tank reactors and upflow anaerobic filter reactors inoculated with sludge from a municipal wastewater treatment plant were operated at pH 5.4 for approximately 8 days with molasses slops as the substrate. The sulfate reduction efficiencies obtained were lower than 20% (Reis et al., 1988). This study investigated the effect of a mixed liquor pH of 4 on sulfate reduction in a reactor fed with sucrose at a COD/SO4
2- ratio of 0.9. For this purpose, a thermophilic (55°C) upflow anaerobic sludge bed (UASB) reactor was operated for 78 days and the acidification efficiency, sulfate reduction efficiency and metabolite production were determined. Trace metals retention in the reactors was assessed by monitoring their concentrations in the reactor effluent and in the sludge. A sequential extraction procedure was applied to the sludge to evaluate their distribution over different chemical fractions. At the end of the experiment, the microbial population present in the sludge was characterized using denaturing gradient gel electrophoresis (DGGE) and phylogenetic analysis.
Sulfate reduction at pH 4 in acidification reactors
157
Cha
pter
6
2 MATERIALS AND METHODS
2.1 Continuous bioreactor
A 0.92 l UASB reactor as described in Chapter 2 was used in this study. Throughout the experiment, the reactor was operated at 55oC, a hydraulic retention time (HRT) of 10h and a superficial liquid upflow velocity of 1 m h-1 (by applying effluent recirculation). The COD/SO4
2- ratio was maintained at 0.9 throughout the experiment, while the organic loading rate (OLR) was 0.8 gCOD (lreactor d)-1 in the first 37 days (Period I) and subsequently increased to 1.9 gCOD (lreactor d)-1 till the end of the 78 day long experiment (Period II) (Table 6.1). The experiment was always conducted with sulfide stripping by purging N2 gas (purity 99.999%, Hoekloos, Dieren, The Netherlands) as small bubbles (0.1-0.3 mm diameter) using a sintered glass gas sparger in a 20 ml stripping compartment placed in the recirculation line. The N2 gas flow was kept at 2.0 l h-1 and was controlled using a Brocks microprocessor control and read-out unit (SHO-rate, R-2-15-AAA, Fisher-Rosemount). The pH in the reactors was measured with a pH electrode (Hamilton, Hilkomij BV, Rijswijk, The Netherlands) and was controlled by automatic pH controllers (Endress and Hauser, Naarden, The Netherlands) by 0.1 M NaOH or 0.1 M HCl addition. The produced biogas was led through two waterlocks filled with NaOH (1 M) and zinc acetate (0.5 M), respectively, in order to remove CO2 and H2S.
2.2 Inoculum sludge
The UASB reactor was inoculated with 320 g wet fresh granular sludge from a thermophilic (55°C) reactor operating for 221 days at pH 5, an OLR of 4 gCOD (lreactor d)-1 and COD/SO4
2- ratio of 4 and 1 (Chapter 5), which had been originally inoculated with sludge harvested from a full-scale UASB reactor treating papermill wastewater (Industriewater Eerbeek B.V., Eerbeek, The Netherlands) (Oude Elferink et al., 1998b).

158
Cha
pter
6
2.3 Medium
The UASB reactor was fed a synthetic influent consisting of sucrose as model carbohydrate (sole electron donor and carbon source), sulfate and nutrients. Sulfate was added as sodium sulfate. The nutrients solution consisted of macronutrients and micronutrients as described in Table 6.2 and yeast extract at an influent concentration of 2.2 mg l-1. In order to avoid precipitation in the storage vessels, the influent consisted of two different streams: 1. sucrose, sodium sulfate and potassium hydrogen phosphate; and 2. macronutrients (except for potassium hydrogen phosphate) and micronutrients. Both solutions were prepared with demineralised water and flushed for 10 minutes with N2 gas (purity 99.999%, Hoekloos, Dieren, The Netherlands) prior to being connected to the reactor pumps, in order to assure anaerobic conditions. Storage vessel 1 was kept at 4°C to prevent acidification.
2.4 Sequential extraction procedure and pseudo-total metal determination
At the end of the experiment, the metal distribution in the sludge was investigated by a sequential extraction procedure based on Tessier et al. (1979) with some modifications (Osuna et al., 2004; van Hullebusch et al., 2005a) as in Chapter 3. Extractants of increasing reactivity were used in each subsequent step, so that the fractions obtained corresponded to metal species with lesser mobility. The pseudo-total metal content (TMC) was determined according to van Hullebusch et al. (2005a). The sequential extractions and the pseudo-total metal content were performed in triplicate on subsamples of about 1 g wet sludge. If the sum of the sequential extraction fractions and the TMC differed more than 25%, the sequential extraction results were not considered. All vessels used for metal analysis were previously cleaned in a 4 M HNO3 acid bath for at least 12 h.
HC
l add
ition
(mm
ol (l
reac
tor d
)-1)
19.0
4 ±
0.22
36.1
0 ±
0.23
p
H
4.04
± 0
.07
4.04
± 0
.04
S
O42-
(mg
l-1)
399.
0 ±
42.6
839.
2 ±
68.4
S
LR c
(gSO
42- (l
reac
tor d
)-1)
0.94
± 0
.10
2.00
± 0
.17
Suc
rose
(mgC
OD
l-1)
353.
0 ±
67.4
786.
0 ±
97.6
OLR
b
(gC
OD
(lre
acto
r d)-1
)
0.83
± 0
.16
1.87
± 0
.23
HR
T a
(h)
10.1
6 ±
0.17
10.1
0 ±
0.20
Influ
ent
flow
(l
d-1)
2.17
± 0
.04
2.19
± 0
.04
C
OD
/SO
42-
ratio
0.89
± 0
.15
0.94
± 0
.09
Day s
0-37
37-7
8
Tab
le 6
.1 O
pera
tiona
l par
amet
ers a
pplie
d to
the
UA
SB re
acto
r in
this
stud
y.
Perio
d
I II
a H
RT:
hyd
raul
ic re
tent
ion
time;
b OLR
: org
anic
load
ing
rate
; c SLR
: sul
fate
load
ing
rate
.
Sulfate reduction at pH 4 in acidification reactors
159
Cha
pter
6
Table 6.2 Macro and micronutrients composition of the reactor influent.
2.5 Denaturing gradient gel electrophoresis
At the end of the experiment, sludge was harvested to determine the major constituents of its microbial community. Genomic DNA was extracted directly from the concentrated biomass using the Ultra Clean Soil DNA extraction kit (MOBIO Laboratories, Inc. California, USA) according to the manufacturer’s protocol. Extracted DNA was stored at -20ºC, until further use. Amplification of 16S rRNA gene fragments was performed using the primer pair 341F-GC (5’ CCT ACG GGA GGC AGC AG 3’)/907R(5’ CCG TCA ATT CMT TTG AGT TT 3’) (Muyzer et al., 1995). The protocol used for the amplification of 16S rRNA gene fragments was the same as described previously (Muyzer et al., 1995). The quality of the PCR products was examined on 1% (w/v) agarose gel and the yield was quantified by absorption spectrophotometry using the Nanodrop ND-1000 TM (NanoDrop Technologies, Delaware, USA). DGGE was performed as described by Schäfer and Muyzer (2001) using the D-Code system (Bio-Rad Laboratories, California, USA). After electrophoresis, the gels were incubated for 30 min in a solution containing ethidium bromide (0.5 µg ml-1), rinsed for 20 min in Milli-Q water, and photographed using a Bio-Rad GelDoc station (Bio-Rad, California, USA). Individual bands were excised, resuspended in 20 µl of Milli-Q water, and stored overnight at 4ºC. A volume of 3 to 5 µl of the supernatant was used for reamplification with the original primer sets. The reamplified PCR products were run again on a denaturing gradient gel to check their purity. Prior to sequencing, the PCR products were purified using the Qiaquick PCR purification kit (QIAGEN GmbH, Hilden, Germany).
Macronutrient Compound Influent (mg l-1)
N NH4Cl 8.72 K K2HPO4 4.19 P K2HPO4 1.66 S MgSO4.7H2O 0.87
Mg MgSO4.7H2O 0.66 Ca CaCl2.2H2O 0.36
Micronutrient (μg l-1) Fe FeCl2 . 4H2O 436.3 B H3BO3 5.6 Zn ZnCl2 34.2 Cu CuCl2. 2H2O 33.3 Mn MnCl2. 4H2O 28.6 Co CoCl2. 6H2O 30.7 Ni NiCl2. 6H2O 30.6 Se Na2SeO3. 5H2O 41.1 W Na2WO4.2H2O 95.8 Mo Na2MoO4.2H2O 50.0

160
Cha
pter
6
2.5.1 Comparative sequence analysis.
The obtained 16S rRNA gene sequences were imported into the ARB software program (Ludwig et al., 2004) and aligned using the automatic aligner function. The alignment was further corrected manually, and an optimized tree was calculated using the Neighbor-Joining algorithm with Felsenstein correction.
2.6 Analysis
Sugars (sucrose, glucose and fructose) and lactate were measured by High-Pressure Liquid Chromatography according to van Lier et al. (1997). Sulfate was measured by Ion Chromatography according to Sipma et al. (2004). Sulfide was fixed with zinc acetate and measured photometrically using the Lange sulfide cuvette test LCK653 (Hach Lange, Düsseldorf, Germany). Volatile Fatty Acids (VFA), alcohols and biogas composition were measured using Gas Chromatography according to Weijma et al. (2000). Total suspended solids (TSS) and volatile suspended solids (VSS) were determined according to standard methods (APHA, 1998). The biogas volume was measured by gas meters (Milligascounter, Ritter MGC-1, Bochum, Germany). Metal samples were filtered through a 0.2 μm microfiber filter (Whatman FP 30, Germany) and element determinations were performed with inductively coupled plasma – optical emission spectroscopy (ICP-OES, Vista-MPX CCD, Varian, Australia). The following wavelengths were employed: 396.152, 249.772, 396.847, 228.615, 324.754, 259.940, 766.491, 279.553, 257.610, 202.032, 216.555, 213.618, 181.972, 196.026 and 213.857 nm for Al, B, Ca, Co, Cu, Fe, K, Mg, Mn, Mo, Ni, P, S, Se and Zn, respectively.
3 RESULTS
3.1 Reactor performance
3.1.1 Sulfate reduction
The sulfate reduction efficiency averaged 95% throughout the reactor run (Figure 6.1A). This corresponded to a sulfate reduction rate of 0.91 and 1.92 g (lreactor d)-1 in Periods I and II, respectively. Sulfate reduction dropped in the first three days from 97 to 90%, but subsequently increased to above 95%. On days 20 and 23, a malfunctioning in the stripping unit affected the pH control system causing pH values to oscillate between 3.4 and 4.6 for a period of approx. 16 and 11 hours, respectively, which provoked a drop in the sulfate reduction efficiency. However, the recovery from this disturbance was fast and sulfate reduction efficiencies reached 93% on day 25, increasing further to approx. 98% from day 32 onwards. The increase in OLR and sulfate loading rate (SLR) on day 37 caused an initial drop in sulfate reduction efficiency, which subsequently rose to approx. 98% four days after, corresponding to the doubling of the amount of sulfate reduced prior to the increase in OLR. On day 59, another problem with the stripping unit caused a pH drop to 2.6, resulting in a lowering of the sulfate reduction efficiency to 40%. The reactor recovered from this disturbance and the sulfate
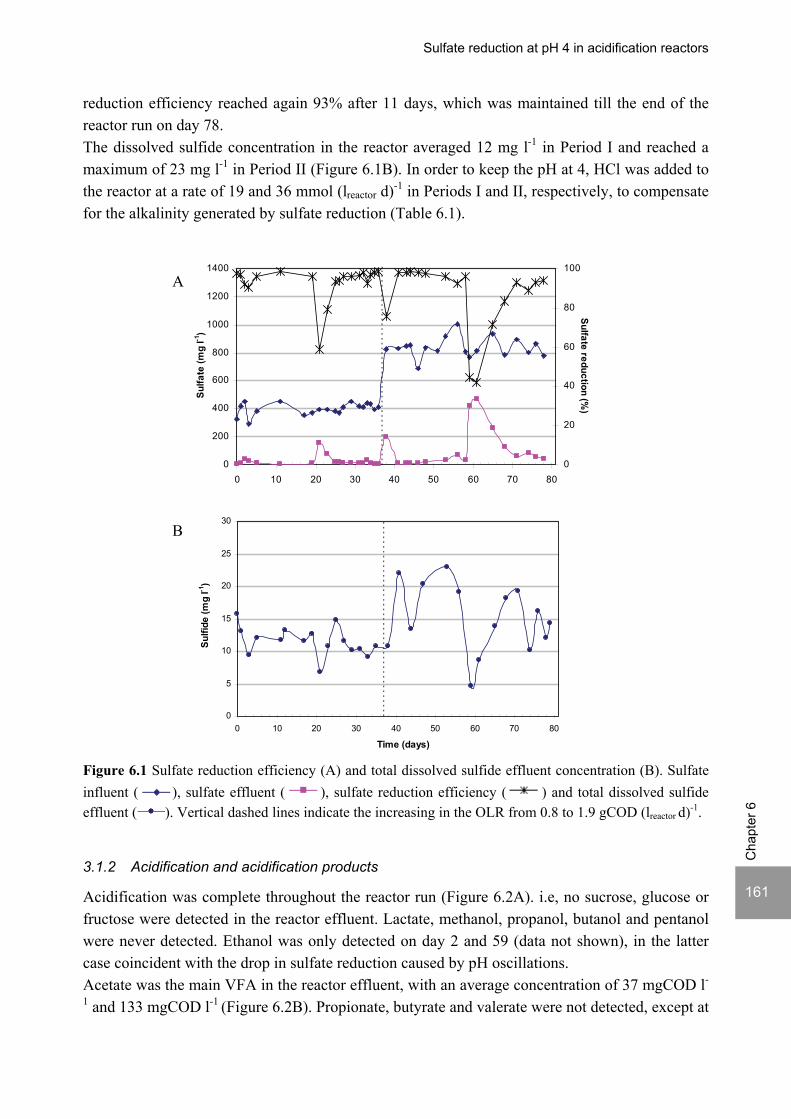
Sulfate reduction at pH 4 in acidification reactors
161
Cha
pter
6
reduction efficiency reached again 93% after 11 days, which was maintained till the end of the reactor run on day 78. The dissolved sulfide concentration in the reactor averaged 12 mg l-1 in Period I and reached a maximum of 23 mg l-1 in Period II (Figure 6.1B). In order to keep the pH at 4, HCl was added to the reactor at a rate of 19 and 36 mmol (lreactor d)-1 in Periods I and II, respectively, to compensate for the alkalinity generated by sulfate reduction (Table 6.1). Figure 6.1 Sulfate reduction efficiency (A) and total dissolved sulfide effluent concentration (B). Sulfate influent ( ), sulfate effluent ( ), sulfate reduction efficiency ( ) and total dissolved sulfide effluent ( ). Vertical dashed lines indicate the increasing in the OLR from 0.8 to 1.9 gCOD (lreactor d)-1.
3.1.2 Acidification and acidification products
Acidification was complete throughout the reactor run (Figure 6.2A). i.e, no sucrose, glucose or fructose were detected in the reactor effluent. Lactate, methanol, propanol, butanol and pentanol were never detected. Ethanol was only detected on day 2 and 59 (data not shown), in the latter case coincident with the drop in sulfate reduction caused by pH oscillations. Acetate was the main VFA in the reactor effluent, with an average concentration of 37 mgCOD l-
1 and 133 mgCOD l-1 (Figure 6.2B). Propionate, butyrate and valerate were not detected, except at
B
A
0
200
400
600
800
1000
1200
1400
0 10 20 30 40 50 60 70 80
Sulfa
te (m
g l-1
)
0
20
40
60
80
100
Sulfate reduction (%)
0
5
10
15
20
25
30
0 10 20 30 40 50 60 70 80
Time (days)
Sulfi
de (m
g l-1
)

162
Cha
pter
6
the beginning of both Periods I and II and in the periods with problems in the stripping unit, coinciding with lower sulfate reduction efficiencies (around day 21 and 59). In those periods, the acetate and butyrate concentrations increased significantly (up to 297 and 114 mgCOD l-1, respectively) and the propionate concentration increased only slightly (Figure 6.2B). Figure 6.2 Acidification efficiency (A) and VFA effluent concentrations versus sulfate removed (B). A: Sucrose influent ( ), sucrose effluent ( ) and sucrose removal efficiency ( ). B: Acetate ( ), propionate ( ), butyrate ( ) and sulfate reduction ( ). Vertical dashed lines indicate the increasing in the OLR from 0.8 to 1.9 gCOD (lreactor d)-1.
3.1.3 Biogas production
The biogas production rate was below 0.1 l (lreactor d)-1 throughout the reactor run (data not shown). Methane was only detected in the biogas in the first four days of the reactor run, hydrogen sulfide was not detected and the hydrogen content of the biogas was below 1%, except on day 61, when it reached 3% (on days 59 and 60, the biogas composition was not analysed). Carbon dioxide and nitrogen contents averaged 3% and 94% of the biogas, respectively. It should be noted that the N2 stripping diluted the other gases in the biogas. Moreover, as the stripping unit was placed in the recirculation line and the recirculation flow rate was high, part of the dissolved
0
50
100
150
200
250
300
350
400
450
500
0 10 20 30 40 50 60 70 80Time (days)
VFA
(mgC
OD
l -1)
0
100
200
300
400
500
600
700
800
900
1000
Sulfate reduced (mg l -1)
B
A
0
200
400
600
800
1000
1200
1400
0 10 20 30 40 50 60 70 80
Sucr
ose
(mgC
OD
l-1)
0
20
40
60
80
100
Sucrose removal (%
)_

Sulfate reduction at pH 4 in acidification reactors
163
Cha
pter
6
gases were released in the stripping unit. Therefore, the biogas volumes measured after the three phase separator in the UASB reactor are not accurate. Consequently, it is impossible to accurately quantify the methane and hydrogen production rates from the data available.
3.1.4 Electron flow
Figure 6.3 shows that the share of electrons was mainly between sulfide and VFA (acetate) (Figure 6.3). Sulfide represented approx. 89 and 80% of the electron flow in Period I and II, respectively, while VFA represented 11 and 20%, respectively. Ethanol represented 10% of the electron flow on day 59. Please note that hydrogen and methane are not included in this balance because their production was not quantified due to the N2 stripping, as referred above. Nevertheless, the COD balance (data not shown) indicates that hydrogen and methane together did not account for more than an average of 10% of the electron flow.
0
0.5
1
1.5
2
0 10 20 30 40 50 60 70 80Time (days)
CO
D c
onve
rsio
n ra
te(g
CO
D (l
reac
tor d
)-1)
Figure 6.3 Electron flow in the reactor. VFA ( ), ethanol ( ) and sulfide ( ).Vertical dashed line indicates the increasing in the OLR from 0.8 to 1.9 gCOD (lreactor d)-1.
3.1.5 Trace metal dynamics
3.1.5.1 Co and Ni
Co and Ni leached from the sludge till approx. day 27, after which Co effluent concentrations were similar to influent concentrations while Ni continued to leach at a lower and constant rate (Figure 6.4A). At the end of the reactor run, Co was mainly present in the exchangeable and OM/S fraction, whereas Ni was present in the first three operationally defined fractions (Figure 6.4B). Compared to the fractionation of the inoculum sludge, analyzed 30 days before the start of the present study, which was operating under similar conditions but at pH 5 and an OLR of 4 gCOD (lreactor d)-1, the Co and Ni content decreased in the OM/S fraction and increased in the exchangeable fraction.
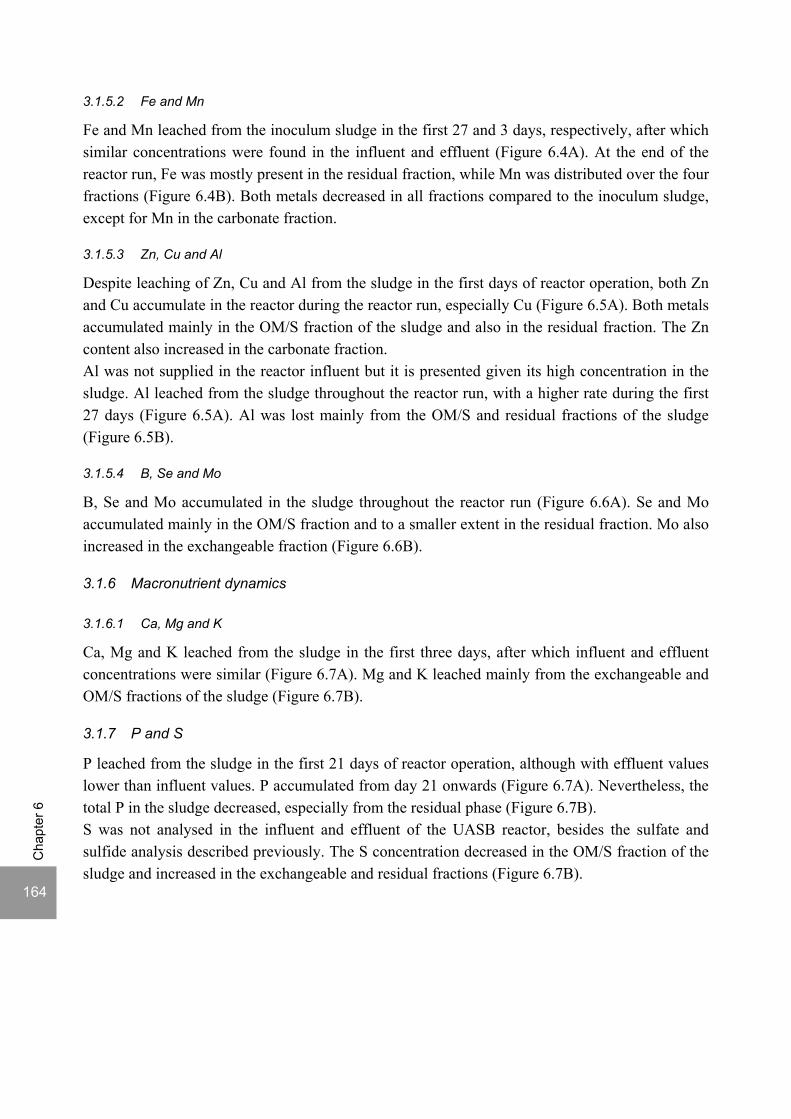
164
Cha
pter
6
3.1.5.2 Fe and Mn
Fe and Mn leached from the inoculum sludge in the first 27 and 3 days, respectively, after which similar concentrations were found in the influent and effluent (Figure 6.4A). At the end of the reactor run, Fe was mostly present in the residual fraction, while Mn was distributed over the four fractions (Figure 6.4B). Both metals decreased in all fractions compared to the inoculum sludge, except for Mn in the carbonate fraction.
3.1.5.3 Zn, Cu and Al
Despite leaching of Zn, Cu and Al from the sludge in the first days of reactor operation, both Zn and Cu accumulate in the reactor during the reactor run, especially Cu (Figure 6.5A). Both metals accumulated mainly in the OM/S fraction of the sludge and also in the residual fraction. The Zn content also increased in the carbonate fraction. Al was not supplied in the reactor influent but it is presented given its high concentration in the sludge. Al leached from the sludge throughout the reactor run, with a higher rate during the first 27 days (Figure 6.5A). Al was lost mainly from the OM/S and residual fractions of the sludge (Figure 6.5B).
3.1.5.4 B, Se and Mo
B, Se and Mo accumulated in the sludge throughout the reactor run (Figure 6.6A). Se and Mo accumulated mainly in the OM/S fraction and to a smaller extent in the residual fraction. Mo also increased in the exchangeable fraction (Figure 6.6B).
3.1.6 Macronutrient dynamics
3.1.6.1 Ca, Mg and K
Ca, Mg and K leached from the sludge in the first three days, after which influent and effluent concentrations were similar (Figure 6.7A). Mg and K leached mainly from the exchangeable and OM/S fractions of the sludge (Figure 6.7B).
3.1.7 P and S
P leached from the sludge in the first 21 days of reactor operation, although with effluent values lower than influent values. P accumulated from day 21 onwards (Figure 6.7A). Nevertheless, the total P in the sludge decreased, especially from the residual phase (Figure 6.7B). S was not analysed in the influent and effluent of the UASB reactor, besides the sulfate and sulfide analysis described previously. The S concentration decreased in the OM/S fraction of the sludge and increased in the exchangeable and residual fractions (Figure 6.7B).
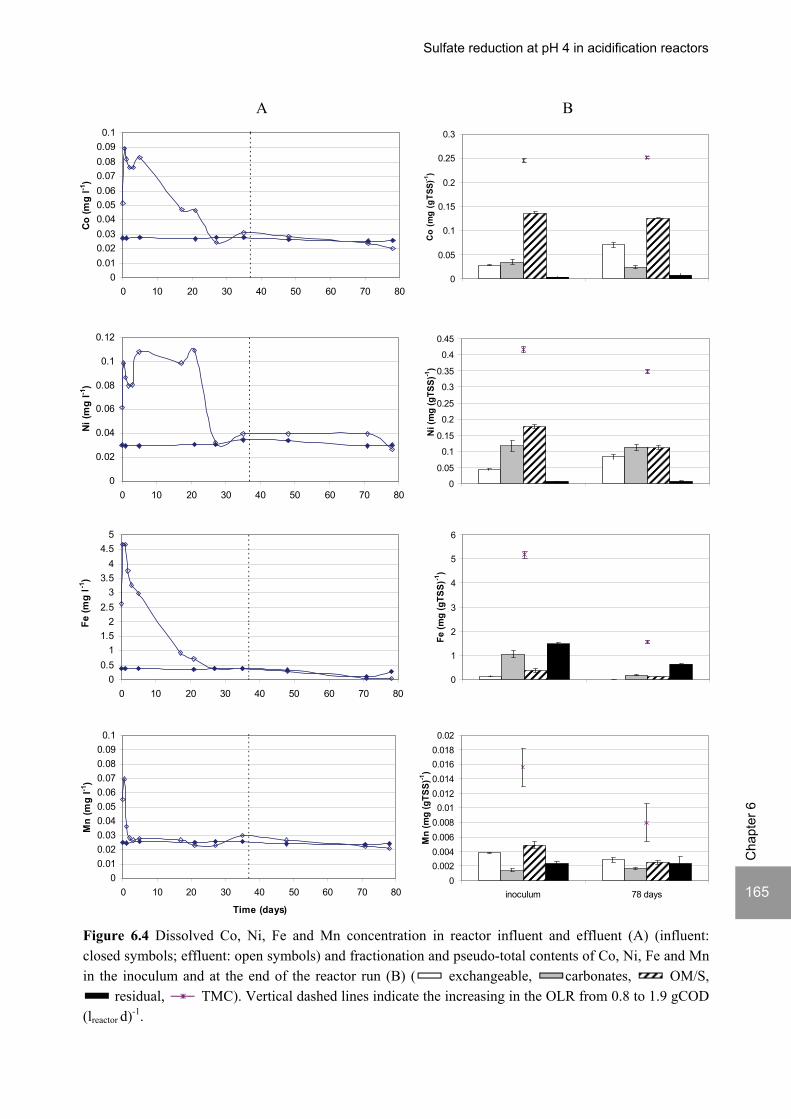
Sulfate reduction at pH 4 in acidification reactors
165
Cha
pter
6
Figure 6.4 Dissolved Co, Ni, Fe and Mn concentration in reactor influent and effluent (A) (influent: closed symbols; effluent: open symbols) and fractionation and pseudo-total contents of Co, Ni, Fe and Mn in the inoculum and at the end of the reactor run (B) ( exchangeable, carbonates, OM/S,
residual, TMC). Vertical dashed lines indicate the increasing in the OLR from 0.8 to 1.9 gCOD (lreactor d)-1.
00.010.020.030.040.050.060.070.080.090.1
0 10 20 30 40 50 60 70 80
Co (m
g l-1
)
0
0.05
0.1
0.15
0.2
0.25
0.3
Co
(mg
(gTS
S)-1
)
0
0.02
0.04
0.06
0.08
0.1
0.12
0 10 20 30 40 50 60 70 80
Ni (
mg
l-1)
0
0.05
0.1
0.15
0.2
0.25
0.3
0.35
0.4
0.45
Ni (
mg
(gTS
S)-1
)
00.5
11.5
22.5
33.5
44.5
5
0 10 20 30 40 50 60 70 80
Fe (m
g l-1
)
0
1
2
3
4
5
6
Fe (m
g (g
TSS)
-1)
00.010.020.030.040.050.060.070.080.090.1
0 10 20 30 40 50 60 70 80
Time (days)
Mn
(mg
l-1)
00.0020.0040.0060.0080.01
0.0120.0140.0160.0180.02
inoculum 78 days
Mn
(mg
(gTS
S)-1
)
A B
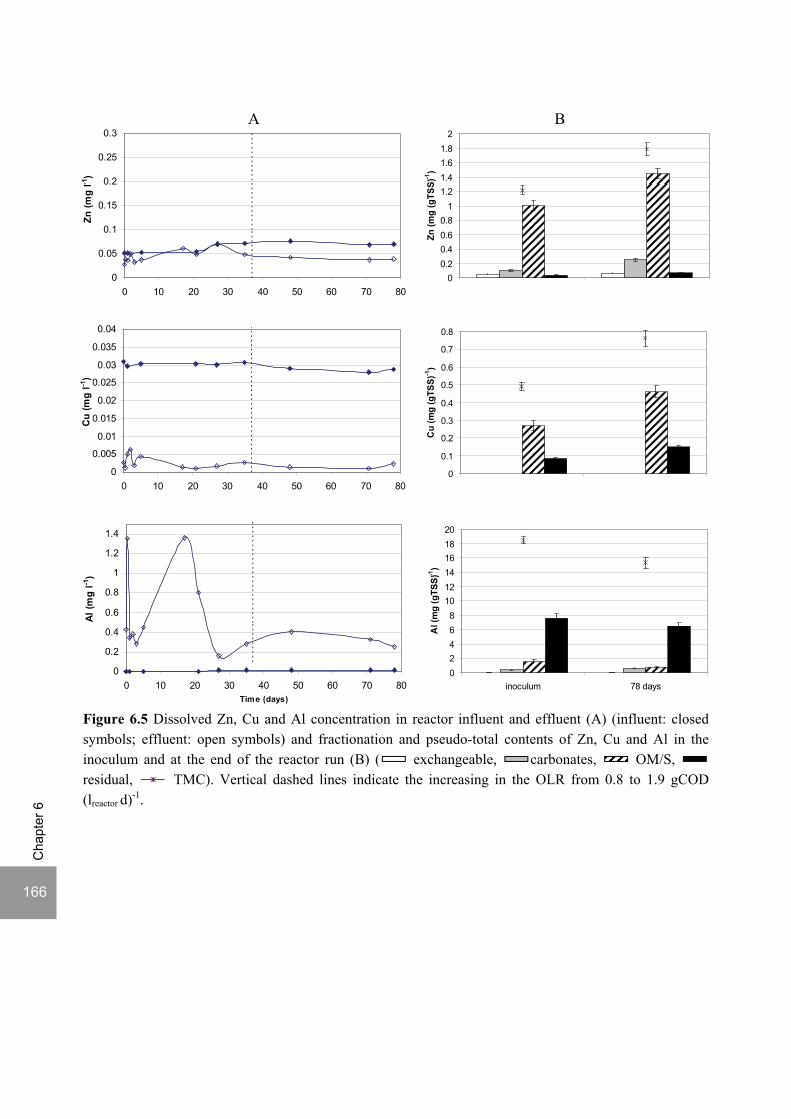
166
Cha
pter
6
Figure 6.5 Dissolved Zn, Cu and Al concentration in reactor influent and effluent (A) (influent: closed symbols; effluent: open symbols) and fractionation and pseudo-total contents of Zn, Cu and Al in the inoculum and at the end of the reactor run (B) ( exchangeable, carbonates, OM/S, residual, TMC). Vertical dashed lines indicate the increasing in the OLR from 0.8 to 1.9 gCOD (lreactor d)-1.
0
0.05
0.1
0.15
0.2
0.25
0.3
0 10 20 30 40 50 60 70 80
Zn (m
g l-1
)
00.20.40.60.8
11.21.41.61.8
2
Zn (m
g (g
TSS)
-1)
0
0.005
0.01
0.015
0.02
0.025
0.03
0.035
0.04
0 10 20 30 40 50 60 70 80
Cu
(mg
l-1)
0
0.1
0.2
0.3
0.4
0.5
0.6
0.7
0.8
Cu
(mg
(gTS
S)-1
)
0
0.2
0.4
0.6
0.8
1
1.2
1.4
0 10 20 30 40 50 60 70 80Time (days)
Al (m
g l-1
)
02468
101214161820
inoculum 78 days
Al (
mg
(gTS
S)-1
)
A B

Sulfate reduction at pH 4 in acidification reactors
167
Cha
pter
6
Figure 6.6 Dissolved B, Se and Mo concentration in reactor influent and effluent (A) (influent: closed symbols; effluent: open symbols) and fractionation and pseudo-total contents of B, Se and Mo in the inoculum and at the end of the reactor run (B) ( exchangeable, carbonates, OM/S, residual, TMC). Vertical dashed lines indicate the increasing in the OLR from 0.8 to 1.9 gCOD (lreactor d)-1.
00.005
0.010.015
0.020.025
0.030.035
0.040.045
0.05
0 10 20 30 40 50 60 70 80
B (m
g l-1
)
00.0050.01
0.0150.02
0.0250.03
0.0350.04
0.0450.05
0 10 20 30 40 50 60 70 80
Se
(mg
l-1)
0
0.01
0.02
0.03
0.04
0.05
0.06
0 10 20 30 40 50 60 70 80Time (days)
Mo
(mg
l-1)
0
0.05
0.1
0.15
0.2
0.25
Se (m
g (g
TSS)
-1)
00.10.20.30.40.50.60.70.80.9
1
inoculum 78 days
Mo
(mg
(gTS
S)-1
)
0
0.05
0.1
0.15
0.2
0.25
0.3
0.35
0.4
B (m
g (g
TSS)
-1)
A B
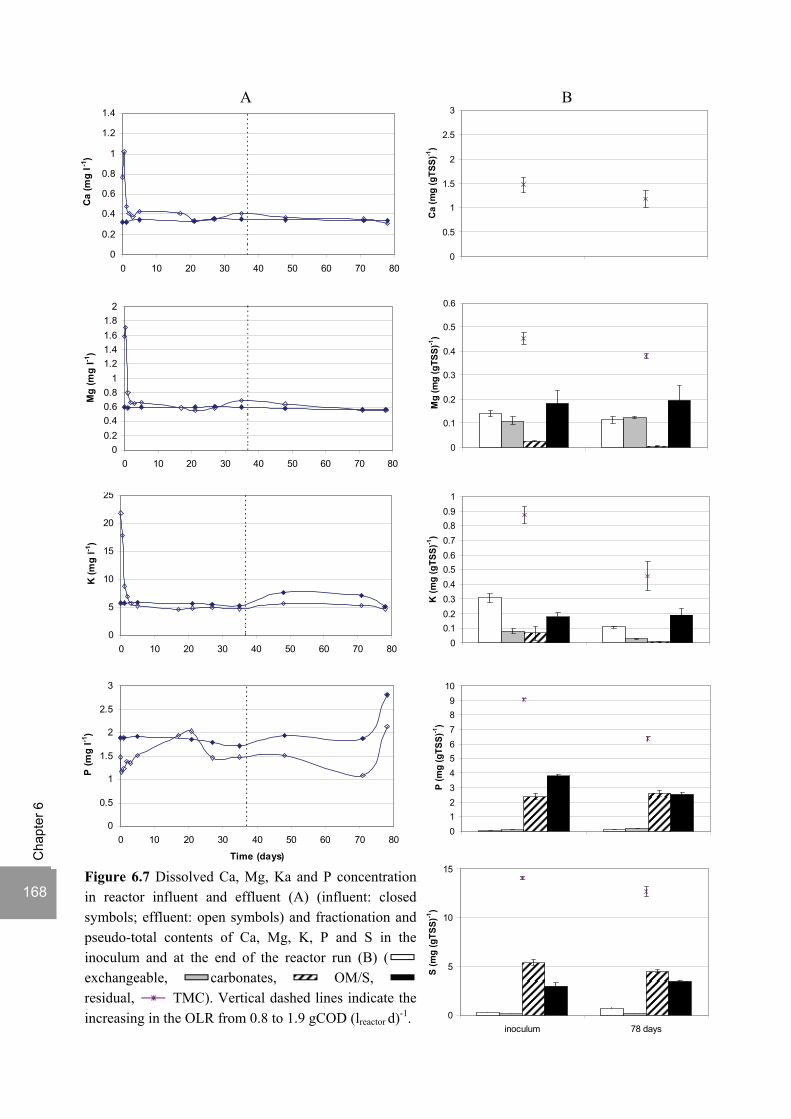
168
Cha
pter
6
0
0.2
0.4
0.6
0.8
1
1.2
1.4
0 10 20 30 40 50 60 70 80
Ca
(mg
l-1)
.
0
0.5
1
1.5
2
2.5
3
Ca
(mg
(gTS
S)-1
)
0
5
10
15
20
25
0 10 20 30 40 50 60 70 80
K (m
g l-1
)
0
0.5
1
1.5
2
2.5
3
0 10 20 30 40 50 60 70 80
Time (days)
P (m
g l-1
)
00.10.20.30.40.50.60.70.80.9
1
K (m
g (g
TSS)
-1)
0123456789
10
P (m
g (g
TSS)
-1)
0
5
10
15
inoculum 78 days
S (m
g (g
TSS)
-1)
00.20.40.60.8
11.21.41.61.8
2
0 10 20 30 40 50 60 70 80
Mg
(mg
l-1)
A B
Figure 6.7 Dissolved Ca, Mg, Ka and P concentration in reactor influent and effluent (A) (influent: closed symbols; effluent: open symbols) and fractionation and pseudo-total contents of Ca, Mg, K, P and S in the inoculum and at the end of the reactor run (B) ( exchangeable, carbonates, OM/S, residual, TMC). Vertical dashed lines indicate the increasing in the OLR from 0.8 to 1.9 gCOD (lreactor d)-1.
0
0.1
0.2
0.3
0.4
0.5
0.6
Mg
(mg
(gTS
S)-1
)

Sulfate reduction at pH 4 in acidification reactors
169
Cha
pter
6
3.2 Granular sludge characteristics
The granular form of the granules was maintained throughout the reactor run and the sludge was well retained in the reactor. During the reactor run, the colour of the granules change from dark grey to light grey with darker spots on the surface (Figure 6.8A). The inside of the granules was coloured lighter than the outside (Figure 6.8B).
Figure 6.8 Photographs of the sludge at the end of the reactor run. (A) Intact granules and (B) Cut granules. Bars represent 2 mm (A) and 1 mm (B).
A
B
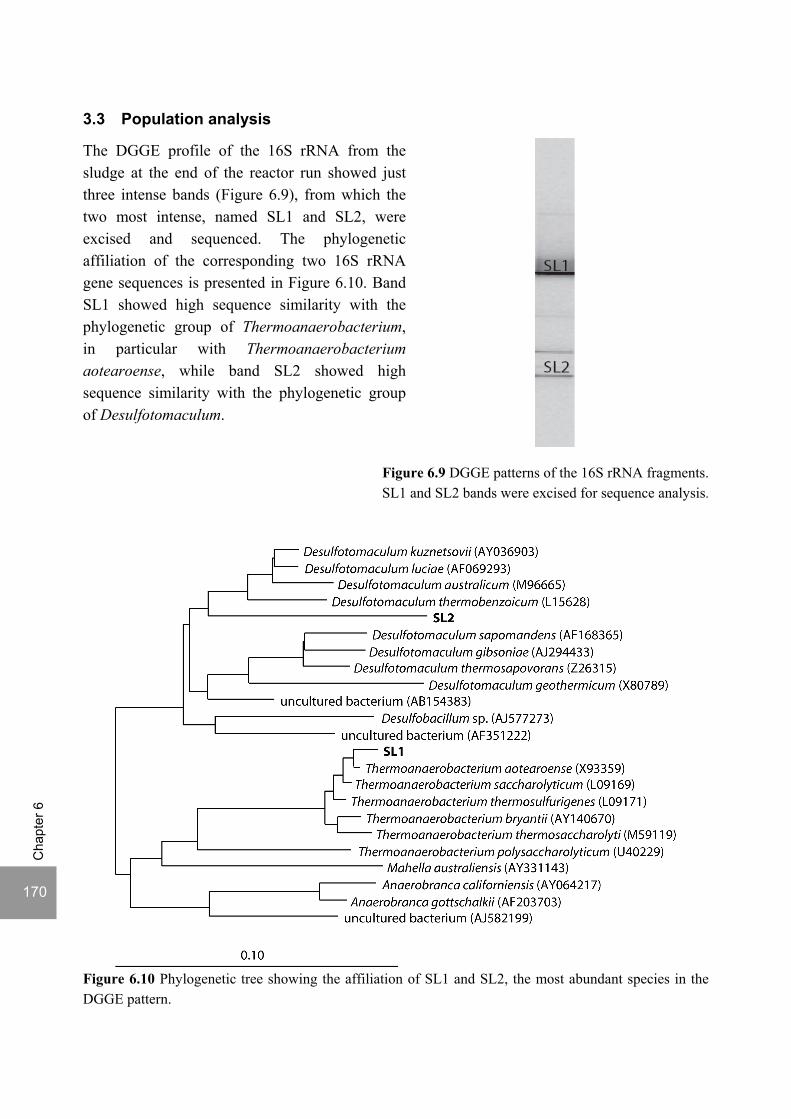
170
Cha
pter
6
3.3 Population analysis
The DGGE profile of the 16S rRNA from the sludge at the end of the reactor run showed just three intense bands (Figure 6.9), from which the two most intense, named SL1 and SL2, were excised and sequenced. The phylogenetic affiliation of the corresponding two 16S rRNA gene sequences is presented in Figure 6.10. Band SL1 showed high sequence similarity with the phylogenetic group of Thermoanaerobacterium, in particular with Thermoanaerobacterium aotearoense, while band SL2 showed high sequence similarity with the phylogenetic group of Desulfotomaculum.
Figure 6.9 DGGE patterns of the 16S rRNA fragments. SL1 and SL2 bands were excised for sequence analysis.
Figure 6.10 Phylogenetic tree showing the affiliation of SL1 and SL2, the most abundant species in the DGGE pattern.
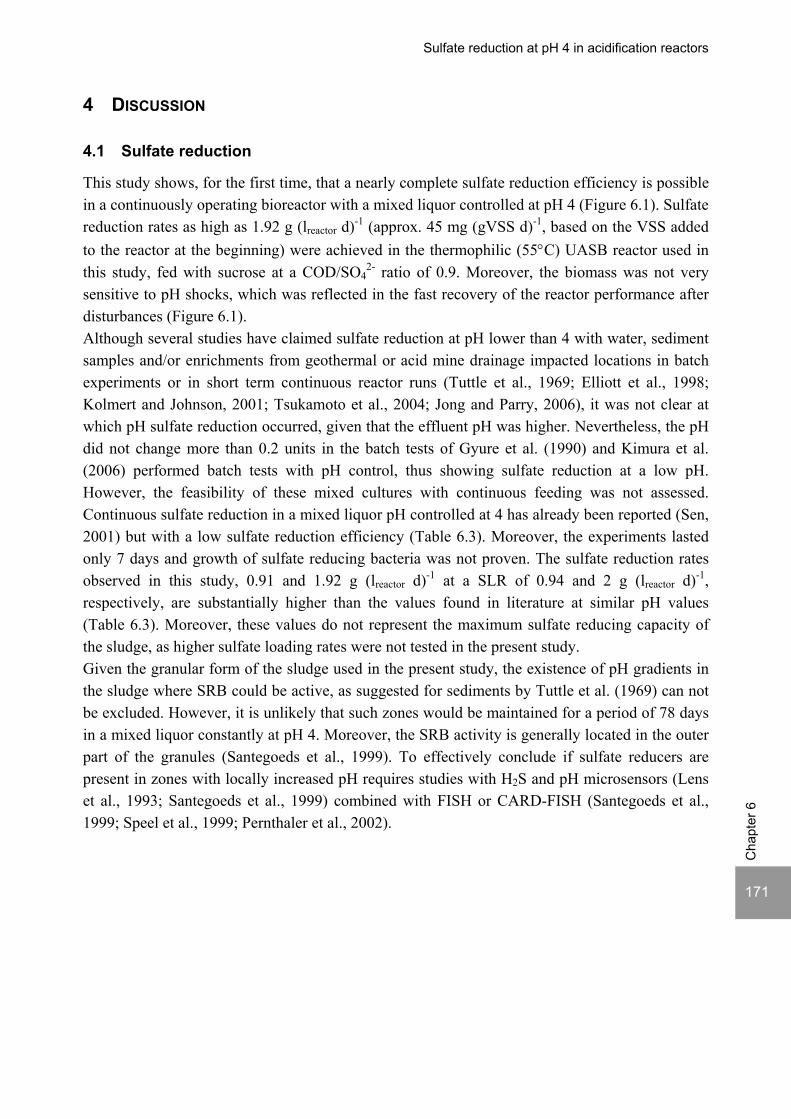
Sulfate reduction at pH 4 in acidification reactors
171
Cha
pter
6
4 DISCUSSION
4.1 Sulfate reduction
This study shows, for the first time, that a nearly complete sulfate reduction efficiency is possible in a continuously operating bioreactor with a mixed liquor controlled at pH 4 (Figure 6.1). Sulfate reduction rates as high as 1.92 g (lreactor d)-1 (approx. 45 mg (gVSS d)-1, based on the VSS added to the reactor at the beginning) were achieved in the thermophilic (55°C) UASB reactor used in this study, fed with sucrose at a COD/SO4
2- ratio of 0.9. Moreover, the biomass was not very sensitive to pH shocks, which was reflected in the fast recovery of the reactor performance after disturbances (Figure 6.1). Although several studies have claimed sulfate reduction at pH lower than 4 with water, sediment samples and/or enrichments from geothermal or acid mine drainage impacted locations in batch experiments or in short term continuous reactor runs (Tuttle et al., 1969; Elliott et al., 1998; Kolmert and Johnson, 2001; Tsukamoto et al., 2004; Jong and Parry, 2006), it was not clear at which pH sulfate reduction occurred, given that the effluent pH was higher. Nevertheless, the pH did not change more than 0.2 units in the batch tests of Gyure et al. (1990) and Kimura et al. (2006) performed batch tests with pH control, thus showing sulfate reduction at a low pH. However, the feasibility of these mixed cultures with continuous feeding was not assessed. Continuous sulfate reduction in a mixed liquor pH controlled at 4 has already been reported (Sen, 2001) but with a low sulfate reduction efficiency (Table 6.3). Moreover, the experiments lasted only 7 days and growth of sulfate reducing bacteria was not proven. The sulfate reduction rates observed in this study, 0.91 and 1.92 g (lreactor d)-1 at a SLR of 0.94 and 2 g (lreactor d)-1, respectively, are substantially higher than the values found in literature at similar pH values (Table 6.3). Moreover, these values do not represent the maximum sulfate reducing capacity of the sludge, as higher sulfate loading rates were not tested in the present study. Given the granular form of the sludge used in the present study, the existence of pH gradients in the sludge where SRB could be active, as suggested for sediments by Tuttle et al. (1969) can not be excluded. However, it is unlikely that such zones would be maintained for a period of 78 days in a mixed liquor constantly at pH 4. Moreover, the SRB activity is generally located in the outer part of the granules (Santegoeds et al., 1999). To effectively conclude if sulfate reducers are present in zones with locally increased pH requires studies with H2S and pH microsensors (Lens et al., 1993; Santegoeds et al., 1999) combined with FISH or CARD-FISH (Santegoeds et al., 1999; Speel et al., 1999; Pernthaler et al., 2002).

172
Cha
pter
6
Tab
le 6
.3 S
ulfa
te re
duct
ion
rate
s and
eff
icie
ncie
s in
cont
inuo
us re
acto
r stu
dies
at p
H 4
. pH
Rea
ctor
In
ocul
um
Subs
trate
C
OD
/SO
42-
ratio
Te
mp.
(°C
) H
RT
(h)
influ
ent
efflu
ent
Dur
atio
n (d
ays)
Su
lfate
re
mov
al ra
te/
effic
ienc
y
Stud
y
Upf
low
col
umn
reac
tor
(fill
ed w
ith sa
nd)
SRB
enr
ichm
ent
from
a m
ine
site
(1)
Lact
ate
na (5
) 30
70
4
6-6.
5 6
na
(32-
45%
) (E
lliot
t et a
l., 1
998)
Upf
low
ana
erob
ic
pack
ed b
ed (s
and)
SR
B e
nric
hmen
t fr
om a
min
e si
te (2
) La
ctat
e 1.
7 23
16
.3
4 5.
8-7
16
50 m
g (l
d)-1
(7
0%)
(Jon
g an
d Pa
rry,
200
6)
Col
umn
reac
tor (
fille
d w
ith g
lass
bea
ds)
SRB
enr
ichm
ent
from
2 m
ines
and
a
geot
herm
al si
te (3
)
Etha
nol,
glyc
erol
an
d la
ctic
aci
d 1
35
49.3
4
> 5
19
250-
300
mg
(l
d)-1
(<45
%)
(Kol
mer
t and
John
son,
20
01)
CST
R (f
illed
with
gl
ass b
eads
) SR
B e
nric
hmen
t fr
om a
min
e si
te (3
) G
lyce
rol
0.3
30
16.5
4
4 (6
) 7
1.06
g (l
d)-1
(3
8%)
(Sen
, 200
1)
Col
umn
reac
tor (
with
di
ffer
ent f
illin
gs)
SRB
enr
ichm
ent
from
hor
se m
anur
e-st
raw
(4)
Etha
nol
0.32
22
26
4.
2 7.
1 11
5 37
0 m
g (l
d)-1
(4
4%)
(Tsu
kam
oto
et a
l.,
2004
)
UA
SB
Gra
nula
r slu
dge
from
a U
ASB
at p
H 5
(C
hapt
er 5
) Su
cros
e
0.9
55
10
4 4
(6)
78
1.92
g (l
d)-1
(9
5%)
This
cha
pter
(1) w
ith P
ostg
ate
med
ium
B a
t pH
4.5
; (2) w
ith P
ostg
ate
med
ium
B a
t pH
7; (3
) enr
iche
d w
ith g
lyce
rol a
t pH
4; (4
) with
met
hano
l; (5
) not
ava
ilabl
e; (6
) reac
tor p
H c
ontro
lled.

Sulfate reduction at pH 4 in acidification reactors
173
Cha
pter
6
4.1.1 Sulfide and VFA toxicity
The almost complete sulfate reduction efficiencies observed in this study contrasts the maximum 65% and 40% sulfate reduction efficiencies (sulfate reduction rates of 0.27 and 0.38 g (lreactor d)-1, respectively) observed at an OLR of 3.5 gCOD (lreactor d)-1 and at COD/SO4
2- ratios of 9 and 3.5, respectively, in a study with the same operational pH, similar experimental conditions and inoculum (Chapter 2). Although the previous study was performed without N2 stripping, dissolved sulfide concentrations did not exceed 30 mg l-1. Therefore it is not likely that sulfide inhibition hampered the sulfate reduction in the study in Chapter 2. In contrast, VFA concentrations were much higher (approx. 1 gCOD l-1) (Chapter 2) compared to the present study (less than 180 mgCOD l-1, Figure 6.2B), due to the higher OLR and COD/SO4
2- ratios and low sulfate reduction efficiencies in the former. Undissociated organic acids are considered toxic to microorganisms because they can diffuse across the cell membrane and prevent the bacterial cell from maintaining a membrane potential and proton motive force (Gyure et al., 1990). At pH 4, acetate, propionate and butyrate are nearly 100% in the undissociated form, given the pKa values in the range of 4.80-4.93 at 55°C (Amend and Shock, 2001). Gyure et al. (1990) showed that organic acid concentrations higher than 5 mM completely inhibited SRB activity in sediments at pH 3.8, while Reis et al. (1990) reported 50% inhibition of SRB growth on lactate (pH 5.8 to 7.0) for undissociated acetic acid concentrations of approximately 54 mg l-1. Therefore, the higher sulfate reduction efficiencies observed in this study compared with Chapter 2 were likely enabled because the VFA concentrations were kept low. This could be further verified if in experiments with increasing COD/SO4
2- ratio, leading to accumulation of VFA due to sulfate limitation and the likely absence of acetoclastic methanogenesis at this pH (Chapter 2). If the sulfate reduction efficiency would decrease, despite the decrease in the sulfate loading rate, VFA toxicity could be proved. This would imply that it is impossible to achieve high sulfate reduction efficiencies in wastewaters with high COD/SO4
2- at low pH, given the impossibility of decreasing undissociated VFA concentrations to non inhibitory concentrations, unless the OLR applied is kept low.
4.1.2 Growth conditions of the sludge
Despite originally harvested from the Eerbeek full scale reactor operating at a pH of 6.9 in both cases, the growth conditions of the sludge differed between the present study and the study in Chapter 2. In the latter study, the inoculum sludge had been developed for 550 days at pH 6 at a COD/SO4
2- ratio of 9 with a sulfate reducing rate of 0.4 g (lreactor d)-1, whereas in the present study the sludge had been developed for 221 days at pH 5, of which the first 125 days at a COD/SO4
2- ratio of 4 with a sulfate reducing rate of 0.7 g (lreactor d)-1, followed by 96 days at a COD/SO4
2- ratio of 1 with a sulfate reducing rate of 4.2 g (lreactor d)-1. Therefore, the long operation of the inoculum at low sulfate concentrations (COD/SO4
2- ratio of 9) in Chapter 2 study most likely resulted in a specialized SRB population at pH 6 but in low numbers, given the low sulfate loading rate. On the contrary, the inoculum used in this study contained an active SRB population at pH 5 and in higher numbers, which very likely contributed to the high sulfate loading rates observed at pH 4. Molecular ecological tools such as FISH and DGGE (Wilderer et al., 2002), combined with activity tests of both sludges at different pH values, would be useful to assess
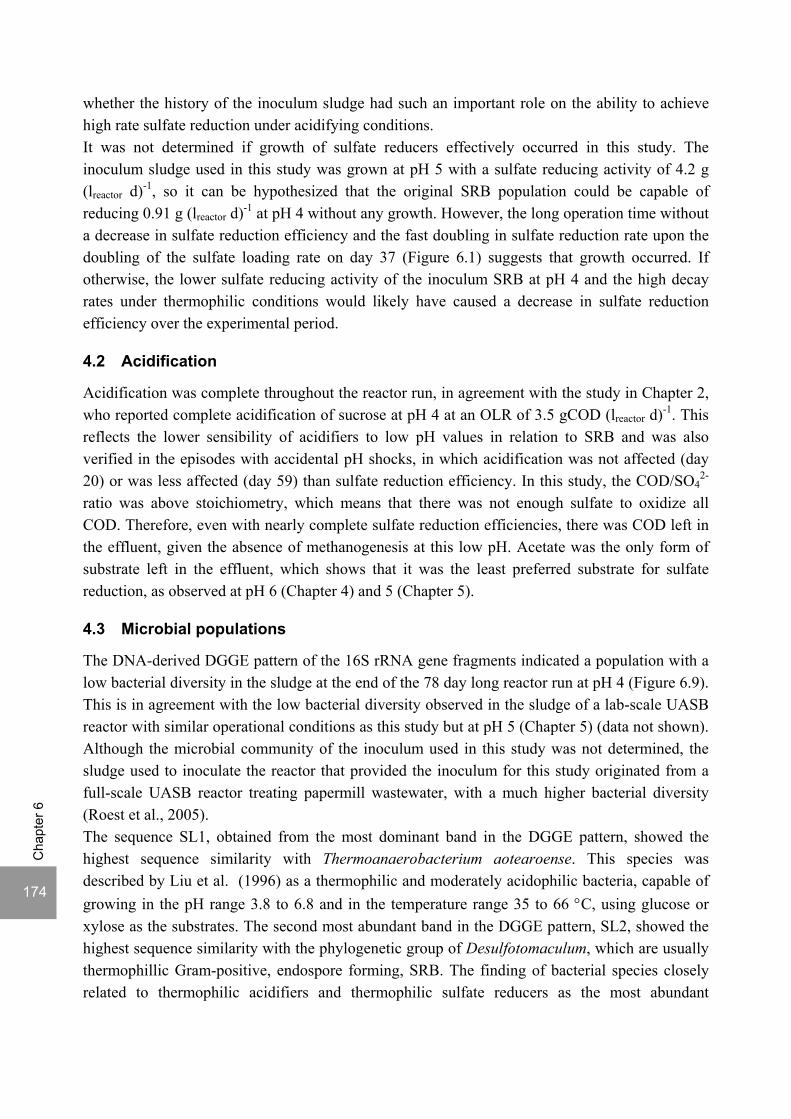
174
Cha
pter
6
whether the history of the inoculum sludge had such an important role on the ability to achieve high rate sulfate reduction under acidifying conditions. It was not determined if growth of sulfate reducers effectively occurred in this study. The inoculum sludge used in this study was grown at pH 5 with a sulfate reducing activity of 4.2 g (lreactor d)-1, so it can be hypothesized that the original SRB population could be capable of reducing 0.91 g (lreactor d)-1 at pH 4 without any growth. However, the long operation time without a decrease in sulfate reduction efficiency and the fast doubling in sulfate reduction rate upon the doubling of the sulfate loading rate on day 37 (Figure 6.1) suggests that growth occurred. If otherwise, the lower sulfate reducing activity of the inoculum SRB at pH 4 and the high decay rates under thermophilic conditions would likely have caused a decrease in sulfate reduction efficiency over the experimental period.
4.2 Acidification
Acidification was complete throughout the reactor run, in agreement with the study in Chapter 2, who reported complete acidification of sucrose at pH 4 at an OLR of 3.5 gCOD (lreactor d)-1. This reflects the lower sensibility of acidifiers to low pH values in relation to SRB and was also verified in the episodes with accidental pH shocks, in which acidification was not affected (day 20) or was less affected (day 59) than sulfate reduction efficiency. In this study, the COD/SO4
2- ratio was above stoichiometry, which means that there was not enough sulfate to oxidize all COD. Therefore, even with nearly complete sulfate reduction efficiencies, there was COD left in the effluent, given the absence of methanogenesis at this low pH. Acetate was the only form of substrate left in the effluent, which shows that it was the least preferred substrate for sulfate reduction, as observed at pH 6 (Chapter 4) and 5 (Chapter 5).
4.3 Microbial populations
The DNA-derived DGGE pattern of the 16S rRNA gene fragments indicated a population with a low bacterial diversity in the sludge at the end of the 78 day long reactor run at pH 4 (Figure 6.9). This is in agreement with the low bacterial diversity observed in the sludge of a lab-scale UASB reactor with similar operational conditions as this study but at pH 5 (Chapter 5) (data not shown). Although the microbial community of the inoculum used in this study was not determined, the sludge used to inoculate the reactor that provided the inoculum for this study originated from a full-scale UASB reactor treating papermill wastewater, with a much higher bacterial diversity (Roest et al., 2005). The sequence SL1, obtained from the most dominant band in the DGGE pattern, showed the highest sequence similarity with Thermoanaerobacterium aotearoense. This species was described by Liu et al. (1996) as a thermophilic and moderately acidophilic bacteria, capable of growing in the pH range 3.8 to 6.8 and in the temperature range 35 to 66 °C, using glucose or xylose as the substrates. The second most abundant band in the DGGE pattern, SL2, showed the highest sequence similarity with the phylogenetic group of Desulfotomaculum, which are usually thermophillic Gram-positive, endospore forming, SRB. The finding of bacterial species closely related to thermophilic acidifiers and thermophilic sulfate reducers as the most abundant
Sulfate reduction at pH 4 in acidification reactors
175
Cha
pter
6
populations present in the sludge is in accordance with the temperature (55°C), the substrate (sucrose) and the presence of sulfate in the reactor influent. The Desulfotomaculum species closely related to SL2 (Figure 6.10) are all neutrophilic (Cord-Ruwisch and Garcia, 1985; Daumas et al., 1988; Nazina et al., 1988; Tasaki et al., 1991; Love et al., 1993; Fardeau et al., 1995; Liu et al., 1997; Kuever et al., 1999; Plugge et al., 2002). Isolation and physiological characterization of SL1 would be required to evaluate whether this species represents an acid-tolerant or an acidophile. To our knowledge, most studies trying to isolate and cultivate acidophilic or acid-tolerant SRB have been unsuccessful (Tuttle et al., 1969; Gyure et al., 1990). Exceptions are the studies of Hard et al. (1997) and Kimura et al. (2006). In the former study, a Gram-negative SRB strain (UFZ B 378) capable of growing at pH 4 was isolated and the growth of Desulfovibrio salexigens at pH 4.5 was observed. Unfortunately, the strain UFZ B 378 was not phylogenetically characterized (Hard et al., 1997). Kimura et al. (2006) described an endospore forming SRB closely related to the Gram-positive neutrophile Desulfosporosinus orientis, that could grow in syntrophy with a Gram-negative (non SRB) acidophile, closely related with Acidocella aromatica in the pH range 3.8 to 4.2. However, the SRB isolate could not grow at low pH in pure culture (Kimura et al., 2006).
4.4 Trace metal dynamics
This study showed that Co, Ni, Fe and Mn partially leached from the sludge at pH 4 and that the Co, Ni, Fe and Mn added in the reactor influent washed-out in the acidifying UASB reactor at pH 4 (Figure 6.4). This is in agreement with the high solubilities of the correspondent metal sulfides at pH 4, as also observed in Chapter 3. Despite the decrease in total Co and Ni concentration in the sludge, the Co and Ni present in the exchangeable fraction increased, which also agrees with the findings of Chapter 3 and indicates a higher bioavailability of the Co and Ni stored in the sludge at pH 4. Al leached from the sludge throughout the reactor run. However, the leached fraction was very small compared to the total Al in the sludge, which reflects the high strength of Al binding in the sludge. Contrary to the previously referred trace metals, Zn, Cu, Se and Mo and B adsorbed or precipitated in the reactor sludge (Figures 6.4, 6.5 and 6.6). Particularly Cu, Se and Mo were retained in the granular sludge bed, by more than 90% of their influent concentrations. The accumulation of Zn and Cu in the sludge at pH 4, mainly in the OM/S fraction is in agreement with the low solubilities of the correspondent sulfides, as also observed in Chapter 3. Immobilization of Se can be due to formation of insoluble metal selenides (Lenz et al., 2006) or selenite co-precipitation with sulfide to elemental selenium and sulfur (Hockin and Gadd, 2003). However, Zandvoort et al. (2005c) showed that the Se accumulation in a mesophilic UASB treating methanol at neutral pH was independent of the addition of a sulfur source. This indicates that probably other mechanisms are involved in the accumulation of Se. Mo immobilization in the sludge can be due to the precipitation of the mineral molybdenite (MoS2(s)) (Tucker et al., 1997), after the reduction of molybdate. Zandvoort et al. (2005c) showed that Mo did not accumulate in the sludge in the absence of a sulfur source, which supports the previous hypothesis of Mo immobilization. Similarly to the present study, Zandvoort et al. (2005c) observed accumulation of Se mainly in the OM/S fraction and accumulation of Mo in the OM/S

176
Cha
pter
6
and exchangeable fractions, despite the different inoculum sludge, pH, temperature and substrate as compared to the present study. The macronutrients Ca, Mg and K fed to the reactor washed-out in the effluent, with the exception of P, which was partially retained (N was not analysed). This agrees with the high solubilities of the sulfide, carbonate, phosphate and hydroxide minerals of Ca, Mg and K at pH 4 (Chapter 3). CaHPO4 and CaSO4 could theoretically be formed, contrary to the experimental results of this study. The accumulation of P can tentatively be attributed to the formation of insoluble AlPO4, given the low solubility of this compound at pH 4 (Chapter 3).
5 CONCLUSIONS
• Sulfate reduction efficiencies up to 98% were achieved in a thermophilic (55°C) acidifying
UASB reactor with the mixed liquor controlled at pH 4 at a COD/SO42- ratio of 0.9 over a 78
day period. This corresponded to sulfate reduction rates of 0.91 and 1.92 g (lreactor d)-1 at a SLR
of 0.94 and 2 g (lreactor d)-1, respectively.
• Acidification was complete throughout the reactor run and acetate was the only form of
residual substrate in the effluent.
• The trace metals fed in the influent solution washed out of the reactor, except for Zn, Cu, Se,
Mo and B which accumulated in the reactor sludge. The macronutrients Ca, Mg and K washed
out while P partially accumulated.
• The granular form of the biomass was maintained throughout the reactor run.
• The main population present in the sludge at the end of the reactor run resembled
Thermoanaerobacterium sp. and Desulfotomaculum sp..
ACKNOWLEDGEMENTS
Shabir Dar and Gerard Muyzer (TU Delft, The Netherlands) are acknowledged for performing the molecular analysis of the bacterial communities in the reactor sludge.

177

179
Chapter
Performance of mesophilic (30oC) UASB and CSTR reactors for the treatment of sulfate rich wastewaters
under acidifying conditions (pH 6 and 5) Abstract The effects of lowering the pH from 6 to 5 on mesophilic (30°C) sulfate reduction during the acidification of sucrose (5 gCOD (lreactor d)-1) at a COD/SO4
2- ratio of 4 were evaluated in a CSTR at a HRT of 24 h and in a UASB reactor at a HRT of 10 h. Lowering the pH from 6 to 5 caused a decrease in sulfate reduction efficiencies in both reactors, from 44% to 25% in the CSTR and from 95% to 34% in the UASB reactor. Acidification was complete in both reactors at pH 6 and the lowering of pH to 5 did not affect the acidification efficiency in the CSTR but caused a decrease in acidification efficiency in the UASB to 72%. The decrease to pH 5 caused an increase in the butyrate and ethanol concentrations in both reactors. Increasing the HRT of the UASB reactor to 24 h at pH 5 caused an increase in sulfate reduction and acidification efficiencies to 67% and 94%, respectively. Submitted
180
Cha
pter
7
1 INTRODUCTION
Two-phase anaerobic treatment systems are thoroughly used in the treatment of wastewaters with high concentrations of unacidified organic matter due to the improved overall treatment efficiency and stability induced by the physical separation of the acidogenic and methanogenic phases (Demirel and Yenigün, 2002; Ke et al., 2005). For unacidified wastewaters with high concentrations of sulfate, this two-stage configuration also allows for the separation of the sulfide production step from the methane formation step, thereby avoiding sulfide inhibition of methanogenesis as well as producing a less sulfide contaminated biogas in the methanogenic reactor (Nanninga, 1987; Reis et al., 1988; Mizuno et al., 1998a). Acidification, however, can cause an excessive lowering of the pH in acidification reactors (Romli et al., 1994). Reis et al. (1988) studied the effect of lowering the pH in the range 6.2 to 5.4 on sulfate reduction in the acidification phase in continuously stirred tank reactors (CSTR) and upflow anaerobic filter reactors, reporting a decrease in sulfate reduction efficiency with decreasing pH, with less than 20% sulfate reduction efficiency at pH 5.4. Wastewater treatment plants using this two-phase configuration add NaOH to the acidification reactor to avoid excessive lowering of the pH and keep it at a pH of 6 (F. Van Esch, personal communication). If the operation of the acidification stage at a lower pH would be possible, the amount of NaOH added could be lowered, thereby making the wastewater treatment cheaper and more environmentally friendly. Besides, the separation of sulfide from the wastewater in the acidification stage would be easier as the fraction of gaseous sulfide increases with decreasing pH. This paper studies the effects of lowering the pH from 6 to 5 in the acidification reactor of a two-phase anaerobic treatment system. Experiments were performed in a CSTR at a HRT of 24 h, a OLR of 5 gCOD (lreactor d)-1 and a COD/SO4
2- ratio of 4 at 30°C, similarly to the operational conditions of the acidification reactor of the two-phase wastewater treatment plant of a starch producing company, Cerestar (The Netherlands). The performance of the CSTR was compared to that of an upflow anaerobic sludge bed (UASB) reactor, initially with a HRT of 10 hour, typical for UASB reactors, and afterwards with a similar HRT as the CSTR, to allow for comparison of the efficiency between the two reactor configurations. The performances of the two reactors were determined in terms of acidification and sulfate reduction efficiencies as well as metabolite production.
2 MATERIALS AND METHODS
2.1 Experimental set-up
One CSTR and one UASB reactor with an effective volume of 2.8 l each were used in this study. The CSTR (Figure 7.1) was made of hard PVC plastic with an internal diameter of 0.15 m and provided with an impeller connected to a Heidolph RZR 1 motor. The UASB was made of glass with an internal diameter of 0.1 m (schematic representation in Chapter 2). The reactors were kept at 30oC due to water heated in a thermostatic waterbath (Frigomix Thermomix 1441) and
Sulfate reduction in mesophilic UASB and CSTR acidification reactors
181
Cha
pter
7
recirculated in the rubber hose covering the outer surface of the CSTR or in the double-wall of the UASB reactor. The influent was fed to the bottom of the reactors using peristaltic pumps (Gilson Minipuls 2 and Watson Marlow 505S) and in order to keep the upflow velocity at 1 m h-1
in the UASB reactor, the effluent was recirculated using a peristaltic pump (Watson Marlow 503 S). The pH in the reactors was measured with a pH electrode (Hamilton, Hilkomij BV, Rijswijk, The Netherlands) and was controlled by automatic pH controllers (Endress and Hauser, Naarden, The Netherlands) by 0.15 M NaOH or HCl addition on the top of the CSTR or in the recirculation line of the UASB reactor. The produced biogas was led through a waterlock filled with NaOH (2 M) and a column filled with soda lime pellets in order to remove CO2 and H2S.
2.2 Inoculum
The reactors were inoculated with a mixture of sludges from the acidification CSTR and methanogenic UASB reactor of the wastewater treatment plant of Cerestar (Sas van Gent, The Netherlands). These two sludges were mixed as the CSTR had a very low biomass concentration and some sludge from the methanogenic UASB reactor is recirculated to the acidification CSTR in the treatment plant. The sludge originating from the CSTR was composed of small light yellowish flocs, while the sludge from the UASB reactor was composed of black granules. These two sludges were mixed at a ratio of 15/85, respectively, on VSS basis, and crushed prior to inoculation of the reactors in order to provide similar initial conditions in the CSTR and in the UASB reactor. The initial biomass concentration in the reactors was 18.8 gVSS l-1.

182
Cha
pter
7
Figure 7.1 Schematic representation of the CSTR used in this study. 1: pH electrode; 2: pH controller; 3: NaOH; 4: HCl; 5: safety bottle; 6: NaOH; 7: soda lime pellets; 8: gas meter, 9: waterbath; 10: rubber hose.
2.3 Medium
The reactors were fed a synthetic influent consisting of sucrose as a model carbohydrate (sole electron donor and carbon source), sulfate and nutrients. The concentrations of sucrose and sulfate, added as sodium sulfate, depended on the applied HRT (Table 7.1). The nutrient solution consisted of macro and micronutrients according to Vallero et al. (2003).
2.4 Experimental design
Throughout the experiment, the two reactors were operated at an average organic loading rate (OLR) of 5 gCOD (lreactor d)-1 and a COD/SO4
2- ratio of 4, similarly to the conditions of the acidification CSTR of Cerestar. The HRT applied was 10 h in the UASB reactor and 24 h in the CSTR, similarly to the HRT used in the respective reactor configurations in Cerestar wastewater treatment plant. In order to investigate the effect of low pH, both reactors were operated at pH 6 until day 77 (Period I), after which the pH was lowered to 5 (Period II). In order to directly compare the performance of the two reactors, the HRT of the UASB reactor was increased to the same HRT of the CSTR, 24 h, on day 167 (Period III). The total duration of the experiment was 150 and 230 days for the CSTR and for the UASB reactor, respectively.
8
Nutrients
Sucrose and sulfate (at 4°C)
2
4 3
6
7
9
51
10
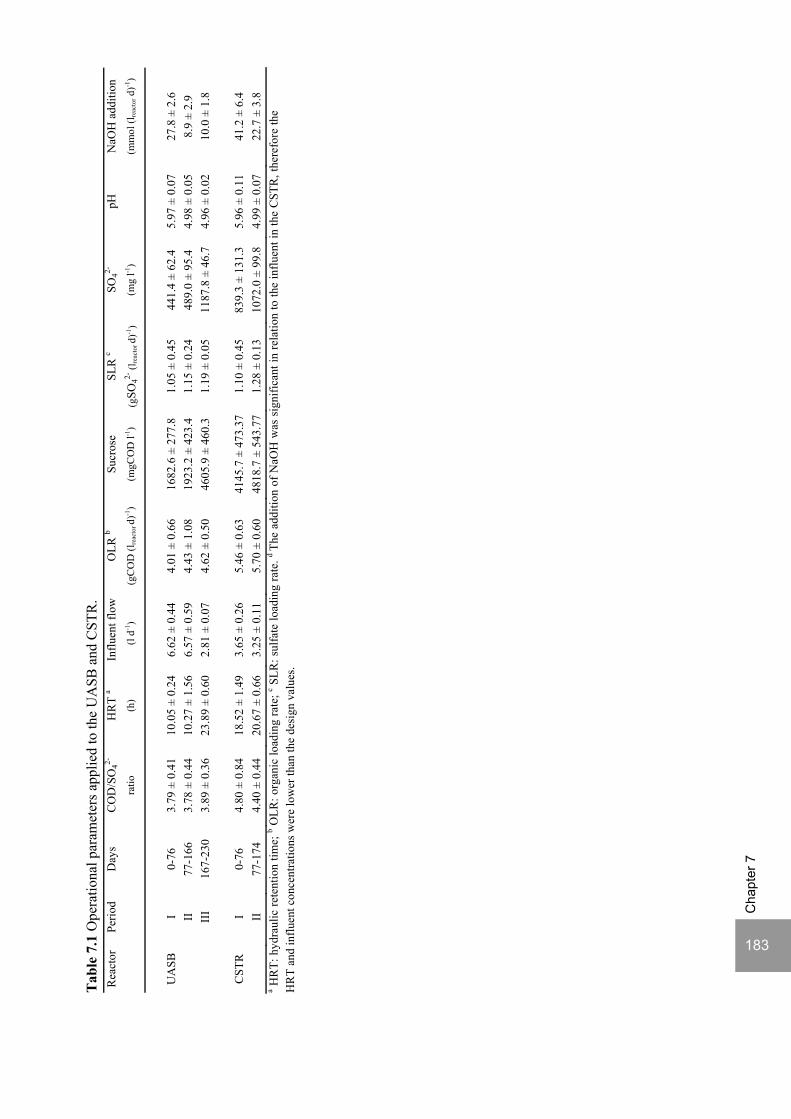
183
Cha
pter
7
Tab
le 7
.1 O
pera
tiona
l par
amet
ers a
pplie
d to
the
UA
SB a
nd C
STR
. R
eact
orPe
riod
Day
s C
OD
/SO
42-
HR
T a
Influ
ent f
low
OLR
b Su
cros
e SL
R c
SO42-
pH
N
aOH
add
ition
ratio
(h
) (l
d-1)
(gC
OD
(lre
acto
r d)-1
) (m
gCO
D l-1
) (g
SO42-
(lre
acto
r d)-1
)(m
g l-1
)
(mm
ol (l
reac
tor d
)-1)
UA
SB
I 0-
76
3.79
± 0
.41
10.0
5 ±
0.24
6.
62 ±
0.4
4 4.
01 ±
0.6
6 16
82.6
± 2
77.8
1.
05 ±
0.4
5 44
1.4
± 62
.4
5.97
± 0
.07
27.8
± 2
.6
II
77
-166
3.
78 ±
0.4
4 10
.27
± 1.
56
6.57
± 0
.59
4.43
± 1
.08
1923
.2 ±
423
.4
1.15
± 0
.24
489.
0 ±
95.4
4.
98 ±
0.0
5 8.
9 ±
2.9
II
I 16
7-23
0 3.
89 ±
0.3
6 23
.89
± 0.
60
2.81
± 0
.07
4.62
± 0
.50
4605
.9 ±
460
.3
1.19
± 0
.05
1187
.8 ±
46.
7 4.
96 ±
0.0
2 10
.0 ±
1.8
C
STR
I
0-76
4.
80 ±
0.8
4 18
.52
± 1.
49
3.65
± 0
.26
5.46
± 0
.63
4145
.7 ±
473
.37
1.10
± 0
.45
839.
3 ±
131.
3 5.
96 ±
0.1
1 41
.2 ±
6.4
II
77-1
74
4.40
± 0
.44
20.6
7 ±
0.66
3.
25 ±
0.1
1 5.
70 ±
0.6
0 48
18.7
± 5
43.7
71.
28 ±
0.1
3 10
72.0
± 9
9.8
4.99
± 0
.07
22.7
± 3
.8
a HR
T: h
ydra
ulic
rete
ntio
n tim
e; b O
LR: o
rgan
ic lo
adin
g ra
te; c S
LR: s
ulfa
te lo
adin
g ra
te. d
The
addi
tion
of N
aOH
was
sig
nific
ant i
n re
latio
n to
the
influ
ent i
n th
e C
STR
, the
refo
re th
e H
RT
and
influ
ent c
once
ntra
tions
wer
e lo
wer
than
the
desi
gn v
alue
s.

Cha
pter
7
184
2.5 Analysis
Sugars (sucrose, glucose and fructose) and lactate were measured by High-Pressure Liquid Chromatography according to van Lier et al. (1997). Sulfate was measured by Ion Chromatography according to Sipma et al. (2004). Sulfide was fixed with zinc acetate and measured photometrically according to Trüpper and Schlegel (1964). Volatile fatty acids (VFA), alcohols and biogas composition were measured using Gas Chromatography, according to Weijma et al. (2000). VSS was analyzed according to standard methods (APHA, 1998). The volume of biogas produced in the reactors was measured using a wet-type precision gas meter (Schlumberger Industries, Dordrecht, The Netherlands) till day 63 and 101 in the CSTR and in the UASB reactor, respectively, after which the biogas production was measured using Mariotte flasks.
3 RESULTS
3.1 Acidification
During operation at pH 6 (Period I), the CSTR and the UASB reactor showed a nearly complete acidification efficiency (Figure 7.2). In the CSTR, a lower efficiency was observed on days 35 to 39, probably due to the lack of influent on days 31 and 38, which was caused by clogging of influent tubes. It should be noted that the sucrose influent concentrations were different in the CSTR and in the UASB reactor, which was determined by the different HRT applied in the two reactors at the same OLR (Figure 7.3). The decrease in pH to 5 on day 77 (Period II) caused a decrease in acidification to 72% in the UASB reactor, while the CSTR showed only a small drop on the first day, after which the acidification efficiency rose to nearly 100% again. When the HRT in the UASB reactor was increased to 24 h on day 167, similar to the HRT as the CSTR, the acidification efficiency rose to approx. 94% in 13 days.
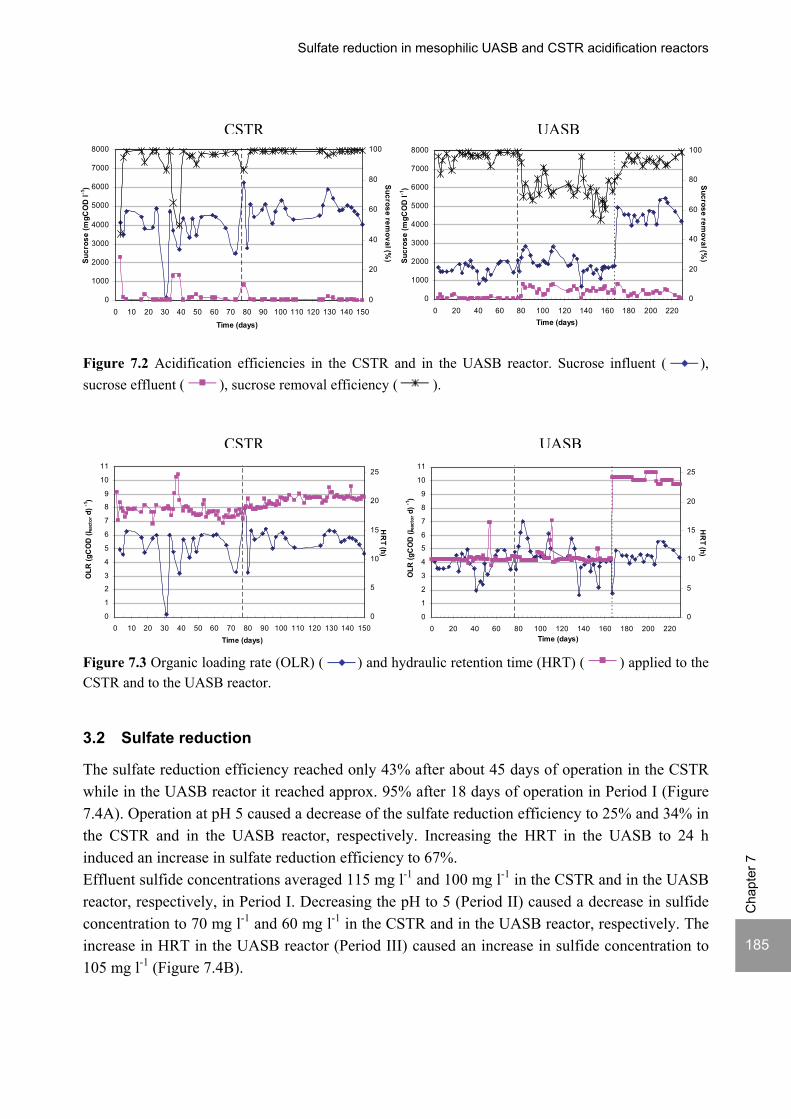
Sulfate reduction in mesophilic UASB and CSTR acidification reactors
185
Cha
pter
7
Figure 7.2 Acidification efficiencies in the CSTR and in the UASB reactor. Sucrose influent ( ), sucrose effluent ( ), sucrose removal efficiency ( ).
Figure 7.3 Organic loading rate (OLR) ( ) and hydraulic retention time (HRT) ( ) applied to the CSTR and to the UASB reactor.
3.2 Sulfate reduction
The sulfate reduction efficiency reached only 43% after about 45 days of operation in the CSTR while in the UASB reactor it reached approx. 95% after 18 days of operation in Period I (Figure 7.4A). Operation at pH 5 caused a decrease of the sulfate reduction efficiency to 25% and 34% in the CSTR and in the UASB reactor, respectively. Increasing the HRT in the UASB to 24 h induced an increase in sulfate reduction efficiency to 67%. Effluent sulfide concentrations averaged 115 mg l-1 and 100 mg l-1 in the CSTR and in the UASB reactor, respectively, in Period I. Decreasing the pH to 5 (Period II) caused a decrease in sulfide concentration to 70 mg l-1 and 60 mg l-1 in the CSTR and in the UASB reactor, respectively. The increase in HRT in the UASB reactor (Period III) caused an increase in sulfide concentration to 105 mg l-1 (Figure 7.4B).
0
1
2
3
4
5
6
7
8
9
10
11
0 20 40 60 80 100 120 140 160 180 200 220Time (days)
OLR
(gC
OD
(l rea
ctor
d) -1
)_
0
5
10
15
20
25
HR
T (h)
0
1
2
3
4
5
6
7
8
9
10
11
0 10 20 30 40 50 60 70 80 90 100 110 120 130 140 150Time (days)
OLR
(gC
OD
(l rea
ctor
d) -1
)
0
5
10
15
20
25
HR
T (h)
0
1000
2000
3000
4000
5000
6000
7000
8000
0 20 40 60 80 100 120 140 160 180 200 220Time (days)
Sucr
ose
(mgC
OD
l -1)
0
20
40
60
80
100
Sucrose removal (%
)_
0
1000
2000
3000
4000
5000
6000
7000
8000
0 10 20 30 40 50 60 70 80 90 100 110 120 130 140 150
Time (days)
Sucr
ose
(mgC
OD
l -1)
0
20
40
60
80
100
Sucrose removal (%
)_
UASBCSTR
UASBCSTR

Cha
pter
7
186
Figure 7.4 Sulfate reduction efficiencies (A) and total dissolved sulfide effluent concentrations and
reactor pH (B) in the CSTR and in the UASB reactor. Sulfate influent ( ), sulfate effluent ( ),
sulfate reduction efficiency ( ), total dissolved sulfide effluent ( ), pH ( ).
3.3 Acidification products
3.3.1 VFA
The total VFA concentration was higher in the CSTR than in the UASB reactor but it should be noted that sucrose influent concentrations were higher in the CSTR than in the UASB reactor as well (Figures 7.2 and 7.5). In the CSTR, the VFA concentration was approx. 2000 mgCOD l-1
already from the first days of operation (Figure 7.5). Butyrate was the main VFA produced (1500 mgCOD l-1) during the first 18 days, but the butyrate concentration subsequently decreased sharply, while the acetate concentration started to increase. Also the propionate concentration increased, although to a lesser extent. This shift in VFA coincided with the increase in sulfate reduction and sulfide concentrations (Figures 7.4 and 7.5). In pseudo-stationary state, the main VFA produced was acetate (1500 mgCOD l-1). In the UASB reactor, VFA concentrations increased in the first 50 days up to a concentration of 1250 mgCOD l-1. The main VFA produced was acetate (850 mgCOD l-1) with lower amounts of propionate and butyrate (less than 250 mgCOD l-1) (Figure 7.5).
0
300
600
900
1200
1500
0 10 20 30 40 50 60 70 80 90 100 110 120 130 140 150
Time (days)
Sulfa
te (m
g l-1
)
0
20
40
60
80
100
Sulfate reduction (%)_
0
20
40
60
80
100
120
140
0 10 20 30 40 50 60 70 80 90 100 110 120 130 140 150Time (days)
Sulfi
de (m
g l-1
)
0
1
2
3
4
5
6
7
8
pH
CSTR
0
300
600
900
1200
1500
0 20 40 60 80 100 120 140 160 180 200 220Time (days)
Sulfa
te (m
g l-1
)
0
20
40
60
80
100
Sulfate reduction (%)_
0
20
40
60
80
100
120
140
0 20 40 60 80 100 120 140 160 180 200 220Time (days)
Sulfi
de (m
g l-1
)
0
1
2
3
4
5
6
7
8
pH
UASB
BA
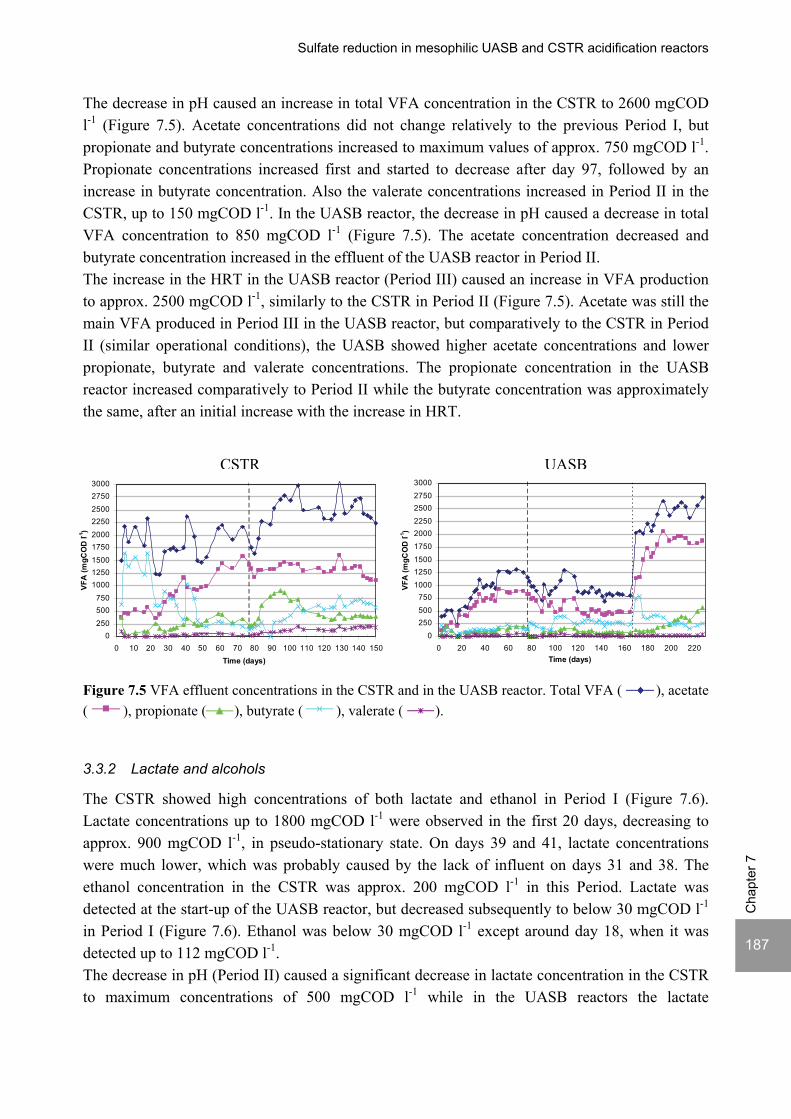
Sulfate reduction in mesophilic UASB and CSTR acidification reactors
187
Cha
pter
7
The decrease in pH caused an increase in total VFA concentration in the CSTR to 2600 mgCOD l-1 (Figure 7.5). Acetate concentrations did not change relatively to the previous Period I, but propionate and butyrate concentrations increased to maximum values of approx. 750 mgCOD l-1. Propionate concentrations increased first and started to decrease after day 97, followed by an increase in butyrate concentration. Also the valerate concentrations increased in Period II in the CSTR, up to 150 mgCOD l-1. In the UASB reactor, the decrease in pH caused a decrease in total VFA concentration to 850 mgCOD l-1 (Figure 7.5). The acetate concentration decreased and butyrate concentration increased in the effluent of the UASB reactor in Period II. The increase in the HRT in the UASB reactor (Period III) caused an increase in VFA production to approx. 2500 mgCOD l-1, similarly to the CSTR in Period II (Figure 7.5). Acetate was still the main VFA produced in Period III in the UASB reactor, but comparatively to the CSTR in Period II (similar operational conditions), the UASB showed higher acetate concentrations and lower propionate, butyrate and valerate concentrations. The propionate concentration in the UASB reactor increased comparatively to Period II while the butyrate concentration was approximately the same, after an initial increase with the increase in HRT.
Figure 7.5 VFA effluent concentrations in the CSTR and in the UASB reactor. Total VFA ( ), acetate ( ), propionate ( ), butyrate ( ), valerate ( ).
3.3.2 Lactate and alcohols
The CSTR showed high concentrations of both lactate and ethanol in Period I (Figure 7.6). Lactate concentrations up to 1800 mgCOD l-1 were observed in the first 20 days, decreasing to approx. 900 mgCOD l-1, in pseudo-stationary state. On days 39 and 41, lactate concentrations were much lower, which was probably caused by the lack of influent on days 31 and 38. The ethanol concentration in the CSTR was approx. 200 mgCOD l-1 in this Period. Lactate was detected at the start-up of the UASB reactor, but decreased subsequently to below 30 mgCOD l-1 in Period I (Figure 7.6). Ethanol was below 30 mgCOD l-1 except around day 18, when it was detected up to 112 mgCOD l-1. The decrease in pH (Period II) caused a significant decrease in lactate concentration in the CSTR to maximum concentrations of 500 mgCOD l-1 while in the UASB reactors the lactate
0250
500750
100012501500
17502000
2250250027503000
0 10 20 30 40 50 60 70 80 90 100 110 120 130 140 150Time (days)
VFA
(mgC
OD
l -1)
0
250500
7501000
12501500
1750
20002250
25002750
3000
0 20 40 60 80 100 120 140 160 180 200 220Time (days)
VFA
(mgC
OD
l -1)
UASBCSTR

Cha
pter
7
188
concentration increased slightly (Figure 7.6). In both reactors, the ethanol concentration increased with the decrease in pH (Period II), up to an average of 500 mgCOD l-1 in the CSTR and 300 mgCOD l-1 in the UASB reactor. The increase in the HRT of the UASB reactor (Period III) caused an increase in both lactate and ethanol concentrations (Figure 7.6). However, after reaching peak concentrations on days 180 and 173 for lactate and ethanol, respectively, both concentrations decreased gradually till approx. 300 mgCOD l-1 at the end of the reactor run.
Figure 7.6 Ethanol ( ) and lactate ( ) effluent concentrations in the CSTR and in the UASB reactor.
3.4 Biogas production
Biogas production was only significant in Period I in the CSTR and decreased to nearly zero at approx. day 40. The decrease in pH did not change this low biogas production rate, but on days 97, 121 and 129 a higher biogas production rate was observed (Figure 7.7). In the UASB reactor, the biogas production rate reached 0.5 l (lreactor d)-1 in the first 30 days of reactor operation, after which it decreased to nearly zero at the end of Period I, which did not change with the decrease in pH (Period II) or the increase in OLR (Period III) (Figure 7.7). In the CSTR, the methane fraction in the biogas was only 5% on day 39, while in the UASB reactor, it was about 43% (Table 7.2). On the other hand, the biogas of the CSTR contained more hydrogen (6%) than the UASB reactor (< 2%). The decrease in pH (Period II) caused a decrease in the methane content of both reactors. The hydrogen fraction of the biogas was kept similar in the CSTR but increased to 25% in the UASB reactor, which did not change with the increase in the HRT. However, given the low amounts of biogas produced (Figure 7.7), the hydrogen production in the UASB reactor was still very low (less than 0.05 gCOD (lreactor d)-1).
0
200
400
600
800
1000
1200
1400
1600
1800
2000
0 10 20 30 40 50 60 70 80 90 100 110 120 130 140 150Time (days)
Etha
nol o
r lac
tate
(mgC
OD
l -1)
0
200
400
600
800
1000
1200
1400
1600
1800
2000
0 20 40 60 80 100 120 140 160 180 200 220Time (days)
Etha
nol o
r lac
tate
(mgC
OD
l -1)
UASBCSTR
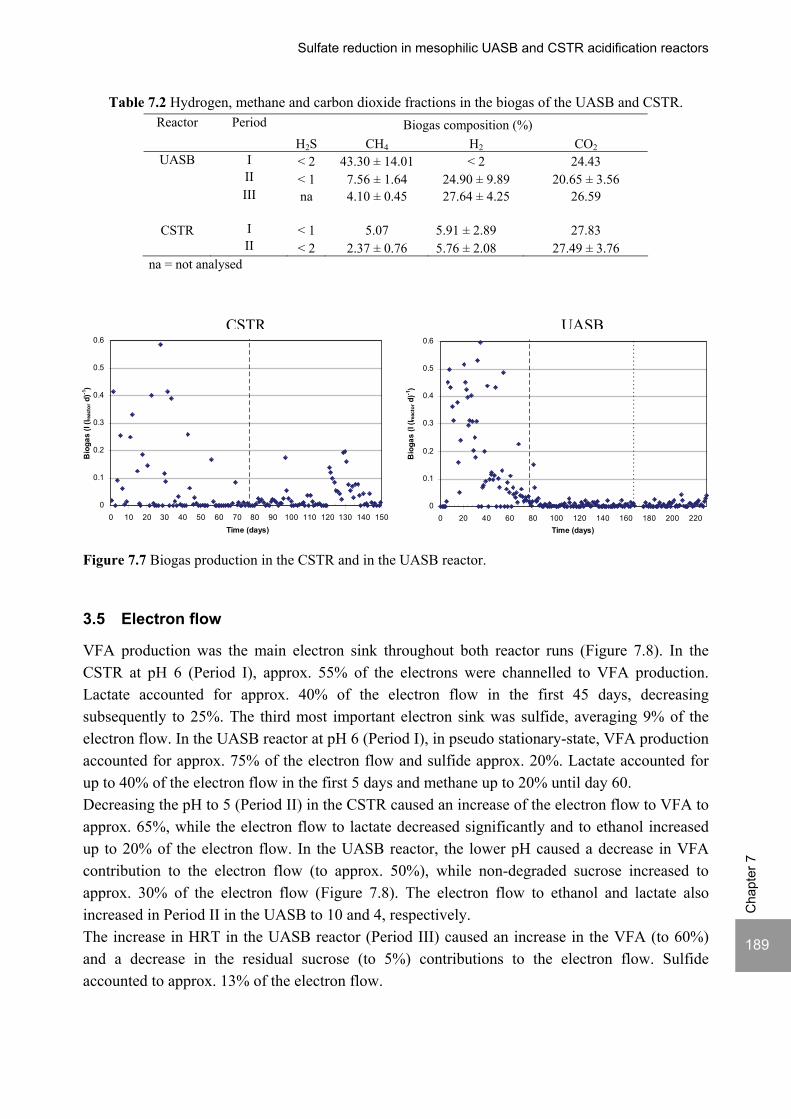
Sulfate reduction in mesophilic UASB and CSTR acidification reactors
189
Cha
pter
7
Table 7.2 Hydrogen, methane and carbon dioxide fractions in the biogas of the UASB and CSTR.
Reactor Period Biogas composition (%) H2S CH4 H2 CO2
UASB I < 2 43.30 ± 14.01 < 2 24.43 II < 1 7.56 ± 1.64 24.90 ± 9.89 20.65 ± 3.56 III na 4.10 ± 0.45 27.64 ± 4.25 26.59
CSTR I < 1 5.07 5.91 ± 2.89 27.83 II < 2 2.37 ± 0.76 5.76 ± 2.08 27.49 ± 3.76
na = not analysed
Figure 7.7 Biogas production in the CSTR and in the UASB reactor.
3.5 Electron flow
VFA production was the main electron sink throughout both reactor runs (Figure 7.8). In the CSTR at pH 6 (Period I), approx. 55% of the electrons were channelled to VFA production. Lactate accounted for approx. 40% of the electron flow in the first 45 days, decreasing subsequently to 25%. The third most important electron sink was sulfide, averaging 9% of the electron flow. In the UASB reactor at pH 6 (Period I), in pseudo stationary-state, VFA production accounted for approx. 75% of the electron flow and sulfide approx. 20%. Lactate accounted for up to 40% of the electron flow in the first 5 days and methane up to 20% until day 60. Decreasing the pH to 5 (Period II) in the CSTR caused an increase of the electron flow to VFA to approx. 65%, while the electron flow to lactate decreased significantly and to ethanol increased up to 20% of the electron flow. In the UASB reactor, the lower pH caused a decrease in VFA contribution to the electron flow (to approx. 50%), while non-degraded sucrose increased to approx. 30% of the electron flow (Figure 7.8). The electron flow to ethanol and lactate also increased in Period II in the UASB to 10 and 4, respectively. The increase in HRT in the UASB reactor (Period III) caused an increase in the VFA (to 60%) and a decrease in the residual sucrose (to 5%) contributions to the electron flow. Sulfide accounted to approx. 13% of the electron flow.
0
0.1
0.2
0.3
0.4
0.5
0.6
0 10 20 30 40 50 60 70 80 90 100 110 120 130 140 150Time (days)
Bio
gas
(l (l r
eact
or d
)-1)
0
0.1
0.2
0.3
0.4
0.5
0.6
0 20 40 60 80 100 120 140 160 180 200 220Time (days)
Bio
gas
(l (l r
eact
or d
)-1)
CSTR UASB
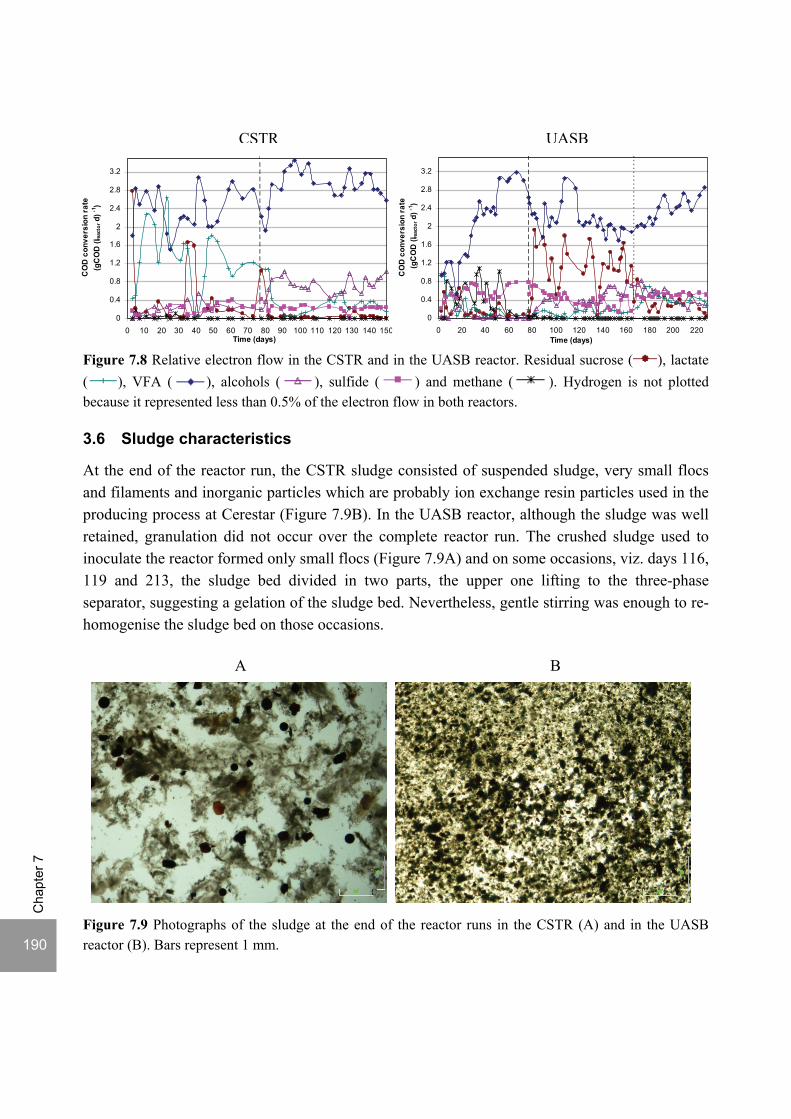
Cha
pter
7
190
Figure 7.8 Relative electron flow in the CSTR and in the UASB reactor. Residual sucrose ( ), lactate ( ), VFA ( ), alcohols ( ), sulfide ( ) and methane ( ). Hydrogen is not plotted because it represented less than 0.5% of the electron flow in both reactors.
3.6 Sludge characteristics
At the end of the reactor run, the CSTR sludge consisted of suspended sludge, very small flocs and filaments and inorganic particles which are probably ion exchange resin particles used in the producing process at Cerestar (Figure 7.9B). In the UASB reactor, although the sludge was well retained, granulation did not occur over the complete reactor run. The crushed sludge used to inoculate the reactor formed only small flocs (Figure 7.9A) and on some occasions, viz. days 116, 119 and 213, the sludge bed divided in two parts, the upper one lifting to the three-phase separator, suggesting a gelation of the sludge bed. Nevertheless, gentle stirring was enough to re-homogenise the sludge bed on those occasions. Figure 7.9 Photographs of the sludge at the end of the reactor runs in the CSTR (A) and in the UASB reactor (B). Bars represent 1 mm.
0
0.4
0.8
1.2
1.6
2
2.4
2.8
3.2
0 10 20 30 40 50 60 70 80 90 100 110 120 130 140 150Time (days)
CO
D c
onve
rsio
n ra
te(g
CO
D (l r
eact
or d
) -1)
0
0.4
0.8
1.2
1.6
2
2.4
2.8
3.2
0 20 40 60 80 100 120 140 160 180 200 220Time (days)
CO
D c
onve
rsio
n ra
te_(g
CO
D (l r
eact
or d
) -1)
CSTR UASB
A B

Sulfate reduction in mesophilic UASB and CSTR acidification reactors
191
Cha
pter
7
4 DISCUSSION
4.1 Effect of reactor configuration on acidification and sulfate reduction
This study showed that the reactor configuration is very important in determining the extent of sulfate reduction in the acidification phase at low pH. At pH 5 and similar HRT, the UASB reactor performed much better than the CSTR, with sulfate reduction efficiencies of 67 and 24%, respectively. This agrees with the findings of Reis et al. (1988) which reported higher sulfate reduction efficiencies in a fixed film reactor than in a CSTR in the pH range 6.6 to 5.4 and indicates that SRB were effectively retained in the UASB reactor. On the other hand, the CSTR performed slightly better than the UASB reactor in terms of acidification efficiency, with averages of 99% and 93%, respectively. However, the incomplete acidification efficiency in the acidification reactor might be beneficial, as it can promote granulation in the second-phase methanogenic UASB reactor. Indeed, the presence of a certain fraction of high energy substrates (7-27% of the COD) is considered beneficial for granulation due to the higher capacity of acidogenic bacteria to produce extracellular polymers (Vanderhaegen et al., 1992; Thaveesri et al., 1995b; Grootaerd et al., 1997). The crushed inoculum sludge used to inoculate the UASB reactor did not evolve into granules during the 230 day-long reactor run, despite the fact that 85% of the inoculum sludge was granular sludge from the methanogenic UASB reactor of the Cerestar wastewater treatment plant. The flocculent biomass developed in the UASB reactor, nevertheless, effectively immobilized SRB, given the higher sulfate reduction rates observed compared with the CSTR reactor under similar conditions and the same HRT. The lack of granulation contrasts the findings of Mulder (1990), who reported granulation during mesophilic acidification of glucose (10 g l-1) in gas-lift reactors at pH 5.5 and suggested that a decrease in pH from 6.4 to 5.9 actually enhanced granulation. However, granulation was only achieved at HRT lower than 5 h, which is lower than the HRT used in this study. Previous studies with the same influent and similar experimental conditions but under thermophilic conditions showed the feasibility of maintaining a good quality granular sludge at pH values as low as 4, given a granular inoculum (without prior crushing) (Chapter 3). This warrants further research on granulation with non-acidified, sulfate rich influents at low pH. Romli et al. (1994) reported that lowering the pH from 6.0 to 5.3 in the acidification CSTR of a mesophilic two-phase anaerobic treatment system treating molasses led to a reduction in the external alkali addition by 30% without any significant deterioration in the final effluent quality. Although the overall treatment efficiency of the two-phase anaerobic treatment system was not evaluated in this study, the decrease in the pH from 6 to 5 caused a 45% and 68% decrease in NaOH addition for pH control in the CSTR and UASB reactor, respectively (Table 7.1).
4.2 Effect of pH on sulfate reduction in the acidifying phase
This study showed that mesophilic (30°C) sulfate reduction is possible in the acidification stage of a two-phase anaerobic treatment process at pH 6 and 5, both in a UASB reactor and in a CSTR (Figure 7.2). This is in agreement with previous studies at pH 6 in CSTR and upflow filters under

Cha
pter
7
192
mesophilic conditions (Reis et al., 1988; Mizuno et al., 1998a; Ren et al., 2007) and in UASB and EGSB reactors under thermophilic conditions ((Sipma et al., 1999; Lens et al., 2001; Lens et al., 2003); Chapters 2 and 6). To our knowledge, this study shows for the first time the feasibility of mesophilic sulfate reduction at pH 5 in the acidification stage. In the CSTR, a poor sulfate reduction efficiency (44%, 0.43 g (lreactor d)-1) was observed at pH 6. This agrees with the 59% and 33% sulfate reduction efficiencies reported by (Reis et al., 1988) in a molasses fed CSTR with an HRT of 22, at pH 6.2 and 5.8, respectively, at a similar COD/SO4
2- ratio as in this study but with higher influent sulfate concentrations (4-5 g l-1). However, higher sulfate reduction efficiencies have been reported by Ren et al. (2007) and Mizuno et al. (1998b) in CSTR fed with molasses or sucrose, respectively, at pH 6. In the UASB reactor, however, the sulfate reduction efficiency averaged 95% at pH 6, equivalent to a sulfate reduction rate of 0.93 g (lreactor d)-1. At a similar COD/SO4
2- ratio but influent sulfate concentration of 4-5 g l-1, Reis et al. (1988) reported a 78% and 31% sulfate reduction efficiency in mesophilic upflow filters fed with molasses at pH 6.2 and 5.8, respectively, at a HRT of 22 h, and 100% and 47%, respectively, at a HRT of 29 h. Under thermophilic conditions, a sulfate reduction efficiency of 66% (0.75 g (lreactor d)-1) has been achieved in a UASB reactor operated with the same operational conditions and COD/SO4
2- ratio as in this study (Chapter 4) and complete sulfate reduction efficiencies have been reported at higher COD/SO4
2- ratios (6.7, 8 and 10) in UASB and EGSB reactors fed with sucrose, sucrose and VFA or starch, sucrose, lactate and VFA at pH 6 ((Sipma et al., 1999; Lens et al., 2001; Lens et al., 2003) and Chapter 2). Decreasing the pH from 6 to 5 caused a decrease in the sulfate reduction efficiency in both reactors, to an average of 25% in the CSTR and 34% in the UASB reactor, equivalent to sulfate reduction rates of 0.32 and 0.33 g (lreactor d)-1, respectively (Figure 7.4). It should be noted that the UASB reactor was operated at a HRT of 10 h while the CSTR was operated at a HRT of 20 h (Table 7.1). The increase of the HRT in the UASB to 24 hours, comparable to the CSTR conditions, provoked an increase in the sulfate reduction efficiency to 67%, equivalent to a sulfate reduction rate of 0.77 g (lreactor d)-1. The study on mesophilic sulfate reduction in the acidification stage with the lowest mixed liquor pH was performed by Reis et al. (1988) at pH 5.4 in CSTR and upflow filters fed with molasses (COD/SO4
2- ratio approx. 9) at HRT of 29 h but with very low sulfate reduction efficiencies, viz. 8 and 18%, respectively (0.33 and 0.66 g (lreactor d)-1, respectively). At a HRT of 22 h, the sulfate reduction efficiency further dropped to 7% in the upflow filter (0.33 g (lreactor d)-1) (Reis et al., 1988). Under thermophilic conditions, however, higher sulfate reduction efficiencies, viz. 90-100% were already demonstrated together with the acidification of sucrose at pH 5 in UASB reactors at a HRT of 10 h (Chapters 2 and 5). Similar sulfide and VFA concentrations were observed in Chapter 2 and in the UASB reactor in the present study. This indicates that the mesophilic biomass in the present study was more sensitive to sulfide and VFA toxicity than the thermophilic granular biomass used Chapter 2 and/or that a larger or more active population of SRB was present in the latter study.
4.3 Effect of pH on acidification efficiency and pathways
Acidification was nearly complete at both pH 6 and 5 in the CSTR. However, in the UASB reactor, operating at a shorter HRT, the lowering of the pH from 6 to 5 caused a decrease in

Sulfate reduction in mesophilic UASB and CSTR acidification reactors
193
Cha
pter
7
acidification efficiency to 72% (Figure 7.2). This confirms previous studies that show a decrease in the acidification rate at pH lower than 6. Zoetemeyer et al. (1982c) showed that in mixed culture systems, the optimum growth of a population of glucose consuming bacteria occurred in a pH range of 5.8-6.2 and a 50% decrease in the growth rate was observed at pH 5. The decrease in acidification rates at pH 5 comparatively to pH 6 was also reported by Sipma et al. (1999) and Lens et al. (2003) under thermophilic conditions. Remarkably, the acidification efficiency did not increase in the UASB during the 90 days of operation at pH 5 and HRT of 9 h. This shows that growth was indeed limited at pH 5. Increasing the HRT in the UASB reactor to 24 h, provoked a fast increase in the acidification to nearly complete, which compares to the acidification performance of the CSTR at the same pH, and proves that acidification in the UASB reactor was indeed limited by the HRT. Moreover, the higher sucrose, VFA and sulfide concentrations observed in the UASB reactor at a HRT of 24 h compared to the HRT of 10 h (Figures 7.2, 7.4 and 7.5), as result of the higher sucrose and sulfate influent concentrations, excluded the inhibition of acidogenesis by sucrose, acidification products or sulfide as the factors dictating the lower acidification efficiency observed in the UASB reactor at a HRT of 10 h. Besides affecting the acidification efficiency, the pH affected the fermentation products obtained. The decrease in pH from 6 to 5 caused in both reactors an increase in butyrate and ethanol production. Moreover, it caused a decrease in acetate and increase in hydrogen production in the UASB and an increase in propionate and decrease in lactate production in the CSTR. Other studies on carbohydrate fermentation under mesophilic and thermophilic conditions show a decrease in the fraction of acetate relatively to the total VFA produced with the decrease of pH together with an increase in the fraction of butyrate ((Reis et al., 1991b; Romli et al., 1994; Fang and Liu, 2002; Hwang et al., 2004; Zheng and Yu, 2004; Rodriguez et al., 2006) and Chapter 2). When sulfate is present in the wastewater, the decrease in sulfate reduction observed with the lowering of the pH can also contribute to the changes in the acidification products observed at lower pH. Reis et al. (1991b) and Chapter 5 showed that sulfate reduction was associated with butyrate consumption and acetate production in acidification reactors. Therefore, the increase in butyrate and concomitant increase in the acetate concentrations with the decrease in sulfate reduction efficiency observed in the UASB reactor (Figures 7.4 and 7.5) can be ascribed to the inhibition of incomplete butyrate oxidizing SRB and/or to the inhibition of hydrogenotrophic SRB in syntrophy with acetogenic bacteria. The increase in ethanol production at low pH has also been reported by Kisaalita et al. (1987) and Ren et al. (1997), although at lower pH values. Kisaalita et al. (1987) reported increased production of ethanol below pH 4.5 in the fermentation of lactose and Ren et al. (1997) described an ethanol-type fermentation from molasses around pH 4.5. An increase in propionate concentration was also observed by Romli et al. (1994) with the decrease in pH from 6.0 to 5.3, but this was accompanied by an increase in lactate, which is not in agreement with the results of the present study. In fact, the lactate concentration decreased remarkably when the pH was lowered from 6 to 5 in the CSTR (Figure 7.6). The decrease in lactate concentration coincided with the increase in ethanol and propionate concentrations (Figures 7.5 and 7.6) and further oscillations in lactate concentration were always coincident with opposite oscillations in ethanol

Cha
pter
7
194
and propionate (Figures 7.5 and 7.6) which suggests a correspondent shift in the acidification pathways or the favoured conversion of lactate into propionate and ethanol at pH 5.
5 CONCLUSIONS
• Mesophilic (30°C) sulfate reduction is possible in the acidification stage at pH 6 and 5 at an
OLR of 5 gCOD (lreactor d)-1 and a COD/SO42- ratio of 4 in CSTR and UASB reactors.
• Decreasing the pH from 6 to 5 decreased the sulfate reduction efficiencies from 44% to 25%
and from 95% to 34% in the CSTR and in the UASB reactor, respectively.
• Complete acidification of sucrose occurred at pH 6 in both reactors. At pH 5, acidification was
complete in the CSTR but decreased to 72% in the UASB.
• The decrease to pH 5 caused an increase in butyrate and ethanol concentrations in both
reactors. Furthermore, the propionate concentration increased and lactate concentration
decreased in the CSTR, whereas acetate concentration decreased in the UASB reactor.
• Lowering the pH from 6 to 5 caused a 45% and 68% decrease in NaOH addition for pH control
in the CSTR and UASB reactor, respectively.
• For a similar HRT, at pH 5, the CSTR performed worse than the UASB reactor in terms of
sulfate reduction (25% versus 67%) and slightly better in terms of acidification efficiency
(99% versus 94%).
• Granulation did not occur in the UASB reactor under the conditions applied.
ACKNOWLEDGEMENT
Frans van Esch (Cerestar, The Netherlands) is acknowledged for useful discussions about the wastewater treatment plant at Cerestar company and for providing the sludge used in this study. Cathelijne Dreissen is acknowledged for her assistance in the practical part of this research.

195


Chapter
Summary and General Discussion

198
Cha
pter
8
1 INTRODUCTION
The objective of this thesis was to determine the operational window of dissimilatory sulfate reduction at low pH (pH 6, 5 and 4) in organic wastewaters. High sulfate reduction efficiencies at low pH are desirable for a more sustainable operation of acidification reactors in a two-phase wastewater treatment system, as less caustic needs to be added to keep the pH at the set-point and/or the effluent recirculation from the second (methanogenic) reactor could be skipped. The low pH would also facilitate the removal of sulfide by stripping, as the fraction of gaseous sulfide increases with decreasing pH, and phase separation, as methanogenesis is inhibited at low pH. Prior to this study, to our knowledge, there were no studies reporting sulfate reduction in the acidification stage with a mixed liquor pH lower than 5.4, and sulfate reduction efficiencies were reported to substantially decrease when the reactor pH became lower than 6.2 (Reis et al., 1988). This chapter summarizes and discusses the main findings of this thesis.
2 SUMMARY
Figures 8.1 and 8.2 illustrate the topics addressed in this thesis and its main conclusions. In chapters 2 and 3, the effect of a low pH (6, 5 and 4) was investigated in terms of UASB reactor performance, sludge characteristics and metal dynamics. Chapter 2 studied the effect of pH (6, 5 and 4) and different COD/SO4
2- ratios (9 and 3.5) on the sulfate reduction and acidification of sucrose at an OLR of 3.5 gCOD (lreactor d)-1 in thermophilic UASB reactors. Acidification was complete for the three pH values and COD/SO4
2- ratios investigated, while the sulfate reduction efficiency decreased with decreasing pH. Sulfate reduction was complete at pH 6 and a COD/SO4
2- ratio of 9. At pH 5, sulfate reduction efficiencies were 80-95% for both COD/SO42-
ratios (9 and 3.5). At pH 4, sulfate reduction efficiencies further dropped to 55-65% at a COD/SO4
2- ratio of 9 and 30-40% at a COD/SO42- ratio of 3.5. The pH decrease from 6 to 5 or 4
caused a shift in the acidification products from mainly acetate to butyrate, as well as a higher production of ethanol, mainly at pH 4. At pH 4, there was no propionate or methane formed and hydrogen concentrations in the biogas reached 50%, equivalent to a hydrogen yield of 1.3 mol H2 (mol glucose)-1. Chapter 3 studied the metal dynamics and the sludge characteristics in the three UASB reactors described in chapter 2 and in batch leaching experiments performed at pH 6, 5 and 4 under thermophilic conditions. In the continuously operating UASB reactors, most metals leached from the sludge granules except for Co at pH 6, Al at pH 6 and 5 and Cu and Zn at all three pH values investigated. At the end of the UASB reactor runs, the sludge granules were almost deprived of Fe and Mn both at pH 5 and 4. Sequential extraction of the metals from the sludge showed that the predominant fractions involved in metal accumulation changed with the pH.
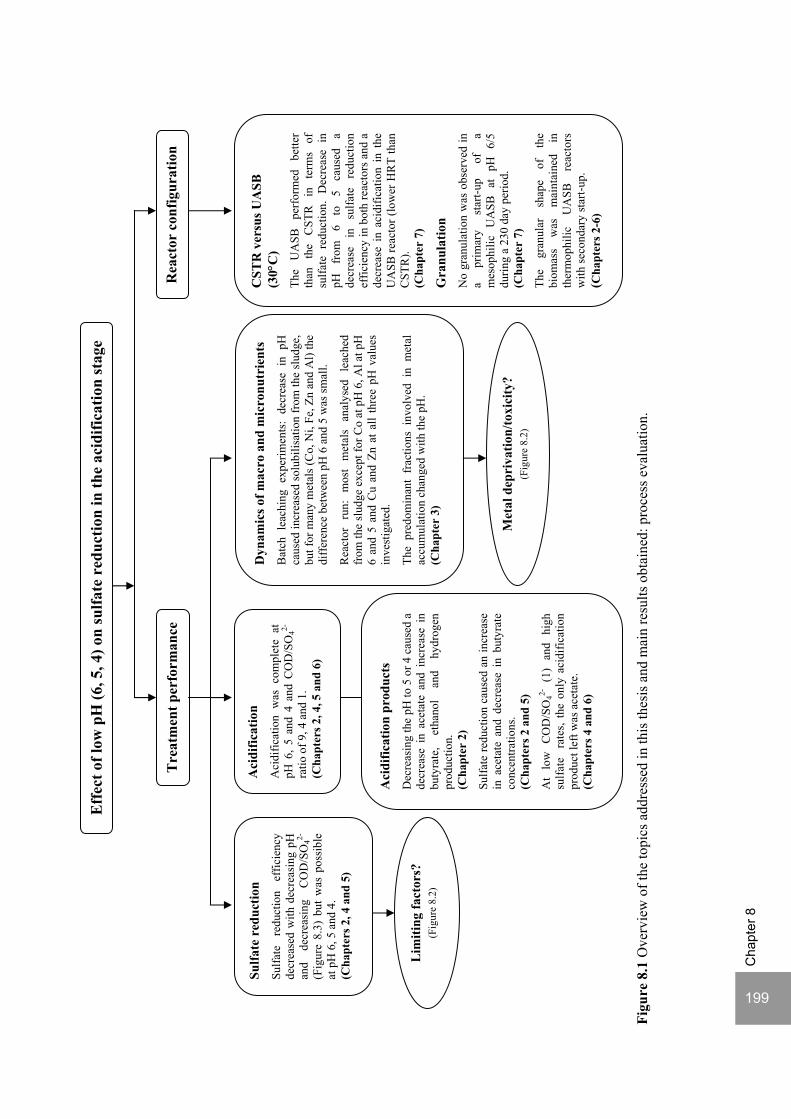
199
Cha
pter
8
Figu
re 8
.1 O
verv
iew
of t
he to
pics
add
ress
ed in
this
thes
is a
nd m
ain
resu
lts o
btai
ned:
pro
cess
eva
luat
ion.
Eff
ect o
f low
pH
(6, 5
, 4) o
n su
lfate
red
uctio
n in
the
acid
ifica
tion
stag
e
Sulfa
te r
educ
tion
Sulfa
te
redu
ctio
n ef
ficie
ncy
decr
ease
d w
ith d
ecre
asin
g pH
an
d de
crea
sing
C
OD
/SO
42-
(Fig
ure
8.3)
but
was
pos
sibl
e at
pH
6, 5
and
4.
(Cha
pter
s 2, 4
and
5)
Aci
dific
atio
n A
cidi
ficat
ion
was
com
plet
e at
pH
6,
5 an
d 4
and
CO
D/S
O42-
ra
tio o
f 9, 4
and
1.
(Cha
pter
s 2, 4
, 5 a
nd 6
)
Aci
dific
atio
n pr
oduc
ts
Dec
reas
ing
the
pH to
5 o
r 4 c
ause
d a
decr
ease
in
acet
ate
and
incr
ease
in
buty
rate
, et
hano
l an
d hy
drog
en
prod
uctio
n.
(Cha
pter
2)
Sulfa
te re
duct
ion
caus
ed a
n in
crea
se
in a
ceta
te a
nd d
ecre
ase
in b
utyr
ate
conc
entra
tions
. (C
hapt
ers 2
and
5)
At
low
C
OD
/SO
42-
(1)
and
high
su
lfate
ra
tes,
the
only
aci
dific
atio
n pr
oduc
t lef
t was
ace
tate
. (C
hapt
ers 4
and
6)
Dyn
amic
s of m
acro
and
mic
ronu
trie
nts
Bat
ch l
each
ing
expe
rimen
ts:
decr
ease
in
pH
caus
ed in
crea
sed
solu
bilis
atio
n fr
om th
e sl
udge
, bu
t for
man
y m
etal
s (C
o, N
i, Fe
, Zn
and
Al)
the
diff
eren
ce b
etw
een
pH 6
and
5 w
as sm
all.
R
eact
or
run:
m
ost
met
als
anal
ysed
le
ache
d fr
om th
e sl
udge
exc
ept f
or C
o at
pH
6, A
l at p
H
6 an
d 5
and
Cu
and
Zn a
t all
thre
e pH
val
ues
inve
stig
ated
. Th
e pr
edom
inan
t fr
actio
ns i
nvol
ved
in m
etal
ac
cum
ulat
ion
chan
ged
with
the
pH.
(Cha
pter
3)
CST
R v
ersu
s UA
SB
(30°
C)
The
UA
SB
perf
orm
ed
bette
r th
an
the
CST
R
in
term
s of
su
lfate
red
uctio
n. D
ecre
ase
in
pH
from
6
to
5 ca
used
a
decr
ease
in
su
lfate
re
duct
ion
effic
ienc
y in
bot
h re
acto
rs a
nd a
de
crea
se i
n ac
idifi
catio
n in
the
U
ASB
reac
tor (
low
er H
RT
than
C
STR
).
(Cha
pter
7)
Gra
nula
tion
No
gran
ulat
ion
was
obs
erve
d in
a
prim
ary
star
t-up
of
a m
esop
hilic
U
ASB
at
pH
6/
5 du
ring
a 23
0 da
y pe
riod.
(C
hapt
er 7
) Th
e gr
anul
ar
shap
e of
th
e bi
omas
s w
as
mai
ntai
ned
in
ther
mop
hilic
U
ASB
re
acto
rs
with
seco
ndar
y st
art-u
p.
(Cha
pter
s 2-6
)
Met
al d
epri
vatio
n/to
xici
ty?
(Fig
ure
8.2)
Lim
iting
fact
ors?
(F
igur
e 8.
2)
Tre
atm
ent p
erfo
rman
ce
Rea
ctor
con
figur
atio
n
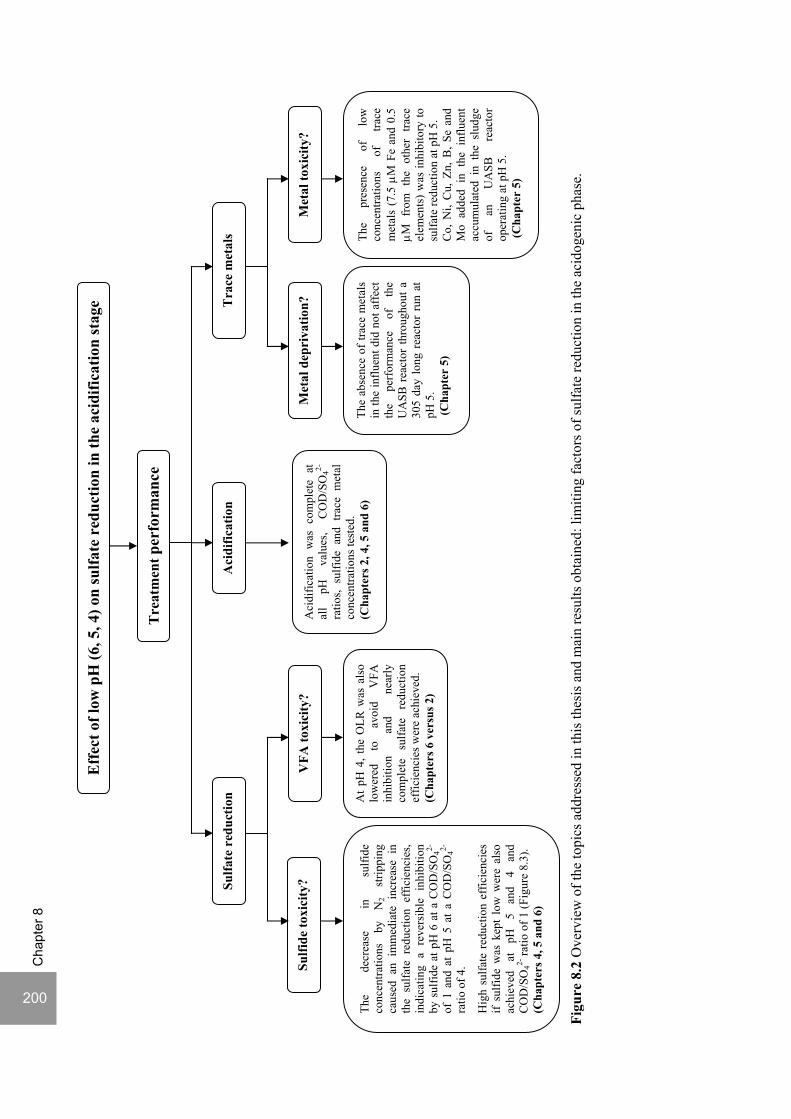
200
Cha
pter
8
Tra
ce m
etal
s
Figu
re 8
.2 O
verv
iew
of t
he to
pics
add
ress
ed in
this
thes
is a
nd m
ain
resu
lts o
btai
ned:
lim
iting
fact
ors o
f sul
fate
redu
ctio
n in
the
acid
ogen
ic p
hase
.
The
abse
nce
of tr
ace
met
als
in th
e in
fluen
t did
not
aff
ect
the
perf
orm
ance
of
th
e U
ASB
rea
ctor
thro
ugho
ut a
30
5 da
y lo
ng r
eact
or r
un a
t pH
5.
(Cha
pter
5)
The
decr
ease
in
su
lfide
co
ncen
tratio
ns
by
N2
strip
ping
ca
used
an
imm
edia
te i
ncre
ase
in
the
sulfa
te r
educ
tion
effic
ienc
ies,
indi
catin
g a
reve
rsib
le i
nhib
ition
by
sul
fide
at p
H 6
at a
CO
D/S
O42-
of
1 a
nd a
t pH
5 a
t a
CO
D/S
O42-
ra
tio o
f 4.
Hig
h su
lfate
red
uctio
n ef
ficie
ncie
s if
sulfi
de w
as k
ept
low
wer
e al
so
achi
eved
at
pH
5
and
4 an
d C
OD
/SO
42- ra
tio o
f 1 (F
igur
e 8.
3).
(Cha
pter
s 4, 5
and
6)
Eff
ect o
f low
pH
(6, 5
, 4) o
n su
lfate
red
uctio
n in
the
acid
ifica
tion
stag
e
Aci
dific
atio
n
Tre
atm
ent p
erfo
rman
ce
Sulfa
te r
educ
tion At p
H 4
, the
OLR
was
als
o lo
wer
ed
to
avoi
d V
FA
inhi
bitio
n an
d ne
arly
co
mpl
ete
sulfa
te
redu
ctio
n ef
ficie
ncie
s wer
e ac
hiev
ed.
(Cha
pter
s 6 v
ersu
s 2)
Met
al d
epri
vatio
n?
Met
al to
xici
ty?
The
pres
ence
of
lo
w
conc
entra
tions
of
tra
ce
met
als
(7.5
μM
Fe
and
0.5
μM f
rom
the
oth
er t
race
el
emen
ts) w
as in
hibi
tory
to
sulfa
te re
duct
ion
at p
H 5
.
Co,
Ni,
Cu,
Zn,
B, S
e an
d M
o ad
ded
in t
he i
nflu
ent
accu
mul
ated
in
the
slud
ge
of
an
UA
SB
reac
tor
oper
atin
g at
pH
5.
(Cha
pter
5)
Aci
dific
atio
n w
as c
ompl
ete
at
all
pH
valu
es,
CO
D/S
O42-
ra
tios,
sulfi
de a
nd t
race
met
al
conc
entra
tions
test
ed.
(Cha
pter
s 2, 4
, 5 a
nd 6
)
Sulfi
de to
xici
ty?
VFA
toxi
city
?

Summary and general discussion
201
Cha
pter
8
Despite the significant changes in the inorganic composition of the sludge granules, the granular form of the sludge was kept at the different pH values and sulfate loading rates applied, and no significant washout occurred, though the granular strength decreased at pH 5 and 4. The colour of the granules changed gradually from black to grey during the operation at pH 6 and to a pale yellow during the operation at pH 5 and 4. The batch leaching tests showed that decreasing the pH led to increased solubilisation of metals from the sludge in the leaching experiments within 48 hours. For many metals (Co, Ni, Fe, Zn and Al), the difference between pH 6 and 5 was very small. For the three pH values investigated, the degree of leaching was the highest for the macronutrients K, Ca and Mg while for the other micronutrients leaching decreased in the following order: Mn > Ni ≈ Co ≈ Fe > Al ≈ Zn ≈ Cu. The most likely chemical species responsible for metal storage in Eerbeek sludge were evaluated by comparing the degree of solubilisation in the batch leaching tests with the theoretical solubilisation (OLI software) of different metal precipitates.
In Chapter 4, the effect of the COD/SO42- ratio (4 and 1) and the sulfide concentration on the
sulfate reduction and acidification of sucrose at pH 6 in thermophilic UASB reactors was evaluated at an OLR of 4.5 gCOD (lreactor d)-1. Acidification was complete at all the conditions tested and the electron flow was similar at the two COD/SO4
2- ratios applied but sulfate reduction efficiencies were only 65% and 25-35% for the COD/SO4
2- ratios of 4 and 1, respectively. The stepwise decrease of the sulfide concentrations in the reactors with a COD/SO4
2- ratio of 1 by N2 stripping caused an immediate stepwise increase in the sulfate reduction efficiencies, indicating a reversible inhibition by sulfide. The degree of reversibility was, however, affected by the growth conditions of the sludge. Acidifying sludge pre-grown at pH 6, at a COD/SO4
2- ratio of 9 and exposed for 150 days to 115 mg l-1 sulfide showed a slower recovery from the sulfide inhibition than a freshly harvested sludge from a full scale treatment plant (pH 7 and COD/SO4
2- = 9.5) exposed for a 70 days to 200 mg l-1 sulfide. In the latter case, the decrease of the sulfide concentration from 200 mg l-1 to 45 mg l-1 (35 mg l-1 undissociated sulfide) by N2 stripping caused an immediate increase of the sulfate reduction efficiency from 35% to 96%.
Chapter 5 studied the effect of trace metal concentrations, sulfide concentrations and COD/SO42-
ratios (4 and 1) on the sulfate reduction and acidification of sucrose (4 gCOD (lreactor d)-1) in thermophilic UASB reactors at pH 5. For that, trace metals were added to one UASB reactor (7.5 μM Fe and 0.5 μM for the other trace elements) and omitted in the influent of a second UASB reactor. The influence of different trace metal concentrations was further assessed in batch tests performed with the sludge from the reactor receiving no trace metals. The low concentrations of trace metals fed to the first reactor were inhibitory to sulfate reduction, while the absence of trace metals in the influent did not affect the performance of the second UASB reactor throughout the 305 day long reactor run. Sulfate reduction efficiencies up to 95% (0.87 and 4.2 g (lreactor d)-1 at COD/SO4
2- ratios of 4 and 1, respectively) and complete acidification were achieved in the trace metal fed UASB reactor with N2 stripping. Sulfide was toxic to sulfate reduction at a total dissolved concentration of 100 mg l-1. At a COD/SO4
2- ratio of 1, acetate was the only substrate left in the reactor (only minor amounts of propionate and butyrate) under the applied loading rates. Metal leaching from the inoculum sludge had an important contribution to the trace metal

202
Cha
pter
8
concentrations in the effluent of both reactors at the beginning of the reactors runs. Fe and Mn leached the fastest from the inoculum sludge. Despite the operation at pH 5, Co, Ni, Cu, Zn, B, Se and Mo added in the influent accumulated in the sludge.
Given the low sulfate reduction efficiencies observed at pH 4 in Chapter 2 even with low sulfide concentrations in the reactor, a higher sulfate reduction efficiency at pH 4 was aimed at in Chapter 6 by keeping VFA concentrations also low. For that, the reactor was started up with an active sludge at pH 5 and with a low OLR (0.8 gCOD (lreactor d)-1), which was subsequently increased to 1.9 gCOD (lreactor d)-1, at a COD/SO4
2- ratio of 0.9. A nearly complete sulfate reduction efficiency was achieved throughout the 78 day long reactor run, corresponding to sulfate rates of 0.91 and 1.92 g (lreactor d)-1 at sulfate loading rates of 0.94 and 2 g (lreactor d)-1, respectively. Acidification was always complete and acetate was the only substrate left in the effluent. Sulfide was kept below 20 mg l-1 by stripping with nitrogen gas and volatile fatty acids concentrations did not exceed 180 mgCOD l-1 in pseudo-stationary states. The sludge was well retained in the reactor and kept its granular shape. Zn, Cu, Se, Mo and B accumulated in the sludge, while Co, Ni, Fe and Mn leached from the sludge, despite their continuous supply in the reactor influent. The biodiversity in the reactor sludge at the end of the reactor run was low and dominated by one acidifying species, resembling Thermoanaerobacterium sp., and one sulfate reducing species, resembling Desulfotomaculum sp..
In Chapter 7, the feasibility of decreasing the pH from 6 to 5 in the acidification reactor of a two-phase treatment plant of a starch producing company was evaluated. Experiments were performed at 30°C and in a CSTR with a HRT of 24 hours, OLR of 5 gCOD (lreactor d)-1 and a COD/SO4
2- ratio of 4, similarly to the conditions at the treatment plant. Furthermore, the performance of a UASB reactor at a HRT of 10 and 24 h was evaluated with the same OLR and COD/SO4
2- ratio. Both reactors were inoculated with a crushed mixture of sludges from the reactors from the wastewater treatment plant. Lowering the pH from 6 to 5 caused a decrease in sulfate reduction efficiencies in both reactors, from 44% to 25% in the CSTR and from 95% to 34% in the UASB reactor. Acidification was complete in both reactors at pH 6 and the lowering of pH to 5 did not affect the acidification efficiency in the CSTR but caused a decrease in acidification efficiency in the UASB to 72%. The decrease to pH 5 caused an increase in the butyrate and ethanol concentrations in both reactors. Increasing the HRT of the UASB reactor to 24 h at pH 5 caused an increase in sulfate reduction and acidification efficiencies to 67% and 94%, respectively. Therefore, the UASB reactor performed much better in terms of sulfate reduction than the CSTR.
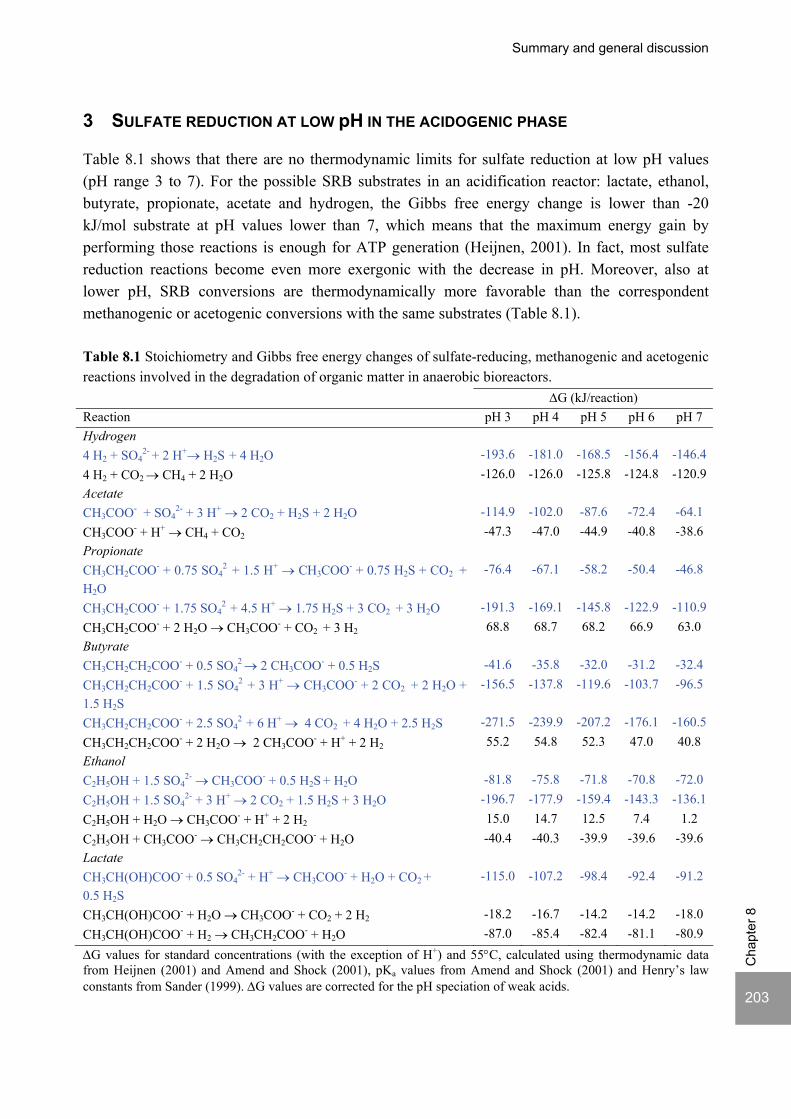
Summary and general discussion
203
Cha
pter
8
3 SULFATE REDUCTION AT LOW pH IN THE ACIDOGENIC PHASE
Table 8.1 shows that there are no thermodynamic limits for sulfate reduction at low pH values (pH range 3 to 7). For the possible SRB substrates in an acidification reactor: lactate, ethanol, butyrate, propionate, acetate and hydrogen, the Gibbs free energy change is lower than -20 kJ/mol substrate at pH values lower than 7, which means that the maximum energy gain by performing those reactions is enough for ATP generation (Heijnen, 2001). In fact, most sulfate reduction reactions become even more exergonic with the decrease in pH. Moreover, also at lower pH, SRB conversions are thermodynamically more favorable than the correspondent methanogenic or acetogenic conversions with the same substrates (Table 8.1). Table 8.1 Stoichiometry and Gibbs free energy changes of sulfate-reducing, methanogenic and acetogenic reactions involved in the degradation of organic matter in anaerobic bioreactors. ΔG (kJ/reaction) Reaction pH 3 pH 4 pH 5 pH 6 pH 7 Hydrogen 4 H2 + SO4
2- + 2 H+→ H2S + 4 H2O -193.6 -181.0 -168.5 -156.4 -146.4 4 H2 + CO2 → CH4 + 2 H2O -126.0 -126.0 -125.8 -124.8 -120.9 Acetate CH3COO- + SO4
2- + 3 H+ → 2 CO2 + H2S + 2 H2O -114.9 -102.0 -87.6 -72.4 -64.1 CH3COO- + H+ → CH4 + CO2 -47.3 -47.0 -44.9 -40.8 -38.6 Propionate CH3CH2COO- + 0.75 SO4
2 + 1.5 H+ → CH3COO- + 0.75 H2S + CO2 +
H2O -76.4 -67.1 -58.2 -50.4 -46.8
CH3CH2COO- + 1.75 SO42 + 4.5 H+ → 1.75 H2S + 3 CO2
+ 3 H2O -191.3 -169.1 -145.8 -122.9 -110.9 CH3CH2COO- + 2 H2O → CH3COO- + CO2
+ 3 H2 68.8 68.7 68.2 66.9 63.0 Butyrate CH3CH2CH2COO- + 0.5 SO4
2 → 2 CH3COO- + 0.5 H2S -41.6 -35.8 -32.0 -31.2 -32.4 CH3CH2CH2COO- + 1.5 SO4
2 + 3 H+ → CH3COO- + 2 CO2 + 2 H2O +
1.5 H2S -156.5 -137.8 -119.6 -103.7 -96.5
CH3CH2CH2COO- + 2.5 SO42 + 6 H+ → 4 CO2
+ 4 H2O + 2.5 H2S -271.5 -239.9 -207.2 -176.1 -160.5 CH3CH2CH2COO- + 2 H2O → 2 CH3COO- + H+ + 2 H2 55.2 54.8 52.3 47.0 40.8 Ethanol C2H5OH + 1.5 SO4
2- → CH3COO- + 0.5 H2S + H2O -81.8 -75.8 -71.8 -70.8 -72.0 C2H5OH + 1.5 SO4
2- + 3 H+ → 2 CO2 + 1.5 H2S + 3 H2O -196.7 -177.9 -159.4 -143.3 -136.1 C2H5OH + H2O → CH3COO- + H+ + 2 H2 15.0 14.7 12.5 7.4 1.2 C2H5OH + CH3COO- → CH3CH2CH2COO- + H2O -40.4 -40.3 -39.9 -39.6 -39.6 Lactate CH3CH(OH)COO- + 0.5 SO4
2- + H+ → CH3COO- + H2O + CO2 + 0.5 H2S
-115.0 -107.2 -98.4 -92.4 -91.2
CH3CH(OH)COO- + H2O → CH3COO- + CO2 + 2 H2 -18.2 -16.7 -14.2 -14.2 -18.0 CH3CH(OH)COO- + H2 → CH3CH2COO- + H2O -87.0 -85.4 -82.4 -81.1 -80.9 ΔG values for standard concentrations (with the exception of H+) and 55°C, calculated using thermodynamic data from Heijnen (2001) and Amend and Shock (2001), pKa values from Amend and Shock (2001) and Henry’s law constants from Sander (1999). ΔG values are corrected for the pH speciation of weak acids.

204
Cha
pter
8
Chapter 2 showed that indeed sulfate reduction is possible in the acidification phase of anaerobic wastewater treatment in UASB reactors at pH values as low as 6 till 4. It represented the first study reporting continuous sulfate reduction in a bioreactor with the reactor liquid controlled at pH 5 and 4. However, decreasing the pH from 6 to 5 and 4 caused a decrease in the sulfate reduction efficiency, especially to pH 4 (Figure 8.3A). Nevertheless, the long reactor runs (pH 6: 425 days; pH 5 and pH 4: 190 days) with significant sulfate efficiencies opened new perspectives in relation to sulfate reduction processes at low pH. Sulfate reduction was not outcompeted by other trophic groups as H2, ethanol and VFA, considered good substrates for SRB at least at neutral conditions, were available in the reactors in high concentrations (Chapter 2). Therefore, Chapters 4 to 6 in this thesis tried to understand the main factors causing the SRB inhibition at low pH values.
3.1 Sulfide toxicity
This thesis showed the strong effect of sulfide on sulfate reduction at low pH. Figure 8.3 summarizes the sulfate reduction efficiencies and rates achieved in reactor experiments without sulfide removal (Figure 8.3A) and with sulfide removal (Figure 8.3B). Chapter 4 clearly showed that at pH 6 and COD/SO4
2- ratio of 1, the presence of sulfide at a concentration of approx. 200 mg l-1 caused the low sulfate reduction efficiencies obtained (35%). The stepwise decrease in sulfide by N2 stripping caused an immediate stepwise increase on the sulfate reduction, which indicated a reversible inhibition. At sulfide concentrations lower than 45 mg l-1, sulfate reduction reached 96%. In chapter 5, the decrease in sulfide concentration from 100 to 20 mg l-1 resulted in a fast increase in sulfate reduction efficiency from approx. 70% to 91% at pH 5 and COD/SO4
2- ratio of 4. The reversible character of sulfide inhibition of SRB had been already proposed (Okabe et al., 1992; Reis et al., 1992; O'Flaherty and Colleran, 1999a) but the results obtained in this thesis demonstrated reversible sulfide inhibition at low pH, based on continuous reactor run studies over considerable time spans. A sulfide concentration below 50 mg l-1 and 25 mg l-1 allowed nearly complete sulfate reduction efficiencies also at pH 5 and 4, respectively, at a COD/SO4
2- ratio of 1 (Chapters 5 and 6). The results from Chapter 2 and 6 also showed that sulfide toxicity was not the factor dictating the low sulfate reduction efficiencies observed at pH 4 in Chapter 2, given that similar sulfide concentrations were observed in Chapters 2 and 6.

Summary and general discussion
205
Cha
pter
8
0
1
2
3
4
5
6 5 4
Sulfa
te re
duct
ion
rate
(g (l
reac
tord
)-1)
0
10
20
30
40
50
60
70
80
90
100
6 5 4
Sulfa
te re
duct
ion
(%)
0
50
100
150
200
6 5 4
Sulfi
de (m
g l-1
)
0
10
20
30
40
50
60
70
80
90
100
6 5 4
Sulfa
te re
duct
ion
(%)
0
1
2
3
4
5
6 5 4
Sulfa
te re
duct
ion
rate
(g (l
reac
tord
)-1)
0
50
100
150
200
6 5 4
Sulfi
de (m
g l-1
)
A B
Figure 8.3 Sulfate reduction efficiency, sulfate reduction rate, total dissolved sulfide and VFA concentrations in the effluent in the thermophilic experiments at pseudo-steady-state without sulfide removal (A) and with sulfide removal (B) by N2 stripping (Chapters 2, 4, 5 and 6) at different COD/SO4
2- ratios (9: , 4: and 1: ). Repeated bars at pH 6 and at pH 5 refer to sludges with different growth conditions (pH 6: chapter 4 and pH 5: chapters 2 and 5). All experiments were performed at an OLR of approx. 4.5 gCOD (lreactor d)-1 except for the experiment at pH 4 with stripping, which was performed at an OLR of 1.9 gCOD (lreactord)-1.
0
2
4
6
8
10
12
14
16
18
6 5 4pH
Tota
l VFA
(mM
)
0
2
4
6
8
10
12
14
16
18
6 5 4pH
Tota
l VFA
(mM
)
206
Cha
pter
8
3.2 VFA toxicity
The undissociated form of VFA is considered the most toxic because it can diffuse across the cell membrane and prevent the bacterial cell from maintaining a membrane potential and proton motive force (Gyure et al., 1990). The pKa of acetate, propionate and butyrate are in the range of 4.80-4.93 at 55°C (Amend and Shock, 2001), which means that approximately 7%, 40% and 90% of those acids are in the undissociated form at pH 6, pH 5 and 4, respectively. Therefore, the decrease in pH from 6 to 5 and 4 has a big impact on the toxicity of the produced VFA. In the experiments performed in this thesis without N2 stripping, total VFA concentrations in the effluent were between 7 and 17 mM (Figure 8.3A). The experiments at pH 5 and 4 showed undissociated VFA concentrations higher than the 5 mM reported by Gyure et al. (1990) as completely inhibitory for sulfate reduction in sediments at pH 3.8. Also acetate concentrations were higher than the 0.9 mM (54 mg l-1) undissociated acetate that provoked 50% inhibition of SRB growth on lactate in the experiments of Reis et al. (1990). Chapters 4 and 5 showed that, in the absence of sulfide toxicity, the SRB were able to use the VFA in high concentrations at pH 6 and 5, respectively, up to nearly complete sulfate reduction efficiency (Figure 8.3A versus Figure 8.3B). Therefore, it was confirmed that the factor dictating the lower sulfate reduction efficiencies prior to sulfide removal was not, or at least not only, VFA toxicity. At pH 4, however, the low sulfate reduction efficiencies in the experiment described in Chapter 2 were not related to sulfide toxicity, given the low sulfide concentrations (below 30 mg l-1) in the reactor. On the other hand, inhibitory concentrations of undissociated VFA were present in the reactor (Figure 8.3A), which indicated VFA toxicity as one possible cause of the low sulfate reduction efficiency observed, besides the direct effect of the low pH. Moreover, the batch tests performed in Chapter 5 showed an increased lag phase with increasing initial VFA concentration, suggesting VFA toxicity. Therefore, in Chapter 6, VFA concentrations were kept low by applying a lower OLR (0.9 gCOD (lreactor d)-1), which was subsequently increased to 1.8 gCOD (lreactor d)-1), a low COD/SO4
2- ratio (0.9) and by using an active inoculum at pH 5, in order to avoid accumulation of VFA. The achievement of complete sulfate efficiencies in Chapter 6 showed, firstly, that 25 mg l-1 were indeed not toxic to SRB at pH 4 and, secondly, that high sulfate reduction rates at pH 4 were possible at VFA concentrations lower than 2 mM. However, the maximum VFA concentrations that SRB can withstand, as well as the maximum sulfate reduction capacity at pH 4 were not evaluated in this study, as higher sulfate loading rates were not tested. Moreover, the difference in inoculum and trace metal concentrations between the studies described in Chapters 2 and 6 do not allow concluding that VFA toxicity was the only cause of the low sulfate reduction efficiencies observed in Chapter 2. This could be further verified in experiments with increasing COD/SO4
2- ratio, leading to accumulation of VFA due to sulfate limitation and the likely absence of acetoclastic methanogenesis at this pH value (Chapter 2). Sulfide concentrations should be kept low to avoid inhibition by sulfide. If the sulfate reduction efficiency would decrease, despite the lower sulfate concentrations in the influent with the increasing COD/SO4
2- ratio, VFA toxicity could be proven. If, effectively, high concentrations of undissociated VFA are toxic to SRB at low pH, the achievement of high sulfate reduction efficiencies in acidification reactors at low pH becomes
Summary and general discussion
207
Cha
pter
8
impossible at high OLR and COD/SO42- ratio, given the impossibility of decreasing undissociated
VFA concentrations to non inhibitory concentrations, unless the fermentation is directed to products other than VFA or other than the most toxic VFA, which is not known so far.
3.3 Effect of trace metals
Trace metals are essential to a good bioreactor performance because they are present in many enzymes and co-factors involved in the microbial conversions (Patidar and Tare, 2004a; Madigan et al., 2000). The importance of trace metals has been well illustrated in bioreactors, particularly for methanogenesis with methanol (Zandvoort, 2005a) and VFA (Osuna et al., 2003) as substrates. It is known that Fe, Co and Zn are very important to dissimilatory sulfate reduction (Gavel et al., 1998). Chapter 3 showed the increased solubility of most trace metals from the sludge granules with decreasing pH, leading to a decrease in the metal stock in the sludge granules (paragraph 5 in this chapter). However, the consequences of metal solubilisation on bioreactor performance were not evaluated on that chapter. On the one hand, a decrease in the metal stock is undesirable due to the losses of metals with the reactor effluent and possible metal deprivation but on the other hand, metal solubilisation can improve metal bioavailability, which can be positive for microbial activity or become toxic if the concentrations are too high. Therefore, in Chapter 5, the effect of trace metals on sulfate reduction was studied at pH 5. For that, trace metals were added to one UASB reactor (7.5 μM Fe and 0.5 μM for the other trace elements) and omitted in the influent of a second UASB reactor. The low concentrations of trace metals fed to the first reactor were inhibitory for sulfate reduction, while the absence of trace metals in the influent did not affect the performance of the second UASB reactor throughout the 305 day long reactor run. The inhibitory effect of low trace metal concentrations was further confirmed in batch tests performed with the sludge from the reactor receiving no trace metals. These concentrations were much lower than reported toxic values for neutral conditions (Hao, 2000; Utgikar et al., 2002), even in studies using media designed to eliminate the formation of metal precipitates and minimize metal complexation (Poulson et al., 1997; Sani et al., 2001). Therefore, Chapter 5 demonstrated the high sensitivity to trace metals of the SRB present in the study and suggested that trace metal supplementation is not an useful tool to stimulate sulfate reduction at low pH.
4 EFFECT OF LOW pH AND SULFATE REDUCTION ON ACIDIFICATION AND
ACIDIFICATION PATHWAYS
At the OLR and HRT applied in this study, the thermophilic acidification of sucrose was complete at all pH values and COD/SO4
2- ratios investigated (Chapters 2, 4, 5, 6). This reflected a lower sensitivity of acidifiers to low pH values and sulfide toxicity than SRB. Nevertheless, under similar OLR and HRT, Chapter 7 showed that under mesophilic conditions and with crushed sludge as inoculum (different than in chapters 2, 4, 5 and 6) acidification dropped to 70% at pH 5. The fermentation products obtained in the acidification reactor are very important for the overall treatment performance as they represent the substrate for the subsequent methanogenic reactor
208
Cha
pter
8
and therefore will determine the metabolic rates and operational stability to be expected. Acetic acid, butyric acid, lactate and ethanol are considered to be the best substrates for the methanogenic reactor (Ren et al., 1997; Yang et al., 2003), contrary to propionate (Reis et al., 1991b; Inanc et al., 1999) Chapter 2 clearly showed the strong effect of the pH on the fermentation pathways. Decreasing the pH from 6 to 5 or 4 shifted the main fermentation products from mainly acetate at pH 6 to mainly butyrate at pH 5 and 4. Lactate, ethanol and hydrogen, absent in the effluent of the reactor at pH 6, accumulated in the reactors at pH 5 and pH 4, especially in the latter. Propionate, the least desirable substrate for methanogenesis (Wang et al., 2006) was minimum in the effluent of the reactor operating at pH 4, as compared with pH 5 and 6. The changes observed in the fermentation pathways according to the pH can be attributed to shifts in the dominant population present (Kisaalita et al., 1987; Horiuchi et al., 1999), to changes in the metabolism of the populations present or to a combination of both (Reis, 1991a). Moreover, the fermentation pathways are not only dependent on acidification reactions, given the use of mixed cultures. Therefore, besides acidogenesis, subsequent processes in the anaerobic degradation also take place, including sulfate reduction. Possible explanations for the shift in fermentation products observed at low pH values were discussed in Chapter 2 of this thesis. The presence of sulfate reduction in the acidification stage obviously affects the concentrations of fermentation products obtained, as fermentation products are used as substrate for SRB. However, Chapters 2, 4 and 5 showed that sulfate reduction did not affect the type of fermentation products obtained, which was mostly a mixed VFA fermentation. Increased sulfate reduction was associated to a decrease in butyrate concentrations and increase in acetate (Chapters 2, 5 and 7), in agreement with Reis et al. (1991b) and Mizuno et al. (1994), who reported a similar relationship between the sulfate reduction rate and butyrate and acetate concentration, under mesophilic conditions and pH 5.4-6.5.
5 TRACE METAL DYNAMICS AT LOW pH
In granular sludge based bioreactors, such as the UASB reactors, trace metals can accumulate in the granular sludge due to (bio)chemical processes such as precipitation, sorption onto minerals or extracellular polymers and chelation or complexation (Patidar and Tare, 2004b). These processes are affected by low pH values. Although metal solubility generally increases with the decrease in pH, it is difficult to predict the extent of metal solubilisation and the changes in chemical speciation induced by the low pH values, due the complexity of the granular sludge matrix. In Chapter 3, the effect of low pH (6, 5 and 4) on metal dynamics was evaluated in batch leaching experiments and in UASB reactors fed with a nutrient solution with very low concentrations of trace metals. In Chapter 5, the metal dynamics in UASB reactors at pH 5 fed without trace metals or with a nutrient solution containing higher concentrations than in Chapter 3 and at equimolar concentrations (0.5μM) of trace metals and 7.5 μM of Fe was evaluated.
5.1 Leaching
Batch leaching experiments performed with Eerbeek sludge at pH 6, 5 and 4 in Chapter 3 showed that decreasing the pH led to increased solubilisation of metals from the sludge in the leaching
Summary and general discussion
209
Cha
pter
8
experiments within 48 hours. For many metals (Co, Ni, Fe, Zn and Al), however, the difference between pH 6 and 5 was very small. The solubilisation extent of each metal according to the pH was compared to the theoretical solubilisations of different precipitates (OLI software) in Chapter 3, which allowed for estimations of the most likely precipitates present in the Eerbeek sludge. In the UASB reactors, despite its supply in the reactors influent, most metals leached from the sludge granules during the reactor run. Exceptions were Co at pH 6 and Al at pH 6 and 5, which remained approx. at constant concentrations in the sludge, and Cu and Zn at the three pH values tested, which accumulated in the sludge. Se and Mo were not analysed in this study, given their low concentrations. Chapters 5 and 6 showed that also B, Se and Mo accumulate in the sludge at pH 5 and 4 and that Co and Ni can accumulate in the sludge at pH 5, given higher influent concentrations (0.5μM) and high sulfate reduction rates (Chapter 5). Chapters 5 and 6 also clearly showed that the metal leaching from the inoculum sludge has an important contribution to the trace metal concentrations in the reactor start-up.
5.2 Metal fractionation
The total metal concentration in the sludge is of limited value as it does not give any information on how strongly bound the metals are present in the sludge. Therefore, in Chapters 3, 5 and 6, the sludges were analyzed with a sequential extraction in order to gain insight on how bioavailable the stored metals are and to provide insight on how trace metals are retained in the sludge. The results showed that the predominant fractions involved in metal accumulation changed with the decrease in pH. In general, the decrease in pH caused a decrease in the fraction of each metal in the more available fractions (Chapter 3). The metals accumulated in the sludge at low pH (Cu, Zn, B, Se and Mo) were mainly accumulated in the OM/S fraction (Chapters 3, 5 and 6).
6 PRACTICAL IMPLICATIONS
This thesis showed that sulfate reduction is possible at pH as low as 4 during the acidification of a carbohydrate, with rates that are of technological interest. Nevertheless, results showed that sulfate reduction at low pH is very sensitive to sulfide. High sulfate reduction rates were only possible if the sulfide concentrations were kept low, which means that sulfide removal should be included in the design of the acidification reactor in the case of wastewaters with high OLR and/or low COD/SO4
2- ratios. This implies that the separation of the sulfide production step from the methanogenic step for protecting methanogens from high sulfide concentrations is not a motivation anymore for the use of a two-phase system. However, a two-phase system is still expected to be more stable than a single phase system to treat unacidified wastewaters, as claimed by several studies (Demirel and Yenigün, 2002; Ke et al., 2005), besides allowing the production of a cleaner methane containing biogas. The confirmation of the better performance of a two-phase system in relation to a one-phase system was beyond the scope of this thesis. The lowering of the pH from 6 to 5 or 4 caused a significant decrease in the NaOH addition to the acidification reactor. At pH 5 and COD/SO4
2- ratio of 1 and at pH 4 and COD/SO42- ratio of 4 and
1, even HCl was added to the reactors to keep the pH, which means that the equilibrium pH was

210
Cha
pter
8
higher. Nevertheless, the information obtained is relevant in the case of shock loadings or when there is a continuous supply of acidic wastewater, like in acid mine drainage. The use of UASB reactors proved to be adequate as acidification reactors, provided that granular biomass is used as inoculum, at the OLR applied in this study. In all the reactor runs performed with Eerbeek sludge as inoculum, a good sludge retention was observed. In the experiment described in Chapter 7, however, granulation was not observed from a crushed inoculum. Nevertheless, the flocculent sludge was retained in the UASB reactor. Chapter 7 showed the importance of biomass immobilization in achieving high sulfate reduction efficiencies at low pH. A UASB reactor was considered a better reactor configuration than a CSTR for the sulfate reduction at low pH, at least at the OLR applied. At higher OLR, attention should be paid if the granular sludge quality is affected by overgrowth of acidifiers as reported at pH 6 (Lens et al., 2003).
7 FUTURE RECOMMENDATIONS
This thesis gives insight on sulfate reducing processes at low pH values and opens perspectives to biotechnological applications for removal of sulfate at low pH, caused either by the acidification of organic matter or by biogeochemical processes like in acid mine drainage (Neculita et al., 2007). Nevertheless, several research questions were raised from the results obtained, which warrant further investigations.
7.1 Operational limits and robustness
A moderate OLR was applied to the reactor experiments in this thesis. The OLR was approximately 5 gCOD (lreactor d)-1, except in Chapter 6, in which an OLR of 0.8 and 1.9 gCOD (lreactor d)-1 was applied, and no attempts were made to investigate the maximum OLR and SLR possible at the different pH values investigated. Previous studies with thermophilic UASB reactors at pH 6 showed that nearly complete acidification and sulfate reduction efficiencies are possible at an OLR of 46.5 gCOD (lreactor d)-1 and COD/SO4
2- ratio of 6.67. At pH 5 and 4 that information is not known. In Chapter 6, it was pointed out that if SRB are indeed very sensitive to high VFA concentrations at pH 4, the maximum OLR becomes limited by the inhibition of SRB, depending on the COD/SO4
2- ratio. The robustness of the process should be evaluated was well. Chapters 5 and 6 showed that the sludge recovered fast from oscillations in pH and HRT, which showed that the sludge was not very sensitive but further verification would be required. The hydrolysis step should also be considered in the acidification stage. In this thesis, sucrose was chosen as a model polysaccharide but hydrolysis of sucrose to glucose and fructose proceeds very fast. Experiments should be performed on the effect of pH on the hydrolysis of more complex molecules, like starch or ligno-cellulosic compounds, which are often present in organic sulfate-rich wastewaters. Finally, it should be noted that the effect of the temperature on the performance of acidification and sulfate reduction at low pH was not addressed in this study. Chapters 2 to 6 refer to thermophilic conditions while Chapter 7 refers to mesophilic conditions but given the different
Summary and general discussion
211
Cha
pter
8
inoculum origin and type of sludge (granular or crushed/flocculent) the contribution of the difference in temperature to the different reactor performances could not be evaluated.
7.2 Granulation and pH gradients
The retention of active biomass in the reactors is of extreme importance for the achievement of high removal efficiencies. Reactors like the UASB rely on the formation of sludge granules for biomass retention. Not much is known on how low pH values affect granulation. Chapters 2 to 6 showed that in UASB reactors inoculated with granular sludge, the granular shape of the biomass was maintained over the long reactor runs performed at pH 6, 5 and 4 and no significant wash-out was noticed. Mulder (1990) reported granulation during the mesophilic acidification of glucose (10 g l-1) in gas-lift reactors at pH 5.5 and suggested that a decrease in pH from 6.4 to 5.9 actually enhanced granulation. However, granulation was only achieved at HRT lower than 5 h, which is lower than the HRT used in this study. The important role of the HRT on granulation in acidification reactors had also been referred by Beeftink and Van den Heuvel (1987). Therefore, further research is needed to elucidate the influence of low pH and HRT on granulation in UASB reactors fed with unacidified wastewaters containing sulfate. Given the granular form of the sludge used in the present study (except on Chapter 7), the existence of pH gradients in the sludge where SRB could be active, as suggested for sediments by Tuttle et al. (1969), can not be excluded. However, it is unlikely that such zones would be maintained in the long reactor runs performed in this research in a mixed liquor constantly at pH 6, 5 or 4. Moreover, the SRB activity is generally located in the outer part of the granules (Santegoeds et al., 1999). To effectively conclude if sulfate reducers are present in zones with locally increased pH requires studies with H2S and pH microsensors (Lens et al., 1993; Santegoeds et al., 1999) combined with FISH or CARD-FISH (Santegoeds et al., 1999; Speel et al., 1999; Pernthaler et al., 2002).
7.3 Microbial populations
The two most abundant species found in the sludge of the UASB reactor performing at pH 4 with nearly complete sulfate reduction efficiencies (Chapter 6), SL1 and SL2, resembled an acidifier and a SRB, closely related to Thermoanaerobacterium aotearoense and to the phylogenetic group of Desulfotomaculum, respectively. Alhough Thermoanaerobacterium aotearoense is a moderately acidophilic bacteria (Liu et al., 1996), the Desulfotomaculum species closely related to the sequence found in the sludge are all neutrophilic. In the UASB reactor operating at pH 5 in Chapter 5, the two most abundant species in the sludge showed high sequence similarity with the phylogenetic group of Thermoanaerobacterium and to uncultured bacteria (data not shown). Isolation and physiological characterization of SL1 (Chapter 6), as well as from a species phylogenetically related to uncultured species found in Chapter 5 (data not shown) would be required to evaluate whether these species are acid-tolerant or acidophiles. To our knowledge, most studies trying to isolate and cultivate acidophilic or acid-tolerant SRB have been unsuccessful (Tuttle et al., 1969; Gyure et al., 1990). Exceptions are the studies of Hard et al. (1997) and Kimura et al. (2006). In the former study, a Gram-negative SRB strain (UFZ B 378) capable of growing at pH 4 was isolated and the growth of Desulfovibrio salexigens at pH 4.5
212
Cha
pter
8
was observed. Unfortunately, the strain UFZ B 378 was not phylogenetically characterized (Hard et al., 1997). Kimura et al. (2006) described an endospore forming SRB closely related to the Gram-positive neutrophile Desulfosporosinus orientis, that could grow in syntrophy with a Gram-negative (non SRB) acidophile. Certainly more research is needed to investigate why the isolation of acidophilic or acid-tolerant SRB has been so unsuccessful so far, if due to the use of inappropriate substrate media or to the need to grow in syntrophy with other species (Kimura et al., 2006).

213


References
216
Ahn, Y.-H., 2000. Physicochemical and microbial aspects of anaerobic granular pellets. J. Environ. Sci. Health A35 (9), 1617-1635.
Alphenaar, A., 1994. Anaerobic granular sludge: characterization, and factors affecting its functioning. Wageningen, The Netherlands, Wageningen University. Ph.D.: 222.
Alphenaar, P.A., Groeneveld, N. and Aelst, A.C.V., 1994. Scanning electron microscopical method for internalstructure analysis of anaerobic granular sludge. Micron 25 (2), 129-133.
Amend, J.P. and Shock, E.L., 2001. Energetics of overall metabolic reactions of thermophilic and hyperthermophilic Archaea and Bacteria. FEMS Microbiol. Rev. 25 (2), 175-243.
APHA, 1998. Standard methods for the examination of water and wastewater. Washington, DC, USA, American Public Health Administration, American Water Works Association, Water Environment Federation.
Aquino, S.F. and Stuckey, D.C., 2007. Bioavailability and toxicity of metal nutrients during anaerobic digestion. J. Environ. Eng. 133 (1), 28-35.
Bahl, H., Andersch, W., Braun, K. and Gottschalk, G., 1982. Effect of pH and butyrate concentration on the production of acetone and butanol by Clostridium acetobutylicum grown in continuous culture. Eur. J. Appl. Microbiol. Biotechnol. 14 (1), 17-20.
Baker-Austin, C. and Dopson, M., 2007. Life in acid: pH homeostasis in acidophiles. Trends Microbiol. 15 (4), 165.
Banks, C.J. and Wang, Z., 1999. Development of a two phase anaerobic digester for the treatment of mixed abattoir wastes. Water Sci. Technol. 40 (1), 69-76.
Barredo, M.S. and Evison, L.M., 1991. Effect of propionate toxicity on methanogen-enriched sludge, Methanobrevibacter smithii, and Methanospirillum hungatii at different pH values. Appl. Environ. Microbiol. 57 (6), 1764-1769.
Beech, I.B. and Cheung, C.W.S., 1995. Interactions of exopolymers produced by sulphate-reducing bacteria with metal ions. Int. Biodeterior. Biodegrad. 35 (1-3), 59-72.
Beeftink, H.H. and Van den Heuvel, J.C., 1987. Novel anaerobic gas-lift reactor (AGLR) with retention of biomass - start-up routine and establishment of hold up. Biotechnol. Bioeng. 30 (2), 233-238.
Bharathi, P.A.L., Sathe, V. and Chandramohan, D., 1990. Effect of lead, mercury and cadmium on a sulfate-reducing bacterium. Environ Pollut. 67 (4), 361-374.
Bridge, T.A.M., White, C. and Gadd, G.M., 1999. Extracellular metal-binding activity of the sulphate-reducing bacterium Desulfococcus multivorans. Microbiology 145 (10), 2987-2995.
Britz, T.J., van Schalkwyk, C. and Roos, P., 2002. Development of a method to enhance granulation in a laboratory batch system. Water SA 28 (1), 49-54.
Buisman, C.J.N., 1989. Biotechnological sulfide removal with oxygen. Sub-department of Environmental Technology. Wageningen, The Netherlands, Agricultural University Wageningen.
Buykx, S.E.J., van den Hoop, M. and Loch, J.P.G., 2002. Dissolution kinetics of heavy metals in Dutch carbonate- and sulfide-rich freshwater sediments. J. Environ. Qual. 31 (2), 573-580.
Carliell, C.M. and Wheatley, A.D., 1997. Metal and phosphate speciation during anaerobic digestion of phosphorus rich sludge. Water Sci. Technol. 36 (6-7), 191-200.
Celis-Garcia, M.L.B., Ramirez, F., Revah, S., Razo-Flores, E. and Monroy, O., 2004. Sulphide and oxygen inhibition over the anaerobic digestion of organic matter: influence of microbial immobilization type. Environ. Technol. 25 (11), 1265-1275.
Chen, C.C. and Lin, C.Y., 2003. Using sucrose as a substrate in an anaerobic hydrogen-producing reactor. Adv. Environ. Res. 7 (3), 695-699.
References
217
Choi, E. and Rim, J.M., 1991. Competition and inhibition of sulfate reducers and methane producers in anaerobic treatment. Water Sci. Technol. 23 (7-9), 1259-1264.
Cohen, A., Breure, A.M., Vanandel, J.G. and Vandeursen, A., 1980. Influence of phase-separation on the anaerobic-digestion of glucose. 1. Maximum COD turnover rate during continuous operation. Water Res. 14 (10), 1439-1448.
Cohen, A., Breure, A.M., Vanandel, J.G. and Vandeursen, A., 1982. Influence of phase-separation on the anaerobic-digestion of glucose. 2. Stability, and kinetic responses to shock loadings. Water Res. 16 (4), 449-455.
Colleran, E., Finnegan, S. and Lens, P., 1995. Anaerobic treatment of sulphate-containing waste streams. Antonie Leeuwenhoek 67 (1), 29-46.
Cooling, F.B., Maloney, C.L., Nagel, E., Tabinowski, J. and Odom, J.M., 1996. Inhibition of sulfate respiration by 1,8-dihydroxyanthraquinone and other anthraquinone derivatives. Appl. Environ. Microbiol. 62 (8), 2999-3004.
Cord-Ruwisch, R. and Garcia, J.L., 1985. Isolation and characterization of an anaerobic benzoate-degrading spore-forming sulfate-reducing bacterium, Desulfotomaculum sapomandens sp. nov. FEMS Microbiol. Lett. 29 (3), 325-330.
Costello, D.J., Greenfield, P.F. and Lee, P.L., 1991. Dynamic modeling of a single-stage high-rate anaerobic reactor. 1. Model derivation. Water Res. 25 (7), 847-858.
Daffonchio, D., Thaveesri, J. and Verstraete, W., 1995. Contact angle measurement and cell hydrophobicity of granular sludge from upflow anaerobic sludge bed reactors. Appl. Environ. Microbiol. 61 (10), 3676-3680.
Daniels, L., Belay, N. and Rajagopal, B.S., 1986. Assimilatory reduction of sulfate and sulfite by methanogenic bacteria. Appl. Environ. Microbiol. 51 (4), 703-709.
Daumas, S., Cordruwisch, R. and Garcia, J.L., 1988. Desulfotomaculum geothermicum sp nov, a thermophilic, fatty acid-degrading, sulfate-reducing bacterium isolated with H2 from geothermal ground-water. Antonie Van Leeuwenhoek 54 (2), 165-178.
De Smul, A., Dries, J., Goethals, L., Grootaerd, H. and Verstraete, W., 1997. High rates of microbial sulphate reduction in a mesophilic ethanol-fed expanded-granular-sludge-blanket reactor. Appl. Microbiol. Biotechnol. 48 (3), 297-303.
De Smul, A., Goethals, L. and Verstraete, W., 1999. Effect of COD to sulphate ratio and temperature in expanded-granular-sludge-blanket reactors for sulphate reduction. Process Biochem. 34 (4), 407-416.
Demirel, B. and Yenigün, O., 2002. Two-phase anaerobic digestion process: a review. J. Chem. Tech. Biotechnol. 77 (7), 743-755.
Denac, M., Miguel, A. and Dunn, I.J., 1988. Modeling dynamic experiments on the anaerobic degradation of molasses waste-water. Biotechnol. Bioeng. 31 (1), 1-10.
Dinopoulou, G., Rudd, T. and Lester, J.N., 1988a. Anaerobic acidogenesis of a complex waste-water. 1. The influence of operational parameters on reactor performance. Biotechnol. Bioeng. 31 (9), 958-968.
Dinopoulou, G., Sterritt, R.M. and Lester, J.N., 1988b. Anaerobic acidogenesis of a complex waste-water. 2. Kinetics of growth, inhibition, and product formation. Biotechnol. Bioeng. 31 (9), 969-978.
Dogan, T., Ince, O., Oz, N.A. and Ince, B.K., 2005. Inhibition of volatile fatty acid production in granular sludge from a UASB reactor. J. Environ. Sci. Health A40 (3), 633-644.
Dolfing, J., 1987. Microbiological aspects of granular methanogenic sludge. Sub-department of Environmental Technology. Wageningen, The Netherlands, Agricultural University Wageningen. PhD: 78.
Dollar, N.L., Souch, C.J., Filippelli, G.M. and Mastalerz, M., 2001. Chemical fractionation of metals in wetland sediments: Indiana Dunes National Lakeshore. Environ. Sci. Technol. 35 (18), 3608-3615.
218
Dries, J., De Smul, A., Goethals, L., Grootaerd, H. and Verstraete, W., 1998. High rate biological treatment of sulfate-rich wastewater in an acetate-fed EGSB reactor. Biodegradation 9 (2), 103-111.
Dubois, M., Gilles, K.A., Hamilton, J.K., Rebers, P.A. and Smith, F., 1956. Colorimetric method for determination of sugars and related substances. Anal. Chem. 28, 350-356.
Dubourgier, H.C., Prensier, G. and Albagnac, G., 1988. Structure and microbial activities of granular anaerobic sludge. Granular anaerobic sludge: Microbiology and technology, Wageningen, The Netherlands, Pudoc.
Elliott, P., Ragusa, S. and Catcheside, D., 1998. Growth of sulfate-reducing bacteria under acidic conditions in an upflow anaerobic bioreactor as a treatment system for acid mine drainage. Water Res. 32 (12), 3724-3730.
Fang, H.H.P. and Liu, H., 2002. Effect of pH on hydrogen production from glucose by a mixed culture. Bioresour. Technol. 82 (1), 87-93.
Fardeau, M.L., Ollivier, B., Patel, B.K.C., Dwivedi, P., Ragot, M. and Garcia, J.L., 1995. Isolation and characterization of a thermophilic sulfate-reducing bacterium, Desulfotomaculum thermosapovorans sp. nov. Int. J. Syst. Bacteriol. 45 (2), 218-221.
Flemming, H.-C. and Wingender, J., 2001. Relevance of microbial extracellular polymeric substances (EPSs) - Part I: Structural and ecological aspects. Water Sci. Technol. 43 (6), 1–8.
Fongastitkul, P., Mavinic, D.S. and Lo, K.V., 1994. A 2-phased anaerobic-digestion process - concept, process failure and maximum system loading rate. Water Environ. Res. 66 (3), 243-254.
Fox, P. and Pohland, F.G., 1994. Anaerobic treatment applications and fundamentals - substrate-specificity during phase-separation. Water Environ. Res. 66 (5), 716-724.
Freese, L.H. and Stuckey, D.C., 2004. Anaerobic treatment of sulphate-enriched wastewaters. Proceedings of the institution of civil engineers-water management 157 (4), 187-195.
Gavel, O.Y., Bursakov, S.A., Calvete, J.J., George, G.N., Moura, J.J.G. and Moura, I., 1998. ATP sulfurylases from sulfate-reducing bacteria of the genus Desulfovibrio. A novel metalloprotein containing cobalt and zinc. Biochemistry 37 (46), 16225-16232.
Gharsallah, N., 1994. Influence of dilution and phase-separation on the anaerobic-digestion of olive mill wastewaters. Bioprocess Eng. 10 (1), 29-34.
Ghose, T.K. and Wiken, T., 1955. Inhibition of bacterial sulphate-reduction in presence of short chain fatty acids. Physiol. Plantarum 8 (1), 116-135.
Gonzalez-Gil, G., Lens, P.N.L., Aelst, A.V., As, H.V., Versprille, A.I. and Lettinga, G., 2001. Cluster structure of anaerobic aggregates of an expanded granular sludge bed reactor. Appl. Environ. Microbiol. 67 (8), 3683-3692.
Greben, H.A., Maree, J.P., Eloff, E. and Murray, K., 2005. Improved sulphate removal rates at increased sulphide concentration in the sulphidogenic bioreactor. Water SA 31 (3), 351-368.
Grootaerd, H., Liessens, B. and Verstraete, W., 1997. Effects of directly soluble and fibrous rapidly acidifying chemical oxygen demand and reactor liquid surface tension on granulation and sludge-bed stability in upflow anaerobic sludge-blanket reactors. Appl. Microbiol. Biotechnol. 48 (3), 304-310.
Grotenhuis, J.T.C., 1992. Structure and stability of methanogenic granular sludge. Sub-department of Environmental Technology. Wageningen, The Netherlands, Agricultural University Wageningen. PhD: 113.
Gyure, R.A., Konopka, A., Brooks, A. and Doemel, W., 1990. Microbial sulfate reduction in acidic (pH-3) strip-mine lakes. FEMS Microbiol. Ecol. 73 (3), 193-201.
Hamilton, W.A., 1998. Bioenergetics of sulphate-reducing bacteria in relation to their environmental impact. Biodegradation 9 (3-4), 201-212.
References
219
Hansen, T.A., 1994. Metabolism of sulfate-reducing prokaryotes. Antonie Leeuwenhoek 66 (1-3), 165-185.
Hao, O.J., 2000. Metal effects on sulfur cycles bacteria and metal removal by sulfate reducing bacteria. Environmental Technologies to Treat Sulfur Pollution: Principles and Engineering. P. N. L. Lens and L. W. Hulshoff Pol. London, International Water Association: 393-414.
Harada, H., Uemura, S. and Momonoi, K., 1994. Interaction between sulfate-reducing bacteria and methane-producing bacteria in UASB reactors fed with low strength wastes containing different levels of sulfate. Water Res. 28 (2), 355-367.
Hard, B.C., Friedrich, S. and Babel, W., 1997. Bioremediation of acid mine water using facultatively methylotrophic metal-tolerant sulfate-reducing bacteria. Microbiol. Res. 152 (1), 65-73.
He, Y.L., Zhang, A.L. and Yang, S.H., 1995. Anaerobic treatment of kenaf stem wood APMP waste-water. Environ. Tech. 16 (5), 467-476.
Heijnen, J.J., 2001. Stoichiometry and kinetics of microbial growth from a thermodynamic perspective. Basic Biotechnology, Chapter 3. C. Ratledge and B. Kristiansen. United Kingdom, University of Cambridge: 45-58.
Hilton, B.L. and Oleszkiewicz, J.A., 1988. Sulfide-induced inhibition of anaerobic-digestion. J. Environ. Eng. 114 (6), 1377-1391.
Hockin, S.L. and Gadd, G.M., 2003. Linked redox precipitation of sulfur and selenium under anaerobic conditions by sulfate-reducing bacterial biofilms. Appl. Environ. Microbiol. 69 (12), 7063-7072.
Horiuchi, J., Shimizu, T., Kanno, T. and Kobayashi, M., 1999. Dynamic behavior in response to pH shift during anaerobic acidogenesis with a chemostat culture. Biotechnol. Tech. 13 (3), 155-157.
Hwang, M.H., Jang, N.J., Hyun, S.H. and Kim, I.S., 2004. Anaerobic bio-hydrogen production from ethanol fermentation: the role of pH. Journal of Biotechnol. 111 (3), 297-309.
Inanc, B., Matsui, S. and Ide, S., 1996. Propionic acid accumulation and controlling factors in anaerobic treatment of carbohydrate: effects of H2 and pH. Water Sci. Technol. 34 (5-6), 317-325.
Inanc, B., Matsui, S. and Ide, S., 1999. Propionic acid accumulation in anaerobic digestion of carbohydrates: an investigation on the role of hydrogen gas. Water Sci. Technol. 40 (1), 93-100.
Ince, O., 1998. Performance of a two-phase anaerobic digestion system when treating dairy wastewater. Water Res. 32 (9), 2707-2713.
Isa, Z., Grusenmeyer, S. and Verstraete, W., 1986a. Sulfate reduction relative to methane production in high-rate anaerobic digestion: technical aspects. Appl. Environ. Microbiol. 51 (3), 572-579.
Isa, Z., Grusenmeyer, S. and Verstraete, W., 1986b. Sulfate reduction relative to methane production in high-rate anaerobic digestion: microbiological aspects. Appl. Environ. Microbiol. 51 (3), 580-587.
IWA, 2002. Anaerobic Digestion Model No.1 (ADM1). London, UK, IWA Publishing. James, A.G., Watson-Craik, I.A. and Senior, E., 1998. The effects of organic acids on the
methanogenic degradation of the landfill leachate molecules butyrate and valerate. Water Res. 32 (3), 792-800.
Jansen, S., Steffen, F., Threels, W.F. and Van Leeuwen, H.P., 2005. Speciation of Co(II) and Ni(II) in anaerobic bioreactors measured by competitive ligand exchange - adsorptive stripping voltammetry. Environ. Sci. Technol. 39 (24), 9493-9499.
Jeyaseelan, S. and Matsuo, T., 1995. Effects of phase-separation in anaerobic-digestion on different substrates. Water Sci. Technol. 31 (9), 153-162.

220
Jia, X.S., Furumai, H. and Fang, H.H.P., 1996. Extracellular polymers of hydrogen-utilizing methanogenic and sulfate-reducing sludges. Water Res. 30 (6), 1439-1444.
Johnson, D.B., Sen, A.M., Kimura, S., Rowe, O.F. and Hallberg, K.B., 2006. Novel biosulfidogenic system for selective recovery of metals from acidic leach liquors and waste streams. Mineral Processing and Extractive Metallurgy 115 (1), 19-24.
Jong, T. and Parry, D.L., 2003. Removal of sulfate and heavy metals by sulfate reducing bacteria in short-term bench scale upflow anaerobic packed bed reactor runs. Water Res. 37 (14), 3379-3389.
Jong, T. and Parry, D.L., 2006. Microbial sulfate reduction under sequentially acidic conditions in an upflow anaerobic packed bed bioreactor. Water Res. 40 (13), 2561.
Kaksonen, A.H., Franzmann, P.D. and Puhakka, J.A., 2004a. Effects of hydraulic retention time and sulfide toxicity on ethanol and acetate oxidation in sulfate-reducing metal-precipitating fluidized-bed reactor. Biotechnol. Bioeng. 86 (3), 332-343.
Kaksonen, A.H., Plumb, J.J., Franzmann, P.D. and Puhakka, J.A., 2004b. Simple organic electron donors support diverse sulfate-reducing communities in fluidized-bed reactors treating acidic metal- and sulfate-containing wastewater. FEMS Microbiol. Ecol. 47 (3), 279-289.
Kaspar, H.F. and Wuhrmann, K., 1978. Product inhibition in sludge digestion. Microb. Ecol. 4 (3), 241-248.
Ke, S.Z., Shi, Z. and Fang, H.H.P., 2005. Applications of two-phase anaerobic degradation in industrial wastewater treatment. Int. J. Environ. Pollut. 23 (1), 65-80.
Kida, K., Ikbal, Teshima, M., Sonoda, Y. and Tanemura, K., 1994. Anaerobic-digestion of coffee waste by 2-phase methane fermentation with slurry-state liquefaction. J. Ferment. Bioeng. 77 (3), 335-338.
Kim, I.S., Hwang, M.H., Jang, N.J., Hyun, S.H.S.H. and Lee, S.T., 2004. Effect of low pH on the activity of hydrogen utilizing methanogen in bio-hydrogen process. Int. J. Hydrogen Energ. 29 (11), 1133-1140.
Kimura, S., Hallberg, K. and Johnson, D., 2006. Sulfidogenesis in low pH (3.8-4.2) media by a mixed population of acidophilic bacteria. Biodegradation 17 (2), 57.
Kisaalita, W.S., Pinder, K.L. and Lo, K.V., 1987. Acidogenic fermentation of lactose. Biotechnol. Bioeng. 30 (1), 88-95.
Kolmert, Å. and Johnson, D.B., 2001. Remediation of acidic waste waters using immobilised, acidophilic sulfate-reducing bacteria. J. Chem. Technol. Biotechnol. 76 (8), 836-843.
Kosaric, N., Blaszczyk, R., Orphan, L. and J, V., 1990. The characteristics of granules from upflow anaerobic sludge blanket reactors. Water Res. 24 (12), 1473-1477.
Koschorreck, M., Wendt-Potthoff, K. and Geller, W., 2003. Microbial sulfate reduction at low pH in sediments of an acidic lake in Argentina. Environ. Sci. Technol. 37 (6), 1159-1162.
Koster, I.W., Rinzema, A., Devegt, A.L. and Lettinga, G., 1986. Sulfide inhibition of the methanogenic activity of granular sludge at various pH-levels. Water Res. 20 (12), 1561-1567.
Kuever, J., Rainey, F.A. and Hippe, H., 1999. Description of Desulfotomaculum sp Groll as Desulfotomaculum gibsoniae sp nov. Int. J. Syst. Bacteriol. 49, 1801-1808.
Kuo, W.C. and Parkin, G.F., 1996. Characterization of soluble microbial products from anaerobic treatment by molecular weight distribution and nickel-chelating properties. Water Res. 30 (4), 915-922.
Kusel, K.A., Roth, U., Trinkwalter, T. and Peiffer, S., 2001. Effect of pH on the anaerobic microbial cycling of sulfur in mining-impacted freshwater lake sediments. Environmental And Experimental Botany 46 (3), 213-223.
Labib, F., Ferguson, J.F., Benjamin, M.M., Merigh, M. and Ricker, N.L., 1992. Anaerobic butyrate degradation in a fluidized-bed reactor - effects of increased concentrations of H2 and acetate. Environ. Sci. Technol. 26 (2), 369-376.

References
221
Lampreia, J., Pereira, A.S. and Moura, J.J.G., 1994. Adenylylsulfate reductases from sulfate-reducing bacteria. Inorganic Microbial Sulfur Metabolism. 243: 241-260.
Laspidou, C.S. and Rittmann, B.E., 2002. A unified theory for extracellular polymeric substances, soluble microbial products, and active and inert biomass. Water Res. 36 (11), 2711-2720.
Lay, J.J., 2000. Modeling and optimization of anaerobic digested sludge converting starch to hydrogen. Biotechnol. Bioeng. 68 (3), 269-278.
Lee, Y.J., Miyahara, T. and Noike, T., 2002. Effect of pH on microbial hydrogen fermentation. J. Chem. Tech. Biotechnol. 77 (6), 694 - 698.
Lens, P.N.L., Debeer, D., Cronenberg, C.C.H., Houwen, F.P., Ottengraf, S.P.P. and Verstraete, W.H., 1993. Heterogeneous distribution of microbial activity in methanogenic aggregates - pH and glucose microprofiles. Appl. Environ. Microbiol. 59 (11), 3803-3815.
Lens, P.N.L., Hulshoff Pol, L.W. and Lettinga, G., 1999. Anaerobic treatment of sulfate-rich wastewaters. Recent Res. Devel. Biotech. & Bioeng. 2, 95-107.
Lens, P.N.L., Klijn, R., van Lier, J.B. and Lettinga, G., 2003. Effect of specific gas loading rate on thermophilic (55°C) acidifying (pH 6) and sulfate reducing granular sludge reactors. Water Res. 37 (5), 1033-1047.
Lens, P.N.L., Korthout, D., van Lier, J.B., Hulshoff Pol, L.W. and Lettinga, G., 2001. Effect of the liquid upflow velocity on thermophilic sulphate reduction in acidifying granular sludge reactors. Environ. Technol. 22 (2), 183-193.
Lens, P.N.L., van den Bosch, M.C., Hulshoff Pol, L.W. and Lettinga, G., 1998b. Effect of staging on volatile fatty acid degradation in a sulfidogenic granular sludge reactor. Water Res. 32 (4), 1178-1192.
Lens, P.N.L., Visser, A.N.L., Janssen, A.J.H., Hulshoff Pol, L.W. and Lettinga, G.W., 1998a. Biotechnological treatment of sulfate-rich wastewaters. Crit. Rev. Environ. Sci. Tech. 28 (1), 41-88.
Lenz, M., Gmerek, A. and Lens, P.N.L., 2006. Selenium speciation in anaerobic granular sludge. Int. J. Environ. Anal. Chem. 86 (9), 615-627.
Lettinga, G., 1995. Anaerobic digestion and wastewater treatment systems. Antonie Leeuwenhoek 67 (1), 3-28.
Lettinga, G., 1996. Sustainable integrated biological wastewater treatment. Water Sci. Technol. 33 (3), 85-98.
Lin, C.Y., 1991. Anaerobic-digestion of landfill leachate. Water SA 17 (4), 301-306. Liu, H. and Fang, H.H.P., 2003. Hydrogen production from wastewater by acidogenic granular
sludge. Water Sci. Technol. 47 (1), 153-158. Liu, S.Y., Rainey, F.A., Morgan, H.W., Mayer, F. and Wiegel, J., 1996. Thermoanaerobacterium
aotearoense sp nov, a slightly acidophilic, anaerobic thermophile isolated from various hot springs in New Zealand, and emendation of the genus Thermoanaerobacterium. Int. J. Syst. Bacteriol. 46 (2), 388-396.
Liu, Y.T., Karnauchow, T.M., Jarrell, K.F., Balkwill, D.L., Drake, G.R., Ringelberg, D., Clarno, R. and Boone, D.R., 1997. Description of two new thermophilic Desulfotomaculum spp., Desulfotomaculum putei sp. nov, from a deep terrestrial subsurface, and Desulfotomaculum luciae sp. nov, from a hot spring. Int. J. Syst. Bacteriol. 47 (3), 615-621.
Love, C.A., Patel, B.K.C., Nichols, P.D. and Stackebrandt, E., 1993. Desulfotomaculum australicum, sp-nov, a thermophilic sulfate-reducing bacterium isolated from the great-artesian-basin of Australia. Syst. App. Microbiol. 16 (2), 244-251.
Lovley, J.A. and Tiedje, J.M., 1984. Competition between sulfate-reducing and methanogenic bacteria for under resting and growing conditions. Arch. Microbiol. 137, 36-32.

222
Lowry, O.H., Rosebrough, N. J., Farr, A. L., and Randall, R. J., 1951. Protein measurement with the Folin phenol reagent. J. Biol. Chem., 265-275.
Ludwig, W., Strunk, O., Westram, R., Richter, L., Meier, H., Yadhukumar, Buchner, A., Lai, T., Steppi, S., Jobb, G., Forster, W., Brettske, I., Gerber, S., Ginhart, A.W., Gross, O., Grumann, S., Hermann, S., Jost, R., Konig, A., Liss, T., Lussmann, R., May, M., Nonhoff, B., Reichel, B., Strehlow, R., Stamatakis, A., Stuckmann, N., Vilbig, A., Lenke, M., Ludwig, T., Bode, A. and Schleifer, K.H., 2004. ARB: a software environment for sequence data. Nucleic Acids Res. 32 (4), 1363-1371.
Lun, S.-Y., Wu, J. and Chen, J., 1995. Anaerobic waste treatment: efficient separation of the acid and methane forming phases using two UASB reactors. Process Biochem. 30 (6), 523-529.
Madigan, M.T., Martinko, J.M. and Parker, J., 2000. Brock Biology of Microorganisms. New Jersey, Prentice Hall.
Maes, A., Vanthuyne, M., Cauwenberg, P. and Engels, B., 2003. Metal partitioning in a sulfidic canal sediment: metal solubility as a function of pH combined with EDTA extraction in anoxic conditions. Sci. Total Environ. 312 (1-3), 181.
Maillacheruvu, K.Y. and Parkin, G.F., 1996. Kinetics of growth, substrate utilization and sulfide toxicity for propionate, acetate, and hydrogen utilizers in anaerobic systems. Water Environ. Res. 68 (7), 1099-1106.
Maillacheruvu, K.Y., Parkin, G.F., Peng, C.Y., Kuo, W.C., Oonge, Z.I. and Lebduschka, V., 1993. Sulfide toxicity in anaerobic systems fed sulfate and various organics. Water Environ. Res. 65 (2), 100-109.
McCartney, D.M. and Oleszkiewicz, J.A., 1991. Sulfide inhibition of anaerobic degradation of lactate and acetate. Water Res. 25 (2), 203-209.
McCarty, P.L., 2001. The development of anaerobic treatment and its future. Water Sci. Technol. 44 (8), 149-156.
McCarty, P.L. and McKinney, R.E., 1961. Volatile acid toxicity in anaerobic digestion. Journal WPCF 33 (3), 223-232.
McCarty, P.L. and Mosey, F.E., 1991. Modeling of anaerobic-digestion processes (a discussion of concepts). Water Sci. Technol. 24 (8), 17-33.
McCarty, P.L. and Smith, D.P., 1986. Anaerobic waste-water treatment. 4. Environmental Science and Technology 20 (12), 1200-1206.
McHugh, S., O'Reilly, C., Mahony, T., Colleran, E. and O'Flaherty, V., 2003. Anaerobic granular sludge bioreactor technology. Rev. Environ. Sci. Biotechnol. V2 (2), 225.
Méndez, R., Ten-Brummeler, E. and Hulshoff-Pol, L.W., 1989. Start-up of UASB reactors treating sucrose-containing substrates with a low COD/sulfate ratio. Environ. Technol. Lett. 10, 83-90.
Mizuno, O., Dinsdale, R., Hawkes, F.R., Hawkes, D.L. and Noike, T., 2000. Enhancement of hydrogen production from glucose by nitrogen gas sparging. Bioresour. Technol. 73 (1), 59.
Mizuno, O., Li, Y.Y. and Noike, T., 1994. Effects of sulfate concentration and sludge retention time on the interaction between methane production and sulfate reduction for butyrate. Water Sci. Technol. 30 (8), 45-54.
Mizuno, O., Li, Y.Y. and Noike, T., 1998a. The behavior of sulfate-reducing bacteria in acidogenic phase of anaerobic digestion. Water Res. 32 (5), 1626-1634.
Mizuno, O., Takagi, H. and Noike, T., 1998b. Biological sulfate removal in an acidogenic bioreactor with an ultrafiltration membrane system. Water Sci. Technol. 38 (4-5), 513-520.
Morse, J.W. and Luther, G.W., 1999. Chemical influences on trace metal-sulfide interactions in anoxic sediments. Geochim. Cosmochim. Acta 63 (19-20), 3373-3378.

References
223
Mulder, A., 1984. The effects of high sulphate concentrations on the methane fermentation of waste water. Progr. Ind. Microbiol. 20, 133-143.
Mulder, R., 1990. Aggregation in an acidifying reactor. Amsterdam, Amsterdam University. Ph.D.: 88.
Muyzer, G., Teske, A., Wirsen, C.O. and Jannasch, H.W., 1995. Phylogenetic-relationships of Thiomicrospira species and their identification in deep-sea hydrothermal vent samples by denaturing gradient gel-electrophoresis of 16S rDNA fragments. Arch. Microbiol. 164 (3), 165-172.
Nanninga, H.J., 1987. Sulfate reduction and fermentation of amino acids in industrial waste water. Department of Microbiology. Groningen, Rijskuniversiteit Te Groningen. Ph.D: 124.
Nazina, T.N., Ivanova, A.E., Kanchaveli, L.P. and Rozanova, E.P., 1988. A new spore-forming thermophilic methylotrophic sulfate-reducing bacterium, Desulfotomaculum kuznetsovii sp-nov. Microbiology 57 (5), 659-663.
Neculita, C.M., Zagury, G.J. and Bussiere, B., 2007. Passive treatment of acid mine drainage in bioreactors using sulfate-reducing bacteria: critical review and research needs. J. Environ. Qual. 36 (1), 1-16.
O'Flaherty, V. and Colleran, E., 1999a. Effect of sulphate addition on volatile fatty acid and ethanol degradation in an anaerobic hybrid reactor. I: process disturbance and remediation. Bioresour. Technol. 68 (2), 101-107.
O'Flaherty, V., Colohan, S., Mulkerrins, D. and Colleran, E., 1999b. Effect of sulphate addition on volatile fatty acid and ethanol degradation in an anaerobic hybrid reactor. II: microbial interactions and toxic effects. Bioresour. Technol. 68 (2), 109-120.
O'Flaherty, V., Mahony, T., O'Kennedy, R. and Colleran, E., 1998. Effect of pH on growth kinetics and sulphide toxicity thresholds of a range of methanogenic, syntrophic and sulphate-reducing bacteria. Process Biochem. 33 (5), 555-569.
O'Reilly, C. and Colleran, E., 2006. Effect of influent COD/SO42- ratios on mesophilic anaerobic
reactor biomass populations: physico-chemical and microbiological properties. FEMS Microbiol. Ecol. 56 (1), 141-153.
Oh, S.-E., van Ginkel, S. and Logan, B.E., 2003. The relative effectiveness of pH control and heat treatment for enhancing biohydrogen gas production. Environ. Sci.Technol. 37 (22), 5186 -5190.
Ohtsuki, T., Tominaga, S., Morita, T. and Yoda, M., 1994. Thermophilic UASB system start-up and management-change in sludge characteristics in the start-up procedure using mesophilic granular sludge. 7th International Symposium on Anaerobic Digestion, Cape Town, South Africa.
Okabe, S., Nielsen, P.H. and Characklis, W.G., 1992. Factors affecting microbial sulfate reduction by Desulfovibrio desulfuricans in continuous culture: limiting nutrients and sulfide concentration. Biotechnol. Bioeng. 40 (6), 725-734.
Okabe, S., Nielsen, P.H., Jones, W.L. and Characklis, W.G., 1995. Sulfide product inhibition of Desulfovibrio desulfuricans in batch and continuous cultures. Water Res. 29 (2), 571-578.
Oleszkiewicz, J.A., Marstaller, T. and McCartney, D.M., 1989. Effects of pH on sulfide toxicity to anaerobic processes. Environ. Technol. Lett. 10 (9), 815-822.
Omil, F., Lens, P., Pol, L.H. and Lettinga, G., 1996. Effect of upward velocity and sulphide concentration on volatile fatty acid degradation in a sulphidogenic granular sludge reactor. Process Biochem. 31 (7), 699-710.
Omil, F., Lens, P., Visser, A., Hulshoff Pol, L.W. and Lettinga, G., 1998. Long-term competition between sulfate reducing and methanogenic bacteria in UASB reactors treating volatile fatty acids. Biotechnol. Bioeng. 57 (6), 676-685.
224
Oremland, R.S. and Capone, D.G., 1988. Use of specific inhibitors in biogeochemistry and microbial ecology. Adv. Microb. Ecol. 10, 285-383.
Osuna, M.B., Iza, J., Zandvoort, M. and Lens, P.N.L., 2003. Essential metal depletion in an anaerobic reactor. Water Sci. Technol. 48, 1-8.
Osuna, M.B., van Hullebusch, E.D., Zandvoort, M.H., Iza, J. and Lens, P.N.L., 2004. Effect of cobalt sorption on metal fractionation in anaerobic granular sludge. J. Environ. Qual. 33 (4), 1256-1270.
Otieno, F.A.O., 1996. Toxicity effects of propionate on two mixed stages culture digesters. Discov. Innovat. 8 (1), 85-91.
Oude Elferink, S.J.W.H., 1998a. Sulfate-reducing bacteria in anaerobic bioreactors. Microbiology department. Wageningen, Wageningen University. Ph.D.: 136.
Oude Elferink, S.J.W.H., Vorstman, W.J.C., Sopjes, A. and Stams, A.J.M., 1998b. Characterization of the sulfate-reducing and syntrophic population in granular sludge from a full-scale anaerobic reactor treating papermill wastewater. FEMS Microbiol. Ecol. 27 (2), 185.
Overmeire, A., Lens, P. and Verstraete, W., 1994. Mass-transfer limitation of sulfate in methanogenic aggregates. Biotechnol. Bioeng. 44 (3), 387-391.
Parkin, G.F., Lynch, N.A., Kuo, W.C., Van Keren, E.L. and Bhattacharya, S.K., 1990. Interaction between sulfate reducers and methanogens fed with acetate and propionate. Research J. WPCF 62, 780-788.
Patidar, S.K. and Tare, V., 2004a. Influence of nutrients on biomass evolution in an upflow anaerobic sludge blanket reactor degrading sulfate-laden organics. Water Environ. Res. 76 (7), 2620-2627.
Patidar, S.K. and Tare, V., 2004b. Effect of micro-nutrients in anaerobic degradation of sulfate laden organics. Can. J. Civil Eng. 31 (3), 420-431.
Patidar, S.K. and Tare, V., 2005. Anaerobic degradation of sulfate laden organics employing different reactor system configurations. J. Environ. Eng. 131 (2), 216-224.
Paulo, P.L., Villa, G., van Lier, J.B. and Lettinga, G., 2003. The anaerobic conversion of methanol under thermophilic conditions: pH and bicarbonate dependence. J. Biosci. Bioeng. 96 (3), 213-218.
Pavlostathis, S.G. and Giraldo Gomez, E., 1991. Kinetics of anaerobic treatment. Water Sci. Technol. 24 (8), 35-59.
Pender, S., Toomey, M., Carton, M., Eardly, D., Patching, J.W., Colleran, E. and O'Flaherty, V., 2004. Long-term effects of operating temperature and sulphate addition on the methanogenic community structure of anaerobic hybrid reactors. Water Res. 38 (3), 619-630.
Pereira, I.A.C., Haveman, S.A. and Voordouw, G., 2007. Biochemical, genetic and genomic characterization of anaerobic electron transport pathways in sulphate-reducing Delta proteobacteria. Sulphate-Reducing Bacteria: Environmental and Engineered Systems. L. L. Barton and W. A. Hamilton. Cambridge, Cambridge University Press: 215-240.
Pernthaler, A., Pernthaler, J. and Amann, R., 2002. Fluorescence in situ hybridization and catalyzed reporter deposition for the identification of marine bacteria. Appl. Environ. Microbiol. 68 (6), 3094-3101.
Plugge, C.M., Balk, M. and Stams, A.J.M., 2002. Desulfotomaculum thermobenzoicum subsp. thermosyntrophicum subsp. nov., a thermophilic, syntrophic, propionate-oxidizing, spore-forming bacterium. Int. J. Syst. Evol. Microbiol. 52 (2), 391-399.
Pohland, F.G. and Ghosh, S., 1971. Developments in anaerobic stabilization of organic wastes, the two-phase concept. Environ. Tech. 1 (4), 255-266.
Postgate, J.R., 1979. The sulfate-reducing bacteria. London, Cambridge University Press.
References
225
Poulson, S.R., Colberg, P.J.S. and Drever, J.I., 1997. Toxicity of heavy metals (Ni, Zn) to Desulfovibrio desulfuricans. Geomicrobiol. J. 14 (1), 41-49.
Qatibi, A.I., Bories, A. and Garcia, J.L., 1990. Effects of sulfate on lactate and C2-volatile, C3-volatile fatty-acid anaerobic degradation by a mixed microbial culture. Antonie Van Leeuwenhoek 58 (4), 241-248.
Quan, Z.X., La, H.J., Cho, Y.G., Hwang, M.H., Kim, L.S. and Lee, S.T., 2003. Treatment of metal-contaminated water and vertical distribution of metal precipitates in an upflow anaerobic bioreactor. Environ. Tech. 24 (3), 369-376.
Rajeshwari, K.V., Balakrishnan, M., Kansal, A., Lata, K. and Kishore, V.V.N., 2000. State-of-the-art of anaerobic digestion technology for industrial wastewater treatment. Renew. Sustain. Energ. Rev. 4 (2), 135-156.
Rebac, S., van Lier, J.B., Lens, P., van Cappellen, J., Vermeulen, M., Stams, A.J.M., Dekkers, F., Swinkels, K.T.M. and Lettinga, G., 1998. Psychrophilic (6-15°C) high-rate anaerobic treatment of malting wastewater in a two-module expanded granular sludge bed system. Biotechnol. Progr. 14 (6), 856-864.
Reis, M.A.M., 1991a. Redução biológica de sulfato em reactores acidogénicos - influência na metanogénese (in portuguese). Faculdade de Ciências e Tecnologia. Lisboa, Universidade Nova de Lisboa, Portugal. Ph.D.: 217.
Reis, M.A.M., Almeida, J.S., Lemos, P.C. and Carrondo, M.J.T., 1992. Effect of hydrogen sulfide on growth of sulfate reducing bacteria. Biotechnol. Bioeng. 40 (5), 593-600.
Reis, M.A.M., Gonçalves, L.M.D. and Carrondo, M.J.T., 1988. Sulfate removal in acidogenic phase anaerobic-digestion. Environ. Technol. Lett. 9 (8), 775-784.
Reis, M.A.M., Lemos, P.C., Almeida, J.S. and Carrondo, M.J.T., 1990. Influence of produced acetic acid on growth of sulfate reducing bacteria. Biotechnol. Lett. 12 (2), 145-148.
Reis, M.A.M., Lemos, P.C., Almeida, J.S. and Carrondo, M.J.T., 1991c. Evidence for the intrinsic toxicity of H2S to sulfate-reducing bacteria. Appl. Microbiol. Biotechnol. 36 (1), 145-147.
Reis, M.A.M., Lemos, P.C. and Carrondo, M.J.T., 1995. Biological sulfate removal of industrial effluents using the anaerobic digestion. Forum for Applied Biotechnology, Gent, Belgium.
Reis, M.A.M., Lemos, P.C., Martins, M.J., Costa, P.C., Gonçalves, L.M.D. and Carrondo, M.J.T., 1991b. Influence of sulfates and operational parameters on volatile fatty-acids concentration profile in acidogenic phase. Bioprocess Eng. 6 (4), 145-151.
Reith, J.H., Wijffels, R.H. and Barten, H., Eds., 2003. Bio-methane & bio-hydrogen. Petten, Dutch Biological Hydrogen Foudation.
Ren, N., Wang, B. and Ma, F., 1995. Hydrogen bio-production of carbohydrate fermentation by anaerobic sludge process. 68th Annual Water Environmental Federal Conference, Miami.
Ren, N.Q., Chua, H., Chan, S.Y., Tsang, Y.F. and Sin, N., 2007. Effects of COD/SO42- ratios on
an acidogenic sulfate-reducing reactor. Ind. Eng. Chem. Res. 46 (6), 1661-1666. Ren, N.Q., Liu, G.M., Wang, A.J., Wang, X. and Tang, J., 2004. A novel way of biological
sulfur-reclamation from sulfate-reduction process. 10th World Congress Anaerobic Digestion 2004, Montréal, Canada.
Ren, N.Q., Wang, B.Z. and Huang, J.C., 1997. Ethanol-type fermentation from carbohydrate in high rate acidogenic reactor. Biotechnol. Bioeng. 54 (5), 428-433.
Rinzema, A. and Lettinga, G., 1988. Anaerobic treatment of sulfate containing wastewater. Bioenvironmental systems. W. DL. Boca Raton, CRC Press-Inc. I: 65-109.
Robinson, J.A. and Tiedje, J.M., 1984. Competition between sulfate-reducing and methanogenic bacteria for H2 under resting and growing conditions. Arch. Microbiol. 137 (1), 26-32.
226
Rodriguez, J., Kleerebezem, R., Lema, J.M. and van Loosdrecht, M.C.M., 2006. Modeling product formation in anaerobic mixed culture fermentations. Biotechnol. Bioeng. 93 (3), 592-606.
Roest, K., Heilig, H.G.H.J., Smidt, H., de Vos, W.M., Stams, A.J.M. and Akkermans, A.D.L., 2005. Community analysis of a full-scale anaerobic bioreactor treating paper mill wastewater. Syst. Appl. Microbiol. 28 (2), 175-185.
Romli, M., Keller, J., Lee, P.L. and Greenfield, P.F., 1994. The influence of pH on the performance of a 2-stage anaerobic treatment system - model prediction and validation. Water Sci. Technol. 30 (8), 35-44.
Ruzicka, M., 1996. An extension of the Mosey model. Water Res. 30 (10), 2440-2446. Sander, R., 1999. Compilation of Henry’s law constants for inorganic and organic species of
potential importance in environmental chemistry, Max-Planck Institute of Chemistry. Sani, R.K., Peyton, B.M. and Brown, L.T., 2001. Copper-induced inhibition of growth of
Desulfovibrio desulfuricans G20: assessment of its toxicity and correlation with those of zinc and lead. Appl. Environ. Microbiol. 67 (10), 4765-4772.
Santegoeds, C.M., Damgaard, L.R., Hesselink, G., Zopfi, J., Lens, P., Muyzer, G. and Beer, D.d., 1999. Distribution of sulfate-reducing and methanogenic bacteria in anaerobic aggregates determined by microsensor and molecular analyses. Appl. Environ. Microbiol. 65 (10), 4618-4629.
Schäfer, H. and Muyzer, G., 2001. Denaturing gradient gel electrophoresis in marine microbial ecology. Methods in Microbiology, Marine Microbiology. J. H. Paul. New York, Academic Press: 425-468.
Schmidt, J.E. and Ahring, B.K., 1993. Effects of magnesium on thermophilic acetate-degrading granules in upflow anaerobic sludge blanket (UASB) reactors. Enzym. Microb. Technol. 15, 304-310.
Sen, A., 2001. Acidophilic sulphate reducing bacteria: candidates for bioremediation of acid mine drainage pollution. School of Biological Sciences. Bangor, University of Wales Bangor. PhD: 310.
Shayegan, J., Ghavipanjeh, F. and Mirjafari, P., 2005. The effect of influent COD and upward flow velocity on the behaviour of sulphate-reducing bacteria. Process Biochem. 40 (7), 2305-2310.
Shin, H.S., Bae, B.U., Lee, J.J. and Paik, B.C., 1992. Anaerobic digestion of distillery waste-water in a 2-phase UASB system. Water Sci. Technol. 25 (7), 361-371.
Sipma, J., Lens, P., Vieira, A., Miron, Y., van Lier, J.B., Hulshoff Pol, L.W. and Lettinga, G., 1999. Thermophilic sulphate reduction in upflow anaerobic sludge bed reactors under acidifying conditions. Process Biochem. 35 (5), 509-522.
Sipma, J., Meulepas, R.J.W., Parshina, S.N., Stams, A.J.M., Lettinga, G. and Lens, P.N.L., 2004. Effect of carbon monoxide, hydrogen and sulfate on thermophilic (55°C) hydrogenogenic carbon monoxide conversion in two anaerobic bioreactor sludges. Appl. Microbiol. Biotechnol. 64 (3), 421-428.
Smul, A.D., Dries, J., Goethals, L., Grootaerd, H. and Verstraete, W., 1997. High rates of microbial sulphate reduction in a mesophilic ethanol-fed expanded-granular-sludge-blanket reactor. Appl. Microbiol. Biotechnol. 48 (3), 297-303.
Speece, R.E., 1996. Anaerobic Biotechnology for Industrial Wastewaters. Tennessee, Archae Press.
Speel, E.J.M., Hopman, A.H.N. and Komminoth, P., 1999. Amplification methods to increase the sensitivity of in situ hybridization: Play CARD(S). J. Histochem. Cytochem. 47 (3), 281-288.
References
227
Stams, A., Van Dijk, J., Dijkema, C. and Plugge, C., 1993. Growth of syntrophic propionate-oxidizing bacteria with fumarate in the absence of methanogenic bacteria. Appl. Environ. Microbiol. 59 (4), 1114-1119.
Stratful, I., Scrimshaw, M.D. and Lester, J.N., 2004. Removal of struvite to prevent problems associated with its accumulation in wastewater treatment works. Water Environ. Res. 76 (5), 437-443.
Stucki, G., Hanselmann, K.W. and Hürzeler, R.A., 1993. Biological sulfuric acid transformation: Reactor design and process optimization. Biotechnol. Bioeng. 41 (3), 303 - 315.
Talarposhti, A.M., Donnelly, T. and Anderson, G.K., 2001. Colour removal from a simulated dye wastewater using a two-phase anaerobic packed bed reactor. Water Res. 35 (2), 425-432.
Tanaka, S. and Matsuo, T., 1986. Treatment characteristics of the 2 phase anaerobic-digestion system using an upflow filter. Water Sci. Technol. 18 (7-8), 217-224.
Tasaki, M., Kamagata, Y., Nakamura, K. and Mikami, E., 1991. Isolation and characterization of a thermophilic benzoate-degrading, sulfate-reducing bacterium, Desulfotomaculum thermobenzoicum sp-nov. Arch. Microbiol. 155 (4), 348-352.
Tessier, A., Campbell, P.G.C. and Bisson, M., 1979. Sequential extraction procedure for the speciation of particulate trace metals. Anal. Chem. 51 (7), 844-851.
Thauer, R.K., 1982. Dissimilatory sulfate reduction with acetate as electron donnor. Philosophical Transactions Of The Royal Society Of London. Series B, Biological Sciences 298, 467-71.
Thauer, R.K., Jungermann, K. and Decker, K., 1977. Energy conservation in chemotrophic anaerobic bacteria. Bacteriol. Rev. 41 (1), 100-180.
Thauer, R.K., Stackebrandt, E. and Hamilton, W.A., 2007. Energy metabolism and phylogenetic diversity of sulphate-reducing bacteria. Sulphate-reducing Bacteria: Environmental and Engineered Systems. L. L. Barton and W. A. Hamilon. Cambridge, Cambridge University Press: 1-38.
Thaveesri, J., Daffonchio, D., Liessens, B. and Verstraete, W., 1995a. Different types of sludge granules in UASB reactors treating acidified wastewaters. Antonie Leeuwenhoek 68 (4), 329-337.
Thaveesri, J., Liessens, B. and Verstraete, W., 1995b. Granular sludge growth under different reactor liquid surface tensions in lab-scale upflow anaerobic sludge blanket reactors treating wastewater from sugar-beet processing. Appl. Microbiol. Biotechnol. 43, 1122-1127.
Trüpper, H.G. and Schlegel, H.G., 1964. Sulphur metabolism in Thiorhodaceae - I, Quantitative measurements on growing cells of Chromatium okenii. Antonie Van Leeuwenhoek 30, 225-238.
Tsukamoto, T.K., Killion, H.A. and Miller, G.C., 2004. Column experiments for microbiological treatment of acid mine drainage: low-temperature, low-pH and matrix investigations. Water Res. 38 (6), 1405-1418.
Tucker, M.D., Barton, L.L. and Thomson, B.M., 1997. Reduction and immobilization of molybdenum by Desulfovibrio desulfuricans. J. Environ. Qual. 26 (4), 1146-1152.
Tuttle, J.H., Dugan, P.R., Macmilla.Cb and Randles, C.I., 1969. Microbial dissimilatory sulfur cycle in acid mine water. J. Bacteriol. 97 (2), 594-602.
Uberoi, V. and Bhattacharya, S.K., 1995. Interactions among sulfate reducers, acetogens, and methanogens in anaerobic propionate systems. Water Environ. Res. 67 (3), 330-339.
Uberoi, V. and Bhattacharya, S.K., 1997. Sulfate-reducing bacteria in anaerobic propionate systems. J. Environ. Eng. 123 (7), 675-682.
Ueno, Y. and Fujii, M., 2001. Three years experience of operating and selling recovered struvite from full-scale plant. Environ. Tech. 22 (11), 1373-1381.

228
Utgikar, V.P., Harmon, S.M., Chaudhary, N., Tabak, H.H., Govind, R. and Haines, J.R., 2002. Inhibition of sulfate-reducing bacteria by metal sulfide formation in bioremediation of acid mine drainage. Environ. Toxicol. 17 (1), 40-48.
Vallero, M.V.G., Trevino, R.H.M., Paulo, P.L., Lettinga, G. and Lens, P.N.L., 2003. Effect of sulfate on methanol degradation in thermophilic (55°C) methanogenic UASB reactors. Enzym. Microb. Technol. 32 (6), 676-687.
van den Heuvel, J.C., Beeftink, H.H. and Verschuren, P.G., 1988. Inhibition of the acidogenic dissimilation of glucose in anaerobic continuous cultures by free butyric-acid. Appl. Microbiol. Biotechnol. 29 (1), 89-94.
van Houten, R.T., 1996. Biological sulphate reduction with synthesis gas. Wageningen, The Netherlands, Wageningen University. PhD: 125.
van Houten, R.T., Pol, L.W.H. and Lettinga, G., 1994. Biological sulfate reduction using gas-lift reactors fed with hydrogen and carbon-dioxide as energy and carbon source. Biotechnol. Bioeng. 44 (5), 586-594.
van Houten, R.T., Yun, S.Y. and Lettinga, G., 1997. Thermophilic sulphate and sulphite reduction in lab-scale gas-lift reactors using H2 and CO2 as energy and carbon source. Biotechnol. Bioeng. 55 (5), 807-814.
van Hullebusch, E.D., Peerbolte, A., Zandvoort, M.H. and Lens, P.N.L., 2005b. Sorption of cobalt and nickel on anaerobic granular sludges: isotherms and sequential extraction. Chemosphere 58 (4), 493-505.
van Hullebusch, E.D., Utomo, S., Zandvoort, M.H. and Lens, P.N.L., 2005a. Comparison of three sequential extraction procedures to describe metal fractionation in anaerobic granular sludges. Talanta 65 (2), 549-558.
van Lier, J.B., Grolle, K.C.F., Frijters, C.T.M.J., Stams, A.J.M. and Lettinga, G., 1993. Effects of acetate, propionate, and butyrate on the thermophilic anaerobic degradation of propionate by methanogenic sludge and defined cultures. Appl. Environ. Microbiol. 59 (4), 1003.
van Lier, J.B., Rebac, S., Lens, P., van Bijnen, F., Elferink, S.J.W.H.O., Stams, A.J.M. and Lettinga, G., 1997. Anaerobic treatment of partly acidified wastewater in a two-stage expanded granular sludge bed (EGSB) system at 8°C. Water Sci. Technol. 36 (6-7), 317-324.
Vanderhaegen, B., Ysebaert, K., Favere, K., van Wambeke, M., Peeters, T., Panic, V., Vandenlangenbergh, V. and Verstraete, W., 1992. Acidogenesis in relation to in-reactor granule yield. Water Sci. Technol. 25 (7), 21-30.
Visser, A., 1995. The anaerobic treatment of sulfate containing wastewater. Wageningen, The Netherlands, Wageningen University. Ph.D.: 145.
Visser, A., Beeksma, I., Vanderzee, F., Stams, A.J.M. and Lettinga, G., 1993b. Anaerobic degradation of volatile fatty-acids at different sulfate concentrations. Appl. Microbiol. Biotechnol. 40 (4), 549-556.
Visser, A., Gao, Y. and Lettinga, G., 1993c. Effects of pH on methanogenesis and sulphate reduction in thermophilic (55oC) UASB reactors. Bioresour. Technol. 44 (2), 113-121.
Wang, G., Mu, Y. and Yu, H.-Q., 2005. Response surface analysis to evaluate the influence of pH, temperature and substrate concentration on the acidogenesis of sucrose-rich wastewater. Biochem. Eng. J. 23 (2), 175-184.
Wang, J.M., Huang, C.P., Allen, H.E., Poesponegoro, I., Poesponegoro, H. and Takiyama, L.R., 1999. Effects of dissolved organic matter and pH on heavy metal uptake by sludge particulates exemplified by copper(II) and nickel(II): three-variable model. Water Environ. Res. 71 (2), 139-147.
Wang, J.S., Song, Y.H., Yuan, P., Peng, J.F. and Fan, M.H., 2006. Modeling the crystallization of magnesium ammonium phosphate for phosphorus recovery. Chemosphere 65 (7), 1182-1187.

References
229
Wang, L., Zhou, Q. and Zheng, G.H., 2006. Comprehensive analysis of the factors for propionic acid accumulation in acidogenic phase of anaerobic process. Environ. Technol. 27 (3), 269-276.
Watson, J.H.P., Ellwood, D.C., Deng, Q.X., Mikhalovsky, S., Hayter, C.E. and Evans, J., 1995. Heavy-metal adsorption on bacterially produced FeS. Miner. Eng. 8 (10), 1097-1108.
Weijma, J., Stams, A.J.M., Pol, L.W.H. and Lettinga, G., 2000. Thermophilic sulfate reduction and methanogenesis with methanol in a high rate anaerobic reactor. Biotechnol. Bioeng. 67 (3), 354-363.
Widdel, F., 1988. Microbiology and ecology of sulfate- and sulfur-reducing bacteria. Biology of anaerobic microorganisms. A. J. B. Zehnder. New York, Wiley. 1: 469-586.
Wiegant, W.M., Hennink, M. and Lettinga, G., 1986. Separation of the propionate degradation to improve the efficiency of thermophilic anaerobic treatment of acidified wastewaters. Water Res. 20 (4), 517.
Wilderer, P.A., Bungartz, H.-J., Lemmer, H., Wagner, M., Keller, J. and Wuertz, S., 2002. Modern scientific methods and their potential in wastewater science and technology. Water Res. 36 (2), 370-393.
Wu, W.M., Hickey, R.F. and Zeikus, J.G., 1991. Characterization of metabolic performance of methanogenic granules treating brewery wastewater: role of sulfate-reducing bacteria. Appl. Environ. Microbiol. 57 (12), 3438-3449.
Yamaguchi, T., Harada, H., Hisano, T., Yamazaki, S. and Tseng, I.-C., 1999. Process behavior of UASB reactor treating a wastewater containing high strength sulfate. Water Res. 33 (14), 3182-3190.
Yanagi, C., Sato, M. and Takahara, Y., 1994. Treatment of wheat starch waste water by a membrane combined two phase methane fermentation system. Desalination 98 (1-3), 161.
Yang, K., Yu, Y. and Hwang, S., 2003. Selective optimization in thermophilic acidogenesis of cheese-whey wastewater to acetic and butyric acids: partial acidification and methanation. Water Res. 37 (10), 2467-2477.
Yeoh, B.G., 1997. Two-phase anaerobic treatment of cane-molasses alcohol stillage. Water Sci. Technol. 36 (6-7), 441-448.
Yilmazer, G. and Yenigun, O., 1999. Two-phase anaerobic treatment of cheese whey. Water Sci. Technol. 40 (1), 289-295.
Yoda, M., Kitagawa, M. and Miyagi, Y., 1987. Long term competition between sulfate-reducing and methane-producing bacteria for acetate in anaerobic biofilm. Water Res. 21, 1547-1556.
Yu, H.-Q., Fang, H.H.P. and Gu, G.-W., 2002. Comparative performance of mesophilic and thermophilic acidogenic upflow reactors. Process Biochem. 38 (3), 447-454.
Yu, H.Q., Fang, H.H. and Tay, J.H., 2000. Effects of Fe2+ on sludge granulation in upflow anaerobic sludge blanket reactors. Water Sci. Technol. 41 (12), 199–205.
Yu, H.Q. and Fang, H.H.P., 2003. Acidogenesis of gelatin-rich wastewater in an upflow anaerobic reactor: influence of pH and temperature. Water Res. 37 (1), 55-66.
Yu, H.Q., Fang, H.H.P. and Tay, J.H., 2001a. Enhanced sludge granulation in upflow anaerobic sludge blanket (UASB) reactors by aluminum chloride. Chemosphere 44 (1), 31-36.
Yu, H.Q., Tay, J.H. and Fang, H.H.P., 2001b. The roles of calcium in sludge granulation during UASB reactor start-up. Water Res. 35 (4), 1052-1060.
Yu, J. and Pinder, K.L., 1993. Utilization of volatile fatty-acids in methanogenic biofilms. Bioresource Technology 46 (3), 241-250.
Zandvoort, M., 2005a. Trace metal dynamics in methanol fed anaerobic granular sludge bed reactors. Sub-department of Environmental Technology. Wageningen, The Netherlands, Wageningen University. PhD: 206.

230
Zandvoort, M.H., van Hullebusch, E.D., Fermoso, F.G. and Lens, P.N.L., 2006. Trace metals in anaerobic granular sludge reactors: bioavailability and dosing strategies. Eng. Life Sci. 6 (3), 293-301.
Zandvoort, M.H., van Hullebusch, E.D., Gieteling, J., Lettinga, G. and Lens, P.N.L., 2005c. Effect of sulfur source on the performance and metal retention of methanol-fed UASB reactors. Biotechnol. Progr. 21 (3), 839-850.
Zandvoort, M.H., van Hullebusch, E.D., Peerbolte, A., Golubnic, S., Lettinga, G. and Lens, P.N.L., 2005b. Influence of pH shocks on trace metal dynamics and performance of methanol fed granular sludge bioreactors. Biodegradation 16 (6), 549 - 567.
Zenhder, A.J.B., Ed. 1988. Biology of anaerobic organisms. New York, John Wiley & Sons. Zhang, X., Bishop, P.L. and Kinkle, B.K., 1999. Comparison of extraction methods for
quantifying extracellular polymers in biofilms. Water Sci. Technol. 39 (7), 211-218. Zheng, X.-J. and Yu, H.-Q., 2004. Roles of pH in biologic production of hydrogen and volatile
fatty acids from glucose by enriched anaerobic cultures. Appl. Biochem. Biotechnol. 12 (79-90).
Zoetemeyer, R.J., Matthijsen, A., Cohen, A. and Boelhouwer, C., 1982a. Product inhibition in the acid forming stage of the anaerobic-digestion process. Water Res. 16 (5), 633-639.
Zoetemeyer, R.J., Matthijsen, A., van den Heuvel, J.C., Cohen, A. and Boelhouwer, C., 1982b. Anaerobic acidification of glucose in an upflow reactor. Biomass 2 (3), 187-199.
Zoetemeyer, R.J., Vandenheuvel, J.C. and Cohen, A., 1982c. pH influence on acidogenic dissimilation of glucose in an anaerobic digester. Water Res. 16 (3), 303-311.

231


Appendixes
Samenvatting (Summary in Dutch) Acknowledgements
About the author List of Publications
Training and Supervision Plan
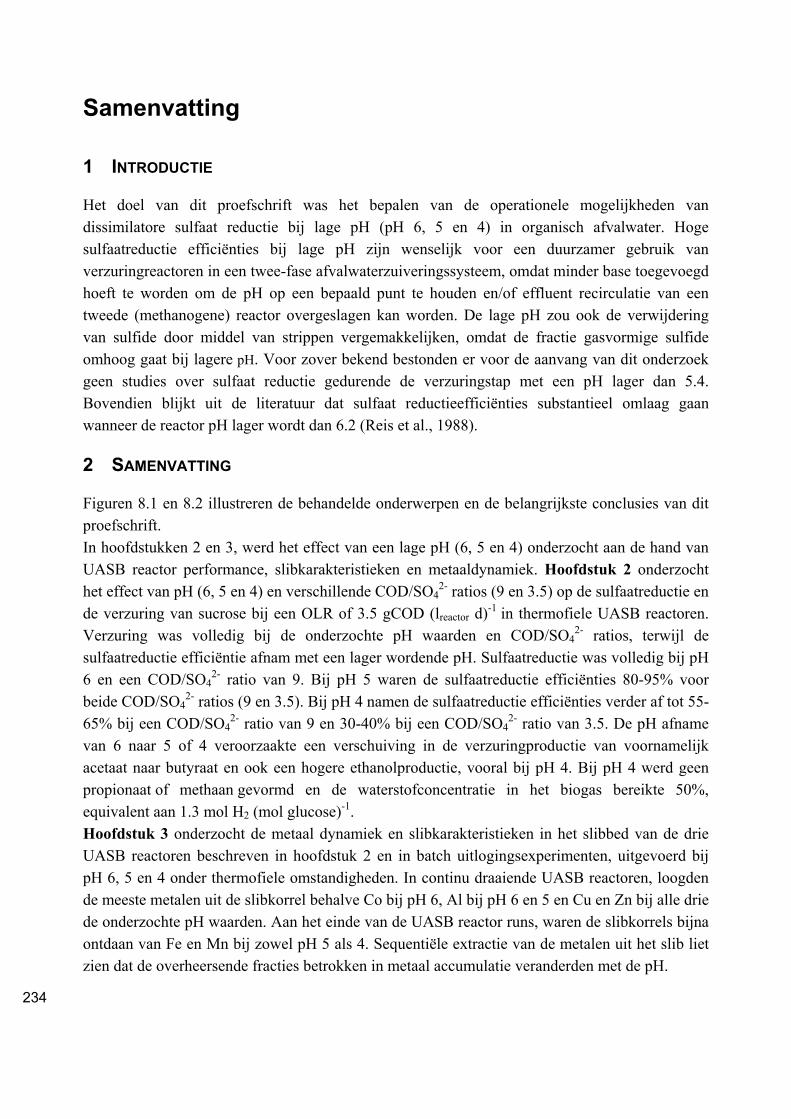
234
Samenvatting
1 INTRODUCTIE
Het doel van dit proefschrift was het bepalen van de operationele mogelijkheden van dissimilatore sulfaat reductie bij lage pH (pH 6, 5 en 4) in organisch afvalwater. Hoge sulfaatreductie efficiënties bij lage pH zijn wenselijk voor een duurzamer gebruik van verzuringreactoren in een twee-fase afvalwaterzuiveringssysteem, omdat minder base toegevoegd hoeft te worden om de pH op een bepaald punt te houden en/of effluent recirculatie van een tweede (methanogene) reactor overgeslagen kan worden. De lage pH zou ook de verwijdering van sulfide door middel van strippen vergemakkelijken, omdat de fractie gasvormige sulfide omhoog gaat bij lagere pH. Voor zover bekend bestonden er voor de aanvang van dit onderzoek geen studies over sulfaat reductie gedurende de verzuringstap met een pH lager dan 5.4. Bovendien blijkt uit de literatuur dat sulfaat reductieefficiënties substantieel omlaag gaan wanneer de reactor pH lager wordt dan 6.2 (Reis et al., 1988).
2 SAMENVATTING
Figuren 8.1 en 8.2 illustreren de behandelde onderwerpen en de belangrijkste conclusies van dit proefschrift. In hoofdstukken 2 en 3, werd het effect van een lage pH (6, 5 en 4) onderzocht aan de hand van UASB reactor performance, slibkarakteristieken en metaaldynamiek. Hoofdstuk 2 onderzocht het effect van pH (6, 5 en 4) en verschillende COD/SO4
2- ratios (9 en 3.5) op de sulfaatreductie en de verzuring van sucrose bij een OLR of 3.5 gCOD (lreactor d)-1 in thermofiele UASB reactoren. Verzuring was volledig bij de onderzochte pH waarden en COD/SO4
2- ratios, terwijl de sulfaatreductie efficiëntie afnam met een lager wordende pH. Sulfaatreductie was volledig bij pH 6 en een COD/SO4
2- ratio van 9. Bij pH 5 waren de sulfaatreductie efficiënties 80-95% voor beide COD/SO4
2- ratios (9 en 3.5). Bij pH 4 namen de sulfaatreductie efficiënties verder af tot 55-65% bij een COD/SO4
2- ratio van 9 en 30-40% bij een COD/SO42- ratio van 3.5. De pH afname
van 6 naar 5 of 4 veroorzaakte een verschuiving in de verzuringproductie van voornamelijk acetaat naar butyraat en ook een hogere ethanolproductie, vooral bij pH 4. Bij pH 4 werd geen propionaat of methaan gevormd en de waterstofconcentratie in het biogas bereikte 50%, equivalent aan 1.3 mol H2 (mol glucose)-1. Hoofdstuk 3 onderzocht de metaal dynamiek en slibkarakteristieken in het slibbed van de drie UASB reactoren beschreven in hoofdstuk 2 en in batch uitlogingsexperimenten, uitgevoerd bij pH 6, 5 en 4 onder thermofiele omstandigheden. In continu draaiende UASB reactoren, loogden de meeste metalen uit de slibkorrel behalve Co bij pH 6, Al bij pH 6 en 5 en Cu en Zn bij alle drie de onderzochte pH waarden. Aan het einde van de UASB reactor runs, waren de slibkorrels bijna ontdaan van Fe en Mn bij zowel pH 5 als 4. Sequentiële extractie van de metalen uit het slib liet zien dat de overheersende fracties betrokken in metaal accumulatie veranderden met de pH.
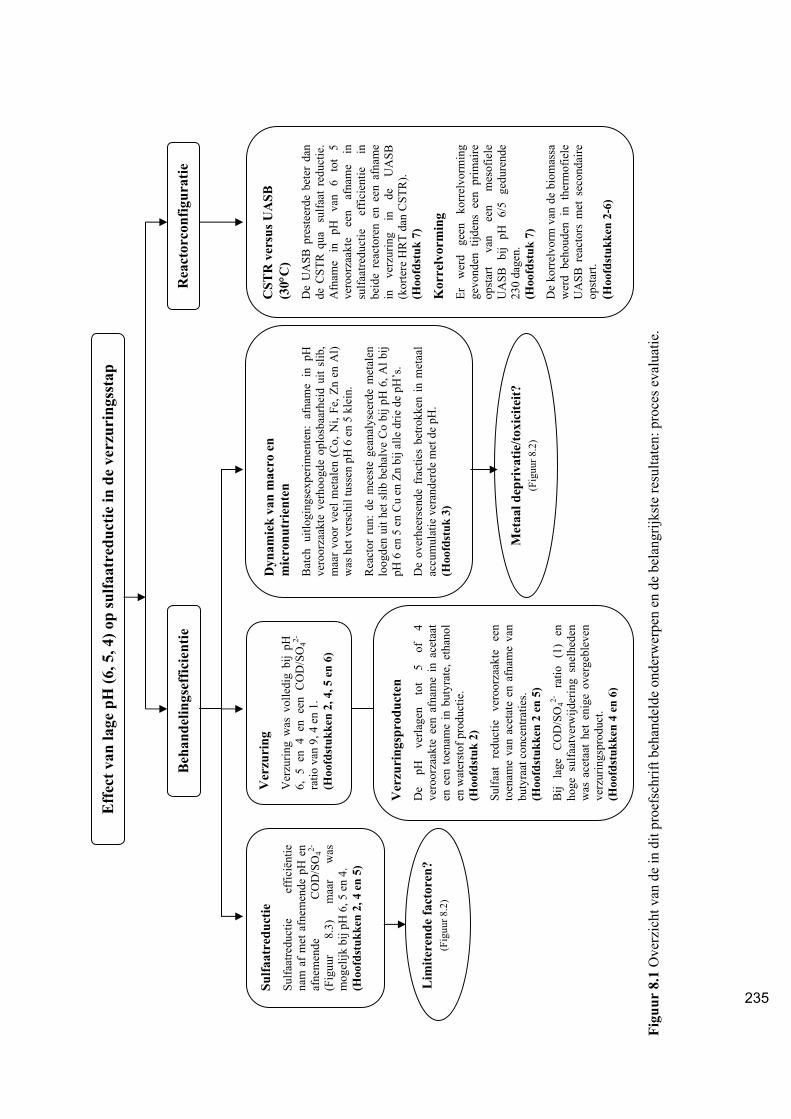
235
Figu
ur 8
.1 O
verz
icht
van
de
in d
it pr
oefs
chrif
t beh
ande
lde
onde
rwer
pen
en d
e be
lang
rijks
te re
sulta
ten:
pro
ces e
valu
atie
.
Eff
ect v
an la
ge p
H (6
, 5, 4
) op
sulfa
atre
duct
ie in
de
verz
urin
gsst
ap
Sulfa
atre
duct
ie
Sulfa
atre
duct
ie
effic
iënt
ie
nam
af
met
afn
emen
de p
H e
n af
nem
ende
C
OD
/SO
42-
(Fig
uur
8.3)
m
aar
was
m
ogel
ijk b
ij pH
6, 5
en
4.
(Hoo
fdst
ukke
n 2,
4 e
n 5)
Ver
zuri
ng
Ver
zurin
g w
as v
olle
dig
bij
pH
6, 5
en
4 en
een
CO
D/S
O42-
ra
tio v
an 9
, 4 e
n 1.
(H
oofd
stuk
ken
2, 4
, 5 e
n 6)
Ver
zuri
ngsp
rodu
cten
D
e pH
ve
rlage
n to
t 5
of
4 ve
roor
zaak
te e
en a
fnam
e in
ace
taat
en
een
toen
ame
in b
utyr
ate,
eth
anol
en
wat
erst
of p
rodu
ctie
. (H
oofd
stuk
2)
Sulfa
at
redu
ctie
ve
roor
zaak
te
een
toen
ame
van
acet
ate
en a
fnam
e va
n bu
tyra
at c
once
ntra
ties.
(Hoo
fdst
ukke
n 2
en 5
) B
ij la
ge
CO
D/S
O42-
ra
tio
(1)
en
hoge
sul
faat
verw
ijder
ing
snel
hede
n w
as a
ceta
at h
et e
nige
ove
rgeb
leve
n ve
rzur
ings
prod
uct.
(Hoo
fdst
ukke
n4
en6)
Dyn
amie
k va
n m
acro
en
mic
ronu
trie
nten
B
atch
uitl
ogin
gsex
perim
ente
n: a
fnam
e in
pH
ve
roor
zaak
te v
erho
ogde
opl
osba
arhe
id u
it sl
ib,
maa
r vo
or v
eel m
etal
en (
Co,
Ni,
Fe, Z
n en
Al)
was
het
ver
schi
l tus
sen
pH 6
en
5 kl
ein.
R
eact
or r
un:
de m
eest
e ge
anal
ysee
rde
met
alen
lo
ogde
n ui
t het
slib
beh
alve
Co
bij p
H 6
, Al b
ij pH
6 e
n 5
en C
u en
Zn
bij a
lle d
rie d
e pH
’s.
De
over
heer
send
e fr
actie
s be
trokk
en i
n m
etaa
l ac
cum
ulat
ie v
eran
derd
e m
et d
e pH
. (H
oofd
stuk
3)
CST
R v
ersu
s UA
SB
(30°
C)
De
UA
SB p
rest
eerd
e be
ter
dan
de C
STR
qua
su
lfaat
red
uctie
. A
fnam
e in
pH
va
n 6
tot
5 ve
roor
zaak
te
een
afna
me
in
sulfa
atre
duct
ie
effic
ient
ie
in
beid
e re
acto
ren
en e
en a
fnam
e in
ve
rzur
ing
in
de
UA
SB
(kor
tere
HR
T da
n C
STR
).
(Hoo
fdst
uk 7
) K
orre
lvor
min
g Er
w
erd
geen
ko
rrel
vorm
ing
gevo
nden
tijd
ens
een
prim
aire
op
star
t va
n ee
n m
esof
iele
U
ASB
bij
pH 6
/5 g
edur
ende
23
0 da
gen.
(H
oofd
stuk
7)
De
korr
elvo
rm v
an d
e bi
omas
sa
wer
d be
houd
en i
n th
erm
ofie
le
UA
SB r
eact
ors
met
sec
onda
ire
opst
art.
(Hoo
fdst
ukke
n 2-
6)
Met
aal d
epri
vatie
/toxi
cite
it?
(Fig
uur 8
.2)
Lim
itere
nde
fact
oren
? (F
iguu
r 8.2
)
Beh
ande
lings
effic
ient
ie
Rea
ctor
conf
igur
atie

236
Figu
ur 8
.2 O
verz
icht
van
de
in d
it pr
oefs
chrif
t be
hand
elde
ond
erw
erpe
n en
de
bela
ngrij
kste
res
ulta
ten:
lim
itere
nde
fact
oren
van
sul
faat
redu
ctie
in
de
verz
urin
gsta
p.
De
afw
ezig
heid
va
n sp
oren
met
alen
ha
d ge
en
invl
oed
op d
e pr
esta
tie v
an
een
UA
SB
reac
tor
gedu
rend
e ee
n ru
n va
n 30
5 da
gen
bij p
H 5
. (H
oofd
stuk
5)
De
afna
me
in s
ulfid
e co
ncen
tratie
do
or
te
strip
pen
met
N
2 ve
roor
zaak
te
een
onm
idde
lijke
to
enam
e in
su
lfaat
redu
ctie
ef
ficie
ntie
, w
at
een
omke
erba
re
inhi
bitie
doo
r su
lfide
aan
duid
t bi
j pH
6 b
ij a
CO
D/S
O42-
van
1 e
n bi
j pH
5 b
ij ee
n C
OD
/SO
42- r
atio
van
4.
H
oge
sulfa
atre
duct
ie e
ffic
ient
ie b
ij la
ag
geho
uden
su
lfide
ge
halte
w
erd
ook
bere
ikt b
ij pH
5 e
n 4
bij
CO
D/S
O42-
ratio
1 (F
igur
e 8.
3).
(Hoo
fdst
ukke
n4,
5 e
n6)
Eff
ect v
an la
ge p
H (6
, 5, 4
) op
sulfa
atre
duct
ie in
de
verz
urin
gsst
ap
Ver
zuri
ng
Spor
enm
etal
en
Beh
ande
lings
effic
ient
ie
Sulfa
atre
duct
ie Bij
pH 4
wer
d de
OLR
ook
ve
rlaag
d om
VFA
inh
ibiti
e te
voo
rkom
en e
n ee
n bi
jna
volle
dige
su
lfaat
redu
ctie
ef
ficie
ntie
wer
d be
reik
t. (H
oofd
stuk
ken
6 ve
rsus
2)
Met
aal d
epri
vatie
? M
etaa
l tox
icite
it?
De
aanw
ezig
heid
van
lag
e co
ncen
tratie
s sp
oren
met
alen
(7.
5 μM
Fe
en
0.5
μM
ande
re
spor
enle
men
ten)
in
hibe
erde
sul
faat
red
uctie
bi
j pH
5.
C
o, N
i, C
u, Z
n, B
, Se
en
Mo
toeg
evoe
gd
met
he
t in
fluen
t ac
cum
ulee
rden
in
het
slib
va
n ee
n U
ASB
re
acto
r bij
pH 5
. (H
oofd
stuk
5)
Ver
zurin
g w
as v
olle
dig
bij a
lle
gete
stte
pH
w
aard
en,
CO
D/S
O42-
ra
tios,
sulfi
de
en
spor
enm
etaa
l con
cent
ratie
s. (H
oofd
stuk
ken
2, 4
, 5 e
n 6)
Sulfi
de to
xici
teit?
V
FA to
xici
teit?

237
Ondanks de significante verschillen in anorganische samenstelling van de slibkorrel werd de korrelvorm behouden bij de verschillende pH waarden en sulfaatbelastingen en er vond geen significante uitspoeling plaats, hoewel de korrelsterkte afnam bij pH 5 en 4. De kleur van de korrels veranderde langzaam van zwart naar grijs gedurende bedrijfsvoering bij pH 6 en naar vaal geel bij pH 5 en 4. De batch uitlogingstesten lieten zien dat een afnemende pH leidde tot verhoogde oplosbaarheid van metalen uit het slib binnen 48 uur. Voor veel metalen (Co, Ni, Fe, Zn en Al) was het verschil tussen pH 6 en 5 klein. Voor de drie onderzochte pH waarden was de uitloging het hoogst voor de macronutriënten K, Ca en Mg, voor de andere micronutriënten nam uitloging af in de volgorde Mn > Ni ≈ Co ≈ Fe > Al ≈ Zn ≈ Cu. De theoretisch te verwachten metaal species in de slibmatrix van het Eerbeek slib werden afgeleid uit de vergelijking van hun oplosbaarheid in batch leaching test met de theoretische oplosbaarheid (OLI software) van de metaal precipitaten.
In Hoofdstuk 4 werd het effect van de COD/SO42- ratio (4 en 1) en de sulfide concentratie op de
sulfaatreductie en verzuring van sucrose bij pH 6 in thermofiele UASB reactors onderzocht bij een OLR van 4.5 gCOD (lreactor d)-1. Verzuring was volledig bij alle geteste condities en de elektronenstroom was vergelijkbaar bij de twee toegepaste COD/SO4
2- ratios maar sulfaatreductie efficiënties waren maar 65% en 25-35% voor de COD/SO4
2- ratios van respectievelijk 4 en 1. De stapsgewijze verlaging van de sulfide concentraties in de reactoren met een COD/SO4
2- ratio van 1 door strippen met N2 veroorzaakte een onmiddellijke verhoging van de sulfaatreductie efficiënties, wat een omkeerbare inhibitie door sulfide aanduidt. De mate van omkeerbaarheid werd beïnvloedt door de groeiomstandigheden van het slib. Verzurend slib voorgekweekt bij pH 6, een COD/SO4
2- ratio van 9 en 150 dagen blootgesteld aan 115 mg l-1 sulfide liet een langzamer herstel van sulfide inhibitie zien dan vers geoogst slib van een full-scale zuiveringsinstallatie (pH 7 en COD/SO4
2- = 9.5), 70 dagen blootgesteld aan 200 mg l-1 sulfide. In het laatste geval veroorzaakte de verlaging van de sulfide concentratie van 200 mg l-1 tot 45 mg l-1 (35 mg l-1 ongedissocieerde sulfide) door strippen met N2 een onmiddellijke verhoging van de sulfaatreductie efficiency van 35% tot 96%.
Hoofdstuk 5 onderzocht het effect van sporenelement concentraties, sulfide concentraties en COD/SO4
2- ratios (4 en 1) op de sulfaatreductie en verduring van sucrose (4 gCOD (lreactor d)-1) in thermofiele UASB reactoren bij pH 5. Hiervoor werden sporenmetalen toegevoegd aan een UASB reactor (7.5 μM Fe en 0.5 μM voor de andere sporenelementen) en weggelaten uit het influent van een tweede UASB reactor. De invloed van verschillende sporenmetaal concentraties werd verder bekeken in batch tests, uitgevoerd met het slib van de reactor die geen sporenmetalen ontving. De lage sporenmetaal concentraties verstrekt aan de eerste reactor inhibeerden sulfaatreductie, terwijl de afwezigheid van sporenmetalen in het influent geen effect had op de prestatie van de tweede UASB reactor gedurende de 305 dagen lange reactor run. Sulfaatreductie efficiënties tot 95% (0.87 en 4.2 g (lreactor d)-1 bij COD/SO4
2- ratios van respectievelijk 4 en 1) en volledige verzuring werden bereikt in de sporenmetaal gevoede UASB reactor met N2 strippen. Sulfide was toxisch voor sulfaatreductie bij een totale opgeloste concentratie van 100 mg l-1. Bij een COD/SO4
2- ratio van 1 was acetaat het enige overgebleven product in de reactor (minimale hoeveelheden propionaat en butyraat) bij de toegepaste belastingen. Metaaluitloging uit het

238
inoculum slib had een belangrijk aandeel in de sporenmetaal concentraties in het effluent van beide reactoren in het begin van de experimenten. Fe en Mn loogden het snelst uit het inoculum slib. Ondanks toepassing van pH 5, accumuleerden Co, Ni, Cu, Zn, B, Se en Mo in het slib.
Aangezien de sulfaatreductie efficiënties bij pH 4 in Hoofdstuk 2 zelfs bij lage sulfide concentraties in de reactor laag waren, was het doel een hogere sulfaatreductie efficientie bij pH 4 te krijgen in Hoofdstuk 6 door de VFA concentraties laag te houden. Hiervoor werd een reactor opgestart met een actief slib bij pH 5 en met een lage OLR (0.8 gCOD (lreactor d)-1), welke vervolgens werd verhoogd naar 1.9 gCOD (lreactor d)-1, bij een COD/SO4
2- ratio van 0.9. Een bijna volledige sulfaatreductie efficientie werd bereikt gedurende de 78 dagen lange reactor run, wat correspondeert met een sulfaat verwijderingsnelheid van 0.91 en 1.92 g (lreactor d)-1 bij sulfaat belastingen van respectievelijk 0.94 en 2 g (lreactor d)-1. Verzuring was altijd volledig en acetaat was het enige overgebleven substraat in het effluent. Sulfide werd onder de 20 mg l-1 gehouden door strippen met stikstof gas en VFA concentraties werden niet hoger dan 180 mgCOD l-1 in een pseudo-stationaire staat. Het slib spoelde niet uit en behield de korrelvorm. Zn, Cu, Se, Mo en B accumuleerden in het slib, terwijl Co, Ni, Fe en Mn uit het slib loogden, ondanks hun continue toevoeging via het reactorinfluent. De biodiversiteit in het reactorslib was laag aan het eind van de reactor run en werd gedomineerd door één verzurend organisme, verwant aan Thermoanaerobacterium sp., en één sulfaatreduceerde, verwant aan Desulfotomaculum sp..
In Hoofdstuk 7 werd de haalbaarheid van het verlagen van de pH van 6 naar 5 in de verzuringreactor van een tweestaps behandelingsinstallatie van een zetmeel producerend bedrijf geëvalueerd. De experimenten werden uitgevoerd bij 30·C, in een CSTR met een verblijftijd van 24 uur, OLR van 5 gCOD (lreactor d)-1 en een COD/SO4
2- ratio van 4, vergelijkbaar met de omstandigheden in de praktijk. Daarnaast werd de performantie van een UASB reactor met een HRT van 10 en 24 uur geëvalueerd bij dezelfde OLR en COD/SO4
2- ratio. Beide reactoren werden geinoculeerd met een vermalen mix van slibben uit de reactoren van de afvalwaterbehandelinginstallatie. Het verlagen van de pH van 6 naar 5 veroorzaakte een verlaging in sulfaatreductie efficiënties in beide reactoren, van 44% naar 25% in de CSTR en van 95% naar 34% in de UASB reactor. Verzuring was volledig in beide reactoren bij pH 6 en het verlagen naar pH 5 had geen effect op de verzuring in de CSTR, maar veroorzaakte een afname van de verzuringefficiency in de UASB tot 72%. De verlaging naar pH 5 veroorzaakte een verhoging van de butyraat en ethanol concentraties in beide reactoren. Het verhogen van de HRT van de UASB reactor naar 24 uur bij pH 5 veroorzaakte een toename in sulfaatreductie- en verzuringsefficiënties naar respectievelijk 67% en 94%. Vanuit het oogpunt van sulfaatreductie presteerde de UASB veel beter dan de CSTR. Tenslotte werden in Hoofdstuk 8 de resultaten van het hier gepresenteerde werk samengevat en bediscussieerd. De praktische betekenis van de belangrijkste bevindingen van dit proefschrift werden behandeld en er werden aanbevelingen voor verder onderzoek gegeven.

239
240
Acknowledgments Doing a flashback to the period of my PhD research makes me feel very fortunate for the numerous group of people that importantly contributed to make this period of my life so special!
I would like to thank Gatze Lettinga for his inspiring work and attitude, which has motivated me to choose this department to conduct my PhD research. I want to express my gratitude to Piet Lens for all the guidance throughout this work. Thanks for all the energy invested in this project, in the frequent discussions during the research period and in your comments on the thesis and papers. To Maria Isabel Capela, I would like to thank the support and input in the project, especially in the last months of the project, which coincided with a very hard period in her life. To Cees Buisman, my thanks for the interesting discussions we had. I would like to acknowledge Frans van Esch, for his willingness to contribute to this project and for the useful discussions about the wastewater treatment plant at Cerestar and the research.
To the dear colleagues of the Environmental Technology department, many thanks for contributing to such a pleasant working atmosphere! Marcus Vallero, thanks for introducing me to the laboratories and guidance in my first steps with reactor set-up and continuous operation, all this with your great mood and sense of humor. I would also like to thank Jarno Gieteling and Ricardo Sampaio for their contribution to the experimental work and to the enthusiasm and hard work of the students that participated in the project: Ita Sulistyawati, Cathelijne Dreissen, Xingang Wang and Pieter Rowlette. I would like to thank Bert Hamelers and Kirsten Steinbusch for their help with the thermodynamic calculations and to Andrea van der Veen and Eric van Hullebusch for contributing to the work with trace metals. Thanks also to the support from the analytical and technical team from the department: Ilse Gerrits, Geert Meijer, Hillion Wegh, Vinnie de Wilde and Katja Grolle, and to Liesbeth Kesaulya, Anita van de Weerd and Gusta de Kaste, for helping in the bureaucratical issues.
Many thanks also to the other colleagues that in many occasions contributed to interesting scientific discussions but also to a feeling of friendship and support. It was a pleasure to extend working hours with borrels, barbecues, dinners, conferences and even holidays with you! Starting with the ‘older’ generation, many of which have left already, my thanks to Fernando Alfaya, Jan and Bego, Eric, Marcus and Marina, André, Renato, Paula Paulo, Marcel and Violeta, Giovanni (and Ilaria), Iemke (and Arturo), Lucas, Vincenzo, Jarno, Robin, Andrea, Martijn S. (and Iris), Isabella, David (and Cecilia). A somewhat ‘newer’ generation and the moving of the Bennekom group to the Biotechnion further enriched this delightful atmosphere: Ricardo and Tânia, which contributed to a shift in the Portuguese heard in the department from Brasilian to Portuguese accent, Fernando Gonzalez, Darja (and Kasper), Kirsten, Pim, Markus, Roel, Martijn B., Pieter-Jan, Jan Bartacek, Ghada, Titia, Hellen and Marco. To Claudia, my deepest gratitude for all the friendship, support and for sharing your wise advices and attitude towards life with me. Thanks for being my paranymph!
241
It was a very fortunate coincidence to have a very similar path and timing as PhD students in Wageningen with Daniela Ribeiro, friend since secondary school. Sharing the ups and downs of a PhD research experience in a foreign country was very rewarding and fun, and helped building a bridge with our home town and culture. It was also quite convenient for our pet sitting schedule when away, as I could blindly trust Condesita to such an animal lover as you are. Thanks a lot for your friendship and also for being my paranymph. I extend my thanks to my dear ‘paranymphs in law’: Sjors and Enrique. Sjors, many thanks for translating the Summary of this thesis in Dutch.
To all the other friends that I had the pleasure to meet during my stay in Wageningen, a big thanks: Sarah and Rene, Susana and Célio (and the little Tomás), Catarina and Gonçalo, Rita e Francesc (and the little Joana and Laura, which I did not meet yet), Guilherme and Ivana, Belmira (it was an honour to be your paranymph!), Ana Assunção, Kikas, Gilma, Ana Costa, Graça da Silveira, Mirjana and Meladgen (and little Gavrilo), Remco and many others that contributed to such pleasant and relaxing moments. Thanks also to my flatmates Maria, Marta, Cecile, Claire, Roberta and Maaria for such an agreeable home.
A special thanks to my musical friends: Leo, Anke, Krisztina, Marijn and other WSKOV players, for the unforgettable moments of music. Leo, it was very fortunate to meet you and share with you many hours of rehearsals and some performances. Your musical talent and culture, enthusiasm, friendship and sense of humor are a great combination! I hope we can still have fun in many more occasions, starting with another of the never-ending Kuhlau flute duets!
The last part of the acknowledgements is dedicated to the most important part of my life: my family, above all to my parents and brother! To their endless and unconditional love, support and care, my deepest gratitude! A última parte dos agradecimentos é dedicada à parte mais importante da minha vida: a minha família, especialmente aos meus pais e irmão! Queridos pais, muito obrigada por todo o vosso apoio e pelo amor incondicional que sempre me dedicaram! Vocês são os melhores pais que eu alguma vez poderia desejar! Muito obrigada pelas pontuais Fogaças no dia das Fogaceiras e pelas fotos que me fizeram sentir mais perto de casa, e por todos os mimos que me deram ao telefone todos os dias! Papá, a próxima tese sera a tua!! Rui, maninho, muito obrigada por todo o cuidado que sempre tiveste comigo, pelas palavras de motivação e pelos ‘kilowatts de energia’ enviados de Basileia nos momentos críticos das vésperas de entregar a tese! A tua disciplina e o teu sentido de humor são uma inspiração para mim!
My dear Tiago, thanks for coming with me to Wageningen at the beginning of my PhD and for staying all this time, despite the difficult first months. Thank you for showing me the bright side of each situation whenever I was ‘blue’, and for your patience in my most stressful moments in the final periods of the PhD. Your love and care have greatly contributed to this achievement!
To Sãozinha de Alenquer, my elected guardian angel, my deepest gratitude for always taking so good care of us!

242
About the author
Sónia Isabel de Castro Lopes was born on 23rd July 1978 in Santa Maria da Feira, Portugal. She finished the secondary school in 1996, as well as the complementary secondary studies in transversal flute, while actively participating in several orchestras and chamber music groups. In 2001, she completed the Environmental Engineering degree at the University of Aveiro. During the course of her studies, she was granted several scholarships and prizes given to the best students of the University, including the ‘Professor Egas Moniz Prize’, given to the best student of the
University in 1998/99 and the ‘Dow Portugal Prize’, given to the best finalist of the Environmental Engineering degree in 2000/01. In the second semester of the fourth year of her studies, she studied in Wageningen University through the Erasmus Programme. In the final project of the Engineering degree, back in the University of Aveiro, she studied the influence of fats on the anaerobic treatment of dairy effluents. She continued her MSc studies within the Environmental Sciences program of Wageningen University, with a Huygens scholarship. In 2002, she obtained her MSc diploma, with distinction. The MSc thesis consisted of a study on the characteristics and formation of anaerobic granular sludge. In December 2002, she was granted a scholarship by the Foundation of Science and Technology (Portugal) to carry out her PhD research at the Environmental Technology group of Wageningen University, which resulted in this thesis. From November 2007, Sónia will work at the Laboratory of Microbiology, Wageningen University, where she will conduct research on oxygen sensitivity of anaerobic microorganisms.
243
List of Publications Scientific journals Hulshoff Pol L.W., Lopes S.I.C., Lettinga G. and Lens P.N.L. (2004) Anaerobic sludge
granulation. Water Research 38(6), 1376-1389. Lopes, S.I.C., Sulistyawati, I., Capela, M.I. and Lens, P.N.L., 2007a. Low pH (6, 5 and 4) sulfate
reduction during the acidification of sucrose under thermophilic (55°C) conditions. Process Biochemistry 42, 580-591.
Lopes, S.I.C., Wang, X., Capela, M.I. and Lens, P.N.L., 2007b. Effect of COD/SO42- ratio and
sulfide on thermophilic (55°C) sulfate reduction during the acidification of sucrose at pH 6. Water Research 41 (11), 2379-2392.
Lopes, S.I.C., Capela, M.I., Hullebusch, E.D.v., Veen, A.v.d. and Lens, P.N.L. Influence of low pH (6, 5 and 4) on nutrient dynamics and characteristics of acidifying sulfate reducing granular sludge. Submitted.
Lopes, S.I.C., Dreissen, C., Capela, M.I. and Lens, P.N.L. Performance of mesophilic (30°C) UASB and CSTR reactors for the treatment of sulfate rich wastewaters under acidifying conditions (pH 6 and 5). Submitted.
Lopes, S.I.C., Capela, M.I., Dar, S., Muyzer, G. and Lens, P.N.L. Thermophilic (55°C) sulfate reduction at pH 4 during the acidification of sucrose in UASB reactors. In preparation.
Lopes, S.I.C., Capela, M.I. and Lens, P.N.L. Effect of trace metals and sulfide on thermophilic (55oC) sulfate reduction during the acidification of sucrose at pH 5. In preparation.
Lopes, S.I.C., Capela, M.I. and Lens, P.N.L. Trace metal dynamics at pH 5 in a sulfate reducing acidifying reactor under thermophilic (55oC) conditions. In preparation.
Conference proceedings Hulshoff Pol, L.W., Lopes, S.I.C., Lens, P.N.L. (2002) Anaerobic sludge granulation –
mechanisms and structure (part 1) In: Granulation and auto-immobilisation processes in wastewater treatment – Papers of the Farewell Seminar of Dr. Ir. Look Hulshoff Pol, Wageningen, The Netherlands, pp 5-26.
Lopes S.I.C, Sulistyawati I. and Lens P.N.L. (2005) Thermophilic (55 oC) sulfate reduction at low pH (5 and 4) during the acidification of sucrose. Third European Bioremediation Conference, Chania, Crete, Greece, P-152.
Lopes S.I.C, Sulistyawati I., Capela M.I. and Lens P.N.L. (2005) Thermophilic (55 oC) sulfate reduction at low pH (6, 5 and 4) during the acidification of sucrose. VIII Latin American Workshop and Symposium on Anaerobic Digestion, Punta del Este, Uruguay, pp 531-536.

244
Netherlands Research School for the
Socio-Economic and Natural Sciences of the Environment
CERTIFICATE
The Netherlands Research School for the Socio-Economic and Natural Sciences of the Environment
(SENSE), declares that
Sónia Isabel de Castro Lopes
Born on: 23 July 1978 at: Santa Maria da Feira, Portugal
has successfully fulfilled all requirements of the Educational Programme of SENSE.
Place: Wageningen Date: 23 October 2007
the Chairman of the the SENSE Director SENSE board of Education
Prof. dr. R. Leemans Dr. C. Kroeze
The SENSE Research School declares that Ms. Sónia Isabel de Castro Lopes has successfully fulfilled all requirements of the Educational PhD Programme of SENSE with a work load of 33 ECTS, including the following activities:
SENSE PhD courses: ° Environmental Research in Context ° Research Context Activity: "Research view on: The biological sulfur
cycle in environmental technology" ° Interactions between Element Cycles and Ecosystems ° Basic and Advanced Statistics ° Speciation and Bioavailability ° Euro Summer School: Biotechnology in Organic Waste Management ° Euro Summer School: Trends in Remediation of Soils and Sediments
Other PhD and MSc courses: ° Techniques for Writing and Presenting a Scientific Paper ° Project and Time Management ° Endnote ° Oral Presentation ° Technologies for the Removal of Pharmaceutical Compounds in
Drinking and Wastewaters ° Bioprocess Engineering Course ° MSc. Course: Biological Processes in Environmental Technology Oral Presentations: ° VIII Latin American Workshop and Symposium on Anaerobic
Digestion, 2 – 5 October 2005, Punta del Este, Uruguay ° Third European Bioremediation Conference, 4 – 7 July 2005, Greece ° Sulfur Contact Days, 2 – 3 November 2005, Wageningen,
The Netherlands ° Sensible Water Technology, 12 – 13 April 2007, Leeuwarden,
The Netherlands
Deputy director SENSE Dr. A. van Dommelen


Cover design: Tiago Vilela. The research described in this thesis was financially supported by the Fundação para a Ciência e Tecnologia - Portugal (Ph.D. grant SFRH/BD/9268/2002) and by the European Social Fund (Community Support Framework III). Printing: PrintPartners Ipskamp, Nijmegen.