Time Domain Simulation Of Accidental Flooding of RoRo Ships
163
Time Domain Simulation Of Accidental Flooding of RoRo Ships Thesis submitted for the degree of Master of Science in Engineering at the University of Glasgow by Tiago A. R. Santos Department of Naval Architecture and Ocean Engineering University of Glasgow 1999
-
Upload
khangminh22 -
Category
Documents
-
view
1 -
download
0
Transcript of Time Domain Simulation Of Accidental Flooding of RoRo Ships

Time Domain Simulation
Of
Accidental Flooding of RoRo Ships
Thesis submitted for the degree of Master of Science in Engineering at theUniversity of Glasgow
by
Tiago A. R. Santos
Department of Naval Architecture and Ocean Engineering
University of Glasgow
1999

ProQuest Number: 13818665
All rights reserved
INFORMATION TO ALL USERS The quality of this reproduction is dependent upon the quality of the copy submitted.
In the unlikely event that the author did not send a com p le te manuscript and there are missing pages, these will be noted. Also, if material had to be removed,
a note will indicate the deletion.
uestProQuest 13818665
Published by ProQuest LLC(2018). Copyright of the Dissertation is held by the Author.
All rights reserved.This work is protected against unauthorized copying under Title 17, United States C ode
Microform Edition © ProQuest LLC.
ProQuest LLC.789 East Eisenhower Parkway
P.O. Box 1346 Ann Arbor, Ml 48106- 1346

i GLASGOWUNIVERSITYLIBRARY
115$

SUMMARY:
RoRo ship accidents have become one of the most challenging engineering problems in the field of
Naval Architecture. A large number of research programmes have been undertaken in several
countries with the objective of improving the safety of these vessels. These investigations have
allowed the conclusion that the main problem with this type of vessel is its poor damage stability.
In this work, the main developments of the principal particulars, characteristic ratios and general
arrangement of this type of vessel are studied, with the objective of determining the reasons for the
damage stability problem. The most significant accidents that have occurred with passenger RoRo
ships {European Gateway (1982), Herald o f Free Enterprise (1987) and Estonia (1994)) are also
reviewed. Some of the solutions that have been proposed in the open literature to solve the damage
stability problem of passenger RoRo ships are indicated. The main steps in the development of the
International Maritime Organisation subdivision and damage stability requirements are also
reviewed and discussed.
The time domain simulation of ship behaviour while flooding is identified as a useful technique to
study the accidents that have occurred with this type of ship and to gain insight into the fundamental
physical mechanisms governing RoRo capsize. A state-of-the-art review of the literature on RoRo
damage stability model experiments and damaged ship motions simulation is performed. Based in
that research, a theoretical model of damaged ship behaviour in calm water and in the absence of
wind and forward speed is developed. The ship hydrostatic properties are obtained using a pressure
integration technique. A theoretical model of the ship flooding process is also developed,
comprising both the accidental flooding of the ship compartments by seawater and the cross
flooding of compartments. These theoretical models are then implemented in a computer program.
Finally, a general numerical model of ship geometry and loading, used to perform the simulation of
its damaged behaviour, is described and a systematic technique to generate this model is presented.
The hydrostatic properties calculated by the computer program using the pressure integration
technique are validated through comparison with a software package. The numerical models of the
barges and ship used to test the program are then presented and described. The time domain
simulation results are validated agains quasi-static results for the flooding of a simple barge. The
results are further validated by studying the influence of a number of parameters on the simulated
motions and flooding of this barge. The results of a number of small-scale model experiments
performed at the Glasgow University Towing Tank to investigate the major parameters influencing
a physical phenomenon known as transient asymmetric flooding are presented, discussed and
compared with simulation results. Finally, the European Gateway accident (1982) is modelled and
simulated. The results of this simulation and its implications are discussed.
A number of general and specific conclusions relating both to the present situation in what regards
the damage stability problem of RoRo vessels and the current research programme are drawn. The
pressure integration technique is a viable technique to calculate the hydrostatic properties of
damaged ships and is susceptible of being used in a time domain simulation of damaged ship
motions. The time domain simulation is a promising technique to analyse the behaviour of flooding
RoRo vessels. Transient asymmetric flooding was observed during the experimental work and was
reproduced using the time domain simulation. The simulation of the European Gateway accident
allows the conclusion that the transient asymmetric flooding might have been the cause of this
accident, but the precise influence of this phenomenon is difficult to evaluate accurately. Further
large-scale model experiments are required to properly calibrate and validate the time domain
simulation, especially the flooding model. Finally, based in the previous conclusions, areas for
future development of this research programme are indicated.
ACKNOWLEDGMENTS:
I would like to thank Prof. Carlos Guedes Soares for giving me the opportunity of taking this degree
and for his advice during these last two years.
I would like to thank Mr. Ian Winkle for his helpful orientation and advice during the period in
Glasgow. I would also like to thank him for his support with all the living problems in Glasgow.
A word also to Mr. David Sinclair for his kind help and concern during the experimental work
carried out at the Glasgow University towing tank.
Finally, but not the least, I would like to thank Mrs. Maureen MacGrady and Mrs. Thelma Wilma
for their kind help during my stay in Glasgow.
Tiago Alexandre Rosado Santos

TABLE OF CONTENTS:
Summary:.......................................................................................................................................................... i
Acknowledgments:........................................................................................................................................ iii
Table o f Contents:......................................................................................................................................... iv
List o f Figures:...............................................................................................................................................vi
Notation:.........................................................................................................................................................xi
Chapter 1 - Introduction ...............................................................................................................................1
Chapter 2 - The Damage Stability Problem o f Passenger RoRo Ships................................................. 5
2.1 The Development of Passenger RoRo Ships....................................................................................... 5
2.2 Passenger RoRo Ship Accidents......................................................................................................... 11
2.3 The Problem Areas.............................................................................................................................. 15
2.4 Suggestions to Improve the Passenger RoRo Ship Concept.............................................................17
2.5 The Development of Passenger RoRo Ship Subdivision and Damage Stability Rules...................23
Chapter 3 - Experimental and Theoretical Studies o f RoRo Ship Damage Stability......................27
3.1 RoRo Ship Damage Stability Experimental Studies........................................................................ 27
3.2 RoRo Ship Damage Stability Theoretical Studies............................................................................ 34
Chapter 4 — The Theoretical Model o f Accidental Flooding o f RoRo Ships.....................................48
4.1 The Theoretical Model Assumptions.................................................................................................48
4.2 The Theoretical Model of Ship Motions............................................................................................50
4.3 The Theoretical Model of Ship Flooding........................................................................................... 56
4.4 The Pressure Integration Technique.................................................................................................58
4.5 The Numerical Model of the Ship......................................................................................................66
4.6 The Computational Implementation.................................................................................................68
Chapter 5 - Application Examples........................................................................................................... 72
5.1 Calculation of Ship Hydrostatic Properties Using the Pressure Integration Technique............ 72
iv

5.2 Time Domain Simulation of Barge Flooding.....................................................................................76
5.3 Time Domain Simulation of RoRo-Shaped Barge Flooding.............................................................84
5.4 Time Domain Simulation of RoRo Ship Flooding.............................................................................99
5.5 Discussion of Results..........................................................................................................................108
Chapter 6 - Conclusions and Recommendations for Future Research............................................118
6.1 Conclusions.........................................................................................................................................118
6.2 Recommendations for Future Research...........................................................................................122
References:.................................................................................................................................................. 124
Appendix A - Development o f the Passenger RoRo Ship General Arrangement.......................... 128
Appendix B - Development o f the Principal Particulars o f Passanger RoRo Ships......................131
Appendix C — Numerical Model o f RoRo Ship .....................................................................................141

LIST OF FIGURES:
Figure 2.1 - A typical passenger RoRo of the 1960’s (from Internet)................................................... 6
Figure 2.2 - A very large passenger RoRo of the 1990’s (from Internet).............................................6
Figure 2.3 - Longitudinal section of a passenger RoRo of the 1990’s (from Internet)........................7
Figure 2.5 - Typical deck arrangement of a passenger RoRo................................................................8
Figure 2.6 - The passenger RoRo Estonia.............................................................................................15
Figure 2.7 - Typical transverse sections of the present and new RoRo concepts............................... 19
Figure 2.8 - Typical transverse section of the Glasgow Concept........................................................ 20
Figure 3.1 - Simulated time history of the EG heeling (from [14])..................................................... 36
Figure 3.2 - Simulated time history of the HFE heeling (from [15]).................................................. 36
Figure 3.3.a - Capsize mechanism with sudden loll angle (from [4]).................................................37
Figure 3.3.b - Capsize mechanism through slow flooding (from [4]).................................................37
Figure 3.4.a - Water-on-deck time history (from [29])........................................................................41
Figure 3.4.b - Roll time history (from [29])......................................................................................... 41
Figure 4.1 - Coordinate systems (from [50])........................................................................................ 50
Figure 4.2 - The types of flooding......................................................................................................... 57
Figure 4.3 - Sea coordinate system........................................................................................................ 59
Figure 4.4 - Panel coordinate system.....................................................................................................62
Figure 4.5 - Panelization of hull surface................................................................................................66
Figure 4.6 - The algorithm of the program Shipflooding.....................................................................69
Figure 5.1 - RoRo ship body plan.......................................................................................................... 72
Figure 5.2 - RoRo ship general arrangement........................................................................................ 73
Figure 5.3 - Cross curves using P IT ......................................................................................................75
Figure 5.4 - Cross-curves using a commercial software......................................................................75
vi

Figure 5.5 - Barge basic internal arrangement..................................................................................... 76
Figure 5.6 - Barge internal arrangements..............................................................................................77
Figure 5.7 - Simulated time history of sinkage.................................................................................... 78
Figure 5.8 - Simulated time histories of sinkage and trim....................................................................79
Figure 5.9 - Simulated time histories of sinkage and heel....................................................................79
Figure 5.10 - Simulated time histories of sinkage, heel and trim........................................................ 80
Figure 5.11 - Influence of the damage area in the simulated time histories of heel........................... 81
Figure 5.12 - Influence of flow coefficient in the simulated time histories of heel........................... 82
Figure 5.13 - Influence of GM in the simulated time histories of heel...............................................83
Figure 5.14 - Influence of a suddenly applied heeling moment in the simulated heel time histories84
Figure 5.15 - RoRo-shaped barge internal arrangement.......................................................................85
Figure 5.16 - Internal layout of the central compartment.....................................................................86
Figure 5.17 - Shape of the damages...................................................................................................... 86
Figure 5.18 - Numerical results for symmetrical flooding (heave and roll time histories)............... 89
Figure 5.19 - Numerical results for symmetrical flooding (water build-up).......................................89
Figure 5.20 - Numerical and experimental results for experiment 1 (heave and roll time histories) 90
Figure 5.21 - Numerical results for experiment 1 (water build-up).................................................... 91
Figure 5.22 - Numerical and experimental results of experiment 2 (heave and roll time histories) .92
Figure 5.23 - Numerical results for experiment 2 (water build-up).................................................... 93
Figure 5.24 - Numerical and experimental results of experiment 3 (heave and roll time histories) .94
Figure 5.25 - Numerical results for experiment 3 (water build-up).................................................... 94
Figure 5.26 - Numerical and Experimental results of experiment 4 (heave and roll time histories) 95
Figure 5.27 - Numerical results for experiment 4 (water build-up).................................................... 96
Figure 5.28 - Numerical and experimental results of experiment 5 (heave and roll time histories) .97
Figure 5.29 - Numerical results for experiment 5 (water build-up).................................................... 97

Figure 5.30 - Numerical and experimental results of experiment 6 (heave and roll time histories) .98
Figure 5.31 - Numerical results for experiment 6 (water build-up).................................................... 98
Figure 5.32- Original cross-section in generator room....................................................................... 100
Figure 5.33 - Modified cross-section in generator room - Variant 1................................................101
Figure 5.34 - Modified cross-section in generator room - Variant 2 ................................................101
Figure 5.35 - Asymmetrical flooding of generator room.................................................................... 102
Figure 5.36 - European Gateway hull damages..................................................................................103
Figure 5.37- Isometric view of the transverse section of the European Gateway.............................104
Figure 5.38 - Influence of asymmetry on the behaviour of a damaged RoRo ship.......................... 105
Figure 5.39 - Centre of gravity offset time history up to grounding................................................. 106
Figure 5.40 - Comparison of heel angle time histories up to grounding........................................... 107
Figure A. 1 - General arrangement of an early passenger RoRo.........................................................128
Figure A.2 - Typical general arrangement of an expanded capacity passenger RoRo..................... 129
Figure A.3 - General arrangement of a modem passenger RoRo......................................................130
Figure B.l - Development of Gross Register Tonnage on the Cross-Channel routes...................... 131
Figure B.2 - Development of number of passengers and cars on the Cross-Channel routes...........132
Figure B.3 - Development of L/B and B/T ratios on the Cross-Channel routes...............................132
Figure B.4 - Development of Freeboard/Draught ratio on the Cross-Channel routes...................... 133
Figure B.5 - Development of angle of deck immersion on the Cross-Channel routes..................... 133
Figure B.6 - Development of Gross Register Tonnage on the Baltic routes.....................................134
Figure B.7 - Development of number of passengers and cars on the Baltic routes.......................... 135
Figure B.8 - Development of L/B and B/T ratios on the Baltic routes.............................................. 135
Figure B.9 - Development of Freeboard/Draught ratio on the Baltic routes.....................................136
Figure B. 10 - Development of angle of deck immersion on the Baltic routes..................................136
Figure B. 11 - Development of Gross Register Tonnage and Lpp on the Far East routes................137

Figure B. 12 - Development of number of passenger and cars on the Far East routes..................... 137
Figure B.l 3 - Development of the L/B and B/T ratios on the Far East routes..................................138
Figure B.14 - Development of Freeboard/Draught ratio on the Far East routes...............................138
Figure B.l 5 - Development of angle of deck immersion on the Far East routes..............................139
ix

LIST OF TABLES:
Table 2.1 - Main causes of serious accidents with RoRo ships (from [16])........................................ 11
Table 2.2 - Main causes of loss of RoRo ships (from [16])................................................................. 12
Table 2.3 - UK transport fatal accident rates (from [4])....................................................................... 12
Table 2.4 - Notable RoRo Ship Losses.................................................................................................. 12
Table 5.1 - RoRo ship main particulars.................................................................................................72
Table 5.2 - Hydrostatics of RoRo ship..................................................................................................73
Table 5.2 - Hydrostatics of RoRo ship (continued).............................................................................. 74
Table 5.3 - Comparison of results for several damage conditions...................................................... 74
Table 5.4 - Barge main particulars........................................................................................................ 76
Table 5.5 - Summary of barge conditions in each numerical experiment...........................................77
Table 5.6 - Barge main particulars........................................................................................................ 84
Table 5.7 - Volumes of barge compartments....................................................................................... 85
Table 5.8 - Dimensions of the damages................................................................................................87
Table 5.9 - Compartments of the symmetrical model......................................................................... 102
Table 5.10 - Compartment volumes in Variant 1 ............................................................................... 102
Table 5.11 - Compartment volumes in Variant 2 ............................................................................... 103
Table 5 .12- Comparison of experimental and numerical results - small damage openings.........112
Table 5 .13- Comparison of experimental and numerical results - large damage openings.........112
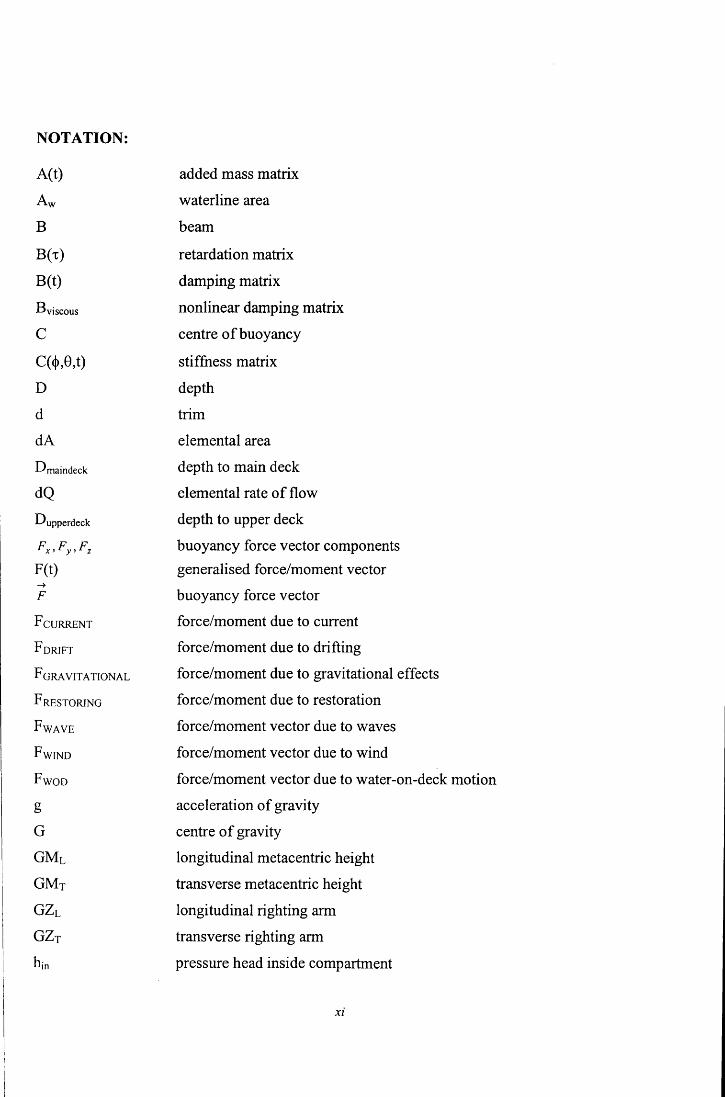
NOTATION:
A(t) added mass matrix
Aw waterline area
B beam
B ( t ) retardation matrix
B(t) damping matrix
B y isc o u s nonlinear damping matrix
c centre of buoyancy
C((|),0,t) stiffness matrix
D depth
d trim
dA elemental area
D m ain d eck depth to main deck
dQ elemental rate of flow
D Upperdeck depth to upper deck
buoyancy force vector componentsF(t) generalised force/moment vector
->
F buoyancy force vector
F cu rrent force/moment due to current
F drift force/moment due to drifting
F g rav ita tio n al force/moment due to gravitational effects
F restoring force/moment due to restoration
F w ave force/moment vector due to waves
F w ind force/moment vector due to wind
F w od force/moment vector due to water-on-deck motion
g acceleration of gravity
G centre of gravity
GMl longitudinal metacentric height
GMt transverse metacentric height
g z l longitudinal righting arm
GZt transverse righting arm
Fjn pressure head inside compartment

hout pressure head outside compartment
hs righting arm in an “effective” longitudinal wave
I buoyancy force
Ixx moment of inertia with respect to x
Ixy product of inertia
Iyy moment of inertia with respect to y
K flow coefficient
k<j, pitch radius of gyration
ke roll radius of gyration
ky yaw radius of gyration
K(t-x) kernel
KMl height of the longitudinal metacentre
KMj height of the transverse metacentre
LCG longitudinal position of centre of gravity
Loa length over all
Lpp length between perpendicularsM displacement
M(t) structural mass matrix
Md nonlinear damping moment due to bilge keels
Msy moment due to sway and yaw motions
M w a v e moment due to waves
M w in d moment due to wind
M Wo d moment due to water-on-deck motion
Lz moment of immersed volume with respect to z axis
Mw (t) flood water matrix
Mx moment of buoyancy force with respect to x axis
M Y moment of buoyancy force with respect to y axis
M Yp moment of buoyancy with respect to Yp axis
M Zp moment of buoyancy with respect to Zp axis
M w (0 rate of flood matrix
Pi pressure inside compartment
p2 pressure outside compartment
X l l

r(t) position vector relative to centre of gravity
Sx first moment of area of waterline with respect to x
Sy first moment of area of waterline with respect to y
T draft
t time
TCG transverse position of centre of gravity
U flow velocity
VCG vertical position of centre of gravity
Xc,Yc,Zc coordinates of the centre of buoyancy
Xf,Yf coordinates of the centre of flotation
X pa, Ypa, Zpa centre of hydrostatic pressure
X(t) displacement vector
X(t) velocity vector
X{t) acceleration vector
Greek letters:
V hull volume
p specific mass
x time lag
Q(t) angular velocity vector
£ heave motion
9 roll motion
(p pitch motion
H/ yaw motion
C heave acceleration

CHAPTER 1 - INTRODUCTION
Since the passenger RoRo vessel Princess Victoria capsized in the Irish Sea (1953), a large number
of accidents have occurred to RoRo vessels, culminating in the capsize and sinking of the Estonia
(1994) [1], which claimed over 800 lives. This unacceptably large loss of human lives has caused a
great deal of concern to public opinion (and, consequently, to the maritime profession) which now
tends to regard RoRo ship as potentially unsafe. Since safety and risk are paramount issues in all
branches of modem engineering, it would be surprising if these accidents had not become one of the
most challenging engineering problems in the field of naval architecture.
In order to address the problem of RoRo capsizing a large number of comprehensive research
programmes has been carried out, both in the UK [2] and in continental Europe [3]. These
programmes have identified the time domain simulation of damaged ship flooding and motions as a
potentially valuable research tool. This is the reason why this MSc thesis is primarily concerned
with the development of a theoretical-numerical model of accidental ship flooding. This model is
intended to constitute the first phase in the construction of a broader and more sophisticated model
of damage ship motions. Furthermore, in spite of the fact that this model was developed in relation
to the RoRo ship problem, it could be also easily applied to other types of ship.
Investigations into RoRo accidents have generally concluded that the main contribution to the rapid
capsize of this type of ship is flooding of the main vehicle deck following operational incidents or
collision [4]. The problem arises from the fact that these ships have large undivided vehicle decks,
which may become flooded after collision damage or for such operational reasons as fire fighting or
intake of water due to open or leaking loading doors. The flooding of this vehicle deck often
triggers a process of rapid capsizing, through the well known “free surface” effect. Moreover, the
interaction of this phenomenon with other aspects of the flooding of a damaged vessel can lead to
complex dynamic behaviour, our understanding of which is yet fairly limited. This shortcoming has
led to simplified approaches to the damage survivability problem that have potentially serious
consequences. Many approaches rely on knowledge of the hydrostatic properties of the ship, both in
the intact and final damaged conditions, while the conditions during intermediate stages of flooding
are often ignored. This is because the final flooded condition is usually assumed the most critical.
The same happens with the influence of these intermediate stages on the capacity of a damaged ship
to survive under giyen environmental conditions. The rapid development of the RoRo ship type,
I

with its peculiar internal layout has had the effect of exposing a much larger number of passengers
to the potentially serious consequences already mentioned, which has resulted in a renewed general
interest in the damage stability of passenger RoRo ships.
In order to solve or minimise the damage stability problem of passenger RoRo ships, a number of
new design concepts or modifications of the existing RoRo concept have been proposed. These
include the transverse subdivision of vehicle decks, introduction of a belt of wing tanks, increased
freeboard, increased metacentric height, removal of the bow door and various devices that improve
stability. The owners and operators of passenger RoRo ships, quite understandably, have shown a
desire to solve the problem by means of modifications to their existing vessels, many of these
modifications consisting of an “active security” rather than a “passive security”. Many people have
expressed doubts about these modifications because failure to activate such devices may result in
catastrophic accident.
The International Maritime Organisation (IMO) has tried to address this problem by issuing a
number of amendments upgrading their subdivision and damage stability requirements for
passenger ships. First, in response to the well-known shortcomings of the 1960 SOLAS
deterministic approach, IMO issued in 1973 Resolution A.265 [VIII] [5], which introduced an
alternative and more rational probabilistic approach to damage stability. After the Herald o f Free
Enterprise accident (1987), IMO introduced new and more stringent damage stability criteria,
which came to be known as SOLAS 90 [6]. Shortly after, in 1992, IMO introduced, for existing
ships, a modified version of the SOLAS 90 criteria, together with a timetable for compliance based
on a simplified form of Resolution A.265 [VIII]. Following the Estonia tragedy (1994), a major
investigation effort was undertaken under the guidance of an IMO Panel of Experts. Consequently,
the 1995 SOLAS conference introduced a number of important amendments [7]. Nevertheless,
unsatisfied with what had been achieved, the Northwest European countries felt it necessary to
adopt a regional agreement known as the Stockholm Agreement [8]. This agreement, specifying
higher safety standards, is being introduced progressively to all ships operating in this region
between 1997 and 2001.
The upgrading of the damage stability criteria above and the development of new damage stability
standards would benefit a great deal from the existence of numerical tools to predict the behaviour
of a given ship when subjected to large scale flooding. Time domain flooding simulation is the most
2

recent method used to predict such behaviour [9]. Some advantages of time domain simulation, in
general, are that it is capable of:
• predicting with sufficient engineering accuracy the capsize resistance of a damaged ship of any
type and arrangement in a seaway, being useful, therefore, in the safety assessment of new ships
and new design concepts, as well as in the analysis of specific accidents
• helping to identify the representative parameters that characterise the ability to survive of a
vessel with a given form, size and arrangement, as function of seastate, therefore being useful in
the development of rational survival criteria for assessing the dynamic stability of damaged
passenger RoRo vessels.
Time domain simulation of ship motions had not been frequently used until recently, mainly
because of the numerical effort involved. However, the continuous advances of computer science
have made available faster and much more powerful machines, capable of handling very complex
models within a short period. Thus, computational time has now been reduced to acceptable levels.
Furthermore, given that the dynamic behaviour of damaged RoRo ships is very complex and
numerically intensive, the application of computers to this problem is only natural.
The objectives of this MSc thesis are to:
• develop a theoretical model, in the time domain, of damaged ship motions in still water that
predicts the progressive flooding of compartments and resulting vessel response
• implement this theoretical model in a computer program
• validate this software through comparisons of the computational results with those obtained by
experiment
• apply the software to the simulation of the motions of a damaged passenger RoRo ship
• improve knowledge in the field of ship damage stability and, especially, of the very crucial
problem of RoRo damage stability.
This thesis is divided in six chapters, the first being this short introduction. Chapter 2 is concerned
with the analysis, characterisation, causes and solutions of the damage stability problem of RoRo
ships. A short description of the development of RoRo ships since their emergence is made. The
development of the major design parameters for this type of vessels is then analysed, taking into
account the major differences between the distinct geographical areas where these vessels operate.
3

The major accidents with this type of ship are reviewed and the main conclusions from inquiries are
presented. From this analysis arises the identification of specific problem areas and of solutions that
have been proposed to meet these problems. Finally, the essential steps in the development of the
current IMO regulations on subdivision and damage stability of passenger RoRo ships are reviewed.
Chapter 3 is concerned with reviewing recent developments in two major research areas:
experimental and theoretical studies of RoRo ship damage stability. This review is important and
closely related to the experimental and theoretical work performed in the current work.
Chapter 4 presents the theoretical model of RoRo ship accidental flooding. First, the main
assumptions of the theoretical model are stated. Then, the development of the theoretical model and
the way in which progressive flooding is modelled are described. The Pressure Integration
Technique (PIT) is reviewed, together with its advantages in the computation of the hydrostatic
properties. Finally, the computational implementation of the theoretical model is explained.
Chapter 5 presents verifications and examples relative to small-scale model experiments performed
at the Glasgow University Towing Tank. First, the hydrostatic calculations performed by the
software are validated using the software package GHS. Then, the numerical models of the bargesIand RoRo ship used to test the program are described. The results of the simulations are then
presented and compared with experiments. The influence of a number of parameters on the motions
of a damaged RoRo shaped barge and a passenger RoRo ship is investigated and discussed. Finally,
the European Gateway accident (1982) is simulated. The results of this simulation are presented
and conclusions are drawn.
| Chapter 6 presents conclusions relating to the present situation in what regards the damage stability
| problem of RoRo vessels and conclusions of the current work. Drawing on the previous
conclusions, recommendations for the future development of this research programme are indicated.I
|
!
4

CHAPTER 2 - THE DAMAGE STABILITY PROBLEM OF PASSENGER RORO SHIPS
2.1 The Development of Passenger RoRo Ships
2.1.1 Passenger RoRo Ship Design
The Roll-On/Roll-Off (RoRo) ship is a special category of ship engaged in the transport of various
cargoes which are loaded and unloaded on rolling vehicles entering the ship through bow, stem and
side openings in the ship’s hull. Modem RoRo ships can trace its origins back some 100 years to
train ferries initially designed to take trains across wide rivers and straits. The same principle was
applied in the late 1940’s and early 1950’s to merchant ships, resulting in RoRo ships [10] which
proved extremely popular with holidaymakers because of the facility with which they could be
loaded and unloaded. This new type of ship also had the advantage of not needing the expensive
work of dockers. Both advantages resulted in a reduced turnaround time. The RoRo concept also
has some advantages over traditional ships in what concerns the shipper, because of its speed and
ability to integrate with other means of transportation such as road or rail containers and customs-
sealed units. This integration has enabled frontiers to be crossed with a minimum delay, thereby
further increasing speed and efficiency for the shipper. Because of these advantages, since the early
1950’s, this type of vessel has become increasingly common, as can be observed by noting the
increasing number of RoRo ships featured in the specialist magazines ([10], [11], [12]). In 1994,
there were several thousands of RoRo ships of various types in operation all over the world. Closely
related to the number of ships, the number of companies operating this type of ship has also
increased steadily.
In this work, the main concern will be the passenger RoRo ship, which is that designed to carry
more than 12 passengers. This is because the safety of this type of RoRo ship is crucial due to the
presence of significant numbers of passengers on board and a large number of these ships operate in
the seas and oceans surrounding the European continent. This makes their safety a major concern
for the European nations.
Passenger RoRo ships developed from short sea passenger vessels. Figure 2.1 shows a typical
passenger RoRo ship of the 1960’s, being worth noting that this ship indeed resembles the short sea
passenger vessels of the time.
5

Figure 2.1 - A typical passenger RoRo o f the 1960’s (from Internet)
Since the 1960’s, the dimensions o f these vessels have increased steadily to accommodate larger
numbers o f vehicles and passengers. In 1963, the 130.0 m long Arveprins Knud was one o f the
largest passenger RoRo ships in the world [10]. This vessel already possessed two vehicle decks
and included a hoistable car deck. In 1968, the St. George, at 128 m length over all, was still the
largest RoRo operated by British Rail [11]. Today, one o f the largest passenger RoRo ships is the
Silja Serenade (203 m long) [12], shown in Figure 2.2, operating in the Baltic Sea. A longitudinal
section o f such a large passenger RoRo may be seen in Figure 2.3.
Figure 2.2 - A very large passenger RoRo o f the 1990’s (from Internet)
6

Figure 2.3 - Longitudinal section of a passenger RoRo o f the 1990’s (from Internet)
The general arrangement o f the first RoRo vessels comprised a bulkhead deck (the first deck above
the deepest load line), running between the fore and aft ends o f the ship, with no transverse
bulkheads subdividing the space above it. The compartments below the bulkhead deck would
occupy the whole breadth o f the vessel. At the aft end o f the ship, there would be a stem ramp and
at the bow there would be a bow ramp, protected by a bow visor. Transverse bulkheads densely
subdivided the spaces below the bulkhead deck in order to achieve a one-compartment standard.
The fore and aft collision bulkheads and other transverse bulkheads were terminated at the bulkhead
deck. The engine-room was located in the aft portion o f the ship. To carry the ventilation system,
the engine exhaust gases, the stairs and the lifts these ships had either side or centre casings in the
vehicle decks. An example o f this type o f arrangement is shown in Figure A.l (in Appendix A).
Due to increased demand for car transportation, the design o f RoRo ships soon evolved towards
multiple vehicle decks. One o f the first solutions adopted to meet this demand was the fitting of
movable platforms on the vehicle deck that could be raised and lowered, as traffic demanded. These
platforms could form an entire new deck or just a partial one. A good example is the Arveprins
Knud passenger RoRo shown in Figure A.2. The next step was taken when ships were designed
with two full permanent vehicle decks, an example o f which may be seen in Figure 2.5. This trend
to increase the number o f vehicle decks led the designers to lower the depth o f the ship up to the
main vehicle deck (subdivision deck), therefore decreasing the freeboard o f the ships (see section
2.1.2). In parallel with the vehicle capacity increase, there was also an increase in passenger
capacity. This was made possible using an increased number o f passenger decks located above the
vehicle decks. Consequently, the ship superstructures became increasingly bigger, as may be seen in
Figures 2.2 and 2.3. Another very concerning consequence o f this search for increased passenger
7

capacity is the location o f passenger accommodations under the main vehicle deck, forward o f the
machinery spaces. Estonia was an example o f this type o f design.
Figure 2.5 - Typical deck arrangement o f a passenger RoRo
A recent development o f RoRo ship design is the use o f cellar decks. These are set forward o f the
machinery spaces, directly on the tank top, and are maintained watertight by sealed ramps.
Watertight wing tanks B/5 wide are fitted to enclose these lower spaces, allowing the exemption
from the need for transverse subdivision contained in the SOLAS regulations. In Figure A.3 the
general arrangement o f the Superfast passenger RoRo is shown, where it is worth noting that this
vessel has two cellar decks, one directly on the tank top, the other being a tweendeck above. This is
an extreme and unusual example o f the use o f cellar decks. Since damages leading to penetrations
larger than B/5 are relatively frequent, the flooding o f the cellar decks may easily occur, causing a
potentially dangerous situation from the damage stability point o f view. For more details on
passenger RoRo ship development, see Bengtsen and Comer-W alker [14].
2.1.2 Principal Particulars of Passenger RoRo Ships
The analysis o f the development o f the principal particulars and characteristic ratios o f passenger
RoRo ships over the past four decades can be useful to gain insight into the damage stability
problem of these ships. This is because such RoRo characteristics as the B/T and freeboard/draught
ratios influence the angle o f bulkhead deck immersion, which is very important in case this deck is
damaged. Therefore, the damage stability characteristics o f a RoRo ship depend on these ratios.

A survey of RoRo ship development between 1960 and 1998 was undertaken using the specialist
magazines The Motorship and The Naval Architect, as well as the Lloyd’s Register Books. The
ships featured in those magazines were organised into subsets according to the geographical area for
which the ships were primarily designed. The geographical areas considered were the Channel of
England, the Baltic Sea and the Far East. The types of passenger RoRo ships considered are the
“conventional” passenger RoRo ship and the “mixed” cargo/passenger RoRo ship. Some ships of
particular relevance in the history of the RoRo problem are indicated with special symbols. The
results of this analysis, as well as its detailed discussion, are included in Appendix B but a brief
review of its main conclusions is now given.
Comparing the development of RoRo ships main particulars in the different geographical areas, it
may be concluded that:
• the GRT of the ships operating in the Baltic Sea has increased more rapidly than that of the ships
operating in the cross-Channel routes. Furthermore, the RoRo ship GRT in the cross-Channel
routes is higher than that of ships operating in the Far East. These observations relate to the
whole period of this analysis. This indicates that ships in Europe have higher cargo and
passenger capacities than those in the Far East
• the development of the passenger capacity has similar trends in the Baltic Sea and cross-Channel
routes, but the number of passengers transported has always been higher in the Baltic Sea.
Although it is difficult to analyse the data from the Far East, it can be seen that the passenger
capacity of the vessels in that area is smaller than the capacity of the vessels operating in the two
other areas. This confirms that cargo and passenger capacity of the vessels in the Far East is
smaller than in Europe
• the development of the car capacity presents a similar trend of growth in the Baltic Sea and
cross-Channel routes. In the Far East the number of cars transported has remained largely
stationary
• the trends of the ratio L/B are very similar in the Baltic Sea and cross-Channel routes. The trend
is for a slight decrease from 6.0 to 5.5 in the Baltic Sea and from 5.75 to 5.25 in the cross-
Channel routes. In what concerns the Far East, the values of the L/B ratio are one unit higher
than those of the other two areas, making the vessels in the Far East more slender than the ones
in Europe. This is because these ships are designed to travel at higher velocities
9

• the B/T ratio has been increasing in the Baltic Sea (from 3.5 to 4.5 in average) while it remains
static in the cross-Channel routes (4.75). The values of this ratio are concentrated mainly in the
4.0 to 4.5 range for both areas. However, for the Baltic Sea, the mean B/T ratio has already
grown to over 4.5. The B/T ratio in the Far East is somewhat lower, around 4, and has remained
constant
• the freeboard/draught ratio and angle of deck immersion present similar trends in the Baltic Sea
and in the cross-Channel routes. In the 1980’s, the values of both parameters in the Baltic Sea
routes were very low (about 0.22 and 2.7° respectively) but the trend is now towards an increase
of the angle of deck immersion. A similar development can be seen in the cross-Channel routes
except that the values were never so low as in the Baltic Sea (minimum of 0.25 and 3.2°). In the
Far East, no tendency can be seen but the values have always been higher than those in Europe.
The current situation in Europe is dictated by the entry into force of the SOLAS 90 damage
stability standard.
Taking into consideration these conclusions and those of section 2.1.1, the future developments in
the design and construction of passenger RoRo ships might be:
• the intact freeboard will continue to increase (as a consequence of the SOLAS 90 damage
stability standard), especially for ships intended to operate in NW Europe, and the damaged
freeboard and residual stability will dominate the design of future passenger RoRo ships
• future passenger RoRo ships will be fitted with longitudinal bulkheads at B/5 below the main
(bulkhead) deck and longitudinal bulkheads at B/10 (or even less) on the car deck itself (for
compliance with the Stockholm Agreement, which proposes an even more severe damage
stability standard than the SOLAS 90)
• twin-hull vessel designs may gain importance against the traditional monohull concept for fast
routes but the conventional concept will continue to dominate the routes where the freight
component is important.
• a significant number of orders for new passenger RoRo ships will be placed world wide,
especially in Europe, as only a few existing ships comply with the SOLAS 90 standard. In
parallel, the industry is also expected to deal with a significant number of conversions of existing
ships for compliance with the SOLAS 90 standard and the Stockholm Agreement
10

• a number of relatively new ships, currently operating in Northwest European waters and having
at least SOLAS 90 standard, might be transferred for trade in other geographical areas due to the
severe requirements of the Stockholm Agreement.
2.2 Passenger RoRo Ship Accidents
A lot of publicity has surrounded the accidents involving the European Gateway [14], Herald o f
Free Enterprise [15] and Estonia [1], leading the public to consider passenger RoRo ships as
potentially hazardous. A study by a Classification Society (1983), mentioned by the IMO [16],
concluded that the main causes of serious accidents with passenger RoRo ships are those listed in
Table 2.1. It is worth noting that risk of collision is one of the greatest risks for this type of ship.
This risk arises from the fact that these ships spend a large proportion of time in crowded port
approaches or crossing busy shipping routes. Furthermore, passenger RoRo vessels are obliged by
their tight schedules to travel at high speed, even in poor visibility or rough weather. That is another
reason why these ships are very vulnerable to collision accidents.
Table 2.1 - Main causes of serious accidents with RoRo ships (from [16])
Type of accident PercentageCollisions 17%Machinery Accident 17%Grounding 17%Shift of cargo or operational 16%Fire or explosion 14%Other 19%
When one considers the accidents that have led to ship loss, the main causes reduce to the four
listed in Table 2.2. Note that the shift of cargo and operational causes assume a large importance.
This is because these ships are highly complex and, although the crews are generally competent,
safe operation of the ship may be prone to human error. The same study concluded that collisions
lead to the loss of the ship much more frequently in this type of ship and that capsize of the ship is
frequently very rapid (less then 10 minutes). It was also concluded that cargo RoRos were more
prone to loss than passenger RoRo ships and minor accidents with passenger RoRos more frequent
than with cargo RoRos.
11

Table 2.2 - Main causes of loss of RoRo ships (from [16])
Type of accident PercentageCollisions 25%Shift of cargo or operational 43%Fire or Explosion 18%Other 14%
Nevertheless, Spouge [4] remarks that in spite of the significant number of accidents, this type of
transportation is no more dangerous than other forms of public transport. This may be seen in Table
2.3.
Table 2.3 - UK transport fatal accident rates (from [4])
Means of Transportation Deaths per 100 million hours
Motor cycle 660Aircraft 240Bicycle 96Car 57Train 5Bus 3Ferry 7
Table 2.4 shows some of the most notable RoRo ship losses since 1953. Spouge [14] and
Papanikolau [17] give detailed reviews of some of these accidents. The most relevant accidents will
now be reviewed in some detail, special consideration being given to the European Gateway
accident, which will be further discussed later (see section 2.4).
Table 2.4 - Notable RoRo Ship Losses
Ship Location Date Pass/Crew Dead Cause of accident
Princess Victoria Irish Sea 1953 172 134 Bow door failureHeraklion Aegean Sea 1966 - 256 Cargo shiftingSkagerak Skagerak 1966 144 1 Side door failureWahine Wellington 1968 735 51 Cargo shiftingZenobia Cyprus 1980 151 0 Cargo shifting
European Gateway Felixstowe 1982 70 6 CollisionHerald Free Enterprise Zeebruge 1987 539 193 Operational
Jan Heweliusz Baltic Sea 1993 - 53 CapsizeEstonia Baltic Sea 1994 -1050 912 Bow door failure
12
The passenger RoRo vessel European Gateway (EG) was struck by the cargo/train ferry Speedlink
Vanguard in December 1982 [14]. The accident occurred at night, with good visibility, moderate
seas and a force 6-7 wind. The EG was struck almost amidships, on the starboard side, both above
and below the waterline, allowing water to flood its machinery spaces and the main vehicle deck.
This accident is a good example of the danger of collisions involving ships fitted with flared and
bulbous bow. The damage analysis of the two vessels indicated that the bow visor of the Speedlink
Vanguard advanced into the EG main deck space. In the process, it teared the shell plate at main
and upper deck level and achieved a maximum penetration of 3.5 m from the side shell. The
bulbous bow of the Speedlink Vanguard penetrated the generator room of the EG as far as 2.0 m
from the side shell, pushed the starboard generator inboard and set down the tank top. The survey of
the collisions also indicated that the EG was inclined 1.5° to port when the maximum penetration
occurred. The simulation of the collision demonstrated that the maximum penetration was achieved
3.4 s after the initial contact and final separation occurred 9 s after the initial contact.
The EG complied with the one-compartment standard contained in SOLAS 60. The traditional
damage stability calculations indicated that sinking would initially have been without heel, since the
four flooded compartments were symmetrical about the centreline. The free-surface loss due to
water spreading over four compartments below the bulkhead deck would eventually give the ship a
negative metacentric height which would cause an angle of loll although, by then, the vessel would
have sunk. However, the Master of the EG estimated that the ship had reached 15° in 1.5 minutes,
that is, the ship began to heel immediately after the collision. Further evidence indicates that the
ship reached 40° in 3 minutes, when it grounded, gradually rolling onto its side about 20 minutes
after the collision.
The investigation considered various possible causes for the very rapid heeling of the ship but
concluded that a previously unknown phenomenon must have been present: transient asymmetric
flooding (TAF). As the generator room, where the hull was breached, had many obstructions to the
water flow across the compartment, it is likely that the water surface could not become level
quickly enough. Therefore, during the flooding, a considerable heeling moment existed causing a
heeling to starboard, which eventually resulted in flooding of the vehicle deck. This accentuated the
heel through rapidly enlarging heeling moments until the vessel capsized.
Another well-known accident is that of the Herald o f Free Enterprise [15]. The ship capsized after
leaving Zeebrugge slightly overloaded and ballasted down at the bow (in order to load the upper
13
vehicle deck from the restricted terminal facilities). As the ship left the harbour, the bow doors were
not closed. A short time after crossing the harbour entrance the quartermaster reported that the ship
would not answer the helm. Very shortly afterwards (in a matter of a minute) the ship started
capsizing and came to rest 90° heeled in shallow water some 930 meters from the channel
centreline.
A study involving model tests, computer modelling (both for flooding simulation and manoeuvring
simulation) and a full-scale trial on a sister ship was carried out by Dand [15]. The studies of the
water ingress demonstrated that, if the speed was 16 knots, the squat alone would have reduced the
freeboard at the bow by about a metre or more (the at-rest freeboard at the bow was about two
metres). It was also concluded that the ship could have generated a bow wave high enough to allow
‘green’ water over the bow spade. The studies also demonstrated that at least 500 to 800 tonnes of
water were needed on the vehicle deck to cause capsizing (the water has the natural tendency to
move to one side, therefore generating a large free-surface effect). Once such a large body of water
was on board capsize would be quick because there would be a serious and lasting reduction in
stability. These findings, made using physical and mathematical models, were verified by
performing a full-scale trial with a sister ship.
In 1994, the passenger RoRo Estonia, shown in Figure 2.6, capsized in the Baltic Sea, causing the
loss of 852 lives [1]. This was one of the greatest maritime tragedies of this century. The
investigations of this accident suggest that the immediate cause was the failure of the bow visor
locking mechanism in stormy sea conditions. In addition, the inner watertight barrier behind the
bow visor was placed too far forward and not structurally independent of the bow visor, thus it was
not according to the regulations, at the time of built. After the detachment of the bow visor due to
heavy wave impact loading, the inner ramp opened allowing the gradual ingress of seawater onto
the vehicle deck. The shipmaster’s attempt to change course so as to avoid bow seas and therefore
decrease the ingress of seawater onto the vehicle deck introduced additional dynamic effects and the
build up of heel up to the complete capsize. The time between the first indications of something
abnormal with the bow visor (metallic noises) and the complete capsize of the vessel was estimated
at about 50 minutes. However, between the first TV monitor observation that water was flooding
into the car deck through the sides of the forward ramp and the complete capsize of the vessel, the
time elapsed was estimated at about 20 minutes.

Ifgl
Figure 2.6 - The passenger RoRo Estonia
Given the large number o f significant accidents with passenger RoRos and its serious consequences,
a study by BMT and Department o f Transportation [2] was undertaken to determine the
probabilities o f the accidents involving these ships. The study concluded that the likely rate of
occurrence o f collisions is one per year (one in each five can lead to capsize). Accidental flooding
can happen once in 7-8 years (once in 200 years leads to capsize). Fire can happen once in each two
or three years, with major consequences once every 10 years. These numbers are very concerning
since the consequence o f a RoRo ship loss is usually considerable both because o f the number o f
lives that may be lost and because o f the high economic value o f these ships and its cargo.
2.3 The Problem Areas
Based on the conclusions o f inquires into RoRo accidents and on the developments in their design
and principal particulars, several problem-areas have been identified. These are the lack o f internal
bulkheads, the subdivision below the bulkhead deck, the extremely low freeboards and the
operational faults.
2.3.1 The Lack of Internal Bulkheads
On conventional ships, the hull is divided into a number o f separate holds by means o f transverse
bulkheads, many o f which have to be watertight. In the event o f the hull being holed, the bulkheads
will limit or delay the inrush o f water, preventing the ship from sinking or resulting in the ship
sinking slowly enough to allow for the evacuation o f those on board. Although passenger RoRos are
all fitted with watertight collision subdivision and engine-room bulkheads below the freeboard deck
15

as prescribed by SOLAS, the huge vehicle decks situated above the bulkhead deck make it possible
for water to spread very rapidly. Flooding of the vehicle decks can occur quite easily because the
bulkhead deck is located very near to the waterline, as seen in section 2.1.2.
2.3.2 Subdivision Below the Bulkhead Deck
Passenger RoRo ships are designed to withstand the flooding of at least one and, more normally,
two compartments below the bulkhead deck. In these arrangements, due to low freeboard, the ship
spaces below the main deck are densely subdivided in order to achieve the necessary standard but
with little reserve of buoyancy remaining. There are, however, various weak points in this
subdivision below the bulkhead deck:
• the collision might damage one or more transverse bulkheads, resulting in the flooding of more
compartments than those specified in the subdivision regulations. As the compartments are very
short, the probability of flooding two or more compartments is high, resulting in very low
probabilities of survival for such ships.
• lack of internal watertight integrity may allow the flooding to spread to neighbouring
compartments. This was the case, due to poor operational procedure, in the European Gateway
accident.
• the damage penetration may be greater than the B/5 assumed in the subdivision regulations. If
that is the case and the ship’s survival depends on a compartment (such as a cellar deck)
remaining intact inside this line the ship might be lost. The statistics suggest that 45% of the
collisions produce deeper damage than B/5. Therefore, the B/5 wing compartments used to
protect cellar decks will be ineffective in such circumstances.
2.3.3 Low Freeboard
As discussed in 2.1.1, passenger RoRo ships have evolved larger beams and lengths between
perpendiculars to achieve increased car and passenger capacity. The beam of these ships has
increased more rapidly than its length, draft and freeboard. Consequently, the angles at which the
bulkhead deck may become immersed have decreased to as little as 3°. It is therefore very easy to
flood the car deck of a passenger RoRo because of damage below the car deck. The deck edge can
become immersed as a result of sinkage, trim and heel inherent to the damage. The trim necessary
to achieve the deck immersion is easily attainable if the damage is aft or forward. The asymmetric
16

flooding of the spaces below the bulkhead deck can easily produce the heel angle necessary to
immerse the deck edge. This is because these spaces are frequently crowded with machinery and
other equipment or have peculiar layouts. Furthermore, if the ship has a cellar deck, the flooding of
the cellar deck fitted between the B/5 wings and of some of those wing compartments, which is a
quite likely event, may make things even worse. The cargo access doors at the stem and bow of the
ship also represent a potential weak spot since over the years such doors can become damaged or
twisted, especially if they are also used as ramps. As the freeboard of this type of ships is very
small, the access doors are often very close to the waterline, offering a high potential risk.
2.3.4 Operational Faults
Passenger RoRo ships are highly complex and sophisticated ships, that require very careful
handling, making them exceptionally vulnerable to human error. An example of the consequences
of human error is the Herald o f Free Enterprise accident. Other problems may occur if, for
example, a list of the ship causes the cargo to break loose because it is not correctly stowed and
secured. The problem is made worse because the crew of the ship cannot normally see how the
cargo is stowed inside or on the trailer in which it is transported. A heavy load that breaks loose can
cause other units to follow suit. The result can be an increased list, the spillage of dangerous
substances and, in extreme cases, damage to the hull and ship's structure.
2.4 Suggestions to Improve the Passenger RoRo Ship Concept
In section 2.3, the problem areas related to the RoRo ship damage stability problem were identified.
Since the beginning of the discussion of this problem in the literature, several solutions have been
envisaged. The advantages and disadvantages of some of these solutions will now be reviewed.
2.4.1 Transverse Subdivision of the Vehicle Decks
The first solution that comes to one’s mind when attempting to solve this problem is to permanently
subdivide transversely the main vehicle deck. However, it has been found that fitting fixed
transverse bulkheads in the RoRo spaces is not feasible. This is because there are severe economical
implications arising from the serious operational difficulties in the handling of RoRo cargo while
using these bulkheads. In fact, the whole present concept of RoRo ship depends upon being able to
drive cargo on to the ship at one end and off again at the other end. The installation of fixed
17

transverse bulkheads would be a severe setback in the economical profitability of this very
successful ship concept.
One other solution is to fit transverse portable bulkheads or fixed bulkheads in the main vehicle
deck. However, according with Spouge [4], the disadvantages of portable transverse bulkheads are
that:
• they increase the turnaround time because of the extra work in closing them
• they cause trim problems while loading/unloading the ship
• they cause a small loss of cargo space
• there exists the possibility that the doors may not be closed when there is the need for them to be
closed or may not be entirely watertight (typical shortcomings of the active safety systems).
Some equipments of this kind are already available. For example, the giant RoRo Silja Symphony
has been equipped with telescopic partial height flood control doors [18]. However, model testing
by Winkle [19], has suggested that partial height bulkheads are of dubious value.
2.4.2 New design Concepts
Several new design concepts for passenger RoRo ships have been presented in recent years.
Pawlowski and Winkle [20] developed one of the more complete concepts. Their concept uses the
idea of deep sinkage, which consist in the fact that the damage stability of a RoRo ship with its
bulkhead deck immersed increases the deeper the ship sinks. This is because an increase in
damaged draught for any constant displacement allows the centre of buoyancy to move closer to the
centre of gravity thereby improving stability. Moreover, ships in the final stages of flooding, with a
much deeper draught have almost no roll due to waves, only heave remaining. If upright, they are
very unlikely to capsize. Based upon these ideas and on parametric studies, Pawlowski and Winkle
[20] concluded that there should be:
• a double-skin extending from the double-bottom to the upper deck, with wing compartments
transversely subdivided, not bigger than B/5 and effectively cross-connected
• a modest flare up to the upper deck
• a limited number of transverse bulkheads below the bulkhead deck (fore and aft peak bulkheads
and machinery spaces bulkheads)
18

• perforated vehicle decks.
Typical cross-sections of the present RoRo concept and of this new concept are shown in Figure
2.7.
DECK 4 DECK 4
DECK 3
71DECK 2
xB /5
DECK 1
fwlX
B / 5
DECK 3
ni
DECK 2
DECK 1
\ AI
Figure 2.7 - Typical transverse sections of the present and new RoRo concepts
According to the same authors, the functions attributed to the wing compartments are:
• to enhance the ability of the ship’s sides to absorb the energy of a collision, thereby decreasing
the extent of damage, while also increasing the resistance to breaching during minor collisions
• to provide a positive contribution to the vessel’s overall strength
• to provide essential trimming ballast capacity in the lower hull
• to contribute directly to improved damage stability.
As to the hull flare, the principal advantages are:
• damage stability is significantly improved
• immersed portion of the hull is more protected in case of collision by the overhanging structure.
The perforated decks are useful because they maximise the damaged metacentric height by both
eliminating the isolated free surfaces and lowering the centre of gravity and they are less expensive
then watertight decks.
In his subsequent work, Pawlowski [21] indicates that the breadth of the wing-tanks should be B/10,
the minimum height of the double-bottom is preferable and buoyant decks could be useful. In fact,
in a RoRo ship, due to the large longitudinal unbalance between the aft part, containing the
machinery, and the forepeak, the ship will assume a large trim by the bow after flooding. As deep
sinkage on an even keel would be best from the standpoint of ship stability, it is worth considering
19

fitting the ship with a buoyant deck or decks. These decks should be transversely and longitudinally
subdivided by watertight bulkheads and fitted with air-escapes dimensioned to ensure that the
downflooding remains possible. The height of the double decks should not be greater than the depth
of the deck girders for relevant single decks. The effect of a buoyant deck in the damage stability is
said to be of 5%, but further improvements can be achieved with multiple buoyant decks and
inclined decks. Pawlowski [21] concluded that this new design configuration provides RoRo ships
with a high level of passive safety and allows the ship to meet the new subdivision and damage
stability probabilistic requirements that came into force in February 1992.
Winkle [22], at the University of Glasgow, has proposed a development of Pawlowski concept,
called Glasgow Concept, shown in Figure 2.8. This incorporates two basic principles:
• “Provide an adequate distribution of residual buoyancy, permanently protected against accidental
loss of integrity, that will ensure the vessel will float after statistically predictable damage or
flooding.”
• “Ensure, by the distribution of this residual buoyancy, that at all stages of collision or flooding
incidents, the vessel will remain stable upright and able to accommodate small angles of heel due
to potentially asymmetric conditions during flooding.”
Paucttgcr Spicci over Paucngcr Space* over
Ccnue
Smittfiwltfil DeckC uing
Siurei
Car*and
TrimTanka
CanMachinery. Tanka. Stores ami Void Spaces
Can
Glasgow ConceptParent
Figure 2.8 - Typical transverse section of the Glasgow Concept
The first principle is achieved by providing an integrated buoyant wing and bottom structure,
permanently segregated from the cargo and passenger spaces. This buoyancy lifebelt has to have
sufficient capacity to support the weight of the ship and its cargo, even with a substantial percentage
of this capacity lost through damage. It also has to provide for a substantial residual freeboard to the
freeboard deck. In order to ensure this last point, adequate permanent transverse subdivision of this
20

buoyant lifebelt must be assured. The second principle requires close attention to the stability of the
vessel at all stages of flooding. Therefore, all compartments should be symmetrical and the main
internal cargo spaces shouldn’t allow a built up of large, elevated, free surfaces. Downflooding
should be provided by large section openings along the freeboard deck.
The translation of the concept into a viable and competitive design faces two design problems [22].
The first is to provide the necessary quantity and distribution of reserve buoyancy within the wing
tanks and double bottom structure. The second is to make as much use as possible of the lower
spaces of the ship for cargo to provide downflooding capacity. One possible solution would be to
move the machinery to the newly formed wing tanks, but this would require electric transmission
rather than mechanical transmission. Access to machinery spaces, once at sea, would have to be
from above, in order not to compromise the integrity of either longitudinal or transverse bulkheads.
An example of such arrangement may be seen in [22]. As to the applicability for conversions, the
fitting of existing ships with downflooding ports improves the amount of floodwater that can be
safely accommodated. However, the fitting of wing tanks causes a reduction in lane length that
might be economically unacceptable. Furthermore, this solution is only practical for vessels with
large cellar decks.
The disadvantages of this concept are that:
• the arrangement requires careful design to ensure the correct balance of downflooding and
buoyant wing spaces
• the downflooding arrangements must be designed to resist the spreading of fire
• increased ship dimensions are required to accommodate the wing tanks and maintain the cargo
capacity.
2.4.3 Increased Freeboard
One other possible measure to increase the safety of these vessels is to increase the freeboard to the
main vehicle deck, which has been seen to be very low (section 2.1.2). This may have a significant
effect in preventing the water to enter the ship. However, increased freeboard may create difficulties
in the design because it may make the KG difficult to control, so tending to reduce stability (or
alternatively requiring a greater beam and consequently causing powering difficulties). It would
21

also probably lead the designers to place more accommodation below the vehicle deck, increasing
the potential number of deaths in case of accident.
2.4.4 Increased Metacentric Height
Increased GM would help to prevent the entry of water due to heeling and reduce the rate of heel in
response to any water entering. However, these vessels already have a large GM and any further
increase would make the ship very unpleasant. The increase of GM has been tried using structural
sponsons, but Marsano [23] has pointed out the problems associated with large GM’s and the
extreme measures used to solve this problem. Besides that, the structural sponsons make the
evacuation of passengers using lifeboats even more difficult and represent an increase in the weight
of the vessel of which no economic benefit can be expected.
Aston and Rydill [24] presented one other option to improve RoRo ship survivability: flare and side
chambers. They demonstrated that by incorporating those features in RoRo ships, significant
improvements could be made to their survivability. The advantages to be expected from these
design modifications are:
• flared sides can be conveniently combined with wing tanks to increase stability in the flooded
condition by providing increased waterline beam and buoyancy reserve
• the effects on resistance and propulsion and seakeeping of these modifications are likely to be
minimal with the modest flare being considered and some measure of protection against collision
damage below the waterline is provided by absorbing more energy in deforming the above water
structure of the raming ship
• if enough flare is used, it may assist in using lifeboats on the high side of a heeling vessel.
The main disadvantages of these modifications are the increased initial cost, the increased structural
complexity, the increased weight and the reduced simplicity of construction.
2.4.5 No Bow Door
It has been argued that in large passenger RoRos, which are wide enough for vehicles to turn around
inside the ship, it is possible to load and unload only through the stem door, avoiding the use of a
bow door. However, this solution entails a penalty in turnaround time with all the associated
economic implications. Furthermore, the problem remains for smaller passenger RoRos. This
22

solution does not diminish, either, the dangers associated with a collision since the internal
arrangement is unchanged. For these reasons, this potential solution has not been used in recent
designs.
2.5 The Development of Passenger RoRo Ship Subdivision and Damage Stability
Rules
2.5.1 The 1960 SOLAS Convention and Resolution A.265
The International Maritime Organisation (IMO) has approved criteria that establish minimum
subdivision and damage stability requirements for passenger RoRo ships. The first convention of
interest for this discussion was the 1960 SOLAS convention. This convention introduced the first
specific criterion on residual stability standards: minimum residual GM of 0.05 m and 7° of final
heel due to asymmetrical flooding. This was intended as a margin to compensate for the upsetting
environmental forces (mainly wind and waves). However, the SOLAS 1960 provisions proved
insufficient to account for the rapid development of passenger RoRo vessel technology in the years
that followed. Furthermore, the deterministic method on which these provisions were based
contained several deficiencies that lead the IMO to conclude that no new proposal could
satisfactorily correct these deficiencies of the deterministic method. Therefore, an ad-hoc panel was
assigned in 1967 to prepare new regulations based on a probabilistic approach. This approach
showed patterns in accidents that could be used in improving the design of ships. Because it is
based on statistical evidence as to what actually happens when ships collide, the probabilistic
concept provides a far more realistic scenario than the earlier deterministic method. The work of the
ad-hoc panel was based upon casualty data studies, voyage data studies (regarding loading, draft
and operating GM) and model tests performed by Middleton [25] and Bird [26]. It resulted in the
adoption of the A.265 [VIII] Resolution [27] (intended as an equivalent to part B of chapter II of
SOLAS 60). The 1974 SOLAS adopted the A.265 [VIII] Resolution as an alternative to the
deterministic approach, which remained in use in that convention. However, for most of the
passenger RoRo vessels the requirements contained within this new probabilistic framework are
more stringent than the deterministic requirements. Therefore, the A.265 [VIII] resolution has not
been much used on passenger RoRo vessels in spite of the efforts of Robertson et al [27],
23

2.5.2 The 1990 SOLAS
The loss of the European Gateway (1982) demonstrated the insufficiency of the amended SOLAS
1974 rules to address the problem of passenger RoRo ships damage stability effectively. However,
it was the loss of the Herald o f Free Enterprise (1987) to draw particular attention to the RoRo ship
damage stability problem. In October 1988, the MSC adopted a package of amendments arising
from the Herald o f Free Enterprise tragedy that entered in force on 29 April 1990. They became
known as the "SOLAS 90" standard [6], These amendments expand the existing regulations and
take into account such factors as the crowding of passengers on one side of the ship, the launching
of survival craft on one side of the ship and wind pressure. The new requirements are:
• a minimum range of positive stability of 15 degrees beyond the angle of equilibrium after
flooding, which should not exceed 12° for the two compartments flooding and 7 degrees for one
compartment flooding
• a minimum area of 0.015 m.rad under the residual righting lever curve
• a minimum residual GM of 0.05 m, with a maximum GZ of at least 0.10 m, increased as
necessary to account to the action of the wind, passenger crowding and lifeboat launching.
Shortly afterwards, important changes applying to cargo ships of 100 metres or more in length built
after 1 February 1992 were made into the way in which the subdivision and damage stability is
calculated. The amendments are contained in a new part B-l of Chapter II-1 [6] and are based upon
the probabilistic approach. This indicates that the development of an “harmonised” damage stability
standard based in probabilistic concepts is to be expected in the near future. Furthermore, this new
standard will be, most probably, mandatory also for passenger RoRo ships.
Although the entry into force of SOLAS 90 meant that all passenger RoRo ships built since April
1990 had been built to improved damage stability standards, some governments were still
concerned at the safety levels of existing ships. The United Kingdom then proposed that the SOLAS
90 standard be made mandatory on existing ships under a phase-in programme that would have
lasted from 1994 to 2004. However, only a modified version of the SOLAS 90 standard was
approved, which included provisions for:
• a reduction of the minimum range of the residual righting lever curve
• calculation of the residual righting lever by the following formula:
24

1V1 •
G Z (m etres) = — - ( 2 . 1)M
provided that in no case shall GZ be less than 0.09m and where Mi is the heeling moment and M
is the ship displacement.
The phase-in period depends upon the value of a ratio known as A/Amax, determined in accordance
with the MSC Circ. 574 [28]. It is worth stressing that these April 1992 amendments are particularly
important because, for the first time, they apply to existing ships.
2.5.3 The Estonia Accident and the November 1995 SOLAS Conference
The Estonia accident seriously affected the public opinion in Western Europe and mobilised the
IMO and several Administrations with the aim of significantly improving the safety level of
existing and future passenger RoRo vessels. The fact that the Estonia accident again involved the
bow door and water on the car deck led to renewed criticisms of RoRos, the way they are operated
and the basic RoRo concept. Because of this disaster, a Panel Of Experts (POE) was set up by IMO
to carry out an intensive study into RoRo design and operations in order to identify weaknesses in
the existing regulations. The main conclusion of the Panel was that the requirements of the SOLAS
90 standard should include the effect of water being accumulated on the RoRo deck, in order to
enable the ship to survive in more severe sea states. It was also concluded that the one-compartment
standard should not be accepted for new passenger RoRo ships carrying more than a relatively low
number of passengers. Furthermore, the existing one-compartment ships should be modified to
comply with a two-compartment standard or have their certified number of passengers reduced. It
was also recognised that there should always be an inner door behind the bow door or visor to act as
a second line of defence and that the drainage of water from the main deck should be improved.
In 1995, a SOLAS conference was held to deal with these important proposals of changes to the
SOLAS. During that conference, amendments that will have the effect of applying the full SOLAS
90 damage stability standard to existing passenger RoRo ferries were adopted. The most
controversial issue during the conference concerned the POE proposal that the SOLAS 90 standard
can be met with up to 50 cm of water on the vehicle deck. The POE proposed this standard to be
applied both to new ships and to existing ferries over a number of years. However, it was
recognised that this could result in extensive modifications having to be made to some existing
ships and that the costs would be so high that some of the ships might have to be scrapped.
25

Furthermore, several governments pointed out that sea and weather condition in their regions meant
that the proposed standard was not necessary. Therefore, proposals that a new requirement dealing
with water on the vehicle deck be included in the SOLAS Convention were given up. Instead, the
conference adopted a resolution (the 14th) that permits regional agreements to be concluded on
specific stability requirements for passenger RoRo ships.
2.5.4 Stockholm Agreement
In accordance with Resolution 14, several governments concluded the Stockholm Agreement [8],
which will enter in force on 1 April 1997. The new standard is essentially the same as that agreed
by the IMO experts, but has been slightly amended because of further research carried out during
the latter half of 1995. The Stockholm Agreement superimposed on the SOLAS 90 standard an
additional layer of water, 0.5 deep, on the RoRo deck. This layer of water can be reduced if the
residual freeboard is more than 0.3 m, with a gradual reduction to 0 m, when 2 m freeboard remain.
A further parameter to reduce the water on deck is the significant wave height in the area of service.
An alternative approach is a model test in accordance with SOLAS regulation II-1/8. The individual
ship is to be tested according to a reasonably realistic testing method and proof established that it
would not capsize in irregular seaways representing the ship’s intended area of operation. However,
it remains to be solved the problem of the transcription of the model results into full scale. This
development indicates that, in the future, the assessment of the safety of RoRo ships through
properly defined experiments (as outlined in Resolution 14 of SOLAS 95) will be considered as a
valid way of improving their safety. Some authors, like Turan [9], have even pointed out that, in the
near future, RoRo safety assessment may be carried out using numerical simulations previously
validated and calibrated by the model experiments. These two developments are responsible for the
renewed interest in experimental and theoretical studies of RoRo ship flooding and capsizing.
2 6

CHAPTER 3 - EXPERIMENTAL AND THEORETICAL STUDIES OF RORO SHIP
DAMAGE STABILITY
3.1 RoRo Ship Damage Stability Experimental Studies
Since the 1960’s, a great deal of damage stability model experiments concerning passenger RoRo
ships have been performed. These investigations have been extremely useful to gain insight into the
mechanisms of water ingress and ship capsizing, both in calm water and in waves. The influence of
such variables as draft, residual GM, damage extension, damage location, static heel angle, stability
improving devices and type of subdivision above and below the bulkhead deck have also been
studied. The knowledge gained through these experiments has been used to improve the
deterministic requirements of the SOLAS, to develop the new probabilistic damage stability
standards and to calibrate and validate the time domain theoretical models of damaged ship
motions. A brief discussion of the most significative model tests programs is here included.
3.1.1 The Department of Transportation Research Programme
Dand [29] reports a comprehensive programme of research aimed at accessing the various factors
affecting capsize and the efficiency of several remedial measures to prevent capsize. For this
purpose, a RoRo ship model with a midship port side damage was used. The main conclusions were
that:
• the wave amplitude, the wave period and the wave spectrum are all variables of importance
when studying how much water gets in to the vehicle deck
• the position of the centre casing has an important effect on the capsize probability, which is
reduced if side casing is used
• a static heel towards the damage increases the probability of capsize while a static heel away
from the damage reduces that probability
• the wind appears to have a minor effect on capsize
During this research programme, a limited number of model tests were performed with deck
obstructions (dummy vehicles). The influence of these obstructions is not clear since for small
27

residual freeboards capsize was largely eliminated, both for damages facing and away from the
waves, and for large residual freeboards the probability of capsize was increased. This paradoxical
behaviour is caused by the complex flow pattern of the water across the vehicle deck. Nevertheless,
the most important conclusion is that the dummy vehicles trap the water on one side of the vehicle
deck, causing the model to heel to that side. This can decrease or increase the survivability of the
model, according whether the side of the heel is that from which the waves are coming or not.
The sudden influx of water was also investigated to obtain any evidence that might suggest the
existence of the transient asymmetric flooding proposed by Spouge [14]. With the damage located
portside, 100% permeability and the model captive, it rolled to starboard due to the inflow passing
across the compartment and impinging on its far side. After about 20 s the model settled at its new
equilibrium draught with zero roll moment. For a compartment with a much lower permeability
Dand [29] has the following opinion: “the transients (roll) would last longer and might have a
greater effect on a ship”. With the model free and in calm water, it rolled initially to starboard and,
after a while, developed a mean heel to port due to the effect of the floodwater moving rapidly to
the port side of the flooded compartment. Further tests performed in waves showed no tendency of
the model to capsize or to behave differently from an intact model with a large flooded tank
amidships.
3.1.2 The Nordic Project “Safety of Passenger/RoRo Vessels”
Following the Estonia accident a joint Northwest European project “Safety of Passenger/RoRo
Vessels” was set up with the aim of taking a new look at the stability and survivability requirements
for passenger RoRo ships. Svensen [3] reports that as a result of the shortcomings found in the
present SOLAS deterministic standard, it was concluded that a new probabilistic standard would be
more logical and consistent with current thinking on safety analysis and risk management. In order
to set up a new probabilistic standard, investigations in damage stability modelling methods,
damage extent, large scale flooding, dynamic effects in waves, cargo securing and shifting and
mathematical models for capsize predictions were undertaken. The experimental research, reported
by Schindler [30], was designed to evaluate the importance of KG, sea state and damaged freeboard
to the model's (1:35 scale) ability to survive a midship damage. The main conclusions drawn from
the experiments were that:
• increasing the damaged freeboard has a positive effect on survivability
28

• assuming the same damaged freeboard the survivability for a forward damage is much better
than that for a midship damage, because the forward slope of the RoRo deck causes the flooding
water to accumulate in the forward area of deck increasing the trim and limiting the amount of
water accumulated in the deck
• a smaller or larger damage opening than the standard SOLAS-74 size opening would provide
less safety against capsize than this standard size (some further research being needed here)
• the ability of the models equipped with centre casing to survive high waves is much lower when
compared to the models with side casings because the centre casing prevents water from crossing
the centreline thus depressing the damaged side and because the undamaged parts of the side
casings represent considerable buoyancy
• full height transverse bulkheads are effective in protecting against capsize, but half height
transverse bulkheads, in combination with the centre casing, when unprotected from above,
provide only limited protection against capsize.
Further model tests were carried by Aanesland [31] to investigate the behaviour of the damaged
models as function of significant wave height for given combinations of KG values and damaged
freeboard. Two models (1:35 and 1:42 scales) were used which were geometrically correct with
respect to hull forms, flooded compartments and RoRo deck. Both vessels were tested having a
midship SOLAS damage covering both the RoRo deck and the compartment below. The main
conclusions were that:
• the model fitted with a side casing is better than with a centrecasing because of the additional
buoyancy at the ship sides and the reduction in flooded area on RoRo deck
• the model fitted with a centrecasing always capsized towards the waves and with a sidecasing
capsized to both sides depending on the initial heel and the specified wave trains that followed.
• introducing transverse bulkheads increases significatively the survivability in both the
centrecasing and sidecasing design
• damage about midship seems to be the worst case when it comes to water ingress and danger of
capsize
29

• damaged freeboard is one of the major parameters defining the survivability of the model
because waves will not reach the main deck so often and will be able to drain through the
damage in larger portions between the waves giving water ingress.
3.1.3 The Canadian Investigations on RoRo Ship Safety
A research project to investigate the major parameters influencing the capsizing of RoRo ships after
the hull is ruptured at amidships is reported by Stubbs et al. [32]. Its purpose was to establish the
effect of ship stability parameters on the limiting significant waveheight in conditions compliant
with the limiting SOLAS 90 GZ, area and 15° range criteria at the selected 0.5, 1.0 and 1.5 m
residual freeboards. In addition, the potential for improving survivability by draining the car deck
through freeing ports with outward opening flaps was investigated. The model used replicates the
design and proportions of a large Canadian flag ferry (1:20 scale). It has a constant cross-section, a
damage opening complying with SOLAS damage stability criteria, freeing ports at the car deck
sides and a removable centreline casing extending over 2/3 of the model length. The main
conclusions derived from the experiments with this model are that:
• SOLAS 90 damage assumptions and stability criteria offer capsize safety in significant wave
heights from 1 m with 0.5 m freeboard, to 3 m with 1.5 m freeboard
• residual freeboard is very important in preventing a capsize, particularly in allowing water to
drain from the car deck through freeing ports
• flapped freeing ports introduce an increase in the model’s survivability as freeing port area is
increased, specially for residual freeboards of 1 m or more
• with freeing ports and sufficient residual freeboard for water drainage from the car deck, removal
of a centreline casing leads to dramatic benefits in survivability.
• capsize is a hydrostatic phenomenon, occurring once sufficient water accumulates on the vehicle
deck.
A subsequent series of tests, reported by Molyneux et al. [33], using a realistically shaped hull (1:16
scale) was carried out over a range of residual freeboards, static stability conditions and freeing port
areas on a model with and without a centreline casing. The objective of the research was again to
define the limiting significant waveheight to cause capsize for a range of stability parameters and
freeing port areas. The main conclusions drawn from this study are that:
30

• the survivability of the model improves if the centreline casing is removed and water is free to
flow across the full width of the model
• SOLAS 90 does not provide a uniform standard of safety (at least for this model hull) and the
residual freeboard is a parameter that should be included in any modifications to the regulations
• significant advantages are to be gained by draining the deck of the damaged RoRo ferry by mean
of freeing ports which prevent the volume of water on the car deck from reaching a critical
amount, provided that there is sufficient residual freeboard to allow effective drainage
• GM in the flooded condition in its non-dimensional form is a reasonable predictor of the
survivability of damaged RoRo ships, when combined with the ratio of residual freeboard to
significant wave height. However, more work is required to define a consistent predictor that
takes into account other known factors such as the width of the floodable deck in relation to the
overall beam.
3.1.4 The Dutch Investigation
A systematic program of model tests has also been carried out in the Netherlands by J. Joumee, H.
Vermeer and A. Vredeveldt [34]. These model tests tested the effects of the GM, ingress area, initial
heel angle, presence of longitudinal bulkheads and cross ducts, reduction of permeabilities and
down-flooding on the behaviour of two different vessels (both at the 1:50 scale). The results are
intended to validate a time domain mathematical model describing the ship’s motion while
flooding. The models were tested in beam waves and the roll angle was measured against time. The
experiments allow the conclusion that:
• obstacles (like engines) in flooded compartments cause a considerable increase of the model roll
damping
• certain combinations of the GM-value, size of the collision gap and initial heel angle may cause
the vehicle deck to flood leading almost certainly to the model capsizing
• for one of the model ferries tested, longitudinal bulkheads in the engine room area improved the
model’s survivability
• the effect of cross-ducts is very positive as long as obstacles in these ducts are avoided.
31

• sloshing may have a significant role in ship behaviour, specially if the flooded compartments
are wide
• deck openings in the RoRo deck, through which water at deck can flow downwards, seemed to
have a small negative effect on the model safety.
3.1.5 The Spanish Investigation
In Spain, Riola and Maron [35] performed a number of model tests in waves with a damaged
passenger RoRo. The aim of this work was to increase the understanding of the effect on stability
and survivability of the water inflow in the main deck after a side damage. The ship forms used in
the tests are based in the ones of a Spanish passenger RoRo. The model was built on a scale of 1:24
and tested in three different seastates while varying the residual freeboard and intact GM. The
damage was located amidships. The main conclusions drawn were that:
• the model tends to heel towards the side opposite to the incoming waves, therefore increasing
the real freeboard at the damage side
• the heeling towards the side opposite to the waves increases until the real freeboard at the
damage is large enough to avoid further ingress of water
• larger GM results in a larger accumulation of water but with a final mean list similar to the case
of lower GM’s
• the model was able to withstand waves up to 4 m significant height with a GM as required by
SOLAS 90 or higher.
3.1.6 The Japanese Investigation
Ishida and Murashige [36] have conducted a number of model experiments with a Japanese
passenger RoRo ship (1:23.5 scale) in beam regular and irregular waves. The model used in these
experiments was fitted with a permanent side casing and a removable centre casing. The influence
of the residual GM, wave height, centre casing and initial heel was investigated. The main
conclusions regarding the influence of damaged freeboard and of centre casing are that:
• capsize only occurs with small GM values, in which SOLAS 90 requirements are not satisfied
32

• as the residual freeboard decreases the final list increases but the quantity of water on deck
decreases since these smaller residual freeboards cause the model to heel to lee side, making the
damage opening higher. As the residual freeboard increases the quantity of water on deck also
increases but the model’s final list is smaller
• when the model is fitted with a centre casing or has an initial heel angle towards the weather
side, if the residual freeboard is small, the ship heels to the weather side and a strong probability
of capsizing exists.
3.1.7 The HSVA Investigation
Chang and Blume [37] report a large number of model tests in waves with a passenger RoRo model
performed at HSVA (Hamburg Towing Tank). The main objective of this research was to
investigate the influence of deck arrangement in the RoRo behaviour and to validate a theoretical
model of damaged RoRo ship motions. Three vehicle deck subdivisions were investigated: centre
casing; centre casing and two full transverse bulkheads; two transverse bulkheads and a longitudinal
bulkhead located at approximately B/4. The main conclusions drawn from the model tests with
these three subdivisions are that:
• larger damage freeboards reduce drastically the necessary stability of a damaged ship to avoid
capsizing
• an unreasonably large metacentric height is required if the model is not to capsize with a
SOLAS 74 damage
• additional vehicle deck subdivisions increase the capsize resistance considerably, but transverse
subdivision is preferable to longitudinal subdivision in what regards survivability.
3.1.8 Conclusions
The damaged RoRo ship model experiments reported above allow the conclusions that:
• damaged RoRo ship behaviour in irregular seas is an extremely complex phenomenon, which
will certainly require more experimental work before it can be fully understood
• freeboard and GM after damage are the governing parameters of RoRo survivability under
given environmental and operational conditions
33

• the SOLAS 90 damage stability standard is appropriate in providing a satisfactory level of RoRo
ship safety but the various research programmes do not agree on its precise safety level
• the SOLAS 74 damage stability standard is inappropriate and inconsistent
• the centre casing is detrimental for the ship’s safety and causes the ship to capsize towards the
damaged side. Sloshing may be of importance in RoRo ship behaviour if flooded compartments
are wide
• the transverse subdivision of the vehicle decks has a very positive influence on RoRo ship
survivability
• the transient asymmetric flooding, the influence of obstacles, the effects of permeability and the
sudden influx of the water inside compartments located below the bulkhead deck is
insufficiently studied. Some model tests suggest that these phenomena may be of importance,
which is the reason for the model experiments undertaken in the current work.
3.2 RoRo Ship Damage Stability Theoretical Studies
A number of time domain theoretical models of damaged ship motions have appeared in recent
years in the literature. These models have been used to investigate RoRo ship accidents and to
identify important parameters in the safety against capsize. The advantages of these theoretical
models are that they provide a more realistic and comprehensive representation of both the flooding
and heeling processes than traditional static calculations. This representation allows the estimation
of the time available for evacuation purposes, the estimation of the capsize resistance of a damaged
ship of any type and with any arrangement in a seaway and is capable of helping the researcher to
identify the critical parameters characterising the survivability of RoRo vessel.
However, because of the very comprehensive nature of this approach, the computational time
required is often quite long. This disadvantage has offset the above-mentioned advantages during
many years but the fast development of computers has now overcome this difficulty and establishes
the time domain modelling of damaged RoRo ship motions as a very promising technique.
3.2.1 The European Gateway Flooding Simulation
In the wake of the European Gateway (EG) investigation, Spouge [14] developed a theoretical
model of the flooding of that vessel in order to explain the accident and investigate the effects of
34

various hypothetical cases of damage control. Flow rates through damage openings and open
watertight doors were calculated using hydraulic methods and integrated to give the volume of
water in each compartment at the end of each time step. The distribution of water in the
compartments was calculated for assumed angles of heel and trim. It was also possible to modify it
to represent the effects of the transient asymmetric flooding. This effect was modelled by
considering the centre of gravity of the floodwater in the compartment to be initially offset towards
the side of the hole and then to move gradually towards its static position. Spouge considered an
additional transient effect: a vertical fluid dynamic force that decayed rapidly, representing the
action of the flooding water falling from the mean level of the hole to the tank. The model was able
to incorporate the effects of the moment of lost buoyancy due to the damage and included the water
washed into the damaged compartments by wind-generated or collision-generated waves. The
asymmetric flooding of the double bottom was taken into account but collision forces, wind forces
and wave-induced motions were neglected.
The simulation started with a known intact condition and proceeded by small time steps, using the
ship condition in one time step to estimate the ship condition in the next time step. The heeling and
righting moments acting on the ship at each time step were then calculated for each assumed heel
angle and the equilibrium angle at the current time step was interpolated from them. The ship
condition at this equilibrium angle was then calculated and used as an estimate of the next time step.
This was, therefore, a quasi-static simulation, since the actual equilibrium angle of the ship with
certain amounts of water in the flooded compartments was calculated assuming that at each time
step the ship was in equilibrium.
Figure 3.1 shows the simulation results that agreed with the available evidence. These indicate that
150 tonnes of water entered the generator room and 5 tonnes entered the main deck while the ships
were in contact, because of the collision-generated wave. Therefore, high initial rates of flow must
have been present. The simulation indicated that grounding on the starboard bilge was achieved at
160s, when the ship had a heel angle in excess of 32°. The transient effects used consisted of the
floodwater centre of gravity in the generator room being initially offset 5 m to starboard. It was also
assumed that the centre of gravity would then move to its static position at a rate proportional to the
square of its offset. The flooding simulation revealed that the doors would have had to be closed
within 50 seconds of the collision to have saved the ship. Furthermore, the extensive vehicle deck
35

and the low freeboard of this type of ship made the European Gateway certain to sink once it had
reached 12° heel in its damaged condition.
t o
30HEEL
ANGLE (O E G ) ?5
20
IS
10
s
0TIM E SINCE COLLISION ( S E C )
Figure 3.1 - Simulated time history of the EG heeling (from [14])
3.2.2 The Herald o f Free Enterprise Flooding Simulation
During the investigation of the Herald o f Free Enterprise (HFE) accident, carried out by Dand [15],
the flooding simulation model used in the previous inquiry was further developed to allow
floodwater to come from stranding or open bow doors. Time histories of the ship motions and
flooding were computed for various assumed departure conditions. The simulation proceeded until
stairwells and other openings flooded the superstructure, that is, it stopped long before capsizing
occurred.
o»n
u_»uzc_»_»ooc.
-SUPERSTRUCTURE BEGINNING TOflood
II -
r TT T
• 10 40 S0 •» iaa iza
TIME ( S a c s )
Figure 3.2 - Simulated time history of the HFE heeling (from [15])
36

Dand [15] finally proposed the time history of the HFE flooding and heeling process shown in
Figure 3.2. According with that Figure, the ship quickly heeled to an angle in excess of 30° and,
after that, it rolled back to around 24° and finally stabilised heeled to 25°, resembling the oscillation
of a heavily damped rigid body. A possible explanation of this behaviour is that the water entering
the ship through the open bow door accumulated on one side of the car deck. A very large heeling
moment was created which caused the vessel to heel quite rapidly. The ship only regained stability
at about 25°. The fact that the ship heeled until it reached 30° suggests that the water flowing into
the car deck may have acted like a suddenly applied heeling moment. The simulation was stopped
at about 80s but it is stated that at least 500 to 800 tonnes of water were needed on the vehicle deck
for capsize to occur. This can be explained bearing in mind that only a sufficient quantity of water
trapped on the vehicle deck can cause such a severe loss of dynamic stability that even a small
upsetting heeling moment may lead to capsize.
KIL
TMi
Figure 3.3.a - Capsize mechanism with sudden loll angle (from [4])
HEEL
Figure 3.3.b - Capsize mechanism through slow flooding (from [4])
Based in the inquires to the EG and HFE accidents, Spouge [4] has outlined the two possible modes
of capsize for passenger RoRo ships shown in Figures 3.3.a and 3.3.b.
37

In the first mode of capsize, the ship is initially upright and water flows to the car deck through
some mechanism because of lost freeboard. As the free surface of even a small quantity of water
spreaded over the car deck causes a loss of initial stability, the ship will suddenly heel, only
regaining initial stability at an angle of loll. If this loll angle cause flooding through some other
opening, then the ship may capsize after sufficient water has collected in the car deck. This
behaviour seems to have caused the HFE accident. It may also happen that the loll angle cause the
shifting of the cargo, which in turn further increases this loll angle up to the point where the ship
cannot sustain the effects of environmental heeling moments and suddenly capsizes.
The second mode of capsize occurs if some separate event causes heel which, in turn, immerses a
damage opening in the main vehicle deck. The water entering through the ship’s side increases the
heel, further immersing the breach and, therefore, increasing the flow rate. In this capsize
mechanism, the increasing heeling moment caused by the floodwater slowly increases the angle of
loll until the dynamic stability becomes so small that the ship capsizes. This mechanism seems to
have been the one present in the EG accident.
3.2.3 The Sen and Konstantinidis Flooding Model
Sen and Konstantinidis [38] have also developed a theoretical model of RoRo ship flooding with
the aim of evaluating the damage stability characteristics of RoRo ships in order to develop
probabilistic criteria and standards. Since in this study the intermediate stages of flooding are very
important, it was necessary to develop a flooding model in order to obtain all the intermediate
stages. The model used the added-weight method of computation to estimate the intermediate
stages. The assumptions of the model were:
• at the end of each time interval the ship is in static equilibrium
• all ship hydrostatic properties are constant during each time interval and equal to those
calculated at the end of the previous time interval
• the flow rate is constant during each time interval and is determined by the relative head of water
at the end of the previous interval
• the discharge coefficient for the damage aperture is constant throughout the simulation
• the sea surface is calm
38

• the incoming water is assumed to settle to an equilibrium surface. However, its centre of gravity
can be kept off the equilibrium position for a certain number of time intervals in order to
simulate the transient effect.
The program stopped when the differential head of water was zero or when the water reached the
upper deck. The hydrostatic properties required by this theoretical model were obtained using
numerical integration of the ship offsets. This theoretical model yielded the time history of the
ship’s behaviour in terms of trim, heel, draft, GMj, GMl and mass of water inside the damaged
compartment, taking into account downflooding and crossflooding.
3.2.4 Early RoRo Ships Motion Simulations
After the pioneering works reported above, two time domain flooding simulation models using the
solution of the ship motion equations have been presented in the literature. Based upon results of
the investigations to the EG and HFE accidents, Paulo [39] attempted to develop a general
theoretical model to simulate the flooding of any marine structure. Due to the complexity of the
problem, the following restrictive assumptions were made:
• only monohull barges with no forward speed were considered and no wind or waves were taken
in account
• the barge moves about its intact upright centre of gravity
• no prediction of capsize was made
• the flow through hole (one in each compartment) was modelled as in classical hydraulics and no
consideration of crossflooding was made. Furthermore, the flow of water was considered
quasistatic, i.e., water settled down to a regular volume with a flat free surface parallel to the
mean sea level
• the compartments are free of significant obstructions
• the external force was made of unbalanced lateral pressure, slamming on the deck of the flooded
compartment and the distribution of water in the compartment.
The one feature of this theoretical model that makes it original is the solution of a set of coupled
non-linear equations of motion with time dependent coefficients for the six rigid body modes. The
simplified equations are:
39

M( t ) + A( t ) x(t)+B(t) x{t)+c(<|>,e, o = F{t) (3.1)
where:
M(t) is the structural mass matrix
A(t) is the added mass matrix
B(t) is the damping matrix
C(<J),0,t) is the stiffness matrix.
In this system of differential equations with constant and variable coefficients, the nonlinearities
arise from the stiffness terms. The equations of motion are solved by a time stepping technique, the
Runge-Kutta 4th Order Method. The flooding is considered as an added weight and an external
exciting force. The objective of the simulation is to establish the time history of the vessel heel, trim
and sinkage in calm waters.
Dand [29] proposes a similar theoretical model which main assumptions are:
• waves are considered and taken as long-crested and unidirectional, regular and irregular
• the water-on-deck is represented by quasi-static methods and no sloshing or time lags due to
flow across the vehicle deck were considered
• the viscous damping and added mass terms are not dependent on frequency
• the yaw and pitch motions are of second order and can be neglected.
This model consists of the numerical integration of the equations of motion. The buoyancy force,
buoyancy moments and centre of buoyancy are computed for each time step. The additional weight
of water on deck was used to recalculate the weight of the vessel and its centre of gravity at each
time step. The water on deck was modelled in a quasi-static manner. The flow of water to the main
deck was assumed to depend on the instantaneous incident wave “overtopping” or not the damage
opening (assumed rectangular) and on the relative heads of the water inside and outside the ship.
Water was assumed to drain outside according to a weir model of flow. The modules responsible
for these calculations were tuned with the experimental results until the heave and roll behaviours
roughly matched the ones shown by the physical model. Among the tests performed with this
model, the results shown in Figure 3.4.a are especially interesting because they resemble Figure
3.3.b, although waves are now being considered. Waves seem to cause oscillations on the heel and
40

water on deck time histories and exacerbate the flooding of the car deck, accelerating the water on
deck build-up leading to the capsize.
i - =
'!ZTZ!ZT'X"Z"IZE”r ■]—+—|—j—i— i z i z n z x x x x x :iz : |z id : : t : j :± : ; t :i—r - i —i— f—r--i— r -
j-.-f-p:1—T—i-ZiZ Z'TZIIZiZ:|zjzj:z|zz{zizi:zjz: i z i z i : ± ± ± : t r :
I—i—H-4-4—i™-i—i—4_i:_±z
’[Z]ZrZ'’Z"Z'"E"Z’!Z]"’-f—i—j-d—j—-j— —j—y ::izi:zi:j::izr::iz:t:iz|_!j z t z f d d i d i ' t t p i-r—i—r~i—f-i—t--i—i- 4—j—j—|—j—4—-j—j—i-x r z n x x x x : i z i : ± ± ± ± : i z ; h
j __L I " I "I ' I L
Figure 3.4.a - Water-on-deck time history (from [29])
iJ -3
i
I j
j i
i:zj::±
-4-4
::r:r;]z:[z!:z[:z::z''i"z']z'!zrz! -4---P4—[—]—i - j —f —! :f::u:n:fZi:zp::x4:r:i::jZj:zi± ::tiz :iz j:± ± :i::t± :h :jz j:z j±:x±:izi:zt:d::i:±:±:iz:izi:z! X-i—i-4-i-4-4-4--i—f-4-l-i—i
k-|-4 -
t+—f- IZj
zj::X:zr;±:-M -4 :4::
:|:::pz:fzj:4:4zl::t:X::tzj . . . j— -j— r ~ ^ — j-— f - - - i— f— -f— -j—
I-”!—1— t—1—I—!—}—!— t x i c p p p p t i i z t z
-l— 1 1 "1 ~ r r r ~ r XJ_
RoD R«ipon«t
Figure 3.4.b - Roll time history (from [29])
3.2.5 The Strathclyde Damaged RoRo Ship Motions Model
One of the most recent time domain theoretical models of damaged ship motions was developed by
Turan [9]. This model can predict the minimum stability needed by a damaged vessel to resist
capsizing in a given sea state. This knowledge was subsequently to be used to establish limiting
parameters that might form the basis of realistic survival criteria. Alternatively, this model could be
used to provide sufficient residual stability to allow enough time for the evacuation of passengers
and crew in realistic sea states. The main characteristics of the model are:
• the ship is stationary with the beam facing the oncoming waves
• progressive flooding is taking place through a damage opening of any shape, longitudinal or
transverse extent and location throughout the vessel
41

• the simulation starts with predefined initial conditions and the ship moves under the action of
random beam waves
• the instantaneous water ingress is considered by taking into account the wave elevation and the
ship motions.
The equations of this non-linear three-degree-of-freedom model, coupled in sway-heave-roll
motions are:
[M(0 + A]X(t) + B X ( t ) + CX{t) = Fmm + Fwave + Fwoo (3.2)
where:
F w ind is the regular or random wind excitation vector
F w a v e is the regular or random wave excitation vector, using 2D or 3D potential flow theory
F w o d is the instantaneous heave force and trim and roll moments due to flood water
(gravitational effects).
It was assumed that the floodwater moves in phase with the ship roll motion with an instantaneous
ffee-surface parallel to the mean waterline. It was also assumed that the centre of gravity of the ship
is fixed and all subdivisions are watertight. Simulations for different loading conditions and
increasing sea states were performed. The seastate was increased until a limit was reached when the
ship capsized systematically, thus allowing for a definition of survival boundaries.
This model has been extensively calibrated, validated and tested for many different ships ([9], [40]).
One of the early test programmes of this theoretical model was performed using two different ships
with various deck layouts, different damaged freeboards, different KG’s and various damage
locations. The studies were undertaken for a 100% SOLAS damage. The wave environment was
simulated using a JONSWAP spectrum the results obtained allow interesting conclusions, which
agree with experimental results, indicating that the theoretical model represents well the reality.
When a vessel suffers a damage forward or aft, she will naturally trim following flooding, thus
causing the floodwater to accumulate over a smaller area rather than spreading over the whole
vehicle deck as is normally the case with midship damage. As a result of this, flooding is more
symmetrical, the heeling moment is reduced and the elevation of the floodwater increases, thus
causing the water to flow out. This improves the vessel’s survivability and agrees with experimental
results. The effect of random waves on the rolling motion of the damaged ship is rather small, its
42

main effect being that of exacerbating flooding. It was also found that the dominant factor
determining the behaviour o f the vessel is the amount of floodwater accumulating on the vehicle
deck. The floodwater on the vehicle deck increases slowly, depending on the vessel and
environmental conditions, until the amount accumulated reaches a level that cannot be supported
and capsize occurs quite rapidly. In this respect, the effect of heave motion in reducing the damaged
freeboard was found as important as the roll motion.
In spite o f the good results of the previous model, Vassalos and Turan [40] realised that the physical
reality presents yet some other effects that can significantly affect ship’s stability and roll motion.
Examples o f these effects are:
• the hydrodynamic coupling of sway into roll
• the non linear hydrostatic coupling of heave into sway and roll
• the heave influence in the rate o f flooding and roll motions
• the vessel’s drift in beam seas causing sloshing of the flood water
• the significant sway movements
» the changes o f heading and pitching motion occurring in beam waves.
Therefore, to represent meaningfully extreme vessel behaviour, those authors concluded that a non
linear coupled six-degree of freedom theoretical model, coupled with a water ingress model and a
sloshing model, would have to be used. This theoretical model is characterised by the following set
of six coupled differential equations:
r "I t
\M+Mw(t) + A }x(t)+ Mw(.t)+Bylscous X(t)+jK(t-x)X(x)dt - FwA VE+ FdRIFT+ F\VIND+ ^CURRENT* (3 3)*- -I 0
FRESTORING1*' GRA VITA TIOIAL ~ WOD
where:
M w (0 is the flood water matrix moving independently of the vessel but with an instantaneous
free surface parallel to the mean waterline
M w (t) is the rate of flood water matrix (acting as damping)
Bviscous is the non-linear damping matrix
t\ K ( t - x ) X ( ? ) d T is the convolution integral, representing radiation damping0
43

K(t-x) is called the kernel and t is the time lag
Fj are the various generalised force vectors comprising wave (1st and 2nd order), wind and
current excitation as well as restoration and gravitational effects.
In this model, the phase/amplitude difference between roll and floodwater was determined by
building a database based on model tests. However, if the floodwater presents a significant dynamic
behaviour, then the global system has to be studied as two interacting physical phenomena, using
CFD techniques to describe flood water sloshing. The water ingress was modelled probabilistically
with basis on the relative position between wave elevation and damage location. The flow is also
affected by the hydrostatic pressure head, the area of the damage hole, the damage location, the
shape of the opening, the dynamic effects and the edge effect. These last two effects are taken in
consideration using the flow coefficient, which is approximated using experimental results. In the
end, the rate of flow can be found by integrating dQ over the damage opening height:
dQ = K,sign(hM - hia)-j2g\hM - h in\.dA (3.4)
where sign(houl - hin) denotes the sign of this difference.
3.2.6 The Greek Damaged Ship Motions Model
One other theoretical model of damaged motions and flooding was presented recently by
Zaraphonitis [41]. This model consists of a six-degree of freedom model of the damaged ship
motions in waves. It allows the simulation of large amplitude motions and the prediction of
capsizing under specific environmental conditions. The ship is assumed stationary. The effect of the
floodwater is taken into account assuming the mass of water to be concentrated at its centre of
volume. A semi-empirical water inflow/outflow model is used for the estimation of the rate of flow
that consists in the integration over the surface of the opening of a semi-empirical formula.
Radiation and wave diffraction forces are calculated using hydrodynamics coefficients resulting
from the application of a 3D-computer code in the frequency domain and by employing the impulse
response function concept for the calculation of forces in the time domain. Froude-Krylov and
hydrostatic forces are calculated by direct pressure integration of the incident wave pressure and
hydrostatic pressure over the instantaneous wetted surface. Integration is extended up to the
instantaneous free surface taking into account the ship motions and the free surface elevation due to
the incident wave. The distortions of the free surface due to the diffraction of the incident wave
44

system and due to radiation are omitted. Radiation forces and moments associated with the
disturbance of the flow due to the ship motion are calculated using the Cummins procedure [42]. A
quadratic roll-damping model is used to correct the employed inviscid flow model for viscous
effects. Diffraction forces and moments are approximated by superposition of the elementary
diffraction forces associated with each of the component waves composing the exciting wave train.
3.2.7 The Dutch Damaged Ship Motions Model
Joumee and al. [44] recently presented a mathematical model of the damaged ship motions in the
time domain. In the derivation of the equations of motion, the authors used the Cummins approach
obtaining the following linear equations of motion:
oo
[M + A]X(t)+ jB (x ) X ( t - \ ) d i +CX(t) = F(t) (3.5)0
where B(x) is the retardation matrix given by:
2 00B(t ) = — \bi • ( go ) cos(cox )dx (3.6)
TZ 1 0
The model incorporates the possibility that the external loads in the right hand side of the equations
may have a non-linear behaviour. Furthermore, non-linear roll terms may be added. The inclining
moment caused by the weight of the floodwater present in the flooded compartments is treated as an
external moment. The amount of water and its centre of gravity are calculated during the
simulation. To calculate the water flow a simple formula from hydraulics is used. Flow is assumed
to stop when the water levels in adjacent compartments are equal. The flow of air out of the flooded
compartments is computed and it is assumed that if a flooded compartment is below the damaged
waterline it will always trap air in it amounting to 10% of its volume.
3.2.8 The German Theoretical Model
This theoretical model, reported by Chang and Blume [37], considers the ship as a six-degree-of-
freedom system travelling at a given mean angle relative to the dominant direction of a stationary
seaway. The seaway is defined by a spectrum and simulated in the usual way, by superimposing a
number of component waves. Strip theory is used to obtain the heave, pitch, sway and yaw motions
as well as the wave exciting moment and the roll moment induced by the sway and yaw motions of
45

f \ . 2 ) ( .. 2 ^
1Q1II
CD
h S ~ l X2 < j ) + ( |) 0 sin0 - vp 0 c o s 0
K I / I
the ship. Roll and surge are simulated using nonlinear motion equations coupled with the other four
degrees of freedom. The roll motion is determined using the following nonlinear motion equation:
+ MWind +Mwod +Msy +Mwave I ^_ \ / X / J J
s in e +<► cose)}
where:
C, is the heaving acceleration at the centre of gravity
hs is the righting arm in an “effective” longitudinal wave
MD is the nonlinear damping moment taking into account the bilge keels
MmND is the moment of v/ind
MWOD is the moment due to water motion on the vehicle deck and in compartments
Msy is the moment due to sway and yaw motions
Mwave is the moment due to waves.
The righting arms in a seaway are computed from the effective wave profile along the ship’s centre
line. In the simulation, at each time step, the water rates of inflow and outflow through the openings
are estimated from the motion of the internal and external water surface relative to the openings.
The variations of the ship’s mass and moment of inertia due to the inflow and outflow of water are
considered, as well as the forces and moments due to the fluid motions in partially flooded
compartments. The internal water flow is computed using two different methods, depending on the
height of the floodwater. If the water depth is small, the water velocity is computed from the
shallow-water equations in two-dimensions for an accelerated reference system. If the water depth
is greater than 15% of the tank width, a simple equation of motion of the liquid free surface is
solved in the time domain.
3.2.9 Conclusions
The conclusions drawn from the theoretical model above are that:
46

• the ship motions were originally simulated using a quasi-static process but, gradually, the
numerical integration of the ship equations of motion replaced the older method. While in the
early models only some of the 6-degree of freedom were analysed, in the latest models all the 6
degrees of freedom are considered
• the theoretical modelling of the flooding uses well-established hydraulics methods, that have the
weakness of requiring an empirical coefficient K which can vary a great deal during the
simulation
• the early models did not consider wind/waves, but the most recent ones incorporate the effects of
both regular and irregular waves
• some of the early models incorporated the dynamic effects of the floodwater, but in a very
empirical way. Recent models have tried to accurately model these dynamic effects by using
extensive experimental work and sophisticated numerical models
• all the models included in this review use the traditional offset integration methods to compute
the hydrostatic properties of the damaged vessel, except that of Zaraphonitis [41], which uses the
numerical integration of pressures over the ship hull surface (although it is not clear what is the
precise method)
• the initial models did not predict capsize, since the simulation was stopped when the heel angle
reached 30 to 40 degrees, but at this stage all models claim to predict the ship capsize
• although some of the first models modelled crossflooding in an empirical way, most of the
current models do not consider it. This is because these models are aimed at predicting the
behaviour of passenger RoRo ships with a typical SOLAS damage, which is known before hand,
and no progressive flooding is taken in consideration.
47

CHAPTER 4 - THE THEORETICAL MODEL OF ACCIDENTAL FLOODING OF RORO
SHIPS
4.1 The Theoretical Model Assumptions
The task of setting up a theoretical model of damaged ship motions and flooding is very difficult.
Some assumptions have to be made to allow the development of such theoretical model in a limited
time. Some of these assumptions, such as not considering waves and wind, are important and
restrict the applications of this model. However, this theoretical model is simply intended as a first
step towards a more comprehensive model of damaged ship motions, so these assumptions are
expected to be dealt with later. In the current work, an attempt was made to keep the model as
general as possible, in order to be able to simulate the flooding of any ship, whatever the
dimensions and arrangement are. The assumptions of the current model will now be enumerated
and discussed.
4.1.1 Ship Model
The geometry of the ship, which flooding is to be simulated, is idealised as a rigid body made of
watertight discrete compartments. These compartments comprise tanks, holds, machinery spaces,
voids, as well as any other ship spaces, all modelled as independent compartments. Superstructures
may also be taken into account as separate compartments. The permeability of the compartments is
taken, in a first approach, as one.
The loading condition of the ship can be simulated exactly in this model because both the individual
weights that constitute the ship’s displacement and the tank contents may be specified individually.
The tank content is included by specifying its quantity and the compartment that contains it.
4.1.2 Environmental Conditions
As far as environmental conditions are concerned, it is assumed that there are no wind, waves or
current. The assumption of no waves simplifies the modelling of the water pressure acting on the
hull and of the water pressure acting across a damage opening. It also simplifies the solution to the
problem of the floodwater motions and its relation to the ship motions. Furthermore, the flooding of
compartments located above the sea level is also excluded. The absence of wind is adopted both

because no waves are being considered and to simplify the model. This would also require the
modelling of forces applied in the ship superstructures and this is difficult to incorporate in an exact
way, especially if the superstructure geometry are complex. These three assumptions are not too
restrictive because many accidents happen in crowded harbour approaches. These are normally
sheltered waters, where the prevailing weather conditions are not very severe.
4.1.3 Ship Motions
The ship is assumed to be stationary, that is, it has no speed. This assumption excludes the existence
of motion generated waves resulting in a simpler modelling of the water pressure acting on the hull
and across any damage openings. This assumption is not unrealistic, since any ship is expected to
reduce its speed following a collision leading to flooding. In that case, the motion-generated waves
are expected to diminish significantly within a short period, therefore not influencing the motions of
the flooding ship.
The motions of the ship during the flooding process are taken about its intact centre of gravity. This
assumption is considered realistic for moderate trim and heel since the changes in the principal axis
of inertia are then of minor importance. However, in each time step, the changes in the centre of
gravity, due to the shift of liquids inside the tanks, are taken into consideration when calculating the
righting moments and restoring force.
4.1.4 Flooding Model
In the current flooding model, the flow of water from the sea to the damaged compartment(s) and
between damaged compartments is modelled using well-established classical hydraulics formulae.
Furthermore, water is assumed to settle down instantaneously with a flat parallel surface to the
waterline. This assumption is considered good if, within the flooded compartment, no significant
obstructions to the free flow of water exist. If such major obstructions do exist within a given
flooded compartment, it is possible to subdivide that compartment in several separate smaller
compartments and cross-flood these compartments (see section 5.4). Therefore, this model
incorporates the possibility of crossflooding several compartments assuming that the connections
between these compartments are flat panels. This is considered acceptable for most connections
between compartments because these connections are generally flat polygonal apertures.
49

This work considers the floodwater inside the ship compartments to constitute a loss of buoyancy.
The lost-buoyancy method was therefore adopted to calculate the ship damage stability data. Since
the concept of metacentric height is not used, this approach can be adopted even in the intermediate
stages of flooding. If waves were being considered, the added-mass method would have to be
adopted, because of the shipping of water on the car deck, above the mean water level. Since no
waves are being considered, the lost-buoyancy is satisfactory because all flooded spaces are located
below the water level. It has been seen, however, that some models in the literature take into
account the water-on-deck as an external force/moment.
4.2 The Theoretical Model of Ship Motions
The equations describing the ship motions can be obtained by applying Newton’s Second Law:
d_dt
M ( t ) + A t y j d , z ) X(t) + Q(t)*r(t) = F(t) (4.1)
and summing the damping and the stiffness terms to the equation on its left hand side. In this
equation, Q(t) is the angular velocity vector and r(t) is the position vector in relation to the centre of
gravity. Figure 4.1 shows the coordinate system, which is located at the centre of gravity.
Heave
C S Yaw
Sway (drift)
Pitch
SurgeRoll
Figure 4.1 - Coordinate systems (from [50])
As it is assumed that the motions occur about the centre of gravity of the intact ship, this leads to
r{t) = 0 so:
d _
dtM ( t ) + A ( $ $ 9 z ) X(t) = F ( I ) (4.2)
50
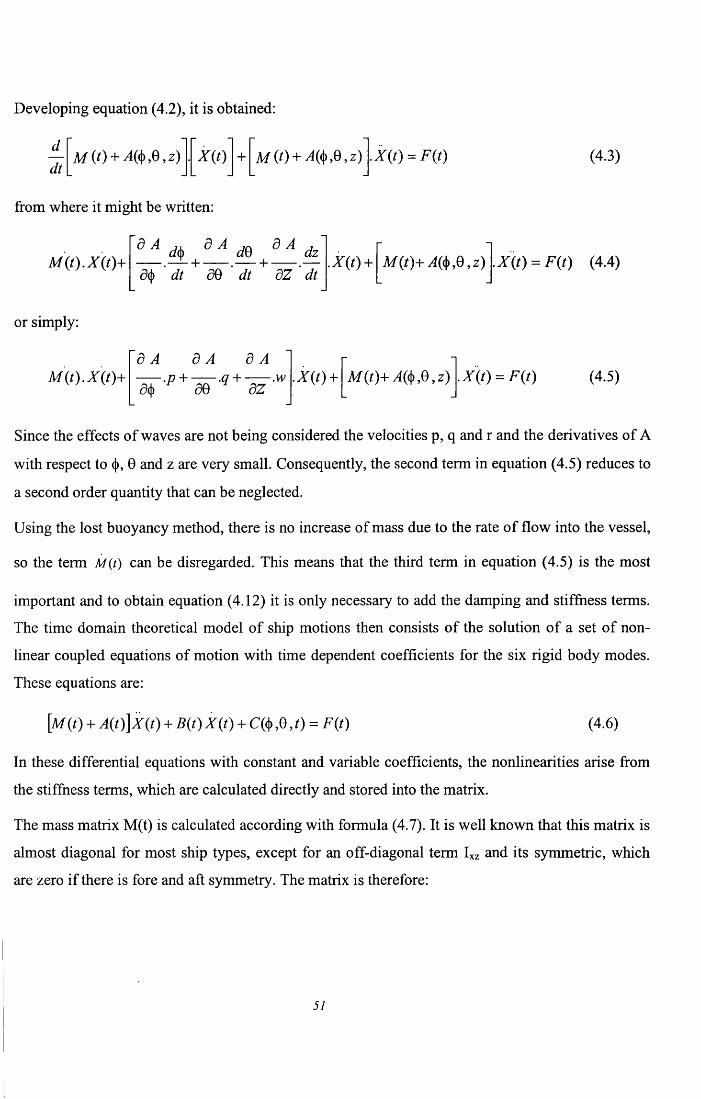
Developing equation (4.2), it is obtained:
d_dt
X(t) + M { t ) + (4.3)
from where it might be written:
M(t).X(t)+e A di ) d A d % d A d z
T + — . — +d(|) dt 00 dt dZ dt
X(t) + M(t)+ A($,Q,z) X(t ) = F(t) (4.4)
or simply:
M(t).X(t)+d A d A
,p +0(|) 00
.q +d A
0Z.w X(t) + M(t)+ A($,Q,z) (4.5)
Since the effects of waves are not being considered the velocities p, q and r and the derivatives of A
with respect to <|), 0 and z are very small. Consequently, the second term in equation (4.5) reduces to
a second order quantity that can be neglected.
Using the lost buoyancy method, there is no increase of mass due to the rate of flow into the vessel,
so the term M(t) can be disregarded. This means that the third term in equation (4.5) is the most
important and to obtain equation (4.12) it is only necessary to add the damping and stiffness terms.
The time domain theoretical model of ship motions then consists of the solution of a set of non
linear coupled equations of motion with time dependent coefficients for the six rigid body modes.
These equations are:
[M{t) + A(t ) ]x( t ) + B(t) X (t) + C(<j),e,t) = F(t) (4.6)
In these differential equations with constant and variable coefficients, the nonlinearities arise from
the stiffness terms, which are calculated directly and stored into the matrix.
The mass matrix M(t) is calculated according with formula (4.7). It is well known that this matrix is
almost diagonal for most ship types, except for an off-diagonal term Ixz and its symmetric, which
are zero if there is fore and aft symmetry. The matrix is therefore:
51

M{ t ) =
M 0 0 M
0 0
0 M
yy0
(4.7)
where M is the mass of the ship in kilograms, Ixx, Iyy and Izz are the principal moments of inertia.
The moments of inertia are calculated using the following formulas:
Ixx = M.ICq
I yy = M -k4
/ „ = M k l
(4.8)
where the k factor represent the radius of gyration (for roll, pitch and yaw, respectively). Values for
these radiuses of gyration can be taken from Paulo [39]:
kQ e [0.255,0.45 ]
k, £ [o .2L „ , ,0.251 . , ]
= 0.25 L pp
or from Bachtrawahi [43]:
kQ = 0.3255
kA = 0.21251
(4.9)
PP(4.10)
K =0-45^
The roll radius of gyration can also be estimated using the formula given in Paulo [39]:
kQ = 0.2895J 1 + 4 VCG
B(4.11)
The products of inertia, which are not zero, are assumed as being second order quantities and
therefore are neglected.
The hydrodynamic added-mass matrix, A(t), for an upright vessel with transverse symmetry and no
forward speed, has the following main characteristics:
• the main diagonal entries are by far the dominant
• it is symmetric
52

• the most important coupling terms are the pitch-surge terms resulting from the separation
between the CG and the free surface
• other relevant coupling may exist between roll and sway
• no coupling exists between symmetric and anti-symmetric modes due to the port/starboard
symmetry.
For a vessel with no forward speed this matrix may be obtained using a number of different
techniques, a full discussion of which can be found, for example, in Lewis [44]. In the current
model, the added mass matrix has to be calculated using 2-D potential flow theory and then placed
into an input file. Since the added-mass matrix changes with the displacement and the angles of heel
and trim, the possibility of inserting in the input file the matrices for several displacements, heel and
trim angles exists. A simple linear interpolation between the available data is used in the program to
compute the matrix for the current position of the vessel.
The literature on the problem of the changes in both the added-mass and damping matrices with
heel and trim is limited. Paulo [39] performed a short study on this problem for a simple barge. His
main conclusions were that for up to 10° list the symmetry of those matrices is not significantly
affected and that the added-mass and damping coefficients in the main diagonal for heave, roll and
pitch seem to increase. However, these results would have to be carefully confirmed and extended
to usual hull shapes. Furthermore, it is quite probable that the changes caused by heel and trim are
dominated by those arising from the change in volume of the ship hull occurring during the
flooding.
The damping matrix, B(t), is also calculated using a 2-D potential flow theory. As this work does
not consider waves, the damping model used is linear for all components and assumes the form of a
damping matrix. The damping matrix is calculated using appropriate external software and the
results obtained included in an input file to this program. As the damping changes with the attitude
of the vessel, the matrices for several displacements, heel and trim angles may be included. The
actual damping matrix for the current position of the ship is then linearly interpolated from the
available data. The damping due to the floodwater moving inside the flooded compartments is not
considered because, due to the absence of waves, no movement of the floodwater is expected.
Among the components of the damping matrix, the roll motion one is very important because it may
have a considerable influence in the flooding process. Furthermore, the roll damping can be highly
53
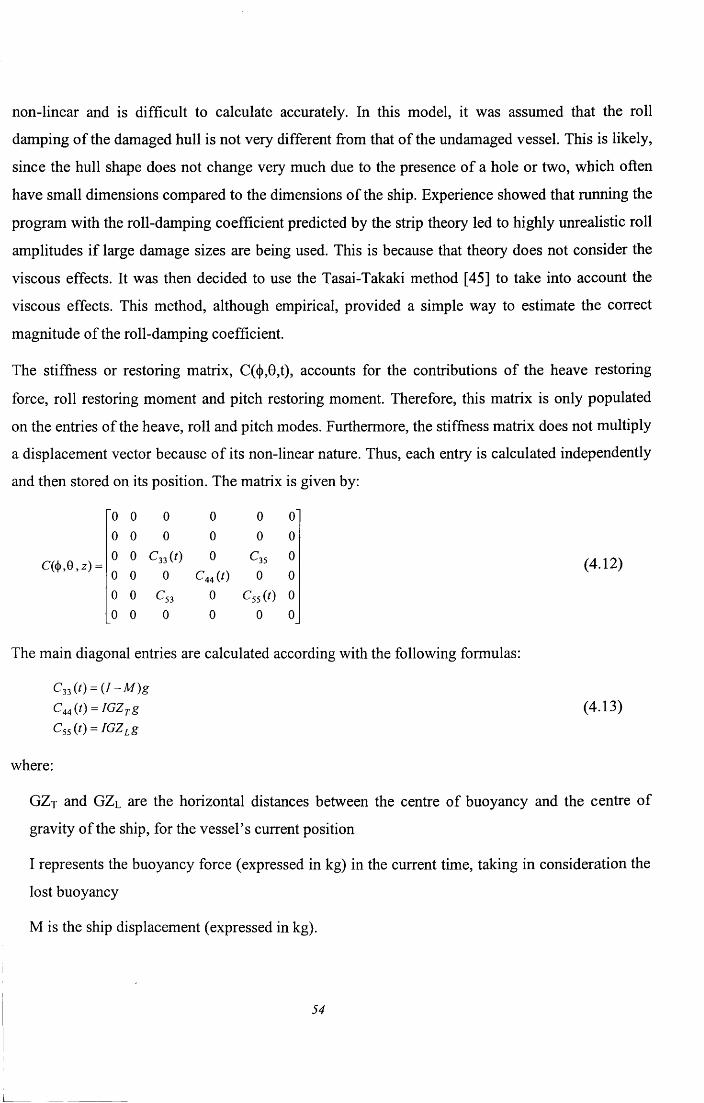
non-linear and is difficult to calculate accurately. In this model, it was assumed that the roll
damping of the damaged hull is not very different from that of the undamaged vessel. This is likely,
since the hull shape does not change very much due to the presence of a hole or two, which often
have small dimensions compared to the dimensions of the ship. Experience showed that running the
program with the roll-damping coefficient predicted by the strip theory led to highly unrealistic roll
amplitudes if large damage sizes are being used. This is because that theory does not consider the
viscous effects. It was then decided to use the Tasai-Takaki method [45] to take into account the
viscous effects. This method, although empirical, provided a simple way to estimate the correct
magnitude of the roll-damping coefficient.
The stiffness or restoring matrix, C(<|),0,t), accounts for the contributions of the heave restoring
force, roll restoring moment and pitch restoring moment. Therefore, this matrix is only populated
on the entries of the heave, roll and pitch modes. Furthermore, the stiffness matrix does not multiply
a displacement vector because of its non-linear nature. Thus, each entry is calculated independently
and then stored on its position. The matrix is given by:
c(<j>,e,z) =
0 0 0 0 0 0
0 0 0 0 0 0
0 0 C33 (t) 0 C35 0
0 0 0 C44 (t ) 0 0
0 0 £53 0 C55 (0 0
0 0 0 0 0 0
(4.12)
The main diagonal entries are calculated according with the following formulas:
C 33(t ) = ( l - M ) g
C 44 ( t ) = IG Z Tg
C55 (0 =
(4.13)
where:
GZj and GZl are the horizontal distances between the centre of buoyancy and the centre of
gravity of the ship, for the vessel’s current position
I represents the buoyancy force (expressed in kg) in the current time, taking in consideration the
lost buoyancy
M is the ship displacement (expressed in kg).
54
L

Therefore, the C 4 4 coefficient represents the restoring moment for roll (the transverse righting
moment) and the C 5 5 coefficient represents the restoring moment for the pitch motion (longitudinal
righting moment). In case there is fore/aft symmetry, C 3 5 and C 5 3 will be zero. This was taken to be
the case.
To calculate these coefficients it is necessary to obtain the hydrostatic properties of the hull, namely
the displacement and righting arms. To obtain these properties, the Pressure Integration Technique
(PIT) was used, which consist of integrating the pressure field over small panels defining the
surface of the hull and the internal subdivision. As some compartments will be flooded during the
process, the internal pressure of the floodwater has also to be integrated, in order to calculate the
properties of the vessel taking into consideration the floodwater effects. The floodwater is assumed
to behave quasistatically, that is, it is assumed that it settles down to a regular volume, with a flat
free surface parallel to the mean sea level and is treated according with the lost buoyancy method.
This approach requires the knowledge of the geometry of the ship hull as well as that of the internal
subdivision. Once the panelisation of the hull and the internal subdivision has been done, the
hydrostatic properties of the ship may be computed in a very straightforward way (see 4.5).
On the right hand of equation (4.6) are represented the generalised external forces and moments. As
has been seen in section 3.2 a considerable number of external forces and moments exist which can
be modelled by using this vector of external forces/moments. The effects that can be included in
this term are:
• waves (1st and 2nd order)
• wind
• sea current
• washed water into open compartments above the mean sea level
• dynamic effects of the floodwater.
However, as was remarked in the model assumptions, no waves are being considered in this work,
therefore there is no possibility of shipping water above the mean sea level. Thus, the first two
effects do not exist as well as the fourth. Furthermore, no dynamic effects of the floodwater were
considered in this work. No currents were considered either. Consequently, the vector of external
forces/moments remains empty, in this work. In order to solve the equations of motion (4.6), the
55

aL
Runge-Kutta 4 Order method is used. The kinematics, mass terms, damping terms, stiffness and
external forces for the previous step are used to generate the kinematics of the next step.
4.3 The Theoretical Model of Ship Flooding
The flooding model consists of two separate components. The first component calculates the
amounts of water that flow both into the damaged compartment(s) and between compartments,
during each time step. The second component consists of taking into account the influence of the
floodwater, contained in the various ship compartments, in the hydrostatic properties of the vessel.
This influence consists of a loss of buoyancy and a shift of centre of buoyancy.
The first of these components involves the integration of the hydrostatic pressures acting on the
geometric areas of the damages that connect the sea to the internal compartments (damage
openings). A similar problem consists of determining the hydrostatic pressures acting on the areas,
which allow communication between compartments, therefore allowing crossflooding to occur. The
simulation of the crossflooding of compartments was made possible because advantage was taken
of the PIT being very close to the physical reality. Besides that, the modelling of the crossflooding
was also used to simulate the effects associated with the flooding of compartments fitted with large
equipements or with special layouts, which may severely interfere in the flooding process. When
this is the case, the compartment was conveniently subdivided into smaller spaces connected by
openings, which represent the areas through which the water can flow.I
The damage openings or crossflooding openings (henceforth referred to as openings) are considered
as flat polygonal panels missing in the ship structure (boundaries between compartments). The
hydrostatic forces acting in these panels are then calculated using the PIT. This is done for both
! sides of the panel to take into account the water pressure of the water both inside and outside the
compartment. From the hydrostatic forces, the pressure on both sides of the panel can be easily
computed. There are, however, several cases to be considered in what regards the type of flooding,
which may be seen in Figure 4.2.
I
56

coapartmeotboundary
opening
Case 1 Case 2 Case 3 Case 4 Case 5
Figure 4.2 - The types of flooding These cases arise because of the relative positions of the water level in each side of the opening,
that is, in each compartment (considering the sea as a compartment). Besides the cases shown in
Figure 4.2, there are other cases to be considered, namely, the opposite cases to those shown there.
Nevertheless, these cases simply consist of flow with opposite direction. In the current model,
consideration is also made of the fact that the flow, in cases two and four, has two distinct areas,
one above the water level in the second compartment and the other below that level. In the first
area, the water coming from the left-side compartment flows freely, while in the second area the
flow suffers an opposition from the water on the right-side compartment. The real flow in such
cases is, however, extremely complex, both turbulent and chaotic. Therefore, a simplification of the
true physical phenomenon was made when it was assumed that the flow could be modelled
considering a mean pressure for each of these two areas and applying the following formula to each
one:
U=Kyl2(p2- p l)lp (4.14)
where:
k is the flow coefficient
P2 and pi are the pressures in the left and right sides of the panel.
Formula (4.14) gives an approximation to the real velocity, which multiplied by the suitable area,
yields the rate of flow. When there is only one area for the type of flow in the opening being
considered, formula (4.14) is applied only once. When the water level in the right side is below the
hole no pressure exists (pl=0).
A fundamental factor in the rate of flow calculation is the flow coefficient (K). This coefficient
depends on the shape of the damaged area, flow direction and thickness and roughness of the
opening edges. Since the values for this coefficient found in the literature vary a great deal, the
57

value adopted was, generally, 0.5. The reason for this value is that this value is a rough mean of the
values found in the literature. This was the best possible estimate, since no detailed experimental
work on this subject was performed.
Having calculated the rate of flow through a certain opening, the amount of water entering or
leaving the compartment within each time step can be computed. Consequently, the quantity of
water in the compartment in the next time step can be estimated, and the second component of the
flooding model comes into action. The problem of taking into account this quantity of floodwater
inside the compartment can then be solved through the integration of the internal pressures caused
by the floodwater. This integration will yield the geometric centre of the floodwater. This
floodwater is then taken as an amount of lost buoyancy within the compartment concerned. This
procedure is repeated for all ship compartments and, after the summation of the values of intact
buoyancy for all compartments, the total amount of buoyancy of the ship is found. In an analogous
way, the centre of buoyancy is found. All these calculations are performed using the PIT.
4.4 The Pressure Integration Technique
4.4.1 Theoretical Formulation
The necessity of knowing the hydrostatic properties of the damaged ship in each time step leads to
the necessity of introducing in the theoretical model of flooding a mathematical module to compute
these properties. One possibility would be to implement the usual stability calculations using the
Simpson integration method applied to the hull shape and internal compartments. However, this
method requires a lot of programming in case of damage stability calculations.
Another possibility would be to calculate those properties using an independent commercial
software for a number of assumed ship positions. The results would then constitute an input to the
simulation, which would simply interpolate between the given data, to obtain the hydrostatic
properties for the current ship position. This approach has the disadvantage of relying on an
interpolation scheme, which is not the same as actually computing the hydrostatic properties for the
current damaged ship position. Besides that, it would be difficult and time-consuming to obtain
sufficient hydrostatic data to allow an accurate interpolation. The Pressure Integration Technique
(PIT) is yet another possible approach to this problem. This method allows the calculation of the
hydrostatic properties of the damaged ship, for any position, by integrating the hydrostatic pressure
58

over the hull. For that purpose, the hull has to be panellised in polygonal panels in order to perform
the integration over its surface. It was decided to use this method in the flooding simulation
program because it relies on physically sound and clear principles, lying very close to the physical
reality. The method is relatively simple and precise, but depends on how small the panels
representing the ship hull are. It allows any hull shape to be studied or the hull to be in an unusual
position. It is incorporated within the flooding program and is available for use whenever necessary,
thus eliminating the problem of data input. This method also allows for the consideration of the
effects of floodwater and tank contents in the ship stability. This way, it is possible to keep very
close to the physical reality. The main disadvantages are its slowness and the necessity of
performing the discretization of the ship hull. This problem was solved by creating a program that
performs the conversion of the data between one very common commercial software (AutoHydro)
and the format required by the flooding simulation program (see section 4.4.2).
There are two main approaches to the PIT. One is explained by Witz & Patel [46]. The other was
adopted in this work and was presented by Schalck and Baatrup [47], but is an extension of that of
J. A. van Santen [48]. According with this approach there are two kinds of hydrostatic properties:
those that depend on the waterline and those that depend on the immersed volume. Both types of
properties can be obtained by surface integration. If B is the desired property then:
B= f B(x,y)dA= f B(x,y)dxdy (4.15)Ja Ja
where the reference system is the sea plane e A is the surface over which the integration is
performed. The coordinate system is shown in Figure 4.3.
Figure 4.3 - Sea coordinate systemi
Due to the hull surface complexity it is necessary to discretize it in small panels. The value of B is
obtained by:
59

m n
B = E £ 5 B „ (4.16)i = l j=l
where m denotes the compartment, n is the panel within the set of panels that define the
compartment and SBjj is the contribution of panel j of compartment i to the B hydrostatic property.
The mathematical principle of this method is to substitute the analytical integration along each
panel’s surface by the analytical integration along the border of the panel. To perform the
transformation of the surface integral to line integral the Green Theorem is used:
(4.17)
The surface over which the integration is to be performed is A and dA denotes the boundary line of
the panel. As all boundaries are straight lines of C1 class, the application of the Green Theorem is
straightforward.
The water plane area is given by:
m(4.18)
by applying the Green Theorem:
m
(4.19)
As the perimeter of the panel is made of p straight lines the k straight line can be represented as a
y(x) function:
y=ocx+P x g [xk; Xk + i] ; y e [yk; yk + 1
where:
(4.20)
a _ Z*±>— 2j _ . (3 = y k — ax kX ^ , - X ,
(4.21)
Substituting, it may be obtained that:
x k + \ \
(4.22)(=i /=i V*=i Lz xk y u
60

In an analogous way, the analytical expressions of other hydrostatic properties can be obtained. The
analytical expressions allow the calculation of the required property for each panel. In the end, the
summation of all panel results should be made in order to calculate the value of the ship hydrostatic
property. The contribution of a given panel to the first area moment, Sx, is:
k = 1
2 „ 31 [ a x2 V 3
The first area moment S y is:
+ o t p . x + P X
k =\
( 2 3a y+ aPy2 + f>2y
xk+\
xk
y k + 1
yk
The second area moment IXx is:
/» = £ - a X + a 2p;r3 + — a p 2x 2 + p 3x 3 V 4 2 >
The second area moment I y y is:
i f e V + a ’(3y3 + 3 2 2 + 3 3 v 4 2
xk
y k + 1
yk
The cross moment of inertia IXy is:
l f a V 2 ft3 1 . 3— -------+ -a P * + — Q x2 V 4 3 2
2 . . 2
x/fc + 1
xk
The position of the centre of the waterline is obtained using:
=
(4.23)
(4.24)
(4.25)
(4.26)
(4.27)
(4.28)
When computing the hydrostatic properties of the immersed portion of the hull a new reference
systems, shown in Figure 4.4, is needed with the origin located in the first vertice of the panel
(O pX pY pZ p).
61
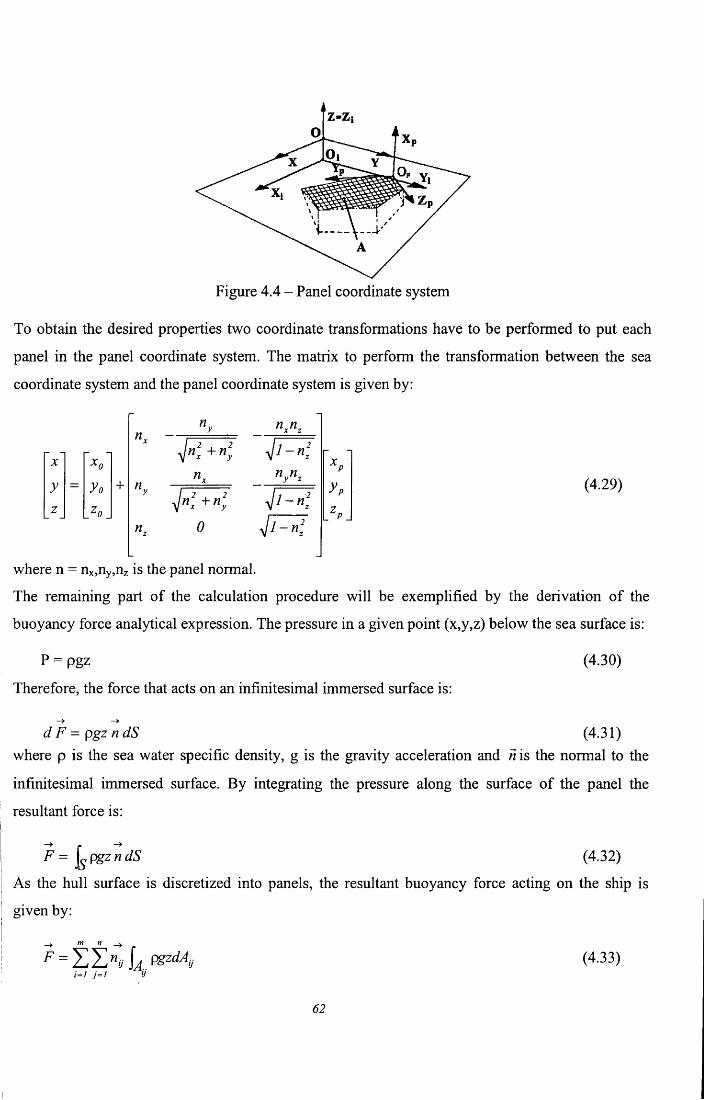
Figure 4.4 - Panel coordinate system
To obtain the desired properties two coordinate transformations have to be performed to put each
panel in the panel coordinate system. The matrix to perform the transformation between the sea
coordinate system and the panel coordinate system is given by:
X x 0
y = y 0z , z o_
+
-
ni + ny
Vn2 +n2y
0
n y n zy, (4.29)
where n = nx,ny,nz is the panel normal.
The remaining part of the calculation procedure will be exemplified by the derivation of the
buoyancy force analytical expression. The pressure in a given point (x,y,z) below the sea surface is:
P = pgz
Therefore, the force that acts on an infinitesimal immersed surface is:
(4.30)
d F = pgz n dS (4.31)where p is the sea water specific density, g is the gravity acceleration and n is the normal to the
infinitesimal immersed surface. By integrating the pressure along the surface of the panel the
resultant force is:
F = J , pgz n dS (4.32)
As the hull surface is discretized into panels, the resultant buoyancy force acting on the ship is
given by:
-> ™ n
F = L L nij U PSzdAo (4.33);=/ j=i
62

As z can be expressed in the following form:
z = z0 4- nzx p + ,](l - n ] ) z p
and xp is always zero:
Z = Z0 +V(1~";2)z;
(4.34)
(4.35)
As z is a function of Zp the surface integral of (4.33) has to be converted from the sea surface
reference system to the panel reference system by using the jacobian J:
j =d(x,y ,z)
S (xp,y p,zp)= 1 (4.36)
Using (4.35), (4.36) and the Green Theorem (4.17) expression (4.33) can be written as:
r ( 1 I ^F = E Z " » L (4-37)
,=/ /=/ ij V 2, /
where:
z„= ay „ + P ; a = Zp"' Zpt ; p = z f t - a y ft (4.38)
Replacing (4.38) in formula (4.37) and calculating the integral:
_> m n _> J ,---------------
F = Z Z nij PS h <X2 ay p + pz0 + - ■J .I - n* ( a y p + p ) 12 d y fi=\ ./=!
m nF = £ X A
/= i j= \ k = 1
a z0y y Pk +1
(=1 /= ! Zt=lz o ( ~ a A yj + PAvP) + — ~ n z (“ a2 AvJ + a PAyJ + P 2AyP)
(4.39)
(4.40)
(4.41)
where:
A" = v" + y ny* spk+i x Pk (4.42)
In an entirely analogous way, the analytical expressions giving the other hydrostatic properties
[ could be obtained. The moment of the buoyancy with respect to the axis Yp is:

M rt = 1 t i z r d Fk = l
(4.43)
r
My = Y,f>gk = l
| z 0( j a 2Ay 3p +af>Ay2p +f>2AyD\ +
+ l ~nz j a 3AyJ+a2p A ^ + -ap 2AyJ+ (33Ay;
The moment of the buoyancy with respect to the axis Zp is:
■ t b , " '
(4.44)
Mr (4.45)k=i
Mzp = 2 > gk=\
Ay 3P +^ ^ y 2P l +
1 ot2- - 4 24T a A y p + - a pAyP+— Ayp (4.46)
The moment of the immersed volume with respect to the z-axis is:
m n
Lz = Y L \ \ A [ zdzdA* (4.47)i= l j = l
m n i p
i = l j = l Z k=I
zo { ^ a A^+PAVp) + ^ l - n 2z0^ j a 2Ay3p +af>Ay2p +f>2Ayt
+ .3 Ay* + a 2 pAy 3p + | a p 2 Ay2 + p 3 Ayp (4.48)
The point of application of the hydrostatic force F in the panel reference system is:
* pam 7
Y = -------\F \
M y
(4.49)
7 = _____/* |F|
The coordinates of the points of action of the buoyancy forces acting on the panels are then
transformed into the sea surface reference system. The moments of those forces about the x and y
axis of the sea reference system are given by:
64

m n
M = E Z ( +F^ * » - ^ z*»l- (4-50)M 7=1
m n
M ' = ' Z l 1( -F’y* .+Fy’* . \ (4-51)xJi= 1 7=1
The coordinates of the centre of buoyancy are now calculated according to:
M yx c = —Fz
(4.52)F z
z c - ^F,
Having obtained the hydrostatic properties of a single compartment, the hydrostatic properties of
the ship may be obtained in a straightforward way by combining the previous results. The volumes
and forces may be just summed and the coordinates of the centres of buoyancy and flotation may be
obtained using the following formulas (just for the centre of buoyancy):
x r =■_ '=ic
1=1
i / o x ? ,yc =— „---- <4-53>
2 > ./=i
5 > c , * V ;
=_ '=1■c
i=i
4.4.2 The Panelization Method
The use of the pressure integration technique (PIT) requires the discretization of the hull surface
into polygonal flat panels. If the ship is considered to be composed of a number of distinct
compartments, then the inner surfaces which compose the internal arrangement of the ship will have
to be equally discritized. Furthermore, in order to achieve correct results, all panels have to have the
vertices ordered in such a way that, according with the right hand rule, they define a normal vector
pointing to the interior of the compartment.
65

To perform the discretization of the hull surface, a program in Fortran was created that converts the
data from a geometry file produced by a software package (Autohydro) to the format required by
the flooding simulation program. The only requirement of that program is that, when building the
sections in Autohydro, each section within a compartment has to have the same number of points as
the other sections defining the same compartment. The points must also be numbered from bottom
to top. Once this is done the software for conversion will simply create rows of triangles between
each two consecutive sections and will create polygons to model the aft and forward bulkheads of
the compartment. If the compartment is asymmetrical, a polygonal panel to represent the central
bulkhead will also be created. Figure 4.5 shows some panels created by this program to represent
the geometry of a RoRo ship, in this case the ship’s side.
Figure 4.5 - Panelization of hull surface
4.5 The Numerical Model of the Ship
The ship model used to perform the simulation is contained in a database comprising four data files.
Each data file covers one major type of information:
• the geometry of the ship hull
; • the flooding and crossflooding geometry of the ship
| • the loading condition
• the added-mass and damping matrices.
66
The geometry of the ship hull and of its internal compartmentation is required to compute its
hydrostatic properties. In order to describe this geometry, the ship is divided in independent
watertight compartments, which external surfaces are defined by a variable number of flat
polygonal panels. The external surfaces of the compartments comprise both pieces of the outer hull
surface and pieces of the internal bulkheads. Over these surfaces, a mesh of panels as to be created,
each panel being defined by its vertices. Therefore, a given panel is defined by an nv number of
vertices and those vertices are the geometrical points p l ,p 2 and so on. All that is further needed is
to record the coordinates of the points that constitute the vertices in order to be able to link each
vertice to its coordinates. Concluding, the ship geometry is defined by a cloud of numbered points
which define flat panels that, in turn, define closed independent compartments. The cluster of these
compartments constitutes the ship. An example of a file containing this geometry database is given
in appendix C.
Simulating the flooding of a ship requires knowing both the geometry of the damage opening and
the geometry of eventual crossflooding openings. In the current work, all openings were considered
representable by means of flat polygonal panels. This type of representation using flat panels has
the advantage of using the PIT potentialities to compute the pressure that would act on the opening
if it didn’t exist. Furthermore, each opening is considered to connect two compartments, one of
them being, eventually, the sea. In this later case, the opening simulates a damage opening putting
watertight compartments in contact with the sea. In the former case, it simulates the effect of
crossflooding. An example of a file containing this flooding geometry database is given in appendix
C.
This model of ship flooding requires the calculation of the heave restoring force and the roll and
pitch restoring moments. Therefore, it is necessary to compute the ship centre of gravity in each
time step. Another reason for wanting to know the centre of gravity is the fact that the ship moves
about its intact centre of gravity. To compute the centre of gravity of the ship it is necessary to
know the loading condition of the ship. This is done by specifying both the fixed weights and the
tank contents that characterise a given condition. The fixed weights are defined by their magnitude
and position and the fluids by its volume, specific density and compartment in which they are
contained. As the ship rolls, heaves and pitches, the position of the centre of gravity of the fluid is
calculated taking into consideration the fact that it moves. It is assumed that the fluid always takes a
67

ffee-surface parallel to the ship waterline. An example of a file containing the loading condition
database is given in appendix C.
Finally, information on the added-mass and damping matrices is required to perform the time
domain simulation. This information may consists of added-mass and damping matrices for several
different heel and trim angles and displacements of the ship, to allow consideration of the fact that
these matrices depend on those variables. An example of a file containing the added mass and
damping matrices database is given in appendix C.
4.6 The Computational Implementation
The time domain simulation of ship flooding is implemented in a Fortran computer program called
Shipflooding, which has the algorithm shown in Figure 4.6 and described below.
This algorithm can be subdivided in two parts: an initial one where the data files are read and the
initial settings made; a second part that comprises the simulation itself. The first subroutine in the
algorithm presents to the user the software by displaying an introductory note (subroutine
Presentation). Then the user is asked what the datafile names are. The names of four data files are
required: the geometry database file, the flooding database file, the loading condition database file
and the hydrocoefficients database file (subroutine DataFiles). The subroutine InitialSettings
completes the initialisation process by performing the following tasks:
• read the data files (subroutine DataAquisition)
• search and position the intact ship in its equilibrium position (subroutine Equilibrium)
• calculate the ship displacement and centre of gravity
• calculate the initial stiffness matrix (using the subroutine Stiffhess_Matrix)
• set the time step and the number of steps.
68

Initialization Process
Sim ulation Process
Y/N
End
InitialSettings
S tm c tu ra lM a ss
T o ta JM a ss
S tif fn e ssM atr ix
E x c ita tio n F o rce
Presentation
D ataFiies
A ddD am p
Flooding_Status
Figure 4.6 - The algorithm of the program Shipflooding
The second part of the algorithm in Figure 4.6 consists of the simulation process itself (a loop). This
process starts with the calculation of the added mass and damping matrices for the current ship
attitude (Subroutine AddedMass_Damping_Matrix). The displacement of the ship used to calculate
the added mass and damping matrices at the current time step is given by the volume of the
immersed portion of the hull without taking into account the flooding.!
After these matrices have been calculated, the flooding situation has to be accessed. This is done
using subroutine FloodingStatus that goes through the damage openings checking if there is a flow
through that opening. If there is, the rate of flow and the amount of water inside the compartment
after one time step has elapsed are computed.I
69

Having done this the stiffness matrix for the current time step is obtained using subroutine
Stiffness Matrix. Most of the numerical effort consists of obtaining the hydrostatic properties
necessary to calculate the C 3 3 , C 4 4 and C 5 5 stiffness coefficients. These are the off balances in the
heave, roll and pitch motions, between the hydrostatic restoring forces and moments and the weight
forces and moments.
The next step consists of obtaining the structural mass matrix for the current time step. The
structural mass coefficients for the three first modes are easily obtainable. The remaining three
coefficients for the rotational motions are then calculated using estimates of the radius of gyration
(Subroutine Structural_Mass_Matrix). The structural mass matrix and the added mass matrix are
then added to obtain the total mass matrix for the current time step (Subroutine
T otal_Mass_Matrix).
The excitation forces and moments are obtained using a subroutine called Excitation_Force_ Vector.
No such forces or moments have been considered, until now. Having obtained all components of
the equations of motion, they can be solved. That is done using the subroutines RK4 and EqMotion.
The hydrostatic properties necessary for the Stiffness_Matrix and FloodingStatus subroutines are
calculated using the PIT, which was coded in a self-contained subroutine, called
CalcH ydPropShip. This subroutine takes the geometry of the ship’s compartments, the current
flooding situation and the loading condition and obtains the hydrostatic properties of the ship in its
current position as well as its centre of gravity. The properties of the various compartments are
accumulated to build the total properties of the ship. The properties of the various compartments are
obtained throughout the use of subroutine Calc_HydProp_Flooded_Comp. If the current
compartment is not flooded then this subroutine simply calls the Calc_HydProp_Intact_Comp
subroutine. Otherwise, the loss of buoyancy due to the flooding is taken into consideration by
calculating the properties of the floodwater inside the compartment using the subroutine
Calc_HydProp_Fluid_Inside. This last subroutine performs a cyclic calculation to find the level of
fluid inside the compartment and, when it finds it, calculates its centre of volume. The lost volume
is then subtracted from the volume of the immersed portion of the compartment yielding the intact
volume and its geometrical centre.
The subroutine CalcH ydPropIntactCom p calculates the hydrostatic properties of an intact
[ compartment. This subroutine calculates the contribution of each individual panel that defines the1
outer surface of the compartment to the properties of that compartment. The individual
70

contributions of each panel are then summed to obtain the overall properties of the compartment.
Those contributions are evaluated using subroutine PropPanel. Within this subroutine, the panel in
consideration is restricted to its underwater part, if any, and the PIT is applied to the immersed
portion. The formulas of the PIT are implemented each in its own subroutine and are called using
two intermediate subroutines, Hidrol and Hidro2. These routines perform the coordinate
transformations necessary to use the subroutines that implement the basic PIT formulas.
The subroutines described shortly above were all done by the author except for the ones relating to
the Runge-Kutta method (RK4 and EqMotion), which were adapted and improved from Press et al
[52]. Also, two subroutines, not mentioned in this short overview of the software (called Ludcmp
and Lubksb) and used to solve equation systems were also taken from the same reference.
71

CHAPTER 5 - APPLICATION EXAMPLES
5.1 Calculation of Ship Hydrostatic Properties Using the Pressure Integration
Technique
The simulation of the flooding and heeling processes of a RoRo ship requires the calculation of the
ship hydrostatic properties, for which purpose, the pressure integration technique (PIT), described
in section 4.4, has been used. To test this complex technique the hull and internal arrangement of a
RoRo ship have been selected, with the objective of allowing the calculation of both the intact and
damaged ship hydrostatic properties using the PIT. The calculation was also done using the
software package GHS [51] and the results were then compared. The RoRo ship main particulars
are given in Table 5.1.
Table 5.1 - RoRo ship main particulars
Displacement 6578 tLpp 122.9 mB 19.9 mD (main deck) 6.4 mT 4.6 m
The RoRo ship body plan is shown in Figure 5.1.
Figure 5.1 - RoRo ship body plan

The RoRo ship simplified general arrangement is shown in Figure 5.2. The compartments of this
ship located forward of the stabiliser room (StabRoom) were not accurately modelled because no
flooding of these compartments was to be undertaken (see section 5.5).
Aft Peak / Gear box room / Cardeck / Garage
- 1 — 1 — — / /
---------DbAfTEngineRoom ^ G enR oom \StabR oom Forw
Figure 5.2 - RoRo ship general arrangement
The first test consisted in calculating the draft and trim of the ship in its intact condition, that is,
with a displacement of 6578.01 and centre of gravity located 56.16 m forward of the AP and 7.71 m
above the baseline. For this condition, the PIT yielded a draught of 4.61 m and 0.45° trim aft. The
software package GHS, for the ship in the intact condition, yielded a draft of 4.55 m and a trim of
0.49° aft. The differences between both results arise from two causes: the small number of panels
used in this model (to keep the computational time as low as possible since this model was to be
used in the time domain simulation); the large number of mathematical operations involved in the
PIT (leading to numerical inaccuracies). For these calculations a total of 926 panels were used to
describe both the external hull surface and the ship internal subdivision.
The hydrostatics of this ship were also calculated by both methods and the results are shown in
Table 5.2. For each property shown in that table the first column represents the GHS results and the
second column the PIT results. The third column contains the differences in percentage between the
PIT and the GHS results.
Table 5.2 - Hydrostatics of RoRo shipD ra f t D is p la c e m e n t( t) % d if L C B (m fro m A P ) % d if L C F (m fro m F P ) % d if T P C (t/cm ) % d if
2.0 2281 2202 -3.6 59.7 59.4 -0.5 58.9 58.7 -0.3 14.5 14.2 -2.0
2.5 3032 2941 -3.1 59.5 59.2 -0.5 58.5 58.3 -0.4 15.5 15.3 -1.4
3.0 3832 3732 -2.7 59.2 59.0 -0.5 58.0 57.9 -0.3 16.4 16.3 -0.63.5 4674 4570 -2.3 59.0 58.7 -0.4 57.5 57.4 -0.1 17.3 17.2 -0.5
4.0 5561 5451 -2.0 58.7 58.5 -0.4 57.0 56.9 -0.1 18.2 18.1 -0.6
4.5 6490 6376 -1.8 58.4 58.2 -0.3 56.5 56.4 -0.1 19.0 18.9 -0.4
5.0 7462 7344 -1.6 58.1 57.9 -0.3 56.0 55.9 -0.1 19.9 19.8 -0.5
5.5 8478 8355 -1.5 57.8 57.7 -0.3 55.6 55.5 -0.2 20.7 20.6 -0.5
6.0 9536 9407 -1.4 57.6 57.4 -0.3 55.4 55.3 -0.2 21.6 21.5 -0.5
6.5 10629 10491 -1.3 57.4 57.2 -0.3 55.3 55.5 0.3 22.1 21.6 -2.3
7.0 11738 11587 -1.3 57.2 57.1 -0.1 55.6 56.2 1.1 22.2 21.9 -1.4
7.5 12849 12681 -1.3 57.0 57.0 0.0 55.8 56.2 0.7 22.2 21.9 -1.68.0 13958 13772 -1.4 57.0 57.0 0.0 56.0 56.4 0.8 22.2 21.8 -1.68.5 15066 14862 -1.4 56.9 56.9 0.1 56.1 56.6 0.8 22.1 21.8 -1.79.0 16173 15951 -1.4 56.8 56.9 0.1 56.2 56.7 0.9 22.1 21.8 -1.79.5 17277 17037 -1.4 56.8 56.9 0.2 56.4 56.9 0.9 22.1 21.7 -1.7

Table 5.2 - Hydrostatics of RoRo ship (continued)Draft VCB (m from base) % dif KMt(m) % dif KM1 (m) % dif
2.0 1.13 1.14 0.5 14.61 14.52 -0.6 394.34 392.10 -0.62.5 1.41 1.42 0.6 12.83 12.88 0.4 342.13 342.15 0.03.0 1.69 1.70 0.4 11.62 11.81 1.6 306.83 310.25 1.13.5 1.98 1.99 0.8 10.79 10.94 1.3 284.89 287.19 0.84.0 2.26 2.27 0.5 10.29 10.38 0.8 268.95 271.04 0.84.5 2.55 2.56 0.6 9.91 10.00 0.9 257.75 260.22 0.95.0 2.83 2.85 0.6 9.71 9.78 0.7 249.85 251.57 0.75.5 3.12 3.14 0.5 9.66 9.70 0.4 242.28 243.36 0.46.0 3.42 3.43 0.4 9.69 9.72 0.3 234.71 235.61 0.46.5 3.71 3.72 0.3 9.55 9.38 -1.8 224.52 217.85 -3.17.0 4.00 4.01 0.3 9.28 9.15 -1.5 208.55 207.16 -0.77.5 4.28 4.29 0.3 9.07 8.96 -1.2 192.76 189.48 -1.78.0 4.55 4.56 0.1 8.93 8.82 -1.2 178.53 175.50 -1.78.5 4.83 4.83 0.1 8.84 8.74 -1.2 166.32 163.61 -1.79.0 5.10 5.10 0.1 8.81 8.72 -1.0 155.84 153.31 -1.79.5 5.36 5.37 0.2 8.81 8.73 -0.9 146.74 144.29 -1.7
Some small differences exist between the results obtained using these two methods, but these
differences do not exceed a maximum of 3.6%. In fact, most differences do not exceed an absolute
value of 1.5%. However, even such small errors in the longitudinal position of the centres of
buoyancy and flotation may have a significant impact, for example, in the trim results, especially
when damage conditions are being analysed.
The cross-curves of stability of the intact ship were also computed using both methods. The results
are shown in Figures 5.3 and 5.4. It may be seen that although some small differences exist between
these two Figures, both sets of curves show the same general layout. These small differences also
arise from the causes stated above.
Finally, some damage stability calculations, using the PIT and the GHS, were made to compare the
equilibrium positions of the ship for several damage conditions. Table 5.3 shows the resulting
equilibrium positions for several damage conditions.
Table 5.3 - Comparison of results for several damage conditions
Damaged Compartments GHS Draught(m)
GHS Trim (°)
PITDraught(m)
PIT Trim (°)
Forw 4.78 0.37f 4.84 0.46fDbAft 4.74 0.76a 4.79 0.69aGenerator. Room 4.98 0.63a 5.04 0.58aStabilizer room 4.98 0.28a 5.04 0 .2 1 aDbAft, AftPeak, VoidAft 5.25 1.96a 5.13 1.89aEng, Gearbox, Stabilizer, Gen Rooms, DB.P 6.58 1.69a 6.65 1 .6 8 aDB.P 4.57 1 . 0 2 (heel) 4.63 1.30 (heel)Note: The draughts are all taken at the centre o f flotation.
74

Righti
ng Arm
(m)
R
ight
ing
Arm
(m)
Cross-Curves using PIT
2 0 '
300.90.80.70.60.50.40.30.2
35'40'
60'
5000 6000 7000 8000 9000 10000 110003000 4000 12000
Displacement (t)
Figure 5.3 - Cross curves using PIT
Cross-Curves using a Commercial Software
30'0.90.80.70.60.50.40.30.2
35'40““UK45'
r— 60
8000 9000 110004000 5000 6000 7000 10000 120003000
Displacement (t)
Figure 5.4 - Cross-curves using a commercial software
75

5.2 Time Domain Simulation of Barge Flooding
5.2.1 The Barge Numerical Model
In Chapter 4 the theoretical background of the time domain simulation of damaged ship motions
was described. Section 5.1 demonstrated that the pressure integration technique (PIT) calculates
satisfactorily the hydrostatic properties of both intact and damaged ships. Flooding simulations of a
simple barge are now presented, with the objective of checking both the intermediate stages of
flooding and the final equilibrium position of the flooded barge, against the quasi-static results of
the software package GHS. Given that the barge characteristics are very simple, the results should
compare very well.
The barge whose flooding was simulated has the main particulars shown in Table 5.4. It is worth
noting the exceptionally high value of GM, which makes this barge very stiff. Consequently, the
barge is expected to behave quasi-statically.
Table 5.4 - Barge main particulars
Displacement 17520tL oa 73 mB 40 mD 2 0 mT 6 mLCG 36.5 m (from AP)VCG 9 m (from baseline)KMt 25.2 mGM 16.2 m
Figure 5.5 shows the barge basic internal arrangement, which consists of two narrow permanent
compartments located at its extremes and a large central compartment.
Figure 5.5 - Barge basic internal arrangement
76

The space located between the narrow compartments at the barge extremes was used to set up two
different internal arrangements, shown in Figure 5.6. These arrangements allow the simulation of
the flooding of compartments of various sizes, both symmetrical and asymmetrical, causing
sinkage, sinkage and heel or both sinkage, heel and trim. The first arrangement is defined using 310
panels and the second by 376 panels.
73 m
Compar. 1
. 20 m .
Compar. 2
. 21 m .
Compar. 1
2
Compar. 2
1
damage opening damage opening
Arrangement 1
40 m
20 m
73 m
20 m 20 m
Compar. 1/■
20 m 21 m
Compaar. 2
damage opening damage openiiing
Arrangement 2
40 m
20 m
Figure 5.6 - Barge internal arrangements
Two sets of numerical experiments were performed with this barge. The first set (simulations 1-4)
was designed to test the basic behaviour of the theoretical model and consisted of simple flooding
of compartments, located in various positions, for two different internal arrangements. The
objective of the second set of numerical experiments (simulations 5-8) was the study of the
influence of such parameters as damage area, flow coefficient and GM in the heeling and flooding
processes. The damage conditions of the barge in each simulation are summarised in Table 5.5.
Table 5.5 - Summary of barge conditions in each numerical experiment
NumericalExperiment Arrangement Flooded
Compartment Damage Opening Damage Area (m2)
1 1 2 1 112 1 1 2 113 2 2 3 114 2 1 4 115 2 2 3 1,4, 8, 166 2 2 3 167 2 2 3 88 2 0 ) (i) 0 )
(i) - This numerical experiment was performed with the intact barge. Only for convenience, it is grouped with damage stability numerical experiments in this Table.
77

5.2.2 Numerical Results
5.2.2.1 Numerical Experiment 1
The results for the first numerical experiment (see Table 5.5) are shown in Figure 5.7. This Figure
shows the sinkage time history. It may be seen that the sinkage increases slowly until a value of
approximately 2.25 m is reached. Note also that the rate of increase of sinkage becomes smaller as
the final condition approaches. This is in accordance with practical intuition concerning this type of
flooding. Furthermore, the intermediate stages of flooding and the final equilibrium position of the
barge were checked using GHS and an excellent agreement between the simulation and quasi-static
results was found, as shown in Figure 5.7.
Sinkage (quasi static)
Sinkage (sim ulation)- 0 . 5
E
- 2 . 5
2 5 02000 100 1 5 05 0Time (s)
Figure 5.7 - Simulated time history of sinkage
5.2.2.2 Numerical Experiment 2
Figure 5.8 shows the results of the second numerical experiment (see Table 5.5) for the sinkage and
trim time histories. A slow increase in sinkage and trim was observed until a gradual stabilisation
occurred with 4.4 m in sinkage and little more than 12° in trim. The simulation results were checked
against quasi-static calculations and compared very well, as can be seen in Figure 5.8. The quasi
static results for sinkage are not shown because they match very closely the simulation results.
78
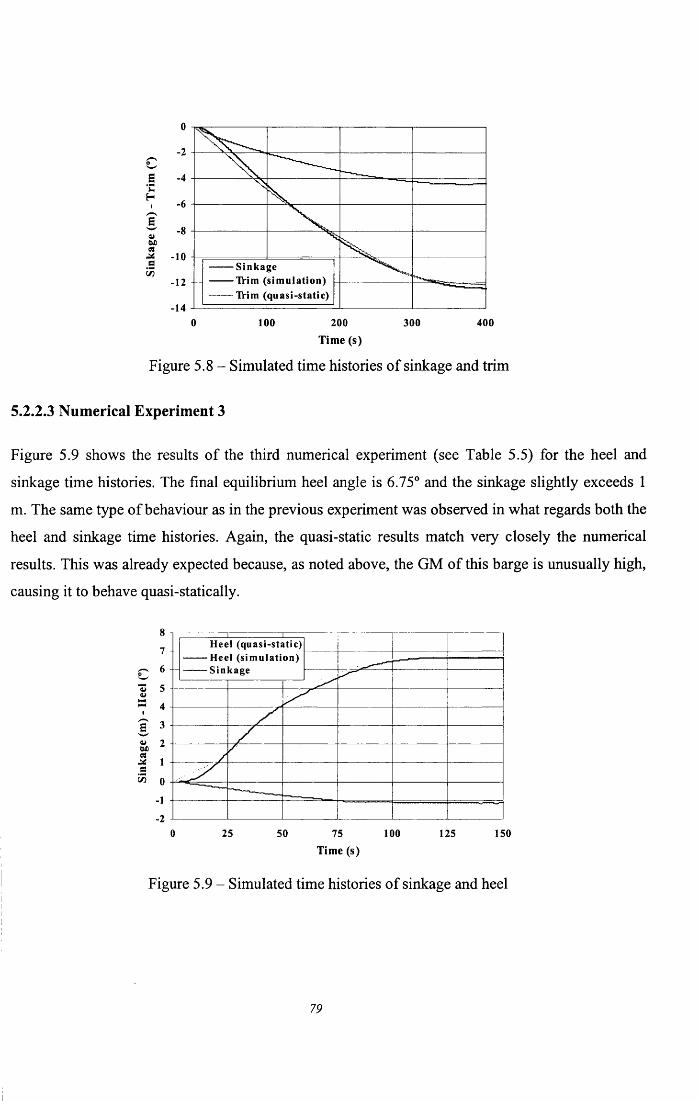
e
S‘CHi
<wbe03
X -10 a53
-12
Sinkage Trim (simulation) Trim (quasi-static)
- 1 4
0 100 200 3 0 0 4 0 0
Tim e (s)
Figure 5.8 - Simulated time histories of sinkage and trim
5.2.2.3 Numerical Experiment 3
Figure 5.9 shows the results of the third numerical experiment (see Table 5.5) for the heel and
sinkage time histories. The final equilibrium heel angle is 6.75° and the sinkage slightly exceeds 1
m. The same type of behaviour as in the previous experiment was observed in what regards both the
heel and sinkage time histories. Again, the quasi-static results match very closely the numerical
results. This was already expected because, as noted above, the GM of this barge is unusually high,
causing it to behave quasi-statically.
8Heel (quasi-static) Heel (simulation) Sinkage
7
65
4
3
2
1
0
1
■20 25 5 0 100 1 2 5 1 5 075
Time (s)
Figure 5.9 - Simulated time histories of sinkage and heel
79

5.2.2.4 Numerical Experiment 4
Figure 5.10 shows the results o f the fourth numerical experiment (see Table 5.5) for the heel, trim
and sinkage time histories. The flooding o f the compartment caused heel (8.5°) and trim (4.1°), as
well as sinkage (1.5 m), in the final equilibrium condition. The quasi-static results follow very
closely the simulation results.
6 t -
EU
0404
X S i n k a g e
cCDae
100 125 150 175 200 2250 25 50 75
T i m e ( s )
Figure 5 .1 0 - Simulated time histories o f sinkage, heel and trim
5.2.2.5 Numerical Experiment 5
Figure 5.11 shows the results o f the fifth numerical experiment (see Table 5.5) for the barge heel
time histories considering several damage opening areas. As expected, the damage area is a very
important parameter, influencing the time the barge takes to achieve its heeled position. It may bei i 2 •seen that the 16 nT damage area causes the barge to heel beyond its equilibrium heel angle (6.75°),
a typical dynamical behaviour associated with the very large rate o f flow. The explanation is that
the barge gathers momentum during the sudden and rapid asymmetrical flooding process and rolls
beyond the equilibrium heel angle. In none o f the other simulations, involving smaller areas, was
such a phenomenon observed, since the damages were small and, consequently, the rates o f flow
were moderate.
80

6
5 1
MOlX
2 F Area - 4 m2 Area - 8 m2
Area - 16 m2
0 200 400 600 800 1000 1200 1400 1600 1800 2000 2200 2400 2600
Time (s)
Figure 5 .1 1 - Influence o f the damage area in the simulated time histories o f heel
5.2.2. 6 Numerical Experiment 6
Figure 5.12 shows the results o f the sixth numerical experiment (see Table 5.5) with a constant
damage area o f 16 m2. The flow coefficient (K) was varied between 0.5 and 1.0, in order to evaluate
its effect in the flooding o f the barge. Figure 5.12 shows the effect o f the variation o f the flow
coefficient. This coefficient changes the rate o f flow dramatically, and the higher is the rate o f flow
the faster the flooding is. Furthermore, values o f K bigger than 0.7 even induce the barge to roll past
the equilibrium angle as already noticed for very large damages. However, the final heel angle is
always the same, as might be expected. A survey o f the literature indicates that the flow coefficient
generally assumes values in the 0.4-0.6 range, much lower than the ones producing this dynamic
behaviour. However, if the damage area is higher than the 16 m , assumed in these simulations,
again, such dynamic behaviours might be observed.
81

©
a><ux K- 0.5
K - 0 .6-— — K - 0.7
K- 0.8 K - 0.9
2
0 10 20 30 40 50 60 70 80 90 100 110 120 130 140 150
Tim e (s)
Figure 5.12 - Influence o f flow coefficient in the simulated time histories o f heel
5.2.2.7 Numerical Experiment 7
To investigate the effect o f GM in the barge flooding and heeling processes, the barge was flooded
with six different intact barge metacentric heights. The damage area was kept constant (8 m ).
Figure 5.13 presents the results o f the seventh numerical experiments (see Table 5.5) using constant
added-mass and damping matrices. The calculation o f these matrices depends on the displacement,
heel and trim, that is, on the underwater form o f the hull, but does not depend explicitly on the GM.
However, since the matrices used in the simulation are those corresponding to the barge natural
frequency, and this depends on the GM, logically, these matrices should change if GM is altered.
However, when running the strip-theory program, it was found that, in spite o f the large changes in
GM, the added-mass and damping coefficients did not change significantly. It was then decided to
run the program keeping these two matrices constant.
The conclusion from Figure 5.13 is that the barge behaves quasi-statically in all simulations. For the
five higher GMs, the barge finds its equilibrium position, at an angle, which increases as the GM
decreases. Finally, for 2.2 m o f metacentric height, the barge capsizes. This type o f behaviour could
be expected since no waves are being considered. In fact, no perturbation o f the barge exists in the
simulation except for the flooding. Therefore, the effect o f the GM is simply to determine the final
equilibrium angle, if any. It does not have other effect such as, for example, causing roll at the barge
82

natural frequency, because a perturbation o f the barge should exist for that to happen, and it does
not exist.
40
35 GM = 3.2 m GM = 4.2 m GM = 6.2 m30
25 GM = 16.2 m
20
15
10
5
030 40 50 60 70 80 90 100 110 12010 200
Time (s)
Figure 5.13 - Influence o f GM in the simulated time histories o f heel
5.2.2. 8 Numerical Experiment 8
To illustrate the dynamic effect o f the GM, the barge was stimulated with a suddenly applied
heeling moment o f 200 MN.m (the barge displacement is 17250 t) and its subsequent behaviour was
simulated. This heeling moment was only applied during the first five seconds and was then
removed. Figure 5.14 shows the results o f the eighth numerical experiment (see Table 5.5) for the
heel time histories using several different GM. It may be seen that the lower the GM is the higher
the maximum heel angle is. Furthermore, for high GM, the barge attains lower maximum heel
angles and, afterwards, tends to roll to the opposite side. No such behaviour was observed for the
lower GMs. All simulations end with the barge approximately upright, the residual heel angles
being caused by numerical inaccuracies.
83

2,5
GM = 2.2 m GM = 3.2 m
GM = 4.2 m GM = 6.2 m— GM = 11.2 m GM = 16.2 m
0.5
-0.50 10 20 30 40 50 60 70 80 90 100 110 120130140 150 160 170 180
Time (s)
Figure 5.14 - Influence o f a suddenly applied heeling moment in the simulated heel time histories
5.3 Time Domain Simulation of RoRo-Shaped Barge Flooding
5.3.1 Experimental Work with a Ro-Ro Shaped Barge
A number o f experiments with a barge model were performed at the Glasgow University towing
tank facilities to evaluate the effect o f damage size in the behaviour o f a barge with some
characteristics similar to those o f a RoRo vessel. These experimental results were subsequently used
to verify if the time domain simulation could predict the observed barge model behaviour.
The barge has the main particulars listed in Table 5.6.
Table 5.6 - Barge main particulars
Displacement 8.41 kg
<o 48.5 cmB 32.4 cm
D m ain deck 10.9 cm
Dupper deck 18.5 cmT 8.3 cm
LCG 24.3 cm (from AP)VCG 14.5 cmGMt 1.1 cm
84

The barge has the internal arrangement shown in Figure 5.15.
0.324 mBulkhead Deck
0.185
0.123 m Compartment 3
Figure 5.15 - RoRo-shaped barge internal arrangement
This barge had been built to illustrate the flooding and capsizing mechanism of a typical RoRo
vessel. It has a large undivided deck located at a height of 10.75 cm. Below this bulkhead deck are
fitted three compartments separated by two transverse bulkheads. These three compartments extend
from the double-bottom to the bulkhead deck. For the sake of simplicity, the double-bottom,
situated 4.15 cm above the baseline, is not represented in Figure 5.15. The volumes of the barge
compartments are shown in Table 5.7.
Table 5.7 - Volumes of barge compartments
Compartment Volume (m3)Aftpeak 3153
2 4583 458
Forwardpeak 3153Car deck 1 2 0 2 1
Double-bottom 33157 6968 696
The internal layout of the central midship compartment, indicated in Figure 5.15, has a special
feature. This compartment, which plan is shown in Figure 5.16, is divided longitudinally by 3
bulkheads into 4 sub-compartments. These bulkheads do not cover the whole distance between the
two transverse bulkheads, since there is a vertical gap of 1.4 cm in each bulkhead extending from
85

the double-bottom to the bulkhead deck. These gaps allowed the water coming from damage
opening H, shown in Figure 5.16, to flow throughout the compartment along the path indicated in
that figure. The longitudinal bulkheads in compartment 3 were expected to act as obstacles to the
free flow of the water, causing a transient asymmetric flooding (TAF) similar to that proposed by
Spouge [4].
■Compartments
Compartment 7
Compartment
Compartment
13cm
Figure 5.16 - Internal layout of the central compartment
The condition of the barge when the tests were performed was characterised by a 8.4 kg
displacement (giving the barge 8.3 cm draft) and a vertical position of the centre of gravity 14.5 cm
above the base line. Under these conditions, the height of the metacentre was 15.6 cm and the
metacentric height was 1.1 cm. The shape of this barge, as well as the vertical position of its centre
of gravity, were originally chosen to simulate the usual metacentric height of a RoRo vessel. This
way, the behaviour of a damaged RoRo vessel with water flowing into compartments 3, 8 , 7 and 2
and, eventually, to the bulkhead deck, could be illustrated.
18.5 cm
10.85 cm
4.157.65 cm cm
Figure 5.17 - Shape of the damages
86

This barge was used to perform a set of experiments designed to investigate the influence of
damage size in the flooding behaviour of the damaged barge. These experiments consisted of
increasing systematically the damage opening sizes and recording the corresponding barge
behaviour. The damage openings are shown in Figure 5.17 (side view) and consisted of a circular
damage opening located below the bulkhead deck and a trapezoidal damage opening above that
deck. Both the circular damage opening (d) diameter and dimensions A and B of the bulkhead deck
damage opening were increased according with Table 5.8. Experiment 6 was performed with an
approximately triangular damage below the bulkhead deck, as shown in Figure 5.17, because it was
not possible to increase any further the circular damage opening.
Table 5.8 - Dimensions of the damages
Experiment d (cm) A (cm) B (cm)1 1 . 0 2 . 0 4.62 1.5 3.0 5.63 2 . 0 4.0 6 . 6
4 2.5 5.0 7.65 3.0 6 . 0 8 . 6
6 Approximately triangular (see Fig. 5.17)
8 . 0 1 1 . 0
For measuring the displacements of the barge, the electronic measurement equipment Selspot was
used. This consisted of two light emitting devices (LED’s) located in the model on top of two poles,
one starboard side, and the other portside. These LED’s emitted light to a tracing camera. When the
damage was open, the camera traced the movements of the LED’s in space and time. Each
experiment (one damage size) was repeated to make sure the results were consistent. After the tests
were carried out, the data acquired by the camera system was analysed to yield the two measurable
motions: heave and roll. As compartment 3 is located amidships, no trim was obtained. The
experimental results obtained are shown in Figures 5.18 to 5.31 to allow an easy comparison with
the simulation results. Before discussing these results, some remarks should be made regarding the
accuracy of the experimental work. Several causes of inaccuracy in the experiments can be pointed
out: the mechanism found to open the damage was not satisfactory, it was very difficult to keep the
barge steady, the measuring system could not follow the barge motions after 40-45° heel and the
barge was very small. Nevertheless, it is believed that these tests yielded some interesting
qualitative results that allow some important conclusions.
87

5.3.2 Numerical and Experimental Results
In this section, the numerical and experimental results will be presented. Although the simulation
objective was to reproduce the experimental behaviour of the barge model, when the simulation
program was run, it was found that the behaviour of such small model (only 48.5 cm) could not be
simulated. The cause was practical numerical problems associated with the use of the pressure
integration technique, which requires complicated calculations, for such a small model. Therefore,
the simulation results shown below, relate to a barge one hundred times bigger than the barge model
used in the experimental work, that is, 48.5 m in length, rather then 48.5 cm. This, in turn, creates a
problem of time scale, which was addressed in a very straightforward way. Since the barge which
flooding was simulated was 1 0 0 times bigger than the model used in the experimental work, the
volumes being flooded are 106 larger than those of the model. The rate of flow depends, among
other factors, on the area of the damage opening, which is 1 0 4 larger, and on the water velocity.
According with formula (4.14), the water velocity depends on the square root of a difference in
heads of water. These heads, in turn, depend linearly on the depth of water and therefore increase
100 times between model scale and full scale. Consequently, the water velocity only increases 10
times. Concluding, the rate of flow is approximately 10 times lower in full scale than in model
scale. One could then expect the flooding of the full-scale barge to be 10 times slower.
The barge numerical model used to produce the numerical results described below consists of 8
compartments defined 96 panels. This small number of panels is sufficient to define the barge shape
since all barge surfaces are flat.
Before describing and discussing both sets of results, a simulation of the flooding of the barge
central compartment will be presented. The objective of this simulation is to demonstrate that the
barge, with no partial longitudinal bulkheads in the central compartment (shown in Figure 5.16),
does not heel due to flooding of this symmetrical compartment. The damage size used in the
simulation is the same used in experiment 6 (see Table 5.8). Figure 5.18 shows the time histories of
the heave and roll motions of the barge. It may be seen that the heave increases until a steady 1.3 m
sinkage remains and that a very small heel develops. This heel is due to numerical causes such as
rounding errors and stabilises at 0 .1°, which is very little indeed.

0.2
- 0 .2S
X -°-4
E<u>OlX
— Heave Roll
0 5 10 15 20 25 30 35 40
Time (s)
Figure 5.18 - Numerical results for symmetrical flooding (heave and roll time histories)
Figure 5.19 shows the water build-up in the central compartment and the rate o f flow. It may be
seen that the water volume increases gradually until equilibrium is reached. The rate o f flow
increases suddenly from zero to a value o f about 12.5 n r /s as the flow begins and then decreases
steadily until only a residual oscillatory rate o f flow remains. The remaining oscillatory rate o f flow
is due to numerical causes associated with the finite time step used in the simulation. Furthermore,
this oscillatory rate o f flow is rather small taking into consideration the damage size. If smaller time
steps are used these oscillations become much smaller.
2000
C/)
g 1500o*
500
- Water— Flowrate
-5000 5 10 25 30 4015 20 35
Time (s)
Figure 5.19 - Numerical results for symmetrical flooding (water build-up)
89

5.3.2.1 Experiment 1
The first experiment on asymmetrical flooding was performed with the damage sizes shown in
Table 5.8 for experiment 1. In Figure 5.20, the experimental results can be observed. It may be seen
that a heel developed towards the side o f the damage. This angle progressively faded away until
only a residual heel angle o f little more than 0.5° remained. No capsize was observed in this
experiment. The maximum heel angle occurred around 10 s after the damage was open and had a
value o f approximately 3.5°. The opening o f the damage causes a peak o f almost 1° to the side
opposite to the damage. This also causes the rapidly vanishing but quite significant rolling motion
shown. This experiment was performed only once because the flooding process was relatively slow
and it was felt that the results were clear. The heave results in a slow increase in draft until a 1.2 m
increase was obtained. Figure 5.20 also shows the numerical results for the barge motions for
experiment 1. The most important feature to notice is the maximum heel reached: 4.5°. This is a
little more than the maximum obtained in the experimental work, which is 3.5°. The heave result is
very near the experimental result.
1—— H e a ve Roll
Heave-Nu merical Rol I-Nu merical
4
2
0
•20 10 20 7030 40 50 60
Time (s)
Figure 5.20 - Numerical and experimental results for experiment 1 (heave and roll time histories)
Figure 5.21 shows the amounts o f water in the various flooded compartments (see Figure 5.16 for
the compartment numbers). It can be seen that compartments two and three, although geometrically
equal, initially have different amounts o f water due to the transient heel o f the barge. A similar
90
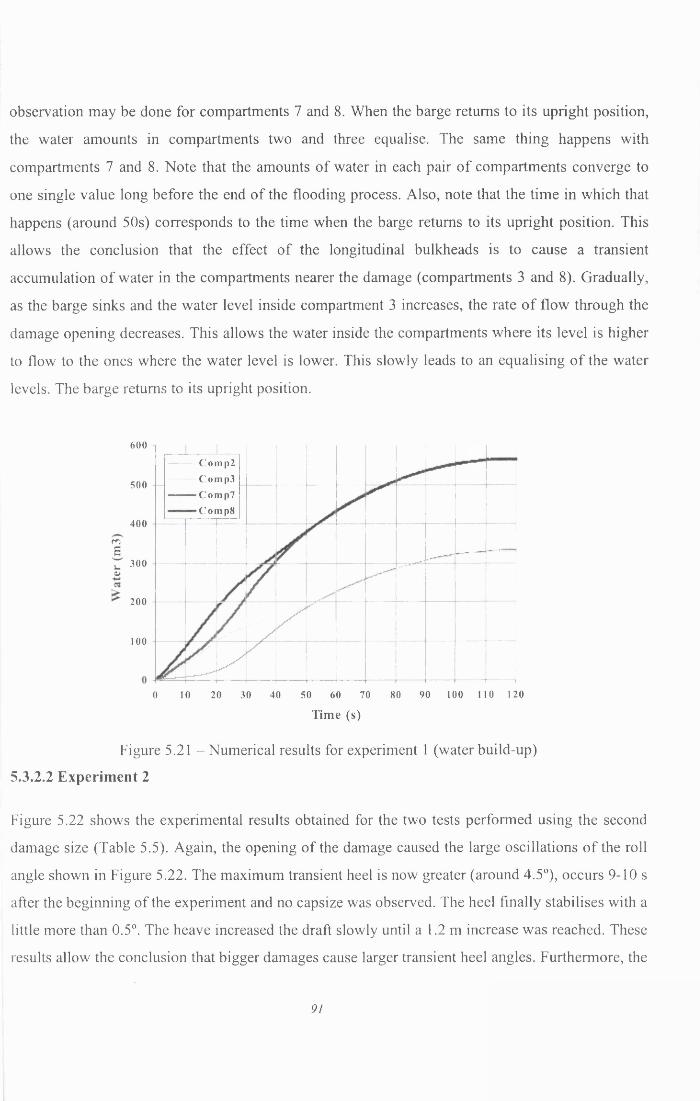
observation may be done for compartments 7 and 8. When the barge returns to its upright position,
the water amounts in compartments two and three equalise. The same thing happens with
compartments 7 and 8. Note that the amounts o f water in each pair o f compartments converge to
one single value long before the end o f the flooding process. Also, note that the time in which that
happens (around 50s) corresponds to the time when the barge returns to its upright position. This
allows the conclusion that the effect o f the longitudinal bulkheads is to cause a transient
accumulation o f water in the compartments nearer the damage (compartments 3 and 8). Gradually,
as the barge sinks and the water level inside compartment 3 increases, the rate o f flow through the
damage opening decreases. This allows the water inside the compartments where its level is higher
to flow to the ones where the water level is lower. This slowly leads to an equalising o f the water
levels. The barge returns to its upright position.
600 Coinp2
C o m p3 — C'omp7
Comp8
500
400mar 300a>
200
100
80 90 100 110 12010 20 30 40 50 60 700
Time (s)
Figure 5.21 - Numerical results for experiment 1 (water build-up)
5.3.2.2 Experiment 2
Figure 5.22 shows the experimental results obtained for the two tests performed using the second
damage size (Table 5.5). Again, the opening o f the damage caused the large oscillations o f the roll
angle shown in Figure 5.22. The maximum transient heel is now greater (around 4.5°), occurs 9-10 s
after the beginning o f the experiment and no capsize was observed. The heel finally stabilises with a
little more than 0.5°. The heave increased the draft slowly until a 1.2 m increase was reached. These
results allow the conclusion that bigger damages cause larger transient heel angles. Furthermore, the
91

maximum heel angle is now achieved slightly earlier and the equalisation happens earlier. These
two tendencies will become clearer in the next experiment.
Figure 5.22 also shows the numerical results for the barge motions for experiment 2. The maximum
heel angle is now o f 5.5°, occurring about 15s after the beginning o f the simulation. This is 1°
higher then the experimental results. Both values are bigger than those obtained in experiment 1.
This is in accordance with what might be expected o f a larger damage opening. The rate o f flow is
now bigger and the accumulation o f water in the compartments closest to the damage opening is,
consequently, bigger. This leads to an increased maximum heel angle towards the damage side. The
time it takes for the barge to return to its upright position is now 10 s smaller (simulation). In Figure
5.22 one can also note that before the barge returns to the upright position, it tends to heel towards
the opposite side until it reaches an angle o f around 0.25°. This transient heel is caused by the large
energy, which takes the barge beyond its upright equilibrium position.
o0*
V
•
10
• Heave (te stl) Heave (test2)
■ Roll ( te s t l)Roll (test2)Heave-NumericalRoll-Numerical
15 20 25Time (s)
30 35 40
Figure 5.22 - Numerical and experimental results o f experiment 2 (heave and roll time histories)
Figure 5.23 shows the amounts o f water in the flooded compartments for experiment 2. It may be
seen that the difference in water amounts between equal compartments located on opposite sides o f
the barge is now bigger than in experiment 1. This corresponds to a bigger accumulation o f water in
the compartments nearer the damage opening. However, the time for the water levels to equalise is
now smaller (about 35 s). In experiment 1, this time was 50s. This reduction in time to equalise is
caused by the bigger damage now being considered.
92

600 Comp2
Comp3 —— Comp7 - Comp8
500
400
i- 300
200
100
600 10 20 30 40 50Time (s)
Figure 5.23 - Numerical results for experiment 2 (water build-up)
5.3.2.3 Experiment 3
Figure 5.24 shows the experimental results o f the two tests performed in the third experiment,
which again corresponds to an increased damage size. The mean maximum heel (8.5°) is achieved
7.5-8 s after the beginning o f the flooding process. The heel becomes negligible after 20 s have
elapsed. The flooding process is, therefore, clearly faster and the maximum heel bigger. No capsize
was observed, but it was recorded visually that the deck edge approached dangerously the water. It
was felt that the immersion o f the deck edge was very near, and this event would trigger almost
certainly a capsize.
Figure 5.24 also shows the numerical results for heave and roll time histories. The maximum heel
angle reached by the barge is 7.4H and occurs at 1 Is after the beginning o f the simulation. That is,
the maximum is higher than in the previous experiments and occurs earlier. It should be noted that
before returning to the final upright position the barge again presents a tendency to roll to the side
opposite the damage. In this experiment, it rolls to about 0.5° before regaining its upright position.
This tendency had already been noted in the previous simulation, but the maximum heel value was
then 0.25°.
93

oDS
<u>at<ua
10 Heave (test 1) Heave (test 2)
Roll (test 1) Roll (test 2)
Heave-Nu merical Rol l-Nu merical
9
8
7
6
5
4
2
0
■2105 15 200 25 30 35 40
Time (s)
Figure 5.24 - Numerical and experimental results o f experiment 3 (heave and roll time histories)
Figure 5.25 shows the numerical results for the water build-up in the flooded compartments. The
differences between the amounts o f water in equal compartments, but on opposite sides o f the
barge, are now very significant. It may also be seen that the water amounts in compartments 2 and 7
oscillate because o f the rolling o f the barge to the side opposite the damage (Figure 5.24). Note that
both events happen at 30s after the beginning o f the simulation.
600
— Comp2 C o m p3
Comp7■" — Comp8
500
400
E>- 300
200
100
0 5 10 15 20 25 30 35 40Time (s)
Figure 5.25 - Numerical results for experiment 3 (water build-up)
94

5.3.2.4 Experiment 4
Figure 5.26 shows the experimental results o f the two tests performed for experiment 4. In all two
tests the barge capsized, although the precise moment o f the capsizing was not always the same
because the moment the flooding process was started also varied. Capsizes occur about 5.5-6.0 s
after the beginning o f the flooding process. The heel angle stabilises at about 9-12° for 2 s (between
3.0 and 5.0 s) before capsize suddenly begins. This is the time required for a considerable amount o f
water to accumulate in the deck causing the capsizing o f the barge. It is in accordance with what
was visually observed.
Figure 5.26 also shows the numerical results for the heave and roll time histories for experiment 4.
These results are very different from the experimental results and clearly show that a certain amount
o f time for the water build-up is necessary before the rate o f increase o f heel dramatically increases,
that is, capsize occurs.
45Heave (test 1)
Heave (test 2)—— Roll ( test l) Roll (test2)
He a ve-Nu merical Roll-N u merical
40
353025
20
15
10
0
4 5 60 2 9 10 11 12 13 14 15 161 7 8
Time(s)
Figure 5.26 - Numerical and Experimental results o f experiment 4 (heave and roll time histories)
Figure 5.27 shows the amounts o f water present in each compartment in the time domain. It may be
seen that the water-on-deck (water on compartment 5) appears only some time after the beginning
of the experiment and that after a brief period the amount o f water-on-deck rises dramatically.
Simultaneously, the water amounts in compartments 2 and 7 decrease, reflecting the sudden heeling
95

towards the damaged side o f the barge. This event drains the water from those two compartments
towards compartments 3 and 8.
3000
Comp2Co mp3 Comp5
—~ Comp7Comp8
2500
2 0 0 0 -
E■—<u
1 000
500
2 3 4 5 6 ■7 8 9 10 11 12 13 14 15 160 1
Time (s)
Figure 5.27 - Numerical results for experiment 4 (water build-up)
5.3.2.5 Experiment 5
Figure 5.28 show's the experimental results o f the two tests performed in experiment 5. Again,
capsize occurs, but it may be seen that the time to capsize is much faster. Capsize occurs between
3.5 s and 5.0 s after the beginning o f the flooding. A certain stabilisation o f the heel angle occurs,
with the duration o f 1.5 s, before capsize occurs. However, this stabilisation period is much shorter
than in the previous experiment.
Figure 5.28 also shows numerical results for the heave and roll motions. These motions are similar
to those shown in Figure 5.26. A small decrease in the rate o f increase o f heel can be noted around
5s after the beginning o f the simulation. The heave increases slowly until capsize is set in motion,
then it increases much faster. Again, the numerical results are very different from the experimental
results.
96

45-— Heave (test!) Heave (test2)— Roll (testl) Roll (test2)
Heave-Numerical Heel-Nu merical
40
35
C 30
4 53 92 6 7 8 10 120 1
T i m e ( s )
Figure 5.28 - Numerical and experimental results o f experiment 5 (heave and roll time histories)
In Figure 5.29, the numerical results concerning the water amounts in the various compartments are
shown. It may be seen that once the accumulation of water on deck has started, the process
accelerates until capsize o f the barge occurs. During the capsizing process, again, drainage o f water
from compartments 2 and 7, located on the opposite side to the damage, occurs. This compartment
drains to compartments 3 and 8.
3500
C o in p 2C o m p 3
- C o m p 5 — - Comp 7
■ Comp 8
3000
2500
E 2000
<u1500
1000
500
0 21 3 4 5 6 10 1 17 8 9
T i m e ( s )
Figure 5.29 - Numerical results for experiment 5 (water build-up)
97

5.3.2. 6 Experiment 6
Figure 5.30 shows the experimental results o f the two tests performed for experiment 6. This
experiment corresponds to the full-size damage, with which the barge model was originally fitted.
Capsize occurs in less than 4 s, that is, almost instantaneously. Almost no period o f stable and slow
progressive flooding o f the car deck can be seen, because the curve corresponding to roll motion
increases almost continuously. Figure 5.30 also shows numerical results for the heave and roll
motions in experiment 6. The increase in the heel angle is continuous. This means that capsizing
also occurs almost instantaneously. The heave motion is quite similar to its behaviour in the
previous tests. The numerical results are again quite different from the experimental results.
- H e a v e ( t e s t 1) H e a v e ( t e s t 2)
Roll ( t e s t l ) Rol l ( t es t2)
He a v e - Nu m e r i c a l R o l l - N u me r i c a l
40
35
30
£ 25
1 20 v 15 —rwX
0
3 50 2 4 6 7 8T i m e (s)
Figure 5.30 - Numerical and experimental results o f experiment 6 (heave and roll time histories)
Figure 5.31 shows the numerical results relating to the amounts o f water in the various
compartments. The sudden and continuous character o f the water-on-deck increase is consequence
o f the almost immediate capsize.
450 0
400 0 C o m p 2
C o m p 3
C o m p 5
C o m p7
C o m p8
350 0
300 0rn2, 2500
13 2000 -----L1500
1000
500
0 2 3 4 6 7 8
Time (s)
Figure 5.31 - Numerical results for experiment 6 (water build-up)
98

5.4 Time Domain Simulation of RoRo Ship Flooding
5.4.1 The Modelling of the European Gateway Accident
The comparison of the numerical and experimental results presented in section 5.3 allows the
conclusion that the theoretical model numerical predictions reproduce qualitatively the physical
phenomena involved in the capsizing of RoRo-shaped barges in calm waters. The theoretical model
will now be used to simulate the heeling and flooding process of a passenger RoRo ship, the
European Gateway (EG).
This accident has been described in section 2.2. A full account and discussion of this accident can
be found in Spouge [14]. It is important, however, to remind here that this ship capsized quickly
after the flooding of four symmetrical compartments. The first one to be flooded was the shallow
‘U’ shaped generator room (shown in Figure 5.32), which was located below the garage space and
was crowded with machinery (generators), pipes, floor plates and pillars. In due time, also the
stabiliser room, the engine room and the gearbox rooms were flooded. The damage stability
calculations did not predict that heel would result from the initial stages of this four-compartment
flooding. However, the inquiry into this accident concluded that the ship heeled much more rapidly
than expected, allowing water to enter the car deck. Spouge [14] attributed the rapid initial heel to
Transient Asymmetric Flooding (TAF). This phenomenon consisted of the water surface being
inclined towards the damage side because of the resistance to the flow offered by the obstacles in
the compartment. The open literature does not contain much research on this effect, leaving a
certain urge for a more in depth understanding of this mechanism, which is the motivation for this
study. Furthermore, the environmental conditions prevailing at the time of the accident (moderate
seas and winds) made it possible to undertake its simulation using the current theoretical model.
Although the European Gateway accident is being modelled, the following work is not an attempt
to accurately model it because the ship lines plan, as well as some other significant information, are
not available. Therefore, the information contained in Spouge [14] and a lines plan found in Bird
and Brown [26] were used, this lines plan being selected because of its similarities to the European
Gateway. The ship body plan is shown in Figure 5.1 and the general arrangement of the vessel in
Figure 5.2. Consequently, the results cannot be said to relate specifically to this accident, but rather
exemplify the behaviour that might be expected of a RoRo ship with some resemblance with the
forms and general arrangement of the European Gateway.
99

As a first check on the proximity of the model (developed with the available information) to the real
EG, its draught and trim in the accident condition were calculated. The European Gateway had a
trim by the stem of 1.0 m and a draught of 4.4 m at the time of the accident. The EG numerical
model has a trim by the stem of 0.96 m and a draught of 4.6 m in the same condition. These results
are considered accurate enough for this work.
Roam
Figure 5.32- Original cross-section in generator room
To model the asymmetric flooding, instead of considering the water surface inside the generator
room to be inclined in relation to the sea surface, as Spouge [14] did, this work assumes that the
generator room was in fact divided in three by the presence of the generators (Variant 1). That is,
the generators shown in Figure 5.32 acted as a “wall” that divided the compartment in three
artificial compartments. These compartments are shown in Figure 5.33 and are located portside,
starboard side and centrally (below the garage). This assumption is close to the physical reality
because the damage opening in the ship hull is directly in front of the starboard generator.
Therefore, the space available for the water to flood the central and portside compartments is
located both at the ends of the generators and above the generators. These are relatively small areas,
which can be considered as openings between independent compartments and modelled as flat
panels. The rates of flow in these openings can then be computed using the PIT and established
hydraulics methods.
100

i[
Gtacnlor Roan Portude
4— Bulkhead1 V*"
Figure 5.33 - Modified cross-section in generator room - Variant 1
Besides this arrangement, a second arrangement (Variant 2), shown in Figure 5.34, was created, in
which the generator room was divided in four compartments. This variant is equal to the first one,
except that a partial height bulkhead fitted centrally divides the central generator room in two
symmetrical compartments. This new subdivision is designed to enhance the asymmetrical
flooding. The partial height bulkhead is 0.2 m high.
ftiTMtf-aH opening opening
Bulkhead1
Figure 5.34 - Modified cross-section in generator room - Variant 2
Both these arrangements of the generator room have the effect of causing the flooding to be
asymmetrical, as shown in Figure 5.35 for Variant 1. This is because the heads of water which drive
the flow between each two compartments are lower than the ones influencing the flow of sea water
through the damage opening to a single compartment. This results in a slower water flow between
101

compartments, therefore creating an asymmetrical distribution o f water. Furthermore, the use o f a
flow coefficient o f 0.5 has the effect o f further enhancing the asymmetry o f the flooding. This
asymmetry consists o f an accumulation o f water in the compartments nearer the damage, while the
compartments farther away from the damage remain comparatively dryer.
uP»C«0fCI
GMUGC s»*ce
Figure 5.35 - Asymmetrical flooding o f generator room
The volumes o f the relevant compartments for the symmetrical model are given in Table 5.9. The
15 compartments o f this model are described in the numerical model using 926 panels.
Table 5.9 - Compartments o f the symmetrical model
Compartm ent Volume (nr3)1- Cardeck 114686 - Engine Room 12167 - Gearbox Room 8809 - Stabiliser Room 96712 - Generator Room 95613 - Double bottom Generator Room -starboard 36
The volumes o f the relevant compartments for Variant 1 are given in Table 5.10. The 17
compartments of this model are described in the numerical model using 978 panels.
Table 5.10 - Compartment volumes in Variant 1
Compartm ent Volume (m 3)1 - Cardeck 114686 - Engine Room 12167 - Gearbox Room 8809 - Generator Room - starboard 25710 - Stabiliser Room 96713 - Generator Room - central 44214 - Double bottom Generator Room -starboard 3617 - Generator Room - port 257
102

The volumes o f the relevant compartments for Variant 2 are given in Table 5.11. The 18
compartments o f this model are described in the numerical model using 998 panels.
Table 5.11 - Compartment volumes in Variant 2
Compartment Volume (nr3)1 - Cardeck 114686 - Engine Room 12167 - G earbox Room 8809 - G enerator Room - starboard 25710 - Stabiliser Room 96713 - G enerator Room - central - port 22118 - G enerator Room - central - starboard 22114 - Double bottom Generator Room -starboard 3617 - G enerator Room - port 257
The damage openings in the EG are shown in Figure 5.36. The damage was divided in 3 damage
openings, which were modelled as flat panels “missing” in the ship’s hull, through which seawater
could flow freely. Damage opening 1 is located in the car deck o f the EG while damage openings 2
and 3 exposed, respectively, the generator room and the starboard side double-bottom.
Damage opening 1
Damage opening 2
opening 3
Base line
Figure 5.36 - European Gateway hull damages
The internal arrangement o f the generator room of the EG is displayed in Figure 5.37. In this
Figure, the three arrangements are superimposed. The shaded areas represent both the damage
103

openings in the EG hull and the openings between the “artificial” compartments that compose the
generator room.
Damage opening 1 Main Decc
Gen Room Port
Central Gen Roo»i Port
Damage opening 3
Gen Room - Starboard Central Gen Room - Starboard
Figure 5.37- Isometric view of the transverse section of the European Gateway
It is worth noting that in all three models of the EG used to perform the simulation, the cross-
flooding of the engine room, gearbox room and stabiliser room from the generator room, due to
open watertight doors is considered. The open watertight doors are modelled, also, using flat panels
and a flow coefficient (K) of 0.5 is used.
The condition of the ship in the moment of the accident was simulated by setting the centre of
gravity 7.71 m above the base line and 56.2 m forward of the aft perpendicular. The displacement of
the ship was 6578 t at the time of the accident.
5.4.2 Numerical Results
The results of the simulation of the EG accident, modelled as described above, are presented in
Figure 5.38. The curve labelled “symmetrical” indicates the results of the simulation of the ship
behaviour considering the generator room as one symmetrical compartment. It can be seen that a
small heel angle slowly develops towards the damaged side shortly after the collision. This is
caused by the fact that, in the simulation, only the starboard double-bottom under the generator
room was flooded (and not because of a loss of initial stability) and by dynamic effects associated
with the rapid flooding. During the accident, the flooding of the double-bottom was symmetrical, at
least in theory, because the spaces of the double-bottom were cross-flooded. As the crossflooding
usually takes some time, the pessimistic assumption that the flooding of the double-bottom was
104

asymmetrical was taken in this simulation. Due to the progressive flooding, when 7° heel are
reached (130 s), the main vehicle deck edge becomes immersed, allowing water to enter that deck.
Between 130 s and 250 s the main vehicle deck is being progressively flooded. This is the time
necessary for enough water to accumulate in the main vehicle deck, triggering the capsizing
process, represented by the rapid increase in heel angle. Note that the “symmetrical” curve
corresponds to the capsize mechanism shown in Figure 3.3.b.
50 - r -
45 - - Sym metrical —•— Spouge
Variantl «— Variant2
40
35
^ 30 —
20
75 100 125 150 175 200 225 250 275 300 325 3500 25 50
Time (s)
Figure 5.38 - Influence o f asymmetry on the behaviour o f a damaged RoRo ship
When the generator room is subdivided in three compartments (Variant 1 - Figure 5.33), the
simulation yields the “Variant 1” heel curve, shown in Figure 5.38. This curve indicates that the rise
in the heel angle is continuous, and the deck immersion occurs 60 s after the beginning o f the
flooding, triggering the capsizing. This does not entirely agree with the results o f Spouge, also
shown in Figure 5.38 under the label “Spouge”. In fact, this author predicted a sudden heeling to 5°
within 10 seconds and a certain decrease in the rate o f increase o f heel between 25 s and 90 s until
capsize is set in motion. The current simulation model, however, predicts correctly the time
necessary for the ship to capsize.
The curve labelled “Variant 2” shows the results o f the flooding simulation when the generator
room is divided in four compartments (Figure 5.34). The height o f the central midship bulkhead is
0.2 m. It may be seen that the initial heeling process is now more rapid than Spouge predicted. The
cause o f this sudden heeling, within a few seconds after the beginning o f the flooding, is the
strongly asymmetrical distribution o f water generated by this arrangement o f the generator room.
105

This allows the conclusion that the asymmetric distribution o f the water in the generator room
might explain the sudden heeling o f the EG if this asymmetry is sufficiently strong. The precise
meaning o f “sufficiently strong” and the details o f this accumulation o f water on one side o f the
generator room can only be accessed through extensive experimental tests performed with large-
scale models.
7
6E-A— Spouge
o£■ 4>C9i_OJ3 3 <*-o <11 £ 2 e4> u 1
010010 20 30 40 50 60 70 80 90 1 10
Time (s)
Figure 5.39 - Centre o f gravity offset time history up to grounding
Figure 5.39 shows the offset o f the centre o f gravity o f the floodwater in the generator room. This
offset, for the two asymmetrical arrangements o f the generator room (Variants 1 and 2), is
calculated approximately using the volumes o f water contained in the various compartments that
compose the generator room. The water offset considered by Spouge [14] is also presented in that
Figure for comparison. It is not clear how this offset was calculated and it might not be directly
comparable with the offsets calculated using the present simulation. In Variant 1 the water centre of
gravity offset increases slowly from an initial value o f 1 m. Because o f its initially moderate values
and slow increase, the water asymmetry cannot cause high initial heel angles. Consequently, the
time domain simulation is not able to predict the large heel angle (5°) reported by the survivors only
10s after the collision.
Variant 2, in spite o f the very low height o f the central bulkhead (0.2 m), creates a severe
asymmetric distribution of the water, which causes the ship to heel very rapidly. From Figure 5.39,
it may be concluded that this asymmetrical distribution o f water is comparable, in magnitude, with
that considered by Spouge. The reason for the increase in the Variant 2 curve is the shifting o f the
106

water due to the heeling o f the EG. The main conclusion is that this modelling o f the generator
room arrangement, therefore, allows the theoretical model to reproduce the behaviour o f the EG.
The results o f the different reconstructions o f the accident up to ship grounding (150 s) are shown in
detail in Figure 5.40. The differences between the time domain simulations using the arrangements
o f Variant 1 or Variant 2 are now clear. The time domain simulation, using Variant 1, o f the heeling
process, does not predict the high initial heel angle (6° at 10s). Because the heel angle increases
slowly, this simulation underpredicts the ship heel angle up to 100 s. However, the time the ship
takes to achieve high heel angles (20°) is similar to that predicted by Spouge. When the time
domain simulation is performed for the arrangement o f Variant 2, the predicted heel angles up to 50
s are well above Spouge predictions and between 50 s and 100 s are below those results. From that
moment onwards the simulation predicts a behaviour quite near the one predicted for Variant 1. The
main conclusion is that Variant 1 is an optimistic estimate (underprediction) o f the initial stages o f
the heeling process and that Variant 2 is an overestimate o f the initial heeling process. It is worth
noting that the Variant 1 curve is close to the Townsend Thorensen reconstruction, which, in fact,
might be expected to be an optimistic view o f the accident.
50
45
40
35
< » u- 20
15
10
5
0 10 20 30 40 50 60 70 80 90 100 1 10 120 130 140 150
Time (s)
♦ Spouge SimulationB Townsend Thorensen Reconstruction ▲ Department of Transportation Reconstruction
Present Simulation - Variant 1 Present Simulation - Variant 2
• Survivors Statements
Figure 5.40 - Comparison o f heel angle time histories up to grounding
107

5.5 Discussion of Results
After having presented the numerical and experimental results of the time domain simulation of
barge and ship flooding and heeling, these results will now be discussed and put in the context of
the current RoRo ship problem.
The calculation of ship hydrostatic properties during the time domain simulation was performed
using the pressure integration technique (PIT). This technique involves a substantial number of
mathematical operations that proved difficult to code and make the time domain simulation slow.
However, this technique is very versatile and easy to understand, because it is very close to the
physical reality. Furthermore, there are only two other possible options besides using the PIT. One
of these options would be to use the traditional areas and volumes integration technique, but these
calculations are also difficult to implement and involve a large number of mathematical operations.
The second option would be to create a database of ship hydrostatic properties, from which the
current properties would be interpolated. However, to obtain reasonably accurate results from this
interpolation, a very large number of hydrostatic calculations would have to be performed in order
to build a comprehensive enough database. This would have to be done for each different ship
whose behaviour was to be studied and a good knowledge of the intermediate stages of flooding
would have to exist in order to build an adequate database.
The results of the PIT and its comparison with the results of the software package GHS were
presented in Tables 5.2 and 5.3, and Figures 5.3 and 5.4, in order to validate its use in the time
domain simulation. In what concerns the hydrostatics, the differences between both methods vary
between extreme values of -3.6% and +1.6%, but most often lie in the [-1;+1] interval. The PIT
underpredicts systematically the displacement and TPC, overpredicts the VCB and either
underpredicts or overpredicts the LCB, LCF, KMx and KML. The displacement and TPC are
underpredicted because the PIT calculates the ship properties using a model defined by flat panels.
As the model used in this comparison was kept simple, because it was to be used in the time domain
simulation, this resulted in an underprediction of those properties. The overpredicted VCB is also a
consequence of this crude panelisation, because of the loss of the volume between each flat panel
and the curved hull shape, shifting the overall centre of buoyancy upwards. The cross-curves of
stability calculated using the PIT present, at the maximum, a difference of 10% in relation to the
GHS results. The results regarding the damage condition equilibrium positions show that, generally,
the PIT underpredicts the trim. The ship draught is generally overpredicted, with differences
108

ranging between -2.3% and +1.3%. These results are, as might be expected, affected by any
inaccuracies in the calculation of the centre of buoyancy, centre of flotation and ship displacement
The major parameter influencing all these discrepancies is the panelisation. In spite of the RoRo
ship model used in these calculations being defined using a small number of panels, the results
obtained using the PIT can be considered satisfactory because the differences are not significant.
Besides the dominant influence of the accuracy of the panelisation, one other possible source of
inaccuracy in the results of the PIT is the influence of the rounding errors associated with the
significant number of mathematical operations. Although this influence is difficult to quantify, its
effects can be neglected, because its influence is certainly minor when compared with that of the
panelisation. The overall conclusion on the use of the PIT is that it is a very promising technique.
The problems associated with the large number of mathematical operations and with the
panelisation will undoubtedly be solved by the rapid developments in computer hardware. This will
make possible the simulation of damaged ship motions using the PIT to calculate the ship
hydrostatic properties, but more accurate ship numerical models will have to be used.
After the validation of the PIT module, the validation of the theoretical model was undertaken
through the simulation of barge flooding. A barge was chosen for this validation process because of
its simplicity. Furthermore, its centre of gravity was set in such a position to generate an
exceptionally high GM, which would cause the barge to be very “stiff’ and, consequently, to
behave quasi-statically. The first four simulations (Figures 5.7 through 5.10) were designed to allow
a comparison with quasi-static results obtained using the software package GHS. The two sets of
results compared well, allowing the conclusion that for medium size damage openings ( 1 1 m2) and
high GM’s the simulation reproduces the barge quasi-static behaviour correctly. This is true for
various damage conditions involving sinkage, sinkage and heel and sinkage, heel and trim.
Observation of Figures 5.7 through 5.10 also allows the conclusion that the simulation tends to
underpredict the heel and trim angles at the intermediate stages of flooding. These differences are,
however, very small. This indicates that the barge takes more time to heel than the instantaneous
motions assumed in the quasi-static calculations.
After these initial simulations, an investigation of the influence of such parameters as damage area,
flow coefficient (K) and metacentric height (GM) in the flooding was undertaken and its main
findings are now presented and discussed. The reason for this investigation is that its influence is
more or less predictable, allowing, therefore, further validation of the theoretical model. Figure 5.11
109

shows the influence of damage area in the heeling process. It is concluded that as damage area
increases, the time the barge takes to achieve its final damaged condition decreases. This is in
accordance with common experience. However, the time the barge takes to complete the flooding is
not linearly dependent on the damage area because of the influence of both the damage area and the
water velocity. For large damage areas (16 m ), an interesting phenomena appears in the heel time
history: very close to the end of the flooding process, the barge assumes, temporarily, larger heel
angles than the equilibrium heel angle. The cause of this dynamic effect is the fact that the heeling
process is, for a 16 m2 damage area, very fast and the barge gathers momentum that takes it to roll
beyond the equilibrium heel angle. Shortly afterwards, the barge returns to the equilibrium heel
angle.
In Figure 5.12 the influence of the flow coefficient (K) in the heeling process is shown. It can be
seen that any value of K over 0.5 causes a dynamic effect of the type previously noted for very large
damage areas. The magnitude of this dynamic effect increases linearly with the value of the flow
coefficient. This is because there is a linear dependency between the flow rate and the flow
coefficient.
Figure 5.13 illustrates the effect of the metacentric height (GM) on the final heel equilibrium angle
while flooding an asymmetric compartment. As expected the larger the GM, the smaller the final
heel angle. No dynamic effects associated with low GM’s can be noted in this Figure because no
perturbation of the barge exists apart from the flooding mechanism. Therefore, the barge tends to
flood slowly and without any oscillations. In these simulations, the added-mass and damping
matrices were considered constant in spite of the knowledge that they depend on the barge
displacement, heel, trim and GM. In fact, those factors affect both the strip-theory results and the
ship’s natural frequency (both matrices were calculated for that frequency). However, the changes
in those two matrices are small so they have a very small impact in the simulation results. This
point deserves some study and experimenting in the future, nevertheless.
The influence of the GM was further investigated through the analysis of the barge response to a
suddenly applied heeling moment. The heeling moment (200 MN.m) lasted 5 s, after which it was
removed. The heeling responses are shown in Figure 5.14, allowing three conclusions. The first
conclusion is that the lower the GM is, the higher the maximum heel angle the barge reaches. The
second conclusion is that the higher the GM, the stronger the tendency the barge presents to roll
back to the opposite side (negative values of heel) after having rolled previously in the direction of
110

the heeling moment. Finally, the third conclusion is that the barge with highest GM returns to the
equilibrium position (approximately 0 ° heel) more quickly than the others (and, in the process, rolls
heavily to the opposite side of the heeling moment). This is the uncomfortable (but safe) type of
behaviour to be expected from a high GM vessel where the motion is heavily damped. None of
these numerical experiments caused barge capsizing because the barge GM was always relatively
high (minimum of 2.2 m) and the heeling moment was applied for a very short period of time (5
seconds).
The final conclusion of the time domain simulation of the barge heeling and flooding is that the
behaviour exhibited by the barge is realistic and varies with damage area, flow coefficient (K) and
metacentric height (GM), according with what might be expected from common sense. Finally,
when the barge is expected to behave quasi-statically (high GM), the simulation, in fact, yields
results very close to this type of behaviour.
Having established the correctness of the time domain simulation of the heeling and flooding of a
simple barge, experiments were undertaken with a RoRo shaped barge and the results compared
with simulation results. The objective of this work was to study the effect of obstacles (Figure 5.16)
located inside compartments in the flooding and heeling processes. Figures 5.18 and 5.19 allow the
conclusion that the RoRo-shaped barge, if there were no longitudinal bulkheads subdividing the
central midship compartment, would slowly flood while remaining upright. This is in accordance
with damage stability predictions (quasi-static results). However, during the experimental work,
with the central compartment partially subdivided by longitudinal bulkheads (Figure 5.16), it was
observed that the barge would heel towards the damaged side in the first stages of flooding. For the
smaller three damage openings, the deck edge never became immersed and no capsize was
observed (Figures 5.20, 5.22, 5.24). For the three experiments performed with larger damage
openings, the barge eventually capsized (Figures 5.26, 5.28, 5.30). Capsize can only be attributed to
the presence of the longitudinal bulkheads.
The time domain simulation succeeded in reproducing numerically this phenomenon. In the first
three simulations, corresponding to the first three experiments, no capsize was predicted by the
simulation. Nevertheless, an increasingly important transient heel towards the damaged side was
noted at the initial stages of flooding. The last three simulations, corresponding to the last three
experiments, demonstrated that the barge might capsize if the damage opening is sufficiently large.
The reason for the barge capsizing is that larger damage openings produce larger flow rates. These,
111

in turn, produce an accumulation of water in the damaged side of the barge because the water
cannot flow sufficiently rapidly along the flooded compartment due to the presence of the
longitudinal bulkheads (Figure 5.16). This accumulation of water produces a transient heel, which
may cause the immersion of the deck edge, exposing the damaged car deck to flooding. Once water
enters this large open space, it is only a matter of time before enough water collects in the car deck
to cause the capsizing of the barge. The time necessary for the water build-up to cause the capsizing
is shown by the slowdown in the rate of heel angle increase that precedes the capsize. The larger the
damage is, the least significant this slowdown becomes, because capsize is increasingly
instantaneous.
Tables 5.12 and 5.13 show some of the main parameters that allow the comparison of the
experimental and simulation results. Table 5.12 shows the maximum heel angle and the time at
which this maximum heel is attained for the first three experiments (differences expressed as a
percentage of the experimental results). Table 5.13 shows the period during which the water is
accumulating on the car deck and the time at which the barge capsizes (considering the capsize as a
40° heel angle) for the last three experiments (differences expressed as percentage of the
experimental results).
Table 5.12 - Comparison of experimental and numerical results - small damage openings
Experimental Results Simulation Results Differences
Exp Maximum Heel (°) Time (s) Maximum Heel (°) Time (s) Maximum Heel (°) Time (s)
1 3.0 10.0 4.4 20.0 +47% +100%2 4.5 8 . 0 5.4 15.0 +20% +8 8 %3 8.5 7.0 7.3 11.0 -14% +57%
Table 5.13 - Comparison of experimental and numerical results - large damage openings
Experimental Results Simulation Results Differences
Exp Water build-up period (s)
Time to capsize (s)
Water build-up period (s)
Time to capsize (s)
Water build-up period (s)
Time to capsize (s)
4 3.25-4.75 5.8 6 .0 - 1 0 . 0 16.0 +85% +110% +176%5 2.25-3.75 4.8 4.5-6.5 1 1 . 0 +100% +73% +129%6 - 3.5 - 7.5 - +114%
The reasons for these very large differences between the experimental and numerical results are
related, mainly, with the experimental inaccuracies and the lack of calibration of the theoretical
model. In what concerns the experimental results, the causes of inaccuracy are:
112

• the mechanism found to open the damage perturbed the model, although great effort was
made to open the damage as smoothly as possible. It was also very difficult to ensure that the
damage was opened exactly at the same moment in each experiment
• the difficulty in keeping the model steady, both before and specially after the beginning of the
flooding, because of the motions caused by the opening of the damage and by the waves in
the small tank. These waves made the model heave and roll, causing an almost stochastic
behaviour (Figures 5.20, 5.22, 5.24) and, inevitably, influencing the interior cross-flooding
process (although this influence is probably of minor importance)
• after the first test in each experiment, it was impossible to remove all water from the model
and a very small residual heel (about 0.25-0.5°) remained when the experiment was repeated.
It is also possible that the barge centre of gravity shifted by a very small amount due to shift
of the weights fitted on the upper deck (used to give the barge model an appropriate draft and
VCG)
• the LED’s could not follow the model after the heel angle exceeded 50° to 60°, because the
tank wall would then be between the LED’s and the camera. Nevertheless, by then, the
capsize was already taking place
An important factor in the correlation of the experimental and numerical results is the time. A
solution was found to connect the model experiment time and numerical experiment time by
dividing time on the second case by a factor of 10, as explained in section 5.3.2. This is the
standard condition of Froude similarity, mentioned in Vassalos [49], and appears to be a
reasonable hypothesis. It is author’s opinion that the differences in time scale between both sets
of results arise from:
• the difficulties of modelling the flooding of the barge accurately
• the scale effects related to the Reynolds number, which might be of importance in what
regards the roll motion of the barge
• the fact that the model scale was 1 :1 0 0 , leading to very important scale effects associated
water flow characteristics (the flow was quite laminar). This source of inaccuracy concerning
the experimental results can only be overcome by using larger models.
113

The type of behaviour evidenced in the experiments above lead to the conclusion that, if some
obstacles exist within a flooded RoRo ship compartment which obstruct the flow of water, a
transient heel may result from the transient asymmetrical flooding. If the asymmetrical flooding is
sufficiently large, the deck edge may become immersed and capsize may occur. Furthermore, if a
RoRo ship has B/5 wing compartments not efficiently cross-connected, the same phenomenon may
occur. The RoRo-shaped barge, used in the experimental work, had an intact angle of deck
immersion of 8 .6 °, but the RoRo ship angle of deck immersion is often smaller than this value
(Figure B.5). This clearly indicates a potential for an accident of this type to occur. In fact, most
probably, such an accident has already occurred: the European Gateway. The importance of being
able to reproduce such type of accident is evident. The only realistic way to do this is to perform a
time domain simulation of the flooding and heeling process, with a very special attention being
given to the intermediate stages of flooding. The accurate modelling of the influence of obstacles in
compartment flooding can only be done by performing experiments with large ship models, in order
to calibrate properly the time domain simulation.
Having identified the importance that obstructions within compartments might have in the vessel
heeling and capsize, it was decided to apply the time domain simulation to the study of the
European Gateway (EG) accident. Spouge [14] explained this accident by considering that the
water level within the first flooded compartment had not become immediately horizontal, causing a
heeling moment that, eventually, immersed the bulkhead deck edge. However, the amount of
asymmetrical flooding (a 10° slope in the free-surface) considered by Spouge [14] was quantified
arbitrarily (it was an input into the accident simulation), leaving the need for some further study of
this phenomenon. Since the environmental conditions prevailing at the time of this accident and
probably didn’t have any influence in the ship capsize, the application of the current time domain
simulation model to this accident is appropriate.
The accident was modelled using three different arrangements of the generator room. In the first
arrangement, the generator room of the EG was taken as strictly symmetrical (no obstructions). In
the second arrangement (Variant 1), the generator room was subdivided in three compartments:
portside, starboard side and central. In the third arrangement (Variant 2), the central compartment of
the generator room was further subdivided in two symmetrical independent compartments. The
flooding of the generator room was then assumed to consist in the cross-flooding of different
generator room compartments, assuming horizontal ffee-surfaces within each compartment. It is
114

worth noting that, using these models of the generator room, the asymmetry of the flooding will
exist as a series of horizontal steps whose lengths are determined by the hydraulic model and
bulkhead opening, rather than be stipulated by the program user, as Spouge did. This is, certainly, a
major advantage of this time domain model of ship heeling and flooding.
The results of the simulation of the EG accident using these three models of the generator room
were presented in Figure 5.38. The simulation of the flooding of the generator room, free of
obstructions (curve labelled “symmetrical”), allows the conclusion that the ship would take
approximately 6 minutes to reach 50°. When the generator room is subdivided in three separate
compartments the ship reaches 50° (see curve “Variant 1”) within about 2.5 minutes, a little faster
than the Spouge prediction indicates it did. The same happens when the generator room is
subdivided in five different compartments (see curve “Variant 2”). Although the ship capsizes in
approximately the same time, the heel time histories for the first 50 s are very different between
these three simulations (Spouge, Variant 1, Variant 2). In fact, Variant 1 underpredicts the heel
angle until 100 s and Variant 2 overpredicts it until 50s. The cause of these differences, shown in
Figure 5.39, is the position of the floodwater centre of gravity. Only Variant 2 is able to reproduce
the large centre of gravity offset predicted by Spouge. This explains that, for this arrangement of the
generator room (Variant 2), large heel angles are predicted at the first stages of flooding. Variant 1
shows much smaller offsets of the centre of gravity at the first stages of flooding, resulting in a
severe underprediction of the observed heel angle.
Some reasons for the discrepancies between Spouge predictions and the numerical results now
being presented are:
• Spouge [14] was using a quasi-static model while the present theoretical model involves the
numerical solution of the ship equations of motion. Furthermore, Spouge assumed an arbitrary
transient asymmetric flooding to explain the water accumulation on one side of the ship, while
the current model uses a cascade method to perform the simulation of that accumulation
• Spouge considered a number of different dynamic effects in his work such as: a vertical fluid
dynamic force, a moment from lost buoyancy, water washed into the damaged compartments by
wind or collision generated waves
• Spouge had access to detailed information on the European Gateway characteristics and accident
details, which was not available in this work
115

• this theoretical model does not take into account the permeability of the ship spaces. If the
compartment permeabilities had been taken into account, the ship capsize would slow down
• the reliability of the theoretical model is questionable once large heel angles are reached.
To conclude this discussion of the numerical results, some words concerning the theoretical model
details are required. First, all simulation results presented in this work use the added-mass and
damping matrices calculated for the intact vessel in the initial upright position. No correction of
these two matrices, to account for the increased vessel displacement and the heel and trim angles,
was made. This may distort the vessel response once moderate sinkage and moderate heel and trim
angles are exceeded. The precise amount of this distortion should be further investigated. However,
the work of Vassalos et al. [40] suggests that the importance of the changes in the matrices is not
very great. Furthermore, the influence of the damage opening(s) in these matrices, because the
underwater forms of the hull are modified by the accident is unknown. However, this is likely to be
a second order problem that might be ignored in a first approach. Nevertheless, since no waves were
considered in this work, all these problems are certainly less relevant than would be the case if
waves were being considered.
The second problem deserving attention, in the current theoretical model, is the fact that the ship
motions are taken about the intact centre of gravity and intact axes of inertia. This is a good
hypothesis if the angles of heel and trim are moderate (less than 1 0 °), but becomes less accurate if
the ship capsizing process is being modelled. Again, as no waves are being considered, the flooding
can only happen in spaces located below the waterline. This allowed the use of the lost buoyancy
method in the damage stability calculations. Consequently, the centre of gravity does not change
with time, except for the shifting of fluids contained in tanks, and part of this problem is overcome.
Given this remark, this effect should not distort significantly the ship response, at least for moderate
heel angles. However, again, this problem should be further investigated.
Finally, the last major remark concerning the theoretical model, is the fact that the simulation of the
flooding process is simplistic, given the complexity of the phenomena under consideration. Namely,
the assumption that, within each compartment, the water becomes instantaneously parallel to the
horizontal is doubtful. Also, the modelling of the flooding and cross-flooding of ship compartments
is clearly unsatisfactory, since very simple hydraulic methods are used, which do not reproduce the
complexity and turbulence of the flooding of the ship internal spaces. Only the use of large-scale
116

experimental results can produce some experimental evidence of the physical reality, based on
which accurate and realistic theoretical modelling of ship flooding can then be built.
117

CHAPTER 6 - CONCLUSIONS AND RECOMMENDATIONS FOR FUTURE RESEARCH
6.1 Conclusions
A number of general conclusions regarding the problem of passenger RoRo ships damage stability
have been drawn from this MSc and are now stated.
The use of passenger RoRo ships of ever increasing car and passenger capacities has increased
dramatically since the 1960’s. The large number of accidents with this type of vessel has caused
great concern among the travelling public with its safety. Inquiries into the accidents show that the
main cause of loss is poor damage stability. The damage stability problem arises from the fact that
the L/B ratio of these ships has been decreasing and the B/T ratio has been increasing.
Consequently, the angle at which the bulkhead deck is immersed has decreased, i.e., the bulkhead
deck has come relatively closer to the waterline. Since collisions are the cause of 17% of the
accidents with this type of ship, and generally cause damages to the ship hull both below and above
the waterline, a high probability of flooding the main vehicle deck exists. Once the main vehicle
deck is flooded, it is only a matter of time before the ship capsizes, especially in bad weather.
During the recent research programmes undertaken to study RoRo damage stability the time domain
simulation of damaged ship motions and flooding has arisen and is expected to allow a
comprehensive assessment of RoRo ship behaviour when subjected to large flooding. Some
theoretical models of damaged ship motions have already been developed, mainly in Europe. These
models have increased in complexity since the early 1980’s, when they first came into existence.
However, they require a large amount of mathematical calculations and some aspects of these
models are still very crude. A common feature of these models is that they require a lot of
experimental work to calibrate their results. Furthermore, analysis of the recent experimental work
performed in this research area shows that physical phenomena like the influence in the flooding of
obstacles inside compartments, have not been fully studied.
In the current work a theoretical model of damaged ship motions in the absence of waves, wind and
forward speed has been developed. This model can be applied to any type of ship, of any size or
arrangement, and allows for flooding and cross-flooding of compartments. To compute the
hydrostatic properties of the damaged ship during the flooding process, the model uses a recent
118

technique: the pressure integration technique (PIT). This theoretical model has been implemented in
a computer program and applied to the study of the flooding of barges, RoRo-shaped barges and a
RoRo ship. This technique has the advantages of being close to the physical reality and allowing the
direct calculation of flow rates and effects of the floodwater inside compartments. It has proved to
be a slow technique, since a large numerical effort is involved in its use. The majority of the results
of this method show differences o f-3% to +3% when compared to the software package GHS. The
biggest differences (less than 1 0 %, however) were found when cross-curves of stability were
calculated. These inaccuracies arise because the PIT uses flat panels to model the curved shapes of
the ship hull. Therefore, the accuracy of the PIT results is greatly dependent on the number of
panels used to model the hull. The RoRo ship model used in this work was somewhat simplified, so
this partially accounts for the differences found between both methods. Consequently, these
differences can be largely overcome using a more accurate model. Some numerical inaccuracies are
still to be expected because of the large number of calculations involved in the PIT. Nevertheless,
the flexibility of the PIT allows the accurate calculation of the ship hydrostatic properties even for
very large heel angles, an advantage that, taken together with the others already mentioned, more
than offsets its inaccuracies and slowness.
The numerical simulation of the motions of a barge, while flooding, allowed the conclusion that the
barge motions, in calm water, while one of its compartments is flooding, consist of quasi-static
motions. This is true if the roll damping is correctly estimated using the Tasai-Takaki method and
the damage size is moderate. Under those conditions, the flooding proceeds slowly until the barge
settles down to its equilibrium position. It was also found that the intermediate stages of flooding
were very close to the quasi-static predictions. Further investigation on the influence of damage
area confirmed that this parameter is determinant of the time the barge takes to attain its final
equilibrium position. If the damage area is very large, the barge may roll beyond its heel
equilibrium position and then, shortly afterwards, return to this position. The effect of the flow
coefficient (K) is similar to that of the damage area because it can also cause the barge to roll
beyond its equilibrium position. This happens for high flow coefficients. Both high flow
coefficients and high damage areas lead to high flow rates, and these are the cause of barge heeling
beyond its heel equilibrium angle. It was also confirmed that the metacentric height (GM) has an
effect in the final heel equilibrium angle after asymmetrical flooding: the bigger the GM, the
smaller the heel angle. Furthermore, a barge with a high GM, when perturbed by a suddenly applied
heeling moment, tends to roll more rapidly than one with a low GM. The maximum heel angles
119

reached by the barge are smaller in the first case and the barge stabilises in the upright position
more quickly. These observations were already expected and show that the theoretical model
l developed in the current work can reproduce the physical reality.
The experimental work undertaken with a RoRo-shaped barge model allows the conclusion that,
when obstructions to the water flow exist inside a compartment, an accumulation of water can be
generated in the compartment portion located nearer the damage opening. This accumulation then
causes a transient heel towards the barge-damaged side. This phenomenon can be simulated using
partial longitudinal bulkheads, which allow water to flow, but delay the water spreading. If, at the
same time, the damage opening area is increased, water distribution becomes progressively more
asymmetric, causing bigger and bigger transient heel angles at the initial stages of flooding.
Eventually, if the barge has a bulkhead deck located relatively near the waterline, and a damage
exists at the main vehicle deck, when the deck edge becomes immersed the flooding of the main
vehicle deck is initiated. Then, the time required to achieve a complete capsize is also largely
determined by the size of the damage, since capsize depends on a certain critical amount of water
accumulating on that deck. Therefore, the experimental work supports Spouge’s prediction that an
important physical phenomenon called transient asymmetric flooding (originating because of major
obstructions inside a RoRo ship compartment) may cause its capsize.
All these observations were confirmed qualitatively using the numerical simulation. The theoretical
model was able to reproduce the accumulation of water on the damaged side of the barge and the
resulting transient heeling. In case the deck edge became submerged, the theoretical model was able
to reproduce the capsizing of the barge. However, the quantitative agreement between the
experimental and numerical results was found poor. This fact can be attributed to two factors: the
lack of calibration of the theoretical model and the experimental inaccuracies. This last factor arises
both from the practical difficulties found when performing the experiments (small tank,
unsatisfactory procedure for opening the damage) and from the small dimensions of the barge
model (scale 1:100). The scale effects between the simulation results and the experimental work
are, therefore, very important. The conclusion is that future experimental work should be performed
with considerably larger models and within large tanks. For comparison, it should be noted that the
minimum scale advised in the Stockholm Agreement [8] for model testing is 1:40 (but in no case
should models be smaller than 3 m in length at the subdivision waterline). Experimental work
120

performed under these improved conditions should yield trustworthy results, appropriate to judge
and calibrate the theoretical model.
The numerical simulation of the European Gateway accident was performed by modelling the
obstructions in this ship’s generator room as artificial bulkheads. The results of the time domain
simulation allow the conclusion that this artificial subdivision can indeed generate a significant heel
angle at the early stages of flooding. This conclusion indicates that the transient asymmetric
flooding phenomenon predicted by Spouge may have been present as a major cause of the
European Gateway accident. This transient heel angle is caused by the accumulation of floodwater
on the compartments located nearer the damage opening, and causes the immersion of the main
vehicle deck edge, which is then exposed to flooding. After the immersion of the deck edge, some
time is necessary for the accumulation of a critical amount of water on the main vehicle deck, which
is a necessary condition for capsize to begin.
Numerical experience demonstrated that the large heel angles predicted by Spouge at the initial
stages of flooding of the EG are indeed possible. However, the ability of the numerical simulation
to reproduce this phenomenon depends on the modelling of the generator room. Only the
subdivision of the generator room in four separate compartments can generate a sufficient
asymmetry of the floodwater distribution, so that heel angles equal or larger than 5° are obtained 10
s after the collision. In fact, this generator room arrangement yielded overpredictions of the heel
angles (in relation to Spouge’s results). No perfect match between Spouge’s predictions and the
simulation results was achieved, however. The large differences between the simulation results for
different arrangements of the generator room suggest that further experimental investigations are
necessary in order to refine the simulation of the generator room flooding. These experiments might
consist of testing large-scale models (in any case bigger than 1:40 scale) of the flooded
compartments. Great care should be taken to ensure a correct and complete modelling of at least the
major obstacles located within these compartments. Such models would allow, then, the study of
the influence of obstacles in the progression of the floodwater and in the heeling process.
The conclusions above indicate that the basic assumption of the current theoretical model (that the
instantaneous waterlines inside the flooded compartments are flat and horizontal) is acceptable
because it allows the prediction of the RoRo-shaped barge capsize and of the European Gateway
capsize. However, since this prediction is, quantitatively, not very accurate, further theoretical and
experimental research is still necessary.
121

6.2 Recommendations for Future Research
The time domain simulation of damaged ship motions is such a vast and complex research area that
the number of topics for future research is almost endless. First, some interesting investigations
using the current model are suggested. Second, a number of recommendations for improving the
theoretical model are made. Finally, some experimental works that might suggest further
improvements to the theoretical model are indicated.
A number of numerical investigations, using the current theoretical model, could be made, such as:
• investigating the influence of the flow coefficient, the damage area, the damage opening shape,
the modelling of the obstacles within the generator room, the collision forces, the hypothetical
dynamic effects of the floodwater and the initial conditions of the ship motion, in the simulation
of the European Gateway accident
• simulating the Herald o f Free Enterprise accident, provided that a model of the water
accumulation in the main vehicle deck is available or be developed and incorporated in the
current simulation
• investigating the influence of hull shape, freeboard up to the bulkhead deck, initial heel, damage
area and external forces in the flooded behaviour of RoRo ships
• investigating the influence of centre casing, side casing and freeing ports in the flooded
behaviour of RoRo ships
• testing the Glasgow Concept, with the advantage of testing, in the process, the capabilities of the
current model to simulate the downflooding of compartments
• investigating the influence in the RoRo heeling and flooding process of the changes occurring in
the added mass and damping matrices, due to heel, trim and increased displacement and of the
effects of the viscous damping
• investigating the influence of the time step in the vessel response.
The following improvements to the current theoretical model could be made:
• the modelling of the flooding and cross-flooding hydraulic models should be improved, possibly
by considering the water surface to be inclined instead of considering it to be composed of
several flat steps. However, this step should be carefully supported by model testing. Also, the
122

flow coefficient should be further investigated, if possible using more sophisticated hydraulic
models
• the changes in the centre of gravity and inertia axes should be further investigated from a
theoretical point of view and, if these changes were found to be significant, they could be
incorporated in the current model
• this model should be upgraded to include the modelling of the ship motions due to waves and
wind, since this would be a major increase in this model’s range of applicability. In this case, the
Cummins approach should be further studied and some of its aspects incorporated in the present
model. First, regular waves could be incorporated and, after extensive validation, irregular seas
could be also included
• the case when a ship has speed would be another interesting extension of the current model
• dynamic effects of the floodwater such as the sloshing might also be incorporated in the model,
especially since this model is being applied to RoRo ships and these ships have large open
spaces (this upgrade of the model is only relevant after having considered the effects of waves
and wind)
• the complexity of RoRo ship flooding, especially if several compartments are being flooded,
suggests that it would be useful to have a graphical display of the simulation results, which
would allow the visualisation and checking of the ship flooding and heeling processes.
The following experimental work might be undertaken:
• the current flooding model should be validated and calibrated using experimental tests with large
models. This is the only way to guarantee the tuning of the simulation results with the physical
reality. For this purpose and for improving the modelling of the flooding, systematic
investigations should be undertaken to identify the critical variables for the transient asymmetric
flooding. For that matter, the following variables should be investigated: damage opening shape,
damage opening area, location and layout of compartment, length of compartment, breadth of
compartment (measured from the ship’s side), depth of compartment (and the ratios between
these dimensions), location and dimension of major obstacles inside the compartment,
smoothness of major obstacle shapes and amount of smaller obstructions (these two variables
should influence the flow coefficient), ship’s GM.
123

REFERENCES:
[1] Joint Accident Commission, “Final Report on the capsizing on 28 September 1994 in the
Baltic Sea of the Ro-Ro Passenger Vessel MV Estonia”, obtained at
http://president.ee/report/.
[2] Lloyd, C.J., “Research into Enhancing the Stability and Survivability Standards of RoRo
Passenger Ferries - Internal Arrangements and Overview Study”, Proceedings of Int.
Symposium on Safety of RoRo Passenger Ships, Department Of Transport of UK.
[3] Svensen, Tor E., “A New Safety Standard For Passenger RoRo Vessels”, Proceedings of
WEGEMT School, 1995.
[4] Spouge, J.R., “The Safety of Ro-Ro Passenger Ferries”, RINA Transactions of the Royal
Institution of Naval Architects, vol. 30, 1988.
[5] IMCO, “Regulations on Subdivision and Damage Stability of Passenger Ships as Equivalent
to Part B of Chapter II of the International Convention for the Safety of Life at Sea, 1960”,
MSC/Circ. 153 (Explanatory Notes to the Regulations), Resolution A.265 [VIII], 1973.
[6] IMO, “SOLAS Consolidated Edition, 1992 - Part B”, London, 1992.
[7] Allan, T., “The New Survivability Requirements for RoRo Passenger Vessels from the 1995
SOLAS Conference and the 1996 Stockholm Regional Conference”, Proceedings of the 30
WEGEMT School, 1998.
[8] IMO, “Regional Agreement Concerning Specific Stability Requirements for Ro-Ro Passenger
Ships”, IMO Circ. Letter N° 1891, 1996.
[9] Turan, O., “Dynamic Stability Assessment of Damaged Passenger Ships Using a Time
Simulation Approach”,PhD Thesis, Department of Ship & Marine Technology, University of
Starthclyde, 1993.
[10] “Europe’s Biggest Car Ferry - Arveprins Knud”, The Motor Ship, November 1963.
[11] “British Rail’s Largest Ship - St. George”, The Motor Ship, August 1968.
[12] “Silja Serenade: a Revolution in Baltic Passenger Ferries”, The Naval Architect, May 1990.
124

[13] Bengtsen, K., Comer-Walker, B.P., “Car Ferry Design and Development”, Transactions of the
Royal Institution of Naval Architects, vol. 122, 1980.
[14] Spouge, J.R., “The Technical Investigation of the Sinking of the Ro-Ro Ferry EUROPEAN
GATEWAY”, Transactions of the Royal Institution of Naval Architects, pp. 49-72, 1985.
[15] Dand, I., “Hydrodynamic Aspects of the Sinking of the Ferry HERALD OF FREE
ENTERPRISE ”, Transaction The Royal institution of Naval Architects, vol. 141, pp. 145-
167, 1988.
[16] IMO, “IMO and RoRo Safety”, obtained at http://www.imo.org.
[17] Papanikolau, A. D., “Critical Review and Practical Implications of the SOLAS 95
Regulations for the Damage stability of RoRo Passenger Ships”, Proceedings of STAB’97,
1997.
[18] Andersson, I., “MacGregor’s RoRo safety initiative”, MacGregor News 126, January 1995.
[19] Winkle, I.E., “Ro-Ro Ferry Survivability - What Have we Learned Since Zeebruge ?”,
Proceedings of the 14th Leith International Conference on Offshore Search & Rescue,
Marine/Aviation Safety and Communications, 1995.
[20] Pawlowski, M., Winkle, I.E., “Capsize resistance Through Flooding: a New Concept for
RoRo Ferries”, Proceedings of the 14th Leith International Conference on Offshore Search
and Rescue, Marine/Aviation Safety and Communications, 1987.
[21] Pawlowsi, M., “Subdivision of RoRo Ships For Enhanced Safety In the Damaged Condition”,
Report of the Ship Design & Research Centre, Gdansk, 1995.
[22] Winkle, I.E., “Meeting the New SOLAS Regulations for RoRo Ships Without the Need for
Transverse Bulkheads on the Vehicle Deck”, Proceedings of RoRo96 Conference, Lubeck,
1996.
[23] Marsano, R., “Stability of RoRo Passenger Ships”, Proceedings of STAB’97, 1997.
[24] Aston, J.G., Rydill, L.J., Beck, M.P., “Improving the Safety of RoRo Ships”, The Naval
Architect, April 1987.
[25] Middleton, E., Numata, E., “Test of a Damage Stability in Waves”, SNAME Spring Meetings
Proceedings, 1970.
125

[26] Bird, R., Browne, R., “Damage Stability Model Experiments44, Transactions of The Royal
Institution of Naval Architects, pp. 69-91, 1973.
[27] Robertson, J.B., Nickum, G.C., Price, R.I., Middleton, E.H., “The New Equivalent
International Regulations on Subdivision and Stability of Passenger Ships”, Transactions of
SNAME, Vol. 82, pp. 344-381,1974.
[28] IMO, “The Calculation Procedure to Assess the Survivability Characteristics of Existing Ro
Ro Passenger Ships when Using a Simplified Method Based Upon Resolution A.265 (VIII)”,
MSC Circ N°574, 1991.
[29] Dand, I., “Factors Affecting the Capsize of Damaged RoRo Vessels in Waves”, Proceedings
Symposium on RoRo Ships Survivability, RINA, November 1994.
[30] Schindler, M., “Damage Stability Tests of Models Representing Ro-Ro Ferries Performed at
DMI”, Danish Maritime Institute, Proceedings of WEGEMT School, 1995.
[31] Aanesiand., V., “Model Tests At Marintek With Damaged Ro-Ro Vessels”, Proceedings of
WEGEMT School, 1985.
[32] Stubbs, J.T., Molyneux, D., Koniecki, M., Peirce, T.H., Rousseau, J.H., “Flooding Protection
of Ro-Ro Ferries”, Transactions of the Royal Institution of Naval Architects, pp. 103-116,
1996.
[33] Molyneux, D., Rousseau, J., Cumming, D., Koniecki, M., “Model Experiments to Determine
the Survivability Limits of Damaged Ro-Ro Ferries in Waves”, Transactions of SNAME,
1997.
[34] J.Joumee, H. Vermeer, A. Vredeveldt, “Systematic Model Experiments on Flooding of Two
Ro-Ro Vessels”, Proceedings of STAB’97, pg. 81-98, 1997.
[35] J. Riola, Maron, A., “Survival Tests of a Damaged Ferry Vessel”, Proceedings STAB’97, pg.
223-232, 1997.
[36] Ishida, Shigesuke, Murashige, S., “Stability of a Ro-Ro Passenger Ship With a Damage
Opening in Bern Seas”, Ship Research Institute, Ministry of Transport.
[37] Bor-Chau Chang, Blume, P., “Survivability of Damaged Ro-Ro Passenger Vessels44, Ship
Technology Research, vol. 45, 1998.
126

[38] Sen, P., Koustantinidis, C., “A Time Domain Simulation Approach to the Assessment of
Damage Survivability of RoRo Cargo Ships”, Transactions of SNAME, 1987.
[39] Paulo, J.S., “Time Domain Simulation of Flooding”, Msc Dissertation Project, University
College of London, 1990.
[40] Vassalos, D., Turan, O., “A Realistic Approach to Assessing the Damage Survivability of
Passenger Ships”, Transactions of SNAME, vol. 102, pp. 367-394, 1994.
[41] Zaraphonitis, G., Papanikolaou, A.D., Spanos, D., “On a 3-D Mathematical Model of the
Damage Stability of Ships in Waves”, Proceedings of STAB’97, 1997.
[42] Cummins, W.E., “The Impulse Response Function and Ship Motions”, Heft 47,
Schiffstechnik, 1962.
[43] Bhattacharyya, R., “Dynamics of Marine Vehicles”, John Wiley & Sons, 1978.
[44] Lewis, E., “Principles of Naval Architecture”, SNAME, vol. Ill, pp. 1-160, 1989.
[45] Himeno, Y., “Prediction of Ship Roll Damping - State of the Art”, Report n° 239, Univ. of
Michigan, 1981.
[46] J. Witz, J., Patel, M., "A Pressure Integration Technique for Hydrostatic Analysis",
Transactions of the Royal Institution of Naval Architects, 1984.
[47] Schalck, S., Baatrup, J., "Hydrostatic Stability Calculations by Pressure Integration", Ocean
Engineering, vol. 17, N !4, pp. 155-169, 1990.
[48] Van Santen, J. A., "Stability Calculations for Jack-ups and Semi-submersibles ", Proceedings
of International Conference CADMO, 1986.
th[49] Vassalos, D., “Physical Modelling and Similitude of Massive Structures”, Proceedings of 30
WEGEMT School, Glasgow, 1998.
[50] Price, W.G., Bishop, R.E.D., “Probabilistic Theory of Ship Dynamics”, Chapman and Hall,
1980.
[51 ] Creative Systems, Inc., “General HydroStatics - User’s Reference Manual”, 1987.
[52] Press, W. H., Flannery, B.P., Teukolsky, S.A., Vetterling, W.T., “Numerical Recipes- The Art
of Scientific Computing”, Cambridge University Press, 1989.
127

APPENDIX A - DEVELOPMENT OF THE PASSENGER RORO SHIP GENERAL
ARRANGEMENT
■2o5t
w i n tL L in m r r n r r r m c r r r r f u u j o n n n i H O O n n
I 1 I 1 I 1 I I 1 I I 1
r~ jimyi "iMMp jiiin.'B
! u d . .
Figure A.l - General arrangement o f an early passenger RoRo
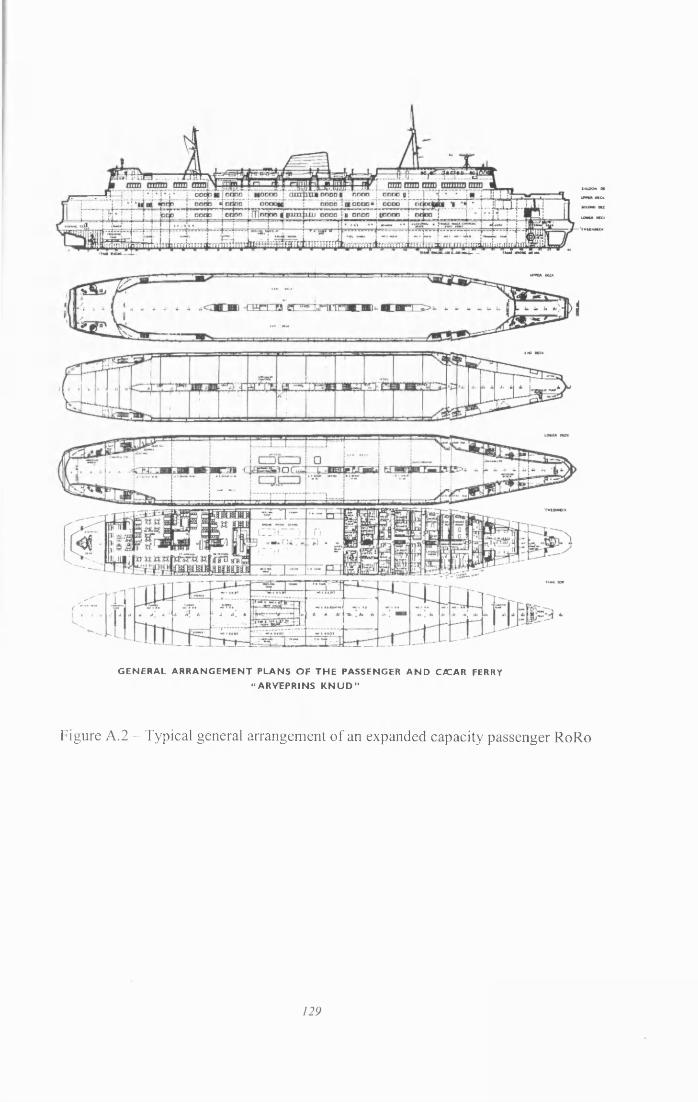
GENERAL ARRANGEMENT PLANS OF THE PASSENGER A N D CATAR FERRY “ ARVEPRINS K N U D ”
Figure A.2 - Typical general arrangement o f an expanded capacity passenger RoRo

uuxiiuBH
•«« $$=■ r n n m m m n w
Figure A.3 - General arrangement o f a modern passenger RoRo
130

APPENDIX B - DEVELOPMENT OF THE PRINCIPAL PARTICULARS OF PASSANGER
RORO SHIPS
Figure B.l shows the development of the gross register tonnage (GRT) on the Cross-Channel
routes. The GRT increased since 1960 due to the increasing cargo and passenger capacities of this
type of ship. Although there is a lack of data in the specialist magazines concerning the ships in the
early 1980’s, it is believed that the GRT of the ships in this period should fit within the general
trend. It is worth noting that the European Gateway (marked with an empty circle), had a GRT
below the average for 1975. The Herald o f Free Enterprise (1980) (marked with an empty triangle),
is well integrated within the general trend of the early 1980’s. An example of the increase in vessel
dimension is the fact that the Pride o f Dover (1987) (marked with an empty losang) ferries have
approximately the triple of the GRT of the Herald o f Free Enterprise class of ships, which were
their predecessors in the same route. The increase of the GRT expresses the fact that the space on
the decks has increased a lot since the 1960’s. This trend reveals a search for increased passenger
and vehicles capacity.
4 0 0 0 0
3 5 0 0 0
3 0 0 0 0
^ 2 5 0 0 04—*
£ 20000OSo1 5 0 0 0
10000
5 0 0 0
01 9 6 0 1 9 7 0 1 9 8 0 1 9 9 0 2 0 0 0
Year
Figure B.l - Development of Gross Register Tonnage on the Cross-Channel routes
Figure B.2 shows the development of the passenger and car capacities on the cross-Channel routes.
Passenger and car capacities have been increasing sharply since the early 1960’s. The ships in the
1990’s with low passenger capacities are a vessel operating in the routes to Brittany (a route where
ui
o mI
S£m
fi
1 1 *i p r
k
a
131

trailers have some importance) and a trailer and passenger RoRo, the Isle o f Innisfree. The type of
these vessels accounts for their low passenger capacities. Note also the very low passenger capacityIof the European Gateway (it was a freight oriented ship) as well as the average capacities of the
Herald o f Free Enterprise both in cars and in passengers.
2500
2000
ue*
u
5 iooot/>«а.
500
01960 1970 1980 1990 2000
Year
Figure B.2 - Development of number of passengers and cars on the Cross-Channel routes
Figure B.3 shows the development of the L/B and B/T ratios on the cross-Channel routes. The L/B
ratio has been decreasing slowly since the 1960’s due to large increases in the breadth of the
vessels. Since 1990, the tendency is to stabilise if not to increase. The B/T ratio has been growing
very slowly, almost imperceptibly, since the early 1960’s until the early 1990’s. The Herald o f Free
Enterprise fits well in the general trends. Both the European Gateway and the Pride o f Dover are
somewhat above the expected values for the years in which they were built.
8.00
7.50
7.00
б.50
H 6.00n
' 5.50nJ 5.00
4.50
4.00
3.50
3.001960 1970 1980 1990 2000
Year
Figure B.3 - Development of L/B and B/T ratios on the Cross-Channel routes
♦ L/B a B/T
1 o ♦ »
♦♦ Passenge rs MCar
►
♦ <4 4
♦ ♦k t
♦
♦ ♦
. o .
♦
?JI ■
. ^ *
Mi
L■
mm
132

Figure B.4 shows the development of the freeboard/draught ratio on the cross-Channel routes. The
freeboard/draught ratio of these vessels shows a tendency to decrease since the 1960’s, but since
1990 that trend has been reversed.
0.70
0.65
0.60
"5) 0.553 3£ 0.50 Q
■g 0.45
| 0.40
u 0.35 h0.30
0.25
0.201960 1970 1980 1990 2000
Year
Figure B.4 - Development of Freeboard/Draught ratio on the Cross-Channel routes
Figure B.5 shows the development of the angle of deck immersion since 1960. After a continuos
decrease since the 1960’s, it has been increasing since the late 1990. Due to that tendency, the
values of the early 1960’s have already been recovered. The tendency is to continue this increase.
Note that the European Gateway, Herald o f Free Enterprise and Pride o f Dover values fit well in
the general trend.
9 .0
C 8-0so
'K 7 .0<uEE 6.0
a« 5 .0"O©« 4 .0"©JDa< 3 .0
2.01 9 6 0 1 9 7 0 1 9 8 0 1 9 9 0 2 0 0 0
Year
Figure B.5 - Development of angle of deck immersion on the Cross-Channel routes
♦
♦
♦ ♦ ♦♦ ♦
♦
<*
♦
L^ O
<>
♦ ♦ ♦ ♦■ ♦* ♦ ♦♦ o ♦♦L o♦
133

Figure B.6 shows the development of the GRT on the Baltic Sea long routes. The GRT of these
ships in the Baltic routes has increased a great deal. A large jump in GRT in the 1980’s is clear.
This trend reveals a search for increased passenger and vehicles capacity. The two relatively small
tonnage vessels in the mid 1990’s represent the vessels Robin Hood and Stena Jutlandica which are
trailer and passenger vessels. The two vessels in the early 1990’s, with very large gross tonnage, are
the Silja Symphony and the Silja Europa The ferry Estonia (marked with an empty triangle) can be
considered as belonging to the main trend. The big empty circle indicates the Nortsea ferry, which
has been designed for the North Sea, but is included for comparison. This ferry has an average
GRT.
70000
60000
50000
S 40000 H
30000
20000
10000
01960 1970 1980 1990 2000
Year
Figure B.6 - Development of Gross Register Tonnage on the Baltic routes
Figure B.7 shows the development of the number of passengers and cars on the Baltic Sea routes. It
may be seen that both the passenger and car capacities have been increasing sharply since the early
1960’s (doubled between 1960 and 1990). The Nortsea has a low passenger capacity in comparison
with other vessels, and a high vehicle capacity. The ferry Estonia had car and passenger capacities
fitting well in the general trend.
<► •
♦
♦♦
L♦ <
♦
»♦
134

3500
3000
u 2500 U
2000tfiu§> 1500
| 1000 Plh
500
01960 1970 1980 1990 2000
Year
Figure B.7 - Development of number of passengers and cars on the Baltic routes
Figure B.8 shows the development of the L/B and B/T ratios on the Baltic Sea routes. Since the
1960’s, the L/B ratio has been decreasing. However, today, the general tendency of the L/B ratio is
for increase. On the contrary, the B/T ratio has been increasing and no tendency to stabilise has
been detected. The ferry Estonia is, once again, a typical Baltic ferry. In what regards the Nortsea,
note the unusually high L/B and low B/T ratios due to limitations on its breadth.
7.0
6.5
6.0
H 5.5n> 5.0W
J 4.5
4.0
3.5
3.01960 1970 1980 1990 2000
Year
Figure B.8 - Development of L/B and B/T ratios on the Baltic routes
Figure B.9 shows the development of the freeboard/draught ratio on the Baltic Sea routes. The
freeboard/draught ratio has been decreasing since 1960 but is now increasing. Note the very low
♦ L/B m B/T o<► ♦ ♦♦ ' '
♦ L^ ♦ ♦ 4►
♦ ♦ ♦ ♦
jgi1 _ wTL\m Wk
\ 'I mm
♦ Passenj ;ers BCar
/ ♦♦ ZA ♦
<♦
►♦ ♦ ♦ o
■ u ~n b" ■, m
1■ a 1 ■ A ■ H1 bi :
135

freeboard/draught ratios of the 1980’s. The ferry Estonia is perfectly integrated in the general
tendency in what regards this ratio. The ferry Nortsea is also well integrated in the general trend.
0.65
0.60
^ 0.55M l
g 0.50 u9 0.45 ~aa* 0.40 o
t °-35u0.30
0.25
0.201960 1970 1980 1990 2000
Year
Figure B.9 - Development of Freeboard/Draught ratio on the Baltic routes
Figure B.10 shows the development of the angle of deck immersion on the Baltic routes. This
parameter decreased since 1960, attained minimum values in the 1980’s, but appears to have been
increasing since 1990. Both the Estonia and Norsea ferries are well integrated within the main
trends.
8.0
C 7.0 a o ’(/)$ 6.06■g 5.013(m© 4.0 v"3d
< 3.0
2.0 -1 -----------------------1960 1970 1980 1990 2000
Year
Figure B.10 - Development of angle of deck immersion on the Baltic routes
Figure B.l 1 shows the development of the GRT on the Far East routes. It may be concluded that the
GRT on these routes has been increasing since the 1960’s.
♦ ♦
♦♦
L ► ♦
* O
: *
c
13
1i
L\ ii Em
M* n
■ ■
136

25000
20000
£ 15000H 06o 10000
5000
01980 1985 1990 1995 2000
Year
Figure B. 11 - Development of Gross Register Tonnage and Lpp on the Far East routes
Figure B.12 shows the development of the passenger and car capacities on the Far East routes. It
may be concluded that the number of passengers carried shows a wide dispersion, probably because
of the differences between routes in this area. The number of cars transported remains constant.
2500
2000V)U03^ 1500viu4>WD5 ioooVi VIe* ft*
500
01980 1985 1990 1995 2000
Year
Figure B.12 - Development of number of passenger and cars on the Far East routes
Figure B.13 shows the development of the L/B and B/T ratios on the Far East routes. There is a
tendency for a slight decrease in the L/B ratio from the 1980’s until 1995 but that ratio now appears
to be increasing. The B/T ratio has slightly increased during the period in analysis.
1
♦♦ Passengers B C ar
♦
♦ < ♦♦
mm i8 * m m t IS
a
137
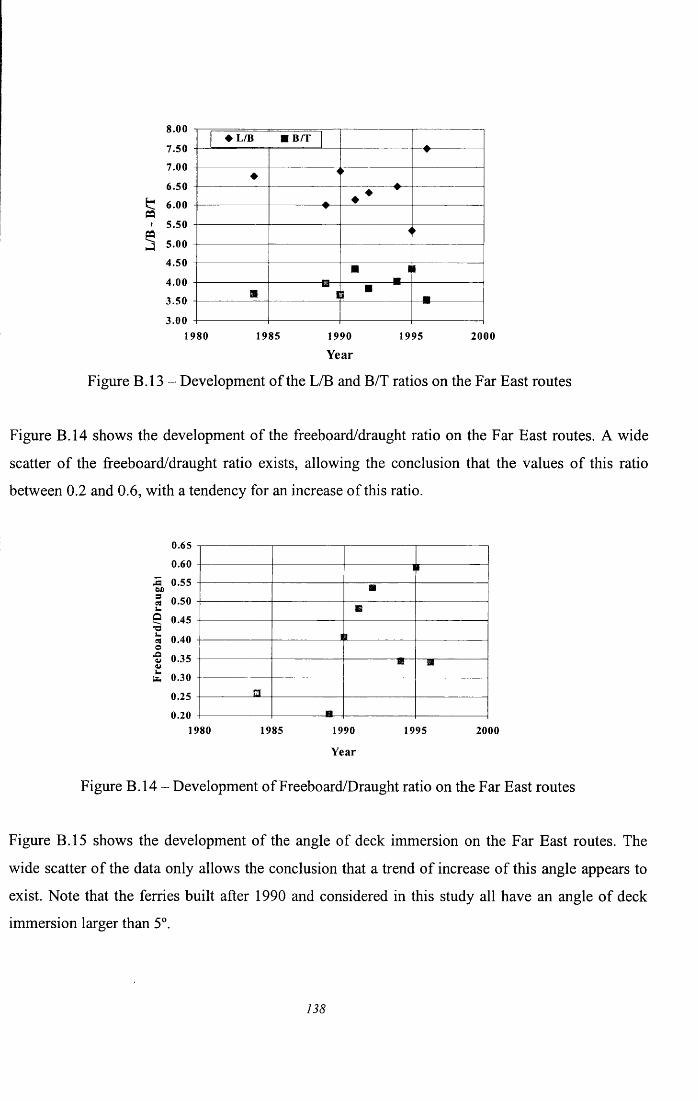
8.00
7.507.00
6.506 6.00 09• 5.50
5 5.004.50
4.003.50
3.001980 1985 1990 1995 2000
Year
Figure B.13 - Development of the L/B and B/T ratios on the Far East routes
Figure B.14 shows the development of the freeboard/draught ratio on the Far East routes. A wide
scatter of the freeboard/draught ratio exists, allowing the conclusion that the values of this ratio
between 0.2 and 0.6, with a tendency for an increase of this ratio.
0.65
0.60 £ 0.55
S J D
a 0.50o 0.45 ■o~ 0.40 o■8 0.35 £ 0.30
0.25
0.201980 1985 1990 1995 2000
Year
Figure B.14 - Development of Freeboard/Draught ratio on the Far East routes
Figure B.15 shows the development of the angle of deck immersion on the Far East routes. The
wide scatter of the data only allows the conclusion that a trend of increase of this angle appears to
exist. Note that the ferries built after 1990 and considered in this study all have an angle of deck
immersion larger than 5°.
♦ L/B ■ B/T
♦ 4►
♦ ♦ .....4
<►
a ii
a i ar a
138

9.0
'S' 8 0!sg 6.0
£ 5.0"O0 4.0o>1 3.0
2.01980 1985 1990 1995 2000
Year
Figure B.15 - Development of angle of deck immersion on the Far East routes
The main conclusions of this study, for the data concerning the UK Cross-Channel routes, are:
• Gross Register Tonnage (GRT) (Figure B.l), and, consequently, passenger and car capacities,
have increased since the 1960’s because of a search for higher cargo and passenger capacities in
this type of ship
• the L/B ratio (Figure B.3) presents a certain tendency to decrease since the 1960’s due to large
increases in the breadth of the vessels. Since 1990, the tendency is to stabilise if not to increase.
The B/T ratio has been growing very slowly, almost imperceptibly, since the early 1960’s until
the early 1990’s. The freeboard/draught ratio (Figure B.4) of these vessels decreased until 1990
but is now increasing
• the development of the angle of deck immersion (Figure B.5) results, therefore, from a relative
increase in beam and relative reduction in freeboard. It consists of a continuos decrease since the
1960’s, followed by an increase for ships built after 1990. Therefore, the values of the 1960’s
have now been recovered. This tendency is dictated by the coming into force of the SOLAS 90
damage stability standard, and will continue, as freeboard becomes an increasingly important
element of damage stability regulations.
For the Baltic Sea routes, the conclusions are:
• the GRT of the ships in the Baltic Sea routes (Figure B.6) has increased a great deal, with a large
jump in the 1980’s. This trend indicates a significant growth in both passenger and vehicles
* I3
i i mB
is
B
139

capacities. The trend of increase in the number of passengers transported was confirmed but the
car capacity is now mainly stationary
• since the 1960’s the L/B ratio (Figure B.8) has been decreasing. However, today, the general
tendency of the L/B ratio is of increasing. On the contrary, the B/T ratio has been increasing and
no tendency to slow has been detected. The freeboard/draught ratio has been decreasing since
1970 but it is now increasing
• the angle of deck immersion (Figure B.10) shows a trend equal to that of the freeboard/draught
ratio. A recovery of the values of this angle has been detected since 1990.
The conclusions relating to the Far East routes are:
• GRT on these routes has been increasing since the 1960’s (Figure B. 11)
• the number of passengers carried shows a wide dispersion (Figure B.12), probably because of the
differences between routes in this area. The number of cars transported remains fairly constant
• there is a tendency for an increase in the L/B ratio (Figure B.13), while the B/T ratio has
remained fairly constant during the period of the analysis
• both the freeboard/draught ratio (Figure B.14) and the angle of deck immersion (Figure B.15)
have very scattered data, only allowing the conclusion that a trend appears to exist for both
parameters to increase.
140

APPENDIX C - NUMERICAL MODEL OF RORO SHIP
Geometry Data
Tom1025.00 9.8148.50 32.40 8.00 18.50 5.00 20.00 83153.00458.00
458.003153.0012021.003315.00696.00696.00
Compartment 1 146 6 5 4 36 8 9 10 113 13 7 143 7 13 63 12 6 133 6 12 53 11 5 123 5 11 43 10 4 113 4 10 33 9 3 103 3 9 23 8 2 93 2 8 1
Compartment 2[04 18 17 16 154 20 21 22 233 23 19 243 19 23 183 22 18 233 18 22 173 21 17 223 17 21 163 20 16 213 16 20 15
Compartment 3 10
141

4 25 26 27 284 33 32 31 303 34 29 333 28 33 293 33 28 323 27 32 283 32 27 313 26 31 273 31 26 303 25 30 26
Compartment 4146 40 39 38 376 42 43 44 453 47 41 483 41 47 403 46 40 473 40 46 393 45 39 463 39 45 383 44 38 453 38 44 373 43 37 443 37 43 363 42 36 433 36 42 35
Compartment 5 146 54 53 526 56 57 583 61 55 623 55 61 543 60 54 613 54 60 533 59 53 603 53 59 523 58 52 593 52 58 513 57 51 583 51 57 503 56 50 573 50 56 49
Compartment i [46 68 67 666 70 71 723 75 69 763 69 75 68
142
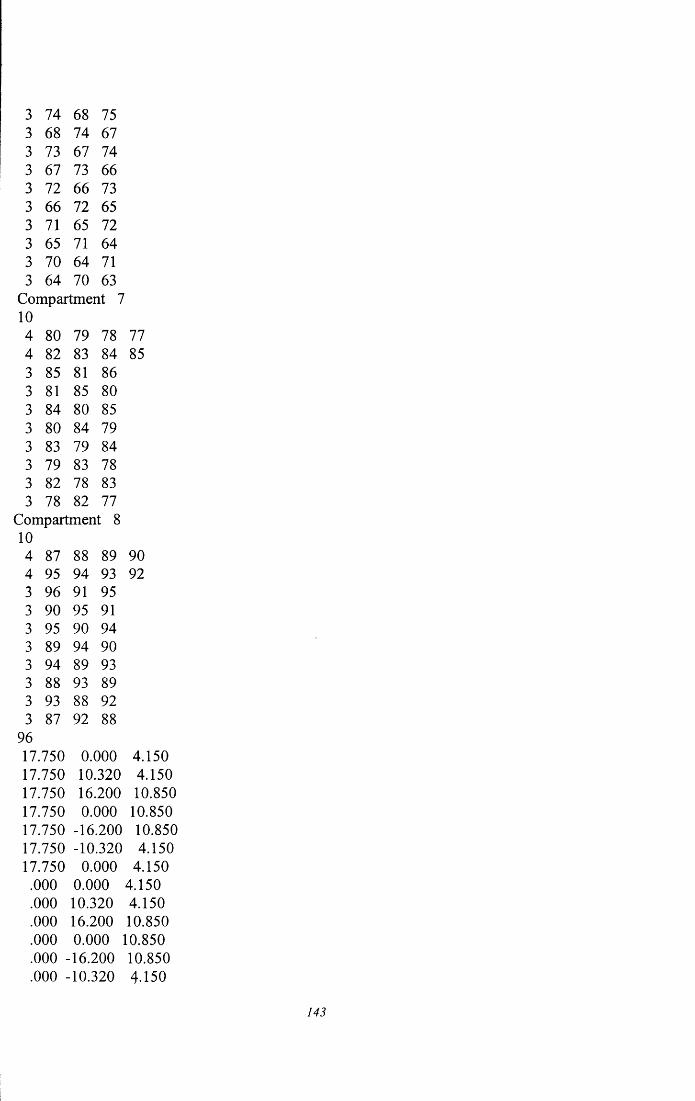
3 74 68 753 68 74 673 73 67 743 67 73 663 72 66 733 66 72 653 71 65 723 65 71 643 70 64 713 64 70 63
Compartment 7104 80 79 78 774 82 83 84 853 85 81 863 81 85 803 84 80 853 80 84 793 83 79 843 79 83 783 82 78 833 78 82 77
Compartment 8104 87 88 89 904 95 94 93 923 96 91 953 90 95 913 95 90 943 89 94 903 94 89 933 88 93 893 93 88 923 87 92 88
9617.750 0.000 4.15017.750 10.320 4.15017.750 16.200 10.85017.750 0.000 10.85017.750 -16.200 10.85017.750 -10.320 4.15017.750 0.000 4.150.000 0.000 4.150 .000 10.320 4.150 .000 16.200 10.850 .000 0.000 10.850 .000 -16.200 10.850 .000 -10.320 4.150
143

.000 0.000 4.15030.750 8.000 4.15030.750 10.320 4.15030.750 16.200 10.85030.750 8.000 10.85030.750 8.000 4.15017.750 8.000 4.15017.750 10.320 4.15017.750 16.200 10.85017.750 8.000 10.85017.750 8.000 4.15030.750 -8.000 4.15030.750 -10.320 4.15030.750 -16.200 10.85030.750 -8.000 10.85030.750 -8.000 4.15017.750 -8.000 4.15017.750 -10.320 4.15017.750 -16.200 10.85017.750 -8.000 10.85017.750 -8.000 4.15048.500 0.000 4.15048.500 10.320 4.15048.500 16.200 10.85048.500 0.000 10.85048.500 -16.200 10.85048.500 -10.320 4.15048.500 0.000 4.15030.750 0.000 4.15030.750 10.320 4.15030.750 16.200 10.85030.750 0.000 10.85030.750 -16.200 10.85030.750 -10.320 4.15030.750 0.000 4.15048.500 0.000 10.85048.500 16.200 10.85048.500 16.200 18.50048.500 0.000 18.50048.500 -16.200 18.50048.500 -16.200 10.85048.500 0.000 10.8500.000 0.000 10.8500.000 16.200 10.8500.000 16.200 18.5000.000 0.000 18.5000.000 -16.200 18.5000.000 -16.200 10.850
144

0.000 0.000 10.85048.500 0.000 0.00048.500 6.150 0.00048.500 10.320 4.15048.500 0.000 4.15048.500 -10.320 4.15048.500 -6.150 0.00048.500 0.000 0.000
.000 0.000 0.000
.000 6.150 0.000
.000 10.320 4.150
.000 0.000 4.150
.000 -■10.320 4.150
.000 -6.150 0.000
.000 0.000 0.00030.750 0.000 4.15030.750 8.000 4.15030.750 8.000 10.85030.750 0.000 10.85030.750 0.000 4.15017.750 0.000 4.15017.750 8.000 4.15017.750 8.000 10.85017.750 0.000 10.85017.750 0.000 4.15030.750 0.000 4.15030.750 -8.000 4.15030.750 -8.000 10.85030.750 0.000 10.85030.750 0.000 4.15017.750 0.000 4.15017.750 -8.000 4.15017.750 -8.000 10.85017.750 0.000 10.85017.750 0.000 4.1500.000 0.000 0.0000.000 0.000 0.0000.000 0.000 0.0000.000 0.000 0.000
End of model data

Flooding Data5
Hole 1 1 0 3 1.0 4
21.00-11.32 5.0325.00 -11.32 5.0325.00 -10.32 4.1521.00-10.32 4.15
Hole 21 0 5 1.0 4
21.00-16.2 10.8525.00-16.2 10.8525.00-16.2 18.521.00-16.2 18.
Hole 3 1 3 8 1.0 4
29.35 -8.0 10.8530.75 -8.0 10.8530.75 -8.0 4.1529.35 -8.0 4.15
Hole 41 8 7 1.0 417.75 0.0 10.8519.15 0.0 10.8519.15 0.04.1517.75 0.0 4.15
Hole 5I 7 2 1.0 4
29.35 8.0 10.8530.75 8.0 10.8530.75 8.0 4.1529.35 8.0 4.15
End of Flooding data

Load Estimate DataLight Condition 1
Total s 8412.00 0.0 0 24.25 0.00 12.50End of Load Estimate Data
Hydrocoeffs Data1 0 00.0 0.0 8412.00
0.00 0.00 0.00 0.00 0.00 0.000.00 5958808.44 0.00 -7603152.55 0.00 -25956630.800.00 0.00 51787636.80 0.00 225585487.30 0.000.00 -7603152.55 0.00 110892417.67 0.00 682880.270.00 0.00 225585487.30 0.00 1289744725.00 0.000.00 -25956630.80 0.00 682880.27 0.00 148401473.800.00 0.00 0.00 0.00 0.00 0.000.00 644.73 0.00 -873.27 0.00 -2808.450.00 0.00 8007965.77 0.00 34882660.32 0.000.00 -873.27 0.00 11710000.20 0.00 78.440.00 0.00 34882660.32 0.00 199437862.60 0.000.00 -2808.45 0.00 78.44 0.00 16056.66
GLASS®*#? | WIVEES2Y I HB5ABT I
147