Institutional Adaptation to Climate Change and Flooding in ...
Upload
independentCategory
view
3download
0
Chapter 7
POLYMER FLOODING
RYEN CAE", DAVID B. BURNETT and GEORGE V. CHILINGARIAN
INTHODUCTION
One of the promising types of enhanced oil recovery is the use of water-soluble polymers. Their use to improve the sweep efficiency of standard waterfloods has been practiced since the early sixties. Many in the industry, however, still consider that the use of a polymer to augment a waterflood is just an extension of that secondary recovery process. Others insist that it should more properly be labeled as a tertiary recovery process, being considered a step away from simply pumping water through the formation. Regardless of the lable put on the process, the use of a polymer is basically to improve the relative mobility ratios of the oil-water front.
During the past 20-25 years many new processes and new polymer forms have been developed to assist the flooding operation. Polymers and other chemical flooding processes have become more sophisticated in recent years. Many organi- zations have ongoing research and development projects dealing with polymers and EOR processes. Thus, one can be assured that as the economical situation permits these newly developed methods will be made available.
This chapter covers the currently available polymer products and the field techniques in common use a t this time. The chapter is organized into two sections as follows:
(1) Polymer products and theory of use (a) description of water soluble polymers (b) properties of polymer solutions (c) mobility control processes (d) wellbore profile control processes
(2) Planning polymer flood projects (a) screening tests (b) process design (c) equipment and operations (d) the economics of polymer projects
The first section covers a general description of polymers including some polymer chemistry. A few definitions of commonly-used polymer terminology are also given and the basic properties of the polymers are described. The data presented on these properties are taken from published sources and in general represent laboratory-derived numbers. The first section also covers the theory involved in mobility control with commonly used polymers.

158
The second section presents general guidelines on setting up and running field projects involving the use of polymers. The various stages of design and con- struction are covered and several examples of published projects are included. A brief discussion is also given on the economics of polymer flooding.
POLYMER PRODUCTS AND THEORY OF USE
The word polymer is derived from the two Greek words, “polys” and “meros”, which literally mean “many parts” (Chatterji and Burchardt, 1981). To a chemist, “part” is an individual molecule that makes up a chemical species. A polymer is, therefore, a chemical that is composed of a number of individual molecules that are attached in some manner. These units are usually associated in a pattern that repeats itself throughout the length of each polymer. The repeating units are called monomers and the polymer can be either a homopoly- mer (one monomer), a dimer (two monomers), etc. Another common term used in polymer chemistry to represent the joining of two different monomers is copo- lymer. One published definition to differentiate a large molecule from a polymer is that a polymer should have a molecular weight greater than 200 and a t least 8 or more repeating units (Clark, 1984).
Polymer flooding operations use high-molecular-weight organic chemicals to alter the flow of water in the formation. Molecular weights of flooding polymers may be as high as several millions. These large molecules are soluble in water because of hydrogen bonding between water molecules and the polymer’s polar side chains. Strictly speaking, a water-soluble polymer is in actuality water dispersable, because i t does not form a true solution as does, for example, table salt.
Some water-soluble polymers, such as the starches, have such large sizes that they do not readily flow through formation pore throats. The size of the hydrated polymer molecule, then, is important in designing a polymer flood for a specific formation.
TABLE 7-1
Polymers commonly used in EOR operations
Polyacrylamides
Xanthan gum
Cellulosics
Polyacrylate copolymers
synthetic, usually anionic dry powder, water solution, emulsion, gel
natural biopolymer, anionic water solution, dry powder
semi-synthetic, non-ionic or anionic dry powder
synthetic, anionic dry powder, water solution
159
r 7 CH2- CH-CCH2-H-CCH2-CH
c=o I
c-= I 0 0 - 1 1 I c- 0
I NH2
I NH2
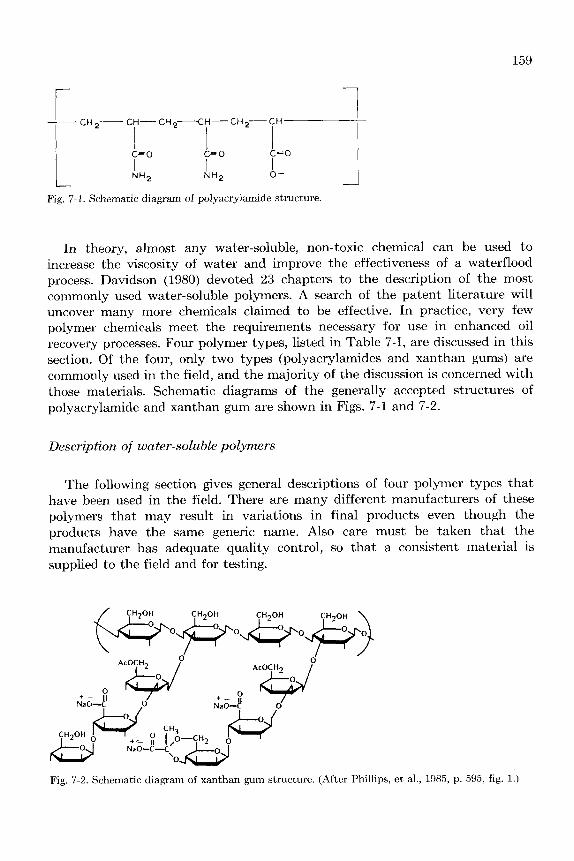
Fig. 7-1. Schematic diagram of polyacrylamide structure.
In theory, almost any water-soluble, non-toxic chemical can be used to increase the viscosity of water and improve the effectiveness of a waterflood process. Davidson (1980) devoted 23 chapters to the description of the most commonly used water-soluble polymers. A search of the patent literature will uncover many more chemicals claimed to be effective. In practice, very few polymer chemicals meet the requirements necessary for use in enhanced oil recovery processes. Four polymer types, listed in Table 7-1, are discussed in this section. Of the four, only two types (polyacrylamides and xanthan gums) are commonly used in the field, and the majority of the discussion is concerned with those materials. Schematic diagrams of the generally accepted structures of polyacrylamide and xanthan gum are shown in Figs. 7-1 and 7-2.
Description of water-soluble polymers
The following section gives general descriptions of four polymer types that have been used in the field. There are many different manufacturers of these polymers that may result in variations in final products even though the products have the same generic name. Also care must be taken that the manufacturer has adequate quality control, so that a consistent material is supplied to the field and for testing.
Fig. 7-2. Schematic diagram of xanthan gum structure. (After Phillips, et al., 1985, p. 595, fig. 1.)

160
Cellulosics Cellulosics are modified natural materials derived from water-insoluble cel-
lulose waste products. Two basic types of cellulosic polymers have been used in flooding. They are hydroxyethylcellulose (HEC) and carboxymethylcellulose (CMC). Side chains of either carboxymethyl or hydroxyethyl are added to the cellulose backbone, thereby rendering the polymer water-soluble. Cellulosics can be manufactured with a variety of molecular weights which, in general, will determine the viscosity imparted to water by the polymer. Most grades for flooding use have higher molecular weights, which give higher viscosities in water. The CMC’s are anionic materials and HEC’s are non-ionic.
Most HEC polymers are completely soluble in cold and hot water and in high-salinty brines. Because the molecule is non-ionic, it is compatible with practically all oilfield brines and is often used in drilling and completion fluids. Their use in polymer floods is mainly due to this high salinity tolerance.
Both CMC and HEC solutions are non-Newtonian, i.e., the solution viscosity decreases with increasing shear rates (see section on rheology). The molecules are resistant to mechanical shear degradation so that their viscosity is recovered when the shear rate is reduced. Cellulosics have temperature stabilities in the 250 O F range, but lose viscosity rapidly as the temperature increases.
Cellulosic solutions are readily degraded by cellulose enzymes found in oilfield waters. Degradation results in a rapid viscosity loss and loss in EOR functional- ity. Different types of CMC and HEC have differing degrees of resistance to biological degradation, but biocides are necessary in all oilfield applications using cellulosics as well as with most other polymers.
Normally, cellulosics are used a t concentrations ranging from 1000 to 5000 ppm. At the higher concentrations, the polymer solutions tend to lose injectivity and can cause plugging in injection wellbores. (See “ Hydratability” later in this section.) Polymer retention within the wellbore is higher because of the relatively high polymer concentrations required for adequate viscosity, in comparison to xanthan gum and polyacrylamides. Cellulosics are easily crosslinked with multi- valent cations.
In addition to HEC’s and CMC’s, there have been proposals to use carboxy- methylhydroxyethylcellulose (CMHEC) for flooding operations. As the name implies, this polymer is a result of reacting both carboxyethyl and hydroxyethyl ethers with the cellulose backbone. To date, no particular advantage to use CMHEC over either CMC or HEC has been reported.
Polyacrylates (PAC) Water-soluble acrylate polymers and copolymers are synthetic materials that
have found limited usage in EOR applications. These polymers can be manufac- tured to have a wide range of physical and chemical properties that make them candidates for many applications in the oilfield. The PAC products offered for polymer flooding have shown resistance to mechanical shear degradation, have
161
adequate injectivity, are compatible with some brines, and demonstrate much higher thermal stability than the other EOR polymers (Ryles, 1983).
Products which have been marketed for oilfield use have not had much success. The side chains on most PAC’s are carboxyl groups (usually supplied as a salt), which may be sensitive to some high-hardness oilfield brines. Also, although they are non-Newtonian in solution, they are not nearly as highly non-Newtonian as other polymers.
Polyacrylamides (PAM) Polyacrylamide polymers are synthetic chemicals which can be tailored to fit
a broad range of applications. The molecule is unique in its strong hydrogen bonding, linearity, very high molecular weight, and a high degree of non-Newto- nian viscosity. For enhanced oil recovery, the polyacrylamide molecule can be modified by copolymerization with ionic substituents or by partial hydrolysis of the amide side chain to the carboxylic acid group (see Fig. 7-1).
The hydrolysis of the side chain amide to a carboxyl group renders that part of the molecule to be a strongly water-soluble moiety. Different grades of polyacrylamides are hydrolyzed to different degrees. Generally, the highest degree of hydrolysis is approximately 35%. As the degree of hydrolysis increases, the water solubility increases and the viscosity of the polymer solution a t a given concentration decreases.
An increasing number of copolymers of polyacrylamide are becoming available to the industry and more will be available in the future. Some copolymers are manufactured to have positively charged substitute groups. These cationic polymers have utility as industrial flocculants and as a component in wellbore profile processes to be discussed later. Also commonly used in these vertical conformance processes are crosslinked or ‘ gelled’ polyacrylamide systems. The hydrolyzed polyacrylamide interacts with polyvalent metals, such as iron, aluminium, and chromium, to form three-dimensional gel networks.
Polyacrylamides are supplied in several forms. Historically, many field poly- mer projects used solid powder, which was then hydrated to form the polymer solution. Because of convenience, however, most field polymer projects today use polyacrylamides supplied in emulsion form as liquids. These materials are available in concentrations ranging from 30 to 50 wt.% solids and offer a fairly efficient and rapid way to get the polyacrylamide into solution. In high-salinity systems, the use of a surfactant to promote hydration may be necessary. Hydration procedures are discussed in a later section covering field techniques (p. 182 ff).
Xanthan gum (XG) Another type of water-soluble polymer, which has found great acceptance in
the oilfield, is xanthan gum. The XG is a high-molecular-weight, natural carbo- hydrate. It is a polysaccharide manufactured by a bacterial fermentation pro- cess. Commercial xanthan gum is obtained from mutant bacterial strains chosen

162
for yield (amount of product produced during fermentation) and polymer func- tionality (injectivity and high non-Newtonian viscosity).
Xanthan gum is a polysaccharide (i.e., it contains differing sugar molecules) with unique intramolecular hydrogen bonding by side chains. The structure, as shown in Fig. 7-2, contains side chains which hold the molecule in a rigid, helical structure. Many of the unusual properties of the polymer, stem from its rodlike structure in solution. The side chains shield the backbone of the polymer molecule and protect against enzymatic attack and backbone cleavage. Thermal stability is also improved by this complex structure. Sensitivity to salt is also greatly reduced even though the molecule is anionic in character.
Unlike many polysaccharide solutions, the viscosity of which decreases with an increase in temperature, xanthan gum solutions show only a slight decrease in viscosity. This and other characteristics make it a preferred material in EOR applications despite its unusual origin and rather high cost (partially caused by the requirement for ‘batch’ manufacturing techniques).
The synthetic polymer, polyacrylamide, and the biopolymer, xanthan gum, offer the best performance/price ratio of the many types of polymers that have been proposed for EOR operations. The discussions in this chapter, therefore, are in general, limited to these two types of polymers.
Properties of polymer solutions
Both polyacrylamide (PAM) and xanthan gum (XG) polymer solutions give high viscosities a t relatively low concentrations. Table 7-11 shows a comparison of the concentrations of material needed to give 10-cP solutions of polyacryla- mide and xanthan gum. The data shown in this table are for polymer mixtures in tap water.
Viscosity is also affected by salinity and divalent ions, such as calcium and magnesium, which cause difficulty in polymer hydration. Hard waters will also cause a decrease in the viscosity of solutions of polyacrylamide polymers to a much greater extent than those with xanthan gum. The following paragraphs give general descriptions of the physical and chemical properties that can be expected from polyacrylamides and xanthan gums.
TABLE 7-11
Comparison of wt.% concentrations of polyacrylamides and xanthan gum required to give a 10-cP viscosity a t 12.5 s- ’
Polyacrylamide (wt.%) Xanthan gum (wt.%)
0.1% NaCl 0.05 0.055 2.0% NaCl 0.115 0.060
163
Hydra ta bility Dry powders are in general difficult to mix efficiently in the field. Care must
be taken to slowly and completely wet the polymers to prevent the formation of " fish-eyes" (dry powder surrounded by wetted polymer) or microgels. Both xanthan gum and polyacrylamides can be supplied as either liquid, water-based products or as dry materials. Polyacrylamide can also be obtained as an emulsion or as a hydrated, gelled log. The emulsion material can also cause difficulty because i t contains an oil-wet dispersion (Kampen and Haynes, 1987). Surfac- tants and surface-coating agents have been used to assist in dispersing dry powders, thereby allowing better hydration of each individual polymer particle. Care must be taken, however, to assure that any particular treatment has not impaired the functionality of the polymer. Anyone of these forms can be utilized in the field, but each has a different effect on the economics of an EOR project. This is discussed in more detail later in the chapter.
Rheology Because of the basic nature of the polymers in solution and their high
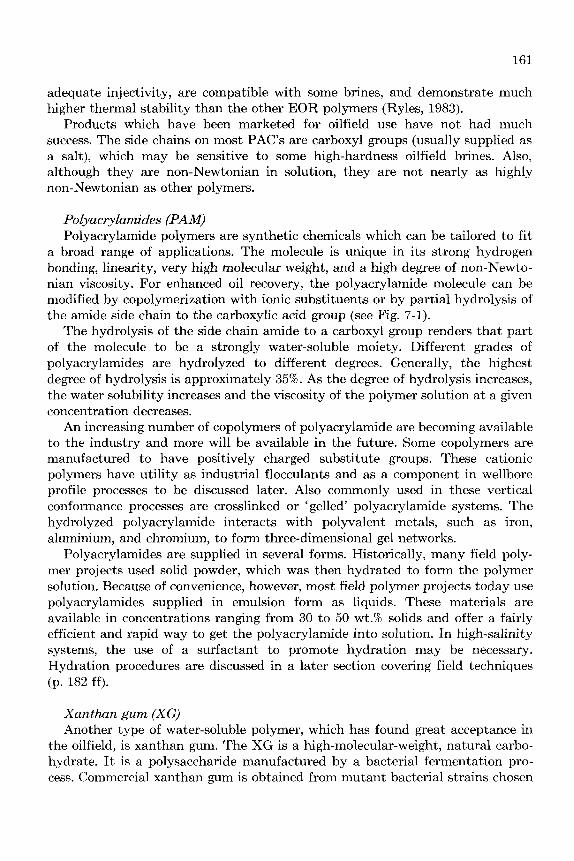
molecular weights, both types of polymers give non-Newtonian flow characteris- tics. Both polyacrylamide and xanthan gum solutions are shear thinning, i.e., as the shear rate increases, the relative viscosity decreases. Plots of typical viscosity versus shear rate development for both PAM and XG are shown in Figs. 7-3 and 7-4. Viscosity at a given shear rate can be calculated by the proper mathematical model. Further discussion of rheology is beyond the scope of this chapter. Viscosity terms as applied to mobility and flow through porous media is, however, discussed in later sections. Further information on the rheology of EOR polymer solutions can be found in the references (e.g., see Baijal, 1982; Liauh and Liu, 1984; Vossoughi et al., 1984; Aurbach, 1985; Sorbie et al., 1985).
The viscosity of polymer solutions decrease with increasing temperature. The loss in viscosity is reversible unless thermal degradation occurs. At moderate
HPAM-I0 HPAM-20
SHEAR RATE, s e c '
Fig. 7-3. Viscosity development of two 500-ppm polyacrylamide solutions in both distilled water and 3% NaCl water.

164
I I I
500 PPM BIOPOLYYER XAN
( A 240 md BEREA)
3% NaCI
n
>
1001 I I 10-1 100 10' lo2
SHEAR RATE, SEC-'
Fig. 7-4. Viscosity development of 500-ppm xanthan gum solution in both distilled water and 3% NaCl water.
temperatures, this change in polymer viscosity with temperature is less than the drop in brine water viscosity caused by the increase in temperature.
Stu bility Stability refers to the maintenance of the integrity of the polymer molecule
during oilfield operations. Polymers must have (1) mechanical strength, (2) thermal stability, (3) bacteriological stability, and (4) chemical stability.
Mechanical strength. Under most circumstances, xanthan gum solutions are shear stable, but polyacrylamides can be degraded by mechanical shear, such as in mixing equipment. Mixing shears and flow rates within the formation, there- fore, can be of extreme importance to the economics of the EOR process. Equipment and field handling of these polymers are discussed later in this chapter.
Thermal stability. PAM and XG solutions are relatively thermally stable to above 200 O F if protected against catalytic degradation by oxygen. Shupe (1981), Ash et al. (1983), Ryles (1983), and Wellington (1983) have discussed thermal degradation mechanisms of EOR polymers and have described protective chem- ical systems to retard their degradation. The following have all been found to be effective and have been recommended as possible temperature stabilizers: thiourea, isopropyl alcohol, nitrogen purges, sulfates, propylene glycol, form- aldehyde, and acetone. Generally, it has been found that xanthan gum solutions are not as stable thermally as are polyacrylamides a t temperatures above 225 F.
Both polymers can be protected to extend their usefullness a t elevated temperatures for many months or even years. In addition, some special poly- acrylamide copolymers have extended temperature stability. Most laboratory

165
TABLE 7-111
Types of bactericides used in treating oilfield waters
Chemical type Physical properties Recommended dosage (ppm)
Amine water dispersable, 5- 15 oil soluble
Polychlorophenols relatively insoluble 50-100 in oil
Quaternary ammonium water dispersable, 25- 70 oil soluble
Formaldehyde water soluble, 30- 60 relatively oil soluble
tests, however, have not shown long-term temperature stability much higher than 250°F for either polymer.
Bacteriological stability. Xanthan gum solutions are more susceptible to micro- bial attack than are polyacrylamides. Degradation of field solutions of xanthan gum have been reported by Exxon (Bragg et al., 1983). Bactericides are always recommended for use with xanthan gum. It should be kept in mind, however, that bacterial protection may well be needed in conjunction with any waterflood- ing project, whether or not polymers are being used. Aerobic bacteria can grow in surface systems causing polymer degradation and injectivity problems. Anaerobic bacteria can flourish within the formation causing plugging problems, polymer degradation, and reportedly can change a sweet crude to sour. Table 7-111 shows some general types of bactericides that can be used in oilfield waters. The use of any bactericide, of course, must be approved by the appropriate environmental regulatory agency.
Chemical stability. Both polyacrylamides and xanthan gums are compatible with modest concentrations of the most commonly-occurring dissolved ions found in oilfield brines. Polyacrylamides, however, are considerably less tolerant to high concentrations of divalent cations, such as calcium and magnesium. As men- tioned before, trivalent cations such as iron, chromium, and aluminum react with the polymers to form gels. Quaternary amine chemicals, often used as corrosion inhibitors, also have a deleterious effect on polymer performance, i.e., loss of viscosity or precipitation. Increased formation temperature will tend to accel- erate any chemical incompatibilities that may be present.
The viscosity of polyacrylamide solutions is sensitive to pH. At low values of pH, the carboxylic side group is nonionic. As pH increases, the side group is converted to the anionic carboxylate ion. The anion exerts repulsive forces along the polymer chain, causing some uncoiling and a stiffening of the molecule with an attendent viscosity increase. A t pH values above 10.5, hydrolysis of poly-

166
acrylamide side chains occurs even a t room temperature. Xanthan gum solu- tions, however, are generally stable a t the pH values found in oilfield systems.
The properties of a polymer solution are generally tested in field makeup and with formation waters as part of the EOR design. Both the type of polymer and the polymer-flooding technique to be used can then be tailored to the water in the candidate reservoir. This is critical to achieving a successful1 polymer flood and is discussed in more detail in the next section.
Mobility control and profile control processes
Polymer flooding can be used in place of waterflooding, or to augment an existing flood. In mobility control processes, the polymer is used to alter the fractional flow characteristics of the water phase which is displacing the oil. In profile control processes, polymer gels are used to block water channels and divert flow to portions of the reservoir which have not been properly swept. Both concepts are discussed in detail in the following sections.
Mobility control The correct polymer type to use in an enhanced oil recovery process depends
upon the field conditions and upon the type of polymer process needed to improve oil production. Polymer solutions must be well understood before a mobility control flood can be properly designed. In addition to the previously mentioned viscosity effects and viscosity stability, the injectivity and residual resistance factor must be taken into account. The following sections describe the mobility control process in relation to these factors.
Definition of mobility. The function of any type of water-soluble polymer in EOR operations is to increase the viscosity of a brine and to reduce the relative permeability to water in the formation. If the flow of brine in a porous medium is decreased in relation to the flow of oil, then the oil’s relative flow is improved. Mobility is a measure of the flow of a fluid through a permeable formation. It is the ratio of the relative permeability of the fluid divided by the apparent viscosity of the fluid. Relative mobility is the ratio of the displaced fluid’s mobility to the mobility of the displacing fluid.
Mobility, M , and mobility ratio, M,, are defined and can be calculated by the following mathematical relationships:
M = WEL, Mr = MJMW
where k , = relative permeability, mD; pa = apparent viscosity, cP; Mcl = mobility to oil (= kro/pao); and M , = mobility to water (= km/,uaw).
A schematic of displacement process is shown in Fig. 7-5. The first diagram, an areal view of an inverted five-spot with water injection into the center well,

167
WATERFLOOD POLYMER FLOOD
Fig. 7-5. Areal sweep schematic diagram showing mobility control with a polymer solution.
has created channels to the producing wells, causing early breakthrough of injection brine to those wells and increasing the producing water/oil ratios, perhaps to uneconomic values. Most of the oil in the pattern is left unproduced.
The second diagram in Fig. 7-5 shows the same pattern response to injection of fluid with reduced mobility in relation to the oil-in-place. In this case, the brine-polymer bank sweeps evenly out from the injection well resulting in increased sweep efficiency and more oil production a t the producing wells with less produced brine.
The same phenomenon occurs in the vertical plane of the well, as shown in Fig. 7-6. In fact, the poor sweep efficiency of water injection is made more pronounced by the vertical permeability variation encountered in most res- ervoirs. As shown in the figure, the majority of the flow is traveling through a relatively small percentage of the total reservoir height.
Through mobility control, polymers improve oil recovery by changing the fractional flow characteristics of the oil and water flowing through the porous media. Volumetric sweep efficiency is improved because of the decreased mobil- ity ratio. A decrease in mobility ratio means that more oil is produced for a given volume of water injected. Large mobility ratios denote inefficient displacements.
For displacement processes where two phases are flowing simultaneously through the porous media, Gogarty et al. (1970) described the use of total mobility to better represent a description of the fluid flow. Total mobility is the
V E R l PROD.
I WATER
' ICAL
Fig. 7-6. Vertical sweep schematic diagram showing mobility control with a polymer solution.

I68
2 0
1 6 -
> k 2 I 2 m 0 z 2 o a
e +
0 4
0 0
TABLE 7-IV
Listing of data to obtain total mobility (based on Gogarty et al., 1970, p. 141, equation 1)
I I I I
- -
; lL l :
Water saturation k ro k d P 0 a k , knv/PLw Total (% pore space) mobility
C' 34 40 50 60 70 72
0.4 1.38 0.0014 0.0028 1.38 0.25 0.86 0.0060 0.0120 0.87 0.1 0.34 0.0340 0.0680 0.41 0.04 0.14 0.0900 0.1800 0.32 0.0065 0.02 0.2200 0.4400 0.46 0.0015 0.01 0.2500 0.500 0.60
a po = 0.29 p,,, = 0.5 Total mobility = cP-'.
sum of the oil and water mobilities a t a particular water saturation. Properly, total mobility must be defined a t a given saturation of one of the phases present in the flowing bank. Table 7-IV and Fig. 7-7 represent a study to determine total mobility. At a certain saturation value, the total mobility is a t a minimum. According to Gogarty et al. (1970), the design point of a mobility control flood should be this minimum value. In many cases, the total mobility is significantly different than the mobility ratio.
Resistance factor Resistance factor is a term referring to the relative pressure drop caused by
polymer solutions in porous media, and normally only applies to polyacrylamide solutions. It would also apply to other polymers that adsorb onto the formation. Inasmuch as xanthan gums do not adsorb onto the formation, the following discussion is confined to polyacrylamides.

169
If a solution of polyacrylamide is passed through a reservoir core a t a constant rate, the pressure drop of the system is much greater than would be calculated by the viscosity change using Darcy’s law. This effect is caused by the poly- acrylamide adsorbing onto the walls of the rock pore spaces and restricting flow. Resistance factor, R, is defined by the following equation:
R =K/M, = (hrw/P,)/(hrp/Pp)
where M , = mobility to water; Mp = mobility to polymer; k,, = water relative permeability, mD; k rp = polymer relative permeability, mD; p = water viscos- ity, cP; and p p = polymer viscosity, cP.
Under many conditions, the reduction in permeability to water caused by the polymer persists after the solution itself has apparently been displaced from the core matrix. When brine is injected after the polymer, this excess mobility reduction is termed residual resistance factor, R,, and is defined by the following equation:
R, = Mw/M,,
where M , = initial water mobility; and Mwp = water mobility after polymer injection.
Injectivity behavior The injectivity behavior of a polymer solution is one of its most important
characteristics. Polymer solutions with good inj ectivity behavior are necessary for successful field use. Systems with poor injectivity behavior must be physi- cally or chemically treated before field injection. This treatment can be very expensive and severely affect the overall economics of a polymer flooding opera tion.
Poor injectivity behavior may be caused by: (1) Incompatibility between the polymer and its makeup brine. (2) Incompatibility between the polymer solution and the formation rock. (3 ) Contamination. Incompatibility among the brine, polymer and the porous media may be
evaluated in the laboratory before beginning extensive design work. Care should be taken to determine if the incompatibility stems from the mixing and hydra- tion of the polymer or from a reaction between dissolved ions or formation clays and the polymer itself.
Contamination can result from the polymer manufacturing process, makeup water, or careless field procedures. Contamination usually results in the forma- tion of particles or microgels that can cause poor injectivity behavior.
Wellbore profile control
The second important function of polymers is the improvement of vertical sweep efficiency around the vicinity of injection wellbores. Water diverting
170
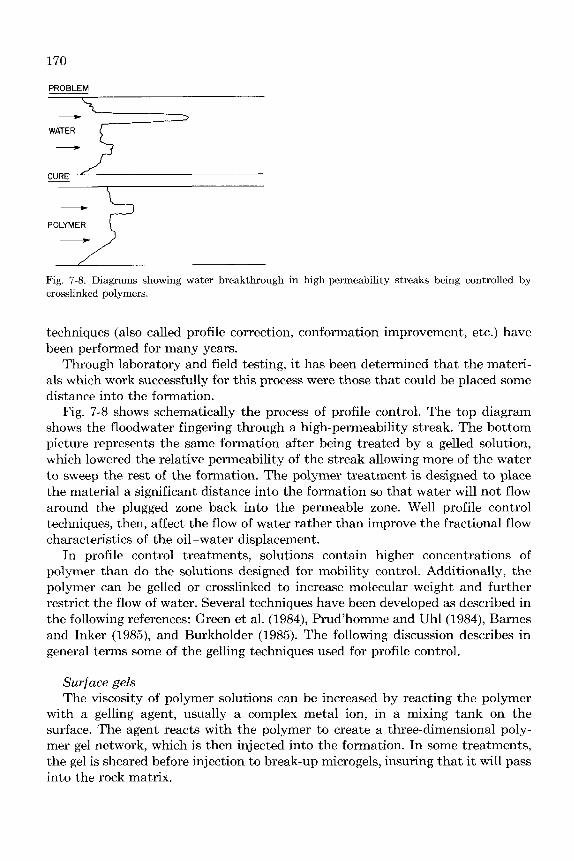
PROBLEM
\
WATER -- Fig. 7-8. Diagrams showing water breakthrough in high-permeability streaks being controlled by crosslinked polymers.
techniques (also called profile correction, conformation improvement, etc.) have been performed for many years.
Through laboratory and field testing, it has been determined that the materi- als which work successfully for this process were those that could be placed some distance into the formation.
Fig. 7-8 shows schematically the process of profile control. The top diagram shows the floodwater fingering through a high-permeability streak. The bottom picture represents the same formation after being treated by a gelled solution, which lowered the relative permeability of the streak allowing more of the water to sweep the rest of the formation. The polymer treatment is designed to place the material a significant distance into the formation so that water will not flow around the plugged zone back into the permeable zone. Well profile control techniques, then, affect the flow of water rather than improve the fractional flow characteristics of the oil-water displacement.
In profile control treatments, solutions contain higher concentrations of polymer than do the solutions designed for mobility control. Additionally, the polymer can be gelled or crosslinked to increase molecular weight and further restrict the flow of water. Several techniques have been developed as described in the following references: Green et al. (1984), Prud’homme and Uhl (1984), Barnes and Inker (1985), and Burkholder (1985). The following discussion describes in general terms some of the gelling techniques used for profile control.
Surf ace gels The viscosity of polymer solutions can be increased by reacting the polymer
with a gelling agent, usually a complex metal ion, in a mixing tank on the surface. The agent reacts with the polymer to create a three-dimensional poly- mer gel network, which is then injected into the formation. In some treatments, the gel is sheared before injection to break-up microgels, insuring that it will pass into the rock matrix.

171
In-situ gels Viscosity enhancement by gelling can also be achieved by crosslinking the
polymer within the formation. The theory is that a low-viscosity solution can be injected easily into the formation, and then permitted to chemically react, creating a gel in place to divert the flow of water. Triggering mechanisms for the reaction are salinity, temperature, or sequestrants. It is also possible to inject a monomer instead of the polymer and then to polymerize it, creating the gel structure within the formation.
Sequential injection The “Phillips Process” is a technique patented by Phillips Petroleum Com-
pany (Gall, 1973; Clampett and Hessert, 1974) and licensed to various groups which perform the treatment. It involves a sequential injection of polymer and crosslinking agent to create a chemical which adsorbs on the walls of the formation pores. Reactants such as aluminium citrate are often employed with polyacrylamide solutions, such as those used in polymer mobility control processes. The technique can increase the resistance factor of reservoir rocks significantly (often tenfold).
PLANNING POLYMER FLOOD PROJECTS
The chemistry of polymers must be considered from the very beginning of the polymer flood design. The salinity of the injection and formation waters dictate both the type and the concentration of polymer to be used. Water must be of high quality to avoid injection-well plugging. The amount of water needed for the project depends on the response of the producing zones to more favorable water/oil mobility ratios.
A t the outset of the polymer flood design, the reservoir must be screened to determine if it is suitable for this type of EOR process. The various options for polymer treatment must also be considered, e.g., use of a large slug of a solution having a relatively low concentration of polymer, versus a vertical conformance treatment. Design criteria for mobility control projects differ from wellbore profile control projects. If the project is to be a mobility control project, then a rather large slug of polymer is injected, beginning early in the life of the waterflood. On the other hand, remedial wellbore profile control treatments use small slugs of crosslinked polymer.
Fig. 7-9 shows the development (various stages) of a project in simplified form. The initial studies (Stage 1) identify the most promising reservoir candidate for polymer flooding. Screening studies include both laboratory tests and field reviews. A t this stage the major reservoir characteristics are determined.
Stage 2 involves the initial process design work. Laboratory and engineering studies provide data in order to consider various design strategies. Performance predictions are made and a simplified study is made of the process economics.

172
PROPOSED TIME SCHEDULE FOR POLYMER FLOOD PROJECT
STUDY PHASE
YEAR 1 YEAR 2 I 1
STAGE 1
1. L a b o r a t o r y Screening 0
i
2. F ie ld R e v i e w
3. Core Ana lys i s 0
STAGE 2
4. P rocess and P r o j e c t
5. Economic F o r e c a s t s
6. EOR L a b o r a t o r y Tests
Design S tudy
STAGE 3
7. P e r f o r m i n j e c t i v i t y Test
8. Ana lyze Tests
9. T r a c e r S t u d y
0 0
STAGE 4
10. Complete P rocess Design
11. Design F a c i l i t i e s
12. Procure Chemicals and Equ ipmen t 0 Fig. 7-9. Proposed time schedule for a polymer flood project.
Stage 3 consists of a field test of the EOR process. When working with chemicals such as polymers, injectivity is determined. Transient tests are run to determine (1) reservoir characteristics, and (2) in-situ fluid characteristics. If necessary, process design is changed to accommodate reservoir characteristics.
Stage 4 is field development. The EOR injection facility is planned during this stage. A field-wide simulation study is performed.
Stage 1 -initial screening
When a candidate reservoir is being considered for an enhanced recovery polymer project, certain guidelines can be used to identify the best choice of techniques. Field characteristics such as reservoir temperature, oil/water mobil- ity ratio, and oil properties have been shown to be good "identifiers" that have pointed out reservoirs that are amenable to EOR. Taber and Martin (1983) have compiled generally accepted principles into guidelines for polymer flooding design (as well as other EOR processes). Their guidelines for polymer flooding are shown in Table 7-V. These guidelines are known as binary screens. That is, a

173
TABLE 7-V
Guidelines for polymer-flooding design (after Taber and Martin, 1983, table 7)
Description
The objective of polymer flooding is to provide better displacement and volumetric sweep efficiencies during a waterflood. Polymer augmented waterflooding consists of adding water-soluble polymers to the water before it is injected into the reservoir. Low concentrations (often 250-2000 mg/l) of certain synthetic polymers or biopolymers are used; properly sized treatments may require 15-25% reservoir PV.
Mechanisms
Polymers improve recovery by: -increasing the viscosity of water -decreasing the mobility of water -contacting a larger volume of the reservoir
Technical screening guides
Crude oil: Gravity 25"API Viscosity Composition not critical
-c 150 CP (preferably < 100 cP)
Reservoir: Oil saturation Type of formation Net thickness not critical Average permeability Depth Temperature
> 10% PV mobile oil sandstones preferred but can be used in carbonates
> 10 mD (as low as 3 mD in some cases) < about 9000 f t (see temperature) -c 200 O F to minimize degradation
Limitations
If oil viscosities are high, a higher polymer concentration is needed to achieve the desired mobility
Results are normally better if the polymer flood is started before the water/oil ratio becomes
Clays increase polymer adsorption. Some heterogeneities are acceptable but, for conventional polymer flooding, reservoirs with extensive
fractures should be avoided. If fractures are present, the crosslinked or gelled polymer techniques may be applicable.
Lower injectivity than with water can adversely affect oil production rate in the early stages of the polymer flood.
Acrylamide-type polymers lose viscosity due to shear degradation, or increases in salinity and divalent ions.
Xanthan gum polymers cost more, are subject to microbial degradation, and have a greater potential for wellbore plugging.
control.
excessively high.
candidate reservoir either meets the criteria or it does not. The advantage of such a screening technique is its speed and simplicity. The disadvantage is that it can be misleading, i.e., a poor process or an inappropriate reservoir can be chosen because the selection protocol was too simplistic.

174
TABLE 7-VI Criteria for crude oil testing
BS & W (basic sediment and water) Viscosity of dead oil API gravity Corrosion inhibitors Acid number Asphaltene content Average molecular weight Paraffin content
Initial screening criteria are general. Successful polymer projects are fre- quently performed that violate one or more of the suggested guidelines. It is up to the engineer in charge to make the final approval. For this reason, laboratory screening test data should be collected for the specific candidate reservoir so that accurate information is available for decision making. The screening program must determine the following variables: (1) the best process, (2) the best location, ( 3 ) the proper operating conditions, and (4) the project’s performance estimate. Polymer screening programs consist of: (1) laboratory screening tests, (2) field reviews, and ( 3 ) core analysis studies.
Laboratory screening Using screening guidelines and preliminary laboratory studies, the engineer
should be able to determine if the candidate reservoir is suitable for polymer injection (Goodlett et al., 1986). The first data to be obtained from laboratory testing should be the characterization of the crude oil. The criteria for crude oil testing are shown in Table 7-VI. Oil viscosity should be low enough so that the polymer augmented flood can provide low mobility ratios. If the oil viscosity is too low, however, then water/oil mobility ratios may be favorable without polymer additions. The BS & W (basic sediment and water) determinations are made of the stocktank oil to be sure the sample is suitable for testing.
Also of crucial importance is the analysis of the injection brine. The total salinity and ionic composition of the brine to be injected must be known, because of the effect of salts upon polymer performance. If polyacrylamides are eventu- ally chosen for the project, compatibility studies must be performed to insure that the brine hardness does not exceed the tolerance of the polymer. Generally, brines of greater than about 50,000 ppm total dissolved solids cause problems with polyacrylamide performance.
If different brines are to be mixed, then water compatibility must be consid- ered. Polymers magnify the problem of injectivity impairment caused by scale buildup. Water softening can be used in some cases where brine salinity affects polymer performance. Conventional water softening techniques can be used for low-salinity brines. For high-salinity brines, weak acid ion exchange softening
175
systems are used. Such systems have been used in large-scale field projects in California, U.S.A. (Morin and Gaucher, 1986).
Bacterial contamination is one of the greatest impediments to successful polymer flooding. The typical water injection system is not designed to prevent bacterial contamination. Even though most of the water passes quickly through a system, residual liquid trapped in dead spots in piping or in tanks allows accumulation of bacterial colonies. The problem of bacterial control in the water-injection system is further complicated by their diverse characteristics and rapid reproduction rate of bacteria.
Bacteria reproduce logarithmically, and under favorable conditions, one cell can produce millions of daughter cells within 24 hours. Bacterial growth is favored by neutral pH, moderately elevated temperature, the presence of nutri- ents, and, depending upon the species, available oxygen. A great deal of research has been performed to find the most effective biocide to use for a given set of field conditions and type of polymer. Most polymer suppliers will recommend preferred biocides for their specific type of polymer. Those recommendations should be considered as well as those of oilfield production chemical companies.
Stage 2- field reviews
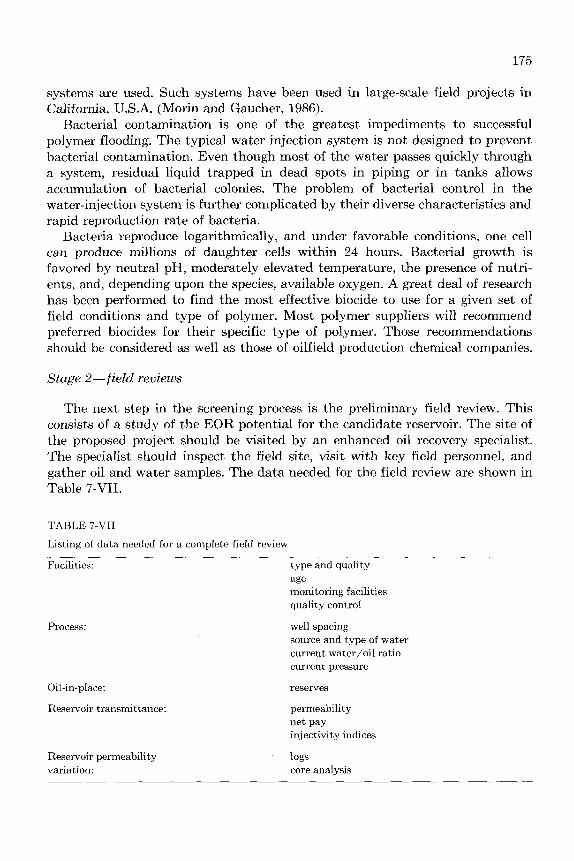
The next step in the screening process is the preliminary field review. This consists of a study of the EOR potential for the candidate reservoir. The site of the proposed project should be visited by an enhanced oil recovery specialist. The specialist should inspect the field site, visit with key field personnel, and gather oil and water samples. The data needed for the field review are shown in Table 7-VII.
TABLE 7-VII
Listing of data needed for a complete field review
Facilities:
Process:
Oil-in-place:
Reservoir transmittance:
type and quality
monitoring facilities quality control
well spacing source and type of water current water/oil ratio current pressure
reserves
permeability net pay injectivity indices
logs core analysis
age
Reservoir permeability variation:

176
TABLE 7-VIII
Types of core analysis data generated for planning polymer flood projects
Description Objectives Data
Conventional tests
Special core analysis
Enhanced recovery tests
to define reservoir and its boundaries
to obtain core for special tests
to determine petrography, wettability and saturation
electrical properties for log analysis
fractional flow charac- teristics
determine compatibility of reservoir injected fluids
measure oil recovery characteristics of EOR process
define permeability alteration tendencies of polymer chemicals
-porosity, permeability, -oil and water saturations
-grain density --lithology
-mineral contents -amounts and types of clays
-formation factor -resistivity index
-relative permeability
-injectivity resistance -factor vs. concentration -polymer retention -shear degradation
-secondary or tertiary oil production
Data from the field review will help to characterize the reservoir. Four key parameters should be identified a t this time: (1) volume of oil-in-place, (2) reservoir transmittance, ( 3 ) reservoir permeability variation, and (4) rock wetta- bility. This will require some expenditure for well testing and analysis. If cores are not available, they will have to be obtained a t this time to fully determine the acceptability of the reservoir for a polymer flood.
Core analysis Characteristics of the reservoir in large measure determine the performance of
a potential polymer project. For this reason, it is of the utmost importance to have core analysis data available for the candidate project. Table 7-VIII defines routine and special core analysis tests. There are only three stages of core analysis, with EOR testing being the final and most sophisticated stage. All these tests are expensive and time consuming.
Special core analysis Special core analysis refers to the specialized tests, which are used to char-
acterize core material. Special core analysis will elucidate the flow behavior of

177
fluids in the porous media. This data will be used to determine how fast a fluid may flow through the rock. Relative permeability curves are needed for water-oil displacements to model a waterflood process. The curves are altered to represent polymer-oil displacements. Capillary pressure tests are performed to determine irreducible fluid saturations. Determination of the wettability of reservoir rocks is also of the utmost importance.
Injection waters should be tested for compatibility in the reservoir cores. The types and amounts of clay minerals, which might react with injection brines and chemicals, must be determined by X-ray analysis and/or petrographic tests. Additionally, cation exchange capacity data are used to support other evidence of the presence of clay minerals in the formation matrix. The above tests can only be used as guidance to possible clay-polymer incompatibilities. Actual core tests and field experience are the only definitive measures for incompatibilities.
It is essential to determine the types and amounts of various clays in the reservoir rocks. In addition to the deleterious effects of clays on chemical inj ectants, these minerals have significant effects on other reservoir properties, such as porosity, permeability, and well log responses.
Process selection The type of polymer and the process to be used in the field depends upon the
results of the above screening tests and the preliminary field review. Information from these sources are evaluated by the use of analytical models to determine the predicted performance of a polymer flood.
Design criteria for polymer mobility control and for polymer vertical confor- mance treatments are different. For instance, if the field has not been under waterflood, then low concentrations of polymer for mobility control are generally used. If the polymer treatment is to correct vertical conformance problems, then crosslinked, small-volume concentrated polymer injections are generally used. Data compiled in the laboratory and field screening stage are used by the engineer for determination of the most effective design possibilities.
Laboratory evaluations
Oil recovery projections are performed using basic reservoir engineering calcu- lations to establish whether or not the process is feasible. It is helpful to perform laboratory enhanced recovery tests on field cores to get an idea of actual performance using the process.
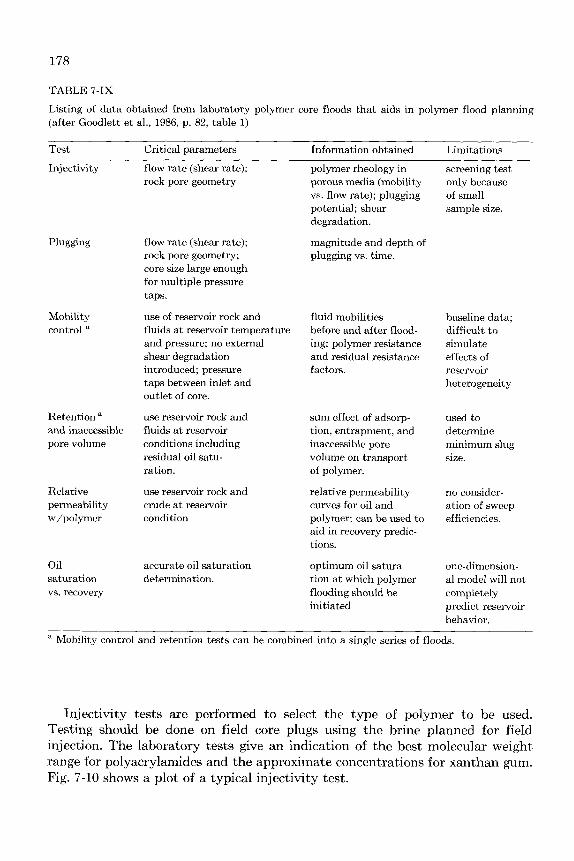
Burnett and Shurz (1983) listed laboratory testing techniques which can be used to select a polymer. Laboratory testing includes (1) compatibility tests with the field oil and brine, and ( 2 ) core testing with polymer solutions to get more information on inj ectivity, polymer retention, and oil recovery efficiency. Good- lett et al. (1986) listed aspects of polymer core floods for polymer flood evalua- tions (Table 7-IX).
178
TABLE 7-IX
Listing of data obtained from laboratory polymer core floods that aids in polymer flood planning (after Goodlett et al., 1986, p. 82, table 1)
Test Critical parameters Information obtained Limitations
Inj ectivity flow rate (shear rate); polymer rheology in screening test rock pore geometry porous media (mobility only because
vs. flow rate); plugging potential; shear sample size. degradation.
of small
Plugging
Mobility control a
Retention a
and inaccessible pore volume
Relative permeability w/polymer
Oil saturation vs. recovery
flow rate (shear rate); rock pore geometry; core size large enough for multiple pressure taps.
use of reservoir rock and fluids a t reservoir temperature and pressure; no external shear degradation introduced; pressure taps between inlet and outlet of core.
use reservoir rock and fluids a t reservoir conditions including residual oil satu- ration.
use reservoir rock and crude a t reservoir condition
accurate oil saturation determination.
magnitude and depth of plugging vs. time.
fluid mobilities before and after flood- ing; polymer resistance and residual resistance factors.
sum effect of adsorp- tion, entrapment, and inaccessible pore volume on transport of polymer.
relative permeability curves for oil and polymer; can be used to aid in recovery predic- tions.
optimum oil satura- tion at which polymer flooding should be initiated
baseline data; difficult to simulate effects of reservoir heterogeneity
used to determine minimum slug size.
no consider- ation of sweep efficiencies.
one-dimension- a1 model will not completely predict reservoir behavior.
a Mobility control and retention tests can be combined into a single series of floods.
Injectivity tests are performed to select the type of polymer to be used. Testing should be done on field core plugs using the brine planned for field injection. The laboratory tests give an indication of the best molecular weight range for polyacrylamides and the approximate concentrations for xanthan gum. Fig. 7-10 shows a plot of a typical injectivity test.

179
FLOW-
TEST CONDITIONS: CASE A - POLYACRYLAMIDE SOLUTION CASE B - B R I N E I + -
w E 3 v)
; 10- n -
CASE cx - - 0
0.2 0 4 0 6 0.8 I .o
PRESSURE DROP AS FUNCTION OF CORE LENGTH
FRACTION CORE LENGTH
Fig. 7-10. Example of polymer injectivity tests.
Retention tests provide information on the adsorption of the polymer on reservoir rock. There are two methods of determining polymer retention:
(1) Polymer adsorption on crushed core may be determined by equilibrating a bulk solution of polymer stored over the core material. To correlate bulk polymer adsorption with polymer adsorption in consolidated media, specific surface areas of cores and crushed material must be known.
(2) Polymer retention in consolidated porous media may be performed by measuring and comparing the injected polymer concentrations to the effluent concentrations. This gives the relative adsorption and desorption characteristics of the polymer.
Inasmuch as xanthan gums do not normally degrade with mechanical shear, polymer shear degradation tests are normally performed only on polyacryla- mides (Kochelek, 1984). The purpose of shear degradation tests is to determine
GLASS BULBS
Fig. 7-11. Schematic diagram of a screen “viscometer”.

180
CONCENRATION (ACTIVE BASIS). mg/L
Fig. 7-12. Typical screen factors for polyacrylamide solutions.
the effect of polymer solution flux on polymer resistance factor and retention. The test is performed on a field core a t varying injection rates. The higher the injection rate, the greater the loss in polymer performance if it shear degrades. The relative amount of shear degradation is defined by viscosity differences, differences in core test pressure drops, or by the use of a test called the screen factor.
Screen factor is a laboratory-designed test using a typical glass capillary viscometer in which the polymer fluid is also passed through five-layered stainless steel screens (Fig. 7-11). This test is specific for polyacrylamide, because xanthan gum passes through these screens relatively unhindered. Some typical screen factors for polyacrylamide solutions are shown in Fig. 7-12.
This type of behavior has been studied by Maerker (1975) and later by Seright (1983). Their correlations can be used to predict injection rates for particular polymer solutions and injection-well configurations. Laboratory testing is recom- mended in order to obtain more precise data.
Reservoir modeling
The mathematical modeling of the performance of a polymer flood can be simple or quite complex (Weiss and Baldwin, 1984). The degree of sophistication used in a simulation study depends upon the amount of information known about the reservoir. If the reservoir data is sparse, it is not wise to perform an expensive computer simulation of the process using assumed or “default” values for key process variables. If not many data are available, it is better to use simpler modeling techniques and to perform a number of “what if” studies to determine the impact of key field properties on the process efficiency. These simple models can often be done on hand-held calculators or microcomputers.
181
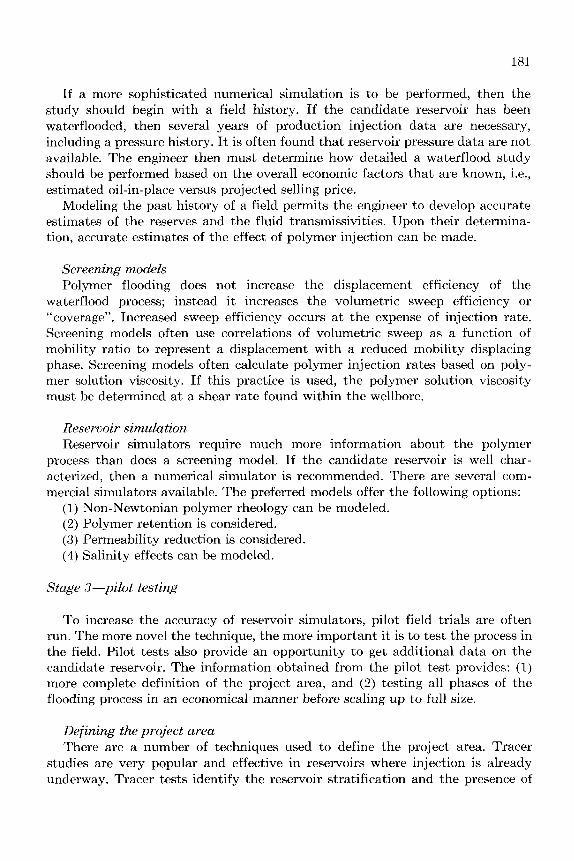
If a more sophisticated numerical simulation is to be performed, then the study should begin with a field history. If the candidate reservoir has been waterflooded, then several years of production-injection data are necessary, including a pressure history. It is often found that reservoir pressure data are not available. The engineer then must determine how detailed a waterflood study should be performed based on the overall economic factors that are known, i.e., estimated oil-in-place versus projected selling price.
Modeling the past history of a field permits the engineer to develop accurate estimates of the reserves and the fluid transmissivities. Upon their determina- tion, accurate estimates of the effect of polymer injection can be made.
Screening models Polymer flooding does not increase the displacement efficiency of the
waterflood process; instead it increases the volumetric sweep efficiency or “coverage”. Increased sweep efficiency occurs at the expense of injection rate. Screening models often use correlations of volumetric sweep as a function of mobility ratio to represent a displacement with a reduced mobility displacing phase. Screening models often calculate polymer injection rates based on poly- mer solution viscosity. If this practice is used, the polymer solution viscosity must be determined a t a shear rate found within the wellbore.
Reservoir simulation Reservoir simulators require much more information about the polymer
process than does a screening model. If the candidate reservoir is well char- acterized, then a numerical simulator is recommended. There are several com- mercial simulators available. The preferred models offer the following options:
(1) Non-Newtonian polymer rheology can be modeled. (2) Polymer retention is considered. (3 ) Permeability reduction is considered. (4) Salinity effects can be modeled.
Stage 3-pilot testing
To increase the accuracy of reservoir simulators, pilot field trials are often run. The more novel the technique, the more important i t is to test the process in the field. Pilot tests also provide an opportunity to get additional data on the candidate reservoir. The information obtained from the pilot test provides: (1) more complete definition of the project area, and (2) testing all phases of the flooding process in an economical manner before scaling up to full size.
Defining the project area There are a number of techniques used to define the project area. Tracer
studies are very popular and effective in reservoirs where injection is already underway. Tracer tests identify the reservoir stratification and the presence of
182
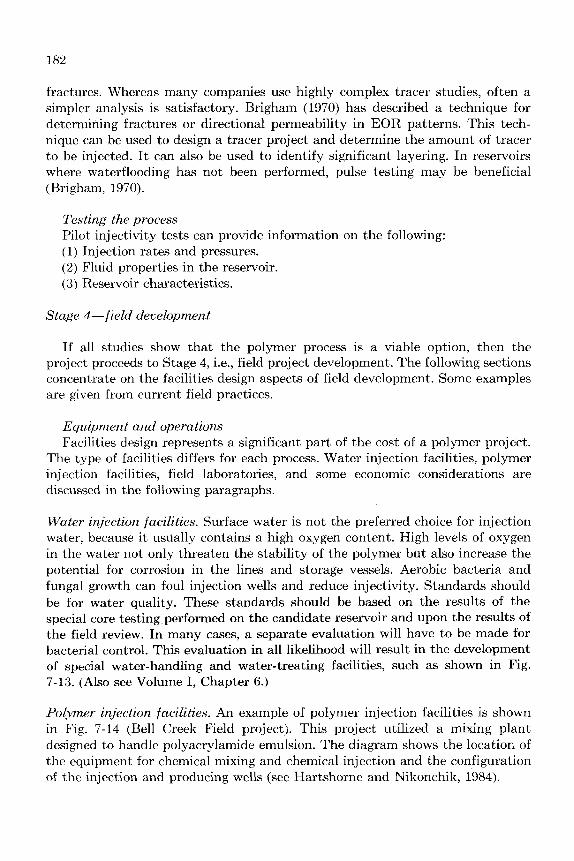
fractures. Whereas many companies use highly complex tracer studies, often a simpler analysis is satisfactory. Brigham (1970) has described a technique for determining fractures or directional permeability in EOR patterns. This tech- nique can be used to design a tracer project and determine the amount of tracer to be injected. It can also be used to identify significant layering. In reservoirs where waterflooding has not been performed, pulse testing may be beneficial (Brigham, 1970).
Testing the process Pilot inj ectivity tests can provide information on the following: (1) Injection rates and pressures. (2) Fluid properties in the reservoir. ( 3 ) Reservoir characteristics.
Stage 4- field development
If all studies show that the polymer process is a viable option, then the project proceeds to Stage 4, i.e., field project development. The following sections concentrate on the facilities design aspects of field development. Some examples are given from current field practices.
Equiprnent and operations Facilities design represents a significant part of the cost of a polymer project.
The type of facilities differs for each process. Water injection facilities, polymer injection facilities, field laboratories, and some economic considerations are discussed in the following paragraphs.
Water injection facilities. Surface water is not the preferred choice for injection water, because i t usually contains a high oxygen content. High levels of oxygen in the water not only threaten the stability of the polymer but also increase the potential for corrosion in the lines and storage vessels. Aerobic bacteria and fungal growth can foul injection wells and reduce injectivity. Standards should be for water quality. These standards should be based on the results of the special core testing,performed on the candidate reservoir and upon the results of the field review. In many cases, a separate evaluation will have to be made for bacterial control. This evaluation in all likelihood will result in the development of special water-handling and water-treating facilities, such as shown in Fig. 7-13. (Also see Volume I, Chapter 6.)
Polymer injection facilities. An example of polymer injection facilities is shown in Fig. 7-14 (Bell Creek Field project). This project utilized a mixing plant designed to handle polyacrylamide emulsion. The diagram shows the location of the equipment for chemical mixing and chemical injection and the configuration of the injection and producing wells (see Hartshorne and Nikonchik, 1984).

183
Sell O i l SCALE INHIBITOR ( i f mix is scaling)
Ai r f lotat ion Backwash surfactant
Skimmings
Fresh surface wa te r
Water storage tanks
Water supply Oxygen scavenger well
Water p re t rea tment system
Fig. 7-13. Schematic diagram of a typical water pretreatment system. (After Kochelek, 1984, p. 3, fig. 4.)
Because of the difficulty encountered with most dry polymer mixing plants, emulsion systems are the most common choice for polyacrylamide operations. The problems encountered in dry powder mixing are microgel formation, fish- eyes, dusting, and inaccurate measurements. It is necessary to realize, however, that the polymers in these emulsions are not hydrated, but are only dispersed in the organic liquid phase of the emulsion. It still must be allowed to hydrate before injection (Kampen and Haynes, 1987). Typical field setups for mixing polyacrylamide solutions are shown in Fig. 7-15.
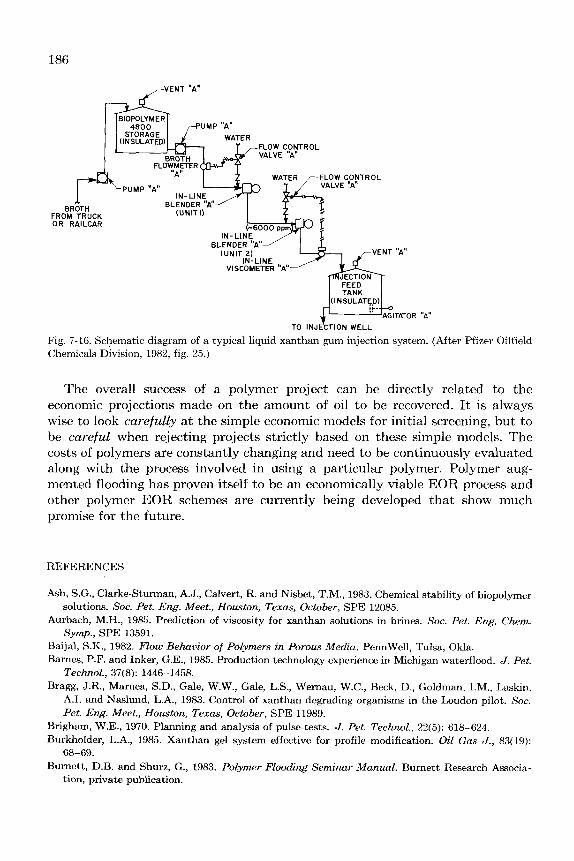
An example of a xanthan gum project is shown in Fig. 7-16 (Ware, 1983). Xanthan gum biopolymers can be supplied as either a dry powder or as a liquid slurry concentrate. The polymer in the slurry concentrate is fully hydrated so the material only needs to be diluted as it is pumped into the injection well. The slurry, or broth as it is sometimes called, can be supplied in 2-3% active content or as a 10-12% concentrate.
Field laboratories. Field laboratories are usually required on polymer flooding projects. Tests performed in such laboratories include water analysis, polymer injectivity, polymer viscosity and bacteriological tests (see Burnett and Shurz, 1983).
Economic considerations for field development
The oil recovery effectiveness of a polymer project must be considered as soon as possible. The use of simple models to provide estimates of oil recovery as early in the project as possible is recommended. The cost of designing a polymer project is directly proportional to the size and sophistication of the project.

POLYMER DAY
KOMAX STATIC MIXERS POLYMER
BUILDING INJECTION -
TO CHEMICAL INJECTION WELLS
NAPTHA TANKS
PROCESS / ELEC. CONTROL CENTER
SOLUBLE OIL MIXING PLANT
SOLUBLE OIL MIXING TANKS
CRUDE OIL TANKS
MADISON SUPPLY
MAIN INJECTION PUMP HOUSE
BELLCREEK UNIT ‘A” TERTIARY INCENTIVE PROJECT CHEMICAL INJECTION FACILITY
SCHEMATIC DIAGRAM MADISON WATER
JSUCTION TANK
FEED. TRANSFER OR ClRCULATlNQ PUMP
CAUSTIC SODA STORAQE SUCTION TANK S T 0 R A Q E
Fig. 7-14. Schematic diagram of the Bellcreek Unit “A” injection facility. (After Hartshorne and Nikonchik, 1984. fig. 6.)

185
Emulsion polymer storage tank
Emulsion polymer injection system (a)
Triplex inject ion
T
Gel log polymer injection system (b)
D r y powder polymer injection system
Fig. 7-15. Schematic diagrams of typical mixing facilities: (a) emulsion and liquid polymer (b) gel log systems; (c) dry powder systems. (After Kochelek, 1984, p. 2, figs. 1, 2, and 3.)
systems;
186
,VENT “A”
-FLOW CONTROL VALVE “A”
IN-LIN!, ,,/‘ BLENDER A
(UNIT 21 IN-LINE
VISCOMETER “A”
1 FEED
II NSULATFD)
Fig. 7-16. Schematic diagram of a typical liquid xanthan gum injection system. (After Pfizer Oilfield Chemicals Division, 1982, fig. 25.)
The overall success of a polymer project can be directly related to the economic projections made on the amount of oil to be recovered. It is always wise to look carefully a t the simple economic models for initial screening, but to be careful when rejecting projects strictly based on these simple models. The costs of polymers are constantly changing and need to be continuously evaluated along with the process involved in using a particular polymer. Polymer aug- mented flooding has proven itself to be an economically viable EOR process and other polymer EOR schemes are currently being developed that show much promise for the future.
REFERENCES
Ash, S.G., Clarke-Stman, A.J., Calvert, R. and Nisbet, T.M., 1983. Chemical stability of biopolymer
Aurbach, M.H., 1985. Prediction of viscosity for xanthan solutions in brines. SOC. Pet. Erg. Chem.
Baijal, S.K., 1982. Flow Behavior of Polymers in Porous Media. PennWell, Tulsa, Okla. Barnes, P.F. and Inker, G.E., 1985. Production technology experience in Michigan waterflood. J. Pet.
Technol., 37 (8) : 1446- 1458. Bragg, J.R., Maruca, S.D., Gale, W.W., Gale, L.S., Wernau, W.C., Beck, D., Goldman, I.M., Laskin,
A.I. and Naslund, L.A., 1983. Control of xanthan degrading organisms in the Loudon pilot. SOC. Pet. Eng. Meet., Houston, Texas, October, SPE 11989.
solutions. SOC. Pet. Eng. Meet., Houston, Texas, October, SPE 12085.
Symp., SPE 13591.
Brigham, W.E., 1970. Planning and analysis of pulse-tests. J. Pet. Technol., 22(5): 618-624. Burkholder, L.A., 1985. Xanthan gel system effective for profile modification. Oil Gas J., 83(19):
Burnett, D.B. and Shurz, G., 1983. Polymer Floodiqg Seminar Manual. Burnett Research Associa- 68-69.
tion, private publication.

187
Chatterji, J. and Burchardt, J.K., 1981. Application of water-soluble polymers on the oil field. J. Pet.
Clampett, R.L. and Hessert, J.E., 1974. Method for controlling formation permeability. U S . Patent,
Clark, R.K., 1984. Applications of water-soluble polymers as shale stabilizers in drilling fluids. Am.
Davidson, R.L., 1980. Handbook of Water Soluble Gums and Resins. McGraw-Hill, Newark, N.J. Gall, J.W., 1973. Subteranean formation permeability correction. U S . Patent, No. 3, 762, 476. Gogarty, W.B., Meabon, H.P. and Milton, H.W., 1970. Mobility control design for miscible-type
waterfloods using micellar solutions. J. Pet. Technol., 22(2): 141-147. Goodlett, G.O., Honarpour, M.M., Carroll, H.B. and Sarathi, P.S., 1986. Lab data aid design and
evaluation of polymer floods. Oil Gas J., 84(26): 82-90. Green, D.W., Willhite, G.P. and Huang, C.G., 1984. An experimental study of the in-situ gelation of
chromium (+ 3) polyacrylamide polymer in porous media. SOC. Pet. Eng. EOR Symp., Tulsa, Okla., SPE 12638.
Hartshorne, J.M. and Nikonchik, J.S., 1984. Micellar polymer flood shows success in Bell Creek Field. Soc. Pet. Eng., Fall Meet., Houston, Texas, SPE 13122.
Holm, L.W., 1983. Evaluation of additional data from Bell Creek micellar pilot indicates success. Oil Gas J., 81(27): 140-142.
Kampen, D.T. and Haynes, H.H., 1987. Proper chemical use improves offshore water clarification. Ocean I d . , 22(2): 38-42.
Kochelek, J.T., 1984. Operational problems associated with polymer applications in oil field EOR projects. Southwestern Petrol. Short Course, Lubbock, Texas, April.
Liauh, W.W. and Liu, T.W., 1984. A capillary viscometer for the study of EOR polymers. Soc. Pet. Eng. EOR Symp., Tulsa, Okla., SPE 12649.
Maerker, J.M., 1975. Shear degradation of polyacrylamide solutions. Soc. Pet. Eng. J., 15(8): 311-322.
Morin, R.J. and Gaucher, D.E., 1986. In-line continuous monitoring system improves water plant EOR performance. Oil Gas J., 84(28): 104-105.
Pfizer Oilfield Chemicals Division, 1982. FLOCON 4800 Brochure. Phillips, J.C., Miller, J.W., Wernau, W.C., Tate, B.E. and Aurbach, M.H., 1985. A high-ppvate
Prud’homme, R.K. and Uhl, J.T., 1984. Kinetics of polymer metal ion gelation. Soc. Pet. Eng. EOR
Ryles, R.G., 1983. Chemical stability of water-soluble polymers used in enhanced oil recovery
Savins, J.G., 1969. Non-Newtonian flow through porous media. I d . Eng. Chem., 61: 18-47. Seright, R.S., 1983. The effects of mechanical degradation and viscoelastic behavior on injectivity.
Shupe, R.D., 1981. Chemical stability of polyacrylamide polymers. J. Pet. Technol., 33(8): 1513-1529. Slaton, M., 1983. Micellar-polymer flood in Illinois showing increased oil cut. Drilling, 44(2): 13. Sorbie, K.S., Parker, A. and Clifford, P.J., 1985. Experimental and theoretical study of polymer flow
in porous media. Soc. Pet. Eng., Fall Meet., September 22-25, SPE 14231. Taber, J.J. and Martin, F.D., 1983. Technical screening guides for the enhanced recovery of oil. Soc.
Pet. Eng., Fall Meet., Sun Francisco, Calif., October 5-8, SPE 12069. Vossoughi, S., Aslam, S. and Willhite, G.P., 1984. Viscometric measurement of chromium I11
polyacrylamide gels by Weissenberg rheogoniometer. SOC. Pet. Eng. EOR Symp., Tulsa, Okla., SPE 12639.
Ware, J.W., 1983. Salem Unit Micellar/Polymer Project. Soc. Pet. Eng., Fall Meet., Sun Francisco, Calif., October 5-8 , SPE 11985.
Weiss, W.W. and Baldwin, R., 1984. Planning and implementing a large-scale polymer flood. SOC. Pet. Eng. EOR Symp., Tulsa, Okla., SPE 12637.
Wellington, S.L., 1983. Biopolymer viscosity stabilization-polymer degradation and antioxidant use. Soc. Pet. Eng. J., 23(12): 901-912.
Technol., 33(11): 2042-2056.
No. 3, 785, 437.
Chem. SOC. 188th Natl. Meet., Philacklphia, Pa.
xanthan for EOR. Soc. Pet. Erg. J., 25(4): 594-602.
Symp., Tulsa, Okla., SPE 12640.
processes. Soc. Pet. Eng. Chem. Symp., SPE 13585.
Soc. Pet. Eng. J., 23(6): 475-485.
Copyright © 2022 FDOKUMEN