Active Flooding Mitigation for Stability Enhancement in ... - MDPI
30
Citation: Valanto, P. Active Flooding Mitigation for Stability Enhancement in a Damaged RoPax Ship. J. Mar. Sci. Eng. 2022, 10, 797. https://doi.org/ 10.3390/jmse10060797 Academic Editors: Apostolos Papanikolaou and Pekka Ruponen Received: 18 May 2022 Accepted: 6 June 2022 Published: 9 June 2022 Publisher’s Note: MDPI stays neutral with regard to jurisdictional claims in published maps and institutional affil- iations. Copyright: © 2022 by the author. Licensee MDPI, Basel, Switzerland. This article is an open access article distributed under the terms and conditions of the Creative Commons Attribution (CC BY) license (https:// creativecommons.org/licenses/by/ 4.0/). Journal of Marine Science and Engineering Article Active Flooding Mitigation for Stability Enhancement in a Damaged RoPax Ship Petri Valanto Hamburg Ship Model Basin HSVA, Bramfelder Strasse 164, D-22305 Hamburg, Germany; [email protected] Abstract: In the framework of the EU project Flooding Accident Response (FLARE), flooding mitiga- tion on a RoPax ship was studied using different active methods to improve ship safety in damage cases leading to a hull breach and flooding. Adding active flooding control systems to ship designs and ships in service, which would mitigate the effects of flooding in a damage case, could be an attractive way to improve ship safety. In order to promote this idea, the effects of such active measures on the ship safety were studied: the choice of them, the required application speed of them, their functionality in waves, the numerical modeling of them, and finally testing them with model scale tests. The following flooding mitigation methods were studied: (1) counter flooding, (2) the recovery of lost buoyancy in a damaged compartment, and (3) deploying a watertight barrier on the trailer deck. This study consists of the numerical simulations carried out with the program HSVA Rolls in chosen damage cases on a current RoPax design, with and without active flooding mitigation measures, and of the following ship model tests based on the a priori computations. Keywords: ship damage stability; active flooding mitigation; numerical simulation; model tests 1. Introduction In the framework of the EU project Flooding Accident Response (FLARE), flooding mitigation on a RoPax ship was studied as an active way to improve ship safety in damage cases leading to a hull breach and flooding. According to the present grandfather policy in IMO regulations, new rules and requirements apply in general only to new buildings, not least as such new requirements in damage stability tend to have effects on the ship subdivision. Changes in the subdivision of existing ships would be prohibitively costly. Another, easier way to elevate the safety level of both new buildings and existing ships would be to add active flooding control systems to the ship designs and ships, which would mitigate the effects of flooding in a damage case, see, e.g., reference [1] for an introduction. In order to promote this idea, the effects of such active measures on the ship safety were studied: the choice of them, the required application speed of them, their functionality in waves, the numerical modeling of them, and finally, testing them with model scale tests. This study describes the numerical simulations carried out by the HSVA in chosen damage cases on a current RoPax design, with and without active flooding mitigation measures applied. The subsequent experimental verification of these mitigation methods and related computations are also described. In order to study the mitigation methods, the behavior of the damaged RoPax vessel in calm water and in waves was simulated with the program HSVA Rolls [2–5] for both the passive cases and those with active flooding control. That is, each case was studied with and without flooding mitigation, allowing a good comparison. These numerical flooding investigations served also as an important preparation for the following model test campaign on mitigation. On few selected damage cases, model tests were carried out to verify the calculations and to demonstrate the benefits of active flooding control. The simulations and tests in calm water provide information on the ability of the mitigation system to prevent a rapid capsize in a transient flooding and heeling phase J. Mar. Sci. Eng. 2022, 10, 797. https://doi.org/10.3390/jmse10060797 https://www.mdpi.com/journal/jmse
-
Upload
khangminh22 -
Category
Documents
-
view
2 -
download
0
Transcript of Active Flooding Mitigation for Stability Enhancement in ... - MDPI

Citation: Valanto, P. Active Flooding
Mitigation for Stability Enhancement
in a Damaged RoPax Ship. J. Mar. Sci.
Eng. 2022, 10, 797. https://doi.org/
10.3390/jmse10060797
Academic Editors: Apostolos
Papanikolaou and Pekka Ruponen
Received: 18 May 2022
Accepted: 6 June 2022
Published: 9 June 2022
Publisher’s Note: MDPI stays neutral
with regard to jurisdictional claims in
published maps and institutional affil-
iations.
Copyright: © 2022 by the author.
Licensee MDPI, Basel, Switzerland.
This article is an open access article
distributed under the terms and
conditions of the Creative Commons
Attribution (CC BY) license (https://
creativecommons.org/licenses/by/
4.0/).
Journal of
Marine Science and Engineering
Article
Active Flooding Mitigation for Stability Enhancement in aDamaged RoPax ShipPetri Valanto
Hamburg Ship Model Basin HSVA, Bramfelder Strasse 164, D-22305 Hamburg, Germany; [email protected]
Abstract: In the framework of the EU project Flooding Accident Response (FLARE), flooding mitiga-tion on a RoPax ship was studied using different active methods to improve ship safety in damagecases leading to a hull breach and flooding. Adding active flooding control systems to ship designsand ships in service, which would mitigate the effects of flooding in a damage case, could be anattractive way to improve ship safety. In order to promote this idea, the effects of such active measureson the ship safety were studied: the choice of them, the required application speed of them, theirfunctionality in waves, the numerical modeling of them, and finally testing them with model scaletests. The following flooding mitigation methods were studied: (1) counter flooding, (2) the recoveryof lost buoyancy in a damaged compartment, and (3) deploying a watertight barrier on the trailerdeck. This study consists of the numerical simulations carried out with the program HSVA Rollsin chosen damage cases on a current RoPax design, with and without active flooding mitigationmeasures, and of the following ship model tests based on the a priori computations.
Keywords: ship damage stability; active flooding mitigation; numerical simulation; model tests
1. Introduction
In the framework of the EU project Flooding Accident Response (FLARE), floodingmitigation on a RoPax ship was studied as an active way to improve ship safety in damagecases leading to a hull breach and flooding. According to the present grandfather policyin IMO regulations, new rules and requirements apply in general only to new buildings,not least as such new requirements in damage stability tend to have effects on the shipsubdivision. Changes in the subdivision of existing ships would be prohibitively costly.Another, easier way to elevate the safety level of both new buildings and existing shipswould be to add active flooding control systems to the ship designs and ships, which wouldmitigate the effects of flooding in a damage case, see, e.g., reference [1] for an introduction.In order to promote this idea, the effects of such active measures on the ship safety werestudied: the choice of them, the required application speed of them, their functionality inwaves, the numerical modeling of them, and finally, testing them with model scale tests.
This study describes the numerical simulations carried out by the HSVA in chosendamage cases on a current RoPax design, with and without active flooding mitigationmeasures applied. The subsequent experimental verification of these mitigation methodsand related computations are also described.
In order to study the mitigation methods, the behavior of the damaged RoPax vesselin calm water and in waves was simulated with the program HSVA Rolls [2–5] for boththe passive cases and those with active flooding control. That is, each case was studiedwith and without flooding mitigation, allowing a good comparison. These numericalflooding investigations served also as an important preparation for the following modeltest campaign on mitigation. On few selected damage cases, model tests were carried outto verify the calculations and to demonstrate the benefits of active flooding control.
The simulations and tests in calm water provide information on the ability of themitigation system to prevent a rapid capsize in a transient flooding and heeling phase
J. Mar. Sci. Eng. 2022, 10, 797. https://doi.org/10.3390/jmse10060797 https://www.mdpi.com/journal/jmse

J. Mar. Sci. Eng. 2022, 10, 797 2 of 30
during and just after the damage opening. For this, both the damage opening durationin time and the reaction of the mitigation system were modeled first in the numericalsimulations and later in the HSVA model tests. The simulations and tests in irregular seasprovide information on the ability of the ship to survive gradual flooding in beam seas indamaged conditions mostly after the flooding mitigation has taken place. All sea states inthis investigation were modeled with JONSWAP-Spectrum, with the peak enhancementfactor γ of 3.3 and peak wave period TP of 10.0 s.
The RoPax ship under this study is a modern northern RoPax design made for researchpurposes only. The safety of this design was studied by various partners in the frameworkof FLARE at a few levels of sophistication in several damage cases. These were firstscreened with simpler methods and consequently six critical cases were further studied withforensic analysis using the HSVA Rolls as a simulation program. Two of these six damagecases (No. 2 and 4) were selected to be used in investigating the effectiveness of floodingmitigation with numerical simulations and model tests.
2. General Description of the RoPax Vessel
The ship used in the numerical simulations and model tests is a 162 m-long RoPaxvessel design to the SOLAS 2020 standard by the Meyer Turku (MT) shipyard. The shipis designed as a day ferry, hosting up to 1900 passengers and a crew of 91. It has 800 mtrailer lanes on the main trailer deck at 9.2 m above the baseline and 1050 m car lanes in thegarage deck [6]. The main particulars of the vessel at the test draught are given in Table 1,and views of the ship and ship lines are given in Figures 1–3.
Table 1. Main data of the vessel in intact (test) condition.
MT RoPax—HSVA Model No: 5539 Symbol Unit Ship
Length overall LOA m 162.00
Length between perpendiculars LPP m 146.72
Breadth at waterline BWL m 28.00
Draught at aft perpendicular TA m 6.30
Draught at forward perpendicular TF m 6.30
Depth to trailer deck D m 9.20
Displaced volume (bare hull) ∇BH m3 16,799.4
Block coefficient CB - 0.6522
Intact transverse GM GM m 2.50/3.40
J. Mar. Sci. Eng. 2022, 10, x FOR PEER REVIEW 2 of 31
The simulations and tests in calm water provide information on the ability of the
mitigation system to prevent a rapid capsize in a transient flooding and heeling phase
during and just after the damage opening. For this, both the damage opening duration in
time and the reaction of the mitigation system were modeled first in the numerical simu‐
lations and later in the HSVA model tests. The simulations and tests in irregular seas pro‐
vide information on the ability of the ship to survive gradual flooding in beam seas in
damaged conditions mostly after the flooding mitigation has taken place. All sea states in
this investigation were modeled with JONSWAP‐Spectrum, with the peak enhancement
factor γ of 3.3 and peak wave period TP of 10.0 s.
The RoPax ship under this study is a modern northern RoPax design made for re‐
search purposes only. The safety of this design was studied by various partners in the
framework of FLARE at a few levels of sophistication in several damage cases. These were
first screened with simpler methods and consequently six critical cases were further stud‐
ied with forensic analysis using the HSVA Rolls as a simulation program. Two of these
six damage cases (No. 2 and 4) were selected to be used in investigating the effectiveness
of flooding mitigation with numerical simulations and model tests.
2. General Description of the RoPax Vessel
The ship used in the numerical simulations and model tests is a 162 m‐long RoPax
vessel design to the SOLAS 2020 standard by the Meyer Turku (MT) shipyard. The ship
is designed as a day ferry, hosting up to 1900 passengers and a crew of 91. It has 800 m
trailer lanes on the main trailer deck at 9.2 m above the baseline and 1050 m car lanes in
the garage deck [6]. The main particulars of the vessel at the test draught are given in
Table 1, and views of the ship and ship lines are given in Figures 1–3.
Figure 1. CAD model of the MT RoPax used in the numerical simulations of flooding mitigation.
Table 1. Main data of the vessel in intact (test) condition.
MT RoPax—HSVA Model No: 5539 Symbol Unit Ship
Length overall LOA m 162.00
Length between perpendiculars LPP m 146.72
Breadth at waterline BWL m 28.00
Draught at aft perpendicular TA m 6.30
Draught at forward perpendicular TF m 6.30
Depth to trailer deck D m 9.20
Displaced volume (bare hull) BH m3 16799.4
Block coefficient CB ‐ 0.6522
Intact transverse GM GM m 2.50/3.40
A version of the MT RoPax subdivision modified by the Maritime Safety Research
Centre of the University of Strathclyde (MSRC) for the purposes of the initial screening of
damage cases in FLARE and for further forensic analysis was used in the present investi‐
gation of the flooding mitigation efforts.
Figure 1. CAD model of the MT RoPax used in the numerical simulations of flooding mitigation.
A version of the MT RoPax subdivision modified by the Maritime Safety ResearchCentre of the University of Strathclyde (MSRC) for the purposes of the initial screeningof damage cases in FLARE and for further forensic analysis was used in the presentinvestigation of the flooding mitigation efforts.

J. Mar. Sci. Eng. 2022, 10, 797 3 of 30
J. Mar. Sci. Eng. 2022, 10, x FOR PEER REVIEW 3 of 31
The ship model was built of reinforced flax fiber composite material in a scale of 1:28
according to the hull lines provided by the Meyer Turku Shipyard, but the bow and stern
thruster tunnels were not modeled. For the model tests, the following appendages were
attached to the model: rudders, propellers and shafts, struts, and bilge keels.
Figure 2. Side view of the MT RoPax design.
All ship and model particulars, as well as results, are presented in full scale (f.sc.). At
the studied draft of 6.3 m, the minimum metacentric height (GM) value according to the
current SOLAS Ch. II‐1 requirements is 3.4 m. This ensures a good survivability level of the
intact vessel. Therefore, also smaller GM values were used in the simulations and model
tests to achieve capsize cases for testing the mitigation methods on the damaged vessel.
Figure 3. Bare hull lines drawing of the studied RoPax ship [7].
3. Collision Damage Opening Times
The damage cases under investigation comprise as loss mechanism both transient cap‐
size and progressive flooding. In many of these cases, the damage opening time (DOT) can
be relevant. For this reason, the damage cases were not studied with an instant damage
opening (0 s), which in case of a collision damage is not realistic, but which as an approxi‐
mation is sometimes applied to study transient damage cases. Instead, all cases were inves‐
tigated using the damage opening time of 15 s, in addition to few cases with the longer
Figure 2. Side view of the MT RoPax design.
J. Mar. Sci. Eng. 2022, 10, x FOR PEER REVIEW 3 of 31
The ship model was built of reinforced flax fiber composite material in a scale of 1:28
according to the hull lines provided by the Meyer Turku Shipyard, but the bow and stern
thruster tunnels were not modeled. For the model tests, the following appendages were
attached to the model: rudders, propellers and shafts, struts, and bilge keels.
Figure 2. Side view of the MT RoPax design.
All ship and model particulars, as well as results, are presented in full scale (f.sc.). At
the studied draft of 6.3 m, the minimum metacentric height (GM) value according to the
current SOLAS Ch. II‐1 requirements is 3.4 m. This ensures a good survivability level of the
intact vessel. Therefore, also smaller GM values were used in the simulations and model
tests to achieve capsize cases for testing the mitigation methods on the damaged vessel.
Figure 3. Bare hull lines drawing of the studied RoPax ship [7].
3. Collision Damage Opening Times
The damage cases under investigation comprise as loss mechanism both transient cap‐
size and progressive flooding. In many of these cases, the damage opening time (DOT) can
be relevant. For this reason, the damage cases were not studied with an instant damage
opening (0 s), which in case of a collision damage is not realistic, but which as an approxi‐
mation is sometimes applied to study transient damage cases. Instead, all cases were inves‐
tigated using the damage opening time of 15 s, in addition to few cases with the longer
Figure 3. Bare hull lines drawing of the studied RoPax ship [7].
The ship model was built of reinforced flax fiber composite material in a scale of 1:28according to the hull lines provided by the Meyer Turku Shipyard, but the bow and sternthruster tunnels were not modeled. For the model tests, the following appendages wereattached to the model: rudders, propellers and shafts, struts, and bilge keels.
All ship and model particulars, as well as results, are presented in full scale (f.sc.). Atthe studied draft of 6.3 m, the minimum metacentric height (GM) value according to thecurrent SOLAS Ch. II-1 requirements is 3.4 m. This ensures a good survivability level of theintact vessel. Therefore, also smaller GM values were used in the simulations and modeltests to achieve capsize cases for testing the mitigation methods on the damaged vessel.
3. Collision Damage Opening Times
The damage cases under investigation comprise as loss mechanism both transientcapsize and progressive flooding. In many of these cases, the damage opening time (DOT)can be relevant. For this reason, the damage cases were not studied with an instantdamage opening (0 s), which in case of a collision damage is not realistic, but which as anapproximation is sometimes applied to study transient damage cases. Instead, all caseswere investigated using the damage opening time of 15 s, in addition to few cases with thelonger opening time of 30 s. The value 15 s is approximately the shortest realistic collisiondamage opening time for the MT RoPax. It is based on the assumption of the shortest time,

J. Mar. Sci. Eng. 2022, 10, 797 4 of 30
at which the striking ship can pull itself back, with its damaged bow withdrawing out ofthe collision damage penetration on the struck ship, using its available propulsion powerfull astern (see Figure 4). The striking ship and the stuck ship are assumed identical. Suchdamage opening times were investigated by HSVA in FLARE and are given for severalvessel types in reference [8]. The value 15 s based on the analysis represents a time in whichca. 90% of the damage opens. The damage opening rate is highly non-linear. Therefore, thisrepresentative effective value was chosen for the numerical simulations and model tests.
J. Mar. Sci. Eng. 2022, 10, x FOR PEER REVIEW 4 of 31
opening time of 30 s. The value 15 s is approximately the shortest realistic collision damage
opening time for the MT RoPax. It is based on the assumption of the shortest time, at which
the striking ship can pull itself back, with its damaged bow withdrawing out of the collision
damage penetration on the struck ship, using its available propulsion power full astern (see
Figure 4). The striking ship and the stuck ship are assumed identical. Such damage opening
times were investigated by HSVA in FLARE and are given for several vessel types in refer‐
ence [8]. The value 15 s based on the analysis represents a time in which ca. 90% of the dam‐
age opens. The damage opening rate is highly non‐linear. Therefore, this representative ef‐
fective value was chosen for the numerical simulations and model tests.
Figure 4. An example of a ship‐to‐ship collision in the Mediterranean Sea on 8 October 2018. The
instant opening of the related collision damage is more a myth than a sound physical assumption.
Photo: © picture‐alliance/AP Photo/Marine Nationale/Benoit Emile.
4. Numerical Simulations and Model Tests on Flooding Mitigation
4.1. The Code HSVA Rolls
The survivability of damaged RoPax ships in case of a flooding accident is critical, as
these ships have a tendency for a rapid capsize, often not allowing for an orderly evacua‐
tion. Various time‐domain flooding simulation tools have been developed to study their
behavior.
The in‐house version of the commonly used German code Rolls [2–4], namely the
HSVA Rolls, was used in this study [5]: Floodwater in internal compartments and on
decks can be modelled either with shallow‐water‐equations (SWE) or with a pendulum
model. For practically all cases in this study, SWEs were used to model the flow on the
trailer deck, and the pendulum model was used for the more deeply flooded compartment
spaces below. Flow rates through the breaches are based on Bernoulli’s equation. For the
ship heave, pitch, sway, and yaw motions the method uses response amplitude operators
(RAO) determined in the frequency domain with a linear strip method. The roll and surge
motions are determined with the time integration of the non‐linear equations of motion
coupled with the other four degrees of freedom. The hydrodynamic contributions are
based on linear strip theory and of those based on the water motions in internal compart‐
ments. The hydrostatic contributions in calm water and waves are non‐linear and are
based on calculations with NAPA software. The trailer deck was discretized with a 160 ×
30 SWE grid, resulting in altogether 3650 elements.
Figure 4. An example of a ship-to-ship collision in the Mediterranean Sea on 8 October 2018. Theinstant opening of the related collision damage is more a myth than a sound physical assumption.Photo: © picture-alliance/AP Photo/Marine Nationale/Benoit Emile.
4. Numerical Simulations and Model Tests on Flooding Mitigation4.1. The Code HSVA Rolls
The survivability of damaged RoPax ships in case of a flooding accident is critical,as these ships have a tendency for a rapid capsize, often not allowing for an orderlyevacuation. Various time-domain flooding simulation tools have been developed to studytheir behavior.
The in-house version of the commonly used German code Rolls [2–4], namely theHSVA Rolls, was used in this study [5]: Floodwater in internal compartments and on deckscan be modelled either with shallow-water-equations (SWE) or with a pendulum model.For practically all cases in this study, SWEs were used to model the flow on the trailerdeck, and the pendulum model was used for the more deeply flooded compartment spacesbelow. Flow rates through the breaches are based on Bernoulli’s equation. For the shipheave, pitch, sway, and yaw motions the method uses response amplitude operators (RAO)determined in the frequency domain with a linear strip method. The roll and surge motionsare determined with the time integration of the non-linear equations of motion coupledwith the other four degrees of freedom. The hydrodynamic contributions are based onlinear strip theory and of those based on the water motions in internal compartments.The hydrostatic contributions in calm water and waves are non-linear and are based oncalculations with NAPA software. The trailer deck was discretized with a 160 × 30 SWEgrid, resulting in altogether 3650 elements.
Such codes are used in the design of new, safer ships and more widely in researchprojects. Consequently, the validation and benchmarking of these tools are essential. Thelatest very recent benchmarking of the HSVA Rolls among other codes can be found inreference [7].

J. Mar. Sci. Eng. 2022, 10, 797 5 of 30
4.2. Introduction to Numerical Simulations and Model Tests on Flooding Mitigation
The damage cases on the RoPax under investigation consist of a breach to the trailerdeck and to several damaged compartments below. When the damage opens, the latterwill be flooded quite rapidly, and the trailer deck with small delay when the ship hasheeled sufficiently.
There is a center casing on the port side adjacent to the centerline on the trailer deck,which has an impact on the accumulation of water on the deck in waves. Further, theflooding of the trailer deck is limited by additional transverse bulkheads present in theMSRC version of the ship subdivision used.
The arrangements of the floodable compartments for the damage cases studied areillustrated below in the following chapters. There are no internal connections between thecompartments. In the physical ship model, all damaged compartments were ventilatedthrough ventilation pipes in the compartment corners. Consequently, full ventilation wasapplied in the simulations. Due to the large scale (1:28) of the model, the openings arequite large, and therefore, the industry standard discharge coefficient 0.6 was used for allopenings. The capsize criterion in this study is the heeling angle of 60◦. The time to capsize(TTC) is based on this value.
The opening of the damage on the ship hull was modeled using a time-dependentdischarge coefficient for the flow into the damaged compartments, with its value typicallychanging from 0 to 0.6 in the pre-set damage opening time.
The counter flooding (CF) was modeled by simply opening two counter floodingcompartments to the sea through a change of the discharge coefficient value from 0 to 0.6once a pre-set ship heeling angle was exceeded in the simulation. The recovery of lostbuoyancy (RLB) by displacing floodwater in a damaged compartment was modeled withreducing the permeability of the compartment in a pre-set duration of time.
The deployment of the watertight barrier (WTB) on the trailer deck was modeledas follows: The floodwater motion was described with shallow-water-equations on anumerical grid spanning over the whole deck. Setting new boundary conditions during thesimulation would be difficult. Instead, in four cell rows at the position of the deployablebarrier, the horizontal fluid acceleration was artificially increased to keep water out of thesecells (see Figure 18). This effectively keeps the barrier watertight after being lowered.
As the corresponding model testing techniques used were all new, a short descriptionof these is given in Appendix A.
4.3. Numerical Simulation of Damage Case 2 with and without Counter Flooding
In Damage Case 2 (MSRC DMC0569; DC2), the compartments T100 (max. volume357 m3) and T141 (777 m3) on the starboard side of the MT RoPax get damaged and areflooded, as illustrated in Figure 5. The damage opening extends also to the trailer deck, thefloodable area of which is limited by two transverse bulkheads. The damage opening sizeis about 18.3 m in length and extends 1 m below the still water level at the ship draught of6.3 m. Without mitigation, the ship capsizes with GM 2.5 m in about 70 s when the damageopens in 15 s. With GM 2.95 m, the ship survives in calm water, but in beam seas withsignificant wave height HS 2.0 m, it capsizes in ca. 75–180 s when damage is opened in 15 s.With the original design GM value of 3.40 m, the ship does not capsize in calm water or inbeam seas until the significant wave height reaches 2.5 m. Thus, the mitigation efforts werestudied using the lowest GM value of 2.5 m in calm water, and with damage opening timesof 15 s and 30 s. In both conditions, the ship capsizes in calm water without mitigation. Thedamaged ship was further studied in beam seas with the GM value 3.4 m.
The mitigation effort consisted of flooding the compartments T042 (586 m3) and T099(357 m3) on the undamaged port side of the ship. In the first test case, the damage openingtime 15 s was used. The counter flooding in the compartments T042 and T099 was assumedto start when the ship heeling angle to the damaged side exceeds 5◦. In the numericalsimulation the relatively small openings to counter flooding compartments were openedinstantly in zero-time duration.

J. Mar. Sci. Eng. 2022, 10, 797 6 of 30
J. Mar. Sci. Eng. 2022, 10, x FOR PEER REVIEW 6 of 31
The mitigation effort consisted of flooding the compartments T042 (586 m3) and T099 (357 m3) on the undamaged port side of the ship. In the first test case, the damage opening time 15 s was used. The counter flooding in the compartments T042 and T099 was as-sumed to start when the ship heeling angle to the damaged side exceeds 5°. In the numer-ical simulation the relatively small openings to counter flooding compartments were opened instantly in zero-time duration.
Figure 5. Damage Case 2 with counter flooding: The grey rectangle shows the damage penetration. The damaged compartments are shown with dark blue-grey, and the compartments for counter flooding with light blue. The first water volume values are those in the numerical model, and the values in brackets are the values realized in the scale model used in the model tests.
In this case, a rapid counter flooding using an opening size of 1.5 m2 to sea for each counter flooding compartment is sufficient to prevent ship capsize, which succeeds, and the ship survives 1800 s easily. The development of the roll angle as a function of time together with the water volumes on the trailer deck and in the compartments are shown in Figure 6 for both cases, with and without counter flooding. The solid red curve shows the roll angle without counter flooding, and the dash-dotted one shows the roll angle with counter flooding. The bluish curves show the floodwater volumes due to the damage opening, and the two green ones due to counter flooding.
In the second test case, the damage opening time of 30 s was used. The counter flood-ing was assumed to start when the ship heeling angle exceeds 5° as before. As the damage opening time is somewhat longer, it is sufficient to use an opening size of 1.1 m2 for each counter flooding compartment, not only to prevent a rapid ship capsize, but also a later
Figure 5. Damage Case 2 with counter flooding: The grey rectangle shows the damage penetration.The damaged compartments are shown with dark blue-grey, and the compartments for counterflooding with light blue. The first water volume values are those in the numerical model, and thevalues in brackets are the values realized in the scale model used in the model tests.
In this case, a rapid counter flooding using an opening size of 1.5 m2 to sea for eachcounter flooding compartment is sufficient to prevent ship capsize, which succeeds, andthe ship survives 1800 s easily. The development of the roll angle as a function of timetogether with the water volumes on the trailer deck and in the compartments are shownin Figure 6 for both cases, with and without counter flooding. The solid red curve showsthe roll angle without counter flooding, and the dash-dotted one shows the roll angle withcounter flooding. The bluish curves show the floodwater volumes due to the damageopening, and the two green ones due to counter flooding.
In the second test case, the damage opening time of 30 s was used. The counterflooding was assumed to start when the ship heeling angle exceeds 5◦ as before. As thedamage opening time is somewhat longer, it is sufficient to use an opening size of 1.1 m2
for each counter flooding compartment, not only to prevent a rapid ship capsize, but alsoa later loss due to gradual flooding. The mitigation succeeds for both cases and the shipsurvives 1800 s easily, as shown in Figure 7.
The computations show that even with the low GM value of 2.5 m, the counter floodingprevents the rapid capsize of the ship. With the applied relatively short damage openingtimes, the compartments used for counter flooding need to be filled rapidly. This requiresduct opening sizes for counter flooding in these compartments of about 1.1 m2 to 1.5 m2.As further study of the water intake into these compartments is beyond the scope of the

J. Mar. Sci. Eng. 2022, 10, 797 7 of 30
present investigation, each of them was opened to sea at ship side 1.0 m in height fromthe compartment bottom, and 1.1–1.5 m in length for the studied cases, respectively. Thisleads to duct opening sizes of 1.1 m2 or 1.5 m2 for each counter flooding compartment. Thedamage case was further studied with the lowest ship GM 3.4 m on the limiting curve at aship draught of 6.3 m, with the damage opening time of 15 s, in beam seas with significantwave heights Hs (2.0), 2.5, 3.0, 3.5, and 4.0 m. The results are shown below in Table 2.
J. Mar. Sci. Eng. 2022, 10, x FOR PEER REVIEW 7 of 31
loss due to gradual flooding. The mitigation succeeds for both cases and the ship survives
1800 s easily, as shown in Figure 7.
Figure 6. Counter flooding with damage opening time 15 s: The roll angle (red) and water volumes
on trailer deck and in damaged compartments (bluish) and in those for counter flooding (green) are
shown. T‐VOL is the total volume of the floodwater in ship, and T001 is the water volume on the
trailer deck.
Figure 7. Counter flooding with damage opening time 30 s: The roll angle (red) and water volumes
on trailer deck and in damaged compartments (bluish) and in those for counter flooding (green) are
shown.
The computations show that even with the low GM value of 2.5 m, the counter flooding
prevents the rapid capsize of the ship. With the applied relatively short damage opening
times, the compartments used for counter flooding need to be filled rapidly. This requires
duct opening sizes for counter flooding in these compartments of about 1.1 m2 to 1.5 m2. As
further study of the water intake into these compartments is beyond the scope of the present
Figure 6. Counter flooding with damage opening time 15 s: The roll angle (red) and water volumeson trailer deck and in damaged compartments (bluish) and in those for counter flooding (green) areshown. T-VOL is the total volume of the floodwater in ship, and T001 is the water volume on thetrailer deck.
J. Mar. Sci. Eng. 2022, 10, x FOR PEER REVIEW 7 of 31
loss due to gradual flooding. The mitigation succeeds for both cases and the ship survives
1800 s easily, as shown in Figure 7.
Figure 6. Counter flooding with damage opening time 15 s: The roll angle (red) and water volumes
on trailer deck and in damaged compartments (bluish) and in those for counter flooding (green) are
shown. T‐VOL is the total volume of the floodwater in ship, and T001 is the water volume on the
trailer deck.
Figure 7. Counter flooding with damage opening time 30 s: The roll angle (red) and water volumes
on trailer deck and in damaged compartments (bluish) and in those for counter flooding (green) are
shown.
The computations show that even with the low GM value of 2.5 m, the counter flooding
prevents the rapid capsize of the ship. With the applied relatively short damage opening
times, the compartments used for counter flooding need to be filled rapidly. This requires
duct opening sizes for counter flooding in these compartments of about 1.1 m2 to 1.5 m2. As
further study of the water intake into these compartments is beyond the scope of the present
Figure 7. Counter flooding with damage opening time 30 s: The roll angle (red) and water volumeson trailer deck and in damaged compartments (bluish) and in those for counter flooding (green)are shown.

J. Mar. Sci. Eng. 2022, 10, 797 8 of 30
Table 2. Damage Case 2, with (red) and without (black) counter flooding in beam seas. The values inbrackets were not explicitly computed, as the result (survival) is clear.
DC2 with GM 3.4 m, DOT 15 s, Counter Flooding Start at 5◦, Heel—TTC Shown in [s],1800 = Survival. Duct Openings from Sea to CF Compartments = 2 × 1.5 m2, Tp = 10.0 s
HS [m] 2.0 2.0 2.5 2.5 3.0 3.0 3.5 3.5 4.0 4.0
Mitigation No Yes No Yes No Yes No Yes No Yes
1 1800 (1800) 1800 1800 496.3 1800 412.2 1800 145.9 528.7
2 1800 (1800) 1800 1800 230.3 1800 122.1 1800 92.1 249.9
3 1800 (1800) 1150 1800 410.1 1800 328.6 1800 203.9 431
4 1800 (1800) 459.8 1800 299.1 1800 116.6 1800 80 132.8
5 1800 (1800) 252.4 1800 67.5 192 58.2 70.2 50.3 54.2
6 1800 (1800) 466.5 1800 216.7 514.6 159.3 467.7 139.5 227.2
7 1800 (1800) 356.7 1800 312 1800 247.8 369 222.9 279.6
8 1800 (1800) 1800 1800 1800 1800 380.7 1800 245.4 1800
9 1800 (1800) 1800 1800 202.5 1800 120.2 964.3 114.7 155.2
10 1800 (1800) 1800 1800 228.4 1800 89.5 1800 71.5 109.6
Survival 10/10 (10/10) 5/10 10/10 1/10 8/10 0/10 6/10 0/10 1/10
Table 2 shows the computed times to capsize with and without counter flooding for10 irregular wave sequence realizations. The following observations can be made:
• At the low significant wave height HS 2.0 m, there is no acute need for counter floodingas the ship survives also without. However, if counter flooding is used, this results ina lower heeling angle, which would be beneficial for all rescue and disembarkationoperations on the ship;
• At significant wave heights HS 2.5, 3.0, and 3.5 m, the counter flooding results in asignificant improvement in the ship survivability. The corresponding survival ratesincrease from 50% (%) to 100%, 10% to 80%, and 0% to 60%, respectively;
• At significant wave height HS 4.0 m, the counter flooding slightly improves the time tocapsize, but in this higher sea state the ship is able to survive due to gradual floodingonly in 10% of the cases. Thus, the effect of flooding mitigation is small. The capsizemechanism in higher sea states is, as usual in RoPax ships, the further accumulationof water on the trailer deck, even if in this case the extent of the trailer deck is alreadylimited with transverse bulkheads;
• It is noteworthy that the mitigation in Damage Case 2 considerably improves theship survivability in a very large portion of the most common sea states, being veryeffective at the wave heights HS 2.5–3.5 m, the range of which covers a large portion ofthose sea states at which ship-to-ship collisions statistically tend to take place. Thus,the mitigation through counter flooding is effective in the relevant, most commonsea state range. A duct opening size for each counter flooding compartment of about1.1 m2 to 1.5 m2 is required.
4.4. Model Test Results on Damage Case 2 with and without Counter Flooding
In Damage Case 2 (DC2), the compartments T100 (max. volume 327 m3) and T141(708 m3) on the starboard side of the MT RoPax get damaged and are flooded, as illustratedin Figure 5. The damage and its opening extensions are identical to those in the numericalmodel. Due to technical reasons, the floodable compartment volumes in the ship model aresomewhat smaller than in the numerical model. It was necessary to use a higher GM valuein the model tests than in the preceding numerical computations.
Without mitigation, the ship with GM 3.018 m capsizes in calm water in about 65–85 swhen the damage opens in 30 s. With a damage opening time of 15 s, these capsize times
J. Mar. Sci. Eng. 2022, 10, 797 9 of 30
would be about 10 s shorter. With GM 3.48 m, the ship capsizes in beam seas with HS 3.5 min ca. 80% of the cases when the damage is opened in 15 s. With HS 5.0 m, the ship capsizesin ca. 100% of the cases when the damage is opened in 15 s.
In the experiments, no valve can open in zero-time duration and, in addition, the twocompartments were flooded through inflow pipes of considerable length (see Appendix A).The inertia of the water mass in these pipes delays the start of flooding in comparison withthe computations. For this reason, an earlier starting point for the counter flooding with1◦ roll angle was necessary. The inside diameter of the mentioned pipes was 49 mm in themodel tests, which leads to a 1.5 m2 cross-sectional area in f.sc. for the flow in the pipe,which is the same as in the numerical model.
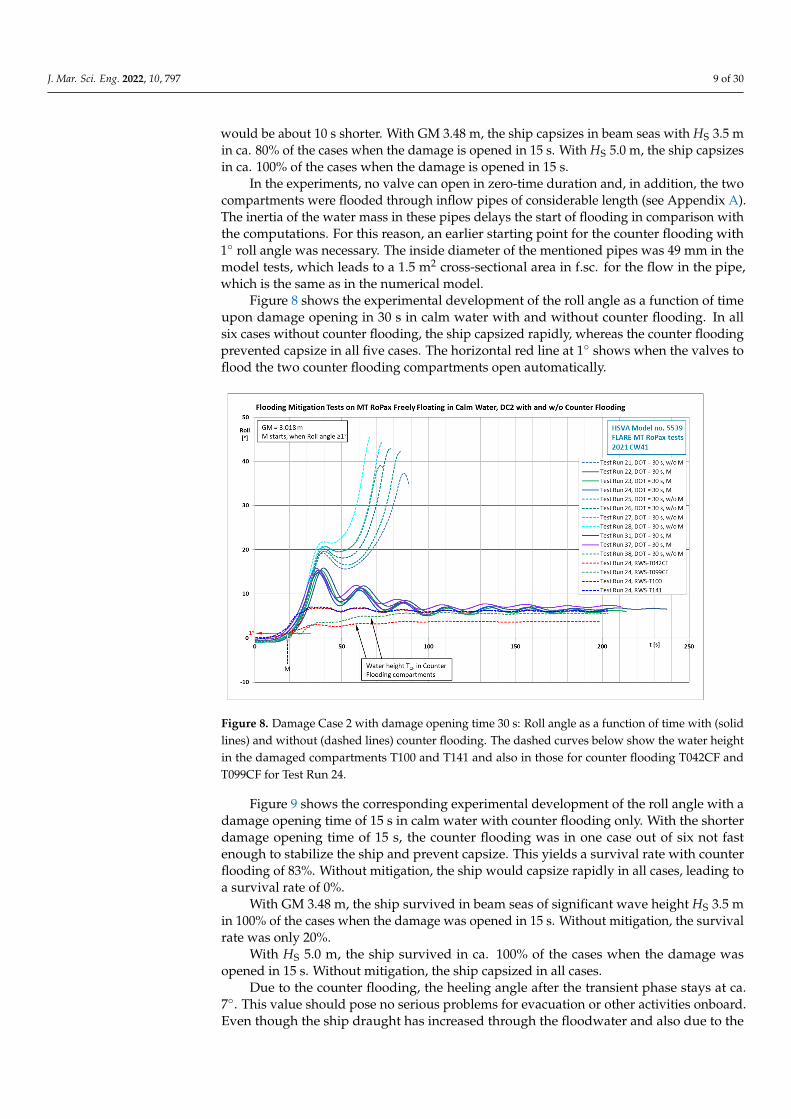
Figure 8 shows the experimental development of the roll angle as a function of timeupon damage opening in 30 s in calm water with and without counter flooding. In allsix cases without counter flooding, the ship capsized rapidly, whereas the counter floodingprevented capsize in all five cases. The horizontal red line at 1◦ shows when the valves toflood the two counter flooding compartments open automatically.
J. Mar. Sci. Eng. 2022, 10, x FOR PEER REVIEW 9 of 31
4.4. Model Test Results on Damage Case 2 with and without Counter Flooding
In Damage Case 2 (DC2), the compartments T100 (max. volume 327 m3) and T141
(708 m3) on the starboard side of the MT RoPax get damaged and are flooded, as illustrated
in Figure 5. The damage and its opening extensions are identical to those in the numerical
model. Due to technical reasons, the floodable compartment volumes in the ship model
are somewhat smaller than in the numerical model. It was necessary to use a higher GM
value in the model tests than in the preceding numerical computations.
Without mitigation, the ship with GM 3.018 m capsizes in calm water in about 65–85
s when the damage opens in 30 s. With a damage opening time of 15 s, these capsize times
would be about 10 s shorter. With GM 3.48 m, the ship capsizes in beam seas with HS 3.5
m in ca. 80% of the cases when the damage is opened in 15 s. With HS 5.0 m, the ship
capsizes in ca. 100% of the cases when the damage is opened in 15 s.
In the experiments, no valve can open in zero‐time duration and, in addition, the two
compartments were flooded through inflow pipes of considerable length (ee Appendix
A). The inertia of the water mass in these pipes delays the start of flooding in comparison
with the computations. For this reason, an earlier starting point for the counter flooding
with 1° roll angle was necessary. The inside diameter of the mentioned pipes was 49 mm
in the model tests, which leads to a 1.5 m2 cross‐sectional area in f.sc. for the flow in the
pipe, which is the same as in the numerical model.
Figure 8 shows the experimental development of the roll angle as a function of time
upon damage opening in 30 s in calm water with and without counter flooding. In all six
cases without counter flooding, the ship capsized rapidly, whereas the counter flooding
prevented capsize in all five cases. The horizontal red line at 1° shows when the valves to
flood the two counter flooding compartments open automatically.
Figure 8. Damage Case 2 with damage opening time 30 s: Roll angle as a function of time with (solid
lines) and without (dashed lines) counter flooding. The dashed curves below show the water height
in the damaged compartments T100 and T141 and also in those for counter flooding T042CF and
T099CF for Test Run 24.
Figure 9 shows the corresponding experimental development of the roll angle with a
damage opening time of 15 s in calm water with counter flooding only. With the shorter
damage opening time of 15 s, the counter flooding was in one case out of six not fast
enough to stabilize the ship and prevent capsize. This yields a survival rate with counter
Figure 8. Damage Case 2 with damage opening time 30 s: Roll angle as a function of time with (solidlines) and without (dashed lines) counter flooding. The dashed curves below show the water heightin the damaged compartments T100 and T141 and also in those for counter flooding T042CF andT099CF for Test Run 24.
Figure 9 shows the corresponding experimental development of the roll angle with adamage opening time of 15 s in calm water with counter flooding only. With the shorterdamage opening time of 15 s, the counter flooding was in one case out of six not fastenough to stabilize the ship and prevent capsize. This yields a survival rate with counterflooding of 83%. Without mitigation, the ship would capsize rapidly in all cases, leading toa survival rate of 0%.
With GM 3.48 m, the ship survived in beam seas of significant wave height HS 3.5 min 100% of the cases when the damage was opened in 15 s. Without mitigation, the survivalrate was only 20%.
With HS 5.0 m, the ship survived in ca. 100% of the cases when the damage wasopened in 15 s. Without mitigation, the ship capsized in all cases.
Due to the counter flooding, the heeling angle after the transient phase stays at ca.7◦. This value should pose no serious problems for evacuation or other activities onboard.Even though the ship draught has increased through the floodwater and also due to the

J. Mar. Sci. Eng. 2022, 10, 797 10 of 30
counter flooding, the reduction of the remaining heeling angle is more significant and theship has a good survivability in waves after the mitigation.
J. Mar. Sci. Eng. 2022, 10, x FOR PEER REVIEW 10 of 31
flooding of 83%. Without mitigation, the ship would capsize rapidly in all cases, leading
to a survival rate of 0%.
Figure 9. Damage Case 2 with damage opening time 15 s: Roll angle as a function of time with counter
flooding (solid lines). The dashed curves below show the water height in the damaged compartments
T100 and T141 and also in those for counter flooding T099CF and T042CF for Test Run 35.
With GM 3.48 m, the ship survived in beam seas of significant wave height HS 3.5 m
in 100% of the cases when the damage was opened in 15 s. Without mitigation, the sur‐
vival rate was only 20%.
With HS 5.0 m, the ship survived in ca. 100% of the cases when the damage was
opened in 15 s. Without mitigation, the ship capsized in all cases.
Due to the counter flooding, the heeling angle after the transient phase stays at ca. 7°.
This value should pose no serious problems for evacuation or other activities onboard.
Even though the ship draught has increased through the floodwater and also due to the
counter flooding, the reduction of the remaining heeling angle is more significant and the
ship has a good survivability in waves after the mitigation.
With the applied relatively short damage opening times of 15 s and 30 s, the com‐
partments used for counter flooding need to be filled rapidly. Based on preliminary nu‐
merical simulations, a duct opening size for counter flooding in these compartments of
1.5 m2 was used in the model tests. The longer than anticipated inflow pipes in the ship
model somewhat delayed the inflow and for this reason an earlier counter flooding start
in the experiments needed to be used. In a real ship in full scale, the ducts can, due to
constructional reasons, be shorter, thus allowing a faster initial flow rate and thus a later
counter flooding start. Altogether, the counter flooding is in the studied case a very suc‐
cessful flooding mitigation method, as shown by the experimental model test results.
4.5. Numerical Hindcast of the Flooding Mitigation with Counter Flooding
The a priori numerical simulations were used to define the parameters for the model
tests. As some technical details in the physical ship scale model deviated from those in the
preceding simulations, a hindcast with a more accurate and improved numerical simula‐
tion was carried out. The compartment volumes and inflow duct lengths were accurately
set to those in the physical model and improved numerical modeling was used: a dynamic
orifice equation was used for compartment inflow instead of the steady‐state Bernoulli
Figure 9. Damage Case 2 with damage opening time 15 s: Roll angle as a function of time withcounter flooding (solid lines). The dashed curves below show the water height in the damagedcompartments T100 and T141 and also in those for counter flooding T099CF and T042CF for TestRun 35.
With the applied relatively short damage opening times of 15 s and 30 s, the compart-ments used for counter flooding need to be filled rapidly. Based on preliminary numericalsimulations, a duct opening size for counter flooding in these compartments of 1.5 m2
was used in the model tests. The longer than anticipated inflow pipes in the ship modelsomewhat delayed the inflow and for this reason an earlier counter flooding start in theexperiments needed to be used. In a real ship in full scale, the ducts can, due to construc-tional reasons, be shorter, thus allowing a faster initial flow rate and thus a later counterflooding start. Altogether, the counter flooding is in the studied case a very successfulflooding mitigation method, as shown by the experimental model test results.
4.5. Numerical Hindcast of the Flooding Mitigation with Counter Flooding
The a priori numerical simulations were used to define the parameters for the modeltests. As some technical details in the physical ship scale model deviated from those in thepreceding simulations, a hindcast with a more accurate and improved numerical simulationwas carried out. The compartment volumes and inflow duct lengths were accurately setto those in the physical model and improved numerical modeling was used: a dynamicorifice equation was used for compartment inflow instead of the steady-state Bernoullimodel [9]. This was particularly important for the counter flooding compartments with thelong inflow ducts. The transient flow into the large open compartment T141 was modeledwith shallow-water-equations instead of the usual pendulum model. These measuresimproved the accuracy of the numerical modeling. However, some differences between thenumerical simulations and model tests results remain. Figure 10 illustrates the situation.In general, such remaining differences are mainly due to shortcomings in the numericalmodeling and much less due to scale effects in the model tests.

J. Mar. Sci. Eng. 2022, 10, 797 11 of 30
J. Mar. Sci. Eng. 2022, 10, x FOR PEER REVIEW 11 of 31
model [9]. This was particularly important for the counter flooding compartments with
the long inflow ducts. The transient flow into the large open compartment T141 was mod‐
eled with shallow‐water‐equations instead of the usual pendulum model. These measures
improved the accuracy of the numerical modeling. However, some differences between
the numerical simulations and model tests results remain. Figure 10 illustrates the situa‐
tion. In general, such remaining differences are mainly due to shortcomings in the numer‐
ical modeling and much less due to scale effects in the model tests.
The correlation between the model test results and the numerical simulation in Figure
10 is altogether very satisfactory. As seen in the pronounced oscillations in all experimental
curves, there are more water dynamics present in the experiments than in the numerical
results. However, the experimental and numerical results were achieved with slightly dif‐
ferent GM values. The in inclination tests measured GM values are reliable when measured,
but in the course of several mitigation tests, some rest water may accumulate in the ship
model hull, having a reducing effect on the actual GM of the vessel. Thus, the given experi‐
mental GM values may be slightly too high to be used directly in computations.
Figure 10. Damage Case 2 with damage opening time 30 s: Roll angle as a function of time with
(solid lines) and without (dashed lines) counter flooding in model tests. The red solid line shows
the numerical hindcast without mitigation, the dashed red line with mitigation.
4.6. Conclusions on Damage Case 2
The mitigation computations on Damage Case 2 show that the counter flooding in
calm water and in lower‐to‐middle sea states can prevent the ship from capsizing,
and can thus have a significant effect on the potential loss of life (PLL);
In higher sea states in beam seas, the counter flooding prevents the ship from rapid
capsize, but the ship with the damaged and counter flooding compartments being all
flooded has a reduced survivability. Thus, when the significant wave height in‐
creases to HS 4.0 m, the ship with GM 3.4 m starts, according to simulations, to cap‐
size. However, even in these cases, capsize is delayed, allowing more passengers and
crew to disembark the ship, reducing the potential loss of life (PLL). According to the
model tests, the damaged ship with intact GM 3.48 m still survives HS 5.0 m in 100%
of the cases with mitigation;
The counter flooding has the significant advantage that few best suitable compart‐
ments on each side of the ship can be prepared for this. Their ship stabilizing effect
Figure 10. Damage Case 2 with damage opening time 30 s: Roll angle as a function of time with(solid lines) and without (dashed lines) counter flooding in model tests. The red solid line shows thenumerical hindcast without mitigation, the dashed red line with mitigation.
The correlation between the model test results and the numerical simulation inFigure 10 is altogether very satisfactory. As seen in the pronounced oscillations in allexperimental curves, there are more water dynamics present in the experiments than in thenumerical results. However, the experimental and numerical results were achieved withslightly different GM values. The in inclination tests measured GM values are reliable whenmeasured, but in the course of several mitigation tests, some rest water may accumulate inthe ship model hull, having a reducing effect on the actual GM of the vessel. Thus, the givenexperimental GM values may be slightly too high to be used directly in computations.
4.6. Conclusions on Damage Case 2
• The mitigation computations on Damage Case 2 show that the counter flooding incalm water and in lower-to-middle sea states can prevent the ship from capsizing, andcan thus have a significant effect on the potential loss of life (PLL);
• In higher sea states in beam seas, the counter flooding prevents the ship from rapidcapsize, but the ship with the damaged and counter flooding compartments being allflooded has a reduced survivability. Thus, when the significant wave height increasesto HS 4.0 m, the ship with GM 3.4 m starts, according to simulations, to capsize.However, even in these cases, capsize is delayed, allowing more passengers and crewto disembark the ship, reducing the potential loss of life (PLL). According to the modeltests, the damaged ship with intact GM 3.48 m still survives HS 5.0 m in 100% of thecases with mitigation;
• The counter flooding has the significant advantage that few best suitable compartmentson each side of the ship can be prepared for this. Their ship stabilizing effect canbe applied to a large variety of damage cases on the opposite side of the ship. Inthe particular case of the MT RoPax, it is not difficult to find two to four suitablecompartments, for example void spaces, on each ship side for this purpose;
• The present numerical modeling techniques available are sufficient for quite-accuratenumerical modeling of ship behavior with counter flooding when attention is paid tothe dynamic character of the flooding phenomena.

J. Mar. Sci. Eng. 2022, 10, 797 12 of 30
4.7. Numerical Simulation of Damage Case 4 with and without Recovery of Lost Buoyancy
In Damage Case 4 (MSRC DMC0385; DC4), the trailer deck T001, and the compart-ments below T043 (max. volume 586 m3), T045 (714 m3), T046 (776 m3), T083 (303 m3),and T098 (262 m3) on the starboard side get damaged and are flooded (see Figure 11). Thedamage opening size is about 8.19 m in length and extends 4.01 m below the still waterlevel at the ship draught of 6.3 m. Without mitigation, the ship capsizes with a GM valueof 2.3 m in about 150 s when the damage opens in 15 s. This is near the limit of capsizingor surviving, as the vessel survives with GM 2.4 m. With the original design GM 3.40 m,the ship does not capsize in calm water or beam seas with a damage opening time of 15 suntil the significant wave HS 5.0 m is reached. Thus, the mitigation efforts in calm waterwere studied using the lowest GM value 2.3 m and damage opening time 15 s, in whichconditions the ship capsizes without mitigation.
J. Mar. Sci. Eng. 2022, 10, x FOR PEER REVIEW 12 of 31
can be applied to a large variety of damage cases on the opposite side of the ship. In the particular case of the MT RoPax, it is not difficult to find two to four suitable compartments, for example void spaces, on each ship side for this purpose;
• The present numerical modeling techniques available are sufficient for quite-accurate numerical modeling of ship behavior with counter flooding when attention is paid to the dynamic character of the flooding phenomena.
4.7. Numerical Simulation of Damage Case 4 with and without Recovery of Lost Buoyancy In Damage Case 4 (MSRC DMC0385; DC4), the trailer deck T001, and the compart-
ments below T043 (max. volume 586 m3), T045 (714 m3), T046 (776 m3), T083 (303 m3), and T098 (262 m3) on the starboard side get damaged and are flooded (see Figure 11). The damage opening size is about 8.19 m in length and extends 4.01 m below the still water level at the ship draught of 6.3 m. Without mitigation, the ship capsizes with a GM value of 2.3 m in about 150 s when the damage opens in 15 s. This is near the limit of capsizing or surviving, as the vessel survives with GM 2.4 m. With the original design GM 3.40 m, the ship does not capsize in calm water or beam seas with a damage opening time of 15 s until the significant wave HS 5.0 m is reached. Thus, the mitigation efforts in calm water were studied using the lowest GM value 2.3 m and damage opening time 15 s, in which conditions the ship capsizes without mitigation.
Figure 11. Damage Case 4 with recovery of lost buoyancy: The grey rectangle shows the damage penetration. The damaged compartments T001, T043, T046, T083, T098, and T045 are shown with dark blue-grey or yellow, the T045 with yellow being the compartment for recovery of lost buoyancy through floodwater displacement. The first water volume values are those in the numerical model, the values in brackets are the values realized in the scale model used in the model tests.
Figure 11. Damage Case 4 with recovery of lost buoyancy: The grey rectangle shows the damagepenetration. The damaged compartments T001, T043, T046, T083, T098, and T045 are shown withdark blue-grey or yellow, the T045 with yellow being the compartment for recovery of lost buoyancythrough floodwater displacement. The first water volume values are those in the numerical model,the values in brackets are the values realized in the scale model used in the model tests.
The mitigation effort consisted of displacing floodwater in the compartment T045 onthe damaged starboard side of the ship, or in other words, recovering lost buoyancy in it(see the yellow compartment in Figure 11). As in the previous damage case, the damageopening time 15 s was used.
In the numerical simulations, the floodwater in the compartment T045 (714 m3) wasdisplaced by linearly reducing the permeability in the compartment to model the fillingof the compartment with a substance (e.g., foam) having a specific density of 50 kg/m3.

J. Mar. Sci. Eng. 2022, 10, 797 13 of 30
The floodwater in the compartment was displaced starting 60 s after the end of the damageopening—75 s from the start of the damage opening—and ending after 180 s—255 s afterthe start of the damage opening.
The mitigation is sufficient to prevent capsize and the ship survives 1800 s easily, asshown in Figure 12. The solid curves show the case without mitigation, the dashed oneswith. The damage case was further studied with the lowest ship GM value 3.4 m on thelimiting curve at the ship draught of 6.3 m, with the damage opening time 15 s, in beamseas with significant wave heights HS (2.0), 5.0, 5.5, 6.0, and 7.0 m. The results are shownin Table 3.
J. Mar. Sci. Eng. 2022, 10, x FOR PEER REVIEW 13 of 31
through floodwater displacement. The first water volume values are those in the numerical model,
the values in brackets are the values realized in the scale model used in the model tests.
The mitigation effort consisted of displacing floodwater in the compartment T045 on
the damaged starboard side of the ship, or in other words, recovering lost buoyancy in it
(see the yellow compartment in Figure 11). As in the previous damage case, the damage
opening time 15 s was used.
In the numerical simulations, the floodwater in the compartment T045 (714 m3) was
displaced by linearly reducing the permeability in the compartment to model the filling
of the compartment with a substance (e.g., foam) having a specific density of 50 kg/m3.
The floodwater in the compartment was displaced starting 60 s after the end of the dam‐
age opening—75 s from the start of the damage opening—and ending after 180 s—255 s
after the start of the damage opening.
The mitigation is sufficient to prevent capsize and the ship survives 1800 s easily, as
shown in Figure 12. The solid curves show the case without mitigation, the dashed ones
with. The damage case was further studied with the lowest ship GM value 3.4 m on the
limiting curve at the ship draught of 6.3 m, with the damage opening time 15 s, in beam
seas with significant wave heights HS (2.0), 5.0, 5.5, 6.0, and 7.0 m. The results are shown
in Table 3.
Figure 12. Recovery of lost buoyancy with damage opening time 15 s: The roll angle (red) and water
volumes on trailer deck (blue) and in damaged compartments (bluish, reddish, deep yellow) and in
the compartment T045 (pink solid/dash‐dotted curves) chosen for floodwater displacement. T‐VOL
is the total volume of the flood water in ship, T001 the water volume on the trailer deck.
Figure 12. Recovery of lost buoyancy with damage opening time 15 s: The roll angle (red) and watervolumes on trailer deck (blue) and in damaged compartments (bluish, reddish, deep yellow) and inthe compartment T045 (pink solid/dash-dotted curves) chosen for floodwater displacement. T-VOLis the total volume of the flood water in ship, T001 the water volume on the trailer deck.
The table shows the computed times to capsize with and without the recovery of lostbuoyancy in the flooded compartment T045 for 10 irregular wave sequence realizations.
The following observations can be made:
• At low significant wave heights HS 2.0–4.5 m there is no acute need for recovering thelost buoyancy in compartment T045, as the ship survives also without. However, ifthe mitigation method is used, this results in a lower heeling angle, which would bebeneficial for all rescue and disembarkation operations on the ship;
• At significant wave heights HS 5.0, 5.5 m, and 6.0 m, recovering the lost buoyancyresults in a clear and significant improvement of the ship survivability. The correspond-ing survival rates increase from 80% to 100%, 40% to 80%, and 10% to 70%, respectively;
• At significant wave height HS 7.0 m, recovering the lost buoyancy in compartmentT045 does not improve the time to capsize, as in this higher sea state the ship is notable to survive the gradual flooding. Thus, the effect of mitigation is practically non-existent. The capsize mechanism in higher sea states is, as usual in RoPax ships, thefurther accumulation of water on the trailer deck, even if the extent of the trailer deckis already limited, as shown in Figure 11;
• The mitigation in Damage Case 4 with the recovery of the lost buoyancy in com-partment T045 considerably improves the ship survivability in a large portion of theprevailing sea states, being very effective at the wave heights HS 5.0–6.0 m, the rangeof which covers a portion of the prevailing sea states. In Damage Case 4, the shipsurvives well in lower beam sea states without mitigation. If the damage were larger,the effective range of mitigation would be located at lower, more frequent sea states.

J. Mar. Sci. Eng. 2022, 10, 797 14 of 30
The mitigation through the recovery of lost buoyancy in a damaged compartment is asuitable method for this;
• In its simplest form, the recovery of lost buoyancy in a damaged compartment reducesthe heeling angle of the ship and thus in most cases also the water ingress on the trailerdeck, which is crucial for RoPax ship survival. The reducing effect of the mitigationon ship draught is likely to be less important.
Table 3. Damage Case 4, with (red) and without (black) recovering the lost buoyancy in compartmentT045, in beam seas. The values in brackets were not explicitly computed, as the result (survival)is clear.
DC4 with GM 3.4 m, DOT 15 s, RLB: Displacement of Floodwater in T045 Starts at 75 s,Ends at 255 s, —TTC Shown in [s], 1800 = Survival, Tp = 10.0 s
HS [m] 2.0 2.0 5.0 5.0 5.5 5.5 6.0 6.0 7.0 7.0
Mitigation No Yes No Yes No Yes No Yes No Yes
1 1800 (1800) 1800 1800 1132.6 1800 843.0 1800 430.8 492.9
2 1800 (1800) 1800 1800 1800 1800 636.8 1800 468.6 190.0
3 1800 (1800) 1800 1800 706.3 1800 707.2 1800 418.8 387.8
4 1800 (1800) 1800 1800 1800 1800 495.6 1800 218.1 249.9
5 1800 (1800) 1800 1800 1800 1800 1800 1800 349.7 155.9
6 1800 (1800) 611.2 1800 426.4 548.5 303.6 493.1 178.1 179.4
7 1800 (1800) 1187.7 1800 348.7 349.1 347.9 332.1 336.6 280.1
8 1800 (1800) 1800 1800 1800 1800 814.2 1800 641.3 687.5
9 1800 (1800) 1800 1800 890.9 1800 300.0 223.3 184.9 170.1
10 1800 (1800) 1800 1800 841.5 1800 842.0 1800 215.2 100.7
Survival 10/10 (10/10) 8/10 10/10 4/10 8/10 1/10 7/10 0/10 0/10
4.8. Model Test Results on Damage Case 4 with and without Recovery of Lost Buoyancy
In Damage Case 4, the trailer deck T001, and the compartments below T043 (max.volume 515 m3), T045 (793 m3), T046 (735 m3), T083 (383 m3), and T098 (207 m3) on thestarboard side get damaged and are flooded (see Figure 11). The damage and its openingextensions are identical to those in the numerical model. Due to model construction, thefloodable compartment volumes in the ship model show some deviations from those in thenumerical model. It was also necessary to use a higher GM value in the model tests than inthe preceding numerical computations: without mitigation, the ship capsizes with a GMvalue of 3.71 m in about 150–180 s, when the damage opens in 15 s. Thus, the mitigationefforts in calm water were studied using this GM value.
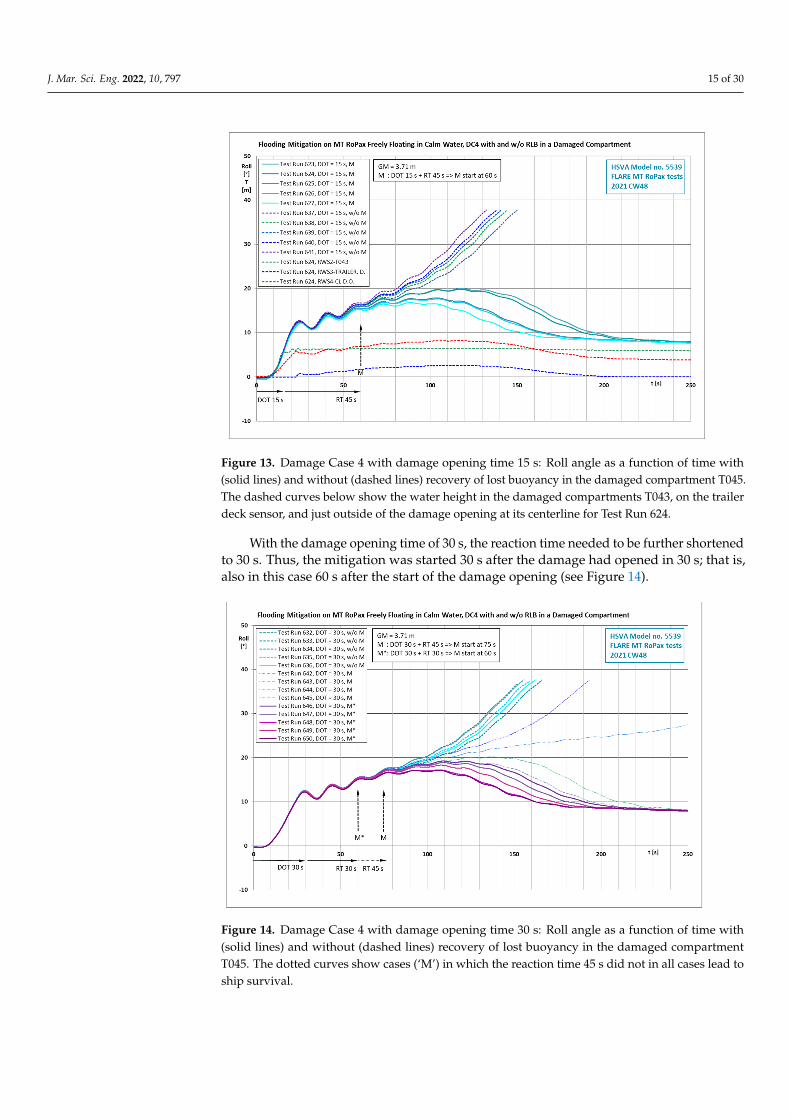
The mitigation effort consisted of displacing floodwater in the compartment T045(void space) on the damaged starboard side of the ship (see the yellow compartment inFigure 11). As in the previous case, the damage opening time 15 s was used. In the a priorinumerical simulations, the floodwater in the compartment T045 (714 m3 in the numericalmodel) was displaced by linearly reducing the permeability in the compartment. Fortechnical reasons in the model tests, it was possible to displace the f.sc. floodwater volumeof only 483 m3 out of the total compartment volume of 793 m3 of the compartment T045.For this reason, the reaction time (RT) to start the mitigation (M) in 60 s based on the apriori simulations could not be used, but a shorter reaction time of 45 s needed to be used.Thus, the mitigation was started 45 s after the damage opening in 15 s was completed; thatis, 60 s after the start of the damage opening. The set-point filling time of the inflatablecontainer with pressurized air was kept unchanged at 180 s, but the effective duration ofthe floodwater displacement in the model tests turned out to be much shorter, ca. 70 s. Thisvalue is based on video analysis after the tests (see Figure 13).
J. Mar. Sci. Eng. 2022, 10, 797 15 of 30
J. Mar. Sci. Eng. 2022, 10, x FOR PEER REVIEW 15 of 31
starboard side get damaged and are flooded (see Figure 11). The damage and its opening
extensions are identical to those in the numerical model. Due to model construction, the
floodable compartment volumes in the ship model show some deviations from those in
the numerical model. It was also necessary to use a higher GM value in the model tests
than in the preceding numerical computations: without mitigation, the ship capsizes with
a GM value of 3.71 m in about 150–180 s, when the damage opens in 15 s. Thus, the miti‐
gation efforts in calm water were studied using this GM value.
The mitigation effort consisted of displacing floodwater in the compartment T045
(void space) on the damaged starboard side of the ship (see the yellow compartment in
Figure 11). As in the previous case, the damage opening time 15 s was used. In the a priori
numerical simulations, the floodwater in the compartment T045 (714 m3 in the numerical
model) was displaced by linearly reducing the permeability in the compartment. For tech‐
nical reasons in the model tests, it was possible to displace the f.sc. floodwater volume of
only 483 m3 out of the total compartment volume of 793 m3 of the compartment T045. For
this reason, the reaction time (RT) to start the mitigation (M) in 60 s based on the a priori
simulations could not be used, but a shorter reaction time of 45 s needed to be used. Thus,
the mitigation was started 45 s after the damage opening in 15 s was completed; that is, 60
s after the start of the damage opening. The set‐point filling time of the inflatable container
with pressurized air was kept unchanged at 180 s, but the effective duration of the flood‐
water displacement in the model tests turned out to be much shorter, ca. 70 s. This value
is based on video analysis after the tests (see Figure 13).
Figure 13. Damage Case 4 with damage opening time 15 s: Roll angle as a function of time with
(solid lines) and without (dashed lines) recovery of lost buoyancy in the damaged compartment
T045. The dashed curves below show the water height in the damaged compartments T043, on the
trailer deck sensor, and just outside of the damage opening at its centerline for Test Run 624.
With the damage opening time of 30 s, the reaction time needed to be further short‐
ened to 30 s. Thus, the mitigation was started 30 s after the damage had opened in 30 s;
that is, also in this case 60 s after the start of the damage opening (see Figure 14).
Figure 13. Damage Case 4 with damage opening time 15 s: Roll angle as a function of time with(solid lines) and without (dashed lines) recovery of lost buoyancy in the damaged compartment T045.The dashed curves below show the water height in the damaged compartments T043, on the trailerdeck sensor, and just outside of the damage opening at its centerline for Test Run 624.
With the damage opening time of 30 s, the reaction time needed to be further shortenedto 30 s. Thus, the mitigation was started 30 s after the damage had opened in 30 s; that is,also in this case 60 s after the start of the damage opening (see Figure 14).
J. Mar. Sci. Eng. 2022, 10, x FOR PEER REVIEW 16 of 31
Figure 14. Damage Case 4 with damage opening time 30 s: Roll angle as a function of time with
(solid lines) and without (dashed lines) recovery of lost buoyancy in the damaged compartment
T045. The dotted curves show cases (‘M’) in which the reaction time 45 s did not in all cases lead to
ship survival.
The ship with GM 3.71 m survived in calm water in all test cases with both damage
opening times 15 s and 30 s; that is, 100% of the cases. Without mitigation, the ship cap‐
sized rapidly in all cases.
With GM 3.81 m, the ship survived with flooding mitigation in beam seas with HS 2.5
m in 100% of the cases when the damage was opened in 15 s, with the mitigation reaction
time being 45 s. Without mitigation, the ship capsized in all cases. With the significant
wave height HS 4.0 m, the ship survived with flooding mitigation in 80% of the cases.
Without mitigation, it capsized in all cases.
4.9. Numerical Hindcast of the Flooding Mitigation with Recovery of Lost Buoyancy
The a priori numerical simulations were used to define the parameters for the model
tests. Additionally, in this case, a hindcast with a more accurate and improved numerical
simulation was carried out. The compartment volumes, as in the physical ship model, and
the actual starting time and achieved duration of the filling of the inflatable container with
pressurized air to displace floodwater, were used in the hindcast. This considerably im‐
proved the accuracy of the numerical hindcast. The use of the dynamic orifice equation
instead of Bernoulli’s equation for the inflow was not relevant in this case. All compart‐
ments below the trailer deck were modeled with the pendulum model, which is suitable
for simple modeling of the complicated compartment geometries at hand. As seen in the
oscillations in all experimental curves in Figure 15, there are more water dynamics present
in the experiments than in the smoother numerical results. Altogether, the correlation be‐
tween the model test results and the numerical simulation in Figure 15 is very satisfactory.
However, the experimental and numerical results were achieved with different GM val‐
ues. The difference is too large to be explained with the small inaccuracies in GM during
the course of several individual model test runs. The difference in the model tests and the
hindcast is more attributable to the limited ability of the numerical model to account for
the rapid flooding of very complicated compartments in the damage area. Due to the com‐
plicated shapes of the compartments, modeling with shallow‐water‐equations was not
possible, but a simple pendulum model needed to be used, which does not always provide
sufficient modeling in very dynamic cases.
Figure 14. Damage Case 4 with damage opening time 30 s: Roll angle as a function of time with(solid lines) and without (dashed lines) recovery of lost buoyancy in the damaged compartmentT045. The dotted curves show cases (‘M’) in which the reaction time 45 s did not in all cases lead toship survival.

J. Mar. Sci. Eng. 2022, 10, 797 16 of 30
The ship with GM 3.71 m survived in calm water in all test cases with both damageopening times 15 s and 30 s; that is, 100% of the cases. Without mitigation, the ship capsizedrapidly in all cases.
With GM 3.81 m, the ship survived with flooding mitigation in beam seas with HS2.5 m in 100% of the cases when the damage was opened in 15 s, with the mitigation reactiontime being 45 s. Without mitigation, the ship capsized in all cases. With the significant waveheight HS 4.0 m, the ship survived with flooding mitigation in 80% of the cases. Withoutmitigation, it capsized in all cases.
4.9. Numerical Hindcast of the Flooding Mitigation with Recovery of Lost Buoyancy
The a priori numerical simulations were used to define the parameters for the modeltests. Additionally, in this case, a hindcast with a more accurate and improved numericalsimulation was carried out. The compartment volumes, as in the physical ship model,and the actual starting time and achieved duration of the filling of the inflatable containerwith pressurized air to displace floodwater, were used in the hindcast. This considerablyimproved the accuracy of the numerical hindcast. The use of the dynamic orifice equationinstead of Bernoulli’s equation for the inflow was not relevant in this case. All compart-ments below the trailer deck were modeled with the pendulum model, which is suitablefor simple modeling of the complicated compartment geometries at hand. As seen in theoscillations in all experimental curves in Figure 15, there are more water dynamics presentin the experiments than in the smoother numerical results. Altogether, the correlationbetween the model test results and the numerical simulation in Figure 15 is very satisfac-tory. However, the experimental and numerical results were achieved with different GMvalues. The difference is too large to be explained with the small inaccuracies in GM duringthe course of several individual model test runs. The difference in the model tests andthe hindcast is more attributable to the limited ability of the numerical model to accountfor the rapid flooding of very complicated compartments in the damage area. Due to thecomplicated shapes of the compartments, modeling with shallow-water-equations was notpossible, but a simple pendulum model needed to be used, which does not always providesufficient modeling in very dynamic cases.
J. Mar. Sci. Eng. 2022, 10, x FOR PEER REVIEW 17 of 31
Figure 15. Damage Case 4 with damage opening time 15 s: Roll angle as a function of time with
(solid lines) and without (dashed lines) recovery of lost buoyancy in the damaged compartment
T045. The red solid line shows the numerical hindcast without mitigation, the dashed red line the
hindcast with mitigation.
4.10. Conclusions on Damage Case 4 with and without Recovery of Lost Buoyancy
The flooding mitigation with the recovery of lost buoyancy in a damaged compartment
is sufficient to prevent capsize and the ship survives 1800 s easily in the studied cases;
In its simplest form, recovering lost buoyancy in a damaged compartment reduces
the heeling angle of the ship and thus in most cases also water ingress on the trailer
deck, which is crucial for RoPax ship survival. The reducing effect of the mitigation
on the draught is likely to be less important;
The righting lever provided by the recovery of the lost buoyancy in a damaged com‐
partment is an important factor for the effectiveness of the mitigation. This depends
on the compartment volume and the distance of its center of volume to the centerline
of the ship;
Recovering lost buoyancy in the damaged compartments in principle implies the
preparation of each compartment that can get damaged for this. At least preparation
of the largest compartments far away from the centerline is necessary;
The idea to displace flood water in a damaged compartment with a lighter substance,
e.g., expandable foam, will always leave some questions open with respect to the
functionality of such a mitigation system in a compartment possibly already heavily
damaged by a collision or grounding;
On one hand, the flooding mitigation with the recovery of lost buoyancy is more diffi‐
cult to arrange than counter flooding. On the other hand, some of the buoyancy lost in
the damaged compartment is recovered, which improves the ship survivability;
As the recovery system of the lost buoyancy in a damaged compartment system
should be available at any arbitrary compartment that can get damaged, it is difficult
to consider that the system could be deployed very rapidly. In this study, the reaction
times needed to be shortened from those originally planned to yield positive results.
During the chosen mitigation time of 180 s between ca. 500 m3 and 793 m3, floodwater
needed to displaced out of the damaged compartment. This is a formidable task.
Figure 15. Damage Case 4 with damage opening time 15 s: Roll angle as a function of time with(solid lines) and without (dashed lines) recovery of lost buoyancy in the damaged compartment T045.The red solid line shows the numerical hindcast without mitigation, the dashed red line the hindcastwith mitigation.

J. Mar. Sci. Eng. 2022, 10, 797 17 of 30
4.10. Conclusions on Damage Case 4 with and without Recovery of Lost Buoyancy
• The flooding mitigation with the recovery of lost buoyancy in a damaged compartmentis sufficient to prevent capsize and the ship survives 1800 s easily in the studied cases;
• In its simplest form, recovering lost buoyancy in a damaged compartment reduces theheeling angle of the ship and thus in most cases also water ingress on the trailer deck,which is crucial for RoPax ship survival. The reducing effect of the mitigation on thedraught is likely to be less important;
• The righting lever provided by the recovery of the lost buoyancy in a damagedcompartment is an important factor for the effectiveness of the mitigation. Thisdepends on the compartment volume and the distance of its center of volume to thecenterline of the ship;
• Recovering lost buoyancy in the damaged compartments in principle implies thepreparation of each compartment that can get damaged for this. At least preparationof the largest compartments far away from the centerline is necessary;
• The idea to displace flood water in a damaged compartment with a lighter substance,e.g., expandable foam, will always leave some questions open with respect to thefunctionality of such a mitigation system in a compartment possibly already heavilydamaged by a collision or grounding;
• On one hand, the flooding mitigation with the recovery of lost buoyancy is moredifficult to arrange than counter flooding. On the other hand, some of the buoyancylost in the damaged compartment is recovered, which improves the ship survivability;
• As the recovery system of the lost buoyancy in a damaged compartment systemshould be available at any arbitrary compartment that can get damaged, it is difficultto consider that the system could be deployed very rapidly. In this study, the reactiontimes needed to be shortened from those originally planned to yield positive results.During the chosen mitigation time of 180 s between ca. 500 m3 and 793 m3, floodwaterneeded to displaced out of the damaged compartment. This is a formidable task.
4.11. Numerical Simulation of Damage Case 4 with and without Deployment of a WatertightBarrier on the Trailer Deck
A further test of a mitigation effort with a deployable watertight barrier (WTB) againstfloodwater spreading on the trailer deck of the MT RoPax was modeled in the numericalsimulation by blocking the flow in the longitudinal direction on the trailer deck at thebuilding frame # 81, 64.8 m in front of the AP (see Figure 16). The barrier is deployed witha delay of 30 s, describing the deployment time needed to lower the curtain barrier in aship. This time is based on the descending times of several rolling gates presently in useand is suitable for a truck passage underneath. After this time, the barrier is assumed tobe watertight in the low water heights on the trailer deck, even if some further filling orreinforcement of the barrier would still be going on. The barrier deployment starts as soonas the water depth of 0.07 m is reached at a chosen location along the outer starboard-sideedge of the trailer deck between the barrier and the damage location. In the numericalsimulation, this takes place as soon as the water height in the chosen corresponding gridcell of the numerical grid for the shallow-water-equations exceeds this threshold value.
The modeled release/trigger system for lowering the curtain barrier works properlyand the system is able to prevent the ship capsize in the simulation, as illustrated inFigure 17. The curtain barrier limits the horizontal floodwater extent and thus also itsvolume on the trailer deck. The flooding of the other damaged compartments is notmitigated. Therefore, the mitigation does not recover anything. This results in a significantremaining heeling angle, which can slow down any evacuation effort on the damaged ship,would such an effort become necessary. As with the case of recovery of lost buoyancy, themitigation efforts in calm water were simulated using the GM value 2.3 m, and a damageopening time of 15 s, in which conditions the ship capsizes without mitigation.

J. Mar. Sci. Eng. 2022, 10, 797 18 of 30
J. Mar. Sci. Eng. 2022, 10, x FOR PEER REVIEW 18 of 31
4.11. Numerical Simulation of Damage Case 4 with and without Deployment of a Watertight Barrier on the Trailer Deck
A further test of a mitigation effort with a deployable watertight barrier (WTB) against floodwater spreading on the trailer deck of the MT RoPax was modeled in the numerical simulation by blocking the flow in the longitudinal direction on the trailer deck at the building frame # 81, 64.8 m in front of the AP (see Figure 16). The barrier is deployed with a delay of 30 s, describing the deployment time needed to lower the curtain barrier in a ship. This time is based on the descending times of several rolling gates presently in use and is suitable for a truck passage underneath. After this time, the barrier is assumed to be watertight in the low water heights on the trailer deck, even if some further filling or reinforcement of the barrier would still be going on. The barrier deployment starts as soon as the water depth of 0.07 m is reached at a chosen location along the outer starboard-side edge of the trailer deck between the barrier and the damage location. In the numerical simulation, this takes place as soon as the water height in the chosen corresponding grid cell of the numerical grid for the shallow-water-equations exceeds this threshold value.
Figure 16. Damage Case 4 with watertight barrier on the trailer deck: The grey rectangle shows the damage penetration. The damaged compartments T001, T043, T045, T046, T083, and T098 are shown with dark blue-grey, the barrier to block the floodwater spreading on the trailer deck with yellow. The first water volume is the one in the numerical model, the value in brackets is the value realized in the scale model used in the model tests.
Figure 16. Damage Case 4 with watertight barrier on the trailer deck: The grey rectangle shows thedamage penetration. The damaged compartments T001, T043, T045, T046, T083, and T098 are shownwith dark blue-grey, the barrier to block the floodwater spreading on the trailer deck with yellow.The first water volume is the one in the numerical model, the value in brackets is the value realizedin the scale model used in the model tests.
J. Mar. Sci. Eng. 2022, 10, x FOR PEER REVIEW 19 of 31
The modeled release/trigger system for lowering the curtain barrier works properly
and the system is able to prevent the ship capsize in the simulation, as illustrated in Figure
17. The curtain barrier limits the horizontal floodwater extent and thus also its volume on
the trailer deck. The flooding of the other damaged compartments is not mitigated. There‐
fore, the mitigation does not recover anything. This results in a significant remaining heel‐
ing angle, which can slow down any evacuation effort on the damaged ship, would such
an effort become necessary. As with the case of recovery of lost buoyancy, the mitigation
efforts in calm water were simulated using the GM value 2.3 m, and a damage opening
time of 15 s, in which conditions the ship capsizes without mitigation.
Figure 17. Deployable barrier (in 30 s) with damage opening time 15 s: The roll angle (red) and water
volumes on trailer deck (deep blue) and in damaged compartments. The solid curves show the sit‐
uation without the deployed barrier, the dash‐dotted ones the results with the barrier.
The mitigation effort was further studied for the ship with GM 3.4 m in irregular
beam sea states with HS 5.0, 5.5, 6.0, and 7.0 m. Additionally, at the higher sea states, the
ship with mitigation is able to show a high survivability. The mitigation effort not only
prevents a rapid capsize, but also compensates the effects of flooding to a sufficient de‐
gree, and the damaged ship is able to survive in higher sea states.
The unavoidable delay in the automatic lowering of the curtain barrier poses a po‐
tential problem possibly requiring some attention: During the damage opening, and later
during the deployment time, before the curtain barrier locks into its final position, flood‐
water can flow onto the trailer deck, also to areas on the deck further beyond the barrier,
as shown by the simulation in Figure 18. After the floodwater flows past the barrier, its
way back is prevented once the barrier is down. The following improvements would be
useful:
The deployment time of such a barrier should be as short as possible;
If any floodwater goes past the barrier, there should a possibility to let this water to
flow out.
Figure 17. Deployable barrier (in 30 s) with damage opening time 15 s: The roll angle (red) andwater volumes on trailer deck (deep blue) and in damaged compartments. The solid curves show thesituation without the deployed barrier, the dash-dotted ones the results with the barrier.

J. Mar. Sci. Eng. 2022, 10, 797 19 of 30
The mitigation effort was further studied for the ship with GM 3.4 m in irregular beamsea states with HS 5.0, 5.5, 6.0, and 7.0 m. Additionally, at the higher sea states, the shipwith mitigation is able to show a high survivability. The mitigation effort not only preventsa rapid capsize, but also compensates the effects of flooding to a sufficient degree, and thedamaged ship is able to survive in higher sea states.
The unavoidable delay in the automatic lowering of the curtain barrier poses a po-tential problem possibly requiring some attention: During the damage opening, and laterduring the deployment time, before the curtain barrier locks into its final position, floodwa-ter can flow onto the trailer deck, also to areas on the deck further beyond the barrier, asshown by the simulation in Figure 18. After the floodwater flows past the barrier, its wayback is prevented once the barrier is down. The following improvements would be useful:
• The deployment time of such a barrier should be as short as possible;• If any floodwater goes past the barrier, there should a possibility to let this water to
flow out.J. Mar. Sci. Eng. 2022, 10, x FOR PEER REVIEW 20 of 31
Figure 18. Water on the trailer deck on both sides of the closed barrier preventing fur‐
ther spreading of the floodwater.
Table 4 shows the computed times to capsize with and without deployment of the
WT barrier for the real ship GM value of 3.40 m for the draught 6.3 m. The following
observations can be made:
At significant wave heights up to HS 4.0 m, there is no acute need for the deployment
of the WT barrier in the given damage case, as the ship survives with the lowest GM
value 3.4 m on the limit curve also without;
At significant wave heights HS 5.0, 5.5, 6.0, and 7.0 m, the deployment of the WT
barrier results in a clear and significant improvement of the ship survivability. With
the ship GM value 3.4 m, the corresponding survival rates increase from 80% to 100%,
from 40% to 100%, from 10% to 100%, and from 0% to 100%, respectively;
The mitigation in Damage Case 4 with the deployment of a WT barrier considerably
improves the ship survivability in a large portion of the prevailing sea states, being
very effective at the wave heights HS 5.0–7.0 m. If the damage were larger, the effec‐
tive range of mitigation would be located at lower, more frequent wave heights. The
mitigation through the deployment of the WT barrier is a suitable method for this.
Table 4. Damage Case 4 with (red) and without (black) deploying the WT barrier on the trailer deck
in beam seas.
DC4 with GM 3.4 m, DOT 15 s, WTB Deployment time 30 s, TTC shown in [s],
1800 = survival, Tp = 10.0 s
HS [m] 5.0 5.0 5.5 5.5 6.0 6.0 7.0 7.0
Mitigation No Yes No Yes No Yes No Yes
1 1800 1800 1132.6 1800 843.1 1800 430.9 1800
2 1800 1800 1800 1800 636.9 1800 468.7 1800
3 1800 1800 706.3 1800 707.3 1800 418.9 1800
4 1800 1800 1800 1800 495.7 1800 218.2 1800
5 1800 1800 1800 1800 1800 1800 349.8 1800
6 611.3 1800 426.4 1800 303.7 1800 178.2 1800
7 1187.8 1800 348.7 1800 348.0 1800 336.7 1800
8 1800 1800 1800 1800 814.3 1800 641.4 1800
9 1800 1800 890.9 1800 300.1 1800 185.0 1800
10 1800 1800 841.5 1800 842.1 1800 215.3 1800
Survival 8/10 10/10 4/10 10/10 1/10 10/10 0/10 10/10
BARRIER
Figure 18. Water on the trailer deck on both sides of the closed barrier preventing further spreadingof the floodwater.
Table 4 shows the computed times to capsize with and without deployment of theWT barrier for the real ship GM value of 3.40 m for the draught 6.3 m. The followingobservations can be made:
• At significant wave heights up to HS 4.0 m, there is no acute need for the deploymentof the WT barrier in the given damage case, as the ship survives with the lowest GMvalue 3.4 m on the limit curve also without;
• At significant wave heights HS 5.0, 5.5, 6.0, and 7.0 m, the deployment of the WTbarrier results in a clear and significant improvement of the ship survivability. Withthe ship GM value 3.4 m, the corresponding survival rates increase from 80% to 100%,from 40% to 100%, from 10% to 100%, and from 0% to 100%, respectively;
• The mitigation in Damage Case 4 with the deployment of a WT barrier considerablyimproves the ship survivability in a large portion of the prevailing sea states, beingvery effective at the wave heights HS 5.0–7.0 m. If the damage were larger, the effectiverange of mitigation would be located at lower, more frequent wave heights. Themitigation through the deployment of the WT barrier is a suitable method for this.
4.12. Model Test Results on Damage Case 4 with and without Deployment of a Watertight Barrieron the Trailer Deck
In Damage Case 4, the ship with GM 3.30 m capsized without mitigation rapidly in allcases with both damage opening times of 15 s and 30 s.

J. Mar. Sci. Eng. 2022, 10, 797 20 of 30
The mitigation effort with a rapidly deployable watertight barrier against floodwaterspreading on the trailer deck of the MT RoPax was also tested in model scale with a physicalmodel. The spreading of the floodwater on the trailer deck was prevented with the barrierat the building frame # 81, exactly as in the numerical simulations before (see Figure 16).Due to model construction, the floodable compartment volumes in the ship model showsome deviations from those in the numerical model (see Section 4.8).
Table 4. Damage Case 4 with (red) and without (black) deploying the WT barrier on the trailer deckin beam seas.
DC4 with GM 3.4 m, DOT 15 s, WTB Deployment Time 30 s, TTC Shown in [s],1800 = Survival, Tp = 10.0 s
HS [m] 5.0 5.0 5.5 5.5 6.0 6.0 7.0 7.0
Mitigation No Yes No Yes No Yes No Yes
1 1800 1800 1132.6 1800 843.1 1800 430.9 1800
2 1800 1800 1800 1800 636.9 1800 468.7 1800
3 1800 1800 706.3 1800 707.3 1800 418.9 1800
4 1800 1800 1800 1800 495.7 1800 218.2 1800
5 1800 1800 1800 1800 1800 1800 349.8 1800
6 611.3 1800 426.4 1800 303.7 1800 178.2 1800
7 1187.8 1800 348.7 1800 348.0 1800 336.7 1800
8 1800 1800 1800 1800 814.3 1800 641.4 1800
9 1800 1800 890.9 1800 300.1 1800 185.0 1800
10 1800 1800 841.5 1800 842.1 1800 215.3 1800
Survival 8/10 10/10 4/10 10/10 1/10 10/10 0/10 10/10
The ship with GM 3.30 m survived in calm water in all test cases with floodingmitigation, that is, in 100% of the cases, with both damage opening times (DOT) of 15 s and30 s. Without mitigation, the ship capsized rapidly in all cases (see Figures 19 and 20).
J. Mar. Sci. Eng. 2022, 10, x FOR PEER REVIEW 21 of 31
4.12. Model Test Results on Damage Case 4 with and without Deployment of a Watertight
Barrier on the Trailer Deck
In Damage Case 4, the ship with GM 3.30 m capsized without mitigation rapidly in
all cases with both damage opening times of 15 s and 30 s.
The mitigation effort with a rapidly deployable watertight barrier against floodwater
spreading on the trailer deck of the MT RoPax was also tested in model scale with a phys‐
ical model. The spreading of the floodwater on the trailer deck was prevented with the
barrier at the building frame # 81, exactly as in the numerical simulations before (see Fig‐
ure 16). Due to model construction, the floodable compartment volumes in the ship model
show some deviations from those in the numerical model (see Chapter 4.8).
The ship with GM 3.30 m survived in calm water in all test cases with flooding miti‐
gation, that is, in 100% of the cases, with both damage opening times (DOT) of 15 s and 30
s. Without mitigation, the ship capsized rapidly in all cases (see Figures 19 and 20).
Figure 19. Damage Case 4 with damage opening time 15 s: Roll angle as a function of time with
(solid lines) and without (dashed lines) deployment of a watertight barrier on the trailer deck. The
dashed curves below show the water height in the damaged compartments, on the trailer deck, and
just outside the damage opening for Test Run 315. Water height TTRD of 7 cm on the trailer deck
starts the deployment of the WT barrier (RSW = relative wave sensor).
Figure 19. Damage Case 4 with damage opening time 15 s: Roll angle as a function of time with(solid lines) and without (dashed lines) deployment of a watertight barrier on the trailer deck. The

J. Mar. Sci. Eng. 2022, 10, 797 21 of 30
dashed curves below show the water height in the damaged compartments, on the trailer deck, andjust outside the damage opening for Test Run 315. Water height TTRD of 7 cm on the trailer deckstarts the deployment of the WT barrier (RSW = relative wave sensor).
J. Mar. Sci. Eng. 2022, 10, x FOR PEER REVIEW 22 of 31
Figure 20. Damage Case 4 with damage opening time 30 s: Roll angle as a function of time with
(solid lines) and without (dashed lines) deployment of a watertight barrier on the trailer deck.
With GM 3.71 m, the ship survived with flooding mitigation in irregular beam seas
with HS 2.5 m in 100% of the cases when the damage was opened in 15 s. Without mitiga‐
tion, the ship capsized in all cases. With HS 4.0 m, the ship survived with flooding mitiga‐
tion in 100% of the cases when the damage was opened in 15 s. Without mitigation, the
ship capsized in all cases, as before.
4.13. Numerical Hindcast of the Flooding Mitigation with Deployment of a Watertight Barrier
The a priori numerical simulations were used to define the parameters for the model
tests. After these, a hindcast with more accurate and improved numerical simulation was
carried out. The compartment volumes exactly as in the physical ship model were used in
the hindcast. The use of the dynamic orifice equation instead of Bernoulli’s equation for
the inflow was not relevant in this case. All compartments below the trailer deck were
modeled with the pendulum model, which is suitable for simple modeling of the compli‐
cated compartment geometries at hand. The oscillations in all experimental curves in Fig‐
ure 21 show more water dynamics presence in the experiments than the numerical
hindcast does. The correlation between the model test results and the numerical simula‐
tion in Figure 21 in the shown time domain is barely satisfactory, but the measured and
computed curves converge to practically the same steady heeling angle value. The water
ingress into the compartments below the trailer deck and onto the trailer deck is compli‐
cated, as the damage penetration was fully cut into the physical model (see Figure 16). As
with the recovery of lost buoyancy in the same damage case, also in this mitigation case
the experimental and numerical results were achieved with different GM values. Based
on one hand on the measured steady heeling angle and the water height on the trailer
deck edge shown in Figure 19, and on the other hand the computed water volume on the
trailer deck, it can be concluded based on a simple volumetric calculation that considera‐
bly more water flows onto the trailer deck in the experiments than in the computations.
Thus, the balance in the heeling angle in the experiments comes into being at a higher GM
value than in the computations. As already mentioned in Chapter 4.9, for the same dam‐
age case, the numerical modeling shows weaknesses in modeling the rapid flooding of
the complicated compartments in the damage area.
Figure 20. Damage Case 4 with damage opening time 30 s: Roll angle as a function of time with(solid lines) and without (dashed lines) deployment of a watertight barrier on the trailer deck.
With GM 3.71 m, the ship survived with flooding mitigation in irregular beam seaswith HS 2.5 m in 100% of the cases when the damage was opened in 15 s. Without mitigation,the ship capsized in all cases. With HS 4.0 m, the ship survived with flooding mitigationin 100% of the cases when the damage was opened in 15 s. Without mitigation, the shipcapsized in all cases, as before.
4.13. Numerical Hindcast of the Flooding Mitigation with Deployment of a Watertight Barrier
The a priori numerical simulations were used to define the parameters for the modeltests. After these, a hindcast with more accurate and improved numerical simulation wascarried out. The compartment volumes exactly as in the physical ship model were used inthe hindcast. The use of the dynamic orifice equation instead of Bernoulli’s equation for theinflow was not relevant in this case. All compartments below the trailer deck were modeledwith the pendulum model, which is suitable for simple modeling of the complicatedcompartment geometries at hand. The oscillations in all experimental curves in Figure 21show more water dynamics presence in the experiments than the numerical hindcast does.The correlation between the model test results and the numerical simulation in Figure 21in the shown time domain is barely satisfactory, but the measured and computed curvesconverge to practically the same steady heeling angle value. The water ingress into thecompartments below the trailer deck and onto the trailer deck is complicated, as the damagepenetration was fully cut into the physical model (see Figure 16). As with the recoveryof lost buoyancy in the same damage case, also in this mitigation case the experimentaland numerical results were achieved with different GM values. Based on one hand onthe measured steady heeling angle and the water height on the trailer deck edge shownin Figure 19, and on the other hand the computed water volume on the trailer deck, itcan be concluded based on a simple volumetric calculation that considerably more waterflows onto the trailer deck in the experiments than in the computations. Thus, the balancein the heeling angle in the experiments comes into being at a higher GM value than inthe computations. As already mentioned in Chapter 4.9, for the same damage case, the

J. Mar. Sci. Eng. 2022, 10, 797 22 of 30
numerical modeling shows weaknesses in modeling the rapid flooding of the complicatedcompartments in the damage area.
J. Mar. Sci. Eng. 2022, 10, x FOR PEER REVIEW 23 of 31
Figure 21. Damage Case 4 with damage opening time 15 s: Roll angle as a function of time with
(solid lines) and without (dashed lines) recovery of lost buoyancy in the damaged compartment
T045. The red solid line shows the numerical hindcast without mitigation, the dashed red line the
hindcast with mitigation.
4.14. Conclusions on Damage Case 4 with and without Deployment of a Watertight Barrier
The deployment of the watertight barrier on the trailer deck is a very straightforward
flooding mitigation measure and can easily be installed on new or existing RoPax
ships. The deployment time 30 s is based on built roll gates in use at HSVA. Before
the barrier descended in the mitigation tests, some floodwater had already passed its
position and had spread further onto the trailer deck. Regardless of this, the mitiga‐
tion gives good results;
If the capsize mechanism is gradual flooding, a short deployment time is certainly
beneficial, but it does not appear to be crucial: in a few test computations with 30 s
and 180 s deployment times, no significant differences in the results were found. Such
a difference can be expected, when one or more high waves hit the breach on the ship
hull just when it has opened. In a ship‐to‐ship collision, however, the damaged bow
of the other ship would be just outside of the breach on the struck ship, between
incoming waves and the breach. Thus, a sheltering effect against incoming waves can
be expected;
An earlier start of the deployment is of course beneficial. There is no practical reason
that would prevent such roll gates to be lowered before the damage opens, letting a
massive amount of floodwater in. The mitigation tests carried out demonstrate that
also a fully automatic start of the mitigation based on floodwater detected on the
trailer deck functions very well;
The weakness of the method is that it does not recover anything, reduce heeling an‐
gle, or increase freeboard at damage location. It just stops the flooding progressing
further on the important trailer deck. The heeling angle, as in this damage case, can
remain high, and any disembarkation, if needed, would remain difficult in these con‐
ditions;
Altogether, the curtain barrier remains an interesting, possibly cost‐efficient solution,
which can be added also to existing ships with relative ease. Instead of using a sensor
to detect water on the vehicle deck, also other trigger/release mechanisms can be con‐
Figure 21. Damage Case 4 with damage opening time 15 s: Roll angle as a function of time with(solid lines) and without (dashed lines) recovery of lost buoyancy in the damaged compartment T045.The red solid line shows the numerical hindcast without mitigation, the dashed red line the hindcastwith mitigation.
4.14. Conclusions on Damage Case 4 with and without Deployment of a Watertight Barrier
• The deployment of the watertight barrier on the trailer deck is a very straightforwardflooding mitigation measure and can easily be installed on new or existing RoPaxships. The deployment time 30 s is based on built roll gates in use at HSVA. Beforethe barrier descended in the mitigation tests, some floodwater had already passed itsposition and had spread further onto the trailer deck. Regardless of this, the mitigationgives good results;
• If the capsize mechanism is gradual flooding, a short deployment time is certainlybeneficial, but it does not appear to be crucial: in a few test computations with 30 sand 180 s deployment times, no significant differences in the results were found. Sucha difference can be expected, when one or more high waves hit the breach on theship hull just when it has opened. In a ship-to-ship collision, however, the damagedbow of the other ship would be just outside of the breach on the struck ship, betweenincoming waves and the breach. Thus, a sheltering effect against incoming waves canbe expected;
• An earlier start of the deployment is of course beneficial. There is no practical reasonthat would prevent such roll gates to be lowered before the damage opens, letting amassive amount of floodwater in. The mitigation tests carried out demonstrate thatalso a fully automatic start of the mitigation based on floodwater detected on thetrailer deck functions very well;
• The weakness of the method is that it does not recover anything, reduce heeling angle,or increase freeboard at damage location. It just stops the flooding progressing furtheron the important trailer deck. The heeling angle, as in this damage case, can remainhigh, and any disembarkation, if needed, would remain difficult in these conditions;
• Altogether, the curtain barrier remains an interesting, possibly cost-efficient solution,which can be added also to existing ships with relative ease. Instead of using a sensorto detect water on the vehicle deck, also other trigger/release mechanisms can be

J. Mar. Sci. Eng. 2022, 10, 797 23 of 30
considered: (1) a general closure of WT doors, including the deployment of curtainbarriers as a precautionary measure in case of a potential flooding hazard, (2) or at thelatest, at the very onset of an accident, such as a collision.
5. An Overview of the Mitigation Methods
Three typical time histories of the roll angle representing flooding mitigation withcounter flooding, with recovery of lost buoyancy, and with deployment of a watertightbarrier on the trailer deck, are shown in Figure 22. As the three mitigation methods wereinvestigated using two damage cases with different values of ship metacentric height GM,the comparison between these different mitigation methods is a more qualitative thanquantitative one. Regardless of this, Figure 22 illustrates well the rapid reducing effectof the counter flooding on the heeling angle (blue curve), the much slower effect of therecovery of the lost buoyancy (violet-red), and the heeling angle remaining rather high incase of the deployment of the watertight barrier (deep green curve). These features aretypical to the investigated mitigation methods.
J. Mar. Sci. Eng. 2022, 10, x FOR PEER REVIEW 24 of 31
sidered: (1) a general closure of WT doors, including the deployment of curtain bar‐
riers as a precautionary measure in case of a potential flooding hazard, (2) or at the
latest, at the very onset of an accident, such as a collision.
5. An Overview of the Mitigation Methods
Three typical time histories of the roll angle representing flooding mitigation with
counter flooding, with recovery of lost buoyancy, and with deployment of a watertight
barrier on the trailer deck, are shown in Figure 22. As the three mitigation methods were
investigated using two damage cases with different values of ship metacentric height GM,
the comparison between these different mitigation methods is a more qualitative than
quantitative one. Regardless of this, Figure 22 illustrates well the rapid reducing effect of
the counter flooding on the heeling angle (blue curve), the much slower effect of the re‐
covery of the lost buoyancy (violet‐red), and the heeling angle remaining rather high in
case of the deployment of the watertight barrier (deep green curve). These features are
typical to the investigated mitigation methods.
Figure 22. Qualitative comparison of the three different flooding mitigation methods on two dam‐
age cases: counter flooding (CF), recovery of the lost buoyancy (RLB), and deployment of the wa‐
tertight barrier (WTB).
Tables 5–7 list the numerical and experimental mitigation results in the two studied
damage cases in irregular beam seas in a concise manner. The arrows in the tables visual‐
ize the effect of the mitigation on the ship survivability in each case. As the tables show,
all tested mitigation methods improve the ship survivability in these two damage cases
on a certain range of wave heights. Due to unavoidable small discrepancies in modeling,
the numerical simulations and the model test results show some differences, but they all
very clearly demonstrate the benefits of the three flooding mitigation methods in the dam‐
age cases investigated.
For the studied damage cases, the different mitigation methods show some differ‐
ences in their effectiveness, which depends also on the size and location of the damage,
on those of the compartments available for counter flooding, or on the damaged compart‐
ment available for recovery of lost buoyancy through displacement of flood water with
another lighter material, e.g., with expanding foam.
Figure 22. Qualitative comparison of the three different flooding mitigation methods on two damagecases: counter flooding (CF), recovery of the lost buoyancy (RLB), and deployment of the watertightbarrier (WTB).
Tables 5–7 list the numerical and experimental mitigation results in the two studieddamage cases in irregular beam seas in a concise manner. The arrows in the tables visualizethe effect of the mitigation on the ship survivability in each case. As the tables show, alltested mitigation methods improve the ship survivability in these two damage cases on acertain range of wave heights. Due to unavoidable small discrepancies in modeling, thenumerical simulations and the model test results show some differences, but they all veryclearly demonstrate the benefits of the three flooding mitigation methods in the damagecases investigated.
For the studied damage cases, the different mitigation methods show some differencesin their effectiveness, which depends also on the size and location of the damage, on thoseof the compartments available for counter flooding, or on the damaged compartmentavailable for recovery of lost buoyancy through displacement of flood water with anotherlighter material, e.g., with expanding foam.

J. Mar. Sci. Eng. 2022, 10, 797 24 of 30
Table 5. Numerical (blue) and experimental (red) flooding mitigation results with counter floodingin Damage Case 2, Tp = 10.0 s.
DC2 Calm HS2.5 m HS3.0 m HS3.5 m HS3.5 m HS4.0 m HS5.0 m
GM [m] 3.018 3.4 3.4 3.4 3.48 3.4 3.48
DOT [s] 15 30 15 15 15 15 15 15
CF no yes no yes no yes no yes no yes no yes no yes no yes
Survivalrate
0/5 5/5 0/6 5/6 5/10 10/10 1/10 8/10 0/10 6/10 2/10 10/10 0/10 1/10 0/10 10/10
J. Mar. Sci. Eng. 2022, 10, x FOR PEER REVIEW 25 of 31
Both the counter flooding and the recovery of lost buoyancy in a damaged compart‐
ment improve the ship’s condition, mainly by reducing the ship list. Deploying a water‐
tight barrier on a trailer deck does not do this: it just prevents the ship stability from fur‐
ther deterioration by limiting the floodwater volume on the trailer deck. A large remain‐
ing heeling angle tends to be an unavoidable consequence. In view of many such aspects,
any ranking of the mitigation methods investigated here is considered somewhat prema‐
ture. The choice of the best flooding mitigation method should depend on the suitability
of the particular method for the ship and the costs for the technical system to facilitate it.
Table 5. Numerical (blue) and experimental (red) flooding mitigation results with counter flooding
in Damage Case 2, Tp = 10.0 s.
DC2 Calm HS 2.5 m HS 3.0 m HS 3.5 m HS 3.5 m HS 4.0 m HS 5.0 m
GM [m] 3.018 3.4 3.4 3.4 3.48 3.4 3.48
DOT [s] 15 30 15 15 15 15 15 15
CF no yes no yes no yes no yes no yes no yes no yes no yes
Survival
rate
0/5 5/5 0/6 5/6 5/10 10/10 1/10 8/10 0/10 6/10 2/10 10/10 0/10 1/10 0/10 10/10
Table 6. Numerical (blue) and experimental (red) mitigation results with recovery of lost buoyancy
in Damage Case 4, Tp = 10.0 s.
DC4 Calm HS 2.5 m HS 4.0 m HS 5.0 m HS 5.5 m HS 6.0 m HS 7.0 m
GM [m] 3.71 3.81 3.81 3.4 3.4 3.4 3.4
DOT [s] 15 30 15 15 15 15 15 15
RLB no yes no yes no yes no yes no yes no yes no yes no yes
Survival
rate
0/5 5/5 0/5 5/5 0/10 10/10 0/10 8/10 8/10 10/10 4/10 6/10 1/10 4/10 0/10 0/10
Table 7. Numerical (blue) and experimental (red) mitigation results with deployment of a water‐
tight barrier in Damage Case 4, Tp = 10.0 s.
DC4 Calm HS 2.5 m HS 4.0 m HS 5.0 m HS 5.5 m HS 6.0 m HS 7.0 m
GM [m] 3.3 3.71 3.71 3.4 3.4 3.4 3.4
DOT [s] 15 30 15 15 15 15 15 15
WTB no yes no yes no yes no yes no yes no yes no yes no yes
Survival
rate
0/5 5/5 0/5 5/5 0/10 10/10 0/10 10/10 8/10 10/10 4/10 10/10 1/10 10/10 0/10 10/10
6. Conclusions
Flooding mitigation measures on a modern RoPax design were investigated with nu‐
merical simulation and model tests in calm water and in irregular beam seas in two
damage cases with and without the following mitigation efforts: (1) counter flooding;
(2) recovery of lost buoyancy by displacing floodwater in a damaged compartment;
and (3) deployment of a watertight barrier to prevent floodwater spreading on the
large open trailer deck of the RoPax ship;
The choice of the compartments for active flooding mitigation measures is based on
the principles: (1) to provide righting moment to reduce ship list due to damage, (2)
to maintain a slight trim (slope down) on the trailer deck towards the damage open‐
ing, (3) not to flood any compartments essential for the ship functions, and (4) to
displace water only in compartments in which a foam system (or equiv.) can be ap‐
plied, e.g., a potable water tank may not be suitable;
Table 6. Numerical (blue) and experimental (red) mitigation results with recovery of lost buoyancyin Damage Case 4, Tp = 10.0 s.
DC4 Calm HS2.5 m HS4.0 m HS5.0 m HS5.5 m HS6.0 m HS7.0 m
GM [m] 3.71 3.81 3.81 3.4 3.4 3.4 3.4
DOT [s] 15 30 15 15 15 15 15 15
RLB no yes no yes no yes no yes no yes no yes no yes no yes
Survivalrate
0/5 5/5 0/5 5/5 0/10 10/10 0/10 8/10 8/10 10/10 4/10 6/10 1/10 4/10 0/10 0/10
J. Mar. Sci. Eng. 2022, 10, x FOR PEER REVIEW 25 of 31
Both the counter flooding and the recovery of lost buoyancy in a damaged compart‐
ment improve the ship’s condition, mainly by reducing the ship list. Deploying a water‐
tight barrier on a trailer deck does not do this: it just prevents the ship stability from fur‐
ther deterioration by limiting the floodwater volume on the trailer deck. A large remain‐
ing heeling angle tends to be an unavoidable consequence. In view of many such aspects,
any ranking of the mitigation methods investigated here is considered somewhat prema‐
ture. The choice of the best flooding mitigation method should depend on the suitability
of the particular method for the ship and the costs for the technical system to facilitate it.
Table 5. Numerical (blue) and experimental (red) flooding mitigation results with counter flooding
in Damage Case 2, Tp = 10.0 s.
DC2 Calm HS 2.5 m HS 3.0 m HS 3.5 m HS 3.5 m HS 4.0 m HS 5.0 m
GM [m] 3.018 3.4 3.4 3.4 3.48 3.4 3.48
DOT [s] 15 30 15 15 15 15 15 15
CF no yes no yes no yes no yes no yes no yes no yes no yes
Survival
rate
0/5 5/5 0/6 5/6 5/10 10/10 1/10 8/10 0/10 6/10 2/10 10/10 0/10 1/10 0/10 10/10
Table 6. Numerical (blue) and experimental (red) mitigation results with recovery of lost buoyancy
in Damage Case 4, Tp = 10.0 s.
DC4 Calm HS 2.5 m HS 4.0 m HS 5.0 m HS 5.5 m HS 6.0 m HS 7.0 m
GM [m] 3.71 3.81 3.81 3.4 3.4 3.4 3.4
DOT [s] 15 30 15 15 15 15 15 15
RLB no yes no yes no yes no yes no yes no yes no yes no yes
Survival
rate
0/5 5/5 0/5 5/5 0/10 10/10 0/10 8/10 8/10 10/10 4/10 6/10 1/10 4/10 0/10 0/10
Table 7. Numerical (blue) and experimental (red) mitigation results with deployment of a water‐
tight barrier in Damage Case 4, Tp = 10.0 s.
DC4 Calm HS 2.5 m HS 4.0 m HS 5.0 m HS 5.5 m HS 6.0 m HS 7.0 m
GM [m] 3.3 3.71 3.71 3.4 3.4 3.4 3.4
DOT [s] 15 30 15 15 15 15 15 15
WTB no yes no yes no yes no yes no yes no yes no yes no yes
Survival
rate
0/5 5/5 0/5 5/5 0/10 10/10 0/10 10/10 8/10 10/10 4/10 10/10 1/10 10/10 0/10 10/10
6. Conclusions
Flooding mitigation measures on a modern RoPax design were investigated with nu‐
merical simulation and model tests in calm water and in irregular beam seas in two
damage cases with and without the following mitigation efforts: (1) counter flooding;
(2) recovery of lost buoyancy by displacing floodwater in a damaged compartment;
and (3) deployment of a watertight barrier to prevent floodwater spreading on the
large open trailer deck of the RoPax ship;
The choice of the compartments for active flooding mitigation measures is based on
the principles: (1) to provide righting moment to reduce ship list due to damage, (2)
to maintain a slight trim (slope down) on the trailer deck towards the damage open‐
ing, (3) not to flood any compartments essential for the ship functions, and (4) to
displace water only in compartments in which a foam system (or equiv.) can be ap‐
plied, e.g., a potable water tank may not be suitable;
Table 7. Numerical (blue) and experimental (red) mitigation results with deployment of a watertightbarrier in Damage Case 4, Tp = 10.0 s.
DC4 Calm HS2.5 m HS4.0 m HS5.0 m HS5.5 m HS6.0 m HS7.0 m
GM [m] 3.3 3.71 3.71 3.4 3.4 3.4 3.4
DOT [s] 15 30 15 15 15 15 15 15
WTB no yes no yes no yes no yes no yes no yes no yes no yes
Survivalrate
0/5 5/5 0/5 5/5 0/10 10/10 0/10 10/10 8/10 10/10 4/10 10/10 1/10 10/10 0/10 10/10
J. Mar. Sci. Eng. 2022, 10, x FOR PEER REVIEW 25 of 31
Both the counter flooding and the recovery of lost buoyancy in a damaged compart‐
ment improve the ship’s condition, mainly by reducing the ship list. Deploying a water‐
tight barrier on a trailer deck does not do this: it just prevents the ship stability from fur‐
ther deterioration by limiting the floodwater volume on the trailer deck. A large remain‐
ing heeling angle tends to be an unavoidable consequence. In view of many such aspects,
any ranking of the mitigation methods investigated here is considered somewhat prema‐
ture. The choice of the best flooding mitigation method should depend on the suitability
of the particular method for the ship and the costs for the technical system to facilitate it.
Table 5. Numerical (blue) and experimental (red) flooding mitigation results with counter flooding
in Damage Case 2, Tp = 10.0 s.
DC2 Calm HS 2.5 m HS 3.0 m HS 3.5 m HS 3.5 m HS 4.0 m HS 5.0 m
GM [m] 3.018 3.4 3.4 3.4 3.48 3.4 3.48
DOT [s] 15 30 15 15 15 15 15 15
CF no yes no yes no yes no yes no yes no yes no yes no yes
Survival
rate
0/5 5/5 0/6 5/6 5/10 10/10 1/10 8/10 0/10 6/10 2/10 10/10 0/10 1/10 0/10 10/10
Table 6. Numerical (blue) and experimental (red) mitigation results with recovery of lost buoyancy
in Damage Case 4, Tp = 10.0 s.
DC4 Calm HS 2.5 m HS 4.0 m HS 5.0 m HS 5.5 m HS 6.0 m HS 7.0 m
GM [m] 3.71 3.81 3.81 3.4 3.4 3.4 3.4
DOT [s] 15 30 15 15 15 15 15 15
RLB no yes no yes no yes no yes no yes no yes no yes no yes
Survival
rate
0/5 5/5 0/5 5/5 0/10 10/10 0/10 8/10 8/10 10/10 4/10 6/10 1/10 4/10 0/10 0/10
Table 7. Numerical (blue) and experimental (red) mitigation results with deployment of a water‐
tight barrier in Damage Case 4, Tp = 10.0 s.
DC4 Calm HS 2.5 m HS 4.0 m HS 5.0 m HS 5.5 m HS 6.0 m HS 7.0 m
GM [m] 3.3 3.71 3.71 3.4 3.4 3.4 3.4
DOT [s] 15 30 15 15 15 15 15 15
WTB no yes no yes no yes no yes no yes no yes no yes no yes
Survival
rate
0/5 5/5 0/5 5/5 0/10 10/10 0/10 10/10 8/10 10/10 4/10 10/10 1/10 10/10 0/10 10/10
6. Conclusions
Flooding mitigation measures on a modern RoPax design were investigated with nu‐
merical simulation and model tests in calm water and in irregular beam seas in two
damage cases with and without the following mitigation efforts: (1) counter flooding;
(2) recovery of lost buoyancy by displacing floodwater in a damaged compartment;
and (3) deployment of a watertight barrier to prevent floodwater spreading on the
large open trailer deck of the RoPax ship;
The choice of the compartments for active flooding mitigation measures is based on
the principles: (1) to provide righting moment to reduce ship list due to damage, (2)
to maintain a slight trim (slope down) on the trailer deck towards the damage open‐
ing, (3) not to flood any compartments essential for the ship functions, and (4) to
displace water only in compartments in which a foam system (or equiv.) can be ap‐
plied, e.g., a potable water tank may not be suitable;
Both the counter flooding and the recovery of lost buoyancy in a damaged compart-ment improve the ship’s condition, mainly by reducing the ship list. Deploying a watertightbarrier on a trailer deck does not do this: it just prevents the ship stability from furtherdeterioration by limiting the floodwater volume on the trailer deck. A large remainingheeling angle tends to be an unavoidable consequence. In view of many such aspects, anyranking of the mitigation methods investigated here is considered somewhat premature.The choice of the best flooding mitigation method should depend on the suitability of theparticular method for the ship and the costs for the technical system to facilitate it.
6. Conclusions
• Flooding mitigation measures on a modern RoPax design were investigated withnumerical simulation and model tests in calm water and in irregular beam seas in twodamage cases with and without the following mitigation efforts: (1) counter flooding;(2) recovery of lost buoyancy by displacing floodwater in a damaged compartment;and (3) deployment of a watertight barrier to prevent floodwater spreading on thelarge open trailer deck of the RoPax ship;
• The choice of the compartments for active flooding mitigation measures is based onthe principles: (1) to provide righting moment to reduce ship list due to damage, (2) tomaintain a slight trim (slope down) on the trailer deck towards the damage opening,(3) not to flood any compartments essential for the ship functions, and (4) to displace

J. Mar. Sci. Eng. 2022, 10, 797 25 of 30
water only in compartments in which a foam system (or equiv.) can be applied, e.g., apotable water tank may not be suitable;
• The investigation throws light on the applicability and effectiveness of the investigatedmitigation methods in calm water and in different beam sea conditions. Informa-tion on the ship stability, damage, and wave parameters suitable for model testingwas generated;
• Damage Case 2 was investigated with and without counter flooding (CF). First, somecomputations with different duct opening sizes to the counter flooding compartmentswere carried out to show how the mitigation works in ideal calm water conditionswith suitable ship GM values;
• Damage Case 4 was accordingly investigated with numerical simulations with andwithout the recovery of the lost buoyancy (RLB) by displacing floodwater in a damagedcompartment, and also with and without the deployment of a watertight barrier (WTB)on the trailer deck to prevent further flooding;
• Although the numerical computations and model test results show some differences,they all very clearly demonstrate the benefits of the three flooding mitigation methodsin the damage cases investigated;
• All the three mitigation methods investigated were found to be effective in eitherpreventing or postponing ship capsize, thus providing good potential for the clear im-provement of ship survivability in foreseeable damage cases. The mitigation methodsstudied are suitable for new and existing ships. This applies both to sudden floodingcases with transient floodwater and ship behavior as well as to gradual flooding cases;
• The GM values used in the tests deviate from the lowest GM value on the limit curve3.4 m because GM values suitable for demonstrating the mitigation efforts were usedin the computations and model tests. Using the GM value 3.4 m in all tests wouldhave meant that a less clear demonstration of the effects would have been obtained,while in some cases the mitigation would not have been necessary, and in some cases,it would not have been sufficient;
• Planning the flooding mitigation for a ship design with a given GM would involvedefining the extent of the mitigation methods that are sufficient to reach a desiredsurvivability level, e.g., at given sea state. This is certainly possible in view of theinformation gained through the computations and model tests of the present study;
• Numerical simulations are required to design a flooding mitigation system. The sim-ulation code should be able to handle different damage opening times and variousrelease mechanisms for mitigation, e.g., the heeling angle or water depth in a compart-ment, and adjustable time delays in mitigation set-up. The programming effort forsuch amendments to an existing simulation code is small;
• The tested mitigation methods improve the ship survivability in these two damagecases on a certain range of wave heights. At low sea states, mitigation is often notneeded. At the rarer high sea states, the effects of mitigation are not always sufficientto secure survival. In between, there is a range of sea states in which all the testedmitigation efforts considerably increase the ship survivability;
• In the simulations, the damage opening time of 15 s was mostly used. This is based onthe assumption of the colliding ship pulling itself back at full power astern with itsdamaged bow withdrawing out of the collision damage penetration in the other ship.Presently, this is the best estimate of the shortest possible damage opening time. In areal case, the chances that the opening time would be longer should be rather high.This means that the calculated results should be conservative. That is, the mitigationsystems are likely to be more effective and more largely applicable to a larger varietyof cases than what the simulations and model tests here show;
• Counter flooding was found to be the easiest and fastest way to stabilize the damagedRoPax ship under study. Counter flooding has the advantage that few best suitablecompartments on each side of the ship can be prepared for this. Their ship stabilizingeffect can be applied to a large variety of damage cases on the opposite side of the ship.

J. Mar. Sci. Eng. 2022, 10, 797 26 of 30
• The recovery of lost buoyancy in the damaged compartment in principle implies thepreparation of each compartment that can get damaged. At least preparation of thelargest compartments far away from the centerline is necessary;
• The typical capsize mechanism of a RoPax ship involves the flooding of the trailerdeck. Once this has progressed far enough, a capsize in waves is only a matter oflimited time. The deployment of a watertight barrier on the trailer deck effectivelyprevents this, and the ship can survive in a damaged condition also in very highsea states. As there is no recovery in the damage extend, but just limitation, and theheeling angle can remain high, which has an adverse effect on all actions onboard.However, once the vessel is not in acute danger, the crew can concentrate on furtherstabilizing the ship.
Funding: The research presented in this paper was carried out in the framework of the projectFlooding Accident Response (FLARE), no. 814753, under the H2020 program funded by the EuropeanUnion, which is gratefully acknowledged. The views set out in this paper are solely those ofthe author.
Institutional Review Board Statement: Not applicable.
Informed Consent Statement: Not applicable.
Data Availability Statement: Not applicable.
Acknowledgments: The research presented would have hardly been possible without the frameworkof the EU project FLARE and it has certainly benefited from the open scientific communicationbetween various distinguished colleagues in this framework and also outside of it. The followingpersons in HSVA have contributed to this study with the experiments carried out: K. Jacobsen, Y.Hong, P. Soukup, A. Schumacher, A. Beck, and T. Wirth.
Conflicts of Interest: The author declares no conflict of interest.
Appendix A Model Testing Techniques Applied in the Flooding Mitigation Tests
Appendix A.1 Damage Opening Mechanisms
The breaches on the hull related to Damage Cases 2 and 4 were opened with control-lable speeds corresponding to the damage opening times of 15 s and 30 s in f.sc. Froudesimilarity is assumed. Thus, the Froude scale ratio for time is λ1/2, in which λ is the modelscale factor. In Damage Case 2, two sliding doors moving horizontally in a purpose-builtframe structure were used. Figure A1 illustrates the opening mechanism: The pullingstrings are used to open the sliding doors at desired speed. The elastic cords pull the doorsclosed once the tension in pulling strings is released.
J. Mar. Sci. Eng. 2022, 10, x FOR PEER REVIEW 27 of 31
The recovery of lost buoyancy in the damaged compartment in principle implies the
preparation of each compartment that can get damaged. At least preparation of the
largest compartments far away from the centerline is necessary;
The typical capsize mechanism of a RoPax ship involves the flooding of the trailer
deck. Once this has progressed far enough, a capsize in waves is only a matter of
limited time. The deployment of a watertight barrier on the trailer deck effectively
prevents this, and the ship can survive in a damaged condition also in very high sea
states. As there is no recovery in the damage extend, but just limitation, and the heel‐
ing angle can remain high, which has an adverse effect on all actions onboard. How‐
ever, once the vessel is not in acute danger, the crew can concentrate on further sta‐
bilizing the ship.
Funding: The research presented in this paper was carried out in the framework of the project
Flooding Accident Response (FLARE), no. 814753, under the H2020 program funded by the Euro‐
pean Union, which is gratefully acknowledged. The views set out in this paper are solely those of
the author.
Institutional Review Board Statement: Not applicable.
Informed Consent Statement: Not applicable.
Data Availability Statement: Not applicable.
Acknowledgments: The research presented would have hardly been possible without the frame‐
work of the EU project FLARE and it has certainly benefited from the open scientific communication
between various distinguished colleagues in this framework and also outside of it. The following
persons in HSVA have contributed to this study with the experiments carried out: K. Jacobsen, Y.
Hong, P. Soukup, A. Schumacher, A. Beck, and T. Wirth.
Conflicts of Interest: The author declares no conflict of interest.
Appendix A. Model Testing Techniques Applied in the Flooding Mitigation Tests
Appendix A.1. Damage Opening Mechanisms
The breaches on the hull related to Damage Cases 2 and 4 were opened with control‐
lable speeds corresponding to the damage opening times of 15 s and 30 s in f.sc. Froude
similarity is assumed. Thus, the Froude scale ratio for time is 1/2, in which is the
model scale factor. In Damage Case 2, two sliding doors moving horizontally in a pur‐
pose‐built frame structure were used. Figure A1 illustrates the opening mechanism: The
pulling strings are used to open the sliding doors at desired speed. The elastic cords pull
the doors closed once the tension in pulling strings is released.
Figure A1. Damage opening mechanism for Damage Case 2.
The breach on the hull in Damage Case 4 lies at the ship shoulder, where the ship
shell has curvature both in horizontal and vertical sections, as shown in Figure A2. The
Figure A1. Damage opening mechanism for Damage Case 2.
The breach on the hull in Damage Case 4 lies at the ship shoulder, where the shipshell has curvature both in horizontal and vertical sections, as shown in Figure A2. Thehorizontal curvature is adopted in the damage opening frame. The curvature in the vertical
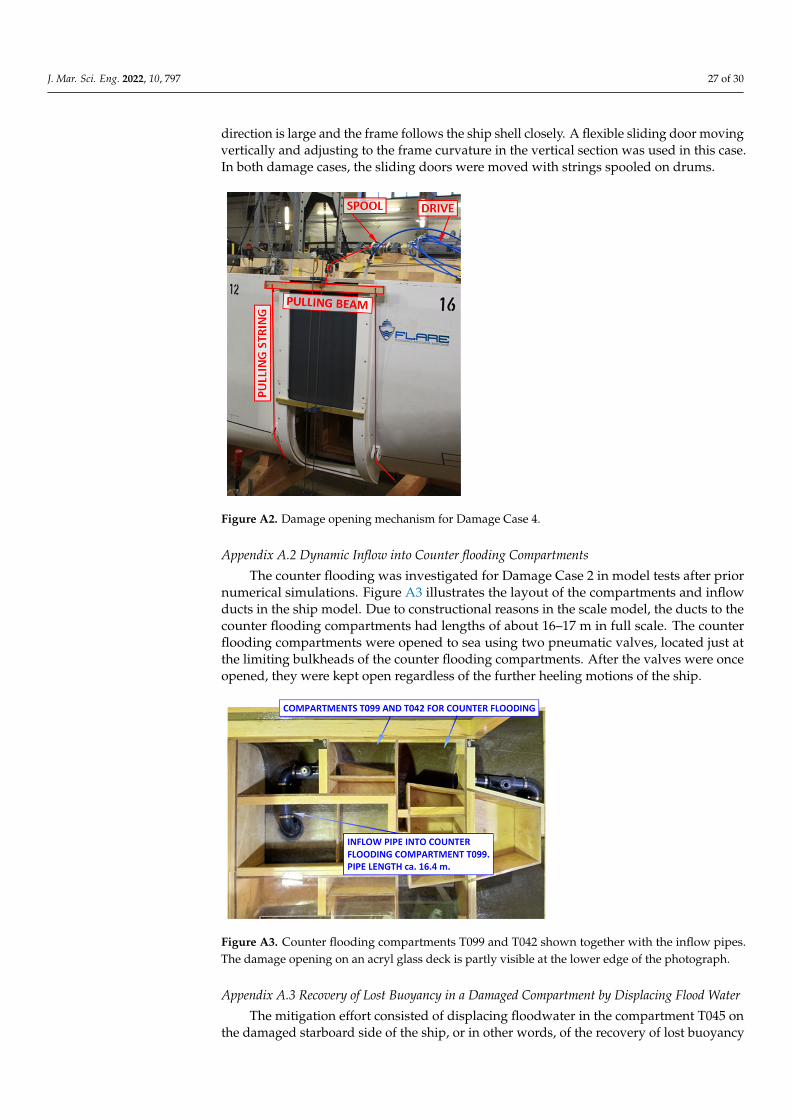
J. Mar. Sci. Eng. 2022, 10, 797 27 of 30
direction is large and the frame follows the ship shell closely. A flexible sliding door movingvertically and adjusting to the frame curvature in the vertical section was used in this case.In both damage cases, the sliding doors were moved with strings spooled on drums.
J. Mar. Sci. Eng. 2022, 10, x FOR PEER REVIEW 28 of 31
horizontal curvature is adopted in the damage opening frame. The curvature in the verti‐
cal direction is large and the frame follows the ship shell closely. A flexible sliding door
moving vertically and adjusting to the frame curvature in the vertical section was used in
this case. In both damage cases, the sliding doors were moved with strings spooled on
drums.
Figure A2. Damage opening mechanism for Damage Case 4.
Appendix A.2. Dynamic Inflow into Counter flooding Compartments
The counter flooding was investigated for Damage Case 2 in model tests after prior
numerical simulations. Figure A3 illustrates the layout of the compartments and inflow
ducts in the ship model. Due to constructional reasons in the scale model, the ducts to the
counter flooding compartments had lengths of about 16–17 m in full scale. The counter
flooding compartments were opened to sea using two pneumatic valves, located just at
the limiting bulkheads of the counter flooding compartments. After the valves were once
opened, they were kept open regardless of the further heeling motions of the ship.
Figure A3. Counter flooding compartments T099 and T042 shown together with the inflow pipes.
The damage opening on an acryl glass deck is partly visible at the lower edge of the photograph.
Figure A2. Damage opening mechanism for Damage Case 4.
Appendix A.2 Dynamic Inflow into Counter flooding Compartments
The counter flooding was investigated for Damage Case 2 in model tests after priornumerical simulations. Figure A3 illustrates the layout of the compartments and inflowducts in the ship model. Due to constructional reasons in the scale model, the ducts to thecounter flooding compartments had lengths of about 16–17 m in full scale. The counterflooding compartments were opened to sea using two pneumatic valves, located just atthe limiting bulkheads of the counter flooding compartments. After the valves were onceopened, they were kept open regardless of the further heeling motions of the ship.
J. Mar. Sci. Eng. 2022, 10, x FOR PEER REVIEW 28 of 31
horizontal curvature is adopted in the damage opening frame. The curvature in the verti‐
cal direction is large and the frame follows the ship shell closely. A flexible sliding door
moving vertically and adjusting to the frame curvature in the vertical section was used in
this case. In both damage cases, the sliding doors were moved with strings spooled on
drums.
Figure A2. Damage opening mechanism for Damage Case 4.
Appendix A.2. Dynamic Inflow into Counter flooding Compartments
The counter flooding was investigated for Damage Case 2 in model tests after prior
numerical simulations. Figure A3 illustrates the layout of the compartments and inflow
ducts in the ship model. Due to constructional reasons in the scale model, the ducts to the
counter flooding compartments had lengths of about 16–17 m in full scale. The counter
flooding compartments were opened to sea using two pneumatic valves, located just at
the limiting bulkheads of the counter flooding compartments. After the valves were once
opened, they were kept open regardless of the further heeling motions of the ship.
Figure A3. Counter flooding compartments T099 and T042 shown together with the inflow pipes.
The damage opening on an acryl glass deck is partly visible at the lower edge of the photograph. Figure A3. Counter flooding compartments T099 and T042 shown together with the inflow pipes.The damage opening on an acryl glass deck is partly visible at the lower edge of the photograph.
Appendix A.3 Recovery of Lost Buoyancy in a Damaged Compartment by Displacing Flood Water
The mitigation effort consisted of displacing floodwater in the compartment T045 onthe damaged starboard side of the ship, or in other words, of the recovery of lost buoyancy

J. Mar. Sci. Eng. 2022, 10, 797 28 of 30
in it. This was realized in the model tests with an inflatable container placed in the damagedcompartment T045, as shown in Figure A4. The compartment has a complicated form andcreating a suitable inflatable container for this purpose was not entirely trivial. For technicalreasons in the model tests, it was possible to displace the floodwater volume of only 483 m3
in full scale out of the total compartment volume of 793 m3 of the compartment T045.
J. Mar. Sci. Eng. 2022, 10, x FOR PEER REVIEW 29 of 31
Appendix A.3. Recovery of Lost Buoyancy in a Damaged Compartment by Displacing Flood
Water
The mitigation effort consisted of displacing floodwater in the compartment T045 on
the damaged starboard side of the ship, or in other words, of the recovery of lost buoyancy
in it. This was realized in the model tests with an inflatable container placed in the dam‐
aged compartment T045, as shown in Figure A4. The compartment has a complicated
form and creating a suitable inflatable container for this purpose was not entirely trivial.
For technical reasons in the model tests, it was possible to displace the floodwater volume
of only 483 m3 in full scale out of the total compartment volume of 793 m3 of the compart‐
ment T045.
Figure A4. The red inflatable container for displacement of floodwater in compartment T045 during
the assembly.
At the onset of mitigation, the filling of the container with compressed air was
started, and the partly filled container rose and floated on top of the floodwater coming
in. This somewhat delayed the mitigation effect. As the container inflated more, it started
to displace floodwater out of the compartment as planned, reaching its maximum volume
in a planned timeframe of 180 s (see Figure A5).
Figure A5. The red inflatable container for displacement of floodwater in compartment T045: (a)
empty container in the empty compartment, (b) water rushes into the compartments, (c) the con‐
tainer being filled with pressurized air floats on the floodwater, (d) the fully inflated container has
displaced most of the floodwater in the compartment.
(a)
(c) (d)
(b)
Figure A4. The red inflatable container for displacement of floodwater in compartment T045 duringthe assembly.
At the onset of mitigation, the filling of the container with compressed air was started,and the partly filled container rose and floated on top of the floodwater coming in. Thissomewhat delayed the mitigation effect. As the container inflated more, it started todisplace floodwater out of the compartment as planned, reaching its maximum volume ina planned timeframe of 180 s (see Figure A5).
J. Mar. Sci. Eng. 2022, 10, x FOR PEER REVIEW 29 of 31
Appendix A.3. Recovery of Lost Buoyancy in a Damaged Compartment by Displacing Flood
Water
The mitigation effort consisted of displacing floodwater in the compartment T045 on
the damaged starboard side of the ship, or in other words, of the recovery of lost buoyancy
in it. This was realized in the model tests with an inflatable container placed in the dam‐
aged compartment T045, as shown in Figure A4. The compartment has a complicated
form and creating a suitable inflatable container for this purpose was not entirely trivial.
For technical reasons in the model tests, it was possible to displace the floodwater volume
of only 483 m3 in full scale out of the total compartment volume of 793 m3 of the compart‐
ment T045.
Figure A4. The red inflatable container for displacement of floodwater in compartment T045 during
the assembly.
At the onset of mitigation, the filling of the container with compressed air was
started, and the partly filled container rose and floated on top of the floodwater coming
in. This somewhat delayed the mitigation effect. As the container inflated more, it started
to displace floodwater out of the compartment as planned, reaching its maximum volume
in a planned timeframe of 180 s (see Figure A5).
Figure A5. The red inflatable container for displacement of floodwater in compartment T045: (a)
empty container in the empty compartment, (b) water rushes into the compartments, (c) the con‐
tainer being filled with pressurized air floats on the floodwater, (d) the fully inflated container has
displaced most of the floodwater in the compartment.
(a)
(c) (d)
(b)
Figure A5. The red inflatable container for displacement of floodwater in compartment T045:(a) empty container in the empty compartment, (b) water rushes into the compartments, (c) thecontainer being filled with pressurized air floats on the floodwater, (d) the fully inflated container hasdisplaced most of the floodwater in the compartment.
Appendix A.4 Deployment of a Watertight Barrier on the Trailer Deck
A further test series of a mitigation effort with a rapidly deployable watertight barrieragainst floodwater spreading on the trailer deck of the MT RoPax was carried out in modelscale with the physical ship model. The deployable curtain barrier on the trailer deck ofthe RoPax ship was realized in the physical scale model with an acryl glass sheet movingvertically in a housing placed on the trailer deck. The smooth descending motion of theacryl glass barrier was realized with a linear actuator with a spindle drive (see Figure A6).
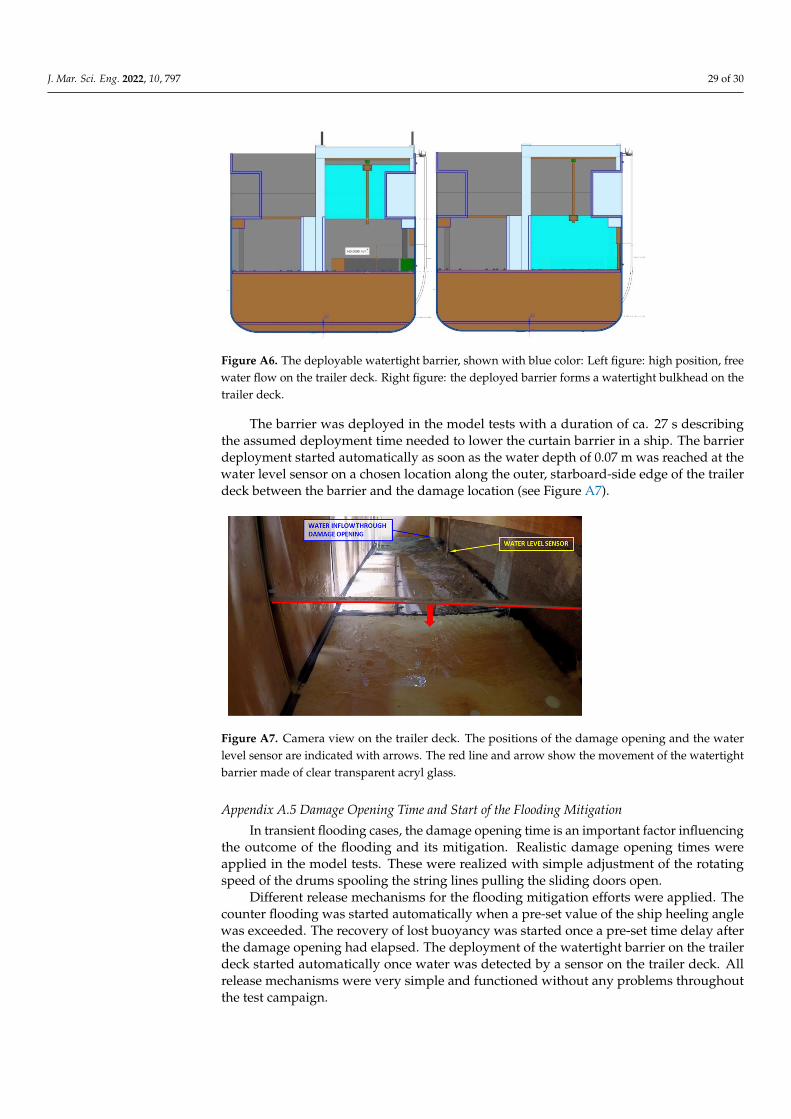
J. Mar. Sci. Eng. 2022, 10, 797 29 of 30
J. Mar. Sci. Eng. 2022, 10, x FOR PEER REVIEW 30 of 31
Appendix A.4. Deployment of a Watertight Barrier on the Trailer Deck
A further test series of a mitigation effort with a rapidly deployable watertight barrier
against floodwater spreading on the trailer deck of the MT RoPax was carried out in model
scale with the physical ship model. The deployable curtain barrier on the trailer deck of
the RoPax ship was realized in the physical scale model with an acryl glass sheet moving
vertically in a housing placed on the trailer deck. The smooth descending motion of the
acryl glass barrier was realized with a linear actuator with a spindle drive (see Figure A6).
Figure A6. The deployable watertight barrier, shown with blue color: Left figure: high position, free
water flow on the trailer deck. Right figure: the deployed barrier forms a watertight bulkhead on
the trailer deck.
The barrier was deployed in the model tests with a duration of ca. 27 s describing the
assumed deployment time needed to lower the curtain barrier in a ship. The barrier de‐
ployment started automatically as soon as the water depth of 0.07 m was reached at the
water level sensor on a chosen location along the outer, starboard‐side edge of the trailer
deck between the barrier and the damage location (see Figure A7).
Figure A7. Camera view on the trailer deck. The positions of the damage opening and the water
level sensor are indicated with arrows. The red line and arrow show the movement of the watertight
barrier made of clear transparent acryl glass.
Appendix A.5. Damage Opening Time and Start of the Flooding Mitigation
In transient flooding cases, the damage opening time is an important factor influenc‐
ing the outcome of the flooding and its mitigation. Realistic damage opening times were
applied in the model tests. These were realized with simple adjustment of the rotating
speed of the drums spooling the string lines pulling the sliding doors open.
Figure A6. The deployable watertight barrier, shown with blue color: Left figure: high position, freewater flow on the trailer deck. Right figure: the deployed barrier forms a watertight bulkhead on thetrailer deck.
The barrier was deployed in the model tests with a duration of ca. 27 s describingthe assumed deployment time needed to lower the curtain barrier in a ship. The barrierdeployment started automatically as soon as the water depth of 0.07 m was reached at thewater level sensor on a chosen location along the outer, starboard-side edge of the trailerdeck between the barrier and the damage location (see Figure A7).
J. Mar. Sci. Eng. 2022, 10, x FOR PEER REVIEW 30 of 31
Appendix A.4. Deployment of a Watertight Barrier on the Trailer Deck
A further test series of a mitigation effort with a rapidly deployable watertight barrier
against floodwater spreading on the trailer deck of the MT RoPax was carried out in model
scale with the physical ship model. The deployable curtain barrier on the trailer deck of
the RoPax ship was realized in the physical scale model with an acryl glass sheet moving
vertically in a housing placed on the trailer deck. The smooth descending motion of the
acryl glass barrier was realized with a linear actuator with a spindle drive (see Figure A6).
Figure A6. The deployable watertight barrier, shown with blue color: Left figure: high position, free
water flow on the trailer deck. Right figure: the deployed barrier forms a watertight bulkhead on
the trailer deck.
The barrier was deployed in the model tests with a duration of ca. 27 s describing the
assumed deployment time needed to lower the curtain barrier in a ship. The barrier de‐
ployment started automatically as soon as the water depth of 0.07 m was reached at the
water level sensor on a chosen location along the outer, starboard‐side edge of the trailer
deck between the barrier and the damage location (see Figure A7).
Figure A7. Camera view on the trailer deck. The positions of the damage opening and the water
level sensor are indicated with arrows. The red line and arrow show the movement of the watertight
barrier made of clear transparent acryl glass.
Appendix A.5. Damage Opening Time and Start of the Flooding Mitigation
In transient flooding cases, the damage opening time is an important factor influenc‐
ing the outcome of the flooding and its mitigation. Realistic damage opening times were
applied in the model tests. These were realized with simple adjustment of the rotating
speed of the drums spooling the string lines pulling the sliding doors open.
Figure A7. Camera view on the trailer deck. The positions of the damage opening and the waterlevel sensor are indicated with arrows. The red line and arrow show the movement of the watertightbarrier made of clear transparent acryl glass.
Appendix A.5 Damage Opening Time and Start of the Flooding Mitigation
In transient flooding cases, the damage opening time is an important factor influencingthe outcome of the flooding and its mitigation. Realistic damage opening times wereapplied in the model tests. These were realized with simple adjustment of the rotatingspeed of the drums spooling the string lines pulling the sliding doors open.
Different release mechanisms for the flooding mitigation efforts were applied. Thecounter flooding was started automatically when a pre-set value of the ship heeling anglewas exceeded. The recovery of lost buoyancy was started once a pre-set time delay afterthe damage opening had elapsed. The deployment of the watertight barrier on the trailerdeck started automatically once water was detected by a sensor on the trailer deck. Allrelease mechanisms were very simple and functioned without any problems throughoutthe test campaign.

J. Mar. Sci. Eng. 2022, 10, 797 30 of 30
References1. Vassalos, D.; Paterson, D. Reconfiguring Passenger Ship Internal Environment for Damage Stability Enhancement. J. Mar. Sci.
Eng. 2020, 8, 693. [CrossRef]2. Söding, H. Leckstabilität im Seegang; Institut für Schiffbau der Universität Hamburg, Bericht Nr. 429: Hamburg, Germany, 1982.3. Söding, H. Simulation of the Motions of Damaged Ships in Waves; DCAMM Ph.D.-Course Stability of Ships: Lyngby, Denmark, 2002.4. Söding, H.; Schigunov, V.; Zorn, T.; Soukup, P. Method Rolls for Simulating Roll Motions of Ships, Ship Technology Research 60(2);
University of Duisburg-Essen: Duisburg, Germany, 2013; pp. 70–84.5. Valanto, P. Numerical Models—HSVA Rolls; EU-Project Flooding Accident Response (FLARE) Deliverable D4.1: Bremen, Germany,
2020; Volume 2.6. Kujanpää, J. Sample Ship No. 6; Deliverable D2.1.6; FLARE: Bremen, Germany, 2019.7. Ruponen, P.; Valanto, P.; Acanfora, M.; Dankowski, H.; Lee, G.J.; Mauro, F.; Murphy, A.; Rosano, G.; van’t Veer, R. Results of an
international benchmark study on numerical simulation of flooding and motions of a damaged ropax ship. Appl. Ocean. Res.2022, 123, 103153. [CrossRef]
8. Valanto, P. Simulation Input for Mitigation of Flooding in WP6, FLARE Deliverable D4.5, Appendix 10 by H. Weede; FLARE: Bremen,Germany, 2021.
9. Lee, G.J. Dynamic orifice flow model and compartment models for flooding simulation of a damaged ship. Ocean. Eng. 2015, 109,635–653. [CrossRef]