vehicular ad hoc network: flooding and routing protocols for ...
245
V EHICULAR A D HOC N ETWORK :F LOODING AND ROUTING P ROTOCOLS FOR S AFETY &MANAGEMENT A PPLICATIONS Dem Fachbereich Produktiontechnik der UNIVERSITÄT BREMEN zur Erlangung des Grades Doktors-Ingenieur genehmigte Dissertation von M.Sc. Kishwer Abdul Khaliq Hauptreferent: Prof. Dr. Jürgen Pannek (Universität Bremen, Germany) Korreferent: Prof. Dr. Nauman Aslam (Northumbria University, Newcastle, United Kingdom) Tag der mündlichen Prüfung: 02.07.2019
-
Upload
khangminh22 -
Category
Documents
-
view
0 -
download
0
Transcript of vehicular ad hoc network: flooding and routing protocols for ...

VEHICULAR AD HOC NETWORK: FLOODING AND ROUTING
PROTOCOLS FOR SAFETY & MANAGEMENT APPLICATIONS
Dem Fachbereich Produktiontechnikder
UNIVERSITÄT BREMEN
zur Erlangung des GradesDoktors-Ingenieur
genehmigte
Dissertation
von
M.Sc. Kishwer Abdul Khaliq
Hauptreferent: Prof. Dr. Jürgen Pannek (Universität Bremen, Germany)
Korreferent: Prof. Dr. Nauman Aslam (Northumbria University, Newcastle, United Kingdom)
Tag der mündlichen Prüfung: 02.07.2019


DECLARATION
I assure, that this work has been done solely by me without any further help from othersexcept for the official support by the Dynamics in Logistics (DIL) group, University ofBremen, Germany. The literature used is listed completely in the bibliography.
Bremen, June 2, 2020M.Sc. Kishwer Abdul Khaliq


ZUSAMMENFASSUNG
Vehicular Ad hoc Network: Flooding and Routing Protocols for Safety & ManagementApplications
MSc. Kishwer Abdul KhaliqDr.-Ing.-
Fachbereich ProduktiontechnikUniversität Bremen, Deutschland
2019
Das Vehicular Adhoc Network (VANET) ist eine der Schlüsseltechnologien in einemintelligenten Transportsystem (ITS), um Fragen des Verkehrsmanagements und derStraßenverkehrssicherheit, der Verkehrssteuerung und der Umleitung zur Just-in-time-Erbringung von sicherheitsrelevanten und nicht sicherheitsrelevanten Dienstleistungenim Transport-und Warenverkehr zu lösen. Diese Dissertation befasst sich mit denHerausforderungen des Vehicular Ad-hoc Network, die sich aus der hohen Mobilität derFahrzeuge, ihrer kurzen Kontaktdauer und der Verkehrsüberlastung auf der Straße ergeben.Besondere Aufmerksamkeit bei Vehicular Ad hoc Network Aufgrund der steigenden Anzahlvon Fahrzeugen, des hohen Bandbreitenbedarfs für Anwendungen und der hochdynamischenTopologie erfordern die Verfahren zur Informationsverbreitung, die als Flooding undRouting für eine zuverlässige und zeitnahe Datenbereitstellung bekannt sind. Obwohldie in der Literatur vorgeschlagenen Protokolle die Leistungsfähigkeit von Flooding imFahrzeugumfeld verbessern, gibt es immer noch Probleme hinsichtlich der Erreichbarkeitvon Warnmeldungen, der hohen Auslastung der Netzwerkressourcen durch redundanteDatenübertragung und der effizienten und zuverlässigen Datenbereitstellung. InsbesondereSicherheits- und Notfallanwendungen erfordern eine schnelle Informationszustellung.Diese Arbeit schlägt einen einfachen hybriden Flooding-Mechanismus (Reliable IntelligentFlooding Mechanism, RIFM) vor, bei dem lokale Informationen und Standorte verwendetwerden, um einen nächsten Akteur zur Informationsweiterleitung auszuwählen, dereine effiziente und zuverlässige Datenlieferung gewährleistet. Um die Leistung desvorgeschlagenen Flooding-Mechanismus zu analysieren, wurde er mit Hilfe des Veins-Frameworks implementiert und für Stadt- und Straßenszenarien untersucht. Der entwickelte
III

ZUSAMMENFASSUNG IV
Mechanismus erzeugt keinen zusätzlichen Aufwand für die Erfassung lokaler Informationenund sorgt für Effizienz in Form von geringem Aufwand, reduzierter Datenredundanz undreduzierter Verzögerung.In einer Vielzahl von Artikeln wurden Routing-Protokolle vorgeschlagen, um denAnforderungen von Sicherheits-, Management- und anderen Anwendungen gerecht zuwerden, wobei diese Protokolle nach mehreren Kriterien kategorisiert werden können.Diese Arbeit kategorisiert sie auf der Grundlage der Routing-Technik und vergleichtsie. In der Literatur wird oft argumentiert, dass Topologie-Routing-Protokolle in einerFahrzeugumgebung nicht geeignet sind, und die meisten dieser Protokolle konzentrierensich nur auf spezielle Szenarien. Darüber hinaus wird auch diskutiert, dass die meisten derpositionsbasierten Routing-Protokolle nicht in der Lage sind, die Leistung in Netzwerken mitniedriger Dichte aufrecht-zuerhalten. Nach unserem Wissensstand haben Forschungsstudiengezeigt, dass die in der Literatur vorgeschlagenen Protokolle die Herausforderungenvon Netzwerken nicht ausreichend betrachten, da die Dynamik des Netzwerks nichtberücksichtigt wird. In dieser Dissertation geht es um die Definition eines adaptivenProtokolls, welches Funktionalität der Topologie und positionsbasiertes Routing kombiniert.Ersteres nutzt die Erhaltung der Route, die eine rechtzeitige Informationszustellungsicherstellt, während letztere die Positionsinformationen beinhaltet, die helfen, eineRichtung zum beabsichtigten Ziel zu bestimmen. Da die Aufrechterhaltung der Routenund Wiederherstellungsmechanismen für Verzögerungen im Routing-Verfahren sorgen,berücksichtigt diese Arbeit die Neuausrichtung des Routings auf der Datenverbindungsschicht(Link Layer). Das vorgeschlagene MAC-basierte adaptive Link-Layer-Routing-Protokollist unter Berücksichtigung der Vergleichbarkeit mit Routing-Protokollen in der Literaturund den entsprechenden Performanc-Metri-ken entworfen worden, die mit Hilfe einesmathematischen Modells für Vehicular Ad hoc Networks analysiert werden. Dasvorgeschlagene Routing-Protokoll ist im Veins-Framework implementiert und stellt Effizienzim Hinblick auf rechtzeitige Informationszustellung sicher.Neben der theoretischen Analyse von Anwendungen, die für den Einsatz in einerFahrzeugum-gebung konzipiert sind, und der Darstellung von Flooding- und Routing-Verfahren zur Verbreitung von Sicherheitswarnungen und -meldungen im Netzwerk zurVermeidung von Massenunfällen oder zur Meldung einer Gefahrensituation, beschäftigtsich diese Arbeit auch mit Experimenten zur Validierung der Nutzung von Fahrzeug-Ad-hoc-Netzen mit neuesten Technologien wie Wireless Sensor Network, Internet-of-Thing,Cloud Computing etc. In dieser Forschungsarbeit werden vier Anwendungen zusammenmit einer entsprechenden Ad-hoc-TestBed-Implementierung und -Konfiguration entworfen,wobei jede Anwendung für die Bewältigung eines bestimmten Problems konzipiert ist.Die erste Anwendung zielt darauf ab, den kompletten Entwurf eines Notfallsystems unddie erfolgreiche Implementierung eines Ad-hoc-Testbeds in einer Fahrzeugumgebung zubehandeln. Darüber hinaus bietet es eine praktische Lösung, die für die zuständigen

ZUSAMMENFASSUNG V
Behörden in Katastrophenszenarien nützlich sein kann. Das Ziel der zweiten Anwendungist die Überwachung der Gesundheit älterer Menschen/ und eingeschränkten Personenwährend der Fahrt. Es wird unter Verwendung des Vehicular Ad-hoc-Netzwerks konzipiert,während es das Wireless Body Area Network für die gesundheitsbezogene Datenerfassungund -überwachung nutzt. Diese Prototyp-Anwendung wird auf dem Ad-hoc-TestBedimplementiert und getestet. Das Ziel der dritten Anwendung ist es, einen Unfall in einerFahrzeugumgebung automatisch zu erkennen und angemessen zu reagieren. Es wirdmit Hilfe von On-Board-Sensoren, Internet-of-Things und Fahrzeug-Ad-hoc-Netzwerk-Komponenten entwickelt und implementiert, um Massenunfälle zu vermeiden undrechtzeitig medizinische Hilfe zu erhalten. Darüber hinaus wird es sowohl in Internet-of-Things- als auch in Vehicular Ad-hoc-Netzwerk-basierten Szenarien getestet.Zum Schluss wird eine Erweiterung der oben genannten Anwendung dargestellt, umVerkehrsbehörden zu helfen, Muster bei Verkehrsunfällen und die Gründe dafür zuanalysieren. Die entwickelte Anwendung verwendet Onboard-Sensoren und intelligenteKameras zur Über-wachung und Erkennung von Unfällen, Fahrzeug-Ad-hoc-Netzwerke/Internet-of-Things für den Datenaustausch zwischen Fahrzeugen und Servicepunkten sowieEdge/Clouds Computing zur Datenspeicherung. Jede Anwendung wird im konfiguriertenAd-hoc-Netzwerk getestet und validiert.


ABSTRACT
Vehicular Ad hoc Network: Flooding and Routing Protocols for Safety & ManagementApplications
MSc. Kishwer Abdul KhaliqDr.-Ing.-
Department of Production EngineeringUniversity of Bremen, Germany, 2019
Vehicular Adhoc Network (VANET) is one of the key technologies in an IntelligentTransportation System (ITS) to address issues regarding traffic management and road safety,traffic control and re-routing for just-in-time delivery of services like safety, non-safety,transport and goods. This dissertation addresses the challenges of Vehicular Ad hocNetwork, which arise from the high mobility of the vehicles, their short contact duration andtraffic congestion on road. Due to an increase in the number of vehicles, high bandwidthrequirements for applications, and highly dynamic topology, Vehicular Ad hoc Networkrequires special attention for data dissemination procedures known as flooding and routingfor reliable in-time data delivery. Though the protocols proposed in the literature improvedthe performance of flooding in vehicular environment, however, there are still issuesregarding reachability of the alert messages, high utilization of network resources due toredundant data transmission and efficient reliable data delivery. Especially, the safety andemergency applications require quick data delivery. This study proposes a simple hybridflooding mechanism by using local information and location to select a next-forwarder toprovide an efficient and reliable data delivery, which is called as Reliable Intelligent FloodingMechanism (RIFM). To analyze the performance of the proposed flooding mechanism, itwas implemented in the Veins framework and evaluated for city and highway scenarios.The designed mechanism generates no additional overhead to collect local information andprovides efficiency in terms of low overhead, reduced data redundancy and delay.Many researchers proposed routing protocols in the literature to meet the requirementsof safety, management and others applications, where these protocols can be categorizedusing multiple criteria. This study categorizes them on the basis of routing technique andcompares them. Many researchers argued that topology routing protocols are not suitablein a vehicular environment and most of these protocols focus on a particular scenario.
VI

ABSTRACT VII
Additionally, it is also discussed that most of the position-based routing protocols are unableto maintain performance in the low-density networks. To the best of our knowledge, researchstudies showed that the protocols proposed in the literature do not adequately address thenetwork challenges due to lack of considering the dynamic nature of the network. In thisdissertation, an adaptive protocol is proposed by combining the functionality of topology andposition-based routing. The first uses route maintenance, which ensures on-time delivery,while the latter includes position information, which helps to identify a direction of theintended destination. Since route maintaining and recovery mechanisms add delays to therouting procedure, this study considers the reorientation of routing at the data link layer.The proposed MAC-based adaptive link layer routing protocol is designed by consideringa comparative study of routing protocols available in the literature and of respectiveperformance metrics, which are analyzed using a mathematical model for Vehicular Adhoc Networks. The proposed routing protocol is implemented in the Veins framework andprovides efficiency in term of in-time data delivery.Apart from the theoretical analysis of applications designed to work in a vehicularenvironment, flooding and routing procedures for the dissemination of the safety alertsand messages in the network to avoid chain-crash or notify hazardous situation, thisstudy also deals with experiments to validate the use of Vehicular Ad hoc network withlatest technologies like Wireless Sensor Network, Internet-of-Thing, Cloud Computingetc. In this research study, four applications are designed along with a respective ad hocTestBed implementation and configuration where each application is designed to copewith a particular problem. The first application aims to deal with the complete design ofan emergency response system and successful implementation of an ad hoc TestBed ina vehicular environment. Moreover, it offers a practical solution that can be useful forthe concern authorities in catastrophic disaster scenarios. The objective of the secondapplication addresses monitoring the health of an elderly/special people while driving. It isdesigned by using Vehicular Ad hoc network, whereas it uses Wirelss Body Area Networkfor health-related data gathering and monitoring. This prototype application is implementedand tested on the ad hoc TestBed. The objective of third application is to detect and managean accident automatically in a vehicular environment. It is designed and implementedusing on-board sensors, Internet-of-Things and Vehicular Ad hoc Network to avoid chaincrashes and get in-time medical assistance. Moreover, it is tested in both Internet-of-Thingand Vehicular Ad hoc Network based scenarios. Last, an extended work of the previousmentioned application is carried out to help the traffic authorities to analyse the patternof road accidents and the reasons behind them. The designed application uses onboardsensors and smart cameras to monitor and detect accidents, Vehicular Ad hoc Network/Internet-of-Things for data sharing among vehicles and service points, and Edge/CloudsComputing for data storage. Each application is tested and validated in the configured adhoc network.

ACKNOWLEDGEMENT
I am extremely grateful to Almighty Allah for providing me the ability to pursue my doctoralstudies. I am highly indebted to my family for their continuous support that made everyopportunity available to me throughout my life.I carried out this research work at the research group of Prof. Dr. Jürgen Pannek, Dynamicsin Logistics (DIL), University of Bremen, Germany.I am cordially thankful to Prof. Dr. Amir Qayyum and Dr. Omer Chughtai for his consistentsupport and valuable suggestions. Additionally, I show my sincere gratitude to Prof. Dr.Jürgen Pannek for support and guidance.Additionally, I am very thankful to master students named Syed Muddasar Raza, AbdullahShahwani and Meghashree for implementation of designed applications and help incollecting results.Moreover, I acknowledge the financial support from the EU programme Erasmus MunduscLINK and Universität Bremen for my doctoral studies. Their financial support made itpossible for me to initiate my doctoral studies. This project has provided me a valuableopportunity to increase my scientific knowledge as well as give me an opportunity to learnInternational cultures. Furthermore, I am sincerely grateful to Dr. Ingrid Rügge for heracceptance, consistent support and guidance at every stage of my doctoral studies. I am alsothankful to my hosting institution, International Graduate School of Dynamics in Logistics(IGS), doctoral training group of LogDynamics, at the University of Bremen.
VIII

I would like to dedicate this work, "To my loving Parents (Abdul Khaliq, Majeeda Khaliq),my loving Parent-in-Law (Niaz Ahmed Khan, Aziza Khatoon), my sweet siblings, my bestfriends Sania Nawaz, Amina Siddiqua and my beloved hubby Toseef Ahmed Khan, whose
continues support, love and prayers assisted me to fulfil my dream.
And above allTo the Almighty Allah!"

CONTENTS
ZUSAMMENFASSUNG V
ABSTRACT VII
LIST OF TABLES XIV
LIST OF FIGURES XVIII
ABBREVIATIONS XXIV
1 INTRODUCTION 11.1 Background and Motivation . . . . . . . . . . . . . . . . . . . . . . . . . . 11.2 Problem Statement . . . . . . . . . . . . . . . . . . . . . . . . . . . . . . 31.3 Dissertation Outline and Contributions . . . . . . . . . . . . . . . . . . . . 5
2 LITERATURE REVIEW OF VANET: ARCHITECTURE, APPLICATIONS,DATA DISSEMINATION 92.1 Overview of VANET . . . . . . . . . . . . . . . . . . . . . . . . . . . . . 92.2 Architecture of VANET . . . . . . . . . . . . . . . . . . . . . . . . . . . . 11
2.2.1 Major Components . . . . . . . . . . . . . . . . . . . . . . . . . . 112.2.2 VANET Protocol Stacks . . . . . . . . . . . . . . . . . . . . . . . 132.2.3 Modes of Communication . . . . . . . . . . . . . . . . . . . . . . 162.2.4 Communication Paradigm in VANET . . . . . . . . . . . . . . . . 17
2.3 Applications of VANET . . . . . . . . . . . . . . . . . . . . . . . . . . . . 182.3.1 Safety Applications . . . . . . . . . . . . . . . . . . . . . . . . . . 192.3.2 Commercial Applications . . . . . . . . . . . . . . . . . . . . . . . 222.3.3 Traffic Management Applications . . . . . . . . . . . . . . . . . . 232.3.4 Eco-friendly Applications . . . . . . . . . . . . . . . . . . . . . . 242.3.5 Health Applications . . . . . . . . . . . . . . . . . . . . . . . . . . 252.3.6 Logistics and Transportation Applications . . . . . . . . . . . . . . 25
2.4 Broadcast Data Dissemination in VANET . . . . . . . . . . . . . . . . . . 312.4.1 Broadcast Data Dissemination in IEEE 802.11p . . . . . . . . . . . 312.4.2 Common Problems in Data Dissemination . . . . . . . . . . . . . . 32
X

CONTENTS XI
2.4.3 Basic Techniques in Data Dissemination . . . . . . . . . . . . . . . 332.4.4 performance Evaluation Metrics . . . . . . . . . . . . . . . . . . . 362.4.5 Comparative Study of Broadcast Data Dissemination . . . . . . . . 372.4.6 Requirement of Broadcast Data Dissemination Protocol . . . . . . . 43
2.5 Routing in VANET . . . . . . . . . . . . . . . . . . . . . . . . . . . . . . 442.5.1 Classification of Routing Protocols . . . . . . . . . . . . . . . . . . 442.5.2 Metrics-based Comparative Study of Routing Protocols . . . . . . . 532.5.3 Requirement of Adaptive Routing Protocol . . . . . . . . . . . . . 57
2.6 Vehicles in Network Simulation (Veins) Framework . . . . . . . . . . . . . 572.6.1 OMNET++ . . . . . . . . . . . . . . . . . . . . . . . . . . . . . . 592.6.2 Simulation of Urban Mobility (SUMO) . . . . . . . . . . . . . . . 59
3 RELIABLE BROADCAST DATA DISSEMINATION MECHANISM 613.1 Background . . . . . . . . . . . . . . . . . . . . . . . . . . . . . . . . . . 613.2 Reliable Intelligent Flooding Mechanism (RIFM) . . . . . . . . . . . . . . 63
3.2.1 Proposed Mechanism . . . . . . . . . . . . . . . . . . . . . . . . . 643.3 Mathematical Model . . . . . . . . . . . . . . . . . . . . . . . . . . . . . 693.4 Simulation and Results Discussion . . . . . . . . . . . . . . . . . . . . . . 69
3.4.1 Defining Threshold for RIFM . . . . . . . . . . . . . . . . . . . . 713.4.2 Evaluation of Proposed Mechanism . . . . . . . . . . . . . . . . . 78
3.5 Summary . . . . . . . . . . . . . . . . . . . . . . . . . . . . . . . . . . . 85
4 MAC-BASED ADAPTIVE LINK LAYER ROUTING PROTOCOL 864.1 Background . . . . . . . . . . . . . . . . . . . . . . . . . . . . . . . . . . 864.2 Reorientation of Routing . . . . . . . . . . . . . . . . . . . . . . . . . . . 884.3 Mathematical Model Based on Selective Performance Metrics . . . . . . . 90
4.3.1 End-to-End Delay . . . . . . . . . . . . . . . . . . . . . . . . . . . 914.3.2 Congestion . . . . . . . . . . . . . . . . . . . . . . . . . . . . . . 934.3.3 Goodput . . . . . . . . . . . . . . . . . . . . . . . . . . . . . . . . 94
4.4 Designing Multi-hop Routing Protocol Framework . . . . . . . . . . . . . 1004.4.1 Terminologies . . . . . . . . . . . . . . . . . . . . . . . . . . . . . 1024.4.2 Assumptions . . . . . . . . . . . . . . . . . . . . . . . . . . . . . 1044.4.3 Proposed Routing Protocol . . . . . . . . . . . . . . . . . . . . . . 1054.4.4 Algorithm for Proposed Routing Mechanism . . . . . . . . . . . . 1084.4.5 Routing Procedure with example . . . . . . . . . . . . . . . . . . . 1084.4.6 Network Participants . . . . . . . . . . . . . . . . . . . . . . . . . 111
4.5 Simulation and Results . . . . . . . . . . . . . . . . . . . . . . . . . . . . 1124.5.1 Simulation Results in Highway Scenario . . . . . . . . . . . . . . . 115
4.5.1.1 Packet Delivery Ratio . . . . . . . . . . . . . . . . . . . 1154.5.1.2 Average Delay . . . . . . . . . . . . . . . . . . . . . . . 118

CONTENTS XII
4.5.1.3 Goodput . . . . . . . . . . . . . . . . . . . . . . . . . . 1194.5.2 Simulation Results in City Scenario . . . . . . . . . . . . . . . . . 120
4.5.2.1 Packet Delivery Ratio . . . . . . . . . . . . . . . . . . . 1204.5.2.2 Average Delay . . . . . . . . . . . . . . . . . . . . . . . 1234.5.2.3 Goodput . . . . . . . . . . . . . . . . . . . . . . . . . . 123
4.6 Summary . . . . . . . . . . . . . . . . . . . . . . . . . . . . . . . . . . . 124
5 EXPERIMENTS AND VALIDATION 1265.1 Emergency Disaster Management System using VANET . . . . . . . . . . 127
5.1.1 Background . . . . . . . . . . . . . . . . . . . . . . . . . . . . . . 1275.1.2 Literature Review . . . . . . . . . . . . . . . . . . . . . . . . . . . 1285.1.3 System Design and Implementation . . . . . . . . . . . . . . . . . 1305.1.4 Implementation . . . . . . . . . . . . . . . . . . . . . . . . . . . . 1345.1.5 Client-Server Model . . . . . . . . . . . . . . . . . . . . . . . . . 1355.1.6 Ad Hoc Routing: Configuration, Scenarios, and Results . . . . . . . 1375.1.7 Configuring BATMAN-ADV Protocol . . . . . . . . . . . . . . . . 1385.1.8 Scenarios and Results . . . . . . . . . . . . . . . . . . . . . . . . . 1385.1.9 Emergency Response System: Real-Time Statistics . . . . . . . . . 1435.1.10 Performance Analysis . . . . . . . . . . . . . . . . . . . . . . . . . 1435.1.11 Summary . . . . . . . . . . . . . . . . . . . . . . . . . . . . . . . 146
5.2 Health Monitoring System for Elderly/Special People using VANET andWBAN . . . . . . . . . . . . . . . . . . . . . . . . . . . . . . . . . . . . . 1475.2.1 Background . . . . . . . . . . . . . . . . . . . . . . . . . . . . . . 1475.2.2 Literature Review . . . . . . . . . . . . . . . . . . . . . . . . . . . 1485.2.3 System Design and Implementation . . . . . . . . . . . . . . . . . 1495.2.4 System Validation . . . . . . . . . . . . . . . . . . . . . . . . . . . 1565.2.5 summary . . . . . . . . . . . . . . . . . . . . . . . . . . . . . . . 160
5.3 Automatic Accident Detection and Emergency Alert System using VANETand IoT . . . . . . . . . . . . . . . . . . . . . . . . . . . . . . . . . . . . 1605.3.1 Background . . . . . . . . . . . . . . . . . . . . . . . . . . . . . . 1605.3.2 Literature Review . . . . . . . . . . . . . . . . . . . . . . . . . . . 1625.3.3 Proposed Application Design and Implementation . . . . . . . . . . 164
5.3.3.1 Selection of Compatible hardware . . . . . . . . . . . . . 1645.3.3.2 Accident Detection Module . . . . . . . . . . . . . . . . 166
5.3.4 Results . . . . . . . . . . . . . . . . . . . . . . . . . . . . . . . . 1695.3.5 Summary . . . . . . . . . . . . . . . . . . . . . . . . . . . . . . . 174
5.4 Road Accidents Detection and Data Collection using VANET, Sensors andEdge/Cloud Computing . . . . . . . . . . . . . . . . . . . . . . . . . . . . 1755.4.1 Background . . . . . . . . . . . . . . . . . . . . . . . . . . . . . . 175

CONTENTS XIII
5.4.2 Literature Review . . . . . . . . . . . . . . . . . . . . . . . . . . . 1785.4.3 Proposed System . . . . . . . . . . . . . . . . . . . . . . . . . . . 1795.4.4 System Implementation . . . . . . . . . . . . . . . . . . . . . . . . 1835.4.5 Summary . . . . . . . . . . . . . . . . . . . . . . . . . . . . . . . 184
6 CONCLUSION AND FUTURE RECOMMENDATIONS 186
BIBLIOGRAPHY 191

LIST OF TABLES
2.1 Active Projects for Transportation in VANET . . . . . . . . . . . . . . . . 272.2 Technical Detailed Requirements of Applications in VANET [1–4] . . . . . 292.3 Comparative Study of Broadcast Data Dissemination on the Bases of
Targeted Problem . . . . . . . . . . . . . . . . . . . . . . . . . . . . . . . 402.4 Comparative Study of Topology-based Routing Protocol . . . . . . . . . . 472.5 Comparative Study of Geographic/Position-based Routing . . . . . . . . . 512.6 Routing Protocols Comparison on the Basis of Selected Parameter . . . . . 55
3.1 Lookup-Table (Maintained at Each Node) . . . . . . . . . . . . . . . . . . 653.2 General Simulation Parameter . . . . . . . . . . . . . . . . . . . . . . . . 713.3 Simulation Scenarios for Defining Threshold . . . . . . . . . . . . . . . . . 733.4 General Simulation Parameter Used for Evaluation . . . . . . . . . . . . . 79
4.1 Simulation Parameters for General, MAC and Physical layer . . . . . . . . 114
5.1 Alert Messages, Their Types, and Transferred Message Codes. . . . . . . . 1325.2 Summary of actions taken by the Server at the Control Room. . . . . . . . . 1335.3 Pulse Rate According to Age . . . . . . . . . . . . . . . . . . . . . . . . . 1555.4 Temperature Reading According to Age . . . . . . . . . . . . . . . . . . . 1555.5 Blood Pressure Categories . . . . . . . . . . . . . . . . . . . . . . . . . . 1555.6 Nodes Used in Test Scenario . . . . . . . . . . . . . . . . . . . . . . . . . 157
XIV

LIST OF FIGURES
1.1 Vehicular Ad hoc Networks (VANET) . . . . . . . . . . . . . . . . . . . . 21.2 Abstract View of Dissertation . . . . . . . . . . . . . . . . . . . . . . . . . 6
2.1 VANETs System Domain . . . . . . . . . . . . . . . . . . . . . . . . . . . 122.2 Protocol Family in IEEE WAVE Architecture . . . . . . . . . . . . . . . . 142.3 Protocol Stack of ISO CALM Architecture . . . . . . . . . . . . . . . . . . 152.4 C2CNET Architecture by C2C-CC . . . . . . . . . . . . . . . . . . . . . . 152.5 Key Functions . . . . . . . . . . . . . . . . . . . . . . . . . . . . . . . . . 162.6 Different Communication Paradigm . . . . . . . . . . . . . . . . . . . . . 182.7 Family Tree of VANET Applications . . . . . . . . . . . . . . . . . . . . . 192.8 An Accident Scenario using flooding Mechanism . . . . . . . . . . . . . . 372.9 Taxonomy of Information Routing Protocols of VANET . . . . . . . . . . . 452.10 Veins Functionality with OMNET++ and SUMO . . . . . . . . . . . . . . 58
3.1 Flowchart of the Proposed Message Dissemination Procedure usingVehicular Environment . . . . . . . . . . . . . . . . . . . . . . . . . . . . 66
3.2 Example of Proposed Flooding Mechanism . . . . . . . . . . . . . . . . . 673.3 Bremen (Germany): Taken Map for City Simulation Scenarios . . . . . . . 713.4 Bremen: Taken Map for Highway Simulation Scenarios . . . . . . . . . . . 723.5 Simulation of City Scenario with 60 Nodes . . . . . . . . . . . . . . . . . . 723.6 Simulation of Highway Scenario with 60 Nodes . . . . . . . . . . . . . . . 733.7 Reachability in City Scenario on Varying Communication and Counter
Threshold . . . . . . . . . . . . . . . . . . . . . . . . . . . . . . . . . . . 743.8 Received Messages for City Scenario . . . . . . . . . . . . . . . . . . . . . 753.9 Received Messages for Highway Scenarios . . . . . . . . . . . . . . . . . . 763.10 Number of Retransmitting Nodes in City Scenario . . . . . . . . . . . . . . 763.11 Number of Retransmitting Nodes in Highway Scenario . . . . . . . . . . . 773.12 City Scenario: Total Received Messages in Varying Network Density . . . . 803.13 City Scenario: No. of Retransmitting Nodes in Varying Network Density . . 813.14 City Scenario: Reachability in Varying Network Density . . . . . . . . . . 813.15 City Scenario: Busy Time of The Network in Varying Network Density . . 823.16 Highway Scenario: Total Received Messages in Varying Network Density . 833.17 Highway Scenario: No. of Retransmitting Nodes in Varying Network Density 83
XV

LIST OF FIGURES XVI
3.18 Highway Scenario: Reachability in Varying Network Density . . . . . . . . 843.19 Highway Scenario: Busy Time of The Network in Varying Network Density 84
4.1 Proposed Move of path Determination Mechanism at Layer 2 . . . . . . . . 894.2 M/M/1 System representing a node n œ N . . . . . . . . . . . . . . . . . . 914.3 Series of M/M/1 System representing a connection C œ G . . . . . . . . . . 914.4 Increasing Trend of the ETE Delay by Varying the Number of Hops (hop
count) . . . . . . . . . . . . . . . . . . . . . . . . . . . . . . . . . . . . . 964.5 Increasing Trend of the ETE Delay by Varying the Number of Neighbors
(Node Density) . . . . . . . . . . . . . . . . . . . . . . . . . . . . . . . . 964.6 Increasing Trend of the ETE Delay by Varying the Packet Size . . . . . . . 974.7 Behavior of Goodput Vs. Hop Count . . . . . . . . . . . . . . . . . . . . . 984.8 Behavior of Goodput Vs. the Number of Neighboring Nodes . . . . . . . . 984.9 Behavior of Goodput Vs Packet Size . . . . . . . . . . . . . . . . . . . . . 994.10 Different Behaviors of the Network with Respect to Data Traffic . . . . . . 1004.11 Framework of Proposed Routing Protocol . . . . . . . . . . . . . . . . . . 1024.12 Flow Chart of Proposed Routing Protocol . . . . . . . . . . . . . . . . . . 1064.13 Procedure of Proposed Routing Protocol . . . . . . . . . . . . . . . . . . . 1084.14 Simulation Map for Highway Scenario: Stretch of Highway on A111, Berlin 1134.15 Simulation Map for City Scenario: Region of Moabit, Berlin . . . . . . . . 1144.16 Highway Simulation Packet Delivery Ratio (%) for MAC-ALLRP, GPSR
and AODV with Respect to Packet Inter-arrival Time (sec) . . . . . . . . . 1164.17 Highway Simulation Packet Delivery Ratio (%) for MAC-ALLRP, GPSR
and AODV with Respect to Number of Source Node (Number of parallelFlows) . . . . . . . . . . . . . . . . . . . . . . . . . . . . . . . . . . . . . 118
4.18 Highway Simulation Delay (ms) for MAC-ALLRP, GPSR and AODV withRespect to Packet Inter-arrival Time (sec) . . . . . . . . . . . . . . . . . . 119
4.19 Highway Simulation Goodput (Mbps) for MAC-ALLRP, GPSR and AODVwith Respect to Packet Inter-arrival Time (sec) . . . . . . . . . . . . . . . . 120
4.20 City Simulation Packet Delivery Ratio (%) for MAC-ALLRP, GPSR andAODV with Respect to Packet Inter-arrival Time (sec) . . . . . . . . . . . . 121
4.21 City Simulation Packet Delivery Ratio (%) for MAC-ALLRP, GPSR andAODV with Respect to Number of Source Node (Number of parallel Flows) 122
4.22 City Simulation Delay (ms) for MAC-ALLRP, GPSR and AODV withRespect to Packet Inter-arrival Time (sec) . . . . . . . . . . . . . . . . . . 123
4.23 City Simulation Goodput (Mbps) for MAC-ALLRP, GPSR and AODV withRespect to Packet Inter-arrival Time (sec) . . . . . . . . . . . . . . . . . . 124
5.1 Emergency Response Plan in Disaster Scenario . . . . . . . . . . . . . . . 1315.2 An Example of Inserting Data at the Client Interface. . . . . . . . . . . . . 132

LIST OF FIGURES XVII
5.3 Hardware Used in Designing an Emergency Response System . . . . . . . 1355.4 Graphical User Interface (GUI) on Server-side . . . . . . . . . . . . . . . . 1375.5 List of all Available Connections through the wlan0 Interface . . . . . . . . 1385.6 One-to-One TCP Communication Between the User and Control Room . . 1395.7 Message Traversing using Multi-hop Communication where Single
Intermediate Hop (40 : 9b : cd : 00 : 5a : 85) Involved . . . . . . . . . . . . 1395.8 Total Travel Time for the Packet is the Sum of Both the Hops . . . . . . . . 1405.9 Multi-hop Scenario Involved Three Intermediate Nodes. . . . . . . . . . . . 1405.10 Link Quality for Single Intermediate Hop Scenario . . . . . . . . . . . . . 1405.11 Trace Route at Server for a Node with MAC Address 40 : 9b : cd : 00 : 5a : 501415.12 The Dynamic Nature of Mobile Users, Indicated through the "batctl" traceroute1415.13 The Same Next-hop for all Five Available Users . . . . . . . . . . . . . . . 1425.14 Dynamism of Routing Protocol in Different Test-cases . . . . . . . . . . . 1425.15 Emergency Response System—the Status of the Inventory after Receiving
200 Queries from the Disaster Area. . . . . . . . . . . . . . . . . . . . . . 1445.16 Emergency Response System—the Level of Disaster in a Particular Area in
Terms of Destruction . . . . . . . . . . . . . . . . . . . . . . . . . . . . . 1445.17 Round Trip Time (RTT) vs Hop Count . . . . . . . . . . . . . . . . . . . . 1455.18 The Trend of Packet Delivery Ratio (%) with Increasing Hop Count . . . . 1455.19 Comparison of Delay with Increasing Hop Count . . . . . . . . . . . . . . 1465.20 Proposed System Design . . . . . . . . . . . . . . . . . . . . . . . . . . . 1505.21 Temperature And Pulse Sensors . . . . . . . . . . . . . . . . . . . . . . . 1515.22 Patient Node: Smart-kit Component Developed for Patient . . . . . . . . . 1525.23 Block Diagram of Application To Indicate the Flow of all Modules . . . . . 1535.24 Flow of Each Sensor Modules Used In Application . . . . . . . . . . . . . 1545.25 Emergency Triggering Module: Action taken based on the Fetched
Information from Each Module . . . . . . . . . . . . . . . . . . . . . . . . 1565.26 Display Window: Message Received At The hospital Node . . . . . . . . . 1565.27 General One Hop Scenario . . . . . . . . . . . . . . . . . . . . . . . . . . 1575.28 Routing Table At 85 . . . . . . . . . . . . . . . . . . . . . . . . . . . . . . 1575.29 Routing Table At 5A . . . . . . . . . . . . . . . . . . . . . . . . . . . . . 1575.30 Patient Node With Relay Nodes . . . . . . . . . . . . . . . . . . . . . . . . 1585.31 Traceroute And Originator Result To The Farthest Node . . . . . . . . . . . 1585.32 Complete System Set Up . . . . . . . . . . . . . . . . . . . . . . . . . . . 1595.33 Traceroute and Originator Result for Complete System . . . . . . . . . . . 1595.34 Differing TTL With Varying Position . . . . . . . . . . . . . . . . . . . . . 1595.35 Population and Road Traffic Deaths by Country Income [5] . . . . . . . . . 1615.36 Expected Application Scenario . . . . . . . . . . . . . . . . . . . . . . . . 165

LIST OF FIGURES XVIII
5.37 A System Design: The Placement of Hardware and Flow of AccidentDetection and Emergency Service in Vehicular Environment . . . . . . . . 165
5.38 Event-based Flow of An Accident Detection Module . . . . . . . . . . . . 1685.39 Measurements Obtained from MPU-6050 . . . . . . . . . . . . . . . . . . 1695.40 Roll-over Detected . . . . . . . . . . . . . . . . . . . . . . . . . . . . . . 1705.41 Collision Detected . . . . . . . . . . . . . . . . . . . . . . . . . . . . . . 1705.42 Noise Detected . . . . . . . . . . . . . . . . . . . . . . . . . . . . . . . . 1715.43 Heart Rate Elevated . . . . . . . . . . . . . . . . . . . . . . . . . . . . . . 1715.44 Drive-Cars for Lab Testing . . . . . . . . . . . . . . . . . . . . . . . . . . 1725.45 Client Application for Vehicles . . . . . . . . . . . . . . . . . . . . . . . . 1735.46 Control Room Initialized . . . . . . . . . . . . . . . . . . . . . . . . . . . 1735.47 Control Room Functionality . . . . . . . . . . . . . . . . . . . . . . . . . 1735.48 Application for Hospitals Initialized . . . . . . . . . . . . . . . . . . . . . 1745.49 Hospital-2 Working . . . . . . . . . . . . . . . . . . . . . . . . . . . . . . 1745.50 An IoT-based Sensor Network Depicting a "Delay Factor" in the Communication
Between Cloud Server and End Users . . . . . . . . . . . . . . . . . . . . 1775.51 A Multi-tier System: The Sensor Network, The Edge Nodes and The Cloud
Server . . . . . . . . . . . . . . . . . . . . . . . . . . . . . . . . . . . . . 1785.52 Proposed System Architecture: Multi-tier Automatic Accident Detection &
Notification System Using IoT-based Vehicular Environment . . . . . . . . 1805.53 Proposed IoT-based Vehicular Testbed System for Automatic Accident
Detection & Notification . . . . . . . . . . . . . . . . . . . . . . . . . . . 181

ABBREVIATIONS
The following abbreviations are used in this dissertation:
AID Adaptive Information DisseminationABSM Acknowledged Broadcast from Static to highly MobileAP Access PointAMB Ad hoc Multi-hop BroadcastA-STAR Anchor-Based Street and Traffic Aware RoutingAODV Ad hoc On-Demand Distance VectorAODV-PGB AODV Preferred Group BroadcastingAU Application UnitsAPI Application Programming InterfaceBATMAN Better Approach To Mobile Ad hoc NetworkingBATMAN-ADV Better Approach To Mobile Ad hoc Networking AdvancedBPM Beats Per MinuteCAREFOR Collision Aware Reliable ForwardingCIF Cluster-based Irresponsible FloodingCOTS Commercial off-the-shelfCPU Central Processing UnitCBF Contention-Based ForwardingCAR Connectivity-Aware RoutingCSMA/CA Carrier-sense multiple access with collision avoidanceC2C-CC Car-to-Car Communication ConsortiumCALM Continuous Communication for VehicularC2CNet Car-to-Car NetCCH Control ChannelCCW Cooperative Collision WarningCARSP Canadian Association of Road Safety and ProfessionalCVSA Cooperative Vehicular Safety ApplicationsCDS Connected Dominating SetCGSR Cluster-head Gateway Switch Routing Protocol
XIX

ABBREVIATIONS XX
CTS Clear to SendCA-HWMP Congestion Avoidance Hybrid Wireless Mesh ProtocolCCU Central Control UnitDBRS Distance Based Relay SelectionDRG Distributed Robust BroadcastDSRC Direct Short Range CommunicationDPMS Data Dissemination based on MAP SplittingDV-CAST Distributed Vehicular BroadCASTDECA Dual-lEvel Compressed AggregationDSR Dynamic Source RoutingDSDV Destination Sequence Distance VectorDSRC Direct Short-Range CommunicationDS Dominating SetDTN Delay Tolerant NetworkDV Distance VectorDYMO Dynamic MANET On-demandDFR Direction Forward RoutingDIFS DCF Interframe SpacingDCF Distributed Coordination FunctionFDA Drug AdministrationEAEP Edge Aware Epidemic ProtocolEPIC Explicitly Parallel Instruction ComputingEDB Effective Directional BroadcastETE End-to-EndETSI European Telecommunication Standards InstitutesEBW Electric Brake WarningEU European UnionE-HAMC Emergency Help Alert Mobile CloudFPGA Programmable Gate ArrayFSR Fisheye State RoutingFCC Federal Communications CommissionGB Gafni-Bertsekas RoutingGPS Global Positioning SystemGUI Graphical User InterfaceGPS-IVC GPS-based Inter Vehicle CommunicationGeoVanet Geocast VANETGRANT Greedy Routing with Abstract Neighbor TableGPSR Greedy Perimeter Stateless RoutingGyTAR Greedy Traffic Aware Routing

ABBREVIATIONS XXI
GPCR Greedy Perimeter Coordinator RoutingGSR Geographic Source RoutingGSM Global System for Mobile communicationGEOADV-PF Geographic Ad hoc On-Demand Distance Vector with Predictive elements and Fuzzy
LogicGoPiGo General Purpose Input OutputGPIO General Purpose Input/OutputHBES Hybrid-based Election BackboneHARP Hybrid Ad Hoc Routing ProtocolHSs Hot-SpotsHALL High Availability and Low LatencyHSLS Hazy Sighted Link State RoutingHSR Hierarchical State RoutingHD High DefinitionHTML Hyper Text Markup LanguageHTTP Hyper Text Transfer ProtocolID IdentityI2I Infrastructure-Infrastructure communicationIBSS Independent Basic Service SetILS Indoor Localization SystemIECS Integrated Emergency Communication SystemIESS Integrated Emergency Service SystemIF Irresponsible FloodingITS Intelligent Transport SystemsIVG Inter Vehicle GeocastIoT Internet of ThingsIVC Inter Vehicle CommunicationIVD inter-vehicle distance (IVD)IEEE Institute of Electrical and Electronic EngineeringISO Internationale Standard OrganizationIARP Intrazone Routing ProtocolIC Integrated CircuitICMP Internet Control Message ProtocolIMU Inertial Measurement UnitIoV Internet of vehiclesJSON Java Script Object NotationLOS Line-of-SightLDMB Link-based Distributed Multi-hop BroadcastLOUVRE Landmark Overlays for Urban Vehicular Routing Environments

ABBREVIATIONS XXII
LCW Lane-Change AssistanceLQSR Link Quality Source RoutingLMR Lightweight Mobile RoutingLTE Long Term EvolutionMAC Medium Access ControlMAC-ALLRP MAC-Based Adaptive Link Layer Routing ProtocolMANET Mobile Ad hoc NetworkMAPs Mesh Access PointsMCs Mesh ClientsMHVB Multihop Vehicular BroadcastMCF Multi-cast Carry and ForwardMPARP Mobility Pattern-Aware Routing ProtocolMMRP Mobile Mesh Routing ProtocolNPPB Nth Power P-persistent BroadcastNCAS Network Coding Assisted SchedulingOSI Open Systems InterconnectionOBU On-Board UnitOS Operating SystemOSI Open Systems InterconnectionOAPB Optimized Adaptive Probabilistic BroadcastOPbG Optimized Position-based GossipingOLSR Optimized Link State RoutingOTW On-coming Traffic WarningOFDM Orthogonal Frequency Division MultiplexingOORP Order One Network ProtocolOMNET++ Objective Modular Network Testbed in C++OpenCV Open Source Computer Vision LibraryP2Pnet Peer-to-Peer Communication NetworkPDAs Personal Digital AssistantsP/S/G-SAB Speed Adaptive BroadcastPPA Push/Pull-based AgencyPRB-DV Position-Based Routing with Distance VectorPREQ Path RequestPREP Path ReplyPERR Path ErrorP2V Pedestrian-to-VehiclePRW Pedestrian in Roadway WarningPDES Parallel Distributed SimulationPREP-ACK Path Reply Acknowledgment

ABBREVIATIONS XXIII
RNs Relay NodesRTT Round Trip TimePDR Packet Delivery RatioRDBMS Relational Database Management SystemQoS Quality of ServiceRSU Road Side UnitRAM Random Access MemoryRNs Relay NodesRFID Radio-frequency identificationRISED Rescue Information System for Earthquake DisastersRBLSM Reliable Broadcast of Life Safety MessageRBRS Range-based Relay-node SelectionRMDSI Reliable Methods of Disseminating InformationRRD Reliable Route-based Data DisseminationRIFM Reliable Intelligent Flooding MechanismRANN Root AnnouncementAERIS Real-Time Information SynthesisRTS Ready to SendRANN Root AnnouncementSB Smart BroadcastSRD Simple and Robust DisseminationStreetCAST Street broadCASTSTBR Street Topology-Based RoutingSCH Service ChannelsSCF Store-Carry-ForwardSSR Scalable Source RoutingSUMO Simulation of Urban MobilitySIFS Sortest Interframe SpacingSOBU Smart-kit On Board UnitSNR Signal to Noise RationSMS Short Message ServiceTCP Transmission Control ProtocolTCP/IP Transmission Control Protocol/Internet ProtocolTTL Time To LiveTRADE TRAck DEtectionTO-GO Topology-assist Geo-Opportunistic RoutingTORA Temporally-Ordered Routing AlgorithmTBRPF Topology Broadcast based on Reverse-Path ForwardingTRIP Transport Research and Innovation Portal

ABBREVIATIONS XXIV
TRaCI Traffic Control InterfaceUNISDR United Nations Office for Disaster Risk ReductionUV-CAST Urban Vehicle broadCASTUMB Urban Multihop BroadcastUMTS Universal Mobile Telecommunication SystemUDP User Datagram ProtocolUSB Universal Serial BusVANETs Vehicular Adhoc NetworksV2I Vehicle-to-InterfaceV2V Vehicle-to-VehicleV2B Vehicle-to-Broadband CloudV-TRADE Vector-based TRADEVMaSC-LTE Vehicular Multi-hop algorithm for Stable Clustering with LTEVDEB Vehicle-Density-Based Emergency BroadcastVCLCR VANET Cross Link Corrected Routing ProtocolVDTP Vehicular Data Transfer ProtocolVDTP Vehicular Data Transfer ProtocolVoD Video on DemandVoIP Voice over IPVeins Vehicles in Network SimulationWAVE Wireless Access in Vehicular NetworksWBSS WAVE Basic Service SetWBISS WAVE Independent Basic Service SetWMN Wireless Mesh NetworksWSN Wireless Sensor NetworkWRP Wireless Routing ProtocolWHO World Health OrganizationWBAN Wireless Body Area NetworkWRP Wireless Routing ProtocolZHLS Zone-based Hierarchical Link StateZRP Zone routing protocol


1 INTRODUCTION
The purpose of Chapter 1 is to provide background and motivation of the dissertation. Italso gives an overview of the Vehicular Ad hoc Network along with its challenges andstates the problem description. Furthermore, it gives an overview of the dissertation andits contribution.
1.1 BACKGROUND AND MOTIVATION
To enhance human lifestyle and ease humans/goods mobility within or between cities,transportation plays a significant role. Advancement in the field of transportation and anincrease in the population of cities, however, has also lead to traffic congestion in majorcities, where it also has negative impacts on human life. Traffic accidents due to trafficcongestion are one of the leading causes of death by injury [5] [6] [7]. According to theWorld Health Organization (WHO) [5] [6] statistics, around 1.3 million people die everyyear in traffic accidents and additionally, 20-50 million people are severely injured ordisabled for life. Nearly 90 % of the road casualties happen in low and middle-incomecountries due to poor infrastructure and traffic management.
Apart from standard road-safety instructions for drivers, vehicles require a littleintelligence to respond to triggered events (along the way in order) to avoid the roadaccidents to handle post-crash scenarios or to provide a specific applications with the helpof On-Board Units (OBU) [8] [9]. Vehicle OBU includes sensors, other smart devicesand communication modules like GSM, LTE or WiFi. They are used to monitor and storedifferent parameters and process the recorded data to handle particular tasks. VehicularAd hoc Networks (VANETs) [10] is one of the key technology in Intelligent TransportSystems (ITS) for achieving the goals of road safety, traffic management and efficiencydue to its cost-effective deployment and suitable design for vehicular environment [11].It can be considered as spin-off of Mobile Ad hoc Networks (MANETs), but it differs in
1

1.1. BACKGROUND AND MOTIVATION 2
terms of path predictability and speed of nodes. VANET [10] has no central controllingentity and it enables vehicles to communicate to other vehicles and Road Side Units (RSU)wirelessly with the help of OBU. In VANET, wireless nodes can communicate using threemodes: Vehicle-to-vehicle (V2V), Vehicle-to-Infrastructure (V2I) and Infrastructure-to-Infrastructure (I2I). Here, infrastructure refers to roadside units (RSUs) depicted in Figure1.1, and higher order backends. VANET mainly deals with cooperative safety applications,
Fig. 1.1: Vehicular Ad hoc Networks (VANET)
traffic management and other non-safety applications such as multimedia, comfort andinfotainment [12]. Safety messages are usually small in size while multimedia or interactiveapplications (bandwidth-hungry applications) like Video on Demand (VoD), Voice overIP (VoIP), video conferencing, online gaming and file transfer, etc., require less delayand high bandwidth [13]. Currently, VANET uses IEEE 802.11p as MAC (Medium AccessControl) and PHY layer standard, and Carrier-sense multiple access with collision avoidance(CSMA/CA) for channel access at MAC layer. Since IEEE 802.11p was developed for safetyapplications and performed well for these small size packets, simulations have shown that itis unsuitable for real-time and bandwidth-hungry applications in vehicular environment [14].Considering the higher rate of road accidents and traffic congestion due to mismanagement
1.2. PROBLEM STATEMENT 3
of traffic, the need for management and safety applications to fix these issues is at highpriority. Furthermore, requiring highly optimized routes, infotainment and lookup servicesare at user’s top list.Ad hoc network is not only attractive because of ease, low cost and fast deployment butalso because of their design. The concept of a non-centralized design makes it robust,self-controlled and self-organized. Though forming of network “on the fly" is attractive,the challenges to design, optimize and analyze it are formidable. Moreover, with thedeployment of infrastructure, mobility and flexibility, these networks have transformedinto hybrid architectures, which require resource utilization and intelligence for efficiency.Never-the-less, the increased mobility in VANET, though it is in an organized fashion,posed challenges to the existing MAC and routing mechanisms. The involvement of highlymobile, static and mixed node deployment pattern and requirement of Quality of Services(QoS) [15] made it more complicated. In addition to it, the emergence of a wide varietyof new applications, e.g., emergency handling services, car parking, infotainment, theftdetection, safety on road, navigation, law enforcement, fleet management and health careassistance, etc., also requires efficiency and flexibility of any deployed network.To achieve the goal of an efficient, flexible and self-organized network, the researchcommunity targets three types of approaches. First, efficient MAC mechanisms ensure themaximal utilization of a physical resource and send information to upper layers for the QoSprovisioning. Second, efficient routing strategies find the best route between source anddestination and recover a route in case of link failure. Third, efficient designed application tooffer services and provide safety to end-users (drivers, passenger). Performance of the thirddepends upon the first two approaches. MAC and routing mechanisms are not simple todefine for all scenarios. In city, highway and rural areas, ad hoc networks face different typesof challenges. In city environments, obstacles like buildings, trees, etc., and higher numberof nodes cause communication loss and congestion issues. In highway scenarios, vehiclesmove with high speed, and in each lane vehicles move with different speed, which causeslink breakage and formation of new links due to change of neighboring nodes. Consideringmultiple scenarios reveals a broad variation in behavior of the wireless network. Therefore,routing strategies differ for particular scenarios. Apart from the dynamics and challengesof the network, the requirements of applications to fulfill the customer’s needs add morecomplexity into the existing framework.
1.2 PROBLEM STATEMENT
By considering the mentioned network challenges and facts about road safety, there is a needto design and develop a system that can reliably disseminate emergency messages in-time.Moreover, the proposed system should achieve the goals of road safety and management atlow cost. Basically, message (data) dissemination is a process of spreading information over

1.2. PROBLEM STATEMENT 4
a distributed network. At the link layer, it requires broadcast capabilities to transmit frames toall neighboring vehicles in transmission range. It infers the implementation of a mechanismfor data dissemination on the network and transport layer in a multi-hop fashion with V2V,V21 or hybrid communication. In IEEE 802.11p, the broadcasting vehicle does not get anyacknowledgment due to broadcast transmission, hence no reliable retransmissions. Here, aswe mentioned that the emergency and safety-related applications require in-time, reliablemessage delivery with low cost. This cost can be in term of time, overhead or deploymentcost. Furthermore, all the safety-related and management applications do not require thebroadcast data dissemination. Therefore, the destination-base routing can also help in-time message delivery with reduced cost. In this work, on the bases of requirements ofapplications, the main problem is divided into sub-problems. Here, we have subproblems toaddress.
PROBLEM 1
Safety-related and management applications like emergency warnings or alerts containessential information that requires reliable transmission and must be sent within anapplication specific time. There are basic forms of broadcast schemes in ad hoc networkslike flooding, probabilistic, counter, location, cluster, push and pull based etc., to spreadthe information. Here, the flooding mechanism is simplest, and it is also called blind orpure flooding where nodes forward the message as received if it is not destined for itself. Itintroduces the broadcast storm in the network. The situation becomes worst, if an accidentoccurs on the road, the queue of vehicles increases due to blocking of road leads to the highdensity in network. To fulfill the requirements of safety applications, and handle the above-mentioned network problem, it is necessary to introduce an efficient and reliable messagedissemination mechanism. Here, we mainly focus on the following research questions:
• What are the main challenges for reliable information dissemination in the vehicularad hoc network?
• How does the flooding mechanism select the reliable next-hop within the neighborhoodto forward the emergency message?
• How does the flooding mechanism disseminate the emergency message withoutadditional signals and maintenance overhead?
PROBLEM 2
A number of traditional routing [16] and forwarding protocols [17] were proposed forVANET to meet the challenges of such a network along with the application requirements.Many safety and non-safety applications require in-time delivery of information to thedestined node. To cope with the network challenges and need of the applications, it is

1.3. DISSERTATION OUTLINE AND CONTRIBUTIONS 5
required to model the problem to identify the routing metrics and design a routing protocol.Here, we particularly focus on the following research questions:
• What are the main challenges for in-time delivery of emergency messages in networks?
• What are the challenges to re-orient the traditional routing for path selection?
• Is the composite routing metric a better choice to identify the next-hop as compared toa single routing metric?
• How does the routing protocol forward the emergency message in less End-to-End(ETE) delay?
• How does the routing algorithm identify the congested node in the network to increasethe goodput?
• How does the routing algorithm identify the congested node to select the best path?
PROBLEM 3
There are three important factors that can effect on the growth of any company, i.e.,cost, efficiency and availability of the technology. Since VANET offers attractive featureswith low deployment cost and is designed to work in vehicular environment, then it issuitable technology for the mentioned objectives. To check its suitability and feasibility fordifferent applications, experimental development and testing is needed. For each consideredapplication, we focus on the following questions in regard of design and development ofspecific applications.
• What are objectives and suitable scenarios?
• How can designed application help in reducing cost?
• How can the solutions of first two problems be used in designing applications?
1.3 DISSERTATION OUTLINE AND CONTRIBUTIONS
This research work highlights several challenges for VANET, need of applications for thesafety of human and existing issues regarding destination-less and destination-based routingprotocols. It also offers solutions for the listed problems, and implications of technologiesin safety and management applications. An abstract view of the dissertation is presentedin Figure 1.2, which highlights its major contributions to target the problems mentioned inSection 1.2.
The dissertation is structured as followed:

1.3. DISSERTATION OUTLINE AND CONTRIBUTIONS 6
Fig. 1.2: Abstract View of Dissertation

1.3. DISSERTATION OUTLINE AND CONTRIBUTIONS 7
• Chapter 1 briefly converses an overview of the dissertation. Firstly, it highlights thebackground and main motivation of the work. Secondly, it discusses the challenges andproblem statements. Lastly, it presents the structure of the dissertation and contributionin its each chapter.
• Chapter 2 provides an overview of VANET along its challenges, architecture andprotocol stacks. Additionally, it confers the need of applications, their classificationsand technical requirements in vehicular environments. Furthermore, floodingmechanisms proposed in the literature targeting the safety and emergency applicationsare discussed. Moreover, the existing routing protocols in literature are discoursed andthe parameters are enlisted, which are considered to meet the requirements of specificapplications or scenarios. An overview of the factors that affect routing protocols isalso provides. Parts of this work have been published in [18], [19], [20], [21].
• Chapter 3 discusses the need of emergency and safety applications. It furtherincludes the proposed mechanism for message dissemination in VANET. In case ofemergency and safety applications, the reachability of the message is important to thetarget group. Here, it discourses the proof for reachability of the proposed protocol.Additionally, it confers the simulation framework used in the evaluation of the thesis.Furthermore, it also presents the results for the analysis of the proposed floodingmechanisms and summarizes the findings. Parts of this chapter have been publishedin [22] and submitted in [23].
• Chapter 4 argues about the selection of routing metrics from the start-of-the-art. Furthermore, it converses the proposed mathematical model based on theperformance metrics and its validation using simulation. Moreover, it includes thedetails about the design of proposed routing protocol, algorithm and its messagesformats. Additionally, this chapter discusses the performance of the proposed routingprotocol using simulations. The last section of this chapter concludes the research.Parts of this work have been published in [21] and submitted in [24, 25].
• Chapter 5 gives the overview of the design and implementation of applications bycombining VANET with other latest technologies like Wireless Body Area Network(WBAN), Wireless Sensor Network (WSN), Internet of Things (IoT) and CloudComputing. Furthermore, it also discusses the testing of each designed applicationsunder lab conditions. The following applications are presented:
(a) Emergency Disaster Management System using VANET
(b) Health Monitoring System for Elderly/Special People using VANET and WBAN
(c) Automatic Accident Detection and Emergency Alert System using VANET andIoT

1.3. DISSERTATION OUTLINE AND CONTRIBUTIONS 8
(d) Road Accidents Detection and Data Collection using VANET, Sensors andEdge/Cloud Computing
Parts of this chapter have been published in [8, 9, 26–28].
• Chapter 6 concludes the research work and outlines future work.

2LITERATURE REVIEW OF VANET:ARCHITECTURE, APPLICATIONS,DATA DISSEMINATION
This chapter gives an overview of the Vehicular ad hoc Networks (VANET), its architectureand most suitable protocol stack for this research. It also discusses the applications ofVANET ranging from safety to non-safety. Additionally, it gives an overview of on-goingresearch projects of VANET. Moreover, it discusses data dissemination mechanisms in IEEE802.11p and comparison of broadcast based data dissemination mechanisms. Furthermore,it discusses routing protocols, their categorization, comparison and also enlists the parameterthat are used in the selection of a route for data sharing.
2.1 OVERVIEW OF VANET
Vehicular ad hoc networks (VANET) have gained research interest over the past few decadesnot only in research communities, but also in industries because of the advanced developmentof smart wearable devices and wireless communication technologies. VANET is a type ofad hoc network, where the principles of Mobile Ad hoc Network (MANET) are applied toit. In VANET, vehicles act as wireless mobile nodes to communicate with other vehicles androadside units. Like other ad hoc networks, it has no fixed infrastructure or central controllingentity to manage network, instead the participant vehicles are used to provide other networkfunctionality such as routing [29] and flooding [22]. With the advanced development ofvehicles in automotive industries, vehicles are becoming intelligent by on-board unit(OBU)that may include wireless interface, Global Positioning System (GPS), sensors along a smartprocessing unit and smart devices. The data monitored and recorded by the sensors canalso be analyzed and shared within the network by using different communication modesof VANET like Vehicle-to-Vehicle (V2V) or Vehicle-to-Infrastructure(V2I) communication.The shared information using this Inter Vehicle Communication (IVC) could help inmany safety related and traffic management applications e.g., increasing traffic efficiency,detecting road conditions and hazards, avoiding road accidents, traffic light detection and
9

2.1. OVERVIEW OF VANET 10
increasing the overall efficiency of the network. VANET provides multi-hop communication,where vehicles also capable of sending or receiving messages to-and-from vehicles thatare not in direct communication range. However, due to highly mobile vehicles and highspeed, VANET has a quite challenging environment. Therefore, ETE connection cannotbe guaranteed as high mobility may lead to connectivity/dis-connectivity of links betweennodes very often [30]. Despite of having dynamic topology, the movement pattern of thevehicles is not completely random and it can be predicted because it is restricted to the roadson which vehicles travel [31].VANET can be characterized by the following factors:
1. High Mobility: The network is built on the participant vehicles, which are usuallymoving at high speed. However, the speed of the vehicles may vary from region toregion.
2. Dynamic Topology: The high mobility of the vehicles along changing speed, an optionof multiple available paths and change in directions define the dynamic topology of anetwork. Sudden changes in the network topology are difficult to manage [29].
3. Connectivity: Due to high dynamic topology, the wireless links between vehicles(nodes) can connect and disconnect very often, therefore an ETE connection cannot beguaranteed. It may also happen that the links between nodes are broken even beforethey can be utilized.
4. Unbound Network Size: The network size of VANET is geographically unboundbecause it can be implemented in one city or many connected/disconnected cities oreven in several countries [32].
5. Wireless Communication: VANET is designed for the wireless communicationof vehicles. However, certain security challenges are there to tackle securecommunications of the vehicles [33].
6. Time Critical: Since high mobility leads to a dynamic topology, the functionality ofnetwork management is time critical. The information gathering from neighboringvehicles and roadside units is time critical for making a decision either for the networkmanagement or for the application usage.
7. Power: Vehicles are capable of providing sufficient computational and powerresources, thus eliminating the need for energy-aware algorithms. Hence, the nodesare free to exchange data without worrying about the power consumption or storagewastage [34].
8. On Board Sensors: In VANETs, it is assumed that nodes are equipped with onboardsensors that are capable of recording and transmitting information to other nodes ordevices in range [34].

2.2. ARCHITECTURE OF VANET 11
9. Open Network: Any vehicle with ad hoc capability can join or leave the network atany time. These incidents frequently happen on traffic signals, road junctions andhighway/ motorway exits.
10. High Computational Ability: Since there are enough power resources to support thecomputational resources and sensors on board, it has an ability for high computation.
Apart from vehicular ad hoc network challenges like high mobility, volatility, privacyand security, scalability and bootstrap, it also faces challenges in managing the network,congestion and collision control, flooding and routing mechanism design, MAC design,security and environmental effect. This work only focuses on the design of flooding androuting mechanisms, and applications running on the top of it to ensure the safety-relatedand management applications.
2.2 ARCHITECTURE OF VANET
This section explains the system architecture of VANET in detail. It introduces the majorcomponents of VANET from a domain point of view. Furthermore, it also discusses theprotocol stack of VANET along with the modes of communication.
2.2.1 MAJOR COMPONENTS
VANET has several domains, where it works in different communication domain. For thebetter understanding, these main components are categorized into the following three maindomains;
1. Mobile Domain: There are basically two main mobile entities in the network, i.e.,a portable mobile device (smartphones, laptops) and a vehicle (all kind of vehicles).The first entity is used in the mobile domain where the portable device is used forcommunication with other devices while it is moving. The second entity is used invehicle domain where vehicles with ad hoc capability are able to communicate withother vehicles.
2. Generic Domain: This domain is also divided into two further domains, i.e., internetand private infrastructure-based domain. Here, portable devices, management centers,roadside unite (RSU) or servers communicates with one another either using Internetor intranet called internet or private infrastructure domain respectively.
3. Infrastructure-based Domain: This domain is further divided into roadside or centralinfrastructure domains. In case of the first, it is comprised of RSUs like towersdeployed near to roads, traffic lights and speed control/monitor devices like cameraswhile the second includes the management centers or toll plazas [30].

2.2. ARCHITECTURE OF VANET 12
The whole concept explained above is presented in Figure 2.1 [30]. However, thedevelopment of VANET is different in different regions. In [35], authors discussed thereference architecture defined in Car-to-Car Communication Consortium (C2C-CC), whereentities are similar to the one explained in Figure 2.1, but the categorization is different.This reference model is also categorized into three domains: in-vehicle domain, ad hoc andInfrastructure. The details of each domain is explained as follow [35, 36]:
Fig. 2.1: VANETs System Domain
1. In-vehicle Domain: It comprises of OBUs and Application Units (AU) that can beconnected to each other via wired or wireless medium. Application Units are basicallydedicated devices such as laptops or PDA that executes certain applications and utilizeOBUs capabilities for communication.
2. Infrastructure Domain: It has two main entities, i.e., RSUs and hot-spots (HSs). OBUscan connect to the Internet using either RSU or HS. In absence of RSU and HS, OBUs

2.2. ARCHITECTURE OF VANET 13
can also use cellular radio networks (GSM, GPRS, WiMAX, 4G) to communicate witheach other.
3. Ad hoc Domain: Here, vehicles are equipped with OBUs and the RSU are therecounter communication part. OBUs are mobile nodes in an ad hoc network whereasthe RSUs can be seen as static nodes. The major role of an RSU is to improve the roadsafety by forwarding or receiving data to extend the coverage of ad hoc network.
2.2.2 VANET PROTOCOL STACKS
The ITS is also working on the critical issues of road safety and traffic management.In this regard, several proposals have been designed and developed or few are in aprocess of development. Other communities like Institute of Electrical and ElectronicEngineering (IEEE), Car-to-Car Communications Consortium/ GeoNet and InternationaleStandard Organization (ISO) are working on these proposals. The most dominantdesigned for the vehicular environment are Wireless Access in Vehicular Environment(WAVE), Continuous Communication for Vehicular (CALM) and Car-to-Car Net (C2CNet)Architecture proposed by IEEE, ISO and C2C-CC respectively. C2CNet [35]. The approvedfrequency for all of the mentioned standard is the same. It is approved by the US FederalCommunications Commission (FCC) and dedicated 75 MHz of spectrum for Direct Short-Range Communication (DSRC) from 5.850 GHz to 5.925 GHz [1]. The spectrum is dividedinto six Service Channels (SCH) numbered 172,174,176,178, 182, 184 and one ControlChannel (CCH), i.e., 178 where each one is divided into 10MHz bandwidth and entirespectrum into time slots of 50ms [18]. SCH 172 is reserved for High Availability and LowLatency (HALL), and SCH 184 is for high power and public safety. In Europe, this band isregulated by European Telecommunication Standards Institutes (ETSI), and only 172, 174,176, 178 channels are used as SCH and 180 as CCH [37]. The brief description of theseprotocol stacks is as follows;
1. WAVE: It is a complete protocol stack of 1609 protocol family. This family includessix sub-standard named 1909.1,2,3,4,5,6, and each one handles different issues atthe respective layer. This architecture is presented in Figure 2.2 [35]. To handle thenetwork topology, it uses two service sets, i.e., WAVE Basic Service Set (WBSS)and WAVE Independent Basic Service Set (WBISS). WBSS is responsible forthe communication between RSUs and vehicles whereas the WBISS supports thecommunication between two vehicles in a mesh network [18, 38].
2. CALM: The concept is based heterogeneous cooperative communication frameworkwhere it is designed for the communication of vehicles with other vehicles,infrastructure and other interfaces. It recommends Infrared for short and mediumdistances, while for long, it prefers Global System for Mobile communication (GSM),

2.2. ARCHITECTURE OF VANET 14
Universal Mobile Telecommunication System (UMTS) or any other technologyavailable at the physical layer, though these are costly. It has three main components,who handle all management processes, i.e., interface, network and applicationmanager [35] and is presented in Figure 2.3.
3. C2CNET: It is a protocol designed by C2C-CC consortium for safety applications.However, it also destined to be used for non-safety applications. It uses dedicated30MHz bandwidth for only safety application in the 5.935GHz band. It is differentthan IP and provides multi-hop communication-based in geographical addressing androuting. The protocols of this architecture are presented in Figure 2.4.
Fig. 2.2: Protocol Family in IEEE WAVE Architecture
As CALM and C2CNET combine different technologies from 802.11p to UMTS, thereforeimplementing them in a real scenario is not an easy task and currently, no open sourcesimulator supports CALM or C2CNET protocols. WAVE, on the other hand, allows onlyone option at the MAC layer, i.e., 802.11p. It is very suitable for safety application as itis based on the concept of dedicated CCH through which urgent traffic can be prioritized.Moreover, it is the only vehicular protocol with full simulation support [35]. It is a feasibleoption to use WAVE for the implementation, simulation and testing of new research in thearea using its open sources simulators like Veins/OMNeT++, NS2 or NS3.In addition to the IEEE WAVE family of 1909, IEEE expanded the 802.11 protocol familyby adding IEEE 802.11p which is an approved improvisation of IEEE 802.11 standards toenable wireless access in vehicles to build a vehicular network. It focuses on the physical

2.2. ARCHITECTURE OF VANET 15
Fig. 2.3: Protocol Stack of ISO CALM Architecture
Fig. 2.4: C2CNET Architecture by C2C-CC

2.2. ARCHITECTURE OF VANET 16
layer and media access control (MAC) sublayer of the stack, and specification of bothlayers defines in 802.11p-2010 [39]. It also represents a group of standards that functionin the middle layers of the protocol stack to flexibly support safety applications in VANETs,while non-safety applications are supported through another set of protocols. Network layerservices and transport layer services for non-safety applications are provided by three quitestable protocols: IPv6, Transmission Control Protocol (TCP), and User Datagram Protocol(UDP) as depicted in Figure 2.2 [1, 40].
2.2.3 MODES OF COMMUNICATION
VANET allows the communication of participant nodes in four communication modes toachieve the property of fully connected network. The key roles of each communicationmode are shown in Figure 2.5 [41].
Fig. 2.5: Key Functions
1. In-vehicle Communication: As mentioned in Section 2.1, vehicles are equipped withOBU and sensors, which are deployed inside the vehicle for monitoring or controlling

2.2. ARCHITECTURE OF VANET 17
purposes. In-vehicle communication takes place between the OBU and the sensors formonitoring the vehicles performance and drivers condition for safety purposes.
2. Vehicle-to-Vehicle (V2V): This mode of communication is between the vehicles inorder to exchange information and warning messages for driver assistance or safetyapplications.
3. Vehicle-to-Road Infrastructure (V2I): This type of communication mode takes placebetween vehicles to RSU. It is used to get updates of the real-time traffic and weatherinformation to assist drivers. Additionally, they also inform the driver about the speedlimit and provide environmental sensing and monitoring.
4. Infrastructure-to-Infrastructure (I2I): This type of communication mode takes placebetween RSUs. It is used to get updates of the real-time traffic and weather informationto assist drivers. Moreover, it also informs drivers for traffic hazards ahead, so thatdriver can take an alternate route to the destination.
5. Vehicle-to-Broadband Cloud (V2B): It indicates that vehicles can also communicatevia wireless broadband technologies (3G,4G) for online offered services. Thebroadband cloud may provide additional traffic information and monitoring data alongwith infotainment. This type of communication can be useful for driver assistance andvehicle tracking. It also involves an additional costs for mobile data usage.
6. Pedestrian-to-Vehicle (P2V): It indicates that a pedestrian can also communicatewith a vehicle for safety warning while walking or running on the road. A personaltransmission device incorporated into smartphones or infrastructure-based pedestriandetection devices can enable communication between these entities.
2.2.4 COMMUNICATION PARADIGM IN VANET
At the network layer of the TCP/IP reference model, the routing protocol has to implementstrategies that provide a reliable communication without disrupting the basic communicationparadigm. VANET supports different communication paradigms, which can be categorizedas follows:
• Unicast communication: In this paradigm, communication takes place from the dataoriginating node to the destination node via multi-hop wireless communication. It isuseful, when the source node already has the information of the destination node.
• Multicast/Geocast communication: Here, communication takes place from one nodeto a group of nodes at once. The specialized form of multicast addressing is Geocast,where a single data packet is sent to a group of destined nodes in a particulargeographic location, usually relative to the message originating node.

2.3. APPLICATIONS OF VANET 18
• Broadcast communication: In this communication paradigm, a source node sends adata packet to all neighbors at once (One-to-all). The receiving node rebroadcastsit upon reception to deliver the message to the destined nodes. In Section 2.4, theconcept of broadcast communication is discussed in detail. However, some of therouting protocols also use broadcast mechanism in the discovery phase of the bestroute between source and destination node in the unicast communication paradigmwhich will be discussed in Section 2.5.
For the vehicular applications, all mentioned paradigms may be helpful, cf., Figure 2.6.Since, this study focus on safety-related applications, which may include emergencymessages and alerts, therefore it is limited to broadcast and unicast communications.
Fig. 2.6: Different Communication Paradigm
2.3 APPLICATIONS OF VANET
The wide range of applications has been offered by VANET. These are categorizeddifferently in the literature, e.g., authors in [4, 30] divided these into two main categoriesnamed safety and non-safety applications. The first one ensures the on-road safety, whereasthe others are used to provide passengers with information and entertainment in order tomake their journey pleasant [19]. In general, a number of researchers categorized it into threemain groups, i.e., applications for road safety, driver assistance and passengers comfort [37].

2.3. APPLICATIONS OF VANET 19
Fig. 2.7: Family Tree of VANET Applications
In [37], the categorization is carried out on the basis of involved entities and introducedfour families of applications, namely; vehicle-oriented, driver-oriented, passenger-orientedand infrastructure-oriented. Since different applications may have different requirements,it is important to know the delay sensitivity of warning/emergency messages or data andservice provision. Many of these applications like electronic break warning, on-comingtraffic warnings for lane change or overtake, stability of vehicle, pedestrian in roadway,car collision avoiding or accidence detection are time-critical and required quick actionson event, whereas many others may tolerate little delays like infotainment, weatherinformation, internet access or video gaming, etc. Here, we divided these applications intosix main groups presented in Figure 2.7.
2.3.1 SAFETY APPLICATIONS
One of the major goals of VANET is to increase the safety of road users and to providecomfort to the passengers. Safety applications ensure the user’s safety on road by avoidingaccidents and making driving safe by informing the drivers about the hazards and obstacleson the road. These applications may monitor the environment, pattern of traffic, trafficcongestions on roads and warn the drivers [2, 3]. A brief overview of some of the safetyapplications are given below:
1. Real Time Traffic Notification: Real time traffic information can help to drivers for

2.3. APPLICATIONS OF VANET 20
the trip planning. Such applications send traffic status or warnings for the particularregion to the drivers. The run time traffic status can be stored in RSU, where it canbe made available for the vehicles whenever it is needed. The timely availability ofwarnings or status can avoid traffic jams or congestions [42].
2. Cooperative Vehicular Safety Applications (CVSA): There are certain requirementsof warning applications like overtake, electric brake, on-coming traffic, post-crashhandling, collision, lane-change, vehicle stability and pedestrian safety. Therequirements include communication frequency, range and latency, which are 1-50Hz, 50-300m and 20-100ms respectively [1]. To implement these applications,the chosen path prediction routine must satisfy the minimum level of mentionedrequirements. It is also possible that different prediction can be used.
• Electric Brake Warning (EBW): This application generates warning messagesto the driver when a preceding vehicle performs a severe braking maneuver.This application is helpful in a scenario when a host vehicle is unable to seethe braking vehicle due to the presence of other vehicles. An event-basedmessage broadcasts to indicate that the vehicle is undergoing severe braking.The surrounding vehicles may identify the relevance of the event, or ignore themessage if are coming from the opposite direction, ahead or far behind [1, 43].
• On-coming Traffic Warning (OTW): It is used to alert host vehicle about theon-coming traffic during overtaking maneuvers to avoid the collision. Beforeentering into the opposite lane of travel, the application checks the relevantpositioning of the host vehicle and oncoming vehicle in the opposite lane.However, this application is highly dependent on the accurate path predictionof host vehicles (vehicles who are approaching each other) and the remotevehicle [1].
• Post-Crash Alert: In highway/ motorway scenarios, a chain crash is a terriblething to happen due to the high speed of the vehicles. In such scenarios, thevehicles may generate warning messages about the position of an accident toavoid secondary accidents, and emergency alerts to the hospitals for medicalassistance [9, 26]. The neighboring vehicles relay information in the extendedcircle or to the medical center [44–46].
• Cooperative Collision Warning (CCW): Sometimes, it may happen that a driveror pedestrian does not follow the traffic signal seriously and crosses the road byviolating the law. Weather can also affect the road conditions, therefore a fallentree or landslide can also disturb the route. To avoid a collision, the applicationgenerates a warning about the change in route or any other vehicle/obstaclecomes in a way just before the crash, so that the driver can change direction [47].

2.3. APPLICATIONS OF VANET 21
• Lane-Change Assistance (LCW): The vehicle continuously monitors the areabehind the vehicle with the help of onboard sensors and camera while changingthe lane about the vehicles coming behind or in next lane. This application canwork in two modes, i.e., active and passive. In the first case, it only monitors thedistance between vehicles, while in another case, it also warns the vehicles whoare coming too close to slow down or change the direction/lane [44].
• Vehicle Stability Warning (VSW): This application warns the preceding vehiclesabout the requirement of the Vehicular Stability Control (VSC) system. Hostvehicles generate warning messages to prepare for the upcoming hazardousconditions due to weather or disaster like ice, oil or fallen trees on the roadthrough the adaption of own VSC system parameters. They may also generatean alert to inform drivers to prepare for the careful driving in hazardouscondition [1].
• Pedestrian in Roadway Warning (PRW): The collision of a vehicle with apedestrian usually happens when a vehicle turns right or left or crosses a signal.This application enables host-drivers to perceive pedestrians that are outsidethe sight of the driver. This idea relies either on smart phones which maybe incorporated with the personal transmission device or an infrastructure-based pedestrian prediction device where communication take place betweenhost-vehicle and pedestrian for the safe turn in busy city centers [1].
Other examples of safety applications include traffic signal violation, curve speedwarning, emergency brake light, stop sign assist etc.
3. Efficiency Applications: This group of applications aims to improve the mobilityof vehicles within the roads with the help of location awareness of the vehicles, andrequire high availability of information to make correct and secure decisions quickly.Here, it requires V2V or V2I communication mode and can be further classifiedinto two categories due to the complex situations and secure decision making,i.e., crossroads and intersections management, and road congestion managementapplications [47].
• Cross-roads and Intersections Management: These application helps inmanaging smooth and safe traffic flow on public roads. For example, usually,there are two or more traffic flows at intersection scenarios. To avoid collisionwith other vehicles or pedestrians, vehicles should drive carefully. Here, thevirtual traffic lights or warning alerts are sent to the drivers of an impendingcollision, where he can take action accordingly to avoid it. In addition to pathprediction, for both applications, i.e., virtual traffic light and safety warning,there are strict requirements to be taken, particularly constraints related toreal-time traffic information and distributed processing.

2.3. APPLICATIONS OF VANET 22
• Road Congestion Management Applications: With the increase in the populationof cities, the number of vehicles are increasing day-by-day. However, thedeployed road structure and capacity is not directly increasing with the increasein a number of vehicles. A road congestion application is useful in such scenarioswhere it can not only provide the best route to the destination but also figure outthe best timing for traffic lights to maintain the traffic flows along the overallroutes. Eventually, this application can best utilize the road capacity and preventtraffic jams.
4. Road Hazard Control Notification: This application is helpful in V2V/ V2Ienvironment, where vehicles notify to the preceding ones about the road conditionsthat may be destroyed due to weather like land sliding, tree fall or sudden downhilldue to heavy rain. It may also be helpful in other road conditions like blocked-roaddue to work in progress on road or traffic jam due to accident on road [1].
5. Traffic Vigilance: VANET can also be useful to monitor traffic vigilance and offenseswith the help of cameras or vehicle speed monitoring devices that can br deployed withthe RSUs or traffic lights in a particular region [2].
2.3.2 COMMERCIAL APPLICATIONS
Non-safety applications are expected to create commercial opportunities by increasing thenumber of vehicles equipped with onboard wireless devices. Commercial applications areoften add-on services which are usually provided on individual request and bear extra-cost. However, these applications do not require any standardization or any collaborationamong vehicles. Additionally, there are no special real-time requirements, but there is arequirement of guaranteed quality of service for multimedia and entertainment services [30].This category includes parking availability, route diversions, electronic toll collection, digitalmap downloading, value-added advertisement, real-time video relay etc., [13, 48–50].
1. Remote vehicle Personalization/ Diagnostics: Vehicle-hiring with or without driveris also common. It comes with the issues of personal safety or offensive behavior withor from customers. This application helps in installing or downloading personalizedvehicle settings, monitoring the customer’s behavior with drivers and vice versa oruploading of vehicle diagnostics to/from infrastructure [51].
2. Internet Access: Since these applications are based on individual subscription,vehicles can access internet through RSUs, which depends upon the availability ofservice on RSU [4].
3. Digital Maps: Exploring the new areas is becoming easy with the availabilityof digital maps readily available whenever they are needed. These maps can be

2.3. APPLICATIONS OF VANET 23
downloaded using internet facilities or offline navigation systems can assist drivers fortravel guides. Additional valuable contents can also be downloaded with maps fromthe portal to get help in exploring the city or town with tips via mobile hotspots orhome stations [52].
4. Real Time Video Relay: Passengers in vehicles can enjoy the on-demand movieexperience, i.e., Video on Demand (VoD) and neighboring vehicles relay it on behalfof them [13].
5. Value Added Advertisements: Advertisement helps in attracting customers andin expanding businesses. This application is helpful for service providers to makeadvertisements about the offered services like restaurants, CNG stations, Petrol pumpsto the drivers on highways or motorways. These applications can even work withoutinternet [53].
6. Comfort and Infotainment Applications: These are used to entertain customers withservices like downloading or online gaming, etc., and aim to make the journey pleasantfor travelers by providing information support and entertainment. Here, driverscan receive tips from vehicular services to make their trips more comfortable andenjoyable. For example, information about weather, gas stations, local restaurants, citytourist, parking places, city leisure, international services, toll plaza, route navigation,local e-commerce and media downloading, etc., is provided to the travelers and are inthis category. In most of the cases, communication mode is V2I and V2V and doesnot require large bandwidth [49].
7. Interactive entertainment: This category aims to distribute and deliver informationrelated to entertainments to the travelers where it relies on two main features, i.e.,connectivity and reliability. Therefore, the communication may take place in V2Vor V2I mode. In such a dynamic network, the challenge lies in maintaining the upto date information and the synchronization between vehicles and the central server.Examples include distributed games, downloading music and videos, blogs, filesharing, home monitoring and internet surfing etc., and these applications may requireinternet access. The future generation application may be more fascinating wheretravelers can send instant messages among themselves in nearby vehicles or can playgames [49].
2.3.3 TRAFFIC MANAGEMENT APPLICATIONS
This category aims to manage the traffic efficiently. This can also help in maintaining smoothtraffic flow, reduce car collisions/accidents and avoid traffic jam [54].

2.3. APPLICATIONS OF VANET 24
1. Route Diversions: In presence of road congestion, route and trips planning is madeto avoid them.
2. Electronic Toll Collection: This helps in speeding up the process of toll paymentcollection, where the manual collection builds long queue. Electric toll collection takesall information electronically from OBU deployed in vehicles. The OBU includesGPS and on-board odometer or technograph to calculate the traveled distance to adigital map. It also includes GSM to authorized the payment via a wireless link. Thisapplication is equally beneficial for travelers and toll operators.
3. Parking Availability: In metropolitan cities, the availability of parking is one of theissues for drivers. In this regard, notification about availability of parking slots inparking lots can save time of drivers. VANET can help in managing parking lots andplanning routes in case of road traffic jams.
4. Active Prediction: The active information about the topography for the road beforeplanning a trip can help in optimizing fuel usage by adjusting VSC system parameters.VANET helps in dissemination of information that can assist drivers for planning andmanaging trips according to the predicted situation.
5. Traffic Surveillance: VANET also helps in city monitoring and sharing data commoninterest. This network can also be used for environmental monitoring and socialactivities. The synergy of VANET and sensors leads to innovative solutions formonitoring and sensing in urban areas [2].
2.3.4 ECO-FRIENDLY APPLICATIONS
Vehicular applications (for example enhanced route guidance [55] and coordination bylogistics providers, traffic light optimal scheduling, and lane merging assistance by publiccoordinators) are intended to optimize routes [56], while also providing a reduction ofgas emissions and fuel consumption [57]. Real-Time Information Synthesis (AERIS) isresearch program which aims for green transportation with slogan of "Cleaner Air throughSmarter Transportation" [58]. It works in partnership with V2V communications and usestransportation data for the innovative solution to mitigate the negative environmental impactsof surface transportation. This category may also include some productive usage of VANETwhile traveling.
1. Time Utilization: While traveling, availability of internet access can help to travelersto continue to work, e.g., composing an email, internet surfing, rescheduling of tasks.
2. Fuel Saving: The information/notifications received from vehicular network services,the driver can adjust VSC system parameters according to the road condition that help

2.3. APPLICATIONS OF VANET 25
in fuel optimization. Apart from it, for applications like electrical toll collections, bestroute prediction to avoid congestion can save around 3% of fuel.
2.3.5 HEALTH APPLICATIONS
To record and monitor the physical health related information of the patient like bloodpressure, pulse rate, temperature, breathing pattern etc., wearable sensor devices andsmart devices are being used in e-health applications. Further, this data can be sent tocentral monitoring cells or to doctors directly or indirectly via different communicationtechnologies. VANET is one of the feasible solutions for relaying this information while thepatient is traveling [8,59]. Similarly, the synergies of VANET and Wireless Sensor Network(WSN) can also help in finding innovation solutions for accident detection, managementand post-crash notifications [9, 60].
2.3.6 LOGISTICS AND TRANSPORTATION APPLICATIONS
This category helps in managing logistics and transportation, road safety, traffic efficiencyor fleets. Logistics includes the number of activities that ensure the timely availability ofthe right product to the customer and these activities create a bridge between production andconsumption [61]. Two things are important in getting market benefits, i.e., the right time todeliver the product and the right product to deliver the right consumer. To meet the challengeof product-delivery from the production-unit to the market, efficiency in transportation isrequired. The development of automobiles, electronic devices or home appliances requiresdifferent place and time-values. The production of food items, however, shows a short lifespan and requires delivery to market when it is fresh. Research studies also showed that withthe help of new technologies [62–65], the process of logistics and transportation has becomemore flexible.
1. Efficient Traffic Management: It helps not only in managing traffic for onlinedelivery of logistics goods from production units to the distributed points orwarehouses, but it allows automatic traffic control, re-routing the traffic in caseof the traffic congestion [66] for improving just in time delivery and speed limitenforcement. Here, city logistics [67, 68] has three main objective: Firstly, mobilityof traffic to maintain smooth and reliable flow. Secondly, sustainability to makecities more environment friendly. Thirdly, livability which consider risen residenceof elderly people within city. In this regard, VANET can help to design an efficientsolution which will help to maintain information system and also provide road safetywith reduction of the cost [69–71].
2. Disaster Management Applications: Catastrophes cost the loss of human lives andin such circumstances, communication plays a vital role, whereby the consequences

2.3. APPLICATIONS OF VANET 26
of relief tasks assigned to the workers may be streamlined by exchanging necessaryinformation among themselves. Moreover, most of the already deployed communicationnetworks either partially or completely damaged in post-disaster scenarios; therefore,VANET is used to carryout the rescue operations due to quick deployment and lowcost [27].
3. Fleet/convoy Management: Fleet refers to a group of vehicles belonging to a singletransportation system, agency or any business group, e.g., car rental, taxicab, bus,police or military departments and cargo/ mail delivery operators [20]. Both types ofnetworks start their journey from fixed points, move towards different destinationsaccording to particular schedules and converge at some specific distant locationsduring the journey. In this regard, management of vehicles and their navigationinvolves V2V and V2I communications for simple road safety applications and otheradd-on services.
4. Current Transportation Projects: Under the European Commission, a wide varietyof projects for transportation is currently underway. Intelligent Transportation Systems(ITS) [72] aims to develop road safety and traffic management applications. Securevehicular communication, passenger comfort and infotainment are also objectivesof ITS. To generate novel ideas and development of novel technology, the projectTransport Research and Innovation Portal (TRIP), [73] consides of transportationaiming to give an overview of research activities at European Union and Nationallevel. The European Commission also started a project for Transport Research andInnovation in Horizon 2020 [74] to generate ideas for growth of transportation,transport sustainability, seamless mobility and also viewing European Union (EU) as aleader on the globe. Car-2-Car is the project of Car-2-Car Communication Consortium(C2C-CC) [75]. This project aims to contribute to the reduction of deaths in roadaccidents, reduce traffic congestion, improve efficiency and reduce the impact of thetraffic on the environment.Many projects are also running to develop prototypes of VANET for industry.Car-to-car cooperation [76] is a VANET project running in the Aqua-lab ofNorthwestern University. This project aims to provide information and entertainmentto the passengers and automotive safety, and to reduce the impact of traffic onenvironment and smooth traffic flow. The project, Innovative Wireless Technologiesfor Industrial Automation (HiFlecs) [77] in the University of Bremen, developsinnovative wireless technologies for industrial real-time closed-loop applications. Inthe future industry, the wireless technologies allow to connect machinery and controlunits wirelessly. There are different challenges for future Industry 4.0 applicationslike low latency, highly reliability, deterministic, and secure communications. Tomeet these challenges, HiFlecs develop key technologies for an industrial wireless

2.3. APPLICATIONS OF VANET 27
Tab. 2.1: Active Projects for Transportation in VANETProject Purpose OrganizationITS [72] Road safety, Traffic management,
Secure vehicular communication
European
Commission
TRIP [73] Research activities for transportation European
Commission
Horizon 2020 [74] Ideas generation and growth,
sustainability of transport
European
Commission
C2C [75] Fatalities reduction during road
accidents, Improve efficiency, Reduce
impact on environment
C2C-CC
Car-to-Car
cooperation [76]
Automotive safety, Infotainment and
entertainment for passengers, Reduce
traffic impact on environment, Smooth
traffic flow
Aqua-lab,
Northwestern
University
HiFlecs [77] To develop innovative wireless
technologies for industry
University of
Bremen
Intelligent system
and sensors [78]
Control and monitoring of vehicle
behavior, Vehicle guidance,
Navigation and telematics, Driving
assistance and automation
Auto21
Vehicular
communication and
applications [79]
Development and testing of
cost-effective communication
infrastructure, Design of cooperative
control strategies
Interlab,University
of Sherbrook,
Funded by Auto21
CARSP [80] Road safety CARSP
communication system with new functionality and features for real-time controlapplications. ’Intelligent System and Sensors’ [78] is the project of Auto21 for thedevelopment of control and monitoring of vehicle behavior, guidance, navigation,telematics, driving assistance and automation. Another funded project [79] of Auto21 named Vehicle Communications And Applications at the Interlab of University ofSherbrook focuses on the development and testing of cost effective communicationinfrastructure, design of cooperative control strategies and their integration forvehicular communication applications. Last, Canadian Association of Road Safetyand Professional (CARSP) [80] is dedicated to enhance road safety.Table 2.1 gives the summary of the all discussed projects. The objective of most

2.3. APPLICATIONS OF VANET 28
of the projects is to provide road safety or automotive safety. Some projects arefocusing on the monitoring of vehicle behavior and trying to provide solution fordriving assistance. With the increased density of vehicles, some projects are workingto improve the traffic efficiency, reduce their impact on the environment and costeffective communication infrastructure. From the current projects objectives, weconcluded that companies are looking for cost effective, automotive safety andmonitoring solutions to support logistics and general applications with high reliability.
COMPARATIVE STUDY OF APPLICATIONS IN VANET
Each application differs due to nature of the need and scenario. Table 2.2 presents thetechnical detailed requirement of each application discussed in Section 2.3.Each application belongs to certain category and can be periodic (P) or event (E) triggered-based, where the first sends messages periodically while the latter sends notification whenan event is triggered. Furthermore, they can communicate using different communicationmodes, frequencies & ranges, and be constrained to maximal latency requirement. The datapresented in Table 2.2 indicates that the emergency and life critical applications requirequick and reliable delivery of notification/warning to immediate connected nodes and theirneighbors while safety warnings and non-safety messages require reliable delivery not onlyin directly connected nodes, but also to the extended network or to the particular destination.Furthermore, safety, emergency and life critical applications require low latency rangeswithin 20-100ms depending upon the urgency level, whereas infotainment, multimediaand interactive-gaming application may tolerate little delay but require high bandwidth.Therefore, the latter case requires higher frequency band than the first. The communicationoccurs mostly among vehicles or to the RSU for information dissemination, safety servicesand add-on amenities offered in vehicular networks.The provision of these application is challenging, specially when the underlying wirelessnetwork is highly dynamic. If the destination node (vehicle) or RSU is not in communicationrange of the source node (vehicle), multi-hop communication helps to relay the data to thedestination vehicle. The relaying information from source vehicle to the destination vianeighboring vehicles requires a procedure/algorithm which can be categorized into twotypes depending upon the requirements of application. These algorithms are named as:destination-less and destination-based routing. The first are also called broadcast-based datadissemination or flooding which may also involve multi-hop flooding or single-hop flooding,while latter are termed as routing protocols.

2.3. APPLICATIONS OF VANET 29
Tab.
2.2:
Tech
nica
lDet
aile
dR
equi
rem
ents
ofA
pplic
atio
nsin
VAN
ET[1
–4]
App
licat
ion
P/E
Cat
egor
yC
omm
unic
atio
nM
ode
Freq
uenc
yM
axim
umA
llow
able
Late
ncy
Com
mun
icat
ion
Ran
geR
eal-t
ime
Traf
ficN
otifi
catio
nP
Safe
tyI2
V,V
2V10
Hz
1000
ms
250m
Elec
tric-
Bra
keW
arni
ngE
Safe
ty:C
VSA
I2V,
V2V
10H
z20
-100
ms
200m
On-
com
ing
Traf
ficW
arni
ngP/
ESa
fety
:CV
SAV
2V10
Hz
20-1
00m
s30
0m
Post
-cra
shA
lert
ESa
fety
:CV
SAI2
V,V
2V10
Hz
100m
s30
0m
Coo
pera
tive
Col
lisio
nW
arni
ngs
ESa
fety
:CV
SAV
2V50
Hz
20m
s15
0m
Lane
Ass
ista
nce
ESa
fety
:CV
SAI2
V,V
2V10
Hz
20-1
00m
s15
0m
Vehi
cle
Stab
ility
War
ning
ESa
fety
:CV
SAI2
V,V
2V10
Hz
20-1
00m
s30
0m
Pede
stria
nin
Roa
dway
War
ning
ESa
fety
:CV
SAI2
V,V
2V10
Hz
20-1
00m
s15
0m
Cro
ss-r
oad
and
Inte
rsec
tion
War
ning
ESa
fety
I2V,
V2V
10H
z10
0ms
150m
Roa
dC
onge
stio
nM
anag
emen
tP
Safe
tyI2
V,V
2V10
Hz
1000
ms
300m
Haz
ard
Con
trola
ndN
otifi
catio
nE
Safe
tyI2
V,V
2V10
Hz
100m
s30
0m
Traf
ficV
igila
nce
E/P
Safe
tyI2
V10
Hz
100m
s25
0m
Rem
ote
Vehi
cle
Pers
onal
izat
ion/
Dia
gnos
ticP
Com
mer
cial
V2I
,V2V
10-5
0Hz
100-
500m
s30
0m
Inte
rnet
Acc
ess
EC
omm
erci
alI2
V10
Hz
500m
s30
0m
Dig
italM
aps
EC
omm
erci
alV
2I10
-50H
z10
0-50
0ms
300m
Rea
l-tim
eV
ideo
Rel
ayE
Com
mer
cial
I2V,V
2V10
-50H
z10
0-10
00m
s30
0m
Vehi
cula
rAdd
edA
dver
tisem
ent
E/P
Com
mer
cial
I2V
10H
z10
0-50
0ms
150-
300m
Com
fort
and
Info
tain
men
tE
Com
mer
cial
I2V,
V2V
10-5
0Hz
100-
1000
ms
300m
Inte
ract
ive
Ente
rtain
men
tsE
Com
mer
cial
I2V,
V2V
10-5
0Hz
100-
1000
ms
300m
Con
tinue
don
next
page

2.3. APPLICATIONS OF VANET 30
Tab.
2.2
–C
ontin
ued
from
prev
ious
page
App
licat
ion
P/E
Cat
egor
yC
omm
u.M
ode
Freq
uenc
yM
ax.
Allo
wab
leLa
tenc
yC
omm
u.R
ange
Roa
dD
iver
sion
sE
Traf
ficm
anag
emen
tI2
V,V
2V10
Hz
100m
s25
0m
Elec
troni
cTo
llPl
aza
ETr
affic
man
agem
ent
I2V
10H
z50
ms
15m
Park
ing
Ava
ilabi
lity
ETr
affic
man
agem
ent
I2V,
V2V
10H
z10
0ms
300m
Act
ive
Pred
ictio
nP
Traf
ficm
anag
emen
tI2
V,V
2V10
Hz
100m
s50
-300
m
Traf
ficSu
rvei
llanc
eE/
PTr
affic
man
agem
ent
I2V,
V2V
10H
z10
0ms
250m
Tim
eU
tiliz
atio
nE
Eco-
frie
ndly
I2V,
V2V
10-5
0Hz
100-
500m
s30
0m
Fuel
Savi
ngE
Eco-
frie
ndly
I2V
10H
z50
ms
15m
Hea
lthM
onito
ring/
Emer
genc
yha
ndlin
gE/
PH
ealth
App
licat
ions
I2V,
V2V
10H
z20
-100
ms
50-3
00m
Effic
ient
Logi
stic
sM
anag
emen
tP
Logi
stic
and
Tran
spor
tatio
nsI2
V,V
2V10
Hz
100-
1000
ms
150-
250m
Dis
aste
rMan
agem
ent
ELo
gist
ican
dTr
ansp
orta
tions
I2V,
V2V
10H
z10
0-10
00m
s15
0-25
0m
Flee
tMan
agem
ent
PLo
gist
ican
dTr
ansp
orta
tions
I2V,
V2V
10H
z10
0-10
00m
s15
0-30
0m

2.4. BROADCAST DATA DISSEMINATION IN VANET 31
2.4 BROADCAST DATA DISSEMINATION IN VANET
Safety and management applications can be more efficient if data from sensors and othersmart devices from OBU is exchanged among the vehicles to alert drivers on the hazardoussituation. It may help drivers to avoid collisions or any other dangerous situations. Datadissemination is a process of spreading information among the vehicles or between vehicleto RSU over wireless ad hoc networks. Basically, this process requires a broadcastcapability at the data link layer to transmit frames to all connected nodes in its radio rangeand also known as flooding. Furthermore, it assumes the implementation of network andtransport mechanisms to spread information in entire network, where it uses V2I and V2Vcommunication in a multihop fashion. The flooding of these messages can be limited to ageographic region or a certain number of hops depending upon the need of the application.Here, the tasks of flooding mechanism is divided into two levels, i.e., selection of vehiclesto spread information in direct connection at the first level and defining the forwardingprocedure on the next level, to ensure its requirements like reliability, delay.
The current section presents an overview and a comparative study of the existingmechanisms and protocols proposed in the literature to achieve the objective of messagedissemination in vehicular environments. Furthermore, it explains, the process of broadcastat the link layer assuming the IEEE 802.11p standard [10]. We focused on this technologybecause of the standardization and its support in future vehicles [81].
2.4.1 BROADCAST DATA DISSEMINATION IN IEEE 802.11P
In the IEEE 802.11p standard [10], broadcasting mechanisms depend upon the fundamentalcomponents of wireless media like channel used to broadcast, transmission procedure, frameformat and rules to access it.
The protocol stacks have already been discussed in Section 2.2.2, where it is mentionedthat the FCC allocated 75 MHz of radio spectrum of 5.9GHz for DSRC. The spectrum isdivided into six SCH and one CCH. Each channel is of 10MHz within allocated spectrumand offers data rates of 3, 4.5, 6, 9, 12, 18, 24, and 27 Mbps including a preamble of 3Mbp/s and uses Orthogonal Frequency Division Multiplexing (OFDM). CCH is dedicatedto broadcast frames for safety applications and vehicular services while SCHs support bothsafety and user oriented applications [10, 49].
In V2V communication, the source vehicle transmits the broadcast frame (includesbroadcast MAC address (ff:ff:ff:ff:ff)) to all vehicles in the radio range, where these vehiclesreceives the broadcast frame directly. In V2I communication, however, wireless interfaceon OBU should have an association with an RSU before sending it. RSU turns it into abroadcast by setting destination address to broadcast address. The frame format of 802.11pis similar to the 802.11, the only difference is the broadcast address that is mentioned in theframe before transmitting it [82].

2.4. BROADCAST DATA DISSEMINATION IN VANET 32
For the guaranteed transmission, a unicast data sharing requires acknowledgment with aspecified acknowledge frame, i.e., ACK. However, it is not practical to receive ACK in caseof broadcast frame from any of the receivers. If each receiving vehicle acknowledges at thesame time, then it may lead to the high rate of collision due to multiple receivers coexists, andis known as ACK explosion problem. To avoid it, ACK should not sent for broadcast frame.However, in absence of ACKs, the major problem is to detect error in transmission, if thereis any. Consequently, there is no retransmission in case of failure and it is also possible toadapt the congestion window. Due to lack of this information, the simultaneous transmissionmay lead to collision and congestion.
2.4.2 COMMON PROBLEMS IN DATA DISSEMINATION
As mentioned, in IEEE 802.11p, broadcast data dissemination is unreliable. However, safetyapplications rely on these messages as they contain important information where it requiresreliable data transmission within a specified time. Therefore, an algorithm at the above layeris required that can compensate the limitation of IEEE 802.11p and ensure its reliable datadissemination. The basic mechanism is called blind/pure flooding, which has own limitationsand is not suitable for VANET. However, it allows to understand the underlying problems andrequirements to design a suitable dissemination protocol [22, 83, 84]. Few of them are givenas follow:
1. Broadcast Storm Problem: It occurs in ad hoc networks, when blind flooding is used todisseminate the information. In this process, each node forwards the frame as receivedand it continues until the application’s required number of hops or specified area isreached. Therefore, each node participates in flooding, which leads to a flood ofredundant information whose intensity is depending on the density of the network.
2. Network Partition Problem: This problem introduces in ad hoc networks, when thereare low number of network nodes. For example, in other than the peak hours of the ofa day, there is low traffic on streets in both city and highways scenarios. This scenarioleads to the partial connectivity of the network and effects data dissemination. Apartfrom it, signal loss, high or variable speed of vehicles and traffic pattern can alsointroduce it. This problem can be resolved by using the Store-Carry-Forward (SCF)technique, however, it may lead to an unknown delay.
3. Temporal Network Fragmentation Problem: It is temporary as compared to thenetwork partition problem and occurs due to high speed of vehicles where vehiclesare located sparsely and far from one another’s radio range. TA possible solution canbe SCF or a use of vehicles which are outside the area of interest for flooding.
In VANET, a multihop relaying mechanism is used to transmit data beyond thetransmission range. Therefore, the number of retransmissions increases with increase

2.4. BROADCAST DATA DISSEMINATION IN VANET 33
in the node density and leads to inefficient bandwidth utilization and collision, due toredundant data transmission and congestion. It also indicates that the pure flooding approachis not scalable. An intelligent data dissemination mechanism can solve this problem byselecting the next-hop for forwarding in order to limit the number of retransmissions andimprove the scalability.
2.4.3 BASIC TECHNIQUES IN DATA DISSEMINATION
1. Pure/ Blind Flooding: In multi-hop broadcast, the generated warning messages arerelayed by intermediate nodes before reaching the destination node. As discussed inprevious section, the simplest way of disseminating the message in the network is byusing the simple flooding mechanism known as blind/pure flooding. In blind flooding,the node receiving a warning message for the first time rebroadcasts it. The totalnumber of retransmitting nodes is equal to (N ≠ 1) whereas N is the total number ofnodes [85]. Although basic flooding is simple, it has the following drawbacks [22, 86,87]:
• Redundant rebroadcasts: Since every node in the network rebroadcasts themessage, this leads to a huge number of unnecessary retransmissions and everynode receives multiple copies of the message.
• Contention over a broadcast medium: Since each participating node rebroadcaststhe message at least once in the network, nodes must contend with each other toacquire the channel over the broadcast medium.
• Packet collision: The participating nodes in the network contend for theacquisition of the channel to share information. Due to the insufficiency ofthe back-off mechanism and the absence of collision detection, collisions aremore likely to occur, which results in lower packet delivery ratio and increasedlatency. Additionally, re-transmissions of the message occur, which degradesthe performance of the network by experiencing an increase in the End-To-End(ETE) delay.
A number of protocols were proposed to reduce broadcast messages in the network,which included Collision Aware Reliable Forwarding (CAREFOR) [88], MultihopVehicular Broadcast (MHVB) [89], TRAck DEtection (TRADE) [84], Vector-basedTRADE (V-TRADE) [90], Smart Broadcast (SB) [91], Dual-lEvel CompressedAggregation (DECA) [92] etc.
2. Probability-based Technique: These techniques make decision of data forwarding onthe basis of probability. When a vehicle receives a broadcast frame for the first time, itforwards it with the probability of P, whose value is between 0 and 1. When it receivesthe same frame again, it simply discards it to avoid duplicate transmissions. However,
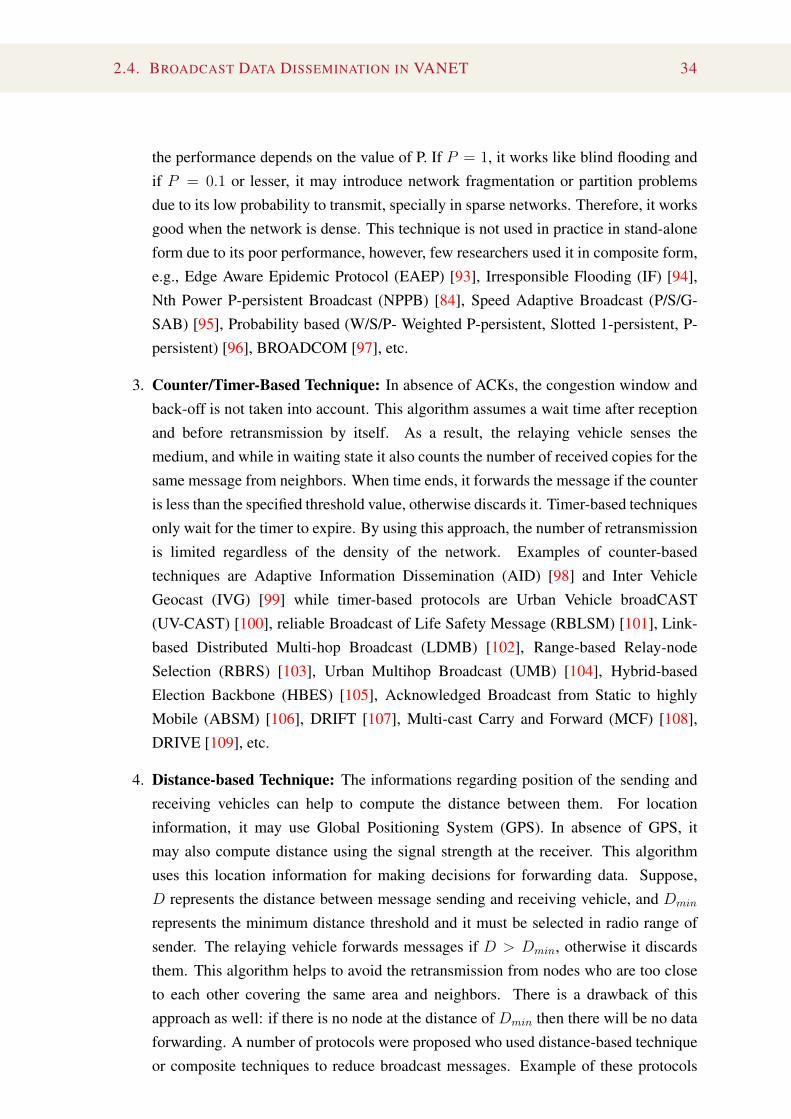
2.4. BROADCAST DATA DISSEMINATION IN VANET 34
the performance depends on the value of P. If P = 1, it works like blind flooding andif P = 0.1 or lesser, it may introduce network fragmentation or partition problemsdue to its low probability to transmit, specially in sparse networks. Therefore, it worksgood when the network is dense. This technique is not used in practice in stand-aloneform due to its poor performance, however, few researchers used it in composite form,e.g., Edge Aware Epidemic Protocol (EAEP) [93], Irresponsible Flooding (IF) [94],Nth Power P-persistent Broadcast (NPPB) [84], Speed Adaptive Broadcast (P/S/G-SAB) [95], Probability based (W/S/P- Weighted P-persistent, Slotted 1-persistent, P-persistent) [96], BROADCOM [97], etc.
3. Counter/Timer-Based Technique: In absence of ACKs, the congestion window andback-off is not taken into account. This algorithm assumes a wait time after receptionand before retransmission by itself. As a result, the relaying vehicle senses themedium, and while in waiting state it also counts the number of received copies for thesame message from neighbors. When time ends, it forwards the message if the counteris less than the specified threshold value, otherwise discards it. Timer-based techniquesonly wait for the timer to expire. By using this approach, the number of retransmissionis limited regardless of the density of the network. Examples of counter-basedtechniques are Adaptive Information Dissemination (AID) [98] and Inter VehicleGeocast (IVG) [99] while timer-based protocols are Urban Vehicle broadCAST(UV-CAST) [100], reliable Broadcast of Life Safety Message (RBLSM) [101], Link-based Distributed Multi-hop Broadcast (LDMB) [102], Range-based Relay-nodeSelection (RBRS) [103], Urban Multihop Broadcast (UMB) [104], Hybrid-basedElection Backbone (HBES) [105], Acknowledged Broadcast from Static to highlyMobile (ABSM) [106], DRIFT [107], Multi-cast Carry and Forward (MCF) [108],DRIVE [109], etc.
4. Distance-based Technique: The informations regarding position of the sending andreceiving vehicles can help to compute the distance between them. For locationinformation, it may use Global Positioning System (GPS). In absence of GPS, itmay also compute distance using the signal strength at the receiver. This algorithmuses this location information for making decisions for forwarding data. Suppose,D represents the distance between message sending and receiving vehicle, and Dmin
represents the minimum distance threshold and it must be selected in radio range ofsender. The relaying vehicle forwards messages if D > Dmin, otherwise it discardsthem. This algorithm helps to avoid the retransmission from nodes who are too closeto each other covering the same area and neighbors. There is a drawback of thisapproach as well: if there is no node at the distance of Dmin then there will be no dataforwarding. A number of protocols were proposed who used distance-based techniqueor composite techniques to reduce broadcast messages. Example of these protocols

2.4. BROADCAST DATA DISSEMINATION IN VANET 35
are Street broadCAST (StreetCAST) [110], SEAD [111], Ad hoc Multi-hop Broadcast(AMB) [112], Distance Based Relay Selection (DBRS) [103], Effective DirectionalBroadcast (EDB) [113], Optimized Adaptive Probabilistic Broadcast (OAPB) [114],MobiCast [115], etc.
5. Location-based Technique: This approach is very similar to the distance-basedtechnique. It also assumes the distance information from the sending vehiclewith the help of GPS or signal strength at the receiver side to be known. Withthis distance, it also assumes to calculate the additional area, which is calledadditional coverage area. If sending and receiving vehicles cover areas J andK respectively, then J
Õ = J ≠ K is the area that does not belong to K. IfJ
Õ is greater than the predefines threshold value, then it forwards the message,otherwise it discards it. However, it is not practical because of the issues incommunications like fading, shadowing, etc. A number of protocols were proposedusing solely concept of location/position information or composite techniques suchas Reliable Route-based Data Dissemination(RRD) [116], Network Coding AssistedScheduling (NCAS) [117], Optimized Position-based Gossiping(OPbG) [118],Reliable Methods of Disseminating Information (RMDSI) [113], Distributed RobustBroadcast (DRG) [119], Mobility Pattern-Aware Routing Protocol (MPARP) [120],AutoCast [121], Simple and Robust Dissemination(SRD) [122] and DistributedVehicular BroadCAST (DV-CAST) [123], etc.
6. Cluster-based Technique: It works on a set of clusters, where a cluster is definedas a subset of vehicles which forms convex network. These clusters are supposed tobe disjoint, which means that each vehicle can belong to one cluster only, howeveroverlapping clusters do exist in some scenarios. In this case, the vehicles whichbelong to multiple clusters act as gateway. This idea changes the flat network into ahierarchical, one which is smaller in size and easier to manage. The induced hierarchyhelps to form a communication infrastructure, which further provides desirableproperties, e.g., reducing communication overhead, selecting data aggregation pointsto utilize bandwidth and increasing the probability of aggregating redundant data, etc.A number of clustering techniques were proposed in the literature [124, 125]. Thebottleneck in such approaches is the cluster-head, because in each cluster, there is onlyone node selected as cluster-head. All the communications among clusters take placevia these cluster-heads. To manage a cluster-based network, additional messagesare introduced in the network, which increases the message overhead. However,these control messages are exchanged using CCH in IEEE 802.11p, which does noteffect the data dissemination. This technique is used in Cluster-based IrresponsibleFlooding (CIF) [126], Vehicular Multi-hop algorithm for Stable Clustering with LTE(VMaSC-LTE) [127], Data Dissemination based on MAP Splitting(DPMS) [128],

2.4. BROADCAST DATA DISSEMINATION IN VANET 36
GPS-based Inter Vehicle Communication (GPS-IVC) [129], etc.
7. Push/Pull-based Techniques: Both techniques are application dependent [130]. Inpush-based, moving vehicles or RSUs periodically broadcast data messages to othervehicles where the broadcasting source can also be called data centers. These datacenters manage these messages after collecting them from applications. This type oftechnique is useful for infotainment applications and advertisement of commercialinformation about the offered services like gas stations, restaurants, etc. The pull-based technique works inversely to the push-based. Here, the data disseminationmechanism is like a client server model. A vehicle needs to send query informationto a specific location or service center, e.g., an inquiry on the nearest restaurant, freeparking slot in a parking lot, petrol/gas station etc. Examples of proposed protocolsusing this technique are Push/Pull-based Agency (PPA) [131], Geocast VANET(GeoVanet) [130], Vehicle-Density-Based Emergency Broadcast (VDEB) [132],H-Hydi [133], etc.
2.4.4 PERFORMANCE EVALUATION METRICS
In state-of-the-art, multi-hop data dissemination protocols are evaluated with a variety ofmetrics such as reachability, redundancy, failure rate, delay, energy etc.
1. Reachability: It is the ratio of vehicles, who successfully received data packets tothe total number of reachable vehicles of the network. This metric is used to evaluatethe transmitted data packet through the entire network. The higher is the value, thebetter is the broadcast efficiency of the data dissemination protocol. Here, broadcastcoverage ratio and broadcast delivery ratio are interchangeable terms.
2. Redundancy: It is the ratio of number of replica data packets received by a vehiclenode to the total number of transmitted data packets by the source node. It measuresthe unnecessary reception of duplicate broadcast data packets by a vehicle. A lowvalue represents a good data dissemination protocol. It can also be computed interms of several metrics such as saved rebroadcast, redundancy overhead, number ofForwarding/retransmitting nodes, number of transmissions, average retransmission perbroadcast, average forwarding percentage, efficiency rate and link load.
3. Reliability: It is used to ensure data packet delivery to the destined node and alsoreferred to BDR. It certifies the delivery of a data packet and can be succeededusing packet rebroadcast mechanism, opportunistic store-forward buffering, gossipalgorithms etc.
4. Failure Rate: It is a ratio of failed data packets to total sent data packet, which ishigher in dense network because of the large number of vehicles. In dense network,

2.4. BROADCAST DATA DISSEMINATION IN VANET 37
vehicles may transmit the same data packet in same area and neighbors which mayencounter huge packet collisions. This term is interchangeable to collision ratio andpacket loss ratio metrics.
5. Delay: It is the amount of time that a data packet consumed to traverse via the network,from sending vehicle to the destined vehicle in the vehicular environment. Since safetyapplications require low delay, therefore, it is the essential performance metric of a datadissemination mechanism. It can be measured using the metrics including ETE delay,propagation time and broadcast latency.
6. Distance/Space: It is used to determine the distance covered by disseminated datapacket. These metrics inlcude propagation distance, number of hops, one-hop and/ormultiple-hops propagated, sustainable number of hops, etc.
7. Incorporated: These metrics are created by combining multiple aforementionedevaluation metrics.
2.4.5 COMPARATIVE STUDY OF BROADCAST DATA DISSEMINATION
Figure 2.8 presents a scenario of an accident, where the affected vehicles generate emergencyalert messages to the neighboring vehicles in their appropriate broadcast domains or withintheir local vicinity. Here, large circles indicate the broadcast coverage area of the vehiclesand the small circles filled with white color are used to specify the respective vehicles. If weconsider the simple case of blind flooding based on the depicted scenario, each neighboringvehicle or node within the vicinity re-broadcasts the received information. Based on this, theflooding continues until the expiry time of alert message is reached. Suppose, one vehiclefrom each colored region depicted in the referred figure is responsible to re-broadcast thepacket, then the above-mentioned issues can be solved efficiently.
Fig. 2.8: An Accident Scenario using flooding Mechanism

2.4. BROADCAST DATA DISSEMINATION IN VANET 38
In addition, the researchers tried to find solutions based on the number of redundantcopies and location of the broadcast node. Such solutions used the combination of basictechniques which have been discussed in Section 2.4.3. A number of improved floodingmechanisms have been proposed in the literature to reduce the rebroadcast overhead in blindflooding mechanisms along a dedicated path by utilizing network information dispensedby the routing mechanisms. Optimized Link State Routing Protocol (OLSR) is one of thebest examples of proactive routing mechanisms [125]. In order to reduce re-broadcasts,an improvement has been made in OLSR. Additionally, it intuitively maximizes thedissemination of information throughout the network by using divergent mechanisms offlooding, which are typically known as intelligent flooding algorithms. However, in such ahighly dynamic network topology, the collection of neighboring information at run time toselect the designated forwarding node is difficult. In the literature, the proposed algorithmsused different approaches to fix re-broadcast at the minimum cost and the have certainadvantages and disadvantages pros and cons. These existing flooding procedures werefurther classified into two main categories, i.e., probabilistic and deterministic [86].
• Probabilistic Rebroadcasting: Number of rebroadcasts can be reduced by usingprobabilistic rebroadcasting. In this approach, whenever a node receives the broadcastfor the first time it will rebroadcast it with the probability P . When P = 1 thistechnique is equivalent to blind flooding. To reduce the contention and collisions,a small random delay is introduced so that the timing of rebroadcasts can bedifferentiated [86]. Each node computes P by using specific parameters such ascounter, distance, or location. As a matter of example, the authors in [134] designeda Speed Adaptive Probabilistic Flooding. Here, the decision to rebroadcast a messageis based on a probability which is determined by using the speed of the vehicle, whichultimately results in reduction of rebroadcast messages. The intelligent floodingis further categorized or classified into two approaches, i.e., sender- and receiver-oriented approaches. The name of these approaches specify that the decision of nextrelay node is made by either a sender or a receiver node, respectively. In the case ofreceiver oriented approach, the selection of receiver depends on multiple factors likedensity of vehicles, their distribution pattern, and fading level of the wireless channel.Each approach has advantages and disadvantages, though the first approach is efficientin the reduction of redundant broadcasts, but it may introduce delay due to packet loss.Packet loss usually happens because of the fading effect over the wireless channel.The latter approach considers the above mentioned metrics before rebroadcasting,but it may also introduce high ETE delays in low density networks because of theprobabilistic rebroadcast. Furthermore, such types of approaches are unable to reduceunnecessary rebroadcasts completely as discussed in [135]. Few examples of type ofapproaches are discussed in [136, 137].

2.4. BROADCAST DATA DISSEMINATION IN VANET 39
• Deterministic Approach: It consists of two main entities named as a connecteddominating set (CDS) and a dominating set (DS). The CDS relays the broadcastmessage whereas, DS constructs the CDS graph by using the global or localinformation. A centralized or distributed approach may use in collecting the globalinformation. In [138] and [139], the researchers argued that flooding mechanismsdo not require fully global information and proposed distributed protocols by usingpartial global information in this context, called quasi-global approach. Later,with some extended scenarios of the same context, a quasi-local approach wasdemonstrated by collecting local state information, however, it may collect the globalstate information if needed. Moreover, the quasi-local model was sub-categorized intocluster-based approaches [127]. In order to reduce the overhead in these approaches,further enhancement can be made with the help of local state information [140, 141].Additionally, it supports locality of maintenance, but the major drawback is that it cannot guarantee the performance in a worst case scenario.
Table 2.3 gives a comprehensive view of proposed protocols in literature. It presents thecomplete information of each mentioned protocol such as targeted problems, scenariosin which it performs well, basic techniques that were used to select the next forwarder,additional metrics or methods that were used to address problems, assumptions and issues.Here, the comparative study is based on the common problems of flooding mechanism 1,which were discussed in Section 2.4.2. This table presents a number of protocols that wereproposed in literature [84, 88–91, 95, 96, 98–101, 103, 110–114, 116, 117, 126, 128, 130, 131,142] to overcome the issue of broadcast storm where each one of them used a particularbasic technique or combination of one or more techniques. The comparative study of thementioned protocols infer that with the decrease in number of duplicate messages, the issuesof reachability, unreliable data delivery, scalability, high delay and communication overheadare introduced in the network. It is concluded that the packet may be lost due to signalissue in presence of obstacles, collisions or temporary partitioning of the network. Thisproblem is named as temporal network fragmentation. Few of the protocols were used fixedinfrastructure to spread the information in the network. Table 2.3 also presents a numberof protocols [84, 93, 94, 102, 103, 113, 115, 118–120, 127] proposed in literature to solvetemporal network fragmentation along the aforementioned problem. It shows that thereare still issues of reachability, scalability, unreliability for safety and emergency messagesdue to the induced high delay. In order to reduce the redundancy 2, the proposed protocolsused the 1-hop or 2-hop neighboring information that leads to slow distribution of data andcaching issue for maintaining long history.
1flooding and broadcast data dissemination are interchangeable terms)2the reception of many copies of the same message at destination or spreading is referred as redundancy

2.4. BROADCAST DATA DISSEMINATION IN VANET 40
[!hb
t]
Tab.
2.3:
Com
para
tive
Stud
yof
Bro
adca
stD
ata
Dis
sem
inat
ion
onth
eB
ases
ofTa
rget
edPr
oble
m
Prot
ocol
Targ
etPr
oble
mSc
enar
ioB
asic
Tech
niqu
eA
dditi
onal
Met
hod
Ass
umpt
ion
Rem
arks
(Iss
ues)
NetworkPartition
NetworkFragmentation
BroadcastStorm
City
Highway
Location-based
Distance-based
Counter-based
Timer-based
Probability-based
Cluster-based
Pull/Push-based
Store-carry-forward
Networkdensity
Topology-information
Repeater
GPS
MAPS
NeighborPosition
CA
REF
OR
[88]
XX
XX
XX
Fails
inhi
ghde
nsity
netw
ork
CIF
[126
]X
XX
XX
Fails
inhi
ghde
nsity
netw
ork
MH
VB
[89]
XX
XX
XX
Scal
abili
ty&
reac
habi
lity
NPP
B[8
4]X
XX
XX
XR
each
abili
ty
TRA
DE
[84]
XX
XX
XX
Rea
chab
ility
VD
EB[1
32]
XX
XX
XX
Rea
chab
ility
V-TR
AD
E[9
0]X
XXX
XX
Rea
chab
ility
P/S/
G-S
AB
[95]
XX
XXX
XU
nrel
iabl
efo
rsaf
ety
appl
icat
ions
EDC
AST
[142
]X
XX
XX
XSc
alab
ility
&re
acha
bilit
y
SB[9
1]X
XX
XC
omm
unic
atio
nov
erhe
ad
Prob
.W,S
,P[9
6]X
XX
XX
XX
Fails
insp
arse
/par
titio
ned
netw
ork
SEA
D[1
11]
XX
XX
XFa
ilsin
spar
se/p
artit
ione
dne
twor
k
AID
[98]
XX
XX
XFa
ilsin
spar
se/p
artit
ione
dne
twor
k
AM
B[1
12]
XX
XX
XXX
Rea
chab
ility
DB
RS
[103
]X
XXX
XR
each
abili
ty
EDB
[113
]X
XXX
XX
XX
Fixe
din
fras
truct
ure
&re
acha
bilit
y

2.4. BROADCAST DATA DISSEMINATION IN VANET 41
Tab.
2.3
cont
inue
dfr
ompr
evio
uspa
ge
Prot
ocol
Targ
etPr
oble
mSc
enar
ioB
asic
Tech
niqu
eA
dditi
onal
Met
hod
Ass
umpt
ion
Rem
arks
(Iss
ues)
NetworkPartition
NetworkFragmentation
BroadcastStorm
City
Highway
Location-based
Distance-based
Counter-based
Timer-based
Probability-based
Cluster-based
Pull/Push-based
Store-carry-forward
Networkdensity
Topology-information
Repeater
GPS
MAPS
NeighborPosition
OA
PB[1
14]
XX
XX
XX
XM
aint
aini
ngN
eigh
bors
info
.&re
acha
bilit
y
RR
DD
[116
]X
XX
XXX
Rea
chab
ility
Stre
etC
AST
[110
]X
XX
XX
Rea
chab
ility
UV-
CA
ST[1
00]
XX
XX
XX
Com
plex
algo
rithm
&re
acha
bilit
y
RB
LSM
[101
]X
XX
XX
XW
eak
eval
uatio
n&
reac
habi
lity
PPA
[131
]X
XX
Hig
hba
ndw
idth
requ
irem
ent
Geo
Vane
t[13
0]X
XX
XXX
Goo
dto
pull
data
DPM
S[1
28]
XX
XX
XXX
Com
plex
met
hod
forM
AP
&zo
nesp
littin
g
NC
AS
[117
]X
XXX
XX
Cac
hest
rate
gy&
high
dela
y
IVG
[99]
XX
XXX
XPe
riodi
cal
erts
&ac
cura
tepo
sitio
n
LDM
B[1
02]
XX
XX
XX
XSl
owda
tadi
ssem
inat
ion
EAEP
[93]
XX
XX
XX
XX
Slow
data
diss
emin
atio
n
IF[9
4]X
XX
XX
XX
XFr
eque
ntbe
acon
exch
ange
Mob
iCas
t[11
5]X
XX
XX
XX
XR
edun
danc
y
OPb
G[1
18]
XX
XX
XX
Fails
insp
arse
netw
ork
RM
DSI
[84,
113]
XX
XXX
XX
XPe
riodi
cal
erts
&re
acha
bilit
y
DR
G[1
19]
XX
XX
XX
XX
Rea
chab
ility
&sl
owda
tadi
ssem
inat
ion

2.4. BROADCAST DATA DISSEMINATION IN VANET 42
Tab.
2.3
cont
inue
dfr
ompr
evio
uspa
ge
Prot
ocol
Targ
etPr
oble
mSc
enar
ioB
asic
Tech
niqu
eA
dditi
onal
Met
hod
Ass
umpt
ion
Rem
arks
(Iss
ues)
NetworkPartition
NetworkFragmentation
BroadcastStorm
City
Highway
Location-based
Distance-based
Counter-based
Timer-based
Probability-based
Cluster-based
Pull/Push-based
Store-carry-forward
Networkdensity
Topology-information
Repeater
GPS
MAPS
NeighborPosition
VM
aSC
-LTE
[127
]X
XX
XX
XSc
alab
ility
MPA
RP
[120
]X
XX
XX
XX
Com
mun
icat
ion
over
head
RB
RS
[103
]X
XX
XX
XX
Rea
chab
ility
Aut
oCas
t[12
1]X
XX
XX
XX
Scal
abili
ty
GPS
-IV
C[1
29]
XX
XXX
XX
XX
Acc
urat
eG
PS&
MA
Pin
form
atio
n
H-H
ydi[
133]
XX
XXX
XX
May
sele
ctin
sign
ifica
ntno
de
UM
B[1
04]
XX
XXX
XX
XX
Fixe
din
fras
truct
ure
HB
ES[1
05]
XX
XX
XXX
Mai
ntai
ning
sour
cein
form
atio
n
AB
SM[1
06]
XX
XX
XX
XXX
XPe
riodi
cbe
acon
ing
&hi
ghde
lay
DEC
A[9
2]X
XXX
XX
XPe
riodi
cbe
acon
ing
&hi
ghde
lay
BRO
AD
CO
M[9
7]XX
XX
XX
XD
epen
denc
yon
neig
hbou
rs
DR
IFT
[107
]XX
XX
XX
XX
Wor
kson
low
dens
ity
MC
F[1
08]
XX
XX
XX
XX
Hig
hde
lay
SRD
[122
]XX
XX
XX
XX
XX
Unr
elia
ble
fors
afet
yap
plic
atio
ns
DR
IVE
[109
]XX
XXX
XX
XX
XX
Triv
ialf
orw
arde
r&m
aint
aini
ngne
ighb
ors
DV-
CA
ST[1
23]
XX
XX
XX
XX
Freq
uent
beac
onex
chan
ge

2.4. BROADCAST DATA DISSEMINATION IN VANET 43
In highway scenarios, the problem of network partition and network fragmentation iscommon and protocols [92, 97, 104–109, 121–123, 129, 133] proposed to handles issues ofthese problems. However, it is concluded from this comparative study that each protocolperformed good in limited scenarios. Though the performance of flooding mechanism isimproved somehow, there are still issues regarding reachability, scalability, on-time dataavailability and reliable data transmission.
2.4.6 REQUIREMENT OF BROADCAST DATA DISSEMINATION
PROTOCOL
According to the comparative study of proposed mechanisms in the literature, these are thekey points to be consider in designing a flooding mechanisms.
• The broadcast mechanism starts from the message originating node and traversethrough many relay nodes in the entire network to cover the target area. Thisspreading process is called multi-hop broadcast.
• Most of the proposed protocols in literature lack the implementation of ACK andretransmissions mechanism for reliable data delivery. Hence, we would have the issuesat data link layer like feedback explosion etc. It would effect the selection of nextforwarding vehicle.
• The selection of next forwarder is key challenge for any broadcast mechanism. Thenext forwarding vehicle must be a network node and can be selected on the basisof higher degree of connectivity, link quality or distance base. However, to ensurereliability, a certain level of redundancy is required in such a challenging network.
• Since the broadcasts have no ACKs, and transmission is unreliable, there is a subtletrade-off between redundancy and reliability. For instance, a vehicle is in a range ofonly one potential forwarding node, and transmission is not successful due to anyof the communication reasons. Therefore, more than one potential forwarder cansignificantly increase the reliability. Meanwhile, the number of next-hop forwardersshould not be so high because this process can introduce congestion or it may utilizethe network resources like bandwidth, battery etc.
Considering the mentioned key points of broadcast data dissemination, an appropriateprotocol is needed that should have the capability of reliable data dissemination. Theoptimal flooding is also not possible in this scenario because of network constraints. Eachapproach exhibits variate complexities in multiple scenarios where most of the approachesare taken from mobile ad hoc networks. In vehicular environments, the mobility ofvehicles is the biggest challenge that leads to a dynamic network topology, whereas therequirements of several developed applications demand the simplest and most efficient

2.5. ROUTING IN VANET 44
mechanism. In VANET, most of the proposed mechanisms are probabilistic due to thedynamics in the network topology, cf., [143, 144]. In the current work, we propose asimple hybrid mechanism by using local information and location in order to make a localforwarding decision. Since the target applications are emergency applications, e.g., accidentmanagement/ prevention, the reachability of the generated alert message is useful to coverthe bounded region. The designed protocol is simple because it generates no additionaloverhead to collect local information. It forwards the information based on the appropriatedecision to select the next-hop vehicle to provide efficiency in terms of low overhead,reachability of messages to targeted nodes and reduced delay. In Chapter 3, we will discussthe design of the proposed protocol and its working principle that how it can eliminaterebroadcasts with high reachability.
2.5 ROUTING IN VANET
A routing protocol determines a route through which information is exchanged between twocommunicating nodes where a data originating node is called source node, a forwardingnode is termed as relay node and a target node is known as destination node. It also includesa process of building a route, criteria to be taken far a decision when a relay node has toforward information on behalf of a neighboring node as well as actions that need to be takento maintain or recover a path if broken or expired. Section 2.5.1 gives an overview of routingin vehicular ad hoc networks and discusses their classification along a comparative studyof routing protocols proposed in the literature to achieve the objective of destination-basedmessage dissemination in vehicular environment. Furthermore, Section 2.5.2 also comparesrouting protocols proposed in literature on the basis of used routing metrics.
2.5.1 CLASSIFICATION OF ROUTING PROTOCOLS
In the literature, a number of routing protocols have been proposed that can be classifiedusing different criteria. These criteria may include characteristics, information, strategy ornetwork architecture. Few researchers also classified them on the basis of Quality of Service(QoS). Based on the information routing technique, these protocols are broadly categories inthree types, i.e., topology, geographic/position-based routing and hybrid routing information.Figure 2.9 presents the taxonomy of information routing protocols of VANET, which wereproposed in the literature.
1. Topology-based Routing:This term refers to the arrangement of links (route), in which network nodes areconnected with one another in order to share information among themselves or to thenodes which are part of another network via internet. In VANET, network formationis temporary and dynamic. Therefore, the objective of routing protocols is to find a

2.5. ROUTING IN VANET 45
Fig. 2.9: Taxonomy of Information Routing Protocols of VANET
best route (on the basis short distance, low cost or any other parameter consideredas a link cost) between data source and destination. In order to obtain a best path,routing-information is maintained in a routing-table. These tables are updated eitherperiodically or on the bases of triggered events like link break, new entered node orroute requests whenever data needs to be shared to a node or a group of nodes. Basedon the strategy of maintaining these routing-information, topology-based routing isfurther categorized into proactive, reactive and hybrid routing protocols.
• Proactive Routing: In this type of routing strategy, routing tables are maintainedfor each node. Since VANET exhibits dynamic topology due to high mobility,new vehicles may join or leave the network. The routing tables must be keptup to date. In case of proactive routing, whenever a node joins or leaves thenetwork, or a link breaks, expires or establishes, it initiates an update procedureto keep the routing information up to date in the tables. Hence, if the changein the network topology is too frequent due to high mobility of nodes, therecurrent update procedure introduces an overhead and leads to degradation

2.5. ROUTING IN VANET 46
of throughput. A number of proactive routing protocols have been proposedsuch as Destination Sequence Distance Vector (DSDV) [145], Optimized LinkState Routing (OLSR) [146, 147], Fisheye State Routing (FSR) [148], TopologyBroadcast based on Reverse-Path Forwarding (TBRPF) [149], Wireless RoutingProtocol (WRP) [150], etc.
• Reactive Routing: This type of routing strategy maintains routing tableswhenever a route is requested from source to destination node. A node, whichhas data to share to a particular destination, requests a route. Upon request,route discovery and maintaining techniques are used to discover and maintain aroute between source to the destination. Examples of this type routing protocolsinclude Ad hoc On Demand Distance Vector (AODV) [151, 152], AODVPreferred Group Broadcasting (AODV-PGB) [153], Dynamic Source Routing(DSR) [152] and The Temporally-Ordered Routing Algorithm (TORA) [154],Vehicular Data Transfer Protocol (VDTP) [155], Vehicular Data TransferProtocol (VDTP) [155], etc.
• Hybrid Routing: This category uses both mentioned strategies to decrease thecontrol overhead and the initial route discovery delay whenever it is needed. Itswitches the strategy modes accordingly. Examples of these protocols includeZone Routing Protocol (ZRP) [152], Hybrid Ad Hoc Routing Protocol (HARP)[156], etc.
Table 2.4 summarizes the topology-based routing, data forwarding strategies fromsource to destination as well as route recovery if a link fails or expires, and highlightsthe pros and cons of each mentioned protocol. These protocols are designed to workin urban areas without requiring a digital map of the geographic region and each onehas its own limitations. Here, it is to be concluded that proactive routing protocols[145–150] require a part of the available bandwidth to build routing tables for unusedroutes while reactive protocols [151–155, 157, 158] show a high route determininglatency. Even in case of hybrid techniques of topology-based routings, the issuesof high latency, message overhead and scalability occur. Additionally, the routingalgorithms are complex in hybrid protocols as discussed in [152, 156]. In general, themessage overhead is high due to maintenance of the routes and frequent link changesand part of bandwidth is used to build tables or share information among neighbors intopology-based routings.

2.5. ROUTING IN VANET 47
Tab.
2.4:
Com
para
tive
Stud
yof
Topo
logy
-bas
edR
outin
gPr
otoc
olSt
rate
gyR
outin
gPr
otoc
olFo
rwar
ding
Stra
tegy
Rec
over
ySt
rate
gyPr
osan
dC
ons
Proactive
DSD
V[1
45]
Mul
ti-ho
pM
ulti-
hop
Pros
:Low
com
plex
,loo
p-fr
eean
dno
rout
edi
scov
ery
late
ncy
Con
s:O
verh
ead
and
high
band
wid
thco
nsum
ptio
nin
rout
ere
cove
ry
OLS
R[1
46]
-Sel
ectio
nof
MPR
-Mul
ti-ho
pM
ulti-
hop
Pros
:Per
iodi
cro
ute
upda
tes,
best
inde
nse
netw
orks
Con
s:Pe
riodi
cro
ute
upda
tes
atea
chno
de,h
igh
band
wid
thco
nsum
ptio
ns
OLS
R2
[147
]-S
elec
tion
ofM
PR
-Mul
ti-ho
pM
ulti-
hop
Pros
:Red
uced
Con
trolM
essa
ges
Con
s:Pe
riodi
cro
ute
upda
tes
FSR
[148
]M
ulti-
hop
Mul
ti-ho
p
Pros
:Per
iodi
cex
chan
geof
topo
logy
tabl
esw
ithin
the
loca
lvic
inity
,
redu
ced
over
head
Con
s:N
otri
gger
forl
ink
failu
re,
poor
perf
orm
ance
insp
arse
netw
orks
TBR
PF[1
49]
Mul
ti-ho
pM
ulti-
hop
Pros
:Exc
hang
eof
smal
lrou
ting
upda
tem
essa
ges
Con
s:W
orst
-cas
eco
nver
genc
eis
doub
leof
the
flood
time.
WR
P[1
50]
Mul
ti-ho
pM
ulti-
hop
Pros
:Loo
p-fr
eepa
thse
lect
ion,
No
late
ncy
forr
oute
disc
over
yw
hen
need
edan
dfa
ster
conv
erge
nce
Con
s:La
rge
band
wid
thco
nsum
ptio
n,
larg
em
emor
yan
dgr
eatp
roce
ssin
gpo
wer
requ
ired
Reactive
AO
DV
[151
,152
]M
ulti-
hop
Stor
e-an
d-Fo
rwar
d
Pros
:Loo
p-fr
eero
utin
g,lo
wro
utin
gla
tenc
y,ca
nw
ork
inla
rge
scal
ene
twor
ks
Con
s:In
cons
iste
ntan
dst
ale
rout
esat
the
rela
yno
de,h
igh
cont
rolo
verh
ead,
high
band
wid
thco
nsum
ptio
nsdu
eto
perio
dic
beac
onin
g
AO
DV
2(D
YM
O)[
152]
Mul
ti-ho
pSt
ore-
and-
Forw
ard
Pros
:Loo
p-fr
eero
ute
sele
ctio
n,ro
ute
reco
very
proc
edur
eon
link
brea
k
Con
s:H
igh
over
head
inde
nse
netw
orks
,
nore
cove
rym
echa
nism
from
cong
estio
n.

2.5. ROUTING IN VANET 48
Tabl
e2.
4co
ntin
ued
from
prev
ious
page
Stra
tegy
Rou
ting
Prot
ocol
Forw
ardi
ngSt
rate
gyR
ecov
ery
Stra
tegy
Pros
and
Con
s
AO
DV-
PGP
[153
]M
ulti-
hop
Stor
e-an
d-Fo
rwar
dPr
os:L
oop-
free
rout
ing,
low
rout
ing
late
ncy,
can
wor
kin
larg
esc
ale
netw
orks
Con
s:H
igh
dela
yin
rout
edi
scov
ery,
unre
liabl
epa
thdi
scov
ery
proc
edur
e
DSR
[152
]M
ulti-
hop
Stor
e-an
d-Fo
rwar
d
Pros
:Bea
con-
less
,sm
allo
verlo
adon
the
netw
ork,
nope
riodi
calu
pdat
e
Con
s:M
emor
yov
erhe
ad,h
igh
band
wid
thus
age,
nopa
thre
cove
rypr
oced
ure
onbr
oken
links
,
nots
uite
dfo
rapp
licat
ions
with
high
mob
ility
patte
rns
TOR
A[1
54]
Mul
ti-ho
pSt
ore-
and-
Forw
ard
Pros
:Red
uce
netw
ork
over
head
,wor
ksw
elli
na
dens
ene
twor
k
Con
s:N
otsc
alab
le,w
orse
perf
orm
ance
than
AO
DV
and
DSR
AO
DV-
VAN
ET[1
57]
Mul
ti-ho
pSt
ore-
and-
Forw
ard
Pros
:Les
sba
ndw
idth
cons
umpt
ion
than
AO
DV,
low
Con
nect
ion
setu
pde
lay
Con
s:H
igh
cont
rolo
verh
ead
due
tom
ultip
leR
REP
sre
spon
ding
toa
sing
leR
REQ
s
AB
R[1
58]
Mul
ti-ho
pSt
ore-
and-
Forw
ard
Pros
:Sta
ble
rout
ing
crite
riale
adto
few
erpa
thbr
eaks
Con
s:M
ayse
lect
long
path
,hen
cehi
ghde
lay
VD
TP[1
55]
Mul
ti-ho
pSt
ore-
and-
Forw
ard
Pros
:Low
pack
etlo
ss
Con
s:Li
mite
dte
stin
g
Hybrid
ZRP
[152
]M
ulti-
hop
Stor
e-an
d-Fo
rwar
dPr
os:P
erfo
rms
wel
lin
larg
ene
twor
ks.
Con
s:In
crea
sing
com
plex
itytre
nd
HA
RP
[156
]M
ulti-
hop
Stor
e-an
d-Fo
rwar
dPr
os:Z
ones
-bas
edro
ute
disc
over
y,st
able
rout
escr
iteria
Con
s:N
otsu
itabl
ead
hoc
netw
orks
whi
chin
volv
ehi
ghly
mob
ility

2.5. ROUTING IN VANET 49
2. Geographic/Position-based Routing:In this category, each node in the network is aware of its own and of its neighbor nodegeographic positions through location determining services like GPS. Interesting,these routing protocols do not maintain routing tables or link state information.Data is shared among nodes using location information. These protocols can befurther categorized as a Delay Tolerant Network (DTN) and Non-DTN protocols. InVANET, as we mentioned that the network topology is dynamic, therefore, forwardingmechanisms need to deal with frequent disconnections which are due to the mobilityof the vehicles and the network density. DTN protocols use a carry-and-forwardmechanism to deal with this issue. Here, a node stores the packet when it is unable tocommunicate with other nodes, and then forwards the message based on the routingstrategy. These protocols are suitable for delay tolerant applications. The focus of thiswork is safety and management applications, which require in-time reliable delivery.Based of the requirement of the focused applications, we only consider non-DTNbased applications which may be beacon-based, beacon-less or hybrid.
• Beacon-based: These protocols use beacon messages to share local networkinformation among themselves. Beacon-based non-DTN protocols are furthercategorized as overlay and non-overlay;
– Non-DTN Overlay include Connectivity-Aware Routing (CAR) [159],Geographic Source Routing (GSR) [159], Greedy Perimeter CoordinatorRouting (GPCR) [160] , GPSRJ+ [161], Street Topology-Based Routing(STBR)[162], Greedy Traffic Aware Routing (GyTAR) [163], Anchor-Based Streetand Traffic Aware Routing (A-STAR) [164], Landmark Overlays for UrbanVehicular Routing Environments (LOUVRE) [165], VANET Cross LinkCorrected Routing Protocol (VCLCR) [166], etc.
– Non-DTN non-overlay include Greedy Perimeter Stateless Routing (GPSR)[167], GPSR+PRedict [168], Greedy Routing with Abstract Neighbor Table(GRANT) [169], Position-Based Routing with Distance Vector (PRB-DV)[170] are the examples of non-overlay protocols.
• Beacon-less: This type of protocols does not rely on beacon messages, butinstead use an alternate approach such as the Contention-Based Forwarding(CBF) [171] protocol, which works on the greedy position-based forwardingalgorithm.
• Non-DTN Hybrid: Apart from the geographic information, Topology-assistGeo-Opportunistic Routing (TO-GO) [172] also uses two-hop beaconing togather topology information in order to find a best route. It utilizes opportunisticforwarding to determine a next forwarder. This protocol is classified as aNon-DTN hybrid.

2.5. ROUTING IN VANET 50
In VANET, the performance of routing protocols depends on multiple factors likemobility of the vehicles in vehicular environments, data traffic or road layout, wherethe designed protocols were needed to deal with the dynamics of network. The needis to further investigate the routing performance for safety applications as discussed inSection 2.3.6, and network characteristics as mentioned in Section 2.1, are consideredaltogether. Table 2.4 discussed the limitation of topology-based routing protocols,where it was mentioned that routing protocols exchange control messages to buildrouting tables in order to find routes between source and destination nodes in amultihop unicast communication paradigm. Position-based routing protocols usemultihop unicast or geocast communication paradigm for information sharing. Thekey point in geographic/position-based routing is that the use of position determiningservice like GPS and digital maps, where this position information is needed inforwarding data packets. These protocols use beacon messages to update locationinformation with neighbors and do not build routing tables, hence they can supporthigh mobility. However, these protocols show a high message overhead due tolocation information sharing and they may introduce a deadlock in location servers.These protocols are summarized in Table 2.5, where information presented regardingthe type of protocols, routing and recovery strategies, scenarios and advantages anddisadvantages of each mentioned protocol.The comparative study presented in Table 2.5 infers that the overlay protocols[159–166] have issues of scalability, voids, routing loops and propose complexsolutions to deal with different network densities. Non-overlay protocols [167–170]are unable to cope with minor network changes on relay nodes, hence lead to thelocal maxima issue. Furthermore, few of the non-overlay protocols use a greedyforwarding strategy, therefore they do not have metrics to ensure the performance interm of PDF and message overhead. Even the beacon-less non-DTN protocol [171]has the issue of local maxima, which occurs too frequently in highway scenario. Thehybrid protocol [172] uses beacon-based/ beacon-less algorithms to avoid issues dueto junction and road segments scenarios, however, it introduces high ETE latency.

2.5. ROUTING IN VANET 51
Tab.
2.5:
Com
para
tive
Stud
yof
Geo
grap
hic/
Posi
tion-
base
dR
outin
gTy
pePr
otoc
olFo
rwar
dSt
rate
gyR
ecov
ery
Stra
tegy
Scen
ario
sPr
os&
Con
s
Overlay(Beacon-based)
CA
R[1
59]
Mul
ti-ho
pM
ulti-
hop
Urb
anPr
os:N
odi
gita
lmap
,no
loca
lmax
imum
issu
e
Con
s:N
oA
dapt
atio
nin
min
orch
ange
intra
ffic
envi
ronm
ent
GSR
[159
]M
ulti-
hop
Mul
ti-ho
pU
rban
Pros
:Hig
herP
DR
and
scal
abili
tyco
mpa
red
toA
OD
Van
dD
SR
Con
s:Fa
ilsin
low
dens
ene
twor
k,hi
gher
rout
ing
over
head
GPC
R[1
60]
Gre
edy
Forw
ardi
ngSt
ore-
and-
forw
ard
Urb
anPr
os:E
limin
ates
plan
ariz
atio
nby
rout
ing
alon
gro
ads
Con
s:M
ayha
vero
utin
glo
ops,
wor
kson
lyin
grid
city
map
s
STB
R[1
62]
Mul
ti-ho
pM
ulti-
hop
Urb
an
Pros
:Uni
cast
com
mun
icat
ion,
trave
rse
leas
thop
-cou
nt
Con
s:N
otsu
itabl
efo
rmix
edsc
enar
ios,
com
plex
ityin
crea
ses
junc
tion
scen
ario
s
GPS
RJ+
[161
]M
ulti-
hop
Mul
ti-ho
pU
rban
Pros
:Inc
reas
ePD
Rof
GPC
R,r
educ
eho
psin
reco
very
mod
e
Con
s:N
otsu
itabl
efo
rthe
safe
tyap
plic
atio
ns,
wor
kson
lygr
idci
tym
aps
A-S
TAR
[164
]M
ulti-
hop
Mul
ti-ho
pU
rban
Pros
:Pac
ketd
eliv
ery
ratio
islo
wer
com
pare
dto
GSR
and
GPS
R
Con
s:H
igh
com
plex
ity
GyT
AR
[163
]G
reed
yFo
rwar
ding
Stor
e-an
d-fo
rwar
dU
rban
Pros
:Effi
cien
tlyha
ndle
sdy
nam
icne
twor
kfr
agm
enta
tion,
bette
rthr
ough
put,
dela
y,an
dro
utin
gov
erhe
adth
anG
SR
Con
s:A
ssum
esV
2Ico
mm
unic
atio
n,
cann
otav
oid
void
s
LOU
VR
E[1
65]
Mul
ti-ho
pM
ulti-
hop
Urb
an
Pros
:Hig
herP
DR
and
low
erho
pco
untt
han
com
pare
dpr
otoc
ols,
allo
ws
fora
nob
stac
le-f
ree
rout
ese
lect
ion
Con
s:Sc
alab
ility
issu
e

2.5. ROUTING IN VANET 52
Tabl
e2.
5co
ntin
ued
from
prev
ious
page
Type
Prot
ocol
Forw
ard
Stra
tegy
Rec
over
ySt
rate
gySc
enar
ios
Pros
&C
ons
VC
LCR
[166
]M
ulti-
hop
Mul
ti-ho
pU
rban
Pros
:Dyn
amic
loop
-det
ectio
nan
dst
atel
essn
ess,
cons
iste
ntPD
Rco
mpa
red
toG
PSR
and
GPC
R
Con
s:Sc
alab
ility
issu
e
Non-Overlay(Beacon-based)
GPS
R[1
67]
Gre
edy
Forw
ardi
ngSt
ore-
and-
forw
ard
Urb
an
Pros
:Sta
tele
ss,d
ynam
icpa
cket
forw
ardi
ngde
cisi
on
Con
s:N
ost
ate
info
rmat
ion
atre
lay
ifde
stin
atio
nm
oves
,
loca
lmax
ima
issu
e
GPS
R-G
-PR
edic
t[16
8]G
reed
yFo
rwar
ding
Stor
e-an
d-fo
rwar
dH
ighw
ay
Pros
:Sta
tele
ss,l
ess
rout
ing
cost
com
pare
dto
GPS
R
Con
s:Li
mite
dev
alua
tion
only
com
pare
dag
ains
tGPS
R,
loca
lmax
ima
issu
e
GR
AN
T[1
69]
Mul
ti-ho
pM
ulti-
hop
Urb
anPr
os:L
owpa
cket
proc
essi
ngde
lay
com
pare
dto
gree
dyro
utin
g
Con
s:N
ope
rfor
man
cem
etric
sto
ensu
repe
rfor
man
ce
PRB
-DV
[170
]M
ulti-
hop
Mul
ti-ho
pU
rban
Pros
:Han
dles
loca
lmax
imum
issu
e
Con
s:U
ncer
tain
perf
orm
ance
forp
acke
tdel
iver
yan
dov
erhe
ad
Beacon-less
CB
F[1
71]
Mul
ti-ho
pM
ulti-
hop
Hig
hway
Pros
:Red
uce
exch
ange
ofbe
acon
mes
sage
s
Con
s:Lo
calm
axim
umfr
eque
ntly
occu
rs
Hybrid
TO-G
O[1
72]
Mul
ti-ho
pM
ulti-
hop
Urb
an
Pros
:Con
side
rsju
nctio
nan
dro
adse
gmen
tsto
find
the
best
forw
ardi
ngno
de,
redu
ces
the
over
head
oftw
o-ho
pbe
acon
ing
Con
s:ET
Ela
tenc
yis
high
erth
anth
eG
PCR
,GPS
R,G
PSR
J+.

2.5. ROUTING IN VANET 53
3. Hybrid Information Routing:These protocols combine the features of both geographic and reactive routing inorder to be adaptive in varying environments. Examples of these protocols includesZone-based Hierarchical Link State (ZHLS) [173], Geographic Ad hoc On-DemandDistance Vector with Predictive elements and Fuzzy Logic (GEOADV-PF) [174]Routing Protocols.
2.5.2 METRICS-BASED COMPARATIVE STUDY OF ROUTING
PROTOCOLS
The performance of the ad hoc network mainly depends upon the successful packettransmission to the destination node through relay nodes using the best available path.Research shows that VANET routing protocols focus on traditional topology based routingprotocols and depend upon the nature of the networks. A number of factors affect therouting strategies like type of networks, mobility patterns and QoS requirements fordifferent applications. Thus, a single routing method appears not to be sufficient to meet allthe different types of required scenarios.Different ad hoc routing protocols were proposed and analyzed to figure out which routingmetrics should be considered to provide in time and scalable routing in different scenarios.Most researchers focused on single environment of VANET, i.e., either on highway or acity, to evaluate the performance of different routing protocols. Due to the aforementionedproblems there is a continuous need to study various ad hoc routing methods in order toselect an appropriate method for each environment of VANET. Routing metrics are the basisof any routing protocol on which it selects a best path. Here, we summarize different metricsagainst different types, approaches used for path selection, and route update mechanisms ofrouting protocols in Table 2.6.Link life is one of the important routing metrics, as longer link life shows good link quality.Since link quality is measured on the demand of the path, this routing metrics is mostly usedfor reactive and flow-based scenarios [175, 176]. Node height is another routing metrics,which is useful in scenarios with low mobility. Therefore, proactive protocols [177] andalso flow-based protocols [176] use this metric in a similar context, but with some limitedbenefits. In reactive protocols like Temporally-Ordered Routing Algorithm (TORA) [177]and Dynamic MANET On-demand (DYMO) [178] and proactive protocols includingDynamic Source Routing (DSR) [179], Better Approach to Mobile Ad hoc Networking(BATMAN) [180], Hierarchical State Routing (HSR) [181], Intrazone Routing Protocol(IARP) [182], Mobile Mesh Routing Protocol (MMRP) [183], Optimized Link StateRouting (OLSR) [184], Optimized Link State Routing Version 2 (OLSRv2) [185], TopologyDissemination Based on Reverse-Path Forwarding (TBRPF) [186] and Link Quality SourceRouting (LQSR) [187], Hop Count is used for the path selection, and route update. In latter

2.5. ROUTING IN VANET 54
case, it is only required when route is timed out. In some scenarios, the same metric is alsoused where these two type of protocols are used in a hybrid form, e.g., Hazy Sighted LinkState Routing (HSLS) [188]. However, with the involvement of high mobility using only thismetric is not enough to find a good path and may also introduce delays for larger networks.To resolve this problem, some protocols were proposed which are cluster-based. Each clustermust have a cluster-head and these Cluster-heads take part in routing. Then a Hop Countrouting metric is used on cluster-head for the route selection. These protocols [189–191]also apply for route update on time-out. Expected Transmission count (Expected Tx Count)is a routing metric which is used by proactive routing protocols [192] for route selection.This routing metric count is good only for delay tolerant applications.Proactive routing protocols build an priory table for routing path. Therefore, Link Cost isalso a routing metric, and protocols [193, 194] use this metric to calculate the total cost ofthe path. The route which has minimum link cost is selected as the best route. However,with frequent link breakage, the calculation of link cost introduces delays. Some hybridprotocols also use Link Cost and Virtual Link Predecessor for route calculation. Table2.6 summarizes this analysis with the additional information of each protocol and theircorresponding approach used for metric calculation.

2.5. ROUTING IN VANET 55
Tab.
2.6:
Rou
ting
Prot
ocol
sC
ompa
rison
onth
eB
asis
ofSe
lect
edPa
ram
eter
Met
ric
Type
Prot
ocol
App
roac
hR
oute
-upd
ate
Link
Life
Rea
ctiv
eLi
nkLi
feB
ased
Rou
ting
(LB
R)[
175]
Sign
alSt
reng
thLi
nkB
reak
Flow
Ligh
twei
ghtM
obile
Rou
ting
(LM
R)[
176]
Dire
cted
Acy
clic
Gra
phan
dLi
nkR
ever
sal
Nod
eH
eigh
tR
eact
ive
Tem
pora
lly-o
rder
edro
utin
gal
gorit
hm(T
OR
A)[
177,
195]
Dire
cted
Acy
clic
Gra
phLi
nkB
reak
Flow
Gaf
ni-B
erts
ekas
Rou
ting
(GB
)[19
6]D
irect
edA
cycl
icG
raph
and
Link
Rev
ersa
lA
utom
ated
Flow
and
Link
Bre
ak
Hop
Cou
ntR
eact
ive
Ada
ptiv
eO
nD
eman
dD
ista
ntVe
ctor
(AO
DV
)[19
7]D
ista
nce
Vect
or(D
V)
Tim
ed
Rea
ctiv
eD
ynam
icM
AN
ETO
n-de
man
d(D
YM
O)[
178]
Dis
tanc
eVe
ctor
Tim
ed
Proa
ctiv
eD
ynam
icSo
urce
Rou
ting
(DSR
)[17
9]D
ista
nce
Vect
orTi
med
Proa
ctiv
eB
ette
rApp
roac
hto
Mob
ileA
dho
cN
etw
orki
ng(B
ATM
AN
)[18
0]D
Van
dC
olle
ctiv
eIn
telli
genc
eTi
med
Proa
ctiv
eH
iera
rchi
calS
tate
Rou
ting
(HSR
)[18
1]H
iera
rchi
calR
outin
gan
dC
lust
er-h
ead
Tim
ed
Proa
ctiv
eIn
trazo
neR
outin
gPr
otoc
ol(I
AR
P)[1
82]
Link
stat
e(L
S)an
dZo
neR
adiu
sTi
med
Proa
ctiv
eM
obile
Mes
hR
outin
gPr
otoc
ol(M
MR
P)[1
83]
Link
Stat
ean
dSe
quen
ceN
umbe
rTi
med
Proa
ctiv
eO
ptim
ized
Link
Stat
eR
outin
g(O
LSR
)[18
4]LS
and
Mul
tiPo
intR
elay
Tim
ed
Proa
ctiv
eO
ptim
ized
Link
Stat
eR
outin
gVe
rsio
n2
(OLS
Rv2
)[18
5]LS
and
Mul
tiPo
intR
elay
Tim
ed
Proa
ctiv
eTo
polo
gyD
isse
min
atio
nB
ased
onR
ever
se-P
ath
Forw
ardi
ng(T
BR
PF)[
186]
Link
Stat
ew
ithD
iffer
entia
lDat
aTi
med
Proa
ctiv
eLi
nkQ
ualit
ySo
urce
Rou
ting
(LQ
SR)[
187]
Wei
ghte
dC
umul
ativ
eEx
pect
edTx
Tim
eTi
med
Hyb
ridH
azy
Sigh
ted
Link
Stat
eR
outin
g(H
SLS)
[188
]Li
nkSt
ate
Tim
edan
dLi
nkB
reak
Tim
ed
Clu
ster
-hea
d/H
opco
unt
Proa
ctiv
eG
uess
wor
k[1
89]
Dis
tanc
eVe
ctor
and
Clu
ster
-hea
dTi
med
Dire
ctio
nFo
rwar
dR
outin
g(D
FR)[
190]
GPS
and
clus
ter-
head
Clu
ster
-hea
dG
atew
aySw
itch
Rou
ting
Prot
ocol
(CG
SR)[
191]
DV
and
Clu
ster
-hea
dTi
med
Expe
cted
Txco
unt
Proa
ctiv
eA
d-ho
cW
irele
ssD
istri
butio
nSe
rvic
e(A
WD
S)[1
92]
Link
Stat
eTi
med
Bab
el[1
98]
Dis
tanc
eVe
ctor
Link
Cos
tPr
oact
ive
Dis
tribu
ted
Bel
lman
-For
d(D
BF)
[193
]B
ellm
anFo
rdTi
med

2.5. ROUTING IN VANET 56
Tabl
e2.
6co
ntin
ued
from
prev
ious
page
Met
ric
Type
Prot
ocol
App
roac
hR
oute
-upd
ate
Des
tinat
ion-
Sequ
ence
dD
ista
nce
Vect
or(D
SDV
)[14
5,19
4]B
ellm
anFo
rdan
dSe
quen
ceN
umbe
rTi
med
Wire
less
Rou
ting
Prot
ocol
(WR
P)B
ellm
anFo
rd
Hyb
ridO
rder
One
Net
wor
kPr
otoc
ol(O
OR
P)[1
99]
Hie
rarc
hica
l-rou
ting
and
Clu
ster
-hea
dTi
med
and
Link
brea
k
Virt
ualL
ink
Pred
eces
sor
Hyb
ridSc
alab
leSo
urce
Rou
ting
(SSR
)[20
0]So
urce
Rou
ting
and
Virt
ualR
ing
Rou
ting
Tim
edan
dLi
nkbr
eak
Not
Spec
ified
Hyb
ridZo
neR
outin
gPr
otoc
ol(Z
RP)
[201
]Zo
ning
Tim
edan
dLi
nkbr
eak

2.6. VEHICLES IN NETWORK SIMULATION (VEINS) FRAMEWORK 57
2.5.3 REQUIREMENT OF ADAPTIVE ROUTING PROTOCOL
In order to obtain efficiency and reliability of VANET communication systems, routingprotocols are considered as one of the key contributers because they depend on the abilityof routing protocols to achieve the requirements of throughput and data delivery of anyapplication running on top of the network. Since road layouts, presence of obstacles andvehicles density is different, most of the routing protocols were designed and developed totackle the challenged of urban and highway scenarios. An adaptive protocol is able to changeits functionality in low and high dense networks without compromising its performance.To design an adaptive protocol in VANET is an challenging task due to its characteristics(discussed in Section 2.1).The comparative study in Section 2.5.1 showed that topology based routing protocols are notsuitable in a VANET environments. Proactive protocols use routing tables to determine thebest route between communication vehicles, however, VANET exhibits elevated mobilityspeeds, which may result in failure of this strategy. Reactive protocols experience routediscover delays, which may not be suitable for emergency applications. To the best of ourknowledge, research studies showed that the protocols proposed in the literature do notadequately address the network challenges due to lack of considering the dynamic nature ofthe network.Position-based protocols as discussed Section in 2.5.1 are intended to be adaptive butexperience message overhead, local maxima and routing loop issues. These protocols areunable to maintain performance in low density network. Here, the need for adaptive protocolis addressed by combining the functionality of topology and position-based routing becausethe first uses route maintenance, which ensure in-time delivery, while the latter uses positioninformation which helps to identify direction of the intended destination. Since routemaintaining and recovery mechanism add delays to the routing procedure, we consider thereorientation of routing at the lower layer. Chapter 4 included the discussion of the proposedreorientation of routing protocol at lower layer. The proposed MAC-based adaptive linklayer routing protocol is designed by considering the comparative study of routing protocolsavailable in the literature and of respective performance metrics which are analyzed usingmathematical model for VANET.
2.6 VEHICLES IN NETWORK SIMULATION (VEINS)FRAMEWORK
A simulation environment is required to analyze the performance of the proposed broadcastdata dissemination mechanism and of MAC-based adaptive routing protocols in vehicularenvironment. Moreover, the combination with traffic simulators is necessary to generaterealistic vehicular mobility and network simulators and to create the components required

2.6. VEHICLES IN NETWORK SIMULATION (VEINS) FRAMEWORK 58
in such a dynamic wireless network. We selected Veins (Vehicles in Network Simulation),which is an open source vehicular network simulation framework. It combines the event-based network OMNET++ (Objective Modular Network Testbed in C++) and a road trafficsimulator SUMO (Simulation of Urban Mobility) as shown in Figure 2.10. Both simulatorsare connected via a TCP socket. TRaCI (Traffic Control Interface) is the standardizedcommunication protocol that allows bidirectionally-coupled simulation of road and networktraffic. Mobility of the vehicles in SUMO represents the mobility of nodes in the OMNET++simulation [202, 203].Veins was selected due to the following features [204]:
1. Online re-configuration and re-routing of vehicles can be done in reaction to networkpackets.
2. It depends on fully detailed models of IEEE 802.11p and IEEE 1609.4 DSRC/WAVEnetwork layers. It also includes multi-channel operation along with noise andinterference effects.
3. Scenarios can be imported from OpenStreetmap with obstacles like buildings, trafficsignals and speed limits.
4. It is capable of the city block level simulations on a single computer.
5. Models for cellular networking like 3G, 4G or LTE can be included.
6. Shadowing effects caused by building and vehicles can be employed.
Fig. 2.10: Veins Functionality with OMNET++ and SUMO
In the following subsections, OMNET++, SUMO and TRaCI will be discussed in detail.

2.6. VEHICLES IN NETWORK SIMULATION (VEINS) FRAMEWORK 59
2.6.1 OMNET++
OMNET++ is an object-oriented discrete event simulator and used for modeling of differentcommunication networks, multiprocessors and other distributed or parallel systems. Itfollows a framework approach and provides tools and infrastructure for writing suchsimulations [205]. OMNET++ models are formed by reusable components known asmodules that communicate with each other through messages. Every model has two types ofmodules namely simple and compound modules. The whole model of OMNET++ known asnetwork is also a compound module. Connections are used to model physical links in orderto facilitate the modeling of communication networks. Data rate, bit error rate, propagationdelay and packet error rate can be defined in connection parameters. It also exhibits otherparameters that can be modified by the user to customize the module behavior and thetopology of the network. It enhances the support of OMNET with the help of other modelsfor realistic outcomes of simulation. These models are as follows;
1. OMNeT++ offers support for Parallel Distributed Simulation (PDES), which helpsin execution of large parallel simulations and fulfill the requirements of speedup ordistributing memory.
2. MIXIM is its another modeling framework designed for wireless networks which,may be infrastructure-based or infrastructure-less. This framework includespropagation, interference, radio transceiver power consumption models and wirelessMAC protocols [206]. For the precise modeling of physical layer effects and forworking with the distribution of transmit power over time and space, Veins relies onfunctionality provided by MIXIM. Furthermore, MIXIM can be used to estimate theeffects of buildings and other objects on Inter Vehicular Communication (IVC).
3. OMNeT++ simulation environment requires the INET Framework, which includesprotocols, agents and models for communication networks. It is available as an opensource model library and build around the concept that modules communicate witheach other by exchanging messages. Agents and network protocols act as componentsand can be joined together to form hosts, routers, switches or other networking devices.INET contains built-in models for Internet stack such as TCP, UDP, IPv4, IPv6 etc.It also includes wired and wireless link layer protocols like Ethernet, 802.11, etc.,along with the support for mobility. Many other frameworks use INET as a foundationand build extended frameworks to use them for particular network such as sensor orvehicular networks [207].
2.6.2 SIMULATION OF URBAN MOBILITY (SUMO)
SUMO is an open source traffic simulator that allows modeling of inter-modal traffic systemsand is widely used in the V2X community for providing realistic vehicle traces. It is also

2.6. VEHICLES IN NETWORK SIMULATION (VEINS) FRAMEWORK 60
used for evaluation of applications with a network simulator. It is a microscopic simulator,i.e, each vehicle in the network is modeled explicitly and has its own route to move in thenetwork [208, 209]. It works along certain libraries to connect SUMO with OMNET++during simulation:
1. Traffic Control Interface (TRaCI) gives access to a running road traffic simulationby allowing to retrieve values of simulation objects and to manipulate their behavioronline. It has a TCP based Client/Server architecture to provide access to SUMO.Upon start, SUMO listens for incoming requests on a predefined port, prepares thesimulation and waits for an external application to connect and take over control.Client connects to SUMO by establishing a TCP based connection on the specifiedport. Once the connection has been established, the client application sends commandsto SUMO to control the simulation or to manipulate the behavior of the vehicles or toask for environmental details. Once the close command has been issued by the client,the simulation will end and all the resources will be cleaned.
2. Both OMNet++ and SUMO are capable of running simulations without a GraphicalUser Interface (GUI). TRaCI modules for OMNeT++ contains a small daemon knownas sumo-launchd to ease running coupled simulations. For every connected instanceof OMNeT++, sumo-launchd creates a small temporary environment that includes allthe required fields and prepares an instance of SUMO listening on a TCP port [210].

3 RELIABLE BROADCAST DATADISSEMINATION MECHANISM
With growth in the population of cities and transport on road, the chances of trafficcongestion and accidents increase. In this regard, safety applications are being developedto avoid traffic jams and collisions using Vehicular Ad hoc Networks. This chapter dealswith designing a reliable data dissemination protocol to disseminate alert messages afteroccurrence of an accident to avoid multiple collisions, roadblocks and to call emergencyservices. To circulate the message to neighboring vehicles and their extended areas, vehiclesequipped such a wireless interface relay the desired information. Additionally, this chapterincludes a detailed description of a protocol using broadcast data dissemination (Flooding)mechanism, which intelligently selects the next-forwarding vehicle for re-broadcastingwithout introducing any new control message in the network. The proposed mechanismpresented in this chapter helps in reducing the number of redundant copies and the amountof time to re-broadcast. It also includes a mathematical model to prove the reachability ofthe broadcast message in the target group. Implementation details, and the evaluation of theproposed work for multiple scenarios in vehicular environment will be considered in thefollowing sections. Parts of this work has been published in [21] and submitted [23].
3.1 BACKGROUND
World Health Organization (WHO) [6, 211] has reported traffic violation and injuryprevention on the road for global road safety. As stated in the referenced report, the deathrate is 1.24 million per annum around the world due to traffic on road, which is very highand undesirable. The poor traffic management and lack of road safety measures in lowincome regions, the likelihood of dying in a road accident is three folded than high-incomeregion, however, the considerable amount of discrepancy exist within the same region. Over-speeding is one of the main reasons of chain crash either on highways or on motorways,which leads to an increase in fatalities. These fatalities can be reduced with the help ofsafety precautions, traffic management, safety measurements and enforcement laws. Almost
61

3.1. BACKGROUND 62
half of the deaths due to the road accidents, occur because of the absence of quick medicalassistance or the lack of provision for required resources at the accident location. Thehigh delay in providing quick medical aid or services is due to the absence of notifyingin-time reliable emergency warning or alert to the nearby medical service centers. Moreover,delay increases to get emergency help due to traffic congestion/jam on the road. WHO notonly works for the safety and accident prevention on the road, but it also offers post-crashcare services when the road accident occurs. These services are on emergency basis, likeaccessing numbers with emergency calls, emergency-rooms/control rooms for handling, andmedical trainings [6, 211].Taking into consideration, the communication challenges of vehicular environment and tosatisfy the need of divergent applications according to the requirements of customers, themechanisms to distribute the information in a network are classified into three major typesof strategies, i.e., reactive, proactive and hybrid. Although safety applications generallyuse proactive dissemination mechanisms, the scope of the current study is to carryout thedissemination of alert messages that are triggered when an event occurs in a vehicularenvironment, cf. [9]. Instead of a proactive, a reactive strategy is used in this work, becausethey are efficient in vehicular environment and they may also offer low message overheadand latency. The basic broadcast-based data dissemination approaches were proposed inthe literature and discussed in details in Section 2.4.3. A number of flooding mechanismwere proposed in the literature by using single or composite basic approaches, and theseflooding mechanisms are discussed in Section 2.4. A comparison study was carried outin Section 2.4.5 to identify the issues of already proposed mechanisms in the literature.It was observed that with the increase in redundant messages, the reachability increases,concurrently, collision and bandwidth consumption also increase which may lead to increasein ETE delay and reduction of packet deliver ratio. In contrast to this, with the decreasein the number of redundant messaged, reachability, unreliable data delivery, scalabilityand communication overhead may be introduced in the network. Apart from this, datapackets may be lost due to signal issue in presence of obstacles, collisions or temporarypartitioning of the network. This problem is called as temporal network fragmentation anddiscussed in Section 2.4.2. To avoid this issue, few of the existing protocols used fixedinfrastructure to spread the information in the network. However, it was concluded fromthe comparative study discussed in Section 2.4.5 that each protocol achieved a satisfactorylevel with respect to the performance but with limited scenarios. Though the performanceof flooding mechanisms has been improved yet, there are issues regarding reachability,scalability, on-time data availability and reliable data transmission.In the proposed study, the essence of message dissemination mechanisms is used, albeitit reduces the broadcast overhead without incorporating any new control message in thedefault configuration of existing mechanism. In a vehicular environment with high mobilityalong with obstacles, the design of the proposed protocol is adopted according to the

3.2. RELIABLE INTELLIGENT FLOODING MECHANISM (RIFM) 63
requirements of safety applications. We also ensure the reachability of the generated alertor warning message to all neighboring vehicles in the network in order to avoid the chaincrash, road jam and avail quick medical assistance. Additionally, destination-less routingis used without discovering a specific route to forward or to relay the desired informationin the network, whereas, the date dissemination is done through an event-based algorithm.The proposed rebroadcast mechanism mainly depends on two types of information, i.e., thecoordinates or the geographical position of the sending/receiving vehicle (node) and thenumber of copies of data message received at a node. Each node in the network intelligentlymonitors the above mentioned parameters in order to rebroadcast the received information.The distance- and counter- based approaches are combined to formulate a new algorithm,which is named as Reliable Intelligent Flooding Mechanism (RIFM).
3.2 RELIABLE INTELLIGENT FLOODING MECHANISM
(RIFM)
To address the issues discussed in Section 2.4.2, i.e., broadcast storm, network partitionand fragmentation, RIFM is proposed. The proposed mechanism includes two phases tocope with the challenges of reliable data dissemination, i.e, event detection phase anddata forwarding phase. It uses information about triggered events, location/position ofthe participating vehicles, the distance between communicating vehicles and wirelesslydirectly connected vehicles to take appropriate actions as the data originating/source, relayand destination node. Within the scope of this study, the data packets are intended to beforwarded in the extended area of the data originating node. The two main phases of inRIFM are characterized as follow:
1. Event Detection Phase: In this phase, the source node detects an event, e.g., anemergency due to accidents, car crash, road hazard, etc., and creates a broadcast datapacket to send in its local vicinity. The data packet includes the identification of thebroadcast data packet and the address of the data originating node 3. The source nodeis also aware of its position via GPS and includes it in the broadcast data packet beforetransmission.
2. Data Forwarding Phase: In multi-hop, communication involves the data forwardingvia relay nodes. In blind flooding, when a relay node receives a broadcast message, itis supposed to rebroadcast in its local vicinity. Since the RIFM targets to resolve theissue of broadcast storm, it selects the next-forwarder intelligently. When a broadcast
3A data originating node creates data packets. It adds its own address in the data originating address field andthe source address field. It indicates that the data originating nodes can be a source node, albeit a sourcenode cannot always be a data originating node because when a relay node forwards a packet to its neighborsit becomes a source node.

3.2. RELIABLE INTELLIGENT FLOODING MECHANISM (RIFM) 64
data packet is received, the relay nodes waits for a random time and computes itsdistance from the source node. Meanwhile it also counts the number of receivedduplicates copies. The relay node uses a threshold for distance between and counter,and compares the computed distance and counter values with the latter. The thresholdvalues are computed in this study with the help of simulation and will be discussed inSection 3.4.1. A relay node is selected as a next-forwarder if the number of receivedduplicates is less than a threshold counter value and if it is beyond the minimumdistance threshold. If a relay node receives only one copy of the broadcast message,it rules out the distance threshold action and forwards it. The proposed protocol alsoaims cope with the network fragmentation and partition issue. To handle that scenario,next-forwarder gets information of its neighbors and it discards the packet when atimer expires. The value of timer is selected by using expiry time of the data packetand link recovery time of the broadcast data packet. If a relay node has no neighboringnode, the case of network fragmentation or partition may occur. To handle it, thenext-forwarder holds the received packet for a random time (timer). As soon as newnode(s) is(are) in its neighboring list, it forwards the packet, otherwise it extracts theuseful information and discards the packet.
3.2.1 PROPOSED MECHANISM
Consider a graph G(N, E), where, N is the set of vehicle or nodes and E is the set of linksor edges among the nodes. The set of nodes and edges are represented as N = {n1, . . . , nq}(where q represents the total number of nodes) and E = {eij | i and j œ N}, respectively.The designed mechanism mainly depends upon two obligatory factors: Firstly, the locationof a receiver, and secondly, the local information that each vehicle receives through thewireless interface.
Assumption 3.1Here, we assume the following to hold:
1. Each and every vehicle ni (where i = 1, 2, 3, ..., q) within the network of nodes N
maintains information about its own position xn; using Global Positioning System(GPS).
2. On the way, if an event (e.g., accident) X occurs with a vehicle, then it creates andgenerates warning/alert message (CPacket) to all the nodes within its vicinity. Here,X depends on the scenario.
3. To represent the distance (D) between sender and receiver of a CPacket, D iscomputed using coordinate of communicating nodes.

3.2. RELIABLE INTELLIGENT FLOODING MECHANISM (RIFM) 65
4. For distance between the nodes, a threshold (dmax > 0) is defined which will alwaysbe less than the transmission range r, i.e., dmax < r.
5. The CPacket incorporates the Broadcast ID BroadcastID of the packet, the positionof the sender, originating source ID OriginatingSourceID and its Time-to-LiveTTL. BroadcastID and OriginationgSourceID are assigned once and remainunchanged until the path expires.
6. Each node can store information about received packets CPackets, i.e., countersc, BroadcastID, OriginatingSourceID and a copy of corresponding receivedCPackets (If received any) as shown in Table 3.1.
7. Each node can get the information of its directly connected nodes or neighbor.
8. Each node stores a copy of broadcast message if and only if it has no neighbor in thevicinity until its timer (counter for time) expires. It rebroadcast the stored copy as soonas new neighbor arrives in its vicinity, otherwise it discards it when timer expires.
Tab. 3.1: Lookup-Table (Maintained at Each Node)
BroadcastID OriginatingSourceID c CPackets1452 2001:db8:0:8d3:0:8a2e:70:1 1 data1568 2001:db8:0:8d3:0:8a2e:70:2 3 data.... .... .... ...
Based on the mentioned assumptions, the proposed reliable intelligent floodingmechanism is presented in Fig. 3.1. To find out the threshold value for the wait timeof a node (t-time) to check counter value and to make decision of rebroadcasting, weused possible DIFS (DCF Interframe Spacing) 4 and SIFS (Sortest Interframe Spacing) 5
intervals [212]. Here, we computed the wait time with 2◊DIFS and 1◊SIFS intervals.Figure 2.8 shows an accident scenario, where collision of two cars occurs. consider one
of the colliding cars is enabled for accident detection and management application [9],therefore, it creates and sends an alert message to all neighbors within its vicinity. Eachreceiving node or the neighboring vehicle receives the alert message, and before re-broadcasting the received message, the vehicle that receives the broadcast message waitsfor other messages and listens to the wireless medium. If the vehicle receives the sameinformation from its neighbors again within the predefined time slot, then it infers that
4In 802.11, it is the time delay for which sender waits after completing it’s backoff, before sending RTSpackage [212].
5It is the time for which receiver waits before sending the CTS (Clear To Send) and acknowledgement packageto sender, and sender waits after receiving CTS and before sending data to receiver [212].

3.2. RELIABLE INTELLIGENT FLOODING MECHANISM (RIFM) 66
Fig. 3.1: Flowchart of the Proposed Message Dissemination Procedure using Vehicular Environment
the information is already disseminated and it then avoids to rebroadcast it in order toreduce redundancy. However, it keeps this information, which may help in other safetyapplications like hard-break safety application to avoid chain crashes. If a particular vehiclein the network receives information prior to the predefined count which is three copiesof the same alert message, then it proceeds by computing the distance using its own GPSposition with respect to the sender’s position. The information about position of sender isincorporated within the broadcast message sent by the sender. If the distance computedusing the coordinates of the two vehicles is greater than the threshold value of a predefineddistance dmax, then it rebroadcasts the message after adding its own position. Otherwise, itconfirms first whether it is not the only vehicle who can relay information in the network, ifso its forwards, otherwise discards it. Before forwarding the broadcast packet, the forwardergets its neighboring list (get(neighborslist())). If the forwarder has no neighbor in its

3.2. RELIABLE INTELLIGENT FLOODING MECHANISM (RIFM) 67
vicinity, it stores the copy of message and waits until a new neighbor arrives in the vicinity.If no neighbor arrives until timer expires, it discards the stored copy.Figure 3.1 presents the flow of the proposed reactive flooding mechanism. When an event-Xoccurs, e.g., car crash, it creates an alert message and broadcasts it to the its directlyconnected nodes. Upon reception, each node checks for the entry of received messages intheir look-up table using BroadcastID and OrigininatingsourceID. If the entry doesnot exist, it creates an entry in the look-up table, increments the counter c + + and waitsfor t-time. otherwise it increments the counter only and discards the received copy. Aftertime t, it checks if the counter c is greater than 2, then that particular node will not select asa forwarding node, otherwise it computes the distance D between its own position and themessages originating node. If D is greater than the threshold value dmax, the node is selectedas a next forwarder. The forwarder gets its neighbors list neighborslist() 6, and forwardsthe message to them. If the forwarder has no neighbor in its vicinity, it sets a timer to wait.During its wait time, if new node(s) arrive(s), it forwards the packet, otherwise on expiringof the timer it discards the stored packet. Focusing the goals of rebroadcast with minimalredundancy as explained with the help of flowchart, the procedure is defined in Algorithm 1.To briefly explain the latter algorithm with an example, the considered scenario is presented
Fig. 3.2: Example of Proposed Flooding Mechanism
in Figure 3.2 where the communication range of a car n1 located at the mid point in the bigsolid line blue circle and dmax threshold is represented with a small dotted line blue circle.By considering the procedure of the proposed solution, each car ni determines its distancefrom the sender nj using eij upon reception of a CPacket. If the computed distance ofeij > dmax, then the vehicle denoted by ni will re-broadcast the packet. Each car alsoconfirms that it is not the only relay node which can forward CPacket prior to distancecomputations. In Figure 3.2, the car n1 broadcasts its CPacket upon triggering an event toneighbors, and all the cars in the communication range receive this packet. By considering
6neigborlist() returns an integer number n, which infers the total of directly connected nodes

3.2. RELIABLE INTELLIGENT FLOODING MECHANISM (RIFM) 68
Algorithm 1 Process of deciding a re-broadcast from node i to node j with CPacketREQUIRE (Notation Used):BID Broadcast IDOSID Originating source IDT T L Time to liveCP acketi Broadcast Packet ici Counter for the no. of CP acketi copies at node jXj Location of node j (receiver node)Xi Location of node i (sending node)eij Distance between the originating/forwarding Node i to receiving node jdmax Distance Thresholdwait() Process that force to hold CP acketi to process for specific timediscard(CP acketi) Delete the copy of broadcast packetrebroadcast(CP acketi) Forward to neighboring nodesget(CP acketi) Receive CP acketi on broadcast mediumget(ci) Fetch value of Ci from routing tableget(neighborslist() > 0) total number of neighborsstore(CP acketi) hold packet in temporary memoryset(timer) set timer for holding the received packetexit() use to exit from current loop
ENSURE:Packet should be forwarded or discarded
INITIALIZE:ci = 0;dmax = threshold;T T L = 32;
1: SUB-PROCEDURE:P acketF orwardingCheck(CP acketi)2: if get(neighborslist() > 0) then3: rebroadcast(CP acketi);4: else5: store(CP acketi);6: set(timer);7: while timer > 0 do8: if get(neighborslist() > 0) then9: rebroadcast(CP acketi);
10: exit();11: end if12: end while13: discard(CP acketi);
14: end if1: MAIN PROCEDURE:2: get(CP acketi);3: if (BID&&OSID) then4: if (T T Li > 0) then5: get(ci);6: ci + +;7: insert(ci);8: T T L ≠ ≠;9: else
10: discard(CP acketi);11: end if12: else13: if (T T Li > 0) then14: ci = 1;15: insert(BID, OSID, ci);16: wait(time);17: get(ci);18: if (Ci < 3) then19: eij = xj ≠ xi;20: if (eij > dmax) OR (ci==1) then21: P acketF orwardingCheck(CP acketi)22: else23: discard(CP acketi);24: end if25: end if26: else27: discard(CP acketi);28: end if
29: end if

3.3. MATHEMATICAL MODEL 69
the proposed mechanism, both cars which are in vicinity, i.e., car n2 and n3 compute thedistances, and only car n3 rebroadcasts this CPacket. Further, n1, n2, and n4 are presentwithin the broadcast range of car n3, where only n4 re-broadcasts the CPacket. As n5 is theonly node within the broadcast range of node or car n4, it rebroadcasts CPacket further.
3.3 MATHEMATICAL MODEL
The fundamentals and assumptions of the RIFM are explained in last section where itdiscussed about the phases involved in proposed mechanism. The flow of the procedureis explained with the help an example. It is observed from the illustrated example thatall the nodes received the CPacket. Here, this section compares the reachability of thepropose mechanism to the blind flooding mechanism, and how it identically provided thenetwork is fully connected. Here, let N(n) be the maximal set of nodes in the network suchthat N(n) µ N , which receive a CPacket originated from node or vehicle n using blindflooding. Similarly, by considering the same scenario ÊN(n) µ N denotes the maximal setof vehicles or nodes, which receive a CPacket originating from node n using the proposedmechanism. Using the latter, we can prove the following:
Theorem 3.2Consider a graph with set of nodes N and edges E such as G = (N, E) and withAssumption 3.1 to hold. Then, ÊN(n) = N(n) holds for any n œ N .
Proof. To prove the statement, we use contradiction. We fix n œ N arbitrarily to support thecontradiction. Here, the proposed solution is not better than the traditional or conventionalblind flooding, N(n) ( ÊN(n) is not possible for any n œ N . Let’s speculate that thereexists n œ N such that N(n) ) ÊN(n). For that reason, there exists a set N1 œ N(n) tothe extent that N1 fl ÊN(n) = ?. As a consequence of the fact we fix n1 œ N1 arbitrarily.Since n1 is able to be accessed or reached by using the conventional blind flooding, thereexists at least one n2 œ N(n) such that e12 Æ r. Since n1 ”œ ÊN(n), then by consideringthe construction of the proposed solution we obtained that n2 ”œ ÊN(n). By continuing theprocess of reasoning systematically in support of an idea inductively, we obtain n ”œ ÊN(n).Since n is the initial broadcasting point, it is a contradiction. Moreover, n1 and the relatedsequences were selected arbitrarily, which highlights the assertion for the selected or chosenn œ N . Last, as n was fixed arbitrarily, the assertion follows.
3.4 SIMULATION AND RESULTS DISCUSSION
A simulation environment is required to analyze the performance of flooding techniquesin vehicular environment with the combination of traffic simulators to generate realisticvehicular mobility and network simulators to create the components required in wireless

3.4. SIMULATION AND RESULTS DISCUSSION 70
network. We selected Veins (Vehicles in Network Simulation), which is an open sourcevehicular network simulation framework and was discussed in details in Section 2.6.The RIFM mechanism was implemented in the Vein framework [202]. We selected city andhighway scenarios for simulation. Results were averaged over 20 number of simulation runsand the mean values were calculated with the confidence interval of 95%. For the evaluationof the above mentioned techniques, following performance metrics were observed:
• Reachability of messages to other Nodes: Considering safety aspects of vehicles, eachand every node in the network is equally important. Therefore, the reachability ofmessages to maximal nodes is also important. For certain applications where alertmessage is needed to send in the extended area, it is crucial to ensure the reachability.The 100% reachability can only be achieved if we have fully connected network withgood network-link quality.
• Total number of received messages: Another objective of this protocol is to reducethe redundant copies in the network. Therefore, it is necessary to compare the totalnumber of received messages in the network to calculate the delta for performance.This metric has counter-performance metric, i.e., reachability. If it is needed to sendthe message in the extended network, then it is required to have maximum reachabilitywith the reduced redundant copies.
• Total number of re-transmitting nodes: The difficult part of the flooding mechanism isthe selection of the next re-broadcasting node. The more re-transmitting nodes exist,the greater is the number of redundant copies circulating in the network. We considerthis parameter for evaluation of the proposed protocol. However, it is also linked withthe counter-performance metrics, i.e., reachability.
• Busy Time of Nodes (Delay): When a relay node receives a message, it processes thepacket to retransmit if it is needed. This busy time of the all the nodes of the networkcan also be a performance parameter of a flooding mechanism. Here, defined theprocessing time of each node in the network as a result of an alert message is calledbusy time or delay of the network. It is needed to compute the busy time in order toobserve the performance of the proposed protocol in term of time.
The general simulation parameters are presented in Table 3.2 and 2.3, and the simulationswere performed in windows environment.For city, we used map of Bremen (Germany), which is presented in Figure 3.3, and forhighway traffic scenarios, we took part of Saint Joseph Valley Parkway located in US asshown in Figure 3.4. The map was imported from OpenStreetMap and then convertedusing NETCONVERT so that it can be used in SUMO. We imported xml files of mentionedscenarios from OpenFlow, then created a topology using SUMO for Veins. In each scenario,we generated the network topology by varying number of nodes (vehicles) as 20, 40, 60, 80

3.4. SIMULATION AND RESULTS DISCUSSION 71
Tab. 3.2: General Simulation ParameterOmnet Version OMNETPP 4.6SUMO Version Sumo-0.22.0Veins Version Veins- 4a2No of Nodes 20, 40, 60, 80, 100Traffic Scenario City and HighwaySpeed 20-60 MphTransmit Power 20 mWSensitivity Threshold -94 dBmCarrier Frequency 5.890e9 HzBandwidth 18 MbpsPacket Size 400 ByteTransport Layer Protocol UDPRTS/CTS Disable
and 100. The other simulation parameters are presented in Table 3.2.Figure 3.5 & 3.6 illustrate the simulation of city and highway scenario using OMNeT++
Fig. 3.3: Bremen (Germany): Taken Map for City Simulation Scenarios
and SUMO in parallel respectively.Before the comparison analysis of the proposed protocol with other related mechanisms,
we first performed basic simulation for the RIFM to determine the suitable thresholds for thescenarios and safety applications. The following section presents the detailed comparison ofproposed protocol for different threshold values.
3.4.1 DEFINING THRESHOLD FOR RIFM
Reachability of messages to all connected nodes in the network is due to many reasons.One of them can be the selection of rebroadcasting nodes. In blind flooding, though each

3.4. SIMULATION AND RESULTS DISCUSSION 72
Fig. 3.4: Bremen: Taken Map for Highway Simulation Scenarios
Fig. 3.5: Simulation of City Scenario with 60 Nodes
and every node is retransmitting the packet, reachability may be disturbed due to bad linkquality and partial disconnected network, e.g., via communication range or obstacles, liketall building, mountains, and short contact duration. In the proposed mechanism, the criteriato select the rebroadcasting node may differ, but the environmental factors are identical. Thesimulation was done for the city and highway scenarios in order to observe the performance.The counter and communication range vary in city and highway scenarios and based on thatthe effect on the performance matrices are observed, i.e., total number of received messages,total number of retransmitting nodes and reachability to the nodes in the network. These are

3.4. SIMULATION AND RESULTS DISCUSSION 73
Fig. 3.6: Simulation of Highway Scenario with 60 Nodes
two threshold in the proposed algorithm, which may effect the performance of the protocol.These threshold values were the distance threshold (we named it D-threshold) and number ofreceived copies of an alert message (i.e., counter ’c’). Based on the proposed idea, we havetwo values of counter that can improve the performance, therefore we selected c = 2, andc = 3 for simulation. We choose first c = 2 and varied the D-threshold and observed results.Then we select c = 3 and varied D-threshold and observed the results. The value for D-threshold is chosen on the bases of communication range of the available interface, which isalways less than the communication range. VANET supports 1000m communication rangeand the selected values for D-threshold were 350m, 450m and 550m. These simulationscenarios with the threshold value are presented in Table 3.3.
Tab. 3.3: Simulation Scenarios for Defining ThresholdNo. Counter (c) D-threshold(m)1 2 3502 2 4503 2 5504 3 3505 3 4506 3 550
REACHABILITY
We evaluated the mentioned scenarios (Table 3.3) for city and highway. We observedthat in the highway environment, the reachability remained 100%, however in case of cityenvironment it was between 90-100%. The reason for 100% reachability in highway is

3.4. SIMULATION AND RESULTS DISCUSSION 74
because of the environment. Highway roads are wider than the city roads and vehicles arenot much closer as compared to the city environment, though the number of nodes wereidentical. However, in case of city environment, the speed of vehicles was slow, but therewere certain other parameters that can effect on the communication, i.e., obstacles, packetcollision. In the absence of Ready to Send (RTS) and Clear to Send (CTS) messages ofCSMA/CA, the chances of collision increase due to hidden/exposed node problem. Figure3.7 presents the reachability in the City environment with varying node densities. The resultsare good in all cases. However, it was observed that the reachability for the values of c = 2and D-threshold= 550 was above 99.7%.
Fig. 3.7: Reachability in City Scenario on Varying Communication and Counter Threshold
RECEIVED MESSAGE
The next performance metrics was computed the total number of received messages in thenetwork as a result of retransmission of an alert message. The comparison of counter 2and 3 for different distance thresholds with varying network densities was made and it wasobserved that the performance of this metrics varies in each scenario as well. The commontrend we observed in the chart is that with the increase in D-threshold, the number of receivedmessages decreased in both city and highway environments, as depicted in Figure 3.8 and3.9. In city scenarios, as presented in Figure 3.8, the number of nodes are on x-axis andnumber of received messages are on y-axis. First we fixed counter 2 and observed resultsby varying D-threshold. With the increase of D-threshold, the number of received messagesincreased because of the increase in coverage area of the re-transmitting node. However, wealso observed that with the increase in D-threshold, the performance of protocol with countervalue 2 and 3 was identical, but with the increase in the number of nodes in the network, it

3.4. SIMULATION AND RESULTS DISCUSSION 75
performed better with counter value 2. Furthermore, we observed that the maximum distanceof retransmitting node from the message forwarding node is 484m, which means 550m isappropriate selection for D-threshold.Considering highway scenarios with the same counter and threshold value, the results are
Fig. 3.8: Received Messages for City Scenario
presented in Figure 3.9. Though, all the scenarios are identical, as in city scenario, the totalnumber of retransmission decreased with the increase in the number of nodes. Observing theresults of highways scenarios, the trend of received messages is similar to the city scenario,and the performance of protocol was better when the counter value is 2 and D-thresholdvalue was 550 with the increasing number of nodes in the network.
Here, if we compare the results of city and highway scenarios for the total number ofreceived messages, the protocol performance is good in both cases when the counter is 2 andD-threshold is 550m.
NUMBER OF RETRANSMITTING NODES
Furthermore, we computed the number of nodes that retransmits alert messages for allscenarios mentioned in Table 3.2 for city and highway environments. Figure 3.10 and3.11 present the simulation results for city and highway, respectively. We observed thatwith counter 2 and 3 and by varying D-threshold, the selection of nodes that were used toretransmit the messages also varied. The retransmission of the messages was reduced withthe selection of less number of retransmitting nodes. In the city scenario, with 20 number ofroads, the selected nodes that retransmit message were identical, because the network densitywas spars and inter-vehicle distance was also large. However, with the increase in number

3.4. SIMULATION AND RESULTS DISCUSSION 76
Fig. 3.9: Received Messages for Highway Scenarios
of nodes in the network, the selection of nodes that retransmit message also varied. Thefactor of selecting less number of nodes that retransmitted message with large D-thresholdwas prominent. It was observed that less number of nodes that retransmit messages, wereselected from results where the value of counter and D-threshold were was 2 and 550mrespectively. Similar trend is observed in the results of highway scenarios.
From the results presented in Figures 3.7 - 3.11, it can be concluded that the proposed
Fig. 3.10: Number of Retransmitting Nodes in City Scenario

3.4. SIMULATION AND RESULTS DISCUSSION 77
Fig. 3.11: Number of Retransmitting Nodes in Highway Scenario
protocol performed better in both city and highway scenarios when its counter value is 2 andD-threshold is 550m as compared to other scenarios where counter is 2 or 3 with D-thresholdvalues from 350-550m. The reason behind this performance is concluded as;
• Decrease in redundant rebroadcasts: The proposed protocol generates less redundantmessages when its counter value is 2 and D-threshold is 550m because the larger theD-threshold is, the lower is the selection of the nodes that are used to retransmit themessage.
• Decrease in Contention over broadcast medium: Another reason behind the betterperformance of the proposed protocol is that, the retransmitting nodes are selectedwhen distance is greater than a certain D-threshold, hence, increased the distancebetween two retransmitting nodes, which leads to the fact of lower nodes participatingin contention of channel access.
• Packet collision: In absence of RTS/CTS, the chances of collision are greater. If theselected node that is used for the retransmission is at the appropriate range, then allnodes in the neighbors do not retransmit packet. This reduces the chances of collision.Here, in city scenario, we observed that the reachability is not 100%. Since in cityscenario, speed of the nodes is not high and inter-vehicle distance is also less, therefore,the collision possibility is greater. Packet may also be lost due to channel access reasonor link quality. The link quality usually reduces with the presence of obstacle likeshopping malls and buildings.
From the simulation results as mentioned above, the proposed protocol performs better

3.4. SIMULATION AND RESULTS DISCUSSION 78
when c=2 and D-threshold= 550m as compared to other scenario. Hence, we selectedthese values as threshold values (counter=2, D-threshold=550) for the proposed mechanism.Furthermore, several simulations were performed using these threshold values for thecomparison of proposed technique with other techniques. This comparison study isdiscussed in detail in the following section.
3.4.2 EVALUATION OF PROPOSED MECHANISM
In the literature, a number of flooding mechanisms were proposed as discussed in Section2.4, where the selection of nodes that retransmit the message was done using local/globalinformation or was used to calculate the probabilities by using distance, speed or counter.The comparison of these techniques is done with the proposed flooding mechanism toanalyze the performance of the protocol in city and highway scenarios. For the comparisonof the RIFM, blind flooding with different probabilistic- (50%, 30% ) and deterministic-based techniques were selected.
• Blind flooding: Each node on receiving message, rebroadcasts packet with 100%probability.
• Probabilistic-based techniques: Each node forwards packet with some probabilityp upon receiving message from neighborhood. As discussed in the literature, thereare multiple approaches to calculate probability. The probability values were used toselect the next-forwarder. Blind flooding mechanism works with 100% probability.Therefore, if p lies between 0 and 1, we select P = 0.7, P = 0.5 and P = 0.3. Fromthe basic results, it was observed that at even 50% probability, the redundancy was toohigh for the comparison with techniques, and removed P = 0.7 from the comparisonstudy.
• Deterministic Based Mechanism: Each node collects local or global information,and takes the decision on the bases of available information. The counter-basedtechnique was included for comparison, because in the literature, it is discussed thatits performance is better than other deterministic based approaches. In counter-basedtechnique, each node rebroadcasts message when its counter threshold value is lessthan the specified value. This value may vary from 2, 3, 4, and 5 redundant copies.In this study, the selected counter value is 2 for comparison purpose, because in theproposed RIFM, the counter was one of the decision threshold, where we used samevalue.
For the evaluation, we used city and highway scenario as presented in Figure 3.3 & 3.4,and the general simulation parameters are mentioned in Table 3.4. For the RIFM, the used

3.4. SIMULATION AND RESULTS DISCUSSION 79
threshold for counter is (c) = 2 and Distance threshold is 550m (dmax = 550). In thecounter-based technique, the used counter threshold 2. The detail of the results for city andhighway scenarios are discussed in the section below.
The general simulation parameters are presented in Table 3.2, and the simulations are
Tab. 3.4: General Simulation Parameter Used for EvaluationOmnet Version OMNETPP 4.6SUMO Version Sumo-0.22.0Veins Version Veins- 4a2No of Nodes 20, 40, 60, 80, 100, 120, 140, 160,
180, 200Traffic Scenario City and HighwaySpeed 20-60 MphTransmit Power 20 mWSensitivity Threshold -94 dBmCarrier Frequency 5.890e9 HzBandwidth 18 MbpsPacket Size 400 ByteTransport Layer Protocol UDP
performed in windows environment.
ANALYSIS OF DIFFERENT FLOODING MECHANISMS IN CITY
SCENARIO
We performed simulations multiple times for all selected techniques in the city scenario.The selected performance metrics were the total number of transmitted messages, totalnumber of retransmitting node, reachability of message in the network and busy time of thenetwork.Figure 3.12 presents the results for the first performance metric, i.e., total number of receivedmessages as a result of an alert message generated in the network. The x-axis represents thenumber of nodes in the network and y-axis presents the total number of received messages inthe network. The lines in the graph depict the performance of different flooding techniques,where blind flooding line in the graph indicates the highest transmit messages in the networkand RIFM line presents the lowest number of transmitted messages in the network. Theobjective of flooding technique was to reduce the redundancy of the messages generated inthe network. The RIFM improved the performance of flooding technique by decreasing theredundancy of messages in the network. The calculated selection of the nodes that retransmitthe message in the RIFM mechanism help to reduce the redundancy of alert messages.The second performance metric is presented in Figure 3.13, where the RIFM line indicates

3.4. SIMULATION AND RESULTS DISCUSSION 80
Fig. 3.12: City Scenario: Total Received Messages in Varying Network Density
the least number of retransmitting nodes, and because of the least number of retransmittingnodes the redundancy of messages reduces which is presented in Figure 3.12. It is alsoobserved that the number of retransmitting node in RIFM is closer to the counter basedtechnique, but the total number of received messages are less than the counter basedtechnique, which means the selection of retransmitting node is important for this difference.Hence, the information about the location of sending node helps to improve the performance.The third performance metric was reachability of alert message to all connected nodes in the
network, which is effected due to many reasons. One of the reasons can be the selection ofthe rebroadcasting node. In blind flooding, though every node is retransmitting the packet,reachability may be disturbed due to bad link quality, and partial disconnected networkdue to communication range or obstacle like high building, mountains, and short contactduration. In all other flooding mechanisms, the criteria for the selection of rebroadcastingnode may differ, but the environmental factors are identical. Considering all these points,the simulation was done using the proposed mechanism for the city scenario to observereachability.Figure 3.14 presents the percentage of the simulation results for the reachability. Thereachability of blind flooding is less than the comparative protocols because in thistechnique, each neighboring node retransmits the message, which increases the chancesof collision in absence of RTS/CTS and reduces the reachability of message. Apart fromcollision, the reachability can also be reduced due to link quality and partial dis-connectivityof the network due to high speed of the vehicle. The reachability of the RIFM is also about99% while the reachability of counter-based flooding is about 99% until number of nodes

3.4. SIMULATION AND RESULTS DISCUSSION 81
Fig. 3.13: City Scenario: No. of Retransmitting Nodes in Varying Network Density
are less than 100. With the increase in node density, reachability value reduces to 96%,77.7% and 70% for counter-based, p50% and p30% respectively.
The fourth performance metric was the busy time of the network. Figure 3.15 presents
Fig. 3.14: City Scenario: Reachability in Varying Network Density
results of the busy time with varying network density. The x-axis presents the number ofnodes in the network and y-axis presents the busy time of the network. The maximum busytime (ms) is observed in the scenarios of blind flooding mechanism due to broadcasting of

3.4. SIMULATION AND RESULTS DISCUSSION 82
high number of redundant copies in the network, while the minimum are RIFM scenariosdue to broadcasting of lowest number of redundant copies in the network. The busy timeof counter-based flooding mechanism is also acceptable, however it is greater than the timeobserved in RIFM scenarios.From the Figure 3.8- 3.15, it is concluded that the overall performance of RIFM is better
Fig. 3.15: City Scenario: Busy Time of The Network in Varying Network Density
than other mechanisms.
ANALYSIS OF DIFFERENT FLOODING MECHANISMS IN HIGHWAY
SCENARIO
The simulation was done for the identical scenarios for highway traffic, and results werecomputed respectively. Figure 3.16 presents the total number of received messages in thenetwork where the RIFM technique that is stable with the increase in the number of nodes.The graph lines of 50% probability and 30% indicate that they are retransmitting with lessnumber in the network than the RIFM. This change is visible when the number of nodes inthe network increase from 60 to 80 and then greater than 100. Same behavior is observed inFigure 3.17, where in case of this technique they select least number of retransmitting nodesas compare to RIFM.From these two results, the first observation was that the performance of the probability
based technique is better than the other techniques. However, when we observed theresults in Figure 3.18, we identified the reason behind less messages and least number ofretransmitting nodes. The reachability lines of these probability-based techniques were

3.4. SIMULATION AND RESULTS DISCUSSION 83
Fig. 3.16: Highway Scenario: Total Received Messages in Varying Network Density
Fig. 3.17: Highway Scenario: No. of Retransmitting Nodes in Varying Network Density
below 45% when the number of nodes increases from 60 and it dropped to 20% when nodedensity was greater than 100 in the network, which means that the message is not forwardedto all nodes after few retransmission. As compare to this, the reachability of RIFM is stillabove 99%, with reduced received messages and retransmitting nodes.The results for the busy time of the network are presented in the Figure 3.19. The busy time
of the nodes in the highway scenario was too less as compare to the city scenario, because

3.4. SIMULATION AND RESULTS DISCUSSION 84
Fig. 3.18: Highway Scenario: Reachability in Varying Network Density
Fig. 3.19: Highway Scenario: Busy Time of The Network in Varying Network Density
in the highway scenario the inter-vehicle distance was greater than the city scenario. Inhighway, the highest busy time was observed in blind flooding scenarios while the lowestwas in the scenarios of probability-based mechanism with 30%. As results of Figure 3.18 arealready presented, where it is discussed that the reachability of probability based mechanismis too less in highway scenario, therefore it also effected the busy time of the network. Inhighway scenario, the inter-vehicle distances was usually greater, and if nodes are selectedon the bases of probability without considering the position and density of the nodes in

3.5. SUMMARY 85
the neighborhood, then, it is likely that after few retransmission the nodes stop to forwardmessages due to partial message flooding. For example, if there is only node available thatcan retransmit message in the neighboring node and because of the 30% of retransmission, itdefer retransmission then the nodes in its neighborhood will not receive this message. Withthe limited reachability, the busy time was minimum for such scenario. In case of RIFMscenarios, the reachability is about 99%, and busy time is lesser than the other technique.The targeted performance of a flooding mechanism was decrease in redundancy andretransmission, and meanwhile it ensure the maximum reachability because of the safety-related services. It was observed from the results as depicted from Figure 3.16 - 3.19 that theperformance of RIFM is better than other techniques that we have chosen for comparison.The reason behind is that the selection of retransmitting by considering the node locationinformation and local dissemination information. Since the RIFM also handles networkpartition and fragmentation, the reachability of the flooded information is up to 99% in highnetwork density.
3.5 SUMMARY
VANET is a promising technology and being used in the development and evolution ofon-road safety, traffic-management and information-/infotainment- based applications. Theresearch community argues on the importance of flooding mechanism for the successfuluse of mentioned applications in vehicular environment. The main objective is to improvethe traditional flooding mechanisms of data traffic in VANET with reduced redundancy,delay and with maximum reachability. This chapter introduced a novel Reliable IntelligentFlooding Mechanism (RIFM) for VANET by considering both city and highway scenarios.The evaluation of the proposed algorithm was done by keeping in view the particular floodingrequirements. Furthermore, it discussed the efficiency in terms of reachability with the helpof a theorem and its proof. The comparison of RIFM was done with existing approaches andallowed to conclude that the proposed RIFM mechanism achieved high reachability withpossible reduced re-broadcasting, which is basically an acceptable outcome of the algorithmin the context of saving network resources. The proposed algorithm was implementedin Veins framework, and evaluated for the city and highway traffic scenarios. Fromthe simulation results we further concluded that the proposed mechanism exhibits betterperformance in terms of less number of retransmissions, busy time, and high reachability.

4 MAC-BASED ADAPTIVE LINKLAYER ROUTING PROTOCOL
This chapter presents the design of proposed routing protocol considering certain selectiveperformance metrics from the literature. In the proposed study, the design of a mathematicalmodel-based multi-hop routing protocol is carried out which aims at scenarios of safety-and information-based applications in vehicular environment. The identification of suitablerouting metrics is one of the crucial parts of this work. Therefore, this work is divided intoseveral parts. Firstly, a thorough literature review has been carried out in the context ofidentifying the suitable routing metrics that can be used to design efficient routing protocolsin Section 2.5, a summarized discussion of which is included in Section 4.1. Secondly, itdiscusses the reorientation of routing mechanism from IP layer of the TCP/IP suits to datalink layer in Section 4.2. Thirdly, a mathematical model is presented based on the identifiedmetrics in Section 4.3 which can be applied to validate the performance of the proposedprotocol. Fourthly, it discusses the design of proposed routing framework in Section 4.4.Moreover, the detailed description of the proposed protocol design along with the controlmessages and terminologies is discussed in the same section. Fifthly, the simulation resultsand discussion of the proposed protocol are presented in Section 4.5. Last Section 4.6presents the summary of this chapter. Parts of this work have been published in [21] andsubmitted in [24, 25].
4.1 BACKGROUND
In VANET, it is usually implausible to support the achievements and services of manyapplications. In-spite of having computing, sensing, and communication capabilities,VANET comes with several challenging characteristics like high mobility and short contactduration in dense and sparse environment as discussed in Section 2.1. These characteristicslead to a dynamic network topology, where the wireless links between vehicles (nodes)connect and disconnect very often. In addition, the emergence of a wide diversification ofnew and innovative applications for safety, commercial, comfort, health, eco-friendly, traffic
86

4.1. BACKGROUND 87
management and logistics as discussed in Section 2.3 require efficiency, reliability, and in-time information delivery in a well deployed network. Furthermore, high mobility and shortcontact duration among vehicles in VANET create a challenging environment for the existingMAC and routing protocols [21]. The exploitation in the deployment of either mobile-nodes,static-nodes, or both types of patterns along with the requirement of QoS [15] add morecomplexity to the routing. Additionally, the routing algorithms used in MANET are notapplicable to design the applications used in vehicular environments. Thus, the researchcommunity puts a lot of effort into upgrading old algorithms and designing new ones [30,49].
The performance of ad hoc networks usually depends on the reliable and in-time datadelivery to the destination node via relay nodes over the best available route. An adaptiveprotocol does not compromise its performance in-spite of change in network scenarios, e.g.,low and high dense networks. In [21], it was discussed that the routing mechanisms usedin VANET mainly focused on topological based strategies. In Sections 2.5.1 and 2.5.2, itwas anatomized that the routing metrics and their performances are highly dependent uponthe type of the networks. It also discussed that there is a number of performance basedparameters and factors that affect on these strategies like the type of network, the mobilitypatterns of the nodes, the speed of nodes in the network, and the QoS requirements of thepotential applications. Considering all of the above-mentioned challenges, a single routingstrategy may not be sufficient to meet all requirements and may not be able to tackle alldistinctive types of indispensable scenarios. In the literature, a number of typological-basedrouting protocols were proposed to cope with the challenges available in different scenarios.In order to figure out suitable routing criteria for in-time and scalable routing, protocolsproposed in the literature were analyzed in different scenarios. Most of the researchersfocused on a single environment, i.e., city or highway, to meet the requirement of anapplication, while designing the routing strategy. Thus, the performance and the workingprinciple of the proposed routing protocols were evaluated in particular scenarios [21, 213].Position-based protocols as discussed Section in 2.5.1 were intended to be adaptive butprotocols were also unable to maintain performance in low density network. Here, anadaptive protocol is addressed by combining the functionality of topology and position-based routing due to their two main key functions, i.e., route maintenance to ensure in-timedelivery, and position information to identify direction of the intended destination. However,route maintaining and recovery mechanism introduce delays, where the solution lies inreorientation of routing at the lower layer. The following section includes the discussion ofthe proposed reorientation of the routing protocol to a lower layer.

4.2. REORIENTATION OF ROUTING 88
4.2 REORIENTATION OF ROUTING
Path determination from source to destination is handled at the network layer and IPaddressing of layer 3 or network layer is used to globally identify the node in the network.IP address at layer 3 is a unique numerical label assigned to each connected computer/devicein a computer network [214]. IP routing is a generic term that is used for the proceduresavailable at the network layer to determine the path from a source node to a destination nodein the network. Basically, data is routed from source to destination via a series of routers(intermediate nodes) across the network. The routing algorithms are responsible to provide away to select the next hop towards the destination in order to determine the end to end path.Additionally, some mechanisms are used to maintain the entries of the selected next hop ateach node in the network. These entries are available either temporarily or permanently ateach node in accordance with the characteristics of the nodes available in the network andthe network type. For path determination in a network where the entries are stored at eachnode, a forwarding table [215] is used that correlates the final destination address with theaddress of next forwarding node. When an IP packet needs to be sent to its destination, arouter or an intermediate node uses its forwarding table to find the next forwarding nodeusing the available destination IP address in the header of an IP packet. The same procedureis repeated at each router/node along the way until the packet reaches to its destination.Therefore, the IP address only is sufficient to reach the final destination. This indicates thatthe need of an IP address in routing is due to its unique label.IP Addresses are basically used to route information depending upon the routing table.Based on the hierarchy, a routing protocol forwards the traffic towards the destination. InVANET, we can have the assumption of location of destination is known by using GPS.Therefore, the function of path determination that we are dealing with is at the networklayer by using IP addresses. This can also be achieved at the lower layer. We have physicaladdressing at data link layer that can work as the unique identification of network participantnodes. The forwarding can also be maintained at the lower layer by maintaining the sameroute information in routing tables. The plus point of such a procedure on the lower layer isthat in case of any link break, it does not need to notify upper layer for route repair. Instead,it can be repaired directly at the lower layer. Another advantage of having routing or pathdetermination at the layer 2 is that it will reduce the routing delay that is the main drawbackwhen it is handled at the network layer. Therefore, only considering a single forwardingmechanism through hop by hop (layer 2) is acceptable and can be used to forward the traffic.The concept of path determination from one end to another using layer 2 is standardized in
IEEE 802.11s (Wireless Mesh Network (WMN)) and is documented in [216] and [217]. InWMN, Hybrid Wireless Mesh Protocol (HWMP) [217] is proposed at layer 2. It is a hybridrouting protocol, which merges the advantages of both reactive and proactive approaches. Itis a default routing protocol available in the standard which must be implemented on all mesh

4.2. REORIENTATION OF ROUTING 89
Fig. 4.1: Proposed Move of path Determination Mechanism at Layer 2
points (mesh nodes that exhibit the portal functionality). In HWMP, the reactive approachbased functionality is used to tackle the routing task in a dynamic topology. Additionally, itsupports mobility as well. In contrast to this, proactive mode is used for the fixed networktopology. The protocols used for path discovery like AODV use different control messages,i.e., Path Request (PREQ), Path Reply (PREP), Path Error (PERR) and Root Announcement(RANN). These control messages except PERR and use destination sequence number,TTL, and metric field for path discovery and maintenance. The proposed path discoverymechanism is somehow similar to the AODV protocol, however, the mechanism used inAODV applies hop-count as a routing metrics along with the flags for routing procedures.At data link layer, the proposed protocol uses MAC addresses as unique identifier of themesh nodes. The message formats for the information elements and other specificationswell documented and available online [218]. If we use the same idea in VANET, then wecan cope with the challenges of VANET, i.e., dynamic typology due to high mobility andshort contact duration. Figure 8 proposes the route determination function from IP layer toData Link layer. It is important to understand the reorientation of routing concept on thelower layer. A routing protocol should be able to maintain a route and the routing procedureshould be loop free. If we continue with the example depicted in Figure 4.1, where labelswere used as a unique identification of nodes, then we can determine a route at the lowerlayer and replace the labels with the MAC addresses of the nodes. The routing procedurewill remain the same for the route determination, i.e., route request and route reply. Eachintermediate node maintains the reverse path entry for each path request where the duplicatepath requests are handled using sequence number and broadcast-ID information. Thesetwo counters also help to maintain a loop-free route. Hence, the routing function can besuccessfully moved to the lower layer [25].

4.3. MATHEMATICAL MODEL BASED ON SELECTIVE PERFORMANCE METRICS 90
To design an adaptive routing protocol, revisit the investigation of the literature in Section2.5 for an overview on routing protocols and the used metrics. A mathematical model isused for the selection of suitable metrics for safety and management application in thenext section. The deployment of safety and informative applications in VANET requirescertain performance metrics such as the reduction of End-to-End (ETE) delays, congestion,and the increase in goodput. If a design of a routing protocol selects the routing criteriaby considering required performance metrics, i.e., high probability of reduced ETE delay,less congested path and maximum goodput, then it may help to satisfy the need of newlydesigned applications. In Section 4.3, study focus on the key performance indexes to identifythe routing metrics.
4.3 MATHEMATICAL MODEL BASED ON SELECTIVE
PERFORMANCE METRICS
This section describes the mathematical foundations of a multi-hop routing protocol forthe aforementioned ad hoc network. The mathematical model shall allow us to identifysetscrews, which are of high-interest for designing a VANET based routing/MAC protocol.Taking into account the previously described issues regarding VANETs, this study isparticularly aiming for low ETE delays, avoiding congestion, and high goodput of thenetwork.In VANET, a number of vehicles/nodes exchange information with each other based on thedesired goals, objectives and their requirements. Hence, a network of vehicles with themathematical representation can be given by a graph G = (N, L), which is composed of aset of nodes N = {n1, . . . , np} and a set of links L = {l1, . . . , lq}. In multi-hop VANET, wecannot assume that every node has a direct link to every other node, therefore, the graph Gis not complete and a connection C between the nodes may have to be established via relaynodes. Hence, a connection can be defined as a set of links and relay nodes via a subgraphC ™ G. Moreover, the network topology and the properties of the link between the nodesare dynamics. Therefore, we assess a given connection C between two nodes via its hopcount hc := ˘{l œ L | C = (N , L)}, that is the number of links.Each node nj œ N comprises of a buffer and a processing unit/server. Hence, it can berepresented by a M/M/1 system with packet arrival rate ⁄(nj) and departure rate µ(nj), cf.Figure 4.2 for an illustration.Now we can represent a connection C by a sequence of M/M/1 systems as illustrated in
Figure 4.3, which forms the basis of our model.As stated before, the goals for designing a VANET protocol are given by the three key
performance indexes;

4.3. MATHEMATICAL MODEL BASED ON SELECTIVE PERFORMANCE METRICS 91
Fig. 4.2: M/M/1 System representing a node n œ N
Fig. 4.3: Series of M/M/1 System representing a connection C œ G
J1(C) ETE delay
J2(C) Congestion (4.1)
J3(C) Goodput.
Here, we like to note that these goals may be contradicting one another, i.e., goodput fromnode nj to node nk may be higher via connection C1 with high ETE delay, while connectionC2 shows low ETE delay but also low goodput. Therefore, any protocol represents a choicebetween these goals.In the following subsections, we will derive formulas to evaluate the performance indexesJj , j œ {1, 2, 3}. The resulting basic parameter dependences regarding, i.e., wait time,probability of packet reception, hop count, and queue utilization, will then form the basis forthe design of our protocol in Section 4.4.3.
4.3.1 END-TO-END DELAY
Within each node n œ N , there are two elements, that is the buffer and the processingunit, inducing waiting and processing delays ”W
n (x) and ”Zn (x) of one packet x, respectively.
Hence, the servicing delay of a node is given by ”‡n(x) := ”W
n (x)+”Zn (x). Similarly, each link
l œ L induces a transmission delay ”Tl (x) and a propagation delay ”g
l (x) of one packet x,where transmission refers to getting the packet into the medium and propagation denotesthe time within the medium. Hence, the transfer delay of a link is given by ”·
l (x) :=”T
l (x) + ”gl (x). Here, we use the subscript to refer to the respective node or link. Due
to the nature of the network, all these delays are random variables. In order to still dealwith a deterministic model, we utilize respective expected values E (”‡
n(x)) and E (”·l (x)) to
evaluate our performance indexes as indicated in (4.1).Based on the delays induced by nodes and links, we obtain the delay ”C(x) of one packet x
for a connection C = {n1, . . . , nhc , nhc+1, l1, . . . , lhc} due to its sequential nature via

4.3. MATHEMATICAL MODEL BASED ON SELECTIVE PERFORMANCE METRICS 92
E1”C(x)
2=
hcÿ
j=1
1E
1”‡
nj(x)
2+ E
1”·
lj (x)22
+ E1”‡
nhc+1(x)2
. (4.2)
Assuming that for all nodes nj œ N and all packets xk œ X the expected servicing andtransfer delays are identical, that isE
1”‡
nj(xk)
2= E (”‡
n(x)) and E1”·
nj(xk)
2= E (”·
n(x)),then (4.2) simplifies t
E1”C(x)
2= (hc + 1) · E (”‡
n(x)) + hc · E (”·l (x)) . (4.3)
Considering a set of packets X = {x1, . . . , xr}, we observe that nodes and links maywork in parallel, i.e. node nj and nj+1 can service packets xk and xk+1 independently fromone another. Identical servicing and transfer delays as in Equation (4.3) induce two possiblecases: (i) If E (”‡
n(x)) Ø E (”·l (x)), that is servicing is more time consuming than transfer,
then each node will be fully utilized from the time instant the first packet x1 enters the queueto the time instant the last packet xr is processed. Due to the case assumption, each linkwill show gaps of size E (”‡
n(x)) ≠ E (”·l (x)) Ø 0 between two successive transfers. (ii) The
second case E (”‡n(x)) Æ E (”·
l (x)) is completely mirrored. Due to full utilization of eithernode or links, no additional interaction delays between the packet occur, hence Equation(4.3) applies for any packet x œ X . Accordingly, after packet x1 has been serviced by nhc+1,only the additional processing at the destination node has to be taken into account. UsingEquation(4.3) for packet x1, case (i) reveals that node nhc+1 is fully utilized as soon as packetx1 arrives until packet xr is serviced. In case (ii), however, the transfer delays induce gapsbetween servicing of size E (”·
l (x))≠E (”‡n(x)) Ø 0. Combined, we obtain that the expected
delay of a set of packets is given by Equation (4.4)
E1”C(X)
2= E
1”C(x1)
2+
Y_______]
_______[
rqj=2
Servicing˙ ˝¸ ˚E
1”‡
nhc+1(xj)2
if E (”‡n(x)) Ø E (”·
l (x))rq
j=2E
1”‡
nhc+1(xj)2
¸ ˚˙ ˝Servicing
+1E
1”·
lhc(xj)
2≠ E
1”‡
nhc+1(xj)22
¸ ˚˙ ˝Gaps
otherwise
= (hc + 1) · E (”‡n(x)) + hc · E (”·
l (x)) +
Y_]
_[
(r ≠ 1) · E (”‡n(x)) if E (”‡
n(x)) Ø E (”·l (x))
(r ≠ 1) · E (”·n(x)) otherwise
=
Y_]
_[
(hc + r) · E (”‡n(x)) + hc · E (”·
l (x)) if E (”‡n(x)) Ø E (”·
l (x))(hc + 1) · E (”‡
n(x)) + (hc + r ≠ 1) · E (”·l (x)) otherwise
(4.4)
where we again used our assumption E1”‡
nj(xk)
2= E (”‡
n(x)) and E1”·
nj(xk)
2=
E (”·n(x)) to hold for all nodes nj œ N and all packets xk œ X .
Reflecting our goals (4.1), we can identify J1(C) := E1”C(X)
2. To improve on this goal,
our aim is to minimize the latter, which can be done by finding a path which has minimum

4.3. MATHEMATICAL MODEL BASED ON SELECTIVE PERFORMANCE METRICS 93
values of hop count.
4.3.2 CONGESTION
Considering Figure 4.3, we observe that any of the nodes n œ N would block the connectionat least temporarily if the respective waiting queue is overflowing. To analyze this issue, weconsider queue utilization Q : N æ R+
0 as a measure to assess whether a node represents abottleneck within a connection C. Formally, queue utilization of a node n œ N is defined asthe fraction of arrival and departure rate via
Q(n) := ⁄(n)µ(n)
Similar to the delays from the previous subsection, also the arrival and departure rates arerandom variables. Again, we utilize the expected value function to evaluate our performanceindexes (4.1). Here, we obtain the following cases
E (Q(n)) = E (⁄(n))E (µ(n))
Y________]
________[
> 1 Congested
= 1 Normalized
< 1 Efficient
= 0 Otherwise
(4.5)
for the normalized average traffic rate |E (Q(n)) | and call E (⁄(n)) ≠ E (µ(n)) thenormalized drift. Here, the case for E (Q(n)) > 1 indicates that the arrival rate of packets atnode n is greater than the respective departure rate. This leads to congestion and ultimatelyto queue overflow. E (Q(n)) = 1, however, means that the queue is fully utilized. In thethird case E (Q(n)) > 1, the arrival rate is less than the departure rate and hence the waittime of packets in the queue decreases. Last, E (Q(n)) = 1 reflects the case without flow onthe node.To assess an entire connection C = {n1, . . . , nhc , nhc+1, l1, . . . , lhc}, a connection isabstracted as node and hence we obtain
E (Q(C)) = E (⁄(n1))E (µ(nhc+1))
.
Now, we can identify J2 = E (Q(C)) from (4.1), where we see that the latter is independentfrom the set of packets. Here, our goal is to maximize the queue utilization but to avoidcongestion. As the departure rate cannot be influenced, the degree of freedom is to controlthe arrival rate of packets.

4.3. MATHEMATICAL MODEL BASED ON SELECTIVE PERFORMANCE METRICS 94
4.3.3 GOODPUT
In order to assess goodput, we consider a transfer of a set of packets X from the set of allpossible packets X ∏ X via link l œ L to be a random variable ·l : 2X æ {0, 1}, which isBernoulli distributed. Here, we denote the probability of a successful transfer of a packetx via link l by P (·l(x)) = pl. Similarly, servicing of a packet x at node n is a Bernoullidistributed random variable ‡n : 2N æ {0, 1} where N is the powerset of all nodes. Incontrast to transfer, servicing reveals P (‡n(x)) = 1.Accordingly, the probability of transferring a set of packets X = {x1, . . . , xr} via aconnection C = {n1, . . . , nhc , nhc+1, l1, . . . , lhc} successfully is given by
P (·C(X)) =rŸ
k=1
Q
ccca
hc+1Ÿ
j=1P
1‡nj (xk)
2
¸ ˚˙ ˝=1
·hcŸ
j=1P
1·lj (xk)
2
¸ ˚˙ ˝=plj
R
dddb =hcŸ
j=1pr
lj . (4.6)
If we additionally assume that the probability of successful transfer is identical for all links,that is plj = pl for all lj œ L, then (4.6) simplifies to
P (·C(X)) = phc·rl . (4.7)
In contrast to packet transfer, throughput fl is the number of bits received per time unit andcan be expressed via
fl = ˘packetstime
. (4.8)
Here, we denote the number of bits for a packet x by xbits and time represents the totaltime consumed to send a packet x from node n to another node via link l. Therefore, thelatter is given by waiting delay ”W
n , processing delay ”Zn as well as transmission delay ”T
l andpropagation delay ”g
l for nodes n and link l. Combining the latter in (4.8) we obtain
fl(x, n, l) = xbits
”Wn + ”Z
n + ”Tl + ”g
l
.
Utilizing the definition of propagation delay given as length of a link ¸l over speed withinthe medium, which is speed of light and the definition of the transmission delay as file sizeover data rate
”gl = ¸l
300.000km/sÆ 0.3 · 10≠5 and ”T
l = xbits
◊l,
where we used the maximum distance in VANET of ¸l Æ 1000m in the inequality and ◊l to
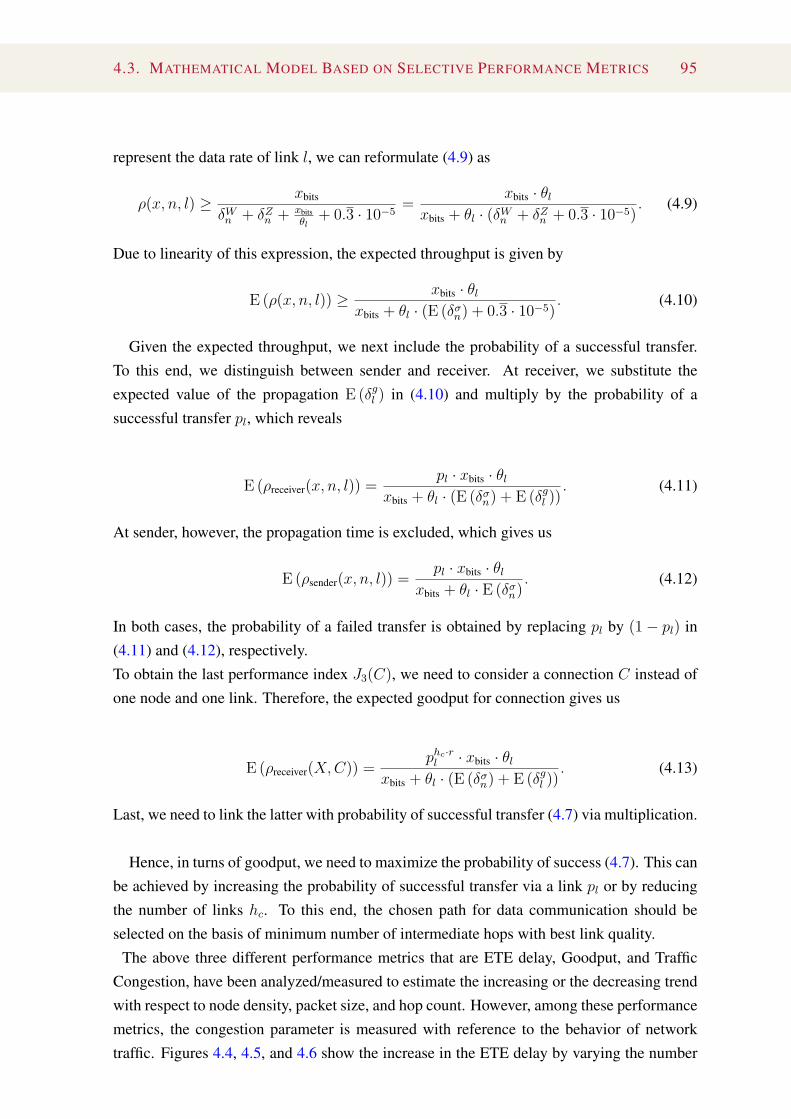
4.3. MATHEMATICAL MODEL BASED ON SELECTIVE PERFORMANCE METRICS 95
represent the data rate of link l, we can reformulate (4.9) as
fl(x, n, l) Ø xbits
”Wn + ”Z
n + xbits◊l
+ 0.3 · 10≠5 = xbits · ◊l
xbits + ◊l · (”Wn + ”Z
n + 0.3 · 10≠5) . (4.9)
Due to linearity of this expression, the expected throughput is given by
E (fl(x, n, l)) Ø xbits · ◊l
xbits + ◊l · (E (”‡n) + 0.3 · 10≠5) . (4.10)
Given the expected throughput, we next include the probability of a successful transfer.To this end, we distinguish between sender and receiver. At receiver, we substitute theexpected value of the propagation E (”g
l ) in (4.10) and multiply by the probability of asuccessful transfer pl, which reveals
E (flreceiver(x, n, l)) = pl · xbits · ◊l
xbits + ◊l · (E (”‡n) + E (”g
l )) . (4.11)
At sender, however, the propagation time is excluded, which gives us
E (flsender(x, n, l)) = pl · xbits · ◊l
xbits + ◊l · E (”‡n) . (4.12)
In both cases, the probability of a failed transfer is obtained by replacing pl by (1 ≠ pl) in(4.11) and (4.12), respectively.To obtain the last performance index J3(C), we need to consider a connection C instead ofone node and one link. Therefore, the expected goodput for connection gives us
E (flreceiver(X, C)) = phc·rl · xbits · ◊l
xbits + ◊l · (E (”‡n) + E (”g
l )) . (4.13)
Last, we need to link the latter with probability of successful transfer (4.7) via multiplication.
Hence, in turns of goodput, we need to maximize the probability of success (4.7). This canbe achieved by increasing the probability of successful transfer via a link pl or by reducingthe number of links hc. To this end, the chosen path for data communication should beselected on the basis of minimum number of intermediate hops with best link quality.
The above three different performance metrics that are ETE delay, Goodput, and TrafficCongestion, have been analyzed/measured to estimate the increasing or the decreasing trendwith respect to node density, packet size, and hop count. However, among these performancemetrics, the congestion parameter is measured with reference to the behavior of networktraffic. Figures 4.4, 4.5, and 4.6 show the increase in the ETE delay by varying the number

4.3. MATHEMATICAL MODEL BASED ON SELECTIVE PERFORMANCE METRICS 96
0
5
10
15
20
25
30
10 15 20 30
ETE
Dela
y (m
s)
Hop count
Contention Window Size (15, 1023) Inter-vehicle distance (IVD) = 2m Packet Size = 200 Bytes node density = 5
Fig. 4.4: Increasing Trend of the ETE Delay by Varying the Number of Hops (hop count)
0
5
10
15
20
25
30
35
2 5 10 15
ETE
Dela
y (m
s)
Node Density
Contention Window Size (15, 1023) Inter-vehicle distance (IVD) = 2m Hop count along the route = 10 Packet Size = 200 Bytes
CW = {47, 58, 61, 97}
Fig. 4.5: Increasing Trend of the ETE Delay by Varying the Number of Neighbors (Node Density)
of hops (hop count) along the route from source to destination, the number of neighbors(node density) per node in the network, and packet size, respectively. It has been observedthat with the increase in the number of nodes along the route from source to destination, theETE delay increases. The reason for such an increase is that each vehicle throughout theroute needs to queue up the incoming traffic, and then it needs to process and forward thedesired information to its next hop along the route from source to destination, which takestime due to queuing delay, processing delay, transmission delay, and the propagation delay.Each vehicle along the route needs to add up these delays and therefore with the increase in

4.3. MATHEMATICAL MODEL BASED ON SELECTIVE PERFORMANCE METRICS 97
the number of vehicles or nodes along the route the total ETE delay increases.In contrast to this, the ETE delay also increases with the increase in node density. Nodedensity is actually referred to as the number of neighboring nodes of a particular node orvehicle. Whenever a vehicle needs to send the data traffic to its next hop node, it needsto acquire the channel for the transmission. However, with the increase in the number ofneighboring nodes, the probability of channel acquisition to send the data traffic increases.The increase in the probability of channel access results in an increase in the ETE delay.Additionally, node density may also result in an interference with respect to the contendingnodes. The interference may introduce in packet loss and such lost packets are usuallyrequired to be resent to the intended destination, which results in an increase in the ETEdelay. Similarly, with the increase in the payload or packet size, the ETE delay increases.As the transmission time is directly proportional to the packet size with the fixed datarate, therefore, with the larger packet size, the transmission time and the propagation timeincreases. Additionally, with larger packet size the channel acquisition time for a particulartransmission increases. This increase in the transmission time and the channel acquisitiontime leads to an increase in the ETE delay with respect to the packet size. The ETE delayalso increases with the increase in the Inter-Vehicle Distance (IVD). As we know that thepropagation delay is directly proportional to the distance, with the increase in the distanceamong the vehicles along the route from source to destination the ETE delay increases.However, this increase in the ETE delay is very small because the propagation delay isdetermined by taking the ratio between distance and speed. Here, the value of the speed isusually taken as the speed of light because of the wireless medium. Therefore, the computedvalue of the propagation delay is small. However, such delays may also affect the ETE delay.
7
7.5
8
8.5
9
9.5
10
10.5
11
200 500 800 1000
ETE
Dela
y (m
s)
Packet Size (bytes)
Contention Window Size (15, 1023) Inter-vehicle distance (IVD) = 2m Hop count along the route = 10 node density = 5
Fig. 4.6: Increasing Trend of the ETE Delay by Varying the Packet Size

4.3. MATHEMATICAL MODEL BASED ON SELECTIVE PERFORMANCE METRICS 98
0
2
4
6
8
10
12
10 15 20 30
Goo
dput
(Mbp
s)
Hop count
Contention Window Size (15 , 1023) Inter-vehicle distance (IVD) = 2m node density = 5
Fig. 4.7: Behavior of Goodput Vs. Hop Count
0
2
4
6
8
10
12
2 5 10 15
Goo
dput
(Mbp
s)
Node Density
Contention Window Size (15, 1023) Inter-vehicle distance (IVD) = 2m Hop count along the route = 15
Fig. 4.8: Behavior of Goodput Vs. the Number of Neighboring Nodes
Figures 4.7, 4.8, and 4.9 depict the behavior of good-put with the increase in the numberof nodes (hop count) along the route from source to destination, the number of neighboringnodes (node density) of each vehicle, and the packet size. It is to be noted that good-putusually refers to throughput or received-rate at the application layer of the TransmissionControl Protocol/Internet Protocol (TCP/IP) model. Good-put shows the actual bytes ofthe message or data packet received per unit time at the receiver, whereas, throughput isdetermined based on the segment size at the transport layer of TCP/IP model per unit time.The segment size at transport layer includes the control information which is based on the

4.3. MATHEMATICAL MODEL BASED ON SELECTIVE PERFORMANCE METRICS 99
transport protocol, used at layer-4 of TCP/IP model. Good-put decreases with the increasein the hop count value within then network. Good-put is determined through the relationbetween data packets received per unit time. Here, packet size is constant so the bytesreceived are somehow dependent on the time period. With the increase in the number ofhops along the route from source to destination, the total time increases that decrease thereceived rate or the good-put. In contrast to this, it has also been observed that with theincrease in node density or number of neighboring nodes of a particular vehicle, throughputor good-put decreases. This is because total time to receive the transmitted packet increasesdue to the number of hops along the route from source to destination. This increase in time inorder to receive the packet decreases the received rate per unit time and hence the good-putdecreases. Similarly, good-put decreases with the increase in the packet size. Because of theincrease in time to forward the packet along the route with 15 number of hops, the packetsize with more number of bytes may result in a decrease in the received rate. However, withless number of hops and with less node density, good-put may increase with the increasein the payload size. Furthermore, with larger packet size, the vehicle needs to allocate orgrap the channel for longer duration of time for transmission of data along the route withmore number of hops. This duration may affect the performance in terms of decrease in thegood-put.Figure 4.10 depicts four different behaviors of the network with respect to data traffic. If
2.7
2.9
3.1
3.3
3.5
3.7
3.9
4.1
4.3
200 500 800 1000
Goo
dput
(Mbp
s)
Packet Size (bytes)
Contention Window Size (15 , 1023) Inter-vehicle distance (IVD) = 2m Hop count along the route = 15 node density = 5
Received rate at application layer (good-put) increases with small period of time and decreases with large amount of time, based on the 15 number of hops along the route
Fig. 4.9: Behavior of Goodput Vs Packet Size
the arrival rate is higher than the departure rate, then there is a high chance that the queuewill fill-up early and may result to drop the incoming packets. In such type of scenarios, thequeue utilization increases, which may lead to a bottleneck at a particular node or vehiclealong the route from source to destination. Therefore, it is recommended that the arrival

4.4. DESIGNING MULTI-HOP ROUTING PROTOCOL FRAMEWORK 100
Fig. 4.10: Different Behaviors of the Network with Respect to Data Traffic
rate should be less than or equal to the departure rate so that the behavior of the networktraffic becomes either normal or efficient with respect to the service time. In order to makethe behavior of the network traffic efficient, the arrival rate should be less than the departurerate so that there is no packet loss and all the traffic may reach at the next hop or destinationnode, reliably. Similarly, if the arrival rate is equal to the departure rate then the networkoperates in its normal state. However, such normal behavior may become congested with theincrease in the number of traffic flows along the discovered route from source to destination.In contrast to this, if there is no traffic, then the behavior of the network is assumed to be infree-state, which is categorized as the otherwise state as depicted in the referred figure.
4.4 DESIGNING MULTI-HOP ROUTING PROTOCOL
FRAMEWORK
In VANET, information about channel condition varies in different vehicular environmentsand would be helpful for path selection strategies. If we use channel quality parameteras a routing criterion, then the corresponding output will be very promising as comparedto the mechanism used in traditional routing protocols discussed in Section 4.3. Fromthe literature review, it has been concluded that there are several routing protocols whichconsider either single or combination of routing criteria. Such protocols were proposed byconsidering particular scenarios as discussed in Section 4.1. The information about channelquality based on Signal to Noise Ration (SNR) or based on channel fading is helpful for theselection of good quality-link in the path selection mechanism, and hop count is helpful in

4.4. DESIGNING MULTI-HOP ROUTING PROTOCOL FRAMEWORK 101
choosing shortest path. Therefore, using SNR and channel fading as a selection criteria in arouting strategy may help to improve the ETE path selection.Traditionally, routing protocols operate at the network layer because of the available networkinformation on the particular layer. However, we can have channel state information at theMAC layer of the TCP/IP layering architecture. In contrast to this, we have introduced arouting mechanism of network layer at MAC layer. This is being carried out because wecan acquire the most recent or up-to-date information of the channel at the MAC layer. Byintroducing the concept of recent information at lower layer, we are able to use the linkquality information immediately for best link selection along the ETE route, that processmay encounter much less delay. Additionally, suitable ETE path selection based on theinformation available at lower layer of each vehicle or node would help to simplify therouting procedure and to enhance the quality link selection along the ETE route by relyingon local available information. As a consequence, there is a need to define a mechanismor a procedure for the routing protocol at link layer for VANET. The presentation of suchmechanisms stiffly depends on the threshold of the chosen metrics. Besides that, it is hard todefine a value, that results in a better performance for all possible scenarios.The performance of data communication in a network may also be influenced by nodedensity, environment, and the characteristics of the nodes. Routing protocols proposedfor VANET must be adaptive to all the discrepancies available in a particular application.In the current work, we address the design challenge of a routing protocol for vehicularenvironment by defining the decision threshold function for link quality along the pathand hop count, which is adaptive with the number of neighboring vehicles. The proposedprotocol is implemented at Layer 2 of the TCP/IP architecture. Based on our findings fromliterature discussed in Section 4.1 and on the analytical model presented in Section 4.3, wedecided to use SINR value, hop count, and queue utilization as routing metrics to design aprotocol.
In theory, it is assumed that the message can be delivered to the wireless nodes locatedwithin the transmission range using the wireless channel and the medium access controlprotocols with appropriate reliability. In practice, this assumption is not correct because thesignals (available) in a wireless medium interfere with each other in unpredictable ways,which apparently results in non-deterministic message reception [21]. Likewise, when twonodes in a wireless medium communicate at the same time, the wireless signals generatedby the nodes may collide with each other, which produces interference, causing data to belost at the receiver side. Considering these issues, we decided to design a routing protocolthat considers one of the parameters that can minimize the failure of data loss in the network.For this purpose, we have used SINR as one of the routing metrics. In order to find a possiblepath from data originating node to the data receiving node, it has been assumed that thenodes in the network must share their SINR values using beacon messages with each otherto find the best path.

4.4. DESIGNING MULTI-HOP ROUTING PROTOCOL FRAMEWORK 102
Fig. 4.11: Framework of Proposed Routing Protocol
The queue threshold function is the second metric which has been used in the proposedrouting mechanism. The queue threshold function is designed to decide about theparticipation of a node in a path between the communicating nodes. It monitors thequeue level of each node in the network and only those nodes are allowed to take partin relaying data to the destination having queue length below the threshold value. Thehop-count is the third parameter, which is a counter used to find the possible shortest pathbetween the communicating nodes while considering the value of first parameter as well.By reducing the number of relay nodes along the way to the destination, the routing protocolmay improve the throughput and may show less ETE delay.The proposed routing protocol operates at the MAC layer and called as MAC-BasedAdaptive Link Layer Routing Protocol (MAC-ALLRP). Its mechanism is divided into twosub-procedures or parts as shown in Figure 4.11. In the first part, we compute the SINRvalue of direct links between the nodes in the network and also measure queue level of eachnode. The proposed protocol periodically computes these values. In the second part, theproposed routing algorithm identifies best available path among several paths on the basis ofthe computed values.
4.4.1 TERMINOLOGIES
The detailed description of the proposed protocol requires the understanding of certainterminologies that we use in designing and defining the procedure. These terminologies areas follow:
1. Source Node: It is a node or an entity that originates data for a desired location in thenetwork. This node is responsible to initiate the path request to find the route to thedesired location.
2. Destination Node:

4.4. DESIGNING MULTI-HOP ROUTING PROTOCOL FRAMEWORK 103
It is a node that is intended to receive the information disseminated by the source node.A destination address is added into the frame, and a node that receives the data knowsthat it is a destination node by looking into the destination address. In this protocol, theroutes are calculated using control messages and in request of the route a destinationaddress is always mentioned.
3. Relay /Intermediate Node:A relay or an intermediate node is a node that is used to forward the information ordata to the destination on behalf of source node.
4. Active Route/Valid Route:A complete path or route from source to destination that can be used to forward theinformation based on the valid routing entry available in the routing table along thepath.
5. Invalid Route:A route that has expired and has no routing information or has an invalid status in therouting table.
6. Broadcast:Broadcasting is a term associated to describe the one-to-all communication in thenetwork.
7. Forward Route:It is a route used to forward a route discovery message to the discovery node.
8. Reverse Route:It is a route which is maintained by each node before forwarding a discovery message.This route is used to forward path a discovery reply to the origination node.
9. Sequence Number:A number that is maintained by each originating node or a node which helps to recoverfrom link breakage or failure by generating a route request in the network. It ismonotonically increasing, which is used by other nodes to determine the updatedinformation in the network.
10. Control Frames:Four different types of control messages have been devised in the proposed frameworkfor path selection. These messages are path request, path reply, path error, andpath reply acknowledgment, abbreviated as PREQ, PREP, PERR, and PREP-ACK,respectively. The elaboration of each control frame is as follows:

4.4. DESIGNING MULTI-HOP ROUTING PROTOCOL FRAMEWORK 104
11. Path Request (PREQ):It is a control frame which is disseminated in the network, whenever a new route isrequired. As a result, a route is supplied based on the action of routing protocol.
12. Path Reply (PREP):It is a control frame which is used to send a unicast path-reply against the PREQ for theoriginating node. On the reception of PREP, the source node starts data forwarding.
13. Path Reply Acknowledgment (PREP-ACK):It is an optional control frame, used to send a uni-cast acknowledgment against thePREP. A flag is set by a node in PREP when its acknowledgment is required.
14. PATH Error (PERROR):It is a control frame in the protocol which is generated in the network whenever anexisted link breaks.
4.4.2 ASSUMPTIONS
To design a protocol for a specific application in a vehicular environment, it is important toknow about the basic assumptions that are made to describe the behavior of the protocol.These assumptions are:
1. The node that has data to disseminate in the network will generate a PREQ.
2. The node that initiates PREQ is called a source node and a node that sends the PREPis a destination node.
3. The destination node sends PREP immediately once it receives the first PREQ. If thedestination node has already sent the PREP against a particular PREQ, then it will sendthe next response according to the degree of its neighbors connectivity.
4. The source node waits for a certain period of time for the PREP, and in case if thesource node does not receive any PREP within the defined time period, then the sourcenode will rebroadcast a new PREQ with new identifiers.
5. The source node adds a unique sequence number in a PREQ before it broadcasts thePREQ in the network, and this sequence number will remain the same till destination.
6. The source node also adds the information about the link quality in its PREQ.
7. Each intermediate node in the network maintains the information received in PREQ.Additionally, each node maintains the information about the previous and forwardlinks, along with the destination address for each flow.

4.4. DESIGNING MULTI-HOP ROUTING PROTOCOL FRAMEWORK 105
8. The node that detects the link breakage or failure will broadcast a PERROR to itsimmediate (2-hop) neighbors and if the flow or the backward path exists then it willuni-cast a message to the source node.
9. The intermediate node that detects the link breakage or failure will initiate a new pathrequest on behalf of the source node with a new sequence number.
10. Each node in the network will also maintain the received hop count value and willforward the incremented hop count value to the next hop along the way from source todestination during PREQ.
11. Each node in the network determines the link quality based on the received beaconmessages and appends the corresponding bit value as good or bad link (0/1) accordingto the calculated SINR in PREQ and PREP.
12. Each node that broadcasts the PREQ examines its respective queue. If it is greater thanthe specified threshold, then it will ignore the PREQ, otherwise it will rebroadcast thePREQ.
4.4.3 PROPOSED ROUTING PROTOCOL
Figure 4.12 presents the sequence of the proposed multi-hop routing protocol, i.e., MAC-Based Adaptive Link Layer Routing Protocol (MAC-ALLRP). Multiple events are generatedon a single trigger. These messages are discussed in the events given below.
1. Event 1: Create PREQWhen a specific node wants to send data to a destination in the network and thatspecific node neither has the address to the destination nor it has been a part ofany previously established route, then the specific node (source) will originate thePREQ. This PREQ incorporates the source MAC address, source sequence number,destination MAC address, destination sequence number, and the address(es) of relaynodes along with their respective bits representing the link quality. Each intermediatenode in the network will broadcast the PREQ with the above mentioned information.
2. Event 2: Update/ Forward PREQ Before re-broadcasting the PREQ, an intermediatenode will check its queue level. If the queue level is greater than the defined threshold,then it will discard the PREQ. However, if the queue level is less than the definedthreshold, then it will process the received frame and will check the sequence numberin the received PREQ. If the received sequence number is new or greater than theprevious saved sequence number, then it will check the destination address, otherwiseit will discard the received message by assuming that the node already has updatedinformation. If the receiving node is not a destination node, then it will create or

4.4. DESIGNING MULTI-HOP ROUTING PROTOCOL FRAMEWORK 106
Fig. 4.12: Flow Chart of Proposed Routing Protocol
update back route. Furthermore, it will append 1-bit of SINR value in PREQ framebefore rebroadcasting to its neighboring nodes. In case, if the node is a destinationnode, then it will generate PREP. This case is discussed in the event of Create PREPmentioned in 3.
3. Event 3: Create PREPWhen a destination node receives PREQ from any node in the network, it will verifywhether the received PREQ is from the new source or is from the same source andthen based on the received information, the destination node will generate and forwarda PREP frame to the source node. The destination node maintains the PREP counterfor each source, and when it creates PREP, it increments the PREP counter by one.Before sending PREP to the source, the destination node always compares the PREPcounter with its own counter, maintained in the neighboring list. The reason behindthis criterion is that the proposed technique includes a procedure, in which the sourcenode chooses the best path from multiple paths (if exist) and destination node considersnumber of PREQ messages less than or equal to the number of its neighboring nodes.
4. Event 4: Forward PREP

4.4. DESIGNING MULTI-HOP ROUTING PROTOCOL FRAMEWORK 107
Algorithm 2 Restrict the Number of PREP at Destination NodeDegreeofneighboringnodes = Deg(g) = get(neighborsList);
if PREPCount Æ deg(x) thenSend PREP;PREPCount++;
elseDiscard PREQ;
end if
When a node receives PREP, it verifies the up-to-date information based on thesequence number. If the received information is old, then it discards the receivedframe, otherwise the receiving node checks the destination address. There aretwo main scenarios, when a nodes receives a PREP. The receiving node can be anintermediate node or it can be a destination node. In case of intermediate node, whenthe PREP is not destined for itself, then it checks for any stored PREQ copy with abetter route to the source, if there is any stored value, it picks that route and appendsthe corresponding one bit for good or bad SINR value and uni-cast the PREP to aspecified address, otherwise it adds only one bit for good or bad SINR value anduni-cast the PREP message.In the case of source node, if the PREP is destined for the receiving node, there mightbe two different scenarios depending upon an already existing path or a new path. Ifno path existed for this PREQ, then the node will create a path and start a session for it.This path creation can be with/without sending PREP-ACK. The case of PREP-ACKis discussed in Event 6. If the path already exists for this PREP, then the scenario isdiscussed in Event 5.
5. Event 5: Update PREPThere are typically two cases for the PREP. In the first case, if the link is brokenbecause of any reason, the immediate 7 node will generate PREQ to recover fromfailure and if it receives PREP for new link from another immediate node, it will updatePREP. In the second case, a list is maintained on the source node for all incomingreplies after establishing the first path for a particular PREP. After a time wait, thesource node selects the best among all of the stored values and compares the value ofthe already established path. If it is better than the existed path, then it updates the pathby sending PREP-ACK to the destination.If wait time is represents as ttime then;
ttime = preqLifeT ime ≠ latency
2 (4.14)
Where preqLifeTime represents the time to live of the PREQ time.
7directly connected node

4.4. DESIGNING MULTI-HOP ROUTING PROTOCOL FRAMEWORK 108
6. Event 6: PREP-ACKOn receiving PREP, the source node creates a path and starts data communication. Ifthe flag is set for the PREP-ACK, it will first create PREP-ACK and then uni-cast it tothe destination before starting data communication.
7. Event 7: PERRORThis control frame is created and broad-casted to the immediate neighboring list whena link expired or is broken. The immediate node, which receive this message, tries torecover from all data sessions by using/establishing the alternate path using a PREQcontrol frame.
4.4.4 ALGORITHM FOR PROPOSED ROUTING MECHANISM
Considering the flow of proposed routing protocol, the pseudocode is presented in Algorithm3.
4.4.5 ROUTING PROCEDURE WITH EXAMPLE
Fig. 4.13: Procedure of Proposed Routing Protocol
Consider a road scenario presented in Figure 4.13, where the road has 3 lanes and all carson the road are moving in the same direction. Suppose the vehicle named as S-source hassome data to share with another vehicle (called D-destination). The routing procedure forsharing this information in this particular scenario is described step-wise:
1. The originating node will broadcast PREQ.
2. On receiving PREQ, the directly connected nodes will rebroadcast PREQ to all theirneighboring nodes.
3. If a node receives more than one PREQ with the same sequence number and from thesame source node, then it will forward PREQ with latest time stamp and discards therest. If it receives multiple PREQ from different neighbors, which have the sequence
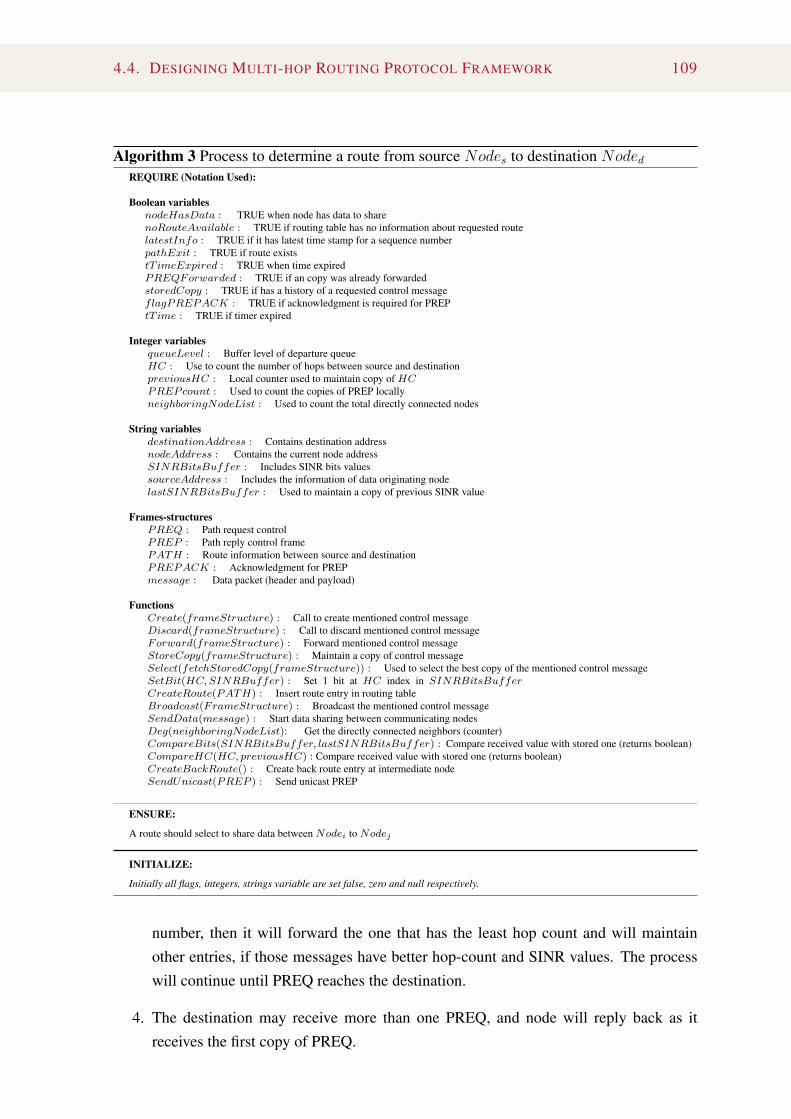
4.4. DESIGNING MULTI-HOP ROUTING PROTOCOL FRAMEWORK 109
Algorithm 3 Process to determine a route from source Nodes to destination Noded
REQUIRE (Notation Used):
Boolean variablesnodeHasData : TRUE when node has data to sharenoRouteAvailable : TRUE if routing table has no information about requested routelatestInfo : TRUE if it has latest time stamp for a sequence numberpathExit : TRUE if route existstT imeExpired : TRUE when time expiredP REQF orwarded : TRUE if an copy was already forwardedstoredCopy : TRUE if has a history of a requested control messageflagP REP ACK : TRUE if acknowledgment is required for PREPtT ime : TRUE if timer expired
Integer variablesqueueLevel : Buffer level of departure queueHC : Use to count the number of hops between source and destinationpreviousHC : Local counter used to maintain copy of HCP REP count : Used to count the copies of PREP locallyneighboringNodeList : Used to count the total directly connected nodes
String variablesdestinationAddress : Contains destination addressnodeAddress : Contains the current node addressSINRBitsBuffer : Includes SINR bits valuessourceAddress : Includes the information of data originating nodelastSINRBitsBuffer : Used to maintain a copy of previous SINR value
Frames-structuresP REQ : Path request controlP REP : Path reply control frameP AT H : Route information between source and destinationP REP ACK : Acknowledgment for PREPmessage : Data packet (header and payload)
FunctionsCreate(frameStructure) : Call to create mentioned control messageDiscard(frameStructure) : Call to discard mentioned control messageF orward(frameStructure) : Forward mentioned control messageStoreCopy(frameStructure) : Maintain a copy of control messageSelect(fetchStoredCopy(frameStructure)) : Used to select the best copy of the mentioned control messageSetBit(HC, SINRBuffer) : Set 1 bit at HC index in SINRBitsBufferCreateRoute(P AT H) : Insert route entry in routing tableBroadcast(F rameStructure) : Broadcast the mentioned control messageSendData(message) : Start data sharing between communicating nodesDeg(neighboringNodeList): Get the directly connected neighbors (counter)CompareBits(SINRBitsBuffer, lastSINRBitsBuffer) : Compare received value with stored one (returns boolean)CompareHC(HC, previousHC) : Compare received value with stored one (returns boolean)CreateBackRoute() : Create back route entry at intermediate nodeSendUnicast(P REP ) : Send unicast PREP
ENSURE:
A route should select to share data between Nodei to Nodej
INITIALIZE:
Initially all flags, integers, strings variable are set false, zero and null respectively.
number, then it will forward the one that has the least hop count and will maintainother entries, if those messages have better hop-count and SINR values. The processwill continue until PREQ reaches the destination.
4. The destination may receive more than one PREQ, and node will reply back as itreceives the first copy of PREQ.

4.4. DESIGNING MULTI-HOP ROUTING PROTOCOL FRAMEWORK 110
1: PROCEDURE:2: Event 1 : CreateP REQ;3: Create(P REQ);4: if (nodeHasData && routeAvailable) then5: Broadcast(P REQ);6: end if
7: Event 2 : ReceiveP REQ;8: if (QueueLevel <= 70%) then9: if (latestInfo == true) then
10: if (destinationAddress == NodeAddress) then11: if (P REP Count <= Deg(neighbouringNodeList)) then12: P REP Count + +;13: goto :: Event 3 : CreateP REP ;14: else15: Discard(P REQ);16: end if17: else18: if (P REQF orwarded) then19: if (CompareBits(SINRBitsBuffer, lastSINRBitsBuffer))&&(CompareHC(HC, previousHC))
then20: storeCopy(P REQ);21: else22: CreateBackRoute();23: SetBit(HC, SINRBitsBuffer);24: F orward(P REQ);25: end if26: end if27: end if28: end if29: end if
30: Event 3 : CreateP REP ;31: Create(P REP );32: SetBit(HC, SINRBitsBuffer);33: SendUnicast(P REP );
34: Event 4 : ReceiveP REP ;35: if (latestInfo == true) then36: if (sourceAddress == NodeAddress) then37: if (pathExist)&&(tT imeExpired) then38: Store(P REP );39: else40: goto :: Event 6 : Create(P AT H);41: end if42: else43: goto :: Event 5 : F orwardP REP ;44: end if45: if (tT ime) then46: Select(fetchStoredCopy(frameStructure));47: goto :: Event 6 : CreateP AT H;48: end if49: end if
50: Event 5 : F orwardP REP ;51: if (storeCopy) then52: Select(fetchStoredCopy(P REP )));53: end if54: SetBit(HC, SINRBitsBuffer);55: F orward(P REP );
56: Event 6 : CreateP AT H;57: CreateRoute(P AT H);58: SendData(message);59: if (flagP REP ACK) then60: Create(P REP ACK);61: end if

4.4. DESIGNING MULTI-HOP ROUTING PROTOCOL FRAMEWORK 111
5. If the destination node receives more than one copy of PREQ, it will reply to all PREQswithin the specified time of PREQ-wait time based on the defined criterion.
6. On receiving PREP, an intermediate node will check the maintained entries. If thereexists a better entry on the basis of SINR and hop count values, then it sends PREP onthe best option and discards the rest.
7. On reception of first PREP, the source node generates PREP-ACK and starts datacommunication.
8. The source node maintains all PREP details for a ttime and then compares the availableinformation to select the best. If the data is already on the best path, then it will discardall PREPs. If the new best path is available, then it will re-route all data to the newpath.
4.4.6 NETWORK PARTICIPANTS
VANET involves the wireless communication of vehicles in adhoc mode and consists ofmultiple participants, which are discussed below.
• Roads for City, Rural and Highway Scenarios:In VANET, road network properties plays an important role. According to theconsidered scenarios, e.g., city and highway, the factors of node speed, density,movement and pause are proportional. These settings vary according to the roadconditions of the particular scenario. The road network itself is constructed byselecting the number of lanes, width of road, and intersections.
• Road Side Units (RSU) and On-board Units (OBU):WAVE defines two types of devices: RSU, and OBU, which are essentially stationaryand mobile devices respectively. RSUs and OBUs can be either a provider or auser of services and can switch between such modes. Typically, a stationary WAVEdevice hosts an application that provides a service, and a mobile device hosts a peerapplication that uses such a service. There may also be applications on devices remotefrom the RSU whose purpose is to provide services to the OBU.
• Mobile Nodes (Vehicles):Mobile nodes are the vehicles equipped with OBUs for communications. TheseOBUs have a wireless interfaces of IEEE standard for VANET. For communication ofvehicles, each vehicle is assigned a unique IP for identity to communicate with othernodes and maximum speed limit. In addition to it, vehicles also have acceleration anddeclaration values.

4.5. SIMULATION AND RESULTS 112
• Traffic Signals:Traffic signals are part of traffic and regulate city traffic. These are also participantsof the network communication and help to deploy safety and traffic managementapplications.
4.5 SIMULATION AND RESULTS
The evaluation of the MAC-Based Adaptive Link Layer Routing (MAC-ALLRP) is doneusing OMNET++, SUMO and Veins, where OMNET++ is used for the simulation ofcommunication network, SUMO provides an environment for the simulation like a largeroads network and veins is a framework, which combines aforementioned tools. SUMOimports maps from the OpenStreetMAP database. A detailed discussion about each tool wasgiven in Section 2.6.The performance of MAC-ALLRP was compared with AODV and GPSR in the vehicularenvironment. We selected these two protocols for comparison because AODV is a reactiveprotocol (i.e., belong to topological-based routing category) and GPSR is a geographicalrouting protocols. Since the proposed solution used a combination of topological- andgeographical-based routing, the selected protocols for comparison can provide a betterinsight. Additionally, we used vehicular environment for the comparison of these protocolsto observe the behavior for each protocol.The proposed protocol was designed to handle the dynamic nature of network and satisfy theneeds of the applications. The metrics used to evaluate the performance are the following:
• Packet Delivery Ratio (PDR): It is the ratio of the number of packets sent bythe source vehicle/node and the number of successfully received packets by thedestination vehicle/node. It represents the ability of routing protocol to transfer datato a destination successfully. Here, we computed PDR for the inter-arrival packettime and number of source nodes who are generating data at the same time (i.e.,created multiple flows in background traffic). This metric is important because itgives insight on successful data delivery in the network. To check the behavior of thenetwork regarding congestion, we selected a PDR comparison with a number of dataoriginating/source node, where multiple flows were generated to introduce congestionon a relay node.
• Average Delay: It specifies the time in milliseconds (ms) or seconds(sec), that a bitof data requires to travel across the network from one vehicle/node to another. Delaymay differ slightly, depending on the location of the specific pair of communicatingnodes. In the evaluation and comparison of MAC-ALLRP with AODV and GPSR,we selected this performance metric because it is one requirement of any VANET

4.5. SIMULATION AND RESULTS 113
applications and one of the objectives of proposed protocols was on-time delivery ofdata.
• Goodput: In computer networks, goodput is the application-level throughput ofcommunication, i.e., the number of useful information bits delivered by the networkto a certain destination per unit of time. Here, we selected this parameter to check thetrend of each compared protocol with respect to the data rate.
The simulation scenarios considered for the evaluation are both city and highway. Forhighway traffic scenarios, we a took stretch of a highway on A111 located in Berlin,Germany, as shown in Figure 4.14, and for city, we used part of Moabit, Berlin, Germany,which is presented in Figure 4.15. The map was imported from OpenStreetMap and thenconverted using NETCONVERT so that it can be used in SUMO. We imported xml files ofthe mentioned scenarios from OpenFlow, then created a topology using SUMO for Veins. Ineach scenario, we generated the network topology by varying number of nodes (vehicles) as100, 200, 300 and 400.Table 4.1 includes the parameter setting. It presents the general, MAClayer and physical layer parameter setting considered for the simulation.
Fig. 4.14: Simulation Map for Highway Scenario: Stretch of Highway on A111, Berlin

4.5. SIMULATION AND RESULTS 114
Fig. 4.15: Simulation Map for City Scenario: Region of Moabit, Berlin
Tab. 4.1: Simulation Parameters for General, MAC and Physical layerParameters Values
General ParametersVANET Mobility Generator SUMONo. of Vehicles 100 ≠ 400Packet Size 512Bytes
Interarrival Time (packets sent by nodes) 0.5s ≠ 5s
MAC/PHY 802.11pMaximum Transmission Range 400m
Number of Receiver 1No. of Lanes 3
MAC Layer ParametersContention Window Minimum (CWMin) 15Contention Window Maximum (CWMax) 1023Slot Time (SlotTime) 9micro secondShort Interframe Space (SIFS) 16micro secondPreamble Length (PreambleLength) 96bits
Physical LayerConvergence Protocol (PLCPHeaderLength)
40bits
PLCP Data Rate(PLCPDataRate)
6Mpbs
Physical Layer ParametersMaximum Transmission Range (Pt) 400m
Simulation Time 600s
Speed of vehicles 5m/s 20m/s

4.5. SIMULATION AND RESULTS 115
Table 4.1 continued from previous pageParameters ValuesFrequency (freq) 5.9GHz
Receiver Sensitivity (RXThresh) 3.652.10≠10
period Carrier Sensing Threshold (CSThresh) 1.559.10≠11
The simulation for each protocol was 600seconds. We selected four scenarios for eachperformance parameter. Here, the comparison of the packet delivery ratio with the decreasingdata rate was simulated for 100, 200, 300 and 400 nodes. Similarly, the comparison of packetdelivery ratio with the number of source node or number of data flows was simulated forscenarios with 100, 200, 300 and 400 nodes. Same number of nodes were used for thesimulation of average delay and goodput against packet inter-arrival time. Each scenariowas simulated 30 times, and the average results of each evaluated performance metric arediscussed in the Section 4.5.1.
4.5.1 SIMULATION RESULTS IN HIGHWAY SCENARIO
Simulation results were computed for highway scenarios using the map presented inFigure 4.14 and parameter setting discussed in Table 4.1. The taken was imported fromOpenStreetMap and then converted using NETCONVERT to use in SUMO. The detaileddiscussion of each scenario is as follows:
4.5.1.1 PACKET DELIVERY RATIO
Two leading cases were chosen for the simulation of packet delivery ratio. In the first case,it was compared with the packet inter-arrival rate while in the second case, it was comparedwith the number of source nodes. A detailed discussion for each case is as follows:
1. Packet Delivery Ratio (PDR) vs. Packet Inter-arrival Time: PDR was computedagainst packet inter-arrival time (sec) to observe the behavior of MAC-ALLRP, GPSRand AODV. Figure 4.16 presents the results of mentioned protocols for 100, 200, 300and 400 nodes per scenario in Figures 4.16a, 4.16b, 4.16c and 4.16d respectively. Ineach graph, the x-axis represents the packet inter-arrival time in seconds and the y-axisrepresents the packet deliver ratio in %.

4.5. SIMULATION AND RESULTS 116
(a) PDR vs. Packet Inter-arrival Time for 100 Nodes (b) PDR vs. Packet Inter-arrival Time for 200 Nodes
(c) PDR vs. Packet Inter-arrival Time for 300 Nodes (d) PDR vs. Packet Inter-arrival Time for 400 Nodes
Fig. 4.16: Highway Simulation Packet Delivery Ratio (%) for MAC-ALLRP, GPSR and AODV withRespect to Packet Inter-arrival Time (sec)
It is observed that the performance of MAC-ALLRP is better than GPSR and AODVin each scenario. The reason behind the good performance of MAC-ALLRP is theselection of route on the basis of queue utilization, hop count and SINR. The queueutilization check avoids the congested path, while the other two parameters selectthe best route among the available ones. The reason behind the comparative badperformance of AODV can be the periodic beaconing, which may introduce additionalinterference and delay in the network due to acquisition of channel, hence nodes mayhave to wait longer to transmit packets. In case of GPSR, It was observed that PDRvalues oscillate in all scenarios. In Figure 4.16d, the GPSR line for PDR showsthat its value is 86% when packets inter-arrival time is1.5, then it goes down forpacket inter-arrival time 2 and 2.5, afterward moves up again at 3. This is becauseGPSR use a greedy-forwarding approach to forward data and it does not maintainthe states, therefore, its performance oscillates in each computed scenario. Here, theresults shows that the PDR values for AODV, GPSR, and MAC-ALLRP are 65≠75%,82 ≠ 92%, and 95 ≠ 100% respectively.
2. Packet Delivery Ratio vs. No. of Source Nodes: Figure 4.17 presents the simulationresults of MAC-ALLRP, GPSR and AODV four scenarios with 100, 200, 300 and400 nodes as shown in Figure 4.17a, 4.17b, 4.17c and 4.17d, respectively. In each

4.5. SIMULATION AND RESULTS 117
graph, the x-axis represents the number of source nodes (data originating nodes)and the y-axis represents the packet delivery ratio. This scenario is considered tounderstand the behavior of each routing protocols by introducing congestion in thenetwork. Therefore, we used 0.5 sec packet inter-arrival time, which was fixed for thementioned scenarios. Then the total of 10, 20, 30, 40, and 50 data originating nodeswere used to send data to random destination. If 50 nodes send data at 0.5sec packetinter-arrival time, it may be possible that a relay node forwards data on the behalf ofmultiple nodes. A relay node queues received packets, and it can overflow if the queueis already full causing congestion.The graphs presented in Figure 4.17 illustrate that the performance of MAC-ALLRP is better than GPSR and AODV in each scenario. The PDR values are87≠100%, 75≠92%, and66≠80% for MAC-ALLRP, GPSR and AODV respectively,which indicate that the MAC-ALLRP maintains the performance more than 95% for20 flows, while the other two drop 70 ≠ 85%. This is because MAC-ALLRP usesthe mechanism to avoid the congested route. AODV applies periodic beaconing,therefore, it adds more overhead on the network. At the end, packets drop from thequeue on the intermediate level, despite the fact that these packet already traversedmany relays. The GPSR forwards data using a greedy-forwarding approach, insome scenarios it performed good and maintained PDR up to 92%, however, it hasno mechanism to handle the congestion, therefore PDR dropped to 70% when thenetwork was congested.

4.5. SIMULATION AND RESULTS 118
(a) PDR vs. No. of Source Nodes for 100 Nodes (b) PDR vs. No. of Source Nodes for 200 Nodes
(c) PDR vs. No. of Source Nodes for 300 Nodes (d) PDR vs. No. of Source Nodes for 400 Nodes
Fig. 4.17: Highway Simulation Packet Delivery Ratio (%) for MAC-ALLRP, GPSR and AODV withRespect to Number of Source Node (Number of parallel Flows)
4.5.1.2 AVERAGE DELAY
Figure 4.18 illustrate the resulting delay when we change the packet inter-arrival time for100, 200, 300 and 400 number of nodes, which are presented in Figures 4.18a, 4.18b, 4.18cand 4.18d, respectively. In each graph, the x-axis represents the packet inter-arrival time(sec) while the y-axis represents delay (ms). It is observed that in each case, the MAC-ALLRP bears less delay as compared to GPSR and AODV. MAC-ALLRP avoids congestedroute while determining path, and also selects the one which has a good link quality and lessnumber of hops. The hop count parameter helps to reduce the number of relay nodes in routediscovery, therefore, the delay involved on the relay nodes reduced as well. In case of theother two protocols, the path selection does not consider congestion along the path duringroute selection and data forwarding. GPSR is stateless, and it forwards data considering localmetrics only, while AODV itself introduces congestion due to periodic beaconing. In bothcase, packets stays in the queue due to congestion and wait for transmission.

4.5. SIMULATION AND RESULTS 119
(a) Delay vs. Packet Inter-arrival Time for 100 Nodes (b) Delay vs. Packet Inter-arrival Time for 200 Nodes
(c) Delay vs. Packet Inter-arrival Time for 300 Nodes (d) Delay vs. Packet Inter-arrival Time for 400 Nodes
Fig. 4.18: Highway Simulation Delay (ms) for MAC-ALLRP, GPSR and AODV with Respect toPacket Inter-arrival Time (sec)
4.5.1.3 GOODPUT
The simulation results of goodput and packet inter-arrival time for MAC-ALLRP, GPSRand AODV in are given in Figure 4.18. To observe the behavior of goodput for eachprotocol, we simulated four scenarios by considering 100, 200, 300 and 400 nodes. Here,the x-axis represents the packet inter-arrival time and the y-axis represents the goodput ineach graph. The general trend shows that goodput increases with the increase in the packetrate and it decreases with the decrease in the packet rate. However, the packets may bedropped due to other reasons like interference, congestion, signal strength, control messagesoverhead, etc., which can be observed via throughput degradation. In case of AODV, ituses periodic beaconing, which can result in degradation of goodput. In case of GPSR, itdoes not consider congestion and may select a single route for many flows due to its greedyapproach. Here, the route can be congested due to relaying multiple flows and lead to bufferoverflow. MAC-ALLRP considers queue utilization of each intermediate node in a route,and avoids congestion and uses SINR for link quality which ensures the correct data deliveryto the destination. Furthermore, it uses hop count to calculate the cost of the route, wherethe preferable route is selected based on least hop count and good quality link. Hence, theresults show that the goodput of MAC-ALLRP is better than AODV and GPSR.

4.5. SIMULATION AND RESULTS 120
(a) Goodput vs. Packet Inter-arrival Time for 100Nodes
(b) Goodput vs. Packet Inter-arrival Time for 200Nodes
(c) Goodput vs. Packet Inter-arrival Time for 300Nodes
(d) Goodput vs. Packet Inter-arrival Time for 400Nodes
Fig. 4.19: Highway Simulation Goodput (Mbps) for MAC-ALLRP, GPSR and AODV with Respectto Packet Inter-arrival Time (sec)
4.5.2 SIMULATION RESULTS IN CITY SCENARIO
Simulation results were computed for city scenarios using the map presented in Figure4.15, and simulation parameter setting discussed in Table 4.1. The was imported fromOpenStreetMap and then converted using NETCONVERT to use in SUMO. A detaileddiscussion of each scenario is as follows:
4.5.2.1 PACKET DELIVERY RATIO
Like highway, two leading cases were chosen for the simulation of packet delivery ratio. Adetailed discussion for each case is as follows:
1. Packet Delivery Ratio Vs. Packet Inter-arrival Time: In the first case, PDR wascomputed against packet inter-arrival time (sec) to observe the behavior of MAC-ALLRP, GPSR and AODV in the city simulations scenario. Figure 4.20 presents theresults of mentioned protocols for 100, 200, 300 and 400 nodes per scenario in Figures4.20a, 4.20b, 4.20c and 4.20d respectively as were observed in highway simulation.In each graph, the x-axis represents the packet inter-arrival time in seconds and the

4.5. SIMULATION AND RESULTS 121
y-axis represents the packet deliver ratio in %.
(a) PDR vs. Packet Inter-arrival Time for 100 Nodes (b) PDR vs. Packet Inter-arrival Time for 200 Nodes
(c) PDR vs. Packet Inter-arrival Time for 300 Nodes (d) PDR vs. Packet Inter-arrival Time for 400 Nodes
Fig. 4.20: City Simulation Packet Delivery Ratio (%) for MAC-ALLRP, GPSR and AODV withRespect to Packet Inter-arrival Time (sec)
In urban areas, the network is dense as compared to the highway scenario. Here, theresults show that MAC-ALLRP performed better than the other protocols, i.e., GPSRand AODV in city scenarios. However, the performance of these protocols is lowerthan the highway scenario. The reason is the increase in the interference, channelcontention, signal issue in the presence of obstacles, etc. The reason for the goodperformance of MAC-ALLRP is its route determining mechanism which considersqueue utilization, hops count and SINR. The queue utilization avoids the congestedroute, and the other two parameters help in determining the route with low hops andbest link quality. The bad comparative performance of AODV is due to the periodicbeaconing, which may introduce additional interference in the network. The GPSR asgiven in Figure 4.20d is lower than MAC-ALLRP due to use of a greedy-forwardingapproach to forwarding data. Therefore, its performance oscillates in each computedscenario. Here, the results shows that the PDR values for AODV, GPSR, and MAC-ALLRP are 61 ≠ 75%, 81 ≠ 90%, and 93 ≠ 100% respectively.
2. Packet Delivery Ratio vs. No. of Source Nodes: In the second case, the comparisonof the packet delivery ratio was done with the number of source nodes to observe the
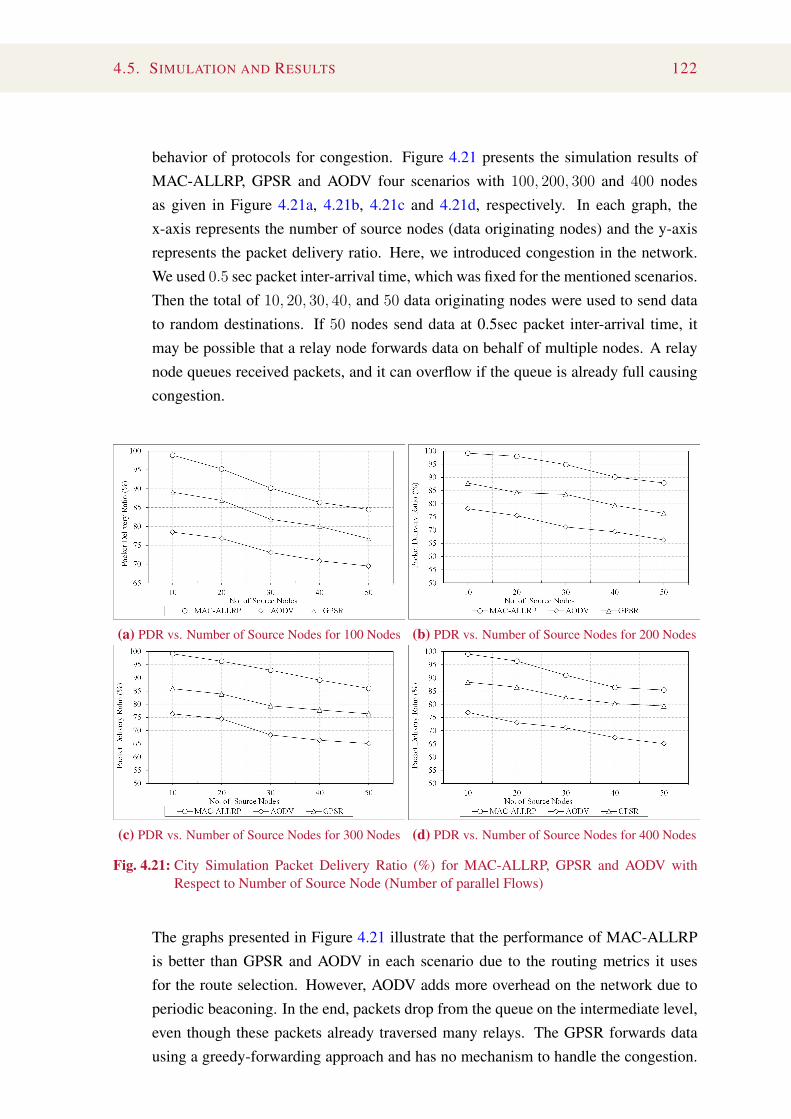
4.5. SIMULATION AND RESULTS 122
behavior of protocols for congestion. Figure 4.21 presents the simulation results ofMAC-ALLRP, GPSR and AODV four scenarios with 100, 200, 300 and 400 nodesas given in Figure 4.21a, 4.21b, 4.21c and 4.21d, respectively. In each graph, thex-axis represents the number of source nodes (data originating nodes) and the y-axisrepresents the packet delivery ratio. Here, we introduced congestion in the network.We used 0.5 sec packet inter-arrival time, which was fixed for the mentioned scenarios.Then the total of 10, 20, 30, 40, and 50 data originating nodes were used to send datato random destinations. If 50 nodes send data at 0.5sec packet inter-arrival time, itmay be possible that a relay node forwards data on behalf of multiple nodes. A relaynode queues received packets, and it can overflow if the queue is already full causingcongestion.
(a) PDR vs. Number of Source Nodes for 100 Nodes (b) PDR vs. Number of Source Nodes for 200 Nodes
(c) PDR vs. Number of Source Nodes for 300 Nodes (d) PDR vs. Number of Source Nodes for 400 Nodes
Fig. 4.21: City Simulation Packet Delivery Ratio (%) for MAC-ALLRP, GPSR and AODV withRespect to Number of Source Node (Number of parallel Flows)
The graphs presented in Figure 4.21 illustrate that the performance of MAC-ALLRPis better than GPSR and AODV in each scenario due to the routing metrics it usesfor the route selection. However, AODV adds more overhead on the network due toperiodic beaconing. In the end, packets drop from the queue on the intermediate level,even though these packets already traversed many relays. The GPSR forwards datausing a greedy-forwarding approach and has no mechanism to handle the congestion.

4.5. SIMULATION AND RESULTS 123
Therefore PDR dropped when the network was congested. However, the performanceof these protocols is lower than the highway scenarios.
4.5.2.2 AVERAGE DELAY
For city simulation, Figure 4.22 presents the graphs of average delay for 100, 200, 300 and400 nodes, where counter-part metric is packet inter-arrival time. The respective graphs aregiven in Figures 4.22a, 4.22b, 4.22c and 4.22d for mentioned scenarios. Like city case, thex-axis and the y-axis represent the packet inter-arrival time (sec) and delay (ms) respectively.It is observed that in each case, the MAC-ALLRP bears less delay as compared to GPSRand AODV. In case of AODV, the periodic beaconing cause data packets to wait in queue,which leads to delay, while GPSR mechanism forwards data using greedy forwarding, whichmay select same relay as other neighbors are using, which may create bottleneck. however,MAC-ALLRP avoids congested route while determining path and improve its performance.
(a) Delay vs. Packet Inter-arrival Time for 100 Nodes (b) Delay vs. Packet Inter-arrival Time for 200 Nodes
(c) Delay vs. Packet Inter-arrival Time for 300 Nodes (d) Delay vs. Packet Inter-arrival Time for 400 Nodes
Fig. 4.22: City Simulation Delay (ms) for MAC-ALLRP, GPSR and AODV with Respect to PacketInter-arrival Time (sec)
4.5.2.3 GOODPUT
The city simulation results are presented in Figure 4.23 for goodput and packet inter-arrival time of MAC-ALLRP, GPSR and AODV. Simulated was done for four scenariosby considering 100, 200, 300 and 400 nodes. Here, the x-axis and the y-axis represent the

4.6. SUMMARY 124
packet inter-arrival time and the goodput in each graph. In a wireless network, the packetsmay be dropped due to interference, congestion, signal strength, control messages overhead,etc., which can be observed via throughput degradation. Hence, the results show that thegoodput of MAC-ALLRP is better than AODV and GPSR.
(a) Goodput vs. Packet Inter-arrival Time for 100Nodes
(b) Goodput vs. Packet Inter-arrival Time for 200Nodes
(c) Goodput vs. Packet Inter-arrival Time for 300Nodes
(d) Goodput vs. Packet Inter-arrival Time for 400Nodes
Fig. 4.23: City Simulation Goodput (Mbps) for MAC-ALLRP, GPSR and AODV with Respect toPacket Inter-arrival Time (sec)
4.6 SUMMARY
With the increase in several vehicles on the road, various types of applications and theirrequirements, challenges of high mobility and highly dynamic topology in a vehicularenvironment, VANET requires special attention for efficient routing mechanisms. In thiswork, we have focused on designing a routing protocol and defining the routing procedureto improve the routing mechanism to tackle the challenges of a vehicular environment forreliable communication.
The selection of routing metrics is a crucial part of our work. The performance of routingmechanisms mainly depends upon the nature of networks, the topology of a network, andthe routing metrics. Many research scholars argued that most of the routing mechanismsor protocols focus on a specific scenario. Therefore, a single routing strategy may not besufficient enough to cope with the challenges in different vehicular environments, i.e., city

4.6. SUMMARY 125
or highway with a variable speed of vehicles and the presence of obstacles along the roads.In the proposed work, we analyzed some of the vital ad hoc routing protocols available inthe literature to figure out the routing metrics used by each type of protocol. Furthermore,we have also used a mathematical model to analyze the performance of the network andto identify the metrics that can improve the performance of the network. Additionally,MAC-Base Adaptive Link Layer Routing Protocol (MAC-ALLRP) was designed by usingselected metrics for the literature and mathematical analysis for a vehicular environment.The proposed protocol was implemented in Veins (Omnet++ and SUMO), evaluated andcompared GPSR and AODV. The simulation was performed to computed results. It wasobserved from simulation results that the MAC-ALLRP performs better than the GPSR andAODV in terms of high packet delivery ratio, reduced delay and high goodput.

5 EXPERIMENTS AND VALIDATION
The information gathering, sharing and monitoring with the help of sensors and smartdevices from OBU among the vehicles can increase the efficiency of safety and managementapplications to alert drivers on a possibly hazardous situation and to avoid collisions or otherdangerous situations. Apart from the theoretical analysis of applications, which may helpfulin vehicular environment, flooding and routing protocols to spread the safety alerts andmessages in the network to avoid chain-crashes or notify of possible hazardous situation,this study also deals with experiments to validate the use of synergies of VANET along withlatest technologies like WSN, IoT, cloud computing etc. During this doctoral research study,four applications were designed along the respective ad hoc TestBed implementation andconfiguration. Each application deals with a particular problem in vehicular environment.This chapter addresses the design of four applications in vehicular environment usingVANET as a key communication technology. Section 5.1 discusses a proposed applicationprototype for emergency management using VANET. Another application is discussed inSection 5.2, which is designed to monitor health of elderly/special people while driving usingVANET. The proposed application is able to send an emergency message to the hospitalfor immediate medical help in case of any abnormal health reading. Here, application usesWBAN for health-related data curation and monitoring. Section 5.3 includes the detailsof a designed application for automatic accident detection and management in a vehicularenvironment. The proposed application design is carried out using sensors on OBU, IoTand VANET to avoid the further accidents and get emergency medical help. An extendedwork of it is discussed in Section 5.4 to help traffic authorities to analyse the pattern ofroad accidents and reasons behind them. The designed application uses onboard sensorsand smart cameras to monitor and detect accidents, VANET/ IoT for data sharing amongvehicles and service points, and clouds computing for data storage and analysis. Moreover,each mentioned section discusses the detailed design of each application and of respectiveresults. Parts of this work has been published in [8, 9, 26–28].
126

5.1. EMERGENCY DISASTER MANAGEMENT SYSTEM USING VANET 127
5.1 EMERGENCY DISASTER MANAGEMENT SYSTEM
USING VANET
This section discusses the background and the current literature regarding the applicationsof VANET in post-disaster management scenarios, and describes some solutions on howwe can further improve them, especially in terms of the practicality of such propositions.Additionally, it presents the design and implementation of the proposed application in detail.Furthermore, it explains the test-bed for the ad hoc network and discusses test results of thedesigned application. At the end of section, it includes the summary of the research study.
5.1.1 BACKGROUND
According to United Nations Office for Disaster Risk Reduction (UNISDR), presentedstatistics showed that natural disasters like forest fires, floods, storms, volcanic eruptions,and droughts left about 606 billion people dead and nearly 4.1 billion injured or homelessaround the globe between 1995 and 2015 [219, 220]. It emphasizes that such disasters notonly leave humankind vulnerable and helpless, but also caused economic vandalize worthover 2.0 trillion dollars.In case of any kind of disaster, a well deployed communication system is expected to playa vital rule while dealing with the post-disaster care and recovery management. However,the reality is the opposite. When a disaster ensues, most of the deployed infrastructureis either entirely destroyed or severely damaged. Thus, making any use of pre-deployedcommunication services is almost impossible. More often than not, such disasters hit areas,e.g., earthquake mostly strikes on the hilly areas, which are far from cities and where thefacilities are already at a minimal level. In such areas, the use of any proceeding rescuemaneuver is relatively inadequate. Hence, researchers persistently seek ways wherebyprecise and timely information could drift among the rescue teams, which can improvework-efficiency and lead to promising results. The deployment of a lucrative and reliablecommunication operation in such regions can make a huge difference. Propitiously,we perceive a revival of VANET as a notion that provides a simple and commerciallypractical solution to the predicament of emergency responses in post-disaster managementsettings [221–223]. VANET has advantages to other potential technologies due to its low-cost deployment, readiness, low complexity, and comparably better coverage. It a supportswide-range of applications which includes management and safety-related ones [44, 224].The most critical role of VANETs lies in emergency response and disaster managementsystems [9, 27, 224]. Here, the design of a prototype for a centralized emergency responsesystem is presented, where location information is carried out with the help of a GPS underfixed settings using VANET. The challenging part of it is to design and develop a systemfor post-disaster management with a user-friendly interface and implement a TestBed with

5.1. EMERGENCY DISASTER MANAGEMENT SYSTEM USING VANET 128
the ad hoc configuration which is also useful to the scientific society due to its goals andobjectives. It can be used to represent real-time statistics of an emergency response system,along with the disaster statistics of an affected area. Additionally, results are discussedconsidering the round-trip-time with reference to the number of hops along the route fromthe source to destination, and the reliability factor in terms of packet delivery ratio basedon the hop-count value along the route within the network. Moreover, it computes delaywith reference to hop-count for the emergency messages based on the characteristics of thenetwork. Furthermore, it provides the flexibility to configure various mobility scenarios ina vehicular environment. In addition to that, it carries out the evaluation of the proposedapplication on the configured TestBed, which is examined through experimental validation.
5.1.2 LITERATURE REVIEW
When a disaster occurs, the first 72 h are the most critical, because the immediate help canincrease the chances of finding survivors. The research study in [144] recommends thatcommunication among the first few responders may play a crucial role in accomplishingefficient coordination and may support in avoiding any further deaths. Moreover, the studyfollowed a systematic approach to make readers understand the possibilities offered byvarious multi-hop ad hoc paradigms and technologies. Additionally, it discussed the analysisand simulation of different mobility models. Moreover, it suggested the use of smartphonesin such scenarios due to its common use. In-spite of inside understanding of the currentstudy in a defined scope to readers, it failed to come up with any practical real-worldsolution. A TestBed was developed in [225] using an on-board V2V multi-hop wirelessnetworking system to evaluate the real-world performance of telematics applications. TheTestBed works with the help of a differential GPS receiver, an IEEE802.11a radio cardmodified to emulate the DSRC, a 1xRTT cellular-data connection, an onboard workstation,and audio-visual-based equipment. The research objective was to evaluate the feasibility ofhigh-speed inter-vehicular communication via a magnetic-mounted wireless antenna withLine-of-Sight (LoS) reception and develop routing protocols for highly mobile networks. Inessence, this application was suitable for V2V communication in an urban scenario, wherevehicles move at a normal speed. However, in a disaster scenario, mobility is not highlydynamic as vehicles are restricted within an abrupt disaster region.In [226], the authors presented a system named DistressNet to address the need for search-and-rescue workers after a natural disaster in an urban scenario. The system integratedinexpensive and heterogeneous battery-powered Commercial Off-The-Shelf (COTS)devices, e.g., smart phones and low-power sensors, into an easy-to-deploy architecture.The overall efficiency of the system could be amended by placing sensors at certain optimalpositions in the deployment area. No comprehensive implementation was carried out,however, the authors executed a distinct assessment for different parts of the system.

5.1. EMERGENCY DISASTER MANAGEMENT SYSTEM USING VANET 129
Moreover, IEEE 802.11a/b/g/n was selected as the main stack with an Independent BasicService Set (IBSS) mode in the proposed architecture. Additionally, Explicitly ParallelInstruction Computing (EPIC) motes were chosen as hardware platforms, thus strictlyrestricting their practicality due to lack of support of IEEE 802.11.Radio-Frequency Identification (RFID)-based Indoor Localization System (ILS) wasproposed in [227] for the first few responders in emergency scenarios. The authors executedvarious tests under different settings to evaluate the proposed system and it turned out to havea high reliance on metrics like the number of RFID tags, the minimum read distance of RFIDtags, installation angles of tags, and the RFID reader positioning on the rescuer. Therefore,the proposed system was less effective in unpredictable environments. The authors in [228]recommended a MANET-based server-less peer-to-peer communication network (P2Pnet).In P2Pnet, Internet service through some satellite communication capability can pass to allnetwork nodes using some of the gateway capable nodes among them. Moreover, the authorsrecommended the use of Walkie-Talkie hand-held devices, or WiFi-ready mini-notebookPCs as communicating nodes, which shall be dependent on portable generators for supplypower. Although it might work in settings where the severity of the disaster is low, willprobably not be a feasible solution in most disaster scenarios. To assess the disaster, RescueInformation System for Earthquake Disasters (RISED) was proposed along P2Pnet, whichused seismic-related information for assessment. RISED provided latest and correct rescue-related information, such as disaster locations, potential destruction to lives and buildings,available rescue-and-relief assets, and the shortest way to disaster spots, etc. This system,however, was not practically deployed.For local communication and information collection in disaster areas, Integrated EmergencyCommunication System (IECS) [229] was proposed and deployed using a WirelessSensor Network (WSN) and MANET where the satellite gateway was used for remotecommunication. Additionally, an Integrated Emergency Service System (IESS) wasproposed to support rescue teams for emergency management services in disaster reliefmissions. Although proposed system seemed feasible in theory, neither any real worknor any actual implementation has been conceded in this affection. In [230], the authorsproposed another MANET-based post-disaster emergency response system. In-spite of thefact that it appears feasible for real-world scenarios, it did not achieve much in terms of aconcrete prototype configuration and implementation. The scope of the proposed systemwas limited because it did not exchange relevant information—for instance, it relied ongeographical coordinates of the disaster area or consolidated the request of any relief-relatedresource.A reconfigurable TestBed development was proposed in [231], which used a FieldProgrammable Gate Array (FPGA). The authors recommended that the same chip canbe reprogrammed handily for customized upgrade purposes. The objective to implementan FPGA-based TestBed rather than a regular microcontroller-based was to achieve higher

5.1. EMERGENCY DISASTER MANAGEMENT SYSTEM USING VANET 130
performance because of the advantages of FPGAs like parallel-processing mechanism,optimized power requirements, cost reduction, remote access, and runtime hardwarereconfigurability for real-time applications. Like other aforementioned solutions, thissystem offered no practical implementation as well and limited to simulations only. In [232],the authors conferred an open TestBed that integrates an ad hoc V2V communication and awireless mesh back-haul.The above-mentioned solutions were carried out on the basis of theoretical analysis,design, and/or simulations to interrogate various applications and multi-hop ad hocrouting of VANET in targeted scenarios. Moreover, these solutions offered no practicalimplementations to assist in real-world scenarios of post-disaster rescue operations.Therefore, this research study is intend to provide a test-bed application along with theconfiguration and implementation of VANET, through dynamic multi-hop ad hoc routingwithout any dependency on the Internet backbone. This is accomplished through anappropriate combination of software and hardware components to form a comprehensivesystem for emergency response in disaster management operations. The proposedapplication has the ability to support the need of communication in the first 72 h toreduce post-disaster effects and help disaster relief operations. The design is simple anduser-friendly. Further details on application design, selected hardware, and implementationare given in Section 5.1.3.
5.1.3 SYSTEM DESIGN AND IMPLEMENTATION
This section discusses the proposed arrangement and the hardware used for a successfulTestBed implementation.The proposed prototype mainly consists of two entities, i.e., a server and a client. The clientpart is integrated on the OBU, which may be deployed inside a vehicle or be used as hand-held device by a volunteer during rescue operations. The server application manages therequests received from volunteers and records inventory in the control room. It is primarilya central entity with user-friendly interface to visualize all of the collected statistics fromthe disaster area. It generates responses for specific requests initiated by a rescue teammember from their hand-held devices, therefore achieving bi-directional communicationbased on the Transmission Control Protocol/Internet Protocol (TCP/IP) suite of the OpenSystems Interconnection (OSI) model. The received request messages contain a structureddata format, which includes the coordinates of the precise location learned from a GPS sensorattached to the transmitting node. The detail description is given below.The proposed emergency response plan is shown in Figure 5.1. A volunteer generatesa peremptory request in a message for certain needs at the incident location. The OBUtransmits a message by encapsulating the GPS coordinates of the location of interest viamulti-hop communication to the Control Room. Here, Raspberry Pi module is used as a

5.1. EMERGENCY DISASTER MANAGEMENT SYSTEM USING VANET 131
processing unit along with a GPS module. The messages are traversed through a wirelessmedium to the control room that processes the received queries according to their severity.Just as in a real-world scenario, as some messages can be more critical for life-savingmeasures than others, they shall be treated accordingly. The control room then executesthe required action by either sending the message to another entity such as a mobile hospital,or provides a notification on the user interface with messages that are less urgent. Sincesmall-size packets like safety/alert messages move swiftly and reliably in the network ascompared to large-size packets, such as multimedia, safety/alert messages are mapped intocodes. The alert messages, their types, and respective codes are illustrated in Table 5.1.
Fig. 5.1: Emergency Response Plan in Disaster Scenario

5.1. EMERGENCY DISASTER MANAGEMENT SYSTEM USING VANET 132
Tab. 5.1: Alert Messages, Their Types, and Transferred Message Codes.
No. Message Type Message Code
1 First Aid Emergency Help Call 12 Ambulance Emergency Help Call 23 Air-help Emergency Help Call 34 Food/Water Help Call 45 Vehicles Help Call 56 Shelter/Camp Help Call 67 Volunteers Help Call 78 Warm Clothes Help Call 89 Collapsed Land Informative 910 Broken Bridge Informative A11 Blocked Road Informative B12 Collapsed Buildings Informative C13 All OK/Clear Informative D
In order to reduce the size of the data packets and the processing, here, instead of sendingthe whole text message, only a message code is sent. The codes for the respective messagesare illustrated in Table 5.1. A typical example of how a message is formatted and sent ispresented in Figure 5.2 using a keypad.
Fig. 5.2: An Example of Inserting Data at the Client Interface.
In order to send a message to the control room by using this application, a user is requiredto press a button according to the specific need, as a matter of an example, button with code 4followed by a # sign, which is used as a separator, indicates the requirement of water or foodat a certain location. Another button can then be pressed if a fixed quantity is desired—for

5.1. EMERGENCY DISASTER MANAGEMENT SYSTEM USING VANET 133
example, a button with code 20 indicates food packages or water bottles. More than onemessage can also be concatenated in one go by pressing more buttons each time with a #separator between them. When the entire message is assembled, D is pressed to specifythe end of a message. This complete structured text is then wrapped in a JavaScript ObjectNotation (JSON) wrapper and sent to the control room.Since the central server at the Control Room is constantly coordinating and interactingwith various departments involved in rescue operations to provide post-disaster managementservices, its actions can be mapped according to the user requests it receives. This can beseen in Table 5.2.
Tab. 5.2: Summary of actions taken by the Server at the Control Room.
Code Action
1 Sends a message to the First-Aid team nearest to the location2 Sends a message to the Hospital service3 Sends a message to the Air-Base Control room4 Sends a message to the Food & Accessories management head, along with location
information5 Sends a message to the Transport service head, along with location information6 Sends a message to the Camping & Shelter management head, along with location
information7 Sends a message to the Volunteers management center asking for volunteers at the
specified location8 Sends a message to the Food & Accessories management head, along with location
information9 Stores the information in database and displays it on the User InterfaceA Stores the information in database and displays it on the User InterfaceB Stores the information in database and displays it on the User InterfaceC Stores the information in database and displays it on the User InterfaceD No action is performed as this only acknowledges the end of the message
The front-end Graphical User Interface (GUI) at the Control Room displays the map ofthe affected region, the list of departments collaborating in the rescue activities, the log ofall the tasks underway, and the status of inventories at disposal. It makes it easier for theauthorities to make effective and timely verdicts based on correct and up-to-date evidence.The GUI of the server-side application is developed in Python using the Tkinter module inPython.

5.1. EMERGENCY DISASTER MANAGEMENT SYSTEM USING VANET 134
5.1.4 IMPLEMENTATION
The deployment of the implemented ad hoc network is done at the Bremer Institut fürProduktion und Logistik GmbH, therefore, the application maps presents the location ofmentioned institute. The deployed setup encompasses Raspberry Pi (a low-cost micro-computer with an opemeshn-source operating system) nodes, which can either transmittheir own packets or forward packets generated by other Raspberry Pies, hence acting asRelay Nodes (RNs). General Purpose Input Output (GoPiGo ) robot cars made-up by DexterIndustries, which comes with their motherboards and can be assembled manually, are usedto provide motion to the Raspberry Pi nodes. Each GoPiGo robot car has a D-Link NanoUSB Adapter Dongle that provides support for routing or forwarding the data dissemination.The hardware setting along GPS module and keypad is named as an OBU.The hardware and software had to be chosen carefully to meet the necessary requirements ofthe task. Therefore, the following hardware was used for successful TestBed implementation:
• Go-Pi-Go Robots: To encompass mobility in Raspberry Pi-based nodes, GoPiGorobots by Dexter Industries were used, as shown in Figure 5.3 A.
• Raspberry Pi 2: The selection of hardware technology plays a significant role becauseof its usefulness and commercial availability; however, it is also constrained by thecost. Raspberry Pi 2 model B, a credit card-sized microcomputer with basic hardwareprocessing, as shown in Figure 5.3 B, is selected due to specified reasons like relativelylow-cost, less power consumption compared to other microcomputers, and its widelyavailability [233–235]. Raspberry Pi obtains user data through a keypad and thelocation from a GPS module. It then passes the attained data to the client application,which is running on a Linux Debian operating system. It is equipped with a powerfulapplication processor [236–238]. The client-end sends 4 ◊ 4 keypad’s user-data andthe GPS sensor’s location data serially to the General Purpose Input/Output (GPIO)pins of the Raspberry Pi. At the further stage, this data gets handled through a clientapplication, whereas the server receives it using web sockets.
• Grove GPS Sensor: For accurate and timely emergency response services, it isassumed that the exact location of the victims or a collapsed building or similarmedical emergencies is known. We used the Grove GPS Breakout board, as shownin Figure 5.3 C, to identify the desired location. It is a cost-efficient and field-programmable gadget, and uses satellite signals to determine the current position,time, and velocity of the OBU. To test the system in an indoor environment, theexternal antenna needs to be attached with the GPS receiver—otherwise, the GPSreceiver may receive deteriorated signals.
• USB Adapter Dongle: Several adapters have been tested with Raspberry Pi, but the adhoc support was not available. Therefore, we selected the DWA-131 (D-link Wireless

5.1. EMERGENCY DISASTER MANAGEMENT SYSTEM USING VANET 135
N Nano USB Adapter) as shown in Figure 5.3 D, which is a convenient wirelessconnectivity solution for microcomputers, Personal Digital Assistants (PDAs), anddesktop or notebook PCs. It comes with the stable driver for Raspberry Pi, whichneeds to be installed prior to use.
• 4 ◊ 4 Matrix Keypad: A small 4 ◊ 4 matrix keypad, as indicated in Figure 5.3 E,provides the most basic user-input capability which serves the main messaging taskfor the TestBed implementation.
Fig. 5.3: Hardware Used in Designing an Emergency Response System
5.1.5 CLIENT-SERVER MODEL
In a dynamic ad hoc network that we have used in our proposed TestBed, these OBUs invehicles make service requests to the Control Room, which acts as a central "server". Asthe network is wireless and the server is a singular entity, all clients cannot reach it directly.Thus, this system included the concept of "multi-hopping", where a message might have topass through multiple nodes to eventually reach the destination.In such a scenario, the most efficient approach is to handle each aspect of the implementationseparately. For this purpose, two parallel applications were developed:
• The server-side application handles multiple clients concurrently.

5.1. EMERGENCY DISASTER MANAGEMENT SYSTEM USING VANET 136
• The client-side application communicates with the server via multihop communication,where a rescue team member inserts a message code which indicates the requiredservice at the current location.
The entire application is built on Python, which is an elegant open-source, cross-platform,high-level, dynamic interpreted language and which runs equally well on Windows andLinux [239]. Hereafter, both client-side and server-side applications are briefly explained,along with their key concepts for successful completion of the task.
1. Client-Side Application: To implement the client side application, three mainPython libraries are used, i.e., socket, RPi.GPIO and threading. Socket provideslow-level inter-process communication on Layer 3 of the TCP/IP (TransmissionControl Protocol/Internet Protocol) architecture by implementing socket system calls8. RPi.GPIO controls the general-purpose I/O pins on a Raspberry Pi. Here, a userinput is taken via an attached keypad and values can be retrieved using the rows andcolumns of the 4 ◊ 4 Matrix keypad as the input and output. Threading 9 is usedto handle concurrent processing [240]. The thread waits for the user input, whilethe GPS modules monitors the current location. Both of these activities need to bedone concurrently, and this can be attained by opening two parallel threads that canrun independently. To periodically get the latitude and longitude from the satellite, aseparate GpsController class with a GPS daemon is used.
2. Server-Side Application: A TCP connection is a reliable one-to-one communicationwindow that facilitates bi-directional talk between two terminals. However, in ourcase, as previously mentioned in Section 5.1.5, a server is required to send a responseto all the queries sent by the clients at any given time. Since a single socket connectionbetween a client and the server is exclusive, no other client can share this channel.In this context, a concurrent server is one that creates a separate logic flow for eachclient. There can be three different approaches to deal with concurrency in modernsystems. In a post-disaster management scenario, the control room is occupied bystrictly professional individuals who have the ability and authority to make criticaldecisions in a real-time environment that can cause a sizable impact on the overalloperating results. In order to do so, a visual image of everything that is taking placein and around the disaster-struck area is needed. Therefore, visualizing the data beingreceived from OBUs mounted on vehicles or hand-held devices in possession ofvolunteers and rescue staff, should be in a meaningful way.Therefore, GUI is divided into three blocks, as can be seen in Figure 5.4, each with a
8A socket, in the simplest term, is a gateway that provides point-to-point, two-way communication betweentwo processes running on two separate endpoints.
9A thread of execution is the smallest sequence of programmed instructions that can be independentlymanaged by a system scheduler, which is typically a part of the Operating System (OS)

5.1. EMERGENCY DISASTER MANAGEMENT SYSTEM USING VANET 137
Fig. 5.4: Graphical User Interface (GUI) on Server-side
very specific responsibility.
• The upper part of the left block is responsible for showing the map 10 of thedisaster area, while the lower part has the list of all the relevant departments thattakes part in the rescue-and-response efforts.
• The top part of the central block presents the statistics of the damage caused bythe calamity, such as the collapsed area, blocked roads, or broken bridges, whilethe bottom part shows the current availability of the resources at disposal;
• Right block is the activity log where all the alert messages are displayed.
5.1.6 AD HOC ROUTING: CONFIGURATION, SCENARIOS, AND
RESULTS
In essence, an ad hoc network has a flat typological structure with dynamic interconnectionof nodes, where each node can communicate with as many nodes as possible in the networkthrough the intermediate or relay nodes, to efficiently forward the information to the desireddestination. Luckily in the implemented TestBed, the nodes are OBUs, mounted in vehicles.Since vehicles or nodes are not random in their movement, they, in fact, follow a predefinedpath, such as a road. Hence, routing can be managed relatively easy. The data disseminationis handles either using flooding or routing as discussed in Chapter 2. To test the designedapplication and the implemented TestBed, it is necessary to consider a routing protocol toconfigure the TestBed. For this purpose, we used the routing protocol Better ApproachTo Mobile Ad hoc Networking (BATMAN), which was developed by the German Freifunkcommunity and available for freely for testing. The protocol uses routing data on Layer 2 of
10captured from an open-source Application Programming Interface (API) provided by Google [241]

5.1. EMERGENCY DISASTER MANAGEMENT SYSTEM USING VANET 138
the TCP/IP Model instead of Layer 3. The improved version of it is known as BATMAN-Advanced (BATMAN-ADV) [242].
5.1.7 CONFIGURING BATMAN-ADV PROTOCOL
Since the nodes in the TestBed are based on Raspberry Pi, which operate on a Linux Debiandistribution (Raspbian Stretch, in this case), the starting point had to be the configuration ofthe operating system through raspi-config, and basic ad hoc routing in Linux. Once the basicinstallation and configuration of Raspberry Pi OS and the ad hoc network [243] was done,respectively, BATMAN-ADV protocol was configured on all Pies. The hands-on settings forconfiguring BATMAN-ADV is available at the project Git repository in [244].
5.1.8 SCENARIOS AND RESULTS
To test and validate the TestBed implementation in various scenarios, a number of testswere performed. The central server was initiated to listen to queries from clients. It handledmultiple connection requests by accepting, thus creating a multi-client scenario whererouting and forwarding took place using the BATMAN-ADV protocol. Tracing the routeusing the traceroute command shows the entire path taken by a packet from end to end.
SCENARIO 1: CLIENT–SERVER DIRECT COMMUNICATION
Firstly, the user can be connected to the server via direct link if both are within the rangeof each other, which can be verified using "$ sudo batctl originators" command on theterminal. It shows the list of all available routes in Figure 5.5. Since the BATMAN-ADVprotocol works with Medium Access Control (MAC) addresses rather than IP addresses, allthe connections are shown in terms of their MAC IDs. One can see that there is a direct pathto the server (with a MAC address of 78 : 32 : 1b : ad : e4 : 11. The path quality is 158 (outof 255), indicating a rather strong connection, and therefore no intermediate hop is requiredfor the packet to reach its destination.
Fig. 5.5: List of all Available Connections through the wlan0 Interface

5.1. EMERGENCY DISASTER MANAGEMENT SYSTEM USING VANET 139
When the client (192.168.2.103) checks its path to the server (192.168.2.102), it receivesa response in around 21 milliseconds, as shown in Figure 5.6. Although there is an alternatepath in the network, where there is a node with an IPv4 address of (192.168.2.101). However,it has a longer route taking at least 150 milliseconds (high link cost) to traverse. Therefore,the client would pick the shorter route (low link cost) to send its message.
Fig. 5.6: One-to-One TCP Communication Between the User and Control Room
SCENARIO 2: FORWARDING THROUGH ONE INTERMEDIATE HOP
For testing, multi-hop communication (with one-intermediate node) scenario was created.Due to mobility, clients moves far from the range of server, therefore another node betweenclient and server was activated to forward data to the server. The screen shot presented inFigure 5.7 confers this scenario.
Fig. 5.7: Message Traversing using Multi-hop Communication where Single Intermediate Hop (40 :9b : cd : 00 : 5a : 85) Involved
When we trace the route of a packet toward the server with a MAC ID 78 : 32 : 1b :ad : e4 : 11, we see that it takes one hop to an intermediate node (with a MAC ID of(40 : 9b : cd : 00 : 5a : 85) in around 10.78 milliseconds, and then travels for another 5.87milliseconds to reach the server. The total time for the packet to complete its journey is thenroughly 16.65 milliseconds, as depicted in Figure 5.8.

5.1. EMERGENCY DISASTER MANAGEMENT SYSTEM USING VANET 140
Fig. 5.8: Total Travel Time for the Packet is the Sum of Both the Hops
SCENARIO 3: FORWARDING THROUGH MULTIPLE INTERMEDIATE HOPS
In this scenario, the mobile user continues its movement away from the server, thereforemore hops involved in the communication. Figure 5.9 presents a scenario of four-hopstraversing of data in 57.5 milliseconds to reach the destination. The link cost in term of timemay vary due to involved distance and number of hopes between communication nodes asshown in Figure 5.9.
Fig. 5.9: Multi-hop Scenario Involved Three Intermediate Nodes.
When routing is confronted with the situation of more than one route to the destination,it will automatically pick the one with the best link strength and least travel time. In thisregard, a scenario is presented in Figure 5.10. In-spite of availability of a one-hop route(using node 40 : 9b : cd : 00 : 5a : 5a), however, it discarded it due to bad link quality.Hence, the selected path used four hops to reach the destination in order to make sure thatthe delivery of message in its entirety.
Fig. 5.10: Link Quality for Single Intermediate Hop Scenario
The test cases were performed to validate the delivery of packets from a number of

5.1. EMERGENCY DISASTER MANAGEMENT SYSTEM USING VANET 141
clients to the server via multiple hops. However, one test-case is shown where server takesthree hops to reach the end-user via a message in the opposite direction of propagation inFigure 5.11.
Fig. 5.11: Trace Route at Server for a Node with MAC Address 40 : 9b : cd : 00 : 5a : 50.
Due to dynamic topology, the communication time for packets from any particular nodeto reach any other is constantly varying as well. It can be seen in Figure 5.12, the packetsent to a node (40 : 9b : cd : 00 : 5a : 50) took 2.33 and 2.72 milliseconds for its twoconsecutive hops, respectively. When another packet was sent from the same node to thesame destination, it took less time for the first hop (1.5 milliseconds) and more time for thesecond hop (3.76 milliseconds), indicating the mobility of its users.
Fig. 5.12: The Dynamic Nature of Mobile Users, Indicated through the "batctl" traceroute
One limitation of the "$sudo batctl originators" command, as shown in Figure 5.13, isthat it only shows the next hop toward any direction of propagation—although there arefive different users in the vicinity, the next hop for any one of those five routes is the same.However, in order to view the end-to-end path, the "$sudo batctl tr" command can be usedwith the MAC address of the destination.

5.1. EMERGENCY DISASTER MANAGEMENT SYSTEM USING VANET 142
Fig. 5.13: The Same Next-hop for all Five Available Users
Link quality between sender and receiver is computed at run time, Therefore, communicationis realistic and ensures the best possible quality at any given time. As shown in Figure 5.14,each time we ran the "$sudo batctl o" command, it assessed the quality of each availablepath in the network and updated the relevant values. For example, a path which had alow link-quality of 86 in the first run had a link strength of 113 the next time we ran thesame command. Similarly, another path with a link quality of 174 had an even greater linkstrength of 219 the second time round.
Fig. 5.14: Dynamism of Routing Protocol in Different Test-cases

5.1. EMERGENCY DISASTER MANAGEMENT SYSTEM USING VANET 143
5.1.9 EMERGENCY RESPONSE SYSTEM: REAL-TIME STATISTICS
In each above-mentioned scenario, queries were generated in order to check the statisticsshowed on the server side at the control room. Figure 5.4 illustrates the user-interface at theserver-side that displays the disaster statistics, activity logs, and resource entities availablein the inventory, to yield the assistance to the affected people. After generating 200 queries,the system presented real-time statistics against the available resources in the inventory andthe disaster statistics for the investigated scenario. It is presumed that the disaster happeneddue to an earthquake, which devastated or destroyed the already installed communicationinfrastructure like LTE, or 3G/4G. Moreover, the proposed system was verified with thepresumption that the volunteers are spread in the affected area. Since the system is designedto support the rescue operation for post-disasters care, it is thus presumed that the rescueoperation is well-prepared with basic units to handle acute life threats. Hence, it is likewisesignificant to have data of available and allocated resources in the inventory. Based on thisassumption, the proposed system gives real-time statistics about the available and allocatedresources on the user-interface at the server side in the control room. Figure 5.15 presentsthe status of the inventory that is maintained to handle the challenges of post-disastermanagement. This chart demonstrates the quantity of resources on the x-axis and availableentities on the y-axis. It provides the information of total resources indicated with the bluebar, available resources with the orange bar, and allocated resources with the grey bar. Thismay differ in different scenarios depending on the need and the level of disaster in a specificarea. Figure 5.16 illustrates the incidents reported via emergency messages to the controlroom. These incidents include collapsed lands, broken bridges, collapsed buildings, andblocked roads. The number of reported events shows the level of disaster.The results in the following section illustrate that the system performed all the above-mentioned tasks. The performance of the system was examined in terms of response time,successful data transmission, and delay. However, the implemented system was tested in alab under the constraints of a restricted availability of hardware and testing area.
5.1.10 PERFORMANCE ANALYSIS
The comparative study helps to understand and reach concluded remarks about differentsettings of a single mechanism. This analysis not only helps in decision-making, but alsohelps to find solutions for any current or future issue. We plotted the average values of theRound Trip Time (RTT) taken by sent packets in various executions of the system, versus thenumber of hops they traversed. Obviously, the data traverse time increases with the increasein the number of hops. We observed that by executing the same operation by changing thepositions of the users (robot cars, in our case) every time, the values for the RTT changedaccordingly, as depicted in Figure 5.17. This change is mainly due to the mobility of the

5.1. EMERGENCY DISASTER MANAGEMENT SYSTEM USING VANET 144
Fig. 5.15: Emergency Response System—the Status of the Inventory after Receiving 200 Queriesfrom the Disaster Area.
Fig. 5.16: Emergency Response System—the Level of Disaster in a Particular Area in Terms ofDestruction
cars, but is due also in part to the disturbances in the wireless environment (e.g., scatteringeffects, interference with other signals).

5.1. EMERGENCY DISASTER MANAGEMENT SYSTEM USING VANET 145
Fig. 5.17: Round Trip Time (RTT) vs Hop Count
Moreover, we performed three different test-cases by executing the proposed applicationson the TestBed. Here, we generated 100, 150, and 200 queries in each hop-count settingwhere values for hop-count were 1, 2, 3, 4, 5, 6 in the first, second, and third test, respectively.In each test-case, the Packet Delivery Ratio (PDR) was observed by increasing the hop-countvalue, as shown in Figure 5.18. It was observed that PDR was 100% with a hop-count valuefrom 1 to 4, which shows that all the queries that were sent to the intended destination weresuccessfully received. However, with an increase in the number of hop-counts greater than4, the PDR decreased, indicating the loss in the received queries which were sent by thesender. This happened possibly because of interference which increases due to increase inthe number of nodes in any wireless communication.
Fig. 5.18: The Trend of Packet Delivery Ratio (%) with Increasing Hop Count

5.1. EMERGENCY DISASTER MANAGEMENT SYSTEM USING VANET 146
As discussed in Section 2.3.6, most of the safety and emergency applications require adelay of 20 ≠ 100ms. Though the proposed application prototype is designed to fulfill thecommunication prerequisite in an emergency situation, the nature of the application cantolerate little delay. During the testing and validation phase of proposed application, theaverage delay was also computed for the sent queries. Figure 5.19 illustrates the comparisonof average delay with the number of hops involved between the communicating nodes. TheTestBed includes a limited number of vehicular nodes, and the observed delay is less thanthe minimum requisite of the safety application.
Fig. 5.19: Comparison of Delay with Increasing Hop Count
This concludes that toward presenting a real-world prototype, which comes with its ownset of advantages and disadvantages. This work can be considered to develop even bettersystems that can be commercially used in rescue-and-relief efforts in disaster-managementareas.
5.1.11 SUMMARY
The main objectives of the proposed work were to accomplish with the complete design of anemergency response system and the successful implementation of an ad hoc TestBed, whichcarried out the intended communication in a vehicular environment. This study presentedthe achieved objective and real-time statistics of an emergency response system along withthe disaster data of an affected region. Furthermore, it helped to measure the performance ofa network in terms of round-trip-time with reference to the number of hops along the routefrom the source to destination. Moreover, the research work may also be used to receiveknowledge about reliability and delay factors based on the hop-count value along the route

5.2. HEALTH MONITORING SYSTEM FOR ELDERLY/SPECIAL PEOPLE USING VANETAND WBAN 147
within the network. It was examined by performing experiments which involved the userinput data from the GPIO pins of the Raspberry Pi through serial communication along withthe geographical coordinates of the user from the GPS module. The communication wasperformed using the Transmission Control Protocol due to reliable transmission requirement.Out of all the commercially available ad hoc routing protocols, BATMAN-ADV was selectedbecause of its sophisticated abstraction. It hid all lower-level complexities and provides aneasy-to-use virtual interface between Layers 2 and of the TCP/IP suits. This study, along withthe implemented TestBed, provided an effective way to share critical information amongstvolunteers and staff working in calamitous situations, like a post-disaster rescue-and-reliefoperation. Since fast and reliable communication plays a vital role in such scenarios, thiswork offers a practical solution that can be implemented by the concerned authorities in caseof disasters.
5.2 HEALTH MONITORING SYSTEM FOR
ELDERLY/SPECIAL PEOPLE USING VANET AND
WBAN
This section explains the background of the work followed by the discussion on similarprojects proposed in the literature to facilitate special/elderly people. It also discussesthe proposed architecture, its design, selected hardware and implementation details.Additionally,it discusses the application testing and the acquired results. At the end, it givesthe brief summary of the research study.
5.2.1 BACKGROUND
It is estimated that, since 1950, the count of elderly people aged 60 years and above hastripled and is expected to reach 2.1 billion by 2050 [245]. As a result, concern towardsage related chronic diseases like abnormal blood pressure or congestive heart failure hasincreased significantly. In addition, there is a large number of people who are suffering fromlong-term medical conditions due to unhealthy lifestyle or bad food habits. Elderly/specialpeople require round the clock attention and health monitoring based on their conditions.In few cases, patients need to be hospitalized for long term, which often makes them to bebed ridden in the hospital due to being monitored. Due to the fact that elderly and specialpeople always need constant attention towards their health condition, they are generallyhandicapped to drive alone.An intelligent monitoring kit helps special and elderly people to have a normal, independentlife by giving them the opportunity to move around. Lack of timely sharing of health data,delay in subsequently situation analysis, contacting hospital and subsequent actions, can

5.2. HEALTH MONITORING SYSTEM FOR ELDERLY/SPECIAL PEOPLE USING VANETAND WBAN 148
be fatal. Therefore, it is necessary to develop an efficient and cost-effective remote healthmonitoring system which could assist them by ubiquitously keeping track of their vital healthparameters, specially while driving. Such system can assist them to lead a independent,practical, healthy and nearly risk free life. Moreover, these systems depend on the traditionalcommunication infrastructure such as cellular network, where user has to pay separately forcommunication and data services. The proposed system uses VANET providing a reliablesolution through low cost wireless communication in vehicular environment. In the currentwork, a prototype application is designed and developed. The proof of concept is testedusing the testbed discussed in Section 5.1.7.
5.2.2 LITERATURE REVIEW
The proposed work is created as a synergy of VANET and emerging wearable physiologicalsensor networks, named as Wireless Body Area Network (WBAN). These sensors areconnected to the gateway, which acts as a base station and relays data to the externalnetwork [246, 247]. Early remote e-health monitoring solutions [248] were generallydesigned to acquire patient’s health parameters and store them at the hospital’s server forfurther analysis and treatments. But, the stored health data was accessible only withinthe hospital’s server. Later researchers [249] tried to integrate smart devices for e-healthmonitoring system using cloud based access. Yet, it only serves for data dumping for remoteaccess. Further with time, the concept of continuous monitoring evolved. These systemsdid not only aim to store sensed data, but also used it to detect any abnormal conditionsin health. In addition, they also rendered the service to alert the doctors immediately inemergency situations [250].Moving a step forward, authors in [251] implemented the WBAN using Wireless MeshNetworks (WMN). WMN is an extension of LAN as a relaying technology to send the sensedpatient’s data to the hospital. It has made a remarkable progress in wireless communicationby sending alert messages over acceptable long distance. The work [217] explained animproved protocol named Congestion Avoidance Hybrid Wireless Mesh Protocol (CA-HWMP) that could be implemented for mesh networks to have better communication inmesh networks. Researchers in [252] proposed a health care system structure, where senseddata was relayed to a nearby server and caretakers monitor patient using cached data.Authors successfully used body area sensor networks coupled with wireless communication.However, the proposed structure was limited to close proximity of hospital only.Similarly, authors in [253] tried continuous monitoring of pulse successfully. But,communication to end points was still using traditional wireless technologies like bluetooth,zigbee, GPRS and so on. The e-health monitoring and alert system [254] was proposed fora vehicular system. To keep driver’s safety, authors used an RFID enabled authentication

5.2. HEALTH MONITORING SYSTEM FOR ELDERLY/SPECIAL PEOPLE USING VANETAND WBAN 149
scheme for health care in vehicular cloud computing. With the automation of vehiclesthrough ITS, authors of [20] provided a solution to apply VANET that uses vehicles as nodesfor secure and safe wireless communication. However, VANET is still an on-going researchfield with mostly theoretical solutions and is focused on simulations and hypotheticalsituations. In-spite of this, [13] inspired to use an IEEE802.11n wireless network interfaceto establish VANET in this project. The proposed system implemented using vehicularad hoc networks for communicating alert messages via a proactive protocol based on thework proposed in [8]. Hence, it was suitable for health care services that aims to have along distance, instant, reliable and continuous health monitoring systems for patient’s whiledriving.
5.2.3 SYSTEM DESIGN AND IMPLEMENTATION
This section presents the detailed architecture and design for proposed prototype.Accordingly, implementation details about hardware, communication modules, routingstrategy, application and testbed parameters are discussed.
BASIC DESIGN:
The design of prototype used following key points:
• Pulse rate, body temperature and blood pressure values of the target user arecontinuously monitored through body sensors.
• All wearable sensors deployed with their control units are integrated with each otherand the setup is collectively known as Smart-kit On Board Unit (SOBU).
• Each user pre-enters his/her personal medical identity and related medical data, whichincludes age and hospital/care-taker and contact number etc.
• Threshold values to detect emergency condition are defined for each type ofphysiological sensed value for different ages according to Food and Drug Administration(FDA).
• The proposed system also consider the health state of the user within the specificthresholds for emergency situations.
• If, there is any abnormal biological reading in the patient’s health, SOBU automaticallygenerates an alert message with necessary information required by medical professionalsto the patient’s registered hospital/care-taker using V2X communication.
• The alert message includes the user’s ID, abnormal health parameter with thecorresponding reading and an geographical co-ordinates of the current position of theuser.

5.2. HEALTH MONITORING SYSTEM FOR ELDERLY/SPECIAL PEOPLE USING VANETAND WBAN 150
• On the basis of received data, the hospital can dispatch an ambulance exactly to thepoint where user waits for help.
The application prototype has two parts, first to integrate the sensors with OBU and secondto implement stable communication between OBU and hospital as shown in Figure 5.20 [8].In the following, details on different modules and submodules used to develop the system
Fig. 5.20: Proposed System Design
are provided:
• Temperature Sensor: Temperature is measured using DS18B20 Integrated Circuit(IC). It is a 3 pin miniature chip with temperature sensor as shown in Figure 5.21,analog to digital converter and 1-wire interface package embedded in it. 1-wire is acommunication bus that provides data, signaling and power over a single lead. Thissensor operates at 3.3V along with a pull-up resistor. The obtained output is a digitalvalue [255]. It can sense temperature in the range of -55°C to +125°C and is suitableto measure human body temperature.
• Pulse Sensor: Pulse Sensor is a 3 pin, tiny and easy to fit sensor with an indicatorLED. This cheap pulse sensor uses ambient light to detect human pulses [256]. Sincethe pulse sensor output is analog, the ADS1015 ada-fruit ADC is used to obtain thecorresponding digital value of the analog output [257].
• Blood Pressure Sensor: It is a non-invasive sensor designed to measure humanblood pressure. It measures systolic, diastolic and mean arterial pressure utilizing theoscillometric technique.
• GPS Module: The GPS module from Grove systems is used to identify the desiredlocation as discussed in Section 5.1.4.

5.2. HEALTH MONITORING SYSTEM FOR ELDERLY/SPECIAL PEOPLE USING VANETAND WBAN 151
Fig. 5.21: Temperature And Pulse Sensors
• Raspberry Pi 2 model B: Raspberry Pi is used as hardware platform for OBU due toits advantages as discussed in Section 5.1.4.
• Wireless Adapters: D-Link USB adapter, model DWA-131, rev E1 series withRTL8192EU chipset is used in this application, where is not a plug-and-playdevice and requires installation of driver on first use as discussed in aforementionedSection 5.1.4.
• GoPiGo Robots: GoPiGo robot is a Raspberry Pi robot car. It includes a base kit thatfits a Raspberry Pi board. These robots can be used as drive-cars to test applications invehicular environments as discussed in Section 5.1.4.
IMPLEMENTATION:
For the Implementation and development of the prototype, firstly algorithms for sensors areimplemented to collect health data. Then, an application is developed, which is deployedon the main unit located in the vehicle/OBU to process the sensed data and analyze it detectan emergency. In the final stage communication in a vehicular environment is established tosend alert messages.
1. Data Collection: All sensors and GPS are connected to the processing unit (RaspberryPi) in a star network topology. The pulse sensor uses both filter and amplifier toincrease the pulse wave and normalize the signal around a reference point. When it isnot in contact with the finger, the analog signal hovers around the voltage mid-point.If it is in contact with a finger, then there is a change in the reflected light as blood ispumped through tissues inducing the signal fluctuate around the reference point. An

5.2. HEALTH MONITORING SYSTEM FOR ELDERLY/SPECIAL PEOPLE USING VANETAND WBAN 152
algorithm is developed in python to cover the output signal from the sensor and todecide if the pulse is found based on a rise in the signal above the midpoint. Thisis the moment when capillary tissues get slammed with a surge of blood. When thesignal falls below the midpoint, the algorithm aims to find the next pulse. If necessaryin the algorithm, rising and falling thresholds can be adjusted. The temperature valueis obtained from the sensor in degree Celsius. The readings for blood pressure aretaken in both systolic and diastolic measurements for the application. The locationinformation is added using the GPS module. After all sensors are connected to theRaspberry Pi, the patient node looks as in Figure 5.22.
Fig. 5.22: Patient Node: Smart-kit Component Developed for Patient
2. Data Flow: All the sensor modules along with the GPS module are integrated in themain processing unit as shown in Figure 5.23. The main module executes the "patient’sdata" module where patient-id, name, age and emergency contact number are storedin a file and can be accessed by all sensor modules when it is required. This step isexecuted just once upon every reboot of the system. The GPS and each sensor moduleare executed periodically, until the system is shut down. It enables the system to updateitself with location and health parameters continuously. The GPS module extracts thelocation and saves it in a file which can be accessed by all the other modules. In caseof an emergency situation, the "trigger emergency module" is executed to generate andsend an alert message.

5.2. HEALTH MONITORING SYSTEM FOR ELDERLY/SPECIAL PEOPLE USING VANETAND WBAN 153
Fig. 5.23: Block Diagram of Application To Indicate the Flow of all Modules
3. Emergency Detection: All sensor modules will be discussed individually as the dataof each sensor is different and each health parameter has unique properties based onthe age. Respective flow of modules are shown in Figure 5.24.The pulse sensor module senses the pulse rate in terms of Beats Per Minute (BPM)
and sends this data to a decision function which accesses the patient’s age from thepatient detail’s file. Now, BPM and age is considered to check the tolerance conditionas shown in Table 5.3. If the age is less than 50 years, BPM is checked to be withinthe range of 60 ≠ 100 BPM. Else, if it is for elderly people with age greater than 50years, the check for BPM is within the range 60 ≠ 110 BPM. If the condition is notmet, emergency is triggered to generate and send an alert message.
In the temperature module, the both the body temperature from the sensor and the

5.2. HEALTH MONITORING SYSTEM FOR ELDERLY/SPECIAL PEOPLE USING VANETAND WBAN 154
Fig. 5.24: Flow of Each Sensor Modules Used In Application
patient’s age from patient’s data file are considered. Next, the tolerance condition asshown in Table 5.4 is checked. Normal human body temperature is between 35°C to38°C for special people below 50 years and it is between 34.5°C to 37.5°C for elderlypersons. If the condition is not met, an emergency is triggered and the alert message

5.2. HEALTH MONITORING SYSTEM FOR ELDERLY/SPECIAL PEOPLE USING VANETAND WBAN 155
Tab. 5.3: Pulse Rate According to AgeAGE(years) normal status Bradychardia Tachycardia
10 ≠ 50 60 to 100 BPM Below 60 BPM Above 100 BPM> 50 60 to 110 BPM Below 60 BPM Above 110 BPM
is sent. Lower temperature is hypothermia and higher is hyperthermia condition, andboth needs to be treated.
The blood Pressure module, however is quite tricky. There are two levels of
Tab. 5.4: Temperature Reading According to AgeAge (years) Normal Status Hypothermia Hyperthermia
10 ≠ 50 35°C to 38°C Below 35°C Above 38°C> 50 34.5°C to 37.5°C Below 34.5°C Above 37.5°C
measurements to be considered systolic (high) and diastolic (low). Both the parameterstogether represent the blood pressure value. Therefore, an alert is to be sent when thereis a violation of normal values in either systolic or diastolic measurements. Table 5.5shows four categories of blood pressure and in each case treatment is required.
Tab. 5.5: Blood Pressure CategoriesSystolic(mmHg) Diastolic(mmHg) Status
Below 120 and Below 80 Normal120 - 139 or Between 80-89 Pre-Hypertension140 - 159 or Between 90-99 Stage 1-Hypertension
Above 160 or 100 or higher Stage 2-Hypertension
4. Communicating Alert Messages: When an emergency is triggered, this module firsttakes the abnormal parameter and its corresponding value from sensor module. Then,it fetches patient id, emergency contact number and location information from thecorresponding files. It forms an alert message which includes all the above mentioneddata. Finally, it calls the communication function which uses a client/server socketapplication to send the message packet form the OBU into VANET network as shownin Figure 5.25.
In socket communication, each node is assigned a specific port and IP forcommunication. It is based on TCP protocol with a reliable 3 way handshakeconnection. The OBU applies the ’client side’ python program and the hospital nodeis deployed with the ’server side’ program. Here, the hospital continuously keepslistening for any clients that want to connect to it. The received message at the hospitalis shown in Figure 5.26.
The ad hoc configuration of robot-car is identical to Section 5.1.7. The test-cases to validatethe prototype application are discussed in Section 5.2.4.

5.2. HEALTH MONITORING SYSTEM FOR ELDERLY/SPECIAL PEOPLE USING VANETAND WBAN 156
Fig. 5.25: Emergency Triggering Module: Action taken based on the Fetched Information from EachModule
Fig. 5.26: Display Window: Message Received At The hospital Node
5.2.4 SYSTEM VALIDATION
The GoPiGo robots with their controlled mobility are used as vehicular nodes in the networkas discussed in Section 5.2.3. Each node is configured with VANET and communicationamong them is now V2V. Henceforth, the message is transmitted to destination/hospital usingother nodes as the relay nodes.To check the route that a data packet used in the TestBed, there are two diagnostic toolsof BATMAN-ADV Named:, "originators" 11 or in short "o" and "traceroute" 12 or in short"tr", were used. Regarding the nodes used in testbed, a respective short form of their MACaddress is used for identification as shown in the Table 5.6. All nodes are named after thelast byte of their MAC address.
1. Scenario 1. Testing Relay Nodes Initially, relay nodes are set up with the topology asdisplayed in Figure 5.27. Node 5A has its range only until 85. Node 50 has its rangetill 85 and node 85 is in range of both 5A and 50.
11Used with command: pi@raspberrypi ≥ $ sudo batctl originators12Used with command: pi@raspberrypi ≥ $ sudo batctl traceroute X; "X" is replaced with the MAC address
of the destination node.
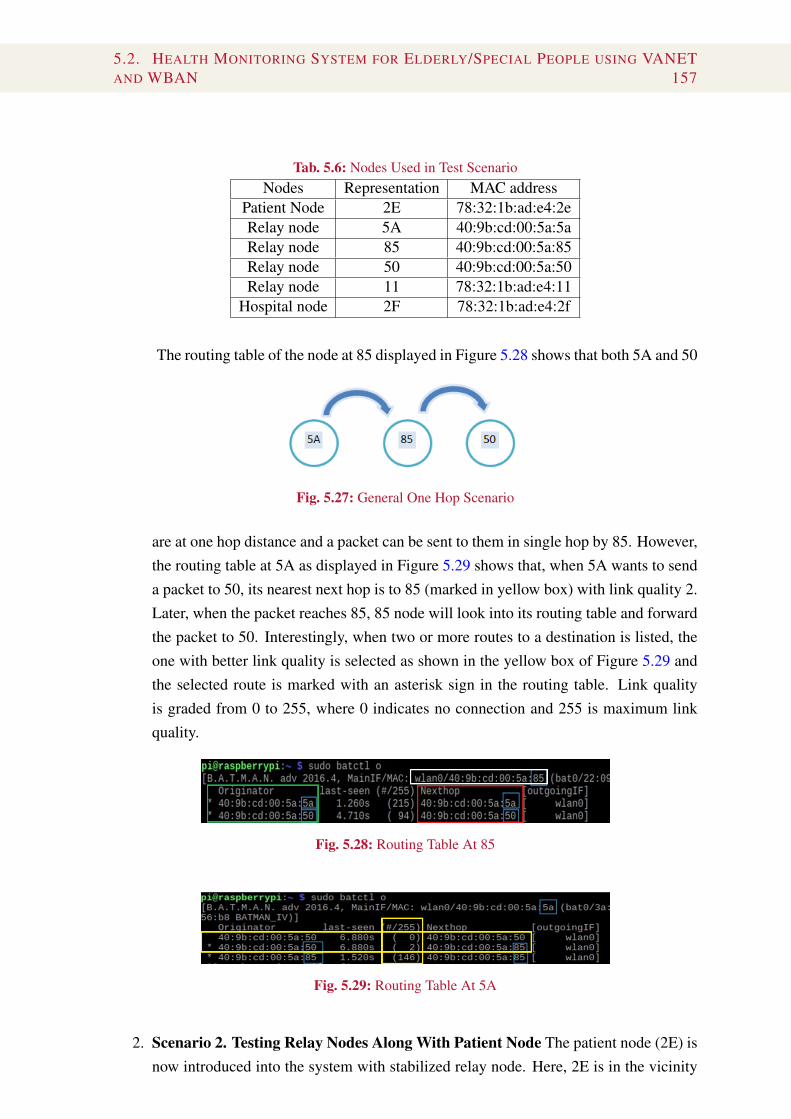
5.2. HEALTH MONITORING SYSTEM FOR ELDERLY/SPECIAL PEOPLE USING VANETAND WBAN 157
Tab. 5.6: Nodes Used in Test ScenarioNodes Representation MAC address
Patient Node 2E 78:32:1b:ad:e4:2eRelay node 5A 40:9b:cd:00:5a:5aRelay node 85 40:9b:cd:00:5a:85Relay node 50 40:9b:cd:00:5a:50Relay node 11 78:32:1b:ad:e4:11
Hospital node 2F 78:32:1b:ad:e4:2f
The routing table of the node at 85 displayed in Figure 5.28 shows that both 5A and 50
Fig. 5.27: General One Hop Scenario
are at one hop distance and a packet can be sent to them in single hop by 85. However,the routing table at 5A as displayed in Figure 5.29 shows that, when 5A wants to senda packet to 50, its nearest next hop is to 85 (marked in yellow box) with link quality 2.Later, when the packet reaches 85, 85 node will look into its routing table and forwardthe packet to 50. Interestingly, when two or more routes to a destination is listed, theone with better link quality is selected as shown in the yellow box of Figure 5.29 andthe selected route is marked with an asterisk sign in the routing table. Link qualityis graded from 0 to 255, where 0 indicates no connection and 255 is maximum linkquality.
Fig. 5.28: Routing Table At 85
Fig. 5.29: Routing Table At 5A
2. Scenario 2. Testing Relay Nodes Along With Patient Node The patient node (2E) isnow introduced into the system with stabilized relay node. Here, 2E is in the vicinity

5.2. HEALTH MONITORING SYSTEM FOR ELDERLY/SPECIAL PEOPLE USING VANETAND WBAN 158
of 5A as shown in Figure 5.30.Now, the end node is 50 and the packet is successfully sent to it. The route of the
Fig. 5.30: Patient Node With Relay Nodes
Fig. 5.31: Traceroute And Originator Result To The Farthest Node
packet was examined by using the tools ’originators’ and ’traceroute’. Trace route todone with 50 as destination node to check the routing path and result is presented inFigure 5.31. It shows that a total of 3 hops are taken to reach 50. The first hop is to5A, then to 85 and finally to 50. The originators result obtained displays neighboringnode forwarding. It is seen that all packets are sent through 5A into the network as 5Ais the only node in the range of the patient node (2E).It was also noted that ’traceroute’ always attempts route discovery three times as shownin white boxes of Figure 5.31. Now, the communication is active with the patient nodeand the hospital node (H-Node) introduced in the network for the further testing, wherethe patient node should able to send monitor data to the hospital periodically, or alertmessage when it requires medical assistance using the configured TestBed.
3. Scenario 3. Complete Prototype Analysis Both patient node (2E) and hospital node(2F) are placed along with the four relay nodes as shown in Figure 5.32. Since theapplication monitors the data continuously, an alert message was successfully sentby the patient node (P-Node) to the hospital node (H-Node) on the detection of anabnormal reading. Both ’traceroute’ and the ’originators’ tool were executed and theresults are shown in Figure 5.33. In the originators table it is noted that all the nodesin the VANET network are listed and the packet form the P-Node is all forwardedthrough the nearest node 5A. The traceroute shows that the packet from 2E is sent tothe destination 2F with 5 hops. First hop to 5A, second to 85, third to 50, fourth to 11

5.2. HEALTH MONITORING SYSTEM FOR ELDERLY/SPECIAL PEOPLE USING VANETAND WBAN 159
and finally to 2F.After 15 minutes, the vehicles moved and the originator result was obtained as
Fig. 5.32: Complete System Set Up
Fig. 5.33: Traceroute and Originator Result for Complete System
displayed in Figure 5.34. The blue box is the link quality before moving and the onein red is after moving. Interestingly, it is noted that the link quality of the path changeseven with slight movement. For example, the path in the white box has better linkquality in the second run while the path in yellow has lower link quality in secondrun. This confirms that the protocol is proactive and continuously updates its routingtables.
Fig. 5.34: Differing TTL With Varying Position

5.3. AUTOMATIC ACCIDENT DETECTION AND EMERGENCY ALERT SYSTEM USINGVANET AND IOT 160
5.2.5 SUMMARY
This research study revealed that continuous remote health monitoring while driving canbe achieved effectively via WBAN and VANET technology. Here, a health monitoringapplication was successfully created by using wearable body area sensors that can be usedto monitor health parameter continuously. With Raspberry Pi as a base station and analysingmodule, an automatic alert message is generated to hospital/care-takers. Additionally, theproposed application provided a practical view of how VANET technology should work inreal-world implementations. Successful testing of the prototype was done on GoPiGo robotsas mobile nodes. Therefore, it can be observed that the developed prototype is valid as afundamental approach towards ITS that intelligently monitors drivers health and generatesalerts in case of emergency. Thus, it provides to the elderly/special people suffering fromchronic diseases with an opportunity to drive safely.
5.3 AUTOMATIC ACCIDENT DETECTION AND
EMERGENCY ALERT SYSTEM USING VANET AND
IOT
This section includes a proposed system design for the application prototype to detect anaccident and post-accident care. Additionally, it contains details about smart devices usedin the prototype, accident detection mechanism, level of accident, and its management withprovision of quick medical help at the accident location. Moreover, it includes the testingand validation of the proposed application. At the end, this section concludes the proposedwork.
5.3.1 BACKGROUND
WHO reported that in 2015 over 3400 people died around the globe every day and tensof millions are injured or disabled every year on the road [5]. Figure 5.35 presents thefatality rates in different regions of the world and shows that the highest fatality rate is inmiddle-income regions. It can be concluded that the risk of dying in a road accident isabout seven-times greater in middle-income countries than high-income countries. Effortsare made to prevent road traffic injuries and promote awareness of best practices to addressthe key behavioral risk factors and how the number of accidents can be reduced by applyingappropriate precautions and safety measurements. Half of the fatalities are due to in-timeunavailability of medical aid at the accident locations and the lack of post-crash care.WHO is making efforts by providing emergency-room based injury surveillance systems,emergency access telephone numbers, and emergency medicine training [211]. Besidesthat, automobile manufacturing companies produce advanced vehicles to provide safety and

5.3. AUTOMATIC ACCIDENT DETECTION AND EMERGENCY ALERT SYSTEM USINGVANET AND IOT 161
comfort to the passengers and drivers [258].Here, the proposed application is divided into two parts to avoid accidents and provide post-
Fig. 5.35: Population and Road Traffic Deaths by Country Income [5]
accident care. In this regard, safety and management can be ensure through communicationand collaboration, whereas the wireless communication technologies are used within thevehicles to enable the communication among vehicles [83]. In the last few years, VANETand its combination with WSN and IoT were applied to achieve the goals such as, safetyand traffic management, secure data sharing and protection, navigation system, eco- friendlytransportation etc. [19]. The growth in development of such technologies is due to lowcost variants available in IEEE 802.11 standards, attractive features and the potential usein the development of safety, informative, and environment friendly applications embeddedin vehicles by the vehicle manufacturing companies [18, 19]. Cellular networks, on theother hand, also provided several voice and infotainment services to their customers even invehicular environments. However, in emergency situations direct communication in V2Vor V2I is preferable to ensure low latency. While this is provided by VANET [13, 83],cellular networks induce comparable high latency and are therefore not well suited for safetyapplications [259].This study deals with the provision of medical services at the accident location as soon aspossible. In this regard, an application is developed, which can detect an accident on roadwith the help of OBU via smart sensors in vehicles and can automatically contact emergencyservices. The proposed application also detects the condition of the driver along the way onthe road with the help of medical sensor and includes the feature of a manual emergencycall.

5.3. AUTOMATIC ACCIDENT DETECTION AND EMERGENCY ALERT SYSTEM USINGVANET AND IOT 162
5.3.2 LITERATURE REVIEW
Though the accident detection and management is well inspected, the further studies areanticipated to increase reliability and efficiency [260, 261]. Most of the studies useda combination of mechanical sensors, smart-devices or android-based applications foraccident detection and medical help using Global System for Mobile Communications(GSM) or using Long Term Evolution (LTE) [262]. Road-safety, traffic-management, pre-or post- accident care solutions are vital to save human life as discussed in [5], however,the provided solution should be low-cost and user-friendly. To the best of our knowledge,the proposed studies [260, 261, 263, 264] highly rely on specific tools, hardware, and theavailability of mobile data services to be used uninterruptedly by smart-phone devices withthe restraint of limited data service and battery capacity. In addition to this, the unremittingsynchronization of smart-phone devices with OBU increases the consumption of power.Similar types of solutions are discussed in the literature, some of the latest works areincluded in the following paragraphs.A system proposed in [260] uses mechanical sensors to detect the a sudden change in speedand direction of the vehicle. It uses a control-unit module to process the acquired data inorder to figure out the extremity of the accident. However, the main downside of this systemis the reliance on Internet technology to notify to the external control unit, which may beunreliable because of the lack of Internet access due to network coverage or unavailability ofInternet services on the device or in a particular region. In this regard, the system remain failto notify about the incident. Moreover, the system depends on mechanical sensors to detectaccidents only, therefore, false alarms may occur. In [265], the authors used the speed ofvehicles and a GPS module as key metrics to distinguish weather an accident occurred or notand to monitor the location of the vehicles in the proposed system. It detects changes in thespeed of a vehicle with reference to an indicated threshold and the application informs theemergency service center. As multiple reasons can affect the speed of a vehicle, the systemmay also generate false alarms. An improved system is proposed in [262], which uses GPSand a map matching algorithm. Here, its applies vehicle move-out of road boundaries inaddition to speed metrics to detect an accident, then notifies the emergency service center.Major constraint is the restriction of the speed of the vehicle and the map entails regularupdates and synchronizations. Moreover, it can generate false alarms in the absence ofupdates on the map, or provisional absence of access to a path due to the road maintenanceor any other reason. Furthermore, the service dependency on the GSM network in [260,262]may increase the cost.The proposed system discussed in [261] includes two modules to detect an accident andsend an alert message respectively. The latter uses an android-based application to reportthe emergency. The On-Board Diagnostics (OBD-II) module monitors the vehicle usingevent-based triggers like the force on the vehicle in accident detection. The accident is

5.3. AUTOMATIC ACCIDENT DETECTION AND EMERGENCY ALERT SYSTEM USINGVANET AND IOT 163
reported via electronic mail or Short Message Service (SMS) to an emergency handlingcenter when the prompted event is positive. It also makes an instant automatic phone call tothe service center for emergency help. This proposed system has certain limitations becauseof its reliance on the Internet service and high consumption of power due to exchangingmessages for the continuous connectivity with OBUs. A similar system is proposedin [264] where OBU detects acceleration/deceleration, airbag deployment, and rolloverand the application generates an emergency alert via web services when triggered event ispositive. This proposed solution has similar sort of issues as discussed for the previouslymentioned systems. In contrast to this, in [266], a system with the similar combination ofhardware embedded in vehicle is proposed. However, it is designed with the help of IEEE802.11p, and generates an emergency alert over 3G/4G networks. The system generatestest results which show that it works correctly and generates emergency Call in case ofemergency. However, the use of smart-phones increases the complexity of system likepreviously discussed systems because it requires constant data and communication protocolsynchronization. With the use of other applications like navigation service, information orentertainment applications, it may suffer from the battery issue.In [267], the intersection scenarios are considered, where image processing techniquesare exploited to observe the mobility of the vehicles. This solution highly relies on thecommunication method, and in case of mobile data networks, such types of proposedsolutions are expensive.In this regard, the identified requirements of target application are as follows:
• Efficient and reliable accidentdetection
• Availability of the service
• Quick response
• Avoiding chain crash
• Route optimization for ambulance
• Cost-effectiveness
Although the proposed solutions in [260, 262, 263, 267] offer attractive applicationservices, each shows certain limitations to deal with the above mentioned requirements.This study aims to develop a system that can satisfy the above mentioned requirements.Automobile companies work on intelligent solutions and most of the new models of carsare equipped with the interface of wireless access. We selected VANET for the targetapplication because it is designed to operate in a highly mobile environment for safetyapplications and bears low deployment costs. The proposed system includes two main tasks,i.e., accident detection and data dissemination. To disseminate the emergency alerts orsafety messages, e.g., to report about accidents and the use of alternate routes, or to clearthe route for an ambulance in the network, we used ad hoc communication. On small sensordevices and other OBUs, we use either IoT- or ad hoc-based communication, which offersefficient communication on low-power devices. The implementation of the application

5.3. AUTOMATIC ACCIDENT DETECTION AND EMERGENCY ALERT SYSTEM USINGVANET AND IOT 164
is done in modules where each sensor module works independently. Hence, in case of amodule failure, the rest of the system continues to operate properly. The evaluation of theproposed application is done on the TestBed presented discussed in Section 5.1.7 or usingIoT scenarios.
5.3.3 PROPOSED APPLICATION DESIGN AND IMPLEMENTATION
Considering the requirements of an application mentioned in the previous section, thefollowing assumptions are made regarding the application settings:
Assumption 5.1Given a vehicular environment, we assume the following to hold:
• Each vehicle in the network is VANET enabled.
• A centralized control-room is available in the region at a remote location.
• The control-room features a database of the hospitals with respective coordinates.
• Each vehicle is equipped with the proposed OBU and the prototype application.
• All ambulances and hospitals are required to have the prototype application in theirsystem.
In a situation as exemplary shown in Figure 5.36, the proposed prototype applicationshould feature the expected outcomes. In order to fulfill the aforementioned requirements,the implemented TestBed and the designed prototype application detect collision/roll-overautomatically using sensors deployed in OBUs, and notify to the dedicated server when anevent is positive. The server finds the nearest medical center using geographical locationservice based on the accident location and maintains the database of medical centers ofa specific region, it then notifies the location of the incident to the latter. Moreover,the application generates an alert to the medical center for an ambulance. The systemdesign is presented in Figure 5.37, which illustrate the scenario and placement of requiredhardware/software solutions. It is a centralized approach, but it can provide efficientand reliable service to customers at a minimum cost with the help of VANET, IoT, andsensors [19, 259].
5.3.3.1 SELECTION OF COMPATIBLE HARDWARE
The basic idea of the prototype is to detect accidents by monitoring the gathered datafrom sensors, which should be installed inside the vehicle as OBU. Moreover, this OBUexamines and validates the collected data before generating an alert to the control room. Theimplemented TestBed and the proposed prototype application use the following hardwarefor the in-vehicle OBUs.

5.3. AUTOMATIC ACCIDENT DETECTION AND EMERGENCY ALERT SYSTEM USINGVANET AND IOT 165
Fig. 5.36: Expected Application Scenario
Fig. 5.37: A System Design: The Placement of Hardware and Flow of Accident Detection andEmergency Service in Vehicular Environment
• UDOO Quad: UDOO quad is considered as a computing base, that uses either anAndroid- or a Linux-based operating system. Moreover, the UDOO Quad has a built-in Wi-Fi module for IoT-based applications [268]. We selected this specific board dueto its built-in support for IoT and Arduino.

5.3. AUTOMATIC ACCIDENT DETECTION AND EMERGENCY ALERT SYSTEM USINGVANET AND IOT 166
• Inertia Measurement Unit Sensor: An electromechanical device is required to detectan unusual, abrupt or sudden change in speed or trajectory of vehicle efficiently whiledriving. An Inertial Measurement Unit (IMU) MPU-6050 was selected for this task.This particular model is selected as sensor due to its compatibility with the UDOOQuad board for precise measurements.
• Pulse Sensor: Heart rate data is used for the development of certain applications formedical care/monitoring services including exercises, running or sports training andhealth management applications. As there is an overwhelming sense of confusionin case of an accident, the heart rate is elevated which can be used for detection ofan accident. In contrast to this, biomedical sensors can generate false alarms, andtherefore we solely considered the heart rate, once the accident is detected by theMPU-6050. In order to avoid false alarms and smoothly consolidate heart-rate datato the proposed prototype application, the Pulse Sensor Amplified [269] is used. Thedetailed working principle was already discussed in Section 5.2.3.
• Sound Sensor: The collision of vehicle with another vehicle or a solid object producesa huge noise. It can be measured with the help of a sound sensor, which typically usesa microphone to monitor the noise and vibration. It requires a user defined thresholdvalue to be detected by the sensor circuitry which is usually selected according tothe requirement of the application. The used sound detector [270] is compatible withArduino and it also satisfies the need of the application.
• GPS Module: For in-time first aid and other medical services, the accident locationmust be known. To cope with it, Adafruit Ultimate GPS Breakout board is usedto identify the location as used in previous mentioned applications and discussed indetails in Section 5.1.4.
• GoPiGo Module: Since the proposed prototype application is designed for thevehicular environment, and to test this application in the lab, we used GoPiGo-Beginner-Kit as discussed in Section 5.1.4
• Raspberry Pi: Beside the use of GPS and GoPiGo modules in the proposed work, asingle On-board computer is needed to acquire the desired results for our applicationscenario. Therefore, Raspberry Pi is the best choice in this context, which offerscompatibility with both modules at low-cost as mentioned in Section 5.1.4.
5.3.3.2 ACCIDENT DETECTION MODULE
An accident may occur on road due to a number of reasons like over-speeding, drunk driving,design defects, bad weather, running red lights, etc. However, there are two major eventsare triggered when an accident happens, i.e., collision and roll-over. These can be used as

5.3. AUTOMATIC ACCIDENT DETECTION AND EMERGENCY ALERT SYSTEM USINGVANET AND IOT 167
foundation to initiate the procedure of detection and notification of the event. Moreover, thereliable detection of accident ensures the reliability in the system, hence the main focus relieson triggered events. The details of the events are as follows:
1. Collision: It is a abrupt change in the acceleration of the moving object. Whenevera vehicle collides with another vehicle or a solid object without any control on itsmobility, the speed of the vehicle decreases radically, which may result in injuries ofpassengers. Exploiting a fixed sampling rate ”t for accessing an accelerometer, sucha change can be described by two successive measurements. Supposing a predefinedthreshold value �C to lessen false alarms, a collision detection event is triggered attime t if the condition
Ò(ax(t) ≠ ax(t ≠ ”t))2 + (ay(t) ≠ ay(t ≠ ”t))2 + (az(t) ≠ az(t ≠ ”t))2
”tØ �
holds true. Here, ax, ay, az denote the acceleration measurements in the body framecoordinate system of the accelerometer.
2. Roll-over: In case of an accident, a vehicles may experience a roll-over. It is aparticularly a severe event and may lead to heavy injuries or even deaths of passengers.It can be detected by monitoring the angular velocity of the vehicle, e.g., by puttingtogether the sensor fusion of accelerometer and the gyroscope using a filter, or byconsidering the angular velocity itself. Here, we follow the latter approach and definea threshold angular speed �R similar to the case where collision occurs to reduce falsealarms. Then, a roll-over detection event is triggered at time t, if the condition
Ò(v„(t))2 + (vÂ(t))2 + (v’(t))2 Ø �R
holds true. In this context, v„, v and v’ denote the angular velocities for pitch, rolland yaw in the body frame coordinate system of the gyroscope, respectively.
Due to the severity of a roll-over, we do not assimilate the data received from sound andpulse sensors before generating an emergency message. In case of the collision, however,we integrate data received from others sensors to extract the detection of a triggered event ina more reliable way to reduce false alarms, cf., Figure 5.38 for a flowchart of the accidentdetection module. In the flowchart, each module along with its communication with the mainmodule is presented in different colors.As demonstrated in the flowchart, there are four threads for the IMU and each is responsible
for the handling one sensor, i.e., the sound sensor, the pulse sensor, and the GPS device.Each of the associated threads continuously updates data, beside that one thread is usedto synchronize the modules. When the IMU detects a collision, our detection module willfetch data from the sound sensor. If the sound data exceeds a noise threshold value �N ,
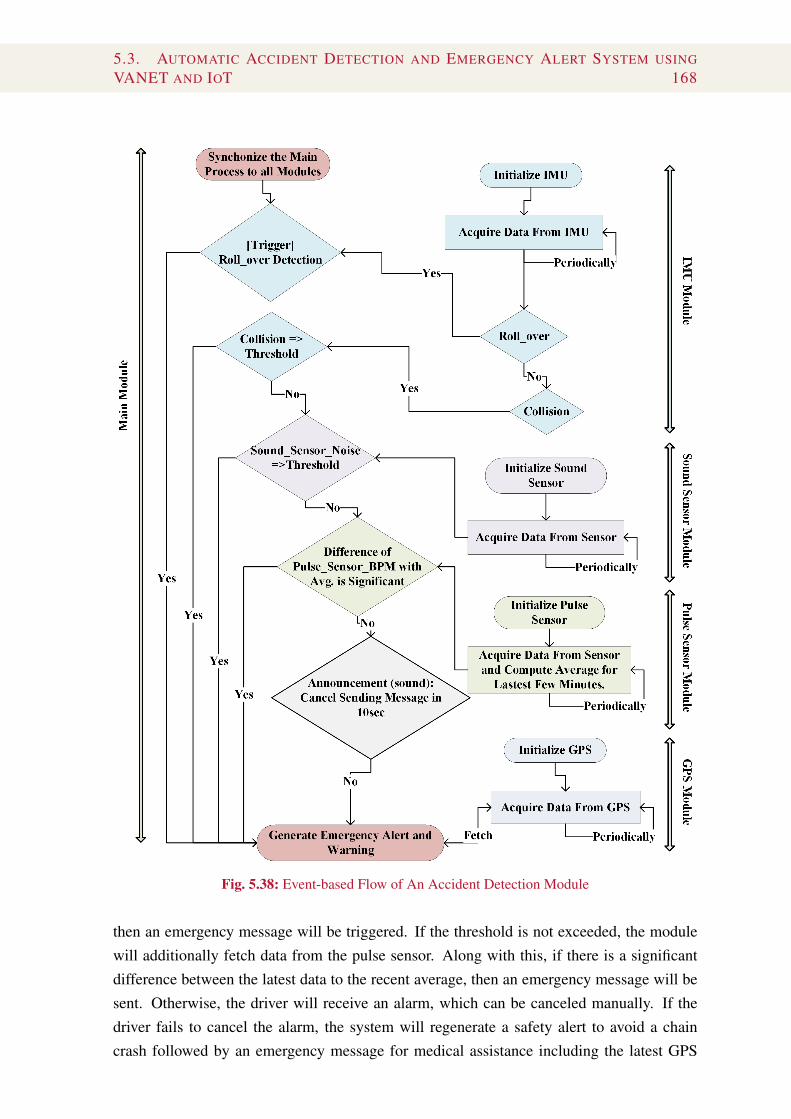
5.3. AUTOMATIC ACCIDENT DETECTION AND EMERGENCY ALERT SYSTEM USINGVANET AND IOT 168
Fig. 5.38: Event-based Flow of An Accident Detection Module
then an emergency message will be triggered. If the threshold is not exceeded, the modulewill additionally fetch data from the pulse sensor. Along with this, if there is a significantdifference between the latest data to the recent average, then an emergency message will besent. Otherwise, the driver will receive an alarm, which can be canceled manually. If thedriver fails to cancel the alarm, the system will regenerate a safety alert to avoid a chaincrash followed by an emergency message for medical assistance including the latest GPS

5.3. AUTOMATIC ACCIDENT DETECTION AND EMERGENCY ALERT SYSTEM USINGVANET AND IOT 169
information in each message.As each emergency message includes the location information of incident, a server deployedin the control room can utilize these coordinates to find the emergency medical aid nearbythe accident location via Haversine’s Formula
d = 2r sin≠1
Û
sin2 („2 ≠ „1)2 + cos(„1) cos(„2) sin2((◊2 ≠ ◊1)
2 ) (5.1)
In Equation (5.1), d denotes the distance between the accident location and the hospital,where, „ and ◊ represent the longitudes and latitudes. On computing the distance, theserver identifies the nearest hospital and sends an emergency message including the locationinformation of the accident to the hospital. Upon receiving an alert, the hospital dispatchesan ambulance to the accident location. The counter client application is installed inside theambulance to disseminate alerts messages to clear a path for the ambulance.
5.3.4 RESULTS
This section presents test results of the implemented system and shows its ability todetect both collisions and roll-overs. Figure. 5.39 represents the measurements obtainedfrom accelerometer and gyroscope with AcX = ax(t), AcY = ay(t), AcZ = az(t) andGyX = v„(t), GyY = vÂ(t) and GyZ = v’(t), whereas Delta_X , Delta_Y and Delta_Z
represent the difference between two consecutive measurements of an accelerometer, thatis Deltai = ai(t) ≠ ai(t ≠ ”t) with i œ {x, y, z}. These measurements are updated every”t = 2 seconds in order to detect an accident.
Fig. 5.39: Measurements Obtained from MPU-6050
If the angular velocity exceeds a predefined threshold �R, a roll-over is detected as it canbe seen in Figure 5.40.

5.3. AUTOMATIC ACCIDENT DETECTION AND EMERGENCY ALERT SYSTEM USINGVANET AND IOT 170
Fig. 5.40: Roll-over Detected
Similarly, once the difference between two successive measurements of an accelerometerexceeds the predefined threshold �C , a collision event is triggered as illustrated inFigure 5.41.
Fig. 5.41: Collision Detected
If the difference is below the predefined threshold �C , then the cause could either be acollision or emergency braking. In such a case, we first incorporate the data from the soundsensor. If the sound sensor detected any noise greater than a predefined threshold, a collisiondetection event is triggered as delineated in Figure 5.42.

5.3. AUTOMATIC ACCIDENT DETECTION AND EMERGENCY ALERT SYSTEM USINGVANET AND IOT 171
Fig. 5.42: Noise Detected
If the sound is below the threshold, readings from the pulse sensor are analyzed. Basedon that, if the heart rate is elevated then again a collision detection is considered to be trueand a message is sent as shown in Figure 5.43.
Fig. 5.43: Heart Rate Elevated
During testing of the proposed application, we concluded that the system is being able todetect accident quickly.The client-server application is developed in order to enable the communication amongthe vehicles, the hospitals, and the control room. Although, VANET interfaces are notcommercially available yet, the developed application should be applicable in a vehicularenvironment. In this regard, the TestBed for ad hoc communication was used as discussed inSection 5.1.7. The application was developed in an open source networking engine namedTwisted. This event-driven engine uses Python programming and cross-platform is available.
• Environment Setup for Testing: The prototype application was tested in two differentenvironments. In the first case, each vehicle in the TestBed was IoT-featured andon detecting an accident, the message was sent to the control room using IoT, and

5.3. AUTOMATIC ACCIDENT DETECTION AND EMERGENCY ALERT SYSTEM USINGVANET AND IOT 172
control room contacted the hospital for corresponding action. In the second scenario,as mentioned above, GoPiGo robot-cars as drive-cars were configured in ad hocmode, cf., details in Section 5.1.7. Each robot-car in the TestBed was able to receivemessages from neighboring nodes and forward to other vehicles in the network. Here,the study scope was limited and we used six robot-cars for initial testing excludingthe one vehicle which featured the proposed embedded OBU for accident detection.Additionally, one system acted as control room.
Fig. 5.44: Drive-Cars for Lab Testing
• Client application for Vehicles: The application ran continuously on the vehicle andwaited for an event to be triggered. As soon as the accident detection modules detecteda positive event, the location coordinates were sent to the client application. Afterreceiving the location coordinates, the client application generated an alert messagefor the control room as shown in the Figure 5.45. Besides the emergency alert, it alsosent the accident location to the nearby vehicles to avoid secondary accidents as aresult of the primary accident.

5.3. AUTOMATIC ACCIDENT DETECTION AND EMERGENCY ALERT SYSTEM USINGVANET AND IOT 173
Fig. 5.45: Client Application for Vehicles
• Server Application for Control Room: The application running in the control roomwas initialized and waited for any connection request from the vehicles as depicted inFigure 5.46.
Fig. 5.46: Control Room Initialized
As soon as an alert message was received by the server, it extracted the location ofthe incident and identified the nearest hospital to the accident location by using theHaversine formula. Then, the server sent a request message to selected hospital foran ambulance to the accident location as depicted in Figure 5.47 and received anacknowledgment from the hospital.
Fig. 5.47: Control Room Functionality
• Client Application for Hospital: The client application for the hospital was initializedand waited for a message from the server as shown in Figure 5.48.

5.3. AUTOMATIC ACCIDENT DETECTION AND EMERGENCY ALERT SYSTEM USINGVANET AND IOT 174
Fig. 5.48: Application for Hospitals Initialized
As seen in Figure 5.49, when a message was received by the server, the hospital sentan acknowledgment in reply and dispatched an ambulance to the accident location.The ambulance sent emergency alert messages to clear its route towards the locationof accident, so that the vehicles on that particular route knew about the ambulancewithout making noise and cleared the way.
Fig. 5.49: Hospital-2 Working
5.3.5 SUMMARY
The increase in the density of vehicles, especially in cities, leads to a large number ofroad accidents. In spite of traffic management and road safety-related applications via newtechnologies, lives may still be mislaid due to the absence of in-time medical assistance. Tocope with latter issue, an application was developed, which was able to detect accidents onthe road via electromechanical and biomedical sensors. When accident occurs, it generatedemergency messages for medical assistance along with accident management and swiftmedical service. For the data communication among intelligent devices installed insidethe vehicle, ad hoc communication was used, and integrated with VANET. The applicationwas tested in both IoT-based and VANET-based scenarios and showed promising results.It was observed that vehicles were able to send emergency messages to a central controlroom and to send warnings to neighboring vehicles. Similarly, the control room in theimplemented TestBed was able to identify the nearest medical center upon receiving anemergency message and to generate a notification/message to an ambulance, which includedthe location of the accident.

5.4. ROAD ACCIDENTS DETECTION AND DATA COLLECTION USING VANET, SENSORSAND EDGE/CLOUD COMPUTING 175
5.4 ROAD ACCIDENTS DETECTION AND DATA
COLLECTION USING VANET, SENSORS AND
EDGE/CLOUD COMPUTING
This section presents an extended work of Section 5.3, which aims to analyze the roadaccidents data to help the traffic authorities to take the precautionary measures to avoid roadaccidents.
5.4.1 BACKGROUND
A rapid increase in number of vehicles is bound to have some negative consequences,including but not limited to, traffic congestion in densely-populated cities and over-burdening of the existing urban-road infrastructure. It also transpires in a greater number oftraffic-related fatalities annually. Due to a dilapidated road infrastructure, this occurs morein underdeveloped countries. Certain key points can prove to be invaluable in drasticallybringing down the number of casualties and injuries caused as a result of road incidents.These major problems are:
• The delay in providing medical aid to the victims of road accidents.
• The first responders not being informed of the exact situation at hand.
• Absence of a permanent database holding all the relevant records, that can beinterrogated, as and when required.
As discussed in last section, the first two problems can be solved solve by the proposedaccident detection and management application. To increase the reliability of accidentdetection mechanism, a tool is required that is capable of producing effective real-timevisualizations. These can then be used by relevant authorities to make informed decisionsand wiser policies. In addition to correctly identifying a road accident, and responding toit in an efficient manner, it is also equally important to store this data securely at a placefrom where it can be fetched and used, whenever required. The goal is to develop anautomatic system for timely accident detection and notification, to clamp down the numberof casualties, by providing immediate medical service to the road accident victims. Thiscould be achieved by using IoT combined with VANETs. It could include any object that iscapable of collecting information through sensors and sharing it with other objects.The proposed system comprises of following three distinct tiers:
• On-Board Sensors: It is responsible for reliable detection of road accidents throughan OBU comprising an accelerometer and a gyroscope along with the identificationof accident location via GPS. It will also be equipped with a high-definition camera

5.4. ROAD ACCIDENTS DETECTION AND DATA COLLECTION USING VANET, SENSORSAND EDGE/CLOUD COMPUTING 176
module, to take a picture of the inside of a vehicle, and append this information to theaccident alert being sent. The notification will be routed through the vehicular networkand reach an Edge node.
• Edge Gateway: It is responsible for the reception of an accident notification and carriesout certain processing on acquired data. One of its tasks is to identify the number ofpeople involved in the accident, with the help of a facial detection algorithm. It willparse the received data, perform the necessary processing and intimate the nearesthospital to dispatch an ambulance immediately. It will also temporarily store the databefore it securely reaches the cloud server.
• Cloud Platform: The third and final tier of the system is responsible for long termstorage of processed data received from the edge nodes. There exists a real-timevisualization tool as well that makes it possible for the user to query the databaseand study or analyze a subset of road accident data for various purposes includingresearch, policy-making, or documentation.
In case of a vehicular environment, as soon as an accident occurs, the OBU of a vehicle withembedded sensors should generate a notification, that shall be sent to an intermediate deviceby the means of ad hoc communication. Upon receiving the information, this device shouldbe able to perform the necessary processing on this information, to customize it accordingly.Once a processed message is ready, it shall be directed to the centralized servers by meansof Internet, to be received, interpreted, and acted upon by the concerned authorities.There are two fundamental requirements of an accident detection and notification system,that is, contextual awareness and time sensitivity. A system having these two features at itscore, can efficiently work in an unpredictable situation like that of a road accident. Also,such a system can help to solve the problems stated in above paragraph. If the system isaware of the current state of victims at the time an accident struck, it can greatly help thepeople who are assigned to the rescue services in making the best estimate of what medicalassistance to provide, thereby improving the probability of the survival of victims in suchscenarios. By only adding a camera to the system, a visual representation of the conditionof victims can be obtained and sent to the rescue officials. It can bring contextual awarenessto the first responders in such situations. Another important requirement of an accidentdetection and notification system is that it should be delay-sensitive. The earlier the accidentinformation can reach the hospital or any relevant authority, the higher are the chances ofproperly treating, or attending to the injured persons.In a compute-intensive system like that of an IoT-based vehicular environment, it becomesall the more important to carry out the processing faster and in a more organized way. Thiscompute-intensive nature of such applications, make them impossible to execute on resource-constrained mobile devices or vehicles. In order to maximize their potential, the resource-intensive tasks need to be delegated to cloud servers. The cloud is capable of providing

5.4. ROAD ACCIDENTS DETECTION AND DATA COLLECTION USING VANET, SENSORSAND EDGE/CLOUD COMPUTING 177
almost unlimited resources, to strengthen such compute-intensive applications, which maynot be available in vehicle OBU. Since there is a large distance between the sensing networkand the cloud itself, there is also a delay factor involved as presented in Figure 5.50.
The Cloud, thus, fails to provide crucial features like low latency, location-awareness,
Fig. 5.50: An IoT-based Sensor Network Depicting a "Delay Factor" in the Communication BetweenCloud Server and End Users
and support for mobility in applications involving vehicles [271]. In such scenarios theconcept of edge or Fog Computing provide an alternative. If there exists some sort of amiddle-ware between the cloud above and the sensing network below, and if it is capable ofcommunicating with both of them simultaneously, it represents a technology sandwich. Itincludes the required situational awareness as well as decreases the duration of accidentnotification to reach the rescue service providers. Hence, this concept of a sandwichedtier between the centralized cloud and the distributed sensing network (as depicted in theFigure 5.51) is capable of handling tasks of urgent nature locally. In other words, thecomputational power of a cloud server can be brought to the edges of the vehicular sensornetwork, increasing the overall efficiency of the automatic accident detection and responsesystem.

5.4. ROAD ACCIDENTS DETECTION AND DATA COLLECTION USING VANET, SENSORSAND EDGE/CLOUD COMPUTING 178
Fig. 5.51: A Multi-tier System: The Sensor Network, The Edge Nodes and The Cloud Server
5.4.2 LITERATURE REVIEW
Accident detection and notification systems have been around for a very long time and arewell-researched by the community of scientists and engineers [9, 272–275]. Nowadays, ITSapplications are becoming more data-intensive and Internet of vehicles (IoV) connects theITS devices to cloud computing centers, where data processing is performed. However,transferring huge amounts of data from geographically distributed devices creates networkoverhead and bottlenecks, and it consumes the network resources. Basically, the fogtechnology complements the role of cloud computing and distributes the data processing atthe edge of the network, which provides faster responses to ITS application queries and savesthe network resources. However, implementing fog computing and the lambda architecturefor real-time big data processing is challenging in the IoV dynamic environment [276].In [277] the authors proposed a cloud based system that receives real-time average speedvalues from the vehicle detectors to detect accidents. Additionally, the system can help inpredicting the severity of an accident, which can be helpful in medical assistance. However,the feasibility of system was not checked in practice.In [278], the authors suggested that in-time is the most important factor in emergencymanagement systems. A smart phone-based service was proposed titled ’Emergency HelpAlert Mobile Cloud (E-HAMC)’ which performed task off-loading for resource-constraintIoT devices, and preprocessing for latency-sensitive services. When an emergency occurred,the application contacted relevant rescue authorities through previously stored contactnumbers. An extended portfolio of the provided services was created over time, by

5.4. ROAD ACCIDENTS DETECTION AND DATA COLLECTION USING VANET, SENSORSAND EDGE/CLOUD COMPUTING 179
automatically transferring each emergency information from edge nodes to the cloud. Thisapplication went a step further by providing not only geographical coordinates of the placean emergency occurred, but also by enriching it with refined location-mapping, which alsoincluded street-view feature and identification of any available paths leading to a hospitalor medical service provider. The successful implementation of this application showedthat by incorporating edge technology to the already available cloud and IoT resources, theoverall delay can be reduced by a facto ref. One major flaw in the system though, was itsabsolute reliance on the smart phone. The application asked the victim or someone in thevicinity to take a picture of the emergency, which shall then be sent automatically to theedge node. However, in a real-world accident scenario, this might not be possible due tomultiple reasons. Either the victim is not in a physical or mental state to take a picture, orthere might also be no other bystander present at the location to take a picture. Moreover,a smart phone can easily be damaged or destroyed as a result of a severe road accident, ascompared to an On-Board Unit installed on the vehicle itself. And since the reliance wascompletely on a cellphone which might just be out-of-charge, the whole system would beworthless in such a situation.Besides the above mentioned pros and cons of the individual approaches, one strikingproblem that is quite visible in most of the existing systems, is that they rarely go beyondaccident detection and notification. Once an incident is detected and acted upon by relevantauthorities and agencies, we ought to conserve this acquired data, to make good use of it,in the minimization of future road accidents. Therefore, a reliable solution should not onlybe capable of timely acquisition of road accident data using Edge and Cloud computingtechnologies, but also be able to provide real-time visualizations of this information. It willenable rescue professionals to present road accidents in a more efficient manner.
5.4.3 PROPOSED SYSTEM
The proposed system is divided into two sub-tasks: The first is to add important specificslike the number of passengers inside the vehicle and their state at the time of accidentto an already developed system discussed in Section 5.3, the second is to safely store theaccumulated road accident data for any future use.To quickly provide the emergency services to the sufferers, a system was proposed and testedin Section 5.3, which had the following characteristics:
• immediate detection of accidents, without any human effort,
• correct identification of accident location,
• provision of accurate and timely medical service,
In order to add the complete information of accident to relevant authorities like the hospital,emergency rescue and traffic departments for further data processing, another system

5.4. ROAD ACCIDENTS DETECTION AND DATA COLLECTION USING VANET, SENSORSAND EDGE/CLOUD COMPUTING 180
architecture is designed and implemented. It includes three tiers, i.e., sensors. IoT or edgegateway, and cloud platform as shown in Figure 5.52. Each tier is responsible for handlinga specific task. Assuming the cloud platform is connected to each control room designatedin each zone of the city, therefore, edge node deployed at each control room transferred thelocal recorded data to the cloud for further data analysis
Fig. 5.52: Proposed System Architecture: Multi-tier Automatic Accident Detection & NotificationSystem Using IoT-based Vehicular Environment
1. Tier 1: On-board Sensors The first tier of the system includes sensors deployed onOBU as presented in Figure 5.53. The installed OBUs inside the vehicles continuouslymonitor their acceleration and orientation, in order to detect any accident. As soonas an accident takes place, the most crucial information, i.e., the date, the time, thegeographical location (latitude and longitude), the chassis number, and the insidetemperature, of the car, will be forwarded to the closest Edge node.

5.4. ROAD ACCIDENTS DETECTION AND DATA COLLECTION USING VANET, SENSORSAND EDGE/CLOUD COMPUTING 181
Fig. 5.53: Proposed IoT-based Vehicular Testbed System for Automatic Accident Detection &Notification
Here, Raspberry Pi, GPS, IMU, and camera module are deployed on OBU. Eachmentioned hardware component of the OBU except for the camera is discussed alongits working and synchronization with other components is mentioned in Section5.3.3.1.
When an emergency service, like a hospital, is informed of a certain accident, itdispatches an ambulance without wasting any time. But since the paramedic staffbeing sent to the location is unaware of the exact situation of the victims, it is difficultfor them to make any judgment regarding the first-aid treatment they might have toprovide for the victim. In case of additional information of a particular accident, abetter medical service can be provided to the sufferers. Moreover, information of thetotal number of people injured in the accident might be helpful for the medical team tocarry along the accurate number of medical kits, tools or any other relevant equipmentto the accident location. This would further help in providing a better and quickermedical assistance to the victims. For this reason, a high-definition (HD) camera isincorporated in the system to capture the moment when the accident occurred. ALogitech HD Universal Serial Bus (USB) C270 Webcam was used which is capable of

5.4. ROAD ACCIDENTS DETECTION AND DATA COLLECTION USING VANET, SENSORSAND EDGE/CLOUD COMPUTING 182
capturing 720 pixel, 30fps 13 wide-screen pictures [279].
2. Tier 2: IoT Gateway Since the above-explained devices are mounted on a boardinside the vehicle, it is more practical to process their generated data at the edge, that is,closer to the source of data-generation, rather than at the distant cloud. In this way, notall the data has to be taken to the cloud, but just the refined data, thereby saving networkbandwidth. Data packets flow through a multi-hop ad-hoc network, connecting OBUinside the vehicle to other vehicles in the vicinity. This communication is based uponTCP/IP because of its connection-oriented nature and reliability. This communicationis facilitated by an IEEE 802.11n Wi-Fi USB dongle. After traversing the whole pathleading to the Edge node, the sent data shall be received at the gateway. The IoT nodewill then perform the various tasks assigned to it, i.e., the segregation of incomingdata, storage of the accompanying picture, and forward transmission of the processedinformation.
• Facial Detection: The facial-detection of people sitting inside the car isobtained from the image encapsulated in the incoming message using OpenSource Computer Vision Library (OpenCV) to identity the number of passengersinside the vehicle at the time of accident. The state of passengers, that is, theirposition or stature at the time the tragedy struck, would prove informative andbeneficial for the rescuers who will arrive at the location of the incident. Byhaving a visual representation of the scene of an accident, the first responders canpossibly predict how long the accident victims can survive without any medicalhelp [280].
• Data Preprocessing: It is highly desirable that the acquired information isprocessed closer to the edge of the network, before sending it to the cloud forlong-term storage. This will serve two purposes; firstly, it will clean the dataof any discrepancies or ill-information beforehand, and secondly, the data willbe packaged in a way that is easier for the end user at the cloud to interpret.Moreover, a temporary storage can be provided for the data at this node beforeforwarding it to the cloud to avoid loss of data due to network between the sensornodes and the cloud.Once all the desired pre-processing has been done, and the data is securelycached, the processed information will be sent to the central server at cloud.Now, the data exchange is not limited by the ad-hoc network boundaries, as thecloud service is universally accessible through the Internet.
3. Tier 3: Cloud Platform At the cloud, the Central Control Unit (CCU) receivesrequests and acts upon them like accident alert notifications sent from the OBU
13frames per second

5.4. ROAD ACCIDENTS DETECTION AND DATA COLLECTION USING VANET, SENSORSAND EDGE/CLOUD COMPUTING 183
installed in the vehicle. It is the responsibility of the CCU to retrieve the informationfrom received packets, and to provide data storage and visualization with the help of afront-end tool, also installed on the Cloud.For testbed purposes, an IaaS model was required, but none of the earlier mentionedcommercial service providers seemed like a feasible option. Therefore, a privatecloud was used to implement and test the designed IoT-based vehicular model. Inmost cases, the commercial cloud computing services are used by start-up businessesor medium-sized enterprises, as it enables them to cut costs of building their ownapplications, hosting them on web servers, and maintaining a workforce dedicatedto the handling and management of these applications and servers. For this reason,a web server application called Apache was used to build a personal web server ona Linux-based operating system. Apache can serve HTML (Hyper Text MarkupLanguage) files over HTTP (Hyper Text Transfer Protocol) on its own, and can servedynamic web pages using scripting languages such as PHP, with the help of additionalmodules. The data collected from the sensors in the testbed may provide insightfulinformation of the occurrences of accidents over time, in different parts of the region.Over time, accident causes and locations may be identified, and effective preventivemeasures may be worked out, to at least lessen their occurrences, if not to completelyget rid of them. In case strong preventive measures appear hard to be implemented,then at least the emergency services like ambulances and paramedic staff, can bestationed nearby identified high risk accident locations for rescue operation.A simple and rather structured data representing concrete values of accident events, isacquired by the sensors. To make a comprehensive and easily-understandable analysisof this data, an open-source Relational Database Management System (RDBMS) wasused with PostgreSQL for data management. PHP is used for server-side scripting sothat the relevant personnel administrating the CCU is able to customize the responseaccording to their needs, and conveniently interact with the database.
5.4.4 SYSTEM IMPLEMENTATION
To detect an accident and notify the control room, the sequential occurrence of events is asfollows:
• IMU MPU6050 detects an accident event and the OBU takes latitude and longitudeinformation from the installed GPS sensor. This way, the system serves as a "blackbox" that can help to indicate location of the accident, cf., in Section 5.3.3.2 andSection 5.4.3.
• The camera module takes a screenshot, an inside view of the car involved in theaccident, and the combined information is sent to the Edge node as mentioned in

5.4. ROAD ACCIDENTS DETECTION AND DATA COLLECTION USING VANET, SENSORSAND EDGE/CLOUD COMPUTING 184
Section 5.4.3 Tier 1. It provides the critical situational awareness of the passengersinside the vehicle to the system.
• The edge device performs facial detection, as well as sorting and temporary storageof data. It then alerts the nearest hospital of this accident as discussed in Section5.4.3 Tier 2.
• The hospital dispatches an ambulance, along with the paramedic staff who will providefirst-aid to the victims and carry them to the hospital, if required.
• Simultaneously, the traffic department carries out their standard protocol and notes thedriver credentials and other useful information about the accident.
• Lastly, the cumulative information is logged into the central database. From thedatabase, the accident information can be queried as and when required. Thisprocessed is done at tier 3 of the proposed system, cf., Section 5.4.3 Tier 3.
After successful implementation of the proposed system architecture at one region, the sameprocedure can be replicated on another regions. All the recoded data from all regions, fromwhere the accident data was initially recorded at locally, then transferred to cloud using edgenode for further process on the stored data. For proof of concept, a hypothetical set of datawas generated, however, the analysis of such data is out of the scope of this thesis.
5.4.5 SUMMARY
As the urban population throughout the world is growing, so are the number of roadaccidents resulting in a greater count of fatalities and injuries. Quick detection of a crash andadequate action on it can save more human lives. Therefore, an automatic system needs to bein place, that can detect and notify about an accident. An Internet-of-Things based vehiculartestbed environment has been designed and developed during this thesis, that automaticallydetects a collision or roll-over and immediately reports the relevant organizations.Cloud and Edge computing are two of the most prominent emerging paradigms, inhandling massive amounts of IoT-generated data. However, they have their own set ofadvantages and limitations and need to be put together adequately. In the proposed IoT-based vehicular TestBed, edge technology is used to provide resource-hungry task offloadingand preprocessing of data, while cloud technology to facilitate data storage that can be usedfor further data analysis. It dramatically reduces data transmission latency and optimizesthe overall communication process. In this research study, an open-source web-serverapplication was implemented, which received accident alerts from all the vehicles in thesystem using installed OBUs. Once this system received a warning, it notified the nearesthospital to dispatch a rescue team. Therefore, it helps in providing immediate medical careto the victims of road accidents. Paramedic staff received the current state of the victims

5.4. ROAD ACCIDENTS DETECTION AND DATA COLLECTION USING VANET, SENSORSAND EDGE/CLOUD COMPUTING 185
through an image appended to the rest of the information. In this regard, once the rescueoperation was completed using the proposed system, the cumulative data was sent to thecentral database for long-term storage. This data can later be fetched from the database, andan insightful analysis can be performed. The stored data at the cloud may allow concernedauthorities to make informed policies and implement effective measures to reduce thenumber of injuries and fatalities caused due to road accidents.

6 CONCLUSION AND FUTURERECOMMENDATIONS
Vehicular Ad hoc Network (VANET) is promising technologies, which is part of thedevelopment and evolution of on-road safety, traffic-management and information-/infotainment- based applications. This dissertation proposed the categorization of VehicularAd hoc Network applications into six groups that are safety, commercial, traffic management,Eco-friendly, health, logistics and transportation applications. A comparative study ofthese application groups was carried out to identify the requirements of the applicationsin each group like communication mode, frequency, maximum allowed frequency andcommunication range. From the comparison study, it was concluded that most of theapplications require just-in-time reliable data delivery. There are two main procedures fordata delivery in multi-hop networks, i.e., flooding and routing. This study also dealt withboth types of procedures.In IEEE 802.11p, broadcast data dissemination is unreliable because of the definedtransmission procedure, frame formats and rules to access it. However, the basic requirementof safety applications is reliable data transmission within a specified time because theseapplications rely on alert or emergency messages. Hence, to compensate for the limitation ofIEEE 802.11p and ensure its reliable data dissemination, a new mechanism is required. Thebasic mechanism defined to achieve this objective is called blind/pure flooding, which hasits limitation and is not suitable for VANET. However, it allows to understand the underlyingproblems such as broadcast storm, partitioning or temporal network fragmentation, etc., andrequirements to design a suitable algorithm. A comparative study was carried out to havecomplete information of each proposed mechanism in the literature, where it consideredthe information of on targeted problem, working scenarios, basic techniques used to definethese mechanisms and requirements of additional metrics or methods. The study concludedthat each protocol performed good in limited scenarios. Although the performance offlooding mechanism was improved, there are still issues regarding reachability, scalability,on-time data availability and reliable data transmission. The proposed study included thedesign of a Reliable Intelligent Flooding Mechanism (RIFM), which intelligently selects thenext-relaying vehicle for re-broadcasting without introducing any new control message in
186
6. CONCLUSION AND FUTURE RECOMMENDATIONS 187
the network. The proposed mechanism was designed by considering both city and highwayscenarios. The RIFM was constructed to help in reducing the number of redundant copiesand the amount of time to re-broadcast. Moreover, it included the proof for its efficiencyin terms of reachability. The simulation-based evaluation of RIFM was done with existingtechniques and allowed to conclude that the proposed RIFM mechanism achieved highreachability with possible reduced re-broadcasting, which is an acceptable outcome ofthe algorithm in the context of saving network resources. The proposed algorithm wasimplemented in Veins framework and evaluated for both city and highway traffic scenarios.From the simulation results of the proposed mechanism, it was further concluded that itexhibits better performance in terms of less number of retransmissions, busy time, and highreachability.Many routing protocols were discussed in the state-of-the-art, where these were categorizedusing different criteria. The proposed study included the comparative study of protocolsdiscussed in the literature for routing techniques, i.e., topology, geographic/position-basedand hybrid routing information. This comparative study showed that topology-based routingprotocols are not suitable in VANET environments. Proactive-based protocols use routingtables to determine the best route between communicating vehicles where this techniquemay fail due to high mobility. Reactive-based protocols experience route discovery delaysand may not be suitable for emergency applications. Position-based protocols are intendedto be adaptive but experience message overhead, local maxima and routing loop issues.These protocols are unable to maintain performance in a low-density network. To the best ofour knowledge, research studies showed that the protocols proposed in the literature do notadequately address the network challenges due to lack of considering the dynamic nature ofthe network. Another comparative study of proposed routing protocols in the literature wascarried out from respective routing metrics and observed the suitability in the correspondingrouting technique. Based on this comparison, certain performance metrics were identifiedlike goodput, congestion, end-to-end delay. A mathematical model was designed out usingthe identified performance metrics for a multi-hop routing protocol. Moreover, the proposedstudy includes the construction of an adaptive protocol by combining the functionalityof topology and position-based routing because the first uses route maintenance, whichensures on-time delivery, while the latter uses position information which helps to identifythe direction of the intended destination. Since route maintaining and recovery mechanismadd delays to the routing procedure, the study also proposed the reorientation of routing atlayer 2. Additionally, the proposed MAC-based Adaptive Data Link layer Routing Protocol(MAC-ALLRP) was implemented in Vein which includes OMNET++ and SUMO. It wasconcluded from the simulation results that the performance of the proposed protocol is goodin term of high packet delivery ratio and goodput, and reduced delay for both cities andhighway scenarios.Apart from the theoretical-based comparative study of the safety, non-safety and other

6. CONCLUSION AND FUTURE RECOMMENDATIONS 188
potential applications of Vehicular Ad hoc Network and the procedures for data disseminationin a vehicular environment, this study also dealt with the experiments and validation of fourproposed applications. During the doctoral research dissertation, these applications weredesigned, implemented and tested by using VANET with other latest technologies like WSN,IoT, Edge/Cloud Computing, etc.The first application was designed to accomplish the complete design of an emergencyresponse system and successful implementation of an ad hoc TestBed, which carriedout the intended communication in a vehicular environment. Moreover, it presented theachieved objective and real-time statistics of an emergency response system along with thedisaster data of an affected region. Furthermore, it helped to measure the performance ofa network in terms of round-trip-time regarding the number of hops along the route fromsource to destination. Moreover, the research work along with the implemented TestBedprovides an effective way to share critical information amongst volunteers and staff workingin unfortunate situations, like a post-disaster rescue-and-relief operation. Since fast andreliable communication plays a vital role in such scenarios, this work offered a practicalsolution that can be implemented and deployed by the concerned authorities at times of acatastrophic disaster.The second application was designed to help elderly/special people or patients with chronicdiseases to drive safely by using a continuous remote health monitoring system. Theproposed intelligent health monitoring system was developed using wearable body areasensors, it is able to monitor health parameters while driving. It was designed and developedby combing the WBAN and VANET technologies and successfully tested on the ad hocTestBed. It was observed that the developed prototype is valid as a basic approach thatintelligently monitors drivers health and generates alerts in case of an emergency. Thus,it provides elderly/special people suffering from chronic diseases an opportunity to drivesafely.The third application aimed to detect road accidents, avoid chain crashes and managepost-accident care. This dissertation developed an application, which is able to detectaccidents on the road via electromechanical and biomedical sensors. When an accidentoccurs, it generates emergency messages for medical assistance for the safety of customersalong with the accident management and swift medical service. For the data communicationamong intelligent devices installed inside the vehicle, ad hoc communication was used, thenintegrated it with VANET. The proposed application was tested in both Internet-of-Thingsand VANET-based scenarios, where the promising results were observed.The last application was an extended version of automatic accident detection. However, theprimary objective was to detect and notify about an accident with a detailed explanation ofthe situation. Additionally, it aimed to record the road accidents data for the further use,such as to analyze the pattern of accidents on different roads in the city and urban, thenumber of causalities and injuries as a result of accidents in particular area, type of vehicles

6. CONCLUSION AND FUTURE RECOMMENDATIONS 189
involved in road accidents or reasons of accidents. An Internet-of-Things based ad hocvehicular TestBed environment was designed and developed during this study, that was ableto detect accidents automatically and notify the relevant emergency centers immediately.Cloud and Edge Computing were used in the implementation of this system, where edgetechnology was used to provide resource-hungry task offloading and preprocessing of data,while cloud technology was used to facilitate data storage. In addition to the previouslymentioned application, the emergency alert includes the image of the inner view of thevehicle at the time of the accident. Once the rescue operation is over, the application sendsthe cumulative data to the central database, for long-term storage. This data can later befetched from the database, and an insightful analysis can be performed. The designed systemwas successfully implemented and tested on the ad hoc configured testbed along with theInternet enable Edge and Cloud.For future work, this study proposed a couple of recommendation considering the differentcontext of its use. In this current study, proposed Reliable Intelligent Flooding Mechanismwas designed and evaluated for data dissemination for city and highway scenarios.The designed focus was on the safety-related and emergency application, however, thecooperative vehicles safety applications like electric break warning, on-coming trafficwarning, lane assistance, etc., require the precise information about the environmentwhere maps can help for the correct data acquisition and dissemination. Here, for futurework, the study recommends further improvement in the proposed protocols using mapsand the evaluation in the specific scenarios. Furthermore, it recommends the practicalimplementation and testing for the improved version because the cooperative vehicleapplication involves the communication of a few nodes and use of a map is a feasiblesolution for such scenarios.In this dissertation, the MAC-Based Link Layer Routing Protocol (MAC-ALLRP) wasdesigned considering the non-DTN environment. Therefore, for the rural areas, wherethe problem of network fragmentation and partitioning is common, it would not work.Though, many researchers proposed several protocols to achieve data delivery in a DTNenvironment. Here, for the future work, it recommends the modification of MAC-Based LinkLayer Routing Protocol (MAC-ALLRP) for DTN environment. Moreover, it recommendsthe keen observation of the evaluation of MAC-based routing protocol for these complexscenarios like rural areas where temporal or network fragmentation issues are prominent,road intersection scenarios to identify the metrics that can help in improving the routingprocedure. One of the suggested solutions is the use of the store-carry-forward mechanism,however not suitable for emergency applications. In this case, the objective of the improvedversion would be different. Additionally, it also recommends the further improvement ofMAC-based Link Layer Routing Protocol for optimized route discovery and Quality ofServices, if an application requires such services.In the presence of the latest communication technologies like LTE/ 5G and use of the

6. CONCLUSION AND FUTURE RECOMMENDATIONS 190
internet, VANET has less acceptability in industries. This study recommends to developmore applications to highlight the importance, change the social acceptability and feasibilityof the practical use of Vehicular Ad hoc Network with other latest technologies likeInternet-of-Things, Edge/Cloud Computing.

BIBLIOGRAPHY
[1] Hannes Hartenstein and Kenneth Laberteaux. VANET Vehicular Applications andInter-networking Technologies, volume 1. John Wiley & Sons, 2009.
[2] Felipe Cunha, Leandro Villas, Azzedine Boukerche, Guilherme Maia, Aline Viana,Raquel AF Mini, and Antonio AF Loureiro. Data Communication in VANETs:Protocols, Applications and Challenges. Ad Hoc Networks, 44:90–103, 2016.
[3] Kamini Kamini and Rakesh Kumar. VANET Parameters and Applications: A review.Global Journal of Computer Science and Technology, 2010.
[4] Asim Rasheed, Saira Gillani, Sana Ajmal, and Amir Qayyum. Vehicular ad hocnetwork (VANET): A survey, Challenges, and Applications. In Vehicular Ad hocNetworks for Smart Cities, pages 39–51. Springer, 2017.
[5] World Health Organization. Global status report on road safety 2015. World HealthOrganization, 2015.
[6] World Health Organization. Global Status Report on Road Safety 2017. World HealthOrganization, 2017.
[7] Worl Health Organization. Road Traffic Injuries. http://www.who.int/
violence_injury_prevention/road_traffic/en/, last access on 29November 2018.
[8] Kishwer Abdul Khaliq, Omer Chughtai, Amir Qayyum, and Jürgen Pannek. AnEmergency Alert System for Elderly/Special People Using VANET and WBAN. In13th International Conference on Emerging Technologies (ICET), pages 1–6. IEEE,2017.
[9] Kishwer Abdul Khaliq, Syed Muddasar Raza, Omer Chughtai, Amir Qayyum, andJuergen Pannek. Experimental validation of an accident detection and managementapplication in vehicular environment. Computers & Electrical Engineering, 71:137 –150, 2018.
191

BIBLIOGRAPHY 192
[10] IEEE Standards Association and others. 802.11 P-2010—IEEE Standardfor Information Technology—local and Metropolitan Area Networks—specificRequirements—part 11: Wireless LAN Medium Access Control (MAC) andPhysical Layer (PHY) Specifications Amendment 6: Wireless Access in VehicularEnvironments. URL http://standards. ieee. org/findstds/standard/802.11 p-2010.html,2010.
[11] Jijun Yin, Tamer ElBatt, Gavin Yeung, Bo Ryu, Stephen Habermas, HariharanKrishnan, and Timothy Talty. Performance Evaluation of Safety Applications overDSRC Vehicular Ad hoc Networks. In Proceedings of the 1st ACM internationalworkshop on Vehicular Ad hoc networks, pages 1–9. ACM, 2004.
[12] Marica Amadeo, Claudia Campolo, and Antonella Molinaro. Enhancing IEEE802.11p/WAVE to Provide Infotainment Applications in VANETs. Ad Hoc Networks,10(2):253–269, 2012.
[13] Muhammad Sajjad Akbar, Muhammad Saleem Khan, Kishwer Abdul Khaliq, AmirQayyum, and Muhammad Yousaf. Evaluation of IEEE 802.11n for MultimediaApplication in VANET. Procedia Computer Science, 32:953–958, 2014.
[14] Bilstrup Katrin, Elisabeth Uhlemann, EG Store, and Urban Bilstrup. On the Abilityof the 802.11p MAC Method and STDMA to Support Real-Time Vehicle-to-VehicleCommunication. EURASIP Journal on Wireless Communications and Networking,2008.
[15] Gianluca Rizzo, Maria Rita Palattella, Torsten Braun, and Thomas Engel. Content andContext Aware Strategies for QoS Support in VANETs. In IEEE 30th InternationalConference on Advanced Information Networking and Applications (AINA), pages717–723. IEEE, 2016.
[16] Salim Bitam and Abdelhamid Mellouk. Conventional Routing Protocols for VANETs.Bio-Inspired Routing Protocols for Vehicular Ad Hoc Networks, pages 51–77, 2014.
[17] Xiaodong Lin, Rongxing Lu, Xiaohui Liang, and Xuemin Sherman Shen. STAP: Asocial-tier-assisted packet forwarding protocol for achieving receiver-location privacypreservation in vanets. In IEEE Proceedings of INFOCOM, pages 2147–2155, 2011.
[18] Kishwer Abdul Khaliq, Muhammad Sajjad Akbar, Amir Qayyum, and JuergenPannek. Suitability of ieee 802.11ac/n/p for bandwidth hungry and infotainmentapplications for cities. pages 903–921, 2018.
[19] Kishwer Abdul Khaliq, Amir Qayyum, and Juergen Pannek. Synergies of AdvancedTechnologies and Role of VANET in Logistics and Transportation. International

BIBLIOGRAPHY 193
Journal of Advanced Computer Science and Applications(IJACSA), 7(11):359–369,2016.
[20] Kishwer Abdul Khaliq, Amir Qayyum, and Juergen Pannek. Methodology forDevelopment of Logistics Information and Safety System Using Vehicular Ad hocNetworks. In Dynamics in Logistics, pages 185–195. Springer, 2017.
[21] Kishwer Abdul Khaliq, Amir Qayyum, and Jürgen Pannek. Novel routing frameworkfor vanet considering challenges for safety application in city logistics. In VehicularAd hoc Networks for Smart Cities, pages 53–67. Springer, 2017.
[22] Kishwer Abdul Khaliq, Amir Qayyum, and Jürgen Pannek. Novel MessageDissemination mechanism and Mathematical Model for Safety Applications inVANET. In 11th International Conference on Software, Knowledge, InformationManagement and Applications (SKIMA), pages 1–5. IEEE, 2017.
[23] Kishwer Abdul Khaliq, Omer Chughtai, Syed Muddasar Raza, Amir Qayyum, andJürgen Pannek. Intelligent Message Dissemination Mechanism for Vehicle-to-VehicleCommunication using VANET for Safety Applications (In press). Eurasip Journal onWireless Communication and Networking, 00:1–26, 2018.
[24] Kishwer Abdul Khaliq, Omer Chughtai, Amir Qayyum, and Jürgen Pannek. Amathematical model for the design of multi-hop routing protocol in VANET (In press).Journal of Advanced Transportations, 00:1–25, 2018.
[25] Kishwer Abdul Khaliq, Omer Chughtai, Amir Qayyum, and Juergen Pannek.Reorientation of Routing from IP to Link Layer for Path Selection, pages 1–17. IGIGlobal, x, 2019. In Press.
[26] Kishwer Abdul Khaliq, Amir Qayyum, and Jürgen Pannek. Prototype of AutomaticAccident Detection and Management in Vehicular Environment Using VANET andIoT. In IEEE 11th International Conference on Software, Knowledge, InformationManagement and Applications (SKIMA), pages 1–7. IEEE, 2017.
[27] Kishwer Abdul Khaliq, Omer Chughtai, Amir Qayyum, and Jürgen Pannek. Designof Emergency Response System for Disaster Management Using VANET. InInternational Conference on Dynamics in Logistics, pages 310–317. Springer, 2018.
[28] Kishwer Abdul Khaliq, Omer Chughtai, Abdullah Shawani, Amir Qayyum, andJürgen Pannek. An Emergency Response System: Construction, Validation, andExperiments for Disaster Management in a Vehicular Environment. Sensors, 19(5):1–23, 2019.

BIBLIOGRAPHY 194
[29] Saleh Yousefi, Mahmoud Siadat Mousavi, and Mahmood Fathy. Vehicular Adhoc Networks (VANETs): Challenges and Perspectives. In IEEE 6th InternationalConference on ITS Telecommunications Proceedings, pages 761–766. IEEE, 2006.
[30] Wenshuang Liang, Zhuorong Li, Hongyang Zhang, Shenling Wang, and RongfangBie. Vehicular Ad Hoc Networks: Architectures, Research Issues, Methodologies,Challenges and Trends. International Journal of Distributed Sensor Networks,11(8):745303, 2015.
[31] Md Humayun Kabir. Research Issues on Vehicular Ad hoc Network. InternationalJournal of Engineering Trends and Technology), 2013.
[32] Bappaditya Jana, Saptarshi Mitra, and Jayanta Poray. An Analysis of Security Threatsand Countermeasures in VANET. In International Conference on Computer, Electrical& Communication Engineering (ICCECE), pages 1–6. IEEE, 2016.
[33] Nimra Rehman Siddiqui, Kishwer Abdul Khaliq, and Juergen Pannek. VANETSecurity Analysis on the Basis of Attacks in Authentication. In Dynamics in Logistics,pages 491–502. Springer, 2017.
[34] Ravi Tomar, Manish Prateek, and GH Sastry. Vehicular Ad hoc Network (VANET)-An Introduction. International Journal of Control Theory and Applications,9(18):8883–8888, 2016.
[35] Sajjad Akbar Mohammad, Asim Rasheed, and Amir Qayyum. VANET Architecturesand Protocol Stacks: A Survey. In Communication Technologies for Vehicles, pages95–105. 2011.
[36] Roberto Baldessari, Bert Bödekker, Matthias Deegener, Andreas Festag, WalterFranz, C Christopher Kellum, Timo Kosch, Andras Kovacs, MassimilianoLenardi, Cornelius Menig, et al. CAR 2 CAR Communication ConsortiumManifesto Overview of the C2C-CC System (Version 1.1). http://www. car-to-car.org/fileadmin/downloads/C2C-CC_manifesto_v1. 1. pdf, 2007.
[37] Mohamed Nidhal Mejri, Jalel Ben-Othman, and Mohamed Hamdi. Survey onVANET Security Challenges and Possible Cryptographic Solutions. VehicularCommunications, 1(2):53–66, 2014.
[38] Todd Murray, Michael Cojocari, and Huirong Fu. Measuring the Performance ofIEEE 802.11p using ns-2 Simulator for Vehicular Networks. In IEEE InternationalConference on Electro/Information Technology, pages 498–503. IEEE, 2008.

BIBLIOGRAPHY 195
[39] Lusheng Miao, Karim Djouani, Barend J van Wyk, and Yskandar Hamam. Evaluationand Enhancement of IEEE 802.11 p standard: A survey. Mobile Computing, 1(1):15–30, 2012.
[40] Fengzhong Qu, Zhihui Wu, Fei-Yue Wang, and Woong Cho. A security andprivacy review of VANETs. IEEE Transactions on Intelligent Transportation Systems,16(6):2985–2996, 2015.
[41] Miad Faezipour, Mehrdad Nourani, Adnan Saeed, and Sateesh Addepalli. Progressand challenges in intelligent vehicle area networks. Communications of the ACM,55(2):90–100, 2012.
[42] Nejdet Dogru and Abdulhamit Subasi. Traffic Accident Detection using RandomForest Classifier. In 15th Learning and Technology Conference (L&T), pages 40–45.IEEE, 2018.
[43] Won Yeoul Lee. A Performance Enhancement of VANET Warning MessagePropagation on Electric Wave Blind Area Problem in the Urban Environment. Journalof Korea Multimedia Society, 17(10):1220–1228, 2014.
[44] Anna Maria Vegni, Mauro Biagi, and Roberto Cusani. Smart Vehicles,Technologies and Main Applications in Vehicular Ad hoc Networks. In VehicularTechnologies-Deployment and Applications. InTech, 2013.
[45] Georgios Karagiannis, Onur Altintas, Eylem Ekici, Geert Heijenk, Boangoat Jarupan,Kenneth Lin, and Timothy Weil. Vehicular Networking: A Survey and Tutorialon Requirements, Architectures, Challenges, Standards and Solutions. IEEEcommunications surveys & tutorials, 13(4):584–616, 2011.
[46] Yasser Toor, Paul Muhlethaler, Anis Laouiti, and Arnaud De La Fortelle. Vehiclead hoc networks: Applications and related technical issues. IEEE communicationssurveys & tutorials, 10(3):74–88, 2008.
[47] Cristofer Englund, Lei Chen, Alexey Vinel, and Shih Yang Lin. Future applicationsof VANETs. In Vehicular ad hoc Networks, pages 525–544. Springer, 2015.
[48] Shailendra Mishra Vishal Kumar and Narottam Chand. Applications of VANETs:Present and Future. Communications and Network, 2012.
[49] Kishwer Abdul Khaliq, Muhammad Sajjad Akbar, Amir Qayyum, and JuergenPannek. Suitability of IEEE 802.11ac/n/p for Bandwidth Hungry and InfotainmentApplications for Cities. In Proceeding of IEEE SAI Intelligent Systems Conference(IntelliSys). IEEE, 2016.
BIBLIOGRAPHY 196
[50] Muhammad Sajjad Akbar, Amir Qayyum, and Kishwer Abdul Khaliq. InformationDelivery Improvement for Safety Applications in VANET by Minimizing Rayleighand Rician Fading Effect. In Springer Vehicular Ad hoc Networks for Smart Cities,pages 85–92. 2015.
[51] Vadim A Butakov and Petros Ioannou. Personalized Driver Assistance forSignalized Intersections using V2I Communication. IEEE Transactions on IntelligentTransportation Systems, 17(7):1910–1919, 2016.
[52] Jyun-Yan Yang, Li-Der Chou, Li-Ming Tseng, and Yi-Ming Chen. AutonomicNavigation System Based on Predicted Traffic and VANETs. Wireless PersonalCommunications, 92(2):515–546, 2017.
[53] Lambros Sarakis, Theofanis Orphanoudakis, Helen C Leligou, Stamatis Voliotis, andArtemis Voulkidis. Providing Entertainment Applications in VANET Environments.IEEE Wireless Communications, 23(1):30–37, 2016.
[54] Cynthia Jayapal and S Sujith Roy. Road Traffic Congestion Management usingVANET. In International Conference on Advances in Human Machine Interaction(HMI), pages 1–7. IEEE, 2016.
[55] Mohammad Khanjary and Seyyed Mohsen Hashemi. Route guidance systems:Review and classification. In Proceedings of the 6th Euro American Conference onTelematics and Information Systems, pages 269–275. ACM, 2012.
[56] Kevin Collins and Gabriel-Miro Muntean. A Vehicle Route Management SolutionEnabled by Wireless Vehicular Networks. In IEEE INFOCOM Workshops, pages1–6. IEEE, 2008.
[57] Michel Ferreira and Pedro M d’Orey. On the Impact of Virtual Traffic Lightson Carbon Emissions Mitigation. IEEE Transactions on Intelligent TransportationSystems, 13(1):284–295, 2012.
[58] Houbing Song, Q Du, P Ren, W Li, and A Mehmood. Cloud Computing forTransportation Cyber-Physical Systems. Cyber-Physical Systems: A ComputationalPerspective, 15:351–369, 2015.
[59] Sourav Kumar Bhoi and Pabitra Mohan Khilar. Vehihealth: An Emergency RoutingProtocol for Vehicular Ad hoc Network to Support Healthcare System. Journal ofmedical systems, 40(3):65, 2016.
[60] Nagarjuna R Vatti, PrasannaLakshmi Vatti, Rambabu Vatti, and ChandrashekharGarde. Smart Road Accident Detection and Communication System. In 2018

BIBLIOGRAPHY 197
International Conference on Current Trends towards Converging Technologies(ICCTCT), pages 1–4. IEEE, 2018.
[61] Raja G Kasilingam. Logistics and Transportation. Great Britain: Kluwer AcademicPublishers, 1998.
[62] Shian-Jong Chuu. An Investment Evaluation of Supply Chain RFIDTechnologies: A Group Decision-making Model with Multiple InformationSources. Knowledge-Based Systems, 66:210–220, 2014.
[63] Asso Prof Catalin Postelnicu and Asso Prof Dan-Cristian Dabija. Transferand Diffusion of New Technologies Within the Supply Chain of MultinationalCompanies with Operations in Romania A Contemporary Approach. In Geopolitics,Development, and National Security, pages 53–66. Springer, 2015.
[64] Ahmed Musa, Angappa Gunasekaran, Yahaya Yusuf, and Abdelrahman Abdelazim.Embedded Devices for Supply Chain Applications: Towards Hardware Integration ofDisparate Technologies. Expert Systems with Applications, 41(1):137–155, 2014.
[65] Ahmed Musa, Angappa Gunasekaran, and Yahaya Yusuf. Supply Chain ProductVisibility: Methods, Systems and Impacts. Expert Systems with Applications,41(1):176–194, 2014.
[66] Sandor Dornbush and Anupam Joshi. Street Smart Traffic: Discovering andDisseminating Automobile Congestion Using VANETs. In IEEE 65th VehicularTechnology Conference (VTC), pages 11–15. IEEE, 2007.
[67] Teodor Gabriel Crainic and Dominique Feillet. Introduction to the special issue onCity Logistics. Springer EURO Journal on Transportation and Logistics, pages 1–2,2015.
[68] Eiichi Taniguchi and Russell G Thompson. City Logistics: Mapping the Future. CRCPress, 2014.
[69] Adrian E Coronado Mondragon and Etienne S Coronado Mondragon. Smart Grid andWireless Vehicular Networks for Seaport Logistics Operations. In 19th ITS WorldCongress, 2012.
[70] Stephan Eichler, Christoph Schroth, and Joerg Eberspaecher. Car-to-CarCommunication. In VDE-Kongress, 2006.
[71] Xinping Yan, Ping Yi, Dunyao Zhu, and Liping Fu. ICTIS 2013: ImprovingMultimodal Transportation Systems-Information, Safety, and Integration. AmericanSociety of Civil Engineers, 2013.

BIBLIOGRAPHY 198
[72] European Comission. Intelligent Transport System (ITS). http://ec.europa.eu/transport/themes/its/index_en.htm, last access on 15 march 2019.
[73] European Comission. Transport Research and Innovation Portal (TRIP). http:
//ec.europa.eu/transport/themes/research/trip_en.htm, lastaccess on 15 march 2019.
[74] European Comission. Transport Research and Innovation in Horizon2020. http://ec.europa.eu/transport/themes/research/
horizon2020_en.htm, last access on 15 march 2019.
[75] Car-2-Car Communication Consortium (C2C-CC),. https://www.car-2-car.org/index.php?id=5, last access on 15 march 2019.
[76] Northwestern University. Car-to-Car Cooperation. http:
//www.aqualab.cs.northwestern.edu/projects/
111-c3-car-to-car-cooperation-for-vehicular-ad-hoc-networks,,last access on 15 march 2019.
[77] Universität Bremen, Institut für Telekommunikation und Hochfrequenztechnik.Innovative wireless technologies for industrial automation (HiFlecs). http://www.ant.uni-bremen.de/en/projects/hiflecs/, last access on 15 march2019.
[78] Auto21. Intelligent Systems and Sensors, 2015. https://auto21.ca/en/
subcontent?page=ae2600, last access on 15 march 2019.
[79] Interlab, University of Sherbrook, Canada. Vehicle Communications AndApplications. http://www.gel.usherbrooke.ca/interlab/index.
php?page=projects, last access on 15 march 2019.
[80] Canadian Association of Road Safety Professionals (CARSP),, 2015.
[81] Alessio Filippi, Kees Moerman, Vincent Martinez, A Turley, Onn Haran, andR Toledano. IEEE 802.11p Ahead of LTE-V2V for Safety Applications. AutotalksNXP, 2017.
[82] Anh Tuan Giang, Anthony Busson, and Véronique Vèque. Message Dissemination inVANET: Protocols and Performances. In Wireless vehicular networks for car collisionavoidance, pages 71–96. Springer, 2013.
[83] Hannes Hartenstein and LP Laberteaux. A tutorial survey on vehicular ad hocnetworks. IEEE Communications Magazine, 46(6), 2008.

BIBLIOGRAPHY 199
[84] Shahid Latif, Saeed Mahfooz, Bilal Jan, Naveed Ahmad, Yue Cao, and MuhammadAsif. A Comparative Study of Scenario-driven Multi-hop Broadcast Protocols forVANETs. Vehicular Communications, 2018.
[85] Sara Najafzadeh, Norafida Ithnin, Shukor Abd Razak, and Ramin Karimi. DynamicBroadcasting in Vehicular Ad hoc Networks. International Journal of ComputerTheory and Engineering, 5(4):629, 2013.
[86] Yu-Chee Tseng, Sze-Yao Ni, Yuh-Shyan Chen, and Jang-Ping Sheu. The BroadcastStorm Problem in a Mobile Ad hoc Network. Wireless networks, 8(2-3):153–167,2002.
[87] M Chitra and S Siva Sathya. Efficient Broadcasting Mechanisms for DataDissemination in Vehicular Ad hoc Networks. International Journal of MobileNetwork Communications & Telematics (IJMNCT), 3(3):47–63, 2013.
[88] Ahmad Mostafa, Anna Maria Vegni, and Dharma P Agrawal. A Probabilistic Routingby using Multi-hop Retransmission Forecast with Packet Collision-aware Constraintsin Vehicular Networks. Ad Hoc Networks, 14:118–129, 2014.
[89] Jianqi Liu, Jiafu Wan, Qinruo Wang, Pan Deng, Keliang Zhou, and YupengQiao. A Survey on Position-Based Routing For Vehicular Ad Hoc Networks.Telecommunication Systems, 62(1):15–30, 2016.
[90] Wai Chen, Ratul K Guha, Taek Jin Kwon, John Lee, and Yuan-Ying Hsu. A Surveyand Challenges in Routing and Data Dissemination in Vehicular Ad Hoc Networks.Wireless Communications and Mobile Computing, 11(7):787–795, 2011.
[91] Elena Fasolo, Andrea Zanella, and Michele Zorzi. An Effective Broadcast Schemefor Alert Message Propagation In Vehicular Ad Hoc Networks. In IEEE InternationalConference on Communications, volume 9, pages 3960–3965. IEEE, 2006.
[92] Nawut Na Nakorn and Kultida Rojviboonchai. DECA: Density-Aware ReliableBroadcasting in Vehicular Ad Hoc Networks. In ECTI International Confernce onElectrical Engineering/Electronics, Computer, Telecommunications and InformationTechnology (ECTI-CON), pages 598–602. IEEE, 2010.
[93] Maziar Nekovee and Benedikt Bjarni Bogason. Reliable and Efficient InformationDissemination in Intermittently Connected Vehicular Ad hoc Networks. In IEEE 65thVehicular Technology Conference (VTC), pages 2486–2490. IEEE, 2007.
[94] Sooksan Panichpapiboon and Wasan Pattara-Atikom. A Review of InformationDissemination Protocols For Vehicular Ad Hoc Networks. IEEE CommunicationsSurveys & Tutorials, 14(3):784–798, 2012.

BIBLIOGRAPHY 200
[95] Moumena Chaqfeh and Abderrahmane Lakas. A Novel Approach for Scalable Multi-Hop Data Dissemination in Vehicular Ad Hoc Networks. Ad Hoc Networks, 37:228–239, 2016.
[96] Nawaporn Wisitpongphan, Ozan K Tonguz, Jayendra S Parikh, Priyantha Mudalige,Fan Bai, and Varsha Sadekar. Broadcast Storm Mitigation Techniques in VehicularAd hoc Networks. IEEE Wireless Communications, 14(6):84–94, 2007.
[97] Mimoza Durresi, Arjan Durresi, and Leonard Barolli. Emergency Broadcast Protocolfor Inter-vehicle Communications. In 11th International Conference on Parallel andDistributed Systems (ICPADS), volume 2, pages 402–406. IEEE, 2005.
[98] Mohamed Bakhouya, Jaafar Gaber, and Pascal Lorenz. An Adaptive Approach forInformation Dissemination in Vehicular Ad Hoc Networks. Journal of Network andComputer Applications, 34(6):1971–1978, 2011.
[99] Abdelmalik Bachir and Abderrahim Benslimane. A Multicast Protocol In Ad HocNetworks Inter-Vehicle Geocast. In The 57th IEEE Semiannual Vehicular TechnologyConference (VTC), volume 4, pages 2456–2460. IEEE, 2003.
[100] Wantanee Viriyasitavat, Ozan K Tonguz, and Fan Bai. UV-CAST: An Urban VehicularBroadcast Protocol. IEEE Communications Magazine, 49(11):116–124, 2011.
[101] Mostafa MI Taha and Yassin MY Hasan. VANET-DSRC Protocol for ReliableBroadcasting of Life Safety Messages. In IEEE International Symposium on SignalProcessing and Information Technology, pages 104–109. IEEE, 2007.
[102] Qiong Yang and Lianfeng Shen. A Multi-hop Broadcast Scheme for Propagationof Emergency Messages in VANET. In IEEE 12th International Conference onCommunication Technology, pages 1072–1075. IEEE, 2010.
[103] Tae-Hwan Kim, Won-Kee Hong, Hie-Cheol Kim, and Yong-Doo Lee. An EffectiveData Dissemination in Vehicular Ad hoc Network. In International Conference onInformation Networking, pages 295–304. Springer, 2007.
[104] Gökhan Korkmaz, Eylem Ekici, Füsun Özgüner, and Ümit Özgüner. Urban Multi-Hop Broadcast Protocol for Inter-Vehicle Communication Systems. In Proceedingsof the 1st ACM international workshop on Vehicular ad hoc networks, pages 76–85.ACM, 2004.
[105] Silvia Iadicicco, Simone Infante, Pierpaolo Salvo, Andrea Baiocchi, and FrancescaCuomo. Multi-originator Data Dissemination in VANETs. In IEEE 12th AnnualConference on Wireless On-demand Network Systems and Services (WONS), pages1–8. IEEE, 2016.

BIBLIOGRAPHY 201
[106] Francisco J Ros, Pedro M Ruiz, and Ivan Stojmenovic. Acknowledgment-basedbroadcast protocol for reliable and efficient data dissemination in vehicular ad hocnetworks. IEEE Transactions on Mobile Computing, 11(1):33–46, 2012.
[107] Leandro A Villas, Tiago PC de Andrade, and Nelson LS da Fonseca. An Efficient andRobust Protocol to Disseminate Data in Highway Environments with Different TrafficConditions. In 2014 IEEE symposium on computers and communications (ISCC),pages 1–6. IEEE, 2014.
[108] Yuh-Shyan Chen and Yun-Wei Lin. A Mobicast Routing Protocol with Carry-And-Forward In Vehicular Ad Hoc Networks. International Journal of CommunicationSystems, 27(10):1416–1440, 2014.
[109] Leandro Aparecido Villas, Azzedine Boukerche, Guilherme Maia, Richard WernerPazzi, and Antonio AF Loureiro. Drive: An Efficient and Robust Data DisseminationProtocol for Highway and Urban Vehicular Ad Hoc Networks. Computer Networks,75:381–394, 2014.
[110] Chih-Wei Yi, Yi-Ta Chuang, Hou-Heng Yeh, Yu-Chee Tseng, and Pin-Chuan Liu.Streetcast: An Urban Broadcast Protocol for Vehicular Ad hoc Networks. In IEEE71st Vehicular Technology Conference, pages 1–5. IEEE, 2010.
[111] Imen Achour, Tarek Bejaoui, Anthony Busson, and Sami Tabbane. Sead: A Simpleand Efficient Adaptive Data Dissemination Protocol in Vehicular Ad hoc Networks.Wireless Networks, 22(5):1673–1683, 2016.
[112] Gokhan Korkmaz, Eylem Ekici, and Fusun Ozguner. An efficient fully ad hocmulti-hop broadcast protocol for inter-vehicular communication systems. In IEEEinternational conference on communications, volume 1, pages 423–428. IEEE, 2006.
[113] Da Li, Hongyu Huang, Xu Li, Minglu Li, and Feilong Tang. A Distance-BasedDirectional Broadcast Protocol for Urban Vehicular Ad Hoc Network. In IEEEInternational Conference on Wireless Communications, Networking and MobileComputing, pages 1520–1523. IEEE, 2007.
[114] Hamada ALshaer and Eric Horlait. An Optimized Adaptive Broadcast Schemefor Inter-Vehicle Communication. In IEEE 61st Vehicular Technology Conference,volume 5, pages 2840–2844. IEEE, 2005.
[115] Yuh-Shyan Chen, Yun-Wei Lin, and Sing-Ling Lee. A Mobicast Routing Protocol inVehicular Ad hoc Networks. Mobile Networks and Applications, 15(1):20–35, 2010.

BIBLIOGRAPHY 202
[116] Brij Bihari Dubey, Naveen Chauhan, and Sudhanshu Pant. RRDD: Reliable RouteBased Data Dissemination Technique in VANETs. In 2011 International Conferenceon Communication Systems and Network Technologies, pages 148–151. IEEE, 2011.
[117] Kai Liu, Joseph Kee-Yin Ng, Junhua Wang, Victor CS Lee, Weiwei Wu, andSang Hyuk Son. Network-coding-assisted Data Dissemination via CooperativeVehicle-to-Vehicle/-Infrastructure Communications. IEEE Transactions on IntelligentTransportation Systems, 17(6):1509–1520, 2016.
[118] Boto Bako, Elmar Schoch, Frank Kargl, and Michael Weber. Optimized PositionBased Gossiping in VANETs. In IEEE 68th Vehicular Technology Conference, pages1–5. IEEE, 2008.
[119] A Malathi and N Sreenath. Multicast Routing Selection for VANET using HybridScatter Search ABC Algorithm. In IEEE International Conference on Power, Control,Signals and Instrumentation Engineering (ICPCSI), pages 441–446. IEEE, 2017.
[120] Chia-Chen Hung, Hope Chan, and Eric Hsiao-Kuang Wu. Mobility Pattern AwareRouting For Heterogeneous Vehicular Networks. In IEEE Wireless Communicationsand Networking Conference, pages 2200–2205. IEEE, 2008.
[121] Axel Wegener, Horst Hellbruck, Stefan Fischer, Christiane Schmidt, and SándorFekete. AutoCast: An Adaptive Data Dissemination Protocol for Traffic InformationSystems. In IEEE 66th Vehicular Technology Conference, pages 1947–1951. IEEE,2007.
[122] Ramon S Schwartz, Rafael RR Barbosa, Nirvana Meratnia, Geert Heijenk, and HansScholten. A Directional Data Dissemination Protocol for Vehicular Environments.Computer Communications, 34(17):2057–2071, 2011.
[123] Ozan K Tonguz, Nawaporn Wisitpongphan, and Fan Bai. DV-CAST: A DistributedVehicular Broadcast Protocol for Vehicular Ad hoc Networks. IEEE WirelessCommunications, 17(2):47–57, 2010.
[124] Manoj D Venkata, MM Manohara Pai, Radhika M Pai, and Joseph Mouzna. TrafficMonitoring and Routing in VANETs—A Cluster Based Approach. In IEEE 11thInternational Conference on ITS Telecommunications (ITST), pages 27–32. IEEE,2011.
[125] Omar Abdel Wahab, Hadi Otrok, and Azzam Mourad. VANET QoS-OLSR:QoS-based clustering protocol for Vehicular Ad hoc Networks. ComputerCommunications, 36(13):1422–1435, 2013.

BIBLIOGRAPHY 203
[126] Stefano Busanelli, Gianluigi Ferrari, and Sooksan Panichpapiboon. Cluster-basedIrresponsible Forwarding. In The Internet of Things, pages 59–68. Springer, 2010.
[127] Seyhan Ucar, Sinem Coleri Ergen, and Oznur Ozkasap. Multihop-cluster-based IEEE802.11 p and LTE Hybrid Architecture for VANET Safety Message Dissemination.IEEE Transactions on Vehicular Technology, 65(4):2621–2636, 2016.
[128] Sabri Allani, Taoufik Yeferny, Richard Chbeir, and Sadok Ben Yahia. DPMS: ASwift Data Dissemination Protocol Based on Map Splitting. In IEEE 40th AnnualComputer Software and Applications Conference (COMPSAC), volume 1, pages817–822. IEEE, 2016.
[129] Samira Jalalvandi and Reza Rafeh. A Cluster-based Routing Algorithm for VANET.In IEEE 2nd International Conference on Computer and Communications (ICCC),pages 2068–2072. IEEE, 2016.
[130] Thierry Delot, Nathalie Mitton, Sergio Ilarri, and Thomas Hien. Decentralized Pull-Based Information Gathering In Vehicular Networks using GeoVanet. In IEEE 12thInternational Conference on Mobile Data Management, volume 1, pages 174–183.IEEE, 2011.
[131] MS Kakkasageri and SS Manvi. Push-Pull Based Critical Information Gathering InVANETs: Multi Agent System Based Approach. In IEEE International Conferenceon Vehicular Electronics and Safety (ICVES), pages 1–6. IEEE, 2009.
[132] Yu-Tian Tseng, Rong-Hong Jan, Chien Chen, Chu-Fu Wang, and Hsia-Hsin Li. AVehicle-Density-Based Forwarding Scheme for Emergency Message Broadcasts inVANETs. In The 7th IEEE International Conference on Mobile Ad hoc and SensorSystems (IEEE MASS), pages 703–708. IEEE, 2010.
[133] Guilherme Maia, Azzedine Boukerche, Andre LL Aquino, Aline C Viana, andAntonio AF Loureiro. A Data Dissemination Protocol for Urban Vehicular Ad HocNetworks with Extreme Traffic Conditions. In IEEE International Conference onCommunications (ICC), pages 5997–6001. IEEE, 2013.
[134] Yiannos Mylonas, Marios Lestas, and Andreas Pitsillides. Speed AdaptiveProbabilistic Flooding in Cooperative Emergency Warning. In Proceedings of the 4thAnnual International Conference on Wireless Internet, page 81. ICST (Institute forComputer Sciences, Social-Informatics and Telecommunications Engineering), 2008.
[135] Cedric Adjih, Philippe Jacquet, and Laurent Viennot.Computing Connected Dominated Sets with Multipoint Relays. PhD thesis, INRIA,2002.

BIBLIOGRAPHY 204
[136] Julien Cartigny and David Simplot. Border Node Retransmission Based ProbabilisticBroadcast Protocols in Ad hoc Networks. In Proceedings of the 36th Annual HawaiiInternational Conference on System Sciences, pages 10–pp. IEEE, 2003.
[137] Yu-Chee Tseng, Sze-Yao Ni, and En-Yu Shih. Adaptive Approaches toRelieving Broadcast Storms in a Wireless Multihop Mobile Ad hoc Network.IEEE Transactions on Computers, 52(5):545–557, 2003.
[138] Sijun Ren, Ping Yi, Dapeng Hong, Yue Wu, and Ting Zhu. Distributed Constructionof Connected Dominating Sets Optimized by Minimum-weight Spanning Tree inWireless Ad hoc sensor Networks. In IEEE 17th International Conference onComputational Science and Engineering (CSE), pages 901–908. IEEE, 2014.
[139] Jonathan Loo, Jaime Lloret Mauri, and Jesús Hamilton Ortiz.Mobile Ad hoc Networks: Current Status and Future Trends. CRC Press, 2016.
[140] Chi Lin, Guowei Wu, Feng Xia, and Lin Yao. Enhancing Efficiency of NodeCompromise Attacks in Vehicular Ad hoc Networks using Connected DominatingSet. Mobile Networks and Applications, 18(6):908–922, 2013.
[141] Hui Cao, Weigang Wu, and Yishun Chen. A Navigation Route Based MinimumDominating Set Algorithm in VANETs. In International Conference on SmartComputing Workshops (SMARTCOMP Workshops), pages 71–76. IEEE, 2014.
[142] Wenjie Wang, Tao Luo, and Ying Hu. An Adaptive Information Quantity-BasedBroadcast Protocol for Safety Services in VANET. Mobile Information Systems,2016, 2016.
[143] Shereen AM Ahmed, Sharifah HS Ariffin, Norsheila Fisal, S Syed-Yusof, andN Latif. Survey on Broadcasting in VANET. Research Journal of Applied Sciences,Engineering and Technology, 7(18):3733–3739, 2014.
[144] DG Reina, SL Toral, P Johnson, and Federico Barrero. A Survey on ProbabilisticBroadcast Schemes for Wireless Ad hoc Networks. Ad Hoc Networks,, 25:263–292,2015.
[145] M Mehic, P Fazio, M Voznak, P Partila, D Komosny, J Tovarek, and Z Chmelikova.On Using Multiple Routing Metrics with Destination Sequenced Distance VectorProtocol For Multihop Wireless Ad Hoc Networks. In Modeling and Simulationfor Defense Systems and Applications XI, volume 9848, page 98480F. InternationalSociety for Optics and Photonics, 2016.

BIBLIOGRAPHY 205
[146] Jamal Toutouh, José García-Nieto, and Enrique Alba. Intelligent OLSR RoutingProtocol Optimization for VANETs. IEEE transactions on vehicular technology,61(4):1884–1894, 2012.
[147] Fatima Lakrami, Najib Elkamoun, and Mohamed El Kamili. A Survey on QoS forOLSR Routing Protocol in MANETs. In Advances in Ubiquitous Networking, pages287–300. Springer, 2016.
[148] Ibrihich Ouafaa, Laassiri Jalal, Krit Salah-ddine, and El Hajji Said. The ComparisonStudy of Hierarchical Routing Protocols for Ad hoc and Wireless Sensor Networks: Aliterature Survey. In Proceedings of the The International Conference on Engineering(MIS), page 32. ACM, 2015.
[149] Richard Ogier, Fred Templin, and Mark Lewis. Topology dissemination based onreverse-path forwarding (TBRPF). RFC 3684, DOI 10.17487/RFC3684, 2004.
[150] Saikat Jana, Souvik Singha, and Jayashree Singha. A Simulation Based PerformanceAnalysis of Proactive, Reactive and Hybrid Routing Protocol. In InternationalConference on Computer, Electrical & Communication Engineering (ICCECE), pages1–10. IEEE, 2016.
[151] Gamal Sallam and Ashraf Mahmoud. Performance Evaluation of OLSR and AODV inVANET Cloud Computing using Fading Model with SUMO and NS3. In InternationalConference on Cloud Computing (ICCC), pages 1–5. IEEE, 2015.
[152] Tareq Emad Ali, Layth A Khalil al Dulaimi, and Yamaan E Majeed. Reviewand Performance Comparison of VANET Protocols: AODV, DSR, OLSR, DYMO,DSDV & ZRP. In Al-Sadeq International Conference on Multidisciplinary in IT andCommunication Science and Applications (AIC-MITCSA), pages 1–6. IEEE, 2016.
[153] Valery Naumov, Rainer Baumann, and Thomas Gross. An Evaluation of Inter-VehicleAd Hoc Networks Based on Realistic Vehicular Traces. In Proceedings of the 7thACM international symposium on Mobile ad hoc networking and computing, pages108–119. ACM, 2006.
[154] Sandeep Gupta, BS Dhaliwal1b, and Rahul Malhotra. Simulation Based ComparativeAnalysis of AODV, TORA and DSR Protocols. An International Journal ofEngineering and Science, 17:70–76, 2016.
[155] Jamal Toutouh and Enrique Alba. Performance Analysis of Optimized VANETprotocols in Real World Tests. In IEEE 7th International Wireless Communicationsand Mobile Computing Conference, pages 1244–1249. IEEE, 2011.

BIBLIOGRAPHY 206
[156] Sabbagh Amani Ahmad and Maxim Shcherbakov. A Survey on Routing Protocols inVehicular Ad hoc Networks. In IEEE 9th International Conference on Information,Intelligence Systems and Applications (IISA), pages 1–8. IEEE, 2018.
[157] Xi Yu, Huaqun Guo, and Wai-Choong Wong. A Reliable Routing Protocol for VANETCommunications. In IEEE 7th International Wireless Communications and MobileComputing Conference, pages 1748–1753. IEEE, 2011.
[158] Pankaj Palta et al. A survey on Routing Protocols in Wireless Sensor Networks.Journal of Wireless Sensor Network, 4, 2016.
[159] Ata Ullah, Xuanxia Yao, Samiya Shaheen, and Huansheng Ning. Advances inPosition Based Routing Towards ITS Enabled FoG-Oriented VANET-A Survey. IEEETransactions on Intelligent Transportation Systems, 2019.
[160] Christian Lochert, Martin Mauve, Holger Füßler, and Hannes Hartenstein.Geographic routing in city scenarios. ACM SIGMOBILE mobile computing andcommunications review, 9(1):69–72, 2005.
[161] Mehdi Tavakoli Garrosi. Enhanced Intersection-based Perimeter Geo-routing inUrban Vehicular Ad hoc Networks. In IEEE 84th Vehicular Technology Conference(VTC),, pages 1–5. IEEE, 2016.
[162] Bijan Paul and Mohammed J Islam. Survey over VANET routing Protocols for Vehicleto Vehicle Communication. IOSR Journal of Computer Engineering (IOSRJCE),7(5):1–9, 2012.
[163] Moez Jerbi, S-M Senouci, Rabah Meraihi, and Yacine Ghamri-Doudane. AnImproved Vehicular Ad hoc Routing Protocol for City Environments. In IEEEInternational Conference on Communications, pages 3972–3979. IEEE, 2007.
[164] Boon-Chong Seet, Genping Liu, Bu-Sung Lee, Chuan-Heng Foh, Kai-Juan Wong, andKeok-Kee Lee. A-STAR: A mobile ad hoc routing strategy for metropolis vehicularcommunications. In International Conference on Research in Networking,, pages989–999. Springer, 2004.
[165] Kevin C Lee, Michael Le, Jerome Harri, and Mario Gerla. Louvre: LandmarkOverlays for Urban Vehicular Routing Environments. In IEEE 68th VehicularTechnology Conference, pages 1–5. IEEE, 2008.
[166] Kevin C Lee, Pei-Chun Cheng, Jui-Ting Weng, Lung-Chih Tung, and Mario Gerla.VCLCR: A Practical Geographic Routing Protocol in Urban Scenarios. UCLAComputer Science Department, Tech. Rep. TR080009, 2008.
BIBLIOGRAPHY 207
[167] Lili Hu, Zhizhong Ding, and Huijing Shi. An improved GPSR Routing Strategyin VANET. In IEEE 8th International Conference on Wireless CommunicationsNetworking and Mobile Computing, pages 1–4. IEEE, 2012.
[168] Zineb Squalli Houssaini, Imane Zaimi, Mohammed Oumsis, and Saïd El AlaouiOuatik. Improvement of GPSR Protocol by Using Future Position Estimation ofParticipating Nodes in Vehicular Ad hoc Networks. In IEEE International Conferenceon Wireless Networks and Mobile Communications (WINCOM), pages 87–94. IEEE,2016.
[169] Sascha Schnaufer and Wolfgang Effelsberg. Position-based Unicast Routing for CityScenarios. In IEEE International Symposium on a World of Wireless, Mobile andMultimedia Networks, pages 1–8. IEEE, 2008.
[170] Nupur Soni, Shikha Tiwari, et al. Survey of Various Protocols in GeographicalBased Routing in Vehicular Ad hoc Networks. International Journal of ComputerApplications Technology and Research, 2(3):357–366, 2013.
[171] Holger Füßler, Hannes Hartenstein, Martin Mauve, Wolfgang Effelsberg, and JörgWidmer. Contention-based forwarding for street scenarios. In 1st Internationalworkshop in intelligent transportation (WIT), number CONF, 2004.
[172] Kevin C Lee, Uichin Lee, and Mario Gerla. TO-GO: TOpology-assist Geo-Opportunistic Routing In Urban Vehicular Grids. In IEEE 6th InternationalConference on Wireless On-Demand Network Systems and Services, pages 11–18.IEEE, 2009.
[173] Zubair Amjad, Wang-Cheol Song, and Khi-Jung Ahn. Two-level Hierarchical RoutingBased on Road Connectivity in VANETs. In IEEEE International Conference onIndustrial Engineering, Management Science and Application (ICIMSA), pages 1–5.IEEE, 2016.
[174] Joanne Skiles and Imad Mahgoub. Investigating the Impact of Adaptive Beaconingon GEOADV Performance. In IEEE 15th Intl Conf on Dependable, Autonomic andSecure Computing, 15th Intl Conf on Pervasive Intelligence and Computing, 3rd IntlConf on Big Data Intelligence and Computing and Cyber Science and TechnologyCongress (DASC/PiCom/DataCom/CyberSciTech), pages 744–751. IEEE, 2017.
[175] BS Manoj, R Ananthapadmanabha, and C Murthy. Link Life Based RoutingProtocol for Ad hoc Wireless Networks. In Proceedings of IEEE Tenth InternationalConference on Computer Communications and Networks,, pages 573–576. IEEE,2001.

BIBLIOGRAPHY 208
[176] M Scott Corson and Anthony Ephremides. A Distributed Routing Algorithm forMobile Wireless Networks. Springer Wireless Networks, 1(1):61–81, 1995.
[177] Vincent Park and M Scott Corson. Temporally-Ordered Routing Algorithm (TORA)Version 1 Functional Specification. Technical report, IETF Internet-Draft, MANET-TORA-Specification-00, 1997.
[178] Ian D Chakeres and Charles E Perkins. Dynamic MANET On-demand RoutingProtocol. Technical report, IETF Internet Draft, MANET-dymo-12, 2008.
[179] David B Johnson. The Dynamic Source Routing Protocol for Mobile Ad hocNetworks. IETF Internet-Draft, MANET-dsr-09, 2003.
[180] C Aichele, M Lindner, and S Wunderlich A Neumann. Better Approach to Mobile Adhoc Networking (batman). IETF Work In Progress Internet-Draft, 2008.
[181] Guangyu Pei, Mario Gerla, Xiaoyan Hong, and Ching-Chuan Chiang. AWireless Hierarchical Routing Protocol with Group Mobility. In IEEE WirelessCommunications and Networking Conference (WCNC), pages 1538–1542. IEEE,1999.
[182] Zygmunt J Haas, Marc R Pearlman, and Prince Samar. The InterzoneRouting Protocol (IERP) for Ad hoc Networks. IETF MANET Working Group,manetzone-ierp-01, 2001.
[183] Kevin Grace. Mobile Mesh Routing Protocol. IETF MANET Working Group,draftgrace-manet-mmrp-00 in progress, 2000.
[184] Thomas Clausen and Philippe Jacquet. Optimized Link State Routing Protocol(OLSR). Network Working Group, RFC-3626, 2003.
[185] Yasunori Owada, Taka Maeno, Hiroei Imai, and Kenichi Mase. OLSRv2Implementation and Performance Evaluation with Link Layer Feedback. InProceedings of the International conference on Wireless communications and mobilecomputing, pages 67–72. ACM, 2007.
[186] Bhargav Bellur, RG Ogier, and FL Temlin. Topology Dissemination Based onReverse-Path Forwarding (TBRPF). Technical report, IETF Internet Draft, manet-tbrpf-08, 2003.
[187] Miguel Elias M Campista, Pedro Miguel Esposito, Igor M Moraes, Luís Henrique MKCosta, Otto Carlos Duarte, Diego G Passos, Célio Vinicius N De Albuquerque, DéboraChristina M Saade, and Marcelo G Rubinstein. Routing Metrics and Protocols forWireless Mesh Networks. IEEE Network,, 22(1):6–12, 2008.

BIBLIOGRAPHY 209
[188] Cesar Santivanez and Ram Ramanathan. Hazy Sighted Link State Routing Protocol(HSLS). Technical report, BBN Technical Memorandum, 2001.
[189] Tom Parker and Koen Langendoen. Guesswork: Robust Routing in an UncertainWorld. In IEEE International Conference on Mobile Ad hoc and Sensor SystemsConference, page 9. IEEE, 2005.
[190] Yeng-Zhong Lee, M Gerla, Jason Chen, and BZA Caruso. DFR (Direction ForwardRouting). Ad hoc Sensor Wireless Networks, 2(2):01–18, 2006.
[191] Ching-Chuan Chiang, Hsiao-Kuang Wu, Winston Liu, and Mario Gerla. Routing inClustered Multihop, Mobile Wireless Networks with Fading Channel. In Proceedingsof IEEE SICON, volume 97, pages 197–211. IEEE, 1997.
[192] Samuel Madden, Michael J Franklin, Joseph M Hellerstein, and Wei Hong. TAG: ATiny Aggregation Service for Ad hoc Sensor Networks, 2002.
[193] Baruch Awerbuch, Amotz Bar-Noy, and Madan Gopal. Approximate DistributedBellman-ford Algorithms. IEEE Transactions on Communications, 42(8):2515–2517,1994.
[194] Charles E Perkins and Pravin Bhagwat. Highly Dynamic Destination-sequencedDistance-vector Routing (DSDV) for mobile computers. In ACM SIGCOMMComputer Communication Review, volume 24, pages 234–244. ACM, 1994.
[195] Shah-An Yang and John S Baras. TORA, Verification, Proofs and Model Checking.In Ad hoc and Wireless Networks Modeling and Optimization in Mobile (WiOpt),,page 2, 2003.
[196] Hüseyin Ackın Erdem and Güray Yilmaz. Creating ad-hoc networks for remotesensing: Routing simulation of a satellite surveillance system. In IEEE 7thInternational Conference on Recent Advances in Space Technologies (RAST), pages217–222. IEEE, 2015.
[197] Elizabeth M Royer and Charles E Perkins. Multicast Operation of the Ad hocOn-demand Distance Vector Routing Protocol. In Proceedings of the 5th annualACM/IEEE international conference on Mobile computing and networking, pages207–218. IEEE, 1999.
[198] Juliusz Chroboczek. The Babel Routing Protocol. 00.04.2011.
[199] Guoyou He. Destination-Sequenced Distance Vector (DSDV) Protocol. NetworkingLaboratory, Helsinki University of Technology, pages 1–9, 2002.

BIBLIOGRAPHY 210
[200] Kendy Kutzner, Christian Wallenta, and Thomas Fuhrmann. Securing the ScalableSource Routing Protocol. In Proceedings of the World Telecommunications Congress,Budapest, Hungary, volume 13, 2006.
[201] Nicklas Beijar. Zone Routing Protocol (ZRP). Networking Laboratory, HelsinkiUniversity of Technology, Finland, 2002.
[202] Christoph Sommer, Reinhard German, and Falko Dressler. Bidirectionally CoupledNetwork and Road Traffic simulation for Improved IVC Analysis. IEEE Transactionson Mobile Computing, 10(1):3–15, 2011.
[203] Hamed Noori. Realistic Urban Traffic Simulation as Vehicular Ad hoc Network(VANET) via Veins Framework. In 12th Conference of Open Innovations FrameworkPrgramme (FRUCT), pages 100–105, 2012.
[204] Christoph Sommer. Veins Features. http://veins.car2x.org/features/,last access on 24 January 2019.
[205] András Varga and Rudolf Hornig. An Overview of the OMNeT++ SimulationEnvironment. In Proceedings of the 1st international conference on Simulation toolsand techniques for communications, networks and systems & workshops, page 60.ICST (Institute for Computer Sciences, Social-Informatics and TelecommunicationsEngineering), 2008.
[206] Andreas Viklund. MIXIM. http://mixim.sourceforge.net/,last access on15 February 2019.
[207] INET Framework. What is inet framework?https://inet.omnetpp.org/Introduction.html, last access on 15 February 2019.
[208] DLR: Institute of Transportation Systems. http://sumo.dlr.de/wiki/
Sumo_at_a_Glance, last access on 15 February 2019.
[209] DLR: Institute of Transportation Systems. SUMO – Simulation of Urban MObility.http://www.dlr.de/ts/en/desktopdefault.aspx/tabid-9883/
16931_read-41000/, last access on 15 February 2019.
[210] Christoph Sommer. Car-to-X Communication in Heterogeneous Environments.2011. https://opus4.kobv.de/opus4-fau/files/1793/
ChristophSommerDissertation.pdf, last access on 03 April 2019.
[211] Violence World Health Organization and Injury Prevention.Global Status Report on Road Safety 2013: Supporting a Decade of Action. WorldHealth Organization, 2013.

BIBLIOGRAPHY 211
[212] Jesús Alonso-Zárate, C Crespo, Ch Skianis, Luis Alonso, and Ch Verikoukis.Distributed Point Coordination Function for IEEE 802.11 Wireless Ad hoc Networks.Ad Hoc Networks, 10(3):536–551, 2012.
[213] Anis Laouiti, Amir Qayyum, Mohamad Naufal Mohamad Saad, and MohamadNaufal. Vehicular Ad hoc Networks for Smart Cities. Springer, 2017.
[214] Azzedine Boukerche, Begumhan Turgut, Nevin Aydin, Mohammad Z Ahmad,Ladislau Bölöni, and Damla Turgut. Routing Protocols in Ad hoc Networks: A survey.Computer networks, 55(13):3032–3080, 2011.
[215] Kevin R Fall and W Richard Stevens. TCP/IP Illustrated, Volume 1: The Protocols.addison-Wesley, 2011.
[216] Guido R Hiertz, Dee Denteneer, Sebastian Max, Rakesh Taori, Javier Cardona, LarsBerlemann, and Bernhard Walke. IEEE 802.11 s: the WLAN Mesh Standard. IEEEWireless Communications, 17(1):104–111, 2010.
[217] Kishwer Abdul Khaliq, Muhammad Sajjad Akbar, Amir Qayyum, Ehsan Elahi, andAmer Zaheer. Congestion Avoidance Hybrid Wireless Mesh Protocol (CA-HWMP)for IEEE 802.11s. Procedia Computer Science, 32:229–236, 2014.
[218] IEEE Computer Society LAN/MAN Standards Committee et al. IEEE Standardfor Information Technology-Telecommunications and Information Exchange betweenSystems-Local and Metropolitan Area Networks-Specific Requirements Part 11:Wireless LAN Medium Access Control (MAC) and Physical Layer (PHY)Specifications. IEEE Std 802.11ˆ, 2007.
[219] United Nations Office for Disaster Risk Reduction (UNISDR). The Human Costof Weather Related Disasters. https://www.unisdr.org/archive/46793,last access date 28 September 2018.
[220] Eduardo De Francesco and Fabio Leccese. Risks Analysis for Already ExistentElectric Lifelines in Case of Seismic Disaster. In IEEE 11th International Conferenceon Environment and Electrical Engineering (EEEIC), pages 830–834. IEEE, 2012.
[221] Manuel Fogue, Piedad Garrido, Francisco J Martinez, Juan-Carlos Cano, Carlos TCalafate, and Pietro Manzoni. Identifying the Key Factors Affecting WarningMessage Dissemination in VANET Real Urban Scenarios. Sensors, 13(4):5220–5250,2013.
[222] Han Zhang, Gengfeng Li, and Hanjie Yuan. Collaborative Optimization of Post-Disaster Damage Repair and Power System Operation. Energies, 11(10):2611, 2018.

BIBLIOGRAPHY 212
[223] Dammika Seneviratne, Lorenzo Ciani, Marcantonio Catelani, Diego Galar, et al.Smart Maintenance and Inspection of Linear Assets: An Industry 4.0 Approach.ACTA IMEKO, 2018.
[224] Kapileswar Nellore and Gerhard P Hancke. Traffic Management for EmergencyVehicle Priority Based On Visual Sensing. Sensors, 16(11):1892, 2016.
[225] Rahul Mangharam, Jacob Meyers, Dr Rajkumar, Daniel D Stancil, et al. A Multi-HopMobile Networking Test-Bed for Telematics. 2005.
[226] Harsha Chenji, Wei Zhang, Radu Stoleru, and Clint Arnett. DistressNet: A DisasterResponse System providing Constant Availability Cloud-like Services. Ad HocNetworks, 11(8):2440–2460, 2013.
[227] Romeo Giuliano, Franco Mazzenga, Marco Petracca, and Marco Vari. IndoorLocalization System for First Responders in Emergency Scenario. In WirelessCommunications and Mobile Computing Conference (IWCMC), 2013 9thInternational, pages 1821–1826. IEEE, 2013.
[228] Yao-Nan Lien, Hung-Chin Jang, and Tzu-Chieh Tsai. A MANET Based EmergencyCommunication and Information System for Catastrophic Natural Disasters. In IEEE29th International Conference on Distributed Computing Systems Workshops (ICDCSWorkshops), pages 412–417. IEEE, 2009.
[229] Yong Bai, Wencai Du, Zhengxin Ma, Chong Shen, Youling Zhou, and Baodan Chen.Emergency Communication System by Heterogeneous Wireless Networking. In IEEEInternational Conference on Wireless Communications, Networking and InformationSecurity (WCNIS), pages 488–492. IEEE, 2010.
[230] C Niranjan Kumar and R Praveen Sam. MANET Test Bed for Rescue Operations inDisaster Management. 2015.
[231] Syed Waqar Alam and Bilal Muhammad Khan. Implementation of VANETs UsingFPGA-based Hardware Test-Bed Approach for Intelligent Transportation System.Bahria University Journal of Information & Communication Technology, 9:30, 2016.
[232] Matteo Cesana, Luigi Fratta, Mario Gerla, Eugenio Giordano, and Giovanni Pau.C-VeT The UCLA Campus Vehicular Testbed: Integration of VANET and MeshNetworks. In European Wireless Conference (EW), pages 689–695. IEEE, 2010.
[233] Fabio Leccese, Marco Cagnetti, Stefano Di Pasquale, Sabino Giarnetti, and MaurizioCaciotta. A New Power Quality Instrument Based on Raspberry-pi. Electronics,5(4):64, 2016.

BIBLIOGRAPHY 213
[234] V Pasquali, G D’Alessandro, R Gualtieri, and F Leccese. A New Data Logger Basedon Raspberry-Pi for Arctic Notostraca locomotion Investigations. Measurement,110:249–256, 2017.
[235] Miha Ambrož. Raspberry Pi as a Low-cost Data Acquisition System for HumanPowered Vehicles. Measurement, 100:7–18, 2017.
[236] Chres W Sørensen, Néstor J Hernández Marcano, Juan A Cabrera Guerrero, SimonWunderlich, Daniel E Lucani, and Frank HP Fitzek. Easy as Pi: A Network CodingRaspberry Pi Testbed. Electronics, 5(4):67, 2016.
[237] Argyrios Samourkasidis and Ioannis Athanasiadis. A Miniature Data Repository on aRaspberry Pi. Electronics, 6(1):1, 2017.
[238] Ulf Jennehag, Stefan Forsstrom, and Federico V Fiordigigli. Low Delay VideoStreaming on the Internet of Things using Raspberry Pi. Electronics, 5(3):60, 2016.
[239] Guido Van Rossum et al. Python 2.7. 10 Tutorial: An Introduction to Python.Samurai Media Limited, 2015.
[240] Robert A Iannucci, Guang R Gao, Robert H Halstead Jr, and BurtonSmith. Multithreaded computer architecture: A Summary of the State of the Art,volume 281. Springer Science & Business Media, 2012.
[241] Maps Static API. https://developers.google.com/maps/
documentation/static-maps, last access on 08 October 2018.
[242] Open Mesh: BATMAN-ADV. https://www.open-mesh.org/projects/
batman-adv, 08 October 2018.
[243] Kishwer Abdul Khaliq. Emergency Disaster Management.https://gitlab.ips.biba.uni-bremen.de/kai/
emergency-disaster-management/blob/master/
adhoc-network-configuration.pdf, 18 March 2018.
[244] Kishwer Abdul Khaliq. Emergency Disaster Management.https://gitlab.ips.biba.uni-bremen.de/kai/
emergency-disaster-management/blob/master/
BATMAN-Adv-configuration.pdf, 18 March 2018.
[245] Chuks J Mba. Population Ageing in Ghana: Research Gaps and the Way Forward.Journal of Aging Research, 8:1–8, 2010.

BIBLIOGRAPHY 214
[246] Kishwer Abdul Khaliq, Amir Qayyum, Jürgen Pannek, et al. Wireless Body AreaNetworks (WBAN): Architecture, Applications and MAC Protocols. Abstract ofEmerging Trends in Scientific Research, 6, 2016.
[247] Garth V Crosby, Tirthankar Ghosh, Renita Murimi, and Craig A Chin. Wireless BodyArea Networks for Healthcare: A survey. International Journal of Ad Hoc, Sensor &Ubiquitous Computing, 3(3):1, 2012.
[248] Hongliang Ren, MQ-H Meng, and Xijun Chen. Physiological Information AcquisitionThrough Wireless Biomedical Sensor Networks. In IEEE International Conference onInformation Acquisition, pages 0–06. IEEE, 2005.
[249] Mrinmoy Barua, Xiaohui Liang, Rongxing Lu, and Xuemin Shen. ESPAC: EnablingSecurity and Patient-centric Access Control for eHealth in Cloud Computing.International Journal of Security and Networks, 6(2-3):67–76, 2011.
[250] Srijani Mukherjee, Koustabh Dolui, and Soumya Kanti Datta. Patient HealthManagement System Using E-Health Monitoring Architecture. In IEEE InternationalAdvance Computing Conference (IACC),, pages 400–405. IEEE, 2014.
[251] B Vijayalakshmi et al. Patient Monitoring System Using Wireless Sensor BasedMesh Network. In Third International Conference on Computing Communicationand Networking Technologies (ICCCNT), pages 1–6. IEEE, 2012.
[252] M Aminian and HR Naji. A Hospital Healthcare Monitoring System Using WirelessSensor Networks. J. Health Med. Inform, 4(02):121, 2013.
[253] Mohammad Ghamari, Balazs Janko, R Simon Sherratt, William Harwin, RobertPiechockic, and Cinna Soltanpur. A survey on Wireless Body Area Networks foreHealthcare Systems in Residential Environments. Sensors, 16(6):831, 2016.
[254] Neeraj Kumar, Kuljeet Kaur, Subhas C Misra, and Rahat Iqbal. An intelligent rfid-enabled authentication scheme for healthcare applications in vehicular mobile cloud.Peer-to-Peer Networking and Applications, 9(5):824–840, 2016.
[255] datasheets360. Temperature Sensors. http://www.datasheets360.com/
part/detail/ds18b20/6701448640602247561/, last accessed on 29December 2018.
[256] Pulse sensor org. Pulse Sensor. https://pulsesensor.com, last accessed on29 November 2018.
[257] Adafruit. ADC. https://learn.adafruit.com/
raspberry-pi-analog-to-digital-converters/
ads1015-slash-ads1115, last accessed on 29 November 2018.

BIBLIOGRAPHY 215
[258] Cyriel Diels, Tugra Erol, Milena Kukova, Joscha Wasser, Maciej Cieslak, WilliamPayre, Abhijai Miglani, Neil Mansfield, Simon Hodder, and Jelte Bos. Designing ForComfort in Shared and Automated Vehicles (SAV): A Conceptual Framework. 1stInternational Comfort Congress (ICC), Salerno, Italy, 2017.
[259] Zhigang Xu, Xiaochi Li, Xiangmo Zhao, Michael H Zhang, and Zhongren Wang.DSRC versus 4G-LTE for connected vehicle applications: a study on field experimentsof vehicular communication performance. Journal of Advanced Transportation, 2017,2017.
[260] Manuel Fogue, Piedad Garrido, Francisco J Martinez, Juan-Carlos Cano, Carlos TCalafate, and Pietro Manzoni. Automatic Accident Detection: Assistance throughCommunication Technologies and Vehicles. IEEE Vehicular Technology Magazine,7(3):90–100, 2012.
[261] Jorge Zaldivar, Carlos T Calafate, Juan Carlos Cano, and Pietro Manzoni. ProvidingAccident Detection in Vehicular Networks through OBD-II Devices and Android-based Smartphones. In IEEE 36th Conference on Local Computer Networks (LCN),pages 813–819. IEEE, 2011.
[262] Md Syedul Amin, Mohammad Arif Sobhan Bhuiyan, Mamun Bin Ibne Reaz, andSalwa Sheikh Nasir. GPS and Map Matching Based Vehicle Accident DetectionSystem. In IEEE Student Conference on Research and Development (SCOReD),pages 520–523. IEEE, 2013.
[263] L Ramos, L Silva, Maribel Yasmina Santos, and J Moura Pires. Detection of RoadAccident Accumulation Zones with a Visual Analytics Approach. Procedia ComputerScience, 64:969–976, 2015.
[264] Jules White, Chris Thompson, Hamilton Turner, Brian Dougherty, and Douglas CSchmidt. Wreckwatch: Automatic Traffic Accident Detection and Notification withSmartphones. Mobile Networks and Applications, 16(3):285, 2011.
[265] Md Syedul Amin, Jubayer Jalil, and MBI Reaz. Accident detection and reportingsystem using GPS, GPRS and GSM technology. In International Conference onInformatics, Electronics & Vision (ICIEV), pages 640–643. IEEE, 2012.
[266] Bruno Fernandes, Muhammad Alam, Vitor Gomes, Joaquim Ferreira, andArnaldo Oliveira. Automatic Accident Detection with Multi-modal Alert SystemImplementation for ITS. Vehicular Communications, 3:1–11, 2016.
[267] Shunsuke Kamijo, Yasuyuki Matsushita, Katsushi Ikeuchi, and Masao Sakauchi.Traffic monitoring and accident detection at intersections. IEEE Transactions onIntelligent Transportation Systems, 1(2):108–118, 2000.

BIBLIOGRAPHY 216
[268] UDOO ORG. UDOO org, All-in-one Embedded System Solution. https://www.udoo.org/, last accessed on 29 August 2018.
[269] sparkfun. Sparkfun Start Something- Shop. https://www.sparkfun.com, lastaccess on 15 February 2019.
[270] Oddwires. Sound detector. http://www.oddwires.com/
sound-detector/, last accessed on 29 August 2018.
[271] Ejaz Ahmed, Arif Ahmed, Ibrar Yaqoob, Junaid Shuja, Abdullah Gani, MuhammadImran, and Muhammad Shoaib. Bringing Computation Closer Toward the UserNetwork: Is Edge Computing the Solution? IEEE Communications Magazine,55(11):138–144, 2017.
[272] Rahul Gautam, S Chaudhary, SI Kaur, and Mamta Bhusry. Cloud-based AutomaticAccident Detection and Vehicle Management System. International Journal ElectricalElectronic Engineering, 7(2), 2015.
[273] Priyal Raut and Vanthana Sachdev. Car Accident Notification System based onInternet of Things. International Journal of Computer Applications, 107(17), 2014.
[274] Lei Chen and Cristofer Englund. Every Second Counts: Integrating Edge Computingand Service Oriented Architecture for Automatic Emergency Management. Journalof Advanced Transportation, 18, 2018.
[275] Manuel Fogue, Piedad Garrido, Francisco J Martinez, Juan-Carlos Cano, Carlos TCalafate, and Pietro Manzoni. Automatic Accident Detection: Assistance throughCommunication Technologies and Vehicles. IEEE Vehicular Technology Magazine,7(3):90–100, 2012.
[276] Tasneem SJ Darwish and Kamalrulnizam Abu Bakar. Fog Based IntelligentTransportation Big Data Analytics in the Internet of Vehicles Environment:Motivations, Architecture, Challenges, and Critical Issues. IEEE Access, 6:15679–15701, 2018.
[277] Hamzah Al Najada and Imad Mahgoub. Anticipation and alert system of congestionand accidents in VANET using Big Data analysis for Intelligent TransportationSystems. In IEEE Symposium Series on Computational Intelligence (SSCI), pages1–8. IEEE, 2016.
[278] Mohammad Aazam and Eui-Nam Huh. E-HAMC: Leveraging Fog Computing forEmergency Alert Service. In IEEE International Conference on Pervasive Computingand Communication Workshops (PerCom Workshops), pages 518–523. IEEE, 2015.

BIBLIOGRAPHY 217
[279] Logitech C270 HD Webcam. https://www.logitech.com/assets/
46735/2/hd-webcam-c270.pdf, last access on 23 December 2018.
[280] Jules White, Chris Thompson, Hamilton Turner, Brian Dougherty, and Douglas CSchmidt. Wreckwatch: Automatic Traffic Accident Detection and Notification withSmartphones. Mobile Networks and Applications, 16(3):285–303, 2011.