
Forensic DNA Typing Protocols
291
Transcript of Forensic DNA Typing Protocols


Forensic DNA Typing Protocols

M E T H O D S I N M O L E C U L A R B I O L O G Y™
John M. Walker, SERIES EDITOR
309. RNA Silencing: Methods and Protocols, edited byGordon Carmichael, 2005
308. Therapeutic Proteins: Methods and Protocols,edited by C. Mark Smales and David C. James,2005
307. Phosphodiesterase Mehtods and Protocols,edited by Claire Lugnier, 2005
306. Receptor Binding Techniques: Second Edition,edited by Anthony P. Davenport, 2005
305. Protein–Ligand Interactions: Methods andProtocols, edited by G. Ulrich Nienhaus, 2005
304. Human Retrovirus Protocols: Virology andMolecular Biology, edited by Tuofu Zhu, 2005
303. NanoBiotechnology Protocols, edited by SandraJ. Rosenthal and David W. Wright, 2005
302. Handbook of ELISPOT: Methods and Protocols,edited by Alexander E. Kalyuzhny, 2005
301. Ubiquitin–Proteasome Protocols, edited byCam Patterson and Douglas M. Cyr, 2005
300. Protein Nanotechnology: Protocols,Instrumentation, and Applications, edited by TuanVo-Dinh, 2005
299. Amyloid Proteins: Methods and Protocols,edited by Einar M. Sigurdsson, 2005
298. Peptide Synthesis and Application, edited byJohn Howl, 2005
297. Forensic DNA Typing Protocols, edited byAngel Carracedo, 2005
296. Cell Cycle Protocols, edited by Tim Humphreyand Gavin Brooks, 2005
295. Immunochemical Protocols, Third Edition,edited by Robert Burns, 2005
294. Cell Migration: Developmental Methods andProtocols, edited by Jun-Lin Guan, 2005
293. Laser Capture Microdissection: Methods andProtocols, edited by Graeme I. Murray andStephanie Curran, 2005
292. DNA Viruses: Methods and Protocols, edited byPaul M. Lieberman, 2005
291. Molecular Toxicology Protocols, edited byPhouthone Keohavong and Stephen G. Grant, 2005
290. Basic Cell Culture Protocols, Third Edition,edited by Cheryl D. Helgason and Cindy L.Miller, 2005
289. Epidermal Cells, Methods and Applications,edited by Kursad Turksen, 2005
288. Oligonucleotide Synthesis, Methods andApplications, edited by Piet Herdewijn, 2005
287. Epigenetics Protocols, edited by Trygve O.Tollefsbol, 2004
286. Transgenic Plants: Methods and Protocols,edited by Leandro Peña, 2005
285. Cell Cycle Control and DysregulationProtocols: Cyclins, Cyclin-Dependent Kinases,and Other Factors, edited by Antonio Giordanoand Gaetano Romano, 2004
284. Signal Transduction Protocols, Second Edition,edited by Robert C. Dickson and Michael D.Mendenhall, 2004
283. Biconjugation Protocols, edited by ChristofM. Niemeyer, 2004
282. Apoptosis Methods and Protocols, edited byHugh J. M. Brady, 2004
281. Checkpoint Controls and Cancer, Volume 2:Activation and Regulation Protocols, edited byAxel H. Schönthal, 2004
280. Checkpoint Controls and Cancer, Volume 1:Reviews and Model Systems, edited by Axel H.Schönthal, 2004
279. Nitric Oxide Protocols, Second Edition, editedby Aviv Hassid, 2004
278. Protein NMR Techniques, Second Edition,edited by A. Kristina Downing, 2004
277. Trinucleotide Repeat Protocols, edited byYoshinori Kohwi, 2004
276. Capillary Electrophoresis of Proteins andPeptides, edited by Mark A. Strege andAvinash L. Lagu, 2004
275. Chemoinformatics, edited by Jürgen Bajorath,2004
274. Photosynthesis Research Protocols, edited byRobert Carpentier, 2004
273. Platelets and Megakaryocytes, Volume 2:Perspectives and Techniques, edited byJonathan M. Gibbins and Martyn P. Mahaut-Smith, 2004
272. Platelets and Megakaryocytes, Volume 1:Functional Assays, edited by Jonathan M.Gibbins and Martyn P. Mahaut-Smith, 2004
271. B Cell Protocols, edited by Hua Gu and KlausRajewsky, 2004
270. Parasite Genomics Protocols, edited by SaraE. Melville, 2004
269. Vaccina Virus and Poxvirology: Methods andProtocols,edited by Stuart N. Isaacs, 2004
268. Public Health Microbiology: Methods andProtocols, edited by John F. T. Spencer andAlicia L. Ragout de Spencer, 2004
267. Recombinant Gene Expression: Reviews andProtocols, Second Edition, edited by PaulinaBalbas and Argelia Johnson, 2004
266. Genomics, Proteomics, and ClinicalBacteriology: Methods and Reviews, edited byNeil Woodford and Alan Johnson, 2004

M E T H O D S I N M O L E C U L A R B I O L O G Y™
Forensic DNA TypingProtocols
Edited by
Angel CarracedoInstitute of Legal Medicine
University of Santiago de CompostelaGalicia, Spain

© 2005 Humana Press Inc.999 Riverview Drive, Suite 208Totowa, New Jersey 07512
www.humanapress.com
All rights reserved. No part of this book may be reproduced, stored in a retrieval system, or transmitted inany form or by any means, electronic, mechanical, photocopying, microfilming, recording, or otherwisewithout written permission from the Publisher. Methods in Molecular BiologyTM is a trademark of TheHumana Press Inc.
All papers, comments, opinions, conclusions, or recommendations are those of the author(s), and do notnecessarily reflect the views of the publisher.
This publication is printed on acid-free paper. ∞ANSI Z39.48-1984 (American Standards Institute)
Permanence of Paper for Printed Library Materials.
Production Editor: Robin B. WeisbergCover illustration from Fig. 5 in Chapter 10, “Universal Tag Arrays in Forensic SNP Analysis,” by MarieAllen and Anna-Maria Divne.Cover design by Patricia F. Cleary
For additional copies, pricing for bulk purchases, and/or information about other Humana titles, contactHumana at the above address or at any of the following numbers: Tel.: 973-256-1699; Fax: 973-256-8341;E-mail: [email protected]; or visit our Website: www.humanapress.com
Photocopy Authorization Policy:Authorization to photocopy items for internal or personal use, or the internal or personal use of specificclients, is granted by Humana Press Inc., provided that the base fee of US $25.00 per copy is paid directlyto the Copyright Clearance Center at 222 Rosewood Drive, Danvers, MA 01923. For those organizationsthat have been granted a photocopy license from the CCC, a separate system of payment has been arrangedand is acceptable to Humana Press Inc. The fee code for users of the Transactional Reporting Service is:[1-58829-264-9/05 $25.00].
Printed in the United States of America. 10 9 8 7 6 5 4 3 2 1
eISBN 1-59259-867-6
Library of Congress Cataloging-in-Publication DataForensic DNA typing protocols / edited by Angel Carracedo. p. ; cm. -- (Methods in molecular biology, ISSN 1064-3745 ; v. 297) Includes bibliographical references and index. ISBN 1-58829-264-9 (alk. paper) 1. DNA fingerprinting. 2. Forensic genetics. [DNLM: 1. DNA Fingerprinting--methods. 2. Polymorphism, Single Nucleotide--genetics.QZ 52 F715 2005] I. Carracedo, Angel. II. Series: Methods in molecular biology (Clifton, N.J.) ; v. 297. RA1057.55.F67 2005 614'.1--dc22
2004010563
v
Preface
The discovery of polymorphisms in repetitive DNA by Dr. Alec Jeffreysand coworkers in 1985 has had a tremendous impact on forensic genetics. Sincethen we have witnessed a revolution in the field of forensic identification, anddifferent markers and technologies for DNA typing have moved at a breathtakingpace.
Rapid advances in technology, from serological or electrophoretic analysisof protein polymorphisms to direct investigation of the underlying DNA poly-morphisms, occurred in a very short space of time in the mid-1980s. Conse-quently, the incorporation of modern molecular biological techniques in theforensic genetic laboratory has resulted in major benefits for justice.
DNA analysis has become the standard method applied by most forensicgenetic labs, especially in criminal forensic casework (e.g., analysis of stainsand hairs, identification of human remains, and paternity testing). Polymerasechain reaction (PCR)-based DNA typing systems have made it possible to ana-lyze DNA obtained from only a few cells as well as from highly degradedhuman samples (recently demonstrated by the identification of relatively oldhuman remains). The potential of DNA typing has made possible the resolu-tion of immigration problems and complicated paternity testing cases when thefather is not available. Rapid identification of individuals in mass disasterusing DNA typing has also been possible. Computerized DNA databases forthe identification of criminal offenders have been created in some countries.
Owing to these many impressive applications, the media have taken greatinterest in DNA profiling, mainly because of the value of the evidence pre-sented through DNA profiling in certain well-known legal cases.
Initially, the use of DNA profiling was very controversial in some countries,perhaps because of a hasty introduction of this new methodology. Ironically,however, this has contributed to a much more reliable use of DNA profiling.
Two parallel upheavals concerning the introduction of DNA typing technol-ogy have been accountable for the aforementioned: the introduction of qualitycontrol and accreditation schemes and, in particular, the spreading use of thestatistics in the evaluation of DNA evidence. Also, progress in standardizingthe tests has proven even more important than the technical advances.
In addition to the DNA revolution, the evolution and development of DNAmarkers and technologies themselves have been rapid and spectacular. In onlya few years we have progressed from the original multilocus DNA fingerprint
vi Preface
analysis of DNA minisatellites, through single locus probe analysis of specificminisatellites, to a host of systems based on the PCR technique.
Microsatellites or short-tandem repeats (STRs) have been almost completelysubstituted for minisatellites in forensic labs. STRs were first analyzed inmanual electrophoretic systems. The introduction of fluorescent-based tech-nology and the use of DNA sequencers have revolutionized the field, allowingthe typing of large multiplexes, as well as the automation of the typing proce-dure. Commercially available and robust multiplexes with up to 15 STRs areroutinely used by most of the forensic labs.
But new markers and methods of detection have been proposed, and themost important new advances are the introduction of the use of mtDNA and Ychromosome polymorphisms and especially the new use of single nucleotidepolymorphisms (SNPs). It is now clear that SNP typing will be of prime impor-tance in the field, owing to the potential advantages of this type of marker,especially for the analysis of degraded samples.
Because STR typing is familiar in all the forensic labs and the typing proto-cols are well established, we have decided to focus Forensic DNA Typing Pro-tocols on the newer methods and technologies forensic scientists use to solvecertain types of cases and to implement these new DNA typing methods intheir laboratories. In addition, we have included a chapter on how to createlarge STR multiplexes, since some labs are interested in the design of STRmultiplexes for specific purposes (e.g., STRs with short amplicons for degradedsamples; pentanucleotide STRs for the analysis of mixtures).
Forensic DNA Typing Protocols provides protocols for the major methods ofDNA analysis that have been recently introduced for identity testing, including Ychromosome, mtDNA, and SNP typing. Chapters with protocols for new applica-tions in the forensic genetics labs—such as species identification or typing of CYPpolymorphisms for the analysis of adverse reactions to drugs—have also beenincluded. Ancient DNA is another field of forensic and anthropological interestwhere there is a need for well-tested protocols from laboratories with extensiveexperience in the field; two chapters are devoted to this topic. Finally, properDNA quantification is a crucial requirement for the analysis of critical forensicsamples, including mixtures, and new methods based on real-time PCR arenow available. For this reason two chapters including protocols for DNA quan-tification of forensic samples and for the determination of the number ofamelogenin gene copies have been added.
I am indebted to Professor John Walker, the series editor, for his helpfulencouragement and patience, but I especially owe my thanks to all the contrib-uting authors who have made this book possible.
Angel Carracedo

vii
Contents
Preface ..............................................................................................................v
Contributors ..................................................................................................... ix
1 Forensic DNA-Typing Technologies: A ReviewAngel Carracedo and Paula Sánchez-Diz ............................................. 1
2 DNA Extraction and Quantitation of Forensic Samples Usingthe Phenol–Chloroform Method and Real-Time PCR
Silvano Köchl, Harald Niederstätter, and Walther Parson ................ 133 A Real-Time PCR Protocol to Determine the Number
of Amelogenine (X–Y) Gene Copies From ForensicDNA Samples
Antonio Alonso and Pablo Martín ...................................................... 314 Species Determination:
The Role and Use of the Cytochrome b GeneAdrian Linacre and James Chun-I Lee ................................................ 45
5 Constructing STR Mulitplex AssaysJohn M. Butler ..................................................................................... 53
6 Y Chromosome STR TypingLeonor Gusmão and Cíntia Alves ....................................................... 67
7 Using Online Databases for Developing SNP Markersof Forensic Interest
Christopher Phillips ............................................................................ 838 SNP Typing in Forensic Genetics: A Review
Beatriz Sobrino and Angel Carracedo .............................................. 1079 Genotyping SNPs With the LightCycler
María Victoria Lareu and Clara Ruiz-Ponte ..................................... 12710 Universal Tag Arrays in Forensic SNP Analysis
Marie Allen and Anna-Maria Divne .................................................. 14111 SNP Typing on the NanoChip Electronic Microarray
Claus Børsting, Juan J. Sanchez, and Niels Morling ......................... 15512 Genotyping SNPs Using a UV-Photocleavable Oligonucleotide
in MALDI-TOF MSPeter M. Vallone, Kristina Fahr, and Markus Kostrzewa.................. 169
13 Mitochondrial D-Loop and Coding Sequence AnalysisUsing Pyrosequencing
Marie Allen and Hanna Andréasson ................................................. 179

viii Contents
14 SNaPshot Typing of Mitochondrial DNA CodingRegion Variants
Antonio Salas, Beatriz Quintáns, and Vanesa Álvarez-Iglesias ........ 19715 Typing of Y Chromosome SNPs With Multiplex PCR Methods
Juan J. Sanchez, Claus Børsting, and Niels Morling ......................... 20916 Y Chromosome SNP Analysis Using Single-Base Extension:
A Hierarchical Multiplex DesignMaría Brión ....................................................................................... 229
17 SNaPshot for Pharmacogenetics by MinisequencingKlaus Bender ..................................................................................... 243
18 Methods for the Study of Ancient DNAChristine Keyser-Tracqui and Bertrand Ludes .................................. 253
19 Protocols for Ancient DNATypingCristian Capelli and Frank Tschentscher .......................................... 265
Index ............................................................................................................ 279
ix
Contributors
ANTONIO ALONSO • Instituto Nacional de Toxicología, Servicio de Biología,Madrid, Spain
VANESA ÁLVAREZ-IGLESIAS • Institute of Legal Medicine, Faculty of Medicine,University of Santiago de Compostela, Santiago de Compostela, Galicia,Spain
CÍNTIA ALVES • Instituto de Patologia e Imunologia Molecular daUniversidade do Porto, Porto, Portugal
MARIE ALLEN • Department of Genetics and Pathology, Uppsala University,Uppsala, Sweden
HANNA ANDRÉASSON • Department of Genetics and Pathology, UppsalaUniversity, Uppsala, Sweden
KLAUS BENDER • Institut für Rechtsmedizin, Mainz, GermanyCLAUS BØRSTING • Department of Forensic Genetics, Institute of Forensic
Medicine, University of Copenhagen, Copenhagen, DenmarkMARÍA BRIÓN • Institute of Legal Medicine, Faculty of Medicine, University
of Santiago de Compostela, Santiago de Compostela, Galicia, SpainJOHN M. BUTLER • Biotechnology Division, National Institute of Standards
and Technology, Gaithersburg, MDCRISTIAN CAPELLI • Institute of Legal Medicine, Catholic University of Rome,
Rome, ItalyANGEL CARRACEDO • Institute of Legal Medicine, Faculty of Medicine,
University of Santiago de Compostela, Santiago de Compostela, Galicia,Spain
ANNA-MARIA DIVNE • Department of Genetics and Pathology, UppsalaUniversity, Uppsala, Sweden
KRISTINA FAHR • Bruker Daltonik GmbH, Leipzig, GermanyLEONOR GUSMÃO • Instituto de Patologia e Imunologia Molecular
da Universidade do Porto, Porto, PortugalCHRISTINE KEYSER-TRACQUI • Laboratoire d’Anthropologie Moléculaire,
Institut de Médecine Légale, Strasbourg, FranceSILVANO KÖCHL • Institute of Legal Medicine, University of Innsbruck,
Innsbruck, AustriaMARKUS KOSTRZEWA • Bruker Daltonik GmbH, Leipzig, GermanyMARÍA VICTORIA LAREU • Institute of Legal Medicine, Faculty of Medicine,
University of Santiago de Compostela, Santiago de Compostela, Galicia,Spain
JAMES LEE • Department of Forensic Science, Central Police University,Kuei-San, Taoyuan, Taiwan, Republic of China
ADRIAN LINACRE • Forensic Science Unit, University of Strathclyde,Glasgow, UK
BERTRAND LUDES • Laboratoire d’Anthropologie Moléculaire, Institutde Médecine Légale, Strasbourg, France
PABLO MARTÍN • Instituto Nacional de Toxicología. Servicio de Biología,Madrid, Spain
NIELS MORLING • Department of Forensic Genetics, Institute of ForensicMedicine, University of Copenhagen, Copenhagen, Denmark
HARALD NIEDERSTÄTTER • Institute of Legal Medicine, University ofInnsbruck, Innsbruck, Austria
WALTHER PARSON • Institute of Legal Medicine, University of Innsbruck,Innsbruck, Austria
CHRISTOPHER PHILLIPS • Institute of Legal Medicine, Faculty of Medicine,University of Santiago de Compostela, Santiago de Compostela, Galicia,Spain
CLARA RUIZ PONTE • Institute of Legal Medicine, Faculty of Medicine,University of Santiago de Compostela, Santiago de Compostela, Galicia,Spain
BEATRIZ QUINTÁNS • Institute of Legal Medicine, Faculty of Medicine,University of Santiago de Compostela, Santiago de Compostela, Galicia,Spain
ANTONIO SALAS • Institute of Legal Medicine, Faculty of Medicine,University of Santiago de Compostela, Santiago de Compostela, Galicia,Spain
JUAN J. SANCHEZ • Department of Forensic Genetics, Institute of ForensicMedicine, University of Copenhagen, Copenhagen, Denmark
PAULA SÁNCHEZ-DIZ • Institute of Legal Medicine, Faculty of Medicine,University of Santiago de Compostela, Santiago de Compostela, Galicia,Spain
BEATRIZ SOBRINO • Institute of Legal Medicine, Faculty of Medicine, Universityof Santiago de Compostela, Santiago de Compostela, Galicia, Spain
FRANK TSCHENTSCHER • Institut für Rechtsmedizin, UniversitaetsklinikumEssen, Essen, Germany
PETER M. VALLONE • Biotechnology Division, National Instituteof Standards and Technology, Gaithersburg, MD
x Contributors
Forensic DNA-Typing Technologies 1
1
From: Methods in Molecular Biology, vol. 297: Forensic DNA Typing ProtocolsEdited by: A. Carracedo © Humana Press Inc., Totowa, NJ
1
Forensic DNA-Typing TechnologiesA Review
Angel Carracedo and Paula Sánchez-Diz
SummarySince the discovery of deoxyribonucleic acid (DNA) profiling in 1985, forensic genet-
ics has experienced a continuous technical revolution, both in the type of DNA markersused and in the methodologies or its detection. Highly informative and robust DNA-typing systems have been developed that have proven to be very effective in the indi-vidualization of biological material of human origin. DNA analysis has become thestandard method in forensic genetics used by laboratories for the majority of forensicgenetic expertise and especially in criminal forensic casework (stain analysis and hairs)and identification.
Key Words: DNA analysis; DNA profiling; DNA typing; forensic genetics.
1. IntroductionDeoxyribonucleic acid (DNA) profiling, or typing, as it is now known, was
first described in 1985 by Alec Jeffreys and co-workers (1) ,and it has had atremendous impact in forensic genetics. Prior to that time, all forensic geneticcasework (e.g., paternity testing, criminal casework, individual identification)was performed using classical serological genetic markers. Blood groups,human leukocyte antigen (HLA), and polymorphic protein and enzymes wereused for solving forensic genetic casework using immunological and electro-phoretic methodologies. These genetic markers were nevertheless limited whenit was necessary to analyze minimal or degraded material, which is commonlyinvolved in forensic cases. It was, in addition, difficult to analyze biologicalmaterial other than blood, and therefore the information obtained from hair,saliva, and even semen in rape cases was rather limited.
2 Carracedo and Sánchez-Diz
Because the polymorphic proteins and enzymes were infrequent, it was nec-essary to obtain as much information as possible. For this reason, sophisticatedelectrophoretic methods, such as isoelectric focusing, immobilines, or hybridisoelectric focusing, were developed and applied. Despite these methods, theinformation that the forensic geneticists were able to report in many cases wasclearly insufficient.
Since the discovery of polymorphisms in repetitive DNA by Jeffreys et al.(1), highly informative and robust DNA-typing systems have been developedthat are quite powerful for the individualization of biological material of humanorigin.
DNA typing has advantages over traditional protein, the first of which beingit is more informative and can be analyzed in minute or degraded materialbecause DNA is physically much more resistant to degradation than proteins.In addition, the same DNA genotype can be obtained from any tissue (i.e.,blood, saliva, semen, hair, skin, bones), whereas the analysis of protein mark-ers is restricted to cells where these proteins are expressed.
DNA analysis has become the standard method in forensic genetics used bylaboratories for the majority of forensic genetic expertise and especially incriminal forensic casework (stain analysis and hairs) and identification.
2. DNA PolymorphismsHidden in the approx 3 billion base pairs of DNA of the haploid human
genome are an estimated 35,000 genes (2). All human genes are encoded inapprox 10% of the human genome. Thus, the great majority (more than 90%)of the human genome represents “noncoding” parts of the genome becausethey do not contain genetic information directly relevant for protein synthesis.Genetic variation is rather limited in coding DNA with the exception of theHLA region. This is the result of the fact that expressed genes are subjected toselection pressure during evolution to maintain their specific function. In con-trast, the noncoding part of the genome is not mainly controlled by selectionpressure, and thus mutations in these regions are usually kept and transmittedto the offspring, leading to a tremendous increase in genetic variability. There-fore, these regions are very appropriate for forensic genetics because they arevery informative and at the same time not useful for drawing conclusions aboutthe individual other than for identification purposes.
An important percentage of the noncoding DNA (30%) consists of repetitivesequences that can be divided into two classes: tandemly repetitive sequencesand interspersed elements. The majority of forensic typing systems in currentuse are based on genetic loci with tandem repetitive DNA sequences.
Tandemly repeated sequences can be found in satellite DNA, but from theforensic point of view, regions of repetitive DNA much shorter than satellite

Forensic DNA-Typing Technologies 3
DNA are much more interesting. These regions can be classified intominisatellites (1) and microsatellites or short tandem repeat (STRs) (3,4).Minisatellites, otherwise known as variable number of tandem repeats (VNTR)loci (5), are composed of sequence motifs ranging from around 15 to 50 bp inlength, reiterated tandemly for a total length of 500 bp to 20 Kb. STRs aremuch shorter. The repeat unit ranges from 2 to 6 bp for a total length between50 and 500 bp.
In addition, minisatellites and STRs have differences in their distribution inthe human genome and probably in their biological function. Thus,minisatellites are more common in subtelomeric regions, whereas STRs arewidely distributed throughout the human genome, occurring with a frequencyof one locus every 6–10 kb (6). The origin of the variability seems to be differ-ent as well. Although unequal crossing over and even gene conversion (7)are involved in the variability of minisatellites, replication slippage is mainlyinvolved in the origin of the variability in microsatellites (8).
The genetic variation between individuals in these minisatellites and STRsystems is mainly based on the number of tandemly arranged core repeat ele-ments, but it is based also on differences in the DNA sequence itself becausethe repeats can have slight differences in the sequence.
3. DNA-Typing MethodsTechnologies used for DNA typing for forensic purposes differ in their abil-
ity to differentiate two individuals and in the speed and sensitivity with whichresults can be obtained. The speed of analysis has dramatically improved forforensic DNA analysis. DNA testing that previously took more than 1 wk cannow be performed in a few hours.
Southern blotting with multi-locus and single-locus (SLP) DNA probes havebeen used for paternity testing and forensic stain typing, and they are still used(especially SLPs) by a few laboratories working in paternity testing
Briefly, the technique is as follows: First, the DNA is extracted and then cutby a specific enzyme (usually HinfI in Europe and HaeIII in the United States)into many small fragments. A tiny fraction of those fragments include the par-ticular minisatellite to be analyzed. The fragments are then separated by elec-trophoresis in submarine agarose gels using TAE or TBE as buffers. After anappropriate length of time, the fragments migrate different distances in theelectric field, depending mainly on their sizes, with the smaller ones migratingmore rapidly. DNA fragments are then chemically treated to separate the doublestrands into single ones.
Because the gels are difficult to work with, the single-stranded fragmentsare then transferred directly to a nylon membrane, to which they adhere. Thisprocess is called Southern blotting, named after its inventor (9). The next step

4 Carracedo and Sánchez-Diz
is to flood the membrane with a single-stranded probe, which will hybridizewith the DNA fragments that contain the target minisatellite sequence andadhere to it. The membrane is then washed several times to remove any probethat does not bind to this specific DNA sequence.
Probes can be labeled using isotopic or nonisotopic methods. Nonisotopicchemiluminescent methods are more popular than isotopic ones.
Whatever the labeling method is, the nylon membrane usually is placed onan x-ray film, with the final result of an autoradiograph with the bands of theminisatellite clearly impressed in the film. The process requires several daysfor sufficient radioactive decay to produce a visible band on the film.
Originally, multilocus probes were proposed for forensic genetic analysis.However, this type of probe was not very successful in the forensic fieldbecause despite its informativeness, statistical problems of evaluation of theevidence in cases of match and standardization problems arose. For these rea-sons, this probe was substituted in the forensic field by the analysis of VNTRsusing SLPs under high-stringency conditions.
Until the introduction of STR analysis by polymerase chain reaction (PCR),minisatellite analysis with single-locus probes was very popular in forensiclaboratories. Nowadays, it is still used in some laboratories, particularly forpaternity testing analysis.
The main advantage of SLP analysis is the enormous variability of some ofthe minisatellites and the adequate knowledge of the mutation rate in some ofthem. The main disadvantages are the time needed for the analysis and espe-cially the need for the relatively large amount of nondegraded DNA requiredfor SLP typing. Because DNA extracted from forensic specimens is oftendegraded because of environmental conditions, these techniques have oftenfailed to produce reliable results. PCR has overcome these difficulties, and ithas strongly enhanced the usefulness of DNA profiling techniques in forensicscience.
PCR is a technique for the in vitro amplification of specific DNA sequencesby the simultaneous primer extension of complementary strands of DNA. ThePCR method was devised and named by Mullis and colleagues at the CetusCorporation (10), although the principle had been described in detail byKhorana et al. (11) more than a decade earlier. The use of PCR was limiteduntil heat-stable DNA polymerases became available. DNA polymerases con-duct the synthesis off a complementary strand of DNA in the 5' to 3' directionusing a single-stranded template, but starting from a double-stranded region.The PCR uses the same principle but uses two primers, each complementary toopposite strands of the region of DNA that have been denatured by heating.The primers are arranged so that each primer extension reaction directs thesynthesis of DNA toward the other. This results in the novo synthesis of theregion flanked by the two primers.
Forensic DNA-Typing Technologies 5
Automated temperature cyclers (usually called thermocyclers) allow theexact control of successive steps of denaturation, annealing of the primers, andextension (when the DNA polymerase extends the primer by using a comple-mentary strand as a template). All these three steps constitute a cycle, and anormal PCR reaction consists of 20–25 cycles, allowing the formation of 2 20–
25 molecules from a single molecule of template DNA.Most PCR-based typing systems allow alleles to be identified as discrete enti-
ties, thus avoiding most of the statistical issues that arise in matching and bindingSLPs bands and making standardization easier. Also, apart from the increasedsensitivity inherent in any PCR technique, it is more likely to be successful inanalyzing old or badly degraded material mainly because of the small size ofsome of the DNA polymorphisms (SNPs and STRs) susceptible to analysis byPCR (12,13).
Once PCR has been used to generate a large number of copies of a DNAsegment of interest, different approaches may be taken to detect genetic varia-tion within the segment amplified. Because 106 or more copies of the targetsequence can be produced, it is possible to use nonisotopic methods of detec-tion. A number of imaginative methods for PCR product detection have beendescribed.
The first one was the use of sequence-specific oligonucleotide (SSO) probes(14) to detect variation in HLA–class II genes, especially in the HLA DQA1system (15). An SSO probe is usually a short oligonucleotide (15–30 nucle-otides in length) with a sequence exactly matching the sequence of the targetallele. The SSO probe is mixed with dissociated strands of PCR product undervery stringent hybridization conditions such that the SSO and the PCR productstrand will be hybridized if there is a perfect sequence complimentary but willnot be if there are different sequences. The classical format for the use of SSOprobes is to spot dissociated PCR product strands onto a nitrocellulose ornylon membrane and to probe the membranes with labeled SSO; because ofthe fact that the samples are spotted as a “dot” on the membrane, this format isknown as dot blotting. A reverse dot-blot format is much more commonly used(16). With this format (which has its antecedents in affinity chromatography),the SSO is immobilized on the membrane and is used to capture PCR productscontaining biotin label in the primers. Several genetic loci can be analyzed bythis technology using commercially available kits. The AmpliType PM PCRamplification kit (Perkin-Elmer, Foster City, CA) was very popular in forensiclaboratories some years ago. With this kit, the loci HLA DQA1, LDLR, GYPA,HBGG, D7S8, and GC are amplified in a multiplex fashion. The last five locilisted are typed simultaneously in a single reverse dot-blot strip containingASO probes; HLA DQA1 must be typed in a separate strip. The system wasvalidated for forensic analysis (17), and it is still used by some laboratoriesalthough most of them currently prefer to use more informative STR systems.
6 Carracedo and Sánchez-Diz
The efforts of forensic scientists have mainly addressed the amplification offragment-length polymorphisms. The minisatellite D1S80 (pMCT118) was thefirst to be applied to the forensic routine (18), but these systems have beensubstituted by STRs. The analysis of STRs by PCR is now the method of choicefor forensic identification. Dinucleotide STRs are the most common STRs inthe human genome and are the genetic markers most commonly used for link-age analysis, although they are not being used in forensic science. The reasonis that analysis of these STRs has been affected by strand slippage duringamplification, producing artifactual stutter bands (19). Nevertheless, tetra andpentanucleotide repeats appear to be less prone to slippage and are more suit-able for forensic purposes. The percent of stutters is very interesting to identifyand select ideal STRs for forensic purposes because having a low percentageof stutters is critical for the analysis of mix stains. Some tetranucleotide STRs(such as TH01) are known to have a good behavior regarding these character-istics, but pentanucleotides are ideal systems for analyzing mixtures.
According to its structure, STRs range from the extremely complex STRs tothe most simple (20). Complex STRs have the advantages of hypervariability.Simple STRs have the advantages of easy standardization and low mutationrates. Mutation events are more frequent in the male germ line, and the rates ofdifferent loci can differ by several orders of magnitude, the structure and lengthbeing the most influential factors in the rate (21). In addition to the character-istics already mentioned, the selection of ideal STRs for forensic purposesinclude the analysis of other artifactual bands, the robustness, and the size. Ingeneral, short sizes are desirable because the size of the amplified product iscritical in degraded samples, and small fragments can be amplified when largerfragments failed (13).
Another important fact is the possibility of amplifying multiple STR loci ina single multiplex reaction. This coupled with the direct detection of amplifiedproducts to polyacrylamide gels, makes STR DNA profiling amenable to auto-mation. For this reason, the ability to be included in multiplexes is anothercharacteristic that should be analyzed for the selection of good STRs for foren-sic purposes.
STRs were firstly analyzed in manual electrophoretic systems. Denaturingpolyacrylamide gels are recommended for standardization purposes, given thatwith native gels sequence variation can also be detected making the typingprone to errors. STR electrophoretic mobility under native and denaturing con-ditions should also be checked since some STRs (especially AT-rich ones)have been shown to have anomalous mobility in polyacrylamide gels (22).
The introduction of fluorescent-based technology and the use of DNAsequencers have revolutionized the field, allowing the typing of large mul-tiplexes (including up to 10 systems) as well as the automation of the typing

Forensic DNA-Typing Technologies 7
procedure. Commercially available STR multiplexes for manual electro-phoretic systems are available, but the major advantages of the use of sequenc-ers is automation and the possibility of using intelligent systems ofinterpretation. The use of sequence reference allelic ladders is essential forSTR typing. In general, the reference allelic ladders comprise most of the alle-les of the system, but intermediate alleles are always possible even in the mostsimple STRs. Interpretation guidelines have been produced (23,24) to distin-guish these intermediate alleles and can be easily implemented in automaticsequencers. There are many multiplexes commercially available. A very popu-lar one is the SGM Plus (Applied Biosystems), which comprises 10 loci-HUMFIBRA/FGA, HUMVWFA, HUMTH01, D18S51, D21S11, D6S477,D8S1179, D16S539, D19S433, and amelogenine. Promega (Madison, WI)multiplexes are also very popular, especially in the laboratories using manual elec-trophoretic systems or monochromatic sequencing platforms. But the extremelydiscriminative 15-plexes are becoming more and more popular and, amongthese, the Poweplex16 (Promega) and the Identifiler (Applied Biosystems) arethe more commonly used by forensic labs.
In general, the combined discrimination power of STRs is enormous and theprobabilities of two unrelated individuals matching by chance (pM) are lower10–15 for some of these large multiplexes.
4. STRs in Sexual Chromosomes and Mitochondrial (mt)DNAY chromosome-specific polymorphisms have proven to be especially useful
in forensic work. The applications of Y polymorphisms include deficiency pater-nity testing, when a male offspring is in question, to different applications incriminal casework. Y polymorphisms are especially interesting in the analysisof male DNA fraction in stains involving male/female mixtures, the most com-mon biological material available in sexual crimes. Especially important is theuse of these markers in cases where preferential sperm DNA extractions fails(this is estimated to occur in 5–15% of forensic cases) and also in rapes com-mitted by azoospermic individuals. Although the variation in the Y chromo-some is low, the nonpseudoautosomal region still bears different kinds ofpolymorphisms, including biallelic markers, STRs, and minisatellites. SNPsand STRs are the most interesting. The most-used Y STRs are the trinucleotiderepeat DYS392 and the tetranucleotide repeats DYS19, DYS385, DYS389-I,DYS389-II, DYS390, DYS391, and DYS393. This STRs comprises the so-calledminimum Y STR haplotype (25), but new STRs have recently been described(26,27). Also, commercially available Y-STR plexes have been recently intro-duced.
As for mtDNA, statistical interpretation in cases of match is more compli-cated and appropriate corrections taking into account population substructure
8 Carracedo and Sánchez-Diz
and sampling errors need to be performed. Population compilations are there-fore very important and many efforts have been done regarding this (28). Areview and a compilation of recent works in the field can be found in reference(29). STRs in the X-chromosome are actually being introduced (30), and theyare of interest for some deficiency paternity testing cases.
Analysis of the mtDNA control region is an efficient method for the studyand comparison of bones, old and degraded DNA and, especially, the analysisof telogenic hairs.
In these cases, samples of mtDNA variation can be analyzed using a varietyof strategies. The combination of PCR amplification with direct DNA sequenc-ing usually is the ultimate choice for identification, and it has been proven tobe a reliable and reproducible method in forensic casework (31).
Analysis of mtDNA is a valid method to be applied in forensic genetics andit is accepted in courts all over the world. However, problems such as mutationrate, heteroplasmy, the statistical approach, make sometimes the interpetationdifficult. A good review of mtDNA analysis in forensics can be found in refer-ence (32). ISFG DNA Commission recommendations and European DNA Pro-filing Group recommendations on the use of mtDNA, including nomenclature,prevention of contamination (aspect that it is crucial in mtDNA analysis) andstatistical interpretation have been recently published (33,34).
5. Future Perspectives: SNP TypingSingle nucleotide polymorphisms (SNPs) represent the most abundant form
of genomic sequence variation among individuals: 3 million common SNPswith a population frequency of more than 5% have been estimated to be presentin the human genome.
SNPs have a number of characteristics that make them very appropriate forforensic studies. First, they have lower mutation rates than STRs, and this isvaluable for paternity testing. Second, they can be analyzed in short ampliconsand, in general, short sizes are desirable because the size of the amplified prod-uct is critical for the successful amplification of degraded samples. Finally,they are very suitable for analysis using high-throughput technologies, whichhave become increasingly necessary because of the implementation of largecriminal databases in European countries and for the need to perform largepopulation studies that provide precise estimations of gene frequencies essen-tial for the correct interpretation of forensic cases.
It is now clear that SNP typing on a large scale is and will be of primeimportance in human genetics and particularly valuable in the identification ofgenes that predispose individuals to common, multifactorial disorders by usinglinkage disequilibrium mapping. In addition, there are crucial markers for phar-macogenetics and pharmacogenomics. These potential applications of SNP

Forensic DNA-Typing Technologies 9
typing, together with progress in identifying large sets of SNPs, are the drivingforces behind intense efforts to establish the technology for large-scale analy-sis of SNPs.
A great variety of chemistries and detection platforms have been proposedfor SNP typing (see Chapter 6). There is not a single ideal method for typingSNPs, and the choice depends on both the need and the field of application, butfor most of the applications (forensics included) the choice of the method mustbe a high-throughput technique that can be easily applied in molecular labs.
References
1. Jeffreys, A. J., Wilson, V., and Thein, S. L. (1985) Hypervariable minisatelliteregions in human DNA. Nature 314, 67–73.
2. The International Human Genome Mapping Consortium. (2001) Nature 409, 934.3. Litt, M., and Luty, J. A. (1989) A hypervariable minisatellite revealed by in vitro
amplification of a dinucleotide repeat within the cardiac muscle actin gene. Am. J.Hum. Genet. 44, 397–401.
4. Tautz, D. (1989) Hypervariability of simple sequences as a general source forpolymorphic DNA markers. Nucleic Acid Res. 17, 6463–6471.
5. Nakamura, Y., Leppert, M., O’Connell, P., Wolff, R., Holm, T., Culver, M., et al.(1987) Variable number of tandem repeats (VNTR) markers for human gene map-ping. Science 235, 1616–1622.
6. Beckman J. S., and Weber, J. L. (1992) Survey of human and rat microsatellites.Genomics 12, 627–631.
7. Jeffreys, A. J., Tamaki, K., MacLeod, A., Monckton, D. G., Neil, D. L., andArmour, J. A.L. (1994) Complex gene conversion events in germline mutation athuman minisatellites. Nat. Genet. 6, 136–145.
8. Di Rienzo, A., Peterson, A. C., Garza, J. C., Valdes, A. M., Slatkin, M., andFreimer, N. B. (1994) Mutational processes of simple-sequence repeat loci inhuman populations. Proc. Natl. Acad. Sci. USA 91, 3166–3170.
9. Southern, E. M. (1975) Detection of specific sequences among DNA fragmentsseparated by gel electrophoresis. J. Mol. Biol. 98, 503–517.
10. Mullis, K., and Faloona, F. (1987) Specific synthesis of DNA in vitro via poly-merase-catalyzed chain reaction, in Methods in Enzymology (Wu, R., ed.), Aca-demic Press, New York, pp. 335–350.
11. Kleppe, K., Ohstuka, E., Kleppe, R., Molineux, L., and Khorana, H. G. (1971)Studies on polynucleotides. XCVI. Repair replications of short synthetic DNA’sas catalyzed by DNA polymerases. J. Mol. Biol. 56, 341–361.
12. Hagelberg, E., Sykes, B., and Hedges, R. (1989) Ancient bone DNA amplified.Nature 342, 485.
13. Alvarez-García, A., Muñoz, I., Pestoni, C., Lareu, M. V., Rodríguez-Calvo, M.S., and Carracedo, A. (1996) Effect of environmental factors on PCR-DNA analy-sis from dental pulp. Int. J. Legal Med. 109, 125–129.

10 Carracedo and Sánchez-Diz
14. Conner, B. J., Reyes, A. A., Morin, C., Itakura, K., Teplitz, R. L., and Wallace, R.B. (1983) Detection of sickle cell beta S-globin allele by hybridization with syn-thetic oligonucleotides. Proc. Natl. Acad. Sci. USA 80, 278–282.
15. Saiki, R., Bugawan, T. L., Horn, T. G., Mullis, K. B., and Erlich, H. A. (1986)Analysis of enzymatically amplified beta-globin and HLA-DQ alpha DNA withallele-specific oligonucleotide probes. Nature 324, 163.
16. Saiki, R. K., Walsh, P. S., Levenson C. H., and Erlich, H. A. (1989) Genetic analy-sis of amplified DNA with immobilized sequence-specific oligonucleotide probes.Proc. Natl. Acad. Sci. USA 86, 6230–6234.
17. Gross, A. M., and Guerrieri, R. A. (1996) HLA DQA1 and Polymarker valida-tions for forensic casework: standard specimens, reproducibility, and mixed speci-mens. J. Forensic Sci. 41, 1022–1026 .
18. Budowle, B., Giusti, A. M., and Allen R. C. (1990). Analysis of PCR products(pMCT118) by polyacrylamide gel electrophoresis, in Advances in ForensicHaemogenetics (Polesky, H. F., and Mayr, W. R., eds), Springer, Berlin, 148–150.
19. Hauge X. Y., and Litt, M. (1993) A study of the origin of “shadow bands” seenwhen typing dinucleotide repeat polymorphisms by the PCR. Hum. Mol. Genet. 2,411–415.
20. Urquhart, A., Kimpton, C., Downes, T. J., and Gill, P. (1994) Variation in shorttandem repeat sequences-a survey of twelve microsatellite loci for use as forensicidentification markers. Int. J. Legal Med. 107, 13–20.
21. Brinkmann, B., Klintschar, M., Neuhuber, F., Hühne, J., and Rolf, B. (1998) Muta-tion rate in human microsatellites: influence of the structure and length of the tan-dem repeat. Am. J. Hum. Genet. 62, 1408–1415.
22. Lareu, M. V., Pestoni, C., Phillips, C., Barros, F., Synder Combe-Court, D., Lin-coln, P., et al. (1998) Normal and anomalous electrophoretic behaviour of PCR-based DNA polymorphisms in polyacrylamide gels. Electrophoresis 19, 1566–1573.
23. Gill, P., Sparkes, R., and Kimpton, C. (1997) Development of guidelines to desig-nate alleles using an STR multiplex system. Forensic Sci. Int. 89, 185–197.
24. Gill, P., Whitaker, J., Flaxman, C., Brown, N., and Buckleton, J. (2000) An inves-tigation of the rigor of interpretation rules for STRs derived from less than 100 pgof DNA. Forensic Sci. Int. 112, 17–40.
25. Kayser, M., Cagliá, A., Corach, D., Fretwell, N., Gehrig, C., Graziosi, G., et al.(1997) Evaluation of Y-chromosomal STRs: a multicenter study. Int. J. LegalMed. 110, 125–133.
26. White, P. S., Tatum, O. L., Deaven, L. L., and Longmire, J. L. (1999) New, male-specific microsatellite markers from the human Y chromosome. Genomics 57,433–437.
27. Ayub, Q., Mohyuddin, A., Qamar, R., Mazhar, K., Zerjal, T., Mehdi, S., et al.(2000) Identification and characterization of novel human Y chromosomalmicrosatellites from sequences database information. Nucl. Acids Res. 28, e8.
28. Roewer, L., Krawczak, M., Willuweit, S., Nagy, M., Alves, C., Amorim, A., et al.(2001) Online reference database of European Y-chromosomal short tandem re-peat (STR) haplotypes. Forensic Sci. Int. 118, 106–113
Forensic DNA-Typing Technologies 11
29. Roewer, L. (2001) Y chromosome polymorphisms. Forensic Sci. Int. 118, 105.30. Hering, S., and Szibor, R. (2000) Development of the X-linked tetrameric
microsatellite marker DXS9898 for forensic purposes. J. Forensic Sci. 45, 929–931.31. Carracedo, A., D’Aloja, E., Dupuy, B., Jangblad, A., Karjalainen, M., Lambert, C.,
et al. (1998) Reproducibility between laboratories of mtDNA analysis: a report ofthe European DNA Profiling Group (EDNAP). Forensic Sci. Int. 97, 165–170.
32. Holland, M. M., and Parsons, T. J. (1999) Mitochondrial DNA analysis-valida-tion and use for forensic casework. Forensic Sci. Rev. 11, 1–25.
33. Carracedo, A., Bär, W., Lincoln, P. J., Mayr, W., Morling, N., Olaisen, B., et al.(2000). DNA Commission of the International Society for Forensic Genetics:guidelines for mitochondrial DNA typing. Forensic Sci. Int. 110, 79–85.
34. Tully, G., Bär, W., Brinkmann, B., Carracedo, A., Gill, P., Morling, N., Parson,W., and Schneider, P. (2001) Considerations by the European DNA Profiling(EDNAP) group on the working practices, nomenclature and interpretation ofmitochodrial DNA profiles. Forensic Sci. Int. 124, 83–91.

Extraction and Quantitation 13
13
From: Methods in Molecular Biology, vol. 297: Forensic DNA Typing ProtocolsEdited by: A. Carracedo © Humana Press Inc., Totowa, NJ
2
DNA Extraction and Quantitationof Forensic Samples Using the Phenol–ChloroformMethod and Real-Time PCR
Silvano Köchl, Harald Niederstätter, and Walther Parson
SummaryForensic laboratories are increasingly confronted with problematic samples from the
scene of crime, containing only minute amounts of deoxyribonucleic acid (DNA),which may include polymerase chain reaction (PCR)-inhibiting substances. EfficientDNA extraction procedures, as well as accurate DNA quantification methods, are criti-cal steps involved in the process of successful DNA analysis of such samples. The phe-nol–chloroform method is a sensitive method for the extraction of DNA from a widevariety of forensic samples, although it is known to be laborious compared with single-tube extraction methods. The relatively high DNA recovery and the quality of the extractedDNA speak for itself. For reliable and sensitive DNA quantitation, the application of real-time PCR is described. We modified a published real-time PCR assay, which allows forthe combined analysis of nuclear and mitochondrial DNA, by introducing 1) improvedhybridization probes with the use of minor groove binders; 2) an internal positive con-trol (for both nuclear and mitochondrial DNA) for the detection of PCR inhibitors; and3) different amplicon lengths for the determination of the degradation state of the DNA.The internal positive controls were constructed by site directed mutagenesis by overlapextension of the wild-type mitochondrial and nuclear DNA target with the advantagethat no additional probes, which are cost-intensive, are required. The quantitation sys-tem is accomplished as a modular concept, which allows for the combined determinationof the above-mentioned features (quantity/inhibition or quantity/degradation) dependingon the situation,
Key Words: Real-time PCR (rtPCR); phenol–chloroform method; forensic DNAextraction.

14 Köchl, Niederstätter, and Parson
1. IntroductionSuccessful deoxyribonucleic acid (DNA) profiling of forensic samples is
largely dependent on the quality and the amount of DNA that is recoveredfrom the sample in question. This is of particular importance when caseworksamples are to be analyzed, which frequently involve difficult specimen thatcontain only minute amounts of DNA and are likely to have suffered environ-mental stress (DNA degradation). Apart from that, the quality of a forensictrace is impacted by the nature of the substrate on which it was deposed (e.g.,blood on denim). When the DNA is extracted from the source, trace compoundsof the substrate may be coextracted, which can further influence the typingprocess. As a consequence, the efficiency and sensitivity of the extraction pro-cedure are critical parameters that define the suitability of an extraction methodfor forensic samples.
The phenol–chloroform method (1) is a well-established forensic extractionprocedure even though it is known to be laborious compared with alternativeapproaches and involves toxic reagents, such as phenol, which requires specialsafety precautions in the laboratory (laminar flow fume hood). As a matter offact, phenol–chloroform extraction is still the method of choice for samplescontaining only very little amounts of DNA (e.g., hair shafts, bone samples,decomposed samples) or samples suspected to contain polymerase chain reac-tion (PCR)-inhibiting substances. Although this method involves intensivemanual interaction—the sample is handled through at least three generationsof reaction tubes—the DNA recovery of the phenol–chloroform extraction isknown to be relatively high.
To control the success of the extraction step, DNA quantitation usually isperformed for forensic casework material, although the usability of a sample inthe forensic context is determined by the ability to generate a DNA profileafter all. The information on the DNA quantity is mostly used to estimate theappropriate amount of DNA extract to be added to the PCR master mix to avoidoverloading with excess of DNA. Common quantitation techniques involve pho-tometric/fluorometric determination of the DNA amount, which are insensi-tive to the source of DNA, in contrast to specific DNA-based hybridizationassays (2–4). Both of these are less sensitive to the detection of DNA com-pared with the subsequent PCR assay, that is, extracts, in which quantitationfailed, may still bring a useful DNA profile. A negative quantitation resultdoes not necessarily indicate the absence of DNA—in contrast, the actual DNAamount may be masked as a result of substances included in the extract thatinterfere with the detection method. This is why some laboratories refrain fromquantitation per se and directly apply an aliquot of the extract to PCR (mostlysingleplex or small multiplexes) to estimate the quantity by analyzing the

Extraction and Quantitation 15
peak heights of the resulting DNA profile. Note that the latter method is notan explicit DNA quantitation method, but the estimate is based on the experi-ence of the individual laboratory.
In contrast to the above-mentioned quantitative techniques, real-time PCR(rtPCR) is a very sensitive, stable, reproducible, and specific DNA quantitationmethod and leads to directly applicable results because the amount of DNA isinferred by the same process (i.e. PCR), which is then used for DNA profiling.
Here, we describe a rtPCR assay that is based on the coamplification of anuclear DNA (nDNA) target (Retinoblastoma gene) and a mitochondrial DNA(mtDNA) target (spans over the genes for transfer ribonucleic acid lysine andATP synthase 8) modifying the method published by Andreasson et al. (5). Weadded the following three features to the assay. First, fluorescent probes with aminor groove binder (MGB; ref. 6) are used, which enhance the sensitivity ofthe hybridization and the PCR efficiency for the amplification of longerfragments. Second, an internal positive control (IPC) is coamplified withthe genome-specific target (either nDNA or mtDNA), which allows for thedetection of PCR inhibitor present in a sample. This information is useful forthe subsequent processing of the sample as (additional) purification or a dilu-tion of the DNA extract may be the consequence to overcome inhibition. Third,the degradation stage of the DNA can be determined by application of differ-ent amplicon lengths used for the quantitation process. This serves as basisfor further selection of amplification kits or locus-specific primer pairs andwhich helps with the interpretation of DNA profiles deduced from that extract.
1.1. Phenol–Chloroform Method
In general, this method involves disruption and lysis of the stain material,digestion of cell components and removal of contaminants by organic solvents.The DNA is finally recovered by alcohol and salt precipitation and subsequentrehydration. An alternative protocol involves the purification of the extractedDNA by means of column based methods instead of the alcohol precipitation (7).
Cell lysis is performed using an enzyme- and detergent-based buffer (Pro-teinase K with sodium dodecyl sulfate). Organic extraction is performed byadding an equal volume of water-saturated, buffered phenol to the aqueousDNA sample, vigorously vortexing the mixture, and centrifugation to allowphase separation. The upper, aqueous layer is carefully removed to a new tube,avoiding the phenol interface. This step is followed by the addition of chloro-form to extract residual phenol from the aqueous phase. The DNA is concen-trated by ethanol precipitation in the presence of salt. After washing with 70%ethanol, the pellet DNA is dried in a speed vac and dissolved in low salt buffer.This method is suitable for the extraction of DNA from a wide range of celltypes and stain materials.
16 Köchl, Niederstätter, and Parson
If the stain material consists of a mixture of sperm and nonsperm cells, suchas epithelial cells, the phenol–chloroform extraction is preceded by a step calleddifferential extraction (8). Differential extraction is a procedure in whichsperms are separated from the other cells before lysis and DNA extraction.This is accomplished by selective digestion of the nonsperm cell fraction andseparation of intact sperms by centrifugation. The nonsperm cell DNA is iso-lated under mild conditions that break only the epithelial cells but leave thesperm cells intact.
For the extraction of DNA from hairs, a buffer system containing ProteinaseK and Ca2+ instead of ethylene diamine tetraacetic acid (EDTA) improves theefficiency of hair digestion significantly, resulting in an enhanced success rate inDNA typing (9).
1.2. rtPCR Quantitation Using the TaqMan Assay
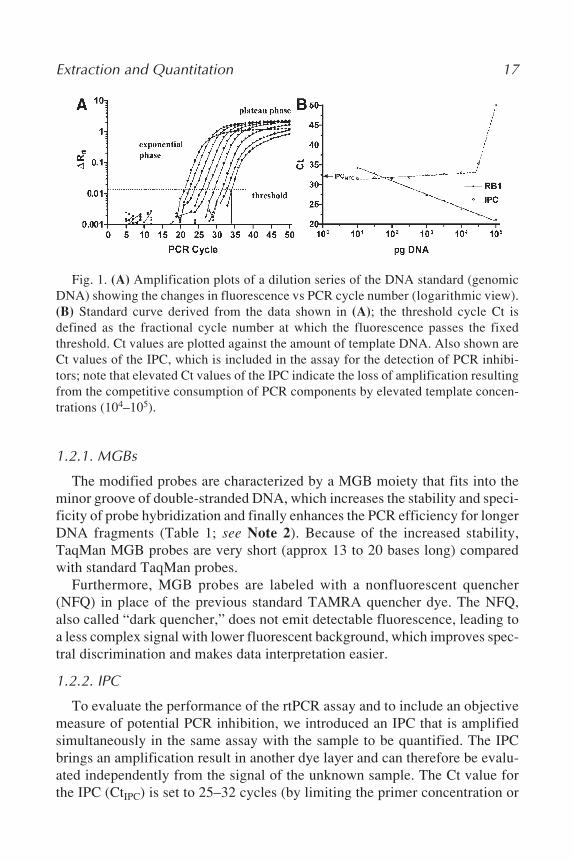
The TaqMan assay is a real-time, homogeneous PCR system in which thesample is amplified and typed simultaneously without the need for additionalmanipulations post-PCR. The assay uses standard PCR primers to generate anamplicon and an internal fluorescent hybridization probe (10), which is spe-cific for a sequence region within the amplicon. The assay is run on an instru-ment that is capable of measuring fluorescence directly through the lid of thereaction tube at each cycle of PCR—so that detection occurs online. A quenchermolecule is attached to the 3' end of the probe, so that the probe does not emitfluorescence in its normal state. During PCR, the amplicon accumulates andthe probe specifically binds to the product during the annealing phase. In theextension phase, Taq polymerase cleaves the probe via its 5'-exonuclease activ-ity and thus separates the fluorochrome and quencher molecules (11–14). At thispoint, fluorescent signal is emitted and detected. The course of the reaction canbe displayed by an amplification plot (Fig. 1A). The initial cycles of PCR, inwhich only little change in fluorescence occurs, are used to define the baselinefor the amplification plot. The threshold fluorescence signal is the level ofdetection or the point at which a reaction reaches a fluorescent intensity abovebackground. The threshold is set in the exponential phase of the amplificationfor the most accurate reading. The cycle at which the sample reaches this levelis called the cycle threshold (Ct; refs. 15 and 16). The ∆Rn-value (baseline-corrected endpoint reporter signal) is a measure of the amount of PCR productamplified in the course of real time PCR. When Ct values are plotted against thedecade log of the initial target copy number, a straight line is obtained (Fig. 1B).This line can be used to identify the dynamic range of the assay and can beused to quantify the amount of initial target DNA from an unknown sample bycalculating the actual template copy number from the derived Ct value (calibra-tion with known DNA standards required; see Note 1).
Extraction and Quantitation 17
1.2.1. MGBs
The modified probes are characterized by a MGB moiety that fits into theminor groove of double-stranded DNA, which increases the stability and speci-ficity of probe hybridization and finally enhances the PCR efficiency for longerDNA fragments (Table 1; see Note 2). Because of the increased stability,TaqMan MGB probes are very short (approx 13 to 20 bases long) comparedwith standard TaqMan probes.
Furthermore, MGB probes are labeled with a nonfluorescent quencher(NFQ) in place of the previous standard TAMRA quencher dye. The NFQ,also called “dark quencher,” does not emit detectable fluorescence, leading toa less complex signal with lower fluorescent background, which improves spec-tral discrimination and makes data interpretation easier.
1.2.2. IPC
To evaluate the performance of the rtPCR assay and to include an objectivemeasure of potential PCR inhibition, we introduced an IPC that is amplifiedsimultaneously in the same assay with the sample to be quantified. The IPCbrings an amplification result in another dye layer and can therefore be evalu-ated independently from the signal of the unknown sample. The Ct value forthe IPC (CtIPC) is set to 25–32 cycles (by limiting the primer concentration or
Fig. 1. (A) Amplification plots of a dilution series of the DNA standard (genomicDNA) showing the changes in fluorescence vs PCR cycle number (logarithmic view).(B) Standard curve derived from the data shown in (A); the threshold cycle Ct isdefined as the fractional cycle number at which the fluorescence passes the fixedthreshold. Ct values are plotted against the amount of template DNA. Also shown areCt values of the IPC, which is included in the assay for the detection of PCR inhibi-tors; note that elevated Ct values of the IPC indicate the loss of amplification resultingfrom the competitive consumption of PCR components by elevated template concen-trations (104–105).

18 Köchl, Niederstätter, and Parson
the copy number), to avoid troublesome competition between the amplifica-tion of the IPC and the genuine sample (see Note 3). PCR inhibitors in theDNA extract would be recorded by increased Ct values. Partial inhibitionwould result in Ct values between that of the negative controls (no templatecontrols) and the total amount of cycles used for PCR (see Note 4).
The IPCs were constructed by site-directed PCR mutagenesis by overlapextension (SOE; refs. 17–19) of the wild-type mtDNA and nuclear RB1 target.SOE results in the introduction of specific mutations in the modified templatediffering from the original sequence in a way that the modified template wouldnot be amplified with the conventional primers, whereas the modified primerswould only amplify the SOE product. This is true for both the nDNA and themtDNA target. This is why the mtDNA–SOE product can be used as IPC forthe quantitation of nDNA and the IPCnDNA as control for the quantitation ofmtDNA. SOE is a fast and technically simple approach for manipulating DNA-sequences. In general, four primers are needed to introduce site-specificmutation(s) (Fig. 2). Two PCRs are performed, each using a perfectly comple-mentary primer at the end of the sequence and a mismatched primer designedto introduce a mutation at a specific position. This results in overlapping frag-ments, in which the mutation is located in the region of the overlap (see Notes5,6). The overlapping fragments are then annealed to each other in a secondround of PCR where the entire mutated DNA fragment is amplified by meansof the two complementary primers at the end of this DNA fragment.
The advantages of this procedure are that IPCs can be easily designed andkept in house, minimizing the costs of the assay. Alternative IPCs would requireadditional probes, which are cost-intensive.
1.2.3. Checking for DNA Degradation
The use of various fragment lengths for the rtPCR quantitation of a specificDNA target allows for the determination of DNA degradation. The latter can
Table 1Apparent rtPCR Efficiency Using BHQ and MGB TaqMan Probesfor Different Amplicon Lengths
Fragment lengths for RB1 BHQ MGB
79-bp fragment 0.9896 (0.9496–1.0331) 0.9852 (0.9417–1.0332)156-bp fragment 0.8604 (0.8257–0.8981) 0.9795 (0.9576–1.0025)246-bp fragment 0.7222 (0.6919–0.7554) 0.8583 (0.7950–0.9318).
The rtPCR efficiency can be calculated from the slope of the standard curve by the formula E= (10–1/slope) – 1. The numbers in brackets show 95% confidence intervals.

Extraction and Quantitation 19
be assessed by comparing the amplification results of the different amplicons.These modifications upgrade the original rtPCR protocol to a modular conceptwhich, depending on the combination of the individual modules, can provideinformation both about the quantity and the quality of DNA by using only twofluorogenic oligoprobes. In Fig. 3, a selection of some of these possible combi-nations is displayed.
2. Materials
2.1. Phenol–Chloroform Method
1. Sterile distilled water.2. Hydrogen peroxide 30%.3. 1 M Tris-HCl solution, pH 8.0.4. 1 M Tris-HCl solution, pH 9.0.5. 0.5 M EDTA disodium salt.6. 5 M Sodium chloride.7. Ethanol 100%.
Fig. 2. First-round PCR: in two separate PCR reactions, two partially overlappingDNA fragments are amplified. The first primer pair is used to amplify the DNA thatcontains the mutation site together with upstream sequences. In this reaction, the reverseSOE primer (rMut) contains the mutation(s) to be introduced into the wild-type DNA-template. The second primer pair is used to amplify the DNA that contains the muta-tion site together with downstream sequences. In this reaction, the forward SOE primer(fMut) contains the mutation(s) to be introduced into the wild-type DNA-template.Second-round PCR: The overlapping fragments are mixed, denatured, annealed, andextended using the flanking primers F and R.

20 Köchl, Niederstätter, and Parson
8. Ethanol 70%.9. Proteinase K stock solution: 20 mg/mL (dissolve 100 mg of proteinase K in 5 mL
of sterile distilled water; store frozen in 1-mL aliquots).10. 1 M dithiothreitol (DTT) solution.11. Phenol solution (+ bottle of equilibration buffer for pH 8.0).12. Chloroform:isoamylalcohol solution 24:1.13. 3 M sodium acetate buffer solution, pH 5.2.14. 10% sodium dodecyl sulfate solution.15. Linear polyacrylamide(LPA; 5 mg/mL, Ambion).16. 1 M Calcium chloride solution.17. Extraction buffer (EB): 10 mM Tris-HCl, pH 8.0, 10 mM EDTA disodium salt,
pH 8.0; 100 mM sodium chloride; and 2% sodium dodecyl sulfate.18. Extraction buffer for hairs (EBH): 10 mM Tris-HCl, pH 8.0, 10 mM CaCl2,
100 mM sodium chloride, 2% sodium dodecyl sulfate.19. Sterile Petri dishes.
All extractions are performed in sterile 1.5-mL Sarstedt tubes with screwcaps.
2.2. rtPCR Quantitation
1. ExoSapIT Amersham/Pharmacia.2. TOPO TA Cloning Kit, Invitrogen Life Technologies.3. TaqMan® Universal PCR Master Mix, No AmpErase® UNG.
Fig. 3. Schematic representation of how the modular concept of rt PCR can be used tocheck besides DNA quantity for PCR inhibition or DNA degradation. Setup 1 allowssimultaneous quantitation of nuclear and mtDNA as published by Andreasson et al.(5). Setup 2 allows simultaneous quantitation of nuclear or mtDNA and detection ofPCR inhibitors. Setup 3 allows quantitation of nuclear DNA and detection of fragmen-tation but needs two separate reactions.
Extraction and Quantitation 21
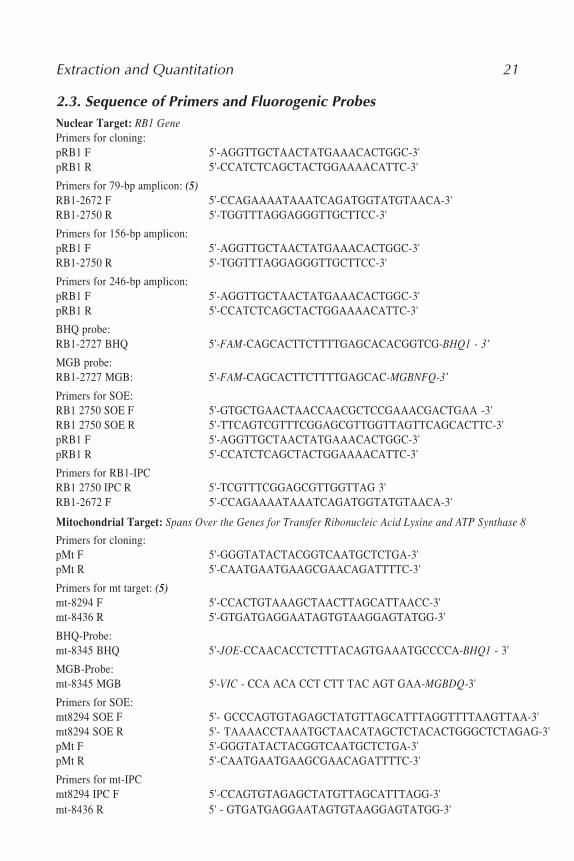
2.3. Sequence of Primers and Fluorogenic ProbesNuclear Target: RB1 GenePrimers for cloning:pRB1 F 5'-AGGTTGCTAACTATGAAACACTGGC-3'pRB1 R 5'-CCATCTCAGCTACTGGAAAACATTC-3'
Primers for 79-bp amplicon: (5)RB1-2672 F 5'-CCAGAAAATAAATCAGATGGTATGTAACA-3'RB1-2750 R 5'-TGGTTTAGGAGGGTTGCTTCC-3'
Primers for 156-bp amplicon:pRB1 F 5'-AGGTTGCTAACTATGAAACACTGGC-3'RB1-2750 R 5'-TGGTTTAGGAGGGTTGCTTCC-3'
Primers for 246-bp amplicon:pRB1 F 5'-AGGTTGCTAACTATGAAACACTGGC-3'pRB1 R 5'-CCATCTCAGCTACTGGAAAACATTC-3'
BHQ probe:RB1-2727 BHQ 5'-FAM-CAGCACTTCTTTTGAGCACACGGTCG-BHQ1 - 3'
MGB probe:RB1-2727 MGB: 5'-FAM-CAGCACTTCTTTTGAGCAC-MGBNFQ-3'
Primers for SOE:RB1 2750 SOE F 5'-GTGCTGAACTAACCAACGCTCCGAAACGACTGAA -3'RB1 2750 SOE R 5'-TTCAGTCGTTTCGGAGCGTTGGTTAGTTCAGCACTTC-3'pRB1 F 5'-AGGTTGCTAACTATGAAACACTGGC-3'pRB1 R 5'-CCATCTCAGCTACTGGAAAACATTC-3'
Primers for RB1-IPCRB1 2750 IPC R 5'-TCGTTTCGGAGCGTTGGTTAG 3'RB1-2672 F 5'-CCAGAAAATAAATCAGATGGTATGTAACA-3'
Mitochondrial Target: Spans Over the Genes for Transfer Ribonucleic Acid Lysine and ATP Synthase 8
Primers for cloning:pMt F 5'-GGGTATACTACGGTCAATGCTCTGA-3'pMt R 5'-CAATGAATGAAGCGAACAGATTTTC-3'
Primers for mt target: (5)mt-8294 F 5'-CCACTGTAAAGCTAACTTAGCATTAACC-3'mt-8436 R 5'-GTGATGAGGAATAGTGTAAGGAGTATGG-3'
BHQ-Probe:mt-8345 BHQ 5'-JOE-CCAACACCTCTTTACAGTGAAATGCCCCA-BHQ1 - 3'
MGB-Probe:mt-8345 MGB 5'-VIC - CCA ACA CCT CTT TAC AGT GAA-MGBDQ-3'
Primers for SOE:mt8294 SOE F 5'- GCCCAGTGTAGAGCTATGTTAGCATTTAGGTTTTAAGTTAA-3'mt8294 SOE R 5'- TAAAACCTAAATGCTAACATAGCTCTACACTGGGCTCTAGAG-3'pMt F 5'-GGGTATACTACGGTCAATGCTCTGA-3'pMt R 5'-CAATGAATGAAGCGAACAGATTTTC-3'
Primers for mt-IPCmt8294 IPC F 5'-CCAGTGTAGAGCTATGTTAGCATTTAGG-3'mt-8436 R 5' - GTGATGAGGAATAGTGTAAGGAGTATGG-3'

22 Köchl, Niederstätter, and Parson
4. Bovine serum albumin fraction V.5. Sterile distilled water.6. DNA standards.
3. Methods3.1. Phenol–Chloroform Method
3.1.1. Extraction of DNA From All Types of Cells and Stain MaterialsExcept Hairs and Sperm-Cell/Nonsperm-Cell Mixtures
1. To the sample add 500 µL of extraction buffer plus 20 µL of proteinase K (20mg/mL).
2. Vortex and incubate at 56°C overnight with agitation in a Thermomixer.3. Add an equal volume of buffered Phenol (pH 8.0; see Notes 7, 8), vortex, and
spin for 10 min at maximum speed in a microcentrifuge.4. Transfer the aqueous (upper) phase to a new microcentrifuge tube with 0.5 mL of
chloroform (see Note 9).5. Vortex and spin for 10 mins at maximum speed in a microcentrifuge.6. Transfer the aqueous (upper) phase to a new microcentrifuge tube with 50 µL of
3 M NaAc, pH 5.2.7. Add 0.8 mL of 100% EtOH, vortex, and precipitate at –20°C for at least 1.5 h
(see Notes 10, 11).8. Recover DNA by centrifugation for 30 min at maximum speed in a microcentri-
fuge and decant the supernatant.9. To the pellet add 1 mL of 70% EtOH and spin for 20 min at maximum speed in a
microcentrifuge.10. Dry pellet in a vacuum centrifuge for 30 min (see Note 12).11. Dissolve pellet in 50 µL of Tris buffer (10 mM, pH 9.0).
3.1.2. Extraction of DNA From Hairs
1. Cut hair in 1.5-mL Sarstedt tube already containing 500 mL of extraction bufferfor hairs (EBH).
2. Add 20 µL of proteinase K solution (20 mg/mL) and 20 µL of DTT solution.3. Proceed with Subheading 3.1.1. at step 2.
3.1.3. Extraction of DNA From Sperm-Cell/Nonsperm-Cell Mixtures
1. To the stain add 500 µL of extraction buffer plus 20 µL of proteinase K (20mg/mL).
2. Vortex and incubate at 37°C for 30 min with agitation in a Thermomixer.3. Remove stain material with tweezers sterilized in 10% H2O2 and spin for 5 min at
maximum speed in a microcentrifuge (see Note 13).4. Transfer supernatant (= nonsperm-cell fraction) to a new tube and proceed with
Subheading 3.1.1., step 2.5. Add 1 mL of sterile water to the pellet, vortex and spin for 5 min at maximum
speed in a microcentrifuge, and remove the supernatant.

Extraction and Quantitation 23
6. Repeat step 5 twice.7. Add 500 µL of extraction buffer plus 20 µL of proteinase K (20 mg/mL) plus
20 µL DTT (1 M) and proceed with Subheading 3.1.1., step 2.
3.2. rtPCR
3.2.1. Generation of IPCs by Site-Directed Mutagenesis by OverlapExtension (SOE) of the RB1 and mtDNA Target
1. Set up PCR for amplification of target sequence to be mutagenized by mixing thefollowing reagents:
RB-1 mtDNA
H2O, sterile 12.8 µL 12.8 µL10X PCR buffer 2 µL 2 µLdNTP mix (2.5 mM each) 1.6 µL 1.6 µLpRB1 F (10 µM) 0.6 µL –pRB1 R (10 µM) 0.6 µL –pMt F (10 µM) – 0.6 µLpMt R (10 µM) – 0.6 µLAmpli Taq Gold (5 u/µL) 0.4 µL 0.4 µLTemplate DNA (5 ng/µL) 2 µL 2 µL
20 µL 20 µL
2. Amplify using the denaturation, annealing, and extension times and temperatureslisted in the table below
Cycle number Denaturation Annealing Extension
Initial hold 10 min at 95°C30 cycles 15 s at 95°C 30 s at 61°C 45 s at 72°CFinal hold 10 min 72°C
3. Set up first-round SOE-PCR 1 by mixing the following reagents:
RB-1 mtDNA
H2O, sterile 12.9 µL 12.9 µL10X PCR buffer 2 µL 2 µLdNTP mix (2.5 mM each) 1.6 µL 1.6 µLpMt F (10 µM) – 1 µLmt8294 SOE R (10 µM) – 1 µLpRB1 F (10 µM) 1 µL –RB1 2750 SOE R (10 µM) 1 µL –Ampli Taq Gold (5 u/µL) 0.5 µL 0.5 µLAmplicon RB1 (1:10.000) 1 µL –-Amplicon mtDNA (1:100.000) – 1 µL
20 µL 20 mL
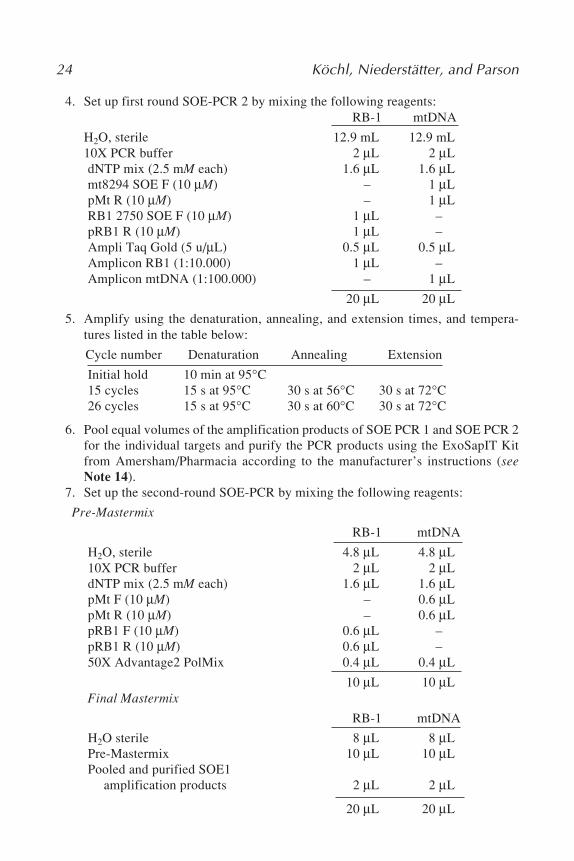
24 Köchl, Niederstätter, and Parson
4. Set up first round SOE-PCR 2 by mixing the following reagents:RB-1 mtDNA
H2O, sterile 12.9 mL 12.9 mL10X PCR buffer 2 µL 2 µLdNTP mix (2.5 mM each) 1.6 µL 1.6 µLmt8294 SOE F (10 µM) – 1 µLpMt R (10 µM) – 1 µLRB1 2750 SOE F (10 µM) 1 µL –pRB1 R (10 µM) 1 µL –Ampli Taq Gold (5 u/µL) 0.5 µL 0.5 µLAmplicon RB1 (1:10.000) 1 µL –Amplicon mtDNA (1:100.000) – 1 µL
20 µL 20 µL
5. Amplify using the denaturation, annealing, and extension times, and tempera-tures listed in the table below:
Cycle number Denaturation Annealing Extension
Initial hold 10 min at 95°C15 cycles 15 s at 95°C 30 s at 56°C 30 s at 72°C26 cycles 15 s at 95°C 30 s at 60°C 30 s at 72°C
6. Pool equal volumes of the amplification products of SOE PCR 1 and SOE PCR 2for the individual targets and purify the PCR products using the ExoSapIT Kitfrom Amersham/Pharmacia according to the manufacturer’s instructions (seeNote 14).
7. Set up the second-round SOE-PCR by mixing the following reagents:
Pre-Mastermix
RB-1 mtDNA
H2O, sterile 4.8 µL 4.8 µL10X PCR buffer 2 µL 2 µLdNTP mix (2.5 mM each) 1.6 µL 1.6 µLpMt F (10 µM) – 0.6 µLpMt R (10 µM) – 0.6 µLpRB1 F (10 µM) 0.6 µL –pRB1 R (10 µM) 0.6 µL –50X Advantage2 PolMix 0.4 µL 0.4 µL
10 µL 10 µLFinal Mastermix
RB-1 mtDNA
H2O sterile 8 µL 8 µLPre-Mastermix 10 µL 10 µLPooled and purified SOE1
amplification products 2 µL 2 µL
20 µL 20 µL

Extraction and Quantitation 25
8. Amplify using the denaturation, annealing, and extension times and temperatureslisted in the table below:
Cycle number Denaturation Annealing Extension
Initial hold 2 min at 95°C5 cycles 15 s at 95°C 45 s at 72°C28 cycles 15 s at 95°C 30 s at 60°C 45 s at 72°CFinal hold 30 min at 72°C
9. Check amplicons on a gel and clone into TAvector according to the manufactur-ers instructions.
10. Verify the induced mutations and the correct sequences of the IPCs by sequencing.
3.2.2. rtPCR for Quantitation of nuclear DNA (+ mtIPC)
1. Set up PCR for quantitation of nuclear DNA (+ mtIPC) by mixing the followingreagents:
rtPCR Pre-Mastermix
10X BSA (2.5 mg/mL) 2 µLpRB1 F (10 µM) 0.6 µLRB1-2750 R (10 µM) 0.6 µLRB1-2727 MGB (10 µM) 0.4 µLmt-8294 IPC F (10 µM) 0.28 µLmt-8436 R (10 µM) 0.28 µLmt-8345 MGB (10 µM) 0.4 µLplasmid mt-IPC (40,000 copies/µL) 0.44 µL
2. rtPCR Mastermix for quantitation of nuclear DNA (+ mtIPC); 10 µL of TaqMan®
Universal PCR Master Mix, 5 µL of rt-PCR Pre-Mastermix for quantitation ofnuclear DNA (+mt-IPC); and up to 20 µL of H2O and/or sample (see Note 15).
3. When the setup is complete, seal reactions, spin briefly (1 min at 1000g), placeplate into the thermal cycler block, and start the run (see Note 16).
4. Interpretation guidelines for possible results, which can be obtained with the realtime PCR-setup: DNA quantitation and test for PCR inhibition.
Target DNA IPC
+ + Detectable signals (i.e. Ct values smaller than the numberof cycles performed) both for the target DNA and the IPCmeans that the extract contains no inhibitors. To excludepartial inhibition, the Ct-values of the IPC obtained for theunknown samples have to be in the range of those observedin the no template controls (NTCs).
+ – A high copy number of target DNA can lead to elevated Ctvalues or even a complete drop-out of the IPC resultingfrom the using up of the reaction components by the moreabundant target.
26 Köchl, Niederstätter, and Parson
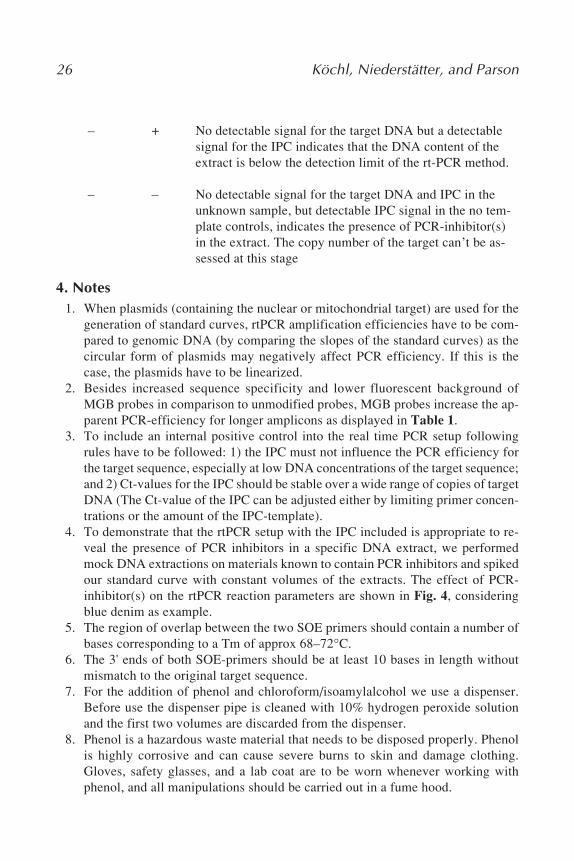
– + No detectable signal for the target DNA but a detectablesignal for the IPC indicates that the DNA content of theextract is below the detection limit of the rt-PCR method.
– – No detectable signal for the target DNA and IPC in theunknown sample, but detectable IPC signal in the no tem-plate controls, indicates the presence of PCR-inhibitor(s)in the extract. The copy number of the target can’t be as-sessed at this stage
4. Notes1. When plasmids (containing the nuclear or mitochondrial target) are used for the
generation of standard curves, rtPCR amplification efficiencies have to be com-pared to genomic DNA (by comparing the slopes of the standard curves) as thecircular form of plasmids may negatively affect PCR efficiency. If this is thecase, the plasmids have to be linearized.
2. Besides increased sequence specificity and lower fluorescent background ofMGB probes in comparison to unmodified probes, MGB probes increase the ap-parent PCR-efficiency for longer amplicons as displayed in Table 1.
3. To include an internal positive control into the real time PCR setup followingrules have to be followed: 1) the IPC must not influence the PCR efficiency forthe target sequence, especially at low DNA concentrations of the target sequence;and 2) Ct-values for the IPC should be stable over a wide range of copies of targetDNA (The Ct-value of the IPC can be adjusted either by limiting primer concen-trations or the amount of the IPC-template).
4. To demonstrate that the rtPCR setup with the IPC included is appropriate to re-veal the presence of PCR inhibitors in a specific DNA extract, we performedmock DNA extractions on materials known to contain PCR inhibitors and spikedour standard curve with constant volumes of the extracts. The effect of PCR-inhibitor(s) on the rtPCR reaction parameters are shown in Fig. 4, consideringblue denim as example.
5. The region of overlap between the two SOE primers should contain a number ofbases corresponding to a Tm of approx 68–72°C.
6. The 3' ends of both SOE-primers should be at least 10 bases in length withoutmismatch to the original target sequence.
7. For the addition of phenol and chloroform/isoamylalcohol we use a dispenser.Before use the dispenser pipe is cleaned with 10% hydrogen peroxide solutionand the first two volumes are discarded from the dispenser.
8. Phenol is a hazardous waste material that needs to be disposed properly. Phenolis highly corrosive and can cause severe burns to skin and damage clothing.Gloves, safety glasses, and a lab coat are to be worn whenever working withphenol, and all manipulations should be carried out in a fume hood.
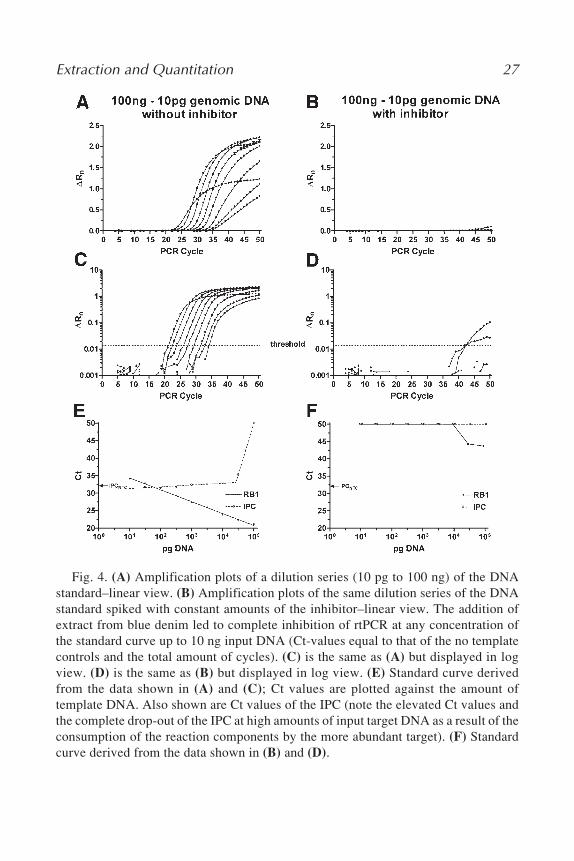
Extraction and Quantitation 27
Fig. 4. (A) Amplification plots of a dilution series (10 pg to 100 ng) of the DNAstandard–linear view. (B) Amplification plots of the same dilution series of the DNAstandard spiked with constant amounts of the inhibitor–linear view. The addition ofextract from blue denim led to complete inhibition of rtPCR at any concentration ofthe standard curve up to 10 ng input DNA (Ct-values equal to that of the no templatecontrols and the total amount of cycles). (C) is the same as (A) but displayed in logview. (D) is the same as (B) but displayed in log view. (E) Standard curve derivedfrom the data shown in (A) and (C); Ct values are plotted against the amount oftemplate DNA. Also shown are Ct values of the IPC (note the elevated Ct values andthe complete drop-out of the IPC at high amounts of input target DNA as a result of theconsumption of the reaction components by the more abundant target). (F) Standardcurve derived from the data shown in (B) and (D).

28 Köchl, Niederstätter, and Parson
9. The two phases (organic phase and aqueous layer) need to be carefully separatedin that the nucleic acids and proteins tend to be at the interface. Leaving too muchof the aqueous layer behind will cause loss of material and aspirating too close tothe interface can include protein.
10. Precipitation of the DNA at –20°C should be performed at least for 1.5 h. It ispossible to place the samples at –20°C overnight at this stage.
11. For extractions from stains with small amounts of DNA, use LPA as acoprecipitant. LPA offers the advantage that it is chemically synthesized and isnot derived from biological sources. Other carriers may contain small amounts ofcontaminating nucleic acids, which may cause problems, especially when typingmtDNA as seen in our laboratory when working with glycogen as carrier.
12. While drying the DNA pellet in the vacuum centrifuge, the screw caps of thetubes are kept in sterile Petri dishes.
13. Concerning DNA extraction from sperm-cell/nonsperm-cell mixtures, when remov-ing the stain material with tweezers, it is important to squeeze the stain firmly toprevent loss of liquid and DNA.
14. Depending on the target sequence, the addition of nontemplate 3' overhanging resi-dues by Taq DNA polymerase can lead to undesired mutations when using theSOE technique. To remove 3' overhanging residues and nonincorporated primers,purify the PCR products using the ExoSapIT Kit from Amersham/Pharmacia.
15. It is recommended to include at least three no template controls in each reactionplate in addition to extraction blocks.
16. rtPCR cocktails in a plate can be stored in the dark at room temperature for acouple of hours.
References1. Sambrook, J., Fritsch E. F., and Maniatis, T. (1989). Molecular Cloning: A Labo-
ratory Manual, 2nd ed., Cold Spring Harbor Laboratory Press, Cold Spring Har-bor, NY.
2. Waye, J. S., and Willard, H. F. (1986). Structure, organization, and sequence ofalpha satellite DNA from human chromosome 17: evidence for evolution byunequal crossing-over and an ancestral pentamer repeat shared with the humanX chromosome. Mol. Cell Biol. 6, 3156–3165.
3. Waye, J. S., Presley, L. A., Budowle, B., Shutler, G. G., and Fourney, R. M.(1989). A simple and sensitive method for quantifying human genomic DNA inforensic specimen extracts. BioTechniques 7, 852–855.
4. Walsh, P. S., Varlaro, J., and Reynolds, R. (1992). A rapid chemiluminescentmethod for quantitation of human DNA. Nucleic Acids Res. 20, 5061–5065.
5. Andreasson, H., Gyllensten, U., and Allen, M. (2002). Real-time DNA quantifi-cation of nuclear and mitochondrial DNA in forensic analysis. BioTechniques 33,402–411.
6. Kutyavin, I. V., Afonina, I. A., Mills, A., Gorn, V. V., Lukhtanov, E. A., Belousov,E. S., et al. (2000). 3'-minor groove binder-DNA probes increase sequence speci-ficity at PCR extension temperatures. Nucleic Acids Res. 28, 655–661.

Extraction and Quantitation 29
7. Hochmeister, M. N., Budowle, B., Borer, U. V., Eggmann, U., Comey, C. T., andDirnhofer, R. (1991). Typing of deoxyribonucleic acid (DNA) extracted fromcompact bone from human remains. J. Forensic Sci. 36, 1649–1661.
8. Gill, P., Jeffreys, A. J., and Werrett, D. J. (1985). Forensic application of DNA‘fingerprints’. Nature 318, 577–579.
9. Hellmann, A., Rohleder, U., Schmitter, H., and Wittig, M. (2001). STR typing ofhuman telogen hairs—a new approach. Int. J. Legal Med. 114, 269–273.
10. Lee, L. G., Connell, C. R., and Bloch, W. (1993). Allelic discrimination by nick-translation PCR with fluorogenic probes. Nucleic Acids Res. 21, 3761–3766.
11. Heid, C. A., Stevens, J., Livak, K. J., and Williams, P. M. (1996). Real time quan-titative PCR. Genome Res. 6, 986–994.
12. Holland, P. M., Abramson, R. D., Watson, R., and Gelfand, D. H. (1991). Detec-tion of specific polymerase chain reaction product by utilizing the 5'–3' exonu-clease activity of Thermus aquaticus DNA polymerase. Proc. Natl. Acad. Sci.USA. 88, 7276–7280.
13. Livak, K. J., Flood, S. J., Marmaro, J., Giusti, W., and Deetz, K. (1995). Oligo-nucleotides with fluorescent dyes at opposite ends provide a quenched probe sys-tem useful for detecting PCR product and nucleic acid hybridization. PCRMethods Appl. 4, 357–362.
14. Lyamichev, V., Brow, M. A., and Dahlberg, J. E. (1993). Structure-specific endo-nucleolytic cleavage of nucleic acids by eubacterial DNA polymerases. Science260, 778–783.
15. Gibson, U. E., Heid, C. A., and Williams, P. M. (1996). A novel method for realtime quantitative RT-PCR. Genome Res. 6, 995–1001.
16. Higuchi, R., Fockler, C., Dollinger, G., and Watson, R. (1993). Kinetic PCR analy-sis: real-time monitoring of DNA amplification reactions. Biotechnology 11,1026–1030.
17. Higuchi, R., Krummel, B., and Saiki, R. K. (1988). A general method of in vitropreparation and specific mutagenesis of DNA fragments: study of protein andDNA interactions. Nucleic Acids Res. 16, 7351–7367.
18. Ho, S. N., Hunt, H. D., Horton, R. M., Pullen, J. K., and Pease, L. R. (1989). Site-directed mutagenesis by overlap extension using the polymerase chain reaction.Gene 77, 51–59.
19. Horton, R. M., Cai, Z. L., Ho, S. N., and Pease, L. R. (1990). Gene splicing byoverlap extension: tailor-made genes using the polymerase chain reaction.BioTechniques 8, 528–535.


Quantification of AMG Gene Copies 31
31
From: Methods in Molecular Biology, vol. 297: Forensic DNA Typing ProtocolsEdited by: A. Carracedo © Humana Press Inc., Totowa, NJ
3
A Real-Time PCR Protocol to Determine the Numberof Amelogenin (X–Y) Gene Copies From Forensic DNASamples
Antonio Alonso and Pablo Martín
SummaryWe present a fluorogenic real-time polymerase chain reaction (PCR) procedure to
target a segment (106–112 base pairs [bp]) of the X–Y homologous amelogenin gene bymeasuring the 5' nuclease activity of the Taq deoxyribonucleic acid (DNA) polymeraseusing two (X-Fam-labeled and Y-Vic-labeled) specific Taqman MGB probes to enablesimultaneous the detection of two specific PCR products (AMGY: 112-bp and AMGX:106 bp) as they accumulate cycle by cycle during PCR. The method makes possible notonly human nuclear DNA quantitation but also sex determination and has been appliedto the analysis of low copy number DNA samples in forensic and ancient DNA studies.Specific quantification of human nuclear DNA is a recommended procedure in forensiccasework as a way to adjust the DNA input on subsequent end-point PCR-based DNAtyping approaches ensuring the optimal use of the limited amounts of nuclear DNA foundin many forensic evidences. Nuclear DNA quantification also aids in the interpretationof the consistency of multiplex STR profiling data obtained from low copy number DNAsamples.
Key Words: Real-time PCR; amelogenin gene; forensic genetics; ancient DNA; lowcopy number DNA samples; sex determination; STR profiling.
1. IntroductionWe present a fluorogenic real-time polymerase chain reaction (PCR) proce-
dure to target a segment (106–112 base pair [bp]) of the X–Y homologousamelogenin gene (1,2) by measuring the 5' nuclease activity of the Taq deox-yribonucleic acid (DNA) polymerase using two (X-Fam-labeled and Y-Vic-labeled) specific Taqman MGB probes to enable the simultaneous detection oftwo specific PCR products (AMGY: 112-bp and AMGX: 106 bp) as they ac-

32 Alonso and Martín
cumulate cycle by cycle during PCR (3). During each extension cycle the 5'nuclease activity of Taq DNA polymerase cleaves the annealed probes separat-ing the reporter dye molecule from the quencher, which results in increasedfluorescence of the reporter dye signal. Therefore, the accumulation of specificAMGX and AMGY PCR products is detected by monitoring the increase influorescence levels of the AMGX-FAM or AMGY-VIC reporter dyes, respec-tively. The higher the initial input of the target genomic DNA, the sooner asignificant increase in fluorescence is observed. The cycle at which fluores-cence reaches an arbitrary threshold level during the exponential phase of thePCR is named threshold cycle (Ct). Different standard curves can be generatedby plotting the log of the starting DNA template amount of a set of previouslyquantified male (XY) and female (XX) DNA standards against their Ct values.Therefore, an accurate estimation of the starting X and Y DNA copies fromunknown samples is accomplished by comparison of the measured Ct valueswith the Ct values of the standard curves. The method makes possible not onlyDNA quantitation but also sex determination and has been applied to the analy-sis of low copy number DNA samples in forensic and ancient DNA studies(3,4). Real-time quantitative PCR offers several advantages with respect toother current DNA-quantification methods (hybridization, refs. 5 and 6) or end-point PCR methods, refs. 7 and 8), including higher sensitivity and dynamicrange of quantitation, unnecessary post-PCR processing, automation feasibil-ity, and high throughput. Other interesting real-time PCR designs for bothnuclear (single copy genes, ref. 9) and repetitive Alu sequences, ref. 10) andmitochondrial (mt)DNA (3,9) have been described. Specific estimation of thehuman DNA quantity is a recommended procedure in forensic casework(11,12) that will aid in deciding whether the isolated DNA is suitable fornuclear or mtDNA analysis and to adjust the DNA input to improve the perfor-mance of subsequent end-point PCR-based DNA typing specially from lowcopy number DNA samples.
2. Materials2.1. Specimens
The method can be applied to any DNA sample that may contain humanDNA. It has been used as described previously to determine sex and to quan-tify the amount of human DNA from DNA extracts isolated from blood, saliva,semen, hair, bone, and teeth samples by using proteolytic digestion followedby phenol–chloroform purification and Centricon-100 filtration (13). Somesamples were further purified with silica columns using the QIAamp DNABlood Midi Kit (Qiagen). The type of DNA extraction method could have agreat influence on the performance of the assay (see Note 1).

Quantification of AMG Gene Copies 33
2.2. Reagents
1. Human female genomic DNA 9947A at a 0.1 ng/µL concentration (AppliedBiosystems, Foster City, CA).
2. Human genomic DNA from the male cell line ATCC CCL-256.1 at a 2.5 ng/µLconcentration (Reliagene Technologies, New Orleans, LA).
3. Forward primer (AMG_F) (CCC TGG GCT CTG TAA AGA ATA GTG).4. Reverse primer (AMG_R) (ATC AGA GCT TAA ACT GGG AAG CTG).5. Probe AMGX (6FAM-TAT CCC AGA TGT TTCTC-MGB).6. Probe AMGY (VIC-CAT CCC AAA TAA AGT G-MGB). (See Note 2 for fur-
ther information on probe designs.)7. Taqman PCR Core Reagent Kit, including AmpliTaqGold DNA polymerase;
dUTP, dATP, dCTP, dGTP; 1.2 mL 10X Taqman buffer A; and 2 × 1.5 mL 25mMMgCl2 (Applied Biosystems).
8. Bovine serum albumin (BSA).9. TE (1X).
2.3. Disposables
1. Micro Amp optical 96-well reaction plates, ABI PRISM optical adhesive covers,and compression pads (Applied Biosystems).
2. 1.5-mL sterile microcentrifuge tubes.3. Aerosol-resistant pipet tips.
2.4. Equipment
1. A laminar flow cabinet.2. ABI PRISM 7000 Sequence Detection System (Applied Biosystems).
2.5. Software
1. ABI Prism 7000 SDS software (Applied Biosystems)2. Primer Express 2.0 (Applied Biosystems)3. Microsoft Excel.
3. Methods3.1. Experimental Design and Plate Document Setup
Before starting a real-time PCR run, the assay type should be determinedand a plate document must be set up. The plate document is a representation ofthe 96-well reaction plate where you can enter sample names, select and modifysample types (unknowns, standards, and no-template controls), and create andad specific detectors. The following procedure can be used to set up an abso-lute AMG X/Y quantification assay using the ABI Prism 7000 SDS Software.
1. Open the ABI Prism 7000 SDS Software and make the appropriate selection (abso-lute quantification, 96-well clear, and blank document) from the “new document”

34 Alonso and Martín
window. By selecting “setup,” then “plate,” a blank 96-well plate document win-dow is acceded.
2. Create two new detectors by selecting “tools,” “detector manager,” “file,” then“new” to open the new detector window where the name (AMGX-FAM andAMG-Y-VIC), an optional description, the reporter dye (FAM for the AMGXdetector and VIC for the AMGY detector), the quencher dye (none for MGBprobes), and the color (blue for AMGX-FAM and pink for AMG-Y-VIC) can bespecified.
3. Open “well inspector” from the “view menu” to add both detectors to all thewells of the plate that are going to be in use. Use also “well inspector” to entersample type information (unknowns, standards, and no-template controls) andthe DNA quantity of the standards. A plate document where both detectors(AMGX-FAM and AMGY-VIC) were added to wells A1 to A12 and B1 to B12by using the well inspector is shown in Fig. 1. For each set of samples to bequantified in one experiment, we routinely include a twofold serial dilution of thefemale DNA standard (from 1000 pg to 8 pg) to generate the standard AMG-Xquantification curve for quantification of both male and female DNA. At leasttwo male DNA controls (2500 pg and 250 pg) should also be included on each
Fig. 1. The plate window (under the set-up menu) showing also (superimposed)the well inspector window used to add both detectors (MG-X-FAM and AMG-Y-VIC) to A1-B12 wells.

Quantification of AMG Gene Copies 35
experiment to monitor the performance of the AMGY-VIC detector or alterna-tively a standard AMG-Y quantification curve can be generated if a twofold serialdilution of a male DNA standard is included (see Note 3). Several no-templatecontrols (including not only PCR blanks but also DNA extraction blanks) needalso to be run along with the samples to monitor background contamination (seeNote 4).
4. When all the information has been set up save the document and print the edited96-well plate document that will be used as the worklist for PCR set up.
3.2. DNA Samples Preparation
To minimize the possibility of contamination, DNA samples preparationand PCR setup were conducted in a laminar flow cabinet located in a dedicatedpre-PCR laboratory. All the reagents, tubes, and plastic tips (aerosol resistant)were sterilized by autoclaving them before use. Ultraviolet irradiation and treat-ment with 10% bleach were used to eliminate possible DNA contaminants.
3.2.1. Preparation of AMG X DNA Standards
Prepare twofold serial dilutions of the female genomic DNA from the cellline 9947A (from 1000 pg/10 µL to 8 pg/10 µL) in TE buffer as follows.
1. Label eight autoclaved microcentrifuge tubes 1 through 8.2. Transfer 40 µL of Human female genomic DNA 9947A at a 100 pg/µL concen-
tration (Applied Biosystems) into the tube labeled 1 (DNA standard 1).3. Aliquot 20 µL of TE buffer into each of the seven remaining tubes labeled 2
through 8.4. Add 20 µL of DNA standard 1 (tube 1) to the 20 µL of TE buffer in tube 2.
Vortex to mix thoroughly.5. Add 20 µL of female DNA standard 2 (tube 2) to the 20 µL of TE buffer in tube
3. Vortex to mix thoroughly.6. Add 20 µL of female DNA standard 3 (tube 3) to the 20 µL of TE buffer in tube
4. Vortex to mix thoroughly.7. Continue the serial dilution through tube 8.If the dilution steps are performed correctly, the eight DNA standards tubes
(1 through 8) will have the following concentrations of female DNA:
Tube DNA quantity
Tube 1 1000 pg/10 µLTube 2 500 pg/10 µLTube 3 250 pg/10 µLTube 4 125 pg/10 µLTube 5 62.5 pg/10 µLTube 6 31.25 pg/10 µLTube 7 15.625 pg/10 µLTube 8 7.8125 pg/10 µL
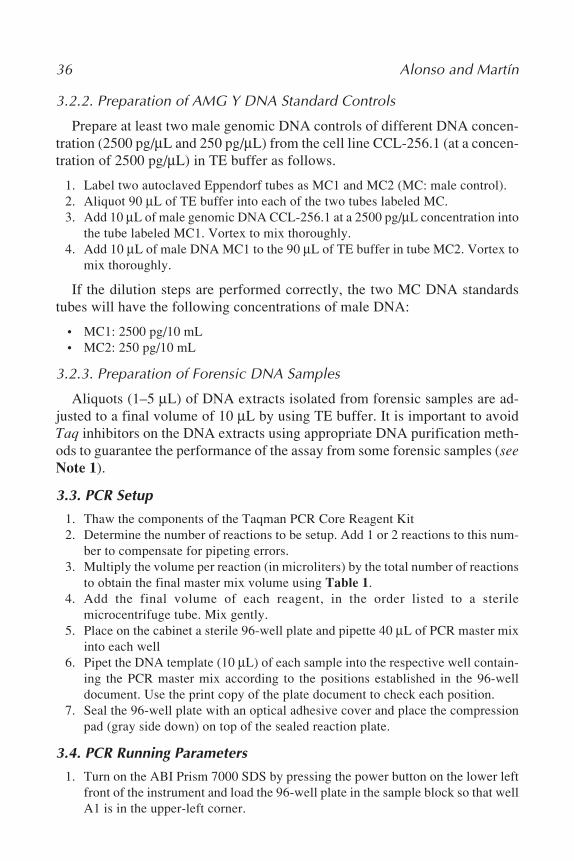
36 Alonso and Martín
3.2.2. Preparation of AMG Y DNA Standard Controls
Prepare at least two male genomic DNA controls of different DNA concen-tration (2500 pg/µL and 250 pg/µL) from the cell line CCL-256.1 (at a concen-tration of 2500 pg/µL) in TE buffer as follows.
1. Label two autoclaved Eppendorf tubes as MC1 and MC2 (MC: male control).2. Aliquot 90 µL of TE buffer into each of the two tubes labeled MC.3. Add 10 µL of male genomic DNA CCL-256.1 at a 2500 pg/µL concentration into
the tube labeled MC1. Vortex to mix thoroughly.4. Add 10 µL of male DNA MC1 to the 90 µL of TE buffer in tube MC2. Vortex to
mix thoroughly.
If the dilution steps are performed correctly, the two MC DNA standardstubes will have the following concentrations of male DNA:
• MC1: 2500 pg/10 mL• MC2: 250 pg/10 mL
3.2.3. Preparation of Forensic DNA Samples
Aliquots (1–5 µL) of DNA extracts isolated from forensic samples are ad-justed to a final volume of 10 µL by using TE buffer. It is important to avoidTaq inhibitors on the DNA extracts using appropriate DNA purification meth-ods to guarantee the performance of the assay from some forensic samples (seeNote 1).
3.3. PCR Setup
1. Thaw the components of the Taqman PCR Core Reagent Kit2. Determine the number of reactions to be setup. Add 1 or 2 reactions to this num-
ber to compensate for pipeting errors.3. Multiply the volume per reaction (in microliters) by the total number of reactions
to obtain the final master mix volume using Table 1.4. Add the final volume of each reagent, in the order listed to a sterile
microcentrifuge tube. Mix gently.5. Place on the cabinet a sterile 96-well plate and pipette 40 µL of PCR master mix
into each well6. Pipet the DNA template (10 µL) of each sample into the respective well contain-
ing the PCR master mix according to the positions established in the 96-welldocument. Use the print copy of the plate document to check each position.
7. Seal the 96-well plate with an optical adhesive cover and place the compressionpad (gray side down) on top of the sealed reaction plate.
3.4. PCR Running Parameters
1. Turn on the ABI Prism 7000 SDS by pressing the power button on the lower leftfront of the instrument and load the 96-well plate in the sample block so that wellA1 is in the upper-left corner.

Quantification of AMG Gene Copies 37
2. Open the plate document previously set up and clicks the “instrument” tab toselect the PCR running conditions (repetitions, temperature, and time) from the“thermal profile” panel.
3. Select the following thermal cycler conditions: An initial denaturation of 95°Cfor 10 min, followed by 50 cycles of 95°C for 15 s and 60°C for 1 min to annealand extend as shown in Fig. 2.
4. Save the plate document.5. Click the “start” button from the “instrument” window to launch the run. The
change in fluorescence can be monitored cycle by cycle during the run by select-ing “results,” then “amplification plot.”
6. When the run has finished disconnect the instrument from the plate documentusing the instrument buttons of the “instrument” window and turn off the ABIPRISM 7000 SDS.
3.5. Analysis and Interpretation Results
1. After a run is complete, the collected data can be analyzed by clicking the “Ana-lyze” button using default or user modified “threshold” and “baseline” analysissettings (in the “analysis setting” dialog box). The results are immediately avail-able in the “Results” tab.
2. Selecting the amplification plot tab (one of the seven secondary tabs of the“Results” tab) you can see the post-run normalized reporter signal of one orboth detectors (Rn or Delta Rn) vs cycle number of all samples selected in thewells. Inspect the results obtained from the female DNA standards with the
Table 1PCR Master Mix Components
Volume per Number of FinalComponents Reaction reactions volume
Sterile water 15 µLAutoclaved BSA (500 ng/mL) 10 µL10X Taqman buffer A 5 µL25 mM MgCl2 solution 3 µLdATP (10 mM) 1 µLdCTP (10 mM) 1 µLdGTP (10 mM) 1 µLdUTP (20 mM) 1 µLAmpliTaqGold polymerase (5 U/mL) 0.5 µLForward Primer (AMG F) (100 mM) 0.25 µLReverse primer (AMG R) (100 mM) 0.25 µLAMG X- FAM Taqman probe (15 mM) 1 µLAMG Y- VIC Taqman probe (15 mM) 1 µLTotal volume 40 µL
×
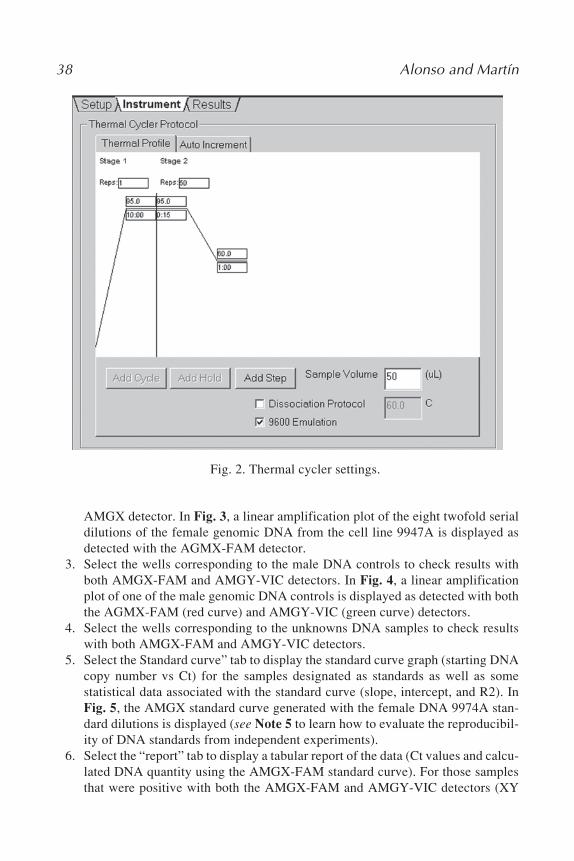
38 Alonso and Martín
AMGX detector. In Fig. 3, a linear amplification plot of the eight twofold serialdilutions of the female genomic DNA from the cell line 9947A is displayed asdetected with the AGMX-FAM detector.
3. Select the wells corresponding to the male DNA controls to check results withboth AMGX-FAM and AMGY-VIC detectors. In Fig. 4, a linear amplificationplot of one of the male genomic DNA controls is displayed as detected with boththe AGMX-FAM (red curve) and AMGY-VIC (green curve) detectors.
4. Select the wells corresponding to the unknowns DNA samples to check resultswith both AMGX-FAM and AMGY-VIC detectors.
5. Select the Standard curve” tab to display the standard curve graph (starting DNAcopy number vs Ct) for the samples designated as standards as well as somestatistical data associated with the standard curve (slope, intercept, and R2). InFig. 5, the AMGX standard curve generated with the female DNA 9974A stan-dard dilutions is displayed (see Note 5 to learn how to evaluate the reproducibil-ity of DNA standards from independent experiments).
6. Select the “report” tab to display a tabular report of the data (Ct values and calcu-lated DNA quantity using the AMGX-FAM standard curve). For those samplesthat were positive with both the AMGX-FAM and AMGY-VIC detectors (XY
Fig. 2. Thermal cycler settings.

Quantification of AMG Gene Copies 39
Fig. 3. Linear amplification plot of the eight twofold serial dilutions of the femalegenomic DNA from the cell line 9947A is displayed as detected with the AGMX-FAM detector.
males), the total DNA amount should be calculated multiplying by two the DNAquantity determined with the AMGX-FAM detector. An example of the data dis-played on the report tab is shown below where the results of the female DNAstandards along with the quantification results obtained from some bone DNAsamples are displayed (Fig. 6).(See Note 4 to learn more about the detection limitof this quantitative assay.)
For further information on the use of the ABI PRISM 7000 SDS, read the ABIPRISM 7000 Sequence Detection System User Guide (Applied Biosystems).
4. Notes1. It is important to remember that the presence of Taq inhibitor compounds on the
DNA extracts could have a great influence on the performance of this quantita-tive assay, producing both completely false-negative results and false DNA con-centration estimations as a result of a partial Taq inhibition. A relatively highincidence of PCR inhibitors could be predicted when analyzing bone and ancientDNA samples and other forensic samples. The presence of Taq inhibitors on theDNA extracts can be prevented or at least reduced by using appropriate DNA-

40 Alonso and Martín
Fig. 4. Linear amplification plot of one of the male genomic DNA controls is dis-played as detected with both the AGMX-FAM (red curve) and AMGY-VIC (greencurve) detectors.
purification methods. In our experience the method of organic extraction afterProteinase K digestion followed by ultrafiltration using Centricon devices(Millipore) is an efficient method to wash out a high proportion of inhibitor com-pounds from the DNA extracts. However, in some occasions (specially from oldbone samples) the use of a silica-based purification method was necessary toremove the inhibitor from the DNA extract. The use of a silica column with ahigh binding capacity (QIAamp DNA Blood Midi Kit) (Qiagen) was essential toprevent the lost of human DNA, which is normally the minor DNA component ofthe DNA extracts isolated from bones that generally contains high amounts ofDNA from bacteria and other microorganisms. However, the use of BSA to pre-vent Taq inhibition should be a standard practice on quantitative real-time PCRassays in forensic and ancient DNA studies. The development of an internal stan-dard control to determine the PCR efficiency from each individual sample couldbe of great help to interpret negative real-time PCR results.
2. Detection of the specific AMGX fragment (106 bp) and AMGY fragment (112 bp)was achieved using the primers pair sequences previously described (1) and twonewly designed fluorogenic MGB probes that specifically detect the AMGX-
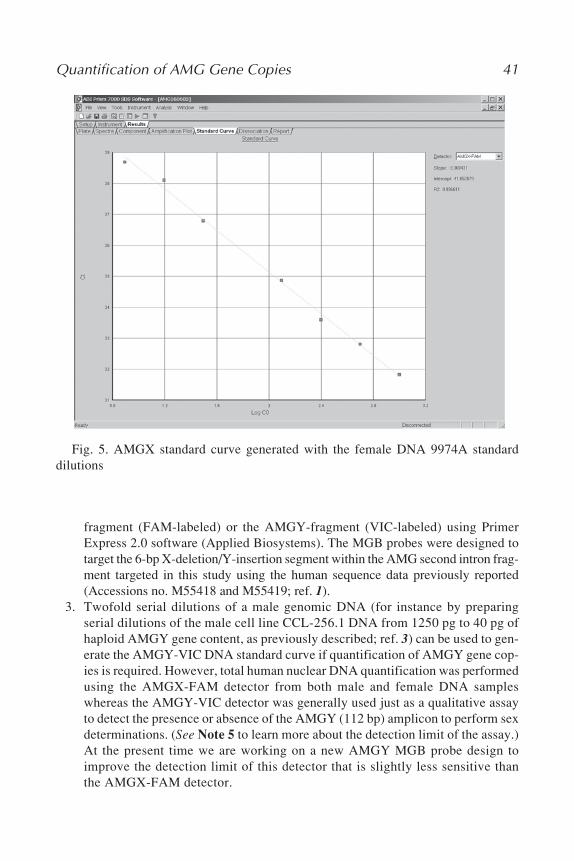
Quantification of AMG Gene Copies 41
fragment (FAM-labeled) or the AMGY-fragment (VIC-labeled) using PrimerExpress 2.0 software (Applied Biosystems). The MGB probes were designed totarget the 6-bp X-deletion/Y-insertion segment within the AMG second intron frag-ment targeted in this study using the human sequence data previously reported(Accessions no. M55418 and M55419; ref. 1).
3. Twofold serial dilutions of a male genomic DNA (for instance by preparingserial dilutions of the male cell line CCL-256.1 DNA from 1250 pg to 40 pg ofhaploid AMGY gene content, as previously described; ref. 3) can be used to gen-erate the AMGY-VIC DNA standard curve if quantification of AMGY gene cop-ies is required. However, total human nuclear DNA quantification was performedusing the AMGX-FAM detector from both male and female DNA sampleswhereas the AMGY-VIC detector was generally used just as a qualitative assayto detect the presence or absence of the AMGY (112 bp) amplicon to perform sexdeterminations. (See Note 5 to learn more about the detection limit of the assay.)At the present time we are working on a new AMGY MGB probe design toimprove the detection limit of this detector that is slightly less sensitive thanthe AMGX-FAM detector.
Fig. 5. AMGX standard curve generated with the female DNA 9974A standarddilutions
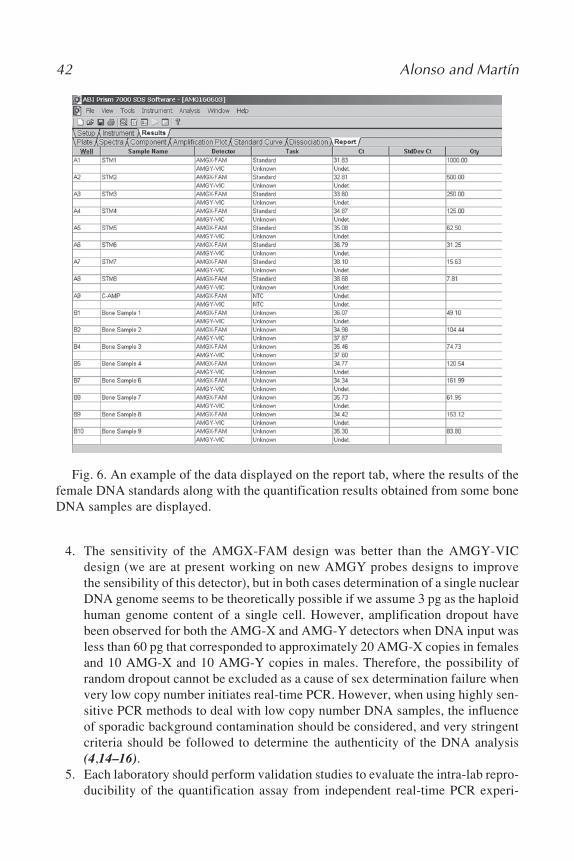
42 Alonso and Martín
4. The sensitivity of the AMGX-FAM design was better than the AMGY-VICdesign (we are at present working on new AMGY probes designs to improvethe sensibility of this detector), but in both cases determination of a single nuclearDNA genome seems to be theoretically possible if we assume 3 pg as the haploidhuman genome content of a single cell. However, amplification dropout havebeen observed for both the AMG-X and AMG-Y detectors when DNA input wasless than 60 pg that corresponded to approximately 20 AMG-X copies in femalesand 10 AMG-X and 10 AMG-Y copies in males. Therefore, the possibility ofrandom dropout cannot be excluded as a cause of sex determination failure whenvery low copy number initiates real-time PCR. However, when using highly sen-sitive PCR methods to deal with low copy number DNA samples, the influenceof sporadic background contamination should be considered, and very stringentcriteria should be followed to determine the authenticity of the DNA analysis(4,14–16).
5. Each laboratory should perform validation studies to evaluate the intra-lab repro-ducibility of the quantification assay from independent real-time PCR experi-
Fig. 6. An example of the data displayed on the report tab, where the results of thefemale DNA standards along with the quantification results obtained from some boneDNA samples are displayed.
Quantification of AMG Gene Copies 43
ments. A standard curve should be rejected if the correlation coefficient of thetrendline is < 0.95. Occasionally one or two points can be removed if a particularDNA dilution deviates significantly from the trendline produced by the rest ofthe data. Microsoft Excel spreadsheets can be used to generate standard curveswith average Ct data from different individual experiments. Validation studiesbetween laboratories also are needed to evaluate the potential applications ofthis technology in forensic studies.
References
1. Nakahori, Y., Takenaka, O., and Nakagome, Y. (1991) A human X–Y homolo-gous region encodes ‘amelogenin.’ Genomics 9, 264–269.
2. Sullivan, K. M., Mannucci, A., Kimpton, C. P., and Gill, P. (1993) A rapid andquantitative DNA sex test: fluorescence-based PCR analysis of X–Y homologousgene amelogenin. BioTechniques 15, 637–641.
3. Alonso, A., Martín, P., Albarrán, C., García, P., García, O., Fernández de Simón,L., et al. Real-time PCR designs to estimate nuclear and mtDNA copy number inforensic and ancient DNA studies. Forensic Sci. Int., in press..
4. Alonso, A., Martín, P., Albarrán, C., García, P., Primorac, D., García, O., et al.(2003) Specific quantification of human genomes from low copy number DNAsamples in forensic and ancient DNA studies. Croat. Med. J. 44, 273–280.
5. Walsh, P. S., Varlaro, J., and Reynolds, R. (1992) A rapid chemiluminescentmethod for quantitation of human DNA. Nucleic Acids Res. 20, 5061–5065.
6. Waye, J. S., and Willard, H. F. (1986) Structure, organization, and sequence ofalpha satellite DNA from human chromosome 17: evidence for evolution by un-equal crossing-over and an ancestral pentamer repeat shared with the human Xchromosome. Mol. Cell Biol. 6, 3156–3165.
7. Sifis, M. E., Both, K., and Burgoyne, L. A. (2000) A more sensitive method for thequantitation of genomic DNA by Alu amplification. J. Forensic Sci. 47, 589–592.
8. Fox, J. C., Cave, C. A., and Schumm, J. W. (2003) Development, characteriza-tion, and validation of a sensitive primate-specific quantification assay for foren-sic analysis. BioTechniques 34, 314–318.
9. Andreasson, H., Gyllensten, U., and Allen, M. (2002) Real-time DNA quantifica-tion of nuclear and mitochondrial DNA in forensic analysis. BioTechniques 33,402–411.
10. Walker, J. A., Kilroy, G. E., Xing, J., Shewale, J., Sinha. S. K., and Batzer, M. A.(2003) Human DNA quantitation using Alu element-based polymerase chain reac-tion. Anal. Biochem. 315, 122–128.
11. Recommendations of the DNA Commission of the International Society for Foren-sic Haemogenetics relating to the use of PCR-based polymorphisms (1992). Foren-sic Sci. Int. 55, 1–3.
12. Quality Assurance Standards for Forensic DNA Testing Laboratories. DNA Advi-sory Board (1998). Forensic Sci. Com. 2,. (Available at www.fbi.gov/hq/lab/fcs/current/index.htm.)

44 Alonso and Martín
13. Alonso, A., Andelinovic, S., Martin, P., Sutlovic, D., Erceg, I., Huffine, E., et al.(2001) DNA typing from skeletal remains: evaluation of multiplex and megaplexSTR systems on DNA isolated from bone and teeth samples. Croat. Med. J. 42,260–266.
14. Hofreiter, M., Serre, D., Poinar, HN., Kuch, M., and Pääbo S. (2001) AncientDNA. Nat. Rev. 2, 353–359.
15. Budowle, B., Hobson, D., Smerick, J., and Smith, J. (2001) Low copy number:consideration and caution. Proceedings from the Twelfth International Sympo-sium on Human Identification 2001, available at www.promega.com.
16. Gill, P., Whitaker, J., Flaxman, C., Brown, N., and Buckelton, J. (2000) An inves-tigation of the rigor of interpretation rules for STRs derived from less than 100 pgof DNA. Forensic Sci. Int. 112,17–40.
Species Determination 45
45
From: Methods in Molecular Biology, vol. 297: Forensic DNA Typing ProtocolsEdited by: A. Carracedo © Humana Press Inc., Totowa, NJ
4
Species DeterminationThe Role and Use of the Cytochrome b Gene
Adrian Linacre and James Chun-I Lee
SummaryMany large mammalian species are on the verge of extinction in part because of the
trade in their skin, bone, horn, or body parts for supposed medicinal purposes. Identifica-tion of the species is required to determine that a crime has been committed. This chapterdetails a robust DNA technique using part of the cytochrome b gene on the mitochon-drial genome that will work on poor-quality samples such as powdered horn. An ap-propriate deoxyribonucleic acid (DNA) extraction technique is required to obtain at least10 ng of DNA. Amplification of part of the cytochrome b gene using universal primersproduces a fragment of approx 486 bp in size. Direct sequencing of the PCR productsallows comparison of the DNA sequence at this locus to those already described on theEMBL DNA database.
Key Words: CITES; DNA; mitochondria; cytochrome b; species; forensic.
1. IntroductionThe trade in endangered species is an acute problem in many parts of the
world that affects many rare animal species. The Convention on InternationalTrade in Endangered Species of Wild Flora and Fauna (CITES) lists a growingand depressing number of species on the verge of extinction in the wild. Manyof these animal species are still traded illegally, often for their skins or forthe supposed medicinal qualities. It is the role of laboratories to determinethe species of origin from powdered remains, skins, bones, and horns.
There are methods of species determination using protein analysis, but thesehave largely been superseded by deoxyribonucleic acid (DNA) typing. Thechoice of DNA locus is key to the success of the test, and there are certaincriteria that must be met. It is necessary to use a locus that is sufficiently con-
46 Linacre and Lee
served such that all members of the same species have a very similar DNAsequence; the locus must be sufficiently polymorphic such that members ofdifferent, but closely related species, can be distinguished; the locus must beon a fragment of DNA that can be amplified from poor-quality samples; and itmust be possible to analyze the locus from a wide range of species using thesame protocol. The cytochrome b gene on the mitochondrial genome has beenfound to successfully meet all the above criteria.
The cytochrome b gene is part of a complex of genes involved with oxida-tive phosphorylation (1). The complete DNA sequence of this gene has beendetermined for a wide number of animal species (2–6) and has been found toexhibit sufficient interspecies polymorphisms with few intraspecies polymor-phisms. The complete cytochrome b gene is approximately 1140 bp. It may notalways be possible to amplify such a large fragment from powdered remains.The method outlined in this chapter uses a part of the gene locus that has beenfound to be highly informative (7). The primers are designed to amplify a 486-bpproduct of which 402 bp are used for sequence comparison. The structure ofthe cytochrome b gene is shown in Fig. 1.
2. Materials1. QIAamp DNA Mini kit.2. L14724 (7.5 µM) 5'-CGAAGCTTGATATGAAAAACCATCGTTG-3'.3. H15149 (7.5 µM) 5'AAACTGCAGCCCCTCAGAATGATATTTGTCCTCA-3'.4. AmpliTaq Gold DNA Polymerase (Applied Biosystems, Foster City, CA; 5 U/
0.5 µL)5. AmpliTaq Gold PCR Buffer (Applied Biosystems; 10X).6. dNTPs (10 mM each of dATP, dCTP, dGTP, and dTTP).7. DNA Terminator Sequencing Kit (ABI PRISM™ BigDye™ Cycle Sequencing
Kit, Applied Biosystems)8. Quick Spin Columns (Boehringer-Mannheim, Mannheim, Germany).9. Template Suppression Reagent (Applied Biosystems).
10. Thermal cycler.11. PRISM 310 Genetic Analyzer (Applied Biosystems).12. Vacuum evacuator.13. MicroAmp reaction tubes .
3. Methods3.1. PCR for Amplification of Part of the Cytochrome b Gene (seeNote 3)
1. Aliquot approx 10 ng of good quality DNA into a sterile 0.2-mL tube (see Note 1).2. Add 1 µL of each primer (final 0.15 µM of each; see Note 2).3. Add 5 µL of PCR buffer.4. Add 5 µL dNTPs.

Species Determination 47
5. Add 0.5 µL of AmpliTaq Gold.6. Add water to 50 µL.7. Amplify using the following conditions: 95°C for 11 min, followed by 35 cycles
of 95°C for 45 s, 50°C for 45 s and 72°C for 90 s, followed by 72°C for 30 min(see Note 4).
3.2. Confirmation of PCR
Samples can be separated on an agarose gel to confirm the success of theamplification (Fig. 2). A 2% agarose gel should be cast in 1X TAE with 1 µg/mL ethidium bromide. A small size gel is normally sufficient requiring 50 mLof agarose mix. Heat the agarose in a microwave to dissolve the agarose com-pletely and allow to cool to 55°C before casting the gel. Once the gel hassolidified, run 5 µL of each sample along with a size marker for 20 min at approx80 volts before visualizing the bands on a uv transilluminator (245 nm). Thepolymerase chain reaction (PCR) products should be approx 486 bp in length.
3.3. Sequencing of PCR Products
The PCR products can be directly sequenced (Fig. 3). Because the size is486 bp, the complete sequence can be determined in one reaction providingthat the PCR product is sufficiently pure. The method of DNA sequencing is astandard dyelabeled terminator method. A commercial kit is used (ABIPRISM™ BigDye™ Terminator) because this method has been found to besuccessful. The optimum amount of template DNA is approx 50 ng, althoughDNA concentrations of between 10 and 80 ng will still produce good qualitysequence data. The primers used in the DNA sequence reaction are the same asthose used in the amplification.
Fig. 1 The primer positions of L14724 and H15149 on mitochondrial DNA. Num-bering is according to the human mtDNA sequence and primer design is according tothe suggestions in refs. 1 and 2.

48 Linacre and Lee
Fig. 2. An agarose image of PCR products after amplification of part of the cyto-chrome b gene. Lane L is the 100-bp ladder; lanes 1–6 are PCR products from human,macaque, Asian elephant, mouse, White Rhino, and pig, respectively.
The DNA sequence of both strands should be determined and compared toensure that there are no differences as a result of the sequencing reaction.
3.3.1. Cycle Sequencing Method
1. Aliquot 10 µL of template solution containing 20 ng into two separate tubes (seeNote 5).
2. Add 8 µL of sequencing reaction mix to the tube.3. Add 2 µL of primer L14724 to one tube and primer H15149 to the other. The
final concentration of each primer should be 0.25 µM.4. Seal the tubes and place on a thermal cycler5. Perform cycle sequencing reactions using the following conditions:
96°C for 1 min, followed by 25 cycles of 96°C for 10 s, 50°C for 5 s, and 60°Cfor 4 min, followed by a rapid thermal ramp to 4°C and hold until ready to purify.
3.3.2. Separation of Sequenced Fragments
1. The extract from the DNA sequencing reaction must be treated to remove theunincorporated primers. A number of methods are available to do this, and mostuse a simple spin column.
2. Place the samples in a vacuum evacuator and allow the samples to dry (seeNote 6).
3. Re-suspend the dried pellet in 25 µL of template suppression reagent.4. The samples are now ready for separation (see Note 7).

Species Determination 49
3.4. Analysis of Results
1. The size of the sequence products should be 486 bp (see Note 8).2. Remove the primer sequences on either end of the sequence data.3. Remove sequence from the 5' end of the L14724 primer to mitochondrial posi-
tion 14746 so that the sequence starts at the start of the cytochrome b gene (posi-tion 14747; see Note 9). This should result in sequence lengths of 402 bp if theoriginal product was 486 bp.
4. Align the sequence data from each of the two primers used to determine a con-sensus DNA sequence for the gene sequence. The two DNA sequences shouldnot show significant differences.
5. Export the consensus DNA sequence data to the GCG Computer Package (seeNote 10).
Fig. 3. Alignment of the first 50 bp of the PCR products from the cytochrome bgene from 19 different mammalian species. The sequence alignment was by the PileUpprogram of the GCG computer package and the consensus sequence was determinedusing the Pretty program. “.” indicates the same base as the consensus sequence.

50 Linacre and Lee
4. Notes1. DNA should be extracted, purified, and quantified using a standard method. The
use of chelating agents such as Chelex® is simple and safe but will not alwaysproduce DNA that is free from inhibitors. QIAamp (Qiagene) is a proven methodfor extracting DNA from a wide range of tissue types. DNA also can be extractedfrom bone using the salt chloroform method (8). A control DNA can be used atthe same time as unknown DNA. A good control DNA is from a domestic orfarmed animal unlikely to be the same species as the unknown. Cow (Bosnamadicus) or mouse (Mus domesticus) DNA is ideal and normally available.
2. The primers used in this method amplify a 486-bp fragment. This primer set hasbeen found to be useful in the amplification of products from highly degradedsamples. The full cytochrome b gene locus can be amplified from good qualitysamples using the primer sets described in ref. 1.
3. If more than three samples are being prepared, it is better to create a master mix.For each sample, add 1.1 µL of each primer, 5.5 µL of buffer, 5.5 µL of dNTPs,0.5 µL of enzyme, and make with a marginal excess of dH2O to a volume of 50 µLper sample. Aliquot the appropriate volume into separate tubes then add 10 ng oftemplate DNA.
4. The cycling parameters have been specified using the Applied Biosystems 9600.It is possible that the parameters will need to be altered if another thermalcycleris used.
5. The quantity of DNA template required to generate optimal sequence data is 50 ng.This should be diluted into a volume of 10 µL. Adequate sequence data can beobtained from concentrations as low as 20 ng and as high as 100 ng. It is advisedto dilute, or concentrate, the sample to between 20 and 100 ng in a volume of10 µL.
6. A vacuum pump is the normal method for drying the sequence products, but ifunavailable it is possible to place the open reaction tubes used to collect the puri-fied sequence products in a heating block with water filling the holes of the heat-ing block. Leave the heating block at 95°C to remove the fluid.
7. There are two main methods of separating sequenced DNA fragments; polyacry-lamide gel electrophoresis using a 377 DNA Sequencer (Applied Biosystems), orby capillary electrophoresis using a PRISM Genetic Analyser (AppliedBiosystems). The authors prefer the simplicity of capillary electrophoresis anduse either the 310 or 3100 versions.
8. Most mammalian species will produce a fragment of 486 bp using the primerslisted in this chapter. An exception includes Lion (Panthera leo) where there is a17-base and 4-base deletion resulting in a fragment size of 464 bp.
9. The human consensus sequence starts at position 14747 with the sequence 5'-ATGACCCCAAT-3'. Edit the sequence to the 5' side of this particular DNAsequence.
10. There are alternative computer programs available, but this program has beenfound to be the most cited and used method for sequence comparison.

Species Determination 51
References1. Irwin, D. M., Kocher, T. D., and Wilson A. C. (1991) Evolution of the cytochrome
b gene of mammals. J. Mol. Evol. 32, 128–144.2. Kocher T. D., Thomas, W. K., Meyer, A., Edwards, S. V., Paabo, S., Villablanca, et
al. (1989) Dynamics of mitochondrial DNA evolution in mammals: amplificationand sequencing with conserved primers. Proc. Natl. Acad. Sci USA 86, 6196–6200.
3. Lau, C. H., Drinkwater, R. D., Yusoff, K., Tan, S. G., Hetzel, D. J. S., and Barker J.S. F. (1998) Genetic diversity of Asian water buffalo (Bubalus bubalis): mitochon-drial DNA D-loop and cytochrome b gene variation. Anim. Genet. 29, 253–264.
4. Cook C. E., Wang, Y., and Sensabaugh G. (1999) A mitochondrial control regionand cytochrome b phylogeny of sika deer (Cervus nippon) and report of tandemrepeats in the control region. Mol. Phyologenet. Evol. 12, 47–56.
5. Su, B., Wang, Y-W., Lan, H., Wang, W., and Zhang, Y. (1999) Phylogeneticstudies of complete cytochrome b genes in musk deer (Genus Moschus) usingmuseum samples. Mol. Phyologenet. Evol. 12, 241–249.
6. Kuwayama, R., and Ozawa, T. (2000) Phylogenetic relationships among Euro-pean red deer, wapiti and sika deer inferred from mitochondrial DNA sequences.Mol. Phyologenet. Evol. 15, 115–123.
7. Hsieh, H-M, Chiang H-L, Tsai L-C, Lai S-Y, Huang N-E, Linacre A. M. T., et al.(2001) Cytochrome b gene for species identification of the conservation animals.Foren. Sci. Int. 122, 7–18.
8. Mullenbach, R., Lagoda P. J. L., and Welter C. (1989). An efficient salt/chloro-form extraction of DNA from blood and tissues. Trends Genet. 5, 391.

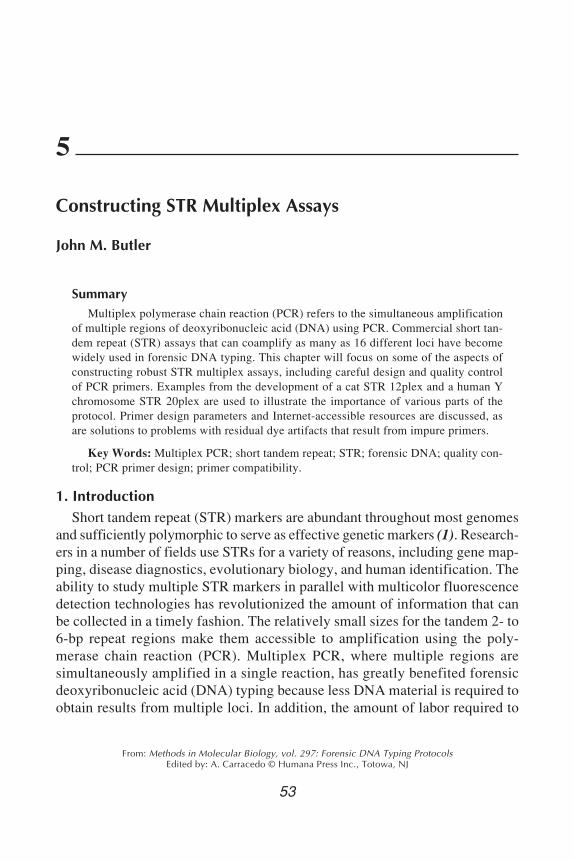
STR Multiplex Assays 53
53
From: Methods in Molecular Biology, vol. 297: Forensic DNA Typing ProtocolsEdited by: A. Carracedo © Humana Press Inc., Totowa, NJ
5
Constructing STR Multiplex Assays
John M. Butler
SummaryMultiplex polymerase chain reaction (PCR) refers to the simultaneous amplification
of multiple regions of deoxyribonucleic acid (DNA) using PCR. Commercial short tan-dem repeat (STR) assays that can coamplify as many as 16 different loci have becomewidely used in forensic DNA typing. This chapter will focus on some of the aspects ofconstructing robust STR multiplex assays, including careful design and quality controlof PCR primers. Examples from the development of a cat STR 12plex and a human Ychromosome STR 20plex are used to illustrate the importance of various parts of theprotocol. Primer design parameters and Internet-accessible resources are discussed, asare solutions to problems with residual dye artifacts that result from impure primers.
Key Words: Multiplex PCR; short tandem repeat; STR; forensic DNA; quality con-trol; PCR primer design; primer compatibility.
1. IntroductionShort tandem repeat (STR) markers are abundant throughout most genomes
and sufficiently polymorphic to serve as effective genetic markers (1). Research-ers in a number of fields use STRs for a variety of reasons, including gene map-ping, disease diagnostics, evolutionary biology, and human identification. Theability to study multiple STR markers in parallel with multicolor fluorescencedetection technologies has revolutionized the amount of information that canbe collected in a timely fashion. The relatively small sizes for the tandem 2- to6-bp repeat regions make them accessible to amplification using the poly-merase chain reaction (PCR). Multiplex PCR, where multiple regions aresimultaneously amplified in a single reaction, has greatly benefited forensicdeoxyribonucleic acid (DNA) typing because less DNA material is required toobtain results from multiple loci. In addition, the amount of labor required to
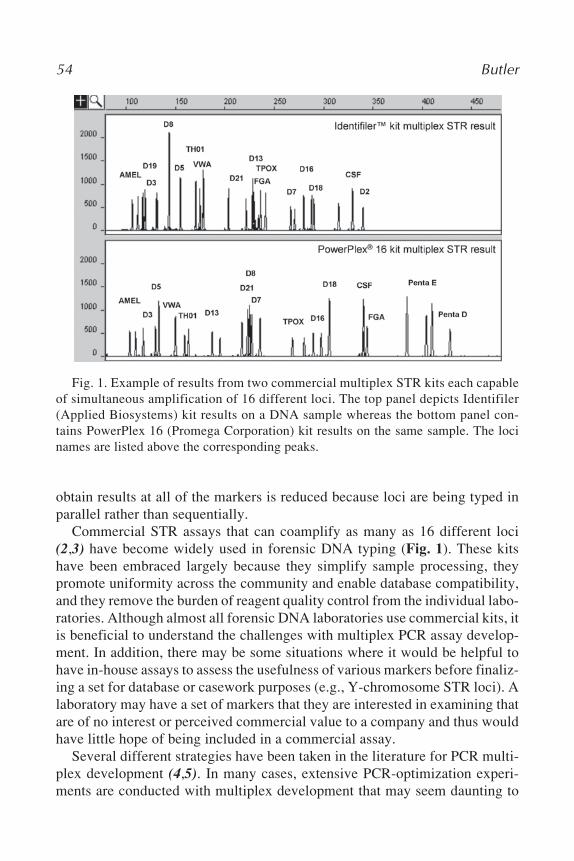
54 Butler
obtain results at all of the markers is reduced because loci are being typed inparallel rather than sequentially.
Commercial STR assays that can coamplify as many as 16 different loci(2,3) have become widely used in forensic DNA typing (Fig. 1). These kitshave been embraced largely because they simplify sample processing, theypromote uniformity across the community and enable database compatibility,and they remove the burden of reagent quality control from the individual labo-ratories. Although almost all forensic DNA laboratories use commercial kits, itis beneficial to understand the challenges with multiplex PCR assay develop-ment. In addition, there may be some situations where it would be helpful tohave in-house assays to assess the usefulness of various markers before finaliz-ing a set for database or casework purposes (e.g., Y-chromosome STR loci). Alaboratory may have a set of markers that they are interested in examining thatare of no interest or perceived commercial value to a company and thus wouldhave little hope of being included in a commercial assay.
Several different strategies have been taken in the literature for PCR multi-plex development (4,5). In many cases, extensive PCR-optimization experi-ments are conducted with multiplex development that may seem daunting to
Fig. 1. Example of results from two commercial multiplex STR kits each capableof simultaneous amplification of 16 different loci. The top panel depicts Identifiler(Applied Biosystems) kit results on a DNA sample whereas the bottom panel con-tains PowerPlex 16 (Promega Corporation) kit results on the same sample. The locinames are listed above the corresponding peaks.

STR Multiplex Assays 55
some laboratories (5). Because compatible primers are the key to successfulmultiplex PCR, careful primer design and appropriate quality control measure-ments are essential to insure that the PCR primers will work under uniformPCR conditions and will not adversely interact with one another (6–8). Upfrontinformatics plays an important role, as does empirical experimentation.
An overview of the steps used in a careful primer design and testing approachis illustrated in Fig. 2. Primer design can be performed with a variety of com-puter programs that will be described in the Subheadings 2 and 3. The cre-ation of a two-dimensional plot that illustrates spatial and spectral aspects ofSTR allele ranges (Fig. 3) makes it easier to conceptualize desired PCR prod-uct sizes (see Note 1). After the purchase of dye-labeled and unlabeled PCRprimers, quality control of each individual primer is performed before combin-ing them for multiplex assay testing (see Note 2). Selecting fluorescent dyecombinations can be important to ensure compatibility with detection instru-mentation and to provide the smallest amount of spectral overlap and potentialbleed through between dye colors (see Note 3).
The approach described here has been used to construct a Y-STR 10plex (8)and a cat STR 12plex (9) with three different dye labels and a Y-chromosomeSTR 20plex using four dye labels (10,11). In addition, a number of multiplexsingle nucleotide polymorphism detection assays have been performed withthis approach (12). Examples from the cat STR 12plex and Y-STR 20plex willbe illustrated.
Fig. 2. Steps for development of STR multiplexes described in this chapter.

56 Butler
2. Materials1. A number of internet-accessible computer programs and databases can be used
for PCR primer design including Primer3 and GenBank. The programs used inthe approach described here are listed in Table 1.
2. An in-house program written in Visual Basic 6.0 has been developed that cancheck potential primer–primer interactions in a pairwise and batch mode fashion(6,13).
3. Numerous commercial sources exist for oligonucleotide synthesis. For these stud-ies, unlabeled oligonucleotides were purchased from Qiagen Operon (Alameda,CA). Fluorescently labeled PCR primers were obtained from Applied Biosystems(Foster City, CA) with 6FAM (blue), VIC (green), NED (yellow), or PET (red)dyes attached.
4. Primers are received lyophilized. The unlabeled primers are brought to 100 µmol/L or 200 µmol/L stocks with appropriate volumes of deionized water. The dyelabeled primers are brought to 100 or 200 µmol/L concentrations with TE buffer(10 mmol/L Tris, 1 mmol/L ethylenediamine tetraacetic acid; see Note 4). Theprimer stocks are stored in the dark at 4°C. Frequent freeze-thaw cycles canaccelerate break down of the dye attachment to the oligonucleotide.
5. The first quality control test performed is usually mass spectrometry to ensure thatthe primer was properly synthesized. Poor-quality primers that contain numeroussynthesis by-products (e.g., Fig. 4) are returned to the manufacturer for resynthe-sis prior to proceeding with primer testing.
Fig. 3. Multiplex STR design layout using spatial (PCR product size) and spectral(dye label color) dimensions. PCR product size ranges for the various loci can beeasily seen with this approach along with the size of the reference allele used for PCRprimer design.

STR Multiplex Assays 57
Table 1Internet Sites Useful for PCR Primer Design Process
GenBankhttp://www.ncbi.nlm.nih.gov/Genbank/
GenBank contains DNA sequence entries that may serve as reference sequences forprimer design. A particular sequence may be located within GenBank by performinga BLAST search with a portion of the sequence for a locus, such as a published PCRprimer.
Primer3http://www-genome.wi.mit.edu/cgi-bin/primer/primer3_www.cgi
Primer3 permits rapid and flexible PCR primer design for one reference sequence ata time. A reference sequence is pasted into an Internet browser window and the userindicates primer design parameters. A set of possible primer pairs is returned overthe World Wide Web in a matter of seconds. The default primer Tm values of 57–63°C generally select primers that work quite well with a PCR annealing tempera-ture of 55°C.
BLASThttp://www.ncbi.nlm.nih.gov/BLAST/
BLAST (Basic Local Alignment Search Tool) enables a rapid search of GenBank orother DNA sequence databases to determine if similar sequences to the query arepresent. If the query is a PCR primer, then similar sequences could indicate possiblemispriming sites. If a high amount of similarity is seen with an undesired sequenceor sequences, then the PCR primer should be redesigned to avoid the potentialmispriming sites that would reduce the efficiency of PCR amplification.
BLAThttp://genome.ucsc.edu/cgi-bin/hgBlat
BLAT (BLAST Like Alignment Tool) performs homology searches. BLAT on DNAsequences is designed to quickly find sequences of 95% and greater similarity oflength 40 bases or more. BLAT does not work well for querying with PCR primersrather it is useful for mapping large portions of a locus into the human genome ref-erence sequence.
BCM Search Launcher: Multiple Sequence Alignmentshttp://searchlauncher.bcm.tmc.edu/multi-align/multi-align.html
A user can input multiple DNA sequences in FASTA format and obtain back analignment of those sequences. This information can be useful in evaluating multiplesequence entries from GenBank in a search for possible single nucleotide polymor-phisms that may disrupt PCR primer annealing.
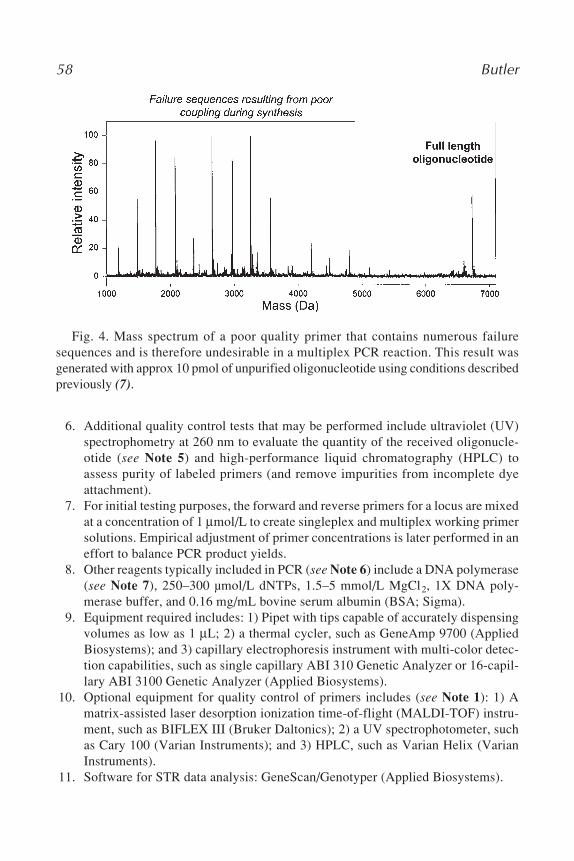
58 Butler
6. Additional quality control tests that may be performed include ultraviolet (UV)spectrophometry at 260 nm to evaluate the quantity of the received oligonucle-otide (see Note 5) and high-performance liquid chromatography (HPLC) toassess purity of labeled primers (and remove impurities from incomplete dyeattachment).
7. For initial testing purposes, the forward and reverse primers for a locus are mixedat a concentration of 1 µmol/L to create singleplex and multiplex working primersolutions. Empirical adjustment of primer concentrations is later performed in aneffort to balance PCR product yields.
8. Other reagents typically included in PCR (see Note 6) include a DNA polymerase(see Note 7), 250–300 µmol/L dNTPs, 1.5–5 mmol/L MgCl2, 1X DNA poly-merase buffer, and 0.16 mg/mL bovine serum albumin (BSA; Sigma).
9. Equipment required includes: 1) Pipet with tips capable of accurately dispensingvolumes as low as 1 µL; 2) a thermal cycler, such as GeneAmp 9700 (AppliedBiosystems); and 3) capillary electrophoresis instrument with multi-color detec-tion capabilities, such as single capillary ABI 310 Genetic Analyzer or 16-capil-lary ABI 3100 Genetic Analyzer (Applied Biosystems).
10. Optional equipment for quality control of primers includes (see Note 1): 1) Amatrix-assisted laser desorption ionization time-of-flight (MALDI-TOF) instru-ment, such as BIFLEX III (Bruker Daltonics); 2) a UV spectrophotometer, suchas Cary 100 (Varian Instruments); and 3) HPLC, such as Varian Helix (VarianInstruments).
11. Software for STR data analysis: GeneScan/Genotyper (Applied Biosystems).
Fig. 4. Mass spectrum of a poor quality primer that contains numerous failuresequences and is therefore undesirable in a multiplex PCR reaction. This result wasgenerated with approx 10 pmol of unpurified oligonucleotide using conditions describedpreviously (7).
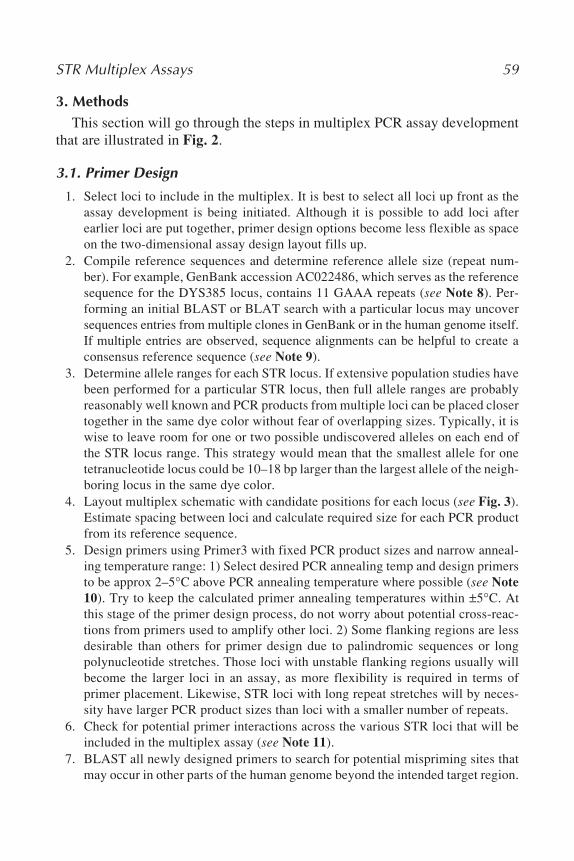
STR Multiplex Assays 59
3. MethodsThis section will go through the steps in multiplex PCR assay development
that are illustrated in Fig. 2.
3.1. Primer Design
1. Select loci to include in the multiplex. It is best to select all loci up front as theassay development is being initiated. Although it is possible to add loci afterearlier loci are put together, primer design options become less flexible as spaceon the two-dimensional assay design layout fills up.
2. Compile reference sequences and determine reference allele size (repeat num-ber). For example, GenBank accession AC022486, which serves as the referencesequence for the DYS385 locus, contains 11 GAAA repeats (see Note 8). Per-forming an initial BLAST or BLAT search with a particular locus may uncoversequences entries from multiple clones in GenBank or in the human genome itself.If multiple entries are observed, sequence alignments can be helpful to create aconsensus reference sequence (see Note 9).
3. Determine allele ranges for each STR locus. If extensive population studies havebeen performed for a particular STR locus, then full allele ranges are probablyreasonably well known and PCR products from multiple loci can be placed closertogether in the same dye color without fear of overlapping sizes. Typically, it iswise to leave room for one or two possible undiscovered alleles on each end ofthe STR locus range. This strategy would mean that the smallest allele for onetetranucleotide locus could be 10–18 bp larger than the largest allele of the neigh-boring locus in the same dye color.
4. Layout multiplex schematic with candidate positions for each locus (see Fig. 3).Estimate spacing between loci and calculate required size for each PCR productfrom its reference sequence.
5. Design primers using Primer3 with fixed PCR product sizes and narrow anneal-ing temperature range: 1) Select desired PCR annealing temp and design primersto be approx 2–5°C above PCR annealing temperature where possible (see Note10). Try to keep the calculated primer annealing temperatures within ±5°C. Atthis stage of the primer design process, do not worry about potential cross-reac-tions from primers used to amplify other loci. 2) Some flanking regions are lessdesirable than others for primer design due to palindromic sequences or longpolynucleotide stretches. Those loci with unstable flanking regions usually willbecome the larger loci in an assay, as more flexibility is required in terms ofprimer placement. Likewise, STR loci with long repeat stretches will by neces-sity have larger PCR product sizes than loci with a smaller number of repeats.
6. Check for potential primer interactions across the various STR loci that will beincluded in the multiplex assay (see Note 11).
7. BLAST all newly designed primers to search for potential mispriming sites thatmay occur in other parts of the human genome beyond the intended target region.

60 Butler
8. Select a primer in each pair to be fluorescently labeled. It is often convenient toselect the forward primer for each locus to maintain consistency when purchas-ing the primers.
9. Add a 5' tail to unlabeled primers to promote full adenylation (i.e., nontemplateaddition) during PCR (see Note 12).
10. Place an order for PCR primers. Until the primer combinations have been dem-onstrated to work well in a multiplex format, it is advisable to purchase the small-est possible quantity of each primer in order to decrease development costs.
3.2. Primer Quality Control and Testing
1. Check primer quality with MALDI-TOF mass spectrometry.2. Check primer quantity with UV spectrophotometer (see Note 5).3. Mix primers in locus-specific pairs at 1 µmol/L concentration.4. Test primer pairs in singleplex reactions with standard PCR conditions to ensure
that the correct size product(s) is generated.5. Combine equimolar amounts (e.g., 1 µmol/L) of primers in multiplex set.6. Test initial equimolar primer mix with standard PCR conditions (8,10).7. Balance primer mix empirically based on PCR product yields.8. Test adjusted primer mix on the same quantity of multiple DNA templates to
ensure consistency across samples (see Notes 13 and 14).9. Perform sensitivity studies with serial dilutions of DNA templates.
10. Create allelic ladders with common alleles. Alternatively typing may be per-formed without allelic ladders using precise sizing and sequence informationfrom a single sample (11).
11. Write Genotyper macro for allele calling.
4. Notes1. The creation of spatial and spectral two-dimensional layouts (Fig. 3) is beneficial
in examining potential PCR product sizes for the loci intended to be present in amultiplex PCR assay. Most multiplex STR assays will involve PCR products inthe size range of 75–400 bp and use three different dye labels. With polymorphicSTR markers, it is important to have a good idea of overall allele ranges beforedesigning the assay to avoid putting loci too close together that are next to oneanother in the same dye color. Typically leaving room for one or two new allelesat each end of the expected allele range is prudent. It is also important to remem-ber that the reference sequence allele (represented by the vertical arrows alongthe horizontal locus allele range bars in Fig. 3), which is used for primer design,only represents one of the possible alleles and could be anywhere along theexpected allele range.
2. Full characterization and quality control of PCR primers involves a UVspectrophometry measurement to determine concentration, an HPLC run to evalu-ate purity, a MALDI-TOF mass spectrometry analysis to confirm correct sequenceand purity, and a capillary electrophoresis run to determine the level of residualdye artifacts (“dye blobs”). Dye artifacts are only a problem with capillary elec-
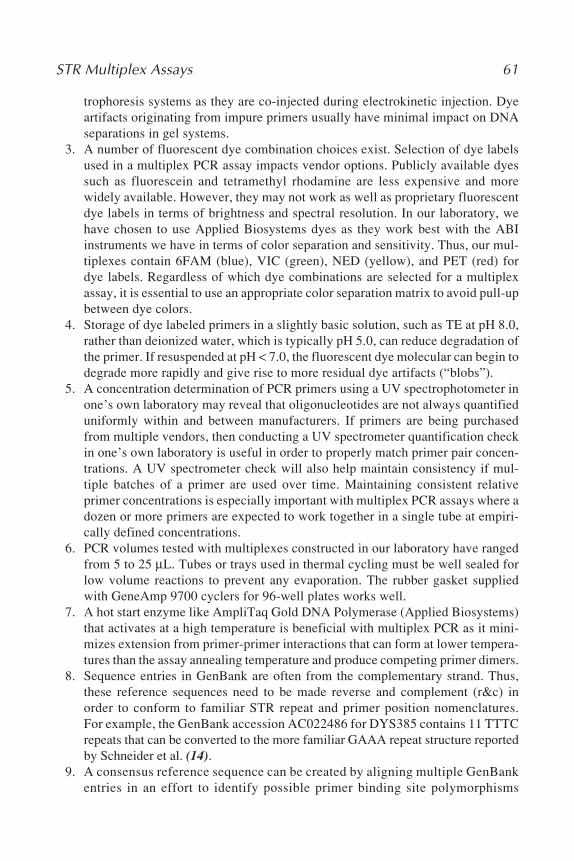
STR Multiplex Assays 61
trophoresis systems as they are co-injected during electrokinetic injection. Dyeartifacts originating from impure primers usually have minimal impact on DNAseparations in gel systems.
3. A number of fluorescent dye combination choices exist. Selection of dye labelsused in a multiplex PCR assay impacts vendor options. Publicly available dyessuch as fluorescein and tetramethyl rhodamine are less expensive and morewidely available. However, they may not work as well as proprietary fluorescentdye labels in terms of brightness and spectral resolution. In our laboratory, wehave chosen to use Applied Biosystems dyes as they work best with the ABIinstruments we have in terms of color separation and sensitivity. Thus, our mul-tiplexes contain 6FAM (blue), VIC (green), NED (yellow), and PET (red) fordye labels. Regardless of which dye combinations are selected for a multiplexassay, it is essential to use an appropriate color separation matrix to avoid pull-upbetween dye colors.
4. Storage of dye labeled primers in a slightly basic solution, such as TE at pH 8.0,rather than deionized water, which is typically pH 5.0, can reduce degradation ofthe primer. If resuspended at pH < 7.0, the fluorescent dye molecular can begin todegrade more rapidly and give rise to more residual dye artifacts (“blobs”).
5. A concentration determination of PCR primers using a UV spectrophotometer inone’s own laboratory may reveal that oligonucleotides are not always quantifieduniformly within and between manufacturers. If primers are being purchasedfrom multiple vendors, then conducting a UV spectrometer quantification checkin one’s own laboratory is useful in order to properly match primer pair concen-trations. A UV spectrometer check will also help maintain consistency if mul-tiple batches of a primer are used over time. Maintaining consistent relativeprimer concentrations is especially important with multiplex PCR assays where adozen or more primers are expected to work together in a single tube at empiri-cally defined concentrations.
6. PCR volumes tested with multiplexes constructed in our laboratory have rangedfrom 5 to 25 µL. Tubes or trays used in thermal cycling must be well sealed forlow volume reactions to prevent any evaporation. The rubber gasket suppliedwith GeneAmp 9700 cyclers for 96-well plates works well.
7. A hot start enzyme like AmpliTaq Gold DNA Polymerase (Applied Biosystems)that activates at a high temperature is beneficial with multiplex PCR as it mini-mizes extension from primer-primer interactions that can form at lower tempera-tures than the assay annealing temperature and produce competing primer dimers.
8. Sequence entries in GenBank are often from the complementary strand. Thus,these reference sequences need to be made reverse and complement (r&c) inorder to conform to familiar STR repeat and primer position nomenclatures.For example, the GenBank accession AC022486 for DYS385 contains 11 TTTCrepeats that can be converted to the more familiar GAAA repeat structure reportedby Schneider et al. (14).
9. A consensus reference sequence can be created by aligning multiple GenBankentries in an effort to identify possible primer binding site polymorphisms

62 Butler
between the various STR alleles reported in GenBank. Alignments may be per-formed via the BCM Search Launcher program (Table 1) once candidate refer-ence sequences have been put into a FASTA format. Sequence differences inflanking regions around the STR repeat can be flagged as possible polymorphismsand these regions should be avoided during primer design.
10. Although it is usually best to have primers with calculated annealing tempera-tures above the PCR annealing temperature, this is not always necessary. Some-times it is not possible to design a primer with a higher melting temperature (Tm)because of the lack of available sequence information or sequence issues (e.g.,palindromes or polynucleotide stretches). For example, in the cat STR 12plex,one of the primers has a calculated Tm of 50°C because of limited sequenceinformation yet it works fine with a PCR annealing temperature of 59°C (data notshown). Thus, a lower than desired primer Tm does not mean that the primer pairwill not work well in a multiplex PCR environment and empirical testing is al-ways required to prove the value of each primer.
11. A computer program has been written within our group at NIST that enablesautomated screening of potential primer–primer interactions via batch analysis.This Autodimer program has been written in Visual Basic and described in previ-ous publications (6,8). It is publicly available through the STRBase web site(http://www.cstl.nist.gov/biotech/strbase).
12. Use of a single G or a 7-base tail GTGTCTT on the 5' end of the unlabeled primerwithin a locus-specific primer pair can promote full adenylation of PCR productsamplified from that locus. Figure 5 demonstrates how the partially adenylateddoublet peaks for a STR locus from a heterozygous individual are converted tofully adenylated ones using the 7-base tail with identical PCR conditions.
13. Residual dye molecules exist for most fluorescent dye labeled primers that havenot been extensively purified or stored properly (see Note 4). These dye blobscan interfere with allele calls in some size ranges but can be removed with EdgeBioscience spin columns after PCR amplification (15), as shown in Fig. 6.
14. The addition of bovine serum albumin (BSA) improves PCR amplification inmultiplex reactions as shown in Fig. 7, most likely because BSA helps reduceinhibition of the polymerase by the residual dye molecules present from the mul-tiple primers in the PCR reaction.
AcknowledgmentsThis multiplex PCR assay design process has been made easier with the
development of an autodimer program, written by Dr. Peter Vallone in ourlaboratory, to screen for potential primer–primer interactions. The work ofRichard Schoske on the Y-STR multiplexes and Margaret Kline for thePowerPlex 16 and Identifiler data also is gratefully acknowledged. Certaincommercial equipment, instruments, and materials are identified to specifyexperimental procedures as completely as possible. In no case does such iden-tification imply a recommendation or endorsement by the National Institute of
STR Multiplex Assays 63
Standards and Technology nor does it imply that any of the materials, instru-ments or equipment identified are necessarily the best available for the pur-pose. This work was funded in part by the National Institute of Justice throughan interagency agreement with the NIST Office of Law Enforcement Stan-dards.
References1. Butler, J. M. (2001) Forensic DNA Typing: Biology and Technology behinds STR
Markers. Academic Press, London.2. Krenke, B. E., Tereba, A., Anderson, S. J., Buel, E., Culhane, S., Finis, C. J., et al.
(2002) Validation of a 16-locus fluorescent multiplex system. J. Forensic Sci. 47,773–785.
3. Applied Biosystems (2001) AmpFlSTR Identifiler PCR Amplification Kit User’sManual, Foster City, CA, P/N 4323291.
4. Shuber, A. P., Grondin, V. J., and Klinger, K. W. (1995) A simplified procedurefor developing multiplex PCRs. Genome Res. 5, 488–493.
5. Henegariu, O., Heerema, N. A., Dlouhy, S. R., Vance, G. H., and Vogt, P. H.(1997) Multiplex PCR: critical parameters and step-by-step protocol.BioTechniques 23, 504–511.
6. Butler, J. M., Ruitberg, C. M., and Vallone, P. M. (2001) Capillary electrophore-sis as a tool for optimization of multiplex PCR reactions. Fresenius J. Anal. Chem.369, 200–205.
Fig. 5. Full adenylation improves with the addition of a 5' tail to the unlabeledprimer. In the top panel, both alleles at this heterozygous locus exhibit doublets from-A and +A peaks that are approx 1 bp apart. The bottom panel shows the same DNAsample amplified at the same locus with 5'-tailed primers that promote full adenlyationof both alleles. The PCR product sizes for this STR locus are approx 7 bp larger withthe 7-base GTGTCTT 5'-tail in the bottom panel.
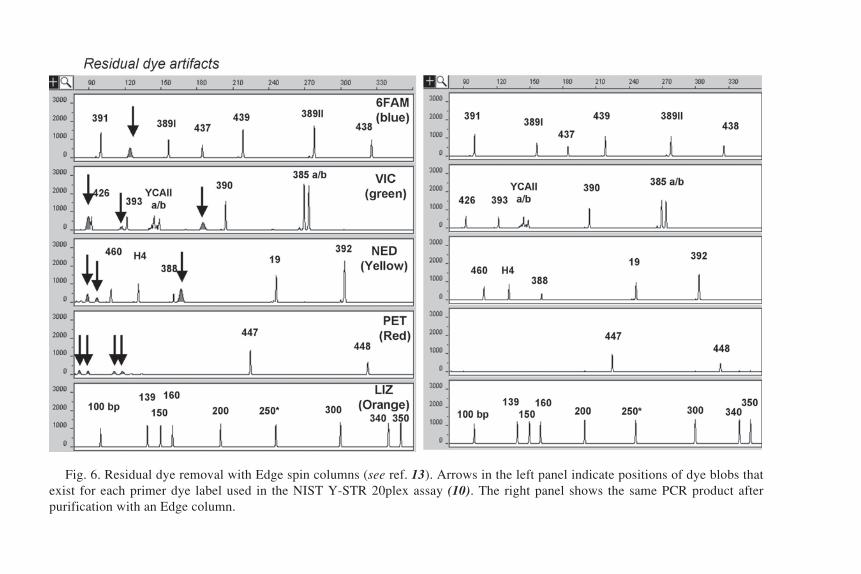
64B
utler
Fig. 6. Residual dye removal with Edge spin columns (see ref. 13). Arrows in the left panel indicate positions of dye blobs thatexist for each primer dye label used in the NIST Y-STR 20plex assay (10). The right panel shows the same PCR product afterpurification with an Edge column.

STR Multiplex Assays 65
7. Butler, J. M., Devaney, J. M., Marino, M. A., and Vallone, P. M. (2001) Qualitycontrol of PCR primers used in multiplex STR amplifications. Forensic Sci. Int.119, 87–96.
8. Schoske, R., Vallone, P. M., Ruitberg, C. M., and Butler, J. M. (2003) MultiplexPCR design strategy used for the simultaneous amplification of 10 Y chromo-some short tandem repeat (STR) loci. Anal. Bioanal. Chem. 375, 333–343.
9. Butler, J. M., David, V. A., O’Brien, S. J., and Menotti-Raymond, M. (2002) TheMeowPlex: a new DNA test using tetranucleotide STR markers for the domesticcat. Profiles in DNA, Promega Corporation, Volume 5, No. 2, pp. 7–10. Availableat: http://www.promega.com/profiles/502/ProfilesInDNA_502_07.pdf; accessed18 May 2004.
10. Butler, J. M., Schoske, R., Vallone, P. M., Kline, M. C., Redd, A. J., and Hammer,M. F. (2002) A novel multiplex for simultaneous amplification of 20 Y chromo-some STR markers. Forensic Sci. Int. 129, 10–24.
11. Schoske, R. (2003) The design, optimization and testing of Y chromosome shorttandem repeat megaplexes. PhD dissertation, American University.
12. Vallone, P. M. and Butler, J. M. (2004) Y-SNP typing of U.S. African Americanand Caucasean samples using allele-specific hybridization and primer extension.J. Forensic Sci. 49, 723–732.
13. Vallone, P. M. and Butler, J. M. (2004) AutoDimer: a screening tool for primer–dimer and hairpin structures. Biotechniques, in press.
14. Schneider, P. M., Meuser, S., Waiyawuth, W., Seo, Y., and Rittner, C. (1998)Tandem repeat structure of the duplicated Y-chromosomal STR locus DYS385and frequency studies in the German and three Asian populations. Forensic Sci.Int. 97, 61–70.
15. Butler, J. M., Shen, Y., and McCord, B. R. (2003) The development of reducedsize STR amplicons as tools for analysis of degraded DNA. J. Forensic Sci. 48,1054–1064.
Fig. 7. Benefits of BSA addition to cat STR 12plex assay (9). DNA sample concen-tration and PCR components are identical between the two panels except that the toppanel contains 0.16 mg/mL BSA.


Y Chromosome STR Typing 67
67
From: Methods in Molecular Biology, vol. 297: Forensic DNA Typing ProtocolsEdited by: A. Carracedo © Humana Press Inc., Totowa, NJ
6
Y Chromosome STR Typing
Leonor Gusmão and Cíntia Alves
SummaryBecause of their unique transmission properties and male specificity, markers located
on the nonrecombining region of the Y chromosome (NRY) have become an importanttool in forensic investigation. In the past few years, more than 50 polymorphic Y chro-mosome-specific short tandem repeats (STRs) have been described and a set of 9 lociwere selected, considered as the minimal haplotype included in the forensic databases,Y-STR Haplotype Reference Databases, the largest now available online (http://www.yhrd.org). Here, we describe a multiplex amplification strategy developed for ABIplatforms to amplify the nine loci included in the minimal haplotype (DYS19, DYS385a/b,DYS389I, DYS389II, DYS390, DYS391, DYS392, DYS393) as well as a second set ofmarkers (DYS437, DYS438, DYS439, DYS460, DYS461, GATA A10, GATA C4, andGATA H4) used to improve the minimal haplotype diversity and, hence, the discrimina-tion power. Together, these 17 Y-STRs can be used to define highly discriminativehaplotypes, providing a powerful tool in male lineage identification.
Key Words: Y chromosome STRs; Multiplex PCR; DYS19; DYS385; DYS389I;DYS389II; DYS390; DYS391; DYS392; DYS393; DYS437; DYS438; DYS439;DYS460; DYS461; GATA A10; GATA C4; GATA H4.
1. IntroductionBecause of their levels of diversity and typing simplicity, the short tandem
repeats (STRs) are the most used markers in the forensics field. In particular,they can be studied using very simple and reliable polymerase chain reaction(PCR) techniques, and they can be typed in low quantity or degraded deoxyri-bonucleic acid (DNA) samples.
Y chromosome-specific markers, located on the nonrecombining portion, orNRY, are transmitted from father to son unchanged (unless a mutation occurs)and, therefore, can be used to construct highly informative haplotypes. Through
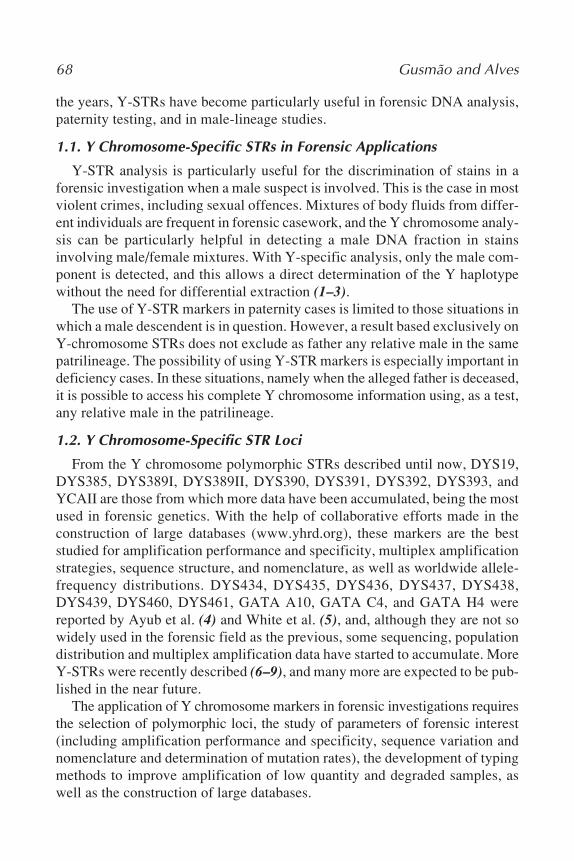
68 Gusmão and Alves
the years, Y-STRs have become particularly useful in forensic DNA analysis,paternity testing, and in male-lineage studies.
1.1. Y Chromosome-Specific STRs in Forensic Applications
Y-STR analysis is particularly useful for the discrimination of stains in aforensic investigation when a male suspect is involved. This is the case in mostviolent crimes, including sexual offences. Mixtures of body fluids from differ-ent individuals are frequent in forensic casework, and the Y chromosome analy-sis can be particularly helpful in detecting a male DNA fraction in stainsinvolving male/female mixtures. With Y-specific analysis, only the male com-ponent is detected, and this allows a direct determination of the Y haplotypewithout the need for differential extraction (1–3).
The use of Y-STR markers in paternity cases is limited to those situations inwhich a male descendent is in question. However, a result based exclusively onY-chromosome STRs does not exclude as father any relative male in the samepatrilineage. The possibility of using Y-STR markers is especially important indeficiency cases. In these situations, namely when the alleged father is deceased,it is possible to access his complete Y chromosome information using, as a test,any relative male in the patrilineage.
1.2. Y Chromosome-Specific STR Loci
From the Y chromosome polymorphic STRs described until now, DYS19,DYS385, DYS389I, DYS389II, DYS390, DYS391, DYS392, DYS393, andYCAII are those from which more data have been accumulated, being the mostused in forensic genetics. With the help of collaborative efforts made in theconstruction of large databases (www.yhrd.org), these markers are the beststudied for amplification performance and specificity, multiplex amplificationstrategies, sequence structure, and nomenclature, as well as worldwide allele-frequency distributions. DYS434, DYS435, DYS436, DYS437, DYS438,DYS439, DYS460, DYS461, GATA A10, GATA C4, and GATA H4 werereported by Ayub et al. (4) and White et al. (5), and, although they are not sowidely used in the forensic field as the previous, some sequencing, populationdistribution and multiplex amplification data have started to accumulate. MoreY-STRs were recently described (6–9), and many more are expected to be pub-lished in the near future.
The application of Y chromosome markers in forensic investigations requiresthe selection of polymorphic loci, the study of parameters of forensic interest(including amplification performance and specificity, sequence variation andnomenclature and determination of mutation rates), the development of typingmethods to improve amplification of low quantity and degraded samples, aswell as the construction of large databases.
Y Chromosome STR Typing 69
1.3. PCR Performance and Specificity
The inclusion of Y STRs in forensic routine requires previous studies con-cerning PCR performance and Y specificity. The PCR amplification of anSTR can be, in some cases, improved by the redesign of previously describedprimers to reduce nonspecific amplification or to reduce the size of the ampli-fied fragments, as the case of DYS389 (10) and DYS385 primers (11). Y-chro-mosome specificity can be tested with the amplification of female DNA, actingas negative amplification controls. An example of non-Y specificity is theamplification of female DNA samples when using the first described primersfor DYS391 (12) and DYS393 (13).The screening of point mutations in theflanking regions of the STRs currently used in forensics is important to avoidnull alleles by primer mismatching. Point mutations have been described inthe flanking regions of DYS391, DYS437, and DYS438 (14).
1.4. Y-STR Nomenclature
The use of a consensus nomenclature is crucial to allow for second opin-ions, proficiency testing, exchange of data, and databasing. Although for someSTRs, with simple repeat structure, it is easy to find a consensus nomencla-ture, for others, with a complex structure, it becomes more difficult. Forexample, for the first described STRs, nomenclature changes were made forDYS19, DYS390, and DYS389 to include nonrepetitive motives or motivesthat were found to be variable with the accumulation of new sequence data.To prevent nomenclature changes, according to the International Society forForensic Genetics guidelines “alleles should be named taking into account bothvariant and nonvariant repeats” (15). However, the use of recently describedSTRs introduced additional nomenclature problems and, although only a fewpopulation studies were so far published for these STRs, for some of themdifferent nomenclatures are being used (16).
1.5. Population Genetics and Databasing
The use of Y STRs as inclusion evidence involves the definition of popula-tion genetic profiles, with the elaboration of a large number of populationdatabases. The construction of Y-specific STR databases is more complex thanthose for unlinked autosomal markers because the informative content ofY-specific STRs results from the possibility of constructing highly discrimi-native haplotypes. The suitability of the Y-STR databases for practical usein the forensics field will be greatly increased with the typing of each indi-vidual to as many loci as possible instead of typing a great number of indi-viduals for a small number of Y-STRs (17).
70 Gusmão and Alves
The development of Y-STR haplotype reference databases is important, notonly for haplotype frequency estimation and subsequent application for matchprobability calculations in forensic studies, but also for performing compara-tive population analysis.
1.6. Y-STR Multiplex AmplificationMultiplex amplification techniques can be used to increase the information
content of the Y-STR haplotype typing approach and also to reduce the needfor large sample quantities in forensic cases (18). A great effort was made bysome groups to develop STR multiplex systems including a large number ofmarkers (8,9,19–21).
There are already some multiplex systems commercially available, namely,from Reliagene (Y-PLEX™ 6 enables simultaneous amplification of DYS393,DYS19, DYS389II, DYS390, DYS391, and DYS385; Y-PLEX™ 5 amplifiesDYS389I, DYS389II, DYS439, DYS438, and DYS392; and Y-PLEX™ 12amplifies all loci in Y-PLEX™ 6 and Y-PLEX™ 5 plus the Amelogenin locus)and from Promega Corporation (PowerPlex® Y System enables simultaneousamplification of DYS19, DYS385, DYS389I, DYS389II, DYS390, DYS391,DYS392, DYS393, DYS437, DYS438, and DYS439).
Two multiplex PCR-amplification methods are here described that allowthe typing of 17 polymorphic Y chromosome-specific STRs. The first multi-plex (YSTRM1) was optimized to efficiently amplify, in the same PCR, thenine Y-STR loci: DYS19; DYS385a/b; DYS389I; DYS389II; DYS390;DYS391; DYS392; DYS393 (minimal haplotype). A second multiplex(YSTRM2) allows the simultaneous amplification of eight additional Y-STRloci: DYS437; DYS438; DYS439; DYS460; DYS461; GATA A10; GATAC4; and GATA H4.
2. Materials1. PCR reagents: deoxynucleotide triphosphate solution (dNTPs, a mixture of
dATP, dCTP, dGTP, and dTTP in the same concentration); magnesium chloride(MgCl2); AmpliTaq Gold® DNA polymerase and Gold buffer (AB AppliedBiosystems); labeled and nonlabeled oligonucleotide primers (primer sequencesand labels are described in Subheading 3). The amplification reagents should bestored at –20°C. The labeled primer solutions are sensitive to light and must bestored in the dark.
2. Analysis of the amplified product can be performed in an ABI PRISM® 310 GeneticAnalyser. The following material is required (according to the instrumentmanufacturer’s instructions): sample tubes and septa (AB Applied Biosystems,Foster City, CA); TAMRA 500 internal size standard (AB Applied Biosystems);dry heating block or thermal cycler; 310 capillaries, 47 cm × 50 µm (AB AppliedBiosystems); Performance Optimizer Polymer 4, POP-4 (AB AppliedBiosystems); deionized formamide; and ice.

Y Chromosome STR Typing 71
To prevent cross-contaminations, it is recommended one use disposablegloves and aerosol-resistant pipet tips. Pre- and post-PCR samples, reagents,and instruments should be used and stored separately. Formamide is poten-tially hazard (irritant and teratogen) and should be handled accordingly.
3. MethodsPCR amplification protocols were optimized in a PCR System 2400 Ther-
mal Cycler (AB Applied Biosystems) and detection tested on an ABI PRISM®
310 Genetic Analyser. Protocols may need to be optimized for different instru-ments.
3.1. Loci Information
The loci included in the YSTRM1 multiplex are the better-studied Y chro-mosome-specific STR markers and, until now, the most used in the forensics field. Together, these nine loci represent the so-called “minimal haplotype”included in the Y-STR Haplotype Reference Databases (YHRDs), the largestforensic databases available online (available at: http://www.yhrd.org). The8 loci included in the YSTRM2 multiplex are the most polymorphic loci ofthe 12 described by Ayub et al. (4) and White et al. (5).
The GenBank accession numbers, repeat motifs, size of PCR products, andthe subsequent repeat units for the Y-STR loci amplified with YSTRM1 andYSTRM2 primers are summarized in Table 1.
DYS392 is a trinucleotide repeat, DYS438 is a pentanucleotide repeat, andthe remaining loci are tetranucleotide repeats. Both DYS389 and DYS385primers amplify two loci. Because the annealing site of the DYS389 forwardprimer is duplicated, two different size PCR fragments are amplified; the larg-est fragment (DYS389 II) includes the smaller one (DYS389 I), both of whichare polymorphic. The DYS385 primers amplify a tetranucleotide repeat sequencethat is duplicated on the Y chromosome and the two PCR-amplified fragmentsare in the same size range and cannot be assigned to either of the two loci.Therefore, data concerning this marker are always reported as allele classesdefined by the combination of both loci alleles.
Although not widespread in forensics, because of the low increase in haplo-type diversity, amplification strategies have already been described for theseparate amplification of both alleles at DYS389 (http://www.medfac.leidenuniv.nl/fldo) and DYS385 loci (22).
In the same way as for DYS434 and DYS437 (19), DYS460 is adjacent toDYS461 and, therefore, when these two STRs are amplified together a thirdfragment is amplified by DYS460 forward and DYS461 reverse primers, includ-ing both loci (Fig. 1).
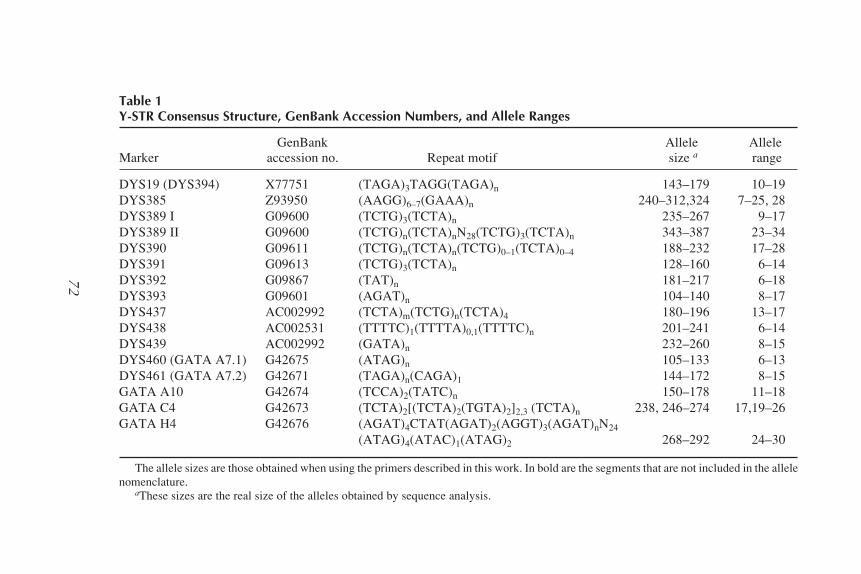
72G
usmão and A
lves
Table 1Y-STR Consensus Structure, GenBank Accession Numbers, and Allele Ranges
GenBank Allele AlleleMarker accession no. Repeat motif size a range
DYS19 (DYS394) X77751 (TAGA)3TAGG(TAGA)n 143–179 10–19DYS385 Z93950 (AAGG)6–7(GAAA)n 240–312,324 7–25, 28DYS389 I G09600 (TCTG)3(TCTA)n 235–267 9–17DYS389 II G09600 (TCTG)n(TCTA)nN28(TCTG)3(TCTA)n 343–387 23–34DYS390 G09611 (TCTG)n(TCTA)n(TCTG)0–1(TCTA)0–4 188–232 17–28DYS391 G09613 (TCTG)3(TCTA)n 128–160 6–14DYS392 G09867 (TAT)n 181–217 6–18DYS393 G09601 (AGAT)n 104–140 8–17DYS437 AC002992 (TCTA)m(TCTG)n(TCTA)4 180–196 13–17DYS438 AC002531 (TTTTC)1(TTTTA)0,1(TTTTC)n 201–241 6–14DYS439 AC002992 (GATA)n 232–260 8–15DYS460 (GATA A7.1) G42675 (ATAG)n 105–133 6–13DYS461 (GATA A7.2) G42671 (TAGA)n(CAGA)1 144–172 8–15GATA A10 G42674 (TCCA)2(TATC)n 150–178 11–18GATA C4 G42673 (TCTA)2[(TCTA)2(TGTA)2]2,3 (TCTA)n 238, 246–274 17,19–26GATA H4 G42676 (AGAT)4CTAT(AGAT)2(AGGT)3(AGAT)nN24
(ATAG)4(ATAC)1(ATAG)2 268–292 24–30
The allele sizes are those obtained when using the primers described in this work. In bold are the segments that are not included in the allelenomenclature.
aThese sizes are the real size of the alleles obtained by sequence analysis.
72

Y Chromosome STR Typing 73
3.2. PCR Amplification
Different technical methods were investigated with the aim of developingthe two multiplex amplification systems for the simultaneous amplification ofYSTRM1 and YSTRM2 loci.
The best YSTRM1 amplification results were obtained when using between 1and 10 ng of male template DNA in a 25-µL reaction volume containing 2 mMMgCl2, 200 µM of each dNTP, 1X Gold Buffer (AB Applied Biosystems) and1 Unit of AmpliTaq Gold® DNA polymerase (AB Applied Biosystems).
The best YSTRM2 amplification results were obtained when using between 1and 10 ng of male template DNA in a 25-µL reaction volume containing 1.5 mMMgCl2, 200 µM of each dNTP, 1X Gold Buffer (AB Applied Biosystems) and 1Unit of AmpliTaq Gold® DNA polymerase (AB Applied Biosystems).
3.2.1. Primer Mix Setup
Primer sequences and labels are given in Table 2. For those systems withoverlapping allele size ranges, amplified in the same multiplex, the primerswere labeled with different dyes (see allele size ranges in Table 1) to allow forunambiguous typing of all the markers (Fig. 2).
Various primer concentrations were tested and the best co-amplificationresults were obtained when using the concentrations indicated in Table 3. Aprimer mix can be prepared for a large number of reactions (Table 3) andstored at –20°C until needed to set up a PCR. This has the advantage of reduc-ing pipetting errors for small volumes and allows better homogeneity betweensamples.
3.2.2. Amplification Procedure
To set up the amplification, prepare a PCR master mix for all samples bydetermining the number of reactions and adding one or two reactions to this
Fig. 1. DYS460 and DYS461 sequences and annealing sites. DYS460 reverse primerannealing sequence is underlined and DYS461 forward primer annealing sequence is ingrey italic.

74 Gusmão and Alves
Table 2Primer Sequences, References, and Labels
Primers Label Primer sequence (5'–3') Ref.
YSTRM1DYS19-F 6-FAM CTA CTG AGT TTC TGT TAT AGT 21DYS19-R GGG TTA AGG AGA GTG TCA CT ADYS385-F HEX AGC ATG GGT GAC AGA GCT A 10DYS385-R CCA ATT ACA TAG TCC TCC TTT CDYS389 -F TET CCA ACT CTC ATC TGT ATT ATC TAT 23DYS389-R TCT TAT CTC CAC CCA CCA GADYS390-F 6-FAM TAT ATT TTA CAC ATT TTT GGG CC 23DYS390-R TGA CAG TAA AAT GAA CAC ATT GCDYS391-F TET CTA TTC ATT CAA TCA TAC ACC CA 12DYS391-R CTG GGA ATA AAA TCT CCC TGG TTG CAA GDYS392-F HEX AAA AGC CAA GAA GGA AAA CAA A 21DYS392-R AGA CCC AGT TGA TGC AAT GTDYS393-F HEX GTG GTC TTC TAC TTG TGT CAA TAC 23DYS393-R AAC TCA AGT CCA AAA AAT GAG GYSTRM2DYS437-F TET GAC TAT GGG CGT GAG TGC AT 4DYS437-R AGA CCC TGT CAT TCA CAG ATG ADYS438-F 6-FAM TGG GGA ATA GTT GAA CGG TAA 4DYS438-R GTG GCA GAC GCC TAT AAT CCDYS439-F TET TCC TGA ATG GTA CTT CCT AGG TTT 4DYS439-R GCC TGG CTT GGA ATT CTT TTDYS460-F 6-FAM AGC AAG CAC AAG AAT ACC AGA G 21DYS460-R TCT ATC CTC TGC CTA TCA TTT ATT ADYS461-F TET AGG CAG AGG ATA GAT GAT ATG GAT 21DYS461-R TGA TGC TGT GTC ACT ATA TTT CTGGATA A10-F HEX CCT GCC ATC TCT ATT TAT CTT GCA TAT A 5GATA A10-R ATA AAT GGA GAT AGT GGG TGG ATTGATA C4-F HEX AGT GTC TCA CTT CAA GCA CCA AGC AC 5GATA C4-R GCA GCA AAA TTC ACA GTT GGA AAA ATG TGATA H4-F TET GTT ATG CTG AGG AGA ATT TCC AA 21GATA H4-R CCT CTG ATG GTG AAG TAA TGG AAT TAG A
number to compensate for pipetting errors. In Table 4, volumes are indicatedfor all the PCR reagents per reaction according to the stock concentration. Ifstock solutions with different concentrations are used, the volumes must beadjusted to keep the same concentration of the reagents in the final reactionsolution. Buffer and MgCl2 volumes are indicated for a buffer without MgCl2.

Y Chromosome STR Typing 75
If the buffer already contains MgCl2 (usually at a concentration of 15 mM), thevolume must be adjusted to reach a final concentration of 2 mM (YSTRM1) or1.5 mM (YSTRM2). Note that the total reaction volume should be 25 µL andthat changes in any reagent volume (primer mix, MgCl2, AmpliTaq Gold, orTemplate DNA) should be compensated by changing the volume of water. Theinclusion of a “negative control” (PCR mix plus water instead of DNA tem-plate) is important for detection of possible PCR contamination by externalDNA.
3.2.3. Thermal Cycling Conditions
The thermal cycling conditions were optimized in a GeneAmp PCR system2400 thermocycler (AB Applied Biosystems). The use of other instrumentsmay require some adjustments on denaturing, annealing, and extension steps.The number of cycles can be also adjusted for different input DNA. In forensicDNA samples, it is not recommended to increase the total number of cycles formore than 35–40 cycles.
YSTRM1 thermal cycling conditions are preincubation for 11 min at 95°Cand 1 min at 96°C; followed by 10 cycles of 30 s at 94°C, 30 s at 58°C, 45 s at70°C (ramp 23%); plus 22 cycles of 30 s at 90°C, 30 s at 56°C, 45 s at 70°C(ramp 23%); and a final incubation step of 60°C for 60 min.
YSTRM2 thermal cycling conditions are preincubation for 11 min at 95°Cand 1 min at 96°C; followed by 10 cycles of 30 s at 94°C, 30 s at 60°C, 45 s at
Fig. 2. YSTRM1 and YSTRM2 allele size ranges and labels.

76 Gusmão and Alves
Table 3Primer Concentrations and Preparation of the PCR Primer Mix.
Final concentration Volume in 25-µL Primer mixPrimers in PCR PCR mix (100 reactions)
YSTRM1DYS19 0.5 µM 2.5 µL 250 µLDYS385 0.25 µM 1.25 µL 125 µLDYS389 0.19 µM 0.95 µL 95 µLDYS390 0.2 µM 1 µL 100 µLDYS391 0.036 µM 0.18 µL 18 µLDYS392 0.27 µM 1.35 µL 135 µLDYS393 0.024 µM 0.12 µL 12 µL
YSTRM2DYS437 0.04 µM 0.2 µL 20 µLDYS438 0.8 µM 4 µL 400 µLDYS439 0.2 µM 1 µL 100 µLDYS460 0.22 µM 1.1 µL 110 µLDYS461 0.12 µM 0.6 µL 60 µLGATA A10 0.12 µM 0.6 µL 60 µLGATA C4 0.12 µM 0.6 µL 60 µLGATA H4 0.18 µM 0.9 µL 90 µL
The primer volumes were calculated for primer stock solutions with a 5 mM con-centration
Note: The primer pair mixture and all the labeled primer solutions are light sensi-tive and must be stored in the dark.
70°C (ramp 23%); plus 22 cycles of 30 s at 90°C, 30 s at 58°C, 45 s at 70°C(ramp 23%); and a final incubation step of 60°C for 60 min.
3.3. Analysis of Amplified Fragments
The detection analysis used for both multiplexes was optimized on an ABIPRISM® 310 Genetic Analyser (AB Applied Biosystems). The results obtainedfor both multiplexes are displayed in Fig. 3 (YSTRM1) and Fig. 4 (YSTRM2).When using other ABI platforms for YSTRM1 and YSTRM2 analysis, use theinstrument’s user’s manual for appropriate adjustments on sample preparationand electrophoresis conditions.
3.3.1. Sample Preparation
For sample preparation, it is recommended that one make a loading mixturefor all the samples to be analyzed (14.4 µL of deionized formamide and 0.6 µL
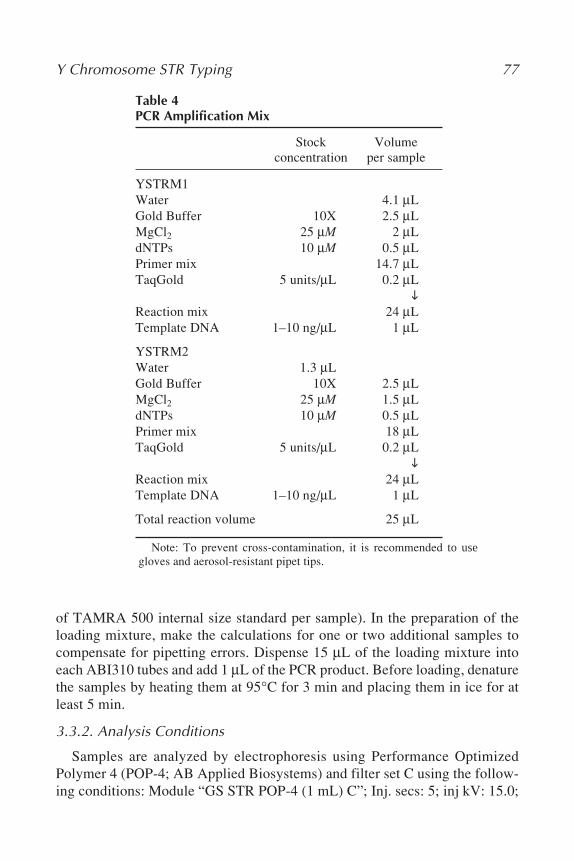
Y Chromosome STR Typing 77
Table 4PCR Amplification Mix
Stock Volumeconcentration per sample
YSTRM1Water 4.1 µLGold Buffer 10X 2.5 µLMgCl2 25 µM 2 µLdNTPs 10 µM 0.5 µLPrimer mix 14.7 µLTaqGold 5 units/µL 0.2 µL
Reaction mix 24 µLTemplate DNA 1–10 ng/µL 1 µL
YSTRM2Water 1.3 µLGold Buffer 10X 2.5 µLMgCl2 25 µM 1.5 µLdNTPs 10 µM 0.5 µLPrimer mix 18 µLTaqGold 5 units/µL 0.2 µL
Reaction mix 24 µLTemplate DNA 1–10 ng/µL 1 µL
Total reaction volume 25 µL
Note: To prevent cross-contamination, it is recommended to use gloves and aerosol-resistant pipet tips.
of TAMRA 500 internal size standard per sample). In the preparation of theloading mixture, make the calculations for one or two additional samples tocompensate for pipetting errors. Dispense 15 µL of the loading mixture intoeach ABI310 tubes and add 1 µL of the PCR product. Before loading, denaturethe samples by heating them at 95°C for 3 min and placing them in ice for atleast 5 min.
3.3.2. Analysis Conditions
Samples are analyzed by electrophoresis using Performance OptimizedPolymer 4 (POP-4; AB Applied Biosystems) and filter set C using the follow-ing conditions: Module “GS STR POP-4 (1 mL) C”; Inj. secs: 5; inj kV: 15.0;
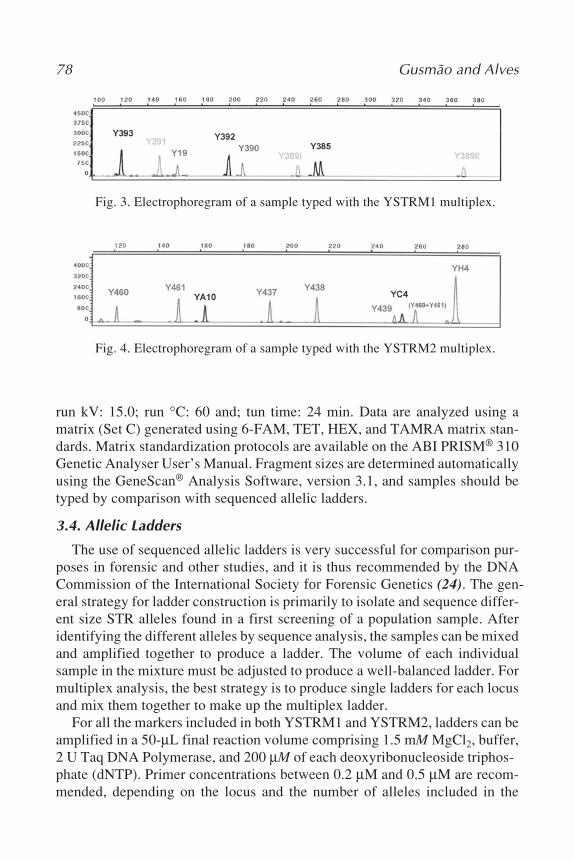
78 Gusmão and Alves
Fig. 3. Electrophoregram of a sample typed with the YSTRM1 multiplex.
Fig. 4. Electrophoregram of a sample typed with the YSTRM2 multiplex.
run kV: 15.0; run °C: 60 and; tun time: 24 min. Data are analyzed using amatrix (Set C) generated using 6-FAM, TET, HEX, and TAMRA matrix stan-dards. Matrix standardization protocols are available on the ABI PRISM® 310Genetic Analyser User’s Manual. Fragment sizes are determined automaticallyusing the GeneScan® Analysis Software, version 3.1, and samples should betyped by comparison with sequenced allelic ladders.
3.4. Allelic Ladders
The use of sequenced allelic ladders is very successful for comparison pur-poses in forensic and other studies, and it is thus recommended by the DNACommission of the International Society for Forensic Genetics (24). The gen-eral strategy for ladder construction is primarily to isolate and sequence differ-ent size STR alleles found in a first screening of a population sample. Afteridentifying the different alleles by sequence analysis, the samples can be mixedand amplified together to produce a ladder. The volume of each individualsample in the mixture must be adjusted to produce a well-balanced ladder. Formultiplex analysis, the best strategy is to produce single ladders for each locusand mix them together to make up the multiplex ladder.
For all the markers included in both YSTRM1 and YSTRM2, ladders can beamplified in a 50-µL final reaction volume comprising 1.5 mM MgCl2, buffer,2 U Taq DNA Polymerase, and 200 µM of each deoxyribonucleoside triphos-phate (dNTP). Primer concentrations between 0.2 µM and 0.5 µM are recom-mended, depending on the locus and the number of alleles included in the

Y Chromosome STR Typing 79
ladder. Amplifications can be performed in 35 cycles of 30 s at 94°C, 30 s at58°C, and 1 min at 72°C (for a GeneAmp PCR system 2400 thermocycler;AB Applied Biosystems). As previously mentioned, some adjustments canbe required in different apparatus. Single-locus ladders can be reamplified using1 µL (in a 50-µL final reaction volume) of between 1:1000 and 1:10.000 dilu-tions of the original ladder.
4. Additional ProblemsApart from those already mentioned, some other problems can arise during
the YSTRM1 and YSTRM2 set up, as follows:
1. Because of variation involving instruments and primer solutions (including dif-ferent dyes) between different laboratories, most of the time it is necessary toadjust primer concentrations to have a well-balanced amplification of all the lociincluded in the multiplexes. When a new primer stock fails to amplify in multi-plex, before increasing the concentration, the quality of the primer should bechecked by a singleplex amplification of the concerned STR.
2. Peak heights between 1000 and 2000 relative fluorescent units are ideal. If peakheights are too high for some loci, reduce the PCR primer concentration of thoseloci. If this happens to all the loci included in the multiplex, use less DNA orreduce the number of PCR cycles.
3. An amplified fragment may show a second peak (–1 bp) because of the incom-plete 3' adenine base addition. This artifact can be reduced with the increase ofthe PCR final extension step or by switching the dye label to the other primer.
4. An excess of DNA during PCR will improve the amplification of smaller sizedloci and a reduced amplification of the larger alleles is observed.
5. A small amount of DNA in the PCR reaction can inhibit the amplification ofsome loci, namely, DYS19, DYS392 (YSTRM1), and DYS438 (YSTRM2),which are the most sensitive markers to PCR variations.
6. Amplification of stutter products (with one repeat less) can appear because of theenzyme slippage during the amplification. For both multiplexes described here,no significant stutter peaks were observed. However, special attention should begiven in successive reamplification of the ladders. Usually, with ladderreamplification, the larger alleles amplify less efficiently with the simultaneousincrease of stutter amplification. This effect has been sometimes responsible fora one repeat less drift in the correct allele typing. Therefore, after reamplification,the ladder should be tested by comparison with the original one or by usingsequenced control samples.
The Y-specific STR typing by PCR amplification and fragment size determina-tion follows the same principles as autosomal STR typing. Therefore, recom-mendations concerning STR typing should be followed, including samples,apparatus, and reagent handling (see Chapter 5 on STR typing). User’s manualsfor commercial STR multiplex amplification kits can also be useful for consult-ing additional topics on troubleshooting.

80 Gusmão and Alves
AcknowledgmentsThis work was partially supported by Fundação para a Ciência e a
Tecnologia (POCTI, Programa Operacional Ciência, Tecnologia e Inovação).
References1. Prinz, M., Boll, K., Baum, H., and Shaler, B. (1997) Multiplexing of Y chromo-
some specific STRs and performance for mixed samples. Forensic Sci. Int. 85,209–218.
2. Prinz, M., Ishii, A., Coleman, A., Baum, H. J., and Shaler, R. C. (2001) Validationand casework application of a Y chromosome specific STR multiplex. ForensicSci. Int. 120, 177–188.
3. Sibille, I., Duverneuil, C., Lorin, G., Guerrouache, K., Teissiere, F., Durigon, M.,and de Mazancourt, P. (2002) Y-STR DNA amplification as biological evidencein sexually assaulted female victim with no cytological detection of spermatozoa.Forensic Sci. Int. 125, 212–216.
4. Ayub, Q., Mohyuddin, A., Qamar, R., Mazhar, K., Zerjal, T., Mehdi, S., and Tyler-Smith, C. (2000) Identification and characterization of novel human Y-chromo-somal microsatellites from sequence database information. Nucleic Acids Res. 28,e8.
5. White, P., Tatum, O., Deaven, L., and Longmire, J. (1999) New, male-specificmicrosatellite markers from the human Y chromosome. Genomics 57, 433–437.
6. Iida, R., Tsubota, E., and Matsuki, T. (2001) Identification and characterization oftwo novel human polymorphic STRs on the Y chromosome. Int. J. Legal Med.115, 54–56.
7. Iida, R., Tsubota, E., Sawazaki, K., Masuyama, M., Matsuki, T., Yasuda, T., andKishi, K. (2002) Characterization and haplotype analysis of the polymorphic Y-STRs, DYS443, DYS444 and DYS445 in a Japanese population. Int. J. LegalMed. 116, 191–194.
8. Bosch, E., Lee, A. C., Calafell, F., Arroyo, E., Henneman, P., De Knijff, P., andJobling, M. A. (2002) High resolution Y chromosome typing: 19 STRs amplifiedin three multiplex reactions. Forensic Sci. Int. 125, 42–51.
9. Redd, A. J., Agellon, A. B., Kearney, V. A., Contreras, V. A., Karafet, T., Park,H., et al. (2002) Forensic value of 14 novel STRs on the human Y chromosome.Forensic Sci. Int. 130, 97–111.
10. Schneider, P. M., Meuser, S., Waiyawuth, W., Seo, Y., and Rittner, C. (1998)Tandem repeat structure of the duplicated Y-chromosomal STR locus DYS385and frequency studies in the German and three Asian populations. Forensic Sci.Int. 97, 61–70.
11. Schultes, T., Hummel, S., and Herrmann, B. (1999) Amplification of Y-chromo-somal STRs from ancient skeletal material. Hum. Genet. 104, 164–166.
12. Gusmão, L., González-Neira, A., Sánchez-Diz, P., Lareu, M. V., Amorim, A., andCarracedo, A. (2000) Alternative primers for DYS391 typing: advantages of theirapplication to forensic genetics. Forensic Sci. Int. 112, 49–57.

Y Chromosome STR Typing 81
13. Dupuy, B. M., Gedde-Dahl, T., and Olaisen, B. (2002) DXYS267: DYS393 andits X chromosome counterpart. Forensic Sci. Int. 112, 111–121.
14. Gusmão, L., Alves, C., Costa, S., Amorim, A., Brion, M., González-Neira, A.,and Carracedo, A. (2002) Point mutations in the flanking regions of the Y-chro-mosome specific STRs DYS391, DYS437 and DYS438. Int. J. Leg Med. 116,322–326.
15. Gill, P., Brenner, C., Brinkmann, B., Budowle, B., Carracedo, A., Jobling, M. A.,et al. (2001) DNA Commission of the International Society of Forensic Genetics:recommendations on forensic analysis using Y-chromosome STRs. Forensic Sci.Int. 114, 305–309.
16. Gusmão, L., González-Neira, A., Alves, C., Lareu, M., Costa, S., Amorim, A., et al.Carracedo, A. (2002) Chimpanzee homologous of human Y specific STRs. A com-parative study and a proposal for nomenclature. Forensic Sci. Int. 126, 129–136.
17. Pascali, V. L., Dobosz, M., and Brinkmann, B. (1998) Coordinating Y-chromo-somal STR research for the courts. Int. J. Legal Med. 112, 1.
18. Carracedo, A., Beckmann, A., Bengs, A., Brinkmann, B., Caglia, A., Capelli, C.,et al. (2001) Results of a collaborative study of the EDNAP group regarding thereproducibility and robustness of the Y-chromosome STRs DYS19, DYS389 Iand II, DYS390 and DYS393 in a PCR pentaplex format. Forensic Sci. Int. 119,28–41
19. Gonzaléz-Neira, A., Elmoznino, M., Lareu, M.V., Sánchez-Diz, P., Gusmão, L.,Prinz, M., and Carracedo, A. (2001) Sequence structure of 12 novel Y chromosomemicrosatellites and PCR amplification strategies. Forensic Sci. Int. 122, 19–26.
20. Butler, J. M., Schoske, R., Vallone, P. M., Kline, M. C., Redd, A. J., and Hammer,M. F. (2002) A novel multiplex for simultaneous amplification of 20 Y chromo-some STR markers. Forensic Sci. Int. 129, 10–24.
21. Beleza, S., Alves, C., González-Neira, A., Lareu, M., Amorim, A., Carracedo, A.,and Gusmão, L. (2003) Extending STR markers in Y chromosome haplotypes.Int. J. Leg. Med. 117, 27–33.
22. Kittler, R., Erler, A., Brauer, S., Stoneking, M., and Kayser, M. (2003) Apparentintrachromosomal exchange on the human Y chromosome explained by popula-tion history. Eur. J. Hum. Genet. 11, 304–314.
23. Bär, W., Brinkmann, B., Budowle, B., Carracedo, A., Gill, P., Lincoln, P., et al.(1997) DNA recommendations—Further report of the DNA Commission of ISFHregarding the use of short tandem repeat systems. Int. J. Legal Med. 110, 175–176.
24. Kayser, M., Cagliá, A., Corach, D., Fretwell, N., Gehrig, C., Graziosi, G., et al.(1997) Evaluation of Y-chromosome STRs: a multicenter study. Int. J. Legal Med.110, 125–133.


Online SNP Databases 83
83
From: Methods in Molecular Biology, vol. 297: Forensic DNA Typing ProtocolsEdited by: A. Carracedo © Humana Press Inc., Totowa, NJ
7
Using Online Databases for Developing SNP Markersof Forensic Interest
Christopher Phillips
SummaryIn this chapter we review and compare the online single nucleotide polymorphism
databases that are now available as research tools. We give an outline of the searchstrategies that can be used to ensure the most appropriate loci for forensic applicationsare chosen.
Key Words: Forensic science; forensic DNA analysis; SNP; genotyping; variation;polymorphism; online databases; linkage disequilibrium; haplotype; haplotype block;genome.
1. IntroductionThe widespread use of deoxyribonucleic acid (DNA) polymorphisms in
forensic analysis really started in earnest with the adoption of amplifiableshort tandem repeat (STR) loci in the mid-1990s. At that time, an initial reportof the identification of a repeat-based polymorphism—with observed variationand flanking sequence—was needed to develop a new marker. Fortunately,from the few-hundred tetranucleotide loci identified in the first 4 yr, a suffi-cient number were adopted to form the robust and sensitive multiplex testsused in every laboratory today. Since 2001, when the draft human genome waspublished, another class of DNA variation, single nucleotide polymorphisms(SNPs), has been available to exploit for forensic analysis (1). These polymor-phisms are considerably more abundant than STRs, and the majority are alreadyvery well characterized. In the same way that the complex and extensive se-quencing data generated by the human genome mapping project (HGMP) hasbecome widely available to everyone through the contemporary advances incomputing power and informatics, now data for more than 4 million Human
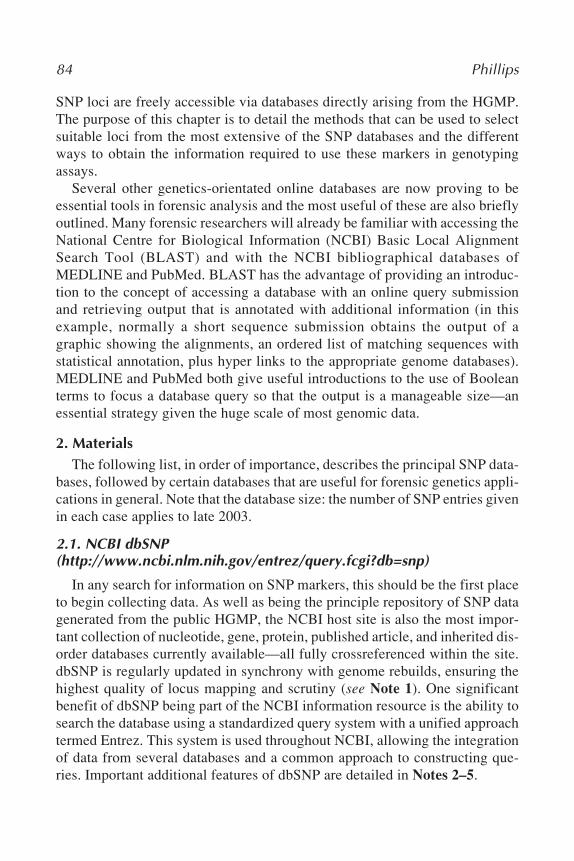
84 Phillips
SNP loci are freely accessible via databases directly arising from the HGMP.The purpose of this chapter is to detail the methods that can be used to selectsuitable loci from the most extensive of the SNP databases and the differentways to obtain the information required to use these markers in genotypingassays.
Several other genetics-orientated online databases are now proving to beessential tools in forensic analysis and the most useful of these are also brieflyoutlined. Many forensic researchers will already be familiar with accessing theNational Centre for Biological Information (NCBI) Basic Local AlignmentSearch Tool (BLAST) and with the NCBI bibliographical databases ofMEDLINE and PubMed. BLAST has the advantage of providing an introduc-tion to the concept of accessing a database with an online query submissionand retrieving output that is annotated with additional information (in thisexample, normally a short sequence submission obtains the output of agraphic showing the alignments, an ordered list of matching sequences withstatistical annotation, plus hyper links to the appropriate genome databases).MEDLINE and PubMed both give useful introductions to the use of Booleanterms to focus a database query so that the output is a manageable size—anessential strategy given the huge scale of most genomic data.
2. MaterialsThe following list, in order of importance, describes the principal SNP data-
bases, followed by certain databases that are useful for forensic genetics appli-cations in general. Note that the database size: the number of SNP entries givenin each case applies to late 2003.
2.1. NCBI dbSNP(http://www.ncbi.nlm.nih.gov/entrez/query.fcgi?db=snp)
In any search for information on SNP markers, this should be the first placeto begin collecting data. As well as being the principle repository of SNP datagenerated from the public HGMP, the NCBI host site is also the most impor-tant collection of nucleotide, gene, protein, published article, and inherited dis-order databases currently available—all fully crossreferenced within the site.dbSNP is regularly updated in synchrony with genome rebuilds, ensuring thehighest quality of locus mapping and scrutiny (see Note 1). One significantbenefit of dbSNP being part of the NCBI information resource is the ability tosearch the database using a standardized query system with a unified approachtermed Entrez. This system is used throughout NCBI, allowing the integrationof data from several databases and a common approach to constructing que-ries. Important additional features of dbSNP are detailed in Notes 2–5.

Online SNP Databases 85
2.2. The SNP Consortium (http://snp.cshl.org/)
This database is run by Cold Spring Harbor Laboratory on behalf of theprivate/public partnership of 17 organizations’ forming The SNP Consortium(TSC). It comprises 1.8 million loci, all of which are listed in dbSNP—bothdatabases are fully crossreferenced by hyperlinks, but note that TSC uses adifferent SNP locus ID numbering system (see Note 6).
2.3. ABI Assays-on-Demand Database(http://myscience.appliedbiosystems.com/cdsEntry/Form/assay_search_basic.jsp)
This database is a selective subset of SNP markers taken from the completeCelera SNP database (http://www.celeradiscoverysystem.com/), which com-prises 4.1 million markers discovered from the private HGMP initiative. Aswith TSC, the SNPs have been chosen from the Celera set specifically to pro-vide a gene-centric SNP linkage map as part of the assay design service for theTaqman SNP typing system provided by ABI. The database can be queriedwith several criteria within certain limitations for the subset of data provided(see Notes 7–9).
2.4. Ensembl (http://www.ensembl.org/Homo_sapiens/)
An extensive genome database and browser run by EBI and The SangerCentre. This database parallels the NCBI content to a large extent and has asimilar search system and graphical browser. The Sanger Centre web site pro-vides an alternative BLAST site (http://www.sanger.ac.uk/cgi-bin/blast/submitblast/hgp) and sequence alignment tool with SSAHA (http://www.sanger.ac.uk/Software/analysis/SSAHA/).
2.5. HGVBase (formerly HGBase; http://hgvbase.cgb.ki.se/)
HGVbase is a database of 2.86 million human genome variants (late 2003)that includes, but is not limited to, SNPs, deletion/insertion polymorphisms(DIPs), and STRs. Low-frequency variants and new mutations are also listedalong with approx 40% of dbSNP loci recurated for the database. A usefulpage provided by the site is a full listing of 45 online SNP-related databases(http://hgvbase.cgb.ki.se/cgi-bin/main.pl?page=databases_.htm).
2.6. Other Databases of Use for Forensic Research
2.6.1. NCBI BLAST http://www.ncbi.nlm.nih.gov/blast/
BLAST is a tool for calculating sequence similarity rather than a database(2), but for developing forensic SNP assays, it will be the most common appli-cation querying the NCBI nucleotide databases collectively termed GenBank.

86 Phillips
There are two main reasons for using nucleotide BLAST: finding a location fora submitted sequence (the query being: does this sequence exist in a database?)and checking for coincidental sequence similarity for a submitted sequence,usually a design for a polymerase chain reaction (PCR) primer or detectionprobe (the query being: what is the degree of specificity or uniqueness of thissequence?). The alignment comparisons required for each of the above queriesare provided by MegaBLAST and standard BLAST (blastn), respectively (seeNote 10). The two statistics that annotate the returns from blastn: the bit scoreand E-value are explained in notes (see Note 11).
2.6.2. NCBI UniSTS(http://www.ncbi.nlm.nih.gov/entrez/query.fcgi?db=unists)
UniSTS is a database collating information about linkage markers, or sequencetagged sites (STS). For each marker, UniSTS displays the primer sequences,product size, and mapping information, as well as cross-references toLocusLink, dbSNP, and Entrez Map Viewer. It gives the most extensive datafor STRs of any database and can be queried directly with a D number (e.g.,D21S11) an accession number or even a common name (e.g., FGA).
2.6.3. NCBI LocusLink (http://www.ncbi.nlm.nih.gov/LocusLink/)
LocusLink is the most important point of reference for all data relating togenetic loci. It provides a single query interface to curated sequence and givesdescriptive information about all the current known genes in 10 organisms.The very extensive genetic information provided is crossreferenced to otherrelevant NCBI sections for official nomenclature, aliases, sequence accessions,phenotypes, EC numbers, MIM (Mendelian inheritance in man) numbers,UniGene clusters, homology, and map locations. This is an essential databasefor checking the characteristics (and therefore the significance of any linkage)of genes in close proximity to candidate SNP markers.
2.6.4. The Dusseldorf STR Database(http://www.uni-duesseldorf.de/WWW/MedFak/Serology/database.htm)
This is an extensive STR allele frequency database with lists of supportingpublications.
2.6.5. The Marshfield Centre for Medical Genetics(http://research.marshfieldclinic.org/genetics/Map_Markers/maps/IndexMapFrames.html)
This site collates mapping information for a range of polymorphisms and isone of the most useful marker databases for locating the positions of STRs (seeNote 12).

Online SNP Databases 87
2.6.6. Mitomap (http://www.mitomap.org/)
Described as “a compendium of polymorphisms and mutations of humanmitochondrial DNA,” this is the best mitochondrial genome resource encom-passing a full range of databases, all of which can be independently queried.
2.6.7. ALFRED (http://alfred.med.yale.edu/alfred/index.asp)
This ALlele FREquency Database now has 856 polymorphisms, 377 popu-lations, and 17,569 frequency tables and includes several of the standard foren-sic loci currently in use. Submissions are encouraged to further extend the scopeof the database.
2.6.8. Y-STR and EMPOP Databases(http://ystr.charite.de/index_gr.html and http://www.empop.org/basis/index.php3)
The Y chromosome STR marker and mtDNA sequence polymorphism data-bases are referred to in detail in other sections of this book.
3. Methods3.1. Selection Criteria for Forensic SNP Markers
Developing SNPs for forensic analysis requires that the markers used possesscertain characteristics that address the specialized needs of the field. It is widelyagreed that there is a need for a large set of SNPs to provide levels of discrimina-tion comparable to the existing panel of STR markers. A recommendation ofbetween 50 and 80 markers made in one study (3) suggests a need to considerlinkage (because multiple SNPs are required per chromosome) and robustness inmultiplex PCR as selection criteria. An upper limit to the number of loci that canbe realistically multiplexed requires that SNPs should have a reasonably highvariability. Therefore three factors emerge as potential selection criteria: link-age, flanking sequence quality, and level of polymorphism.
3.1.1. Linkage
Detailed analysis of the human genome and the patterns of associationbetween genes and neighboring polymorphic markers has revealed a nonran-dom distribution of linkage disequilibrium (LD). Current studies examiningLD distribution have found that chromosome segments or blocks exist wherethe markers and genes are in almost complete LD across relatively large dis-tances (4–6). Such blocks are not consistent with the established model ofgenetic distance measured by a uniform recombination rate, and it is gener-ally agreed that they represent areas of extremely low recombination inter-spersed with mostly, smaller chromosome segments, often with recombination

88 Phillips
rates much higher than average that are called recombination hotspots (7). Theinternational hapmap project aims to map haplotype blocks and analyze blockvariability in different population groups (www.hapmap.org). Because datafrom hapmap is not yet available, an alternative approach is to use a minimumdistance between markers based on the observations of average haplotype blocksize found so far. Two studies obtained similar observations from differentchromosomes: Daly et al. (8) reported blocks ranging in size between 3 and92 kb on 5q, whereas De La Vega et al. (9,10) reported a wider range ofblock size in chromosomes 6, 21, and 22 (5 to 300 kb) but with an averageblock size of 26 kb and 18 kb in Europeans and Africans, respectively. How-ever, in the latter study more than 95% of blocks in Europeans and 97% inAfricans were in the range of 1 to 100 kb. The biggest block found so far is 804kb (4), but it is safe to conclude that blocks longer than 100 kb are rare andrepresent only 2–3% of the blocks found on chromosomes 6, 21, and 22 (9). Ifa minimum distance of 100 kb is used to separate a SNP and a nearby gene,very few selected markers are likely to be in LD beyond this distance. Many ofthe principles underlying haplotype block mapping do not have universal sup-port; for a thorough review, see Wall and Pritchard (11).
3.1.2. Flanking Sequence Quality
The sequence around a SNP directly affects the ability to design a robustand extensive multiplex genotyping assay. Flanking sequence must be freefrom: extremes in %GC, additional substitution sites in close proximity (clus-tering SNPs), consecutive identical bases (polybase sequence), potential forsecondary structures (e.g. hairpins arising from GCGC or GGCC type basemotifs), and segments of short tandem repeats (see Note 13).
3.1.3. Polymorphism Levels
The traditional forensic measurement of polymorphism: discrimination index(Dp) does not fall significantly between a minimum allele frequency of 0.5 and0.3. As shown by the red lines in Fig. 1, the Dp only drops in this allele fre-quency range by 6.5% of the highest value (from 0.62 to 0.58). This suggests0.3 could be a reasonable lower limit of minimum allele frequency that will beinclusive enough to provide a large pool of candidates. An additional feature ofSNP variability is a consistent difference in polymorphism level between popu-lations. Approximately 20–30% of SNPs show a minimum allele frequencybelow 0.1 in at least one of the three TSC study populations. Whether thispresents a problem in selecting markers depends on the eventual cumulativeDp of the SNP set in each population and on the demographics of the regionserved by each lab. Some markers show such extensive stratification in allelefrequency distributions that this characteristic can be used by itself to predictthe population of origin of an unknown sample (12).
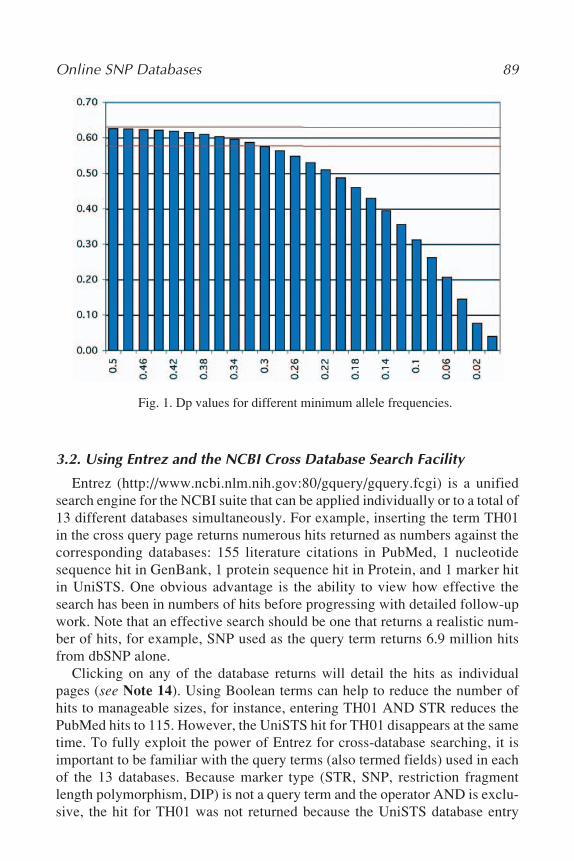
Online SNP Databases 89
3.2. Using Entrez and the NCBI Cross Database Search Facility
Entrez (http://www.ncbi.nlm.nih.gov:80/gquery/gquery.fcgi) is a unifiedsearch engine for the NCBI suite that can be applied individually or to a total of13 different databases simultaneously. For example, inserting the term TH01in the cross query page returns numerous hits returned as numbers against thecorresponding databases: 155 literature citations in PubMed, 1 nucleotidesequence hit in GenBank, 1 protein sequence hit in Protein, and 1 marker hitin UniSTS. One obvious advantage is the ability to view how effective thesearch has been in numbers of hits before progressing with detailed follow-upwork. Note that an effective search should be one that returns a realistic num-ber of hits, for example, SNP used as the query term returns 6.9 million hitsfrom dbSNP alone.
Clicking on any of the database returns will detail the hits as individualpages (see Note 14). Using Boolean terms can help to reduce the number ofhits to manageable sizes, for instance, entering TH01 AND STR reduces thePubMed hits to 115. However, the UniSTS hit for TH01 disappears at the sametime. To fully exploit the power of Entrez for cross-database searching, it isimportant to be familiar with the query terms (also termed fields) used in eachof the 13 databases. Because marker type (STR, SNP, restriction fragmentlength polymorphism, DIP) is not a query term and the operator AND is exclu-sive, the hit for TH01 was not returned because the UniSTS database entry
Fig. 1. Dp values for different minimum allele frequencies.
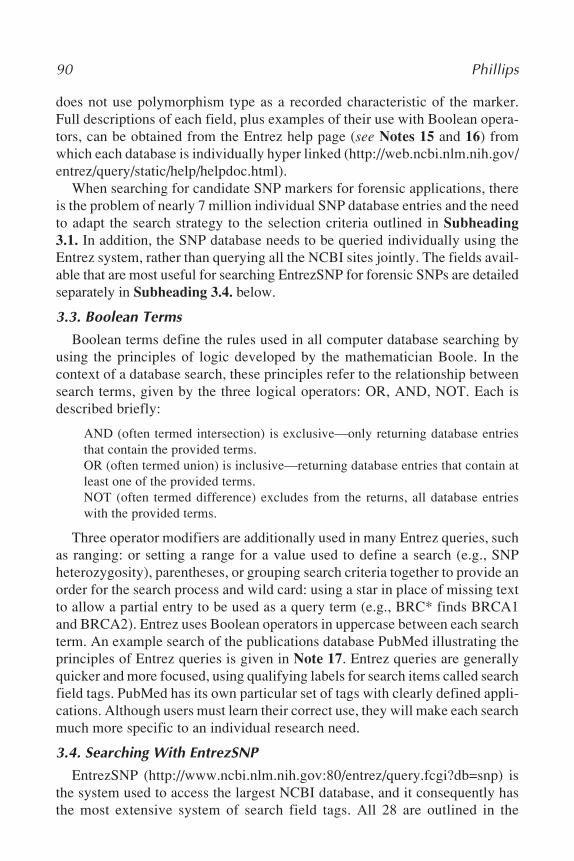
90 Phillips
does not use polymorphism type as a recorded characteristic of the marker.Full descriptions of each field, plus examples of their use with Boolean opera-tors, can be obtained from the Entrez help page (see Notes 15 and 16) fromwhich each database is individually hyper linked (http://web.ncbi.nlm.nih.gov/entrez/query/static/help/helpdoc.html).
When searching for candidate SNP markers for forensic applications, thereis the problem of nearly 7 million individual SNP database entries and the needto adapt the search strategy to the selection criteria outlined in Subheading3.1. In addition, the SNP database needs to be queried individually using theEntrez system, rather than querying all the NCBI sites jointly. The fields avail-able that are most useful for searching EntrezSNP for forensic SNPs are detailedseparately in Subheading 3.4. below.
3.3. Boolean Terms
Boolean terms define the rules used in all computer database searching byusing the principles of logic developed by the mathematician Boole. In thecontext of a database search, these principles refer to the relationship betweensearch terms, given by the three logical operators: OR, AND, NOT. Each isdescribed briefly:
AND (often termed intersection) is exclusive—only returning database entriesthat contain the provided terms.OR (often termed union) is inclusive—returning database entries that contain atleast one of the provided terms.NOT (often termed difference) excludes from the returns, all database entrieswith the provided terms.
Three operator modifiers are additionally used in many Entrez queries, suchas ranging: or setting a range for a value used to define a search (e.g., SNPheterozygosity), parentheses, or grouping search criteria together to provide anorder for the search process and wild card: using a star in place of missing textto allow a partial entry to be used as a query term (e.g., BRC* finds BRCA1and BRCA2). Entrez uses Boolean operators in uppercase between each searchterm. An example search of the publications database PubMed illustrating theprinciples of Entrez queries is given in Note 17. Entrez queries are generallyquicker and more focused, using qualifying labels for search items called searchfield tags. PubMed has its own particular set of tags with clearly defined appli-cations. Although users must learn their correct use, they will make each searchmuch more specific to an individual research need.
3.4. Searching With EntrezSNP
EntrezSNP (http://www.ncbi.nlm.nih.gov:80/entrez/query.fcgi?db=snp) isthe system used to access the largest NCBI database, and it consequently hasthe most extensive system of search field tags. All 28 are outlined in the

Online SNP Databases 91
EntrezSNP home page, and the more important of these tags for forensic SNPselection are detailed below in Table 1.
Other tags are fixed for forensic SNP searching. First, the tag “organism”:[ORGN] or [TAX_ID] prefixed with search field “human” ensures the listdoes not include the increasing number of SNPs now being collated fromother genomes. Next, map weight (the number of times a SNP maps to thegenome) using the term 1[WEIGHT] ensures all SNPs returned are unique.Finally, all SNPs should be validated by repeat genotyping using: byfrequency[VALIDATION]. The actual final list of tags that are incorporatedinto any search will depend on the SNP assay to be developed, the order ofimportance of the search criteria for candidate loci, and the way the SNP willbe used in an analysis. SNPs will be mainly selected for discrimination assays,but also it may be desirable to find SNP markers for specialized forensic appli-cations, such as the analysis of mixtures, phenotypic traits, or population oforigin, all of which require more detailed and carefully constructed search strat-egies (12–14). The requirements of the kind of SNP assay to be used are dis-cussed in detail in another chapter but mainly concern the type of allelesubstitution or the flanking sequence. Allele type can be selected with the term[ALLELE] prefixed with the IUPAC codes listed in Table 2 as search fields.
To selecting SNPs with the appropriate flanking sequence, one needs to care-fully scrutinize the list of loci produced by a search because it is not possible toselect particular flanking sequence features. The graphical annotation that sum-marizes the properties of each SNP returned from EntrezSNP is shown by anexample in Fig. 2. For a discrimination set, the criteria discussed earlier can
Table 1EntrezSNP Search Field Tags of Importance for Forensic SNP Marker Searches
Description Tag / Qualifier Search field used Example
Observed alleles [ALLELE] IUPAC allele code R[ALLELE] find SNPswith (Table 2) a or g substitutionsChromosome [CHR] number / X, Y 21[CHR] OR 22[CHR]
find SNPs on chromo-somes 21 and 22
Base position [BPOS] ranged number 18000:28000[BPOS](used with AND AND& [CHR] Y[CHR] find SNPs in
10kb section of Y-chromosome
Heterozygosity [HET] ranged number 30:50[HET] find SNPswith heterozygosityvalue in range 30–50%

92 Phillips
Table 2IUPAC Codes Used With the [ALLELE] Tag DenotingSNP Base Substitutions
Code Substitution Code Substitution
M A or C V A or C or GR A or G H A or C or TW A or T D A or G or TS C or G B C or G or TY C or T N A or C or G or TK G or T (or indeterminate base)
dictate the search terms to a certain extent but assessing linkage disequilibriumusing EntrezSNP is made difficult by the absence of information on othergenome features. Specific chromosome regions can be applied using theranged search field tag [BPOS], but checking linkage when searching for SNPsby map browsing (Subheading 3.6.) is always an easier process. However, it ispossible to order a SNP list with a critical characteristic to obtain a shortenedlist of candidates that can then be scrutinized for other important characteris-tics in Map Viewer (see Note 18).
Fig. 2. Allele-frequency distributions in 100 randomly selected SNP loci in threepopulations.
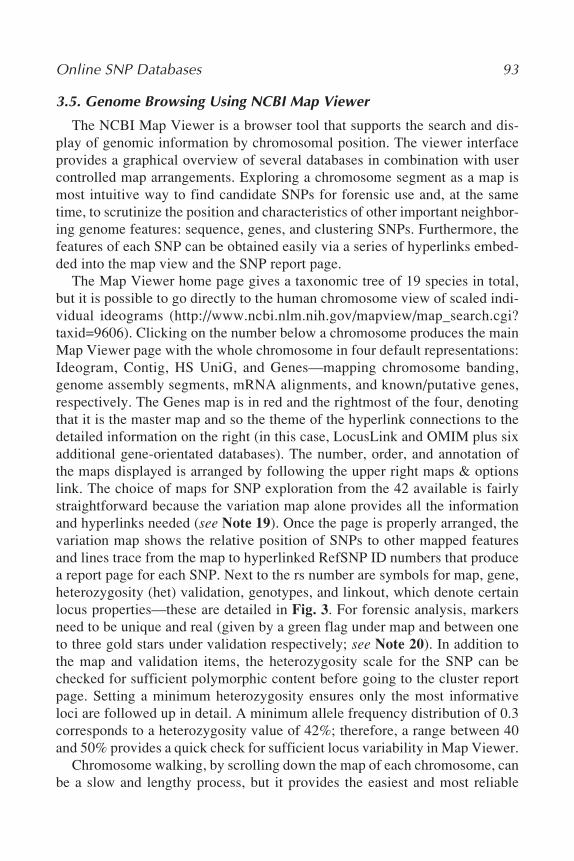
Online SNP Databases 93
3.5. Genome Browsing Using NCBI Map Viewer
The NCBI Map Viewer is a browser tool that supports the search and dis-play of genomic information by chromosomal position. The viewer interfaceprovides a graphical overview of several databases in combination with usercontrolled map arrangements. Exploring a chromosome segment as a map ismost intuitive way to find candidate SNPs for forensic use and, at the sametime, to scrutinize the position and characteristics of other important neighbor-ing genome features: sequence, genes, and clustering SNPs. Furthermore, thefeatures of each SNP can be obtained easily via a series of hyperlinks embed-ded into the map view and the SNP report page.
The Map Viewer home page gives a taxonomic tree of 19 species in total,but it is possible to go directly to the human chromosome view of scaled indi-vidual ideograms (http://www.ncbi.nlm.nih.gov/mapview/map_search.cgi?taxid=9606). Clicking on the number below a chromosome produces the mainMap Viewer page with the whole chromosome in four default representations:Ideogram, Contig, HS UniG, and Genes—mapping chromosome banding,genome assembly segments, mRNA alignments, and known/putative genes,respectively. The Genes map is in red and the rightmost of the four, denotingthat it is the master map and so the theme of the hyperlink connections to thedetailed information on the right (in this case, LocusLink and OMIM plus sixadditional gene-orientated databases). The number, order, and annotation ofthe maps displayed is arranged by following the upper right maps & optionslink. The choice of maps for SNP exploration from the 42 available is fairlystraightforward because the variation map alone provides all the informationand hyperlinks needed (see Note 19). Once the page is properly arranged, thevariation map shows the relative position of SNPs to other mapped featuresand lines trace from the map to hyperlinked RefSNP ID numbers that producea report page for each SNP. Next to the rs number are symbols for map, gene,heterozygosity (het) validation, genotypes, and linkout, which denote certainlocus properties—these are detailed in Fig. 3. For forensic analysis, markersneed to be unique and real (given by a green flag under map and between oneto three gold stars under validation respectively; see Note 20). In addition tothe map and validation items, the heterozygosity scale for the SNP can bechecked for sufficient polymorphic content before going to the cluster reportpage. Setting a minimum heterozygosity ensures only the most informativeloci are followed up in detail. A minimum allele frequency distribution of 0.3corresponds to a heterozygosity value of 42%; therefore, a range between 40and 50% provides a quick check for sufficient locus variability in Map Viewer.
Chromosome walking, by scrolling down the map of each chromosome, canbe a slow and lengthy process, but it provides the easiest and most reliable

94 Phillips
means to discover suitable SNPs (see Note 21). The candidate loci pinpointedcan be quickly scrutinized using the map symbols. They can then be readilychecked in each report page for the locus characteristics important in forensicanalysis: sufficient polymorphic content—with variability in most populationgroups, good flanking sequence quality, and an absence of other closely clus-tering SNPs. Linkage can also be assessed in Map Viewer by holding themouse over a gene “edge” to obtain the chromosome co-ordinates of the geneon the SNP side. A more precise figure is given in LocusLink (hyperlinkedfrom the gene symbol annotating the gene).
3.6. Scrutiny of Data From a RefSNP Cluster Report Page
NCBI compiles a cluster report page for all SNP loci with a refSNP number.On this page, below the summary box, more detailed locus characteristics aresummarized in seven sections: submission, fasta, resource, locus, map, varia-tion, and validation.
3.6.1. Variation
In the submission section, each of the submitter reports can be examinedindividually, and this can be useful for checking the extent of genotyping per-formed and the populations studied in estimating the allele frequencies. This isan important step because the variation section only provides an average allelefrequency for each allele, and this can disguise substantial differences in allelefrequency distributions between populations in some cases. When TSC is asubmitting group, it is useful to be able to follow the hyperlink to the equiva-lent TSC SNP report page directly and obtain allele frequency figures becausethis is invariably the most detailed publicly available genotyping data.
Checking the information in the variation section of the NCBI report pageprovides a quickly assessed summary of polymorphism level, ensuring it issufficiently high in the first place. This section provides the all-important aver-age heterozygosity and allele frequency figures plus the assay sample size, thenumber of populations studied and the total number of individuals with geno-
Fig. 3. An example return from EntrezSNP showing annotation. The rs numberhyper links to the RefSNP cluster report, this SNP locus occurs on chromosome 11once (underline to chromosome number), is sited in a locus (L), has 46% heterozygos-ity (graduated scale), and has been validated by genotyping (V).

Online SNP Databases 95
type data. Forensic candidates require the most reliable data possible plus areasonable balance between populations, but inevitably a few loci are mainlypolymorphic in Africans while others are mainly polymorphic in Europeans orChinese. As a generalized rule of thumb roughly 30% of SNPs show more than30% variation in polymorphic content between two or more populations.
3.6.2. Sequence Quality
The fasta section details the flanking sequence around the SNP substitutionsite—the amount of sequence given can vary between tens and hundreds ofbases. Furthermore, the substitution site can often be positioned close to thestart or end of the given sequence. This can make recovery of sufficient flank-ing sequence on one side an awkward process that necessitates alignment ofsummary sequence from the fasta section with extended sequence obtainedfrom NCBI Sequence Viewer (see next section). Fasta sequence is arranged in10 base blocks and in two ways: in upper case/lower case and in black/green.Upper case denotes normal, unique, genomic sequence, while lower case isused for sequence identified by RepeatMasker (http://repeatmasker.genome.washington.edu/cgi.bin/RepeatMasker) as low-complexity or repetitive ele-ment sequence. The color green is used for sequences identified by the submit-ter during the SNP assay process. The color black is used for flanking sequence,identified and extracted from the nucleotide databases by NCBI as part of thequality analysis of the SNP submission before incorporation into dbSNP. Thefasta sequence should be carefully checked for lowercase text denoting genomicrepeat elements that cannot be safely used to develop assays guaranteed to bespecific only to the selected SNP. At this point, the flanking sequence alsoshould be scrutinized for additional characteristics that might compromise theassay design process: polybase sequence, higher than average %GC (human
Fig. 4. NCBI Map Viewer variation map annotation symbols.

96 Phillips
average: 41% ± 5%), and potential secondary structures. Examples of observedproblem sequences are given in Fig. 5. These characteristics, the latter in par-ticular, can be difficult to spot by visual examination, and the sequence may needto be imported into software specifically designed to reveal secondary structuressuch as Primer Express or Primer3 (http://www-genome.wi.mit.edu/cgi-bin/primer/primer3_www.cgi).
Fig. 5. Gene density plots for two chromosomes of comparable size: 18 and 19.
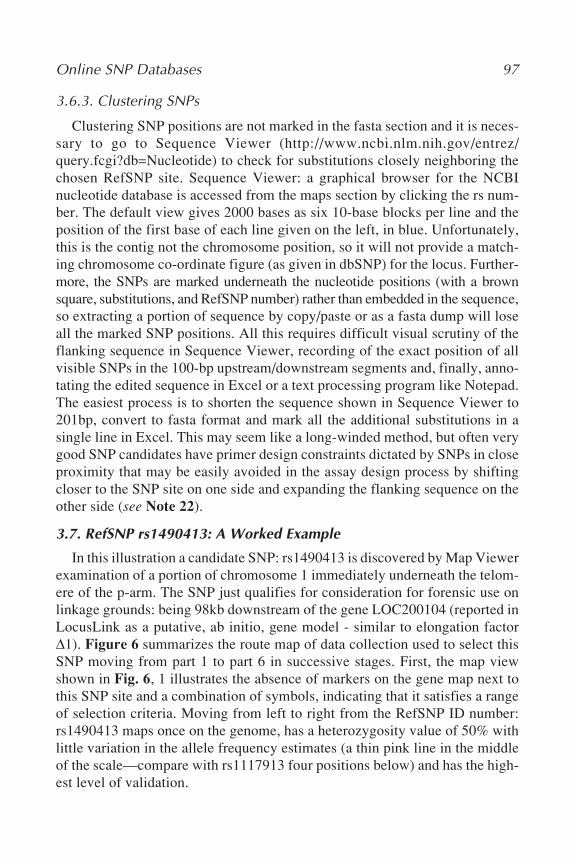
Online SNP Databases 97
3.6.3. Clustering SNPs
Clustering SNP positions are not marked in the fasta section and it is neces-sary to go to Sequence Viewer (http://www.ncbi.nlm.nih.gov/entrez/query.fcgi?db=Nucleotide) to check for substitutions closely neighboring thechosen RefSNP site. Sequence Viewer: a graphical browser for the NCBInucleotide database is accessed from the maps section by clicking the rs num-ber. The default view gives 2000 bases as six 10-base blocks per line and theposition of the first base of each line given on the left, in blue. Unfortunately,this is the contig not the chromosome position, so it will not provide a match-ing chromosome co-ordinate figure (as given in dbSNP) for the locus. Further-more, the SNPs are marked underneath the nucleotide positions (with a brownsquare, substitutions, and RefSNP number) rather than embedded in the sequence,so extracting a portion of sequence by copy/paste or as a fasta dump will loseall the marked SNP positions. All this requires difficult visual scrutiny of theflanking sequence in Sequence Viewer, recording of the exact position of allvisible SNPs in the 100-bp upstream/downstream segments and, finally, anno-tating the edited sequence in Excel or a text processing program like Notepad.The easiest process is to shorten the sequence shown in Sequence Viewer to201bp, convert to fasta format and mark all the additional substitutions in asingle line in Excel. This may seem like a long-winded method, but often verygood SNP candidates have primer design constraints dictated by SNPs in closeproximity that may be easily avoided in the assay design process by shiftingcloser to the SNP site on one side and expanding the flanking sequence on theother side (see Note 22).
3.7. RefSNP rs1490413: A Worked Example
In this illustration a candidate SNP: rs1490413 is discovered by Map Viewerexamination of a portion of chromosome 1 immediately underneath the telom-ere of the p-arm. The SNP just qualifies for consideration for forensic use onlinkage grounds: being 98kb downstream of the gene LOC200104 (reported inLocusLink as a putative, ab initio, gene model - similar to elongation factor∆1). Figure 6 summarizes the route map of data collection used to select thisSNP moving from part 1 to part 6 in successive stages. First, the map viewshown in Fig. 6, 1 illustrates the absence of markers on the gene map next tothis SNP site and a combination of symbols, indicating that it satisfies a rangeof selection criteria. Moving from left to right from the RefSNP ID number:rs1490413 maps once on the genome, has a heterozygosity value of 50% withlittle variation in the allele frequency estimates (a thin pink line in the middleof the scale—compare with rs1117913 four positions below) and has the high-est level of validation.
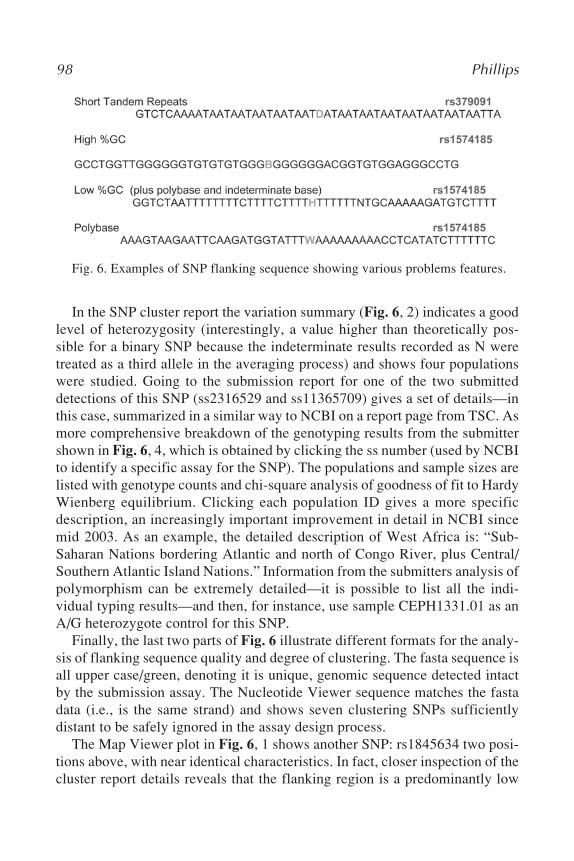
98 Phillips
In the SNP cluster report the variation summary (Fig. 6, 2) indicates a goodlevel of heterozygosity (interestingly, a value higher than theoretically pos-sible for a binary SNP because the indeterminate results recorded as N weretreated as a third allele in the averaging process) and shows four populationswere studied. Going to the submission report for one of the two submitteddetections of this SNP (ss2316529 and ss11365709) gives a set of details—inthis case, summarized in a similar way to NCBI on a report page from TSC. Asmore comprehensive breakdown of the genotyping results from the submittershown in Fig. 6, 4, which is obtained by clicking the ss number (used by NCBIto identify a specific assay for the SNP). The populations and sample sizes arelisted with genotype counts and chi-square analysis of goodness of fit to HardyWienberg equilibrium. Clicking each population ID gives a more specificdescription, an increasingly important improvement in detail in NCBI sincemid 2003. As an example, the detailed description of West Africa is: “Sub-Saharan Nations bordering Atlantic and north of Congo River, plus Central/Southern Atlantic Island Nations.” Information from the submitters analysis ofpolymorphism can be extremely detailed—it is possible to list all the indi-vidual typing results—and then, for instance, use sample CEPH1331.01 as anA/G heterozygote control for this SNP.
Finally, the last two parts of Fig. 6 illustrate different formats for the analy-sis of flanking sequence quality and degree of clustering. The fasta sequence isall upper case/green, denoting it is unique, genomic sequence detected intactby the submission assay. The Nucleotide Viewer sequence matches the fastadata (i.e., is the same strand) and shows seven clustering SNPs sufficientlydistant to be safely ignored in the assay design process.
The Map Viewer plot in Fig. 6, 1 shows another SNP: rs1845634 two posi-tions above, with near identical characteristics. In fact, closer inspection of thecluster report details reveals that the flanking region is a predominantly low
Fig. 6. Examples of SNP flanking sequence showing various problems features.
Online SNP Databases 99
complexity sequence and the 50% heterozygosity value has been artificiallyinflated by the variation summary averaging process, being well below aminimum heterozygosity value for forensic applications in two populationsamples (approx 32% in Europeans and Africans).
4. Notes1. As an open database, dbSNP receives submissions from active labs in the field
and collates the data into a merged reference set. Because different laboratorieswill routinely report identical SNPs, the submissions are clustered into referenceSNPs (termed refSNPs by NCBI). The distinction between submitted SNPs andreference SNPs is made by prefixing ID numbers with ss and rs, respectively.
2. Despite the name, dbSNP also includes STRs and DIPs (which are alternativelytermed Indels). dbSNP takes submissions for SNPs discovered in all species witha fully or partially sequenced genome (totaling 23 in late 2003); the vast major-ity, however, are human and mouse.
3. The admission criteria of NCBI are very effective at detecting nonunique SNPs,with a checking process for all submissions that analyses a minimum 100-bpflanking sequence to position the SNP uniquely in the genome or not. The pro-portion of nonunique SNPs remains very small (approx 5%), and it appears tohave much more in common with the pericentromeric areas; therefore, searchesare best directed to the other regions of each chromosome.
4. Users can subscribe to a mailing list providing updates on the regular changes inextent and arrangement of dbSNP (http://www.ncbi.nlm.nih.gov/mailman/listinfo/dbsnp-announce).
5. Outlines of the structure and routine use of the NCBI sites are detailed in a pdfhandbook (http://www.ncbi.nlm.nih.gov/books/bv.fcgi?call=bv.View..ShowTOC&rid=handbook.TOC&depth=2), which can be downloaded by chapter. Ofparticular relevance are chapters 5 (dbSNP), 15 (Entrez), 16 (BLAST), and 20(Map Viewer).
6. TSC SNPs have been chosen specifically for their proximity to genes because themain purpose of TSC is to construct a high-density SNP linkage map. The sig-nificant feature is the detailed genotype frequency data for 96,000 loci—most ofthese for three population groups. This will eventually rise to 300,000 loci. Thefull dataset can be searched by gene or chromosome region and data for eachSNP can be downloaded in text-file format. There is a mailing list for news andupdate notifications (e-mail: [email protected]).
7. The Celera database (CDS) requires an annual subscription but the assays-on-demand subset (AOD) can be freely accessed. AOD data consists of the CDS IDnumber and the dbSNP ID number (when the marker is a refSNP). In addition,AOD lists accurate allele frequency estimates from 46 individuals in two to fourpopulation groups (African, European, plus less extensive Chinese and Japanesefrequencies). AOD provides the best data for scrutinizing SNPs with stratifiedallele frequency distributions between the population groups but flanking sequence
100 Phillips
data and map positions are not provided on the public AOD site for Celera-onlySNPs.
8. Searches of the AOD database are handled by a page with query fields for 18different characteristics and a fixed 10-kb flanking region around genes. It ispossible to structure the query using set fields for the SNP type (untranslatedregion, coding, intronic) and allele frequency in each of the four populations inthe range 0 of 0.5 in 0.01 increments. This latter field is useful for finding SNPsin particular frequency ranges in particular populations, but uses the union queryoperator OR, giving very large outputs.
9. CDS is a valuable database for forensic research principally because of the extracoverage it provides: approx 2.6 million of the 4.8 listed SNPs are unique toCelera, the other loci being the better validated public SNPs and new SNPs dis-covered from comparative sequence passes between public and Celera contigs.One of the criterion for inclusion of SNPs in CDS is a minimum level of poly-morphism, so a larger proportion of loci will be useful for forensic applicationson the basis of variability alone.
10. MegaBLAST is designed for long sequences and for a certain degree of mis-match, whereas blastn is designed to give a list of sequences in order of similar-ity. Note that a third option: “Search for short and near exact matches” isrecommended for sequence specificity checks with less than 20 bases. A verygood guide to program choice is provided by NCBI (http://www.ncbi.nlm.nih.gov/BLAST/producttable.shtml). Although the NCBI BLAST site is the mostcommonly used sequence alignment tool several other BLAST sites exist (e.g.,The Sanger HGMP BLAST tool. This site can e-mail results to avoid long waitswith NCBI BLAST at busy periods).
11. BLAST returns a three-part report: the header with query sequence informationand a summarizing graphical overview, single-line matching sequence descrip-tions and, lastly, the matching alignments themselves. The graphical overviewshows the query sequence as a numbered red bar, and below this the database hitsas colored bars aligned to the query. The colors and proximity to the query repre-sent the alignment scores from red (highest) through to black (lowest) and upper-most to lowest bars. The single-line descriptions give both a bit score indicatinggoodness of fit of each matched sequence and an expect value (E-value). The bitscore is calculated from a formula that takes into account all the matching nucle-otides and gaps, the higher the score the better the alignment (http://www.ncbi.nlm.nih.gov/BLAST/tutorial/Altschul-1.html). The E-value gives anidea of the statistical significance of the alignment, reflecting both the size of thedatabase used to prepare the alignments and the score system used. The lower theE-value the more significant the hit. For example a value of 0.05 equates to 5 in100 or 1 in 20 signifying the probability of this match by chance alone. This latterstatistic requires careful interpretation in the context of the sequence comparisonbeing performed.
12. To find the position of STRs using The Marshfield Clinic linkage map databasego to “Search for Markers.” Enter a D number or common name (e.g., D12S391)

Online SNP Databases 101
and using the marker description provided (e.g., GATA11H08) obtain a precisemap position with NCBI Map Viewer (http://www.ncbi.nlm.nih.gov/mapview/maps.cgi) by filling the search box and clicking find, then clicking the chromo-some number in the genome map view to give the detailed chromosome mapview and hyper links to the marker characteristics in UniSTS. This can be donedirectly using the UniSTS query system (http://www.ncbi.nlm.nih.gov/entrez/query.fcgi?db=unists) but the Marshfield site allows easier comparisons withadditional STR markers and provides more latitude with nonstandard names, suchas VWA or TPOX.
13. Flanking sequence features can compromise the primer (and assay probe) designprocess by excluding sections of sequence as potential binding sites. Poor sequencewill also hinder PCR quality because primers will be difficult to balance in amultiplex with those from problem-free sequence. With the aim of finding prim-ers that perform best in generalized PCR environments, a high-quality sequencewill provide the widest range of candidate primers that can work well withoutspecialized conditions, such as higher annealing temperatures. Choice of candi-date primers is already reduced in forensic assays by the need to keep theamplicon size small. An absence of clustering SNPs is a particularly importantcharacteristic because any variable site in close proximity will exclude 20–24primer candidates for the available flanking sequence of a SNP (conditional onaverage primer length and substitution sites more than 20 bases distant from theSNP of interest).
14. Closer examination of the hits obtained for the example used: TH01 shows thatEntrez can be, at once, both too powerful and too loosely defined. If the searchquery is not carefully constructed or the hits returned are not followed up in thecorrect database, the required information can be difficult to track down. Thesequence hit returned for TH01 is for a plant species: Rosa chinensis, the proteinhit is for cow (Bos taurus) thyroglobulin precursor (TH = thyroid hormone), andone literature citation is for an article on allopolyploidy in wheat (TH01 being aninbred line ID used in an experimental cross but a term only used once in themiddle of the article text). The hit for UniSTS returns more appropriate informa-tion (from a forensic genetics viewpoint) giving STS marker 240639 which isHUMTH01 providing primer sequences (one the same as that used in the initialforensic development of this STR) plus the precise marker co-ordinates forchromosome 11 (2156529-2156690 bp) and a genome map view—all the datarequired for the development of this marker from scratch today.
15. The query system for SNPs is called EntrezSNP to distinguish it from the databasename dbSNP and from generalized Entrez use. Hyperlinks to the other databasesremain intact throughout the SNP report pages that are returned using EntrezSNP,so the benefits of the cross database functionality of using Entrez as a whole arenot lost.
16. Two useful tools are provided in EntrezSNP by clipboard and history. The clip-board is a workspace for holding up to 500 items manually selected from searchreturns, the contents are cleared after 8 h of inactivity. History lists the database

102 Phillips
search activity (again cleared after eight hours inactivity) as numbers prefixed bya hash (#). These can be combined using Boolean operators (e.g., placing #1AND #2 in the search box provides an intersection of the first two searches of thecurrent session)
17. As an example, to find an article that describes the forensic application of DNAfingerprinting that also includes the authors (A. Jeffreys and P. Gill), a searchcould begin with the term DNA fingerprinting. This returns 5944 hits: a list of allthe publications that include some aspect of this topic in the reported work. Add-ing the term “forensic” using the operator AND returns 868 hits and because theterms used in combination remain in the search box each time, it is easy to thenadd: AND Jeffreys to obtain a list of 13, followed by: AND Gill. Note that when“Gill” is placed as the final search term, no articles are returned, even though the1985 Nature article we were actually interested in finding appears on the previ-ous list with Jeffreys alone. This is because any search of PubMed using unquali-fied terms as a query (i.e., without a qualifier or search field tag) will only matchkey text words within each article to the query (in the case of Jeffreys this includescitations within the text). To find articles by Jeffreys and Gill, we need to use theauthor search field tag: [au]. So adding AND Gill [au] returns a single article—the correct target of the search. Another tag [dp],or date of publication, providesan example of ranging: a range that is set using a colon (:) between defined lim-its. Therefore, to get a list of articles from P Gill in the 1990s, we could use GillP [au] AND 1990:1999 [dp]. To avoid a list of articles from several differentauthors named P Gill, it is possible to use a flexible and powerful PubMed tag:text word [tw]—in this case, using forensic [tw] reduces the list from 281 to 36.Finally, parentheses can be used to group search terms together into a set ofchoices for the query. Entrez processes all Boolean operators in a left-to-rightsequence, so the order in which a search statement is processed can be directedby enclosing individual concepts in parentheses. Terms placed inside parenthe-ses are processed first as a unit and then incorporated into the overall searchstrategy. For example, the search statement: genotyping AND (MALDI-TOF ORmicroarrays) is processed by ORing the terms in parentheses first and thenANDing the resulting set with genotyping. Without the parentheses, all articleson microarrays would be returned. As is the norm with most online databases,PubMed defaults to AND if a space is used between query terms (so SNP, forexample, returns 6157 hits, whereas SNP genotyping returns 497).
18. Ordering an EntrezSNP list of returns involves use of a drop down list of sixpossible criteria of which heterozygosity, success rate, and chromosome baseposition are the most useful. Generally, ordered heterozygosity will allow theeasiest selection of loci providing the highest polymorphic content in most popu-lations. The list is in reverse order, so it is necessary to go to the last page andwork backwards.
19. Using several maps in tandem can provide helpful reference points for precisepositioning of the segment of the chromosome being explored. For this reason, itcan be useful to place an ideogram map and a gene map alongside the variation

Online SNP Databases 103
map. In the map options window it is possible to toggle a chromosome co-ordi-nates ruler against any map to further aid navigation using co-ordinates. Twoother maps could be helpful in exploring SNP linkage issues when browsing.One is the Marshfield genetic map: a comprehensive linkage map incorporating8000 polymorphic markers with a total sex-averaged genetic distance of 3500 cM.(15). This provides a framework of genetic distance based on recombination ratesthat can be used to check that two candidate SNP markers are sufficiently distantto avoid linkage. The second map: dbSNP Haplotype is an annotation of genomeregions in high linkage disequilibrium. The current data is patchy and mostlyfocused on chromosome 21 (illustrated in Fig. 7). When the HapMap Projectdata release is completed in 2004–2005, all chromosome maps will have linkagemeasurements indicating regions of strong or weak LD.
20. Full marker validation by independent resequencing or by multiple reports of thesame substitution is important for forensic assay development because large-scaleresources would be needed to revalidate unconfirmed SNPs. There are a growingnumber of markers in dbSNP that have been resequenced and genotyped in morethan one population: giving high levels of confidence for the allele frequencyreports provided in dbSNP. With so many SNPs now validated to the highestlevel, choosing only loci with three gold stars in Map Viewer does not seriouslylimit the pool of candidate markers.
Fig. 7. A seven-SNP, four-haplotype allele distribution in haplotype blockB000661, chromosome 21 as displayed in dbSNP.

104 Phillips
21. Map Viewer can be used to find suitable SNPs either by concentrating a searchon a region of a chromosome, known to have low gene densities (so called“gene deserts”) or by simple chromosome walking—moving in set intervalsalong the chromosome. Although finding gene deserts is straightforwardenough, there are several distinct problems with this approach. Firstly, becauseSNP discovery has concentrated on genes and the flanking regions around them,areas with low gene density normally coincide with low SNP density because ofacquisition bias. Second, it is necessary to decide on simple rules for avoidinglinkage of SNPs to other markers. Unfortunately, traditional genetic distancemeasurements, such as a centiMorgan scale, are not a completely reliable guideto linkage because, as previously discussed, LD is highly variable throughout thegenome. Until haplotype block maps become widely available a minimum dis-tance of 100 kb between markers can be used. Thirdly, variation in gene densitywithin the human genome means some chromosomes are difficult to search witha standardized minimum spacing. Chromosome 19 in particular has a very highgene density (figure z) and in this case obtaining sufficient markers with a mini-mum of 100 kb between SNP and gene is difficult. Finally, many gene map posi-tions are assumed to exist. Identifying genes in the absence of a described proteinproduct is very difficult and putative sites are widespread. Until the human genomeis fully annotated, putative sites may require the same minimum distance spacingas known genes when selecting SNPs.
22. A commonly encountered problem is the disparity in the direction of the dis-played sequence in Sequence Viewer and in dbSNP. Always crosscheck theimmediate flanking region of the SNP in both databases and if necessary flip thestrand to reverse in Sequence Viewer before tracking any clustering SNP posi-tions. The length of sequence examined depends to some extent on the assaydesign but forensic PCR requires that approx 100–120 bp of flanking region eachside is needed to allow sufficient flexibility in primer design.
AcknowledgmentsThe selection and study of SNP markers from online genetic databases,
described in this chapter, formed part of research work supported by the grant(estancias de doctores y tecnologos extranjeros en Espana) from the Ministeriode Educación y Ciencia (SB2000-0236), Madrid.
References1. Sachidanandam, R., et al. (2001) A map of human genome sequence variation
containing 1.42 million single nucleotide polymorphisms. Nature 409, 928–33.2. Gill, P. (2001). An assessment of the utility of single nucleotide polymorphisms
(SNPs) for forensic purposes. Int. J. Legal Med. 114, 204–210.3. Altschul, S. F., Gish, W., Miller, W., Myers, E. W., and Lipman, D. J. (1990)
Basic local alignment search tool. J. Mol. Biol. 215, 403–410.4. Dawson, E., et al. (2002) A first generation linkage disequilibrium map of chro-
mosome 22. Nature 418, 544–548.

Online SNP Databases 105
5. Pati, N., et al. (2001) Blocks of limited haplotype diversity revealed by high reso-lution scanning of human chromosome 21. Science 25, 1719–1723.
6. Gabriel, S. B., et al. (2002) The structure of haplotype blocks in the human genome.Science 296, 2225–2229.
7. Phillips, M. S., et al. (2003) Chromosome-wide distribution of haplotype blocksand the role of recombination hotspots. Nat. Genet. 33, 382–387.
8. Daly, M., Rioux, J. D., Schaffer, D. F., Hudson, T. J., and Lander, E. S. (2001) Highresolution haplotype structure in the human genome. Nat. Genet. 29, 229–232.
9. De La Vega, F. M., et al. (2003) A whole genome gene-centric linkage disequilib-rium SNP Map. XIX Congress of Genetics July 6–11, Melbourne, Australia; 2003.
10. De La Vega, F. M., et al. (2003) Selection of single nucleotide polymorphisms fora whole-genome linkage disequilibrium mapping set. CSH Genome Sequencing& Biology Meeting, May 7–11, Cold Spring Harbor, NY, 2003.
11. Wall, J. D., and Pritchard, J. K. (2003) Haplotype blocks and linkage disequilib-rium in the human genome. Nat. Rev. Genet. 4, 587–597.
12. Phillips, C., Lareu, M., Salas, A., Fondevila, M., Berniel, G., Carracedo, A., et al.Population specific single nucleotide polymorphism, in Progress in Forensic Genet-ics 10 (Doutremepuich, C., and Morling, N., eds.), Elsevier, Amsterdam.
13. Phillips, C., Lareu, M., Salas, A., and Carracedo, A.. (2004) Nonbinary singlenucleotide polymorphism markers, in Progress in Forensic Genetics 10(Doutremepuich, C., and Morling, N., eds.), Elsevier, Amsterdam.
14. Brion, M., Blanco-Verea, A., Lareu, M., and Carracedo, A. 29 Y-chromosomeSNP analysis in European populations, in Progress in Forensic Genetics 10(Doutremepuich, C., and Morling, N., eds.), Elsevier, Amsterdam.
15. Broman, K. W., Murray, J. C., Sheffield, V. C., White, R. L., and Weber, J. L.(1999) Comprehensive human genetic maps: Individual and sex-specific varia-tion in recombination. Am. J. Hum. Genet. 63, 861–869.


SNP Typing in Forensic Genetics 107
107
From: Methods in Molecular Biology, vol. 297: Forensic DNA Typing ProtocolsEdited by: A. Carracedo © Humana Press Inc., Totowa, NJ
8
SNP Typing in Forensic GeneticsA Review
Beatriz Sobrino and Angel Carracedo
SummarySingle nucleotide polymorphisms (SNPs) are emerging as new markers of interest to
the forensic community because of their abundance in the human genome, their lowmutation rate, the opportunity they present of analyzing smaller fragments of deoxyribo-nucleic acid (DNA) than with short tandem repeats—important in degraded DNAsamples—and the possibility of automating the analysis with high-throughput technolo-gies. Many new technologies for genotyping SNPs have been developed in the past fewyears. We describe the principles of the allelic discrimination reactions and the technolo-gies used for each of them. The aim of this chapter is to help in the understanding of themethodologies used in SNP genotyping and in the selection of the most appropriate tech-niques for forensic purposes.
Key Words: Single nucleotide polymorphism (SNP); SNP genotyping; DNA typing;forensic genetics.
1. IntroductionSingle nucleotide polymorphisms (SNPs) are single-base variations at a
unique physical location. Comparison of genomic deoxyribonucleic acid(DNA) sequences in different individuals reveals positions at which two, or insome cases, more than two bases, can occur. SNPs are highly abundant and areestimated to occur at 1 in every 1000 bases in the human genome (1,2). Theytherefore represent the most common class of human polymorphism.
Depending on where a SNP occurs, the polymorphism can have differentconsequences at the phenotypic level. SNPs in the coding regions of genes thatalter the function or structure of the encoded proteins can have clinical conse-

108 Sobrino and Carracedo
quences and are important in medicine for genetic diagnosis, genetic coun-seling, or pharmacogenetics. However, most SNPs are located in noncodingregions of the genome and have no detectable impact on the phenotype of anindividual. These noncoding SNPs are useful as markers in population genet-ics and evolutionary studies (3,4) and for forensic analysis (5).
The reason for the current great interest in SNPs is the prediction that theycould be used as markers to identify genes that predispose individuals to com-plex disorders by using linkage disequilibrium. In addition, in the field of foren-sic genetics, SNPs have generated increasing interest, and a large proportion ofcurrent research activity is now being focused on SNP typing.
Whether SNPs will replace STRs as the primary method of choice for foren-sic purposes is a matter of conjecture at present. However, SNPs have a num-ber of characteristics that make them very suitable for forensic studies. First,they have lower mutation rates than STRs, and this is valuable for paternitytesting. Second, they can be analyzed from short amplicons and, in general,this is desirable, because the size of the amplified product is critical for thesuccessful amplification of degraded samples. Finally, they are particularlysuitable for analysis using high-throughput technologies, which have becomeincreasingly important for the successful implementation of large criminalDNA databases. High-throughput techniques also make it easier to perform thelarge-population studies required for precise estimates of allele frequenciesessential for the correct interpretation of cases involving haplotype analysis,such as Y-chromosome and mitochondrial typing.
In addition to this, there is no doubt about the usefulness of SNPs for somespecialized forensic applications, in particular, mitochondrial DNA (currentlyused for bone, teeth, hair shaft); Y-chromosome DNA (used to analyze themale component from mixed stains and to possibly elucidate geographical ori-gin of a sample); and commonplace physical characteristics (skin, hair, eyecolor) that could be developed in the future for investigative purposes.
There is not one single ideal method for typing SNPs, and the choice dependson both the requirements of the investigation and the field of application. Inforensic analysis, the method must be easily applied in the majority of labora-tories, with the highest level of accuracy, with a sensitivity sufficient for theanalysis of low copy number or degraded DNA, and finally with good multi-plexing capacity.
But how many SNPs are needed for a forensic test? It has been shown (5,6)that, on average, and considering SNPs with frequencies close to 0.5 for eachallele, five SNPs are equivalent to one STR; therefore, a total of between 50and 75 SNPs equates to the current STR multiplexes used in forensic case-work.

SNP Typing in Forensic Genetics 109
The selection of SNPs for forensic analysis is not an easy task. Recently, theEuropean Consortium: SNPforID (Growth Program GRD1-2002-71802) hasselected a core group of candidate SNPs based on the validation status, poly-morphism, sequence quality, SNP typing technologies, and linkage.
Linkage is one of the most important issues and needs to be carefullyaddressed because although recent studies indicate that linkage disequilib-rium (LD) is structured into discrete blocks in the human genome (7), the vari-ability, range, and distribution of LD in different populations is not yet fullyunderstood.
Strategies for the selection of Y chromosome SNPs (8), nonbinary autoso-mal SNPs (9), and SNPs suggesting the geographical origin of samples (10)have all been recently proposed for forensic purposes.
2. DNA Typing MethodologiesIntense efforts to establish technologies for the large-scale analysis of SNPs
are being conducted to identify both the genes that underlie complex diseasesand to realize the full potential of pharmacogenomics in elucidating variableresponses to drugs. New genotyping methods, chemistries, and platforms arecontinuously being proposed, and it is often difficult to keep up to date and tomake informed decisions on the best-available options. To understand each ofthe methods, it is important to distinguish between reaction principles, assayformats, and detection methods. Reaction products can be detected with morethan one method, and the same detection method can analyze products obtainedwith different reaction principles or assay formats (Table 1).
The majority of SNP genotyping assays can be assigned to one of four groupsbased on molecular mechanism: allele specific hybridization, primer exten-sion, oligonucleotide ligation, and invasive cleavage. There are several detec-tion methods for analyzing the products of each type of reaction.
2.1. Allele-Specific Hybridization
Allele-specific hybridization, also known as ASO (allele specific oligonucle-otide hybridization), is based on distinguishing between two DNA targets dif-fering at one nucleotide position by hybridization (11). Two allele-specificprobes are designed, usually with the polymorphic base in a central position inthe probe sequence. Under optimized assay conditions, only the perfectlymatched probe-target hybrids are stable, and hybrids with one-base mismatchare unstable (Fig. 1).
ASO probes with reverse dot-blot formats were used to detect the first poly-merase chain reaction (PCR)-based polymorphisms introduced in the forensicfield, and they are still used in some laboratories, although they have now

110 Sobrino and Carracedo
largely been substituted by STR analysis. To take full advantage of new ASOprobe formats for SNP typing, it is necessary to use detection methods thatprovide high accuracy, high sensitivity, and high throughput.
2.1.1. Homogeneous Hybridization Using FRET
Fluorescence resonance energy transfer (FRET) occurs when two fluores-cent dyes are in close proximity to one another and the emission spectrum ofone fluorophore overlaps the excitation spectrum of the other fluorophore (12).These genotyping methods combine allele discrimination using ASO probeswith real-time PCR reactions and quantification. Therefore, in addition to theprobes for genotyping, two PCR primers are required. The increase in fluores-cence can be measured in real-time during the PCR or when the PCR has fin-ished. There are several variations based on the same principle.
2.1.1.1. LIGHTCYCLER (ROCHE)
Two specially designed sequence specific oligonucleotides labeled withfluorescent dyes are applied for this detection method. Probe 1 carries a fluo-rescein label at its 3' end and probe 2 carries another label (LC Red 640 or 705)at the 5' end. The sequences of the two oligonucleotides are selected such that
Table 1Detection Method Used for Each Allelic Discrimination Reaction
Allelic discrimination reaction Detection method
Hybridization FRETFPMicroarrays (Fluorescence)
Primer Extension ElectrophoresisMass spectrometryMicroarrays (Fluorescence)FRETFPLuminescence
Ligation ElectrophoresisFRET
Invasive cleavage Mass spectrometryFRETFP
FRET, fluorescence resonance energy transfer; FP, fluorescence polarization.

SNP Typing in Forensic Genetics 111
they hybridize adjacent to one another on the DNA target. When the oligo-nucleotides are hybridized, the two fluorescence dyes are positioned in closeproximity to each other. The first dye (fluorescein) is excited and emits greenfluorescent light and with the two dyes in close proximity, the emitted energyexcites the adjacent LC Red 640 or 705, which subsequently emits fluorescentlight (Fig. 2A). This energy transfer, referred to as FRET, is highly dependenton the spacing between the two dye molecules. The energy transferred at ahigh enough efficiency only if both molecules are within a distance of one tofive nucleotides. The intensity of the light emitted by the dye LC Red 640 isfiltered and measured by the optics in the LightCycler instrument. The increas-ing amount of measured fluorescence is proportional to the increasing amountof DNA generated during the ongoing PCR process. Because LC Red 640 or705 only emit a signal when both oligonucleotides are hybridized, the fluores-cence measurement is performed after the annealing step.
Two hybridization probes complementary to a specific region of the ampli-fied sequence are designed. One of the probes is arranged with the polymor-phic base in a central position and the other must be adjacent to allow for FRET.
Fig. 1. Representation of the allelic discrimination reactions.

112 Sobrino and Carracedo
It is well known that a single mismatch can significantly reduce the meltingtemperature of the oligonucleotide and that this reduction primarily dependson the length of the oligonucleotide and the position of the mismatch. Thereduced melting temperature is measured by performing a melting curve analy-sis. This method may, of course, also be applied by using hybridization probesmatching the mutant and having a mismatch with the wild type.
More than one SNP can be simultaneously genotyped combining the use ofthe two different fluorescent labels with the design of probes with differentmelting temperatures. Nevertheless, it is difficult to perform more than four-plex PCR (13). The main advantage of this system is the high sensitivity (13).
Fig. 2. Representation of different SNP genotyping methods by real-time PCR andFRET detection. (A) LightCytcler; (B) TaqMan; (C) Molecular Beacon.
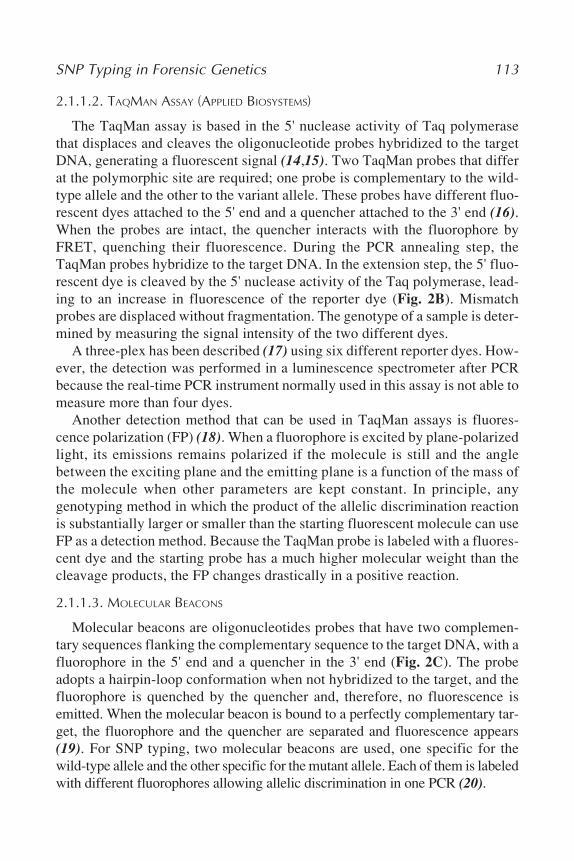
SNP Typing in Forensic Genetics 113
2.1.1.2. TAQMAN ASSAY (APPLIED BIOSYSTEMS)
The TaqMan assay is based in the 5' nuclease activity of Taq polymerasethat displaces and cleaves the oligonucleotide probes hybridized to the targetDNA, generating a fluorescent signal (14,15). Two TaqMan probes that differat the polymorphic site are required; one probe is complementary to the wild-type allele and the other to the variant allele. These probes have different fluo-rescent dyes attached to the 5' end and a quencher attached to the 3' end (16).When the probes are intact, the quencher interacts with the fluorophore byFRET, quenching their fluorescence. During the PCR annealing step, theTaqMan probes hybridize to the target DNA. In the extension step, the 5' fluo-rescent dye is cleaved by the 5' nuclease activity of the Taq polymerase, lead-ing to an increase in fluorescence of the reporter dye (Fig. 2B). Mismatchprobes are displaced without fragmentation. The genotype of a sample is deter-mined by measuring the signal intensity of the two different dyes.
A three-plex has been described (17) using six different reporter dyes. How-ever, the detection was performed in a luminescence spectrometer after PCRbecause the real-time PCR instrument normally used in this assay is not able tomeasure more than four dyes.
Another detection method that can be used in TaqMan assays is fluores-cence polarization (FP) (18). When a fluorophore is excited by plane-polarizedlight, its emissions remains polarized if the molecule is still and the anglebetween the exciting plane and the emitting plane is a function of the mass ofthe molecule when other parameters are kept constant. In principle, anygenotyping method in which the product of the allelic discrimination reactionis substantially larger or smaller than the starting fluorescent molecule can useFP as a detection method. Because the TaqMan probe is labeled with a fluores-cent dye and the starting probe has a much higher molecular weight than thecleavage products, the FP changes drastically in a positive reaction.
2.1.1.3. MOLECULAR BEACONS
Molecular beacons are oligonucleotides probes that have two complemen-tary sequences flanking the complementary sequence to the target DNA, with afluorophore in the 5' end and a quencher in the 3' end (Fig. 2C). The probeadopts a hairpin-loop conformation when not hybridized to the target, and thefluorophore is quenched by the quencher and, therefore, no fluorescence isemitted. When the molecular beacon is bound to a perfectly complementary tar-get, the fluorophore and the quencher are separated and fluorescence appears(19). For SNP typing, two molecular beacons are used, one specific for thewild-type allele and the other specific for the mutant allele. Each of them is labeledwith different fluorophores allowing allelic discrimination in one PCR (20).

114 Sobrino and Carracedo
Different targets can be detected in the same reaction. This is accomplishedusing different molecular beacons for each target and attaching a different colorfluorophore to each (21). The number of different fluorophores that can beused in the same reaction is limited by the detection capability of availableinstruments. Instruments that can be used to perform PCR while simultaneouslymonitoring fluorescence in real-time use a monochromatic light source, suchas a laser or light-emitting diodes. By using wavelength-shifting molecularbeacons, this problem is solved. These probes emit fluorescent light in a dis-tinct range of colors even though they are excited by the same monochromaticlight source (22). This approach increases the multiplex capability for SNPtyping.
The principal advantage of homogenous hybridization methods is that nopost-PCR process is necessary because PCR and detection are performed inthe same reaction. This allows for high-throughput genotyping of a few SNPsin many samples, but the method has the serious drawback of limited multi-plexing capability.
2.1.2. Array Hybridization and Fluorescence Detection
In this approach, short oligonucleotides are attached to a solid support, tocreate a microarray, and are hybridized with fluorescent-labeled PCR productscontaining the SNP sequence. This is more suitable to analyze many SNPs inparallel. However, the efficiency of the hybridization and the stability of hybridsdepend not only on the polymorphic site but also on the SNP flanking sequence(23). Therefore it is very difficult to design optimum conditions to simulta-neously analyze a large number of SNPs. This difficulty is overcome in theGeneChip system (Affymetrix) using tens of ASO probes for each SNP. Theprobes include all possible sequences at the polymorphic site and some nucle-otides that flank the SNP: a technique referred to as tiling strategy (24,25).The GeneChip is produced with parallel light-directed chemistry to synthesizespecific oligonucleotide probes covalently bound at defined locations on a chip(26,27). This method is designed for genotyping a large number of SNPs at ascale that far exceeds current forensic requirements.
2.2. Primer Extension
Primer extension is based on the ability of DNA polymerase to incorporatespecific deoxyribonucleotides that are complementary to the sequence of thetemplate DNA. There are several variations of the primer extension reaction;however, they can be divided into two main types of reaction. First, there is theminisequencing reaction or single nucleotide primer extension, where the poly-morphic base is determined by the addition of the ddNTP complementary tothe base interrogated by a DNA polymerase. Second, there is the allele-spe-
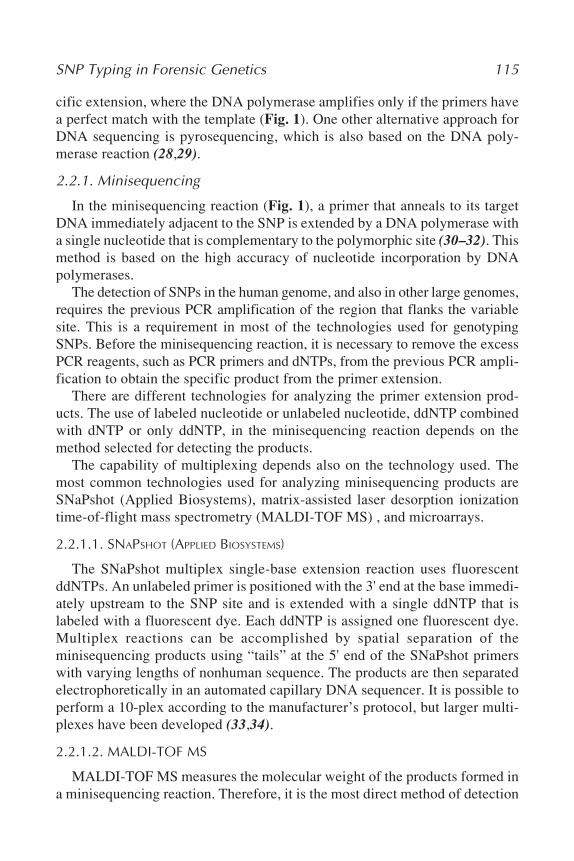
SNP Typing in Forensic Genetics 115
cific extension, where the DNA polymerase amplifies only if the primers havea perfect match with the template (Fig. 1). One other alternative approach forDNA sequencing is pyrosequencing, which is also based on the DNA poly-merase reaction (28,29).
2.2.1. Minisequencing
In the minisequencing reaction (Fig. 1), a primer that anneals to its targetDNA immediately adjacent to the SNP is extended by a DNA polymerase witha single nucleotide that is complementary to the polymorphic site (30–32). Thismethod is based on the high accuracy of nucleotide incorporation by DNApolymerases.
The detection of SNPs in the human genome, and also in other large genomes,requires the previous PCR amplification of the region that flanks the variablesite. This is a requirement in most of the technologies used for genotypingSNPs. Before the minisequencing reaction, it is necessary to remove the excessPCR reagents, such as PCR primers and dNTPs, from the previous PCR ampli-fication to obtain the specific product from the primer extension.
There are different technologies for analyzing the primer extension prod-ucts. The use of labeled nucleotide or unlabeled nucleotide, ddNTP combinedwith dNTP or only ddNTP, in the minisequencing reaction depends on themethod selected for detecting the products.
The capability of multiplexing depends also on the technology used. Themost common technologies used for analyzing minisequencing products areSNaPshot (Applied Biosystems), matrix-assisted laser desorption ionizationtime-of-flight mass spectrometry (MALDI-TOF MS) , and microarrays.
2.2.1.1. SNAPSHOT (APPLIED BIOSYSTEMS)
The SNaPshot multiplex single-base extension reaction uses fluorescentddNTPs. An unlabeled primer is positioned with the 3' end at the base immedi-ately upstream to the SNP site and is extended with a single ddNTP that islabeled with a fluorescent dye. Each ddNTP is assigned one fluorescent dye.Multiplex reactions can be accomplished by spatial separation of theminisequencing products using “tails” at the 5' end of the SNaPshot primerswith varying lengths of nonhuman sequence. The products are then separatedelectrophoretically in an automated capillary DNA sequencer. It is possible toperform a 10-plex according to the manufacturer’s protocol, but larger multi-plexes have been developed (33,34).
2.2.1.2. MALDI-TOF MS
MALDI-TOF MS measures the molecular weight of the products formed ina minisequencing reaction. Therefore, it is the most direct method of detection
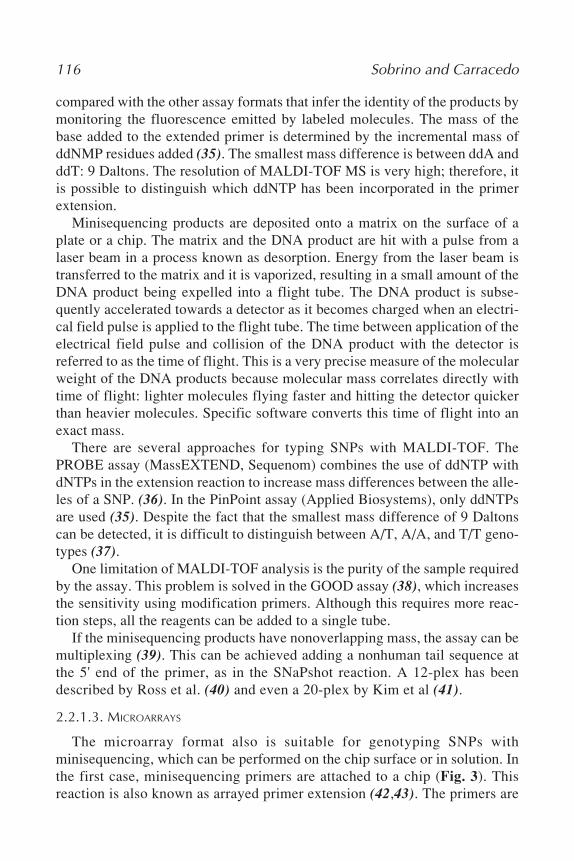
116 Sobrino and Carracedo
compared with the other assay formats that infer the identity of the products bymonitoring the fluorescence emitted by labeled molecules. The mass of thebase added to the extended primer is determined by the incremental mass ofddNMP residues added (35). The smallest mass difference is between ddA andddT: 9 Daltons. The resolution of MALDI-TOF MS is very high; therefore, itis possible to distinguish which ddNTP has been incorporated in the primerextension.
Minisequencing products are deposited onto a matrix on the surface of aplate or a chip. The matrix and the DNA product are hit with a pulse from alaser beam in a process known as desorption. Energy from the laser beam istransferred to the matrix and it is vaporized, resulting in a small amount of theDNA product being expelled into a flight tube. The DNA product is subse-quently accelerated towards a detector as it becomes charged when an electri-cal field pulse is applied to the flight tube. The time between application of theelectrical field pulse and collision of the DNA product with the detector isreferred to as the time of flight. This is a very precise measure of the molecularweight of the DNA products because molecular mass correlates directly withtime of flight: lighter molecules flying faster and hitting the detector quickerthan heavier molecules. Specific software converts this time of flight into anexact mass.
There are several approaches for typing SNPs with MALDI-TOF. ThePROBE assay (MassEXTEND, Sequenom) combines the use of ddNTP withdNTPs in the extension reaction to increase mass differences between the alle-les of a SNP. (36). In the PinPoint assay (Applied Biosystems), only ddNTPsare used (35). Despite the fact that the smallest mass difference of 9 Daltonscan be detected, it is difficult to distinguish between A/T, A/A, and T/T geno-types (37).
One limitation of MALDI-TOF analysis is the purity of the sample requiredby the assay. This problem is solved in the GOOD assay (38), which increasesthe sensitivity using modification primers. Although this requires more reac-tion steps, all the reagents can be added to a single tube.
If the minisequencing products have nonoverlapping mass, the assay can bemultiplexing (39). This can be achieved adding a nonhuman tail sequence atthe 5' end of the primer, as in the SNaPshot reaction. A 12-plex has beendescribed by Ross et al. (40) and even a 20-plex by Kim et al (41).
2.2.1.3. MICROARRAYS
The microarray format also is suitable for genotyping SNPs withminisequencing, which can be performed on the chip surface or in solution. Inthe first case, minisequencing primers are attached to a chip (Fig. 3). Thisreaction is also known as arrayed primer extension (42,43). The primers are

SNP Typing in Forensic Genetics 117
extended by a DNA polymerase with labeled ddNTPs and the microarray isscanned to measure fluorescence. In the second case, the SNPs are genotypingby a single base extension using minisequencing primers with a unique sequencetag at the 5' end (44,45). Each SNP has a distinct identifying tag. The product ofthe multiplex minisequencing reaction performed in solution is hybridized tothe reverse complementary sequences of the tags arrayed onto the chip (Fig. 3).
In Pastinen et al. (46), an “array of arrays” format for slides was described.This allows the analysis of up to 80 different samples per slide by creatingdifferent hybridization chambers with silicon rubber grids.
2.2.1.4. FP
As previously described, FP can be used for detecting any allelic discrimi-nation product where the initial molecules have different sizes. In the case ofminisequencing, the primer is extended by the dye-terminator that is specificfor the allele present on the template, increasing approximately 10-fold themolecular weight of the fluorophore (47).
2.2.2. Pyrosequencing
Pyrosequencing is a sequencing-by-synthesis method. This technology usesan enzyme cascade system, consisting of four enzymes and specific substrates,to produce light whenever a nucleotide is complementary to the template DNAstrand (28,29). This light signal is detected, the base registered, and the next
Fig. 3. SNP typing technologies with microarrays.

118 Sobrino and Carracedo
nucleotide added. If the added nucleotide is not complementary to the nextbase in the template, no light will be generated. The detection is based on thepyrophosphate released during the DNA polymerase reaction. The reactionmixture consists of single-stranded DNA with an annealed primer, DNA poly-merase, ATP sulfurylase, luciferase, and apyrase. The four nucleotides areadded to the mixture in a defined order (i.e., CGAT). If the added nucleotideforms a base pair, the DNA polymerase incorporates the nucleotide and pyro-phosphate will consequently be released. The released pyrophosphate will beconverted to ATP by ATP sulfurylase. Luciferase then uses the ATP to gener-ate detectable light. The light intensity is proportional to the number of incor-porated nucleotides. The excess of each nucleotide will be degraded by apyrase.If the added nucleotide does not form an incorporated base pair with DNAtemplate no light will be produced.
Pyrosequencing provides rapid real-time determination of 20–30 base pairsof target DNA. With this technology, the SNP alleles are determined, includ-ing adjacent base positions as a built in control.
The limiting factors of pyrosequencing are the template preparation requiredand the degree of multiplexing. Before analysis, PCR products need to be con-verted to single stranded template onto which a sequencing primer is annealed.This is achieved using biotinylated PCR products. In addition, as with realtime PCR, the method has the problem of limited multiplex capability.
2.2.3. Allele-Specific Extension
Allele-specific extension relies on the difference in extension efficiency ofDNA polymerase between primers with matched and mismatched 3' ends. DNApolymerase extends a primer only when the 3' end is perfectly complementaryto the DNA template (Fig. 1). Two primers are required, one for each allele ofa SNP. By detecting which primer forms the product, the genotype of a samplecan be determined. The product of this reaction can be detected on a microarrayusing fluorescently labeled nucleotides (48).
Another variant of this reaction is the use of allelic-specific primers: wherethe matching primer allows the amplification of a specific allele in a sample. Inthis case, the reaction is called allele-specific PCR. The detection of the appro-priate PCR products allows the genotyping of the sample (49,50). The use oftag-primers allows the specific identification of each PCR product, in somecases based on melting curve analysis (51) and in other cases on the detectionof fluorescent tags (52).
2.3. ASO Ligation
DNA ligase is highly specific in repairing nicks (a missing phosphodiesterbond) in the DNA. Landergren et al., (53) described the oligonucleotide liga-tion assay (OLA) as a method for SNP typing based on the ability of ligase to

SNP Typing in Forensic Genetics 119
covalently join two oligonucleotides when they hybridize next to one anotheron a DNA template. The OLA assay requires that three probes are designed,one common and two allele specific. The common probe anneals to the targetDNA immediately downstream of the SNP. One allelic probe has at the 3' endthe nucleotide complementary to one allele, with the other allelic probe comple-mentary to the alternative allele. These two allelic probes compete to anneal tothe DNA target adjacent to the common probe. This generates a double strandedregion containing a nick at the allele site. Only the allelic probe perfectlymatched to the target will be ligated to the common probe by the DNA ligase(Fig. 1). The use of thermostable DNA ligase allows repeated thermal cycles,resulting in a linear increase in ligation products. If both strands of genomicDNA are used as targets for oligonucleotide hybridization, the increasing ofligation products can be exponential. This reaction is called ligase chain reac-tion (54). Two sets of oligonucleotides, complementary to each target strand,are used. The ligation products from the first ligation reaction can then be thetargets for the next round of ligation (Fig 4). Different assay formats have beendeveloped for detecting the ligated product. The use of biotin on the commonprobe and a reporter group on the allelic specific probe allows for productcapture and detection (53). Other assays have replaced the biotin with mobilitymodifiers and the allelic specific probes have been labeled with different fluo-rescent dyes, enabling the ligation products to be discriminated by size andcolor (55). The use of mobility modifiers and fluorescent dyes allows a multi-plexed OLA to be performed where the products of this reaction are resolvedelectrophoretically under denatured conditions with fluorescent detection
Fig. 4. Representation of ligase chain reaction (A) and sequence-coded separationof OLA reactions (B).

120 Sobrino and Carracedo
(Fig. 4). The mobility modifiers allow the precise regulation of the mobility ofeach ligation product regardless of oligonucleotide length. This strategy hasbeen termed sequence-coded separation by Grossman et al. (55). In this assay aPCR is performed before the OLA reaction. However, the coupled amplifica-tion and oligonucleotide ligation procedure (56) combines multiplex amplifi-cation and SNP typing in one reaction. This is achieved using PCR primerswith high melting temperatures and oligonucleotide ligation probes with lowermelting temperatures. All the reagents are added simultaneously to one tube,minimizing the manual work and allowing easy automation. During the firststage of the reaction the PCR primers anneal to the DNA target and amplifica-tion occurs at a temperature above the melting temperature of the oligonucle-otide ligation probes. In the second stage the temperature is lowered, allowingthe probes to hybridize and for ligation to occur. Ligation products are detectedusing a fluorescence DNA sequencer.
A variation of the coupled amplification and oligonucleotide ligation assayis the dye-labeled oligonucleotide ligation (57). In this case the ligation prod-ucts are detected by monitoring FRET in real time. Three dye-labeled ligationoligonucleotides are needed for each biallelic marker. The common probe islabeled at 5' end with a donor dye, and the allele-specific probes have an accep-tor dye at the 3' end. When ligation occurs, an increase in FRET is detected.
2.4. Invasive Cleavage
The Invader assay (Third Wave Technology) is based on the specificity ofrecognition, and cleavage, by a Flap endonuclease, of the three-dimensionalstructure formed when two overlapping oligonucleotides hybridize perfectlyto a target DNA (58,59).
The two oligonucleotides required, called “invader oligonucleotide” and“probe,” anneal to the target DNA with an overlap of one nucleotide. Theinvader oligonucleotide is complementary to the sequence on the 3' side ofthe SNP. The probe is designed with the allelic base at the overlapping frag-ment and contains two regions, one complementary to one of the alleles of theSNP and the sequence on the 5' side of the polymorphic site and a noncomplementary 5' arm region (Fig. 1). When the allelic base is complemen-tary to the base in the probe, the probe overlaps the 3' end of the invaderoligonucleotide, forming the structure that is recognized and cleaved by theFlap endonuclease, releasing the 5' arm probe. If there is a mismatch, the struc-ture formed will not be recognized by the Flap endonuclease and cleavage willnot occur. This specificity of substrate structure recognition enables detectionof single nucleotide mutations. The 5' arm probe serves as an invader oligo-nucleotide in a secondary cleavage reaction with a signal probe.
SNP Typing in Forensic Genetics 121
Performing the invasive reaction at elevated temperatures allows for rapiddenaturation of the probe after cleavage, enabling the endonuclease to producemultiple cleaved probes per target DNA molecule. Because of this, the signalis amplified and, together with the secondary cleavage reaction, the amplifica-tion is exponential. Therefore, the Invader assay is a genotyping method with-out the requirement of previous PCR amplification (58,60,61), but a largeamount of target DNA is needed. In order to increase the sensitivity, this assaycan also performed with a PCR step before the invader reaction, known asPCR-Invader assay (62).
Different detection methods can be used, involving different designs ofprobe. When FRET is the detection method, a reporter dye is placed on the 5'arm and the quencher is placed on the complementary region of the probe(60,62). The cleavage event removes the fluorophore and enhances fluores-cence. With FP detection, the probe is labeled with a fluorophore at the 5' end.When the probe is cleaved, the molecular weight of the fluorophore decreaseswith the corresponding decrease in FP (63). If mass spectrometry is the detec-tion method, probes are designed with different numbers of nucleotides (64).
3. DiscussionSNP genotyping technologies have been developing rapidly in the last few
years. As a result, a great variety of different SNP typing protocols havebecome available for researchers, but there is no single protocol that meetsall research needs. The level of throughput required depends on each applica-tion. Some applications use few SNP markers but a large sample size, otherapplications require a large number of SNPs in a few samples and, finally,there are other applications that need large number of both SNPs and samples.For forensic purposes, a medium throughput is required for paternity testingand criminal casework, but a high throughput is necessary to implement crimi-nal DNA databases.
An important limiting step in virtually all these technologies is the PCRamplification. In forensic applications the development of multiplex PCR isessential, not only from the throughput point of view but also as a consequenceof the small amount of DNA available to be analyzed in much criminal case-work. There are some technologies that analyze SNP markers without a previ-ous PCR, like the Invader assay, but these strategies are not suitable for forensicgenetics because of the large amount of DNA required for the analysis. At thispoint, considerable effort is needed to successfully develop PCR with increasedmultiplex capability. All the technologies that have limited multiplexing capa-bility should be excluded as candidates for routine forensic analysis; however,they could be useful for estimating the allele frequencies of the SNPs selectedSNPs and also for creating large criminal DNA databases.

122 Sobrino and Carracedo
Another important issue in forensic genetics is the analysis of mixtures.Because of the biallelic nature of the majority of the SNPs, it will be moredifficult to detect the presence of a mixture in a sample using these markers.Therefore, the possibility of the quantification of each allele in a sample canhelp in the determination of the contribution of each component in a mixedprofile. Some technologies such as mass spectrometry and pyrosequencingallow the possibility of some quantification. This feature is routinely usedfor estimating allele frequencies in pooled samples, but could be an advanta-geous feature useful in forensic genetics. All these aspects need to be takeninto account in making the decision about which technology to use, notably theaccuracy, sensitivity, flexibility, time-consumption, and cost of the SNP typ-ing technique.
Biotechnology companies have been developing new strategies and havecreated considerable technical advances for SNP genotyping in the last fewyears. Rapid technological progress makes it all the more difficult to chooseappropriate methods for specific applications, especially as technical advancesare published at such regular intervals.
Acknowledgments
This work was supported by grants from Xunta de Galicia ((PGIDT01PXI20806 PR) and Ministerio de Educación y Ciencia (DGCYT.P4.BIO2000-0145-P4-02). B.S. has a fellowship from the Ramón Areces Foundation.
References
1. Sachidanandam, R., Weissman ,D., Schmidt, S. C., Kakol, J. M., Stein, L. D.,Marth, G., et al. (2001) A map of human genome sequence variation containing1.42 million single nucleotide polymorphisms. Nature 409, 928–933.
2. Venter, J. C., Adams, M. D., Myers, E. W., Li, P. W., Mural, R. J., Sutton, G. G.,et al. (2001) The sequence of the human genome. Science 291, 1304–1351.
3. Zhao, Z., Fu, Y.X., Hewett-Emmett, D., and Boerwinkle, E. (2003) Investigatingsingle nucleotide polymorphism (SNP) density in the human genome and its im-plications for molecular evolution. Gene 312, 207–213.
4. The Y Chromosome Consortium. (2002) A nomenclature system for the tree ofhuman Y-chromosomal binary haplogroups. Genome Res. 12, 339–348.
5. Gill, P. (2001) An assessment of the utility of single nucleotide polymorphisms(SNPs) for forensic purposes. Int. J. Legal Med. 114, 204–210.
6. Chakraborty, R., Stivers, D. N., Su, B., Zhong, Y., and Budowle, B. (1999) Theutility of short tandem repeat loci beyond human identification: implications fordevelopment of new DNA typing systems. Electrophoresis 20, 1682–1696.
7. Gabriel, S. B., Schaffner, S. F., Nguyen, H., Moore, J. M., Roy, J., Blumenstiel,B., et al. (2002) The structure of haplotype blocks in the human genome. Science296, 2225–2229.
SNP Typing in Forensic Genetics 123
8. Brion, M., Blanco-Verea, A., Lareu, M., Carracedo, A. (in press) 29 Y-chromo-some SNP analysis in European populations, in Progress in Forensic Genetics,10 (Doutremepuich, C., and Morling, N., eds), Elsevier, Amsterdam.
9. Phillips, C., Lareu, M., Salas, A., Carracedo, A. (in press) Non binary SingleNucleotide Polymorphism markers, in Progress in Forensic Genetics, 10(Doutremepuich, C., and Morling, N., eds), Elsevier, Amsterdam.
10. Phillips, C., Lareu, M., Salas, A., Fondevila, M., Berniel, G., Carracedo, A., et al(in press) Population specific single nucleotide polymorphism, in Progress inForensic Genetics, 10 (Doutremepuich, C., and Morling, N., eds), Elsevier,Amsterdam.
11. Wallace, R. B., Shaffer, J., Murphy, R. F., Bonner, J., Hirose, T., and Itakura, K.(1979) Hybridization of synthetic oligodeoxyribonucleotides to phi 174 DNA:the effect of single base pair mismatch. Nucleic Acids Res. 6, 3543–3557.
12. Clegg, R. M. (1992) Fluorescence resonance energy transfer and nucleic acids.Methods Enzymol. 221, 353–388.
13. Lareu, M., Puente, J., Sobrino, B., Quintans, B., Brion, M., and Carracedo, A. (2001)The use of the LightCycler for the detection of Y chromosome SNPs. Forensic Sci.Int. 118, 163–168.
14. Holland, P. M., Abramson, R. D., Watson, R., and Gelfand, D. H. (1991) Detec-tion of specific polymerase chain reaction product by utilizing the 5'–3' exonu-clease activity of Thermus aquaticus DNA polymerase. Proc. Natl. Acad. Sci.USA 88, 7276–7280.
15. Livak, K. J., Flood, S. J., Marmaro, J., Giusti, W., and Deetz, K. (1995) Oligo-nucleotides with fluorescent dyes at opposite ends provide a quenched probe sys-tem useful for detecting PCR product and nucleic acid hybridization. PCRMethods Appl. 4, 357–362.
16. Livak, K.J. (1999) allelic discrimination using fluorogenic probes and the 5'nuclease assay. Genet. Anal. Biomol. Engin. 14, 143–149.
17. Lee, L. G., Livak, K. J., Mullah, B., Graham, R. J., Vinayak, R. S., andWoudenberg, T. M. (1999) Seven-color, homogeneous detection of six PCR prod-ucts. BioTechniques 27, 342–349.
18. Latif, S., Bauer-Sardina, I., Ranade, K., Livak, K. J., and Kwok, P. Y. (2001)Fluorescence polarization in homogeneous nucleic acid analysis II: 5'-nucleaseassay. Genome Res. 11, 436–440.
19. Tyagi, S., and Kramer, F. R. (1996) Molecular beacons: probes that fluoresceupon hybridization. Nat. Biotechnol. 14, 303–308.
20. Kostrikis, L. G., Tyagi, S., Mhlanga, M. M., Ho, D. D., and Kramer, F. R. (1998)Spectral genotyping of human alleles. Science 279, 1228–1229.
21. Tyagi, S., Bratu, D. P., and Kramer, F. R. (1998) Multicolour molecular beaconsfor allele discrimination. Nat. Biotechnol. 16, 49–53.
22 Tyagi, S., Marras, S. A. E., and Kramer, F. R. (2000) Wavelength-shifting molecu-lar beacons. Nat. Biotechnol. 18, 1191–1196.
23. Conner, B. J., Reyes, A. A., Morin, C., Itakura, K., Teplitz, R. L., and Wallace, R.B. (1983) Detection of sickle cell beta S-globin allele by hybridization with syn-thetic oligonucleotides. Proc Natl Acad Sci USA 80, 278–282.

124 Sobrino and Carracedo
24. Wang, D. G., Fan, J. B., Siao, C. J., Berno, A., Young, P., Sapolsky, R., et al.(1998) Large-scale identification, mapping, and genotyping of single-nucleotidepolymorphisms in the human genome. Science 280, 1077–1082.
25. Mei, R., Galipeau, P. C., Prass, C., Berno, A., Ghandour, G., Patil, N., et al. (2000)Genome-wide detection of allelic imbalance using human SNPs and high-densityDNA arrays. Genome Res. 10, 1126–1137.
26. Fodor, S. P., Read, J. L., Pirrung, M. C., Stryer, L., Lu, A. T., and Solas, D. (1991)Light-directed, spatially addressable parallel chemical synthesis. Science 251,767–773.
27. Pease, A. C., Solas, D., Sullivan, E. J., Cronin, M. T., Holmes, C. P., and Fodor, S.P. (1994) Light-generated oligonucleotide arrays for rapid DNA sequence analy-sis. Proc Natl Acad Sci USA 91, 5022–5026.
28. Ronaghi, M., Karamohamed, S., Pettersson, B., Uhlen, M., and Nyren, P. (1996)Real-time DNA sequencing using detection of pyrophosphate release. Anal.Biochem. 242, 84–89.
29. Ronaghi, M., Uhlen, M., and Nyrén, P., (1998) A sequencing method based onreal-time pyrophosphate. Science 281, 363–365.
30. Syvanen, A. C., Aalto-Setala, K., Harju, L., Kontula, K., and Soderlund, H. (1990)A primer-guided nucleotide incorporation assay in the genotyping ofapolipoprotein E. Genomics 8, 684–692.
31. Sokolov, B. P. (1990) Primer extension technique for the detection of single nucle-otide in genomic DNA. Nucleic Acids Res. 18, 3671.
32. Kuppuswamy, M. N., Hoffmann, J. W., Kasper, C. K., Spitzer, S. G., Groce, S. L.,and Bajaj, S. P. (1991) Single nucleotide primer extension to detect genetic dis-eases: experimental application to hemophilia B (factor IX) and cystic fibrosisgenes. Proc. Natl. Acad. Sci. USA 88, 1143–1147.
33. Sanchez, J., Børsting, C., Hallenberg, C., Buchard, A., Hernandez, A., andMorling, N. (2003) Multiplex PCR and minisequencing of SNPs—a model with35 Y chromosome SNPs. Forensic Sci. Int. 137, 74–84.
34. Quintans, B., Alvarez-Iglesias, V., Salas, A., Phillips, C., Lareu, M., andCarracedo, A. (2004) Typing of mitochondrial coding region SNPs of forensicand anthropological interest using SNaPshot minisequencing. Forensic Sci. Int.140, 251.
35. Haff, L. A., and Smirnov, I. P. (1997) Single-nucleotide polymorphism identifi-cation assays using a thermostable DNA polymerase and delayed extractionMALDI-TOF mass spectrometry. Genome Res. 7, 378–388.
36. Braun, A., Little, D. P., and Koster, H. (1997) Detecting CFTR gene mutations byusing primer oligo base extension and mass spectrometry. Clin. Chem. 43, 1151–1158.
37. Fei, Z., Ono, T., and Smith, L. M. (1998) MALDI-TOF mass spectrometric typingof single nucleotide polymorphisms with mass-tagged ddNTPs. Nucleic Acids Res.26, 2827–2828.
38. Sauer, S., Lechner, D., Berlin, K., Lehrach, H., Escary, J. L., Fox, N., et al. (2000)A novel procedure for efficient genotyping of single nucleotide polymorphisms.Nucleic Acids Res. 28, E13.

SNP Typing in Forensic Genetics 125
39. Haff, L. A., and Smirnov, I. P. (1997) Multiplex genotyping of PCR products withMassTag-labeled primers. Nucleic Acids Res. 25, 3749–3750.
40. Ross, P., Hall, L., Smirnov, I., and Haff, L. (1998) High level multiplexgenotyping by MALDI-TOF mass spectrometry. Nat. Biotechnol. 16, 1347–1351.
41. Kim, S., Shi, S., Bonome, T., Ulz, M. E., Edwards, J. R., Fodstad, H., et al. (2003)Multiplex genotyping of the human beta2-adrenergic receptor gene using solid-phase capturable dideoxynucleotides and mass spectrometry. Anal. Biochem. 316,251–258.
42. Shumaker, J. M., Metspalu, A., and Caskey, C. T. (1996) Mutation detection bysolid phase primer extension. Hum Mutat. 7, 346–354.
43. Pastinen, T., Kurg, A., Metspalu, A., Peltonen, L., and Syvanen, A. C. (1997)Minisequencing: a specific tool for DNA analysis and diagnostics on oligonucle-otide arrays. Genome Res. 7, 606–614.
44. Fan, J. B., Chen, X., Halushka, M. K., Berno, A., Huang, X., Ryder, T., et al.(2000) Parallel genotyping of human SNPs using generic high-density oligonucle-otide tag arrays. Genome Res. 10, 853–860.
45. Hirschhorn, J. N., Sklar, P., Lindblad-Toh, K., Lim, Y. M., Ruiz-Gutierrez, M.,Bolk, S., et al. (2000) SBE-TAGS: an array-based method for efficient single-nucleotide polymorphism genotyping. Proc. Natl. Acad. Sci. USA 97, 12,164–12,169.
46. Pastinen, T., Raitio, M., Lindroos, K., Tainola, P., Peltonen, L., and Syvänen, A.C. (2000) A system for specific, high-throughput genotyping by allele-specificprimer extension on micorarrays. Genome Res. 10, 1031–1042.
47. Chen, X., Levine, L., and Kwok, P. Y. (1999) Fluorescence polarization in homo-geneous nucleic acid analysis. Genome Res. 9, 492–498.
48. Pastinen, T., Raitio, M., Lindroos, K., Tainola, P., Peltonen, L., and Syvanen, A.C. (2000) A system for specific, high-throughput genotyping by allele-specificprimer extension on microarrays. Genome Res. 10, 1031–1042.
49. Newton, C. R., Graham, A., Heptinstall, L. E., Powell, S. J., Summers, C.,Kalsheker, N., et al. (1989) Analysis of any point mutation in DNA. The amplifi-cation refractory mutation system (ARMS). Nucleic Acids Res. 17, 2503–2516.
50. Okayama, H., Curiel, D. T., Brantly, M. L., Holmes, M. D., and Crystal, R. G.(1989) Rapid, nonradioactive detection of mutations in the human genome byallele-specific amplification. J. Lab. Clin. Med. 114, 105–113.
51. Germer, S., and Higuchi, R. (1999) Single-tube genotyping without oligonucle-otide probes. Genome Res. 9, 72–78.
52. Myakishev, M. V., Khripin, Y., Hu, S., and Hamer, D. H. (2001) High-throughputSNP genotyping by allele-specific PCR with universal energy-transfer-labeledprimers. Genome Res. 11, 163–169.
53. Landergren, U., Kaiser, R., Sanders, J., and Hood, L. (1988) A ligase-mediatedgene detection technique. Science 241, 1077–1080.
54. Barany, F. (1991) The ligase chain reaction in a PCR world. PCR Methods Appl.1, 5–16.
55. Grossman, P. D., Bloch, W., Brinson, E., Chang, C. C., Eggerding, F. A., Fung,S., et al. (1994) High-density multiplex detection of nucleic acid sequences: oli-

126 Sobrino and Carracedo
gonucleotide ligation assay and sequence-coded separation. Nucleic Acids Res.22, 4527–4534.
56. Eggerding, F. A. (1995) A one-step Coupled Amplification and OligonucleotideLigation procedure for multiplex genetic typing. PCR Methods Appl. 4, 337–345.
57. Chen, X., Livak, K. J., and Kwok, P. Y. (1998) A homogeneous, ligase-mediatedDNA diagnostic test. Genome Res. 8, 549–556.
58. Lyamichev, V., Mast, A. L., Hall, J. G., Prudent, J. R., Kaiser, M. W., Takova, T., etal. (1999) Polymorphism identification and quantitative detection of genomic DNAby invasive cleavage of oligonucleotide probes. Nat. Biotechnol. 17, 292–296.
59. Kaiser, M. W., Lyamicheva, N., Ma, W., Miller, C., Neri, B., Fors, L., et al. (1999)A comparison of eubacterial and archaeal structure-specific 5'-exonucleases. J.Biol. Chem. 274, 21387–21394.
60. Ryan, D., Nuccie, B., and Arvan, D. (1999) Non-PCR-dependent detection of thefactor V Leiden mutation from genomic DNA using a homogeneous Invadermicrotiter plate assay. Mol. Diagn. 4, 135–144.
61. Hall, J. G., Eis, P. S., Law, S. M., Reynaldo, L. P., Prudent, J. R., Marshall, D. J.,et al. (2000) Sensitive detection of DNA polymorphisms by the serial invasivesignal amplification reaction. Proc. Natl. Acad. Sci. USA 97, 8272–8277.
62. Mein, C. A., Barratt, B. J., Dunn, M. G., Siegmund, T., Smith, A. N., Esposito, L.,et al. (2000) Evaluation of single nucleotide polymorphism typing with Invaderon PCR amplicons and its automation. Genome Res. 10, 330–343.
63. Hsu, T. M., Law, S. M., Duan, S., Neri, B. P., and Kwok, P. Y. (2001) Genotypingsingle-nucleotide polymorphisms by the invader assay with dual-color fluores-cence polarization detection. Clin. Chem. 47, 1373–1377.
64. Griffin, T. J., Hall, J. G., Prudent, J. R., and Smith, L. M. (1999) Direct geneticanalysis by matrix-assisted laser desorption/ionization mass spectrometry. Proc.Natl. Acad. Sci. USA 96, 6301–6306.

Genotyping SNPs With the LightCycler 127
127
From: Methods in Molecular Biology, vol. 297: Forensic DNA Typing ProtocolsEdited by: A. Carracedo © Humana Press Inc., Totowa, NJ
9
Genotyping SNPs With the LightCycler
María Victoria Lareu and Clara Ruiz-Ponte
SummaryHere, a single nucleotide polymorphism typing methodology is described based on
polymerase chain reaction monitoring, in real time, of fluorescently labeled amplifiedproducts using the LightCycler. The main advantages of the system are the time requiredfor the analysis (about 20 min), combined with the robustness, accuracy, and the sensi-tivity of the method.
Key Words: SNPs; LightCycler; forensic science; DNA analysis; PCR on-line; real-time PCR.
1. IntroductionThe study of single nucleotide polymorphism (SNPs) is becoming an increas-
ingly important part of forensic genetics analysis. SNP loci are widespread andare adaptable to analysis from small amplicons, presenting the possibility oftyping degraded deoxyribonucleic acid (DNA). One drawback of SNPs is thereduced discrimination resulting from having only two alleles compared withthe much higher variability shown by short tandem repeats (STRs). This prob-lem can be addressed by using high-throughput technologies that are less timeconsuming and give one the opportunity to automatically analyze large multi-plexes. In comparison, the classical methods for typing SNPs are time-con-suming and involve the use of restriction enzymes followed by polyacrylamidegel electrophoresis and silver staining (1). Improved methods for SNP analysishave been proposed, such as the use of DNA microarrays (including electroni-cally activated microchips), matrix-assisted laser desorption ionization time-of-flight (MALDI-TOF) mass spectrometry, pyrosequencing, or Taq Man SNPassay (2). Other methods proposed for SNP analysis, such as heteroduplex

128 Lareu and Ruiz-Ponte
analysis by denaturating high performance liquid chromatography, are notrobust enough for forensic analysis because of the difficulties in producingconsistent and reproducible heteroduplex patterns (3,4). However, denaturatinghigh performance liquid chromatography (5) methods using denaturing gradi-ents are robust and should be explored.
Among the new methodologies for SNP analysis worth consideration, one ison-line fluorescent polymerase chain reaction (PCR) monitoring in real time(6,7). Several fluorescent formats and systems are available for correlating thefluorescent signals to the amount of PCR product amplified. The LightCycler(Roche Molecular Biochemicals, Mannheim, Germany) is an ultrarapid ther-mal cycler that allows one to monitor amplified PCR product in real time. Thecombination of using air for heating and fine capillaries to hold up to 20 µL ofsample is essential in reducing the time for a single PCR cycle to less than30 s. Therefore, a complete PCR run of 30 cycles can be typically performed in20 min.
Real-time PCR allows quantification of target DNA using fluorescent hybrid-ization probes or double-stranded dyes, such as SYBR Green I. The use of fluo-rescent hybridization probes with the LightCycler instrument offers theadditional advantage of genotyping by melting curve analysis. Genotyping usinghybridization probes is based on the principle of fluorescence resonance energytransfer (FRET; Fig. 1). FRET occurs when the donor fluorophore is excitedphotometrically and transfers its energy to the acceptor fluorophore. Then, theacceptor fluorophore emits fluorescence at a longer wavelength and is conse-quently detected by the instrument. This phenomenon only occurs when thetwo probes hybridize to the target together and in close proximity. The probesare designed to hybridize between the amplification primers. Fluorescein isthe donor fluorophore and is usually the label attached to the 3' end of theprobe whereas the 5' end of the adjacent probe is labeled with an acceptorfluorophore (either LCRed640 or LCRed705). The probe that spans the alteredsequence is called the mutation probe. This probe can be complementary to themutation or to the wild-type allele. If a mismatch occurs between the probe andthe target DNA, the melting temperature (Tm) will decrease and detected dif-ferences in Tm thus allow the identification of alternative alleles at a SNP site.
There are different formats and strategies for PCR monitoring using theLightCycler. We have successfully used the LightCycler for Y chromosome SNPanalysis for forensic applications (8) and autosomal SNP typing (9). The strat-egy described will illustrate the methods used for SNP genotyping using fluo-rescent hybridization probes and melting curve analysis.
We successfully developed singleplexes of four different SNPs (M9, sY81,SRY-1532, and SRY-2627) in addition to two duplexes (M9 with sY81 plusSRY-1532 with SRY-2627). The simultaneous amplification and analysis of
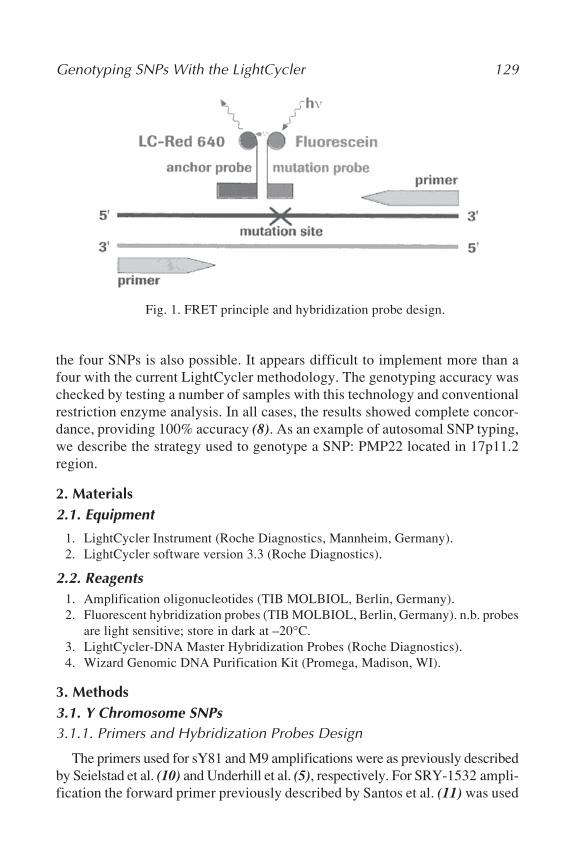
Genotyping SNPs With the LightCycler 129
the four SNPs is also possible. It appears difficult to implement more than afour with the current LightCycler methodology. The genotyping accuracy waschecked by testing a number of samples with this technology and conventionalrestriction enzyme analysis. In all cases, the results showed complete concor-dance, providing 100% accuracy (8). As an example of autosomal SNP typing,we describe the strategy used to genotype a SNP: PMP22 located in 17p11.2region.
2. Materials2.1. Equipment
1. LightCycler Instrument (Roche Diagnostics, Mannheim, Germany).2. LightCycler software version 3.3 (Roche Diagnostics).
2.2. Reagents1. Amplification oligonucleotides (TIB MOLBIOL, Berlin, Germany).2. Fluorescent hybridization probes (TIB MOLBIOL, Berlin, Germany). n.b. probes
are light sensitive; store in dark at –20°C.3. LightCycler-DNA Master Hybridization Probes (Roche Diagnostics).4. Wizard Genomic DNA Purification Kit (Promega, Madison, WI).
3. Methods3.1. Y Chromosome SNPs3.1.1. Primers and Hybridization Probes Design
The primers used for sY81 and M9 amplifications were as previously describedby Seielstad et al. (10) and Underhill et al. (5), respectively. For SRY-1532 ampli-fication the forward primer previously described by Santos et al. (11) was used
Fig. 1. FRET principle and hybridization probe design.
130 Lareu and Ruiz-Ponte
with an alternative reverse primer SRY-1532, developed to avoid dimer forma-tion with the anchor probe. For the SRY-2627 SNP, the SRY gene sequence (GeneBank database accession no. L08063) was used for the selection of primers.
To calculate the melting point and test for possible primer-primer interac-tions, the program designed by Williamstone Enterprises was used (http://www.williamstone.com/primers/calculator). To test for possible repetitivesequences, primers were aligned with the GenBank nucleotide database atthe National Center for Biotechnology Information (NCBI) using the BasicLocal Alignment Search Tool (BLAST) program. The unlabeled oligonucle-otides used as amplification primers are listed in Table 1.
The fluorogenic sequence specific hybridization probes (see Table 2) weredesigned according to guidelines recommended by Roche MolecularBiochemicals (Technical Note LC 6/99; see Note 1). The upstream probe waslabeled with fluorescein as donor fluorophore at the 3' end; the other probe waslabeled at the 5' end with either LightCycler-Red 640 (sY81 and M9) orLightCycler-Red 705 (SRY-1532 and SRY-2627).
Genotyping with two hybridization probes is possible using the probe withthe lowest stability (“sensor probe”) positioned directly over the mutation tobe detected and a longer “anchor probe” that recognizes an adjacent sequence.It is well known that a hybridization probe spanning one mismatch can stillhybridize to the target sequence but will dissociate at a lower melting tempera-ture than a probe with a perfect match; therefore, polymorphic alleles can bedistinguished by the Tm of the sensor probe. Unlabeled primers andfluorescently labeled hybridization probes were synthesized by TIB MOLBIOL(Berlin, Germany).
3.1.2. Rapid Cycle PCR and Melting Curve Analysis
PCR and melting curve analysis were performed in a 32-sample rapid fluo-rescent thermal cycler with three-color fluorescence monitoring capability(LightCycler). Each SNP was amplified at a 20 µL final volume using the fol-lowing:
1. 10 ng of genomic human DNA.2. 0.25 µmol/L each primer,3. 0.1 µmol/L anchor and sensor probe.4. 2 µL of 10X LightCycler-DNA Master Hybridization Probes (Roche Molecular
Biochemicals) containing Taq DNA polymerase, Taq PCR buffer, a dNTP mix-ture, and 10 mmol/L MgCl2. The final Mg2+ concentration in the reaction mix-ture was adjusted to 3 mmol/L.
Samples were loaded into composite glass disposable capillaries, capped,briefly centrifuged, and placed in the LightCycler sample carousel.
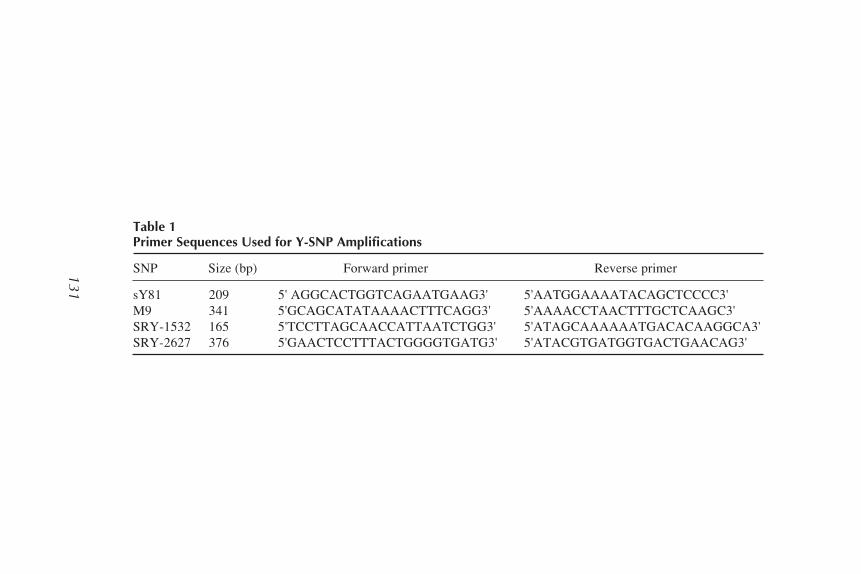
Genotyping SN
Ps With the LightC
ycler131
Table 1Primer Sequences Used for Y-SNP Amplifications
SNP Size (bp) Forward primer Reverse primer
sY81 209 5' AGGCACTGGTCAGAATGAAG3' 5'AATGGAAAATACAGCTCCCC3'M9 341 5'GCAGCATATAAAACTTTCAGG3' 5'AAAACCTAACTTTGCTCAAGC3'SRY-1532 165 5'TCCTTAGCAACCATTAATCTGG3' 5'ATAGCAAAAAATGACACAAGGCA3'SRY-2627 376 5'GAACTCCTTTACTGGGGTGATG3' 5'ATACGTGATGGTGACTGAACAG3'
131
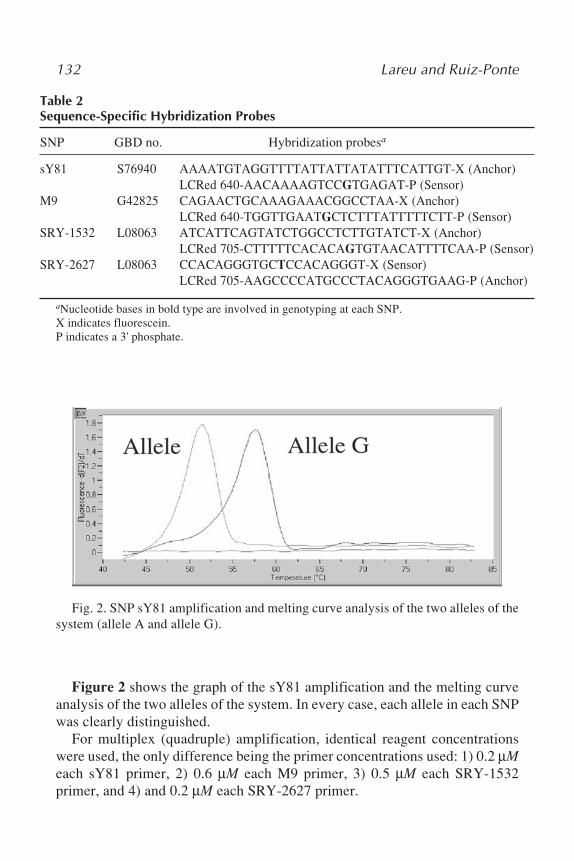
132 Lareu and Ruiz-Ponte
Table 2Sequence-Specific Hybridization Probes
SNP GBD no. Hybridization probesa
sY81 S76940 AAAATGTAGGTTTTATTATTATATTTCATTGT-X (Anchor)LCRed 640-AACAAAAGTCCGTGAGAT-P (Sensor)
M9 G42825 CAGAACTGCAAAGAAACGGCCTAA-X (Anchor)LCRed 640-TGGTTGAATGCTCTTTATTTTTCTT-P (Sensor)
SRY-1532 L08063 ATCATTCAGTATCTGGCCTCTTGTATCT-X (Anchor)LCRed 705-CTTTTTCACACAGTGTAACATTTTCAA-P (Sensor)
SRY-2627 L08063 CCACAGGGTGCTCCACAGGGT-X (Sensor)LCRed 705-AAGCCCCATGCCCTACAGGGTGAAG-P (Anchor)
aNucleotide bases in bold type are involved in genotyping at each SNP.X indicates fluorescein.P indicates a 3' phosphate.
Fig. 2. SNP sY81 amplification and melting curve analysis of the two alleles of thesystem (allele A and allele G).
Figure 2 shows the graph of the sY81 amplification and the melting curveanalysis of the two alleles of the system. In every case, each allele in each SNPwas clearly distinguished.
For multiplex (quadruple) amplification, identical reagent concentrationswere used, the only difference being the primer concentrations used: 1) 0.2 µMeach sY81 primer, 2) 0.6 µM each M9 primer, 3) 0.5 µM each SRY-1532primer, and 4) and 0.2 µM each SRY-2627 primer.

Genotyping SNPs With the LightCycler 133
The LightCycler protocol for sequence-specific detection and analysis ofDNA with hybridization probes contains four cycling programs: initial dena-turation of template DNA, amplification of target DNA, melting curve analy-sis (for identification of mutated sequences), and cooling of the instrument. Allprograms used, except for the amplification program, were identical in allassays (including multiplexes). The protocol is shown in Table 3.
The melting temperatures of the four SNPs analyzed are shown in Table 4(see Note 2). The SNPs labeled with the same fluorophore have different Tmvalues so without overlap. They can be accurately distinguished and typed.
An advantage of genotyping Y chromosome SNPs with the LightCycler isthat these loci are much more sensitive when used in the detection of male
Table 3Experimental Conditions for the Four Y-SNPs
Program Cycles Segment 1a Segment 2a Segment 3a
Denaturation 1 95°C for 30 s
SY81 60°C for 10 s 72°C for 8 sM9 59°C for 10 s 72°C for 13 sSRY-1532 60°C for 10 s 72°C for 7 s
Amplification 40 95°C for 0 s SRY-2627 60°C for 10 s 72°C for 15 sSRY-1532/2627 61°C for 10 s 72°C for 15 sSY81/M9 59°C for 10 s 72°C for 13 sQuadruplex 60°C for 10 s 72°C for 15 s
Melting 1 95°C for 0 s 40°C for 60 s 85°C for 0 sCooling 1 40°C for 0 s
aThe temperature transition rate was 20°C/s, except in the segment 3 of the melting program, whereit was 0.2°C/s.
Table 4Melting Temperatures of the Four Y-SNPs Analyzed
Average melting temperatures
SNP Allele 0 Allele 1 Mismatch Label
SY81 51.35°C 57.48°C G–T LCRed-640M9 57.85°C 61.78°C G–C LCRed-640SRY-1532 59.26°C 64.02°C G–T LCRed-705SRY-2627 65.68°C 68.57°C T–G LCRed-705
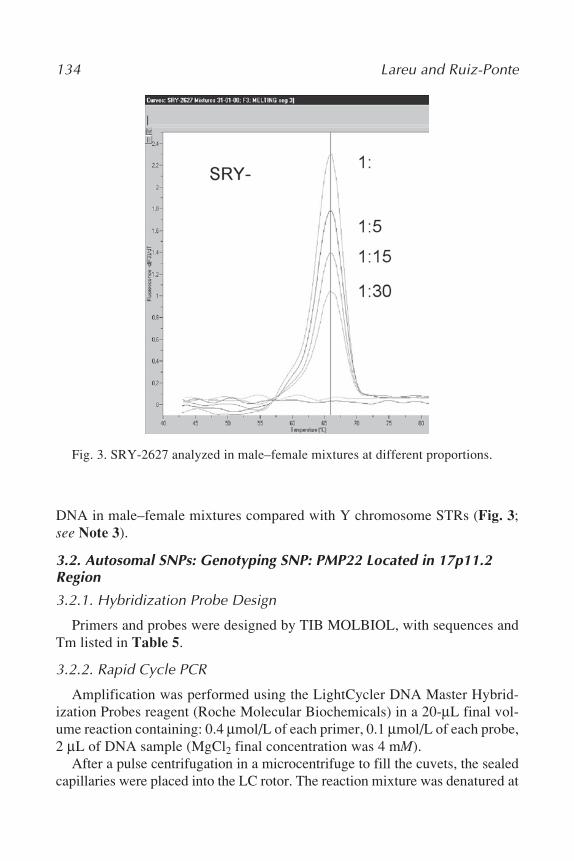
134 Lareu and Ruiz-Ponte
DNA in male–female mixtures compared with Y chromosome STRs (Fig. 3;see Note 3).
3.2. Autosomal SNPs: Genotyping SNP: PMP22 Located in 17p11.2Region
3.2.1. Hybridization Probe Design
Primers and probes were designed by TIB MOLBIOL, with sequences andTm listed in Table 5.
3.2.2. Rapid Cycle PCR
Amplification was performed using the LightCycler DNA Master Hybrid-ization Probes reagent (Roche Molecular Biochemicals) in a 20-µL final vol-ume reaction containing: 0.4 µmol/L of each primer, 0.1 µmol/L of each probe,2 µL of DNA sample (MgCl2 final concentration was 4 mM).
After a pulse centrifugation in a microcentrifuge to fill the cuvets, the sealedcapillaries were placed into the LC rotor. The reaction mixture was denatured at
Fig. 3. SRY-2627 analyzed in male–female mixtures at different proportions.

Genotyping SNPs With the LightCycler 135
95°C for 2 min followed by 31 cycles of (95°C for 0 s, ramp rate, 20°C/s),annealing (55°C for 10 s, ramp rate, 20°C/s), and extension (72°C for 5 s, ramprate, 20°C/s).
3.2.3. Melting Curve Analysis and Genotyping
After amplification, melting curves were determined by a denaturation stepat 95°C for 2 min followed by holding the reaction at 55°C for 10 s and thenheating slowly to 80°C with a linear rate of 0.2°C/s. Fluorescence was moni-tored continually during the melting stage. As the temperature increased, thedetection probe dissociated first from the allele with the mismatch and at laterpoint in time, from the perfectly matched allele.
Melting curves were obtained by plotting fluorescence (F) vs temperature (T)and were seen as loss of fluorescent signal as the probes melted from the PCRproduct (Fig. 4a). The LightCycler software calculated the rate of change offluorescence (–dF/dT) vs T. These derivative melting curves discriminate dif-ferent alleles by differences in Tm (Fig. 4b). The SNP analyzed was a substitu-tion of a C-T. The difference in Tm between the two alleles is 7°C (see Note 4).
4. Notes1. For the design of specific hybridization probes, sequence was selected to delay
displacement of the probe by the polymerase and to allow for maximum hybrid-ization time, both hybridization probes for each SNP were placed as far away aspossible from the extension primers and with the Tm set 5–10°C higher than theTm of the primers. To avoid extension by the Taq polymerase, the 3' end of thedownstream probe was phosphorylated. Only when the two probes are hybrid-
Table 5Oligonucleotides (GenBank Accession No. AC005703)
GC TmSequence (5'-3') Position Length (%) (°C)
PrimersF CCATGGCCAGCTCTCCTAAC 186862–186881 20 60 66.16R CATTCCGCAGACTTTGATGC 187099–187080 20 50 63.58
ProbesAnchor TTCCAAATTCTTGCTGGTAAGTTG
TGGAT-F 187027–187055 29 37.9 68.52Sensor LCRed640-TAAAGTCCATGTGGAAGCG
GGGT 187058–187080 23 52.2 69.70
Tm, melting temperature.

136 Lareu and Ruiz-Ponte
Fig. 4. Hybridization melting curves of five samples. (A) Melting curves, probesdissociating from the target DNA results in decreasing fluorescence. (B) Derivativemelting curves. The negative derivative of the melting curves versus temperature in amelting “peak.”
ized and in close proximity, does FRET occur. To achieve optimal energy trans-fer, the spacing between each of the probes was chosen not to exceed more thanone to four bases because a greater distance would lead to a loss of the fluores-cence signal.
2. Genotyping using fluorescent hybridization probes offers the possibility of mul-tiplex reactions with amplified products distinguished either by Tm, color, orboth. Multiplex by color uses different acceptor fluorophores (LCRed640 andLCRed705) that are detected in different fluorescent channels on the LightCycler.A color compensation file is required to correct fluorescent at each temperature

Genotyping SNPs With the LightCycler 137
Fig. 5. Duplex amplification and analysis of M9 and sY81 in two different samples.The sample in blue shows sY81 allele A and M9 allele G. In red sY81 allele A and M9allele C.
and to correct spectral overlap of dyes between channels. Multiplex by Tm usesthe same acceptor fluorophore for the two probes. In this strategy the mutationprobes are designed with differences in G-C content or length. Simultaneousanalysis of two SNPs can therefore easily be performed as shown in the Fig. 5. Itis more difficult to design multiplexes for more than two SNPs because it is dif-ficult to avoid the overlapping of melting temperatures of the different alleles.We were able to simultaneously amplify four Y-SNPs in the same reaction withvery good results, although some problems did arise. For example, with a sampleexhibiting the allele G of the sY81 system (Tm 57–58°C) and the allele C of theM9 system (55–56°C) labeled with the same fluorophore, a single peak is obtainedwith an intermediate Tm of 56–57°C. Despite this, typing can be made withoutproblems because there is no overlap with the individual Tm of both systems.The same occurs with the allele G of SRY-1532 (63–64°C) and allele C of SRY-
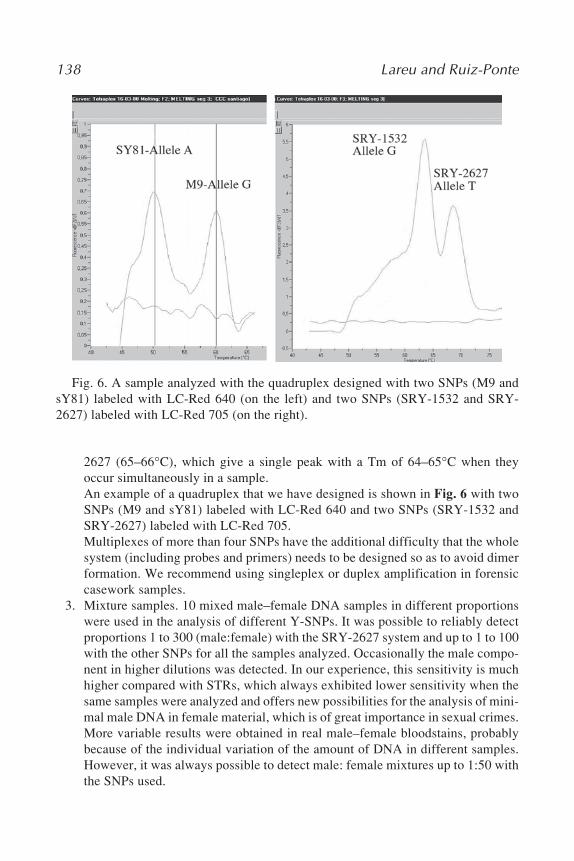
138 Lareu and Ruiz-Ponte
2627 (65–66°C), which give a single peak with a Tm of 64–65°C when theyoccur simultaneously in a sample.An example of a quadruplex that we have designed is shown in Fig. 6 with twoSNPs (M9 and sY81) labeled with LC-Red 640 and two SNPs (SRY-1532 andSRY-2627) labeled with LC-Red 705.Multiplexes of more than four SNPs have the additional difficulty that the wholesystem (including probes and primers) needs to be designed so as to avoid dimerformation. We recommend using singleplex or duplex amplification in forensiccasework samples.
3. Mixture samples. 10 mixed male–female DNA samples in different proportionswere used in the analysis of different Y-SNPs. It was possible to reliably detectproportions 1 to 300 (male:female) with the SRY-2627 system and up to 1 to 100with the other SNPs for all the samples analyzed. Occasionally the male compo-nent in higher dilutions was detected. In our experience, this sensitivity is muchhigher compared with STRs, which always exhibited lower sensitivity when thesame samples were analyzed and offers new possibilities for the analysis of mini-mal male DNA in female material, which is of great importance in sexual crimes.More variable results were obtained in real male–female bloodstains, probablybecause of the individual variation of the amount of DNA in different samples.However, it was always possible to detect male: female mixtures up to 1:50 withthe SNPs used.
Fig. 6. A sample analyzed with the quadruplex designed with two SNPs (M9 andsY81) labeled with LC-Red 640 (on the left) and two SNPs (SRY-1532 and SRY-2627) labeled with LC-Red 705 (on the right).

Genotyping SNPs With the LightCycler 139
4. When genotyping by melting curve analysis, it was not always possible to distin-guish the two alleles of a heterozygote by the software analysis. One broadercurve could be obtained representing the two alleles. This problem is attributableto PCR mixtures and can be resolved by repeating the assay or adjusting thenumber of degrees selected to calculate the derivative curves. Another solution isto click on the “enable” filter of the LC data analysis software to deactivate thepredetermined option of “enable.” This provokes melting curves that are not assmooth but are sufficient in discriminating between the two alleles.
Acknowledgments
This work was supported by grants from the Xunta de Galicia (XUGA20806B97 and PGIDT99PXI20807B). The technical assistance of MeliRodriguez is highly appreciated.
References
1. Brión, M., Lareu, M. V., Pereira, L., Gonzalez-Neira, A., Salas, A., Prata, M. J.,Amorin, A., and Carracedo, A. (2000) Y chromosome lineages in Iberians: Con-struction of highly informative haplotypes using biallelic markers, STRs and theminisatellite MSY1, in Progress in Forensic Genetics, Vol. 8 (Sensabaugh, G. F.,et al eds.), Elsevier, Amsterdam, pp. 263–265.
2. Carracedo, A., Barros, F., Loidi, L., and Dominguez, F. (1998) Progress in meth-odology and standards in European molecular genetics laboratories. Clin. Chim.Acta 278, 163–169.
3. Barros, F., Carracedo, A., Lareu, M. V., and Rodríguez-Calvo, M. (1991), Elec-trophoretic HLADQA1 DNA typing after polymerase chain reaction amplifica-tion. Electrophoresis 12, 1041–1045.
4. Barros, F., Lareu, M. V., and Carracedo, A. (1992) Detection of polymorphismsof human DNA after PCR by miniaturized SDS-polyacrylamide gel electrophore-sis. Foren. Sci. Int. 55, 27–36.
5. Underhill, P.A., Jin, L., Lin, A.A., Qasim Mehdi, S., Jenkins, T., Vollrath, D., et al.(1997) Detection of numerous Y chromosome biallelic polymorphisms by denatur-ing high-performance liquid chromatography. Genome Res. 7, 996–1005.
6. Wittwer, C. T., Ririe, K. M., Andrew, R. V., David, D. A., Gundry, R. A., andBalis, U. J. (1997) The LightCycler: a microvolume multi-sample fluorimeter withrapid temperature control. Biotechniques 22, 176–181.
7. Bernard, P. S., Lay, M. J., and Wittwer, C. T. (1998) Integrated amplification anddetection of the C677T point mutation in the methylenetetrahydrofolate reductasegene by fluorescence resonance energy transfer and probe melting curves. Anal.Biochem. 255, 101–107.
8. Lareu. M. V., Puente, J., Sobrino, B., Quintans, B., Brión, M., and Carracedo, A.(2001) The use of the LightCycler for the detection of Y chromosome SNPs.Foren. Sci. Int. 118, 163–168

140 Lareu and Ruiz-Ponte
9. Ruiz-Ponte C., Loidi L., Vega A., Carracedo A., and Barros F. (2000) Rapid real-time fluorescent PCR gene dosage test for the diagnosis of DNA duplications anddeletions. Clin. Chem. 46, 1574–1582
10. Seielstad, M. T., Hebert, J. M., Lin, A. A., Underhill, P. A., Ibrahim, M., Vollrath,D., et al. (1994) Construction of human Y-chromosomal haplotypes using a newpolymorphic A to G transition. Hum. Mol. Genet. 12, 2159–2161.
11. Santos, F. R., Pandya, A., Tyler-Smith, C., Pena, S., Schanfield, M., Leonard, W.Ret al. (1999) The Central Siberian origin for native American Y chromosomes.Am. J. Hum. Genet. 64, 619–628.
Microarray-Based SNP Genotyping 141
141
From: Methods in Molecular Biology, vol. 297: Forensic DNA Typing ProtocolsEdited by: A. Carracedo © Humana Press Inc., Totowa, NJ
10
Universal Tag Arrays in Forensic SNP Analysis
Marie Allen and Anna-Maria Divne
SummaryMicroarray-based single nucleotide polymorphism (SNP) genotyping enables simul-
taneous and rapid detection of a large number of markers and is thus an attractive methodfor forensic individual acid identification. This assay relies on a one-color detection sys-tem and minisequencing in solution before hybridization to universal tag arrays. Theminisequencing reaction is based on incorporation of a fluorescent dideoxynucleotide to aprimer containing a tag-sequence flanking the position to be interrogated. This one-colorsystem detects C and T polymorphisms in separate reactions on multiple polymerasechain reaction targets with the fluorophore TAMRA coupled to the respectivedideoxynucleotide. After incorporation, tagged primer sequences are hybridizedthrough their complementary sequence on the array, and positive signals are detectedby a confocal laser-scanner.
Key Words: Microarrays; universal tag-arrays; minisequencing; forensic; SNP.
1. IntroductionThe field of microarray-based deoxyribonucleic acid (DNA) analysis has
expanded greatly during recent years and provides a powerful tool for the rapidand cost-effective detection of a large number of polymorphisms. This chapterdescribes the protocols for a microarray-based single nucleotide polymorphism(SNP) detection system, which is under development for analysis of forensicmaterial. Markers for 21 polymorphisms in the mitochondrial genome and 12nuclear SNPs were designed for simultaneous or separate analysis of forensicsamples. This system is based on a limited number of markers, and a fullydeveloped system will require approx 40–50 nuclear SNP markers to achieve adiscrimination power similar to what is obtained using nuclear STR-markers(1). The combination of nuclear and mitochondrial markers allow different

142 Allen and Divne
types of materials to be analyzed on the same platform. A sample with largerDNA amounts enables detection of the nuclear markers, whereas smalleramounts can be analyzed using the mitochondrial part of the chip. As foren-sic samples often contain highly degraded DNA, the polymerase chain reac-tion (PCR) design of very small amplicons (74–130 base pairs) increase thesensitivity.
Figures 1 and 2 illustrate the outline of a one-color microarray-based SNPdetection system and its experimental procedure. The region of interest is firstamplified by PCR and the SNP is detected by minisequencing in solutionbefore hybridization onto universal tag arrays. The minisequencing primer isdesigned to contain two different sequences, one that is complementary to theregion located 20 base pairs upstream of the SNP and one tag-sequence (zipaddress) that is complementary to the oligonucleotide (zip code) printed on thechip. In the minisequencing reaction, primers are extended with fluorescentdideoxynucleotides at the polymorphic site, and the solution is thereafter placed
Fig. 1. The region of interest is amplified and used as template in theminisequencing reaction. Fluorescently labeled ddNTPs are incorporated at the SNPsite in the 3' end of the minisequencing primer. The primers are then hybridizedthrough their complementary zip addresses to the zip codes on the array

Microarray-Based SNP Genotyping 143
in a reaction chamber on the microarray. The zip address sequences are hybrid-ized to their complementary zip code on the array, and positive signals aredetected by a confocal laser-scanner. The arrays are produced with an in-houserobotic arrayer using slides with aldehyde chemistry.
2. Materials2.1. Oligonucleotides
The 39-mer zip code oligonucleotides contain 15 T residues as a spacercoupled to an aminolinker C7 at the 3' end.
Fig. 2. Overview of the experimental procedure. Oligonucleotides are printed onslides using a 417 arrayer (Affymetrix) with a capacity of 42 slides. After washing andblocking of the slide surface, slides are ready for hybridization experiments. AfterPCR and minisequencing the solution is placed in a hybridization chamber on theslide. Hybridization is carried out for 2 h and the slides are thereafter washed. Theslides are scanned in the laser scanner ScanArray 5000 and the results are read andquantified by the software provided with the instrument.

144 Allen and Divne
2.2. PCR Primer Design
PCR reverse primers carry phosphorothioate in the first five bases in the 5'-end.
2.3. Array Preparation and Blocking Procedure
1. NaHCO3, pH 9.0.2. Phosphate-buffered saline (PBS).3. 99.5% Ethanol.4. Sodium dodecyl sulfate (SDS).5. NaBH4 (fire hazard, creates toxic gas in contact with water; Sigma; St Louis, MO).6. Silylated Slides, aldehyde groups (ArrayIt/TeleChem, Sunnyvale, CA).7. GMS 417 Arrayer (Affymetrix, Santa Clara, CA).
2.4. PCR Amplification and Purification
1. AmpliTaq™ Gold Polymerase 5 U/µL (Applied Biosystems, Foster City, CA).2. 1X PCR Taq Gold buffer (Applied Biosystems).3. dNTPs.4. MgCl2.5. QIAquick™ PCR Purification Kit (MERCK Eurolab, Germany).6. T7 Gene Exonuclease 50 U/µL (USB Corporation, Cleveland, OH).7. T7 Gene Exonuclease 6 Reaction Buffer (USB Corporation).
2.5. Multiplex Minisequencing
1. Thermo Sequenase™NA polymerase 32 U/µL (unstable in diluted aliquots)(Amersham Bioscience, Piscataway, NJ).
2. Thermo Sequenase Reaction Buffer.3. ddATP, ddGTP.4. Fluorescently labeled ddCTP-TAMRA and ddUTP-TAMRA (light-sensitive;
NEN Life Science, Boston, MA).
2.6 Hybridization of Minisequencing Products to Zip Code Arrays
1. 15 × 15 or 9 × 9-mm Frame Seal Incubation Chambers (MJ Research, Watertown,MA, USA)
2. Saline sodium citrate (SSC).3. N-lauroyl sarcosine (Sigma).4. SDS.5. Scan Array 5000 with autoloader function (Packard BioScience, Wellesley, MA).
3. Methods3.1. Chip Design
A total of 33 mitochondrial and nuclear SNP markers with allele frequen-cies close to 0.5, among European populations, were chosen to design a foren-sic chip. Frequencies and locations of 10 autosomal nuclear markers were
Microarray-Based SNP Genotyping 145
obtained from the HGbase database of human SNPs (http://hgybase.cgb.ki.se)with the exception of markers 2629 and XY, which corresponds to SNP PD-1.5 (2) and a SNP for sex determination (3), respectively, Table 1.
3.2. Oligonucleotides
To enable covalent binding to the aldehyde groups on the microscopic slide,an aminolinker C7 is attached in the 3' end. To further improve hybridization,the spotted zip code contains a spacer of 15 T residues after the aminolinker atthe 3' end. The 39-mer oligonucleotide also comprises a 24-mer zip codecomplementary to a corresponding zip address in the minisequencing primer.The design of the zip codes and their complementary zip addresses werefollowed as described by Gerry et al. 1999 (5). In short, the zip code se-quences consist of six tetramers, each of which differs from all others by atleast two bases and all were designed to have similar Tm- values. Eachminisequencing primer covers 20 bases upstream of the SNP and is taggedwith a zip address in the 5' end (see Notes 1 and 2).
3.3. PCR Primer Design
PCR primer pairs covering SNP containing regions were designed to am-plify fragments of lengths between 74 and 130 base pairs using the PrimerExpress 3.1 package software (Applied Biosystems). Reverse primers carryphosphothioate in the last six bases in the 3' end to protect the strand fromdegradation during exonuclease treatment.
3.4. Array Preparation and Blocking Procedure
1. Prepare spot solutions with a final concentration of 60 µM zip code oligonucle-otide; 200 mM NaHCO3, pH 9.0; and 0.07 % SDS in a 96-microtiter plate. Printtwo sets of 4 × 6 oligonucleotide arrays with two vertical replicates on SilylatedSlides (Fig. 3) with reactive aldehyde groups using a 417 Arrayer. To obtain thedense spot pattern shown in Fig. 3 using a four-pin-head arrayer, two consecu-tive rounds of printing is performed using the same preprogrammed pattern.
2. Before hybridization, remove uncoupled oligonucleotides and block unboundaldehyde residues by sequential washing in 0.2% SDS for 2 min, ddH2O for 2min, 0.5 g of NaBH4 resuspended in 150 mL of 1X PBS and 50 mL of 99.5%ethanol for 5 min, 0.2% SDS for 2 min, followed by ddH2O twice for 2 min.
3. Dry the slides by fan or put the slides in a slide box that fits a plate centrifuge andspin the slides at 82g for about 1 min. Incubate printed arrays for 12 h at roomtemperature and store at 4°C until use. Arrays are spotted with 3 µM of the con-trol oligonucleotide sequence 5'-aminolinkC6-Poly (dT)35-GACT-TAMRA-3' atthe upper left corner and the lower right corner of the array. The TAMRA controlis used as a control of successful binding to the support (see Notes 3–5).
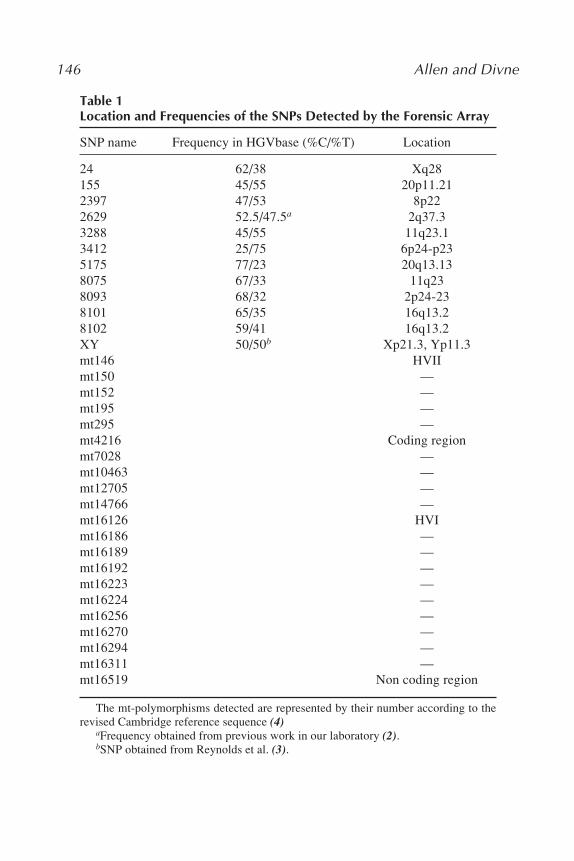
146 Allen and Divne
Table 1Location and Frequencies of the SNPs Detected by the Forensic Array
SNP name Frequency in HGVbase (%C/%T) Location
24 62/38 Xq28155 45/55 20p11.212397 47/53 8p222629 52.5/47.5a 2q37.33288 45/55 11q23.13412 25/75 6p24-p235175 77/23 20q13.138075 67/33 11q238093 68/32 2p24-238101 65/35 16q13.28102 59/41 16q13.2XY 50/50b Xp21.3, Yp11.3mt146 HVIImt150 —mt152 —mt195 —mt295 —mt4216 Coding regionmt7028 —mt10463 —mt12705 —mt14766 —mt16126 HVImt16186 —mt16189 —mt16192 —mt16223 —mt16224 —mt16256 —mt16270 —mt16294 —mt16311 —mt16519 Non coding region
The mt-polymorphisms detected are represented by their number according to therevised Cambridge reference sequence (4)
aFrequency obtained from previous work in our laboratory (2).bSNP obtained from Reynolds et al. (3).

Microarray-Based SNP Genotyping 147
3.5. PCR Amplification and Purification
1. Perform PCR amplifications of mitochondrial and nuclear DNA in 50-µL singleor multiplex reactions.
2. Treat amplified products with 0.27 units/µL T7 gene exonuclease 6 in 1X T7gene exonuclease 6 reaction buffer at 37°C for 15 min followed by inactivationof the enzyme at 80°C for 15 min. If dsDNA is used, go directly to step 3.
3. Pool single or double-stranded PCR products two and two and purify them byusing the QIAquick™ PCR purification kit. Pool the purified PCR fragmentsinto one mitochondrial and/or one nuclear reaction and resuspend the residualpellets in elution buffer or DI water to yield 2.25 times concentrated products.PCR amplifications of DNA from case material are performed as above with thefollowing exceptions: the reactions are performed in 25-µL duplex reactions con-taining 0.25 µM of the primers and 1 ng of DNA (see Note 6).
3.6. Multiplex Minisequencing
Perform two separate C and T minisequencing reactions in 30- or 15-µLvolumes containing 5 µL of pooled, concentrated single-stranded PCR prod-ucts, 0.25 µM each of ddATP and ddGTP, 0.25 µM of either ddCTP or ddTTP,
Fig. 3. Array pattern. Triplicates of the zip codes for the mitochondrial DNA andnuclear DNA markers are printed in two sets of 4 × 6-arrays. The two sets are dividedinto two separate areas on the slide to allow separate C and T reactions. Light greyspots denote reference spots of a TAMRA-labeled control oligonucleotide. Emptyspots are printed with water or reagent blanks. The grey frames on the slide shows thethin adhesive hybridization chamber (size 15 × 15 mm)
148 Allen and Divne
and 1.6 µM of the fluorescently labeled ddCTP-TAMRA or ddUTP-TAMRA(NEN Life Science), 0.5 µM of each zip address, 1X Thermo Sequenase reac-tion buffer, and 0.32 U/µL Thermo Sequenase enzyme. The cycling procedureis performed by preheating at 95°C for 1 min followed by 10 cycles at 94°C for15 s, 50°C for 30 s, 68°C for 1 min, 10 cycles at 94°C for 15 s, 45°C for 30 s,68°C for 1 min, and 10 cycles at 94°C for 15 s, 40°C for 30 s, 68°C for 1 min ina 9700 thermal cycler (Applied Biosystems; see Notes 7–9).
3.7. Hybridization of Minisequencing Products to Zip Code Arrays
1. Preincubate the arrays in 4X SSC for 10 min and dry the slides by fan or centrifu-gation. Place two separate reaction chambers (15 × 15 or 9 × 9-mm Frame SealIncubation Chambers) on the slides and hybridize the mitochondrial and nuclearminisequencing reactions on separate arrays or pooled together on the same array.For separate reactions, 10 µL of the C or T-minisequencing reaction are dilutedwith 40 µL or 20 µL of SSC (depending on the size of the incubation chamber) toyield a final concentration of 4X SSC. For pooled reactions, 9 µL of the nuclearand 15 µL of the mitochondrial reaction are added in a total volume of 30 µL.
2. Pipet the solution on the slide and carefully place the adhesive, plastic cover lidon top of the hybridization chamber. Start at one side of the frame and press it tocover the whole chamber. Press hard on the side of the frame to assure strongadhesion to the slide.
3. Put the slides in a rotating slide holder or in tubes that fit a rotisserie in a hybrid-ization oven. Place cellstoff paper in the ends of the glass tubes for fixation andso that the slides don’t break during rotation. Conduct hybridization at 50°C for1–2 h (see Notes 10 and 11).
4. Remove the hybridization chambers. Wash slides in 6X SSC/0.05% N-lauroylSarcosine 2 × 5 min at room temperature and in 0.2X SSC/0.1%SDS for 3 × 15min at 50°C on a shaker. Dry slides by fan or by using a plate centrifuge. Slidesare thereafter ready for scanning.
3.8. Image Analysis
1. Positive signals on the arrays are detected using the confocal laser scanner ScanArray 5000 with autoloader function (Packard Biochip). Scan the slides using theScanArray® version 2.11 software and start at default settings of PMT and laser(80, 80 respectively) and adjust if necessary.
2. Quantify the results by importing the scan images into the QuantArray® softwareone by one. The first image will be given a red color and the next a green color. Ifthis order is used consequently, red spots will always denote the incorporation ofa certain ddNTP in a one- or two-color system. Spots are analyzed using an adap-tive quantitation method with a p value of 0.0001, and signal intensities are readusing total intensities. As controls for background signals, four to six spots ofreagent blanks and nonprinted positions outside the array are quantified and com-pared to the other spots on the array. The lowest acceptable level for identifica-

Microarray-Based SNP Genotyping 149
tion of a true positive signal is set to two times the background signal (see Notes12–14).
3. The text file generated by the quantifying software is further imported into MSExcel for calculations of mean values of the triplicate spots and background-subtracted signals. A summary of the scanning and quantification procedure isshown in Fig. 4, and an example of the results from mtDNA and nDNAgenotyping is shown in Fig. 5.
4. Notes1. Microarray analysis of SNPs can be achieved by different strategies, either by
direct extension or ligation of a hybridized PCR product or probe sequence onthe chip (6–10) or an indirect detection by hybridization of ligated or extendedtarget sequences to probes on the array (5,11–13).
2. Clustered polymorphisms within a few base pairs, which are common in thehypervariable region of the mitochondrial genome, can affect the incorporationefficiency of the dideoxynucleotide by destabilizing the priming event and resultin a reduction or complete loss of signal (7). To reduce expected loss of signalfrom mismatches, the minisequencing primer may be designed with degeneratepositions where mismatches are expected (14).
3. To obtain homogenous spots and improve the spot quality, a detergent like SDScan be used, which decreases the surface tension. Be careful not to add too muchas it can lead to spreading of the solution. Different surface chemistries requireoptimization of the spot solution.
4. To increase sensitivity, the binding to the solid support is an important factor.One strategy is to evaluate the binding capacity for adjustment of the amount ofspotted oligonucleotide. Concentrations of 20–120 µM (in increments of 20 µM)showed the largest increase in signal intensity at 60 µM; only a minor increasewas observed above this concentration. Comparisons of 20, 40, and 60 µM oligo-nucleotides showed approximately a 1.5- to 2-fold increase in signal intensity foreach increment. A choice of a solid support with a porous gel layer on top cantheoretically bind a larger proportion of the spotted oligonucleotides and therebydecrease the need for a compensating higher oligonucleotide concentration.
5. Carryover between microtiter plate wells during spotting may be observed depend-ing on the technology used for spotting or the sensitivity of the solid support. Spot-ting a suitable serial dilution of a control oligonucleotide followed by three tofour water blanks can be used to evaluate carryover. Design the experiment sothat spotting of only water blanks using the same pin follows every round ofcompleted spotting of a certain oligonucleotide concentration.
6. If an analysis of both mitochondrial DNA and nuclear DNA is performed, keepthe mitochondrial and nuclear reactions separately throughout the amplificationand purification steps. However, in the following minisequencing reaction, thePCR products may be pooled into one reaction.
7. A cycling procedure is preferable to minimize self-complementary binding betweenminisequencing primers.
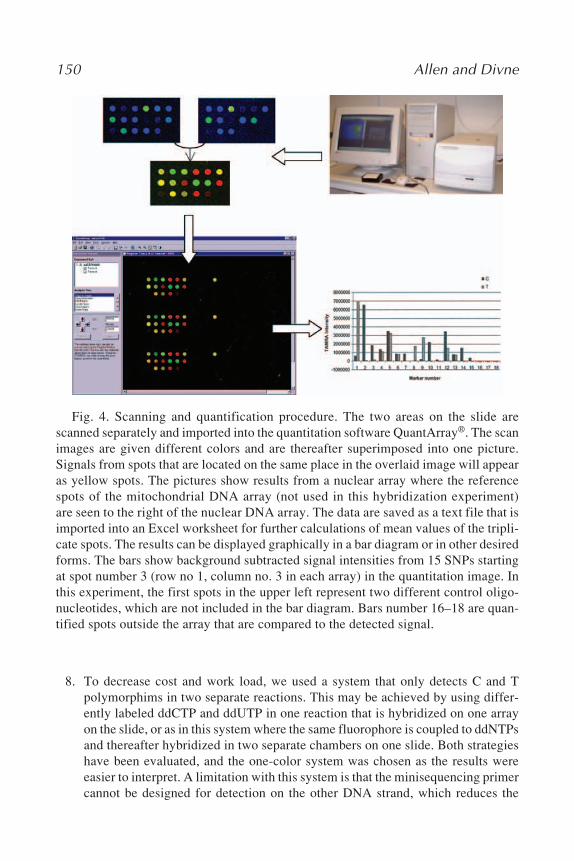
150 Allen and Divne
Fig. 4. Scanning and quantification procedure. The two areas on the slide arescanned separately and imported into the quantitation software QuantArray®. The scanimages are given different colors and are thereafter superimposed into one picture.Signals from spots that are located on the same place in the overlaid image will appearas yellow spots. The pictures show results from a nuclear array where the referencespots of the mitochondrial DNA array (not used in this hybridization experiment)are seen to the right of the nuclear DNA array. The data are saved as a text file that isimported into an Excel worksheet for further calculations of mean values of the tripli-cate spots. The results can be displayed graphically in a bar diagram or in other desiredforms. The bars show background subtracted signal intensities from 15 SNPs startingat spot number 3 (row no 1, column no. 3 in each array) in the quantitation image. Inthis experiment, the first spots in the upper left represent two different control oligo-nucleotides, which are not included in the bar diagram. Bars number 16–18 are quan-tified spots outside the array that are compared to the detected signal.
8. To decrease cost and work load, we used a system that only detects C and Tpolymorphims in two separate reactions. This may be achieved by using differ-ently labeled ddCTP and ddUTP in one reaction that is hybridized on one arrayon the slide, or as in this system where the same fluorophore is coupled to ddNTPsand thereafter hybridized in two separate chambers on one slide. Both strategieshave been evaluated, and the one-color system was chosen as the results wereeasier to interpret. A limitation with this system is that the minisequencing primercannot be designed for detection on the other DNA strand, which reduces the
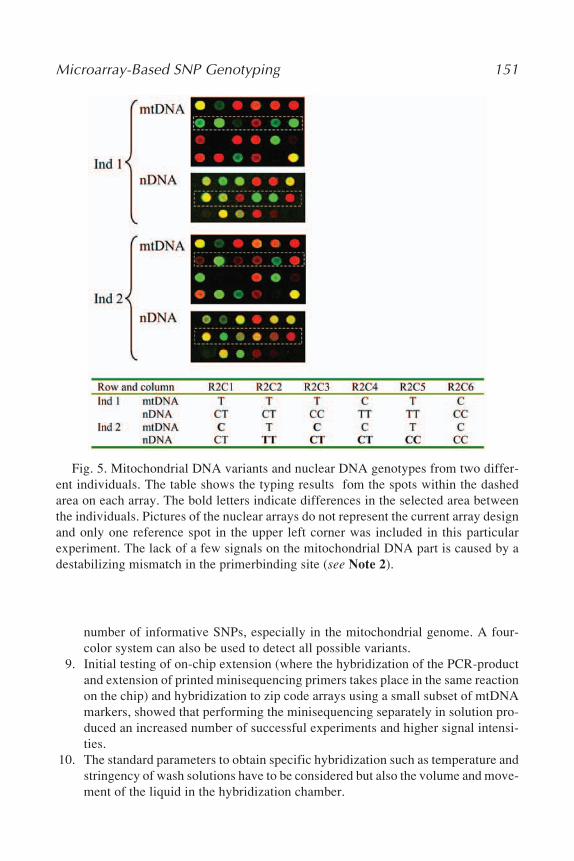
Microarray-Based SNP Genotyping 151
Fig. 5. Mitochondrial DNA variants and nuclear DNA genotypes from two differ-ent individuals. The table shows the typing results fom the spots within the dashedarea on each array. The bold letters indicate differences in the selected area betweenthe individuals. Pictures of the nuclear arrays do not represent the current array designand only one reference spot in the upper left corner was included in this particularexperiment. The lack of a few signals on the mitochondrial DNA part is caused by adestabilizing mismatch in the primerbinding site (see Note 2).
number of informative SNPs, especially in the mitochondrial genome. A four-color system can also be used to detect all possible variants.
9. Initial testing of on-chip extension (where the hybridization of the PCR-productand extension of printed minisequencing primers takes place in the same reactionon the chip) and hybridization to zip code arrays using a small subset of mtDNAmarkers, showed that performing the minisequencing separately in solution pro-duced an increased number of successful experiments and higher signal intensi-ties.
10. The standard parameters to obtain specific hybridization such as temperature andstringency of wash solutions have to be considered but also the volume and move-ment of the liquid in the hybridization chamber.

152 Allen and Divne
11. To test potential crosshybridizations between different zip addresses and zipcodes, each zip address may be run in separate minisequencing reactions fol-lowed by separate hybridization reactions on the array.
12. In the QuantArray software, three different quantitation methods can be used.The adaptive method is suitable if the spots are nonhomogenous in size orshape. The signal intensity can be presented as total, mean, or median intensityas desired.
13. Quantify spots outside the array and spots that only contain water to get an esti-mate of the background signal. Avoid scanning at maximum PMT and laser, un-less the spots are very weak, as it may produce saturated spots and increase thebackground signal and the risk of photo bleaching. Inclusion of a control oligo-nucleotide on the array as a control for adhesion to the surface and as referenceduring quantitation is recommended.
14. If different fluorophores are used that have overlapping emission spectra, thesignals in the two channels have to be normalized.
AcknowledgmentThis work was supported by grants from the Beijer Foundation and the
Swedish Research Council for Medical Sciences (MFR grants K2002-31P-12577-05C and K2002-31X-13095-04B).
References1. Gill, P. (2001) An assessment of the utility of single nucleotide polymorphisms
(SNPs) for forensic purposes. Int. J. Legal Med. 114, 204–210.2. Prokunina, L., Castillejo-Lopez, C., Oberg, F., Gunnarsson, I., Berg, L.,
Magnusson, V., et al. (2002) A regulatory polymorphism in PDCD1 is associatedwith susceptibility to systemic lupus erythematosus in humans. Nat. Genet. 32,666–669.
3. Reynolds, R., & Varlaro, J. (1996) Gender determination of forensic samples usingPCR amplification of ZFX/ZFY gene sequences. J. Forensic Sci. 41, 279–286.
4. Andrews, R. M., Kubacka, I., Chinnery, P. F., Lightowlers, R. N., Turnbull, D.M., and Howell, N. (1999) Reanalysis and revision of the Cambridge referencesequence for human mitochondrial DNA. Nat. Genet. 23, 147.
5. Gerry, N. P., Witowski, N. E., Day, J., Hammer, R. P., Barany, G., and Barany, F.(1999) Universal DNA microarray method for multiplex detection of low abun-dance point mutations. J. Mol. Biol. 292, 251–262.
6. Syvanen, A. C. (1999) From gels to chips: “minisequencing” primer extension foranalysis of point mutations and single nucleotide polymorphisms. Hum Mutat.13, 1–10.
7. Dubiley, S., Kirillov, E., and Mirzabekov, A. (1999). Polymorphism analysis andgene detection by minisequencing on an array of gel-immobilized primers. NucleicAcids Res. 27, e19.
8. Fortina, P., Delgrosso, K., Sakazume, T., Santacroce, R., Moutereau, S., Su, H. J.,
Microarray-Based SNP Genotyping 153
Graves, D., McKenzie, S., and Surrey, S. (2000). Simple two-color array-basedapproach for mutation detection. Eur. J. Hum. Genet. 8, 884–94.
9. Pastinen, T., Raitio, M., Lindroos, K., Tainola, P., Peltonen, L., and Syvanen, A.C. (2000). A system for specific, high-throughput genotyping by allele-specificprimer extension on microarrays. Genome Res. 10, 1031–1042.
10. Landegren, U. (1993). Ligation-based DNA diagnostics. Bioessays 15, 761–5.11. Guo, Z., Guilfoyle, R. A., Thiel, A. J., Wang, R., and Smith, L. M. (1994). Direct
fluorescence analysis of genetic polymorphisms by hybridization with oligonucle-otide arrays on glass supports. Nucleic Acids Res. 22, 5456–5465.
12. Hirschhorn, J. N., Sklar, P., Lindblad-Toh, K., Lim, Y. M., Ruiz-Gutierrez, M.,Bolk, S., et al. (2000). SBE-TAGS: an array-based method for efficient single-nucleotide polymorphism genotyping. Proc. Natl. Acad. Sci. USA 97, 12,164–12,169.
13. Fan, J. B., Chen, X., Halushka, M. K., Berno, A., Huang, X., Ryder, T., et al.(2000). Parallel genotyping of human SNPs using generic high-density oligonucle-otide tag arrays. Genome Res. 10, 853–860.
14. Knoth, K., Roberds, S., Poteet, C., and Tamkun, M. (1988). Highly degenerate,inosine-containing primers specifically amplify rare cDNA using the polymerasechain reaction. Nucleic Acids Res. 16, 10,932.


NanoChip Microarray 155
155
From: Methods in Molecular Biology, vol. 297: Forensic DNA Typing ProtocolsEdited by: A. Carracedo © Humana Press Inc., Totowa, NJ
11
SNP Typing on the NanoChip Electronic Microarray
Claus Børsting, Juan J. Sanchez, and Niels Morling
SummaryWe describe a single nucleotide polymorphism (SNP) typing protocol developed for
the NanoChip electronic microarray. The NanoChip array consists of 100 electrodes cov-ered by a thin hydrogel layer containing streptavidin. An electric currency can be appliedto one, several, or all electrodes at the same time according to a loading protocol gener-ated by the user. Biotinylated deoxyribonucleic acid (DNA) is directed to the pad(s) viathe electronic field(s) and bound to streptavidin in the hydrogel layer. Subsequently,fluorescently labeled reporter oligos and a stabilizer oligo are hybridized to the boundDNA. Base stacking between the short reporter and the longer stabilizer oligo stabilizesthe binding of a matching reporter, whereas the binding of a reporter carrying a mis-match in the SNP position will be relatively weak. Thermal stringency is applied to theNanoChip array according to a reader protocol generated by the user and the fluorescentlabel on the matching reporter is detected.
Key Words: NanoChip microarray; nanogen molecular biology workstation; elec-tronic addressing of DNA; hybridization; base stacking effect; SNP typing.
1. IntroductionIn recent years, the number of different methods for determination of single
nucleotide polymorphisms (SNPs) has increased dramatically (1,2). Hybridiza-tion of a labeled target specific probe to endonuclease-digested genomic deox-yribonucleic acid (DNA) was the first technique to be widely used that did notrequire actual sequencing of the target DNA. However, this method can beapplied only to SNPs in endonuclease-recognition sites (restriction fragmentlength polymorphisms), and in order to use hybridization techniques for SNPdetection, a more general approach was needed.

156 Børsting et al.
The difference in hybridization energy between a perfect match and asingle nucleotide mismatch is very small, and it may be very difficult to findthe conditions where discrimination is possible. However, the difference canbe increased by exploitation of the so-called base stacking effect: Two shortoligos placed right next to each other bind stronger to a DNA target than eitherof the oligos alone because of noncovalent interactions between the two oligos(3,4). The SNP typing protocol developed for the NanoChip electronicmicroarray (5,6) makes use of this phenomenon (Fig. 1). The NanoChip arrayconsists of 100 electrodes with a diameter of 80 µm in a 10 × 10 format cov-ered with a thin hydrogel layer containing streptavidin. Biotin-labeled poly-merase chain reaction (PCR) products are electronically directed to the padsand bound to streptavidin, allowing a fast and efficient way to concentrate thetarget DNA. Two fluorescently labeled reporter oligos, one for each SNPallele, and one stabilizer oligo are hybridized to the target DNA on the pads.The reporter oligos are short (8–16 bp), whereas the stabilizer oligo is rela-tively long (25–30 bp). The SNP is positioned at the 3' end of the reporter, andthe 5' end of the stabilizer oligo hybridizes to the neighboring base. Thus, thebinding of the matching reporter is stabilized by the stabilizer oligo, whereasthe reporter carrying a mismatch in the 3' end binds weakly to the target andcan be removed by applying thermal stringency. Finally, the fluorescent labelon the matching reporter is excitated by laser light and detected by a CCDcamera.
Here, we describe the NanoChip SNP typing protocol in detail, and we dis-cuss alternatives to the standard protocol. In addition, we describe how to ana-lyze small multiplexes, and we comment on some of the problems involved.The NanoChip electronic microarray can be used for other applications thanSNP typing, but these techniques are outside the scope of this chapter, and theyare described elsewhere (7–12).
2. Materials1. High-performance liquid chromatography purified oligonucleotides.2. Purified genomic DNA.3, Taq polymerase, polymerase buffer, 25 mM MgCl2, dNTPs.4. Thermal cycler.5. MultiScreen® PCR plates (Millipore, Copenhagen, Denmark).6. MultiScreen® separation system (Millipore).7. MinElute™ PCR purification kit (Qiagen, Albertslund, Denmark).8. Nanogen® Molecular Biology Workstation (Nanogen, Helmond, Netherlands).9. NanoChip® H2 cartridge (Nanogen, Helmond, Netherlands), stored at 4°C.
10. nLAB™ 1.12.16L software (Nanogen, San Diego, CA).11. 96-well Nunc™ plates (Merck Eurolab, Albertslund, Denmark).

NanoChip Microarray 157
Fig. 1. Diagram of the NanoChip SNP typing protocol.
12. Twin conductivity meter B-173 (Horiba Europe GmbH, Salzbach, Germany).13. 1.41 mS/cm calibration solution (Horiba Europe GmbH).14. 50 mM histidine (Nanogen), stored at 4°C. Usually, the 50 mM histidine solution
is stable for 1–2 wk at 4°C.15. 100 mM histidine (Nanogen), stored at –20°C.16. High salt buffer: 500 mM NaCl, 50 mM NaH2PO4, pH 7.0.17. Low salt buffer: 50 mM NaH2PO4, pH 7.018. 0.1 N NaOH.
3. MethodsThe methods described below outline 1) the initial planning by the computer
leading to the design of the PCR product, and to the design of the reporter andstabilizer oligos, 2) the PCR purification protocols, 3) the loading and readingof the NanoChip microarray, and 4) the multiplexing protocol.
3.1. Work in Silica
The initial work in front of the computer is pivotal for the outcome of theexperiment. Spending a few extra hours searching the various SNP and genomicdatabases (see Note 1), as well as analyzing the primer and oligo design care-fully (see Note 2) may easily save days or weeks later on.
3.1.1. Design of PCR product
1. Search the genomic databases for the sequence surrounding the SNP (see Note 1).2. Search the databases for homologous and repetitive sequences (see Note 1).3. Search the SNP databases for additional SNPs in the target sequence (see Note 1).4. Use primer software to find the most promising position for the primers (see
Notes 2 and 3). Look for similar sequences in any homologous sequence foundabove and select unique primer binding sites.
5. Use the primer sequences to search the genomic databases for homologoussequences. If strong homology is found, search for different primer bindingsites.

158 Børsting et al.
3.1.2. Design of Reporter and Stabilizer Oligos
1. Calculate the theoretical melting temperature (Tm) of the reporter in 50 mM Na+
(the concentration in the stringent wash buffer) using the nearest neighbor algo-rithm (see Note 2). Tm should be between 31 and 42°C, thus, depending on theG/C content, the reporter will be between 8 and 16 nt. long.
2. Calculate the free energy of any primer dimer formation and hairpin structures inthe reporter (see Note 2).
3. Determine the free energy of the base stacking effect (see Table 1 and Note 4).4. Select the best reporter design (see Note 5 and 6).5. When the reporters have been selected, calculate the Tm and the free energy of
any primer dimer formation and hairpin structure in the stabilizer (see Note 7).The Tm of the stabilizer should be approx 60°C.
6. Order the PCR primers (see Note 8), the fluorescently labeled reporters, and thestabilizer oligo (see Note 9).
3.2. Purification of PCR Products
Below, we describe two efficient methods for purification of PCR products,but other methods may be equally efficient. The Millipore protocol is based ona 96-well plate system with high throughput, whereas the Qiagen protocol isbased on single spin columns that are useful for purification of a small numberof samples (see Note 10).
3.2.1. Millipore Purification Protocol
1. Place the MultiScreen® PCR plate on the Millipore manifold.2. Add 50–250 µL sample per well.3. Start the pump and set the pressure at 8–10 inch Hg.4. When the fluid is sucked through, stop the pump and add 100 µL ddH2O.5. Start the pump and set the pressure at 8–10 inch Hg.6. When the water is sucked through, stop the pump and add 60 µL ddH2O or 60 µL
50 mM histidine to each well.
Table 1Base Stacking Energies Calculatedby the Nearest Neighbor Algorithm
5' end of stabilizer
∆G A C G T
A –5.37 –10.5 –6.78 –6.57C –6.57 –8.26 –9.69 –6.78G –9.81 –14.6 –8.26 –10.5T –3.82 –9.81 –6.57 –5.37
From ref. 13.
3'en
d of
rep
orte
r

NanoChip Microarray 159
7. Place the MultiScreen PCR plate on a shaking table for 5 min.8. Recover the dissolved DNA from the wells.
3.2.2. Qiagen Purification Protocol
1. Add 5X volume of PB buffer to the PCR reaction and mix.2. Place the MinElute™ spin column in the 2-mL collection tube and add the
sample.3. Spin for 1 min at 10,000g and discard the flow-through.4. Add 750 µL PE buffer.5. Spin for 1 min at 10,000g, discard the flow-through, and spin again.6. Place the spin column in a clean Eppendorf tube.7. Add 30 µL ddH2O and leave the column for 1 min.8. Spin for 1 min at 10,000g.
3.3. Nanogen Molecular Biology Workstation
The Nanogen Molecular Biology Workstation consists of a loader and areader. In the loader, DNA samples, oligos, and controls are moved from a 96-well plate and electronically addressed to the NanoChip array. The reader con-tains a temperature controller and a robotic system that will perform thestringent washes (see Note 11). In addition, the reader contains two lasers (exci-tation at 635 nm and 532 nm) and a detector (emission at 660–720 nm and 550–600 nm) for the collection of the fluorescent signal. The loader and the readerare equipped with barcode scanners that register the barcode on the NanoChiparray and ensure the identity of the NanoChip array throughout the experimentfrom loading of the array to analysis of the collected data.
3.3.1. Loading Protocol
1. Test the conductivity of the 50 mM histidine solution using a conductivity meter.The conductivity should be less than 100 µS/cm.
2. Place the bottle with 50 mM histidine in the left-hand drawer on the loader. Makesure that the trash bottle is in place.
3. Place the bottles with low and high salt buffer in the reader. Make sure that thetrash bottle is in place.
4. Turn on the Nanogen Molecular Biology Workstation (the reader first). The instru-ment will prime all fluid lines automatically when turned on.
5. Make 60 µL 50 mM histidine solutions (see Note 12) of your samples, oligos,and controls in a 96-well plate (see Note 13). Three controls are needed: 1) a 50mM histidine solution is used for background subtraction, 2) a heterozygotecontrol is used for normalization of the fluorescent signals (see Note 14), and 3)two homozygous controls (one for each allele) are used as positive controls.
6. Logon to the Nanogen Molecular Biology Workstation and go to “Loader protocols.”7. Click on “New,” select the desired plate format (96 or 384 wells), and create a
Target/Amplicon submap (see Note 15). An image of the 96-well plate and theNanoChip array is displayed.

160 Børsting et al.
8. Click on a well and name the sample in the well. The well will be given a distinctcolor.
9. Click on the pad(s) where the sample should be addressed. The pads will be giventhe same color as the well. Right-click on a pad to set the amplitude and theduration of the electronic addressing (default is 2000 V and 120 s).
10. When all samples in the 96-well plate have been defined and all submaps created,save the file.
11. Click on “Loader run.” A panel with start, stop, pause, and eject buttons is dis-played.
12. Place the 96-well plate and the NanoChip array(s) in the front drawer of theloader.
13. Press the start button in the panel. The loader will perform a conductivity test ofevery pad on the NanoChip array(s). If the conductivity test fails, the loader pro-tocol will pause.
14. When the loader protocol is completed, remove the NanoChip array and the96-well plate.
15. Replace the 50 mM histidine bottle in the left-hand drawer with a water bottleand shutdown the loader. The loader will automatically prime the fluid lines beforeit can be turned off.
3.3.2. Hybridization of Reporters and Stabilizer Oligo
1. Add 150 µL 0.1 N NaOH to the NanoChip array and leave the array for 3 min onthe table to denature the PCR products (this step can be performed as part of theloader protocol).
2. Wash the NanoChip array three times with 150 µL high salt buffer and leave thelast wash in the NanoChip array for 3–5 min to ensure that the permeation layeris saturated with high salt buffer.
3. Mix 1 µM of each reporter and 250 nM stabilizer in 150 µL high salt buffer.4. Add the mix to the NanoChip array and leave the array on the table for 5 min.5. Wash the NanoChip array three times with 150 µL high salt buffer and leave the
last wash in the NanoChip array.
3.3.3. Reader Protocol
1. Logon to the Nanogen Molecular Biology Workstation, go to “Reader protocol”and click on “New.” A window with the reader protocol will be displayed. Thefirst “General” stage of the protocol is automatically listed. Information aboutthe experiment can be entered here.
2. Create the desired stages of the protocol (see Notes 16 and 17).3. Save the file.4. Click on “Reader run.” A panel with start, stop, pause and eject buttons is dis-
played.5. Insert the NanoChip array into the Reader.6. Select the initial temperature to 24°C and instruct the Reader to fill the NanoChip
array with low salt buffer. A live picture of the NanoChip array will be displayed.

NanoChip Microarray 161
7. Mark the corner pads on the array and click on the “Set pads” button.8. Press the start button in the panel.9. When the reader protocol is completed, eject the NanoChip array.
10. Replace the bottles with low and high salt buffer with water bottles and shutdownthe reader. The reader will automatically prime the fluid lines before it can beturned off.
3.3.4. Data Analysis
1. Logon to the Nanogen Molecular Biology Workstation and go to “Cartridges.”2. Click on the desired NanoChip array and click on the nLAB™ button. A window
containing all the experiments (see Note 18) performed with the selectedNanoChip array is displayed.
3. Click on “NanoChip® Config.” A summary of all the submaps from the loaderprotocol(s) will be displayed.
4. Click on “Edit” and create a capture layer (see Note 19) that covers all samplesand controls. The histidine control should be defined separately within the layer.
5. Remove any samples from the target layer that will not need to be analyzed andsave the configuration.
6. Click on “Analysis tools” and select the desired scan(s) for analysis.7. Click on “Analyze selected data” and select the histidine control for background
subtraction.8. Select the heterozygote control for normalization of the fluorescent signal (see
Note 20).9. Set the minimum signal-to-noise ratio for an accepted call (default is 5:1).
10. Set the minimum normalized signal-to-signal ratio for a homozygotic SNP call(default is 5:1).
11. Set the maximum normalized signal-to-signal ratio for a heterozygotic SNP call(default is 2:1).
12. Select the desired scan(s) for analysis and click on “Generate summary.” A bardiagram and a table with the analyzed data is displayed (see Note 21).
3.4. Analysis of Multiplex PCRs
If different amplicons are addressed to the same pad on the NanoChip array(14,15) or several interesting SNPs are located on the same amplicon (16),more than one SNP needs to be analyzed in the same pad. This is done bysequential hybridization, analysis, and stripping of the fluorescent reportersand stabilizer oligo (see Subheadings 3.3.2. and 3.3.3.). Approximately 10–15rounds of stripping and hybridization can be performed on the same NanoChiparray before the signal strength is affected (see Note 22).
4. Notes1. Genome and SNP databases:
http://www.ncbi.nlm.nih.gov/
162 Børsting et al.
http://snp.cshl.org/http://snpper.chip.org/bio/snpper-enter/ (password required)http://genome.ornl.gov/http://genome.ucsc.edu/
2. Oligo design software:http://www.molbiol.bbsrc.ac.uk/reviews.htmlhttp://searchlauncher.bcm.tmc.edu/multi-align/multi-align.htmlhttp://www-genome.wi.mit.edu/cgi-bin/primer/primer3_www.cgihttp://biotools.idtdna.com/gateway/http://ftp.genome.washington.edu/cgi-bin/RepeatMasker
3. The length of the amplicon is important. Strong fluorescent signals on theNanoChip array have been obtained from as little as 10–30 fmol 50-bp ampliconswhereas the hybridization efficiency towards the same SNPs on 200- to 300-bpamplicons was up to 10 times lower (14).
4. Make a list of all possible reporters containing the sequence, the Tm and the freeenergy of primer dimer formation, hairpin structures, and base stacking effect(for example, see Fig. 2). Each possible reporter pair (one for each allele) canthen be compared and rated against each other. Remember to divide the list intwo parts, one for each DNA strand.
5. The best reporter pair (one for each allele) is determined from the followingguidelines: 1) the Tm should be between 31°C and 42°C, 2) the theoretical Tm ofthe two selected reporters must not differ by more than 2°C, 3) avoid the lowestbase stacking energies (T:A, A:A and T:T) if possible, 4) the base stacking ener-gies should be similar if possible, and if this is not possible, the reporter with thehighest Tm should have the lowest base stacking energy, 5) avoid strong hairpinstructures (∆G < –7 kcal/mol) and palindromic sequences longer than four nucle-otides.
6. A reporter pair can work even though the reporter pair does not fulfill all theguidelines mentioned in Note 5. Similarly, a reporter pair is not guarantied towork even though the reporter pair fulfills all the guidelines. Often, it is neces-sary to design new reporters because it is impossible to normalize the fluorescentsignal (see Subheading 3.3.4. and Note 20). Recently, a universal reporter sys-tem was described (16), where the fluorescent reporter binds to the tail of anotheroligo consisting of a 3' target specific sequence and a 5' universal sequence. Inthis way, only one pair of fluorescent reporters is needed during the assay devel-opment phase and different target sequences can be tested at a relatively lowcost.
7. If very strong secondary structures (∆G < –10 kcal/mol) are found in the stabi-lizer sequence, consider using the other DNA strand. Alternatively, the so-calleddot-blot assay could also be used, where the SNP is placed in the middle of thereporter and a stabilizer is not used. This should be the last alternative, becausewithout the base-stacking effect the discrimination between match and mismatchis less.

NanoChip Microarray 163
Fig. 2. Analysis of the Y chromosome SNP M173 using the NanoChip SNP typingprotocol. Possible reporters in the forward and reverse direction were listed in a tablecontaining the sequence, the length of the reporter, the theoretical Tm in degree centi-grade, and the free energy in kcal/mol of the strongest primer dimer, the strongesthairpin and the base stacking effect. A similar table was made for the potential stabi-lizer oligos. The selected reporters and stabilizer oligo are marked by asterisks. Belowthe table is shown the normalized results from eight Danish males.
The reverse direction was selected because the forward stabilizer oligo will form arelatively strong primer dimer. Two different reporter pairs (12 and 13 nucleotideslong) were tested before the final selection was made because the reporters had unusu-ally high Tm values compared with their theoretical Tm values. In the experimentshown, the NanoChip was analyzed at 42°C.

164 Børsting et al.
8. Biotin-labeled oligos are expensive, and the PCR primers may have to be rede-signed. Therefore, the PCR should be tested and optimized in the laboratorybefore the biotin-labeled PCR primer is ordered.
9. Make 8 µL 30 µM aliquots of the reporter oligos and store the aliquots and thestock at –20°C. In this way, we have successfully used oligo stocks that are morethan 1 yr old.
10. The recoveries from both the Millipore and the Qiagen protocols are more than80%. However, PCR products shorter than 100–110 bp are lost in the Milliporeprotocol. In contrast, we successfully purified 44-bp PCR products with theQiagen protocol (14).
11. The Nanogen Molecular Biology Workstation can also apply electronic strin-gency. However, we do not recommend this feature, because electronic strin-gency is difficult to optimize.
12. It will take approx 8 to 9 h to load the entire NanoChip array. Some of the samplesolution will evaporate during this period. If there is too little fluid in the well,the sample solution cannot fill the channels in the NanoChip and there will be noconnection between the electrode in the NanoChip array and the electrode in theLoader. Consequently, no DNA will be addressed to the array. Therefore, it isnecessary to make 100 µL 50 mM histidine solutions if you are going to load theentire array.
13. Make a diagram of the 12 × 8 96-well plate and the 10 × 10 NanoChip microarray,and document where each sample is loaded. This will also facilitate the construc-tion of the loader protocol.
14. The heterozygote control should be a sample with known genotype. The concen-tration of your heterozygote control and your samples on the NanoChip arraymust be approximately the same. If this is not the case, you can normalize thesignal, but the fluorescent signal from your samples will either be too strong(saturated) or too weak. Therefore, amplify your heterozygote control in the samePCR experiment as your samples and address the heterozygote control in twodifferent concentrations on the NanoChip array. Synthetic oligos can be used ascontrols if a heterozygote control is not available. However, as mentioned inNote 3, the hybridization efficiency depends strongly on the length of your DNAtarget. Thus, if the PCR product is long and your oligo control is relatively short,you will normalize your signal under one condition and type your samples underanother condition.
15. There are four different submaps. Each submap has different default settings.The “capture submap” is used for the electronic addressing of short capture oligos(for capture down protocol, see Note 23). The “target/amplicon submap” is usedfor electronic addressing of amplicons. The “passive submap” is used for incuba-tion of the NanoChip array in a solution for any given time. The “target prepsubmap” is used for electronic denaturation of double-stranded DNA. One loaderprotocol can contain several different submaps.
16. The first stage should be an initial florescence scan at 24°C. This stage will reg-ister the level of fluorescence before any thermal stringency has been applied.
NanoChip Microarray 165
For each temperature you want to test, there are four stages: 1) “Environment”sets the desired temperature, 2) “Fluidics” washes the NanoChip array with 250 µLof wash buffer at 75 µL/s, 3) “Environment” sets the temperature to 24°C, and 4)“Fluorescence” scans the desired pads on the NanoChip array. Once the readerprotocol is optimized, it is usually sufficient to analyze two or three differenttemperatures, but for the initial experiments, analyze six to eight different tem-peratures near the theoretical Tm of your reporters.
17. In addition to the stages mentioned in Note 16, the following stages can be appliedto the reader protocol: “Activation” sets the desired amplitude (either electronicstringency or electronic capture); “Conductivity” tests the conductivity of thepads on the NanoChip array; “Image” will take a picture of the NanoChip array;and “Wait” will pause the reader protocol for up to one hour.
18. From this window you have access to detailed information on date and time ofevery experiment, the electronic addressing of your samples, the conductivitytest performed by the loader, temperature measurements during the reader proto-col, and results from the florescence scans. The later can be given by either colorsymbols or numeric values.
19. The analysis tool can only analyze your data if you have created a capture layer,equivalent to a capture submap (see Note 15). The reason for this peculiarityprobably is that the software was developed for the capture down protocol (seeNote 23).
20. If the normalization factor is more than 2, “no designation calls” can occur fromthe homozygotes carrying the allele with the strongest signal because the back-ground signal from the other channel (the weak one) is multiplied with the nor-malization factor and, consequently, the signal-to-signal ratio may be less than5:1. “No calls” from homozygotes carrying the allele with the weakest signalmay also occur because the signal-to-noise ratio is less than 5:1 at the tempera-ture where normalization is possible (the temperature window where the fluores-cent signal from the heterozygote control is not saturated or too weak, will bevery small). A large normalization factor is a sign of poor reporter design, and itusually originates from a large difference in Tm of the two reporters. Therefore,trying a different reporter pair may be warranted.
21. The nLAB™ software contains very few options. If the normalized data is to bepresented in any other way than the bar diagram, the data in the table must betransferred to a spreadsheet, and if raw data is to be presented, a “print screen” ofthe color image of the desired scan must be pasted into another software.
22. If more than one amplicon is addressed to the same pad or the amplicon is long,the risk of cross-hybridization increases. The use of short reporters and the rela-tively low temperatures at which the reporters bind to their targets complicatesthe development of large multiplexes. We have experienced several examples ofreproducible cross hybridization between a reporter and a different amplicon thanthe intended target amplicon, even at stringent temperatures (unpublished results).In each case, we redesigned the multiplexes and, instead of one large multiplex,we ended up with several smaller multiplexes. In addition, the presence of differ-
166 Børsting et al.
ent amplicons on the same pad decreases the hybridization efficiency (14), mostlikely because interactions between the amplicons shield the target sequence fromthe reporters. This can only be avoided by directing the different amplicons todifferent pads on the NanoChip array (see Note 23).
23. In the capture down protocol, a 3' biotin-labeled capture oligo is electronicallyaddressed to the NanoChip array. The amplicon is electronically addressed to thesame pad and hybridizes to the capture oligo. The fluorescent reporters are hybrid-ized to the amplicon immediately upstream of the capture, resulting in base stack-ing between the 3' end of the reporter (in case of a perfect match) and the 5' end ofthe capture. If different captures are addressed to different pads on the NanoChiparray, the different amplicons in a multiplex PCR can be bound to different padsand interactions between amplicons can be avoided. We have tried the capturedown protocol on 7 different amplicons (in singleplex) using DNA captures.We obtained reproducible results from only one of the amplicons and only ifwe pooled the DNA from two to four 25-µL PCR reactions and addressed it all tothe NanoChip array (unpublished results). We are in the process of testing othercapture molecules than DNA, but at the present time, the capture down protocolworks for only a small number of assays.
AcknowledgmentsWe thank Ms. Rikke W. Hansen for technical assistance. The work was
supported by grants to Juan J. Sanchez from Ellen and Aage Andersen’s Foun-dation.
References1. Chen, X., and Sullivan, P. F. (2003) Single nucleotide polymorphism genotyping:
biochemistry, protocol, cost and throughput. Pharmacogenomics J. 3, 77–96.2. Kwok, P. Y. and Chen, X. (2003) Detection of single nucleotide polymorphisms.
Curr. Issues Mol. Biol. 5, 43–60.3. Yershov, G., Barsky, V., Belgovskiy, A., Kirillov, E., Kreindlin, E., Ivanov, I., et
al. (1996) DNA analysis and diagnostics on oligonucleotide microchips. Proc.Natl. Acad. Sci. USA 93, 4913–4918.
4. Lane, M. J., Paner, T., Kashin, I., Faldasz, B. D., Li, B., Gallo, F. J., and Benight, A.S. (1997) The thermodynamic advantage of DNA oligonucleotide ‘stacking hybrid-ization’ reactions: energetics of a DNA nick. Nucleic Acid Res. 25, 611–616.
5. Sosnowski, R. G., Tu, E., Butler, W. F., O’Connell, J. P., and Heller, M. J. (1997)Rapid determination of single base mismatch mutations in DNA hybrids by directelectric field control. Proc. Natl. Acad. Sci. USA 94, 1119–1123.
6. Gilles, P. N., Wu, D. J., Foster, C. B., Dillon, P. J., and Chanock S. J. (1999)Single nucleotide polymorphic discrimination by an electronic dot blot assay onsemiconductor microchips. Nat. Biotechnol. 17, 365–370.
7. Huang, Y., Sunghae, J., Duhon, M., Heller, M., Wallace, B., and Xu, X. (2002)
NanoChip Microarray 167
Dielectronic cell separation and gene expression profiling on microelectronic chiparrays. Anal. Chem. 74, 3362–3371.
8. Westin, L., Xu, X., Miller, C., Wang, L., Edman, C. F. and Nerenberg, M. (2000)Anchored multiplex amplification on a microelectronic chip array. Nat.Biotechnol. 18, 199–204.
9. Weidenhammer E. M., Kahl B. F., Wang L., Wang L., Duhon M., Jackson J. A., etal. (2002) Multiplexed, targeted gene expression profiling and genetic analysis onelectronic microarrays. Clin. Chem. 48, 1873–1882.
10. Yang J. M., Bell J., Huang Y., Tirado M., Thomas D., Forster A. H., et al. (2002)An integrated, stacked microlaboratory for biological agent detection with DNAand immunoassays. Biosensors Bioelectronics 17, 605–618.
11. Radtkey R., Feng L., Muralhidar M., Duhon M., Canter D., DiPierro D., et al.(2000) Rapid, high fidelity analysis of simple sequence repeats on an electroni-cally active DNA microchip. Nucleic Acid Res. 28, e17.
12. Behrensdorf, H. A., Pignot, M., Windhab, N., and Kappel, A. (2002) Rapid paral-lel mutation scanning of gene fragments using a microelectronic protein-DNAchip format. Nucleic Acid Res. 30, e64.
13. Saenger W. (1984) Forces stabilizing base associations: hydrogen bonding andbasestacking, in Principles of nucleic acid structure. Springer-Verlag, New York,pp 116–158.
14. Børsting, C., Sanchez, J. J., and Morling, N. (2004) Multiplex PCR, amplicon sizeand hybridization efficiency on the NanoChip electronic microarray. Int. J. LegalMed. 118, 75–82 .
15. Thistlethwaite W. A., Moses L. M., Hoffbuhr K. C., Devaney J. M., and HoffmanE. P. (2003) Rapid genotyping of common MeCP2 mutations with an electronicDNA microchip using serial differential hybridization. J. Mol. Diag. 5, 121–126.
16. Santacroce R., Ratti A., Caroli F., Foglieni B., Ferraris A., Cremonesi L., et al.(2002) Analysis of clinically relevant single-nucleotide polymorphisms by use ofmicroelectronic array technology. Clin. Chem. 48, 2124–2130.
17. Cooper K. L. F., and Goering R. V. (2003) Development of a universal probe forelectronic microarray and its application in characterization of the Staphylococ-cus aureus polC gene. J. Mol. Diag. 5, 28–33.


MALDI-TOF MS and SNP Genotyping 169
169
From: Methods in Molecular Biology, vol. 297: Forensic DNA Typing ProtocolsEdited by: A. Carracedo © Humana Press Inc., Totowa, NJ
12
Genotyping SNPs Using a UV-PhotocleavableOligonucleotide in MALDI-TOF MS
Peter M. Vallone, Kristina Fahr, and Markus Kostrzewa
SummaryMatrix-assisted laser desorption time-of-flight mass spectrometry coupled with allele-
specific primer extension is a proven method for typing single nucleotide polymorphisms(SNPs). A novel modification upon this methodology is the incorporation of aphotocleavable linker within the extension primer. After completion of the primer exten-sion reaction, photocleavage of the extension products results in two deoxyribonucleicacid (DNA) fragments of lower mass. Typically, the smaller cleavage product, whichcontains the genotyping information, is in the range of 1000–3000 Daltons. The decreasein primer mass allows for higher sensitivity in mass spectrometric measurement andincreases the potential for higher levels of multiplexing.The disturbing mass spectromet-ric analysis peaks caused by salt adducts and doubly charged ions are diminished whenanalyzing lower-mass DNA fragments. Here, we illustrate the methodology for usingphotocleavable modified extension primers for detection of SNPs located on the Y chro-mosome.
Genomic templates were prepared from anonymous male donors. Five regions of theY chromosome containing the SNP markers M9, M42, M45, M89, and M96 were ampli-fied by polymerase chain reaction, treated with shrimp alkaline phosphatase, and sub-jected to primer extension reactions using primers containing a photocleavable buildingblock at specific sites. After elongation, the extension primers were desalted and sub-jected to ultraviolet irradiation to cleave the products at the photocleavable site. Subse-quently, the small fragments derived from the 3' ends of the molecules containing thegenotype information were analyzed by matrix-assisted laser desorption ionization time-of-flight using a 3-hydroxypicolinic acid matrix.
Key Words: MALDI-TOF MS; primer extension; multiplex; SNP; PCR; genotype;Y chromosome.
170 Vallone et al.
1. IntroductionGenotyping single nucleotide polymorphisms (SNPs) by matrix-assisted laser
desorption ionization time-of-flight (MALDI-TOF MS) is a well-establishedmethod (1–4). For cost-efficiency reasons, multiplexing at high levels is nec-essary for the high-throughout analyses that are necessary for unbiased geneticprofiling. One approach for increasing the information content of data acquisi-tion is to use smaller analytes, and so make use of a larger spectrum size (5–8).Classical primer extension reactions are limited by the necessity of usinganalytes with a large-enough molecular weight to form a stable duplex previ-ous to elongation (at least 15–18 bases; approx 5000–8000 Daltons). By usingan extension primer of a typical length (18–30 nucleotides) with an internalphotocleavable building block, the resulting extension product can be short-ened before mass spectrometric analysis at the discretion of the experimenter(5). The ability to control the mass of the fragment analyzed by MALDI-TOFMS allows for greater freedom in the design of extension primers that mustanneal under identical experimental conditions. Uniform hybridization of exten-sion primers is critical for the success of multiple primer extension events occur-ring in the same reaction. With respect to the position of the photocleavablelinker within the extension primer, the fragments analyzed by MALDI-TOFMS after ultraviolet (UV) cleavage are in the range of 1000–3000 Daltons. Therelatively small mass window (maximum 2000 Daltons) in which the cleavedfragments are analyzed allows for greater uniformity in analyte ionization andsensitivity.
Genetic markers located on the nonrecombining region of the Y chromo-some are useful from a standpoint of evolutionary studies (9). These same siteshave potential use as genetic markers for human identification, for example, inforensics. In an ongoing project probing the forensic utility of Y chromosomeSNPs for human identity purposes, we illustrate the usage of photocleavableextension primers in allele-specific primer extension reactions in combinationwith MALDI-TOF MS for typing five Y SNPs discovered by denaturing high-performance liquid chromatography (10; see Note 1).
2. Materials1. Oligonucleotide synthesis and purity: Oligonucleotides used for polymerase
chain reaction (PCR) were purchased from Qiagen Operon (Alameda, CA).Oligonucleotides were delivered lyophilized and desalted. Stock solutions of100 µM were prepared by adding in the appropriate volumes of deionized wa-ter. The integrity of each oligonucleotide was confirmed by mass spectrometry(11). The PCR primer sequences can be found in Table 1.Bruker Daltonik (Leipzig, Germany) kindly provided extension primers contain-ing the photocleavable linker. The photocleavable linker (PC-O-nitrophenyl-CE-
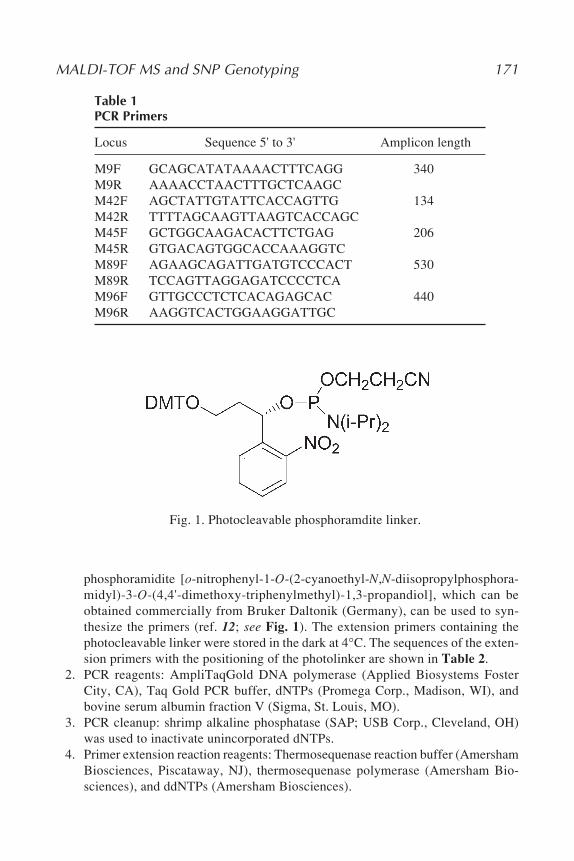
MALDI-TOF MS and SNP Genotyping 171
Table 1PCR Primers
Locus Sequence 5' to 3' Amplicon length
M9F GCAGCATATAAAACTTTCAGG 340M9R AAAACCTAACTTTGCTCAAGCM42F AGCTATTGTATTCACCAGTTG 134M42R TTTTAGCAAGTTAAGTCACCAGCM45F GCTGGCAAGACACTTCTGAG 206M45R GTGACAGTGGCACCAAAGGTCM89F AGAAGCAGATTGATGTCCCACT 530M89R TCCAGTTAGGAGATCCCCTCAM96F GTTGCCCTCTCACAGAGCAC 440M96R AAGGTCACTGGAAGGATTGC
phosphoramidite [o-nitrophenyl-1-O-(2-cyanoethyl-N,N-diisopropylphosphora-midyl)-3-O-(4,4'-dimethoxy-triphenylmethyl)-1,3-propandiol], which can beobtained commercially from Bruker Daltonik (Germany), can be used to syn-thesize the primers (ref. 12; see Fig. 1). The extension primers containing thephotocleavable linker were stored in the dark at 4°C. The sequences of the exten-sion primers with the positioning of the photolinker are shown in Table 2.
2. PCR reagents: AmpliTaqGold DNA polymerase (Applied Biosystems FosterCity, CA), Taq Gold PCR buffer, dNTPs (Promega Corp., Madison, WI), andbovine serum albumin fraction V (Sigma, St. Louis, MO).
3. PCR cleanup: shrimp alkaline phosphatase (SAP; USB Corp., Cleveland, OH)was used to inactivate unincorporated dNTPs.
4. Primer extension reaction reagents: Thermosequenase reaction buffer (AmershamBiosciences, Piscataway, NJ), thermosequenase polymerase (Amersham Bio-sciences), and ddNTPs (Amersham Biosciences).
Fig. 1. Photocleavable phosphoramdite linker.

172 Vallone et al.
5. Thermal cycling: Thermal cycling for PCR and extension assays was conductedusing the GeneAmp 9700 (Applied Biosystems) running in 9600-emulation mode(i.e. ramp speeds of 1°C/s).
6. Desalting: The desalting of primer extension reactions was accomplished byusing commercially available Genopure oligo™ purification kit, which is basedon the specific binding of single-stranded deoxyribonucleic acid (DNA) to thesurface of magnetic beads (Bruker Daltonics, Billerica, MA).
7. Photocleavage: Photocleavage of the linker was performed by irradiation with a254 nm light by a hand-held lamp typically used for gel illumination. (AppligeneOncor, France).
8 MALDI matrix: 3-hydroxypicolinic acid (Bruker Daltonics) and ammonium cit-rate (Sigma) were the components of the MALDI matrix.
9. MALDI plate: A 384-spot AnchorChip™ MALDI sample plate with 600 µManchor sizes was used (Bruker Daltonik, Bremen, Germany).
10. Mass spectrometry: Mass spectra were collected on a Bruker BIFLEX III time-of-flight mass spectrometer (Bruker Daltonik, Bremen, Germany) equipped witha pulsed nitrogen laser (337.1 nm).
11. Data analysis: Mass spectra were smoothed and enhanced by the application ofmatrix convolution filters contained in the XMASS 5.0 analysis software pack-age (Bruker Daltonik, Bremen, Germany). Mass spectrometry data were normal-ized to the largest peak in the spectrum as a reference, resulting in relativeintensities between 0 and 100%.
3. Methods3.1. Perform PCR
Approximately 1–2 ng of human template (genomic) DNA was presentin amplification reactions. Final PCR reagent concentrations were as fol-lows: 1 unit of AmpliTaqGold DNA polymerase, 1X Taq Gold PCR buffer,
Table 2Extension Primers Containing Photocleavable Linker
Fragment massLocus Extension primer sequence (Daltons)
M9R(C/G) ACATGTCTAAATTAAAGAAAAATAA AOMeGAOMeG 1362.9M42R(A/T) CCAGCTCTCTTTTTCATTATGTAGT 1268.8M45F(G/A) GCAGTGAAAAATTATAGOMeATA 1307.8M89F(C/T) CTCTTCCTAAGGTTATGTACAAAAATCT 1228.8M96F(G/C) AACTTGGAAAACAGGTCTCTCATAATA 1261.8
The underlined base designates the position of the photolinker. The photolinker replaces the speci-fied base in the extension primer (this acts similar to an abasic site). AOMe and GOMe are 2'-O-methyladenosine and 2'-O-methylguanosine, respectively.
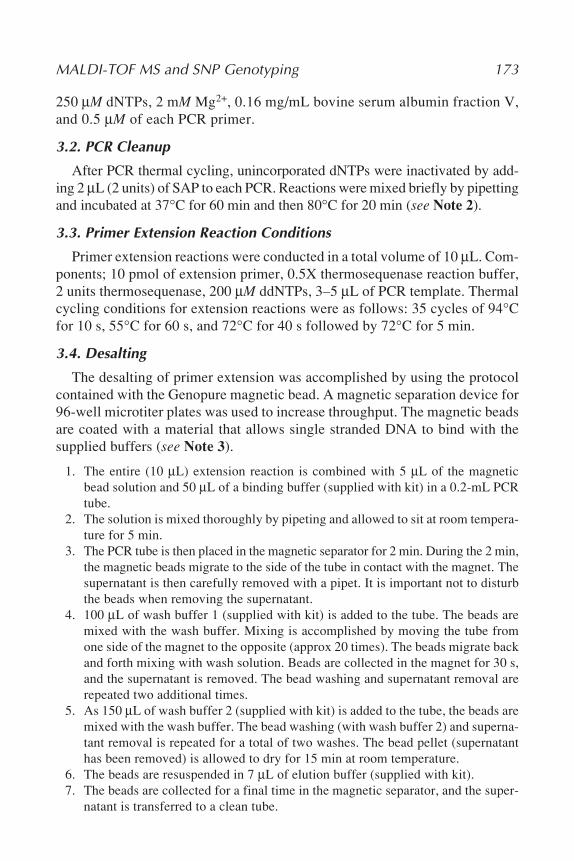
MALDI-TOF MS and SNP Genotyping 173
250 µM dNTPs, 2 mM Mg2+, 0.16 mg/mL bovine serum albumin fraction V,and 0.5 µM of each PCR primer.
3.2. PCR Cleanup
After PCR thermal cycling, unincorporated dNTPs were inactivated by add-ing 2 µL (2 units) of SAP to each PCR. Reactions were mixed briefly by pipettingand incubated at 37°C for 60 min and then 80°C for 20 min (see Note 2).
3.3. Primer Extension Reaction Conditions
Primer extension reactions were conducted in a total volume of 10 µL. Com-ponents; 10 pmol of extension primer, 0.5X thermosequenase reaction buffer,2 units thermosequenase, 200 µM ddNTPs, 3–5 µL of PCR template. Thermalcycling conditions for extension reactions were as follows: 35 cycles of 94°Cfor 10 s, 55°C for 60 s, and 72°C for 40 s followed by 72°C for 5 min.
3.4. Desalting
The desalting of primer extension was accomplished by using the protocolcontained with the Genopure magnetic bead. A magnetic separation device for96-well microtiter plates was used to increase throughput. The magnetic beadsare coated with a material that allows single stranded DNA to bind with thesupplied buffers (see Note 3).
1. The entire (10 µL) extension reaction is combined with 5 µL of the magneticbead solution and 50 µL of a binding buffer (supplied with kit) in a 0.2-mL PCRtube.
2. The solution is mixed thoroughly by pipeting and allowed to sit at room tempera-ture for 5 min.
3. The PCR tube is then placed in the magnetic separator for 2 min. During the 2 min,the magnetic beads migrate to the side of the tube in contact with the magnet. Thesupernatant is then carefully removed with a pipet. It is important not to disturbthe beads when removing the supernatant.
4. 100 µL of wash buffer 1 (supplied with kit) is added to the tube. The beads aremixed with the wash buffer. Mixing is accomplished by moving the tube fromone side of the magnet to the opposite (approx 20 times). The beads migrate backand forth mixing with wash solution. Beads are collected in the magnet for 30 s,and the supernatant is removed. The bead washing and supernatant removal arerepeated two additional times.
5. As 150 µL of wash buffer 2 (supplied with kit) is added to the tube, the beads aremixed with the wash buffer. The bead washing (with wash buffer 2) and superna-tant removal is repeated for a total of two washes. The bead pellet (supernatanthas been removed) is allowed to dry for 15 min at room temperature.
6. The beads are resuspended in 7 µL of elution buffer (supplied with kit).7. The beads are collected for a final time in the magnetic separator, and the super-
natant is transferred to a clean tube.

174 Vallone et al.
3.5. Sample Preparation with 3 HPA Matrix
The stock matrix solution consisted of 0.7 M 3-hydroxypicolinic acid and0.07 M ammonium citrate in 1:1 water and acetonitrile (13,14). Stock matrixsolution was diluted 2.5-fold with water before usage. Samples were spottedonto the MALDI plate using 1 µL of sample and 1 µL of matrix material. Thematrix solution was applied to MALDI plate first and allowed to dry before add-ing the desalted primer extension products. Approximately 15 min were requiredfor completion of the drying process.
3.6. Mass Spectrometry
The following operating voltages were used for signal collection, IS1 = 19.0kV, IS2 = 15.0 kV, reflector = 20.0 kV, detector 1.7 kV. All spectra werecollected in positive ion mode with between 15 and 50 laser shots collected oneach sample for signal averaging purposes. Laser power attenuation was adjustedwith each sample to obtain optimal sensitivity and resolution. Before data col-lection, the mass spectrometer was calibrated with 4- and 16-base single-strandDNA oligomers with masses of 1173.8 and 4881.3 Daltons, respectively, where1 Dalton is equivalent to 1 g/mol.
3.7. Type SNP Based on Measurement of Mass Difference
In mass spectrometric analysis, a signal should be detected from the exten-sion product(s) and potentially from any remaining unextended extensionprimer. The singleplex spectra for five Y SNP markers are depicted in Fig. 2.The SNPs probed are located on the nonrecombining region of the Y chromo-some; therefore, all results will be homozygous (i.e., a single extension prod-uct). The masses of ddA, ddG, ddC, and ddT are 297, 313, 273, and 288Daltons, respectively. By subtracting the mass of the extension primer fromdetected products(s) the identity of the extended base is elucidated.
4. Notes1. It is assumed that the researcher will have specific SNP sites of interest. Use of
the Y chromosome SNP sites was chosen to illustrate the photocleavable exten-sion assays. For discussion of the selection of successful PCR and extension prim-ers, see refs. 15 and 16.
2. PCR cleanup: Digestion (removal) of the PCR primers by Exonuclease I was notrequired because PCR primer extension products of would be observed out of themass range of the photocleaved extension primer fragments.
3. Desalting: Desalting primer extension reactions is essential before MALDI analy-sis. The salts (Mg2+ K+) present in PCR and primer extension reactions will sup-press the ionization efficiency of the DNA, thereby decreasing the sensitivity(17). In extreme cases, the presence of salts can completely suppress the analyte
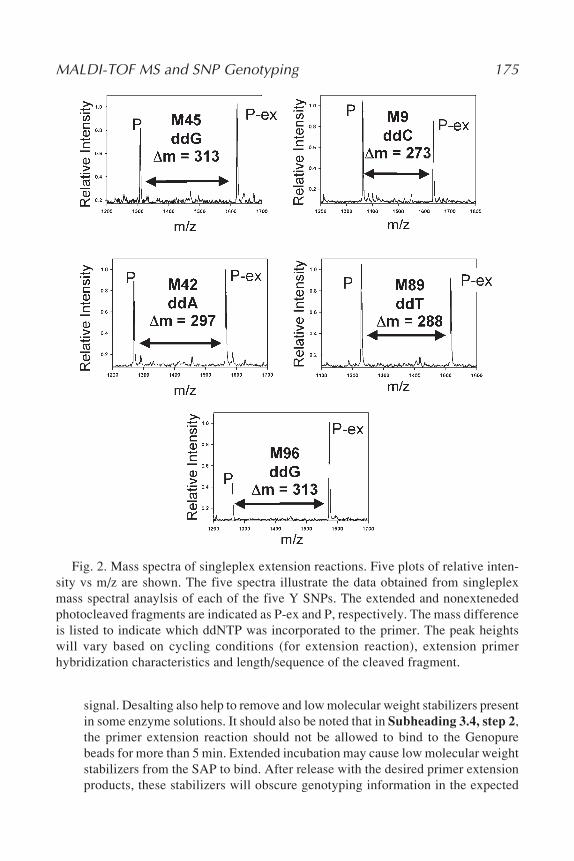
MALDI-TOF MS and SNP Genotyping 175
Fig. 2. Mass spectra of singleplex extension reactions. Five plots of relative inten-sity vs m/z are shown. The five spectra illustrate the data obtained from singleplexmass spectral anaylsis of each of the five Y SNPs. The extended and nonextenededphotocleaved fragments are indicated as P-ex and P, respectively. The mass differenceis listed to indicate which ddNTP was incorporated to the primer. The peak heightswill vary based on cycling conditions (for extension reaction), extension primerhybridization characteristics and length/sequence of the cleaved fragment.
signal. Desalting also help to remove and low molecular weight stabilizers presentin some enzyme solutions. It should also be noted that in Subheading 3.4, step 2,the primer extension reaction should not be allowed to bind to the Genopurebeads for more than 5 min. Extended incubation may cause low molecular weightstabilizers from the SAP to bind. After release with the desired primer extensionproducts, these stabilizers will obscure genotyping information in the expected
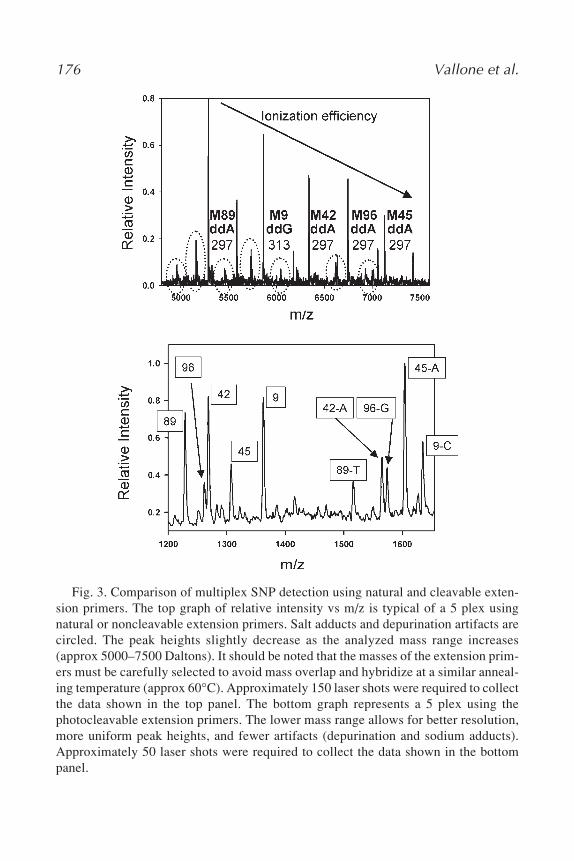
176 Vallone et al.
Fig. 3. Comparison of multiplex SNP detection using natural and cleavable exten-sion primers. The top graph of relative intensity vs m/z is typical of a 5 plex usingnatural or noncleavable extension primers. Salt adducts and depurination artifacts arecircled. The peak heights slightly decrease as the analyzed mass range increases(approx 5000–7500 Daltons). It should be noted that the masses of the extension prim-ers must be carefully selected to avoid mass overlap and hybridize at a similar anneal-ing temperature (approx 60°C). Approximately 150 laser shots were required to collectthe data shown in the top panel. The bottom graph represents a 5 plex using thephotocleavable extension primers. The lower mass range allows for better resolution,more uniform peak heights, and fewer artifacts (depurination and sodium adducts).Approximately 50 laser shots were required to collect the data shown in the bottompanel.

MALDI-TOF MS and SNP Genotyping 177
mass range of 1000–3000 Daltons. Alternatively, PCR templates can be “cleanedup” using methods such as the Genopure DS™ purification kit, PurEX DNA™extraction kit (Edge Biosystems, Gaithersburg, MD), Montage™ PCR (Millipore,Billerica, MA) clean up plates, or similar chromatographic methods for removalor unincorporated primer and dNTPs.
4. Multiplexing: The PCR amplicons can be pooled or generated in multiplex forincreased throughput. The extension primer reaction can then also be performedin multiplex. By carefully selecting the length of the analyte masses, all fiveSNPs can be typed in a single assay. Figure 3 illustrates the contrast betweenusing non-cleavable and photocleavable extension primers. The five Y SNPs wereamplified, extended and analyzed in multiplex.
AcknowledgmentsNational Institute of Justice (NIJ) funded the work described here through
an interagency agreement with the NIST Office of Law Enforcement Stan-dards. Official Disclaimer: Contribution of the U.S. National Institute of Stan-dards and Technology. Certain commercial equipment, instruments, andmaterials are identified to specify experimental procedures as completely as pos-sible. In no case does such identification imply a recommendation or endorse-ment by the National Institute of Standards and Technology, nor does it implythat any of the materials, instruments, or equipment identified are necessarilythe best available for the purpose.
References1. Little, D. P., Braun, A., Darnhofer-Demar, B., Frilling, A., Li, Y., McIver, R. T.,
Jr., et al. (1997) Detection of RET proto-oncogene codon 634 mutations usingmass spectrometry. J. Mol. Med.75, 745–750.
2. Haff, L. A., and Smirnov, I. P. (1997) Single-nucleotide polymorphism identifi-cation assays using a thermostable DNA polymerase and delayed extractionMALDI- TOF mass spectrometry. Genome Res. 7, 378–388.
3. Griffin, T. J. and Smith, L. M. (2000) Single-nucleotide polymorphism analysisbyMALDI-TOF mass spectrometry. Trends Biotechnol. 18, 77–84.
4. Pusch, W., Wurmbach, J. H., Thiele, H., and Kostrzewa, M. (2002) MALDI-TOFmass spectrometry-based SNP genotyping. Pharmacogenomics 3, 537–548.
5. Sauer, S., Lechner, D., Berlin, K., Lehrach, H., Escary, J. L., Fox, N., and Gut, I.G. (2000) A novel procedure for efficient genotyping of single nucleotide poly-morphisms. Nucleic Acids Res. 28, E13.
6. Sauer, S., Lechner, D., Berlin, K., Plancon, C., Heuermann, A., Lehrach, H., et al.(2000) Full flexibility genotyping of single nucleotide polymorphisms by theGOOD assay. Nucleic Acids Res. 28, E100.
7. Sauer, S., Lehrach, H., and Reinhardt, R. (2003) MALDI mass spectrometry analy-sis of single nucleotide polymorphisms by photocleavage and charge-tagging.Nucleic Acids Res. 31, E63.

178 Vallone et al.
8. Sauer, S., and Gut, I. G. (2003) Extension of the GOOD assay for genotypingsingle nucleotide polymorphisms by matrix-assisted laser desorption/ionizationmass spectrometry. Rapid Commun.Mass Spectrom. 17, 1265–1272.
9. Jobling, M. A., and Tyler-Smith, C. (2003) The human Y chromosome: an evolu-tionary marker comes of age. Nat. Rev. Genet. 4, 598–612.
10. Underhill, P. A., Shen, P., Lin, A. A., Jin, L., Passarino, G., Yang, W. H., et al.(2000) Y chromosome sequence variation and the history of human populations.Nat. Genet. 26, 358–361.
11. Butler, J. M., Devaney, J. M., Marino, M. A., and Vallone, P. M. (2001) Qualitycontrol of PCR primers used in multiplex STR amplification reactions. ForensicSci. Int. 119, 87–96.
12. Ordoukhanian, P., and Taylor, J-S. (1995) Design and synthesis of a versatilephotocleavable DNA building block. Application to phototriggered hybridization.J. Am. Chem. Soc. 117, 9570-9571.
13. Wu, K. J., Steding, A., and Becker, C. H. (1993) Matrix-assisted laser desorptiontime-of-flight mass spectrometry of oligonucleotides using 3-hydroxypicolinic acidas an ultraviolet-sensitive matrix. Rapid Commun. Mass Spectrom. 7, 142–146.
14. Chiu, N. H., Tang, K., Yip, P., Braun, A., Koster, H., and Cantor, C. R. (00) Massspectrometry of single-stranded restriction fragments captured by an undigestedcomplementary sequence. Nucleic Acids Res. 28, E31.
15. Innis, M. A., Gelfand, D. H., Sninsky, J. J., and White, T.J. (ed.) (1990) PCRProtocols A Guide to Methods and Application, Academic Press, San Diego, CA.
16. Kaderali, L., Deshpande, A., Nolan, J. P., and White, P. S. (03) Primer-design formultiplexed genotyping. Nucleic Acids Res. 31, 1796–1802.
17. Shaler, T. A., Wickham, J. N., Sannes, K. A., Wu, K. J., and Becker, C. H. (1996)Effect of impurities on the matrix-assisted laser desorption mass spectra of single-stranded oligodeoxynucleotides. Anal. Chem. 68, 576–579.
Pyrosequencing for DNA Analysis 179
179
From: Methods in Molecular Biology, vol. 297: Forensic DNA Typing ProtocolsEdited by: A. Carracedo © Humana Press Inc., Totowa, NJ
13
Mitochondrial D-Loop and Coding Sequence AnalysisUsing Pyrosequencing
Marie Allen and Hanna Andréasson
SummaryIn forensic casework analysis, mitochondrial deoxyribonucleic acid (DNA) often is
used when the evidence material contains scarce amounts of DNA. Here, a mitochon-drial DNA typing system for D-loop and coding region analysis based on pyrosequencingis described. Pyrosequencing is a real-time, single-tube sequencing-by-synthesis method,in which a cascade of enzymatic reactions yields detectable light. This pyrosequencingsystem has a higher resolution than the D-loop analysis performed routinely today as it alsocovers informative positions in the mitochondrial coding region. The system is composedof 16 polymerase chain reaction (PCR) fragments and 24 pyrosequencing reactionswith a turn around time for a 96-well plate of less than 3 h after PCR.
Key Words: Forensic science; forensic DNA analysis; forensic evidence material;mitochondrial DNA; D-loop; coding region; polymorphism; sequencing; pyrosequenc-ing; real-time; single-tube; PPi; SSB.
1. IntroductionBecause of the high copy number of mitochondrial genomes per cell, mito-
chondrial deoxyribonucleic acid (DNA) analysis often is used for human iden-tification (1) when the forensic evidence contains limited or degraded DNA.Here, we describe a unique, rapid, and easy-to-use typing system for analysisof mitochondrial DNA based on pyrosequencing technology. Pyrosequencingis a novel sequencing-by-synthesis method that is nonelectrophoretic, withoutneed of dyes or specific labels. It is performed in a single-tube format, in whicha cascade of enzymatic reactions enables nucleotide incorporation and pyro-phosphate (PPi) release to yield detectable light (Fig. 1). The nucleotides are

180 Allen and Andréasson
Fig. 1. Left panel, Schematic illustration of the pyrosequencing reaction. Light isproduced after enzymatic conversion of PPi, which is released after nucleotide incor-poration. The nucleotides are added one at a time in a known order. If a nucleotide isnot incorporated, it will be degraded by the enzyme apyrase. Right panel, The light isdetected by the pyrosequencing instrument and shown as a peak in a pyrogram, wherethe peaks represent each nucleotide in the template sequence. When the sequence con-tains two (or more) identical nucleotides consecutively, they will result in a doublepeak (or in a proportional higher peak).
added one at a time in a known order, cyclic or directed (directed in respect tothe template sequence).
The produced light is detected in real-time using a luminometric detectionsystem and is proportional to incorporated nucleotides and the released PPi (2–4). This pyrosequencing system is developed for analysis of the highly poly-morphic mitochondrial D-loop as well as short fragments in the mitochondrialcoding region (Fig. 2).
To achieve a more discriminating analysis than the D-loop sequence analy-sis alone, the mitochondrial sequencing system has been further developed toinclude coding sequence polymorphisms. Coding sequence analysis might beespecially useful where none or a single difference between different individu-als are found, which is common for sequences closely related to the Cambridgereference sequence (5). The coding region fragments were chosen based on thediversity determined in 26 Swedish (Nilsson M, Divne A. and Allen M, inpreparation) as well as 52 European whole mitochondrial-sequenced individuals(6) and cover highly informative polymorphic sites throughout the entire mito-chondrial genome. For an optimal discrimination, the complete mitochon-drial DNA typing system consists of 16 polymerase chain reaction (PCR)
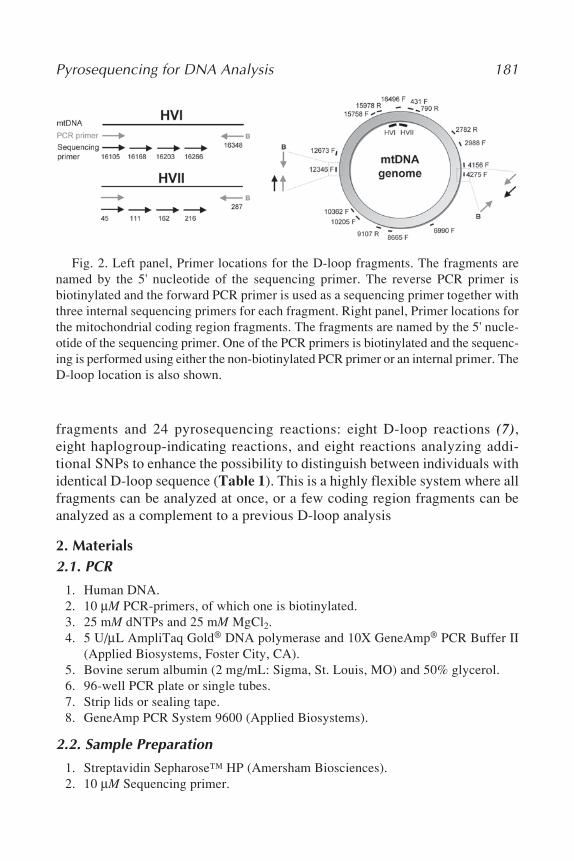
Pyrosequencing for DNA Analysis 181
fragments and 24 pyrosequencing reactions: eight D-loop reactions (7),eight haplogroup-indicating reactions, and eight reactions analyzing addi-tional SNPs to enhance the possibility to distinguish between individuals withidentical D-loop sequence (Table 1). This is a highly flexible system where allfragments can be analyzed at once, or a few coding region fragments can beanalyzed as a complement to a previous D-loop analysis
2. Materials2.1. PCR
1. Human DNA.2. 10 µM PCR-primers, of which one is biotinylated.3. 25 mM dNTPs and 25 mM MgCl2.4. 5 U/µL AmpliTaq Gold® DNA polymerase and 10X GeneAmp® PCR Buffer II
(Applied Biosystems, Foster City, CA).5. Bovine serum albumin (2 mg/mL: Sigma, St. Louis, MO) and 50% glycerol.6. 96-well PCR plate or single tubes.7. Strip lids or sealing tape.8. GeneAmp PCR System 9600 (Applied Biosystems).
2.2. Sample Preparation
1. Streptavidin Sepharose™ HP (Amersham Biosciences).2. 10 µM Sequencing primer.
Fig. 2. Left panel, Primer locations for the D-loop fragments. The fragments arenamed by the 5' nucleotide of the sequencing primer. The reverse PCR primer isbiotinylated and the forward PCR primer is used as a sequencing primer together withthree internal sequencing primers for each fragment. Right panel, Primer locations forthe mitochondrial coding region fragments. The fragments are named by the 5' nucle-otide of the sequencing primer. One of the PCR primers is biotinylated and the sequenc-ing is performed using either the non-biotinylated PCR primer or an internal primer. TheD-loop location is also shown.
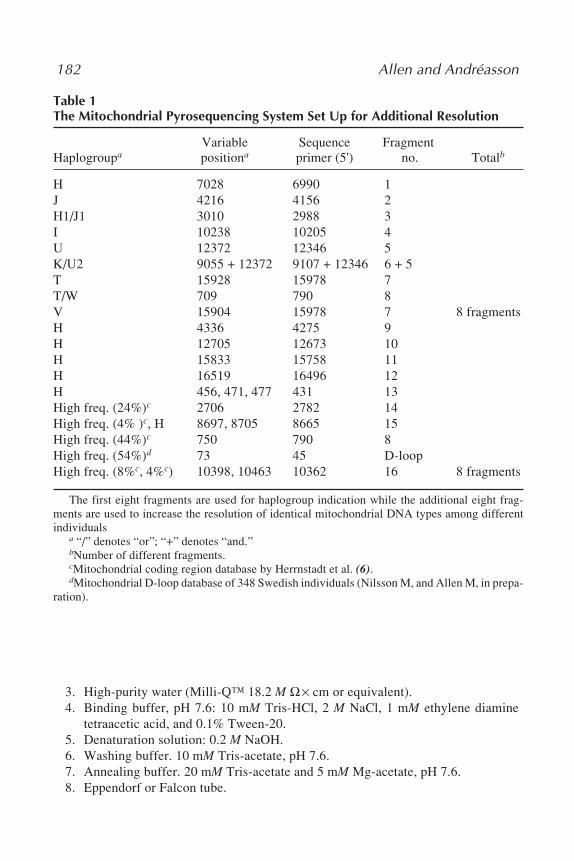
182 Allen and Andréasson
Table 1The Mitochondrial Pyrosequencing System Set Up for Additional Resolution
Variable Sequence FragmentHaplogroupa positiona primer (5') no. Totalb
H 7028 6990 1J 4216 4156 2H1/J1 3010 2988 3I 10238 10205 4U 12372 12346 5K/U2 9055 + 12372 9107 + 12346 6 + 5T 15928 15978 7T/W 709 790 8V 15904 15978 7 8 fragmentsH 4336 4275 9H 12705 12673 10H 15833 15758 11H 16519 16496 12H 456, 471, 477 431 13High freq. (24%)c 2706 2782 14High freq. (4% )c, H 8697, 8705 8665 15High freq. (44%)c 750 790 8High freq. (54%)d 73 45 D-loopHigh freq. (8%c, 4%c) 10398, 10463 10362 16 8 fragments
The first eight fragments are used for haplogroup indication while the additional eight frag-ments are used to increase the resolution of identical mitochondrial DNA types among differentindividuals
a “/” denotes “or”; “+” denotes “and.”bNumber of different fragments.cMitochondrial coding region database by Herrnstadt et al. (6).dMitochondrial D-loop database of 348 Swedish individuals (Nilsson M, and Allen M, in prepa-
ration).
3. High-purity water (Milli-Q™ 18.2 M Ω × cm or equivalent).4. Binding buffer, pH 7.6: 10 mM Tris-HCl, 2 M NaCl, 1 mM ethylene diamine
tetraacetic acid, and 0.1% Tween-20.5. Denaturation solution: 0.2 M NaOH.6. Washing buffer. 10 mM Tris-acetate, pH 7.6.7. Annealing buffer. 20 mM Tris-acetate and 5 mM Mg-acetate, pH 7.6.8. Eppendorf or Falcon tube.

Pyrosequencing for DNA Analysis 183
9. 96-well PCR plate.10. Strip lids or sealing tape.11. 96-well MultiScreen® Filter Plate (Millipore Corporation, Billerica, MA).12. Mixer/shaker for microtiter plates (room temperature).13. Heating block (80°C).14. PSQ™96 Sample Prep Thermoplate Low (Pyrosequencing AB, Uppsala, Sweden).15. Vacuum manifold (220 V/50 Hz; Millipore Corporation).16. Vacuum source (minimum vacuum 300 mm Hg; Millipore Corporation).17. Liquid trap flask.
2.3. Pyrosequencing Reaction
1. 220 ng/µL Single-Stranded DNA Binding Protein® (Amersham PharmaciaBiotech AB, Uppsala, Sweden).
2. Enzyme- and Substrate-mixtures, dNTPs (AαS, C, G, and T) (Pyrosequencing AB).3. PSQ™96 Plate Low (Pyrosequencing AB).4. PSQ™96 Reagent Cartridge (Pyrosequencing AB).5. PSQ™96MA System SQA (Pyrosequencing AB).6. PSQ™96MA SQA software v. 2.02 (Pyrosequencing AB).
2.4. Pyrosequencing Analysis
1. PSQ™96MA SQA software v. 2.02 (Pyrosequencing AB).
3. MethodsThe methods described below outlines 1) PCR, 2) sample preparation, 3) pyro-
sequencing reaction, and 4) pyrosequencing analysis.
3.1. PCR
The mitochondrial D-loop is PCR amplified in two separate reactions (HVIand HVII). Each of the templates is analyzed using four sequencing primersper fragment, including the forward PCR primer. When necessary, the codingregion fragments are amplified in 14 separate reactions, followed by analysisin 16 pyrosequencing reactions using either the forward or the reverse PCRprimer or an internal sequencing primer. The reactions are incubated for 10min at 95°C followed by 40 cycles of 30 s at 95°C, 45 s at 60°C (53°C for thecoding region primers), and 60 s at 72°C, with a final extension step for 7 minat 72°C in an ABI 9600 instrument (Applied Biosystems).
3.1.1. Control Samples
PCRs for control samples are set up in 70 µL (30 µL for the coding regionfragments) containing 1.5 µL of DNA, 200 nM of each primer (Table 2), 200 µMof each dNTP, 1.5 mM MgCl2, 2 U AmpliTaq® Gold DNA Polymerase, and1X GeneAmp® PCR Buffer II.
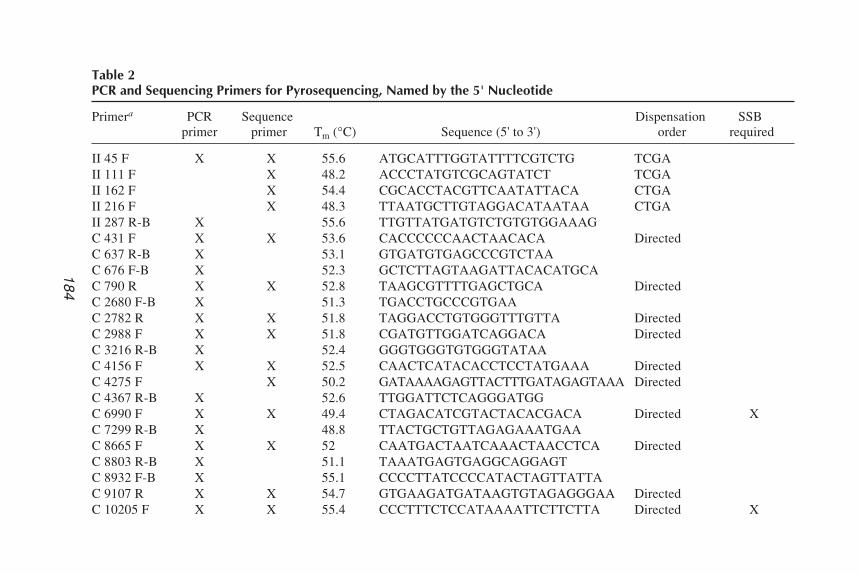
184A
llen and Andréasson
Table 2PCR and Sequencing Primers for Pyrosequencing, Named by the 5' Nucleotide
Primera PCR Sequence Dispensation SSBprimer primer Tm (°C) Sequence (5' to 3') order required
II 45 F X X 55.6 ATGCATTTGGTATTTTCGTCTG TCGAII 111 F X 48.2 ACCCTATGTCGCAGTATCT TCGAII 162 F X 54.4 CGCACCTACGTTCAATATTACA CTGAII 216 F X 48.3 TTAATGCTTGTAGGACATAATAA CTGAII 287 R-B X 55.6 TTGTTATGATGTCTGTGTGGAAAGC 431 F X X 53.6 CACCCCCCAACTAACACA DirectedC 637 R-B X 53.1 GTGATGTGAGCCCGTCTAAC 676 F-B X 52.3 GCTCTTAGTAAGATTACACATGCAC 790 R X X 52.8 TAAGCGTTTTGAGCTGCA DirectedC 2680 F-B X 51.3 TGACCTGCCCGTGAAC 2782 R X X 51.8 TAGGACCTGTGGGTTTGTTA DirectedC 2988 F X X 51.8 CGATGTTGGATCAGGACA DirectedC 3216 R-B X 52.4 GGGTGGGTGTGGGTATAAC 4156 F X X 52.5 CAACTCATACACCTCCTATGAAA DirectedC 4275 F X 50.2 GATAAAAGAGTTACTTTGATAGAGTAAA DirectedC 4367 R-B X 52.6 TTGGATTCTCAGGGATGGC 6990 F X X 49.4 CTAGACATCGTACTACACGACA Directed XC 7299 R-B X 48.8 TTACTGCTGTTAGAGAAATGAAC 8665 F X X 52 CAATGACTAATCAAACTAACCTCA DirectedC 8803 R-B X 51.1 TAAATGAGTGAGGCAGGAGTC 8932 F-B X 55.1 CCCCTTATCCCCATACTAGTTATTAC 9107 R X X 54.7 GTGAAGATGATAAGTGTAGAGGGAA DirectedC 10205 F X X 55.4 CCCTTTCTCCATAAAATTCTTCTTA Directed X
184

Pyrosequencing for DN
A A
nalysis185
C 10362 F X 55 CTGGCCTATGAGTGACTACAAAA Directed XC 10586 R-B X 53 CGATAGTATTATTCCTTCTAGGCAC 12346 F X X 47.9 CACACTACTATAACCACCCTAA Directed XC 12541 R-B X 49.1 CTCAGTGTCAGTTCGAGATAAC 12673 F X X 45.7 AACATTAATCAGTTCTTCAAA Directed XC 12861 R-B X 46.7 GTTGTATAGGATTGCTTGAAC 15588 F X 51.3 TCCGATCCGTCCCTAAC 15758 F X 51.5 ATCGGAGGACAACCAGTAA DirectedC 15978 R-B X 50.6 GGAGTTAAAGACTTTTTCTCTGAC 15588 F-B X 51.3 TCCGATCCGTCCCTAAC 15978 R X X 50.6 GGAGTTAAAGACTTTTTCTCTGA DirectedNC 16496 F X X 48.5 GACATCTGGTTCCTACTTCA Directed XNC 149 R-B X 47.7 ATGAGGCAGGAATCAAAI 16105 F X X 55.4 TGCCAGCCACCATGAATA CTGA XI 16168 F X 50.3 CCAATCCACATCAAAACC CTGA XI 16203 F X 45.7 AGCAAGTACAGCAATCAA CTGAI 16266 F X 47.3 CCCACTAGGATACCAACA CTGAI 16348 R-B X 55.6 GACTGTAATGTGCTATGTACGGTAAA
aI denotes HVI; II denotes HVII; C denotes coding region; F denotes forward primer; R denotes reverse primer;B denotes biotinylated primer,and NC denotes non-coding.
185

186 Allen and Andréasson
3.1.2. Evidence Materials
PCR amplification of forensic evidence material is set up in 100 mL (30 µLfor the coding region fragments) with 10 µL of DNA, 200 nM of each primer(Table 2), 200 µM of each dNTP, 2.4 mM MgCl2, 10 U AmpliTaq® Gold DNAPolymerase, 1.2X GeneAmp® PCR Buffer II, 0.16 mg/mL bovine serum albu-min, and 10% glycerol.
3.2. Sample Preparation
The pyrosequencing system is performed on single-stranded PCR products,to which a sequencing primer can be annealed. We have used a method forgenerating single-stranded DNA that use the binding of biotinylated PCR prod-ucts to Streptavidin-coated Sepharose beads (3).
3.2.1. Immobilization of PCR Product to Beads
1. Let the solutions reach room temperature (see Note 1).2. Shake the Streptavidin Sepharose bottle to obtain a homogenous solution of the
beads.3. Transfer the total required amount of Streptavidin Sepharose beads (4 µL per
well) to a tube.4. To the tube, with Streptavidin beads, add binding buffer to a volume equivalent
to the total volume of the PCR product to be used (control samples: 15 µL, evi-dence: 25 µL per well). Vortex the tube.
5. Mix the PCR product (control samples: 15 µL, evidence: 25 µL per well) with anequal volume (1:1) of the binding buffer-Streptavidin Sepharose bead mix in a96-well PCR plate. Seal the plate.
6. Incubate at room temperature for 10 min while agitating constantly to keep thebeads dispersed, using a mixer/shaker.
3.2.2. Strand Separation
1. Transfer, by pipeting, the immobilized template to a 96-well filter plate (see Note2). Place the filter plate on the vacuum manifold and apply vacuum to remove allliquid (Fig. 3, Note 3).
2. Release the vacuum and add 50 µL of denaturation solution.3. Incubate for 1 min before applying the vacuum again to remove the denaturation
solution.4. Wash twice with 150 µL of washing buffer; carefully remove all liquid between
and after the washing steps (see Note 4).
3.2.3. Primer Annealing
1. Add 45 µL of annealing buffer per well to the filter plate and resuspend the beadswith the immobilized template by pipeting up and down four to five times (onerow at the time using a 12-channel pipet).
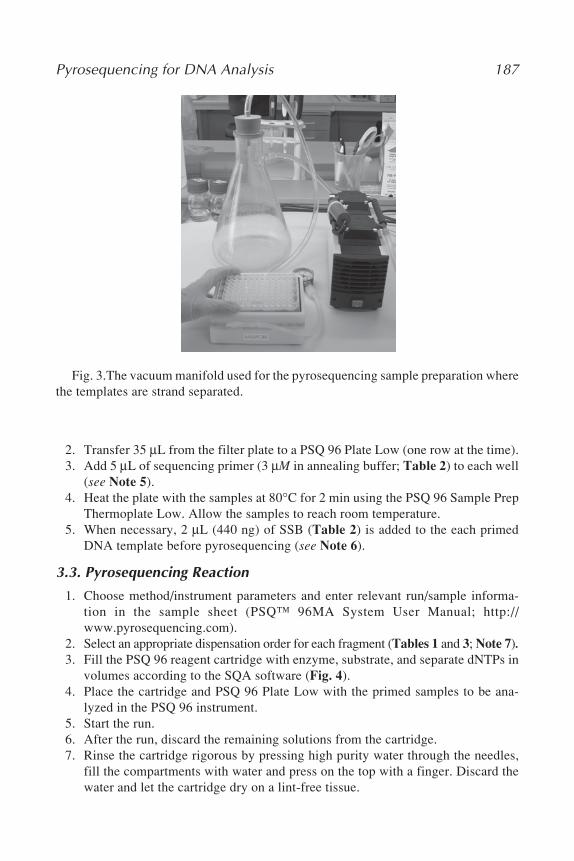
Pyrosequencing for DNA Analysis 187
Fig. 3.The vacuum manifold used for the pyrosequencing sample preparation wherethe templates are strand separated.
2. Transfer 35 µL from the filter plate to a PSQ 96 Plate Low (one row at the time).3. Add 5 µL of sequencing primer (3 µM in annealing buffer; Table 2) to each well
(see Note 5).4. Heat the plate with the samples at 80°C for 2 min using the PSQ 96 Sample Prep
Thermoplate Low. Allow the samples to reach room temperature.5. When necessary, 2 µL (440 ng) of SSB (Table 2) is added to the each primed
DNA template before pyrosequencing (see Note 6).
3.3. Pyrosequencing Reaction
1. Choose method/instrument parameters and enter relevant run/sample informa-tion in the sample sheet (PSQ™ 96MA System User Manual; http://www.pyrosequencing.com).
2. Select an appropriate dispensation order for each fragment (Tables 1 and 3; Note 7).3. Fill the PSQ 96 reagent cartridge with enzyme, substrate, and separate dNTPs in
volumes according to the SQA software (Fig. 4).4. Place the cartridge and PSQ 96 Plate Low with the primed samples to be ana-
lyzed in the PSQ 96 instrument.5. Start the run.6. After the run, discard the remaining solutions from the cartridge.7. Rinse the cartridge rigorous by pressing high purity water through the needles,
fill the compartments with water and press on the top with a finger. Discard thewater and let the cartridge dry on a lint-free tissue.

188 Allen and Andréasson
Table 3Directed Dispensation Orders
Sequenceprimer (5') Dispensation order (5' to 3')
431 TATTCCTCTCACTCCATACTCACTCATCTCATCAATACAACCGCATCTACCAGCACACACACACGCTGCTACCATACCGAACCACAACCAAGACA
790 TTGACTGCGTGGCTGATTGCTGTCATTGATCGGTGATGATTAGAGCTTGGAACTCACTGGAACTGGATTGCTGCATGTGTATCTACTAGAGCTA
2680 GAGCGGACATACACAGCAGACGAGAGACCTATGAGCTTATTATATGCAACAGTACTACAACCACAGTCTAACTACAC
2988 TCCGTACATGTGCAGCGCTATCAGAAGTCGTTGTCACGATAAGTTCTACGTGAATCTGAGTTCAAGACGGAGTAGCAGTCG
4156 AACTCTACACTGCTCACCTAGCATACTATATGATCAGATGTCTCATACCATACATCTCAGCATCCTCAACTAGAAT
4275 TATAGAGCTAACCTATTCTAGACTATGAGA
6990 CGATACTAACGTTGTAGCTCACTTCCACTAATGTCCTATCAATAGGAAGCTGTTATTGGCCATCAATAGGAGGCTTCATTCACTGATTCCTATTCTCAGCTA
8665 AACAATGATCATACATGACACACAATCGCACTAAGGACGACCTGATCGTCTCTATACTAGTATCTATCATTATGCACACTACTC
9107 GTATGTGATATGCTAGGTGCTGCTCATAGTGCATGAGTAGTGCTGCAGTATGTAGCGTAGCGTACGCAGGCTATGTGATGAGTAGCTGATGTTCGA
10205 GTAGCTATACTCTATATTGATCTAGAATGCTCCTTACCTACATGAGCCTACAACACTACTGCCACTATAGTATGTCATCCTCTATATCATCATC
10362 AGATAGACTGAGCGAATTGTATATAGTTACAACGATTGATCGGACCTCCATATATGATATCATTATTACATGCCTCATTAC
12346 CCTGTACACTCCTATCCATCTTATCGCACTCGTACCTGACACAACTCATACCATATGTAATCATGTCGCATCACCTTATTATCAGTCTC
12673 TATGCACTACTCATCGTATCCTAATTACATACTATCTAGTTACGCTGACACCAACTATCCACTGTCATCGCTGAGAGGCGTAGAT
15758 GCTACCTTACATCATGACAGTAGCATCGTACTATACTCACACAATCTAATCTATACACCTATCTCTATGACA
15978 TTGTCTGAAGTTCATCTCGTCTACAAGACTGGTGTATAGTTATACTACAAGACAGGCCATTGAGTTATTGTCATAGG
16496 GGTCAGCATAAGTCACTGACTAATAGCCACACGTCCTTAATAGACATCACGATGATCACAGTCTATCACCTATACACTCACGG
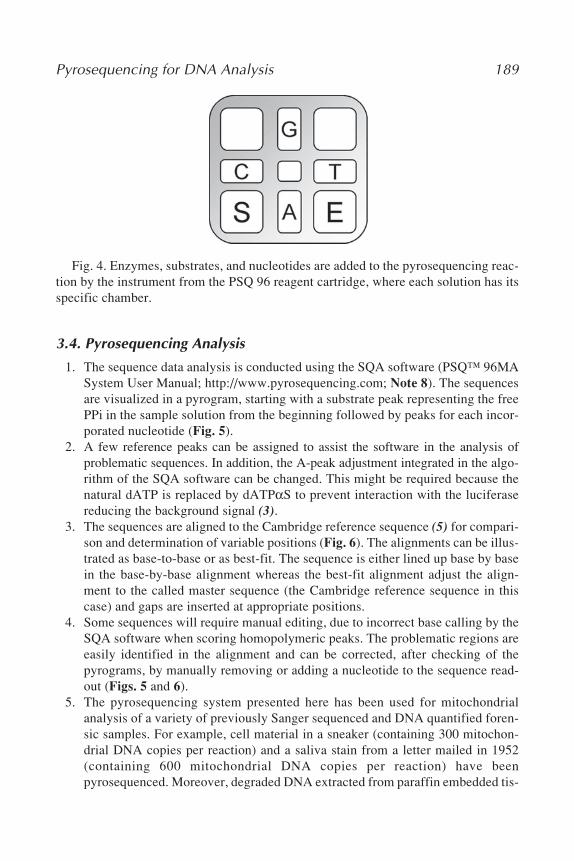
Pyrosequencing for DNA Analysis 189
Fig. 4. Enzymes, substrates, and nucleotides are added to the pyrosequencing reac-tion by the instrument from the PSQ 96 reagent cartridge, where each solution has itsspecific chamber.
3.4. Pyrosequencing Analysis
1. The sequence data analysis is conducted using the SQA software (PSQ™ 96MASystem User Manual; http://www.pyrosequencing.com; Note 8). The sequencesare visualized in a pyrogram, starting with a substrate peak representing the freePPi in the sample solution from the beginning followed by peaks for each incor-porated nucleotide (Fig. 5).
2. A few reference peaks can be assigned to assist the software in the analysis ofproblematic sequences. In addition, the A-peak adjustment integrated in the algo-rithm of the SQA software can be changed. This might be required because thenatural dATP is replaced by dATPαS to prevent interaction with the luciferasereducing the background signal (3).
3. The sequences are aligned to the Cambridge reference sequence (5) for compari-son and determination of variable positions (Fig. 6). The alignments can be illus-trated as base-to-base or as best-fit. The sequence is either lined up base by basein the base-by-base alignment whereas the best-fit alignment adjust the align-ment to the called master sequence (the Cambridge reference sequence in thiscase) and gaps are inserted at appropriate positions.
4. Some sequences will require manual editing, due to incorrect base calling by theSQA software when scoring homopolymeric peaks. The problematic regions areeasily identified in the alignment and can be corrected, after checking of thepyrograms, by manually removing or adding a nucleotide to the sequence read-out (Figs. 5 and 6).
5. The pyrosequencing system presented here has been used for mitochondrialanalysis of a variety of previously Sanger sequenced and DNA quantified foren-sic samples. For example, cell material in a sneaker (containing 300 mitochon-drial DNA copies per reaction) and a saliva stain from a letter mailed in 1952(containing 600 mitochondrial DNA copies per reaction) have beenpyrosequenced. Moreover, degraded DNA extracted from paraffin embedded tis-

190A
llen and Andréasson
Fig. 5. Pyrogram with the added components (enzyme, substrate, or nucleotides) on the x-axis and light intensity on the y-axis.The height of the peaks is proportional to the number of incorporated nucleotides; however, there is a drop off in peak height overtime, which is taken in to account by the software. The substrate peak shows the conversion of free PPi in the sequencing reactionfrom the start. In this example a directed dispensation order has been used (fragment 15978).
Fig. 6. Best-fit alignment of three control samples to the Cambridge reference sequence (5) (fragment 15978) Two variablepositions (position 15928 and 15930) can easily be detected. When scoring the sequence, a problematic homopolymeric region forthe SQA algorithm occurs 53–56 nucleotides downstream. However, these errors can easily be edited manually.

Pyrosequencing for DNA Analysis 191
sue was successfully analyzed using pyrosequencing (Fig. 7). The mitochondrialDNA quantification was performed with a highly sensitive, rapid and reliablereal-time 5' exonuclease detection system, using the ABI PRISM® 7700 instru-ment (Applied Biosystems, Foster City, CA). The system is based on simulta-neous amplification of the nuclear retinoblastoma 1 gene (for nuclearquantification) and the mitochondrial tRNA Lys gene (for mitochondrial quanti-fication; ref. 8).
6. The mitochondrial pyrosequencing system has been used on previously mtDNAanalyzed forensic casework materials. In a case in Stockholm, in 1999, a girl anda boy were severely molested by adults who thought that the children were ob-sessed by demons. In what was thought to be a exorcism ritual, the girl was mur-dered, and a bible with a small stain was found on the scene of the crime. Themitochondrial DNA analysis showed identical sequences between the stain onthe bible and the blood of the 11-yr-old girl (Fig. 8).
4. Notes1. All solutions for sample preparation (binding buffer, denaturation solution, wash-
ing buffer, and annealing buffer) are available from Pyrosequencing AB, UppsalaSweden, separate or together in a PSQ 96 Sample Preparation Kit.
2. There is a PSQ 96 Vacuum Prep Tool available from Pyrosequencing AB tofacilitate the production of single-stranded DNA. This hand-held tool with 96replaceable filter probes is connected to a vacuum source and can be used with orwithout the use of the PSQ 96 Vacuum Prep Worktable, which has specific hold-ers for all plates and trays used in the strand separation process. A vacuum switchand a manometer are positioned on the front of the table to assist handling andmonitoring (Fig. 9). These sample preparation tools (PSQ™ Vacuum Prep Work-station; Product Information 014; http://www.pyrosequencing.com) are designedto process up to 96 DNA samples in parallel, from PCR-products to single-stranded sequencing templates, in less than 15 min. Actual hands-on time is lessthan 1 min, and each set of filter probes can be reused at least 100 times, if simplycleaned (flushing with water) after each use.
3. When using only a few wells of the filter plate, cover the rest of the plate toaccelerate the filtration.
4. Excess wash liquid may remain underneath the wells of the filter plate after thewash step. Remove the liquid by gently tapping the filter plate on a piece of lint-free tissue.
5. To save time, dilute the sequencing primer in annealing buffer during the immo-bilization step and add it to the PSQ 96 Plate Low before the single-strandedtemplate from the filter plate.
6. SSB can alternatively be added to the primed samples in the PSQ 96 Plate Lowwith the help of the PSQ 96 reagent cartridge (50 µL as a dead volume plus 3.3µL per well) prior to the actual pyrosequencing run (see PSQ 96 software usermanual for details).

192A
llen and Andréasson
Fig. 7. Pyrosequencing of different evidence materials (fragment 45). A variable position can be seen at nucleotide position 73.Top, DNA sample from a paraffin-embedded tissue. Middle, Cell material from a sneaker. Bottom, Saliva stain from an old letter.
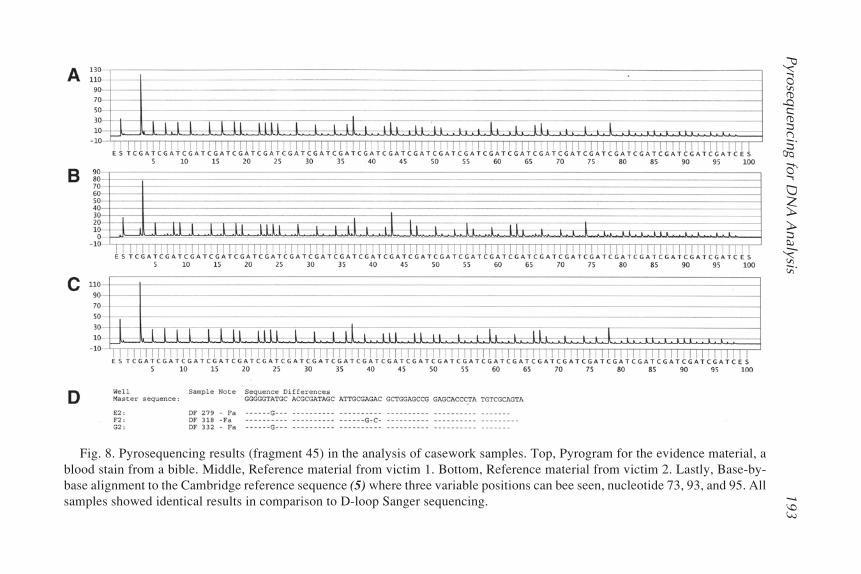
Pyrosequencing for DN
A A
nalysis193
Fig. 8. Pyrosequencing results (fragment 45) in the analysis of casework samples. Top, Pyrogram for the evidence material, ablood stain from a bible. Middle, Reference material from victim 1. Bottom, Reference material from victim 2. Lastly, Base-by-base alignment to the Cambridge reference sequence (5) where three variable positions can bee seen, nucleotide 73, 93, and 95. Allsamples showed identical results in comparison to D-loop Sanger sequencing.
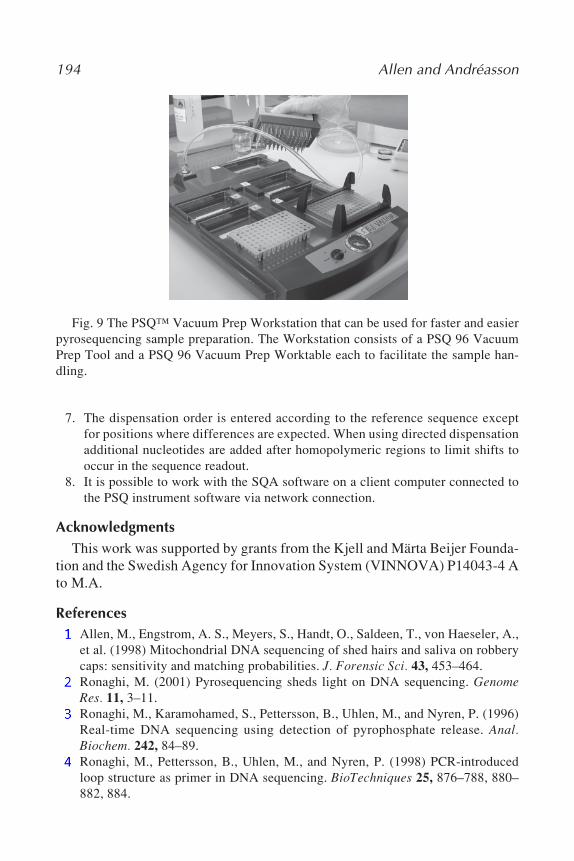
194 Allen and Andréasson
Fig. 9 The PSQ™ Vacuum Prep Workstation that can be used for faster and easierpyrosequencing sample preparation. The Workstation consists of a PSQ 96 VacuumPrep Tool and a PSQ 96 Vacuum Prep Worktable each to facilitate the sample han-dling.
7. The dispensation order is entered according to the reference sequence exceptfor positions where differences are expected. When using directed dispensationadditional nucleotides are added after homopolymeric regions to limit shifts tooccur in the sequence readout.
8. It is possible to work with the SQA software on a client computer connected tothe PSQ instrument software via network connection.
AcknowledgmentsThis work was supported by grants from the Kjell and Märta Beijer Founda-
tion and the Swedish Agency for Innovation System (VINNOVA) P14043-4 Ato M.A.
References1. Allen, M., Engstrom, A. S., Meyers, S., Handt, O., Saldeen, T., von Haeseler, A.,
et al. (1998) Mitochondrial DNA sequencing of shed hairs and saliva on robberycaps: sensitivity and matching probabilities. J. Forensic Sci. 43, 453–464.
2. Ronaghi, M. (2001) Pyrosequencing sheds light on DNA sequencing. GenomeRes. 11, 3–11.
3. Ronaghi, M., Karamohamed, S., Pettersson, B., Uhlen, M., and Nyren, P. (1996)Real-time DNA sequencing using detection of pyrophosphate release. Anal.Biochem. 242, 84–89.
4. Ronaghi, M., Pettersson, B., Uhlen, M., and Nyren, P. (1998) PCR-introducedloop structure as primer in DNA sequencing. BioTechniques 25, 876–788, 880–882, 884.
Pyrosequencing for DNA Analysis 195
5. Anderson, S., Bankier, A. T., Barrell, B. G., de Bruijn, M. H., Coulson, A. R.,Drouin, J., et al. (1981) Sequence and organization of the human mitochondrialgenome. Nature 290, 457–465.
6. Herrnstadt, C., Elson, J. L., Fahy, E., Preston, G., Turnbull, D. M., Anderson, C.,et al. (2002) Reduced-median-network analysis of complete mitochondrial DNAcoding-region sequences for the major African, Asian, and European haplogroups.Am. J. Hum Genet. 70, 1152–1171.
7. Andreasson, H., Asp, A., Alderborn, A., Gyllensten, U., and Allen, M. (2002)Mitochondrial sequence analysis for forensic identification using pyrosequencingtechnology. BioTechniques 32, 124–126, 128, 130–133.
8. Andreasson, H., Gyllensten, U., and Allen, M. (2002) Real-time DNA quantifica-tion of nuclear and mitochondrial DNA in forensic analysis. BioTechniques 33,402–404, 407–411.

SNaPshot for mtDNA Genotyping 197
197
From: Methods in Molecular Biology, vol. 297: Forensic DNA Typing ProtocolsEdited by: A. Carracedo © Humana Press Inc., Totowa, NJ
14
SNaPshot Typing of Mitochondrial DNA CodingRegion Variants
Antonio Salas, Beatriz Quintáns, and Vanesa Álvarez-Iglesias
SummaryWe describe a rapid and robust assay to genotype mitochondrial deoxyribonucleic
acid (mtDNA) coding region single nucleotide polymorphism (SNPs) using the SNaPshot(Applied Biosystems, Foster City, CA) minisequencing reaction kit. A protocol formtDNA SNaPshot typing is described in detail, although we emphasize that this methodallows great flexibility in the implementation of whatever set of mtDNA SNPs. We dis-cuss the utility of our selection of mtDNA SNPs for molecular anthropologists and foren-sic geneticists. Firstly, these SNPs allow allocating common mitochondrial West Eurasianhaplotypes into their corresponding branches of the mtDNA skeleton, with especial at-tention to the subdivision of sequences belonging to haplogroup H, the most frequentEuropean haplogroup (40–50%) and the worst phylogenetically characterized in the firstand second hypervariable segments (HVS-I/II; by far, the most common segments ana-lyzed by sequencing). Second, the polymorphic positions selected for this multiplex reac-tion considerably increase the discrimination power of current mitochondrial analysis inthe forensic field. The method shows high accuracy and robustness, avoiding both theuse of alternative time-consuming classical strategies (i.e., restriction fragment lengthpolymorphism typing) and the requirement of high quantities of DNA template.
Key Words: SNaPshot; SNPs; mtDNA; hypervariable region; human identification.
1. IntroductionThe interest in single nucleotide polymorphisms (SNPs) is continuously
growing as a result of their numerous applications in medical genetics (1,2),for instance, disease diagnostics and pharmacological response studies, in humanand evolutionary genetics (e.g., 3), and also in the forensics field (e.g., 4).
Mitochondrial deoxyribonucleic acid (mtDNA) molecules have specific fea-tures that make them especially useful in forensic casework and human popu-lation studies: 1) rapid mutation rate, 2) high copy number per mitochondrion
198 Salas et al.
and cell, and 3) it does not recombine and it is maternally inherited as an hap-lotype block. Analysis of mtDNA polymorphisms has become a useful tool forhuman population and molecular evolution studies, allowing the inference ofpatterns of female migrations and peopling of different worldwide populations(e.g., 5,6). Mutations are recorded in the molecule, and transferred generationto generation mirroring the evolutionary history of the locus. In forensic genet-ics, polymorphisms of the mtDNA genome are useful for human identification,especially for the analysis of degraded material or samples containing little orno genomic DNA (i.e., skeletal remains and hair shafts; refs, 7–12). However,the two routinely analyzed mtDNA hypervariable regions (HVS-I and HVS-II)provide limited power of discrimination in a forensic context and, in many cases,provide scarce information in evolutionary studies. Because sequencing of theentire mitochondrial molecule is not practical, the analysis of additional infor-mation found in the mtDNA-coding region seems to be a good strategy to shortcut this drawback.
Polymerase chain reaction (PCR) amplification followed by restriction frag-ment analysis (RFLP typing) and manual polyacrylamide gel electrophoresisis a popular technique commonly used for studying point mutations in mtDNA(specially outside the control region). This method has the drawback of beingtime-consuming, costly, and requiring high amounts of DNA. Note that thelater is of particular relevance in the forensic context. During the last few years,new methodologies for high-throughput SNP analysis have been developed.These methods include real-time PCR analysis, microarrays scanning, matrix-assisted laser desorption ionization time-of-flight, pyrosequenc-ing, TaqManprobes, and molecular beacons (13–15). Most of these high-throughput tech-nologies are extremely expensive and therefore cannot be used by a greatmajority of researchers in standard laboratories. Furthermore, many of themare still in varying phases of development.
Here we show an alternative for SNP typing that is rapid, robust, and rela-tively cheap. The SNaPshot (Applied Biosystems, Foster City, CA) multiplexreaction is a single-base extension reaction that enables robust multiplex SNPinterrogation of PCR-generated templates.
SNaPshot reaction is based on the dideoxy (ddNTP) single-base extensionof an unlabeled oligonucleotide at the 3' end of the base immediately adjacentto the SNP (in absence of dNTPs in the reaction). Unlabeled primers (with the 5'end tailed) with varying lengths of noncomplementary oligonucleotide sequencesserve as a mobility modifier. In addition, each ddNTP is labeled with differentfluorescent dyes. The extended SNaPshot primers used to interrogate differentSNPs differ between them by size and color. The resulting products can beseparated electrophoretically in a single capillary and analyzed in the presenceof a fifth-dye-labeled size standard.

SNaPshot for mtDNA Genotyping 199
Here, we describe a method for typing 17 coding region SNPs in two inde-pendent multiplex amplifications and one SNaPshot reaction (that is, the twomultiplexes amplification products are mixed in a tube and minisequenced in asingle reaction). Figure 1 shows the electropherogram for the 17 coding regionmtDNA SNPs. With this technology and using a 16 multicapillary machine, 16samples can be typed for 17 SNPs in less than 25 min, including capillaryfilling, sample loading, and separation of the fragments. Thus, 17 SNPs can beanalyzed in an approximately maximum number of 920 samples per day.
Note that the method SNaPshot is flexible and performs well with othercombinations of SNPs. As we explain below, it is only necessary to optimizeSNaPshot reaction conditions depending on the number of SNPs we desire totype, as well as primer amplification, and minisequencing primers. Therefore,SNaPshot has an enormous potential as a substitute technique for SNP typingin more complex platforms, such as matrix-assisted laser desorption/ionizationtime-of-flight, microarrays technologies, etc. Note, however, that the number
Fig. 1. Electropherograms of 17 SNPs-multiplex assay for three different samples.Polymorphisms refer to the L strand and following the rCRS (19), including thoseinterrogated using minisequencing primers located in H chain (3915, 10400, 4769,10873, 4793, and 6776).
200 Salas et al.
of SNPs that can be typed in single SNaPshot reaction is probably limited to afew (probably less than 40).
Therefore, as an example of the potential of the SNaPshot method, we showa protocol to simultaneously genotype 17 mtDNA-selected SNPs for forensicand anthropological applications. The selected markers avoid the use of com-mon time-consuming and expensive strategies when typing individuals ofwestern European ancestry. Special attention has been placed on thesubtyping of haplogroup H, which is the most frequent lineage in these popu-lations and the worst characterized when looking at the HVS-I/II segments (themost common mtDNA region analyzed by medical, forensic, and anthropo-logical geneticists).
2. Materials1. PCR reagents: Human DNA, AmpliTaq Gold® DNA polymerase and 10X
GeneAmp® PCR Buffer II (Applied Biosystems), MgCl2, dNTPs, PCR primers(Sigma-Genosys Ltd, Pampisford, Cambs, UK).
2. PCR purification: ExoSap IT (Amershan Biosciences).3. SNaPshot reaction: Purified PCR products, SNaPshot multiplex kit (Applied
Biosystems, Foster City, CA, USA), high-performance liquid chromatography-purified extension primers (Sigma-Genosys Ltd, Pampisford, Cambs, UK).
4. Purification post-extension: Minisequencing product, SAP (Amershan Bio-sciences).
5. Data analysis: Purified minisequencing product, HiDi™ formamide (AppliedBiosystems), GeneScan-120 LIZ size standard (Applied Biosystems), ABIPRISM 3100® Genetic Analyzer (Applied Biosystems), Performance optimumpolymer 4 (POP4®), GeneScanTM 3.7 Software (Applied Biosystems).
3. MethodsThe SNaPshot multiplex kit (Applied Biosystems) provides all the neces-
sary reagents to perform high-throughput SNP typing in a multicapillary sequencer.Although the manufacture protocol recommends SNP marker sized between 20and 105 bp, as we will see, bigger amplicon sizes can perfectly be typed. Moreinstructions related to the kit, size standard, software, and matrix standard areprovided by the company. Here, we describe a protocol specifically designedfor mtDNA typing.
3.1. PCR Multiplex
Two multiplex reactions were designed to type 17 different mtDNA codingregion SNPs.
1. Multiplex 1 includes a selection of SNPs defining common European haplogroups(see ref. 16 and references therein).

SNaPshot for mtDNA Genotyping 201
2. Multiplex 2 exclusively includes polymorphisms defining subhaplogroups insidehaplogroup H. The characterization of H sublineages is mainly based on the com-plete sequences available in Herrnstadt et al. (17).
3.2. Multiplex Primers Design
Primers were designed (except for testing position 12308, which were pre-viously described by Torroni et al. [18]), in order to adjust the annealing tem-peratures and amplicon lengths to the multiplex reactions (Table 1).
Primers3 software (http://frodo.wi.mit.edu/cgi-bin/primer3/primer3_www.cgi) was used for primer design. It is recommended to test the primersfor possible repetitive sequences. Primer sequences were also screened usingthe BLAST at the National Center for Biotechnology Information (NCBI)(http://www.ncbi.nlm.nih.gov/blast/blast.cgi).
3.3. Coamplification of PCR Products
Coamplification in the same amplicon can be conducted for those SNPsclosely related within the mtDNA molecule. It is important to remember that,for forensic purposes, it is convenient to obtain PCR products of low size tofacilitate the analysis of degraded samples or carrying low quantities of DNA.In our set of SNPs, amplicons range from 80 to 224 bp.
3.4. Optimization of PCR Reactives
It is convenient to optimize all PCR reactives to obtain a well-balancedmultiplex amplification; special attention should be given to primer concentra-tion, MgCl2, and amount of DNA template. Our multiplex were performedusing 10 ng of DNA template in a 25-µL reaction volume comprising 1X TaqGold Buffer (Applied Biosystems), 200 µM of each dNTP, 2 mM MgCl2, and0.5 units of AmpliTaq Gold Polymerase (Applied Biosystems). Primers con-centrations for Multiplex 1 are between 0.1 µM and 0.4 µM (Table 1), and0.15 µM of each forward and reverse for Multiplex 2.
3.5. Amplification Reaction
We have conducted PCR amplifications in a 9700 Termocycler (AppliedBiosystems) according to the following protocol: 1) 95°C preincubation stepfor 11 min; 2) 32 cycles using the following conditions: denaturation: 94°C for30 s, annealing at 60°C for 30 s, and extension at 72°C during 1 min; and 3)15 min of final extension at 72°C. It is convenient to check the multiplexPCR products using polyacrylamide gel electrophoresis (i.e., T9C5), at leastwhile the conditions for the specific multiplex under study are not completelyoptimized.
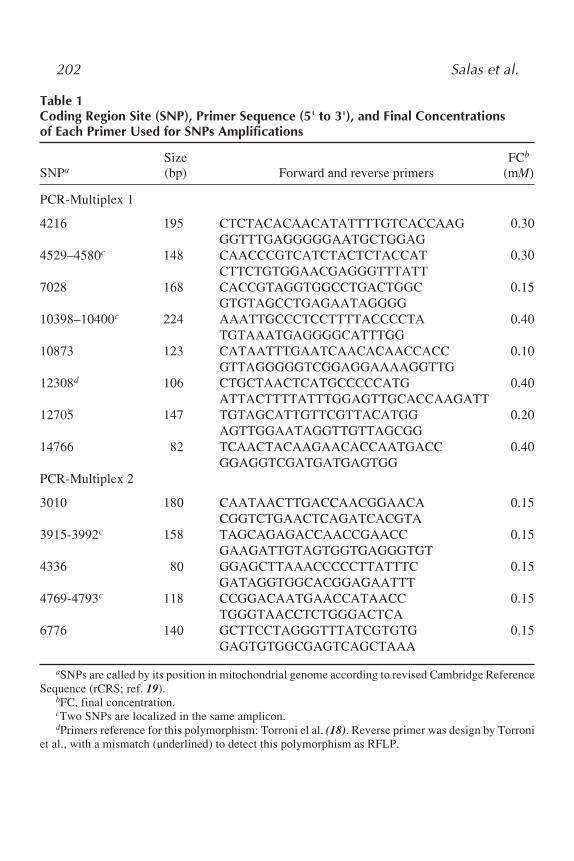
202 Salas et al.
Table 1Coding Region Site (SNP), Primer Sequence (5' to 3'), and Final Concentrationsof Each Primer Used for SNPs Amplifications
Size FCb
SNPa (bp) Forward and reverse primers (mM)
PCR-Multiplex 1
4216 195 CTCTACACAACATATTTTGTCACCAAG 0.30GGTTTGAGGGGGAATGCTGGAG
4529–4580c 148 CAACCCGTCATCTACTCTACCAT 0.30CTTCTGTGGAACGAGGGTTTATT
7028 168 CACCGTAGGTGGCCTGACTGGC 0.15GTGTAGCCTGAGAATAGGGG
10398–10400c 224 AAATTGCCCTCCTTTTACCCCTA 0.40TGTAAATGAGGGGCATTTGG
10873 123 CATAATTTGAATCAACACAACCACC 0.10GTTAGGGGGTCGGAGGAAAAGGTTG
12308d 106 CTGCTAACTCATGCCCCCATG 0.40ATTACTTTTATTTGGAGTTGCACCAAGATT
12705 147 TGTAGCATTGTTCGTTACATGG 0.20AGTTGGAATAGGTTGTTAGCGG
14766 82 TCAACTACAAGAACACCAATGACC 0.40GGAGGTCGATGATGAGTGG
PCR-Multiplex 2
3010 180 CAATAACTTGACCAACGGAACA 0.15CGGTCTGAACTCAGATCACGTA
3915-3992c 158 TAGCAGAGACCAACCGAACC 0.15GAAGATTGTAGTGGTGAGGGTGT
4336 80 GGAGCTTAAACCCCCTTATTTC 0.15GATAGGTGGCACGGAGAATTT
4769-4793c 118 CCGGACAATGAACCATAACC 0.15TGGGTAACCTCTGGGACTCA
6776 140 GCTTCCTAGGGTTTATCGTGTG 0.15GAGTGTGGCGAGTCAGCTAAA
aSNPs are called by its position in mitochondrial genome according to revised Cambridge ReferenceSequence (rCRS; ref. 19).
bFC, final concentration.cTwo SNPs are localized in the same amplicon.dPrimers reference for this polymorphism: Torroni el al. (18). Reverse primer was design by Torroni
et al., with a mismatch (underlined) to detect this polymorphism as RFLP.
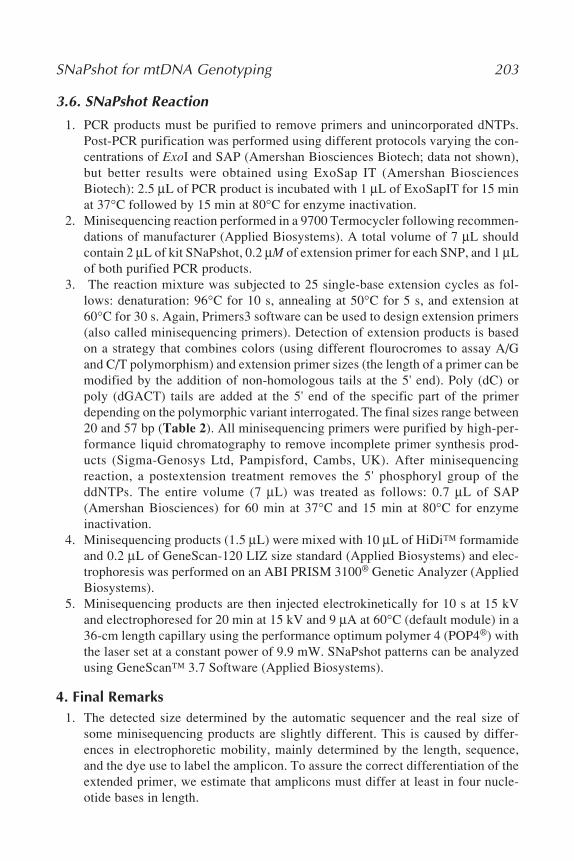
SNaPshot for mtDNA Genotyping 203
3.6. SNaPshot Reaction
1. PCR products must be purified to remove primers and unincorporated dNTPs.Post-PCR purification was performed using different protocols varying the con-centrations of ExoI and SAP (Amershan Biosciences Biotech; data not shown),but better results were obtained using ExoSap IT (Amershan BiosciencesBiotech): 2.5 µL of PCR product is incubated with 1 µL of ExoSapIT for 15 minat 37°C followed by 15 min at 80°C for enzyme inactivation.
2. Minisequencing reaction performed in a 9700 Termocycler following recommen-dations of manufacturer (Applied Biosystems). A total volume of 7 µL shouldcontain 2 µL of kit SNaPshot, 0.2 µM of extension primer for each SNP, and 1 µLof both purified PCR products.
3. The reaction mixture was subjected to 25 single-base extension cycles as fol-lows: denaturation: 96°C for 10 s, annealing at 50°C for 5 s, and extension at60°C for 30 s. Again, Primers3 software can be used to design extension primers(also called minisequencing primers). Detection of extension products is basedon a strategy that combines colors (using different flourocromes to assay A/Gand C/T polymorphism) and extension primer sizes (the length of a primer can bemodified by the addition of non-homologous tails at the 5' end). Poly (dC) orpoly (dGACT) tails are added at the 5' end of the specific part of the primerdepending on the polymorphic variant interrogated. The final sizes range between20 and 57 bp (Table 2). All minisequencing primers were purified by high-per-formance liquid chromatography to remove incomplete primer synthesis prod-ucts (Sigma-Genosys Ltd, Pampisford, Cambs, UK). After minisequencingreaction, a postextension treatment removes the 5' phosphoryl group of theddNTPs. The entire volume (7 µL) was treated as follows: 0.7 µL of SAP(Amershan Biosciences) for 60 min at 37°C and 15 min at 80°C for enzymeinactivation.
4. Minisequencing products (1.5 µL) were mixed with 10 µL of HiDi™ formamideand 0.2 µL of GeneScan-120 LIZ size standard (Applied Biosystems) and elec-trophoresis was performed on an ABI PRISM 3100® Genetic Analyzer (AppliedBiosystems).
5. Minisequencing products are then injected electrokinetically for 10 s at 15 kVand electrophoresed for 20 min at 15 kV and 9 µA at 60°C (default module) in a36-cm length capillary using the performance optimum polymer 4 (POP4®) withthe laser set at a constant power of 9.9 mW. SNaPshot patterns can be analyzedusing GeneScan™ 3.7 Software (Applied Biosystems).
4. Final Remarks1. The detected size determined by the automatic sequencer and the real size of
some minisequencing products are slightly different. This is caused by differ-ences in electrophoretic mobility, mainly determined by the length, sequence,and the dye use to label the amplicon. To assure the correct differentiation of theextended primer, we estimate that amplicons must differ at least in four nucle-otide bases in length.

204Salas et al.
Table 2Minisequencing Primer Sequences
Base Size FCSNP Chain change (bps) Extension primera (µM)b
3010 L G-A 24 CTCGATGTTGGATCAGGACATCCC 0.103915 H G-A 32 TGACTGACTAAGCCTGAGACTAGTTCGGACTC 0.203992 L C-T 45 TGACTGACTGACTGACTGACTCCCTATTCTTCATAGCCGAATACA 0.304216 L T-C 33 CCCCTACCACTCACCCTAGCATTACTTATATGA 0.204336 L T-C 55 CTGACTGACTGACTGACTGACTGACTGACTGCTTAAACCCCCTTATTTCTAGGAC 0.204529 L A-T 21 CTTTGCAGGCACACTCATCAC 0.154580 L G-A 28 TTACCTGAGTAGGCCTAGAAATAAACAT 0.104769 H A-G 40 GACTGACTGACTGGGCTATTCCTAGTTTTATTGCTATAGC 0.304793 H A-C 50 GACTGACTGACTGACTGACTGACTGACTCTACTCAGAAGTGAAAGGGGGC 0.406776 H T-C 55 ACTGACTGACTGACTGACTGACTCGTGTGTCTACGTCTATTCCTACTGTAAATAT 0.307028 L C-T 25 TACACGACACGTACTACGTTGTAGC 0.1010398 L A-G 57 GACTGACTGACTGACTGACTGACTGACTATGAGTGACTACAAAAAGGATTAGACTGA 0.5010400 H C-T 37 CCCCCCCCCCCGTTTTGTTTAAACTATATACCAATTC 0.5010873 H T-C 45 CCCCCCCCCCCCCCCGTTGTTGTTGATTTGGTTAAAAAATAGTAG 0.1012308 L A-G 41 CCCCCCCCCCCCCCCCCCCCCCCATTGGTCTTAGGCCCCAA 0.4012705 L C-T 49 CCCCCCCCCCCCCCCCCAACATTAATCAGTTCTTCAAATATCTACTCAT 0.3014766 L C-T 20 AATGACCCCAATACGCAAAA 0.30
Second column denotes the chain for primer annealing. Polymorphisms refer to the L strand and follow the standard nomenclature of rCRS (21).aThe nonspecific primer tail of polyC or polyGACT is underlined.bFC, final concentration.
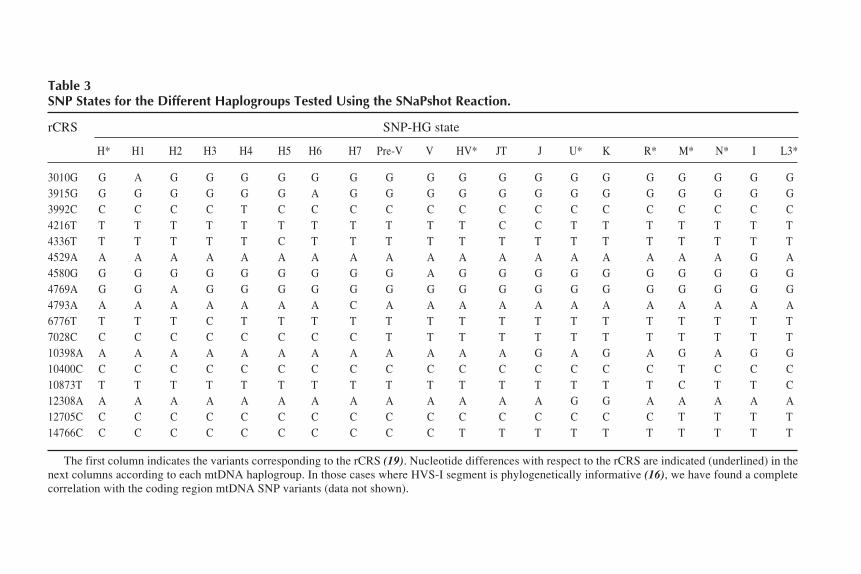
SNaPshot for m
tDN
A G
enotyping205
Table 3SNP States for the Different Haplogroups Tested Using the SNaPshot Reaction.
rCRS SNP-HG state
H* H1 H2 H3 H4 H5 H6 H7 Pre-V V HV* JT J U* K R* M* N* I L3*
3010G G A G G G G G G G G G G G G G G G G G G3915G G G G G G G A G G G G G G G G G G G G G3992C C C C C T C C C C C C C C C C C C C C C4216T T T T T T T T T T T T C C T T T T T T T4336T T T T T T C T T T T T T T T T T T T T T4529A A A A A A A A A A A A A A A A A A A G A4580G G G G G G G G G G A G G G G G G G G G G4769A G G A G G G G G G G G G G G G G G G G G4793A A A A A A A A C A A A A A A A A A A A A6776T T T T C T T T T T T T T T T T T T T T T7028C C C C C C C C C T T T T T T T T T T T T10398A A A A A A A A A A A A A G A G A G A G G10400C C C C C C C C C C C C C C C C C T C C C10873T T T T T T T T T T T T T T T T T C T T C12308A A A A A A A A A A A A A A G G A A A A A12705C C C C C C C C C C C C C C C C C T T T T14766C C C C C C C C C C C T T T T T T T T T T
The first column indicates the variants corresponding to the rCRS (19). Nucleotide differences with respect to the rCRS are indicated (underlined) in thenext columns according to each mtDNA haplogroup. In those cases where HVS-I segment is phylogenetically informative (16), we have found a completecorrelation with the coding region mtDNA SNP variants (data not shown).

206 Salas et al.
2. As seen in the electropherograms, some fragments display a stronger fluorescentsignal than others (even after color compensation with corresponding matrix) asa result of the nature of the minisequencing chemistry; therefore, the same SNPcan be detected by the automatic sequencer as a higher or lower peak dependingon the inserted ddNTPs. In general, guanines labeled with dR100 bring a highersignal than the others ddNTPs. However, this fact does not alter the readability ofthe electropherogram.
3. All the samples SNaPshot typed in this experiment were previously sequenced forthe mtDNA HVS-I region. There was good phylogenetic agreement (16) betweenHVS-I segments and the coding region SNPs typed (Table 3).The forensic utility of the SNPs selected are clearly manifested when looking atthe most frequent European lineage (H; 40–50%). Haplogroup H represents 45%of our samples (a similar value is found in other European populations or ofEuropean ancestry). The use of the SNaPshot reaction allows to subtype thishaplogroup in 6 different sublineages with the following frequencies: 1) H*(23%); 2) H1 (variant 3010A; 39%); 3) H2 (variant 4769A; 7%); 4) H3 (variant6776C; 18%); 5) H4 (variant 3992T; 6%); 6) H5 (variant 4336C; 6%); and 7) H6(variant 3915A; 1%). We did not find any representative of H7 (4793G). Themaximum increment in haplotype diversity corresponds to the most commonHVS-I sequence in Europe, the rCRS in HVS-I (19). There are a total of 44 iden-tical rCRS HVS-I sequences in our (northwest Spain) sample, 18% of them areH*, 41% H1, 5% H2, 20% H3, 14% H4, and 2% HV* (all of them 7028C; haplo-type diversity increase from 0 to 0.737 in this specific set of samples). OtherHVS-I haplotypes also gain in discrimination power when using this set of cod-ing region SNPs. For instance, there are four sequences characterized by the onlytransition at position 16380, two of them harbor 7028T-12308G (U*), one ofthem is 6776C-7028C (H3), and the other is 7028T-14766T (R*).
4. Mitochondrial coding region SNPs are especially useful for human populationgenetics. The use of multiplexes appears as the best methodology for typing smallamounts of SNPs. The need of low quantity of DNA template is valuable in manyanthropological studies. Here, polymorphic sites were selected to assess majorhaplogroups and subhaplogruops of the mtDNA European phylogeny, with spe-cial focus on those with ambiguous HVS-I motifs (16), including the most com-mon haplogroup in Europe (H; 40–50% of the European mtDNA sequences).H-sequences have not diagnostic positions in HVS-I and II segments and are byfar the most common regions analyzed in the clinical, forensic, and human popu-lation genetic literature. A subclassification of these lineages is therefore neces-sary to disentangle population relationships in Europe.
AcknowledgmentsThis work was supported by grants from the Ministerio de Educación y
Ciencia (DGCYT-P4. BIO2000-0145-P4-02), Ministerio de Sanidad (FIS 01/0024), and the Xunta de Galicia (PGIDT-01-PXI-20806-PR and PGIDIT02PXIC20804PN). AS has a research contract with the University of Santiago deCompostela.
SNaPshot for mtDNA Genotyping 207
References1. Evans, W. E., and Relling, M. V. (1999) Pharmacogenomics: translating func-
tional genomics into rational therapeutics. Science 286, 487–491.2. Gwee, P. C., Tang, K., Chua, J. M. Z., Lee, E. J. D., Chong, S. S., and Lee, C. G. L.
(2003) Simultaneous genotyping of seven single-nucleotide polymorphisms in theMDR1 gene by single-tube multiplex minisequencing. Clin. Chem. 49, 672–676
3. Jobling, M., and Tyler-Smith, C. (2000) The human Y chromosome: an evolu-tionary marker comes of age. TIG 16, 356–362
4. Jobling, M., Pandya, A., and Tyler-Smith, C. (1997) The Y chromosome in foren-sic analysis and paternity testing. Int. J. Legal Med. 110, 118–124.
5. Salas, A., Richards, M., De la Fe, T., Lareu, M. V., Sobrino, B., Sánchez-Diz, P.,Macaulay, V., and Carracedo, A. (2002) The making of the African mtDNA land-scape. Am. J. Hum. Genet. 71, 1082–1111.
6. Underhill, P., Passarino, G., Lin, A. A., Shen, P., Mirazon Lahr, M., Foley, R. A.,et al. (2001) The phylogeography of Y chromosome binary haplotypes and theorigins of modern human populations. Ann. Hum. Genet. 65, 43–62.
7. Wilson, M. R., DiZinno, J. A., Polanskey, D., Replogle, J., and Budowle, B. (1995)Validation of mitochondrial DNA sequencing for forensic casework analysis. Int.J. Legal Med. 108, 68–74.
8. Tully, G., Bär, W., Brinkmann, B., Carracedo, A., Gill, P., Morling, N., et al.(2001) Considerations by the European DNA profiling (EDNAP) group on theworking practices, nomenclature and interpretation of mitochondrial DNA pro-files. Forensic Sci. Int. 124, 83–91.
9. Salas, A., Lareu, M. V., and Carracedo, A. (2001) Heteroplasmy in mtDNA andthe weight of evidence in forensic mtDNA analysis: a case report. Int. J. LegalMed. 114, 186–190.
10. Salas, A., Rasmussen, E. M., Lareu, M. V., Morling, N., Carracedo, A. (2001)Fluorescent SSCP of overlapping fragments (FSSCP-OF): a highly sensitivemethod for the screening of mitochondrial DNA variation. Forensic Sci. Int. 124,97–103.
11. Alonso, A., Martin, P., Albarran, C., Garcia, P., Primorac, D., Garcia, O., et al.(2003) Specific quantification of human genomes from low copy number DNAsamples in forensic and ancient DNA studies. Croat. Med. J. 44, 273–280.
12. Prieto, L., Montesino, M., Salas, A., Alonso, A., Albarran, C., Alvarez S, et al.(2003) The 2000–2001 GEP-ISFG Collaborative Exercise on mtDNA: assessingthe cause of unsuccessful mtDNA PCR amplification of hair shaft samples. Foren-sic Sci. Int. 134, 46–53.
13. Syvänen, A. C. (2001)Accessing genetic variation: genotyping single nucleotidepolymorphisms. Nat. Rev. Gent. 2, 930–942.
14. Carracedo, A., Barros, F., Loidi, L., and Domínguez, F. (1998) Progress in meth-odology and standards in European molecular genetics laboratories. Clin. Chim.Acta 278, 163–169.
15. Lareu, M. V., Puente, J., Sobrino, B., Quintáns, B., Brión, M., and Carracedo, A.(2001) The use of the LightCycler for the detection of Y chromosome SNPs. Foren-sic Sci. Int. 118, 163–168.

208 Salas et al.
16. Richards, M., Macaulay, V., Hickey, E., Vega, E., Sykes, B., Guida, V., et al.(2000) Tracing European founder lineages in the Near Eastern mtDNA pool. Am.J. Hum Genet. 67, 1251–1276.
17. Herrnstadt, C., Elson JL, Fahy E, Preston G, Turnbull DM, Anderson C, et al.(2002) Reduced-median-network analysis of complete mitochondrial DNA cod-ing-region sequences for the major African, Asian, and European haplogroups.Am. J. Hum Genet. 70, 1152–1171.
18. Torroni, A., Huoponen, K., Francalacci, P., Petrozzi, M., Morelli, L., Scozzari,R., et al. (1996) Classification of European mtDNAs from an analysis of threeEuropean populations. Genetics 144,, 1835–1850
19. Andrews, R. M., Kubacka, I., Chinnery, P. F., Lightowlers, R. N., Turnbull, D.M., and Howell, N. (1999) Reanalysis and revision of the Cambridge referencesequence for human mitochondrial DNA. Nat. Genet. 23, 147.
Multiplex PCR for SNP Typing 209
209
From: Methods in Molecular Biology, vol. 297: Forensic DNA Typing ProtocolsEdited by: A. Carracedo © Humana Press Inc., Totowa, NJ
15
Typing of Y Chromosome SNPs With MultiplexPCR Methods
Juan J. Sanchez, Claus Børsting, and Niels Morling
SummaryWe describe a method for the simultaneous typing of Y-chromosome single nucle-
otide polymorphism (SNP) markers by means of multiplex polymerase chain reaction(PCR) strategies that allow the detection of 35 Y chromosome SNPs on 25 ampliconsfrom 100 to 200 pg of chromosomal deoxyribonucleic acid (DNA). Multiplex PCR ampli-fication of the DNA was performed with slight modifications of standard PCR conditions.Single-base extension (SBE) was performed using the SNaPshot kit containingfluorescently labeled ddNTPs. The extended primers were detected on an ABI 3100sequencer. The most important factors for the creation of larger SNP typing PCR mul-tiplexes include careful selection of primers for the primary amplification and the SBEreaction, use of DNA primers with homogenous composition, and balancing the primerconcentrations for both the amplification and the SBE reactions.
Key Words: Y chromosome; single nucleotide polymorphism; multiplex PCR;single-base extension; genotyping.
1. IntroductionTyping for single nucleotide polymorphism (SNP) markers in forensic genet-
ics is of interest in certain situations, for example, when only partly degradeddeoxyribonucleic acid (DNA) is available for typing. Typing of Y chromo-some markers (short tandem repeats [STRs] and SNPs) may be of special inter-est in cases with mixed stains with a large proportion of female DNA and asmall proportion of male DNA. To obtain a weight of the evidence from SNPtyping that is comparable to that of STR typing with, for example, 10 autoso-mal STRs, 50–100 autosomal SNPs must be typed (1). A reliable, complete
210 Sanchez et al.
STR profile can be obtained from as few as 100–200 pg of intact DNA. If SNPtyping is going to be used in forensic cases with limited amounts of DNA, it isimportant that all SNPs can be typed from 100 to 1000 pg of DNA. One way toobtain this amount is to amplify a number of DNA regions in multiplex poly-merase chain reaction (PCR). Other methods exist, including an initial randomamplification of DNA and other DNA-amplification methods (2). The subse-quent SNP typing may be performed with assays that are already available,such as primer extension, hybridization, and melting point analysis.
To study the possibilities of typing large number of SNPs for forensic case-work, we decided to analyze the Y chromosome SNPs because Y chromosomeSNPs have only one allele and the results are simple to interpret. We chose toamplify the chromosomal DNA by PCR because we had most experience withthis technology, although other methods are available. We chose the single-base extension (SBE) method with subsequent detection of fluorescently labeledprimers on an ABI 3100 sequencer because this technology was well establishedfor SNP typing in small multiplexes.
Here, we describe the methods for the development of a SNP typing pack-age containing 35 SNPs on 25 amplified DNA fragments on the Y chromo-some. We have successfully used this strategy to build other large SNPmultiplexes, so we anticipate that the strategy can be used by others. A fewconsiderations concerning the strategy and specific comments for the develop-ment of multiplex PCR Y chromosome SNP typing packages and practicalexperiences are offered.
2. Materials2.1. PCR for Target Amplification
1. DNA purification: QIAamp DNA Blood Mini Kit (Qiagen, Hagen, Germany) orFTA paper (Whatman International, Cambridge, UK).
2. Assay for DNA quantification: SYBR Green I using a LightCycler instrument(Roche Diagnostics GmbH, Germany) or Hoechst 33258 (Molecular Probes Inc.,Eugene, OR) using a Hoefer DyNA Quant 200 instrument (Molecular Vision)and calf thymus DNA standard (Sigma-Aldrich, St. Louis, MO).
3. High-performance liquid chromatography-purified PCR primers (TAG A/S,Copenhagen, Denmark).
4. Tris/ethylenediamine tetraacetic acid (EDTA) buffer solution: 10 mM Tris,100 mM EDTA, pH 7.5 (Sigma-Aldrich).
5. GeneAmp PCR reagent kit with AmpliTaq Gold DNA polymerase containing 10XPCR buffer and 25 mM MgCl2 from Applied Biosystems (AB), Foster City, CA.
6. PCR nucleotide mix, 25 mM (Amersham Biosciences, Uppsala, Sweden;Invitrogen, Groningen, The Netherlands).
7. PCR instrument GeneAmp 9600 thermal cycler (PerkinElmer, Wellesley, MA;(see Note 1).
Multiplex PCR for SNP Typing 211
2.2. Electrophoresis
2.2.1. Using Polyacrylamide Gels
1. 40% acrylamide/bisacrylamide 29:1 solution (Bio-Rad Laboratories, Hercules, CA).2. TBE: 89 mM Tris-base, 89 mM boric acid, 2 mM EDTA, pH 8.3 (Sigma-Aldrich).3. TEMED (Tetramethylethylenediamine; Bio-Rad).4. 10-bp ladder (Invitrogen, Groningen, The Netherlands).5. Ethidium bromide (Sigma-Aldrich).
2.2.2. Terminal Transferase Nucleotide Labeling
1. R6G-ddATP (PerkinElmer Life Science).2. Terminal Transferase (20 units/µL) and 5X TdT reaction buffer (Roche Diagnos-
tics GmbH, Germany).
2.3. Single-Base Extension Assay
2.3.1. Purification of the PCR Template Amplification Product
1. MinElute PCR purification spin column (Qiagen, Hagen, Germany).2. Escherichia coli exonuclease I (ExoI), shrimp alkaline phosphatase (SAP) and
ExoSAP-IT (USB Corporation, Cleveland, OH).
2.3.2. Reaction and Electrophoresis
1. ABI Prism SNaPshot Multiplex kit (AB).2. HiDi formamide (Invitrogene).3. Gel or capillary electrophoresis platform for detection of fluorescently labeled
oligonucleotides.
2.4. Databases with Genetic Information
2.4.1. DNA Sequences and SNPs
The following web sites offer free information about DNA sequences, SNPs,chromosome position, surrounding sequence, association with genes, etc.
http://www.ncbi.nlm.nih.gov/SNP/ (NCBI and NHGRI dbSNP)http://snp.cshl.org/ (SNP Consortium)http://hgbase.interactiva.de or http://hgvbase.cgb.ki.se/ (intragenic SNPs)http://snp.ims.u-tokyo.ac.jp/ (Japanese SNP database)http://www.ensembl.org/ (EMBL-EBI and Sanger Institute)http://www-genome.wi.mit.edu/snp/human (Whitehead Institute/MIT Centre forGenome Research)http://ihg.gsf.de/ihg/databases.html (Genetic information servers and databases).http://lpg.nci.nih.gov/GAI (Cancer Genome Anatomy Project).

212 Sanchez et al.
2.4.2. PCR Primer Design
The following web sites offer free assistance for the design of DNA primers.Other sites exist.
http://www.molbiol.bbsrc.ac.uk/reviews.html (reviews of primer design pro-grams)http://ftp.genome.washington.edu/cgi-bin/RepeatMasker (screen for interspacedrepeats and low complexity DNA sequences)http://www-genome.wi.mit.edu/cgi-bin/primer/primer3_www.cgi (primer designprogram with easy to use interface and good help pages)http://biotools.idtdna.com/gateway/ (primer and probe design tool, secondarystructure prediction and comprehensive oligo analysis)http://www.zaik.uni-koeln.de/AFS/Projects/Bioinformatics/sbeprimer.html(primer design program for multiplex SBE-based genotyping).
2.4.3. DNA Sequence Alignment
The following web sites can all be used for alignment. We use them prima-rily to check for ambiguous or homologous sequences.
http://searchlauncher.bcm.tmc.edu/multi-align/multi-align.htmlhttp://genome.ucsc.edu/cgi-bin/hgGateway?org=humanhttp://www.ncbi.nlm.nih.gov/blast/http://www.sanger.ac.uk/HGP/blast_server.shtmlhttp://genes.mit.edu/GENSCAN.htmlhttp://genome.ornl.gov/http://www.ncbi.nlm.nih.gov/genome/sts/epcr.cgihttp://www.ddbj.nig.ac.jp/E-mail/homology.htmlhttp://www.ebi.ac.uk/services/.
3. MethodsThe process of designing a Y chromosome multiplex PCR package for SNP
typing includes the establishment of 1) multiplex PCR amplification of a num-ber of DNA fragments, the concentrations of which are balanced, and 2) amultiplex SBE reaction that gives balanced amounts of SBE products that canbe detected unequivocally so that clear SNP types can be recorded.
In the first amplification phase, it is important to choose a strategy that allowsa combination of 1) flexibility in choosing primers, 2) highly specific reactions,and 3) uniform amplification of PCR products. Once the PCR conditions havebeen selected and a multiplex PCR package has been developed, the additionof further amplicons can only be performed if the new primers can work underthe conditions chosen. If two or more packages have been developed, inter-changes of amplicons between the packages can be performed only if theamplicons can be amplified under similar conditions. We decided to use PCR

Multiplex PCR for SNP Typing 213
conditions primarily defined by a theoretical melting temperature of 60 ± 5°Cat a salt concentration of 180 mM and a purine:pyrimidine ratio close to 1:1. Itis important to be able to detect all the amplicons in order to analyse the prod-ucts for homogeneity and estimate the yield of the PCR amplification so that,at the end, a balanced PCR multiplex consisting of homogeneous ampliconscan be obtained. We chose to detect the individual amplicons by their electro-phoretic mobility in gels and, therefore, the sizes of the amplicons differ by atleast four base pairs. For forensic purposes, one should consider the size rangeof the amplicons. Ideally, the amplicon sizes should be as small as possible inorder to be able to analyse heavily degraded DNA. We ended up with ampliconsizes in the range of 79 to 180 bp.
In our experience, the greatest problems in creating a multiplex PCR is toensure that the primers do not interact, that the primers are specific, that eachprimer batch consists of homogeneous molecules, and that the concentrationsof the primers are balanced in such a way that the multiplex reaction givesequal amounts of each amplicon.
In the multiplex SBE reaction, it is important to be able to obtain an equalnumber of extended primers for each SNP, and it is also important that theprimers can be separated under the chosen electrophoretic conditions to obtainclear SNP typing results. SBE is performed as a thermal cycling reaction withone annealing step and one denaturation step. The annealing temperature is50–60°C and consequently, the SBE primers must have a minimal length of17–18 nt. The synthesis of oligonucleotides longer than 80–90 nt is presentlyvery costly, and the quality of the primers vary considerately between vendorswhen the size of the primers are longer than 60–70 nt. In general, it is possibleto separate extended SBE primers on an ABI 3100 sequencer, if the primersdiffer by 4 nt, although there may be difficulties in separating some primersthat are shorter than 30–35 nt because the electrophoretic mobility of shortprimers depend strongly on the nucleotide composition. In a four colour fluo-rescence system like the SNaPshot kit, two different biallelic SNPs can bedetected within the same 4-nt window. Thus, with a range from 18 to 100 ntand 4-nt windows, approx 40 SNPs may be detected in a single experiment.
The establishment of detection primers of various lengths necessitates thatthe primers contain a 5' tail with nucleotides that do not influence thehybridisation process. This can be done by adding polymers of A, G, T, or C orby adding random nucleotide sequences that do not bind to human DNA. Iftwo or more packages have been developed, interchanges of amplicons andSBE primers between the packages can be performed only if both the ampliconsand the SBE primers are compatible.
In the sections below, special emphasis is put on information about the toolsthat can be used for obtaining the DNA sequences, polymorphisms, detailed

214 Sanchez et al.
information about annealing, etc., design rules for the primers multiplexes, thereaction components and the cycling conditions of the multiplex PCR reaction,and SBE assays capable of detecting multiple SNPs in a single reaction.
3.1. DNA Preparation
Rather clean DNA is needed for multiplex PCR amplification. We useQIAamp, Chelex, and phenol/chloroform-prepared DNA or cells spotted onFTA paper.
3.2. Obtaining the DNA Sequences
The sequences surrounding the selected SNPs are collected from genomedatabases (e.g., dbSNP or SNP Consortium, see Subheading 2.4.1.). It is essen-tial for successful multiplex PCR that the DNA sequences are correct. Further-more, it is important to check for other SNPs in the flanking region (e.g., usingthe BLAST option, see Subheading 2.4.3.), where the amplification primersare expected to bind and to check for homologous and repetitive regions, whichare especially abundant on the Y chromosome (3).
3.3. Primer Design Strategy for Multiplex PCR Amplification
The major problem in designing large multiplexes is to obtain a balancedamplification of a number of DNA fragments in the same tube under the sameconditions. By applying the same design rules to each primer in the multiplex(see Subheading 3.3.1.), the likelihood of obtaining a balanced amount of PCRproducts in the multiplex is increased. Similar reaction conditions to some extentalso require similar amplicon sizes. However, the amplicons in the multiplexmust differ by size so that the amount of each amplicon can be assessed inorder to balance the multiplex PCR (see Subheading 3.3.3.).
Computer programs are used for predicting the best PCR primers for a targetsequence (see Subheading 2.4.2.). The programs will predict which regions arefree of secondary structures, and the software will suggest primer location basedon conditions given by the user.
3.3.1. Initial Primer Evaluation
1. Use the software (see Subheading 2.4.2.) to find the best primer sites. We workwith a theoretical melting temperature of the primers of 60C ± 5°C at a saltconcentration of 180 mM. Primers between 18 and 35 nt will usually work (seeNote 2). The purine: pyrimidine ratio should be close to 1:1. If the templatesequence prevents this, the primers can be extended or shortened to compen-sate for the difference in G + C content. Primers should have one to two G/Cs atthe 3' end if possible. However, the last 7 nt. in the 3' end of the primer must notcontain more than four G/Cs (see Note 3).
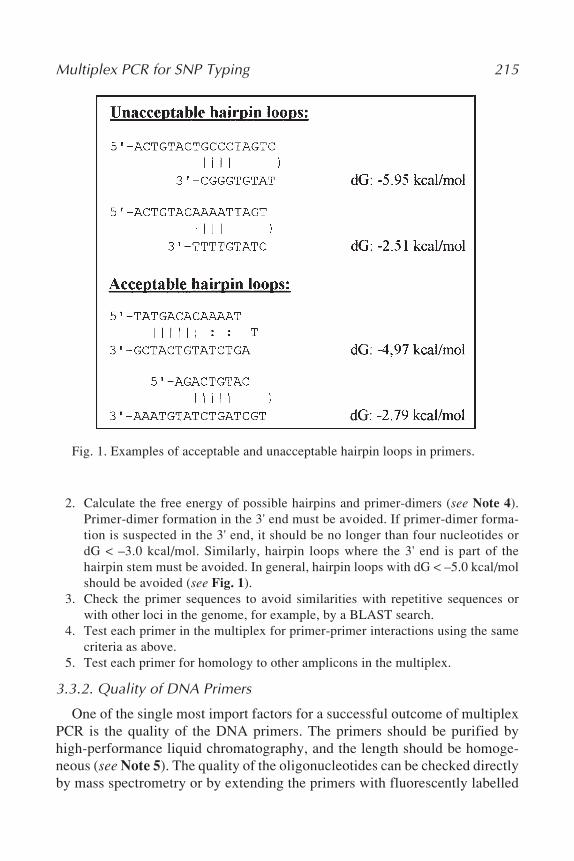
Multiplex PCR for SNP Typing 215
Fig. 1. Examples of acceptable and unacceptable hairpin loops in primers.
2. Calculate the free energy of possible hairpins and primer-dimers (see Note 4).Primer-dimer formation in the 3' end must be avoided. If primer-dimer forma-tion is suspected in the 3' end, it should be no longer than four nucleotides ordG < –3.0 kcal/mol. Similarly, hairpin loops where the 3' end is part of thehairpin stem must be avoided. In general, hairpin loops with dG < –5.0 kcal/molshould be avoided (see Fig. 1).
3. Check the primer sequences to avoid similarities with repetitive sequences orwith other loci in the genome, for example, by a BLAST search.
4. Test each primer in the multiplex for primer-primer interactions using the samecriteria as above.
5. Test each primer for homology to other amplicons in the multiplex.
3.3.2. Quality of DNA Primers
One of the single most import factors for a successful outcome of multiplexPCR is the quality of the DNA primers. The primers should be purified byhigh-performance liquid chromatography, and the length should be homoge-neous (see Note 5). The quality of the oligonucleotides can be checked directlyby mass spectrometry or by extending the primers with fluorescently labelled

216 Sanchez et al.
nucleotides using the terminal transferase method (see Subheading 3.3.3.1)and analyzing the extended primers on an ABI 3100. Figure 2 shows an exampleof a reasonably homogenous oligonucleotide preparation and a preparation witha broad distribution of DNA oligonucleotides of various lengths that willdestroy any multiplex PCR reaction.
3.3.3. Test of the Primers in Singleplex PCR and Construction of theMultiplex
1. Test the selected primer pair in singleplex PCR, e.g., with 10 ng template DNA ina 25-µL reaction volume containing 1X PCR buffer, 1.5 mM MgCl2, 200 µM ofeach dNTP, 0.4 µM of each primer, and 0.6 units of AmpliTaq Gold DNA poly-merase (see Subheadings 3.4. and 3.5. for thermocycling conditions).
2. Analyze the PCR products by polyacrylamide gel electrophoresis or on ABI 3100after labeling of the PCR product with the terminal transferase (TdT) method(see Subheading 3.3.3.1. and Note 6) to check whether a single fragment of thecorrect size is amplified.
3. Combine the primers in sets of 7–12 SNPs and perform the PCR with, for example,1 ng of DNA in a 50-µL reaction volume containing 1X PCR buffer, 8 mM MgCl2,400 µM of each dNTP, 0.2 µM of each primer, and 2.5 units of AmpliTaq GoldDNA polymerase (AB; see Subheading 3.4.).
4. Analyze the PCR products as describe above. Each fragment must be visible andhave the correct size.
5. Estimate the amplification efficiency (see Note 7).6. Combine the packages of 7–12 amplicons into a final set and adjust the primer
concentrations in order to get a balanced set of amplicons (see Subheading 3.4.).
3.3.3.1. TERMINAL TRANSFERASE PCR PRODUCT LABELING AND DETECTION
1. Make an 8 µM stock of R6G-ddATP (PerkinElmer; cat. no. NEL490).2. Make the reaction cocktail (for 10 µL of total volume): 2 µL of 5X TdT reac-
tion buffer, 1.25 µL of R6G-ddATP stock (8 µM), 1 µL of terminal transferase(20 Units/µL), and 4.75 µL of ddH2O.
3. Dispense 9 µL per tube and add 1 µL of the PCR product at 0.5–1 ng/µL.4. Incubate the reaction at 37°C for 1 h.5. Terminate the reaction by incubation at 75°C for 15 min.6. Add 1 unit of SAP to remove the 5' phosphoryl groups of the unincorporated
fluorescent ddNTPs.7. Incubate the tube at 37°C for 1 h.8. Inactivate the SAP by incubation at 75°C for 15 min.9. Mix 3 µL of the purified product, 16.8 µL of Hi-Di formamide, and 0.2 µL of the
GeneScan-120 LIZ™ size standard and spin briefly.10. Run for 10 s at 3 kV on an ABI 3100 sequencer or similar (use of the internal-line
size standard and GeneScan Analysis software (AB) offers a high level of sensi-tivity and precision in identifying the fragments).

Multiplex PCR for SNP Typing 217
Fig. 2. Examples of oligonucleotide quality. The primers were labeled using theSNaPshot kit (see Note 5). A shows a reasonably homogenous batch of DNA oligo-nucleotides and B shows a poor batch of oligonucleotides.
218 Sanchez et al.
3.4. Optimization of the SNP Multiplex PCR Template AmplificationReaction
1. We use 2.5 U/50 µL reaction volume of AmpliTaq Gold DNA polymerase(Applied Biosystems), but other polymerases can be used (see Note 8).
2. Buffer concentration can be altered from 0.8- to 2.0-fold (see Note 9).3. Optimize the MgCl2 concentration. We use 8 mM MgCl2 (higher concentrations
may inhibit the amplification; see Note 10).4. Adjust the amount of dNTPs (proportional to the MgCl2 concentration, 200 µM
for each 1.75 mM of MgCl2; see Note 11).5. The final concentration of the primers in the multiplex may vary considerably
(Table 1). In our hands, primer concentrations less than 0.01 µM were insuffi-cient to amplify the fragments in the multiplex, and concentrations greater than0.5 µM inhibited multiplex PCR probably by increasing primer–primer anneal-ing. The primer mix must be kept on ice at all times in order to avoid artefacts dueto hairpin or primer–dimer formation (see Note 12).
6. Consider the use of dsDNA-destabilizing additives (see Note 13).
3.5. Optimization of Multiplex Thermocycling Conditions
1. Find the optimal annealing temperatures by titration of the temperatures between,for example, 54°C and 63°C with 3°C intervals (see Note 1).
2. Find the optimal elongation temperature by titration of the temperatures between65 and 72°C.
The final conditions of the 35 SNP Y chromosome multiplex were as fol-lows: denaturation at 94°C for 5 min followed by 33 cycles at 95°C, 30 s;60°C, 30 s; and 65°C, 30 s; followed by a final extension at 65°C for 7 min (seeNote 14).
3.6. Purification of the PCR Template Amplification Product
Unused dNTPs in the PCR amplification multiplex must be removed beforethe SBE reaction can be performed. We use enzymatic purification by Escheri-chia coli exonuclease I (ExoI) and SAP or the ExoSAP-IT kit following thisprotocol:
1. Six microliters ExoSAP-IT kit (USB Corporation, Cleveland, OH) or 5 units ofSAP and 2 units of ExoI are added to 15 µL of PCR product and mixed.
2. Incubate at 37°C for 1 h and inactivate the enzyme at 75°C for 15 min.Other methods may be used (see Note 15).
3.7. SBE With SNaPshot
3.7.1. Design of SBE Primers
The rules of thumbs for design of amplification primers are also valid for thedesign of SBE primers. The recommended annealing temperature for theSNaPshot kit is 50°C. However, the SNaPshot kit will, in most cases, work up
Multiplex PCR for SNP Typing 219
to 60°C. Thus, specific reactions can be obtained by adjusting the annealingtemperature in the range of 50–60°C. Annealing temperatures less than 50°Cmay cause unspecific reactions.
3.7.2. Primer Tailing Strategy for SBE Assay
Because the reactions are going to be analyzed on the ABI 3100 or a similarunit, the fluorescent colors as well as the size of the extended primers shouldbe considered. Two SNPs with different alleles (e.g., A/G and C/T) can beanalysed in a 4-nt size interval. However, for primers shorter than approx 35 nt,the electrophoretic mobility depends strongly on the oligonucleotides composi-tion and, therefore, it is not always possible to predict the exact mobility of theextended primer (Table 2). Our strategy for designing tails involves a piece ofa “neutral” sequence, for example, a sequence that is not found in the humangenome (4) and a poly-C tail (Table 3). This tail will not in itself influence thehybridization to a significant degree.
3.7.2.1. TEST OF THE TAILED SBE PRIMERS
The length and the homogeneity of each SBE primer as well as the yield ofthe SBE reaction should be tested (see Subheading 3.3.2.).
3.7.2.2. MULTIPLEX SBE PRIMER MIX
The primers are mixed in concentrations corresponding to the signal intensi-ties in the singleplex reactions and titrated. The primer concentration can beadjusted in the range from 0.01 to 0.50 µM to obtain balanced signals from theSBE primers. We use the SNaPshot multiplex kit with the following condi-tions:
1. 6–10 ng purified PCR product (equivalent to 5–8 fmol of each fragment) in 10 µL.2. 4–5 µL of SNaPshot reaction mix and 0.01–0.50 µM of each primer.3. Thermal cycling protocol with a rapid thermal ramp to 96°C for 10 s, 50–60°C
for 5 s, and 60°C for 30 s for 25 cycles.4. Include a positive control (known sample instead of that provided with the kit)
and a negative control (sterile water or PCR product from a female).The amounts of primers must usually be titrated further to obtain balanced
reactions. Also, the annealing temperature must be titrated between 50 and60°C to optimize the reaction. Table 3 shows the details of the method thatallowed simultaneous typing of 35 Y chromosome SNPs.
3.7.2.3. CAPILLARY ELECTROPHORESIS AND MULTICOLOR DETECTION ON ABI 3100
1. After the SBE reaction, add 1 unit of SAP in order to remove the 5' phosphorylgroups of the unincorporated fluorescent ddNTPs.
2. Incubate at 37°C for 1 h.

220Sanchez et al.
Table 1Y Chromosome SNPs and Primer Sequences for PCR Amplification of 25 Y Chromosome DNA Fragments With 35 SNP loLi
PCR primers (5' 3')
GenBank or AmpliconLocus dbSNPs accesion no Mutation Forward primer Reverse primer µM size (bp)
M2/sY81 Rs3893 A/G acggaaggagttctaaaattcagg aaaatacagctccccctttatcct 0.15 128M9* Rs3900 C/G aggaccctgaaatacagaactg aaatatttcaacatttcacaaaggaa 0.36 186M17* Rs3908 4G/3G cctggtcataacactggaaatc agctgaccacaaactgatgtaga 0.09 170M18* Rs3909 2 bp insertion cctggtcataacactggaaatc agctgaccacaaactgatgtaga 0.09 170M19* Rs3010 T/A cctggtcataacactggaaatc agctgaccacaaactgatgtaga 0.09 170M32* AC009977 T/C tgaccgtcataggctgagaca ttgaagcccccaagagagac 0.07 160M33* AC009977 A/C tgaccgtcataggctgagaca ttgaagcccccaagagagac 0.07 160M35 Rs1179188 G/C Agggcatggtccctttctat tccatgcagactttcggagt 0.42 96M40/SRY4064 AC006040 G/A tggtctcaatctcttcaccctgt catttcagtaaatgccacacaaga 0.18 119M45* Rs2032631 G/A gagagaggatatcaaaaattggcagt tgacagtggcaccaaaggtc 0.03 138M46/Tat AC002531 T/C tatatggactctgagtgtagacttgtga ggtgccgtaaaagtgtgaaataatc 0.46 115M52 AC009977 A/C Cctcaacttcccagagtgttg gacgaagcaaacatttcaagagag 0.03 152M78* AC010889 C/T Tgcattactccgtatgttcgac tggaagcttaccatctttttatga 0.08 132M81* Rs2032640 C/T catctcttaacaaaagaggtaaattttgtcc cattgtgttacatggcctataatattcagt 0.24 179M89 Rs2032652 C/T tggattcagctctcttcctaaggttat ctgctcaggtacacacagagtatca 0.03 135M96 AC010889 G/C Tgccctctcacagagcactt ccacccactttgttgctttg 0.27 143M123 AC010889 G/A Gttgcccaggaatttgcat cacagagcaagtgactctcaaag 0.02 88M139* AC010137 5G/4G ccccgaaagttttattttattcca ttctcagacaccaatggtcctatc 0.06 113M151* AC010889 G/A catctcttaacaaaagaggtaaattttgtcc cattgtgttacatggcctataatattcagt 0.24 179M153* AC010137 T/A ccccgaaagttttattttattcca ttctcagacaccaatggtcctatc 0.06 113M154* AC010889 T/C catctcttaacaaaagaggtaaattttgtcc cattgtgttacatggcctataatattcagt 0.24 179M157* AC010889 A/C gagagaggatatcaaaaattggcagt tgacagtggcaccaaaggtc 0.03 138M163* AC009977 A/C aggaccctgaaatacagaactg aaatatttcaacatttcacaaaggaa 0.36 186
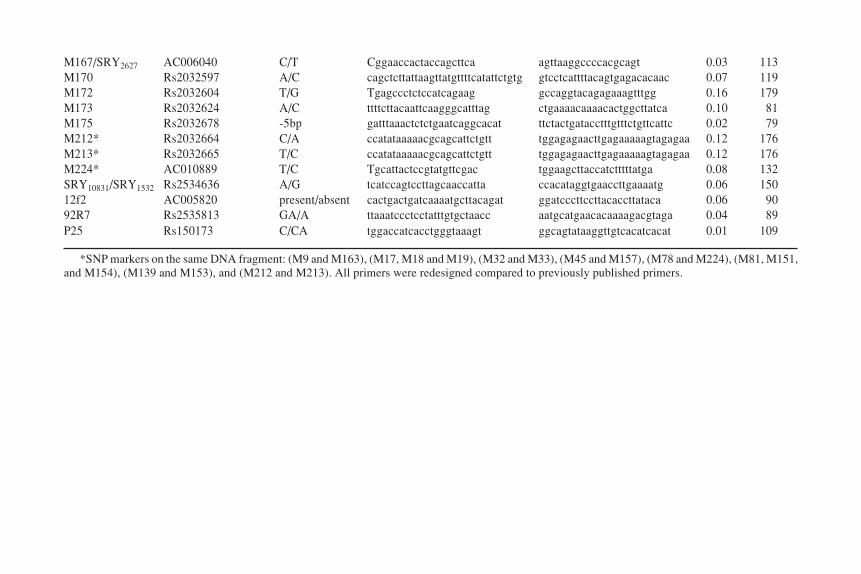
Multiplex PC
R for SN
P Typing221
M167/SRY2627 AC006040 C/T Cggaaccactaccagcttca agttaaggccccacgcagt 0.03 113M170 Rs2032597 A/C cagctcttattaagttatgttttcatattctgtg gtcctcattttacagtgagacacaac 0.07 119M172 Rs2032604 T/G Tgagccctctccatcagaag gccaggtacagagaaagtttgg 0.16 179M173 Rs2032624 A/C ttttcttacaattcaagggcatttag ctgaaaacaaaacactggcttatca 0.10 81M175 Rs2032678 -5bp gatttaaactctctgaatcaggcacat ttctactgatacctttgtttctgttcattc 0.02 79M212* Rs2032664 C/A ccatataaaaacgcagcattctgtt tggagagaacttgagaaaaagtagagaa 0.12 176M213* Rs2032665 T/C ccatataaaaacgcagcattctgtt tggagagaacttgagaaaaagtagagaa 0.12 176M224* AC010889 T/C Tgcattactccgtatgttcgac tggaagcttaccatctttttatga 0.08 132SRY10831/SRY1532 Rs2534636 A/G tcatccagtccttagcaaccatta ccacataggtgaaccttgaaaatg 0.06 15012f2 AC005820 present/absent cactgactgatcaaaatgcttacagat ggatcccttccttacaccttataca 0.06 9092R7 Rs2535813 GA/A ttaaatccctcctatttgtgctaacc aatgcatgaacacaaaagacgtaga 0.04 89P25 Rs150173 C/CA tggaccatcacctgggtaaagt ggcagtataaggttgtcacatcacat 0.01 109
*SNP markers on the same DNA fragment: (M9 and M163), (M17, M18 and M19), (M32 and M33), (M45 and M157), (M78 and M224), (M81, M151,and M154), (M139 and M153), and (M212 and M213). All primers were redesigned compared to previously published primers.
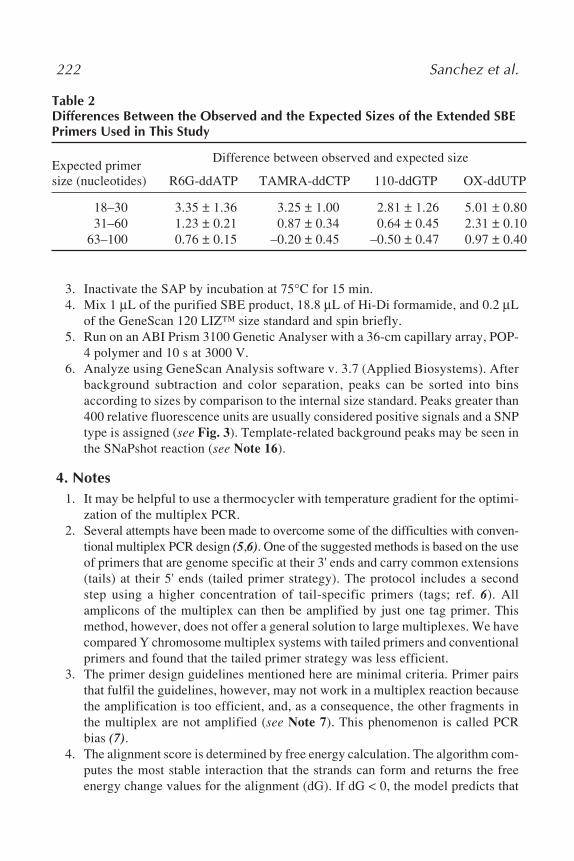
222 Sanchez et al.
Table 2Differences Between the Observed and the Expected Sizes of the Extended SBEPrimers Used in This Study
Expected primerDifference between observed and expected size
size (nucleotides) R6G-ddATP TAMRA-ddCTP 110-ddGTP OX-ddUTP
18–30 3.35 ± 1.36 3.25 ± 1.00 2.81 ± 1.26 5.01 ± 0.8031–60 1.23 ± 0.21 0.87 ± 0.34 0.64 ± 0.45 2.31 ± 0.10
63–100 0.76 ± 0.15 –0.20 ± 0.45 –0.50 ± 0.47 0.97 ± 0.40
3. Inactivate the SAP by incubation at 75°C for 15 min.4. Mix 1 µL of the purified SBE product, 18.8 µL of Hi-Di formamide, and 0.2 µL
of the GeneScan 120 LIZ™ size standard and spin briefly.5. Run on an ABI Prism 3100 Genetic Analyser with a 36-cm capillary array, POP-
4 polymer and 10 s at 3000 V.6. Analyze using GeneScan Analysis software v. 3.7 (Applied Biosystems). After
background subtraction and color separation, peaks can be sorted into binsaccording to sizes by comparison to the internal size standard. Peaks greater than400 relative fluorescence units are usually considered positive signals and a SNPtype is assigned (see Fig. 3). Template-related background peaks may be seen inthe SNaPshot reaction (see Note 16).
4. Notes1. It may be helpful to use a thermocycler with temperature gradient for the optimi-
zation of the multiplex PCR.2. Several attempts have been made to overcome some of the difficulties with conven-
tional multiplex PCR design (5,6). One of the suggested methods is based on the useof primers that are genome specific at their 3' ends and carry common extensions(tails) at their 5' ends (tailed primer strategy). The protocol includes a secondstep using a higher concentration of tail-specific primers (tags; ref. 6). Allamplicons of the multiplex can then be amplified by just one tag primer. Thismethod, however, does not offer a general solution to large multiplexes. We havecompared Y chromosome multiplex systems with tailed primers and conventionalprimers and found that the tailed primer strategy was less efficient.
3. The primer design guidelines mentioned here are minimal criteria. Primer pairsthat fulfil the guidelines, however, may not work in a multiplex reaction becausethe amplification is too efficient, and, as a consequence, the other fragments inthe multiplex are not amplified (see Note 7). This phenomenon is called PCRbias (7).
4. The alignment score is determined by free energy calculation. The algorithm com-putes the most stable interaction that the strands can form and returns the freeenergy change values for the alignment (dG). If dG < 0, the model predicts that

Multiplex PCR for SNP Typing 223
strand pairing may take place, but it does not necessarily mean that a significantinteraction will take place in the multiplex reaction.
5. The synthesis process may produce a mix of oligonucleotides of varying lengths.To day, a 99% coupling efficiency is usually obtained. For practical proposes,short oligonucleotides are rather homogeneous, but 50- to 100-mer oligonucle-otides tend to be heterogeneous. Therefore, high-quality synthesis and effectivecheck of the product is essential.
6. It is also possible to use the intrinsic Taq DNA polymerase terminal transferase-like activity for analysis of the PCR product(s) by performing a SBE reaction(see Subheading 3.7.2.2.) without SBE primers. The PCR products are labeledwith fluorescent ddATP and can be detected on the ABI 3100. This reaction ismore efficient than the TdT method. However, the Taq DNA polymerase termi-nal transferase-like activity has been shown by others to be sequence dependent(8,9). We performed both assays on several large multiplexes and we neverobserved any differences in the relative amounts of PCR product(s) detected bythe two methods.
7. The amounts of the amplicons in the multiplex must be balanced. This can beobtained by adjusting the primer concentrations. However, if the amount of PCRproduct differs more than threefold, it may not be possible to balance the multi-plex PCR by altering the concentration of the primers, and new primers may haveto be designed for one or several of the amplicons. Often, the results from thesingleplex PCR will indicate whether the amplification efficiency of the differentfragments in the multiplex will be similar. However, the reaction conditions ofthe multiplex reaction are so different from the singleplex reaction that it is notalways possible to predict the results in the multiplex. Therefore, doubtful primerpairs should be tested in the multiplex reaction.
8. Use heat-activated DNA polymerases to reduce primer-dimer formation in themultiplex PCR. Consider the use of a proofreading polymerase.
9. It has been suggested that many primer pairs producing short amplification prod-ucts (<200 bp) work better at higher KCl concentration in multiplex systems(10). Increasing the concentration of KCl in the PCR buffer 1.6- or 2-fold in ourY SNP reactions did not increase the yield of PCR products significantly and hadno effect on the synthesis of fragments >150 bp.
10. The optimal MgCl2 concentration needs to be determined empirically for effi-ciency of multiplex PCR amplification by testing 2, 4, and 8 mM in the initialexperiments.
11. dNTPs are sensitive to repeated freezing and thawing while the storage time isless important (11). We store dNTPs in small aliquots at –20°C for up to 8 mo.
12. We have observed that even with 10 min incubation at 95°C, before the PCR,these constructs are amplified once they have been formed.
13. We do not use dsDNA-destabilizing additives such as bovine serum albumin,dimethyl sulfoxide (DMSO), glycerol, formamide, or betaine. Such additives givevariable results in multiplex PCR. For example, betaine makes GC-rich and AT-rich DNA melt at the same temperature (12), possibly by increasing the hydration

224Sanchez et al.
Table 3SBE Primer Sequences Used in the 35 Y Chromosome SNP Package
Neutral sequence Target-specific sequence PrimerLocus Poly (dC) (5'3') (5'3') µM size (nt)
M170 None None caacccacactgaaaaaaa 0.02 19M45 None caa ctcagaaggagctttttgc 0.02 22M139 None aa taatctgacttggaaagggg 0.01 22M2/sY81 None gacaa ctttatcctccacagatctca 0.28 26M46/Tat None None gctctgaaatattaaattaaaacaac 0.25 26M167/SRY2627 None tgaaagtctgacaa aagccccacagggtgc 0.35 30M213 None tgacaa tcagaacttaaaacatctcgttac 0.02 30M52 None tctgacaa aatatcaagaaacctatcaaacatcc 0.02 34P25 None tcgtgaaagtctgacaa tgcctgaaacctgcctg 0.04 34M78 None gaaagtctgacaa cttattttgaaatatttggaagggc 0.02 3892R7 None gtgaaagtctgacaa catgaacacaaaagacgtagaag 0.01 38M89 None cacgtcgtgaaagtctgacaa aactcaggcaaagtgagagat 0.09 42M123 None acgtcgtgaaagtctgacaa atttctaggtattcaggcgatg 0.03 42M35 None ggtgccacgtcgtgaaagtctgacaa tcggagtctctgcctgtgtc 0.25 46M153 None ggtgccacgtcgtgaaagtctgacaa gctcaaagggtatgtgaaca 0.02 46M40/SRY4064 None aaactaggtgccacgtcgtgaaagtctgacaa tccaccctgtgatccgct 0.08 50M154 None gccacgtcgtgaaagtctgacaa gttacatggcctataatattcagtaca 0.03 50M32 None taggtgccacgtcgtgaaagtctgacaa agacaagatctgttcagtttatctca 0.50 54M151 None aggtgccacgtcgtgaaagtctgacaa caatctactacatacctacgctatatg 0.02 54M17 None actaaactaggtgccacgtcgtgaaagtctgacaa ccaaaattcacttaaaaaaaccc 0.02 58M96 None aactgactaaactaggtgccacgtcgtgaaagtctgacaa ggaaaacaggtctctcataata 0.15 62M172 7(dC) aactgactaaactaggtgccacgtcgtgaaagtctgacaa caaacccattttgatgctt 0.10 66M173 3(dC) aactgactaaactaggtgccacgtcgtgaaagtctgacaa tacaattcaagggcatttagaac 0.03 66
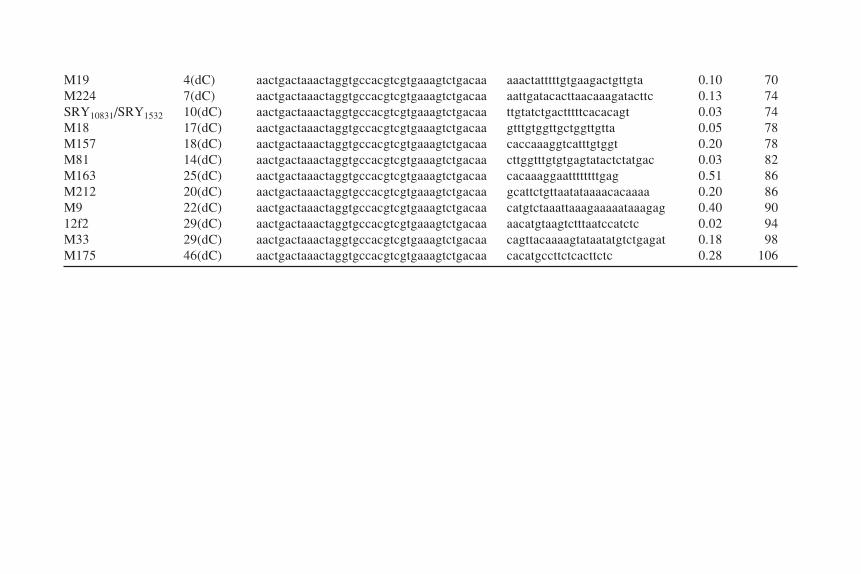
Multiplex PC
R for SN
P Typing225
M19 4(dC) aactgactaaactaggtgccacgtcgtgaaagtctgacaa aaactatttttgtgaagactgttgta 0.10 70M224 7(dC) aactgactaaactaggtgccacgtcgtgaaagtctgacaa aattgatacacttaacaaagatacttc 0.13 74SRY10831/SRY1532 10(dC) aactgactaaactaggtgccacgtcgtgaaagtctgacaa ttgtatctgactttttcacacagt 0.03 74M18 17(dC) aactgactaaactaggtgccacgtcgtgaaagtctgacaa gtttgtggttgctggttgtta 0.05 78M157 18(dC) aactgactaaactaggtgccacgtcgtgaaagtctgacaa caccaaaggtcatttgtggt 0.20 78M81 14(dC) aactgactaaactaggtgccacgtcgtgaaagtctgacaa cttggtttgtgtgagtatactctatgac 0.03 82M163 25(dC) aactgactaaactaggtgccacgtcgtgaaagtctgacaa cacaaaggaattttttttgag 0.51 86M212 20(dC) aactgactaaactaggtgccacgtcgtgaaagtctgacaa gcattctgttaatataaaacacaaaa 0.20 86M9 22(dC) aactgactaaactaggtgccacgtcgtgaaagtctgacaa catgtctaaattaaagaaaaataaagag 0.40 9012f2 29(dC) aactgactaaactaggtgccacgtcgtgaaagtctgacaa aacatgtaagtctttaatccatctc 0.02 94M33 29(dC) aactgactaaactaggtgccacgtcgtgaaagtctgacaa cagttacaaaagtataatatgtctgagat 0.18 98M175 46(dC) aactgactaaactaggtgccacgtcgtgaaagtctgacaa cacatgccttctcacttctc 0.28 106

226 Sanchez et al.
Fig. 3. Electropherogram of peaks corresponding to different primer extension prod-ucts of the 35 Y chromosome SNP multiplex. The identity of each polymorphism wasdetermined by fragment size and by the incorporated fluorescent ddNTP.
of GC-rich regions (13). Ten percent DMSO decreases the melting temperatureof the primers by 5–-6°C but DMSO also inhibits Taq DNA polymerase (14).These cosolutes may be useful for some sequences and long PCR products.
14. The touchdown PCR protocol starts with an annealing temperature 5 or 10°Chigher than the highest calculated Tm. The annealing temperature is reduced atthe rate of 1–3°C in successive PCR cycles until the annealing temperature isthe same as the calculated Tm. This increases the specificity of the PCR (15)because elongation from unspecific annealing is unlikely during the first cycles.We have not used this strategy because our primers have been designed to workunder homogeneous conditions. The technique is especially useful when primerswith different melting temperatures must be used together.
15. MinElute PCR purification spin columns (Qiagen, Hagen, Germany) can also beused. In this case, the DNA should be diluted in at least 10 µL of Milli-Q water.The recovery with the Exo I-SAP is usually almost 100% whereas the columnpurification has a recovery of approx 80%. Spin column and enzymatically puri-fied PCR products give equal satisfactory SBE results. Qiagen purification ispreferable if excess of salts is a problem in the detection phase or if a sampleneeds to be concentrated.
Multiplex PCR for SNP Typing 227
16. Small, fluorescent adenosine-nucleotide peaks with sizes equivalent to those ofPCR amplified fragments plus one nucleotide may be seen, especially if the con-centrations of the PCR amplified fragments are high, most likely the result of thenontemplate addition of a single adenosine molecules to the 3' end of the PCR-amplified fragments (16).
AcknowledgmentsWe thank Ms. Annemette Holbo Birk for technical assistance. The
work was supported by grants to Juan Sanchez from Ellen and Aage Andersen’sFoundation.
References1. Gill, P. (2001) An assessment of the utility of single nucleotide polymorphisms
(SNPs) for forensic purposes. Int. J. Legal Med. 114, 204–210.2. Andras, S. C, Power, J. B., Cocking, E. C., Davey, M. R. (2001) Strategies for
signal amplification in nucleic acid detection. Mol. Biotechnol. 19, 29–44.3. Rozen, S., Skaletsky, H., Marszalek, J. D., Minx, P. J., Cordum, H. S., Waterston,
R. H., et al. (2003) Abundant gene conversion between arms of palindromes inhuman and ape Y chromosomes. Nature 423, 873–876.
4. Lindblad-Toh, K., Winchester, E., Daly, M. J., Wang, D. G., Hirschhorn, J. N.,Laviolette, J. P., et al. (2000) Large-scale discovery and genotyping of single-nucleotide polymorphisms in the mouse. Nat. Genet. 24, 381–386.
5. Broude, N. E., Zhang, L., Woodward, K., Englert, D., and Cantor, C. R. (2001)Multiplex allele-specific target amplification based on PCR suppression. Proc.Natl. Acad. Sci. USA 98, 206–211.
6. Brownie, J., Shawcross, S., Theaker, J., Whitcombe, D., Ferrie, R., Newton, C., etal. (1997) The elimination of primer-dimer accumulation in PCR. Nucleic AcidsRes. 25, 3235–3241.
7. Mutter, G. L., and Boynton, K. A. (1995) PCR bias in amplification of androgenreceptor alleles, a trinucleotide repeat marker used in clonality studies. NucleicAcids Res. 23,1411–1418.
8. Hu, G. (1993) DNA polymerase-catalyzed addition of nontemplated extra nucle-otides to the 3' end of a DNA fragment. DNA Cell Biol. 12, 763–770.
9. Magnuson, V. L., Ally, D. S., Nylund, S. J., Karanjawala, Z. E., Rayman, J. B.,Knapp, J. I., et al. (1996) Substrate nucleotide-determined non-templated addi-tion of adenine by Taq DNA polymerase: implications for PCR-based genotypingand cloning. BioTechniques 21, 700–709.
10. Henegariu, O., Heerema, N. A., Dlouhy, S. R., Vance, G. H., and Vogt, P.H.(1997) Multiplex PCR: critical parameters and step-by-step protocol.BioTechniques 23, 504–511.
11. Markoulatos, P., Siafakas, N., and Moncany, M. (2002) Multiplex polymerasechain reaction: a practical approach. J. Clin. Lab. Anal. 16, 47–51.

228 Sanchez et al.
12. Rees, W. A., Yager, T. D., Korte, J., and Von Hippel, P. H. (1993) Betaine caneliminate the base pair composition dependence of DNA melting. Biochemistry32, 137–144.
13. Hogan, M., LeGrange, J., and Austin, B. (1983) Dependence of DNA helix flex-ibility on base composition. Nature 304, 752–754.
14. Pomp, D., and Medrano, J. F.(1991) Organic solvents as facilitators of polymerasechain reaction. BioTechniques 10, 58–59.
15. Don, R. H., Cox, P. T., Wainwright, B. J., Baker, K., and Mattick, J. S. (1991)‘Touchdown’ PCR to circumvent spurious priming during gene amplification.Nucleic Acids Res. 19, 4008.
16. Brownstein, M. J., Carpten, J. D., and Smith, J. R. (1996) Modulation of non-templated nucleotide addition by Taq DNA polymerase: primer modifications thatfacilitate genotyping. BioTechniques 20, 1004–1010.
Hierarchical Y Chromosome SNP Analysis 229
229
From: Methods in Molecular Biology, vol. 297: Forensic DNA Typing ProtocolsEdited by: A. Carracedo © Humana Press Inc., Totowa, NJ
16
Y Chromosome SNP Analysis Using the Single-BaseExtensionA Hierarchical Multiplex Design
María Brión
SummarySingle nucleotide polymorphisms (SNPs) are the most frequent polymorphisms
described in the human genome, and their analysis is becoming an extensive routinein molecular biology, not only in the forensic field, but also in population and clinicalgenetics. In particular, SNPs located on the Y chromosome have a specific utility asforensic tools, and based on this fact, we have designed a strategy that allows us toidentify the most frequent haplogroups in European populations. We selected 29 mark-ers among the 245 binary polymorphisms described in the Y-Chromosome Consortiumtree. The whole set was grouped into four multiplexes in a hierarchical way, allowing usto determine the final haplogroup using only one or two multiplexes. In this way, weonly type in the best-case nine SNPs, and in the worst possible combination 17 SNPs, todefine the haplogroup. The selected strategy to type the SNPs was a single-base exten-sion method using the SNaPshot™ multiplex kit from Applied Biosystems, and detailedpractical procedures are described here. With this hierarchical strategy adapted for Euro-pean populations the massive typing of SNPs was avoided, and therefore the time andmoney involved in the study was also reduced.
Key Words: Y chromosome; SNP; multiplex PCR; single-base extension (SBE);SNaPshot.
1. IntroductionSingle nucleotide polymorphisms (SNPs, including small insertions and dele-
tions) are the markers of choice for many applications for localizing and identi-fying disease susceptibility genes, for understanding the molecular mechanismof mutation, for studying the origin of modern human populations, or for mea-suring the variability between them (1,2).

230 Brión
In particular, SNPs located on the Y chromosome have a specific utility asforensic tools for several reasons. First, in the case of the Y chromosome, as inautosomes, the SNPs are the most frequent kind of polymorphism. Second,because of their simplicity, SNPs can be analyzed from a very low quantity ofDNA and are amenable to analysis with high-throughput technologies. Third,the low mutation rate of SNPs allows their use in paternity testing. Finally,there is the opportunity to genotype fragments smaller in size than those neededfor existing deoxyribonucleic acid (DNA) polymorphisms. Nevertheless, becauseof the presence of only two alleles in each variable position in addition to thelack of recombination and the highly population specific distribution, shown inthe Y chromosome, one often requires the analysis of large numbers of SNPsto obtain enough information.
Despite slow progress in the discovery of Y-chromosome variation untilrecently, now a large number of SNPs have been described, defining a highlyresolved tree of NRY binary haplogroups (3,4).
Checking the literature, we performed an extensive search, looking for theallele frequencies of each SNP in European populations. As a result of thissearch, a set of 29 SNPs were selected to determine the most frequenthaplogroups present in European populations. Figure 1 represents the maxi-mum parsimony tree defined with these SNPs.
A large number of SNP genotyping methods are now available, and usuallythe choice of the appropriate method depends on the number of SNPs and thenumber of individuals that need to be typed. Because this study typed 29 SNPs,the selected genotyping strategy was a single-base (SBE) extension methodusing the SNaPshot multiplex kit (AB Applied Biosystems), which allows, withprevious multiplex amplification and with an automatic sequencer, the quickdevelopment of a sufficiently large study, without investment in new technolo-gies. The strategy adopted here for typing SNPs includes on one hand thedevelopment of four multiplex polymerase chain reactions (PCRs), and onthe other hand the development of four multiplex SNaPshot reactions.
2. Materials2.1. PCR
1. Oligonucleotides were purchased from Sigma-Genosys and MWG, desalted andlyophilized, and 100 µM stock aliquots were performed with deionized water andstored at –20°C.
2. AmpliTaq Gold™ with GeneAmp® 10X PCR buffer II (100 mM Tris-HCl, pH8.3, 500 mM KCl) and 25 mM MgCl2 Solution from AB Applied Biosystems,stored at –20°C.
3. GeneAmp® 10 mM dNTP Mix with dTTP from AB Applied Biosystems, storedat –20°C.
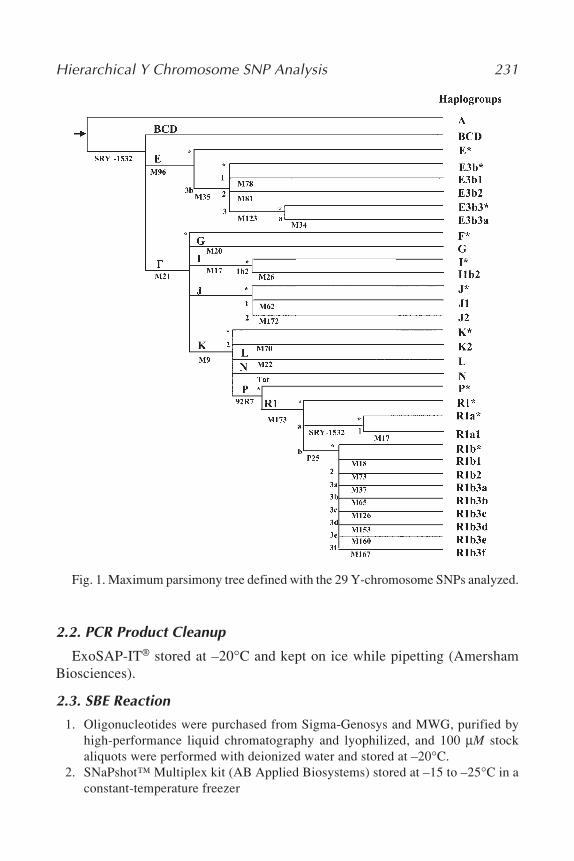
Hierarchical Y Chromosome SNP Analysis 231
Fig. 1. Maximum parsimony tree defined with the 29 Y-chromosome SNPs analyzed.
2.2. PCR Product Cleanup
ExoSAP-IT® stored at –20°C and kept on ice while pipetting (AmershamBiosciences).
2.3. SBE Reaction
1. Oligonucleotides were purchased from Sigma-Genosys and MWG, purified byhigh-performance liquid chromatography and lyophilized, and 100 µM stockaliquots were performed with deionized water and stored at –20°C.
2. SNaPshot™ Multiplex kit (AB Applied Biosystems) stored at –15 to –25°C in aconstant-temperature freezer
232 Brión
2.4. Postextension Treatment
Shrimp alkaline phosphatase (SAP) from Amersham Biosciences, stored at–20°C and kept on ice while pipetting
2.5. Analysis of the Amplified Products
The analysis was performed in an ABI PRISM® 3100 Genetic Analyser andthe material required is listed below.
1. Performance Optimizer Polymer 4 or 6 (POP-4 or POP-6) stored at 4°C and keptat room temperature before being loaded in the genetic analyser (may cause eye,skin and respiratory tract irritation; see Note 1).
2. 36-cm array.3. Matrix standard set DS-02 [dR110, dRGG, dTAMRA™, dROX™, LIZ™] stored
at 4°C.4. GeneScan-120 LIZ size standard stored at 4°C.5. Hi-Di™ formamide stored at –20°C (it also may cause eye, skin, and respiratory
tract irritation, in addition to cause damage to the central nervous system and thereproductive systems).
6. GeneScan® software, version 3.7.All materials were purchased from Applied Biosystems.
3. MethodsThe 29 SNPs were divided in four multiplex PCRs, in a hierarchical way
according to their location on the Y-chromosome consortium tree. This meansthat for each sample, we only needed to amplify one or two multiplexes todetermine the final haplogroup we can get with these SNPs.
Multiplex 1 included nine SNPs (see Note 2), which allowed for the detec-tion of the major clades more frequent in Europe (5,6) and showed the secondmultiplex we needed to perform. Multiplex 2 included five SNPs and deter-mined haplogroups G, I, and J. Multiplex 3 subdivides haplogroup E andincluded six SNPs. The last one, multiplex 4 subdivides haplogroup R1aband included nine binary polymorphisms, five SNPs, three deletions, and oneinsertion.
3.1. PCR
The first step in the development of the multiplex PCR was the selection ofthe primers for each of the SNPs, trying to get amplicons with different size(Table 1). The primer 3 software (http://www-genome.wi.mit.edu/cgi-bin/primer/primer3_www.cgi) was used to check for the best place in the flankingregion of each of the SNPs. The melting temperature of each primer was se-lected to be among 59 and 61°C to allow the multiplex amplification. In addi-tion, possible secondary structures of the oligonucleotides were checked with
Hierarchical Y Chromosome SNP Analysis 233
the Oligonucleotide properties calculator software vs 3.02 (http://www.basic.nwu.edu/biotools/oligocalc.html).
PCR multiplexes were performed in a GeneAmp® PCR System 9700 ther-mal cycler (AB Applied Biosystems), in 25 µL of final volume. The reactionincluded 1X buffer, 300 µM of dNTPs, 2 mM of MgCl2, 2 U of Taq Goldpolymerase, and 10 ng of genomic DNA, except multiplex 2, which was per-formed with 200 µM, 1.5 mM of MgCl2, and 0.5 U of Taq Gold. The cyclingconditions were 95°C for 10 min, 32 cycles of 94°C for 30 s, 59°C for 30 s,and 70°C for 30 s, and a final extension at 65°C for 15 min. Primer sequencesand detailed concentrations are shown in Table 1. Some of the SNPs as M73and M160 on one hand, and M17 and M18 on the other hand, are amplified inthe same amplicon.
Because the size of the amplicons included in each multiplex is different,the PCR product can be detected in manual polyacrylamide gels to knowwhether all the SNPs have been successfully amplified or not. The smallestdifference in size between two SNPs included in the same multiplex is 3 bp(Table 1); therefore, using 9% polyacrylamide gels (T = 9 and C = 5) silverstained, there are no problems distinguishing both fragments (Fig. 2).
3.2. PCR Product Cleanup
After PCR, unincorporated primers and dNTPs have to be removed becausethey can affect in the following primer extension reaction. To eliminate theexcess of PCR primers and dNTPs, the product was cleaned up with ExoSAP-IT® (see Note 3). One microliter of the PCR product was mixed with 0.5 µL ofExoSAP-IT® kept on ice while pipetting and incubated at 37°C for 15 min andat 85°C for 15 min to inactivate the enzyme.
3.3. SBE Reaction
Mutation detection, through a SBE reaction, was performed by use of theSNaPshot Multiplex kit of Applied Biosystem. With this strategy, unlabeledprimers placed with the 3' end immediately upstream to the SNPs are extendedwith a single ddNTP labeled with a fluorescence dye (Table 2). The develop-ment of multiplex SNaPshot reactions has been possible because the productswere spatially separated tailing the 5' end of the minisequencing primers withvarying lengths of poly (dC) nonhomologous tails (Table 2; see Note 4). In ourcase the smallest difference in size between two SNPs included in the samemultiplex, with at least one of the polymorphic nucleotides in common, wasfour bases.
The same software as for PCR primers design were used to select the SBEoligonucleotides. Because the recommended annealing temperature for a
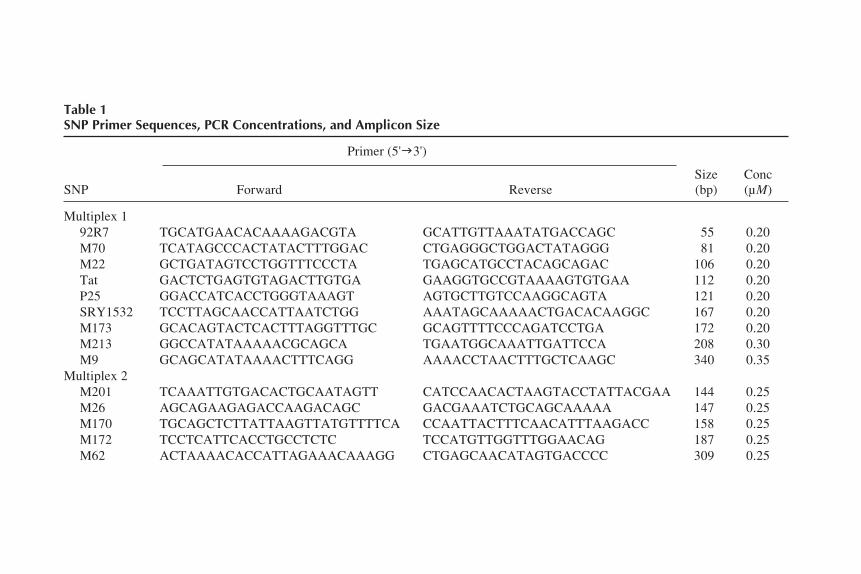
234B
rión
Table 1SNP Primer Sequences, PCR Concentrations, and Amplicon Size
Primer (5'3')
Size ConcSNP Forward Reverse (bp) (µM)
Multiplex 192R7 TGCATGAACACAAAAGACGTA GCATTGTTAAATATGACCAGC 55 0.20M70 TCATAGCCCACTATACTTTGGAC CTGAGGGCTGGACTATAGGG 81 0.20M22 GCTGATAGTCCTGGTTTCCCTA TGAGCATGCCTACAGCAGAC 106 0.20Tat GACTCTGAGTGTAGACTTGTGA GAAGGTGCCGTAAAAGTGTGAA 112 0.20P25 GGACCATCACCTGGGTAAAGT AGTGCTTGTCCAAGGCAGTA 121 0.20SRY1532 TCCTTAGCAACCATTAATCTGG AAATAGCAAAAACTGACACAAGGC 167 0.20M173 GCACAGTACTCACTTTAGGTTTGC GCAGTTTTCCCAGATCCTGA 172 0.20M213 GGCCATATAAAAACGCAGCA TGAATGGCAAATTGATTCCA 208 0.30M9 GCAGCATATAAAACTTTCAGG AAAACCTAACTTTGCTCAAGC 340 0.35
Multiplex 2M201 TCAAATTGTGACACTGCAATAGTT CATCCAACACTAAGTACCTATTACGAA 144 0.25M26 AGCAGAAGAGACCAAGACAGC GACGAAATCTGCAGCAAAAA 147 0.25M170 TGCAGCTCTTATTAAGTTATGTTTTCA CCAATTACTTTCAACATTTAAGACC 158 0.25M172 TCCTCATTCACCTGCCTCTC TCCATGTTGGTTTGGAACAG 187 0.25M62 ACTAAAACACCATTAGAAACAAAGG CTGAGCAACATAGTGACCCC 309 0.25

Hierarchical Y
Chrom
osome SN
P Analysis
235Multiplex 3
M96 GTGATGTGTAACTTGGAAAACAGG GGACCATATATTTTGCCATAGGTT 88 0.25M34 CACAGTGTTTTCTCATGTTAATGC GGGGACCCCAATAATCATAA 92 0.25M81 TTATAGTTTCAATCCCTCAGTAATTTT TGTTTCTTCTTGGTTTGTGTGAGTA 176 0.25M35 GCATGGTCCCTTTCTATGGAT GAGAATGAATAGGCATGGGTTC 198 0.25M123 CACAGAGCAAGTGACTCTCAAAG TCTTTCCCTCAACATAGTTATCTCA 248 0.25M78 CTTCAGGCATTATTTTTTTTGGT ATAGTGTTCCTTCACCTTTCCTT 301 0.25
Multimplex 4M65 AAGGCTACCCATTCCCAAAT AAGTCTGGCATCTGCAAAATC 71 0.15M126 GTGCTTGAAACCGAGTTTGT TCGGGAAACACAATTAAGCA 83 0.15M73-M160 AAAACAATAGTTCCAAAAACTTCTGA CCTTTGTGATTCCTCTGAACG 98 0.5M37 ATGGAGCAAGGAACACAGAA AAGAAAGGAGATTGTTTTCAATTTT 124 0.3M167 GAGGCTGGGCCAAGTTAAGG CTTCCTCGGAACCACTACCA 130 0.15M17-M18 CTGGTCATAACACTGGAAATC AGCTGACCACAAACTGATGTAGA 171 0.10M153 TCTGACTTGGAAAGGGGAAA TTTTCTCCTCATTATTTGTCTTCA 239 0.5

236 Brión
Table 2Fluorescence Dyes Assigned to Each ddNTP
ddNTP Dye label Color of analyzed data
A dR6G GreenT dROX® RedG dR110 BlueC dTAMRA® Black
Fig. 2. PCR multiplexes in a silver-stained polyacrylamide gel. For each multiplex,two samples and a negative control were run. Lane 1 to 3 represent multiplex 1, lane 4to 6 multiplex 2, lane 8 to 10 multiplex 3, and lane 11 to 13 multiplex 4. Lanes 7 and14 show a pBR322 DNA-Msp I Digest molecular weight standard (New EnglandBioLabs).
SNaPshot control oligonucleotide is 50°C, the melting temperature for theselected oligos was at least 50°C.
The nucleotide composition of the smaller oligonucleotides can modify sig-nificantly the electrophoresis mobility, so we tested all the used primers in

Hierarchical Y Chromosome SNP Analysis 237
singleplex, before being multiplexed, to ensure the spatial position of each ofthem.
The multiplex SBE reactions were performed in 5 µL of final volume,including 2 µL of multiplex SNaPshot kit and 1.5 µL of cleaned PCR product(see Note 5). Oligonucleotide sequences and concentrations are shown inTable 3. The cycling conditions were 96°C for 10 s, 50°C for 5 s, and 60°Cfor 30 s during 25 cycles.
Table 3 also shows the size of the oligonucleotides used with each SNP;however, during the analysis we have to take in account the single ddNTPextended besides the fluorescence dye, which will affect the mobility of theextended primers in the electrophoresis.
3.4. Postextension Treatment
Because unincorporated ddNTPs will coemigrate with the fragments ofinterest, to avoid interference in the SNaPshot products detection, the migra-tion of ddNTPs has to be altered, removing the 5' phosphoryl groups (see Note6). For this purpose, the final product was incubated with 1 U of SAP kept onice while pipetting for 1 h at 37°C and 15 min at 85°C to inactivate the enzyme.
3.5. Analysis of the Amplified Products
SNapShot products were run on an ABI 3100 Genetic Analyser (AppliedBiosystems). To prepare samples for the capillary electrophoresis, 1.5 µL ofthe minisequencing product was mixed with 10 µL of Hi-Di™ formamide and0.2 µL of GeneScan-120 LIZ size standard. The mix was spin briefly and dena-tured by placing the plate at 95°C for 5 min. Until the samples are loaded in theanalyzer, they have to be placed on ice or at 4°C.
Samples were analyzed using POP-4 as recommended by the manufactureror POP-6 (see Note 1) with SNP36_POP4 default module independent of thepolymer used. The parameters included in the run module are as follows: runtemperature 60°C, prerun time and voltage 60 s and 15 kV, injection time andvoltage 60 s and 2 kV, run time and voltage 1000 s and 15 kV. Data wereanalyzed with dye set E5 created with dR110, dRGG, dTAMRA™, dROX™,LIZ™ matrix standards
Analysis of files was performed according to the ABI PRISM GeneScanAnalysis Software User’s Manual, using the GeneScan 3.7 software (AB Ap-plied Biosystems), and determining the size of the fragments was based onGeneScan-120 Liz size standard.
As in this case, when we are working with Y-chromosome SNPs, the inter-pretation of results becomes easy because we only have one allele for SNP andtherefore we avoid any possible difficulty in the determination of heterozy-gous against homozygous (see Note 7)
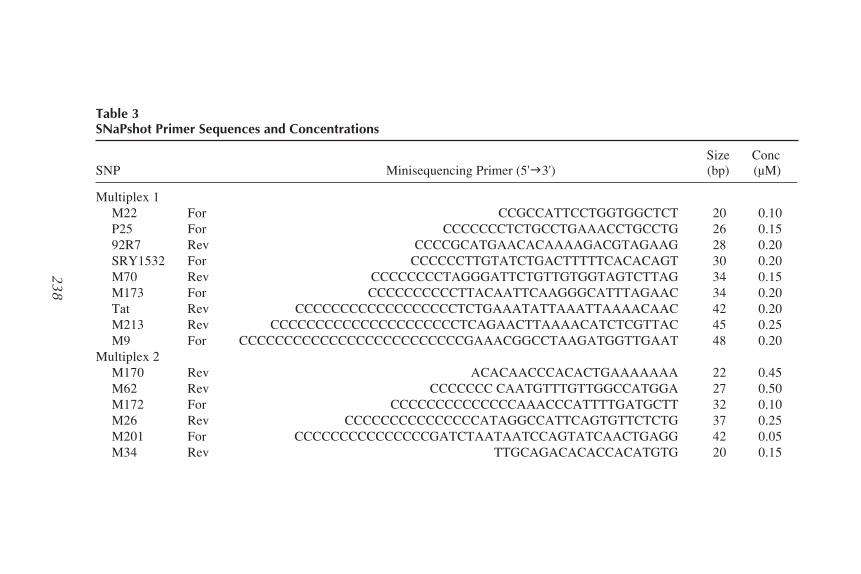
238B
rión
Table 3SNaPshot Primer Sequences and Concentrations
Size ConcSNP Minisequencing Primer (5'3') (bp) (µM)
Multiplex 1M22 For CCGCCATTCCTGGTGGCTCT 20 0.10P25 For CCCCCCCTCTGCCTGAAACCTGCCTG 26 0.1592R7 Rev CCCCGCATGAACACAAAAGACGTAGAAG 28 0.20SRY1532 For CCCCCCTTGTATCTGACTTTTTCACACAGT 30 0.20M70 Rev CCCCCCCCTAGGGATTCTGTTGTGGTAGTCTTAG 34 0.15M173 For CCCCCCCCCCTTACAATTCAAGGGCATTTAGAAC 34 0.20Tat Rev CCCCCCCCCCCCCCCCCCTCTGAAATATTAAATTAAAACAAC 42 0.20M213 Rev CCCCCCCCCCCCCCCCCCCCCTCAGAACTTAAAACATCTCGTTAC 45 0.25M9 For CCCCCCCCCCCCCCCCCCCCCCCCCGAAACGGCCTAAGATGGTTGAAT 48 0.20
Multiplex 2M170 Rev ACACAACCCACACTGAAAAAAA 22 0.45M62 Rev CCCCCCC CAATGTTTGTTGGCCATGGA 27 0.50M172 For CCCCCCCCCCCCCCAAACCCATTTTGATGCTT 32 0.10M26 Rev CCCCCCCCCCCCCCCATAGGCCATTCAGTGTTCTCTG 37 0.25M201 For CCCCCCCCCCCCCCCGATCTAATAATCCAGTATCAACTGAGG 42 0.05M34 Rev TTGCAGACACACCACATGTG 20 0.15
238

Hierarchical Y
Chrom
osome SN
P Analysis
239Multiplex 3
M81 For CCCCCCTAAATTTTGTCCTTTTTTGAA 27 0.20M78 For CCCCCCCCCCACACTTAACAAAGATACTTCTTTC 34 0.35M35 Rev CCCCCCCCCCCCCCCCCCCCAGTCTCTGCCTGTGTC 36 0.03M96 For CCCCCCCCCCCGTAACTTGGAAAACAGGTCTCTCATAATA 40 0.05M123 Rev CCCCCCCCCCCCCCCCCCCCCCCCCCCCCCCTTCTAGGTATTCAGGCGATG 51 0.35M167 For CCCAAGCCCCACAGGGTGC 19 0.45
Multiplex 4M153 For AAAGCTCAAAGGGTATGTGAACA 23 0.30M17 For CCAAAATTCACTTAAAAAAACCC 23 0.20M18 For CCCCAGTTTGTGGTTGCTGGTTGTTA 26 0.15M126 For CCCCGCTTGAAACCGAGTTTGTACTTAATA 30 0.05M37 For CCGGAACACAGAAAATAAAATCTATGTGTG 30 0.35M73 Rev CCCCCCCCCCCGATTCCTCTGAACGTCTAACCA 33 0.30M65 Rev CCCCCCCCCCCCCCCCCCCCCCCCACCCGCGGTAAG 36 0.05M160 For CCCCCCCCTTACAAGTTTAATACATACAACTTCAATTTTC 40 0.20
239

240 Brión
Each of the SNPs included in the multiplex is going to be represented afterthe analysis, as an electrophoretic peak with a different color depending on thebase that has been extended. Fig. 3 shows one example of each of the fourmultiplexes (see Notes 8 and 9).
4. Notes1. According to the manufacturer, the SNaPshot multiplex kit should be used with
POP-4™ polymer; however, we have realized that when the fragments are simi-lar in size, the use of POP-6™ polymer results in a better resolution and discrimi-nation in size.
2. Despite the four multiplexes that include 29 SNPs, Fig. 1 shows 30 SNPsbranches. The reason is because the SRY1532, included in multiplex 1, is one ofthe few SNPs showing recurrence, so it appears twice in the tree.
3. PCR product was also cleaned up according to the manufacturer’s recommenda-tions by mixing 15 µL of it with 5 U of SAP and 2 U of Exonuclease I (ExoI,Amersham Biosciences) and incubating at 37°C for 1 h and at 85°C for 15 min.In our experience, ExoSAP-IT® (Amersham Biosciences) gives clearer results,especially when small minisequencing primers are being used.
4. We have selected poly (dC) 5' tails because they are predicted to have minimalsecondary structures. However, there are more available possibilities, such as theuse of non-homologous tag sequences, as the published by Hirschorn et al. (7).
5. To avoid the loss of material and possible contaminations, it is strongly recom-mended adding the SNaPshot kit and the oligonucleotides directly to the sametubes or plates where the clean-up has been conducted.
6. When the digestion with SAP does not remove all the ddNTP, in the electro-pherogram of the SNaPshot products some artefact peaks larger than 70 bp willappear (excess ddNTP also result in peaks of smaller sizes).
7. Because the intensity of the emitted fluorescence is different for each dye used tolabel ddNTPs, when the strategy includes autosomal markers, special consider-ation should be given to detect heterozygous.
8. In multiplex 1, the SNPs P25 and 92R7 are paralogous sequence variants origi-nated for segmental duplications, where at least one of the variants is polymor-phic (8). This means that in the SBE reaction, the polymorphic position of eachSNP can be extended with one ddNTP and the nonpolymorphic position with thesame of another ddNTP. In the example represented in Fig. 3A, in the P25 theparalogous sequence variants are extended with two different ddNTP (C and A)and in the 92R7 with the same ddNTP (A).
9. In multiplex 2, the SBE reaction always shows the artifact blue peak indicatedwith an arrow in Fig. 3B. This artifact is generated in the M26 SNaPshot reactionbecause it also appears in the singleplex reaction of this SNP. Because M26 is aG to A transition, the artifact blue peak does not affect the interpreting of results.However, other SBE primers should be tried to avoid artifacts.

Hierarchical Y
Chrom
osome SN
P Analysis
241
Fig. 3. Example of results for the four SNaPshot multiplexes from different samples. (A) multiplex 1 from sample assigned tohaplogroup R1b, the P25 shows a duplicated pattern (see Note 8); (B) multiplex 2 from sample assigned to Hg I*(xI1b2), M26 alwaysshows an artefact blue peak (see Note 9); (C) multiplex 3 from sample assigned to Hg E3b2; (D) multiplex 4 from sample assigned toHg R1b3f.
242 Brión
AcknowledgmentsThe technical assistance of Meli Rodríguez and Raquel Calvo is highly ap-
preciated. This work was supported by the grants from the “Xunta de Galicia”(PGIDT01PXI20806PR) and from the “Ministerio de Ciencia y Tecnología”(DGCYT.P4.BIO2000-0145-P4-02).
References1. Jorde, L. B., Watkins, W. S., and Bamshad, M. J. (2001) Population genomics:
a bridge from evolutionary history to genetic medicine. Hum. Mol. Genet. 10,2199–2207.
2. Zhao, Z., Fu, Y. X., Hewett-Emmett, D., and Boerwinkle, E. (2003) Investigat-ing single nucleotide polymorphism (SNP) density in the human genome and itsimplications for molecular evolution. Gene 312, 207–213.
3. Y Chromosome Consortium. (2002) A nomenclature system for the tree of humanY-chromosomal binary haplogroups. Genome Res. 12, 339–348.
4. Jobling, M. A., and Tyler-Smith, C. (2003) The human Y chromosome: an evolu-tionary marker comes of age. Nat. Rev. Genet. 4, 598–612.
5. Rosser, Z., Zerjal, T., Hurles, M. H., Adojaan, M., Alavantic, D., Amorim, A., etal. (2000) Y chromosomal diversity within Europe is clinal and influenced prima-rily by geography, rather than language. Am. J. Hum. Genet. 67, 1526–1543.
6. Semino, O., Passarino, G., Oefner, P. J., Lin, A. A., Arbuzova, S., Beckman, L.E., et al. (2000) The Genetic legacy of paleolithic homo sapiens sapiens in extantEuropeans: a Y chromosome perspective. Science 290, 1155–1159.
7. Hirschorn, J. N., Sklar, P., Lindblad-Toh, K., Lim, Y-M., Ruiz-Gutierrez, M.,Bolk, S., et al. (2000) SBE-TAGS: an array-based method for efficient singlenucleotide polymorphism genotyping. Proc. Natl. Acad. Sci. USA 97, 12,164–12,169.
8. Sanchez, J. J. S., Brion, M., Parson, W., Blanco-Verea, A. J., Boersting, C., Lareu,M. V., et al. (2004) Duplications of the Y-chromosome specific loci P25 and 92R7and forensic implications. Forensic Sci. Int. 140, 147–250.
SNaPshot for Pharmacogenetics 243
243
From: Methods in Molecular Biology, vol. 297: Forensic DNA Typing ProtocolsEdited by: A. Carracedo © Humana Press Inc., Totowa, NJ
17
SNaPshot for Pharmacogenetics by Minisequencing
Klaus Bender
SummaryGenetic polymorphisms of genes coding for metabolic enzymes are helpful to predict
how an individual may respond to medication or drugs. The described approach for theidentification of genetic variations for the cytochrome P450 enzymes CYP2D6 andCYP2C19 has been designed for the rapid genotyping of relevant alleles (CYP2D6*1,-*3, -*4, -*6, -*7, and -*8 and CYP2C19*1, -*2, -*3, -*4, and -*5) by performingpolymerase chain reaction amplifications of genomic regions containing the SNP fol-lowed by a single-tube multiplex single base extension (minisquencing) reaction. Thismultiplex assay can easily be expanded for additional genes and single nucleotide poly-morphisms (SNPs). Minisequencing is a sensitive, reproducible, and time-saving methodfor SNP typing that can be performed using ordinary laboratory equipment.
Key Words: SNPs; pharmacogenetic; CYP2D6; CYP2C19; minisequencing.
1. IntroductionSingle nucleotide polymorphisms (SNPs) are informative in the study of
human genetic diversity and may be used in the diagnosis of disease-relatedalleles, pharmacogenetic typing, the identification of victims in mass disasters,and in population genetic studies. SNP typing can be performed by a variety ofdifferent methods (1). The SNP analysis described in this chapter makes use of aDNA polymerase-mediated single-base extension (SBE). The reaction is robust,allowing specific genotyping of most SNPs at similar reaction conditions.
The typing of SNPs in the cytochrome P450 genes CYP2D6 and CYP2C19is chosen as an example for a detailed explanation of this method. Because theproteins encoded by these genes are involved in the metabolism of many drugs,polymorphisms in the coding sequence can either modify the activity or lead tothe inactivation of the enzymes. The reduction or loss of enzyme activity can

244 Bender
result in a nonresponse to medication or adverse drug reactions (2,3). There-fore the prediction of the genotypes for drug-metabolizing enzymes may havean impact on the choice of the drug prescribed and could be helpful in the tailor-ing of medication that is specific to patients.
The method depends on the PCR amplification of the genomic region thatcontains the SNPs before the actual genotyping reaction is performed by mul-tiplex minisequencing. The typing principle can be compared with a conven-tional sequencing reaction but makes use of a minisequencing primer annealingdirectly with its 3' end adjacent to the polymorphic site and using fluorescence-labeled ddNTPs rather than a mixture of dNTP and ddNTPs. The 3' end isextended with a single nucleotide that is complementary to the nucleotide atthe site of the SNP. The assay itself involves three phases. First, the amplifica-tion of the target sequences by PCR; second, the removal of non-incorporatedPCR primers and dNTPs; third, the minisequencing reaction (SBE) followedby separation and detection of the extended minisequencing primers by capil-lary gel electrophoresis (Fig. 1). By attaching oligo dT-tags with definedlengths to the 5' end of each minisequencing primer, the combined analysis ofseveral SNPs can be performed in a single reaction tube (4,5).
For the typing of the above-mentioned genes, a single PCR for CYP2D6 anda 4-plex PCR for CYP2C19 is performed. All PCR products are then pooledfor exonuclease I and shrimp alkaline phosphatase (SAP) digestion.Minisequencing is performed by using the commercially available SNaPshot™Kit (Applied Biosystems). The minisequencing products are analyzed by cap-illary gel electrophoresis. Figure 2 summarizes the strategy for the combinedtyping of the most important SNPs for the two cytochrome P450 genes.
Minisequencing cannot be performed for the detection of whole gene dele-tions and duplications present in the CYP2D6 gene. These mutations can onlybe analyzed by using long-PCR technologies developed by Steen et al. (6) andLundqvist et al. (7), respectively.
2. Materials1. PCR Thermocycler Gene® Amp PCR System 2400/9600 (Applied Biosystems).2. Oligonucleotide primers (Invitrogen) (see Note 1).3. 10 mM deoxy-ribonucleotide triphosphates (dNTPs) mixture (peqlab Biotech-
nology).4. SAWADY “Mid Range PCR” Kit (peqlab Biotechnology).5. Platinum Polymerase (Invitrogen).6. 10X PCR Buffer, 50 mM MgCl2 (Invitrogen).7. Horizontal electrophoresis chamber for minimum gel length of 8 cm.8. 10X TBE buffer: 109 g Tris-base, 55.6 g boric acid, 9.3 g ethylene diamine
tetraacetic acid per liter.

SNaPshot for Pharmacogenetics 245
Fig. 1. Scheme of the minisequencing typing. The migration of the particularminisequencing primers corresponds to the difference in the length of the attachedoligoT tails.
Fig. 2. Strategy for the typing of relevant alleles for CYP2D6 and CYP2C19.
9. Universal agarose (e.g., peqGOLD, peqlab Biotechnology).10. Ethidium bromide (10 mg/mL).11. 6X DNA loading buffer: 0.25% cresolred, 30% glycerol in water.12. DNA size markers (100-bp ladder DNA and λ DNA digested with HindIII).13. Power supply capable of delivering a constant voltage between 60 and 200 V.14. Long-wave ultraviolet transilluminator (312 nm).
246 Bender
15. Photographic equipment with filter for ultraviolet.16. Exonuclease I (Amersham Pharmacia).17. SAP (Roche Diagnostics).18. ABI PRISM SNaPshot™ Kit (Applied Biosystems).19. Genetic Analyzer ABI PRISM 310 (Applied Biosystems).20. Formamide Sigma Ultra (F-5786).21. ABI PRISM® dRhodamine Matrix Standards Kit (Applied Biosystems).22. Matrix Standard Set DS-02 (Applied Biosystems).
3. Methods3.1. PCR Amplification for the CYP2D6 Locus
1. The amplification protocol of the CYP2D6 gene is in general the protocol for theexamination of gene duplications of CYP2D6 (7). The PCR is conducted in 50-µLreaction volumes containing 10–150 ng template DNA, 5 µL of 10X reaction buffer(500 mM Tris-HCl, pH 9.1, 140 mM (NH4)2SO4, 17.5 mM MgCl2), 350 µMdNTPs, 15 µM of each primer (Table 1), and 2.5 units of “Mid Range PCR”enzyme
2. Place the PCR tubes into a PerkinElmer Thermocycler Gene® Amp PCR System2400/9600 with the following conditions: initial denaturation at 94°C for 2 min,32 cycles of denaturation at 96°C for 30 s, primer annealing and extension at68°C for 4 min, and a final extension step at 72°C for 10 min.
3.2. PCR Amplification for the CYP2C19 Locus
1. The 4-PlexPCR is conducted in a 50-µL reaction volume containing 10–150 ngtemplate of DNA, 5 µL of 10X PCR buffer (200 mM Tris-HCl, pH 8.4; 500 mMKCl), 3 mM MgCl2, 200 µM dNTPs, 10 µM of each primer (Table 2), and 2.5units of Platinum Taq polymerase.
2. Place the PCR tubes into a PerkinElmer Thermocycler Gene® Amp PCR System2400/9600 with the following conditions: initial denaturation at 94°C for 5 min,37 cycles of denaturation at 96°C for 30 s, primer annealing at 57°C for 20 s,extension at 72°C for 45 s, and a final extension step at 72°C for 7 min.
3.3. Agarose Gel Electrophoresis
1. Agarose gel electrophoresis is conducted to check the presence and correct sizeof the amplified PCR products (see Note 2). Mix 5 µL of a 50-µL PCR with 1.3µL of 6X DNA loading buffer for electrophoresis. Load the mixture into the slotsof a 1–2% agarose gel prestained with ethidium bromide (0.3 µg/mL), preparedwith 1X TBE, and run the gel with 60V for 30–60 min.
2. After running the gel examine the PCR fragments under ultraviolet light and pho-tograph them for documentation (Fig. 3).

SNaPshot for Pharmacogenetics 247
Table 1Primers for CYP2D6 According to Lundqvist et al. (7)
Ref. seq. LengthPrimer Orientation acc. no. Sequence (5' to 3') (nt)
CYP2D6F ForwardM33388
CCA GAA GGC TTT GCA GGC TTC A 22CYP2D6R Reverse ACT GAG CCC TGG GAG GTA GGT A 22
Table 2Primers for CYP2C19, CYP2C19*2, and *3 Primers According to Goldstein et al.(8); CYP2C19*5 Primers According to Xiao et al. (9); and CYP2C19*4 PrimersAccording to Ferguson et al. (10)
Ref. seq. LengthPrimer Orientation acc. no. Sequence (5' to 3') (nt)
CYP2C19*2-A Forward M61854 CAG AGC TTG GCA TAT TGT ATC 21CYP2C19*2-B Reverse “ GTA AAC ACA CAA CTA GTC AAT G 22CYP2C19*3-A Forward “ AAA TTG TTT CCA ATC ATT TAG CT 23CYP2C19*3-B Reverse “ ACT TCA GGG CTT GGT CAA TA 20CYP2C19*4-A Forward “ TTA ACA AGA GGA GAA GGC TTC A 22CYP2C19*4-B Reverse “ TTG GTT AAG GAT TTG CTG ACA 21CYP2C19*5-A Forward “ TCC CTA TGT TTG TTA TTT CCA GG 23CYP2C19*5-B Reverse “ GAG CAG CCA GAC CAT CTG TG 20
Fig. 3. Example for the 4-plex PCR of CYP2C19.
248 Bender
3.4. SNaPshot Minisequencing Protocol
3.4.1. Minisequencing Primer Design
1. Check both strands of each SNP target sequence to ensure that the plus- or theminus-strand minisequencing primer will not wrongly anneal somewhere else(see Notes 3 and 4).
2. The melting temperature (tm) of the minisequencing primer should be greaterthan the PCR annealing temperature, at least 50°C.
3. Check whether the minisequencing primers can form stable duplex moleculeswith each other at the given temperature in the experiment (see Note 5).
4. Check each primer for homodimers and hairpins by calculating the free energyalignment of a primer with itself.
5. Calculate a convenient length for the 5' oligo-dT tail for the proper separation ofthe minisequencing primers in the electrophoresis. A spacing of four to six nucle-otides between two adjacent primers is sufficient (see Note 6).
3.4.2. Performing the Minisequencing
3.4.2.1. PURIFICATION OF PCR PRODUCTS
1. All reactions are performed in 0.2-mL tubes using a PerkinElmer ThermocyclerGene®Amp PCR System 2400/9600.
2. Remove the remaining primers and dNTPs by treating the PCR reactions withExonuclease I- and SAP. PCR products from one or several single or multiplexPCR reactions can be combined. The total volume has to be adjusted to 15 µLwith water.
3. Mix of PCR products
PCR products x µL max. 15 µLH2O y µL up to 15 µL
Total volume 15 µL
4. ExoI + SAP-mastermix
H2O 3.24 µL10X SAP buffer 0.36 µLExonuclease I (10 U/mL) 0.4 µLSAP (1 U/mL) 2 µL
Total volume 6 µL
5. Digestion protocol
Mix of PCR products 15 µLExoI + SAP-mastermix 6 µL
Total volume 21 µL
6. Incubate the reaction for 60 min at 37°C, then inactivate the enzymes by heat-ing to 75°C for 15 min. The reaction can be kept on ice. For longer storage,store at –20°C (see Note 7).
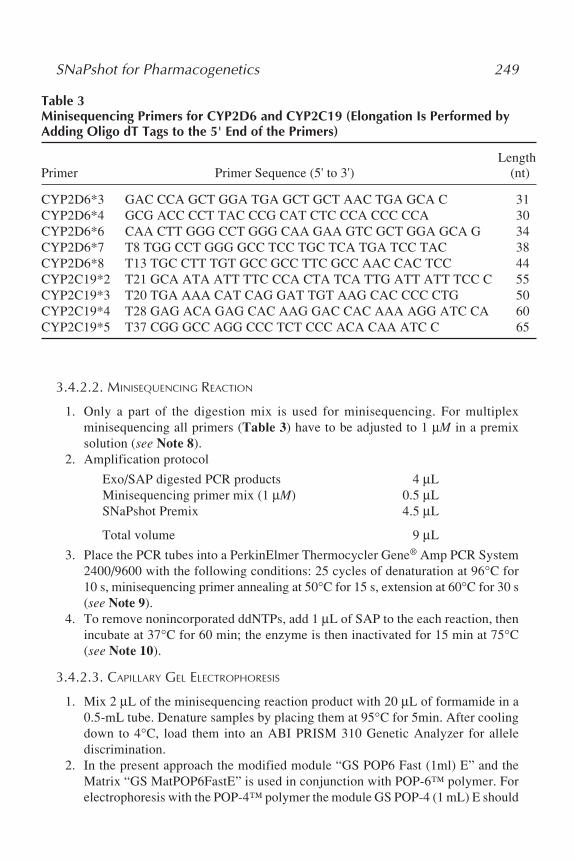
SNaPshot for Pharmacogenetics 249
3.4.2.2. MINISEQUENCING REACTION
1. Only a part of the digestion mix is used for minisequencing. For multiplexminisequencing all primers (Table 3) have to be adjusted to 1 µM in a premixsolution (see Note 8).
2. Amplification protocol
Exo/SAP digested PCR products 4 µLMinisequencing primer mix (1 µM) 0.5 µLSNaPshot Premix 4.5 µL
Total volume 9 µL
3. Place the PCR tubes into a PerkinElmer Thermocycler Gene® Amp PCR System2400/9600 with the following conditions: 25 cycles of denaturation at 96°C for10 s, minisequencing primer annealing at 50°C for 15 s, extension at 60°C for 30 s(see Note 9).
4. To remove nonincorporated ddNTPs, add 1 µL of SAP to the each reaction, thenincubate at 37°C for 60 min; the enzyme is then inactivated for 15 min at 75°C(see Note 10).
3.4.2.3. CAPILLARY GEL ELECTROPHORESIS
1. Mix 2 µL of the minisequencing reaction product with 20 µL of formamide in a0.5-mL tube. Denature samples by placing them at 95°C for 5min. After coolingdown to 4°C, load them into an ABI PRISM 310 Genetic Analyzer for allelediscrimination.
2. In the present approach the modified module “GS POP6 Fast (1ml) E” and theMatrix “GS MatPOP6FastE” is used in conjunction with POP-6™ polymer. Forelectrophoresis with the POP-4™ polymer the module GS POP-4 (1 mL) E should
Table 3Minisequencing Primers for CYP2D6 and CYP2C19 (Elongation Is Performed byAdding Oligo dT Tags to the 5' End of the Primers)
LengthPrimer Primer Sequence (5' to 3') (nt)
CYP2D6*3 GAC CCA GCT GGA TGA GCT GCT AAC TGA GCA C 31CYP2D6*4 GCG ACC CCT TAC CCG CAT CTC CCA CCC CCA 30CYP2D6*6 CAA CTT GGG CCT GGG CAA GAA GTC GCT GGA GCA G 34CYP2D6*7 T8 TGG CCT GGG GCC TCC TGC TCA TGA TCC TAC 38CYP2D6*8 T13 TGC CTT TGT GCC GCC TTC GCC AAC CAC TCC 44CYP2C19*2 T21 GCA ATA ATT TTC CCA CTA TCA TTG ATT ATT TCC C 55CYP2C19*3 T20 TGA AAA CAT CAG GAT TGT AAG CAC CCC CTG 50CYP2C19*4 T28 GAG ACA GAG CAC AAG GAC CAC AAA AGG ATC CA 60CYP2C19*5 T37 CGG GCC AGG CCC TCT CCC ACA CAA ATC C 65
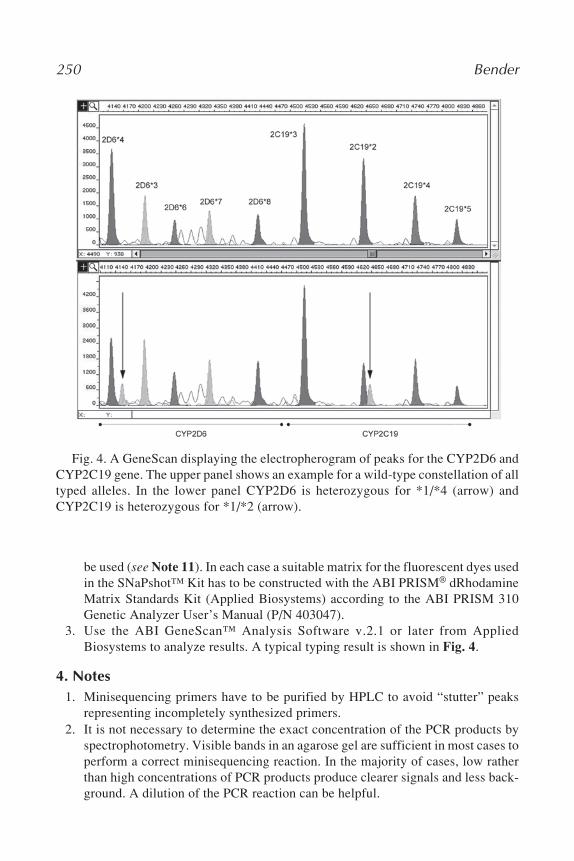
250 Bender
be used (see Note 11). In each case a suitable matrix for the fluorescent dyes usedin the SNaPshot™ Kit has to be constructed with the ABI PRISM® dRhodamineMatrix Standards Kit (Applied Biosystems) according to the ABI PRISM 310Genetic Analyzer User’s Manual (P/N 403047).
3. Use the ABI GeneScan™ Analysis Software v.2.1 or later from AppliedBiosystems to analyze results. A typical typing result is shown in Fig. 4.
4. Notes1. Minisequencing primers have to be purified by HPLC to avoid “stutter” peaks
representing incompletely synthesized primers.2. It is not necessary to determine the exact concentration of the PCR products by
spectrophotometry. Visible bands in an agarose gel are sufficient in most cases toperform a correct minisequencing reaction. In the majority of cases, low ratherthan high concentrations of PCR products produce clearer signals and less back-ground. A dilution of the PCR reaction can be helpful.
Fig. 4. A GeneScan displaying the electropherogram of peaks for the CYP2D6 andCYP2C19 gene. The upper panel shows an example for a wild-type constellation of alltyped alleles. In the lower panel CYP2D6 is heterozygous for *1/*4 (arrow) andCYP2C19 is heterozygous for *1/*2 (arrow).

SNaPshot for Pharmacogenetics 251
3. To check whether a given minisequencing primer produces background signalsand is well purified, test each primer separately before it is used in an multiplexassay. This should also be done after a new batch of primers has been ordered.
4. Run one negative control without template DNA when evaluating a new primer.5. Calculation of all interactions between different minisequencing primers can be
performed by using a corresponding computer program (e.g., FastPCR, free avail-able in www.biocenter. helsinki.fi/bi/bare-1_html/download.htm). The programscomputes the most stable interactions the strands can form, and returns freeenergy change ∆G for the reaction. If the free energy is negative, the DNAstrands can interact in the experiment.
6. poly (dT), poly (dA), poly (dC) and poly GACT can be used as 5' nonhomologoustags.
7. Removal of residual primers and unincorporated dNTPs from the PCR also canbe performed by using purification columns (e.g., MinElute PCR purificationspin column, Quiagen). Attention has to be paid to the length of the PCR prod-ucts, because the retention of very small amplicons (e.g., 55–90 bps) by columnscan be critical.
8. To get more uniform signals for all typed SNPs in an multiplex or if a particularprimer has a consistently low or high signal, increase or decrease the concen-tration of that primer in the primer premixture. The concentration can rangebetween 0.05 µM and 1 µM. To adjust the amount of template DNA is usually notnecessary.
9. Amplification can also be increased to 30 cycles compared with the original pro-tocol from Applied Biosystems to make the system more sensitive. The increasethe injection times for capillary gel electrophoresis or an increase of the amountof minisequencing product from 2 to 4 µL make the analysis more sensitive.
10. To minimize the costs for the analysis calf intestinal phosphatase can be usedinstead of SAP for the postextension treatment. Also, the amount of SNaPshotPremix in the minisequencing reaction can be reduced to 3.5 µL by filling up thereaction to the original volume of 4.5 µL with water.
11. To reduce the time for the electrophoresis run, the Fast GS Template E run mod-ule for GeneScan analysis can be used. This module requires the Fast NativeProtocol polymer, but can also be performed with POP-6™ polymer.
12. For lower background signals, especially when multiple PCRs with many prod-ucts are combined, the use of a higher concentration of exonuclease I results inlower peaks from an excess of PCR primers.
13. Unspecific signals larger than 70 bps are often caused by undigested ddNTPs.The use of a higher concentration of calf intestinal phosphatase /SAP or freshenzyme is recommended.
14. Electropherograms from SNPs similar to a conventional Sanger sequencing reac-tion can be caused by the incomplete removal of dNTPs. Use fresh SAP.
15. To remove extra peaks or background peaks higher stringency thermal cyclingconditions can be used: denaturation at 96°C for 10s, minisequencing primerannealing at 64°C for 5 s, and extension at 72°C for 30s.
252 Bender
16. If you have installed the data collection software for 5-dye detection, then theinternal standard “GeneScan™-120 LIZ™ size” can be used to size the SNaPshotfragments in basepairs. The POP-4™ polymer is used in conjunction with the GSPOP-4 (1 mL) E5 module. For matrix construction, use the Matrix Standard SetDS-02 (Applied Biosystems) according to the ABI PRISM 310 Genetic AnalyzerUser’s Manual (P/N 4323050). For data analysis, the ABI GeneScan™ AnalysisSoftware v.3.1 or higher is required.
References1. Syvanen, A. C. (2001) Accessing genetic variation: genotyping single nucleotide
polymorphisms. Nat. Rev. Genet. 2, 930–942.2. Ingelman-Sundberg, M. (2001) Pharmacogenetics: an opportunity for a safer and
more efficient pharmacotherapy. J. Intern. Med. 250, 186–200.3. Pirmohamed, M., and Park, B.K. (2001) Genetic susceptibility to adverse drug
reactions. Trends Pharmacol. Sci. 22, 298–305.4. Sanchez, J. J., Borsting, C., Hallenberg, C., Buchard, A., Hernandez, A., and
Morling, N. (2003) Multiplex PCR and minisequencing of SNPs—a model with35 Y chromosome SNPs. Forensic Sci. Int. 137, 74–84.
5. Morley, J.M., Bark, J.E., Evans, C.E., Perry, J.G., Hewitt, C.A., and Tully, G.(1999) Validation of mitochondrial DNA minisequencing for forensic casework.Int. J. Legal Med. 112, 241–248.
6. Steen, V. M., Andreassen, O. A., Daly, A. K., Tefre, T., Borresen, A.-L., Idle, J.R., and Gulbrandsen, A.-K. (1995) Detection of the poor metabolizer-associatedCYP2D6(D) gene deletion allele by long-PCR technology. Pharmacogentetics 5,215–223.
7. Lundqvist, E., Johansson, I., and Ingelman-Sundberg, M. (1999) Genetic mecha-nisms for duplication and multiduplication of the human CYP2D6 gene and meth-ods for detection of duplicated CYP2D6 genes. Gene 226, 327–338.
8. Goldstein, J. A., and Blaisdell, J. (1996) Genetic tests which identify the principaldefects in CYP2C19 responsible for the polymorphism in mephenytoin metabo-lism. Methods Enzymol. 272, 210–218.
9. Xiao, Z. S., Goldstein, J. A., Xie, H. G., Blaisdell, J., Wang, W., Jiang, C. H., et al.(1997) Differences in the incidence of the CYP2C19 polymorphism affecting the S-mephenytoin phenotype in Chinese Han and Bai populations and identification of anew rare CYP2C19 mutant allele. J. Pharmacol. Exp. Ther. 281, 604–609.
10. Ferguson, R. J., De Morais, S. M., Benhamou, S., Bouchardy, C., Blaisdell, J.,Ibeanu, G., et al. . (1998) A new genetic defect in human CYP2C19 mutation ofthe initiation codon is responsible for poor metabolism of S-mephenytoin. JPET284, 356–361.
Studying Ancient DNA 253
253
From: Methods in Molecular Biology, vol. 297: Forensic DNA Typing ProtocolsEdited by: A. Carracedo © Humana Press Inc., Totowa, NJ
18
Methods for the Study of Ancient DNA
Christine Keyser-Tracqui and Bertrand Ludes
SummaryWhereas the analysis of ancient DNA (aDNA) has become an increasingly popular
mode of investigation in both archaeological and evolutionary studies, this approach iscomplicated by the degraded nature of ancient nucleic acids, the presence of enzymaticinhibitors in aDNA extracts, as well as the risk of contamination during either excava-tion or manipulation of samples. Despite these difficulties, numerous methods have beendeveloped to optimize the recovery, study, and authentication of aDNA. In this article,we describe the procedures used in our laboratory to extract and amplify informativeDNA segments from prehistoric or protohistoric human samples, as well as the precau-tions and strategies implemented to avoid or at least detect contaminations.
Key Words: Ancient DNA; bone; inhibition; contamination; DNA markers.
1. IntroductionThe interest in ancient deoxyribonucleic acid (aDNA) has grown consider-
ably since it was first demonstrated that at least some molecules of aDNA havesurvived until today (1,2). From these molecules, biologists and anthropolo-gists have attempted to understand issues such as the social organization ofpast human populations, their cultural and funeral customs, their evolutionaryhistories, their migrations and interactions with other populations, and eventheir diseases (3–6).
The analysis of aDNA sequences became possible with the invention of thepolymerase chain reaction (PCR; ref. 7). However, aDNA molecules tend to bedamaged, which prohibits the application of usual procedures of nucleic acidanalysis. Two types of damage are mainly likely to affect DNA over time:hydrolytic and oxidative damage. Hydrolytic damage results in deamination ofbases and in depurination and depyrimidination, whereas oxidative damage

254 Keyser-Tracqui and Ludes
results in modified bases (8). Both mechanisms reduce the number as well asthe size of the fragments that can be amplified by PCR: the amount of DNAavailable for genetic typing is thus often in the picogram range, and the sizeof the amplified DNA fragment is rarely longer than 300–400 base pairs. Theconditions under which the ancient specimens have been preserved may beof decisive importance. Low temperatures during the burial period as well asenvironmental stability, rather than simply presence or absence of water, in-crease the chance of DNA survival by slowing its breakdown by hydrolysisand oxidation.
Failure to amplify DNA may also result from the presence of inhibitors thatinterfere with the PCR. Archaeological samples may indeed contain low-mo-lecular-weight compounds, supposedly derived from the burial environment,which coextract with the DNA molecules and potently inhibit the activity ofthe DNA polymerase. Among these inhibitors are Maillard products,byproducts of sugar reduction in which DNA may be entrapped (9), and col-lagen type I (10). Contamination of ancient specimens and molecular extractsby modern DNA represents another major limitation to ancient DNA analysisbecause, as a result of its higher concentration and quality, contemporary DNAamplification is favored over that of the endogenous DNA in the sample (11).This is particularly the case when human remains are studied because humanDNA is the most common source of contamination. Therefore, a number of cri-teria need to be fulfilled before an aDNA sequence determined from extracts ofan ancient specimen can be taken to be genuine (11,12).
Because many techniques developed for use with modern samples do notwork equally well with ancient material, we describe here the experimentalprotocols and strategies developed in our laboratory to study the genetic rela-tionships between human individual and/or populations from the past as wellas the stringent criteria applied to ensure the reliability of the results obtained.
2. Materials2.1. Biological Samples
The main source of DNA used in our laboratory for ancient investigations isbone. Bones are much more abundant than soft tissue remains and are gener-ally better preserved. Moreover, it has been suggested that the adsorption ofthe DNA to an inorganic component of the bone called hydroxyapatite makesthe DNA more stable (8).
Teeth are also sometimes used owing to the relatively impervious outerenamel layer, which protects DNA from degradation and contamination. Weusually apply either one of two methods to extract DNA from teeth. The first issimply powdering the tooth. The second requires sectioning the tooth before

Studying Ancient DNA 255
removing the pulp (Fig. 1). The latter method is less destructive because thetooth can be glued back after pulp removal.
2.2. DNA Analyses
Compared with the standard apparatus of a molecular biology laboratory,we advocate additional equipment:
1. Germicidal ultraviolet (UV) sterilizing lamps + tubes (254 nm) positioned aboveevery door of the laboratory.
2. High-speed grinding machine + accessories (collets, drill bit; Dremel®).3. Cryogenic grinder (6800 Freezer/Mill, Spex CertiPrep).4. Drill press (Practyl PC13-35).5. Disposal perforator (Codman®).
Fig. 1. The tooth is sectioned (A) then opened (B) prior to removal of the pulp.

256 Keyser-Tracqui and Ludes
2.3. Other Materials Required
1. Cleanmix kit (Talent).2. Microconcentrators Microcon® YM-30 (Amicon).3. DNA Away™ (Molecular BioProducts) or DNAZap™ (Ambion).4. Aerosol-Resistant Tips (Molecular BioProducts).5. Bovine serum albumin (BSA; Sigma).6. AmpliTaqGold DNA polymerase (Applied Biosystems).
3. MethodsThe sample preparation procedure described below only concern bone
samples, these being preferably chosen as DNA sources in our studies. TheDNA extraction procedure described optimizes the recovery of DNA and mini-mizes the impact of PCR inhibitors.
3.1. Bone Sample Preparation
3.1.1. Bone Sample Selection
The limiting factor for any aDNA study is the quality of the biologicalmaterial tested (if the sample selected contains no amplifiable aDNA, theneven the most efficient extraction procedure will not be successful). Carefulsample choice is therefore prerequisite. There is no methodology for the rapididentification of bones from which DNA may be successfully extracted. Nev-ertheless, we have observed a correlation between macroscopic preservationof bone samples and DNA recovery. Our practice is thus to preferably chooseheavy (dense) bone rather than more brittle bone, which has lost lipid and col-lagen and has therefore increased in porosity. Long bones (such as femur, tibia,and humerus) are preferred over rib or other thin bones. Moreover, compact(cortical) bone is preferred to spongy bone.
3.1.2. Bone Sample Cleaning
The preparation of most bone samples (which should take place in a roomphysically separated from downstream work areas) begins with cleaning. Toget rid of modern DNA contamination, the surface of each bone sample isremoved as follows:
1. Use a sterile scalpel blade to shave the surface of the bone sample and removedirt, soil, and any other foreign material.
2. Prepare the high-speed grinding machine (Dremel®) and the drill bit (the wholeunit previously UV irradiated) in the aspiration hood and abrade the surface ofthe bone sample 2 to 3 mL deep. The release of bone dust outside the hood isnecessary to prevent DNA cross-contamination between ancient samples.
3. Wrap carefully the cleaned bone sample or fragment in a sterile paper.

Studying Ancient DNA 257
3.1.3. Bone Sample Pulverization
Cleaned bone sample can be powdered in two ways:
1. To pulverize fragmentary pieces (such as skeletal elements from juvenile speci-mens or sections of bone diaphyses), we use a cryogenic grinder (Freezer mill)that preserves the chemical and structural features which would otherwise bedegraded by the heat generated by milling. The bone sample, contained in agrinding vial, is immersed in liquid nitrogen, and then pulverized by the ham-mering of a magnetically driven impactor against the end plugs of the vial.Typical grinding time is 1 min with several rounds. Between each sample, thegrinding vial is carefully cleaned by washing, application of DNA away™/orDNAZap™ and, finally, UV irradiation (see Note 1).
2. When long cortical bones are available, we preferably use a drill press. Thelong bone, wrapped in the sterile paper, is placed on the table of the column andkept in position with hold down clamps. The column supports a head contain-ing a motor that turns a spindle at a controlled speed. The spindle holds a surgi-cal drill bit that generates bone chips while avoiding overheating, a procedurethat we believe is fundamental for correct DNA recovery (Fig. 2). The advan-tage of this method is that the bone morphology is not profoundly altered.
3.1.4. Bone Sample Decalcification
Once the bone powder is obtained, we generally operate as follows (all thesteps are now carried out under a laminar flow hood):
1. Pour the powdered bone (2 g) into a sterile 50-mL tube.2. Add 5 mL of an extraction buffer containing 5 mM ethylene diamine tetraacetic
acid, 2% sodium dodecyl sulfate, 10 mM Tris-HCl (pH 8.0), 0.3 M sodiumacetate, as well as 1 mg proteinase-K/mL (to solubilize DNA; see Note 2).
3. Vortex, seal the tube cap and incubate tube overnight at 50°C with continuousvertical rotation.
3.2. DNA Extraction and Purification
Whereas the organic extraction of proteins with phenol and/or chloroform/isoamyl alcohol is sometimes considered as unnecessary (13,14), it consti-tutes an important step of our DNA recovery method.
3.2.1. Extraction of Nucleic Acids
1. The next morning, remove the sample from the incubator and add phenol/chlo-roform/isoamyl alcohol (25/24/1, v/v) to separate DNA from cellular debris.
2. Spin the sample tube at 1000g for 15 min.3. Carefully remove the top aqueous layer with a P5000 pipet and transfer to a
fresh 50-mL tube (the organic layer will be very dark and possibly contain anopaque precipitate constituted of fatty acids near the interface). Because the
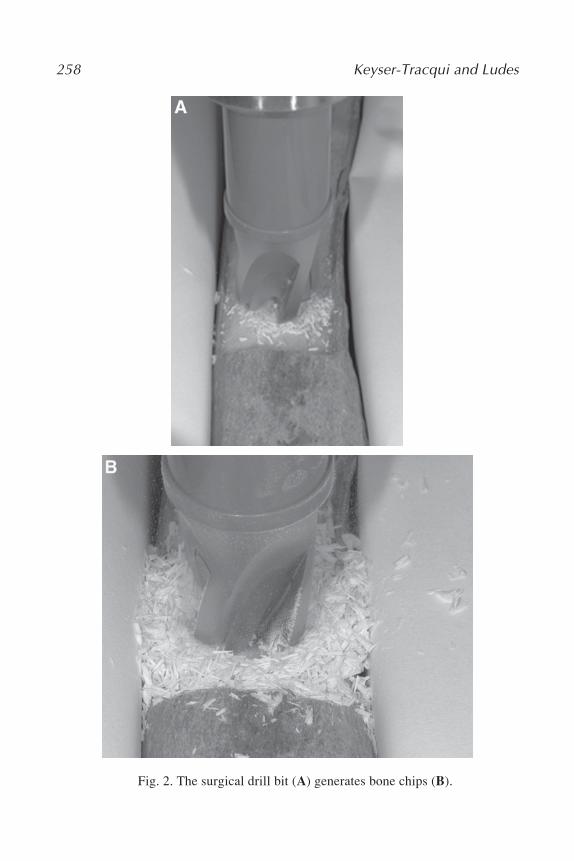
258 Keyser-Tracqui and Ludes
Fig. 2. The surgical drill bit (A) generates bone chips (B).
Studying Ancient DNA 259
aqueous phase is a large volume, do not be concerned with recovering everymicroliter of this layer. A 1-mL pipet can be helpful to take the remainder ofthis phase, but avoid disrupting and drawing in the interface and the fatty layerbelow it.
3.2.2. Purification of Nucleic AcidsAfter extraction, the aqueous phase is purified with a commercially avail-
able CleanMix purification kit. This kit is based on a high capacity silicamatrix that binds quickly to DNA and purifies it from some of its contaminantsin the presence of the chaotropic agent guanidium thiocyanate. CleanMix spincolumns are notably designated to trap PCR products that are larger than 100 pband smaller than 10 kb. They are thus ideally suited for ancient DNA samplesbecause these samples are generally degraded and the target regions for ampli-fication generally quite small.
1. Add 2.5 mL of the Cleanmix-binding solution and 250 µL of the Cleanmix-highcapacity purification resin to the extracted ancient DNA solution (see Note 3).
2. Put one Cleanmix filter into a 2-mL centrifuge tube. Transfer 500 µL of the mix-ture into the filter and spin for 30 s at 6000 rpm (until the column is empty).Discard the filtrate and repeat the process until all of the extracted solution haspassed through the column.
3. Once the total volume of the sample has been placed into the column and spunthrough, wash the DNA by adding 500 µL of Cleanmix washing solution andcentrifuging for 30 s. Repeat this step once.
4. Transfer the filter to a clean microcentrifuge tube. To elute DNA, add to thefilter 400 µL of sterile water preheated at 65–70°C. Allow the DNA to resus-pend for 2 min.
5. Spin the filter in the microcentrifuge tube for 2 min at 6000 rpm.
3.2.3. Concentration of Nucleic AcidsAfter the elution step, the diluted DNA is concentrated by passing through a
Microcon YM30 filter containing an anisotropic membrane that retainsmacrosolutes (including DNA) while allowing low-molecular-weight solutesto pass through.
1. Transfer the eluted 400 µL into the sample reservoir without touching the mem-brane with the pipet tip.
2. Spin for 9 min at 7000g (the remaining volume on the membrane should approxi-mate 30 µL).
3. Remove assembly from centrifuge; separate vial from sample reservoir.4. Place sample reservoir upside down in a new vial, then spin 4 min at 1500g to
transfer concentrate to vial.5. Remove from centrifuge and separate sample reservoir.6. Store the purified DNA sample at 4°C while in use and then place it at 20°C for
long-term storage (successive freeze–thaw cycles can damage the DNA templatesover time).

260 Keyser-Tracqui and Ludes
3.3. DNA AmplificationThe DNA recovered using the procedure described above is then amplified
using PCR. To enhance the efficiency of the PCR amplifications, we selectedseveral strategies.
3.3.1. Addition of BSA in the PCR Mix
Amplification efficiency (yield of product) and specificity (absence of non-specific products) can be improved by the addition of an enhancer to the PCR.We usually use BSA, which has the ability to bind to enzyme inhibitors presentin aDNA preparations. Our reaction mix is thus generally prepared as follows:
GeneAmp 10X PCR buffer 500 µL25 mM MgCl2 solution 300 µLdATP (100 mM) 10 µLdCTP (100 mM) 10 µLdGTP (100 mM) 10 µLdTTP (100 mM) 10 µLBSA (20 mg/mL) 50 µLWater 110 µL
Total 1000 µL
3.3.2. Hot Starting PCR
To increase the yield from PCR, it also is possible to use a hot-start proce-dure. Hot starting a PCR prevents the creation of primer oligomers and reducesthe rate of mispriming during the initial heating up to the denaturation tem-perature. Although annealing is not a problem for routine PCR applications,room temperature extension is a major problem affecting the specificity of theamplification reaction when the PCR target is less than 100–500 copies.
Hot-start PCR is a simple modification of the original PCR process, wherebythe enzyme is kept inactive until the PCR temperature is above normal primerannealing temperature. The yield of specific product increases because reac-tants are not wasted in the formation of unintended products. To hot start aPCR, we generally use a chemically modified form of Taq DNA polymerasecalled AmpliTaqGold, which is commercially available from AppliedBiosystems. This enzyme is activated for PCR by heating at 95°C for 10 min.
3.3.3. Increasing the Number of Amplification Cycles
Another way to increase the sensitivity of the PCR is to raise the number ofamplification cycles. This is routinely used by anthropologists and forensicscientists to analyze ancient DNA from bones (15,16). We used, for example,
Studying Ancient DNA 261
37 cycles instead of 28 to analyze short tandem repeats (STRs) from 2000- to2400-yr-old skeletons (6).
3.3.4. Stringent PCR
Amplification yield may also be increased by starting a PCR using stringent(high) annealing temperatures during the first three cycles, and then reducingthe annealing temperature for the remaining cycles of the amplification. Althoughthis results in low primer binding during the early cycles, mispriming is mini-mized, increasing the proportion of high-quality target sequences in each suc-cessive cycle. We used this approach to amplify DNA from ancient CentralAsian horse specimens (article in preparation).
3.4. DNA Markers Selection and Analysis
DNA from archaeological specimens is usually of low average molecularsize and low copy number because of various forms of damage (see Subhead-ing 1.). For these reasons, primers that amplify short sequences are recom-mended. The short size of the STR markers (100–400 pb) makes them suitablefor the investigation of degraded DNA. Moreover, these markers can be simul-taneously amplified (notably with commercially available kits), reducing to anabsolute minimum the amount of sample material necessary for kinship analy-sis. We generally use autosomal STR markers (AmpFlSTR Profiler Plus kit,Applied Biosystems) to study close biological relationships (see Notes 4 and5) and Y-chromosome STR markers (Y-Plex 6 kit, Reliagene or PowerPlex® Ysystem, Promega) to identify male lineages (6). The maternal genetic inherit-ance is tested through sequencing of the hypervariable region (HVR-I) of themitochondrial control region (D-loop). Mitochondrial DNA is especially use-ful because it is present at a high copy number in cells and is more likely tosurvive for prolonged periods compared with nuclear DNA. All these markerswere also selected because of their ability to discriminate between aDNA andprobable DNA contaminants (see Subheading 3.5.6.).
We also amplify the amelogenin locus (included in the human identificationkits from Applied Biosystems or Promega). Amplification of this region leadsto a single amplification product of 106 base pair (bp) for females and to twoamplification products of 106 and 112 bp for males. This short marker is rela-tively easy to analyze, and it could represent a criteria of authenticity (morpho-logical and genetic sex typing methods in accordance with each other).
Analysis of the amplification products will not be detailed here because itdoes not differ from classical genotyping or sequencing. Both can be performedin the laboratory alongside modern work because contamination is no longer aproblem at this stage.
262 Keyser-Tracqui and Ludes
3.5. Contamination Precautions and Check for Contaminants
To minimize the chances of contamination and to identify contamination ifit occurs, we use the following procedures:
1. All aDNA extractions and PCR set-ups should be conducted in a dedicated labo-ratory that undergoes regular decontamination. Modern DNA or PCR productsare not introduced to this dedicated environment. We attempt to apply the “one-way traffic” rule: once you have entered a laboratory where modern DNA orPCR products are present, you cannot in principle return to the aDNA lab untilthe next day. This prevents contamination by aerosol particles. The laminar flowhoods as well as the top of the doors of each room are equipped with shortwave(254 nm) UV source. These UV sources are left switched on when nobody isworking. All appliances, containers, pipets, racks, laboratory coats, and workareas (laminar airflow surfaces, PCR box) are cleaned and irradiated with UVlight during this time. The extraction buffer (without proteinase K) and deionizeddistilled water also are irradiated by placing the tubes directly on the light source.
2. Personnel always wear laboratory coats and face masks and change gloves regu-larly. All general equipment (e.g., centrifuges) is dedicated to pre-PCR work(there is no shared equipment) and apparatus, pipets, or protective clothing froma post-PCR laboratory are never taken into the clean-room facility. All solutions,PCR reagents, and primers are kept in small carefully labeled aliquots dedicatedsolely for work with one ancient DNA collection. Pre- and post-PCR activitiesare spatially separated in the laboratory or performed in different laboratories.
3. Two parallel control reactions are used: an extraction control (blank) to check thepurity of the extraction reagents with no bone added, and an amplification con-trol to check the purity of the PCR reagents with no DNA added. The presence ofamplified target in any of these negative control samples is evidence of contami-nation. Positive controls, comprising modern DNA, are not used to monitor thesuccess of aDNA PCRs (but see Note 5).
4. Multiple DNA extractions (from a different skeletal element of the same indi-vidual when possible) and PCR amplifications are conducted at least severalweeks or months apart. Only fully reproducible results are considered as authen-tic (see Note 5). aDNA sequences are characterized with respect to the lengths ofthe amplification products they lead to. In general, shorter fragments are easier toamplify, and the sequence obtained from these fragments contains fewer ambi-guities.
5. All results are compared against a staff database: indeed, all archaeologists, anthro-pologists, and other workers who handle the skeletal material during excavationplus all personnel laboratory (including trainees and visitors) are typed for thevarious genetic loci examined by our group.
6. We use multiallelic markers (such as STRs), which allow the detection of con-tamination (17) as well as a multimarker approach: data obtained with biparen-tally, paternally, and maternally inherited markers should be consistent to beconsidered as genuine. Moreover, because we work in close collaboration withanthropologists, we often know the morphological sex of the sample studied,
Studying Ancient DNA 263
which allows for comparison with the molecular sex obtained. Finally, geneticdata from the ancient sample and likely descendant populations should be consis-tent and the mitochondrial sequences obtained should be those that can be rea-sonably expected considering the origin of people (e.g., Central Asia).
4. Notes1. DNA away™ and DNAZap™ provide a convenient method to decontaminate a
variety of surfaces in a matter of minutes. All nucleic acid is degraded to nucle-otides, preventing any chance of false-positive amplification.
2. Ethylenediamine tetraacetic acid chelates calcium in the bone material and henceallows for its removal.
3. The binding solution that contains the chaotropic agent guanidium thiocyanatepromotes the DNA association to the purification resin. For effective binding ofDNA, the ratio of binding solution/sample should be 2:1 or higher, especially inthe case of short fragments.
4. PCRs were performed according to the manufacturer’s protocol (User’s Manual,PE Applied Biosystems) except that 37 cycles were used instead of 28 in a reac-tion volume of 10 µL, reducing the volume of the DNA samples and improvingthe amplification yield.
5. Ideally, replicates should be analyzed by different laboratories. However, thisprocedure is usually time consuming, impractical, and difficult to arrange whenmany samples are studied. Therefore in our opinion, as long as replicate samplesare extracted and analyzed according to stringent procedures, this type of repro-ducibility should not be insisted upon. This procedure is particularly relevant ifthe sample material is of limited quantity, unique, or extremely valuable.
References
1. Higuchi, R., Bowman, B., Freiberger, M., Ryder, O. A., and Wilson, A. C. (1984)DNA sequences from the quagga an extinct member of the horse family. Nature312, 282–284.
2. Pääbo, S. (1985) Molecular cloning of Ancient Egyptian mummy DNA. Nature314, 644–645.
3. Stone, A. C., and Stoneking, M. (1998) mtDNA analysis of a prehistoric Onetapopulation: implications for the peopling of the New World. Am. J. Hum. Genet.62, 1153–1170.
4. Raoult, D., Aboudharam, G, Crubézy, E., Larrouy, G., Ludes, B., and Drancourt,M. (2000) Molecular identification by “suicide PCR” of Yersinia pestis as theagent of Medieval Black Death. Proc. Natl. Acad. Sci. USA 97, 12800–12803.
5. Clisson, I., Keyser, C., Francfort, H.-P., Crubézy, E., Samashev, K., and Ludes B.(2002) Genetic analysis of human remains from a frozen kurgan in Kazakhstan(Berel site, 200–300 B.C.). Int. J. Legal Med. 116, 304–308.
6. Keyser-Tracqui, C., Crubézy, E., and Ludes B. (2003) Nuclear and mitochondrialDNA analysis a 2,000-year-old necropolis in the Egyin Gol valley of Mongolia.Am. J. Hum. Genet. 73, 247–260.

264 Keyser-Tracqui and Ludes
7. Mullis, K. B., and Faloona, F. A. (1987) Specific synthesis of DNA in vitro via apolymerase-catalysed chain reaction. Methods Enzymol. 155, 335–350.
8. Lindahl, T. (1993) Instability and decay of the primary structure of DNA. Nature362, 709–715.
9. Pääbo, S. (1989) Ancient DNA: extraction, characterization, molecular cloning,and enzymatic amplification. Proc. Natl. Acad. Sci. USA 86, 1939–1943.
10. Scholtz, M., Giddings, I., and Pusch, C.M. (1998) A polymerase chain reactioninhibitor of ancient hard and soft tissue DNA extracts is determined as humancollagen type I. Anal. Biochem. 92, 463–471.
11. Handt, O., Höss, M., Krings M., and Pääbo S. (1994) Ancient DNA: method-ological challenges. Experientia 50, 521–619.
12. Cooper, A., and Poinar, H. N. (2000) Ancient DNA: do it right or not at all. Sci-ence 289, 1139.
13. Yang, D. G., Eng, B., Waye, J. S., Dudar, J. C., and Saunders, S. R. (1998) Tech-nical note: improved DNA extraction from ancient bones using silica-based spincolumns. Am. J. Phys. Anthropol. 105, 539–543.
14. Kolman, C. J. and Tuross, N. (2000) Ancient DNA analysis of human popula-tions. Am. J. Phys. Anthropol. 111, 5–23.
15. Gill, P., Ivanov, P. L., Kimpton, C., Piercy, R., Benson, N., and Tully, G. (1994)Identification of the remains of the Romanov family by DNA analysis. Nat. Genet.6, 130–135.
16. Schmerer, W. M., Hummel, S., and Herrmann, B. (1999) Optimized DNA extrac-tion to improve reproducibility of short tandem repeat genotyping with highlydegraded DNA as target. Electrophoresis 20, 1712–1716.
17. Hummel, S., Bramanti, B., Schultes, T., Kahle, M., Haffner, S., and Herrmann, B.(2000) Megaplex DNA typing can provide a strong indication of the authenticityof ancient DNA amplifications by clearly recognizing any possible type of mod-ern contamination. Anthrop. Anz 58, 15–21.
Protocols for Ancient DNA Typing 265
265
From: Methods in Molecular Biology, vol. 297: Forensic DNA Typing ProtocolsEdited by: A. Carracedo © Humana Press Inc., Totowa, NJ
19
Protocols for Ancient DNA Typing
Cristian Capelli and Frank Tschentscher
SummaryMolecular analysis of fossil and archaeological remains has been established as a
powerful tool in providing new insight in phylogenetic investigations. The overlappingset of molecular modifications and degradation that forensic samples share with archaeo-logical specimen suggests the application of similar technical approaches to the respec-tive biological material. Polymerase chain reaction is the molecular technique of choicefor the retrieval of specimen deoxyribonucleic acid (DNA) molecules. Because of intrin-sic sensitivity, potential contaminations from exogenous DNA sources must be moni-tored through the entire process by the introduction of multiple blank controls. Cloningand sequencing of polymerase chain reaction products often is the only way to discrimi-nate between contaminations and endogenous sequences as well as to identify variablepositions from nucleotide modifications/DNA polymerase errors. Phylogenetic analysisand investigations of the pattern of substitutions are an additional and necessary step tovalidate the retrieved sequence. Comparison with available related samples (modern orextinct) is critical to correctly validate the results and to avoid artifactual data.
Key Words: Ancient DNA, cloning of PCR products, phylogenetic analysis, degra-dation, contamination, molecular archaeology.
1. IntroductionThe investigation of evolutionary relationships among contemporary and
extinct species for a long time has been conducted using classical morphologi-cal and functional comparisons. Both are still valuable and important methods,and it is somewhat regrettable that there are fewer scientists involved in these“classical” methods. However, the development of molecular techniques hasprovided new tools for species comparisons that is now bringing new andunexpected results (1). The pattern of difficulties faced by molecular analysisof fossil remains is similar to the one routinely encountered in genetic analysisof forensic specimens (2,3). The invention of polymerase chain reaction
266 Capelli and Tschentscher
(PCR) was the technical breakthrough in both application fields. This madefeasible the retrieval of a minute amount of genetic material, but at the sametime it raised issues regarding authenticity of results (4,5). DNA modificationsand contamination are the main issues in result validation (6,7). Despite theselimits, the scientific community has testified a large interest in archaeologicalmolecular analysis, and this has contributed to the creation of a brand new disci-pline, “molecular archaeology” (8–13).
PCR allows the retrieval of deoxyribonucleic (DNA) sequences of ancientand minute, often degraded remains (it was by the way the method that revolu-tionized the forensic analysis of biological stains; ref. 14), but its critical sensi-tivity to low-amount DNA target also is a weak point, making the relevantanalyses very prone to molecular contamination. Because of this, one shouldalways seek to avoid contaminations and carefully spot its sources of it duringthe amplification procedure. Throughout the entire PCR procedure, negativecontrols must be introduced. The careful control of any possible labware usedin the process also is mandatory to prevent cross contamination across varioussections of the same laboratory. Disposable plastics, coats, and breathing masksare necessary. An ad hoc workspace with routine ultraviolet (UV) irradiation isnecessary to avoid risks of contamination (4,5), to a point that many laborato-ries involved in daily ancient DNA (aDNA) analysis are being quickly relo-cated into rooms with positive pressure.
The protocol we describe should be reproduced in compliance with as manyof these precautions as possible. This protocol has been adopted, with minorvariants, in a number of aDNA studies (15–20). We start by a classical phenol–chloroform extraction followed by a silica purification step (21,22). The organicextraction removes most of the protein molecules present in the sample. Often,especially in the case of bone extraction, several PCR inhibitors might bepresent as molecular constituents of the samples to test. The silica step is essen-tial to bind the DNA and to get rid of inhibitors that tend to remain in the aqueousphase. The PCR folliws a hot-start approach to avoid mispriming and primer-dimers during the initial denaturing ramping phase.
2. Materials1. 10% Sodium hypochlorite (“bleach”).2. Double-distilled (dd) water (in alternative autoclaved water exposed to UV light
and filtered with centricon 30 can be used).3. 0.5 M ethylene-diamine tetraacetic acid (EDTA), pH 8.0.4. 5% Sarkosyl.5. Proteinase K 10 µg/µL.6. Phenol.7. Chloroform:Isoamylalcohol 24:1.

Protocols for Ancient DNA Typing 267
8. Amicon Centricon 30 centrifugal filter devices (Millipore, Billerica, MA).9. Silica (Sigma).
10. HCl.11. 5 M guanidiniumisothiocyanate.12. 0.1 M Tris-HCl, pH 7.4.13. Ethanol 70%.14. Acetone.15. TE, pH 8.0.16. dNTPs.17. PCR buffer (supplied with the enzyme).18. Taq polymerase.19. Agarose reagents and equipment for electrophoresis.20. Primers of choice ,10 µM each.21. SmaI (e.g. New England Biolabs).22. SmaI-specific buffer (New England Biolabs).23. T4 DNA polymerase (e.g. New England Biolabs).24. 10X T4 DNA polymerase buffer (New England Biolabs).25. 3 M Na-Acetate, pH 5.2.26. Glycogen 1 mg/mL.27. Ethanol 100%.28. SmaI-cut pUC18 vector, 25 ng/µL, (Pharmacia).29. T4 DNA ligase (New England Biolabs).30. ATP 500 µM.31. Transformation and cell growth reagents.32. Sequencing reagents.
3. MethodsSeveral kits are currently available, based on, inspired by, or just competing
with to the protocols we describe here. For example, a number of commer-cially available kits for DNA extraction from archaeological remains have beenintroduced, and different cloning systems, combined with various sequencingprotocols, have been proposed. Our protocols are meant to just exemplify abasic approach, not necessarily the only one.
Most protocols have been conceived and or implemented by Matthias Hoss,Oliva Handt, and Matthias Krings at the Evolutionary Laboratory, ZoologicalInstitute, University of Munich, Germany. They have been published in sev-eral articles (15–20), as such or with alterations.
3.1. Extraction
Most samples in aDNA studies are bone remains. Therefore, our protocolspecifically addresses this evidentiary sample. It is, of course, possible to anytime modify or readapt the protocol to suit other materials. For example, the

268 Capelli and Tschentscher
initial digestion step could be modulated to extract from samples with differentcharacteristics, and the silica protocol could be easily introduced at some stageto remove inhibitors.
3.1.1. Sample Preparation
1. Compact, long bone is often better preserved. Cut out a bone section by a sterilesaw blade, then rinse it with dd water, repeatedly.
2. Remove the surface of the bone by a scalpel or drill the bone and take the powdermaterial from the inner part. It might be advisable to wash the surface of thepiece with 10% sodium hypochlorite for 10 s, or less, and extensively rinse itwith dd water. All of this is done to remove possible contaminants (from previ-ous handling) from the sample surface.
3. Grind the bone fragment into fine powder. This is usually the most difficult partof this initial step. Commercially available freeze mills are the best option but arequite expensive. Any mechanical grinding is in principle an equally good option.
4. Weigh the ground bone and transfer 0.4 g to a 2-mL tube. Add 1 mL of 0.5 MEDTA, pH 8.0, 5% sarkosyl. Seal with plastic film and mount on a rotary wheelat room temperature (RT) for 48 h, or longer if need. You might want to refillwith fresh EDTA after 2 d incubation. In that case, pellet by centrifugation, dis-pose of the saturated solution, and replace with fresh EDTA (1 mL).
5. After the EDTA treatment, add 10 µL of proteinase K (10 µg/µL) and incubatefor another 48 h. More proteinase can be added if required and the incubationtime prolonged accordingly.
6. Sample material is then pelleted by centrifugation for 1 min at maximum speed.We suggest keeping the pellet material for eventual subsequent re-extraction.
3.1.2. Organic Extraction
Extract the supernatant with a classical phenol:chlorophorm approach asfollows:
1. Add 1 mL of phenol, equilibrated at pH 8.0, vortex, and then centrifuge 3 min atmaximum speed. Transfer the aqueous phase to a clean tube—keep in mind thatphase reversal caused by high salt concentration in the EDTA solution mightoccur so the phenol could built the upper layer.
2. Add 1 mL of phenol:chloroform/isoamylalcohol (24:1), vortex, and centrifuge.Move the upper aqueous phase to a clean tube. Note that the phenol and thechloroform:isoamylalcohol (24:1) are in a 1:1 ratio. Prepare and store at 4°C.
3. Add 1 mL of chloroform:isoamylalcohol (24:1), vortex, and centrifuge.4. Move aqueous phase to a clean tube for the subsequent centricon 30 concentra-
tion step, following the supplier’s recommendations for centrifugal speed. Wetthe membrane for 15 min with 50 µL of dd water, add the aqueous phase fromchloroform/isoamylalcohol step to the filter, and spin at recommended rpm.
Protocols for Ancient DNA Typing 269
(Note: the filter is sensitive to chlorophorm, so be careful not to carry itover from the previous steps. Avoid filter dehydration by overcentrifugation.After all the supernatant has been passed through the filter, wash twice with acorresponding volume of dd water.)
Finally, invert the filter to recover the DNA solution by a short centrifuga-tion (2 min). Transfer the DNA solution to a 1.5-mL tube. The recoveredvolume should be approx 100 µL.
3.1.3. Silica Purification
Because inhibitors of PCR are often present, it is advised to purify thesample. We used a Silica purification process as described previously (22).
3.1.3.1. PREPARATION OF REAGENTS FOR SILICA EXTRACTION
3.1.3.1.1. Silica
1. Dilute 4.8 g of SiO2 (Sigma) in 40 mL of dd water (total volume) using a 50-mLtube, vortex, and sediment by leaving it on the lab bench for 24 h at RT.
2. Remove 35 mL of the supernatant and fill up to 40 mL with dd water. Resuspendsilica pellet by vortexing and sediment for additional 5 h at room temperature.
3. Remove 36 mL of the supernatant and add 48 µL of HCl (32%, weight/volume,pH 2.0). Aliquot 0.5 mL in different tubes. The silica is stable for at least 6 mowhen stored at RT in the dark.
3.1.3.1.2. Buffer L2
1. Dissolve 24 g of guanidinium thiocyanate in 20 mL of 0.1 M Tris-HCl, pH 7.4, ina 50-mL tube. To facilitate dissolution the tube with the solution can be heated abit, but do not boil it!
2. Add 1 mL of silica. This will bind all the eventual contaminant DNA.3. Spin down and transfer the supernatant in 50-mL tubes in aliquots of approx 20 mL
each. Buffer L2 is stable at least 3 wk at RT in the dark.
3.1.3.2. SILICA PURIFICATION
1. Add 40 µL of the silica solution plus 1 mL of L2 buffer to the organicallyextracted solution. Vortex briefly and rotate for at least 15 min (as long as 1 h isfeasible).
2. Centrifuge to pellet the silica.3. Wash twice with 1 mL of ethanol 70% and once with acetone. In all steps, vortex,
centrifuge to pellet again and remove the liquid. Avoid touching the pellet withthe tip.
4. Dry for a short period at 56°C.5. Elute the DNA twice, adding 65 µL of TE pH 8.0, per time by dissolving the
pellet carefully with a pipette and incubating each time at 56°C for 15 min. Donot pipet up and down in the tip but dissolve by turning the tip gently in the silica.Pellet the silica by full speed centrifugation and collect the supernatant. The final

270 Capelli and Tschentscher
volume should range between 120 and 130 µL. Aliquot this in 3 different tubes,leaving the silica behind. Store extracts at –20°C. Usually 5 µL of the extract isused for subsequent PCR.
3.2. PCR Amplification
The use of a hot-start protocol is highly recommended (23). Until a fewyears ago the only option was to mechanically separate the Taq polymeraseenzyme from nucleotides, primers, and DNA by a wax layer that just melted asthe initial denaturing step started (24). Nowadays a number of geneticallyengineered enzymes or antibody-conjugated enzymes, active only at specifictemperatures, are available. This makes PCR setup much easier and less proneto contaminations by reducing the necessary number of manipulations. We sug-gest using those enzymes as a valid alternative to previously described protocols.
The PCR can be set up in a final volume of 20 µL as follows:
10X PCR buffer 2 µLPrimer A, 10 pmolµL 0.5 µLPrimer B, 10 pmol/µL 0.5 µLdNTPs, 25 mM each 0.1 µLTaq polymerase, 5 UµL 0.2 µLdd water 11.7 µLDNA extract 5 µL
3.2.1. PCR Conditions
Forty cycles with 15 s 95°C/1 min primer-specific annealing temperature/1 min 72°C. Note that by using hot-start polymerases, an extended initialdenaturing step has to be included.
If only faint bands are visible after agarose gel electrophoresis, one mightconsider reamplifying the PCR products. For this purpose, a modified freeze–squeeze protocol (25) can be applied to quickly recover the PCR products cutout of the agarose gel.
1. Cut out the desired product band with a razor blade and transfer it to a 1.5-mLmicrotube filled with 100 µL of dd water.
2. Melt it shortly on a heater (between 65 and 90°C) and snap freeze it in liquidnitrogen (alternatively, shock freeze using a dry ice/ethanol bath).
3. After thawing the solution, centrifuge it for 30 min with maximum rpm and use0.5–5 µL for reamplification under the conditions described above but with only25–30 cycles and increasing annealing temperature by 3°C.
3.3. Cloning of PCR products
We usually used the SmaI-cut pUC18 screening vector and performed blunt-end cloning of the PCR products. A preliminary requirement is not to have a

Protocols for Ancient DNA Typing 271
SmaI recognition site internal of your PCR product and to rule out a GGG,CGGG, or CCGGG at the 5' end of the amplification primers.
Despite our positive experiences with blunt-end cloning, it should be men-tioned that another very efficient and easy method for PCR-product cloning isat hand nowadays. The so called “TA cloning method” takes advantage of theterminal transferase activity of Taq polymerase. The enzyme adds a single, 3'-A overhang to each end of the PCR product. This makes it possible to clonethis PCR product directly into a linearized cloning vector with single, 3'-Toverhangs. Note that DNA polymerases with proofreading activity, such asPfu polymerase, cannot be used because they provide blunt-ended PCR prod-ucts. TA cloning kits are available from different manufacturers.
To maximize your cloning rate, it is preferable to have a significant amountof PCR product. If not, a possibility is to try to reamplify the amplicon (refer toSubheading 3.2.).
The PCR should be optimized to avoid the amplification of unspecific bands.If this is the case, extract the band of interest from the agarose gel and reamplifyit using the method described above.
3.3.1. T4 DNA Polymerase Reaction (Fill-In)
This reaction is necessary to fill-in eventual gaps left at the 3' end of theamplicon by Taq polymerase. Mix the following reagents in a 1.5-mL tube:10 µL of PCR products (from the first amplification); 2 µL of 10X T4 DNApolymerase buffer (New England Biolabs); 1 µL of T4 DNA polymerase (3 units/µL) (New England Biolabs); and 7 µL of dd water. Leave the tube for 20 min at12°C and then move it to 75°C for 10 min.
It is also possible to T4-treat the PCR band excised from an agarose gel (ifthe amount is enough):
Bring the purified band up in 10 µL of dd water (purification by, e.g., freeze–squeeze) and add 2 µL of 10X T4 DNA polymerase buffer (New EnglandBiolabs); 1 µL of T4 DNA polymerase (3 units/µl) (New England Biolabs); 5 µLof dd water; and 2 µL of dNTPs (1 mM each). Leave the tube for 20 min at 12°Cand then move it to 75°C for 10 min.
(Note: When using the PCR product directly from the PCR tube, nucleotidesare in excess and are sufficient for the T4 treatment. Using the excised band,the addition of nucleotides is required.)
After the 75°C incubation, a precipitation step follows:
1. Bring the final volume to 100 µL, then add 10 µL of 3 M Na-acetate, pH 5.2; 2 µLglycogen (1 mg/mL); and 300 µL of ice-cold ethanol 100%.
2. Spin at 4°C at maximum speed for 40 min.3. Wash pellet with 500 µL of 70% ethanol.
272 Capelli and Tschentscher
4. Discard the ethanol being careful to not dislodge the pellet and dry in a speed vacfor 3 min.
5. Resuspend in 5 µL of dd water.
3.3.2. Ligation Reaction
The T4-treated, resuspended amplicons are then added to 1 µL of the pUCvector, 25 ng/µL, SmaI cut, not dephosphorilated; 1 µL of SmaI-specific buffer;1 µL of SmaI, 10 units (New England Biolabs); 1 µL T4 DNA ligase (400 U/µL, New England Biolabs); and 1 µL of ATP (500 µM). Leave at RT (16–25°C)overnight (approx 16 h). After incubation, precipitate and bring up in 20 µL ddwater.
3.3.3. Transformation
After ligation and precipitation, competent cells require to be transformedwith the ligated plasmid. We routinely used 40 µL of a suspension of readilycompetent E. coli SURE™ cells and transformed by electroporation:
1. To the 40 µL of E. coli suspension, add 10 µL of the ligation and transfer to acooled cuvette for electroporation.
2. Electroporate at 1.6 to 1.8 kV, 200 Ohm, and 25 µFd.3. Transfer the suspension to 1 mL of regular SOC medium for 20-25 minutes (at
maximum to avoid sister clones). Gently shake at 37°C.4. Plate 20–200 µL of the cell suspension on a selective medium afterward. In our
experiments we used standard LB-agar plates with IPTG/X-gal (26). Incubateplates overnight at 37°C.
Note: Our regular transformation efficiency was around 4 × 10⁸ transform-ants/µg circular plasmid; generally, we plated 50 µL of 1000 µL. The usedplasmid contains the E. coli gene LacZ. The LacZ gene codes for the produc-tion of an enzyme called β-galactosidase. β-Galactosidase converts substratessuch as X-Gal into a product of blue color. In order for the gene to be activelytranscribed from the DNA and for the enzyme to be produced, the activatorcalled IPTG is added.
Within the LacZ gene, there are multiple cloning sites (including the usedSmaI site) where the plasmid may be cut and DNA may be added. Because ofits location within the enzyme-coding sequence, the foreign DNA disrupts activ-ity and function of the enzyme. The disrupted enzyme activity is observed as awhite bacterial colony (if the enzyme is fully functioning meaning no insertionhas taken place, each colony is of bright blue color). Very small inserts offoreign DNA may lead to light blue colonies.

Protocols for Ancient DNA Typing 273
3.3.4. Colony PCR Screening
The blue–white selection is a preliminary screening method to maximizethe retrieval of cloned PCR products. The white colonies then have to be addi-tionally screened by colony PCR to avoid sequencing of false-positive clones.Moreover, colony PCR generates a sufficient amount of the desired PCR prod-uct for sequencing. This protocol follows the one described (27).
1. Per PCR add:dd water 9.4 µLBSA, 10 µg/µL 1.25 µL10X Taq buffer 1.25 µLPlasmid universal primers, 10 µM 0.25 µL
0.25 µLdNTPs, 25 mM each 0.05 µLTaq polymerase, 5 µ/µL 0.04 µL
2. Distribute the PCR master mix into reaction tubes.3. Touch the selected colonies with a micropipet tip and pipet then, one by one, into
the PCR tubes. To create a back-up plate, touch first an LB plate and then pipettein the PCR tube. PCR cycling should be performed as follows: an initial denatur-ation step of 90°C for 5 min then 30 cycles; 95°C for 30 s; (X°)C for 1 min (anneal-ing temperature must be adjusted according to the used primers); 72°C for 1 min;and a final hold of 4°C until tubes are recovered from the PCR machine.
4. PCR products are loaded on a 2% agarose gel (3 µL of the 12.5 µL reactionvolume). The colonies containing the insert should show a length equal to 144 basepair (bp) plus the insert length (if the pUC18 vector is used). Colonies of interestcan be selected for the subsequent sequencing step.
3.4. Sequencing
Sequencing strategies are quickly evolving from four-lane-radioisotopes-X-ray films procedures to single-lane multifluorescent multichannel process-ing. Each laboratory has its own sequencing technology with optimized ad hocprotocols. We used 1.5 µL of the colony PCR to perform the sequencing reac-tion, without any prior purification step. In the case of a single lane multichan-nel detection system, a prior purification step removing unincorporatednucleotides and primers is necessary for subsequent sequencing steps. Criticalinformation can be recovered by individual suppliers.
We also note that direct sequencing of the PCR product, avoiding a cloningstep, is sometimes used in aDNA analysis. In principle, when dealing withanimal remains, the probability of a contamination is very low so a directsequencing approach can be a possibility. Additionally, polymerase-inducederrors should be easily identified as overlapping peaks in the electrophero-
274 Capelli and Tschentscher
grams. Sequencing of different amplification products should permit discrimi-nation between those and endogenous variable positions.
3.5. Phylogenetic Analysis
When an ancient sequence is obtained, the phylogenetic plausibility of thefinding should be checked. The crucial importance of this step is easily stressedby retelling the now classical example of the so-called dinosaur bone analysis(8,9). The clamorous announcement was quickly called in doubt by the merefact that the relevant sequence was clearly too closer to humans than to birds orreptiles as one would have expected. The whole case is a formidable caveatabout the absolute need of result authentication. Consulting a database withcontemporary species is part of the protocol when the consistency of the finalconsensus sequence to the original expectations is needed. At this stage, allapparent mutations should be retrieved in evolutionarily neighboring species.A large excess of unseen variants should be regarded as suspicious.
There is plenty of phylogenetic software to use for reconstructing relation-ships between “ancient” sequences and the rest of known sequences—someare available free of charge. Softaware programs differ one another with respectto the tree reconstructing method. PAUP (http://paup.csit.fsu.edu/index.html)(http://evolution.genetics.washington.edu/phylip/getme.html), Phylip, andtree-puzzle (http://www.tree-puzzle.del) are among the most used (see theattached web addresses for download information; ref. 28,29).
4. NotesaDNA is an extremely difficult field. Not only might it be painstaking to
successfully establish a laboratory in the field, but ensuring authenticity of theresults is every time challenging. Since the beginning, aDNA analysis has livedon a flimsy equilibrium between the “hall of fame” of sensational results (withthe invariable footage of the daily press) and forceful retractions. In the past,sequences of extinct organisms (including lithified samples and amber entombedinsects), millions of years old, have been described (10,30), and they have trig-gered the hunt to older and even more spectacular preys. Some of these publi-cations are clearly unlikely, but they were never retracted and the results areoccasionally found in citation lists and textbooks (9,11,31). Some of these re-sults (the claims of DNA retrieval out of amber-entombed insects or bones of adinosaur) have invariably ended up to inspire the media and the movie industry.
Another example for illusions inspired by aDNA reports are the claims ofcloning a mammoth, which cannot work neither technically nor theoreticallybut of course raised dreams and hope by a broad spectrum of people (32,33).Today we know that there is a theoretical upper limit for DNA preservation(34), even if our methods are more sophisticated than earlier.

Protocols for Ancient DNA Typing 275
The recent dispute over DNA sequences obtained from 24,000-yr-old mod-ern human (Cro-Magnon) has also suggested that the problem of authenticityis always open even if a research group acts in full conformity with the pro-posed criteria of authentication (4,5,35–37).
How can one come to terms with the whole issue is hard to say. A new-comer in the field has better start working with animal samples before talk-ing humans. The example of aDNA research on mammoth shows that thereare many very well preserved specimen available, even proven to containnuclear DNA (38). These samples are less prone to contamination than humansamples. The following rules should be adopted anyway.
1. In general it is decisive to control for possible contaminations throughout allsteps of aDNA analysis, from extraction to PCR amplification. Several controlshave to be added at each step. A blank control for the extraction has to be per-formed each time using the same extraction materials without adding samples.This control has to pass over all the extraction steps and must be included insubsequent amplification reactions. Additionally, two PCR controls, with noDNA added but containing the same reagents, have to be included to monitoreventual contaminants present in the reagents or occurring during amplificationset-up. Similarly, if a reamplification is performed, a reamplification PCR con-trol must be included.
2. Another laboratory’s assistance should be always sought in the authenticationprocess, if only to ensure that the whole sequence production process has beenstarted afresh, with no contamination risks from the same source.
3. The samples we deal with are precious and unique and should therefore be treatedwith respect. There should always be a reason to believe that DNA might havesurvived in the material. Whether the often proposed determination of aminoacid racemization by high-performance liquid chromatography is the method ofchoice is not clear (39). The advantage of this method is that only minute amountsof the sample is needed; however, it is not proven that the racemization of certainamino acids directly permits predictions about DNA survival. Other hints toamplifiable DNA in a specimen could be the surrounding conditions at the placeof excavation. A very good hint would also be successful DNA retrieval fromother samples of the same layer at the excavation site. It might therefore be anoption trying to extract and analyze DNA from less valuable bone fragmentsfrom the same site.Also because of its cellular abundance, mitochondrial (mt)DNA has been thetarget of choice in most ancient DNA analyses. Despite this, mtDNA bears theproblem that there are translocated pieces in the nuclear genome of many speciesthat might be mistaken for authentic organellar mtDNA sequences (40). In orderto avoid this, it was suggested to take explicit measures to authenticate mtDNAsequences in newly studied taxa or when any suspicious sequence is retrieved.

276 Capelli and Tschentscher
aDNA and molecular archaeology/evolution are fascinating fields that recruitsenthusiastic young scientists, and we have no doubts about the fact that mostproblems affecting the field will be solved in the future. In the meantime, nochance to verify and critically question results should be missed.
AcknowledgmentsThe authors would like to thank Matthias Krings for helpful support in pro-
viding exhaustive clarification of the described protocols and Vincenzo Pascalifor suggestions. F. Tschentscher is deeply grateful to Petra and JakobBärschneider for continuous support and understanding. C. Capelli would liketo thank Sonia Bortoletto.
References1. Hofreiter, M., Serre, D., Poinar, H. N., Kuch, M., and Pääbo, S. (2001) Ancient
DNA. Nat. Rev. Genet. 2, 353–359.2. Jeffreys, A. J., Allen, M. J., Hagelberg, E., and Sonnberg, A. (1992) Identification
of the skeletal remains of Josef Mengele by DNA analysis. Forensic Sci. Int. 56,65–76.
3. Gill, P., Ivanov, P. L., Kimpton, C., Piercy, R., Benson, N., Tully, G., et al. (1994)Identification of the remains of the Romanov family by DNA analysis. Nat. Genet.6, 130–135.
4. Capelli, C., Tschentscher, F, and Pascali, V. L. (2003) “Ancient” protocols for thecrime scene? Similarities and differences between forensic genetics and ancientDNA analysis. Forensic Sci. Int. 131, 59–64.
5. Cooper, A. and Poinar, H. N. (2000) Ancient DNA: do it right or not at all. Sci-ence 289, 1139.
6. Gilbert, M. T., Willerslev, E., Hansen, A. J., Barnes, I., Rudbeck, L., Lynnerup,N., et al. (2003) Distribution patterns of postmortem damage in human mitochon-drial DNA. Am. J. Hum. Genet. 72, 32–47.
7. Gilbert, M. T., Hansen, A. J., Willerslev, E., Rudbeck, L., Barnes, I., Lynnerup,N., et al. (2003) Characterization of genetic miscoding lesions caused by post-mortem damage. Am. J. Hum. Genet. 72, 48–61.
8. Woodward, S. R., Weyand, N. J., and Bunnell, M. (1994) DNA sequence fromCretaceous period bone fragments. Science 266, 1229–1232.
9. Zischler, H., Hoss, M., Handt, O., von Haeseler, A., van der Kuyl, A. C.,Goudsmit, J., et al. (1995) Detecting dinosaur DNA. Science 268, 1192–1193.
10. Cano, R. J., Poinar, H. N., Pieniazek, N. J., Acra, A., and Poinar, G. O. (1993)Amplification and sequencing of DNA from a 120-135-million-year-old weevil.Nature 363, 536–538.
11. Gutierrez, G., Sanchez, D., and Marin, A. (1998) The most ancient DNA recov-ered from an amber-preserved specimen may not be as ancient as it seems. Mol.Biol. Evol. 15, 926–929.
Protocols for Ancient DNA Typing 277
12. Mullis, K. B. and Faloona, F. A. (1997) Specific synthesis of DNA in vitro via apolymerase-catalyzed chain reaction. Methods Enzymol. 155, 335–350.
13. Pääbo, S., Higuchi, R. G., and Wilson, A. (1989) Ancient DNA and the poly-merase chain reaction: the emerging field of molecular archeology. J. Biol. Chem.264, 9709–9712.
14. Presley, L .A. and Budowle, B. (1993) The application of PCR-based technolo-gies to forensic analysis, in PCR Technology Current Innovations (Griffin, H. G.and Griffin A. M., eds), CRC Press, Boca Raton, FL.
15. Hoss, M., Jaruga, P. , Zastawny, T. H., Dizdaroglu, M., and Pääbo, S. (1996)DNA damage and DNA sequence retrieval from ancient tissues. Nucleic AcidsRes. 24, 1304–1307.
16. Handt, O., Krings, M., Ward, R. H., and Pääbo, S. (1996) The retrieval of ancienthuman DNA sequences. Am. J. Hum. Genet. 59, 368–376.
17. Krings, M., Stone, A., Schmitz, R. W., Krainitzki, H., Stoneking, M., and Pääbo,S. (1997) Neandertal DNA sequences and the origin of modern humans. Cell 90,19–30.
18. Krings, M., Geisert, H., Schmitz, R. W., Krainitzki, H., and Pääbo, S. (1999)DNA sequence of the mitochondrial hypervariable region II from the neandertaltype specimen. Proc. Natl. Acad. Sci. USA 96, 5581–5585.
19. Greenwood, A. D., Capelli, C., Possnert, G., and Pääbo, S. (1999) Nuclear DNAsequences from late Pleistocene megafauna. Mol. Biol. Evol. 16, 1466–1473.
20. Krings, M., Capelli, C., Tschentscher, F., Geisert, H., Meyer, S., von Haeseler,A., et al. (2000) A view of Neandertal genetic diversity. Nat. Genet. 26, 144–146.
21. Boom, R., Sol, C. J. A., Salimans, M. M. M., Jansen, C. L., Wertheim-van Dillen,P. M. E., and van der Noordaa, J. (1990) Rapid and simple method for purificationof nucleic acids. J. Clin. Microbiol. 28, 495–503.
22. Hoss, M. and Pääbo, S. (1993) DNA extraction from Pleistocene bones by a silica-based purification method. Nucleic Acid Res. 21, 3913–3914
23. Nuovo, G. J., Gallery, F., MacConnell, P., Becker, J., and Bloch, W. (1991) Animproved technique for the in situ detection of DNA after polymerase chain reac-tion amplification. Am. J. Pathol. 139, 1239–1244.
24. Chou, Q., Russell, M., Birch, D. E., Raymond, J., and Bloch, W. (1992) Preven-tion of pre-PCR mis-priming and primer dimerization improves low-copy-num-ber amplifications. Nucleic Acids Res. 20, 1717–1723.
25. Tautz, D. and Renz, M. (1983) An optimized freeze-squeeze method for the recov-ery of DNA fragments from agarose gels. Anal. Biochem. 132, 14–19.
26. Ausubel, F. A., Brent, R., Kingston, R. E., Moore, D. D., Seidman, J. G., Smith, J.A., et al., eds. (1995) Current Protocols in Molecular Biology. John Wiley &Sons, New York, NY.
27. Kilger, C., Krings, M., Poinar, H., and Pääbo, S. (1997) “Colony sequencing”:direct sequencing of plasmid DNA from bacterial colonies. BioTechniques 22,412–414.
278 Capelli and Tschentscher
28. Strimmer, K. and von Haeseler, A. (1997) Likelihood-mapping: a simple methodto visualize phylogenetic content of a sequence alignment. Proc. Natl. Acad. Sci.USA 94, 6815–6819.
29. Schmidt, H. A., Strimmer, K., Vingron, M., and von Haeseler, A.(2002) TREE-PUZZLE: maximum likelihood phylogenetic analysis using quartets and parallelcomputing. Bioinformatics 18, 502–504.
30. Golenberg, E. M., Giannasi, D. E., Clegg, M. T., Smiley, C. J., Durbin, M.,Henderson, D., et al. (1990) Chloroplast DNA sequence from a miocene Magno-lia species. Nature 344, 656–658.
31. Austin, J. J., Smith, A. B., and Thomas, R. H. (1997) Paleontology in a molecularworld: the search for authentic ancient DNA. Trends Ecol. Evol. 12, 303–306.
32. Stone, R. (1999) Siberian mammoth find raises hopes. Questions Sci. 286, 876–877.33. Tschentscher, F. (1999) Too mammoth an undertaking. Science 286, 2084.34. Lindahl,T.(1993) Recovery of antediluvian DNA. Nature 365, 700.35. Caramelli, D., Lalueza-Fox, C., Vernesi, C., Lari, M., Casoli, A., Mallegni, F.,
et al. (2003) Evidence for a genetic discontinuity between Neandertals and24000-year-old anatomically modern Europeans. Proc. Natl. Acad. Sci. USA100, 6593–6597.
36. Abbott, A. (2003) Anthropologists cast doubt on human DNA evidence. Nature423, 468.
37. Barbujani, G. and Bertorelle, G. (2003) Were Cro-Magnons too like us for DNAto tell? Nature 424, 127.
38. Greenwood, A. D., Lee, F., Capelli, C., DeSalle, R., Tikhonov, A., Marx, P.A., etal. (2001) Evolution of endogenous retrovirus-like elements of the woolly mam-moth (Mammuthus primigenius) and its relatives. Mol. Biol. Evol. 18, 840–847.
39. Poinar, H. N., Hoss, M., Bada, J. L., and Pääbo, S. (1996) Amino acid racemiza-tion and the preservation of ancient DNA. Science 272, 864–866.
40. Thalmann, O., Hebler, J., Poinar, H. N., Pääbo, S., and Vigilant, L. (2004) Unre-liable mtDNA data due to nuclear insertions: a cautionary tale from analysis ofhumans and other great apes. Mol. Ecol. 13, 321–335.

Index 279
279
Index
A
Allele-specific extension, 118Allele-specific oligonucleotides (ASO), 109Amelogenin, 31AmpliType PM, 5Ancient DNA, 253, 265
cloning of PCR products, 270contamination, 250, 262PCR strategies, 260, 270phylogenetic analysis, 274sequencing, 273
Array hybridization, 114ASO ligation, 118Autodimer program, 62
B
Blast, 84Bolean terms, 90Bone sample extraction, 257, 267
C
Chip design, 144Cycle-sequencing method, 48CYPs, 243Cytochrome b, 45Cytochrome P450, 243
D
Degraded DNA, 18Differential extraction, 16DNA polymorphisms, 2DNA profiling, 1
E
EMPOP, 87Ensembl, 85Entrez SNPs, 90Extraction, 13
from bones, 257, 267from hairs, 22from mixtures, 16from sperm cells, 22
F
FRET, 110, 128
G
Genome browsing, 93
H
HGV Base, 85HLA DQA1, 5HPA Matrix, 173
I
Identifiler, 7Image analysis, 148Invasive cleavage, 120
L
Ligation Chain Reaction, 119Light Cycler, 127Linkage, 87Linkage disequilibrium, 87
M
MALDI-TOF-MS, 115, 169desalting, 173primer extension, 173sample preparation, 174SNP typing, 174
Mammalian identification, 49Mass Spectrometry (see MALDI-TOF MS)Melting curve analysis, 130Microarrays, 115, 141
image analysis, 148Minisequencing, 115
multiplex, 147for pharmacogenetics, 243to ZIP code arrays, 144
Mitochondrial DNA (mtDNA), 197haplogroup H typing, 197, 199sequencing, 8SNP typing, 151, 181

280 Index
Molecular beacons, 113Multiplex assays, 53Multiplex minisequencing, 147
N
NanoChip Electronic Microarrays,155
Nanogen Workstation, 159NCBIdbSNP, 84
P
Pharmacogenetics, 243Photocleavable linkers, 172PCR clean-up, 158
for MALDI-TOF, 173for microarrays, 158for Y chromosome SNPs, 218, 231
PCR optimization, 53for mtDNA SNPs, 201for Y chromosome SNPs, 218, 230
Phenol-chloroform extraction, 15, 19PowerPlex 16, 7, 16Primer design, 55, 57
for electronic microarrays, 157for microarrays, 144for mtDNA SNPs, 201for Y chromosome SNPs, 214
Primer extension, 114Primer optimization, 53
for mtDNA SNPs, 201for Y chromosome SNPs, 213, 230
Primer–primer interactions, 62Primer quality control and testing,
60Pyrosequencing, 117, 179
pyrosequencing analysis, 189sample preparation, 186
Q
Quantitation by RT-PCR, 16, 25, 31
R
Real-time PCR, 13
S
Sequence specific oligonucleotides (SSO), 5SGM Plus, 7Short-tandem repeats (STRs), 6Single-base extension (see minisequencing)Single-locus probes (SLPs), 3SNaPshot, 115, 197
for pharmacogenetics, 243SNPs, 8
linkage, 87number requirements,
108online databases, 83polymorphism level, 88selection criteria, 83SNP consortium, 85typing methods, 107
Species identification, 45Southern blotting, 3
T
TaqMan assay, 16, 113
Y
Y chromosome STRs, 67allelic ladders, 78forensic applications, 68multiplex, 69nomenclature, 68performance and specificity, 68population genetics and databasing,
69Y chromosome SNPs, 209, 229
hierarchical approach, 229LightCycler typing, 127SNaPshot, 209, 229