PCR Mutation Detection Protocols
224
Transcript of PCR Mutation Detection Protocols
M E T H O D S I N M O L E C U L A R B I O L O G YTM
John M. Walker, SERIES EDITOR
215. Cytokines and Colony Stimulating Factors: Methods andProtocols, edited by Dieter Körholz and Wieland Kiess, 2003
214. Superantigen Protocols, edited by Teresa Krakauer, 2003213. Capillary Electrophoresis of Carbohydrates, edited by Pierre
Thibault and Susumu Honda, 2003212. Single Nucleotide Polymorphisms: Methods and Protocols,
edited by Piu-Yan Kwok, 2003211. Protein Sequencing Protocols, 2nd ed., edited by Bryan John
Smith, 2003210. MHC Protocols, edited by Stephen H. Powis and Robert W.
Vaughan, 2003209. Transgenic Mouse Methods and Protocols, edited by Marten
Hofker and Jan van Deursen, 2002208. Peptide Nucleic Acids: Methods and Protocols, edited by Peter
E. Nielsen, 2002207. Human Antibodies for Cancer Therapy: Reviews and Protocols.
edited by Martin Welschof and Jürgen Krauss, 2002206. Endothelin Protocols, edited by Janet J. Maguire and Anthony
P. Davenport, 2002205. E. coli Gene Expression Protocols, edited by Peter E.
Vaillancourt, 2002204. Molecular Cytogenetics: Protocols and Applications, edited
by Yao-Shan Fan, 2002203. In Situ Detection of DNA Damage: Methods and Protocols,
edited by Vladimir V. Didenko, 2002202. Thyroid Hormone Receptors: Methods and Protocols, edited
by Aria Baniahmad, 2002201. Combinatorial Library Methods and Protocols, edited by
Lisa B. English, 2002200. DNA Methylation Protocols, edited by Ken I. Mills and Bernie
H. Ramsahoye, 2002199. Liposome Methods and Protocols, edited by Subhash C. Basu
and Manju Basu, 2002198. Neural Stem Cells: Methods and Protocols, edited by Tanja
Zigova, Juan R. Sanchez-Ramos, and Paul R. Sanberg, 2002197. Mitochondrial DNA: Methods and Protocols, edited by William
C. Copeland, 2002196. Oxidants and Antioxidants: Ultrastructural and Molecular
Biology Protocols, edited by Donald Armstrong, 2002195. Quantitative Trait Loci: Methods and Protocols , edited by
Nicola J. Camp and Angela Cox, 2002194. Posttranslational Modifications of Proteins: Tools for Functional
Proteomics, edited by Christoph Kannicht, 2002193. RT-PCR Protocols, edited by Joseph O’Connell, 2002192. PCR Cloning Protocols, 2nd ed., edited by Bing-Yuan Chen
and Harry W. Janes, 2002191. Telomeres and Telomerase: Methods and Protocols, edited
by John A. Double and Michael J. Thompson, 2002190. High Throughput Screening: Methods and Protocols, edited
by William P. Janzen, 2002189. GTPase Protocols: The RAS Superfamily, edited by Edward
J. Manser and Thomas Leung, 2002188. Epithelial Cell Culture Protocols, edited by Clare Wise, 2002187. PCR Mutation Detection Protocols, edited by Bimal D. M.
Theophilus and Ralph Rapley, 2002
186. Oxidative Stress Biomarkers and Antioxidant Protocols, ed-ited by Donald Armstrong, 2002
185. Embryonic Stem Cells: Methods and Protocols, edited byKursad Turksen, 2002
184. Biostatistical Methods, edited by Stephen W. Looney, 2002183. Green Fluorescent Protein: Applications and Protocols, edited
by Barry W. Hicks, 2002182. In Vitro Mutagenesis Protocols, 2nd ed. , edited by Jeff
Braman, 2002181. Genomic Imprinting: Methods and Protocols, edited by
Andrew Ward, 2002180. Transgenesis Techniques, 2nd ed.: Principles and Protocols,
edited by Alan R. Clarke, 2002179. Gene Probes: Principles and Protocols, edited by Marilena
Aquino de Muro and Ralph Rapley, 2002178.`Antibody Phage Display: Methods and Protocols, edited by
Philippa M. O’Brien and Robert Aitken, 2001177. Two-Hybrid Systems: Methods and Protocols, edited by Paul
N. MacDonald, 2001176. Steroid Receptor Methods: Protocols and Assays, edited by
Benjamin A. Lieberman, 2001175. Genomics Protocols , edited by Michael P. Starkey and
Ramnath Elaswarapu, 2001174. Epstein-Barr Virus Protocols, edited by Joanna B. Wilson
and Gerhard H. W. May, 2001173. Calcium-Binding Protein Protocols, Volume 2: Methods and
Techniques, edited by Hans J. Vogel, 2001172. Calcium-Binding Protein Protocols, Volume 1: Reviews and
Case Histories, edited by Hans J. Vogel, 2001171. Proteoglycan Protocols, edited by Renato V. Iozzo, 2001170. DNA Arrays: Methods and Protocols, edited by Jang B.
Rampal, 2001169. Neurotrophin Protocols, edited by Robert A. Rush, 2001168. Protein Structure, Stability, and Folding, edited by Kenneth
P. Murphy, 2001167. DNA Sequencing Protocols, Second Edition, edited by Colin
A. Graham and Alison J. M. Hill, 2001166. Immunotoxin Methods and Protocols, edited by Walter A. Hall, 2001165. SV40 Protocols, edited by Leda Raptis, 2001164. Kinesin Protocols, edited by Isabelle Vernos, 2001163. Capillary Electrophoresis of Nucleic Acids, Volume 2:
Practical Applications of Capillary Electrophoresis, edited byKeith R. Mitchelson and Jing Cheng, 2001
162. Capillary Electrophoresis of Nucleic Acids, Volume 1:Introduction to the Capillary Electrophoresis of Nucleic Acids,edited by Keith R. Mitchelson and Jing Cheng, 2001
161. Cytoskeleton Methods and Protocols, edited by Ray H. Gavin, 2001160. Nuclease Methods and Protocols, edited by Catherine H.
Schein, 2001159. Amino Acid Analysis Protocols, edited by Catherine Cooper,
Nicole Packer, and Keith Williams, 2001158. Gene Knockoout Protocols, edited by Martin J. Tymms and
Ismail Kola, 2001157. Mycotoxin Protocols, edited by Mary W. Trucksess and Albert
E. Pohland, 2001
Humana Press Totowa, New Jersey
M E T H O D S I N M O L E C U L A R B I O L O G YTM
PCR MutationDetection Protocols
Edited by
Bimal D. M. TheophilusDepartment of Haematology, Birmingham Children's Hospital
NHS Trust, Birmingham, UK
and
Ralph RapleyDepartment of Biosciences, University of Hertfordshire,
Hatfield, UK
© 2002 Humana Press Inc.999 Riverview Drive, Suite 208Totowa, New Jersey 07512
www.humanapress.com
All rights reserved. No part of this book may be reproduced, stored in a retrieval system, or transmitted inany form or by any means, electronic, mechanical, photocopying, microfilming, recording, or otherwisewithout written permission from the Publisher. Methods in Molecular Biology™ is a trademark of TheHumana Press Inc.
The content and opinions expressed in this book are the sole work of the authors and editors, who havewarranted due diligence in the creation and issuance of their work. The publisher, editors, and authors arenot responsible for errors or omissions or for any consequences arising from the information or opinionspresented in this book and make no warranty, express or implied, with respect to its contents.
This publication is printed on acid-free paper. ∞ANSI Z39.48-1984 (American Standards Institute) Permanence of Paper for Printed Library Materials.
Production Editor: Jessica Jannicelli.
Cover design by Patricia F. Cleary.
For additional copies, pricing for bulk purchases, and/or information about other Humana titles, contactHumana at the above address or at any of the following numbers: Tel.: 973-256-1699; Fax: 973-256-8341;E-mail: [email protected]; or visit our Website: www.humanapress.com
Photocopy Authorization Policy:Authorization to photocopy items for internal or personal use, or the internal or personal use of specificclients, is granted by Humana Press Inc., provided that the base fee of US $10.00 per copy, plus US $00.25per page, is paid directly to the Copyright Clearance Center at 222 Rosewood Drive, Danvers, MA 01923.For those organizations that have been granted a photocopy license from the CCC, a separate system ofpayment has been arranged and is acceptable to Humana Press Inc. The fee code for users of the TransactionalReporting Service is [0-89603-617-0/02 $10.00 + $00.25].
Printed in the United States of America. 10 9 8 7 6 5 4 3 2 1
Library of Congress Cataloging in Publication Data
PCR mutation detection protocols / edited by Bimal d. Theophilus and Ralph Rapley. p. cm. -- (Methods in molecular biology ; v. 187) Includes bibliographical references and index. ISBN 0-89603-617-0 (alk. paper) 1. Mutation (Biology)--Laboratory manuals. 2. Polymerase chain reaction--Laboratory manuals. I. Theophilus, Bimal D. II. Rapley, Ralph. III. Methods in molecular biology (Totowa, N.J.) ; v. 187.
QH462.A1 P37 2002 576.5'49--dc21
2002020563
Preface
v
As we enter the new millennium, it is tempting to speculate what may lie aheadin future years, decades, and even centuries. In the area of the medical and lifesciences at least, we can speculate with perhaps more certainty than may bepossible in other areas. The exciting stage at which we find ourselves in the fieldof molecular genetics means that we can be in no doubt that the application ofDNA technology will underlie many major advances in medicine in the comingdecades. While international research efforts seek to demonstrate the viability ofgene therapy, a major present application of human molecular genetics is theidentification of disease-causing mutations. This information may be used forprenatal and carrier diagnoses, or to aid early detection and determine appropri-ate treatment of various disease states. While, traditionally, progress has been indiseases caused by mutations in single genes, present research is unraveling theunderlying molecular basis of multigene disorders such as cancers, as well asidentifying increasing numbers of disease-associated single nucleotide poly-morphisms (SNPs). In addition, the completion of the human genome projectwill no doubt advance the pace of discovery even further, and also provide newpossibilities for diagnosis and treatment.
The rapidly increasing applications of DNA technology to disease diagnosishas spawned numerous molecular diagnostic laboratories with an interest inmutation detection methodology. Such laboratories would like the availability ofa single mutation method that is cheap, fast, with 100% detection in kilobaselengths of DNA, and does not require specialized equipment or harmful reagents.However, because no such universally applicable method exists, the present stateof play is a plethora of methodology, from which the user makes a choice basedon facilities, expertise, frequency of use, detection rate demanded, and whetherthe application purpose is diagnostic (detection of the presence or absence of aknown mutation) or involves screening a candidate gene for a new unidentifiedmutation.
PCR Mutation Detection Protocols comprises a comprehensive step-by-stepguide that brings together the large number of PCR-based mutation detectionmethods described to date. Many of the earlier chapters describe the basic tech-nology and techniques, e.g., the principles and methodology of PCR, labelingDNA probes, restriction fragment length polymorphism analysis, and Southernblotting. Further techniques are then presented covering both categories of

vi Preface
mutation detection: detection of the presence of a known mutation and screeningfor new mutations. The techniques presented in each involve different approachesappropriate to different mutation types: point mutations (e.g., ASO-PCR, SSCP,DGGE, chemical cleavage), deletions (multiplex PCR, FISH, blotting), non-sense mutations (PTT), etc. The new and exciting techniques of DNA arrayanalysis are also presented. The final chapters deal with different approaches toDNA sequencing as a detection method in its own right, or for characterizingmutations previously located by one of the other screening techniques. Recentlydeveloped and experimental methods, such as conformation sensitive gel elec-trophoresis, are presented in addition to the more established methods.
Each chapter includes the underlying basis of the techniques, and enables thereader to select the optimum method to use in relation to the above criteria.Particularly useful are the Notes sections containing the small details necessaryfor the successful execution of the technique. PCR Mutation Detection Protocolsis aimed at postgraduate scientists and researchers in diagnostic and researchlaboratories. In addition, the basic techniques covered in the introductory chap-ters will ensure the book constitutes a fitting initiation to molecular techniquesfor individuals in related medical and scientific fields.
Bimal D. M. TheophilusRalph Rapley
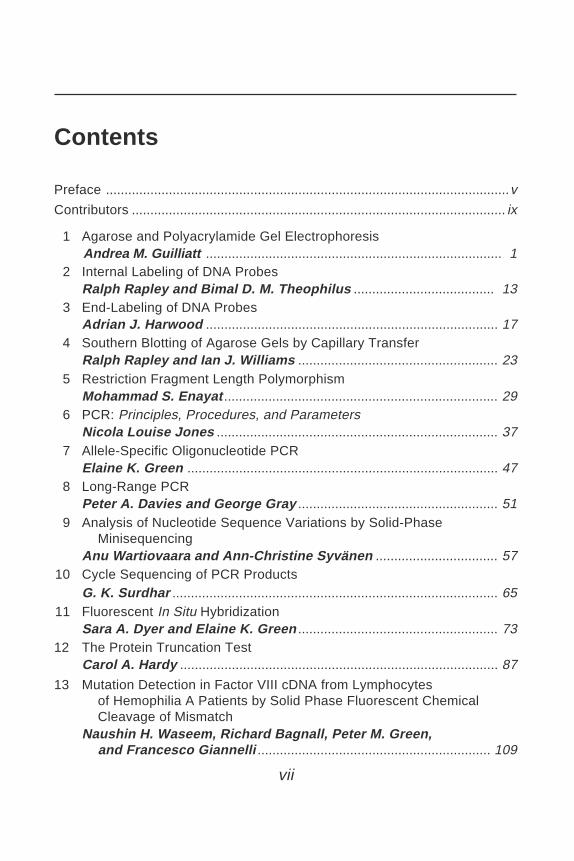
Contents
Preface .............................................................................................................v
Contributors ..................................................................................................... ix
1 Agarose and Polyacrylamide Gel ElectrophoresisAndrea M. Guilliatt ................................................................................ 1
2 Internal Labeling of DNA ProbesRalph Rapley and Bimal D. M. Theophilus ...................................... 13
3 End-Labeling of DNA ProbesAdrian J. Harwood ............................................................................... 17
4 Southern Blotting of Agarose Gels by Capillary TransferRalph Rapley and Ian J. Williams ...................................................... 23
5 Restriction Fragment Length PolymorphismMohammad S. Enayat .......................................................................... 29
6 PCR: Principles, Procedures, and ParametersNicola Louise Jones ............................................................................ 37
7 Allele-Specific Oligonucleotide PCRElaine K. Green .................................................................................... 47
8 Long-Range PCRPeter A. Davies and George Gray ...................................................... 51
9 Analysis of Nucleotide Sequence Variations by Solid-PhaseMinisequencing
Anu Wartiovaara and Ann-Christine Syvänen ................................. 5710 Cycle Sequencing of PCR Products
G. K. Surdhar ........................................................................................ 6511 Fluorescent In Situ Hybridization
Sara A. Dyer and Elaine K. Green ...................................................... 7312 The Protein Truncation Test
Carol A. Hardy ...................................................................................... 87
13 Mutation Detection in Factor VIII cDNA from Lymphocytesof Hemophilia A Patients by Solid Phase Fluorescent ChemicalCleavage of Mismatch
Naushin H. Waseem, Richard Bagnall, Peter M. Green,and Francesco Giannelli ............................................................... 109
vii
viii Contents
14 Denaturing Gradient Gel ElectrophoresisYvonne Wallis ..................................................................................... 125
15 Conformation-Sensitive Gel ElectrophoresisIan J. Williams and Anne C. Goodeve ............................................. 137
16 SSCP/Heteroduplex AnalysisAndrew J. Wallace ............................................................................. 151
17 Cleavase® Fragment Length Polymorphism Analysis for Genotypingand Mutation Detection
Laura Heisler and Chao-Hung Lee .................................................. 16518 Automated Genotyping Using the DNA MassArray™ Technology
Christian Jurinke, Dirk van den Boom, Charles R. Cantor,and Hubert Köster ......................................................................... 179
19 An Introduction to BioinformaticsHenry Brzeski ..................................................................................... 193
Index ............................................................................................................ 209
Contributors
RICHARD BAGNALL • Division of Medical and Molecular Genetics, GKTSchool of Medicine, Guy's Hospital, London, UK
HENRY BRZESKI • Windber Research Institute, Windber, PACHARLES R. CANTOR • Sequenom Inc., San Diego, CAPETER A. DAVIES • Institute of Medical Genetics, University of Wales
College of Medicine, Cardiff, UKSARA A. DYER • Regional Genetics Laboratory, Birmingham Women's
Hospital, Birmingham, UKMOHAMMAD S. ENAYAT • Department of Haematology, Birmingham
Children's Hospital NHS Trust, Birmingham, UKFRANCESCO GIANNELLI • Division of Medical and Molecular Genetics, GKT
School of Medicine, Guy's Hospital, London, UKANNE C. GOODEVE • Division of Genomic Medicine, Royal Hallamshire
Hospital, Sheffield, UKGEORGE GRAY • Department of Clinical Chemistry, Birmingham Children's
Hospital NHS Trust, Birmingham, UKELAINE K. GREEN • Department of Psychiatry, Queen Elizabeth Psychiatric
Hospital, University of Birmingham, Birmingham, UKPETER M. GREEN • Division of Medical and Molecular Genetics, GKT School
of Medicine, Guy's Hospital, London, UKANDREA M. GUILLIATT • Department of Haematology, Birmingham Children's
Hospital NHS Trust, Birmingham, UKCAROL A. HARDY • Molecular Genetics Laboratory, Regional Genetics
Service, Birmingham Women's Hospital, Birmingham, UKADRIAN J. HARWOOD • MRC Laboratory for Molecular Cell Biology and
Department of Biology, University College London, London, UKLAURA HEISLER • Third Wave Technologies, Inc., Madison, WINICOLA LOUISE JONES • Department of Haematology, Birmingham Children's
Hospital NHS Trust, Birmingham, UKCHRISTIAN JURINKE • Sequenom Inc., San Diego, CAHUBERT KÖSTER • Sequenom Inc., San Diego, CA
ix
x Contributors
CHAO-HUNG LEE • Department of Pathology and Laboratory Medicine,Indiana University School of Medicine, Indianapolis, IN
RALPH RAPLEY • Department of Biosciences, University of Hertfordshire,Hatfield, UK
G. K. SURDHAR • Department of Haematology, Birmingham Children'sHospital NHS Trust, Birmingham, UK
ANN-CHRISTINE SYVÄNEN • Department of Medical Sciences, UppsalaUniversity, Sweden
BIMAL D. M. THEOPHILUS • Department of Haematology, BirminghamChildren's Hospital NHS Trust, Birmingham, UK
DIRK VAN DEN BOOM • Sequenom Inc., San Diego, CAANDREW J. WALLACE • DNA Laboratory, Department of Medical Genetics, St.
Mary's Hospital, Manchester, UKYVONNE WALLIS • Regional Genetics Laboratory, Birmingham Women's
Hospital, Birmingham, UKANU WARTIOVAARA • Department of Neurology, University of Helsinki,
Helsinki, FinlandNAUSHIN H. WASEEM • Division of Medical and Molecular Genetics, GKT
School of Medicine, Guy's Hospital, LondonIAN J. WILLIAMS • Department of Haematology, Birmingham Children's
Hospital NHS Trust, Birmingham, UK
Agarose and Polyacrylamide Gel Electrophoresis 1
1
From: Methods in Molecular Biology, vol. 187: PCR Mutation Detection ProtocolsEdited by: B. D. M. Theophilus and R. Rapley © Humana Press Inc., Totowa, NJ
1
Agarose and Polyacrylamide Gel Electrophoresis
Andrea M. Guilliatt
1. IntroductionElectrophoresis through agarose or polyacrylamide gels is a standard method
used to separate, identify, and purify nucleic acids. The technique is simple,rapid to perform and capable of resolving fragments that differ by as little as0.2% in size. Electrophoresis occurs under the influence of an electric field:Charged molecules such as nucleic acids migrate in the direction of the elec-trode having the opposite charge (anode). The electrophoretic mobility ofnucleic acids is determined by a number of parameters, but molecules of lineardouble-stranded DNA migrate through gel matrices at rates that are inverselyproportional to the log10 of the number of base pairs (1) and therefore largermolecules migrate more slowly because of the greater frictional drag (seeNote 1). Other factors affecting electrophoretic mobility include the pK value,base composition, concentration of gel matrix, composition and ionic strengthof the electrophoresis buffer, temperature and the use of intercalating dyes suchas ethidium bromide.
The matrix used for electrophoresis should have adjustable but regular poresizes and be chemically inert, and the choice of which gel matrix to use dependsprimarily on the sizes of fragments being separated. Agarose gels are the mostpopular medium for the separation of moderate and large-sized nucleic acidsand have a wide range of separation but a relatively low resolving power.Polyacrylamide gels are most effective for separating smaller fragments, andalthough the gels are generally more difficult to prepare and handle, they havethree major advantages over agarose gels. They have a greater resolving power,can accommodate larger quantities of DNA without significant loss in resolu-tion, and the DNA recovered from polyacrylamide gels is extremely pure.
2 Guilliatt
Two electrophoresis buffers are commonly used and contain EDTA andTris-acetate (TAE) or Tris-borate (TBE) at a concentration of approx 50 mM.For historical reasons, TAE is the most commonly used buffer for agarose gelelectrophoresis, but its buffering capacity is low and may become exhaustedduring extended electrophoresis. TBE is slightly more expensive, but it offerssignificantly higher buffering capacity. Although the resolving power of thebuffers is almost identical, double-stranded linear DNA migrates approx 10%faster in TAE than in TBE. Electrophoresis buffers are routinely prepared asconcentrated solutions and stored at room temperature (see Note 2).
The most convenient method for visualizing DNA in agarose and polyacry-lamide gels is by staining with the fluorescent dye ethidium bromide (3,8-diamino-6-ethyl-5-phenyl-phenanthridium bromide), which contains a fixedplanar group that intercalates between the stacked bases of the DNA (2). Thefixed position and the close proximity to the bases causes the bound dye todisplay an increased fluorescent yield compared to that of the free dye in solu-tion. Ultraviolet (UV) radiation at a range of 260–360 nm is absorbed by theDNA and transmitted to the dye, and the energy is re-emitted at 590 nm in thered–orange region of the visible spectrum. Because the fluorescent yield ofethidium bromide: DNA complexes is greater than that of unbound dye, smallamounts of DNA can be detected in the presence of free ethidium bromide inthe gel. Ethidium bromide promotes damage of the nucleic acids when viewedunder UV light (photonicking); therefore, if the nucleic acid is to be used inreactions following visualization, the gel should be viewed using long-wave-length UV light (300 nm).
1.1. Agarose Gel Electrophoresis
Agarose is a linear polymer extracted from seaweed that forms a gel matrixby hydrogen-bonding when heated in a buffer and allowed to cool. Manychemically modified forms of agarose are available commercially that gel ormelt at different temperatures without any significant loss of mechanicalstrength. Although these different forms of agarose can be useful in both thequalitative and preparative electrophoresis of DNA, the resolving power is stillnot comparable to that of polyacrylamide gels.
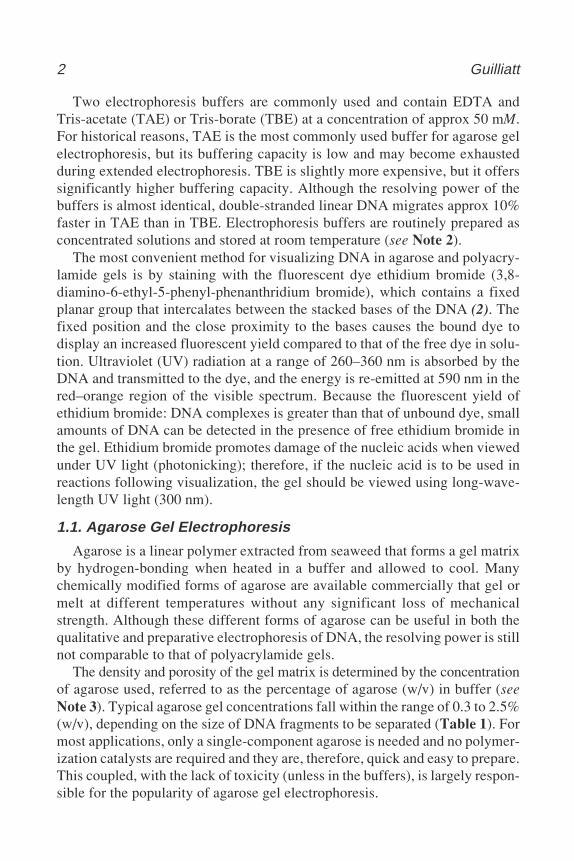
The density and porosity of the gel matrix is determined by the concentrationof agarose used, referred to as the percentage of agarose (w/v) in buffer (seeNote 3). Typical agarose gel concentrations fall within the range of 0.3 to 2.5%(w/v), depending on the size of DNA fragments to be separated (Table 1). Formost applications, only a single-component agarose is needed and no polymer-ization catalysts are required and they are, therefore, quick and easy to prepare.This coupled, with the lack of toxicity (unless in the buffers), is largely respon-sible for the popularity of agarose gel electrophoresis.
Agarose and Polyacrylamide Gel Electrophoresis 3
Many configurations and sizes of agarose gel electrophoresis tanks are avail-able, of which the most common is the horizontal slab gel. Because of their rela-tively poor mechanical strength, agarose gels are cast in clear plasticUV-transparent trays allowing handling and transfer of the gel once set (see Note 4).Electrophoresis is carried out with the gel submerged just beneath the surface ofthe buffer, and as the resistance of the gel is similar to that of the buffer, a currentpasses through the gel. The principle advantage of submarine gel electrophoresisis that the thin layer of buffer prevents the gel from drying out and provides somedegree of cooling.
The electrophoretic behavior of DNA in agarose gels is not significantlyaffected by temperature or the base composition of the DNA (3); therefore,agarose gels are generally run at room temperature unless low-melting-tem-perature agarose is used or the agarose concentration is less than 0.5% (w/v),when the mechanical strength can be improved by running at 4°C.
1.2. Polyacrylamide Gel Electrophoresis
Polyacrylamide gels are formed by the vinyl polymerization of acrylamidemonomers, (CH2=CH-CO-NH2) crosslinked by the bifunctional co-monomerN,N'-methylene-bis-acrylamide (CH2=CH-CO-NH-CH2-NH-CO-CH=CH2).The resulting crosslinked chains form a gel structure whose pore size is deter-mined by the initial concentrations of both acrylamide and the crosslinker.The nomenclature introduced by Hjertén et al. (4) is now widely used todescribe gel composition, the term T being the total monomer concentration(acrylamide and Bis) in grams/100 mL and C being the percentage (by weight)of total monomer T that is contributed by the crosslinker (Bis). The pore size ofthe gel can be altered in an easy and controllable fashion by changing the con-centrations of the two monomers. The polymerization proceeds by a free-radi-
Table 1Range of Separation of Linear DNA Moleculesin Different Agarose Gel Concentrations
Concentration of agarose Efficient range of separation of(% [w/v]) linear DNA molecules (kb)
0.3 5–600.6 1–200.7 0.8–100.9 0.5–71.2 0.4–61.5 0.2–32.0 0.1–2
4 Guilliatt
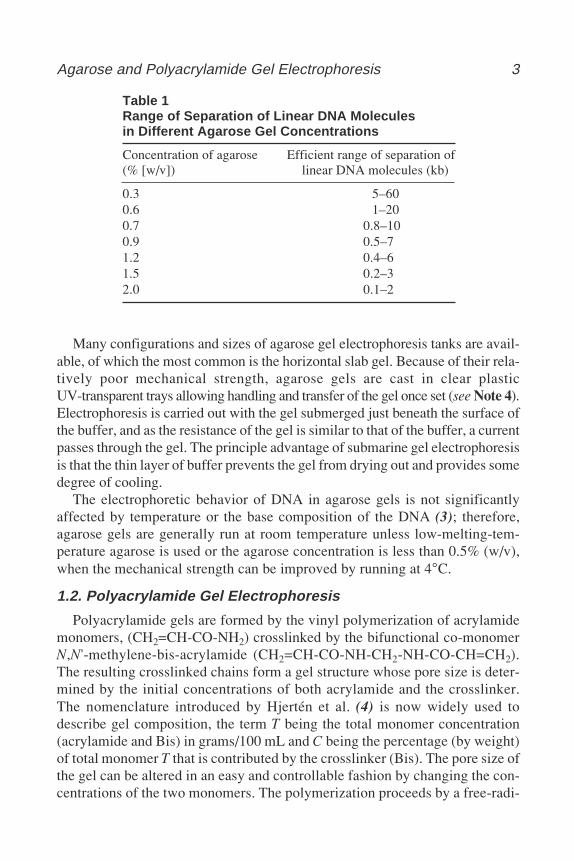
cal mechanism and the most common method of initiation is with ammoniumpersulfate, which produces oxygen free radicals by a base-catalyzed mechanism,typically tertiary aliphatic amines such as N,N,N'N'-tetramethylethylene-diamine (TEMED) (see Note 5). The length of the chains is determined by theconcentration of the acrylamide in the polymerization reaction (between 3.5%and 20%). One molecule of crosslinker is included for every 29 monomers ofacrylamide. The effective range of separation in nondenaturing gels containingdifferent concentrations of acrylamide is shown in Table 2.
Polyacrylamide gels are usually run between two glass plates, ensuring uni-form electrical conditions across the slab so that comparison between differentsample zones is far more accurate and a large number of samples may be runon the gel.
Polyacrylamide gels are poured and run in 1X TBE at low voltages to pre-vent denaturation of small fragments of DNA by heat generated by passage ofthe electric current. Most species of double-stranded DNA migrate through thegel at a rate approximately inversely proportion to the log10 of their size, how-ever, their electrophoretic mobility is affected by their base composition andsequence, so that two DNAs of exactly the same size can differ in mobility byup to 10%, as a result of secondary structures that may form at specificsequences in the double-stranded DNA (5).
Denaturing polyacrylamide gels are used for the separation and purificationof single-stranded fragments of DNA and are polymerized in the presence of
Table 2Range of Separation of Linear DNA Moleculesin Agarose and Polyacrylamide Gels and thePosition of Migration of Bromophenol Blue and Xylene Cyanol
Agarose gelconcentration Effective range Xylene cyanol Bromophenol blue(%[w/v]) of resolution (bp) migration (bp) migration (bp)
0.5–1.5 1000–3000 4000–5000 400–500
Acrylamide gelconcentration(%[w/v])
3.5 1000–2000 460 1005.0 80–500 260 658.0 60–400 160 4512.0 40–200 70 2015.0 25–150 60 1520.0 6–100 45 12
Agarose and Polyacrylamide Gel Electrophoresis 5
an agent that suppresses base-pairing in nucleic acids, usually urea. DenaturedDNA migrates though these gels at a rate that is almost completely dependenton its base composition and sequence and is discussed elsewhere in this vol-ume (see Chapters 14–16).
2. Materials2.1. Agarose Gel Electrophoresis
All of the chemicals used are of molecular biology grade, and solutions areprepared with double-distilled water unless otherwise stated.
1. Agarose gel apparatus, comprising:a. Gel tank and safety lidb. Gel trayc. Combd. Gel caster (optional)
2. Power supply capable of at least 100 V, 100 mA.3. Powdered agarose.4. Electrophoresis buffer (see Note 2 for formulations).5. 10X Gel loading buffer: The loading buffer for sample application should contain
0.25% bromophenol blue (BPB) and 0.25% xylene cyanol as tracking dyes and 30%sucrose, glycerol, or Ficoll to increase the sample solution density (see Note 6).
6. Ethidium bromide solution is generally prepared as a stock solution at a concen-tration of 10 mg/mL in water and stored at room temperature protected fromlight. Ethidium bromide is toxic and a powerful mutagen; therefore, gloves shouldalways be worn. Solutions containing ethidium bromide should be disposed ofappropriately as discussed in the Material Safety Data Sheets.
7. Microwave oven or hot plate.8. UV transilluminator and gel documentation system.
2.2. Polyacrylamide Gel Electrophoresis
All of the chemicals used are of molecular biology grade and solutions areprepared with double-distilled water unless otherwise stated.
1. Polyacrylamide gel apparatus, comprising:a. Gel tank and safety lidb. Glass platesc. Spacers and combs of the same thicknessd. Clamps or gel caster assembly (optional)
2. 30% Acrylamide stock, prepared by the addition of 29 g of acrylamide and 1 gN,N'-methylene-bis-acrylamide to 100 mL water (see Note 7).
3. 10X TBE (see Note 2 for formulation).4. 10% Ammonium persulfate, prepared by adding 1 g ammonium persulfate to
10 mL water. This solution may be kept at 4°C for several weeks.5. TEMED.
6 Guilliatt
6. Power supply.7. Siliconizing solution (dimethyl dichlorosilane [e.g., Sigmacote®]).
3. Methods
3.1. Agarose Gel Electrophoresis
3.1.1. Assembly and Pouring of the Gel
1. Seal the edges of the UV-transparent plastic casting tray with strong maskingtape or use a commercial gel casting system (see Note 8).
2. Place the tray/gel caster onto a horizontal section of bench, using a glass levelingplate if necessary, and place the comb(s) in the appropriate position(s) so thatwells are formed at the cathode end of the gel.
3. Add the desired amount of powdered agarose to a measured quantity of 1X elec-trophoresis buffer in an Erlenmeyer flask or beaker and cover with Saran-Wrap.Heat the mixture in a microwave oven swirling every 30 s until the agarose isvisibly seen to have dissolved. Alternatively, the agarose can be heated usinga hot plate. Any undissolved agarose appears as small translucent particles(see Note 9).
4. Allow the solution to cool to 50°C, unless a high concentration of agarose orhigh-gelling-temperature agarose is used where gelation will occur more rapidly.A low level (0.5 µg/mL) of ethidium bromide can be added at this stage, allowingthe progression of the electrophoresis to be analyzed during electrophoresis byilluminating the gel with UV light (see Note 10).
5. Pour the agarose into the gel mold, ensuring that no air bubbles form between theteeth of the comb, and allow the gel to set at room temperature for 30–40 min.
3.1.2. Running the Gel
1. Carefully remove the comb and place the gel and tray into the gel tank orientedwith the wells at the cathode end, and add sufficient 1X electrophoresis buffer tocover the gel to a depth of approx 1 mm (see Note 11).
2. Mix the DNA samples with gel loading buffer to produce a 1X concentration ofbuffer and load into the wells through the thin layer of running buffer. Placing ablack piece of paper behind the wells may facilitate in the loading process bymaking the wells more visible (see Note 12).
3. Load a DNA size standard to allow the determination of the sizes of the DNAfragments, because although the tracking dyes in the loading buffer give a roughestimate of the migration of the DNA, they do not give the exact size. Size stan-dards can be purchased commercially or prepared by restriction enzyme diges-tion of plasmid DNA, producing DNA fragments of known sizes.
4. Place the lid onto the gel tank, being careful not to disturb the samples, and beginelectrophoresis (see Note 13).
5. When the dyes have migrated the appropriate distance on the gel as shown inTable 2, turn off the power supply and proceed with visualization of the DNA.
Agarose and Polyacrylamide Gel Electrophoresis 7
3.1.3. Staining and Visualization of the Nucleic AcidsThe gel can be stained during electrophoresis by the addition of ethidium
bromide as described in Subheading 3.1.1. or following electrophoresis byimmersion in a solution of 0.5 µg/mL ethidium bromide.
1. If ethidium bromide has been incorporated in the gel, the DNA can be visualizedprogressively during the run. If post-electrophoretic staining is necessary, placethe gel in an appropriate volume of 0.5 µg/mL ethidium bromide for 30 min andthen destain in water for 10 min (see Note 14).
2. Following staining, place the gel on a UV transilluminator and photograph thegel using standard cameras and film such as a Polaroid camera with a red filterand 667 black and white film, or a charged-coupled devise (CCD)-based digitalanalysis system (see Note 15).
3.2. Polyacrylamide Gel Electrophoresis
There are many types of commercially available electrophoresis equipmentwith differing arrangements of glass plates and spacers. In all cases, the aim isto form an airtight seal between the plates and the spacers so that anyunpolymerized gel solution does not leak.
Most vertical electrophoresis tanks are constructed to hold glass plates.Spacers vary in thickness from 0.5 to 2 mm, but the thicker the gel, the hotter itwill become during electrophoresis and overheating may occur.
3.2.1. Assembly and Pouring of the Gel1. Prepare the glass plates and spacers by washing with warm detergent and rinsing
with water. The plates should only be held by the edges so that oils from hands donot become deposited on the working surface of the plates and lead to the forma-tion of bubbles in the gel. Rinse the plates with ethanol and allow to dry. Onesurface of the glass plate should be periodically treated with silicone solution toprevent the gel from sticking to both plates and therefore reduce the possibilitythat the gel will tear when it is removed from the plates following electrophoresis.
2. Most modern commercial gel systems provide gel casting units for the prepara-tion of polyacrylamide gels; therefore, the manufacturers guidelines should befollowed. Generally, lay one plate on the bench siliconized side upward andposition the spacers on the plate. Place the inner glass plate onto the spacers andseal the edges of the gel with electrical tape or a clamping unit (see Note 16).
3. Calculate and prepare the desired quantities of reagents needed to make suffi-cient solution to fill the gel mould. For example, to pour a 5% acrylamide gel ina total volume of 100 mL, add 10 mL 10X TBE and 16.67 mL 30% acrylamide to72.23 mL water (see Note 17).
4. Immediately before pouring, add the ammonium persulfate solution and TEMEDand mix. Quickly fill the mould with the solution, trying not to trap any airbubbles in the mould. Apply a comb to the top of the gel and then flush out thesyringe and needle (see Note 18).

8 Guilliatt
3.2.2. Assembly and Running of the Gel
1. When the gel has polymerized, assemble the gel tank apparatus as recommendedby the manufacturers.
2. Fill the tank with 1X buffer, remove the comb, and wash out the wells with buffer.Remove the tape from the bottom of the plates or cut with a sharp blade (seeNote 19).
3. Mix the DNA samples with appropriate gel loading buffer and apply to the wells(see Note 20).
4. Run the gel at a voltage between 1 and 8 V/cm. If electrophoresis is carried out ata higher voltage, differential heating in the center of the gel may cause bowing ofthe DNA bands or even melting of small strands of DNA.
5. When the marker dyes have migrated the desired distance, turn off the powersupply and disconnect the leads. Remove and detach the glass plates and pryapart using a spatula.
3.2.3. Staining and Visualization of Nucleic Acids
1. Because polyacrylamide quenches the fluorescence of ethidium bromide, it is notpossible to detect bands that contain less than 10 ng of DNA using this method.To stain the gel, gently submerge the gel and its attached glass plate in 0.5 µg/mLethidium bromide in 1X TBE buffer for 10–30 min at room temperature.
2. Destain for 10 min in water and following removal from the glass plate view thegel as described in Subheading 3.1.3.
4. Notes1. At low voltages, the rate of migration of linear DNA fragments is proportional to
the voltage applied, but as the electric field strength is increased, the mobility ofhigh-molecular-weight DNA fragments increases preferentially. Therefore, theeffective range of separation decreases as the voltage is increased.
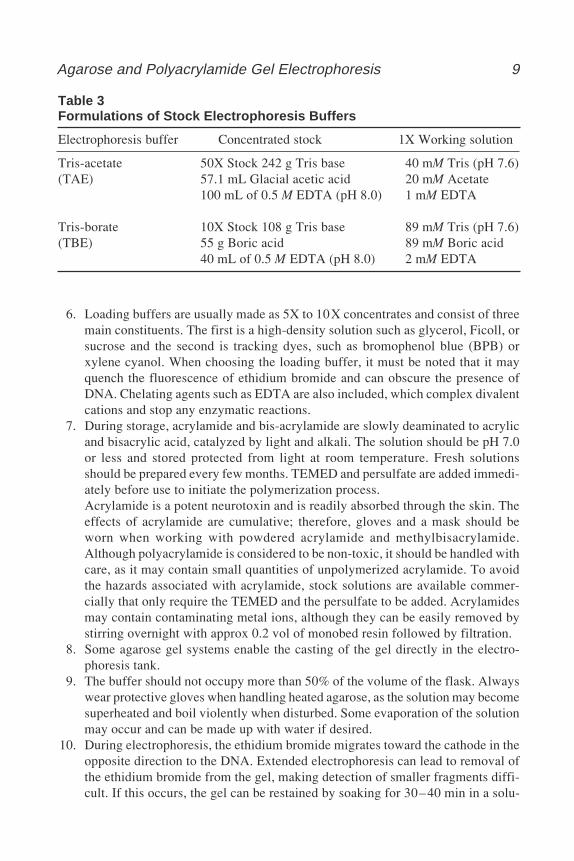
2. Electrophoresis buffers are generally prepared as concentrated stock solutions,as shown in Table 3.A precipitate may form when 10X TBE is stored for extended periods of time;therefore, it should be stored in brown glass bottles at room temperature anddiscarded if a precipitate develops.
3. The unavoidable loss of water that occurs during the heating of the gel meansthat, in practice, the percentage value is not precise.
4. If the gel is to be handled extensively, it may be convenient to place a sheet ofhydrophilic plastic support at the bottom of the gel mould, aiding in the handlingof the gel once set.
5. Oxygen at above trace levels acts as an inhibitor; therefore, many people advo-cate the deaeration of stock acrylamide solutions. Gelation should ideally occurwithin 10–30 min of the addition of the catalysts, because outside of these times,uneven polymerization may result, leading to non-homogenous gels and poorseparations. Because of the nature of the gel casting, inhibition of the polymer-ization by oxygen is confined to a narrow layer at the top of the gel.
Agarose and Polyacrylamide Gel Electrophoresis 9
6. Loading buffers are usually made as 5X to 10X concentrates and consist of threemain constituents. The first is a high-density solution such as glycerol, Ficoll, orsucrose and the second is tracking dyes, such as bromophenol blue (BPB) orxylene cyanol. When choosing the loading buffer, it must be noted that it mayquench the fluorescence of ethidium bromide and can obscure the presence ofDNA. Chelating agents such as EDTA are also included, which complex divalentcations and stop any enzymatic reactions.
7. During storage, acrylamide and bis-acrylamide are slowly deaminated to acrylicand bisacrylic acid, catalyzed by light and alkali. The solution should be pH 7.0or less and stored protected from light at room temperature. Fresh solutionsshould be prepared every few months. TEMED and persulfate are added immedi-ately before use to initiate the polymerization process.Acrylamide is a potent neurotoxin and is readily absorbed through the skin. Theeffects of acrylamide are cumulative; therefore, gloves and a mask should beworn when working with powdered acrylamide and methylbisacrylamide.Although polyacrylamide is considered to be non-toxic, it should be handled withcare, as it may contain small quantities of unpolymerized acrylamide. To avoidthe hazards associated with acrylamide, stock solutions are available commer-cially that only require the TEMED and the persulfate to be added. Acrylamidesmay contain contaminating metal ions, although they can be easily removed bystirring overnight with approx 0.2 vol of monobed resin followed by filtration.
8. Some agarose gel systems enable the casting of the gel directly in the electro-phoresis tank.
9. The buffer should not occupy more than 50% of the volume of the flask. Alwayswear protective gloves when handling heated agarose, as the solution may becomesuperheated and boil violently when disturbed. Some evaporation of the solutionmay occur and can be made up with water if desired.
10. During electrophoresis, the ethidium bromide migrates toward the cathode in theopposite direction to the DNA. Extended electrophoresis can lead to removal ofthe ethidium bromide from the gel, making detection of smaller fragments diffi-cult. If this occurs, the gel can be restained by soaking for 30–40 min in a solu-
Table 3Formulations of Stock Electrophoresis Buffers
Electrophoresis buffer Concentrated stock 1X Working solution
Tris-acetate 50X Stock 242 g Tris base 40 mM Tris (pH 7.6)(TAE) 57.1 mL Glacial acetic acid 20 mM Acetate
100 mL of 0.5 M EDTA (pH 8.0) 1 mM EDTA
Tris-borate 10X Stock 108 g Tris base 89 mM Tris (pH 7.6)(TBE) 55 g Boric acid 89 mM Boric acid
40 mL of 0.5 M EDTA (pH 8.0) 2 mM EDTA
10 Guilliatt
tion containing 0.5 µg/mL ethidium bromide. The mobility of linear DNA isreduced by the presence of ethidium bromide by about 15%.
11. The electrical resistance of the gel is almost the same as that of the buffer and soa significant proportion of the current passes through the gel, but the deeper thebuffer layer, the less efficient this becomes.
12. The maximum volume of solution that can be loaded is determined by the dimen-sions of the well. To reduce the possibility of contaminating neighboring samples,it is not advisable to fill the wells completely. The minimum amount of DNA thatcan be detected by ethidium-bromide-stained gels is approx 2 ng in a 5-mm-wideband, but if there is more than 500 ng of DNA, the well may become overloaded.
13. The power requirements for electrophoresis depend on the thickness and lengthof the gel and the concentration of agarose and buffer used. It is recommendedthat for maximal resolution, voltages applied to the gels should not exceed 10 V/cm,as higher voltages may preferentially increase the migration rate of higher-molecular-weight DNA and reduce the range of separation. Overnight separa-tions using lower voltages are frequently used.
14. Extended destaining can lead to the removal of the ethidium bromide and lower-ing of the detection sensitivity. Insufficient de-staining will lead to a higher back-ground of fluorescence.
15. Ultraviolet radiation is particularly dangerous to the eyes; therefore, to minimizeexposure, protective goggles or a face shield that efficiently blocks ultravioletradiation should be worn.
16. The bottom corners of the plates is where leaks are most likely to occur. Analternative method is to seal the glass plate with a strip of filter paper impreg-nated with catalyzed acrylamide or use a commercial gel casting apparatus.
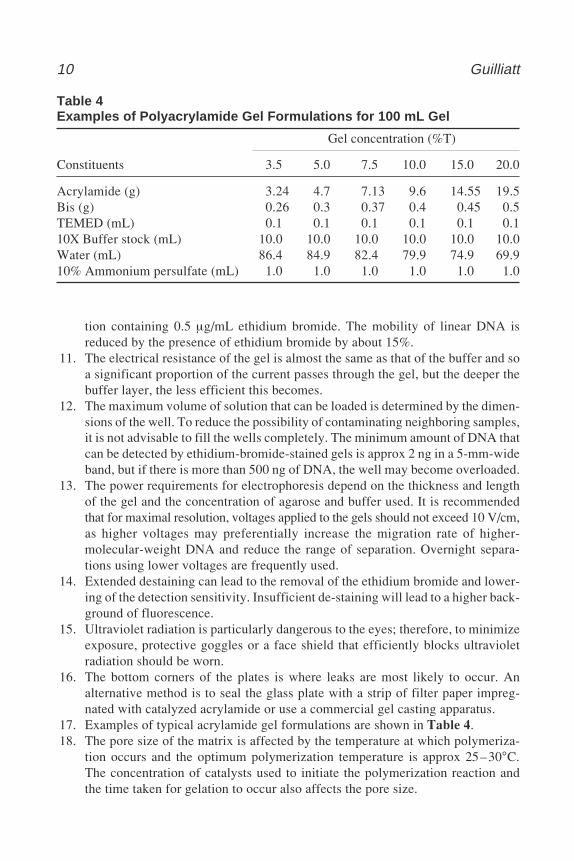
17. Examples of typical acrylamide gel formulations are shown in Table 4.18. The pore size of the matrix is affected by the temperature at which polymeriza-
tion occurs and the optimum polymerization temperature is approx 25–30°C.The concentration of catalysts used to initiate the polymerization reaction andthe time taken for gelation to occur also affects the pore size.
Table 4Examples of Polyacrylamide Gel Formulations for 100 mL Gel
Gel concentration (%T)
Constituents 3.5 5.0 7.5 10.0 15.0 20.0
Acrylamide (g) 3.24 4.7 7.13 9.6 14.55 19.5Bis (g) 0.26 0.3 0.37 0.4 0.45 0.5TEMED (mL) 0.1 0.1 0.1 0.1 0.1 0.110X Buffer stock (mL) 10.0 10.0 10.0 10.0 10.0 10.0Water (mL) 86.4 84.9 82.4 79.9 74.9 69.910% Ammonium persulfate (mL) 1.0 1.0 1.0 1.0 1.0 1.0
Agarose and Polyacrylamide Gel Electrophoresis 11
19. It is important to wash out the wells thoroughly, as any unpolymerized acrylamidein the wells may subsequently polymerize, giving rise to irregular surfaces, whichlead to distorted bands.
20. It is important that the gel is not loaded symmetrically, as the orientation of thegel can become lost during subsequent steps as it is removed from the plates forvisualization and staining. When loading the samples, do not attempt the expel ofany remaining sample from the pipet, as the resulting air bubbles may blow outthe sample from the well. It is important not to take too long to complete the gelloading process, as the samples may diffuse from the wells.
References1. Helling, R. B., Goodman, H. M., and Boyer, H. W. (1974) Analysis of EcoRI
fragments of DNA from lambdoid bacteriophages and other viruses by agarosegel electrophoresis. J. Virol. 14, 1235–1244.
2. Sharp, P. A., Sugden, B., and Saunders, J. (1973) Detection of two restrictionendonuclease activities in Haemophilus parainfluenzae using analytical agarose-ethidium bromide electrophoresis. Biochemistry 12, 3055–3063.
3. Thomas, M. and Davis, R. W. (1975) Studies on the cleavage of bacteriophagelambda DNA with EcoRI restriction endonuclease. J. Mol. Biol. 91, 315–321.
4. Hjertén, S., Jerstedt, S., and Tiselius, A. (1965) Some aspects of the use of “con-tinuous” and “discontinuous” buffer systems in polyacrylamide gel electrophore-sis. Anal. Biochem. 11, 219–223.
5. Orita, M., Suzuki, Y., Sekilya, T., and Hayashi, K. (1989) Rapid and sensitivedetection of point mutations and DNA polymorphisms using the polymerase chainreaction. Genomics 5, 874–879.
Further ReadingRickwood, D. and Hanes, B. D., eds. (1988) Gel Electrophoresis of Nucleic Acids:A Practical Approach. IRL, Oxford, UK.Sambrook, J., Fritsch, E. F., and Maniatis, T. Molecular Cloning: A LaboratoryManual, 2nd ed. Cold Spring Harbor Laboratory, Cold Spring Harbour, NY.

150 Wells
Internal Labeling of DNA Probes 13
13
From: Methods in Molecular Biology, vol. 187: PCR Mutation Detection ProtocolsEdited by: B. D. M. Theophilus and R. Rapley © Humana Press Inc., Totowa, NJ
2
Internal Labeling of DNA Probes
Ralph Rapley and Bimal D. M. Theophilus
1. IntroductionOne of the most common precursors to undertaking a protocol for mutation
detection is the production of a suitably labeled DNA probe (1). Labeled nucle-otides (radioactive or fluorescent) can be incorporated efficiently into double-stranded DNA by a number of methods. One of the most common is by aprocess termed nick translation. Nick translation works by using DNase andDNA polymerase I enzymes. DNase cuts one strand of the DNA, exposing 5'-phosphoryl and 3'-hydroxyl (OH) termini. Polymerase I adds dNTPs, includ-ing labeled dNTPs to the exposed 3'-OH strand, and at the same time, thepolymerase exonuclease activity digests from the exposed 5' end. In this way, anew complementary strand, including labeled dNTPs, is produced (2). It isalso possible to incorporate radioactive nucleotides into a DNA using a enzy-matic primer extension technique, usually termed random primer labeling (3).In this method, random hexanucleotides are annealed to denatured DNA to beused as the probe. These are used as a primer for enzymatic extension in thepresence of the four deoxyribonucleotides, one of which is radiolabeled. Alter-native probes may be prepared where the label occurs on one of the termini ofthe DNA, either the 3' or the 5' end. The protocol for this type of labeling isfound in Chapter 3.
2. Materials (see Note 1)2.1. Nick Translation of DNA
1. 10X Nick translation buffer: 0.5 M Tris-HCl (pH 7.5), 0.1 M MgSO4, 1 mMdithiothreitol, 500 mg/mL bovine serum albumin (optional).
2. DNase I: 10 ng/mL.3. DNA polymerase I: 0.5 U/µL.
14 Rapley and Theophilus
4. Unlabeled dNTP: 2 mM each of dATP, dGTP, and dTTP.5. Radiolabeled dCTP: 10 mCi/mL [α-32P]dCTP, specific activity approx 3000 Ci/
mmol (see Note 2). This is stored at –20°C and should be removed from thefreezer approx 20 min before setting up the reaction.
6. Stop solution: 0.5 M EDTA (pH 8.0).7. Sephadex separation spin column (see Note 3).
2.2. Random Hexamer Labeling of DNA
1. DNA probe to be labeled in TE buffer (10 mM Tris-HCl, 1 mM EDTA, pH 8.0).2. Hexamer mix: 0.043 M each of dCTP, dTTP, and dGTP, 0.43 M HEPES, pH 7.0,
12 U/mL random hexanucleotides (Amersham Pharmacia Biotech, UK).3. [α-32P]dATP, specific activity 6000 Ci/mM (Amersham Pharmacia Biotech).
This is stored at –20°C and should be removed from the freezer approx 20 minbefore setting up the reaction.
4. Stop solution: 0.5 M EDTA, pH 8.0.5. DNA polymerase (e.g., Klenow fragment) (6 U/µL).
3. Methods3.1. Nick Translation of DNA
1. Dilute DNA to be labeled to 20–200 ng/mL with sterile distilled H2O and add 1 mgto a sterile microcentrifuge tube.
2. Add the following to the tube:a. 10 µL 10X nick translation bufferb. 10 µL 20 nM unlabeled dNTPsc. 10 µL 30 pmol labeled [α-32P]dCTP
3. Add 1 ng/mL DNase (10 mL) and 2.5 U DNA polymerase I (5 mL). Gently mixby pipetting solution up and down.
4. Add water to ensure a final volume of 100 µL.5. Incubate for 2 h at 15°C.6. Stop the reaction by adding 10 µL EDTA.7. The probe is now ready for hybridization. However, it may be necessary to
remove any unincorporated nucleotides, using Sephadex spin columns (see Notes3 and 4).
3.2. Random Hexamer Labeling of DNA
1. Take 25–100 ng of DNA to be labeled and adjust the volume of TE to 11 µL.2. Denature the DNA by boiling for 5 min and transfer immediately to an ice bucket.3. Add 11 µL of the primer mix, 2 µL of the [α-32P]dATP, and 3 U of the Klenow
polymerase (0.5 µL).4. Incubate the mix at room temperature for approx 4 h.5. Add 5 µL of stop mix to terminate the reaction.6. At this point, the probe may be purified from free nucleotides by use of Sephadex
spin columns (see Notes 3 and 4).
Internal Labeling of DNA Probes 15
7. Following recovery of the labeled DNA, it must be rendered single-stranded byboiling before it may be used in hybridization experiments.
4. Notes1. Enzymes and buffers are now available in kit forms (Amersham [Amersham
Pharmacia Biotech, UK], Promega [Promega, UK]); however, slight variationsexist in concentrations of enzymes and buffer ingredients.
2. Nick translation can also be used to label DNA with nonradioactive markers,including incorporation of Cy3–dCTP and fluorescein, or rhodamine–dUTP intoDNA. However, radiolabeled probes are more sensitive markers for low quanti-ties of DNA. It is also possible to label more than one dNTP if higher specificactivity is required for hybridizing low amounts of DNA. However, this increasesnonspecific hybridization.
3. To remove unincorporated labeled dNTPs, the probe can be purified by passingthe solution through a Sephadex spin column or push column. UnincorporateddNTPs are trapped inside the Sephadex beads, whereas DNA is too large to enterthe beads and passes straight through the column.
4. Percentage incorporation and the specific activity of the probe can be calculatedby measuring the radioactivity in the mixture before and after separation.
Percentage incorporation = cpm incorporated × 100
Total cpm
Specific activity (cpm/mg DNA) = cpm incorporated × dilution × 100
mg input DNA
References1. Aquino de Muro, M. (1998) Gene Probes, in The Molecular Biomethods Hand-
book (Rapley, R. and Walker, J. M., eds.) Humana, Totowa, NJ.2. Rigby, P. W. J., Dieckmann, M., Rhodes, C., and Berg, P. (1977) Labelling deox-
yribonucleic acid to a high specific activity in vitro by nick translation with DNApolymerase I. J. Mol. Biol. 113, 237–251.
3. Feinberg, A. P. and Vogelstein, B. (1983) A technique for radiolabelling DNArestriction endonuclease fragments to a high specific activity. Anal. Biochem.132, 6–13.

150 Wells
End-Labeling of DNA Probes 17
17
From: Methods in Molecular Biology, vol. 187: PCR Mutation Detection ProtocolsEdited by: B. D. M. Theophilus and R. Rapley © Humana Press Inc., Totowa, NJ
3
End-Labeling of DNA Probes
Adrian J. Harwood
1. IntroductionEnd-labeling is a rapid and sensitive method for radioactively, or nonisoto-
pically, labeling DNA fragments and is useful for visualizing small amounts ofDNA. End-labeling can also be used to label fragments at one end. All of theenzymes employed are specific to either the 3' or 5' termini of DNA and will,consequently, only incorporate label once per DNA strand. If double-strandedDNA is used, both ends are labeled, but single end-labeled fragments can beproduced by further restriction enzyme digestion. This works well with DNAfragments cloned into polylinkers, as one labeled end can be removed as a tinyDNA fragment, making subsequent purification easier. Such single end-labeledmolecules can be used to order restriction enzyme fragments and are a prereq-uisite for Maxam–Gilbert DNA sequencing (1). End-labeled synthetic oligo-nucleotides have numerous applications, including sequence specific probes(2), gel retardation and Southwestern assays (3), and sequencing polymerasechain reaction (PCR) products (4).
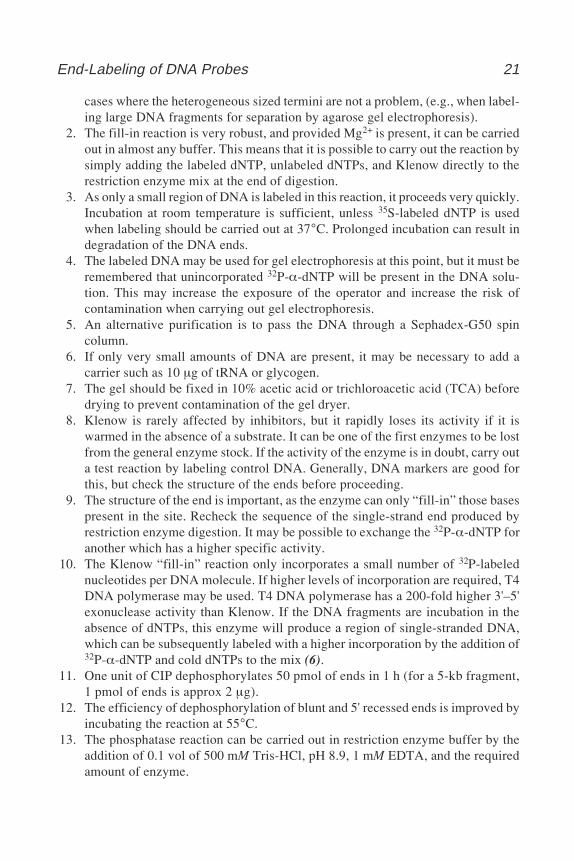
There are two common methods of end-labeling: the “fill-in” reaction andthe “kinase” reaction. The fill-in reaction uses the Klenow fragment ofEscherichia coli DNA polymerase (5) and labels DNA fragements that havebeen digested with a restriction enzyme to create a 5' overhang. Klenow extendsthe 3' recessed end of one DNA strand by using the 5' overhang of the otherstrand as a template (Fig. 1A). This is the method of choice for double-strandedDNA fragments because of its ease. When suitable restriction enzyme sites areunavailable or when the substrate is single stranded, the kinase reaction is used.The “kinase” reaction uses T4 polynucleotide kinase (T4 kinase) to transferlabeled phosphate to the 5' end of the DNA molecule (6) (Fig. 1B). This method
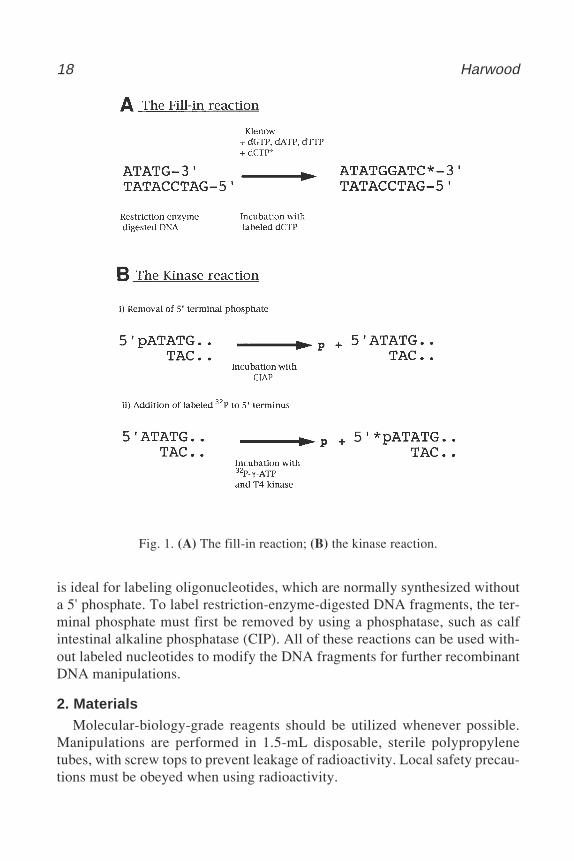
18 Harwood
is ideal for labeling oligonucleotides, which are normally synthesized withouta 5' phosphate. To label restriction-enzyme-digested DNA fragments, the ter-minal phosphate must first be removed by using a phosphatase, such as calfintestinal alkaline phosphatase (CIP). All of these reactions can be used with-out labeled nucleotides to modify the DNA fragments for further recombinantDNA manipulations.
2. MaterialsMolecular-biology-grade reagents should be utilized whenever possible.
Manipulations are performed in 1.5-mL disposable, sterile polypropylenetubes, with screw tops to prevent leakage of radioactivity. Local safety precau-tions must be obeyed when using radioactivity.
Fig. 1. (A) The fill-in reaction; (B) the kinase reaction.
End-Labeling of DNA Probes 19
2.1. End-Labeling with Klenow
1. 10X Klenow buffer: 200 mM Tris-HCl, pH 7.6, 100 mM MgCl2, 15 mMβ-mercaptoethanol, 25 mM dithiothreitol.
2. Labeled nucleotide: 32P-α-dNTP, most commonly supplied dATP or dCTP, butdGTP and dTTP are available. It is also possible to substitute nonisotopic labelsuch as fluoroscein-11-dUTP and digoxygenin-11-dUTP.
3. Unlabeled dNTPs:a. dNTP mix: a mixture of 0.25 mM of each unlabeled dNTP, excluding that
which corresponds to the labeled nucleotide (see Note 1).b. dNTP chase: 0.25 mM dNTP corresponding to the labeled nucleotide (see
Note 1).4. Klenow: the Klenow (large) fragment of DNA polymerase I at 1 U/µL. Store
at –20°C.5. TE: 10 mM Tris-HCl (pH 7.5), 1 mM EDTA. Autoclave and store at room
temperature.6. Phenol: Tris-HCl equilibrated phenol containing 0.1% hydroxyquinoline (as an
antioxidant). Use ultrapure, redistilled phenol. Extract repeatedly with 0.5 MTris-HCl (pH 8.0) until the aqueous phase is 8.0 and then extract once with 0.1 MTris-HCl (pH 8.0). Can be stored at 4°C for at least 2 mo. Phenol is both causticand toxic and should be handled with care.
7. Chloroform.8. Phenol: chloroform mixture: A 1:1 mixture was made by adding an equal volume
of chloroform to 0.1 M Tris-HCl, pH 8.0, equilibrated phenol. Can be stored at4°C for at least 2 mo.
9. Ethanol and 70% ethanol (v/v in water).10. 5 M Ammonium acetate, pH 7.5: Store at room temperature.
2.2. End-Labeling with T4 Kinase
11. 10X CIP buffer: 10 mM ZnCl2, 10 mM MgCl2, 100 mM Tris-HCl, pH 8.3.12. CIP: calf intestinal alkaline phosphatase (Boehringer Mannhiem Gmbh) at
1 U/µL. Store at 4°C.13. 10X Kinase buffer: 700 mM Tris-HCl, pH 7.6, 100 mM MgCl2, 50 mM
dithiothreitol.14. 32P-γ-ATP: Specific activity > 3000 Ci/mmol.15. T4 kinase: T4 polynucleotide kinase at 1 U/µL. Store at –20°C.16. Cold ATP: 1.0 mM ATP (freshly made from 20 mM stock).
3. Methods
3.1. End-Labeling with Klenow
1. Resuspend 1–1000 ng of DNA in 42 µL of dH2O (see Note 2). Add 5 µL of 10XKlenow buffer, 1 µL of 32P-α-dNTP, 1 µL of dNTP mix, and 1 µL of Klenow.Incubate at room temperature for 15 min (see Note 3).
20 Harwood
2. Add 1 µL of dNTP chase. Incubate at room temperature for a further 15 min (seeNotes 1 and 4).
3. Add 50 µL of TE followed by 100 µL of phenol:chloroform. Vortex briefly andseparate by centrifugation at 12,000g in a microfuge (see Note 5).
4. Remove the aqueous (top) phase to a fresh tube and add 100 µL of chloroform.Separate the layers as in step 3 and remove the aqueous phase to a fresh tube.Care must be taken, as the discarded reagents are contaminated with unincorpo-rated 32P-α-dNTP.
5. Add 60 µL (0.6 vol) of 5 M ammonium acetate and 200 µL (2 vol) of ethanol (seeNote 6) and place on ice for 5 min. Centrifuge at 12,000g for 15 min. Carefullyremove the supernatant (remember that it is radioactive) and wash the pelletin 70% ethanol.
6. Air-dry the pellet for 10 min and resuspend in the required amount of TE(10–100 µL).
The labeled DNA can be either immediately separated by gel electrophoresisand detected by autoradiography (see Note 7) or digested further with a secondrestriction enzyme. In either case, it is a good idea to count a 1-µL sample in ascintillation counter, between 5000 and 10,000 counts are required to detectthe fragment by autoradiography. Possible causes of poor labeling and pos-sible solutions are discussed in Notes 8–10.
3.2. End-Labeling with T4 Kinase1. Dissolve 1–2 µg of restriction-enzyme-digested DNA in 44 µL of dH2O. Add 5 µL
of 10X CIP buffer and 0.05–1 U of CIP (see Note 11). Incubate for 30 min at37°C (see Notes 12 and 13).
2. Heat-inactivate at 60°C for 10 min. Phenol extract and precipitate as in Sub-heading 3.1., steps 3–5 (see Notes 14 and 15).
3. Resuspend the DNA in 17.5 µL of dH2O. Add 2.5 µL of 10X kinase buffer, 5 µLof 32P-γ-ATP, and 1 µL of T4 kinase. Incubate at 37°C for 30 min.
4. Add 1 µL of cold ATP and incubate for a further 30 min (see Note 16).5. Phenol extract and precipitate as in Subheading 3.1., steps 3–6 (see Note 17).
4. Notes1. Unlabeled dNTPs are required for two reasons. First, the labeled nucleotide may
not correspond to the first nucleotide to be filled within the restriction enzymesite. In the example shown in Fig. 1A, which is a BamHI site, the labeled nucle-otide, dCTP*, corresponds to the fourth nucleotide; therefore, the other threenucleotides must be filled with cold dNTPs before the label is incorporated. Forconvenience, a general 7.5 mM mix of the unlabeled dNTPs can be used regard-less of the actual composition of the restriction enzyme site. Second, a “chase” isrequired to generate molecules with flush ends, as the polymerase stalls in thelimited concentrations of the labeled nucleotide. This step may be omitted in
End-Labeling of DNA Probes 21
cases where the heterogeneous sized termini are not a problem, (e.g., when label-ing large DNA fragments for separation by agarose gel electrophoresis).
2. The fill-in reaction is very robust, and provided Mg2+ is present, it can be carriedout in almost any buffer. This means that it is possible to carry out the reaction bysimply adding the labeled dNTP, unlabeled dNTPs, and Klenow directly to therestriction enzyme mix at the end of digestion.
3. As only a small region of DNA is labeled in this reaction, it proceeds very quickly.Incubation at room temperature is sufficient, unless 35S-labeled dNTP is usedwhen labeling should be carried out at 37°C. Prolonged incubation can result indegradation of the DNA ends.
4. The labeled DNA may be used for gel electrophoresis at this point, but it must beremembered that unincorporated 32P-α-dNTP will be present in the DNA solu-tion. This may increase the exposure of the operator and increase the risk ofcontamination when carrying out gel electrophoresis.
5. An alternative purification is to pass the DNA through a Sephadex-G50 spincolumn.
6. If only very small amounts of DNA are present, it may be necessary to add acarrier such as 10 µg of tRNA or glycogen.
7. The gel should be fixed in 10% acetic acid or trichloroacetic acid (TCA) beforedrying to prevent contamination of the gel dryer.
8. Klenow is rarely affected by inhibitors, but it rapidly loses its activity if it iswarmed in the absence of a substrate. It can be one of the first enzymes to be lostfrom the general enzyme stock. If the activity of the enzyme is in doubt, carry outa test reaction by labeling control DNA. Generally, DNA markers are good forthis, but check the structure of the ends before proceeding.
9. The structure of the end is important, as the enzyme can only “fill-in” those basespresent in the site. Recheck the sequence of the single-strand end produced byrestriction enzyme digestion. It may be possible to exchange the 32P-α-dNTP foranother which has a higher specific activity.
10. The Klenow “fill-in” reaction only incorporates a small number of 32P-labelednucleotides per DNA molecule. If higher levels of incorporation are required, T4DNA polymerase may be used. T4 DNA polymerase has a 200-fold higher 3'–5'exonuclease activity than Klenow. If the DNA fragments are incubation in theabsence of dNTPs, this enzyme will produce a region of single-stranded DNA,which can be subsequently labeled with a higher incorporation by the addition of32P-α-dNTP and cold dNTPs to the mix (6).
11. One unit of CIP dephosphorylates 50 pmol of ends in 1 h (for a 5-kb fragment,1 pmol of ends is approx 2 µg).
12. The efficiency of dephosphorylation of blunt and 5' recessed ends is improved byincubating the reaction at 55°C.
13. The phosphatase reaction can be carried out in restriction enzyme buffer by theaddition of 0.1 vol of 500 mM Tris-HCl, pH 8.9, 1 mM EDTA, and the requiredamount of enzyme.
22 Harwood
14. It is important to remove all phosphatase in order to prevent removal of the newlyincorporated labeled phosphate.
15. The T4 kinase reaction is very sensitive to inhibitors such as those found in aga-rose. Care should be taken to ensure that the DNA is inhibitor-free. In addition,T4 kinase will readily phosphorylate RNA molecules; therefore, the presence ofRNA should be avoided, as this will severely reduce the incorporation of labeled32P into the DNA.
16. The labeling reaction is only approx 10% efficient. To get all of the moleculesphosphorylated, it is necessary to chase the reaction with excess cold ATP.
17 This is a poor way to purify oligonulceotides, instead I recommend a Sephadex-G25 spin column.
References1. Pickersky, E. (1996) Terminal labelling for Maxam-Gilbert sequencing, in Basic
DNA and RNA Protocols (Harwood, A. J., ed.), Methods in Molecular Biology,vol. 58, Humana, Totowa, NJ.
2. Wallace, R. B., Shaffer, J., Murphy, R. F., Bonner, J., Hirose, T., and Itakura, K.(1979) Hybridisation of synthetic oligodeoxyribonucleotides to phi chi 174 DNA:the effect of single base pair mismatch. Nucl. Acid Res. 6, 3543.
3. Harwood, A. J., ed. (1994) Protocols for Gene Analysis, in Methods in MolecularBiology, vol. 31. Humana, Totowa, NJ.
4. Harwood, J. C. and Phear, G. A. (1996) Direct sequencing of PCR products, inBasic DNA and RNA Protocols, (Harwood, A. J., ed.), Methods in MolecularBiology, vol. 58, Humana, Totowa, NJ.
5. Klenow, H., Overgaard-Hansen, K., and Patkar, S. A. (1971) Proteolytic cleavageof native DNA polymerase into two different catalytic fragments. Eur. J. Biochem.22, 371–381.
6. Challberg, M. D. and Englund, P. T. (1980) Specific labelling of 3' termini withT4 DNA polymerase. Meth. Enzymol. 65, 39–43.
Southern Blotting by Capillary Transfer 23
4
23
From: Methods in Molecular Biology, vol. 187: PCR Mutation Detection ProtocolsEdited by: B. D. M. Theophilus and R. Rapley © Humana Press Inc., Totowa, NJ
Southern Blotting of Agarose Gelsby Capillary Transfer
Ralph Rapley and Ian J. Williams
1. IntroductionThe detection of specific nucleic acid species following electrophoretic sepa-
ration of a complex sample may be undertaken by the use of Southern blotting(1). Genomic DNA fragments are separated according to size by agarose gelelectrophoresis following digestion with suitable restriction enzymes (seeChapter 5).
To facilitate the transfer of larger DNA fragments, the immobilized DNAcontained within the gel matrix is partially cleaved by depurination with HCl.Subsequent soaking of the gel in NaOH denatures the double-stranded DNA toproduce single strands, which may be probed with an appropriately labeledsingle-stranded DNA fragment (2).
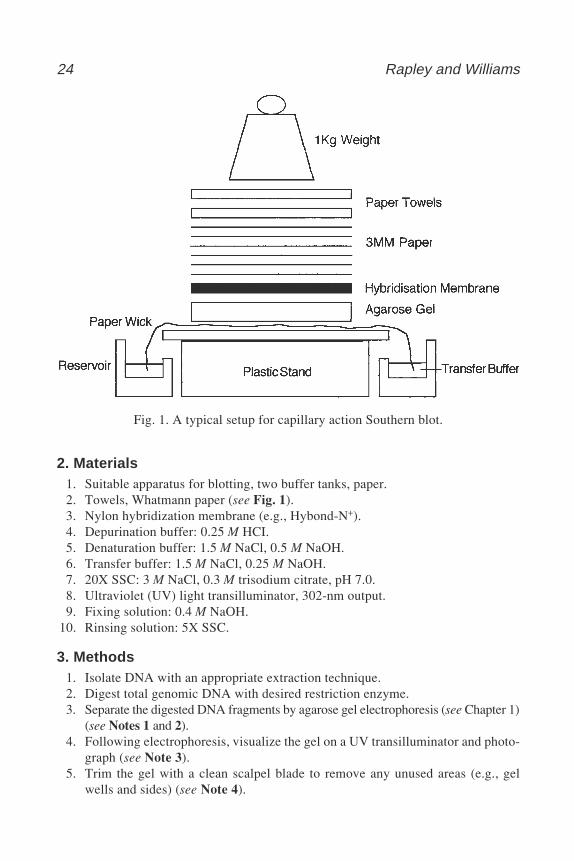
Traditionally, the DNA is transferred to a nitrocellulose filter, although nowthe membrane is usually constructed of nylon. Nylon has an improved capacityfor DNA binding and is more robust allowing reprobing to be undertaken. Thesimplest and least expensive method of transfer utilizes capillary action to drawliquid through the gel matrix, transferring the nucleic acid fragments onto thenylon membrane. The nylon-bound immobilized DNA fragments provide anexact representation of their original location following agarose gel electro-phoresis. Alternative methods of transfer such as vacuum blotting orelectroblotting may provide a more efficient method of transfer and reduceblotting time, but they are generally more expensive. Following transfer, theDNA is covalently crosslinked to the nylon membrane by exposure to ultravio-let irradiation, after which the blot may be stored or probed.
24 Rapley and Williams
2. Materials1. Suitable apparatus for blotting, two buffer tanks, paper.2. Towels, Whatmann paper (see Fig. 1).3. Nylon hybridization membrane (e.g., Hybond-N+).4. Depurination buffer: 0.25 M HCI.5. Denaturation buffer: 1.5 M NaCl, 0.5 M NaOH.6. Transfer buffer: 1.5 M NaCl, 0.25 M NaOH.7. 20X SSC: 3 M NaCl, 0.3 M trisodium citrate, pH 7.0.8. Ultraviolet (UV) light transilluminator, 302-nm output.9. Fixing solution: 0.4 M NaOH.
10. Rinsing solution: 5X SSC.
3. Methods1. Isolate DNA with an appropriate extraction technique.2. Digest total genomic DNA with desired restriction enzyme.3. Separate the digested DNA fragments by agarose gel electrophoresis (see Chapter 1)
(see Notes 1 and 2).4. Following electrophoresis, visualize the gel on a UV transilluminator and photo-
graph (see Note 3).5. Trim the gel with a clean scalpel blade to remove any unused areas (e.g., gel
wells and sides) (see Note 4).
Fig. 1. A typical setup for capillary action Southern blot.
Southern Blotting by Capillary Transfer 25
6. Soak the gel in three gel volumes of depurination buffer for 30 min at roomtemperature with gentle agitation on an orbital shaker (see Notes 5 and 6).
7. Decant depurination buffer and rinse the gel in distilled H2O.8. Discard H2O and soak in three gel volumes of denaturation buffer. Incubate with
gentle agitation at room temperature for 30 min.9. Decant denaturation buffer. Replace with three gel volumes of transfer buffer.
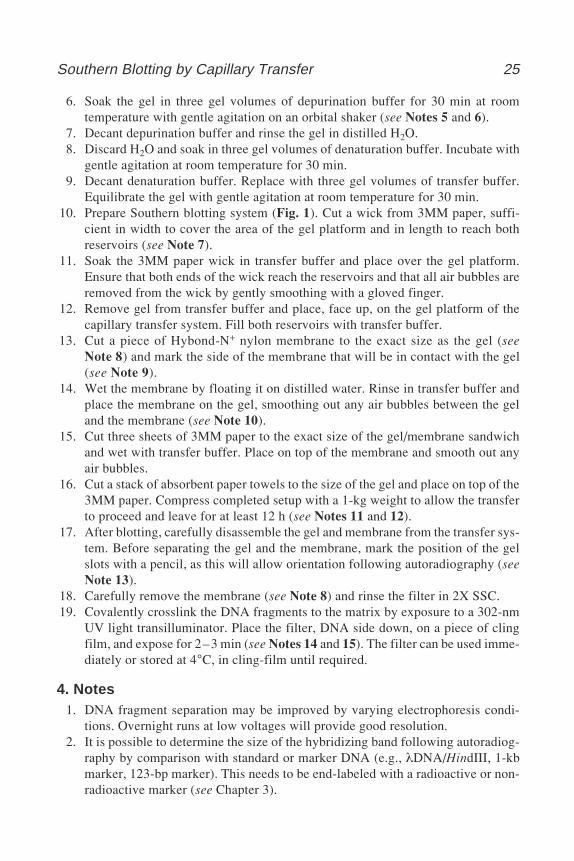
Equilibrate the gel with gentle agitation at room temperature for 30 min.10. Prepare Southern blotting system (Fig. 1). Cut a wick from 3MM paper, suffi-
cient in width to cover the area of the gel platform and in length to reach bothreservoirs (see Note 7).
11. Soak the 3MM paper wick in transfer buffer and place over the gel platform.Ensure that both ends of the wick reach the reservoirs and that all air bubbles areremoved from the wick by gently smoothing with a gloved finger.
12. Remove gel from transfer buffer and place, face up, on the gel platform of thecapillary transfer system. Fill both reservoirs with transfer buffer.
13. Cut a piece of Hybond-N+ nylon membrane to the exact size as the gel (seeNote 8) and mark the side of the membrane that will be in contact with the gel(see Note 9).
14. Wet the membrane by floating it on distilled water. Rinse in transfer buffer andplace the membrane on the gel, smoothing out any air bubbles between the geland the membrane (see Note 10).
15. Cut three sheets of 3MM paper to the exact size of the gel/membrane sandwichand wet with transfer buffer. Place on top of the membrane and smooth out anyair bubbles.
16. Cut a stack of absorbent paper towels to the size of the gel and place on top of the3MM paper. Compress completed setup with a 1-kg weight to allow the transferto proceed and leave for at least 12 h (see Notes 11 and 12).
17. After blotting, carefully disassemble the gel and membrane from the transfer sys-tem. Before separating the gel and the membrane, mark the position of the gelslots with a pencil, as this will allow orientation following autoradiography (seeNote 13).
18. Carefully remove the membrane (see Note 8) and rinse the filter in 2X SSC.19. Covalently crosslink the DNA fragments to the matrix by exposure to a 302-nm
UV light transilluminator. Place the filter, DNA side down, on a piece of clingfilm, and expose for 2–3 min (see Notes 14 and 15). The filter can be used imme-diately or stored at 4°C, in cling-film until required.
4. Notes1. DNA fragment separation may be improved by varying electrophoresis condi-
tions. Overnight runs at low voltages will provide good resolution.2. It is possible to determine the size of the hybridizing band following autoradiog-
raphy by comparison with standard or marker DNA (e.g., λDNA/HindIII, 1-kbmarker, 123-bp marker). This needs to be end-labeled with a radioactive or non-radioactive marker (see Chapter 3).
26 Rapley and Williams
3. Ethidium bromide stain can be incorporated into the gel or the buffer tank duringelectrophoresis. Similarly, the gel can be stained after the run is complete.
4. Trimming away unwanted areas of the gel reduces the size of the nylon mem-brane required to cover the gel.
5. The depurination step partially cleaves large DNA fragments within the gelmatrix. The smaller DNA fragments are transferred more efficiently during theblotting procedure. When the xylene cyanol loading dye changes color to agreenish color or the bromophenol blue turns yellow, the depurination buffercan be removed. Alternatively, this step can be achieved by exposing the gel toUV light (302 nm) for 30 s, to cleave high-molecular-weight DNA.
6. The blotting apparatus can be set up during the 30-min incubation periods insteps 6–9.
7. The width of the 3MM paper wick is cut to accommodate the width or length ofeach agarose gel. The gel platform can vary in size to accommodate differentgel sizes.
8. Avoid touching the surface of the nylon membrane as any dirt or grease mayaffect the result. Hold the membrane at the edges and wear gloves.
9. A small portion of the corner can be cut off for orientation.10. Air bubbles trapped between the gel and nylon membrane sandwich will affect
DNA transfer.11. A glass plate can be placed on top of the stack in order to distribute the weight
evenly, allowing a more even transfer of DNA. It is necessary to cover the blot-ting apparatus with cling film to avoid evaporation of transfer buffer.
12. With the completed setup, ensure that only the gel is in contact with the wick.To ensure correct and only vertical transfer of DNA fragments from the gel tothe nylon membrane, contact of blotting items within the stack should only bewith the layer above or below. In some cases, the wick can be covered or “sec-tioned off” using cling film. This will also prevent evaporation from the wickand the reservoirs.
13. Alternatives to the capillary system include vacuum blotting or electroblotting.There are a number of manufacturers that produce equipment for this purpose,and although they are more expensive, they reduce the transfer process to aslittle as 1 h. In some cases, a more even transfer takes place.
14. For neutral nylon membranes (e.g., Amersham, Hybond-N), crosslinking is neces-sary; however, for positively charged membranes (e.g., Amersham Hybond-N+)crosslinking may be undertaken by placing the membrane in 0.4 N NaOH for30 min and rinsing in 5X SSC with gentle agitation for 1 min. If using nitrocellu-lose, it is necessary to bake the filter at 80°C for 20–60 min.
15. Efficient crosslinking of DNA to nylon filters is achieved with an optimalamount of exposure to UV light. Some manufacturers (e.g., Stratagene) pro-duce UV crosslinkers (Stratalinker) that exposes the filter to the radiation forthe optimal amount of time. It is useful if no equipment such as this is availableto calibrate a UV source before use. This can be done by exposing filters withidentical amounts of DNA on each filter to UV for different lengths of time.

Southern Blotting by Capillary Transfer 27
Hybridization to the same probe will reveal the strongest signal that can beused to establish the optimal time for exposure. With standard UV transillumi-nator, regular recalibration is required.
References1. Southern, E. M. (1975) Detection of specific sequences among DNA fragments
separated by gel electrophoresis. J. Mol. Biol. 98, 503–517.2. Evans, M. R., Bertera, A. L., and Harris, D. W. (1994) The Southern blot: an
update. Mol. Biotechnol. 1, 1–12.

150 Wells
Restriction Fragment Length Polymorphism 29
5
29
From: Methods in Molecular Biology, vol. 187: PCR Mutation Detection ProtocolsEdited by: B. D. M. Theophilus and R. Rapley © Humana Press Inc., Totowa, NJ
Restriction Fragment Length Polymorphism
Mohammad S. Enayat
1. IntroductionDNA sequence changes within a gene result either in polymorphism or muta-
tion, causing different diseases. Some of these polymorphisms that occur with ahigh frequency within the population can be a useful tool for gene tracking for agiven disease. Such investigations have initially been done by Southern blottechniques, but, where possible, they have now been replaced by polymerasechain reaction (PCR)-based methodology. The nucleotide substitutions can beidentified in two ways:
1. By use of restriction enzyme analysis or restriction fragment length polymorphisms(RFLPs).
2. Allele specific oligonucleotide hybridization (ASO-H) or similar techniques.
Another type of polymorphism, a polymorphic tandem dinucleotide repeatsequence or variable number tandem repeat (VNTR) can also be used for genetracing in a familial disease. In these cases, a segment containing the repeats isamplified and the fragment size differences are detected by gel electrophoresis.
Hemophilia A or Factor VIII deficiency is the most common inherited bleed-ing disorder in humans. This X-chromosome-linked disorder affects approx 1in every 10,000 males, and within the families of these patients, the femalesare at risk of being carriers of this disorder. Factor VIII is a component of theintrinsic coagulation pathway and the FVIII gene is a large gene, encompasses186 kb at Xq28. It has 26 exons encoding a mRNA of 9 kb (1). Both RFLP andVNTR analysis have been extensively used in carrier detection and antenataldiagnosis in families with classical or familial hemophilia A. So far, 10 usefulpolymorphisms have been identified within (intragenic) or flanking (extragenic)
30 Enayat
the FVIII gene (Table 1). Seven of these polymorphisms are diallelic RFLP andone, within the intron 7, is a nucleotide substitution (G/A) usually detected byASO-H (3).
The most useful intragenic polymorphic sites with high heterozygosity indifferent ethnic populations are in intron 18 and intron 22, recognized with theBclI and XbaI restriction enzymes, respectively. A closely linked polymor-phism recognized by the BglII restriction is also highly informative, but with a5% theoretical chance of recombination. All three of these RFLPs have origi-nally been identified and analyzed by Southern blotting. However, this methodis time-consuming and may need the radioactive method for DNA band visual-ization. To this end, the BclI intragenic RFLP method has now been replacedby a fast and nonradioactive polymerase chain reaction (PCR) analysis (4,5).
1.1. Use of Southern Blotting in BclI RFLP Analysis of Hemophilia A
This method involves a series of techniques some of which are dealt with indetail elsewhere (6). These techniques include extraction of DNA from bloodsamples, digestion with appropriate restriction enzyme and electrophoresis, prepa-ration, extraction, isolation, purification, and radiolabeling of the DNA probe,Southern blotting, hybridization, and, finally, autoradiography for DNA bandvisualization.
2. Materials2.1. Restriction of DNA with the BclI Enzyme
1. Assay buffer (10X): The composition of this buffer varies from one manufac-turer to another. For example, the composition of Amersham Pharmacia Bio-
Table 1DNA Polymorphisms Within or Flanking the Factor VIII Gene (2)
RestrictionDetection
Heterozygosityenzyme Site PCR Probe in Caucasian
BclI Intron 18 + + 0.43XbaI Intron 22 + + 0.49HindIII Intron 19 + + 0.38MspI Intron 22 – + 0.01TaqI 5' – + 0.40BglI 3' – + 0.25MspI 3' – + 0.43(CA repeat) Intron 13 + – (10 alleles approx 0.80)(CA repeat) Intron 22 + – (6 alleles approx 0.55)(G/A) Intron 7 + – 0.33
Restriction Fragment Length Polymorphism 31
tech (Amersham Pharmacia Biotech, Buckinghamshire, UK) reaction buffercalled One-Phor-All buffer PLUS (OPA) is 10 mM Tris-HCl (pH 8.0), 100 mMKCl, 10 mM MgCl2, 10 mM β-Mercaptoethanol (β-ME), 100 µg bovine serumalbumin (BSA)/mL.
2. 200 µg/mL BSA.3. Loading buffer (LB): 30% xylene in 30% glycerol.4. See Notes 1–4 for the restriction enzyme.
2.2. Southern Blotting1. 0.25 M HCl.2. Standard saline citrate (SSC) (20X): 175.3 g/L NaCl and 88.2 g/L trisodium cit-
rate. Adjust to pH 7.0 with concentrated HCl.3. Denaturation buffer: 87.66 g/L NaCl and 20 g/L NaOH.4. Neutralization buffer: 60.55 g/L Tris and 87.66 g/L NaCl. Adjust to pH 7.4 with
concentrated HCl.5. 0.4 M NaOH.6. Amersham Hybond-N+ (nylon) (Amersham Pharmacia Biotech, Buckingham-
shire, UK) as transfer membrane7. Whatman 3MM chromatography paper (Whatman International, Ltd., Maid-
stone, Kent, UK).
3. Methods3.1. Restriction of DNA
1. Isolate and purify DNA using standard methods.2. Pipet a desired amount (about 25 µg) of DNA into a small Eppendorf tube and
dilute to 20 µL with distilled water.3. Add 3 µL of the appropriate 10X assay buffer, 5 µL of 200 µg/mL BSA, and an
appropriate number of units (usually 10 U) of the restriction enzyme diluted indilution buffer (usually supplied with the enzymes) as desired, in a 2-µL volume(see Notes 2 and 3).
4. Mix by pipetting and incubate at desired temperature for at least 60 min, prefer-ably 3–4 h.
5. Centrifuge contents in bench-top microcentrifuge at full speed to recover the fullcontent of the tubes.
6. Add 6 µL of loading buffer mixture and mix thoroughly.7. Load the samples into a suitable size submarine gel well without touching the
sides (see Note 4).8. Electrophorese the gel at 30 V for 8 h, but usually overnight.9. Observe the gels on an ultraviolet (UV) transilluminator and make a permanent
record by taking a photograph of the gel. If the DNA has been digested properly,a smearing from the well to the bottom of the gel should be present.
3.2. Southern BlottingThis method is used for the determination of the molecular sizes of the DNA
fragments after digestion with restricted enzymes and gel electrophoresis. DNA
32 Enayat
fragments are transferred to a nylon membrane for reaction with a labeled probefor band visualization and molecular-weight sizing of each of the fragments.
All of the procedures are done at room temperature and the buffers used donot have to be sterile.
1. After electrophoresis, trim away unwanted areas in the gel. Mark on the cornerfor gel orientation and identification.
2. Soak the gel in 0.25 M HCl for 15 min with gentle agitation on an orbital shaker (seeNote 5).
3. Wash the gel twice with denaturation buffer for 30 min.4. Neutralize the gel by replacing fluid with neutralization buffer and soak as in
step 2 for 30 min and repeat (see Note 6).5. While the gel is in final soak, construct a bridge for blotting. Cut a piece of the
3MM paper to the same width as the base glass plate but long enough to form awick into the buffer compartment over the edges of the bridge.
6. After the final soak in the neutralization buffer, pour off the excess fluid and takeup the gel onto a spare piece of 3MM paper.
7. Place the gel onto the bridge with the DNA side up.8. Smooth out the gel gently with a gloved finger to remove any air bubbles between
the bridge and the gel.9. Cut piece of Hybond-N+ membrane to the approximate size of the gel and place
on the gel. Trim to the exact size of the gel, again ensuring that no air bubbles aretrapped underneath the membrane.
10. Cut two or three pieces of paper to the size of the gel and then presoak briefly in2X SSC. Layer on top of membrane.
11. Surround the bridge/gel with Saran Wrap to prevent buffer bypass and evaporation.12. Cut a stack of paper towels to size and place on top of the presoaked papers.
Finally, compress with a glass plate and a 1- to 1.5-kg weight.13. Add transfer buffer (approx 400 mL) 0.4 M NaOH and allow the DNA to
transfer overnight.14. After blotting, carefully remove the membrane and soak in 2X SSC to remove
any adherent agarose.15. Briefly blot dry the membrane, which is now ready for either storage at 4°C or
immediate hybridization.
3.3. Hybridization and Autoradiography
There are many different methods of hybridization that are dealt with else-where (6). However, after hybridization, the filter is probed with a 32P-labeledDNA fragment from the FVIII gene. This genomic probe, called p114.12, is a647-bp StuI/SacI-restricted FVIII (7). The probed filter is exposed to an X-rayfilm (Hyperfilm MP, Amersham) for 4–7 d at –70°C in a cassette fitted with anintensifying screen. In this polymorphism, a restriction fragment of variablelength of 879 bp and/or 1165 bp can be detected in Southern blots of genomicDNA. About 42% of females are heterozygous at this locus. Figure 1 shows the
Restriction Fragment Length Polymorphism 33
Southern blot using restricted DNA samples with BclI and probed with the32P-labeled p114.12 probe.
3.4. Use of PCR and BclI RFLP Analysis in Hemophilia A
The same RFLP, identified by BclI Southern blotting, has now been demon-strated by PCR followed by digestion with the restriction enzyme (6). The PCRproduct of this highly polymorphic allele gives a 142-bp (–) allele and 99+43-bp (+) allele after restriction with the enzyme (see Fig. 2).
4. Notes1. Keep the restriction enzyme cold at all times; if removed from the freezer, it
should be immediately kept on ice. In the majority of cases, it can be used straightfrom the freezer.
2. Reaction volume here is fixed at 30 µL, as it is manageable. Generally, the smallerthe volume, the better. Note that if the reaction volume is changed:a. Change the volume 10X assay buffer.b. Ensure that the enzyme added is <10% of the reaction volume.c. LB mixture added is one-fifth the reaction volume.
Fig. 1. A family with history of hemophilia A was investigated for BclI polymor-phism and found to be fully informative. Patient (II:2) has inherited the hemophilichaplotype (0.8 bp) from her mother, who is the daughter of a hemophiliac and anobligate carrier. The patient’s sister (II:1) is also a carrier and has the hemophilichaplotype, whereas his other sister (II:3) is unaffected. She has inherited the unaffected1.1-bp haplotype from her mother.
34 Enayat
3. Less enzyme can be used if the incubation period is lengthened.4. To ensure adequate digestion before full-size gel electrophoresis, a minigel
should be run. During digestion, remove 2–3 µL of reaction mix and add 6 µLLB mixture. Load into 1% minigel and run at 50–60 mA for 1 h. View under UVillumination to check digestion (see Chapter 1).
5. HCl acid denaturation allows large >13-kb fragments to be transferred more effi-ciently by breaking the DNA into smaller fragments. Do not leave in HCl formore than 30 min or smaller DNA fragments will also be broken up into <300 bp,significantly reducing the ability to DNA to bind covalently to the membrane.
6. Gels may be left in neutralization buffer for longer than 1 h with no adverseeffects if kept at 4°C so as to limit diffusion. Maximum time in neutralizationbuffer is 4 h.
References1. White, G. C. and Shoemaker, C. B. (1989) Factor VIII and haemophilia A. Blood
73, 1–12.2. Peake, I. R., Lillicrap, D. P., Boulyjenkov, V., Briet, E., Chan, V., et al. (1993)
Report of a joint WHO/WFH meeting on the control of haemophilia: carrierdetection and prenatal diagnosis. Blood Coag. Fibrinol. 4, 313–344.
3. Peake, I. (1995) Molecular genetics and counselling in haemophilia. Thromb.Haemost. 74, 40–44.
Fig. 2. BclI-restricted (lanes 3, 5, and 7) and -unrestricted (lanes 2, 4, and 6) PCRproducts, showing 142-bp (–) and 99-bp (+) fragments. Lane 1 is the molecular-weight marker.

Restriction Fragment Length Polymorphism 35
4. Gitschier, J., Drayna, D., Tuddenham, E. G. D., White, R. L., and Lawn, R. M.(1985) Genetic mapping and diagnosis of haemophilia A achieved through a BclIpolymorphism in the factor VIII gene. Nature 314, 738–740.
5 Gitschier, J., Lawn, R. M., Rotblat, F., and Goldman, E. (1985) Antenatal diagno-sis and carrier detection of haemophilia A using factor VIII gene probe. Lancet 1,1093–1094.
6. Rapley, R., ed. (2000) The Nucleic Acid Protocol Handbook. Humana Press,Totowa, NJ.
7. Kogan, S. C., Doherty, N., and Gitschier, J. (1987) An improved method forprenatal diagnosis of genetic diseases by analysis of amplified DNA sequences:application to haemophilia A. New Engl. J. Med. 317, 980–990.

150 Wells
PCR: Principles, Procedures, and Parameters 37
37
From: Methods in Molecular Biology, vol. 187: PCR Mutation Detection ProtocolsEdited by: B. D. M. Theophilus and R. Rapley © Humana Press Inc., Totowa, NJ
6
PCR
Principles, Procedures, and Parameters
Nicola Louise Jones
1. IntroductionIn 1983, the Cetus scientist Kary Mullis developed an ingenious “in vitro”
nucleic acid amplification technique termed the polymerase chain reaction(PCR). This technique involves the use of a pair of short (usually 20 bp long)pieces of synthesized DNA called primers and a thermostable DNA polymeraseto achieve near-exponential enzymatic amplification of target DNA. Becauseof the sensitivity of this technique, DNA of relatively poor condition maybe amplified, as only short intact sequences are required. Therefore, it is notalways necessary to carry out lengthy template sample preparation. For example,a simple boiling step is often enough to release DNA from blood samples (1).The starting material for PCR may be DNA from a variety of sources such asblood, tissues, paraffin-embedded material, ancient archaeological samples, orforensic material. The PCR may also be used to amplify RNA, which must firstbe converted into cDNA by the enzyme reverse transcriptase (RT-PCR). Incontrast to DNA, great care must be taken in the preparation and handling ofRNA because of its instability and susceptibility to degradation.
Polymerase chain reaction proceeds in three stages:
1. Denaturation of double-stranded DNA. (This initial denaturation step is notnecessary when amplifying RNA because it is a smaller target molecule.)
2. Primer annealing.3. Extension of the annealed primers.
The target DNA is suspended in a reaction mixture consisting of distilledwater, buffer (containing MgCl2, which is necessary for the polymerase to work
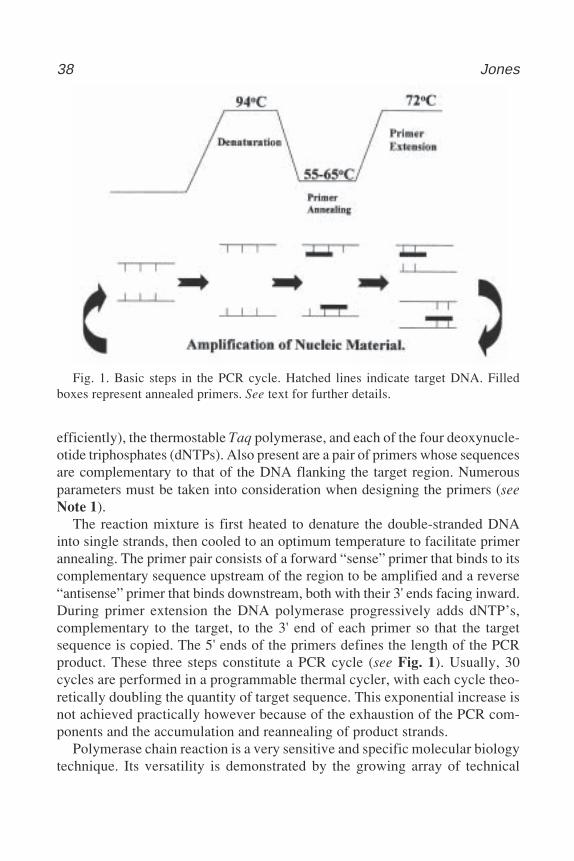
38 Jones
efficiently), the thermostable Taq polymerase, and each of the four deoxynucle-otide triphosphates (dNTPs). Also present are a pair of primers whose sequencesare complementary to that of the DNA flanking the target region. Numerousparameters must be taken into consideration when designing the primers (seeNote 1).
The reaction mixture is first heated to denature the double-stranded DNAinto single strands, then cooled to an optimum temperature to facilitate primerannealing. The primer pair consists of a forward “sense” primer that binds to itscomplementary sequence upstream of the region to be amplified and a reverse“antisense” primer that binds downstream, both with their 3' ends facing inward.During primer extension the DNA polymerase progressively adds dNTP’s,complementary to the target, to the 3' end of each primer so that the targetsequence is copied. The 5' ends of the primers defines the length of the PCRproduct. These three steps constitute a PCR cycle (see Fig. 1). Usually, 30cycles are performed in a programmable thermal cycler, with each cycle theo-retically doubling the quantity of target sequence. This exponential increase isnot achieved practically however because of the exhaustion of the PCR com-ponents and the accumulation and reannealing of product strands.
Polymerase chain reaction is a very sensitive and specific molecular biologytechnique. Its versatility is demonstrated by the growing array of technical
Fig. 1. Basic steps in the PCR cycle. Hatched lines indicate target DNA. Filledboxes represent annealed primers. See text for further details.
PCR: Principles, Procedures, and Parameters 39
modifications that lend PCR to multiple applications. Such variations includeRT-PCR, nested, multiplex, long-range, and allele-specific PCR.
1. RT-PCR: RNA may be amplified following its conversion to cDNA by the enzymereverse transcriptase. The use of RNA as a starting material ensures that only thecoding regions, or exons, are amplified during the PCR reaction. RT-PCR not onlyprovides a useful tool for analyzing the transcriptional activity of genes but alsoenables the investigation of many contiguous exons in a single analysis.
2. Nested PCR: This involves the use of two sets of primers. The first set (externalprimers), which flanks the region of interest, allows for a first round of amplifi-cation. A small aliquot from the first round of PCR is then used as the target fora second round of amplification, primed by a second pair of primers that lie inter-nal to the first. This technique is designed to increase the sensitivity of the PCRreaction and is particularly useful for the amplification of small quantities oftarget material from readily accessible cell types expressing very low levels ofmRNA. For example, Factor VIII mRNA present at a quantity of 1 molecule per500–1000 cells can be amplified in this manner from the lymphocytes of hemo-philia A patients (2).
3. Multiplex PCR: More than one target sequence can be amplified in a single PCRreaction by using multiple primer pairs. Multiplex PCR has been utilized in theanalysis of deletions, mutations, and polymorphisms as well as in RT-PCR andquantitative assays (3). A specific application of multiplex PCR is in deletionscreening of the dystrophin gene in patients with Duchenne muscular dystrophy.
4. Long-range PCR: It is possible to amplify long fragments of DNA (>20 kb) usingan enzyme mixture of Taq and Pwo DNA polymerases. High yields of PCR prod-ucts from episomal and genomic DNA can be obtained from this powerful poly-merase mixture. An example of its application is in the routine diagnosis ofFragile X syndrome. The mutation in Fragile X syndrome involves the expansionof CGG repeats in the FMR1 gene. These repeats are resistant to amplification byordinary PCR methods possibly because of the stopping or pausing of the Taqpolymerase enzyme during the amplification of regions containing high levels ofCGG repeats (4). The presence of Pwo polymerase, with its proofreading ability,can reduce this error frequency, whereas improved cycle and buffer conditionscan overcome the length limitation for PCR. Thiel et al. (5) have reported a sys-tem encompassing the effective amplification of up to 20 kb of viral genomicRNA. The subject of long-range PCR is reviewed in Chapter 8.
5. Allele-specific PCR: PCR can be used to discriminate between alleles by usingallele specific oligonucleotides as primers. Successful PCR amplification requiresthat the 3' end of the primers are complementary to the target DNA sequence; anymismatch results in the inability of Taq polymerase to extend the primer. Thisphenomenon can be exploited by designing primers that contain a base at the 3'end that matches either that of a known mutation or its wild-type counterpart.These primers will only anneal to and amplify target DNA containing that par-
40 Jones
ticular sequence. Allele identity may therefore by determined by the presence orabsence of PCR products. Diseases that encompass only one mutation are par-ticularly well suited to this technique. Examples include the Prothrombin 20210Amutation (6), sickle cell anemia, Fc-γ receptor IIA polymorphism (7), andα-1antitrypsin deficiency, where the technique is termed the amplification refrac-tory mutation system (ARMS). Allele-specific PCR is reviewed in Chapter 7.
Polymerase chain reaction plays two roles in molecular biology. First, it pro-vides enough material to allow further technical manipulations such as for thedetection of mutations, conformation sensitive gel electrophoresis (e.g., in muta-tion screening methods such as chemical mismatch cleavage, single-strand con-formational polymorphism, denaturing gradient gel electrophoresis, and DNAsequencing). Second, it can be used analytically as a direct tool in mutationdetection as in allele-specific PCR and multiplex for deletion analysis. Follow-ing are given two standard methods for PCR: first, for amplification of DNAand, second, for amplification of RNA by first converting it to cDNA. The manyvariations on the standard method are covered in later chapters of this volume.
2. Materials2.1. DNA PCR
1. Programmable thermal cycler.2. Sterile distilled water (use as fresh).3. Solution A: containing MgCl2 and a source of buffer/salt (usually KCl and
Tris-HCl) at a pH of 8.3. In our laboratory, solution A comprises 670 mMTris-HCl, 166 mM ammonium sulfate, and 67 mM magnesium chloride. Twenty-milliliter batches are usually prepared and stored at room temperature for up to1 mo (see Note 2).
4. 10X Reaction buffer: To 1 mL of solution A, add 34 µL of 5% bovine serumalbumin (BSA) and 7 µL of 14.4 M β-mercaptoethanol. (Note: β-Mercaptoethanolis toxic; use in a fume cupboard.) Store at –20°C for up to 1 mo (see Note 3).
5. 5 mM dNTPs: dilute 50 mM stock solution of dNTPs (i.e., dATP, dCTP, dGTP,and dTTP) in distilled water. Store at -20°C for up to 1 mo.
6. 15 pmol primers 1 (forward) and 2 (reverse): approx 0.1 µg/µL for a 20-mer.7. 5 U/µL Taq polymerase.8. Mineral oil. Store at room temperature.
2.2. RT-PCR
1. Programmable thermal cycler.2. Sterile distilled water. Use fresh and keep supply separate from that used for
DNA PCR.3. 15 pmol of primers 1 (forward) and 2 (reverse): approx 0.1 µg/µL for a 20-mer.
Store at –20°C.
PCR: Principles, Procedures, and Parameters 41
4. 10X Reaction buffer (see Subheading 2.1., items 3 and 4).5. 5 mM dNTPs (see Subheading 2.1., items 5).6. 5X Reverse transcriptase (RT) buffer containing 250 mM Tris-HCl, pH 8.3,
375 mM KCl, and 15 mM MgCl2. This is usually supplied with the reversetranscriptase. Store at –20°C.
7. Maloney Murine Leukaemia Virus (MMLV) Reverse Transcriptase (200 U/µL).Store at –20°C.
8. 100 mM Dithiothreitol (DTT). Store at –20°C.9. Rnase inhibitor (50 U/µL). Store at –20°C.
10. 5 U/µL Taq polymerase. Store at –20°C.11. Mineral oil. Store at room temperature.
3. Methods
3.1. DNA PCR
Note: Always wear, and frequently change, gloves to prevent contaminationby DNA from human skin cells. As likely sources of contamination includeother samples and previous amplification products, separate rooms, away fromsites of DNA/RNA extraction, manipulation, and recovery of PCR products,should ideally be allocated for the setup of PCR. Designate separate sets ofpipets for DNA and RT-PCR and use filter tips whenever possible. Solutionsand buffers must be stored in sterile containers and always prepared with freshdistilled water.
1. Into a sterile tube, prepare the following master mix according to the number ofsamples to be analyzed:
10 µL of 10X reaction buffer;10 µL of 5 mM dNTPs;15 pmol primer 1 (approx 0.1 µg for a 20-mer);15 pmol primer 2 (approx 0.1 µg for a 20-mer);0.5 µL (2.5 U) Taq polymerase;Distilled water to a volume of 98 µL per sample.
2. Aliquot 98 µL of master mix into a PCR reaction tube. Add 2 µL genomic DNA(50 µg/mL) to give a final volume of 100 µL. PCR may be done in much smallervolumes down to 10 µL, especially for analytical PCR, by reducing the reactioncomponents proportionately.
3. Always perform a blank control alongside the samples by replacing the genomicDNA with dH2O. This will check for contamination.
4. Overlay the reaction mixture with 1 drop of mineral oil to prevent evaporation,unless using an “oil-free” thermal cycler that has a heated lid to prevent evaporation.
5. Denature the template for 5 min at 94°C.6. PCR at the following settings for 30 cycles:
42 Jones
a. Denaturation: 94°C for 1 min.b. Annealing: 55–65°C for 1 min (adjust temperature according to the calculated
Tm of the primers; see Note 1).c. Extension: 72°C for 3 min (optimum temperature for Taq polymerase activity)
(see Note 4).
7. Analyze 10 µL of the sample on a 1–2% agarose gel containing ethidium bromide.(Ethidium bromide is carcinogenic.) See Chapter 1.
3.2. RT-PCR
Note: Follow the same precautions outlined in the note at the beginningof Subheading 3.1. The sterile technique is even more critical with RT-PCRthan DNA PCR in order to prevent RNA degradation as well as protectingagainst contamination.
1. Pipet 5 µL (0.2–0.5 µg) RNA into a sterile PCR reaction tube. Always run ablank alongside the sample by replacing the RNA with distilled water.
2. Prepare a premix of 15 pmol primer 2 (reverse primer) and distilled water to avolume of 2.5 µL per sample. Add 2.5 µL of premix to the RNA. Overlay withmineral oil (see Note 5).
3. Incubate at 65°C for 10 min.4. Prepare the following premix according to the number of samples to be analyzed:
4 µL of 5X RT buffer;2 µL of 100 mM DTT;1 µL of MMLV Reverse Transcriptase (200 U);0.5 µL of RNase inhibitor (25 U);5 µL of 5 mM dNTPs.
5. Add 12.5 µL of this second premix to each sample. Incubate at 42°C for 1 h.6. Prepare a PCR mix:
5 µL of 10X reaction buffer;15 pmol primer 1 (forward primer);2.5 U Taq polymerase;Distilled water to a volume of 30 µL per sample.
7. Add 30 µL of the PCR mix to each sample.8. Perform 30 PCR cycles at the following settings:
a. Denaturation: 93°C for 1 min.b. Annealing: 55–65°C for 1 min (adjust according to the calculated Tm of the
primers; see Note 1).c. Extension: 72°C for 5 min (see Note 4).
9. Remove 10 µL of sample for analysis on a 1–2% agarose gel containing ethidiumbromide (carcinogen). See Chapter 1.
3.3. Troubleshooting
1. Inadequate design of the primers may result in the formation of a hairpin loop.This is where internal complementarity of the primer sequence enables it to bindto itself rather than the DNA template so that the PCR cannot proceed.
PCR: Principles, Procedures, and Parameters 43
2. Complementarity between a primer pair allows them to bind to each other, thusforming “primer-dimers.” As with internal complementarity, the primers are nolonger free to bind to the DNA template, resulting in failure of the PCR. Primer-dimers can also be produced as a byproduct of a successful PCR if the primersare present in excess (8).
3. Heparin, porphyrins, and high concentrations of ionic detergent (e.g., ProteinaseK, phenol, and sodium dodecyl sulfate), inhibit PCR.
4. As RNase enzymes can degrade target RNA, RT-PCR requires the use of Rnase-free reagents and equipment to prevent false-negative results.
5. Polymerase chain reaction failure or poor yield may result from a low target copynumber (e.g., where the RNA is from cell types expressing low levels of targetmaterial). This may be remedied by using a second set of primers, as in nestedPCR (see Note 6).
6. It has been noted that mineral oil breaks down under 254-nm UV light, withbreakdown products inhibiting PCR. Remedial suggestions include the additionof 0.1% of the antioxidant 8-hydroxyquinoline to the mineral oil prior to UVtreatment (8).
7. False negatives may also result from “stalling” of the Taq DNA polymeraseduring primer extension. This occurs when regions of target DNA form second-ary structures (9). Suggestions for overcoming this problem include addingglycerol or tetramethylammonium chloride (TMAC) to the PCR mix. Elimina-tion of buffer components stabilizing these secondary structures (e.g., KCl) mayalso help.
8. If the annealing temperature is too high, the primers will not bind to the targetDNA, and PCR failure may ensue. Conversely, if the temperature is too low,nonspecific binding will occur.
9. It has been suggested that an increase in amplification products from GC-richsequences may be obtained following the addition of either betaine or trim-ethylamine N-oxide to the PCR reaction. Betaine is thought to reduce the for-mation of secondary structures caused by GC-rich regions, however, the effectof betaine on the fidelity of Taq polymerase is unknown (10).
10. Reagents and plasticware may be treated with UV irradiation to convert contami-nating DNA into a nonamplifiable form. Times and conditions for irradiation aredependant upon the energy of irradiation, length of contaminating DNA, and itsthymidine content.
11. To control contamination, PCR may be performed routinely with dUTP substi-tuted for dTTP. Treatment of PCR reactions with uracil N-glycosylase then pre-vents contamination by carry over of PCR products from a previous reaction.
12. In order to eliminate false primer binding in the initial stages of DNA PCR,which may produce nonspecific products, a technique known as “hot-start” PCRcan be used. Hot-start PCR ensures the physical separation of one essentialcomponent of the PCR reaction (e.g., primers or Taq polymerase) prior to dena-turation of the DNA template. Using a solid wax bead keeps the reagents sepa-rate. Upon heating, the wax bead melts and the components mix. An alternativeapproach involves the use of a variant Taq polymerase that is inactive at room
44 Jones
temperature but is activated at 94°C. Conversely, the missing component can beadded manually immediately following the initial 5-min denaturation at 94°C
4. Notes
1. Primers are usually 20 bp in length, but typically between 15 and 30 bp withapprox 50% GC content. It is desirable to have a G or C at the 3' end, as this bindsto the target DNA with a triple hydrogen bond, thus anchoring the primer moreeffectively than A or T. The primers should not contain self-complementarysequences that might produce loop back or hairpin structures. The annealingtemperature of the primers varies according to their sequence, but, it is usually50–65°C. For primers up 20 bp in length, the theoretical melting temperature(Tm) (in °C) can be calculated approximately as:
2× (Number of A/T bases) + 4× (Number of G/C bases)
The starting point for determining the optimal annealing temperature is approx5–10°C below that of the primer with the lowest Tm. Ideally, the two primersshould have similar Tm’s. The primers usually completely complement thesequence of interest, although for specific purposes such as allele-specific PCR,primers with mismatches to the target sequence may be used. See Chapter 7.
2. The pH of the reaction buffer is important, as enzymes are sensitive to pHchanges. The optimal pH for Taq polymerase activity is 8.3. The magnesiumconcentration of the buffer is also critical. Insufficient Mg2+ leads to low productyields, whereas excessive Mg2+ gives nonspecific products. Free magnesium, inaddition to that complexed to dNTPs, is required for the polymerase to workefficiently. Therefore, because the concentration of dNTPs affects the amount offree Mg2+, optimum concentrations of MgCl2 should be determined for each PCRprotocol.
3. The addition of denaturants and other reagents such as dimethyl sulfoxide(DMSO), formamide, glycerol, polyethylene glycol (PEG), Triton X-100, bo-vine serum albumin, and spermadine appear to enhance the PCR reaction. Suchcompounds may stabilize the polymerase, prevent loop-back sequences, andincrease the specificity of primer binding.
4. Owing to the superior quality of modern Taq polymerases and the technologicaladvances in thermal cyclers, it is often possible to reduce the extension time toapprox 1 min/kb.
5. In the protocol described, the primer that is used subsequently as the reverseprimer in the PCR reaction is also used to prime the cDNA reaction. As an alter-native, the cDNA may be primed by an oligo-dT primer, which binds to the polyA tail present at the 3' end of most mammalian mRNAs, or by “randomhexamers.” In these cases, the whole mRNA population is converted to cDNA,and both forward and reverse PCR primers must be added subsequently toamplify the sequence of interest.
6. Nested RT-PCR: Follow steps 1–8 in Subheading 3.2., then make the followingmaster mix:
PCR: Principles, Procedures, and Parameters 45
10 µL of 10X reaction buffer;10 µL of 5 mM dNTP;15 pmol primer 3 (internal forward primer);15 pmol primer 4 (internal reverse primer);2.5 U Taq polymerase;Distilled water to a volume of 98 µL per sample.
To 98 µL of master mix, add 2 µL of the primary PCR product (this may also bedone in a 50 µL or smaller reaction). Overlay with mineral oil (except whenusing an oil-free thermal cycler that has a heated lid to prevent evaporation).Perform 30 cycles at the following settings:a. Denaturation: 93°C for 1 min.b. Annealing: 55–65°C for 1 min (adjust according to the calculated Tm of the
primers; see Note 1).c. Extension: 72°C for 5 min (see Note 4).Link to a program of:a. 72°C for 2 min.b. 4°C soak.
Remove 10 µL of sample for analysis on a 1–2% agarose gel containingethidium bromide (carcinogenic). See Chapter 1.
Acknowledgments
The author wishes to express her gratitude to Mr. Charles Williams (HeadMLSO, Haematology Department, Birmingham Children’s Hospital) for hishelp and support in the writing of this chapter.
References
1. Rapley, R. (1998) Polymerase chain reaction, in Molecular Biomethods Hand-book (Rapley, R. and Walker, J. M., ed.), Humana, Totowa, NJ, pp. 305–325.
2. Cooper, D. N. and Krawczak, M., ed. (1993) Human Gene Mutation, BIOS Scien-tific, Oxford.
3. Henegariu, O., Heerema, N. A., Dlouhy, S. R., Vance, G. H., and Vogt, P. H.(1997) Multiplex PCR: critical parameters and step-by-step protocol. Biotech-niques 23, 504–511.
4. Hecimovic, S., Barisic, I., Muller, A., Petkovic, I., Baric, I., Ligutic, I., et al.(1997) Expand Long PCR for Fragile X mutation detection. Clin. Genet. 52,147–154.
5. Thiel, V., Rashtchian, A., Herold, J., Schuster, D. M., Guan, N., and Siddell, S.G.(1997) Effective amplification of 20-kb DNA by reverse transcription PCR.Anal. Biochem. 252, 62–70.
6. Poort, S. R., Bertina, R. M., and Vos, H. L. (1997) Rapid detection of the pro-thrombin 20210A variation by allele specific PCR. Thromb. and Haemost. 78,1157–1163.
46 Jones
7. Flesch, B. K., Bauer, F., and Neppert, J. (1998) Rapid typing of the human Fcγreceptor IIA polymorphism by polymerase chain reaction amplification withallele-specific primers. Transfusion 38, 174–176.
8. Dzik, S. (1998) The power of primers. Transfusion 38, 118–121.9. Hengen, P. N. (1997) Optimizing multiplex and LA-PCR with betaine. Trends
Biomed. Sci. 22, 225–226.10. Henke, W., Herdel, K., Jung, K., Schnorr, D., and Loening, S. A. (1997) Betaine
improves the PCR amplification of GC-rich DNA sequences. Nucl. Acids Res.25(19), 3957–3958.
Further ReadingBauer, P., Rolfs, A., Regitz-Zagrosek, V., Hildebrandt, A., and Fleck, E. (1997)Use of manganese in RT-PCR eliminates PCR artifacts resulting from Dnase Idigestion 2. Biotechniques 2, 1128–1132.Maudru, T. and Peden, K. (1997) Elimination of background signals in a modifiedpolymerase chain reaction-based reverse transcriptase assay. J. Virol. Meth. 66,247–261.Tang, Y., Procop, G. W., and Persing, D. H. (1997) Molecular diagnostics ofinfectious diseases. Clin. Chem. 43(11), 2021–2038.Vaneechoutte, M. and Van Eldere, J. (1997) The possibilities and limitations ofnucleic acid amplification technology in diagnostic microbiology. J. Med.Microbiol. 46, 188–194.
Allele-Specific Oligonucleotide PCR 47
7
47
From: Methods in Molecular Biology, vol. 187: PCR Mutation Detection ProtocolsEdited by: B. D. M. Theophilus and R. Rapley © Humana Press Inc., Totowa, NJ
Allele-Specific Oligonucleotide PCR
Elaine K. Green
1. IntroductionMany single-base substitutions that lead to inherited diseases, the predispo-
sition to genetic disorders, and cancer are increasingly being discovered. Theability to amplify specific DNA sequences by the polymerase chain reaction(PCR) (1) has made it possible to rapidly and accurately diagnose many inher-itable diseases.
Prior to the use of PCR, point mutations were identified by using directcloning and sequencing, Southern blotting and hybridization with labeledoligonucleotide probes centered on the site of the mutation or digestion withrestriction endonucleases. These methods have been greatly enhanced by PCR,which allows amplification of DNA fragments containing the polymorphic sitesfrom minute quantities of DNA. However, these techniques tend to be time-consuming, complex, require the use of radioactive label, and, in the case ofthe restriction endonuclease detection, are only applicable when the mutationalters a known cleavage site.
Polymerase chain reaction using allele-specific oligonucleotides (ASOs) isan alternative method for the detection of mutations in which only the per-fectly matched oligonucleotide is able to act as a primer for amplification. Theadvantage of ASO PCR is that it is a rapid, simple, and nonradioactive method.ASO-PCR, otherwise known as the amplification refractory mutation system(ARMS) was first described for the detection of mutations in the α1-antitrypsingene (2). It has since been adopted in the study of a number of genes, includingprenatal diagnosis of cystic fibrosis (3), polymorphisms of apolipoprotein E(4,5), and point mutations in the ras oncogene (6). In this technique oligonucle-otide primers are designed such that they are complementary to either the nor-
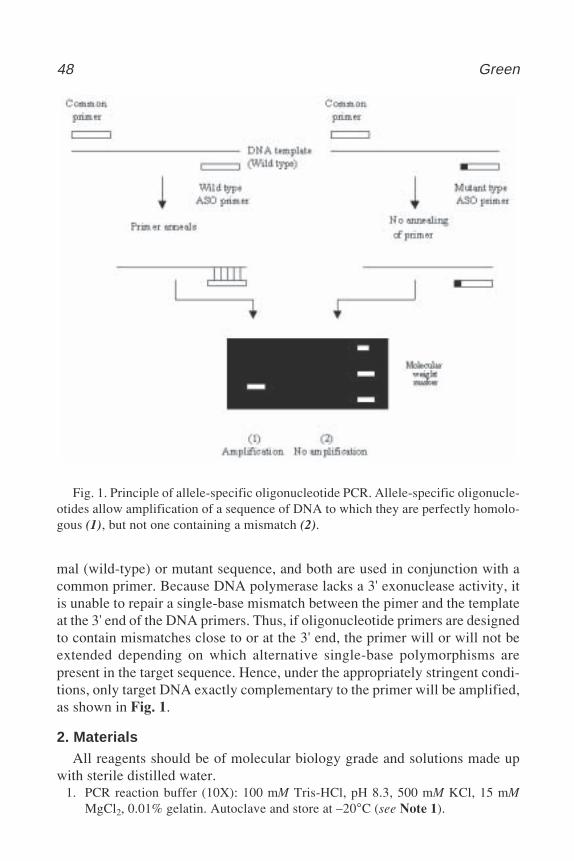
48 Green
mal (wild-type) or mutant sequence, and both are used in conjunction with acommon primer. Because DNA polymerase lacks a 3' exonuclease activity, itis unable to repair a single-base mismatch between the pimer and the templateat the 3' end of the DNA primers. Thus, if oligonucleotide primers are designedto contain mismatches close to or at the 3' end, the primer will or will not beextended depending on which alternative single-base polymorphisms arepresent in the target sequence. Hence, under the appropriately stringent condi-tions, only target DNA exactly complementary to the primer will be amplified,as shown in Fig. 1.
2. MaterialsAll reagents should be of molecular biology grade and solutions made up
with sterile distilled water.1. PCR reaction buffer (10X): 100 mM Tris-HCl, pH 8.3, 500 mM KCl, 15 mM
MgCl2, 0.01% gelatin. Autoclave and store at –20°C (see Note 1).
Fig. 1. Principle of allele-specific oligonucleotide PCR. Allele-specific oligonucle-otides allow amplification of a sequence of DNA to which they are perfectly homolo-gous (1), but not one containing a mismatch (2).
Allele-Specific Oligonucleotide PCR 49
2. Nucleotide mix: 200 mM each of dATP, dCTP, dGTP, and dTTP in sterile dis-tilled water and store at –20°C.
3. Allele-specific oligonucleotide primers and common primer: 10 µM. Store at –20°C(see Note 2).
4. DNA Taq polymerase.5. Sterile distilled water.6. Sample DNA (see Note 3).7. Mineral oil.
3. Methods1. To 0.5 mL Eppendorf tube, add 5 µL 10X reaction buffer, 5 µL nucleotide mix,
5 µL ASO primer (either wild or mutant type primer) (see Note 4) and 5 µLcommon primer, 100 ng template DNA, and 2 U Taq polymerase (see Note 5),make up to a final volume of 50 µL with sterile distilled water (see Note 6) andoverlay with mineral oil to prevent evaporation.
2. Place Eppendorf tubes on the thermal cycler to amplify the DNA by repeatedcycles of denaturation, annealing, and extension: initial denaturation of 94°C for5 min, followed by 30 cycles of 94°C for 30 s, 55°C for 30 s and 72°C for 1 min(see Note 7).
3. Following thermal cycling, electrophoresis 10 µL of the reaction sample throughan agarose gel, with a DNA size marker and stain with ethidium bromide. Atypical result is shown in Fig. 1 (see Note 8).
4. Notes1. The concentration of MgCl2 may be altered (0.5–5 mM) to optimize the
specificity and yield of the reaction.2. The design of the ASO PCR primer is essential for specific amplification of the
template. Primers are synthesized in two forms (the wild or normal type andthe mutant), with the correspondingly different bases at the 3' end. However, asingle mismatch is often not enough to prevent nonspecific amplification and theintroduction of additional deliberate mismatches near the 3' terminal end (e.g.,four bases from the 3' end) of the primers may overcome this problem. Several inves-tigations have examined the effect of the type of the 3' terminal primer–templatemismatches on the PCR amplification (2–7), however it appears to differ dependingon the gene being studied. Where possible, select primers of random-base distri-bution and approx 50% GC content. The primers should not be complementary toeach other or contain a sequence with significant secondary structure. The com-mon primer should be designed to give a product of suitable size (e.g., 200 bp).
3. A concentration 100 ng of template DNA is usually sufficient to amplify.4. Two reactions are required for the detection of a point mutation: one including
the wild type and common primers, and the other with the mutant type and com-mon primers.
5. Addition of the Taq polymerase following the initial denaturation step while thePCR reaction is held at 80°C prior to the cycling reactions may increase the speci-ficity of the PCR products.
50 Green
6. The volume of PCR reaction can be altered according to requirements: 10–100 µL.7. These are standard PCR reaction conditions, which may not amplify the template
specifically. By varying the conditions and constituents of the reaction (altering themagnesium [0.5–5 mM], deoxynucleotide triphospates [dNTPs] [50–200 µM],ASO primer concentration, DNA template, and Taq polymerase concentration(1,8), and increasing the annealing temperature), this may be overcome. A goodindication of the correct annealing temperature is the melting template of theoligonucleotide primers. This can calculated using the formula 64.9 + 0.41(%C + %G) –600/n. The addition of specificity enhancers such as DMSO (10%)(9), may also increase the specificity. However, it may be necessary to redesignthe primers altering the 3' mismatches.
8. Amplification of a control DNA template with known point mutations will aidthe establishment of the ASO PCR. By including an internal control reaction,such as β-globin amplification, the risk of false negatives will be reduced.
References1. Saiki, R. K., Scharf, S., Faloona, F., Mullis, K. B., Horn, G. T., Erlich, H. A. et al.
(1985) Enzymatic amplification of β-globin genomic sequences and restrictionsite analysis for diagnosis of sickle cell anaemia. Science 230, 1350–1354.
2. Newton, C. R., Graham, A., Heptinsall, L. E., Powell, S. J., Kalsheker, K., Smith,J. C. et al. (1989) Analysis of point mutation in DNA. The amplification refrac-tory mutation system (ARMS). Nucl. Acids. Res. 17, 2503–2516.
3. Newton, C. R., Summers, C., Schwarz, M., Graham, A., Heptinstall, LE.,Super, M., et al. (1989) Amplification refractory mutation system for prenataldiagnosis and carrier assessment in cystic fibrosis. Lancet II, 1481–1483.
4. Green, E. K., Bain, S. C., Day, P. J. R., Barnett, A. H., Charleson, F., Jones, A. F.et al. (1991) Detection of human apolipoprotein E3, E2, and E4 genotypes by anallele-specific oligonucleotide-primed polymerase chain reaction assay: develop-ment and validation. Clin. Chem. 37, 1263–1268.
5. Main, B. J., Jones, P. J., MacGillivary, R. T. A., and Banfield, D. K. (1991)Apoliprotein E genotyping using the polymerase chain reaction and allele-specific oligonucleotide primers. J. Lipid Res. 32, 183–187.
6. Ehlen, T. and Dubeau, L. (1989) Detection of Ras point mutations by polymerasechain reaction using mutation-specific, inosine-containing oligonucleotideprimers. Biochem. Biophys. Res. Commun. 160, 441–447.
7. Kwok, S., Kellog, DE., McKinney, N., Spasic, D., Goda, L., Levenson, C., et al.(1990) Effects of primer–template mismatches on the polymerase chain reac-tion: human immunodeficiency virus type I model studies. Nucl. Acids Res. 18,999–1005.
8. Rychlik, W., Spencer, W. J., and Rhoads, R. E. (1990) Optimisation of theannealing temperature for DNA amplification in vitro. Nucl. Acids Res. 18,6904–6912.
9. Winship, P. R. (1989) An improved method for directly sequencing PCR amplifiedmaterial using dimethyl sulphoxide. Nucl. Acids Res. 17, 1266.
Long-Range PCR 51
51
From: Methods in Molecular Biology, vol. 187: PCR Mutation Detection ProtocolsEdited by: B. D. M. Theophilus and R. Rapley © Humana Press Inc., Totowa, NJ
8
Long-Range PCR
Peter A. Davies and George Gray
1. IntroductionThe heat-stable DNA polymerase utilized in the polymerase chain reaction
(PCR) has been widely used to amplify DNA fragments since its conception byKerry Mullis in 1985. However, it soon became apparent that there was aconstraint on the maximum size of amplified fragments. For genomic DNA,this was 3–4 kb (1), whereas for phage lambda DNA amplifications of up to15 kb have been possible (2).
The basis for this constraint is the rate of errors of misincorporation of TaqDNA polymerase, which have been shown to be 2 × 10 –4 to 2 × 10 –5 (3) muta-tions per nucleotide per cycle. Incorporation of a mismatched base causesstrand extension to stall and the Taq DNA polymerase to dissociate from thetemplate strand. The longer the PCR product, the more likely misincorporationis to occur.
Barnes (4) demonstrated that inclusion of a proofreading enzyme with theTaq polymerase could greatly increase the length of amplified DNA strands.The proofreader removes misincorporated nucleotides and allows the Taq poly-merase to continue. Although capable of high-fidelity DNA synthesis, proof-reading enzymes alone produce a low yield of amplified template. CombiningTaq polymerase with the proofreader produces an increased yield of a high-fidelity long-range PCR product.
Using this mixture of enzymes, it is possible to obtain amplifications of 40 kbfrom phage DNA clones and up to 22 kb from genomic DNA (5).
Applications of long-range PCR (L-PCR) include looking for structural rear-rangements of mitochondrial DNA (mtDNA) in patients with neuromusculardiseases (6), rapid alignment of clones in gene libraries, amplification andmapping of chromosomal translocation break points, and successful amplifi-
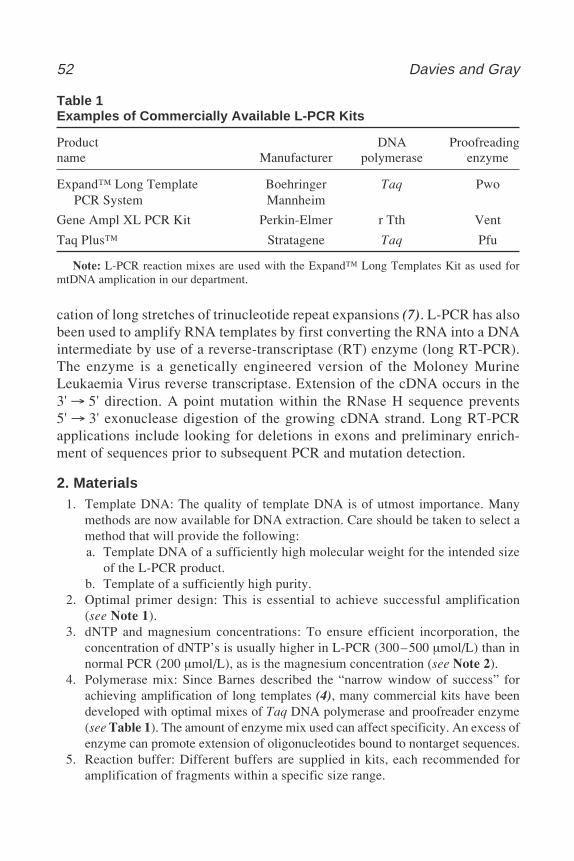
52 Davies and Gray
cation of long stretches of trinucleotide repeat expansions (7). L-PCR has alsobeen used to amplify RNA templates by first converting the RNA into a DNAintermediate by use of a reverse-transcriptase (RT) enzyme (long RT-PCR).The enzyme is a genetically engineered version of the Moloney MurineLeukaemia Virus reverse transcriptase. Extension of the cDNA occurs in the3' → 5' direction. A point mutation within the RNase H sequence prevents5' → 3' exonuclease digestion of the growing cDNA strand. Long RT-PCRapplications include looking for deletions in exons and preliminary enrich-ment of sequences prior to subsequent PCR and mutation detection.
2. Materials1. Template DNA: The quality of template DNA is of utmost importance. Many
methods are now available for DNA extraction. Care should be taken to select amethod that will provide the following:a. Template DNA of a sufficiently high molecular weight for the intended size
of the L-PCR product.b. Template of a sufficiently high purity.
2. Optimal primer design: This is essential to achieve successful amplification(see Note 1).
3. dNTP and magnesium concentrations: To ensure efficient incorporation, theconcentration of dNTP’s is usually higher in L-PCR (300–500 µmol/L) than innormal PCR (200 µmol/L), as is the magnesium concentration (see Note 2).
4. Polymerase mix: Since Barnes described the “narrow window of success” forachieving amplification of long templates (4), many commercial kits have beendeveloped with optimal mixes of Taq DNA polymerase and proofreader enzyme(see Table 1). The amount of enzyme mix used can affect specificity. An excess ofenzyme can promote extension of oligonucleotides bound to nontarget sequences.
5. Reaction buffer: Different buffers are supplied in kits, each recommended foramplification of fragments within a specific size range.
Table 1Examples of Commercially Available L-PCR Kits
Product DNA Proofreadingname Manufacturer polymerase enzyme
Expand™ Long Template Boehringer Taq Pwo PCR System Mannheim
Gene Ampl XL PCR Kit Perkin-Elmer r Tth Vent
Taq Plus™ Stratagene Taq Pfu
Note: L-PCR reaction mixes are used with the Expand™ Long Templates Kit as used formtDNA amplication in our department.
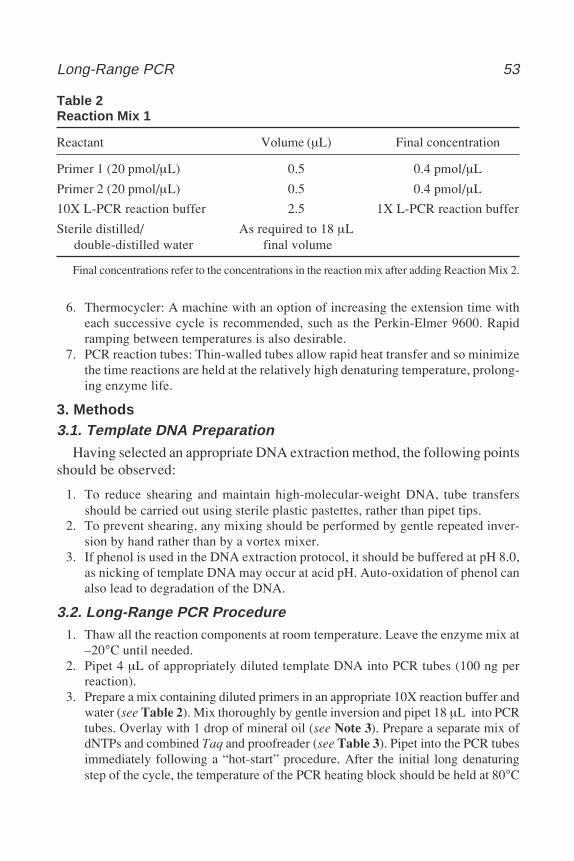
Long-Range PCR 53
6. Thermocycler: A machine with an option of increasing the extension time witheach successive cycle is recommended, such as the Perkin-Elmer 9600. Rapidramping between temperatures is also desirable.
7. PCR reaction tubes: Thin-walled tubes allow rapid heat transfer and so minimizethe time reactions are held at the relatively high denaturing temperature, prolong-ing enzyme life.
3. Methods3.1. Template DNA Preparation
Having selected an appropriate DNA extraction method, the following pointsshould be observed:
1. To reduce shearing and maintain high-molecular-weight DNA, tube transfersshould be carried out using sterile plastic pastettes, rather than pipet tips.
2. To prevent shearing, any mixing should be performed by gentle repeated inver-sion by hand rather than by a vortex mixer.
3. If phenol is used in the DNA extraction protocol, it should be buffered at pH 8.0,as nicking of template DNA may occur at acid pH. Auto-oxidation of phenol canalso lead to degradation of the DNA.
3.2. Long-Range PCR Procedure1. Thaw all the reaction components at room temperature. Leave the enzyme mix at
–20°C until needed.2. Pipet 4 µL of appropriately diluted template DNA into PCR tubes (100 ng per
reaction).3. Prepare a mix containing diluted primers in an appropriate 10X reaction buffer and
water (see Table 2). Mix thoroughly by gentle inversion and pipet 18 µL into PCRtubes. Overlay with 1 drop of mineral oil (see Note 3). Prepare a separate mix ofdNTPs and combined Taq and proofreader (see Table 3). Pipet into the PCR tubesimmediately following a “hot-start” procedure. After the initial long denaturingstep of the cycle, the temperature of the PCR heating block should be held at 80°C
Table 2Reaction Mix 1
Reactant Volume (µL) Final concentration
Primer 1 (20 pmol/µL) 0.5 0.4 pmol/µL
Primer 2 (20 pmol/µL) 0.5 0.4 pmol/µL
10X L-PCR reaction buffer 2.5 1X L-PCR reaction buffer
Sterile distilled/ As required to 18 µL double-distilled water final volume
Final concentrations refer to the concentrations in the reaction mix after adding Reaction Mix 2.
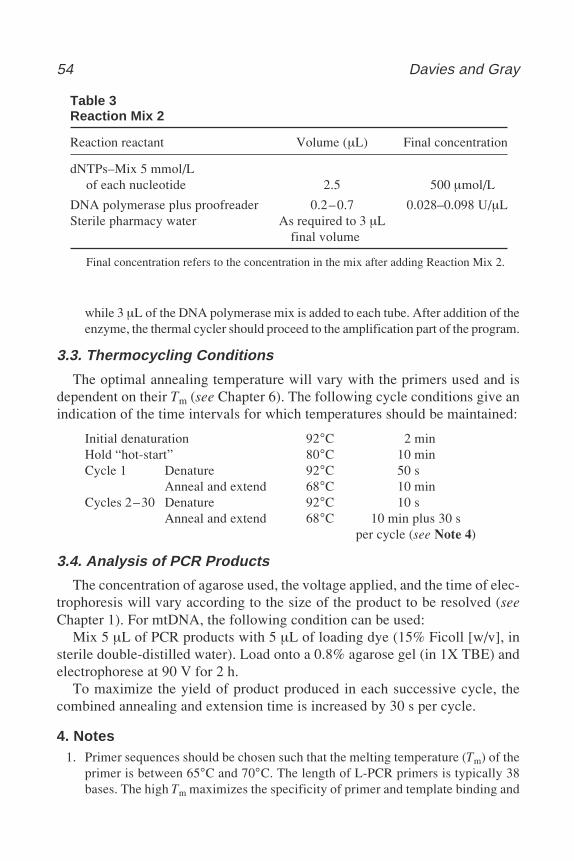
54 Davies and Gray
while 3 µL of the DNA polymerase mix is added to each tube. After addition of theenzyme, the thermal cycler should proceed to the amplification part of the program.
3.3. Thermocycling Conditions
The optimal annealing temperature will vary with the primers used and isdependent on their Tm (see Chapter 6). The following cycle conditions give anindication of the time intervals for which temperatures should be maintained:
Initial denaturation 92°C 2 minHold “hot-start” 80°C 10 minCycle 1 Denature 92°C 50 s
Anneal and extend 68°C 10 minCycles 2–30 Denature 92°C 10 s
Anneal and extend 68°C 10 min plus 30 sper cycle (see Note 4)
3.4. Analysis of PCR Products
The concentration of agarose used, the voltage applied, and the time of elec-trophoresis will vary according to the size of the product to be resolved (seeChapter 1). For mtDNA, the following condition can be used:
Mix 5 µL of PCR products with 5 µL of loading dye (15% Ficoll [w/v], insterile double-distilled water). Load onto a 0.8% agarose gel (in 1X TBE) andelectrophorese at 90 V for 2 h.
To maximize the yield of product produced in each successive cycle, thecombined annealing and extension time is increased by 30 s per cycle.
4. Notes1. Primer sequences should be chosen such that the melting temperature (Tm) of the
primer is between 65°C and 70°C. The length of L-PCR primers is typically 38bases. The high Tm maximizes the specificity of primer and template binding and
Table 3Reaction Mix 2
Reaction reactant Volume (µL) Final concentration
dNTPs–Mix 5 mmol/Lof each nucleotide 2.5 500 µmol/L
DNA polymerase plus proofreader 0.2–0.7 0.028–0.098 U/µLSterile pharmacy water As required to 3 µL
final volume
Final concentration refers to the concentration in the mix after adding Reaction Mix 2.
Long-Range PCR 55
minimizes internal mispriming over long template reads. The Tm values for eachprimer in the pair should not vary by more than 1°C or 2°C.
2. Nucleotides and magnesium ions form a complex that forms the substrate forthe DNA polymerase. A relatively high magnesium ion concentration (2.5 mM)in the reaction buffer ensures that there is a sufficient supply of substrate forincorporation.
3. Use of a mineral oil overlay is recommended even with oil-free PCR machines.4. The combined annealing and extension time is increased by 30 s per cycle to
maximize the yield of product produced in each successive cycle.
References1. Ehrlich, H. A., Gelfand, D., and Skinsky, J. J. (1991) Recent advances in the
polymerase chain reaction. Science 252, 1643–1651.2. Kainz, P., Schmiedtechner, A., and Strack, H. B. (1992) In vitro amplification of
DNA fragments greater than 10 kb. Anal. Biochem. 202, 46–49.3. Lundberg, K. S., Shoemaker, D. D., Adam, M. W. W., Short, J. M., Sorge, J. A.,
and Mathur, E. J. (1991) High fidelity amplification using a thermostable DNApolymerase isolated from Pyrococcus furiosus. Gene 108, 1–6.
4. Barnes, W. M. (1994) PCR amplification of up to 35 kb DNA with high fidelityand high yield from lambda bacteriophage templates. Proc. Natl. Acad. Sci. USA91, 2216–2220.
5. Cheng, S., Fockler, C., Barnes, W.M., and Higuchi, R. (1994) Effective amplifi-cation of long targets from cloned inserts and human genome DNA. Proc. Natl.Acad. Sci. USA 99, 5695–5699.
6. Li, Y. Y., Hengstenberg, C., and Maisch, B. (1995) Whole mitochondrial genomeamplification reveals basal level multiple deletions in mtDNA of patients withdilated cardiomyopathy. Biochem. Biophys. Res. Comm. 210, 211–218.
7. Campuzano, V., Montermini, L., Molto, M. D., Pianese, L., Cossee, M.,Cavalcanti, F., et al. (1996) Friedreichs ataxia—an autosomal recessive disordercaused by an intronic GAA triplet repeat expansion. Science 271, 1423–1427.

150 Wells
Solid-Phase Minisequencing 57
57
From: Methods in Molecular Biology, vol. 187: PCR Mutation Detection ProtocolsEdited by: B. D. M. Theophilus and R. Rapley © Humana Press Inc., Totowa, NJ
9
Analysis of Nucleotide Sequence Variationsby Solid-Phase Minisequencing
Anu Wartiovaara and Ann-Christine Syvänen
1. IntroductionThe Sanger dideoxy-nucleotide sequencing method has been simplified by a
number of methodological improvements, such as the use of the polymerasechain reaction (PCR) technique for generating DNA templates in sufficientquantities for sequencing, the use of affinity-capture techniques for convenientand efficient purification of the PCR fragments for sequencing, the develop-ment of laboratory robots for carrying out the sequencing reactions, and thedevelopment of instruments for automatic on-line analysis of fluorescentproducts of the sequencing reactions. Despite these technical improvements,the requirement for gel electrophoretic separation remains an obstacle whensequence analysis of large numbers of samples are needed, as in DNAdiagnosis, or in the analysis of sequence variation for genetic, evolutionary, orepidemiological studies.
We have developed a method for analysis of DNA fragments differing fromeach other in one or a few nucleotide positions (1), denoted as solid-phaseminisequencing, in which gel electrophoretic separation is avoided. Analogousto the methods for solid-phase sequencing of PCR products, the solid-phaseminisequencing method is based on PCR amplification using one biotinylatedand one unbiotinylated primer, followed by affinity capture of the biotinylatedPCR product on an avidin- or streptavidin-coated solid support. The nucleotideat the variable site is detected in the immobilized DNA fragment by a primerextension reaction: A detection step primer that anneals immediately adjacentto the nucleotide to be analyzed is extended by a DNA polymerase with a singlelabeled nucleotide complementary to the nucleotide at the variable site (Fig. 1).
58 Wartiovaara and Syvänen
The amount of the incorporated label is measured, and it serves as a specificindicator of the nucleotide present at the variable site.
We have used the solid-phase minisequencing method for detecting numer-ous mutations causing human genetic disorders (2), for analyzing allelic varia-tion in genetic linkage studies, and for identification of individuals (3). Theprotocol presented here is generally applicable for detecting any variable nucle-otide. The method suits well for analyzing large numbers of samples because itcomprises simple manipulations in a microtiter plate or test-tube format andthe result of the assay is obtained as an objective numeric value, which is easyto interpret. Furthermore, the solid-phase minisequencing method allows quan-titative detection of a sequence variant present as a minority of less than 1% ina sample (4). We have utilized the possibility of the sensitive quantitative analy-sis for detecting point mutations in malignant cells present as a minority in acell population (4) and for analyzing heteroplasmic mutations of mitochon-drial DNA (5,6). The high sensitivity is an advantage of the minisequencingmethod, compared to dideoxy-nucleotide sequencing, in which a sequence vari-ant must be present as 10–20% of a mixed sample to be detectable. On theother hand, a limitation of the solid-phase minisequencing method is that it isrestricted to analyzing variable nucleotides only at positions predefined by thedetection step primers used. The minisequencing reaction principle is utilizedin a variety of other assay fomats than the one described here, for reviews, seerefs. 2 and 12.
2. Materials2.1. Equipment and Materials
1. One of the PCR primers should be biotinylated at its 5' end during the oligonucle-otide synthesis, and the other primer is not biotinylated, resulting in a PCR prod-uct with one biotinylated strand (see Note 1).
2. Detection step primer: an oligonucleotide complementary to the biotinylatedstrand, designed to hybridize with its 3' end with the nucleotide adjacent to thevariant nucleotide to be analyzed (see Fig. 1 and Note 2).
3. Facilities for PCR.4. Microtiter plates with streptavidin-coated wells (e.g., Combiplate 8, Labsystems,
Finland) (see Note 3).5. Shaker at 37°C.6. Water bath or incubator at 50°C.7. Liquid scintillation counter.8. Multichannel pipet and microtiter plate washer (optional).
2.2. Reagents
All of the reagents should be of standard molecular biology grade. Use ster-ile distilled or deionized water.
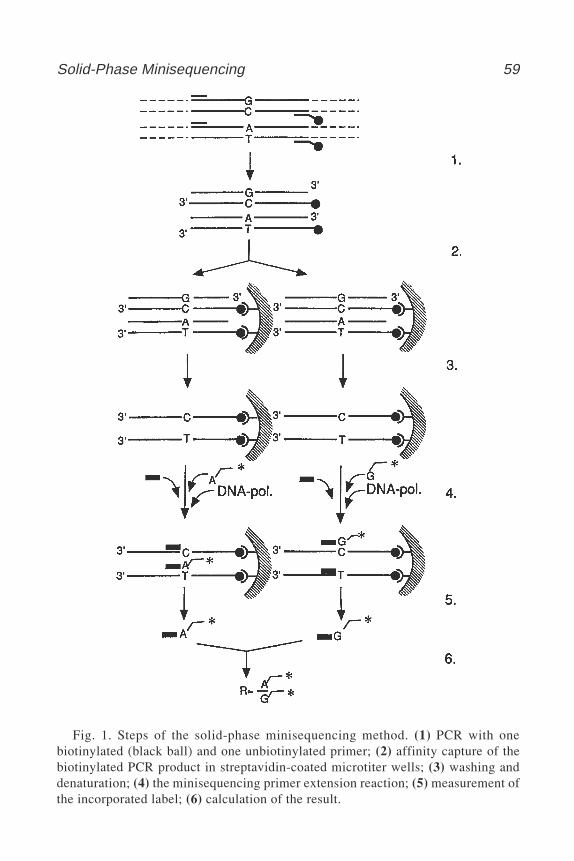
Solid-Phase Minisequencing 59
Fig. 1. Steps of the solid-phase minisequencing method. (1) PCR with onebiotinylated (black ball) and one unbiotinylated primer; (2) affinity capture of thebiotinylated PCR product in streptavidin-coated microtiter wells; (3) washing anddenaturation; (4) the minisequencing primer extension reaction; (5) measurement ofthe incorporated label; (6) calculation of the result.
60 Wartiovaara and Syvänen
1. PBS/Tween solution: 20 mM sodium phosphate buffer, pH 7.5, 0.1% (v/v)Tween-20. Store at 4°C; 50 mL is enough for several full-plate analyses.
2. TENT solution: 40 mM Tris-HCl, pH 8.8, 1 mM EDTA, 50 mM NaCl, 0.1% (v/v)Tween-20. Store at 4°C. Prepare 1–2 L at a time, which is enough for severalfull-plate analyses.
3. 50 mM NaOH (make fresh every 4 wk); store at room temperature (about 20°C).Prepare 50 mL.
4. Thermostable DNA polymerase: Thermus aquaticus (Taq) DNA polymerase(Promega, 5 U/µL) (see Note 4).
5. 10X concentrated Taq DNA polymerase buffer: 500 mM Tris-HCl, pH 8.8,150 mM (NH4)2SO4, 15 mM MgCl2, 0.1% (v/v) Triton X-100, 0.01% (w/v)gelatin; store at –20°C.
6. [3H]-labeled deoxynucleotides (dNTPs): dATP to detect a T at the variant site,dCTP to detect a G, and so forth (Amersham; [3H] dATP, TRK 625; dCTP, TRK576; dGTP, TRK 627; dTTP, TRK 633); store at –20°C (see Note 5).
7. Scintillation reagent (e.g., Hi-Safe II, Wallac).
3. Method
3.1. PCR for Solid-Phase Minisequencing Analysis
The PCR is done according to routine protocols, except that the amount ofthe biotin-labeled primer used should be reduced so as not to exceed the biotin-binding capacity of the microtiter well (see Note 3). For a 50-µL PCR reaction,we use 10 pmol of biotin-labeled primer and 50 pmol of the unbiotinylatedprimer. The PCR should be optimized (i.e., the annealing temperature and tem-plate amount) to be efficient and specific; to be able to use [3H] dNTPs, whichare low-energy emitters, for the minisequencing analysis, one tenth of the PCRproduct should produce a single visible band after agarose gel electrophoresis,stained with ethidium bromide. After optimization, there is no need for purifi-cation of the PCR product.
3.2. Solid-Phase Minisequencing Analysis
1. Affinity capture: Transfer 10-µL aliquots of the PCR product and 40 µL of thePBS/Tween solution to two streptavidin-coated microtiter wells (see Note 6).Include a control reaction (i.e., a well with no PCR product). Seal the wells witha sticker and incubate the plate at 37°C for 1.5 h with gentle shaking.
2. Discard the liquid from the wells and tap the wells dry against a tissue paper.3. Wash the wells three times at room temperature as follows: pipet 200 µL of TENT
solution to each well, discard the washing solution, and empty the wells thor-oughly between the washings (see Note 7).
4. Denature the captured PCR product by adding 100 µL of 50 mM NaOH to eachwell, incubate at room temperature for 3 min. Discard the NaOH and wash thewells as in step 3.
Solid-Phase Minisequencing 61
5. For each DNA fragment to be analysed, prepare two 50-µL mixtures of nucle-otide-specific minisequencing solution—one for detection of the normal andone for the mutant nucleotide (see Note 8). Mix 5 µL of 10X Taq DNA poly-merase buffer, 10 pmol of detection step primer, 0.2 µCi (usually equal to 0.2 µL)of one [3H] dNTP, 0.1 U of Taq DNA polymerase, and dH2O to a total volume of50 µL. It is obviously convenient to prepare master mixes for the desired numberof analyses with a certain nucleotide.
6. Pipet 50 µL of one nucleotide-specific mixture per well, incubate the plate at50°C for 10 min in a water bath or 20 min in an oven (see Note 9).
7. Discard the contents of the wells and wash them as in step 3.8. Release the detection step primer from the template by adding 60 µL of 50 mM
NaOH and incubating for 3 min at room temperature.9. Transfer the eluted primer to the scintillation vials, add scintillation reagent, and
measure the radioactivity (i.e., the amount of incorporated label) in a liquid scin-tillation counter (see Note 10).
10. The result is obtained as counts per minute (cpm) values. The cpm value of eachreaction expresses the amount of the incorporated [3H] dNTP. Calculate the ratio(R) between the mutant and normal nucleotide cpms. In a sample of a subjecthomozygous for the mutant nucleotide, the R will be >10; in a homozygote forthe normal nucleotide, R<0.1; and in the case of a heterozygote, R varies between0.5 and 2.0, depending on the specific activities of the [3H] dNTPs (see Note 11).
4. Notes1. The efficiency of the 5'-biotinylation of an oligonucleotide on a DNA synthesizer
is most often 80–90%. The biotin-labeled oligonucleotides can be purified fromthe unbiotinylated ones either by high-performance liquid chromatography (7),polyacrylamide gel electrophoresis (8), or ion-exchange columns manufacturedfor this purpose (Perkin-Elmer/ABI). If the biotin-labeled primer is not purified,the biotinylation should be confirmed after the PCR by affinity capture of thebiotinylated PCR product, followed by detection of possible unbound productsby agarose gel electrophoresis; see Chapter 1.
2. The detection step primer for our standard protocol is a 20-mer. It is advisable touse a nested primer as a detection step primer, to ensure that possible unspecificPCR products remain undetected. The primer should be at least five nucleotidesnested in relation to the unbiotinylated PCR primer.
3. The binding capacity of a streptavidin-coated microtiter well is 2–5 pmol ofbiotinylated oligonucleotide. If higher binding capacity is desired, avidin-coatedpolystyrene beads (Fluoricon, 0.99 µm [IDEXX Corp., Portland ME]; biotin-binding capacity over 2 nmol of oligonucleotide/mg beads) or streptavidin-coatedmagnetic polystyrene beads (Dynabeads M-280, streptavidin; biotin-bindingcapacity 300 pmol/mg) can be used (9). The biotin-binding capacity of amicrotiter well allows reliable detection of up to 2% of a sequence variant presentin the sample (6), whereas a detection sensitivity of less than 0.1% is obtainedwith the bead-based format (4).
62 Wartiovaara and Syvänen
4. It is advantageous to use a thermostable DNA polymerase for the single-nucle-otide primer extension reaction, because a high temperature, favorable for thesimultaneous primer annealing reaction, can be used.
5. Although the specific activities of the [3H] dNTPs are low, their half-lives arelong (13 yr) and the necessary precautions for working with [3H] should be taken.Also dNTPs or dideoxy-nucleotides labeled with other isotopes ([35S] or [32P]) orwith haptens can be used (1,10).
6. Each nucleotide to be detected at the variant site is analyzed in a separate well.Thus, at least two wells are needed per PCR product.
7. The washings can be performed utilizing an automated microtiter plate washer orby manually pipetting the washing solution to the wells, discarding the liquid,and tapping the plate against a tissue paper. Thorough emptying of the wells isimportant to avoid unspecific nucleotide incorporation.
8. The minisequencing reaction mixture can be stored at room temperature for 1–2 h.It is convenient to prepare it during the incubation of step 1.
9. The conditions for hybridizing the detection step primer are not stringent and thetemperature of 50°C can be applied to the analysis of most PCR products irre-spective of the sequence of the detection step primer. If the primer, however, isconsiderably shorter than a 20-mer or its GC content is low (melting temperatureclose to 50°C), lower temperatures for the primer annealing may be required.
10. Streptavidin-coated microtiter plates made of scintillating polystyrene are avail-able (ScintiStrips, Wallac, Finland). When these plates are used, the final wash-ing, denaturation, and transfer of the eluted detection primer can be omitted, buta scintillation counter for microtiter plates is needed (11).
11. The ratio between the cpm values for the two nucleotides reflects the ratiobetween the two sequences in the original sample. Therefore, the solid-phaseminisequencing method can be used for quantitative PCR analyses (4–6). TheR value is affected by the specific activities of the [3H] dNTPs used, and ifeither the mutant or the normal sequence allows the detection step primer to beextended by more than one [3H] dNTP, this will obviously also affect the R value.Both of these factors can easily be corrected for when calculating the ratiobetween the two sequences. Another possibility is to construct a standard curveby mixing the two sequences in known ratios and plotting the obtained cpm val-ues as a function of the ratios to obtain a linear standard curve (5,6). The testresults can then be interpreted from the standard curve without the need to takethe specific activities of the number of [3H] dNTPs incorporated into account.
References1. Syvänen, A.-C., Aalto-Setälä, K., Harju, L., Kontula, K., and Söderlund, H. (1990)
A primer-guided nucleotide incorporation assay in the genotyping ofapolipoprotein E. Genomics 8, 684–692.
2. Syvänen, A.-C. (1999) From gels to chips: “minisequencing” primer extensionfor analysis of point mutations and single nucleotide polymorphisms. Hum. Mutat.13, 1–10.
Solid-Phase Minisequencing 63
3. Syvänen, A.-C., Sajantila, A., and Lukka M. (1993) Identification of individualsby analysis of biallelic DNA markers, using PCR and solid-phase minisequencing.Am. J. Hum. Genet. 52, 46–59.
4. Syvänen, A.-C., Söderlund, H., Laaksonen, E., Bengtström, M., Turunen, M., andPalotie, A. (1992) N-ras gene mutations in acute myeloid leukemia: accuratedetection by solid-phase minisequencing. Int. J. Cancer 50, 713–718.
5. Suomalainen, A., Kollmann, P., Octave, J.-N., Söderlund, H., and Syvänen, A.-C.(1993) Quantification of mitochondrial DNA carrying the tRNA8344
Lys pointmutation in myoclonus epilepsy and ragged-red-fiber disease. Eur. J. Hum. Genet.1, 88–95.
6. Suomalainen, A., Majander, A., Pihko, H., Peltonen, L., and Syvänen, A.-C.(1993) Quantification of tRNA3243
Leu point mutation of mitochondrial DNA inMELAS patients and its effects on mitochondrial transcription. Hum. Mol. Genet.2, 525–534.
7. Bengtström M., Jungell-Nortamo, A., and Syvänen, A.-C. (1990) Biotinylation ofoligonucleotides using a water soluble biotin ester. Nucleosides Nucleotides 9,123–127.
8. Wu, R., Wu, N.-H., Hanna, Z., Georges, F., and Narang, S. (1984) Oligonucle-otide Synthesis: A Practical Approach. (Gait, M. J., ed.), IRL, Oxford, p. 135.
9. Syvänen, A.-C. and Söderlund, H. (1993) Quantification of polymerase chainreaction products by affinity-based collection. Meth. Enzymol. 218, 474–490.
10. Harju, L., Weber, T., Alexandrova, L., Lukin, M., Ranki, M., and Jalanko, A.(1993) Colorimetric solid-phase minisequencing assay illustrated by detection ofalpha-1-antitrypsin Z mutation. Clin. Chem. 39, 2282–2287.
11. Ihalainen, J., Siitari, H., Laine, S., Syvänen, A.-C., and Palotie, A. (1994) Towardsautomatic detection of point mutations: use of scintillating microplates in solid-phase minisequencing. BioTechniques 16, 938–943.
12. Syvänen, A.-C. (2001) Accessing genetic variation: genotyping single nucleotidepolymorphisms. Nat. Rev. Genet. 2, 930–942.

150 Wells
Cycle Sequencing of PCR Products 65
65
From: Methods in Molecular Biology, vol. 187: PCR Mutation Detection ProtocolsEdited by: B. D. M. Theophilus and R. Rapley © Humana Press Inc., Totowa, NJ
10
Cycle Sequencing of PCR Products
G. K. Surdhar
1. IntroductionThe development of the polymerase chain reaction (PCR) has allowed the
rapid isolation of DNA sequences utilizing the hybridization of two oligonucle-otide primers and subsequent amplification of the intervening sequences byTaq polymerase. This technique has facilitated the identification and typing ofsingle-nucleotide substitutions in the analysis of DNA sequence polymor-phisms and the screening of large numbers of samples to either detect knownmutations or search for unknown mutations at a defined locus (1–4).
Since the introduction of PCR, a variety of methods for sequencing PCR-generated fragments have been described, based on the Sanger chain-terminat-ing dideoxynucleotide sequencing method (5). Cycle sequencing (6–10) is akind of PCR sequencing approach. Like standard PCR, it utilizes a thermo-stable DNA polymerase and a temperature cycling format of denaturation,annealing, and DNA synthesis. Cycle sequencing, also called the linear ampli-fication process, in contrast with a traditional PCR reaction where the increaseis exponential, employs a single primer so that the amount of product DNAincreases linearly with the number of cycles in contrast with a traditional PCRreaction where the increase is exponential.
Initially, cycle sequencing utilized 32P-labeled primers and a nonthermo-stable polymerase, which needed to be added after every denaturation cycle(6). Further progress was made with the introduction of thermostable Taq poly-merase (7,8) and the replacement of labeled primers with internal labelingusing α-labeled 35S or 32P dATPs and mixtures of nucleotides similar to thoseused originally by Sanger (9,10). The latest manual method available is thetermination cycle sequencing (Amersham Pharmacia Biotech), which incorpo-rates the isotopic label into the sequencing reaction products by the use of four
66 Surdhar
[α-33P]dideoxynucleotide (ddNTP) terminators (G, A, T, and C). This methodis the most efficient in terms of radioactivity usage, as the labeled nucleotideslabel only the properly terminated DNA chains. As a result, prematurely termi-nated chains are not labeled, therefore, “stop” artifacts that result in bandsacross all four lanes and most background bands are eliminated. All resultsobtained from the above-mentioned methods are visualized by running thesamples on a polyacrylamide gel followed by exposure to X-ray film for 24 hor more depending on the age of the radioactivity and amount of template used.
Fluorescent or automated sequencing methodology is commonly used nowin order to avoid the use of radioactive materials. The other advantage of thismethod is that approx 500 bp can be read per reaction on an automated DNAsequencer with 99.3% accuracy compared to 150–200 bp on an average manualsequencing gel (11,12). The automated sequencing market is divided between4-dye and 1-dye technology. With the 4-dye technology, there is one tube perreaction with the four dyes corresponding to the four bases; therefore, eachsample can be run on a gel in one lane. This is in contrast to the 1-dye four-laneapproach, where there are four tubes per reaction, each tube corresponding toone of the four bases and is, therefore, run on a gel in four lanes. The formersingle-lane approach has been the option for both large-scale and large-sample-number application groups. The 4-dye single-lane instrumentation allows forhigher sample throughput and consistent results among the large numbers ofsamples that are processed on a single run. The other advantage of the 4-dyesingle-lane approach compared to the 1-dye four-lane approach is that varia-tions in electrophoretic mobility across the four lanes with the single-dye tech-nology may result in artifacts of sequence miscalling between adjacent lanes.The Big Dye™ Terminators from Perkin-Elmer and the DYEnamic dyes fromAmersham Pharmacia Biotech are examples of the 4-dye and single-laneapproach respectively. The Big Dyes have been an improvement on previ-ous systems, as they produce more even peak heights, which facilitates theidentification of heterozygosity. Prior to this system, the recommended methodfor recognizing heterozygotes was to use the dye primer technology, whichgave even peak heights. This method of sequencing requires the primer to befluorescently labeled with a dye, so four separate reactions have to be carriedout. It is possible to label each primer four times, each time using a differentdye, and then pool the reactions together for sequencing, but this turns out tobe very expensive. There have been vast improvements in sequencing technol-ogy such that the 4-dye terminator kits available on the market now result invery even peak heights, which allows for an easier detection of heterozygotes.
This chapter describes the two recent technologies for cycle sequencing:manual, radioactive termination cycle sequencing, and automated sequencingusing the Big Dye™ Terminators (Perkin-Elmer Applied Biosystems). Both ofthese methods produce sequences of high quality.
Cycle Sequencing of PCR Products 67
2. Materials
2.1. Manual Cycle Sequencing
2.1.1. Purification of PCR Products
1. Geneclean Kit II (Anachem).
2.1.2. Termination Cycle Sequencing
1. Termination cylce sequencing kit (Amersham). The following components areprovided in the kit:a. 10X Reaction buffer concentrate: 260 mM Tris-HCl,pH 9.5, 65 mM MgCl2.b. dGTP termination master mix: 7.5 µM dATP, dCTP, dGTP, dTTP.c. dITP termination master mix: 7.5 µM dATP, dCTP, dTTP, 37.5 µM dITP.d. Four Redivue™ 33P-labeled terminators which consist of the following, which
are all 0.3 µM [α-33P] ddNTP (1500 Ci/mmol, 450 µCi/mL), 11.25 µCi:
ddGTPddATPddTTPddCTP
2.1.3. Treatment of PCR Products After Cycle Sequencing
1. Stop solution: 95% formamide, 20 mM EDTA, 0.05% bromophenol blue, 0.05%xylene cyanol (store at 4°C).
2.1.4. 6% Polyacrylamide Sequencing Gels
1. 20X Glycerol tolerant gel buffer (1 L): 216 g Tris base, 72 g taurine, 4 gNa2EDTA·2H2O (stable at room temperature).
2. 30 mL 30% (w/v) acrylamide stock solution (19:1 acrylamide/bis-acrylamide)(store at 4°C).
3. 63 g Urea.4. TEMED (N,N,N',N'-tetramethylethylenediamine).5. 25% Ammonium persulfate (APS) (made fresh).6. Loading buffer: stop solution as in Subheading 2.1.3.
2.1.5. Autoradiography
1. X-ray Hyperfilm 18 cm × 43 cm (Sigma) and cassettes.
2.2. Automated Fluorescent Cycle Sequencing2.2.1. Purification of PCR Products Before Cycle Sequencing
1. Microcon-100 Microconcentrators (Amicon).
2.2.2. Cycle Sequencing1. Terminator Ready Reaction Mix, Applied Biosystems (ABI) contains the following:
A-Dye terminator labeled with dichloro [R6G];C-Dye terminator labeled with dichloro [ROX];
68 Surdhar
G-Dye terminator labeled with dichloro [R110];T-Dye terminator labeled with dichloro [TAMRA];Deoxynucleoside triphosphates (dATP, dCTP, dITP, dUTP);AmpliTaq DNA polymerase, FS, with thermally stable pyrophosphatase;MgCl2;Tris-HCl buffer, pH 9.0.
2.2.3. Purifying Extension Products1. 3 M Sodium acetate, pH 5.2.2. Absolute ethanol.3. 70% Ethanol.4. Distilled water.
2.2.4. Preparing and Loading Samples1. Template suppression reagent (ABI) (store at 4°C).
3. Methods3.1. Manual Cycle Sequencing
3.1.1. Purification of PCR Products Before Cycle SequencingPurify the PCR products prior to sequencing using a Geneclean Kit II
(Anachem) according to manufacturer’s instructions (see Note 1).
3.1.2. Termination Cycle SequencingThe amount of genecleaned PCR products should be roughly estimated on
an agarose gel before sequencing. The approximate range of template requiredis about 2–50 ng/µL. A general outline of the protocol is as follows (details areavailable in the manual provided by the kit [Amersham Pharmacia Biotech]):
1. Prepare four termination mixes (one each for ddA, ddC, ddG and ddT):
Termination mix dGTP (or dITP) (see Note 2)×1
2 µL
α33P ddNTP0.5 µL2.5 µL
This can be multiplied by the number of samples to make a master mix and2.5 µL aliquoted into each tube.
2. Dispense 2.5 µL each of ddA, ddC, ddG, and ddT termination mix into respec-tively labeled tubes for each template to be sequenced.
3. Prepare a reaction mix:
Reaction buffer 2 µLDNA (2–50 ng/µL) µL*
Primer (0.1 µg/µL) (see Note 3) 1 µL*The concentration of the PCR product should be as stated above.
Cycle Sequencing of PCR Products 69
Water µL+
Thermo Sequenase (4 U/µL) 2 µL20 µL
Add 4.5 µL of this reaction mix to each of the termination mixes. Mix contentsof the tube with a pipet and then add one drop of mineral oil.
4. Incubate the reactions in a thermal cycler using the following conditions: 50 cyclesat 95°C, 30 s; 50 cycles at 50°C, 30 s; and 50 cycles at 72°C, 60 s (see Note 4).
3.1.3. Treatment of PCR Products After Cycle Sequencing
Add 4 µL stop solution to each tube and store at –20°C until ready to run on a gel.
3.1.4. 6% Polyacrlyamide Sequencing Gels
1. To make 150 mL of acrylamide solution, add 63 g urea, 30 mL of 30% acryla-mide stock solution, and 12 mL of 20X glycerol tolerant buffer and make up to150 mL with distilled water.
2. Just before pouring the gel, add 50 µL of 25% APS and 50 µL TEMED to 50 mLof the acrylamide solution to initiate polymerization. Pour this into a sandwich oftwo 45 inches long gel plates that have been sealed at the bottom with 10 mL 6%acrylamide, 50 µL 25% APS and 50 µL TEMED.
3. Leave gel to set for approx 1 h or overnight.4. Set up the gel apparatus, using 0.8X glycerol tolerant buffer (see Note 5).5. Load 4 µL of each sample into each well.6. Run the gel at 50°C, approx 50 W until the sample dyes have migrated the required
distance. As a general guide, bromophenol blue migrates with a DNA fragment ofapprox 26 bp and xylene cyanol with a fragment of approx 106 bp in a 6% gel.
3.1.5. Autoradiography
Following electrophesis, allow the glass plates to cool to room temperature. Care-fully separate the glass plates, leaving the gel adhered to one of the plates. Transferthe gel to a piece of Whatmann 3MM paper cut out to the same size of the gel byslowly placing it over the gel. Slowly peel off the paper with the attached gel.
Cover the gel with cling film and dry in a slab gel dryer at 80°C for 30–120min until the gel is dry. Remove the cling film and autoradiograph the gelagainst a high-speed X-ray film in an appropriate cassette.
Exposure of the film at room temperature varies from about 1 d to 6 d dependingon the amount of starting DNA template used and the age of the radioactivity.
3.2. Automated Cycle Sequencing
3.2.1. Purification of PCR Products Before Cycle Sequencing
There are various methods used for this procedure. The Microcon-100 spincolumns are recommended by ABI to give good sequencing results, as they+Adjust the amount of water to make up to a total volume of 20 µL.

70 Surdhar
remove salt which can interfere with the sequencing reaction. There are alter-native methods available (see Note 1).
3.2.2. Cycle Sequencing
1. For each reaction, mix the following reagents in a labeled tube:(This is a half-reaction; one-eighth and one-quarter reactions can also be carriedout, but this requires a propietary buffer from ABI that maintains a reasonablereaction volume.)
Terminator-ready reaction mix 4 µLPCR product (30–90 ng) x µLPrimer (0.02 µg/µL) (see Note 3) 1 µLdH2O y µL
10 µLSet up and keep the reaction on ice until ready to transfer to the thermal cycler.
2. Perform the sequencing reactions in a thermal cycler using the following con-ditions: 96°C for 10 s; 25 cycles of 96°C for 10 s, 50°C for 5 s, 60°C for 4 min(see Note 4).Make up to 20 µL with water following the reaction.
3.2.3. Purifying Extension Products
This method utilizes ethanol and sodium acetate to purify the extension prod-ucts (see Note 6).
1. After completion of the sequencing reactions, transfer the 20 µL extension prod-ucts to 0.5 µL tubes.
2. Add the following to the tubes:2 µL of 3 M NaOAc, pH 5.2;50 µL of 95% EtOH at room temperature (see Note 7).
3. Cap the tubes and vortex briefly.4. Incubate the tubes at room temperature for 15 min.5. Place the capped tubes in a microcentrifuge,and spin the tubes for 20 min at
maximum speed. This should be at least 1400g but less than 3000g.6. Without disturbing the pellet, carefully aspirate the supernatant with a pipettor
and discard it.7. Rinse the pellet by adding 200 µL of 70% EtOH. Cap the tubes and vortex briefly.
Centrifuge for 5 min at maximum speed.8. Without disturbing the pellet, carefully aspirate the supernatant with a pipettor
and discard.9. Dry the pellet in a vacuum centrifuge for 10–15 min, or remove the caps and
place the tubes in a heat block at 90°C for 1 min.
3.2.4. Preparing and Loading Samples
Resuspend each pellet in 20 µL of Template Suppression Reagent (ABI) andheat denature at 95°C on a heating block for 2 min, 30 s; immediately place on
Cycle Sequencing of PCR Products 71
ice. Load sample on to automated analyzer according to manufacturer’sinstructions.
4. Notes
1. Geneclean Kit II (Anachem) or any other silica-based purification methods, puri-fication with Exonuclease and Shrimp Alkaline Phosphatase, and spin columnsthat concentrate and desalt the PCR products, such as the Microcon-100 spin col-umns (Millipore), may be used. For automated fluorescent sequencing, the lattermethod of purification is more appropriate as silica from the Geneclean can inter-fere with the sequencing reaction, such that a shorter read is obtained. When thereare multiple bands present because of nonspecific amplification, then Genecleanis used to purify the sample, in which case it is very important to not get any silicacarryover into the sequencing reaction. The enzyme method of PCR purificationgives good sequencing, as it removes the excess dNTPs and primers: 8 µL of a50-µL PCR product is digested with 1 µL of Exonuclease I (10 U/µL) and 1 µL ofshrimp alkaline phosphatase (2 U/µL) (Amersham supplies both enzymes togetheras a presequencing kit), incubated at 37°C for 15 min and then inactivated at 80°Cfor 15 min; 5 µL is used for the sequencing reaction.
2. Compressions occur when the DNA (usually G-C rich) synthesized by the DNApolymerase does not remain fully denatured during electrophoresis. dITP can beused instead of dGTP to reduce compressions in the sequence.
3. Primers should be about 18–25 nucleotides long. It is also important to check thesequence of the primer for possible self-complementarity.
4. The number of cycles required depends on the amount of template used forsequencing, as well as the purity and sensitivity of autoradiographic detection.In general, when the amount of template is low, more cycles should be used.Most reactions can be carried out at the 50°C default annealing temperature.Polymerization is optimal at 70–75°C, except when using dITP, which requiresa maximum temperature between 55°C and 60°C. Big Dye Terminators™utilize dITP; therefore, the polymerization is carried out at 60°C.
5. The 0.8X glycerol tolerant buffer is recommended, as it results in faster gelmigration.
6. When using Big Dye™ Terminators, there are two other methods recommendedfor purifying extension products; using either 60% ± 5% isopropanol or 60% ± 3%ethanol. These methods are described further in the ABI manual. All three methodshave been tested simultaneously and the described ethanol/sodium acetate methodwas found to be the most efficient for purifying the extension products.
7. When exposed to air, absolute ethanol absorbs moisture and becomes more dilute.Also, slight variations in concentration occur when ethanol is diluted to 95%. Thesevariations can result in increased residual dyes. Use of a commercially preparedmolecular-biology-grade 95% ethanol is therefore recommended to eliminate varia-tions. Alternatively, 100% molecular-grade ethanol can be diluted to 95% withmolecular-grade isopropanol.
72 Surdhar
References1. Orita, M., Suzuki, Y., Sekeiya, T., and Hayashi, K. (1989) Rapid and sensitive
detection of point mutations and DNA polymorphisms using the polymerase chainreaction. Genomics 5, 874–879.
2. Kwok, P. Y., Carlson, C., Yager, T. D., Ankener, W., and Nickerson, D. A. (1994)Comparative analysis of human DNA variations by fluorescence based sequenc-ing of PCR products. Genomics 23, 138–144.
3. Martin-Gallardo, A., McCombie, W. R., Gocayne, J. D., Fitzgerald, M. G.,Wallace, S., Lee, B. M. B., et al. (1992) Automated DNA sequencing and analysisof 106 kilobases from human chromosome 19q 13.3. Nature Genet. 1, 34–39.
4. NIH/CEPH Collaborative Mapping Group (1992) A comprehensive genetic link-age map of the human genome. Science 258, 67–86.
5. Sanger, F., Nicklen, S., and Coulson, A. R. (1977) DNA sequencing with chainterminating inhibitors. Proc. Natl. Acad. Sci. USA 74, 5463–5467.
6. McMahon, G., Davis, E., and Wogan, G. N. (1987) Characterization of c-Ki-rasoncogene alleles by direct sequencing of enzymatically amplified DNA from car-cinogen induced tumours. Proc. Natl. Acad. Sci. USA 84(14), 4974–4978.
7. Carothers, A. M., Urlab, G., Mucha, J., Grunberger, D., and Chasin, L. A. (1989)Point mutation analysis in a mammalian gene: rapid preparation of total RNA,PCR amplification of cDNA, and Taq sequencing by a novel method.BioTechniques 7(5), 494–499.
8. Murray, V. (1989) Improved double-stranded DNA sequencing using the linearpolymerase chain reaction. Nucl. Acids Res. 17(21), 8889.
9. Levedakou, E. N., Landegren, U., and Hood, L. E. (1989) A strategy to study genepolymorphism by direct sequence analysis of cosmid clones and amplifiedgenomic DNA. BioTechniques 7(5), 438–442.
10. Lee, J. S. (1991) Alternative dideoxy sequencing of double-stranded DNA bycyclic reactions using Taq polymerase. DNA Cell Biol. 10(1), 67–73.
11. McBride, L. J., Koepf, S. M., Gibbs, R. A., Nyugen, P., Salser, W., Mayrand, P.E., et al. (1989) Automated DNA sequencing methods involving PCR. Clin. Chem.35, 2196–2201.
12. Tracy, T. E. and Mulcahy, L. S. (1991) A simple method for direct automatedsequencing of PCR products. BioTechniques 11(1), 68–75.
Fluorescent In Situ Hybridization 73
73
From: Methods in Molecular Biology, vol. 187: PCR Mutation Detection ProtocolsEdited by: B. D. M. Theophilus and R. Rapley © Humana Press Inc., Totowa, NJ
11
Fluorescent In Situ Hybridization
Sara A. Dyer and Elaine K. Green
1. IntroductionSingle-stranded DNA will recognize a complementary strand with high
specificity under suitably controlled conditions. In situ hybridization (ISH)exploits this phenomenon by hybridizing an appropriately labeled single-stranded DNA “probe” to target sequences in situ in either dissociated cellpreparations or tissue sections.
Early ISH protocols used radioactivity to label probes, whereas current tech-niques use fluorescent labels giving rise to the term “fluorescent in situ hybrid-ization” (FISH). FISH probes may be directly labeled by the incorporation of afluorochrome-conjugated molecule (e.g., fluoroscein d-UTP or Texas red d-UTP)or indirectly labeled by the incorporation of a reporter molecule (e.g., biotind-UTP or digoxygenin d-UTP). If probes are indirectly labeled, they must bedetected posthybridization using a reporter-binding fluorescent molecule. Aschematic representation of the FISH principle is shown in Fig. 1.
Fluorescent in situ hybridization probes fall into three main categoriesdepending on the region of the genome to which they hybridize: repetitive-sequence probes, single-copy probes, and whole-chromosome libraries. Repeti-tive-sequence probes are specific for repetitive DNA regions found within thehuman genome. Centromeric probes are a family of repetitive-sequence probeshybridizing to mainly α-satellite DNA found near the centromeres of all humanchromosomes. Subtelomeric probes are also repetitive-sequence probes.Single-copy probes are specific for unique sequences within the genome.Whole-chromosome libraries are made up of a mixture of DNA sequences com-prising the entire length of a specific chromosome; these probes are also knownas chromosome paints.
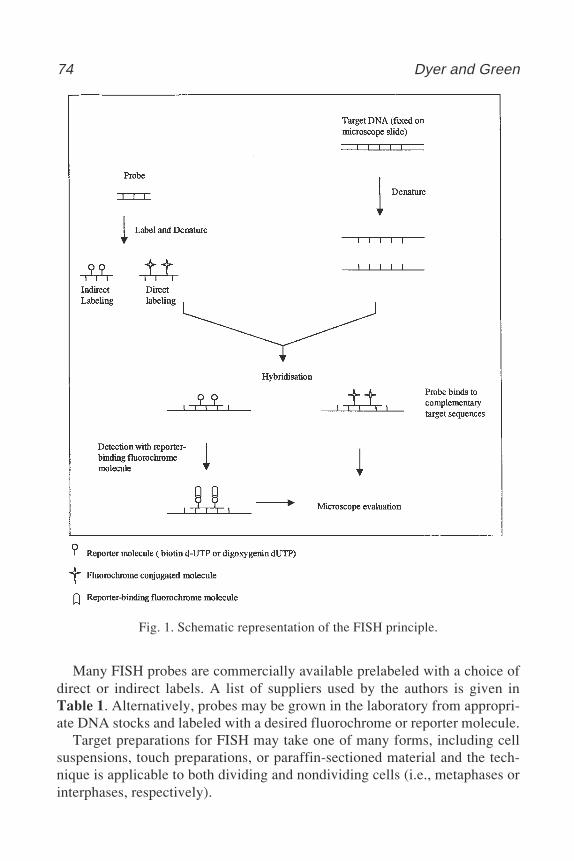
74 Dyer and Green
Fig. 1. Schematic representation of the FISH principle.
Many FISH probes are commercially available prelabeled with a choice ofdirect or indirect labels. A list of suppliers used by the authors is given inTable 1. Alternatively, probes may be grown in the laboratory from appropri-ate DNA stocks and labeled with a desired fluorochrome or reporter molecule.
Target preparations for FISH may take one of many forms, including cellsuspensions, touch preparations, or paraffin-sectioned material and the tech-nique is applicable to both dividing and nondividing cells (i.e., metaphases orinterphases, respectively).
Fluorescent In Situ Hybridization 75
Over the last decade, FISH has proved to be an invaluable technique inboth diagnostic and research laboratories. The appropriate choice of probeand target can lead to the characterization of chromosomal and gene rear-rangements and the ascertainment of chromosome copy number. Single-copyunique-sequence probes have proved useful in the detection of microdeletionssuch as those found on chromosomes 7, 15, and 22 in Williams, Prader Willi,and Di George syndromes, respectively. Single-copy probes have also beenwidely used in recent years in the identification of gene rearrangements suchas BCR/ABL and PML/RARA fusion in blood and bone marrow samples frompatients with leukemia. Chromosome libraries and subtelomeric probes haveproved to be valuable in the characterization of complex and sometimes subtlechromosomal rearrangements in both constitutional and acquired geneticabnormalities. Centromeric probes have been widely used to determine thechromosomal origin of small marker chromosomes that are unidentifiable byconventional Giemsa-banding analysis. These repetitive-sequence probes arealso of great value in determining the chromosome copy number in nondivid-ing cells. In recent years, “multi-probe” devices have been developed thatallow simultaneous detection of all human telomeres or centromeres on asingle microscope slide.
Over the past 10 years the basic FISH principle has been used to developnew molecular cytogenetic techniques, including multicolor FISH (M-FISH)(1) and comparative genomic hybridization (CGH) (2). M-FISH allows eachchromosome to be visualized in a different color, enabling the rapid identifica-tion of chromosome rearrangements, whereas CGH allows a whole genome tobe scanned for genetic imbalances in a single hybridization. Both M-FISH andCGH rely on sophisticated image-analysis equipment, which is becomingincreasingly important in the growing field of molecular cytogenetics.
Table 1Suggested Probe Suppliers
Supplier Address
Appligene Oncor QbiogeneSalamander Quay WestPark LaneHarefieldMiddlesex UB9 6NZUnited Kingdom
Vysis Ltd. Vysis SAUK Customer Department81470 Maurens ScopontFrance
76 Dyer and Green
Practically, FISH involves probe labeling, denaturation of probe and targetDNA, hybridization of probe to target DNA, stringency washing to removeexcess probe, detection (of indirectly labeled probes), and counterstaining. Basichybridization methods are given in the following sections, together with proto-cols for growing and labeling probes in the laboratory. All methods are designedas general guidelines only, and in the case of commercially purchased probes,manufacturer’s guidelines should always be followed. Particularly hazardousreagents have been highlighted but appropriate safety precautions should befollowed for all laboratory work.
2. Materials2.1. Growing Probes in the Laboratory
1. Plasmid Maxi kit (Qiagen, cat. no. 12162) containing Qiagen 100 tips, andbuffers: P1 (resuspension buffer), P2 (lysis buffer), P3 (neutralization buffer),QBT (equilibration buffer), QC (wash buffer) and QF (elution buffer).
2. LB broth (Luria–Bertani medium): Dissolve 10 g bacto-tryptone, 5 g bacto-yeastextract, and 10 g NaCl in 950 mL of distilled water, adjust the pH to 7.0 with 5 NNaOH, and make up to 1 L with distilled water. Sterilize by autoclaving.
3. Kanamycin (50 mg/mL) store at –20°C.4. Shaking incubator.5. Sorvall centrifuge (GSA and SS-34 rotors).6. 250 mL and 50 mL centrifuge tubes.7. Isopropanol.8. 70% Ethanol; store at –20°C.
2.2. Probe Labeling
1. Nick translation kit (e.g., Roche Diagnostics, cat. no. 976776, containing dNTPs,buffer, DNA polymerase/DNase I enzyme mix).
2. Labeled dUTP: digoxygenin-11-dUTP, biotin-11-dUTP, fluoroscein-11-dUTP,or Texas Red-11-dUTP at a concentration of 0.4 mM (see Note 1).
3. 0.2 M EDTA, pH 8.0.4. Herring sperm DNA (Gibco-BRL) (5 µg/mL).5. Human COT-1 DNA (Gibco-BRL) (1 mg/mL).6. 100% Ethanol.7. 3 M Sodium acetate, pH 5.2.8. Glycogen: 20 mg/mL (Gibco-BRL).9. 20X SSC: Dissolve 87.66 g NaCl and 44.11 g Na3 citrate in 500 mL distilled H2O
(dH2O). Adjust pH to 7.0. Autoclave and store at room temperature.10. For use with repetitive-sequence probes: Hybridization buffer 1 (HB1), contain-
ing 50% formamide. Dissolve 1 g dextran sulfate in 5 mL deionized formamide(see Note 2) by heating to 70°C. Add 1 mL 20X SSC and adjust pH to 7.0. Makeup final volume to 10 mL with dH2O. Store at –20°C.
Fluorescent In Situ Hybridization 77
11. For use with single-copy probes or whole-chromosome libraries: Hybridizationbuffer 2 (HB2), containing 71% formamide. Dissolve 1 g dextran sulfate in 5 mLdeionized formamide (see Note 2) by heating to 70°C. Add 1 mL of 20X SSCand adjust pH to 7.0. Make up final volume to 7 mL with H20. Store at –20°C.
12. Water bath, 15°C.13. Microcentrifuge.
2.3. Hybridization
1. Labeled probe(s).2. Methanol (100%, 95%, 75%).3. For use with repetitive-sequence probes: HB1 (see Subheading 2.2.).4. For use with single-copy probes and whole-chromosome libraries: HB2 (see Sub-
heading 2.2.).5. Denaturation solution: 70% deionized formamide/2X SSC. To 35 mL deionized
formamide (see Note 2), add 5 mL of 20X SSC (see Subheading 2.2.) and 10 mLdH2O, adjust pH to 7.0. Note: Denaturation solution is not required when usingrepetitive-sequence probes.
6. Diamond pen to mark target slides.7. Sealable plastic hybridization chamber lined with moist tissue.8. Hot plate, 50°C.9. Water bath, 75°C.
10. Incubator, 37°C, 42°C.
2.4. Stringency Washing
1. SSC (see Table 2 for concentration).2. PN buffer: Titrate 4 L of 0.1 M sodium phosphate dibasic (Na2HPO4) solution
with 0.1 M sodium phosphate monobasic (NaH2PO4) solution to give a pH of 8.0.Add 4.5 mL nonidet-P-40 (detergent). Mix well and store at room temperaturefor up to 2 wk.
3. Water bath, 75°C.
Table 2Suggested Stringency Washing Conditions
Repetitive sequence Single copy Chromosome library
SSC concentrationa 0.5X SSC 2X SSC 1X SSCTemperatureb 75°C 75°C 75°CTime 5 min 5 min 2 × 5 min
aTo prepare various SSC concentrations use 20X SSC (see Subheading 2.2.) and dilute asappropriate (e.g., to make 2X SSC, use 1 vol of 20X SSC to 9 vol H2O).
bIncubate wash chamber containing SSC in a 75°C water bath for at least 30 min prior towashing. Check temperature inside the chamber before commencing washing.
78 Dyer and Green
2.5. Detection
1. PNM buffer: To 250 mL PN buffer (see Subheading 2.4.), add 12.5 g nonfatdried milk (or other blocking agent [e.g., bovine serum albumin] and 0.05 gsodium azide; see Note 3), mix well, and incubate at 37°C for 60 min. Cool andstore at 4°C for up to 2 mo.
2. Fluoroscein avidin (Vector Laboratories, Inc.) (2 mg/mL).3. Biotinylated anti-avidin D, affinity purified (Roche Diagnostics) (0.5 mg/mL).4. Mouse monoclonal anti-digoxin (Sigma Biosciences) (100 µg/mL).5. Sheep anti-mouse Ig-digoxygenin, F(ab)2-fragment (Roche Diagnostics)
(200 µg/mL).6. Sheep anti-digoxygenin–rhodamine, FAB fragments (Roche Diagnostics)
(200 µg/mL).7. PN buffer (see Subheading 2.4.).
2.6. Counterstaining
1. Propidium iodide (PI) (Vector Laboratories, Inc.) in an antifade solution (e.g.,Vectashield, Vector Laboratories, Inc.) to give a final concentration of 1 µg/mL(see Note 4).
2. 6-Diamidine-2-phenylindole (DAPI) (Vector Laboratories, Inc.) in an antifadesolution (e.g., Vectashield, Vector Laboratories, Inc.) to give a final concentra-tion of 0.5 µg/mL.
3. Methods3.1. Growing Probes in the Laboratory
Plasmid, cosmid, and P1 clone (PAC) DNA suitable for labeling as FISHprobes can be isolated using a Qiagen Plasmid kit. In the following methodol-ogy, the isolation of PACs will be described (see Note 5), for plasmid andcosmid preparations, see the Qiagen Plasmid purification handbook.
1. Grow a single colony, picked from a freshly streaked LB (kanamycin,25 µg/mL) plate, in a starter culture of 5 mL LB medium containing kanamycin(25 µg/mL) and incubate in a shaking incubator for approx 8 h at 37°C withvigorous shaking at 300 rpm.
2. Inoculate a 500-mL LB kanamycin (25 µg/mL) culture with 1 mL of the starterculture and grow as in step 1 for 12–16 h.
3. Transfer the culture to clean centrifuge tubes and pellet the bacterial cellsat 7500 rpm for 15 min.
4. Resuspend the bacterial pellet in 10 mL of P1 buffer containing RNase A(100 µg/mL) until there are no visible clumps.
5. Add 20 mL of P2 buffer and mix gently by inverting the tube 10 times andleave at room temperature for 5 min.
6. Add 20 mL of chilled P3 buffer, mix immediately by inverting four to five timesand incubate on ice for 20 min.
Fluorescent In Situ Hybridization 79
7. Centrifuge at 9500 rpm for 30 min at 4°C.8. In the meantime, prepare the Qiagen tip by adding 10 mL of equilibration buffer
QBT and allowing to drip through by gravity flow.9. If the supernatant is clear, pipet onto the Qiagen tip and allow to enter the resin
by gravity flow. If the supernatant is not clear, centrifuge again before applyingto the Qiagen tip.
10. Wash the Qiagen tip with 2 × 10 mL buffer QC.11. To elute the DNA, apply 5 mL buffer QF prewarmed to 50°C (see Note 6).12. Precipitate the DNA with 0.7 vol isopropanol at room temperature, centrifuge
immediately at 4°C for 30 min and carefully remove the supernatant (see Note 7).13. Wash the pellet by adding 2 mL cold 70% ethanol and inverting. Centrifuge at
11,000 rpm for 10 min.14. Remove the supernatant, air-dry the pellet, and redissolve in sterile water.
3.2. Probe LabelingNick translation is the method of choice for labeling FISH probes. The tech-
nique involves the use of two enzymes; a DNase that randomly nicks probeDNA and a DNA polymerase that repairs the nicked DNA and, at the sametime, incorporates labeled dNTP molecules into the probe. The following pro-tocol uses a nick translation kit and describes a basic method suitable for indi-rect or direct labeling of FISH probes.
1. To label 1 µg of DNA, add the following to a 0.5-mL Eppendorf tube on ice:1 µg DNA;10 µL dNTP mix (1 vol labeled dUTP[0.4 mmol/L], 2 vol dTTP [0.1 mM], 3vol each dATP, dCTP, dGTP [0.1 mM]);2 µL 10X buffer;2 µL enzyme mix (see Note 8);Sterile water to give final volume of 20 µL.
2. Mix well and incubate at 15°C for 90 min.3. Add 2 µL EDTA (0.2 M) to stop enzyme activity.4. For nick translation of single-copy probes or whole-chromosome libraries, add
25 µL Human COT-1 DNA (1 mg/mL) (see Note 9).5. Add 10 µL Herring sperm DNA (5 µg/mL) (see Note 10)6. To precipitate DNA, add the following:
0.1 × total volume sodium acetate (3 M, pH 5.2);1 µL glycogen (20 mg/mL);2 × total volume 100% ethanol.
7. Mix well and incubate at –20°C for 30 min to aid DNA precipitation.8. Spin at 13,000 rpm for 30 min to pellet the DNA.9. Discard aqueous phase and air-dry DNA pellet at room temperature for 15 min or
until supernatant is no longer visible.10. Resuspend dried pellet in 20 µL HB1 (for centromeric probes) or HB2 (for
single-copy probes and whole-chromosome libraries) to give a final concentra-tion of 50 ng/µL.
80 Dyer and Green
11. Incubate at 37°C for 30 min to aid resuspension of DNA. Store probe at –20°Cwhile not in use.
3.3. Hybridization
The methodology for hybridization depends on the nature of the probe. Threehybridization protocols are described for use with laboratory-grown repetitive-sequence, single-copy, and whole-chromosome library probes. The protocolsare designed for use on fixed cell preparations.
Target slides should be checked prior to hybridization under a phase-con-trast microscope. The cells should not be overlapping and there should be mini-mal visible cytoplasm. Chromosomes, if present, should be of an appropriatelength and adequately spread. They should appear a dark gray color; light graychromosomes or those with a “glassy” appearance are likely to result in poorhybridization. Optimum results are achieved on unbaked slides that are lessthan 1 mo old.
3.3.1. Hybridization Protocol 1:For Use with Repetitive Sequence Probes
Repetitive-sequence probes can be applied with equal success to metaphaseor interphase preparations. By using differentially labeled probes, it is possibleto apply more than one probe to a single target slide. The following protocolinvolves codenaturation of target and probe DNA.
1. Prewarm the hybridization chamber in a 75°C water bath.2. Mark the hybridization area on the underside of each target slide using a
diamond pen.3. Dehydrate the target slide(s) by incubating through an alcohol series; 2 min in
each of 75%, 95%, and 100% methanol at room temperature; dry briefly on a50°C hot plate.
4. For each slide, aliquot 0.5 µL of each labeled probe into an Eppendorf tube andmake volume up to 10 µL with HB1 (e.g., if simultaneously applying two differ-entially labeled probes to two slides, use 1 µL of each probe and 18 µL of HB1);mix well.
5. Apply 10 µL of probe mix to the marked hybridization area of each dehydratedslide, cover the hybridization area with a 22 × 22-mm coverslip (see Note 11),and seal the edges with rubber sealant.
6. Place the slide (s) in the prewarmed hybridization chamber, seal the lid, and incu-bate at 75°C for exactly 10 min in order to codenature the probe and target DNA.
7. Incubate the hybridization chamber containing the slide(s) at 37°C overnight.
3.3.2. Hybridization Protocol 2: For Use with Single-Copy Probes
Single-copy probes can be applied to metaphase or interphase preparations.The use of differentially labeled probes allows the simultaneous application ofmore than one probe to a single target slide.
Fluorescent In Situ Hybridization 81
1. At least 30 min prior to hybridization, prewarm a lidded plastic Coplin jarcontaining denaturation solution in a 75°C water bath. The water bath should besited in a Class 1 fume hood to contain formamide fumes.
2. Mark the hybridization area on the underside of each target slide using a dia-mond pen.
3. For each slide, aliquot 1 µL of each labeled single-copy probe into an Eppendorftube and make up volume to 10 µL with HB2 (e.g., if simultaneously applyingtwo differentially labeled probes to two slides, use 1 µL of each probe and 18 µLof HB2); mix well.
4. Denature by incubating the probe mix at 75°C for exactly 5 min, snap-chill on icefor 30 s and prehybridize by incubating at 37°C for 30 min (see Note 12).
5. Shortly before the end of prehybridization, check that the temperature of thedenaturation solution is 75°C. Denature the target slide(s) by incubating in thedenaturation solution for exactly 2 min (see Note 13). Dehydrate the targetslide(s) by incubating through an ice-cold alcohol series; 2 min in each of 75%,95%, and 100% methanol and dry briefly on a 50°C hot plate.
6. Apply 10 µL of the denatured, prehybridized probe mix to the markedhybridization area of each denatured slide. Cover the hybridization area with a22 × 22-mm coverslip and seal the edges with rubber sealant (see Note 11). Placeslide(s) in a hybridization chamber and hybridize overnight at 37°C.
3.3.3. Hybridization Protocol 3:For Use with Whole-Chromosome Libraries
Whole-chromosome libraries are usually used for the characterization ofmetaphase chromosomes rather than interphases cells, where the signals appearas indistinct, often overlapping domains. Dual-color painting refers to thesimultaneous application of two differentially labeled chromosome libraries totarget chromosome spreads.
1. At least 30 min prior to hybridization, prewarm a lidded plastic Coplin jar con-taining denaturation solution in a 75°C water bath. The water bath should besited in a Class 1 fume hood to contain formamide fumes.
2. Mark the hybridization area on the underside of each target slide using a diamond pen.3. If using a single library, dilute 3 µL of labeled library with 7 µL HB2 (per slide);
mix well. For dual-color painting, use 3 µL of each of two differentially labeledchromosome libraries and 4 µL HB2 (per slide). Denature the probe(s) at 75°Cfor exactly 5 min. Snap-chill on ice for 30 s and prehybridize at 37°C for at least2 h (see Note 12).
4. Shortly before the end of prehybridization, check that the temperature of thedenaturation solution is 75°C. Denature the target slide(s) in denaturation solu-tion for exactly 2 min. Dehydrate the target slide(s) by incubating through an ice-cold alcohol series; 2 min in each of 75%, 95%, and 100% methanol and drybriefly on a 50°C hot plate.
5. Apply 10 µL denatured probe mix to the marked hybridization area of eachdenatured slide. Cover the hybridization area with a 22 × 22 mm coverslip (see
82 Dyer and Green
Note 11) and seal the edges with rubber sealant. Place the slide(s) in a hybrid-ization chamber and hybridize overnight at 42°C.
3.4. Stringency WashingStringency washing removes unbound probe from the target slide. The amount
of probe left on the slide depends on the stringency of the wash; high-stringencywashes have a low salt concentration and/or high temperature, whereas low-stringency washes have a high salt concentration and/or low temperature.
1. After hybridization, gently remove coverslips and rubber sealant using fine for-ceps and wash the slide(s) in the appropriate SSC concentration at 75°C (seeNote 13) for the required time (see Table 2).
2. Rinse briefly in PN buffer and then allow the slide to stand in PN buffer for atleast 10 min. If using indirectly labeled probes, proceed to the detection stage(see Subheading 3.5.). If using directly labeled probes, proceed to the counter-staining stage (see Subheading 3.6.).
3.5. DetectionThis stage is only necessary for slides hybridized with indirectly labeled
probes; if directly labeled probes have been used, slides may be counterstainedimmediately (see Subheading 3.6.). Protocols are given for the detection ofboth biotin- and digoxygenin-labeled probes and involve “amplifying” detec-tion reagents to give high-intensity signals. Biotin is detected with a greenfluorescent label (fluoroscein) and digoxygenin with a red label (rhodamine).
1. Prepare detection reagents I, II, and III in light-protected plastic Coplin jars asshown in Table 3. The detection reagents can be reused over a 6 wk period andshould be stored at 4°C while not in use.
2. After washing, incubate the hybridized slide(s) in detection reagent I at roomtemperature for 20 min. Rinse briefly in PN buffer and leave standing at roomtemperature in fresh PN buffer for 10 min. Do not allow the slides to dry out atany stage.
3. Repeat step 2 using detection reagents II and III, consecutively. Leave slide(s)standing in PN buffer prior to the counterstaining stage.
3.6. Counterstaining
For optimum contrast, probes labeled or detected with a green label are bestviewed on a red (PI) background, whereas red probes are best viewed on a blue(DAPI) background. If both red and green probes have been applied, a DAPIcounterstain should be used.
1. Remove slide(s) from PN buffer (i.e., the final stage of either stringency washingor detection for directly or indirectly labeled probes, respectively) and drain off
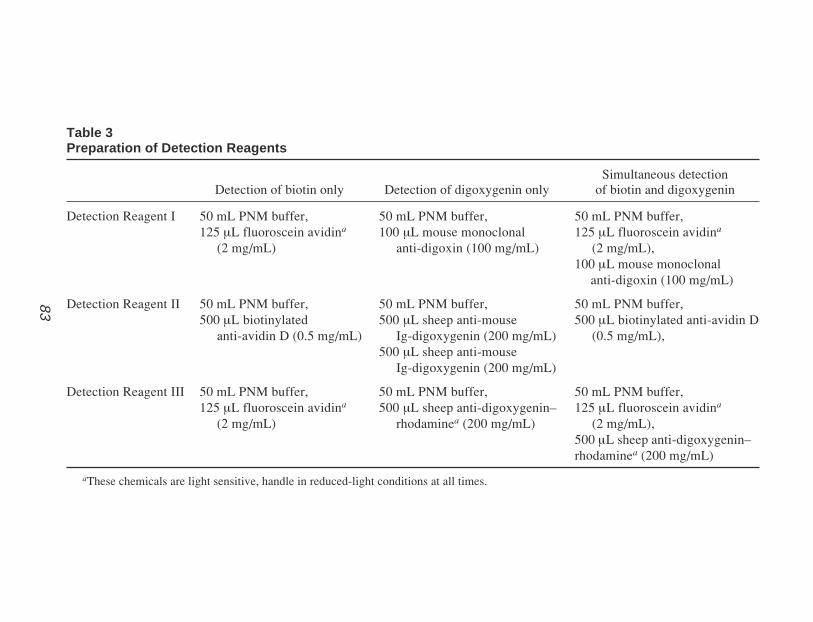
FluorescentIn S
itu Hybridization
83
83
Table 3Preparation of Detection Reagents
Simultaneous detectionDetection of biotin only Detection of digoxygenin only of biotin and digoxygenin
Detection Reagent I 50 mL PNM buffer, 50 mL PNM buffer, 50 mL PNM buffer,125 µL fluoroscein avidina 100 µL mouse monoclonal 125 µL fluoroscein avidina
(2 mg/mL) anti-digoxin (100 mg/mL) (2 mg/mL),100 µL mouse monoclonal
anti-digoxin (100 mg/mL)
Detection Reagent II 50 mL PNM buffer, 50 mL PNM buffer, 50 mL PNM buffer,500 µL biotinylated 500 µL sheep anti-mouse 500 µL biotinylated anti-avidin D anti-avidin D (0.5 mg/mL) Ig-digoxygenin (200 mg/mL) (0.5 mg/mL),
500 µL sheep anti-mouse Ig-digoxygenin (200 mg/mL)
Detection Reagent III 50 mL PNM buffer, 50 mL PNM buffer, 50 mL PNM buffer,125 µL fluoroscein avidina 500 µL sheep anti-digoxygenin– 125 µL fluoroscein avidina
(2 mg/mL) rhodaminea (200 mg/mL) (2 mg/mL),500 µL sheep anti-digoxygenin–rhodaminea (200 mg/mL)
aThese chemicals are light sensitive, handle in reduced-light conditions at all times.
84 Dyer and Green
excess buffer by touching the end of each slide to a paper towel. Do not allow theslide(s) to dry out completely.
2. Apply 10 µL of the appropriate counterstain to the marked hybridization area ofeach target slide.
3. Cover the hybridization area with a 22 × 32-mm coverslip (avoiding air bubbles)and store at 4°C in the dark until ready for microscopic evaluation.
3.7. Microscope Evaluation
A fluorescent microscope is required for analysis of FISH preparations, andgood signal intensities are achieved using a 100-W mercury bulb. The micro-scope needs to be fitted with excitation and barrier filters appropriate for thefluorescent labels used. At this stage, slides are prone to fading if exposed tolight and should be kept in reduced-light conditions.
During microscopic evaluation, probe signals should appear as distinct sig-nals with minimal background fluorescence. Single-copy probes should be seenas small bright signals and there should be virtually no background nonspecifichybridization. Repetitive-sequence probes tend to show some degree of cross-hybridization across the genome, but specific signals should still be bright andeasily recognizable. It should be noted that certain repetitive-sequence centro-meric probes hybridize to more than one centromeric pair because of extensivesequence homology (e.g., the chromosome 1 centromeric probe hybridizes tothe centromeric regions of chromosomes 1, 5, and 19 whereas centromericprobes specific for chromosomes 13 and 14 also hybridize to the centromeresof chromosomes 21 and 22, respectively). Whole-chromosome libraries shouldhybridize specifically along the length of a chromosome pair although it is notuncommon to see low levels of cross-hybridization across the rest of thegenome. Occasionally, FISH preparations show no signal or excessive cross-hybridization; there is usually a simple reason for this and some troubleshoot-ing tips are given in Table 4.
4. Notes1. If using direct labels (i.e., fluoroscein-11-dUTP or Texas Red-11-dUTP), handle
in reduced-light conditions at all times.2. Formamide is a known teratogen and should be handled with extreme care.3. Sodium azide is a known mutagen and should be handled with extreme caution.4. Propidium iodide is a potential carcinogen and should be treated with care.5. Yield for PAC DNA can be as little as 10 µg from a 500-mL culture.6. After precipitation, if no DNA appears to have been eluted, apply a higher-pH
buffer, pH 9.0, to the Qiagen tip and precipitate as before.7. Isopropanol pellets have a glassy appearance and tend to be easily dislodged. If
this occurs, use a standard ethanol precipitation in an Eppendorf and add thefollowing:
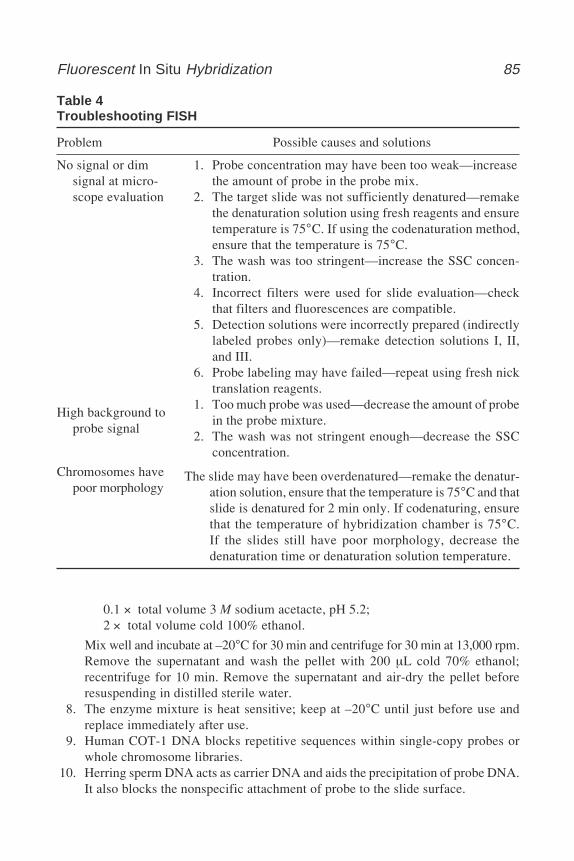
Fluorescent In Situ Hybridization 85
0.1 × total volume 3 M sodium acetacte, pH 5.2;2 × total volume cold 100% ethanol.
Mix well and incubate at –20°C for 30 min and centrifuge for 30 min at 13,000 rpm.Remove the supernatant and wash the pellet with 200 µL cold 70% ethanol;recentrifuge for 10 min. Remove the supernatant and air-dry the pellet beforeresuspending in distilled sterile water.
8. The enzyme mixture is heat sensitive; keep at –20°C until just before use andreplace immediately after use.
9. Human COT-1 DNA blocks repetitive sequences within single-copy probes orwhole chromosome libraries.
10. Herring sperm DNA acts as carrier DNA and aids the precipitation of probe DNA.It also blocks the nonspecific attachment of probe to the slide surface.
Table 4Troubleshooting FISH
Problem Possible causes and solutions
No signal or dimsignal at micro-scope evaluation
High background toprobe signal
1. Probe concentration may have been too weak—increasethe amount of probe in the probe mix.
2. The target slide was not sufficiently denatured—remakethe denaturation solution using fresh reagents and ensuretemperature is 75°C. If using the codenaturation method,ensure that the temperature is 75°C.
3. The wash was too stringent—increase the SSC concen-tration.
4. Incorrect filters were used for slide evaluation—checkthat filters and fluorescences are compatible.
5. Detection solutions were incorrectly prepared (indirectlylabeled probes only)—remake detection solutions I, II,and III.
6. Probe labeling may have failed—repeat using fresh nicktranslation reagents.
1. Too much probe was used—decrease the amount of probein the probe mixture.
2. The wash was not stringent enough—decrease the SSCconcentration.
The slide may have been overdenatured—remake the denatur-ation solution, ensure that the temperature is 75°C and thatslide is denatured for 2 min only. If codenaturing, ensurethat the temperature of hybridization chamber is 75°C.If the slides still have poor morphology, decrease thedenaturation time or denaturation solution temperature.
Chromosomes havepoor morphology
86 Dyer and Green
11. Take care to avoid trapping air bubbles, as the probe will not hybridize to targetDNA under the bubbles.
12. This step allows COT-1 DNA included in the probe mixture to hybridize torepetitive sequences within the probe DNA, thus blocking these region fromhybridizing to target DNA. This process is known as competitive in situsuppression (CISS) (3).
13. A maximum of four slides should be processed at any one time to avoid a signifi-cant decrease in temperature.
References1. Speicher, M. R., Ballard, S. G., and Ward, D. C. (1996) Karyotyping human chro-
mosomes by combinatorial multi-fluor FISH. Nature Genet. 12, 368–375.2. Kallioniemi, A., Kallioniemi O-P., Sudar, D., Rutovitz, D. Gray, J. W., Waldman
F., et al. (1992) Comparative genomic hybridization for molecular cytogeneticanalysis of solid tumours. Science 258, 818–821.
3. Lichter, P., Cremer, T., Borden, J., Manuelidis, L., and Ward, D. C. (1988) Delin-eation of individual human chromosomes in metaphase and interphase cells by insitu suppression hybridization using recombinant DNA libraries. Hum. Genet. 80,224–234.
Further ReadingBarch, M. J., Knutsen, T., and Spurbeck, J., eds. (1997) The AGT CytogeneticsLaboratory Manual,. Lippincott–Raven, PA.Rooney, D. E. and Czepulkowski, B. H., eds. (1992) Human Cytogenetics, Volume I,IRL, Oxford.
Protein Truncation Test 87
87
From: Methods in Molecular Biology, vol. 187: PCR Mutation Detection ProtocolsEdited by: B. D. M. Theophilus and R. Rapley © Humana Press Inc., Totowa, NJ
12
The Protein Truncation Test
Carol A. Hardy
1. IntroductionThe protein truncation test (PTT) (1), occasionally referred to as the in vitro
synthesized-protein (IVSP) assay (2), is a method for screening the codingregion of a gene for mutations that result in the premature termination ofmRNA translation. The techniques involved in performing PTT are relativelystraightforward and begin with the isolation of genomic DNA or RNA. Thepolymerase chain reaction (PCR) is used to amplify a DNA template, usuallyof 1–3 kb in size, that is tested in an in vitro transcription and translation assay.Truncated proteins are identified by sodium dodecyl sulfate polyacrylamidegel electrophoresis (SDS-PAGE) and autoradiography or fluorography. Asingle, large exon of a gene can be amplified directly from genomic DNA inseveral overlapping fragments. The complete coding sequence of a large gene,with many small exons, can be amplified in several overlapping fragments byreverse-transcription PCR (RT-PCR) starting from RNA. Amplifying the genein several segments that overlap each other by 300–500 bp increases the sensi-tivity of PTT. A truncating mutation located toward the 3' end of one segmentwill also occur near the 5' end of the next overlapping segment, thus increasingthe likelihood of identifying a truncated protein. A specially modified forwardPCR primer is required for PTT. In addition to the in-frame gene-specificprimer sequence, an extension at the 5' end includes the T7 promoter sequencefor RNA transcription by T7 RNA polymerase, the eukaryotic consensussequence for the initiation of protein translation, and the ATG protein transla-tion start site. The yield and specificity of the PCR amplification is checked byagarose gel electrophoresis. Then, an aliquot of the PCR product is used as thetemplate for in vitro transcription and translation, using RNA polymerase andrabbit reticulocyte lysate or wheat-germ extract. A radiolabeled amino acid is
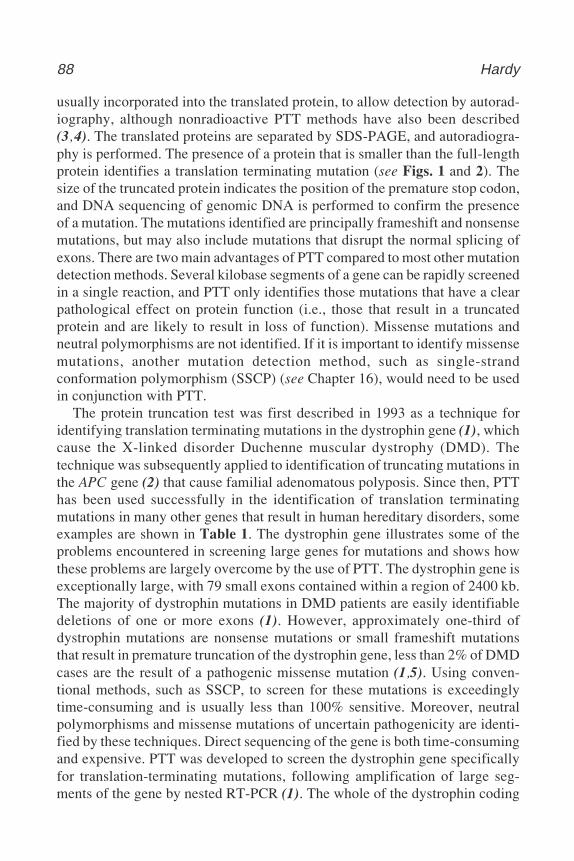
88 Hardy
usually incorporated into the translated protein, to allow detection by autorad-iography, although nonradioactive PTT methods have also been described(3,4). The translated proteins are separated by SDS-PAGE, and autoradiogra-phy is performed. The presence of a protein that is smaller than the full-lengthprotein identifies a translation terminating mutation (see Figs. 1 and 2). Thesize of the truncated protein indicates the position of the premature stop codon,and DNA sequencing of genomic DNA is performed to confirm the presenceof a mutation. The mutations identified are principally frameshift and nonsensemutations, but may also include mutations that disrupt the normal splicing ofexons. There are two main advantages of PTT compared to most other mutationdetection methods. Several kilobase segments of a gene can be rapidly screenedin a single reaction, and PTT only identifies those mutations that have a clearpathological effect on protein function (i.e., those that result in a truncatedprotein and are likely to result in loss of function). Missense mutations andneutral polymorphisms are not identified. If it is important to identify missensemutations, another mutation detection method, such as single-strandconformation polymorphism (SSCP) (see Chapter 16), would need to be usedin conjunction with PTT.
The protein truncation test was first described in 1993 as a technique foridentifying translation terminating mutations in the dystrophin gene (1), whichcause the X-linked disorder Duchenne muscular dystrophy (DMD). Thetechnique was subsequently applied to identification of truncating mutations inthe APC gene (2) that cause familial adenomatous polyposis. Since then, PTThas been used successfully in the identification of translation terminatingmutations in many other genes that result in human hereditary disorders, someexamples are shown in Table 1. The dystrophin gene illustrates some of theproblems encountered in screening large genes for mutations and shows howthese problems are largely overcome by the use of PTT. The dystrophin gene isexceptionally large, with 79 small exons contained within a region of 2400 kb.The majority of dystrophin mutations in DMD patients are easily identifiabledeletions of one or more exons (1). However, approximately one-third ofdystrophin mutations are nonsense mutations or small frameshift mutationsthat result in premature truncation of the dystrophin gene, less than 2% of DMDcases are the result of a pathogenic missense mutation (1,5). Using conven-tional methods, such as SSCP, to screen for these mutations is exceedinglytime-consuming and is usually less than 100% sensitive. Moreover, neutralpolymorphisms and missense mutations of uncertain pathogenicity are identi-fied by these techniques. Direct sequencing of the gene is both time-consumingand expensive. PTT was developed to screen the dystrophin gene specificallyfor translation-terminating mutations, following amplification of large seg-ments of the gene by nested RT-PCR (1). The whole of the dystrophin coding
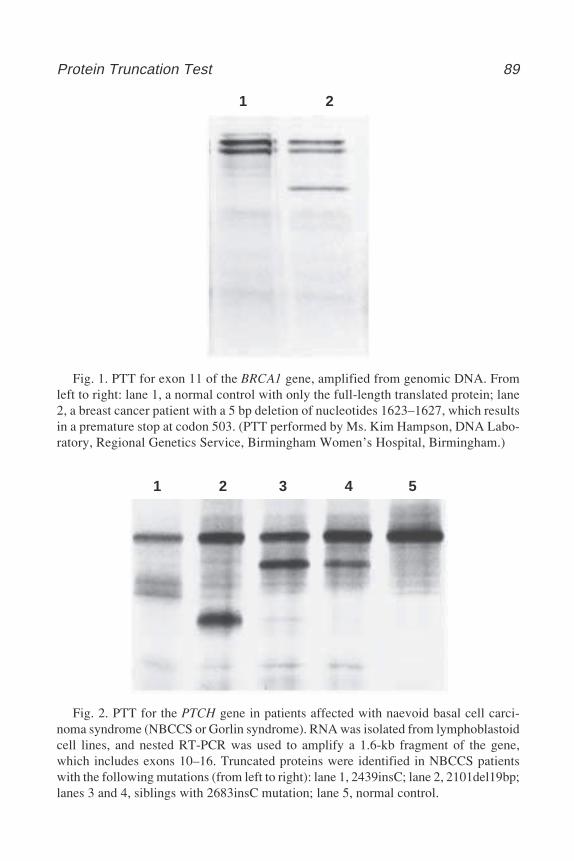
Protein Truncation Test 89
Fig. 2. PTT for the PTCH gene in patients affected with naevoid basal cell carci-noma syndrome (NBCCS or Gorlin syndrome). RNA was isolated from lymphoblastoidcell lines, and nested RT-PCR was used to amplify a 1.6-kb fragment of the gene,which includes exons 10–16. Truncated proteins were identified in NBCCS patientswith the following mutations (from left to right): lane 1, 2439insC; lane 2, 2101del19bp;lanes 3 and 4, siblings with 2683insC mutation; lane 5, normal control.
Fig. 1. PTT for exon 11 of the BRCA1 gene, amplified from genomic DNA. Fromleft to right: lane 1, a normal control with only the full-length translated protein; lane2, a breast cancer patient with a 5 bp deletion of nucleotides 1623–1627, which resultsin a premature stop at codon 503. (PTT performed by Ms. Kim Hampson, DNA Labo-ratory, Regional Genetics Service, Birmingham Women’s Hospital, Birmingham.)
1 2 3 4 5
1 2
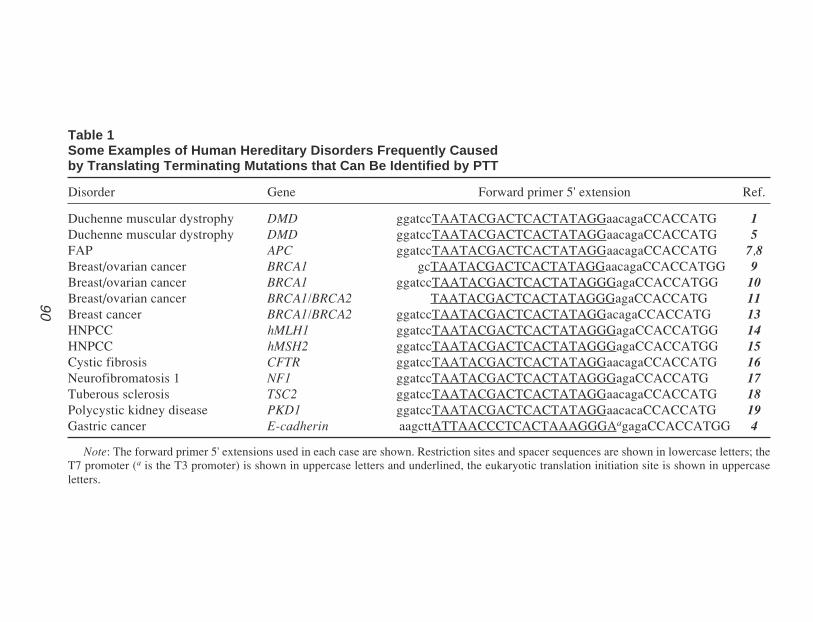
90H
ardy
90
Table 1Some Examples of Human Hereditary Disorders Frequently Causedby Translating Terminating Mutations that Can Be Identified by PTT
Disorder Gene Forward primer 5' extension Ref.
Duchenne muscular dystrophy DMD ggatccTAATACGACTCACTATAGGaacagaCCACCATG 1Duchenne muscular dystrophy DMD ggatccTAATACGACTCACTATAGGaacagaCCACCATG 5FAP APC ggatccTAATACGACTCACTATAGGaacagaCCACCATG 7,8Breast/ovarian cancer BRCA1 gcTAATACGACTCACTATAGGaacagaCCACCATGG 9Breast/ovarian cancer BRCA1 ggatccTAATACGACTCACTATAGGGagaCCACCATGG 10Breast/ovarian cancer BRCA1/BRCA2 TAATACGACTCACTATAGGGagaCCACCATG 11Breast cancer BRCA1/BRCA2 ggatccTAATACGACTCACTATAGGacagaCCACCATG 13HNPCC hMLH1 ggatccTAATACGACTCACTATAGGGagaCCACCATGG 14HNPCC hMSH2 ggatccTAATACGACTCACTATAGGGagaCCACCATGG 15Cystic fibrosis CFTR ggatccTAATACGACTCACTATAGGaacagaCCACCATG 16Neurofibromatosis 1 NF1 ggatccTAATACGACTCACTATAGGGagaCCACCATG 17Tuberous sclerosis TSC2 ggatccTAATACGACTCACTATAGGaacagaCCACCATG 18Polycystic kidney disease PKD1 ggatccTAATACGACTCACTATAGGaacacaCCACCATG 19Gastric cancer E-cadherin aagcttATTAACCCTCACTAAAGGGAagagaCCACCATGG 4
Note: The forward primer 5' extensions used in each case are shown. Restriction sites and spacer sequences are shown in lowercase letters; theT7 promoter (a is the T3 promoter) is shown in uppercase letters and underlined, the eukaryotic translation initiation site is shown in uppercaseletters.
Protein Truncation Test 91
sequence can by amplified and screened by PTT in just 10 overlapping frag-ments and has been successfully used to identify translation-terminating muta-tions in affected males and carrier females (5). More recently, multiplex PTTfor the dystrophin gene has been described (6). The complete coding sequencecan be analyzed in just five overlapping RT-PCR products, which are simulta-neously tested for truncating mutations in a single in vitro transcription–trans-lation reaction, translated proteins from one reaction are separated in a singlelane of an SDS-PAGE gel (6).
The advantages PTT has over conventional mutation screening methodsmake it an ideal choice for identifying translation-terminating mutations thatoccur in several important tumor suppressor genes. Familial adenomatous poly-posis (FAP) is caused by germline mutations of the APC gene, and somaticmutation of the APC gene occurs frequently in sporadic colorectal carcinomas(CRC). In both FAP and CRC, approx 95% of the mutations identified in theAPC gene result in premature termination of protein translation (7). The APCgene is large with 15 exons and a coding sequence of 8.5 kb. Exon 15 of theAPC gene is 6.5 kb in length and approx 70% of the mutations found in FAPpatients occur in the 5' end of exon 15. Approximately 65% of the somaticmutations found in sporadic CRC are located within a small region of exon 15known as the mutation cluster region. By direct amplification of a 2-kb seg-ment of exon 15 of the APC gene from genomic DNA and a single PTT, it istheoretically possible to identify 50% of germline mutations in FAP patientsand 75% of somatic mutations in sporadic CRC (7). PTT analysis of the com-plete coding region of the APC gene can be accomplished by amplification ofthe whole gene in five or six overlapping segments (2,8). Exon 15 is amplifieddirectly from genomic DNA in four overlapping segments (2,8). Exons 1–14are amplified in one (2) or two overlapping segments by RT-PCR amplifica-tion of RNA (8). Using this approach, translation-terminating mutation wereidentified in 82% of FAP patients tested (2).
A similar approach has been described for the identification of translation-terminating mutations that occur in the BRCA1 and BRCA2 genes, which causethe majority of cases of hereditary breast and ovarian cancer where a singlegene is involved (9–11). BRCA1 and BRCA2 are similar in structure, bothare large genes with many exons, and in each case, the majority of mutationsresult in the premature termination of translation. The BRCA1 gene encodes a7.5-kb transcript, spread over 100-kb of DNA. It has 22 coding exons, andexon 11 alone contains 60% of the coding sequence (10,12). Approximately86% of the mutations identified in BRCA1 are truncating mutations and approx50% of these are located within exon 11 (10). Similarly, BRCA2 has 26 codingexons and encodes a 10.5-kb transcript; exon 11 is exceptionally large andcontains 50% of the entire coding sequence (12). Virtually all of the mutations
92 Hardy
so far identified in BRCA2 are protein truncating (11). Thus, like the APC gene,translation-terminating mutations in BRCA1 and BRCA2 are most easily iden-tified by PTT. In both cases, exon 11 is amplified directly from genomic DNAin one (11) or three (9,10) overlapping segments for BRCA1 and in two to fiveoverlapping segments for BRCA2 (11–13). Exon 10 of the BRCA2 gene canalso be amplified directly from genomic DNA as a single 1.2-kb segment (13).PTT for the other, smaller exons is performed following nested RT-PCR(9,11,12).
In summary, PTT is a simple, rapid, and cost-effective method of screeninglarge genes, with a high frequency of mutations that result in premature termi-nation of protein translation. The following sections describe how to performmutation analysis by PTT, and consideration is given to some of the problemsmost often encountered when using this technique.
2. Materials2.1. PCR Amplification of Templatefor In Vitro Transcription and Translation
2.1.1. Reverse Transcription of RNA
1. Total cellular RNA prepared from the appropriate tissue (see Note 1).2. Oligo-d(N)6 primer, 0.5 µg/µL (Promega Ltd.). Store at –20°C (see Note 2).3. Diethyl pyrocarbonate (DEPC) treated distilled H2O. Add 100 µL of DEPC to
100 mL of distilled H2O contained in a glass bottle. Mix vigorously for 10 minand then leave at room temperature overnight. Inactivate the DEPC by autoclav-ing for 30 min at 120°C. Store at 4°C. DEPC should be handled with care, as it isa powerful acylating agent, always handle in a fume hood and never add to Trisbuffers or solutions containing ammonia.
4. 5X Reverse transcription buffer (Invitrogen Life Technologies Ltd.). Store at –20°C.5. 0.1 M Dithiothreitol (DTT) (Invitrogen Life Technologies Ltd.). Store at –20°C.6. 10 mM dNTP mix in sterile DEPC-treated H2O, prepared from 100 mM stocks of
dATP, dCTP, dGTP; and dTTP (Amersham Pharmacia Biotech Ltd.). Store at –20°C.7. RNasin ribonuclease inhibitor (Promega Ltd.). Store at –20°C.8. M-MLV reverse transcriptase, 200 U/µL (Invitrogen Life Technologies Ltd.). Store
at –20°C.
2.1.2. Nested RT-PCR
1. 10X Taq Extender™ reaction buffer (see Note 3), 200 mM Tris-HCl (pH 8.8),100 mM KCl, 100 mM (NH4)2SO4, 20 mM MgSO4, 1% Triton X-100, 1 mg/mLnuclease-free bovine serum albumin (Stratagene Ltd., Cambridge, UK). Storeat –20°C.
2. 2 mM dNTP mix in sterile H2O, prepared from 100 mM stocks of dATP, dCTP,dGTP, and dTTP (Amersham Pharmacia Biotech Ltd). Store at –20°C.
Protein Truncation Test 93
3. Nested PCR primers pairs. The forward primer of the inner pair must have the5' extension, which includes the T7 promoter sequence, the eukaryotic proteintranslation initiation sequence, followed by the in-frame ATG start codonand the gene-specific primer sequence (see Table 1 and Note 4). Some examplesof 5' extension sequences are shown in Table 1. Primers stock solutions are200 pmol/µL in TE buffer (10 mM Tris-HCL, 1 mM Na2EDTA, pH 8.0), store at–20°C. Working solutions are 20 pmol/µL in sterile dH2O. Store at –20°C.
4. Sterile dH2O.5. Taq Extender™ PCR additive, 5 U/µL (see Note 3) (Stratagene Ltd., Cambridge,
UK). Store at –20°C.6. Taq DNA polymerase (see Note 5), 5 U/µL (Invitrogen Life Technologies Ltd.).
Store at –20°C.7. 50 mM MgCl2 (Invitrogen Life Technologies Ltd.). Store at –20°C.8. Mineral oil (Sigma Chemical Company). Store at room temperature.
2.1.3. PCR Amplification of Genomic DNA
1. Genomic DNA. (see Note 6).2. 10X PCR buffer minus magnesium (see Note 5), 200 mM Tris-HCl (pH 8.4),
500 mM KCl (Invitrogen Life Technologies Ltd.). Store at –20°C.3. T7 modified forward primer and reverse primer pairs. Stock solutions are
200 pmol/µL in TE buffer; store at –20°C. Working solutions are 20 pmol/µL, insterile dH2O. Store at –20°C.
4. 2 mM dNTP mix (see Subheading 2.1.2.).5. 50 mM MgCl2 (Invitrogen Life Technologies Ltd.). Store at –20°C.6. Taq DNA polymerase, 5 U/µL (Invitrogen Life Technologies Ltd.). Store at –20°C.7. Mineral oil (Sigma Chemical Company). Store at room temperature.
2.2. Agarose Gel Electrophoresis
1. 1X TBE buffer: 89 mM Tris-borate, 89 mM boric acid, 2 mM EDTA. Prepare a10X stock solution by dissolving 108 g Trizma base, 55 g boric acid, and 9.3 gNa2EDTA dissolved in a final volume of 1000 mL distilled H2O without adjust-ment of pH. Store at room temperature.
2. Ethidium bromide solution, 5 mg/mL in dH2O. Store at 4°C in a dark glass bottle.Great care should be taken when handling solutions and gels containing ethidiumbromide, as it is a powerful mutagen. Gloves should be worn at all times and amask should be worn when weighing out the solid. Solutions of ethidium bro-mide should be disposed of in compliance with the local safety regulations.
3. Agarose gel, 1% (w/v) agarose in 1X TBE buffer, with 0.5 µg/mL ethidiumbromide.
4. 1-kb Ladder (Invitrogen Life Technologies Ltd.), supplied at a concentration of1.0 µg/µL. Store at –20°C. Prepare a working solution of 100 ng/µL in 1X gelloading buffer Store at –20°C. Load approx 100 ng of ladder per millimeterlane width.
94 Hardy
5. 6X DNA loading buffer, 0.25% bromophenol blue, 0.25% xylene cyanol, 30%glycerol in dH2O. Prepare 2X DNA loading buffer by dilution in dH2O. Storeat –20°C.
2.3. In Vitro Transcription and Translation
1. TnT® T7 Quick Coupled Transcription/Translation system (Promega Ltd.) (seeNote 7). Stable for 1 yr when stored at –70°C. Avoid unnecessary thawing andrefreezing, as this will severely reduce the activity of the kit. The kit contains200-µL aliquots of the TnT® T7 Quick master mix, which should be thawed andrefrozen no more than twice. After thawing and using part of a 200-µL aliquot,divide the remaining master mix into smaller aliquots. For example, aliquots of50-µL of master mix is sufficient for five 12.5 µL reactions.
2. T7 luciferase control DNA, 0.5 mg/mL. Supplied withTnT® T7 Quick CoupledTranscription/Translation system (Promega Ltd.). Store at –20°C.
3. Nuclease-free H2O: Supplied with TnT® T7 Quick Coupled Transcription/Trans-lation system (Promega Ltd.). Store at –20°C.
4. Redivue™ L- [35S]methionine (see Notes 7 and 8), specific activity 37 TBq/mmol(1000 Ci/mmol) (product code AG1594, Amersham Life Science). Store at –20°C.Observe local regulations for handling and disposal of radioactive isotopes.
2.4. SDS-PAGE and Autoradiography
1. 0.5 M Tris-HCl buffer (pH 6.8), autoclave and store at room temperature.2. 10% (w/v) Sodium dodecyl sulfate (SDS). Store at room temperature. Wear a
mask and gloves when weighing out the solid SDS; if possible, use a fume cup-board. SDS is extremely irritating to the respiratory system by inhalation, and bydirect contact with eyes and skin.
3. SDS-PAGE sample loading buffer. Mix 2 mL glycerol, 2 mL 10% SDS (w/v),0.25 mg bromophenol blue, and 2.5 mL of 0.5 M Tris buffer (pH 6.8); add dH2Oto a final volume of 9.5 mL. Just before use, add 0.5 mL β-Mercaptoethanol.Stored at room temperature, the loading buffer is stable for about 1 wk, and thendiscard and prepare a fresh batch. β-Mercaptoethanol is harmful by inhalationand contact with skin, as well as having a very unpleasant smell. Therefore, onlyopen the stock of β-Mercaptoethanol in a fume cupboard and always wear dis-posable latex gloves. If possible, only handle the SDS-PAGE sample loadingbuffer in a fume cupboard or use only in a well-ventilated laboratory.
4. 1.5 M Tris buffer (pH 8.8); autoclave and store at room temperature.5. 30% Acrylamide solution (29:1 ratio of acrylamide to bis-acrylamide), store at
4°C. Both acrylamide and bis-acrylamide are neurotoxins that are readily absorbedthrough the skin and by inhalation of the dust. A mask, safety spectacles, and glovesmust be worn when weighing them. Therefore, it is more convenient to purchasepreprepared 30% acrylamide solution, which is available from a number of suppli-ers of chemicals and molecular-biology reagents. The solution is still extremelyharmful, and great care should be taken when using it. Always wear protectiveclothing, disposable latex gloves, and safety spectacles.
Protein Truncation Test 95
6. 10% (w/v) Ammonium persulfate solution in dH2O. Store at 4°C and discardafter 1 wk.
7. N,N,N',N'-tetramethylethylenediamine (TEMED). Store at 4°C.8. Polyacrylamide gel apparatus (e.g., the Mini-Protean II electrophoresis cell [see
Note 9] [Bio-Rad Laboratories Ltd.]).9. 1X Tris-glycine gel running buffer: 25 mM Tris, 250 mM glycine, 0.1% SDS.
Prepare a 5X stock solution by dissolving 15.1 g Tris base and 94 g glycine dis-solved in 900 mL of dH2O, add 50 mL 10% SDS solution, adjust final volume to1000 mL with dH2O. Store at room temperature.
10. Rainbow™ colored protein molecular-weight markers (see Note 10), low-molecu-lar-weight range 2.35–46 kDa or high-molecular-weight range 14.3–220 kDa(Amersham Life Sciences). Stable for at least 3 mo stored at –20°C.
11. Fix solution, 10% (v/v) acetic acid and 20% (v/v) methanol in dH2O, freshlyprepared before use.
12. 3MM Chromatography paper (Whatman).13. Vacuum gel drier.14. X-ray film (e.g., Hyperfilm MP [Amersham Life Science], Kodak T-mat or
Kodak X-OMAT AR [Kodak]) and cassettes.
3. Methods3.1. PCR Amplification of Templatefor In Vitro Transcription and Translation
3.1.1. Reverse Transcription of RNA (9)
Particular care must be taken when preparing and working with RNA toprevent contamination with RNases. The workbench should be clean. Cleandisposable latex gloves should be worn at all times. New, autoclaved dispos-able plastic microtubes and pipet tips should be used. Some laboratories preferto have a set of automatic pipets kept exclusively for RNA work only in orderto minimize contamination problems.
1. Place approx 1–3 µg of total cellular RNA and 500 ng of oligo-d(N)6 primer (seeNote 2) in a 0.5-mL microtube. Make the final volume to 32 µL with DEPC-treatedH2O. Heat to 65°C for 10 min and then place on ice.
2. Add 12 µL of 5X reverse transcriptase buffer, 6 µL of 0.1 M DTT, 6 µL of 10 mMdNTP mix, 1 µL RNasin (30–40 U/µL), and 3 µL M-MLV reverse transcriptase(200 U/µL). Incubate at 42°C for 1 h. Inactivate the reverse transcriptase by heat-ing to 95°C for 5 min.
3. Perform RT-PCR immediately or store at –20°C until required. Reverse-tran-scribed RNA should be stable for several months when stored at –20°C.
3.1.2. Nested RT-PCR
The gene under investigation may not be highly expressed in tissues that areeasily sampled, such as blood lymphocytes, cultured skin fibroblasts, or
96 Hardy
lymphoblastoid cell lines. In some cases, the mRNA may be present only asillegitimate transcripts. This problem can usually be overcome by performingnested RT-PCR. In the first round of PCR, gene-specific primers are used toamplify a segment of the gene using the reverse-transcribed RNA as thetemplate. A second round of PCR is then performed using an aliquot of the firstPCR as template. The primers for the second round of PCR are nested withinthe first primer pair; the forward primer has the 5' modification required forPTT. If low-level transcription of the gene is not a problem, then one round ofPCR should be adequate, using the 5' modified T7 primer and a suitable reverseprimer. Obtaining good, reproducible results for PTT depends to a large extenton obtaining a single PCR product of high yield. Therefore, it is important toensure that the PCR conditions are optimized (see Note 11).
1. Place 1–5 µL of the reverse-transcribed RNA in a 0.5 mL microtube. Store theremainder of the reverse-transcribed RNA at –20°C.
2. Add 2.5 µL of 10X Taq extender reaction buffer, 2.5 µL of 2 mM dNTPs, 20pmol forward primer, 20 pmol reverse primer, and sterile H2O to bring the totalvolume to 24 µL. When setting up a number of reactions, it is more convenient toprepare a master mix containing the appropriate volumes of the PCR compo-nents. The master mix is added to the tubes containing the reverse-transcribedRNA, thus reducing the number of pipetting steps. Mix well and overlay thereaction with 1 or 2 drops of mineral oil to prevent evaporation.
3. Perform “hot-start” PCR (see Note 12). Place the tubes in the thermal cycler andheat to 94°C for 4 min. Pause the thermal cycler at 94°C and add 1 U Taq DNApolymerase and 1 U Taq extender additive. Add the two enzymes simultaneouslyas a mixture diluted to 1 U/µL in 1X reaction buffer.
4. Resume thermal cycling and perform 30–35 rounds of amplification consistingof denaturing at 94°C for 1 min, annealing at 50–65°C for 1 min, and extensionat 72°C for 2 min (see Note 13). End the program with a final extension step of72°C for 10 min.
5. When the thermal cycling program has ended, check 2–5 µL from each sampleby agarose gel electrophoresis (see Subheading 3.2.). It may be possible to seethe first-round amplification product. If a PCR product is visible, check if it is ofthe expected size by comparison with the DNA size ladder.
6. Transfer 1–5 µL of the first-round PCR into a fresh 0.5 mL microtube. Store theremainder of the first-round PCR product at –20°C. Add 2.5 µL 10X Taq extenderreaction buffer, 2.5 µL of 2 mM dNTPs, 20 pmol of 5' modified forward primer,20 pmol reverse primer, and sterile H2O to bring the total volume to 24 µL. Mixwell and overlay the reaction with 1 or 2 drops of mineral oil.
7. Perform “hot-start” PCR. Add 1 U Taq DNA polymerase and 1 U Taqextender additive. Perform 30–35 rounds of amplification consisting of dena-turing at 94°C for 1 min, annealing at 50–65°C for 1 min, extension at 72°Cfor 2 min (see Note 13). End the program with a final extension step of 72°Cfor 10 min.
Protein Truncation Test 97
8. Check the specificity and yield of the amplification by agarose gel electrophore-sis (see Subheading 3.2.).
3.1.3. PCR Amplification of Genomic DNA
1. Place 100–500 ng of genomic DNA in a 0.5-mL microtube. Add 2.5 µL of 10XPCR buffer, 2.5 µL of 2 mM dNTPs, 0.75 µL of 50 mM MgCl2 (see Note 11),20 pmol 5' modified forward primer, 20 pmol reverse primer, and sterile H2O tobring the total volume to 24 µL. Mix well and overlay the reaction with 1 or 2drops of mineral oil.
2. Perform “hot-start” PCR. Add 1 U Taq DNA polymerase. Perform 30–35 roundsof amplification consisting of denaturing at 94°C for 1 min, annealing at50–65°C for 1 min, extension at 72°C for 2 min (see Note 13). End the programwith a final extension step of 72°C for 10 min.
3. Check the specificity and yield of the amplification by agarose gel electrophoresis.
3.2. Agarose Gel Electrophoresis of PCR Products
1. Mix 2–5 µL of each PCR sample with an equal volume of 2X DNA loadingbuffer. Load the samples onto the 1% agarose gel and load the appropriate vol-ume of the 1-kb ladder into one lane. Separate by electrophoresis at 75 Volts for1–2 h.
2. View the gel on an ultraviolet (UV) transilluminator. A single product of theexpected size should be seen. Estimate the yield of the PCR product. This canmost easily done by comparison with a similar-sized DNA band of known con-centration. For example, the 1.6-kb fragment of the 1-kb ladder contains 10%of the mass loaded on the gel. It is useful to take a Polaroid photograph of theagarose gel as a record of the PCR product concentration and the specificity ofthe amplification.
3. A single PCR product of high yield can be used directly, without purification, inthe in vitro transcription–translation reaction. The mineral oil can be removedfrom the PCR sample if preferred, although this is not essential when using theTnT® T7Quick kit. This can be easily done by addition of 1 or 2 drops ofchloroform, vortexing, and spinning for 2 min in a microcentrifuge. Retain theupper aqueous layer and transfer to a fresh tube. Proceed directly with the in vitrotranscription–translation or store the PCR samples at –20°C until required.
3.3. In Vitro Transcription and Translation
When performing the in vitro transcription and translation reaction, it isimportant to maintain an Rnase-free environment. Use new, sterile plasticmicrotubes and pipet tips; always wear clean, disposable latex gloves.
1. Remove a tube of TnT® T7 Quick master mix from the -70°C freezer. Thawrapidly by hand warming; then place on ice. The TnT® T7 Quick master mixshould always be kept on ice while the reactions are being set up and should bereturned to the –70°C freezer afterward to minimize the loss of activity.

98 Hardy
2. Place approx 250–500 ng of PCR product in a 0.5-mL microtube, if necessary,make the volume up to 2 µL with nuclease-free H2O. Add 0.5 µL [35S]methionineand 10 µL TnT® T7 Quick master mix to give a final volume of 12.5 µL (seeNote 14). Mix well by gently pipetting; avoid mixing too vigorously and causingthe mixture to foam, as this will reduce the activity of the lysate. When testing anumber of PCR templates, it is more convenient to prepare a master mix contain-ing the appropriate volumes of [35S]methionine and TnT® T7 Quick kit. The num-ber of pipetting steps is reduced by dispensing the master mix directly to tubescontaining the PCR products. To monitor the efficiency of the in vitro transcrip-tion–translation, it is useful to include a reaction containing 250 ng of the T7Luciferase control DNA that is supplied with the TnT® T7 Quick kit. The controlDNA translation product is an intensely labeled 61-kDa protein. This provides auseful way of monitoring the activity of the kit, particularly after prolonged peri-ods of storage, and provides an additional size marker for SDS-PAGE. Include acontrol reaction without any PCR product to monitor the background incorpora-tion of labeled amino acid. If possible, include a positive control (i.e., a PCRproduct with a characterized translation-terminating mutation).
3. Incubate at 30°C for 90 min (see Note 15). Store at –20°C until required or pro-ceed with the SDS-PAGE immediately.
3.4. SDS-PAGE and Autoradiography
1. When the in vitro transcription–translation reaction is complete, transfer 5 µL toa fresh tube containing 45 µL SDS-PAGE sample loading buffer. Heat at 100°Cfor 2 min to denature the protein; then centrifuge briefly. Store the remainder ofthe reaction at –20°C.
2. Ensure that the gel electrophoresis apparatus is clean and dry. Assemble the glassplates and spacers in between the side clamps. Ensure that the spacers and theglass plates are flush at the bottom end. Position the clamped plates into the gelpouring stand.
3. Prepare two 12% resolving gels (see Note 16), mixing 3.3 mL H2O, 4.0 mL of30% acrylamide solution, 2.5 mL of 1.5 M Tris buffer (pH 8.8), and 100 µLof 10% SDS in a 15-mL disposable plastic tube. Add 4 µL TEMED and 100 µLof 10% ammonium persulfate. Mix by inversion and pour approx 3 mL intoeach of the gel molds. Tap the glass plate to dislodge any air bubbles as theyform. To ensure that the top of the gel sets with a straight edge, overlay the gelwith 0.1% SDS solution. Leave the gel to polymerise for about 1 h.
4. When the gel is fully polymerized, pour off the 0.1% SDS solution and rinse thetop of the gel with distilled H2O. Drain away as much water as possible and soakup the remainder using a piece of Whatman 3MM paper.
5. Prepare two 5% stacking gels by mixing 2.77 mL H2O, 0.83 mL of 30% acryla-mide solution, 1.26 mL of 0.5 M Tris buffer (pH 6.8), and 50 µL of 10% SDS ina 15-mL disposable plastic tube. Add 5 µL TEMED and 50 µL of 10% ammoniumpersulfate. Mix by inversion and pour on top of the resolving gel, fill the gel mold
Protein Truncation Test 99
up to the level of the small glass plate. Insert the comb so that there is a depth of1 cm between the bottom of each well and the top of the resolving gel. Leave thegel to polymerize for at least 30 min.
6. When the stacking gel is polymerized, carefully remove the comb. Remove theclamped glass plates from the pouring stand and clip in to the central cooling core.Place the central core within the electrophoresis chamber. Place approx 100 mL of1X Tris-glycine running buffer in the upper buffer chamber and approx 200 mL inthe lower buffer chamber. Flush out the wells with 1X running buffer.
7. Gently load 10–15 µL of each sample into the bottom of each well using a finegel loading tip. Load only 5 µL of the Luciferase control reaction. Mix 3.5 µL ofthe Rainbow colored protein molecular-weight marker with an equal volume ofSDS-PAGE sample loading buffer. Load the marker directly into one of the lanesof the gel, there is no need to heat denature the size marker.
8. Perform electrophoresis at a constant voltage of 200 V for a period of 45–60 min,or until the bromophenol dye has reached the bottom of the gel.
9. When electrophoresis is complete, dismantle the apparatus and carefully sepa-rate the glass plates containing the gel. Remove the stacking gel (the gel will beradioactive and should be disposed of in the appropriate way) and cut off a smallpiece of one corner, for orientation purposes.
10. Place the gel in a plastic box containing approx 200–300 mL of fix solution.Leave for 20–30 min with gentle shaking.
11. Pour off the fix solution, the solution will be radioactive and should be disposedof appropriately. Place the gel on a piece of 3MM paper that is just slightly largerthan the gel. Cover the gel and 3MM paper completely with Saran Wrap and dryon a vacuum gel drier at 60°C for approx 1 h. Do not release the vacuum until thegel is completely dried; premature release of the vacuum will cause the gel tocrack. The 1-mm thickness of the gel should be reduced to a negligible thicknesswhen the gel is completely dry. Remove the gel from the drier and discard theSaran Wrap. Tape the gel inside an X-ray film cassette; and perform autoradiog-raphy overnight at room temperature (see Note 17).
12. Develop the X-ray film and align the film over the gel. Mark the position of theRainbow colored protein molecular-weight markers on to the film with a perma-nent marker pen. The size of any truncated proteins can be estimated from agraph of log10 of the mass of the size standards plotted against electrophoreticmobility. A shorter or longer exposure time may be required, depending on thelevel of [35S]methionine incorporation.
3.5. Interpretation
1. The presence of a translation-terminating mutation within the PCR-amplifiedfragment is indicated by the presence of a protein of lower molecular weight thanthe full-length protein (see Figs. 1 and 2). The size of the truncated protein, esti-mated by comparison with protein molecular-weight markers or with the trun-cated protein of a characterized mutation, indicates the position of the premature

100 Hardy
stop codon. The position of a nonsense mutation can be determined quite accu-rately; whereas a frameshift mutation may be located some distance upstreamfrom the site of the premature stop codon. Another mutation detection method,such as SSCP or heteroduplex analysis, can be used to locate the mutation moreprecisely and confirm the presence of the mutation in genomic DNA. Sequencingof genomic DNA should be used to definitively characterize the mutation.
2. Other labeled polypeptides, in addition to the full-length protein and any trun-cated protein, are often observed on the autoradiograph (see Figs. 1 and 2). Thesenonspecific proteins are usually weakly labeled and easily distinguishable fromtrue truncated proteins. These extra bands often arise from protein translationinitiated from internal methionine codons and do not usually affect the overallresult. Occasionally, these internally initiated proteins may be quite intenselylabeled and may be wrongly identified as truncated proteins. The addition ofmagnesium chloride to a final concentration of 1.5 mM in the in vitro transcrip-tion–translation reaction is reported to reduce nonspecific bands that result frominitiation at internal methionine codons (6). Translation of mRNA transcriptsfrom the reticulocyte lysate is another cause of nonspecific protein bands appear-ing in all of the lanes of the gel, including the “no DNA” control. In the case ofthe PTT for the BRCA1 gene, the presence of nonspecific translated proteins hasbeen shown to be both sequence dependent and to vary with the type of in vitrotranslation system being used (10). One of the PCR fragments tested was foundto be more efficiently translated, with fewer nonspecific protein bands, whenwheat-germ extract was used compared with a rabbit reticulocyte-based transla-tion system (10). The inclusion of a myc reporter tag (see Note 8) in the trans-lated protein provides a means of eliminating these nonspecific protein bands(3). Immunopreciptitaion can be used to isolate radiolabeled proteins containingthe myc reporter tag. Hence, only proteins initiated from the methionine start siteare identified (3). Alternatively, nonradioactive PTT can be performed (see Note8), with the myc reporter tag providing a means of identifying the translated pro-teins using Western blot methodology (3).
3. An additional RT-PCR product, observed by agarose gel electrophoresis, sug-gests the presence of a splice site mutation. However, the presence of smaller,nonspecific PCR products in samples from both affected individuals and normalcontrols is frequently observed when performing nested RT-PCR from low-levelmRNA transcripts and may lead to a false-positive result by PTT (11,20,21). Thepresence of additional RT-PCR products has been correlated with the quality ofthe RNA preparation and is often simply a nonreproducible PCR artifact that cansometimes be eliminated by adjustment of the conditions for cDNA preparationand optimization of the PCR conditions (11,20). The presence of alternativemRNA transcripts can also lead to a false-positive result and has been describedin PTT for the hMLH1 gene in hereditary nonpolyposis colorectal cancer(HNPCC) (14). Alternative transcripts resulted in the identification of truncatedproteins in many samples from both affected individuals and normal controls.The alternative transcripts were found to be more common in RNA samples
Protein Truncation Test 101
obtained from lymphocyte blood samples compared with RNA samples fromlymphoblastoid cell lines. These alternative transcripts were often found to havea deletion of one or more exons. However, sequencing of genomic DNA failed toidentify any splice site defects involving these exons, indicating that the unusualtranscripts were unrelated to the HNPCC (14). Thus, PCR artifacts and alterna-tive transcripts can make the identification of translation-terminating mutationsand splice site mutations complicated. However, translation-terminating muta-tions and splice site mutations should give a consistently reproducible result andcan be confirmed by sequencing of genomic DNA.
4. For samples that show only the full-length translation product and no truncatedprotein, a number of possibilities must be considered. The most obvious explana-tion is that no translation-terminating mutation is present. However, a number ofother explanations must be considered, as there are certain situations when PTTwill fail to identify a truncating mutation. Truncating mutations that occur at theextreme 5' and 3' ends of the gene are not easily identified by PTT (22). A trun-cating mutation close to the 5' end may result in a truncated protein that is toosmall to be seen by SDS-PAGE. A mutation close to the 3' end of the gene mayresult in a truncated protein that is not significantly different in size from the full-length protein, which cannot be resolved by SDS-PAGE (22). As it is not pos-sible to design overlapping PCR segments for these regions, another mutationdetection method, such as SSCP or direct sequencing, should be used to screenthe extreme 5' and 3' ends of the segment in question (22). Mutations that alterprimer binding sites may not be detected because of failure to amplify the mutatedallele; although this should not present a problem when the gene is amplified inseveral overlapping fragments. Deletion, insertion, or duplication of severalkilobases or a translocation with a break point within the gene will result in failureto amplify the mutant allele (22). Consequently, these abnormalities cannot bedetected by PTT. A mutation in the promotor or 3' untranslated region thatreduces the level of mRNA will not be detected by PTT. Small in-frame deletionsor insertions, which cause only a small change to the size of the mutant protein,may not be resolved by SDS-PAGE (22). A mutation that causes instability of themRNA may result in failure to identify a mutation by PTT when RT-PCR is used.The instability of mutant mRNA transcripts with in-frame stop codon mutationsis a recognized phenomenon that is often cited as a cause of false-negative resultsfor PTT. For example, PTT analysis of the PAX6 gene, following RT-PCR, was foundto be less sensitive than expected (21). PTT failed to identify truncated proteinsin a number of samples with characterized mutations, because of low levels (or,in some cases, the complete absence) of the mutant mRNA (21). Similarly,Whittock et al. (6) postulated that the instability of mutant mRNA resulted in thefailure to identify a characterized truncating mutation in an obligate female DMDcarrier. In contrast, Lui et al. identified truncating mutations in the hMSH2 geneby PTT, even though the mutant mRNA transcripts were shown to be less abun-dant than the normal transcript because of nonsense mediated mRNA instability(15). Samples that show no evidence of a translation-terminating mutation by
102 Hardy
PTT should be investigated by another mutation detection method, such as SSCPor denaturing gradient gel electrophoresis (DGGE), to exclude the possibility of afalse-negative result and to investigate the pathogenic role of missense mutations.
4. Notes1. Total cellular RNA can be isolated using a variety of well-established methods
and a number of kits can be purchased for this purpose. The RNeasy total RNAkit (Qiagen Ltd.) is reliable and very easy to use. Using the spin columns sup-plied with the kit, RNA can be rapidly isolated from a wide variety of tissueswith minimum preparation and without the use of organic solvents. The TRIzolreagent (Invitrogen Life Technologies Ltd.) offers another reliable method forisolating RNA. Whatever method is chosen to prepare RNA, the integrity andyield should be assessed by agarose gel electrophoresis (see Chapter 1).
2. Oligo-d(T) primer (23), or a gene-specific primer complimentary to the 3' end ofthe sense strand can also be used to prime the first-strand synthesis of cDNA (5,6).
3. Taq Extender™ PCR additive improves the efficiency of standard Taq DNA poly-merase by increasing the number of extension reactions that go to completion byimproved proof reading activity. It increases the yield of PCR product and canimprove the amplification of long and difficult PCR templates. Optimized 10XTaq Extender™ reaction buffer is used instead of 10X Taq DNA polymerasereaction buffer.
4. Sequence-specific primers should be chosen to amplify a segment of between1 and 2 kb. It is possible to amplify larger segments, although this is technicallymore difficult. The length of the gene-specific primer sequences should be about18–25 bases. A number of computer programs (e.g., PRIMER) are available thatcan be a useful aid in designing gene-specific primer pairs. For large genes, PTTis more sensitive when the coding sequence is amplified in a number of overlap-ping segments. In most published methods the overlap is 300–500 bp, althoughoverlaps of 750 bp have been reported to further improve the sensitivity of PTT(11). Overlapping the PCR segments will maximize the chances of detecting alltruncating mutations. A mutation occurring near the end of segment 1 is likely toresult in a truncated peptide that is only fractionally shorter than the full-lengthproduct. Hence, the two proteins may not be easily resolved by SDS-PAGE.However, if segment 2 overlaps with segment 1 by 300–500 bp, then a mutationnear the end of segment 1 will also occur near the start of segment 2. The smallertruncated protein should be easily identified by SDS-PAGE. The forward primermust have an extension at the 5' end, containing the sequence motifs that areessential for in vitro transcription and translation. Essentially, most PTT primersare of a similar design with minor variations. Some examples of the 5' modifica-tions that are used in PTT are shown in Table 1. The extreme 5' end of the for-ward primer may include a restriction enzyme recognition site, often BamH1,which can be useful for cloning the PCR product into a plasmid vector (22). Theaddition of a restriction enzyme site is not essential for the success of the PTTand may be replaced by any 2 or 3 bases. These are followed directly by the
Protein Truncation Test 103
bacteriophage T7 promoter sequence required for RNA synthesis. Alternatively,the T3 or SP6 promoter may be used, in which cases an in vitro transcription–translation system designed for use with these promoters must be used (see Note 7).The promoter sequence is followed by a small spacer sequence of 2–5 bp. Thespacer is followed by the eukaryotic translation initiation sequence, the in-frameATG translation start site, and the gene-specific sequence. It is most important toensure that the ATG codon and the gene-specific sequence are in frame; other-wise, an incorrect translation product will be obtained and the results of the PTTwill be meaningless. The forward primer sequence should be positioned in aregion that contains at least one or, preferably, more, codons for the labeled aminoacid (22) (see Note 8). The reverse primer may be modified at the 5' end so that astop codon is incorporated at the 3' end of the PCR product. This is said toimprove the efficiency of the translation reaction by preventing the ribosomesfrom stalling at the end of the PCR segment (TnT® T7 Quick kit user manual),although, in practice, this modification does not seem to be essential for thesuccess of PTT.
5. Taq DNA polymerase is available from a variety of suppliers of molecular-biol-ogy reagents. Taq DNA polymerase supplied by Invitrogen Life TechnologiesLtd. gives consistently good results. It is supplied with 10X Taq DNA polymerasebuffer, a separate vial of 50 mM MgCl2, and 1% W1 reagent. Added to PCRs at afinal concentration of 0.05%, the W1 reagent acts to stabilize the Taq DNA poly-merase and improve the yield of the PCR product.
6. A number of methods have been described for the isolation of genomic DNA anda variety of commercially available kits can be obtained for this purpose. Anymethod that gives good quality, high-molecular-weight DNA should be adequatefor PCR amplification for PTT. The phenol/chloroform method, Nucleon II kit(Scotlabs Ltd.), and the Puregene DNA isolation kit (Gentra Systems) are allreliable methods of extracting DNA suitable for PCR amplification prior to PTT.
7. The TnT® T7 Quick coupled transcription–translation system is recommendedbecause it is very straightforward to use. The TnT® T7 Quick master mix containsall the components required for in vitro transcription–translation; hence, fewpipetting steps are involved. One limitation of the TnT® T7 Quick kit is that it canonly be used in conjunction with T7 promoters, and [35S]methionine is the onlylabeled amino acid that can be used. If it is necessary to use a different radiolabeledamino acid the TnT® T7 coupled reticulocyte lysate or wheat-germ extract tran-scription–translation systems may be used (Promega Ltd.). These are supplied withthree separate amino acid mixtures—one for use with [35S]methionine, one for[35S]cysteine, and one for [3H]leucine. These systems are also available with dif-ferent RNA polymerases to allow the use of T7, T3, or SP6 promoters.
8. The choice of radiolabeled amino acid for detection of the translation productsshould be determined from the amino acid composition of the gene product underinvestigation. Ideally, the labeled amino acid should occur frequently within theprotein, particularly near the start of each translated segment. Truncating muta-tions near the start of each segment will not be identified if they do not contain
104 Hardy
any labeled amino acid, and this should be taken into consideration whendesigning PCR primers. Practically, the choice of labeled amino acid is limitedby the configuration of the in vitro transcription–translation kits and the avail-ability of labeled amino acids. Most published PTT methods use[35S]methionine, [35S] cysteine and [3H] leucine are the two other alternatives.Nonradioactive methods have been described that involve the incorporation ofbiotinylated lysine, with the additional steps of electroblotting of the SDS-PAGE gel and detection of the proteins by chemiluminescence (4). Commer-cially available kits for nonradioactive PTT are the Transcend™ nonradioactivetranslation detection system (Promega Ltd.), and the protein truncation test,nonradioactive kit (Boehringer Mannheim). An alternative nonradioactivemethod for detecting the products of the in vitro transcription–translation reac-tion involves the incorporation of a myc reporter tag into the translated protein(3). This is accomplished by the inclusion of 36 basepairs of the human c-mycsequence in the forward primer sequence. The in-frame c-myc sequence is posi-tioned directly between the ATG start site and the in-frame gene-specific primersequence. The presence of the myc epitope in the translated protein allows non-radioactive detection of the translated proteins using an anti-myc monoclonalantibody and enhanced chemiluminescence technology (3). PCR amplificationof the template is performed in the usual way, using a T7 modified forwardprimer that also contains the myc tag reporter sequence. Nonradioactive in vitrotranscription–translation is performed using the TnT® T7 coupled wheat-germextract system. In vitro transcription–translation systems that contain rabbitreticulocyte lysate cannot be used because the antibodies used for the detectionof the myc tag crossreact with the proteins in the reticulocyte lysate. The trans-lated proteins are separated by SDS-PAGE and elec-troblotted onto a hybrid-ization membrane. Detection of the proteins is accomplished by hybridizationwith an anti-myc monoclonal antibody, followed by a rabbit anti-mouse anti-body, and, finally, with a horseradish peroxidase conjugated swine anti-rabbitantibody. The translation products are visualized by enhanced chemilumines-cence. The main advantage of myc tag PTT is that only proteins that contain themyc epitope are detected. This greatly reduces the number of protein bands thatare seen and simplifies the identification of truncated proteins. The advantagesof these nonradioactive PTT methods are that there is no handling of radioac-tive isotopes, chemiluminescence detection methods are sensitive and often quickerthan autoradiography, and the translated proteins can be stored indefinitely.
9. The Mini-Protean II electrophoresis cell is a convenient format for the separationof translated proteins in PTT. Two gels 7 cm in length and 8 cm in width, eachwith 10 or 15 lanes, can be run simultaneously in under 1 h. Any similar gelsystem can used (e.g., the Hoefer “Mighty Small” electrophoresis cell [SE245] isof a similar design to the Mini-Protean II model). Some laboratories prefer to uselarger-format gels for the separation of PTT translation products. The Protean IIelectrophoresis cell (Bio-Rad Laboratories Ltd.) is an alternative for those whowish to run longer gels. Up to four gels of 16 × 16 cm, or 16 × 20 cm can be run
Protein Truncation Test 105
simultaneously to separate between 60 and 100 samples. Using the Protean IIsystem, electrophoresis is performed over a period of 16 h at 30 mA.
10. The Rainbow™ colored protein molecular-weight markers provide a lessexpensive alternative to 14C-radiolabeled protein molecular-weight standards.The Kaleidoscope prestained SDS-PAGE standards are a similar product (Bio-Rad Laboratories Ltd.). The main disadvantage of using the nonradioactive mo-lecular-weight standards is that the position of the protein standards must bemarked on to the X-ray film, after the film has been developed, by aligning thefilm with the gel. Hence, the molecular weight of the truncated proteins calcu-lated in this way may be slightly inaccurate. The Rainbow™ colored proteinmolecular weight markers are also available labeled with a 14C label(Amersham Life Sciences).
11. In optimizing the RT-PCR, it may be necessary to adjust the amounts of cDNAand primers added to the first round of amplification. To establish the optimalMgCl2 concentration for specific amplification, it is necessary to perform a MgCl2titration. The efficiency of amplification by Taq DNA polymerase and the com-position of 10X reaction buffer from different suppliers may vary. In establishingoptimal amplification conditions, it may be useful to try different types of TaqDNA polymerases and buffers to see which gives the best result. Amplificationof templates with a strong secondary structure can sometimes be improved by theaddition of dimethyl sulfoxide to a final concentration of 5–10%.
12. Performing “hot-start” PCR reduces mispriming and thus increases the specific-ity of the amplification.
13. The melting temperature ™ of the PCR primers can be calculated using a varietyof formulas (e.g., 4[G+C] + 2[A+T]), the PCR annealing temperature is usuallytaken as 5°C below the Tm. In practice, the optimal annealing temperature is bestdetermined empirically. The duration of the 72°C extension step is determinedby the length of the fragment to be amplified. Allowing 1 min for each kilobaseto be amplified should be sufficient time for the extension reactions to be com-pleted. The number of cycles can be decreased if the amplification efficiency isgood. The use of thin-walled PCR tubes allows the duration of the 94°C denatur-ing step and the annealing step to be reduced considerably, thus minimizing theloss of activity of the Taq DNA polymerase and reducing the time in whichmisannealing of primers can occur.
14. The volumes given here for performing the in vitro transcription–translationare actually one-quarter of those recommended in the TnT® Quick kit protocol.Between 0.25 and 1 µL [35S]methionine can be added to the reaction. For tem-plates that translate well, the minimum volume of [35S]methionine can be used.For templates that contain few methionine residues or translate less efficiently,the volume may be increased. If it is necessary to use more than 2 µL of PCRproduct, the volumes of reaction components can be scaled up.
15. Incubation at 22°C for 90 min has been reported to improve the efficiency oftranscription and translation in PTT analysis of the BRCA1, BRCA2, NF1, andAPC genes using the Promega TnT/T7 coupled reticulocyte lysate system (24).
106 Hardy
16. A 12% SDS-PAGE gel is suitable for separating proteins in the range of approx14–100 kDa. The volumes of reagents given in this method to prepare a 12%SDS-PAGE gel are adapted from Sambrook et al. (25), which also gives the vol-umes of reagents required to prepare gels of 6%, 8%, 10%, and 15% concentra-tion. Separating the translation products on several gels of different percentages(e.g., 8%, 10%, and 14% gels) (21) can increase the likelihood of detecting thelarger and smaller truncated proteins. The use of 5–18% gradient SDS-PAGEhas been reported to give better resolution for a broad size range of truncatedproteins (11).
17. The signal strength may be increased by treatment of the gel with Amplify™fluorographic enhancement reagent (Amersham Life Science) for 20–30 minafter the gel has been fixed. The gel is then rinsed in distilled water and driedunder vacuum. Fluorography is performed with intensifying screens overnight at–70°C. Some loss in resolution may be observed following fluorographic enhance-ment. Fluorographic enhancement is unnecessary if a strong signal can be obtainedby autoradiography.
Acknowledgments
I would like to thank all my colleagues for many helpful discussions onPTT, in particular Dr. David Bourn for his advice and comments during prepa-ration of the manuscript and Kim Hampson for providing the BRCA1 autoradand information used in the preparation of Fig. 1. I would also like to thankProfessor Georgia Chenevix-Trench and Dr Sue Shanley, of the QueenslandInstitute of Medical Research, Brisbane, Australia, for the primer sequencesused for PTT of the PTCH gene illustrated in Fig. 2.
References1. Roest, P. A. M., Roberts, R. G., Sugino, S., van Ommen, G-J. B., and den Dunnen,
J. T. (1993) Protein truncation test (PTT) for rapid detection of translation-termi-nating mutations. Hum. Mol. Genet. 2, 1719–1721.
2. Powell, S. M., Petersen, G. M., Krush, A. J., Booker, S., Jen, J., Giardiello, F. M.,et al. (1993) Molecular diagnosis of familial adenomatous polyposis. N. Engl. J.Med. 329, 1982–1987.
3. Rowan, A. J. and Bodmer, W. F. (1997) Introduction of a myc reporter tag toimprove the quality of mutation detection using the protein truncation test. Hum.Mutat. 9, 172–176.
4. Becker, K.-F., Reich, U., Handschuh, G., Dalke, C., and Höfler, H. (1996) Non-radioactive protein truncation test (nrPTT) for rapid detection of gene mutations.Trends Genet. 12, 250.
5. Gardner, R. J., Bobrow, M., and Roberts, R. G. (1995) The identification of pointmutations in Duchenne muscular dystrophy by using reverse-transcription PCRand the protein truncation test. Am. J. Hum. Genet. 57, 311–320.
Protein Truncation Test 107
6. Whittock, N. V., Roberts, R. G., Mathew, C. G., and Abbs, S. J. (1997) Dystrophinpoint mutation screening using a multiplexed protein truncation test. Genet. Test.1, 115–123.
7. van der Luijt, R., Khan, P. M., Vasen, H., Van Leeuwen, C., Tops, C., Roest, P., et al.(1994) Rapid detection of translation-terminating mutations at the adenomatouspolyposis coli (APC) gene by direct protein truncation test. Genomics 20, 1–4.
8. Prosser, J., Condie, A., Wright, M., Horn, J. M., Fantes, J. A., Wyllie, A. H., et al.(1994) APC mutation analysis by chemical cleavage of mismatch and a proteintruncation assay in familial adenomatous polyposis. Br. J. Cancer 70, 841–846.
9. Hogervorst, F. B. L., Cornelis, R. S., Bout, M., van Vliet, M., Oosterwijk, J. C.,Olmer, R., et al. (1995) Rapid detection of BRCA1 mutations by the protein trun-cation test. Nature Genetics 10, 208–212.
10. Plummer, S. J., Anton-Culver, H., Webster, L., Noble, B., Liao, S., Kennedy, A.,et al. (1995) Detection of BRCA1 mutations by the protein truncation test. Hum.Mol. Genet. 4, 1989–1991.
11. Garvin, A. M. (1998) A complete protein truncation test for BRCA1 and BRCA2.Eur. J. Hum. Genet. 6, 226–234.
12. Garvin, A. M., Attenhofer-Haner, M., and Scott, R.J. (1997) BRCA1 and BRCA2mutation analysis in 86 early onset breast/ovarian cancer patients. J. Med. Genet.34, 990–995.
13. Friedman, L. S., Gayther, S. A., Kurosaki, T., Gordon, D., Noble, B., Casey, G., et al.(1997) Mutation analysis of BRCA1 and BRCA2 in a male breast cancer popula-tion. Am. J. Hum. Genet. 60, 313–319.
14. Kohonen-Corish, M., Ross, V. L., Doe, W. F., Kool, D. A., Edkins, E., Faragher,I., et al. (1996) RNA-based mutation screening in hereditary nonpolyposiscolorectal cancer. Am. J. Hum. Genet. 59, 818–824.
15. Lui, B., Parsons, R. E., Hamilton, S. R., Petersen, G. M., Lynch, H. T., Watson,P., et al. (1994) hMSH2 mutations in hereditary nonpolyposis colorectal cancerkindreds. Cancer Res. 54, 4590–4594.
16. Romey, M.-C., Tuffery, S., Desgeorges, M., Bienvenu, T., Demaille, J., andClautres, M. (1996) Transcript analysis of CFTR frameshift mutations in lympho-cytes using the reverse transcription-polymerase chain reaction and the proteintruncation test. Hum. Genet. 98, 328–332.
17. Heim, R. A., Kam-Morgan, L. N. W., Binnie, C. G., Corns, D. D., Cayouette, M.C, Farber, R. A., et al. (1995) Distribution of 13 truncating mutations in the neu-rofibromatosis 1 gene. Hum. Mol. Genet. 4, 975–981.
18. van Bakel, I., Sepp, T., Ward, S., Yates, J. R. W., and Green, A. J. (1997) Muta-tions in the TSC2 gene: analysis of the complete coding sequence using the pro-tein truncation test (PTT). Hum. Mol. Genet. 6, 1409–1414.
19. Peral, B., Gamble, V., Strong, C., Ong, A. C. M., Sloane-Stanley, J., Zerres, K.,et al. (1997) Identification of mutations in the duplicated region of the polycystickidney disease 1 gene (PKD1) by a novel approach. Am. J. Hum. Genet. 60,1399–1410.
108 Hardy
20. Fitzgerald, M. G., Bean, J. M., Hegde, S. R., Unsal, H., MacDonald, D. J.,Harkin, D. P., et al. (1997) Heterozygous ATM mutations do not contribute toearly onset of breast cancer. Nature Genet. 15, 307–310.
21. Axton, R., Hanson, I., Danes, S., Sellar, G., van Heyningen, V., and Prosser, J.(1997) The incidence of PAX6 mutation in patients with simple aniridia: an evalu-ation of mutation detection in 12 cases. J. Med. Genet. 34, 279–286.
22. Hogervorst, F. B. L. (1998) Protein truncation test (PTT). Promega Notes 62, 7–10.23. Lo Ten Foe, J. R., Rooimans, M. A., Bosnoyan-Collins, L., Alon, N., Wijker, M.,
Parker, L., et al. (1996) Expression cloning of a cDNA for the major fanconianaemia gene FAA. Nature Genet. 14, 320–323
24. Claes, K., Macháckova, E., Callens, T., Van der Cruyssen, G., and Messiaen, L.(1998) Improved conditions for PTT analysis of the BRCA1, BRCA2, NF1 andAPC genes. Elsevier Trends Journals Technical Tips Online, T01457, 22/7/98.Available from: URL: http://www.elsevier.com/homepage/sab/tto/menu.htm
25. Sambrook, J., Fritsch, E. F., and Maniatis, T. (1989) Molecular Cloning: A Labora-tory Manual, 2nd ed., Cold Spring Harbor Laboratory, Cold Spring Harbor, NY.
Mutation Detection in Factor VIII 109
109
From: Methods in Molecular Biology, vol. 187: PCR Mutation Detection ProtocolsEdited by: B. D. M. Theophilus and R. Rapley © Humana Press Inc., Totowa, NJ
13
Mutation Detection in Factor VIII cDNA fromLymphocytes of Hemophilia A Patients by SolidPhase Fluorescent Chemical Cleavage of Mismatch
Naushin H. Waseem, Richard Bagnall,Peter M. Green, and Francesco Giannelli
1. IntroductionDefects of the factor VIII gene causes (f8) hemophilia A, an hemorrhagic
X-linked disorder. The factor VIII gene is 186 kb long with 26 exons, varyingfrom 69 bp (exon 5) to 3106 bp (exon 14) (1). The factor VIII mRNA is 9028bases in length with a coding region of 7053 nucleotides (2).
Hemophilia A mutations in factor VIII genes are quite heterogeneous andvarious methods have been used for the detection of these mutations. The mostwidely used are:
1. Denaturing gradient gel electrophoresis (DGGE): This is based on the ability ofmutations to reduce the melting temperature of DNA domains resulting in alteredmobility on a formamide and urea gradient polyacrylamide gel. This method candetect any sequence change but requires 41 PCR to amplify the 26 exons of factorVIII gene and the putative promoter region. The maximum length of the suitablePCR product is 600–700 bp and the product must have appropriate melting domainstructure. Some splicing signal region were not screened by this procedure (3).
2. Single strand conformation polymorphism (SSCP): This method is based on thefact that single stranded DNAs differing in a single nucleotide will acquire dif-ferent conformations that have different mobilities on a polyacrylamide gel. Vari-ous exons of factor VIII are amplified using polymerase chain reaction (PCR)and subjected to electrophoresis. The exon showing an altered electrophoreticmobility is then sequenced (4). The PCR products must be between 100–300 bpfor efficient screening.
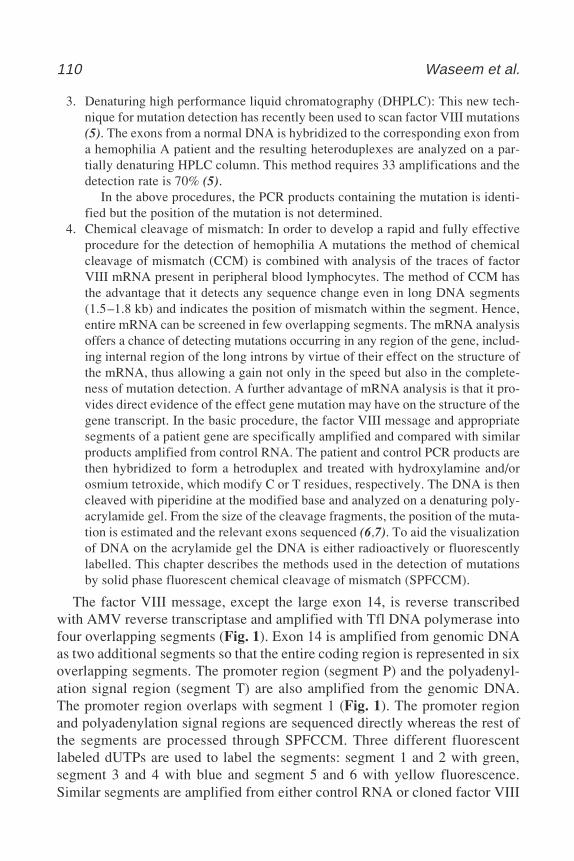
110 Waseem et al.
3. Denaturing high performance liquid chromatography (DHPLC): This new tech-nique for mutation detection has recently been used to scan factor VIII mutations(5). The exons from a normal DNA is hybridized to the corresponding exon froma hemophilia A patient and the resulting heteroduplexes are analyzed on a par-tially denaturing HPLC column. This method requires 33 amplifications and thedetection rate is 70% (5).
In the above procedures, the PCR products containing the mutation is identi-fied but the position of the mutation is not determined.
4. Chemical cleavage of mismatch: In order to develop a rapid and fully effectiveprocedure for the detection of hemophilia A mutations the method of chemicalcleavage of mismatch (CCM) is combined with analysis of the traces of factorVIII mRNA present in peripheral blood lymphocytes. The method of CCM hasthe advantage that it detects any sequence change even in long DNA segments(1.5–1.8 kb) and indicates the position of mismatch within the segment. Hence,entire mRNA can be screened in few overlapping segments. The mRNA analysisoffers a chance of detecting mutations occurring in any region of the gene, includ-ing internal region of the long introns by virtue of their effect on the structure ofthe mRNA, thus allowing a gain not only in the speed but also in the complete-ness of mutation detection. A further advantage of mRNA analysis is that it pro-vides direct evidence of the effect gene mutation may have on the structure of thegene transcript. In the basic procedure, the factor VIII message and appropriatesegments of a patient gene are specifically amplified and compared with similarproducts amplified from control RNA. The patient and control PCR products arethen hybridized to form a hetroduplex and treated with hydroxylamine and/orosmium tetroxide, which modify C or T residues, respectively. The DNA is thencleaved with piperidine at the modified base and analyzed on a denaturing poly-acrylamide gel. From the size of the cleavage fragments, the position of the muta-tion is estimated and the relevant exons sequenced (6,7). To aid the visualizationof DNA on the acrylamide gel the DNA is either radioactively or fluorescentlylabelled. This chapter describes the methods used in the detection of mutationsby solid phase fluorescent chemical cleavage of mismatch (SPFCCM).
The factor VIII message, except the large exon 14, is reverse transcribedwith AMV reverse transcriptase and amplified with Tfl DNA polymerase intofour overlapping segments (Fig. 1). Exon 14 is amplified from genomic DNAas two additional segments so that the entire coding region is represented in sixoverlapping segments. The promoter region (segment P) and the polyadenyl-ation signal region (segment T) are also amplified from the genomic DNA.The promoter region overlaps with segment 1 (Fig. 1). The promoter regionand polyadenylation signal regions are sequenced directly whereas the rest ofthe segments are processed through SPFCCM. Three different fluorescentlabeled dUTPs are used to label the segments: segment 1 and 2 with green,segment 3 and 4 with blue and segment 5 and 6 with yellow fluorescence.Similar segments are amplified from either control RNA or cloned factor VIII
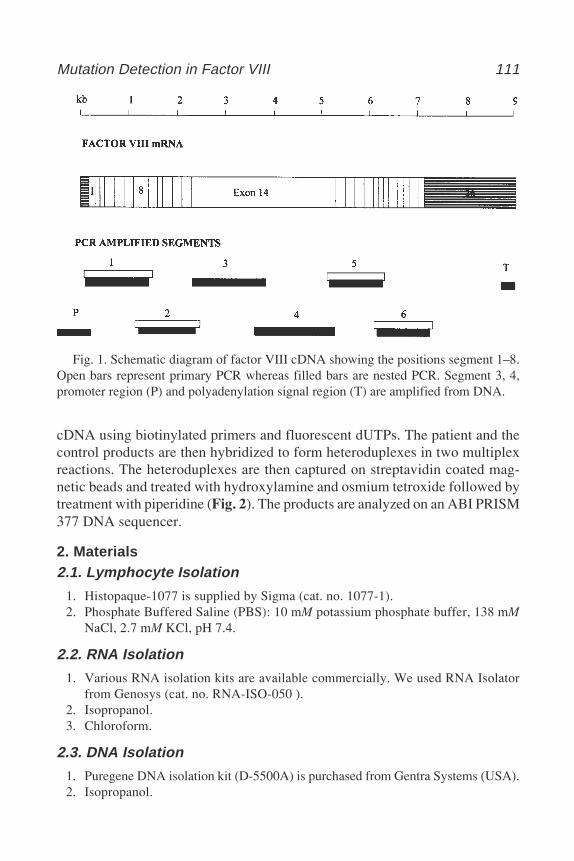
Mutation Detection in Factor VIII 111
cDNA using biotinylated primers and fluorescent dUTPs. The patient and thecontrol products are then hybridized to form heteroduplexes in two multiplexreactions. The heteroduplexes are then captured on streptavidin coated mag-netic beads and treated with hydroxylamine and osmium tetroxide followed bytreatment with piperidine (Fig. 2). The products are analyzed on an ABI PRISM377 DNA sequencer.
2. Materials2.1. Lymphocyte Isolation
1. Histopaque-1077 is supplied by Sigma (cat. no. 1077-1).2. Phosphate Buffered Saline (PBS): 10 mM potassium phosphate buffer, 138 mM
NaCl, 2.7 mM KCl, pH 7.4.
2.2. RNA Isolation
1. Various RNA isolation kits are available commercially. We used RNA Isolatorfrom Genosys (cat. no. RNA-ISO-050 ).
2. Isopropanol.3. Chloroform.
2.3. DNA Isolation
1. Puregene DNA isolation kit (D-5500A) is purchased from Gentra Systems (USA).2. Isopropanol.
Fig. 1. Schematic diagram of factor VIII cDNA showing the positions segment 1–8.Open bars represent primary PCR whereas filled bars are nested PCR. Segment 3, 4,promoter region (P) and polyadenylation signal region (T) are amplified from DNA.
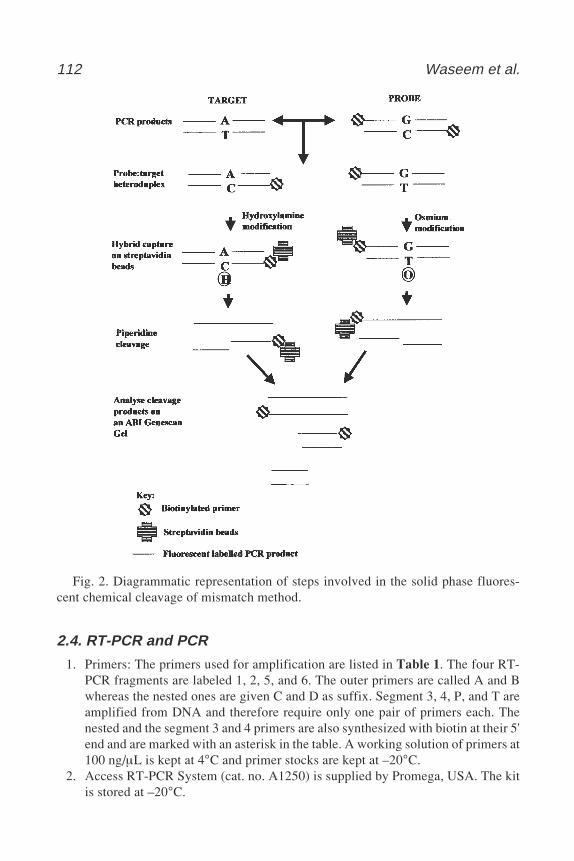
112 Waseem et al.
2.4. RT-PCR and PCR
1. Primers: The primers used for amplification are listed in Table 1. The four RT-PCR fragments are labeled 1, 2, 5, and 6. The outer primers are called A and Bwhereas the nested ones are given C and D as suffix. Segment 3, 4, P, and T areamplified from DNA and therefore require only one pair of primers each. Thenested and the segment 3 and 4 primers are also synthesized with biotin at their 5'end and are marked with an asterisk in the table. A working solution of primers at100 ng/µL is kept at 4°C and primer stocks are kept at –20°C.
2. Access RT-PCR System (cat. no. A1250) is supplied by Promega, USA. The kitis stored at –20°C.
Fig. 2. Diagrammatic representation of steps involved in the solid phase fluores-cent chemical cleavage of mismatch method.
Mutation Detection in Factor VIII 113
Table 1Primers Used for the Amplication of Factor VIII cDNA
1A GGGAGCTAAAGATATTTTAGAGAAG1B CAACAGTGTGTCTCCAACTTCCCCAT1C* GAGAAGATTAACCTTTTGCTTCTC1D* CCTACCAATCCGCTGAGGGCCATTG2A GAAGAAGCGGAAGACTATGATGATG2B GCCTAGTGCTACGGTGTCTTGAATTC2C* CTGATTCTGAAATGGATGTGGTCAGG2D* GGGAGAAGCTTCTTGGTTCAATGGC3A AGAGTTCTGTGTCACTATTAAGACCC3B TCTGAGGCAAAACTACATTCTCTTGG4A CAAAGGACGTAGGACTCAAAGAGATGG4B CACCAGAGTAAGAGTTTCAAGACAC5A CTTCAG TCAGATCAAGAGGAAATTGAC5B GAAGTCTGGCCAGCTTTGGGGCCCAC5C* TATGATGATACCATATCAGTTGAAATG5D* CTCTAATGTGTCCAGAAGCCATTCCC6A TTCATTTCAGTGGACATGTG6B CAGGAGGCTTCAAGGCAGTGTCTG6C* CAGTGGACATGTGTTCACTGTACGAA6D* TAGCACAAAGGTAGAAGGCAAGCPA GGATGCTCTAGGACCTAGGCPB AAGAAGCAGGTGGAGAGCTCTA CAAATGTTCATGGAACTAGCTB CTGTTCTCCTGGATTGAGGC
* The outer primers for seg 1, 2, 5, and 6 are given A and B as suffix,whereas the nested ones are called C and D. The primers also synthe-sized with biotin at their 5' end are marked with an asterisk.
3. Fluorescent deoxynucleotides: Fluorescent deoxynucleotides for labeling thePCR products can be obtained from Perkin-Elmer Applied Biosystems. [F]dUTPset (cat. no. P/N 401894) contains 12 nmol of [TAMRA]dUTP, 3 nmol of[R110]dUTP and 3 nmol of [R6G]dUTP. These are stored as 2 µL aliquots at–20°C in the dark to avoid repeated freezing and thawing.
2.5. Solid Phase Fluorescent Chemical Cleavage of Mismatch
1. Hydroxylamine hydrochloride (Sigma, cat no. H 2391): A 4 M solution is pre-pared and titrated to pH 6.0 with diethylamine (Sigma, cat. no. D 3131). Sincevery little hydroxylamine (20 µL/reaction ) is required for the reaction a roughguide to prepare a 4 M solution, pH 6.0, is: weight (in mg) of hydroxylaminedivided by 0.28 gives the volume (in µL) of water to be added. This value times0.2 to 0.3 gives the volume of diethylamine (in µL) to be added to the solution toreach pH 6.0. The volume of diethylamine to be added varies from batch to batch
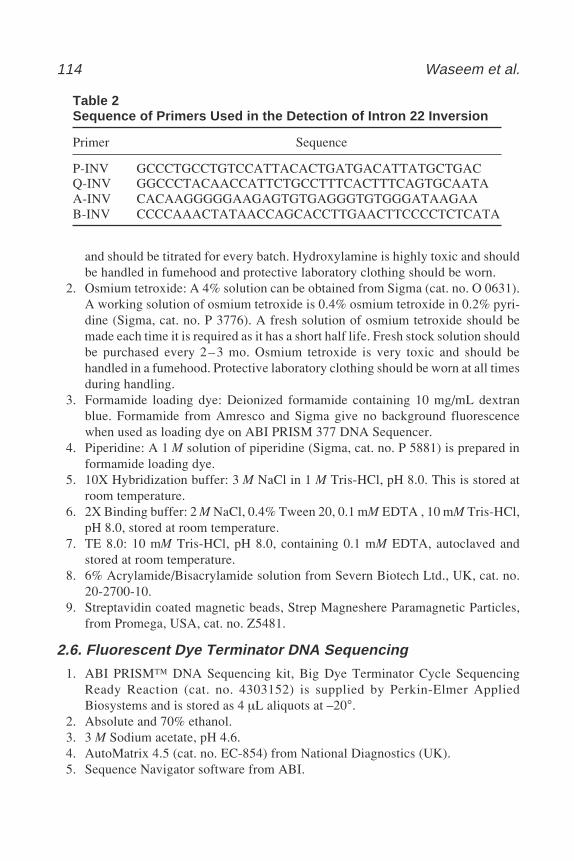
114 Waseem et al.
and should be titrated for every batch. Hydroxylamine is highly toxic and shouldbe handled in fumehood and protective laboratory clothing should be worn.
2. Osmium tetroxide: A 4% solution can be obtained from Sigma (cat. no. O 0631).A working solution of osmium tetroxide is 0.4% osmium tetroxide in 0.2% pyri-dine (Sigma, cat. no. P 3776). A fresh solution of osmium tetroxide should bemade each time it is required as it has a short half life. Fresh stock solution shouldbe purchased every 2– 3 mo. Osmium tetroxide is very toxic and should behandled in a fumehood. Protective laboratory clothing should be worn at all timesduring handling.
3. Formamide loading dye: Deionized formamide containing 10 mg/mL dextranblue. Formamide from Amresco and Sigma give no background fluorescencewhen used as loading dye on ABI PRISM 377 DNA Sequencer.
4. Piperidine: A 1 M solution of piperidine (Sigma, cat. no. P 5881) is prepared informamide loading dye.
5. 10X Hybridization buffer: 3 M NaCl in 1 M Tris-HCl, pH 8.0. This is stored atroom temperature.
6. 2X Binding buffer: 2 M NaCl, 0.4% Tween 20, 0.1 mM EDTA , 10 mM Tris-HCl,pH 8.0, stored at room temperature.
7. TE 8.0: 10 mM Tris-HCl, pH 8.0, containing 0.1 mM EDTA, autoclaved andstored at room temperature.
8. 6% Acrylamide/Bisacrylamide solution from Severn Biotech Ltd., UK, cat. no.20-2700-10.
9. Streptavidin coated magnetic beads, Strep Magneshere Paramagnetic Particles,from Promega, USA, cat. no. Z5481.
2.6. Fluorescent Dye Terminator DNA Sequencing
1. ABI PRISM™ DNA Sequencing kit, Big Dye Terminator Cycle SequencingReady Reaction (cat. no. 4303152) is supplied by Perkin-Elmer AppliedBiosystems and is stored as 4 µL aliquots at –20°.
2. Absolute and 70% ethanol.3. 3 M Sodium acetate, pH 4.6.4. AutoMatrix 4.5 (cat. no. EC-854) from National Diagnostics (UK).5. Sequence Navigator software from ABI.
Table 2Sequence of Primers Used in the Detection of Intron 22 Inversion
Primer Sequence
P-INV GCCCTGCCTGTCCATTACACTGATGACATTATGCTGACQ-INV GGCCCTACAACCATTCTGCCTTTCACTTTCAGTGCAATAA-INV CACAAGGGGGAAGAGTGTGAGGGTGTGGGATAAGAAB-INV CCCCAAACTATAACCAGCACCTTGAACTTCCCCTCTCATA
Mutation Detection in Factor VIII 115
2.7. Detection of Intron 22 Inversions
1. Primers used for the detection of intron 22 inversion are shown in Table 2.2. Expand Long Template PCR System (cat. no. 1681842) from Boehringer
Mannheim, Germany.3. Deaza dGTP (cat. no. 988537) from Boehringer Mannheim, Germany.
3. Methods3.1. Isolation of Lymphocytes
1. In a 50 mL polypropylene conical tube, add 10 mL of Histopaque 1077. Gradu-ally overlay equal volume of EDTA anti-coagulated blood. This can be facili-tated by tilting the centrifuge tube containing Histopaque so that the blood tricklesdown the side of the tube. It is essential that Histopaque and the blood are at roomtemperature (see Note 1).
2. Centrifuge at 400g at room temperature for 20 min.3. Transfer the opaque layer of lymphocytes at the interface with a disposable plas-
tic Pasteur pipet into a fresh 50 mL centrifuge tube and add 35 mL of phosphatebuffered saline. At this stage, divide the suspension equally between two tubes.
4. Centrifuge at 400g for 10 min at room temperature.5. In one tube resuspend the pellet in 500 µL of RNA Isolator (Genosys) and store at
–70°C until further use. In the other tube add 600 µL of Cell Lysis Solution(Gentra, USA) and store at 4°C for DNA isolation.
3.2. Isolation of DNA and RNA
There are a number of kits available for the isolation of RNA and DNA. Weuse Puregene DNA isolation kit for DNA isolation and RNA Isolator (Genosys)for RNA isolation.
3.2.1. Isolation of DNA
1. To the 600 µL cell lysate add 300 µL of Protein Precipitation Solution (suppliedwith the kit). Mix 20 times and centrifuge at 16,000g for 10 min. The precipitatedprotein forms a tight pellet at the bottom of the tube.
2. Transfer the supernatant into a fresh 2 mL microfuge tube and add 1 mL of 100%isopropanol to it and mix by inverting several times.
3. Centrifuge at 16,000g for 10 min at room temperature.4. Decant the supernatant and add 70% ethanol and repeat the centrifugation.5. Air-dry the pellet for 5 min and resuspend in 500 µL of TE, pH 8.0.
3.2.2. Isolation of RNA
1. Thaw the cell lysate in RNA Isolator (Genosys). Add 100 µL chloroform and mixgently 15 times and incubate for 15 min at room temperature.
2. Centrifuge at 16,000g for 15 min at room temperature.
116 Waseem et al.
3. Transfer the upper aqueous phase to a fresh 1.5 mL microfuge tube and add 250 µLisopropanol. Mix and incubate for 10 min at room temperature.
4. Centrifuge at 16,000g for 10 min at room temperature. At this stage, RNA shouldbe visible as translucent pellet.
5. Wash pellet with 70% ethanol.6. Air-dry the RNA pellet and dissolve it in RNA Hydration Solution (see Note 2).
3.3. RT-PCR
For reverse transcription and amplification of four out of the eight segmentfrom factor VIII mRNA, we use Access RT-PCR System. In this kit, thereverse transcription by AMV reverse transcriptase and initial 10 cycles ofamplification by Tfl DNA polymerase is performed in a single tube (primaryPCR) (see Note 3). An aliquot is then amplified for another 30 cycles withnested primers (secondary PCR). Two of the four segments (segment 1,5 and2,6) are multiplexed in the primary PCR so in total we have two primary andfour secondary PCRs.
1. Add 5 µL 5X reaction buffer, 0.5µL 10 mM dNTP, 3.0 µL 25 mM MgSO4,2.5 µL of 100 ng/µL primer 1A, 1B, 5A, 5B, 0.5 µL AMV reverse transcriptase,0.5 µL Tfl DNA polymerase, 100– 200 ng RNA. Make up the volume withRNAse-free water to 25 µL. Set up a second RT-PCR substituting primer 1A, 1B,5A, and 5B for 2A, 2B, 6A, and 6B.
2. Place the tubes in controlled temperature block equilibrated at 48°C and incubatefor 1 h and proceed immediately to thermal cycling reactions: 93°C for 30 s,65°C for 30 s, 68°C for 5 min for 10 cycles.
3. To set up secondary PCR, add 2.5 µL of 10X Tfl buffer, 0.5 µL of 10 mM dNTP,1.0 µL of 25 mM MgSO4, 2.5 µL of 100 ng/µL primer XC & XD (x is the segmentnumber), 0.5 µL Tfl I, 0.4 µL [F]dUTP, 14.5 µL water, 2.5 µL of primary PCR.This reaction mix is also used for the amplification of segment 3 and 4 from DNA(see Note 4).
4. Set up the cycling conditions as follows: 94°C for 5 min and 30 cycles of 93°Cfor 30 s, 65°C for 30 s, 72°C for 3 min.
5. For amplification from control RNA or cloned factor VIII cDNA (referred to asprobe from now on) use the same recipe except use biotinylated primers. Theproducts should be gel purified before using in the solid phase fluorescent chemi-cal cleavage of mismatch (see Note 5).
3.4. Solid Phase Fluorescent Chemical Cleavage of Mismatch
3.4.1. Preparation of Hybrids
1. Set up the hybridization as follows: 3 µL 10X hybridization buffer, 30 ng each ofthe probe 1, 3 and 6 (the other multiplex will be 2, 4, and 5), 300 ng of target 1, 3,and 6. Make up the volume to 30 µL with TE 8.0.
2. Incubate at 95°C for 5 min and 65°C for 1 h (see Note 6).
Mutation Detection in Factor VIII 117
3. 10 µL of Streptavidin coated magnetic beads (a 50% suspension is supplied) arerequired to bind the biotin tagged products per reaction. Take out the requiredvolume and wash twice with 2X binding buffer. Resuspend in three times theoriginal volume of the beads with 2X binding buffer.
4. Add 30 µL of the washed streptavidin beads to each reaction. Incubate 15 min atroom temperature.
5. Place the tube on a magnetic stand to pellet the beads and aspirate the supernatant.
3.4.2. Hybrid Modification and Cleavage
3.4.2.1. HYDROXYLAMINE
1. Resuspend the beads in 20 µL of 4 M hydroxylamine, pH 6.0 (see Methods forpreparation procedure).
2. Incubate 2 h at 37°C.3. Pellet the streptavidin beads on a magnetic stand and wash the beads with TE 8.0
and proceed to Subheading 3.4.2.3. below.
3.4.2.2. OSMIUM TETROXIDE
1. Resuspend the beads from step 5 above in 20 µL 0.4% osmium tetroxide, 0.2%pyridine and incubate for 15 min at 37°C (see Note 7).
2. Pellet the streptavidin beads on a magnetic stand, wash with TE 8.0 (see Note 8).
3.4.2.3. CLEAVAGE OF DNA
Add 5 µL of piperidine/ formamide loading dye to the reaction and incubate at90°C for 30 min (see Note 9).
3.5. Analysis of the Products from SPFCCMon ABI PRISM 377 DNA Sequencer
3.5.1. Preparation and Loading of Polyacrylamide Gel
1. Clean the glass plates with 3% Alconox. After rinsing them with water wipethem with isopropanol soaked lint free tissue paper.
2. Set up the glass plates on the cassette, with notched plate at the bottom.3. Prepare the following mix for the acrylamide gel for 12-cm plates (see Note 10):
6% Acrylamide/Bisacrylamide solution 20 mL10% APS 47 µLTEMED 33 µL
4. Pour in between the plates and allow it to set for 1 h. Save the rest of acrylamidesolution to check for its polymerization (see Note 11).
5. Prerun the gel for 15 min at PR 12A-1200.6. Load 2 µL of the sample from Subheading 3.4.2.3. above. Dilute Rox GS-2500
1:5 in formamide loading dye. Heat it at 92°C for 2 min and use 2 µL of this as amarker (see Note 12).
7. Electrophorese the gel on GS12A-1200 for 5 h.8. Analyze the gel using Genescan software (Fig. 3).
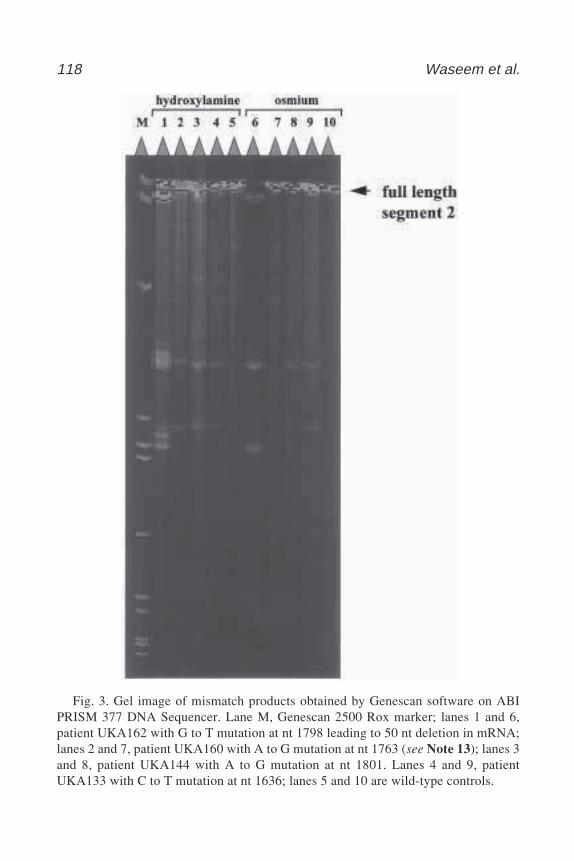
118 Waseem et al.
Fig. 3. Gel image of mismatch products obtained by Genescan software on ABIPRISM 377 DNA Sequencer. Lane M, Genescan 2500 Rox marker; lanes 1 and 6,patient UKA162 with G to T mutation at nt 1798 leading to 50 nt deletion in mRNA;lanes 2 and 7, patient UKA160 with A to G mutation at nt 1763 (see Note 13); lanes 3and 8, patient UKA144 with A to G mutation at nt 1801. Lanes 4 and 9, patientUKA133 with C to T mutation at nt 1636; lanes 5 and 10 are wild-type controls.
Mutation Detection in Factor VIII 119
3.6. Analysis of the Promoter and Polyadenylation Signal Region
Samples with mutations in the promoter or polyadenylation signal region offactor VIII may have reduced levels or no transcripts. Therefore, RNA samplesthat fail to amplify or do not give any mismatch bands (see Note 13) should bescreened for the mutations in these regions. Segment P (promoter region) andsegment T (polyadenylation signal region) are amplified in the same way asabove (Subheading 3.3., step 4) except no FdUTP is added. The primers usedfor amplification are shown in Table 1. The PCR products are gel purified andsequenced with one of the primers used for amplification.
3.7. Sequence Analysis for Complete Mutation Characterization
3.7.1. Setting up the Sequencing Reaction
1. From the size of the mismatch fragment estimate the position of the mutationfrom either end of the segment.
2. Amplify either the same segment from a new RT-PCR or amplify the relevantexons (see Note 14).
3. Gel purify the products (see Note 15).4. Set up the sequencing reaction as follows: BigDye terminator mix 4 µL, primer
0.8 pmol, DNA (200–400 ng) water to 10 µL.5. Start the following thermal cycling condition: 96°C for 30 s, 50°C for 15 s, 60°C
for 4 min, 25 cycles and hold at 4°C.6. Transfer the content of the reaction tube to a fresh tube and add 1 µL 3 M sodium
acetate, pH 4.6, and 25 µL ethanol. Mix and incubate on ice for 10 min.7. Centrifuge at the maximum speed for 15 min at room temperature.8. Wash pellet with 70% ethanol. Vortex to resuspend for about 30 s. This is very
crucial in removing unincorporated nucleotides.9. Repeat the centrifugation step (step 7).
10. Discard the supernatant and air-dry the pellet for 10 min at room temperature.11. Resuspend in 2 µL of formamide loading dye. Just before loading heat the sample
at 92°C for 2 min.
3.7.2. Preparation of Polyacrylamide Gel
1. Clean and set up the 36-cm glass plates as described in Subheading 3.5.2. Prepare acrylamide mix as follows:
AutoMatrix 4.5 45 mL10X TBE 5 mL10% APS 250 µLTEMED 35 µL
Stir to mix
3. Immediately pour it between the plates from the top end, pressing the plates toavoid bubbles.
120 Waseem et al.
4. Allow it to set for 1 h at room temperature.5. Prerun the gel for 15 min on Seq PR 36E-1200.6. Load the samples from step 11 above (Subheading 3.7.1.) and electrophorese
for 7 h on Seq Run 36E-1200.
3.7.3. Sequence Analysis
1. To start the sequence analysis program, double click on the Gel file from thesequence run.
2. Define the first and last track on the gel and the click Track and Extract lanesfrom the Gel menu.
3. Quit sequence analysis program and open Sequence Navigator Program for theanalysis of mutations.
4. Import relevant sequences together with the published factor VIII sequence andcompare them using Comparative or Clustal program from Align menu.
3.8. Detection of Intron 22 Inversion by Long PCR
Forty five percent of the severe hemophilia A patients have inversions intheir factor VIII gene involving intron 22 resulting in the factor VIII codingsequence ending at exon 22 and leading to segment 6 amplification failure (8).The inversions are due to intra-chromatid homologous recombination betweena sequence in intron 22 called int22h-1 and either of the two repeats of thesesequence (int22h-2 and int22h-3) located 500 and 600 kb more telomericallyand in inverted orientation relative to int22h-1 (9). In 1998, Lui et al. (10)developed a rapid PCR method for the detection of these inversions. The reac-tion is performed in a single tube containing four primers. Primers P and Qamplify a 12 kb int22h-1 specific sequence and primers A and B amplify 10 kbof int22h-2 and int22h-3. When an inversion occurs, two new recombined PCRproducts, PB (11 kb) and AQ (11 kb) are amplified together with the AB (10 kb)from unrecombined int22h-2 or int22h-3 and can be readily distinguished astwo bands on a 0.5 % agarose gel (Fig. 4).
1. In a 0.2 mL microfuge tube, add 1 µL of 10X Expand buffer 2 (supplied with theenzyme), 1 µL 5 mM dNTP (made with 2.5 mM deaza dGTP, 2.5 mM dGTP and5 mM each of dCTP, dTTP and dATP), 7.5% DMSO, 120 ng of primer P and Q,50 ng of primer A and B, 0.3 µL of Expand (Boehringer Mannheim, Germany)and 250 ng of DNA, make up the volume to 10 µL with TE 8.0.
2. Place the tube in a controlled temperature block and cycle under following condi-tions: after 2 min denaturation at 94°, 10 cycles of 94° for 15 s, 68° for 12 minfollowed by 20 cycles of 94° for 15 s, 68° for 12 min with 20-s increment per cycle.
3. Load the products on 0.5% agarose gel and visualize the band after staining withethidium bromide.
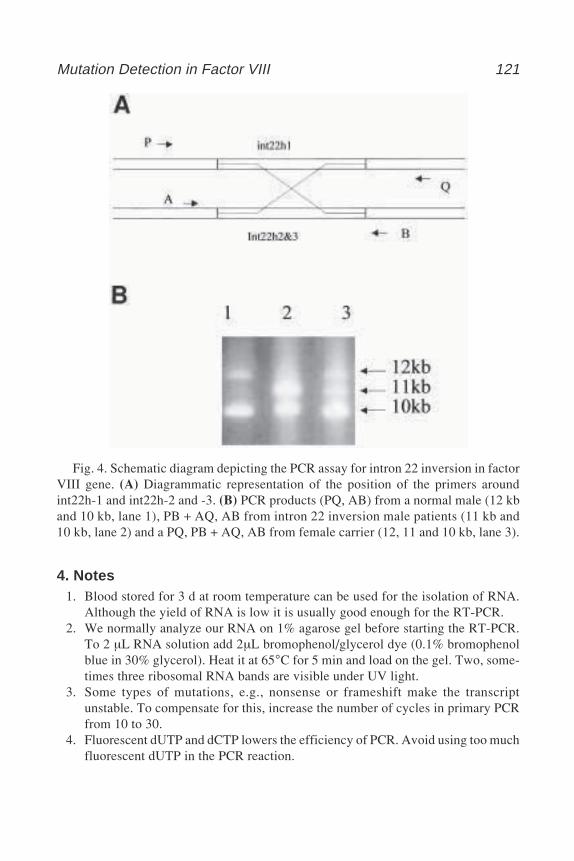
Mutation Detection in Factor VIII 121
4. Notes1. Blood stored for 3 d at room temperature can be used for the isolation of RNA.
Although the yield of RNA is low it is usually good enough for the RT-PCR.2. We normally analyze our RNA on 1% agarose gel before starting the RT-PCR.
To 2 µL RNA solution add 2µL bromophenol/glycerol dye (0.1% bromophenolblue in 30% glycerol). Heat it at 65°C for 5 min and load on the gel. Two, some-times three ribosomal RNA bands are visible under UV light.
3. Some types of mutations, e.g., nonsense or frameshift make the transcriptunstable. To compensate for this, increase the number of cycles in primary PCRfrom 10 to 30.
4. Fluorescent dUTP and dCTP lowers the efficiency of PCR. Avoid using too muchfluorescent dUTP in the PCR reaction.
Fig. 4. Schematic diagram depicting the PCR assay for intron 22 inversion in factorVIII gene. (A) Diagrammatic representation of the position of the primers aroundint22h-1 and int22h-2 and -3. (B) PCR products (PQ, AB) from a normal male (12 kband 10 kb, lane 1), PB + AQ, AB from intron 22 inversion male patients (11 kb and10 kb, lane 2) and a PQ, PB + AQ, AB from female carrier (12, 11 and 10 kb, lane 3).
122 Waseem et al.
5. We use cloned factor VIII cDNA from Genentech as a probe to amplify segment1, 2, 5, and 6. Segment 3 and 4 are amplified from normal DNA.
6. Hybrids of target and control DNA can be stored at –20° for up to 3 d.7. Osmium tetroxide is a strong oxidizing agent, avoid undue exposure to the air.8. Hydroxylamine and osmium tetroxide reaction can either be performed separately
or can be combined. To do that, first do the reaction with hydroxylamine thenosmium tetroxide followed by the piperidine cleavage step. Follow the reactionuntil step 3 (Subheading 3.4.2.1.) then start step 1 of Subheading 3.4.2.2. (theosmium tetroxide reaction) as described in the protocol.
9. On a Genescan gel, a couple of fluorescent bands appear around 150–200 bp.These are the degraded fluorescent moieties from the fluorescence dUTPs. Theycan be removed from the reaction mixture by ethanol precipitation. Perform thecleavage step with aqueous 1 M piperidine at 90°C for 30 min. To the supernantadd 1/10 vol of 3 M sodium acetate, pH 4.6 and 2.5 vol of ethanol. Place the tubein dry ice for 5 min, spin at maximum speed for 10 min in a microfuge. Wash thepellet with 70% ethanol, air-dry and resuspend in 5 µL of formamide loading dye.
10. Twelve centimeter plates give good separation of most of the mismatch bands.However, samples that have large mismatch products are better separated on36-cm plates.
11. The manufacturer of ABI PRISM 377 DNA sequencer recommend the gel to agefor 2 h before loading the samples, However, we find that 15 min setting time isenough. Gels left to set for more 2 h run slower.
12. More accurate sizing of the mismatched products on a Genescan gel will requireinternal standards. For this purpose, GS 2500-Rox diluted 1:400 in formamideloading dye should be used in place of formamide loading dye at the cleavage step.
13. A T nucleotide mispaired with G is not modified by osmium tetroxide if precededby G at the 5' end and will only show up in the hydroxylamine reaction (11).
14. Fluorescent DNA sequencing requires more template than 35S dATP sequencing.Don’t even attempt to sequence from a poor PCR.
15. For gel purifying the PCR product, remove the relevant band from the low melt-ing agarose gel and add equal volume of water. Heat at 70°C for 10 min, thiskeeps it in solution. Several matrices are available commercially, e.g., Geneclean(BIO101), PCR purification kit (Promega), centrisep column (Amicon), whichcan be used for the purification of DNA from this gel.
References1. Gitschier, J., Wood, W. I., Goralka, T. M., Wion, K. L., Chen, E. Y., Eaton, D. H.,
et al. (1984) Characterization of the human factor VIII gene. Nature 312,326–330.
2. Toole, J. J., Knopf, J. L., Wozney, J. M., Sultzman, L. A., Buecker, J. L., Pittman,D. D., et al. (1984) Molecular-cloning of a cDNA-encoding human antihemo-philic factor. Nature 312, 342–347.
3. Higuchi, M., Antonarakis, S. E., Kasch, L., Oldenburg, J., Economou-Petersen,E., Olek, K., et al. (1991) Molecular characterisation of mild-to-moderate hemo-
Mutation Detection in Factor VIII 123
philia A: detection of the mutation in 25 of 29 patients by denaturing gel electro-phoresis. Proc. Natl. Acad. Sci. USA 88, 8307–8311.
4. Orita, M., Iwahana, H., Kanazawa, H., Hayashi, K., and Sekiya, T. (1989) Detec-tion of polymorphisms of human DNA by gel-electrophoresis as single-strandconformation polymorphisms. Proc. Natl. Acad. Sci. USA 86, 2766–2770.
5. Oldenburg, J., Ivaskevicius, V., Rost S., Fregin, A., White, K., Holinski-Feder,E., et al. (2001) Evaluation of DHPLC in the analysis of hemophilia A. J. Biochem.Biophys. Meth. 47, 39–51.
6. Waseem, N. H., Bagnall, R., Green, P. M., and Giannelli, F. (1999). Start of UKconfidential haemophilia A database: analysis of 142 patients by solid phase fluo-rescent chemical cleavage of mismatch. Throm. Haemost. 81, 900–905.
7. Naylor, J. A., Green, P. M., Montandon, A. J., Rizza, C. R., and Giannelli, F.(1991) Detection of three novel mutations in two haemophilia A patients by rapidscreening of whole essential region of factor VIII gene. Lancet 337, 635–639.
8. Naylor, J. A., Green, P. M., Rizza, C. R., and Giannelli, F. (1992) Factor VIIIgene explains all cases of haemophilia A. Lancet 340, 1066–1067.
9. Naylor, J. A., Buck D., Green P., Williamson H., Bentley D., and Giannelli F.(1995) Investigation of the factor VIII intron 22 repeated region (int22h) and theassociated inversion junctions. Hum. Mol. Genet. 4, 1217–1224.
10. Liu, Q., Nozari, G., and Sommer S. S. ( 1998) Single-tube polymerase chain reac-tion for rapid diagnosis of the inversion hotspot of mutation in hemophilia A.Blood 92, 1458–1459.
11. Forrest, S. M., Dahl, H. H., Howells, D.N., Dianzani, I., and Cotton R. G. H.(1991) Mutation detection in phenylketonuria using the chemical cleavage of mis-match method: Importance of using probes from both normal and patient samples.Am. J. Hum. Genet. 49, 175–183.

150 Wells
Denaturing Gradient Gel Electrophoresis 125
125
From: Methods in Molecular Biology, vol. 187: PCR Mutation Detection ProtocolsEdited by: B. D. M. Theophilus and R. Rapley © Humana Press Inc., Totowa, NJ
14
Denaturing Gradient Gel Electrophoresis
Yvonne Wallis
1. IntroductionDenaturing gradient gel electrophoresis (DGGE) is a powerful mutation
detection technique described by Fisher et al. in 1983 (1). It allows the resolu-tion of relatively large DNA fragments (usually polymerase chain reaction[PCR] products) differing by only a single nucleotide. DGGE is most frequentlyemployed for the detection of unknown mutations. A related technique referredto as constant denaturing gradient gel electrophoresis (CDGE) is used for thesensitive detection of known mutations (2,3). More recently a modifiedversion of DGGE known as 2-dimensional DGGE has been employed for thesimultaneous analysis of several PCR fragments (4). PCR fragments areinitially separated by size on a polyacrylamide gel prior to loading onto a con-ventional denaturing gradient gel system, as will be described in this chapter.
Denaturing gradient gel electrophoresis offers a number of advantages overother mutation detection techniques, including:
1. It is capable of detecting up to 100% of all single base substitutions in fragmentsup to 500 bp in length. It has been shown to be more sensitive than many othercommonly used mutation detection methods including single-strandconformation polymorphism (SSCP) and heteroduplex analysis (5,6).
2. The availability of user-friendly computer programs reduces the amount ofpreliminary work required prior to fragment analysis.
3. It uses a nonradioactive method of DNA band detection.4. The formation of heteroduplexes significantly improves the detection of
heterozygotes.5. Variant DNA bands may be readily isolated from gels for subsequent sequencing
analysis.
126 Wallis
DGGE also has a number of limitations, including:
1. Its sensitivity decreases for fragments larger than 500 bp.2. It requires the use of specialist equipment.3. The addition of GC clamps makes the purchase of PCR primers expensive.4. Knowledge of melting behaviour is essential for efficient analysis and therefore
preliminary work-ups must be performed before fragment analysis can take place.
DGGE analysis involves the electrophoresis of double-stranded DNAfragments through a polyacrylamide gel containing a linearly increasingconcentration of denaturants usually urea and formamide (1). Temperature mayalso be employed as the denaturant using a similar technique known as tempera-ture denaturing gradient gel electrophoresis (TGGE). During migration dis-crete regions within the DNA fragments, referred to as melting domains,denature (“melt”) at specific positions along the denaturing gradient. The con-centration of denaturant at which denaturation of a melting domain occurs isreferred to as the melting temperature or Tm. Branched denatured portions ofDNA fragments entangle more readily in the polyacrylamide matrix and as a con-sequence cause an abrupt decrease in the mobility of the whole DNA fragment.
A DNA fragment may contain more than one melting domain with the Tm ofeach one being strictly dependent upon its nucleotide sequence. Alterations inthe nucleotide sequence (e.g., disease-causing mutations) in all but the highestmelting temperature domain will alter the melting properties of the whole DNAmolecule thereby altering its electrophorectic mobility (Fig. 1).
Base changes in the domain with the highest melting temperature will not bedetected due to the loss of sequence dependent migration upon complete stranddissociation. This limitation is easily overcome by the attachment of a highlythermostable segment referred to as a GC clamp to one end of the DNA frag-ment. The GC clamp is efficiently introduced during the PCR amplificationstep prior to DGGE analysis by the use of a modified primer containing a GCtail at its 5' end. In general a GC clamp of 40 bp as originally described bySheffield et al. (7) is sufficient (see Note 1). Longer GC clamps may be requiredfor the sensitive analysis of particularly GC-rich sequences (8). The introduc-tion of a GC clamp increases the percentage of mutations detectable by DGGEclose to 100% in fragments up to 500 bp therefore making it more sensitivethan other commonly used mutation detection systems.
Successful DGGE requires knowledge of the melting behavior of each DNAfragment to be analyzed. Optimal DGGE results are obtained if the DNA frag-ment under analysis contains only one or two melting domains (excluding theGC-clamp domain). In fragments containing two melting domains, the GCclamp should be positioned immediately adjacent to the domain with the highermelting temperature. Computational analysis using software such as MELT95
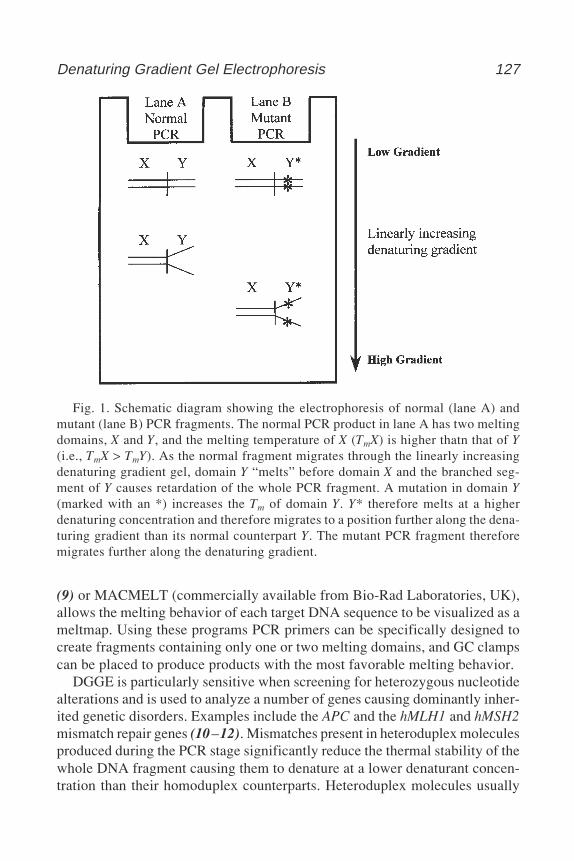
Denaturing Gradient Gel Electrophoresis 127
(9) or MACMELT (commercially available from Bio-Rad Laboratories, UK),allows the melting behavior of each target DNA sequence to be visualized as ameltmap. Using these programs PCR primers can be specifically designed tocreate fragments containing only one or two melting domains, and GC clampscan be placed to produce products with the most favorable melting behavior.
DGGE is particularly sensitive when screening for heterozygous nucleotidealterations and is used to analyze a number of genes causing dominantly inher-ited genetic disorders. Examples include the APC and the hMLH1 and hMSH2mismatch repair genes (10–12). Mismatches present in heteroduplex moleculesproduced during the PCR stage significantly reduce the thermal stability of thewhole DNA fragment causing them to denature at a lower denaturant concen-tration than their homoduplex counterparts. Heteroduplex molecules usually
Fig. 1. Schematic diagram showing the electrophoresis of normal (lane A) andmutant (lane B) PCR fragments. The normal PCR product in lane A has two meltingdomains, X and Y, and the melting temperature of X (TmX) is higher thatn that of Y(i.e., TmX > TmY). As the normal fragment migrates through the linearly increasingdenaturing gradient gel, domain Y “melts” before domain X and the branched seg-ment of Y causes retardation of the whole PCR fragment. A mutation in domain Y(marked with an *) increases the Tm of domain Y. Y* therefore melts at a higherdenaturing concentration and therefore migrates to a position further along the dena-turing gradient than its normal counterpart Y. The mutant PCR fragment thereforemigrates further along the denaturing gradient.
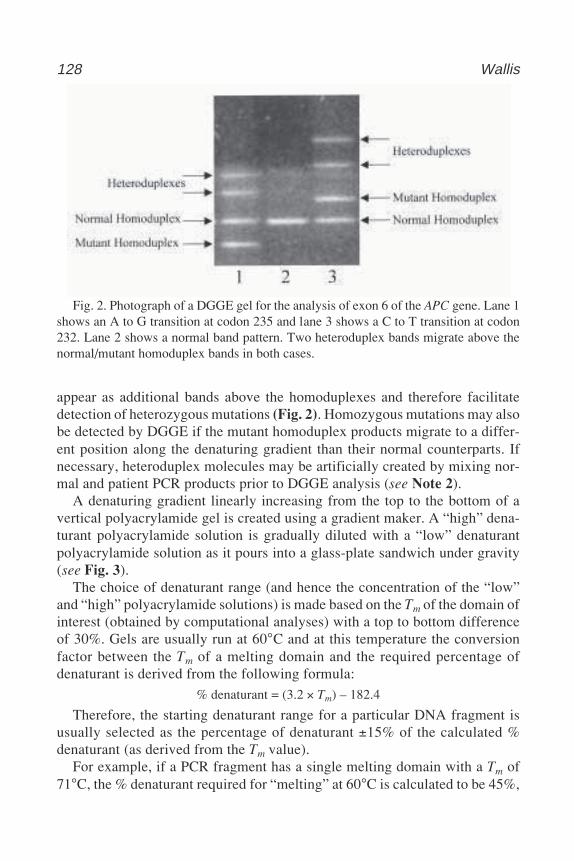
128 Wallis
appear as additional bands above the homoduplexes and therefore facilitatedetection of heterozygous mutations (Fig. 2). Homozygous mutations may alsobe detected by DGGE if the mutant homoduplex products migrate to a differ-ent position along the denaturing gradient than their normal counterparts. Ifnecessary, heteroduplex molecules may be artificially created by mixing nor-mal and patient PCR products prior to DGGE analysis (see Note 2).
A denaturing gradient linearly increasing from the top to the bottom of avertical polyacrylamide gel is created using a gradient maker. A “high” dena-turant polyacrylamide solution is gradually diluted with a “low” denaturantpolyacrylamide solution as it pours into a glass-plate sandwich under gravity(see Fig. 3).
The choice of denaturant range (and hence the concentration of the “low”and “high” polyacrylamide solutions) is made based on the Tm of the domain ofinterest (obtained by computational analyses) with a top to bottom differenceof 30%. Gels are usually run at 60°C and at this temperature the conversionfactor between the Tm of a melting domain and the required percentage ofdenaturant is derived from the following formula:
% denaturant = (3.2 × Tm) – 182.4
Therefore, the starting denaturant range for a particular DNA fragment isusually selected as the percentage of denaturant ±15% of the calculated %denaturant (as derived from the Tm value).
For example, if a PCR fragment has a single melting domain with a Tm of71°C, the % denaturant required for “melting” at 60°C is calculated to be 45%,
Fig. 2. Photograph of a DGGE gel for the analysis of exon 6 of the APC gene. Lane 1shows an A to G transition at codon 235 and lane 3 shows a C to T transition at codon232. Lane 2 shows a normal band pattern. Two heteroduplex bands migrate above thenormal/mutant homoduplex bands in both cases.
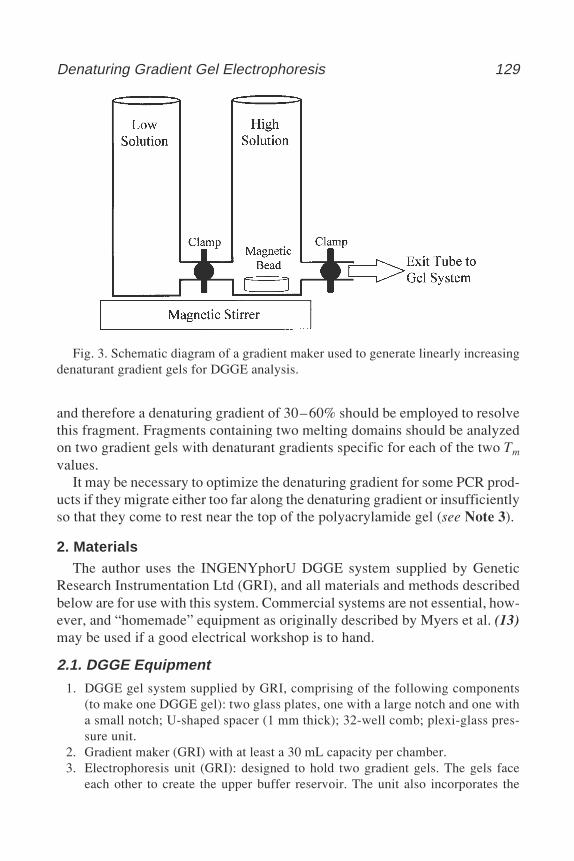
Denaturing Gradient Gel Electrophoresis 129
and therefore a denaturing gradient of 30–60% should be employed to resolvethis fragment. Fragments containing two melting domains should be analyzedon two gradient gels with denaturant gradients specific for each of the two Tm
values.It may be necessary to optimize the denaturing gradient for some PCR prod-
ucts if they migrate either too far along the denaturing gradient or insufficientlyso that they come to rest near the top of the polyacrylamide gel (see Note 3).
2. MaterialsThe author uses the INGENYphorU DGGE system supplied by Genetic
Research Instrumentation Ltd (GRI), and all materials and methods describedbelow are for use with this system. Commercial systems are not essential, how-ever, and “homemade” equipment as originally described by Myers et al. (13)may be used if a good electrical workshop is to hand.
2.1. DGGE Equipment
1. DGGE gel system supplied by GRI, comprising of the following components(to make one DGGE gel): two glass plates, one with a large notch and one witha small notch; U-shaped spacer (1 mm thick); 32-well comb; plexi-glass pres-sure unit.
2. Gradient maker (GRI) with at least a 30 mL capacity per chamber.3. Electrophoresis unit (GRI): designed to hold two gradient gels. The gels face
each other to create the upper buffer reservoir. The unit also incorporates the
Fig. 3. Schematic diagram of a gradient maker used to generate linearly increasingdenaturant gradient gels for DGGE analysis.
130 Wallis
cathode and anode platinum electrodes. There is an inlet at the top of the unit thatconnects to a buffer flow tube. During electrophoresis, buffer is continuouslypumped into the upper buffer reservoir and overflows from the chamber via twoholes present on each side of the unit positioned above the level of the wells.Circulating buffer maintains a constant pH in the upper reservoir.
4. Buffer tank (GRI): holds 17L TAE (Tris/acetate/EDTA) buffer and incorporatesa thermostat to keep the buffer at the designated temperature, as well as a pumpto circulate buffer from the tank in to the upper buffer reservoir via a buffer flowtube. A safety mechanism cuts the current off if the tank lid is opened duringelectrophoresis.
2.2. Reagents and Solutions1. 20X TAE buffer, pH 8.0: 800 mM Tris base, 20 mM EDTA and 400 mM sodium
acetate. For 1 L dissolve the following in 950 mL distilled water: 97 g Trisbase, 7.5 g Na2EDTA, and 54.5 g sodium acetate.3H2O
Adjust to pH 8 with acetic acid (approx 30 mL). Make up to 1 L with distilledwater. Store at room temperature.
2. 80% denaturant polyacrylamide stock: 8% polyacrylamide (see Note 4), 5.6 Murea, and 32% formamide. For 500 mL add together the following: 100 mL40% polyacrylamide (19:1 acrylamide:bis-acylamide), 170 g urea, 160 mLdeionized formamide (see Note 5), 25 mL 20X TAE buffer, and distilled waterup to 500 mL.
Stir until urea is completely dissolved. Store at 4°C in a dark bottle, stable at4°C for 3 mo.
3. 0% Denaturant polyacrylamide (8%) stock. For 500 mL combine 100 mL 40%polyacrylamide (19:1 acrylamide:bis-acylamide) and 400 mL distilled water.Store at 4°C, stable at 4°C for 3 mo.
4. 10% Ammonium sulphate (APS). Dissolve 1 g in 10 mL distilled water. Divideinto 500 µL aliquots and store at –20°C until required.
5. N,N,N',N'-Tetramethylethylenediamine (TEMED). Store in the dark at roomtemperature.
6. 6X Gel loading buffer: 0.025% bromophenol blue, 0.025% xylene cyanol, and20% Ficoll. Dissolve 250 mg bromophenol blue, 250 mg xylene cyanol, and 20 gFicoll in 100 mL distilled water; can be stored at room temperature.
7. 10 mg/mL Ethidium bromide solution. Dissolve 1 g ethidium bromide in 100 mLdistilled water. Store at room temperature in a dark bottle. Note: Ethidium bro-mide is a highly hazardous substance. In addition to standard laboratory safetyprocedures, always wear appropriate protective equipment when handlingethidium bromide powder (i.e., face mask) and solution (i.e., gloves).
3. Methods3.1. Preparation of DGGE Gel System
It is important to use thoroughly cleaned glass plates as grease and dustmay disrupt the denaturing gradient gel during pouring. Plates should there-
Denaturing Gradient Gel Electrophoresis 131
fore be washed in water immediately after use and cleaned with 100% ethanolbefore use.
1. Assemble the glass plates and spacer(s) according to manufacturers instructions(GRI or other company). If using a homemade system, use plates that are at least20 cm by 20 cm and use spacers that are 0.75–1 mm thick.
2. Insert the glass plate sandwich in to the electrophoresis cassette so that the innersmaller plate faces inwards (to create an upper buffer chamber). Insert the plexi-glass pressure unit so that it rests against the larger outer glass plate (this preventsover tightening of the screws and therefore plate cracking during electrophore-sis). Lift the U-shaped spacer until it locks into position and tighten all screws tosecure the glass plate sandwich into the electrophoresis unit. The design of theU-shaped spacer prevents leakage of the gradient gel during pouring.
3. The comb may be inserted at this point in to the top of the glass plate sandwich.
3.2. Preparation of Denaturing Gradient Gel
1. For each denaturing gradient gel, prepare appropriate “low” and “high” poly-acrylamide solutions, e.g., 30% and 60% denaturant solutions should be preparedto make a 30–60% denaturing gradient gel. The “low” and “high” solutions areprepared by mixing appropriate volumes of 0% and 80% denaturant polyacryla-mide solutions (see Note 6). The volume of the “low” and “high” solutions isdependent up on the total volume held by the glass plates. The INGENYphorUplates hold a total volume of 55 mL. Therefore, 27.5 mL volumes of “low” and“high” solutions are prepared separately for each denaturing gradient gel. The“low” and “high” solutions should be placed at 4°C for 15 min before pouring.
2. Place the gradient maker on a magnetic stirrer positioned 25–30 cm above thetop edge of the glass plate sandwich. The connection between the two chambersshould be closed, and the exit tube should be clamped. Insert the end of the exittube into the top of the glass plate sandwich (this may be facilitated by attachinga yellow tip onto the end of the tubing). Place a magnetic bar into the “high”chamber (see Fig. 3). The apparatus is now ready for pouring a gradient gel.
3. Add appropriate volumes of 10% APS and TEMED to the “low” and “high”denaturing solutions and mix gently. 140 µL of 10% APS and 14 µL TEMED areadded to the 27.5 mL solutions required to make an INGENYphorU gel.
4. Pour the “low” denaturant solution into the “low” chamber. Briefly open the con-nection between the two chambers to release a small quantity of polyacrylamideinto the “high” chamber. This action prevents air bubbles blocking the connec-tion tube.
5. Pour the “high” denaturant solution into the “high” chamber. Activate the mag-netic bar to create a vortex, and open the clamped exit tube.
6. By gravity, the “high” denaturant solution will then leave the “high” chamberand pass into the glass plate sandwich via the exit tube. At this point, open theconnection between the two chambers. The “low” solution will then flow into the“high” chamber, and mix with the “high” solution.
132 Wallis
7. The clamp should be used to adjust the rate of flow of polyacrylamide solutionfrom the “high” chamber through the exit tubing so that a denaturing gradient gelis poured in 5–10 min.
8. Allow the gel to polymerize for between 1–2 h.9. In the meantime, heat the TAE buffer in the buffer tank to 60°C (see Note 7).
Please note that the TAE buffer may be used three times before replacing.
3.3. Gel Electrophoresis
1. Following polymerization, loosen all screws until they just touch the plexi-glasspressure unit.
2. Place the electrophoresis cassette into the INGENYphorU buffer tank and con-nect the buffer flow tube. Buffer should overflow from the upper buffer chamberinto the main tank through holes in the sides of the cassette. A valve on the out-side of the tank controls the rate of buffer flow into the upper buffer reservoir.
3. Carefully remove the comb and push the U-shaped spacer downwards so that thebottom of the polyacrylamide gel makes contact with the buffer. Dislodge anylittle air bubbles lying below the gel by briefly holding the cassette at a 45° angle.
4. Retighten the upper two screws on each side of the cassette. Connect the elec-trodes and prerun the gel at 100 V for 10–15 min before loading.
5. During this time, add 6X gel-loading buffer to the PCR samples to be analyzed(see Note 8). Depending on the yield of the PCR product, load 5–10 µL of samplefrom a 25 µL PCR reaction (see Note 9).
6. Before loading, disconnect the power supply and flush out the wells thoroughlywith TAE buffer using a needle and syringe. After sample loading reconnect thepower supply and electrophorese for the required running time. The optimumrunning time may be calculated using software mentioned in the introduction. Asa guide, the author runs all gels for the analysis of exons 3 –14 of theAdenomatous polyposis coli gene at 100 V (for a gel 30 cm in length) for 16 h.Products may be electrophoresed at a higher voltage for a shorter time if required.
3.4. Gel Staining
1. After the required electrophoresis time disconnect the power supply, and switchoff the buffer tank. Carefully remove the hot gel electrophoresis unit from thebuffer tank.
2. Remove the gel(s) from the unit and separate the glass plates gently to leave thegel on the noneared plate. Remove as appropriate a top gel corner to assign thegel-loading end.
3. Place the gel (still on a noneared plate) into a staining box and stain in 1X TAEbuffer (or distilled water) containing 0.5 µg/µL ethidium bromide.
4. Shake gently for 15–30 min.5. Decant ethidium bromide solution and rinse gel in distilled water and visualize
the DNA bands under UV light (254 nm).
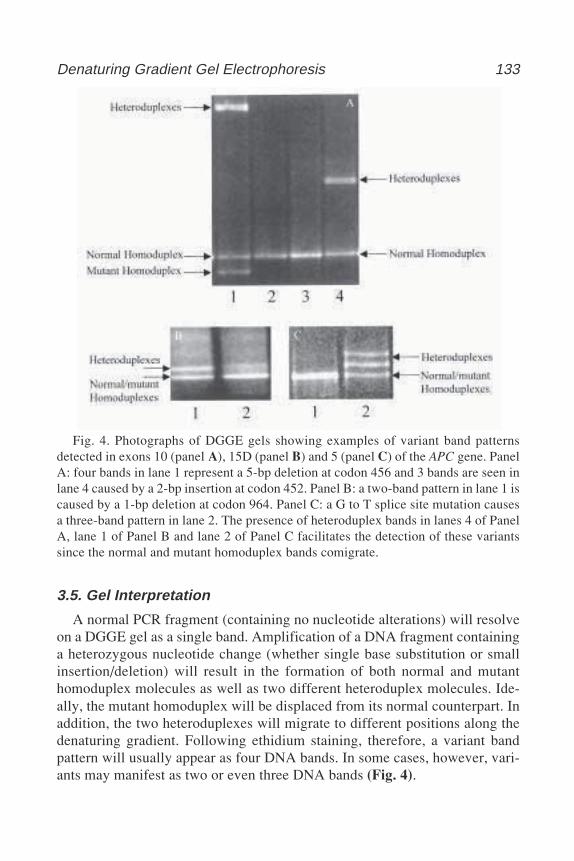
Denaturing Gradient Gel Electrophoresis 133
3.5. Gel Interpretation
A normal PCR fragment (containing no nucleotide alterations) will resolveon a DGGE gel as a single band. Amplification of a DNA fragment containinga heterozygous nucleotide change (whether single base substitution or smallinsertion/deletion) will result in the formation of both normal and mutanthomoduplex molecules as well as two different heteroduplex molecules. Ide-ally, the mutant homoduplex will be displaced from its normal counterpart. Inaddition, the two heteroduplexes will migrate to different positions along thedenaturing gradient. Following ethidium staining, therefore, a variant bandpattern will usually appear as four DNA bands. In some cases, however, vari-ants may manifest as two or even three DNA bands (Fig. 4).
Fig. 4. Photographs of DGGE gels showing examples of variant band patternsdetected in exons 10 (panel A), 15D (panel B) and 5 (panel C) of the APC gene. PanelA: four bands in lane 1 represent a 5-bp deletion at codon 456 and 3 bands are seen inlane 4 caused by a 2-bp insertion at codon 452. Panel B: a two-band pattern in lane 1 iscaused by a 1-bp deletion at codon 964. Panel C: a G to T splice site mutation causesa three-band pattern in lane 2. The presence of heteroduplex bands in lanes 4 of PanelA, lane 1 of Panel B and lane 2 of Panel C facilitates the detection of these variantssince the normal and mutant homoduplex bands comigrate.
134 Wallis
4. Notes1. The 40 bp GC clamp originally described by Sheffield et al. (7) has the following
sequence: 5'-CGCCCGCCGCGCCCCGCGCCCGTCCCGCCGCCCCCGCCCC-3' and should be attached to the 5' end of either the forward or reverse primer.
2. To make heteroduplex molecules when screening homozygous mutations, mixequal quantities of normal and mutant PCR products and denature at 95°C for10 min followed by 30 min at the product-specific annealing temperature. Coolto room temperature before loading.
3. Optimization of DNA band migration may be achieved by altering the denatur-ant gradient range. For example, if fragments migrate too far into the gel beforethey resolve, the denaturant concentration at the top should be increased. How-ever, if fragments do not migrate sufficiently, the concentration at the topshould be lowered.
4. The concentration of polyacrylamide may be altered to suit the fragment sizeunder analysis.
5. To deionize formamide, add 3 g of mixed bed resin to 100 mL formamide andmix for 30 min (in a fume hood). Filter through Whatman paper (again in a fumehood) and store in a dark bottle at 4°C.
6. Appropriate volumes of 0% and 80% denaturant polyacrylamide solutions aremixed to make “low” and “high” gradient solutions. For example, 30% “low”and 60% “high” solutions are made to pour a denaturing gradient gel with a rangeof 30–60%. The following volumes of 0% and 80% denaturant polyacrylamidesolutions are mixed to give 27.5 mL volumes of 30% and 60% solutions:
30% Low solution 60% High solution
volume 0% solution 17.2 mL 6.9 mLvolume 80% solution 10.3 mL 20.6 mL
7. The temperature of the running buffer is very important, and it must not beallowed to deviate from 60°C, as this is a factor in the derivation of the denatur-ing gradient. If the temperature is too high, DNA fragments may not migrate farenough into the gel, and if it is too low, migration may be too far.
8. PCR conditions are specific to the fragment under analysis, and therefore havenot been discussed in this chapter other than the necessity to incorporate a GCclamp into the product. Reactions however should be free from nonspecificamplification products to avoid confusion caused by extra bands.
9. It is important to avoid overloading the gel as this leads to “fuzzy” bands orsmeared lanes making interpretation difficult. “Fuzzy” bands and smeared lanesmay also be caused if the samples have not properly focused, a problem that mayrequire either optimization of the denaturing gradient conditions or primer design.
References1. Fischer, S. G. and Lerman, L. S. (1983) DNA fragments differing by a single
base-pair substitution are separated in denaturing gradient gels: correspondencewith melting theory. Proc. Natl. Acad. Sci USA 80, 1579–1583.
Denaturing Gradient Gel Electrophoresis 135
2. Hovig, E., Smith-Sorenson, B., Brogger, A., and A. L. (1991) Constant denatur-ant gel electrophoresis, a modification of denaturing gradient gel electrophoresis,in mutation detection. Mut. Res. 262, 63–71.
3. Borresen, A. L., Hovig, E., Smith-Sorenson, B., Malkin, D., Lystad, S., Andersen,T. I., Nesland, J. M., Isselbacher, K. J., and Friend, S. H. (1991) Constant denatur-ant gel electrophoresis as a rapid screening technique for p53 mutations. Proc.Natl. Acad. Sci. USA 88, 8405–8409.
4. Van Orsouw, N. J., Vijg, J. (1999) Design and application of 2-D DGGE-basedgene mutational scanning tests. Genet Analyt. 14, 205–213.
5. Takahashi, N., Hiyami, K., Kodaira, M., and Satoh, C. (1990) An improvedmethod for the detection of genetic variations in DNA with denaturing gradientelectrophoresis. Mut. Res. 234, 61–70.
6. Moyret, C., Theillet, C., Puig, P. L., Moles, J. P., Thomas, G., and Hamelin, R.(1994) Relative efficiency of denaturing gradient gel electrophoresis and singlestrand conformation polymorphism in the detection of mutations in exon 5 to 8 ofthe p53 gene. Oncogene 9, 1739–1743.
7. Sheffield, V. C., Cox, D. R., Lerman, L. S., and Myers, R. M. (1989) Attachmentof a 40 base pair G+C-rich sequence (GC-clamp) to genomic DNA fragments bythe polymerase chain reaction results in improved detection of single basechanges. Proc. Natl. Acad. Sci USA 86, 232–236.
8. Olschwang, S., Laurent-Puig, P., Groden, J., White, R., and Thomas, G. (1993)Germ-line mutations in the first 14 exons of the adenomatous polyposis coli (APC)gene. Am. J. Hum. Genet. 52, 273–279.
9. Lerman, L. S. and Silverstein, K. (1987) Computational simulation of DNA melt-ing and its application to denaturing gradient gel electrophoresis, in Methods inEnzymology Volume 155, (Wu, R., ed.), Academic Press, NY, pp. 482–501
10. Wallis, Y. L., Morton, D. G., McKeown, C. M., and Macdonald, F. (1999)Molecular analysis of the APC gene in 205 families: extended genotype-pheno-type correlations in FAP and evidence for the role of APC amino acid changes incolorectal cancer predisposition. J. Med. Genet. 36, 14–20.
11. Fidalgo, P., Almeida, M. R., West, S., Gaspar, C., Maia, L., Wijnen, J., et al.(2000) Detection of mutations in mismatch repair genes in Portuguese familieswith hereditary non-polyposis colorectal cancer (HNPCC) by a multi-methodapproach. Eur. J. Hum. Genet. 8, 49–53.
12. Fodde, R., Vander Luijt, R., Wijnen, J., Tops, C., Van der Klift, H., Van Leeuwen-Cornelisse, I., et al. (1992) Eight novel inactivating germ line mutations of theAPC gene identified by denaturing gradient gel electrophoresis. Genomics 13,1162–1168.
13. Myers, R. M., Maniatis, T. and Lerman, L. S. (1987) Detection and localisation ofsingle base changes by denaturing gradient electrophoresis, in Methods in Enzy-mology, Volume 155 (Wu, R., ed), Academic Press, NY, pp. 501–527.

150 Wells
Conformation-Sensitive Gel Electrophoresis 137
137
From: Methods in Molecular Biology, vol. 187: PCR Mutation Detection ProtocolsEdited by: B. D. M. Theophilus and R. Rapley © Humana Press Inc., Totowa, NJ
15
Conformation-Sensitive Gel Electrophoresis
Ian J. Williams and Anne C. Goodeve
1. IntroductionConformation-sensitive gel electrophoresis (CSGE) was first described by
Ganguly et al. in 1993 (1). This technique was developed as the result of astudy into a rapid, non-radioactive heteroduplex-based detection method formutation screening. The method relies on the differential migration of DNAheteroduplexes in comparison with homoduplexes during polyacrylamide gelelectrophoresis under mildly denaturing conditions. Ethidium bromide stain-ing and visualization under ultraviolet (UV) light determines those sampleswith aberrant banding patterns resulting from heteroduplexes. These samplesare subsequently subjected to DNA sequencing to determine the nature of thenucleotide alteration.
This chapter aims to describe the theory behind CSGE and provide infor-mation to establish this method both quickly and effectively in most labora-tory situations.
1.1. CSGE TheoryThe difference in electrophoretic mobility of DNA homoduplexes from DNA
heteroduplexes has been the focal point for the development of rapid screeningtechniques in the detection of DNA sequence alterations. A DNA homoduplexdiffers from a DNA heteroduplex in its complete Watson–Crick base pairing ofadenine–thymine and guanine–cytosine pairs. A DNA homoduplex consists ofentirely complementary DNA and is completely Watson–Crick base-paired. ADNA heteroduplex has incomplete Watson–Crick base-pairing in opposition.Mismatched, noncomplementary base-pairing may involve a single mismatchednucleotide to produce a DNA heteroduplex, detectable by CSGE.
138 Williams and Goodeve
The CSGE method relies upon mildly denaturing solvents to amplify theconformational changes caused by single-base mismatches during polyacryla-mide gel electrophoresis (1). Under nondenaturing conditions, slight confor-mational changes caused by single-base mismatches in DNA fragments willhave an almost identical electrophoretic mobility to wild-type DNA fragmentsof identical sequence. Under mildly denaturing conditions, one mismatchedbase becomes rotated out of the double helix, creating a bend or kink in theDNA fragment. The conformational change causes aberrant migration of thisfragment compared with wild-type DNA during polyacrylamide gel electro-phoresis under mildly denaturing conditions. If the denaturants within the gelmatrix are increased above optimal conditions for CSGE, both mismatchedbases are rotated out of the double helix and the bend or kink causing theconformational change is eliminated. In this situation, homoduplexed andheteroduplexed DNA will have similar electrophoretic mobilities. Bhattacharryaand Lilley (2) proposed that under nondenaturing conditions, DNA fragmentswith an additional base or bases on one side of the DNA helix, such as a dele-tion or insertion resulting in a frameshift mutation, exhibit more marked gelretardation than DNA fragments possessing single mismatches, where two non-Watson–Crick bases are in opposition. They also reported an increased gelretardation with an increasing number of mismatched bases. This increased gelretardation with insertion and deletion mutations is also observed under themildly denaturing conditions of CSGE (see Subheading 3.4.). Therefore,CSGE aims to optimize conditions for mismatched bases in heteroduplexedDNA to result in a shift in band migration during polyacrylamide gel electro-phoresis.
1.2. CSGE Conditions
Optimized conditions for CSGE were described by Ganguly and Prockop(3). Denaturants ethylene glycol and formamide, known to alter the conforma-tion of DNA, were chosen for inclusion into the CSGE gel mix at concentra-tions of 10% and 15% respectively, because of their compatibility withpolyacrylamide gel electrophoresis. A tris-taurine buffer system was employed,replacing a tris-borate buffer, as the tris-taurine buffer is glycerol tolerant (1).Finally, a 10% polyacrylamide gel of 1 mm thickness was used withbisacryloylpiperazine (BAP), replacing bis(N,N-methylene bisacrylamide) asa crosslinker. These conditions provide strength to CSGE gels and enhance thesieving action of the gel during electrophoresis (3).
1.3. Sensitivity of Technique
Originally, Ganguly et al. tested CSGE on a range of polymerase chain reac-tion (PCR) products possessing known single-nucleotide changes in amplified
Conformation-Sensitive Gel Electrophoresis 139
DNA fragments varying in size from 200 to 800 base pairs (bp) (1). Eighteenof twenty-two single-base changes were detected in four different collagengenes. Of the four not detected, three mismatches were located in an isolatedhigh-melting-temperature domain. The remaining undetected mismatch waslocated 51 bp from one end of the PCR fragment. Subsequently, this mismatchwas detected when present 81 bp from the end of a new PCR fragment. Asimilar observation was made with samples from patients having known factorIX gene (FIX) mutations, where 31/35 mismatches were detected (1). The fourundetected mismatches were located within 50 bp of the end of the PCR frag-ment. This led to PCR primers being designed further away from the sequenceof interest, with 50–100 bp of redundant sequence being incorporated into eachend of the region amplified. In the same study, 100% detection of mutationswas achieved in a further 11 samples having sequence alterations in the M13phage and in the elastin gene, giving a total of 60/68 mismatches detected. Themutations not detected were either located in the terminal sequence of the PCRproduct or located in a high-melting temperature domain. In our laboratory,CSGE was applied to screening the factor VIII (FVIII) gene of hemophilia Apatients with similar success (4). Analysis of the FVIII gene of seven patientswith hemophilia A revealed seven nucleotide alterations plus an intragenicdeletion, detected because of the failure of amplification of exons 23–25. TheFIX gene has also been examined by CSGE in our laboratory. CSGE detectednucleotide alterations in 21 of 21 individuals with hemophilia B, 11 of whichwere previously unknown (5). Recent improvements by Korkko et al. (6)yielded 100% detection of mutations by CSGE in 76 different PCR products,ranging in size from 200– 450 bp using altered electrophoresis conditions.CSGE has also been adapted to use fluorescent dyes and automated detectionon a DNA sequencer for an increased screening throughput (7). In summary,CSGE will detect close to 100% of nucleotide sequence alterations.
1.4. Applications of CSGE
Conformation-sensitive gel electrophoresis has been used for detectionof sequence alterations in many different genes. These include inheriteddefects in several collagen genes (1,6,8–10) and genes involved in hae-mostasis (4,5,11,12), plus acquired mutations in c-kit (13) and BRCA1 andBRCA2 (7,14).
1.5. Variations on CSGE
Many variations on CSGE conditions have been presented by different labo-ratories. As a standard, we use the PCR sample alone in the heteroduplex reac-tion, covered by mineral oil to prevent evaporation of the sample, and a 10%acrylamide (99:1 acrylamide:BAP) gel containing 10% ethylene glycol and
140 Williams and Goodeve
15% formamide. This CSGE gel is prerun for 1 h at 750 V and then samples areelectrophoresed at 400 V for 16–17 h. Early work involved the addition ofethylene glycol, formamide, xylene cyanol, and bromophenol blue to samplesto be heteroduplexed (1,3,9,10). Most laboratories heteroduplex samples with-out additives. Markoff et al. (14) used urea as a denaturant in the gel, at 15%, inplace of formamide (15%). Electrophoresis conditions have ranged from 40 Wfor 6 h (6) to a 400 V overnight run (4). Gel documentation has been reportedby both ethidium bromide staining and by silver staining (14). A more recentdevelopment has also adapted the CSGE mutation scanning assay for use withfluorescent detection (F-CSGE) (7).
1.6. PCR Amplification1.6.1. Primer Design
Primers for use in PCR amplification of a gene for mutation detection shouldencompass the entire coding region, including intron/exon boundaries, the pro-moter region, and the polyadenylation signal. Most primer sets will thus beintronic and should include, for the purpose of CSGE, an additional 80–100 bpat either end of each exon. Larger exons can be split into smaller PCR frag-ments, with an overlap of 80–100 bp for each fragment.
1.6.2. PCR Conditions
Polymerase chain reaction optimization for mutation screening enhances thequality of CSGE results and reduces PCR product purification steps for subse-quent DNA sequencing. Following PCR amplification, samples are electro-phoresed on 5% polyacrylamide:bis (see Note 1) minigels to assess DNA purityand concentration. A single strong PCR product is ideal for CSGE and sequenceanalysis. Polyacrylamide gel electrophoresis will also provide informationrelating to the volume of sample to be loaded onto the CSGE gel. If the sampleis too concentrated, a smaller volume can be loaded or even diluted in water tomaintain the loading volume. An increased volume can also be loaded if theDNA concentration is too low (see Note 2).
In some situations we have found that the components of the PCR reactionscan affect the DNA sample when loaded onto the CSGE gel. In these cases,smearing of the sample has occurred and, instead of a single band, the sampleresembles a long streak blending into the DNA front, masking any indicationof heteroduplex band separation. This smearing can be easily eliminated bychanging PCR buffer components or buffer manufacturer. In our laboratory,Bioline Taq polymerase is used with the manufacturers 10X (NH4)2SO4 bufferwith excellent results. Bioline Taq also works reliably with a homemade ammo-nium-sulfate-based buffer (see Note 3). Use of commercially supplied bufferensures standard amplification conditions and eliminates the batch-to-batchvariation with homemade buffer.
Conformation-Sensitive Gel Electrophoresis 141
An incompatibility between PCR amplification buffer and CSGE gel can beidentified at an early stage in the procedure by the appearance of smeared bandson CSGE gels, not present on polacrylamide:bis mini gels, even with a dilutionof the CSGE sample. Once PCR conditions have been identified that give sharpsingle bands on CSGE gels, test samples can be amplified, heteroduplexed,and screened by CSGE.
1.7. Heteroduplexing DNA Samples
DNA heteroduplexes are formed between mismatched wild-type and mutantDNA fragments. The heteroduplexing method is a simple two-step processinvolving an initial denaturing stage, where hydrogen bonds between pairednucleotides are broken, producing single-stranded DNA fragments. This dena-turing step involves heating the sample to 98°C for 5 min. The second step, orannealing stage, involves cooling the sample to 65°C for 30 min (see Note 4).At this temperature, the DNA can reform back into double-stranded DNA, withthe possibility of each sense strand pairing with a different antisense strand(Fig. 1). Heteroduplexes are formed when the new paired strands differ insequence by one or more nucleotides. For inherited disorders, the inheritancepattern of the expected nucleotide change requires consideration. Males possesonly one copy of X-linked genes, such as FVIII. For their analysis, a PCRsample from a normal individual is mixed with the patient’s sample, enablingthe two (potentially different) alleles to mix and form heteroduplexes. Fivemicroliters each of patient plus control PCR product are mixed and overlaidwith mineral oil to avoid evaporation during heteroduplexing (see Note 5). Inthe situation where the subject is expected to be heterozygous for a mutation,such as female carriers of hemophilia, PCR product is heteroduplexed with itsown normal allele. This also applies to autosomal dominant inherited disorderssuch as von Willebrand disease (chromosome 12). Therefore, if heterozygosityfor a defect is expected, heteroduplexing can be added at the end of the PCRthermocycling and an aliquot loaded directly onto the CSGE gel. Where thereis an uncertainty about the nature of a mutation, samples should be analyzed byCSGE following both heteroduplexing against self and against a wild-typesample. The latter technique has been used determine allele frequency in poly-morphism analysis (4).
2. Materials2.1. Gel Preparation
All chemicals were obtained from Sigma, unless specified.
1. 20X TTE (1.78 M Tris, 570 mM taurine, 4 mM EDTA). A Tris-taurine buffersystem was developed for CSGE gels, as it is more alcohol tolerant than the tra-ditional Tris-borate buffer. A 500-mL stock solution of 20X TTE can be used for
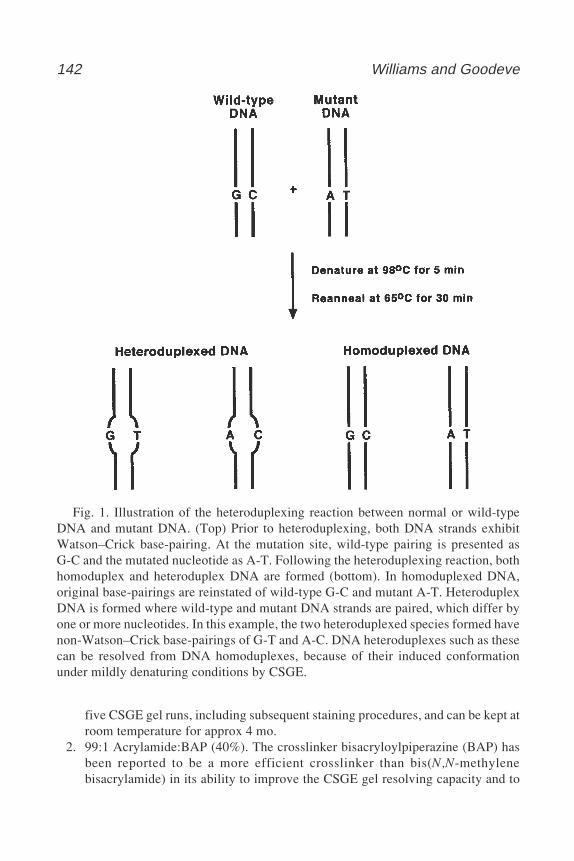
142 Williams and Goodeve
five CSGE gel runs, including subsequent staining procedures, and can be kept atroom temperature for approx 4 mo.
2. 99:1 Acrylamide:BAP (40%). The crosslinker bisacryloylpiperazine (BAP) hasbeen reported to be a more efficient crosslinker than bis(N,N-methylenebisacrylamide) in its ability to improve the CSGE gel resolving capacity and to
Fig. 1. Illustration of the heteroduplexing reaction between normal or wild-typeDNA and mutant DNA. (Top) Prior to heteroduplexing, both DNA strands exhibitWatson–Crick base-pairing. At the mutation site, wild-type pairing is presented asG-C and the mutated nucleotide as A-T. Following the heteroduplexing reaction, bothhomoduplex and heteroduplex DNA are formed (bottom). In homoduplexed DNA,original base-pairings are reinstated of wild-type G-C and mutant A-T. HeteroduplexDNA is formed where wild-type and mutant DNA strands are paired, which differ byone or more nucleotides. In this example, the two heteroduplexed species formed havenon-Watson–Crick base-pairings of G-T and A-C. DNA heteroduplexes such as thesecan be resolved from DNA homoduplexes, because of their induced conformationunder mildly denaturing conditions by CSGE.
Conformation-Sensitive Gel Electrophoresis 143
enhance the physical strength of polyacrylamide gels. A 500 mL gel mix con-tains 198 g of solid acrylamide (BDH) (see Note 6) and 2 g of BAP (Fluka). Oncedissolved, this stock is kept at 4°C and has a shelf life of 4 mo.
3. Gel loading buffer: 50% glycerol, 0.25% xylene cyanol, 0.25% bromophenolblue. The ingredients are mixed and dissolved in water.
4. 10% Ammonium persulfate (APS). Used in the polymerization of acrylamidegels. A solution of 10% (w/v) APS dissolved in water is made fresh every 2 wk.Reduced APS activity prolongs the polymerization reaction.
5. Ethidium bromide (EtBr, 10 mg/mL). Used in powder form and dissolved in waterto yield a concentration of 10 mg/mL. Care must be taken in the preparation,handling, and disposal of this solution (see Note 7).
6. Gel rigs. Electrophoresis equipment required for running CSGE gels are of astandard design and have few special requirements. Electrophoresis tanks usedfor manual sequencing can be used for CSGE and make a good starting point to“test” the procedure. Preferably, shorter rigs should be used to minimize wastedgel space. For this reason, we use gel tanks which are 410 mm × 330 mm(Flowgen).
7. Gel plates. The glass plates are a standard plain and lugged glass plate set,dimensions 410 mm × 330 mm, with a siliconized lugged plate. One-millimeterspacers and 1-mm castle combs are used in casting CSGE gels. The thickness ofthe gel will affect its run time, heat dissipation, and the strength of the gel duringthe later handling stages. Once the lugged glass plate has been siliconized andboth plates cleaned with 70% ethanol, the plates can be sealed using electricaltape (Genetic Research Instrumentation Ltd., code AFT/UT), to prevent leakingof the gel during casting.
8. Combs. One-millimeter castle combs (Web Scientific, special request) are usedto cast a CSGE gel with overall comb dimension width 280 mm, depth 35 mm,and thickness 10 mm. Each comb has 40 teeth, but it can be cut in half to give twoequal-sized combs of 20 teeth to use with standard sequencing-sized plates. Thewell dimensions are important to prevent overloading of the well. Well dimen-sions are 5 mm width, 10 mm depth, and 2 mm well separation.
2.2. Casting the Gel
1. (40%) 99:1 acrylamide:BAP.2. 20X TTE buffer.3. Formamide.4. Ethylene glycol.5. Deionized water.6. 10% Ammonium persulfate (APS).7. TEMED (N,N,N',N'-tetramethylethylenediamine).8. Sealed glass plates (1 mm-thick spacers and comb).9. Bulldog clips.
10. 50 mL syringe with a 21-gauge needle.
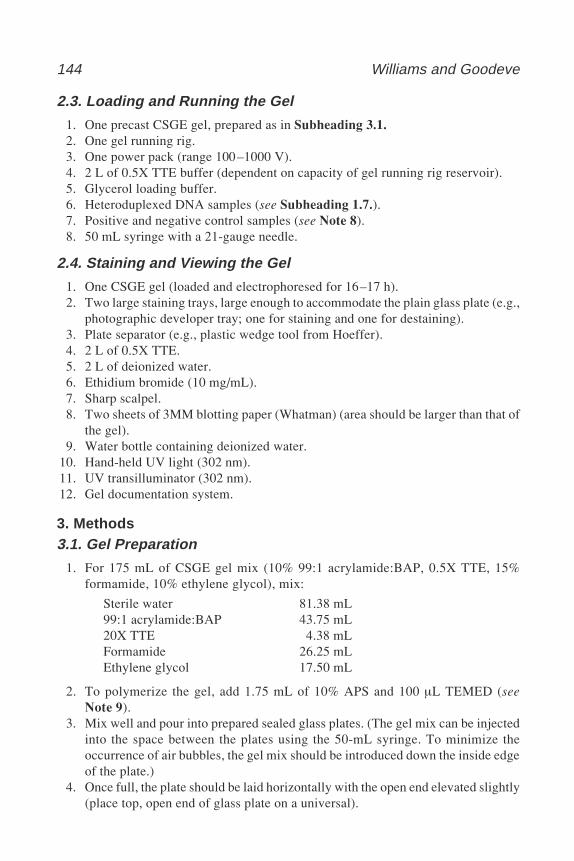
144 Williams and Goodeve
2.3. Loading and Running the Gel
1. One precast CSGE gel, prepared as in Subheading 3.1.2. One gel running rig.3. One power pack (range 100–1000 V).4. 2 L of 0.5X TTE buffer (dependent on capacity of gel running rig reservoir).5. Glycerol loading buffer.6. Heteroduplexed DNA samples (see Subheading 1.7.).7. Positive and negative control samples (see Note 8).8. 50 mL syringe with a 21-gauge needle.
2.4. Staining and Viewing the Gel
1. One CSGE gel (loaded and electrophoresed for 16–17 h).2. Two large staining trays, large enough to accommodate the plain glass plate (e.g.,
photographic developer tray; one for staining and one for destaining).3. Plate separator (e.g., plastic wedge tool from Hoeffer).4. 2 L of 0.5X TTE.5. 2 L of deionized water.6. Ethidium bromide (10 mg/mL).7. Sharp scalpel.8. Two sheets of 3MM blotting paper (Whatman) (area should be larger than that of
the gel).9. Water bottle containing deionized water.
10. Hand-held UV light (302 nm).11. UV transilluminator (302 nm).12. Gel documentation system.
3. Methods3.1. Gel Preparation
1. For 175 mL of CSGE gel mix (10% 99:1 acrylamide:BAP, 0.5X TTE, 15%formamide, 10% ethylene glycol), mix:
Sterile water 81.38 mL99:1 acrylamide:BAP 43.75 mL20X TTE 4.38 mLFormamide 26.25 mLEthylene glycol 17.50 mL
2. To polymerize the gel, add 1.75 mL of 10% APS and 100 µL TEMED (seeNote 9).
3. Mix well and pour into prepared sealed glass plates. (The gel mix can be injectedinto the space between the plates using the 50-mL syringe. To minimize theoccurrence of air bubbles, the gel mix should be introduced down the inside edgeof the plate.)
4. Once full, the plate should be laid horizontally with the open end elevated slightly(place top, open end of glass plate on a universal).
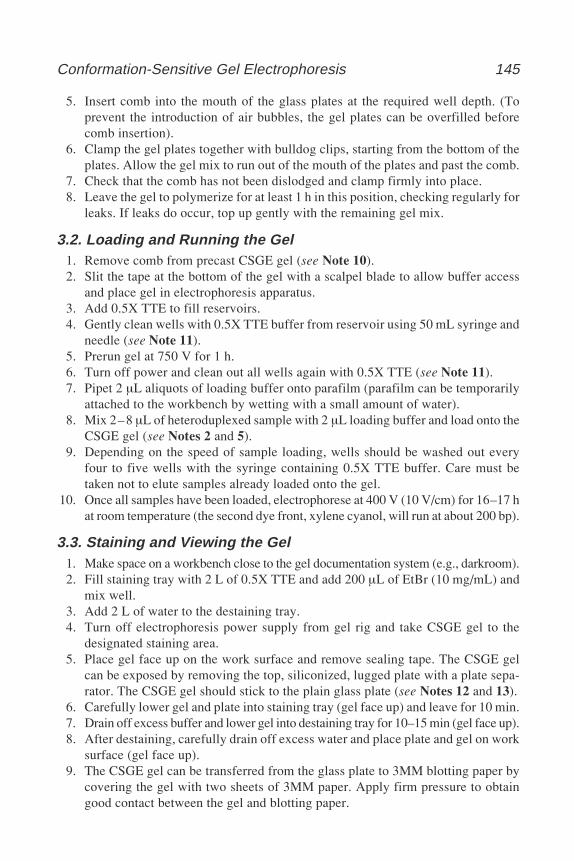
Conformation-Sensitive Gel Electrophoresis 145
5. Insert comb into the mouth of the glass plates at the required well depth. (Toprevent the introduction of air bubbles, the gel plates can be overfilled beforecomb insertion).
6. Clamp the gel plates together with bulldog clips, starting from the bottom of theplates. Allow the gel mix to run out of the mouth of the plates and past the comb.
7. Check that the comb has not been dislodged and clamp firmly into place.8. Leave the gel to polymerize for at least 1 h in this position, checking regularly for
leaks. If leaks do occur, top up gently with the remaining gel mix.
3.2. Loading and Running the Gel1. Remove comb from precast CSGE gel (see Note 10).2. Slit the tape at the bottom of the gel with a scalpel blade to allow buffer access
and place gel in electrophoresis apparatus.3. Add 0.5X TTE to fill reservoirs.4. Gently clean wells with 0.5X TTE buffer from reservoir using 50 mL syringe and
needle (see Note 11).5. Prerun gel at 750 V for 1 h.6. Turn off power and clean out all wells again with 0.5X TTE (see Note 11).7. Pipet 2 µL aliquots of loading buffer onto parafilm (parafilm can be temporarily
attached to the workbench by wetting with a small amount of water).8. Mix 2–8 µL of heteroduplexed sample with 2 µL loading buffer and load onto the
CSGE gel (see Notes 2 and 5).9. Depending on the speed of sample loading, wells should be washed out every
four to five wells with the syringe containing 0.5X TTE buffer. Care must betaken not to elute samples already loaded onto the gel.
10. Once all samples have been loaded, electrophorese at 400 V (10 V/cm) for 16–17 hat room temperature (the second dye front, xylene cyanol, will run at about 200 bp).
3.3. Staining and Viewing the Gel1. Make space on a workbench close to the gel documentation system (e.g., darkroom).2. Fill staining tray with 2 L of 0.5X TTE and add 200 µL of EtBr (10 mg/mL) and
mix well.3. Add 2 L of water to the destaining tray.4. Turn off electrophoresis power supply from gel rig and take CSGE gel to the
designated staining area.5. Place gel face up on the work surface and remove sealing tape. The CSGE gel
can be exposed by removing the top, siliconized, lugged plate with a plate sepa-rator. The CSGE gel should stick to the plain glass plate (see Notes 12 and 13).
6. Carefully lower gel and plate into staining tray (gel face up) and leave for 10 min.7. Drain off excess buffer and lower gel into destaining tray for 10–15 min (gel face up).8. After destaining, carefully drain off excess water and place plate and gel on work
surface (gel face up).9. The CSGE gel can be transferred from the glass plate to 3MM blotting paper by
covering the gel with two sheets of 3MM paper. Apply firm pressure to obtaingood contact between the gel and blotting paper.
146 Williams and Goodeve
10. Carefully peel back the blotting paper, ensuring that the CSGE gel is firmlyattached.
11. Place gel face up on the work surface.12. Locate bands by visualizing the gel with a hand-held UV light (302 nm) and
excise relevant portions of DNA band containing gel using the scalpel blade (seeNotes 13 and 14).
13. Wet the surface of the UV transilluminator with deionized water from the waterbottle.
14. Place the excised gel section face down on the wet transilluminator.15. Wet the 3MM paper with water from the water bottle and peel off the 3MM
paper, leaving the excised gel section on the UV transilluminator (see Note 15).16. Visualize bands in the gel using the UV transilluminator and document results
(see Note 16).
3.4. Gel Banding Patterns
The CSGE results often reflect the nature of the nucleotide change. Thevariation in enhancement or retardation of DNA migration of heteroduplexesfrom homoduplexes will mainly depend on the type or nature of the nucleotidechange. The overall fragment size, sequence composition, and flanking nucle-otide sequence at the mutation site will also play a role in the degree of DNAband separation during polyacrylamide gel electrophoresis.
Small insertions or deletions of one or a few base pairs produce the largestband separations, because of an increased conformational change from wild-type DNA. In these cases, all four possible reannealled conformations canoften be seen on CSGE gels (Figs. 2 and 3). Single-nucleotide substitutionsproduce less marked band separations, because of the small conformationalchange induced. Results obtained from CSGE gels detecting different nucle-otide substitutions, insertions, or deletions will vary dramatically.
Most banding patterns produced by single-nucleotide substitutions can beeasily identified when compared to wild-type homoduplex DNA. Some het-eroduplexes only induce a slight retardation or enhancement of migration dur-ing polyacrylamide gel electrophoresis. These CSGE patterns consist of asingle band, which is slightly thicker in width than wild-type DNA. These “fat-ter” bands can mimic an overloaded well and the nucleotide substitution can beoverlooked. An extensive visual examination of the CSGE gel is essential forcomparing all samples with normal or wild-type DNA. After gel documenta-tion, all altered banding patterns must be investigated, either by a repeat CSGE,possibly with loading less DNA, or direct sequencing of the sample. Allsamples displaying altered CSGE migration should then be sequenced to deter-mine the nature of the nucleotide change (see Chapter 10).
Conformation-Sensitive Gel Electrophoresis 147
Fig 2. FVIII gene, exon 6 (423 bp): Lane 1, negative control, heteroduplexed againstself; lane 2, heteroduplexed sample with an A to G substitution; lane 3, heteroduplexedsample with a 2-bp insertion of CC; lane 4, heteroduplexed sample with a single-basedeletion of a T.
Fig 3. FVIII gene, exon 8 (547 bp): Lane 1, negative control heteroduplexed againstself; lane 2, heteroduplexed sample with an A to G substitution; lane 3, heteroduplexedsample with an A to G substitution and a C to T substitution, hence the different band-ing pattern; lane 4, heteroduplexed sample with an A to G substitution.
Figs. 2 and 3. CSGE gel stained with ethidium bromide and visualized under UVlight. All samples have been mixed with a negative control or wild-type sample ofequal concentration and subjected to the heteroduplexing reaction, 98°C for 5 min,65°C for 30 min). Each lane contains a total of 5 µL heteroduplexed PCR productmixed with 2 µL dye and electrophoresed at 400 V for 17 h on a 10% polyacrylamideget (99:1, acrylamide:BAP), 0.5X TTE, 15% formamide, 10% ethylene glycol).
148 Williams and Goodeve
4. Notes1. Stock of 40% (w/v) acrylamide: 2.105% (w/v) N,N-methylene bisacrylamide
ratio 19:1.2. Both well preparation and sample loading are an essential part in obtaining
reproducible results. When loading the gel, keep the sample volume to a mini-mum and allow it to cover the bottom few millimeters of the well.
3. Homemade PCR buffer (10X) is 166 mM (NH4)2SO4, 670 mM Tris-HCl, pH 8.8,67 mM MgCl2, 2% β-Mercaptoethanol, and 1 mg/mL bovine serum albumin(BSA). The latter two ingredients are added immediately prior to use. Commer-cial PCR buffer (1X) is 16 mM (NH4)2SO4, 67 mM Tris-HCl, pH 8.8, 0.1%Tween-20.
4. DNA thermocyclers, hot blocks, hot ovens, and water baths can all be used forheteroduplexing PCR product.
5. This will give a total sample volume of 10 µL, of which 2–8 µL can be loadedonto the CSGE gel. Where PCR product volume is limited, each PCR productcan be reduced to, for example, 3 µL, providing a total volume to load of 5 µL.Where one PCR sample is at a lower concentration, volumes mixed should beadjusted to produce equal DNA concentrations to be mixed together.
6. Care must be taken when handling solid acrylamide. Always read safety guide-lines before attempting to make solutions.
7. Ethidium bromide is mutagenic. Care must be taken in its use and disposal.8. A “heterozygous” positive control sample should be loaded with each CSGE run
to ensure that the gel has run properly and is capable of heteroduplex detection.Samples with a known polymorphism or mutation genotype can be used. A nega-tive control must also be included where wild-type DNA is heteroduplexed toself. For samples that require mixing with wild-type DNA, the same wild-typeDNA should also be used in the negative control. A negative control should beincorporated into the CSGE screening procedure for each DNA fragment stud-ied, for comparison with band characteristics of heteroduplexed samples.
9. The CSGE gels should be prepared, polymerized, and electrophoresed on thesame day. Keeping the CSGE gel overnight, even in a cold room, may affectresults.
10. Combs must be removed from the gel without disfiguring the wells. The loadedsample will take up the shape of the well, so avoid loading misshapen wells.These can be marked on the glass plates with a marker pen prior to loading andthen avoided during loading. Vacuum pressure may also cause wells to collapsewhen the comb is removed. Two methods are available to remove combs; in bothinstances, unpolymerized liquid acrylamide is first removed by blotting the areaaround the comb with blue roll or tissue, enabling air to enter the well space morefreely. The first method involves carefully coaxing the comb out of the well spaceat the same time as allowing air to enter the well space. The second methodinvolves the separation of the lugged glass plate from the cast gel. With the gellaid flat and open face up on the bench, a sharp object, such as the point of a pairof scissors, can be inserted in the center of the gel plate between the comb and the
Conformation-Sensitive Gel Electrophoresis 149
plate (in a gap between the teeth of the comb) and rotated slightly. The gel will beseen to come away from the glass plate and the comb can be removed with ease.This will not affect the running of the gel.
11. The syringe can be filled from the top reservoir, providing that there is bufferremaining to cover the wells. Take care when placing the needle onto the syringe.With constant pressure, the needle tip can be inserted into each well, but avoidingtouching the well base. Salts collecting at the base of the well will be seen as aviscous liquid.
12. The CSGE gels can stretch when mishandled, mainly at the edges where the gelhas come away from the glass plate. Care must be taken to avoid agitating the gelwhen staining and destaining. A CSGE gel that has become unstuck from theplain glass plate will grow a few centimeters in all directions. Therefore, stretch-ing the gel can affect the results and must be avoided.
13. Make a note of the orientation of the gel. Cut a corner off each segment of the gelto indicate the location of the first sample loaded.
14. To help to locate the DNA bands when using the hand-held UV light, samples ofsimilar size should be loaded in clusters. The detection of minor changes isimproved when samples are loaded adjacent to a wild-type sample or negativecontrol. Samples will not be visualized with a hand-held UV light before the gelis transferred from the glass plate to the blotting paper.
15. The procedure of transferring the CSGE gel with 3MM paper can be repeated, ifrequired, to reposition the gel for accurate documentation.
16. It is important to document all CSGE results. Banding patterns can vary fromlarge band separations to slightly thicker bands when compared with the negativecontrol. All banding patterns that differ from the negative control must be treatedas a positive result until proven otherwise.
References
1. Ganguly, A., Rock, M. J., and Prockop, D. J. (1993) Conformation-sensitive gelelectrophoresis for rapid detection of single-base differences in double-strandedPCR products and DNA fragments: evidence for solvent induced bends in DNAheteroduplexes. Proc. Natl. Acad. Sci. USA 90, 10,325–10,329.
2. Bhattacharyya, A. and Lilley, D. M. J. (1989) The contrasting structures of mis-matched DNA sequences containing looped-out bases (bulges) and multiple mis-matches (bubbles). Nucl. Acids Res. 17, 6821–6840.
3. Ganguly, A. and Prockop, D. J. (1995) Detection of mismatched bases in doublestranded DNA by gel electrophoresis. Electrophoresis 16, 1830–1835.
4. Williams, I. J. Abuzenadah, A. Winship, P. R. Preston, F. E. Dolan, G. Wright, J.et al. (1998) Precise carrier diagnosis in families with haemophilia A: use of con-formation sensitive gel electrophoresis for mutation screening and polymorphismanalysis. Thromb. Haemost. 79, 723–726.
5. Hinks, J. L., Winship, P. R., Makris, M., Preston, F. E., Peake, I. R., andGoodeve, A. C. (1999) Conformation sensitive gel electrophoresis for precisehaemophilia B carrier analysis. Br. J. Haematol. 104, 915–918.
150 Williams and Goodeve
6. Körkkö, J., Annunen, S., Pihlajamaa, T., Prockop, D. J., and Ala-Kokko, L. (1998)Conformation sensitive gel electrophoresis for simple and accurate detection ofmutations: Comparison with denaturing gradient gel electrophoresis and nucle-otide sequencing. Proc. Natl. Acad. Sci. USA 95, 1681–1685.
7. Ganguly, G., Dhulipala, R., Godmilow, L., and Ganguly, A. (1998) High through-put fluorescence-based conformation-sensitive gel electrophoresis (F-CSGE)identifies six unique BRCA2 mutations and an overall low incidence of BRCA2mutations in high-risk BRCA1-negative breast cancer families. Hum. Genet. 102,549–556.
8. Ganguly, A. and Williams, C. (1997) Detection of mutations in multi-exon genes:Comparison of conformation sensitive gel electrophoresis and sequencing strate-gies with respect to cost and time for finding mutations. Hum. Mut. 9, 339–343.
9. Williams, C. J., Rock, M., Considine, E., McCarron, S., Gow, P., Ladda, R., et al.(1995) Three new point mutations in type II procollagen (COL2A1) and identifi-cation of a fourth family with the COL2A1 Arg519(Cys base substitution usingconformation sensitive gel electrophoresis. Hum. Mol. Genet. 4, 309–312.
10. Williams, C. J., Ganguly, A., Considine, E., McCarron, S., Prockop, D. J., Walsh-Vockley, C., et al. (1996) A-2(G Transition at the 3' acceptor splice site of IVS17characterises the COL2A1 gene mutation in the original stickler syndrome kin-dred. Am. J. Med. Genet. 63, 461–467.
11. Beauchamp, N. J., Daly, M. E., Makris, M., Preston, F. E., and Peake, I. R. (1998)A novel mutation in intron K of the PROS1 gene causes aberrant RNA splicingand is a common cause of protein S deficiency in a UK thrombophilia cohort.Thromb. Haemost. 79, 1086–1091.
12. Abuzenadah, A. M., Gursel, T., Ingerslev, J., Nesbitt, I. M., Peake, I. R., andGoodeve, A. C. (1999) Mutational analysis of the von Willebrand disease.Thromb. Haemost. (Suppl. A) Abstract 887.
13. Gari, M., Goodeve, A. C., Wilson, G., Winship, P. R., Langabeer, S., Linch, D.,et al. (1999) c-kit proto-oncogene exon 8 in frame deletion plus insertion muta-tions in acute myeloid leukaemia. Br. J. Haematol. 10, 894–900.
14. Markoff, A., Sormbroen, H., Bogdanova, N., Priesler-Adams, S., Ganev, V.Dworniczak, B., et al. (1998) Comparison of conformation-sensitive gel electro-phoresis and single-strand conformation polymorphism analysis for detection ofmutations in the BRCA1 gene using optimised conformation analysis protocols.Eur. J. Hum. Genet. 6, 145–150.
SSCP/Heteroduplex Analysis 151
151
From: Methods in Molecular Biology, vol. 187: PCR Mutation Detection ProtocolsEdited by: B. D. M. Theophilus and R. Rapley © Humana Press Inc., Totowa, NJ
16
SSCP/Heteroduplex Analysis
Andrew J. Wallace
1. IntroductionSingle-strand conformation (SSCP) and heteroduplex analysis are separate
mutation scanning methods in their own right. They are, however, unusual inthat they can be carried out simultaneously on a single gel.
The technique of SSCP analysis was originally described in 1989 (1). Itinvolves the heat denaturation of polymerase chain reaction (PCR) amplifiedDNA followed by electrophoresis under nondenaturing conditions. The frag-ments in the original protocol were visualized by radiolabeling and autorad-iography, although a variety of nonisotopic methods are now available,including silver staining (2), fluorescent labels (3), and ethidium bromide stain-ing (4). The SSCP technique relies on the propensity for single-stranded DNA(ssDNA) in nondenaturing conditions to take on a three-dimensional, or sec-ondary, structure that is highly sequence dependent. Consequently, sequencedifferences can cause alterations to the DNA’s secondary structure. Becausethe electrophoretic mobility of DNA under nondenaturing conditions is depen-dent on its shape as well as other factors like charge, point mutations can giverise to mobility shifts. The gels used for SSCP are usually native acrylamide,typically with a low level of crosslinking (49:1), although there is a great dealof variability between published protocols. The low level of crosslinking givesa large pore size, thus permitting efficient separation of the bulky structuresthat ssDNA forms under these conditions. The detection efficiency of SSCPis highly variable, the most important parameter to consider is fragment size.The optimum sensitivity is with fragments as small as 150 bp, where under asingle condition, 90% of mutations are detected (5).
Heteroduplexes are hybrid DNA molecules that, although largely matched,have one or more mismatched base pairs. Heteroduplexes have been used as a
152 Wallace
tool to scan for point mutations since 1992 (6). They typically appear on nativepolyacrylamide gels as one or two bands of reduced mobility relative to thehomoduplex DNA. The mismatched bases present in heteroduplexes are thoughtto affect electrophoretic mobility by inducing bends in the DNA (7). Because twodifferent DNA sequence variants must be present to form heteroduplexes, theymay need to be created for some types of analysis. For example, in order toanalyze male samples for loci on the X chromosome by heteroduplex analysis,heteroduplexes can be created by mixing, denaturing, and annealing the testsample PCR amplification with a known normal control amplification. Inheterozygotes, however, heteroduplexes form as a natural by product of PCRreactions. During the latter stages of PCR amplification, when the polymeraseactivity is limiting, some of the denatured ssDNA can spontaneously reannealwithout primer extension with an opposite strand from the other allele, thuscreating heteroduplex DNA.
Heteroduplex analysis is carried out by electrophoresis of the fragment ofinterest on long (usually polyacrylamide) gels with low ratios of crosslinking.Heteroduplexes have been visualized using radioisotopes (6), silver staining(2), and ethidium bromide staining (8). Fluorescent labeling should also betheoretically possible. The detection efficiency of heteroduplex analysis hasbeen reported to approach 90% under ideal conditions (7) and the optimumsize, 250–500 bp, is not as tightly defined as SSCP.
Combined SSCP/heteroduplex analysis exploits the tendency for a propor-tion of the DNA denatured during sample preparation for SSCP to spontane-ously reanneal to form dsDNA and, hence, heteroduplexes when there aresequence differences in the sample. The gel conditions for both SSCP and het-eroduplex analysis are compatible and so it is possible to get “two techniquesfor the price of one.” There are, however, some limitations to the technique;foremost among these is that the dsDNA, with which the heteroduplexes areassociated, have a much higher mobility than the SSCPs formed by the ssDNA.This limits the electrophoresis time in order to retain the dsDNA on the gel,reducing the resolution of the SSCPs. In practice, the loss of sensitivity is morethan made up for by the complementarity between the two techniques, a pointevinced by the observation that every one of 134 different cystic fibrosis trans-membrane conductance regulator (CFTR) mutations are detectable by a com-bined SSCP/heteroduplex strategy (9). Consequently, a combined SSCP/heteroduplex approach is now used more frequently by laboratories than eithertechnique alone.
2. Materials2.1. Preparation and Electrophoresis of SSCP/Heteroduplex Gels
1. S2 or SA32 sequencing gel system (Gibco-BRL; cat. nos. S2–21105-036 andSA32–31096-027) (see Note 1).

SSCP/Heteroduplex Analysis 153
2. 1-mm-thick combs and spacers. These are a nonstandard thickness and need tobe custom-made to order.
3. Acrylamide powder preweighed (49:1 acrylamide:bis-acrylamide) (e.g., Sigma;cat. no. A0924). Dissolve according to the manufacturer’s instructions withdeionized water to make a 40% stock solution and store at 4°C. Use within 1 mo(see Notes 2 and 3).
4. TEMED (N,N,N',N'-tetramethylethylenediamine) (e.g., Sigma; cat. no. T7024).5. 10% Ammonium persulfate solution (10% AMPS) (e.g., Sigma; cat. no. A9164).
Make up fresh on the day of use.6. 10X TBE electrophoresis buffer (e.g., Gibco-BRL; cat. no. 15581-036). Use
within 1 mo of opening.7. Formamide loading buffer: 10 mL deionized formamide, 200 µL of 0.5 M
EDTA, pH 8.0, 15 mg xylene cyanol, 3 mg bromophenol blue. Store at roomtemperature.
8. Electrophoresis power pack capable of maintaining 600 V and with a voltagepreset.
9. Access to a 4°C cold room or cold cabinet with power supply (see Note 4).10. Flat gel loading tips (e.g., Life Sciences International; cat. no. PP000-0GEL-F01).
2.2. Silver Staining and Drying of SSCP/Heteroduplex Gels
1. Plastic photographic style staining trays (e.g., Jencons Scientific; part no.682-172).
2. Orbital shaker.3. Silver staining solution 1: 10% industrial methylated spirit, 0.5% glacial acetic
acid. Store at room temperature. Solution 1 may be recycled up to 10 times.4. Silver staining solution 2: 0.1% AgNO3. Prepare as a 10X stock solution (1%
AgNO3). Store at room temperature in a brown bottle. Prepare and store the 1Xworking solution in a clear bottle so that any precipitate is clearly visible, anindication that the solution should not be used. Both the 10X stock and the 1Xworking solution should be stored out of direct sunlight. The 1X working solutionmay be reused to stain up to three gels.
5. Silver staining solution 3: 1.5% NaOH, 0.15% formaldehyde (see Note 5). Thissolution is labile and the formaldehyde should only be added immediately priorto use. The 1.5% NaOH may be made up in bulk and stored at room temperature.
6. Silver staining solution 4: 0.75% Na2CO3. Make as a 10X stock and dilute downas necessary;, store the 10X stock at room temperature.
7. Gel drying frame and platform (e.g., Pharmacia Biotech; part no. 80-6122-37 and80-6122-94).
8. Cellophane sheets (e.g., Pharmacia Biotech; part no. 80-6121-99).
3. Methods3.1. Preparation and Electrophoresis of SSCP/Heteroduplex Gels
1. Wash a suitable comb, pair of glass plates, and spacers thoroughly with warmwater and a household detergent. Rinse with deionized water and dry with dis-posable tissues.
154 Wallace
2. Lay the glass plates on a clean section of the bench and wipe with a disposabletissue soaked in 100% ethanol.
3. Smear the spacers with Pritt™ or an equivalent paper adhesive to prevent themfrom slipping while assembling and pouring the gel. Assemble the glass platesand spacers as shown in Fig. 1A,B using four strong binder clips to to hold theplates together.
4. Lay the gel plates, short plate uppermost, on a box or upturned Eppendorf rack ona flat section of benching.
5. For an 8% gel for the SA32 system, place the following reagents in a clean drybeaker:
15 mL 40% (49:1) acrylamide solution;7.5 mL of 10X TBE solution; 52 mL dH2O; 90 µL TEMED.
For the S2 system all these volumes should be doubled (see Notes 2, 4, and 6).6. Add 500 µL (for SA32 gel) or 1 mL (for S2 gel) of freshly prepared 10% AMPS
solution to the acrylamide solution and mix thoroughly by gently swirling.7. Carefully draw the acrylamide solution into a 50-mL disposable syringe, avoid-
ing introducing air bubbles.8. Rest the nozzle of the syringe on the protruding portion of the long glass plate,
about 2 mm from the edge of the short plate, and slowly expel the contents of thesyringe. The acrylamide solution should run down between the plates quite evenlyby capillary action (Fig. 1A). The syringe will need to be refilled three to fourtimes for the S2 system. Gently tapping the glass plates just ahead of theacrylamide solution can help to prevent the formation of trapped air bubbles.
9. Once the acrylamide has completely filled the space between the plates, any airbubbles can be removed using a hook-shaped “bubble catcher.” The comb shouldthen be carefully inserted while avoiding the introduction of further air bubbles.The gel should be left to polymerize at room temperature for at least 1 h prefer-ably 2 h.
10. Remove the comb and straighten any uneven wells using an old gel loading tip.11. Place the gel in the electrophoresis apparatus and firmly tighten the four locking
nuts. Close the drain tap for the upper buffer chamber and fill the upper bufferchamber with 1X TBE. Check for leaks by leaving the gel for 10 min and inspect-ing the lower buffer chamber.
12. Fill the lower buffer chamber with 1X TBE and leave the whole apparatus toequilibrate for at least 4 h at 4°C (see Notes 4 and 7).
13. Combine the PCR amplification with an equal volume of formamide loadingbuffer (typically 10 µL) and mix well (see Notes 8–10).
14. Place the samples on a heated block or thermal cycler set at 94°C for 3 min thensnap-chill in a bath of crushed ice.
15. Load between 6 and 12 µL of each sample (the optimum volumes depend on thesize of well and amplification efficiency) in each well using flat gel loading tips.
SSCP/Heteroduplex Analysis 155
16. Electrophorese for typically 16 h at a constant voltage of 370 V (for SA32 gel) or450 V (for S2 gel).
17. After 16 h the xylene cyanol should have run to the end of the aluminum coolingplate on an 8% gel. Double-stranded DNA (heteroduplexes) of about 180 bpcomigrates with the xylene cyanol on an 8% gel, although there can be consider-able sequence-dependent variability. It is best to determine optimum electro-phoresis times empirically.
3.2. Silver Staining and Drying of SSCP/Heteroduplex Gels
1. Slide one of the spacers out from between the glass plates and gently prise apartwith a plastic spatula or other nonmetal instrument. Ensure that the gel is attachedto the lowermost plate before completely removing the upper plate. Mark the gelorientation by removing a corner adjacent to lane 1. For S2 gels, cut the gel ver-tically in half for staining by applying pressure on the gel with the edge of a ruler.
Fig. 1. Assembly of glass plates for S2/SA32 sequencing system and pouring with-out tape: (A) view from above to illustrate the pouring of the gel on a horizontal benchusing a syringe; (B) profile view to illustrate the position of the foam block against theshort upper plate, which forms a watertight seal against the gel tank gasket.

156 Wallace
2. Carefully lift the bottom edge of the gel and fold over a 10-cm length. Repeat thisaction until the gel is completely rolled up; then, place the plate in a clean stain-ing tray and dislodge or lift the gel into the tray. For S2 gels, place each half in aseparate tray.
3. Pour on 400 mL of silver staining solution 1 and leave on an orbital shaker forabout 5 min. In the specified trays, the gel should unfurl to a degree but remainfolded in half during the staining process.
4. Pour off solution 1 (see Note 11) and save for reuse. Pour on 500 mL of silverstaining solution 2 and shake gently for 15 min (see Note 12).
5. Pour off solution 2, remembering to reuse for up to three gels. Add 400 mL offreshly prepared silver staining solution 3 (see Note 5). Place the tray in a fumecabinet and leave for 20 min, shaking occasionally. A small amount of powderyblack precipitate should be observed when solution 3 is added and the bandsslowly appear on the gel during this stage.
6. Pour off solution 3 and rinse the gel twice with deionized water. Add 400 mL ofsilver staining solution 4 and leave for 15 min (see Notes 13–15).
7. Take two sheets of precut cellophane and soak in a sink of tap water. The sheetsbecome pliable when wet; ensure that the whole sheet is adequately soaked.
8. Place a drying frame inner section over the platform, ensuring that the inner sec-tion is in the correct orientation. Place a moistened sheet of cellophane over theinner section, ensuring that the whole of the inner section is covered.
9. Gently slide an old sheet of X-ray film under the gel while still in solution 4.Carefully pour off solution 4 and rinse the gel briefly twice with tap water. Liftthe gel out of the staining tray using the X-ray film as a support onto a clean areaof benching or plastic sheet. The gel can now be carefully unfolded and unwantedareas of the gel trimmed away by pressing with the edge of a ruler. If the wholegel is to be dried down, then the gel will have to be cut in half and dried down intwo separate frames.
10. Transfer the gel onto the cellophane sheet placed over the drying frame and wetthe gel surface with a few milliliters of deionized water from a wash bottle.
11. Carefully lay the second sheet of moistened cellophane over the top of the geland frame, taking care not to trap air bubbles between the sheets. Place the outersection of the drying frame firmly over the inner section’s rubber gasket. Thecellophane should now be drawn taut and the frame can be carefully lifted off theplatorm.
12. Turn the retaining screws 90° to retain the inner frame in position and trim anysurplus cellophane away with a pair of scissors. Wipe away excess water with adisposable tissue and leave the frame to dry either on a warm shelf for 24 h or ina 37°C incubator for 6 h (see Note 16).
13. Once the gel is thoroughly dry, dismantle the frame and cut excess cellophaneaway from the dried gel with scissors. Seal the cellophane by folding strips ofadhesive tape around all of the edges. This prevents the cellophane from peel-ing apart.
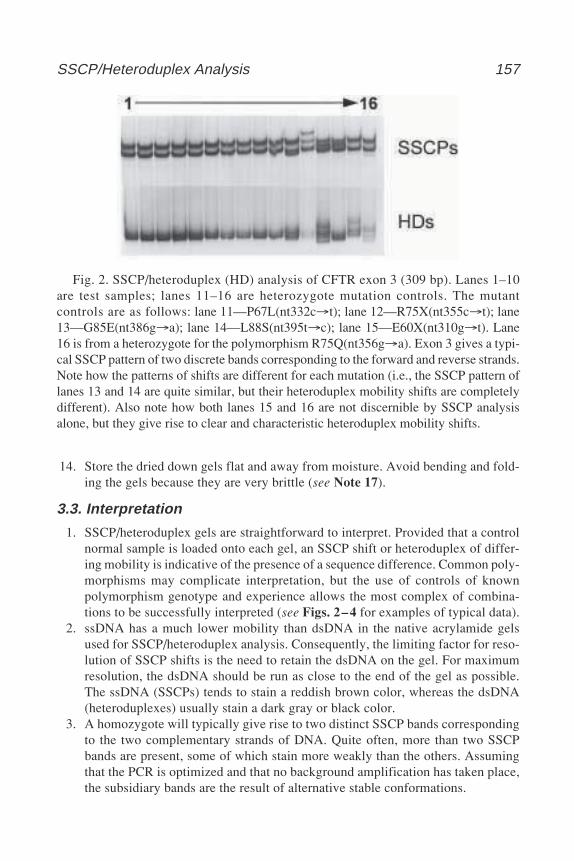
SSCP/Heteroduplex Analysis 157
14. Store the dried down gels flat and away from moisture. Avoid bending and fold-ing the gels because they are very brittle (see Note 17).
3.3. Interpretation
1. SSCP/heteroduplex gels are straightforward to interpret. Provided that a controlnormal sample is loaded onto each gel, an SSCP shift or heteroduplex of differ-ing mobility is indicative of the presence of a sequence difference. Common poly-morphisms may complicate interpretation, but the use of controls of knownpolymorphism genotype and experience allows the most complex of combina-tions to be successfully interpreted (see Figs. 2–4 for examples of typical data).
2. ssDNA has a much lower mobility than dsDNA in the native acrylamide gelsused for SSCP/heteroduplex analysis. Consequently, the limiting factor for reso-lution of SSCP shifts is the need to retain the dsDNA on the gel. For maximumresolution, the dsDNA should be run as close to the end of the gel as possible.The ssDNA (SSCPs) tends to stain a reddish brown color, whereas the dsDNA(heteroduplexes) usually stain a dark gray or black color.
3. A homozygote will typically give rise to two distinct SSCP bands correspondingto the two complementary strands of DNA. Quite often, more than two SSCPbands are present, some of which stain more weakly than the others. Assumingthat the PCR is optimized and that no background amplification has taken place,the subsidiary bands are the result of alternative stable conformations.
Fig. 2. SSCP/heteroduplex (HD) analysis of CFTR exon 3 (309 bp). Lanes 1–10are test samples; lanes 11–16 are heterozygote mutation controls. The mutantcontrols are as follows: lane 11—P67L(nt332c→t); lane 12—R75X(nt355c→t); lane13—G85E(nt386g→a); lane 14—L88S(nt395t→c); lane 15—E60X(nt310g→t). Lane16 is from a heterozygote for the polymorphism R75Q(nt356g→a). Exon 3 gives a typi-cal SSCP pattern of two discrete bands corresponding to the forward and reverse strands.Note how the patterns of shifts are different for each mutation (i.e., the SSCP pattern oflanes 13 and 14 are quite similar, but their heteroduplex mobility shifts are completelydifferent). Also note how both lanes 15 and 16 are not discernible by SSCP analysisalone, but they give rise to clear and characteristic heteroduplex mobility shifts.
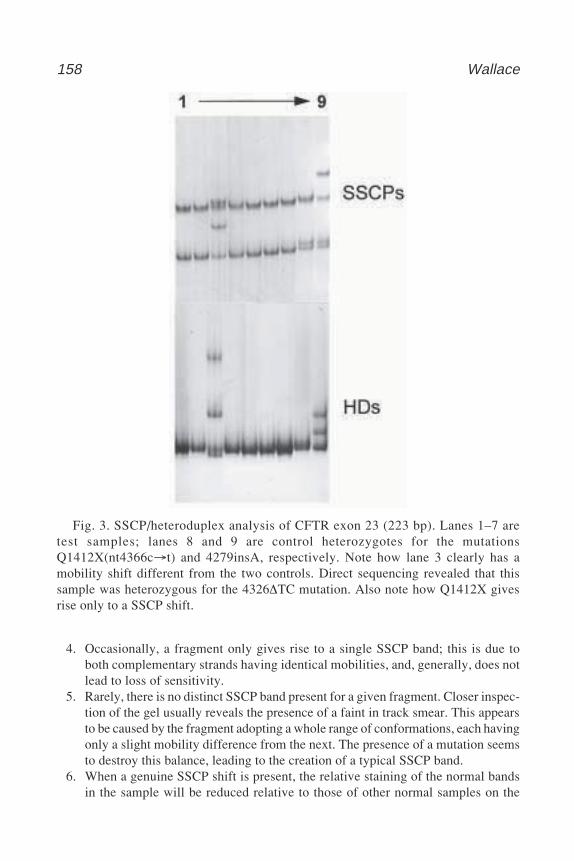
158 Wallace
4. Occasionally, a fragment only gives rise to a single SSCP band; this is due toboth complementary strands having identical mobilities, and, generally, does notlead to loss of sensitivity.
5. Rarely, there is no distinct SSCP band present for a given fragment. Closer inspec-tion of the gel usually reveals the presence of a faint in track smear. This appearsto be caused by the fragment adopting a whole range of conformations, each havingonly a slight mobility difference from the next. The presence of a mutation seemsto destroy this balance, leading to the creation of a typical SSCP band.
6. When a genuine SSCP shift is present, the relative staining of the normal bandsin the sample will be reduced relative to those of other normal samples on the
Fig. 3. SSCP/heteroduplex analysis of CFTR exon 23 (223 bp). Lanes 1–7 aretest samples; lanes 8 and 9 are control heterozygotes for the mutationsQ1412X(nt4366c→t) and 4279insA, respectively. Note how lane 3 clearly has amobility shift different from the two controls. Direct sequencing revealed that thissample was heterozygous for the 4326∆TC mutation. Also note how Q1412X givesrise only to a SSCP shift.
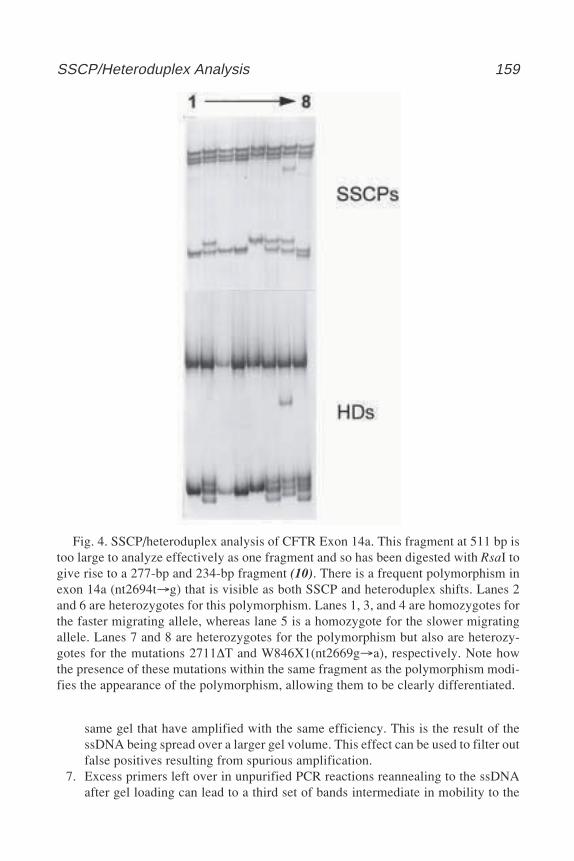
SSCP/Heteroduplex Analysis 159
Fig. 4. SSCP/heteroduplex analysis of CFTR Exon 14a. This fragment at 511 bp istoo large to analyze effectively as one fragment and so has been digested with RsaI togive rise to a 277-bp and 234-bp fragment (10). There is a frequent polymorphism inexon 14a (nt2694t→g) that is visible as both SSCP and heteroduplex shifts. Lanes 2and 6 are heterozygotes for this polymorphism. Lanes 1, 3, and 4 are homozygotes forthe faster migrating allele, whereas lane 5 is a homozygote for the slower migratingallele. Lanes 7 and 8 are heterozygotes for the polymorphism but also are heterozy-gotes for the mutations 2711∆T and W846X1(nt2669g→a), respectively. Note howthe presence of these mutations within the same fragment as the polymorphism modi-fies the appearance of the polymorphism, allowing them to be clearly differentiated.
same gel that have amplified with the same efficiency. This is the result of thessDNA being spread over a larger gel volume. This effect can be used to filter outfalse positives resulting from spurious amplification.
7. Excess primers left over in unpurified PCR reactions reannealing to the ssDNAafter gel loading can lead to a third set of bands intermediate in mobility to the
160 Wallace
ssDNA and dsDNA. Although they usually show a similar pattern to the stan-dard SSCPs, they can occasionally highlight differences that are not detectedelsewhere.
8. Heteroduplexes usually show as bands of reduced mobility relative to thehomoduplex dsDNA. They are often more weakly staining than the homoduplexDNA (see Note 8).
9. Occasionally, the homoduplex DNA itself displays mobility shifts. This may bethe result of the presence of an insertion/deletion mutation leading to an alter-ation in molecular weight. Some single-base substitutions can also give the sameeffect. This is thought to be caused by the base substitution causing the DNA tobend to a greater or lesser degree, thus affecting mobility.
10. Frequently, homozygous normal samples will give rise to two homoduplex bands;the reason for this is not known.
4. Notes1. Fluorescent SSCP/heteroduplex analysis is possible. Both the Perkin-Elmer 377
fluorescent analyzer and the 310 capillary electrophoresis instrument have tem-perature control and are thus suitable for this technique. There are several advan-tages to this approach. Fluorescent analysis permits multiplexing by dye color, thusincreasing productivity. The gel images are also analyzed and stored electroni-cally, thus avoiding the need to dry down and store gels. The internal size stan-dards commonly used in fluorescent analysis also makes comparisons betweensamples more objective (11). However, the major drawback is one of cost, notonly in capital equipment and software but also the fluorescently labeled primers.
2. There are commercial gel matrices specifically marketed for SSCP and heterodu-plex analysis, such as Hydrolink and MDE™. They do have different character-istics from the 49:1 acrylamide recommended here. They tend to work out to bequite expensive for routine use.
3. Acrylamide is a cumulative neurotoxin. Great care should be taken when han-dling acrylamide powder, solution, and gels. Gloves should be worn at all timeswhen handling acrylamide. A face mask and fume cabinet should also be usedwhen adding water to preweighed bottles of acrylamide powder.
4. Gel additives are recommended in many SSCP protocols to improve detectionefficiency. The addition of glycerol in particular is reported to enhance the sensi-tivity of SSCP analysis (9). Gels containing glycerol should also be run at roomtemperature, thus offering an alternative method to workers without access to acold room or cabinet. We have found that the detection rate of heteroduplex analy-sis is compromised in the presence of glycerol, so we can only recommend its useas an additional condition to enhance the detection rate when this needs to bemaximized. The addition of 10% sucrose to SSCP gels has also been used toenhance the sensitivity of SSCP (9).
5. Formaldehyde is usually sold as a 37% solution; remember to take this into accountwhen calculating volumes for solution 3.
SSCP/Heteroduplex Analysis 161
6. There is some evidence that the addition of mild denaturants like 10% urea (6) or10% ethanediol and 15% formamide (7) can enhance the efficiency of heterodu-plex analysis. We have found that these additives reduce the efficiency of SSCPanalysis and are not recommended for combined SSCP/heteroduplex analysis.
7. Replicate gels can vary markedly in appearance; the major causes of variability aregel quality and environmental factors. Take great care when measuring reagentsand always use fresh 10% AMPS solution. Try to get into a routine so that gelsare always poured at a certain time of the day and left to polymerize and thenequilibrate at 4°C for the same time. Your results will become more reproduc-ible, although some variability should still be expected.
8. The formation of heteroduplex DNA is dependent on spontanous reannealing inthe formamide loading buffer or during the earliest phase of electrophoresis.Some fragments reanneal very poorly, preventing efficient heteroduplex analysisand thus reducing the mutation detection rate. This problem can be overcomesimply by preloading the gel with a proportion of the sample in formamide load-ing buffer (usually 25% of the final volume to be loaded) before heat denatur-ation of the sample. The remainder of the sample can then be loaded afterdenaturation in the same wells and electrophoresis commenced.
9. Larger fragments can be analyzed without loss of detection efficiency by cuttingthe sample with an appropriate restriction enzyme to yield fragments of optimumsize (200–250 bp) (Fig. 4) (10). Running both restricted and unrestricted samplesin the same lane can increase efficiency still further because some loss of heterodu-plex detection efficiency has been noted within 50 bp of the end of fragments (7).
10. If the gene under analysis is X-linked or mitochondrial in origin, or if the mutationcould be homozygous or hemizygous, the samples should be mixed with a knownnormal control DNA and then subjected to a single round of denaturation and rena-turation in order to encourage the formation of heteroduplexes prior to loading.
11. Pouring solutions off can be difficult, the gels are large and can easily tear. Thetalc on some latex gloves can also mark the gels. Placing a piece of old X-rayfilm over the gel while pouring off the solutions helps to support the gel, prevent-ing it from tearing. It also prevents gloves from marking the gels.
12. Contaminating salts or alkali can make silver salts precipitate out in solution 2,causing the gel to become milky white in appearance. If you continue to stain insolution 3 once this has happened, these areas will turn black and the gel will beunreadable. The gel can often be saved by washing twice in dH2O and thenimmersing in 2.5% ammonium hydroxide for 15 min followed by two furtherwashes in dH2O. Silver staining can then be recommenced with solution 1. How-ever, prevention is better than cure, the most common causes of this are dirtystaining trays and contact with gloves that have been used to prepare solution 3.Always wash trays thoroughly before use and change gloves after preparingsolution 3 if you need to subsequently pour off solution 2.
13. Sometimes, we have observed gels with bands that fade and disappear while dry-ing down; this is due to solution 4 being made up incorrectly.
162 Wallace
14. It is not possible to isolate and reamplify from silver stained bands with the givenprotocol because of the inhibitory effect of residual silver ions on PCR. How-ever, if solution 4 is substituted for a 50 mM solution of EDTA (pH 8.0), then thischelates the remaining silver ions and permits reamplification from the band ofinterest. We have found this to be particularly useful for isolating minority alle-les in mosaic samples.
15. Silver-stained gels can be temporarily stored by heat sealing in plastic. However,the gels are delicate and easily crushed and tend to dry out after 2–3 yr.
16. High-percentage acrylamide gels (i.e., over 9%) are prone to cracking while dry-ing down. Try to dry these slowly at room temperature rather than in an incuba-tor, as this minimizes cracking.
17. Sometimes, a salty deposit builds up on the surface of old gels, making themdifficult to read. This can be removed by spraying the gel with a little householdpolish and then rubbing the gel firmly with a soft cloth.
References1. Orita, M., Iwahana, H., Kanazawa, H., Hayashi, K., and Sekiya, T. (1989) Detec-
tion of polymorphisms of human DNA by gel electrophoresis as single-strandconformation polymorphisms. Proc. Natl. Acad. Sci. USA 86, 2766–2770.
2. Tassabehji, M., Newton, V. E., Turnbull, K., Seemanova, E., Kunze, J., Sperling,K., et al. (1994) PAX3 gene structure and mutations: close analogies betweenWaardenburg syndrome and the Splotch mouse. Hum. Mol. Genet. 7, 1069–1074.
3. Makino, R., Yazyu, H., Kishimoto, Y., Sekiya, T., Hayashi, K. (1992) F-SSCP:fluorescence-based polymerase chain reaction single-strand conformation poly-morphism (PCR-SSCP) analysis. PCR Meth. Applic. 2, 10–13.
4. Hongyo, T., Buzard, G. S., Calvert, R. J., and Weghorst, C. M. (1993) ‘ColdSSCP’: a simple, rapid and non-radioactive method for optimized single-strandconformation polymorphism analyses. Nucl. Acids Res. 21, 3637–3642.
5. Sheffield, V. C., Beck, J. S., Kwitek, A. E., Sandstrom, D. W., and Stone, E. M.(1993) The sensitivity of single-strand conformation polymorphism analysis forthe detection of single base substitutions. Genomics 16, 325–332.
6. White, M. B., Carvalho, M., Derse, D., O’Brien, S. J., and Dean, M. (1992)Detecting single base substitutions as heteroduplex polymorphisms. Genomics12, 301–306.
7. Ganguly, A., Rock, M. J., and Prockop, D. J. (1993) Conformation-sensitive gelelectrophoresis for rapid detection of single-base differences in double-strandedPCR products and DNA fragments: evidence for solvent-induced bends in DNAheteroduplexes. Proc. Natl. Acad. Sci. USA 90, 10,325–10,329.
8. Keen, J., Lester, D., Inglehearn, C, Curtis, A., and Bhattacharya, S. (1991) Rapiddetection of single base mismatches as heteroduplexes on Hydrolink gels. TrendsGenet. 7, 5.
9. Ravnik-Glavac, M., Glavac, D., and Dean, M. (1994) Sensitivity of single-strandconformation polymorphism and heteroduplex method for mutation detection inthe cystic fibrosis gene. Hum. Mol. Genet. 3, 801–807.

SSCP/Heteroduplex Analysis 163
10. Lee, H.-H., Lo, W.-J., and Choo, K.-B. (1992) Mutational analysis by a combinedapplication of the multiple restriction fragment-single strand conformation poly-morphism and the direct linear amplification sequencing protocols. Anal.Biochem. 205, 289–293.
11. Inazuka, M., Wenz, H. M., Sakabe, M., Tahira, T., and Hayashi, K. (1997) Astreamlined mutation detection sysytem: multicolor post-PCR fluorescence label-ing and single-strand conformational polymorphism analysis by capillary electro-phoresis. Genome Res. 7, 1094–1103.

150 Wells
CFLP Analysis for Genotyping and Mutation Detection 165
165
From: Methods in Molecular Biology, vol. 187: PCR Mutation Detection ProtocolsEdited by: B. D. M. Theophilus and R. Rapley © Humana Press Inc., Totowa, NJ
17
Cleavase® Fragment Length PolymorphismAnalysis for Genotyping and Mutation Detection
Laura Heisler and Chao-Hung Lee
1. IntroductionDNA sequencing is the gold standard in DNA diagnostics and is the only
absolute means of establishing the identity of a new mutation. However, theclinical cost of obtaining this information is often prohibitive, particularly whenlarge DNA fragments are interrogated for the presence of any of a number ofeither known or previously undescribed genetic alterations (1). Instead, severalmutation scanning methods have been developed to eliminate the need tosequence every nucleotide when it is only the precise identity of one or a fewnucleotides that is clinically significant. Until now such methods have pro-vided only a “yes” or “no” answer in determining whether a test sample differsfrom a known reference. Relatively few methods have been proven capableof unambiguously identifying unique nucleic acid variants, particularly whenmultiple sequence changes occur (2). Consequently, the majority of existingmutation scanning methods are unsuitable for PCR-based genotyping applica-tions in which regions of sequence variability are used to categorize isolatesfor their similarities to known variants.
Third Wave Technologies has pioneered a novel mutation and polymor-phism screening method that accurately and precisely distinguishes nucleic acidvariants (3). This approach relies on enzymatic cleavage of characteristic struc-tures formed by single-stranded nucleic acids. On sequential denaturation andrenaturation, both single-stranded DNA and RNA molecules assume three-dimensional conformations that are a precise reflection of their nucleic acidsequences (4). This principle is the foundation of several mutation scanningtechniques, such as single-strand conformation polymorphism (SSCP) anddideoxy fingerprinting (5,6). Instead of relying on direct observation of these
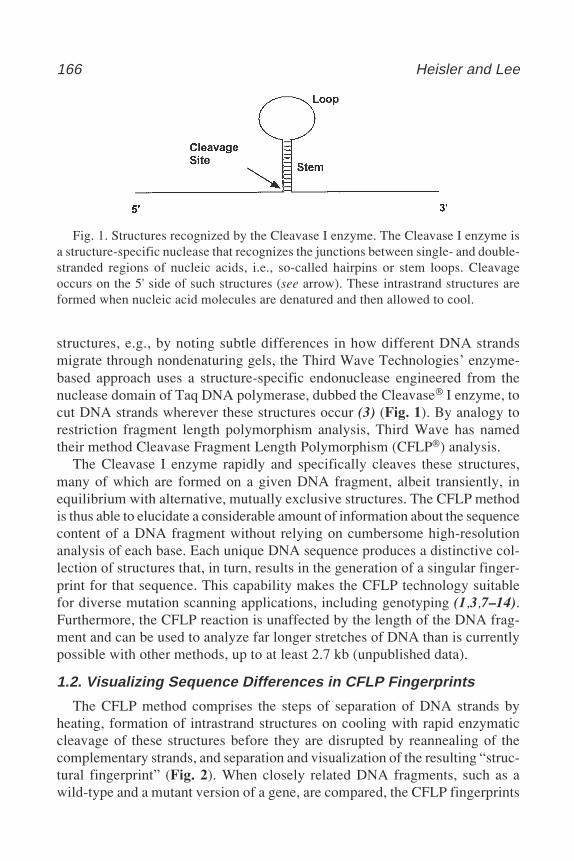
166 Heisler and Lee
structures, e.g., by noting subtle differences in how different DNA strandsmigrate through nondenaturing gels, the Third Wave Technologies’ enzyme-based approach uses a structure-specific endonuclease engineered from thenuclease domain of Taq DNA polymerase, dubbed the Cleavase® I enzyme, tocut DNA strands wherever these structures occur (3) (Fig. 1). By analogy torestriction fragment length polymorphism analysis, Third Wave has namedtheir method Cleavase Fragment Length Polymorphism (CFLP®) analysis.
The Cleavase I enzyme rapidly and specifically cleaves these structures,many of which are formed on a given DNA fragment, albeit transiently, inequilibrium with alternative, mutually exclusive structures. The CFLP methodis thus able to elucidate a considerable amount of information about the sequencecontent of a DNA fragment without relying on cumbersome high-resolutionanalysis of each base. Each unique DNA sequence produces a distinctive col-lection of structures that, in turn, results in the generation of a singular finger-print for that sequence. This capability makes the CFLP technology suitablefor diverse mutation scanning applications, including genotyping (1,3,7–14).Furthermore, the CFLP reaction is unaffected by the length of the DNA frag-ment and can be used to analyze far longer stretches of DNA than is currentlypossible with other methods, up to at least 2.7 kb (unpublished data).
1.2. Visualizing Sequence Differences in CFLP Fingerprints
The CFLP method comprises the steps of separation of DNA strands byheating, formation of intrastrand structures on cooling with rapid enzymaticcleavage of these structures before they are disrupted by reannealing of thecomplementary strands, and separation and visualization of the resulting “struc-tural fingerprint” (Fig. 2). When closely related DNA fragments, such as awild-type and a mutant version of a gene, are compared, the CFLP fingerprints
Fig. 1. Structures recognized by the Cleavase I enzyme. The Cleavase I enzyme isa structure-specific nuclease that recognizes the junctions between single- and double-stranded regions of nucleic acids, i.e., so-called hairpins or stem loops. Cleavageoccurs on the 5' side of such structures (see arrow). These intrastrand structures areformed when nucleic acid molecules are denatured and then allowed to cool.
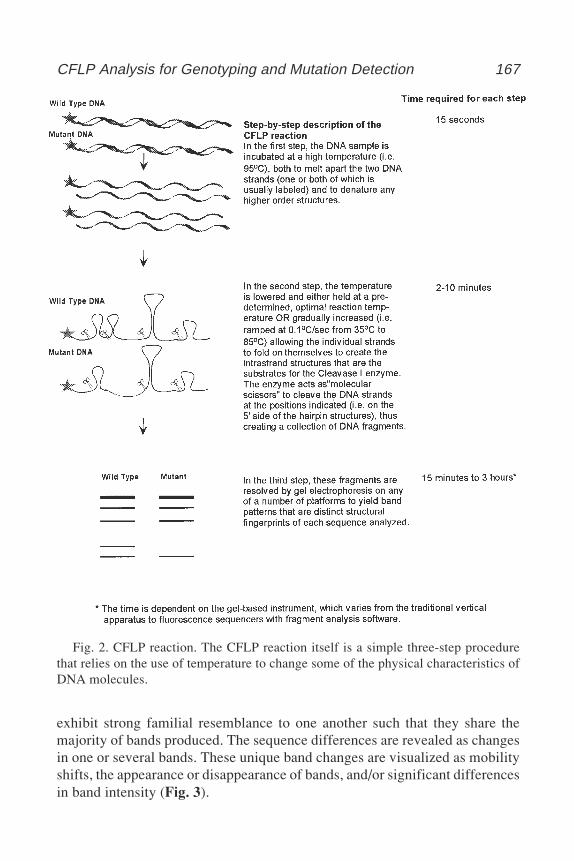
CFLP Analysis for Genotyping and Mutation Detection 167
exhibit strong familial resemblance to one another such that they share themajority of bands produced. The sequence differences are revealed as changesin one or several bands. These unique band changes are visualized as mobilityshifts, the appearance or disappearance of bands, and/or significant differencesin band intensity (Fig. 3).
Fig. 2. CFLP reaction. The CFLP reaction itself is a simple three-step procedurethat relies on the use of temperature to change some of the physical characteristics ofDNA molecules.
168 Heisler and Lee
Fig. 3. CFLP analysis of the ITS regions of P. carinii. PCR products spanning theITS1 and ITS2 regions of P. carinii, 534 bp long and labeled on the 5' ends of bothstrands with TET, were subjected to CFLP analysis. Approximately 250 fmol oflabeled PCR product was analyzed in the “ramped” reactions and approx 150 fmol inthe single temperature reactions. The DNA aliquots were supplemented with DNAdilution buffer. The ramping assay was performed as described in Subheading 3.2.The genotypes of the samples from which the DNA was amplified are indicated abovethe lanes. Lanes marked “mw” contain molecular weight markets with fragment sizesas indicated. The gel was electrophoresed at constant wattage (20 W) until a bro-mophenol blue market dye, loaded in a far lane (not shown), reached the bottom of thegel. The gel cassette was scanned on a Hitachi FMBIO-100 fluorescence imager witha 585-nm emission filter.
CFLP Analysis for Genotyping and Mutation Detection 169
CFLP analysis is exquisitely sensitive to the presence of minor sequencevariations and can detect changes involving one or more bases, including mis-sense mutations, with >95% sensitivity and 100% specificity. Because theCFLP method results in an easily examined pattern, rather than base-by-baseanalysis of each sequence, the value of this approach may be even more pro-nounced in genotyping applications. In these cases, what is sought is the rapididentification of compound sequence variations occurring throughout an ampli-fied fragment. Rapid inspection of the patterns generated by CFLP analysis offragments containing multiple, dispersed base changes has proven to be aneffective approach to classifying bacterial and viral sequences according togenotype (1,3,11).
Pneumocystis carinii f. sp. hominis is the leading cause of pneumonia andthe most commonly transmitted life-threatening opportunistic infection amongAIDS patients (15). To establish the origin of particular infections, verifylocalized outbreaks, and determine whether an individual has sustained mul-tiple, coincident infections, researchers have attempted to classify individualP. carinii strains based on sequence variability among isolates (16). Sequencevariation in the internal transcribed spacer (ITS) regions of the rRNA genes ofP. carinii can be used for such genotypic identification (17). The region locatedbetween the 18S and 5.8S rRNA genes is called ITS1, and that between the 5.8Sand 26S rRNA genes is ITS2. Among the two regions, approx 60 different ITSsequences have been characterized by direct DNA sequencing (18). Sequencevariation occurs throughout these 161- and 192-bp regions, respectively, andthe majority of sequence changes within each ITS have been determined to besignificant in establishing type (18).
The suitability of the CFLP scanning method for differentiating sequencesin the ITS region of five cloned P. carinii sequences belonging to differenttypes was investigated. The ITS region was amplified by polymerase chainreaction (PCR), and the 5' ends of both strands were labeled by usingtetrachlorofluorescein (TET) sense strand labeled primers (see Note 1). Theamplified products were purified and then partially digested with the CleavaseI enzyme. The samples were analyzed in duplicate sets, one of which was sub-jected to CFLP digestion at a predetermined, optimized reaction temperature,whereas the other was digested under conditions in which the temperature wascontinually increased, or “ramped” (see Subheading 3.2. and Note 2).
The results indicate that the CFLP method is highly effective in reproduc-ibly distinguishing different P. carinii types (Fig. 3). An inspection of the fin-gerprints generated from these samples reveals a high degree of similarityoverall, indicative of the fact that only a few bases are altered in the variants,with some marked differences that reflect those base changes. In Fig. 3, thereare several examples of bands that appear in some lanes but that are absent in
170 Heisler and Lee
others, as well as bands that appear shifted in some lanes relative to others.Unique bands, indicated by arrows, are apparent, e.g., in lanes Bm. In othercases, the most notable difference is a composite shifting downward of a sub-stantial portion of the pattern, indicative of a small deletion, such that the frag-ments are shortened relative to the labeled 5′ ends (e.g., lanes Ed and Di, asindicated by brackets).
Note that the patterns generated by the ramping procedure appear to beenhanced relative to the single temperature procedure in several places. In par-ticular, note the appearance of additional bands between 82 and 118 bp. Thisimprovement in the richness of the patterns is likely due to the fact that certainsubstrate structures may not be as favored at a single temperature, as is used inthe conventional approach, but rather emerge as the temperature changes overthe course of the ramping reaction. In some cases the ramping approach notonly eliminates the need for preliminary optimization steps but may also serveto improve the sensitivity of the CFLP method.
2. Materials
2.1. Preparation of End-Labeled PCR-Amplified Fragments
2.1.1. PCR Reagents
1. Sterile double-distilled H2O.2. 10X PCR buffer: 500 mM KCl, 100 mM Tris-HCl, pH 9.0, 15 mM MgCl2.3. dNTP (deoxynucleotide) mix: 0.2 mM each dNTP in sterile double-distilled H2O.4. Mineral oil or wax overlay.5. Oligonucleotide primers at a concentration of 10 µM, at least one of which is
labeled with a fluorescent dye (e.g., tetrachlorofluorescein, fluorescein) or a moi-ety detectable by chemiluminescence (e.g., biotin, digoxyigenin).
2.1.2. Post-PCR Fragment Purification
1. Exonuclease I: Available at 10 U/µL from Amersham Pharmacia Biotech (Arling-ton Heights, IL), cat. no. E70073Z, or at 20 U/µL from Epicentre Technologies(Madison, WI), cat. no. X40505K.
2. High Pure PCR Product Purification Kit (HPPPPK), available from RocheMolecular Biochemicals (Indianapolis, IN), cat. no. 1732668.
3. Sterile double-distilled H2O or T10E0.1: 10 mM Tris-HCl, pH 8.0, 0.1 mM EDTA,pH 8.0.
2.2. CFLP Analysis
1. Cleavase I enzyme (25 U/µL) in Cleavase enzyme dilution buffer: 20 mM Tris-HCl, pH 8.0, 50 mM KCl, 0.05% Tween® 20, 0.05% Nonidet™ P 40, 100 µg/mLbovine serum albumin, and 50% (v/v) glycerol.
2. DNA dilution buffer: 5 mM MOPS, pH 7.5.
CFLP Analysis for Genotyping and Mutation Detection 171
3. 10X CFLP buffer: 100 mM MOPS, pH 7.5, 0.5% Tween 20, 0.5% Nonidet P 40.4. 2 mM MnCl2.5. 10 mM MgCl2.6. Stop solution (for nonfluorescent gel-based detection): 95% formamide, 10 mM
EDTA, pH 8.0, 0.05% xylene cylanol, 0.05% bromophenol blue (see Note 3).7. Stop solution (for fluorescent gel-based detection): 95% formamide, 10 mM
EDTA, pH 8.0, 0.05% crystal violet (see Note 3).8. Sterile double-distilled H2O.9. Thin-walled reaction tubes (200 or 500 µL).
2.3. Gel Electrophoresis
1. Gel solution: 6–10% acrylamide�bis (19�1) solution, 7 M urea, 0.5X Tris-borateEDTA (TBE) buffer.
2. 0.5X TBE gel running buffer (pH 8.3): 44.5 mM Tris, 44.5 mM borate, 1 mMEDTA, pH 8.0.
3. Ammonium persulfate (10% [w/v]).4. TEMED.5. Teflon flat-bottomed combs and spacers (0.5 mM thick) (2).6. Glass plates (20 × 20 cm), nonfluorescing for use with fluorescence imager or
standard for chemiluminescence detection.7. Gel electrophoresis support.8. Power supply capable of supplying up to 2000 V.
2.4. Visualization of CFLP Patterns2.4.1. Fluorescence Detection
1. Hitachi FMBIO®-100 Fluorescent Method Bio-Image Analyzer (Hitachi Soft-ware, San Bruno, CA) or Molecular Dynamics 595 FluorImager™ (MolecularDynamics, Sunnyvale, CA).
2. Lint-free laboratory wipes.3. Lens paper.4. Nonfluorescing detergent, e.g., RBS 35 Detergent Concentrate (Pierce, Rock-
ford, IL).
2.4.2. Chemiluminescence Detection
1. 10X SAAP: 1 M NaCl, 0.5 M Tris-base, pH 10.0.2. 1X SAAP, 0.1% sodium dodecyl sulfate (SDS): 100 mM NaCl, 50 mM Tris-
Base, pH 10.0, 0.1% SDS (w/v).3. 1X SAAP, 1 mM MgCl2: 100 mM NaCl, 50 mM Tris-base, pH 10.0, 1 mM MgCl2.4. Sequenase Images™ 5X Blocking Buffer (cat. no. US75354; Amersham
Pharmacia Biotech).5. Streptavidin-Alkaline-Phosphatase Conjugate (cat. no. US11687; Amersham
Pharmacia Biotech).6. CDP-Star™ substrate (cat. no. MS250R; Tropix, Bedford, MA).
172 Heisler and Lee
7. Isopropanol.8. Latex gloves (powder free).9. X-ray film.
10. Positively charged nylon membrane, pore size 0.2 µm (e.g., Nytran® Plus Mem-brane, Schleicher and Schuell, Keene, NH).
11. Blotting paper (20 × 20 cm) (cat. no. 28303-100; VWR Scientific).12. Sealable plastic bags.13. Forceps.14. Small plastic containers for processing membranes.15. Darkroom/film-developing facilities.16. Permanent laboratory marker.
3. Methods
3.1. Purification of PCR-Generated Fragments (see Note 1)
PCR amplification should be performed according to established protocolsfor the particular locus in question. When PCR products are visualized by gelelectrophoresis followed by sensitive detection of the label to be used to visu-alize CFLP products, contamination by labeled primers and prematurely trun-cated single-stranded PCR products is evident. These contaminating DNAspecies are effectively removed by the procedures noted. In particular, theHPPPPK procedure has been proven effective for eliminating lower molecularweight (i.e., >100 bp) DNA species, whereas Exonuclease I digestion is effec-tive for removing larger DNA species. An alternative to the HPPPPK columnsin conjunction with Exonuclease I digestion is to precipitate with 1 vol of iso-propanol following Exonuclease I digestion.
If a single, labeled product is detected following PCR and HPPPPK andExonuclease I digestion, then proceed with CFLP analysis. If more than oneproduct is detected, then optimization of the PCR reaction or gel isolation ofthe desired product is necessary. The following protocol describes the methodfor Exonuclease I digestion:
1. Following PCR amplification, incubate the reaction mixture at 70°C for 10 min.2. Bring the reaction mixture to 37°C.3. Add 1 U of Exonuclease I/µL of original PCR reaction mixture (e.g., 100 U to a
100-µL reaction mixture).4. Incubate for 30 min at 37°C.5. Inactivate the reaction by heating at 70°C for 30 min.6. Following Exonuclease I digestion, apply the reaction mixtures to the HPPPPK
spin columns according to the manufacturer’s suggested procedures. The sup-plied elution buffer should be replaced with either sterile double-distilled H2O orT10E0.1, pH 8.0.
CFLP Analysis for Genotyping and Mutation Detection 173
3.2. Preparation and Performance of CFLP ReactionsPrior to performing CFLP analysis, it is strongly recommended that the qual-
ity and quantity of the PCR-generated fragments following purification bechecked. This can be done by visualizing the label used (i.e., by fluorescenceanalysis or chemiluminescence detection) on an aliquot of the DNA in a smalldenaturing polyacrylamide gel.
As seen in Fig. 3, there are two alternative approaches to be taken in config-uring the CFLP reaction. The initial configuration of the assay involves per-forming the reaction under an abbreviated matrix of reaction times andtemperatures in order to identify the optimal conditions for generation of apattern with a broad spectrum of evenly distributed bands (temperature/timeoptimization). Alternatively, recent studies have demonstrated that the use of aprogrammable thermal cycler enables informative patterns to be generated byincreasing the reaction temperature throughout the course of the reaction, spe-cifically from 25 to 85°C at a rate of 0.1°C/s for a total ramping time of 10 min.In some genetic systems, such as P. carinii, the ramping approach appears togenerate somewhat more even distributions of fragments and has improvedmutation detection sensitivity. Furthermore, provided suitable thermal cyclersare available, the ramping approach is simpler and requires less DNA, sinceoptimization reactions need not be run prior to analysis of test samples. Thefollowing protocol describes the method of performing CFLP analysis utiliz-ing either the single temperature or ramping procedure:
1. Aliquot the desired amount of end-labeled DNA (approx 100–200 fmol) into athin-walled reaction tube (200 or 500 µL, depending on the capacity of the ther-mal cycler). Bring the DNA to a final volume of 13 µL with DNA dilution buffer,if necessary.
2. In a separate tube, prepare an enzyme master mix that contains the following foreach reaction: 2 µL of 10X CFLP buffer, 2 µL 2 mM MnCl2, 1 µL of Cleavase Ienzyme, 2 µL of 10 mM MgCl2 (optional, see Note 4), and DNA dilution bufferto a final volume of 7 µL (if needed).
3. To denature samples, place tubes containing DNA in a programmable thermalcycler (or heat block) and incubate at 95°C for 15 s. If the single temperaturemethod is used proceed to step 4. If the ramping method is to be used proceed tostep 5.
4. Temperature/time optimization: After the 15-s denaturation step, set the thermalcycler to the desired reaction temperature (or place the tubes in a heat block heldat reaction temperature if no thermal cycler is available). Optimal times and tem-peratures can be determined by examining matrices of different reaction times(e.g., 1, 3, and 5 min) and temperatures (40, 50, and 55°C). Choose the con-ditions that yield the richest and most even pattern (see Note 5). Incubate theCFLP reactions for the amount of time determined to be optimal, holding the
174 Heisler and Lee
temperature constant. After the incubation period, stop the reactions with 16 µLof stop solution. Proceed to Subheading 3.3.
5. Ramping: After the 15-s denaturation step, set the thermal cycler to 35°C. Assoon as the thermal cycler reaches 35°C, add 7 µL of the enzyme/buffer mixture.Mix well by pipetting up and down several times. Incubate the CFLP reactionsfor 15 s at 35°C. Program the thermal cycler to increase in temperature at a rate of0.1°C/s to 85°C, or set to ramp for an 8-min period from 35 to 85°C. On reaching85°C, stop the reactions with 16 µL stop solution (see Note 3).
3.3. Separation of CFLP Fragments1. Prepare a denaturing polyacrylamide gel, choosing a percentage of acrylamide
(19�1) appropriate for the size of the fragment being analyzed (see Note 6).2. Prerun the gel for approx 30 min before loading the samples at sufficient wattage
to warm the gel (e.g., 18–20 W).3. Heat denature the CFLP reactions at 80°C for 2 min immediately prior to load-
ing onto the gel. The best resolution is achieved when the samples are fullydenatured.
4. Load 5–10 µL of the appropriate CFLP reaction per well. The remainder of thereactions can be stored at 4°C or –20°C for later analysis.
5. Continue electrophoresis until sufficient separation of the CFLP fragments isachieved (the time will depend on the fragment size and the percentage ofacrylamide used).
3.4. Visualization of CFLP Patterns3.4.1. Fluorescence Imaging of CFLP Patterns
1. Following gel electrophoresis, thoroughly wash the outside of the gel plates usingnonfluorescent soap.
2. Dry and wipe clear with lens paper to remove residual debris.3. Place the gel carefully in the fluorescence scanning unit (Hitachi FMBIO-100 or
Molecular Dynamics 595).4. Scan using the correct wavelength or filter for the fluorescent group to be detected.
3.4.2. Chemiluminescence Detection of CFLP Patterns1. After electrophoresis, wearing powder-free latex gloves that have been washed
with isopropanol (see Note 7), carefully separate the glass plates to expose theacrylamide gel.
2. Cut a piece of Nytran Plus membrane (Schleicher and Schuell) to fit the gel sizeand moisten by applying 5–10 mL of 0.5X TBE.
3. Carefully place the moistened membrane onto the gel, avoiding lifting and repo-sitioning the membrane, and smooth out air bubbles with a clean pipet. Transferstarts immediately, so the membrane should not be picked up and repositionedonce it has come into contact with the gel.
4. Cover the membrane with two pieces of precut blotting paper, cover with a glassplate, and place a binder clip on each side of the sandwiched gel. Alternatively,
CFLP Analysis for Genotyping and Mutation Detection 175
for large gels (i.e., 20 × 20 cm or larger), place an approx 2-kg weight on top ofthe sandwich.
5. Allow the DNA to transfer onto the membrane for 4–16 h (e.g., overnight, ifconvenient) at room temperature.
6. After the transfer, disassemble the sandwiched gel and remove the membrane bycarefully moistening it with distilled water. Mark the DNA side (i.e., the sidetouching the gel during transfer) using a permanent laboratory marker.
7. Rinse a dish thoroughly with isopropanol (see Note 7) and fill with 0.2 mL/cm2
of 1X blocking buffer (e.g., 100 mL for a 20 × 20 cm membrane).8. Transfer the membrane to the dish containing the blocking buffer and allow to
rock gently for 15 min.9. Repeat the 15-min wash with fresh blocking buffer and discard the buffer.
10. Add 2 µL of Streptavidin-Alkaline-Phosphatase Conjugate to 50 mL of fresh block-ing buffer (or add conjugate to the blocking buffer at a volume ratio of 1�4000).
11. Pour the conjugate/blocking buffer mixture onto the blocked membrane and rockgently for 15 min.
12. Remove the conjugate and rinse for 5 min with 0.1% SDS/1X SAAP buffer,0.5 mL/cm2 each (200 mL for a 20 × 20 cm membrane). Repeat twice, for a totalof three washes.
13. Remove the SDS and rinse 5 min with 0.5 mL/cm2 1 mM MgCl2/1X SAAP buffer.Repeat twice, for a total of three washes.
14. Place the membrane in a sealable bag and add 4 mL of CDP-Star (or 0.01 mL/cm2).15. Seal the bag and spread the CDP-Star gently over the membrane for 3–5 min.16. Completely remove the CDP-Star and any air bubbles. Transfer the membrane
while still in the bag to a film exposure cassette.17. In the darkroom, expose the membrane to X-ray film. Initially expose for 30 min.
For subsequent exposures, adjust the time for clarity and intensity (see Note 8).18. Develop the film.
4. Notes
1. Depending on the objective of the analysis in question, the DNA can be labeledon either strand or on both strands using this approach. Single end labeling, i.e.,of the sense or the antisense strand, permits some degree of localization of thebase change(s) corresponding to the observed pattern changes (3). The sensitiv-ity of the CFLP method is approx 90% for single-stranded analysis and >95% fortwo-strand analysis. While double end labeling precludes this localization, itaffords more sensitive mutational analysis.
2. It has been determined empirically that samples analyzed according to the ramp-ing procedure require approximately twofold more DNA than do those analyzedby the conventional method. This is likely because in the ramping procedure,digestion occurs throughout the course of the temperature increase and optimallycleaves different hairpins at different temperatures.
3. The choice of dyes used in the stop solution depends on the system used to visu-alize the CFLP patterns. If chemiluminescence detection is used, then the stop
176 Heisler and Lee
solution should include 0.05% bromophenol blue and 0.05% xylene cyanol (Sub-heading 2.2., item 6). If fluorescent scanning is used, then a dye that migrateswith opposite polarity, such as crystal violet (0.05%), is preferable, because dyesthat migrate into the gel fluoresce at the wavelengths used to detect the fluores-cent dyes, thereby obscuring a portion of the CFLP pattern. Note that when a dyewith opposite polarity is used, it is advisable to load 3–5 µL of stop solutioncontaining bromophenol blue and xylene cyanol in a lane that does not containCFLP reactions in order to monitor the progress of gel electrophoresis.
4. MgCl2 dramatically reduces the rate of cleavage in the CFLP reaction. When MgCl2
is added to a final concentration of 1 mM in the presence of standard MnCl2 con-centrations of 0.2 mM, the rate of cleavage is slowed by as much as 10-fold. Thisreduced reaction rate can be useful for analysis of DNA fragments that assumehighly favored secondary structures that are rapidly cleaved in the CFLP reac-tion. The presence of such structures is readily identified by the appearance of astructural fingerprint comprising one or two prominent bands. When 1 mM MgCl2
is added, the optimal time and temperature of digestion should be reevaluated toreflect the reduced rate of cleavage (see Note 5).
5. The structural fingerprint produced by CFLP digestion is a collection of fragmentsresulting from partial digestion, usually of 5' end labeled fragments. Becausethe CFLP reaction is a partial digestion and because the formation of the sub-strate secondary structures depends on reaction temperature, it is possible tomodulate the extent of digestion through variations in the duration and tempera-ture of the reaction. Specifically, lower temperatures stabilize secondary struc-ture formation whereas higher temperatures reduce the number of structuresformed by a given molecule. Similarly, longer reaction times lead to increasedaccumulation of smaller cleavage products. The most informative fingerprintsare those that contain a relatively even distribution of low and high molecularweight products, including a fraction of full-length, uncut DNA. Ensuring thatthe entire size distribution of cleavage products is visible increases the likelihoodof detecting the products that reflect the presence of a polymorphism.
6. The percentage of polyacrylamide to be used is dictated by the size of the PCRfragment being analyzed. Appropriate percentages of polyacrylamide for varioussize ranges are well established (19).
7. The objective of this step is to minimize carryover of alkaline phosphatase fromprevious reactions and from exogenous sources (e.g., skin). Throughout this pro-cedure, it is of paramount importance to minimize contamination by this ubiqui-tous enzyme.
8. An alkaline phosphatase reaction with the chemiluminescence substrate pro-duces a long-lived signal, especially on membranes. Light emission increases of>300-fold are seen in the first 2 h on application of the substrate onto nylonmembranes, with the chemiluminescence signal persisting up to several days.Because film exposure times range from minutes to several hours, multiple imagesmay be acquired. Varying film exposure times enables the user to optimizesignal to noise.
CFLP Analysis for Genotyping and Mutation Detection 177
Acknowledgments
We wish to acknowledge the efforts of Mary Oldenburg, Senior TechnicalScientist, Third Wave Technologies, in performing much of the CFLP reactionoptimization as well as in providing critical commentary on the manuscript.
References
1. Sreevatsan, S., Bookout, J. B., Ringpis, F. M., Pottathil, M. R., Marshall, D. J.,de Arruda, M., Murvine, C., Fors, L., Pottathil, R. M., and Barathur, R. R.(1998) Algorithmic approach to high-throughput molecular screening for alphainterferon-resistant genotypes in hepatitis C patients. J. Clin. Microbiol. 36,1895–1901.
2. Cotton, R. G. H. (1997) Slowly but surely towards better scanning for mutations.Trends Genet. 13, 43–46.
3. Brow, M. A., Oldenberg, M., Lyamichev, V., Heisler, L., Lyamicheva, N., Hall,J., Eagan, N., Olive, D. M., Smith, L., Fors, L., and Dahlberg, J. (1996) Differen-tiation of bacterial 16S rRNA genes and intergenic regions and Mycobacteriumtuberculosis katG genes by structure-specific endonuclease cleavage. J. Clin.Microbiol. 34, 3129–3137.
4. Orita, M., Suzuki, Y., Sekiya, T., and Hayashi, K. (1989) Rapid and sensitivedetection of point mutations and DNA polymorphisms using the polymerase chainreaction. Genomics 5, 874–879.
5. Hayashi, K. (1991) PCR-SSCP: a simple and sensitive method for detection ofmutations in the genomic DNA. PCR Meth. Applica. 1, 34–38.
6. Sarkar, G., Yoon, H., and Sommer, S. S. (1992) Dideoxy fingerprinting (ddE):a rapid and efficient screen for the presence of mutations. Genomics 13, 441–443.
7. Sreevatsan, S., Bookout, J. B., Ringpis, F. M., Mogazeh, S. L., Kreiswirth, B. N.,Pottathil, R. R., and Barathur, R. R. (1998) Comparative evaluation of cleavasefragment length polymorphism with PCR-SSCP and PCR-RFLP to detect antimi-crobial agent resistance in Mycobacterium tuberculosis. Mol. Diagn. 3, 81–91.
8. Tahar, R. and Basco, L. K. (1997) Analysis of Plasmodium falciparum multidrug-resistance (pfmdr1) gene mutation by hairpin-dependent cleavage fragment lengthpolymorphism. Mol. Biochem. Parasitol. 88, 243–247.
9. Wartiovaara, K., Hytonen, M., Vuori, M., Paulin, L., Rinne, J., and Sariola, H.(1998) Mutation analysis of the glial cell line-derived neurotrophic factor gene inParkinson’s disease. Exp. Neurol. 152, 307–309.
10. Schlamp, C., Poulsen, G. L., Nork, M., and Nickells, R. W. (1997) Nuclear exclu-sion of wild-type p53 in immortalized human retinoblastoma cells. J. Natl. Can-cer Inst. 89, 1530–1536.
11. Marshall, D. J., Heisler, L. M., Lyamichev, V., Murvine, C., Olive, D. M., Ehrlich,G. D., Neri, B. P., and de Arruda, M. (1997) Determination of hepatitis C virusgenotypes in the United States by Cleavase Fragment Length Polymorphismanalysis. J. Clin. Microbiol. 35, 3156–3162.
178 Heisler and Lee
12. Rainaldi, G., Marchetti, S., Capecchi, B., Meneveri, R., Piras, A., and Leuzzi, R.(1998) Absence of mutations in the highest mutability region of the p53 gene intumour-derived CHEF18 Chinese hamster cells. Mutagenesis 13, 153–155.
13. Rossetti, S., Englisch, S., Bresin, E., Pignatti, P. F., and Turco, A. E. (1997)Detection of mutations in human genes by a new rapid method: cleavage frag-ment length polymorphism analysis (CFLPA). Mol. Cell. Probes 11, 155–160.
14. Eisinger, F., Jacquemier, J., Charpin, C., Stoppa-Lyonnet, D., Bressac-de Paillerets, B., Peyrat, J.-P., Longy, M., Guinebretiere, J.-M., Sauvan, R.,Noguichi, T., Birnbaum, D., and Sobol, H. (1998) Mutations at BRCA1: the med-ullary breast carcinoma revisited. Cancer Res. 58, 1588–1592.
15. Centers for Disease Control and Prevention (1989) AIDS Weekly SurveillanceReport, Centers for Disease Control and Prevention, Atlanta, GA.
16. Latouche, S., Ortona, E., Masers, E., Margutti, P., Tamburrini, E., Siracusano, A.,Guyot, K., Nigou, M., and Roux, P. (1997) Biodiversity of Pneumocystis cariniihominis: typing with different DNA regions. J. Clin. Microbiol. 35, 383–387.
17. Lu, J.-J., Bartlett, M. S., Shaw, M. M., Queener, S. F., Smith, J. W., Ortiz-Rivera,M., Leibowitz, M. J., and Lee, C.-H. (1994) Typing of Pneumocystis carinii strainsthat infect humans based on nucleotide sequence variations of internal transcribedspacers of rRNA genes. J. Clin. Microbiol. 32, 2904–2912.
18. Lee, C.-H., Tang, X., Jin, S., Li, B., Bartlett, M. S., Helweg-Larsen, J., Olsson,M., Lucas, S. B., Roux, P., Cargnel, A., Atzori, C., Matos, O., and Smith, J. W.(1998) Update on Pneumocystis carinii f. sp. hominis typing based on nucleotidesequence variations in internal transcribed spacer regions of rRNA genes. J. Clin.Microbiol. 36, 734–741.
19. Sambrook, J., Fritsch, E. F., and Maniatis, T. (eds.) (1989) Molecular Cloning:A Laboratory Manual, Cold Spring Harbor Laboratory Press, Cold Spring Har-bor, NY.
Genotyping Using DNA MassArray™ Technology 179
179
From: Methods in Molecular Biology, vol. 187: PCR Mutation Detection ProtocolsEdited by: B. D. M. Theophilus and R. Rapley © Humana Press Inc., Totowa, NJ
18
Automated Genotyping Usingthe DNA MassArray™ Technology
Christian Jurinke, Dirk van den Boom, Charles R. Cantor,and Hubert Köster
1. Introduction1.1. Markers Used for Genetic Analysis
The ongoing progress in establishing a reference sequence as part of theHuman Genome Project (1) has revealed a new challenge: the large-scale iden-tification and detection of intraspecies sequence variations, either betweenindividuals or populations. The information drawn from those studies will leadto a detailed understanding of genetic and environmental contributions to theetiology of complex diseases.
The development of markers to detect intraspecies sequence variations hasevolved from the use of restriction fragment length polymorphisms (RFLPs) tomicrosatellites (short tandem repeats [STRs]) and very recently to single nucle-otide polymorphisms (SNPs).
Although RFLP markers (2) are useful in many applications, they are oftenof poor information content, and their analysis is cumbersome to automate.STR markers (3), by contrast, are fairly highly informative (through their highlypolymorphic number of repeats) and easy to prepare using polymerase chainreaction (PCR)-based assays with a considerable potential for automation.However, using conventional gel electrophoresis-based analysis, typing of largenumbers of individuals for hundreds of markers still remains a challenging task.
Within the last few years, much attention has been paid to discovery andtyping (scoring) of SNPs and their use for gene tracking (4,5). SNPs arebiallelic single-base variations, occurring with a frequency of at least 1 SNP/1000 bp within the 3 billion bp of the human genome. Recently, a study on the
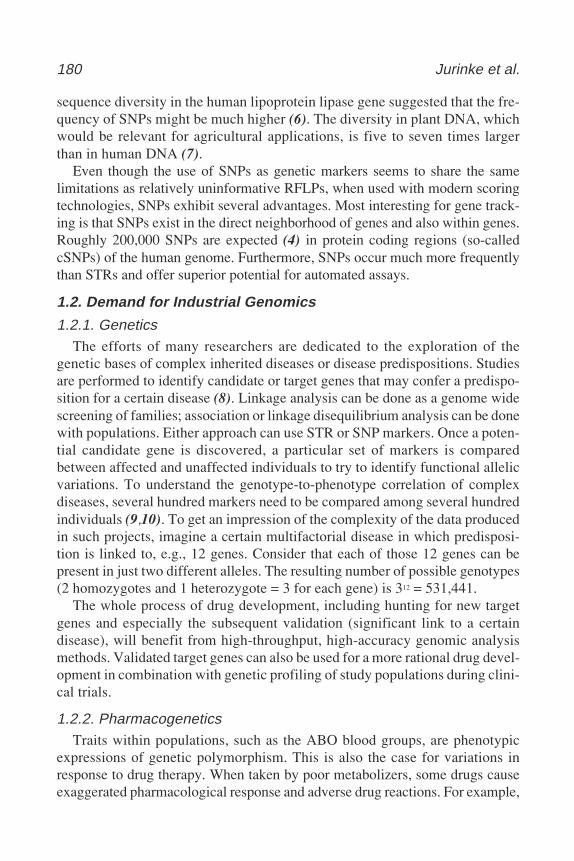
180 Jurinke et al.
sequence diversity in the human lipoprotein lipase gene suggested that the fre-quency of SNPs might be much higher (6). The diversity in plant DNA, whichwould be relevant for agricultural applications, is five to seven times largerthan in human DNA (7).
Even though the use of SNPs as genetic markers seems to share the samelimitations as relatively uninformative RFLPs, when used with modern scoringtechnologies, SNPs exhibit several advantages. Most interesting for gene track-ing is that SNPs exist in the direct neighborhood of genes and also within genes.Roughly 200,000 SNPs are expected (4) in protein coding regions (so-calledcSNPs) of the human genome. Furthermore, SNPs occur much more frequentlythan STRs and offer superior potential for automated assays.
1.2. Demand for Industrial Genomics
1.2.1. GeneticsThe efforts of many researchers are dedicated to the exploration of the
genetic bases of complex inherited diseases or disease predispositions. Studiesare performed to identify candidate or target genes that may confer a predispo-sition for a certain disease (8). Linkage analysis can be done as a genome widescreening of families; association or linkage disequilibrium analysis can be donewith populations. Either approach can use STR or SNP markers. Once a poten-tial candidate gene is discovered, a particular set of markers is comparedbetween affected and unaffected individuals to try to identify functional allelicvariations. To understand the genotype-to-phenotype correlation of complexdiseases, several hundred markers need to be compared among several hundredindividuals (9,10). To get an impression of the complexity of the data producedin such projects, imagine a certain multifactorial disease in which predisposi-tion is linked to, e.g., 12 genes. Consider that each of those 12 genes can bepresent in just two different alleles. The resulting number of possible genotypes(2 homozygotes and 1 heterozygote = 3 for each gene) is 312 = 531,441.
The whole process of drug development, including hunting for new targetgenes and especially the subsequent validation (significant link to a certaindisease), will benefit from high-throughput, high-accuracy genomic analysismethods. Validated target genes can also be used for a more rational drug devel-opment in combination with genetic profiling of study populations during clini-cal trials.
1.2.2. PharmacogeneticsTraits within populations, such as the ABO blood groups, are phenotypic
expressions of genetic polymorphism. This is also the case for variations inresponse to drug therapy. When taken by poor metabolizers, some drugs causeexaggerated pharmacological response and adverse drug reactions. For example,
Genotyping Using DNA MassArray™ Technology 181
tricyclic antidepressants exhibit order of magnitude differences in blood con-centrations depending on the enzyme status of patients (11). Pharmacogeneticsis the study of genetic polymorphism in drug metabolism. Today, pharmaceu-tical companies screen individuals for specific genetic polymorphisms beforeentry into clinical trials to ensure that the study population is both relevant andrepresentative. Targets for such screenings are cytochrome P450 enzymes orN-acetyltransferase isoenzymes (NAT1 and NAT2). Potential drug candidatesaffected by polymorphic metabolism include antidepressants, antipsychotics,and cardiovascular drugs.
1.2.3. Current Technologies
In addition to candidate gene validation and pharmacogenetics, many otherapplications such as clinical diagnostics, forensics, as well as the human sequencediversity program (12) are dealing with SNP scoring. In agricultural approaches,quantitative trait loci can be explored, resulting in significant breeding advances.Methods are required that provide high-throughput, parallel sample process-ing; flexibility; accuracy; and cost-effectiveness to match the different needsand sample volumes of such efforts.
Large-scale hybridization assays performed on microarrays have enabledrelatively high-throughput profiling of gene expression patterns (13). How-ever, several issues must be considered in attempting to adapt this approachfor the large-scale genotyping of populations of several hundred individuals.Hybridization chips for SNP scoring can potentially analyze in parallel severalhundred SNPs per chip—with DNA from one individual. Therefore, severalhundred hybridization chips would be needed for projects with larger popula-tions. If during the course of a study an assay needs to be modified or newassays have to be added, all chips might have to be completely remanufactured.
Also, note that DNA hybridization lacks 100% specificity. Therefore, highlyredundant assays have to be performed, providing a statistical result with afalse-negative error rate of up to 10% for heterozygotes (14). Finally, becauseof the inherent properties of repeated sequences, hybridization approaches arehardly applicable to STR analysis.
1.3. DNA MassArray Technology
Within the last decade, mass spectrometry (MS) has been developed to apowerful tool no longer restricted to the analysis of small compounds (somehundred Daltons) but also applicable to the analysis of large biomolecules(some hundred thousand Daltons). This improvement is mainly based on theinvention of soft ionization techniques. A prominent example is matrix assistedlaser desorption/ionization (MALDI) time-of-flight (TOF) MS, developed inthe late 1980s by Karas and Hillenkamp (15).
182 Jurinke et al.
The general principle of MS is to produce, separate, and detect gas-phaseions. Traditionally, thermal vaporization methods are used to transfer mol-ecules into the gas phase. Most biomolecules, however, undergo decomposi-tion under these conditions. Briefly, in MALDI MS, the sample is embedded inthe crystalline structures of small organic compounds (called matrix), and thecocrystals are irradiated with a nanosecond ultraviolet-laser beam. Laser energycauses structural decomposition of the irradiated crystal and generates aparticle cloud from which ions are extracted by an electric field. After accel-eration, the ions drift through a field-free path (usually 1 m long) and finallyreach the detector (e.g., a secondary electron multiplier) (see Fig. 1). Ion masses(mass-to-charge ratios, m/z) are typically calculated by measuring their TOF,which is longer for larger molecules than for smaller ones (provided their ini-tial energies are identical). Because predominantly single-chargednonfragmented ions are generated, parent ion masses can easily be determinedfrom the spectrum without the need for complex data processing and are acces-sible as numerical data for direct processing.
The quality of the spectra, which is reflected in terms of resolution, massaccuracy, and also sensitivity, is highly dependent on sample preparation andthe choice of matrix compound. For this reason, the early applications ofMALDI-TOF MS were mostly for analyzing peptides and proteins. The discov-ery of new matrix compounds for nucleic acid analysis (16) and the develop-
Fig. 1. Schematic drawing of the MALDI-TOF MS process, as used in the DNAMassArray method.
Genotyping Using DNA MassArray™ Technology 183
ment of solid-phase sample conditioning formats (17,18) enabled the analysisof nucleic acid reaction products generated in ligase chain reaction or PCR (19).
The more demanding DNA sequence determination with MALDI-TOF MScan be addressed using exonucleolytic digestion (20), Sanger sequencing (21),or solid-phase Sanger sequencing approaches (22). These approaches are cur-rently restricted to comparative sequencing, and the read length is limited toabout 100 bases. Further improvements in reaction design and instrumentation(23) will surely lead to enhanced efficacy and longer read length. Forgenotyping applications, this limitation is not relevant because scientists atSequenom (San Diego, CA) developed the primer oligo base extension(PROBE) reaction especially for the purpose of assessing genetic polymorphismby MS (24). The PROBE assay format can be used for the analysis of deletion,insertion, or point mutations, and STR, and SNP analysis, and it allows thedetection of compound heterozygotes. The PROBE process comprises apostPCR solid-phase primer extension reaction carried out in the presence ofone or more dideoxynucleotides (ddNTPs) and generates allele-specific termi-nated extension fragments (see Fig. 2). In the case of SNP analysis, the PROBEprimer binding site is placed adjacent to the polymorphic position. Dependingon the nucleotide status of the SNP, a shorter or a longer extension product isgenerated. In the case of heterozygosity, both products are generated. Aftercompletion of the reaction, the products are denatured from the solid phase andanalyzed by MALDI-TOF MS. In the example given in Fig. 2, the elongationproducts are expected to differ in mass by one nucleotide. Figure 3 presentsraw data for a heterozygous DNA sample analyzed by this PROBE assay. Thetwo SNP alleles appear as two distinct mass signals. Careful assay design makesa high-level multiplexing of PROBE reactions possible.
In the case of STR analysis, a ddNTP composition is chosen that terminatesthe polymerase extension at the first nucleotide not present within the repeat(25). For length determination of a CA repeat, a ddG or ddT termination mix isused. Even imperfect repeats harboring insertion or deletion mutations can beanalyzed with this approach. Figure 4 displays raw data from the analysis of ahuman STR marker in a heterozygous DNA sample. Both alleles differ by fourCA repeats. The DNA polymerase slippage during amplification generates apattern of “stutter fragments” (marked with an asterisk in Fig. 4). In the case ofheterozygotes that differ in just one repeat, the smaller allele has higher intensi-ties than the larger allele, because allelic and stutter signals are added together.A DNA MassArray compatible STR portfolio with a 5-cM intermarker dis-tance is currently under development at Sequenom.
When compared to the analysis of hybridization events by detecting labels,even on arrays, the DNA MassArray approach differs significantly. ThePROBE assay is designed to give only the relevant information. The mass spec-
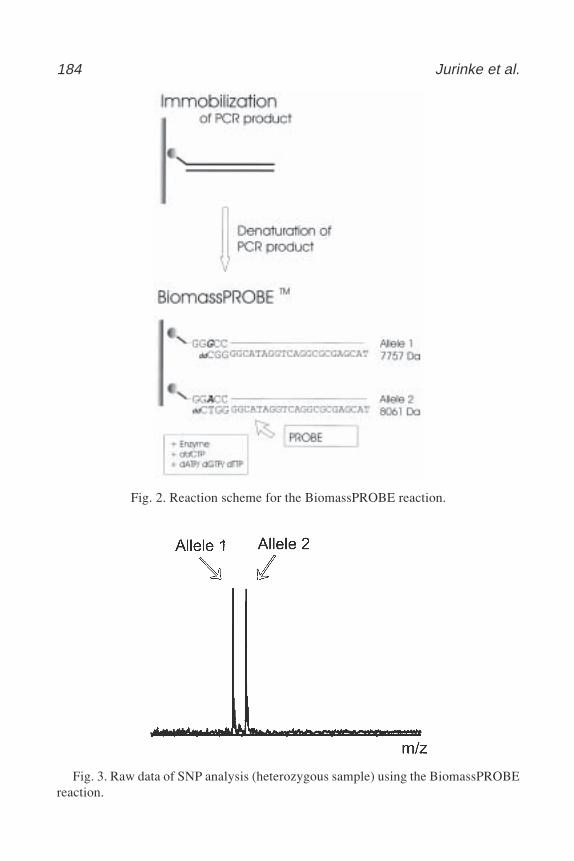
184 Jurinke et al.
Fig. 2. Reaction scheme for the BiomassPROBE reaction.
Fig. 3. Raw data of SNP analysis (heterozygous sample) using the BiomassPROBEreaction.
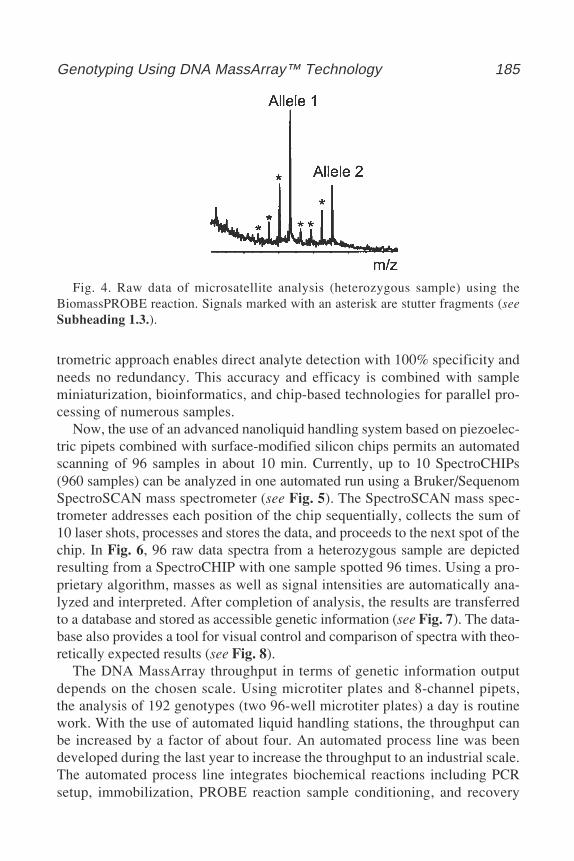
Genotyping Using DNA MassArray™ Technology 185
trometric approach enables direct analyte detection with 100% specificity andneeds no redundancy. This accuracy and efficacy is combined with sampleminiaturization, bioinformatics, and chip-based technologies for parallel pro-cessing of numerous samples.
Now, the use of an advanced nanoliquid handling system based on piezoelec-tric pipets combined with surface-modified silicon chips permits an automatedscanning of 96 samples in about 10 min. Currently, up to 10 SpectroCHIPs(960 samples) can be analyzed in one automated run using a Bruker/SequenomSpectroSCAN mass spectrometer (see Fig. 5). The SpectroSCAN mass spec-trometer addresses each position of the chip sequentially, collects the sum of10 laser shots, processes and stores the data, and proceeds to the next spot of thechip. In Fig. 6, 96 raw data spectra from a heterozygous sample are depictedresulting from a SpectroCHIP with one sample spotted 96 times. Using a pro-prietary algorithm, masses as well as signal intensities are automatically ana-lyzed and interpreted. After completion of analysis, the results are transferredto a database and stored as accessible genetic information (see Fig. 7). The data-base also provides a tool for visual control and comparison of spectra with theo-retically expected results (see Fig. 8).
The DNA MassArray throughput in terms of genetic information outputdepends on the chosen scale. Using microtiter plates and 8-channel pipets,the analysis of 192 genotypes (two 96-well microtiter plates) a day is routinework. With the use of automated liquid handling stations, the throughput canbe increased by a factor of about four. An automated process line was beendeveloped during the last year to increase the throughput to an industrial scale.The automated process line integrates biochemical reactions including PCRsetup, immobilization, PROBE reaction sample conditioning, and recovery
Fig. 4. Raw data of microsatellite analysis (heterozygous sample) using theBiomassPROBE reaction. Signals marked with an asterisk are stutter fragments (seeSubheading 1.3.).
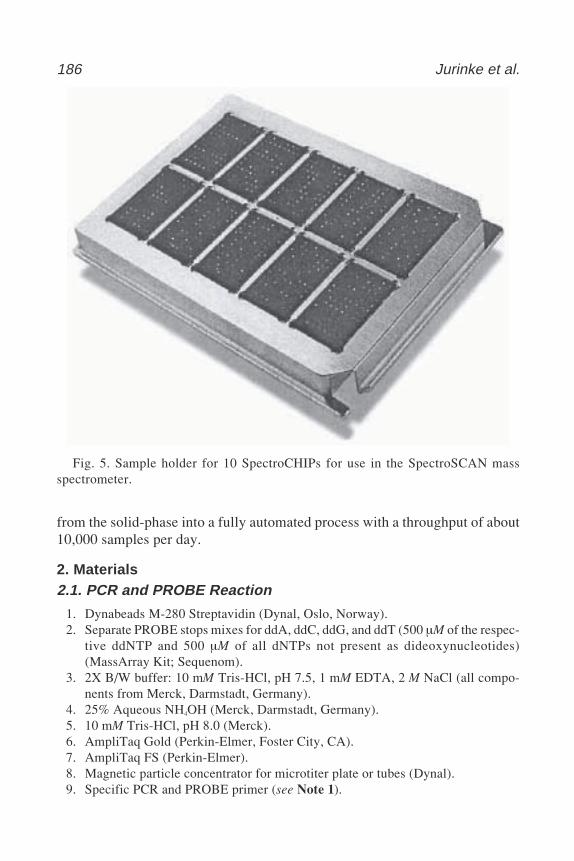
186 Jurinke et al.
from the solid-phase into a fully automated process with a throughput of about10,000 samples per day.
2. Materials2.1. PCR and PROBE Reaction
1. Dynabeads M-280 Streptavidin (Dynal, Oslo, Norway).2. Separate PROBE stops mixes for ddA, ddC, ddG, and ddT (500 µM of the respec-
tive ddNTP and 500 µM of all dNTPs not present as dideoxynucleotides)(MassArray Kit; Sequenom).
3. 2X B/W buffer: 10 mM Tris-HCl, pH 7.5, 1 mM EDTA, 2 M NaCl (all compo-nents from Merck, Darmstadt, Germany).
4. 25% Aqueous NH4OH (Merck, Darmstadt, Germany).5. 10 mM Tris-HCl, pH 8.0 (Merck).6. AmpliTaq Gold (Perkin-Elmer, Foster City, CA).7. AmpliTaq FS (Perkin-Elmer).8. Magnetic particle concentrator for microtiter plate or tubes (Dynal).9. Specific PCR and PROBE primer (see Note 1).
Fig. 5. Sample holder for 10 SpectroCHIPs for use in the SpectroSCAN massspectrometer.
Genotyping U
sing DN
A M
assArray™
Technology
187
Fig. 6. Raw data generated during the analysis of one sample spotted 96 times on a SpectroCHIP.
188 Jurinke et al.
Fig. 8. Tool for visual comparison of spectra with the theoretical results.
Fig. 7. Sequenom data analysis software reports for automated sex typing using theDNA MassArray.
Genotyping Using DNA MassArray™ Technology 189
2.2. Nanoliquid Handling and SpectroCHIPs
1. SpectroCHIP (Sequenom).2. SpectroJET (Sequenom).
2.3. SpectroCHIP Analysis
1. SpectroSCAN (Sequenom).2. SpectroTYPER (Sequenom).
3. Methods
3.1. PCR and PROBE Reaction
The following steps can be performed either in microtiter plates using mul-tichannel manual pipettors or automated pipetting systems or on the single-tube scale.
3.1.1. Preparation of PCR
Perform one 50-µL PCR per PROBE reaction with 10 pmol of biotinylatedprimer and 25 pmol of nonbiotinylated primer (see Note 2).
3.1.2. Immobilization of Amplified Product
1. For each PCR use 15 µL of streptavidin Dynabeads (10 mg/mL).2. Prewash the beads twice with 50 µL of 1X B/W buffer using the magnetic rack.3. Resuspend the washed beads in 50 µL of 2X B/W buffer and add to 50 µL of
PCR mix.4. Incubate for 15 min at room temperature. Keep the beads resuspended by gentle
rotation.
3.1.3. Denaturation of DNA Duplex
1. Remove the supernatant by magnetic separation.2. Resuspend the beads in 50 µL of 100 mM NaOH (freshly prepared).3. Incubate for 5 min at room temperature.4. Remove and discard the NaOH supernatant by magnetic separation.5. Wash three times with 50 µL of 10 mM Tris-HCl, pH 8.0.
3.1.4. PROBE Reaction
1. Remove the supernatant by magnetic separation, and add the following PROBEmix: 3 µL of 5X reaction buffer, 2 µL of PROBE nucleotide mix (ddA, ddC, ddG,or ddT with the respective dNTPs), 2 µL of PROBE primer (20 pmol), 7.6 µL ofH2O, 0.4 µL of enzyme (2.5 U).
2. The PROBE temperature profile comprises 1 min at 80°C, 3 min at 55°C, fol-lowed by 4 min at 72°C. Cool slowly to room temperature. Keep the beads resus-pended by gentle rotation (see Notes 3 and 4).
190 Jurinke et al.
3.1.5. Recovery of PROBE Products
1. After the reaction is completed, remove the supernatant by magnetic separation.2. Wash the beads twice with 50 µL of 10 mM Tris-HCl, pH 8.0.3. Resuspend the beads in 5 µL of 50 mM NH4OH (freshly aliquoted from 25%
stock solution).4. Incubate for 4 min at 60°C.5. Transfer the supernatant to a microtiter plate, and discard (or store) the beads.
3.2. SpectroCHIP Loading (see Note 5)
1. Fill containers with ultrapure water.2. Initialize the nanoplotter.3. Place the SpectroCHIP and microtiter plate on the nanoplotter (see Note 6).4. Start the sample spotting program.
3.3. SpectroCHIP Scanning
1. Place the loaded SpectroCHIP on the sample holder.2. Insert the sample holder into the SpectroSCAN.3. Define which spots or chips have to be analyzed.4. Choose analysis method and start the automated run.5. Transfer the data to the processing server.
4. Notes1. For PCR as well as PROBE primers it is useful to verify the masses before use.
Primers that are not completely deprotected (mass shift to higher masses) ormixed with n-1 synthesis products should not be used.
2. Use asymmetric primer concentrations in PCR, with the nonbiotinylated primerin excess.
3. The length of the PROBE primer should not exceed 20-25 bases; try to have C orG at the 3' end, and avoid mismatches, especially at the 3' end.
4. The second temperature step in the PROBE program (55°C) depends on theprimer length.
5. After the reaction, the beads can be stored for further reactions in Tris-HCl bufferat 4°C.
6. Be sure to handle SpectroCHIPs with gloves and avoid any contact with moisture.
References1. Collins, F. S., Patrinos, A., Jordan, E., Chakravarti, A., Gesteland, R., Walters, L.,
and the members of DOE and NIH planning groups. (1998) New goals for theU.S. human genome project: 1998-2003. Science 282, 682–689.
2. Botstein, D., White, D. L., Skolnick, M., and Davis, R. W. (1980) Construction ofa genetic linkage map in man using restriction fragment length polymorphisms.Am. J. Hum. Genet. 32, 314–331.
Genotyping Using DNA MassArray™ Technology 191
3. Weber, J. L. and May, P. E. (1989) Abundant class of human DNA polymor-phisms which can be typed using the polymerase chain reaction. Am. J. Hum.Genet. 44, 388–396.
4. Collins, F. S., Guyer, M. S., and Chakravarti, A. (1997) Variations on a theme:Cataloging human DNA sequence variation. Science 278, 1580–1581.
5. Kruglyak, L. (1997) The use of a genetic map of biallelic markers in linkage stud-ies. Nat. Genet. 17, 21–24.
6. Nickerson, D. A., Taylor, S. L., Weiss, K. M., Clark, A. G., Hutchinson, R. G.,Stengard, J., Salomaa, V., Vartiainen, E., Boerwinkle, E., Sing, C.F. (1998) DNAsequence diversity in a 9.7-kb region of the human lipoprotein lipase gene. NatureGenet. 19, 233–240.
7. Sun, G. L., Diaz, O., Salomon, B., von Bothmer, R. (1999) Genetic diversity inElymus caninus as revealed by isozyme, RAPD, and microsatellite markers.Genome 42, 420–431.
8. Gusella, J. F., Wexler, N. S., Conneally, P. M., Naylor, S. L., Anderson, M. A.,Tanzi, R. E., Watkins, P. C., Ottina, K., Wallace, M. R., and Sakaguchi, A. Y.(1983) A polymorphic DNA marker genetically linked to Huntigton’s disease.Nature 306, 234–238.
9. Risch, N. and Merikangas, K. (1996) The future of genetic studies of complexhuman diseases. Science 273, 1516–1517.
10. Risch, N. and Teng, J. (1998) The relative power of family-based and case-con-trol designs for linkage disequilibrium studies of complex human diseases.Genome Res. 8, 1273–1288.
11. Larrey, D., Berson, A., Habersetzer, F., Tinel, M., Castot, A., Babany, G.,Letteron, P., Freneaux, E., Loeper, J., and Dansette, P. (1989) Genetic predisposi-tion to drug hepatotoxicity: role in hepatitis caused by amineptine, a tricyclic an-tidepressant. Hepatology 10, 168–173.
12. Collins, F. S., Brooks, L. D., and Chakravarti, A. (1998) A DNA polymorphism dis-covery resource for research on human genetic variation. Genome Res. 8, 1229–1231.
13. Christopoulos, T. K. (1999) Nucleic acid analysis. Anal. Chem. 71, 425R–438R.14. Hacia, J. G. (1999) Resequencing and mutational analysis using oligonucleotide
microarrays. Nat. Genetics Suppl. 21, 42–47.15. Karas, M. and Hillenkamp, F. (1988) Laser desorption ionization of proteins with
molecular masses exceeding 10,000 daltons. Anal. Chem. 60, 2299–2301.16. Wu, K. J., Steding, A., and Becker, C. H. (1993) Matrix-assisted laser desorption
time-of-flight mass spectrometry of oligonucleotides using 3-Hydroxypicolinic acidas an ultraviolet-sensitive matrix. Rapid Commun. Mass Spectrom. 7, 142–146.
17. Tang, K., Fu, D., Kötter, S., Cotter, R. J., Cantor, C. R., and Köster, H. (1995)Matrix-assisted laser desorption/ionization mass spectrometry of immobilizedduplex DNA probes. Nucleic Acids Res. 23, 3126–3131.
18. Jurinke, C., van den Boom, D., Jacob, A., Tang, K., Wörl, R., and Köster, H.(1996) Analysis of ligase chain reaction products via matrix assisted laser desorp-tion/ionization time-of-flight mass spectrometry. Anal. Biochem. 237, 174–181.
192 Jurinke et al.
19. Jurinke, C., Zöllner, B., Feucht, H.-H., Jacob, A., Kirchhübel, J., Lüchow, A., vanden Boom, D., Laufs, R., and Köster, H. (1996) Detection of Hepatitis B virusDNA in serum samples via nested PCR and MALDI-TOF mass spectrometry.Genet. Anal. 13, 67–71.
20. Pieles, U., Zurcher, W., Schar, M., and Moser, H. E. (1993) Matrix-assisted laserdesorption ionization time-of-flight mass spectrometry: a powerful tool for themass and sequence analysis of natural and modified oligonucleotides. Nucl. AcidsRes. 21, 3191–3196.
21. Köster, H., Tang, K., Fu, D. J., Braun, A., van den Boom, D., Smith, C. L., Cotter,R. J., and Cantor, C. R. (1996) A strategy for rapid and efficient DNA sequencingby mass spectrometry. Nat. Biotechnol. 14, 1123–1129.
22. Fu, D. J., Tang, K., Braun, A., Reuter, D., Darnhofer-Demar, B., Little, D. P.,O’Donnell, M. J., Cantor, C. R., and Köster, H. (1998) sequencing exons 5 to 8of the p53 gene by MALDI-TOF mass spectrometry. Nature Biotechnol. 16,381–384.
23. Berkenkamp, S., Kirpekar, F., and Hillenkamp, F. (1998) Infrared MALDI massspectrometry of large nucleic acids. Science 281, 260–262.
24. Braun, A., Little, D. P., and Köster, H. (1997) Detecting CFTR gene mutationsby using primer oligo base extension and mass spectrometry. Clin. Chem. 43,1151–1158.
25. Braun, A., Little, D. P., Reuter, D., Muller-Mysock, B., and Köster, H. (1997)Improved analysis of microsatellites using mass spectrometry. Genomics 46,18–23.
Bioinformatics 193
193
From: Methods in Molecular Biology, vol. 187: PCR Mutation Detection ProtocolsEdited by: B. D. M. Theophilus and R. Rapley © Humana Press Inc., Totowa, NJ
19
An Introduction to Bioinformatics
Henry Brzeski
The purpose of this chapter is to illustrate how to obtain information onDNA and protein sequences from databases. This is most convenientlyachieved using a Web browser (Netscape or Internet Explorer). This chapter isloosely based on a course given by the author at the University of Hertfordshirefrom a set of Web pages that facilitate Internet navigation by using hyperlinksand allow sequences to be copied from the Web page and pasted into the rel-evant search engine. (The online version of this information can be found athttp://www.herts.ac.uk/natsci/Bio/informatics.htm.)
Many simple queries about protein and DNA sequences can now be answeredusing a Web browser. The purpose of this chapter is to give you a flavor of thesorts of things which are now possible, but first it is necessary to explain some ofthe jargon. If you know all about the World Wide Web (WWW or “the Web”),URLs, and hyperlinks then you can bypass the introductory information.
1. Introduction1.1. The World Wide Web
The World Wide Web and the Internet were not invented by Bill Gates! Itwas originally put together in the 1960s by, primarily, the US Department ofDefense (DOD) to ensure continuity of communication during a war. The DODrelied on the fact that every computer connected to its lines could communicatewith any other computer. However, to make the system impregnable to attack,there was not a straightforward connection between each computer. Instead,multiple computers were connected to each other. As a result of this form ofconnection, there was always more than one way to connect between A and J.It may have been A-B-C-G-J, it may have been A-C-H-I-J, or it may havebeen, A-G-C-I-J, etc. This provided the resilience to possible attempts at dis-
194 Brzeski
ruption. The original work was done by the Advanced Research ProjectsAgency, and the network was known as ARPAnet. Later on, academic institu-tions saw this as a wonderful way for researchers to communicate and so theystarted to connect their computers to this international network or “Internet.”This gave rise to the ability to communicate via e-mail and also allowed col-laborators to share large amounts of data by transferring the files rapidly viathe Internet rather than by mailing a pile of disks or tapes. Now the Internet isbeing used for advertising and other commercial purposes.
1.2. Navigating on the Web
The files on computers scattered around the world must all have a uniquename so that you can access each one specifically. This means that their namessometimes can be rather complex. Initially, it is necessary to tell your Webbrowser where to go to pick up a specific page. (The address of this page isgiven a jargon name; it is a “URL,” which stands for Universal Resource Loca-tor.) However, navigating (surfing) on the Internet would be tedious if surfershad to type in these names continually. They would soon get bored with typing“http://www.expasy.ch/prosite/,” one of the addresses we will used later.) Forthis reason navigation is accomplished by using “hyperlinks” displayed in thenow ubiquitous Web browsers. Hyperlinks can readily be identified on Webpages, because they are usually represented as underlined text in color, or as abutton that is ‘pressed’ by clicking on it with the computer mouse and cursor.If the pointer is positioned over the hyperlink the address or URL it representswill appear in the status bar at the bottom of the browser window. Single clickon the hyperlink and the Web browser will load the page at the new address.Hyperlinks can refer to different places in the same document or to totally newaddresses. Hyperlinks should be traversed with care, as it is all to easy to fol-low links without thinking and end up miles from home, both figuratively andliterally. It is usually possible to retrace the original path by pressing the Backbutton, but take care, this does not always work. All Web browsers record ahistory of traversed links, which can be used to connect rapidly to recentlyvisited sites.
1.3. Databases and the Web
Since the early days of DNA and protein sequencing, such information hasbeen deposited in computer databases so that many individuals could access thisinformation. When the World Wide Web greatly expanded the reach of net-worked computers, it was not long before the Web browser became the interfacebetween a very widely scattered population of researchers and the programs thatcould sift through the large amounts of data that were being accumulated.
Bioinformatics 195
2. DNA Databases
In the following sections, I will introduce the reader to a few of the programsavailable via the Web for finding and analyzing biochemical information.
2.1. Using Entrez to Search for Relevant Database Entries
Sooner or later a project reaches the point when it is necessary to deviseprimers to amplify known sequences from cells. This section describes how toobtain sequences for known genes/mRNAs, making it possible to devise prim-ers to characterize genes/mRNAs. The National Center for BiotechnologyInformation (NCBI) has a very powerful computer with an easy-to-use Web-based interface for accessing sequence information. Follow these instructionsto find sequences of particular genes/mRNAs.
1. Start a Web browser (Netscape or Internet Explorer) by clicking on its icon.2. Go to File/Open in the menubar, enter http://www.ncbi.nlm.nih.gov/Entrez/ in the
dialog box and press the OK button. This will not load the file into a new window.3. This will load the Entrez page which allows users to quiz the databases available
at NCBI for textual information connected with any required topic.4. Click on the Nucleotide hyperlink.5. In the text box enter ‘p53’ and press the Search button.6. This very simple search will find many records (note the button with Retrieve N
records at the top right hand side of the page).7. These matches or ‘hits’ will consist of database entries containing partial and com-
plete genomic or cDNA sequences from Homo sapiens and many other species.8. Press the Back button on the browser.9. Change the query to p53 & human (the “&” tells the server to find all records
which contain both the word “p53” and the word “human”—an example of Bool-ean logic) and press the Search button. (You can find out more about Booleanexpressions by clicking on Detailed help on the Entrez page: scroll to the top ofthe page, find the section labeled For Experts Only, and click on Entering Com-plex Boolean Expressions.)
10. This query finds fewer records. You can adjust your query using various requiredwords and Boolean operators. By adding extra keywords, e.g., “complete,”“mRNA,” etc., you can fine tune your search and hit fewer documents.
11. Once the list is manageable, press the Retrieve N records to receive the firstsummary page of hits.
12. Each hit contains a checkbox, an accession number (the ID of the record), a briefsummary of the entry (taken from the file), and various related links.
13. Check the boxes of the relevant hits and then press the Display button to retrievethe actual record(s).
14. Each record contains a number of fields that describe the sequence, e.g., theorganism, whether the sequence is genomic or derived from mRNA, or relevant
196 Brzeski
published information. Depending on the sequence, the record may contain infor-mation on biologically important areas of the sequence, e.g., promoters, startAUG, introns, etc.) followed by the final, and most important, part of the record,the sequence itself.
2.2. Searching for Database Entries That Match a Sequence
The first step of the human genome sequencing project has involved identi-fying those DNA sequences most important for a cell. These code for proteinssynthesized by the cell, which defines the cell’s enzymatic complement andtherefore its function. For this reason, people have been isolating the mRNAsexpressed in cells, converting them to DNA (cDNA), cloning and sequencingthem in their thousands. These expressed sequences are given the jargon nameof Expressed Sequence Tag (EST) and will define the proteins made by a cell.As the sequencing of the human genome progresses, the function of more andmore DNA/protein sequences will be identified. It is now routine to generatemany ESTs and then to compare them with sequences in the databases todetermine their function. A number of such ESTs are given in Table 1 (2–8)along with one bacterial gene (1). The next procedure illustrates how to com-pare these sequences against the DNA databanks using Basic Local AlignmentSearch Tool (BLAST) to find out what they code for.
1. Identify a sequence to use (this can be an in house sequence or one of thoseprovided in Table 1). Copy the sequence to your clipboard.
2. Open your Web browser and go to http://www.ncbi.nlm.nih.gov/BLAST/. Clickon Basic BLAST Search to load a page containing the search form.
3. Paste the copy on the clipboard into the search window.4. Use the default conditions for the search, i.e., blastn.5. Press the Search button and wait while the sequence is compared to the data-
bases and the matches displayed. (There is now a formal queuing system at NCBI,and you will wait for your results as explained on the page.)
The Washington University-Merck collaboration for EST sequencing (http://genome.wustl.edu/est/esthmpg.html) generates a large amount of sequencinginformation, and pictures of every sequencing gel are available at this site.
The Washington University Medical School Genome Sequencing Centre(http://genome.wustl.edu/gsc/index.shtml) is also involved in sequencing thehuman genome and information can be found here.
2.2.1. Interpreting the Results
The results from the NCBI BLAST server are presented both graphically andtextually. The graphical view shows the query sequence as a thick red line withbase numbers attached to it. Below this are a series of thin lines which repre-sent matches to the query sequence. The length of the line indicates that part of
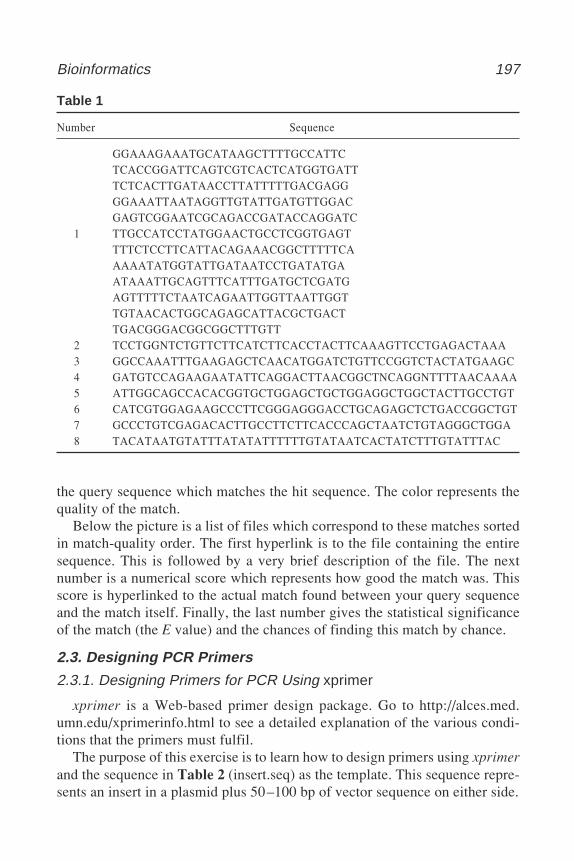
Bioinformatics 197
the query sequence which matches the hit sequence. The color represents thequality of the match.
Below the picture is a list of files which correspond to these matches sortedin match-quality order. The first hyperlink is to the file containing the entiresequence. This is followed by a very brief description of the file. The nextnumber is a numerical score which represents how good the match was. Thisscore is hyperlinked to the actual match found between your query sequenceand the match itself. Finally, the last number gives the statistical significanceof the match (the E value) and the chances of finding this match by chance.
2.3. Designing PCR Primers
2.3.1. Designing Primers for PCR Using xprimer
xprimer is a Web-based primer design package. Go to http://alces.med.umn.edu/xprimerinfo.html to see a detailed explanation of the various condi-tions that the primers must fulfil.
The purpose of this exercise is to learn how to design primers using xprimerand the sequence in Table 2 (insert.seq) as the template. This sequence repre-sents an insert in a plasmid plus 50–100 bp of vector sequence on either side.
Table 1
Number Sequence
GGAAAGAAATGCATAAGCTTTTGCCATTCTCACCGGATTCAGTCGTCACTCATGGTGATTTCTCACTTGATAACCTTATTTTTGACGAGGGGAAATTAATAGGTTGTATTGATGTTGGACGAGTCGGAATCGCAGACCGATACCAGGATC
1 TTGCCATCCTATGGAACTGCCTCGGTGAGTTTTCTCCTTCATTACAGAAACGGCTTTTTCAAAAATATGGTATTGATAATCCTGATATGAATAAATTGCAGTTTCATTTGATGCTCGATGAGTTTTTCTAATCAGAATTGGTTAATTGGTTGTAACACTGGCAGAGCATTACGCTGACTTGACGGGACGGCGGCTTTGTT
2 TCCTGGNTCTGTTCTTCATCTTCACCTACTTCAAAGTTCCTGAGACTAAA3 GGCCAAATTTGAAGAGCTCAACATGGATCTGTTCCGGTCTACTATGAAGC4 GATGTCCAGAAGAATATTCAGGACTTAACGGCTNCAGGNTTTTAACAAAA5 ATTGGCAGCCACACGGTGCTGGAGCTGCTGGAGGCTGGCTACTTGCCTGT6 CATCGTGGAGAAGCCCTTCGGGAGGGACCTGCAGAGCTCTGACCGGCTGT7 GCCCTGTCGAGACACTTGCCTTCTTCACCCAGCTAATCTGTAGGGCTGGA8 TACATAATGTATTTATATATTTTTTGTATAATCACTATCTTTGTATTTAC
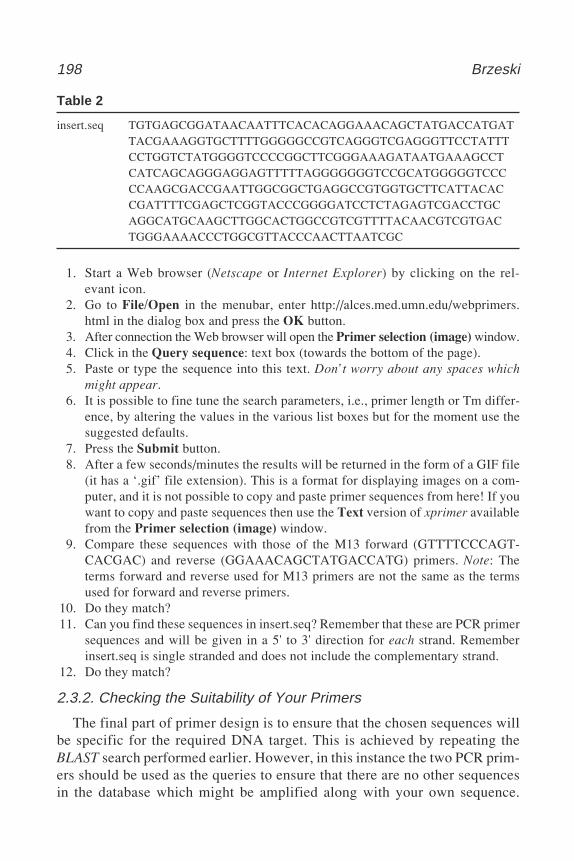
198 Brzeski
1. Start a Web browser (Netscape or Internet Explorer) by clicking on the rel-evant icon.
2. Go to File/Open in the menubar, enter http://alces.med.umn.edu/webprimers.html in the dialog box and press the OK button.
3. After connection the Web browser will open the Primer selection (image) window.4. Click in the Query sequence: text box (towards the bottom of the page).5. Paste or type the sequence into this text. Don’t worry about any spaces which
might appear.6. It is possible to fine tune the search parameters, i.e., primer length or Tm differ-
ence, by altering the values in the various list boxes but for the moment use thesuggested defaults.
7. Press the Submit button.8. After a few seconds/minutes the results will be returned in the form of a GIF file
(it has a ‘.gif’ file extension). This is a format for displaying images on a com-puter, and it is not possible to copy and paste primer sequences from here! If youwant to copy and paste sequences then use the Text version of xprimer availablefrom the Primer selection (image) window.
9. Compare these sequences with those of the M13 forward (GTTTTCCCAGT-CACGAC) and reverse (GGAAACAGCTATGACCATG) primers. Note: Theterms forward and reverse used for M13 primers are not the same as the termsused for forward and reverse primers.
10. Do they match?11. Can you find these sequences in insert.seq? Remember that these are PCR primer
sequences and will be given in a 5' to 3' direction for each strand. Rememberinsert.seq is single stranded and does not include the complementary strand.
12. Do they match?
2.3.2. Checking the Suitability of Your Primers
The final part of primer design is to ensure that the chosen sequences willbe specific for the required DNA target. This is achieved by repeating theBLAST search performed earlier. However, in this instance the two PCR prim-ers should be used as the queries to ensure that there are no other sequencesin the database which might be amplified along with your own sequence.
Table 2
insert.seq TGTGAGCGGATAACAATTTCACACAGGAAACAGCTATGACCATGATTACGAAAGGTGCTTTTGGGGGCCGTCAGGGTCGAGGGTTCCTATTTCCTGGTCTATGGGGTCCCCGGCTTCGGGAAAGATAATGAAAGCCTCATCAGCAGGGAGGAGTTTTTAGGGGGGGTCCGCATGGGGGTCCCCCAAGCGACCGAATTGGCGGCTGAGGCCGTGGTGCTTCATTACACCGATTTTCGAGCTCGGTACCCGGGGATCCTCTAGAGTCGACCTGCAGGCATGCAAGCTTGGCACTGGCCGTCGTTTTACAACGTCGTGACTGGGAAAACCCTGGCGTTACCCAACTTAATCGC
Bioinformatics 199
This is obviously not a guarantee against mis-primes, but it will help avoidthe more obvious problems, such as unknowingly including regions contain-ing repeated sequences.
2.4. The Human Genome Project
The chromosomal location of completed human DNA sequences can befound at (http://www.ncbi.nlm.nih.gov/genemap/). This Web address containsdata on all chromosomes. Selection of a chromosome number will display afigure which contains three parts. First, there are three different ways of dis-playing the mapping data: two RH (radiation hybrid G3 and GB4) and onegenetic map. Second, a drawing of the gene density on this particular chromo-some is shown, and, third, the chromosome is drawn as an ideogram. Belowthis is a wealth of information on what has been sequenced and its relevance, ifknown. This site is continually updated.
Clicking on a region on the GB4 or G3 map will display the availablesequencing information below the mapping data. All this information containshypertext links to the actual sequencing data itself.
2.4.1. Genes Associated with Human Diseases
The Online Mendelian Inheritance in Man (OMIM) Web site, edited byDr. Victor A. McKusick and his colleagues at Johns Hopkins University, andelsewhere, contains information on a large number (10,000) of diseases thathave been identified as being linked with particular genes. This site can beaccessed at http://www3.ncbi.nlm.nih.gov/omim and provides not only adescription of the clinical symptoms of the disease but also the genetic lesionthat gives rise to it.
It is possible to display the results from a search of this site in two differ-ent ways.
1. Searching the Gene map (http://www3.ncbi.nlm.nih.gov/Omim/searchmap.html) accesses the database using the name of the disease of interest and willdisplay the result in the order in which the genes are found on the chromosome.
2. Searching the Morbid map (http://www3.ncbi.nlm.nih.gov/Omim/searchmorbid.html) will allow a search of the database using the name of the disease of interest(or a general descriptive term such as anemia) and will display, in alphabeticalorder, a list of diseases found that contain the keyword(s). The list contains infor-mation on the chromosome location and details of the genetics and clinical symp-toms of the disease.
2.5. Sequencing Genomes
The genomes of the following species have been or are being sequenced,and data can be found at the given Web site.
200 Brzeski
• Human (http://www.ornl.gov/TechResources/Human_Genome/home.html).• Mouse (http://www.informatics.jax.org).• Escherrichia coli (http://www.genetics.wisc.edu).• Haemophilus influenzae (http://www.tigr.org/tdb/mdb/hidb/hidb.html).• Caenorhabditis elegans (http://www.sanger.ac.uk/Projects/C_elegans).• Arabidopsis thaliana (http://genome-www.stanford.edu/Arabidopsis).• Rice (http://www.dna.affrc.go.jp:82).• Yeast (http://genome-www.stanford.edu/Saccharomyces).
A more exhaustive list can be found at http://www.ncbi.nlm.nih.gov/Entrez/Genome/org.html.
3. Protein Databases3.1. The Databases
There are essentially three databases: the Protein Information Resource(PIR®; http://pir.georgetown.edu), SWISS-PROT ® (http://www.expasy.ch/prosite) and OWL (http://www.biochem.ucl.ac.uk/bsm/dbbrowser/OWL/OWL.html).
3.2. The Sequence Retrieval System (SRS)
SRSWWW is a World Wide Web interface to the Sequence Retrieval System(SRS). It can be accessed at a number of different Web sites. SRSWWW iswidely used because of the simplicity of Web browsers as an interface.
Detailed instructions on how to use SRS can be found in the SRS onlinemanual (http://www.expasy.ch/srs5/man/srsman.html). Here I will introducethe basics of the program. In essence, SRS will allow the construction of aquery that will look for the requested information in a number of databases.This is not as straightforward as it may seem because different databases orga-nize the data into different fields, so it is necessary to construct the query withcare. SRS ensures that this query construction is as simple as possible.
There are a number of SRS Web sites at which users can search various data-bases. Compare the SRS page at Heidelberg (http://www.embl-heidelberg.de/srs5; set up to find nucleic acid and protein database entries) with the version ofSRS at SWISS-PROT (http://www.expasy.ch/srs5).
1. Go to the SWISS-PROT SRS page (http://www.expasy.ch/srs5).2. Press the Start button to Start a new SRS session.3. Click on the TREMBL check box to deselect it.4. A detailed explanation of the databases are available by clicking on the
hyperlinked database name.5. Press the Continue button.6. Type oxygen in the first field (leave the default All text in the drop-down list
box) in the SRS: Query Form Page.
Bioinformatics 201
7. Press the Do query button.8. This search will find over 1000 entries.9. Press the Back button on your Web browser to return to the SRS: Query Form
Page.10. Click on the drop down list box to the left of the first text field and select
Description.11. Press the Do query button.12. This search will find about 100 entries.13. Press the Back button to return to the SRS: Query Form Page.14. On the next line change All text to Organism.15. Type Homo sapiens in the adjacent text box.16. Press the Do query button.17. This search will find just less than 10 entries.18. This query is looking for database entries in SWISS-PROT that contain only the
word “oxygen” in the Description field and “Homo sapien” in the Organismfield. (It is possible to change this to an OR search in the drop down list boxadjacent to the Do query button.)
19. Using this search technique it is possible to find entries from one or many data-bases using only one set of search parameters.
3.3. Searching for Database Entries That Match a Sequence
The first step of the human genome sequencing project has involved identi-fying those DNA sequences most important for a cell: the ones coding for pro-teins synthesized by the cell and, hence, which define the cell’s enzymaticcomplement and thus its function. For this reason, people have been isolatingthe mRNAs expressed in cells, converting them to DNA (cDNA), cloning andsequencing them in their thousands. These expressed sequences (cDNAs)define those proteins made by a cell and are given the jargon name ExpressedSequence Tag (EST). As the sequencing of the human genome progresses, thefunctions of more and more DNA/protein sequences are identified. It is nowroutine to generate many ESTs, which are then sequenced and translated intoproteins that can be compared with the protein databases to determine theirfunction. You will find a number of such protein sequences derived from ESTsin Table 3. Compare these against the protein databanks using Basic LocalAlignment Search Tool (BLAST) to find out what they code for:
1. Choose a sequence to use (this can be an in-house sequence or one of those pro-vided in Table 3).
2. Copy the sequence to your clipboard.3. Now click on Basic BLAST SEARCH at (http://www.ncbi.nlm.nih.gov/BLAST/)
to load a page containing the search form.4. Paste the copy on the clipboard into the search window.
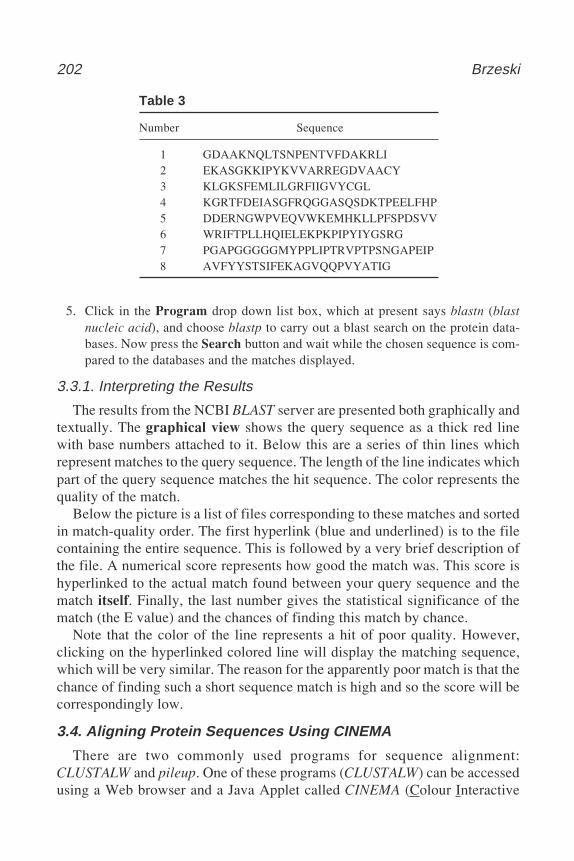
202 Brzeski
5. Click in the Program drop down list box, which at present says blastn (blastnucleic acid), and choose blastp to carry out a blast search on the protein data-bases. Now press the Search button and wait while the chosen sequence is com-pared to the databases and the matches displayed.
3.3.1. Interpreting the Results
The results from the NCBI BLAST server are presented both graphically andtextually. The graphical view shows the query sequence as a thick red linewith base numbers attached to it. Below this are a series of thin lines whichrepresent matches to the query sequence. The length of the line indicates whichpart of the query sequence matches the hit sequence. The color represents thequality of the match.
Below the picture is a list of files corresponding to these matches and sortedin match-quality order. The first hyperlink (blue and underlined) is to the filecontaining the entire sequence. This is followed by a very brief description ofthe file. A numerical score represents how good the match was. This score ishyperlinked to the actual match found between your query sequence and thematch itself. Finally, the last number gives the statistical significance of thematch (the E value) and the chances of finding this match by chance.
Note that the color of the line represents a hit of poor quality. However,clicking on the hyperlinked colored line will display the matching sequence,which will be very similar. The reason for the apparently poor match is that thechance of finding such a short sequence match is high and so the score will becorrespondingly low.
3.4. Aligning Protein Sequences Using CINEMA
There are two commonly used programs for sequence alignment:CLUSTALW and pileup. One of these programs (CLUSTALW) can be accessedusing a Web browser and a Java Applet called CINEMA (Colour Interactive
Table 3
Number Sequence
1 GDAAKNQLTSNPENTVFDAKRLI2 EKASGKKIPYKVVARREGDVAACY3 KLGKSFEMLILGRFIIGVYCGL4 KGRTFDEIASGFRQGGASQSDKTPEELFHP5 DDERNGWPVEQVWKEMHKLLPFSPDSVV6 WRIFTPLLHQIELEKPKPIPYIYGSRG7 PGAPGGGGGMYPPLIPTRVPTPSNGAPEIP8 AVFYYSTSIFEKAGVQQPVYATIG
Bioinformatics 203
Editor for Multiple Alignment). This applet will access local or databasesequences over the Internet and then, once they have been retrieved, align them.The alignments are color coded. If you wish to modify the alignment, it ispossible using the CINEMA interface.
The purpose of an alignment is to compare two sequences and align therelated regions to identify conserved and non-conserved regions. This align-ment is built on the underlying assumption that the two sequences beingaligned have evolved from a common precursor. If this evolutionary relation-ship is, in fact, true, then substitution, addition, or deletion of amino acids willbe a rare occurrence because of the evolutionary constraints on biologicalfunction; the relationship is scored by assigning positive and negative valuesto matches and mismatches. However, not all amino acid changes are neces-sarily equally disadvantageous (for instance, the substitution of one hydro-phobic amino acid with another is less likely to cause dramatic changes inprotein structure than substituting a hydrophobic amino acid with a polar one).Each substitution has a “cost” associated with it and this cost is contained intables which have such names as PAM-30, PAM-70, BLOSUM-80, andBLOSUM-62. This concept of “cost” is also true for the introduction of gapsinto either sequence (addition or deletion of amino acids). The introduction ofgaps is an undesirable event and so the introduction of gaps carries penaltiesin the summation of the final score.
There are penalties to pay for mismatches and introduction of gaps into analignment. Depending on the specific aims of your own particular alignment,you might want to change these penalties (press the Advanced button in theCLUSTALW interface window). If you do so, then the results you obtain willprobably be different. The default values suggested by the program are a goodstarting point. Don’t be afraid to experiment with these penalties to look forless obvious similarities.
The CINEMA home page can be found at http://www.biochem.ucl.ac.uk/bsm/dbbrowser/CINEMA2.1. Alternatively, if this server is proving slow, thentry one of the mirror sites at Venus Internet (http://www.venus.co.uk/cinema)or The Weizmann Institute (http://bioinformatics.weizmann.ac.il/CINEMA).
1. Go to the CINEMA home page (http://www.biochem.ucl.ac.uk/bsm/dbbrowser/CINEMA2.1) directly into a Web browser.
2. In the top window click on Applet here under the CINEMA logo.3. This will load a separate window entitled CINEMA which contains multiple color
sequences.4. Select File/Clear all in the menu bar to give a clean starting window.5. Select Pluglets/Load pluglets in the menu bar.6. This opens the Load Pluglet window, and you should select Clustal and then
press the Load Pluglets button. AutoAlign will appear in the menu bar.

204 Brzeski
7. Press the Close button in the Load Pluglet window.8. Use SRS at SWISS-PROT to find human globin sequences (All text = globin,
Organism = Homo sapiens) and note the SWISS-PROT file names, e.g., HBAHUMAN.
9. In the CINEMA window.EITHERa. Press the DB seq buttonb. In the Load database sequence window, delete Enter ID code here and then
EITHER i. Enter the OWL code (use the protein ID code, e.g., opsd_sheep, not acces-
sion number).
OR i. Change the Database name to SWISSPROT (or PIR) in the drop down list
box at the top of the window.ii. Enter the SWISS-PROT (PIR) code, e.g., hba_human (this is not case
sensitive).c. Press the Get sequence button.d. The requested sequence will be loaded into the CINEMA window.e. Repeat this procedure until you have accumulated all your sequences.
OR (if the OWL server is down)a. Load a database file in the browser window (e.g., from SWISS-PROT) by
clicking on the relevant hyperlink.b. Find the protein sequence at the end of the file.c. Drag the mouse across the sequence to select it (you will know it is selected
because the sequence is now seen as white text on a black background; don’tworry if you have selected numbers.
d. Choose Edit/Copy from the menu bare. Click on the button labeled CINEMA in the task bar at the foot of the screen.f. Click on the Seq Editor button.g. Give your sequence a title in the Accession name window.h. Click in the large text window at the bottom and
EITHER i. Press Ctrl-V to paste your sequence from the clipboard
OR i. Right click in the window then select Paste from the Shortcut menu.ii. Press the Add sequence button.
iii. Press the Clear All button then repeat this procedure until you haveincluded all the required sequences.
10. Select AutoAlign/Clustal interface in the menu bar.11. In the CLUSTALW interface window note that you have a series of dark gray but-
tons with white text on them which will indicate the progress of the alignment.12. In the CLUSTALW interface window enter a name for your job and then press the
Submit job button.
Bioinformatics 205
a. You can fine tune your search by pressing the Advanced button. This will giveyou the opportunity of using a different scoring matrix (default is PAM 250) orby altering the criteria used for the alignment, e.g., by changing the penaltiesfor opening or extending a gap.
13. When the alignment has been performed the dark gray buttons will change tolight gray and the text will become blue.
14. The alignment will be loaded into the CINEMA window so you should clear thisfirst by switching to the CINEMA window and choosing File/Clear all from themenu bar.
15. Move back to the CLUSTALW interface window and view your alignment bypressing the Load Alignment button.
16. Note that
a. The amino acids are color coded according to their properties, e.g., Polar posi-tive—H, K, R (Blue); Polar negative—D, E (Red); Polar neutral—S, T, N, Q(Green); Non-polar aliphatic-A, V, L, I, M (White); Non-polar aromatic-F, Y,W (Purple); P, G (Brown); and C (Yellow). Colors can be viewed and modi-fied by pressing the COLORS button.
b. Where gaps have been introduced this is indicated with a - (dash).c. You can move through the aligned sequences using the scroll bars on the
CINEMA window.
3.5. Comparing 2D Gels in Databases from Different Tissues
Identifying differences between two 2D gels is not always easy. Using theFlicker program it is possible to compare two 2D gels on the screen at the sametime, and this program will make differences between the two gels more obvi-ous by making the unique spots flicker.
1. Go to the Flicker Web site, http://www-lmmb.ncifcrf.gov/flicker.2. Scroll down the page until you see C) Lists of 2D PAGE gel images—you pick
two from each list to compare (in Section 1.1), then locate 6.T-lymphocytephosphoproteins from IL-2/IL-4 dependent cell line 2D gel studies and clickon this. The reason for choosing these gels are that they contain only phosphop-roteins; this makes the patterns simpler and so differences are more easily seen.
3. Click on the hyperlink Select two gels and Flicker Compare them and thenaccept the default choices, i.e., lymphocyte-T_mouse_32P_59g-PPDB - G1-phase in the upper window and lymphocyte-T_mouse_32P_59h-PPDB - G2/M-phase in the lower window.
4. Press the Go Flicker button.5. This may take some time to display the gels but you will eventually see a new
page with two 2D gels, one from each stage of the cell cycle, at the bottom ofthe window.
6. Each gel image will have a set of cross hairs in blue. Look at the two gels and
a. Decide on a common spot,
206 Brzeski
b. Press and hold down the Control key (Ctl), andc. Click on the common spot with the mouse in each gel.
7. This will move the gel image and position the cross hairs onto the spot. If you arenot happy with the position then repeat this procedure.
8. Scroll back up the screen and click in the Flicker box to check it. The two imageswill be viewed in quick succession so that small changes can be easily seen.
3.6. Comparing 2D Gels in House from Different Tissues (Flicker)This is relatively easy to accomplish as long as you can download your 2D
gels onto a Web server that can be accessed using a normal Web addressingsystem.
1. Log onto the Flicker home page, http://www-lmmb.ncifcrf.gov/flicker.2. Once you have connected with the Flicker page you should scroll down the page
until you see 4. Flicker compare images from any two URLs, then scroll fur-ther until you get to Enter two images URLs:.
3. Click in the Left image box and type http://www.herts.ac.uk/natsci/Bio/2Dimages/Image10alt.gif (or select, copy, and paste!).
EITHERa. Click in the Right image box and type in the gel address, i.e., http://www.
herts. ac.uk/natsci/Bio/2Dimages/Image12alt.gif (or select, copy, and paste!)
ORa. Drag the mouse cursor across the whole of the address you have just typed in
step 3 to highlight it.b. Hold down (Ctrl).c. Press and release the C key to copy the address to the clipboard.d. Click in the Right image box.e. Hold down Ctrl.f. Press and release the V key to paste the address into the box.g. Edit the address to give http://www.herts.ac.uk/natsci/Bio/2Dimages/
Image12alt.gif (or select, copy, and paste!).
4. Now press the Go Flicker button.5. The relevant gels and the program to view them will now be downloaded. This
may take some time but you will eventually see a new page with your two 2Dgels. These will be found at the bottom of the window, and if you can’t see themthen scroll down the window.
6. Each gel image will have a set of cross hairs in blue. Look at the two gels anddecide on a common spot, press and hold down Ctl, and click on the common spotwith the mouse in each gel. This will move the gel image and position the crosshairs on the spot. If you are not happy with the position then repeat this procedure.
7. Now scroll back up the screen and click in the Flicker box to check it. The twoimages will be viewed in quick succession so that small changes can be easilyseen.
Bioinformatics 207
4. URLs CitedChromosomal location of genes, http://www.ncbi.nlm.nih.gov/genemapChromosomal location of completed human DNA sequences, http://www.ncbi.
nlm.nih.gov/genemapCINEMA, http://www.biochem.ucl.ac.uk/bsm/dbbrowser/CINEMA2.1Entrez, NCBI http://www.ncbi.nlm.nih.gov/EntrezfFlicker (comparing two images), http://www-lmmb.ncifcrf.gov/flickerGenes associated with human diseases, http://www3.ncbi.nlm.nih.gov/omimGenomes which have been or are being sequenced:
Human, http://www.ornl.gov/TechResources/Human Genome/home.htmlMouse, http://www.informatics.jax.orgE. coli, http://www.genetics.wisc.eduHaemophilus influenzae, http://www.tigr.org/tdb/mdb/hidb/hidb.htmlCaenorhabditis elegans, http://www.sanger.ac.uk/Projects/C elegansArabidopsis thaliana, http://genome-www.stanford.edu/ArabidopsisRice, http://www.dna.affrc.go.jp:82Yeast, http://genome-www.stanford.edu/Saccharomyces
A list can be found at http://www.ncbi.nlm.nih.gov/Entrez/Genome/org.htmlHuman genome, http://www.ornl.gov/TechResources/Human Genome/research.
htmlHuman diseases which have been identified as being linked with particular genes.
This site can be accessed at the NCBI home page, http://www3.ncbi.nlm.nih.gov/omim
OWL, http://www.biochem.ucl.ac.uk/bsm/dbbrowser/OWL/OWL.htmlPCR primers, xprimer, http://alces.med.umn.edu/xprimerinfo.html and http://
alces.med.umn.edu/webprimers.htmlPositioning ORFs on 2D gels, http://expasy.hcuge.ch/ch2dProDom (protein domains), http://protein.toulouse.inra.fr/prodom.htmlProtein Information Resource (PIR), http://pir.georgetown.eduSWISS-PROT, http://www.expasy.ch/sprot/sprot-top.htmlSequence retrieval system (SRS), http://www.expasy.ch/srs5/man/srsman.html
or http://www.embl-heidelberg.de/srs5/ c) http://www.expasy.ch/srs5/Searching the OMIM Gene Map, http://www3.ncbi.nlm.nih.gov/Omim/
searchmap.htmlSearching the OMIM Morbid Map, http://www3.ncbi.nlm.nih.gov/Omim/
searchmorbid.htmlThe address of the online version of this chapter, http://www.herts.ac.uk/natsci/
Bio/informatics.htmWashington University-Merck collaboration for EST sequencing, http://genome.
wustl.edu/est/esthmpg.htmlWashington University Medical School Genome Sequencing Center, http://
genome. wustl.edu/gsc/index.shtml
208 Brzeski
4.1. Other URLs Concerned with Bioinformatics
1. University College London, A Taste of Bioinformatics, http://www.biochem.ucl.ac.uk/bsm/dbbrowser/jj. The aim of this tutorial is to provide a gentle intro-duction to sequence and structure function analysis.
2. DNA Learning Center Cold Spring Harbor Laboratory, Online DNA SequenceAnalysis and Comparison Tutorial, http://vector.cshl.org/SequenceAnlaysisExercise/index1.html.
This tutorial uses reference human mitochondrial DNA sequences and onlineresources to:
• Search for like DNA sequences in online databanks• Locate DNA sequences in genomes• Compare modern human DNA sequences• Compare modern human DNA sequences to Neanderthal• Compare modern human DNA sequences to other organisms
3. EMBnet, DNA analysis tutorial, http://www.ie.embnet.org/other/tut.html.This tutorial considers three popular sets of DNA and protein sequence analy-sis programs:
• The Staden Package, from Rodger Staden et al., MRC Laboratory of Molecu-lar Biology, Cambridge, UK• The Wisconsin Package (GCG), from the Genetics Computer Group, Inc.,Madison, WI.• EGCG (Extended GCG) from a consortium of researchers mostly based inEurope at EMBnet Nodes.
4. University of Adelaide, A tutorial on sequence analysis: From sequence to struc-ture, http://www.microbiology.adelaide.edu.au/learn/index.html
An unusual tutorial by Harry Mangalam subtitled, “one person’s cautionarytale of model building.”
Index 209
209
Index
A
ABI PRISM, 111, 122Agarose, see Gel electrophoresisAmplification refractory mutation
system (ARMS), see ASO-PCRAlkaline phosphatase, 18Allele-specific oligo PCR (ASO-PCR),
44, 47,cycling conditions, 49primer design, 49
Autoradiography, 20, 32, 69
B
Basic Local Alignment Search Tool(BLAST), 196, 201
Big Dye™ Terminators, 66, 71, 119Bioinformatics, 193BiomassPROBE, 184, 185Biotin, 57Bovine serum albumin, 13Bromophenol blue, 4, 9
C
CA repeat, 30CDP-Star™, 171Capillary electrophoresis, 160Capillary transfer, see Southern
blottingChemical cleavage of mismatch
(CCM), 109Chemiluminescence detection, 174Chromosome paint, 73CINEMA, 203Cleavase fragment length
polymorphism (CFLP), 165
Clustal analysis, 120, 202Competitive in situ suppression, 86Complementary DNA (cDNA), 40Conformation sensitive gel
electrophoresis (CSGE), 137Counter staining, 82Cycle sequencing, see SequencingCystic fibrosis, 152, 157, 158, 159
D
DAPI, 78Databases, genetic, 194Denaturing gradient gel electrophoresis
(DGGE), 109, 125,preparation of, 130gel staining of, 132
Denaturing high performance liquidchromatography, 110
Dideoxy fingerprinting, 165Digoxygenin, 19Dimethylsulfoxide, 44Dithiothreitol (DTT), 41DNA,
affinity capture, 60end-labeling, 17, 170extragenic, 29GC content, 44, 49, 62hairpin structures, 44internal labeling, 13intragenic, 29interphase, 73isolation, 115melting temparature (Tm), 44,
126, 128metaphase, 73
210 Index
mitochondrial, 51, 58misincorporation, 51PCR of, see Polymerase chain reactionparaffin embedded, 37probes, see Probesrandom primer labeling, 13restriction of, 31size standards, 6,
staining, 8visualization, 8
DNA polymerase I, 13Duchenne muscular dystrophy
(DMD), 88DYEnamic dyes, 66Dynabeads, 61
E
EMBnet, 208Ethidium bromide, 1, 42, 147Exonuclease I, 71, 170Expressed sequence tag (EST), 196
F
Factor VIII deficiency, 29Fill-in reaction, 17Flicker, 205Fluorescence, 15, 19, 73Fluorescent in situ hybridization
(FISH), 73,multicolor, 75
Fluoricon, 61Formaldehyde, 153, 160Fragile X syndrome, 39
G
Gel electrophoresis,agarose, 1, 97,
low melting temperature, 3size separation, 3, 4
polyacrylamide, 1, 94, 119, 171,formulation of, 10, 119
denaturing, 4, 130, 141, 153,destaining of, 10
N,N'-methylene-bis-acrylamide, 3SDS-PAGE, 94
two-dimensional, 206Gel drying, 155Geneclean, 67, 71, 122Genome sequencing, 199Giemsa banding, 75Glycogen, 79Gradient maker, 129
H
High performance liquidchromatography (HPLC), 61
Hemophilia A, 29, 109, 110Heteroduplex analysis, 151Heteroplasmic mutations, 58Heterozygosity, 30Hexanucleotides, 14Histopaque, 111Human genome project, 179, 199Hybond, 25, 26, 31Hybridization, 30, 31, 32, 80Hydrolink, 160Hyperfilm, 32
I
Ion exchange column, 61Immunoprecipitation, 100Industrial genomics, 180Internal transcribed spacer, 169
K
Kinase reaction, 17Klenow polymerase, 14, 19
L
Labeling, of DNA, see DNALinear amplification, 65Luciferase, 99Lymphocyte, isolation of, 111
M
MALDI-TOF, 181
Index 211
Mass array technology, 179Mass spectrometry, 181M13, 139Melting domains, 126Microcon, 67, 71Maloney murine leukemia virus
(MMLV), 41
N
Nanoliquid, 189National Center for Biotechnoloy
Information (NCBI), 195Nick translation, 13, 76Nylon, 23Nucleon II, 103
O
Oligo-dT primer, 44, 102Online Mendelian Inheritance in Man
(OMIM), 199Osmium tetroxide, 114, 117
P
P1 artificial chromosomes (PAC), 78Pharmacogenetics, 180Polyacrylamide, see Gel
electrophoresisPolyethylene glycol (PEG), 44Polymerase chain reaction (PCR), 37,
allele-specific, see ASO-PCRbetaine, 43expand system, 52GC clamp, 126Gene Ampl XL, 52hot start, 43, 53, 96, 105nested, 39long-range, 39, 51, 120magnesium, 55multiplex, 39primer-dimers, 43primer design, 140purification, 70, 172
RT-PCR, 44, 88, 92, 112, 120Reverse transcriptase, see Reverse
transcriptasesecondary, 116Taq Plus™, 52template DNA, 53
Probes, 13, 17,centromeric, 75detection, 82, 83multiprobe, 75plasmid, 78repetitive sequence, 73, 80single copy, 75, 80
Protein Information Resource (PIR), 200Protein truncation test (PTT), 87Propidium iodide (PI), 78PWO DNA polymerase, 39Push column, 15
R
Rainbow markers, 95, 105Redivue™, 94Restriction enzymes, 17, 30Restriction length fragment
polymorphism (RFLP), 29Reverse transcriptase, 39, 52, 92,
112, 116Rhodamine-DUTP, 15RNA, 42,
extraction, 115rRNA, 169
RNeasy extraction, 102RNAse inhibitor, 41
S
Sephadex, 14, 15, 21Sequence navigator, 114Sequence Retrieval System (SRS), 200Sequencing, of DNA,
automated, 66Maxam-Gilbert sequencing, 17mini-sequencing, see Solid phase
mini-sequencing
212 Index
PCR cycle, 65Sanger, 65, 183stutter fragments, 183
Sex typing, 188Short tandem repeats (STR), 179Sigmacote, 6Silver staining, 153Single nucleotide polymorphism
(SNP), 179Single strand conformation
polymorphism (SSCP),109, 151
Solid phase mini-sequencing, 57Southern blotting, 23, 30, 31SpectroCHIP, 185, 189Streptavidin, 57Stringency, 76, 77, 82SWISS-PROT, 200
T
Taq polymerase, 38, 49, 60, 93Temperature denaturing gradient gel
electrophoresis (TGGE), 126T4 polynucleotide kinase, 17T7 RNA polymerase, 87
TEMED (N,N,N',N' tetramethyl-ethylenediamine), 4, 7, 98
Tetramethylammonium chloride(TMAC), 43
Thermal cycler, 38, 148Transcend detection system, 104Transilluminator, 7, 24Trichloroacetic acid (TCA), 21Tris-acetate (TAE), 2,
formulation of, 9Tris-borate (TBE), 2,
formulation of, 9TRIzol, 102
U
Ultraviolet radiation, 2Uracil N-glycosylase, 43
V
Variable number tandem repeats(VNTR), 29
Von Willebrand disease, 141
X
X primer, 197Xylene cyanol, 4, 9
METHODS IN MOLECULAR BIOLOGYTM • 187
Series Editor: John M.Walker
FEATURES
CONTENTS
9 780896 036178
9 0 0 0 0
Methods in Molecular BiologyTM • 187PCR MUTATION DETECTION PROTOCOLSISBN: 0-89603-617-0
humanapress.com
PCR Mutation Detection Protocols
Bimal D. M. TheophilusDepartment of Haematology, Birmingham Children’s Hospital NHS Trust, Birmingham, UK
Ralph RapleyDepartment of Biosciences, University of Hertfordshire, Hatfield, UK
Edited by
Agarose and Polyacrylamide Gel Electrophoresis. InternalLabeling of DNA Probes. End-Labeling of DNA Probes.Southern Blotting of Agarose Gels by Capillary Transfer.Restriction Fragment Length Polymorphism. PCR: Princi-ples, Procedures, and Parameters. Allele-Specific Oligo-nucleotide PCR. Long-Range PCR. Analysis of NucleotideSequence Variations by Solid-Phase Minisequencing.Cycle Sequencing of PCR Products. Fluorescent In SituHybridization. The Protein Truncation Test. Mutation
Application of DNA technology to the identification of disease-causing mutations has becomewidespread in recent years. PCR Mutation Detection Protocols provides biological and clinical inves-tigators with a comprehensive collection of new, recent, and updated PCR-based screening methodssuitable for detecting the presence of both known and novel mutations. The methods cover pointmutations (e.g., ASO-PCR, SSCP, DGGE, chemical cleavage), deletions (multiplex PCR, FISH, blot-ting), non-sense mutations (PTT), and more. The new and exciting techniques of DNA array analysis,along with such recently developed experimental methods as conformation-sensitive gel electro-phoresis, are also included. Additional coverage is given to the direct use of DNA sequencing as adetection method in its own right and to the characterization of mutations previously located by otherscreening techniques. Each chapter explains the basic theory behind the technique and providesvaluable notes essential for its successful execution.
Comprehensive and highly practical, PCR Mutation Detection Protocols assures both seasonedand novice investigators access to the highly productive and readily reproducible PCR-based mutationdetection methods, techniques that are laying the groundwork for many of today’s major scientific andmedical advances.
• All the key PCR-based mutation detection methodsin a readily reproducible format
• Methods for detecting a known mutation orscreening for new mutations
• New techniques of DNA array analysis• Experimental methods such as conformation-
sensitive gel electrophoresis
Detection in Factor VIII cDNA from Lymphocytes of He-mophilia A Patients by Solid Phase Fluorescent ChemicalCleavage of Mismatch. Denaturing Gradient Gel Electro-phoresis. Conformation-Sensitive Gel Electrophoresis.SSCP/Heteroduplex Analysis. Cleavase® FragmentLength Polymorphism Analysis for Genotyping and Muta-tion Detection. Automated Genotyping Using the DNAMassArray™ Technology. An Introduction to Bioinformat-ics. Index.