Data Management in Vehicular Networks - TUprints
163
DATA MANAGEMENT in VEHICULAR NETWORKS Relevance-Aware Networking for Advanced Driver Assistance Systems Vom Fachbereich Elektrotechnik und Informationstechnik der Technischen Universität Darmstadt zur Erlangung des akademischen Grades eines Doktor-Ingenieurs (Dr.-Ing.) genehmigte Dissertation von tobias meuser, m.sc. Geboren am 13. Juli 1993 in Wetzlar Vorsitz: Prof. Dr.-Ing. Anja Klein Referent: Prof. Dr.-Ing. Ralf Steinmetz Korreferent: Prof. Dr. Ioannis Stavrakakis Tag der Einreichung: 22. Oktober 2019 Tag der Disputation: 16. Dezember 2019 Darmstadt 2019
-
Upload
khangminh22 -
Category
Documents
-
view
0 -
download
0
Transcript of Data Management in Vehicular Networks - TUprints

DATA M A NAG E M E N Tin V E H I C U L A R N E T WO R K S
Relevance-Aware Networking for Advanced Driver Assistance Systems
Vom Fachbereich Elektrotechnik und Informationstechnikder Technischen Universität Darmstadt
zur Erlangung des akademischen Grades einesDoktor-Ingenieurs (Dr.-Ing.)
genehmigte Dissertation
von
tobias meuser, m.sc.
Geboren am 13. Juli 1993 in Wetzlar
Vorsitz: Prof. Dr.-Ing. Anja KleinReferent: Prof. Dr.-Ing. Ralf Steinmetz
Korreferent: Prof. Dr. Ioannis Stavrakakis
Tag der Einreichung: 22. Oktober 2019Tag der Disputation: 16. Dezember 2019
Darmstadt 2019

Tobias Meuser, M.Sc.: Data Management in Vehicular Networks,
Relevance-Aware Networking for Advanced Driver Assistance SystemsDarmstadt, Technische Universität Darmstadt,Jahr der Veröffentlichung der Dissertation auf TUprints: 2020Tag der mündlichen Prüfung: 16. Dezember 2019
Dieses Dokument wird bereitgestellt von This document is provided bytuprints, E-Publishing-Service der Technischen Universität Darmstadt.
http://tuprints.ulb.tu-darmstadt.de
Bitte zitieren Sie dieses Dokument als: Please cite this document as:URN: urn:nbn:de:tuda-tuprints-113780
URL: https://tuprints.ulb.tu-darmstadt.de/id/eprint/11378
Die Veröffentlichung steht unter folgender Creative Commons Lizenz:Namensnennung - Keine Bearbeitungen 4.0 International
https://creativecommons.org/licenses/by-nd/4.0/deed.de
This publication is licensed under the following Creative Commons License:Attribution-NoDerivatives 4.0 International
https://creativecommons.org/licenses/by-nd/4.0/deed.en

A B S T R AC T
Future vehicles will exchange an increasing amount of data to increase their aware-ness beyond their local perception. This data is generated by the sensors of
other vehicles, which share their local view of the environment. Compared to thedata exchanged by today’s vehicles, this data is much more fine-granular and, thus,changes more frequently, requiring much higher bandwidth to maintain an up-to-date view of the environment. The diverse level of accuracy or potential inaccuracy ofvehicle-generated data, in conjunction with their increased bandwidth volume, posesconsiderable challenges for future vehicular networks.
The potential inaccuracy of data provided by other vehicles necessitates a validation,which requires knowledge about the measuring sensors. Besides, the higher band-width consumption requires a more accurate consideration of each vehicle’s interestin data, as not everything can be exchanged. The paradigm of Approximate Networks isparticularly well suited for the provisioning of fine-granular data, as it allows to tradenetwork and computation resources with the availability and quality of data.
Our contributions in this thesis amount to developing mechanisms to apply theconcept of approximate networks in the vehicular scenario. For this purpose, we firstdevelop mechanisms for the assessment of data in these networks, which are the ba-sis for our approach to approximate vehicular networks. As our first contribution, wepropose an aggregation scheme to increase the data quality in the network. Our in-novative aggregation scheme considers the heterogeneity of sensors and data-specificproperties to adapt the influence of old measurements and increase the quality of theresulting aggregate. We then investigate the relevance of data to a specific vehicle asour second contribution, which relies on the prediction of the specific vehicle’s futurecontext. By combining the accuracy of the aggregate and its relevance, we determinethe expected gain for a specific vehicle, the so-called impact. This impact is key foreffective data prioritization and builds the foundation of our approximate vehicularnetwork. As our third contribution, we design and implement an approximate vehicularnetwork based on Diverse Prioritization and Treatment, aiming at improving networkperformance without increasing the resources consumed, as typically advocated underapproximate networking. A probabilistic mechanism is proposed to properly modu-late the redundancy of the messages in the network, leading to their increased overallavailability to the interested vehicles without increasing the consumed resources.
Finally, we design and develop our VEHICLE.KOM platform that is used to as-sess the effectiveness of the developed mechanisms under varying environmentalconditions. We show that our aggregation scheme drastically reduces the false ag-gregates and adapts its behavior to lifetime and accuracy effectively. In addition, wedemonstrate the effectiveness of our approach to approximate vehicular networking,by showing a drastic increase in the network performance under dynamic networkconditions, especially when considering cooperation between vehicles.
iii


K U R Z FA S S U NG
In den nächsten Jahren werden Fahrzeuge immer mehr Daten austauschen, ummögliche Gefahren auch außerhalb ihrer eigenen Sensorreichweite wahrnehmen
zu können. Die so ausgetauschten Daten werden von anderen Fahrzeugen generiert,die ihre lokale Wahrnehmung mit den Fahrzeugen im Netzwerk teilen. Dadurch ist esmöglich, deutlich feingranularer auf Veränderungen der Umwelt zu reagieren als esheute möglich ist. Allerdings hat dies zur Folge, dass deutlich mehr Kommunikations-bandbreite benötigt wird, um diese Veränderungen mit anderen Fahrzeugen zu teilen.Dabei stellt die mögliche Ungenauigkeit der ausgetauschten Daten in Kombinationmit dem steigenden Bandbreitenbedarf eine große Herausforderung für zukünftigeFahrzeugnetzwerke dar.
Durch diese mögliche Ungenauigkeit der Daten sind Verfahren nötig, die Sensor-daten von anderen Fahrzeugen validieren können, wozu Informationen über die mes-sende Sensorik benötigt werden. Zusätzlich muss der steigende Bandbreitenbedarfkompensiert werden, was eine Analyse des Datenbedarfs eines einzelnen Fahrzeugserfordert. In diesem Kontext eignet sich das Konzept der Approximate Networks beson-ders gut, da dieses eine Abwägung zwischen Ressourceneffizienz und der Verfügbar-keit/Qualität von Daten ermöglicht.
Dementsprechend tragen unsere Beiträge in dieser Arbeit zum Konzept der Ap-
proximate Networks in Fahrzeugnetzwerken bei. Dazu entwickeln wir zunächst Me-chanismen zur Datenbewertung in Fahrzeugnetzwerken, welche dann als Grundlagefür unseren Ansatz für unsere entwickelten Fahrzeugnetzwerke dienen. Als unserenersten Beitrag entwickeln wir ein innovatives Aggregationsschema, welches die Da-tenqualität in Fahrzeugnetzwerken erhöht, indem es die Heterogenität von Sensorenin Kombination mit den Eigenschaften der generierten Daten berücksichtigt, um denEinfluss von älteren Messdaten auf das Aggregationsergebnis zu bestimmen. DiesesGewicht wird so gewählt, dass für den jeweiligen Datentyp die Qualität des Aggre-gates erhöht wird. Im Anschluss untersuchen wir die Relevanz von Daten für einspezifisches Fahrzeug als unseren zweiten Beitrag, wobei wir eine Prädiktion desFahrzeugkontexts nutzen, um die Nützlichkeit eines Datums für das Fahrzeug zubestimmen. Basierend auf der Genauigkeit der Daten und der fahrzeugspezifischenRelevanz bestimmen wir den Einfluss der generierten Daten auf ein spezifisches Fahr-zeug. Diese Einfluss Metrik ist ein wichtiger Aspekt für eine effektive Priorisierungvon Daten und bildet die Grundlage für unser Konzept von Approximate Vehicular
Networks. Dieses designen und entwickeln wir als unseren dritten Beitrag basierendauf dem Konzept von Diverse Prioritization and Treatment. Mit diesem Konzept ist esuns möglich, die Netzwerkperformanz zu erhöhen, ohne dabei die Menge der ver-brauchten Kommunikationsressourcen zu ändern. Dadurch folgt unser Konzept derGrundidee der Approximate Networks. In diesem Kontext schlagen wir ein wahrschein-lichkeitsbasiertes Verfahren vor, welches die Redundanz der Nachrichten im Netzwerk
v

so anpasst, dass die Verfügbarkeit von Nachrichten für interessierte Fahrzeuge erhöhtwird, ohne dabei jedoch die genutzten Kommunikationsressourcen zu verändern.
Wir nutzen dann unser VEHICLE.KOM Framework, um die entwickelten Verfah-ren in einer ausgiebigen Evaluation zu analysieren und zu bewerten., wobei wir ver-schiedene Umwelteinflüsse auf unsere Ansätze betrachten. Wir zeigen, dass unserAggregationsschema die Datenqualität im Netzwerk durch Anpassung an die Genau-igkeit und Langlebigkeit der Daten signifikant erhöht. Zusätzlich demonstrieren wirdie Verbesserungen durch unseren Ansatz für Approximate Vehicular Networks in dyna-mischen Umgebungen, wobei besonders der Mehrwert von Kooperationen zwischenFahrzeugen beleuchtet wird.
vi

CO N T E N T S
1 introduction 1
1.1 Motivation for Approximate Vehicular Networks . . . . . . . . . . . . 21.2 Research Challenges . . . . . . . . . . . . . . . . . . . . . . . . . . 31.3 Research Goals and Contributions . . . . . . . . . . . . . . . . . . . 41.4 Structure of the Thesis . . . . . . . . . . . . . . . . . . . . . . . . . 6
2 background and related work 7
2.1 Communication Technologies for Vehicular Data Exchange . . . . . . . 72.2 Data Exchange in Vehicular Networks . . . . . . . . . . . . . . . . . 112.3 Network Quality Assessment in Distributed Networks . . . . . . . . . 142.4 Approximate Networks . . . . . . . . . . . . . . . . . . . . . . . . 152.5 Summary and Identified Research Gap . . . . . . . . . . . . . . . . . 16
3 large-scale vehicular communication networks 17
3.1 Issues of Large-Scale Vehicular Communication Networks . . . . . . . 173.2 Approaches for Large-Scale Vehicular Networks . . . . . . . . . . . . 22
4 data quality assessment for vehicular networks 27
4.1 Scenario Description . . . . . . . . . . . . . . . . . . . . . . . . . . 274.2 Sensor-specific Influence on Data Impact . . . . . . . . . . . . . . . . 294.3 Relevance of Data for the Receiving Vehicles . . . . . . . . . . . . . . 384.4 Model for the Impact of Messages on Receiving Vehicles . . . . . . . . 42
5 approximate vehicular networks 47
5.1 Scenario Description . . . . . . . . . . . . . . . . . . . . . . . . . . 485.2 Non-cooperative Approximate Vehicular Networks . . . . . . . . . . 535.3 Cooperative Approximate Vehicular Networks . . . . . . . . . . . . . 545.4 Determining the Privacy Adaptation Factor . . . . . . . . . . . . . . 655.5 Consideration of the Specific-Impact in the Dissemination of Messages . 675.6 System Analysis . . . . . . . . . . . . . . . . . . . . . . . . . . . . 70
6 vehicle.kom: platform for approximate vehicular networks 77
6.1 Overview of the Vehicle.KOM platform . . . . . . . . . . . . . . . . 776.2 Prototypical Realization of Approximate Vehicular Networks . . . . . . 82
7 evaluation 85
7.1 Evaluation Setup and Methodology . . . . . . . . . . . . . . . . . . 857.2 Aggregation Scheme for Inaccurate Measurements . . . . . . . . . . . 907.3 Prioritization based on the Specific-Impact . . . . . . . . . . . . . . . 997.4 Cooperation in Approximate Vehicular Networks . . . . . . . . . . . 106
vii

viii contents
8 summary, conclusions, and outlook 119
8.1 Summary of the Thesis . . . . . . . . . . . . . . . . . . . . . . . . . 1198.2 Outlook . . . . . . . . . . . . . . . . . . . . . . . . . . . . . . . . 121
bibliography 123
A appendix 143
A.1 Transformation to Obtain the Weight Function for the Adaptive Aggre-gation Scheme . . . . . . . . . . . . . . . . . . . . . . . . . . . . . 143
A.2 Transformations to Obtain a Solution for the Approximate Vehicular Net-work . . . . . . . . . . . . . . . . . . . . . . . . . . . . . . . . . . 144
A.3 Additional Insights on the Influence of Sensor Heterogeneity . . . . . . 145A.4 Additional Insights into the Influence of Location Privacy . . . . . . . 146A.5 List of Acronyms . . . . . . . . . . . . . . . . . . . . . . . . . . . . 147A.6 Supervised Student Theses . . . . . . . . . . . . . . . . . . . . . . . 149
B author’s publications 151

1I N T RO D U C T I O N
Today’s vehicles become increasingly connected, which enables the exchange ofroad-traffic data with other vehicles. In addition to the currently available cellu-
lar communication via Long Term Evolution (LTE), decentralized communication viathe Wifi-based 802.11p is expected to be deployed in the future. Today’s vehicles al-ready exchange coarse-grained road-traffic data, like accidents and jams, and providemaintenance information to the manufacturer [143]. These coarse-grained road-trafficdata are provided to the driver by a central entity via the radio, radio-related tech-nologies like Traffic Message Channel (TMC), or the cellular network. This centralentity relies on reports of traffic participants (passengers and vehicular sensors) toverify the correctness of the provided data and distributes only validated data backto the vehicles. This validation of data entries is often performed statically withoutconsideration of the quality of the provided data. Additionally, the validated data isprovided to all vehicles within a certain region, without considering the individualcontext (e. g., location, future route) of the vehicle. For coarse-grained road-traffic data,this approach induces limited overhead due to the limited amount of shared data.
With the expected increase in the level of autonomy of future vehicles, road-trafficdata of much finer granularity than currently available will be required [181]. Examplesfor these fine-granular data are minor changes in traffic flow, changes in lane-marking,and properties of the road, to which we refer to as road events in the following.Compared to high-importance data like traffic jams and accidents, these fine-granulardata changes more frequently. Thus, they are also exchanged more frequently and canonly be reported by the sensors of the vehicles driving on the street [87–89, 115]. Thisincrease load renders the aforementioned strategies for validation and disseminationof these data impractical: For the validation, the amount of available data increasesdrastically, such that a validation process based on static parameters is hardly possible.Additionally, vehicle-specific properties like heterogeneous sensors and the diverseaccuracy of the generated data complicate an automated validation of this data. Forthe dissemination, the available communication bandwidth will be insufficient toprovide this amount of validated data to all vehicles in the network or even in a region.Additionally, these data is not relevant to all vehicles in a region, but generally only toa small subset of these. Consequently, the vehicles on the streets form a huge, context-aware sensor-actuator network, intending to provide maximum safety and comfortto the passengers of the vehicles given the available communication bandwidth ofthe communication network. In this thesis, we propose the concept of approximatevehicular networks to cope with the aforementioned challenges.
1

2 introduction
1.1 motivation for approximate vehicular networks
In accordance with approximate computing [25], approximate networking may beviewed as a networking paradigm that trades communication and computation re-sources with the availability and quality of data. While the performance of conven-tional networks is generally increased by increasing the available communicationresources, approximate networks focus on adapting the performance to predefinedcommunication resources by, e. g., decreasing the quality or quantity of the provideddata to free bandwidth for the transmission of previously not transmitted data. Ap-proximate vehicular networks are approximate networks tailored for the vehicularenvironment. In this environment, the data itself is commonly more important thenthe provider [15] which is generally unknown, as data is proactively generated by thevehicles in the network and shared among them. Due to the inaccuracy of the built-insensors and environmental conditions, these data and the associated measurementsare not always correct and thus introduce uncertainty. Today’s networks commonlyignore this uncertainty and its influence on the data consumer, which is expected tobecome a major issue for future vehicular networks.
The data generated by vehicles is transmitted to other vehicles to improve theirdecision-making [192]. While some works follow a completely decentralized datamanagement approach [109, 184, 187], others rely on server-based coordination toimprove the performance of data management [45, 147]. Decentralized data man-agement is commonly used to distribute data to vehicles close to the measurementlocation via Wifi-based communication technology to support, e. g., accident preven-tion [24, 86]. Although long-range data exchange is also possible using decentralizedsolutions with multi-hop relaying, the induced latency is generally very high [103],which renders decentralized data management approaches unsuitable for short-livedor high-importance data. For this purpose, the cellular network is generally used, asthe transmission latency is almost unaffected by the transmission distance. The dataexchange via the cellular network often relies on a centralized coordination unit (stor-age server, broker) to manage the data transmission to the vehicles. However, dueto the limitations in bandwidth and the induced costs due to the usage of licensedfrequency bands, the transmission of data via the cellular network is limited. Thus,data is filtered at the server to avoid unnecessary transmission to unconcerned vehi-cles [66, 128]. However, the state-of-the-art approaches for data exchange in vehicularnetworks are controlled by static attributes, like the distance between a vehicle and adata location [54, 187]. Such approaches are very inefficient, as the influence of data toa vehicle commonly does not depend on these static attributes. That is, the data in suchnetworks should generally improve the vehicle’s driving behavior, and the possibleimprovement depends strongly on a multitude of attributes, which consider the vehi-cle and the shared piece of data. For a vehicle, the context of the vehicle (e. g., vehicletype, passenger preferences, location) needs to be considered. For the piece of dataitself, the available meta-information (e. g., measurement location, measurement date,accuracy, data type) determines the importance of that piece of data for the vehicle.

1.2 research challenges 3
In addition to increasing the filtering of data at the server, different approaches to-wards hybrid vehicular networks have been proposed to further increase the efficiencyof the bandwidth utilization by combining cellular and local communication [175, 201].These approaches commonly organize vehicles in so-called clusters, such that all com-munication is performed by one so-called cluster-head. These clusters increase thecommunication efficiency, as each piece of data only needs to be transmitted onceto each individual cluster. While these approaches perform well if the rate of topol-ogy changes is low, they become inefficient in highly dynamic networks, as vehiclesregularly disconnect from their cluster head. This disconnect leads to a loss of dataentries with potentially high impact, which drastically reduces the performance ofcluster-based approaches in urban areas.
The influence of data on the behavior of the vehicles has barely been studied in theliterature, although it is a pivotal aspect of the relevance of data for the receiving vehi-cles. Additionally, this influence is generally not deterministic, but is influenced by theuncertainty of these data-specific properties and the vehicle’s context changes. In therelated-work, this uncertainty has commonly been compensated for through drasticover-provisioning, but has rarely been considered as a pivotal property of the network.Uncertainty in this context refers to the network conditions, and the assessment ofdata itself, for both the dissemination and validation of data. To be efficient, futurevehicular networks will require (i) the assessment of data and the determination ofits influence on a vehicle and (ii) the utilization of uncertainty to increase the networkperformance. Uncertainty can be used to increase network performance by designingadaptive and robust communication mechanisms, as addressed in this thesis basedon the paradigm of approximate vehicular networks.
1.2 research challenges
The increasing amount of data shared in vehicular networks poses additional chal-lenges to their dissemination, processing, and validation. The following research chal-lenges are the basis for our approximate vehicular network.
Challenge: Providing high-quality measurements to data consumers.
In vehicular networks, the heterogeneity of the sensors regarding availability andquality influences the quality of the data provided to the vehicles or any relevant dataconsumer. While heterogeneity is not an issue when only local sensor measurementsand specialized applications are used, future vehicular applications will be requiredto utilize data provided by other vehicles to increase traffic safety and driver comfortfurther. In these networks, vehicles will receive multiple measurements generatedfrom diverse sources with diverse quality and at different measurement times. Thesepotentially contradicting measurements need to be properly aggregated into high-quality measurement data to support effectively various vehicular applications relyingon them. Such an aggregation or joint processing of diverse measurements is a major

4 introduction
challenge, due to the aforementioned diverse quality and measurement times of theprovided measurements.
Challenge: Influence of context on the relevance of data.
The data exchanged in a vehicular network is commonly context-sensitive, i. e., aproduced piece of data is not relevant for all vehicles in the network. The relevanceof data for a specific vehicle is strongly connected to its expected behavior and itscurrent context, like location and type of the vehicle. A piece of data is consideredrelevant for a vehicle if this piece of data is expected to improve the vehicle’s futurebehavior regarding safety or driver comfort. The assessment of relevance poses asignificant challenge because of the uncertainty in future behavior and context of thevehicles, and the uncertainty of the influence of a piece of data on that behavior andthe associated improvements. Thus, an appropriate measure for the influence of datato a data consumer needs to consider these two influence factors.
Challenge: Impact-aware dissemination considering privacy demands.
The data in a vehicular network has different usability to the data consumers, whichdepends on multiple factors like data quality, the context of the vehicle, and theimportance of the data. As an example, a traffic jam in proximity is much more usefulthan a traffic sign far away. When exchanging data, especially via the cellular network,the available communication bandwidth is limited. Thus, appropriate prioritization ofdata entries in this network is necessary to utilize the available bandwidth efficiently.This may also include the cooperative reception of data by vehicles to further increasethe efficiency of the network. In addition, the dissemination of context-sensitive datavia the cellular network often requires the location of the vehicle, which compromisesthe privacy of the passengers. Thus, privacy-sensitive vehicles would not be able toreceive context-sensitive data unless their location privacy is considered by the datadissemination mechanisms.
1.3 research goals and contributions
The main goal of this thesis is the modeling, design, and evaluation of our concept forapproximate vehicular networks and the necessary assessment for data quality. Theseobjectives are divided into the following research goals.
Research Goal 1: Aggregation scheme for data of diverse accuracy due to sourceheterogeneity or age.
When multiple sources provide measurements with diverse sensor quality, these mea-surements will potentially be contradicting. In this case, it is pivotal for the vehicle todetermine the real value, so that the applications running on the vehicle are properly

1.3 research goals and contributions 5
supported and not negatively impacted by false or low-quality measurements. For thispurpose, we develop a model for inaccurate measurements that tracks the inaccuracyof the sensors through the aggregation [118]. We develop an aggregation scheme toproduce high-quality data, which modulates the influence of old measurements onthe aggregate. The proposed aggregation scheme considers data-specific properties -such as the quality of the data and its expected lifetime - and aims to maximize thequality of the resulting aggregates [121, 124].
Research Goal 2: Assessment of the usability of data for the data consumers.
While our aggregation scheme for data of diverse accuracy increases the overall qualityof data available, this more accurate data may or may not be useful to certain vehicles.The usability of such data for a specific data consumer (vehicle) depends on thedata’s quality and type, as well as the context and expected behavior of the specificdata consumer. To determine the usability of data for a data consumer, we proposean approach considering the future context of the vehicle and the future state ofthe measured road event [119]. We utilize statistical methods to predict both thefuture context and event state, as these quantities are generally unknown to the serverassessing the usability. To quantify the usability of data for a vehicle, we proposea mechanism to determine the specific-impact of a message for a specific vehicle,which is a pivotal meta-information for efficient dissemination of data in vehicularnetworks [122].
Research Goal 3: Approximate vehicular networking: Improving efficiencies by ex-ploiting uncertainties and trading resources.
In our vehicular network, a central server forwards the data to concerned vehiclesbased on the impact value prioritizing high-impact data. For this reason, data is typi-cally received redundantly by all vehicles in proximity. When we consider cooperationbetween vehicles, the benefit provided through cooperation is low, as only known datais received. To increase the potential of cooperation, our approach for approximatevehicular networks relies on probabilistic mechanisms to coordinate the transmissionfrom the server to the vehicles [122]. These probabilistic mechanisms reduce the uti-lized bandwidth for high-impact messages and, thus, frees communication resources,which can then be used to receive data that would not have been received previously.This concept constitutes our contribution to approximate vehicular networking, inwhich even high-impact data may be dropped to free network resources, which canthen be used more efficiently.
Besides, the utilization of a central server requires the vehicles to share their con-text with this server, which compromises the privacy of the passengers. To alleviatethis issue, we explicitly model privacy constraints in our approach for approximatevehicular networks, such that vehicles are able to protect their privacy by sharing animprecise representation of their context [123, 125].

6 introduction
In this thesis, we focus on concepts for approximate vehicular networks relying oncellular or hybrid vehicular networks, i. e., vehicular networks with more than oneavailable communication technology. For this purpose, we communicate using cen-tralized and decentralized communication technologies. However, we do not performresearch in decentralized communication protocols, as plenty of research is availablein this field [90, 103, 136, 137].
In a real-world vehicular network, vehicles might not want to cooperate or providefalse measurements to increase their own benefit or damage the network. Many workshave analyzed the impact of malicious or non-cooperative vehicles or network partic-ipants in general [91, 94, 139, 186], thus, we do provide relevant related work and donot conduct own research in this area.
In this work, incentive mechanisms for the sharing of data between vehicles arenot investigated, but possible incentives are a promising research direction to beinvestigated in future work. Especially, the pricing of data in these networks is stillan open issue, which needs to be addressed to increase the willingness of vehicles toshare their perceived data.
1.4 structure of the thesis
After this short introduction to this thesis, we describe the necessary background andprevious works regarding data dissemination and assessment in vehicular networksin Chapter 2. In Chapter 3, we describe the properties of large-scale vehicular net-works and analyze them to motivate the core contributions of this thesis. Based onthis analysis, we propose our framework for data assessment in vehicular networks inChapter 4, which is then utilized in Chapter 5 to increase the performance of the net-work by prioritizing data according to their influence to the vehicles. We then presentour Vehicle.KOM framework in Chapter 6, which is tailored for the rapid developmentof data dissemination mechanisms for vehicular networks and the basis for our eval-uation In Chapter 7, we then perform an in-depth evaluation of the influence of ourdata assessment for the data quality in vehicular networks, which is followed by theevaluation of our cooperative approximate vehicular networks. We then conclude thisthesis in Chapter 8 by providing a summary of our core contributions. Finally, weprovide an outlook on potential future work.

2BAC KG RO U N D A N D R E L AT E D WO R K
In this chapter, we provide background information about communication tech-nologies for data exchange in vehicular networks and discuss the current state-of-
the-art regarding quality-centric vehicular networks. We first provide an insight intotechnologies used for data exchange in vehicular networks in Section 2.1. After that,we investigate the different types of communication in these networks in Section 2.2and approaches to consider the quality of the network in Section 2.3. Then, we describethe current research state regarding Approximate Networking in Section 2.4. In Sec-tion 2.4, we describe state-of-the-art combining the assessment of data with vehicularnetworks by adapting the network to the quality of data. Finally, we conclude thischapter in Section 2.5.
2.1 communication technologies for vehicular data exchange
Vehicular networks are highly mobile and dynamic, posing additional challenges tothe underlying communication technology [50, 68]. While many works focus on thedissemination of data, other research has been performed in the efficient processingof data in a vehicular network [111, 112]. Data dissemination in vehicular networkshas been researched for almost three decades [161], always adapting to the currenttrends in network technology and methods. In the literature, different communicationtechnologies have been used for the construction of vehicular networks, which can bedivided into infrastructure-based and infrastructure-less communication technologies.Especially for infrastructure-less communication technologies, the high frequency ofdisconnects, and the potentially high relative speed of the vehicles is an issue [9].
2.1.1 Infrastructure-less Communication
Infrastructure-less communication technologies do not utilize any infrastructure toexchange data between two vehicles. This communication type can be used to eitherexchange data locally or to improve the efficiency of the infrastructure-based commu-nication by transmitting it to only a single vehicle, which distributes the received datalocally (offloading). In these networks, there are issues concerning the coordination ofdata transmission, the transmission range, and the mobility that can be compensatedfor. These parameters vary between the different communication technologies, whichare presented in the following.
7
8 background and related work
2.1.1.1 Wifi-based Device-to-Device Communication
Wifi-based communication in vehicular networks is commonly performed via 802.11p,which is an extension of the 802.11a standard. 802.11p is specially tailored for datatransmission in vehicular environments. While its PHY-layer is based on 802.11a,802.11p has additional adaptations to increase the transmission range, reduced chan-nel width, better support for varying temperatures [82], and an adapted DistributedCoordination Function (DCF) [9]. Based on 802.11p, different standards evolved tosupport local communication between vehicles. In the United Stated, Dedicated Short-Range Communication (DSRC) utilizes 802.11p as a basis to communicate in an un-licensed spectrum between 5.850GHz and 5.925GHz [5]. In Europe, ITS-G5 follows asimilar idea and is performed in the unlicensed 5GHz frequency band [61], which isalmost similar.
Many different works analyze the performance of 802.11p based on simulative en-vironments [43, 60, 179] and mathematical models [28, 174], which is justified by thelack of evaluation hardware. These works conclude that the delay of message transmis-sion is comparably low, especially compared to infrastructure-based communicationtechnologies like LTE [126]. These simulative works, however, confirm the drasticallydecreasing bandwidth and a drastically increasing message delay with an increasingnumber of vehicles in proximity. This bandwidth increase is, to a large degree, causedby the inefficiency of the utilized Decentralized Congestion Control (DCC) [19, 76, 79,173]. To further improve the efficiency of 802.11p, different approaches to improvethe DCC have been proposed [77, 116, 165]. However, 802.11p cannot provide anyguarantees regarding latency due to the DCC [14].
2.1.1.2 Cellular Device-to-Device Communication
Although cellular communication, including 5G, is generally considered to be aninfrastructure-based communication technology, it supports the possibility for in-band device-to-device communication [18, 169, 191]. In the literature, many worksinvestigated the potential performance increase by utilizing device-to-device commu-nication [55, 93, 141]. For vehicular networks, cellular-based device-to-device com-munication has been commonly used to increase the efficiency of multicast distri-bution of messages [23, 202], which is an important factor for the centralized dataexchange in vehicular networks. In addition, its use for the exchange of local Machine-to-Machine (M2M) communication has been considered in [145]. Since the descriptionof the standard, the automotive community investigates the possibility of utilizing thisdevice-to-device communication to exchange data locally via 5G [67]. Compared to802.11p-based data exchange, 5G-based device-to-device communication provides thepossibility for coordination of data transmission by the cell tower [18, 99]. While thisis not necessary for this type of communication, this coordination by the cell removesthe necessity for DCC and, thus, increase the performance compared to traditionaldevice-to-device communication [69].

2.1 communication technologies for vehicular data exchange 9
2.1.1.3 On the Usability of Communication Technologies in Vehicular Networks
In conclusion, both technologies have their advantages and disadvantages. For 802.11p,the transmission is free of charge due to the use of an unlicensed spectrum, but thetransmission is comparably inefficient due to the lack of a centralized coordinationunit. This lack is compensated for by cellular-based device-to-device communication.However, this communication type commonly utilizes a licensed spectrum to performdata exchange, although the coexistence on the Wifi spectrum has also been consid-ered [40, 168, 185, 195]. Especially the usage of the licensed spectrum might not be freeof charge, while the usage of the unlicensed spectrum might interfere with other com-munication technologies. Yet, the direction of vehicular communication is not entirelyclear, but will likely be determined within the next years in projects like [46].
2.1.2 Infrastructure-based Communication
In contrast to infrastructure-less communication, infrastructure-based communicationrelies on cell towers and the Internet to exchange data between vehicles. This is oftenreferred to as the Internet of Vehicles (IoV) [8, 73, 189]. In IoV, vehicles can exchangearbitrary data between each other and with a so-called Vehicular Cloud, which pro-vides all services required by fully-autonomous vehicles [73]. The data exchange withthe Vehicular Cloud is then performed via the cellular network, which enables effi-cient data transmission over large distances through the utilization of the Internet. Inthe following, we provide a short overview of the available cellular communicationtechnologies and discuss their suitability for vehicular networks.
2.1.2.1 Universal Mobile Telecommunications System
UMTS is an umbrella term for standards developed in the third generation of ra-dio technologies. It provides Frequency Division Duplex (FDD) [1] and Time DivisionDuplex (TDD) [2], and later introduced High Speed Packet Access (HSPA) to further in-crease the transmission speed. A big advantage compared to stationary Wifi-networksis the increased stability under mobility [52]. Regarding 3G networks, most worksinvestigated on the possibility of increasing the network performance through local(infrastructure-less) offloading of data [22, 30, 83]. That aside, the research focus onthird-generation radio technologies is comparably limited due to the limited availablebandwidth and the initial high costs of data transmission.
2.1.2.2 Long Term Evolution
LTE is still part of the third generation of radio technologies, although often consideredto be part of the fourth generation [3]. Starting from LTE Release 10, Long TermEvolution-Advanced (LTE-A) is available, which is the first real standard of the fourthgeneration of radio technologies. With LTE-A, even higher bandwidths are availablethan with LTE, peaking at 1Gb/s in downlink and 500Mb/s in uplink [74]. Thisbandwidth increase is achieved through carrier aggregation, in which multiple smaller

10 background and related work
frequency bandwidth bands are virtually merged into one large frequency band. Withthe introduction of LTE-A, it is first possible to also perform carrier-controlled device-to-device communication using cellular communication technology [99].
For vehicular networks, both LTE and LTE-A have been considered. There are sev-eral applications scenarios for these technologies in vehicular networks [16]. EuropeanTelecommunications Standards Institute (ETSI) has performed an analysis for the suit-ability of LTE for the dissemination of highly periodic messages [62], like CooperativeAwareness Messages (CAMs) which are described in Section 2.1.3. They show thatthe performance regarding latency of CAMs drops quite severely if the number ofmessages in proximity is high. In contrast, the Decentralized Environment Notifica-tion Messages (DENMs), also introduced in Section 2.1.3, can be transmitted via thecellular network, as the frequency of messages might be much lower [62]. In this case,the backend-server needs to filter the messages and only share an aggregated value.This leads to better scalability and has been demonstrated in [144]. However, the poten-tially high bandwidth consumption might interfere with other traffic in the network,if all data is transmitted through the backend. Thus, solutions have been proposed toreduce the utilized bandwidth through probabilistic filtering [37, 84] or cluster-basedcommunication [117, 148].
2.1.3 Vehicular Data Types
In vehicular networks, different messages have been standardized, which supportthe functionality and efficiency of the vehicles in the network. While many messagescould be named here, we focus the Cooperative Awareness Message (CAM) and theDecentralized Environment Notification Message (DENM) in the following, as thesemessages are most influential for this thesis.
2.1.3.1 Cooperative Awareness Message
Cooperative Awareness Messages (CAMs) are disseminated in a vehicular networkand provide ”information of presence, positions as well as basic status of commu-nicating ITS stations to neighbouring ITS stations that are located within a singlehop distance” [64]. This message is periodically generated and frequently exchangedbetween all vehicles in proximity to provide awareness of the presence of other ve-hicles [35]. This frequent exchange of messages increases the load to the wirelesschannel, which has been studied by several works [36, 49, 59]. Due to their periodic na-ture, these CAMs can then be used to determine the vehicle’s current neighborhood tocoordinate, for example, offloading of the cellular connection between vehicles. In thisthesis, we do consider CAMs only as periodic beacons to determine the neighborhoodof a vehicle.
2.1.3.2 Decentralized Environment Notification
The purpose of Decentralized Environment Notification Messages (DENMs) is to alertroad users of detected events and, thus, is an event-driven message [65]. Possible road

2.2 data exchange in vehicular networks 11
events are an emergency breaking and an accident, but also less severe events like roadadhesion or strong wind [65]. DENMs are generally disseminated in an area, which canbe rectangular, circular, or elliptical [63]. In this thesis, we consider the disseminationof DENM-like messages for the dissemination of road events. However, compared tothe specification provided by ETSI [65], we employ a more accurate concept for thenecessity for the transmission of a DENM to a vehicle.
2.2 data exchange in vehicular networks
In this section, we present the state-of-the-art for data-exchange in vehicular networks.While today’s vehicle networking capabilities can exchange information about freeparking spaces [95] or jams [78], future data will become much more fine-granular [89].The communication of this data via vehicular networks is commonly context-sensitivedue to the context-sensitivity of the active vehicular applications [172]. Examples forsuch applications are, amount others, collision warnings [166] and traffic conditions no-tification [182]. In the following, we first investigate infrastructure-less data exchangesupporting vehicular applications, followed by infrastructure-based data exchange.Then, we describe the possibilities for hybrid dissemination of data, which is moreefficient than relying on a single communication technology.
2.2.1 Infrastructure-less Data Exchange
Vehicular Ad-hoc Networks (VANETs) are a special type of Mobile Ad-hoc Networks(MANETs), in which vehicles form a self-organizing and decentrally controlled net-work [10, 180]. This general idea is similar to Peer-to-Peer (P2P) networks, in whichnodes decentrally coordinate themselves [163]. In VANETs, the mobility of nodes ismuch higher than in MANETs, which increases the frequency of topology changes [10,103] and decreases the lifetime of routing paths drastically [20]. Via these networks,different applications are possible, like alert generations, vehicle maintenance, com-municate services, and security services [167]. We divide the available VANET routingprotocols into four categories, which are topology-based, broadcast, geographic, andinformation-centric protocols.
2.2.1.1 Topology-based Protocols
Topology-based protocols generally suffer from frequent changes in the network topol-ogy [129]. There are two types of topology-based protocols, which are proactive andreactive protocols. Proactive data routing approaches maintain the network topologyeven if no payload is transmitted by periodically probing the network. Due to the muchhigher mobility and the necessary overhead for route maintenance, proactive protocolsdesigned for MANETs [42, 72, 142, 157] do not perform well in the vehicular setting.Thus, special proactive routing approaches are tailored for VANETs, which focus onthe compensation for topology changes [132, 171]. However, even these protocols suf-fer from the high frequency of topological changes and induce a lot of control traffic.

12 background and related work
Compared to that, reactive routing is slower, as the route finding is only performedafter a vehicle wants to transmit data [57]. Different works proposed adaptations tocommon MANET protocols to adapt them for the usage in vehicular networks [6, 53].However, the management overhead remains an issue for these protocols.
2.2.1.2 Broadcast Protocols
For certain data entries of high importance, a broadcast of data in the network isrequired, i. e., data is disseminated to all vehicles in the network until the lifetime isexpired [21, 38]. For these protocols, the high number of rebroadcasts, especially ofvehicles in proximity, is an issue and reduces the available bandwidth. This problemis known as the broadcast storm problem, which is addressed by several works inthe literature [113, 159, 170, 203, 204]. These approaches can be utilized well for dataof high-importance, but generally might lead to channel congestion if the number ofexchanged messages increases.
2.2.1.3 Geographic Protocols
Geographic routing protocols aim at routing data to a certain location [57]. For thispurpose, many protocols have been proposed that deliver data to a certain locationusing the store-carry-forward paradigm [54, 109, 184, 187, 199]. In general, theseapproaches consider the road topology and the movement of vehicles to select vehiclesthat are most suitable as data carriers. However, as these approaches rely only onVANETs, the data dissemination is very slow, which is not suitable for all use cases.
2.2.1.4 Information-Centric Protocols
While the geographic protocols already introduce context to the dissemination ofmessages, this context might not be efficient in capturing the required data of thevehicles. For this purpose, information-centric approaches have been investigated [15].The information-centric protocols enable the request of certain data entries usinginformation-specific properties, which is considered to be more accurate than IP-basednetworking. These approaches partially face similar issues compared to broadcastprotocols, as the requests for data are often broadcasted in the network. For the efficientdissemination of data, different approaches have been designed [13, 177, 178, 193],which drastically outperform IP-based networks. These protocols can capture theinterest of vehicles well, but still introduce a potentially high delay to the messagedelivery if data is to be transmitted over multiple hops in the network.
2.2.2 Cloud-Supported Provisioning of Data
While infrastructure-less communication is well suited for the dissemination of localdata, it performs poorly if data shall be disseminated to distant areas. In this case,infrastructure-based communication is well suited, which can transmit data indepen-dent of the distance between the sender and the receiver, but relies on cell coverage.

2.2 data exchange in vehicular networks 13
The data shared between them is often information-centric [15], i. e., only vehiclesquery individual pieces of information instead of information from a specific host.
2.2.2.1 Geocast Protocols
Geocast is a location-dependent type of multicast, in which vehicles in a certain areareceive data. It is frequently used in practice as a simple possibility to consider thelocation of nodes in the dissemination and reduce the load on the cellular network.However, most geocast protocols have been developed for infrastructure-less com-munication, as the developed approaches consider additional information-specificproperties like age and type. These protocols are presented in the following.
2.2.2.2 Information-Centric Protocols
For cloud-based communication, the Publish/Subscribe (Pub/Sub) paradigm is wellsuited to support vehicular communication [66, 128]. In the Pub/Sub paradigm, ve-hicles express their interest in data with certain properties using subscriptions. Thesesubscriptions are shared with a so-called broker, which is responsible for the dissem-ination of messages. When a vehicle wants to share a DENM, it creates a notification
containing the available data and sends it to the broker. The broker then forwards thereceived notification to the vehicles with matching subscriptions.
Several approaches have been developed, which consider the location, age, and typeof data for the matching of subscriptions to notifications [45, 56]. In these approaches,the broker has only forwarding capabilities, which is not necessarily true for all cloud-based solutions. Some approaches consider a central server, which manages the dataand can perform aggregation and filtering to reduce the overall network traffic [31,34]. Through the centralized management of the cloud, these approaches reduce thenetwork traffic compared to pure forwarding-based brokers and increase the qualityof the provided data. For an efficient usage of cloud-based approaches, the dataconsumption needs to be reduced, which we investigate in the next section.
2.2.3 Offloading in Heterogeneous Networks
When multiple communication technologies are available, there is the possibility touse the concept of transitions [12] to adapt the communication technology or dis-semination strategy to the current environment. One possible dissemination strategyis offloading, which can be used to increase the efficiency of the utilized cellularnetwork resource [147, 153]. There is the possibility to perform offloading with andwithout the additional infrastructure [147]. While several works have investigated onthe usage of so-called Road Side Units (RSUs) (mobile access points) [27, 41, 44, 114,155, 156] and achieved good results regarding the efficiency of the offloading, thedeployment of these RSUs is still unclear. Thus, we focus on the approaches withoutadditional infrastructure in the following. While some approaches use opportunisticnetworks to disseminate data locally [102], the majority create clusters, i. e., groupsof vehicles, which perform their transmission in a coordinated manner. That is, one

14 background and related work
or more vehicles are elected as a so-called cluster head, which is responsible for thetransmission and reception of data via the cellular network. In the literature, clusteringapproaches for MANETs [80, 106, 151] have been proposed. Similarly to the differencebetween routing approaches for MANETs and VANETs, the clustering approaches forMANETs are not directly applicable to VANETs due to the lack of mobility support.For VANET clustering approaches, there are three main directions for the election ofthe cluster head: (i) reducing the number of disconnects of cluster members from thecluster head [26, 96, 130, 196], (ii) increasing the connectivity of the cluster by select-ing the best-connected vehicle [200], and (iii) a combination of the two [175, 201]. Inaddition to clustering approaches that actively transmit control information, there arealso hybrid approaches that are passively coordinating the transmission of data [98,117]. While VANET clustering approaches generally reduce the number of topologychanges, these approaches still have issues with changes in the network topology, i. e.,if a member of a cluster detaches from its cluster head. In this case, the member ofthe cluster is without connection until a reclustering is initiated [47]. This happensafter a timeout to prevent too frequent reclustering caused by packet loss on the localcommunication channel. To reduce the impact of disconnects to the members of thecluster, several approaches have been introduced [108, 202].
2.3 network quality assessment in distributed networks
In addition to the networking aspects, the assessment of data quality is a pivotalaspect of this thesis, which later influences the transmission of data between vehicles.Data quality is a pivotal aspect and has commonly been referred to in the literature,often without defining good or bad data quality like in [17, 75]. For this purpose, wedescribe previous works aiming at defining data quality for different scenarios. Westart with data-independent network quality parameters in Section 2.3.1, followed bythe data-dependent network quality parameters in Section 2.3.2.
2.3.1 Quality of Service Assessment
Regarding context-independent network quality assessment, many works have fo-cused on increasing the QoS, which they generally connect to the share of transmitteddata [104, 107, 135, 162, 188]. Examples for considered QoS parameters are the packetloss probability and the average packet delay, which can estimate the behavior of anapplication to the data or lack of data. Thus, these works consider the influence of datatransmission and the age of data but do not investigate the effects of outdated data.
2.3.2 Data-Quality Assessment
While many works do not focus on the assessment of data quality and utilize lessprecise definitions [138], the definition of data-dependent network quality parameterslike the accuracy, relevance, and freshness of data has become a hot topic in recentliterature [71, 134, 140, 190, 198]. These approaches rate the quality of data consid-

2.4 approximate networks 15
ering the reputation of the providing entity, which depends on the accuracy of theprovided data. These works, however, mainly focus on the assessment of the measure-ment itself, without considering the usability of a piece of data for the underlyingapplication, which is reflected in metrics like the relevance and freshness. To assessthe usability of data, the usage of machine learning has been proposed [75]. However,these approaches have flaws due to the unpredictability of the output of most machinelearning approaches. In contrast, type-based prioritization for resource-constraint en-vironments has been used to increase network performance [105]. In contrast, otherworks used statistical methods to investigate the planned trajectories of the vehiclesto assess the requirement of sharing data [11, 51]. In addition to that, the influence ofage on data on applications has also been considered [92, 197]. However, these worksgenerally assume fixed restrictions to the age of data, while the restrictions generallyvary depending on the context of the vehicle and the application.
2.4 approximate networks
In a typical (digital) communications environment, the received symbol in the pres-ence of noise is a good approximation of the transmitted symbol, as it will be eitherthe same symbol as the transmitted one or a neighboring signal/symbol to the truetransmitted one in the signal constellation. Such a neighboring symbol differs fromthe transmitted symbol only in one or more (if the noise level is higher) of the LeastSignificant Bits (LSBs) it represents [160]. This is the case because signals next to thetransmitted one in the signal constellation correspond to symbols that differ fromthe original in the LSBs; the top Most Significant Bits (MSBs) would be the last to beaffected as the noise level increases. One can say that in general (digital) communica-tions is Approximate Communications in the sense that typically errors occur and, thus,the received signal/symbol is an approximation of the transmitted one. By increasingthe available resources, the approximation will be improving, and beyond a thresh-old, the approximation will be practically always perfect (i.e., no approximation). As,in general, the better the approximation, the higher the QoS provided by the com-munication system, one can trade off resources for QoS, approximation, or accuracy.The latter is in line with the recently coined concept of Approximate Computing, un-der which computational accuracy can be traded off for (energy/processor/memory)resources [25].
One can extend the aforementioned concepts to a networking environment anddefine similarly as Approximate Networking to be a networking environment in whichthe availability or quality of data is traded off for networking resources [32, 146].These concepts are generally applied in resource-constraint environments, in whichit is undesired or infeasible to increase network performance by adding additionalcommunication resources. According to Betzel [32], different methods like compres-sion [48], relaxed synchronization [127], and prediction are used to relieve the loadon the network in such approximate networks. For Approximate Vehicular Networks,all of these methods are possible, but their applicability depends strongly on the con-sidered set of vehicular applications. Different works have proposed the utilization

16 background and related work
of loss-based compression to increase the efficiency of vehicular networks [176, 194].Similarly, relaxed synchronization has already been considered for vehicular networksfor data that is not immediately required by the vehicles [100, 101]. Prediction alsohas been considered in vehicular networks [39]. However, a concept for ApproximateNetworking in vehicular networks has not yet been considered fully, which is partiallyjustified by the generally assumed high requirements to data quality in these networks.However, these requirements do not always hold, and the limited predictability of thewireless communication link prevents a deterministic behavior of vehicular networks.Thus, it is beneficial to consider this uncertainty in the applications, such that they candeal with this uncertainty.
2.5 summary and identified research gap
In this work, we investigate the concept of Approximate Vehicular Networks and thepossible improvement compared to state-of-the-art methods. Approximate VehicularNetworks face additional challenges due to the high safety requirements of vehicularapplications [97]. In this thesis, we investigate this potential conflict and developrobust and efficient communication mechanisms to enable the usage of ApproximateVehicular Networks. For this purpose, we investigate the quality of data and methodsfor efficient dissemination of these data, which is considered to be pivotal [16]. The dataquality is then used in the form of an impact score to prioritize high-impact data. Thisprioritization increases the benefit of the network provided to each vehicle, but reducesthe benefit of this cooperation between vehicles, as all vehicles in proximity receive thesame data. While approaches in the literature commonly form clusters to coordinatethe transmission and prevent this redundant transmission of data [26, 130, 196], thefrequent topology changes may lead to a loss of data. This loss might also affect high-impact data, which might severely decrease the performance of an individual vehicle.To utilize cooperation in this network, we propose our concept Approximate VehicularNetworks, which adapts its properties to the impact of the transmitted data. Forhigh-impact data, the network focuses on a highly robust and close-to-deterministictransmission, such that the negative influence of a loss of this data is prevented. For low-impact data entries, the network utilizes the bandwidth more efficiently, i. e., reducesthe number of receiving vehicles. This adaptive behavior of the network increasesthe benefit through cooperation, while simultaneously being very robust to topologychanges and messages loss for high-impact messages. With these contributions, weallow for more efficient and robust vehicular networks, that drastically outperformdeterministic networks regarding the efficiency of communication.

3L A RG E - S C A L E V E H I C U L A R CO M M U N I C AT I O N N E T WO R K S
In this chapter, we analyze the properties of a large-scale vehicular communicationnetwork and outline the necessity for intelligent mechanisms for data aggregation
and dissemination as proposed later in this thesis. In our description of issues of large-scale vehicular communication networks Section 3.1. First, we describe the componentsparticipating in this network, their interaction, and the influence of the environment.Based on the description of the issues of these networks, we describe the necessity forour developed approaches regarding approximate vehicular networking in Section 3.2.In approximate networking, reducing the data provided to a consumer, who does notneed them, allows us to enhance the data availability/quality to other consumers whoneed them, without necessarily consuming more resources. This is achieved throughDiverse Prioritization and Treatment (DPT), which filters unnecessary data to utilizethe freed bandwidth for the transmission of necessary data.
3.1 issues of large-scale vehicular communication networks
A vehicle receives messages containing the local perception of distant vehicles toimprove safety and comfort of its passengers. Based on these remote perceptions, avehicle can react to traffic anomalies, like traffic jams early by, for example, detouringor decelerating. This message exchange is influenced by several factors, such as: (i) theenvironment, (ii) the vehicles in the network, (iii) entities supporting the communi-cation between vehicles, and (iv) the available communication infrastructure. In thefollowing, we analyze each of these factors and their influence on the network.
3.1.1 Influence of the Vehicular Environment
The vehicular environment is captured through a graph-based representation of theroad network, in which each road can be modified through the appearance of roadevents, like accidents, bumps, and traffic jams. The local environment of each vehicleis measured by the vehicular sensors, which update the model of the environmentstored in each vehicle. If the environment matches the model stored in the vehicle,i. e., there are no anomalies, generally no message exchange with other vehicles isnecessary. If the stored model of the environment differs from the local perception ofthe vehicle, the vehicle shares messages with other (concerned) vehicles stating thatthe environment has changed. We call these changes of the environment road events.The receiving vehicles then update their model of the environment based on thismessage. While it is possible to always exchange the full perception of each vehicle,this is neither necessary nor reasonable given the limitations in bandwidth. Thus,the environment has a major influence on the vehicular network, as it influences the
17

18 large-scale vehicular communication networks
number of messages generated. Depending on the frequency and type of road events,different reactions may be triggered by the vehicles, e. g., change of planned path ordriving behavior.
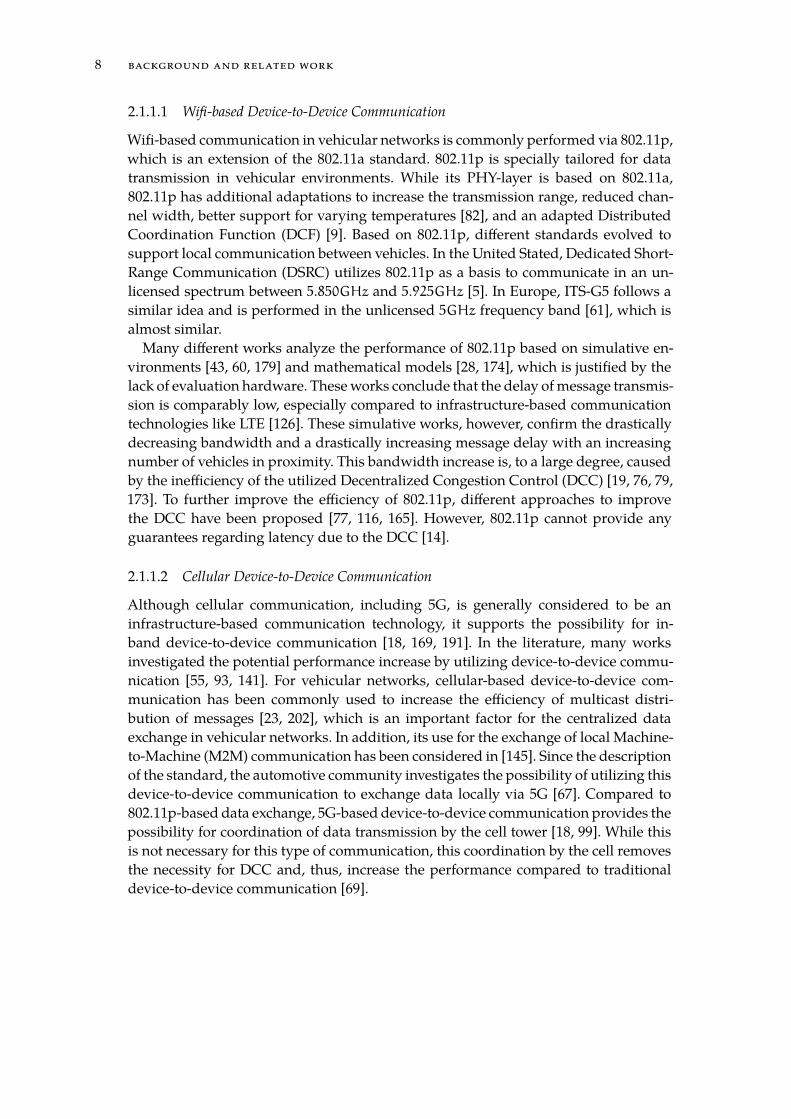
A road event is a change of the environment that will potentially affect the drivingperformance of the vehicles, i. e., by reducing either traffic safety or driver comfort.Examples of road events are bumps, traffic jams, and traffic signs. A road event is char-acterized by several attributes, such as the date of occurrence, the impacted location,a lifetime estimate, a value specifying or providing some key information about theevent and others as needed. It is evident that not all of these attributes are possible tobe determined by the vehicles themselves, but some of them may be inferred from his-toric knowledge or through aggregation. For instance, the appearance date of a roadevent can be estimated using the first observation of the event by a vehicle. Similarly,the lifetime can only be estimated using the lifetime of past events of similar value/-type. The value of an event can either be continuous (road temperature, traffic speed)or discrete (glace, traffic jam). Continuous variables in our model are approximated bydiscrete ones by dividing the value range of a continuous variable into a finite numberof buckets. The resulting approximation error depends on the number of buckets anddiminishes to zero for a very high numbers of buckets.
To exchange a road event, it is packed into a message, containing all attributesassociated with the specific event. The resulting message is clearly context-sensitive,as it is only relevant in a certain (limited) area around the measurement location. Thesize of this area depends on multiple factors and may also depend on each individualvehicle: Depending on the active applications of this vehicle, the relevance of a messageto the specific vehicle might vary. As an example, the size of the area that is relevant tovehicular path-planning applications can be fairly large, depending on the path anddetour options available.
3.1.2 Influence of the Vehicles
The aforementioned road events can be detected and measured by vehicles in theproximity of the event. As the available resources and sensors of a vehicle can befairly diverse, it is important that the heterogeneity of the vehicles be taken intoconsideration. This heterogeneity applies to multiple components of the vehicle, likesensor and networking and computational resources.
The sensor heterogeneity of vehicles has two different dimensions, (i) the availabilityof sensors, and (ii) the accuracy of the equipped sensors. According to ISO-5725, theaccuracy of a measurement method is described through the terms "trueness" and"precision". "’Trueness’ refers to the closeness [...] between the arithmetic mean of alarge number of test results and the true or accepted reference value. ’Precision’ refersto the closeness [...] between test results." [85] If a vehicular onboard sensor producesmeasurements of low trueness, the sensor can be considered to be broken. However,the sensors might have low precision, i. e., produce measurements with a high standarddeviation. For instance, the accuracy of a measurement of a certain road event carriedout by diverse sensor technologies can be fairly different. A common example is

3.1 issues of large-scale vehicular communication networks 19
the comparison between a lidar and a camera. Although these two sensors aim atcapturing the same type of road events, a lidar generally achieves higher accuracy, asit is less dependent on the weather conditions and the daylight. Similarly, the accuracyof sensors of the same technology may differ between two vehicles, as the quality ofthe built-in sensor equipment may be quite different for various reasons (e.g., type ofvehicle or brand dependent). Thus, the different accuracy of shared measurements isa pivotal aspect and needs to be considered.
Similarly to the sensor equipment, the available network and computational re-sources may vary between different vehicles. As described in Section 2.1, there aredifferent communication technologies available, like Long Term Evolution (LTE) and802.11p. In the future, this heterogeneity might increase with the introduction of 5G tovehicular networks. While LTE and Long Term Evolution-Advanced (LTE-A) are thevery commonly used for cellular communication in today’s vehicular network [3, 4],there is still a lot of discussion about Vehicle to Vehicle (V2V) communication, whichcan either be performed via 802.11p or the cellular-based LTE-Device-to-Device (LTE-D2D)/5G. While it cannot be predicted which technology will become standard, therewill most likely be one uniform technology for local communication and one uniformtechnology for cellular communication available, which provides additional possibil-ities for efficient message dissemination in future vehicular networks. In contrast, thecomputational resources available to the vehicles might vary greatly, especially com-paring future automated vehicles with conventional vehicles. Thus, the processingof data should generally be computationally lightweight, as computational expensiveoperations need to be performed either at a central server (to relief the vehicles) or onthe vehicles with sufficient computation resources. This poses additional challengesto our vehicular network, as the selection of suitable processing components dependson multiple factors, like the load on the individual components and time-criticality ofthe processed data. In this thesis, we assume that the available computation resourcesare sufficient to perform the validation of data at the vehicles, but also provide thepossibility to shift the validation to the server. Thus, we focus on the heterogeneity ofsensors and communication technologies.
3.1.3 Influence of Supporting Entities
The heterogeneity regarding communication technology is a pivotal aspect of vehicularnetworks, as the available technologies compensate for the weaknesses of each other.However, especially the communication via the cellular network relies on additionalinfrastructure like cell towers, and a central server to manage the transmission process.While we do not investigate closer on the role of the cell tower, we describe the influenceof the server and other support entities for vehicular networks in the following.
A central server can have different roles in the network: it can either focus purelyon forwarding or provide additional services like persistent storage and processing.In the first case, the server is used as a Publish/Subscribe (Pub/Sub) broker, whichdisseminates messages to vehicles based on previously performed subscriptions andthe vehicles’ context. Thus, it only needs to monitor the context of the vehicles and

20 large-scale vehicular communication networks
forward incoming messages without any additional processing. The resource require-ments of such a broker are much lower than the resource requirements of a serverwith storage and processing capabilities, but force the vehicles to manage the data in adecentralized manner after the reception. In the second case, the server has additionalstorage and processing capabilities, which it uses to manage data in a centralizedmanner. As an example, the server could only provide already validated messages tothe vehicles to reduce the processing required by them. Thus, the vehicles rely muchmore on this server compared to the first case, but the quality of the shared messagesis generally superior. While both approaches have their advantages and drawbacks,we generally assume a resource-less broker for the dissemination of messages to thevehicles, such that the costs for the server and its maintenance are reduced. However,the server needs to coordinate the dissemination of data to concerned vehicles.
For this purpose, the vehicles actively update their current location at the server toreceive the context-sensitive messages, such that the server can provide the relevantdata directly to them. However, other supporting entities have also been proposedin the literature, the so-called Road Side Units (RSUs). These RSUs are basically Wifihotspots at the side of the road, which are capable of storing and (potentially) process-ing data. Due to their fixed location and short range, they can provide context-sensitivedata and notify all vehicles in their proximity. Thus, the server would not necessarilyneed to monitor the location of the vehicles, but could also provide the data to theRSUs only. While the concept of RSUs has been frequently used in the literature, itfaces some practical issues due to the potentially high deployment and maintenancecosts, due to its required dense deployment to achieve a good network coverage andperformance. For that reason, we will not consider RSUs in this thesis and focus onthe communication of road properties between vehicles either via direct V2V commu-nication or via the cellular network and a central server.
3.1.4 Influence of Communication
Communication, both vehicle-to-vehicle and vehicle-to-server, heavily influences thedata available to the vehicles and, thus, the performance of the vehicular commu-nication network. An important aspect of vehicular communication is its content-centrality [15], i. e., traditional host-based networks are generally considered ineffi-cient in this context. For this purpose, we rely on the Pub/Sub paradigm with context-awareness and transitions, as introduced in Bypass.KOM [149], to distributed messagesin the network. As LTE is a quasi-standard for mobile communication, we assume LTEas the underlying communication technology. The usage of LTE induces costs for thevehicle manufacturer or the owner. Thus, LTE should be used cautiously to keep thesecosts low and provide bandwidth to other applications. In fully automated vehicles,bandwidth consuming applications - especially video-streaming and gaming - shouldnot be influenced by the exchange of road events. While this may change with theintroduction of 5G, the general limitations (limited bandwidth, energy consumption,costs) will still be present, although at other levels of magnitude. However, the pasthas shown that the available resources are generally used to extend existing services

3.1 issues of large-scale vehicular communication networks 21
or accommodate new ones, leading soon to a new resource shortage; that could be thecase, for instance, by exchanging fine-granular sensor data between vehicles.
(a) Area-baseddissemination.
(b) Geohash-baseddissemination.
(c) Road-baseddissemination.
Figure 1: Various data dissemination schemes.
For context-aware Pub/Sub, different methods are available to incorporate context-awareness into the system. In this thesis, we consider the location and time as possibleinfluence factors to the dissemination of data. Possible schemes for context-aware datadissemination are depicted by Figure 1. They differ in the accurateness of their filteringand their computational overhead. The area-based approach is a commonly used andeasy-to-implement approach, in which each vehicle shares its location with the server,and the server provides data that are inside a certain (data-dependent) area around thevehicle’s location. Thus, the filtering is computationally cheap, but in certain cases sucha filtering could be fairly inaccurate inducing substantial overhead by transmitting datato non-concerned vehicles. An example of such behavior can appear in a highway thatis close to a small village. Information about a traffic jam in the village will mostlikely not be of interest to the vehicles in the highway, as they will most likely neverencounter the traffic jam. The same holds for the Geohash-based approach, which relieson the Geohash-mechanism [133] to provide data to the vehicles, and is a special caseof the area-based approach. A Geohash is a sequence of characters with a maximum of11 characters, which can express each location on earth with a precision of up to 7.4cm.The region associated with a Geohash of length n contains the regions associated withall Geohashes of length n+ 1, that start with that Geohash of length n. The advantageof Geohash-based compared to traditional area-based filtering is its natural supportof different transmission ranges through Geohash’s hierarchical structure. Thus, thefiltering is even less complex and, thus, faster compared to area-based filtering.
Besides these universal area-based filter mechanisms, there are also filtering meth-ods available which are tailored for vehicular networks: These approaches use road-
based dissemination and are generally more computationally expensive, but also moreaccurate, i. e., the amount of unnecessarily transferred data is reduced. Under thisapproach, data can be provided more accurately to certain road segments, which aregenerally around 200m of size. This dissemination scheme utilizes a natural propertyof the road network, i. e., the partially predefined movement of the vehicles on theroads. That is, the length of the shortest path towards the data location can be utilizedto determine if data should be shared. However, the road-based approach still does not

22 large-scale vehicular communication networks
consider the relevance of a road event in the dissemination. This causes unnecessarytransmissions to uninterested vehicles like in our previously mentioned example withthe village near the highway.
In this section, we described the properties and issues of large-scale vehicular net-works: the high heterogeneity of the vehicles, especially regarding their sensing ca-pabilities, and the dissemination of messages in the network towards ensuring thatvehicles receive all relevant data and do not receive irrelevant data. In the next section,we analyze the properties of these networks and motivate our work and contributionto approximate vehicular networks.
3.2 approaches for large-scale vehicular networks
In this section, we provide a detailed insight into the consequences of the issues oflarge-scale vehicular communication networks described previously. For that purpose,we first discuss the influences of road properties and their measurements inaccuracy tothe data dissemination in the network. Based on the insights gained there, we discussthe issue of context-sensitive data dissemination and the link to data quality. Finally,we conclude this section with a motivation of the necessity of approximate vehicularnetworks to efficiently exchange data between future connected vehicles.
3.2.1 Aggregation of Measurements with Diverse Quality
Vehicles can measure different types of road events, which have a different influenceon the future behavior of the vehicles and, consequently, are of different importancein the data dissemination. The measurements of these road events are influenced bymultiple factors, like weather, measurement conditions, and sensor quality. While themeasurement conditions are generally similar for all vehicles in the area, the quality ofthe equipped sensors, as well as their availability, might vary heavily among vehicles.Thus, the measurements that are shared with other vehicles are of diverse quality,which complicates the interpretation of the provided data. In most situations, theprovided data may even be contradicting regarding the current state of the road.
This contradiction can either be handled at the application layer or directly in thenetwork: data from different participants (vehicles, servers) of the network may beaggregated to obtain the true state of the road. To perform this aggregation efficientlyand correctly, it is pivotal that meta-information, like sensor quality and the associatedaccuracy of the provided data, be available to the aggregating unit, such that the datacan be weighted accordingly. An example is the availability of two contradicting dataentries, one with very high accuracy and the other with very low accuracy. It isintuitive that the high accuracy data entry generally should have a higher influence onthe final aggregation result, but this entry might be very old and, thus, the real stateof the road might have changed in the meantime. To resolve this conflict effectively,a data-centric approach is necessary, to aggregate the data entries considering theirindividual (event-dependent and sensor-dependent) properties.

3.2 approaches for large-scale vehicular networks 23
(a) p > 100%. (b) p > 10% (c) p > 1% (d) p > 0.1%
Figure 2: Road segments (marked yellow) for which at least p of the vehicles, driving on it,will encounter the event (marked with red cross).
3.2.2 Accurate Modeling of Vehicle’s Interest
Figure 2 displays cases of different percentages of vehicles encounter a specific event(marked with a red cross). The number of yellow road segment depends on theparameter p, which indicates if a segment should be colored yellow or purple. Asegment is colored yellow if at least p of the vehicles, that are located at the specificsegment when the event spawns, will encounter the event while it is active. If lessthan p vehicles located at the specific segment encounter the event, the color of thesegment is purple.
When we analyze the number of yellow segments in the road network, it is evidentthat the number of yellow segments increases with decreasing p. In addition, we canobserve that segments that are part of main roads or highways become yellow even forlarge p, while small roads are only considered if p is very low or they are in proximityto the event. If we assume that an event is only relevant for a vehicle if the event isencountered by the vehicle, we can use this visualization to determine where dataabout the event might be required. To this end, we can utilize this visualization todetermine the vehicles interested in the reception of messages.
In general, vehicles on a yellow segment are more likely to be interested in the eventthan vehicles on the purple edges. Thus, only vehicles on yellow edges should beconsidered for receiving the event. However, as mentioned previously, the number ofyellow segments, and thus the expected bandwidth used for transmitting the event toall vehicles on yellow edges, depends on the parameter p. In Figure 2a, p = 100%, i. e.,the event is only transmitted to vehicles who certainly require the event, which pre-vents unnecessary transmission of the event. This reduces the necessary bandwidthdrastically, but negatively influences the dissemination of the event to interested vehi-cles which are distant from the event. That is, as the necessity for a transmission of theevent to a distant vehicle cannot be assured. Thus, the number of vehicles that receivethe event and are encountering it is comparably low. In contrast, Figure 2d almostensures that every vehicle, that might be encountering the event, receives it. As thenumber of yellow segments in this scenario is very high, the bandwidth consumptionis likewise, i. e., the event is transmitted to many vehicles Thus, most of the receivingvehicles are unlikely to encounter the event, which increases the amount of unnec-

24 large-scale vehicular communication networks
essarily used bandwidth. Figure 2b and Figure 2c achieve a certain balance betweenthese two extreme cases.
Especially when we analyze the dissemination for Figure 2b and Figure 2c, it isevident that the assumption of area-based approaches does not accurately capture thedata requirements of the vehicles. While these approaches assume that the distanceof a vehicle to the event estimates the interest of a vehicle, we can clearly observethat the distance to an event is not necessarily expressive to estimate the interest. Asmentioned previously, the structure of the road network, especially regarding mainroads and highways, has a very high influence on the possibility of a vehicle beinginterest in a certain event. Due to the wrong estimation the vehicles’ interest by area-based approaches, unnecessary bandwidth is consumed, which could be used to notifyvehicles that are more likely to encounter the event. Thus, efficient dissemination ofmessages requires an accurate model for the relevance of a message to a vehicle, whichconsiders the road topology and event-specific properties like the lifetime.
3.2.3 Necessity for Approximate Vehicular Networks
The more accurate assessment of the relevance of an event for a specific vehicle alreadyconstitutes a first step in the direction of approximate vehicular networks, in whichthe performance of the network is increased without increasing the available com-munication resources. However, in a general network, not only the total bandwidthis restricted, but in which also different types of events are disseminated. The avail-able bandwidth needs to be shared between these event types, such that the networkperformance is maximized. For this purpose, not only the relevance of the event andthe accuracy of the measurement are important, but further the impact that a certainpiece of data has on the vehicular network. As an example, events of high impact, likeaccidents, should generally have more bandwidth available than events of low impact,like small changes in the traffic flow.
When an event is disseminated, it generally cannot decrease the performance of thevehicle, i. e., a transmission can never decrease the performance of the vehicle, unlessother (more important) events cannot be transmitted due to that transmission. In com-bination with the limited bandwidth a vehicle can utilize, this opens very interestingpossibilities: Vehicles may filter events with low impact to receive high-impact data,i. e., the vehicle may prioritize high-impact events. While this approach is commonfor networks without cooperation between vehicles, the prioritization of high-impactevents decreases the potential of cooperation. That is, as all vehicles, that could ex-change messages via Wifi, will generally receive the same events redundantly, i. e., theperformance gain of cooperation would be low. Additionally, coordinated mechanismsfor the cooperative reception of messages suffer from the frequent topology changesin a vehicular network.
For this purpose, we employ the concept of approximate vehicular networks, inwhich network and communication resources are traded with data availability andquality. Specifically, we focus on approximate vehicular networks that rely on proba-bilistic mechanisms to modulate the redundancy to improve the performance of the

3.2 approaches for large-scale vehicular networks 25
network. That is, we decrease the redundancy for high-impact events, with the po-tential consequence of missing some events, to free bandwidth for the reception ofpreviously not received events. This seems to be counter-intuitive for vehicular net-works, as events might have a high impact to the receiving vehicle. However, ourconcept for approximate vehicular network performs deterministically for very high-impact events, while becoming increasingly probabilistic with decreasing impact ofan event. This increases the flexibility and bandwidth efficiency of vehicular networksdrastically, as the removed determinism of the network offers new possibilities to thedata processing and transmission in this network.


4DATA Q UA L I T Y A S S E S S M E N T FO R V E H I C U L A R N E T WO R K S
Based on our findings in the state-of-the-art in Chapter 2, in this chapter we analyzethe vehicle-generated data shared in a vehicular network and outline possible
influence factors to data quality and impact. We propose a holistic approach to deter-mine the impact of data in a vehicular network, considering the participating entitiesin the generation and dissemination of data: (i) the measuring sensors, (ii) the contextof the receiving vehicle, and (iii) the data itself. This impact is an abstract measure ofthe increase (or decrease) in performance of the vehicle’s behavior, like an increase/de-crease in travel time, fuel consumption, or driver comfort. It is an important foundationfor our proposed approach towards approximate vehicular networks in Chapter 5, asit provides an assessment of the influence of data, which is utilized to adapt theproposed probabilistic mechanisms in order to maximize efficiency.
In the following, we start with a description of the scenario in Section 4.1. In Sec-tion 4.2, we describe our innovative aggregation scheme for improving the quality ofdata from different sources (vehicles) considering data-specific properties to reducethe amount of false data. In Section 4.3, we propose a mechanism to determine therelevance of a piece of data to a specific vehicle. Our approach predicts the vehicle’sfuture context and the state of the road event contained in the data to determine thenecessity to transfer a particular piece of data to a particular vehicle. We then proposeour holistic approach for assessing the specific-impact of a piece of data for a vehicle,which combines our findings of Section 4.2 and Section 4.3 to determine the specific-impact for a vehicle in Section 4.4. The specific-impact is then used in Chapter 5 toimprove the efficiency of the vehicular network.
4.1 scenario description
Figure 3 displays the considered scenario for the data assessment in vehicular networks.In this scenario, vehicles on the right (vehicles 1 and 2), which are in the proximity of anevent, measure it and generate a message ~d containing this measurement ~m. Due to thepotential inaccuracy of the measuring sensors, the measurements generated by thesevehicles might be contradicting. The generated measurements are then shared withthe vehicles on the left (vehicles 3 and 4), which are distant from the event. However,only vehicle 3 needs to receive the measurements, as vehicle 4 takes an exit and willnever encounter the event. Thus, the goal of this chapter is to determine decide on thecorrect aggregate for vehicle 3 based on possibly contradicting measurements, and todetermine which vehicles need to be notified with the measurements of the event.
For the aggregation, not only the measurement ~m itself, but also a description of thedata type w is provided. Additionally, the sender includes meta-information aboutthe measurement conditions in the provided message as shown in Equation 1, like the
27

28 data quality assessment for vehicular networks
1234
Figure 3: Visualization of the scenario for data assessment in vehicular networks.
measurement location ~l and time t to increase the usability of data for the receivingvehicle.
~d =
~m
w
t
~l
(1)
Based on these data, the receiving vehicle aims at determining the true value ofthe underlying variable, which is only described by the received measurements. Forthis purpose, the vehicle aggregates the received data. In Section 4.2, we investigatethe efficient handling of possibly inaccurate sensor data and propose an aggregationscheme for sensor data to reduce the number of false aggregates in the vehicularnetwork. In previous work, we have analyzed the necessity for a correct aggregatebefore encountering the event, like in the case of vehicular path-planning [120].
It should be noted that the amount of improvement of the vehicle’s decision-makingis affected by the limited network resources. For this purpose, it is pivotal to assessthe relevance of an event for a vehicle (see Section 4.3) before consuming networkresources for transmitting it to the vehicle. An event is considered relevant to a vehicleif it influences the decision-making of that vehicle. In this work, we assume that thedecision-making is influenced only if the vehicle is in the proximity of the event whilethe event is active.
To decide on which vehicles to notify, the relevance of an event to a specific vehicleneeds to be determined. This relevance accounts for the uncertainty regarding thefuture path of the vehicle and the lifetime of the event. Although the paths mightbe known to the vehicle itself, disclosing themto the server is a severe intrusion intothe passengers’ privacy. Additionally, the lifetime of an event is considered to beunpredictable. Thus, statistical methods are required to predict the relevance based

4.2 sensor-specific influence on data impact 29
on the probability that the vehicle passes by the event location and the event is active.To determine this probability, the future path of a vehicle and the lifetime of the eventwill need to be predicted first.
Based on the quality of the measurement and the relevance of the event to the re-ceiving vehicle, we design a model for the impact of a measurement on a vehicle inSection 4.4. This impact will be critical for the effective handling of certain measure-ment data, as it will determine the usefulness of such data to a vehicle by balancingproperly the quality and relevance of such data.
4.2 sensor-specific influence on data impact
To assess the impact of a piece of data (referred to also as message), the quality ofthe sensor generating the measurement ~m is taken into consideration, along with thecomplete representation of a measurement in ~d. While the quality of the measuringsensor has no essential importance for today’s vehicular applications, it is a pivotalaspect if multiple (possibly contradicting) values of the same underlying variableare sensed from multiple vehicles with different sensor setups. Each measurementmight have a different accuracy, which needs to be considered in the aggregation ofthese measurements. In this case, the vehicle needs to decide on the true state of theunderlying variable, considering that (i) some of the measurements might be erroneousand (ii) the underlying variable might have changed between the measurements. Toprovide the necessary meta-information for this decision to the receiving vehicles,we first employ a model for inaccurate measurements in Section 4.2.1. Based on thismodel, we describe basic methods for the aggregation of measurements in Section 4.2.2,which considers measurements with the same detection times and measurementswith different detection times. The latter increases the complexity of the aggregationprocess, as the underlying variable might have changed between two measurements.As existing aggregation schemes do not appropriately consider this factor, we proposeour innovative aggregation scheme in Section 4.2.3, which considers the accuracy ofmeasurements and the lifetime of events to adapt the influence of old measurementson the aggregate. With this approach, the possibility of false measurements and achange of the underlying variable are considered in the aggregation, so that falseaggregates are reduced.
4.2.1 Model for Inaccurate Measurements
As motivated in Chapter 3, the high heterogeneity of the available sensors and theirquality leads to measurements of different accuracy. This creates additional issues forthe interpretation of messages, especially when several (contradicting) messages havebeen received. Thus, the meta-information about the message accuracy needs to bepreserved throughout the dissemination of the message and in all processing steps.
For that purpose, a measurement ~m is represented as a vector with nw entries(states), one for each possible state of the underlying variable. Notice that continuousvariables are divided into buckets before, such that a sufficient level of granularity

30 data quality assessment for vehicular networks
is reached. In this state probability vector representing a measurement, each entrydescribes the (conditional) probability that the underlying variable is in a certain state,given the specific physical measurement by the sensor, as shown in Equation 2. Forsimplicity, we do not show the dependence of this probability on the measurement inthe notation.
~m =
p1...
pnw
(2)
for which holdsnw∑
ψ=1
pψ = 1
andpψ > 0, ∀ψ ∈ {1, . . . ,nw}
The properties of a measurement ~m strongly depend on the quality of the installedsensor and the environmental conditions. Since the quality of a measurement is alsoaffected by the capabilities of the specific sensor, the standard deviation of the mea-surements generated by the specific sensor is encoded in the measurement ~m; thisstandard deviation is recorded in the sensor’s datasheet. In general, multiple vehiclesthat use multiple sensors to detect a road event can provide more accurate measure-ments. The standard deviation σ ~m is defined according to Equation 3 with ψ beingthe expected value of a measurement. Notice that ψ is not necessarily a real state, butmight also be between two states.
σ ~m =
nw∑
ψ=1
pψ ·(
ψ−ψ)2
(3)
In case of a very inaccurate measurement, the probabilities are similar, as the sensorcannot exclude any states. In this case, all probabilities could be pψ = 1/nw and σ ~m
would become very high. For an optimal measurement, ∃ψ | pψ = 1∧ pi = 0, ∀i 6= ψ.In this case, the standard deviation σ ~m = 0 and the expected value corresponds to theonly state with a non-zero probability. The accuracy of the measuring sensors is con-sidered in the aggregation of measurements using the aforementioned representationof a measurement.
4.2.2 On the Aggregation of Inaccurate Measurements
In general, multiple vehicles measure the same underlying event and share theirmeasurements with others. Due to the diverse sensor quality, these measurementsmight be very diverse and lead to contradicting decisions as to what the true state ofthe underlying variable is. In such a case, a decision on the real state of the event needs

4.2 sensor-specific influence on data impact 31
to be made by using (or properly aggregating) these contradicting measurements. Inthe following, we first introduce the aggregation of measurements that have beenmeasured at the same time. After that, we consider the aggregation of measurementsthat have been measured at different times.
4.2.2.1 Aggregation of Measurements with the Same Measurement Time
Consider the merging of two measurements, ~m1 and ~m2, that have been measured atthe same time and location, and are of the same type. For this purpose, conditionalprobabilities are used. Due to the spatio-temporal similarity of the measurements, thevehicles have observed the same underlying event, i. e., the underlying variable is inthe same state for both measurements. Equation 4 displays the probability that theunderlying variable is in a certain state ψ1.
P(ψ = ψ1) = P(ψ ~m1= ψ1 ∧ψ ~m2
= ψ1 | ψ ~m1= ψ ~m2
) (4)
Notice that the measurement of vehicle 1 is independent of the measurement ofvehicle 2. Thus, the aggregate ~ma can be calculated according to Equation 5, where pirefers to a probability that ψi is the correct state in ~m1 and qi refers to a probabilitythat ψi is the correct state in ~m2.
~ma =
p1 · q1...
pnw · qnw
~m1 · ~m2(5)
Thus, a vehicle or the server can aggregate data considering their individual accu-racy level, which is reflected in the probability vector representing a measurement.Notice that this does not include the false reporting of data by malicious or non-cooperative vehicles. We performed some separate analyses and showed that mali-cious vehicles can be detected and removed from the vehicular network [131].
This aggregation assumes that the measurements are describing the same underly-ing event, i. e., are performed at the exact same time, which is not commonly happeningin vehicular networks. This issue is addressed by modeling the aging of measurementsin a vehicular network, which enables the aggregation of measurements with differentdetection times.
4.2.2.2 Aggregation of Measurements with Diverse Measurement Times
If data is not measured at the same time, the measurements may observe a differentstate of the underlying variable, i. e., the previous conditional probability cannot beapplied directly. To aggregate two measurements of different times, any change changeof the underlying variable over the duration between the measurements needs to beconsidered. A discrete-time model is utilized, in which data is aged by 1s in eachdiscrete time instant.

32 data quality assessment for vehicular networks
Measure
ment
Variable
Sta
te
State 2 State 1
Geographical Dependency
Temporal Dependency
Figure 4: Sample HMM utilized for the short-term aging of data. Taken from [118].
To predict the change of the underlying variable, HMM, as depicted by Figure 4, canbe used, which models both the aging and sensing of data in the vehicular network.Every event type is modeled according to an HMM with its own underlying MarkovChain, such that prediction of value changes is possible. The parameters of the MarkovChain can be estimated based on measurements gathered by the vehicles. In order toapply the aging to the probability vector, the transition matrix T(t) of the HMM isrequired. This transition matrix T(t) captures the possible state transitions from everystate over a certain time t. Each entry Tij(t) in the transition matrix is equal to theprobability that the event switches to j after t, if it is previously in i. Thus, the agedprobability vector ~m(t) can be retrieved by multiplying transition matrix T(t) and theoriginal vector ~m as shown in Equation 6.
~m(t) = T(t) · ~m (6)
According to the associativity of matrix multiplications, we can obtain T(t) by mul-tiplying the transition matrix for one timestep T(1) t-times by itself. To aggregatetwo measurements taken at different times, the future state of the older measurementneeds to be estimated, i. e., it needs to be aged by the difference of measurement timesto the newer measurement. The aged measurement can then be aggregated with thenewer measurement using Equation 5, as the two measurements then describe theunderlying variable at the same time.
When we extend this approach to more than two measurements by aggregatingadditional measurement with the aggregate, we can observe that is really robustto false measurements, as all measurements are considered until they exceed theirlifetime. However, this also reduces the adaptability to a change of the environmentdue to the influence of old measurements.

4.2 sensor-specific influence on data impact 33
4.2.3 Proposed Adaptive Aggregation Scheme for Inaccurate Measurements
The aggregation of data using Markov Chains performs well if the data is not changingfrequently, as it adapts slowly to environmental changes. After an environmentalchange, the majority of the measurements in a vehicle’s cache have been generatedbefore the event change. As these measurements decrease in influence over time andthe number of fresh measurements increases, the aggregate does adapt to the changeeventually. However, it generally takes a long time for the aggregate to adapt to thischange, which decreases the performance of the approach in this setting.
To alleviate this issue, we propose our adaptive aggregation scheme, which con-siders the required robustness and adaptability of an event type in the aggregationto reduce false aggregates. Robustness is defined as the ability of the aggregationscheme to alleviate false measurements, while adaptability is defined as the ability toadapt quickly to changes of the environment. To increase the robustness of an aggre-gation scheme, generally more (potentially old) measurements may be considered inthe aggregation process, such that the aggregate is less prone to false measurements.In contrast, the adaptability of an aggregation scheme is increased if only a few (orno) old measurements are considered, such that an adaptation to an environmentalchange can be performed immediately. It is evident that the requirements for robust-ness and adaptability are contrary, i. e., a tradeoff between these two is necessary forthe design of our aggregation scheme. This trade-off depends on the average accuracypa of the provided measurements and the expected lifetime T of the event. If thedata provided by the vehicles is always error-free, the system is intrinsically robustand does not require the consideration of additional (past) measurements, i. e., it canadapt to updates immediately. If the data type has a very long lifetime, the system isnot required to react to an environmental change and, thus, can be very robust.
4.2.3.1 Robustness vs. Adaptability
To find this tradeoff between robustness and adaptability, the expected number offalse aggregates per timestep ntotal needs to be reduced, as described in Equation 7.The parameter t is the time window, after which an adaptation of the aggregate isperformed given measurements in a different state.
minntotal(t) (7)
ntotal(t) is shaped by the two possible causes for false aggregates, (i) the numbernrob(t) of false aggregates due to an adaptation to a series of false measurements(missing robustness) and (ii) the number nada(t) of false aggregates due to a lateadaptation to a changing environment (missing adaptability), i. e., ntotal(t) = nrob(t)+
nada(t). We now provide a definition fornrob(t, r) andnada(t), which we then utilize toderive the time window topt, for which the number of false aggregates is minimized.
To analyze the number nrob(t, r) of false aggregates due to robustness, the averageaccuracy pa of a sensor is analyzed, which refers to the probability that the correctstate is the state with the highest probability. Based on pa, the average number of falseaggregations per timestep nrob(t, r) due to missing robustness can be derived using

34 data quality assessment for vehicular networks
Equation 8. It refers to the probability that all measurements since a time t before thecurrent time are correct, and an adaptation to a false state would be performed in thistimestep. For this purpose, the number of messages during that period t is estimatedbased on the average message rate r. This message rate r is assumed to be constant,which is a necessary assumption for our optimization problem, which is addressedlater.
nrob(t, r) = (1− pa)
t
r (8)
Similarly, the average number of false aggregations per timestep nada(n) due tomissing adaptability can be derived using Equation 9. In utilizes the expected lifetimeT to estimate the change that is expected over a certain period t, i. e., there is a chanceof 1/T for a change of the environment per timestep, for which the aggregation schemeneeds t to adapt. Notice that the changes in different timesteps are not independentof each other, but a change in timestep 2 requires that the variable has not changed intimestep 1.
nada(t) =
t∑
i=0
i∏
j=0
T − j
T
1
T
(9)
However, for t ≪ T , Equation 9 can be approximated using the much simplerEquation 10, which is used in the following. t≪ T is generally true, as an adaptationneeds to be performed much faster than the change of the underlying value, otherwisethe aggregation will always deliver wrong results. If T is itself very low, then the sizeof the timestep is inappropriate and needs to be adapted for that event, such that t canbe chosen much smaller than T .
nada(t) ≈t
T(10)
ntotal is a combination of nrob and nada, which are generally equally important. Asntotal should be minimized, the partial derivative of ntotal with respect to t needs to be0 as shown in Equation 11.
∂ntotal
∂t= (1− pa)
t
r · ln(1− pa) +1
T= 0 (11)
After some transformations, the optimal value for the time until adaptation topt canbe obtained as shown in Equation 12, which states after which time an adaptation shallbe performed given the current rate of incoming messages r. Due to the exponentially

4.2 sensor-specific influence on data impact 35
decreasing nrob(t) and the linearly increasing nada(t), the derived solution is always aminimum.
topt =
ln
[
−1
ln(1− pa) · T
]
ln(1− pa)· r (12)
One way to consider the time interval topt in the aggregation is to adapt the ag-gregate only if all measurements over this time interval are similar. However, thereare two main issues with that approach, (i) for data types with low average accuracy,the aggregate would almost never change to a new value, as the low sensor accuracymakes a series of correct measurement improbable, and (ii) time between two mes-sages is generally not constant. To alleviate this issue, weighting function fw(t) is used,which weights messages according to their age. The purpose of the weighting functionfw(t) is to adapt the robustness and the adaptability of the aggregation. This functionmodulates the aggregation such that a value change of the aggregate is performed ifthe same message arrives for a time topt with a constant rate r, but an aggregationscheme using this function can still handle varying message rates and false measure-ments. The function fw(t) depends on the type w of the data, as it requires the datatype dependent topt and T . The idea is to utilize the expected lifetime T of an eventto reduce the weight of a measurement in the aggregation process accordingly. Thus,the weight of a fresh measurement is 1 (Equation 13), while the weight of an outdatedmeasurement (higher age than the expected lifetime) is 0 (Equation 14). The latter alsoreduces the fluctuation of the aggregate when measurements are invalidated, as theirinfluence degrades slowly to 0 previous to their invalidation.
fw(0) = 1 (13)
fw(T) = 0 (14)
While these two special cases of fw(t) are evident, the behavior of fw(t) between0 and T needs to be determined. For this purpose, an exponential function withthree configuration variables, a, b, and d is utilized, as shown in Equation 15, i. e.,an exponential function that can be scaled along the x-axis and y-axis and translatedalong the y-axis.
fw(t) = a · ebt + d (15)
Based on Equation 13 and Equation 14, the parameters a and d can be derived toobtain the family of functions shown in Equation 16. The derivation of this family offunctions is shown in Section A.1.
fw(0) = a+ d = 1
36 data quality assessment for vehicular networks
0.0 1.0 2.0 3.0 4.0 5.0t [min]
0.0
0.2
0.4
0.6
0.8
1.0Va
lue
for f
w(t) b
b= 0.1b 0b= 0.01b
Figure 5: Aging function fw for different parameters bwith T = 5min. Adapted from [121].
fw(T) = a · ebT + d = 0
fw(t) =ebt − ebT
1− ebT(16)
This family of functions depending on the parameter b as shown in Figure 5, andeach function assigns different weights to old measurements. On the y-axis, the weightof a data of a certain age is displayed. For high values ofb, the weight of data is relativelyconstant over time and drops drastically to 0 at the end of the expected lifetime. Ahigh value of b would be used for very inaccurate or constant data types, in whichold data can improve the performance of the system. For low values of b, the weightof data decreases drastically with increasing age. Thus, low values of b are suitablefor frequently changing or accurately measured data types. As the exact value of bdepends on the utilized aging function, we first describe the aging function based onthe weight metric.
4.2.3.2 Weight-based Long-Term Aging
In order to use the weighting function in our aggregation process, the influence ofa certain measurement to the aggregate over time needs to be determined. For thispurpose, the probability vector ~p0 with |~p0| = |~m| is used as shown in Equation 17,which has no influence on the previously presented aggregation process, and thusshould be equal to a measurement aged by its expected lifetime T . ~p0 has no influence

4.2 sensor-specific influence on data impact 37
to the aggregate, as every probability in~p0 is equal, and the aggregation via conditionalprobability will always return the other input as result of the aggregation.
~p0 =
1
nw...1
nw
(17)
To obtain ~p0 after the expected lifetime of the event, the aging of any measurement~mwith the transformed transition matrix T
∗(T) needs to output ~p0. For this purpose,the original transition matrix T(t) needs to be transformed to T
∗(t) such that agingany probability vector with T
∗(T) always leads to ~p0. This transition matrix alwaysdistributes the probability of each state equally to all the other states, which leads to~p0, and is shown in Equation 18.
T∗(T) =
1
nw. . .
1
nw... ·
...1
nw. . .
1
nw
(18)
Between 0 and T , the transition matrix is adapted, i. e., T∗ is combined with the
original transition matrix T(t) weighted by fw(t). Thus, every entry T∗mn, where m
refers to the column and n refers to the row, is calculated as shown in Equation 19.
T∗mn(t) = Tmn(t) · fw(t) +
1
nw· (1− fw(t)) (19)
Based on the modified transition matrix T∗(t), data is aged considering the param-
eter b. b can now be determined such that the aggregation performs an adaptationafter topt, given a rate of incoming messages r.
4.2.3.3 Determining the Aging Function fw(t)
As shown in the optimization problem that minimizes the number of false aggregates,an adaptation should be performed after topt. Thus, we need to choose fw(t) suchthat an adaptation to a new value is performed after topt. For this purpose, our ag-gregation scheme simulates the incoming messages based on the message rate r forthe expected lifetime of a message T . Older messages do not need to be simulated, asthey are invalidated after exceeding their expected lifetime. In the time between T andtopt, measurements of a certain stateψi are incoming, which then changes in the timebetween topt and 0 to a stateψj. The messages themselves are generated based on theaverage accuracy pa, that is given to the system, and assuming a Gaussian distributionof noise. Our aggregation scheme starts with b = 0 and observes the behavior of the

38 data quality assessment for vehicular networks
aggregation. For the optimal b, an adaptation of the aggregate value is performedexactly with the last incoming measurement. If not, there are two possibilities: (i) thereis no change in the value at all, i. e., the adaptation is performed too late and, thus,b is too high (ii) there is a change at or prior to the second last measurement, i. e.,the adaptation is performed too early and, thus, b is too low. If b is not optimal, ouraggregation scheme adapts b (reduce if it is too high, increase if it is too low) andrepeats the process, until a value for b is found that matches the adaptation criteria.However, the determination of b still relies on the initial state ψi and the destinationstate ψj, which may have a major influence to the final value of b. As neither i norj are known with certainty, our aggregation scheme needs to determine b for everypossible combination of i and j. To determine the overall value for b, the determinedvalues for b are weighted according to their transition probability from i to j, whichis derived from the underlying Markov Chain. This enables us to optimally aggregatedata to achieve data of higher quality and increased usability for the receiving vehicle.
In this section, we proposed our innovative aggregation scheme, which dynamicallyadapts to the data that is being aggregated. That is, it considers both the accuracy ofthe aggregated data and an estimate of the lifetime to adapt the influence of oldmeasurements in the aggregation process. In Section 7.2, we describe the performanceof our aggregation scheme under varying environmental conditions. We show thatour aggregation scheme reduces false aggregates drastically and adapts its robustnessand adaptability to the requirements given through the data properties. While thissection focused on the measurement ~m itself, the next section analyzes the influenceof the consumer context and its connection to the meta-information like the location~land the measurement time t.
4.3 relevance of data for the receiving vehicles
Data is not important for all vehicles in the network, as some vehicles may not requirecertain pieces of data due to their current and future context. Context-sensitive data isfiltered by comparing the location of the data~lwith the current location ~lv of the vehiclev. For this purpose, several methods, like area-based or region-based filtering [63], areavailable, which have already been described in detail in Section 3.1.4. However, thesemethods commonly assume that the linear distance is the only metric capturing theinterest of a vehicle. This assumption is flawed in many cases, as a message is oftenonly required if the vehicle is actually traversing the location of the message (compareSection 3.2.2). An example is an accident in a village which is close to a highway.Although the accident is really close to the highway, it is most likely not encounteredby many vehicles, as the majority of vehicles generally stays on the highway. Thus, itis not reasonable to provide the data to all vehicles on the highway, but only to theones that leave it and are, thus, much more likely to encounter the accident.
In this section, we propose the utilization of the future context of the vehicles andfuture event state to determine the relevance of an event to a vehicle. This relevanceneeds to be determined by the server disseminating the event, such that the relevance

4.3 relevance of data for the receiving vehicles 39
can be used to improve the network efficiency. To determine the relevance, the dis-tributing server needs to not only consider the current location of the vehicle andthe location of the event but also needs to consider the probability of the vehicle en-countering the event. This probability can be calculated based on two factors: (i) theprobability that the vehicle will traverse the event location at some point in the future,and (ii) the probability that the event is still active when the vehicle traverses the eventlocation. To predict the probability of the vehicle traversing the event location, theserver utilizes the planned path of the vehicle. However, the planned path needs tobe known to the server disseminating the data in the network, which is not alwaysthe case due to privacy considerations. If the planned path is unknown, the serverwill need to predict the planned path based on historic knowledge about the trafficflow. The server considers the probability that the vehicle encounters an event in con-junction with the probability that the event is active by developing a set of recursiveequations. These equations describe the probability that the vehicle traverses alonga certain road segment sj, given it is currently located at the end of road segmentsi, and that the event is still active when the vehicle arrives at the end of sj. For thispurpose, the server also predicts the lifetime of the event based on historic data aboutthe average event lifetime.
While we focus on the definition of relevance based on events at fixed locations in thisthesis, we also analyzed the relevance of data for other applications like cooperativemaneuver coordination [33], in which location data of possible cooperation partnersare disseminated to concerned vehicles.
4.3.1 Relevance Assessment Assuming Knowledge of the Vehicle’s Path
If the server knows the path φ = {s1, . . . , sn} consisting of road segments that avehicle plans to traverse, it can easily determine if the vehicle will, at some point intime, traverse the segment se containing the event. As discussed previously, the eventmay only be relevant if se ∈ φ, i. e., the vehicle traverses this segment. If se /∈ φ,the relevance is 0. However, even if the vehicle traverses the event location, it is notguaranteed that the vehicle encounters the event, as the event might have turnedinactive in the meantime. Thus, the server needs to check if the event is still activeby the time the vehicle arrives, which is generally unknown to both the vehicle andthe server. To assess the state of the event by the time the vehicle passes, the serverutilizes historic knowledge to predict the lifetime of the event. Based on this historicknowledge, the prediction of the event state is based on the distribution functionpw(t), which depends on the event type w. This function returns the probability thatthe event is still active after a certain time t, which is monotonically decreasing. Inthe following, we assume that the lifetime t is exponentially distributed. Thus, pw isthe complementary cumulative distribution function of this exponential distributionbased on the expected lifetime T as shown in Equation 20.
pw(t) = e−t
T (20)

40 data quality assessment for vehicular networks
Notice that Equation 20 determines the probability that the lifetime of the eventexceeds t. To determine the probability of the event being active when the vehicleencounters it, the server utilizes the travel time t(φ, se) of the vehicle. t(φ, se) returnsthe time to get to the end of the segment containing the event se along the path φstarting at the end of the first segment in the path. t(φ, se) returns ∞ if se /∈ φ. Therelevance R(sv, se) is defined as the probability that the vehicle encounters the eventlocated at the segment se, thus, the relevance for a vehicle driving on segment sv isdefined as shown in Equation 21.
R(sv, se) = pw(t(φ, se)) (21)
4.3.2 Relevance Assessment Assuming No Knowledge of the Vehicle’s Path
If the server has no knowledge of the path a vehicle plans to take, it can only relyon historic knowledge to predict the path the vehicle is likely to follow. For thispurpose, a set of recursive equations is developed, defining the probability of a vehicleencountering the event, given the current road network S, the vehicle’s current locationsv, and the event location se. In the road network graph, each end of each segmentis represented as an edge, and the connection between segments (i. e., intersections)are represented as edges in the graph, with their respective transition probability.This probability pij is the joint probability that (i) the vehicle moves from si to sj,and (ii) that the event is still active after the vehicle has moved. Thus, pij is shapedby spatial and temporal dimensions. For the spatial dimension, the server uses thepath probability plij, i. e., the fraction of vehicles at the end of si to drive over sj.We assume that plij does only depend on the adjacent segments si and sj, thus, itdoes not capture the possibility of multi-edge dependencies like paths, but is mucheasier to store, determine, and process. For the temporal dimension, the server uses theprobability that the event is still active when the vehicle arrives at the end of sj based onEquation 20. The travel time along every road segment can be considered separately,due to the memoryless property of the exponential function lifetime function, i. e.,pw(t+∆) = pw(t) · pw(∆). Thus, the server uses the travel time t(s1, s2) between twosegments s1 and s2, which is the time required to travel from the end of s1 to the endof s2. The probability pij can be calculated according to Equation 22, as the spatialand the temporal dimension are independent.
pij = plij · pw(t(s1, s2)) (22)
While the event to traverse from sj to sk requires the vehicle being in sj, it doesnot account for how the vehicle got there. Thus, the pair of probabilities pij and pjkare independent of each other. Consequently, the probability to get from si to a non-adjacent segment sk over the connecting segment sj, given that there is only one validpath between si and sk, can be calculated according to Equation 23.
pik = pij · pjk (23)

4.3 relevance of data for the receiving vehicles 41
Algorithm 1 : Determining encounter probability for every segment si and theevent edge seResult : p(i, e), ∀si ∈ S
1 p(i, j, e)←0, ∀si, sj ∈ S | sj ∈ neighbors(si);2 p(e, j, e)←1, ∀sj ∈ neighbors(se);3 n←0 while n < |S| do
4 for si, sj | sj ∈ neighbors(si)∧ si 6= se do
5 p(i, j, e) = pi,j ·∑sk∈neighbors(sj) p(j,k, e);
6 end
7 end
8 for si ∈ S do
9 p(i, e) =∑sj∈neighbors(si) p(i, j, e);
10 end
If there are multiple paths connecting si and sk, one over sj1 and one over sj2 , theprobability of traversing sk when starting at si can be calculated using Equation 24.This combination of probabilities is possible as two paths are excluding each other, avehicle can take either one or the other.
pik = pij1 · pj1k + pij2 · pj2k (24)
Let p(i, e) denote the probability of a vehicle at road segment si to encounter theevent located at se. Then, this probability can be defined as a recursive function usingthe probability of the neighbors to encounter that event as shown in Equation 25.
p(i, e) =
{ ∑sj∈neighbors(si) pij · p(j, e) i 6= e
1 i = e(25)
The solution of this set of recursive equations can only be estimated due to thepresence of cycles in the road network and the size of the road network. To estimatethe solution for the recursive equations, we develop Algorithm 1, which is very similarto Bellman-Ford shortest paths algorithm [29, 70] and updates the probabilities eachround, such that the probabilities considering paths with maximum of n hops aredetermined correctly.
The server needs to execute Algorithm 1 once per road event that should be trans-mitted. While the worst-case runtime can be very large for large-scale road networks,the relevant probabilities can be determined much faster terminating the algorithm ifthe expected improvement of the result is very small. That is, if there are no changesperformed to probabilities above a predefined threshold in one round, i. e., it is likelythat the induced error by early termination is small. The relevance score R(sv, se) for aspecific vehicle v is equal to the probability p(i, e) for the segment sv associated withthe current location of the vehicle and is shown in Equation 26.
R(sv, se) = p(sv, se) (26)

42 data quality assessment for vehicular networks
In this section, we proposed our novel approach towards assessing the relevance ofdata for a specific vehicle. We consider a piece of data to be relevant if the vehicle islikely to encounter it on its planned path. As the planned path is generally unknown tothe server, the server predicts the future path of the vehicle and utilizes the predictedpaths and their respective probabilities to estimate the probability of the vehicle toencounter the event. This encounter probability also considers the requirement thatthe event is still active by the time the vehicle arrives at the event location, whichis achieved by predicting the lifetime of the event based on an exponential function.In Section 7.3, we evaluate our relevance assessment to increase the efficiency of themessage dissemination. We provide a detailed discussion about the influence factorson the performance of this relevance-based dissemination approach and highlight thesituations in which our approach provides the largest benefit to the network.
4.4 model for the impact of messages on receiving vehicles
While relevance captures the influence of the vehicle’s context on the message dissem-ination, it does not capture the influence of the measurement accuracy. Similarly, themeasurement accuracy does not consider the relevance of a message to a vehicle. Todetermine the importance of a message to a vehicle, a holistic metric is required, whichconsiders both the relevance, the measurement accuracy, and the possible impact ofthe sensed event. As an example, a traffic jam is generally of higher importance than atraffic sign, which should be reflected in the impact of the associated measurements.
In this section, we describe the modeling of the base-impact and specific-impactof a message carrying some road event for a vehicle. The base-impact is defined inDefinition 4.4.1 and the specific-impact is defined in Definition 4.4.2.
Definition 4.4.1: Base-Impact (event type dependent)
The base-impact of a message is a metric that captures the maximum possible gain (or
reduction in costs) for a vehicle when receiving a message containing a road event. The
base-impact is generally without unit and captures the maximum impact that could be
provided by a specific message without considering its contents, but only its type.
Definition 4.4.2: Specific-Impact (associated with a vehicle)
The specific-impact of a message is a metric that captures the expected gain (or reduction
in costs) for a vehicle when receiving this message. This specific-impact is generally with-
out unit and considers data-specific properties like accuracy and the vehicle’s context.
It is to be used for comparing the gain provided by messages in order to prioritize/filter
them accordingly under limited bandwidth conditions.
While the base-impact is determined based on the type of event contained in the mes-sage, the specific-impact considers the relevance of a message to a vehicle (Section 4.3)

4.4 model for the impact of messages on receiving vehicles 43
as well as the accuracy of the measurement (see Section 4.2). The accuracy influencesthe usability of the message for the vehicular applications, while the relevance influ-ences the probability that a vehicular application requires that message. To determinethe specific-impact of a message, a state-dependent modifier is utilized to consider theinfluence of an event state on a vehicular application, as shown Section 4.4.1. After that,we discuss the implications of this derivation of the specific-impact in Section 4.4.2.
4.4.1 Derivation of the Specific-Impact Considering the Measurement Accuracy
In the following, we assume that the influence of application-specific behavior islimited or known in advance. Thus, for every possible state ψ of the event associatedwith the data type w, an impact value µ(ψ,w) is assigned that captures the influenceof this event state ψ to the application. The base-impact for a data type w equals themaximum specific-impact value of the states of the data type (i. e., of the states of thecontained road event of type w). An example of a data type with multiple states isthe event jam. It can have multiple states like no jam, stop-and-go traffic, jam, andcomplete closure. While these states belong to the same event, it is evident that theirimpact on the system differs drastically: Stop-and-go traffic might not require a detour,but complete closure almost always requires a detour due to the unpredictability of theclosure duration. It is, however, important that these states have the same base-impactfor our networking approach described in Chapter 5, as otherwise messages statingthe disappearance of an event would not be transmitted to the vehicles that receivedthe initial notification that the event was active.
To consider the accuracy of the measurements contained in the provided data inthe definition of specific-impact, we utilize the benefit β(~m,w) of the contained mea-surement ~m, as shown in Equation 27. There, pi refers to the (conditional) probabilityassociated with state ψi, given the measurement ~m; for simplicity, we do not showin the notation the dependence of this probability on the measurement. The productoperator refers to the scalar product of the two vectors.
β(~m,w) =
p0...
pnw
·
µ(ψ0,w)...
µ(ψnw ,w)
(27)
The benefit β(~m,w) only describes the influence of the measurement but does notconsider the relevance for a certain vehicle. This relevance depends, as mentionedpreviously, on the probability that the vehicle requires the message. The specific-impact of a message for a certain vehicle v is shown in Equation 28.
µ(~m, se,w, v) = β(~m,w) · R(sv, se) =
p0...
pnw
·
µ(ψ0,w)...
µ(ψnw ,w)
· R(sv, se) (28)

44 data quality assessment for vehicular networks
(a) Client-side aggregation. (b) Server-side aggregation.
Figure 6: Possibilities of aggregation in our vehicular network (showing the flow ofaggregated data with arrows).
The advantage of a definition of the specific-impact using Equation 28 is its sim-plicity and comprehensibility, which enables the prediction of the network behavior.However, it does not always capture the exact influence of the message to the vehicle,as the vehicle’s applications might handle the message using the additional knowledgeavailable at the vehicle like the future path. For example, a jam might only be detouredif a shorter path is available. If no shorter path towards the planned destination is avail-able, the value of the jam notification decreases for the vehicle. We investigated onthis aspect in previous works [120], in which we showed that the consideration ofapplication behavior can further increase the performance of the network. However,this puts additional load to the server, thus we focus on the specific-impact definitionas shown in Equation 28 in this thesis.
4.4.2 Implications of the Usage of the Specific-Impact for Prioritization of Messages
The specific-impact of a message might be high for wrong measurements, which erro-neously detect high-impact states. These wrong messages would be distributed to thevehicles and potentially never be revoked if the bandwidth is insufficient to transmitlow-impact messages. Although this error can be alleviated by the receiving vehiclesthrough invalidation of the message upon the expiration of the Time to Live (TTL), thiseffect can potentially decrease the system performance through unnecessary actionslike detours of vehicles. To prevent this behavior, the vehicles can pre-aggregate mea-surements locally and send those aggregates to the server, which again can aggregatethese measurements with other measurements.
The possible realizations of this process are displayed in Figure 6. Figure 6a dis-plays the client-side aggregation, in which only aggregates are distributed to othervehicles. While the dissemination area of low-impact messages is generally limited,the vehicles in proximity will generally still receive this aggregate and can considerit in their decision-making. Thus, wrong measurements are not distributed in thewhole vehicular network, as they are previously merged with the knowledge alreadyavailable to the vehicle. The client-side aggregation, however, relies on the vehicles in
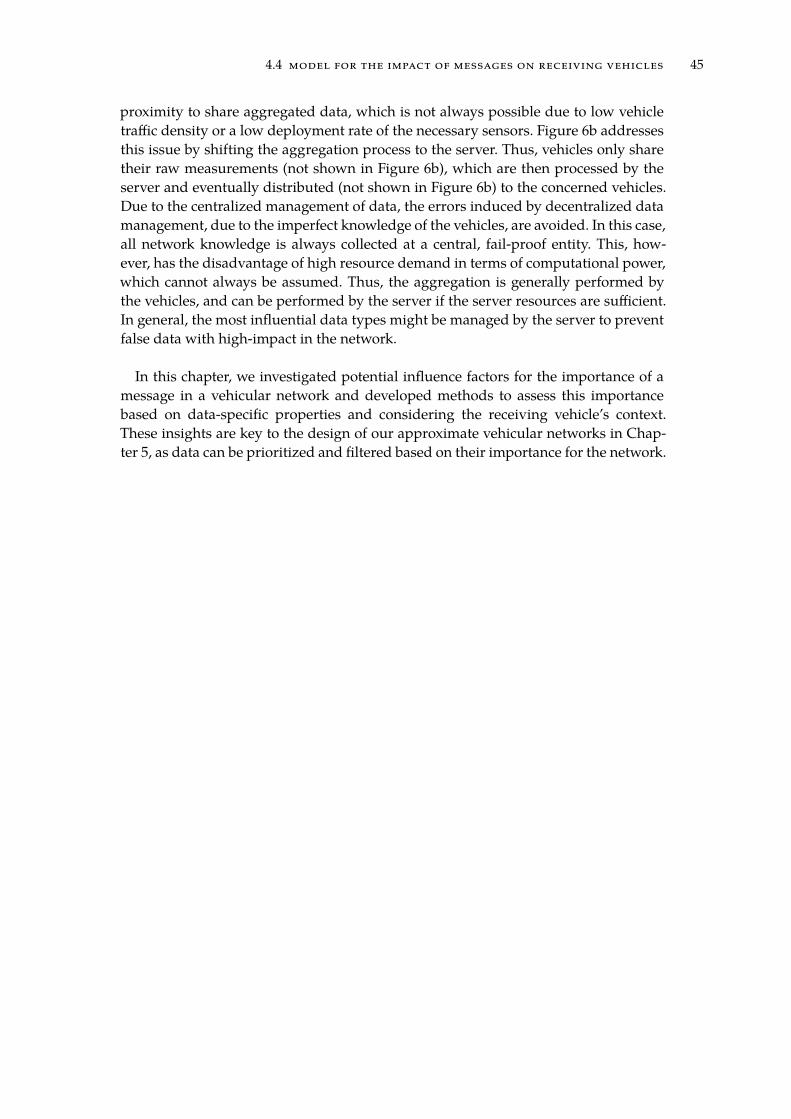
4.4 model for the impact of messages on receiving vehicles 45
proximity to share aggregated data, which is not always possible due to low vehicletraffic density or a low deployment rate of the necessary sensors. Figure 6b addressesthis issue by shifting the aggregation process to the server. Thus, vehicles only sharetheir raw measurements (not shown in Figure 6b), which are then processed by theserver and eventually distributed (not shown in Figure 6b) to the concerned vehicles.Due to the centralized management of data, the errors induced by decentralized datamanagement, due to the imperfect knowledge of the vehicles, are avoided. In this case,all network knowledge is always collected at a central, fail-proof entity. This, how-ever, has the disadvantage of high resource demand in terms of computational power,which cannot always be assumed. Thus, the aggregation is generally performed bythe vehicles, and can be performed by the server if the server resources are sufficient.In general, the most influential data types might be managed by the server to preventfalse data with high-impact in the network.
In this chapter, we investigated potential influence factors for the importance of amessage in a vehicular network and developed methods to assess this importancebased on data-specific properties and considering the receiving vehicle’s context.These insights are key to the design of our approximate vehicular networks in Chap-ter 5, as data can be prioritized and filtered based on their importance for the network.


5A P P ROX I M AT E V E H I C U L A R N E T WO R K S
Using the specific-impact definition presented in the previous chapter, we presentour innovative approach for approximate vehicular networks, which are de-
scribed by Definition 5.0.1 based on the definition of approximate computing [25].
Definition 5.0.1: Approximate Vehicular Networks
Approximate networking is a networking paradigm that trades communication and
computation resources with the availability or quality of data. Approximate vehicular
networks are approximate networks tailored for the vehicular environment.
In traditional networks, the availability/quality of data is commonly increased byincreasing the amount of available resources. In contrast, approximate networks focuson resource-constrained environments, in which an increase of available networkingresources is either undesired or infeasible. In these networks, some data may not bepossible to become available to certain consumers or their quality might be low.
As an alternative to increasing the amount of available resources, we can enhanceQuality of Service (QoS) in an approximate networking environment through what wewill refer to in general as Diverse Prioritization and Treatment (DPT). The Unequal ErrorProtection (UEP) scheme [160] described in Section 2.4 is basically a special instance ofthe aforementioned DPT framework, in which unequal error protection to bits that areof diverse importance to an application is provided, without consuming any additionalresources. By applying the UEP scheme, the QoS to a specific application will beimproved without increasing the amount of resources consumed. Similarly, the qualityor availability of data could be enhanced in an approximate networking environmentby applying the concept of DPT, without increasing the resources consumed. TheDPT framework can be stochastic and not limited to deterministic prioritization andtreatment only. The main focus of this chapter is to show the potential benefits ofApproximate Vehicular Networking through the development and study of a DPTmechanism that enhances data availability and quality in vehicular networks withoutincreasing the amount of resources consumed.
When a vehicle subscribes to receive data from a central server, it generally prior-itizes high-impact messages to increase its communication efficiency. However, thisleads to redundant transmission of a message to all vehicles with similar context, asevery vehicle receives all messages ordered by their priority. When these vehicles co-operate, this redundancy is unnecessary and can be reduced to increase the efficiencyof the network. Our proposed mechanism adapts this redundancy probabilisticallyto reduce the utilized communication resources, that can then be used to receivelower-priority messages, that would previously have not been received.
47

48 approximate vehicular networks
In Section 5.1, we describe our system including the required assumptions. In Sec-tion 5.2, we analyze approximate vehicular networks without cooperation, that isassuming that vehicles do not share any messages with vehicles in proximity. Thisscenario will be used as a baseline to assess the improvements through cooperation.In Section 5.3, we propose our probabilistic approach to approximate vehicular net-working using a utility-based game to modulate the vehicle’s subscription such thatthe benefit of the local sharing of messages is increased. In Section 5.4, we proposemechanisms to determine the necessary parameters of our system. In Section 5.5,we describe possible mechanisms to consider the specific-impact for a vehicle in thedissemination of messages. We conclude this chapter with the description with theanalysis of our cooperative approximate vehicular networks in Section 5.6.
5.1 scenario description
In the following, we describe the proposed approach to approximate vehicular net-working. As also prescribed in the previous chapter, such an approximate vehicularnetwork will be a context-aware vehicular network, in which a central server providescontext-sensitive messages to interested vehicles. The vehicles may cooperate to im-prove the communication efficiency, by sharing messages received by the server withtheir neighborhood via Wifi-based communication technology, which is consideredto be free of cost.
Our approximate vehicular network is slotted in time. In each timeslot, a vehicleis willing to receive up to A bits on average via the cellular network. This does notmean that this bandwidth may not be temporarily exceeded, but only that the vehicleneeds to receive at most A bits per timeslot on average. Since the available bandwidthA is assumed to be limited, a vehicle aims to receive high-impact per bit messagesand might drop low-impact per bit messages if the bandwidth is insufficient to receiveeverything. The size a(~d) of every message ~d and its base-impact are known and thus,the average base-impact per received bit µB(~d). We use the normalized metric of thebase-impact per bit as the bandwidth is a limiting factor, and thus, the base-impactper utilized bandwidth is pivotal for our approach.
The available messages are divided to nµ buckets, the so-called impact-levels. Asthe specific-impact of future messages is not known, these impact-levels are based onthe base-impact of the available message types. A message is assigned to an impact-level i if the base-impact per bit of the message is similar to the impact assigned tothat impact-level (µB(~d) ≈ µBi). Each impact-level is generally associated with onespecific event type, such that the base-impact per bit of that message type equals thebase-impact µBi of the impact-level i. The server then considers the specific-impactof a message by filtering messages based on their specific-impact before consideringthe transmission to the vehicles. This specific-impact is based on the vehicles, i. e., thecontext-based filtering of messages is performed at the server. In Section 5.5.2, wedescribe the server-side filtering in detail.
For each impact-level i, a vehicle expects a load of a0,i bits for receiving all messages,with an average specific-impact per bit µ0,i if it shares its exact location with the

5.1 scenario description 49
server. At the beginning of each timeslot, the vehicles announce the impact-levels theyare interested in, such that its bandwidth restrictions are fulfilled on average. Thisannouncement must not be changed over the course of a timeslot. During the timeslot,the vehicles update their context at the server, such that the server can calculate thespecific-impact of a message to provide proper messages to the vehicles. If a vehicle isnot willing to share its exact context to protect its privacy, it is also possible to share aninaccurate representation of this context (i. e., location in the discussion in this thesis)as discussed in Section 5.1.1. In the following, we focus our attention on one vehiclein the network, the so-called tagged vehicle.
5.1.1 Privacy-based Context Sharing
As mentioned previously, the server calculates the specific-impact of a message forevery vehicle to consider this specific-impact in the dissemination. As the specific-impact is context-dependent, a tagged vehicle needs to constantly share its contextwith a central server. However, this constant sharing of context compromises theprivacy of its passengers and might be undesired. Thus, the vehicles can preserve theprivacy of their passengers by sharing an inaccurate representation of the context, suchthat privacy-sensitive vehicles can participate in the network. This concept is knownas obfuscation [58] and its privacy protection depends on the degree of the inaccuracyof the context. For this purpose, different privacy-levels φ ∈ Φ with Φ ⊂ N0 areavailable, which differ in the amount of inaccuracy introduced on purpose to thecontext. The privacy level φ = 0 does not add any privacy and, thus, corresponds tothe privacy-insensitive case. Each vehicle can then select its privacy-level such that itsprivacy demands are satisfied. We focus on adding imprecision to the location of thevehicle, as it provides the most insights about the person’s everyday life. Instead ofproviding the exact location, the vehicle only provides a (circular) area (imprecisionarea), in which it is certainly located (uniformly distributed). The radius rφ of theimprecision area varies depending on the privacy-level. While a large imprecision areacomplicates tracking of vehicles along their route, it also degrades the performance ofthe dissemination of context-sensitive messages: The server shares a message with avehicle based on the highest possible specific-impact for any possible location of thevehicle, which is necessary to guarantee the reception of a context-sensitive message.Thus, large imprecision areas naturally induce a higher load compared to the smallimprecision areas, as more messages need to be considered to assure the reception of allmessages. For an impact-level i and the privacy level φ, the bandwidth consumptionaφ,i depends on the bandwidth consumption a0,i of the privacy-insensitive case,which is adapted using the privacy adaptation factor ρφ,i.
The base-impact µBi of impact-level i is independent of relevance, but a metric for atagged vehicle’s performance needs to take relevance into account, which is capturedby the specific-impact. As the specific-impact considers the current context of thevehicle, which is (potentially) unknown by the server, the average (over all possiblelocations of the tagged vehicle) specific-impact per bit is used, which is assumed tobe independent of the current context of the vehicle. Thus, we derive for a tagged

50 approximate vehicular networks
vehicle the average specific-impact per bit µφ,i for the impact-level i and the privacy-level φ using the average specific-impact per bit µ0,i for the privacy level 0, whichdoes not add any privacy. The privacy adaptation factor ρφ,i captures the increase inbandwidth consumption and the decrease in the average specific-impact per bit forthe the impact-level i caused by the privacy-level φ compared to the non-privacy case.That is, as messages with a smaller dissemination scope (or, more context-sensitive)are more affected by privacy than than messages with a large dissemination scope (orcontext-insensitive). In Section 5.4, we describe methods to determine ρφ,i.
To account for the additional bandwidth consumption, we introduce the variableaφ,i > a0,i, which captures the load in bits per time interval for subscribing to impact-level i if the vehicle has a privacy-level φ and is shown in Equation 29.
aφ,i = a0,i · ρφ,i (29)
Similarly, the average specific-impact per bit µφ,i 6 µ0,i for impact-level i andprivacy-level φ is given by Equation 30.
µφ,i =µ0,i
ρφ,i(30)
A property of the privacy-dependent specific-impact and bandwidth is the fact that thetotal specific-impact of messages in an impact-level is independent of the privacy-level,as the specific-impact associated with the vehicle is independent of the privacy-level.This is also shown in Equation 31.
µφ,i · aφ,i =µ0,i
ρφ,i· a0,i · ρφ,i = µ0,i · a0,i (31)
5.1.2 Announcement of Impact-Levels of Interest
In addition to the context-sharing with the server, the tagged vehicle announces in-terest in a set of impact-levels to receive messages from a server. When considering asetting with limited cellular bandwidth, vehicles generally aim at receiving messageswith the highest specific-impact per bit. To achieve that, each vehicle could communi-cate its available bandwidth to the server, which then could share the messages withthe highest specific-impact per bit with the vehicles. This approach would maximizethe communication efficiency of each individual vehicle.
However, with this approach, the server delivers the same messages to all vehicleswith the same context. While this is no issue for non-cooperative networks, it drasticallyreduces the possible benefits of cooperation between vehicles. To increase the benefitsof cooperation, the similarity between the messages received by vehicles in communi-cation range needs to be reduced. For this purpose, we generalize the aforementionedprioritization strategy using a probabilistic strategy. In this probabilistic strategy, eachvehicle has a certain probability of subscribing to a certain impact-level. For the non-cooperative case, all probabilities for impact-levels with a high base-impact per bit(and thus high average specific-impact per bit) will be 1, until the available bandwidth
5.1 scenario description 51
is insufficient. However, for the cooperative case, the probabilistic strategy enablesthe modulation of the redundancy for high-impact-levels, such that the similarity ofmessages received by vehicles in proximity is reduced.
The impact-levels a tagged vehicle of privacy level φt subscribes to are expressedthrough a set of probabilities pφt,i, with one probability per impact-level i; the vectorcontaining these probabilities for all i’s is denoted by ~pφt , and is referred to as thevehicle’s strategy. The strategy of the tagged vehicle ~pφt depends on the current levelof privacy φt. Depending on the probability pφt,i to receive messages of impact-level i and the expected total load aφt,i of an impact-level i in the next timeslot,the vehicle calculates the expected traffic load for each impact-level i. To fulfill thebandwidth restrictions, the vehicle needs to choose its strategy ~pφt such that the sumof the expected traffic loads for all impact-levels is smaller or equal to the availablebandwidth A. If the vehicle detects that its average bandwidth usage is lower thanthe available bandwidth A, the vehicle may share the information about the unusedbandwidth with the server. In this case, the server may adapt its dissemination usingthis knowledge as discussed in Section 5.5.2.
Based on the strategy ~pφt , there are two possibilities for the tagged vehicle toannounce its impact-levels of interest based on a probabilistic strategy, (i) determine itsimpact-levels of interest probabilistically in the vehicle itself and provide only the finalset of impact-levels, or (ii) transfer the probabilities stating the impact-levels of interestin certain impact-levels to the server. In the first case, the vehicle communicates to theserver its derived interest in certain impact-levels and receives all messages assignedto these levels. It may coordinate this announcement of impact-levels of interest locallywith other vehicles in proximity, but we do not consider this approach in this thesisdue to the higher vulnerability to malicious nodes. In the second case, the vehicles mayannounce their impact-levels of interest probabilistically, i. e., they announce that theywant to receive a certain fraction of messages of a certain impact-level. This enablesthe server to provide different messages to neighboring vehicles, but increases the sizeof a subscription and does not provide any benefit for privacy-sensitive vehicles. Thus,we focus on the first option in this thesis.
5.1.3 Distribution of Messages
The central server uses the context representation and the impact-levels of interestprovided by the vehicles to actively push incoming road events to the interestedvehicles. A vehicle is considered to be interested in receiving a message iff (i) the vehiclehas subscribed to the impact-level associated with the message, and (ii) the serverconsiders the message transmission to the vehicle by taking the specific-impact of themessage for the potential receiver into account. The description of the disseminationof messages based on their specific-impact is described in detail in Section 5.5.1. Noticethat the specific-impact considers the context of the vehicle, i. e., prevents messagesfrom being flooded in the network.

52 approximate vehicular networks
5.1.4 Utility Metric for Approximate Vehicular Networks
The utility of the tagged vehicle is an appropriate metric for the influence of thedeveloped approaches to our approximate vehicular network. The utility is definedas the sum of specific-impact values of the set of messages Drcv received by thatvehicle. Consequently, the utility is defined as shown in Equation 32. a(~d) describesthe bandwidth consumption for the message ~d, and µ(~d) the specific-impact per usedbandwidth.
u =∑
~d∈Dsnt
a(~d) · µ(~d) (32)
In order to use the utility to optimize our approximate network, the expected utilityfor a vehicle is required. As mentioned previously, we assume that the subscriptionstrategy ~pφt of the tagged vehicle is probabilistic, as well as the (unknown) strategiesof the vehicles in proximity. In this vector, each probability pφt,i refers to the prob-ability that the vehicle subscribes to a certain impact-level i. Thus, this probabilityalso captures the share of messages of impact-level i received by the vehicle via thecellular network. However, the utility is based on the probability of the tagged vehicleto receive a message of a particular impact-level via any communication channel. Eachvehicle has two options to receive a message, (i) via the cellular network (the only pos-sibility under the non-cooperative case), and (ii) via Wifi from at least one vehicle inits neighborhood (possible only under the cooperative case). For the reception via thecellular network, the tagged vehicle with privacy level φt can influence the receptionprobability pcel
i to receive a message of impact-level i by adapting its strategy ~pφt , withwhich it receives messages via the cellular communication channel. For this case, alsothe bandwidth restrictions apply. Notice that pcel
i might potentially differ from pφ,i, asmessages might get lost. For the reception via Wifi, the tagged vehicle cannot influencethe probability pwif
i to receive the message of impact-level i from its neighbors, as thispurely relies on their willingness to share data and their respective probabilities to re-ceive a message via the cellular communication channel. A vehicle receives a messageif it is received via either communication channel, which is captured by the expectedutility of the tagged vehicle as shown in Equation 33.
u(pcel0 , . . . ,pcel
nµ,pwif0 , . . . ,pwif
nµ) =
nµ∑
i=1
aφ,i · µφ,i ·[
1− (1− pceli ) · (1− pwif
i )]
(33)
Notice that the restriction on the average cellular bandwidth needs to be fulfilled bythe tagged vehicle as shown in Equation 34.
nµ∑
i=1
aφ,i · pceli 6 A (34)
5.2 non-cooperative approximate vehicular networks 53
Furthermore, the constraints for each probability pceli and pwif
i need to be fulfilledas shown in Equation 35.
0 6 pceli 6 1, ∀i ∈ {1, . . . ,nµ} and 0 6 pwif
i 6 1, ∀i ∈ {1, . . . ,nµ} (35)
In the following, we develop strategies for the determination of the probabilitiespceli , ∀i ∈ {1, . . . ,nµ} of the tagged vehicle for the reception of cellular messages, such
that the overall utility is maximized. We first consider the case of a vehicular net-work without cooperation between vehicles in Section 5.2, followed by the case of acooperative network in Section 5.3.
5.2 non-cooperative approximate vehicular networks
In vehicular networks without cooperation, vehicles cannot rely on others to providemessages to them, i. e., pwif = 0. In this thesis, we assume that there is no message dropduring the transmission of messages from the server to the vehicle and, consequently,pceli = pφt,i for the privacy level φt of the tagged vehicle. That is, the probabilistic
strategy (to be optimized below) coincides with the set of probabilities of receivingmessages through the cellular network. This reliable transmission can be achievedwith reliable transport layer protocols like Transmission Control Protocol (TCP) andMultipath TCP (MPTCP), or protocols achieving reliability on the application layerlike Quick UDP Internet Connections (QUIC). With that, the expected utility can beexpressed using Equation 36. Notice that Equation 36 can be obtained from Equation 33if pcel
i = pφt,i and pwif = 0.
u(~pφt ,φt) =
nµ∑
i=1
aφt,i · µφt,i · pφt,i (36)
To maximize the expected utility, the partial derivatives of the expected utilitywith respect to each probability pφt,i need to set equal to 0. In order to do that, thebandwidth is included as a side condition into the term, as otherwise the utility wouldgrow untilpφt,i = 1, ∀i ∈ {1, . . . ,nµ}. Thus, the bandwidth condition from Equation 34is utilized to express the probability pφt,m as a combination of the others consideringpceli = pφt,i as shown in Equation 37.
pφt,m 6A−
∑nµi=1 | i 6=m
aφt,i · pφt,i
aφt,m(37)
As less bandwidth consumption cannot increase the utility due to the assumptionof positive-only values of the specific-impact, an optimal strategy always utilizes theavailable bandwidth fully (if possible). Thus, the inequality presented in Equation 37 is

54 approximate vehicular networks
assumed to be an equality. If this equality is inserted into the expected utility function,Equation 38 is obtained.
u(~pφt ,φt) =
nµ∑
i=1 | i 6=m
aφt,i · (µφt,i − µφt,m) · pφt,i + µφt,m ·A (38)
Based on Equation 38, the expected utility depends on each probability pφt,i | i 6= m.As there is only a linear dependency of the expected utility from the probabilities, thepartial derivatives of the expected utility with respect to any probability pφt,i | i 6= mare always non-zero. Thus, the average utility is maximized at the boundaries of theeligible values of the variables we are trying to determine, which are the probabilities.Being probabilities, their values are limited between 0 and 1. Notice that the valuesof probabilities maximizing the average utility may not be the maximum possible,so that any other constraint that is in place be met; this is the bandwidth constraintin Equation 34. As a result, it turns out that the optimal solution for the networkswithout cooperation is achieved by setting all probabilities to 1, until the bandwidth isinsufficient, starting from the impact-level with the highest expected specific-impactper bit µφt,i. The probability that would exceed the bandwidth when being set to 1 isthen chosen such that the bandwidth is utilized completely.
5.3 cooperative approximate vehicular networks
In cooperative approximate vehicular networks, vehicles may also rely on their neigh-bors to receive messages of interest to them, besides getting them directly by the servervia the cellular network. In the previously discussed non-cooperative case, vehicleswill follow the same optimal (probabilistic) strategy derived in the previous sectionand will receive all messages possible (subject to cellular bandwidth capacity limits),starting from the ones of the highest impact to the vehicle; we will also refer to sucha strategy as a selfish or greedy-local strategy. As a result and since a given messagewill very likely be of the same specific-impact level for all vehicles around the same lo-cation, it is expected that vehicles in the same neighborhood will pretty much receivethe same messages and will miss out (due to bandwidth restrictions) again prettymuch the same messages. Consequently, if the vehicles cooperated and exchangedmessages in order to receive some messages from other vehicles (or to save cellularbandwidth), such cooperation would bring almost no benefit, due to the similarity ofmessages of the vehicles in the same neighborhood. In other words, cooperation isbeneficiary only if the vehicles in the same neighborhood do not receive exclusively allthe highest impact level messages, but decide to leave out some high impact messagesand get some lowest impact instead. This way, the set of messages available to theentire neighborhood will be larger and the messages in the vehicles would be morediverse, compared to that under the non-cooperative strategy, Section 5.2.
Based on the above it is clear that in a cooperative environment vehicles wouldneed to adopt a strategy different than the selfish or greedy-local one. That is, vehiclesshould not receive the highest impact messages which would maximize their utility if

5.3 cooperative approximate vehicular networks 55
no cooperation is available, but opt for receiving also some messages of lower impactand reducing the resulting total utility, aiming at more than compensating for thisutility reduction by fetching missing (high impact) messages from the neighbors. Infact, the average over all vehicles utility in a cooperative network is expected to behigher than that under no cooperation (greedy-local strategy).
One possibility to coordinate the reception of messages is through explicit coop-eration using cluster-based approaches, in which one selected vehicle, the so-calledcluster-head, coordinates the reception of messages. While this approach is very effi-cient regarding the additional gain of cooperation, it decreases in performance if thetopology changes frequently, as happening in vehicular networks. Thus, we develop anon-cooperative game, in which the vehicles in the neighborhood adapt their strategywithout explicitly coordinating with the other vehicles. It is clear that the vehiclesin a neighborhood choose their strategy ~pφ, aiming at maximizing their utility in thecooperative networking environment. In the following, we investigate the utility of thetagged vehicle, i. e., pick one vehicle and derive the optimal strategy for this vehicle.
5.3.1 Game-Theoretic Model
In contrast to the approach without cooperation between vehicles, the utility of thetagged vehicle in the cooperative use-case depends not only on its own strategy but alsoon the strategies of the vehicles in proximity. These vehicles can forward messagesto the tagged vehicle and, thus, increase its utility. However, the strategies of theneighboring vehicles are generally unknown to the tagged vehicle and, again, dependon the strategies of their respective neighbors. Thus, the global optimal solution wouldrequire knowledge of the full vehicular network, which cannot be obtained due tocomplexity reasons.
To address this issue, we develop a local algorithm by assuming a common strategyfor all vehicles of the same privacy-level in the neighborhood. This assumption is notfar from realistic as the neighborhoods are (partially) overlapping. It is evident thatthis assumption is a simplification, but converts the problem to be solved to a problemonly dependent on the current neighborhood of the tagged vehicle.
To determine the optimal strategy for the tagged vehicle, we again employ a prob-abilistic behavior, i. e., we use the probability pφ,i to receive a certain fraction ofmessages of impact-level i given its current privacy-level φ. As discussed previously,we assume that there is no message drop during the transmission of messages fromthe server to the vehicle. Thus, the faction of received messages of impact-level i isprecisely the probability for the tagged vehicle to subscribe to this impact-level i, i. e.,pceli = pφt,i. In contrast to the approach without vehicular cooperation, the tagged
vehicles might receive a message from one of the neighbors. As already mentioned,every vehicle is willingly sharing every message that it receives via the cellular channelwith its one-hop neighborhood. Given the number of vehicles nφ with privacy-levelφin Wifi communication range, we can determine the probability to receive a messagevia Wifi as shown in Equation 39. It is equal to the probability that any of the neigh-bors has received the message via the cellular channel, i. e., not none of the neighbors

56 approximate vehicular networks
has received the message. Notice that the probability to receive a message from one
specific vehicle via Wifi is equal to the probability that the tagged vehicle receives ititself via the cellular network due to the assumption of equal strategies. Additionally,notice that nφ includes the tagged vehicle, i. e., the number of neighbors with thesame privacy-level is nφt − 1.
pwifi = 1− (1− pφt,i)
nφt−1 ·∏
φ∈Φ\{φt}
(1− pφ,i)nφ (39)
Based on pceli and pwif
i , we can use Equation 33 to describe the utility of the taggedvehicle based on its neighborhood and its own strategy as shown in Equation 40.
u(~p1, . . . ,~p|Φ|,φt) =
nµ∑
i=1
aφt,i · µφt,i ·
1−∏
φ∈Φ
(1− pφ,i)nφ
(40)
with the constraintsnµ∑
i=1
aφ,i · pφ,i 6 A, ∀φ ∈ Φ (41)
and
pφ,i ∈ [0, 1], ∀φ ∈ Φ, ∀i ∈ {1, . . . ,nµ} (42)
5.3.2 Deriving the Optimal Strategy
The optimal strategy can be derived by finding the set of probabilities pφt,i, for whichthe utility is maximized. To maximize the utility, we use a method which is alignedwith the KarushKuhnTucker conditions. The KarushKuhnTucker conditions can beused to derive the input values (in this case pφt,i) for which a function (in this caseu(~p1, . . . ,~p|Φ|,φt)) is maximized. Our method devides the set of privacy-levels, for agiven impact-level i, into the set of privacy-levelsΦ+(i), containing the privacy levelsunder which the tagged vehicle may subscribe to impact-level i (subscribing or notwill depend on the derived strategy), and the set of privacy-levels Φ−(i), containingthe privacy levels under which the tagged vehicle will never subscribe to impact-leveli. With that, the cases in which invalid values of pφt,i maximize the expected utilityare handled similarly as with the KarushKuhnTucker conditions. The upper bound ofpφt,i do not need to be considered as shown later in the derivations.
Similar to the non-cooperative case, we assume that the bandwidth available throughEquation 41 is fully utilized; that is, the left hand side is equal to the right hand side.Based on that, any probability pφt,m can be replaced by a combination of all otherprobabilities as shown in Equation 43.
pφt,m =A−
∑nµi=1 | i 6=m
aφt,i · pφt,i
aφt,m(43)

5.3 cooperative approximate vehicular networks 57
Based on this equation, an increase (decrease) in any of these probabilities wouldrequire the decrease (increase) of some other one(s). Notice that all probabilities pφt,iare independently selected (subject to the constraints in Equation 42) except one ofthem, say pφt,m, due to Equation 43. Then, we will try to derive the values of the prob-abilities pφt,i that maximize the expected utility by considering the partial derivativesof the expected utility with respect to pφt,l, for all l except m. As it is only possibleto decrease pφt,m if it is above 0, it is necessary that φt ∈ Φ+(m). Otherwise, thederivative of the expected utility with respect to any probability pφt,l for l 6= mwouldnot necessarily be 0, as the optimal value for this probability might be outside of theallowed value range, which would lead to a wrong value of pφ,l. Additionally, theprobability pφ,m needs to be greater than 0 for all privacy-levels, to provide the nec-essary coordination between them. Otherwise, the impact-level m could not be usedas a reference, would increase the complexity of Theorem 1, which is necessary toobtain the optimal strategy. This requirement cannot always be assured and limits theapplicability of our solution to a subset of the possible solutions. In Section 5.3.3, wediscuss possibilities to alleviate this requirement and obtain all possible solutions.
Until required, pφ,m is kept in the equation to increase readability and only considerits dependency from all other probabilities pφ,i, ∀i 6= m when calculating derivatives.The requirements of the probabilities from Equation 42 are not considered in thecalculation but are considered later in Section 5.3.3 by changing the impact-levels towhich a privacy-level may subscribe to. This ensures the detection of the utility-optimalsolution and enables us to choose slightly less optimal solutions to reduce the relianceon the vehicles in proximity. The utility-optimal strategy is derived for consideringevery impact-level i individually. For this purpose, we calculate the partial derivativesof the utility with respect to the probability to subscribe to any impact-level l anyprivacy-level φ ∈ Φ+(l) as shown in Equation 44. As pφt,m is used in Equation 43to account for the bandwidth dependency, all other two probabilities pφ,i and pφ,j
are independent if i 6= j and i 6= m and j 6= m. Thus, we only need to consider thesummands containing the probability pφt,l and pφt,m in the derivative with respectto pφ,l, as the derivative of all other summands are 0. As we are searching for optimalpoints, the derivative of the expected utility is set to 0 to find the turning points ofthe utility function. We provide an analysis of these turning points showing that theymaximize the utility function (and, thus, yield the optimal points) in Section 5.6.1.
∂u
∂pφt,l= µφt,l · aφt,l ·nφt · (1− pφt,l)
nφt−1 ·∏
φ∈Φ\{φt}
(1− pφ,l)nφ
+µφt,m ·aφt,m ·
(
∂pφt,m
∂pφt,l
)
nφt · (1−pφt,m)nφt−1 ·∏
φ∈Φ\{φt}
(1−pφ,m)nφ!= 0
(44)

58 approximate vehicular networks
Notice that the derivative of pφt,m with respect to pφt,l appears in Equation 44 sincepφt,m depends on pφt,l as explained earlier; this derivative can be calculated basedon Equation 43 as follows.
∂pφt,m
∂pφt,l= −
aφt,l
aφt,m(45)
After some transformations and the insertion of the derivative of pφt,m with respectto pφt,l, we obtain Equation 46.
µφt,l · aφt,l ·nφt · (1− pφt,l)nφt−1 · Pl(Φ \ {φt})
= µφt,m · aφt,m ·aφt,l
aφt,m·nφt · (1− pφt,m)nφt−1 · Pm(Φ \ {φt}) (46)
withPj(Φ) =
∏
φ∈Φ
(1− pφ,j)nφ
This equation can be simplified considering that (i) µφt,i = µ0,i/ρφt ,i as discussed inSection 5.1.1, and (ii) aφt,l and nφt are contained on both sides of the equation. Thisleads to Equation 47, which needs to be fulfilled for the optimal solution.
(
1− pφt,l
1− pφt,m
)nφt−1
=
(
µ0,m
µ0,l
)
·
(
ρφt,l
ρφt,m
)
·Pm(Φ \ {φt})
Pl(Φ \ {φt})(47)
In this equation, not only the probabilitypφt,l of the impact-level l of the tagged vehi-cle is contained, but also the probabilities pφ,l, ∀φ ∈ Φ \ {φt} of all other privacy-levels.To be able to calculate pφt,l, for all l exceptm, we need to represent pφ,l, ∀φ ∈ Φ \ {φt}
as pφt,l. According to Theorem 1, Equation 47 can be represented as Equation 48.In this equation, we use the auxiliary variables Φ+(l), which is a set containing allprivacy-levels with pφ,l > 0, and Φ−(l), which is a set containing all privacy-levelswith pφ,l = 0. It is evident, that any φ can only be contained in eitherΦ+(l) orΦ−(l),i. e., Φ+(l)⊕Φ−(l) = Φ and Φ+(l)∩Φ−(l) = ∅.
(
1− pφt,l
1− pφt,m
)n+(l)
=
(
µ0,m
µ0,l
)
·
(
ρφt,l
ρφt,m
)
·∏
φ∈Φ+(l)\{φt}
(
ρφ,l · ρφt,mρφ,m · ρφt,l
)nφ
·Pm(Φ−(l))
(48)
withn+(l) =
∑
φ∈Φ+(l)
nφ − 1
Notice that Equation 48 depends on the probability pφ,m of all privacy-levels φ ∈Φ−(l). Additionally, n+(l) is the total number of neighbors that may subscribe to theimpact-level l.

5.3 cooperative approximate vehicular networks 59
Theorem 1. We can represent Equation 47 as Equation 48.
Proof. We use full-induction to show that Equation 47 can be represented as Equa-tion 48. For this purpose, we utilize the partial derivatives of the utility with respectto the probabilities of all privacy-level φ ∈ Φ+(l) that are in the neighborhood of thetagged vehicle.
For the base-case, we set Φ = {φt}. Based on Equation 47, we observe that Pm(Φ \
{φt}) = 1 and Pl(Φ \ {φt}) = 1, as Φ contains only φt. Additionally n+(l) = nφt − 1
and φt ∈ Φ+(l) as the derivative with respect to pφt,l has only been considered ifφt ∈ Φ
+(l). Thus, we can immediately represent Equation 47 as Equation 48 for thebase-case.
For the induction step, we introduce additional auxiliary variables. These areΦ+
+(l) ⊆ Φ+(l) and Φ+−(l) ⊆ Φ+(l) with φ ∈ Φ+
+(l) ⊕Φ+−(l), ∀φ ∈ Φ
+(l) \ {φt}.Φ+
+(l) contains all privacy-levels φ, for which the derivative of the utility with respectto pφ,l has already been included in the calculation ofφt. Similarly,Φ+
−(l) contains allprivacy-levels that have not been included. Notice that the privacy-level after whichthe utility has been derived is not included inΦ+
+(l), but always considered separately.In each induction step, the probability pφn,l of one additional privacy-level φn isinserted into all equations that have not yet been considered, i. e., that are part ofΦ+
−(l).Based on Φ+
−(l) and Φ++(l), we can introduce Equation 49 as a combination of
Equation 47 and Equation 48, which captures the intermediate result, in which onlya subset of the probabilities has already been inserted. n+
+(l) is defined similar ton+(l), but only considers privacy-levels in Φ+
+(l). For all privacy-levels in Φ++(l), the
representation from Equation 48 is used, while Equation 47 is used for all privacy-levels inΦ+
−(l), which still needs to be handled. Notice that n++(l) contains the −1 that
would otherwise be missing, as the original exponent is nφt − 1.
(
1− pφt,l
1− pφt,m
)n++(l)+nφt
=
(
µ0,m
µ0,l
)
·
(
ρφt,l
ρφt,m
)
·∏
φ∈Φ++(l)
(
ρφ,l · ρφt,mρφ,m · ρφt,l
)nφ
·Pm((Φ−(l)∪Φ+
−(l))} \ {φt})
Pl(Φ+−(l) \ {φt})
(49)
In the following, we aim at including the privacy-level φn, which is currently inΦ+
−(l), into Φ++(l). For this purpose, we utilize a similar equation as Equation 49,
just with the difference that the utility has been derived with respect to pφn,l insteadof pφt,l. The remainder of the equation remains similar except for the difference inadaptation factors (ρφn,m vs. ρφt,m and ρφn,l vs. ρφt,l), which leads to Equation 50.

60 approximate vehicular networks
(
1− pφn,l
1− pφn,m
)n++(l)+nφn
=
(
µ0,m
µ0,l
)
·
(
ρφn,l
ρφn,m
)
·∏
φ∈Φ++(l)
(
ρφ,l · ρφn,m
ρφ,m · ρφn,l
)nφ
·Pm((Φ−(l)∪Φ+
−(l)) \ {φn})
Pl(Φ+−(l) \ {φn})
(50)
We now insert the probability pφn,l associated with the privacy-level φn into Equa-tion 49. This probability is contained in Pl(. . .) of Equation 49 respectively, which isadjusted such that pφn,l can be considered separately. Additionally, the probabilitiespφt,l and pφt,m are contained in Pl(. . .) and Pm(. . .) of Equation 50 respectively, whichare also adjusted such that these probabilities can be considered separately. After sometransforms, we obtain Equation 51. While pφn,l is the replaced variable and, thus, notcontained in this equation, pφn,m could be canceled immediately by adjusting Pm(. . .).
(
1− pφt,l
1− pφt,m
)n++(l)+nφt−
nφn ·nφtn++(l) +nφn =
(
µ0,m
µ0,l
)1−nφn
n++(l) +nφn
·
(
ρφt,l
ρφt,m
)1−∑
φ∈Φ++(l)
nφ
·∏
φ∈Φ++(l)
(
ρφ,l
ρφ,m
)nφ·
(
1−nφn
n++(l) +nφn
)
·
(
Pm({Φ−(l)∪Φ+−(l)} \ {φt,φn})
Pl(Φ+−(l) \ {φt,φn})
)1−nφn
n++(l) +nφn
·
(
ρφn,l
ρφn,m
)
(
∑
φ∈Φ++(l)
nφ−1
)
·nφn
n++(l) +nφn (51)
These exponents can be transformed now according to Equation 52, Equation 53,and Equation 54. Notice that
∑φ∈Φ+
+(l) nφ − 1 = n++(l).
n++(l) +nφt −
nφn ·nφtn++(l) +nφn
=n++(l) ·
(
n++(l) +nφn +nφt
)
n++(l) +nφn
(52)
1−nφn
n++(l) +nφn
=n++(l)
n++(l) +nφn
(53)
∑
φ∈Φ++(l)
nφ − 1
·nφn
n++(l) +nφn
=n++(l) ·nφn
n++(l) +nφn
(54)
We can observe that all these exponents share n++(l)/
(
n++(l)+nφn
)
common factor,which we eliminate in the following to transform Equation 51 to Equation 55.

5.3 cooperative approximate vehicular networks 61
(
1− pφt,l
1− pφt,m
)n++(l)+nφn+nφt
=
(
µ0,m
µ0,l
)
·
(
ρφt,l
ρφt,m
)−(
n++(l)+nφn
)
·
∏
φ∈Φ++(l)
(
ρφ,l
ρφ,m
)nφ
·Pm({Φ−(l)∪Φ+
−(l)} \ {φt,φn})
Pl(Φ+−(l) \ {φt,φn})
·
(
ρφn,l
ρφn,m
)nφn
(55)
With some minor transformations, like the grouping of the adaptation factors ρ...,we can then obtain Equation 56.
(
1− pφt,l
1− pφt,m
)n++(l)+nφn+nφt
=
(
µ0,m
µ0,l
)
·
(
ρφt,l
ρφt,m
)
·
∏
φ∈Φ++(l)
(
ρφ,l · ρφt,mρφ,m · ρφt,l
)nφ
·
(
ρφn,l · ρφt,mρφn,m · ρφt,l
)nφn
·Pm((Φ−(l)∪Φ+
−(l)) \ {φt,φn})
Pl(Φ+−(l) \ {φt,φn})
(56)
If we addφn intoΦ++(l) and remove it fromΦ+
−(l) in Equation 49, we end up exactlywith Equation 56. Additionally, if we set Φ+
+(l) = {Φ+(l) \ {φt}} and Φ+−(l) = ∅ by
considering all privacy-levels, we obtain Equation 48. Thus, we successfully showedthat the derivative of the utility function can be simplified as described above.
According to Equation 48, we can calculatepφt,l only based on the other probabilitiesof φt through the auxiliary variable pφt,m and the other privacy-levels φ for whichpφ,l = 0. To determine the value of pφt,l, we need to replace pφt,m with all otherprobabilities pφt,i | i 6= m as shown in Equation 57.
1− pφt,l
1−
(
A
aφt,m−∑nµi=1 | i6=m
aφt,i · pφt,iaφt,m
)
n+(l)
=
(
µ0,m
µ0,l
)
·
(
ρφt,l
ρφt,m
)
·∏
φ∈Φ+(l)\{φt}
(
ρφ,l · ρφt,mρφ,m · ρφt,l
)nφ
· Pm(Φ−(l)) (57)
After taking the n+(l)-th root of the equation, and some manipulations, we obtainEquation 58. This equation still contains the dependency on other privacy-levels en-capsulated in Pm(Φ−(l)), which increases the complexity of the solution. For now,we assume that Pm(Φ−(l)) is constant, i. e., the strategy associated with the otherprivacy-levels is already known. The implications or this assumption are discussedand addressed later for the general case. Notice also that no such assumption is neededin certain cases, such as when Φ+(i) = Φ or Φ+(i) = ∅ for all i ∈ {1, . . . ,nµ}, when

62 approximate vehicular networks
there is only one privacy level, etc. In this case, Equation 58 is a linear equation and,thus, can be simplified.
1− pφt,l =
1−
A
aφt,m−
nµ∑
i=1 | i 6=m
aφt,i · pφt,iaφt,m
·Λl (58)
with
Λl = n+(l)
√
√
√
√
(
µ0,m · ρφt,lµ0,l · ρφt,m
)
·∏
φ∈Φ+(l)\{φt}
(
ρφ,l · ρφt,mρφ,m · ρφt,l
)nφ
· Pm(Φ−(l)) (59)
Notice that since Pm(Φ−(l)) only considers the privacy levels φ for which pφ,l is zero,Λl depends only on system inputs and pφ,m for the privacy levels φ for which pφ,l iszero. Also notice that φt is never included in Φ−(l).
Equation 58 still depends on pφt,i, which needs to be resolved to obtain the optimalvalue for pφt,l. To remove this dependency, we first investigate the ratio between anypair pφt,i and pφt,j, with the assumption that i /∈ Φ−(i) and j /∈ Φ−(j), i. e., pφt,i 6= 0and pφt,j 6= 0. If i ∈ Φ−(i), then pφt,i does not appear in any of the other equation aspφt,i = 0. By considering Equation 58 for l = i and l = j, and taking the ratio of theresulting equations, the following is obtained.
1− pφt,i
1− pφt,j=Λi
Λj⇒ pφt,i = Λi
(
pφt,j − 1
Λj
)
+ 1 (60)
We insert Equation 60 into Equation 58 for every i 6= m, which leads to Equation 61.Notice that Equation 60 can also calculate the dependency if i = j, which is 1.
1−pφt,l =
1−
A
aφt,m−
nµ∑
i=1 | i 6=m ∧ φt/∈Φ−(i)
aφt,i ·
[
Λi
(
pφt,l − 1
Λl
)
+ 1
]
aφt,m
·Λl
(61)
This equation can be simplified to Equation 62. The complete derivation of thisequation is shown in the appendix in Section A.2.
pφt,l =
[
A−∑nµi=1 | φt/∈Φ−(i)
aφt,i
]
·Λl∑nµi=1 | φt/∈Φ−(i)
aφt,i ·Λi+ 1 (62)
The optimal probability for the tagged vehicle to receive a message of impact-levell, given its privacy-level φt, depends on (i) the total available bandwidth A, (ii) thebandwidth consumption aφt,i associated with the reception of messages of impact

5.3 cooperative approximate vehicular networks 63
level i by the tagged vehicle of privacy level φt, and (iii) the expected specific-impactsµφt,l and µφt,m associated with the privacy-level of the tagged vehicle φt and thestrategies associated with the other privacy-levels encapsulated in Λi. Notice that Λionly depends on the strategies associated with the privacy-levels contained in Φ−(i).Additionally, any probability pφt,l is always smaller than 1 as long as the availablebandwidth is smaller than the bandwidth required to receive all messages. In thiscase, all probabilities pφt,l = 1, ∀l ∈ {1, . . . ,nµ}, i. e., all messages are being receivedby the tagged vehicle. On the contrary, pφt,l might also be smaller than 0 in certainsituations. In this case, there is no valid solution available with the current definitionof Φ−(i) and Φ+(i). To obtain the optimal strategy, all possible Φ−(i) and Φ+(i) areevaluated as described in Section 5.3.3.
Based on Equation 62, we can derive the strategy ~pφt using the strategy of allother vehicles. As these strategies are generally unknown as no explicit coordinationis assumed, the vehicle needs to also calculate the strategy of the other vehicles andfind their optimal strategy for every privacy-level. For this purpose, the strategy forevery privacy-level is determined based on Heuristic 2. This heuristic determines theoptimal strategy for each privacy-level based on the strategies of all other privacy-levelsin a round-robin fashion: While the strategy of a certain privacy-level is determined,the strategies of the other privacy-levels are assumed to be fixed. This behavior isrepeated until no change (within ǫ) to the strategy of any privacy-level is observed,which terminates the heuristic and the optimal strategy is determined. While wecannot prove that our heuristic terminates, there are some cases in which the heuristiccan be easily shown to terminate:
1. There is no inter-dependency between privacy-levels, i. e., Φ+(i) = Φ, ∀i ∈
{0, . . . ,nµ}. In this case, the privacy-levels are calculated independent of eachother, as each privacy-level can predict the strategy of the others.
2. There is no circular dependency, i. e., if privacy-level φ1 depends on φ2 asφ1 ∈ Φ
+(i) and φ2 ∈ Φ−(i), and ∄j | φ1 ∈ Φ−(j)∧φ2 ∈ Φ
+(j), i. e., φ2 doesnot depend on φ1. In this case, we can solve φ2 first, and then utilize the finalstrategy of φ2 to determine the strategy of φ1.
As we cannot prove that our heuristic terminates in the general case, the iterationsneed to be terminated at some point and the goodness of the found strategy be checked.In our simulative analysis, we observed that the heuristic terminates yielding thecorrect strategies, which we attribute to the following three factors:
1. If the calculation of an impact-level i depends on any other privacy-level φo forwhich φo ∈ Φ−(i), then pφo,m is considered in the calculation of pφt,l. pφo,m
depends on all probabilities pφo,i | i 6= m, i. e., possible errors of pφo,i maycompensate each other.
2. The deviation from the optimal solution influences Λl and Λi in Heuristic 62,where Λl is in the nominator and Λi is in the denominator, i. e., they potentiallybalance the error of the other.

64 approximate vehicular networks
3. ∃ j,φo | n+(j) > nφo , in which case the error is reduced, as the overall influenceof the error is determined by the relation between these parameters.
Heuristic 2 : Determination of the optimal strategy for all privacy-levels.recal(. . .) recalculates pφt,i based on the current values of pφ,i. ǫ is the in-finitesimal.Result : pφ,i, ∀φ ∈ Φ, i ∈ {1, . . . ,nµ}
1 pφ,i ← 0, ∀φ ∈ Φ, i ∈ {1, . . . ,nµ};2 c←∞;3 for i← 1; c > ǫ; i← (imod |Φ|) + 1 do
4 tempj ← pi,j, ∀j ∈ {1, . . . ,nµ};5 recal(pi,j), ∀j ∈ {1, . . . ,nµ};6 c←
∑nµj=1 |tempj − pi,j|;
7 end
8 return pφ,i, ∀φ ∈ Φ, i ∈ {1, . . . ,nµ};
5.3.3 Approximating the Optimal Strategy
As already mentioned in the previous section, our approach utilizes the variablesΦ+(i) andΦ−(i) for every impact-level i. This strategy is necessary as the bandwidth ofan privacy-level might not be able to achieve the optimal solution due to the restrictionsto probabilities (pφ,i ∈ [0, 1], ∀φ ∈ Φ, i ∈ {1, . . . ,nµ}). For this purpose, we analyzeevery possible combination of Φ+(i) and Φ−(i) and calculate the solution for eachpossible combination according to the previous chapter. As assumed by Theorem 1, itis necessary that there is one impact-levelm for which Φ+(m) = Φ, as the associatedprobability pφt,m might be used in the calculation of the strategies of the other privacylevels according to Equation 59. 1
As for every privacy-levelφ and every impact-level i eitherφ ∈ Φ+(i) orφ ∈ Φ−(i)
holds, there are in the worst-case 2|Φ|·nµ combinations. This leads to a worst-casecomplexity of our approach ofO(2|Φ|·nµ), i. e., scales exponentially with the number ofprivacy-levels and impact-levels. An exponentially growing complexity of the solutionis generally an issue. However, for this specific problem, the growth in complexity isgenerally low, as the number of privacy-levels and impact-levels is rather limited. Inorder to reduce the computational complexity if the computational resources are low,we can exclude solutions beforehand, such that the number of required calculationsdecreases. Solutions that can be excluded are:
1 While it cannot always be assumed that there is such an impact-level available, we could introduce avirtual impact-level nµ + 1, which as a anµ+1 = ǫ and µnµ+1 = 1/ǫ, with ǫ being the infinitesimal.This impact-level is assumed to be context-insensitive, i. e., aφ,nµ+1 = anµ+1, ∀φ ∈ Φ and µφ,nµ+1 =
µnµ+1, ∀φ ∈ Φ. Due to the high expected specific-impact and the context insensitivity, this impact-levelis always subscribed to by every vehicle but does not consume a relevant amount of bandwidth whenbeing subscribed to. The obtained solution is then still an approximation, but the approximation is veryclose to the optimal value and depends on the value for ǫ used in the actual implementation.

5.4 determining the privacy adaptation factor 65
1. Solutions in which ∃i ∈ {1, . . . ,nµ} | Φ−(i) 6= ∅∧Φ+(i) 6= ∅, i. e., we exclude all
solutions in which the privacy-levels do not subscribe to the same impact-levels.This reduces the computational complexity to O(2nµ), as each impact-level canbe either active or passive.
2. Solutions in which ∃i | φ ∈ Φ−(i)∧φ /∈ Φ−(i+ 1), i. e., a vehicle needs to sub-scribe to all impact-levels above the impact-level with the lowest index (orderedby the impact µ0,i). Removing these solutions also reduces the possibility ofimplicit coordination, but reduces the computational complexity to O(n
|Φ|µ ), as
there are nµ possibilities per privacy-level which need to be combined with thepossibilities of all other privacy-levels.
3. Solutions in which any of the conditions are fulfilled. In this case, the number ofcalculations is linear with the number of impact-levels, i. e., the computationallycomplexity reduces to O(nµ).
While all three possibilities greatly reduce the computational overhead induced by ourapproach, its performance also drops. In general, our approach can be refined withincreasing computation time, starting with the solutions from 3, followed by 1 and 2starting with the less computational expensive, and finally calculating the remainingcombinations. That way, the calculation can be aborted at any time and still provide areasonable result.
5.4 determining the privacy adaptation factor
The privacy adaptation factor ρφ,i determines the imprecision area which affectsthe context-based dissemination of messages. For a given impact-level i, the relationbetween the resulting context-based dissemination scope (e. g., an area) of a givenevent and the original dissemination scope (under no privacy concerns) is captured bythe privacy adaptation factor ρφ,i defined to be the ratio of these dissemination scopes(e. g., areas). Thus, the negative influence of location privacy to the system is stronglycorrelated with the associated distribution mechanism. As the vehicle provides an areain which it is certainly located with a uniform distribution, the only way to ensure thereception of messages is by providing all messages that are relevant to any vehicle inthis area. For context-sensitive data, location privacy thus impacts the area in whichdata is considered to be relevant. With increasing size of this area, the load for thevehicles increases drastically. In this section, we describe the influence of locationprivacy to the data distribution mechanisms described in this thesis and proposemechanisms to determine ρφ,i for each described data distribution mechanism.
5.4.1 Area-based Dissemination
Consider an event of impact-level i and a circular dissemination area of radius ηi. Anyvehicle whose exact location is within this area will be receiving this event. For a non-privacy-sensitive vehicle, the radius κφ,0 of the dissemination area κφ,0 = ηi. Suppose

66 approximate vehicular networks
now that a tagged such vehicle would like to hide its exact location within a circularimprecision area of radius rφ. Since the maximum displacement of the exact locationof this vehicle is rφ, the reception of the event by such a vehicle will be guaranteedas long as the radius ηi of the original circular dissemination area is extended by rφ.The latter ensures reception of the event by a vehicle whose exact location is on theperiphery of the original circular dissemination area of radius ηi and on the peripheryof its imprecision area with radius rφ. As data relevant to any vehicle in the area needsto be provided, κφ,i = κφ,0 + rφ = ηi + rφ, where rφ is the size of the area hiding thevehicle’s real location. The adaptation factor is shown in Equation 63. It assumes thatthe area in which the vehicle hides is of the same geometrical form as the messagedissemination area. In this equation, ζ is the relation between the actual size of theinterest area compared to the size of the maximum circle fitting inside this area, whichis ζ = 4/π for squares and ζ = 1 for circles.
ρφ,i =ζ · π · κ2φ,i
ζ · π · r2i=η2i + 2 · ηi · rφ + r2φ
η2i= 1+ 2 ·
rφ
ηi+
(
rφ
ηi
)2
=
(
rφ
ηi+ 1
)2
(63)
5.4.2 Road-based Dissemination
For road-based dissemination, the adaptation factor is more context-sensitive than for thearea-based dissemination. That is, as the events are not necessarily uniformly distributed.In general, a road segment has at least one incoming road segment. Thus, the numberof road segments the vehicles retrieves data from seems to grow exponentially withthe length of the maximum path. However, this exponential growth is only true forvery short paths, as the possibility of segments that appear in more than one pathincreases. As every road segment occupies a certain space, and the maximum lengthof a path limits the available area, the scaling in the number of road segments is notexponential, but only squared. Thus, the adaptation factor ρφ,i can be estimated usingthe length of the maximum path (in meters) and utilizing Equation 63.
It is evident that this upper-bound does not accurately describe the additionaloverhead induced through privacy, which reduces the performance of our approach.To more accurately capture it, the vehicle can determine the adaptation factor ρφ,i forits current context by determining the segments contained in the imprecision area anddetermining the relevant road segments for each of these segments. The adaptationfactor ρφ,i is then the ratio between the number of segments for the privacy-level φand the number of road segments for no privacy-sensitivity.
5.4.3 Relevance-based Dissemination
The adaptation factor ρφ,i for the road-based dissemination can be determined simi-larly to the road-based dissemination. For this purpose, either the length of the longestpath in conjunction with Equation 63 can be utilized to estimate ρφ,i, or the numberof road segments with and without privacy are compared to obtain ρφ,i.

5.5 consideration of the specific-impact in the dissemination of messages 67
5.5 consideration of the specific-impact in the dissemination of messages
In this section, we describe the consideration of the specific-impact in the messagedissemination. As described in the previous sections, vehicles subscribe to messagesbased on the base-impact. While the strategy of the vehicle is determined by estimatingthe average specific-impact of a message in each impact-level, mechanisms for theconsideration of the specific-impact of each message need to be proposed.
There are multiple options to address this issue: (i) let every impact-level address arange of specific-impact values, (ii) create a new impact state for every possible specific-impact value, or (iii) reduce the influence of lower-impact messages by reducing theprobability of them being transmitted on the server-side. The first option inducesinaccuracy into the system, as the specific-impact value of a message in an impact-level can only be estimated. Thus, the found solution is suboptimal. To address thisissue, the second option removes that inaccuracy, but induces a severe scalability issue,as the number of possible impact states is very high and the optimal strategy can hardlybe determined. Thus, we decided to use the third option, in which the lower-impactmessages are only transmitted with a certain probability pserver(~m) on the server-side,which depends on the measurement ~m. This leads to a lower bandwidth consumptionof these messages, as only a share is transmitted, and ensures the transmission of low-impact measurements (of that high-impact state) with a low probability. To determinethe probability, we divide the specific-impact µ(~m, t) of a measurement ~m by the base-impact of the message as shown in Equation 64. This leads to an implicit prioritizationof highly relevant messages, as the transmission probability for messages with lowspecific-impact is reduced. Notice that per definition, the base-impact is representedby one impact-level.
pserver(~m) =µ(~m, t)
µ0,i(64)
To decide on the vehicles that receive a certain measurement ~m, the server creates arandom value r ∈ [0, 1]. The server transmits the message to a vehicle if (i) the vehiclehas stated its interest in the corresponding impact-level, and (ii) the probability for thevehicle to receive this message is larger than r. As events are generally measured bymultiple vehicles, this probabilistic filtering in principle reduces the update frequencyof these messages to reduce the overall network load.
For this purpose, we describe the handling of the measurement-specific influenceon the specific-impact in Section 5.5.1, followed by the handling of the context-specificinfluence on the specific-impact in Section 5.5.2.
5.5.1 Consideration of Inaccurate Measurements and the Event State
One influence on the specific-impact is the measurement itself, including its inaccuracyand the measured event state. As an example, the server has two measurements

68 approximate vehicular networks
~m1 = (0, 1)T and ~m2 = (1, 0)T of type t, which has an impact vector ~µt as shown inEquation 65.
~µt =
(
1
1000
)
(65)
Thus, we can derive µ(~m1, t) = 500 and µ(~m2, t) = 0.5 based on the calculation forthe specific-impact of a message. Thus, we would transmit ~m1 with a probability ofpserver(~m1) = 500/1000 = 50% and ~m2 with a probability of pserver(~m2) = 0.5/1000 =
0.05%.This reduces the expectation for the bandwidth requirements a0,i of the correspond-
ing impact state i to the corresponding probability, but we need to guarantee that theexpected specific-impact of that specific measurement equals the base-impact µ0,i
of the corresponding impact-level µ0,i. For this purpose, we analyze the providedinformation if the measurement is received by one specific vehicle: While only onemessage is received, the vehicle can assume the existence of a certain number of non-transmitted measurements based on its knowledge about the message’s relevance foritself and the measurement accuracy. These two factors are both considered to beknown by the vehicle, either by deriving them from the actual message/measurementor by the server explicitly communicating them to the vehicles. Based on these factors,the receiving vehicle can estimate the average number nmiss of missed measurementswith a similar specific-impact µ(~m, t), which is reciprocal to the probability pserver(~m)
for ~m being transmitted, as shown in Equation 66.
nmiss =1
pserver(~m)(66)
Based on that, by transmitting ~m, the server implicitly provides information aboutthe missed measurements. This information can be used in the measurement aggre-gation process by weighting the measurement accordingly. This induces some errorif the probability is comparably low, as a single transmitted measurement has a highweight in this case. However, since measurements are pre-aggregated by either thevehicles locally or by the server, this effect is considered to be low. Notice that high-impact measurement (in case an event in a high-impact state) are still communicatedrapidly, while communicating the resolution of this high-impact state might takeslightly longer than normal. The effect of this behavior is, however, bound by the max-imum lifetime of measurements, which invalidates high-impact measurements aftera predefined time. These considerations change the effective specific-impact µeff(~m, t)
of transmitting such a measurement ~m to the combined specific-impact of all thesemissed measurements as shown in Equation 67.
µeff(~m, t) = µ(~m, t) ·nmiss =µ(~m, t)
pserver(~m)(67)

5.5 consideration of the specific-impact in the dissemination of messages 69
When replacing pserver(~m) according to its definition in Equation 64, we obtainEquation 68.
µeff(~m, t) =µ(~m, t)
pserver(~m)=µ(~m, t) · µ0,i
µ(~m, t)= µ0,i (68)
Thus, the effective specific-impact µeff(~m, t) equals the base-impact µ0,i of the corre-sponding impact-level i, which enables the transmission of lower-accuracy measure-ment using this method by considering the non-transmitted measurements.
5.5.2 Consideration of the Vehicle’s Context
The vehicle’s context influences the specific-impact for a specific vehicle. While mes-sages with a low specific-impact are considered to be less relevant for the vehicle,it is reasonable to transmit them with a low transmission frequency to reduce theeffects of bad prediction. Due to this low transmission frequency, the number of avail-able messages with low specific-impact is small, but the vehicle is still aware that theevent exists. Thus, our probabilistic server-side filtering decreases the rate with whichmessages with low relevance are provided to the vehicle.
However, this approach reduces the bandwidth used for the transmission of mes-sages, which might lead to a vehicle not utilizing its bandwidth fully in certain situa-tions. To account for this issue, each vehicle transmits the share of utilized bandwidthto the server. With that, it is possible for the server to adapt its filtering if the vehi-cle does not fully utilize its available bandwidth. In this case, the server adapts thetransmission probability such that the expected bandwidth consumption matches theavailable bandwidth of the vehicle (if possible). With that, the unused bandwidth ofthe vehicles is minimized, which further increases the performance of our approximatevehicular network.
The definition of relevance proposed in Section 4.3 can be used to influence thespecific-impact, and, thus, the dissemination of messages. However, also other dis-semination mechanisms might be viable and can be used to limit the dissemination ofmessages to, for example, a certain geographical area using the specific-impact. Area-based dissemination can be, for example, employed by using a definition of relevanceaccording to Equation 69.
R(sv, se) =
{1 if sv in area around se
0 else(69)
In this definition, a message is considered to be relevant if the vehicle is currentlylocated in an area around the event. While this definition is very inaccurate regardingits approximation of interest as described in Section 4.3, it may already be in usefor the filtering of messages in existing networks. With this redefinition of relevance,our mechanisms for approximate vehicular networks can be used with most availablemessage dissemination mechanisms, by adapting the relevance calculation such thatthe dissemination behavior is reflected.

70 approximate vehicular networks
5.6 system analysis
In this section, we describe the properties of our found solution and analyze thebehavior of this solution in a controlled setting to gain insights into the behavior ofour approach.
5.6.1 Properties of the Found Solution
In the following, we describe three properties of our solution, which are (i) optimality,(ii) stability, and (iii) coordination. Optimality and stability are important propertiesfor the applicability of our found solution in vehicular networks, while coordinationcan further increase the performance of the network.
5.6.1.1 Optimality
In Section 5.3, we found solutions that potentially maximize the utility of each indi-vidual vehicle, given the strategies of the other vehicles. However, we did not analyzeif the found solution is an optimal value, and if it is a local or global optimum, givenit is an optimal value. One possibility to prove the optimality of the found solution isto prove that the expected utility is a concave function. We prove that by showing thatthe Hessian matrix is negative definite. In the function of the expected utility function,the derivative
∂2u
∂pφt,i∂pφt,j= 0
for i 6= j, as there is no dependency between any two probabilities of the same strategy.Thus, it is sufficient to show that the diagonal of the Hessian matrix smaller than 0,what we do by calculating the second derivative of the expected utility with respectto any pφt,l as shown in Equation 70.
∂2u
∂2pφt,l= −µφt,l · aφt,l ·nφt · (nφt − 1) · (1− pφt,l)
nφt−1 · Pl(Φ \ {φt})
−µφt,m ·aφt,m ·
(
∂pφt,m
∂pφt,l
)2
nφt · (nφt − 1) · (1−pφt,m)nφt−1 · Pm(Φ \ {φt})
(70)
Notice that the second derivative is always smaller than 0 in the allowed range ofparameters if pφt,l < 1 and nφt > 2. That is, as every factor in the first summand isgreater 0, which leads to the product to be always greater than 0. In our optimizationproblem, pφt,l = 1will only occur iff the bandwidth is sufficient to receive everything,as otherwise this bandwidth utilization is comparably inefficient. If nφt = 1, weutilize a similar procedure as for the non-cooperative case, which is not captured byour considerations for cooperative vehicular networks. The same holds for the secondsummand, but its dependency on the other privacy-levels through Pm(. . .) might leadto the second summand being 0. As the first summand is always negative and the

5.6 system analysis 71
second summand is at most 0, we can observe that the Hessian matrix is negativedefinite. Thus, the expected utility is a concave function in the allowed range of theparameters. One property of a concave function is that each found optimum is alwaysa global optimum. Thus, our found solution is a global optimum, that guarantees thatthere is no other strategy that achieves a higher performance for this specific setupconsidering the strategies of the other privacy-levels.
5.6.1.2 Stability
For our developed solution to work, every vehicle needs to stick to the calculatedstrategy. If a vehicle could improve its own utility (and potentially the utility of others),it could derivate from the developed strategy and, thus, increase its own benefit. Innon-cooperative games, a state in which an actor has no incentive to change its strategyis called Nash equilibrium. A Nash equilibrium is reached if there no possibility forany actor to improve its decision while the decision of the other actors remains thesame. If this holds true for every actor in the system, there is no incentive for the overallsystem to change, leading to a stable system. A Nash equilibrium can be reached eitherbased on pure strategies or, as in our case, with mixed strategies. To show that ourfound solution is a Nash equilibrium, we optimize the strategy ~q of the tagged vehicleindependently of the other vehicles. We assume that all other vehicles stick to thepreviously derived solution, while the tagged vehicle aims to improve its utility u∗,which is shown in Equation 71.
u∗ =
nµ∑
i=1
µφt,i · aφt,i ·[
1− Pi(Φ \ {φt}) · (1− pφt,i)nφt ,i−1 · (1− qi)
]
(71)
The dependency of ql and qm remains the same as for the other vehicles, as thetagged vehicle also needs to stick to its bandwidth constraints. When calculating thederivative of the modified expected utility u∗, we derive Equation 72.
∂u∗
∂ql= µφt,l · aφt,l · (1− pφt,l)
nφt−1 · Pl(Φ \ {φt})
+ µφt,m · aφt,m
(
∂qm
∂ql
)
· (1− pφt,m)nφt−1 · Pm(Φ \ {φt})!= 0 (72)
As stated previously, the dependency of ql and qm persists and is similar to allother vehicles. When comparing Equation 72 with the derivative of the expected utilityshown in Equation 44, we can observe the similarity between these two equations. Infact, the only difference between them is the factor nφt , which is only contained in thederivative of the expected utility, but not in the derivative of the modified expectedutility. This relation is shown in Equation 73.
∂u∗
∂ql·nφt =
∂u
∂pφt,l, ∀ l ∈ {1, . . . ,nµ} (73)

72 approximate vehicular networks
As we already showed that the derivative of the expected utility is 0, we utilize thisknowledge to proof the correctness of Equation 72 as shown in Equation 74.
∂u
∂pφt,l= 0⇒
∂u∗
∂ql= 0, ∀ l ∈ {1, . . . ,nµ} (74)
This, however, does not necessarily state that there is no other possible solution witha higher utility, but only states that the found solution is a local optimum. The proofof the non-existence of another global optimum with a higher utility again requiresthe analysis of the second derivative with respect to the modified expected utility.As Equation 72 does not depend on ql anymore, the second derivative is always 0.Thus, there is no better solution available to the vehicle, i. e., there is no incentivefor the vehicle to adapt its strategy. Due to the fact that the decision of the vehicle,given it utilizes its bandwidth fully, does not decrease the vehicle’s performance, it iscrucial that every vehicle in the network knows the derivation of the optimal strategy.Otherwise, the vehicles might deviate from the optimal solution, as a change does notdecrease their performance immediately. However, if all vehicles change their strategy,the performance of the overall system will decrease.
5.6.1.3 Coordination
Through the introduction of multiple privacy-levels, coordination between these be-comes a possibility. That is, a certain privacy-level may be responsible for the receptionof a certain impact-level and all other privacy-levels ignore this impact-level, i. e., setthe corresponding probability of reception to 0. The advantage of this coordinationis the reduced redundancy compared to a shared responsibility, but this is at costsof reliability: If there is only one vehicle at a certain privacy-level, which is responsi-ble for the reception of a certain impact-level, a disconnect from this specific vehiclewould have similar consequences as disconnecting from a cluster-head. Thus, furtherquestions arise, like the minimum number of vehicles at a privacy-level such that othervehicles can rely on that privacy-level.
The solution for this issue is based on the fact that the different adaptation factorsρφ,i for each privacy-level. As completely relying on another vehicles is hardly ap-propriate for high-impact messages, we do not only use the solution with the highestutility as described in Section 5.3, but also consider the performance of the vehicle ifall other vehicles fail. Thus, we have two utility values based on the current strategyof the vehicle, one considering the cooperation with others, while the other accountsfor the case of failure. With this combination, there might be better solutions availablefor a vehicle than the chosen one from a model perspective, which are not appropriatein a realistic setting. Thus, in a realistic setting, we cannot guarantee that there is nobetter strategy available for a vehicle and rely on cooperation between them.
To choose the optimal strategy for the vehicle in real-world environments, the vehiclecombines these two utility values using the trust factor τ. τ is a value between 0 and1, where 1 states full trust on the vehicles in proximity, i. e., choosing the strategy onlybased on the cooperative utility uc, and 0 states no trust on the vehicles in proximity,

5.6 system analysis 73
1 6 10Bandwidth [msg./s]
1
6
11
Num
ber o
f Veh
icles
0.0 0.2 0.4 0.6 0.8 1.0
(a) Utility.
1 6 10Bandwidth [msg./s]
1
6
11
Num
ber o
f Veh
icles
0.0 0.2 0.4 0.6 0.8 1.0
(b) Probability ofImpact Level 1.
1 6 10Bandwidth [msg./s]
1
6
11
Num
ber o
f Veh
icles
0.0 0.2 0.4 0.6 0.8 1.0
(c) Probability ofImpact Level 2.
Figure 7: Behavior of our game-theoretic approach depending on the available bandwidth.
i. e., choosing the strategy only based on the utility uf in case of full failure. Betweenthese values, the final utility ut is derived from a linear combination of uc and uf asshown in Equation 75.
ut = τ · uc + (1− τ) · uf (75)
5.6.2 Numerical Analysis
In this section, we analyze the behavior of our game-theoretic approach in a controlledenvironment to gain a better understanding of the behavior of our developed approach.For this purpose, we analyze the influence of the available bandwidth per vehicle andof privacy, both depending on the size of the neighborhood.
5.6.2.1 Influence of the Available Bandwidth per Vehicle
A major influence to the performance of our game-theoretic approach is the availablebandwidth per vehicle A. That is, a high bandwidth enables the reception of moremessages, such that each individual vehicles is more self sustained and can also offermore to the vehicle in its proximity. To display the effects of the available bandwidth, weconsider a scenario with two impact-levels, in which all vehicles are privacy-insensitive.The first impact-level has an expected specific-impact value µ0 = 1 and consumesbandwidth of ai = 7. The second impact-level has an expected specific-impact valueof µ1 = 10 and consumes bandwidth of ai = 3. Thus, a bandwidth of 10 is requiredto receive all available messages.
In Figure 7, all figures analyze the influence of the available bandwidth A on the x-axis, while the number of vehicles in proximity is on the y-axis. When we investigate theutility in Figure 7a, we can observe that both the available bandwidth and the numberof vehicles in proximity increase the utility for the tagged vehicle. For the bandwidth,a high available bandwidth increases the system performance to the maximum, whilethe effect of the number of vehicles in proximity strongly depends on the available

74 approximate vehicular networks
0 1000 2000Radius [m]
1
6
11Nu
mbe
r of V
ehicl
es0.0 0.2 0.4 0.6 0.8 1.0
(a) Utility.
0 1000 2000Radius [m]
1
6
11
Num
ber o
f Veh
icles
0.0 0.2 0.4 0.6 0.8 1.0
(b) Probability ofImpact Level 1.
0 1000 2000Radius [m]
1
6
11
Num
ber o
f Veh
icles
0.0 0.2 0.4 0.6 0.8 1.0
(c) Probability ofImpact Level 2.
Figure 8: Behavior of our game-theoretic approach depending on the imprecision area.
bandwidth. That is, as a high available bandwidth enables the reliable reception ofmessages for a vehicle. This is not possible by increasing the number of vehicles inproximity due to the lack of explicit coordination. When investigating the strategy ofthe tagged vehicle depicted in Figure 7b, we can observe that the first impact-level(with lower specific-impact) is only considered if the available bandwidth increases.That is, as the specific-impact value of the second impact-level is significantly higherthan the specific-impact value of the first impact-level, such that a loss of a high-impact messages can hardly be compensated by the lower impact-level. This is alsoobservable in Figure 7c, in which the probability remains relatively constant if theavailable bandwidth is low. However, when the bandwidth increases, we can clearlyobserve that pφt,2 is decreased such that bandwidth can be used to receive messagesof the first impact-level. This effect then disappears when the bandwidth reaches 10,as all messages can be received by all vehicles.
5.6.2.2 Influence of the Radius of the Imprecision Area
Similar to the available bandwidth, the radius of the imprecision area has a majorinfluence to the utility of the tagged vehicle. In Figure 8, we display the geocast-baseddissemination of two impact-levels. The first impact-level has a dissemination radiusof r1 = 10000 and an associated expected specific-impact value of µ1 = 1. The secondimpact-level has a dissemination radius of r2 = 1000 and an associated expectedspecific-impact value of µ2 = 4. With that setup, the impact µφ,1 considering theprivacy-level φ is lower than µφ,2 until rφ > 1250. The bandwidth requirementsare similar for both impact-levels, and without privacy the available bandwidth issufficient to receive either one of them completely. To analyze the influence of theimprecision area, we vary the radius rφ of this area on the x-axis, and the number nφof vehicles in that privacy-level on the y-axis.
Figure 8a shows that the utility decreases with an increasing radius of the impre-cision area, and increases with an increasing number of vehicles. However, it is veryinteresting to analyze the degree of performance loss due to the increasing size of the

5.6 system analysis 75
imprecision area depending on the number of vehicles. While the decrease for a singlevehicle (without cooperation) is above 82%, the performance decrease with 11 vehiclesis below 33%. Even though these vehicles all have the same privacy-level, cooperationstill reduces the negative influence of privacy. Analyzing the behavior of the strategyof the vehicles is very interesting due to the change in expected specific-impact due tothe change in the imprecision area. Figure 8b displays the probability to receive theimpact-level with a lower base-impact. For a small imprecision area, this impact-levelis only considered if the number of vehicles is really high. But starting from rφ = 1250,the vehicles start focusing on this impact-level, as the expected specific-impact per bitof this impact-level is higher due to the lower influence of privacy to this impact-level.This is most visible for the case without cooperation, in which the vehicle completelyswitches from receiving only messages of impact-level 2 to receiving only messagesfrom impact-level 1. In contrast, Figure 8c displays the focus of the vehicles to impact-level 2, which is far above impact-level 1 at the beginning. However, with an increasingsize of the imprecision area, an increasing amount of bandwidth is used to compen-sate for the additionally required bandwidth usage for the reception of these messages.Starting from rφ = 1250, the vehicles focus on the reception of impact-level 1.
Summarizing, our system dynamically adapts to the environmental conditions andonly receives low-impact messages if the reception does not decrease the performanceof high-impact messages drastically. In addition, our approach considers the privacyof the vehicles and its influence on the available impact-levels to adapt to the environ-mental conditions.
In this chapter, we developed our innovative approach to approximate vehicular net-
working based on Diverse Prioritization and Treatment (DPT), which improves theperformance of the network without increasing the utilized communication resources.Our basic concept is the reduction of redundancy introduced through prioritizationin the network. We employ a probabilistic mechanism derived from a utility-basedgame to reduce this redundancy and, thus, free bandwidth for the reception of pre-viously not received messages. In our numerical analysis in Section 5.6, we alreadyshowed the behavior of our approach in a controlled environment. Our approach toapproximate vehicular networking is additionally evaluated in Section 7.4, where weshow the performance increase achieved through our concept of approximate vehic-ular networking and highlight the robustness of our approach against message lossand adversaries.


6V E H I C L E . KO M : P L AT FO R M FO R A P P ROX I M AT E V E H I C U L A RN E T WO R K S
To evaluate the performance of our approximate vehicular network, we need to de-sign and implement the possibility to evaluate large-scale vehicular networks in
a network simulator. For this purpose, we introduce Vehicle.KOM, a scalable platformfor the simulation of approximate vehicular networks. Our platform is based on theSimonstrator.KOM framework [150, 164] and enables the evaluation of approximatevehicular networks, which might consider the quality of data for prioritization. InSection 6.1, we present our extensions to the Simonstrator platform that are necessaryto simulate large-scale vehicular networks. For this purpose, we provide an overviewof our extensions to the Simonstrator.KOM platform and describe the design decisionsfor the platform components in Section 6.1.1, and our separation of networking andapplication logic in Section 6.1.2. Based on our Vehicle.KOM platform, we create aprototypical implementation of approximate vehicular networks based on the Pub-lish/Subscribe (Pub/Sub) paradigm in Section 6.2. Our prototypical implementationconsists of our mechanisms for data assessment in Section 6.2.1, and our impact-baseddata dissemination in Section 6.2.2.
6.1 overview of the vehicle.kom platform
In this section, we describe our VEHICLE.KOM platform and the necessary extensionsof the underlying Simonstrator platform. While we utilize the existing channel modelsand components of the Simonstrator platform, large changes were necessary to allowfor the simulation of large-scale vehicular networks. Similar to the Simonstrator plat-form, we provide reproducibility based on seeds, which are used to configure boththe networking and the movement of the vehicles. When changing these seeds, theinfluence of randomness to the approaches can be investigated. In the following, wedescribe the design and implementation of the platform components. Next, we de-scribe the encapsulation of networking and application logic to analyze the influenceof dissemination mechanisms to the system performance.
6.1.1 Platform Components
Similar to the Simonstrator framework, our Vehicle.KOM is event-driven and eachhost (vehicle, Road Side Unit (RSU), server) is assigned a set of components definingits behavior. This behavior includes communication, message storage and processing,and decision-making as shown in Figure 9. These components are derived from thescenario described in Chapter 3. In the following, we provide a detailed overview ofthe components and their interaction in our VEHICLE.KOM platform. While RSUs can
77

78 vehicle.kom: platform for approximate vehicular networks
Figure 9: Components and their interaction in the Vehicle.KOM platform.
be modeled in our simulation framework, we omit them in this description due to theneglectable influence on our developed approaches.
6.1.1.1 Road Event Modeling
As described in Chapter 3, the measurable road events have a significant influenceon the load on the vehicular network. Thus, the configurability of road events is animportant aspect of our VEHICLE.KOM platform. Each road event has a location andassociated road segment, a creation time, and an expected and actual lifetime. Everydata entry created by a vehicle contains all these meta-information, but approachesdo not access hidden simulation knowledge like the actual event lifetime.
To accurately model the network load in vehicular networks, we created events ofdifferent severity, which are fog, bumps, hazards, jams, rain, and traffic signs. Whilethese are generally sufficient to create a diverse network load, new properties canbe added easily due to the extensible design of our environment properties. Thisextensible design allows the creation of new road events in the simulation by adjustingthe event-specific properties like lifetime and appearance probability.
Based on these properties, the events are generated using an extensible event-generator. This event generator can be extended with plugins, which are responsiblefor the generation of exactly one event type. As an input, a plugin requires the lifetimedistribution of the event, the share of active events in the road network, and the type ofthe event that is generated. For the lifetime, both an exponential lifetime distributionand a Gaussian distribution are available.
When the simulation starts, there are no active events in the road network, i. e., ev-ery road is in its default state. After a configurable warmup-time, the event generatorplugins generate events with a randomly selected location, and a randomly selected

6.1 overview of the vehicle.kom platform 79
lifetime from its lifetime distribution until the share of active events is reached. Ad-ditionally, an event can be assigned a value parameter that may change over time toemulate changing road events, like the increasing average vehicle speed in a dissolvingjam. The generated value of a road event can be either discrete or continuous. We usea Markov chain to determine the transitions between the states of the variable for bothcontinuous and discrete values. To accurately choose values for continuous variables,we interpolate the value linearly between the two states. If an event turns active duringthe simulation, a new event is generated. In our generation process, we prevent thegeneration of the same event type at the same segment, but do not restrict the totalnumber of events that are active on one segment. Thus, the event types are generatedindependently from each other and the share of active events is between 0 and 1.
6.1.1.2 Vehicle Modeling
When modeling the vehicles’ behavior in a vehicular network, a realistic movementof the vehicles is pivotal due to the context-sensitivity of vehicular networks. TheSimonstrator natively only supports a map-based movement targeted at human mo-bility [152], which does not satisfy the requirements of realistic vehicle movement. Forrealistic vehicle movement, we extended the Simonstrator framework by connectingit to the traffic simulator Simulation of Urban Mobility (SUMO) [110], which is con-sidered accurately model the movement of vehicles. We connect our VEHICLE.KOMplatform to SUMO using the Traffic Control Interface (TraCI) [183], which enables con-trolling SUMO via a network socket. While the number of hosts in the Simonstratoris considered to be stable, the number of active vehicles in SUMO may change duringthe simulation. We address this issue by initializing a high number of offline hosts inour VEHICLE.KOM platform, which are managed by the VehicleMovement class. Oncea new vehicle becomes active in SUMO, the VehicleMovement selects one previouslyinactive hosts and binds it to the respective vehicle in SUMO.
This binding is managed by the VehicleInformationComponent, which also offers thepossibility to manipulate the vehicle movement in SUMO, i. e., by breaking, accelerat-ing, our detouring. The VehicleInformationComponent is accessible by every applicationrunning on a vehicle. It provides the possibility to retrieve and change the vehicle’spath and speed. After the vehicle is inactive in SUMO, it is removed from the Simon-strator by turning the host’s network interfaces offline.
The vehicles and their components are displayed on the left side of Figure 9. Eachvehicle can sense its environment using its on-board sensors, which can be adjusted toprovide data of varying quality. The data from these sensors are both processed locallyand shared with other vehicles. For communication with other vehicles, two networkinterfaces are available, a local communication interface based on Wifi and a cellu-lar communication interface. The communication of data via Wifi does not requirethe availability of a central server, while cellular communication is managed by thebackend. Incoming data are merged with locally perceived data to generate the envi-ronmental model in each vehicle. Based on this environmental model, each vehicle maymake decisions regarding its future path, braking, and other adaptations of drivingbehavior. These adaptations are executed using a bidirectional link to SUMO, which

80 vehicle.kom: platform for approximate vehicular networks
enables the manipulation of vehicle behavior. Thus, not only the network-specific met-ric, but also vehicle-specific metrics like driving duration and average speed can beused in our simulation.
6.1.1.3 Backend Modeling
The backend is responsible for coordinating the distribution of data provided bythe vehicles. For this purpose, the server has processing capabilities, which can (i)preprocess data before providing it to the vehicle, which is necessary if the availableresources for communication or processing are not necessary, and (ii) filter data toprovide only relevant data to each vehicle. Additionally, the server can adapt thefiltering to the available resources, as the different filtering mechanisms have differentprocessing and networking demands. To determine the relevance of data for a vehicle,the server manages a virtual vehicle for each real vehicle driving on the streets. Thisvirtual vehicle contains all the necessary data to enable the filtering process of the server.There are two possibilities to model this virtual vehicle, (i) mirror only the context ofthe vehicle or (ii) mirror the context and the decision-making of the vehicle. Thelatter enables the consideration of active vehicular applications to model the necessityof data for a vehicle more accurately. This application-aware mirroring might becomputationally expensive, which might require a transition to context-only filteringif the backend resources are not sufficient.
6.1.1.4 Interaction between Backend and Vehicles
The vehicles need to provide data to the backend to enable the dissemination of road-related data, which are (i) road-based data sensed by the vehicles, (ii) the currentcontext of the vehicles, and (iii) a description of the currently running applications ofthe vehicles. The server uses the provided road-based data to either to (i) create anenvironmental model and provide this model to the vehicles or (ii) directly providethe raw input to the vehicles. The current context of the vehicle and the description ofthe running applications are used to update the virtual vehicle. Depending on the cur-rent network load and available backend resources, the server can transition betweendifferent representations of the virtual vehicle, which changes the required data. Theupdate frequency of the vehicle’s context can also be adapted to reduce the load onthe network if the amount of payload is low.
6.1.2 Separation of Networking and Application Logic
For an efficient analysis of the performance of different networking approaches, theseparation of networking and application logic is a pivotal aspect. That is, as today’svehicular applications adapt to the network conditions very rarely, i. e., such an adap-tation cannot be assumed for our scenario. Consequently, we model the applicationlogic independently of the networking logic to analyze the influence of our network-ing approaches to the running vehicular applications. This analysis is pivotal to assessthe performance of data-centric vehicular networks, as the achieved performance is

6.1 overview of the vehicle.kom platform 81
heavily connected to the applications running on the vehicle and the vehicle’s contextin general.
For the separation of networking and application logic, we employed two classes, theVehicularSender and the VehicularReceiver interface. These interfaces utilize the Pub/Subparadigm as a basis to organize the data-centric dissemination of road data. Theyadditionally support the communication between vehicles without consideration ofthe underlying communication technology. Thus, these interfaces enable the exchangeof the communication method without any changes to the application.
Listing 1 displays the available methods for the transmission of data to other vehicles.For this purpose, the vehicle packs the available data into the EnvironmentInforma-tion class, which can contain any road-related and environment-related data. Thiscontainer can then either be transmitted to vehicles in proximity using the local Wifiinterface (sendLocally(...)), or transmitted to a central backend, which distributes thedata to concerned vehicles (sendViaCellular(...)). The application can decide on theused interface to account for the relevance area of messages: If a message is relevant ina large area, long-range data transmission via the cellular interface is preferred, whilea locally relevant message is only shared via Wifi. To separate the data received viacellular and Wifi, the vehicle can access the topic used via the getLocalTopic() function.The VehicularSender class is commonly very similar for the approaches presented inthis thesis, as we focus on the reception of data via the cellular network. That is, aseach message generated by a vehicle is disseminated to a number of vehicles, leadingto a high load on the cellular network. We prevent this by adapting the receptionof messages such that the network is not overloaded. In the next step, the transmis-sion of data could further be optimized using approaches we investigated in previousworks [37, 117].
1 publ ic i n t e r f a c e VehicularSender extends HostComponent {void i n i t i a l i z e ( ) ;
boolean sendViaCel lular ( EnvironmentInformation <? extendsLocationBasedEnvironmentProperty > pInformation ) ;
6 boolean sendLocal ly ( EnvironmentInformation <? extendsLocationBasedEnvironmentProperty > pInformation ) ;
Topic getLocalTopic ( ) ;}
Listing 1: VehicularSender.java
The reception of data is managed by the Listing 2 interface. To manage the vehicularapplications, we utilize the observer pattern: Each vehicular application is an observerof the VehicularReceiver, who manages the reception of messages. Thus, each regis-tered application is notified if a new relevant message arrives. The advantage of thisarchitecture is the flexibility regarding the number and type of supported vehicularapplications, as each application only need to implement the CommunicationListenerinterface and register at the VehicularReceiver. Compared to the VehicularSender,which is commonly similar for all the approaches presented in this thesis, the Vehic-

82 vehicle.kom: platform for approximate vehicular networks
ularReceiver is commonly adapted to implement the different communication mech-anisms presented in Section 3.2.2. Thus, the application is only provided with thedata received by the respective implemented VehicularReceiver, which enables thelink between application performance and networking mechanism.
1 publ ic i n t e r f a c e VehicularRece iver extends HostComponent {void i n i t i a l i z e ( ) ;
void registerCommunicat ionListener ( CommunicationListener pLis tener ) ;
6 double getAvailableBandwidth ( ) ;}
Listing 2: VehicularReceiver.java
6.2 prototypical realization of approximate vehicular networks
In this section, we describe the necessary extensions to the Simonstrator.KOM platformto implement approximate vehicular networks. For that purpose, a quality-centricview of data is required, as well as a probabilistic and impact-centric behavior of theunderlying Pub/Sub system. In the following, we describe the necessary changes tothe data representation and to the implemented Pub/Sub system.
6.2.1 Reflecting Quality in Measurements
The main challenges to reflect the quality in measurements are the implementation ofsensor inaccuracy and the tracking of inaccuracy through the aggregation of measure-ments. In its initial version, the Simonstrator supports the possibility to add an errorto the measurement of a host, but this possibility does not allow for the adaptationof the provided measurement value. That is, a quality-centric measurement shouldnot only be potentially erroneous but also state the possibility for a wrong value in itsmeta-information. In order to not only provide the possibility of erroneous data butalso track the inaccuracy through aggregation and processing, we extended the datarepresentation in the Simonstrator framework to provide this meta-information byproviding the distribution of values as a probability function. Based on this function,two measurements can easily be aggregated as described in Chapter 4. Based on thequality-centric view on data, the networking can be improved, which is described inthe following.
6.2.2 Impact-based Data Dissemination
For the impact-based data dissemination, the Bypass.KOM framework [149] neededto be adapted to support the non-atomic announcement of interest. This adaptationneeds to be performed in multiple components due to the dependency of differentcomponents on each other. Thus, adaptations are necessary to the subscriptions to an-

6.2 prototypical realization of approximate vehicular networks 83
nounce interest, the handling of messages on the server-side, and the Pub/Sub client.Notice that there are no adaptations to the notifications necessary, as the specific-impact of a message solely depends on the receiving vehicle and the message itself.As the specific-impact of message on the receiving vehicle is unknown, the server esti-mates this specific-impact. Thus, the performance of the network increases drasticallyif this estimation is accurate, and decreases otherwise.
6.2.2.1 Subscriptions
In the Pub/Sub paradigm, vehicles need to announce their interest to the broker toreceive interesting messages. In the case of our impact-based networks, each vehiclecommunicates one or multiple base-impact ranges out of which it wants to receivemessages. This mechanism can be used to adapt the load of the vehicle to networkconditions and personal preferences, such that the vehicle receives exactly as muchdata as desired. For this purpose, as impact-based subscription consists of a set ofbase-impact ranges, in which the vehicle considers the messages to be relevant. Athreshold-based approach is not applicable in this case, as vehicles might want tocooperate and coordinate their transmission. In that case, threshold-based approacheswould greatly reduce the efficiency of this cooperation and decrease the performanceof the network.
6.2.2.2 Client Behavior
At the client, the vehicular applications need to be able to create impact-based sub-scriptions to announce their interest in certain message types. For this purpose, weextended the existing implementation of the Bypass Pub/Sub client to support the cre-ation of impact-based subscriptions. These changes allow for the creation of subscrip-tions based on the base-impact of messages, which are suitable for our impact-basedvehicular applications.
6.2.2.3 Handling of Messages at the Server
In Bypass, the handling of messages at the broker is managed by the Subscription-Storage class, which matches of notifications to subscriptions, partially consideringthe context of the message and receivers. However, the current context-aware imple-mentations of the SubscriptionStorage only support a limited set of context-awaredissemination mechanisms, which are area-based and, thus, not usable for our imple-mentation of impact-based data dissemination. Thus, we design a new extension of theSubscriptionStorage, which considers the specific-impact of a message and matchesthem with the base-impact based subscriptions described previously. Before decidingon the transmission of a message, the SubscriptionStorage calculates the base-impactof the message and the specific-impact for each individual vehicle. While this pro-cess might become computationally expensive for large-scale networks, brokers withonly regional responsibility and approximations for distant vehicles can be used toincrease scalability. For most vehicles, there will not be an exact match between thespecific-impact assigned with the message for a certain vehicle and the base-impact.

84 vehicle.kom: platform for approximate vehicular networks
As described in Chapter 5, the broker filters messages previously to the disseminationprocess. The broker then matches the base-impact of the message with the base-impactranges in which the vehicle stated interest, and transmits the message to the vehiclein case of a match. With that behavior, our designed SubscriptionStorage is capable offiltering messages based on their specific-impact and disseminate these messages tothe concerned vehicles.

7E VA LUAT I O N
Based on our VEHICLE.KOM platform, we perform an extensive evaluation ofour data assessment and dissemination approaches presented in this thesis. We
highlight the key properties of our developed approaches, especially regarding therobustness to errors in the network and in measurements, and the efficiency regardingbandwidth usage. In Section 7.1, we discuss our evaluation setup and the commonsimulation parameters of all simulation scenarios. Next, we analyze the performanceof our contributions, starting the data assessment in Section 7.2 presented in Chapter 4.Based on these findings, we analyze the dissemination of data via the cellular networkusing our impact-aware dissemination approach in Section 7.3, which is described inboth Chapter 4 and Chapter 5, but only relies on non-cooperative networks. After that,we analyze the performance of our approach to cooperation in approximate vehicularnetworks described in Chapter 5 and show the high performance even when comparedto approaches with close-to-optimal bandwidth usage.
The goal of this evaluation is to show the adaptability of approximate vehicularnetworks to the data that is carried over the network, especially the prioritization ofhigh-impact data. Additionally, we show that the explicit handling of uncertainty inthese networks can greatly improve the performance of the decision made based onthe data. Thus, the consideration of uncertainty and approximation is an essentialaspect of future efficient vehicular networks, even though the performance of thisnetwork is stochastic. We also show the convergence towards deterministic networksfor high-impact messages, which might be desired in real-world vehicular networks.
7.1 evaluation setup and methodology
In this section, we describe the common parameters and assumptions for the eval-uation of our proposed mechanisms for approximate vehicular networks. For thispurpose, we first describe the assumed communication models in Section 7.1.1, fol-lowed by a description of the underlying road networks in Section 7.1.2. Finally, weintroduce the plot types used in this thesis in Section 7.1.4.
7.1.1 Communication Models
We use the communication models available at the Simonstrator.KOM platform, whichare originally tailored for the simulation of P2P networks. For the cellular network, werely on the implemented model for 4G communication as presented in [152], whichmodels the latency, available bandwidth, and message drop. While this model is com-parably simple, the influence of message drop on the cellular channel is not focus ofthis thesis, as it can be compensated for by reliable transfer protocols like the Trans-
85

86 evaluation
Parameter Value
Wifi model 802.11
Loss exponent 4
Error model NistErrorRateModel
Cellular bandwidth (down) 100Mbits/s
Cellular bandwidth (up) 10Mbits/s
Cellular latency 30ms
Table 1: Simulation parameters for the evaluation of data assessment.
mission Control Protocol (TCP). Additionally, we do not investigate the influence ofthe lack of communication infrastructure in this thesis, i. e., this simplified implemen-tation of the cellular network is sufficient in our case. For local Vehicle to Vehicle(V2V) communication, we use a NS-3 model for the 802.11 model with distributedcoordination [154], which has been included in the Simonstrator.KOM platform [149,150]. This model simulates the noise floor caused by concurrent transmissions to de-termine if a sent packet is transmitted to the receiver, which is important to investigatethe influence of message transmissions on the Wifi channel. While this model differsfrom the Decentralized Congestion Control (DCC) utilized in 802.11p, it is sufficientto accurately model the communication in our evaluation.
Table 1 provides an overview of the assumed network parameters. For the Wifimodel available in the Simonstrator.KOM platform, we use a loss exponent of 4, whichis considered to be suitable for urban areas [7]. For the cellular network, we consideran LTE-based network, with a maximum downlink of 100Mbits/s, a maximum uplinkof 10Mbits/s, and a latency of 30ms.
7.1.2 Simulation Scenarios
In this section, we describe the properties of the two road networks we utilize to eval-uate the performance of our contributions. We use different scenarios to gain clearerinsights into the influence of certain parameters on the system performance: We utilizea highway scenario without detours to evaluate our contributions towards data qualityassessment and aggregation. For our relevance assessment and message distributionin large-scale approximate vehicular networks, this scenario is not sufficient. Thus, weuse the TAPAS Cologne scenario [81] to evaluate the performance of these approaches.
7.1.2.1 Highway Scenario
We utilize the highway scenario as a controlled environment, in which we can betteranalyze the influence of parameters like traffic density and vehicle speed. It consists oftwo highways, which are connected through four highway exits as shown in Figure 10.On the right side of the scenario, an event is generated at some point in the simulation,which is then measured by the vehicles in proximity and shared with the other vehicles

7.1 evaluation setup and methodology 87
Figure 10: Highway scenario. Taken from [158].
in the scenario. With this scenario, the data assessment can be evaluated and analyzeddepending on the number of available measurements.
7.1.2.2 TAPAS Cologne Scenario
The TAPAS Cologne Scenario is, with a simulated area of roughly 30km× 30km, oneof the largest available scenarios for the vehicular traffic simulator Simulation of UrbanMobility (SUMO), which simulates a whole day in the city of Cologne, Germany. Themobility pattern of the population is derived from the TAPAS dataset [81], whichcontains information about the traveling habits of Germans. Figure 11 displays theroad network of the TAPAS cologne scenario including the load on the streets. A redroad is most occupied, while a blue road is barely occupied. The black roads are onlypart of the underlying road network but are not utilized by any vehicle. In Figure 11a, itis evident that the main road occupation is the city center of Cologne. Thus, simulatingthe whole scenario is generally not necessary, and we focused on network simulationto an area in the city center, which is marked with a green box in the figure and has asize of 2km× 2km. Figure 11b is a zoomed-in version of Figure 11a. We can observethat this area is indeed quite trafficked and contains streets of different types, likehighways, rural roads, and urban roads. Thus, it is well suited to simulate the datadissemination in vehicular networks and to analyze the necessity of data at certainlocations. In this scenario, a certain number of events of different types is generatedrandomly after the start of the simulation. These events are measured by vehicles inproximity and shared with a central server, who then forwards the data to concernedvehicles. With this scenario, the dissemination efficiency of both our impact-awareserver-side approach and our game-theoretic client-side approach can be evaluated.

88 evaluation
(a) Full scenario. (b) Network simulated.
Figure 11: TAPAS Cologne scenario with road occupation. Red roads are highly trafficked,while blue roads are barely trafficked.
7.1.3 Threads to Validity
The evaluation of our work relies on several assumptions, which we discuss in thefollowing. Additionally, we assess the influence of these assumptions on the validityof our evaluation. These assumptions can be categorized into assumptions related tothe behavior of the vehicles, the behavior of the wireless communication channel, andthe behavior of the environment. These factors are discussed in the following.
7.1.3.1 Behavior of the Vehicles
In this evaluation, we assumed that the movement of the vehicles is appropriatelymodeled by the traffic simulation SUMO. While this assumption is commonly usedfor the evaluation of vehicular networks in general, a different movement behavior ofthe vehicles might lead to a different behavior of the vehicular network. In this case,the number of topology changes might change, which may change the performanceof the cluster-based approaches presented in Section 7.4. With a decreasing number oftopology changes, the performance of the cluster-based approaches would increase,potentially outperforming our developed approach from Chapter 5. However, ourdeveloped approach would still provide highly reliable transmission of high-impactdata, which is especially valuable if packets may be lost when transmitted via the localWifi channel.
7.1.3.2 Behavior of the Wireless Communication Channel
The wireless communication channel has a strong influence on the performance ofthe developed approaches for Approximate Vehicular Networks. While a real Wifi

7.1 evaluation setup and methodology 89
Sample0.4
0.7
1.0
median
2.5th percentile
25th percentile
75th percentile
97.5th percentile
mean ofmeans
standarddeviation
Sample
(a) Box Plot.
Sample0.0
0.1
0.2
0.3
0.4 mean ofmeans
standarddeviation
Sample
(b) Bar Plot.
0 0.5 1.0Sample
0.2
0.4
mean ofmeans
standarddeviation
mean ofmeans
Sample 1 Sample 2
(c) Line Plot.
Figure 12: Examples of the plots used in this evaluation.
and LTE channel suffer from effects like shadowing, mirroring, and interference, theutilized Wifi communication model only considers interference to keep the computa-tional complexity appropriate. Thus, the communication channels will likely behavedifferently in real-world communication networks. However, when we consider theproperties of our Approximate Vehicular Network, these effects are partially compen-sated, considering the induced high redundancy of high-impact messages. In contrast,the cluster-based approaches used for comparison are expected to decrease further inperformance, as unexpected and unpredictable disconnects from the cluster-head willoccur more frequently.
7.1.3.3 Behavior of the Environment
In our evaluation, we assumed no background traffic, which might be generated byother vehicular applications, smartphones, and other wireless communication devices.As a result, the wireless communication channel is more congested than assumed inour evaluation, which decreases the bandwidth available for our Approximate Vehicu-lar Network evaluated in Section 7.4. To this end, the available bandwidth at the wire-less communication channel might be insufficient to allow for the redundant broad-casts of high-impact messages. Additionally, the frequency of interference-causedmessage loss might increase, reducing the performance of our developed approaches.Thus, approaches to reduce the utilized bandwidth on the wireless communicationchannel might be necessary for the applicability in a real-world environment, whichmight reduce the performance of our developed approaches. However, the prioritiza-tion of high-impact messages in conjunction with the increased redundancy of thesemessages is expected to compensate for message loss on the wireless communicationchannel.
7.1.4 Plot Types
In this thesis, we rely on different types of plots, which we introduce in the following.

90 evaluation
7.1.4.1 Box Plot
We utilize box plots whenever we present the aggregated results of one simulationrun. In a box plot, the median and the respective percentiles refer to the performanceof the active hosts in the simulation, i. e., the median represents the performance ofthe host, which performed better than 50% of all other hosts in the simulation. Thus,the boxes provide a good insight into the performance distribution of the hosts in thenetwork and describes the consistency between multiple hosts. To allow statementsover multiple simulation runs, we provide the mean of means as a point next to thebox, which also displays the standard deviation of the mean values of all simulationruns. This provides good insights into the average performance of the hosts, and thestability of the approaches over multiple simulation runs.
7.1.4.2 Bar Plot
In contrast to the box plot, the bar plot is utilized to display the average performanceover multiple simulation runs. For this purpose, the height of the bar refers to the meanover all simulation runs. When bar plots are used, it is often not feasible or desirable todisplay the performance of individual hosts, e. g., if the time until an event happens ismeasured. In addition, we provide the standard deviation over these simulation runs,to show the variation between different runs.
7.1.4.3 Line Plot
We utilize line plots to visualize a development for the change of one parameter. Inthese line plots, the change of the metric is often easier to observe compared to abox plot or bar plot. In the line plot, the mean performance of the approach overthe simulation runs is displayed. For the main approach, we additionally display thestandard deviation of the mean value over multiple simulation runs to assess thestability of our approach over multiple simulation runs.
7.2 aggregation scheme for inaccurate measurements
In this section, we evaluate the performance of our data accuracy assessment and dataaggregation, with the goal of reducing wrong aggregates in our vehicular network.For this purpose, we compare the performance of our approach with state-of-the-artapproaches. In this evaluation, we want to investigate the following two hypotheses.
1. Our approach significantly reduces the number of false decisions compared tostate-of-the-art methods.
2. Our approach adapts its robustness and adaptability to the requirements giventhrough the sensor accuracy of the measuring vehicles, the lifetime of the roadevent, and the environment.
First, we introduce the scenario model in Section 7.2.1 including the reference ap-proaches, the metrics used, and the parameters. Following, we investigate the influence
7.2 aggregation scheme for inaccurate measurements 91
of different parameters: In Section 7.2.2, we analyze the influence of the sensor accu-racy to the performance of the approaches. Next, we analyze the event lifetime assecond information-specific parameter in Section 7.2.3. As the last influence factor, weanalyze the influence of vehicular traffic in Section 7.2.4.
7.2.1 Scenario Model
In this section, we describe the specific properties of this evaluation and the neces-sary changes compared to the default setup. For the data assessment, we rely on thehighway-scenario to limit the noise induced by varying traffic conditions. This scenariohas a warmup period of 30min.2.5min after the start of the simulation, an event with a specified duration is started,
which has 15 possible states. While the event is active, the value of the underlying vari-able changes 10 times between these states. The vehicles at the event location generatemessages using their local sensors, which have a predefined accuracy. This accuracyreflects the quality of the generated measurements and is added as meta-informationto the shared message using our vector-based representation of a measurement asdescribed in Section 4.2.1. Additionally, each message has a Time to Live (TTL) of10% of the event lifetime to invalidate messages, as they are likely to not describethe correct value. The generated messages are then broadcasted to all vehicles in thenetwork using the cellular network, which is assumed to have sufficient resourcesto deliver all available messages to all vehicles. When a vehicle receives a message,it stores it locally in its cache and creates a new aggregate based on the previouslystored measurements. When a vehicle traverses the event location, the current state ofthe aggregate is investigated. The aggregate is considered correct if the state with thehighest probability is equal to the current state of the underlying variable.
In the following, we first introduce the scenario-specific metrics and parameters andthen describe the considered state-of-the-art approaches for data assessment.
7.2.1.1 Metrics
In this section, we utilize metrics associated with the number of correct decisions,which are the share of correct aggregates, the adaptation time, and the number ofaggregate changes.
Share of Correct Aggregates: The share of correct aggregates reflects the overall perfor-mance of the approaches. A high share of correct aggregates is desirable, as the shareof vehicles that need to work with false data is reduced. The share of correct aggregatesis measured when the vehicles are at the event location by analyzing the current stateof their aggregate. If the state with the highest probability equals the correct state,then the aggregate is considered correct, otherwise it is considered false.
Adaptation Time: The adaptation time measures the time until an approach adapts itsaggregate after a state change of the underlying variable. Thus, this metric captures the

92 evaluation
Parameter Value
Sensor accuracy 100%, 90%, 80%, 60%
Sensor heterogeneity 0%, 10%, 20%
Event lifetime [min] 10, 20, 40
Traffic density 0.05, 0.1, 0.3, 0.9
Traffic speed [km/h] mixed, 80, 100, 130, 180
Table 2: Simulation parameters for the evaluation of data assessment.
time between a state change of the underlying variable and the first correctly calculatedaggregate. It is a metric to determine the adaptability of the approaches.
Number of Aggregate Changes: The number of aggregate changes measures the numberof changes of the aggregate. This metric is measured when the aggregate has been cor-rect, i. e., the adaptation to the new state of the underlying variable has been performed.We then track all changes of the aggregate value, which are undesired as this capturesfalse aggregates and is caused by incorrect adaptations to false measurements. It is ametric to determine the robustness of the approaches.
7.2.1.2 Parameters
Besides the parameters discussed in Section 7.1, we require additional parameters toanalyze the performance of our developed approaches. These parameters are centeredaround (i) the accuracy of the measured data values, i. e., the average sensor accuracyand the variation of the sensor accuracy, and (ii) the lifetime of measurements. Theaverage sensor accuracy reflects the possibility of vehicles to measure accurate data,which influences the required robustness of the aggregation approach. We measurethe sensor accuracy in the percentage of correct data entries delivered by the sensor. Toreduce the impact of a single vehicle, we assume that every vehicle may measure everyevent exactly once. The variation of the sensor accuracy influences the requirement ofthe approaches to consider the accuracy of each individual measurement. The datalifetime, influences the required adaptability of the aggregation approaches.
In addition to data-related parameters, we also analyze the performance of ourapproaches in varying traffic environments. For this purpose, we vary the trafficdensity and the average vehicle speed. The traffic density is set using the spawn rateparameter in SUMO, which indicates the probability that a vehicle is spawned in acertain time interval. The vehicle speed is generally mixed, i. e., 10% trailers (80km/h),30% trucks (100km/h), 50% normal cars (130km/h), and 10% sport cars (180km/h),but we also analyze the performance for the different vehicle types separately.
A summary of the parameters and their values is provided in Table 2. In the follow-ing, we analyze the influence of every parameter separately.

7.2 aggregation scheme for inaccurate measurements 93
7.2.1.3 Reference Approaches
We assess the performance of our developed approaches using the reference ap-proaches described in this section. These reference approaches are based on state-of-the-art methods for data aggregation.
Newest-Only (NEW): The newest-only approach always relies on the newest measure-ment that is received to determine the real value. This approach adapts quickly toenvironmental changes but lacks robustness to false measurements. Thus, this ap-proach is heavily impacted by false measurements, which decrease its performance ifthe measurement accuracy is low.
Majority-based (MAJ): The majority-based approach always selects the measurementvalue that is most commonly represented in its storage. Notice that we only considerdiscrete variables, as continuous variables can be approximated using discrete vari-ables. This approach is very robust to false measurements, as a high number of falsemeasurements is required to change the result of the majority-based approach. How-ever, this approach has the downside of adapting slowly to environmental changesdue to the same reason. Thus, this approach is expected to perform well for staticvariables (without frequent changes) or if the average measurement accuracy is low.
Oracle (Oracle): The oracle approach is used as an upper baseline for our analysis. Itselects the correct value out of the storage if it exists, and provides the closest valueif not. However, it does not aggregate measurements, i. e., it is not considered tobe an optimal aggregation strategy. The difference is only noticeable for low-qualitymeasurements, in which the performance of the other approaches drops likewise.
Accuracy-Aware (CP): Our accuracy-aware approach has a similar idea as the majority-
based approach and has been proposed by us in [118]. Similar as the majority-based
approach, this approach generally chooses the measurement value that is most rep-resented but also considers the accuracy of the measurements in this process. Theadvantage of this approach is most significant in heterogeneous environments, inwhich the accuracy of provided measurement can vary significantly. However, similarto the majority-based approach, this approach requires a high number of measurementsto adapt to new values if the sensor accuracy is low and, thus, takes a long time toadapt to environmental changes.
Data-Centric (QoI): Our data-centric approach considers the average accuracy and life-time of data to adapt the aggregation such that the number of wrong decisions isminimized and has been proposed by us in [121]. Due to the consideration of averageaccuracy and lifetime, the number of false aggregates can already be reduced signifi-cantly. However, this approach does not consider the potentially varying accuracy ofthe available measurements, which reduce the performance in highly heterogeneousenvironments.

94 evaluation
100% 90% 80% 60%Average Sensor Accuracy
0
20
40
60
80
100Co
rrect
Agg
rega
tes [
%]
NEW MAJ CP QoI CP-QoI Oracle
Figure 13: Influence of the average sensor accuracy on the quality of the aggregates for thedifferent approaches.
Accuracy-Aware Data-Centric (CP-QoI): Our accuracy-aware data-centric approach com-bines the accuracy-aware and the QoI approach as described in Section 4.2. Thus, thisapproach combines the advantages of both approaches, which is assumed to furtherreduce false aggregates.
7.2.2 Influence of Data Accuracy
In this section, we analyze the influence of data accuracy on the number of correctaggregates, the robustness, and the adaptability of each approach. Notice that the totalnumber of aggregates is similar in the simulation of each approach, as the underly-ing movement models are not affected by the aggregates. Thus, the share of correctaggregates corresponds to the total number of correct aggregates.
Figure 13 displays the performance of the different approaches depending on thesensor accuracy. The figure visualizes the share of correct aggregates of the overallnetwork, as every vehicle only performs one aggregation in our scenario. For a sensoraccuracy of 100%, all approaches except the MAJ approach perform well, as they canalways rely on the newest measurement to reflect the real state of the road. Thus, anadaptation is performed immediately after an environmental change, and no falsemeasurements need to be handled by the approaches. The MAJ approach performspoorly as its adaptation speed is very low, i. e., the aggregates produced by the MAJ
approach remain in the old state for a long time. With decreasing sensor accuracy,the performance of all approaches decreases, but the level of decrease differs stronglybetween the different approaches. The NEW approach loses performance linearlywith decreasing accuracy, as every wrong measurement in the system induces a falseaggregate for the next vehicle passing the event. The performance of the MAJ approachis only marginally affected by the decreasing data quality, as it is very robust to

7.2 aggregation scheme for inaccurate measurements 95
100% 90% 80% 60%Average Sensor Accuracy
0
10
20
30
40
50
60
70Ad
apta
tion
Tim
e [s
]NEW MAJ QoI CP-QoI
(a) Adaptation Time.
100% 90% 80% 60%Average Sensor Accuracy
0
5
10
15
20
25
30
Num
ber o
f Agg
rega
te C
hang
es
NEW MAJ QoI CP-QoI
(b) Number of Aggregate Changes.
Figure 14: Influence of the average sensor accuracy on the adaptability and robustness of thedifferent approaches.
false measurements. However, as the MAJ approach reaches a stable state very late,the overall performance still remains low. In contrast, the performance of the CP
approach decreases, as its adaptability decreases drastically at low sensor accuracies.Our developed approaches, the QoI approach and the CP-QoI approach, also reduce inperformance, but their decrease is much less severe compared to the NEW approachand the CP approach. That is, the QoI approach and the CP-QoI approach find anappropriate balance between robustness and adaptability to preserve the quality ofthe aggregates. Additionally, the CP-QoI approach outperforms the QoI approach forlow sensor accuracies, as it is less prone to the heterogeneity of vehicular sensorsand utilizes knowledge of the state transitions of the underlying variable to predictthe future state of the event. The Oracle approach almost always achieves a share ofcorrect aggregates of 100%, which is justified by the long time that the vehicles traveluntil they reach the event location, i. e., the correct value is almost always availablein the cache. Based on these observations, we can confirm hypothesis 1 for varyingsensor accuracy, i. e., our approach drastically outperforms state-of-the-art methodsregarding the number of false aggregates.
In Figure 14, we further analyze the performance of the approaches regarding theiradaptability to environmental changes and their robustness to false measurements. Inthis plot, we omit the results for the CP approach and the Oracle to improve readability.Figure 14a depicts the adaptation time to environmental changes of the different ap-proaches, which gives insights into the adaptability of the approaches. We can clearlysee that the adaptation time of the MAJ approach is very significant and almost inde-pendent of the sensor accuracy. That is, the MAJ approach fails to quickly adapt to thenew state, which leads to all aggregates being false until the adaptation is performed.This aspect also explains the poor performance of the MAJ approach regarding its

96 evaluation
10 20 40Event Lifetime [min]
0
20
40
60
80
100Co
rrect
Agg
rega
tes [
%]
NEW MAJ CP QoI CP-QoI Oracle
Figure 15: Influence of the event lifetime on the quality of the aggregates for the differentapproaches.
overall performance, even though it is considered very robust to false measurements.For the other approaches, the adaptation time increases with decreasing sensor ac-curacy. We can use the NEW approach as a reference to determine the influence ofthe measurement accuracy on the adaptation time. For a decreasing measurementaccuracy, the adaptation time of our QoI approach and our CP-QoI approach are muchhigher, which is justified by the required robustness of the aggregation. As our ap-proaches adapt to the measurement accuracy, they increase their adaptation time togain robustness to compensate for wrong measurements. This can also be observed inFigure 14b, in which we can clearly observe that the NEW adapts frequently to falsemeasurements, i. e., produces false aggregates. Compared to this, the other approacheshave a much lower number of adaptations, which is due to their higher robustness tofalse measurements. As assumed, the MAJ approach is the most robust approach, asour QoI approach and CP-QoI approach reduce their robustness to allow for fast adap-tation to environmental changes. In conclusion, Figure 14 displays the adjustment ofthe robustness and adaptability of our CP-QoI approach based on the sensor accuracyand, thus, confirms hypothesis 2 regarding the sensor accuracy. While the level ofsensor heterogeneity has an influence on the approaches, all approaches handle theheterogeneity of sensors well due to the high number of available measurements. Thecorresponding figures are presented in the appendix in Section A.3.
7.2.3 Influence of Event Lifetime
In this section, we analyze the influence of the event lifetime on the quality of theaggregates. A long event lifetime generally benefits approaches with high robustness,as the influence of environmental changes is much lower. In contrast, a short event

7.2 aggregation scheme for inaccurate measurements 97
10 20 40Event Lifetime [min]
0
20
40
60
80
100
120
Adap
tatio
n Ti
me
[s]
NEW MAJ QoI CP-QoI
(a) Adaptation Time.
10 20 40Event Lifetime [min]
0
10
20
30
40
Num
ber o
f Agg
rega
te C
hang
es
NEW MAJ QoI CP-QoI
(b) Number of Aggregate Changes.
Figure 16: Influence of the event lifetime on the adaptability and robustness of the differentapproaches.
lifetime generally benefits approaches with high adaptability, as the influence of theenvironmental changes increases drastically.
Figure 15 displays the influence of the event lifetime on the share of correct ag-gregates. An increase in the event duration has a different influence on the differentapproaches. While the performance of the NEW approach remains unchanged as itsperformance mainly depends directly on the sensor accuracy, the performance of theMAJ approach and the CP approach decreases, which is unexpected as we antici-pated a performance gain for these approaches. However, due to the higher numberof outdated messages in the cache after an adaptation, the time until an adaptationis performed increases even further, as more messages are available in the cache. Forour QoI approach and our CP-QoI approach, the performance increases with an in-creasing event lifetime, as the number of environmental changes is lower if the eventlifetime is high, i. e., the number of certainly false aggregates (after the change of theenvironment) is reduced.
Figure 16 displays the adaptability and robustness depending on the event lifetime.There are two properties that change when the lifetime of an event increases: (i) thefrequency of environmental changes reduces and (ii) the number of measurementsof the old state increases, i. e., the difficulty of an early adaptation also increases.The time until an adaptation is performed is shown in Figure 16a. When analyzingthe adaptation speed of the MAJ approach, we can clearly observe that the time untiladaptation increases with increasing lifetime, which is justified by the aforementionedhigh number of measurements of the old state. Our QoI and CP-QoI approach remaincomparably constant in terms of adaptation speed, which showcases the adaptationto the event lifetime. Thus, the influence of the high number of measurements inthe old state is seemingly not required to keep the robustness of the approach high.

98 evaluation
0.05 0.1 0.3 0.9Traffic Density
0
20
40
60
80
100Co
rrect
Agg
rega
tes [
%]
NEW MAJ QoI CP-QoI
(a) Traffic Density.
80 100 130 180Speed
0
20
40
60
80
Corre
ct A
ggre
gate
s [%
]
NEW MAJ QoI CP-QoI
(b) Traffic Speed.
Figure 17: Influence of the traffic conditions on the quality of the aggregates for the differentapproaches.
Thus, our approaches decrease the impact of old measurements to allow for a fastadaptation. Figure 16b displays the number of aggregate changes during this interval.For all approaches except for the MAJ approach, we can observe that the number ofaggregate changes increases with increasing event lifetime, which is justified by thelonger durations in which the event remains constant and robustness is required. Forthe MAJ approach, this number actually decreases, as more messages are availablein the cache, which further increases the performance of the approach. In conclusion,we can observe that our CP-QoI approach has a constant adaptation time for differentevent lifetimes, which generally increases due to the higher number of messages inthe cache. Thus, we can confirm hypothesis 2, that our CP-QoI approach adapts itsrobustness and adaptability to the event lifetime.
7.2.4 Influence of Traffic Conditions
In this section, we vary the average speed and density of vehicular traffic. This in-fluences the number of measurements available to the vehicles: an increasing trafficdensity increases the number of available measurements, while an increasing vehiclespeed reduces the time until the vehicle needs to determine the aggregate.
Figure 17 displays the quality of the aggregates depending on the traffic conditions.Figure 17a displays the influence of the traffic density on the quality of the aggregatesfor the different approaches. If the traffic density is very low, the number of availablemeasurements is also very low. Thus, the advantage of the approaches relying on theaggregation of multiple measurements decreases, while the performance of the NEW
approach is unaffected. This leads to the NEW approach being comparable or evenslightly better than our developed approaches. However, with increasing traffic density

7.3 prioritization based on the specific-impact 99
and, thus, an increasing number of available measurements, the performance of ourQoI and CP-QoI approach increases drastically, while the NEW approach remainsconstant. For high traffic densities, the advantage of our approaches over the MAJ
and NEW approach is most significant. While the NEW approach is unaffected bythe traffic density, the MAJ approach increases in performance if the traffic densityincreases, as the adaptation time is similar, but its robustness to false measurementincreases due to the higher number of messages in the cache. Compared to that, thespeed of the vehicles seems to have only a minor influence as shown in Figure 17b.All approaches are only marginally affected by the changes in the vehicle speed. Thus,the speed of vehicles seems to have only a minor influence on the number of availablemeasurements, as otherwise the performance of our approaches would change.In conclusion, we can state that our approach performs better if the number of availablemeasurements is high, as it can ignore existing measurements if required to increasethe quality of the aggregates. This is a major improvement over the MAJ approach,which seemingly decreases in performance if the number of available measurementsincreases. Thus, we can again confirm hypothesis 2, that our CP-QoI approach adaptsits robustness and adaptability to the environment.
7.3 prioritization based on the specific-impact
In this section, we analyze the influence of relevance to the dissemination of data ina cellular-based vehicular network. For this purpose, we compare the performanceof our impact-aware dissemination with state-of-the-art methods for the distributionof context-sensitive messages. In this part of the evaluation, we want to evaluate thefollowing hypotheses:
1. Our impact-aware dissemination increases the efficiency of message distributionin vehicular networks compared to state-of-the-art approaches.
2. Our impact-aware dissemination adapts to the data impact, i. e., high-impactdata is prioritized over low-impact data.
7.3.1 Scenario Model
In this section, we describe the specific properties of this evaluation and the necessarychanges towards the default setup. For the analysis of data relevance and its impact onthe message dissemination, we utilize the TAPAS Cologne scenario to simulate realistictraffic flow conditions. This is important to assess the possible improvements of ourimpact-aware communication, as this type of communication relies on prediction, i. e.,predictable traffic flow would increase the performance of our impact-aware approachunnaturally. In order to pre-train the prediction model, we let the simulation runningfor 30minwithout interfering with it, i. e., not simulating any communication. Duringthis time, we observe the movement of traffic flow and build our prediction modeldescribed in Section 4.3.

100 evaluation
In this scenario, the data is not generated by the vehicles themselves, but the datais assumed to be already available at the server, as the influence of our approximatevehicular network can be analyzed much better if the randomness in the messagegeneration is reduced. In simulations where the generation of data by the vehiclesshould be considered, an active monitoring strategy of incoming data at the vehiclesas described in [122] can be utilized. However, these strategies cannot adapt proac-tively and, thus, need to predict the future bandwidth consumption, which introducesadditional errors to the system. Based on the available bandwidth and the anticipatedfuture bandwidth consumption, each vehicle may update its reception strategy consid-ering the current state of the environment, i. e., announce what share of the availablemessages it can receive given its bandwidth constraints. This reception strategy iscommunicated to the server and utilized to decide on the transmission of data.
In the following, we first introduce the scenario-specific metrics and parameters andthen describe the considered state-of-the-art approaches for cellular data dissemina-tion in vehicular networks.
7.3.1.1 Metrics
In this section, we utilize metrics associated with the efficiency and the behavior ofdata distribution to assess the performance of the reference approaches. We use themetrics recall and precision to assess the performance of the message dissemination.In the following, we describe our definition of the aforementioned metrics.
Recall: Recall is the ratio between the number of messages that have been received andare relevant, divided by the total number of relevant messages. Thus, recall is a metricdescribing the quality of the communication regarding the availability of data. Weconsider a message to be relevant if the corresponding event is located on the vehicle’splanned path and the vehicle will arrive at the event location while the event is active,which are determined using simulation knowledge.
Precision: Precision is the ratio between the number of messages that have been re-ceived and are relevant, divided by the total number of received messages. Thus,precision captures the unnecessary usage of bandwidth in a system, that is to bereduced. The definition of relevant messages is similar to the definition of relevantmessages for the recall metric.
7.3.1.2 Parameters
To assess the influence of our impact-aware dissemination approach, we considerdifferent parameter settings listed in Table 3. The first parameter, the event lifetime,influences the possibility of the network to propagate data to distant vehicles. Thatis, if the expected event lifetime is short, a dissemination of messages to a distantvehicle is not reasonable, as the event will expire by the time the vehicle arrives at theevent location. The second parameter, the available bandwidth, restricts the numberof messages that may be transmitted to each individual vehicle. The influence of this

7.3 prioritization based on the specific-impact 101
Parameter Value
Event lifetime [min] 5, 10, 30, 60
Available bandwidth [msg./s] 0.1, 1, 10, 100
Base-impact 1, 10, 100, 1000
Table 3: Simulation parameters for the evaluation of impact-aware communication.
parameter is very high, as it restricts the possibility to share knowledge between thevehicles and the server. The third parameter, the base-impact, is used to determine theinfluence of the base-impact of a message to the performance of the approach. Theperformance of high-impact messages should generally be better than the performanceof low-impact messages.
7.3.1.3 Reference Approaches
For reference, we use two state-of-the-art approaches for message distribution in ve-hicular networks, which are described in the following.
Broadcast: The broadcast approach is mainly used to estimate the amount of transfer-able data in the network and assess the possible savings by adding context-awareness.The broadcast approach transmits every message to every vehicle in the network, with-out consideration of their individual context. Thus, this approach produces the highestdata traffic but also ensures that every vehicle has received every message. We expectthat this approach receives every relevant message if the bandwidth is sufficient, butthe share of relevant messages is the lowest, as the context of both message and vehicleare not considered in the dissemination.
Geocast: The geocast approach is a conventional approach for message dissemination invehicular networks. Geocasting disseminates messages inside a predefined area, whichcan be of any shape. In this evaluation, we assume a circular dissemination area formessages with a radius of 1km. While geocasting is more efficient than broadcastingregarding bandwidth usage, it still assumes that the relevance of messages for avehicle depends only on the distance to the contained event. The performance of thegeocasting approach strongly depends on the area in which messages are distributed:If this area is large, then more vehicles receive relevant data, but the transmission ofunnecessary messages also decreases. In contrast, a small area decreases the numberof transmitted messages but increases the relevance of a transmitted message to thereceiving vehicles.
Impact-Aware: Our impact-aware data dissemination approach has been described inSection 4.4 and considers the specific-impact of a message to increase the efficiencyof bandwidth utilization. In the specific-impact, the measurement and the relevanceof the measurement for a vehicle are considered. To determine the relevance of ameasurement for a vehicle, the server predicts the future movement of the vehicles

102 evaluation
5 10 30 60Event Lifetime [min]
0.0
0.2
0.4
0.6
0.8
Prec
ision
BroadcastGeocastSpecific-Impact
(a) Precision.
5 10 30 60Event Lifetime [min]
0.0
0.5
1.0
Reca
ll
BroadcastGeocastSpecific-Impact
(b) Recall.
Figure 18: Influence of the event lifetime on the performance of message dissemination forthe different approaches.
and the future state of the event. While our impact-aware dissemination approachsignificantly reduces the utilized bandwidth, its performance depends greatly on theperformance of the utilized prediction mechanism, leading to a performance drop ifthe prediction is poor. In general, we expect this approach to be much more efficientthan the geocast and broadcast approach.
7.3.2 Influence of Event Lifetime
The degree of consideration of context varies drastically between the reference ap-proaches. While the broadcast dissemination does not consider context during the dis-semination process, the geocast approach introduces some level of context-awarenessto limit the dissemination area of data. However, even the geocast approach simplifiesthe assessment of context, although an exact assessment of context is pivotal for thedata dissemination. Our impact-aware approach assesses the probability of the vehi-cle encountering the contained road event and can drastically increase the usability ofdata for each vehicle.
Figure 18 displays the performance of the impact-aware approach. In Figure 18a,we can see the relevance of the transmitted message for the receiving vehicle, i. e., theprecision score. It is evident that our impact-aware dissemination drastically increasesthe average relevance of received messages compared to the broadcast and geocast ap-proach because it models the relevance of data much more accurately. Thus, it does notonly rely on the distance to the event but also considers the topology of the road net-work and the lifetime of the event. As described in Section 5.5.2, relevance reduces theprobability of a message being transmitted. Thus, messages of low relevance are trans-mitted with a lower probability, i. e., the average relevance of a transmitted message

7.3 prioritization based on the specific-impact 103
100 10 1 0.1Bandwidth [msg./s]
0.0
0.5
1.0
Reca
llBroadcastGeocastSpecific-Impact
(a) Recall.
100 10 1 0.1Bandwidth [msg./s]
0.0
0.5
1.0
Prec
ision
BroadcastGeocastSpecific-Impact
(b) Precision.
Figure 19: Influence of the available bandwidth on the performance of messagedissemination for the different approaches.
increases. In contrast, the broadcast approach transmits all messages if the bandwidthis sufficient, which decreases the share of relevant messages compared to the numberof overall transmitted messages. The geocast approach considers a message relevantif the vehicle is within a certain distance of the event. However, this does not reflectthe actual relevance of a message, which is shown by the very low performance of thegeocast approach. As our impact-aware approach explicitly considers the lifetime ofthe event, it can keep the precision high even if the event lifetime decreases. The shareof received relevant messages compared to all relevant messages by an individual ve-hicle is displayed in Figure 18b. It is evident that the performance of our impact-awareapproach is much higher compared to both static approaches in a limited bandwidthsetting, as it uses the available bandwidth much more efficiently. Additionally, theperformance of our impact-aware approach increases with decreasing event lifetime,which is justified by the more accurate predictability of short paths. That is, for shortevent lifetimes all paths with long travel times can be directly discarded from theprediction, as the event will most probably be disappeared by the time the vehiclearrives at the event location. For all other approaches, the performance increases withincreasing event lifetime, as they utilize static attributes which are independent of theevent lifetime. Thus, these approaches benefit from longer paths, which increase thenumber of vehicles in the network that potentially benefit from that message.
When we analyze the influence of the available bandwidth to the different ap-proaches in Figure 19, the influence of the less efficient bandwidth utilization for thegeocast and broadcast approach becomes even more evident. In Figure 19a, the recallof the different dissemination approaches depending on the available communica-tion bandwidth is displayed. The geocast and the broadcast approach both performwell if the available bandwidth is high, but degrade drastically in performance if the

104 evaluation
bandwidth is limited. In this case, messages are dropped randomly at some point,as the available communication bandwidth is not sufficient to handle the load. Incontrast, our impact-aware approach performs slightly worse than these approachesif the bandwidth is high, which is justified by a lack of accuracy in the relevancecalculation. To keep the runtime of our impact-aware approach reasonable, we used alower threshold to cancel the computation if the expected gain in accuracy of the resultis low. While this approach is working well in general, it decreases the performancein high bandwidth scenarios as some relevance values of the transmitted messagesare below that threshold. Thus, the relevance of a message for certain vehicles isestimated to be 0, which leads to these vehicles never receiving this message. Theserver can only increase the transmission probability if the relevance is non-zero, as itmultiplies the ratio between the available resources and the used resources with theoriginal transmission probability. However, our impact-aware approach is designedfor networks with restricted available bandwidth, this behavior should generally notaffect the system performance. We can see the improvement of our impact-aware ap-proach when the available bandwidth decreases. The performance of our approachremains much higher than the performance of the geocast and broadcast approachdue to the more accurate evaluation of relevance. Since messages of high relevance areprioritized, this leads to a higher share of relevant messages received by the vehicles.This can also be observed in Figure 19b, which shows the share of relevant messagesout of all messages received by a vehicle. It is evident that the precision of the geocastand broadcast approach is independent of the bandwidth, while the precision of ourimpact-aware approach increases due to the prioritization of highly relevant messages.This increase of our impact-aware approach is an important prospect of the efficiencyof our proposed approach, as it displays the usability of path prediction for messagedissemination in vehicular networks.
These observations let us confirm hypothesis 1, i. e., our approach utilizes band-width much more efficiently compared to state-of-the-art approaches. This is mainlyvisible in the plots showing the precision metric in different environments. In the sametime, our impact-aware approach achieves a higher recall compared to state-of-the-artapproaches if the bandwidth is limited due to the more efficient bandwidth utilization.
7.3.3 Influence of Data Impact
Data impact should generally influence the data dissemination if the available band-width is limited. This means that high-impact data should be prioritized if the commu-nication bandwidth is insufficient to transmit all available data to the vehicles. Thus,we analyze the dissemination of high-impact and low-impact messages in networkswith different bandwidths per vehicle.
Figure 20 displays the recall of each message type depending on the base-impact ofthe message. As expected, there is no observable influence of the message impact on thetraffic load in an unconstraint network as shown in Figure 20a. Therefore, all messagescan be transmitted by the server and the vehicles do not need to limit the reception ofmessages themselves as described in Chapter 5. Thus, the recall is only limited by the

7.3 prioritization based on the specific-impact 105
1 10 100 1000Base-Impact
0.2
0.4
0.6
0.8
1.0
Reca
llSpecific-Impact
(a) Unconstrained bandwidth.
1 10 100 1000Base-Impact
0.0
0.2
0.4
0.6
0.8
1.0
Reca
ll
Specific-Impact
(b) Constrained bandwidth.
Figure 20: Influence of the base-impact of messages on the performance of messagedissemination for our impact-aware approach.
imprecision of the relevance assessment as discussed previously. As the impact doesnot influence the server-side transmission probability, this leads to an equal recall forall impact-levels. However, if we limit the available bandwidth and force the vehiclesto limit the reception of low-impact messages as shown in Figure 20b, the recall of low-impact messages drops. Thus, the vehicle prioritizes high-impact messages over thelow-impact messages, which enables the server to also transmit high-impact messageswith lower relevance values. This also increases the recall, as the number of receivedrelevant messages increases, but the change in the recall is comparably small. This isjustified by the fact that a message with a low relevance value is generally less relevant,i. e., the chance of belonging to the set of relevant messages is much lower than formessages with a high relevance value.
The effect of the message impact becomes even more significant if we reduce theavailable bandwidth further as shown in Figure 21. Through the reduction of availablebandwidth, the vehicle-side filtering of data becomes even more significant, leadingto a significant reduction in recall for messages with low base-impact as shown inFigure 21a. Thus, our impact-aware approach correctly prioritizes messages with highbase-impact as expected, receiving a high share of this data. When analyzing theprecision of the message dissemination in Figure 21b, we observe that the precision ofmessages with high base-impact is much lower than the precision of messages withlow base-impact. This is justified by the fact that the vehicles filter messages withlow base-impact already on the client-side, leading to a significant reduction of theselow-impact messages that are considered for transmission. If messages with a highlow base-impact shall be transmitted to a vehicle, both the server and the vehicle needto decide on a transmission, which is much more unlikely compared to high-impactmessages, for which only the server needs to decide on a transmission. This behavior

106 evaluation
1 10 100 1000Base-Impact
0.0
0.2
0.4
0.6
0.8
1.0
Reca
llSpecific-Impact
(a) Traffic load.
1 10 100 1000Base-Impact
0.0
0.2
0.4
0.6
0.8
1.0
Prec
ision
Specific-Impact
(b) Precision.
Figure 21: Influence of the base-impact of messages on the performance of messagedissemination for our impact-aware approach with very low bandwidth.
is justified by the limited bandwidth of the vehicle, which is insufficient to receiveall messages. Based on these findings, we can confirm hypothesis 2, that our impact-aware approach appropriately prioritizes high-impact data, while low-impact data isdropped if the available communication bandwidth is insufficient.
7.4 cooperation in approximate vehicular networks
In this section, we evaluate the performance of our developed approximate vehicularnetworks considering the contributions regarding impact-aware data disseminationand efficient offloading using our game-theoretic approach as described in Chapter 5.We analyze the performance of our developed game-theoretic approach in compari-son with state-of-the-art approaches using a geocast approach for the disseminationof messages via the cellular network. That is, as the server-side performs determin-istically for the geocast approach, which enables us to provide a clearer view to theimprovements achieved by our game-theoretic approach. For this purpose, we first de-termine the influence of approximate vehicular networks under varying conditions. Atfirst, we determine the trust factor τ, which is a parameter for the remaining evaluationruns. Next, we analyze the influence of the available bandwidth and of location pri-vacy. Finally, analyze the robustness of our game-theoretic approach to misbehavingvehicles.
In this evaluation, we evaluate the following hypotheses:
1. Our game-theoretic approach manages to transmit high-impact messages muchmore reliable than realistic clustering approaches and modulates the redundancy
7.4 cooperation in approximate vehicular networks 107
of messages such that bandwidth can be utilized for the reception of previouslynot received messages.
2. Our game-theoretic approach mitigates the negative effects of location privacyand manages to maintain a constant performance if the share of privacy in thenetwork is low.
3. Our game-theoretic approach is very robust to message loss in the network, andcompensates for misbehaving vehicles in the network.
7.4.1 Scenario Model
In this section, we describe the specific properties of this evaluation and the necessarychanges towards the default setup. For the evaluation of our approximate vehicularnetworks, we rely on the TAPAS Cologne scenario to guarantee realistic neighborhoodsof the vehicles. This scenario has a warmup period of 30min.
The scenario used in this section is very similar to the previous scenario in Sec-tion 7.3, but differs in the dissemination strategy, the consideration of privacy, and thecooperation between vehicles. For the dissemination strategy, we utilize a range-baseddissemination strategy to reduce the probabilistic influence of the filtering based onthe specific-impact of the messages. Regarding the consideration of privacy, the ve-hicles only provide a representation of their location to the server, which may beinaccurate for privacy-sensitive vehicles. The server considers this imprecision-area inthe dissemination of messages, by providing every message that might be relevant fora vehicle at any possible location in this area. This also increases the transmission rangeof events, which we solve by generating events around the simulated area, i. e., eventsat locations outside of the area in which vehicle traffic is simulated. This is necessary to(i) analyze the influence of privacy appropriately and (ii) keep the simulation runtimeat an acceptable level. As the third difference to the previous scenario, a vehicle broad-casts every message, received via the cellular network, in its one-hop environment ifnot stated differently. This is required to enable the cooperative reception of messages,which is analyzed in this section.
In the following, we first introduced the scenario-specific metrics and parametersand then describe the considered state-of-the-art approaches for hybrid communica-tion in vehicular networks.
7.4.1.1 Metrics
For the evaluation of our approach to approximate vehicular networking, we utilizemetrics capturing achieved communication quality and the consumed bandwidth.
Relative Utility: The relative utility measures the achieved utility compared to themaximum achievable utility for each vehicle. For the maximum achievable utility, itis assumed that all relevant messages had been received. Thus, a relative utility of 1states that all sent messages have been received, while a relative utility of 0 states thatnot a single message sent to the vehicle has been received.

108 evaluation
Parameter Value
Trust factor 0%, 25%, 50%, 75%, 100%
Assigned bandwidth [msg./s] 0.01, 0.1, 1, 10
Radius of imprecision area (vector) [km] (0, 1, 10)
Distribution of privacy (vector) (50%, 30%, 20%)
Share of misbehaving vehicles 0%, 25%, 50%, 75%, 100%
Base-impact (vector) (1, 10, 100, 1000)
Relative event frequency (vector) (90%, 9%, 0.9%, 0.1%)
Dissemination radius [km] (vector) (10, 1, 100, 100)
Table 4: Simulation parameters for the evaluation of hybrid vehicular networks.
Used Bandwidth: The used bandwidth captures the bandwidth usage of the vehiclesand is always relative to the available bandwidth. Thus, a used bandwidth of 1 statesthat the vehicles have used all available bandwidth without exceeding it. If the usedbandwidth is above 1, it means that the vehicles exceed the available bandwidth.Similarly, a used bandwidth below 1 states that the available bandwidth has not beenused fully.
7.4.1.2 Parameters
In Table 4, a list of parameters is presented, which are expected to influence theperformance of the different approaches. The bold values are the values used asdefault if not stated differently. In the beginning, we determine the trust factor τ,which is utilized to increase the robustness of our game-theoretic approach at the costof the maximum achievable performance. Thus, we first determine the trust factor,which maximizes the performance of our game-theoretic approach in our simulationscenario. After that, we investigate the influence of bandwidth and the influence ofprivacy to the system. Our last parameter is the share of malicious vehicles, that donot share any data with the vehicles in their proximity.
In addition, we need to generate load for the network. For this purpose, we intro-duced four different event types, with an exponentially distributed impact. We assumethat the event appearance is high for messages with a low base-impact, and high formessages with a high base-impact. Besides, the generated messages are disseminatedin a circular area around the event, which is chosen such that the influence of privacyto the event types differs.
7.4.1.3 Reference Approaches
In this section, we describe the reference approaches used to evaluate the performanceof our approach to approximate vehicular networking. For better comparability, weimplemented our impact-based prioritization for all of the approaches. Thus, all ap-

7.4 cooperation in approximate vehicular networks 109
proaches generally prioritize high-impact messages but vary in the coordination ofthe transmission between vehicles.
Non-Cooperative Approach (NC): The non-cooperative approach does not exchange anymessages with other vehicles, i. e., relies only on its cellular network interface to re-ceive messages about its environment. This approach is used as a baseline to evaluatethe performance gain through performance in various settings. It is expected to per-form worse than the cooperative approaches in most of the cases, as the cooperativeapproach can share bandwidth to coordinate the transmission of messages.
Cluster-based Approach (CL): In the cluster-based approach, vehicles form clusters withvehicles in their proximity to coordinate the transmission of data [130, 196, 200]. Forthis purpose, they elect a leader, so-called cluster-head, which is responsible for thereception of messages provided by the backend and shares them locally. All othervehicles disable their network interfaces and fully rely on the cluster-head. As a result,the transmission is very efficient, but the reliance on a single other vehicle might causemessage loss in case of a disconnect or misbehavior of the cluster-head. Due to thecomplexity of fault detection in wireless networks, the cluster-members wait for thecluster-head to timeout in case of a connection loss until they reorganize the cluster.This limits the maximum performance of this approach but is a necessary assump-tion for the real-world applicability of cluster-based approaches. In conclusion, thisapproach is expected to perform well if the number of disconnects and misbehavingvehicles in the network is low.
Global-Knowledge Cluster-based Approach (GK): Similar to the cluster-based approach,the global-knowledge cluster-based approach forms clusters to increase the efficiencyof the message transmission. In contrast to the cluster-based approach, this approachcan immediately detect disconnects and initiate a reclustering. Thus, the time of dis-connect is minimized, which improves the performance of the cluster-based approach.Additionally, every message transmitted via Wifi is immediately delivered to everyvehicle in range without considering message loss. These assumptions are not realistic,but this approach is only used as a reference to analyze the maximum capabilities ofthe network. We expect this approach to perform well in settings without misbehavingvehicles.
Game-Theoretic Approach (GTP): The last of the reference approaches is our game-theoretic approach as described in Chapter 5. This approach adapts to the environ-mental conditions by adapting its robustness to the impact of data. That is, the vehiclesoptimize their communication compared to the NC approach by reducing the redun-dancy of data transmission. The level of reduction depends on the impact of the datathat could be missed and the impact of the data that could be additionally receivedbased on the freed bandwidth. We expect this approach to perform well in most set-tings, but perform slightly worse than the global-knowledge cluster-based approachdue to the additional redundancy of our approach.

110 evaluation
0.0 0.25 0.5 0.75 1.0Trust Factor
0.5
0.6
0.7
0.8
0.9
1.0u
u max
GTP
(a) Relative utility.
0.0 0.25 0.5 0.75 1.0Trust Factor
0.0
0.5
1.0
1.5
2.0
2.5
3.0
Used
Ban
dwid
th
GTP
(b) Utilized bandwidth.
Figure 22: Influence of the trust factor τ on the performance of our GTP approach.
7.4.2 Determining the Trust Factor τ
In order to analyze the performance of our GTP approach, we need to analyze theinfluence of the trust factor τ. This trust factor τ can be between 0 and 1, whichinfluences the selected strategy of a specific vehicle. That is, the chosen strategy mightnot be optimal regarding our developed game. However, every strategy that may beselected is developed using the methods proposed in Chapter 5, i. e., even a trustfactor τ = 0 is not assuming non-cooperative networks but selects the strategy for acooperative network with the least negative influence if other vehicles do not cooperate.While no cooperation is one possibility for τ 6= 1, frequent topology changes and theinduced disconnects also might require a lower τ.
We aim at selecting the τ that leads to the highest average performance for a vehicle.Figure 22 displays the performance of our GTP approach for different trust factors τ.We can observe in Figure 22a that the influence of the trust factor on the performanceof the results is small. The only major change is the standard deviation of the achievedutility, which is the smallest for between τ = 0.25 and τ = 0.75. The utilized bandwidthis almost independent of the trust factors as shown in Figure 22b. Thus, we choosea trust factor of 0.5 for the remainder of this evaluation to increase the predictabilityand expressiveness regarding the performance of the obtained results.
7.4.3 Influence of the Available Communication Bandwidth
Figure 23 displays the performance of the approaches depending on the availablebandwidth. In general, all approaches increase in utility with an increasing amountof available bandwidth as shown in Figure 23a. A higher bandwidth leads to a higher

7.4 cooperation in approximate vehicular networks 111
0.01 0.1 1 10Bandwidth [msg./s]
0.0
0.5
1.0u
u max
NC CL GTP GK
(a) Relative utility.
0.01 0.1 1 10Bandwidth [msg./s]
0
1
2
3
Used
Ban
dwid
th
NC CL GTP GK
(b) Utilized bandwidth.
Figure 23: Influence of the available bandwidth on the performance of the approaches.
share of messages that can be received by each individual vehicle, which consequentlyincreases the total impact of received messages and thus the utility. We can observethat our GTP approach always performs better than the approach without cooperation,which shows the advantages of cooperation between vehicles in a vehicular network.However, compared to the cluster-based approaches, our approach performs worseif the available bandwidth is 0.01, as our approach induces redundancy to ensurethe reception of high-impact messages even after topology changes. However, thisredundancy reduces the available bandwidth for the reception of other messages. Incontrast, the cluster-based approaches utilize the available bandwidth generally moreefficiently as the messages are not received redundantly. For a low bandwidth of0.01, the performance decrease due to redundancy is higher than the performancegain by the robustness to topology changes. This changes when we increase the avail-able bandwidth to 0.1 and 1, for which our approach outperforms the CL approach.For these bandwidths, the negative influence of a limited redundancy on the utilitydecreases, while the negative influence of topology changes remains constant. Weperform worse compared to the GK approach, which is justified by the optimal co-ordination and bandwidth utilization of this approach. At a bandwidth of 10, theperformance increase of our GTP approach over the realistic cluster-based approachbecomes even more significant, as the utility increase of the CL approach is small. Thisis justified by the difficulty of failure-detection for the CL approach, which limits itsmaximum utility. Thus, the robustness of our approach gained by redundancy im-proves the performance significantly in this setting. Additionally, the difference to theglobal-knowledge-based approach becomes very small, although our approach is lessefficient due to its induced redundancy. The reason for this is shown in the bandwidthutilization in Figure 23b. While the cluster-based approaches do not fully utilize theavailable bandwidth at a bandwidth of 10, our GTP approach and the NC approach

112 evaluation
0.01 0.1 1 10Bandwidth [msg./s]
0.0
0.5
1.0u
u max
|1(m
)<10
NC CL GTP GK
(a) Base-impact per bit µB(m) = 1.
0.01 0.1 1 10Bandwidth [msg./s]
0.0
0.5
1.0
uu m
ax|1
000
(m)
NC CL GTP GK
(b) Base-impact per bit µB(m) = 1000.
Figure 24: Influence of the available bandwidth on the utility of messages with differentbase-impact for the different approaches.
still utilize the bandwidth fully. The cluster-based approach cannot fully utilize thebandwidth due to the selection of only a single cluster-head. If this cluster-head ag-gregates enough bandwidth to receive all available messages, bandwidth might beleft unused. In contrast, our GTP approach always selects the number of receivingvehicle based on its neighborhood, the message importance, and the available band-width. Thus, it ensures the full utilization of bandwidth and utilizes it to increase therobustness of the system. Besides, we can observe that all approaches do not exceedthe predefined bandwidth requirements on average, while the distribution of band-width utilization varies greatly between vehicles. Due to the explicit coordination incluster-based approaches, these approaches select few vehicles with very high band-width usage, which are responsible for the reception of all messages. Compared tothat, our GTP approaches distribute the load much more evenly in the network, asevery vehicle is considered to be similar. It is evident that there is still some fluctua-tion in bandwidth between our vehicles, but this fluctuation is much less significantcompared to the cluster-based approaches. Thus, our GTP approach distributes theload in the network much more equally compared to cluster-based approaches.
When investigating the utility score only considering certain impact-levels as shownin Figure 24, we can observe a clear dependency between the achieved utility andthe message impact. That is, as high-impact messages are generally prioritized byall approaches, the low-impact messages generally achieve a worse communicationquality than the high-impact messages. Figure 24a displays the relative utility forthe low-impact messages. If the assigned bandwidth is 0.01, the bandwidth is notsufficient to transmit these messages, which leads to a relative utility of almost 0. Withincreasing bandwidth, the possibility of receiving these messages increases likewise.For a bandwidth of 0.1, we can observe the efficiency of the cluster-based approaches,
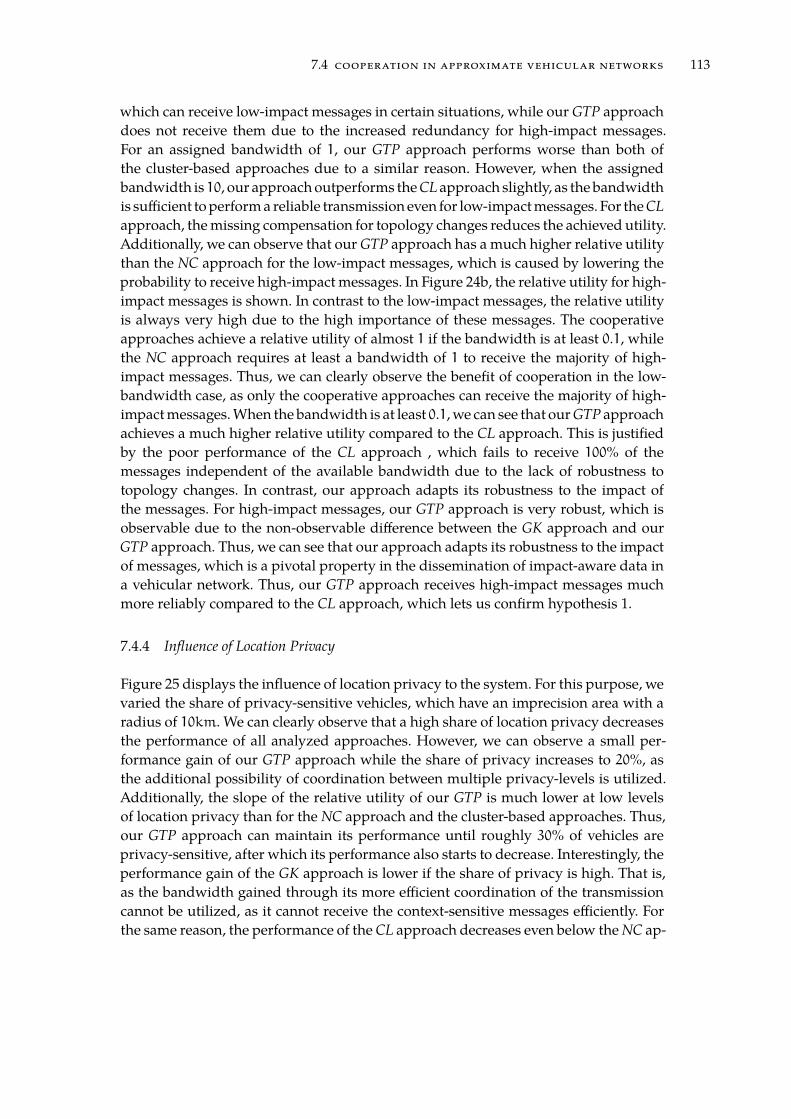
7.4 cooperation in approximate vehicular networks 113
which can receive low-impact messages in certain situations, while our GTP approachdoes not receive them due to the increased redundancy for high-impact messages.For an assigned bandwidth of 1, our GTP approach performs worse than both ofthe cluster-based approaches due to a similar reason. However, when the assignedbandwidth is 10, our approach outperforms the CL approach slightly, as the bandwidthis sufficient to perform a reliable transmission even for low-impact messages. For the CL
approach, the missing compensation for topology changes reduces the achieved utility.Additionally, we can observe that our GTP approach has a much higher relative utilitythan the NC approach for the low-impact messages, which is caused by lowering theprobability to receive high-impact messages. In Figure 24b, the relative utility for high-impact messages is shown. In contrast to the low-impact messages, the relative utilityis always very high due to the high importance of these messages. The cooperativeapproaches achieve a relative utility of almost 1 if the bandwidth is at least 0.1, whilethe NC approach requires at least a bandwidth of 1 to receive the majority of high-impact messages. Thus, we can clearly observe the benefit of cooperation in the low-bandwidth case, as only the cooperative approaches can receive the majority of high-impact messages. When the bandwidth is at least 0.1, we can see that our GTP approachachieves a much higher relative utility compared to the CL approach. This is justifiedby the poor performance of the CL approach , which fails to receive 100% of themessages independent of the available bandwidth due to the lack of robustness totopology changes. In contrast, our approach adapts its robustness to the impact ofthe messages. For high-impact messages, our GTP approach is very robust, which isobservable due to the non-observable difference between the GK approach and ourGTP approach. Thus, we can see that our approach adapts its robustness to the impactof messages, which is a pivotal property in the dissemination of impact-aware data ina vehicular network. Thus, our GTP approach receives high-impact messages muchmore reliably compared to the CL approach, which lets us confirm hypothesis 1.
7.4.4 Influence of Location Privacy
Figure 25 displays the influence of location privacy to the system. For this purpose, wevaried the share of privacy-sensitive vehicles, which have an imprecision area with aradius of 10km. We can clearly observe that a high share of location privacy decreasesthe performance of all analyzed approaches. However, we can observe a small per-formance gain of our GTP approach while the share of privacy increases to 20%, asthe additional possibility of coordination between multiple privacy-levels is utilized.Additionally, the slope of the relative utility of our GTP is much lower at low levelsof location privacy than for the NC approach and the cluster-based approaches. Thus,our GTP approach can maintain its performance until roughly 30% of vehicles areprivacy-sensitive, after which its performance also starts to decrease. Interestingly, theperformance gain of the GK approach is lower if the share of privacy is high. That is,as the bandwidth gained through its more efficient coordination of the transmissioncannot be utilized, as it cannot receive the context-sensitive messages efficiently. Forthe same reason, the performance of the CL approach decreases even below the NC ap-
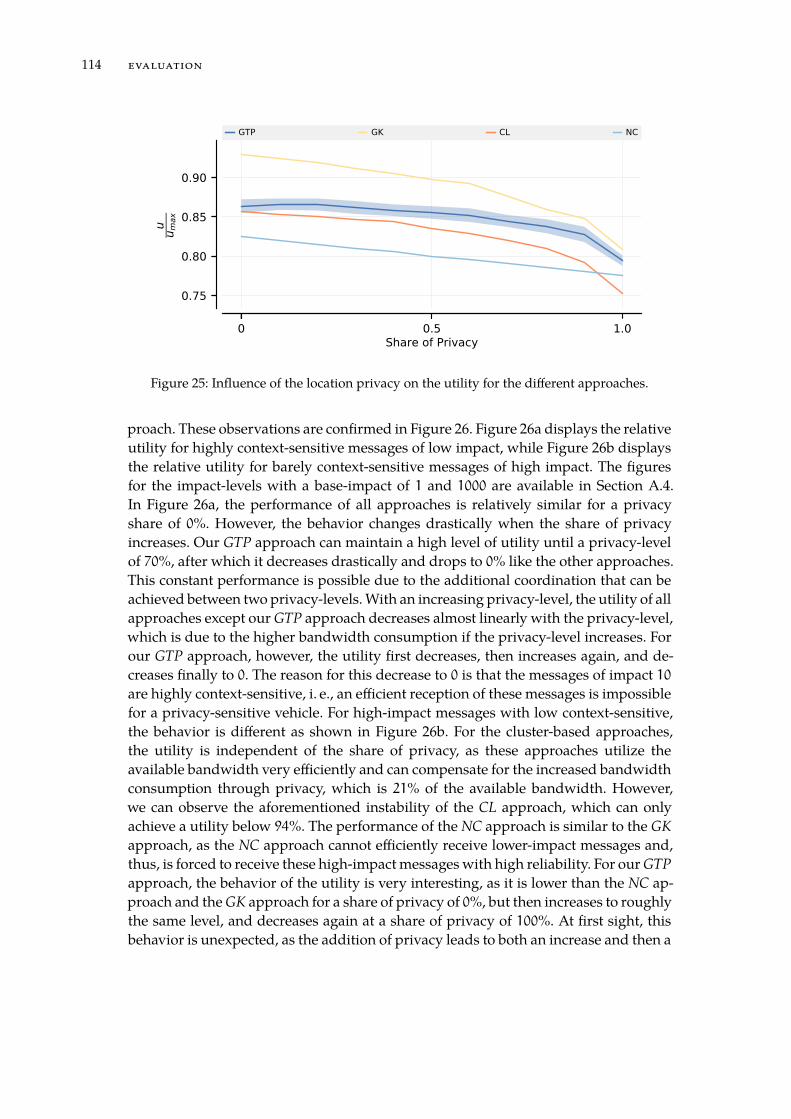
114 evaluation
0 0.5 1.0Share of Privacy
0.75
0.80
0.85
0.90u
u max
GTP GK CL NC
Figure 25: Influence of the location privacy on the utility for the different approaches.
proach. These observations are confirmed in Figure 26. Figure 26a displays the relativeutility for highly context-sensitive messages of low impact, while Figure 26b displaysthe relative utility for barely context-sensitive messages of high impact. The figuresfor the impact-levels with a base-impact of 1 and 1000 are available in Section A.4.In Figure 26a, the performance of all approaches is relatively similar for a privacyshare of 0%. However, the behavior changes drastically when the share of privacyincreases. Our GTP approach can maintain a high level of utility until a privacy-levelof 70%, after which it decreases drastically and drops to 0% like the other approaches.This constant performance is possible due to the additional coordination that can beachieved between two privacy-levels. With an increasing privacy-level, the utility of allapproaches except our GTP approach decreases almost linearly with the privacy-level,which is due to the higher bandwidth consumption if the privacy-level increases. Forour GTP approach, however, the utility first decreases, then increases again, and de-creases finally to 0. The reason for this decrease to 0 is that the messages of impact 10are highly context-sensitive, i. e., an efficient reception of these messages is impossiblefor a privacy-sensitive vehicle. For high-impact messages with low context-sensitive,the behavior is different as shown in Figure 26b. For the cluster-based approaches,the utility is independent of the share of privacy, as these approaches utilize theavailable bandwidth very efficiently and can compensate for the increased bandwidthconsumption through privacy, which is 21% of the available bandwidth. However,we can observe the aforementioned instability of the CL approach, which can onlyachieve a utility below 94%. The performance of the NC approach is similar to the GK
approach, as the NC approach cannot efficiently receive lower-impact messages and,thus, is forced to receive these high-impact messages with high reliability. For our GTP
approach, the behavior of the utility is very interesting, as it is lower than the NC ap-proach and the GK approach for a share of privacy of 0%, but then increases to roughlythe same level, and decreases again at a share of privacy of 100%. At first sight, thisbehavior is unexpected, as the addition of privacy leads to both an increase and then a

7.4 cooperation in approximate vehicular networks 115
0 0.5 1.0Share of Privacy
0.0
0.2
0.4
0.6
0.8
1.0
uu m
ax|1
0(m
)<10
0GTP GK CL NC
(a) Base-impact per bit µB(m) = 10.
0 0.5 1.0Share of Privacy
0.94
0.96
0.98
1.00
uu m
ax|1
00(m
)<10
00
GTP GK CL NC
(b) Base-impact per bit µB(m) = 100.
Figure 26: Influence of location privacy on the utility of messages with different base-impactfor the different approaches.
decrease in utility. This behavior can be explained again with the implicit coordinationthat can be achieved if vehicles of multiple privacy-levels are close to each other. Inthis case, the privacy-sensitive and the privacy-insensitive vehicles can coordinate thetransmission of data, which increases the available bandwidth for both privacy-levelsthrough cooperation. Thus, the performance of our GTP approach increases if thispotential is available, i. e., if the share of privacy in the system is neither 0% nor 100%.This analysis lets us confirm hypothesis 2, i. e., our GTP approach mitigates the neg-ative effects of location privacy and is able to maintain a constant performance if theshare of privacy is low.
7.4.5 Influence of Misbehaving Vehicles
In this section, we analyze the robustness of the approaches to misbehaving vehicles.As already shown in Chapter 5, it is not reasonable to utilize a different strategy toincrease the benefit of a single vehicle. Similarly, it is not feasible for any vehicle toforge messages, as the messages disseminated in a vehicular network are generally con-sidered to be cryptographically protected. However, a misbehaving vehicle might notshare received messages with vehicles in its proximity, which does not influence theutility of the misbehaving vehicle, but decreases the performance of its surroundings.We assume that the vehicles in proximity of the misbehaving vehicle (both behavingand misbehaving) are not aware of the misbehaving vehicle’s unwillingness to cooper-ate, and the misbehaving vehicle behaves as a cooperating vehicle in role-finding andcoordination processes.
Figure 27 displays the influence of misbehaving vehicles on the behaving vehiclesin the network. Notice that this plots ends at an share of misbehaving vehicles of 75%,

116 evaluation
0.0% 25% 50% 75%Share of Misbehaving Vehicles
0.00
0.25
0.50
0.75
1.00u
u max
NC CL GTP GK
Figure 27: Influence of the misbehaving vehicles on the utility of behaving vehicles for thedifferent approaches.
as there are no behaving vehicles if the share of misbehaving vehicles is 100%. It isevident that all cooperative approaches are negatively influenced by an increasingshare of misbehaving vehicles, while the NC approach remains unaffected. For theNC approach, there is no communication between vehicles, such that an misbehavingvehicle does not behave any different to the other vehicles. The only noticeable changeto the NC approach is a decrease in the variation, as the number of behaving vehiclesdecreases with an increasing share of misbehaving vehicles. For the cluster-basedapproaches, a big performance drop can be observed, which is almost linear with theshare of misbehaving vehicles. That is expected, as the vehicles in the cluster-basedapproaches generally rely on exactly one other vehicle to deliver messages to them. Ifthis vehicle is misbehaving, they do not receive any messages, leading to a utility of 0while they rely on that vehicle. Thus, the performance of the cluster-based approachesdrops below the NC approach already if 25% of vehicles are misbehaving. While 25%of vehicles is a large share of vehicles when considering the whole network, the localperformance of a vehicle will always drop if an misbehaving vehicle is elected as cluster-head. Compared to that, our GTP approach never relies only on a single vehicle whenreceiving data, but ensures that high-impact messages are transmitted redundantly.Thus, the performance stays relatively stable even for a high share of misbehavingvehicles, while only decreasing below the NC approach if this share is 75%. Buteven at a share of misbehaving vehicles of 75%, the performance decrease of ourNC approach is only marginal. In total, our GTP approach decreases its performanceby only 16.4%, which shows the comparably high robustness of our approach to thistype of misbehavior. While such a high share of misbehaving vehicles is unlikely dueto the highly restricted access to the hardware in vehicles, it also shows the robustnessof our GTP approach to message drop or any form of transmission errors, which wouldhave a similar effect as this type of misbehavior, which lets us confirm hypothesis 3.

7.4 cooperation in approximate vehicular networks 117
25% 50% 75% 100%Share of Misbehaving Vehicles
0.00
0.25
0.50
0.75
1.00u
u max
NC CL GTP GK
Figure 28: Influence of the misbehaving vehicles on the utility of misbehaving vehicles for thedifferent approaches.
As an addition, we review our claim that this type of non-cooperation does not in-crease the performance of a misbehaving vehicle. For this purpose, Figure 28 displaysthe performance of only the misbehaving vehicles in the network. Notice that a shareof misbehaving vehicles of 0% is excluded from this graph, as there are no misbe-having vehicles in the network in this case. When comparing the performance of themisbehaving vehicles with the corresponding performance of behaving vehicles, wecan see that their performance is only slightly higher. However, when comparing theresults to the case without misbehavior, we can clearly observe that the performance ofmisbehaving vehicles does not increase, but only decreases slightly less compared tobehaving vehicles. That is, as the misbehaving vehicles also rely on other misbehavingvehicles for the reception of messages in some situations, which also decreases theiroverall performance. Thus, there is no gain for misbehaving vehicles from refusingto cooperate. At a share of misbehaving vehicles of 100%, we can observe that theperformance of all approaches except the NC approach decreases drastically, but ourGTP approach is able to maintain a higher utility than the cluster-based approaches.
Summarizing, we provide an insight into the performance of our approach toapproximate vehicular networking based on probabilistic mechanisms. Based thesemechanisms, vehicles can coordinate the reception of messages and increase theiroverall utility significantly. Compared to cluster-based approaches, which rely on onlya single other vehicle, our game-theoretic approach adapts the number of recipientsof the transmission based on the impact for each individual vehicle, such that thetransmission of high-impact messages is very robust. This robustness is an importantfactor to compensate for the frequent topology changes, message drops, and misbe-havior. Thus, our concept to approximate vehicular networking adapts its behavior tothe transmitted data and networking conditions, such that the overall performance ofthe network participants is maximized.

8S U M M A RY, CO NC LU S I O N S , A N D O U T LO O K
To conclude our work, we summarize the content of the previous chapters and stateour main contributions in the following. We then draw conclusions based on our
obtained results. Finally, we discuss potential future work regarding data assessmentand approximate vehicular networks.
8.1 summary of the thesis
In Chapter 1, we described the challenges for future vehicular networks, focusing onthe data dissemination over large distances to support future autonomous vehicles.We motivated the necessity for approximate vehicular networks and the advantagesof prioritization based on the quality of the disseminated data. In Chapter 2, we an-alyzed existing mechanisms for data dissemination in large-scale vehicular networksand analyzed existing concepts for data quality assessment in these networks. As apossible combination, we analyzed the concept of approximate networks in generaland the possibilities of quality-aware vehicular networks. For that purpose, we pro-vide a detailed insight into the necessary components and mechanisms of large-scalevehicular networks in Chapter 3. Based on our analysis of the state-of-the-art and ourscenario, we present and discuss the following contributions of this thesis.
8.1.1 Contributions
Chapter 4 contains our first two contributions, which focus on the determinationof data impact considering different influence factors. As the first contribution, weproposed our accuracy-aware aggregation scheme for measurements produced bymultiple vehicles with different accuracy in Section 4.2. This is a common issue forvehicular networks, as the quality of measurements provided by a certain vehicledepends on a multitude of factors, like manufacturer and vehicle type. Additionally,the lifetime of an event influences the weight that old measurements should have on thecurrent aggregate. Thus, our innovative aggregation scheme considers the accuracyof sensors on a measurement basis and the properties of the underlying event toreduce the number of false aggregates in the network. For this purpose, we designeda weighting function, that constitutes the influence of measurements depending ontheir age. To determine the behavior of this function, we developed and solved anoptimization problem aiming at reducing false aggregates in the system.
In Section 4.3 and Section 4.4, we describe our second contribution, which is thedetermination of data relevance and its impact on a receiving vehicle. An accurateestimation of data relevance and impact is an important aspect of future vehicularnetworks due to the increase in data availability in these networks. To cope with this
119

120 summary, conclusions, and outlook
issue, we develop a prediction-based approach for the determination of data relevance,which predicts the future context of the vehicle and the future state of the event. Thatis, we utilize the expected lifetime of the event in comparison with the available routesof the vehicle to estimate the probability that the vehicle will encounter that eventwhile it is active. We then combine these two contributions to determine the impact ofa piece of data on a vehicle, considering its accuracy, its relevance, and the importancegiven by its data type. This impact is an important metric to prioritize and filter datain large-scale vehicular networks.
As our third contribution in Chapter 5, we propose our concept of approximate ve-hicular networks using probabilistic filtering of messages based on their impact. Weinvestigate both cellular networks and hybrid networks, i. e., networks in which thevehicles may cooperate locally via the Wifi interface. As both these networks rely onthe transmission of data by a server, the server generally requires an accurate rep-resentation of the vehicle’s context at the server, which compromises the privacy ofthe passengers. Our innovative concept of approximate vehicular networks naturallyincludes the privacy of passengers in the transmission process, as vehicles can chooseto provide only an inaccurate representation of their context. We then develop anapproach to coordinate the transmission of data in a network, in which vehicles withdifferent privacy constraints are present. For this purpose, we model the transmissionof data as a utility-based game, in which the vehicles utilize a mixed strategy consider-ing the strategies of vehicles in proximity. We then develop a concept of determiningthe optimal strategy for each vehicle in this network and analyze the properties of ourfound solution. Furthermore, we designed and developed our VEHICLE.KOM plat-form described in Chapter 6, which is used as the basis for our extensive evaluationin Chapter 7. For this purpose, we modeled the environment and the vehicles accord-ing to our findings from Chapter 3, and connected the traffic simulator Simulation ofUrban Mobility (SUMO) to utilize realistic vehicle movement in our simulation.
8.1.2 Conclusions
In our extensive evaluation, we provided insights into the behavior of our approachesunder varying environmental conditions and show that our approaches improve theperformance of future vehicular networks.
In Section 7.2, we showed that our innovative aggregation scheme drastically im-proves the data quality when aggregating measurements of heterogeneous sensorsources. Our approach can compensate low sensor accuracies by increasing its robust-ness dynamically and, thus, increasing the influence of old measurements, such thatthe aggregation relies on more data. Additionally, our approach adapts its behavior tothe lifetime of the event, by increasing its adaptability to changes if the expected eventlifetime is low. Thus, our aggregation scheme constitutes a significant advance towardsan increased data quality in future vehicular network, in which heterogeneous sensorsources will dominate.
We then evaluate the performance of our relevance-based dissemination approachin cellular-only vehicular networks in Section 7.3. Our relevance-based dissemination

8.2 outlook 121
approach is a pivotal contribution to reduce the bandwidth usage in future vehicu-lar networks. In the evaluation, we show that our approach achieves a significantlyhigher precision compared to geocast-based approaches, i. e., our approach trans-mits a higher share of relevant data to the receiving vehicles. Our relevance-basedapproach performs slightly worse regarding the total number of relevant messagesreceived compared to the geocast-based approaches if the available bandwidth is veryhigh, but utilizes the bandwidth much more efficiently. This enables our relevance-based approach to maintain its performance if the bandwidth decreases, while thegeocast-based approach drastically drops in performance. We also showed that ourrelevance-based approach considers the impact of a message in the dissemination,leading to a higher share of high-impact messages being transmitted if the bandwidthis limited. This is an important aspect of future vehicular networks to reduce theinfluence of insufficient bandwidth. With that, our relevance-based approach consti-tutes a significant contribution towards efficient dissemination of messages in futurevehicular networks.
In Section 7.4, we then evaluate the performance of our innovative approach forapproximate vehicular networks based on probabilistic mechanisms. Our approachnaturally incorporates privacy in the system and enables the vehicles to cooperate with-out explicit coordination. We investigated the performance of our approach comparedwith approaches for explicit coordination and showed that our approach outperformsthese approaches in a realistic setting. That is, as our approach adapts its robustness tothe impact of messages transferred through the network, which makes the reception ofhigh-impact messages very probable. Approaches with explicit coordination lack thisrobustness, which leads to a stronger influence of topology changes and message dropto these approaches. We then investigated the influence of privacy on our developedapproach and observed that our approach compensates for low levels of privacy andmaintains the network performance. To additionally emphasize the robustness of ourapproach, we investigated its performance in networks with adversaries, which donot cooperate with other vehicles. Our approach can handle this type of adversariesvery well, which again proves the robustness of our developed approach. Thus, ourconcept for approximate vehicular networks based on probabilistic mechanisms is asignificant contribution, which enables cooperation in future vehicular networks byadapting the coordination to the impact of the shared messages.
8.2 outlook
Our concept for approximate networks with probabilistic behavior builds the founda-tion for further research. While we proposed the usage of this paradigm and conceptsfor data-centric data dissemination in vehicular networks, other research field cangreatly benefit from the insights gained in this thesis. Especially when data is sharedthat imposes the user’s privacy, our approach can be used as a concept to incorporatedifferent privacy demands into the system. Additionally, our concept for the implicitcooperation between nodes in decentralized networks provides very interesting chal-lenges when applied to other (potentially less mobile) networks, in which, e. g., a

122 summary, conclusions, and outlook
reliance on a single other node is not desired. Additionally, the impact-based prior-itization and filtering offer new research challenges in other areas, which should befurther investigated. As an example, the impact of data in disaster networks needs tobe determined differently from our impact considerations in this thesis and is arguablymore human-centric. In addition to that, incentive mechanisms for cooperation andsharing of data have not been considered in this thesis, which are considered to beinteresting especially in Smart Cities and in the Internet of Things. For that purpose,also pricing mechanisms for data need to be developed, which can base our consider-ations of the event impact. As an example, high-quality data can be sold for a higherprice compared to low-quality data. With these considerations, intermediate nodescould use our aggregation scheme to aggregate low-quality and low-price data, andsell the obtained high-quality and high-price data. This provides network nodes withspare resources the possibility to utilizes these resources to benefit the network andobtain a benefit by themselves.
Our mechanisms for the assessment of data quality and for the consideration of thisquality in the dissemination, provide the foundation of further research in the directionof approximate networks. With our VEHICLE.KOM platform, we additionally providethe possibility for other researchers to develop new concepts for approximate vehicularnetworks and test them in a simulative environment.
acknowledgments
This thesis was funded by the LOEWE initiative (Hessen, Germany) within the NICERproject, by German Federal Ministry of Education and Research (BMBF) within theSMARTER project, and by the German Research Foundation (DFG) as part of theproject B1 within the Collaborative Research Center (CRC) 1053 - MAKI.

B I B L I O G R A P H Y
[1] User Equipment (UE) radio transmission and reception (FDD). Technical specifica-tion. Sophia Antipolis, FR: 3GPP, 1999.
[2] User Equipment (UE) radio transmission and reception (TDD). Technical specifica-tion. Sophia Antipolis, FR: 3GPP, 1999.
[3] Evolved Universal Terrestrial Radio Access (E-UTRA) and Evolved Universal Terres-
trial Radio Access Network (E-UTRAN). Technical specification. Sophia Antipolis,FR: 3GPP, 2010.
[4] Technical Specifications and Technical Reports for a UTRAN-based 3GPP system.Technical specification. Sophia Antipolis, FR: 3GPP, 2011.
[5] Dedicated Short Range Communications (DSRC) Service. Standard. WashingtonDC, USA: Federal Communications Commission, Mar. 1999.
[6] Omid Abedi, Mahmood Fathy, and Jamshid Taghiloo. “Enhancing AODV rout-ing protocol using mobility parameters in VANET.” In: Proc. of International
Conference on Computer Systems and Applications (AICCSA). Mar. 2008, pp. 229–235. doi: 10.1109/AICCSA.2008.4493539.
[7] V. S. Abhayawardhana, I. J. Wassell, D. Crosby, M. P. Sellars, and M.G. Brown.“Comparison of empirical propagation path loss models for fixed wirelessaccess systems.” In: Proc. of Vehicular Technology Conference (VTC). Vol. 1. IEEE.2005, pp. 73–77.
[8] Kazi Masudul Alam, Mukesh Saini, and Abdulmotaleb El Saddik. “Towardsocial internet of vehicles: Concept, architecture, and applications.” In: IEEE
access 3 (2015), pp. 343–357.
[9] Waleed Alasmary and Weihua Zhuang. “Mobility impact in IEEE 802.11p in-frastructureless vehicular networks.” In: Ad Hoc Networks 10.2 (2012). RecentAdvances in Analysis and Deployment of IEEE 802.11e and IEEE 802.11p Pro-tocol Families, pp. 222–230. issn: 1570-8705. doi: https://doi.org/10.1016/j.adhoc.2010.06.006.
[10] Salim Allal and Saadi Boudjit. “Geocast routing protocols for vanets: Surveyand guidelines.” In: Proc. of International Conference on Innovative Mobile and
Internet Services in Ubiquitous Computing (IMIS). IEEE. 2012, pp. 323–328.
[11] Sabri Allani, Taoufik Yeferny, and Richard Chbeir. “A scalable data dissemina-tion protocol based on vehicles trajectories analysis.” In: Ad Hoc Networks 71(2018), pp. 31–44. issn: 1570-8705. doi: https://doi.org/10.1016/j.adhoc.2017.12.003.
123

124 bibliography
[12] Bastian Alt, Markus Weckesser, Christian Becker, Matthias Hollick, Sounak Kar,Anja Klein, Robin Klose, Roland Kluge, Heinz Koeppl, Boris Koldehofe, WasiurR. Khudabukhsh, Manisha Luthra, Mahdi Mousavi, Max Mühlhäuser, MartinPfannemüller, Amr Rizk, Andy Schürr, and Ralf Steinmetz. “Transitions: AProtocol-Independent View of the Future Internet.” In: Proceedings of the IEEE
107.4 (Apr. 2019), pp. 835–846. doi: 10.1109/JPROC.2019.2895964.
[13] Marica Amadeo, Claudia Campolo, and Antonella Molinaro. “CRoWN: Con-tent-centric networking in vehicular ad hoc networks.” In: IEEE Communications
Letters 16.9 (2012), pp. 1380–1383.
[14] Marica Amadeo, Claudia Campolo, and Antonella Molinaro. “Enhancing IEEE802.11 p/WAVE to provide infotainment applications in VANETs.” In: Ad Hoc
Networks 10.2 (2012), pp. 253–269.
[15] Marica Amadeo, Claudia Campolo, and Antonella Molinaro. “Information-centric networking for connected vehicles: a survey and future perspectives.”In: IEEE Communications Magazine 54.2 (2016), pp. 98–104.
[16] Giuseppe Araniti, Claudia Campolo, Massimo Condoluci, Antonio Iera, andAntonella Molinaro. “LTE for vehicular networking: a survey.” In: IEEE commu-
nications magazine 51.5 (2013), pp. 148–157.
[17] Mohammad Hadi Arbabi and Michele Weigle. “Using vehicular networks tocollect common traffic data.” In: Proc. of International Workshop on Vehicular
Internetworking (VANET). ACM. 2009, pp. 117–118.
[18] Arash Asadi, Qing Wang, and Vincenzo Mancuso. “A survey on device-to-device communication in cellular networks.” In: IEEE Communications Surveys
& Tutorials 16.4 (2014), pp. 1801–1819.
[19] Alessia Autolitano, Claudia Campolo, Antonella Molinaro, Riccardo M. Sco-pigno, and Andrea Vesco. “An insight into Decentralized Congestion Controltechniques for VANETs from ETSI TS 102 687 V1.1.1.” In: Proc. of IFIP Wireless
Days (WD). Nov. 2013, pp. 1–6. doi: 10.1109/WD.2013.6686471.
[20] Fan Bai, Narayanan Sadagopan, Bhaskar Krishnamachari, and Ahmed Helmy.“Modeling path duration distributions in MANETs and their impact on reactiverouting protocols.” In: IEEE Journal on Selected Areas in Communications 22.7(2004), pp. 1357–1373.
[21] Mohamed Bakhouya, Jaafar Gaber, and Pascal Lorenz. “An adaptive approachfor information dissemination in Vehicular Ad hoc Networks.” In: Journal of
Network and Computer Applications 34.6 (2011). Control and Optimization overWireless Networks, pp. 1971–1978. issn: 1084-8045. doi: https://doi.org/10.1016/j.jnca.2011.06.010.
[22] Aruna Balasubramanian, Ratul Mahajan, and Arun Venkataramani. “Augment-ing mobile 3G using WiFi.” In: Proc. of International Conference on Mobile Systems,
Applications, and Services (MobiSys). ACM. 2010, pp. 209–222.

bibliography 125
[23] Xuan Bao, Uichin Lee, Ivica Rimac, and Romit R. Choudhury. “DataSpotting:offloading cellular traffic via managed device-to-device data transfer at dataspots.” In: ACM SIGMOBILE Mobile Computing and Communications Review 14.3(2010), pp. 37–39.
[24] Javier Barrachina, Piedad Garrido, Manuel Fogue, Francisco J. Martinez, Juan-Carlos Cano, Carlos T. Calafate, and Pietro Manzoni. “VEACON: A VehicularAccident Ontology designed to improve safety on the roads.” In: Journal of
Network and Computer Applications 35.6 (2012), pp. 1891–1900. issn: 1084-8045.doi: https://doi.org/10.1016/j.jnca.2012.07.013.
[25] Hrishav Bakul Barua and Kartick Chandra Mondal. “Approximate Computing:A Survey of Recent Trends—Bringing Greenness to Computing and Commu-nication.” In: Journal of The Institution of Engineers (India): Series B (June 2019).issn: 2250-2114. doi: 10.1007/s40031-019-00418-8.
[26] Prithwish Basu, Naved Khan, and Thomas DC Little. “A mobility based metricfor clustering in mobile ad hoc networks.” In: Proc. of International Conference on
Distributed Computing Systems Workshops (ICDCS). IEEE. 2001, pp. 413–418.
[27] Alessandro Bazzi, Barbara M. Masini, Alberto Zanella, and Gianni Pasolini.“IEEE 802.11 p for cellular offloading in vehicular sensor networks.” In: Com-
puter Communications 60 (2015), pp. 97–108.
[28] Alessandro Bazzi, Barbara M. Masini, Alberto Zanella, and Ilaria Thibault. “Onthe Performance of IEEE 802.11p and LTE-V2V for the Cooperative Awarenessof Connected Vehicles.” In: IEEE Transactions on Vehicular Technology 66.11 (Nov.2017), pp. 10419–10432. doi: 10.1109/TVT.2017.2750803.
[29] Richard Bellman. “On a routing problem.” In: Quarterly of applied mathematics
16.1 (1958), pp. 87–90.
[30] Abderrahim Benslimane, Tarik Taleb, and Rajarajan Sivaraj. “Dynamic clus-tering-based adaptive mobile gateway management in integrated VANET3Gheterogeneous wireless networks.” In: IEEE Journal on Selected Areas in Commu-
nications 29.3 (2011), pp. 559–570.
[31] David Bernstein, Nino Vidovic, and Sohrab Modi. “A Cloud PAAS for HighScale, Function, and Velocity Mobile Applications - With Reference Applicationas the Fully Connected Car.” In: Proc. of International Conference on Systems and
Networks Communications (ICSNC). Aug. 2010, pp. 117–123. doi: 10.1109/ICSNC.2010.24.
[32] Filipe Betzel, Karen Khatamifard, Harini Suresh, David J. Lilja, John Sartori,and Ulya Karpuzcu. “Approximate Communication: Techniques for ReducingCommunication Bottlenecks in Large-Scale Parallel Systems.” In: ACM Comput.
Surv. 51.1 (Jan. 2018), 1:1–1:32. issn: 0360-0300. doi: 10.1145/3145812.
[33] Daniel Bischoff and Tobias Meuser. “Geo-based Backend Dissemination forSafety-relevant V2X Applications.” In: Proc. of Automotive meets Electronics
(AmE). VDE Verlag, Mar. 2019, pp. 1–6. isbn: 978-3-8007-4877-8.

126 bibliography
[34] Salim Bitam and Abdelhamid Mellouk. “ITS-cloud: Cloud computing for In-telligent transportation system.” In: Proc. of Global Communications Conference
(GLOBECOM). Dec. 2012, pp. 2054–2059. doi: 10.1109/GLOCOM.2012.6503418.
[35] Jakob Breu, Achim Brakemeier, and Michael Menth. “Analysis of cooperativeawareness message rates in vanets.” In: Proc. of International Conference on ITS
Telecommunications (ITST). IEEE. 2013, pp. 8–13.
[36] Jakob Breu, Achim Brakemeier, and Michael Menth. “A quantitative studyof Cooperative Awareness Messages in production VANETs.” In: EURASIP
Journal on Wireless Communications and Networking 2014.1 (2014), p. 98.
[37] Daniel Burgstahler, Tobias Meuser, Ulrich Lampe, Doreen Böhnstedt, and RalfSteinmetz. “ProbSense.KOM: A Probabilistic Sensing Approach for GatheringVehicular Sensed Data.” In: Proc. of International Conference on Mobile Services
(MS). Washington, DC, USA: IEEE Computer Society, June 2016, pp. 9–16. isbn:978-1-5090-2625-8.
[38] Carlos T. Calafate, Giancarlo Fortino, Sascha Fritsch, Janio Monteiro, Juan-Carlos Cano, and Pietro Manzoni. “An efficient and robust content deliverysolution for IEEE 802.11 p vehicular environments.” In: Journal of Network and
Computer Applications 35.2 (2012), pp. 753–762.
[39] Murat Caliskan, Andreas Barthels, Bjorn Scheuermann, and Martin Mauve.“Predicting Parking Lot Occupancy in Vehicular Ad Hoc Networks.” In: Proc.
of Vehicular Technology Conference (VTC-Spring). Apr. 2007, pp. 277–281. doi:10.1109/VETECS.2007.69.
[40] Cristina Cano and Douglas J. Leith. “Coexistence of WiFi and LTE in unli-censed bands: A proportional fair allocation scheme.” In: Proc. of International
Conference on Communication Workshop (ICCW). IEEE. 2015, pp. 2288–2293.
[41] Bin B Chen and Mun C. Chan. “MobTorrent: A framework for mobile Internetaccess from vehicles.” In: Proc. of International Conference on Computer Communi-
cations (INFOCOM). IEEE. 2009, pp. 1404–1412.
[42] Tsu-Wei Chen and Mario Gerla. “Global state routing: A new routing schemefor ad-hoc wireless networks.” In: Proc. of International Conference on Communi-
cations (ICC). Vol. 1. IEEE. 1998, pp. 171–175.
[43] Xianbo Chen, Hazem H. Refai, and Xiaomin Ma. “On the enhancements to IEEE802.11 MAC and their suitability for safety-critical applications in VANET.” In:Wireless Communications & Mobile Computing 10.9 (2010), pp. 1253–1269.
[44] Nan Cheng, Ning Lu, Ning Zhang, Xuemin S. Shen, and Jon W. Mark. “Vehic-ular WiFi offloading: Challenges and solutions.” In: Vehicular Communications
1.1 (2014), pp. 13–21.
[45] Sejin Chun, Sangjin Shin, Seungmin Seo, Sungkwang Eom, Jooik Jung, andKyong-Ho Lee. “A Pub/Sub-Based Fog Computing Architecture for Internet-of-Vehicles.” In: Proc. of International Conference on Cloud Computing Technology and
Science (CloudCom). Dec. 2016, pp. 90–93. doi: 10.1109/CloudCom.2016.0029.

bibliography 127
[46] IMAGinE consortium. IMAGinE. 2017. url: https://www.imagine-online.de/home/.
[47] Craig Cooper, Daniel Franklin, Montserrat Ros, Farzad Safaei, and MehranAbolhasan. “A comparative survey of VANET clustering techniques.” In: IEEE
Communications Surveys & Tutorials 19.1 (2016), pp. 657–681.
[48] L. G. Cuthbert. “Data Compression and Error Control Techniques and Applica-tions.” In: IEE Proceedings F - Communications, Radar and Signal Processing 134.1(Feb. 1987), pp. 118–119. doi: 10.1049/ip-f-1.1987.0020.
[49] Pedro M. d’Orey and Mate Boban. “Empirical evaluation of cooperative aware-ness in vehicular communications.” In: Proc. of Vehicular Technology Conference
(VTC Spring). IEEE. 2014, pp. 1–5.
[50] Kashif Dar, Mohamed Bakhouya, Jaafar Gaber, Maxime Wack, and PascalLorenz. “Wireless communication technologies for ITS applications [Topicsin Automotive Networking].” In: IEEE Communications Magazine 48.5 (2010),pp. 156–162.
[51] Thierry Delot, Nicolas Cenerario, and Sergio Ilarri. “Estimating the relevanceof information in inter-vehicle ad hoc networks.” In: Proc. of International Con-
ference on Mobile Data Management Workshops (MDMW). IEEE. 2008, pp. 151–158.
[52] Pralhad Deshpande, Xiaoxiao Hou, and Samir R. Das. “Performance compar-ison of 3G and metro-scale WiFi for vehicular network access.” In: Proc. of
Conference on Internet Measurement (IMC). ACM. 2010, pp. 301–307.
[53] Ben Ding, Zehua Chen, Yan Wang, and Hui Yu. “An improved AODV routingprotocol for VANETs.” In: Proc. of International Conference on Wireless Communi-
cations and Signal Processing (WCSP). Nov. 2011, pp. 1–5. doi: 10.1109/WCSP.2011.6096736.
[54] Yong Ding and Li Xiao. “SADV: Static-Node-Assisted Adaptive Data Dissem-ination in Vehicular Networks.” In: IEEE Transactions on Vehicular Technology
59.5 (June 2010), pp. 2445–2455. doi: 10.1109/TVT.2010.2045234.
[55] Klaus Doppler, Mika P. Rinne, Pekka Janis, Cassio B. Ribeiro, and Klaus Hugl.“Device-to-device communications; functional prospects for LTE-advanced net-works.” In: Proc. of International Conference on Communications (ICC) Workshops.IEEE. 2009, pp. 1–6.
[56] Wassim Drira and Fethi Filali. “A Pub/Sub extension to NDN for efficientdata collection and dissemination in V2X networks.” In: Proc. of International
Symposium on a World of Wireless, Mobile and Multimedia Networks (WoWMoM).June 2014, pp. 1–7. doi: 10.1109/WoWMoM.2014.6918991.
[57] Amit Dua, Neeraj Kumar, and Seema Bawa. “A systematic review on rout-ing protocols for vehicular ad hoc networks.” In: Vehicular Communications 1.1(2014), pp. 33–52.

128 bibliography
[58] Matt Duckham and Lars Kulik. “Location privacy and location-aware comput-ing.” In: Dynamic and Mobile GIS. CRC press, 2006, pp. 63–80.
[59] David Eckhoff, Nikoletta Sofra, and Reinhard German. “A performance studyof cooperative awareness in ETSI ITS G5 and IEEE WAVE.” In: Proc. of Annual
Conference on Wireless On-demand Network Systems and Services (WONS). IEEE.2013, pp. 196–200.
[60] Stephan Eichler. “Performance Evaluation of the IEEE 802.11p WAVE Commu-nication Standard.” In: Proc. of Vehicular Technology Conference (VTC). Sept. 2007,pp. 2199–2203. doi: 10.1109/VETECF.2007.461.
[61] Intelligent Transport Systems (ITS); Access layer specification for Intelligent Transport
Systems operating in the 5 GHz frequency band. Standard. Sophia Antipolis, FR:European Telecommunications Standards Institute, Mar. 2012.
[62] Intelligent Transport Systems (ITS); Framework for Public Mobile Network. Tech-nical Report. Sophia Antipolis, FR: European Telecommunications StandardsInstitute, Feb. 2012.
[63] Intelligent Transport System (ITS); Vehicular communications; GeoNetworking; Part
4: Geographical addressing and forwarding for point-to-point and point-to-multipoint
communications; Subpart 1: Media independent functionalities. Technical Specifica-tion. Sophia Antipolis, FR: European Telecommunications Standards Institute,May 2014.
[64] Intelligent Transport Systems (ITS); Vehicular Communications; Basic Set of Ap-
plications; Part 2: Specification of Cooperative Awareness Basic Service. TechnicalSpecification. Sophia Antipolis, FR: European Telecommunications StandardsInstitute, Mar. 2011.
[65] Intelligent Transport Systems (ITS); Vehicular Communications; Basic Set of Applica-
tions; Part 3: Specifications of Decentralized Environmental Notification Basic Service.Technical Specification. Sophia Antipolis, FR: European TelecommunicationsStandards Institute, Sept. 2010.
[66] Patrick T. Eugster, Pascal A. Felber, Rachid Guerraoui, and Anne-Marie Ker-marrec. “The many faces of publish/subscribe.” In: ACM computing surveys
(CSUR) 35.2 (2003), pp. 114–131.
[67] Andreas Festag. “Standards for vehicular communicationfrom IEEE 802.11 pto 5G.” In: e & i Elektrotechnik und Informationstechnik 132.7 (2015), pp. 409–416.
[68] Marco Fiore and Jérôme Härri. “The networking shape of vehicular mobility.”In: Proc. of International Symposium on Mobile Ad Hoc Networking and Computing
(MobiHoc). ACM. 2008, pp. 261–272.
[69] Gábor Fodor, Erik Dahlman, Gunnar Mildh, Stefan Parkvall, Norbert Reider,György Miklós, and Zoltán Turányi. “Design aspects of network assisted device-to-device communications.” In: IEEE Communications Magazine 50.3 (2012),pp. 170–177.
[70] Lester R. Ford. Network flow theory. Tech. rep. Rand Corp Santa Monica Ca, 1956.

bibliography 129
[71] Hui Gao, Chi Harold Liu, Jian Tang, Dejun Yang, Pan Hui, and Wendong Wang.“Online Quality-Aware Incentive Mechanism for Mobile Crowd Sensing withExtra Bonus.” In: IEEE Transactions on Mobile Computing (2018), pp. 1–1. doi:10.1109/TMC.2018.2877459.
[72] Jose J. Garcia-Luna-Aceves and Marcelo Spohn. “Source-tree routing in wirelessnetworks.” In: Proc. of International Conference on Network Protocols (ICNP). IEEE.1999, pp. 273–282.
[73] Mario Gerla, Eun-Kyu Lee, Giovanni Pau, and Uichin Lee. “Internet of vehicles:From intelligent grid to autonomous cars and vehicular clouds.” In: Proc. of
World Forum on Internet of Things (WF-IoT). IEEE. 2014, pp. 241–246.
[74] Amitava Ghosh, Rapeepat Ratasuk, Bishwarup Mondal, Nitin Mangalvedhe,and Tim Thomas. “LTE-advanced: next-generation wireless broadband tech-nology.” In: IEEE wireless communications 17.3 (2010), pp. 10–22.
[75] Marco Giordani, Andrea Zanella, Takamasa Higuchi, Onur Altintas, and Mi-chele Zorzi. “Emerging Trends in Vehicular Communication Networks.” In:Emerging Wireless Communication and Network Technologies: Principle, Paradigm
and Performance. Ed. by Karm Veer Arya, Robin Singh Bhadoria, and NarendraS. Chaudhari. Singapore: Springer Singapore, 2018, pp. 37–57. isbn: 978-981-13-0395-1. doi: 10.1007/978-981-13-0396-8_3.
[76] Hendrik-Jörn Günther, Raphael Riebl, Lars Wolf, and Christian Facchi. “Col-lective perception and decentralized congestion control in vehicular ad-hocnetworks.” In: 2016 IEEE Vehicular Networking Conference (VNC). Dec. 2016,pp. 1–8. doi: 10.1109/VNC.2016.7835931.
[77] Hendrik-Jörn Günther, Raphael Riebl, Lars Wolf, and Christian Facchi. “TheEffect of Decentralized Congestion Control on Collective Perception in DenseTraffic Scenarios.” In: Computer Communications 122 (2018), pp. 76–83. issn:0140-3664. doi: https://doi.org/10.1016/j.comcom.2018.03.009.
[78] Hannes Hartenstein and Kenneth P. Laberteaux. “A tutorial survey on vehicularad hoc networks.” In: IEEE Communications Magazine 46.6 (June 2008), pp. 164–171. doi: 10.1109/MCOM.2008.4539481.
[79] Heecheol Song and Hwang Soo Lee. “A survey on how to solve a decentralizedcongestion control problem for periodic beacon broadcast in vehicular safetycommunications.” In: Proc. of International Conference on Advanced Communica-
tions Technology (ICACT). Jan. 2013, pp. 649–654.
[80] Wendi R. Heinzelman, Anantha Chandrakasan, and Hari Balakrishnan. “En-ergy-efficient communication protocol for wireless microsensor networks.” In:Proc. of Annual Hawaii international Conference on System Sciences (HICSS). IEEE.2000, 10–pp.
[81] Georg Hertkorn. “Mikroskopische Modellierung von zeitabhängiger Verkehrs-nachfrage und von Verkehrsflußmustern.” PhD dissertation. University of Co-logne, 2004.

130 bibliography
[82] Guido R. Hiertz, Dee Denteneer, Lothar Stibor, Yunpeng Zang, Xavier P. Costa,and Bernhard Walke. “The IEEE 802.11 universe.” In: IEEE Communications
Magazine 48.1 (Jan. 2010), pp. 62–70. doi: 10.1109/MCOM.2010.5394032.
[83] Xiaoxiao Hou, Pralhad Deshpande, and Samir R. Das. “Moving bits from 3Gto metro-scale WiFi for vehicular network access: An integrated transport layersolution.” In: Proc. of International Conference on Network Protocols (ICNP). IEEE.2011, pp. 353–362.
[84] Christoph Ide, Bjoern Dusza, Markus Putzke, and Christian Wietfeld. “Channelsensitive transmission scheme for V2I-based Floating Car Data collection viaLTE.” In: Proc. of International Conference on Communications (ICC). IEEE. 2012,pp. 7151–7156.
[85] Accuracy (trueness and precision) of measurement methods and results – Part 1: Gen-
eral principles and definitions. Standard. Geneva, CH: International Organizationfor Standardization, Dec. 1994.
[86] Mohammad R. Jabbarpour, Ali Jalooli, Erfan Shaghaghi, Rafidah M. Noor,Leon Rothkrantz, Rashid H. Khokhar, and Nor B. Anuar. “Ant-based vehiclecongestion avoidance system using vehicular networks.” In: Engineering Ap-
plications of Artificial Intelligence 36 (2014), pp. 303–319. issn: 0952-1976. doi:https://doi.org/10.1016/j.engappai.2014.08.001.
[87] Florian Jomrich, Daniel Bischoff, Steffen Knapp, Tobias Meuser, Björn Richerz-hagen, and Ralf Steinmetz. “Lane Accurate Detection of Map Changes basedon Low Cost Smartphone Data.” In: SCITEPRESS, May 2019, pp. 126–137. isbn:978-989-758-374-2.
[88] Florian Jomrich, Josef Schmid, Steffen Knapp, Alfred Höß, Ralf Steinmetz, andBjörn Schuller. “Analysing communication requirements for crowd sourcedbackend generation of HD Maps used in automated driving.” In: Proc. of Vehic-
ular Networking Conference (VNC). Dec. 2018, pp. 1–8. doi: 10.1109/VNC.2018.8628335.
[89] Florian Jomrich, Aakash Sharma, Tobias Rückelt, Daniel Burgstahler, and Dore-en Böhnstedt. “Dynamic Map Update Protocol for Highly Automated DrivingVehicles.” In: Proc. of International Conference on Vehicle Technology and Intelligent
Transport Systems (VEHITS). SCITEPRESS, Apr. 2017, pp. 68–78. isbn: 978-989-758-242-4.
[90] Luo Junhai, Ye Danxia, Xue Liu, and Fan Mingyu. “A survey of multicastrouting protocols for mobile ad-hoc networks.” In: IEEE communications surveys
& tutorials 11.1 (2009), pp. 78–91.
[91] Mohammed Saeed Al-Kahtani. “Survey on security attacks in Vehicular Ad hocNetworks (VANETs).” In: Proc. of International Conference on Signal Processing and
Communication Systems. IEEE. 2012, pp. 1–9.

bibliography 131
[92] Seiya Kato, Matti Hiltunen, Kaustubh Joshi, and Richard Schlichting. “Enablingvehicular safety applications over LTE networks.” In: Proc. of International Con-
ference on Connected Vehicles and Expo (ICCVE). Dec. 2013, pp. 747–752. doi:10.1109/ICCVE.2013.6799889.
[93] Brett Kaufman and Behnaam Aazhang. “Cellular networks with an overlaiddevice to device network.” In: Proc. of Asilomar Conference on Signals, Systems
and Computers (ACSSC). IEEE. 2008, pp. 1537–1541.
[94] Uzma Khan, Shikha Agrawal, and Sanjay Silakari. “Detection of maliciousnodes (DMN) in vehicular ad-hoc networks.” In: Procedia computer science 46(2015), pp. 965–972.
[95] Evangelia Kokolaki, Merkouris Karaliopoulos, and Ioannis Stavrakakis. “Lever-aging Information in Parking Assistance Systems.” In: IEEE Transactions on Ve-
hicular Technology 62.9 (Nov. 2013), pp. 4309–4317. doi: 10.1109/TVT.2013.2269015.
[96] Charalampos Konstantopoulos, Damianos Gavalas, and Grammati Pantziou.“Clustering in mobile ad hoc networks through neighborhood stability-basedmobility prediction.” In: Computer Networks 52.9 (2008), pp. 1797–1824.
[97] Sjaanie Koppel, Judith Charlton, Brian Fildes, and Michael Fitzharris. “Howimportant is vehicle safety in the new vehicle purchase process?” In: Accident
Analysis & Prevention 40.3 (2008), pp. 994–1004. issn: 0001-4575. doi: https://doi.org/10.1016/j.aap.2007.11.006.
[98] Taek Jin Kwon and Mario Gerla. “Efficient Flooding with Passive Clustering(PC) in Ad Hoc Networks.” In: SIGCOMM Computer Communication Review 32.1(Jan. 2002), pp. 44–56. issn: 0146-4833. doi: 10.1145/510726.510730.
[99] Lei Lei, Zhangdui Zhong, Chuang Lin, and Xuemin Shen. “Operator controlleddevice-to-device communications in LTE-advanced networks.” In: IEEE Wire-
less Communications 19.3 (2012), pp. 96–104.
[100] Ilias Leontiadis, Paolo Costa, and Cecilia Mascolo. “Persistent content-basedinformation dissemination in hybrid vehicular networks.” In: Proc. of Inter-
national Conference on Pervasive Computing and Communications (PerCom). Mar.2009, pp. 1–10. doi: 10.1109/PERCOM.2009.4912758.
[101] Ilias Leontiadis and Cecilia Mascolo. “GeOpps: Geographical OpportunisticRouting for Vehicular Networks.” In: Proc. of International Symposium on a World
of Wireless, Mobile and Multimedia Networks (WoWMoM). June 2007, pp. 1–6. doi:10.1109/WOWMOM.2007.4351688.
[102] Ilias Leontiadis and Cecilia Mascolo. “Opportunistic Spatio-temporal Dissem-ination System for Vehicular Networks.” In: Proc. of International MobiSys Work-
shop on Mobile Opportunistic Networking. MobiOpp ’07. San Juan, Puerto Rico:ACM, 2007, pp. 39–46. isbn: 978-1-59593-688-2. doi: 10.1145/1247694.1247702.
[103] Fan Li and Yu Wang. “Routing in vehicular ad hoc networks: A survey.” In:IEEE Vehicular Technology Magazine 2.2 (June 2007), pp. 12–22. doi: 10.1109/MVT.2007.912927.

132 bibliography
[104] Meng Li, Pengbo Si, and Yanhua Zhang. “Delay-tolerant data traffic to software-defined vehicular networks with mobile edge computing in smart city.” In: IEEE
Transactions on Vehicular Technology 67.10 (2018), pp. 9073–9086.
[105] Patrick Lieser, Nils Richerzhagen, Simon Luser, Björn Richerzhagen, and RalfSteinmetz. “Understanding the Impact of Message Prioritization in Post-Disas-ter Ad Hoc Networks.” In: Proc. of International Conference on Networked Systems
(NetSys). Mar. 2019.
[106] Stephanie Lindsey and Cauligi S. Raghavendra. “PEGASIS: Power-efficientgathering in sensor information systems.” In: Proc. of Aerospace Conference. Vol. 3.IEEE. 2002, pp. 3–3.
[107] Xiao Liu, Yuxin Liu, Neal N. Xiong, Ning Zhang, Anfeng Liu, Hailan Shen, andChangqin Huang. “Construction of Large-Scale Low-Cost Delivery Infrastruc-ture Using Vehicular Networks.” In: IEEE Access 6 (2018), pp. 21482–21497. doi:10.1109/ACCESS.2018.2825250.
[108] Shou-Chih Lo, Yi-Jen Lin, and Jhih-Siao Gao. “A multi-head clustering algo-rithm in vehicular ad hoc networks.” In: International Journal of Computer Theory
and Engineering 5.2 (2013), p. 242.
[109] Christian Lochert, Hannes Hartenstein, Jing Tian, Holger Fussler, D. Hermann,and Martin Mauve. “A routing strategy for vehicular ad hoc networks in cityenvironments.” In: Proc. of Intelligent Vehicles Symposium (IV). June 2003, pp. 156–161. doi: 10.1109/IVS.2003.1212901.
[110] Pablo A. Lopez, Michael Behrisch, Laura Bieker-Walz, Jakob Erdmann, Yun-Pang Flötteröd, Robert Hilbrich, Leonhard Lücken, Johannes Rummel, PeterWagner, and Evamarie Wießner. “Microscopic Traffic Simulation using SUMO.”In: Proc. of International Conference on Intelligent Transportation Systems (ITSS).IEEE, 2018.
[111] Manisha Luthra, Boris Koldehofe, and Ralf Steinmetz. “Transitions for In-creased Flexibility in Fog Computing: A Case Study on Complex Event Pro-cessing.” In: Informatik Spektrum 42.4 (2019), pp. 244–255.
[112] Manisha Luthra, Boris Koldehofe, Pascal Weisenburger, Guido Salvaneschi,and Raheel Arif. “TCEP: Adapting to dynamic user environments by enablingtransitions between operator placement mechanisms.” In: Proc. of International
Conference on Distributed and Event-based Systems (DEBS). ACM. 2018, pp. 136–147.
[113] Guilherme Maia, Andre LL Aquino, Aline Viana, Azzedine Boukerche, andAntonio AF Loureiro. “HyDi: a hybrid data dissemination protocol for highwayscenarios in vehicular ad hoc networks.” In: Proc. of International Symposium on
Design and Analysis of Intelligent Vehicular Networks and Applications (DIVANet).ACM. 2012, pp. 115–122.

bibliography 133
[114] Francesco Malandrino, Claudio Casetti, Carla-Fabiana Chiasserini, and MarcoFiore. “Offloading cellular networks through ITS content download.” In: Proc.
of Conference on Sensor, Mesh and Ad Hoc Communications and Networks (SECON).IEEE. 2012, pp. 263–271.
[115] K. Massow, B. Kwella, N. Pfeifer, F. Häusler, J. Pontow, I. Radusch, J. Hipp, F.Dölitzscher, and M. Haueis. “Deriving HD maps for highly automated drivingfrom vehicular probe data.” In: Proc. of International Conference on Intelligent
Transportation Systems (ITSC). Nov. 2016, pp. 1745–1752. doi: 10.1109/ITSC.2016.7795794.
[116] Chetan B. Math, Hong Li, Sonia H. de Groot, and Ignas Niemegeers. “Fairdecentralized data-rate congestion control for V2V communications.” In: Proc.
of International Conference on Telecommunications (ICT). May 2017, pp. 1–7. doi:10.1109/ICT.2017.7998229.
[117] Tobias Meuser, Daniel Burgstahler, Tobias Rueckelt, Doreen Boehnstedt, andRalf Steinmetz. “Hybrid-ProbSense.KOM: Probabilistic Sensing with HybridCommunication for Gathering Vehicular Sensed Data.” In: Proc. of Automotive
meets Electronics (AmE). Vol. 87. Mar. 2017, pp. 1–6. isbn: 978-3-8007-4369-8.
[118] Tobias Meuser, Patrick Lieser, The An Binh Nguyen, Doreen Böhnstedt, andRalf Steinmetz. “Adaptive Information Aggregation for Application-specificDemands.” In: Proc. of International Balkan Conference on Communications and
Networking (BalkanCom). May 2017, pp. 1–6.
[119] Tobias Meuser, Björn Richerzhagen, Ioannis Stavrakakis, The An Binh Nguyen,and Ralf Steinmetz. “Relevance-Aware Information Dissemination in VehicularNetworks.” In: Proc. of International Symposium on a World of Wireless, Mobile and
Multimedia Networks (WoWMoM). IEEE, June 2018, pp. 588–590. isbn: 978-1-5386-4725-7. doi: 10.1109/WoWMoM.2018.8449751.
[120] Tobias Meuser, Ioannis Stavrakakis, and Antonio Fernández Anta. “DynamicVehicle Path-Planning in the Presence of Traffic Events.” In: Proc. of Conference
on Local Computer Networks (LCN). IEEE, Oct. 2019, pp. 1–4.
[121] Tobias Meuser, Martin Wende, Patrick Lieser, Björn Richerzhagen, and RalfSteinmetz. “Adaptive Decision Making Based on Temporal Information Dy-namics.” In: Proc. of International Conference on Vehicle Technology and Intelligent
Transport Systems (VEHITS). SCITEPRESS, Mar. 2018, pp. 91–102. isbn: 978-989-758-293-6.
[122] Tobias Meuser, Daniel Bischoff, Björn Richerzhagen, and Ralf Steinmetz. “Coop-erative Offloading in Context-Aware Networks: A Game-Theoretic Approach.”In: Proc. of International Conference on Distributed and Event-based Systems (DEBS).ACM, June 2019, pp. 55–66. isbn: 978-1-4503-6794-3. doi: 10.1145/3328905.3338535.
134 bibliography
[123] Tobias Meuser, Daniel Bischoff, and Ralf Steinmetz. “Location Privacy in Het-erogeneous Vehicular Networks.” In: Proc. of International Conference on Dis-
tributed and Event-based Systems (DEBS). ACM, 2019, pp. 260–261. isbn: 978-1-4503-6794-3. doi: 10.1145/3328905.3332515.
[124] Tobias Meuser, Patrick Lieser, The An Binh Nguyen, Doreen Böhnstedt, andRalf Steinmetz. “Lifetime-aware information aggregation under uncertainty foradvanced driver assistance systems.” In: Ad Hoc Networks 82 (2019), pp. 56–67.issn: 1570-8705. doi: https://doi.org/10.1016/j.adhoc.2018.07.018.
[125] Tobias Meuser, Oluwasegun Taiwo Ojo, Daniel Bischoff, Antonio FernándezAnta, Ioannis Stavrakakis, and Ralf Steinmetz. Hide Me: Enabling Location Pri-
vacy in Heterogeneous Vehicular Networks. 2020. arXiv: 2001.07170 [cs.CR].
[126] Zeeshan Hameed Mir and Fethi Filali. “LTE and IEEE 802.11 p for vehicularnetworking: a performance evaluation.” In: EURASIP Journal on Wireless Com-
munications and Networking 2014.1 (2014), p. 89.
[127] Sasa Misailovic, Stelios Sidiroglou, and Martin C. Rinard. “Dancing with Un-certainty.” In: Proc. of Workshop on Relaxing Synchronization for Multicore and
Manycore Scalability. RACES ’12. Tucson, Arizona, USA: ACM, 2012, pp. 51–60.isbn: 978-1-4503-1632-3. doi: 10.1145/2414729.2414738.
[128] Tulika Mishra, Deepak Garg, and Manoj Madhav Gore. “A publish/subscribecommunication infrastructure for VANET applications.” In: Proc. of Workshops
of International Conference on Advanced Information Networking and Applications
(AINA). IEEE. 2011, pp. 442–446.
[129] Shima Mohseni, Rosilah Hassan, Ahmed Patel, and Rozilawati Razali. “Com-parative review study of reactive and proactive routing protocols in MANETs.”In: Proc. of International Conference on Digital Ecosystems and Technologies (DEST).IEEE. 2010, pp. 304–309.
[130] Mildred M. C. Morales, Choong Seon Hong, and Young-Cheol Bang. “Anadaptable mobility-aware clustering algorithm in vehicular networks.” In: Proc.
of Asia-Pacific Network Operations and Management Symposium. IEEE. 2011, pp. 1–6.
[131] Johannes Müller, Tobias Meuser, Ralf Steinmetz, and Michael Buchholz. “ATrust Management and Misbehaviour Detection Mechanism for Multi-AgentSystems and its Application to Intelligent Transportation Systems.” In: Proc.
of International Conference on Control and Automation (ICCA). IEEE, June 2019,pp. 1–7.
[132] Vinod Namboodiri and Lixin Gao. “Prediction-Based Routing for Vehicular AdHoc Networks.” In: IEEE Transactions on Vehicular Technology 56.4 (June 2007),pp. 2332–2345. doi: 10.1109/TVT.2007.897656.
[133] Gustavo Niemeyer. Geohash. 2008. url: http://geohash.org/.

bibliography 135
[134] Zhaolong Ning, Xiping Hu, Zhikui Chen, MengChu Zhou, Bin Hu, Jun Cheng,and Mohammad S. Obaidat. “A Cooperative Quality-Aware Service AccessSystem for Social Internet of Vehicles.” In: IEEE Internet of Things Journal 5.4(Aug. 2018), pp. 2506–2517. doi: 10.1109/JIOT.2017.2764259.
[135] Dusit Niyato, Ekram Hossain, and Ping Wang. “Optimal channel access man-agement with QoS support for cognitive vehicular networks.” In: IEEE Transac-
tions on Mobile Computing 10.4 (2010), pp. 573–591.
[136] Konstantinos Oikonomou, Dimitrios Kogias, and Ioannis Stavrakakis. “Proba-bilistic flooding for efficient information dissemination in random graph topolo-gies.” In: Computer Networks 54.10 (2010), pp. 1615–1629. issn: 1389-1286. doi:https://doi.org/10.1016/j.comnet.2010.01.007.
[137] Konstantinos Oikonomou and Ioannis Stavrakakis. “Performance Analysis ofProbabilistic Flooding Using Random Graphs.” In: Proc. of International Sympo-
sium on a World of Wireless, Mobile and Multimedia Networks (WoWMoM). June2007, pp. 1–6. doi: 10.1109/WOWMOM.2007.4351694.
[138] Sergio Ortiz, Carlos T. Calafate, Juan-Carlos Cano, Pietro Manzoni, and ChaiK. Toh. “A UAV-Based Content Delivery Architecture for Rural Areas andFuture Smart Cities.” In: IEEE Internet Computing 23.1 (Jan. 2019), pp. 29–36.doi: 10.1109/MIC.2018.2884277.
[139] Christoforos Panos, Christos Xenakis, and Ioannis Stavrakakis. “A novel In-trusion Detection System for MANETs.” In: Proc. of International Conference on
Security and Cryptography (SECRYPT). July 2010, pp. 1–10.
[140] Dan Peng, Fan Wu, and Guihai Chen. “Pay As How Well You Do: A Qual-ity Based Incentive Mechanism for Crowdsensing.” In: Proc. of International
Symposium on Mobile Ad Hoc Networking and Computing (MobiHoc). MobiHoc’15. Hangzhou, China: ACM, 2015, pp. 177–186. isbn: 978-1-4503-3489-1. doi:10.1145/2746285.2746306.
[141] Tao Peng, Qianxi Lu, Haiming Wang, Shaoyi Xu, and Wenbo Wang. “Interfer-ence avoidance mechanisms in the hybrid cellular and device-to-device sys-tems.” In: Proc. of International Symposium on Personal, Indoor and Mobile Radio
Communications (PIMRC). IEEE. 2009, pp. 617–621.
[142] Charles E. Perkins and Pravin Bhagwat. Highly dynamic destination-sequenced
distance-vector routing (DSDV) for mobile computers. New York, NY, USA, Oct.1994. doi: 10.1145/190809.190336.
[143] “Personen + Unternehmen.” In: ATZelektronik 12.4 (Aug. 2017), pp. 6–7. issn:2192-8878. doi: 10.1007/s35658-017-0055-9.
[144] Mai-Anh Phan, Rene Rembarz, and Sabine Sories. “A capacity analysis for thetransmission of event and cooperative awareness messages in LTE networks.”In: Proc. of ITS World Congress. 2011.
[145] Nuno K. Pratas and Petar Popovski. “Low-rate machine-type communicationvia wireless device-to-device (D2D) links.” In: arXiv preprint arXiv:1305.6783
(2013).

136 bibliography
[146] Junaid Qadir, Arjuna Sathiaseelan, Liang Wang, and Jon Crowcroft. “TamingLimits with Approximate Networking.” In: Proc. of Workshop on Computing
Within Limits. LIMITS 2016. Irvine, California: ACM, 2016, 9:1–9:8. isbn: 978-1-4503-4260-5. doi: 10.1145/2926676.2926678.
[147] Filippo Rebecchi, Marcelo D. de Amorim, Vania Conan, Andrea Passarella,Raffaele Bruno, and Marco Conti. “Data Offloading Techniques in CellularNetworks: A Survey.” In: IEEE Communications Surveys Tutorials 17.2 (Apr. 2015),pp. 580–603. doi: 10.1109/COMST.2014.2369742.
[148] Guillaume Rémy, Sidi-Mohammed Senouci, François Jan, and Yvon Gourhant.“LTE4V2XCollection, dissemination and multi-hop forwarding.” In: Proc. of
International Conference on Communications (ICC). IEEE. 2012, pp. 120–125.
[149] Björn Richerzhagen, Dominik Stingl, Ronny Hans, Christian Gross, and RalfSteinmetz. “Bypassing the cloud: Peer-assisted event dissemination for aug-mented reality games.” In: Proc. of International Conference on Peer-to-Peer Com-
puting (P2P). Sept. 2014, pp. 1–10. doi: 10.1109/P2P.2014.6934296.
[150] Björn Richerzhagen, Dominik Stingl, Julius Rückert, and Ralf Steinmetz. “Si-monstrator: Simulation and Prototyping Platform for Distributed Mobile Ap-plications.” In: Proc. of International Conference on Simulation Tools and Techniques
(SIMUTools). SIMUTools ’15. Athens, Greece: ICST (Institute for Computer Sci-ences, Social-Informatics and Telecommunications Engineering), 2015, pp. 99–108. isbn: 978-1-63190-079-2. doi: 10.4108/eai.24-8-2015.2261064.
[151] Nils Richerzhagen, Björn Richerzhagen, Boris Koldehofe, and Ralf Steinmetz.“Towards Transitions between Role Assignment Schemes: Enabling AdaptiveOffloading in Challenged Networks.” In: Proc. of Workshop on Challenged Net-
works (CHANTS). ACM, Oct. 2017, pp. 1–6. isbn: 978-1-4503-5144-7/17/10.
[152] Nils Richerzhagen, Björn Richerzhagen, Dominik Stingl, and Ralf Steinmetz.“The human factor: A simulation environment for networked mobile socialapplications.” In: Proc. of International Conference on Networked Systems (NetSys).Mar. 2017, pp. 1–8. doi: 10.1109/NetSys.2017.7903955.
[153] Nils Richerzhagen, Björn Richerzhagen, Michael Walter, Dominik Stingl, andRalf Steinmetz. “Buddies, not Enemies: Fairness and Performance in CellularOffloading.” In: Proc. of International Symposium on a World of Wireless, Mobile
and Multimedia Networks (WoWMoM). IEEE, June 2016, pp. 1–9. isbn: 978-1-5090-2185-7/16.
[154] George F. Riley and Thomas R. Henderson. “The ns-3 network simulator.” In:Modeling and tools for network simulation. Springer, 2010, pp. 15–34.
[155] Tobias Rückelt, Daniel Burgstahler, Frank Englert, Christian Gottron, SebastianZöller, and Ralf Steinmetz. “A concept for vehicle internet connectivity for non-safety applications.” In: Proc. of Local Computer Networks Workshops (LCN). IEEE.2014, pp. 718–721.

bibliography 137
[156] Tobias Rückelt, Ioannis Stavrakakis, Tobias Meuser, Imane Horiya Brahmi,Doreen Böhnstedt, and Ralf Steinmetz. “Data transmission plan adaptationcomplementing strategic time-network selection for connected vehicles.” In:Ad Hoc Networks 82 (2019), pp. 146–154. issn: 1570-8705. doi: https://doi.org/10.1016/j.adhoc.2018.08.006.
[157] César A. Santiváñez, Ram Ramanathan, and Ioannis Stavrakakis. “Making Link-state Routing Scale for Ad Hoc Networks.” In: Proc. of International Symposium
on Mobile Ad Hoc Networking &Amp; Computing. MobiHoc ’01. Long Beach, CA,USA: ACM, 2001, pp. 22–32. isbn: 1-58113-428-2. doi: 10.1145/501417.501420.
[158] Sophie Schönherr. “Hybrid Communication in Vehicular Networks: Combin-ing the Advantages of Cellular and V2V Communication.” Master Thesis. TUDarmstadt, 2017.
[159] Ramon S. Schwartz, Rafael R. R. Barbosa, Nirvana Meratnia, Geert Heijenk, andHans Scholten. “A simple and robust dissemination protocol for VANETs.” In:Proc. of European Wireless Conference (EW). IEEE. 2010, pp. 214–222.
[160] Sayandeep Sen, Syed Gilani, Shreesha Srinath, Stephen Schmitt, and SumanBanerjee. “Design and Implementation of an "Approximate" CommunicationSystem for Wireless Media Applications.” In: Proc. of SIGCOMM. SIGCOMM’10. New Delhi, India: ACM, 2010, pp. 15–26. isbn: 978-1-4503-0201-2. doi: 10.1145/1851182.1851187.
[161] Mihail L. Sichitiu and Maria Kihl. “Inter-vehicle communication systems: asurvey.” In: IEEE Communications Surveys & Tutorials 10.2 (2008), pp. 88–105.
[162] Jabari Stegall and Alexander Wyglinski. “Secure Distributed Anonymous DataCollection for Vehicular Ad-Hoc Networks.” In: Proc. of Vehicular Technology
Conference (VTC-Fall). Aug. 2018, pp. 1–5. doi: 10.1109/VTCFall.2018.8690568.
[163] Ralf Steinmetz and Klaus Wehrle. Peer-to-Peer Systems and Applications. Vol. 3485.Springer, 2005.
[164] Dominik Stingl, Christian Gross, Julius Rückert, Leonhard Nobach, AleksandraKovacevic, and Ralf Steinmetz. “PeerfactSim.KOM: A simulation framework forPeer-to-Peer systems.” In: Proc. of International Conference on High Performance
Computing Simulation (HPCS). July 2011, pp. 577–584. doi: 10.1109/HPCSim.2011.5999877.
[165] Sundar Subramanian, Marc Werner, Shihuan Liu, Jubin Jose, Radu Lupoaie,and Xinzhou Wu. “Congestion Control for Vehicular Safety: Synchronous andAsynchronous MAC Algorithms.” In: Proc. of International Workshop on Vehicular
Internetworking, Systems, and Applications (VANET). VANET ’12. Low WoodBay, Lake District, UK: ACM, 2012, pp. 63–72. isbn: 978-1-4503-1317-9. doi:10.1145/2307888.2307900.
[166] Saif Al-Sultan, Moath M. Al-Doori, Ali H. Al-Bayatti, and Hussien Zedan. “Acomprehensive survey on vehicular Ad Hoc network.” In: Journal of Network
and Computer Applications 37 (2014), pp. 380–392. issn: 1084-8045. doi: https://doi.org/10.1016/j.jnca.2013.02.036.

138 bibliography
[167] Saif Al-Sultan, Moath M. Al-Doori, Ali H. Al-Bayatti, and Hussien Zedan. “Acomprehensive survey on vehicular ad hoc network.” In: Journal of network and
computer applications 37 (2014), pp. 380–392.
[168] Tarik Tabet, Farouk Belghoul, Dawei Zhang, and Huarui Liang. Wi-Fi signaling
by cellular devices for coexistence in unlicensed frequency bands. US Patent 9,549,080.Jan. 2017.
[169] Mohsen Nader Tehrani, Murat Uysal, and Halim Yanikomeroglu. “Device-to-device communication in 5G cellular networks: challenges, solutions, andfuture directions.” In: IEEE Communications Magazine 52.5 (2014), pp. 86–92.
[170] Ozan K. Tonguz, Nawaporn Wisitpongphan, and Fan Bai. “DV-CAST: A dis-tributed vehicular broadcast protocol for vehicular ad hoc networks.” In: IEEE
Wireless Communications 17.2 (2010), pp. 47–57.
[171] Jamal Toutouh, José Garca-Nieto, and Enrique Alba. “Intelligent OLSR routingprotocol optimization for VANETs.” In: IEEE transactions on vehicular technology
61.4 (2012), pp. 1884–1894.
[172] Hamed Vahdat-Nejad, Azam Ramazani, Tahereh Mohammadi, and WathiqMansoor. “A survey on context-aware vehicular network applications.” In: Ve-
hicular Communications 3 (2016), pp. 43–57. issn: 2214-2096. doi: https://doi.org/10.1016/j.vehcom.2016.01.002.
[173] Andrea Vesco, Riccardo Scopigno, Claudio Casetti, and Carla-Fabiana Chi-asserini. “Investigating the effectiveness of decentralized congestion control invehicular networks.” In: 2013 IEEE Globecom Workshops. Dec. 2013, pp. 1314–1319. doi: 10.1109/GLOCOMW.2013.6825176.
[174] Alexey Vinel. “3GPP LTE Versus IEEE 802.11p/WAVE: Which Technology isAble to Support Cooperative Vehicular Safety Applications?” In: IEEE Wireless
Communications Letters 1.2 (Apr. 2012), pp. 125–128. doi: 10.1109/WCL.2012.022012.120073.
[175] Omar A. Wahab, Hadi Otrok, and Azzam Mourad. “VANET QoS-OLSR: QoS-based clustering protocol for vehicular ad hoc networks.” In: Computer Commu-
nications 36.13 (2013), pp. 1422–1435.
[176] Hongjian Wang, Yanmin Zhu, and Qian Zhang. “Compressive sensing basedmonitoring with vehicular networks.” In: Proc. of International Conference on
Computer Communications (INFOCOM). Apr. 2013, pp. 2823–2831. doi: 10.1109/INFCOM.2013.6567092.
[177] Lucas Wang, Alexander Afanasyev, Romain Kuntz, Rama Vuyyuru, RyujiWakikawa, and Lixia Zhang. “Rapid Traffic Information Dissemination Us-ing Named Data.” In: Proc. of Workshop on Emerging Name-Oriented Mobile
Networking Design - Architecture, Algorithms, and Applications. NoM ’12. HiltonHead, South Carolina, USA: ACM, 2012, pp. 7–12. isbn: 978-1-4503-1291-2. doi:10.1145/2248361.2248365.

bibliography 139
[178] Lucas Wang, Ryuji Wakikawa, Romain Kuntz, Rama Vuyyuru, and Lixia Zhang.“Data naming in vehicle-to-vehicle communications.” In: Proc. of International
Conference on Computer Communications (INFOCOM) Workshops. IEEE. 2012,pp. 328–333.
[179] Yi Wang, Akram Ahmed, Bhaskar Krishnamachari, and Konstantinos Psounis.“IEEE 802.11p performance evaluation and protocol enhancement.” In: Proc. of
International Conference on Vehicular Electronics and Safety (ICVES). Sept. 2008,pp. 317–322. doi: 10.1109/ICVES.2008.4640898.
[180] Yu Wang and Fan Li. “Vehicular Ad Hoc Networks.” In: Guide to Wireless Ad
Hoc Networks. Ed. by Sudip Misra, Isaac Woungang, and Subhas Chandra Misra.London: Springer London, 2009, pp. 503–525. isbn: 978-1-84800-328-6. doi: 10.1007/978-1-84800-328-6_20.
[181] Waymo. Building maps for a self-driving car. 2016. url: https://medium.com/waymo/building-maps-for-a-self-driving-car-723b4d9cd3f4.
[182] Jan W. Wedel, Björn Schünemann, and Ilja Radusch. “V2X-Based Traffic Con-gestion Recognition and Avoidance.” In: Proc. of International Symposium on
Pervasive Systems, Algorithms, and Networks (I-SPAN). Dec. 2009, pp. 637–641.doi: 10.1109/I-SPAN.2009.71.
[183] Axel Wegener, Micha Piórkowski, Maxim Raya, Horst Hellbrück, Stefan Fischer,and Jean-Pierre Hubaux. “TraCI: An Interface for Coupling Road Traffic andNetwork Simulators.” In: Proc. of Communications and Networking Simulation
Symposium (CNS). CNS ’08. Ottawa, Canada: ACM, 2008, pp. 155–163. isbn:1-56555-318-7. doi: 10.1145/1400713.1400740.
[184] Hao Wu, Richard Fujimoto, Randall Guensler, and Michael Hunter. “MDDV:a mobility-centric data dissemination algorithm for vehicular networks.” In:Proc. of International Workshop on Vehicular Ad Hoc Networks (VANET). ACM.2004, pp. 47–56.
[185] Yue Wu, Weisi Guo, Hu Yuan, Long Li, Siyi Wang, Xiaoli Chu, and Jie Zhang.“Device-to-device meets LTE-unlicensed.” In: IEEE Communications Magazine
54.5 (2016), pp. 154–159.
[186] Christos Xenakis, Christoforos Panos, and Ioannis Stavrakakis. “A comparativeevaluation of intrusion detection architectures for mobile ad hoc networks.”In: Computers & Security 30.1 (2011), pp. 63–80. issn: 0167-4048. doi: https://doi.org/10.1016/j.cose.2010.10.008.
[187] Yong Xiang, Zheng Liu, Ruilin Liu, Weizhen Sun, and Wei Wang. “GeoSVR: Amap-based stateless VANET routing.” In: Ad Hoc Networks 11.7 (2013), pp. 2125–2135.
[188] Shouzhi Xu, Pengfei Guo, Bo Xu, and Huan Zhou. “QoS evaluation of VANETrouting protocols.” In: Journal of Networks 8.1 (2013), p. 132.
[189] Fangchun Yang, Shangguang Wang, Jinglin Li, Zhihan Liu, and Qibo Sun. “Anoverview of internet of vehicles.” In: China communications 11.10 (2014), pp. 1–15.

140 bibliography
[190] Shuo Yang, Fan Wu, Shaojie Tang, Xiaofeng Gao, Bo Yang, and Guihai Chen.“On Designing Data Quality-Aware Truth Estimation and Surplus SharingMethod for Mobile Crowdsensing.” In: IEEE Journal on Selected Areas in Com-
munications 35.4 (Apr. 2017), pp. 832–847. doi: 10.1109/JSAC.2017.2676898.
[191] Chia-Hao Yu, Klaus Doppler, Cassio B. Ribeiro, and Olav Tirkkonen. “Resourcesharing optimization for device-to-device communication underlaying cellularnetworks.” In: IEEE Transactions on Wireless communications 10.8 (2011), pp. 2752–2763.
[192] Rong Yu, Yan Zhang, Stein Gjessing, Wenlong Xia, and Kun Yang. “Towardcloud-based vehicular networks with efficient resource management.” In: arXiv
preprint arXiv:1308.6208 (2013).
[193] Yu-Ting Yu, Mario Gerla, and MY Sanadidi. “Scalable VANET content rout-ing using hierarchical bloom filters.” In: Wireless Communications and Mobile
Computing 15.6 (2015), pp. 1001–1014.
[194] Xiaoxiao Yu, H. Zhao, Lin Zhang, S. Wu, Bhaskar Krishnamachari, and VictorO. K. Li. “Cooperative Sensing and Compression in Vehicular Sensor Networksfor Urban Monitoring.” In: Proc. of International Conference on Communications
(ICC). May 2010, pp. 1–5. doi: 10.1109/ICC.2010.5502562.
[195] Ran Zhang, Miao Wang, Lin X. Cai, Zhongming Zheng, Xuemin Shen, andLiang-Liang Xie. “LTE-unlicensed: the future of spectrum aggregation for cel-lular networks.” In: IEEE Wireless Communications 22.3 (2015), pp. 150–159.
[196] Yan Zhang, Jim Mee Ng, and Chor Ping Low. “A distributed group mobil-ity adaptive clustering algorithm for mobile ad hoc networks.” In: Computer
Communications 32.1 (2009), pp. 189–202.
[197] Yang Zhang, Jing Zhao, and Guohong Cao. “On scheduling vehicle-roadsidedata access.” In: Proc. of International Workshop on Vehicular Ad Hoc Networks
(VANET). ACM. 2007, pp. 9–18.
[198] Cong Zhao, Shusen Yang, Ping Yan, Qing Yang, Xinyu Yang, and Julie Mc-Cann. “Data Quality Guarantee for Credible Caching Device Selection in Mo-bile Crowdsensing Systems.” In: IEEE Wireless Communications 25.3 (June 2018),pp. 58–64. doi: 10.1109/MWC.2018.1700299.
[199] Jing Zhao and Guohong Cao. “VADD: Vehicle-assisted data delivery in vehic-ular ad hoc networks.” In: IEEE transactions on vehicular technology 57.3 (2008),pp. 1910–1922.
[200] Ghayet el mouna Zhioua, Houda Labiod, Tabbane Nabil, and Sami Tabbane.“An efficient QoS based gateway selection algorithm for VANET to LTE ad-vanced hybrid cellular network.” In: Proc. of International Conference on Model-
ing, Analysis and Simulation of Wireless and Mobile Systems (MSWiM). ACM. 2012,pp. 353–356.

bibliography 141
[201] Ghayet el mouna Zhioua, Nabil Tabbane, Houda Labiod, and Sami Tabbane.“A Fuzzy Multi-Metric QoS-Balancing Gateway Selection Algorithm in a Clus-tered VANET to LTE Advanced Hybrid Cellular Network.” In: IEEE Transactions
on Vehicular Technology 64.2 (Feb. 2015), pp. 804–817. doi: 10.1109/TVT.2014.2323693.
[202] Bin Zhou, Honglin Hu, Sheng-Qiang Huang, and Hsiao-Hwa Chen. “Intra-cluster device-to-device relay algorithm with optimal resource utilization.” In:IEEE transactions on vehicular technology 62.5 (2013), pp. 2315–2326.
[203] L. Zhou, G. Cui, H. Liu, Z. Wu, and D. Luo. “NPPB: A broadcast scheme indense VANETs.” In: Information Technology Journal 9.2 (2010), pp. 247–256.
[204] Julian Zobel, Patrick Lieser, Bastian Drescher, Bernd Freisleben, and Ralf Stein-metz. “Optimizing Inter-Cluster Flights of Post-Disaster Communication Sup-port UAVs.” In: Proc. of Conference on Local Computer Networks (LCN). IEEE. Oct.2019.
All web pages cited in this work have been checked in October 2019. However, due to the
dynamic nature of the World Wide Web, their long-term availability cannot be guaranteed.


AA P P E N D I X
a.1 transformation to obtain the weight function for the adaptive ag-
gregation scheme
In the following, we provide the derivation of the weight function using Equation 15from Section 4.2.3 and the two side conditions shown in Equation 77 and Equation 78.For better readability, we copied Equation 15 to Equation 76.
fw(t) = a · ebt + d (76)
fw(0) = a+ d = 1⇒ a = 1− d (77)
fw(T) = a · ebT + d = 0 (78)
When we insert a = 1−d from Equation 77 into Equation 76, we obtain Equation 79.
fw(t) = (1− d) · ebt + d (79)
This also changes the second side condition as shown in Equation 78, which leadsto Equation 80.
fw(T) = (1− d) · ebT + d = 0⇒ d = −
(
ebT
1− ebT
)
(80)
When we now insert Equation 80 into Equation 79, we obtain Equation 81.
fw(t) =
(
1−
[
−
(
ebT
1− ebT
)])
· ebt −
(
ebT
1− ebT
)
= ebt +ebt · ebT
1− ebT−
ebT
1− ebT=ebt − ebt · ebT
1− ebT+ebt · ebT
1− ebT−
ebT
1− ebT(81)
From Equation 81, Equation 82 can be derived directly, which completes the deriva-tion of the modified weight function.
fw(t) =ebt − ebT
1− ebT(82)
143
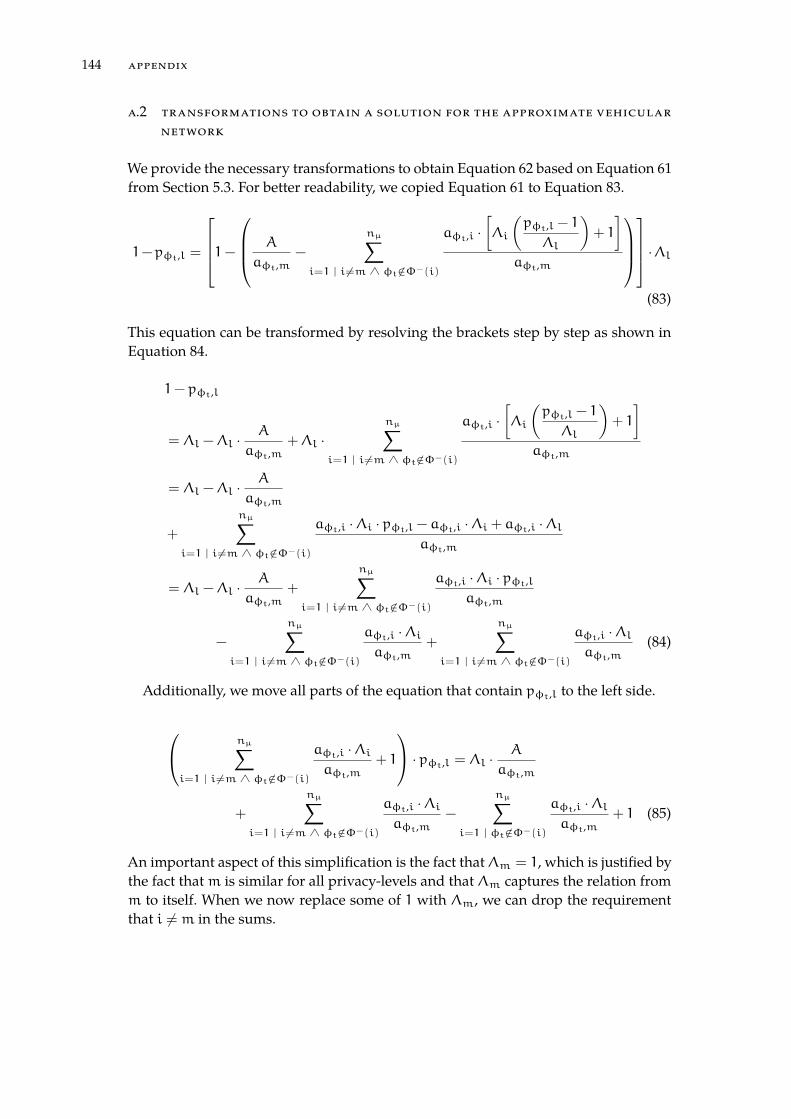
144 appendix
a.2 transformations to obtain a solution for the approximate vehicular
network
We provide the necessary transformations to obtain Equation 62 based on Equation 61from Section 5.3. For better readability, we copied Equation 61 to Equation 83.
1−pφt,l =
1−
A
aφt,m−
nµ∑
i=1 | i 6=m ∧ φt/∈Φ−(i)
aφt,i ·
[
Λi
(
pφt,l − 1
Λl
)
+ 1
]
aφt,m
·Λl
(83)
This equation can be transformed by resolving the brackets step by step as shown inEquation 84.
1− pφt,l
= Λl −Λl ·A
aφt,m+Λl ·
nµ∑
i=1 | i6=m ∧ φt/∈Φ−(i)
aφt,i ·
[
Λi
(
pφt,l − 1
Λl
)
+ 1
]
aφt,m
= Λl −Λl ·A
aφt,m
+
nµ∑
i=1 | i6=m ∧ φt/∈Φ−(i)
aφt,i ·Λi · pφt,l − aφt,i ·Λi + aφt,i ·Λlaφt,m
= Λl −Λl ·A
aφt,m+
nµ∑
i=1 | i 6=m ∧ φt/∈Φ−(i)
aφt,i ·Λi · pφt,laφt,m
−
nµ∑
i=1 | i 6=m ∧ φt/∈Φ−(i)
aφt,i ·Λiaφt,m
+
nµ∑
i=1 | i 6=m ∧ φt/∈Φ−(i)
aφt,i ·Λlaφt,m
(84)
Additionally, we move all parts of the equation that contain pφt,l to the left side.
nµ∑
i=1 | i 6=m ∧ φt/∈Φ−(i)
aφt,i ·Λiaφt,m
+ 1
· pφt,l = Λl ·A
aφt,m
+
nµ∑
i=1 | i6=m ∧ φt/∈Φ−(i)
aφt,i ·Λiaφt,m
−
nµ∑
i=1 | φt/∈Φ−(i)
aφt,i ·Λlaφt,m
+ 1 (85)
An important aspect of this simplification is the fact thatΛm = 1, which is justified bythe fact thatm is similar for all privacy-levels and that Λm captures the relation fromm to itself. When we now replace some of 1 with Λm, we can drop the requirementthat i 6= m in the sums.

A.3 additional insights on the influence of sensor heterogeneity 145
nµ∑
i=1 | φt/∈Φ−(i)
aφt,i ·Λiaφt,m
· pφt,l = Λl ·A
aφt,m
+
nµ∑
i=1 | φt/∈Φ−(i)
aφt,i ·Λiaφt,m
−
nµ∑
i=1 | φt/∈Φ−(i)
aφt,i ·Λlaφt,m
(86)
We then divide by the sum to separate pφt,l.
pφt,l =
Λl ·A
aφt,m+∑nµi=1 | φt/∈Φ−(i)
aφt,i ·Λiaφt,m
−∑nµi=1 | φt/∈Φ−(i)
aφt,i ·Λlaφt,m
∑nµi=1 | φt/∈Φ−(i)
aφt,i ·Λiaφt,m
(87)
With canceling aφt,m and other minor transformations, this then leads to
pφt,l =
(
A−∑nµi=1 | φt/∈Φ−(i)
aφt,i
)
·Λl∑nµi=1 | φt/∈Φ−(i)
aφt,i ·Λi+ 1 (88)
This equation is similar to Equation 62 from Section 5.3.
a.3 additional insights on the influence of sensor heterogeneity
0% 10% 20%Sensor heterogeneity
0
20
40
60
80
100
Corre
ct A
ggre
gate
s [%
]
NEW MAJ CP QoI CP-QoI Oracle
Figure 29: Influence of the sensor heterogeneity on the quality of the aggregates for thedifferent approaches.
In addition to the average sensor accuracy, the heterogeneity of sensors might in-fluence the performance of the approaches. The overall performance depending onthe sensor heterogeneity is shown in Figure 29. We can observe that the influence

146 appendix
of sensor heterogeneity is only marginal regarding the share of correct aggregates.That is, as a high number of aggregates partially compensates for the heterogeneity ofsensors, which is the reason for the marginal influence on the performance of the ap-proaches. There is a minor performance increase for the CP approach and the CP-QoIapproach, but this increase is hardly visible in the figure. Thus, we can observe thatthe heterogeneity of sensors is well compensated for by the presented approaches.
a.4 additional insights into the influence of location privacy
0 0.5 1.0Share of Privacy
0.0
0.1
0.2
0.3
0.4
0.5
0.6
uu m
ax|1
(m)<
10
GTP GK CL NC
(a) Base-impact per bit µB(m) = 1.
0 0.5 1.0Share of Privacy
0.94
0.96
0.98
1.00
uu m
ax|1
000
(m)
GTP GK CL NC
(b) Base-impact per bit µB(m) = 1000.
Figure 30: Influence of location privacy on the utility of messages with different base-impact.
Figure 30 describes the utility of the impact-levels with the lowest and the highestbase-impact, depending on the share of privacy. In Figure 30a, the performance of theprivacy-level with the lowest base-impact is displayed. While the NC approach cannotreceive messages from this impact-level, the cooperative approaches can all receivemessages of this impact-level. The cluster-based approaches are very efficient in theutilization of bandwidth and, thus, can often receive data associated with this impact-level. With an increasing privacy-level, the relative utility decreases constantly, as themessages associated with this impact-level are context-sensitive (see Section 7.4.1). In-terestingly, the relative utility of our GTP approach has a completely different behavior,which is caused by two factors: (i) the possibilities of implicit coordination betweenprivacy-levels allows for a more efficient bandwidth utilization (explaining the firstincrease in utility at a low share of privacy), and (ii) this impact-level is more efficientthan the impact-level with a base-impact of 10 if received by a privacy-sensitive vehicle(explaining the second increase in utility at a high share of privacy). In contrast, therelative utility for the impact-level with the highest base-impact, shown in Figure 30bis only marginally affected by the share of privacy. This is caused by the low context-sensitivity of these messages and the high base-impact, which leads to a prioritizationof these messages independent of the privacy-level.

A.5 list of acronyms 147
a.5 list of acronyms
CAM Cooperative Awareness Message
DCC Decentralized Congestion Control
DCF Distributed Coordination Function
DEN Decentralized Environment Notification
DENM Decentralized Environment Notification Message
DPT Diverse Prioritization And Treatment
DSRC Dedicated Short-Range Communication
ETSI European Telecommunications Standards Institute
FDD Frequency Division Duplex
HSPA High Speed Packet Access
IoV Internet Of Vehicles
LSB Least Significant Bit
LTE Long Term Evolution
LTE-A Long Term Evolution-Advanced
LTE-D2D LTE-Device-to-Device
M2M Machine-to-Machine
MANET Mobile Ad-hoc Network
MPTCP Multipath TCP
MSB Most Significant Bit
P2P Peer-to-Peer
Pub/Sub Publish/Subscribe
QoS Quality Of Service
QUIC Quick UDP Internet Connections
RSU Road Side Unit
SUMO Simulation Of Urban Mobility
TCP Transmission Control Protocol
TDD Time Division Duplex
TMC Traffic Message Channel
TraCI Traffic Control Interface
TTL Time To Live
UEP Unequal Error Protection
UMTS Universal Mobile Telecommunications System
V2V Vehicle To Vehicle
VANET Vehicular Ad-hoc Network


A.6 supervised student theses 149
a.6 supervised student theses
[1] Jan-Thomas Becker. “Positioning with Sensor Inaccuracy: A Robust WalkingNavigation for Last Mile Logistics.” Master Thesis. TU Darmstadt, 2019.
[2] Yahia Brini. “Utilizing Machine Learning for Efficient Information Dissemina-tion in Vehicular Networks.” Bachelor Thesis. TU Darmstadt, 2018.
[3] Tobias Brudermüller. “Interpreting Feature Spaces of Neural Networks forVehicular Perception.” Bachelor Thesis. TU Darmstadt, 2018.
[4] Björn Büschke. “Using Crowd-sensed Data for Predictive Information-CentricVehicle Feature Enhancement.” Master Thesis. TU Darmstadt, 2018.
[5] Sven Dotzauer-Klier. “Scalability Analysis of Context-Aware Publish/Subscribevia MQTT.” Bachelor Thesis. TU Darmstadt, 2019.
[6] Lukas Heidt. “Heterogeneous Communication in Vehicular Networks: Influ-ence Factors on the Performance of 802.11p and LTE-A.” Student ResearchProject. TU Darmstadt, 2018.
[7] Mathias Hornjak. “Analyse und Einsatz von IoT-Technologien im Parkraum-management.” Master Thesis. TU Darmstadt, 2019.
[8] Deepak Jayaram. “Cooperative Caching in Vehicular Networks: DistributedCache Invalidation using Information Freshness.” Master Thesis. TU Darm-stadt, 2018.
[9] Li Ming. “Information Quality in Mobile Ad-Hoc Networks: Development of aModel for Information Relevancy Evaluation.” Master Thesis. TU Darmstadt,2017.
[10] Martin Möbus. “Self-Learning Location-based Information to Support Au-tonomous Vehicle Drive-Planning in Urban Environments.” Master Thesis. TUDarmstadt, 2017.
[11] Sophie Schönherr. “Hybrid Communication in Vehicular Networks: Combin-ing the Advantages of Cellular and V2V Communication.” Master Thesis. TUDarmstadt, 2017.
[12] Torben Unzicker. “Assessing Information Quality for Efficient Information Dis-semination in Vehicular Networks.” Master Thesis. TU Darmstadt, 2019.
[13] Marcel Verst. “Design of a Disaster Mobility Model based on real-world Move-ment Traces.” Master Thesis. TU Darmstadt, 2018.
[14] Tim Walter. “Modell basiertes Eco-Routing: Entwicklung eines Modells zurBestimmung des Energiebedarfs von Fahrzeugrouten.” Bachelor Thesis. TUDarmstadt, 2017.
[15] Martin Wende. “Data Validity Model: Evaluation Of Information Freshness InMobile Ad-Hoc Networks.” Bachelor Thesis. TU Darmstadt, 2017.


BAU T H O R ’ S P U B L I C AT I O N S
main publications
[1] Flor Álvarez, Lars Almon, Patrick Lieser, Tobias Meuser, Yannick Dylla, BjörnRicherzhagen, Matthias Hollick, and Ralf Steinmetz. “Conducting a Large-scaleField Test of a Smartphone-based Communication Network for EmergencyResponse.” In: Proc. of Workshop on Challenged Networks (CHANTS). ACM, Nov.2018, pp. 3–10. doi: 10.1145/3264844.3264845.
[2] Tobias Meuser, Daniel Bischoff, Ralf Steinmetz, and Björn Richerzhagen. “Sim-ulation Platform for Connected Heterogeneous Vehicles.” In: Proc. of Interna-
tional Conference on Vehicle Technology and Intelligent Transport Systems (VEHITS).SCITEPRESS, May 2019, pp. 412–419. isbn: 978-989-758-374-2.
[3] Tobias Meuser, Daniel Burgstahler, Tobias Rueckelt, Doreen Boehnstedt, andRalf Steinmetz. “Hybrid-ProbSense.KOM: Probabilistic Sensing with HybridCommunication for Gathering Vehicular Sensed Data.” In: Proc. of Automotive
meets Electronics (AmE). Vol. 87. Mar. 2017, pp. 1–6. isbn: 978-3-8007-4369-8.
[4] Tobias Meuser, Patrick Lieser, The An Binh Nguyen, Doreen Böhnstedt, andRalf Steinmetz. “Adaptive Information Aggregation for Application-specificDemands.” In: Proc. of International Balkan Conference on Communications and
Networking (BalkanCom). May 2017, pp. 1–6.
[5] Tobias Meuser, Björn Richerzhagen, Ioannis Stavrakakis, The An Binh Nguyen,and Ralf Steinmetz. “Relevance-Aware Information Dissemination in VehicularNetworks.” In: Proc. of International Symposium on a World of Wireless, Mobile and
Multimedia Networks (WoWMoM). IEEE, June 2018, pp. 588–590. isbn: 978-1-5386-4725-7. doi: 10.1109/WoWMoM.2018.8449751.
[6] Tobias Meuser, Ioannis Stavrakakis, and Antonio Fernández Anta. “DynamicVehicle Path-Planning in the Presence of Traffic Events.” In: Proc. of Conference
on Local Computer Networks (LCN). IEEE, Oct. 2019, pp. 1–4.
[7] Tobias Meuser, Martin Wende, Patrick Lieser, Björn Richerzhagen, and RalfSteinmetz. “Adaptive Decision Making Based on Temporal Information Dy-namics.” In: Proc. of International Conference on Vehicle Technology and Intelligent
Transport Systems (VEHITS). SCITEPRESS, Mar. 2018, pp. 91–102. isbn: 978-989-758-293-6.
[8] Tobias Meuser, Martin Wende, Patrick Lieser, Björn Richerzhagen, and RalfSteinmetz. “Distributed Quality of Information-Aware Decision-Making inVehicular Networks.” In: Smart Cities, Green Technologies and Intelligent Trans-
port Systems. Ed. by Brian Donnellan, Cornel Klein, Markus Helfert, and Oleg
151

152 author’s publications
Gusikhin. Cham: Springer International Publishing, 2019, pp. 304–327. isbn:978-3-030-26633-2.
[9] Tobias Meuser, Daniel Bischoff, Björn Richerzhagen, and Ralf Steinmetz. “Coop-erative Offloading in Context-Aware Networks: A Game-Theoretic Approach.”In: Proc. of International Conference on Distributed and Event-based Systems (DEBS).ACM, June 2019, pp. 55–66. isbn: 978-1-4503-6794-3. doi: 10.1145/3328905.3338535.
[10] Tobias Meuser, Daniel Bischoff, and Ralf Steinmetz. “Location Privacy in Het-erogeneous Vehicular Networks.” In: Proc. of International Conference on Dis-
tributed and Event-based Systems (DEBS). ACM, 2019, pp. 260–261. isbn: 978-1-4503-6794-3. doi: 10.1145/3328905.3332515.
[11] Tobias Meuser, Patrick Lieser, The An Binh Nguyen, Doreen Böhnstedt, andRalf Steinmetz. “Lifetime-aware information aggregation under uncertainty foradvanced driver assistance systems.” In: Ad Hoc Networks 82 (2019), pp. 56–67.issn: 1570-8705. doi: https://doi.org/10.1016/j.adhoc.2018.07.018.
co-authored publications
[12] Lars Almon, Flor Alvarez, Patrick Lieser, Tobias Meuser, and Fabian Schaller.“Ad-Hoc-Kommunikation - Gesellschaftlich wünschenswert, rechtlich unge-regelt.” In: Die Fortentwicklung des Datenschutzes - Zwischen Systemgestaltung
und Selbstregulierung. Ed. by Prof. Marit Hansen Prof. Dr. Alexander RoßnagelDr. Michael Friedewald. Springer Fachmedien Wiesbaden, Oct. 2018, pp. 77–98.isbn: 978-3-658-23726-4.
[13] Lars Baumgärtner, Jonas Höchst, and Tobias Meuser. “B-DTN7: Browser-basedDisruption-tolerant Networking via Bundle Protocol 7.” In: Proc. of International
Conference on Information and Communication Technologies for Disaster Management
(ICT-DM). IEEE, Dec. 2019, pp. 1–8.
[14] Daniel Bischoff, Harald Berninger, Steffen Knapp, Tobias Meuser, Björn Rich-erzhagen, Lars Häring, and Andreas Czylwik. “Safety-relevant V2X beaconingin realistic and scalable heterogeneous radio propagation fading channels.”In: Proc. of International Conference on Vehicle Technology and Intelligent Transport
Systems (VEHITS). SCITEPRESS, May 2019, pp. 404–411. isbn: 978-989-758-374-2.
[15] Daniel Bischoff and Tobias Meuser. “Geo-based Backend Dissemination forSafety-relevant V2X Applications.” In: Proc. of Automotive meets Electronics
(AmE). VDE Verlag, Mar. 2019, pp. 1–6. isbn: 978-3-8007-4877-8.
[16] Daniel Burgstahler, Tobias Meuser, Ulrich Lampe, Doreen Böhnstedt, and RalfSteinmetz. “ProbSense.KOM: A Probabilistic Sensing Approach for GatheringVehicular Sensed Data.” In: Proc. of International Conference on Mobile Services
(MS). Washington, DC, USA: IEEE Computer Society, June 2016, pp. 9–16. isbn:978-1-5090-2625-8.

author’s publications 153
[17] Daniel Burgstahler, Martin Möbus, Tobias Meuser, Doreen Böhnstedt, and RalfSteinmetz. “A Categorization Scheme for Information Demands of Future Con-nected ADAS.” In: Proc. of Automotive meets Electronics (AmE). Vol. 87. Berlin:VDE Verlag, Mar. 2017, pp. 32–37. isbn: 978-3-8007-4369-8.
[18] Florian Jomrich, Daniel Bischoff, Steffen Knapp, Tobias Meuser, Björn Richerz-hagen, and Ralf Steinmetz. “Lane Accurate Detection of Map Changes basedon Low Cost Smartphone Data.” In: SCITEPRESS, May 2019, pp. 126–137. isbn:978-989-758-374-2.
[19] Florian Jomrich, Florian Fischer, Steffen Knapp, Tobias Meuser, Björn Richerzha-gen, and Ralf Steinmetz. “Enhanced Cellular Bandwidth Prediction for HighlyAutomated Driving.” In: Smart Cities, Green Technologies and Intelligent Trans-
port Systems. Ed. by Brian Donnellan, Cornel Klein, Markus Helfert, and OlegGusikhin. Cham: Springer International Publishing, 2019, pp. 328–350. isbn:978-3-030-26633-2.
[20] Florian Jomrich, Markus Grau, Tobias Meuser, The An Binh Nguyen, DoreenBöhnstedt, and Ralf Steinmetz. “ICCOMQS - Intelligent measuring frameworkto ensure reliable communication for highly automated vehicles.” In: Proc. of
Vehicular Networking Conference (VNC). IEEE, Nov. 2017, pp. 311–318. isbn: 978-1-5386-0985-9.
[21] Florian Jomrich, Alexander Herzberger, Tobias Meuser, Björn Richerzhagen,Ralf Steinmetz, and Cornelius Wille. “Cellular Bandwidth Prediction for HighlyAutomated Driving - Evaluation of Machine Learning Approaches based onReal-World Data.” In: Proc. of International Conference on Vehicle Technology and
Intelligent Transport Systems (VEHITS). Ed. by Oleg Gusikhin Markus Helfert. 4.SCITEPRESS, Mar. 2018, pp. 121–131. isbn: 978-989-758-293-6.
[22] Patrick Lieser, Nils Richerzhagen, Tim Feuerbach, Tobias Meuser, Björn Rich-erzhagen, and Ralf Steinmetz. “Collaborative Decentralized Resource Reserva-tion for Emergency Communication Networks.” In: Proc. of Conference on Local
Computer Networks (LCN). IEEE, Oct. 2018, pp. 150–158.
[23] Johannes Müller, Tobias Meuser, Ralf Steinmetz, and Michael Buchholz. “ATrust Management and Misbehaviour Detection Mechanism for Multi-AgentSystems and its Application to Intelligent Transportation Systems.” In: Proc.
of International Conference on Control and Automation (ICCA). IEEE, June 2019,pp. 1–7.
[24] The An Binh Nguyen, Marius Rettberg-Päplow, Christian Meurisch, TobiasMeuser, Björn Richerzhagen, and Ralf Steinmetz. “Complex Services Offload-ing in Opportunistic Networks.” In: Proc. of IFIP Networking. May 2018, pp. 532–540. isbn: 978-3-903176-08-9.
[25] Tobias Rückelt, Ioannis Stavrakakis, Tobias Meuser, Doreen Böhnstedt, andRalf Steinmetz. “Data Transmission Plan Adaptation for Connected Vehicles.”In: Proc. of International Balkan Conference on Communications and Networking
(BalkanCom). May 2017, pp. 1–6. isbn: 978-3-901882-94-4.

154 author’s publications
[26] Tobias Rückelt, Ioannis Stavrakakis, Tobias Meuser, Imane Horiya Brahmi,Doreen Böhnstedt, and Ralf Steinmetz. “Data transmission plan adaptationcomplementing strategic time-network selection for connected vehicles.” In:Ad Hoc Networks 82 (Jan. 2019), pp. 146–154. issn: 1570-8705.
demo papers
[27] Patrick Lieser, Nils Richerzhagen, Michal Lipinski, Clemens Krug, Tobias Meu-ser, Björn Richerzhagen, and Ralf Steinmetz. “Decentralized Disaster Area De-tection in Mobile Networks.” In: Demonstrations of Conference on Local Computer
Networks (LCN Demonstrations). IEEE, Oct. 2018, pp. 1–3.
technical reports
[28] Tobias Meuser, Oluwasegun Taiwo Ojo, Daniel Bischoff, Antonio FernándezAnta, Ioannis Stavrakakis, and Ralf Steinmetz. Hide Me: Enabling Location Pri-
vacy in Heterogeneous Vehicular Networks. 2020. arXiv: 2001.07170 [cs.CR].

E R K L Ä RU NG L AU T P RO M O T I O N S O R D N U NG
§8 Abs. 1 lit. c PromO
Ich versichere hiermit, dass die elektronische Version meiner Dissertation mit derschriftlichen Version übereinstimmt.
§8 Abs. 1 lit. d PromO
Ich versichere hiermit, dass zu einem vorherigen Zeitpunkt noch keine Promotionversucht wurde. In diesem Fall sind nähere Angaben über Zeitpunkt, Hochschule,Dissertationsthema und Ergebnis dieses Versuchs mitzuteilen.
§9 Abs. 1 PromO
Ich versichere hiermit, dass die vorliegende Dissertation selbstständig und nur unterVerwendung der angegebenen Quellen verfasst wurde.
§9 Abs. 2 PromO
Die Arbeit hat bisher noch nicht zu Prüfungszwecken gedient.
Darmstadt, 22. Oktober 2019
Tobias Meuser