cell cycle and cell death
44
“Where a cell arises, there must be a previous cell, just as animals can only arise from animals and plants from plants.” This cell doctrine, proposed by the Ger- man pathologist Rudolf Virchow in 1858, carried with it a profound message for the continuity of life. Cells are generated from cells, and the only way to make more cells is by division of those that already exist. All living organisms, from the unicellular bacterium to the multicellular mammal, are products of repeated rounds of cell growth and division extending back in time to the beginnings of life on Earth over three billion years ago. A cell reproduces by performing an orderly sequence of events in which it duplicates its contents and then divides in two. This cycle of duplication and division, known as the cell cycle, is the essential mechanism by which all living things reproduce. In unicellular species, such as bacteria and yeasts, each cell division produces a complete new organism. In multicellular species, long and complex sequences of cell divisions are required to produce a functioning organism. Even in the adult body, cell division is usually needed to replace cells that die. In fact, each of us must manufacture many millions of cells every sec- ond simply to survive: if all cell division were stopped—by exposure to a very large dose of x-rays, for example—we would die within a few days. The details of the cell cycle vary from organism to organism and at different times in an organism’s life. Certain characteristics, however, are universal. The minimum set of processes that a cell has to perform are those that allow it to accomplish its most fundamental task: the passing on of its genetic information to the next generation of cells. To produce two genetically identical daughter cells, the DNA in each chromosome must first be faithfully replicated to produce two complete copies, and the replicated chromosomes must then be accurately distributed (segregated) to the two daughter cells, so that each receives a copy of the entire genome (Figure 17–1). Eucaryotic cells have evolved a complex network of regulatory proteins, known as the cell-cycle control system, that governs progression through the cell cycle. The core of this system is an ordered series of biochemical switches that control the main events of the cycle, including DNA replication and the THE CELL CYCLE AND PROGRAMMED CELL DEATH AN OVERVIEW OF THE CELL CYCLE COMPONENTS OF THE CELL- CYCLE CONTROL SYSTEM INTRACELLULAR CONTROL OF CELL-CYCLE EVENTS PROGRAMMED CELL DEATH (APOPTOSIS) EXTRACELLULAR CONTROL OF CELL DIVISION, CELL GROWTH, AND APOPTOSIS 983 17
Transcript of cell cycle and cell death

“Where a cell arises, there must be a previous cell, just as animals can only arisefrom animals and plants from plants.” This cell doctrine, proposed by the Ger-man pathologist Rudolf Virchow in 1858, carried with it a profound message forthe continuity of life. Cells are generated from cells, and the only way to makemore cells is by division of those that already exist. All living organisms, from theunicellular bacterium to the multicellular mammal, are products of repeatedrounds of cell growth and division extending back in time to the beginnings oflife on Earth over three billion years ago.
A cell reproduces by performing an orderly sequence of events in which itduplicates its contents and then divides in two. This cycle of duplication anddivision, known as the cell cycle, is the essential mechanism by which all livingthings reproduce. In unicellular species, such as bacteria and yeasts, each celldivision produces a complete new organism. In multicellular species, long andcomplex sequences of cell divisions are required to produce a functioningorganism. Even in the adult body, cell division is usually needed to replace cellsthat die. In fact, each of us must manufacture many millions of cells every sec-ond simply to survive: if all cell division were stopped—by exposure to a verylarge dose of x-rays, for example—we would die within a few days.
The details of the cell cycle vary from organism to organism and at differenttimes in an organism’s life. Certain characteristics, however, are universal. Theminimum set of processes that a cell has to perform are those that allow it toaccomplish its most fundamental task: the passing on of its genetic informationto the next generation of cells. To produce two genetically identical daughtercells, the DNA in each chromosome must first be faithfully replicated to producetwo complete copies, and the replicated chromosomes must then be accuratelydistributed (segregated) to the two daughter cells, so that each receives a copy ofthe entire genome (Figure 17–1).
Eucaryotic cells have evolved a complex network of regulatory proteins,known as the cell-cycle control system, that governs progression through thecell cycle. The core of this system is an ordered series of biochemical switchesthat control the main events of the cycle, including DNA replication and the
THE CELL CYCLE AND PROGRAMMEDCELL DEATH
AN OVERVIEW OF THE CELL CYCLE
COMPONENTS OF THE CELL-CYCLE CONTROL SYSTEM
INTRACELLULAR CONTROL OF CELL-CYCLE EVENTS
PROGRAMMED CELL DEATH (APOPTOSIS)
EXTRACELLULAR CONTROL OFCELL DIVISION, CELL GROWTH,AND APOPTOSIS
983
17

segregation of the replicated chromosomes. In most cells, additional layers ofregulation enhance the fidelity of cell division and allow the control system torespond to various signals from both inside and outside the cell. Inside the cell,the control system monitors progression through the cell cycle and delays laterevents until earlier events have been completed. Preparations for the segrega-tion of replicated chromosomes, for example, are not permitted until DNA repli-cation is complete. The control system also monitors conditions outside the cell.In a multicellular animal, the system is highly responsive to signals from othercells, stimulating cell division when more cells are needed and blocking it whenthey are not. The cell-cycle control system therefore has a central role in regu-lating cell numbers in the tissues of the body. When the system malfunctions,excessive cell divisions can result in cancer.
In addition to duplicating their genome, most cells also duplicate their otherorganelles and macromolecules; otherwise, they would get smaller with eachdivision. To maintain their size, dividing cells must coordinate their growth (i.e.,their increase in cell mass) with their division; it is still not clear how this coor-dination is achieved.
This chapter is concerned primarily with how the various events of the cellcycle are controlled and coordinated. We begin with a brief overview of theseevents, the molecular details of which are discussed in other chapters (DNAreplication in Chapter 5; chromosome segregation and cell division in Chapter18). We then describe the cell-cycle control system, examining how it organizesthe sequence of cell-cycle events and how it responds to intracellular signals toregulate cell division. We next discuss how multicellular organisms eliminateunwanted cells by the process of programmed cell death, or apoptosis, in whicha cell commits suicide when the interests of the organism demand it. Finally, weconsider how animals regulate cell numbers and cell size—using extracellularsignals to control cell survival, cell growth, and cell division.
AN OVERVIEW OF THE CELL CYCLEThe most basic function of the cell cycle is to duplicate accurately the vastamount of DNA in the chromosomes and then segregate the copies preciselyinto two genetically identical daughter cells. These processes define the twomajor phases of the cell cycle. DNA duplication occurs during S phase (S for syn-thesis), which requires 10–12 hours and occupies about half of the cell-cycletime in a typical mammalian cell. After S phase, chromosome segregation and
984 Chapter 17 : THE CELL CYCLE AND PROGRAMMED CELL DEATH
CHROMOSOMEREPLICATION ANDCELL GROWTH
1CELLDIVISION
3
CHROMOSOME SEGREGATION
2
daughter cells
CELLCYCLE
Figure 17–1 The cell cycle. Thedivision of a hypothetical eucaryotic cellwith two chromosomes is shown toillustrate how two genetically identicaldaughter cells are produced in each cycle.Each of the daughter cells will often divideagain by going through additional cellcycles.

cell division occur in M phase (M for mitosis), which requires much less time(less than an hour in a mammalian cell). M phase involves a series of dramaticevents that begin with nuclear division, or mitosis. As discussed in detail inChapter 18, mitosis begins with chromosome condensation: the duplicatedDNA strands, packaged into elongated chromosomes, condense into the muchmore compact chromosomes required for their segregation. The nuclear enve-lope then breaks down, and the replicated chromosomes, each consisting of apair of sister chromatids, become attached to the microtubules of the mitoticspindle. As mitosis proceeds, the cell pauses briefly in a state called metaphase,when the chromosomes are aligned at the equator of the mitotic spindle, poisedfor segregation. The sudden separation of sister chromatids marks the begin-ning of anaphase, during which the chromosomes move to opposite poles of thespindle, where they decondense and reform intact nuclei. The cell is thenpinched in two by cytoplasmic division, or cytokinesis, and cell division is com-plete (Figure 17–2).
Most cells require much more time to grow and double their mass of pro-teins and organelles than they require to replicate their DNA and divide. Partlyto allow more time for growth, extra gap phases are inserted in most cell cycles—a G1 phase between M phase and S phase and a G2 phase between S phase andmitosis. Thus, the eucaryotic cell cycle is traditionally divided into four sequen-tial phases: G1, S, G2, and M (Figure 17–3). G1, S, and G2 together are called inter-phase. In a typical human cell proliferating in culture, interphase might occupy23 hours of a 24 hour cycle, with 1 hour for M phase.
The two gap phases serve as more than simple time delays to allow cellgrowth. They also provide time for the cell to monitor the internal and externalenvironment to ensure that conditions are suitable and preparations are com-plete before the cell commits itself to the major upheavals of S phase and mito-sis. The G1 phase is especially important in this respect. Its length can varygreatly depending on external conditions and extracellular signals from other
AN OVERVIEW OF THE CELL CYCLE 985
Figure 17–2 The events of eucaryoticcell division as seen under amicroscope. The easily visible processesof nuclear division (mitosis) and celldivision (cytokinesis), collectively called M phase, typically occupy only a smallfraction of the cell cycle.The other, muchlonger, part of the cycle is known asinterphase.The five stages of mitosis areshown: an abrupt change in thebiochemical state of the cell occurs at thetransition from metaphase to anaphase.A cell can pause in metaphase before thistransition point, but once the point hasbeen passed, the cell carries on to the endof mitosis and through cytokinesis intointerphase. Note that DNA replicationoccurs in interphase.The part ofinterphase where DNA is replicated iscalled S phase (not shown).
+
M PHASE
INTERPHASE
DNA replication
prophase prometaphase metaphase anaphase telophaseinterphase
metaphase-to-anaphase transition
mitosis cytokinesis
G2
G1
mitosis(nucleardivision) cytokinesis
(cytoplasmicdivision)
M PHASE
G2 PHASE
G1 PHASES PHASE(DNA replication)
INTERPHASE
S
M
Figure 17–3 The phases of the cellcycle. The cell grows continuously ininterphase, which consists of three phases:DNA replication is confined to S phase;G1 is the gap between M phase and S phase, while G2 is the gap between S phase and M phase. In M phase, thenucleus and then the cytoplasm divide.

cells. If extracellular conditions are unfavorable, for example, cells delayprogress through G1 and may even enter a specialized resting state known as G0(G zero), in which they can remain for days, weeks, or even years before resum-ing proliferation. Indeed, many cells remain permanently in G0 until they or theorganism dies. If extracellular conditions are favorable and signals to grow anddivide are present, cells in early G1 or G0 progress through a commitment pointnear the end of G1 known as Start (in yeasts) or the restriction point (in mam-malian cells). After passing this point, cells are committed to DNA replication,even if the extracellular signals that stimulate cell growth and division areremoved.
The Cell-Cycle Control System Is Similar in All Eucaryotes
Some features of the cell cycle, including the time required to complete certainevents, vary greatly from one cell type to another, even in the same organism.The basic organization of the cycle and its control system, however, are essen-tially the same in all eucaryotic cells. The proteins of the control system firstappeared over a billion years ago. Remarkably, they have been so well conservedover the course of evolution that many of them function perfectly when trans-ferred from a human cell to a yeast cell. We can therefore study the cell cycle andits regulation in a variety of organisms and use the findings from all of them toassemble a unified picture of how eucaryotic cells divide. In the following sec-tion, we briefly review the three eucaryotic systems in which cell-cycle control iscommonly studied—yeasts, frog embryos, and cultured mammalian cells.
The Cell-Cycle Control System Can Be Dissected Genetically in Yeasts
Yeasts are tiny, single-celled fungi whose mechanisms of cell-cycle control areremarkably similar to our own. Two species are generally used in studies of thecell cycle. The fission yeast Schizosaccharomyces pombe is named after theAfrican beer it is used to produce. It is a rod-shaped cell that grows by elongationat its ends. Division occurs by the formation of a septum, or cell plate, in the cen-ter of the rod (Figure 17–4A). The budding yeast Saccharomyces cerevisiae isused by brewers, as well as by bakers. It is an oval cell that divides by forming abud, which first appears during G1 and grows steadily until it separates from themother cell after mitosis (Figure 17–4B).
Despite their outward differences, the two yeast species share a number offeatures that are extremely useful for genetic studies. They reproduce almost asrapidly as bacteria and have a genome size less than 1% that of a mammal. Theyare amenable to rapid molecular genetic manipulation, whereby genes can be
986 Chapter 17 : THE CELL CYCLE AND PROGRAMMED CELL DEATH
START
START
G1 S G2 M
S M
(A) FISSION YEAST (Schizosaccharomyces pombe)
(B) BUDDING YEAST (Saccharomyces cerevisiae)
G1
Figure 17–4 A comparison of the cellcycles of fission yeasts and buddingyeasts. (A) The fission yeast has a typicaleucaryotic cell cycle with G1, S, G2, and M phases. In contrast with what happensin higher eucaryotic cells, however, thenuclear envelope of the yeast cell doesnot break down during M phase.Themicrotubules of the mitotic spindle (lightgreen) form inside the nucleus and areattached to spindle pole bodies (darkgreen) at its periphery.The cell divides byforming a partition (known as the cellplate) and splitting in two.The condensedmitotic chromosomes (red) are readilyvisible in fission yeast, but are less easilyseen in budding yeasts. (B) The buddingyeast has normal G1 and S phases butdoes not have a normal G2 phase. Instead,a microtubule-based spindle begins toform inside the nucleus early in the cycle,during S phase. In contrast with a fissionyeast cell, the cell divides by budding.As infission yeasts, but in contrast with highereucaryotic cells, the nuclear enveloperemains intact during mitosis, and thespindle forms within the nucleus.

deleted, replaced, or altered. Most importantly, they have the unusual ability toproliferate in a haploid state, in which only a single copy of each gene is presentin the cell. When cells are haploid, it is easy to isolate and study mutations thatinactivate a gene, as one avoids the complication of having a second copy of thegene in the cell.
Many important discoveries about cell-cycle control have come from sys-tematic searches for mutations in yeasts that inactivate genes encoding essen-tial components of the cell-cycle control system. The genes affected by thesemutations are known as cell-division-cycle genes, or cdc genes. Many of thesemutations cause cells to arrest at a specific point in the cell cycle, suggesting thatthe normal gene product is required to get the cell past this point.
A mutant that cannot complete the cell cycle cannot be propagated. Thus,cdc mutants can be selected and maintained only if their phenotype is condi-tional—that is, if the gene product fails to function only in certain specific condi-tions. Most conditional cell-cycle mutations are temperature-sensitive mutations,in which the mutant protein fails to function at high temperatures but functionswell enough to allow cell division at low temperatures. A temperature-sensitivecdc mutant can be propagated at a low temperature (the permissive condition)and then raised to a higher temperature (the restrictive condition) to switch offthe function of the mutant gene. At the higher temperature, the cells continuethrough the cell cycle until they reach the point where the function of themutant gene is required for further progress, and at this point they halt (Figure17–5). In budding yeasts, a uniform cell-cycle arrest of this type can be detectedby just looking at the cells: the presence or absence of a bud, and bud size, indi-cate the point in the cycle at which the mutant is arrested (Figure 17–6).
The Cell-Cycle Control System Can Be Analyzed Biochemically in Animal Embryos
While yeasts are ideal for studying the genetics of the cell cycle, the biochemistryof the cycle is most easily analyzed in the giant fertilized eggs of many animals,which carry large stockpiles of the proteins needed for cell division. The egg ofthe frog Xenopus, for example, is over 1 mm in diameter and carries 100,000times more cytoplasm than an average cell in the human body (Figure 17–7).Fertilization of the Xenopus egg triggers an astonishingly rapid sequence ofcell divisions, called cleavage divisions, in which the single giant cell divides,without growing, to generate an embryo containing thousands of smaller cells
AN OVERVIEW OF THE CELL CYCLE 987
Figure 17–5 The behavior of a temperature-sensitive cdc mutant.(A) At the permissive (low) temperature, the cells divide normally and arefound in all phases of the cycle (the phase of the cell is indicated by itscolor). (B) On warming to the restrictive (high) temperature, at which themutant gene product functions abnormally, the mutant cells continue toprogress through the cycle until they come to the specific step that they areunable to complete (initiation of S phase, in this example). Because the cdcmutants still continue to grow, they become abnormally large. By contrast,non-cdc mutants, if deficient in a process that is necessary throughout thecycle for biosynthesis and growth (such as ATP production), halt haphazardlyat any stage of the cycle—depending on when their biochemical reservesrun out (not shown).
G1 S G2 M G1 S G2 M
(A) PERMISSIVE (LOW) TEMPERATURE (B) RESTRICTIVE (HIGH) TEMPERATURE
Figure 17–6 The morphology ofbudding yeast cells arrested by a cdcmutation. (A) In a normal population ofproliferating yeast cells, buds vary in sizeaccording to the cell-cycle stage. (B) In acdc15 mutant grown at the restrictivetemperature, cells complete anaphase butcannot complete the exit from mitosis andcytokinesis.As a result, they arrestuniformly with the large buds, which arecharacteristic of late M phase. (Courtesyof Jeff Ubersax.)
20 mm
(A)
(B)

(Figure 17–8). In this process, almost the only macromolecules synthesized areDNA—required to produce the thousands of new nuclei—and a small amount ofprotein. After a first division that takes about 90 minutes, the next 11 divisionsoccur, more or less synchronously, at 30-minute intervals, producing about 4096(212) cells within 7 hours. Each cycle is divided into S and M phases of about 15minutes each, without detectable G1 or G2 phases.
The cells in early embryos of Xenopus, as well as those of the clam Spisulaand the fruit fly Drosophila, are thus capable of exceedingly rapid division in theabsence of either growth or many of the control mechanisms that operate inmore complex cell cycles. These early embryonic cell cycles therefore reveal theworkings of the cell-cycle control system stripped down and simplified to theminimum needed to achieve the most fundamental requirements—the duplica-tion of the genome and its segregation into two daughter cells. Another advan-tage of these early embryos for cell-cycle analysis is their large size. It is relativelyeasy to inject test substances into an egg to determine their effect on cell-cycleprogression. It is also possible to prepare almost pure cytoplasm from Xenopuseggs and reconstitute many events of the cell cycle in a test tube (Figure 17–9).In such cell extracts, one can observe and manipulate cell-cycle events underhighly simplified and controllable conditions.
The Cell-Cycle Control System of Mammals Can Be Studied in Culture
It is not easy to observe individual cells in an intact mammal. Most studies onmammalian cell-cycle control therefore use cells that have been isolated fromnormal tissues or tumors and grown in plastic culture dishes in the presence ofessential nutrients and other factors (Figure 17–10). There is a complication,however. When cells from normal mammalian tissues are cultured in standardconditions, they often stop dividing after a limited number of division cycles.Human fibroblasts, for example, permanently cease dividing after 25–40 divi-sions, a process called replicative cell senescence, which we discuss later.
Mammalian cells occasionally undergo mutations that allow them to prolif-erate readily and indefinitely in culture as “immortalized” cell lines. Althoughthey are not normal, such cell lines are used widely for cell-cycle studies—andfor cell biology generally—because they provide an unlimited source of geneti-cally homogeneous cells. In addition, these cells are sufficiently large to allowdetailed cytological observations of cell-cycle events, and they are amenable tobiochemical analysis of the proteins involved in cell-cycle control.
988 Chapter 17 : THE CELL CYCLE AND PROGRAMMED CELL DEATH
0.5 mm
Figure 17–7 A mature Xenopus egg,ready for fertilization. The pale spotnear the top shows the site of thenucleus, which has displaced the brownpigment in the surface layer of the eggcytoplasm.Although this cannot be seen inthe picture, the nuclear envelope hasbroken down during the process of eggmaturation. (Courtesy of Tony Mills.)
Figure 17–8 Oocyte growth and egg cleavage in Xenopus. The oocyte grows without dividing formany months in the ovary of the mother frog and finally matures into an egg. Upon fertilization, the eggcleaves very rapidly—initially at a rate of one division cycle every 30 minutes—forming a multicellular tadpolewithin a day or two.The cells get progressively smaller with each division, and the embryo remains the samesize. Growth starts only when the tadpole begins feeding.The drawings in the top row are all on the samescale (but the frog below is not).
oocyte grows without dividing(months)
fertilized egg divides without growing(hours)
egg
sperm1 mm
FERTILIZATION
tadpole feeds, grows,and becomes an adult frog

Studies of cultured mammalian cells have been especially useful for exam-ining the molecular mechanisms governing the control of cell proliferation inmulticellular organisms. Such studies are important not only for understandingthe normal controls of cell numbers in tissues but also for understanding theloss of these controls in cancer (discussed in Chapter 23).
Cell-Cycle Progression Can Be Studied in Various Ways
How can one tell at what stage an animal cell is in the cell cycle? One way is tosimply look at living cells with a microscope. A glance at a population of mam-malian cells proliferating in culture reveals that a fraction of the cells haverounded up and are in mitosis. Others can be observed in the process of cytoki-nesis. The S-phase cells, however, cannot be detected by simple observation.They can be recognized, however, by supplying them with visualizablemolecules that are incorporated into newly synthesized DNA, such as 3H-thymi-dine or the artificial thymidine analog bromo-deoxyuridine (BrdU). Cell nucleithat have incorporated 3H-thymidine are visualized by autoradiography (Figure17–11A), whereas those that have incorporated BrdU are visualized by stainingwith anti-BrdU antibodies (Figure 17–11B).
Typically, in a population of cells that are all proliferating rapidly but asyn-chronously, about 30–40% will be in S phase at any instant and become labeledby a brief pulse of 3H-thymidine or BrdU. From the proportion of cells in such apopulation that are labeled (the labeling index), one can estimate the duration
AN OVERVIEW OF THE CELL CYCLE 989
Figure 17–9 Studying the cell cycle in a cell-free system. A large batch ofactivated frog eggs is broken open by gentle centrifugation, which also separates thecytoplasm from other cell components.The undiluted cytoplasm is collected, and spermnuclei are added to it, together with ATP.The sperm nuclei decondense and then gothrough repeated cycles of DNA replication and mitosis, indicating that the cell-cyclecontrol system is operating in this cell-free cytoplasmic extract.
ATP
cytoplasm fromactivated frog
eggs
nuclei fromfrog
sperm
cell-free mitotic cycle: 40–60 min 10 mm
Figure 17–10 Mammalian cellsproliferating in culture. The cells inthis scanning electron micrograph are ratfibroblasts. (Courtesy of GuenterAlbrecht-Buehler.)
20 mm 50 mm(B)(A)
Figure 17–11 Labeling S-phase cells.(A) The tissue has been exposed for ashort period to 3H-thymidine and thelabeled cells have been visualized byautoradiography. Silver grains (black dots)in the photographic emulsion over anucleus indicate that the cell incorporated3H-thymidine into its DNA and thus wasin S phase some time during the labelingperiod. In this specimen, showing thesensory epithelium from the inner ear ofa chicken, the presence of an S-phase cellis evidence of cell proliferation occurringin response to damage. (B) Animmunofluorescence micrograph of BrdU-labeled glial precursor cells inculture.The cells were exposed to BrdUfor 4 h and were then fixed and labeledwith fluorescent anti-BrdU antibodies(red). All the cells are stained with a bluefluorescent dye. (A, courtesy of MarkWarchol and Jeffrey Corwin; B, from D.Tang,Y.Tokumoto, and M. Raff, J. Cell Biol.148:971–984, 2000. © The RockefellerUniversity Press.)

of S phase as a fraction of the whole cell cycle duration. Similarly, from the pro-portion of these cells in mitosis (the mitotic index), one can estimate the dura-tion of M phase. In addition, by giving a pulse of 3H-thymidine or BrdU andallowing the cells to continue around the cycle for measured lengths of time, onecan determine how long it takes for an S-phase cell to progress through G2 intoM phase, through M phase into G1, and finally through G1 back into S phase.
Another way to assess the stage that a cell has reached in the cell cycle is bymeasuring its DNA content, which doubles during S phase. This approach isgreatly facilitated by the use of DNA-binding fluorescent dyes and a flow cytome-ter, which allows large numbers of cells to be analyzed rapidly and automatically(Figure 17–12). One can also use flow cytometry to determine the lengths of G1,S, and G2 + M phases, by following over time a population of cells that have beenpreselected to be in one particular phase of the cell cycle: DNA content mea-surements on such a synchronized population of cells reveal how the cellsprogress through the cycle.
Summary
Cell reproduction begins with duplication of the cell’s contents, followed by distri-bution of those contents into two daughter cells. Chromosome duplication occursduring S phase of the cell cycle, whereas most other cell components are duplicatedcontinuously throughout the cycle. During M phase, the replicated chromosomes aresegregated into individual nuclei (mitosis), and the cell then splits in two (cytokine-sis). S phase and M phase are usually separated by gap phases called G1 and G2,when cell-cycle progression can be regulated by various intracellular and extracel-lular signals. Cell-cycle organization and control have been highly conserved dur-ing evolution, and studies in a wide range of systems—including yeasts, frogembryos, and mammalian cells in culture—have led to a unified view of eucaryoticcell-cycle control.
COMPONENTS OF THE CELL-CYCLE CONTROL SYSTEMFor many years cell biologists watched the puppet show of DNA synthesis, mito-sis, and cytokinesis but had no idea of what lay behind the curtain controllingthese events. The cell-cycle control system was simply a black box inside the cell.It was not even clear whether there was a separate control system, or whetherthe processes of DNA synthesis, mitosis, and cytokinesis somehow controlledthemselves. A major breakthrough came in the late 1980s with the identificationof the key proteins of the control system, along with the realization that they aredistinct from the proteins that perform the processes of DNA replication, chro-mosome segregation, and so on.
We first consider the basic principles upon which the cell-cycle control sys-tem operates. Then we discuss the protein components of the system and howthey work together to activate the different phases of the cell cycle.
The Cell-Cycle Control System Triggers the Major Processes of the Cell Cycle
The cell-cycle control system operates much like the control system of an auto-matic clothes-washing machine. The washing machine functions in a series ofstages: it takes in water, mixes it with detergent, washes the clothes, rinses them,and spins them dry. These essential processes of the wash cycle are analogous tothe essential processes of the cell cycle—DNA replication, mitosis, and so on. Inboth cases, a central controller triggers each process in a set sequence (Figure17–13).
How might one design a control system that safely guides the cell throughthe events of the cell cycle (or a wash cycle, for that matter)? In principle, one can
990 Chapter 17 : THE CELL CYCLE AND PROGRAMMED CELL DEATH
0 1 2
relative amount of DNA per cell
(arbitrary units)
nu
mb
er o
f ce
lls
cells in G1phase
cells in G2 and M phases
cells in S phase
Figure 17–12 Analysis of DNAcontent with a flow cytometer. Thisgraph shows typical results obtained for aproliferating cell population when theDNA content of its individual cells isdetermined in a flow cytometer. (A flowcytometer, also called a fluorescence-activated cell sorter, or FACS, can also beused to sort cells according to theirfluorescence—see Figure 8–2).The cellsanalyzed here were stained with a dyethat becomes fluorescent when it binds toDNA, so that the amount of fluorescenceis directly proportional to the amount ofDNA in each cell.The cells fall into threecategories: those that have an unreplicatedcomplement of DNA and are therefore inG1 phase, those that have a fully replicatedcomplement of DNA (twice the G1 DNAcontent) and are in G2 or M phase, andthose that have an intermediate amount ofDNA and are in S phase.The distributionof cells in the case illustrated indicatesthat there are greater numbers of cells inG1 phase than in G2 + M phase, showingthat G1 is longer than G2 + M in thispopulation.

imagine that the most basic control system should possess the following features: • A clock, or timer, that turns on each event at a specific time, thus providing
a fixed amount of time for the completion of each event. • A mechanism for initiating events in the correct order; entry into mitosis,
for example, must always come after DNA replication. • A mechanism to ensure that each event is triggered only once per cycle. • Binary (on/off) switches that trigger events in a complete, irreversible fash-
ion. It would clearly be disastrous, for example, if events like chromosomecondensation or nuclear envelope breakdown were initiated but not com-pleted.
• Robustness: backup mechanisms to ensure that the cycle can work prop-erly even when parts of the system malfunction.
• Adaptability, so that the system’s behavior can be modified to suit specificcell types or environmental conditions.
We shall see in this chapter that the cell-cycle control system possesses all ofthese features, and that we are now beginning to understand the molecularmechanisms involved.
The Control System Can Arrest the Cell Cycle at Specific Checkpoints
We can illustrate the importance of an adjustable cell-cycle control system byextending our washing machine analogy. The control system of simple embry-onic cell cycles, like the controller in a simple washing machine, is based on aclock. The clock is unaffected by the events it regulates and will progress throughthe whole sequence of events even if one of those events has not been success-fully completed. In contrast, the control system of most cell cycles (and sophis-ticated washing machines) is responsive to information received back from theprocesses it is controlling. Sensors, for example, detect the completion of DNAsynthesis (or the successful filling of the washtub), and, if some malfunction pre-vents the successful completion of this process, signals are sent to the controlsystem to delay progression to the next phase. These delays provide time for themachinery to be repaired and also prevent the disaster that might result if thecycle progressed prematurely to the next stage.
COMPONENTS OF THE CELL-CYCLE CONTROL SYSTEM 991
Figure 17–13 The control of the cellcycle. The essential processes of the cellcycle—such as DNA replication, mitosis,and cytokinesis—are triggered by a cell-cycle control system. By analogy with awashing machine, the cell-cycle controlsystem is shown here as a central arm—the controller—that rotates clockwise,triggering essential processes when itreaches specific points on the outer dial.
G2
M
SG1
CONTROLLER
ENTER M EXIT M
ENTER S
trigger DNAreplication machinery
REPLICATE DNA(see Chapter 5)
trigger mitosis machinerytrigger anaphase andproceed to cytokinesis
ASSEMBLEMITOTIC SPINDLE(see Chapter 18)
COMPLETE CELL DIVISION(see Chapter 18)

In most cells there are several points in the cell cycle, called checkpoints, atwhich the cycle can be arrested if previous events have not been completed(Figure 17–14). Entry into mitosis is prevented, for example, when DNA replica-tion is not complete, and chromosome separation in mitosis is delayed if somechromosomes are not properly attached to the mitotic spindle.
Progression through G1 and G2 is delayed by braking mechanisms if the DNAin the chromosomes is damaged by radiation or chemicals. Delays at these DNAdamage checkpoints provide time for the damaged DNA to be repaired, afterwhich the cell-cycle brakes are released and progress resumes.
Checkpoints are important in another way as well. They are points in the cellcycle at which the control system can be regulated by extracellular signals fromother cells. These signals—which can either promote or inhibit cell prolifera-tion—tend to act by regulating progression through a G1 checkpoint, usingmechanisms discussed later in the chapter.
Checkpoints Generally Operate Through Negative Intracellular Signals
Checkpoint mechanisms like those just described tend to act through negativeintracellular signals that arrest the cell cycle, rather than through the removal ofpositive signals that normally stimulate cell-cycle progression. The followingargument suggests why this is so.
Consider, for example, the checkpoint that monitors the attachment ofchromosomes to the mitotic spindle. If a cell proceeds into anaphase and startsto segregate its chromosomes into separate daughter cells before all chromo-somes are appropriately attached, one daughter receives an incomplete chro-mosome set, while the other daughter receives a surplus. The cell thereforeneeds to be able to detect the attachment of the last unattached chromosome tothe microtubules of the spindle. In a cell with many chromosomes, if each chro-mosome sends a positive signal to the cell-cycle control system once it isattached, the attachment of the last chromosome will be hard to detect, as it willbe signaled by only a small fractional change in the total intensity of the “go” sig-nal. On the other hand, if each unattached chromosome sends a negative signalto inhibit progress through the cell cycle, the attachment of the last chromo-some will be easily detected because it will cause a change from some “stop” sig-nal to none. A similar argument would imply that unreplicated DNA inhibits theinitiation of mitosis, creating a stop signal that persists until the completion ofDNA replication.
992 Chapter 17 : THE CELL CYCLE AND PROGRAMMED CELL DEATH
Figure 17–14 Checkpoints in the cell-cycle control system. Informationabout the completion of cell-cycle events,as well as signals from the environment,can cause the control system to arrest thecycle at specific checkpoints.The mostprominent checkpoints occur at locationsmarked with yellow boxes.
G2
M
SG1
CONTROLLER
ENTER M EXIT M
ENTER S
G1 CHECKPOINT
Is environment favorable?
METAPHASE CHECKPOINT
Are all chromosomesattached to the spindle?
G2 CHECKPOINT
Is environment favorable?
Is all DNA replicated?

The most convincing evidence that checkpoints operate through negativesignals comes from studies of cells in which a checkpoint is inactivated by eithermutation or chemical treatment. In these cells, the cell cycle continues toprogress even if DNA replication or spindle assembly is incomplete, indicatingthat checkpoints are generally not essential for cell-cycle progression. Check-points are best viewed as accessory braking systems that have been added to thecell-cycle control system to provide a more sophisticated form of regulation.
Although most checkpoints are not essential for normal cell-cycle progres-sion under ideal conditions, populations of cells with checkpoint defects oftenaccumulate mutations due to occasional malfunctions in DNA replication, DNArepair, or spindle assembly. Some of these mutations can promote the develop-ment of cancer, as we discuss later and in Chapter 23.
The Cell-Cycle Control System Is Based on CyclicallyActivated Protein Kinases
At the heart of the cell-cycle control system is a family of protein kinases knownas cyclin-dependent kinases (Cdks). The activity of these kinases rises and fallsas the cell progresses through the cycle. The oscillations lead directly to cyclicalchanges in the phosphorylation of intracellular proteins that initiate or regulatethe major events of the cell cycle—DNA replication, mitosis, and cytokinesis. Anincrease in Cdk activity at the beginning of mitosis, for example, leads toincreased phosphorylation of proteins that control chromosome condensation,nuclear envelope breakdown, and spindle assembly.
Cyclical changes in Cdk activity are controlled by a complex array ofenzymes and other proteins. The most important of these Cdk regulators areproteins known as cyclins. Cdks, as their name implies, are dependent oncyclins for their activity: unless they are tightly bound to a cyclin, they have noprotein kinase activity (Figure 17–15). Cyclins were originally named as suchbecause they undergo a cycle of synthesis and degradation in each cell cycle.Cdk levels, by contrast, are constant, at least in the simplest cell cycles. Cyclicalchanges in cyclin levels result in the cyclic assembly and activation of thecyclin–Cdk complexes; this activation in turn triggers cell-cycle events (Figure17–16).
COMPONENTS OF THE CELL-CYCLE CONTROL SYSTEM 993
cyclin-dependentkinase (Cdk)
cyclin
Figure 17–15 Two key components ofthe cell-cycle control system. Acomplex of cyclin with Cdk acts as aprotein kinase to trigger specific cell-cycleevents.Without cyclin, Cdk is inactive.
S
M
G1
G2
Cdk
M-cyclin
S-cyclin
trigger DNA replication machinery
trigger mitosis machinery
M-Cdk
S-Cdk
Figure 17–16 A simplified view of thecore of the cell-cycle control system.Cdk associates successively with differentcyclins to trigger the different events ofthe cycle. Cdk activity is usuallyterminated by cyclin degradation. Forsimplicity, only the cyclins that act in S phase (S-cyclin) and M phase (M-cyclin)are shown, and they interact with a singleCdk; as indicated, the resulting cyclin–Cdkcomplexes are referred to as S-Cdk andM-Cdk, respectively.

There are four classes of cyclins, each defined by the stage of the cell cycle atwhich they bind Cdks and function. Three of these classes are required in alleucaryotic cells:
1. G1/S-cyclins bind Cdks at the end of G1 and commit the cell to DNA repli-cation.
2. S-cyclins bind Cdks during S phase and are required for the initiation ofDNA replication.
3. M-cyclins promote the events of mitosis.In most cells, a fourth class of cyclins, the G1-cyclins, helps promote passage
through Start or the restriction point in late G1. In yeast cells, a single Cdk protein binds all classes of cyclins and drives all
cell-cycle events by changing cyclin partners at different stages of the cycle. Invertebrate cells, by contrast, there are four Cdks. Two interact with G1-cyclins,one with G1/S- and S-cyclins, and one with M-cyclins. In this chapter, we simplyrefer to the different cyclin–Cdk complexes as G1-Cdk, G1/S-Cdk, S-Cdk, andM-Cdk. The names of the individual Cdks and cyclins are given in Table 17–1.
How do different cyclin–Cdk complexes drive different cell-cycle events?The answer, at least in part, seems to be that the cyclin protein does not simplyactivate its Cdk partner but also directs it to specific target proteins. As a result,each cyclin–Cdk complex phosphorylates a different set of substrate proteins.The same cyclin–Cdk complex can also induce different effects at different timesin the cycle, probably because the accessibility of some Cdk substrates changesduring the cell cycle. Certain proteins that function in mitosis, for example, maybecome available for phosphorylation only in G2.
Studies of the three-dimensional structures of Cdk and cyclin proteins haverevealed that, in the absence of cyclin, the active site in the Cdk protein is partlyobscured by a slab of protein, like a stone blocking the entrance to a cave (Fig-ure 17–17A). Cyclin binding causes the slab to move away from the active site,resulting in partial activation of the Cdk enzyme (Figure 17–17B). Full activa-tion of the cyclin–Cdk complex then occurs when a separate kinase, the Cdk-activating kinase (CAK), phosphorylates an amino acid near the entrance of the
994 Chapter 17 : THE CELL CYCLE AND PROGRAMMED CELL DEATH
TABLE 17–1 The Major Cyclins and Cdks of Vertebrates and Budding Yeast
CYCLIN–CDK VERTEBRATES BUDDING YEASTCOMPLEX CYCLIN CDK PARTNER CYCLIN CDK PARTNER
G1-Cdk cyclin D* Cdk4, Cdk6 Cln3 Cdk1**G1/S-Cdk cyclin E Cdk2 Cln1, 2 Cdk1S-Cdk cyclin A Cdk2 Clb5, 6 Cdk1M-Cdk cyclin B Cdk1** Clb1, 2, 3, 4 Cdk1* There are three D cyclins in mammals (cyclins D1, D2, and D3).** The original name of Cdk1 was Cdc2 in both vertebrates and fission yeast, and Cdc28 in budding yeast.
ATPATPATP
P
Cdk active site activating phosphate
cyclin
INACTIVE(A) (B) (C) FULLY ACTIVEPARTLY ACTIVE
Cdk-activating kinase (CAK)
T-loop
cyclin
Figure 17–17 The structural basis ofCdk activation. These drawings arebased on three-dimensional structures ofhuman Cdk2, as determined by x-raycrystallography.The location of the boundATP is indicated.The enzyme is shown inthree states. (A) In the inactive state,without cyclin bound, the active site isblocked by a region of the protein calledthe T-loop (red). (B) The binding of cyclincauses the T-loop to move out of theactive site, resulting in partial activation ofthe Cdk2. (C) Phosphorylation of Cdk2(by CAK) at a threonine residue in the T-loop further activates the enzyme bychanging the shape of the T-loop,improving the ability of the enzyme tobind its protein substrates.

Cdk active site. This causes a small conformational change that further increasesthe activity of the Cdk, allowing the kinase to phosphorylate its target proteinseffectively and thereby induce specific cell-cycle events (Figure 17–17C).
Cdk Activity Can Be Suppressed Both by Inhibitory Phosphorylation and by Inhibitory Proteins
The rise and fall of cyclin levels is the primary determinant of Cdk activity dur-ing the cell cycle. Several additional mechanisms, however, are important forfine-tuning Cdk activity at specific stages in the cell cycle.
The activity of a cyclin–Cdk complex can be inhibited by phosphorylation ata pair of amino acids in the roof of the active site. Phosphorylation of these sitesby a protein kinase known as Wee1 inhibits Cdk activity, while dephosphoryla-tion of these sites by a phosphatase known as Cdc25 increases Cdk activity (Fig-ure 17–18). We see later that this regulatory mechanism is particularly importantin the control of M-Cdk activity at the onset of mitosis.
Cyclin–Cdk complexes can also be regulated by the binding of Cdk inhibitorproteins (CKIs). There are a variety of CKI proteins, and they are primarilyemployed in the control of G1 and S phase. The three-dimensional structure of acyclin–Cdk–CKI complex reveals that CKI binding dramatically rearranges thestructure of the Cdk active site, rendering it inactive (Figure 17–19).
The Cell-Cycle Control System Depends onCyclical Proteolysis
Cell-cycle control depends crucially on at least two distinct enzyme complexesthat act at different times in the cycle to cause the proteolysis of key proteins ofthe cell-cycle control system thereby, inactivating them. Most notably,cyclin–Cdk complexes are inactivated by regulated proteolysis of cyclins at cer-tain cell-cycle stages. This cyclin destruction occurs by a ubiquitin-dependentmechanism, like that involved in the proteolysis of many other intracellular pro-teins (discussed in Chapter 6). An activated enzyme complex recognizes specificamino-acid sequences on the cyclin and attaches multiple copies of ubiquitin toit, marking the protein for complete destruction in proteasomes.
The rate-limiting step in cyclin destruction is the final ubiquitin-transferreaction catalyzed by enzymes known as ubiquitin ligases (see Figure 6–87B).Two ubiquitin ligases are important in the destruction of cyclins and other cell-cycle regulators. In G1 and S phase, an enzyme complex called SCF (after itsthree main protein subunits) is responsible for the ubiquitylation and destruc-tion of G1/S-cyclins and certain CKI proteins that control S-phase initiation. InM phase, the anaphase-promoting complex (APC) is responsible for the ubiqui-tylation and proteolysis of M-cyclins and other regulators of mitosis.
These two large, multisubunit complexes contain some related compo-nents, but they are regulated in different ways. SCF activity is constant duringthe cell cycle. Ubiquitylation by SCF is controlled by changes in the phosphory-lation state of its target proteins: only specifically phosphorylated proteins arerecognized, ubiquitylated, and destroyed (Figure 17–20A). APC activity, by con-trast, changes at different stages of the cell cycle. APC is turned on mainly by theaddition of activating subunits to the complex (Figure 17–20B). We discuss thefunctions of SCF and APC in more detail later.
COMPONENTS OF THE CELL-CYCLE CONTROL SYSTEM 995
Wee1kinase
P Cdc25phosphatase
P
activatingphosphate
P
inhibitory phosphatecyclin
Cdk
INACTIVEACTIVE
Figure 17–18 The regulation of Cdkactivity by inhibitoryphosphorylation. The active cyclin–Cdkcomplex is turned off when the kinaseWee1 phosphorylates two closely spacedsites above the active site. Removal ofthese phosphates by the phosphataseCdc25 results in activation of thecyclin–Cdk complex. For simplicity, onlyone inhibitory phosphate is shown.Theactivating phosphate is added by CAK, asshown in Figure 17–17.
P P
Cdkcyclin
activecyclin–Cdkcomplex
inactivep27–cyclin–Cdk
complexp27
Figure 17–19 The inhibition of acyclin–Cdk complex by a CKI. Thisdrawing is based on the three-dimensionalstructure of the human cyclin A–Cdk2complex bound to the CKI p27, asdetermined by x-ray crystallography.Thep27 binds to both the cyclin and Cdk inthe complex, distorting the active site ofthe Cdk. It also inserts into the ATP-binding site, further inhibiting theenzyme activity.

Cell-Cycle Control Also Depends on Transcriptional Regulation
In the frog embryonic cell cycle discussed earlier, gene transcription does notoccur. Cell-cycle control depends exclusively on post-transcriptional mecha-nisms that involve the regulation of Cdk activity by phosphorylation and thebinding of regulatory proteins such as cyclins, which are themselves regulatedby proteolysis. In the more complex cell cycles of most cell types, however, tran-scriptional control provides an added level of regulation. Cyclin levels in mostcells, for example, are controlled not only by changes in cyclin degradation butalso by changes in cyclin gene transcription and cyclin synthesis.
In certain organisms, such as budding yeasts, one can use DNA arrays (dis-cussed in Chapter 8) to analyze changes in the expression of all of the genes inthe genome as the cell progresses through the cell cycle. The results of thesestudies are surprising. About 10% of the yeast genes encode mRNAs whose lev-els oscillate during the cell cycle. Some of these genes encode proteins withknown cell-cycle functions, but the functions of many others are unknown. Itseems likely that these oscillations in gene expression are controlled by thecyclin–Cdk-dependent phosphorylation of gene regulatory proteins, but thedetails of this regulation remain unknown.
Summary
Events of the cell cycle are triggered by an independent cell-cycle control system,which ensures that the events are properly timed, occur in the correct order, andoccur only once per cell cycle. The control system is responsive to various intracellu-lar and extracellular signals, so that cell-cycle progression can be arrested when thecell either fails to complete an essential cell-cycle process or encounters unfavorableenvironmental conditions.
996 Chapter 17 : THE CELL CYCLE AND PROGRAMMED CELL DEATH
P P
ubiquitin ( )+
E1 E2
ubiquitylationenzymes
multiubiquitinchain
DEGRADATIONOF CKI IN
PROTEASOME
DEGRADATIONOF M-CYCLIN INPROTEASOME
ubiquitin ( )+
E1 E2
ubiquitylationenzymes
kinase
Cdk inhibitor protein(CKI)
(A) control of proteolysis by SCF
(B) control of proteolysis by APC
active APC
inactive APC
activatingsubunit (Cdc20)
active SCF
multiubiquitinchain
M-cyclin
Cdk
Figure 17–20 The control ofproteolysis by SCF and APC duringthe cell cycle. (A) The phosphorylationof a target protein, such as the CKIshown, allows the protein to berecognized by SCF, which is constitutivelyactive.With the help of two additionalproteins called E1 and E2, SCF serves as aubiquitin ligase that transfers multipleubiquitin molecules onto the CKI protein.The ubiquitylated CKI protein is thenimmediately recognized and degraded in aproteasome. (B) M-cyclin ubiquitylation isperformed by APC, which is activated inlate mitosis by the addition of an activatingsubunit to the complex. Both SCF andAPC contain binding sites that recognizespecific amino acid sequences of thetarget protein.

The central components of the cell-cycle control system are cyclin-dependentprotein kinases (Cdks), whose activity depends on association with regulatory sub-units called cyclins. Oscillations in the activities of various cyclin–Cdk complexesleads to the initiation of various cell-cycle events. Thus, activation of S-phasecyclin–Cdk complexes initiates S phase, while activation of M-phase cyclin–Cdkcomplexes triggers mitosis. The activities of cyclin–Cdk complexes are influenced byseveral mechanisms, including phosphorylation of the Cdk subunit, the binding ofspecial inhibitory proteins (CKIs), proteolysis of cyclins, and changes in the tran-scription of genes encoding Cdk regulators. Two enzyme complexes, SCF and APC,are also crucial components of the cell-cycle control system; they induce the proteol-ysis of specific cell-cycle regulators by ubiquitylating them and thereby trigger severalcritical events in the cycle.
INTRACELLULAR CONTROL OF CELL-CYCLE EVENTSEach of the different cyclin–Cdk complexes serves as a molecular switch thattriggers a specific cell-cycle event. We now consider how these switches initiatesuch events and how the cell-cycle control system ensures that the switches firein the correct order and only once per cell cycle. We begin with the two centralevents of the cell cycle: the replication of DNA during S phase and the chromo-some segregation and cell division of M phase. We then discuss how crucial reg-ulatory mechanisms in G1 phase control whether or not a cell proliferates.
S-Phase Cyclin–Cdk Complexes (S-Cdks) Initiate DNAReplication Once Per Cycle
A cell must solve several problems in controlling the initiation and completionof DNA replication. Not only must replication occur with extreme accuracy tominimize the risk of mutations in the next cell generation, but every nucleotidein the genome must be copied once, and only once, to prevent the damagingeffects of gene amplification. In Chapter 5, we discuss the sophisticated proteinmachinery that performs DNA replication with astonishing speed and accuracy.In this chapter, we consider the elegant mechanisms by which the cell-cyclecontrol system initiates the replication process and, at the same time, preventsit from happening more than once per cycle.
Early clues about the regulation of S phase came from studies in whichhuman cells at various cell-cycle stages were fused to form single cells with twonuclei. These experiments revealed that when a G1 cell is fused with an S-phasecell, DNA replication occurs in the G1 nucleus (presumably triggered by S-Cdkactivity in the S-phase cell). Fusion of a G2 cell with an S-phase cell, however, doesnot cause DNA synthesis in the G2 nucleus (Figure 17–21). These studies provideda clear hint that only G1 cells are competent to initiate DNA replication and thatcells that have completed S phase (i.e. G2 cells) are not able to rereplicate their
INTRACELLULAR CONTROL OF CELL-CYCLE EVENTS 997
S G1 S G2 G2G1
G1-phase nucleusimmediately enters S phase;S-phase nucleuscontinues DNAreplication
(A)
G2-phase nucleusstays in G2; S-phase nucleuscontinues DNAreplication
(B) (C)
G2-phase nucleusstays in G2; G1-phase nucleusenters S phaseaccording to itsown timetable
Figure 17–21 Evidence from cell-fusion experiments for arereplication block. These experimentswere carried out in 1970 in culturedmammalian cells. (A) The results show thatS-phase cytoplasm contains factors thatdrive a G1 nucleus directly into DNAsynthesis. (B) A G2 nucleus, having alreadyreplicated its DNA, is refractory to thesefactors. (C) Fusion of a G2 cell with a G1 cell does not drive the G1 nucleus intoDNA synthesis, indicating that thecytoplasmic factors for DNA replicationthat were present in the S-phase celldisappear when the cell moves from S phase into G2. (Adapted from R.T. Johnson and P.N. Rao, Nature226:717–722, 1970.)

DNA, even when provided with S-Cdk activity. Apparently, passage throughmitosis is required for the cell to regain the ability to undergo S phase.
We have begun to decipher the molecular basis of these cell fusion experi-ments only recently. DNA replication begins at origins of replication, which arescattered at various locations in the chromosome. Replication origins are simpleand well defined in the budding yeast S. cerevisiae, and most of our understand-ing of the initiation machinery comes from studies of this organism. Analyses ofproteins that bind to the yeast replication origin have identified a large, multi-protein complex known as the origin recognition complex (ORC). These com-plexes bind to replication origins throughout the cell cycle and serve as landingpads for several additional regulatory proteins.
One of these regulatory proteins is Cdc6. It is present at low levels duringmost of the cell cycle but increases transiently in early G1. It binds to ORC atreplication origins in early G1, where it is required for the binding of a complexcomposed of a group of closely related proteins, the Mcm proteins. The result-ing large protein complex formed at an origin is known as the pre-replicativecomplex, or pre-RC (Figure 17–22).
998 Chapter 17 : THE CELL CYCLE AND PROGRAMMED CELL DEATH
Cdc6
Cdc6
ORC-binding site
assembledreplication fork
ORC (origin recognition complex)
DNA
Mcm
pre-replicativecomplex (pre-RC)
Cdc6
P
P
P
P
P
DEGRADATION OFPHOSPHORYLATED Cdc6
S-Cdk TRIGGERSS PHASE
PHOSPHORYLATIONOF ORC
S
G1
COMPLETIONOF DNA
REPLICATION
G2/M
Figure 17–22 The initiation of DNAreplication once per cell cycle. TheORC remains associated with a replicationorigin throughout the cell cycle. In earlyG1, Cdc6 associates with ORC.Aided byCdc6, Mcm ring complexes then assembleon the adjacent DNA, resulting in theformation of the pre-replicative complex.The S-Cdk (with assistance from anotherprotein kinase, not shown) then triggersorigin firing, assembling DNA polymeraseand other replication proteins andactivating the Mcm protein rings tomigrate along DNA strands as DNAhelicases.The S-Cdk also blocksrereplication by causing the dissociation ofCdc6 from origins, its degradation, and theexport of all excess Mcm out of thenucleus. Cdc6 and Mcm cannot return toreset an ORC-containing origin foranother round of DNA replication untilM-Cdk has been inactivated at the end ofmitosis (see text).

Once the pre-RC has been assembled in G1, the replication origin is ready tofire. The activation of S-Cdk in late G1 pulls the trigger and initiates DNA repli-cation. The initiation of replication also requires the activity of a second proteinkinase, which collaborates with S-Cdk to cause the phosphorylation of ORC.
The S-Cdk not only initiates origin firing, but also helps to prevent rerepli-cation in several ways. First, it causes the Cdc6 protein to dissociate from ORCafter an origin has fired. This results in the disassembly of the pre-RC, which pre-vents replication from occurring again at the same origin. Second, it preventsthe Cdc6 and Mcm proteins from reassembling at any origin. By phosphorylat-ing Cdc6, it triggers Cdc6 ubiquitylation by the SCF enzyme complex discussedearlier. As a result, any Cdc6 protein that is not bound to an origin is rapidlydegraded in proteasomes. S-Cdk also phosphorylates certain Mcm proteins,which triggers their export from the nucleus, further ensuring that the Mcm pro-tein complex cannot bind to a replication origin (see Figure 17–22).
S-Cdk activity remains high during G2 and early mitosis, preventing rerepli-cation from occurring after the completion of S phase. M-Cdk also helps ensurethat rereplication does not occur during mitosis by phosphorylating the Cdc6and Mcm proteins. The G1/S-Cdks help as well, by inducing Mcm export fromthe nucleus, ensuring that excess Mcm proteins that have not bound to originsin late G1 are taken out of action before replication begins.
Thus, several cyclin–Cdk complexes cooperate to restrain pre-RC assemblyand prevent DNA rereplication after S phase. How, then, is the cell-cycle controlsystem reset to allow replication to occur in the next cell cycle? The answer issimple. At the end of mitosis, all Cdk activity in the cell is reduced to zero. Theresulting dephosphorylation of the Cdc6 and Mcm proteins allows pre-RCassembly to occur once again, readying the chromosomes for a new round ofreplication.
The Activation of M-Phase Cyclin–Cdk Complexes (M-Cdks) Triggers Entry into Mitosis
The completion of DNA replication leaves the G2 cell with two accurate copiesof the entire genome, with each replicated chromosome consisting of two iden-tical sister chromatids glued together along their length. The cell then undergoesthe dramatic upheaval of M phase, in which the duplicated chromosomes andother cell contents are distributed equally to the two daughter cells. The eventsof mitosis are triggered by M-Cdk, which is activated after S phase is complete.
The activation of M-Cdk begins with the accumulation of M-cyclin (cyclinB in vertebrate cells, see Table 17–1). In embryonic cell cycles, the synthesis ofM-cyclin is constant throughout the cell cycle, and M-cyclin accumulationresults from a decrease in its degradation. In most cell types, however, M-cyclinsynthesis increases during G2 and M, owing primarily to an increase in M-cyclingene transcription. This increase in M-cyclin protein leads to a gradual accumu-lation of M-Cdk (the complex of Cdk1 and M-cyclin) as the cell approachesmitosis. Although the Cdk in these complexes is phosphorylated at an activatingsite by the enzyme CAK discussed earlier, it is held in an inactive state byinhibitory phosphorylation at two neighboring sites by the protein kinase Wee1(see Figure 17–18). Thus, by the time the cell reaches the end of G2, it containsan abundant stockpile of M-Cdk that is primed and ready to act, but the M-Cdkactivity is repressed by the presence of two phosphate groups that block theactive site of the kinase.
What, then, triggers the activation of the M-Cdk stockpile? The crucial eventis the activation in late G2 of the protein phosphatase Cdc25, which removes theinhibitory phosphates that restrain M-Cdk (Figure 17–23). At the same time, theactivity of the inhibitory kinase Wee1 is also suppressed, further ensuring thatM-Cdk activity increases abruptly. Two protein kinases activate Cdc25. One,known as Polo kinase, phosphorylates Cdc25 at one set of sites. The other acti-vating kinase is M-Cdk itself, which phosphorylates a different set of sites onCdc25. M-Cdk also phosphorylates and inhibits Wee1.
The ability of M-Cdk to activate its own activator (Cdc25) and inhibit its own
INTRACELLULAR CONTROL OF CELL-CYCLE EVENTS 999

1000 Chapter 17 : THE CELL CYCLE AND PROGRAMMED CELL DEATH
S MG2
S
S
S MG2
M
control
+ caffeine
+ hydroxyurea
+ hydroxyurea+ caffeine
+
+
+
NORMAL MITOSIS
NORMAL MITOSIS
HALT IN S PHASE
SUICIDAL MITOSIS
Figure 17–24 The DNA replicationcheckpoint. In the experimentsdiagrammed here, mammalian cells inculture were treated with caffeine andhydroxyurea, either alone or incombination. Hydroxyurea blocks DNAsynthesis.This block activates a checkpointmechanism that arrests the cells in S phase, delaying mitosis. But if caffeine isadded as well as hydroxyurea, thecheckpoint mechanism fails, and the cellsproceed into mitosis according to theirnormal schedule, with incompletelyreplicated DNA.As a result, the cells die.
P
M-cyclin
P
P
P
active M-CdkinactiveM-Cdk
inactiveM-Cdk
Cdk-inhibitorykinase
Cdk-activatingkinase
Cdk1
Wee1
CAK
inhibitoryphosphate
activatingphosphate
Cdc25
Cdc25
POSITIVEFEEDBACK
inactivephosphatase
Figure 17–23 The activation of M-Cdk. Cdk1 associates with M-cyclin asthe levels of M-cyclin gradually rise.Theresulting M-Cdk complex isphosphorylated on an activating site bythe Cdk-activating kinase (CAK) and on apair of inhibitory sites by the Wee1 kinase.The resulting inactive M-Cdk complex isthen activated at the end of G2 by thephosphatase Cdc25. Cdc25 is stimulated inpart by Polo kinase, which is not shownfor simplicity. Cdc25 is further stimulatedby active M-Cdk, resulting in positivefeedback.This feedback is enhanced by theability of M-Cdk to inhibit Wee1.
inhibitor (Wee1) suggests that M-Cdk activation in mitosis involves a positivefeedback loop (see Figure 17–23). According to this attractive model, the partialactivation of Cdc25, perhaps by Polo kinase, leads to the partial activation of asubpopulation of M-Cdk complexes, which then phosphorylate more Cdc25and Wee1 molecules. This leads to more M-Cdk dephosphorylation and activa-tion, and so on. Such a mechanism would quickly promote the complete acti-vation of all the M-Cdk complexes in the cell, converting a gradual increase inM-cyclin levels into a switchlike, abrupt rise in M-Cdk activity. As mentioned ear-lier, similar molecular switches operate at various points in the cell cycle toensure that events such as entry into mitosis occur in an all-or-none fashion.
Entry into Mitosis Is Blocked by Incomplete DNA Replication:The DNA Replication Checkpoint
If a cell is driven into mitosis before it has finished replicating its DNA, it willpass on broken or incomplete sets of chromosomes to its daughter cells. Thisdisaster is avoided in most cells by a DNA replication checkpoint mechanism,which ensures that the initiation of mitosis cannot occur until the lastnucleotide in the genome has been copied. Sensor mechanisms, of unknownmolecular nature, detect either the unreplicated DNA or the correspondingunfinished replication forks and send a negative signal to the cell-cycle controlsystem, blocking the activation of M-Cdk. Thus, normal cells treated with chem-ical inhibitors of DNA synthesis, such as hydroxyurea, do not progress intomitosis. If the checkpoint mechanism is defective, however, as in yeast cells withcertain mutations or in mammalian cells treated with high doses of caffeine, thecells plunge into a suicidal mitosis despite the failure to complete DNA replica-tion (Figure 17–24).
The final targets of the negative checkpoint signal are the enzymes that con-trol M-Cdk activation. The negative signal activates a protein kinase that inhibitsthe Cdc25 protein phosphatase (see Figures 17–18 and 17–23). As a result, M-Cdkremains phosphorylated and inactive until DNA replication is complete.

M-Cdk Prepares the Duplicated Chromosomes for Separation
One of the most remarkable features of cell-cycle control is that a single proteinkinase, M-Cdk, is able to bring about all of the diverse and complex rearrange-ments that occur in the early stages of mitosis (discussed in Chapter 18). At aminimum, M-Cdk must induce the assembly of the mitotic spindle and ensurethat replicated chromosomes attach to the spindle. In many organisms, M-Cdkalso triggers chromosome condensation, nuclear envelope breakdown, actincytoskeleton rearrangement, and the reorganization of the Golgi apparatus andendoplasmic reticulum. Each of these events is thought to be triggered whenM-Cdk phosphorylates specific structural or regulatory proteins involved in theevent, although most of these proteins have not yet been identified.
The breakdown of the nuclear envelope, for example, requires the disassem-bly of the nuclear lamina—the underlying shell of polymerized lamin filamentsthat gives the nuclear envelope its structural rigidity. Direct phosphorylation oflamin proteins by M-Cdk results in their depolymerization, which is an essentialfirst step in the dismantling of the envelope (see Figure 12–21).
Chromosome condensation also seems to be a direct consequence of phos-phorylation by M-Cdk. A complex of five proteins, known as the condensincomplex, is required for chromosome condensation in Xenopus embryos. AfterM-Cdk has phosphorylated several subunits in the complex, two of the subunitsare able to change the coiling of DNA molecules in a test tube. It is thought thatthis coiling activity is important for chromosome condensation during mitosis(see Figure 4–56).
Phosphorylation by M-Cdk also triggers the complex microtubule rearrange-ments and other events that lead to the assembly of the mitotic spindle. As dis-cussed in Chapter 18, M-Cdk is known to phosphorylate a number of proteinsthat regulate microtubule behavior, causing the increase in microtubule insta-bility that is required for spindle assembly.
Sister Chromatid Separation Is Triggered by Proteolysis
After M-Cdk has triggered the complex rearrangements that occur in earlymitosis, the cell cycle reaches its culmination with the separation of the sisterchromatids at the metaphase-to-anaphase transition. Although M-Cdk activitysets the stage for this event, an entirely different enzyme complex—theanaphase-promoting complex (APC) introduced earlier—throws the switchthat initiates sister-chromatid separation. The APC is a highly regulated ubiqui-tin ligase that promotes the destruction of several mitotic regulatory proteins(see Figure 17–20B).
The attachment of the two sister chromatids to opposite poles of the mitoticspindle early in mitosis results in forces tending to pull the two chromatidsapart. These pulling forces are initially resisted because the sister chromatids arebound tightly together, both at their centromeres and all along their arms. Thissister-chromatid cohesion depends on a complex of proteins, the cohesin com-plex, that is deposited along the chromosomes as they are duplicated in S phase.The cohesin proteins (cohesins) are closely related to the proteins of the con-densin complex involved in chromosome condensation, suggesting a commonevolutionary origin for the two processes (see Figure 18–3).
Anaphase begins with a sudden disruption of the cohesion between sisterchromatids, which allows them to separate and move to opposite poles of thespindle. This process is initiated by a remarkable cascade of signaling events.The sister-chromatid separation requires the activation of the APC enzyme com-plex, suggesting that proteolysis is central to the process (Figure 17–25). The rel-evant target of the APC is the protein securin. Before anaphase, securin binds toand inhibits the activity of a protease called separase. The destruction of securinat the end of metaphase releases separase, which is then free to cleave one of thesubunits of the cohesin complex. In an instant, the cohesin complex falls awayfrom the chromosomes, and the sister chromatids separate (Figure 17–26).
If the APC triggers anaphase, what triggers the APC? The answer is onlypartly known. APC activation requires the protein Cdc20, which binds to and
INTRACELLULAR CONTROL OF CELL-CYCLE EVENTS 1001

activates the APC at mitosis (see Figures 17–26 and 17–20B). At least two pro-cesses regulate Cdc20 and its association with the APC. First, Cdc20 synthesisincreases as the cell approaches mitosis, owing to an increase in the transcrip-tion of its gene. Second, phosphorylation of the APC helps Cdc20 bind to theAPC, thereby helping to create an active complex.
It is not clear what kinases phosphorylate and activate the Cdc20–APCcomplex. M-Cdk activity is required for the activity of these kinases, but there isa significant delay, or lag phase, between M-Cdk activation and the activationof the Cdc20–APC complex. The molecular basis of this delay is still mysterious,but it is likely to hold the key to how anaphase is initiated at the correct time inM phase.
Unattached Chromosomes Block Sister-Chromatid Separation:The Spindle-Attachment Checkpoint
The cell does not commit itself to the momentous events of anaphase before itis fully prepared. In most cell types, a spindle-attachment checkpoint mecha-nism operates to ensure that all chromosomes are properly attached to the spin-dle before sister-chromatid separation occurs. The checkpoint depends on asensor mechanism that monitors the state of the kinetochore, the specializedregion of the chromosome that attaches to microtubules of the spindle. Any
1002 Chapter 17 : THE CELL CYCLE AND PROGRAMMED CELL DEATH
Figure 17–26 The triggering of sister-chromatid separation by the APC.The activation of APC by Cdc20 leads tothe ubiquitylation and destruction ofsecurin, which normally holds separase inan inactive state.The destruction ofsecurin allows separase to cleave a subunitof the cohesin complex holding the sisterchromatids together.The pulling forces ofthe mitotic spindle then pull the sisterchromatids apart. In budding yeasts atleast, cohesin cleavage by separase isfacilitated by the phosphorylation of thecohesin complex adjacent to the cleavagesite, just before anaphase begins.Thephosphorylation is mediated by Polokinase and provides an additional controlon the timing of the metaphase-to-anaphase transition.
active APCinactive APC
G2 metaphase anaphase
cleaved anddissociated cohesins
UBIQUITYLATION ANDDEGRADATION OF SECURIN
inactiveseparase
activeseparase
Cdc20
M-Cdk
cohesincomplex
securin
mitoticspindle
metaphasearrest
anaphasearrest
(A) APC INHIBITION (B) NONDEGRADABLE M-CYCLIN
Figure 17–25 Two experiments thatdemonstrate the requirement forprotein degradation to exit frommitosis. (A) An APC inhibitor was addedto frog egg extracts undergoing mitosis invitro (see Figure 17–9).The inhibitorarrested mitosis at metaphase, indicatingthat proteolysis is required for theseparation of sister chromatids at themetaphase-to-anaphase transition. Asimilar arrest occurs in budding yeastswith mutations in components of theAPC. (B) A nondegradable mutant form of M-cyclin was added to mitotic frog eggextracts.This addition arrested mitosisafter sister-chromatid separation,indicating that destruction of M-cyclin isnot required for sister-chromatidseparation but is required for thesubsequent exit from mitosis.(Based on S.L. Holloway et al., Cell73:1393–1402, 1993.)

kinetochore that is not properly attached to the spindle sends out a negative sig-nal to the cell-cycle control system, blocking Cdc20–APC activation and sister-chromatid separation.
The nature of the signal generated by an unattached kinetochore is not clear,although several proteins, including Mad2, are recruited to unattached kineto-chores and are required for the spindle-attachment checkpoint to function.Even a single unattached kinetochore in the cell results in Mad2 binding and theinhibition of Cdc20–APC activity and Securin destruction (Figure 17–27). Thus,sister-chromatid separation cannot occur until the last kinetochore is attached.
Surprisingly, the normal timing of anaphase does not require a functionalspindle-attachment checkpoint, at least in frog embryos and yeasts. Mutantyeast cells with a defective checkpoint undergo anaphase with normal timing,indicating that some other mechanism normally determines the timing ofanaphase in these cells. In mammalian cells, however, a defect in the spindle-attachment checkpoint causes anaphase to occur slightly earlier than normal.This finding suggests that, in our cells, the checkpoint has evolved from a usefulaccessory to an essential component of the cell-cycle control system.
Exit from Mitosis Requires the Inactivation of M-Cdk
After the chromosomes have been segregated to the poles of the spindle, the cellmust reverse the complex changes of early mitosis. The spindle must be disas-sembled, the chromosomes decondensed, and the nuclear envelope reformed.Because the phosphorylation of various proteins is responsible for getting cellsinto mitosis in the first place, it is not surprising that the dephosphorylation ofthese same proteins is required to get them out. In principle, these dephospho-rylations and the exit from mitosis could be triggered by the inactivation ofM-Cdk, the activation of phosphatases, or both. Evidence suggests that M-Cdkinactivation is primarily responsible.
M-Cdk inactivation occurs mainly by ubiquitin-dependent proteolysis of M-cyclins. Ubiquitylation of the cyclin is usually triggered by the same Cdc20–APCcomplex that promotes the destruction of Securin at the metaphase-to-anaphase transition (see Figure 17–20B). Thus, the activation of the Cdc20–APCcomplex leads not only to anaphase, but also to M-Cdk inactivation—which inturn leads to all of the other events that take the cell out of mitosis.
The G1 Phase Is a State of Stable Cdk Inactivity
In early animal embryos, the inactivation of M-Cdk in late mitosis is due almostentirely to the action of Cdc20–APC. Recall, however, that M-Cdk stimulatesCdc20–APC activity (see Figure 17–26). Thus, the destruction of M-cyclin in latemitosis soon leads to the inactivation of all APC activity in an embryonic cell.This is a useful arrangement in rapid embryonic cell cycles, as APC inactivationimmediately after mitosis allows the cell to quickly begin accumulating newM-cyclin for the next cycle (Figure 17–28A).
Rapid cyclin accumulation immediately after mitosis is not useful, however,in cell cycles containing a G1 phase. In these cycles, progression into the nextS phase is delayed in G1 to allow for cell growth and for the cycle to be regulatedby extracellular signals. Thus, most cells employ several mechanisms to ensurethat Cdk reactivation is prevented after mitosis. One mechanism makes use of
INTRACELLULAR CONTROL OF CELL-CYCLE EVENTS 1003
Figure 17–27 Mad2 protein onunattached kinetochores. Thisfluorescence micrograph shows amammalian cell in prometaphase, with themitotic spindle in green and the sisterchromatids in blue. One sister chromatidpair is not yet attached to the spindle.Thepresence of Mad2 on the kinetochore ofthe unattached chromosome is revealedby the binding of anti-Mad2 antibodies (red dot, indicated by red arrow). Anotherchromosome has just attached to thespindle, and its kinetochore has a low levelof Mad2 still associated with it (pale dot,indicated by white arrow). (From J.C.Waters et al., J. Cell Biol.141:1181–1191, 1998. © The RockefellerUniversity Press.)
(A) embryonic cells with no G1 phase
(B) cells with G1 phase
M-cyclin level
Cdc20–APC activity
Cdc20–APC activity
Hct1–APC activitykeeps M-cyclinlevel low in G1
M S
M G1
M-cyclin level
Figure 17–28 The creation of a G1 phase by stable Cdk inhibitionafter mitosis. (A) In early embryonic cell cycles, Cdc20–APC activity risesat the end of metaphase, triggering M-cyclin destruction. Because M-Cdkactivity stimulates Cdc20–APC activity, the loss of M-cyclin leads to APCinactivation after mitosis, which allows M-cyclins to begin accumulating again.(B) In cells containing a G1 phase, the drop in M-Cdk activity in late mitosisleads to the activation of Hct1–APC (as well as to the accumulation of CKIproteins, not shown).This ensures a continued suppression of Cdk activityafter mitosis, as required for a G1 phase.

1004 Chapter 17 : THE CELL CYCLE AND PROGRAMMED CELL DEATH
Figure 17–29 The control of G1progression by Cdk activity inbudding yeast. As cells exit from mitosisand inactivate M-Cdk, the resultingincrease in Hct1 and Sic1 activities resultsin stable Cdk inactivation during G1.Whenconditions are right for entering a newcell cycle, the increase in G1-Cdk andG1/S-Cdk activities leads to the inhibitionof Sic1 and Hct1 by phosphorylation,allowing S-Cdk activity to increase.
G1 SM
activeM-Cdk
inactiveM-Cdk
inactiveSic1-
activeG1-Cdk
activeS-Cdk
activeG1
/S-Cdk
P
inactiveHct1-
active Sic1 inactive Sic1–
activeHct1–APCP
M-Cdk inactivation byactive Sic1 and Hct1–APC
inactivation of Sic1 and Hct1by active G1 /S-Cdk
+
APC
P
inactive Hct1– P
another APC-activating protein called Hct1, a close relative of Cdc20. Althoughboth Hct1 and Cdc20 bind and activate the APC, they differ in one importantrespect. Whereas the Cdc20–APC complex is activated by M-Cdk, the Hct1–APCcomplex is inhibited by M-Cdk, which directly phosphorylates Hct1. As a resultof this relationship, Hct1–APC activity increases in late mitosis after theCdc20–APC complex has initiated the destruction of M-cyclin. M-cyclindestruction therefore continues after mitosis: although Cdc20–APC activity hasdeclined, Hct1–APC activity is high (Figure 17–28B).
A second mechanism that suppresses Cdk activity in G1 depends on theincreased production of CKIs, the Cdk inhibitory proteins discussed earlier.Budding yeast cells, in which this mechanism is best understood, contain a CKIprotein called Sic1, which binds to and inactivates M-Cdk in late mitosis and G1.Like Hct1, Sic1 is inhibited by M-Cdk, which phosphorylates Sic1 during mito-sis. M-Cdk also phosphorylates and inhibits a gene regulatory protein requiredfor Sic1 synthesis, resulting in decreased Sic1 production. Thus, Sic1 and M-Cdk,like Hct1 and M-Cdk, mutually inhibit each other. As a result, the decline in M-Cdk activity that occurs in late mitosis triggers the rapid accumulation of Sic1protein, and this CKI helps ensure that M-Cdk activity is stably inhibited aftermitosis.
In most cells, M-Cdk inactivation in late mitosis also results from decreasedtranscription of M-cyclin genes. In budding yeast, for example, M-Cdk promotesthe expression of these genes, resulting in a positive feedback loop. This loop isturned off as cells exit from mitosis: the inactivation of M-Cdk by Hct1 and Sic1leads to decreased M-cyclin gene transcription and thus decreased M-cyclinsynthesis.
In summary Hct1–APC activation, CKI accumulation, and decreased cyclinproduction act together to ensure that the early G1 phase is a time when essen-tially all Cdk activity is suppressed. As in many other aspects of cell-cycle con-trol, the use of multiple regulatory mechanisms makes the suppression systemrobust, so that it still operates with reasonable efficiency even if one mechanismfails.
How does the cell escape from this stable G1 state to initiate S phase? As wedescribe later, escape usually occurs through the accumulation of G1-cyclins. Inbudding yeast, for example, these cyclins are not targeted for destruction byHct1–APC and are not inhibited by Sic1. As a result, the accumulation of G1cyclins leads to an unopposed increase in G1-Cdk activity (Figure 17–29). In ani-mal cells, the accumulation of G1-cyclins is stimulated by the extracellular sig-nals that promote cell proliferation, as we discuss later.
In budding yeast, G1-Cdk activity triggers the transcription of G1/S-cyclingenes, leading to increased synthesis of G1/S-cyclins and the formation of G1/S-Cdk complexes, which are also resistant to Hct1–APC and Sic1. The increasedG1/S-Cdk activity initiates the events that commit the cell to enter S phase. Itstimulates the transcription of S-cyclin genes, leading to the synthesis of S-cyclins and the formation of S-Cdk complexes. These complexes are inhibited bySic1, but G1/S-Cdk phosphorylates and inactivates Sic1, thereby causing S-Cdkactivation. G1/S-Cdk and S-Cdk also phosphorylate and inactivate Hct1–APC.

Thus, the same feedback loops that trigger rapid M-Cdk inactivation in latemitosis now work in reverse at the end of G1 to ensure the rapid and completeactivation of S-Cdk activity.
The Rb Protein Acts as a Brake in Mammalian G1 Cells
The control of G1 progression and S-phase initiation is often disrupted in cancercells, leading to unrestrained cell-cycle entry and cell proliferation (discussed inChapter 23). To develop improved methods for controlling cancer growth, weneed a better understanding of the proteins that control G1 progression in mam-malian cells.
Animal cells suppress Cdk activity in G1 by the same three mechanismsmentioned earlier for budding yeast: Hct1 activation, the accumulation of a CKIprotein (p27 in mammalian cells), and the inhibition of cyclin gene transcrip-tion. As in yeasts, the activation of G1-Cdk complexes reverses all three inhibitorymechanisms in late G1.
The best understood effects of G1-Cdk activity in animal cells are mediatedby a gene regulatory protein called E2F. It binds to specific DNA sequences inthe promoters of many genes that encode proteins required for S-phase entry,including G1/S-cyclins and S-cyclins. E2F function is controlled primarily by aninteraction with the retinoblastoma protein (Rb), an inhibitor of cell-cycle pro-gression. During G1, Rb binds to E2F and blocks the transcription of S-phasegenes. When cells are stimulated to divide by extracellular signals, active G1-Cdkaccumulates and phosphorylates Rb, reducing its affinity for E2F. The Rb thendissociates, allowing E2F to activate S-phase gene expression (Figure 17–30).
This transcriptional control system, like so many other control systems thatregulate the cell cycle, includes feedback loops that sharpen the G1/S transition(see Figure 17–30):• The liberated E2F increases the transcription of its own gene. • E2F-dependent transcription of G1/S-cyclin and S-cyclin genes leads to
increased G1/S-Cdk and S-Cdk activities, which in turn increase Rb phos-phorylation and promote further E2F release.
• The increase in G1/S-Cdk and S-Cdk activities enhances the phosphoryla-tion of Hct1 and p27, leading to their inactivation or destruction.
As in yeast cells, the result of all these interactions is the rapid and completeactivation of the S-Cdk complexes required for S-phase initiation.
The Rb protein was identified originally through studies of an inherited formof eye cancer in children, known as retinoblastoma (discussed in Chapter 23).The loss of both copies of the Rb gene leads to excessive cell proliferation in theimmature retina, suggesting that the Rb protein is particularly important forrestraining the rate of cell division in the developing retina. The complete loss ofRb does not immediately cause increased proliferation of other cell types, in partbecause Hct1 and p27 provide assistance in G1 control, and in part because
INTRACELLULAR CONTROL OF CELL-CYCLE EVENTS 1005
Figure 17–30 Mechanisms controllingS-phase initiation in animal cells.G1-Cdk activity (cyclin D–Cdk4) initiatesRb phosphorylation.This inactivates Rb,freeing E2F to activate the transcription ofS-phase genes, including the genes for aG1/S-cyclin (cyclin E) and S-cyclin (cyclinA).The resulting appearance of G1/S-Cdkand S-Cdk activities further enhances Rbphosphorylation, forming a positivefeedback loop. E2F acts back to stimulatethe transcription of its own gene, forminganother positive feedback loop.
PP
active Rbprotein
inactivatedE2F protein
activeG1-Cdk
S-phase genetranscription
G1/S-cyclin(cyclin E)S-cyclin
(cyclin A)
activeS-Cdk
DNASYNTHESIS
+
+
positive feedback
positivefeedback
G1 S
inactivated Rbprotein
active E2Fprotein
activeG1/S-Cdk

other cell types contain Rb-related proteins that provide backup support in theabsence of Rb. It is also likely that other proteins, unrelated to Rb, help to regu-late the activity of E2F.
Cell-Cycle Progression Is Somehow Coordinated With Cell Growth
For proliferating cells to maintain a relatively constant size, the length of the cellcycle must match the time it takes the cell to double in size. If the cycle time isshorter than this, the cells will get smaller with each division; if it is longer, thecells will get bigger with each division. Because cell growth depends on nutrientsand growth signals in the environment, the length of the cell cycle has to be ableto adjust to varying environmental conditions (Figure 17–31). It is not clear howproliferating cells coordinate their growth with the rate of cell-cycle progressionto maintain their size.
There is evidence that budding yeasts coordinate their growth and cell-cycleprogression by monitoring the total amount of a G1 cyclin called Cln3 (see Table17–1, p. 994). Because Cln3 is synthesized in parallel with cell growth, its con-centration remains constant while its total amount increases as the cell grows. Ifthe amount of Cln3 is artificially increased, the cells divide at a smaller size thannormal, whereas if it is artificially decreased, the cells divide at a larger size thannormal. These experiments are consistent with the idea that the cells committhemselves to division when the total amount of Cln3 reaches some thresholdvalue. How, then, can the cell monitor the total amount of Cln3, rather than itsconcentration? One possibility is that cells inherit a fixed amount of an inhibitorthat can bind to Cln3 and block its activity. When the amount of Cln3 exceedsthe amount of this inhibitor, the extra Cln3 triggers G1-Cdk activation and a newcell cycle. Since all cells receive a fixed and equal quantity of DNA, it has beenspeculated that the Cln3 inhibitor could be DNA itself, or some protein boundto DNA (Figure 17–32). Such a mechanism would also explain why cell size in allorganisms is proportional to ploidy (the number of copies of the nucleargenome per cell).
Whereas yeast cells grow and proliferate constitutively if nutrients are plen-tiful, animal cells generally grow and proliferate only when they are stimulatedto do so by signals from other cells. The size at which an animal cell dividesdepends, at least in part, on these extracellular signals, which can regulate cellgrowth and proliferation independently. Animal cells can also completelyuncouple cell growth and division so as to grow without dividing or to dividewithout growing. The eggs of many animals, for example, grow to an extremelylarge size without dividing. After fertilization, this relationship is reversed, andmany rounds of division occur without growth (see Figure 17–8). Thus, although
1006 Chapter 17 : THE CELL CYCLE AND PROGRAMMED CELL DEATH
1 2 3 4 5 6 70
reduce nutrition units of time
mas
s o
f ce
ll
1 2 3 4 5 6 70
reduce nutrition units of time
(A) WITHOUT NUTRITIONAL CELL-CYCLE CONTROL (B) WITH NUTRITIONAL CELL-CYCLE CONTROL
Figure 17–31 Cell size control through control of the cell cycle in yeasts. These graphs show therelationship between growth rate, cell size, and cell cycle time. (A) If cell division continued at an unchangedrate when cells were starved and stopped growing, the daughter cells produced at each division wouldbecome progressively smaller. (B) Yeast cells respond to some forms of nutritional deprivation by slowing therate of progress through the cell cycle so that the cells have more time to grow.As a result, cell size remainsunchanged or is reduced slightly. (A unit of time is the cycle time observed when nutrients are in excess.)

cell growth and cell division are usually coordinated, they can be regulated inde-pendently. Cell growth does not depend on cell-cycle progression. Yeast cellscontinue to grow when cell-cycle progression is blocked by a mutation; andmany animal cells, including neurons and muscle cells, grow large after theyhave withdrawn permanently from the cell cycle.
Cell-Cycle Progression is Blocked by DNA Damage and p53: DNA Damage Checkpoints
When chromosomes are damaged, as can occur after exposure to radiation orcertain chemicals, it is essential that they be repaired before the cell attempts toduplicate or segregate them. The cell-cycle control system can readily detectDNA damage and arrest the cycle at DNA damage checkpoints. Most cells haveat least two such checkpoints—one in late G1, which prevents entry into S phase,and one in late G2, which prevents entry into mitosis.
The G2 checkpoint depends on a mechanism similar to the one discussedearlier that delays entry into mitosis in response to incomplete DNA replication.When cells in G2 are exposed to damaging radiation, for example, the damagedDNA sends a signal to a series of protein kinases that phosphorylate and inacti-vate the phosphatase Cdc25. This blocks the dephosphorylation and activationof M-Cdk, thereby blocking entry into mitosis. When the DNA damage isrepaired, the inhibitory signal is turned off, and cell-cycle progression resumes.
The G1 checkpoint blocks progression into S phase by inhibiting the activa-tion of G1/S-Cdk and S-Cdk complexes. In mammalian cells, for example, DNAdamage leads to the activation of the gene regulatory protein p53, which stimu-lates the transcription of several genes. One of these genes encodes a CKI pro-tein called p21, which binds to G1/S-Cdk and S-Cdk and inhibits their activities,thereby helping to block entry into S phase.
DNA damage activates p53 by an indirect mechanism. In undamaged cells,p53 is highly unstable and is present at very low concentrations. This is becauseit interacts with another protein, Mdm2, that acts as a ubiquitin ligase that tar-gets p53 for destruction by proteasomes. DNA damage activates protein kinasesthat phosphorylate p53 and thereby reduce its binding to Mdm2. This decreasesp53 degradation, which results in a marked increase in p53 concentration in thecell. In addition, the decreased binding to Mdm2 enhances the ability of p53 tostimulate gene transcription (Figure 17–33).
Like many other checkpoints, DNA damage checkpoints are not essential fornormal cell division if environmental conditions are ideal. Conditions are rarelyideal, however: a low level of DNA damage occurs in the normal life of any cell,and this damage accumulates in the cell’s progeny if the damage checkpointsare not functioning. Over the long term, the accumulation of genetic damage incells lacking checkpoints leads to an increased frequency of cancer-promoting
INTRACELLULAR CONTROL OF CELL-CYCLE EVENTS 1007
Figure 17–32 A hypothetical model of how budding yeast cells might coordinate cell growthand cell-cycle progression. The cell contains a fixed number of proteins (red) that are bound to DNA andbind and inhibit Cln3 molecules (green). As the cell grows, the total number of Cln3 molecules increases inparallel with total cell protein.When the cell is small (left), all of the Cln3 is inactivated by the excess of Cln-3-binding protein.As the cell grows, however, it reaches a threshold size at which the number of Cln3molecules equals the number of Cln-3-binding proteins (middle). When the cell exceeds this size, free Cln3can bind to Cdk, which can now trigger the next cell cycle (right).
Cdkactivation
S phase
G1-cyclin (Cln3)
Cln3-bindingprotein bound
to DNA
DNACELL
GROWTHCELL
GROWTH
free Cln3

mutations. Indeed, mutations in the p53 gene occur in at least half of all humancancers (discussed in Chapter 23). This loss of p53 function allows the cancercell to accumulate mutations more readily. Similarly, a rare genetic diseaseknown as ataxia telangiectasia is caused by a defect in one of the protein kinasesthat phosphorylates and activates p53 in response to x-ray-induced DNA dam-age; patients with this disease are very sensitive to x-rays due to the loss of theDNA damage checkpoints, and they consequently suffer from increased rates ofcancer.
What if DNA damage is so severe that repair is not possible? In this case, theresponse is different in different organisms. Unicellular organisms such as bud-ding yeast transiently arrest their cell cycle to repair the damage. If repair cannotbe completed, the cycle resumes despite any damage. For a single-celled organ-ism, life with mutations is apparently better than no life at all. In multicellularorganisms, however, the health of the organism takes precedence over the life ofan individual cell. Cells that divide with severe DNA damage threaten the life ofthe organism, since genetic damage can often lead to cancer and other lethaldefects. Thus, animal cells with severe DNA damage do not attempt to continuedivision, but instead commit suicide by undergoing programmed cell death, orapoptosis, as we discuss in the next section. The decision to die in this way alsodepends on the activation of p53, and it is this function of p53 that is apparentlymost important in protecting us aganist cancer.
As a review, the major cell-cycle regulatory proteins are summarized in Table17–2, with the general structure of the cell-cycle control system shown in Figure17–34.
1008 Chapter 17 : THE CELL CYCLE AND PROGRAMMED CELL DEATH
stable,active p53
p21 gene
p21 mRNA
p21 (Cdkinhibitor protein)
TRANSCRIPTION
TRANSLATION
ACTIVE
G1/S-Cdkand S-Cdk
INACTIVE
G1/S-Cdk and S-Cdkcomplexed with p21
ACTIVE p53 BINDS TOREGULATORY REGIONOF p21 GENE
P
P
P
P
PROTEIN KINASEACTIVATION AND
PHOSPHORYLATIONOF p53
p53 DEGRADATIONIN PROTEASOMES
p53
Mdm2
DNA
x-rays Figure 17–33 How DNA damagearrests the cell cycle in G1. WhenDNA is damaged, protein kinases thatphosphorylate p53 are activated. Mdm2normally binds to p53 and promotes itsubiquitylation and destruction inproteasomes. Phosphorylation of p53blocks its binding to Mdm2; as a result,p53 accumulates to high levels andstimulates transcription of the gene thatencodes the CKI protein p21.The p21binds and inactivates G1/S-Cdk and S-Cdkcomplexes, arresting the cell in G1. Insome cases, DNA damage also induceseither the phosphorylation of Mdm2 or adecrease in Mdm2 production, whichcauses an increase in p53 (not shown).

INTRACELLULAR CONTROL OF CELL-CYCLE EVENTS 1009
TABLE 17–2 Summary of the Major Cell-cycle Regulatory Proteins
GENERAL NAME FUNCTIONS AND COMMENTS
Protein kinases and proteinphosphatases that modify CdksCdk-activating kinase (CAK) phosphorylates an activating site in Cdks
Wee1 kinase phosphorylates inhibitory sites in Cdks; primarily involved in controlling entry into mitosis
Cdc25 phosphatase removes inhibitory phosphates from Cdks; three family members (Cdc25A, B, C) in mammals; Cdc25C is the activator of Cdk1 at the onset of mitosis
Cdk inhibitory proteins (CKIs)Sic1 (budding yeast) suppresses Cdk activity in G1; phosphorylation by Cdk1 triggers its destruction
p27 (mammals) suppresses G1/S-Cdk and S-Cdk activities in G1; helps cells to withdraw from cell cycle when they terminally differentiate; phosphorylation by Cdk2 triggers its ubiquitylation by SCF
p21 (mammals) suppresses G1/S-Cdk and S-Cdk activities following DNA damage in G1; transcriptionally activated by p53
p16 (mammals) suppresses G1-Cdk activity in G1; frequently inactivated in cancer
Ubiquitin ligases and their activatorsSCF catalyzes ubiquitylation of regulatory proteins involved in G1 control, including CKIs
(Sic1 in budding yeast, p27 in mammals); phosphorylation of target protein usually required for this activity
APC catalyzes ubiquitylation of regulatory proteins involved primarily in exit from mitosis, including Securin and M-cyclins; regulated by association with activating subunits
Cdc20 APC-activating subunit in all cells; triggers initial activation of APC at metaphase-to-anaphase transition; stimulated by M-Cdk activity
Hct1 maintains APC activity after anaphase and throughout G1; inhibited by Cdk activity
Gene regulatory proteinsE2F promotes transcription of genes required for G1/S progression, including genes
encoding G1/S cyclins, S-cyclins, and proteins required for DNA synthesis; stimulated when G1-Cdk phosphorylates Rb in response to extracellular mitogens
p53 promotes transcription of genes that induce cell cycle arrest (especially p21) or apoptosis in response to DNA damage or other cell stress; regulated by association with Mdm2, which promotes p53 degradation
Figure 17–34 An overview of the cell-cycle control system. The coreof the cell-cycle control system consists of a series of cyclin-Cdk complexes(yellow). The activity of each complex is also influenced by various inhibitorycheckpoint mechanisms, which provide information about the extracellularenvironment, cell damage, and incomplete cell-cycle events (top). Thesemechanisms are not present in all cell types; many are missing in earlyembryonic cell cycles, for example.
G1 G1S
CO
RE
CH
EC
KP
OIN
TS
G1-Cdk S-CdkG1/S-CdkHct1CKI
p53
Cdc25 M-Cdk APC
G1/S-cyclin synthesis
S-cyclin synthesis
unfavorableextracellularenvironment
chromosomeunattached to
spindle
excessmitogenic
stimulationDNA
damageDNA
damageunreplicated
DNA
DNA rereplication
?
G2 M

1010 Chapter 17 : THE CELL CYCLE AND PROGRAMMED CELL DEATH
(A) (B)1 mm
Figure 17–35 Sculpting the digits inthe developing mouse paw byapoptosis. (A) The paw in this mouseembryo has been stained with a dye thatspecifically labels cells that have undergoneapoptosis.The apoptotic cells appear asbright green dots between the developingdigits. (B) This interdigital cell deatheliminates the tissue between thedeveloping digits, as seen one day later,when few, if any, apoptotic cells can beseen. (From W.Wood et al., Development127:5245–5252, 2000. © The Company of Biologists.)
Summary
An ordered sequence of cyclin–Cdk activities triggers most of the events of the cellcycle. During G1 phase, Cdk activity is reduced to a minimum by Cdk inhibitors(CKIs), cyclin proteolysis, and decreased cyclin gene transcription. When environ-mental conditions are favorable, G1- and G1/S-Cdks increase in concentration, over-coming these inhibitory barriers in late G1 and triggering the activation of S-Cdk.The S-Cdk phosphorylates proteins at DNA replication origins, initiating DNA syn-thesis through a mechanism that ensures that the DNA is duplicated only once percell cycle.
Once S phase is completed, the activation of M-Cdk leads to the events of earlymitosis, whereby the cell assembles a mitotic spindle and prepares for segregation ofthe duplicated chromosomes—which consist of sister chromatids glued together.Anaphase is triggered by the destruction of the proteins that hold the sisters together.The M-Cdk is then inactivated by cyclin proteolysis, which leads to cytokinesis andthe end of M phase. Progression through the cell cycle is regulated precisely by vari-ous inhibitory mechanisms that arrest the cell cycle at specific checkpoints whenevents are not completed successfully, when DNA damage occurs, or when extracel-lular conditions are unfavorable.
PROGRAMMED CELL DEATH (APOPTOSIS)The cells of a multicellular organism are members of a highly organized com-munity. The number of cells in this community is tightly regulated—not simplyby controlling the rate of cell division, but also by controlling the rate of celldeath. If cells are no longer needed, they commit suicide by activating an intra-cellular death program. This process is therefore called programmed cell death,although it is more commonly called apoptosis (from a Greek word meaning“falling off,” as leaves from a tree).
The amount of apoptosis that occurs in developing and adult animal tissuescan be astonishing. In the developing vertebrate nervous system, for example,up to half or more of the nerve cells normally die soon after they are formed. Ina healthy adult human, billions of cells die in the bone marrow and intestineevery hour. It seems remarkably wasteful for so many cells to die, especially asthe vast majority are perfectly healthy at the time they kill themselves. What pur-poses does this massive cell death serve?
In some cases, the answers are clear. Mouse paws, for example, are sculptedby cell death during embryonic development: they start out as spadelike struc-tures, and the individual digits separate only as the cells between them die (Fig-ure 17–35). In other cases, cells die when the structure they form is no longerneeded. When a tadpole changes into a frog, the cells in the tail die, and the tail,which is not needed in the frog, disappears (Figure 17–36). In many other cases,cell death helps regulate cell numbers. In the developing nervous system, forexample, cell death adjusts the number of nerve cells to match the number oftarget cells that require innervation. In all these cases, the cells die by apoptosis.
In adult tissues, cell death exactly balances cell division. If this were not so,the tissue would grow or shrink. If part of the liver is removed in an adult rat, forexample, liver cell proliferation increases to make up the loss. Conversely, if a rat

is treated with the drug phenobarbital—which stimulates liver cell division (andthereby liver enlargement)—and then the phenobarbital treatment is stopped,apoptosis in the liver greatly increases until the liver has returned to its originalsize, usually within a week or so. Thus, the liver is kept at a constant size throughthe regulation of both the cell death rate and the cell birth rate.
In this short section, we describe the molecular mechanisms of apoptosisand its control. In the final section, we consider how the extracellular control ofcell proliferation and cell death contributes to the regulation of cell numbers inmulticellular organisms.
Apoptosis Is Mediated by an Intracellular Proteolytic Cascade
Cells that die as a result of acute injury typically swell and burst. They spill theircontents all over their neighbors—a process called cell necrosis—causing apotentially damaging inflammatory response. By contrast, a cell that undergoesapoptosis dies neatly, without damaging its neighbors. The cell shrinks and con-denses. The cytoskeleton collapses, the nuclear envelope disassembles, and thenuclear DNA breaks up into fragments. Most importantly, the cell surface isaltered, displaying properties that cause the dying cell to be rapidly phagocy-tosed, either by a neighboring cell or by a macrophage (a specialized phagocyticcell, discussed in Chapter 24), before any leakage of its contents occurs (Figure17–37). This not only avoids the damaging consequences of cell necrosis but alsoallows the organic components of the dead cell to be recycled by the cell thatingests it.
The intracellular machinery responsible for apoptosis seems to be similar inall animal cells. This machinery depends on a family of proteases that have acysteine at their active site and cleave their target proteins at specific asparticacids. They are therefore called caspases. Caspases are synthesized in the cell asinactive precursors, or procaspases, which are usually activated by cleavage ataspartic acids by other caspases (Figure 17–38A). Once activated, caspases cleave,and thereby activate, other procaspases, resulting in an amplifying proteolytic
PROGRAMMED CELL DEATH (APOPTOSIS) 1011
Figure 17–36 Apoptosis during themetamorphosis of a tadpole into afrog. As a tadpole changes into a frog, thecells in the tadpole tail are induced toundergo apoptosis; as a consequence, thetail is lost.All the changes that occurduring metamorphosis, including theinduction of apoptosis in the tail, arestimulated by an increase in thyroidhormone in the blood.
(A) (B)10 mm
(C) engulfed dead cell phagocytic cell
Figure 17–37 Cell death. Theseelectron micrographs show cells that havedied by (A) necrosis or (B and C)apoptosis.The cells in (A) and (B) died ina culture dish, whereas the cell in (C) diedin a developing tissue and has beenengulfed by a neighboring cell. Note thatthe cell in (A) seems to have exploded,whereas those in (B) and (C) havecondensed but seem relatively intact.Thelarge vacuoles visible in the cytoplasm ofthe cell in (B) are a variable feature ofapoptosis. (Courtesy of Julia Burne.)

cascade (Figure 17–38B). Some of the activated caspases then cleave other keyproteins in the cell. Some cleave the nuclear lamins, for example, causing theirreversible breakdown of the nuclear lamina; another cleaves a protein thatnormally holds a DNA-degrading enzyme (a DNAse) in an inactive form, freeingthe DNAse to cut up the DNA in the cell nucleus. In this way, the cell dismantlesitself quickly and neatly, and its corpse is rapidly taken up and digested byanother cell.
Activation of the intracellular cell death pathway, like entry into a new stageof the cell cycle, is usually triggered in a complete, all-or-none fashion. The pro-tease cascade is not only destructive and self-amplifying but also irreversible, sothat once a cell reaches a critical point along the path to destruction, it cannotturn back.
Procaspases Are Activated by Binding to Adaptor Proteins
All nucleated animal cells contain the seeds of their own destruction, in the formof various inactive procaspases that lie waiting for a signal to destroy the cell. Itis therefore not surprising that caspase activity is tightly regulated inside the cellto ensure that the death program is held in check until needed.
How are procaspases activated to initiate the caspase cascade? A generalprinciple is that the activation is triggered by adaptor proteins that bring multi-ple copies of specific procaspases, known as initiator procaspases, close togeth-er in a complex or aggregate. In some cases, the initiator procaspases have asmall amount of protease activity, and forcing them together into a complexcauses them to cleave each other, triggering their mutual activation. In othercases, the aggregation is thought to cause a conformational change that acti-vates the procaspase. Within moments, the activated caspase at the top of thecascade cleaves downstream procaspases to amplify the death signal and spreadit throughout the cell (see Figure 17–38B).
1012 Chapter 17 : THE CELL CYCLE AND PROGRAMMED CELL DEATH
many molecules of active caspase Y
one molecule of active caspase X
even more molecules of active caspase Z
cleavage ofnuclear lamin
(A) procaspase activation
(B) caspase cascade
inactiveprocaspase
activecaspaseprodomain
largesubunit
smallsubunit
activationby cleavage
cleavagesites
COOH
NH2
cleavage ofcytosolic protein
activecaspase
Figure 17–38 The caspase cascadeinvolved in apoptosis. (A) Each suicideprotease is made as an inactive proenzyme(procaspase), which is usually activated byproteolytic cleavage by another memberof the caspase family.As indicated, two ofthe cleaved fragments associate to formthe active site of the caspase.The activeenzyme is thought to be a tetramer oftwo of these units (not shown). (B) Eachactivated caspase molecule can cleavemany procaspase molecules, therebyactivating them, and these can thenactivate even more procaspase molecules.In this way, an initial activation of a smallnumber of procaspase molecules (calledinitiator caspases) can lead, via anamplifying chain reaction (a cascade), tothe explosive activation of a large numberof procaspase molecules. Some of theactivated caspases (called effectorcaspases) then cleave a number of keyproteins in the cell, including specificcytosolic proteins and nuclear lamins,leading to the controlled death of the cell.

Procaspase activation can be triggered from outside the cell by the activa-tion of death receptors on the cell surface. Killer lymphocytes (discussed inChapter 24), for example, can induce apoptosis by producing a protein calledFas ligand, which binds to the death receptor protein Fas on the surface of thetarget cell. The clustered Fas proteins then recruit intracellular adaptor proteinsthat bind and aggregate procaspase-8 molecules, which cleave and activate oneanother. The activated caspase-8 molecules then activate downstream procas-pases to induce apoptosis (Figure 17–39A). Some stressed or damaged cells killthemselves by producing both the Fas ligand and the Fas protein, thereby trig-gering an intracellular caspase cascade.
When cells are damaged or stressed, they can also kill themselves by trigger-ing procaspase aggregation and activation from within the cell. In the bestunderstood pathway, mitochondria are induced to release the electron carrierprotein cytochrome c (see Figure 14–26) into the cytosol, where it binds and acti-vates an adaptor protein called Apaf-1 (Figure 17–39B). This mitochondrialpathway of procaspase activation is recruited in most forms of apoptosis to ini-tiate or to accelerate and amplify the caspase cascade. DNA damage, for exam-ple, as discussed earlier, can trigger apoptosis. This response usually requiresp53, which can activate the transcription of genes that encode proteins that pro-mote the release of cytochrome c from mitochondria. These proteins belong tothe Bcl-2 family.
Bcl-2 Family Proteins and IAP Proteins Are the MainIntracellular Regulators of the Cell Death Program
The Bcl-2 family of intracellular proteins helps regulate the activation of pro-caspases. Some members of this family, like Bcl-2 itself or Bcl-XL, inhibit apop-tosis, at least partly by blocking the release of cytochrome c from mitochondria.Other members of the Bcl-2 family are not death inhibitors, but instead promoteprocaspase activation and cell death. Some of these apoptosis promoters, suchas Bad, function by binding to and inactivating the death-inhibiting members of
PROGRAMMED CELL DEATH (APOPTOSIS) 1013
Figure 17–39 Induction of apoptosisby either extracellular orintracellular stimuli. (A) Extracellularactivation.A killer lymphocyte carrying theFas ligand binds and activates Fas proteinson the surface of the target cell.Adaptorproteins bind to the intracellular region ofaggregated Fas proteins, causing theaggregation of procaspase-8 molecules.These then cleave one another to initiatethe caspase cascade. (B) Intracellularactivation. Mitochondria releasecytochrome c, which binds to and causesthe aggregation of the adaptor proteinApaf-1.Apaf-1 binds and aggregatesprocaspase-9 molecules, which leads tothe cleavage of these molecules and thetriggering of a caspase cascade. Otherproteins that contribute to apoptosis arealso released from the mitochondrialintermembrane space (not shown).
CASPASECASCADE
activation ofprocaspase-9
aggregation of Apaf-1and binding ofprocaspase-9
inactiveprocaspase-9
cytochrome crelease andbinding to
Apaf-1
cytochrome c (in intermembrane space)
adaptor protein(Apaf-1)
injuredmitochondrion
(A) ACTIVATION OF APOPTOSIS FROM OUTSIDE THE CELL (EXTRINSIC PATHWAY)
(B) ACTIVATION OF APOPTOSIS FROM INSIDE THE CELL (INTRINSIC PATHWAY)
killer lymphocyte
Fas ligand
Fas protein
adaptorprotein
inactiveprocaspase-8
target cell
aggregationand cleavage of procaspase-8molecules
activatedcaspase-8
CASPASE CASCADE
apoptotictarget cell
activatedcaspase-9

the family, whereas others, like Bax and Bak, stimulate the release ofcytochrome c from mitochondria. If the genes encoding Bax and Bak are bothinactivated, cells are remarkably resistant to most apoptosis-inducing stimuli,indicating the crucial importance of these proteins in apoptosis induction. Baxand Bak are themselves activated by other apoptosis-promoting members of theBcl-2 family such as Bid.
Another important family of intracellular apoptosis regulators is the IAP(inhibitor of apoptosis) family. These proteins are thought to inhibit apoptosisin two ways: they bind to some procaspases to prevent their activation, and theybind to caspases to inhibit their activity. IAP proteins were originally discoveredas proteins produced by certain insect viruses, which use them to prevent theinfected cell from killing itself before the virus has had time to replicate. Whenmitochondria release cytochrome c to activate Apaf-1, they also release a proteinthat blocks IAPs, thereby greatly increasing the efficiency of the death activationprocess.
The intracellular cell death program is also regulated by extracellular signals,which can either activate apoptosis or inhibit it. These signal molecules mainlyact by regulating the levels or activity of members of the Bcl-2 and IAP families.We see in the next section how these signal molecules help multicellular organ-isms regulate their cell numbers.
Summary
In multicellular organisms, cells that are no longer needed or are a threat to theorganism are destroyed by a tightly regulated cell suicide process known as pro-grammed cell death, or apoptosis. Apoptosis is mediated by proteolytic enzymescalled caspases, which trigger cell death by cleaving specific proteins in the cyto-plasm and nucleus. Caspases exist in all cells as inactive precursors, or procaspases,which are usually activated by cleavage by other caspases, producing a proteolyticcaspase cascade. The activation process is initiated by either extracellular or intra-cellular death signals, which cause intracellular adaptor molecules to aggregateand activate procaspases. Caspase activation is regulated by members of the Bcl-2and IAP protein families.
EXTRACELLULAR CONTROL OF CELL DIVISION,CELL GROWTH,AND APOPTOSISA fertilized mouse egg and a fertilized human egg are similar in size, yet theyproduce animals of very different sizes. What factors in the control of cell behav-ior in humans and mice are responsible for these size differences? The same fun-damental question can be asked for each organ and tissue in an animal’s body.What factors in the control of cell behavior explain the length of an elephant’strunk or the size of its brain or its liver? These questions are largely unanswered,at least in part because they have received relatively little attention comparedwith other questions in cell and developmental biology. It is nevertheless possi-ble to say what the ingredients of an answer must be.
The size of an organ or organism depends mainly on its total cell mass,which depends on both the total number of cells and the size of the cells. Cellnumber, in turn, depends on the amounts of cell division and cell death. Organand body size are therefore determined by three fundamental processes: cellgrowth, cell division, and cell death. Each is independently regulated—both byintracellular programs and by extracellular signal molecules that control theseprograms.
The extracellular signal molecules that regulate cell size and cell number aregenerally either soluble secreted proteins, proteins bound to the surface of cells,or components of the extracellular matrix. The factors that promote organ ororganism growth can be operationally divided into three major classes:
1. Mitogens, which stimulate cell division, primarily by relieving intracellularnegative controls that otherwise block progress through the cell cycle.
1014 Chapter 17 : THE CELL CYCLE AND PROGRAMMED CELL DEATH

2. Growth factors, which stimulate cell growth (an increase in cell mass) bypromoting the synthesis of proteins and other macromolecules and byinhibiting their degradation.
3. Survival factors, which promote cell survival by suppressing apoptosis. Some extracellular signal molecules promote all of these processes, while otherspromote one or two of them. Indeed, the term growth factor is often used inappro-priately to describe a factor that has any of these activities. Even worse, the termcell growth is often used to mean an increase in cell number, or cell proliferation.
In this section, we first discuss how these extracellular signals stimulate celldivision, cell growth, and cell survival, thereby promoting the growth of an ani-mal and its organs. We then consider how other extracellular signals can act inthe opposite way, to inhibit cell growth or cell division or to stimulate apoptosis,thereby inhibiting organ growth.
Mitogens Stimulate Cell Division
Unicellular organisms tend to grow and divide as fast as they can, and their rateof proliferation depends largely on the availability of nutrients in the environ-ment. The cells of a multicellular organism, however, divide only when more cellsare needed by the organism. Thus, for an animal cell to proliferate, nutrients arenot enough. It must also receive stimulatory extracellular signals, in the form ofmitogens, from other cells, usually its neighbors. Mitogens act to overcome intra-cellular braking mechanisms that block progress through the cell cycle.
One of the first mitogens to be identified was platelet-derived growth factor(PDGF), and it is typical of many others discovered since. The path to its isola-tion began with the observation that fibroblasts in a culture dish proliferatewhen provided with serum but not when provided with plasma. Plasma is pre-pared by removing the cells from blood without allowing clotting to occur;serum is prepared by allowing blood to clot and taking the cell-free liquid thatremains. When blood clots, platelets incorporated in the clot are triggered torelease the contents of their secretory vesicles (Figure 17–40). The superior abil-ity of serum to support cell proliferation suggested that platelets contain one ormore mitogens. This hypothesis was confirmed by showing that extracts ofplatelets could serve instead of serum to stimulate fibroblast proliferation. Thecrucial factor in the extracts was shown to be a protein, which was subsequentlypurified and named PDGF. In the body, PDGF liberated from blood clots proba-bly has a major role in stimulating cell division during wound healing.
PDGF is only one of over 50 proteins that are known to act as mitogens. Mostof these proteins are broad-specificity factors, like PDGF and epidermal growthfactor (EGF), that can stimulate many types of cells to divide. Thus, PDGF acts ona range of cell types, including fibroblasts, smooth muscle cells, and neuroglialcells. Similarly, EGF acts not only on epidermal cells but also on many other celltypes, including both epithelial and nonepithelial cells. At the opposite extremelie narrow-specificity factors such as erythropoietin, which induces the prolifer-ation of red blood cell precursors only.
In addition to mitogens that stimulate cell division, there are factors, such assome members of the transforming growth factor-b (TGF-b) family, that act onsome cells to stimulate cell proliferation and others to inhibit it, or that stimulateat one concentration and inhibit at another. Indeed, like PDGF, many mitogenshave other actions beside the stimulation of cell division: they can stimulate cellgrowth, survival, differentiation, or migration, depending on the circumstancesand the cell type.
Cells Can Delay Division by Entering a Specialized Nondividing State
In the absence of a mitogenic signal to proliferate, Cdk inhibition in G1 is main-tained, and the cell cycle arrests. In some cases, cells partly disassemble theircell-cycle control system and exit from the cycle to a specialized, nondividingstate called G0.
EXTRACELLULAR CONTROL OF CELL DIVISION, CELL GROWTH, AND APOPTOSIS 1015
1 µm
secretory vesicle
glycogen
microtubule
mitochondrion
Figure 17–40 A platelet. Platelets areminiature cells without a nucleus.Theycirculate in the blood and help stimulateblood clotting at sites of tissue damage,thereby preventing excessive bleeding.They also release various factors thatstimulate healing.The platelet shown herehas been cut in half to show its secretoryvesicles, some of which contain platelet-derived growth factor (PDGF). See alsoFigure 16–47B–D.

Most cells in our body are in G0, but the molecular basis and reversibility ofthis state vary in different cell types. Neurons and skeletal muscle cells, forexample, are in a terminally differentiated G0 state, in which their cell-cycle con-trol system is completely dismantled: the expression of the genes encoding var-ious Cdks and cyclins are permanently turned off, and cell division never occurs.Other cell types withdraw from the cell cycle only transiently and retain the abil-ity to reassemble the cell-cycle control system quickly and reenter the cycle.Most liver cells, for example, are in G0, but they can be stimulated to divide if theliver is damaged. Still other types of cells, including some lymphocytes, with-draw from and re-enter the cell cycle repeatedly throughout their lifetime.
Almost all the variation in cell-cycle length in the adult body occurs duringthe time the cell spends in G1 or G0. By contrast, the time taken for a cell toprogress from the beginning of S phase through mitosis is usually brief (typically12–24 hours in mammals) and relatively constant, regardless of the interval fromone division to the next.
Mitogens Stimulate G1-Cdk and G1/S-Cdk Activities
For the vast majority of animal cells, mitogens control the rate of cell division byacting in the G1 phase of the cell cycle. As discussed earlier, multiple mecha-nisms act during G1 to suppress Cdk activity and thereby hinder entry into Sphase. Mitogens act to release the brakes on Cdk activity, thereby allowing Sphase to begin. They do so by binding to cell-surface receptors to initiate acomplex array of intracellular signals that penetrate deep into the cytoplasmand nucleus (discussed in Chapter 15). The ultimate result is the activation ofG1-Cdk and G1/S-Cdk complexes, which overcome the inhibitory barriers thatnormally block progression into S phase.
As we discuss in Chapter 15, an early step in mitogen signaling is often theactivation of the small GTPase Ras, which leads to the activation of a MAP kinasecascade. By uncertain mechanisms, this leads to increased levels of the gene reg-ulatory protein Myc. Myc promotes cell-cycle entry by several overlappingmechanisms (Figure 17–41). It increases the transcription of genes that encodeG1 cyclins (D cyclins), thereby increasing G1-Cdk (cyclin D–Cdk4) activity. Inaddition, Myc increases the transcription of a gene that encodes a component ofthe SCF ubiquitin ligase. This mechanism promotes the degradation of the CKIprotein p27, leading to increased G1/S-Cdk (cyclin E–Cdk2) activity. As dis-cussed earlier, increased G1-Cdk and G1/S-Cdk activities stimulate phosphory-lation of the inhibitory protein Rb, which then leads to activation of the generegulatory protein E2F. Myc may also stimulate the transcription of the geneencoding E2F, further promoting E2F activity in the cell. The end result is theincreased transcription of genes required for entry into S phase (see Figure17–30). As we discuss later, Myc also has a major role in stimulating the tran-scription of genes that increase cell growth.
Abnormal Proliferation Signals Cause Cell-Cycle Arrest or Cell Death
As we discuss in Chapter 23, many of the components of intracellular signalingpathways are encoded by genes that were originally identified as cancer-promot-ing genes, or oncogenes, because mutations in them contribute to the develop-ment of cancer. The mutation of a single amino acid in Ras, for example, causesthe protein to become permanently overactive, leading to constant stimulation ofRas-dependent signaling pathways, even in the absence of mitogenic stimula-tion. Similarly, mutations that cause an overexpression of Myc promote excessivecell growth and proliferation and thereby promote the development of cancer.
Surprisingly, however, when Ras or Myc is experimentally hyperactivatedin most normal cells, the result is not excessive proliferation but the opposite:the activation of checkpoint mechanisms causes the cells to undergo eithercell-cycle arrest or apoptosis. The normal cell seems able to detect abnormalmitogenic stimulation, and it responds by preventing further division. Such
1016 Chapter 17 : THE CELL CYCLE AND PROGRAMMED CELL DEATH

checkpoint responses help prevent the survival and proliferation of cells withvarious cancer-promoting mutations.
Although it is not known how a cell detects excessive mitogenic stimulation,such stimulation often leads to the production of a cell-cycle inhibitor proteincalled p19ARF, which binds and inhibits Mdm2. As discussed earlier, Mdm2normally promotes p53 degradation. Activation of p19ARF therefore causes p53levels to increase, thereby inducing either cell-cycle arrest or apoptosis (Figure17–42).
How do cancer cells ever arise if these mechanisms block the division or sur-vival of mutant cells with overactive proliferation signals? The answer is that theprotective system is often inactivated in cancer cells by mutations in the genesthat encode essential components of the checkpoint responses, such as p19ARF
or p53.
Human Cells Have a Built-in Limitation on the Number of Times They Can Divide
Cell division is controlled not only by extracellular mitogens but also by intracel-lular mechanisms that can limit cell proliferation. Many animal precursor cells,for example, divide a limited number of times before they stop and terminally
EXTRACELLULAR CONTROL OF CELL DIVISION, CELL GROWTH, AND APOPTOSIS 1017
Figure 17–41 A simplified model ofone way that mitogens stimulate celldivision. The binding of mitogens to cell-surface receptors leads to the activationof Ras and a MAP kinase cascade. Oneeffect of this pathway is the increasedproduction of the gene regulatory proteinMyc. Myc increases the transcription ofseveral genes, including the gene encodingcyclin D and a gene encoding a subunit ofthe SCF ubiquitin ligase.The resultingincrease in G1-Cdk and G1/S-Cdkactivities promotes Rb phosphorylationand activation of the gene regulatoryprotein E2F, resulting in S-phase entry (seeFigure 17–30). Myc may also promote E2Factivity directly by stimulating thetranscription of the E2F gene.Although,for simplicity, Myc is shown as a monomer,it functions as a heterodimer with anotherprotein called Max.
Ras
mitogen receptor
mitogen
MAP kinase
activation of gene regulatory protein
Myc
Myc MycSCF subunit
genecyclin D
gene
increasedcyclin D
increasedp27 degradation
G1 /S-Cdk activation(cyclin E–Cdk2)
Rbphosphorylation
G1-Cdk activation(cyclin D–Cdk4)
increasedE2F synthesis
increasedE2F activity
MycE2F
gene
ENTRY INTOS PHASE
CYTOSOL
NUCLEUS
myc gene
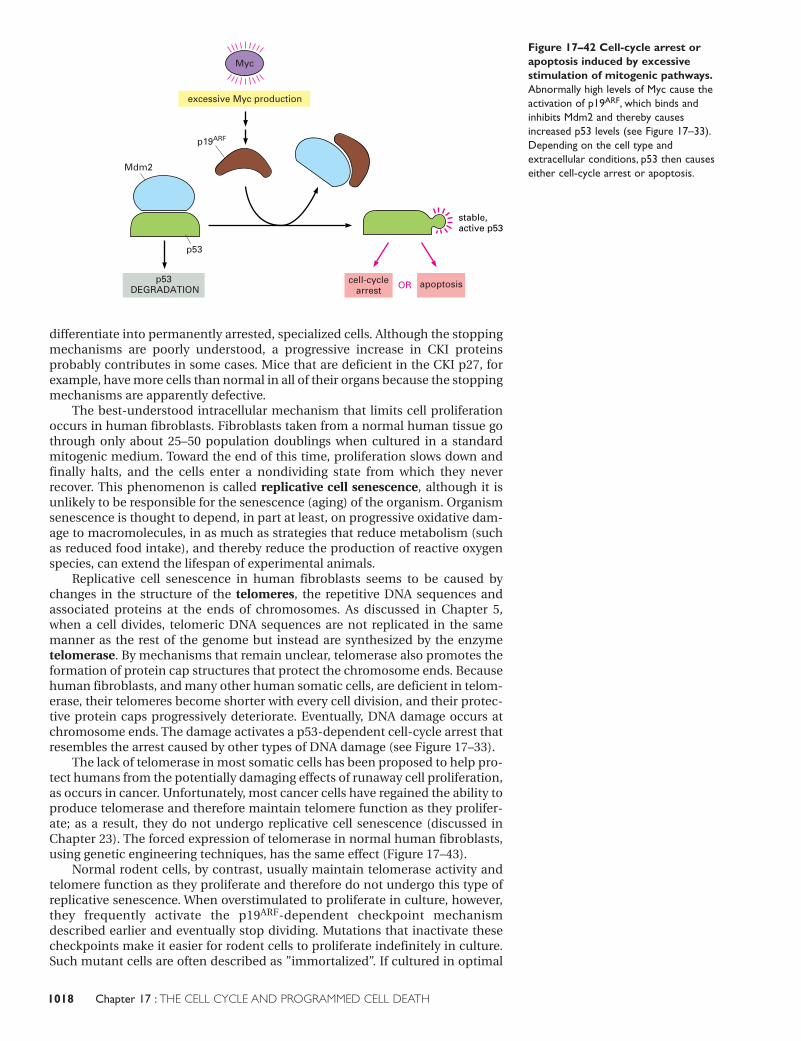
differentiate into permanently arrested, specialized cells. Although the stoppingmechanisms are poorly understood, a progressive increase in CKI proteinsprobably contributes in some cases. Mice that are deficient in the CKI p27, forexample, have more cells than normal in all of their organs because the stoppingmechanisms are apparently defective.
The best-understood intracellular mechanism that limits cell proliferationoccurs in human fibroblasts. Fibroblasts taken from a normal human tissue gothrough only about 25–50 population doublings when cultured in a standardmitogenic medium. Toward the end of this time, proliferation slows down andfinally halts, and the cells enter a nondividing state from which they neverrecover. This phenomenon is called replicative cell senescence, although it isunlikely to be responsible for the senescence (aging) of the organism. Organismsenescence is thought to depend, in part at least, on progressive oxidative dam-age to macromolecules, in as much as strategies that reduce metabolism (suchas reduced food intake), and thereby reduce the production of reactive oxygenspecies, can extend the lifespan of experimental animals.
Replicative cell senescence in human fibroblasts seems to be caused bychanges in the structure of the telomeres, the repetitive DNA sequences andassociated proteins at the ends of chromosomes. As discussed in Chapter 5,when a cell divides, telomeric DNA sequences are not replicated in the samemanner as the rest of the genome but instead are synthesized by the enzymetelomerase. By mechanisms that remain unclear, telomerase also promotes theformation of protein cap structures that protect the chromosome ends. Becausehuman fibroblasts, and many other human somatic cells, are deficient in telom-erase, their telomeres become shorter with every cell division, and their protec-tive protein caps progressively deteriorate. Eventually, DNA damage occurs atchromosome ends. The damage activates a p53-dependent cell-cycle arrest thatresembles the arrest caused by other types of DNA damage (see Figure 17–33).
The lack of telomerase in most somatic cells has been proposed to help pro-tect humans from the potentially damaging effects of runaway cell proliferation,as occurs in cancer. Unfortunately, most cancer cells have regained the ability toproduce telomerase and therefore maintain telomere function as they prolifer-ate; as a result, they do not undergo replicative cell senescence (discussed inChapter 23). The forced expression of telomerase in normal human fibroblasts,using genetic engineering techniques, has the same effect (Figure 17–43).
Normal rodent cells, by contrast, usually maintain telomerase activity andtelomere function as they proliferate and therefore do not undergo this type ofreplicative senescence. When overstimulated to proliferate in culture, however,they frequently activate the p19ARF-dependent checkpoint mechanismdescribed earlier and eventually stop dividing. Mutations that inactivate thesecheckpoints make it easier for rodent cells to proliferate indefinitely in culture.Such mutant cells are often described as ”immortalized”. If cultured in optimal
1018 Chapter 17 : THE CELL CYCLE AND PROGRAMMED CELL DEATH
stable,active p53
p53 DEGRADATION
cell-cyclearrest
apoptosis
p53
Mdm2
Myc
excessive Myc production
p19ARF
OR
Figure 17–42 Cell-cycle arrest orapoptosis induced by excessivestimulation of mitogenic pathways.Abnormally high levels of Myc cause theactivation of p19ARF, which binds andinhibits Mdm2 and thereby causesincreased p53 levels (see Figure 17–33).Depending on the cell type andextracellular conditions, p53 then causeseither cell-cycle arrest or apoptosis.

conditions that avoid the activation of checkpoint responses, however, at leastsome normal rodent cells also seem able to proliferate indefinitely. Nevertheless,rodents age much more rapidly than humans.
Extracellular Growth Factors Stimulate Cell Growth
The growth of an organism or organ depends on cell growth: cell division alonecannot increase total cell mass without cell growth. In single-celled organismssuch as yeasts, cell growth (like cell division) requires only nutrients. In animals,by contrast, cell growth and cell division both depend on signals from othercells.
The extracellular growth factors that stimulate cell growth bind to receptorson the cell surface and activate intracellular signaling pathways. These pathwaysstimulate the accumulation of proteins and other macromolecules, and they doso by both increasing their rate of synthesis and decreasing their rate of degra-dation.
One of the most important intracellular signaling pathways activated bygrowth factor receptors involves the enzyme PI 3-kinase, which adds a phos-phate from ATP to the 3 position of inositol phospholipids in the plasmamembrane. As discussed in Chapter 15, the activation of PI 3-kinase leads tothe activation of several protein kinases, including S6 kinase. The S6 kinasephosphorylates ribosomal protein S6, increasing the ability of ribosomes totranslate a subset of mRNAs, most of which encode ribosomal components.Protein synthesis therefore increases. When the gene encoding S6 kinase isinactivated in Drosophila, the mutant flies are small; whereas cell numbers arenormal, cell size is abnormally small. Growth factors also activate a translationinitiation factor called eIF4E, further increasing protein synthesis and cellgrowth (Figure 17–44).
Growth factor stimulation also leads to increased production of the generegulatory protein Myc, which also plays an important part in signaling by mito-gens (see Figure 17–41). Myc increases the transcription of a number of genesthat encode proteins involved in cell metabolism and macromolecular synthe-sis. In this way, it stimulates both cell metabolism and cell growth.
Some extracellular signal proteins, including PDGF, can act as both growthfactors and mitogens, stimulating both cell growth and cell-cycle progression.This functional overlap is achieved in part by overlaps in the intracellular sig-naling pathways that control these two processes. The signaling protein Ras, forexample, is activated by both growth factors and mitogens. It can stimulate thePI3-kinase pathway to promote cell growth and the MAP-kinase pathway to trig-ger cell-cycle progression. Similarly, as described above, Myc stimulates bothcell growth and cell-cycle progression. Extracellular factors that act as both
EXTRACELLULAR CONTROL OF CELL DIVISION, CELL GROWTH, AND APOPTOSIS 1019
telo
mer
e le
ng
th
55 60 50 60 70 8065cell divisions cell divisions
(A) effect on telomere length (B) effect on proliferative potential
cells expressing telomerase
cells not expressing telomerase
Figure 17–43 Overcoming replicativecell senescence by the forcedexpression of telomerase. (A) Normalhuman fibroblasts do not containtelomerase, and so their telomeresgradually shorten and lose their normalcap structure as the cells proliferate. Cellsforced to express telomerase, however,maintain telomere length (and normal capstructures) after many divisions. (B) Thenormal human fibroblasts stopped dividingafter about 50–60 divisions in theseexperiments, where as the cells expressingtelomerase were still dividing at the endof the experiment. (Based on A. Bodnar et al., Science 279:349–352, 1998.)
growth factorreceptor
growth factor
STIMULATION OF CELL GROWTH
PI 3-kinase
protein kinase activation
activephosphorylated
S6 kinase
activeeIF4E
increased mRNA translation
Figure 17–44 One way in whichgrowth factors promote cell growth.In this simplified scheme, activation of cell-surface receptors leads to theactivation of PI 3-kinase, which promotesprotein synthesis, at least partly throughthe activation of eIF4E and S6 kinase.Growth factors also inhibit proteinbreakdown (not shown) by poorlyunderstood pathways.

growth factors and mitogens help ensure that cells maintain their appropriatesize as they proliferate.
Cell growth and division, however, can be controlled by separate extracellu-lar signal proteins in some cell types. Such independent control may be particu-larly important during embryonic development, when dramatic changes in thesize of certain cell types can occur. Even in adult animals, however, growth factorscan stimulate cell growth without affecting cell division. The size of a sympa-thetic neuron, for example, which has permanently withdrawn from the cellcycle, depends on the amount of nerve growth factor (NGF) secreted by the tar-get cells it innervates. The greater the amount of NGF the neuron has access to,the larger it becomes. It remains a mystery, however, how different cell types inthe same animal grow to be so different in size (Figure 17–45).
Extracellular Survival Factors Suppress Apoptosis
Animal cells need signals from other cells—not only to grow and proliferate, butalso to survive. If deprived of such survival factors, cells activate their intracel-lular death program and die by apoptosis. This arrangement ensures that cellssurvive only when and where they are needed. Nerve cells, for example, are pro-duced in excess in the developing nervous system and then compete for limitedamounts of survival factors that are secreted by the target cells they contact.Nerve cells that receive enough survival factor live, while the others die by apop-tosis (Figure 17–46). A similar dependence on survival signals from neighboringcells is thought to control cell numbers in other tissues, both during develop-ment and in adulthood.
Survival factors, just like mitogens and growth factors, usually bind to cell-surface receptors. Binding activates signaling pathways that keep the death pro-gram suppressed, often by regulating members of the Bcl-2 family of proteins.Some factors, for example, stimulate the increased production of apoptosis-sup-pressing members of this family. Others act by inhibiting the function of apop-tosis-promoting members of the family (Figure 17–47A). In Drosophila, andprobably in vertebrates as well, some survival factors also act by stimulating theactivity of IAPs, which suppress apoptosis (Figure 17–47B).
Neighboring Cells Compete for Extracellular Signal Proteins
When most types of mammalian cells are cultured in a dish in the presence ofserum, they adhere to the bottom of the dish, spread out, and divide until aconfluent monolayer is formed. Each cell is attached to the dish and contactsits neighbors on all sides. At this point, normal cells, unlike cancer cells, stop
1020 Chapter 17 : THE CELL CYCLE AND PROGRAMMED CELL DEATH
Figure 17–46 The function of celldeath in matching the number ofdeveloping nerve cells to the numberof target cells they contact. Morenerve cells are produced than can besupported by the limited amount ofsurvival factors released by the targetcells.Therefore, some cells receive aninsufficient amount of survival factors tokeep their suicide program suppressedand, as a consequence, undergo apoptosis.This strategy of overproduction followedby culling ensures that all target cells arecontacted by nerve cells and that theextra nerve cells are automaticallyeliminated.
nerve cellsapoptotic
nerve cells
nervecellbody
nervecellaxon
target cells
CELL DEATHMATCHES
NUMBER OFNERVE CELLS
TO NUMBER OFTARGET CELLS
survival factorreleased by target cells
25 µm
neuron
lymphocyte
Figure 17–45 The size difference between a neuron (from theretina) and a lymphocyte in a mammal. Both cells contain the sameamount of DNA.A neuron grows progressively larger after it haspermanently withdrawn from the cell cycle. During this time, the ratio ofcytoplasm to DNA increases enormously (by a factor of more than 105 forsome neurons). (Neuron from B.B. Boycott, in Essays on the NervousSystem [R. Bellairs and E.G. Gray, eds]. Oxford, UK: Clarendon Press, 1974.)

proliferating—a phenomenon known as density-dependent inhibition of celldivision. This phenomenon was originally described in terms of “contact inhibi-tion” of cell division, but it is unlikely that cell–cell contact interactions are solelyresponsible. The cell population density at which cell proliferation ceases in theconfluent monolayer increases with increasing concentration of serum in themedium. Moreover, passing a stream of fresh culture medium over a confluentlayer of fibroblasts reduces the diffusional limitation to the supply of mitogens,and it induces the cells under the stream of medium to divide at densities atwhich they would normally be inhibited from doing so (Figure 17–48). Thus,density-dependent inhibition of cell proliferation seems to reflect, in part atleast, the ability of a cell to deplete the medium locally of extracellular mitogens,thereby depriving its neighbors.
This type of competition could be important for cells in tissues as well as inculture, because it prevents them from proliferating beyond a certain popula-tion density, determined by the available amounts of mitogens, growth factors,and survival factors. The amounts of these factors in tissues is usually limited,and increasing their amounts results in an increase in cell number, cell size, orboth. Thus, the concentrations of these factors in tissues have important roles indetermining cell size and number.
Many Types of Normal Animal Cells Need Anchorage to Grow and Proliferate
The shape of a cell changes as it spreads and crawls out over a substratum to occu-py vacant space, and this can have a major impact on cell growth, cell division,
EXTRACELLULAR CONTROL OF CELL DIVISION, CELL GROWTH, AND APOPTOSIS 1021
P P
P
active PKB
Bad Bcl-2active Bcl-2
APOPTOSIS
APOPTOSIS
P
expression of cell-death-promoting genes
inactive Bad
active generegulatory
protein
inactive generegulatory
protein
survival factor
receptor
survival factor
receptor
plasma membrane
(A) MAMMALS (B) FRUIT FLIES
MAP-kinase
P
active Hid inactive Hid
inhibitor ofapoptosis (IAP)
Figure 17–47 Two ways in which survival factors suppress apoptosis. (A) In mammalian cells, thebinding of some survival factors to cell-surface receptors leads to the activation of various protein kinases,including protein kinase B (PKB), that phosphorylate and inactivate the Bcl-2 family member Bad.When notphosphorylated, Bad promotes apoptosis by binding and inhibiting Bcl-2. Once phosphorylated, Baddissociates, freeing Bcl-2 to suppress apoptosis.As indicated, PKB also suppresses death by phosphorylatingand thereby inhibiting gene regulatory proteins of the Forkhead family that stimulate the transcription ofgenes that encode proteins that promote apoptosis. (B) In Drosophila, some survival factors inhibit apoptosisby stimulating the phosphorylation of the Hid protein.When not phosphorylated, Hid promotes cell death byinhibiting IAPs. Once phosphorylated, Hid no longer inhibits IAPs, which become active and block cell death.

1022 Chapter 17 : THE CELL CYCLE AND PROGRAMMED CELL DEATH
8% 30% 90%
probability of entering S phase
cell suspended in agarcell perched on small
adhesive patchcell spread on large
adhesive patch
(A)
(B) (C)50 mm
Figure 17–49 The dependence of celldivision on cell shape and anchorage.In this experiment, cells are either held insuspension or allowed to settle onpatches of an adhesive material (palladium)on a nonadhesive substratum.The patchdiameter, which is variable, determines theextent to which an individual cell spreadsand the probability that it will progressinto S phase. 3H-thymidine is added to theculture medium, and after 1 or 2 days, theculture is fixed and autoradiographed todetermine the percentage of cells thathave entered S phase (see Figure 17–11A).(A) Few cells of the 3T3 cell line enter Sphase when held rounded up insuspension, but adherence even to a verytiny patch—one that is too small to allowspreading—enables many of them to enterS phase. (B and C) These scanningelectron micrographs show a cell perchedon a small patch compared with a cellspread on a large patch.
In contrast to fibroblasts and epithelialcells, some cell types in the body(including lymphocytes and blood cellprecursors) can divide readily insuspension (see also Figure 19–62).(B and C, from C. O’Neill, P. Jordan, and G. Ireland, Cell 44:489–496, 1986.© Elsevier.)
and cell survival. When normal fibroblasts or epithelial cells, for example, arecultured in suspension, unattached to any solid surface and therefore roundedup, they almost never divide—a phenomenon known as anchorage dependenceof cell division (Figure 17–49). But when these cells are allowed to settle andadhere to a sticky substrate, they rapidly form focal adhesions at sites of attach-ment, and then begin to grow and proliferate.
How are the growth and proliferation signals generated by cell attachments?Focal adhesions are places where extracellular matrix molecules, such as lamininor fibronectin, interact with cell-surface matrix receptors called integrins, whichare linked to the actin cytoskeleton (discussed in Chapter 19). The binding ofextracellular matrix molecules to integrins leads to the local activation of proteinkinases, including focal adhesion kinase (FAK), which in turn leads to the activa-tion of intracellular signaling pathways that can promote the survival, growth,and division of cells (Figure 17–50).
Like other controls on cell division, anchorage control operates in G1. Cellsrequire anchorage to progress through G1 into S phase, but anchorage is notrequired for completing the cycle. In fact, cells commonly loosen their attach-ments and round up as they pass through M phase. This cycle of attachment anddetachment presumably allows cells in tissues to rearrange their contacts withother cells and with the extracellular matrix. In this way, tissues can accommo-date the daughter cells produced by cell division and then bind them securelyinto the tissue before they are allowed to begin the next division cycle.
Figure 17–48 The effect of freshmedium on a confluent cellmonolayer. Cells in a confluentmonolayer do not divide (gray). The cellsresume dividing (green) when exposeddirectly to fresh culture medium.Apparently, in the undisturbed confluentmonolayer, proliferation has haltedbecause the medium close to the cells isdepleted of mitogens, for which the cellscompete.
cells proliferate confluent monolayer: cellsno longer proliferate
fresh medium pumpedacross cells
flow of medium stimulatescell proliferation

Some Extracellular Signal Proteins Inhibit Cell Growth,Cell Division, and Survival
The extracellular signal proteins discussed in this chapter—mitogens, growthfactors and survival factors—are positive regulators of cell-cycle progression,cell growth, and cell survival, respectively. They therefore tend to increase thesize of organs and organisms. In some tissues, however, cell and tissue size alsois influenced by inhibitory extracellular signal proteins that oppose the positiveregulators and thereby inhibit organ growth.
The best-understood inhibitory signal proteins are TGF-b and its relatives.TGF-b inhibits the proliferation of several cell types, either by blocking cell-cycleprogression in G1 or by stimulating apoptosis. As discussed in Chapter 15, TGF-b
binds to cell-surface receptors and initiates an intracellular signaling pathwaythat leads to changes in the activities of gene regulatory proteins called Smads.This results in complex and poorly understood changes in the transcription ofgenes encoding regulators of cell division and cell death.
One example of an apoptosis-inducing extracellular signal is bone morpho-genetic protein (BMP), a TGF-b family member. BMP helps trigger the apoptosisthat removes the tissue between the developing digits in the mouse paw (seeFigure 17–35). Like TGF-b, BMP stimulates changes in the transcription of genesthat regulate cell death, although the nature of these genes remains unclear.
The overall size of an organ may be limited in some cases by inhibitory sig-naling proteins. Myostatin, for example, is a TGF-b family member that normallyinhibits the proliferation of myoblasts that fuse to form skeletal muscle cells.When the gene that encodes myostatin is deleted in mice, muscles grow to beseveral times larger than normal (see Figure 22–43). Both the number and thesize of muscle cells increase. Remarkably, two breeds of cattle that were bred forlarge muscles have both turned out to have mutations in the gene encodingmyostatin (Figure 17–51).
Intricately Regulated Patterns of Cell Division Generate and Maintain Body Form
The life of multicellular organisms begins with a series of division cycles that arecontrolled according to intricate rules. This is strikingly illustrated by the nema-tode Caenorhabditis elegans. The fertilized egg of C. elegans divides to producean adult worm with precisely 959 somatic cell nuclei (in the male), each of whichis generated by its own characteristic and absolutely predictable sequence of celldivisions. (The initial cell number is greater than this, but more than 100 cellsdie by apoptosis during development.) In general, the controls that generate
EXTRACELLULAR CONTROL OF CELL DIVISION, CELL GROWTH, AND APOPTOSIS 1023
Figure 17–50 Focal adhesions asproduction sites of intracellularsignals. This fluorescence micrographshows a fibroblast cultured on asubstratum coated with the extracellularmatrix molecule fibronectin.Actinfilaments have been labeled to fluorescegreen, while activated proteins that containphosphotyrosine have been labeled withan antibody that is tagged to fluoresce red.Where the two components overlap, theresulting color is orange.The actinfilaments terminate at focal adhesions,where the cell attaches to the substratum.Proteins containing phosphotyrosine arealso concentrated at these sites.This isthought to reflect the local activation offocal adhesion kinase (FAK) and otherprotein kinases stimulated bytransmembrane integrin proteins that bindto fibronectin extracellularly and(indirectly) to actin filamentsintracellularly. Signals generated at suchadhesion sites help regulate cell division,growth, and survival, in both fibroblastsand epithelial cells. (Courtesy of KeithBurridge.)
10 mm

such precise cell numbers do not operate by merely counting cell divisionsaccording to a clocklike schedule. Instead, the organism seems mainly to controltotal cell mass, which depends not only on cell numbers but also on cell size.Salamanders of different ploidies, for example, are the same size but have dif-ferent numbers of cells. Individual cells in a pentaploid salamander are aboutfive times the volume of those in a haploid salamander, and in each organ thepentaploids have generated only one-fifth as many cells as their haploidcousins, so that the organs are about the same size in the two animals (Figures17–52 and 17–53). Evidently, in this case (and in many others) the size oforgans and organisms depends on mechanisms that can somehow measuretotal cell mass.
The development of limbs and organs of specific size and shape depends oncomplex positional controls, as well as on local concentrations of extracellularsignal proteins that stimulate or inhibit cell growth, division, and survival. As we
1024 Chapter 17 : THE CELL CYCLE AND PROGRAMMED CELL DEATH
Figure 17–52 Sections of kidney tubules from salamanderlarvae of different ploidies. In all organisms, from bacteria tohumans, cell size is proportional to ploidy. Pentaploid salamanders,for example, have cells that are much larger than those of haploidsalamanders.The animals and their individual organs, however, arethe same size because each tissue in the pentaploid animal containsfewer cells.This indicates that the size of an organism or organ isnot controlled simply by counting cell divisions or cell numbers;total cell mass must somehow be regulated. (Adapted from G. Fankhauser, in Analysis of Development [B.H.Willier, P.A.Weiss,and V. Hamburger, eds.], pp. 126–150. Philadelphia: Saunders, 1955.)
Figure 17–53 The hindbrain in ahaploid and in a tetraploidsalamander. (A) This light micrographshows a cross section of the hindbrain ofa haploid salamander. (B) A correspondingcross section of the hindbrain of atetraploid salamander, revealing howreduced cell numbers compensate forincreased cell size. (From G. Fankhauser,Int. Rev. Cytol. 1:165–193, 1952.)
10 µm
DIPLOID
22 chromosomes
HAPLOID
11 chromosomes
PENTAPLOID
55 chromosomes
(A)
(B)100 mm
Figure 17–51 The effects of amyostatin mutation on muscle size.The mutation leads to a dramatic increasein the mass of muscle tissue, as illustratedin this Belgian Blue bull.The Belgium Bluewas produced by cattle breeders and wasonly recently found to have a mutation inthe myostatin gene. Mice purposely madedeficient in the same gene also haveremarkably big muscles (see Figure22–43). (From A.C. McPherron and S.-J. Lee, Proc. Natl. Acad. Sci. USA94:12457–12461, 1997. © NationalAcademy of Sciences.)

discuss in Chapter 21, some of the genes that help pattern these processes in theembryo are now known. A great deal remains to be learned, however, about howthese genes regulate cell growth, division, survival, and differentiation to generatea complex organism (discussed in Chapter 21).
The controls that govern these processes in an adult body are also poorlyunderstood. When a skin wound heals in a vertebrate, for example, about adozen cell types, ranging from fibroblasts to Schwann cells, must be regeneratedin appropriate numbers and in appropriate positions to reconstruct the losttissue. The mechanisms that control cell proliferation in tissues are likewisecentral to the understanding of cancer, a disease in which the controls go wrong,as discussed in Chapter 23.
Summary
In multicellular animals, cell size, cell division, and cell death are carefully con-trolled to ensure that the organism and its organs achieve and maintain an appro-priate size. Three classes of extracellular signal proteins contribute to this control,although many of them affect two or more of these processes. Mitogens stimulatethe rate of cell division by removing intracellular molecular brakes that restraincell-cycle progression in G1. Growth factors promote an increase in cell mass bystimulating the synthesis and inhibiting the degradation of macromolecules. Sur-vival factors increase cell numbers by inhibiting apoptosis. Extracellular signalsthat inhibit cell division or cell growth, or induce cells to undergo apoptosis, alsocontribute to size control.
EXTRACELLULAR CONTROL OF CELL DIVISION, CELL GROWTH, AND APOPTOSIS 1025
ReferencesGeneralBaserga R (1985) The Biology of Cell Reproduction. Cambridge, MA: Har-
vard University Press.Mitchison JM (1971) The Biology of the Cell Cycle. Cambridge: Cambridge
University Press.Murray AW & Hunt T (1993) The Cell Cycle: An Introduction. New York:
WH Freeman.
An Overview of the Cell CycleHartwell LH, Culotti J, Pringle JR & Reid BJ (1974) Genetic control of the
cell division cycle in yeast. Science 183, 46–51.Kirschner M, Newport J & Gerhart J (1985) The timing of early develop-
mental events in Xenopus. Trends Genet. 1, 41–47.Lohka MJ, Hayes MK & Maller JL (1988) Purification of maturation-pro-
moting factor, an intracellular regulator of early mitotic events. Proc. Natl.Acad. Sci. USA 85, 3009–3013.
Masui Y & Markert CL (1971) Cytoplasmic control of nuclear behaviorduring meiotic maturation of frog oocytes. J. Exp. Zool. 177, 129–146.
Nurse P,Thuriaux P & Nasmyth K (1976) Genetic control of the cell divi-sion cycle in the fission yeast Schizosaccharomyces pombe. Mol. Gen.Genet. 146, 167–178.
Components of the Cell-Cycle Control SystemDeshaies R (1999) SCF and cullin/Ring H2-based ubiquitin ligases. Ann. Rev.
Cell Dev. Biol. 15, 435–467.Hartwell LH & Weinert TA (1989) Checkpoints: controls that ensure the
order of cell cycle events. Science 246, 629–634.Koch C & Nasmyth K (1994) Cell cycle regulated transcription in yeast.
Curr. Opin. Cell Biol. 6, 451–459.Morgan DO (1997) Cyclin-dependent kinases: engines, clocks, and micro-
processors. Annu. Rev. Cell Dev. Biol. 13, 261–291.Pavletich NP (1999) Mechanisms of cyclin-dependent kinase regulation:
structures of Cdks, their cyclin activators, and CIP and Ink4 inhibitors. J.Mol. Biol. 287, 821–828.
Spellman PT, Sherlock G, Zhang MQ et al. (1988) Comprehensive identifi-cation of cell cycle-regulated genes of the yeast Saccharomyces cerevisi-ae by microarray hybridization. Mol. Biol. Cell 9, 3273–3297.
Zachariae W & Nasmyth K (1999) Whose end is destruction: cell divisionand the anaphase-promoting complex. Genes Dev. 13, 2039–2058.
Intracellular Control of Cell-Cycle EventsCaspari T (2000) How to activate p53. Curr. Biol. 10, R315–R317.Donaldson AD & Blow JJ (1999) The regulation of replication origin acti-
vation. Curr. Opin. Genet. Dev. 9, 62–68.Dunphy WG (1994) The decision to enter mitosis. Trends Cell Biol. 4,
202–207.Elledge SJ (1996) Cell cycle checkpoints: preventing an identity crisis. Sci-
ence 274, 1664–1672.Harbour JW & Dean DC (2000) The Rb/E2F pathway: expanding roles and
emerging paradigms. Genes Dev. 14, 2393–2409.Hirano T (2000) Chromosome cohesion, condensation, and separation.
Annu. Rev. Biochem. 69, 115–144.Johnston GC, Pringle JR & Hartwell LH (1977) Coordination of growth
with cell division in the yeast Saccharomyces cerevisiae. Exp. Cell Res. 105,79–98.
Kelly TJ & Brown GW (2000) Regulation of chromosome replication. Annu.Rev. Biochem. 69, 829–880.
Nasmyth K, Peters JM & Uhlmann F (2000) Splitting the chromosome: cut-ting the ties that bind sister chromatids. Science 288, 1379–1385.
Neufeld TP & Edgar BA (1998) Connections between growth and the cellcycle. Curr. Opin. Cell Biol. 10, 784–790.
Rao PN & Johnson RT (1970) Mammalian cell fusion: studies on the regu-lation of DNA synthesis and mitosis. Nature 225, 159–164.
Shah JV & Cleveland DW (2000) Waiting for anaphase: Mad2 and the spin-dle assembly checkpoint. Cell 103, 997–1000.
Stillman B (1996) Cell cycle control of DNA replication. Science 274,1659–1664.
Zhou BB & Elledge SJ (2000) The DNA damage response: putting check-points in perspective. Nature 408, 433–439.

Programmed Cell Death (Apoptosis)Adams JM & Cory S (1988) The Bcl-2 protein family: arbiters of cell sur-
vival. Science 281, 1322–1326.Chao DT & Korsmeyer SJ (1998) BCL-2 family: regulators of cell death.
Annu. Rev. Immunol. 16, 395–419.Ekert PG, Silke J & Vaux DL (1999) Caspase inhibitors. Cell Death Differ. 6,
1081–1086.Ellis RE, Yuan JY & Horvitz RA (1991) Mechanisms and functions of cell
death Annu. Rev. Cell Biol. 7, 663–698.Kerr JF, Wyllie AH & Currie AR (1972) Apoptosis: a basic biological phe-
nomenon with wide-ranging implications in tissue kinetics. Br. J. Cancer26, 239–257.
Li H & Yuan J (1999) Deciphering the pathways of life and death. Curr. Opin.Cell Biol. 11, 261–266.
Nicholson DW & Thornberry NA (1977) Caspases: killer proteases. TIBS22, 299–306.
Extracellular Control of Cell Division, Cell Growth,and ApoptosisAssoian RK (1997) Anchorage-dependent cell cycle progression. J. Cell Biol.
136, 1–4.Blackburn EH (2000) Telomere states and cell fates. Nature 408, 53–56.Conlon I & Raff M (1999) Size control in animal development. Cell 96,
235–244.Datta SR, Brunet A & Greenberg ME (1999) Cellular survival: a play in
three Akts. Genes Dev. 13, 2905–2927.Raff MC (1992) Social controls on cell survival and cell death. Nature 356,
397–400.Sherr CJ (1994) G1 phase progression: cycling on cue. Cell 79, 551–555.Sherr CJ (1998) Tumor surveillance via the ARF-p53 pathway. Genes Dev.
12, 2984–2991.Sherr CJ & DePinho RA (2000) Cellular senescence: mitotic clock or cul-
ture shock? Cell 102, 407–410.Stocker H & Hafen E (2000) Genetic control of cell size. Curr. Opin. Genet.
Dev. 10, 529–535.
1026 Chapter 17 : THE CELL CYCLE AND PROGRAMMED CELL DEATH