Cell cycle control, DNA damage repair, and apoptosis-related ...
16
RESEARCH ARTICLE Open Access Cell cycle control, DNA damage repair, and apoptosis-related pathways control pre-ameloblasts differentiation during tooth development Chengcheng Liu 1† , Yulong Niu 2† , Xuedong Zhou 1 , Xin Xu 1 , Yi Yang 2 , Yan Zhang 3* and Liwei Zheng 1* Abstract Background: Ameloblast differentiation is the most critical stepwise process in amelogenesis, and it is controlled by precise molecular events. To better understand the mechanism controlling pre-ameloblasts (PABs) differentiation into secretory ameloblasts (SABs), a more precise identification of molecules and signaling networks will elucidate the mechanisms governing enamel formation and lay a foundation for enamel regeneration. Results: We analyzed transcriptional profiles of human PABs and SABs. From a total of 28,869 analyzed transcripts, we identified 923 differentially expressed genes (DEGs) with p < 0.05 and Fold-change > 2. Among the DEGs, 647 genes showed elevated expression in PABs compared to SABs. Notably, 38 DEGs displayed greater than eight-fold changes. Comparative analysis revealed that highly expressed genes in PABs were involved in cell cycle control, DNA damage repair and apoptosis, while highly expressed genes in SABs were related to cell adhesion and extracellular matrix. Moreover, coexpression network analysis uncovered two highly conserved sub-networks contributing to differentiation, containing transcription regulators (RUNX2, ETV1 and ETV5), solute carrier family members (SLC15A1 and SLC7A11), enamel matrix protein (MMP20), and a polymodal excitatory ion channel (TRPA1). Conclusions: By combining comparative analysis and coexpression networks, this study provides novel biomarkers and research targets for ameloblast differentiation and the potential for their application in enamel regeneration. Keywords: Ameloblasts, Differentiation, Tooth development, Transcriptional profile Background Enamel is one of the hardest mineralized tissues in verte- brates [1], and it is formed through extracellular matrix deposition by secretory ameloblasts (SABs) and the subse- quent mineralization of organic matrix by mature amelo- blasts (MABs) [2]. SABs and MABs are terminally differentiated cells derived from pre-ameloblasts (PABs), which are undifferentiated ameloblasts that are specified during odontogenesis [3]. PABs are elongated columnar dental epithelial cells characterized by nuclei localized near the stellate reticulum side and cytoplasm filled with organelles required for enamel protein synthesis and secretion. Amelogenesis is a progressive differentiation process characterized by enamel formation and ameloblast dif- ferentiation, and it is regulated by various molecular and morphogenetic events. The transition of PAB to SAB is considered a hallmark of amelogenesis. Signals from the underlying dental mesenchymal compartment initiate this differentiation process by inducing PABs to SABs after basement membrane degradation during the bell stage of tooth development [4]. Differentiated SABs are * Correspondence: [email protected]; [email protected] † Equal contributors 3 Department of Orofacial Sciences, University of California, San Francisco, CA 94143, USA 1 State Key Laboratory of Oral Diseases, West China Hospital of Stomatology, Sichuan University, Chengdu, PR China Full list of author information is available at the end of the article © 2015 Liu et al. Open Access This article is distributed under the terms of the Creative Commons Attribution 4.0 International License (http://creativecommons.org/licenses/by/4.0/), which permits unrestricted use, distribution, and reproduction in any medium, provided you give appropriate credit to the original author(s) and the source, provide a link to the Creative Commons license, and indicate if changes were made. The Creative Commons Public Domain Dedication waiver (http://creativecommons.org/publicdomain/zero/1.0/) applies to the data made available in this article, unless otherwise stated. Liu et al. BMC Genomics 201516:592 DOI 10.1186/s12864-015-1783-y
-
Upload
khangminh22 -
Category
Documents
-
view
2 -
download
0
Transcript of Cell cycle control, DNA damage repair, and apoptosis-related ...
RESEARCH ARTICLE Open Access
Cell cycle control, DNA damage repair,and apoptosis-related pathways controlpre-ameloblasts differentiation during toothdevelopmentChengcheng Liu1†, Yulong Niu2†, Xuedong Zhou1, Xin Xu1, Yi Yang2, Yan Zhang3* and Liwei Zheng1*
Abstract
Background: Ameloblast differentiation is the most critical stepwise process in amelogenesis, and it is controlledby precise molecular events. To better understand the mechanism controlling pre-ameloblasts (PABs) differentiationinto secretory ameloblasts (SABs), a more precise identification of molecules and signaling networks will elucidatethe mechanisms governing enamel formation and lay a foundation for enamel regeneration.
Results: We analyzed transcriptional profiles of human PABs and SABs. From a total of 28,869 analyzedtranscripts, we identified 923 differentially expressed genes (DEGs) with p < 0.05 and Fold-change > 2. Amongthe DEGs, 647 genes showed elevated expression in PABs compared to SABs. Notably, 38 DEGs displayed greaterthan eight-fold changes. Comparative analysis revealed that highly expressed genes in PABs were involved in cellcycle control, DNA damage repair and apoptosis, while highly expressed genes in SABs were related to celladhesion and extracellular matrix. Moreover, coexpression network analysis uncovered two highly conservedsub-networks contributing to differentiation, containing transcription regulators (RUNX2, ETV1 and ETV5), solutecarrier family members (SLC15A1 and SLC7A11), enamel matrix protein (MMP20), and a polymodal excitatory ionchannel (TRPA1).
Conclusions: By combining comparative analysis and coexpression networks, this study provides novelbiomarkers and research targets for ameloblast differentiation and the potential for their application in enamelregeneration.
Keywords: Ameloblasts, Differentiation, Tooth development, Transcriptional profile
BackgroundEnamel is one of the hardest mineralized tissues in verte-brates [1], and it is formed through extracellular matrixdeposition by secretory ameloblasts (SABs) and the subse-quent mineralization of organic matrix by mature amelo-blasts (MABs) [2]. SABs and MABs are terminallydifferentiated cells derived from pre-ameloblasts (PABs),which are undifferentiated ameloblasts that are specified
during odontogenesis [3]. PABs are elongated columnardental epithelial cells characterized by nuclei localizednear the stellate reticulum side and cytoplasm filled withorganelles required for enamel protein synthesis andsecretion.Amelogenesis is a progressive differentiation process
characterized by enamel formation and ameloblast dif-ferentiation, and it is regulated by various molecular andmorphogenetic events. The transition of PAB to SAB isconsidered a hallmark of amelogenesis. Signals from theunderlying dental mesenchymal compartment initiatethis differentiation process by inducing PABs to SABsafter basement membrane degradation during the bellstage of tooth development [4]. Differentiated SABs are
* Correspondence: [email protected]; [email protected]†Equal contributors3Department of Orofacial Sciences, University of California, San Francisco, CA94143, USA1State Key Laboratory of Oral Diseases, West China Hospital of Stomatology,Sichuan University, Chengdu, PR ChinaFull list of author information is available at the end of the article
© 2015 Liu et al. Open Access This article is distributed under the terms of the Creative Commons Attribution 4.0International License (http://creativecommons.org/licenses/by/4.0/), which permits unrestricted use, distribution, andreproduction in any medium, provided you give appropriate credit to the original author(s) and the source, provide alink to the Creative Commons license, and indicate if changes were made. The Creative Commons Public DomainDedication waiver (http://creativecommons.org/publicdomain/zero/1.0/) applies to the data made available in thisarticle, unless otherwise stated.
Liu et al. BMC Genomics (2015) 16:592 DOI 10.1186/s12864-015-1783-y

tall, columnar, and polarized cells, and they cansynthesize and secrete various enamel-specific pro-teins, such as amelogenin, ameloblastin, amelotin andenamelin [5]. These extracellular matrix proteins areessential for enamel formation and mineralization [6],and perturbation in ameloblast protein synthesis inhumans results in malformed enamel [7]. After depositingfull-thickness enamel matrix, ameloblasts further differen-tiate into short MABs to regulate enamel mineralization.Following tooth eruption, MABs undergo apoptosis [8].Because there are no readily available ameloblast-lineagecells in human adults, they cannot restore or regenerateenamel.Ameloblast differentiation is critical for enamel forma-
tion and enamel regeneration, thus, recent studies havefocused on the molecular mechanisms of ameloblast dif-ferentiation [3, 9]. Roles of growth factors, enamelmatrix proteins and transcription factors have beenidentified; for example, bone morphogenetic protein 2(BMP2) and transforming growth factor-β1 (TGFβ1)were shown to induce ameloblast differentiation in vitro[10]. Studies on cultured tooth explants have also indi-cated that ameloblast differentiation is regulated by an-tagonistic effects between bone morphogenetic protein 4(BMP4) and activin A [11]. In addition to these non-cellautonomous molecules, some secreted proteins, such asameloblastin (AMBN), amelogenin (AMEL), enamelin(ENAM), and enamel proteinases such as matrix metal-loproteinase 20 (MMP20) play key roles in full amelo-blast differentiation [8]. The stage-specific expression ofthese genes is controlled by specific transcription factors.For example, the overexpression of Runt-related tran-scription factor (Runx2) and Distal-less homeobox 3(Dlx3) result in the up-regulation of AMEL and ENAMmRNA levels [12]. These studies identified fundamentalmolecular events that control ameloblast differentiationand enamel regeneration. However, the differentiationfrom PAB to SAB is likely controlled by a precise mo-lecular network like most cell differentiation processes.Therefore, further study of the transcriptional profileduring ameloblast differentiation is important to identifynovel biomarkers and research targets for the future in-vestigation of tooth development and regeneration.Here, we performed a comprehensive analysis of
PABs and SABs transcriptional profiles from individualgene transcriptional levels to functional categories ofenriched genes. This strategy revealed that the transitionfrom PABs to SABs coincided with diverse DEGs involvedin multiple pathways. Particularly, genes encoding growthfactors, signaling molecules, transcription factors and theircorresponding receptors, as well as membrane transportproteins were specifically expressed, and these moleculeslikely govern the biological processes essential for amelo-blast differentiation and amelogenesis, including cell cycle,
cell proliferation, cell adhesion, apoptosis and biomineraltissue development. Finally, we used bioinformatic ap-proaches to explore significant coexpression networksand identify novel coexpression associations of centralhubs in these networks.
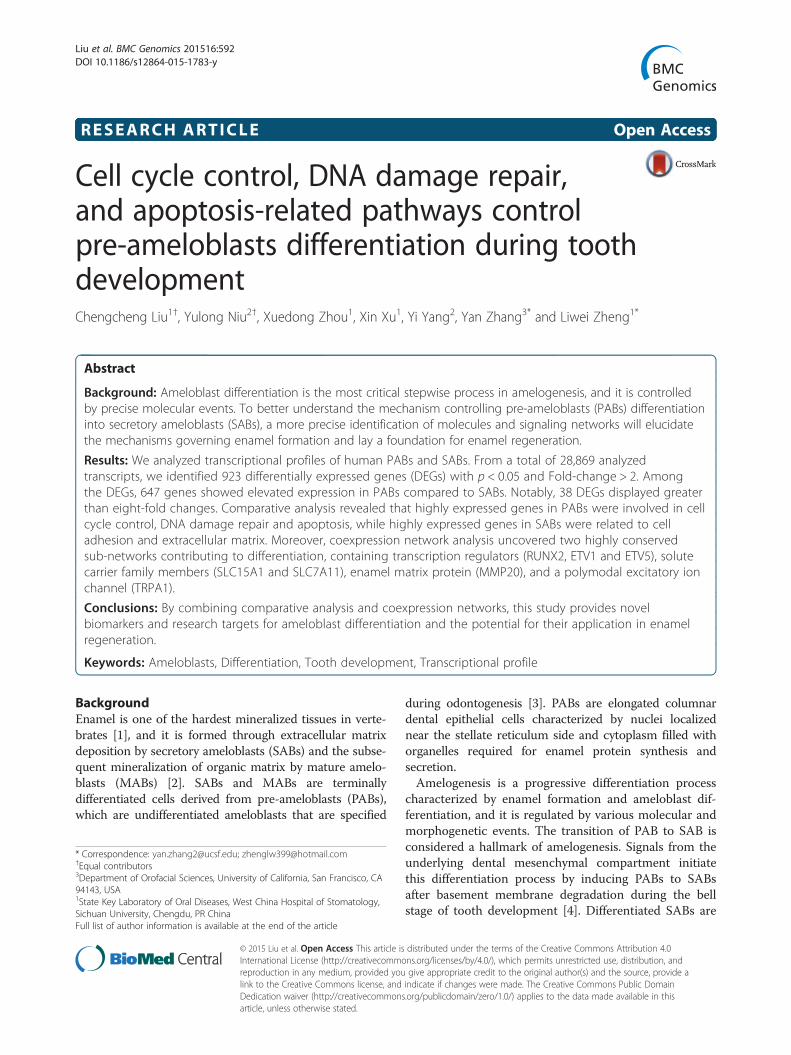
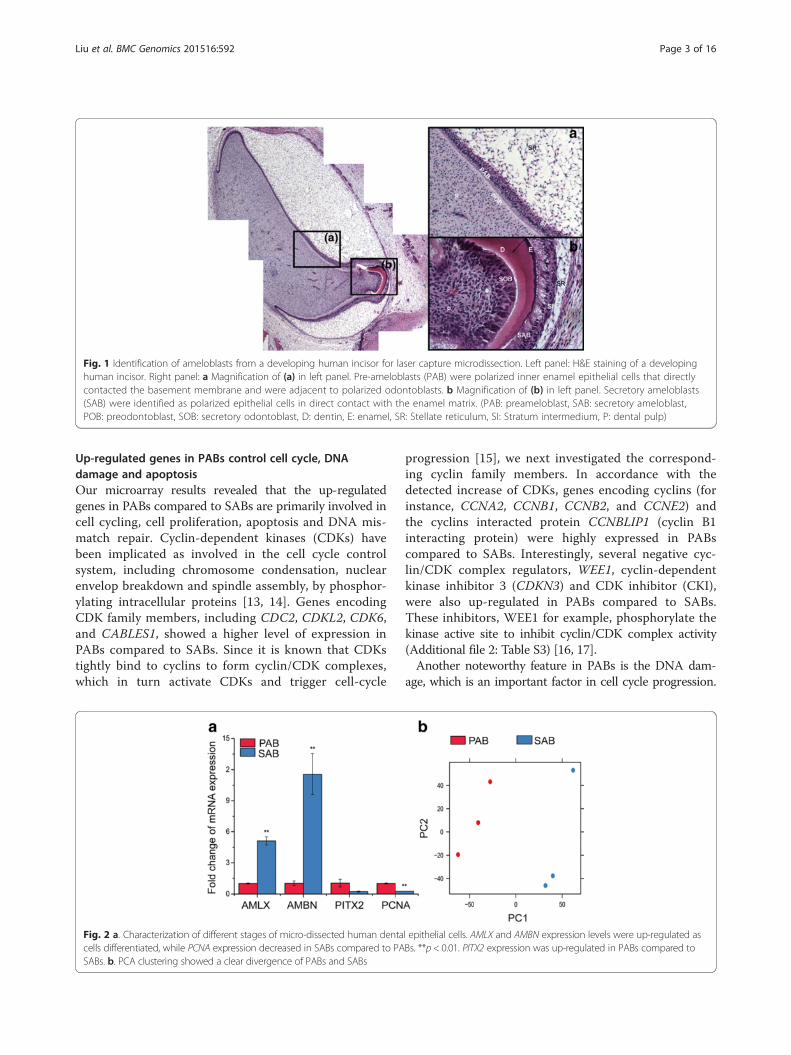
ResultsPAB and SAB morphology and gene markercharacterizationTo isolate PABs and SABs from human tooth buds, weperformed rapid H&E staining to identify each cell type bylocation and morphology, then collected the cells by lasercapture microdissection (LCM) (Fig. 1). In addition, weperformed quantitative real-time PCR (qPCR) on micro-dissected cells (PABs and SABs) from human incisors toexamine the expression of four genes known to be in-volved in ameloblast differentiation. As expected, SABsmore highly expressed AMLX and AMBN compared toPABs, and PABs expressed higher levels of PCNA com-pared to SABs. PITX2 expression was up-regulated inPABs compared to SABs (Fig. 2a).
Distinct transcriptional patterns in PABs and SABsTo generate the transcriptional profiles of PABs andSABs, we performed Affymetrix Human Genome 1.0STArrays on RNA from laser-captured cells. First, to obtainthe whole transcriptional changes related to the differen-tiation from PABs to SABs, we applied principal compo-nent analysis (PCA) to the normalized microarray data.As anticipated, when the group number was set as 2, thetranscriptional landscapes of the PABs and SABs sepa-rated into independent clusters, indicating distinct geneexpression patterns for the two cell types (Fig. 2b). Bycomparing the probe intensity of 28,869 transcripts weidentified a total of 923 DEGs with a threshold foldchange (FC) > 2 and p < 0.05 between PABs and SABs.Among these DEGs, 647 genes were upregulated inPABs compared to SABs and 276 genes were upregu-lated in SABs compared to PABs. (See Additional file 1for a full list of identified genes). Furthermore, 38 geneswere dramatically changed (FC > 8) between PABs andSABs (Table 1).
KEGG pathway analysis of differentially expressed genesWe annotated the DEGs identified in the comparison ofPABs to SABs using the Kyoto Encyclopedia of Genesand Genomes (KEGG) pathway. We assigned DEGs to280 pathways, and we identified a total of 23 signifi-cantly enriched pathways (threshold p-value < 0.05)(Fig. 3a). We applied size-dependent enrichment analysisto map each gene cluster into pathways. Cluster maps ofDNA replication, mismatch repair, cell cycle, p53 signal-ing, Notch signaling, small cell lung cancer and ECM-receptor interaction pathways are shown in Fig. 3b.
Liu et al. BMC Genomics (2015) 16:592 Page 2 of 16
Up-regulated genes in PABs control cell cycle, DNAdamage and apoptosisOur microarray results revealed that the up-regulatedgenes in PABs compared to SABs are primarily involved incell cycling, cell proliferation, apoptosis and DNA mis-match repair. Cyclin-dependent kinases (CDKs) havebeen implicated as involved in the cell cycle controlsystem, including chromosome condensation, nuclearenvelop breakdown and spindle assembly, by phosphor-ylating intracellular proteins [13, 14]. Genes encodingCDK family members, including CDC2, CDKL2, CDK6,and CABLES1, showed a higher level of expression inPABs compared to SABs. Since it is known that CDKstightly bind to cyclins to form cyclin/CDK complexes,which in turn activate CDKs and trigger cell-cycle
progression [15], we next investigated the correspond-ing cyclin family members. In accordance with thedetected increase of CDKs, genes encoding cyclins (forinstance, CCNA2, CCNB1, CCNB2, and CCNE2) andthe cyclins interacted protein CCNBLIP1 (cyclin B1interacting protein) were highly expressed in PABscompared to SABs. Interestingly, several negative cyc-lin/CDK complex regulators, WEE1, cyclin-dependentkinase inhibitor 3 (CDKN3) and CDK inhibitor (CKI),were also up-regulated in PABs compared to SABs.These inhibitors, WEE1 for example, phosphorylate thekinase active site to inhibit cyclin/CDK complex activity(Additional file 2: Table S3) [16, 17].Another noteworthy feature in PABs is the DNA dam-
age, which is an important factor in cell cycle progression.
Fig. 2 a. Characterization of different stages of micro-dissected human dental epithelial cells. AMLX and AMBN expression levels were up-regulated ascells differentiated, while PCNA expression decreased in SABs compared to PABs. **p < 0.01. PITX2 expression was up-regulated in PABs compared toSABs. b. PCA clustering showed a clear divergence of PABs and SABs
Fig. 1 Identification of ameloblasts from a developing human incisor for laser capture microdissection. Left panel: H&E staining of a developinghuman incisor. Right panel: a Magnification of (a) in left panel. Pre-ameloblasts (PAB) were polarized inner enamel epithelial cells that directlycontacted the basement membrane and were adjacent to polarized odontoblasts. b Magnification of (b) in left panel. Secretory ameloblasts(SAB) were identified as polarized epithelial cells in direct contact with the enamel matrix. (PAB: preameloblast, SAB: secretory ameloblast,POB: preodontoblast, SOB: secretory odontoblast, D: dentin, E: enamel, SR: Stellate reticulum, SI: Stratum intermedium, P: dental pulp)
Liu et al. BMC Genomics (2015) 16:592 Page 3 of 16
DNA damage initiates a signaling pathway, and the cellcycle control system can detect signals to arrest the cellcycle at late G1 or G2/M checkpoints [18]. We foundthat MDM2 expression was increased in PABs compared
to SABs. MDM2 is a critical regulator of the cell cycle,as it ubiquitinates P53, targeting it for destruction bythe proteasome [19]. Moreover, members of the DNAmismatch repair pathway, including MSH2, PMS2l5,
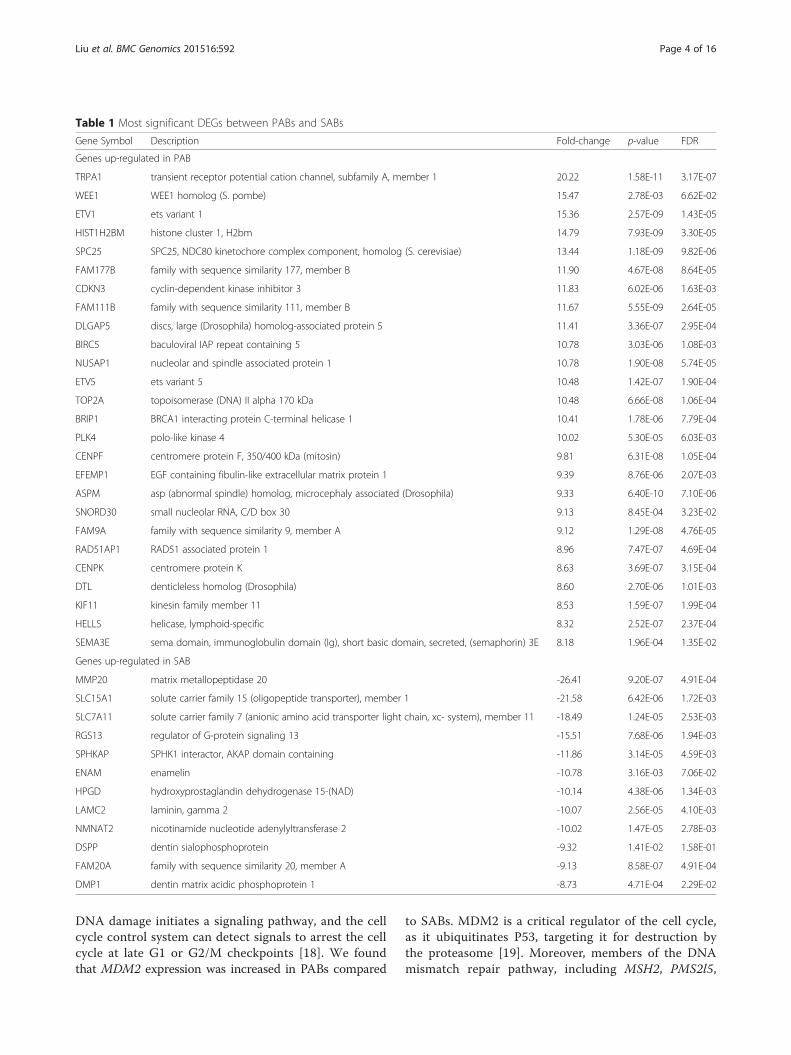
Table 1 Most significant DEGs between PABs and SABs
Gene Symbol Description Fold-change p-value FDR
Genes up-regulated in PAB
TRPA1 transient receptor potential cation channel, subfamily A, member 1 20.22 1.58E-11 3.17E-07
WEE1 WEE1 homolog (S. pombe) 15.47 2.78E-03 6.62E-02
ETV1 ets variant 1 15.36 2.57E-09 1.43E-05
HIST1H2BM histone cluster 1, H2bm 14.79 7.93E-09 3.30E-05
SPC25 SPC25, NDC80 kinetochore complex component, homolog (S. cerevisiae) 13.44 1.18E-09 9.82E-06
FAM177B family with sequence similarity 177, member B 11.90 4.67E-08 8.64E-05
CDKN3 cyclin-dependent kinase inhibitor 3 11.83 6.02E-06 1.63E-03
FAM111B family with sequence similarity 111, member B 11.67 5.55E-09 2.64E-05
DLGAP5 discs, large (Drosophila) homolog-associated protein 5 11.41 3.36E-07 2.95E-04
BIRC5 baculoviral IAP repeat containing 5 10.78 3.03E-06 1.08E-03
NUSAP1 nucleolar and spindle associated protein 1 10.78 1.90E-08 5.74E-05
ETV5 ets variant 5 10.48 1.42E-07 1.90E-04
TOP2A topoisomerase (DNA) II alpha 170 kDa 10.48 6.66E-08 1.06E-04
BRIP1 BRCA1 interacting protein C-terminal helicase 1 10.41 1.78E-06 7.79E-04
PLK4 polo-like kinase 4 10.02 5.30E-05 6.03E-03
CENPF centromere protein F, 350/400 kDa (mitosin) 9.81 6.31E-08 1.05E-04
EFEMP1 EGF containing fibulin-like extracellular matrix protein 1 9.39 8.76E-06 2.07E-03
ASPM asp (abnormal spindle) homolog, microcephaly associated (Drosophila) 9.33 6.40E-10 7.10E-06
SNORD30 small nucleolar RNA, C/D box 30 9.13 8.45E-04 3.23E-02
FAM9A family with sequence similarity 9, member A 9.12 1.29E-08 4.76E-05
RAD51AP1 RAD51 associated protein 1 8.96 7.47E-07 4.69E-04
CENPK centromere protein K 8.63 3.69E-07 3.15E-04
DTL denticleless homolog (Drosophila) 8.60 2.70E-06 1.01E-03
KIF11 kinesin family member 11 8.53 1.59E-07 1.99E-04
HELLS helicase, lymphoid-specific 8.32 2.52E-07 2.37E-04
SEMA3E sema domain, immunoglobulin domain (Ig), short basic domain, secreted, (semaphorin) 3E 8.18 1.96E-04 1.35E-02
Genes up-regulated in SAB
MMP20 matrix metallopeptidase 20 -26.41 9.20E-07 4.91E-04
SLC15A1 solute carrier family 15 (oligopeptide transporter), member 1 -21.58 6.42E-06 1.72E-03
SLC7A11 solute carrier family 7 (anionic amino acid transporter light chain, xc- system), member 11 -18.49 1.24E-05 2.53E-03
RGS13 regulator of G-protein signaling 13 -15.51 7.68E-06 1.94E-03
SPHKAP SPHK1 interactor, AKAP domain containing -11.86 3.14E-05 4.59E-03
ENAM enamelin -10.78 3.16E-03 7.06E-02
HPGD hydroxyprostaglandin dehydrogenase 15-(NAD) -10.14 4.38E-06 1.34E-03
LAMC2 laminin, gamma 2 -10.07 2.56E-05 4.10E-03
NMNAT2 nicotinamide nucleotide adenylyltransferase 2 -10.02 1.47E-05 2.78E-03
DSPP dentin sialophosphoprotein -9.32 1.41E-02 1.58E-01
FAM20A family with sequence similarity 20, member A -9.13 8.58E-07 4.91E-04
DMP1 dentin matrix acidic phosphoprotein 1 -8.73 4.71E-04 2.29E-02
Liu et al. BMC Genomics (2015) 16:592 Page 4 of 16

RMI1 and EXO1, were enriched in PABs compared toSABs (Additional file 2: Table S3) [20, 21].Notably, CASP6 and CASP8AP2 expression was in-
creased in PABs compared to SABs (Additional file 2:Table S3), and they encode the apoptosis-related exe-cutioner caspase (Caspase 6) and initiator caspase(Caspase 8), respectively [22].Taken together, the significantly up-regulated genes in
PABs will work coordinately to form a sophisticated net-work that tightly controls the cell cycle, DNA damageand apoptosis, altogether contributing to ensuring thatPABs remain in a proper state to support differentiation.
SABs are enriched for genes associated with extracellularmatrix and adhesionAmelogenin, ameloblastin, enamelin and amelotin are fourEMPs, which are highly expressed during the secretory
and early maturation stages of amelogenesis [23]. They aresubsequently degraded step-wise from the matrix byMMP20 and kallikrein 4 (KLK4) during the ameloblastsecretory stage and maturation stage, respectively [2].Among them, amelogenin is the most abundant protein inenamel matrix and is continuously expressed throughoutamelogenesis. Ameloblastin is the second most abundantEMP, and it localizes between enamel rods. Enamelin isthe largest enamel matrix protein of developing teeth andcomprises approximately 5 % of total EMPs. As expected,genes encoding AMBN, ENAM, AMTN and MMP20were more highly expressed in SAB cells compared toPAB cells [6] (Additional file 2: Table S3). However, AMLXand KLK4 expression did not significantly differ betweenPABs and SABs. Other genes encoding proteins involvedin biomineral tissue development (DSPP, DMP1, PHEX,ALPL and MMP16) [24–27] were also more highly
Fig. 3 KEGG pathway analysis. a. KEGG pathway enrichment analysis was performed by Fisher exact test. Significantly enriched KEGG pathways (p< 0.05)are presented. For each KEGG pathway, the bar shows the fold-enrichment of the pathway. b. The expression intensity of genes in the selectedKEGG pathway. The italic values on the right of gene names were the fold changes of corresponding genes in PABs compared to SABs
Liu et al. BMC Genomics (2015) 16:592 Page 5 of 16

expressed in SABs compared to PABs (Additional file 2:Table S3).In addition to genes encoding secreted proteins, SABs
were enriched in five genes encoding laminins, includ-ing LAMC1, LAMC2, LAMB3, LAMA3 and LAMA2(Additional file 2: Table S3). Laminins are primary basallamina components, and they play key roles in differenti-ation, migration and adhesion [28]. Laminin alpha5(LAMA5)-null mice have been shown to display aberrantcusp formation and dental epithelium proliferation [29].Apart from adhering to the extracellular matrix, cell-
cell adhesions also play an indispensable role in stabiliz-ing the cellular and tissue structure. Cell-cell adhesionsites are strengthened by the connected underlying cyto-skeleton, which then forms a network across severalcells. In vertebrates, cell-cell adhesion is primarily medi-ated by the cadherin superfamily, which are importantfor cell rearrangements during tissue morphogenesis[30]. We found that cadherin superfamily membersCDH8 and CDH13 were enriched in SABs compared toPABs (Additional file 2: Table S3). In addition, adhesionmolecule with Ig-like domain 2 (AMIGO2) and IGJ ex-pression were both elevated in SABs compared to PABs(Additional file 2: Table S3) [31, 32].
Differential expression of transcription factors andsignaling pathways between PABs and SABsBy comparing PAB and SAB transcriptional profiles, wefound that several growth factors, signaling molecules andtranscription factors were differentially expressed betweenthe two cell types. The transforming growth factor familymembers transforming growth factor β2 (TGFβ2) wasmore highly expressed in PABs compared to SABs, whilebone morphogenetic protein 8A (BMP8A) was morehighly expressed in SABs compared to PABs. Several othergrowth factors were differentially expressed between thecell types, suggesting that they may be critical regulatorsin ameloblast differentiation. One fibroblast growth factorfamily member (FGF20) was increased in SABs, whilefibroblast growth factor 9 (FGF9) and nuclear factor I b(NFIB) expression were decreased in SABs compared toPABs. Interestingly, several negative regulators of thefibroblast growth factor receptor signaling pathway(SPRY1, SPRY2, SPRY4, THBS1 and SULF1) [33–36] wereenriched in PABs compared to SABs (Additional file 2:Table S3).Notch signaling and MAPK signaling contribute to cell
differentiation during tissue development [37, 38]. Inthis study, we found that Notch 2 and MAPK6 expres-sion was increased in SABs compared to PABs. However,two other MAPK members (MAPK10 and MAPK14)were enriched in PABs compared to SABs. Moreover,the distalless related homeodomain proteins (Dlx5) andtranscription factor AP-2 alpha (TFAP2A) were highly
expressed in PABs compared to SABs (Additional file 2:Table S3). Two G protein-coupled receptor pathwaymembers (GPR110 and GPSM2) were more highlyexpressed in PABs. In addition, three interleukin geneswere differentially expressed between PABs and SABs.IL17 receptor (IL17RD) expression increased, while IL1receptor (IL1R1) and IL33 expression decreased in PABscompared to SABs (Additional file 2: Table S3).
Transporters and ion channels are differentially expressedbetween PABs and SABsTranscellular Ca2+ transport plays an important part inthe formation of calcium hydroxyapatite during amelo-genesis. Previous studies have shown that stromal inter-action molecule 1 (STIM1) and solute carrier family 24,member 4 (SLC24A4) were critical ion transport sys-tems in enamel maturation [39]. We found that inaddition to SLC24A4, nine other solute carrier familymembers (SLC15A1, SLC7A11, SLC41A2, SLC13A5,SLC4A4, SLC17A5, SLC25A33 and SLC45A4) wereenriched in SABs compared to PABs. In contrast, six fam-ily members (SLC26A4, SLC4A7, SLC35A3, SLC27A2,SLC16A10 and SLC35F1) were increased in PABs com-pared to SABs (Additional file 2: Table S3).Channels are another major class of membrane trans-
port proteins [40]. We found that three genes encodingtransient receptor potential (TRP) channels, includingTRPM7, TRPA1 and TRPC1, were differentially expressedbetween the two cell types. TRPM7 is essential for manycellular processes, including proliferation, survival, differ-entiation, growth, and migration [41]. Its expression in-creased in SABs compared to PABs, while TRPA1 andTRPC1 were more highly expressed in PABs. Strikingly,TRPA1 expression was more than 16 fold higher in PABsthan SABs (Additional file 2: Table S3).Other ion transport-associated genes that were differ-
entially expressed include members of Na-K-ATPase(ATP1B1) and V-ATPase (ATP6V0D1 and ATP6V0A1),which were all increased in SABs compared to PABs(Additional file 2: Table S3).
Genome-wide coexpression network constructionidentified ameloblast development-associated modulesDifferent cell types synthesize different sets of proteins, so,to a large extent, gene expression defines the cell differen-tiation program. However, rather than functioning ascompletely independent components, genes interface inintricate ways to create a network. In particular, signalingnetworks precisely regulate diverse cellular events, includ-ing cell cycle, morphogenesis, proliferation, cell adhesion,and programmed cell death [42].To further explore specific networks that orchestrate
ameloblast differentiation and identify the gene coexpres-sion associations of DEGs in these networks, we used
Liu et al. BMC Genomics (2015) 16:592 Page 6 of 16
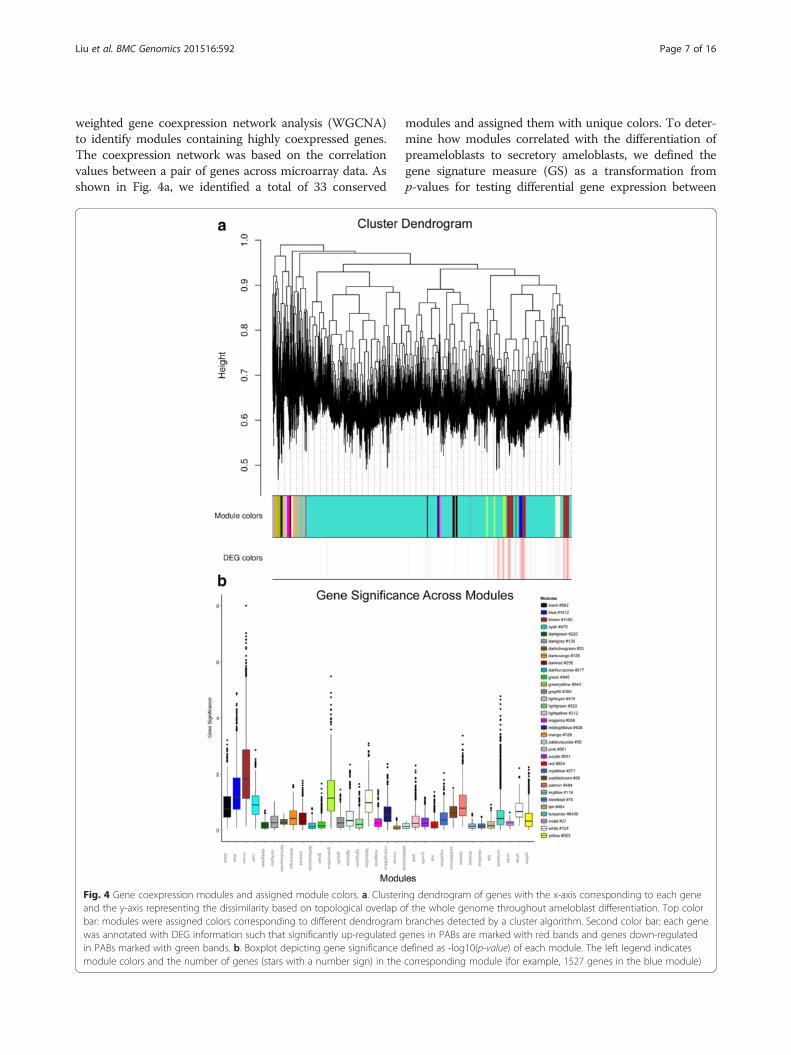
weighted gene coexpression network analysis (WGCNA)to identify modules containing highly coexpressed genes.The coexpression network was based on the correlationvalues between a pair of genes across microarray data. Asshown in Fig. 4a, we identified a total of 33 conserved
modules and assigned them with unique colors. To deter-mine how modules correlated with the differentiation ofpreameloblasts to secretory ameloblasts, we defined thegene signature measure (GS) as a transformation fromp-values for testing differential gene expression between
Fig. 4 Gene coexpression modules and assigned module colors. a. Clustering dendrogram of genes with the x-axis corresponding to each geneand the y-axis representing the dissimilarity based on topological overlap of the whole genome throughout ameloblast differentiation. Top colorbar: modules were assigned colors corresponding to different dendrogram branches detected by a cluster algorithm. Second color bar: each genewas annotated with DEG information such that significantly up-regulated genes in PABs are marked with red bands and genes down-regulatedin PABs marked with green bands. b. Boxplot depicting gene significance defined as -log10(p-value) of each module. The left legend indicatesmodule colors and the number of genes (stars with a number sign) in the corresponding module (for example, 1527 genes in the blue module)
Liu et al. BMC Genomics (2015) 16:592 Page 7 of 16
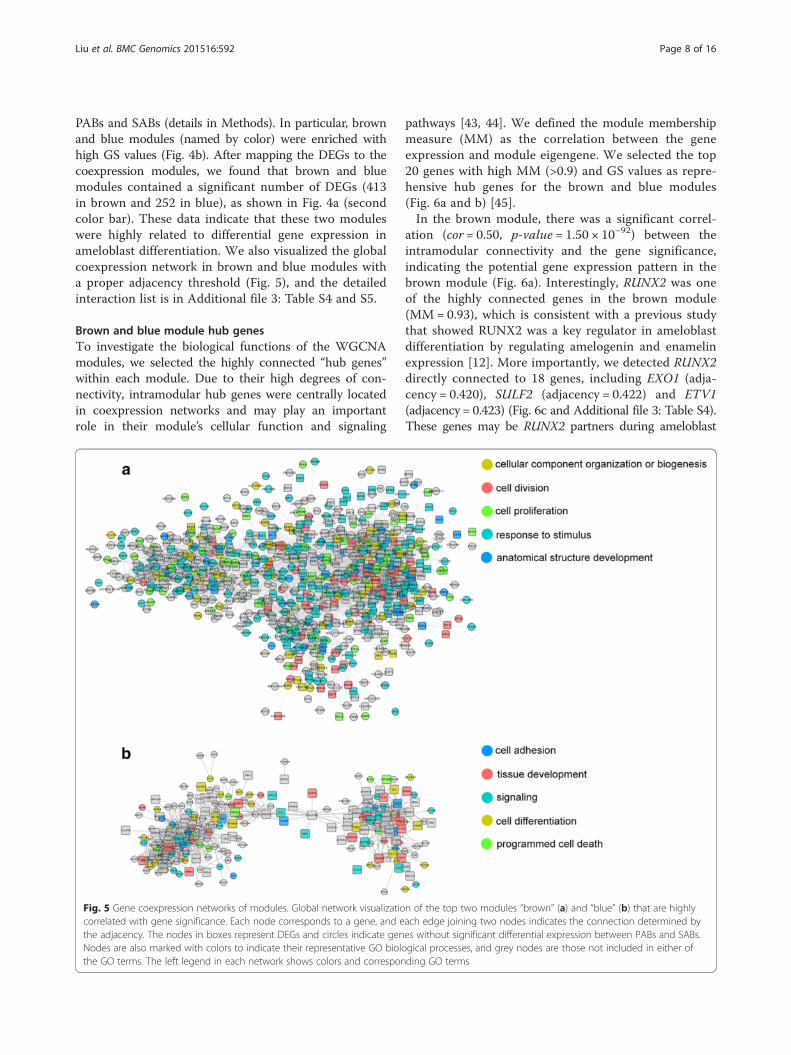
PABs and SABs (details in Methods). In particular, brownand blue modules (named by color) were enriched withhigh GS values (Fig. 4b). After mapping the DEGs to thecoexpression modules, we found that brown and bluemodules contained a significant number of DEGs (413in brown and 252 in blue), as shown in Fig. 4a (secondcolor bar). These data indicate that these two moduleswere highly related to differential gene expression inameloblast differentiation. We also visualized the globalcoexpression network in brown and blue modules witha proper adjacency threshold (Fig. 5), and the detailedinteraction list is in Additional file 3: Table S4 and S5.
Brown and blue module hub genesTo investigate the biological functions of the WGCNAmodules, we selected the highly connected “hub genes”within each module. Due to their high degrees of con-nectivity, intramodular hub genes were centrally locatedin coexpression networks and may play an importantrole in their module’s cellular function and signaling
pathways [43, 44]. We defined the module membershipmeasure (MM) as the correlation between the geneexpression and module eigengene. We selected the top20 genes with high MM (>0.9) and GS values as repre-hensive hub genes for the brown and blue modules(Fig. 6a and b) [45].In the brown module, there was a significant correl-
ation (cor = 0.50, p-value = 1.50 × 10−92) between theintramodular connectivity and the gene significance,indicating the potential gene expression pattern in thebrown module (Fig. 6a). Interestingly, RUNX2 was oneof the highly connected genes in the brown module(MM = 0.93), which is consistent with a previous studythat showed RUNX2 was a key regulator in ameloblastdifferentiation by regulating amelogenin and enamelinexpression [12]. More importantly, we detected RUNX2directly connected to 18 genes, including EXO1 (adja-cency = 0.420), SULF2 (adjacency = 0.422) and ETV1(adjacency = 0.423) (Fig. 6c and Additional file 3: Table S4).These genes may be RUNX2 partners during ameloblast
Fig. 5 Gene coexpression networks of modules. Global network visualization of the top two modules “brown” (a) and “blue” (b) that are highlycorrelated with gene significance. Each node corresponds to a gene, and each edge joining two nodes indicates the connection determined bythe adjacency. The nodes in boxes represent DEGs and circles indicate genes without significant differential expression between PABs and SABs.Nodes are also marked with colors to indicate their representative GO biological processes, and grey nodes are those not included in either ofthe GO terms. The left legend in each network shows colors and corresponding GO terms
Liu et al. BMC Genomics (2015) 16:592 Page 8 of 16
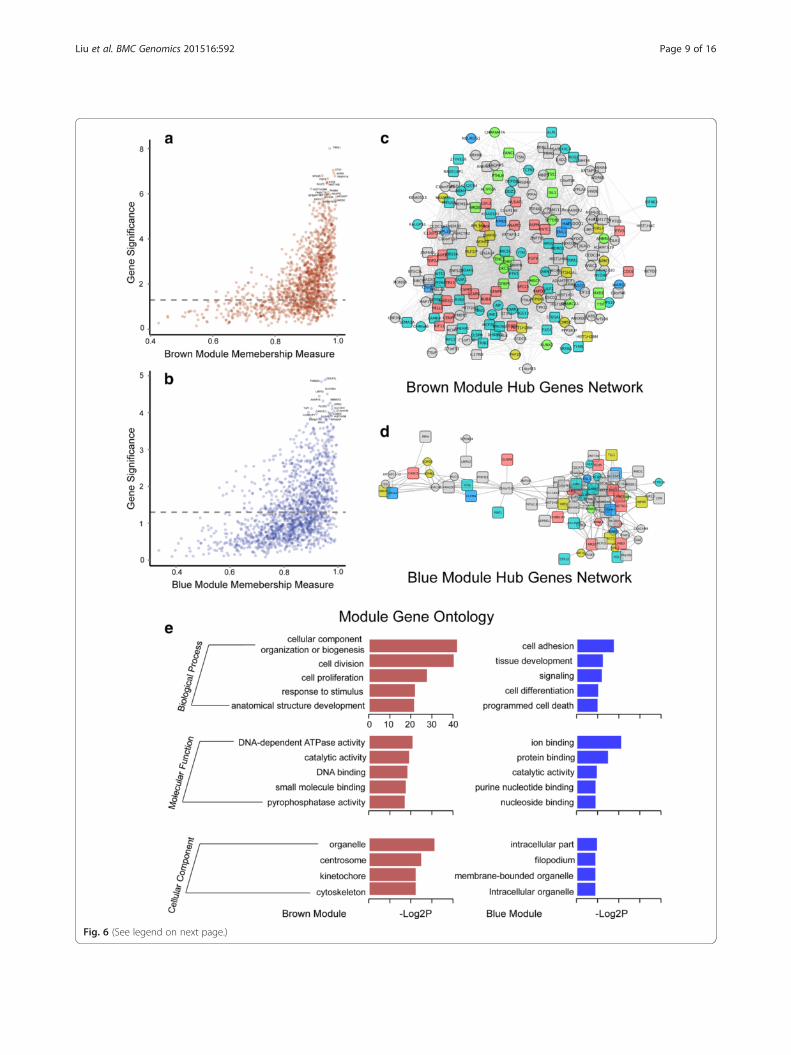
Fig. 6 (See legend on next page.)
Liu et al. BMC Genomics (2015) 16:592 Page 9 of 16

differentiation. In addition, we identified other genes en-coding RUNX proteins (RUNX1 and RUNX3) in the brownmodule. The hub genes RUNX1 (MM= 0.99) and RUNX3(MM= 0.95) directly connected to 21 and 8 genes in thebrown module, respectively (Fig. 6c and Additional file 3:Table S4). This was consistent with previous reports thatthey act as master developmental regulators [46] andindicated their function and partners in ameloblastdifferentiation. Another highly connected gene MMP20(MM = 0.94) was significantly increased (FC = 25) inSABs and was associated with anatomical structuredevelopment. This result was consistent with a recentstudy that MMP20 facilitates ameloblast movement bycleaving ameloblast cell-cell contacts [47]. FGF9 (MM=0.97) was also located in the center of the coexpressionnetwork (Fig. 6c), which suggests that they also play animportant role in ameloblast differentiation. This was inline with their role in transcription regulation throughoutdevelopment [48].We also detected another group of hub genes in-
cluding TRPA1, ETV1, ASPM, SPC25 and NUSAP1(Additional file 3: Table S6). Although these genes havenot been previously associated with ameloblast differenti-ation, their functions have been demonstrated in previousstudies. TRPA1 is a stress sensor [49], and ETV1 is anETS transcription factor required for retinal neuron differ-entiation [50]. Their appearance as hub genes in thebrown module and up-regulation (FC > 8) in PABs highlysuggest that they play critical functions in ameloblast dif-ferentiation. Notably, TRPA1 and ETV1 directly interactedwith each other (adjacency = 0.428), and both of them haddirect interactions with three other mitosis-associatedhub genes (ASPM, SPC25 and NUSAP1) (Fig. 6c andAdditional file 3: Table S4 and S6) [51–53]. It is thereforereasonable to infer that TRPA1 and ETV1 influenceameloblast differentiation by regulating cell division.Strikingly, ETV1 also directly interacted with RUNX2,suggesting that ETV1 plays pleiotropic roles in ameloblastdifferentiation.Moreover, ETV5 was a hub gene with the highest MM
(0.97), but it was not directly connected with ETV1.Rather, it was surrounded by another hub gene in thebrown module (FAM111B) with an adjacency of 0.42(Fig. 6c and Additional file 3: Table S4). These data sug-gest that the two ETS transcription factors are not
regulated in the same fashion and may therefore performdistinct physiological functions. This is consistent with therecent discovery that ETV4 and ETV5 often perform simi-lar functions during morphogenesis, whereas ETV1 hasdistinct roles [54].Similar to the brown module, we observed that the
intramodular connectivity and GS were highly correlatedin the blue module (cor = 0.49, p = 1.00 × 10−90), asshown in Fig. 6b. SLC15A1, SLC7A11 and SPHKAP werehubs in the blue module with a module membership of0.96, 0.98 and 0.97, respectively. We found thatSLC15A1 directly interacted with 27 genes and SLC7A11directly connected with 24 genes (Fig. 6d and Additionalfile 3: Table S5). Interestingly, SPHKAP showed a coex-pression relationship with both SLC15A1 (adjacency =0.414) and SLC7A11 (adjacency = 0.414) (Fig. 6d andAdditional file 3: Table S5). SPHKAP is annotated as anSPHK1-interacting protein. However, its role is still un-clear. The interaction between SPHKAP and solute car-rier family members (SLC15A1 and SLC7A11) suggeststhat it may function in solute transport during amelo-blast differentiation.LAMC2 showed a high MM of 0.97 in the blue mod-
ule, suggesting that it has an indispensable function(Additional file 3: Table S7). By performing GO analysis,we found that it was involved in tissue development(Fig. 6d), which could suggest that laminin plays animportant role in ameloblast differentiation. Though theexact function of laminin in ameloblast differentiation hasnot been reported, its function as an extracellular matrixcomponent suggests that it is involved in cell proliferationand differentiation during tooth morphogenesis [55].As an epithelial-to-mesenchymal (EMT) transcription
factor, zinc finger E-box binding protein 1 (ZEB1) hasbeen implicated in neural crest cell biology [56]. ThoughZEB1 was not detected as a hub gene in the blue mod-ule, it directly connected with the SLC15A1 hub genewith an adjacency of 0.41, and it was surrounded byDEGs in the blue module hub gene network (Fig. 6d),indicating its potential role in ameloblast differentiation.Interestingly, we also identified two BMP family mem-
bers in the two coexpression modules. However, BMP6(MM= 0.95) localized to the brown module (Additionalfile 3: Table S4 and S6), and BMP8A (MM= 0.95) localizedto the blue module (Additional file 3: Table S5 and S7),
(See figure on previous page.)Fig. 6 Hub gene selection and gene ontology analysis of brown and blue modules. a and b are the scatterplots between module membershipmeasure (x-axis) and the gene significance of the “brown” and “blue” module. The top 20 genes with both the highest gene significance andmembership measure larger than 0.9 were chosen as “hub genes”, and they are annotated with their gene symbols. The grey dashed line in theplot is the threshold for choosing significantly expressed genes, and the threshold value is –log10(0.05). c and d are the hub gene networkvisualizations for the “brown” and “blue” modules. The colors of the hub genes and their directly connected genes indicate the GO terms fromFig. 5 (a) and (b). e. Barplots represent enriched GO terms of all genes included in the “brown” (left with brown color) and “blue” (right with bluecolor) networks, and –log2(p-value) represents the relative enrichment of each GO term
Liu et al. BMC Genomics (2015) 16:592 Page 10 of 16

indicating an independent regulatory function in amelo-blast differentiation.
Gene Ontology (GO) analysis reveals gene association andbiological processes essential to ameloblastdifferentiationTo functionally characterize genes in the brown and bluemodules, we performed GO analysis. Genes associatedwith cellular component organization or biogenesis, celldivision and proliferation were significantly enriched inthe brown module, whereas genes related to ion binding,cell adhesion, and tissue development were enriched inthe blue module (Fig. 6e), which indicated a striking differ-ence in the functions of the two modules. The brownmodule closely associated with cell division and prolifera-tion, and almost all of the hub genes in the brown modulewere up-regulated in PABs compared to SABs. While theblue module was likely related to cell adhesion and tissuedevelopment, its hub genes were upregulated in SABscompared to PABs. Collectively, these results suggestedthat the blue and brown modules play critical and distinctroles in ameloblast differentiation. We also identified sev-eral genes with high MM but low GS in both modules(Fig. 6a and b), suggesting that they were closely related tocertain functions of the corresponding modules but thatthey not serve as DEGs. By separately plotting the geneswithin each GO term (Additional file 4), we found that thegenes with high MM and low GS were functionally anno-tated. For example, those genes in the brown module wereannotated as being involved in response to stimulus, whilethose in the blue module were annotated as functioning incell differentiation. We speculated that these genes mayact by interacting with hub genes or as indispensable com-ponents in biological pathways, and they should be exam-ined as potential players in ameloblast differentiation.
qPCR validation of microarray resultsTo validate microarray results, we confirmed the tran-scriptional levels of 12 genes in PABs and SABs byqPCR, including seven DEGs and AMLX, KRT14, RUNX2,KLK4 and STAT2 (Table 2). Most of the genes exhibiteddifferential expression in qPCR that was consistent withthe microarray data, indicating good concordance of bothmethods.
DiscussionAmeloblasts are a tooth-specific cell type, and they se-crete extracellular matrix proteins and deposit teeth en-amel [6]. Full ameloblast differentiation occurs by threedistinct processes: the presecretory, secretory and matur-ation stages [4]. The sequential differentiation of amelo-blast lineage cells requires signals from the underlyingmesenchymal compartment and dentinal matrix. Amelo-blasts differentiate in a niche composed of secretory pro-teins, enzymes, signaling molecules and other factors.Ameloblast differentiation is defined by the shift frompreameloblast to secretory ameloblast, and it can signifi-cantly influence enamel matrix protein secretion andmineralization initiation. This process is regulated by acomplex signaling network composed of signaling mole-cules, their receptors and transcriptional regulators [3].However, the field lacks a full understanding of thetranscriptional program underlying ameloblast differen-tiation. In this study, we aimed to identify molecularevents governing the shift from PABs to SABs and genecoexpression networks that control ameloblast maturation.Comparison of transcriptional profiles of PAB and
SAB together with KEGG pathway analysis revealed thatPAB cells express genes that allow them to control cellcycle, repair DNA mismatch and eliminate abnormal,misplaced, or nonfunctional cells by apoptosis, which
Table 2 Results of microarray and qPCR experiments
Gene name Description Gene expression Microarray qPCR
FC p-Value FDR FC p-Value
AMLX amelogenin −1.68 4.09E-02 4.36E-01 −33.27 5.22E-03
AMBN ameloblastin −4.80 1.44E-02 1.59E-01 −5.71 3.29E-03
ENAM enamelin −10.78 3.16E-03 7.06E-02 −1.48 6.13E-02
MMP20 matrix metallopeptidase 20 −26.41 9.20E-07 4.91E-04 −15.22 4.52E-03
KRT14 keratin 14 1.14 5.89E-01 8.53E-01 24.33 1.11E-02
RUNX2 runt related transcription factor 2 −1.68 1.37E-03 1.08E-01 −1.26 3.72E-01
KLK4 kallikrein-related peptidase 4 −1.18 1.75E-01 6.25E-01 1.03 7.18E-01
STAT2 signal transducer and activator of transcription 2 −1.28 2.03E-01 6.48E-01 −1.01 8.37E-01
ETV1 ets variant 1 15.36 2.57E-09 1.43E-05 25.01 3.97E-02
SLC15A1 solute carrier family 15, member 1 −21.58 6.42E-06 1.72E-03 −14.82 8.21E-04
SLC7A11 solute carrier family 7, member 11 −18.49 1.24E-05 2.53E-03 −6.19 1.32E-02
DSPP dentin sialophosphoprotein −9.32 1.41E-02 1.58E-01 −4.64 6.38E-03
Liu et al. BMC Genomics (2015) 16:592 Page 11 of 16
are necessary quality-control processes for PAB differen-tiation. In contrast, pathways enriched in SAB were pri-marily related to extracellular matrix and cell adhesion.It is widely accepted that SABs secrete EMPs into theenamel matrix, which is primarily composed of threestructural proteins (AMELX, AMBN and ENAM). Theseproteins are degraded step-wise from the matrix byMMP20 and KLK4 at ameloblast secretory stage andmaturation stage, respectively [2]. In this study, weidentified the increased expression of four secretoryameloblast-specific genes (AMBN, AMTN, ENAM andMMP20) in SABs by microarray, which is consistentwith previous studies and further validated by our LCMand microarray approach. Although microarray failed todetect AMELX enrichment in SABs, we confirmed its in-creased expression in SABs by real time PCR. This dis-crepancy may be due to the detection limit of microarrays,as fold-changes observed by microarray are usually lowerthan those observed by real-time PCR [57]. In addition,we identified five other genes (DSPP, DMP1, PHEX, ALPLand MMP16) related to biomineral tissue developmentenriched in SABs, suggesting that these genes may regu-late ameloblast maturation and enamel formation.In addition to genes encoding extracellular matrix
proteins, we also noted the enrichment of cadherin andlaminin genes in SABs. Cadherins control the selective cellsorting, and the upregulation and downregulation of spe-cific cadherins correlate with specific steps in embryonicdevelopment [58]. Previous studies have shown increasedexpression of E-cadherin and N-cadherin in PABs andSABs, respectively [47]. We found that cadherin superfam-ily genes (CDH8, CDH13 and CDHR3) and laminin genes(LAMC1, LAMC2, LAMB3, LAMA3 and LAMA2) weremore highly expressed in SABs compared to PABs, sug-gesting that they may regulate secretory ameloblast cell re-arrangement and morphogenesis. However, this is the firstimplication that they may function in amelogenesis; thus,their precise function in ameloblast differentiation requirefurther investigation.Some signaling pathways are critical for animal develop-
ment, including receptor tyrosine kinase (RTK), transform-ing growth factor family, Wnt, Hedgehog and Notch. Inaddition, JAK/STAT, nuclear hormone receptor, and G-protein-coupled receptor pathways are important in somedevelopmental processes [42, 59]. Terminal ameloblast dif-ferentiation is regulated by the interactions between theepithelium and mesenchyme. PAB differentiation can beinfluenced by odontoblasts signals, such as TGFβ1, BMP2and BMP4 [3, 60]. Our study provides proof that membersof growth factors (BMP8A, TGFβ2, NFIB, FGF9 andFGF20), signaling pathways (MAPK6, MAPK10, MAPK14and Notch2), G protein coupled receptor pathways(GPR110 and GPSM2) and transcription factors (Dlx5 andTFAP2A) participate in the differentiation of PABs to SABs.
Differentially expressed genes and KEGG pathway ana-lysis revealed key genes and metabolic characteristicsthat may regulate PAB differentiation to SABs. Furthercoexpression network analysis allowed us to identifymodules of highly correlated genes from whole tran-scriptome profiles and identify hub genes and their ex-pression associations during ameloblast differentiation.Moreover, a functional enrichment analysis of the brownand blue modules revealed basic functional pathwayspreserved in these modules.
ConclusionsIn this study, we found that the PAB to SAB differenti-ation relies on a highly regulated network of interactionsbetween conserved signal transduction pathways, includ-ing members of the BMP/TGF-β, Notch, MAPK pathwaysto coordinate all aspects of ameloblasts in intracellularprocesses and their social contexts. Specifically, expressionof genes associated with cell cycle control, DNA damagerepair, and apoptosis pathways regulate pre-ameloblastmaturation during tooth development. SAB cells are regu-lated by several signaling pathways that control enamelmatrix protein secretion and cell adhesion, which arecritical for enamel formation and cell-cell interactions.Furthermore, the application of bioinformatic analysisallowed us to explore potential key genes and gene-associations involved in ameloblast differentiation. Thesefindings will aid in the design of new strategies to promoteameloblast differentiation in tooth regeneration and tissueengineering. However, further experiments are required toconfirm the roles of these genes and their interacting genes.Although transcriptional controls are paramount for mostgene expression, these genes and pathways can also be reg-ulated by a complex array of genetic (e.g., RNA splicing andselecting), epigenetic (e.g., histone modification), non-coding RNA (e.g., microRNA and long non-coding RNA)and exogenous signaling factors that serve to guide cell fateand behavior during development and differentiation.
MethodsEthics statementAll human tissues were collected from legally abortedfetuses at West China Women and Children’s Hospitalunder the approved guidelines of Sichuan University. Thewritten informed consent of all human subjects wasobtained. The study and the consent procedure wereapproved by the Ethical Committees of West ChinaSchool of Stomatology, Sichuan University and StateKey Laboratory of Oral Diseases.
Sample collectionHuman tooth buds (18-22 weeks) were obtained fromfetal cadaver tissue within three hours after legal abor-tion under the guidelines of the West China School of
Liu et al. BMC Genomics (2015) 16:592 Page 12 of 16

Stomatology, Sichuan University Committee on HumanResearch. Teeth were dissected from the mandiblesunder a laminar flow hood, embedded in OCT com-pound (Sakura Finetek, Torrance, CA, USA), and cryo-sectioned at 10-μm thickness. These sections were usedfor LCM.
Laser capture microdissection (LCM)A PALM MicroBeam system (Carl Zeiss Micro Imaging,Inc. Thornwood, NY, USA) laser capture microscope wasused for cell dissection [61, 62]. All reagents used forLCM and RNA purification were prepared in RNase-freewater. Cryosectioned human tooth organs were mountedon polyethylene naphthalate (PEN) foil glass slides. Afterrapid hematoxylin-eosin (H&E) staining, slides wereair-dried, and dental epithelial cells were identified bylocation and morphology. PABs and SABs were separ-ately dissected and catapulted to Adhesive Cap (CarlZeiss MicroImaging Gmbh, München, Germany) con-taining ß-Mercaptoethanol-supplemented RLT buffer(RNeasy Plus Micro Kit, RNeasy Lysis Buffer, Qiagen,Valencia, CA, USA). The caps containing buffer andcells were incubated upside-down at room temperature(RT) for 30 min and then briefly centrifuged to collectthe buffer and cell complexes. RNA purification wasperformed with an RNeasy Plus Micro Kit (Qiagen),and reverse transcription was performed with Super-Script™ III First-Strand Synthesis System (InvitrogenCorporation, Carlsbad, CA, USA) following the manu-facturer’s instructions.
Microarray proceduresAffymetrix Human Genome 1.0ST Arrays (Affymetrix,Santa Clara, CA, USA) covering 28,869 transcripts inthe human genome were employed for transcriptionalprofiling and performed by Affymetrix. Three to fourpre-ameloblast and secretory ameloblast samples col-lected by LCM were pooled for each array. RNA sampleswere extracted and purified by RNeasy Mini kits (Qiagenand Rnase-Free DNase Set) as described previously [63].A Nanodrop ND 1000 spectrophotometer (ThermoFisher Scientific, Pittsburgh, PA, USA) was used to de-termine total RNA concentrations, and an Agilent 2100Bioanalyzer (Agilent Technologies, Santa Clara, CA,USA) was used to evaluate RNA quality [64] Both RNAsamples were of acceptable quality (Average RIN of 9.0and 8.0 for PABs and SABs, respectively), and there wasno significant difference between their qualities. For eachreplicate, 100 ng of total RNA was amplified and labeledusing the Affymetrix Whole-Transcript (WT) Sense Tar-get Labeling Protocol without rRNA reduction. Arrayhybridization, washing, and scanning were performedaccording to the protocol described in WT Sense TargetLabeling Assay Manual.
Microarray expression analysisThe R/Bioconductor Package “Affy” was used to performgene expression quartile normalization to adjust themarginal distribution of each sample. We used the“limma” package to identify DEGs [65]. Genes with fold-change greater than 2 and p < 0.05 between PABs andSABs were considered statistically significant.
KEGG pathway analysisThe complete list of human pathways was retrieved fromthe KEGG Pathway Database (http://www.genome.jp/kegg/). A functional gene enrichment analysis was per-formed based on the KEGG pathways [66]. We appliedFisher’s exact test to determine whether a set of DEGs wasselectively enriched in a pathway. KEGG pathways con-taining at least two DEGs with p-value less than 0.05 wereconsidered significant.
Weighted gene coexpression network analysis (WGCNA)The WGCNA package in R was used to construct un-signed coexpression networks [45, 67]. After filteringraw data without gene function annotation, 22,247probes were used to construct the pair-wise Pearson’scorrelation coefficient matrix. Next, the correlationmatrix was transformed to an adjacency matrix by a softpower adjacency function provided by Bin Zhang andSteven Horvath [45]. The scale-free topology criterionmethod was used to choose the power parameter β.Specifically, β = 16 was used as a balance between themaximization of scale-free topology model fit (topo-logical scale R square was 0.73) and the number of con-nections. The adjacency value for each pair of gene wasdefined as raising the absolute value of their Pearson’scorrelation coefficient to the power β, and the adjacencyvalues ranged from 0 to 1. By using the adjacencymatrix, the topological overlap measure, which is a simi-larity measurement, was calculated for each pair ofgenes. The topological overlap-based dissimilarity wasthen used for clustering and dynamic tree cutting withthe minimum module size of 30 and merged tree-cutheight of 0.25 [68]. A group of genes that were tightlygathered into the same cluster was considered a coex-pression module. The blockwiseModules function inWGCNA R package was used to automatically selectmodules in PABs and SABs, and the maximum blocksize was set to 10,000 due to the limitation of computermemory.The T-statistics-based p-value yielded from “limma” R
package [65] was used for each gene as a criterion tochoose proper modules associated with ameloblast differ-entiation. The gene significance (GS) should be a positivevalue calculated by the formula: GS = −log10 (p-value).The top two modules with the highest GS values (equalto the enrichment of more DEGs) were selected and
Liu et al. BMC Genomics (2015) 16:592 Page 13 of 16
identified as the brown and blue modules. To make a rep-resentative visualization of the correlation network, onlythe strongest linkages were drawn (correlation was greaterthan 0.95). Correlation networks of the brown moduleand blue module were generated in Cytoscape withadjacency thresholds of 0.42 and 0.41, respectively [69].
Hub gene selection and gene ontology analysisThe most highly connected genes, which were alsowell-known hub genes, were used to represent the ex-pression profiles and biological characters of the entiremodule. The module membership measure (MM) for agene was defined as the correlation between the eigen-gene of the module and the gene expression; therefore,the MM was also named the module eigengene basedconnectivity (kME) [45]. As we used the p-value basedGS for module selection, the top 20 genes with bothhighest GS and MM (0.9 or greater) were defined asintramodular hub genes. Subnetworks consisting ofintramodular hub genes and their directly connectedgenes were also plotted.Functional enrichment analysis for each selected mod-
ule was conducted by the R/Bioconductor package clus-terProfiler [70]. The background gene set was the totallist of genes used for coexpression network construction.The threshold level to determine the significance of allthe GO enrichment was set as p < 0.05.
Microarray data accessionAll raw microarray data were submitted to the NCBIGene Expression Omnibus database with the accessionnumber GSE59214, which can now be viewed throughthe link http://www.ncbi.nlm.nih.gov/geo/query/acc.cgi?acc=GSE59214
Quantitative real-time PCRFor cell-type confirmation after LCM, AMLX, AMBN,PITX2, and PCNA expression was examined by quanti-tative real-time PCR in an ABI 7500 system (AppliedBiosystems, Foster City, CA, USA). For microarray datavalidation, we examined the transcriptional levels of 12genes in PABs and SABs by qPCR. RNA was extractedwith the same method as described for microarray. Therelative abundance of mRNA transcripts was quantifiedrelative to GAPDH levels using the ΔΔCT method [71].Primers and probe sets including an endogenousGAPDH control were purchased from Applied Biosys-tems (Applied Biosystems, Foster City, CA, USA). Thecorresponding arithmetic formulas used are as follows:ΔCTcondition = CTtarget gene − CTendogeneous con-trol and ΔΔCT =ΔCTcondition1 −ΔCTcondition2. Forexample, we compared the gene expression fold changebetween different cell types. Take amelogenin expressionin PABs and SABs as an example, ΔCTPAB = CTamelogenin
at PAB-CTGAPDH at PAB, ΔCTSAB = CTamelogenin at SAB-CTGAPDH at SAB, ΔΔCT = ΔCTSAB-ΔCTPAB. The foldchange of SAB to PAB is calculated as FoldSAB to PAB =2(−ΔΔCT) (amelogenin expression at PAB was used as abaseline value of 1). Data were compared by one-wayANOVA followed by the post hoc Tukey’s test.
Additional files
Additional file 1: Differentially expressed genes between PABs andSABs. Table S1. Genes significantly up-regulated in PABs. Table S2.Genes significantly up-regulated in SABs. (XLS 194 kb)
Additional file 2: Table S3. Expression of selected genes in PABscompared to SABs. (XLS 40 kb)
Additional file 3: Table S4 and Table S5. Selected connections,including gene symbols of nodes and adjacency, in the brown andblue modules. Table S6 and Table S7: Selected connections withmembership measure and gene significance in the brown and bluemodules. (XLS 933 kb)
Additional file 4: Scatterplots between module membershipmeasure (x-axis) and gene significance of GO terms in the brownmodule (A-E) and blue module (F-J). The grey dashed line in the plotis the threshold for choosing significantly expressed genes, and thethreshold value is –log10(0.05). (TIFF 1712 kb)
Competing interestsThe authors declare that they have no competing interests.
Authors’ contributionsCL and YN performed the majority of the experiments, carried data analysisand drafted the manuscript. XZ helped to design the study and draft themanuscript. XX and YY provided suggestions for the project and criticallyreviewed the manuscript. YZ and LZ supervised the project and wrote mostof the manuscript. All authors read and approved the final manuscript.
AcknowledgementsThis work was supported by grant from the National Natural ScienceFoundation of China (grant number: 81371136 to XZ, 81470711 and81200760 to LZ). YN was supported by China Scholarship Council.
Author details1State Key Laboratory of Oral Diseases, West China Hospital of Stomatology,Sichuan University, Chengdu, PR China. 2Key Laboratory of Bio-Resources andEco-Environment of Ministry of Education, College of Life Sciences, SichuanUniversity, Chengdu, PR China. 3Department of Orofacial Sciences, Universityof California, San Francisco, CA 94143, USA.
Received: 24 October 2014 Accepted: 16 July 2015
References1. Wald T, Osickova A, Sulc M, Benada O, Semeradtova A, Rezabkova L, et al.
Intrinsically disordered enamel matrix protein ameloblastin forms ribbon-likesupramolecular structures via an N-terminal segment encoded by exon 5.J Biol Chem. 2013;288(31):22333–45.
2. Gibson CW. The Amelogenin proteins and enamel development in humansand mice. J Oral Biosci. 2011;53(3):248–56.
3. Bei M. Molecular genetics of ameloblast cell lineage. J Exp Zool B Mol DevEvol. 2009;312B(5):437–44.
4. Zeichner-David M, Diekwisch T, Fincham A, Lau E, MacDougall M,Moradian-Oldak J, et al. Control of ameloblast differentiation. Int J DevBiol. 1995;39(1):69–92.
5. Bartlett JD, Smith CE. Modulation of cell-cell junctional complexes by matrixmetalloproteinases. J Dent Res. 2013;92(1):10–7.
6. Bartlett JD. Dental enamel development: proteinases and their enamelmatrix substrates. ISRN Dent. 2013;2013:684607.
Liu et al. BMC Genomics (2015) 16:592 Page 14 of 16
7. Wright JT. The molecular etiologies and associated phenotypes ofamelogenesis imperfecta. Am J Med Genet A. 2006;140(23):2547–55.
8. Sierant ML, Bartlett JD. Stress response pathways in ameloblasts:implications for amelogenesis and dental fluorosis. Cells. 2012;B1(3):631–45.
9. Li Z, Yu M, Tian W. An inductive signalling network regulates mammaliantooth morphogenesis with implications for tooth regeneration. Cell Prolif.2013;46(5):501–8.
10. Coin R, Haikel Y, Ruch JV. Effects of apatite, transforming growth factorbeta-1, bone morphogenetic protein-2 and interleukin-7 on ameloblastdifferentiation in vitro. Eur J Oral Sci. 1999;107(6):487–95.
11. Wang XP, Suomalainen M, Jorgez CJ, Matzuk MM, Werner S, Thesleff I.Follistatin regulates enamel patterning in mouse incisors by asymmetricallyinhibiting BMP signaling and ameloblast differentiation. Dev Cell.2004;7(5):719–30.
12. Athanassiou-Papaefthymiou M, Kim D, Harbron L, Papagerakis S, Schnell S,Harada H, et al. Molecular and circadian controls of ameloblasts. Eur J OralSci. 2011;119 Suppl 1:35–40.
13. Murray AW, Kirschner MW. Cyclin synthesis drives the early embryonic cellcycle. Nature. 1989;339(6222):275–80.
14. Bruyere C, Meijer L. Targeting cyclin-dependent kinases in anti-neoplastictherapy. Curr Opin Cell Biol. 2013;25(6):772–9.
15. Ear PH, Booth MJ, Abd-Rabbo D, Kowarzyk Moreno J, Hall C, Chen D, et al.Dissection of Cdk1-cyclin complexes in vivo. Proc Natl Acad Sci U S A.2013;110(39):15716–21.
16. Do K, Doroshow JH, Kummar S. Wee1 kinase as a target for cancer therapy.Cell cycle. 2013;12(19):3159–64.
17. Lim S, Kaldis P. Cdks, cyclins and CKIs: roles beyond cell cycle regulation.Development. 2013;140(15):3079–93.
18. Harrison JC, Haber JE. Surviving the breakup: the DNA damage checkpoint.Annu Rev Genet. 2006;40:209–35.
19. Tollini LA, Jin A, Park J, Zhang Y. Regulation of p53 by Mdm2 E3 ligasefunction is dispensable in embryogenesis and development, but essential inresponse to DNA damage. Cancer cell. 2014;26(2):235–47.
20. Hsieh P, Yamane K. DNA mismatch repair: molecular mechanism, cancer,and ageing. Mech Ageing Dev. 2008;129(7–8):391–407.
21. Bocquet N, Bizard AH, Abdulrahman W, Larsen NB, Faty M, Cavadini S, et al.Structural and mechanistic insight into Holliday-junction dissolution bytopoisomerase IIIalpha and RMI1. Nat Struct Mol Biol. 2014;21(3):261–8.
22. van Raam BJ, Ehrnhoefer DE, Hayden MR, Salvesen GS. Intrinsic cleavage ofreceptor-interacting protein kinase-1 by caspase-6. Cell Death Differ.2013;20(1):86–96.
23. Hu JC, Chun YH, Al Hazzazzi T, Simmer JP. Enamel formation andamelogenesis imperfecta. Cells Tissues Organs. 2007;186(1):78–85.
24. Guo S, Lim D, Dong Z, Saunders TL, Ma PX, Marcelo CL, et al. DSPP: Aregulatory protein for dental pulp stem cell identity and fate. Stem CellsDev. 2014;23(23):2883–94.
25. Lin SX, Zhang Q, Zhang H, Yan K, Ward L, Lu YB, et al. Nucleus-targetedDmp1 transgene fails to rescue dental defects in Dmp1 null mice. Int J OralSci. 2014;6(3):133–41.
26. Uchihashi K, Aoki S, Matsunobu A, Toda S. Osteoblast migration into type Icollagen gel and differentiation to osteocyte-like cells within a self-produced mineralized matrix: a novel system for analyzing differentiationfrom osteoblast to osteocyte. Bone. 2013;56(1):227.
27. Liu J, Nam HK, Campbell C, Gasque KC, Millan JL, Hatch NE. Tissue-nonspecific alkaline phosphatase deficiency causes abnormal craniofacialbone development in the Alpl mouse model of infantile hypophosphatasia.Bone. 2014;67C:81–94.
28. Timpl R, Rohde H, Robey PG, Rennard SI, Foidart JM, Martin GR. Laminin–aglycoprotein from basement membranes. J Biol Chem. 1979;254(19):9933–7.
29. Fukumoto S, Miner JH, Ida H, Fukumoto E, Yuasa K, Miyazaki H, et al.Laminin alpha 5 is required for dental epithelium growth and polarity andthe development of tooth bud and shape. J Biol Chem. 2006;281(8):5008–16.
30. Gumbiner BM. Regulation of cadherin-mediated adhesion inmorphogenesis. Nat Rev Mol Cell Biol. 2005;6(8):622–34.
31. Stoeckli ET, Kilinc D, Kunz B, Kunz S, Lee GU, Martines E, et al. Analysis ofcell-cell contact mediated by Ig superfamily cell adhesion molecules. CurrProtoc Cell Biol. 2013;61:9.5.1–9.5.85.
32. Marie PJ, Hay E, Saidak Z. Integrin and cadherin signaling in bone: role andpotential therapeutic targets. Trends Endocrinol Metab. 2014;25(11):567–75.
33. Felfly H, Klein OD. Sprouty genes regulate proliferation and survival ofhuman embryonic stem cells. Sci Rep. 2013;3:2277.
34. Edwards AK, van den Heuvel MJ, Wessels JM, Lamarre J, Croy BA, Tayade C.Expression of angiogenic basic fibroblast growth factor, platelet derivedgrowth factor, thrombospondin-1 and their receptors at the porcinematernal-fetal interface. Reprod Biol Endocrinol. 2011;9:5.
35. Otsuki S, Hanson SR, Miyaki S, Grogan SP, Kinoshita M, Asahara H, et al.Extracellular sulfatases support cartilage homeostasis by regulating BMP andFGF signaling pathways. Proc Natl Acad Sci U S A. 2010;107(22):10202–7.
36. Nan Su MJ, Chen L. Role of FGF/FGFR signaling in skeletal development andhomeostasis: learning from mouse models. Bone Research. 2014;2:14003.
37. Sun F, Wan M, Xu X, Gao B, Zhou Y, Sun J, et al. Crosstalk between miR-34aand Notch signaling promotes differentiation in Apical Papilla Stem Cells(SCAPs). J Dent Res. 2014;93(6):589–95.
38. Boucherat O, Nadeau V, Berube-Simard FA, Charron J, Jeannotte L. Crucialrequirement of ERK/MAPK signaling in respiratory tract development.Development. 2014;141(16):3197–211.
39. Wang S, Choi M, Richardson AS, Reid BM, Seymen F, Yildirim M, et al. STIM1and SLC24A4 are critical for enamel maturation. J Dent Res. 2014;93(7suppl):94S–100S.
40. Duan X. Ion channels, channelopathies, and tooth formation. J Dent Res.2014;93(2):117–25.
41. Yee NS, Kazi AA, Yee RK. Cellular and developmental biology of TRPM7Channel-Kinase: implicated roles in cancer. Cells. 2014;3(3):751–77.
42. Alberts B, Johnson A, Lewis J, Raff M, Roberts K, Walter P. Molecular biologyof the cell. 5th ed. New York: Garland Science; 2008.
43. Han JD, Bertin N, Hao T, Goldberg DS, Berriz GF, Zhang LV, et al. Evidencefor dynamically organized modularity in the yeast protein-proteininteraction network. Nature. 2004;430(6995):88–93.
44. Carlson MR, Zhang B, Fang Z, Mischel PS, Horvath S, Nelson SF. Geneconnectivity, function, and sequence conservation: predictions frommodular yeast co-expression networks. BMC Genomics. 2006;7:40.
45. Zhang B, Horvath S. A general framework for weighted gene co-expressionnetwork analysis. Stat Appl Genet Mol Biol. 2005;4:Article17.
46. Appleford PJ, Woollard A. RUNX genes find a niche in stem cell biology.J Cell Biochem. 2009;108(1):14–21.
47. Guan X, Bartlett JD. MMP20 modulates cadherin expression in ameloblastsas enamel develops. J Dent Res. 2013;92(12):1123–8.
48. Yin Y, Wang F, Ornitz DM. Mesothelial- and epithelial-derived FGF9 havedistinct functions in the regulation of lung development. Development.2011;138(15):3169–77.
49. Laursen WJ, Bagriantsev SN, Gracheva EO. TRPA1 channels: chemical andtemperature sensitivity. Curr Top Membr. 2014;74:89–112.
50. Willardsen M, Hutcheson DA, Moore KB, Vetter ML. The ETS transcriptionfactor Etv1 mediates FGF signaling to initiate proneural gene expressionduring Xenopus laevis retinal development. Mech Dev. 2014;131:57–67.
51. Bond J, Roberts E, Mochida GH, Hampshire DJ, Scott S, Askham JM, et al.ASPM is a major determinant of cerebral cortical size. Nat Genet.2002;32(2):316–20.
52. Sun SC, Lee SE, Xu YN, Kim NH. Perturbation of Spc25 expression affectsmeiotic spindle organization, chromosome alignment and spindle assemblycheckpoint in mouse oocytes. Cell cycle. 2010;9(22):4552–9.
53. Nie J, Wang H, He F, Huang H. Nusap1 is essential for neural crest cellmigration in zebrafish. Protein Cell. 2010;1(3):259–66.
54. Oh S, Shin S, Janknecht R. ETV1, 4 and 5: an oncogenic subfamily of ETStranscription factors. Biochim Biophys Acta. 2012;1826(1):1–12.
55. Fukumoto S, Yamada Y. Review: extracellular matrix regulates toothmorphogenesis. Connect Tissue Res. 2005;46(4–5):220–6.
56. Denecker G, Vandamme N, Akay O, Koludrovic D, Taminau J, Lemeire K,et al. Identification of a ZEB2-MITF-ZEB1 transcriptional network thatcontrols melanogenesis and melanoma progression. Cell Death Differ.2014;21(8):1250–61.
57. Gao H, Wang Y, Liu X, Yan T, Wu L, Alm E, et al. Global transcriptomeanalysis of the heat shock response of Shewanella oneidensis. J Bacteriol.2004;186(22):7796–803.
58. Pokutta S, Weis WI. Structure and mechanism of cadherins and catenins incell-cell contacts. Annu Rev Cell Dev Biol. 2007;23:237–61.
59. Maupin KA, Scha CJ, Williams BO. A comprehensive overview of skeletalphenotypes associated with alterations in Wnt/β-catenin signaling inhumans and mice. Bone Research. 2013;1(1):27–71.
60. Vainio S, Karavanova I, Jowett A, Thesleff I. Identification of BMP-4 as asignal mediating secondary induction between epithelial and mesenchymaltissues during early tooth development. Cell. 1993;75(1):45–58.
Liu et al. BMC Genomics (2015) 16:592 Page 15 of 16
61. Espina V, Milia J, Wu G, Cowherd S, Liotta LA. Laser capture microdissection.Methods Mol Biol. 2006;319:213–29.
62. Espina V, Wulfkuhle JD, Calvert VS, VanMeter A, Zhou W, Coukos G, et al.Laser-capture microdissection. Nat Protoc. 2006;1(2):586–603.
63. Wan M, Gao B, Sun F, Tang Y, Ye L, Fan Y, et al. microRNA miR-34a regulatescytodifferentiation and targets multi-signaling pathways in human dentalpapilla cells. PLoS One. 2012;7(11):e50090.
64. Sun JX, Horst OV, Bumgarner R, Lakely B, Somerman MJ, Zhang H. Lasercapture microdissection enables cellular and molecular studies of tooth rootdevelopment. Int J Oral Sci. 2012;4(1):7–13.
65. Wettenhall JM, Smyth GK. limmaGUI: a graphical user interface for linearmodeling of microarray data. Bioinformatics. 2004;20(18):3705–6.
66. Subramanian A, Kuehn H, Gould J, Tamayo P, Mesirov JP. GSEA-P: a desktopapplication for Gene Set Enrichment Analysis. Bioinformatics.2007;23(23):3251–3.
67. Langfelder P, Horvath S. WGCNA: an R package for weighted correlationnetwork analysis. BMC Bioinformatics. 2008;9:559.
68. Langfelder P, Zhang B, Horvath S. Defining clusters from a hierarchicalcluster tree: the Dynamic Tree Cut package for R. Bioinformatics.2008;24(5):719–20.
69. Shannon P, Markiel A, Ozier O, Baliga NS, Wang JT, Ramage D, et al.Cytoscape: a software environment for integrated models of biomolecularinteraction networks. Genome Res. 2003;13(11):2498–504.
70. Yu G, Wang LG, Han Y, He QY. clusterProfiler: an R package for comparingbiological themes among gene clusters. OMICS. 2012;16(5):284–7.
71. Schmittgen TD, Livak KJ. Analyzing real-time PCR data by the comparativeC(T) method. Nat Protoc. 2008;3(6):1101–8.
Submit your next manuscript to BioMed Centraland take full advantage of:
• Convenient online submission
• Thorough peer review
• No space constraints or color figure charges
• Immediate publication on acceptance
• Inclusion in PubMed, CAS, Scopus and Google Scholar
• Research which is freely available for redistribution
Submit your manuscript at www.biomedcentral.com/submit
Liu et al. BMC Genomics (2015) 16:592 Page 16 of 16