
A model of photosynthesis and photo-protection based on reaction center damage and repair
18
A model of photosynthesis and photo-protection based on reaction center damage and repair Oliver N. Ross, C. Mark Moore, 2 and Dave J. Suggett Department of Biological Sciences, University of Essex, Wivenhoe Park, Colchester CO4 3SQ, United Kingdom Hugh L. MacIntyre Dauphin Island Sea Lab, 101 Bienville Boulevard, Dauphin Island, Alabama 36528 Richard J. Geider 1 Department of Biological Sciences, University of Essex, Wivenhoe Park, Colchester CO4 3SQ, United Kingdom Abstract Phytoplankton photosynthesis under the rapidly fluctuating irradiance which results from turbulent mixing through the vertical light gradient is poorly understood. Ship-based measurements often apply the fast repetition rate fluorescence (FRRF) technique in situ or in vivo to gauge the physiological state of the phytoplankton community and infer some of the physical properties of the water column (such as mixing time scales). We describe the development and validation of a model of photosynthetic electron turnover at photosystem II with consideration of downstream limitation, based on the redox state of photosystem II. We also include empirical formulations for slower processes such as photo-protection (from nonphotochemical quenching) and photo-inhibition. By confronting the simple model with laboratory data for Dunaliella tertiolecta, we were able to refine the model so that it faithfully produced rates of photosynthetic electron transfer determined by FRR fluorescence. Further, we were able to validate the model estimates of linear photosynthetic electron transfer rates against completely independent measurements obtained using 14 C-bicarbonate assimilation in photosynthesis-light curves. The light dependence of phytoplankton photosynthesis is one of the most intensively studied aspects of phyto- plankton physiology (Jassby and Platt 1976; Cullen 1990; Falkowski and Raven 2007). Nonetheless, most commonly used incubation procedures (e.g., Knap et al. [1996] p. 159) do not resolve photosynthesis rates on the time scales of variability in photon flux density (PFD) that are experi- enced by the phytoplankton in situ. It has long been recognized that variability in the light environment due to vertical mixing can affect the accuracy of estimates of in situ photosynthesis (Marra 1980; MacIntyre et al. 2000). Higher frequency variability, such as that caused by wave- focusing in the upper euphotic zone (Dera and Gordon 1970), does not appear to affect photosynthetic physiology in those eukaryotes studied (Stramski et al. 1993; Mouget et al. 1995a, b) but has been shown to induce an acclimative change in a cyanobacterium (MacKenzie and Campbell 2005). Numerous approaches have been made to mimic variability in the light regime in incubation experiments. These include manual (Yoder and Bishop 1985; Randall and Day 1987) or automated (Kirkpatrick et al. 1990; Gocke and Lenz 2004) movement of incubation bottles through the water column; circulation of the sample through a light gradient in a deck incubator (Jewson and Wood 1975; Gallegos et al. 1977); and imposing variable attenuation on a static sample through mechanical rotation of multiple filters (Mallin and Paerl 1992; Bertoni and Balseiro 2005). Empirical approaches may fail to match the variability (both magnitude and frequency) imposed by the experi- menter in the incubation to the variability that is experienced by phytoplankton in the natural environment. Accurately reproducing the natural light regime requires a priori knowledge of both the dynamic range and rate of change of irradiance. These can be derived from three parameters (the attenuation coefficient, the depth of the mixed layer, and the vertical diffusivity) for deck incuba- tions and two (mixed-layer depth and diffusivity) for in situ incubations. Each of these input variables can vary within the duration of an hours-long incubation. Methods that have been tested or proposed for providing a match between the natural variability and the imposed regime include analysis of dye diffusion (Mallin and Paerl 1992), incorporation of motion sensors on a submersible incuba- tor (Kirkpatrick et al. 1990) and parallel estimation of diffusivity, using an acoustic Doppler current profiler (Bertoni and Balseiro 2005). Incubations that use sub- merged samples account for changes in both the magnitude and spectral dependence of the attenuation coefficient. This is not the case for deck incubations, in which the use of filters with fixed optical characteristics imposes a defined 1 Present address: National Oceanography Centre, University of Southampton, Southampton SO14 3ZH, United Kingdom. Acknowledgments ONR and RJG gratefully acknowledge financial support from the MarQUEST initiative as part of the Natural Environment Research Council funded QUEST consortium. DJS and CMM were supported by Natural Environment Research Council postdoctoral fellowships. HLM was supported by National Science Foundation grant OCE-9907702. We are also grateful to K. Oxborough for useful discussions of the manuscript and to M. Behrenfeld for providing a helpful and thorough review. 2 Corresponding author ([email protected]). Limnol. Oceanogr., 53(5), 2008, 1835–1852 E 2008, by the American Society of Limnology and Oceanography, Inc. 1835
Transcript of A model of photosynthesis and photo-protection based on reaction center damage and repair
A model of photosynthesis and photo-protection based on reaction center damage
and repair
Oliver N. Ross, C. Mark Moore,2 and Dave J. SuggettDepartment of Biological Sciences, University of Essex, Wivenhoe Park, Colchester CO4 3SQ, United Kingdom
Hugh L. MacIntyreDauphin Island Sea Lab, 101 Bienville Boulevard, Dauphin Island, Alabama 36528
Richard J. Geider1
Department of Biological Sciences, University of Essex, Wivenhoe Park, Colchester CO4 3SQ, United Kingdom
Abstract
Phytoplankton photosynthesis under the rapidly fluctuating irradiance which results from turbulent mixingthrough the vertical light gradient is poorly understood. Ship-based measurements often apply the fast repetitionrate fluorescence (FRRF) technique in situ or in vivo to gauge the physiological state of the phytoplanktoncommunity and infer some of the physical properties of the water column (such as mixing time scales). We describethe development and validation of a model of photosynthetic electron turnover at photosystem II with considerationof downstream limitation, based on the redox state of photosystem II. We also include empirical formulations forslower processes such as photo-protection (from nonphotochemical quenching) and photo-inhibition. Byconfronting the simple model with laboratory data for Dunaliella tertiolecta, we were able to refine the model sothat it faithfully produced rates of photosynthetic electron transfer determined by FRR fluorescence. Further, wewere able to validate the model estimates of linear photosynthetic electron transfer rates against completelyindependent measurements obtained using 14C-bicarbonate assimilation in photosynthesis-light curves.
The light dependence of phytoplankton photosynthesisis one of the most intensively studied aspects of phyto-plankton physiology (Jassby and Platt 1976; Cullen 1990;Falkowski and Raven 2007). Nonetheless, most commonlyused incubation procedures (e.g., Knap et al. [1996] p. 159)do not resolve photosynthesis rates on the time scales ofvariability in photon flux density (PFD) that are experi-enced by the phytoplankton in situ. It has long beenrecognized that variability in the light environment due tovertical mixing can affect the accuracy of estimates of insitu photosynthesis (Marra 1980; MacIntyre et al. 2000).Higher frequency variability, such as that caused by wave-focusing in the upper euphotic zone (Dera and Gordon1970), does not appear to affect photosynthetic physiologyin those eukaryotes studied (Stramski et al. 1993; Mougetet al. 1995a, b) but has been shown to induce an acclimativechange in a cyanobacterium (MacKenzie and Campbell2005). Numerous approaches have been made to mimicvariability in the light regime in incubation experiments.
These include manual (Yoder and Bishop 1985; Randalland Day 1987) or automated (Kirkpatrick et al. 1990;Gocke and Lenz 2004) movement of incubation bottlesthrough the water column; circulation of the samplethrough a light gradient in a deck incubator (Jewson andWood 1975; Gallegos et al. 1977); and imposing variableattenuation on a static sample through mechanical rotationof multiple filters (Mallin and Paerl 1992; Bertoni andBalseiro 2005).
Empirical approaches may fail to match the variability(both magnitude and frequency) imposed by the experi-menter in the incubation to the variability that isexperienced by phytoplankton in the natural environment.Accurately reproducing the natural light regime requires apriori knowledge of both the dynamic range and rate ofchange of irradiance. These can be derived from threeparameters (the attenuation coefficient, the depth of themixed layer, and the vertical diffusivity) for deck incuba-tions and two (mixed-layer depth and diffusivity) for in situincubations. Each of these input variables can vary withinthe duration of an hours-long incubation. Methods thathave been tested or proposed for providing a matchbetween the natural variability and the imposed regimeinclude analysis of dye diffusion (Mallin and Paerl 1992),incorporation of motion sensors on a submersible incuba-tor (Kirkpatrick et al. 1990) and parallel estimation ofdiffusivity, using an acoustic Doppler current profiler(Bertoni and Balseiro 2005). Incubations that use sub-merged samples account for changes in both the magnitudeand spectral dependence of the attenuation coefficient. Thisis not the case for deck incubations, in which the use offilters with fixed optical characteristics imposes a defined
1 Present address: National Oceanography Centre, University ofSouthampton, Southampton SO14 3ZH, United Kingdom.
AcknowledgmentsONR and RJG gratefully acknowledge financial support from
the MarQUEST initiative as part of the Natural EnvironmentResearch Council funded QUEST consortium. DJS and CMMwere supported by Natural Environment Research Councilpostdoctoral fellowships. HLM was supported by NationalScience Foundation grant OCE-9907702. We are also grateful toK. Oxborough for useful discussions of the manuscript and to M.Behrenfeld for providing a helpful and thorough review.
2 Corresponding author ([email protected]).
Limnol. Oceanogr., 53(5), 2008, 1835–1852
E 2008, by the American Society of Limnology and Oceanography, Inc.
1835

but invariable light spectrum. Last, both in situ and deckincubations employ end-point measurements, which pro-vide the integrated production over the incubation period;thus, they do not resolve the time dependence of theproductivity. Uncertainty in estimates of primary produc-tivity due to vertical mixing is likely to be greatest whenphytoplankton are mixed through large light gradients.Such conditions exist in a pre-spring bloom scenario in atemperate shelf sea and in estuaries, for instance, wherestrong vertical mixing due to tidal and wind-inducedturbulence rapidly cycles the phytoplankton through theentire water column.
Figure 1 shows two example trajectories including theassociated light variability experienced by cells in twodifferent turbulence regimes in a modeled oceanic watercolumn. These results were obtained from a Lagrangianrandom walk model applied to a fully mixed surface layerusing the method described in Ross and Sharples (2004)and the exponential light absorption from Beer–Lambert’sLaw (e.g., Ross and Sharples 2007) with an absorptioncoefficient of 0.09 m21. In the low-turbulence case, thelight received by the cells simply mimics the semidiurnalvariation of the solar irradiance incident upon the sea
surface because the vertical displacement of the cells isslow. In contrast, cells that are subject to a highly turbulentoceanic environment can travel from complete darkness tonear-surface irradiance levels and back within just 1 h.Cells in estuarine water columns, where attenuation ishigher and the mixed depth shallower by an order ofmagnitude or more, can undergo the same transition in10 min or less (MacIntyre et al. 2000).
Primary productivity is commonly calculated from lightresponse curves using bio-optical formalisms (Platt et al.1980). Under these ‘static’ experimental conditions, theeffects of photo-inhibition may be overestimated in surfacewaters and underestimated in deeper waters, with the errorsdepending on the time scales of photo-protection, photo-inhibition, and the turbulent displacement through the lightgradient (Lewis et al. 1984).
The photosynthesis-light (P-I) response curve, or pa-rameterizations that can be reformulated in terms of a P-Icurve, are commonly used in bio-optical calculations ofprimary productivity. The parameters of the P-I curve aretypically treated as ‘constants’ in models used to computeprimary productivity. However, time-series observationsover varying incubation times often show that theseparameters are not constant (Marra 1980; MacIntyre etal. 2002). Furthermore, the light dependence of photosyn-thesis often differs in rising and falling light regimes(MacIntyre et al. 2000). Variability in the light dependenceof biomass-specific photosynthesis in fluctuating light canresult from the interaction of photo-protection, photo-inhibition, and photo-acclimation on discrete and/oroverlapping time scales (Harris 1978; Geider et al. 1998).
Phytoplankton possess various mechanisms for copingwith the wide range of PFDs to which they are exposed innature (Harris 1978; Raven and Geider 2003). Theseinclude photo-protective mechanisms that either redirectexcitation energy away from photosystem II (state transi-tions) or quench excitation energy to heat (Falkowski andRaven 2007) and photo-acclimation via changes in cellularpigment contents and, thus, light harvesting, operating onlonger time scales (Geider et al. 1996). When photo-protection and photo-acclimation fail to provide adequateprotection, photo-inactivation of photosynthesis may occur(Long et al. 1994).
It has been a long-standing goal of research inphytoplankton ecophysiology to be able to describe andpredict the response of phytoplankton to fluctuating light(Cullen and Lewis 1988). Of particular interest is develop-ing a predictive understanding of the response to verticalmixing (Lewis et al. 1984). The conceptual basis for thisunderstanding is clear: the time scale for PFD fluctuationsassociated with vertical mixing depends on the depth of themixed layer, the light attenuation coefficient, and the rateof vertical displacement through the resulting lightgradient. Nondimensional solutions to simple reaction–diffusion equations describing phytoplankton responses tomixing have been developed (Lewis et al. 1984), althoughthere are still open questions regarding the effect ofturbulence and its effectiveness at mixing phytoplanktonthrough vertical light gradients (Huisman and Sommeijer2002).
Fig. 1. Example PFD variability experienced in a 150-msurface mixed layer for two different vertical turbulent diffusivitiesKz, using the random walk method from Ross and Sharples(2004). (a) shows an example particle trajectory in the SML for alow- and high-diffusivity scenario. (b) shows the sinusoidalvariation of irradiance incident upon the sea surface, and (c) thelight received by the cells at the depths shown in (a).
1836 Ross et al.

Because ocean observation systems will never be capableof capturing the spatial and temporal heterogeneity of theplanktonic ecosystem in its entirety, numerical models havebeen recognized as a valuable supplement to fill thisobservational gap. In the past, most photosynthesis modelswere empirical best-fit algorithms applied to experimentaldata sets (Steele 1962; Platt et al. 1980). An increasingdemand by large-scale ecological and biogeochemicalmodelers for better representations of the phytoplanktonphysiology under realistic physical conditions has led to theadvent of models with semiempirical to mechanisticdescriptions of photosynthesis (Zonneveld 1997; Geider etal. 1998; Han 2002) and more realistic representations ofturbulent mixing in coupled biological–physical models(Ross and Sharples 2007).
Our ultimate aim is to combine both approaches (i.e., todevelop a mechanistic photosynthesis model that canexplain the interaction between fluorescence, photosynthe-sis, photo-inhibition, photo-protection, and photo-accli-mation at all PFDs and time scales, and to combine thisbiological model with a Lagrangian turbulence modelwhere realistic physical forcing drives the verticallyheterogeneous turbulent mixing). As a first step in thisprocess, we present a model based on light absorption andphotochemistry within photosystem II (PSII). As such, it issuitable for use in interpreting and exploiting the datagenerated by fast repetition rate (FRR) fluorescence(Kolber et al. 1998; Suggett et al. 2004). Our model issimilar to that of Han (2002) who developed a model ofphoto-inhibition based on damage to PSII. However, thecurrent model differs from previous formulations (Han2002) in two important respects. First, it includes adownstream ‘sink’ limitation (e.g., limitations on the ratesof inorganic carbon fixation and nitrate reduction). Secondit includes photo-protection associated with the light-dependent reduction in the functional cross-section ofPSII. The model allows us to simulate the time-dependenceof photosynthesis under specified light regimes, includingconventional P-I response curves. Model state variables, orproxies for these variables, can be measured by biophysicaltechniques including FRR fluorescence. Model parameterscan be derived from experiments. We calibrated the modelwith PI curves for photosynthetic electron transfer rateobtained from experiments with the chlorophyte Dunaliellatertiolecta. We then validated the model against indepen-dent measurements of PI curves obtained from 14Cassimilation. To our knowledge, this is the first study inwhich an attempt is made to confront this type of modelwith experimental data.
Background to model structure
Recently, fluorescence techniques such as fast repetitionrate (FRR) fluorescence have been used to determine therate of photosynthetic electron transfer in marine phyto-plankton (Kolber et al. 1998). These techniques usevariable fluorescence that arises from photosystem II(PSII) to calculate the rate of linear electron transfer fromwater to nicotinamide adenine dinucleotide phosphate-oxidase (NADPH), where the electron transfer reactions
within and beyond PSII have been summarized byFalkowski and Raven (2007). Linear electron transferrelies on use of a photon absorbed by PSII to photochem-ically oxidize a reaction-center chlorophyll, designatedP680. The electron that is extracted from P680 is veryrapidly (about 20 ps) transferred to a quinone, designatedQA. Oxidized QA is a fluorescence quencher. The changes influorescence associated with the dynamics of the reductionand oxidation of QA can be used to investigate photosyn-thetic transfer at PSII. Reoxidation of Q {
A occurs when itpasses its electron to a second quinone, QB. When QB isoxidized, this transfer occurs with an e-folding time ofreduced QA of about 400 ms (Falkowski and Raven 2007).
Q{A z QB ?
reoxidation of Q{A
QA z Q{B ð1Þ
with
1
Q{A
dQ{A
dt~ exp {
t
400
� �where t is in ms: ð2Þ
Once QB has been doubly reduced, it is protonated andbecomes part of the plastoquinol pool. The plastoquinolpool is subsequently reoxidized by transfer of electrons tothe cytochrome b6 : f complex and ultimately to NADPHfollowing a second photochemical reaction in photosystemI. Plastoquinone is the oxidized form of plastoquinol.
Many features of variable fluorescence, and its relation-ship to linear electron transfer, can be explained using amodel of the photosynthetic electron transfer chain. Forexample, Kroon and Thoms (2006) have recently presenteda model of photosynthetic electron transfer in chlorophytesthat explicitly considers the entire reaction sequence fromQA to NADPH. The model includes 31 state variables and29 rate constants. It can simulate the types of signalsgenerated by FRR and other fluorescence techniques.
We consider a much simpler model in which the onlystate variable of the photosynthetic electron transfer chainis QA, and the reoxidation of reduced QA is characterizedby two time constants. The rate of QA reduction isdetermined by the rate of photon absorption by PSII andthe efficiencies of exciton transfer to, and charge separationwithin the PSII reaction center (RCII). We assume thatunder low-light conditions when the pool of Q {
A is smallcompared with the pool of oxidized plastoquinone, Q {
A willbe reoxidized with a time constant determined by themaximum rate allowed by the kinetics of electron transferto QB. However, under high-light conditions when thereduced plastoquinol pool becomes large, the rate ofreoxidation of plastoquinol will become the limiting step,and the rate constant for reoxidation of Q {
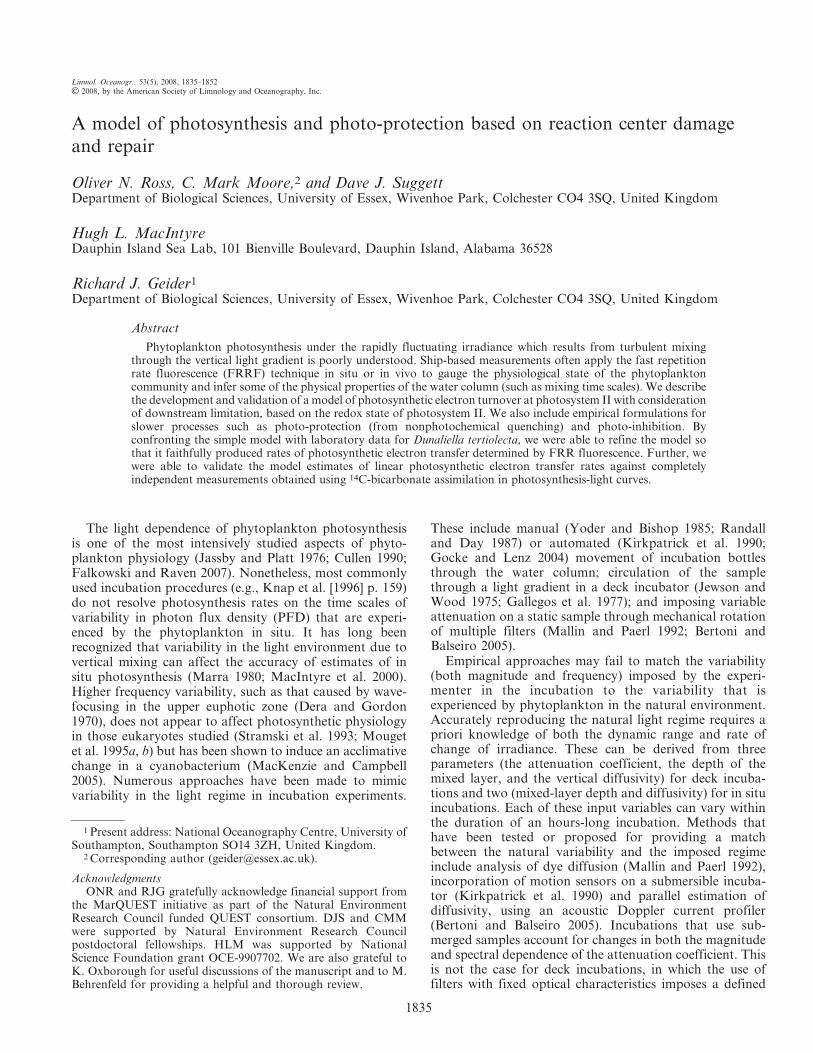
A will beincreased (Sukenik et al. 1987; Behrenfeld et al. 1998;Falkowski and Raven 2007). Graphically, we represent thisdescription of electron transfer in Fig. 2.
Although Kroon and Thoms (2006) provide a completemodel of the photosynthetic electron transfer chain, themodel does not include important processes that canmodify the rate of photosynthetic transfer. Amongst theseprocesses is nonphotochemical quenching, which is thoughtto play a role in protecting PSII reaction centers from
A model of photosynthesis 1837
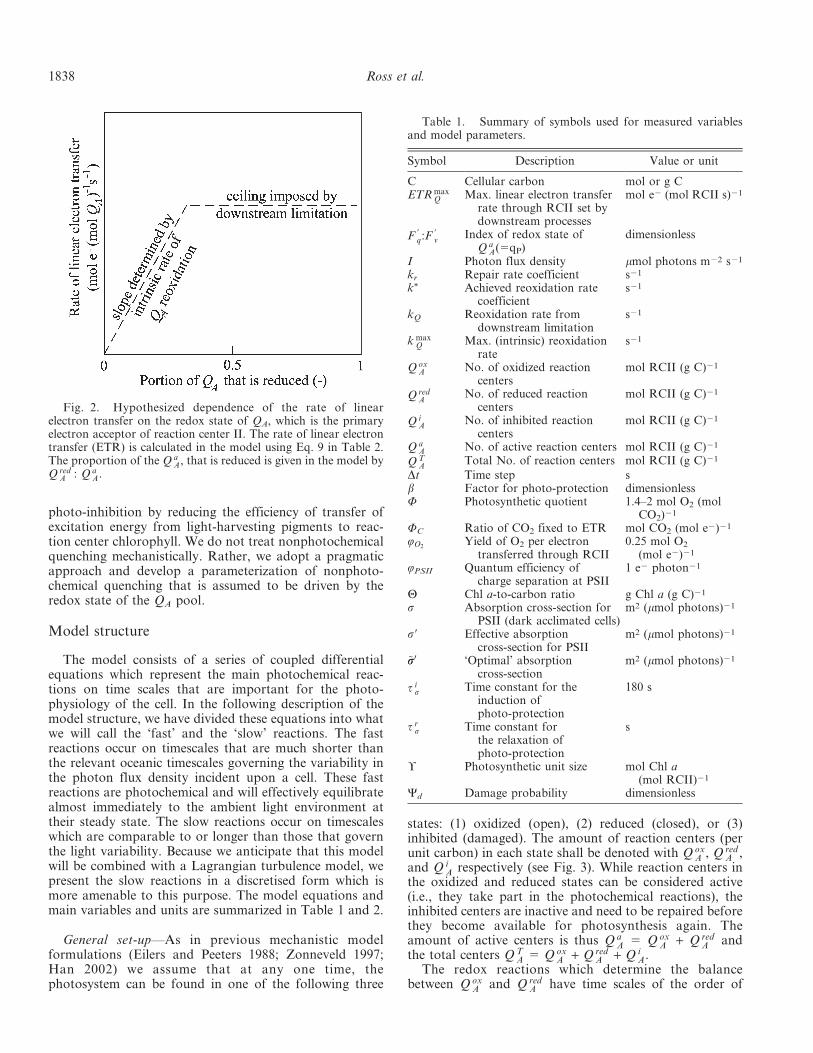
photo-inhibition by reducing the efficiency of transfer ofexcitation energy from light-harvesting pigments to reac-tion center chlorophyll. We do not treat nonphotochemicalquenching mechanistically. Rather, we adopt a pragmaticapproach and develop a parameterization of nonphoto-chemical quenching that is assumed to be driven by theredox state of the QA pool.
Model structure
The model consists of a series of coupled differentialequations which represent the main photochemical reac-tions on time scales that are important for the photo-physiology of the cell. In the following description of themodel structure, we have divided these equations into whatwe will call the ‘fast’ and the ‘slow’ reactions. The fastreactions occur on timescales that are much shorter thanthe relevant oceanic timescales governing the variability inthe photon flux density incident upon a cell. These fastreactions are photochemical and will effectively equilibratealmost immediately to the ambient light environment attheir steady state. The slow reactions occur on timescaleswhich are comparable to or longer than those that governthe light variability. Because we anticipate that this modelwill be combined with a Lagrangian turbulence model, wepresent the slow reactions in a discretised form which ismore amenable to this purpose. The model equations andmain variables and units are summarized in Table 1 and 2.
General set-up—As in previous mechanistic modelformulations (Eilers and Peeters 1988; Zonneveld 1997;Han 2002) we assume that at any one time, thephotosystem can be found in one of the following three
states: (1) oxidized (open), (2) reduced (closed), or (3)inhibited (damaged). The amount of reaction centers (perunit carbon) in each state shall be denoted with Q ox
A , Q redA ,
and Q iA respectively (see Fig. 3). While reaction centers in
the oxidized and reduced states can be considered active(i.e., they take part in the photochemical reactions), theinhibited centers are inactive and need to be repaired beforethey become available for photosynthesis again. Theamount of active centers is thus Q a
A 5 Q oxA + Q red
A andthe total centers Q T
A 5 Q oxA + Q red
A + Q iA.
The redox reactions which determine the balancebetween Q ox
A and Q redA have time scales of the order of
Fig. 2. Hypothesized dependence of the rate of linearelectron transfer on the redox state of QA, which is the primaryelectron acceptor of reaction center II. The rate of linear electrontransfer (ETR) is calculated in the model using Eq. 9 in Table 2.The proportion of the Q a
A, that is reduced is given in the model byQ red
A : Q aA.
Table 1. Summary of symbols used for measured variablesand model parameters.
Symbol Description Value or unit
C Cellular carbon mol or g CETR max
Q Max. linear electron transferrate through RCII set bydownstream processes
mol e2 (mol RCII s)21
F 9q:F 9
vIndex of redox state of
Q aA(5qP)
dimensionless
I Photon flux density mmol photons m22 s21
kr Repair rate coefficient s21
k* Achieved reoxidation ratecoefficient
s21
kQ Reoxidation rate fromdownstream limitation
s21
k maxQ Max. (intrinsic) reoxidation
rates21
Q oxA No. of oxidized reaction
centersmol RCII (g C)21
Q redA
No. of reduced reactioncenters
mol RCII (g C)21
Q iA
No. of inhibited reactioncenters
mol RCII (g C)21
Q aA No. of active reaction centers mol RCII (g C)21
Q TA
Total No. of reaction centers mol RCII (g C)21
Dt Time step sb Factor for photo-protection dimensionlessW Photosynthetic quotient 1.4–2 mol O2 (mol
CO2)21
WC Ratio of CO2 fixed to ETR mol CO2 (mol e2)21
QO2Yield of O2 per electron
transferred through RCII0.25 mol O2
(mol e2)21
QPSII Quantum efficiency ofcharge separation at PSII
1 e2 photon21
H Chl a-to-carbon ratio g Chl a (g C)21
s Absorption cross-section forPSII (dark acclimated cells)
m2 (mmol photons)21
s9 Effective absorptioncross-section for PSII
m2 (mmol photons)21
~ss0 ‘Optimal’ absorptioncross-section
m2 (mmol photons)21
t is
Time constant for theinduction ofphoto-protection
180 s
t rs Time constant for
the relaxation ofphoto-protection
s
U Photosynthetic unit size mol Chl a(mol RCII)21
Yd Damage probability dimensionless
1838 Ross et al.

1 ms (Falkowski and Raven 2007), several orders ofmagnitude faster than any relevant physical-mixing timescale in the ocean and, hence, we will refer to them as the‘fast reactions.’ The reactions which determine the balancebetween damage and repair of reaction centers occur oncomparatively longer timescales. Photo-protection is as-sumed to decrease the effective cross-section for photosys-tem II, whereas photo-inhibition involves the inactivationof PSII reaction centers. Although this part of the modelhas not yet been fully validated, we have included it herefor the sake of completeness (see also the Discussion).
Fast reactions: Photosynthetic electron transfer isinitiated in PSII, with the requirement that the light-drivenreduction of the primary acceptor (e.g., the quinone QA) isbalanced by its reoxidation (Eq. 7 in Table 2). The ratio ofoxidized and reduced centers in the steady state is thusgiven by the ratio of the achieved turnover rate k* and therate of photon arrival s9I (Eq. 8; we assume that thequantum efficiency of charge separation in RCII wPSII 5 1).Equation 7 contains already one difference to previousformulations (Han 2002; Baklouti et al. 2006). Rather thanassuming a constant turnover rate for the reoxidationreactions, we introduce a potential downstream limitationin the electron transport rate (ETR) given by the conditionin Eq. 7c (see also Fig. 2). Under light-limiting conditionsthe reoxidation of Q red
A occurs much faster than the rate ofphoton arrival (i.e., k* . s9I). Hence only few centers are inthe reduced state (Q red
A is small) and k* 5 k maxQ (note that
k maxQ corresponds to t21 in Han (2002) and Baklouti
et al. [2006]). As the PFD increases and, thus, the rate of
photon arrival s9I increases, Q redA will also increase. At
some point kQ will drop below k maxQ and the downstream
limitation comes into effect. This corresponds to light-saturating conditions where the reoxidation of Q red
A isdetermined by the demand for reductant by CO2 fixation,nitrate assimilation, and biosynthesis. Other processes thatmay allow reoxidation of Q red
A , such as the Mehler reaction(Asada 2000) are not included in the model. Under theselight-saturating conditions, the ETR through QA is at amaximum as indicated by the ‘‘ceiling’’ in Fig. 2. Essen-tially, this model includes one possible formulation of the‘‘excess’’ PSII capacity identified by Behrenfeld et al.(1998). Photo-inhibition (see below) will lead to a reductionof active centers, Q a
A, and therefore also a decline in theamount of Q red
A which counteracts the downstreamlimitation (Behrenfeld et al. 1998).
The rate of linear electron transfer (ETRQ) through PSII(Eq. 3, see below) is calculated in a manner that is directlyanalogous to calculations of ETRQ using FRR fluorescence(Suggett et al. 2006). This facilitates calibration of themodel based on FRR data and comparison of modeloutputs with FRR data.
We assume that the carbon-specific gross CO2 fixationrate, PC, is directly proportional to the product of ETRQ
and Q TA (Eq. 10), with the proportionality factor deter-
mined by the yield of O2 per electron transferred throughRCII, rO2
, and the photosynthetic quotient, W. This is asimplification because a number of processes may lead touncoupling of CO2 fixation from electron transfer throughRCII, and the importance of these processes may differamongst algal taxa (Wagner et al. 2006; Wilhelm et al.2006). The photosynthetic quotient is determined by thebiochemical composition (e.g., protein : lipid : carbohy-drate) and nitrogen source (e.g., nitrate or ammonium)(Kroon and Thoms 2006).
Photo-inhibition and repair: All processes that wedescribe in this section occur on timescales which can bemodeled explicitly with the currently available computingpower of a standard desktop computer.
The slow reactions depicted in Fig. 3 are photo-inactivation (i.e., the transition from Q red
A to Q iA) and the
subsequent repair of RCII. Both processes have relevanttimescales that are several orders of magnitude larger thanthose for the fast redox-reactions that determine the steady-state equilibrium between Q ox
A and Q redA (Eq. 8). Net photo-
inhibition is treated as the difference between the rates ofdamage and repair of PSII reaction centers (Eq. 11 inTable 2). Following Han (2002), we assume that the rate of
Table 2. List of model equations.
dQoxA
dt~ {s0rPSII IQox
A z k�QredA , with
Q oxA + Q red
A 5 Q aA
(7a)
dQredA
dt~ s0rPSII IQox
A { k�QredA
(7b)
with k� ~ minkQ
kmaxQ
�, where kQ ~ ETRmax
Q
QTA
QredA z Qi
A
(7c)
Steady-state solutions: ~QQoxA ~
k�QaA
s0rPSII I z k�and
~QQredA ~
s0rPSII IQaA
s0rPSII I z k�
(8)
ETRQ ~ s0rPSII
QoxA
QaA
QaA
QTA
I ~ s0rPSII
QoxA
QTA
I(9)
PC ~ ETRQ
rO2
WQT
A ~ s0rPSII
rO2
WQox
A I (10)
Photo-inhibition and -repair:
QiA
� �n z 1
~ QiA
� �n
z Yds0IQredA { krQ
iA
� �Dt
(11)
Photo-protection:~ss0
s~ 1 { b
QredA z Qi
A
QTA
� �,
where b 5 f(U) (see text)
(12)
Induction of photo-protection:
s0n z 1 ~ s0n z1
tis
~ss0n { s0n� �
Dt
(13a)
Relaxation of photo-protection:
s0n z 1 ~ s0n z1
trs
~ss0n { s0n� �
Dt
(13b)
Fig. 3. Schematic representation of Eqs. 7 and 11 fromTable 2.
A model of photosynthesis 1839

photo-inhibition is proportional to the rate of excitationenergy transfer to Q red
A , consistent with the mechanismsuggested by Melis (1999). The steady state between Q ox
Aand Q red
A is reached immediately at the beginning of amodel time step Dt. At the end of the time step, somecenters will have become inhibited, others repaired, andthe number of active centers is adjusted accordingly as(Q a
A)n+1 5 (Q TA 2 Q i
A)n+1 for use in Eq. 8 during the nextiteration.
Photo-protection: Photo-protection is assumed to oper-ate by reducing the effective cross-section of PSII (s9), thusaccounting for the component of nonphotochemicalquenching that is associated with processes that operatein the light-harvesting antenna. Photo-protection may alsooccur through nonphotochemical quenching in the reactioncenter (Gorbunov et al. 2001); however, this process is notcurrently included. In the model, antenna quenching isparameterized by requiring that s9 adjust to a value ~ss0
which depends on the ratio of oxidized to total reactionscenters (Eq. 12) and a parameter b which depends on theacclimation state of the cell, represented by the photosyn-thetic unit size U.
We assume that the phytoplankton cell is not able to reach~ss0 immediately. Instead, at each time step, the value ~ss0 iscalculated from Eq. 12 and we then assume first-orderkinetics to calculate the actual cross-section s9 (Eq. 13). s9thus contains a cumulative account of the recent light-history of the cell. The time constants t i;r
s can be determinedfrom FRRF measurements. Note that we assume differenttime constants for transitions from low to high light(induction) and from high to low light (relaxation). Thisagrees with findings from Lohr and Wilhelm (2001) whofound differences in rate constants for xanthophyll cyclepigment conversions in a diatom. Reported time-constantsfor xanthophyll de-epoxidation in the light are higher (i.e.,faster) than those reported for epoxidation in the darkness,albeit in different microalgae (Olaizola et al. 1994; Goss et al.2006) . If the nonphotochemical quenching is assumed to bedue to the xanthophyll cycle, then the time constants forchanges of s9 will differ as well.
Methods, results, and model evaluation
The FRRF experiments—In this section we calibrate andtest the model against data obtained from laboratory FRRfluorescence measurements on the chlorophyte Dunaliellatertiolecta.
Cell growth: Dunaliella tertiolecta (strain CCMP 1320)was cultured under continuous illumination at threephoton flux densities (PFD; 18, 80, and 300 mmol photonsm22 s21, provided by cool-white fluorescent lamps) andat constant temperature (20uC). We will refer to thesecultures as the low-light (LL), mid-light (ML), and high-light (HL) cultures respectively. All cultures were grown in‘semi-batch’ mode in artificial seawater (ASW; Keller et al.1987) enriched with f/2 nutrients (Guillard and Ryther1962). Cell growth was monitored from daily measure-ments of biomass as chlorophyll concentration and each
alga was maintained and harvested in exponential growthphase.
Chlorophyll a and particulate organic carbon: Thecultures used in this model were in exponential growthphase. For chlorophyll a (Chl a) analysis 1–5 ml of culturewas filtered on to 25-mm Whatman GF/F glass fiber filters atlow pressure (,50 Hg or ,16 kPa). Pigments were extractedfor 15 min in darkness at room temperature in a 5-mLvolume of 3 : 2 90% acetone : dimethyl sulfoxide (DMSO)(Shoaf and Lium 1976). Chl a was determined in a TurnerTD-700 fluorometer using the nonacidification method(Welschmeyer 1994). The fluorometer was calibrated onpure Chl a (Sigma 25730), whose concentration wascalculated from optical density via the coefficients in Jeffreyet al. (1997). For particulate organic carbon (POC), 50-mLsamples were collected on Whatman GF/Fs that had beenbaked at 500uC for 2 h. After drying the filters, C and N weredetermined with an elemental analyzer (Costech CHN),using ethylene diamine tetraacetic acid (EDTA; Sigma46081) as a standard.
FRR fluorometry and PSU size: A FASTtracka FastRepetition Rate (FRR) fluorometer (Chelsea Technology)was programmed to deliver sequences that induce single-turnover (ST) saturation of PSII as described by Suggett etal. (2003, 2004). Between 10 and 20 individual ST sequenceswere averaged to reduce the random error associated withinstrument noise (Suggett et al. 2004). A biophysical modeldescribing ST saturation of PSII (Kolber et al. 1998) wasthen fitted to each averaged ST sequence to generatemeasures of minimum and maximum fluorescence yieldand of PSII effective absorption, termed Fo (F9), Fm (F 9
m),and sPSII (s 9
PSII ) under dark-adapted (and actinic) lightconditions. PSII photochemical efficiency was calculated as(Fm2Fo) : Fm (5Fv : Fm) or (F 9
m2F9) : F 9m (5 Fq9 : F 9
m) underdark-adapted and actinic light conditions, respectively (seeSuggett et al. 2003). Samples were dark-adapted for 1 hprior to fluorescence measurements to yield maximumvalues of Fv : Fm (dimensionless) and of sPSII (m2 mmolphotons21). Each sample was then exposed to a gradient ofactinic light between 5 and 1,250 mmol photons m22 s21 tocharacterize the light-response of PSII fluorescence (seeSuggett et al. 2003). Actinic illumination was provided byquartz-halogen bulbs, attenuated through Lee neutral-densityfilters and filtered through a 2.5-cm layer of 10 g L21 CuSO4
(aq.). Each actinic PFD was delivered for a period of ,4 minfollowed by a dark period of 20 s (Fig. 4). ST sequences wereaveraged for the final 30 s of each actinic PFD treatment, bywhich time fluorescence yields had reached a steady state andfor each dark period. All values of PSII effective absorptionand actinic PFD were adjusted to the spectrum of light usedfor growth (Suggett et al. 2004).
The ratio of Chl a to functional RCII, which is oftendesignated the photosynthetic unit size for PSII, (U, molChl a [mol RCII]21; Table 3) was determined from oxygenevolution during flash yield experiments. ST saturatingflashes were provided at frequencies of 10 s21 to 50 s21 viaa custom-built ST saturation flash system (as described inSuggett et al. 2003, 2004). Prior to measurement, samples were
1840 Ross et al.

gently concentrated by gravity filtration to provide thebiomass necessary to yield the O2 signal. Chl a was determinedon 0.25 mL of concentrate as described above for unconcen-trated samples. Calculation of U enabled determination ofchlorophyll- and carbon-normalized electron transfer rates(ETRx, mmol e2 (g X)21 s21) for each PFD as
ETRChl ~Is0PSII
892
F 0qF 0v
U{1 ð3aÞ
ETRC ~ Is0PSII
F 0qF 0v
U{1 : H : 1,120:5 ð3bÞ
where H is the Chl a-to-carbon ratio in units of g Chl a(g C)21, U is the photosynthetic unit size (mol Chl a [molRCII]21) and the factor 1,120.5 accounts for the conversion ofmol Chl a to g Chl a (892 gChl a [mol Chl a]21), mol RCII tommol RCII and assumes 1 mol e2 (mol RCII)21.
14C uptake, light absorption—Photosynthesis-light (PI)response curves were determined for uptake of 14C viaincubations in a temperature-controlled photosynthetron(Lewis and Smith 1983), essentially as described byMacIntrye et al. (1996). Samples were illuminated for40 min at PFDs between 10 and 1,700 mmol photonsm22 s21 using quartz-halogen lamps, filtered through a2.5-cm layer of 10 g L21 CuSO4 (aq.). Chlorophyll-specificand carbon-specific 14C uptake rates were normalized tothe Chl a and C concentrations measured in the initialsample.
Light-absorption coefficients were calculated frommeasurements of optical density on the concentrates ofeach sample using a U-3000 spectrophotometer fittedwith an integrating sphere (w60; Hitachi). Growthmedium was used as a blank. Absorption was calculatedfrom optical density after correcting for path length and
residual scattering at 750 nm. An absorption coefficientwas determined as the mean absorption between 400 and750 nm normalized to Chl a concentration (achl, m2 mgChl a21).
Results and parameter estimation from the FRRFexperiments—Table 3 summarizes the main parametersand characteristics for the three different cultures. Thecultures show the typical pattern of acclimation ofphotosynthetic unit size (U) and the Chl a-to-carbon ratio(H) to growth at different PFDs. Both U and H decreasedin response to growth at higher PFDs. However, thecarbon-specific light-saturated electron transfer rate,ETR max
C , was largely independent of the growth PFD (cf.Fig. 5c) while Q a
A declined by .56% between the lowestand highest growth PFDs (Table 3).
The carbon-specific initial slope of a plot of ETRC vs. thefraction of the Qa that is reduced, which we denote k max
C ,was also found to be largely independent of the growthPFD (Fig. 5d), where Q red
A :Q aA was calculated as
12(F 9q:F 9
v). The numerical value for k maxC was determined
from a least-squares regression of the initial data pointsfrom the LL, ML, and HL experiments, yielding k max
C 5156.5 mmol e2 (g C)21 s21 (r2 5 0.75). The electron transferrate ETRC is equivalent to the rate of exciton arrivalsIQ ox
A :892UH where we estimated Q oxA as F 9
q:F 9v (cf. Eq. 3).
ETR maxC was obtained by averaging the light-saturated
values of ETRC. for the LL and HL cultures yieldingETR max
C 5 15.75 mmol e2 (g C)21 s21.As the model is formulated on a reaction-center basis, we
need to convert the above values from a carbon to areaction-center basis. This was achieved by using themeasured Q a
A (mol RCII [mol C]21) from Table 3. Therelationship between ETR max
Q and ETR maxC is
ETRmaxC ~ ETRmax
Q: Q a
A ð4Þ
The graphical result is shown in Fig. 5a and b andthe numerical values for k max
Q and ETR maxQ which are used
in Eq. 7c can be found in Table 3. Contrary to ourexpectation that k max
Q would be independent of the accli-mation state of the cells (see Fig. 2), we found that k max
Q in-creased during acclimation to higher PFD (Fig.5b) (Kana et al. 2002). The observed increase of ETR max
Qwith growth PFD is consistent with a decline in Q a
A with growthPFD (Table 3) at constant ETR max
C (Fig. 5c). In our model,we assumed that the rate of whole-chain linear electrontransfer (and thus ETR max
C ) is set by the rate of regenerationof NADP+ and ADP by CO2 fixation in the Calvin cycle,consistent with results reported previously for D. tertiolecta(Sukenik et al. 1987).
Model configuration and results—The model was initial-ized with the values of U, H, and s9 from Table 3 andforced with the time course of the PFDs from the FRRFmeasurements (cf. Fig. 4). ETR max
Q and k maxQ were deter-
mined from Fig. 5 as described in the previous section, andb was chosen such that the model would reproduce theamplitude of the maximum observed depression in s9 : sdue to photo-protection (see below). The overall sensitivity
Fig. 4. Time course of the actinic photon flux density duringthe FRRF experiments. After every 4 min of light exposure, thecells are kept in the dark for 20 s to obtain measurements of s9.Note that the ML and HL experiments reach slightly highermaximum PFDs of ,1,250 mmol photos m2 s21.
A model of photosynthesis 1841

of the model to changes in these parameters is discussedbelow. Considering that the model is a very simplifiedrepresentation of the photochemical processes in PSII, theoverall agreement between the model and the FRRF data isvery good (Fig. 6). The model needed very little tuning inorder to fit the data. In fact, the only two remainingparameters that were chosen freely are the photo-protec-tion parameter b and the time constant t i
s (cf. Table 1).The value of the latter determines how quickly the cell canactivate photo-protective mechanisms in response to anexcess in light availability.
In some respects, it is not surprising that we obtainedgood agreement between the model-derived ETR (Eq. 9)and the ETR obtained from FRR fluorescence (Eq. 3b)since the model was parameterized with the same FRR dataas were used in Eq. 3b. What the model provides is amechanism to account for the observations of the PFDdependencies of Fq9 : Fv9 and s9 (Eqs. 8, 12, 13) obtained byFRR fluorescence during the generation of an ETRQ vs.PFD curve.
One clear mismatch between our model and theobservations can be seen in the ML data set (Fig. 6b),where the model overestimates Q ox
A at intermediate PFDsof about 350–750 mmol photons m22 s21. This discrepancyresults from the way we have set up the model for thisparticular figure, using the same value of ETRC for all threecultures. The high ETRC values at intermediate PFDs inthe ML culture appear to be anomalous when compared tothe ETRC values for the LL and HL cultures. We do nothave an explanation for this anomalous behavior. Inter-estingly, this anomalous behavior is not evident whenETRC is compared with CO2 assimilation. We will return tothis issue in the Discussion.
The magnitude of k maxQ affects the balance between
Q oxA and Q red
A at a given PFD (Eq. 8) within the rangewhere ETR is light-limited (i.e., where k* 5 k max
Q ). Athigher photon flux densities, the achieved reoxidation rate, k*,is independent of k max
Q as it is set by the downstreamlimitation (Fig. 6j–l). We found a linear relationshipbetween the degree of photo-protection applied in themodel, b (cf. Eq. 12), and the measured photosynthetic unitsize U (Fig. 7)
b ~ c1U z c2 ð5Þ
At a given PFD, cells that were acclimated to low lightshowed a greater reduction in s9 : s than cells that weregrown under higher light intensities (cf. Fig. 6). The valuefor t i
s was chosen such that it would give a goodrepresentation of the s9 : s data in Fig. 6. The value thatis used in Fig. 6 comes from the upper end of the range ofpossible values that deliver a good fit. Choosing a shortertime scale for the induction of photo-protection (t i
s,180 s) will also produce good fits but larger values willnot.
Model sensitivity—We test the sensitivity of the model byexamining its response to 50% changes in the key modelparameters. The first two, k max
Q and ETR maxQ , were
determined directly from FRRF measurements (Fig. 5), whilethe third, b, had to be set during the tuning procedure. Bothsources have uncertainties associated with them and thissection aims to elucidate how these could affect the modelbehavior and to gauge how well these parameters areconstrained.
The first parameter to be examined is k maxQ . As men-
tioned previously, the magnitude of k maxQ affects the balance
between Q oxA and Q red
A but only at low PFDs. This is shownfor the example of the LL and HL cultures in Fig. 8. If weuse a value for k max
Q that is 50% below the one determinedfrom Fig. 5, we find that the model slightly underestimates theamount of reaction centers in the oxidized state (dashed curvein Fig. 8a). Using a value for k max
Q that is 50% above thechosen value, the effect is much smaller because most ofthe reaction centers will be in the oxidized state at low lightintensities anyway. The ratio of s9 : s and ETR max
Q (Fig. 8d, g)are essentially unaffected by a 50% change in k max
Q .In contrast, the model is much more sensitive to changes
in ETR maxQ . A 50% over- or underestimation leads to notice-
able discrepancies between the model output and data(Fig. 8b, e, h). This value affects the amount of oxidizedcenters, Q ox
A , which in turn affects the amount of photo-protection (cf. Eq. 12) and, therefore, also the point at whichthe downstream limitation comes into effect (Fig. 8k).
Table 3. Main parameters for the low light (LL), medium light (ML), and high light (HL)FRRF experiments on Dunaliella tertiolecta. Values for s have been spectrally corrected. See texton how ETR max
Q and k maxQ have been determined.
Experiment LL ML HL
Growth irradiance Ig (mmol photons m22 s21) 18 80 300Specific growth m (d21) 0.20 1.19 1.67aCHL (400–700 nm) (m2 [g Chl a]21) 4.81 5.31 6.67ETR max
Q (mol e2 [mol RCII s]21) 121 159 280
Fv : Fm 0.55 0.51 0.53k max
Q (s21) 1,215 1,595 2,805
Q aA(mmol RCII [mol C]21) 1.54 1.16 0.67
s (m2 [mmol photons]21) 0.945 0.87 0.65s(UaCHL)21(2) 0.32 0.28 0.21H (g Chl a [g C]21) 0.0849 0.0555 0.0247U (mol Chl a [mol RCII]21) 741 638 498
1842 Ross et al.

The third parameter to be examined here is b, themagnitude of photo-protection. In the LL scenario, b islarge, and a 50% change will lead to a significantly differentmodel output for Q ox
A :Q TA (Fig. 8c). Since a lower (higher)
s9 : s is matched by an equally higher (lower) ratio ofQ ox
A :Q TA, the net effect on ETRQ is zero. In the HL scenario,
b is rather small (0.25) and a 50% under- or overestimationwill, therefore, have very little effect on the model.
Discussion
To date, FRR fluorescence has been used to calculate therate of linear electron transfer. When used in situ, FRRfluorescence provides instantaneous (typically ,1-s timeresolution) point measurements of ETR. Extrapolationfrom these measurements to hourly or daily integralsrequires either that the instrument be deployed continu-ously, or that the results be incorporated into a model. Insome comparisons of FRR-based measurements of ETRwith conventional measurements of 14C assimilation, theimplicit assumption has been that the instantaneous ETRalso applies to longer time scales associated with the 14Cmeasurements (Kolber and Falkowski 1993). The mostcommon model that can be used for extrapolation is alight-response curve with constant parameters, althoughother models such as those based on light absorption andthe light dependence of quantum efficiency can beenvisaged (Smyth et al. 2004; Suggett et al. 2006). Incontrast to these empirical approaches, we have used asimple mechanistic model of PSII photochemistry tointerpret FRR fluorescence data.
In this paper, our strategy has been to model explicitlythe proportions of the Q T
A pool that are oxidized andreduced (Eqs. 7a–c and 10). We have chosen to use a verysimple representation of the PSII functioning (as depictedin Fig. 2). One advantage of this approach is that itminimizes the number of parameters that need to bespecified. Another advantage is that these parameters canbe measured directly by FRR fluorescence. To these fastreactions, we have added empirical descriptions of photo-inhibition (Eq. 11) and photo-protection (Eqs. 12 and 13)based on the redox state of the Q T
A pool. For the latter wefound a direct proportionality between the amount ofphoto-protection and the acclimation state of the cellsrepresented by the photosynthetic unit size (Fig. 7).
The light response of ETR—The most common formal-ism that oceanographers use to describe the light depen-dence of photosynthesis is the photosynthesis-light re-sponse (P-I) curve (MacIntyre et al. 2002). An alternativeapproach based on quantum-yield–light curves (Kiefer andMitchel 1983; Sakshaug et al. 1989) has also beenemployed, particularly within the context of bio-opticalmodels of primary productivity. The equivalence of theseapproaches can be readily demonstrated (Geider 1990).Plots of ETRQ and ETRC vs. photon flux density (Fig. 5a,c) show striking similarities to plots of chlorophyll- andcarbon-specific photosynthesis rates against PFD (MacIn-tyre et al. 2002). Specifically, the initial slope of the ETRQ
vs. I and Pchl vs. I curves are largely independent ofwhether cells are acclimated to high or low light, whereasthe light-saturated ETRQ and Pchl are higher in cells
Fig. 5. Dependence of the (linear) electron transfer rate, ETRQ 5 s9I F9q:F9v (a) on PFD and(b) on the proportion of the QA pool that is reduced. (c) and (d) show the corresponding plots ona carbon-specific basis instead of reaction center basis. The ML data have been omitted from thisplot (but see Figs. 6b, 9).
A model of photosynthesis 1843

Fig. 6. Comparison between the model output (solid lines) and FRRF data (symbols) for (a, d, g, j) the LL culture with b 5 0.95, (b,e, h, k) the ML culture with b 5 0.65, and (c, f, i, l) the HL culture with b 5 0.25. In frames (a), (b) and (c), the model predictions ofQ ox
A :Q TA are shown together with estimates of this variable given FRR measurements of F 9
q:F 9v. See Table 1 for the remaining parameter
values. Photo-inhibition has been disabled for these plots (i.e., Yd 5 0).
1844 Ross et al.

acclimated to high light. In contrast, the light-saturatedcarbon-specific ETR, ETR max
C , and the light-saturatedcarbon-specific photosynthesis rate, P max
C , are largelyindependent of whether cells are acclimated to high orlow light, whereas the initial slopes of ETRC vs. I or PC vs.I curves decrease in high light. This strategy of acclimationallows for a decline in the C-specific rate of light absorptionin high-light conditions through reductions of cell chloro-phyll and RCII contents relative to cell carbon contents.
The dependence of ETR on QA redox state—Whenformulating our model, we hypothesized that the slope ofa plot of ETRQ vs. Q red
A :Q aA should be a constant (Fig. 2)
that is determined by the maximum rate of electron transferfrom Q {
A to QB. We designated this slope k maxQ . Exper-
imentally, we found that k maxQ was not constant. Rather
k maxQ showed acclimation to the photon flux density
at which the cells were grown (Fig. 5b). We also foundthat k max
Q was correlated with ETR maxQ . In other words, the
maximum rate of reoxidation of closed RCII reactioncenters, k max
Q , depended on the photo-acclimation state inD. tertiolecta. The highest value of k max
Q (2,800 s21) wasobtained in cells acclimated to high light. This value isconsistent with that expected for the transfer of an electronfrom Q {
A to QB with an average e-folding time of about375 ms. A much lower value of k max
Q (1,200 s21) wascalculated for cells acclimated to low light. This suggeststhat reoxidation of Q2
A in low-light cells was limited byreactions downstream of the transfer to QB, even when theQA pool was largely oxidized. The observed time constantfor the reoxidation of Q {
A is the result of the sequentialreduction of QB to Q {
B and Q {B to Q 2{
B (Falkowski andRaven 2007). The first reduction step has a time constant of
about 150 ms whereas the second has a time constant of600 ms (the mean of these two time constants is 375 ms).Thus, the time constant for reoxidation of Q {
A will dependon whether the associated QB is oxidized or singly reduced.One possible explanation for the variability of k max
Q that weobserved (Fig. 5b) is that the relationship between Q {
A andthe redox state of QB, which is not included in our model,under actinic light depends on the photo-acclimation stateof the cells. This in turn implies that the rate constant forexchange of Q 2{
B with plastoquinone decreases at low light.Variability in the rate constant for this exchange has beensuggested to occur as a response to photo-inhibition inChlorella (Kana et al. 2002).
Light harvesting in puddle and lake models—Lightharvesting by PSII can be described as either a puddle ora lake (Govindjee 2004). In the puddle model, an exciton isabsorbed by a discrete PSII antenna and can only visit thespecific reaction center associated with this antenna, (i.e.,all reaction centers are isolated from each other). In a lakemodel, the PSII reaction centers share a common antenna,and an exciton can freely migrate amongst them. In reality,the light harvesting by PSII is intermediate between a lakeand a puddle: in this case the PSII are said to be connected,but the degree of connectivity can vary amongst taxa andwith physiological condition (Falkowski and Raven 2007).Whether PSII in Dunaliella is organized as lakes or puddles(or has intermediate degrees of connectivity) has importantimplications for determining the average size of the antennathat is associated with a PSII reaction center, therelationship between light absorption and photochemistry,and the use of fluorescence to assess the redox state of QA
(Kramer et al. 2004). Fortunately, the antenna organizationof PSII does not affect the use of fluorescence to estimatephotosynthetic electron transfer rates via Eq. 3. Althoughconnectivity should be taken into account in calculating theredox state of QA from fluorescence (Kramer et al. 2004),the linear relationship between F 9
q:F 9v and Q ox
A that weassume in our calculations (Eq. 3) appears a reasonableapproximation for Dunaliella tertiolecta in which theconnectivity parameter, p, has a typical value of about 0.3.
Photo-inhibition and recovery—Our model, like those ofHan (2002) and Baklouti et al. (2006) assumes that thefunction for photo-inactivation of PSII reaction centersdepends on the rate of exciton delivery to the reducedreaction centers (e.g., to overexcitation of Q red
A ). Thisformulation is consistent with evidence summarized byMelis (1999) based largely on experiments done with thechlorophyte Dunaliella salina. This formulation is by nomeans universally accepted. There is considerable evidenceindicating that RCII inactivation is proportional to thephoton flux density, independent of the redox state of QA.Thus, a simpler model assumes that photo-inactivation ofRCII is proportional to the rate of light absorption,consistent with data for vascular plant leaves (Anderson etal. 1998), the cyanobacterium Synechocystis (Allakhyver-diev et al. 2005) and even Melis’ (1999) data for Dunaliellasalina. In our model simulations (Fig. 6) we chose toexclude photo-inhibition because the FRRF data from
Fig. 7. Dependence of the amount of photo-protection(expressed through the parameter b) on the photosynthetic unitsize U for D. tertiolecta. The values for b are chosen indepen-dently, such that the model reproduces the magnitude of theobserved depression in s9 : s (see Fig. 6). It is expected that the fitconstants are species dependent. The error bars are based on thepossible range of values for b that still delivers acceptable fits tothe data.
A model of photosynthesis 1845

Fig. 8. Sensitivity of the model to changes in (a, d, g, j) k maxQ , (b, e, h, k) ETR max
Q and (c, f, i, l) b for the LL (open symbols) and theHL culture (filled symbols). The solid lines show the original model results with the values from Table 3. The dashed lines are for theparameter values 250% and the dash-dotted lines are for the parameter values +50%.
1846 Ross et al.

both the low- (LL) and high-light (HL) cultures did notshow any significant decrease in ETR at very high PFDsduring the short exposure times. However, by includingphoto-inhibition, we can improve the fit to the data fromthe medium light (ML) culture which showed higher valuesof ETRmax at intermediate light intensities and a decreasetowards the high PFDs. If we thus apply a higher value ofETRmax while allowing for photo-inhibition, the fit of themodel to the data is considerably improved (Fig. 9). It isunclear, however, why the ML culture should exhibitphoto-inhibitory behavior while the LL culture does not.
Photo-protection—The amount of photo-protection, b, isone of the two tuneable parameters of this model. Ourcomparison of b with the acclimation state of the cellsexpressed as the photosynthetic unit size U, yielded astriking relationship (Fig. 7) which suggests that b may bedirectly related to experimentally measured parameters. Wedid not investigate the mechanism responsible for the lightdependence of s9 in Dunaliella tertiolecta. It is possible thata proportion of the reduction of s9 with increasing PFD isdue to state-transitions, whereby excitation energy isredirected from RCII to RCI (Allen 2002). This hypothesisis consistent with the greater dependence of s9 on PFD inlow-light than high-light acclimated conditions. Both theratio of Chl a-to-RCII (U) and the value of the effectivecross-section in darkness (s) are larger in LL- than in HL-acclimated D. tertiolecta. Thus, there is greater potentialfor state-transition quenching in the LL culture, which iswhat we observe. Furthermore, both the PSII to PSItransition and the PSI to PSII transitions are mediated bythe redox state of the PQ pool (Allen 2002). Similarly,
Garcia-Mendoza et al. (2002) observed that NPQ wasgreater in low-light–acclimated Chlorella fusca than inhigh-light–acclimated cells. Furthermore, they observedthat most of the NPQ in low-light cells was due to statetransitions rather than the xanthophyll cycle (e.g., NPQwas little affected by dithiothreithol, an inhibitor of thexanthophyll cycle).
Photo-acclimation—In D. tertiolecta, as in other phyto-plankton, the ratio of Chl a-to-carbon declines in cells asthey acclimate to high light (Table 3). This reduces the rateof light absorption and, thus, the excitation pressure on thetotal pool of RCII. Reductions in light absorption relativeto the rate of photosynthesis reduces the potential forphoto-inhibitory damage (Melis 1999). The photosyntheticunit size, defined as the ratio of Chl a to Q a
A, also declinesduring acclimation to high light in D. tertiolecta (Table 3)and other phytoplankton (Dubinsky et al. 1986). Again,this can be seen as a strategy that reduces the excitationpressure on RCII. The reduction of photosynthetic unit sizeis mechanistically responsible for a reduction in theeffective cross-section of PSII (Table 3), and concomitantwith changes in the ratio Q a
A : C is an increase in both k maxQ
and ETR maxQ (Fig. 5).
A number of steps are required before our model can beextended to include photo-acclimation of Chl a : C andQ a
A : C. First, the dependence of the parameters s, k maxQ ,
and ETR maxQ on the state variables Q a
A : C and Chl a : Q aA
need to be established. Our data suggest that such rela-tionships exist. For example, the degree of photo-protec-tion was linearly related to photosynthetic unit size (Fig. 7),and s was linearly related to Chl a : Q a
A (Fig. 10) for D.
Fig. 9. Alternative model results to Fig. 6b, e, h, k where photo-inhibition has now beenturned on and a higher value for ETR max
Q is used (Yd 5 1.6?1026 and ETR maxQ 5 229 mol e2 [mol
RCII]21 s21).
A model of photosynthesis 1847

tertiolecta in balanced growth. Given the assumptions ofconstant ETR max
C and k maxC , ETR max
Q and k maxQ are linearly
related to (Q aA)21.
In previous models of photo-acclimation of Chl a : C(Geider et al. 1998), it was assumed that the values ofmodel parameters were determined by the ratios of statevariables whether cells were in balanced growth or exposedto transient conditions. Having established the dependenceof parameter values on state variables under conditions ofbalanced growth (Figs. 7, 10), we only need to specify a setof coupled differential equations to describe the rates ofchange of the state variables. The rate of change of organiccarbon, C, is simply the difference between carbon-specificphotosynthesis (PC) and carbon-specific respiration (RC)(Geider et al. 1998):
1
C
dC
dt~ PC { RC ð6Þ
Currently, there are several formulations available foracclimation of the Chl a-to-carbon ratio (Chl a : C) to choosefrom (Geider et al. 1998; Flynn 2001; Pahlow 2005). Finally,it will be necessary to develop an additional equation todescribe the acclimation of photosynthetic unit size. There isstrong evidence that photo-acclimation is regulated by asignal generated within the photosynthetic electron transferchain, specifically by the redox state of the plastoquinonepool (Escoubas et al. 1995). One issue that must be addressedbefore photo-acclimation can be included in the model ishow to represent this signal. Within our model, the possiblesignals are the redox state of QA and the relative size of theeffective cross-section of PSII, s9 : s. In future research, weplan to explore the possibility of using Q ox
A , Q redA , and s9 : s
as signals in differential equations describing the photo-acclimation of Chl a : C.
Comparison to 14C—Since the introduction of the 14Cmethod by Steemann-Nielsen (1952), 14C productivitymeasurements have been the primary data source that
informs our knowledge of marine primary productivity(Barber and Hilting 2002). Validation of the FRR method-ology for applications to marine primary productivity haverested on comparisons with results obtained using the 14Cmethod (e.g., Kolber and Falkowski 1993). Here wecompare our model estimates of carbon-specific electrontransfer rates, ETRC, with carbon-specific carbon fixationrates measured by 14C assimilation, PC (Fig. 11). Asdescribed in the methods, ETRC is based on the modeloutput, which was calibrated with measurements made for4 min at each of 13 PFDs, whereas PC was based on 40-minincubations at each of 24 PFDs. The independent lightresponse curves show extremely good agreement (Fig. 11).This comparison indicates that PC is proportional to ETRC,with the ratio of CO2 assimilation to ETR being WC 5 0.111.The reciprocal of WC is the electron requirement for CO2
fixation, which from Fig. 11 is 9 mol e2 (mol CO2)21. Thisvalue is higher than expected. Based on the reductantrequired for CO2 fixation into carbohydrate, we expect aratio of 4 mol e2 (mol CO2)21. This must be increased bythe photosynthetic quotient to account for the additionalreductant required for nitrate assimilation and biosynthesisof organic matter that is more reduced than carbohydrate(Kroon and Thoms 2006). A typical photosynthetic quotientfor growth on nitrate is 1.5 mol O2 (mol CO2)21, raising theelectron requirement to 6 mol e2 (mol CO2)21. Thus, aboutone-third of the ETRC (about 3 mol e2 [mol CO2]21) isunaccounted for. Significantly, this mismatch applies at bothlight-limiting and light-saturating PFDs.
Several processes or errors may account for thedifference between ETRC and PC that we observed.Systematic methodological errors that could lead to anoverestimate of ETR include overestimating the photonflux density and/or the effective cross-section (s9; see Eq.10). A systematic methodological error that could result inunderestimate of PC is underestimation of the effect ofisotope discrimination against 14C relative to 12C: the factorused in calculating PC assumed a discrimination factor of1.04. Although we cannot discount the possible individualor cumulative effects of such systematic methodologicalerrors, we also need to look for photosynthetic (orrespiratory) processes that could account for the mismatch.
There are at least five mechanisms that could account forthe mismatch between ETRC and 14C assimilation. Theseare cyclic electron flow around RCII (Falkowski et al.1986), reduction of O2 at PSI as part of the water–watercycle (Asada 2000), photorespiratory O2 consumption bythe oxygenase activity of Rubisco (Miziorko and Lorimer1983), chlororespiration (Peltier and Cournac 2002), andmitochodrial respiration of recent photosynthate (Weger etal. 1989). Most of these mechanisms have been hypothe-sized to increase the dissipation of excess energy at highlight. As such, they cannot account for our observation of aconstant ratio of ETRC to PC at all PFDs from light-limitation to light-saturation. Of these mechanisms, photo-respiratory O2 consumption could account for diversion ofa constant proportion of NADPH from CO2 fixation at allPFDs provided that the ratio of O2 to CO2 at the active siteof Rubisco does not vary with PFD. That photorespirationmay play a significant role in D. tertiolecta is indicated by
Fig. 10. Dependence of the PSII absorption cross-section, s,on the acclimation state of the cultures (using data from Table 3).
1848 Ross et al.

high rates of light-dependent glyocate production observedin this alga (Leboulanger et al. 1998). Thus the only light-independent candidate for the uncoupling of ETR from 14Cfixation is photorespiration, but we do not have directinformation to confirm this hypothesis.
Towards modeling the variability of quantum efficiency inthe ocean—To infer primary productivity in the sea, weneed to know the rate of light absorption by thephytoplankton and the quantum efficiency of photosyn-thesis. To a first approximation, the rate of light absorptiondepends on the incident photon flux density and the Chl aconcentration, both of which can be measured in a varietyof ways including satellite remote-sensing. Increases inaccuracy of primary-productivity algorithms have beenobtained by including information on the vertical light-attenuation coefficient, the vertical distribution of Chl aconcentration and the Chl a–specific light-absorptioncoefficient. All of these factors affect the rate of lightabsorption by the phytoplankton.
Less easy to characterize than the underwater light andchlorophyll fields is the variability of the quantumefficiency of photosynthesis. However, the introduction ofpump-and-probe (Kolber and Falkowski 1993) and fastrepetition rate (Kolber et al. 1998) fluorometry providedmethods for more accurately evaluating the spatial andtemporal variability of the quantum efficiency of PSIIphotocehmistry. Consistent with this assertion are obser-vations of co-variability between FRR-based estimates ofETRc, which rely on an estimate of quantum efficiency ofPSII photocehmistry, and 14C-fixation across ocean regionsdominated by diatoms and dinoflagellates (r2 5 0.81;Melrose et al. 2006) and by picophytoplankton (r2 5 0.90;Corno et al. 2006). These methods promised to provide‘‘not only a means of quantifying the variability in such keyparameters as quantum yield’’ but also to permit ‘‘inves-tigation of the relationship of the variability of phyto-plankton photosynthesis to physics and chemistry of the
ocean on matched time and space scales’’ (Kolber andFalkowski 1993).
Oceanographers are rapidly accumulating a database ofobservations of quantum efficiency of PSII based on FRRfluorescence. It is therefore appropriate to consider how toexploit this data base using dynamic models of phyto-plankton photosynthesis. These models must be simpleenough to be used in conjunction with physical models ofocean mixing, yet they must still capture essential processesthat influence the rate of light absorption and quantumefficiency of phytoplankton photosynthesis. These process-es include photosynthesis, photo-protection, photo-inhibi-tion, and photo-acclimation. Development of these modelsrequires appropriate data sets obtained under controlledconditions in the laboratory and at sea. In turn, thesemodels can inform oceanographers about how to collectdata using FRR fluorometry that will not only allow us todocument the variability of the quantum efficiency ofphotosynthesis, but also to determine how phytoplanktonadapt to and exploit the fluctuating light field in nature.
References
ALLAKHYVERDIEV, S. I., Y. NASHIYAMA, S. TAKAHASHI, S. MIYAIRI,I. SUZUKI, AND N. MURATA. 2005. Systematic analysis of therelation of electron transport and ATP synthesis to thephotodamage and repair of photosystem II in Synechocystis.Plant Physiol. 137: 263–273.
ALLEN, J. F. 2002. Plastoquinone redox control of chloroplastthylakoid protein phosphorylation and distribution of exci-tation energy between photosystems: Discovery, background,implications. Photosynth. Res. 73: 139–148.
ANDERSON, J. M., Y.-I. PARK, AND W. S. CHOW. 1998.Unifying model for the photoinactivation of photosystem IIin vivo under steady-state photosynthesis. Photosynth. Res.56: 1–13.
ASADA, K. 2000. The water–water cycle as alternative photon andelectron sinks. Philos. Trans.: Biol. Sci. 355: 1419–1431.
Fig. 11. Results from 14C measurements (open symbols, left axes) on (a, d) the LL, (b, e) the ML, and (c, f) the HL culture. The solidlines (right axes) represent the model curves of ETRC from Fig. 6.
A model of photosynthesis 1849

BAKLOUTI, M., F. DIAZ, C. PINAZO, V. FAURE, AND B. QUEGUINER.2006. Investigation of mechanistic formulations depictingphytoplankton dynamics for models of marine pelagicecosystems and description of a new model. Prog. Oceanogr.71: 1–33.
BARBER, R. T., AND A. K. HILTING. 2002. History of the study ofplankton productivity, p. 16–43. In P. J. L. Willams, D. N.Thomas and C. S. Reynolds [eds.], Phytoplankton produc-tivity: Carbon assimilation in marine and freshwater ecosys-tems. Blackwell.
BEHRENFELD, M. J., O. PRASIL, Z. S. KOLBER, M. BABIN, AND P. G.FALKOWSKI. 1998. Compensatory changes in photosystem IIelectron turnover rates protect photosynthesis from photo-inhibition. Photosynth. Res. 58: 259–268.
BERTONI, R., AND E. BALSEIRO. 2005. Mixing layer runningincubator (MIRI): An instrument for incubating sampleswhile moving vertically in the mixing layer. Limnol.Oceanogr: Methods 3: 158–163.
CORNO, G., R. M. LETELIER, M. R. ABBOTT, AND D. M. KARL. 2006.Assessing primary production variability in the north Pacificsubtropical gyre: A comparison of Fast Repetition Ratefluorometry and 14C measurements. J. Phycol. 42: 51–60.
CULLEN, J. J. 1990. On models of photosynthesis in phytoplank-ton. Deep-Sea Res. 37: 667–683.
———, AND M. R. LEWIS. 1988. The kinetics of algal photo-adaptation in the context of vertical mixing. J. Plankton Res.10: 1039–1063.
DERA, J., AND H. R. GORDON. 1970. Light field fluctuations in thephotic zone. Limnol. Oceanogr. 13: 697–699.
DUBINSKY, Z., P. G. FALKOWSKI, AND K. WYMAN. 1986. Lightharvesting and utilization by phytoplankton. Plant CellPhysiol. 27: 1335–1349.
EILERS, P. H. C., AND J. C. H. PEETERS. 1988. A model for therelationship between light intensity and the rate of photosyn-thesis in phytoplankton. Ecol. Model. 42: 199–215.
ESCOUBAS, J. M., M. LOMAS, J. LAROCHE, AND P. G. FALKOWSKI.1995. Light intensity regulation of cab gene transcription issignaled by the redox state of the plastoquinone pool. Proc.Natl. Acad. Sci. U. S. A. 92: 10237–10241.
FALKOWSKI, P. G., AND J. A. RAVEN. 2007. Aquatic photosynthe-sis, 2nd ed. Princeton Univ. Press.
———, K. WYMAN, A. C. LEY, AND D. C. MAUZERALL. 1986.Relationship of steady-state photosynthesis to fluorescence ineucaryotic algae. Biochim. Biophys. Acta 849: 183–192.
FLYNN, K. J. 2001. A mechanistic model for describing dynamicmulti-nutrient, light, temperature interactions in phytoplank-ton. J. Plankton Res. 23: 977–997.
GALLEGOS, C. L., G. M. HORNBERGER, AND M. G. KELLY. 1977. Amodel of river benthic algal photosynthesis in response torapid changes in light. Limnol. Oceanogr. 22: 226–233.
GARCIA-MENDOZA, E., H. C. P. MATTHIJS, H. SCHUBERT, AND L. R.MUR. 2002. Non-photochemical quenching of chlorophyllfluorescence in Chlorella fusca acclimated to constant anddynamic light conditions. Photosynth. Res. 74: 303–315.
GEIDER, R. J. 1990. The relationship between steady statephytoplankton growth and photosynthesis. Limnol. Ocean-ogr. 35: 971–972.
———, H. L. MACINTYRE, AND T. M. KANA. 1996. A dynamicmodel of photoadaptation in phytoplankton. Limnol. Ocean-ogr. 41: 1–15.
———, ———, AND ———. 1998. A dynamic regulatory modelof phytoplanktonic acclimation to light, nutrients, andtemperature. Limnol. Oceanogr. 43: 679–694.
GOCKE, K., AND J. LENZ. 2004. A new ‘turbulence incubator’ formeasuring primary production in non-stratified waters. J.Plankton Res. 26: 357–369.
GORBUNOV, M. Y., Z. S. KOLBER, M. P. LESSER, AND P. G.FALKOWSKI. 2001. Photosynthesis and photoprotection insymbiotic corals. Limnol. Oceanogr. 46: 75–85.
GOSS, R., B. LEPETIT, AND C. WILHELM. 2006. Evidence for arebinding of antheraxanthin to the light-harvesting complexduring the epoxidation reaction of the violaxanthin cycle. J.Plant Physiol. 163: 585–590.
GOVINDJEE, 2004. Chlorophyll a fluorescence: A bit of basics andhistory, p. 1–42. In G. C. Papageorgiou and Govindjee [eds.],Chlorophyll a fluorescence: A signature of photosynthesis.Springer.
GUILLARD, R. R. L., AND J. H. RYTHER. 1962. Studies of marineplanktonic diatoms. I. Cyclotella nana Hustedt and Detonulaconfervacea (Cleve). Can. J. Microbiol. 8: 229–239.
HAN, B.-P. 2002. A mechanistic model of algal photoinhibitioninduced by photodamage to photosystem-II. J. Theor. Biol.214: 519–527.
HARRIS, G. P. 1978. Photosynthesis, productivity and growth: Thephysiological ecology of phytoplankton. Arch. Hydrobiol. 10:1–171.
HUISMAN, J., AND B. SOMMEIJER. 2002. Population dynamics ofsinking phytoplankton in light-limited environments: Simu-lation techniques and critical parameters. J. Sea Res. 48:83–96.
JASSBY, A. D., AND T. PLATT. 1976. Mathematical formulation ofthe relationship between photosynthesis and light for phyto-plankton. Limnol. Oceanogr. 21: 540–547.
JEFFREY, S. W., R. F. C. MANTOURA, AND S. W. WRIGHT. 1997.Phytoplankton pigments in oceanography: Guidelines tomodern methods. UNESCO.
JEWSON, D. H., AND R. B. WOOD. 1975. Some effects on integralphotosynthesis of artificial circulation of phytoplanktonthrough light gradients. Verh. Internat. Verein. Limnol. 19:1037–1044.
KANA, R., D. LAZAR, O. PRASIL, AND J. NAUS. 2002. Experimentaland theoretical studies on the excess capacity of photosystemII. Photosynth. Res. 72: 271–284.
KELLER, M. D., R. C. SELVIN, W. CLAUS, AND R. R. L. GUILLARD.1987. Media for the culture of oceanic ultraphytoplankton. J.Phycol. 23: 633–638.
KIEFER, D. A., AND B. G. MITCHEL. 1983. A simple, steady statedescription of phytoplankton growth based on absorption crosssection and quantum efficiency. Limnol. Oceanogr. 28: 770–776.
KIRKPATRICK, G. J., T. B. CURTIN, D. KAMYKOWSKI, M. D.FEEZOR, M. D. SARTIN, AND R. E. REED. 1990. Measurementof photosynthetic response to euphotic zone physical forcing.Oceanography 3: 18–22.
KNAP, A., A. MICHAELS, A. CLOSE, H. DUCKLOW AND A. DICKSON
[EDS.]. 1996. Protocols for the Joint Global Ocean Flux Study(JGOFS) core measurements. JGOFS Project Office, ReportNo. 19.
KOLBER, Z., AND P. G. FALKOWSKI. 1993. Use of activefluorescence to estimate phytoplankton photosynthesis insitu. Limnol. Oceanogr. 38: 1646–1665.
KOLBER, Z. S., O. PRASIL, AND P. G. FALKOWSKI. 1998.Measurements of variable chlorophyll fluorescence usingfast repetition rate techniques: Defining methodology andexperimental protocols. Biochim. Biophys. Acta 1367:88–106.
KRAMER, D. M., T. J. AVENSON, AND G. E. EDWARDS. 2004.Dynamic flexibility in the light reactions of photosynthesisgoverned by both electron and proton transfer reactions.Trends Plant Sci. 9: 349–357.
KROON, B. M. A., AND S. THOMS. 2006. From electron to biomass:A mechanistic model to describe phytoplankton photosyn-thesis and steady-state growth rates. J. Phycol. 42: 593–609.
1850 Ross et al.

LEBOULANGER, C., V. MARTIN-JEZEQUEL, C. DESCOLAS-GROS, A.SCIANDRA, AND H. J. JUPIN. 1998. Photorespiration incontinuous culture of Dunaliella tertiolecta (Chlorophyta):Relationships between serine, glycine, and extracellularglycolate. J. Phycol. 34: 651–654.
LEWIS, M. R., E. P. W. HORNE, J. J. CULLEN, N. S. OAKEY, AND T.PLATT. 1984. Turbulent motions may control phytoplanktonphotosynthesis in the upper ocean. Nature 311: 49–50.
———, AND C. J. SMITH. 1983. A small-volume, short-incubationtime method for the measurement of photosynthesis as afunction of incident irradiance. Mar. Ecol. Prog. Ser. 13: 99–102.
LOHR, M., AND C. WILHELM. 2001. Xanthophyll synthesis indiatoms: Quantification of putative intermediates and com-parison of pigment conversion kinetics with rate constantsderived from a model. Planta 212: 382–391.
LONG, S. P., S. HUMPHRIES, AND P. G. FALKOWSKI. 1994.Photoinhibition of photosynthesis in nature. Annu. Rev.Plant Physiol. Plant Mol. Biol. 45: 633–662.
MACINTYRE, H. L., R. J. GEIDER, AND R. M. MCKAY. 1996.Photosynthesis and regulation of rubisco activity in netphytoplankton from Delaware Bay. J. Phycol. 32: 718–732.
———, T. M. KANA, T. ANNING, AND R. J. GEIDER. 2002.Photoacclimation of photosynthesis irradiance responsecurves and photosynthetic pigments in microalgae andcyanobacteria. J. Phycol. 38: 17–38.
———, ———, AND R. J. GEIDER. 2000. The effect of watermotion on short-term rates of photosynthesis by marinephytoplankton. Trends Plant Sci. 5: 12–17.
MACKENZIE, T. D. B., AND D. A. CAMPBELL. 2005. Cyanobacterialaclimation to rapidly fluctuating light is constrained byinorganic carbon status. J. Phycol. 41: 801–811.
MALLIN, M. A., AND H. W. PAERL. 1992. Effects of variableirradiance on phytoplankton productivity in shallow estuar-ies. Limnol. Oceanogr. 37: 54–62.
MARRA, J. 1980. Vertical mixing and primary production,p. 121–137. In P. G. Falkowski [ed.], Primary productivityin the sea. Plenum Press.
MELIS, A. 1999. Photosystem-II damage and repair cycle inchloroplasts: What modulates the rate of photodamage invivo? Trends Plant Sci. 4: 130–135.
MELROSE, D. C., C. A. OVIATT, J. E. O’REILLY, AND M. S. BERMAN.2006. Comparisons of fast repetition rate fluorescenceestimated primary production and 14C uptake by phyto-plankton. Mar. Ecol. Prog. Ser. 311: 37–44.
MIZIORKO, H. M., AND G. H. LORIMER. 1983. Ribulose-1,5-bisphosphate carboxylase-oxygenase. Annu. Rev. Biochem.52: 507–535.
MOUGET, J.-L., J. DE AL NOUE, L. LEGENDRE, Y. JEAN, AND P.VIAROUGE. 1995a. Long-term acclimatization of Scenedesmusbicellularis to high-frequency intermittent lighting (100 Hz). I.Growth, photosynthesis and photosystem II activity. J.Plankton Res. 17: 859–874.
———, L. LEGENDRE, AND J. DE AL NOUE. 1995b. Long-termacclimatization of Scenedesmus bicellularis to high-frequencyintermittent lighting (100 Hz). II. Photosynthetic pigments,carboxylating enzymes and biochemical composition. J.Plankton Res. 17: 875–890.
OLAIZOLA, M., J. LA ROCHE, Z. KOLBER, AND P. G. FALKOWSKI.1994. Non-photochemical fluorescence quenching and thediadinoxanthin cycle in a marine diatom. Photosynth. Res.41: 357–370.
PAHLOW, M. 2005. Linking chlorophyll-nutrient dynamics to theRedfield N:C ratio with a model of optimal phytoplanktongrowth. Mar. Ecol. Prog. Ser. 287: 33–43.
PELTIER, G., AND L. COURNAC. 2002. Chlororespiration. Annu.Rev. Plant Biol. 53: 523–550.
PLATT, T., C. L. GALLEGOS, AND W. G. HARRISON. 1980.Photoinhibition of photosynthesis in natural assemblages ofmarine phytoplankton. J. Marine Res. 38: 687–701.
RANDALL, J. M., AND J. W. DAY. 1987. Effects of river dischargeand vertical circulation on aquatic primary production in aturbid Louisiana (USA) estuary. Neth. J. Sea Res. 21:231–242.
RAVEN, J. A., AND R. J. GEIDER. 2003. Adaptation, acclimationand regulation in algal photosynthesis, p. 385–412. In A. W.D. Larkum, S. Douglas and J. A. Raven [eds.], Photosyn-thesis of algae. Kluwer Academic.
ROSS, O. N., AND J. SHARPLES. 2004. Recipe for 1-D Lagrangianparticle tracking models in space-varying diffusivity. Limnol.Oceanogr.: Methods 2: 289–302.
———, AND ———. 2007. Phytoplankton motility and thecompetition for nutrients in the thermocline. Mar. Ecol.Prog. Ser. 347: 21–38.
SAKSHAUG, E., K. ANDRESEN, AND D. A. KIEFER. 1989. A steadystate description of growth and light absorption in the marineplanktonic diatom Skeletonema costatum. Limnol. Oceanogr.34: 198–205.
SHOAF, W. T., AND B. W. LIUM. 1976. Improved extraction ofchlorophyll a and b from algae using dimethyl sulfoxide.Limnol. Oceanogr. 21: 926–928.
SMYTH, T. J., K. L. PEMBERTON, J. AIKEN, AND R. J. GEIDER. 2004.A methodology to determine primary production andphytoplankton photosynthetic parameters from fast repeti-tion rate fluorometry. J. Plankton Res. 26: 1337–1350.
STEELE, J. H. 1962. Environmental control of photosynthesis inthe sea. Limnol. Oceanogr. 7: 137–150.
STEEMANN-NIELSEN, E. 1952. The use of radioactive carbon (C14)for measuring organic carbon production in the sea. J. duConseil 18: 117–140.
STRAMSKI, D., G. ROSENBERG, AND L. LEGENDRE. 1993.Photosynthetic and optical properties of the marine chlo-rophyte Dunaliella tertiolecta grown under fluctuatinglight caused by surface-wave focusing. Mar. Biol. 115:363–372.
SUGGETT, D. J., S. C. MABERLY, AND R. J. GEIDER. 2006. Grossphotosynthesis and lake community metabolism during thespring phytoplankton bloom. Limnol. Oceanogr. 51:2064–2076.
———, H. L. MACINTYRE, AND R. J. GEIDER. 2004. Evaluation ofbiophysical and optical determinations of light absorption byphotosystem II in phytoplankton. Limnol. Oceanogr.: Meth-ods 2: 316–332.
———, K. OXBOROUGH, N. R. BAKER, H. L. MACINTYRE,T. M. KANA, AND R. J. GEIDER. 2003. Fast repetition rateand pulse amplitude modulation chlorophyll a fluorescencemeasurements for assessment of photosynthetic electrontransport in marine phytoplankton. Eur. J. Phycol. 38:371–384.
SUKENIK, A., J. BENNETT, AND P. FALKOWSKI. 1987. Light-saturated photosynthesis—limitation by electron transportor carbon fixation? Bioch. Biophys. Acta 891: 205–215.
WAGNER, H., T. JAKOB, AND C. WILHELM. 2006. Balancing theenergy flow from captured light to biomass under fluctuatinglight conditions. New Phytol. 169: 95–108.
WEGER, H. G., R. HERZIG, P. G. FALKOWSKI, AND D. H. TURPIN.1989. Respiratory losses in the light in a marine diatom—measurements by short-term mass spectrometry. Limnol.Oceanogr 34: 1153–1161.
WELSCHMEYER, N. A. 1994. Fluorometric analysis of chlorophyll ain the presence of chlorophyll b and phaeopigments. Limnol.Oceanogr. 39: 1985–1992.
A model of photosynthesis 1851

WILHELM, C., AND oTHERS. 2006. The regulation of carbon andnutrient assimilation in diatoms is significantly different fromgreen algae. Protist 157: 91–124.
YODER, J. A., AND S. S. BISHOP. 1985. Effects of mixing-induced irradiance fluctuations on photosynthesis of naturalassemblages of coastal phytoplankton. Mar. Biol. 90:87–93.
ZONNEVELD, C. 1997. Modeling effects of photoadaptation on thephotosynthesis–irradiance curve. J. Theor. Biol. 186: 381–388.
Received: 15 November 2007Accepted: 14 March 2008
Amended: 8 April 2008
1852 Ross et al.