Cell death discrimination with Raman spectroscopy and support vector machines
11
See discussions, stats, and author profiles for this publication at: https://www.researchgate.net/publication/24276923 Cell Death Discrimination with Raman Spectroscopy and Support Vector Machines Article in Annals of Biomedical Engineering · May 2009 DOI: 10.1007/s10439-009-9688-z · Source: PubMed CITATIONS 34 READS 84 6 authors, including: Some of the authors of this publication are also working on these related projects: Inventory Management and Transshipment Policies for Drugs with No Annual Contract in Pharmaceutical Supply Chain Planning Under Uncertainty View project Georgios Pyrgiotakis Harvard University 51 PUBLICATIONS 1,430 CITATIONS SEE PROFILE O. Erhun Kundakcioglu Ozyegin University 33 PUBLICATIONS 146 CITATIONS SEE PROFILE Panos Pardalos University of Florida 953 PUBLICATIONS 14,949 CITATIONS SEE PROFILE Kevin Powers University of Florida 38 PUBLICATIONS 1,331 CITATIONS SEE PROFILE All content following this page was uploaded by O. Erhun Kundakcioglu on 01 December 2016. The user has requested enhancement of the downloaded file. All in-text references underlined in blue are linked to publications on ResearchGate, letting you access and read them immediately.
Transcript of Cell death discrimination with Raman spectroscopy and support vector machines

Seediscussions,stats,andauthorprofilesforthispublicationat:https://www.researchgate.net/publication/24276923
CellDeathDiscriminationwithRamanSpectroscopyandSupportVectorMachines
ArticleinAnnalsofBiomedicalEngineering·May2009
DOI:10.1007/s10439-009-9688-z·Source:PubMed
CITATIONS
34
READS
84
6authors,including:
Someoftheauthorsofthispublicationarealsoworkingontheserelatedprojects:
InventoryManagementandTransshipmentPoliciesforDrugswithNoAnnualContractin
PharmaceuticalSupplyChainPlanningUnderUncertaintyViewproject
GeorgiosPyrgiotakis
HarvardUniversity
51PUBLICATIONS1,430CITATIONS
SEEPROFILE
O.ErhunKundakcioglu
OzyeginUniversity
33PUBLICATIONS146CITATIONS
SEEPROFILE
PanosPardalos
UniversityofFlorida
953PUBLICATIONS14,949CITATIONS
SEEPROFILE
KevinPowers
UniversityofFlorida
38PUBLICATIONS1,331CITATIONS
SEEPROFILE
AllcontentfollowingthispagewasuploadedbyO.ErhunKundakciogluon01December2016.
Theuserhasrequestedenhancementofthedownloadedfile.Allin-textreferencesunderlinedinbluearelinkedtopublicationsonResearchGate,lettingyouaccessandreadthemimmediately.
Cell Death Discrimination with Raman Spectroscopy
and Support Vector Machines
GEORGIOS PYRGIOTAKIS,1 O. ERHUN KUNDAKCIOGLU,2 KATHRYN FINTON,1,3 PANOS M. PARDALOS,2
KEVIN POWERS,1 and BRIJ M. MOUDGIL1,4
1Particle Engineering Research Center, University of Florida, Gainesville, FL, USA; 2Department of Industrial and SystemsEngineering, University of Florida, Gainesville, FL, USA; 3Biochemistry Department, BMSD, University of Washington,Pullman, WA, USA; and 4Department of Materials Science and Engineering, University of Florida, Gainesville, FL, USA
(Received 19 September 2008; accepted 27 March 2009; published online 14 April 2009)
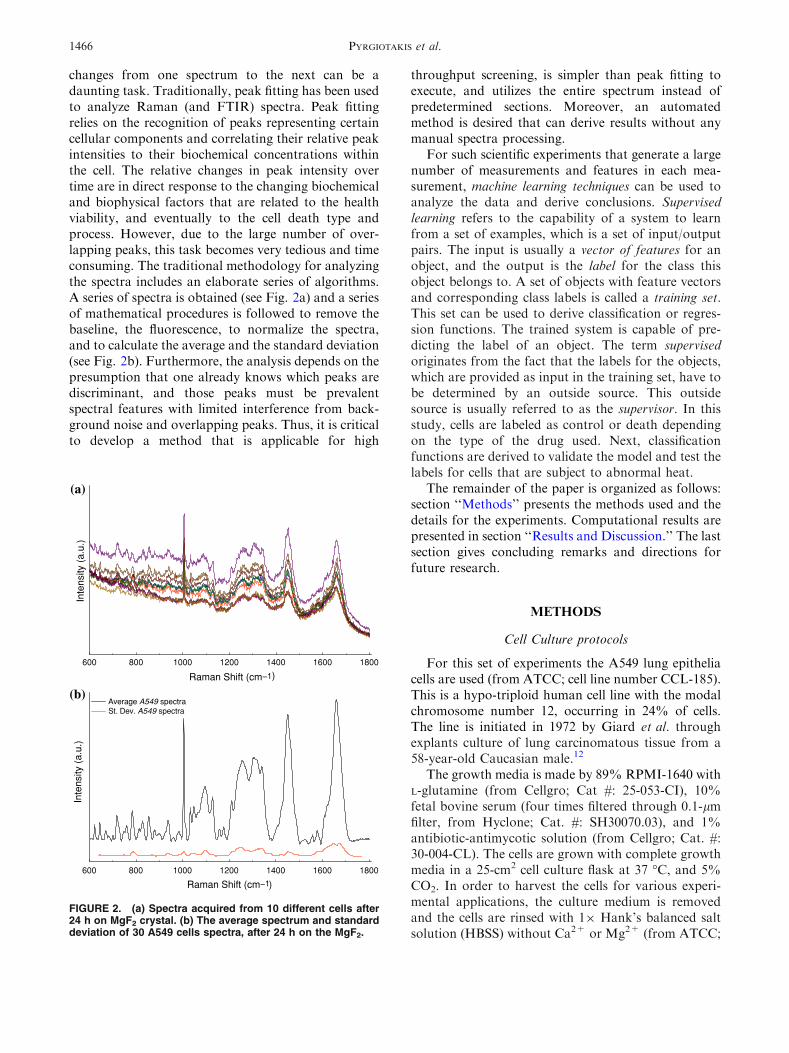
Abstract—In the present study, Raman spectroscopy isemployed to assess the potential toxicity of chemical sub-stances. Having several advantages compared to othertraditional methods, Raman spectroscopy is an ideal solutionfor investigating cells in their natural environment. In thepresent work, we combine the power of spectral resolution ofRaman with one of the most widely used machine learningtechniques. Support vector machines (SVMs) are used in thecontext of classification on a well established database. Thedatabase is constructed on three different classes: healthycells, Triton X-100 (necrotic death), and etoposide (apoptoticdeath). SVM classifiers successfully assess the potential effectof the test toxins (Triton X-100, etoposide). The cells thatare exposed to heat (45 �C) are tested using the classificationrules obtained. It is shown that the heat effect resultsin apoptotic death, which is in agreement with existingliterature.
Keywords—Raman spectroscopy, Support vector machines,
Death cell discrimination, Toxic chemicals, Cancer treat-
ment.
INTRODUCTION
Cell death and the post-mortem aftermath are inte-gral to the study of many genetic and infectiousdiseases. It is strongly linked to the toxicological effectof various materials and is of great importance for safetoxicity assessment. In recent literature, cell death isclassified in three alternative modes: apoptotic (or type Iprogrammed), autophagic (or type II programmed),and necrotic (or oncotic) cell death. Apoptosis andautophagy are important considerations in the devel-opment and treatment of diseases such as cancer,21–23
and in certain pathogenic infections.30 Usually apop-tosis is marked by caspase activation, chromatin con-densation, and the formation of apoptotic bodies.Autophagic is marked by autophagic engulfment oforganelles and particles. Cells dying by necrosis displayorganelle swelling with the eventual loss of plasma,membrane integrity, and subsequent inflammation.Monitoring the cell death process, therefore, is animportant step in understanding the pathological pro-cesses induced by both disease and pharmaceuticaltreatments such as anti-cancer drugs.
Despite the importance of this topic, the pathologyand biochemical factors and processes adding to celldeath are not yet fully understood. Except morpho-logy, in vivo there is no single assay that can unam-biguously identify cell death type (if such an absolutedelineation exists),18 which makes characterizing celldeath even more difficult. A wide range of cytotoxicityassays are presently in use for the determination of cellviability; however, these techniques have shortcom-ings. They are destructive, time consuming, andexpensive. Current assays depend on large populationsand cannot measure the health of individual cells.Furthermore, many factors must be considered wheninterpreting results. Because cytotoxicity assays rely onchemicals and biomarkers, problems may arise due tounwanted interactions during pharmaceutical testing.Furthermore, in the case where assays are dependentupon enzymatic reactions (e.g., MTT, LDH), resultsmay be skewed by promiscuous enzymatic inhibitors.Specificity issues can also lead to complications in theinterpretation of results. Kanduc et al. comparedmany of the conventional cytotoxicity assays and findthat the reported viability of treated cells differeddepending on the assay used.24 Moreover, a largenumber of cells is required to determine the exact cel-lular death and to conclude on the toxicologicalassessment.
Address correspondence to Panos M. Pardalos, Department
of Industrial and Systems Engineering, University of Florida,
Gainesville, FL, USA. Electronic mail: [email protected],
[email protected], [email protected], [email protected], kpowers@
perc.ufl.edu, [email protected]
Annals of Biomedical Engineering, Vol. 37, No. 7, July 2009 (� 2009) pp. 1464–1473
DOI: 10.1007/s10439-009-9688-z
0090-6964/09/0700-1464/0 � 2009 Biomedical Engineering Society
1464

Raman spectroscopy, a well established analyticaltool, is being employed as an alternative for studyingcell health. It does not share many of the disadvantagesinherent in traditional cytotoxicity assays describedabove.33,34 Raman spectroscopy relies on the inelasticscattering of light on matter. It is a complementarytechnique to the infrared (IR) spectroscopy (FTIR,DRIFT, etc.). The basic difference lies on the polar-izability of the molecule that is required by Raman vs.the polarity that is required by traditional IR spec-troscopy. In both cases, the material is radiated with alight of specific frequency that induces an electrontransition to a different vibrational state, with anenergy loss of the photon. In the case of Ramanspectroscopy, due to the polarizability of the molecule,the transition occurs through an intermediate state,usually called the virtual state (see Fig. 1). The Ramanmeasurements are based on vibrational modes specificto a molecule and its environment. The spectrum of a
cell is a representation of its chemical composition andprovides an insight for the bio-molecular changesaccompanying cellular processes. There are four mainadvantages for using Raman spectroscopy: (i) themethod is noninvasive and does not require chemicalsor markers; (ii) measurements can be taken rapidlyand in real time, in vivo, or in vitro without deleteriousresults to living cells; (iii) it is possible to analyze thehealth of either a single cell or the entire population;and (iv) the asymmetric nature of water gives a weakRaman signal that, unlike in IR spectroscopy, does notinterfere with the spectrum of interest.50 It has beensuccessfully used to evaluate the toxicity of pharma-ceuticals,36 toxins,32 and more recently the toxic effectof particles.41
While Raman spectroscopy has many advantages,there exists one large drawback; highly complex spec-tra. Because the spectrum of a cell contains informa-tion from all cellular components, detecting minute
(a)
(b)
FIGURE 1. The basic principles of Raman spectroscopy. (a) A photon of a certain energy and frequency induces vibrationaltransitions on the examined molecule, by giving a portion of its energy. The transition occurs through a virtual state, created due tothe polarizability of the studied molecule. The scattered photon has lower energy than the incident and the energy difference inbetween is measured by the detector. This is referred to as the Raman Shift. (b) The micro Raman utilizes a microscope andfocuses the laser through the objective lens on the sample. The scattered photons are collected by the same objective lens andtravel the Raman spectrometer, where they are analyzed by a grating and a CCD detector.
Cell Death Discrimination with Raman Spectroscopy and SVMs 1465
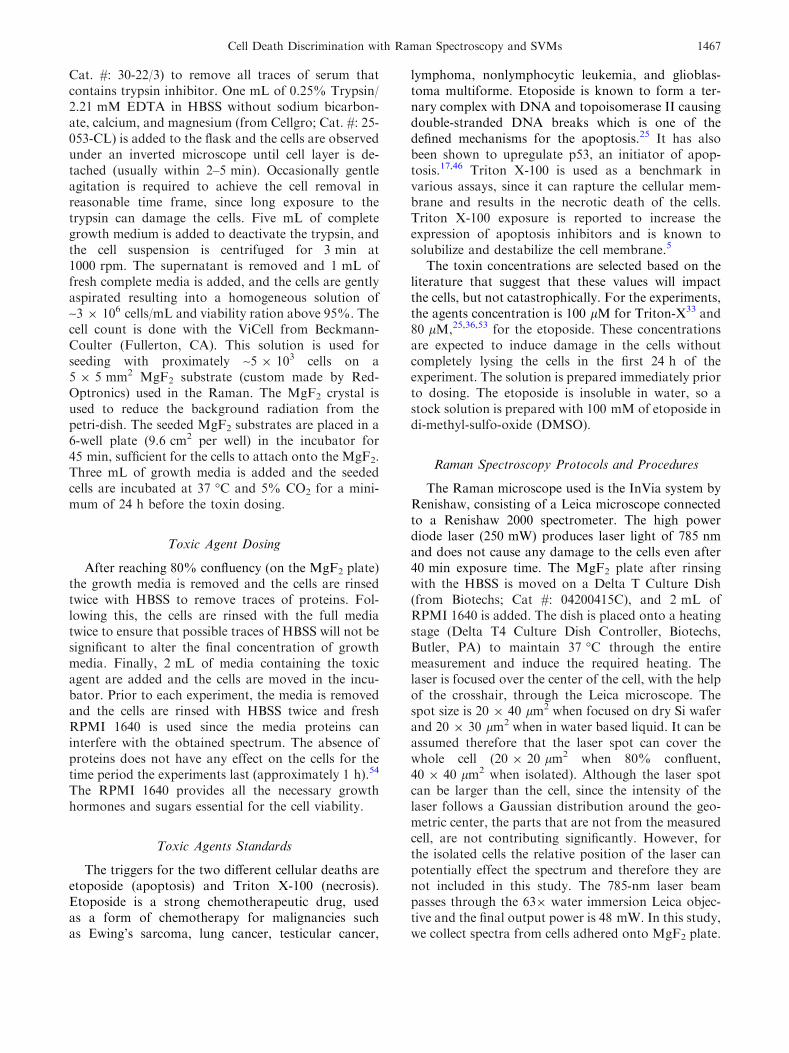
changes from one spectrum to the next can be adaunting task. Traditionally, peak fitting has been usedto analyze Raman (and FTIR) spectra. Peak fittingrelies on the recognition of peaks representing certaincellular components and correlating their relative peakintensities to their biochemical concentrations withinthe cell. The relative changes in peak intensity overtime are in direct response to the changing biochemicaland biophysical factors that are related to the healthviability, and eventually to the cell death type andprocess. However, due to the large number of over-lapping peaks, this task becomes very tedious and timeconsuming. The traditional methodology for analyzingthe spectra includes an elaborate series of algorithms.A series of spectra is obtained (see Fig. 2a) and a seriesof mathematical procedures is followed to remove thebaseline, the fluorescence, to normalize the spectra,and to calculate the average and the standard deviation(see Fig. 2b). Furthermore, the analysis depends on thepresumption that one already knows which peaks arediscriminant, and those peaks must be prevalentspectral features with limited interference from back-ground noise and overlapping peaks. Thus, it is criticalto develop a method that is applicable for high
throughput screening, is simpler than peak fitting toexecute, and utilizes the entire spectrum instead ofpredetermined sections. Moreover, an automatedmethod is desired that can derive results without anymanual spectra processing.
For such scientific experiments that generate a largenumber of measurements and features in each mea-surement, machine learning techniques can be used toanalyze the data and derive conclusions. Supervisedlearning refers to the capability of a system to learnfrom a set of examples, which is a set of input/outputpairs. The input is usually a vector of features for anobject, and the output is the label for the class thisobject belongs to. A set of objects with feature vectorsand corresponding class labels is called a training set.This set can be used to derive classification or regres-sion functions. The trained system is capable of pre-dicting the label of an object. The term supervisedoriginates from the fact that the labels for the objects,which are provided as input in the training set, have tobe determined by an outside source. This outsidesource is usually referred to as the supervisor. In thisstudy, cells are labeled as control or death dependingon the type of the drug used. Next, classificationfunctions are derived to validate the model and test thelabels for cells that are subject to abnormal heat.
The remainder of the paper is organized as follows:section ‘‘Methods’’ presents the methods used and thedetails for the experiments. Computational results arepresented in section ‘‘Results and Discussion.’’ The lastsection gives concluding remarks and directions forfuture research.
METHODS
Cell Culture protocols
For this set of experiments the A549 lung epitheliacells are used (from ATCC; cell line number CCL-185).This is a hypo-triploid human cell line with the modalchromosome number 12, occurring in 24% of cells.The line is initiated in 1972 by Giard et al. throughexplants culture of lung carcinomatous tissue from a58-year-old Caucasian male.12
The growth media is made by 89% RPMI-1640 withL-glutamine (from Cellgro; Cat #: 25-053-CI), 10%fetal bovine serum (four times filtered through 0.1-lmfilter, from Hyclone; Cat. #: SH30070.03), and 1%antibiotic-antimycotic solution (from Cellgro; Cat. #:30-004-CL). The cells are grown with complete growthmedia in a 25-cm2 cell culture flask at 37 �C, and 5%CO2. In order to harvest the cells for various experi-mental applications, the culture medium is removedand the cells are rinsed with 19 Hank’s balanced saltsolution (HBSS) without Ca2+ or Mg2+ (from ATCC;
600
(a)
(b)
800 1000 1200 1400 1600 1800
Raman Shift (cm−1)
Inte
nsity
(a.
u.)
600 800 1000 1200 1400 1600 1800
Raman Shift (cm−1)
Inte
nsity
(a.
u.)
Average A549 spectraSt. Dev. A549 spectra
FIGURE 2. (a) Spectra acquired from 10 different cells after24 h on MgF2 crystal. (b) The average spectrum and standarddeviation of 30 A549 cells spectra, after 24 h on the MgF2.
PYRGIOTAKIS et al.1466
Cat. #: 30-22/3) to remove all traces of serum thatcontains trypsin inhibitor. One mL of 0.25% Trypsin/2.21 mM EDTA in HBSS without sodium bicarbon-ate, calcium, and magnesium (from Cellgro; Cat. #: 25-053-CL) is added to the flask and the cells are observedunder an inverted microscope until cell layer is de-tached (usually within 2–5 min). Occasionally gentleagitation is required to achieve the cell removal inreasonable time frame, since long exposure to thetrypsin can damage the cells. Five mL of completegrowth medium is added to deactivate the trypsin, andthe cell suspension is centrifuged for 3 min at1000 rpm. The supernatant is removed and 1 mL offresh complete media is added, and the cells are gentlyaspirated resulting into a homogeneous solution of~3 9 106 cells/mL and viability ration above 95%. Thecell count is done with the ViCell from Beckmann-Coulter (Fullerton, CA). This solution is used forseeding with proximately ~5 9 103 cells on a5 9 5 mm2 MgF2 substrate (custom made by Red-Optronics) used in the Raman. The MgF2 crystal isused to reduce the background radiation from thepetri-dish. The seeded MgF2 substrates are placed in a6-well plate (9.6 cm2 per well) in the incubator for45 min, sufficient for the cells to attach onto the MgF2.Three mL of growth media is added and the seededcells are incubated at 37 �C and 5% CO2 for a mini-mum of 24 h before the toxin dosing.
Toxic Agent Dosing
After reaching 80% confluency (on the MgF2 plate)the growth media is removed and the cells are rinsedtwice with HBSS to remove traces of proteins. Fol-lowing this, the cells are rinsed with the full mediatwice to ensure that possible traces of HBSS will not besignificant to alter the final concentration of growthmedia. Finally, 2 mL of media containing the toxicagent are added and the cells are moved in the incu-bator. Prior to each experiment, the media is removedand the cells are rinsed with HBSS twice and freshRPMI 1640 is used since the media proteins caninterfere with the obtained spectrum. The absence ofproteins does not have any effect on the cells for thetime period the experiments last (approximately 1 h).54
The RPMI 1640 provides all the necessary growthhormones and sugars essential for the cell viability.
Toxic Agents Standards
The triggers for the two different cellular deaths areetoposide (apoptosis) and Triton X-100 (necrosis).Etoposide is a strong chemotherapeutic drug, usedas a form of chemotherapy for malignancies suchas Ewing’s sarcoma, lung cancer, testicular cancer,
lymphoma, nonlymphocytic leukemia, and glioblas-toma multiforme. Etoposide is known to form a ter-nary complex with DNA and topoisomerase II causingdouble-stranded DNA breaks which is one of thedefined mechanisms for the apoptosis.25 It has alsobeen shown to upregulate p53, an initiator of apop-tosis.17,46 Triton X-100 is used as a benchmark invarious assays, since it can rapture the cellular mem-brane and results in the necrotic death of the cells.Triton X-100 exposure is reported to increase theexpression of apoptosis inhibitors and is known tosolubilize and destabilize the cell membrane.5
The toxin concentrations are selected based on theliterature that suggest that these values will impactthe cells, but not catastrophically. For the experiments,the agents concentration is 100 lM for Triton-X33 and80 lM,25,36,53 for the etoposide. These concentrationsare expected to induce damage in the cells withoutcompletely lysing the cells in the first 24 h of theexperiment. The solution is prepared immediately priorto dosing. The etoposide is insoluble in water, so astock solution is prepared with 100 mM of etoposide indi-methyl-sulfo-oxide (DMSO).
Raman Spectroscopy Protocols and Procedures
The Raman microscope used is the InVia system byRenishaw, consisting of a Leica microscope connectedto a Renishaw 2000 spectrometer. The high powerdiode laser (250 mW) produces laser light of 785 nmand does not cause any damage to the cells even after40 min exposure time. The MgF2 plate after rinsingwith the HBSS is moved on a Delta T Culture Dish(from Biotechs; Cat #: 04200415C), and 2 mL ofRPMI 1640 is added. The dish is placed onto a heatingstage (Delta T4 Culture Dish Controller, Biotechs,Butler, PA) to maintain 37 �C through the entiremeasurement and induce the required heating. Thelaser is focused over the center of the cell, with the helpof the crosshair, through the Leica microscope. Thespot size is 20 9 40 lm2 when focused on dry Si waferand 20 9 30 lm2 when in water based liquid. It can beassumed therefore that the laser spot can cover thewhole cell (20 9 20 lm2 when 80% confluent,40 9 40 lm2 when isolated). Although the laser spotcan be larger than the cell, since the intensity of thelaser follows a Gaussian distribution around the geo-metric center, the parts that are not from the measuredcell, are not contributing significantly. However, forthe isolated cells the relative position of the laser canpotentially effect the spectrum and therefore they arenot included in this study. The 785-nm laser beampasses through the 639 water immersion Leica objec-tive and the final output power is 48 mW. In this study,we collect spectra from cells adhered onto MgF2 plate.
Cell Death Discrimination with Raman Spectroscopy and SVMs 1467
The MgF2 plate is used to eliminate the backgroundsignal from the petri dish. The collection time for eachspectrum is set to 30 s. However, the instrumentrequires an additional 70 s to read the detector, duringwhich the cell is exposed to the laser. Therefore, thetotal exposure time is 100 s and immediately after themeasurement is preformed, the laser shutter is turnedoff, a new cell is selected, and the following measure-ment is immediately executed.
The RPMI media with or without the presence ofthe various toxins does not influence the spectra. Inprevious publications, we have developed an algorithmthat takes the background, the fluorescence, and thenormalization of the spectra into account.3,29 In thepresent work, the background is obtained and sub-tracted from the spectra following nonlinear subtrac-tion.29 The spectrum before and after are used forclassification, but there is no significant difference inthe final results. Therefore we omit this step since it islikely that these processes hinder or remove informa-tion, essential for the classification techniques.
Support Vector Machines
Developed by Vapnik,48 support vector machines(SVMs) are the state-of-the-art supervised machinelearning methods. SVM classifiers classify two linearlyseparable sets of pattern vectors that belong to twodifferent classes. The classification function is definedby a hyperplane. Although there are infinitely manyhyperplanes that separate the two classes, SVM clas-sifiers find the hyperplane that maximizes the distancefrom the convex hulls of both classes by solving aquadratic convex optimization problem. The successand robustness of SVM classifiers rely on strong fun-damentals from the statistical learning theory, fromwhich generalization bounds are derived. SVMs can beextended to nonlinear classification by implicitlyembedding the original data in a nonlinear space usingkernel functions.45
SVMs have a wide spectrum of application areassuch as pattern recognition,28 text categorization,19
biomedicine,6,7,31,37,44 brain–computer interface,10,27
and finance.16,47 The training is performed by mini-mizing a quadratic convex function that is subject tolinear constraints. Quadratic programming (QP) is anextensively studied field of optimization theory andthere are many general purpose methods to solve QPproblems such as quasi-Newton, primal-dual, andinterior-point methods.2 These general purpose meth-ods are suitable for small size problems. In order tosolve large problems, faster methods are required. ForSVM classifiers, these faster methods involve chunk-ing35 and decomposition39 techniques, which use sub-sets of points to find the optimal hyperplane. SVM
Light20 and LIBSVM15 are among the most frequentlyused software applications that use chunking anddecomposition methods efficiently.
Next, we give a brief introduction to the mathe-matical aspects of SVM classifiers. Let xi 2 Rd be a setof pattern vectors, with class labels yi 2 f1;�1g fori ¼ 1; . . . ; n: The problem of classifying these patternvectors consists of finding a function f(Æ) which cor-rectly assigns a class label for a given pattern vector x.Assume that the pattern vectors in the positive andnegative classes are to be separated by a hyperplanehw � xii þ b ¼ 0 which is represented as the vector w
and the offset parameter b. Let the distance betweenthe hyperplane and the closest pattern vector x* bejðhw � x�iÞ þ bj; which is called the functional margin.Note that the goal is to maximize the geometric margin,which is obtained by dividing the functional margin bythe norm of the hyperplane, kwk: Setting the functionalmargin to 1 for the closest pattern vectors in positiveand negative classes, the separating hyperplane withthe maximum geometric margin is obtained by maxi-mizing the reciprocal of kwk: This is equivalent tominimizing kwk which can be rewritten as
minw;b;n
12 kwk
2 þ C2
Pn
i¼1n2i
subject to yiðhw � xii þ bÞ � 1� ni i ¼ 1; . . . ; n
ð1Þ
where n are the slack variables for misclassified patternvectors and C is the penalty term in the objectivefunction for such vectors. The role of scalar C is tocontrol the trade-off between margin violation andregularization. This formulation can be converted intoa nonlinear classification method by taking itsLagrangian dual and implementing kernel methods.8,49
The Lagrangian dual problem for (1) can be writtenas
maxa
Pn
i¼1ai� 1
2C
Pn
i¼1a2i � 1
2
Pn
i¼1
Pn
j¼1yiyjaiajhxi �xji
subject toPn
i¼1yiai ¼ 0
ai � 0 i¼ 1; . . . ;n:
ð2Þ
In formulation (2), the pattern vectors appear only inthe form of dot products and nonlinear maps can beused to embed them in a higher dimensional space.Then the separation can be done on the mapped pat-tern vectors in this higher dimensional space. Theembedding is done via the kernel trick and the mappingis defined over dot product Hilbert spaces. Thistransformation replaces the dot product hxi � xji; with anonlinear kernel K(xi,xj). Kernel functions are some-times referred to as Mercer kernels, because they mustsatisfy Mercer’s condition.38
PYRGIOTAKIS et al.1468
The experimental procedure starts by constructing abasic 56 9 1301 matrix based on the two classes thedata must be discriminated to. The discrimination isdone always among two different classes. The 56 col-umns consist of 25 from class 1, 25 from class 2, 3 testsubjects from class 1, and 3 test subjects from class 2.The rows represent the different frequencies (600–1800 cm�1 with step 0.92 cm�1), while the columns arespectra of different cells in different environmentalconditions. There are three different matrices studied;Necrotic (NC): Triton X-100 and Control, Apoptotic(AC): Etoposide and Control, and Necrotic vs. Apop-totic (NA): Triton X-100 and Etoposide. For the val-idation of classification algorithm, in addition to the 50data instances of the library, we use three control cellsand seven cells with toxins.
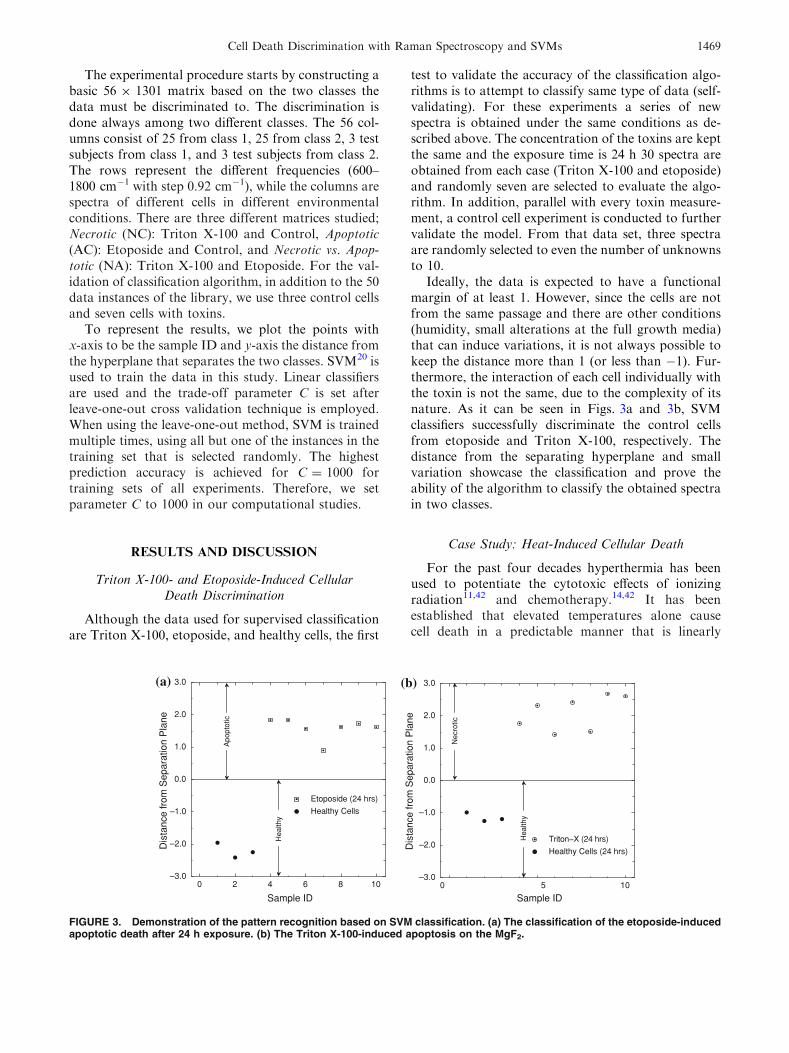
To represent the results, we plot the points withx-axis to be the sample ID and y-axis the distance fromthe hyperplane that separates the two classes. SVM20 isused to train the data in this study. Linear classifiersare used and the trade-off parameter C is set afterleave-one-out cross validation technique is employed.When using the leave-one-out method, SVM is trainedmultiple times, using all but one of the instances in thetraining set that is selected randomly. The highestprediction accuracy is achieved for C = 1000 fortraining sets of all experiments. Therefore, we setparameter C to 1000 in our computational studies.
RESULTS AND DISCUSSION
Triton X-100- and Etoposide-Induced CellularDeath Discrimination
Although the data used for supervised classificationare Triton X-100, etoposide, and healthy cells, the first
test to validate the accuracy of the classification algo-rithms is to attempt to classify same type of data (self-validating). For these experiments a series of newspectra is obtained under the same conditions as de-scribed above. The concentration of the toxins are keptthe same and the exposure time is 24 h 30 spectra areobtained from each case (Triton X-100 and etoposide)and randomly seven are selected to evaluate the algo-rithm. In addition, parallel with every toxin measure-ment, a control cell experiment is conducted to furthervalidate the model. From that data set, three spectraare randomly selected to even the number of unknownsto 10.
Ideally, the data is expected to have a functionalmargin of at least 1. However, since the cells are notfrom the same passage and there are other conditions(humidity, small alterations at the full growth media)that can induce variations, it is not always possible tokeep the distance more than 1 (or less than �1). Fur-thermore, the interaction of each cell individually withthe toxin is not the same, due to the complexity of itsnature. As it can be seen in Figs. 3a and 3b, SVMclassifiers successfully discriminate the control cellsfrom etoposide and Triton X-100, respectively. Thedistance from the separating hyperplane and smallvariation showcase the classification and prove theability of the algorithm to classify the obtained spectrain two classes.
Case Study: Heat-Induced Cellular Death
For the past four decades hyperthermia has beenused to potentiate the cytotoxic effects of ionizingradiation11,42 and chemotherapy.14,42 It has beenestablished that elevated temperatures alone causecell death in a predictable manner that is linearly
Sample ID
Dis
tanc
e fr
om S
epar
atio
n P
lane
0 2 4 6 8 10–3.0
–2.0
–1.0
0.0
1.0
2.0
3.0(a) (b)
Apo
ptot
ic
Hea
lthy
Etoposide (24 hrs)
Healthy Cells
Sample ID
Dis
tanc
e fr
om S
epar
atio
n P
lane
50 10–3.0
–2.0
–1.0
0.0
1.0
2.0
3.0
Triton−X (24 hrs)
Healthy Cells (24 hrs)
Nec
rotic
Hea
lthy
FIGURE 3. Demonstration of the pattern recognition based on SVM classification. (a) The classification of the etoposide-inducedapoptotic death after 24 h exposure. (b) The Triton X-100-induced apoptosis on the MgF2.
Cell Death Discrimination with Raman Spectroscopy and SVMs 1469

dependent on exposure time and is nonlinearlydependent on temperature.9,43 A variety of cell lines,including A549, have been reported to undergo apop-tosis1,13 during mild heat treatment and necrosis dur-ing prolonged or intensified exposure.14,26,40 In thisstudy, heat treatment at 45 �C over 30 min is used totest the predictive strength of the model by using adifferent cell death trigger that would induce a form ofprogrammed cell death. The heating stage Delta T4Culture Dish Controller is used and the ramping rate isapproximately 0.5 �C/min. The spectra are obtainedafter 30 min of exposure to the heat. As in the previouscase, in parallel to this experiment, control, apoptotic(etoposide), and necrotic (Triton X-100) cells are usedafter 24 h exposure.
Assuming that the effect of the heat is the unknownsample, we try to attempt classification, among all thethree classes, healthy, apoptotic, and necrotic. Sincethere are many drawbacks of hyperplane-based multi-class learning techniques,4 pairwise examination isperformed across all the possible combinations. So in
this particular case we examine, Healthy–Necrotic,Healthy–Apoptotic, and Apoptotic–Necrotic. In Fig. 4aare the results of the heating experiment as it isattempted for apoptotic death vs. healthy cells. Theheating experiment is classified as apoptotic death. Asit can be seen in the figure, most of the samples arelying between 0.3 and 1.0 in regards to the distancefrom the hyperplane. The next step is to check the caseof the necrotic cell death vs. healthy cells. In this case,the results of the classification appear to be scatteredamong both classes, while the test instances are clas-sified correctly (see Fig. 4b). This is an inconclusiveresult since there is no particular trend. This canhappen, either because the classification is wrong, orbecause some of the instances are indeed necrotic. Ifthe second is true, then a classification among apop-totic vs. necrotic will classify them again as necrotic.Therefore, the last classification is performed amongthe necrotic and apoptotic cells. Figure 4c shows thatall the heating spectra are classified again as apoptotic.So in the cases where the apoptotic death is used as one
Sample ID
Dis
tanc
e fr
om S
epar
atio
n P
lane
0 5 10 15 20–1.5
–1.0
–0.5
0.0
0.5
1.0
1.5(a) (b)
(c)
Control A549 (24 hrs)
Etoposide (24hrs)
Heating at 45oC
Apo
ptot
ic
Hea
lthy
Sample ID
Dis
tanc
e fr
om S
epar
atio
n P
lane
0 5 10 15 20–8.0
–4.0
0.0
4.0
8.0
Control (24 hrs)
Triton–X (24 hrs)
Heating at 45oC
Nec
rotic
Hea
lthy
Sample ID
Dis
tanc
e fr
om S
epar
atio
n P
lane
0 5 10 15 20–1.5
–1.0
–0.5
0.0
0.5
1.0
1.5
Triton–X (24 hrs)
Etoposide (24 hrs)
Heating 45oC
Apo
ptot
ic
Nec
rotic
FIGURE 4. The classification of the heating effect. (a) The heating in comparison with the healthy and the apoptotic, (b) theheating in comparison with the healthy and the necrotic, and (c) the heating in comparison to the necrotic and the apoptotic.
PYRGIOTAKIS et al.1470

of the two classes, the heat exposed cells are classifiedas apoptotic.
CONCLUDING REMARKS
The coupling of Raman spectroscopy, a very pow-erful and noninvasive technique, with SVM classifica-tion algorithms is used to identify cellular deathinduced by toxins and by low temperature heating.Although there are very few known reports51,52 thatcombine these two fields, it is the first known attempttoward the issue of cell death identification. The clas-sification models built with Raman spectral data canbe used to discriminate between minute biochemicaldifferences within cells rapidly, in real time, and in anondestructive and noninvasive manner. A veryimportant aspect, further highlighting the results, is thesuccess to classify biological samples that can presentalteration, and differences in their signal due toexternal (or internal) parameters. Those alterations aremanifested to the current project by the variations inthe distance from the separating hyperplane. Cases,however, in real biological systems always exhibitminute variations and alteration. The success of thistechnique (Raman-SVM) is showcased by the fact thatalthough it is able to detect these minute changes, itdoes not prevent the algorithm from correctly classi-fying the results.
This study sets the foundation for developingdiagnostic tools for cancer or other genetic diseases,the cellular response to chemotherapy, and the toxicityassessment of drugs and particles. Future work willexplore the sensitivity of this technique in terms of itsability to distinguish finer biochemical or biophysicalprocesses related to cell death such as caspase activa-tion or chromatin condensation. It is critical to expandthis methodology to include more than two classeswithout pairwise comparison and therefore being ableto distinguish immediately between various stages ofthe cell.
ACKNOWLEDGMENTS
The authors are grateful for useful comments fromtwo anonymous referees. The authors also acknowl-edge the financial support of the Particle EngineeringResearch Center (PERC) at the University of Florida,the State of Florida, the National Science Foundation(NSF Grant EEC-94-02989, NSF-NIRT Grant EEC-0506560, National High Field Magnet Laboratory),the National Institutes of Health (Grants 1-P20-RR020654-01, RO1HL75258, R01HL78670), and the
Industrial Partners of the PERC for support of thisresearch. Any opinions, findings, and conclusions orrecommendations expressed in this material are thoseof the author(s) and do not necessarily reflect those ofthe National Science Foundation. Research of PanosM. Pardalos is partially supported by NSF and AirForce grants.
REFERENCES
1Armour, E. P., D. McEachern, Z. Wang, P. M. Corry, andA. Martinez. Sensitivity of human cells to mild hyper-thermia. Cancer Res. 53(12):2740–2744, 1993.2Bennet, K., and C. Campbell. Support vector machines:Hype or hallelujah? SIGKDD Explor. 2(2):1–13, 2000.3Bhowmick, T. K., G. Pyrgiotakis, K. Finton, A. K. Suresh,S. G. Kane, J. R. Bellare, and B. M. Moudgil. A study ofthe effect of JB particles on Saccharomyces cerevisiae(yeast) cells by Raman spectroscopy. J. Raman Spectrosc.39(12):1859–1868, 2009. doi:10.1002/jrs.2051.4Bishop, C. M. Pattern Recognition and Machine Learning(Information Science and Statistics). Berlin: Springer,2006.5Boesewetter, D., J. Collier, A. Kim, and M. Riley. Alter-ations of a549 lung cell gene expression in response tobiochemical toxins. Cell Biol. Toxicol. 22(2):101–108, 2006.6Brown, M., W. Grundy, D. Lin, N. Cristianini, C. Sugne,T. Furey, M. Ares, and D. Haussler. Knowledge-basedanalysis of microarray gene expression data by using sup-port vector machines. Proc. Natl. Acad. Sci. USA 97(1):262–267, 2000.7Cifarelli, C., and G. Patrizi. Solving large protein foldingproblem by a linear complementarity algorithm with 0-1variables. Optim. Methods Softw. 22(1):25–49, 2007.8Cristianini, N., and J. Shawe-Taylor. An Introduction toSupport Vector Machines. Cambridge: Cambridge Uni-versity Press, 2000.9Dewhirst, M. W., D. A. Sim, S. Sapareto, and W. G.Connor. Importance of minimum tumor temperature indetermining early and long-term responses of spontaneouscanine and feline tumors to heat and radiation. Cancer Res.44(1):43–50, 1984.
10Garcia, G. N., T. Ebrahimi, and J. M. Vesin. Joint time-frequency-space classification of EEG in a brain-computerinterface application. J. Appl. Signal Process. 7:713–729,2003.
11Gerner, E. W., W. G. Connor, M. L. Boone, J. D. Doss,E. G. Mayer, and R. C. Miller. The potential of localizedheating as a adjunct to radiation therapy. Radiology116(02):433–439, 1975.
12Giard, D. J., S. A. Aaronson, G. J. Todaro, P. Arnstein,J. H. Kersey, H. Dosik, and W. P. Parks. In vitro culti-vation of human tumors: Establishment of cell lines derivedfrom a series of solid tumors. J. Natl. Cancer Inst.51(5):1417, 1973.
13Hayashi, S., M. Hatashita, H. Matsumoto, Z. H. Jin,H. Shioura, and E. Kano. Modification of thermosensi-tivity by amrubicin or amrubicinol in human lung adeno-carcinoma a549 cells and the kinetics of apoptosis andnecrosis induction. Int. J. Mol. Med. 16:381–387, 2005.
Cell Death Discrimination with Raman Spectroscopy and SVMs 1471
14Hildebrandt, B., P.Wust,O.Ahlers,A.Dieing,G.Sreenivasa,T.Kerner, R. Felix, andH.Riess. The cellular andmolecularbasis of hyperthermia. Crit. Rev. Oncol. Hematol. 43(1):33–56, 2002.
15Hsu, C. W., C. C. Chang, and C .J. Lin. A practical guideto support vector classification. http://www.csie.ntu.edu.tw/~cjlin/papers/guide/guide.pdf, 2004.
16Huang, Z., H. Chen, C. J. Hsu, W. H. Chen, and S. Wuc.Credit rating analysis with support vector machines andneural networks: A market comparative study. Decis.Support Syst. 37:543–558, 2004.
17Huang, P., and W. Plunkett. A quantitative assay forfragmented DNA in apoptotic cells. Anal. Biochem. 207(1):163–167, 1992.
18Jaeschke, H., J. S. Gujral, and M. L. Bajt. Apoptosis andnecrosis in liver disease. Liver Int. 24(2):85–89, 2004.
19Joachims, T. Text categorization with support vectormachines: Learning with many relevant features. In: Pro-ceedings of the European Conference on Machine Learn-ing, edited by C. Nedellec and C. Rouveirolpages. Berlin:Springer, 1998, pp. 137–142.
20Joachims, T. Making large–scale SVM learning practical.In: Advances in Kernel Methods: Support Vector Learn-ing, edited by B. Scholkopf, C. J. C. Burges, and A. J.Smola. Cambridge, MA: MIT Press, 1999, pp. 169–184.
21Kanduc, D., P. Bannasch, and E. Farber. A critical per-spective in cancer research (review). Int. J. Oncol. 15(6):1213–1220, 1999.
22Kanduc, D., F. Capuano, S.A. Capurso, J. Geliebter,D. Guercia, A. Lucchese, A. Mittelman, S. M. Simone,A. A. Sinha, R. Tiwari, and E. Farber. Cancer preventionand therapy: Strategies and problems. J. Exp. Ther. Oncol.3(3):108–114, 2003.
23Kanduc, D., J. Geliebter, A. Lucchese, R. Mazzanti,A. Mittelman, L. Polimeno, A. Ponzetto, R. Santacroce,S. Simone, E. Sinigaglia, A. A. Sinha, L. Tessitore, R. K.Tiwari, and E. Farber. Gene therapy in cancer: The missingpoint. J. Exp. Ther. Oncol. 5(2):151–158, 2005.
24Kanduc, D., A. Mittelman, R. Serpico, E. Sinigaglia, A. A.Sinha, C. Natale, R. Santacroce, M. G. Di Corcia,A. Lucchese, L. Dini, P. Pani, S. Santacroce, S. Simone,R. Bucci, and E. Farber. Cell death: Apoptosis versusnecrosis (review). Int. J. Oncol. 21(1):165–170, 2002.
25Karpinich, N. O., M. Tafani, R. J. Rothman, M. A. Russo,and J. L. Farber. The course of etoposide-induced apop-tosis from damage to DNA and p53 activation to mito-chondrial release of cytochrome c. J. Biol. Chem. 277(19):16547–16552, 2002.
26Komata, T., T. Kanzawa, N. Takeo, A. Hiroshi, S. Endo,M.Nameta, T.Hideaki,Y.Tadashi,K. Seiji, andT.Ryuichi.Mild heat shock induces autophagic growth arrest, but notapoptosis in u251-mg and u87-mg human malignant gliomacells. J. Neuro-Oncol. 68:101–111, 2004.
27Lal, T. N., M. Schroeder, T. Hinterberger, J. Weston,M. Bogdan, N. Birbaumer, and B. Scholkopf. Supportvector channel selection in BCI. IEEE Trans. Biomed. Eng.51(6):1003–1010, 2004.
28Lee, S., and A. Verri. Pattern recognition with supportvector machines. In: SVM 2002, Niagara Falls, Canada.Berlin: Springer, 2002.
29Maquelin, K., L. P. Choo-Smith, T. van Vreeswijk, H. P.Endtz, B. Smith, R. Bennett, H. A. Bruining, and G. J.Puppels. Raman spectroscopic method for identification ofclinically relevant microorganisms growing on solid culturemedium. Anal. Chem. 72(1):12–19, 2000.
30Navarre, W. W., and A. Zychlinsky. Pathogen-inducedapoptosis of macrophages: A common end for differentpathogenic strategies. Cell. Microbiol. 2(4):265–273, 2000.
31Noble, W. S. Support vector machine applications incomputational biology. In: Kernel Methods in Computa-tional Biology, edited by B. Schoelkopf, K. Tsuda, andJ.-P. Vert. Cambridge, MA: MIT Press, 2004, pp. 71–92.
32Notingher, I., C. Green, C. Dyer, E. Perkins, N. Hopkins,C. Lindsay, and L. L. Hench. Discrimination between ricinand sulphur mustard toxicity in vitro using Raman spec-troscopy. J. R. Soc. Interface 1(1):79–90, 2004.
33Notingher, I., S. Verrier, S. Haque, J. M. Polak, and L. L.Hench. Spectroscopic study of human lung epithelial cells(a549) in culture: Living cells versus dead cells. Biopolymers72(4):230–240, 2003.
34Notingher, I., S. Verrier, H. Romanska, A. E. Bishop, J. M.Polak, and L. L. Hench. In situ characterisation of livingcells by Raman spectroscopy. Spectrosc. Int. J. 16(2):43–51,2002.
35Osuna, R. F. E., and F. Girosi. An improved training algo-rithm for support vector machines. In: IEEE Workshop onNeural Networks for Signal Processing, Amelia Island, FL,1997, pp. 276–285.
36Owen, C. A., J. Selvakumaran, I. Notingher, G. Jell, L. L.Hench, and M. M. Stevens. In vitro toxicology evaluationof pharmaceuticals using Raman micro-spectroscopy.J. Cell. Biochem. 99(1):178–186, 2006.
37Pardalos, P. M., V. L. Boginski, and A. Vazacopoulos,editors. Data Mining in Biomedicine. Berlin: Springer,2007.
38Pardalos, P. M., and P. Hansen, editors. Data Mining andMathematical Programming. Providence, RI: AmericanMathematical Society, 2008.
39Platt, J. Fast training of SVMs using sequential minimaloptimization. In: Advances in Kernel Methods: SupportVector Learning, edited by B. Scholkopf, C. J. C. Burges,and A. J. Smola. Cambridge, MA: MIT Press, 1999,pp. 185–208.
40Prasad, K. V., A. Taiyab, D. Jyothi, U. K. Srinivas, andA. S. Sreedhar. Heat shock transcription factors regulateheat induced cell death in a rat histiocytoma. J. Biosci.32(3):585–593, 2007.
41Pyrgiotakis, G., T. K. Bhowmick, K. Finton, A. K. Suresh,S. G. Kane, J. R. Bellare, and B. M. Moudgil. Cell (a549)-particle (Jasada Bhasma) interactions using Raman spec-troscopy. Biopolymers 89(6):555–564, 2008.
42Robinson, J. E., M. J. Wizenberg, and W. A. McCready.Combined hyperthermia and radiation suggest and alter-native to heavy particle therapy for reduced oxygenenhancement ratios. Nature 251(5475):521–522, 1974.
43Sapareto, S. A., and W. C. Dewey. Thermal dose deter-mination in cancer therapy. Int. J. Radiat. Oncol. Biol.Phys. 10(6):787–800, 1984.
44Seref, O., O. E. Kundakcioglu, and P. M. Pardalos, editors.Data Mining, Systems Analysis and Optimization in Bio-medicine, vol. 953. Melville, NY: American Institute ofPhysics, 2008.
45Shawe-Taylor, J., and N. Cristianini. Kernel Methods forPattern Analysis. Cambridge: Cambridge University Press,2004.
46Solovyan, V., Z. Bezvenyuk, V. Huotari, T. Tapiola,T. Suuronen, and A. Salminen. Distinct mode of apoptosisinduced by genotoxic agent etoposide and serum with-drawal in neuroblastoma cells. Brain Res. Mol. Brain Res.62(1):43–55, 1998.
PYRGIOTAKIS et al.1472

47Trafalis, T. B., and H. Ince. Support vector machine forregression and applications to financial forecasting. In:International Joint Conference on Neural Networks(IJCNN’02), Como, Italy, 2002.
48Vapnik, V. The Nature of Statistical Learning Theory.Berlin: Springer-Verlag, 1995.
49Vapnik, V. Statistical Learning Theory. New York: Wiley,1998.
50Verrier, S., I. Notingher, J. M. Polak, and L. L. Hench. Insitu monitoring of cell death using Raman microspectros-copy. Biopolymers 74(1–2):157–162, 2004.
51Widjaja, E., G. H. Lim, and A. An. A novel method forhuman gender classification using Raman spectroscopy offingernail clippings. Analyst 133:493–498, 2008.
52Widjaja, E., W. Zheng, and Z. Huang. Classification ofcolonic tissues using near-infrared Raman spectroscopyand support vector machines. Int. J. Oncol. 32(3):653–662,2008.
53Yogalingam, G., and A. M. Pendergast. Serum withdrawaland etoposide induce apoptosis in human lung carcinomacell line a549 via distinct pathways. Apoptosis 2(2):199–206,1997.
54Yogalingam, G., and A. M. Pendergast. Abl kinases reg-ulate autophagy by promoting the trafficking and functionof lysosomal components. J. Biol. Chem. 283(51):35941–35953, 2008.
Cell Death Discrimination with Raman Spectroscopy and SVMs 1473