Caveolin-1 Is a Critical Determinant of Autophagy, Metabolic Switching, and Oxidative Stress in...
11
Caveolin-1 Is a Critical Determinant of Autophagy, Metabolic Switching, and Oxidative Stress in Vascular Endothelium Takashi Shiroto 1. , Natalia Romero 1. , Toru Sugiyama 1 , Juliano L. Sartoretto 1 , Hermann Kalwa 1 , Zhonghua Yan 1 , Hiroaki Shimokawa 2 , Thomas Michel 1 * 1 Cardiovascular Division, Department of Medicine, Brigham and Women’s Hospital, Harvard Medical School, Boston, Massachusetts, United States of America, 2 Department of Cardiovascular Medicine, Tohoku University Graduate School of Medicine, Sendai, Japan Abstract Caveolin-1 is a scaffolding/regulatory protein that interacts with diverse signaling molecules. Caveolin-1 null mice have marked metabolic abnormalities, yet the underlying molecular mechanisms are incompletely understood. We found the redox stress plasma biomarker plasma 8-isoprostane was elevated in caveolin-1 null mice, and discovered that siRNA- mediated caveolin-1 knockdown in endothelial cells promoted significant increases in intracellular H 2 O 2 . Mitochondrial ROS production was increased in endothelial cells after caveolin-1 knockdown; 2-deoxy-D-glucose attenuated this increase, implicating caveolin-1 in control of glycolytic pathways. We performed unbiased metabolomic characterizations of endothelial cell lysates following caveolin-1 knockdown, and discovered strikingly increased levels (up to 30-fold) of cellular dipeptides, consistent with autophagy activation. Metabolomic analyses revealed that caveolin-1 knockdown led to a decrease in glycolytic intermediates, accompanied by an increase in fatty acids, suggesting a metabolic switch. Taken together, these results establish that caveolin-1 plays a central role in regulation of oxidative stress, metabolic switching, and autophagy in the endothelium, and may represent a critical target in cardiovascular diseases. Citation: Shiroto T, Romero N, Sugiyama T, Sartoretto JL, Kalwa H, et al. (2014) Caveolin-1 Is a Critical Determinant of Autophagy, Metabolic Switching, and Oxidative Stress in Vascular Endothelium. PLoS ONE 9(2): e87871. doi:10.1371/journal.pone.0087871 Editor: Nanette H. Bishopric, University of Miami School of Medicine, United States of America Received November 8, 2013; Accepted December 30, 2013; Published February 3, 2014 Copyright: ß 2014 Shiroto et al. This is an open-access article distributed under the terms of the Creative Commons Attribution License, which permits unrestricted use, distribution, and reproduction in any medium, provided the original author and source are credited. Funding: This work was supported by National Institutes of Health Grants HL46457, HL48743, and GM36259 (to TM). TS was supported by fellowship grants from the Japan Heart Foundation and the Uehara Memorial Foundation. NR had sabbatical support from the Facultad de Medicina, Universidad de la Republica (Uruguay), and by a Pew Latinoamerican Fellowship. HK had support from a postdoctoral fellowship from the Fonds National de Recherche, Luxembourg and from a postdoctoral fellowship from the American Heart Association. Partial support for these studies was also provided by an unrestricted gift from Bayer Yakuhin, Ltd. The funders had no role in study design, data collection and analysis, decision to publish, or preparation of the manuscript. Competing Interests: The authors make the statement about their commercial funding (in the form of an unrestricted educational grant) from Bayer Yakuhin, Ltd: This does not alter the authors’ adherence to PLOS ONE policies on sharing data and materials. * E-mail: [email protected] . These authors contributed equally to this work. Introduction Caveolin-1 is a scaffolding/regulatory protein localized in plasmalemmal caveolae that modulates signaling proteins in diverse mammalian cells, including endothelial cells and adipo- cytes [1]. Plasmalemmal caveolae have a distinctive lipid composition, and serve as microdomains for the sequestration of signaling proteins including G proteins, receptors, protein kinases, phosphatases, and ion channels. In the vascular endothelium, a key caveolin-1 binding partner is the endothelial isoform of nitric oxide synthase (eNOS) [2]. eNOS-derived nitric oxide (NO) plays a central role in vasorelaxation; the binding of caveolin-1 to eNOS inhibits NO synthesis. Caveolin-1 null mice show enhanced NO- dependent vascular responses, consistent with the inhibitory role of caveolin-1 in eNOS activity in the vascular wall [3,4]. Yet the phenotype of the caveolin-1 null mouse goes far beyond effects on cardiovascular system: caveolin-1 null mice have profound meta- bolic abnormalities [5,6] and altered redox homeostasis, possibly reflecting a role of caveolin-1 in mitochondrial function [6,7]. Caveolin-1 null mice also develop cardiomyopathy and pulmonary hypertension [8], associated with persistent eNOS activation secondary to the loss of caveolin-1. This increase in NO leads to the inhibition of cyclic GMP-dependent protein kinase due to tyrosine nitration [9]. Caveolin-1 null mice show increased rates of pulmonary fibrosis, cancer, and atherosclerotic cardiovascular disease [1], all of which are pathological states associated with increased oxidative stress. Functional connections between caveolin and oxidative stress have emerged in several recent studies. The association between oxidative stress and mitochondria has stimulated studies of caveolin in mitochondrial function and reactive oxygen species (ROS). The muscle-specific caveolin-3 isoform may co-localize with mitochondria [10], and mouse embryonic fibroblasts isolated from caveolin-1 null mice show evidence of mitochondrial dysfunc- tion [7]. Endothelial cell mitochondria have been implicated in both physiological and pathophysiological pathways [11], and eNOS itself may synthesize ROS when the enzyme is ‘‘uncoupled’’ by oxidation of one of its cofactors, tetrahydrobiopterin. At the same time, the stable ROS hydrogen peroxide (H 2 O 2 ) modulates physiological activation of phosphorylation pathways that influ- ence eNOS activity [12,13]. Clearly, the pathways connecting caveolin, eNOS, mitochondria, and ROS metabolism are complex PLOS ONE | www.plosone.org 1 February 2014 | Volume 9 | Issue 2 | e87871
-
Upload
independent -
Category
Documents
-
view
0 -
download
0
Transcript of Caveolin-1 Is a Critical Determinant of Autophagy, Metabolic Switching, and Oxidative Stress in...

Caveolin-1 Is a Critical Determinant of Autophagy,Metabolic Switching, and Oxidative Stress in VascularEndotheliumTakashi Shiroto1., Natalia Romero1., Toru Sugiyama1, Juliano L. Sartoretto1, Hermann Kalwa1,
Zhonghua Yan1, Hiroaki Shimokawa2, Thomas Michel1*
1 Cardiovascular Division, Department of Medicine, Brigham and Women’s Hospital, Harvard Medical School, Boston, Massachusetts, United States of America,
2 Department of Cardiovascular Medicine, Tohoku University Graduate School of Medicine, Sendai, Japan
Abstract
Caveolin-1 is a scaffolding/regulatory protein that interacts with diverse signaling molecules. Caveolin-1null mice havemarked metabolic abnormalities, yet the underlying molecular mechanisms are incompletely understood. We found theredox stress plasma biomarker plasma 8-isoprostane was elevated in caveolin-1null mice, and discovered that siRNA-mediated caveolin-1 knockdown in endothelial cells promoted significant increases in intracellular H2O2. Mitochondrial ROSproduction was increased in endothelial cells after caveolin-1 knockdown; 2-deoxy-D-glucose attenuated this increase,implicating caveolin-1 in control of glycolytic pathways. We performed unbiased metabolomic characterizations ofendothelial cell lysates following caveolin-1 knockdown, and discovered strikingly increased levels (up to 30-fold) of cellulardipeptides, consistent with autophagy activation. Metabolomic analyses revealed that caveolin-1 knockdown led to adecrease in glycolytic intermediates, accompanied by an increase in fatty acids, suggesting a metabolic switch. Takentogether, these results establish that caveolin-1 plays a central role in regulation of oxidative stress, metabolic switching,and autophagy in the endothelium, and may represent a critical target in cardiovascular diseases.
Citation: Shiroto T, Romero N, Sugiyama T, Sartoretto JL, Kalwa H, et al. (2014) Caveolin-1 Is a Critical Determinant of Autophagy, Metabolic Switching, andOxidative Stress in Vascular Endothelium. PLoS ONE 9(2): e87871. doi:10.1371/journal.pone.0087871
Editor: Nanette H. Bishopric, University of Miami School of Medicine, United States of America
Received November 8, 2013; Accepted December 30, 2013; Published February 3, 2014
Copyright: � 2014 Shiroto et al. This is an open-access article distributed under the terms of the Creative Commons Attribution License, which permitsunrestricted use, distribution, and reproduction in any medium, provided the original author and source are credited.
Funding: This work was supported by National Institutes of Health Grants HL46457, HL48743, and GM36259 (to TM). TS was supported by fellowship grants fromthe Japan Heart Foundation and the Uehara Memorial Foundation. NR had sabbatical support from the Facultad de Medicina, Universidad de la Republica(Uruguay), and by a Pew Latinoamerican Fellowship. HK had support from a postdoctoral fellowship from the Fonds National de Recherche, Luxembourg andfrom a postdoctoral fellowship from the American Heart Association. Partial support for these studies was also provided by an unrestricted gift from BayerYakuhin, Ltd. The funders had no role in study design, data collection and analysis, decision to publish, or preparation of the manuscript.
Competing Interests: The authors make the statement about their commercial funding (in the form of an unrestricted educational grant) from Bayer Yakuhin,Ltd: This does not alter the authors’ adherence to PLOS ONE policies on sharing data and materials.
* E-mail: [email protected]
. These authors contributed equally to this work.
Introduction
Caveolin-1 is a scaffolding/regulatory protein localized in
plasmalemmal caveolae that modulates signaling proteins in
diverse mammalian cells, including endothelial cells and adipo-
cytes [1]. Plasmalemmal caveolae have a distinctive lipid
composition, and serve as microdomains for the sequestration of
signaling proteins including G proteins, receptors, protein kinases,
phosphatases, and ion channels. In the vascular endothelium, a
key caveolin-1 binding partner is the endothelial isoform of nitric
oxide synthase (eNOS) [2]. eNOS-derived nitric oxide (NO) plays
a central role in vasorelaxation; the binding of caveolin-1 to eNOS
inhibits NO synthesis. Caveolin-1null mice show enhanced NO-
dependent vascular responses, consistent with the inhibitory role of
caveolin-1 in eNOS activity in the vascular wall [3,4]. Yet the
phenotype of the caveolin-1null mouse goes far beyond effects on
cardiovascular system: caveolin-1null mice have profound meta-
bolic abnormalities [5,6] and altered redox homeostasis, possibly
reflecting a role of caveolin-1 in mitochondrial function [6,7].
Caveolin-1null mice also develop cardiomyopathy and pulmonary
hypertension [8], associated with persistent eNOS activation
secondary to the loss of caveolin-1. This increase in NO leads to
the inhibition of cyclic GMP-dependent protein kinase due to
tyrosine nitration [9].
Caveolin-1null mice show increased rates of pulmonary fibrosis,
cancer, and atherosclerotic cardiovascular disease [1], all of which
are pathological states associated with increased oxidative stress.
Functional connections between caveolin and oxidative stress have
emerged in several recent studies. The association between
oxidative stress and mitochondria has stimulated studies of
caveolin in mitochondrial function and reactive oxygen species
(ROS). The muscle-specific caveolin-3 isoform may co-localize
with mitochondria [10], and mouse embryonic fibroblasts isolated
from caveolin-1null mice show evidence of mitochondrial dysfunc-
tion [7]. Endothelial cell mitochondria have been implicated in
both physiological and pathophysiological pathways [11], and
eNOS itself may synthesize ROS when the enzyme is ‘‘uncoupled’’
by oxidation of one of its cofactors, tetrahydrobiopterin. At the
same time, the stable ROS hydrogen peroxide (H2O2) modulates
physiological activation of phosphorylation pathways that influ-
ence eNOS activity [12,13]. Clearly, the pathways connecting
caveolin, eNOS, mitochondria, and ROS metabolism are complex
PLOS ONE | www.plosone.org 1 February 2014 | Volume 9 | Issue 2 | e87871

yet critical determinants of cell function– both in normal cell
signaling and in pathological states associated with oxidative stress.
Analyses of the roles of caveolin in metabolic pathways have
exploited gene-targeted mouse models focusing on the metabolic
consequences of caveolin-1 knockout on energy flux in classic
‘‘energetically active’’ tissues of fat, liver, and muscle [6]. The role
of the vascular endothelium as a determinant of energy
homeostasis has been recognized only more recently. For example,
endothelial cell-specific ‘‘knockout’’ of insulin receptors [14] was
found to affect systemic insulin resistance, and we found that
endothelial cell-specific knockout of PPAR-gamma [15] affects
organismal carbohydrate and lipid metabolism. In turn, metabolic
disorders can markedly influence endothelial signaling pathways:
hyperglycemia suppresses NO-dependent vascular responses [16],
while high glucose treatment of cultured endothelial cells increases
intracellular levels of ROS, including H2O2 [17].
The present studies have used biochemical, cell imaging, and
metabolomic approaches to explore the roles of caveolin-1 in
endothelial cell redox homeostasis, and have identified novel roles
for caveolin-1 in modulation of endothelial cell oxidative stress,
metabolic switching, and autophagy.
Materials and Methods
Ethics statementProtocols for all animal experiments were approved by the
Harvard Medical Area Standing Committee on Animals, which
adheres strictly to national and international guidelines for animal
care and experimentation.
MaterialsAnti-caveolin-1 antibody was from BD Transduction Labora-
tories (Lexington, KY). Antibodies against apoptosis induction
factor (AIF), LC3B and cytochrome c oxidase IV were from Cell
Signaling Technologies (Beverly, MA). Amplex Red, 5-(and-6)-
chloromethyl-2’,7’dichlorodihydrofluorescein diacetate acetyl ester
(CM-H2DCFDA), MitoSOX Red, MitoTracker Green FM and
tetramethyl rhodamine methyl ester (TMRM), Lipofectamine
2000, Alexa Fluor 488- and Alexa Fluor 568-coupled secondary
antibodies were from Invitrogen. Cyto-ID autophagy probe and
VAS-2870 was from Enzo Life Science. GSH/GSSG-Glo Assay
kit was from Promega Corporation (Madison, WI). 8-isoprostane
Affinity Purification Kit, 8-isopronstane EIA kit and catalase assay
kit were from Cayman Chemicals. Bovine aortic endothelial cells
(BAEC) were obtained from Genlantis (San Diego, CA). Cell
culture media was from Gibco, Life science. Fetal bovine serum
was purchased from HyClone Laboratories. All other reagents
were from Sigma.
Cell culture and siRNA transfectionBAEC were maintained in Dulbecco’s modified Eagles medium
(DMEM) with glucose (5.5 mM) and supplemented with FBS
(10% v/v). BAEC were cultured in gelatin-coated culture dishes,
and studies were performed prior to cell confluence between
passages 5 and 8. For siRNA transfection experiments, cells were
transfected with the indicated siRNA duplex targeting constructs
(30 nM) with Lipofectamine (0.15% v/v); medium was changed 5
h after transfection. 24–48 h later, cells were split (1:5) and were
analyzed 72 h after transfection. siRNA targeting constructs for
caveolin-1, eNOS, Rac-1 and AMPKa-1 have been previously
characterized in detail [18,19]. In some ‘‘double knockdown’’
experiments, cells were transfected with two different siRNA
targeting constructs at a total siRNA concentration of 60 nM,
comprising 30 nM of each targeting siRNA or control siRNA as
needed to yield a final concentration of 60 nM; for these
experiments, Lipofectamine (0.15% v/v) was used.
Amplex red assay72 h following transfection with siRNA targeting constructs,
BAEC were washed two times with Dulbecco’s phosphate-
buffered saline (dPBS) and incubated with dPBS containing
Amplex Red (50 mM), horseradish peroxidase (0.1 U/ml) and
superoxide dismutase (10 U/ml) for 30 min in the dark. In some
experiments, pharmacological inhibitors were added 1 h before
starting the Amplex Red assay. Following treatments, fluorescence
intensity was determined in cell supernatants at 530 nm excitation
and 590 nm emission wavelengths. Following the Amplex Red
assay, cells were collected for protein determinations and/or
immunoblot analyses in order to normalize fluorescence values to
levels of protein abundance.
Plasma 8-isoprostane determination8–10 week-old male caveolin-1null and age-matched wild-type
control mice (Jackson Labs) were starved overnight; blood was
collected from the tail vein, treated with 20 mM indomethacin and
centrifuged at 3000 rpm for 10 min at 4uC to separate the plasma
fraction. Plasma samples were immediately treated with butylated
hydroxytoluene (BHT, 50 mg/mL) and stored at -80u C until
analysis. 8-isoprostanes determination was performed using a
commercial kit (Cayman Chemicals) according to the manufac-
turer’s protocol.
HyPer2 lentivirus cloning and tail vein injectionRecombinant lentivirus expressing the H2O2 biosensor HyPer2
(described in detail in [13]) was infused through the tail vein
(250 ml of 108 pfu/ml) of wild-type or caveolin-1null adult male
mice (8–10 wk old). Two weeks after lentivirus injection, mice were
sacrificed and the descending aortae carefully dissected and fixed
with 4% paraformaldehyde, and then transverse sections of aorta
were mounted on slides and processed for confocal microscopy.
Metamorph software was used to determine the HyPer2 ratio, as
we have previously described[13]. The intracellular HyPer2 ratio
was calculated for individually selected endothelial cells to
determine levels of intracellular H2O2.
Glutathione determinationsiRNA-transfected endothelial cells were trypsinized 48 h
following transfection, diluted 1:8 and seeded in 96 multi-well
dishes pre-coated with gelatin; parallel tissue culture dishes were
prepared for protein determination and western blot analysis. 24 h
later, the GSH/GSSG ratio was determined using GSH/GSSG-
Glo Assay Kit (Cayman) according to manufacturer’s instructions.
Catalase assay by aminotriazole-mediated enzymeinactivation
Cells grown in 6-well dishes were transfected with control or
caveolin-1 siRNA. Forty eight hours after transfection, media was
replaced by fresh cell culture media containing either 10 mM 3-
amino-1,2,4-triazole (ATZ) or vehicle, and incubated for addi-
tional 21 hrs. Cells were then rinsed with PBS, scraped into 0.5 ml
of potassium phosphate buffer (50 mM, pH 7) containing 1 mM
EDTA and protease inhibitors cocktail. Cells were sonicated and
centrifuged (13,200 rpm615 min), and catalase activity was
assayed in the supernatants using a catalase assay (Cayman
Chemicals) according to the manufacturer’s instructions.
Caveolin-1 and Endothelial Oxidative Metabolism
PLOS ONE | www.plosone.org 2 February 2014 | Volume 9 | Issue 2 | e87871
Detection of H2O2 using Hyper2 or Hyper2-M biosensorin BAEC
BAEC cultured in DMEM without phenol red containing FBS
(10%) were concurrently transfected with Hyper2 or Hyper2-M
(2 mg) plasmids and with Cav-1 or control siRNAs (30 nM) using
Lipofectamine (0.15%v/v). 24 h after transfection cells were split
and seeded in 8 well cover slips, grown for other 24 h and then
fixed using 4% PFA. Ratiometric images were acquired using
420/40 and 500/16 band-pass excitation filters and 535/30 band-
pass emission filter as described [20] and analysis was performed
using Metamorph software.
Metabolomic studiesEach sample for metabolomic analysis was generated from three
p100 mm dishes that were harvested, pooled, and immediately
frozen in liquid nitrogen. Six independent samples for each siRNA
transfection condition (control, caveolin-1 and PKA siRNA) were
individually prepared for separate analysis on the GC/MS and
LC/MS/MS platforms by Metabolon (Durham, NC). All cell
treatments, metabolite analysis, sample preparation, quality
assurance procedures, spectroscopy, and statistical analysis was
performed as previously described[21]. The raw metabolomic data
was normalized to the total cellular protein content (using the
Bradford assay) prior to statistical analysis. The data set comprises
a total 319 named biochemicals. Following log transformation and
imputation with minimum observed values for each compound,
Welch’s two-sample t-test was used to identify biochemicals that
differed significantly between Cav-1 or PKA siRNA transfected
cells and control cells. Heatmaps were generated using online
software Matrix2png [22].
Autophagy marker measurementssiRNA-transfected endothelial cells were stained and fixed 72 h
after transfection using the CytoID Autophagy Detection Kit
(Enzo Lifescience) according to the manufacturers protocol, and
analyzed either by flow cytometry or by fluorescence microscopy.
Results
Analyses of H2O2 metabolism in cultured endothelialcells following siRNA-mediated caveolin-1 knockdown
We explored the role of caveolin-1 in the regulation of redox
metabolism in the endothelium in studies in cultured aortic
endothelial cells following siRNA-mediated knockdown of caveo-
lin-1. We utilized bovine aortic endothelial cells (BAEC), a
tractable and informative cultured endothelial cell model in which
caveolin-modulated pathways have been characterized [23,24].
We used a caveolin-1 duplex siRNA targeting construct that has
been validated in these cells [18,19] and which promotes a ,85%
knockdown in caveolin-1 protein with no substantive off-target
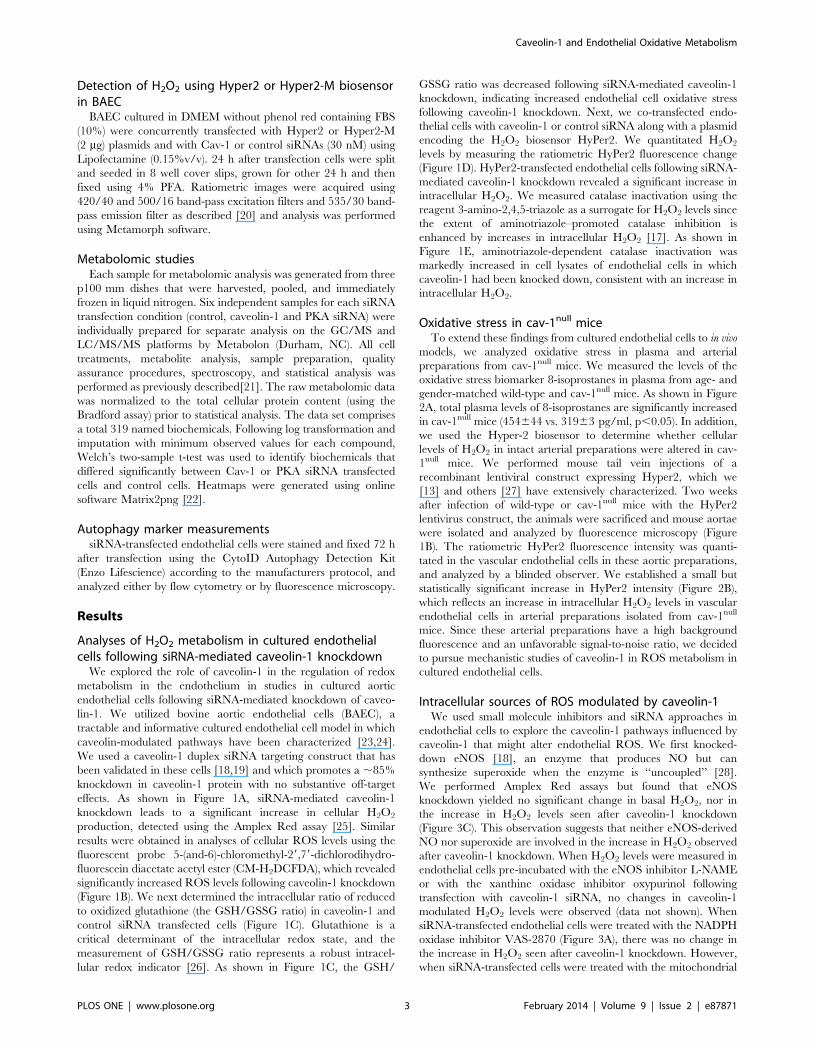
effects. As shown in Figure 1A, siRNA-mediated caveolin-1
knockdown leads to a significant increase in cellular H2O2
production, detected using the Amplex Red assay [25]. Similar
results were obtained in analyses of cellular ROS levels using the
fluorescent probe 5-(and-6)-chloromethyl-29,79-dichlorodihydro-
fluorescein diacetate acetyl ester (CM-H2DCFDA), which revealed
significantly increased ROS levels following caveolin-1 knockdown
(Figure 1B). We next determined the intracellular ratio of reduced
to oxidized glutathione (the GSH/GSSG ratio) in caveolin-1 and
control siRNA transfected cells (Figure 1C). Glutathione is a
critical determinant of the intracellular redox state, and the
measurement of GSH/GSSG ratio represents a robust intracel-
lular redox indicator [26]. As shown in Figure 1C, the GSH/
GSSG ratio was decreased following siRNA-mediated caveolin-1
knockdown, indicating increased endothelial cell oxidative stress
following caveolin-1 knockdown. Next, we co-transfected endo-
thelial cells with caveolin-1 or control siRNA along with a plasmid
encoding the H2O2 biosensor HyPer2. We quantitated H2O2
levels by measuring the ratiometric HyPer2 fluorescence change
(Figure 1D). HyPer2-transfected endothelial cells following siRNA-
mediated caveolin-1 knockdown revealed a significant increase in
intracellular H2O2. We measured catalase inactivation using the
reagent 3-amino-2,4,5-triazole as a surrogate for H2O2 levels since
the extent of aminotriazole–promoted catalase inhibition is
enhanced by increases in intracellular H2O2 [17]. As shown in
Figure 1E, aminotriazole-dependent catalase inactivation was
markedly increased in cell lysates of endothelial cells in which
caveolin-1 had been knocked down, consistent with an increase in
intracellular H2O2.
Oxidative stress in cav-1null miceTo extend these findings from cultured endothelial cells to in vivo
models, we analyzed oxidative stress in plasma and arterial
preparations from cav-1null mice. We measured the levels of the
oxidative stress biomarker 8-isoprostanes in plasma from age- and
gender-matched wild-type and cav-1null mice. As shown in Figure
2A, total plasma levels of 8-isoprostanes are significantly increased
in cav-1null mice (454644 vs. 31963 pg/ml, p,0.05). In addition,
we used the Hyper-2 biosensor to determine whether cellular
levels of H2O2 in intact arterial preparations were altered in cav-
1null mice. We performed mouse tail vein injections of a
recombinant lentiviral construct expressing Hyper2, which we
[13] and others [27] have extensively characterized. Two weeks
after infection of wild-type or cav-1null mice with the HyPer2
lentivirus construct, the animals were sacrificed and mouse aortae
were isolated and analyzed by fluorescence microscopy (Figure
1B). The ratiometric HyPer2 fluorescence intensity was quanti-
tated in the vascular endothelial cells in these aortic preparations,
and analyzed by a blinded observer. We established a small but
statistically significant increase in HyPer2 intensity (Figure 2B),
which reflects an increase in intracellular H2O2 levels in vascular
endothelial cells in arterial preparations isolated from cav-1null
mice. Since these arterial preparations have a high background
fluorescence and an unfavorable signal-to-noise ratio, we decided
to pursue mechanistic studies of caveolin-1 in ROS metabolism in
cultured endothelial cells.
Intracellular sources of ROS modulated by caveolin-1We used small molecule inhibitors and siRNA approaches in
endothelial cells to explore the caveolin-1 pathways influenced by
caveolin-1 that might alter endothelial ROS. We first knocked-
down eNOS [18], an enzyme that produces NO but can
synthesize superoxide when the enzyme is ‘‘uncoupled’’ [28].
We performed Amplex Red assays but found that eNOS
knockdown yielded no significant change in basal H2O2, nor in
the increase in H2O2 levels seen after caveolin-1 knockdown
(Figure 3C). This observation suggests that neither eNOS-derived
NO nor superoxide are involved in the increase in H2O2 observed
after caveolin-1 knockdown. When H2O2 levels were measured in
endothelial cells pre-incubated with the eNOS inhibitor L-NAME
or with the xanthine oxidase inhibitor oxypurinol following
transfection with caveolin-1 siRNA, no changes in caveolin-1
modulated H2O2 levels were observed (data not shown). When
siRNA-transfected endothelial cells were treated with the NADPH
oxidase inhibitor VAS-2870 (Figure 3A), there was no change in
the increase in H2O2 seen after caveolin-1 knockdown. However,
when siRNA-transfected cells were treated with the mitochondrial
Caveolin-1 and Endothelial Oxidative Metabolism
PLOS ONE | www.plosone.org 3 February 2014 | Volume 9 | Issue 2 | e87871
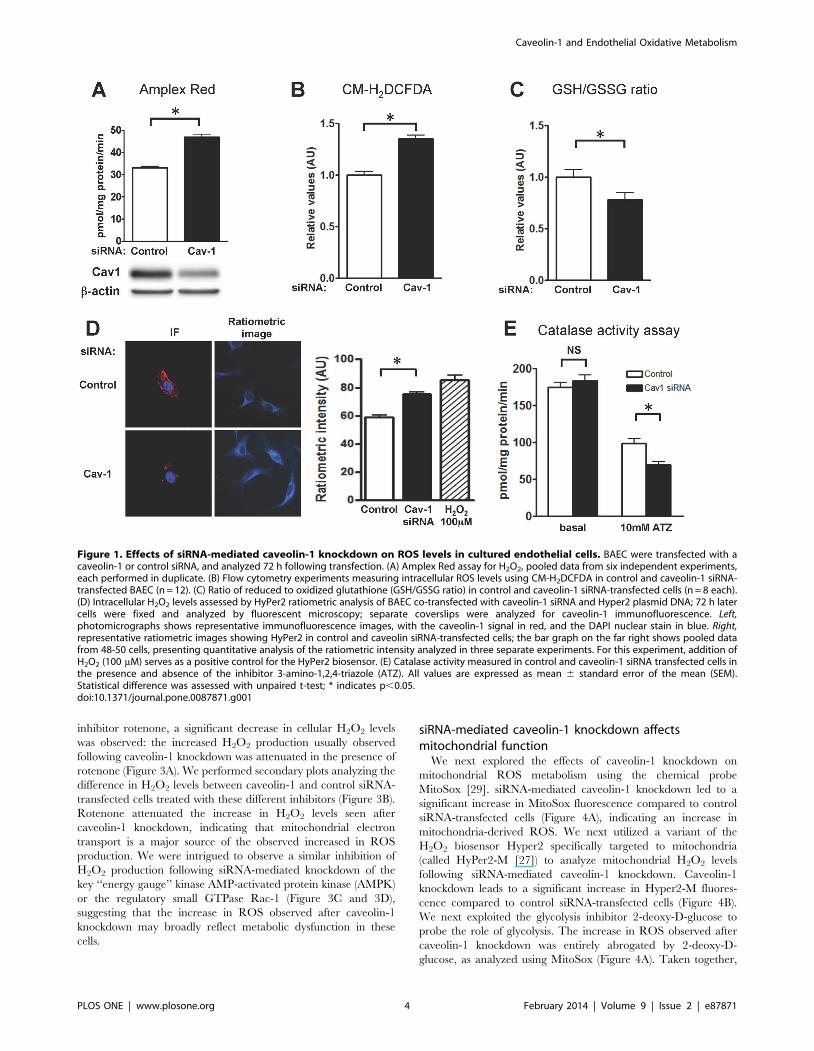
inhibitor rotenone, a significant decrease in cellular H2O2 levels
was observed: the increased H2O2 production usually observed
following caveolin-1 knockdown was attenuated in the presence of
rotenone (Figure 3A). We performed secondary plots analyzing the
difference in H2O2 levels between caveolin-1 and control siRNA-
transfected cells treated with these different inhibitors (Figure 3B).
Rotenone attenuated the increase in H2O2 levels seen after
caveolin-1 knockdown, indicating that mitochondrial electron
transport is a major source of the observed increased in ROS
production. We were intrigued to observe a similar inhibition of
H2O2 production following siRNA-mediated knockdown of the
key ‘‘energy gauge’’ kinase AMP-activated protein kinase (AMPK)
or the regulatory small GTPase Rac-1 (Figure 3C and 3D),
suggesting that the increase in ROS observed after caveolin-1
knockdown may broadly reflect metabolic dysfunction in these
cells.
siRNA-mediated caveolin-1 knockdown affectsmitochondrial function
We next explored the effects of caveolin-1 knockdown on
mitochondrial ROS metabolism using the chemical probe
MitoSox [29]. siRNA-mediated caveolin-1 knockdown led to a
significant increase in MitoSox fluorescence compared to control
siRNA-transfected cells (Figure 4A), indicating an increase in
mitochondria-derived ROS. We next utilized a variant of the
H2O2 biosensor Hyper2 specifically targeted to mitochondria
(called HyPer2-M [27]) to analyze mitochondrial H2O2 levels
following siRNA-mediated caveolin-1 knockdown. Caveolin-1
knockdown leads to a significant increase in Hyper2-M fluores-
cence compared to control siRNA-transfected cells (Figure 4B).
We next exploited the glycolysis inhibitor 2-deoxy-D-glucose to
probe the role of glycolysis. The increase in ROS observed after
caveolin-1 knockdown was entirely abrogated by 2-deoxy-D-
glucose, as analyzed using MitoSox (Figure 4A). Taken together,
Figure 1. Effects of siRNA-mediated caveolin-1 knockdown on ROS levels in cultured endothelial cells. BAEC were transfected with acaveolin-1 or control siRNA, and analyzed 72 h following transfection. (A) Amplex Red assay for H2O2, pooled data from six independent experiments,each performed in duplicate. (B) Flow cytometry experiments measuring intracellular ROS levels using CM-H2DCFDA in control and caveolin-1 siRNA-transfected BAEC (n = 12). (C) Ratio of reduced to oxidized glutathione (GSH/GSSG ratio) in control and caveolin-1 siRNA-transfected cells (n = 8 each).(D) Intracellular H2O2 levels assessed by HyPer2 ratiometric analysis of BAEC co-transfected with caveolin-1 siRNA and Hyper2 plasmid DNA; 72 h latercells were fixed and analyzed by fluorescent microscopy; separate coverslips were analyzed for caveolin-1 immunofluorescence. Left,photomicrographs shows representative immunofluorescence images, with the caveolin-1 signal in red, and the DAPI nuclear stain in blue. Right,representative ratiometric images showing HyPer2 in control and caveolin siRNA-transfected cells; the bar graph on the far right shows pooled datafrom 48-50 cells, presenting quantitative analysis of the ratiometric intensity analyzed in three separate experiments. For this experiment, addition ofH2O2 (100 mM) serves as a positive control for the HyPer2 biosensor. (E) Catalase activity measured in control and caveolin-1 siRNA transfected cells inthe presence and absence of the inhibitor 3-amino-1,2,4-triazole (ATZ). All values are expressed as mean 6 standard error of the mean (SEM).Statistical difference was assessed with unpaired t-test; * indicates p,0.05.doi:10.1371/journal.pone.0087871.g001
Caveolin-1 and Endothelial Oxidative Metabolism
PLOS ONE | www.plosone.org 4 February 2014 | Volume 9 | Issue 2 | e87871
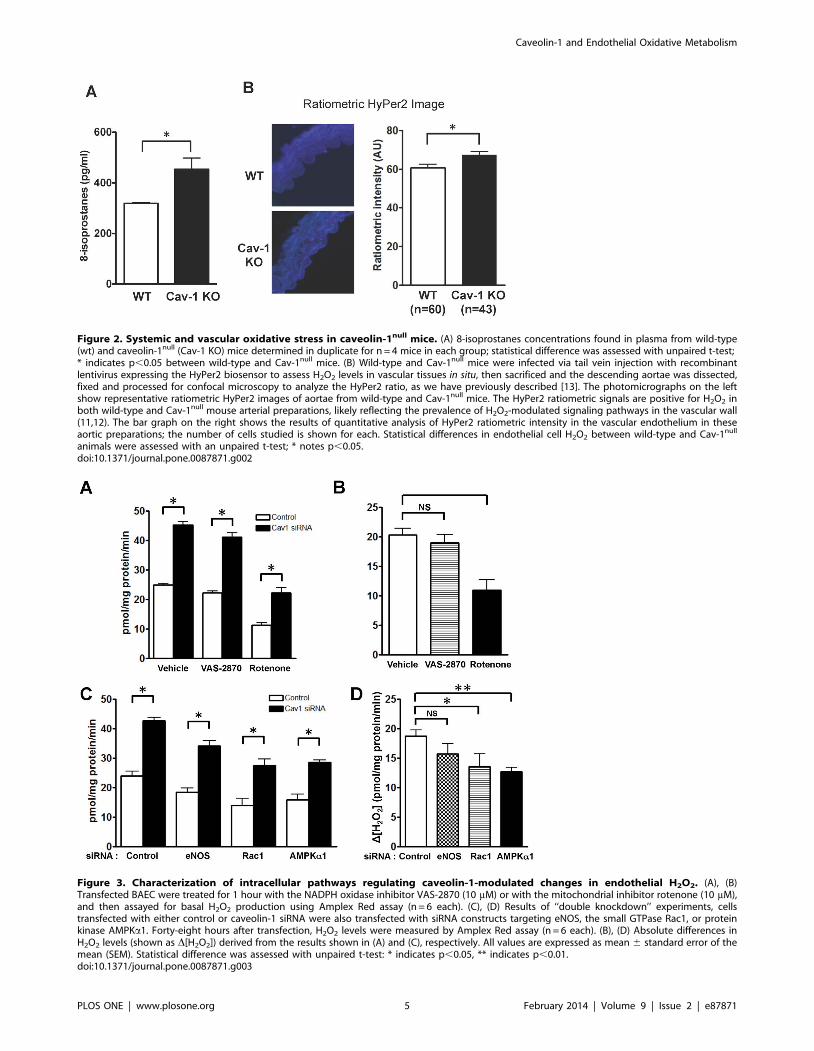
Figure 2. Systemic and vascular oxidative stress in caveolin-1null mice. (A) 8-isoprostanes concentrations found in plasma from wild-type(wt) and caveolin-1null (Cav-1 KO) mice determined in duplicate for n = 4 mice in each group; statistical difference was assessed with unpaired t-test;* indicates p,0.05 between wild-type and Cav-1null mice. (B) Wild-type and Cav-1null mice were infected via tail vein injection with recombinantlentivirus expressing the HyPer2 biosensor to assess H2O2 levels in vascular tissues in situ, then sacrificed and the descending aortae was dissected,fixed and processed for confocal microscopy to analyze the HyPer2 ratio, as we have previously described [13]. The photomicrographs on the leftshow representative ratiometric HyPer2 images of aortae from wild-type and Cav-1null mice. The HyPer2 ratiometric signals are positive for H2O2 inboth wild-type and Cav-1null mouse arterial preparations, likely reflecting the prevalence of H2O2-modulated signaling pathways in the vascular wall(11,12). The bar graph on the right shows the results of quantitative analysis of HyPer2 ratiometric intensity in the vascular endothelium in theseaortic preparations; the number of cells studied is shown for each. Statistical differences in endothelial cell H2O2 between wild-type and Cav-1null
animals were assessed with an unpaired t-test; * notes p,0.05.doi:10.1371/journal.pone.0087871.g002
Figure 3. Characterization of intracellular pathways regulating caveolin-1-modulated changes in endothelial H2O2. (A), (B)Transfected BAEC were treated for 1 hour with the NADPH oxidase inhibitor VAS-2870 (10 mM) or with the mitochondrial inhibitor rotenone (10 mM),and then assayed for basal H2O2 production using Amplex Red assay (n = 6 each). (C), (D) Results of ‘‘double knockdown’’ experiments, cellstransfected with either control or caveolin-1 siRNA were also transfected with siRNA constructs targeting eNOS, the small GTPase Rac1, or proteinkinase AMPKa1. Forty-eight hours after transfection, H2O2 levels were measured by Amplex Red assay (n = 6 each). (B), (D) Absolute differences inH2O2 levels (shown as D[H2O2]) derived from the results shown in (A) and (C), respectively. All values are expressed as mean 6 standard error of themean (SEM). Statistical difference was assessed with unpaired t-test: * indicates p,0.05, ** indicates p,0.01.doi:10.1371/journal.pone.0087871.g003
Caveolin-1 and Endothelial Oxidative Metabolism
PLOS ONE | www.plosone.org 5 February 2014 | Volume 9 | Issue 2 | e87871

these observations implicate caveolin-1 in the modulation of
mitochondrial oxidative metabolism.
To better understand the pathways leading to an increase in
mitochondrial ROS production following caveolin-1 knockdown,
we used the fluorescent probe tetramethyl rhodamine methyl ester
(TMRM) to measure the mitochondrial membrane potential in
siRNA-transfected endothelial cells. We found that caveolin-1
knockdown led to a significant increase in mitochondrial
membrane potential (Figure 4C and 4D), with no change in total
mitochondria content, as assayed both in flow cytometry analyses
with MitoTracker green (Figure 4G) or by analyzing levels of the
mitochondrial protein cytochrome oxidase (Figure 4F). While most
caveolin is targeted to plasmalemmal caveolae [30], recent reports
have observed caveolin in other intracellular membrane-limited
structures, including mitochondria [10]. As shown in Figure 4E a
small but significant fraction of the intracellular caveolin-1 staining
co-localizes with the mitochondrial marker APF-1 in endothelial
cells, providing suggestive evidence for the presence of caveolin-1
in mitochondria, as previously proposed [10,31].
Figure 4. Effects of caveolin-1 knockdown on endothelial mitochondria ROS metabolism, mitochondrial function and abundance.(A) Analysis of mitochondrial ROS using the dye MitoSox Red in cells incubated in low-glucose DMEM medium (5.5 mM D-glucose) or after 6 hours inD-glucose-free DMEM medium containing 5.5 mM 2-deoxy-D-glucose (2DG). MitoSox fluorescence was analyzed by flow cytometry (n = 12). (B) BAECwere transfected with plasmids encoding mitochondria-targeted HyPer2 (HyPer-M) concomitantly with caveolin-1 or control siRNA. The cells werefixed 72 h after transfection and analyzed by HyPer2 ratiometric imaging and by immunofluorescence staining using the confocal microscope. Left,representative immunofluorescence, with caveolin-1 immunofluorescence signal in red and the HyPer2-M ratiometric image in green; the nuclearDAPI stain is in blue. The bar graph on the right shows the quantitative analysis of ratiometric signals pooled from analysis of 42 cells from threeindependent experiments. (C) and (D) Mitochondrial membrane potential assessed by labeling cells with the dye TMRM. Membrane potential wasboth quantitated by flow cytometry (panel C, n = 8) and analyzed by live cell imaging (D). (E) Co-localization of caveolin-1 with mitochondria inendothelial cells. Representative confocal images of endothelial cells transfected with caveolin-1 or control siRNA and subsequently stained withantibodies directed against caveolin-1 (cav-1, green) or the mitochondrial protein marker apoptosis inhibitor factor (AIF, red). Co-localization (yellow)is seen in the right-hand images, which also show nuclear staining with DAPI (blue). This experiment was repeated three times with similar results.(F) Representative immunoblots following siRNA-mediated caveolin-1 knockdown in endothelial cells. Immunoblots were probed with themitochondrial marker protein cytochrome c oxidase subunit 4 (COX-IV), with b-actin as a loading control or with caveolin-1 to determine the extentof protein knockdown. (G) Mitochondrial abundance in control or caveolin-1 siRNA transfected cells assessed by flow cytometry using the probeMitoTracker Green FM (n = 4 each). All values are expressed as mean 6 standard error of the mean (SEM). Statistical differences were assessed withunpaired t-tests: * indicates p,0.05, ** indicates p,0.01, NS, not significant.doi:10.1371/journal.pone.0087871.g004
Caveolin-1 and Endothelial Oxidative Metabolism
PLOS ONE | www.plosone.org 6 February 2014 | Volume 9 | Issue 2 | e87871

Metabolomic analysis of caveolin-1 siRNA transfectedcells: evidence for autophagy
We performed unbiased metabolic profiling of endothelial cell
lysates following transfection with caveolin-1 or control siRNA; we
also analyzed the effects of knockdown of the cyclic AMP-
dependent protein kinase (PKA). Metabolites in cell lysates
obtained from six replicates per condition were analyzed by
coupled LC-MS and GC-MS methods, as described [32]. After
normalization to protein concentration, log transformation and
imputation with minimum observed values for each compound,
Welch’s two-sample t-tests were used to identify biochemicals that
differed significantly between experimental groups. A total of 319
metabolites were identified in cell samples including amino acids,
peptides, carbohydrates, lipids, nucleotides, cofactors and vitamins
(Supplemental Table S1). From the identified compounds, 156
metabolites exhibited significant differences between control and
caveolin-1 siRNA-transfected cells. In contrast, in cell lysates
prepared from cells transfected with PKA siRNA, only 20
compounds showed significant differences compared with control
siRNA-transfected cells (Fig. 5B). Figure 5A shows the hierarchical
‘‘heat map’’ representing the fold change obtained in the
concentration of the different compounds grouped according to
their metabolic pathways. The most striking difference is the
remarkable increase in cellular dipeptides, seen across a broad
range of dipeptide species. As shown in Figure 5C and
Supplemental Table S2, among the 97 different dipeptides
detected in the cell lysates, the levels of 84 discrete dipeptides
are significantly increased following siRNA-mediated caveolin-1
knockdown. In addition, there is a marked decrease in the levels of
glycolytic intermediates following caveolin-1 knockdown, suggest-
ing that increased flux through glycolysis results in the depletion of
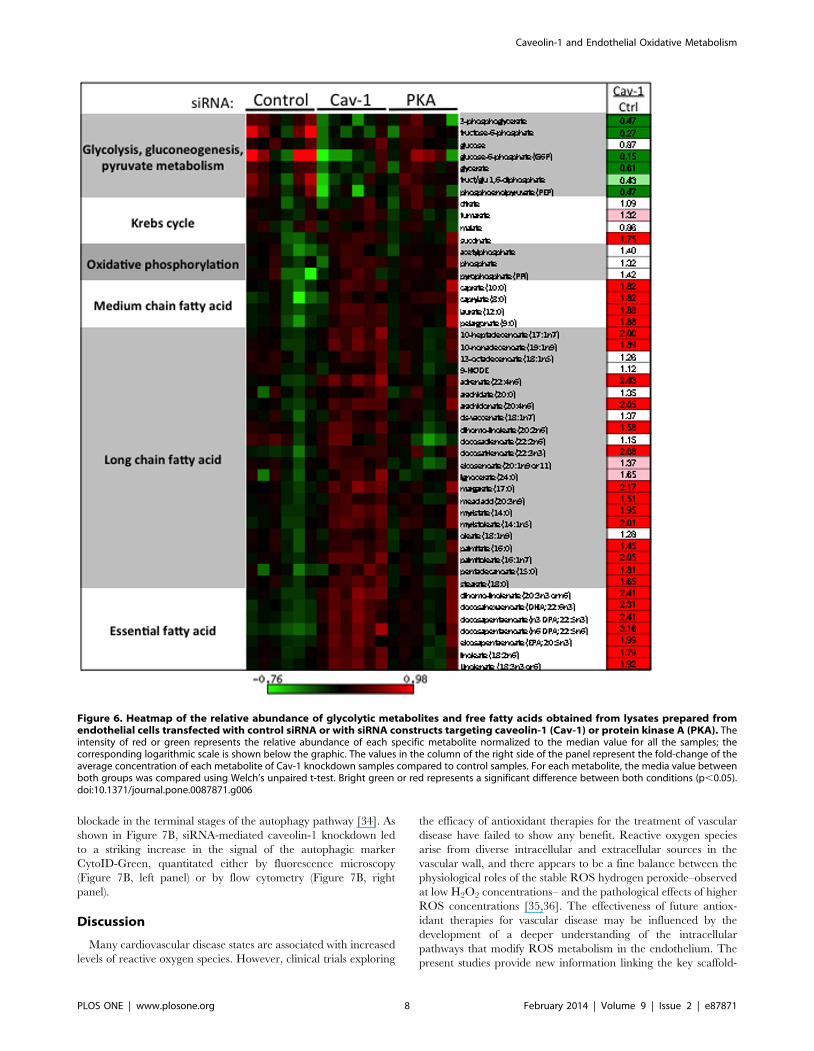
glycolytic intermediates in these cells (Figure 6). Conversely, there
is a significant increase in the abundance of free fatty acids in
lysates from endothelial cells after caveolin-1 knockdown, suggest-
ing either increased lipolysis and/or suppression of fatty acid
oxidation. We also observed an increase in the concentration of
the amino acids L-arginine, L-citrulline, and asymmetric dimethyl
arginine (Supplemental Table S1); these amino acids are
implicated in NOS metabolism.
We hypothesized that the increase in endothelial cell dipeptides
seen after caveolin-1 knockdown represents an increase in
autophagy [33]. We used two complementary methods for the
quantitation of autophagy in endothelial cells. siRNA-mediated
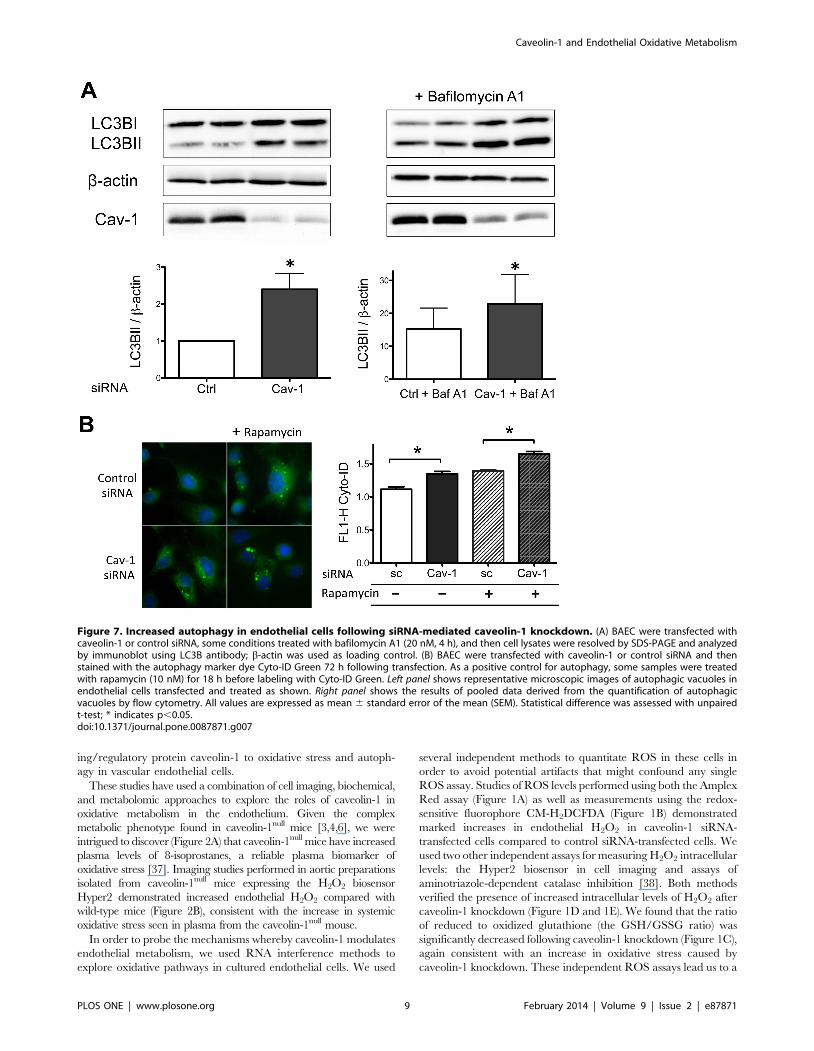
caveolin-1 knockdown led to a striking increase of the autophagic
marker protein LC3B-II, indicating an increase in cellular
autophagy (Figure 7A). Treatment of control or caveolin-1
siRNA-transfected cells with the lysosomal inhibitor bafilomycin
A1 (20 nM for 4 h) markedly increased LC3B-II (Figure 7A),
indicating that the increase in LC3B-II seen after caveolin-1
knockdown represents an increase in autophagy flux and not a
Figure 5. Metabolomic profile of endothelial cell lysates following caveolin-1 knockdown. Lysates prepared from endothelial cellstransfected with control, caveolin-1 (Cav-1) or protein kinase A (PKA) siRNA underwent metabolic profiling as described in the text. (A) ‘‘Heat map’’portraying the relative abundance of the 319 metabolites detected in cell lysates analyzed 72 h. after transfection with siRNA duplexes as shown; sixindependent samples were analyzed for each condition. The intensity of red or green represents the relative abundance of each specific metabolitenormalized to the median value for all the samples; the corresponding logarithmic scale is shown below the graphic. Metabolites are grouped in theheat map according to the metabolic sub-pathways in which they participate, and then structural categories are ordered alphabetically within eachclassification. Highlighted on the left of the heat map is the region showing the most striking change following caveolin-1 knockdown, correspondingto specific dipeptides (‘‘Dipeptides’’). (B) Table with the number of different metabolites that showed statistically different abundance followingcaveolin-1 knockdown. (C) General distribution of the categories of metabolites that are altered in lysates prepared from cells after siRNA-mediatedcaveolin-1 knockdown demonstrating that marked increases in the abundance of cellular dipeptides represent the most striking alteration in themetabolic profile seen after caveolin-1 knockdown.doi:10.1371/journal.pone.0087871.g005
Caveolin-1 and Endothelial Oxidative Metabolism
PLOS ONE | www.plosone.org 7 February 2014 | Volume 9 | Issue 2 | e87871
blockade in the terminal stages of the autophagy pathway [34]. As
shown in Figure 7B, siRNA-mediated caveolin-1 knockdown led
to a striking increase in the signal of the autophagic marker
CytoID-Green, quantitated either by fluorescence microscopy
(Figure 7B, left panel) or by flow cytometry (Figure 7B, right
panel).
Discussion
Many cardiovascular disease states are associated with increased
levels of reactive oxygen species. However, clinical trials exploring
the efficacy of antioxidant therapies for the treatment of vascular
disease have failed to show any benefit. Reactive oxygen species
arise from diverse intracellular and extracellular sources in the
vascular wall, and there appears to be a fine balance between the
physiological roles of the stable ROS hydrogen peroxide–observed
at low H2O2 concentrations– and the pathological effects of higher
ROS concentrations [35,36]. The effectiveness of future antiox-
idant therapies for vascular disease may be influenced by the
development of a deeper understanding of the intracellular
pathways that modify ROS metabolism in the endothelium. The
present studies provide new information linking the key scaffold-
Figure 6. Heatmap of the relative abundance of glycolytic metabolites and free fatty acids obtained from lysates prepared fromendothelial cells transfected with control siRNA or with siRNA constructs targeting caveolin-1 (Cav-1) or protein kinase A (PKA). Theintensity of red or green represents the relative abundance of each specific metabolite normalized to the median value for all the samples; thecorresponding logarithmic scale is shown below the graphic. The values in the column of the right side of the panel represent the fold-change of theaverage concentration of each metabolite of Cav-1 knockdown samples compared to control samples. For each metabolite, the media value betweenboth groups was compared using Welch’s unpaired t-test. Bright green or red represents a significant difference between both conditions (p,0.05).doi:10.1371/journal.pone.0087871.g006
Caveolin-1 and Endothelial Oxidative Metabolism
PLOS ONE | www.plosone.org 8 February 2014 | Volume 9 | Issue 2 | e87871
ing/regulatory protein caveolin-1 to oxidative stress and autoph-
agy in vascular endothelial cells.
These studies have used a combination of cell imaging, biochemical,
and metabolomic approaches to explore the roles of caveolin-1 in
oxidative metabolism in the endothelium. Given the complex
metabolic phenotype found in caveolin-1null mice [3,4,6], we were
intrigued to discover (Figure 2A) that caveolin-1null mice have increased
plasma levels of 8-isoprostanes, a reliable plasma biomarker of
oxidative stress [37]. Imaging studies performed in aortic preparations
isolated from caveolin-1null mice expressing the H2O2 biosensor
Hyper2 demonstrated increased endothelial H2O2 compared with
wild-type mice (Figure 2B), consistent with the increase in systemic
oxidative stress seen in plasma from the caveolin-1null mouse.
In order to probe the mechanisms whereby caveolin-1 modulates
endothelial metabolism, we used RNA interference methods to
explore oxidative pathways in cultured endothelial cells. We used
several independent methods to quantitate ROS in these cells in
order to avoid potential artifacts that might confound any single
ROS assay. Studies of ROS levels performed using both the Amplex
Red assay (Figure 1A) as well as measurements using the redox-
sensitive fluorophore CM-H2DCFDA (Figure 1B) demonstrated
marked increases in endothelial H2O2 in caveolin-1 siRNA-
transfected cells compared to control siRNA-transfected cells. We
used two other independent assays for measuring H2O2 intracellular
levels: the Hyper2 biosensor in cell imaging and assays of
aminotriazole-dependent catalase inhibition [38]. Both methods
verified the presence of increased intracellular levels of H2O2 after
caveolin-1 knockdown (Figure 1D and 1E). We found that the ratio
of reduced to oxidized glutathione (the GSH/GSSG ratio) was
significantly decreased following caveolin-1 knockdown (Figure 1C),
again consistent with an increase in oxidative stress caused by
caveolin-1 knockdown. These independent ROS assays lead us to a
Figure 7. Increased autophagy in endothelial cells following siRNA-mediated caveolin-1 knockdown. (A) BAEC were transfected withcaveolin-1 or control siRNA, some conditions treated with bafilomycin A1 (20 nM, 4 h), and then cell lysates were resolved by SDS-PAGE and analyzedby immunoblot using LC3B antibody; b-actin was used as loading control. (B) BAEC were transfected with caveolin-1 or control siRNA and thenstained with the autophagy marker dye Cyto-ID Green 72 h following transfection. As a positive control for autophagy, some samples were treatedwith rapamycin (10 nM) for 18 h before labeling with Cyto-ID Green. Left panel shows representative microscopic images of autophagic vacuoles inendothelial cells transfected and treated as shown. Right panel shows the results of pooled data derived from the quantification of autophagicvacuoles by flow cytometry. All values are expressed as mean 6 standard error of the mean (SEM). Statistical difference was assessed with unpairedt-test; * indicates p,0.05.doi:10.1371/journal.pone.0087871.g007
Caveolin-1 and Endothelial Oxidative Metabolism
PLOS ONE | www.plosone.org 9 February 2014 | Volume 9 | Issue 2 | e87871
robust conclusion that siRNA-mediated caveolin-1 knockdown
promotes a significant increase in endothelial cell oxidative stress.
We next used a series of siRNA targeting constructs as well as
pharmacological inhibitors to identify the intracellular source(s) of the
increased ROS levels observed following caveolin-1 knockdown.
Enzymatic sources for oxidative stress in endothelial cells include
members of the NADPH oxidase family [39], xanthine oxidases [40]
and ‘‘uncoupled’’ eNOS [28]. However, neither the NADPH oxidase
inhibitor VAS-2870, nor the xanthine oxidase inhibitor oxypurinol,
nor the NOS inhibitor L-NAME blocked the increase in ROS seen
after caveolin-1 knockdown. siRNA-mediated knockdown of the
AMP-activated protein kinase (AMPK) partially attenuated the
increase in ROS seen after caveolin-1 knockdown, providing
suggestive evidence that caveolin-1 may modulate endothelial energy
metabolism as part of its effect on autophagy and ROS abundance.
Similarly, after siRNA-mediated Rac1 knockdown, the increase in
ROS seen after caveolin-1 knockdown is partially attenuated. We
speculate that this reflects the role of Rac1 in the modulation of
signaling pathways controlled by caveolin-1 (18, 19). The quantita-
tively most important source for ROS in these cells is from
mitochondrial electron leakage during oxidative metabolism. We
found the mitochondrial inhibitor rotenone significantly attenuated
the increase in ROS observed after caveolin-1 knockdown, suggesting
that mitochondrial dysfunction is responsible for the increase in H2O2
levels observed after caveolin-1 knockdown. This interpretation was
confirmed using the mitochondrial ROS sensor MitoSox Red [29]
(Figure 4A) as well as using the mitochondria-targeted H2O2
biosensor HyPer2-M (Figure 4B).
Caveolin-1 is clearly an important regulator of eNOS in
endothelial cells: the absence of caveolin-1 leads to increased
activity of the enzyme, with a concomitant increase in NO
production [41]. Since NO is a competitive inhibitor of oxygen in
the cytochrome oxidase present in mitochondrial complex IV,
increased NO production could promote mitochondria inhibition
by attenuating the terminal phase of the mitochondrial electron
transport chain complex, leading to electron leakage and
superoxide formation. In addition, upregulation of eNOS activity
could also promote depletion of arginine substrate and enzyme
‘‘uncoupling’’ to eNOS-dependent generation of O2.-. However,
neither siRNA-mediated eNOS knockdown nor pharmacological
inhibition of eNOS blocked the effect of caveolin-1 knock down on
increased ROS production in endothelial cells, suggesting instead
that caveolin-1 has a direct effect on mitochondrial oxidative
metabolism. We found that siRNA-mediated caveolin-1 knock-
down promoted a striking increase in the mitochondrial produc-
tion of oxidant species, associated with mitochondrial membrane
hyperpolarization. In addition, we found that caveolin-1 knock-
down led to a metabolic switch in cellular energy utilization, with
preferential utilization of the glycolytic pathway over free fatty acid
consumption, concomitant with activation of the autophagy
pathway. An important caveat in our conclusions on the role of
caveolin-1 in metabolic switching is that these studies were
conducted in cells cultured only with a carbohydrate source,
without analyzing differential effects of lipids; metabolic flux in the
presence of different energy sources was not directly measured.
The role of caveolin-1 in mitochondrial function and redox
modulation has not previously reported in endothelial cells, nor
have prior studies connected these responses with cellular
autophagy. However, recent reports have suggested that caveo-
lin-1 may modulate mitochondrial function in diverse cell types
[6,7,10]. Indeed, we could detect co-localization between caveolin-
1 and the mitochondrial marker APF-1 in control endothelial cells
using confocal microscopy (Figure 4E), perhaps reflecting a direct
effect of caveolin-1 on mitochondrial membrane function.
In addition to the modulation of mitochondrial function by caveolin-
1, our data also implicate glycolysis as an important source of the
substrates and reducing equivalents provided to the mitochondrial
electronic transport chain in these cells. We found (Figure 4A) that the
glycolytic inhibitor 2-deoxyglucose effectively abrogated the increase in
ROS seen following caveolin-1 knockdown. Results of our metabo-
lomic analysis (Figure 6) provide another clue to a central role for
glycolysis. The fact that five intermediates of the glycolytic pathway are
present at a significant lower level in lysates from caveolin-1 siRNA
transfected endothelial cells- accompanied by a striking increase in free
fatty acids following caveolin-1 knockdown- strongly suggests that
glucose is being preferentially utilized as an energetic substrate when
caveolin-1 abundance is suppressed. Previous studies of caveolin-1
cancer-associated fibroblasts also revealed a metabolic switch from an
oxidative mitochondrial phenotype to a glycolytic phenotype [1].
Possibly this increased reliance on glycolysis over fatty acid oxidation
reflects a compensatory mechanism that avoids the generation of
excessive mitochondria-derived ROS that could have deleterious
effects.
Perhaps the most dramatic and surprising cellular response
observed following siRNA-mediated caveolin-1 knockdown was the
activation of the autophagy pathway, which we quantitated using
two independent assays for autophagy (Figure 7). The dramatic
increase in the level of cytosolic dipeptides following caveolin-1
knockdown (Figure 5A) is consistent with activation of autophagy
[42]. Autophagy is a regulated catabolic pathway that promotes
lysosome-mediated degradation of proteins and organelles inside a
cell. Autophagy was originally described as a ‘‘self-eating’’ pathway
activated by cells under starvation conditions or in the face of energy
deprivation, with the consequence that starving or stressed cells
could generate intracellular molecules that are essential for cell
homeostasis. However, is now widely accepted that even under
normal nutritional states, autophagy has a role in normal cellular
homeostasis by mediating the turnover of long-lived proteins. We
found that caveolin-1 knockdown in endothelial cells led to a
marked increase in intracellular dipeptide levels across a very large
number (,85) of unrelated dipeptides that have no discernable
common structural characteristics (Supplemental Table S2). The
striking increase in intracellular dipeptides observed in endothelial
cell lysates after siRNA-mediated caveolin-1 knockdown probably
arises from the general breakdown of intracellular proteins by
lysosomal proteases, and we speculate that these dipeptides are
probably the products of general proteolytic degradation and are
not generated by specific dipeptidyl-peptidases.
Oxidative stress may play a role in autophagy, although the
molecular mechanisms remain incompletely understood [33,43,44,45].
Activation of autophagy following caveolin-1 knockdown may reflect
an adaptive response to the marked increase in oxidative stress caused
by the decrease in caveolin-1 protein expression in endothelial cells.
Modulation of endothelial cell autophagy may represent another
critical control point in the modulation of vascular function in disease
states associated with oxidative stress.
Supporting Information
Table S1 Metabolite profile of endothelial cells 72 hafter transfection with control, caveolin-1, or PKAsiRNA. Data Set 1 shows the raw values and Data Set 2 shows
the normalized and imputed values for metabolites analyzed
following siRNA-mediated knockdown using control, caveolin-1,
or PKA siRNA in endothelial cells. These data provide the basis
for the heat maps shown in Figure 5 and 6.
(XLSX)
Caveolin-1 and Endothelial Oxidative Metabolism
PLOS ONE | www.plosone.org 10 February 2014 | Volume 9 | Issue 2 | e87871

Table S2 Dipeptides detected in endothelial cells aftertransfection with control or caveolin-1 siRNA. This table
shows the heat map associated with the statistical analysis of
quantitative metabolomic data for dipeptides following siRNA-
mediated caveolin-1 knockdown in endothelial cells.
(XLSX)
Author Contributions
Conceived and designed the experiments: T. Shiroto NR T. Sugiyama JLS
HK ZY HS TM. Performed the experiments: T. Shiroto NR T. Sugiyama
JLS HK ZY. Analyzed the data: T. Shiroto NR T. Sugiyama JLS HK ZY
HS TM. Contributed reagents/materials/analysis tools: NR T. Sugiyama
HK. Wrote the paper: NR TM.
References
1. Sotgia F, Martinez-Outschoorn UE, Howell A, Pestell RG, Pavlides S, et al.(2012) Caveolin-1 and cancer metabolism in the tumor microenvironment:
markers, models, and mechanisms. Annu Rev Pathol 7: 423–467.
2. Dudzinski DM, Michel T (2007) Life history of eNOS: partners and pathways.Cardiovasc Res 75: 247–260.
3. Drab M, Verkade P, Elger M, Kasper M, Lohn M, et al. (2001) Loss of caveolae,vascular dysfunction, and pulmonary defects in caveolin-1 gene-disrupted mice.
Science 293: 2449–2452.4. Razani B, Engelman JA, Wang XB, Schubert W, Zhang XL, et al. (2001)
Caveolin-1 null mice are viable but show evidence of hyperproliferative and
vascular abnormalities. J Biol Chem 276: 38121–38138.5. Razani B, Combs TP, Wang XB, Frank PG, Park DS, et al. (2002) Caveolin-1-
deficient mice are lean, resistant to diet-induced obesity, and show hypertri-glyceridemia with adipocyte abnormalities. J Biol Chem 277: 8635–8647.
6. Asterholm IW, Mundy DI, Weng J, Anderson RG, Scherer PE (2012) Altered
mitochondrial function and metabolic inflexibility associated with loss ofcaveolin-1. Cell Metab 15: 171–185.
7. Bosch M, Mari M, Herms A, Fernandez A, Fajardo A, et al. (2011) Caveolin-1deficiency causes cholesterol-dependent mitochondrial dysfunction and apoptot-
ic susceptibility. Curr Biol 21: 681–686.8. Zhao YY, Liu Y, Stan RV, Fan L, Gu Y, et al. (2002) Defects in caveolin-1 cause
dilated cardiomyopathy and pulmonary hypertension in knockout mice. Proc
Natl Acad Sci U S A 99: 11375–11380.9. Zhao YY, Zhao YD, Mirza MK, Huang JH, Potula HH, et al. (2009) Persistent
eNOS activation secondary to caveolin-1 deficiency induces pulmonaryhypertension in mice and humans through PKG nitration. J Clin Invest 119:
2009–2018.
10. Fridolfsson HN, Kawaraguchi Y, Ali SS, Panneerselvam M, Niesman IR, et al.(2012) Mitochondria-localized caveolin in adaptation to cellular stress and
injury. FASEB J 26: 4637–4649.11. Widlansky ME, Gutterman DD (2011) Regulation of endothelial function by
mitochondrial reactive oxygen species. Antioxid Redox Signal 15: 1517–1530.
12. Jin BY, Sartoretto JL, Gladyshev VN, Michel T (2009) Endothelial nitric oxidesynthase negatively regulates hydrogen peroxide-stimulated AMP-activated
protein kinase in endothelial cells. Proc Natl Acad Sci U S A 106: 17343–17348.13. Sartoretto JL, Kalwa H, Pluth MD, Lippard SJ, Michel T (2011) Hydrogen
peroxide differentially modulates cardiac myocyte nitric oxide synthesis. ProcNatl Acad Sci U S A 108: 15792–15797.
14. Vicent D, Ilany J, Kondo T, Naruse K, Fisher SJ, et al. (2003) The role of
endothelial insulin signaling in the regulation of vascular tone and insulinresistance. J Clin Invest 111: 1373–1380.
15. Kanda T, Brown JD, Orasanu G, Vogel S, Gonzalez FJ, et al. (2009)PPARgamma in the endothelium regulates metabolic responses to high-fat diet
in mice. J Clin Invest 119: 110–124.
16. Taylor PD, Wickenden AD, Mirrlees DJ, Poston L (1994) Endothelial functionin the isolated perfused mesentery and aortae of rats with streptozotocin-induced
diabetes: effect of treatment with the aldose reductase inhibitor, ponalrestat. Br JPharmacol 111: 42–48.
17. Quijano C, Castro L, Peluffo G, Valez V, Radi R (2007) Enhancedmitochondrial superoxide in hyperglycemic endothelial cells: direct measure-
ments and formation of hydrogen peroxide and peroxynitrite. Am J Physiol
Heart Circ Physiol 293: H3404–3414.18. Gonzalez E, Nagiel A, Lin AJ, Golan DE, Michel T (2004) Small interfering
RNA-mediated down-regulation of caveolin-1 differentially modulates signalingpathways in endothelial cells. J Biol Chem 279: 40659–40669.
19. Levine YC, Li GK, Michel T (2007) Agonist-modulated regulation of AMP-
activated protein kinase (AMPK) in endothelial cells. Evidence for an AMPK -.Rac1 -. Akt -. endothelial nitric-oxide synthase pathway. J Biol Chem 282:
20351–20364.20. Pase L, Nowell CJ, Lieschke GJ (2012) In vivo real-time visualization of
leukocytes and intracellular hydrogen peroxide levels during a zebrafish acuteinflammation assay. Methods Enzymol 506: 135–156.
21. Reitman ZJ, Jin G, Karoly ED, Spasojevic I, Yang J, et al. (2011) Profiling the
effects of isocitrate dehydrogenase 1 and 2 mutations on the cellularmetabolome. Proc Natl Acad Sci U S A 108: 3270–3275.
22. Pavlidis P, Noble WS (2003) Matrix2png: a utility for visualizing matrix data.
Bioinformatics 19: 295–296.
23. Feron O, Saldana F, Michel JB, Michel T (1998) The endothelial nitric-oxide
synthase-caveolin regulatory cycle. J Biol Chem 273: 3125–3128.
24. Park H, Go YM, Darji R, Choi JW, Lisanti MP, et al. (2000) Caveolin-1
regulates shear stress-dependent activation of extracellular signal-regulated
kinase. Am J Physiol Heart Circ Physiol 278: H1285–1293.
25. Zhou M, Diwu Z, Panchuk-Voloshina N, Haugland RP (1997) A stable
nonfluorescent derivative of resorufin for the fluorometric determination of trace
hydrogen peroxide: applications in detecting the activity of phagocyte NADPH
oxidase and other oxidases. Anal Biochem 253: 162–168.
26. Schafer FQ, Buettner GR (2001) Redox environment of the cell as viewed
through the redox state of the glutathione disulfide/glutathione couple. Free
Radic Biol Med 30: 1191–1212.
27. Malinouski M, Zhou Y, Belousov VV, Hatfield DL, Gladyshev VN (2011)
Hydrogen peroxide probes directed to different cellular compartments. PLoS
One 6: e14564.
28. Forstermann U, Munzel T (2006) Endothelial nitric oxide synthase in vascular
disease: from marvel to menace. Circulation 113: 1708–1714.
29. Robinson KM, Janes MS, Pehar M, Monette JS, Ross MF, et al. (2006) Selective
fluorescent imaging of superoxide in vivo using ethidium-based probes. Proc
Natl Acad Sci U S A 103: 15038–15043.
30. Rothberg KG, Heuser JE, Donzell WC, Ying YS, Glenney JR, et al. (1992)
Caveolin, a protein component of caveolae membrane coats. Cell 68: 673–682.
31. Li WP, Liu P, Pilcher BK, Anderson RG (2001) Cell-specific targeting of
caveolin-1 to caveolae, secretory vesicles, cytoplasm or mitochondria. J Cell Sci
114: 1397–1408.
32. Milburn MV, Lawton KA (2013) Application of metabolomics to diagnosis of
insulin resistance. Annu Rev Med 64: 291–305.
33. Lee J, Giordano S, Zhang J (2012) Autophagy, mitochondria and oxidative
stress: cross-talk and redox signalling. Biochem J 441: 523–540.
34. Klionsky DJ, Abeliovich H, Agostinis P, Agrawal DK, Aliev G, et al. (2008)
Guidelines for the use and interpretation of assays for monitoring autophagy in
higher eukaryotes. Autophagy 4: 151–175.
35. Finkel T (2011) Signal transduction by reactive oxygen species. J Cell Biol 194:
7–15.
36. Nathan C (2003) Specificity of a third kind: reactive oxygen and nitrogen
intermediates in cell signaling. J Clin Invest 111: 769–778.
37. Morrow JD (2005) Quantification of isoprostanes as indices of oxidant stress and
the risk of atherosclerosis in humans. Arterioscler Thromb Vasc Biol 25: 279–
286.
38. Giulivi C, Hochstein P, Davies KJ (1994) Hydrogen peroxide production by red
blood cells. Free Radic Biol Med 16: 123–129.
39. Zafari AM, Ushio-Fukai M, Akers M, Yin Q, Shah A, et al. (1998) Role of
NADH/NADPH oxidase-derived H2O2 in angiotensin II-induced vascular
hypertrophy. Hypertension 32: 488–495.
40. White CR, Darley-Usmar V, Berrington WR, McAdams M, Gore JZ, et al.
(1996) Circulating plasma xanthine oxidase contributes to vascular dysfunction
in hypercholesterolemic rabbits. Proc Natl Acad Sci U S A 93: 8745–8749.
41. Wang H, Wang AX, Liu Z, Chai W, Barrett EJ (2009) The trafficking/
interaction of eNOS and caveolin-1 induced by insulin modulates endothelial
nitric oxide production. Mol Endocrinol 23: 1613–1623.
42. Chaudhri VK, Salzler GG, Dick SA, Buckman MS, Sordella R, et al. (2013)
Metabolic alterations in lung cancer-associated fibroblasts correlated with
increased glycolytic metabolism of the tumor. Mol Cancer Res.
43. Filomeni G, Desideri E, Cardaci S, Rotilio G, Ciriolo MR (2010) Under the
ROS...thiol network is the principal suspect for autophagy commitment.
Autophagy 6: 999–1005.
44. Gurusamy N, Das DK (2009) Autophagy, redox signaling, and ventricular
remodeling. Antioxid Redox Signal 11: 1975–1988.
45. Scherz-Shouval R, Shvets E, Fass E, Shorer H, Gil L, et al. (2007) Reactive
oxygen species are essential for autophagy and specifically regulate the activity of
Atg4. EMBO J 26: 1749–1760.
Caveolin-1 and Endothelial Oxidative Metabolism
PLOS ONE | www.plosone.org 11 February 2014 | Volume 9 | Issue 2 | e87871