
Case Study: Design of Flood Control Systems on the Vara River by Numerical and Physical Modeling
10
CASE STUDIES Case Study: Design of Flood Control Systems on the Vara River by Numerical and Physical Modeling Annunziato Siviglia 1 ; Alessandro Stocchino 2 ; and Marco Colombini 3 Abstract: In the present paper, we investigate the effectiveness of a flood defense project based on storage reservoirs, presently under study for the Magra River and Vara River Italy. We have focused the analysis on two detention reservoirs and studied their response to different hydrological scenarios mostly in terms of flood mitigation efficiency, leaving aside sediment transport issues. The analysis has been carried out with the aid of a physical model and one-dimensional numerical simulations. Experimental and numerical simulations have been performed spanning a wide range of hydrological conditions. Some of the results can be generalized for different applications where similar flood control systems are employed. DOI: 10.1061/ASCEHY.1943-7900.0000135 CE Database subject headings: Floods; Numerical models; Italy; Design; Case studies. Introduction Water management measures are closely linked to a variety of needs within human society. If on one hand, they have to improve the water utilization for different purposes. On the other hand, they must also provide a protection against the possible destruc- tive effects, e.g., during a flood event. Flood control projects are of crucial importance in preserving lands from the occurrence of natural disasters caused by river floods. A great variety of flood control measures are available that can be generally classified as structural projects, which rely on different kinds of hydraulic structures and nonstructural projects. Among the structural measures, detention reservoirs have proven to be effective in reducing downstream flooding risk. Reservoirs are designed to temporarily store floodwater behind dams or in- side detention basins. In the present paper, we investigate the effectiveness of a flood mitigation project based on storage reser- voirs to be built on the Vara River Italy. The Vara River is the main tributary of the Magra River, which has a basin of about 1,698 km 2 and is confined between the basin of the Po River North and the Tyrrhenian Sea South, crossing the Tuscany and Liguria regions. The Vara basin has a watershed of about 600 km 2 , with average annual rainfall of about 1,770 mm/y and an estimated average inflow of about 570 10 6 m 3 per year. The purpose of river training is primarily to control floods with a particular attention being given to the protection of floodplains and human settlements Wu et al. 2005. Starting from the iden- tification of vulnerable regions in the basin, the actions consid- ered in the mentioned plan are mainly aimed to regulate the floodwater and to control the sediment conveyance along the en- tire river. The feasibility of a system of relatively small volume floodwater reservoirs distributed on the entire basin, taking ad- vantage of the limited natural floodplains, has been studied. The number of the reservoirs distributed on the entire network should be 29 for an available total volume of about 20 10 6 m 3 , for a corresponding cost estimated to be about 110 million euros. Many examples of distributed flood control-systems are re- ported in the literature, see for instance Avakyan and Polyushkin 1989, Slutzman and Smith 2006, and Giesecke 2007. In the present work, we have studied in detail a system of two floodwa- ter storage reservoirs located in the upper part of the Vara River. In particular, we • Evaluate the flood mitigation effects produced by the flood control measures; • Compare the performance of different configurations of the flood control systems; • Investigate the response of a system of multiple detention ba- sins to different hypothetical floods with a wide range of oc- currence periods, eventually suggesting a simple relationship to estimate the global flood attenuation efficiency; • Produce a rating curve appropriate to describe the hydraulic behavior of the designed dam, which might be generalized to other dams of the same kind but with different geometrical characteristics; and • Formulate a 1D numerical model capable to describe the un- steady dynamics of the flood propagation and attenuation pro- duced by the presence of the detention basins. To accomplish the above tasks, we make use of both numerical and a physical modeling specifically designed in order to repro- duce one of the two floodwater control structures. 1 Dr., Dept. of Civil and Environmental Engineering, Univ. of Trento, via Mesiano 77, Trento 38050, Italy corresponding author. E-mail: [email protected]. 2 Dr., Dept. of Civil, Environmental, and Architectural Engineering, Univ. of Genova, via Montallegro 1, Genova 16145, Italy. E-mail: [email protected] 3 Professor, Dept. of Civil, Environmental, and Architectural Engineer- ing, Univ. of Genova, via Montallegro 1, Genova 16145, Italy. E-mail: [email protected] Note. This manuscript was submitted on February 15, 2008; approved on July 8, 2009; published online on July 13, 2009. Discussion period open until May 1, 2010; separate discussions must be submitted for indi- vidual papers. This paper is part of the Journal of Hydraulic Engineer- ing, Vol. 135, No. 12, December 1, 2009. ©ASCE, ISSN 0733-9429/ 2009/12-1063–1072/$25.00. JOURNAL OF HYDRAULIC ENGINEERING © ASCE / DECEMBER 2009 / 1063 Downloaded 17 Nov 2009 to 130.251.56.150. Redistribution subject to ASCE license or copyright; see http://pubs.asce.org/copyright
-
Upload
independent -
Category
Documents
-
view
1 -
download
0
Transcript of Case Study: Design of Flood Control Systems on the Vara River by Numerical and Physical Modeling

CASE STUDIES
Case Study: Design of Flood Control Systems on the VaraRiver by Numerical and Physical Modeling
Annunziato Siviglia1; Alessandro Stocchino2; and Marco Colombini3
Abstract: In the present paper, we investigate the effectiveness of a flood defense project based on storage reservoirs, presently understudy for the Magra River and Vara River �Italy�. We have focused the analysis on two detention reservoirs and studied their response todifferent hydrological scenarios mostly in terms of flood mitigation efficiency, leaving aside sediment transport issues. The analysis hasbeen carried out with the aid of a physical model and one-dimensional numerical simulations. Experimental and numerical simulationshave been performed spanning a wide range of hydrological conditions. Some of the results can be generalized for different applicationswhere similar flood control systems are employed.
DOI: 10.1061/�ASCE�HY.1943-7900.0000135
CE Database subject headings: Floods; Numerical models; Italy; Design; Case studies.
Introduction
Water management measures are closely linked to a variety ofneeds within human society. If on one hand, they have to improvethe water utilization for different purposes. On the other hand,they must also provide a protection against the possible destruc-tive effects, e.g., during a flood event.
Flood control projects are of crucial importance in preservinglands from the occurrence of natural disasters caused by riverfloods. A great variety of flood control measures are available thatcan be generally classified as structural projects, which rely ondifferent kinds of hydraulic structures and nonstructural projects.Among the structural measures, detention reservoirs have provento be effective in reducing downstream flooding risk. Reservoirsare designed to temporarily store floodwater behind dams or in-side detention basins. In the present paper, we investigate theeffectiveness of a flood mitigation project based on storage reser-voirs to be built on the Vara River �Italy�. The Vara River is themain tributary of the Magra River, which has a basin of about1 ,698 km2 and is confined between the basin of the Po River�North� and the Tyrrhenian Sea �South�, crossing the Tuscany andLiguria regions. The Vara basin has a watershed of about600 km2, with average annual rainfall of about 1,770 mm/y and
1Dr., Dept. of Civil and Environmental Engineering, Univ. of Trento,via Mesiano 77, Trento 38050, Italy �corresponding author�. E-mail:[email protected].
2Dr., Dept. of Civil, Environmental, and Architectural Engineering,Univ. of Genova, via Montallegro 1, Genova 16145, Italy. E-mail:[email protected]
3Professor, Dept. of Civil, Environmental, and Architectural Engineer-ing, Univ. of Genova, via Montallegro 1, Genova 16145, Italy. E-mail:[email protected]
Note. This manuscript was submitted on February 15, 2008; approvedon July 8, 2009; published online on July 13, 2009. Discussion periodopen until May 1, 2010; separate discussions must be submitted for indi-vidual papers. This paper is part of the Journal of Hydraulic Engineer-ing, Vol. 135, No. 12, December 1, 2009. ©ASCE, ISSN 0733-9429/
2009/12-1063–1072/$25.00.JOURNAL
Downloaded 17 Nov 2009 to 130.251.56.150. Redistribution subject to
an estimated average inflow of about 570�106 m3 per year. Thepurpose of river training is primarily to control floods with aparticular attention being given to the protection of floodplainsand human settlements �Wu et al. 2005�. Starting from the iden-tification of vulnerable regions in the basin, the actions consid-ered in the mentioned plan are mainly aimed to regulate thefloodwater and to control the sediment conveyance along the en-tire river. The feasibility of a system of relatively small volumefloodwater reservoirs distributed on the entire basin, taking ad-vantage of the limited natural floodplains, has been studied. Thenumber of the reservoirs distributed on the entire network shouldbe 29 for an available total volume of about 20�106 m3, for acorresponding cost estimated to be about 110 million euros.
Many examples of distributed flood control-systems are re-ported in the literature, see for instance Avakyan and Polyushkin�1989�, Slutzman and Smith �2006�, and Giesecke �2007�. In thepresent work, we have studied in detail a system of two floodwa-ter storage reservoirs located in the upper part of the Vara River.In particular, we• Evaluate the flood mitigation effects produced by the flood
control measures;• Compare the performance of different configurations of the
flood control systems;• Investigate the response of a system of multiple detention ba-
sins to different hypothetical floods with a wide range of oc-currence periods, eventually suggesting a simple relationshipto estimate the global flood attenuation efficiency;
• Produce a rating curve appropriate to describe the hydraulicbehavior of the designed dam, which might be generalized toother dams of the same kind but with different geometricalcharacteristics; and
• Formulate a 1D numerical model capable to describe the un-steady dynamics of the flood propagation and attenuation pro-duced by the presence of the detention basins.To accomplish the above tasks, we make use of both numerical
and a physical modeling specifically designed in order to repro-
duce one of the two floodwater control structures.OF HYDRAULIC ENGINEERING © ASCE / DECEMBER 2009 / 1063
ASCE license or copyright; see http://pubs.asce.org/copyright
Study Area and Impounding Structures
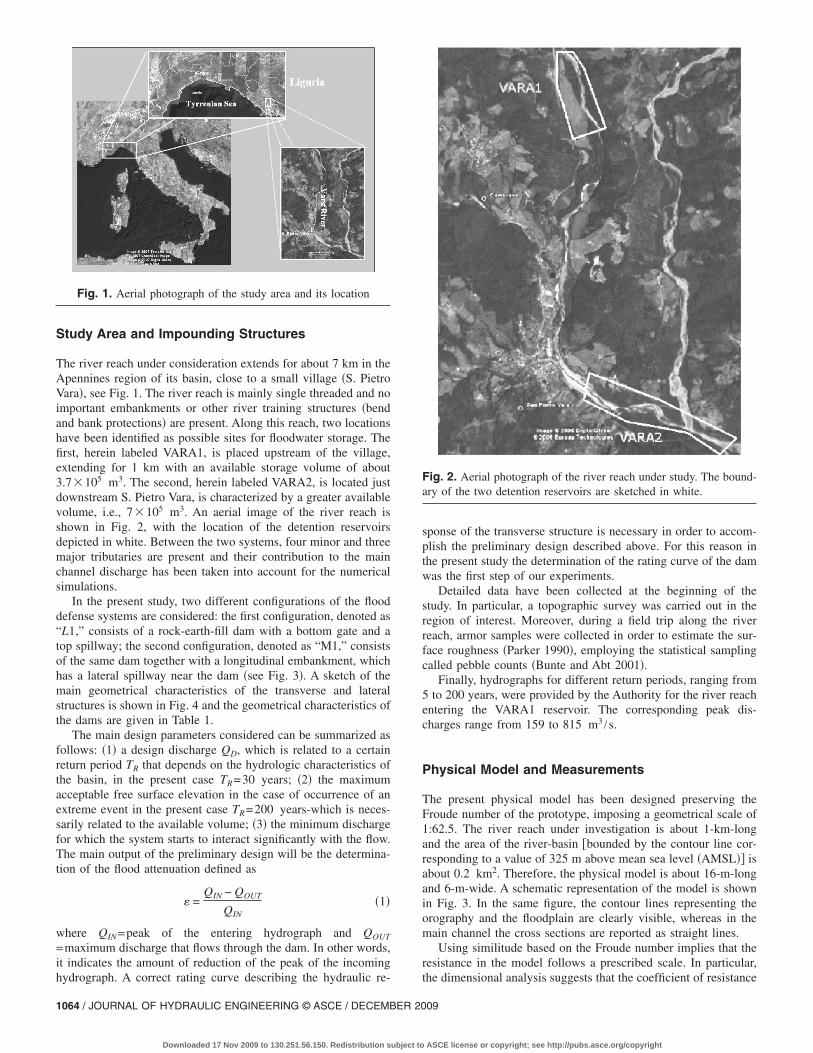
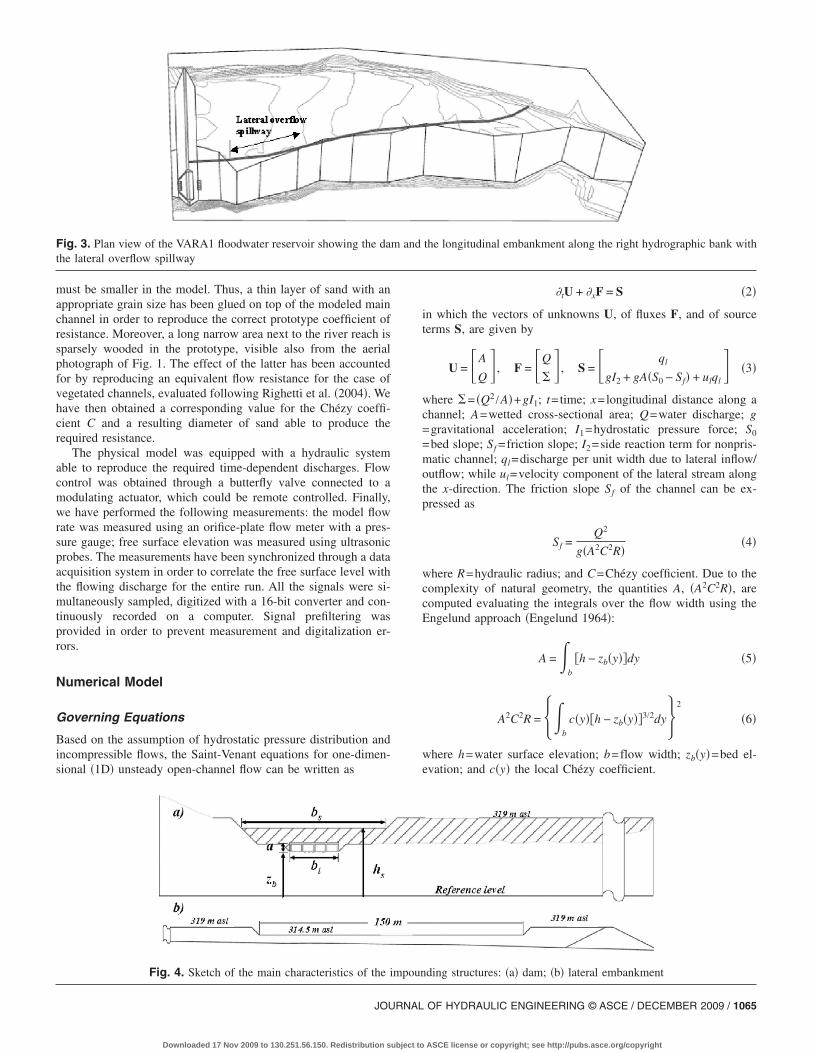
The river reach under consideration extends for about 7 km in theApennines region of its basin, close to a small village �S. PietroVara�, see Fig. 1. The river reach is mainly single threaded and noimportant embankments or other river training structures �bendand bank protections� are present. Along this reach, two locationshave been identified as possible sites for floodwater storage. Thefirst, herein labeled VARA1, is placed upstream of the village,extending for 1 km with an available storage volume of about3.7�105 m3. The second, herein labeled VARA2, is located justdownstream S. Pietro Vara, is characterized by a greater availablevolume, i.e., 7�105 m3. An aerial image of the river reach isshown in Fig. 2, with the location of the detention reservoirsdepicted in white. Between the two systems, four minor and threemajor tributaries are present and their contribution to the mainchannel discharge has been taken into account for the numericalsimulations.
In the present study, two different configurations of the flooddefense systems are considered: the first configuration, denoted as“L1,” consists of a rock-earth-fill dam with a bottom gate and atop spillway; the second configuration, denoted as “M1,” consistsof the same dam together with a longitudinal embankment, whichhas a lateral spillway near the dam �see Fig. 3�. A sketch of themain geometrical characteristics of the transverse and lateralstructures is shown in Fig. 4 and the geometrical characteristics ofthe dams are given in Table 1.
The main design parameters considered can be summarized asfollows: �1� a design discharge QD, which is related to a certainreturn period TR that depends on the hydrologic characteristics ofthe basin, in the present case TR=30 years; �2� the maximumacceptable free surface elevation in the case of occurrence of anextreme event in the present case TR=200 years-which is neces-sarily related to the available volume; �3� the minimum dischargefor which the system starts to interact significantly with the flow.The main output of the preliminary design will be the determina-tion of the flood attenuation defined as
� =QIN − QOUT
QIN�1�
where QIN=peak of the entering hydrograph and QOUT
=maximum discharge that flows through the dam. In other words,it indicates the amount of reduction of the peak of the incoming
Fig. 1. Aerial photograph of the study area and its location
hydrograph. A correct rating curve describing the hydraulic re-
1064 / JOURNAL OF HYDRAULIC ENGINEERING © ASCE / DECEMBER 20
Downloaded 17 Nov 2009 to 130.251.56.150. Redistribution subject to
sponse of the transverse structure is necessary in order to accom-plish the preliminary design described above. For this reason inthe present study the determination of the rating curve of the damwas the first step of our experiments.
Detailed data have been collected at the beginning of thestudy. In particular, a topographic survey was carried out in theregion of interest. Moreover, during a field trip along the riverreach, armor samples were collected in order to estimate the sur-face roughness �Parker 1990�, employing the statistical samplingcalled pebble counts �Bunte and Abt 2001�.
Finally, hydrographs for different return periods, ranging from5 to 200 years, were provided by the Authority for the river reachentering the VARA1 reservoir. The corresponding peak dis-charges range from 159 to 815 m3 /s.
Physical Model and Measurements
The present physical model has been designed preserving theFroude number of the prototype, imposing a geometrical scale of1:62.5. The river reach under investigation is about 1-km-longand the area of the river-basin �bounded by the contour line cor-responding to a value of 325 m above mean sea level �AMSL�� isabout 0.2 km2. Therefore, the physical model is about 16-m-longand 6-m-wide. A schematic representation of the model is shownin Fig. 3. In the same figure, the contour lines representing theorography and the floodplain are clearly visible, whereas in themain channel the cross sections are reported as straight lines.
Using similitude based on the Froude number implies that theresistance in the model follows a prescribed scale. In particular,
Fig. 2. Aerial photograph of the river reach under study. The bound-ary of the two detention reservoirs are sketched in white.
the dimensional analysis suggests that the coefficient of resistance
09
ASCE license or copyright; see http://pubs.asce.org/copyright
must be smaller in the model. Thus, a thin layer of sand with anappropriate grain size has been glued on top of the modeled mainchannel in order to reproduce the correct prototype coefficient ofresistance. Moreover, a long narrow area next to the river reach issparsely wooded in the prototype, visible also from the aerialphotograph of Fig. 1. The effect of the latter has been accountedfor by reproducing an equivalent flow resistance for the case ofvegetated channels, evaluated following Righetti et al. �2004�. Wehave then obtained a corresponding value for the Chézy coeffi-cient C and a resulting diameter of sand able to produce therequired resistance.
The physical model was equipped with a hydraulic systemable to reproduce the required time-dependent discharges. Flowcontrol was obtained through a butterfly valve connected to amodulating actuator, which could be remote controlled. Finally,we have performed the following measurements: the model flowrate was measured using an orifice-plate flow meter with a pres-sure gauge; free surface elevation was measured using ultrasonicprobes. The measurements have been synchronized through a dataacquisition system in order to correlate the free surface level withthe flowing discharge for the entire run. All the signals were si-multaneously sampled, digitized with a 16-bit converter and con-tinuously recorded on a computer. Signal prefiltering wasprovided in order to prevent measurement and digitalization er-rors.
Numerical Model
Governing Equations
Based on the assumption of hydrostatic pressure distribution andincompressible flows, the Saint-Venant equations for one-dimen-sional �1D� unsteady open-channel flow can be written as
Fig. 3. Plan view of the VARA1 floodwater reservoir showing the damthe lateral overflow spillway
Fig. 4. Sketch of the main characteristics of the i
JOURNAL
Downloaded 17 Nov 2009 to 130.251.56.150. Redistribution subject to
�tU + �xF = S �2�
in which the vectors of unknowns U, of fluxes F, and of sourceterms S, are given by
U = �A
Q�, F = �Q
��, S = � ql
gI2 + gA�S0 − Sf� + ulql� �3�
where �= �Q2 /A�+gI1; t=time; x=longitudinal distance along achannel; A=wetted cross-sectional area; Q=water discharge; g=gravitational acceleration; I1=hydrostatic pressure force; S0
=bed slope; Sf =friction slope; I2=side reaction term for nonpris-matic channel; ql=discharge per unit width due to lateral inflow/outflow; while ul=velocity component of the lateral stream alongthe x-direction. The friction slope Sf of the channel can be ex-pressed as
Sf =Q2
g�A2C2R��4�
where R=hydraulic radius; and C=Chézy coefficient. Due to thecomplexity of natural geometry, the quantities A, �A2C2R�, arecomputed evaluating the integrals over the flow width using theEngelund approach �Engelund 1964�:
A =�b
�h − zb�y��dy �5�
A2C2R = ��b
c�y��h − zb�y��3/2dy2
�6�
where h=water surface elevation; b=flow width; zb�y�=bed el-evation; and c�y� the local Chézy coefficient.
the longitudinal embankment along the right hydrographic bank with
ding structures: �a� dam; �b� lateral embankment
and
mpoun
OF HYDRAULIC ENGINEERING © ASCE / DECEMBER 2009 / 1065
ASCE license or copyright; see http://pubs.asce.org/copyright

Due to its hyperbolic nature, the system of governing Eq. �3�can be cast in characteristic form. If we neglect the source termsin the governing equations, we obtain the following compatibilityequations
dQ
dt− csw�F � 1�
dA
dt= 0 �7�
to be integrated along characteristic paths defined by
dx
dt=
Q
A� csw = csw�F � 1� �8�
where csw=Q /A�gA /b=celerityof small amplitude waves; b=width of the water surface; and F=Q /AgA /b=Froude number.Alternatively, using the chain rule, compatibility Eq. �7� can bewritten in terms of variables � and Q as
d�
dt− csw�F � 1�
dQ
dt= 0 �9�
Numerical Solution
System of Eq. �3� is numerically integrated using a finite volumeversion of the predictor-corrector scheme of MacCormack �1971�,which is second-order accurate and still widely used for solvingopen-channel flow problems. The solution at new time level n+1 at computational node i is obtained as follows
Uin+1 = Ui
n −�t
�x�Fi+1/2
n − Fi−1/2n � + �tSi �10�
where �t and �x=time and spatial steps used for integration. Theintermediate flux computed at the intercell boundary i+1 /2 isgiven by
Fi+1/2n =
1
2�Fi+1
n + Fip� + Di+1/2 �11�
where
Fip = F�Ui
p� Fin = F�Ui
n� Si = S�1
2�Ui
n + Uip�� �12�
with
Uip = Ui
n −�t
�x�Fi+1
n − Fin� + �tS�Ui
n� �13�
The term Di+1/2 furnishes the scheme with total variation dimin-ishing �TVD� dissipation capable of making the solution oscilla-tion free while retaining second-order accuracy both in space andtime. This is a very important property indeed when dealing withsupercritical and rapidly varying flows with hydraulic jumps andbores. Details on the TVD corrections term, can be found inGarcia-Navarro and Alcrudo �1992� and Tseng �2003�. The stabil-ity of the method is assured by imposing the Courant condition
Table 1. Main Geometrical Characteristics of the Dams
zb
�m AMSL�a
�m�bl
�m�bs
�m�hs
�m AMSL�
VARA1 307.5 2.8 16 60 315
VARA2 267.6 3 24 150 277.6
for computing the time step.
1066 / JOURNAL OF HYDRAULIC ENGINEERING © ASCE / DECEMBER 20
Downloaded 17 Nov 2009 to 130.251.56.150. Redistribution subject to
Boundary Conditions
If the computational domain is divided in M volumes, the finite-volume version of the MacCormack method �Eq. �10�� can beapplied directly to all cells i, for i=2, . . .M −1. For the first andM-th volume, which are adjacent to the upstream and downstreamboundaries respectively, we only have one intercell flux. In orderto find the solution at time level n+1 using Eq. �10�, we have tofind the upstream flux terms F1/2 and their downstream counter-parts FM+1/2. Thus, for the Saint-Venant equations, the unknownsare Q1/2, �1/2, and QM+1/2 and �M+1/2. In what follows we describethe procedure for the downstream boundary condition; the up-stream boundary condition is treated similarly. Two different flowregimes are possible: subcritical flow �F�1� or supercritical flow�F�1�. For F�1, one exterior condition must be supplied, i.e., aprescribed rating curve that imposes a nonlinear relationship ofthe kind
QM+1/2n+1/2 = f��M+1/2
n+1/2 ,tn+1/2� �14�
Eq. �14� must be combined with a characteristic equation whichtakes information from the interior of the domain and projects itoutside at the boundary. As in Capart et al. �1999�, we assume thefollowing approximation for the characteristic equation
��M+1/2n+1/2 − �M
n � − csw�F − 1��QM+1/2n+1/2 − QM
n � = 0 �15�
Finally, the solution is obtained iteratively solving the two Eqs.�14� and �15�. For supercritical flows, no exterior conditions arerequired, all the information necessary to obtain numerical fluxesQM+1/2 and �M+1/2 come from the interior domain solving bothEqs. �9� discretized as in Eq. �15�.
Modeling Description of Configurations M1 and L1
The numerical description of the two designed configurations M1and L1 was implemented using the 1D model described in theprevious section. During the rising limb of the flood wave, due tothe presence of the dam, the water surface level increases. Oncethe top of the embankment height is reached, the floodplain startsto be inundated. The flooding mechanism has been modeled as-suming that the rising �falling� velocity of the water level in themain channel �dhm� / �dt�=vm, could be different from the one ofthe floodplain ��dhf� / �dt�=v f�. Configuration L1 has been simu-lated imposing vm=v f while configuration M1 has been modeledassuming that vm differs from v f. In particular, we have assumedthat the floodplain starts to be inundated only after the wateroverflows the crest of the levee, which divides the main channelfrom the floodplain. The floodplain is assumed to behave as areservoir of known geometry that is statically filled. The relation-ship between the volume and the water surface level inside thereservoir has been estimated from the topographic data and testedexperimentally.
Initially, when the storage area is empty, the behavior of thelateral weir can be described by a broad-crested weir model, inwhich the overflow discharge �ql�f�� depends exclusively on thewater surface level in the main channel �free overflow�. When thewater level in the floodplain achieves the weir crest elevation, thetwo levels hm and hf begin to interact ultimately decreasing theoverflow discharge �ql�s��: i.e., the overflow is submerged. Thedischarge that fills the storage area decreases and can be deter-mined from the overflow depth, measured from the crest elevation�Y0� and from the tailwater depth �Yt�, measured positively up-wards from the weir crest �see Fig. 5�. During the falling limb of
the flood wave, direction of flow reverts, moving water from the09
ASCE license or copyright; see http://pubs.asce.org/copyright

storage area to the main channel. When the water surface level inthe storage area reaches the weir crest, the overflow ends.
The spillway law governing the lateral discharge has been de-fined as follows:• Free overflowThe lateral discharge per unit width ql�f� is given by
ql�f� = Cd�2gY03�1/2 �16�
where the discharge coefficient Cd was chosen as 0.385.• Submerged overflowFor submerged overflow, ql�s� is obtained by reducing the lat-
eral discharge ql�f�. The relationship between ql�s� and ql�f� is givenby
ql�s� = ql�f� �17�
where the reduction coefficient depends exclusively on the sub-mergence ratio Sr, which reads
Sr =Yt
Y0�18�
The reduction factor is evaluated by a power law of the form
= �1 − P�1/n P =Sr − yL
1 − yL0 P 1 �19�
with
yL = 0.85 − 0.50� �20�
and where �=Y0
Y0+Lwand Lw=crest length. The coefficient n has
been chosen equal to 3 as suggested by Fritz and Hager �1998�.
Results
Steady Flow Experiments
A first set of experiments was devoted to evaluate the rating curveappropriate for the kind of dam analyzed in the present study. Thephysical model was fed with different values of constant dis-charge Q �ranging between 44 and 822 m3 /s�, until steady flowconditions were achieved, and the level of the free surface up-stream of the dam was measured and related to the Q value.
Fig. 5. Schematization for the submerged flow case
Measurements were interpreted in terms of analytical rating curve
JOURNAL
Downloaded 17 Nov 2009 to 130.251.56.150. Redistribution subject to
able to describe the different flow regimes depending on the in-flow discharges and the level upstream the dam. All power lawscan be easily obtained imposing the conservation of the totalhead, assuming the value of the velocity head negligible, which isin general true as shown in Savage and Johnson �2001�. Theresulting laws have an exponent equal to 3/2 when the flowcrosses the critical depth, whereas the exponent 1/2 is derivedwhen the behavior is similar to a sluice gate. Moreover, down-stream submergence is not considered in the present analysis.
The analytical rating curve can be finally written as• Regime A
Q = CQl2gbl�h − zb�3/2 �zb � h � zb + a� �21�
where bl=net width of the gate; CQl=discharge coefficient tobe determined; and a=height of the bottom gate.
• Regime B
Q = CQlabl2g�h − zb�1/2 �zb + a � h � hs� �22�
• Regime C
Q = CQlabl2g�h − zb�1/2 + ��h�CQsbs
2g�h − hs�3/2 �hs � h
� hs + � �23�
where bs=width of the spillway; ��h�=function specified inthe following in order to join Regime B smoothly with RegimeD; while =smoothing function coefficient which is set, to 0.5m.
• Regime D
Q = CQlabl2g�h − zb�1/2 + CQsbs
2g�h − hs�3/2 �h � hs + �
�24�
The coefficients CQl and CQs, obtained by means of a nonlin-ear regression on the experimental measurements, were foundas
CQl = 0.588 CQs = 0.354 �25�
The function ��h� was introduced in the intermediate RegimeC in order to obtain a continuous transition from the half-power law of the Regime B to the 3/2 law of the Regime D. Apossible structure for the function � that fulfills the aboverequirements may be written as
��h� =arctan��h − hs − �20�
�+ �26�
The comparison between the experimental measurements andthe analytical interpretation given above, shown in Fig. 6,demonstrates good agreement in all the regimes of the ratingcurve.A series of steady flow experiments varying the original ge-
ometry of the bottom gate, reducing the width by half, was alsoperformed. The analytical rating curve, keeping the coefficientsCQl and CQs equal to the values reported in Eq. �25�, is still ingood agreement with experimental observation as shown in Fig.6. The latter result suggest that the rating curve described by Eqs.�21�–�24� may be extended to any composite transversal structurewith a design similar to the one here investigated �bottom gateand overflow spillway� changing only the geometrical dimen-
sions.OF HYDRAULIC ENGINEERING © ASCE / DECEMBER 2009 / 1067
ASCE license or copyright; see http://pubs.asce.org/copyright

Unsteady Flow Experiments: Numerical versusExperimental Results
In this section, the results obtained numerically with the floodpropagation model have been compared against the experimentalmeasurements. The numerical simulations of the VARA1 wereperformed imposing at the inlet section hydrographs with differ-ent return period and, at the outlet section, the empirical ratingcurve �Eqs. �21�–�24�� representing the dam; 140 equal spacedcells with �x=7 m has been used. For the sake of brevity onlyresults obtained with the 30-year return period events will bepresented. Initially, for small discharge values, the flow is char-acterized by supercritical conditions. During the rising limb of theflood, the downstream water level rises imposing locally a sub-critical flow. Upstream and downstream flows are joined by ahydraulic jump that amplifies during its upstream migration. Dur-ing the falling limb of the flood this process reverts and the hy-draulic jump travels in the downstream direction.
Configuration L1In Fig. 7, a comparison between the inflow �Tr=30 years� andoutflow hydrographs for the L1 configuration is shown. Theagreement between numerical and experimental results is fairlygood everywhere but in proximity of the peak of the hydrograph.In fact, the numerical model predicts a water surface level abovethe broad crest of the top of the spillway, with an abrupt growthof the outflow discharge, whereas during the experiments thewater level remains below of the top of the spillway. This dis-
Fig. 6. Comparison between the measured rating curve �symbols�geometry �solid line� and the modified geometry �dashed line�. The c
crepancy, which appears large in terms of discharge, is more ac-
1068 / JOURNAL OF HYDRAULIC ENGINEERING © ASCE / DECEMBER 20
Downloaded 17 Nov 2009 to 130.251.56.150. Redistribution subject to
ceptable if the water level is considered �see Fig. 8�. In fact, themaximum difference between the water surface level experimen-tally measured and numerically computed is 85 cm over a waterdepth of 8 m, corresponding to a relative error of 10%. This smallerror on the prediction of the water level results in a larger errorin the discharge since the water surface level is very close to thebroad crest level �315 m AMSL�, where the slope of the ratingcurve changes rapidly. This error is most likely due to 2D effects,that are not taken into account by the 1D numerical model. Infact, the presence of the floodplain on the right side of the riverreach generates a large scale horizontal recirculation, observedduring the experimental runs, which can delay the propagation ofthe flood wave.
Configuration M1The results obtained for the M1 configuration are shown in Figs.9 and 10. Agreement between the results obtained from numericalsimulations and experiments is fairly good, due to the fact that thelongitudinal embankment constrains the river reach to behave as aconfined channel, thus with a hydraulic behavior that can be ap-propriately described even with a 1D model. In this case, theagreement between the numerical prediction and the experimentalmeasurements is satisfactory even near the peak of the hy-drograph. The water discharge predicted during the falling limb ofthe hydrograph exceeds that measured in the physical model. Thisis due to the fact that the emptying process of the storage area,which take places once the peaks pass through, is not simulated
e analytical rating curve given in Eqs. �21�–�24� for the designedletters correspond to the different regimes.
and thapital
numerically, whereas in the physical model it is.
09
ASCE license or copyright; see http://pubs.asce.org/copyright

Flood Attenuation EfficiencyThe comparison between the efficiency computed for both con-figurations L1 and M1, plotted as a function of the inflow dis-charge peak, is shown in Fig. 11. For the L1 configuration thefollowing considerations stand out. The maximum efficiency�20%� is achieved for the design discharge Qd �416 m3 /s� havinga 30 years return period. Efficiency decreases for dischargeswhich are either higher or lower than the designed discharge, andtends to vanish as the discharge increases approaching the 200-year discharge �Q=815 m3 /s�. This reflects the choice adoptedfor designing the attenuation flood works of the river reach underconsideration. The efficiency is even significant �greater than 5%�for discharge values having a return period greater than 100 years.The agreement between the numerical results and the experimen-tal observations is, in this case, less satisfactory. A difference of5% in the evaluation of the outflow discharge becomes a differ-ence of 45% in terms of efficiency. The predicted water depth has
Fig. 7. L1 comparison between the in
Fig. 8. L1 water surface level
JOURNAL
Downloaded 17 Nov 2009 to 130.251.56.150. Redistribution subject to
a maximum difference with the observed values of 16% and amean error less than 2%. Finally, the maximum of the numeri-cally computed efficiency is obtained for a discharge value that isslightly smaller than what is experimentally observed. For the M1configuration the behavior of the flood mitigation is qualitativelyanalogous to the L1 case, with a better quantitative description.This confirms that the hydrodynamics of the storage area is betterdescribed in this configuration, with a consequent more detailedprediction of the flood reduction effect. The comparison betweenthe two efficiencies evaluated for the two configurations, L1 andM1, suggests some conclusions. The maximum efficiency in theM1 case is slightly better than the L1 case with, however, a de-fense structure that has a more significant environmental impact.For discharge values having a return period less than 30 years, theefficiency of the L1 configuration is systematically greater thanthe efficiency for the M1 configuration. This is expected, sincethe M1 configuration has an embankment that confines the flow in
nd outflow hydrographs: Tr=30 years
stream the dam: Tr=30 years
flow a
just up
OF HYDRAULIC ENGINEERING © ASCE / DECEMBER 2009 / 1069
ASCE license or copyright; see http://pubs.asce.org/copyright

the main channel until the water depth reaches the crest of thelateral spillway and part of the discharge inundates the floodplain,producing an attenuation of the flood itself. However, differencestends to disappear for discharge with a return period greater than30 years and, for both the configurations, the flood attenuationefficiency rapidly decreases. In fact, for such hydrological eventsthe available flood storage volume is already occupied long be-fore the peaks passes, strongly reducing the efficiency.
Flood Attenuation Efficiency of the System
Since in the Magra and Vara basins the construction of a series offloodwater storages for flood prevention is planned, an obviousquestion to be answered in this case is what would be the effi-ciency of the entire system and how the latter is related to the
Fig. 9. M1 comparison between the in
Fig. 10. M1 water surface lev
1070 / JOURNAL OF HYDRAULIC ENGINEERING © ASCE / DECEMBER 20
Downloaded 17 Nov 2009 to 130.251.56.150. Redistribution subject to
efficiency of the single floodwater storage. In the present study,this analysis was possible only via numerical simulations, sincethe physical model simulated only one of the two floodwater de-fense systems. Because we have demonstrated that the numericalmodel is able to reproduce correctly the results for a single struc-ture, as shown in the previous sections, a series of numericalsimulations was conducted in order to predict the flood attenua-tion efficiency for the entire system �VARA1 plus VARA2�. Inthis case, the discharge flowing into the VARA2 flood water stor-age area is affected by the attenuation effect produced by theupstream one. Indeed, the output discharge from VARA1 is theinput for the downstream flood water storage. Furthermore, fourminor tributaries join the Vara River along its reach between theVARA1 and VARA2. The discharge flowing into the main chan-
nd outflow hydrographs: Tr=30 years
tream the dam: Tr=30 years
flow a
el ups
09
ASCE license or copyright; see http://pubs.asce.org/copyright

nel must be accounted for and summed to the output dischargefrom the VARA1. The resulting flood attenuation efficiency curveas a function of the flow discharge is shown in Fig. 12. As for theVARA1 the best efficiency is recovered for the design discharge,corresponding to a return period equal to 30 years. Moreover, theshape of the efficiency curve is similar to the one obtained for theVARA1 case, consistently with the analog geometrical configura-tion. Also in this case, discharges far from the design value pro-duces a substantial decrease in the flood attenuation efficiency.
If we now consider the flood mitigation obtained by the simul-taneous presence of the two detention systems, the highest attenu-ation is again recovered for the design discharge, where the twosystems show their efficiency peak, and its value is equal to20.0%.
Fig. 11. Flood attenuation efficiency: numerical results superim-posed to the experimental results for both configurations, i.e., M1 andL1
Qin (m3/s)
=(1
-Qou
t/Qin)
*10
0(%
)
200 400 600 800 1000 1200 1400 16000
5
10
15
20
ε
Fig. 12. Flood attenuation efficiency for the VARA2 floodwater stor-age
JOURNAL
Downloaded 17 Nov 2009 to 130.251.56.150. Redistribution subject to
The above result can be generalized to a system of detentionreservoirs, including the contribution to the main channel dis-charge due to the presence of tributaries. In fact, the flood attenu-ation efficiency of a system composed by N basins can beexpressed by the following relationship:
�1,N = 1 −
�i=1
N
�1 − �i� + �i=1
NQT
i−1
QIN1 �
k=i
N
�1 − �k�
1 +1
QIN1 �
i=2
N
QTi−1
�27�
where �i=attenuation produced by the i-th basin; QTi =total tribu-
tary discharge in the reach between the reservoir i and i+1; andQIN
1 =discharge at the most upstream river section. The above for-mulation is valid under the hypothesis that the flood attenuation isnegligible during its propagation along the main channel. Eq. �27�in the absence of tributaries reduces to
�1,N = 1 − �i=1
N
�1 − �i� �28�
Conclusions and Future Developments
The hydraulic design of a system of two flood control detentionreservoirs has been investigated in detail through both experimen-tal runs on a physical model and 1D numerical simulations. Fromthe analysis of the results obtained for the specific case studypresented some general conclusions can be drawn, which can bebriefly summarized as follows:• A rating curve able to describe a composite hydraulic behavior
of a structures of the kind as the one designed for the presentdam has been derived and tested experimentally; the proposedformulation eventually depends only on the geometrical char-acteristics of the dam itself �sluice gate and spillway�;
• The 1D numerical model fit the experimental measurements,provided that correct boundary conditions are imposed; theagreement between the numerical predictions and the experi-mental observations is fairly good during the entire propaga-tion of the flood;
• If correctly designed, a system of relatively small detentionreservoirs distributed inside the watershed of the main riverand its tributaries is able to produce a reasonable flood miti-gation, such that their construction is justifiable; in this regard,it is fundamental to analyze a wide range of return periods inorder to assess the response of the flood control measure todifferent hydrological scenarios; and
• A simple relationship for the flood attenuation efficiency hasbeen proposed for a system of reservoirs, which might be usedin order to estimate the response of the entire system based onthe knowledge of the performance of the single flood controlsystem.Future investigations will regard the impact of flood defense
measures as the ones studied on the natural balance of sedimentand water quality. In particular, sediment deposition is likely tooccur behind the dam �see the example given in �Siviglia et al.�2008�� producing a decrease, in the long run, of the storage ca-pacity and an abrupt disconnection for the natural sediment con-veyance. For the above reason, experimental and numerical tests
including the sediment transport have been planned to be per-OF HYDRAULIC ENGINEERING © ASCE / DECEMBER 2009 / 1071
ASCE license or copyright; see http://pubs.asce.org/copyright

formed on the physical model and using a morphological numeri-cal model, with the aim of investigating all the aforementionedscenarios.
Acknowledgments
The present research project has been cofunded by Autorita’ diBacino del Fiume Magra. The MODITE project is also acknowl-edged.
Notation
The following symbols are used in this paper:A � cross-sectional area �m2�;a � sluice gate height �m�;b � width of the water surface �m�;bl � net width of the bottom gate �m�;bs � width of the top spillway �m�;Cd � discharge coefficient;
CQl � discharge coefficient;CQs � discharge coefficient;
c�y� ,C � local and global conductivity coefficient;csw � celerity of small amplitude waves �m/s�;D � vector of TVD terms;F � vector of fluxes;F � Froude number;g � acceleration due to gravity �m /s2�;h � water surface elevation �m�;
hs � top spillway elevation �m�;hf � water surface elevation in the floodplain �m�;hm � water surface elevation in the main channel
�m�;I1 � first moment of the wetted cross section �m3�;I2 � spatial variation of the first moment �m2�;
Lw � crest length �m�;Q � discharge �m3 /s�;
QIN � peak of the hydrograph �m3 /s�;QIN
1 � discharge at the most upstream river section;QOUT � maximum discharge that flows through the
dam; �m3 /s�;QT
i � total tributary discharge between the reservoiri and i+1 �m3 /s�;
ql � lateral discharge �m2 /s�;ql�f� � overflow discharge �m2 /s�;ql�s� � overflow discharge reduction �m2 /s�;
S � vector of source terms;Sf � friction term;Sr � submergence ratio;S0 � longitudinal slope;U � vector of conservative variable;ul � velocity component of the lateral stream
along the x-direction; �m/s�;v f � rising/falling velocity in the floodplain �m/s�;vm � rising/falling velocity in the main channel
�m/s�;
1072 / JOURNAL OF HYDRAULIC ENGINEERING © ASCE / DECEMBER 20
Downloaded 17 Nov 2009 to 130.251.56.150. Redistribution subject to
Y � water depth �m�;Yt � tailwater depth �m�;Y0 � overflow depth, measured from the crest
elevation �m�;zb � bed elevation;
�x ,�t � spatial and time steps; � smoothing function coefficient;� � flood attenuation efficiency;�i � attenuation produced by the i-th basin;
�1,N � attenuation efficiency of a system composedby N basins;
� � reduction coefficient;� � flux of momentum equation; and� � rating curve function.
References
Avakyan, A. B., and Polyushkin, A. �1989�. “Flood control experience inthe usa.” Power Tech. and Eng., 23�1�, 53–58.
Bunte, K., and Abt, S. R. �2001�. “Sampling surface and subsurfaceparticle-size distributions in wadable gravel- and cobble-bed streamsfor analyses in sediment transport, hydraulics, and streambed moni-toring.” Gen. Tech. Rep. No. RMRS-GTR-74, U.S. Dept. of Agricul-ture, Forest Service, Rocky Mountain Research Station, Fort Collins,Colo.
Capart, H., Bogaerts, C., Kevers-Leclercq, J., and Zech, Y. �1999�. “Ro-bust numerical treatment of flow transitions at drainage pipe bound-aries.” Water Sci. Technol., 39�9�, 113–120.
Engelund, F. �1964�. “Book of abstracts.” Rep. No. 6, Univ. of Denmark.Fritz, H. M., and Hager, W. H. �1998�. “Hydraulics of embankment
weirs.” J. Hydraul. Eng., 124�9�, 963–971.Garcia-Navarro, P., and Alcrudo, F. �1992�. “1D open channel flow simu-
lation using TVD McCormack scheme.” J. Hydraul. Eng., 118�10�,1359–1373.
Giesecke, J. �2007�. “Dams and flood control-systems of detention reser-voirs in southwestern Germany.” Proc., 14th German Dam Symp.,�http://www.talsperrenkomitee.de/german_research/index.cgi/page/2�.
MacCormack, R. �1971�. “Numerical solution of the interaction of ashock wave with a laminar boundary layer.” Proc. 2nd Int. Conf. onNumerical Methods in Fluid Dynamics, Springer, Berlin, 151–163.
Parker, G. �1990�. “Surface-based bedload transport relation for gravelrivers.” J. Hydraul. Res., 20�4�, 417–436.
Righetti, M., Armanini, A., and Rampanelli, L. �2004�. “Effetto dellascabrezza di parete in alvei vegetati.” Proc., 29th Convegno Nazionaledi Idraulica e Costruzioni Idrauliche, BIOS, 549–554.
Savage, B. M., and Johnson, M. C. �2001�. “Flow over ogee spillway:Physical and numerical model case study.” J. Hydraul. Eng., 127�8�,640–649.
Siviglia, A., Nobile, G., and Colombini, M. �2008�. “Quasi-conservativeformulation of the one dimensional Saint Venant-Exner model.” J.Hydraul. Eng., 134�10�, 1521–1526.
Slutzman, J., and Smith, J. �2006�. “Effects of flood control structures onflood response for hurricane Floyd in the Brandwyne Creek Water-shed, Pennsylvania.” J. Hydrol. Eng., 11�5�, 432–441.
Tseng, M. �2003�. “The improved surface gradient method for flow simu-lation in variable bed topography channel using tvd-maccormackscheme.” Int. J. Numer. Methods Fluids, 43, 71–91.
Wu, B., Wang, G., Ma, J., and Zhang, R. �2005�. “Case study: Rivertraining and its effects on fluvial processes in the Lower Yellow River,
China.” J. Hydraul. Eng., 131�2�, 85–96.09
ASCE license or copyright; see http://pubs.asce.org/copyright