
Calcium signalling-dependent mitochondrial dysfunction and bioenergetics regulation in respiratory...
36
Complex II defect-mediated calcium deregulation MBaya et al 1 Calcium signalling-dependent mitochondrial dysfunction and bioenergetics regulation in respiratory chain Complex II deficiency Eléonore MBaya 1, 2# , Bénédicte Oulès 1, 2# , Casper Caspersen 1, 2 , Rachida Tacine 1, 2 , Hélène Massinet 1, 2 , Maria Pennuto 6 , Dominique Chrétien 2, 3 , Arnold Munnich 2, 3 , Agnès Rötig 2, 3 , Rosario Rizzuto 4 , Guy A. Rutter 5 , Patrizia Paterlini-Bréchot 1, 2 and Mounia Chami 1, 2, 6, . 1 INSERM U 807, Paris, F-75015 France; 2 Paris V University, Paris, F-75015, France; 3 INSERM U 781, Paris, F-75015 France; 4 Department of Experimental and Diagnostic Medicine, Section of General Pathology, University of Ferrara, 44100, Italy; 5 Section of Cell Biology, Division of Medicine, Faculty of Medicine, Imperial College London, London SW72AZ, United Kingdom. 6 The Italian Institute of Technology, Via Morego, 30, 16163, Genova, Italy. Running title: Complex II defect-mediated calcium deregulation Address correspondence to: Mounia Chami, The Italian Institute of Technology, Via Morego 30, 16163, Genova, Italy. Tel: 00.39.01071781566, Email: [email protected] # Mbaya E. and Oulès B. contributed equally to this work
-
Upload
independent -
Category
Documents
-
view
2 -
download
0
Transcript of Calcium signalling-dependent mitochondrial dysfunction and bioenergetics regulation in respiratory...

Complex II defect-mediated calcium deregulation MBaya et al
1
Calcium signalling-dependent mitochondrial dysfunction and bioenergetics regulation in
respiratory chain Complex II deficiency
Eléonore MBaya1, 2#, Bénédicte Oulès1, 2#, Casper Caspersen1, 2, Rachida Tacine1, 2, Hélène
Massinet1, 2, Maria Pennuto6, Dominique Chrétien 2, 3, Arnold Munnich2, 3, Agnès Rötig2, 3,
Rosario Rizzuto4, Guy A. Rutter5, Patrizia Paterlini-Bréchot1, 2 and Mounia Chami1, 2, 6,.
1INSERM U 807, Paris, F-75015 France; 2Paris V University, Paris, F-75015, France; 3INSERM U 781, Paris, F-75015 France; 4Department of Experimental and Diagnostic
Medicine, Section of General Pathology, University of Ferrara, 44100, Italy; 5Section of Cell
Biology, Division of Medicine, Faculty of Medicine, Imperial College London, London
SW72AZ, United Kingdom.6The Italian Institute of Technology, Via Morego, 30, 16163,
Genova, Italy.
Running title: Complex II defect-mediated calcium deregulation
Address correspondence to: Mounia Chami, The Italian Institute of Technology, Via Morego
30, 16163, Genova, Italy. Tel: 00.39.01071781566, Email: [email protected]
# Mbaya E. and Oulès B. contributed equally to this work

Complex II defect-mediated calcium deregulation MBaya et al
2
Abstract
Despite advanced knowledge on the genetic basis of oxidative phosphorylation
(OXPHOS)-related diseases, the molecular and/or cellular determinants for tissue specific
dysfunction are not completely understood. Here, we report the cellular events associated with
mitochondrial respiratory Complex II deficiency occurring prior to cell death. Mutation or
chronic inhibition of Complex II determined a large increase of basal and agonist-evoked Ca2+
signals in the cytosol and the mitochondria, in parallel with mitochondrial dysfunction
characterized by membrane potential (∆ψmit) loss, [ATP] reduction and increased Reactive
Oxygen Species (ROS) production. cytosolic and mitochondrial Ca2+ overload are linked to
increased ER Ca2+ leakage, and to SERCA2b and PMCA proteasome-dependent degradation.
Increased [Ca2+]mit is also contributed by decreased mitochondrial motility and increased ER-
mitochondria contact sites. Interestingly, increased intracellular [Ca2+] activated on the one
hand a compensatory Ca2+-dependent glycolytic ATP production and determined on the second
hand mitochondrial pathology. These results revealed the primary role for Ca2+ signalling in
the control of mitochondrial dysfunction and cellular bioenergetics outcomes linked to
respiratory chain Complex II deficiency.
Keywords: Mitochondria, respiratory chain pathologies, calcium, bioenergetics, SERCA,
PMCA, proteasome, cell death.
Abbreviation list: Ca2+: Calcium; Cyt: cytosol; [Ca2+]cyt: cytosolic free Ca2+ concentration;
ER, endoplasmic reticulum; [Ca2+]er: endoplasmic reticulum Ca2+ concentration; [Ca2+]mit:
mitochondrial free Ca2+ concentration; IP3: inositol 1, 4, 5-triphosphate; Δψm: mitochondrial
potential; [ATP]mit: mitochondria ATP free concentration; OXPHOS: oxidative
phosphorylation; PMCA: Plasma membrane Ca2+ ATPase; ROS: reactive oxygen species;
SERCA2: Sarco-Endoplasmic Reticulum Ca2+ ATPase 2; SDHA: succinate dehydrogenase A
subunit.

Complex II defect-mediated calcium deregulation MBaya et al
3
Introduction
Mitochondria are the driving force behind life, as mitochondrial oxidative
phosphorylation provides the main source of ATP in the cell. In addition to energy
production, mitochondria play a crucial role in mediating amino acid biosynthesis, fatty acid
oxidation, intermediate metabolic pathways, free radicals production and scavenging and Ca2+
homeostasis (1).
Mitochondria affect intracellular Ca2+ metabolism in two ways: i) directly by
regulating both the amplitude, duration, location and propagation of cytosolic Ca2+ elevations
and the recycling of Ca2+ towards the ER (2); ii) indirectly by producing ATP which is used
by Ca2+-dependent ATPases to pump Ca2+ out of the cell (by the plasma-membrane Ca2+
ATPase: PMCA) or into intracellular stores (by the sarco-endoplasmic reticulum Ca2+
ATPase: SERCA). Conversely Ca2+ entering to the mitochondrial matrix regulates
mitochondrial metabolism through the activation of the Ca2+-dependent enzymes of the Krebs
cycle (3).
Leigh’s syndrome is a rare (1/36,000 births) but severe and fatal encephalopathy of
early childhood that is most frequently associated with deficiencies in nucleus-encoded
subunits of Complex I (NDUFS3 and NDUFS7) (4, 5), Complex II (SDHA) (6), Complex IV
(SURF1) (7) or pyruvate dehydrogenase (8). Despite the identification of the genetic origin of
Leigh’s syndrome, the molecular and cellular events associated with pathology are not
completely understood.
Deregulations of intracellular Ca2+ signalling have been reported in different models of
mitochondrial respiratory chain diseases and the most studied ones are those related to
mitochondrial DNA mutations (9, 10) and nuclear DNA mutations affecting Complex I (11),
while data on Complex II deficiency are still lacking.
Complex II (succinate: ubiquinone oxidoreductase) plays a central role in oxidative
metabolism, being a key enzyme of the citric acid cycle as well as a Complex of the
mitochondrial respiratory chain (12).
We report here the cellular events deriving from Complex II mutation associated with
Leigh’s syndrome. The study was conducted both in human derived mutated fibroblasts and
in cellular models in which we mimicked Complex II deficiency by using Complex II
inhibitors. We showed broad subcellular Ca2+ signalling alterations occurring prior to cell
demise in Complex II deficient cells. Interestingly, we showed that cytosolic and
mitochondrial Ca2+ overload are linked to SERCA and PMCA degradation occurring in a

Complex II defect-mediated calcium deregulation MBaya et al
4
proteasome-dependent manner. Our study revealed a dual role of Ca2+ deregulation in the
control of cellular bioenergetics outcome and mitochondrial pathology.

Complex II defect-mediated calcium deregulation MBaya et al
5
Results
We studied fibroblasts isolated from a patient with Leigh’s syndrome harbouring a
homozygous Arg554Trp substitution in the Fp subunit of the Complex II (SDHAR554W) (13).
These fibroblasts were shown to harbour a reduction of Complex II activity to ~ 30 % of
control values in the absence of cell death (14). Leigh’s syndrome associated with Complex II
mutations was described in very rare cases (6). To bypass this limitation, we conducted the
whole study in parallel with two inhibitors of Complex II. We thus used fibroblasts derived
from healthy individuals and the neuronal derived cell line (SH-SY5Y) left untreated or
treated with Complex II inhibitors: 3-NP (3-nitropropionic acid) or Atpenin A5 (15, 16). 3-NP
is structurally similar to Complex II substrate succinate thus interacting with some residue in
the active site of the enzyme (15). Atpenins were shown to share structural similarity with
Ubiquinone (UQ) thus blocking the electron transfer between the enzyme and UQ by binding
to a region that partly overlaps with the physiological UQ-binding site (16). To note, we
deliberately used: i) concentrations of 3-NP (300 μM) and Atpenin A5 (100 nM) which did
not induce cell death at 20 h thus affording to study Complex II deficiency independently
from cell death (Supplementary Figure S1a); and ii) extended application (20 h) of the drugs
in order to chronically inhibit Complex II (Supplementary Figure S1b). Importantly, Complex
II activity was reduced to 15-40 % of control values in both mutated cells and control
fibroblasts and SH-SY5Y cells treated with 300 μM 3-NP and 100 nM Atpenin A5 for 20 h
(Supplementary Figure S1b and Table S1). Finally, we show that application of 300 μM 3-NP
or 100 nM Atpenin A5 for 72 h or 1 mM 3-NP for 20 h determined cell death demonstrating
that complex II inhibition is linked to cell death (Supplementary Figure S1c and 1d right).
In order to demonstrate that in our conditions we mimicked chronic Complex II
inhibition upon drug application, we measured Complex II activity at 6 h and 20 h after
treatment with 300 μM 3-NP. Interestingly, reduction of Complex II activity occurred upon 6
h of treatment and was maintained to a similar level upon 20 h of treatment (data not shown).
We assessed mitochondrial functionality upon Complex II mutation or inhibition.
Mitochondrial potential (∆ψmit) was measured by using TMRM dye which accumulates within
the mitochondrial matrix as a function of ∆ψmit. As expected, we observed a significant
decrease (~ 70 % vs control considered as 100 %) of ∆ψmit (normalized TMRM signal) upon
Complex II mutation or inhibition in both fibroblasts and SH-SY5Y cells (Figure 1a and 1b
respectively and Supplementary Table S2).

Complex II defect-mediated calcium deregulation MBaya et al
6
The mitochondrial respiratory chain is known to be the major source of Reactive
Oxygen Species (ROS) within the cell. Moreover, it has been shown that ROS can stimulate
mitochondrial uncoupling and that the processes of uncoupling and ROS generation exist in a
feedback loop (17). We thus measured mitochondrial production of superoxide (O2•-) by using
MitoSOX red mitochondrial superoxide indicator (18). Complex II mutated cells displayed an
increase in mitochondrial O2•- production of almost 25 % as compared to control (Figure 1c
and Supplementary Table S3). A similar result was also observed upon chronic application of
Complex II inhibitors. The specificity of the test was confirmed by using the ROS scavenger
pyrrolidine dithiocarbamate (PDCT) (Figure 1c and Supplementary Table S3). This result is
consistent with previously reported data which show increased activities of both
mitochondrial and cytosolic inducible superoxide dismutase in SDHAR554W cells (19).
Next, we sought to analyze the impact of the mitochondrial Complex II defect on ATP
level. Basal mitochondrial ATP concentration ([ATP]mit) was measured using a luciferase
probe targeted to the mitochondria (mitLuc) (20). We observed a decreased basal [ATP]mit in
SDHAR554W mutated fibroblasts (74 % of that in control cells) as well as in SH-SY5Y cells
upon chronic Complex II inhibition (83 % in 3-NP, and 77 % in Atpenin A5 of that in control
cells) (Figure 1d and 1e, and Supplementary Table S4).
Ca2+ is a key regulator of mitochondrial function and acts at several levels within the
organelle to stimulate OXPHOS (3). We thus measured subcellular Ca2+ signalling in
fibroblasts and SH-SY5Y cells upon Complex II mutation or inhibition. Measurement of basal
[Ca2+]cyt, by using the Fluo-4,AM dye, revealed a significant increase (∼ 2 to 4 fold) of basal
[Ca2+]cyt in SDHAR554W mutated fibroblasts and in control fibroblasts upon Complex II
inhibition as compared to non-treated ones (Figure 2a and Supplementary Table S5).
Similarly, we also observed an increase of basal [Ca2+]mit in SDHAR554W mutated fibroblasts
and in control fibroblasts upon Complex II inhibition (∼ 1.5 to 2 fold) as compared to non-
treated cells as measured by X-Rhod-1, AM probe (Figure 2b and Supplementary Table S6).
We then analyzed agonist-evoked cytosolic and mitochondrial Ca2+ signals using
adenovirus-delivered recombinant aequorin Ca2+ probes (cytAEQ, mitAEQ respectively).
By using the cytosolic aequorin probe, we first showed a significant increase (∼ 1.5 to
1.7 fold) of the agonist-evoked cytosolic Ca2+ signal ([Ca2+]cyt) in SDHAR554W mutated
fibroblasts and SH-SY5Y cells upon Complex II inhibition as compared to controls (Figure
2c, and Supplementary Table S7).

Complex II defect-mediated calcium deregulation MBaya et al
7
By using the mitochondrial aequorin probe, we also noticed a significant increase of
agonist-evoked mitochondrial Ca2+ signal ([Ca2+]mit) in SDHAR554W mutated fibroblasts (∼ 3
fold increase) and SH-SY5Y cells upon Complex II inhibition (∼ 1.5 fold increase) as
compared to controls (Figure 2d and Supplementary Table S8).
Mitochondrial Ca2+ uptake and Δψmit are tightly cross-regulated (1). On the one hand,
the main driving force for Ca2+ accumulation across the inner mitochondrial membrane is the
electrochemical gradient (ΔμH) established and maintained by the respiratory chain, while, on
the other hand, depolarization occurs transiently following Ca2+ uptake in physiological
conditions (21). We thus measured the kinetics of the Ca2+ and potential changes occurring in
mitochondria of Complex II deficient cells. Interestingly, we observed an increased agonist-
evoked mitochondrial Ca2+ response as early as after 4 h of treatment with Complex II
inhibitors. Increased mitochondrial Ca2+ signal was also seen after 6 h of treatment (Figure 3a
and Supplementary Table S8). This result was observed with both inhibitors 3-NP and
Atpenin A5 and in both fibroblasts and SH-SY5Y cells (Figure 3a and Supplementary Table
S8). In parallel, no modification of Δψmit was noticed in cells treated in the same conditions as
for Ca2+ analyses (Figure 3b and Supplementary Table S2). This result suggests that increase
of mitochondrial Ca2+ uptake precedes the loss of Δψmit in Complex II deficient cells.
We then investigated the mechanisms underlying increased [Ca2+] associated with
Complex II deficiency. Since cytosolic and mitochondrial Ca2+ signals are largely contributed
by the endoplasmic reticulum (ER) Ca2+ store, we measured the state of ER Ca2+ load by
using the ER targeted aequorin probe. Mutation of the SDHA subunit was shown to induce a
decrease of steady state ER free Ca2+ ([Ca2+]ER) by almost ∼ 40 % as compared to three
different controls (Figure 4a and Supplementary Table S9). A slighter but significant decrease
(∼ 15 %) of ER steady state was also obtained upon Complex II inhibition by 3-NP and
Atpenin A5 (Supplementary Figure S2a and Table S9). We then demonstrated that the
decreased [Ca2+]ER is associated with decreased ER Ca2+ uptake rate, and increased passive
ER Ca2+ leakage (Figure 4b and 4c respectively). No modification of agonist-evoked Ca2+
release from the store was noticed between control and Complex II deficient cells
(Supplementary Figure S2b).
Previous data have shown that ER Ca2+ depletion can be linked to the induction of the
unfolded protein response (UPR) (22). However, our data revealed no induction of UPR in
SDHAR554W cells (Supplementary Figure S3).
Complex II defect-mediated calcium deregulation MBaya et al
8
Finally, no clear modification of capacitative Ca2+ entry was noted in SDHAR554W
mutated cells as compared to controls (Figure 4d) ruling out a change in Ca2+ influx in the
observed [Ca2+]cyt and [Ca2+]mit increase.
These results may indicate that the increased cytosolic and mitochondrial agonist-
evoked Ca2+ signals are largely contributed by increased basal Ca2+ levels. This late event is a
likely due, at least in part, to decreased ER Ca2+ store load and increased ER Ca2+ emptying
through increased Ca2+ leak.
In order to decipher the molecular mechanisms underlying the intracellular Ca2+
overload related to Complex II deficiency, we next analyzed SERCA and PMCA expression
by western blotting. SH-SY5Y cells are known to express mostly SERCA2b and PMCA2
isoforms. As shown in Figure 5a, a significant decrease of SERCA2b and PMCA2 expression
was observed in SDHAR554W cells and in SH-SY5Y cells upon Complex II inhibition (Figure
5a). Interestingly, a similar result was observed upon inhibition of mitochondrial ATP
synthase by Oligomycin (Figure 5a)
We then investigated the mechanism underlying SERCA2b and PMCA2 down-
regulation upon complex II or ATP synthase inhibition. SERCA and PMCA down-regulation
could be due to reduced transcription level or increased rate of degradation. By using semi-
quantitative RT-PCR, we showed that SERCA2b and PMCA2 transcription level is not
altered upon Complex II or ATP synthase inhibition (Figure 5b). We then investigated
SERCA2b and PMCA2 degradation. SH-SY5Y Cells were treated with the protein synthesis
inhibitor cyclohexemide in the presence or not of Complex II inhibitor (3-NP) or ATP
synthase inhibitor (Oligomycin). Kinetic analyses revealed a rapid degradation of both
SERCA2b and PMCA2 upon Complex II or ATP synthase (Figure 5c) inhibition. These
results showed that Complex II-dependent SERCA and PMCA down-regulation is due to their
rapid degradation. To determine whether SERCA2b and PMCA are degraded by the
proteasome, we treated the cells with the proteasome inhibitor MG132 for 2 h and then
applied cyclohexemide alone or in the presence of 3-NP and Oligomycin for 1 h. As shown in
Figure 5d, treatment of the cells with MG132 prevented SERCA2b and PMCA2 degradation
upon Complex II or ATP synthase inhibition (Figure 5d).
These data reveal the role of the proteasome-dependent degradation pathway in
SERCA2b and PMCA2 down-regulation. The result obtained upon ATP synthase blockade by
Oligomycin may reveal that rapid degradation of SERCA2b and PMCA2 is an ATP-
dependent mechanism. All over, these data suggests that cytosolic and mitochondrial Ca2+
overload upon Complex II deficiency are a consequence of suppressed cytosolic Ca2+

Complex II defect-mediated calcium deregulation MBaya et al
9
extrusion through the plasma membrane and accumulation in ER by PMCA and SERCA
respectively.
As mitochondrial Ca2+ overload is a major actor triggering mitochondrial structure
alteration and swelling, we then analyzed the mitochondrial structure in the context of
Complex II defect. High resolution imaging analyses of mitochondrial structure revealed no
clear mitochondrial structure modification in Complex II deficient cells as compared to
controls (Supplementary Figure S4a). Accordingly, mitochondrial volume was also not
modified upon Complex II mutation or inhibition in both fibroblasts and SH-SY5Y cells
(Supplementary Figure S4b). These data are in accordance with the absence of apoptosis in
both models and showed also that increased mitochondrial Ca2+ content is not associated with
increased mitochondrial biogenesis (as estimated by unchanged volume).
It has been demonstrated that elevated Ca2+ signals in micro-domains between
mitochondria and ER Ca2+ release sites immobilize mitochondria close to the ER, thus
increasing Ca2+ transfer between the organelles (23). Since we showed that Complex II
mutation induced on the one hand an increased ER Ca2+ leak and on the other hand an
elevation of mitochondrial Ca2+ load (Figure 4c and Figure 2b and d), we tested whether these
modifications are associated with mitochondrial movement inhibition and ER-mitochondria
increased contact sites. Indeed, high resolution time-lapse imaging of the mitochondrial
network revealed a significant reduction of mitochondrial movements upon Complex II
mutation or inhibition in both fibroblasts and SH-SY5Y cells (Figure 6a and Supplementary
Table S10). Accordingly, high resolution imaging revealed an increase of the extent of
association between ER and mitochondria upon Complex II deficiency (Figure 6b and
Supplementary Table S11).
We then investigated the impact of Ca2+ deregulation on cellular bioenergetics and
mitochondrial dysfunction related to Complex II deficiency.
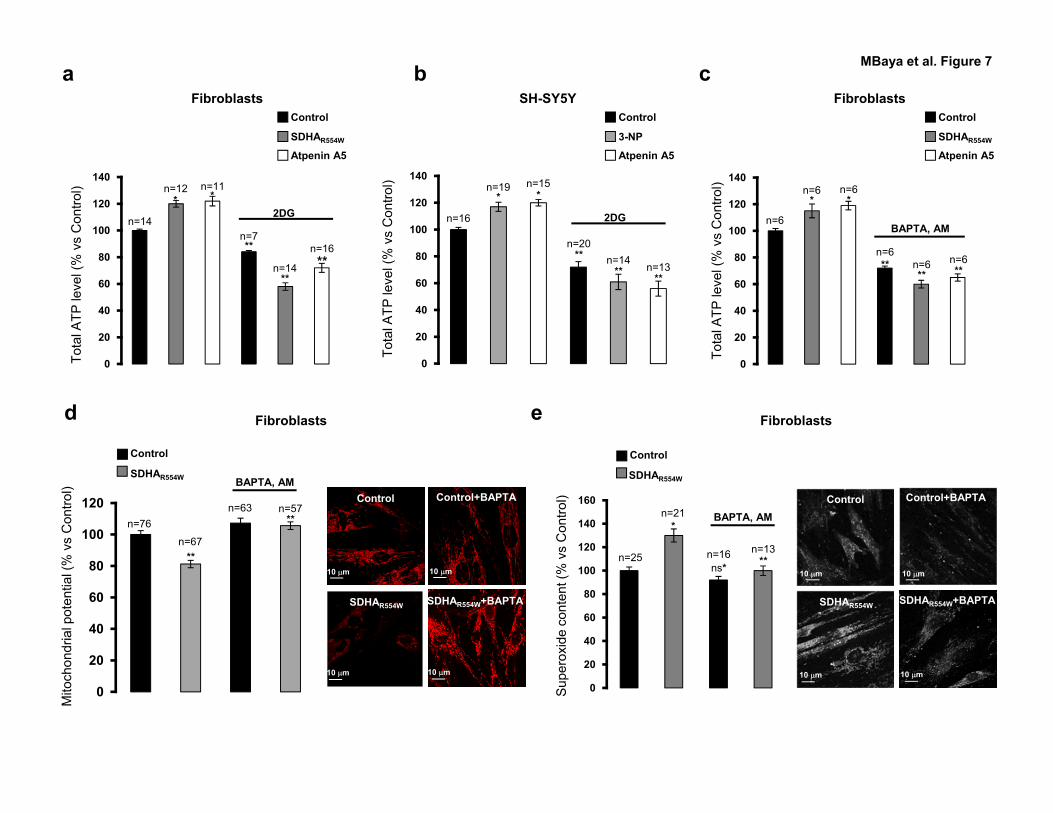
Measurement of total ATP level on total cell homogenates revealed increased total
[ATP] in SDHAR554W fibroblasts and in control fibroblasts treated with Atpenin A5 (∼ + 15 %
vs. control) (Figure 7a and Supplementary Table S12). Similar results were obtained in SH-
SY5Y cells upon Complex II inhibition (Figure 7b and Supplementary Table S12). Besides
the mitochondrial respiratory chain, glycolysis constitutes a second source of cellular ATP.
Since we showed a decrease of [ATP]mit (Figure 1d and e), the increased total [ATP] is
expected to be due to glycolysis activation. Indeed, glycolysis inhibition with 2-deoxy-D-
glucose (2-DG) (a non-metabolizable analog of glucose) leads to a decrease of total [ATP]
(Figure 7a and b, and Supplementary Table S12). In agreement with this result,

Complex II defect-mediated calcium deregulation MBaya et al
10
hyperlactatemia derived from increased glycolysis has been reported in SDHAR554W
fibroblasts (14). It has been recently shown that intracellular Ca2+ may activate glycolytic
ATP synthesis (24). Accordingly, we showed that Ca2+ chelation by BAPTA, AM reduced
total [ATP] in control and Complex II deficient cells (Figure 7c and Supplementary Table
S13). Interestingly, the extent of ATP reduction was larger in Complex II deficient cells as
compared to controls (72 % in control, 60 % in SDHAR554W and65 % in Atpenin A5 ) (Figure
7c and Supplementary Table S13), suggesting that increased glycolytic ATP production upon
Complex II deficiency may have resulted from Ca2+ overload as a compensation to decreased
mitochondrial ATP loss.
The data presented in Figure 1 showed an overt mitochondrial pathology upon
Complex II deficiency. Different laboratories have reported the complex cross-interactions
between Δψmit, Ca2+ and ROS production (1). It was also shown that mitochondrial
depolarization requires and is maintained by the high [Ca2+]cyt (25). We thus investigated the
role of cytosolic Ca2+ overload on ∆ψmit loss linked to Complex II deficiency. As shown in
Figure 7d, application of BAPTA, AM rescue mitochondrial potential in SDHAR554W cells
(Figure 7d and Supplementary Table S14). We assume that mitochondrial potential recovery
observed in SDHAR554W is due to reduced mitochondrial Ca2+ uptake as a consequence of
removal of [Ca2+]cyt by BAPTA, AM. Indeed, BAPTA, AM application reduces mitochondrial
basal and agonist-evoked [Ca2+] (data not shown). In accordance with this result, cell
treatment with BAPTA, AM also revealed a significant reduction of [O2•-] in SDHAR554W
cells(Figure 7e and Supplementary Table S15). These findings suggest that Ca2+ overload
participated to mitochondrial pathology observed in Complex II deficient cells.
We finally addressed the question about the final consequences of mitochondrial
pathology upon Complex II deficiency. In accordance with previously reported data (26, 27),
we showed that complete Complex II inhibition (1 mM 3NP treatment for 20 h)
(Supplementary Figure S1d, right panel) determined cell death (Supplementary Figure S1d,
left panel), mitochondrial structure alteration (Supplementary Figure S5a) and reduction of
mitochondrial Ca2+ load (Supplementary Figure S5b). These processes are known as markers
of mitochondrial outer membrane permeabilization and swelling accompanying cell death.
Complex II defect-mediated calcium deregulation MBaya et al
11
Discussion
By studying fibroblasts isolated from a patient affected by Leigh’s syndrome harbouring
respiratory chain Complex II (SDHAR554W) mutation (13) and fibroblasts and neuronal
derived cells chronically treated with Complex II inhibitors, we reported subcellular Ca2+-
deregulations occurring prior to cell death and showed that Complex II deficiency induced a
deep regulation of Ca2+ signalling-dependent bioenergetics and mitochondrial dysfunction
which control cellular fate.
Only few studies have been focusing on the study of Complex II inhibition and none has
provided a global assessment of subcellular Ca2+ signalling prior to cell death. These studies
reported that inhibition of Complex II by 3-NP enhances basal and NMDA-induced
intracellular [Ca2+] in neurons (26, 28, 29), potentially leading to Δψmit loss, mitochondrial
structure alteration, ROS production and cell death (26, 29, 30).
The parallel and thorough investigation of subcellular Ca2+ and bioenergetics alterations
upon Complex II mutation or chronic inhibition allowed us to reveal the following pattern
(Figure 8): Complex II defecincy is associated with the a proteasome-dependent degradation
of the two key Ca2+ ATPases, SERCA and PMCA thus leading to increase cytosolic Ca2+
signals. Increased [Ca2+]cyt and ER Ca2+ leak likely caused increased [Ca2+]mit through
increased ER-mitochondria contact sites and mitochondrial immobilization.
The situation in Complex II deficient cells is particular since a large number of studies
have reported reduced Ca2+ signals (cytosolic and mitochondrial) in different models of
mitochondrial respiratory chain diseases (in MELAS: mitochondrial encephalopathy, lactic
acidosis and stroke-like episodes (10), MERRF: myoclonic epilepsy and ragged-red fibres (9),
NARP: neurogenic muscle weakness, ataxia and retinitis pigmentosa) (31), and in Complex I
mutated fibroblasts (11). To note, our study was conducted in models prior to cell death thus
revealing primary Ca2+ deregulation events occurring upon Complex II deficiency.
Importantly mitochondrial pathology associated with respiratory chain deficiency can
be reverted by counteracting Ca2+ signalling deregulation, namely by using BAPTA, AM (this
work) or by increasing [Ca2+]mit through inhibition of the mitochondrial Na+/Ca2+ exchanger
(9, 32). This leads us to conclude that Ca2+ homeostasis deregulation plays a pivotal role in
mitochondrial related pathology.
We demonstrated that cytosolic and mitochondrial Ca2+ overload linked to Complex II
deficiency are likely to be due to rapid degradation of SERCA2b and PMCA2 occurring in a
proteasome-dependent manner. This phenomenon is predictably related to the decreased

Complex II defect-mediated calcium deregulation MBaya et al
12
mitochondrial ATP production, since SERCA2b and PMCA2 degradation was also observed
upon ATP synthase inhibition. Complex II-dependent SERCA2b and PMCA2 degradation
occurs despite the slight increase of glycolysis-dependent, cytosolic [ATP] pointing out a
primary role of mitochondrial ATP in the degradation process. Indeed, mitochondrial ATP is
considered the major cellular ATP source. Alternatively, and not exclusively, the proximity
between mitochondria and plasma and/or ER membranes could explain the sensitivity of
SERCA2b and PMCA2 to mitochondrial ATP production. Accordingly, the existence of ATP
micro-domains beneath the plasma membrane and in ER- mitochondria contact sites has been
already demonstrated in some cell models (33, 34).
Proteasome-dependent degradation of SERCA2a isoform was reported in a previous
work by Ihara et al in 2005 (35). To our knowledge, proteasome-dependent degradation of
PMCA has not been reported before. However, ubiquitination of PMCA1 isoform has been
detected after preconditioning ischemia in rat cortical neuronal cultures (36). Since
polyubiquitylated proteins are the preferred proteasome 26S substrates (37), we postulate that
SERCA2b and PMCA2 undergo proteasome-dependent degradation after their ubiquitination.
Further analyses are necessary to demonstrate this phenomenon.
It is largely known that ATP/Mg2+ regulates the 26S proteasome activity, its assembly
and stability (38, 39). However, Geng, Q et al. showed that a subset of 26S proteasome is
activated as ATP levels decline (40). In the context of Complex II deficiency, mitochondrial
ATP depletion may have favored the activation of a subsets of 26S proteasome leading to
SERCA2b and PMCA2 degradation.
Kinetic analyses revealed that increased mitochondrial Ca2+ signals occur prior to Δψmit
loss (presumably before mitochondrial ATP decrease) suggesting a potential additional
mechanism, independently from SERCA2b and PMCA2 degradation, involved in increased
mitochondrial [Ca2+] upon Complex II inhibition (4 h-6 h). Since 99.9 % of the total matrix
Ca2+ content is in bound form (41), we cannot exclude a role for an increased mitochondrial
retention capacity in the observed mitochondrial Ca2+ overload (e. g. Ca2+ binding to
cardiolipin, anionic phospholipids, the carboxy-anion-containing metabolites of the Krebs
cycle (citrate, oxaloacetate) and inorganic phosphate (41)).
Increased total ATP production has been recently reported in MELAS syndrome
linked to Complex I ND5 gene mutation (42). In this study, glycolytic ATP has been shown to
be consumed by mitochondria to maintain Δψmit. In addition, Ca2+-dependent activation of
anaerobic glycolysis and increased cytosolic ATP have been recently described during
apoptotic cell death (24). Since our study was conducted prior to cell death, increased

Complex II defect-mediated calcium deregulation MBaya et al
13
glycolysis-dependent [ATP] may be a compensatory mechanism to the decreased oxidative
phosphorylation-dependent ATP production. This phenomenon is Ca2+-dependent since we
showed that Ca2+ chelation by BAPTA, AM reversed glycolytic-dependent ATP production.
Thus, the increase of intracellular Ca2+ signals may be considered as a first attempt to
delay cellular pathology through the activation of glycolytic-dependent ATP production.
Our study revealed a double hint of Ca2+ signalling deregulation in Complex II
deficient cells since besides increasing glycolytic ATP production, Ca2+ overload favored
mitochondrial pathology. Thus, depending on their energetic needs, cells with Complex II
defect may thus undergo a progressive mitochondrial dysfunction, characterized by Δψmit loss,
Ca2+ overload, and increased ROS, eventually leading to cell death (Supplementary Figure
S5). As a matter of fact, neuronal loss was reported in the brain of the patient harboring
SDHAR554W mutation (43).

Complex II defect-mediated calcium deregulation MBaya et al
14
Materials and methods
Chemicals. Culture material was obtained from Invitrogen, coelenterazine, and fluorescent
dyes from Molecular Probes (Invitrogen, SARL), and Atpenin A5 from Coger
(eMarketLabo.com). All the other reagents and chemicals were from Sigma-Aldrich (Sigma-
Aldrich, SARL).
Cell culture. Fibroblasts were grown as already described (19). Human SH-SY5Y
neuroblastoma cells (CRL-2266: ATCC) were cultured following manufacturer’s instructions.
Aequorin measurements. To bypass low transfection efficiency of fibroblasts and SH-
SY5Y cells, we used the previously described adenoviral system expressing cytosolic-
(AdCMVcytAEQ), mitochondrial-(AdCMVmitAEQmut and AdCMVmitAEQwt), and ER-
(AdCMVerAEQ) targeted aequorin probes (44-46) . For infection, approximately 20000 cells
(fibroblasts) and 150000 cells (SH-SY5Y) were spotted on 13-mm coverslips, and placed 24 h
later in contact with the appropriate virus (105 infectious particles/ml). Aequorin
measurements were performed 48 h post infection. Specific targeting of adenoviral aequorin
probes to desired organelles was verified by immunohistochemistry (Supplementary Figure
S6).
MitAEQ and cytAEQ were reconstituted with 5 µM coelenterazine for 2 h in Krebs-Ringer
modified buffer (KRB: 125 mM NaCl, 5 mM KCl, 1 mM Na3PO4, 1 mM MgSO4, 5.5 mM
glucose, and 20 mM Hepes, pH 7.4) supplemented with 1 mM CaCl2 (KRB/CaCl2) at 37 °C.
Cytosolic and mitochondrial signals were obtained upon application of 100 µM Histamine
(fibroblasts) or 500 µM Carbachol (SH-SY5Y).
Capacitative Ca2+ entry analyses were performed by using cytosolic-(AdCMVcytAEQ)
aequorin probe. Cells transferred to the luminometer were treated as specified in the legend of
the figure.
For reconstitution with high efficiency of the erAEQ, the luminal [Ca2+] of this compartment
was first reduced. This was achieved by incubating the cells for 1 h at 4 °C in KRB
supplemented with 5 µM n-coelenterazine, 1 µM Ca2+ ionophore ionomycin and 600 µM
EGTA. After this incubation, cells were extensively washed with KRB supplemented with 2
% bovine serum albumin (BSA) before the luminescence measurement was initiated. The ER
was refilled by exposing the cells to extracellular 1 mM CaCl2. After reaching the steady state
value, agonist evoked Ca2+ release was initiated by application of agonists. The SERCA
blocker, TBuBHQ (2, 5 -Di (tert-butyl) - 1, 4 – benzohydroquinone) was used to initiate the
release of stored Ca2+ and thus to analyse ER Ca2+ leak. All aequorin measurements were

Complex II defect-mediated calcium deregulation MBaya et al
15
carried out in a purpose built luminometer. The experiments were terminated by lysis of the
cells with 100 µM digitonin in a hypotonic Ca2+-rich solution (10 mM CaCl2 in H2O), thus
discharging the remaining aequorin pool. The light signal was collected and calibrated into
[Ca2+] values, as previously described (22). Based on the experimental traces, the maximum
rates of ER Ca2+ uptake were measured from the first derivative of the ascending refilling
phase obtained after CaCl2 addition, and the maximum rates of ER Ca2+ leak were measured
from the first derivative of the curve upon addition of TBuBHQ using Origin 5 software.
Fitting of the curve was performed using Microsoft Excel software.
[Ca2+]mit in permeabilized cells. After infection with AdCMVmitAEQ and AEQ
reconstitution, plasma membrane was permeabilized for 1 min by perfusing with 25 µM
digitonin. After permeabilization, cells were perfused with an intracellular mimicking buffer
(IB: 120 mM KCl, 10 mM NaCl, 2 mM KH2PO4, 1 mM MgCl2, 10 mM Hepes, 1 mM
succinic acid, 1 mM pyruvic acid, 50 μM EGTA, and 2 mM of ATP/MgCl2, pH 7.4 at 37 °C).
This experimental setting largely renders mitochondrial Ca2+ concentration independent of
contacts sites with the ER and was used to assess the activity of Ca2+ uptake and extrusion
mechanisms.
After a brief wash, mitochondrial Ca2+ uptake was initiated by perfusing IB buffered free
[Ca2+] (1.5). Mitochondrial Ca2+ efflux was initiated by application of the mitochondrial
uniporter inhibitor ruthenium red (RuR) (10 μM). Cyclosporin A (CSA) (0.5 µM) was used to
inhibit mitochondrial permeability transition pore (PTP).
ATP measurements. Mitochondrial [ATP] was measured after transient transfection of
mitochondrial targeted luciferase probe (mit-LUC) as already described (9). Briefly, cell
luminescence was measured in the same luminometer used for aequorin measurements. Cells
were perfused with KRB, supplemented with 1 mM CaCl2 and then shifted to the same buffer
supplemented with 20 μM luciferin. At the end of each experiment, cells were permeabilized
with digitonin (25 μM) and placed in IB ) supplemented with, 5 mM of ATP/MgCl2 and 20
μM luciferin. Mitochondrial basal ATP level was normalized to the maximum luciferase
signal obtained after cell permeabilization with digitonin and considered as 100 %. For total
ATP level we used ATP Bioluminescence Assay kit CL II (Roche).
Measurements of cytosolic and mitochondrial basal [Ca2+] concentrations. Cells spotted
on 24-mm coverslips were loaded with 5 µM Fluo-4, AM (cytosolic Ca2+ probe) or 1 µM X-
rhod-1, AM (mitochondrial Ca2+ probe) prepared in a KRB/1 mM CaCl2 at 37 °C for 30 min.
After a brief washout, time lapse images were acquired on a Zeiss LSM 510 confocal
Complex II defect-mediated calcium deregulation MBaya et al
16
microscope (Carl Zeiss). We calibrated Fluo4, AM and X-Rhod-1, AM probes as recently
described by our group (22) and provided absolute basal Ca2+ values in the cytosol and the
mitochondria. Following a control period (providing the basal fluorescent intensity, F), Fmax
was obtained upon application of ionomycin/Ca2+ solution (ionomycin: 10 µM and Ca2+: 50
mM). Then, the Fmin value was obtained upon addition of 10 mM EGTA solution in the same
bath. We used the equation provided by the manufacturer (Ca2+]free=Kd*((F-Fmin)/(Fmax-F))
and the Kd value of 700 nM for X-Rhod-1, AM and of 345 nM for Fluo4, AM.
Measurements of mitochondrial superoxide concentration. MitoSOX Red is a novel
fluorogenic dye recently developed and validated (47) for highly selective detection of
superoxide in the mitochondria of living cells. Cells spotted on 24-mm coverslips were loaded
with 5 µM MitoSOX red prepared in a KRB/1 mM CaCl2 at 37 °C for 30 min. After a brief
washout, Z-stack images were acquired on a Zeiss LSM 510 confocal microscope (Carl
Zeiss). Dyeintensity was quantified on maximal projection of Z-stack images after
thresholding, using the Zeiss LSM and ImageJ softwares. We presented data as mean
fluorescence intensity of oxidized MitoSOX. We assume that MitoSOX probe give a semi
quantitative detection and not an absolute estimation of mitochondrial superoxide value.
Importantly, as control we used the ROS scavenger PDCT to show the specificity of this
probe.
Imaging analyzes. For the measurement of mitochondrial movements or mitochondrial
potential (Δψmit), images were acquired on a Zeiss LSM 510 confocal microscope after
loading the cells with 10 nM Mitotracker red (movement analysis) or 20 nM tetramethyl
rhodamine methyl ester (TMRM) (Δψm analysis) in KRB/1 mM CaCl2 at 37°C for 30 min.
For mitochondria movement analysis, time series images were taken with a time interval of 5
s between each image. Images were 2D-deconvolved, median filtered, thresholded and
clipped to 8 bit binary images using Metamorph (Universal Imaging) software. Using the
stack-T-functions/Delta-F-down plugin of the WCIF ImageJ software
(http://www.uhnres.utoronto.ca/facilities/wcif/), pixels in each frame were subtracted from the
next frame. The resulting images were quantified by measuring the total area of object on the
binary and ΔF images by the Integrated Morphometry Analysis function of the Metamorph
software. Data were normalized as the ratio of ΔF area values over the total area of the
original binary images for each cell. This parameter is referred to as the mitochondrial
movement index (MI) (22). Binarization and normalization were applied to avoid artefacts
eventually arising from changes of intensity and focal plane.

Complex II defect-mediated calcium deregulation MBaya et al
17
To obtain normalized TMRM fluorescence signal, time lapse images were acquired on a Zeiss
LSM 510 confocal microscope. Images were acquired before and after application of 10 μM
mitochondrial uncoupler FCCP. To demonstrate specific TMRM binding, measurements were
routinely corrected for residual TMRM fluorescence after full Δψmit collapse with the
mitochondrial uncoupler FCCP (48). Basal TMRM signal was normalized to the remaining
signal obtained upon FCCP application and presented as f/f0 where f is the mean of basal
TMRM intensity along 10 s in the plateau phase and f0 the mean of TMRM intensity along
the baseline after FCCP application.
For analyzes of ER-mitochondria contact sites, cells were transfected with erGFP and loaded
with Mitotracker Deep Red. The spectral properties of these two fluorochromes allow specific
identification of the two compartments and quantification of contact sites. 16-bit images were
acquired with a pixel size equal or lower to the maximal resolution of the 63X-objective to
allow optimal detection of colocalized pixels on the stage of a Leica SP5 confocal
microscope. ER and mitochondria colocalization was calculated as the number of voxels
(volume pixels) occupied by both signals (i.e. erGFP and Mitotracker Deep Red) over all
voxels occupied by the mitochondria (Mitotracker Deep Red signal) in thresholded images
using Imaris software.
Protein preparation and western-blot analyses. Plasma membrane and microsomal
fractions were isolated as already described (22, 49). SDS-PAGE was then performed. The
signal was revealed using ECL Plus Western blot detection reagent (Amersham Biosciences).
For the experiments shown in figure 5 c and d, membrane fraction obtained as already
described (22) was used to reveal both SERCA and PMCA. Protein synthesis was inhibited
using 100 μM cyclohexemide (CHX) alone or in the presence of 300 μM 3-NP or 5 μM
Oligomycin for the indicated time points. Proteasome-dependent degradation of SERCA2b
and PMCA2 was assessed using proteasome inhibitor MG132. After 2 h pre-incubation of
SH-SY5Y cells with or without MG132 (5 μM), cells were treated for 1 h with 100 μM
cyclohexemide in the presence or not of 300 μM 3-NP or 5 μM Oligomycin. Loading control
was assessed using α tubulin, GRP94 as a marker of a resident endoplasmic reticulum protein
and cadherin as a marker of a resident plasma membrane protein. Similar result was obtained
using these loading controls. Only the result of α tubulin is shown.
RNA extraction and RT-PCR analysis. Total RNA was extracted using RNeasy Mini kit
(Qiagen). One μg of total RNA was used for reverse transcription using High-Capacity cDNA
Archive Kit (Applied Biosystems) with random hexamer primers according to the

Complex II defect-mediated calcium deregulation MBaya et al
18
manufacturer’s protocol. The final reaction volume was 25 μl. The reaction tubes were
incubated at 25°C for 10 min, 120 min at 37°C and 5 min at 85 °C. The primers for
polymerase chain reaction (PCR) for PMCA2 transcript were forward:
TCCCGACCAGCAGACTCAAGTT, reverse: CGAGTTCTGCTTGAGCGCGG (fragment
size: 350 bp). For SERCA 2b transcript, the following primers were used: forward:
TTTCCTACAGTGTAAAGAGGACAACC, reverse:
AGACCAGAACATATCGCTAAAGTT (fragment size: 514 bp). PMCA and SERCA2b
transcript levels were normalized to GAPDH transcript level amplified using forward:
CTTCATTGACCTCAACTACATGGT, reverse: CTCAGTGTAGCCCAGGATGCCCTT
(fragment size: 727 bp). PCR was performed using 0.5 μ of the reverse transcription mixture
in a final volume of 50 μl containing: 1X Green GoTaq buffer, primers (10 μM each) and
Gren Go Taq Hot start polymerase (2.5 U) and dNTP (10 mM each). PCR amplification
cycles were run using a thermal cycler (Perkin-Elmer) as following: denaturation at 95 °C, 5
min; annealing at 60 °C, 1 min; extension at 72 °C, 1 min, and heating at 72 °C, 10 min. For
semi-quantitative PCR, three different amplification cycles were used see figure legend.
Relative signal intensities were quantified using NIH Image J software and are shown in
graphs.
Statistical analyses. Results are reported from at least three different experiments. Statistical
analyses were done using ANOVA. Bonferroni Post hoc analysis were subsequently
performed on ANOVA results to determine significance. Bonferroni t test was calculated
versus respective control (Supplementary Tables S1-11) and graphs in Figure 5, or all
pairwise (Supplementary Tables S12-15).

Complex II defect-mediated calcium deregulation MBaya et al
19
References
1. Brookes PS, Yoon Y, Robotham JL, Anders MW, Sheu SS. Calcium, ATP, and ROS: a mitochondrial love-hate triangle. Am J Physiol Cell Physiol 2004 Oct; 287 (4): C817-833.
2. Hajnoczky G, Hager R, Thomas AP. Mitochondria suppress local feedback activation
of inositol 1,4, 5-trisphosphate receptors by Ca2+. J Biol Chem 1999 May 14; 274 (20): 14157-14162.
3. McCormack JG, Halestrap AP, Denton RM. Role of calcium ions in regulation of
mammalian intramitochondrial metabolism. Physiol Rev 1990 Apr; 70 (2): 391-425. 4. Benit P, Slama A, Cartault F, Giurgea I, Chretien D, Lebon S, et al. Mutant NDUFS3
subunit of mitochondrial complex I causes Leigh syndrome. J Med Genet 2004 Jan; 41 (1): 14-17.
5. Lebon S, Minai L, Chretien D, Corcos J, Serre V, Kadhom N, et al. A novel mutation
of the NDUFS7 gene leads to activation of a cryptic exon and impaired assembly of mitochondrial complex I in a patient with Leigh syndrome. Mol Genet Metab 2007 Sep-Oct; 92 (1-2): 104-108.
6. Pagnamenta AT, Hargreaves IP, Duncan AJ, Taanman JW, Heales SJ, Land JM, et al.
Phenotypic variability of mitochondrial disease caused by a nuclear mutation in complex II. Mol Genet Metab 2006 Nov; 89 (3): 214-221.
7. Zhu Z, Yao J, Johns T, Fu K, De Bie I, Macmillan C, et al. SURF1, encoding a factor
involved in the biogenesis of cytochrome c oxidase, is mutated in Leigh syndrome. Nat Genet 1998 Dec; 20 (4): 337-343.
8. Schon EA, Santra S, Pallotti F, Girvin ME. Pathogenesis of primary defects in
mitochondrial ATP synthesis. Semin Cell Dev Biol 2001 Dec; 12 (6): 441-448. 9. Brini M, Pinton P, King MP, Davidson M, Schon EA, Rizzuto R. A calcium signaling
defect in the pathogenesis of a mitochondrial DNA inherited oxidative phosphorylation deficiency. Nat Med 1999; 5 (8): 951-954.
10. Moudy AM, Handran SD, Goldberg MP, Ruffin N, Karl I, Kranz-Eble P, et al.
Abnormal calcium homeostasis and mitochondrial polarization in a human encephalomyopathy. Proc Natl Acad Sci U S A 1995 Jan 31; 92 (3): 729-733.
11. Visch HJ, Koopman WJ, Leusink A, van Emst-de Vries SE, van den Heuvel LW,
Willems PH, et al. Decreased agonist-stimulated mitochondrial ATP production caused by a pathological reduction in endoplasmic reticulum calcium content in human complex I deficiency. Biochim Biophys Acta 2006 Jan; 1762 (1): 115-123.
12. Ackrell BA. Progress in understanding structure-function relationships in respiratory
chain complex II. FEBS Lett 2000 Jan 21; 466 (1): 1-5.

Complex II defect-mediated calcium deregulation MBaya et al
20
13. Bourgeron T, Rustin P, Chretien D, Birch-Machin M, Bourgeois M, Viegas-Pequignot E, et al. Mutation of a nuclear succinate dehydrogenase gene results in mitochondrial respiratory chain deficiency. Nat Genet 1995 Oct; 11 (2): 144-149.
14. Birch-Machin MA, Marsac C, Ponsot G, Parfait B, Taylor RW, Rustin P, et al.
Biochemical investigations and immunoblot analyses of two unrelated patients with an isolated deficiency in complex II of the mitochondrial respiratory chain. Biochem Biophys Res Commun 1996 Mar 7; 220 (1): 57-62.
15. Huang LS, Sun G, Cobessi D, Wang AC, Shen JT, Tung EY, et al. 3-nitropropionic
acid is a suicide inhibitor of mitochondrial respiration that, upon oxidation by complex II, forms a covalent adduct with a catalytic base arginine in the active site of the enzyme. J Biol Chem 2006 Mar 3; 281 (9): 5965-5972.
16. Miyadera H, Shiomi K, Ui H, Yamaguchi Y, Masuma R, Tomoda H, et al. Atpenins,
potent and specific inhibitors of mitochondrial complex II (succinate-ubiquinone oxidoreductase). Proc Natl Acad Sci U S A 2003 Jan 21; 100 (2): 473-477.
17. Echtay KS, Roussel D, St-Pierre J, Jekabsons MB, Cadenas S, Stuart JA, et al.
Superoxide activates mitochondrial uncoupling proteins. Nature 2002 Jan 3; 415 (6867): 96-99.
18. Iuso A, Scacco S, Piccoli C, Bellomo F, Petruzzella V, Trentadue R, et al.
Dysfunctions of cellular oxidative metabolism in patients with mutations in the NDUFS1 and NDUFS4 genes of complex I. J Biol Chem 2006 Apr 14; 281 (15): 10374-10380.
19. Geromel V, Kadhom N, Cebalos-Picot I, Ouari O, Polidori A, Munnich A, et al.
Superoxide-induced massive apoptosis in cultured skin fibroblasts harboring the neurogenic ataxia retinitis pigmentosa (NARP) mutation in the ATPase-6 gene of the mitochondrial DNA. Hum Mol Genet 2001 May 15; 10 (11): 1221-1228.
20. Jouaville LS, Pinton P, Bastianutto C, Rutter GA, Rizzuto R. Regulation of
mitochondrial ATP synthesis by calcium: evidence for a long-term metabolic priming. Proc Natl Acad Sci U S A 1999 Nov 23; 96 (24): 13807-13812.
21. Murgia M, Giorgi C, Pinton P, Rizzuto R. Controlling metabolism and cell death: At
the heart of mitochondrial calcium signalling. J Mol Cell Cardiol 2009 Mar 12. 22. Chami M, Oules B, Szabadkai G, Tacine R, Rizzuto R, Paterlini-Brechot P. Role of
SERCA1 truncated isoform in the proapoptotic calcium transfer from ER to mitochondria during ER stress. Mol Cell 2008 Dec 5; 32 (5): 641-651.
23. Yi M, Weaver D, Hajnoczky G. Control of mitochondrial motility and distribution by
the calcium signal: a homeostatic circuit. J Cell Biol 2004 Nov 22; 167 (4): 661-672. 24. Zamaraeva MV, Sabirov RZ, Manabe K, Okada Y. Ca(2+)-dependent glycolysis
activation mediates apoptotic ATP elevation in HeLa cells. Biochem Biophys Res Commun 2007 Nov 23; 363 (3): 687-693.
Complex II defect-mediated calcium deregulation MBaya et al
21
25. Abramov AY, Duchen MR. Mechanisms underlying the loss of mitochondrial membrane potential in glutamate excitotoxicity. Biochim Biophys Acta 2008 Jul-Aug; 1777 (7-8): 953-964.
26. Liot G, Bossy B, Lubitz S, Kushnareva Y, Sejbuk N, Bossy-Wetzel E. Complex II
inhibition by 3-NP causes mitochondrial fragmentation and neuronal cell death via an NMDA- and ROS-dependent pathway. Cell Death Differ 2009 Jun; 16 (6): 899-909.
27. Lim D, Fedrizzi L, Tartari M, Zuccato C, Cattaneo E, Brini M, et al. Calcium
homeostasis and mitochondrial dysfunction in striatal neurons of Huntington disease. J Biol Chem 2008 Feb 29; 283 (9): 5780-5789.
28. Calabresi P, Gubellini P, Picconi B, Centonze D, Pisani A, Bonsi P, et al. Inhibition of
mitochondrial complex II induces a long-term potentiation of NMDA-mediated synaptic excitation in the striatum requiring endogenous dopamine. J Neurosci 2001 Jul 15; 21 (14): 5110-5120.
29. Nasr P, Gursahani HI, Pang Z, Bondada V, Lee J, Hadley RW, et al. Influence of
cytosolic and mitochondrial Ca2+, ATP, mitochondrial membrane potential, and calpain activity on the mechanism of neuron death induced by 3-nitropropionic acid. Neurochem Int 2003 Jul; 43 (2): 89-99.
30. Rosenstock TR, Carvalho AC, Jurkiewicz A, Frussa-Filho R, Smaili SS.
Mitochondrial calcium, oxidative stress and apoptosis in a neurodegenerative disease model induced by 3-nitropropionic acid. J Neurochem 2004 Mar; 88 (5): 1220-1228.
31. Szczepanowska J, Zablocki K, Duszynski J. Influence of a mitochondrial genetic
defect on capacitative calcium entry and mitochondrial organization in the osteosarcoma cells. FEBS Lett 2004 Dec 17; 578 (3): 316-322.
32. Visch HJ, Rutter GA, Koopman WJ, Koenderink JB, Verkaart S, de Groot T, et al.
Inhibition of mitochondrial Na+-Ca2+ exchange restores agonist-induced ATP production and Ca2+ handling in human complex I deficiency. J Biol Chem 2004 Sep 24; 279 (39): 40328-40336.
33. Kaasik A, Veksler V, Boehm E, Novotova M, Minajeva A, Ventura-Clapier R.
Energetic crosstalk between organelles: architectural integration of energy production and utilization. Circ Res 2001 Jul 20; 89 (2): 153-159.
34. Kennedy HJ, Pouli AE, Ainscow EK, Jouaville LS, Rizzuto R, Rutter GA. Glucose
generates sub-plasma membrane ATP microdomains in single islet beta-cells. Potential role for strategically located mitochondria. J Biol Chem 1999 May 7; 274 (19): 13281-13291.
35. Ihara Y, Kageyama K, Kondo T. Overexpression of calreticulin sensitizes SERCA2a
to oxidative stress. Biochem Biophys Res Commun 2005 Apr 22; 329 (4): 1343-1349. 36. Meller R, Thompson SJ, Lusardi TA, Ordonez AN, Ashley MD, Jessick V, et al.
Ubiquitin proteasome-mediated synaptic reorganization: a novel mechanism underlying rapid ischemic tolerance. J Neurosci 2008 Jan 2; 28 (1): 50-59.
Complex II defect-mediated calcium deregulation MBaya et al
22
37. Depraetere V. Getting activated with poly-ubiquitination. Nat Cell Biol 2001 Aug; 3
(8): E181. 38. Babbitt SE, Kiss A, Deffenbaugh AE, Chang YH, Bailly E, Erdjument-Bromage H, et
al. ATP hydrolysis-dependent disassembly of the 26S proteasome is part of the catalytic cycle. Cell 2005 May 20; 121 (4): 553-565.
39. Liu CW, Li X, Thompson D, Wooding K, Chang TL, Tang Z, et al. ATP binding and
ATP hydrolysis play distinct roles in the function of 26S proteasome. Mol Cell 2006 Oct 6; 24 (1): 39-50.
40. Geng Q, Romero J, Saini V, Baker TA, Picken MM, Gamelli RL, et al. A subset of
26S proteasomes is activated at critically low ATP concentrations and contributes to myocardial injury during cold ischemia. Biochem Biophys Res Commun 2009 Dec 25; 390 (4): 1136-1141.
41. Spat A, Szanda G, Csordas G, Hajnoczky G. High- and low-calcium-dependent
mechanisms of mitochondrial calcium signalling. Cell Calcium 2008 Jul; 44 (1): 51-63.
42. McKenzie M, Liolitsa D, Akinshina N, Campanella M, Sisodiya S, Hargreaves I, et al.
Mitochondrial ND5 gene variation associated with encephalomyopathy and mitochondrial ATP consumption. J Biol Chem 2007 Dec 21; 282 (51): 36845-36852.
43. Burgeois M, Goutieres F, Chretien D, Rustin P, Munnich A, Aicardi J. Deficiency in
complex II of the respiratory chain, presenting as a leukodystrophy in two sisters with Leigh syndrome. Brain Dev 1992 Nov; 14 (6): 404-408.
44. Ainscow EK, Rutter GA. Mitochondrial priming modifies Ca2+ oscillations and
insulin secretion in pancreatic islets. Biochem J 2001 Jan 15; 353 (Pt 2): 175-180. 45. Mitchell KJ, Pinton P, Varadi A, Tacchetti C, Ainscow EK, Pozzan T, et al. Dense
core secretory vesicles revealed as a dynamic Ca(2+) store in neuroendocrine cells with a vesicle-associated membrane protein aequorin chimaera. J Cell Biol 2001 Oct 1; 155 (1): 41-51.
46. Mitchell KJ, Tsuboi T, Rutter GA. Role for plasma membrane-related Ca2+-ATPase-1
(ATP2C1) in pancreatic beta-cell Ca2+ homeostasis revealed by RNA silencing. Diabetes 2004 Feb; 53 (2): 393-400.
47. Robinson KM, Janes MS, Pehar M, Monette JS, Ross MF, Hagen TM, et al. Selective
fluorescent imaging of superoxide in vivo using ethidium-based probes. Proc Natl Acad Sci U S A 2006 Oct 10; 103 (41): 15038-15043.
48. Duchen MR, Surin A, Jacobson J. Imaging mitochondrial function in intact cells.
Methods Enzymol 2003; 361: 353-389.

Complex II defect-mediated calcium deregulation MBaya et al
23
49. Chami M, Ferrari D, Nicotera P, Paterlini-Brechot P, Rizzuto R. Caspase-dependent alterations of Ca2+ signaling in the induction of apoptosis by hepatitis B virus X protein. J Biol Chem 2003 Aug 22; 278 (34): 31745-31755.
Complex II defect-mediated calcium deregulation MBaya et al
24
ACKNOWLEDGEMENTS
High resolution imaging analyses were performed in Pasteur institute (PFID), Paris,
France. Fluorescence imagery analyses were performed in the imaging core facility of
Necker-Enfants Malades, Paris V University, France. We thank the vector core of the
university Hospital of Nantes supported by the association Française contre les myopathies
(AFM) for producing the Adenovirus vectors.
This work was supported by grants from INSERM (Institut National de Santé et Recherche
Médicale), AFM (11456 and 13291) and la Fondation pour la Recherche Médicale (FRM)
(DEQ20071210550). C. Caspersen was supported by “region Ile de France” postdoctoral
fellowship. M. Chami was supported by an INSERM young researcher contract and by the
Italian Institute of Technology funds. E. MBaya was supported by a doctoral fellowship from
Congo Ministry. We gratefully acknowledge the Ecole de l’INSERM for supporting the MD-
PhD curriculum of B. Oulès. GAR was supported by grants from the Welcome trust
(081958/Z/07/Z), MRC (90401641), NIH (DK071962-01) and EU (FP6 “SAVEBETA”).
M.P. is supported by Muscular Dystrophy Association and Kennedy Disease Association
Grants.
We declare that we do not have competing financial interests.

Complex II defect-mediated calcium deregulation MBaya et al
25
Figure 1 Mitochondrial function is altered upon Complex II defect. (a, b) Δψmit, as
assessed by TMRM probe in SDHAR554W mutated fibroblasts, and in control fibroblasts (a)
and SH-SY5Y cells (b) left untreated (Control) or treated with 300 µM 3-NP or 100 nM
Atpenin A5 for 20 h. Basal TMRM intensity was normalized to the fluorescence drop (Δψmit
collapse) upon 10 µM FCCP application. Representative traces show normalized f/f0 TMRM
intensity, where f is the basal TMRM intensity, and f0 the TMRM intensity after FCCP
application. Graphs show normalized TMRM (f/f0) intensity in % versus control considered as
100 %. Images are representative of TMRM loading in mutated fibroblasts and controls left
untreated or treated as detailed before. The mean of normalized TMRM signal ± SEM,
normalized TMRM signal (%) and the number of experiments are represented in
Supplementary Table S2. (c) Superoxide content as determined with MitoSOX dye in
SDHAR554W fibroblasts, and in control fibroblasts left untreated (Control) or treated as in (a).
Representative images of MitoSOX loading are shown. The mean of MitoSOX intensity ±
SEM and the number of experiments are represented in Supplementary Table S3. (d, e)
Mitochondrial basal ATP level normalized to the maximum luciferase signal in SDHAR554W
and control fibroblasts (d) and in SH-SY5Y cells left untreated (Control) or treated as in (a)
(e). Data are expressed as percentage of luciferase light output (CPS: counts per second) with
respect to the value obtained after cell permeabilization in the presence of maximal [ATP]
(see experimental procedures for details). Representative traces of normalized luciferase
signal (% CPS) are shown in the insets. The mean of basal ATP level ± SEM and the number
of experiments are represented in Supplementary Table S4. (a-e) Data are representative of
three independent experiments. (*) P ≥ 0.001, (**) P < 0.001 vs Control.
Figure 2 Complex II defect leads to cytosolic and mitochondrial Ca2+ signalling
deregulation. (a, b) Basal cytosolic [Ca2+] (calibrated Fluo-4, AM intensity, see experimental
procedures for details) (a) and basal mitochondrial [Ca2+] (calibrated X-Rhod-1, AM
intensity, see experimental procedures for details) (b) in SDHAR554W mutated fibroblasts and
in control fibroblasts left untreated (Control) or treated as in Figure 1a. Representative images
for Fluo-4, AM and X-Rhod-1, AM loading are shown. The mean value ± SEM and the
number of experiments are indicated in Supplementary Tables S5 and S6. (c, d)
Representative curves of agonist-evoked cytosolic Ca2+ signal ([Ca2+]cyt) (c) and
mitochondrial Ca2+ signal ([Ca2+]mit) (d) in control and SDHAR554W fibroblasts (left panel) and
in SH-SY5Y cells (right panel) left untreated (Control) or treated as in Figure 1a. The mean
values ± SEM and the number of experiments are indicated in Supplementary Tables S7 and

Complex II defect-mediated calcium deregulation MBaya et al
26
S8. (a-d) Data are representative of three independent experiments. (*) P ≥ 0.001, (**) P <
0.001 vs Control.
Figure 3 Mitochondrial Ca2+ overload occurs early upon complex II deficiency. (a)
Agonist-evoked mitochondrial Ca2+ signal ([Ca2+]mit) in control fibroblasts and SH-SY5Y
cells untreated (Control) or treated with 300 μM 3-NP or 100 nM Atpenin A5 for 2, 4 or 6 h.
The mean values ± SEM and the number of experiments are indicated in Supplementary
Table S8. (b) Δψmit, as performed in Figure 1a, and b in control fibroblasts and SH-SY5Y
cells untreated (Control) or treated as in (a). Graphs show normalized TMRM intensity (f/f0).
The mean f/f0 values ± SEM and the number of experiments are represented in Supplementary
Table S2. Data are representative of three independent experiments. (*) P ≥ 0.001, (**) P <
0.001 vs Control.
Figure 4 Increased Intracellular Ca2+ signals upon complex II deficiency is associated
with deregulated ER Ca2+ homeostasis without a modification of calcium entry through
plasma membrane. (a) Representative curves of ER Ca2+ concentration ([Ca2+]ER) in control
and SDHAR554W fibroblasts. Graph: mean ± SEM. The mean values ± SEM and the number of
experiments are indicated in Supplementary Table S9. (b) Dependence on [Ca2+] of the ER
Ca2+ uptake rate analysed upon application of CaCl2 solution (see experimental procedures for
details). (c) Dependence on [Ca2+] of the ER Ca2+ leak rate analysed upon application of the
SERCA inhibitor TBuBHQ (see experimental procedures for details). (d) Capacitative Ca2+
influx analysis in control and SDHAR554W fibroblasts challenged first with 100 μM histamine
in 1 mM EGTA to empty intracellular Ca2+ pools and then with 100 μM histamine in 1 mM
CaCl2 to activate Ca2+ entry. (a-d) Data are representative of three independent experiments.
(**) P < 0.001 vs Control.
Figure 5 Complex II deficiency is associated with down-regulation of SERCA2b and
PMCA expression. (a) Western blot analyses of microsomal fraction (SERCA2b and
GRP94) and of plasma membrane fraction (PMCA, and transferrin (TFN)) of control and
SDHAR554W fibroblasts and SH-SY5Y cells left untreated (Control) or treated with 300 µM 3-
NP, 100 nM Atpenin A5 or 5 µM Oligomycin for 20 h. Quantification of SERCA2b protein
level was normalized to GRP94 signal and PMCA to TFN signal and is represented in
arbitrary units (A.U.). (b) SERCA and PMCA expression down-regulation in complex II

Complex II defect-mediated calcium deregulation MBaya et al
27
deficient cells is not linked to reduced mRNA levels. Semi-quantitative RT-PCR analysis of
SH-SY5Y cells left untreated (Control) or treated as in (a). The blots show the results of
different cycles of the PCR of SERCA2b (24, 26 and 28 cycles), PMCA2 (32, 34 and 36
cycles) and GAPDH used as control (22, 24, 26 cycles). Quantification of three independent
experiments is shown in graphs as mean ± SEM., ns non-significant vs Control.
Representative blots are shown. (c) Rapid degradation of SERCA 2b and PMCA2 upon
complex II inhibition by 3-NP (300 μM) or ATP synthase inhibition by Oligomycin (5 μM).
SH-SY5Ycells were treated with 100 μM cyclohexemide (CHX) alone or in the presence of
3-NP or Oligomycin for the indicated time points. α-Tubulin was used as loading control.
Quantification of three independent experiments is shown in graphs as mean ± SEM., ns non-
significant, (*) P ≥ 0.01 vs untreated cells (Control) considered as 1. Representative blots are
shown. (d) Effect of proteasome inhibitor MG132 on SERCA2b and PMCA2 expression.
After 2 h pre-incubation of SH-SY5Y cells with or without MG132 (5 μM), cells were treated
for 1 h with 100 μM cycloheximide in the presence or not of 300 μM 3-NP or 5 μM
Oligomycin. α-Tubulin was used as loading control.
Figure 6 Mitochondrial motility and ER-mitochondria contact sites are modified upon
complex II defect. (a) Mitochondrial movement index (MI) was analyzed in the same
conditions as in Figure 1a and 1b by using Mitotracker red dye. Images converted to binary
files were sequentially subtracted to generate ∆F. MI corresponds to the ratio of ∆F on total
mitochondrial area. Data are presented as MI vs Control considered as 1. MI ± SEM are
shown in Supplementary Table S10. (b) ER-mitochondria contact sites were analyzed in cells
transfected with erGFP and loaded with MitoTracker Deep Red in the same conditions as in
(a). Representative images of ER (erGFP, green), mitochondria (Mito Deep Red, red) and
overlay images (Merge) are shown. Graph: quantitative analysis of the colocalization of ER
and mitochondria (% of mitochondrial volume in contact with ER). % of ER-mitochondria
contact sites ± SEM is presented in Supplementary Table S11. (a-b) Data are representative of
three independent experiments. (*) P ≥ 0.001, (**) P < 0.001 vs Control.
Figure 7 Mitochondrial Ca2+ overload is implicated in the modulation of cellular
bioenergetics and mitochondrial dysfunction. (a, b) Total ATP level in SDHAR554W
mutated fibroblasts and in control fibroblasts left untreated (Control) or treated with Atpenin
A5 as in Figure 1a (a) and in SH-SY5Y cells left untreated (Control) or treated as in Figure 1b

Complex II defect-mediated calcium deregulation MBaya et al
28
(b) in the presence or not of 10 mM 2-deoxy-D-Glucose (2-DG). % of total ATP vs Control ±
SEM and number of experiments are represented in Supplementary Table S12. (c) Total ATP
level in SDHAR554W mutated fibroblasts and in control fibroblasts left untreated (Control) or
treated with 100 nM Atpenin A5 in the presence or not of 5 µM BAPTA, AM for 20 h. % of
total ATP vs Control ± SEM and number of experiments are represented in Supplementary
Table S13. (d) Δψmit analyses in control and SDHAR554W fibroblasts left untreated or treated
with BAPTA, AM as in (d). % of TMRM intensity vs Control ± SEM and number of
experiments are represented in Supplementary Table S14. (e) Mitochondrial superoxide
content quantification performed as in Figure 1c in control and SDHAR554W fibroblasts left
untreated or treated with BAPTA-AM as in (d). The mean of MitoSOX intensity in % vs
Control ± SEM and number of experiments are represented in Supplementary Table S15. (d-
e) Representative images are shown. (a-e) Data are representative of three independent
experiments. (*) P ≥ 0.001, (**) P < 0.001 (ns) non significant vs Control or vs untreated
conditions (see Supplementary Tables S13-15).
Figure 8 Schematic model representing subcellular Ca2+ deregulation, mitochondrial
dysfunction and bioenergetics outcomes upon Complex II mutation or inhibition.
Complex II deficiency induces mitochondrial function alteration (reduced Δψmit and [ATP]mit
and increased [O2•-]), and subcellular Ca2+ deregulation. The increased [Ca2+]cyt is mediated
by: i) increased ER Ca2+ leak; and ii) degradation of PMCA and SERCA2b. Mitochondrial
Ca2+ overload is facilitated by mitochondrial movement inhibition and increased ER-
mitochondria contact sites. This leads on the one hand to mitochondrial Ca2+ overload and on
the other hand to glycolysis-dependent ATP production. RCC: respiratory chain complexes.
CLC: Ca2+ leak channels. U: uniporter.

SDHAR554WControl
3-NP Atpenin A5
Nor
mal
ized
TMR
M in
tens
ity(f/
f 0)
a
Supe
roxi
deco
nten
tM
itoS
OX
inte
nsity
(A.U
.)
c
** ** **
**
Control SDHAR554W
3-NP Atpenin A5 SDHAR554W+PDCT
d
Bas
al [A
TP] m
it(%
CP
S)
Control
SDHAR554W
**
e
Control
3-NP
Atpenin A5Bas
al [A
TP] m
it(%
CP
S)
MBaya et al. Figure 1
Fibroblasts
SH-SY5Y
Fibroblasts
n=25
n=21 n=22n=16
n=19
n=20
n=19
30 S
SH-S
Y5Y
Nor
mal
ized
TMR
M in
tens
ity(%
vs
cont
rol)
0
20
40
60
80
100
120n=31
n=17n=10
**
Control
3-NP
Atpenin A5
30 S
Nor
mal
ized
TMR
M in
tens
ity(f/
f 0)
FCCP
Nor
mal
ized
TMR
M in
tens
ity(%
vs
cont
rol)
n=24
n=16n=24
**
Fibr
obla
sts
**n=10
Control
3-NP
Atpenin A5
SDHAR554W
FCCP
0
1
2
3
4
5
6
Control
3-NP
Atpenin A5
Control
3-NP
Atpenin A5
0
500
1000
1500
2000
b
0
20
40
60
80
100
120
***
0
1
2
3
4
Control
SDHAR554W
3-NP
Atpenin A5
Control
3-NP
Atpenin A5
SDHAR554W
05
1015202530354045
0
5
10
15
20
25
Luciferin
( % C
PS
)
30 S
0
5
10
15
20
( % C
PS
)
30 S
Luciferin
n=15n=10 n=14
** **
20 �m
20 �m
20 �m
20 �m
10 �m 10 �m 10 �m
10 �m 10 �m
0
10
20
30
40
50

ca
b d
Control SDHAR554W
3-NP Atpenin A5
Bas
al [C
a2+ ] c
yt(n
M)
Bas
al [C
a2+ ] m
it (n
M)
MBaya et al. Figure 2
Control
Atpenin A53-NP
SDHAR554W
0
100
200
300
400
500
600
700
800
900
0
200
400
600
800
1000
1200
0
20
40
60
80
100
10 S
Histamine
ControlSDHAR554W
[Ca2
+ ] mit
(µM
)
ControlSDHAR554W
10 S
[Ca2
+ ] cyt
(µM
)
Histamine
10 S
ControlAtpenin A5
Carbachol
0
1
2
3
Fibroblasts SH-SY5Y
[Ca2
+ ] cyt
(µM
)
ControlAtpenin A53-NP
Carbachol
10 S
Fibroblasts SH-SY5Y
n=17
n=13
n=9
n=10
**
**
**
n=12**
n=9*
n=8**
n=11
20 �m 20 �m
20 �m 20 �m
20 �m 20 �m
20 �m 20 �m
0
1
2
[Ca2
+ ] mit
(µM
)
0
10
20
30
40
50
60
3-NP

MBaya et al. Figure 3
a
0
20
40
60
80
100
120
[Ca2
+ ] mit
(�M
)
Atpenin A53-NP
SH-SY5Y
n=7
n=4
n=4 n=5
n=5
n=4
n=5N
orm
aliz
edTM
RM
inte
nsity
(f/f 0)
Fibroblasts
Atpenin A53-NP
2 h 4 h 6 h 2 h 4 h 6 h
0
10
20
30
40
50[C
a2+ ] m
it(�
M)
Nor
mal
ized
TMR
M in
tens
ity(f/
f 0)
n=5 n=5
n=6n=6
n=9n=6 n=5
ns
nsns
nsns
nsn=14
n=13 n=11 n=10n=11
n=11 n=12ns ns ns
nsns ns
n=5
n=4
n=5 n=8
n=5
n=5n=7
ns
* **
ns
* **
ns
****
ns
**
**
b SH-SY5YFibroblasts
2 h 4 h 6 h 2 h 4 h 6 h
Atpenin A53-NP
2 h 4 h 6 h 2 h 4 h 6 h
0
1
2
3
4
5
6
7
0
1
2
3
4
5
6
7
Atpenin A53-NP
2 h 4 h 6 h 2 h 4 h 6 h

b
d
[Ca2
+ ] ER
(µM
)
0
50
100
150
200
250
300CaCl2
Control
SDHAR554W
30 S 0
50
100
150
200
250
300
[Ca2
+ ] ER
(µM
)
Controls SDHAR554W
c
ER
Ca2
+Le
ak(µ
M/S
)
[Ca2+] (µM)
ER
Ca2
+U
ptak
e(µ
M/S
)
[Ca2+] (µM)
**
ControlsSDHAR554W
n=15 n=12
n=17
n=12
MBaya et al. Figure 4
a
0
1
2
30 s
ControlSDHAR554W
[Ca2
+ ] cyt
(µM
)
EGTA+HistamineCaCl2+Histamine
0
2
4
6
8
10
0 100 200 3000
5
10
15
20
0 10 20 30 40 50 60
ControlsSDHAR554W

SERCA 2b
Tubulin
PMCA2
CHX
3-NP
Oligomycin0 20 60 120 20 60 120 20 60 120 (min)
-
-
-
+
-
-
+
-
-
+
-
-
+
+
-
+
+
-
+
+
-
+
-
+
+
-
+
+
-
+
a
PMCA
SERCA2b
SH�SY5YFibroblasts
TFN
GRP941 0.13
1 0.33
1 0.11 0.10 0.10
1 0.62 0.14 0.03
(A.U.)
(A.U.)
b
c d
SERCA2b
PMCA2
GAPDH
Control 3-NP Atpenin A5 Oligomycin
500
500
300
700
1000
700
(bp)RT-PCR cycles
0
0,5
1
1,5
2
0
0,5
1
1,5
2
SER
CA2
b/G
APD
H
mR
NA
PM
CA
/GA
PD
H
mR
NA Control
3-NP
Atpenin A5
Oligomycin
nsns
nsns
ns
ns
SERCA 2b
PMCA2
CHX
3-NP
Oligomycin
MG123
-
-
-
-
+
-
-
-
+
+
-
-
+
-
+
-
+
-
-
+
+
+
-
+
0
0,5
1
0 20 60 120
Tubulin
(min) (min)
SE
RC
A 2
b pr
otei
n le
vel
(fold
)
PM
CA
pro
tein
leve
l (fo
ld)
CHX
CHX + 3-NP
CHX + Oligomycinns
ns
ns*
*
*
ns
ns*
*
ns
ns
MBaya et al. Figure 5
+
-
+
+
-
-
-
+
0
0,5
1
0 20 60 120

a
Control SDHAR554W
Binary �F Binary �F
Mito
chon
dria
l mov
emen
t (M
I)
b
MBaya et al. Figure 6
00,20,40,60,8
11,2
Fibroblasts SH-SY5Y
erGFPMito
Deep red Merge
Con
trol
ER
-mito
chon
dria
con
tact
site
s (%
)
Fibroblasts SH-SY5Y
SDH
AR
554W
* * * *
**
**
*
** **
n=47n=20 n=32 n=30
n=23
n=39
n=29
n=29
0
2
4
6
8
10n=40
n=31n=40
n=41
n=31n=54
Control
3-NPAtpenin A5
SDHAR554W
Control
3-NPAtpenin A5
SDHAR554W
10 �m 10 �m 10 �m 10 �m
10 �m
10 �m
c
d
MBaya et al. Figure 7a
Fibroblasts SH-SY5Yb
e
Control Control+BAPTA
SDHAR554W+BAPTASDHAR554W
Control+BAPTAControl
SDHAR554W+BAPTASDHAR554W
0
20
40
60
80
100
120
140
0
20
40
60
80
100
120
140
0
20
40
60
80
100
120
140
Atpenin A5
3-NP
Control
SDHAR554W
Atpenin A5
Control
n=12*
n=11*
n=7
n=14
**
****
n=16
n=142DG
n=19*
n=15*
n=20n=14**
** **n=13
n=16 2DG
n=6n=6**** **
n=6
n=6*
n=6*
n=6
SDHAR554W
Atpenin A5
Control
BAPTA, AM
Mito
chon
dria
l pot
entia
l (%
vs
Con
trol) BAPTA, AM
n=76
**
**
n=67
n=63 n=57
ns*
SDHAR554W
Control
0
20
40
60
80
100
120
140
160BAPTA, AM
n=25
*
**
n=21
n=16 n=13
ns*
SDHAR554W
Control
Supe
roxi
de c
onte
nt (%
vs
Con
trol)
10 �m
10 �m
10 �m
10 �m
10 �m
10 �m
10 �m
10 �m
Tota
l ATP
leve
l (%
vs
Con
trol)
Tota
l ATP
leve
l (%
vs
Con
trol)
Tota
l ATP
leve
l (%
vs
Con
trol)
Fibroblasts
Fibroblasts Fibroblasts
0
20
40
60
80
100
120
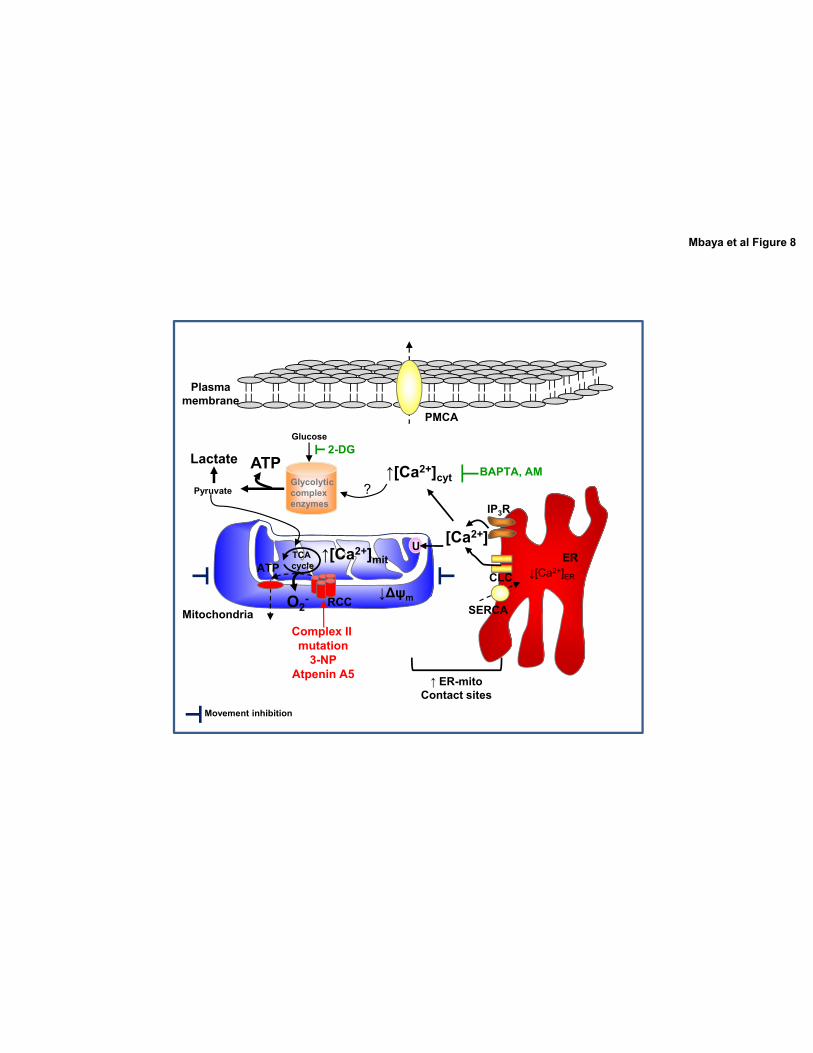
TCA cycle
ATP
ATP
Glycolyticcomplexenzymes
Glucose
Pyruvate
Lactate
ER
Mitochondria
Plasmamembrane
SERCA
�[Ca2+]cyt
PMCA
RCC���m
?
O2-
CLC
Complex II mutation
3-NPAtpenin A5
2-DG
BAPTA, AM
IP3R
U
Mbaya et al Figure 8
�[Ca2+]mit
� ER-mitoContact sites
�[Ca2+]ER
[Ca2+]
Movement inhibition