Sensing and signalling mechanical stress during intercalary ...
301
Copyright is owned by the Author of the thesis. Permission is given for a copy to be downloaded by an individual for the purpose of research and private study only. The thesis may not be reproduced elsewhere without the permission of the Author.
-
Upload
khangminh22 -
Category
Documents
-
view
0 -
download
0
Transcript of Sensing and signalling mechanical stress during intercalary ...

Copyright is owned by the Author of the thesis. Permission is given for a copy to be downloaded by an individual for the purpose of research and private study only. The thesis may not be reproduced elsewhere without the permission of the Author.
Sensing and signalling mechanical stress
during intercalary growth in Epichloë grass
endophytes
A thesis presented in partial fulfilment of the
requirements for the degree of
Doctor of Philosophy (PhD) in
Genetics
at Massey University, Manawatu
New Zealand
Kahandawa Geeganaarachchige Sameera
Upanada Ariyawansa
2015

i
Abstract
Epichloë festucae is an agronomically important seed-transmitted endophytic fungus
that grows symbiotically within the intercellular spaces of temperate grass species. This
fungus has previously been shown to undergo hyphal intercalary growth during host
leaf colonization, a highly unusual mechanism of division and extension in non-apical
compartments in vegetative hyphae, as an adaptation to colonise rapidly elongating host
cells in the developing leaf. However the exact mechanism that triggers intercalary
growth was not known. In this study I aimed to test the hypothesis that intercalary
growth is stimulated by mechanical stretch imposed by attachment of hyphae to
elongating host cells, and that this stress is sensed by mechano-sensors located on
hyphal membranes.
To test this hypothesis a novel technique was designed and optimised to stretch fungal
hyphae under in vitro conditions. Investigation of un-stretched hyphae showed that de
novo compartmentalization occurs in sub-apical compartments of E. festucae hyphae
according to a compartment length-dependent hierarchy. Subjecting these sub-apical
compartments to mechanical stretching showed that hyphal compartment lengths can be
increased while maintaining viability, provided that the stretch is within tolerable limits.
It further showed that the stretched compartments undergo de novo
compartmentalization (nuclear division and septation) similar to un-stretched hyphae
but at a significantly higher rate, fulfilling the basic requirements for intercalary growth.
E. festucae WscA and MidA, which are orthologues of a yeast cell wall stress and a
stretch-activated calcium channel protein respectively, were functionally characterized
in order to test the possible involvement of these mechano-sensors in intercalary
ii
growth. Their roles in general hyphal apical growth, cell wall construction and integrity
maintenance during growth in culture were confirmed. The limited ability of ΔmidA
mutants to colonise developing leaves indicated a possible role in intercalary growth,
while ΔwscA mutants showed wild-type levels of host colonization. In future, the
ΔmidA and ΔwscA mutants will be subjected to mechanical stretch in vitro to further
understand their roles in mechano-sensing and intercalary growth.
Given the possible involvement of the stretch-activated calcium channel MidA in
intercalary growth, a successful technique was developed to study calcium signalling
and distribution in E. festucae using the genetically-encoded calcium sensor GCaMP5.
Investigations revealed the presence of MidA-driven Ca2+ pulses confined to the hyphal
tips with unique signatures of temporal and spatial dynamics generated by influx of
Ca2+. The presence of active sub-apical Ca2+ uptake systems were confirmed,
manifested as occasional Ca2+ pulses in sub-apical compartments that seemed to
increase in frequency with mechanical perturbation, indicating a potential crucial role in
mechanical stress-driven intercalary growth.
In conclusion a prospective model for intercalary growth in the leaf expansion zone is
proposed. Mechanical stretching of hyphae results in increased compartment lengths,
accompanied by compartmentalization in sub-apical compartments that allows hyphae
to extend along their length. Membrane distortion due to stretching activates MidA,
triggering a calcium signalling cascade to stimulate cell wall synthesis and other cellular
processes.
iii
Acknowledgements
I’m incredibly grateful to my supervisors Dr Christine Voisey (AgResearch Ltd) and
Prof Rosie Bradshaw (Massey University) for the remarkable supervision provided
throughout my studies. Despite the very busy working schedules, both had time to
discuss matters at any time and the prompt attention given to issues greatly helped me to
conduct my studies smoothly. The immense academic knowledge and training I
received, I believe has shaped me to become an independent researcher. I also
appreciate them for being so patient and having faith in me despite the delays and
encouraging me during the writing period. I thank Prof Bradshaw for making me part of
her lab team, guiding and training me throughout and supporting me with all the
activities at Massey University. I’m so grateful to Dr Voisey for assisting me in every
possible way not just in my academic work, but also in settling down and living in New
Zealand. Thank you for finding funds and encouraging me to participate in international
conferences and getting me an opportunity to present in a prestigious forum.
I acknowledge Prof Nick Read (University of Manchester, UK) and Prof Neil Gow for
the discussions, advice and support extended. Also I’m grateful to Prof Nick Read for
kindly providing the vector pAM13-9-GCaMP5 (harbours the genetically-encoded
calcium sensor GCaMP5) and Dr Alberto Muñoz for training me on calcium imaging. I
acknowledge Prof. Kelly Craven's laboratory (Samuel Roberts Noble Foundation,
Oklahoma, USA) for providing the plasmid pYH2A for nuclear tagging. I thank Dr
Duane Harland for the support given by sugesting the fibre stretcher to stretch fungal
hyphae and working through various mechanisms. I also thank Steve Gebbie
(AgResearch engineering workshop, Lincoln) for making me the stretching cassettes.

iv
I’m grateful to Dr Richard Johnson for accepting me into the team initially and advising
me on my research work. Also I’m grateful to PFI team leader Dr Linda Johnson for
being so supportive and providing me with opportunities. I thank Mike Christenson for
sharing his expert knowledge, working along with me to help me understand the
endophyte fungi. My warm gratitude goes to Jaspreet Sing for being a great friend, my
lab companion and assisting me in so many ways. I’m grateful to Dr Tash forester for
teaching me all the techniques, sharing experiences and always willing to help me to
conduct experiments. I also thank Dr Milan Gagic and Dr Stuart Card for advice,
sharing experiences and the discussions we had. Thank you also to Anouck de Bonth,
Wayne Simpson, Debbie Hudson and Kelly Dunstan for teaching me techniques and for
lab support. I acknowledge Dr John Koolard for providing statistical support, and
AgResearch support staff for the administrative help I received. I acknowledge the team
members of Prof Rosie Bradshaw’s lab members for discussing my results while
sharing their experiences and the staff at the Institute of Fundamental Sciences and the
Graduate Research School at Massey University for all the support. Further, I’m
grateful to all the present and past Heads along with the staff at the Department of Plant
Sciences, University of Colombo, for giving me study leave and supporting my studies.
I’m so grateful to my wife, Thriratni Ariyawansa, for shouldering the family
responsibilities and commitments for nearly 5 years while I was away in New Zealand.
Thank you for handling a huge workload on your own with the kids and giving me the
freedom to conduct my studies. Without her immense support, encouragement and
understanding this endeavour wouldn’t have been possible at all. To my kids, Lithum
and Ranuga Ariyawansa, thank you so much for being so patient until I finished the
thesis to go to school, play and to do so many other postponed activities together. I am
incredibly thankful to my parents for giving me everything and supporting me through

v
all my endeavours. I greatly appreciate my sister and her family and the parent-in-laws
for their huge support extended to my wife. Finally, I am grateful to the Marsden fund,
New Zealand, for funding my studies and the research project along with AgResaerch
Ltd for providing me this opportunity.

vi
Table of Contents
Abstract ……………………………………………………………………………….i
Acknowledgements …………………………………………………………………..iii
Table of contents ……………………………………………………………………..vi
List of Figures ………………………………………………………………………..xiv
List of tables …………………………………………………………………………..xx
List of movie clips …………………………………………………………………….xx
Abbreviations ………………………………………………………………………...xxi
1. Introduction …………………………………………………………………….. 1
1.1 Epichloë festucae …………………………………………………………………….. 2
1.1.1 Transmission ……………………………………………………………. 3
1.1.2 Host colonization ……………………………………………………….. 4
1.2 Apical hyphal growth …………………………………………………………. 6
1.2.1 Mechanism of hyphal extension ………………………………………... 7
1.3 Intercalary hyphal growth …………………………………………………….. 9
1.3.1 E. festucae host colonization through hyphal intercalary growth ……… 9
1.3.2 Evidence to support hyphal intercalary growth in developing leaves ….. 10
1.3.3 Evidence of intercalary growth in other fungal species …………………13
1.3.4 Cellular processes associated with intercalary growth …………………. 15
1.3.4.1 Cell wall synthesis …………………………………………………. 15
1.3.4.2 Exocytosis ………………………………………………………….. 17
1.3.4.3 Role of the Spitzenkörper away from hyphal apex ………………... 18
1.3.5 Signalling mechanisms that may have a role in intercalary growth ……. 19
1.4 Sensing and signalling mechanical stress in E. festucae hyphae ……………... 20
vii
1.5 Calcium transporters and maintenance of calcium homeostasis in fungi …….. 21
1.5.1 Calcium transporters in the vacuole, Golgi apparatus and endoplasmic
reticulum ………………………………………………………………... 22
1.5.2 Calcium uptake systems in the plasma membrane ……………………... 23
1.5.2.1 Structural characteristics of Mid1 and Cch1 proteins ……………... 26
1.5.2.2 Functions of the Mid1 and Cch1 complex ………………………… 27
1.5.2.3 Other proteins in the calcium/calcineurin pathway ………………... 29
1.6 Cell wall integrity MAP kinase pathway ……………………………………... 30
1.6.1 Role of the cell wall integrity MAP kinase pathway …………………… 30
1.6.2 The CWI MAP kinase pathway is highly conserved …………………… 32
1.6.3 Structure of Wsc and Mid2 proteins ……………………………………. 33
1.6.4 Function of Wsc and Mid2 proteins …………………………………… 34
1.7 Hypotheses, aims and objectives ……………………………………………… 37
2. Materials and Methods …………………………………………………………. 39
2.1 Biological material/ strains …………………………………………………… 40
2.2 Media preparation …………………………………………………………….. 43
2.2.1 Luria Bertani (LB) medium …………………………………………….. 44
2.2.2 Potato Dextrose (PD) medium ………………………………………….. 44
2.2.3 Regeneration medium (RG) …………………………………………….. 44
2.2.4 Water agar ………………………………………………………………. 44
2.2.5 Antibiotic selection ……………………………………………………... 44
2.3 Growth conditions …………………………………………………………….. 45
2.3.1 Escherichia coli ………………………………………………………….45
2.3.2 Epichloë festucae…………………………………………………………45
viii
2.3.3 Lolium perenne L. ……………………………………………………… 46
2.3.3.1 Surface sterilization of seeds ………………………………………. 46
2.3.3.2 Seedling inoculation and plant growth conditions ………………… 46
2.4 DNA isolation and storage ……………………………………………………. 47
2.4.1 Plasmid DNA isolation………………………………………………….. 47
2.4.2 Isolation of high molecular weight genomic DNA from E. festucae …... 47
2.4.3 Rapid isolation of genomic DNA from E. festucae …………………….. 48
2.4.4 DNA Storage …………………………………………………………… 48
2.5 DNA manipulation ……………………………………………………………. 48
2.5.1 DNA quantification …………………………………………………….. 48
2.5.2 DNA concentration ……………………………………………………... 49
2.5.3 Agarose gel electrophoresis …………………………………………….. 49
2.5.4 DNA recovery from agarose gels ………………………………………. 50
2.5.5 DNA sequencing ………………………………………………………... 50
2.5.6 Restriction endonuclease digestion ……………………………………...51
2.5.7 PCR amplification ……………………………………………………… 51
2.5.7.1 Standard PCR ………………………………………………………51
2.5.7.2 High fidelity PCR ………………………………………………….. 52
2.5.8 Ligation …………………………………………………………………. 55
2.6 Transformation ………………………………………………………………... 56
2.6.1 E. coli transformation …………………………………………………... 56
2.6.2 E. festucae protoplast preparation ……………………………………….56
2.6.3 Transformation of E. festucae protoplasts ……………………………… 57
2.7 Plasmid Construction …………………………………………………………. 59
2.7.1 Overview of the Gateway cloning system ……………………………… 59

ix
2.7.2 Construction of E. festucae gene replacement vectors …………………. 60
2.7.2.1 Overview …………………………………………………………... 60
2.7.2.2 Construction of midA replacement vectors …………………………… 60
2.7.2.3 Construction of wscA replacement vectors …………………………… 61
2.7.3 E. festucae complementation vector construction to complement ΔmidA
and ΔwscA ……………………………………………………………… 61
2.7.3.1 Overview ……………………………………………………………… 61
2.7.3.2 Construction of midA complementation vector ……………………….. 62
2.7.3.3 Construction of wscA complementation vector ……………………….. 62
2.7.4 E. festucae expression vector construction ……………………………... 63
2.7.4.1 Construction of the wscA:egfp expression vector with the native
promoter……………………………………………………………….. 63
2.7.4.2 Construction of Ptef: wscA:egfp expression vector …………………... 64
2.8 Purification of E. festucae Fl1 transformants …………………………………. 65
2.9 Southern blotting ……………………………………………………………… 65
2.10 Endophyte colonization in plants ……………………………………………. 66
2.10.1 Endophyte detection in plants by tissue print immunoassay …………… 66
2.10.2 Endophyte detection in plants via aniline blue staining ………………... 67
2.11 Staining techniques ………………………………………………………….. 68
2.11.1 Calcofluor White staining ………………………………………………. 68
2.11.2 FM4-64 staining ………………………………………………………... 68
2.12 Microscopy ………………………………………………………………….. 68
2.12.1 Obtaining leaf and tiller tissue samples for microscopy ………………... 68
2.12.2 Light, DIC and florescence microscopy ………………………………... 69
2.12.3 Confocal laser scanning microscopy …………………………………… 69
x
2.12.3.1 Calcium imaging using confocal laser scanning
microcopy ……………………………………………….. 70
2.12.3.2 Visualising nuclear tagged hyphae using confocal laser
scanning microcopy……………………………………... 70
2.12.3.3 Hyphal apical growth rate determination using confocal
microscopy………………………………………………. 71
2.13 Radial colony growth rate determination …………………………………… 71
2.14 Statistics ……………………………………………………………………... 72
2.15 Bioinformatics ………………………………………………………………. 72
3. Characterisation of WscA of E. festucae and its role in intercalary growth ... 74
3.1 Identification of the S. cerevisiae wscA gene orthologue in E. festucae ……… 75
3.2 Targeted deletion of the wscA gene in E. festucae ……………………………. 78
3.3 Functional characterisation of the E. festucae wscA gene during growth in
culture …………………………………………………………………………. 82
3.3.1 Deletion of wscA in E. festucae affects radial growth and morphology in
axenic culture …………………………………………………………… 82
3.3.2 Osmotic stabilization can rescue E. festucae ∆wscA phenotypes on the
PDA culture medium …………………………………………………… 87
3.3.3 E. festucae ∆wscA mutants are sensitive to cell wall perturbation agents 90
3.4 WscA localization in E. festucae hyphae ……………………………………... 92
3.5 Impact of wscA deletion on colonization of plants by E. festucae ……………. 96
3.5.1 Deletion of wscA does not influence E. festucae colonization of its host
(L. perenne) …………………………………………………………….. 96
3.5.2 Deletion of wscA has no impact on the phenotype of the host …………101
xi
3.6 Discussion …………………………………………………………………….101
4. Characterisation of MidA of E. festucae and its role in intercalary growth..113
4.1 Identification of the S. cerevisiae mid1 orthologue in E. festucae ………...... 114
4.2 Targeted deletion of the midA gene in E. festucae ………………………….. 118
4.3 Functional characterisation of the E. festucae midA gene during growth in
culture ……………………………………………………………………….. 122
4.3.1 Deletion of midA in E. festucae affects radial growth and morphology on
PDA …………………………………………………………………… 122
4.3.2 Osmotic stabilization can rescue E. festucae ∆midA phenotypes on the
PDA culture medium ………………………………………………….. 128
4.3.3 Influence of calcium supplementation on the phenotype of E. festucae
∆midA in culture ………………………………………………………. 130
4.3.4 E. festucae ∆midA mutants are sensitive to cell wall perturbation
agents…………………………………………………………………... 135
4.4 Deletion of midA in E. festucae restricts hyphal entry into the host intercalary
growth zone …………………………………………………………………. 138
4.4.1 ∆midA host colonization ………………………………………………. 138
4.4.2 Deletion of midA has no impact on the phenotype of the host ………... 144
4.5 Calcium distribution in E. festucae hyphae and the role of MidA in calcium
uptake ………………………………………………………………………... 145
4.5.1 Calcium pulses in apical compartments of E. festucae during growth in
axenic culture …………………………………………………………. 146
4.5.2 Deletion of midA in E. festucae effects dynamics of Ca2+ pulses …….. 151
xii
4.5.3 Ca2+ pulses occur in intercalary compartments in E. festucae WT and
ΔmidA hyphae ………………………………………………………… 156
4.5.4 Ca2+ pulses in E. festucae are due to influx of exogenous Ca2+ ……… 158
4.5.5 Intensely-labelled calcium foci visible at hyphal tips ………………… 160
4.6 Discussion …………………………………………………………………… 162
5. Intercalary growth in E. festucae hyphae …………………………………….176
5.1 Evidence of intercalary growth in sub-apical compartments of E. festucae
hyphae ……………………………………………………………………….. 177
5.1.1 Nuclear division and septation occurs in sub-apical compartments of
E. festucae hyphae …………………………………………………….. 177
5.1.2 Sub-apical compartment division occurs according to a compartment
length-dependent hierarchy …………………………………………… 181
5.2 Nuclear shape differs in different plant regions …………………………….. 185
5.3 Can mechanical stretching trigger intercalary growth in E. festucae hyphae?.188
5.3.1 Optimization of a technique to mechanically stretch fungal hyphae under
in vitro conditions ………………………………………………………. 189
5.3.1.1 The strategy ………………………………………………………….. 189
5.3.1.2 Selection of a suitable membrane …………………………………… 190
5.3.1.3 Selection of a suitable nutrient medium ……………………………... 190
5.3.1.4 Stretching hyphae ……………………………………………………. 192
5.3.2 Stretching E. festucae hyphae in vitro ………………………………….. 197
5.3.3 Applied mechanical stretch can increase the length of hyphal
compartments……………………………………………………………. 198
xiii
5.4 Mechanical stretching applied in intervals can increase overall length of hyphae
while maintaining viability ………………………………………………….. 203
5.5 E. festucae hyphae increase the rate of compartmentalization as a response to
sub-apical compartment elongation caused by mechanical stretching ……... 213
5.6 A possible role for calcium in sensing mechanical stress in E. festucae? …... 216
5.6.1 Mechanical disturbance of E. festucae in vitro induces Ca2+ pulses …... 216
5.7 Discussion …………………………………………………………………… 218
6. Summery, conclusions and future work ……………………………………... 232
6.1 Stimulation of intercalary growth in E. festucae through mechanical stress ... 233
6.2 Putative sensors of mechanical stress in E. festucae ………………………... 236
6.3 General conclusion ………………………………………………………….. 242
7. References ……………………………………………………………………... 244
8. Appendices …………………………………………………………………….. 260
8.1 Appendix 1: Buffers used in this study ……………………………………… 260
8.2 Appendix 2: PCR and restriction enzyme reaction mixtures and conditions .. 262
8.3 Appendix 3: Plasmid vector maps …………………………………………... 263
8.4 Appendix 4: MidA and WscA protein sequences …………………………… 272

xiv
List of figures
Figure 1.1: Growth zones and hyphal distribution of E. festucae in L. perenne……… 6
Figure 1.2: A diagrammatic representation of intercalary growth in E. featucae hyphae
in the host (L. perenne) elongation zone. ………………………………... 13
Figure 1.3: Diagram showing the involvement of fungal calcium transporters in
maintenance of calcium homeostasis and calcium signalling. ………….. 25
Figure 1.4: Diagram showing the main components and signal transduction of the Cell
Wall Integrity (CWI) MAP kinase pathway of S. cerevisiae. …………… 32
Figure 3.1: Multiple sequence alignment between Mid1 of S. cerevisiae and
orthologues of E. festucae, N. crassa and A. fumigatus. …………………77
Figure 3.2: PCR screening to identify E. festucae wscA gene replacement mutants….79
Figure 3.3: Southern blot analysis to confirm the wscA replacement locus in putative
wscA replacement mutants. ……………………………………………… 81
Figure 3.4: Comparison of E. festucae WT and ΔwscA radial growth rates in culture on
the PDA medium. ……………………………………………………….. 83
Figure 3.5: Aberrant colony morphology in E. festucae ΔwscA mutants. …………… 84
Figure 3.6: Cell wall aberrations in E. festucae ∆wscA mutants. ……………………. 86
Figure 3.7: Effect of sorbitol concentration on the growth rate, colony morphology and
hyphal morphology of E .festucae WT and ∆wscA mutants. ……………. 89
Figure 3.8: Sorbitol mitigation of defects in radial growth rate and colony morphology
caused by Calcofluor White in E. festucae WT and ∆wscA mutants. …… 91
Figure 3.9: Subcellular localization of WscA fused to EGFP. ………………………. 95
Figure 3.10: Perennial ryegrass leaf sheath showing sub-cellular localization of WscA-
EGFP in hyphae growing in planta. ……………………………………... 96
xv
Figure 3.11: Comparison of hyphal colonization in L. perenne tillers infected with
E. festucae WT and wscA deletion mutants expressing EGFP. ………...100
Figure 4.1: Multiple sequence alignment between Mid1 of S. cerevisiae and
orthologues of E. festucae, C. purpurea, N. crassa and G. zeae. ……... .117
Figure 4.2: PCR screening to identify E. festucae midA gene replacement mutants...119
Figure 4.3: Southern blot analysis to confirm midA replacement and absence of ectopic
integration in putative E. festucae midA replacement mutants. ………... 121
Figure 4.4: A comparison of the colony radial growth rate and colony morphology of
E. festucae ΔmidA with the wild-type. …………………………………. 124
Figure 4.5: Hyphal tip damage in E. festucae ∆midA in culture. …………………... 125
Figure 4.6: Comparison of the hyphal morphology of E. festucae ΔmidA mutant with
the WT & complemented strain cultured on PDA. ……………………. 127
Figure 4.7: Effect of sorbitol concentration on growth rate, colony morphology and
hyphal morphology of E. festucae WT and ∆midA. …………………… 129
Figure 4.8: Analysis of E. festucae WT and ∆midA radial growth rate and colony
morphology on PDA with elevated Ca2+ or EGTA. ………………….. 133
Figure 4.9: Analysis of hyphal morphology of E. festucae WT and ∆midA on PDA
supplemented with different [Ca2+]. …………………………………… 134
Figure 4.10: Analysis of radial growth rate and colony morphology of E. festucae WT
and ∆midA on PDA in the presence of CW and CR. …………………. 137
Figure 4.11: Comparison of hyphal colonization in L. perenne tillers infected with WT
and midA deletion mutants expressing EGFP. ………………………...142
Figure 4.12: Comparison of hyphal colonization in the meristem and the developing
leaves by WT and ∆midA expressing EGFP. ………………………… 143
xvi
Figure 4.13: Transverse section from a pseudostem of a single tiller infected with
∆midA showing distribution of hyphae along the length of the leaves...143
Figure 4.14: The effect of ∆midA colonisation on morphology of L. perenne host
plants. ………………………………………………………………………………... 144
Figure 4.15: Temporal Ca2+ dynamics in E. festucae WT hyphal tips expressing calcium
sensor GCaMP5. ………………………………………………………. 149
Figure 4.16: Analysis of spatial distribution of Ca2+ at the E. festucae WT hyphal tip
expressing the GCaMP5 calcium sensor. ……………………………... 150
Figure 4.17: Temporal Ca2+ dynamics in E. festucae ∆midA hyphal tips expressing
calcium sensor GCaMP5. ……………………………………………... 153
Figure 4.18: Spatial distribution of Ca2+ at the hyphal tip of E. festucae ∆midA
expressing the GCaMP5 calcium sensor. ……………………………... 154
Figure 4.19: Ca2+ pulses in E. festucae ∆midA complemented strains expressing
calcium sensor GCaMP5. …………………………………………….. 155
Figure 4.20: Ca2+ pulses in an intercalary compartment and in a sub-apical region of
E. festucae hyphae. ……………………………………………………. 157
Figure 4.21: Effect of elevated or depleted exogenous calcium on Ca2+ pulses in
E. festucae WT hyphal tips expressing GCaMP5. ……………………..159
Figure 4.22: Fluorescent foci in E. festucae hyphal tips expressing the GCaMP5
calcium sensor. ………………………………………………………... 161
Figure 5.1: Phase contrast and florescence images of CW-stained and nuclear-labelled
apical and sub-apical compartments of E. festucae WT hyphae. ……... 178
Figure 5.2: Positions of nuclei relative to cell walls and septa in sub-apical
compartments of nuclear-tagged E. festucae hyphae. …………………. 179
xvii
Figure 5.3: Comparison of compartment lengths and longitudinal nuclear lengths along
WT E. festucae hyphae. ………………………………………………... 181
Figure 5.4: Fluorescence images of a nuclear-tagged E. festucae WT hyphal segment
showing compartmentalization in sub-apical compartments. …………... 183
Figure 5.5: Analysis of compartmentalization in sub-apical compartments of nuclear
tagged E. festucae hyphae. …………………………………………….. 184
Figure 5.6: E. festucae nuclear shape variation in different tissues of a developing
leaf. ……………………………………………………………………... 187
Figure 5.7: Calculation of E. festucae longitudinal nuclear lengths in different growth
zones of the developing leaf. …………………………………………… 188
Figure 5.8: Diagrammatic representation showing the arrangement of components used
to grow E. festucae hyphae on amino-coated silicon membranes. …….. 191
Figure 5.9: Selection of the best medium to grow hyphae on amino-coated silicon
membranes. …………………………………………………………....... 192
Figure 5.10: The apparatus used to stretch E. festucae hyphae under in vitro
conditions. ……………………………………………………………...194
Figure 5.11: Fibre stretcher used to stretch fungal hyphae growing on a silicon
membrane. ……………………………………………………………. 196
Figure 5.12: Effects of excessive stretching on hyphal integrity. …………………... 198
Figure 5.13: Effect of mechanical stretching on compartment lengths in E. festucae
hyphae. ………………………………………………………………... 201
Figure 5.14: Effect of mechanical stretching on the integrity of plasma membranes in
nuclear tagged E. festucae hyphae. …………………………………… 203
Figure 5.15: Mitosis and septation in sub-apical compartments of un-stretched and
stretched hyphae. ……………………………………………………… 208
xviii
Figure 5.16: Change in length of each sub-apical compartment (2nd to the 11th) in
stretched and un-stretched E. festucae hyphae. ………………………. 212
Figure 5.17: Septation (new compartment formation) rate in sub-apical compartments
of stretched and un-stretched hyphae. ………………………………… 215
Figure 5.18: Diagrammatic representation showing the arrangement of components
used to grow E. festucae hyphae on amino-coated silicon membranes…217
Figure 5.19: A model showing compartment length-dependent nuclear division and
septation in sub-apical compartments of E. festucae hyphae. ………… 222
Figure 5.20: A sketch of the proposed model for mechanical stretch induced intercalary
growth in sub-apical compartments of E. festucae hyphae. ………….. 227
Figure 5.21: A representative sketch comparing nuclear division and septation at 4 time
points between an un-stretched hypha and a stretched hypha. ………... 228
Figure 8.1: Donor vectors pDONR-SML and pDONR-SMR (InvitrogenTM)
used to construct gene replacement vectors. ………………………….. 263
Figure 8.2: Replacement vectors for midA harbouring the 5' flank pSAM1 and 3'
flank pSAM2 . …………………………………………………………264
Figure 8.3: Replacement vectors for wscA harbouring the 5' flank pSAM3 and 3'
flank pSAM4 . ……………………………………………………… 265
Figure 8.4: Vector pII99 used for complementation vector construction. …………. 266
Figure 8.5: Vector pSAM5 for ΔmidA complementation. …………………………. 266
Figure 8.6: Vector pSAM6 for ΔwscA complementation. …………………………. 267
Figure 8.7: Donor vector pDONR/Zeo (InvitrogenTM) used for wscA:egfp expression
vector construction. ……………………………………………………. 267
xix
Figure 8.8: Entry vector pSAM7 harbouring wscA with native promoter. ………… 268
Figure 8.9: Destination vector pFPLGh used for wscA:egfp expression vector
construction. ……………………………………………………………. 268
Figure 8.10: Expression vector pSAM8 with wscA:egfp……………………………….. 269
Figure 8.11: Donor vector pDONR221 used for Ptef:wscA:egfp expression vector
construction. ………………………………………………………… 269
Figure 8.12: Entry vector pSAM7 harbouring wscA………………………………... 270
Figure 8.13: Entry vector pDONR-TEF harbouring tef2 promoter. ………………... 270
Figure 8.14: Entry vector pDONR-EGFP harbouring egfp…………………………. 271
Figure 8.15: Expression vector pSAM10 harbouring Ptef:wscA:egfp………………..271

xx
List of Tables
Table 2.1: Organisms and Plasmids used in this study...…………………………… 41
Table 2.2: Antibiotic concentrations used for transformant selection ……………… 45
Table 2.3: Primers used in this study ……………………………………………….. 52
Table 5.1: A representative table showing the division of sub-apical compartments with
time in a hypha from 2nd to the 11th compartment growing on PDA. …... 184
Table 5.2: Compartment length and compartmentalization in sub-apical compartments
of un-stretched and stretched E. festucae hyphae. ………………………. 210
Table 5.3: Sample calculation of the number of new sub-apical compartments formed
per 100 μm of hyphae within a period of 9 h. …………………………... 214
List of movie clips (in annexed CD)
1. E. festucae ΔmidA hyphal tip lysis
2. Calcium imaging in E. festucae
3. Calcium imaging in E. festucae ∆midA
4. Calcium imaging in E. festucae ΔmidA complemented
5. Calcium imaging in sub-apical regions of E. festucae hyphae
6. Calcium imaging in E. festucae hyphae in EGTA
7. Calcium foci in E. festucae hyphal tips
8. Calcium pulses when disturbed
xxi
Abbreviations
aa Amino acid
AmpR Ampicillin resistant
ATP Adenosine triphosphate
BAPTA 1,2-bis(o-aminophenoxy)ethane-N,N,N',N'-tetraacetic acid
BLAST Basic Local Alignment Search Tool
bp Base pair(s)
BS Blocking solution
CaM Calmodulin
ChloR chloramphenicol resistant
cm Centimeter
CR Congo red
CW Calcofluor White
CWI Cell wall integrity
DIC Differential interference contrast
DIG Digoxigenin
DNA Deoxyribonucleic acid
dNTP Deoxynucleotide triphosphates
E value Expect value
EGFP Enhanced Green Fluorescent Protein
xxii
EGTA Ethylene glycol-bis(2aminoethylether)-N,N,N′,N′-tetraacetic acid
ER Endoplasmic reticulum
fmole Femtomole
FRET Förster resonance energy transfer
g Gram
GECI Genetically encoded calcium indicator
GenR Geniticin resistant
GS 1,3-β-glucan synthase complex
GTP Guanosine triphosphate
h Hour(s)
HACS High affinity calcium system
HygR Hygromycin resistant
Kb Kilobase(s)
KanR Kanamycin resistant
L.S Longitudinal section
LACS Low-affinity calcium system
LB Luria-Bertani
LBA Luria-Bertani agar
M Molar
m/s Meters per second
MAPK Mitogen-activated protein kinases
MAPKK Mitogen-activated protein kinase kinase
MAPKKK Mitogen-activated protein kinase kinase kinase
xxiii
mg Milligram
min Minutes
mm Millimeter
mM Millimole
NCBI National Center for Biotechnology Information
NCM Nitrocellulose membrane
ng Nanograms
nM Nanomole
nm Nanometers
oC Degrees Celsius
ORF Open reading frame
PCR Polymerase chain reaction
PDA Potato dextrose agar
PDB Potato dextrose broth
PEG Polyethylene glycol
PKC Protein kinase C
rcf Relative centrifugal force
RE Restriction enzyme
RG Regeneration
rpm Revolutions per minute
RT Room temperature
s Seconds
SAM Shoot apical meristem
xxiv
SD Standard deviation
SDS Sodium dodecyl sulphate
SNARE N-ethylmaleimide-sensitive factor attachment protein receptors
Sorb Sorbitol
T.S Transverse section
TAE Tris-acetate-EDTA
tBLASTn Translated nucleotide database search using a protein query
TEF Translation elongation factor
U Unit
USA United States of America
v/v Volume/volume ratio
w/v Weight/volume ratio
WT Wild type
YFP Yellow fluorescent Protein
YH2A Histone protein HH2A fused to yellow fluorescent protein
[Ca2+]c Cytoplasmic calcium concentration
μg Microgram
μL Microliters
μm Micrometer
μM Micromolar

1
1. Introduction
2
1.1 Epichloë festucae
Epichloë festucae is an important biotrophic endophytic fungus that grows
symbiotically within the intercellular spaces of cool-season grasses Festuca and
Koeleria spp. within the subfamily Pooideae (Leuchtmann et al., 1994; Schardl et al.,
1997; Craven et al., 2001; Christensen et al., 2002). E. festucae and its close asexual
relative E. festucae var. lolii (formally Neotyphodium lolii, host Lolium perenne L sub
species perenne) (Glenn et al., 1996; Leuchtmann et al., 2014) belong to the fungal
phylum Ascomycota, order Hypocreales, family Clavicipitaceae. The family
Clavicipitaceae contain mostly biotrophs that grow in plants, invertebrates or other
fungi as mutualistic symbionts or pathogens (Kuldau et al., 1997; Schardl et al., 2013).
Within Clavicipitaceae, Epichloë spp. are categorised into sub family Clavicipitoideae
along with other economically important graminicolous fungi that belong to the genera
Claviceps and Balansia (White Jr et al., 2000; Sung et al., 2007).
E. festucae forms mostly mutualistic symbioses with its grass hosts, although can
become antagonistic during sexual reproduction. The endophyte gains nutrients while
living within grass intercellular spaces and also can use the host for vertical (asexual) or
horizontal (sexual) dissemination. In return, the endophyte produces alkaloidal
secondary metabolites such as ergot alkaloids, indole-diterpenes, lolines and peramine
that give protection against insect herbivory (Wilkinson et al., 2000; Tanaka et al.,
2005; Schardl et al., 2007; Schardl et al., 2013). As Festuca and Lolium species are
frequently used in pastoral agriculture, mutualistic interactions between E. festucae or
E. festucae var. lolii and these grasses have become the subject of numerous studies.
Although the natural hosts of E. festucae are Festuca or Koeleria spp., most studies
aimed at understanding the molecular interactions between the two organisms have been
3
conducted using L. perenne as the host due to the ease of inoculation and maintenance
of plants. E. festucae can colonise L. perenne and forms a stable mutualistic symbiosis
similar to that which it forms with its natural host (Christensen et al., 1997; Christensen
et al., 2002; Scott et al., 2012).
1.1.1 Transmission
Epichloë fungi can be vertically transmitted via direct colonization of host seeds, or
horizontally transmitted between plants by entering the sexual cycle and producing
infective ascospores (Schardl et al., 2004). During vertical transmission, asexual hyphae
colonize the emerging inflorescence axis and then spread into the ovaries. Subsequent to
fertilization the ovule develops into a seed and the hyphae colonise the developing
embryo and associated tissues in the seed. As the seed germinates, the hyphae colonise
the emerging shoot apical meristem and spread to newly emerging aerial tissues. This
asexual form of reproduction is not antagonistic to the host (Schardl et al., 2004).
During horizontal transfer, hyphae grow epiphytically around the inflorescence axis
forming a band-like stroma containing the spermatia. Conidia are transmitted via
invertebrates to stromata of the opposite mating type and ascospores are produced in
fruiting bodies (perithecia). The ascospores are released to the air, land on host stigmas
and infect the developing ovules (Scott et al., 1993; Chung et al., 1997; Brem et al.,
1999). This sexual form of reproduction is considered antagonistic as the stroma
completely supresses seed production (choke disease)(Schardl et al., 2004).
Interestingly E. festucae can produce both infected seeds (asymptomatic inflorescences)
and stroma in different tillers of the same plant having both mutualistic and antagonistic
symbiosis (Schardl et al., 2004).
4
1.1.2 Host colonization
Epichloë fungi colonise intercellular spaces of aerial vegetative and reproductive
structures of the host except the anthers and pollen (Christensen et al., 2002; Tanaka et
al., 2006). Hyphae are confined to the intercellular spaces of the host, often attached to
the cell walls. They rarely colonise the vascular bundles and in such a case are mainly
present in the phloem and the protophloem (Christensen et al., 1997; Christensen et al.,
2008). Below ground, hyphae are confined to the apical meristem of the primary root
(colonised during radical formation) and do not colonise the rest of the root system
(Mike Christensen pers. comm.).
Epichloë colonization is finely synchronised with the growth stages of the host. Grass
leaves originate from the Shoot Apical Meristem (SAM) located at the stem apex. The
stem is highly contracted and the apex is therefore located at the base of the plant. Leaf
primordia form by rapid division of cells on the outermost layer of the SAM (Langer,
1979). Soon after a leaf primordium has formed, an axillary bud will develop on the
opposite flank, which will eventually form a new tiller (bundle of grass leaves). A grass
leaf consists of a leaf sheath and a leaf blade separated by collar tissue (Fig 1.1). The
leaf primordia give rise to two meristems, each responsible for separate development of
either the leaf sheath or the leaf blade. In the two meristems, cells divide and thereafter
undergo rapid cell expansion displacing the older cells upwards and thus giving rise to
the leaf sheath and blade. A developing grass leaf therefore consists of three broadly
distinguishable zones, a meristematic zone where cell division occurs, an expansion
zone where cell elongation occurs and mature zones where cell expansion ceases and
cells mature (Fig 1.1).
5
Within a developing host leaf, most Epichloë hyphae show a very distinct pattern of
distribution (Fig 1.1). The hyphae are very dense and highly branched in the basal
meristematic regions where cell division occurs (stem, shoot apical meristem (SAM)
and lateral meristems), while in the leaf expansion zone (where cell elongation occurs)
and the mature leaf they are arranged parallel with the longitudinal axis of the leaf, and
are seldom branched (Tan et al., 2001; Christensen et al., 2002; Christensen et al.,
2008). The transition from proliferative hyphal growth in the meristematic region to
controlled growth in the leaf expansion zone reflects hyphal responses to changes in
host development (Fig 1.1). Hyphae appear to colonise the leaf meristematic zone
largely through apical growth, and the cell expansion zone through intercalary growth
(growth along the length of the filament)(Christensen et al., 2008). This is thought to
result in development of long straight hyphae in the expansion zone and the mature leaf.
When host cell expansion ceases and the leaf starts to mature, the hyphae too cease
further colonisation (Tan et al., 2001; Christensen et al., 2008). This results in a fungal
lifecycle that is finely synchronised with the host.
The intercalary growth process occurring in vegetative Epichloë hyphae during host
colonization is defined as the expansion and septation/division of sub-apical hyphal
compartments (discussed in detail in Section 1.3) (Christensen et al., 2008; Voisey,
2010). Apical hyphal growth has long been accepted as the only mode of growth in
vegetative fungal hyphae, where hyphae extend/grow only at the apex and not in sub-
apical/intercalary compartments (discussed in detail in Section 1.2). Thus the
documentation of intercalary growth in vegetative hyphae of E. festucae during
colonisation of grasses represents a significant departure from standard fungal growth
processes and warrants further research to understand the underlying mechanisms.

6
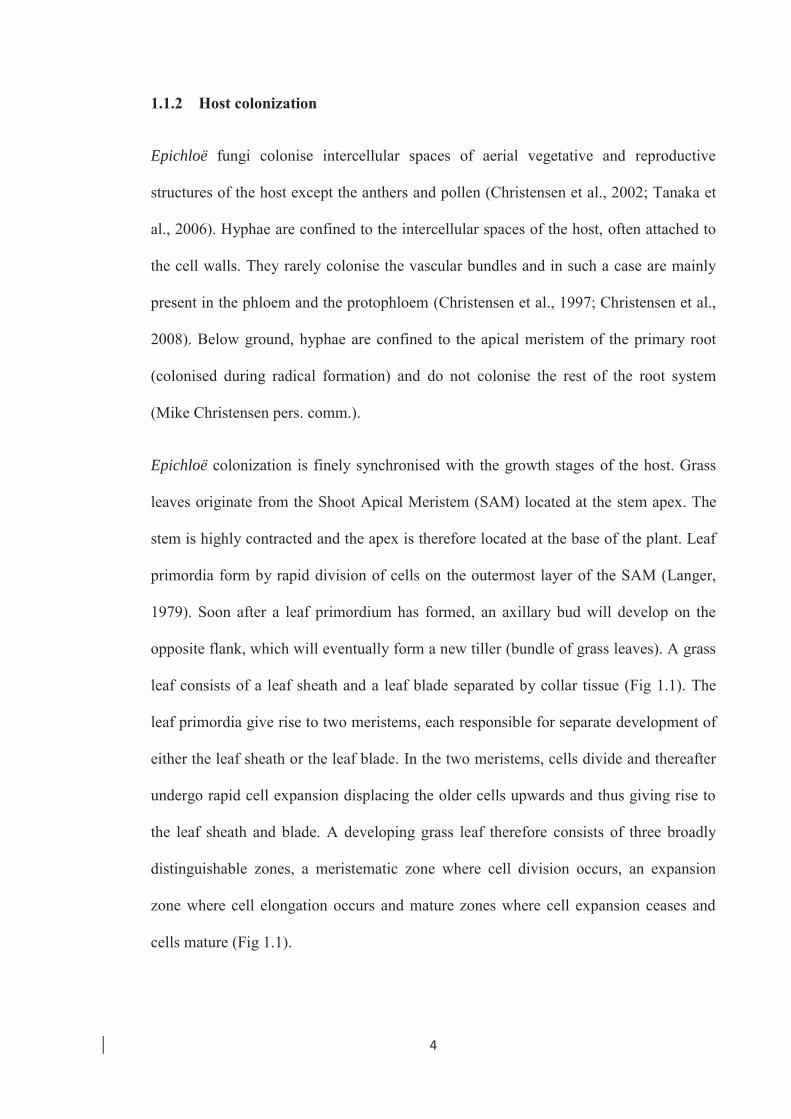
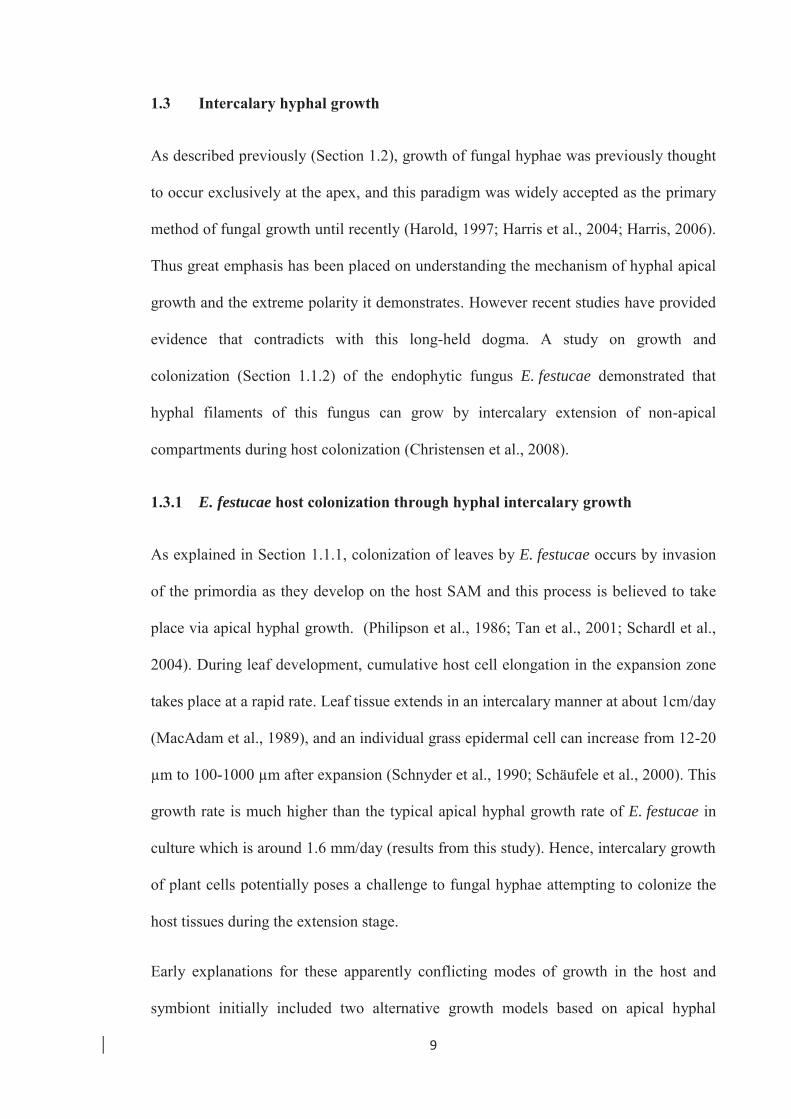
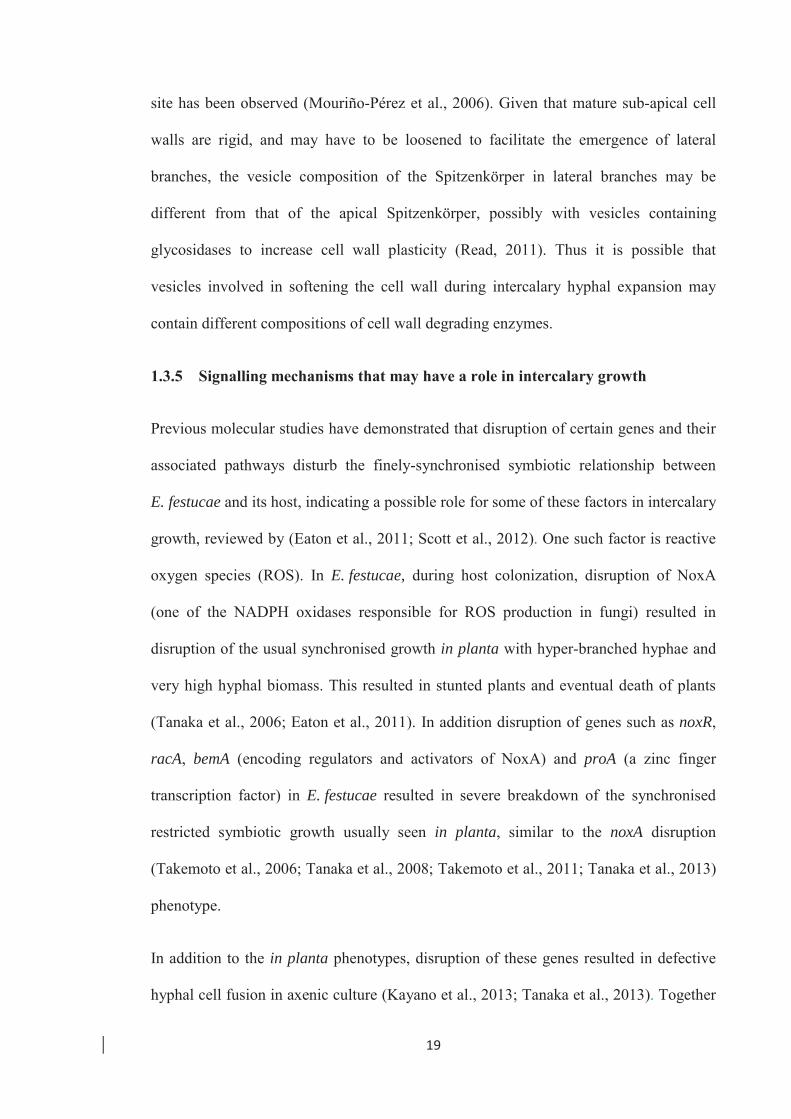
Figure 1.1: Growth zones and hyphal distribution of E. festucae in L. perenne.
The three main development zones (meristematic, expansion and mature) in a developing
L. perenne leaf and the distribution of E. festucae hyphae in these zones are presented. A & B –
Image (A) of L. perenne tillers and a diagram (B) of a developing leaf (not drawn to scale),
Meristematic zone - endophyte colonization occurs through apical growth where host cell
division occurs. Expansion zone - hyphal apical growth transitions to intercalary growth where
host cell expansion occurs. Mature zone - no further host cell expansion or hyphal colonisation.
C & D - Fluorescent and phase contrast images of wild type (WT) E. festucae Fl1 hyphae
expressing EGFP in the meristematic zone, expansion zone and mature zone. E & F –
Fluorescent and phase contrast images of WT E. festucae Fl1 hyphae expressing EGFP in
developing leaves (E) and the shoot apical meristem (F).
1.2 Apical hyphal growth
Filamentous fungi are comprised of tubular hyphae that grow and extend to explore new
environments to obtain nutrients or form complex specialized structures such as fruiting
bodies. Hyphal extension in vegetative hyphae is believed to take place exclusively at
A B C D
E E F F
7
the apex in a polar manner (Gooday, 1995). Polarized apical extension is crucial for
filamentous fungi to colonize and exploit new hosts or substrates (Gooday, 1995; Harris
et al., 2004). Apical growth was proposed and later supported by evidence of deposition
of cell wall material (chitins and glucans) at the apex (Ward et al., 1888; Bartnicki-
Garcia et al., 1969; Gooday, 1971). Two models have been proposed to explain this
phenomenon (Steinberg, 2007) ; the steady state model (Wessels, 1986; Sietsma et al.,
2006) and the vesicle supply centre model (Bartnicki-Garcia et al., 1989; Bartnicki-
Garcia et al., 1995). In the steady state model the cell wall of the growing apex always
remains flexible, allowing extension of the hypha via cytoplasmic turgor pressure.
Synthesis of cell wall material takes place at the apex (chitin and glucan chains) but
these do not cross link until later to form a rigid cell wall (Sietsma et al., 2006). As the
hyphae extend, chitins are covalently bound to β-1-3-glucans forming a rigid cell wall
just behind the apex, while allowing hyphal extension at the extreme tip to continue to
take place (Wessels, 1986; Sietsma et al., 2006). In the vesicle supply centre model,
exocytic vesicles containing materials for hyphal extension accumulate at the apex
forming a supply centre known as the Spitzenkörper. The Spitzenkörper moves forward
during growth, providing the materials for cell wall synthesis and determining the
direction and the rate of hyphal extension (Grove et al., 1970; Howard, 1981; Bartnicki-
Garcia et al., 1995; Harris et al., 2005).
1.2.1 Mechanism of hyphal extension
As reviewed by Harris and Momany (2004), the major steps involved in apical
extension in the vesicle supply centre model include polarity establishment (in the germ
tube or the emerging branch) followed by relaying of the polarity signal, recruitment of
the morphogenetic machinery, organization of the cytoskeleton, vesicle transport,
8
exocytosis and deposition of new cell wall material (Harris et al., 2004). Once polarity
has been established it needs to be maintained continuously. In S. cerevisiae cortical
markers composed of proteins Bud3, Bud4, Axl2, Bud8, Bud9, and Rax2 assist in
deciding the polarity, reviewed by (Pringle et al., 1995; Pruyne et al., 2000; Harris et al.,
2004). Once polarity has been established the next step is to relay the signal to establish
the Spitzenkörper necessary for apical growth. In S. cerevisiae a protein called Cdc24
first moves to the site of polar growth and then activates the protein Cdc42-GDP by
promoting the exchange of GDP for GTP. The activated Cdc42-GTP, together with
Bem1, relays the signal to organize the cytoskeleton for apical growth (Johnson et al.,
1990; Chenevert et al., 1992; Zheng et al., 1995; Pruyne et al., 2000). As a result of
Cdc42 signalling, two multi protein complexes are formed in S. cerevisiae known as the
polarisome and the Arp2/3 complex.
Organization of the actin filaments and transport of exocytic vesicles results in a
collection of vesicles at the Spitzenkörper which also contains F-actins (Howard, 1981),
formins (Sharpless et al., 2002), exocytic vesicles and ribosomes involved in protein
synthesis (Howard et al., 1979). Microtubules and F-actins are involved in transporting
vesicles to the Spitzenkörper and from there to the apex respectively (Fuchs et al.,
2005). In filamentous fungi the molecular motors kinesin 1 and 3, along with dynein,
are mainly involved in long distance vesicle transport along microtubules. Transport of
vesicles from the Spitzenkörper to the plasma membrane at the apex is probably carried
out by F-actins using class V myosin motors, which carry the vesicles toward the apex
(Schuchardt et al., 2005). According to research findings so far, the hyphal extension
machinery appears to be localized to the apex of the hypha due to the initial
establishment of polarity. During hyphal branching the entire machinery is reorganized
and a new polarity axis is established to allow the branch to develop.
9
1.3 Intercalary hyphal growth
As described previously (Section 1.2), growth of fungal hyphae was previously thought
to occur exclusively at the apex, and this paradigm was widely accepted as the primary
method of fungal growth until recently (Harold, 1997; Harris et al., 2004; Harris, 2006).
Thus great emphasis has been placed on understanding the mechanism of hyphal apical
growth and the extreme polarity it demonstrates. However recent studies have provided
evidence that contradicts with this long-held dogma. A study on growth and
colonization (Section 1.1.2) of the endophytic fungus E. festucae demonstrated that
hyphal filaments of this fungus can grow by intercalary extension of non-apical
compartments during host colonization (Christensen et al., 2008).
1.3.1 E. festucae host colonization through hyphal intercalary growth
As explained in Section 1.1.1, colonization of leaves by E. festucae occurs by invasion
of the primordia as they develop on the host SAM and this process is believed to take
place via apical hyphal growth. (Philipson et al., 1986; Tan et al., 2001; Schardl et al.,
2004). During leaf development, cumulative host cell elongation in the expansion zone
takes place at a rapid rate. Leaf tissue extends in an intercalary manner at about 1cm/day
(MacAdam et al., 1989), and an individual grass epidermal cell can increase from 12-20
μm to 100-1000 μm after expansion (Schnyder et al., 1990; Schäufele et al., 2000). This
growth rate is much higher than the typical apical hyphal growth rate of E. festucae in
culture which is around 1.6 mm/day (results from this study). Hence, intercalary growth
of plant cells potentially poses a challenge to fungal hyphae attempting to colonize the
host tissues during the extension stage.
Early explanations for these apparently conflicting modes of growth in the host and
symbiont initially included two alternative growth models based on apical hyphal
10
growth. In the first, colonization of developing host leaf tissues by Epichloë endophytes
was believed to occur via hyphal apical growth. Hyphae were first proposed to grow
independently of the host, with hyphae sliding between host cells within the
intercellular spaces when the host cells elongated (Schmid et al., 2000; Tan et al., 2001).
However evidence from microscopy investigations revealed that fungal hyphae are
closely attached to the host cell walls, preventing them from sliding independently
within the intercellular spaces of the host tissues (Christensen et al., 2008). The other
evidence was the presence of lateral hyphal branches penetrating between files of host
cells in the intercalary growth zone. If hyphae were sliding between host cells, lateral
branches could not persist as they would be forcibly detached from the main hypha. As
a result of these observations an alternative hypothesis was proposed. According to the
second hypothesis the hyphae break when the host cells elongate and then grow apically
to re-join via anastomosis (Read et al., 2006; Christensen et al., 2008). However there is
no evidence of fragmented hyphae in host tissue or evidence of leakage of cytoplasm
due to breaks in compartment walls (Christensen et al., 2008). It therefore became
apparent that colonization of leaf tissues by E. festucae could not be explained by
classical apical growth models. Intercalary hyphal growth was therefore proposed as the
third model to explain how hyphae are able to colonize, and remain intact, in the leaf
expansion zone (Christensen et al., 2008).
1.3.2 Evidence to support hyphal intercalary growth in developing leaves
Intercalary growth involves extension of hyphal compartments and the formation of
new compartments along the length of the filament. This mode of growth was proposed
to explain how Epichloë hyphae are able to grow (cumulatively) through intercalary
growth at a much higher rate than through apical growth alone. Furthermore since
11
fungal hyphae are attached to host cells, when the host cells elongate rapidly, it is
reasonable to assume that this rapid elongation imposes a mechanical stress/force on the
hyphae (Fig 1.2). It has been hypothesised that this results in intercalary cell wall
synthesis and new compartment formation (discussed in detail later), enabling the
hyphae to grow in synchrony with the rapidly elongating host cells and along the
longitudinal axis of the growing leaf. This hyphal growth model was supported by
microscopic evidence (Christensen et al., 2008). TEM studies revealed that hyphae,
firmly attached to host cell walls, could be observed to be stretched between cells. The
presence of angled septa was further evidence to support hyphal stretching.
The study also showed that the distance between two lateral hyphal branches in the leaf
elongation zone increased by about 3.7% per hour, which implied that the length of the
intact hyphae in the elongation zone had increased. Conversely, no intercalary growth
was observed in hyphae occupying the mature leaves. Furthermore, there was no
correlation between compartment lengths and distance from the base of the leaf as
would be expected if hyphal compartments simply increased in length over time. The
study therefore suggested that the primary cause for hyphal extension was formation of
new compartments (initiation of the cell cycle) and not solely expansion of pre-existing
compartments. Moreover, the hyphae within each host developmental zone looked
uniform in ultra-structure, which implied that they were of similar age and development
stage, and had not entered the tissue at different times as would have been expected if
hyphae were entering the tissue from the base by growing at the tip. Hyphae in the host
elongation zone had a simple ultra-structure with thin cell walls, and hyphae in the
mature zone of the leaf had thicker cell walls and a complex ultra-structure composed of
crystaloid bodies (Christensen et al., 2008). This provided further support that cell wall
synthesis/intercalary growth was taking place in the elongation zone of the leaf.
12
Also evident was that the hyphae grow in synchrony with the host tissues as larger,
thick-walled hyphae were always found in association with mature leaf tissues
(Christensen et al., 2008). Although hyphae do not extend in mature leaf tissues, they
remain metabolically active and continue to synthesise cell wall resulting in thicker
hyphal walls in mature parts of the leaf (Tan et al., 2001; Christensen et al., 2008). The
study by Christensen, Bennett et al. 2008 proposed that mechanical stress imposed by
rapidly elongating, closely attached, host cells provide the stimulus for intercalary
hyphal growth, and in the absence of this stimulus intercalary growth will cease (Fig
1.2). This proposed mechanism explains why younger hyphae are only observed in the
leaf elongation zone where intercalary growth occurs and mature hyphae (with thick cell
walls but no extension) are present in the mature part of the leaf, where host cells do not
expand (no stimulus). This hypothesis also explains why mature leaf tissues cannot be
infected after they have ceased growing. Therefore, in summary, E. festucae hyphal
colonization occurs in perfect synchrony with its host plant. In the meristematic tissues,
where rapid cell division is taking place, host tissues are colonized via apical growth. In
the leaf elongation zone, where host cells elongate, colonization is predominantly via
intercalary growth and then hyphal extension ceases as the host cells mature and stop
further growth.
13
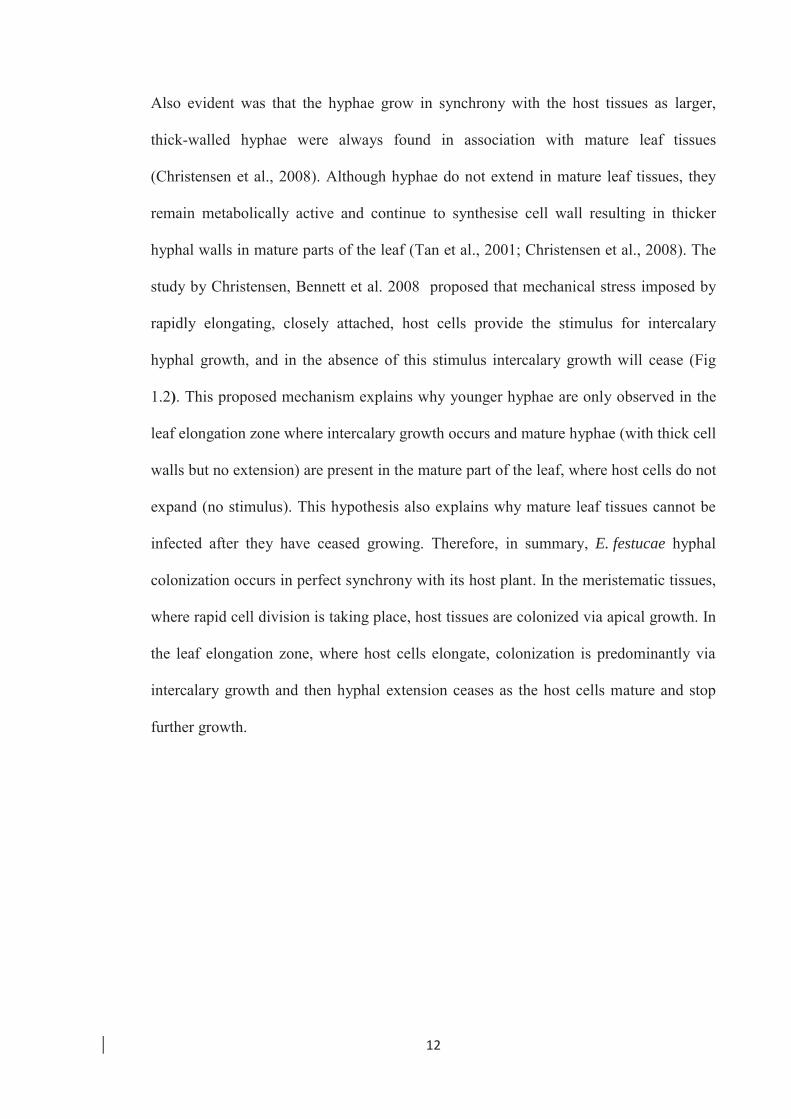
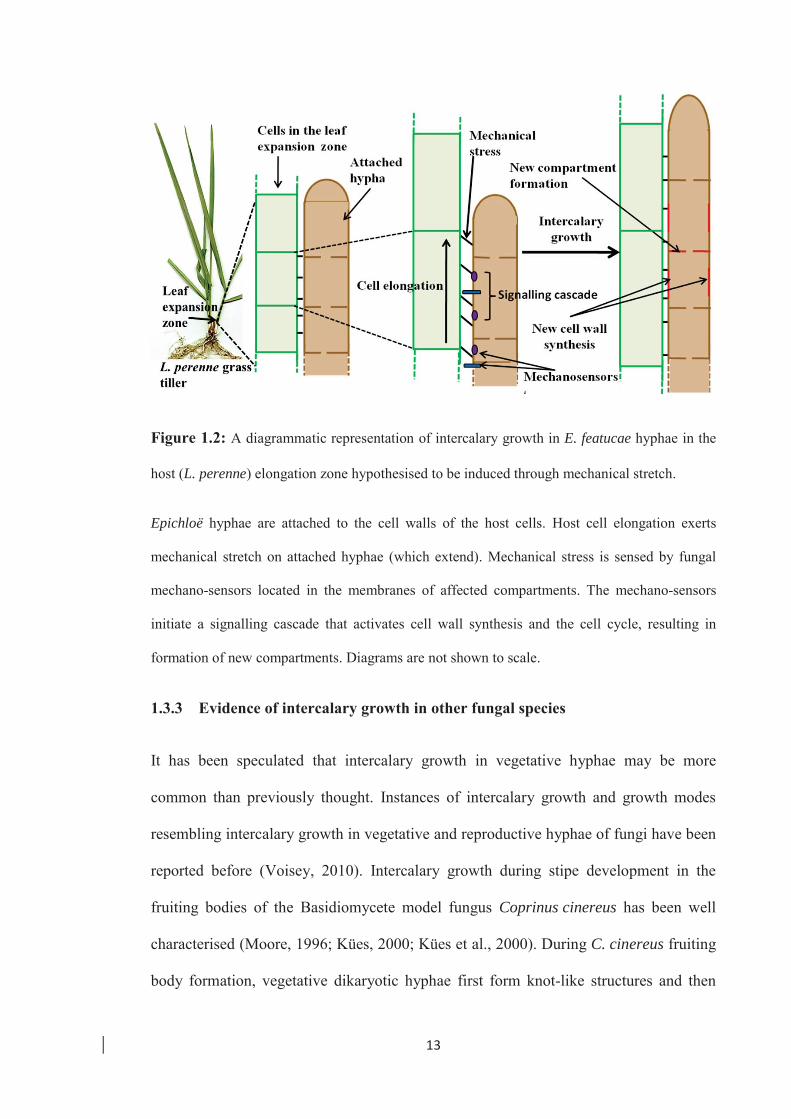
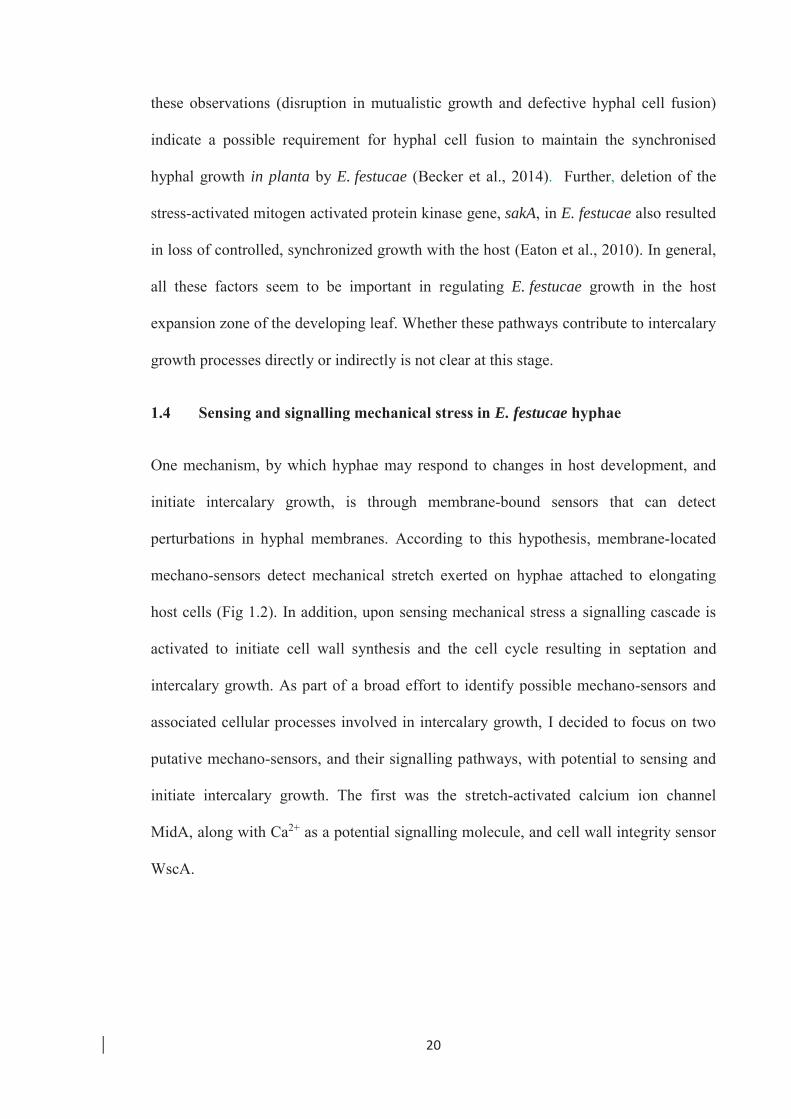
Figure 1.2: A diagrammatic representation of intercalary growth in E. featucae hyphae in the
host (L. perenne) elongation zone hypothesised to be induced through mechanical stretch.
Epichloë hyphae are attached to the cell walls of the host cells. Host cell elongation exerts
mechanical stretch on attached hyphae (which extend). Mechanical stress is sensed by fungal
mechano-sensors located in the membranes of affected compartments. The mechano-sensors
initiate a signalling cascade that activates cell wall synthesis and the cell cycle, resulting in
formation of new compartments. Diagrams are not shown to scale.
1.3.3 Evidence of intercalary growth in other fungal species
It has been speculated that intercalary growth in vegetative hyphae may be more
common than previously thought. Instances of intercalary growth and growth modes
resembling intercalary growth in vegetative and reproductive hyphae of fungi have been
reported before (Voisey, 2010). Intercalary growth during stipe development in the
fruiting bodies of the Basidiomycete model fungus Coprinus cinereus has been well
characterised (Moore, 1996; Kües, 2000; Kües et al., 2000). During C. cinereus fruiting
body formation, vegetative dikaryotic hyphae first form knot-like structures and then
14
aggregate and differentiate to form a primordium (Matthews et al., 1972; Kües et al.,
2000) . The primordium expands rapidly to form the basal plectenchyma, stipe and cap
of the mushroom (Hammad et al., 1993). The cells in the middle section of the
primordium give rise to the stipe (Kües et al., 2000), and it has been shown that rapid
development and elongation of the stipe is predominantly due to hyphal intercalary
growth via rapid cell elongation, and not due to cell division (although limited cell
division can occur) (Eilers, 1974; Kamada et al., 1977b; Hammad et al., 1993). Rapid
cell expansion is driven by cellular turgor pressure maintained throughout the expansion
(Craig et al., 1977; Gooday, 1982; Moore, 1984; Kamada, 1994) and cell elongation
occurs vertically in a diffuse manner while cell width remains the same (Hammad et al.,
1993). To facilitate this, the cell walls need to be flexible and harder at the same time to
withstand the high turgor pressure created within elongating cells. Another example of
intercalary growth occurring in reproductive hyphae is seen in ascocarp formation in the
Ascomycete Trichometasphaeria turcica. During ascocarp formation hyphae that
originate from the stroma forming a paraphysis like structure is suspected to occur via
intercalary growth (Voisey, 2010).
Although intercalary growth has been experimentally confirmed in reproductive hyphae,
intercalary growth occurring in vegetative hyphae has not been shown experimentally
thus far except in E. festucae. However there are some instances of vegetative hyphal
growth that resemble intercalary growth. In Allomyces macrogynus intercalary growth
can occur in vegetative aseptate hyphae originating from germinated zoospores when
exposed to atmospheric oxygen concentrations. Under these conditions the hyphae start
cell wall synthesis in intercalary zones increasing the overall width. Under microaerobic
conditions these hyphae grow exclusively at the tip (Cleary et al., 1986; Youatt, 1986;
Youatt et al., 1988). As seen in rhizomorph extension through agar, intercalary growth
15
is suspected to occur in the vegetative hyphae comprising the rhizomorphs of
Armillaria gallica, but yet to be shown experimentally (Yafetto et al., 2009). The thalli
of several lichens have been shown to undergo intercalary growth along with apical
growth to achieve faster growth during thalli expansion (Hestmark, 1997; Sanders,
2001).
1.3.4 Cellular processes associated with intercalary growth
Thus far, a comprehensive mechanism to explain the underlying cellular processes
supporting intercalary growth has not yet been proposed. It is plausible to assume that
cellular processes involved in apical growth also play a similar role in intercalary
growth. Research thus far provides evidence to suggest that cellular processes such as
exocytosis and cell wall synthesis occur in sub-apical compartments under standard
growth conditions (Read, 2011). The exact involvement of these cellular processes
during intercalary growth in vegetative hyphae is yet to be elucidated. However, studies
conducted on C. cinereus stipe elongation provide an insight into cellular activities that
may be occurring during intercalary growth in vegetative hyphae of E. festucae and
other fungi.
1.3.4.1 Cell wall synthesis
One of the basic and critical requirements of hyphal intercalary growth is the ability of
cell walls to adjust and expand during compartment elongation. During intercalary
growth, the cell walls need to be flexible for expansion and also undergo nascent cell
wall synthesis or incorporation of cell wall constituents. Stipe elongation in mushrooms
provides a good analogy to understand the possible activities of the cell wall during
intercalary growth. Stipes in mushrooms can elongate 80 mm within 12 hrs (Stephenson
et al., 1984; Kües, 2000). In Coprinus species during stipe elongation, the sub-apical

16
hyphal compartments expand rapidly and expanding cell walls are reinforced by
deposition of new chitin microfibrils uniformly over the cell wall surfaces (Gooday,
1973; Kamada et al., 1991). Further proof of new cell wall synthesis was provided by
the increase in chitin and glucan synthase activity in the regions of stipe elongation
(Gooday, 1973; Gooday et al., 1975). In contrary to the randomly-arranged chitin
microfibrils of vegetative non-expanding cells (Kamada et al., 1993), chitin microfibrils
in stipe compartments are arranged as helices and positioned parallel and transverse to
the axis of the elongating stipe cells with cross links between chitin and glucans to
provide elasticity for cell expansion and sufficient rigidity to withstand the high turgor
pressure (Kamada et al., 1977b; Kamada et al., 1991; Kamada et al., 1993). In
A. bisporus, autoradiography studies revealed non-polar deposition of new cell wall
material in expanding intercalary compartments (Craig et al., 1977). Use of polyxin D,
which is a specific chitin synthase inhibitor, and N-acetyl-D-[I-3H] glucosamine, which
is a precursor of chitin, has confirmed the importance of chitin synthesis during stipe
elongation in C. cinereus (Gooday et al., 1976).
Cell walls formed during stipe formation may be accompanied by loosening of the cell
wall and resealing between chitin and glucans. As hyphal growth continues, older cell
walls become rigid with cross linking between chitin and β (1→3)-glucan and hydrogen
bonding between chitin microfibrils (Vermeulen et al., 1984; Sietsma et al., 2006).
Further, as the older cell walls mature, secondary cell wall growth can occur, thickening
the cell wall, or additional cell wall layers are added outside the previous cell wall (Klis
et al., 2007; Read, 2011). As a result of these changes, the sub apical cell wall can
become very rigid and may require loosening before undergoing intercalary extension.
Increased activity of cell wall autolytic enzymes during stipe elongation in Coprinus
species has been also demonstrated (Kamada et al., 1982; Kamada et al., 1985).

17
A new form of adaptation in cell wall synthesis during intercalary growth has been
shown for Ramalina menziesii which is a lichen fungus. It is believed that this fungus is
capable of intercalary expansion during lichen growth. According to studies conducted
using TEM it has been shown that the expanding compartments lay down a new cell
wall beneath the old cell wall during expansion and the old cell wall disintegrates and
detaches forming a thick matrix around the hypha (Sanders et al., 1995). It is reasonable
to assume that some of these processes might be involved in intercalary growth in
E. festucae in developing leaves due to the mechanical strain applied by rapidly
elongating host cells. During this process it is necessary to loosen the cell walls
allowing stretching and then to reseal the matrix during or after elongation.
1.3.4.2 Exocytosis
Exocytosis is an essential process that occurs at the tip of an actively growing hypha to
provide the necessary enzymes and material for growth. Numerous vesicles
continuously fuse with the apical plasma membrane releasing cell wall synthesising
enzymes, cell wall constituents, proteins and lipids to facilitate the synthesis of new
membrane and cell walls (Wösten et al., 1991; Harris et al., 2005; Steinberg, 2007). In
addition to tip-centred exocytosis; there is evidence to support exocytosis away from the
hyphal tips in many filamentous fungi (Read, 2011).
A localization study conducted on three soluble N-ethylmaleimide-sensitive factor
attachment protein receptors (SNARE) proteins SNCI, SSOI and SSO2 of the
filamentous fungus Trichoderma reesei revealed that some of the protein complexes can
be seen in sub apical compartments (Valkonen et al., 2007). SNARE proteins are
important in mediating vesicle fusion with cell membranes during exocytosis. In
Aspergillus oryzae, it has been revealed that secretory vesicles containing EGFP-fused
18
AoSnc1 always localizes to the plasma membranes in sub apical septal regions
(Hayakawa et al., 2011).
Secretion of enzymes necessary for cell wall and membrane extension at the hyphal tip
is well established (Wösten et al., 1991; Momany, 2002; Steinberg, 2007). Similarly,
recent studies provide strong evidence to support exocytosis of secretory enzyme from
sub apical compartments. A study conducted using A. oryzae demonstrated that the
secretory enzyme α amylase (AmyB) fused with EGFP (AmyB–EGFP) accumulates at
the Spitzenkörper in hyphal tips, and also between the plasma membrane and the cell
wall of sub-apical septa (Hayakawa et al., 2011). The same study showed that the
plasma membrane transporters, AoUapC (purine uptake) and AoGap1 (amino acid
permease) of A. oryzae accumulate at the septa and lateral plasma membranes and not at
the apex. Together these studies suggest that proteins associated with vesicle fusion
localise to cell membranes in sub-apical compartments implying that exocytosis may
also occur behind the apex.
1.3.4.3 Role of the Spitzenkörper away from hyphal apex
An appropriate mechanism to assist in understanding the role of the Spitzenkörper
behind the hyphal apex is the formation of lateral branches behind the hyphal tip in
filamentous fungi. Lateral branching can occur just behind the septa or at a random
points in sub apical compartments (Harris, 2008). In general, similar to tip growth, de
novo establishment of the morphogenetic machinery/Spitzenkörper and
plasticisation/loosening of the cell wall at the branching site can be considered as two
crucial processes associated with branch formation. In N. crassa, Spitzenkörper
establishment, deformation of the cell wall at the branch initiation site (Riquelme et al.,
2004) and the association of microtubules with the Spitzenkörper at the branch initiation
19
site has been observed (Mouriño-Pérez et al., 2006). Given that mature sub-apical cell
walls are rigid, and may have to be loosened to facilitate the emergence of lateral
branches, the vesicle composition of the Spitzenkörper in lateral branches may be
different from that of the apical Spitzenkörper, possibly with vesicles containing
glycosidases to increase cell wall plasticity (Read, 2011). Thus it is possible that
vesicles involved in softening the cell wall during intercalary hyphal expansion may
contain different compositions of cell wall degrading enzymes.
1.3.5 Signalling mechanisms that may have a role in intercalary growth
Previous molecular studies have demonstrated that disruption of certain genes and their
associated pathways disturb the finely-synchronised symbiotic relationship between
E. festucae and its host, indicating a possible role for some of these factors in intercalary
growth, reviewed by (Eaton et al., 2011; Scott et al., 2012). One such factor is reactive
oxygen species (ROS). In E. festucae, during host colonization, disruption of NoxA
(one of the NADPH oxidases responsible for ROS production in fungi) resulted in
disruption of the usual synchronised growth in planta with hyper-branched hyphae and
very high hyphal biomass. This resulted in stunted plants and eventual death of plants
(Tanaka et al., 2006; Eaton et al., 2011). In addition disruption of genes such as noxR,
racA, bemA (encoding regulators and activators of NoxA) and proA (a zinc finger
transcription factor) in E. festucae resulted in severe breakdown of the synchronised
restricted symbiotic growth usually seen in planta, similar to the noxA disruption
(Takemoto et al., 2006; Tanaka et al., 2008; Takemoto et al., 2011; Tanaka et al., 2013)
phenotype.
In addition to the in planta phenotypes, disruption of these genes resulted in defective
hyphal cell fusion in axenic culture (Kayano et al., 2013; Tanaka et al., 2013). Together
20
these observations (disruption in mutualistic growth and defective hyphal cell fusion)
indicate a possible requirement for hyphal cell fusion to maintain the synchronised
hyphal growth in planta by E. festucae (Becker et al., 2014). Further, deletion of the
stress-activated mitogen activated protein kinase gene, sakA, in E. festucae also resulted
in loss of controlled, synchronized growth with the host (Eaton et al., 2010). In general,
all these factors seem to be important in regulating E. festucae growth in the host
expansion zone of the developing leaf. Whether these pathways contribute to intercalary
growth processes directly or indirectly is not clear at this stage.
1.4 Sensing and signalling mechanical stress in E. festucae hyphae
One mechanism, by which hyphae may respond to changes in host development, and
initiate intercalary growth, is through membrane-bound sensors that can detect
perturbations in hyphal membranes. According to this hypothesis, membrane-located
mechano-sensors detect mechanical stretch exerted on hyphae attached to elongating
host cells (Fig 1.2). In addition, upon sensing mechanical stress a signalling cascade is
activated to initiate cell wall synthesis and the cell cycle resulting in septation and
intercalary growth. As part of a broad effort to identify possible mechano-sensors and
associated cellular processes involved in intercalary growth, I decided to focus on two
putative mechano-sensors, and their signalling pathways, with potential to sensing and
initiate intercalary growth. The first was the stretch-activated calcium ion channel
MidA, along with Ca2+ as a potential signalling molecule, and cell wall integrity sensor
WscA.
21
1.5 Calcium transporters and maintenance of calcium homeostasis in fungi
Calcium ions act as universal secondary messengers in all eukaryotes and regulate a
wide range of cellular processes. In yeast and filamentous fungi, Ca2+ is involved in cell
cycle regulation, morphogenesis, sporulation, spore germination, pathogenesis,
circadian rhythms and polarized hyphal extension (Jackson et al., 1993; Torralba et al.,
2001; Silverman-Gavrila et al., 2002). When exposed to stress conditions, Ca2+ ions
play a major role in signalling and modulating a number of downstream effectors
involved in gene expression and cytoskeleton rearrangement (Cyert, 2003; Rispail et al.,
2009).
Calcium homeostasis in the cytoplasm of fungi is dependent on an equilibrium between
storage, release of calcium from intracellular calcium stores and influx of external
calcium into the cell (de Castro et al., 2014). Typically the cytoplasmic calcium
concentration in fungi is maintained at low levels, for example in S. cerevisiae the free
cytoplasmic Ca2+ concentration at resting state is 50-100 nM and excessive levels can
become toxic (Harren et al., 2013; de Castro et al., 2014). Excess Ca2+ in the cytoplasm
is stored in intracellular compartments such as the vacuole, Golgi apparatus,
mitochondria and the endoplasmic reticulum (Harren et al., 2013; de Castro et al.,
2014), or alternatively expelled from cells across the plasma membrane (Miller et al.,
1990; Bowman et al., 2011). Intracellular calcium stores are replenished by uptake of
calcium from the external environment (Putney Jr, 1990; Hong et al., 2010). In response
to stresses or other stimuli, calcium signalling is triggered by transient increases in
cytoplasmic Ca2+ concentration that are 10 to 100 fold over the basal level, caused by
Ca2+ release from sequestering organelles or transport across the plasma membrane
(Nelson et al., 2004). Immediately thereafter, excess Ca2+ is exported from the
22
cytoplasm across the plasma membrane or sequestered into the vacuole (Cornelius et al.,
1987; Miller et al., 1990; Cunningham et al., 1994a). Calcium homeostasis in fungi is
therefore usually maintained through the activity of calcium channels, pumps and
antiporters located in the plasma membrane, vacuole, endoplasmic reticulum and Golgi
apparatus (Lew et al., 2008; Bowman et al., 2011; Bowman et al., 2012; Harren et al.,
2013; de Castro et al., 2014). Coordination and regulation between these channels,
pumps and antiporters are crucial for eliciting the appropriate calcium signal under
internal and external stresses and subsequent maintenance of general calcium
homeostasis (Harren et al., 2013). Calcium transporters in S. cerevisiae have been very
well characterised and recent sequencing of genomes of many filamentous fungi have
enabled the identification and characterization of similar systems in other fungi (Zelter
et al., 2004; Benčina et al., 2009).
1.5.1 Calcium transporters in the vacuole, Golgi apparatus and endoplasmic
reticulum
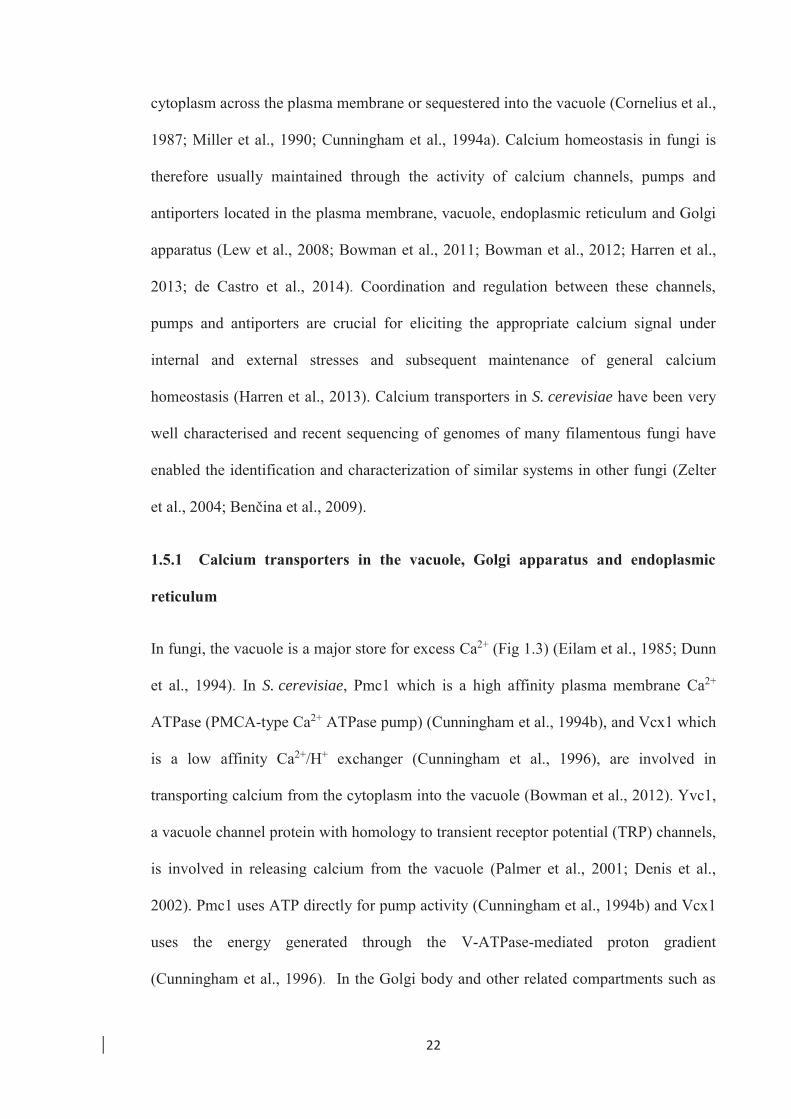
In fungi, the vacuole is a major store for excess Ca2+ (Fig 1.3) (Eilam et al., 1985; Dunn
et al., 1994). In S. cerevisiae, Pmc1 which is a high affinity plasma membrane Ca2+
ATPase (PMCA-type Ca2+ ATPase pump) (Cunningham et al., 1994b), and Vcx1 which
is a low affinity Ca2+/H+ exchanger (Cunningham et al., 1996), are involved in
transporting calcium from the cytoplasm into the vacuole (Bowman et al., 2012). Yvc1,
a vacuole channel protein with homology to transient receptor potential (TRP) channels,
is involved in releasing calcium from the vacuole (Palmer et al., 2001; Denis et al.,
2002). Pmc1 uses ATP directly for pump activity (Cunningham et al., 1994b) and Vcx1
uses the energy generated through the V-ATPase-mediated proton gradient
(Cunningham et al., 1996). In the Golgi body and other related compartments such as
23
the ER, Pmr1, a secretory pathway Ca2+-ATPase (SPCA) is another crucial calcium
pump discovered in S. cerevisiae and found to be involved in Ca2+ and manganese
sequestration (Fig 1.3)(Rudolph et al., 1989; Antebi et al., 1992).
Filamentous fungi have a range of calcium transport proteins additional to those
described in S. cerevisiae (Fig 1.3) (Bowman et al., 2011). For example, in N. crassa, a
sarco/endoplasmic reticulum Ca2+-ATPase (SERCA), Nca-1, and two PMCA-type Ca2+-
ATPases, Nca-2 and Nca-3, play a crucial role in maintenance of general calcium
homeostasis (Bowman et al., 2011). Nca-1 localises to the ER and nuclear envelope,
and Nca-2 and Nca-3 co-localise to the vacuoles close to the hyphal tip, and the plasma
membrane away from the tip (Bowman et al., 2009). Plasma membrane-located Nca-2
and 3 are involved in pumping excess calcium across the plasma membrane (Bowman
et al., 2011). Overall, although S. cerevisiae and filamentous fungi share common
features in the calcium homeostasis mechanism, the presence of Nca1, 2 and 3 in
N. crasssa also suggest that there are significant differences between the two groups
(Fig 1.3).
1.5.2 Calcium uptake systems in the plasma membrane
Studies to date have identified two major calcium uptake systems operating in fungi, a
high affinity calcium system (HACS) and a low affinity calcium system (LACS), which
operate in response to low or high calcium availability respectively (Lew et al., 2008;
Cavinder et al., 2012; Wang et al., 2012). The HACS is a protein complex consisting of
the stretch-activated non-selective calcium ion channel/regulatory protein Mid1 (Iida et
al., 1994), and the L-type voltage-gated calcium channel Cch1 (Fig 1.3) (Fischer et al.,
1997; Paidhungat et al., 1997). Deletion studies of mid1 and cch1 in S. cerevisiae, and
certain filamentous fungi, have demonstrated a common phenotype of impaired growth

24
under low calcium concentration signifying their role in HACS (Liu et al., 2006;
Cavinder et al., 2011; Harren et al., 2013). The calcium channel Fig1, a pheromone-
inducible plasma membrane protein, is the major component of the LACS which is
responsible for calcium uptake when availability is high (Muller et al., 2003; Cavinder
et al., 2012). In addition, in C. albicans and S. cerevisiae , PMP22 Claudin superfamily
member Ecm7 has been shown to be part of the HACS and LACS and involved in
hyphal development and oxidative stress responses (Martin et al., 2011; Ding et al.,
2013).
The three membrane proteins Mid1, Cch1 of HACS and Fig1 of LACS act as the main
calcium influx transporters in the calcium/calcineurin signalling pathway which
regulates many responses under stimulatory and stress conditions (Fig 1.3) (Rispail et
al., 2009). This pathway was initially characterized in S. cerevisiae, and later,
orthologues for most of the proteins in this pathway were found in other fungi (Iida et
al., 1994; Rispail et al., 2009). A comparative analysis conducted by Rispail et al, 2009
across 10 different fungi from a range of genera (S. cerevisiae, Ashbya gossypii,
N. crassa, Schizosaccharomyces pombe, Fusarium graminearum, Magnaporthe grisea,
Ustilago maydis, Aspergillus fumigatus, C. albicans, and Rhizopus oryzae) has revealed
that most of the components in the pathway are conserved (Rispail et al., 2009). The
study revealed that at least one orthologue of each of the proteins in the pathway could
be identified in the genomes studied, and for some proteins multiple gene copies could
be detected. This underpins the importance of the calcium/calcineurin pathway for
growth and development of fungi generally.
This study is focused on investigating the involvement of Mid1 in intercalary growth as
a mechanosensor and in the general maintenance of calcium homeostasis in E. festucae.

25
Recent studies in yeast and certain filamentous fungi have indicated that Mid1 forms a
complex with Cch1 and acts as one unit during influx of calcium (discussed in detail
later). Thus, henceforth, the characteristics of Mid1 in fungi are reviewed along with
Cch1 with more emphasis on Mid1.
Figure 1.3: Diagram showing the involvement of fungal calcium transporters in the
maintenance of calcium homeostasis and calcium signalling. Red arrows indicate the direction
of Ca2+ movement. Calcium entering the cytoplasm binds to calmodulin (Cmd1) that activates
Calcineurin (a complex of Cna1, Cmp2 and Cnb1). Activated calcineurin dephosphorylates
Crz1 (a zinc finger transcription factor) resulting in its translocation to the nucleus. Crz1
regulate genes involved in cell wall synthesis and/or in maintenance of calcium
homeostasis.
26
1.5.2.1 Structural characteristics of Mid1 and Cch1 proteins
Mid1 is a stretch-activated channel protein that responds to cell membrane deformation
due to environmental stress/stimuli (Garrill et al., 1993; Iida et al., 1994; Kanzaki et al.,
1999; Brand et al., 2007). Cch1 however is a voltage gated channel sensitive to
membrane potential (Paidhungat et al., 1997; Zelter et al., 2004). In S. cerevisiae, Cch1
localizes to the plasma membrane (Locke et al., 2000). Orthologues of Cch1 within
different fungi share conserved functional domains. The Cch1 protein consists of an
acidic motif with glutamate residues which provide ionic selectivity, and four domains
each containing 6 transmembrane helices. These helices assemble to form the aqueous
pore of the channel (Zelter et al., 2004; Harren et al., 2013). The structure of the Mid1
protein was first solved in S. cerevisiae. It is a 548 amino acid protein with an estimated
molecular mass of 61,506 Da (Iida et al., 1994). Structural analysis of S. cerevisiae
Mid1 revealed important structural and functional domains which appear to be
conserved in other fungal Mid1 proteins. It has four hydrophobic transmembrane
domains, 16 N-glycosylation sites, and 10 conserved cysteine residues at the C
terminus. Of the 10 cysteine residues, four are essential for its function, three are
intermediate, and three are dispensable. The cysteine-rich region in the C-terminus is
highly conserved and may be involved in protein-protein interactions along with the EF-
hand domain (Iida et al., 1994; Maruoka et al., 2002; Zelter et al., 2004; Ozeki-
Miyawaki et al., 2005). Mid1 proteins identified in other filamentous fungi have
significant structural homology with S. cerevisiae Mid1. The C. purpurea Mid1, which
has 628 amino acids, is 40.6% identical to S. cerevisiae Mid1, 48.8% to N. crassa and
41.9% to C. albicans across the open reading frame with all the key structural features
represented (Bormann et al., 2009).
27
In S. cerevisiae, the Mid1 protein is a membrane protein embedded into the lipid bi-
layer of the plasma membrane via a glycosylphosphatidylinositol (GPI) anchor and has
also been shown to localize to the ER membrane (Yoshimura et al., 2004; Pei et al.,
2012). The 16 N-glycosylation sites are glycosylated in the ER and the protein is then
transported to the plasma membrane by Sec12 (Ozeki-Miyawaki et al., 2005). EGFP-
labelled Mid1 protein in S. cerevisiae accumulates in the plasma-membrane when
exposed to pheromone-α factor (Ozeki-Miyawaki et al., 2005). Similarly, localization
studies showed that the Mid1-Cch1 complex in Cryptococcus neoformans localises to
the plasma-membrane (Hong et al., 2010).
1.5.2.2 Functions of the Mid1 and Cch1 complex
A review of relevant studies conducted to date in S. cerevisiae and filamentous fungi
has identified three broad roles for Mid1 and Cch1: uptake of calcium under low
exogenous calcium conditions, response to ER stress or depleted intracellular calcium
levels and response to environmental stresses/stimuli via transient influxes of calcium
(Viladevall et al., 2004; Hong et al., 2010; Harren et al., 2013). Mid1 and Cch1 are
crucial for calcium uptake under low external concentrations and this is very evident by
the inability of mid1 and cch1 single or double mutants to survive in low calcium
environments created using calcium chelator BAPTA (1,2-Bis(2-
Aminophenoxy)ethane-N,N,N′,N′-tetra acetic acid) or EGTA (Ethylene glycol-bis (2-
aminoethylether)-N,N,N′,N′-tetraacetic acid) (Cavinder et al., 2011; Harren et al.,
2013).
The other main function of Mid1 and Cch1 is to replenish intracellular calcium stores in
the ER. An ER stress response in S. cerevisiae is created when calcium levels in ER
stores become depleted, and is relieved through influx of calcium via the activity of
28
Mid1 and Cch1 (Bonilla et al., 2003). In S. cerevisiae under ER calcium stress,
activation of Cch1–Mid1 occurs via the Mpk1 pathway (Bonilla et al., 2003). Patch
clamping of C. neoformans protoplasts revealed that the Cch1-Mid1 channel complex is
mainly responsible for influx of calcium when intracellular calcium is depleted using
BAPTA-AM (1,2-Bis(2-aminophenoxy)ethane-N,N,N′,N′-tetraacetic acid tetrakis
(acetoxymethyl ester) (Hong et al., 2013).
The third function of Mid1 and Cch1 is to respond to internal or external stresses or
stimuli. For an example, in S. cerevisiae both Mid1 and Cch1 are involved in influx of
Ca2+ when exposed to pheromones (Iida et al., 1994; Fischer et al., 1997). In
S. cerevisiae, mid1 deletion mutants lose viability upon exposure to the mating
pheromone, α factor; they die after differentiating into cells with mating projections/
shmoos. These mutants can be rescued by incubating cells in high concentrations of
CaCl2 but not with other salts or cell wall stabilizing sorbitol (Iida et al., 1994). In
addition, the importance of Mid1 and Cch1 in thigmotropism (responses to surface
ridges), sensitivity to fungicides (Watts et al., 1998; Brand et al., 2009), oxidative stress
(Yu et al., 2012) and cell wall peturbation agents is evident in other fungi (Bormann et
al., 2009; Cavinder et al., 2011). One of the crucial properties of Mid1 relevant to this
study is its assumed ability to act as a mechano-sensor. Mechano-sensitive ion channels
are capable of detecting and responding to mechanical stimuli that cause structural
changes or deformation to the cell membrane (Kloda et al., 2008; Kumamoto, 2008). It
has been shown that Mid1 can import Ca2+ ions under mechanical stress imposed on the
plasma membrane in a number of organisms such as Saprolegnia ferax (Garrill et al.,
1993) and C. albicans (Watts et al., 1998). Also, it is possible that the Mid1 response to
pheromones in S. cerevisiae is a mechanical stress response, as exposure to pheromone
triggers morphological changes in the cell membrane (Iida et al., 1994).
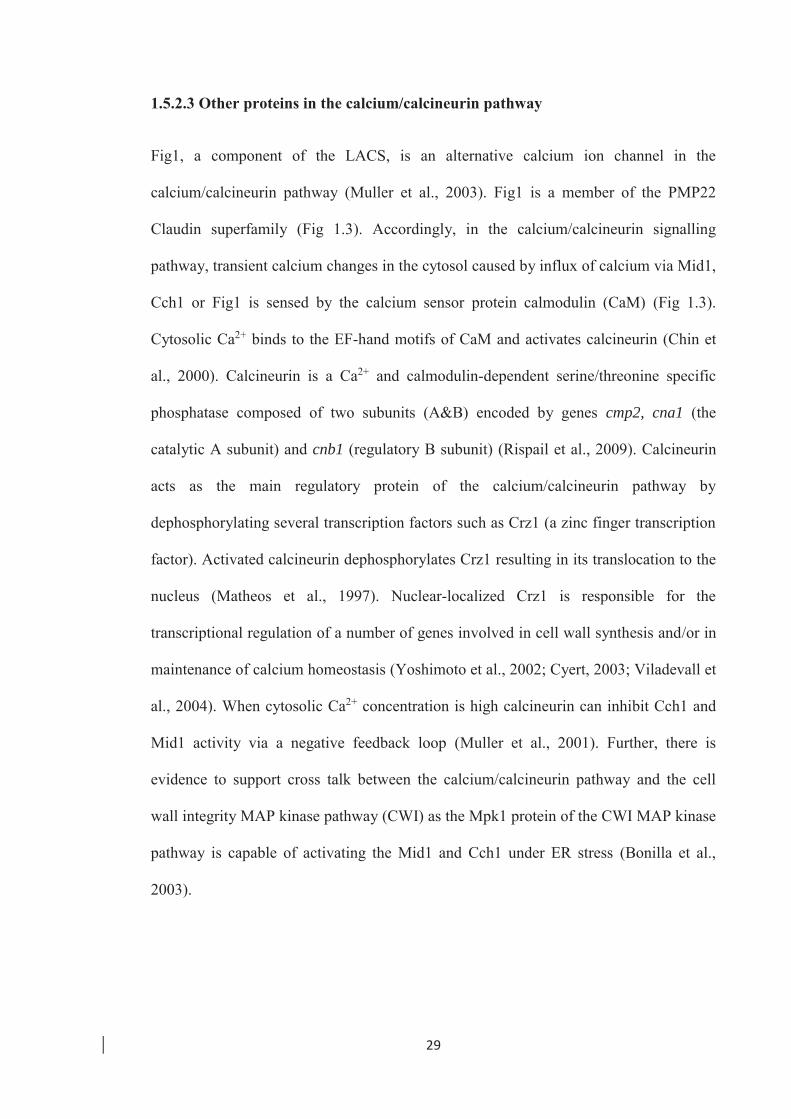
29
1.5.2.3 Other proteins in the calcium/calcineurin pathway
Fig1, a component of the LACS, is an alternative calcium ion channel in the
calcium/calcineurin pathway (Muller et al., 2003). Fig1 is a member of the PMP22
Claudin superfamily (Fig 1.3). Accordingly, in the calcium/calcineurin signalling
pathway, transient calcium changes in the cytosol caused by influx of calcium via Mid1,
Cch1 or Fig1 is sensed by the calcium sensor protein calmodulin (CaM) (Fig 1.3).
Cytosolic Ca2+ binds to the EF-hand motifs of CaM and activates calcineurin (Chin et
al., 2000). Calcineurin is a Ca2+ and calmodulin-dependent serine/threonine specific
phosphatase composed of two subunits (A&B) encoded by genes cmp2, cna1 (the
catalytic A subunit) and cnb1 (regulatory B subunit) (Rispail et al., 2009). Calcineurin
acts as the main regulatory protein of the calcium/calcineurin pathway by
dephosphorylating several transcription factors such as Crz1 (a zinc finger transcription
factor). Activated calcineurin dephosphorylates Crz1 resulting in its translocation to the
nucleus (Matheos et al., 1997). Nuclear-localized Crz1 is responsible for the
transcriptional regulation of a number of genes involved in cell wall synthesis and/or in
maintenance of calcium homeostasis (Yoshimoto et al., 2002; Cyert, 2003; Viladevall et
al., 2004). When cytosolic Ca2+ concentration is high calcineurin can inhibit Cch1 and
Mid1 activity via a negative feedback loop (Muller et al., 2001). Further, there is
evidence to support cross talk between the calcium/calcineurin pathway and the cell
wall integrity MAP kinase pathway (CWI) as the Mpk1 protein of the CWI MAP kinase
pathway is capable of activating the Mid1 and Cch1 under ER stress (Bonilla et al.,
2003).
30
1.6 Cell wall integrity MAP kinase pathway
The cell wall integrity MAP kinase pathway (CWI) was first discovered in S. cerevisiae
as a response mechanism to factors that alter the integrity of the cell wall (Verna et al.,
1997). Cell wall integrity can be challenged as a result of normal growth and
differentiation, or through environmental stresses. The rigid structure of the cell wall of
S. cerevisiae requires alteration to accommodate changes during growth (budding) and
also pheromone-induced morphogenesis (mating projection formation). On the other
hand various environmental stresses that can challenge the integrity of the cell wall need
to be sensed and responded to accordingly (Levin et al., 1993; Cid et al., 1995; Kamada
et al., 1995; Fuchs et al., 2009; Levin, 2011). The cell wall integrity MAP kinase
signalling pathway acts as the machinery that senses and monitors these changes or
stresses to the cell wall, and activates necessary responsive mechanisms to remodel or
repair the cell wall. Hence CWI MAP kinase pathway is important in regulating and
maintaining cell shape and synthesis of the cell wall. The signalling pathway is a
MAPK signalling cascade composed of sensing proteins and a PKC1-MPK1 signalling
cascade (Levin, 2005).
1.6.1 Role of the cell wall integrity MAP kinase pathway
A number of phenotypes relating to this pathway were initially discovered in
S. cerevisiae via gene mutation studies. Null mutations in genes of this pathway resulted
in the inability to acquire thermotolerance when treated with mild heat (37oC); mutants
die when exposed to higher temperatures that normal cells are able to survive
(temperatures of up to 55oC) (Kamada et al., 1995; Verna et al., 1997; Ketela et al.,
1999). Additionally, mutations in the pathway made the cells susceptible to hyper
osmotic shock due to inability to activate the PKC1-MPK1 signalling pathway
31
(Davenport et al., 1995; García-Rodríguez et al., 2005). When S. cerevisiae is exposed
to the mating hormone pheromone, cells normally undergo morphogenesis by producing
mating projections, but when CWI mutants are exposed, this results in cell lysis
(Buehrer et al., 1997; Verna et al., 1997).
Stresses that cause changes to the cell wall in S. cerevisiae are detected by a family of
cell membrane sensors Wsc1, Wsc2, Wsc3, Mid2 and Mtl2 (Verna et al., 1997; Philip et
al., 2001). Investigations revealed that Wsc1 and Mid2 perform a more prominent
function than the others (Philip et al., 2001; Straede et al., 2007). The Wsc1 and Mid2
sensors activate GTPase Rho1 through the guanine nucleotide exchange factors (GEFs)
Rom1 and Rom2 (Fig 1.4) (Ozaki et al., 1996; Philip et al., 2001). Rho1 acts as the
crucial mediator in the CWI MAP kinase pathway, as it activates protein kinase C
(PKC1) (Nonaka et al., 1995), which then activates a mitogen activated protein kinase
(MAPK) signalling cascade (Nonaka et al., 1995; Levin, 2005). The MAPK cascade
(Fig 1.4) consists of MAPKKK Bck1 (Lee et al., 1992), the MAPKKs Mkk1 and Mkk2
(Irie et al., 1993) and the MAPK Mpk1 (Lee et al., 1993). MPK1 ultimately activates a
number of regulatory factors, cytoskeletal proteins, protein kinases and other enzymes
required to activate necessary cell wall responses (Qi et al., 2005). Some of the
transcription factors regulated by this cascade include Rlm1, Swi4 and Swi6 (Watanabe
et al., 1995; Fuchs et al., 2009; Levin, 2011). Research carried out on S. cerevisiae has
revealed that regulation of nearly 25 genes is controlled by MPK1 via the transcription
factor Rlm1. Approximately 20 genes are up-regulated and about 5 are down regulated.
Many of these up-regulated genes are involved in cell wall synthesis (Jung et al., 2002).
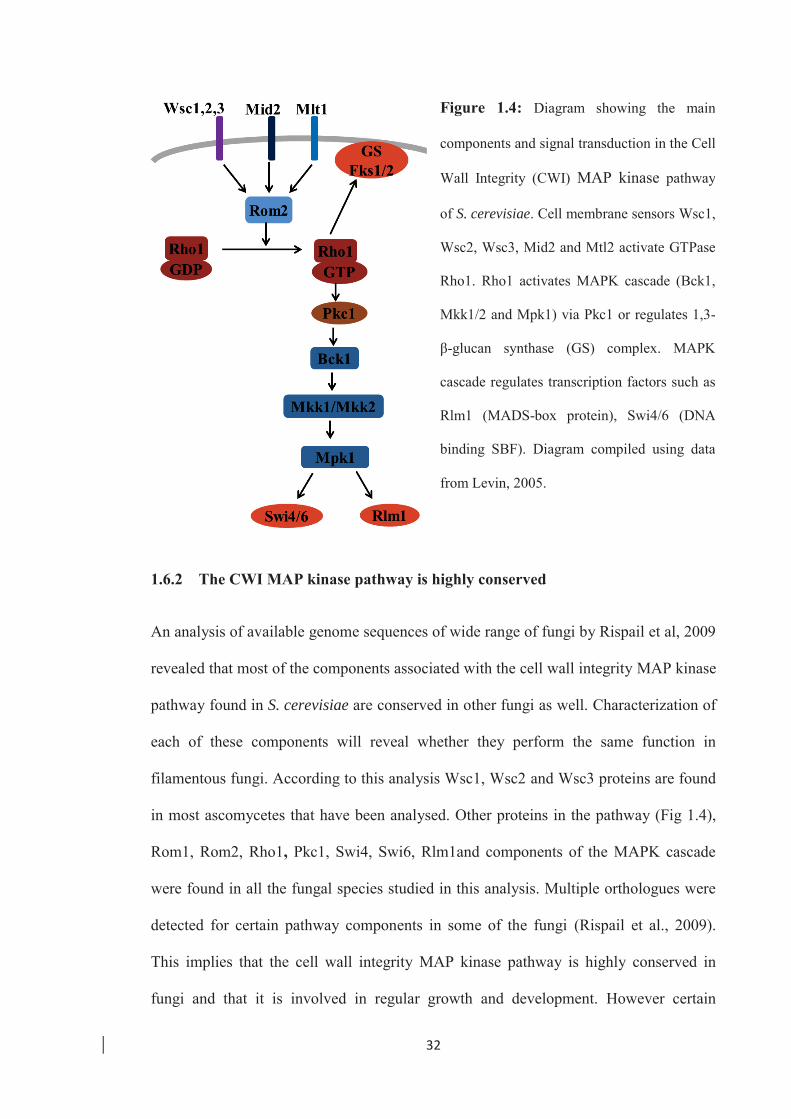
32
Figure 1.4: Diagram showing the main
components and signal transduction in the Cell
Wall Integrity (CWI) MAP kinase pathway
of S. cerevisiae. Cell membrane sensors Wsc1,
Wsc2, Wsc3, Mid2 and Mtl2 activate GTPase
Rho1. Rho1 activates MAPK cascade (Bck1,
Mkk1/2 and Mpk1) via Pkc1 or regulates 1,3-
β-glucan synthase (GS) complex. MAPK
cascade regulates transcription factors such as
Rlm1 (MADS-box protein), Swi4/6 (DNA
binding SBF). Diagram compiled using data
from Levin, 2005.
1.6.2 The CWI MAP kinase pathway is highly conserved
An analysis of available genome sequences of wide range of fungi by Rispail et al, 2009
revealed that most of the components associated with the cell wall integrity MAP kinase
pathway found in S. cerevisiae are conserved in other fungi as well. Characterization of
each of these components will reveal whether they perform the same function in
filamentous fungi. According to this analysis Wsc1, Wsc2 and Wsc3 proteins are found
in most ascomycetes that have been analysed. Other proteins in the pathway (Fig 1.4),
Rom1, Rom2, Rho1, Pkc1, Swi4, Swi6, Rlm1and components of the MAPK cascade
were found in all the fungal species studied in this analysis. Multiple orthologues were
detected for certain pathway components in some of the fungi (Rispail et al., 2009).
This implies that the cell wall integrity MAP kinase pathway is highly conserved in
fungi and that it is involved in regular growth and development. However certain

33
components in the CWI MAP kinase pathway, particularly upstream components like
the sensors Wsc1, Wsc2, Wsc3 and Mid2 have not as yet been functionally
characterised in most fungi with the exception of S. cerevisiae (Verna et al., 1997),
A. fumigatus (Dichtl et al., 2012) and N. crassa (Maddi et al., 2012).
1.6.3 Structure of Wsc and Mid2 proteins
Wsc1, Wsc2, Wsc3 and Mid2 are integrin-like O-glycosylated proteins that reside in the
plasma membrane (Verna et al., 1997; Levin, 2005). An important feature of all these
proteins is that they have a high degree of conservation among them and share similar
functional and structural domains (Verna et al., 1997; Dichtl et al., 2012; Lengeler et al.,
2013). All Wsc1 proteins consist of a cytoplasmic domain at the C terminal followed by
a single transmembrane domain. Thereafter, there is a serine/threonine rich highly
mannosylated extracellular domain, a cysteine rich motif and a hydrophobic signal
peptide at the N terminal. The cysteine motif is extracellular (termed the WSC domain)
and is the most conserved domain in the Wsc protein family, but the exact function is
not known (Verna et al., 1997; Lodder et al., 1999; Straede et al., 2007). The C
terminal cytoplasmic domain is highly charged and interacts with Rom2 to activate
Rho1 (Philip et al., 2001; Vay et al., 2004). The serine/threonine domain is variable in
length among the three Wsc proteins and it is O-mannosylated by a family of O-
mannosyl transfereases (Pmt) (Gentzsch et al., 1996; Lommel et al., 2004).
Mannosylation of the domain results in extension and stiffening of the protein, thus
helping it to act as a probe and sense the changes occurring in the cell wall (Dupres et
al., 2009). The importance of glycosylation of Wsc1 proteins is reflected by deletion
studies of Pmt proteins. Deletion of Pmt family proteins in various combinations has
resulted in phenotypes similar to CWI mutants in S. cerevisiae. The cells become non-
34
viable when exposed to high temperatures and cell wall perturbing agents like
Calcofluor white in the absence of an osmotic stabilizer (Gentzsch et al., 1996; Lommel
et al., 2004). Studies on pmt mutants of A. nidulans have also shown susceptibility to
cell wall perturbing agents (Kriangkripipat et al., 2009).
The Mid2 proteins in S. cerevisiae and A. fumigatus are similar to Wsc1 proteins in
structure (except the wsc domain is absent) and function, and are also glycosylated by
Pmt proteins (Ketela et al., 1999; Rajavel et al., 1999; Lommel et al., 2004; Dichtl et al.,
2012). Similar to Wsc1, Mid2 activates Rho1 through Rom2 in the CWI MAP kinase
pathway in response to perturbation in the cell wall and the signal is relayed to the
downstream signalling cascade by Rho1 (Fig 1.4) (Ketela et al., 1999). Studies
conducted with GFP-labelled Wsc1 proteins in S. cerevisiae have shown that the
proteins localize at the plasma membrane (Verna et al., 1997). Localization studies
conducted in A. fumigatus demonstrate that constitutively-expressed GFP fusions with
Wsc1-3 and Mid1 localise to the plasma membrane (Dichtl et al., 2012). Furthermore
atomic force microscopy studies conducted on S. cerevisiae have shown that Wsc1
proteins can resist high mechanical stress and sense cell surface stress by acting as a
nanospring. The same study emphasized the importance of glycosylation by Pmt
proteins to maintain its nanospring property which enables it to act as a sensing probe
(Dupres et al., 2009)
1.6.4 Function of Wsc and Mid2 proteins
Functional characterization of the sensors in the CWI MAP kinase pathway has revealed
mostly overlapping functions. However there are a few functions that seem to be unique
for Wsc1 and Mid2 proteins and in most of the situations Wsc1 and Mid2 have a more
prominent role as sensors. Thermotolerance studies using S. cerevisiae mutants has
35
revealed that wsc1 mutants lyse when exposed to high temperatures (37oC), but mutants
of wsc2 or wsc3 are able to survive at this temperature. However double mutants of
wsc3 or wsc2 with wsc1 exacerbate the lysis effect (Verna et al., 1997). The cell lysis
defect can be rescued by over-expression of PKC1 or in the presence of sorbitol at a
concentration of 1M, which can act as an osmotic stabiliser (Verna et al., 1997).
A study in A. fumigatus showed that wsc1 deletion slightly altered radial growth rate
and conidiation, and a double deletion of wsc1 with wsc3 exacerbated the phenotype.
However wsc1 deletion alone in A. gossypii and N. crassa resulted in a severe growth
defect (Maddi et al., 2012; Lengeler et al., 2013) while single deletions of wsc2, wsc3 or
mid2 had no effect on radial growth rate or conidiation. In addition, investigations have
revealed that Mid2 is essential for resistance against cell wall perturbing agents such as
congo red and Calcofluor white, and tolerance to high temperature, while wsc1 is
redundant in A. fumigatus (Dichtl et al., 2012). In contrast, wsc1 deletion in N. crassa
has confirmed its role in tolerance to cell wall perturbing agents Caspofungin and
Calcofluor white (Maddi et al., 2012).
Extensive studies on the cell wall integrity MAP kinase pathway of S. cerevisiae have
been able to functionally characterize many of the components involved. Since most of
these proteins are conserved in other filamentous fungi, it is likely that it performs
similar or related functions involved in protecting cell wall integrity in most species.
Taking into consideration the extensive research carried out on the structure of Wsc1
and Mid2 proteins of S. cerevisiae and other filamentous fungi, it is clear that Wsc
proteins sense the changes in the cell wall by acting as a probe or nanospring. Moreover
studies on proteins downstream of the CWI MAP kinase pathway have proved their
direct involvement in processes related to cell wall synthesis and cytoskeletal

36
organization. This implies that Wsc proteins could act as sensors to detect mechanical
stress in the cell wall of filamentous fungi; however this is yet to be proven.
37
1.7 Hypotheses, aims and objectives
Two hypotheses were tested in this study:
1. Intercalary growth in Epichloë festucae would occur in response to mechanical
stress caused by elongation of host cells to which hyphae are attached.
2. Mechanical stress is sensed via the mechanosensitive membrane proteins MidA
and/or WscA which stimulate intercalary growth.
Aims and objectives
The above hypotheses were tested by undertaking the following aims and objectives.
Aim 1- Identification and characterization of WscA and MidA of E. festucae and
investigation of their role in intercalary growth. The following objectives were
addressed under this aim.
a. To identify E. festucae orthologues of the wsc1 and mid1 genes of S. cerevisiae.
b. To determine the functional characteristics of WscA and MidA in axenic
culture.
c. To investigate the role of MidA and WscA in host colonization and intercalary
growth.
Aim 2- Determining the distribution of calcium and the role of calcium signalling
in E. festucae hyphal growth. The following objectives were addressed under this
aim.
a. To optimise a technique to observe calcium distribution and signalling in
growing E. festucae hyphae.
b. To determine calcium distribution and signalling during hyphal apical
growth in axenic culture under various conditions.
38
c. To determine the impact of deleting MidA (a stretch-activated calcium
channel) on calcium distribution and signalling during hyphal apical growth
and under mechanical stress.
Aim 3 – Investigating the ability of mechanical stretching to trigger intercalary
growth in E. festucae hyphae under in vitro conditions. The following objectives
were addressed under this aim.
a. To optimise a technique to mechanically stretch fungal hyphae under in
vitro conditions.
b. To determine the pattern of compartmentalization (nuclear division and
septation) in sub-apical compartments of E. festucae hyphae in axenic
culture under un-stretched conditions.
c. To determine the effect of mechanical stretching on E. festucae hyphae.
d. To determine whether mechanical stretching triggers intercalary growth in
E. festucae hyphae under in vitro conditions.

39
2. Materials and Methods
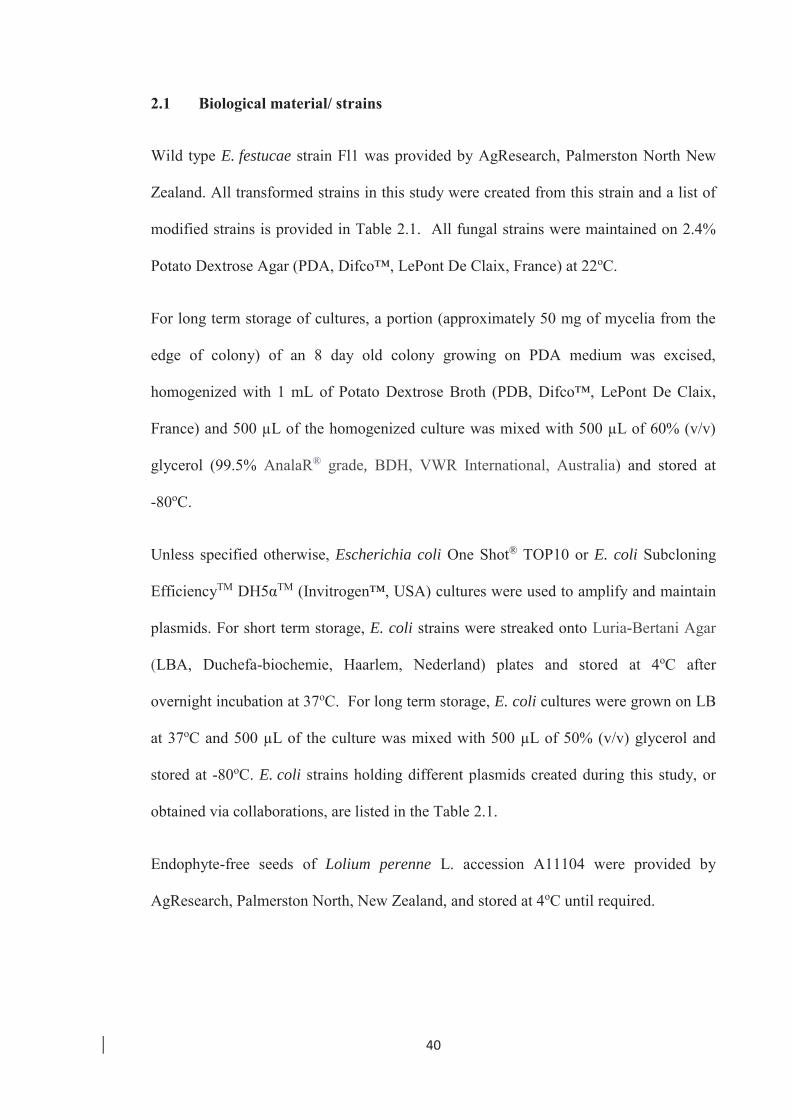
40
2.1 Biological material/ strains
Wild type E. festucae strain Fl1 was provided by AgResearch, Palmerston North New
Zealand. All transformed strains in this study were created from this strain and a list of
modified strains is provided in Table 2.1. All fungal strains were maintained on 2.4%
Potato Dextrose Agar (PDA, Difco™, LePont De Claix, France) at 22oC.
For long term storage of cultures, a portion (approximately 50 mg of mycelia from the
edge of colony) of an 8 day old colony growing on PDA medium was excised,
homogenized with 1 mL of Potato Dextrose Broth (PDB, Difco™, LePont De Claix,
France) and 500 μL of the homogenized culture was mixed with 500 μL of 60% (v/v)
glycerol (99.5% AnalaR® grade, BDH, VWR International, Australia) and stored at
-80oC.
Unless specified otherwise, Escherichia coli One Shot® TOP10 or E. coli Subcloning
EfficiencyTM DH5αTM (Invitrogen™, USA) cultures were used to amplify and maintain
plasmids. For short term storage, E. coli strains were streaked onto Luria-Bertani Agar
(LBA, Duchefa-biochemie, Haarlem, Nederland) plates and stored at 4oC after
overnight incubation at 37oC. For long term storage, E. coli cultures were grown on LB
at 37oC and 500 μL of the culture was mixed with 500 μL of 50% (v/v) glycerol and
stored at -80oC. E. coli strains holding different plasmids created during this study, or
obtained via collaborations, are listed in the Table 2.1.
Endophyte-free seeds of Lolium perenne L. accession A11104 were provided by
AgResearch, Palmerston North, New Zealand, and stored at 4oC until required.
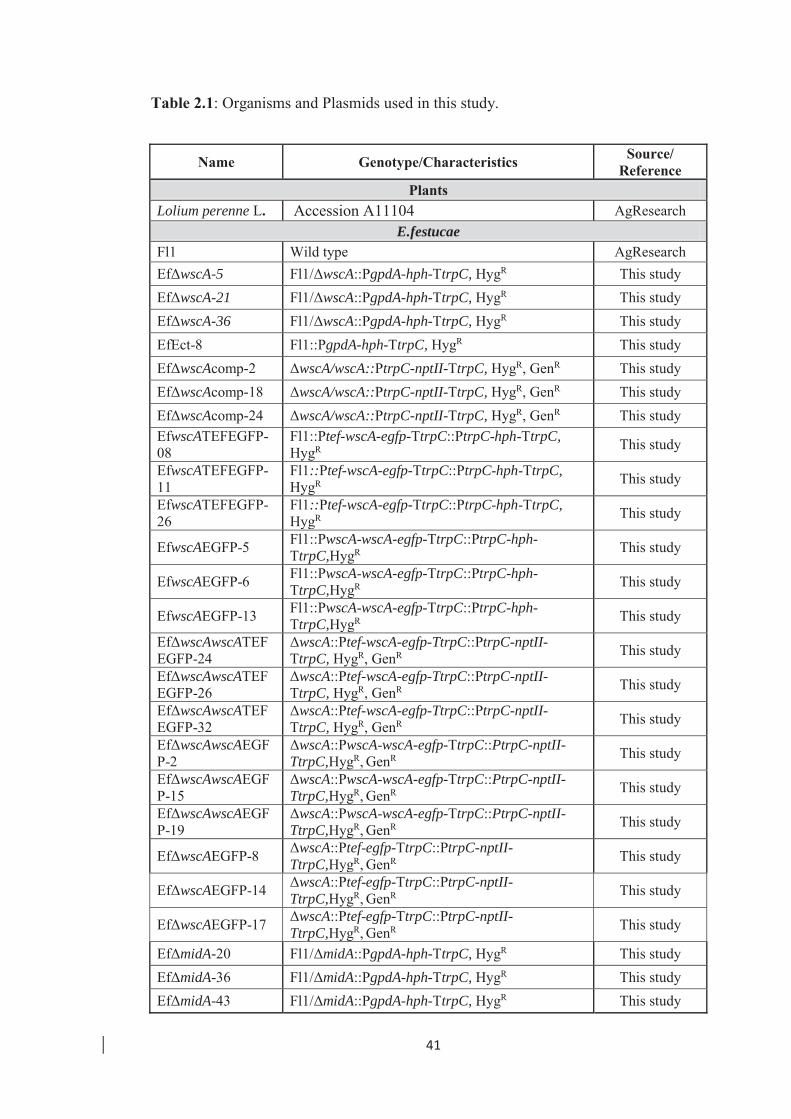
41
Table 2.1: Organisms and Plasmids used in this study.
Name Genotype/Characteristics Source/ Reference
Plants Lolium perenne L. Accession A11104 AgResearch
E.festucae Fl1 Wild type AgResearch EfΔwscA-5 Fl1/ΔwscA::PgpdA-hph-TtrpC, HygR This study EfΔwscA-21 Fl1/ΔwscA::PgpdA-hph-TtrpC, HygR This study EfΔwscA-36 Fl1/ΔwscA::PgpdA-hph-TtrpC, HygR This study EfEct-8 Fl1::PgpdA-hph-TtrpC, HygR This study EfΔwscAcomp-2 ΔwscA/wscA::PtrpC-nptII-TtrpC, HygR, GenR This study EfΔwscAcomp-18 ΔwscA/wscA::PtrpC-nptII-TtrpC, HygR, GenR This study EfΔwscAcomp-24 ΔwscA/wscA::PtrpC-nptII-TtrpC, HygR, GenR This study EfwscATEFEGFP-08
Fl1::Ptef-wscA-egfp-TtrpC::PtrpC-hph-TtrpC, HygR This study
EfwscATEFEGFP-11
Fl1::Ptef-wscA-egfp-TtrpC::PtrpC-hph-TtrpC, HygR This study
EfwscATEFEGFP-26
Fl1::Ptef-wscA-egfp-TtrpC::PtrpC-hph-TtrpC, HygR This study
EfwscAEGFP-5 Fl1::PwscA-wscA-egfp-TtrpC::PtrpC-hph-TtrpC,HygR This study
EfwscAEGFP-6 Fl1::PwscA-wscA-egfp-TtrpC::PtrpC-hph-TtrpC,HygR This study
EfwscAEGFP-13 Fl1::PwscA-wscA-egfp-TtrpC::PtrpC-hph-TtrpC,HygR This study
EfΔwscAwscATEFEGFP-24
ΔwscA::Ptef-wscA-egfp-TtrpC::PtrpC-nptII-TtrpC, HygR, GenR This study
EfΔwscAwscATEFEGFP-26
ΔwscA::Ptef-wscA-egfp-TtrpC::PtrpC-nptII-TtrpC, HygR, GenR This study
EfΔwscAwscATEFEGFP-32
ΔwscA::Ptef-wscA-egfp-TtrpC::PtrpC-nptII-TtrpC, HygR, GenR This study
EfΔwscAwscAEGFP-2
ΔwscA::PwscA-wscA-egfp-TtrpC::PtrpC-nptII-TtrpC,HygR, GenR This study
EfΔwscAwscAEGFP-15
ΔwscA::PwscA-wscA-egfp-TtrpC::PtrpC-nptII-TtrpC,HygR, GenR This study
EfΔwscAwscAEGFP-19
ΔwscA::PwscA-wscA-egfp-TtrpC::PtrpC-nptII-TtrpC,HygR, GenR This study
EfΔwscAEGFP-8 ΔwscA::Ptef-egfp-TtrpC::PtrpC-nptII-TtrpC,HygR, GenR This study
EfΔwscAEGFP-14 ΔwscA::Ptef-egfp-TtrpC::PtrpC-nptII-TtrpC,HygR, GenR This study
EfΔwscAEGFP-17 ΔwscA::Ptef-egfp-TtrpC::PtrpC-nptII-TtrpC,HygR, GenR This study
EfΔmidA-20 Fl1/ΔmidA::PgpdA-hph-TtrpC, HygR This study EfΔmidA-36 Fl1/ΔmidA::PgpdA-hph-TtrpC, HygR This study EfΔmidA-43 Fl1/ΔmidA::PgpdA-hph-TtrpC, HygR This study
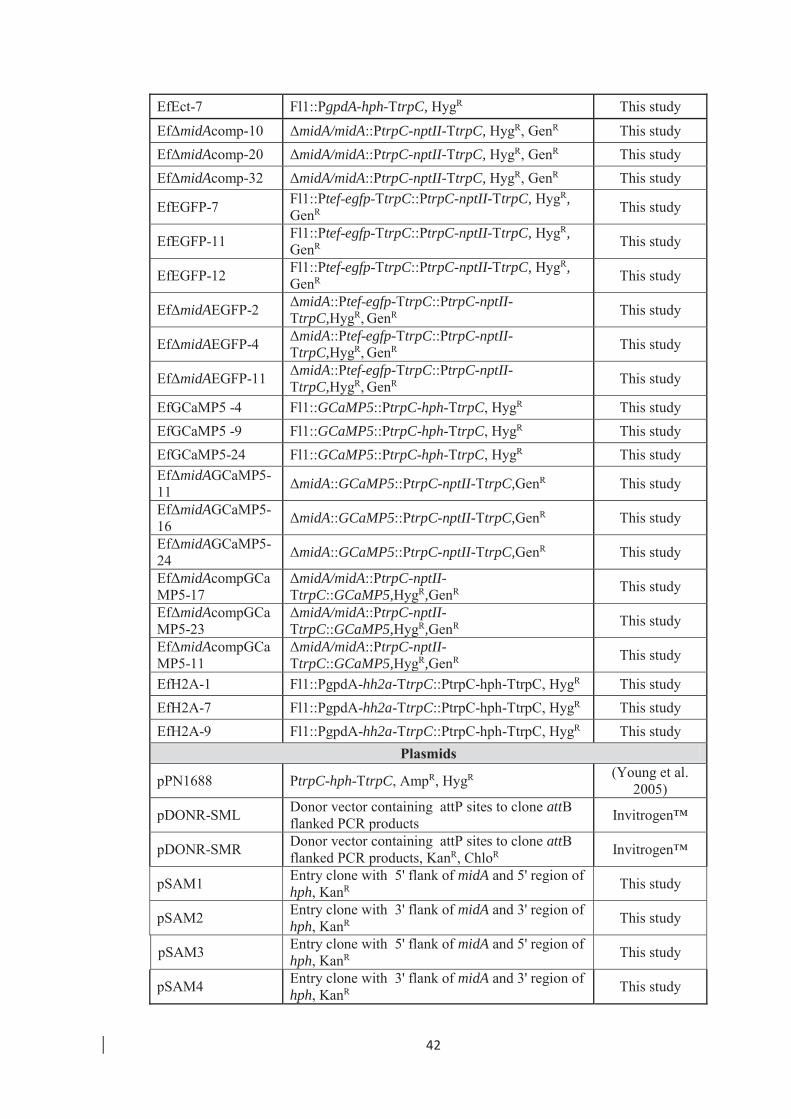
42
EfEct-7 Fl1::PgpdA-hph-TtrpC, HygR This study
EfΔmidAcomp-10 ΔmidA/midA::PtrpC-nptII-TtrpC, HygR, GenR This study EfΔmidAcomp-20 ΔmidA/midA::PtrpC-nptII-TtrpC, HygR, GenR This study EfΔmidAcomp-32 ΔmidA/midA::PtrpC-nptII-TtrpC, HygR, GenR This study
EfEGFP-7 Fl1::Ptef-egfp-TtrpC::PtrpC-nptII-TtrpC, HygR, GenR This study
EfEGFP-11 Fl1::Ptef-egfp-TtrpC::PtrpC-nptII-TtrpC, HygR, GenR This study
EfEGFP-12 Fl1::Ptef-egfp-TtrpC::PtrpC-nptII-TtrpC, HygR, GenR This study
EfΔmidAEGFP-2 ΔmidA::Ptef-egfp-TtrpC::PtrpC-nptII-TtrpC,HygR, GenR This study
EfΔmidAEGFP-4 ΔmidA::Ptef-egfp-TtrpC::PtrpC-nptII-TtrpC,HygR, GenR This study
EfΔmidAEGFP-11 ΔmidA::Ptef-egfp-TtrpC::PtrpC-nptII-TtrpC,HygR, GenR This study
EfGCaMP5 -4 Fl1::GCaMP5::PtrpC-hph-TtrpC, HygR This study EfGCaMP5 -9 Fl1::GCaMP5::PtrpC-hph-TtrpC, HygR This study EfGCaMP5-24 Fl1::GCaMP5::PtrpC-hph-TtrpC, HygR This study EfΔmidAGCaMP5-11 ΔmidA::GCaMP5::PtrpC-nptII-TtrpC,GenR This study
EfΔmidAGCaMP5-16 ΔmidA::GCaMP5::PtrpC-nptII-TtrpC,GenR This study
EfΔmidAGCaMP5-24 ΔmidA::GCaMP5::PtrpC-nptII-TtrpC,GenR This study
EfΔmidAcompGCaMP5-17
ΔmidA/midA::PtrpC-nptII-TtrpC::GCaMP5,HygR,GenR This study
EfΔmidAcompGCaMP5-23
ΔmidA/midA::PtrpC-nptII-TtrpC::GCaMP5,HygR,GenR This study
EfΔmidAcompGCaMP5-11
ΔmidA/midA::PtrpC-nptII-TtrpC::GCaMP5,HygR,GenR This study
EfH2A-1 Fl1::PgpdA-hh2a-TtrpC::PtrpC-hph-TtrpC, HygR This study EfH2A-7 Fl1::PgpdA-hh2a-TtrpC::PtrpC-hph-TtrpC, HygR This study EfH2A-9 Fl1::PgpdA-hh2a-TtrpC::PtrpC-hph-TtrpC, HygR This study
Plasmids
pPN1688 PtrpC-hph-TtrpC, AmpR, HygR (Young et al. 2005)
pDONR-SML Donor vector containing attP sites to clone attB flanked PCR products Invitrogen™
pDONR-SMR Donor vector containing attP sites to clone attB flanked PCR products, KanR, ChloR Invitrogen™
pSAM1 Entry clone with 5' flank of midA and 5' region of hph, KanR This study
pSAM2 Entry clone with 3' flank of midA and 3' region of hph, KanR This study
pSAM3 Entry clone with 5' flank of midA and 5' region of hph, KanR This study
pSAM4 Entry clone with 3' flank of midA and 3' region of hph, KanR This study
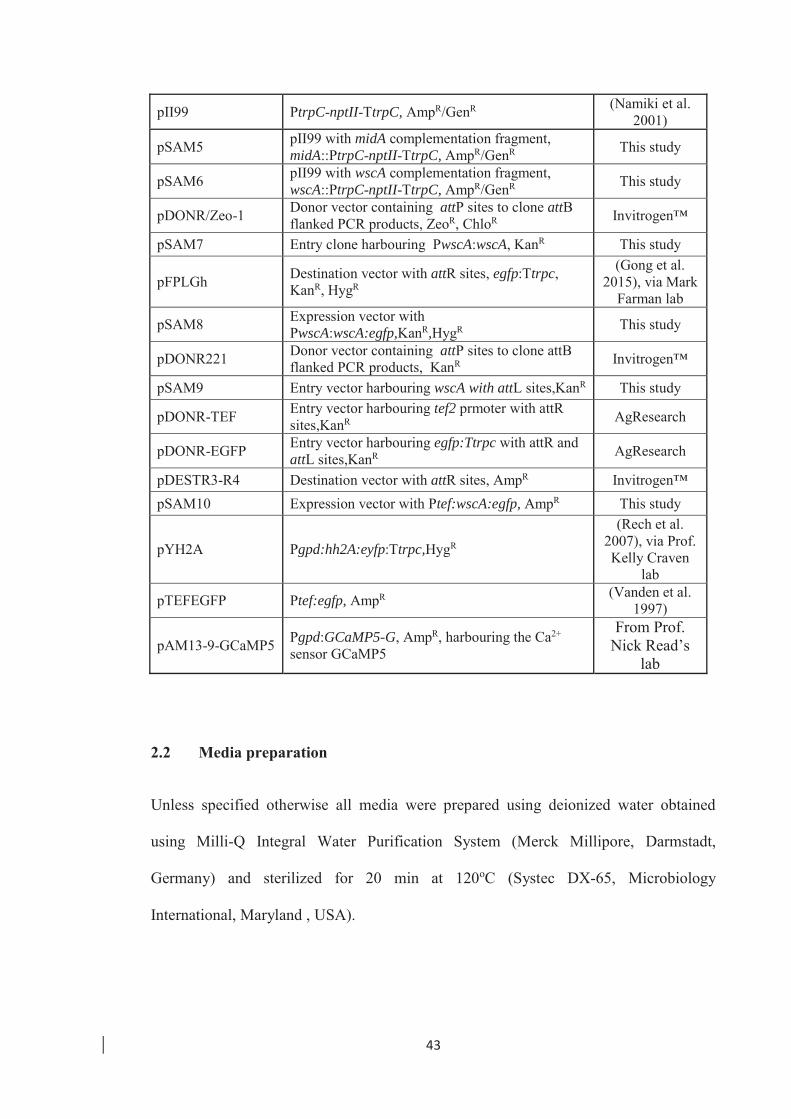
43
pII99 PtrpC-nptII-TtrpC, AmpR/GenR (Namiki et al. 2001)
pSAM5 pII99 with midA complementation fragment, midA::PtrpC-nptII-TtrpC, AmpR/GenR This study
pSAM6 pII99 with wscA complementation fragment, wscA::PtrpC-nptII-TtrpC, AmpR/GenR This study
pDONR/Zeo-1 Donor vector containing attP sites to clone attB flanked PCR products, ZeoR, ChloR Invitrogen™
pSAM7 Entry clone harbouring PwscA:wscA, KanR This study
pFPLGh Destination vector with attR sites, egfp:Ttrpc, KanR, HygR
(Gong et al. 2015), via Mark
Farman lab
pSAM8 Expression vector with PwscA:wscA:egfp,KanR,HygR This study
pDONR221 Donor vector containing attP sites to clone attB flanked PCR products, KanR Invitrogen™
pSAM9 Entry vector harbouring wscA with attL sites,KanR This study
pDONR-TEF Entry vector harbouring tef2 prmoter with attR sites,KanR AgResearch
pDONR-EGFP Entry vector harbouring egfp:Ttrpc with attR and attL sites,KanR AgResearch
pDESTR3-R4 Destination vector with attR sites, AmpR Invitrogen™ pSAM10 Expression vector with Ptef:wscA:egfp, AmpR This study
pYH2A Pgpd:hh2A:eyfp:Ttrpc,HygR
(Rech et al. 2007), via Prof. Kelly Craven
lab
pTEFEGFP Ptef:egfp, AmpR (Vanden et al. 1997)
pAM13-9-GCaMP5 Pgpd:GCaMP5-G, AmpR, harbouring the Ca2+ sensor GCaMP5
From Prof. Nick Read’s
lab
2.2 Media preparation
Unless specified otherwise all media were prepared using deionized water obtained
using Milli-Q Integral Water Purification System (Merck Millipore, Darmstadt,
Germany) and sterilized for 20 min at 120oC (Systec DX-65, Microbiology
International, Maryland , USA).
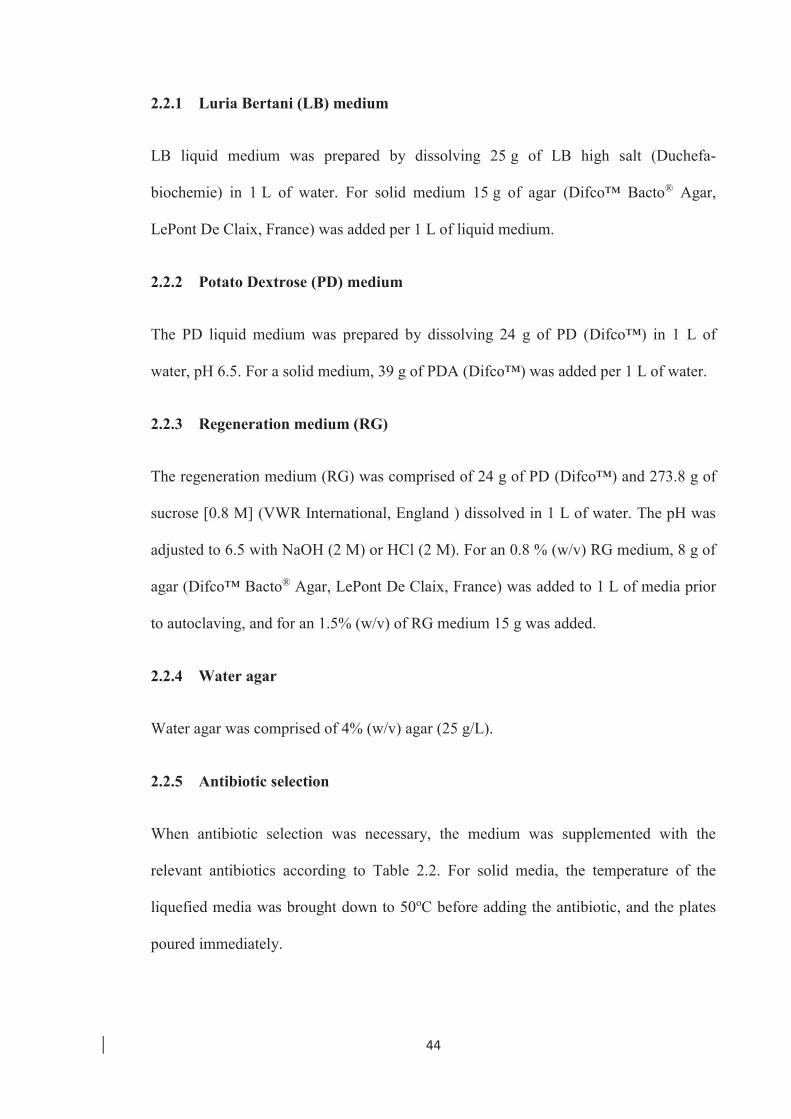
44
2.2.1 Luria Bertani (LB) medium
LB liquid medium was prepared by dissolving 25 g of LB high salt (Duchefa-
biochemie) in 1 L of water. For solid medium 15 g of agar (Difco™ Bacto® Agar,
LePont De Claix, France) was added per 1 L of liquid medium.
2.2.2 Potato Dextrose (PD) medium
The PD liquid medium was prepared by dissolving 24 g of PD (Difco™) in 1 L of
water, pH 6.5. For a solid medium, 39 g of PDA (Difco™) was added per 1 L of water.
2.2.3 Regeneration medium (RG)
The regeneration medium (RG) was comprised of 24 g of PD (Difco™) and 273.8 g of
sucrose [0.8 M] (VWR International, England ) dissolved in 1 L of water. The pH was
adjusted to 6.5 with NaOH (2 M) or HCl (2 M). For an 0.8 % (w/v) RG medium, 8 g of
agar (Difco™ Bacto® Agar, LePont De Claix, France) was added to 1 L of media prior
to autoclaving, and for an 1.5% (w/v) of RG medium 15 g was added.
2.2.4 Water agar
Water agar was comprised of 4% (w/v) agar (25 g/L).
2.2.5 Antibiotic selection
When antibiotic selection was necessary, the medium was supplemented with the
relevant antibiotics according to Table 2.2. For solid media, the temperature of the
liquefied media was brought down to 50oC before adding the antibiotic, and the plates
poured immediately.
45
Table 2.2: Antibiotic concentrations used for transformant selection.
Medium Antibiotic Selection Concentration (μg/mL)
LB and LBA
Ampicillin (Gibco®,USA) E.coli transformants 100
Kanamycin (Gibco®) E.coli transformants 50
Zeocin™ (Gibco®) E.coli transformants 50
RG, PDA
and PDB
HygromycinB (Gibco®) E. festucae transformants
100
Geneticin® (Gibco®) 200
2.3 Growth conditions
2.3.1 Escherichia coli
E. coli were grown at 37oC overnight on LB solid media (25 mL/plate), or in LB broth
(5 mL) with 200 rpm shaking. For antibiotic selection ampicillin, kanamycin or
zeocin™ was used. See Table 2.2 for concentrations.
2.3.2 Epichloë festucae
Unless specified otherwise E. festucae strains were grown under continuous light on
PDA at 22oC for 8 days or in PDB with 150 rpm shaking for 4 to 5 days. Subcultures
were prepared by excising 2 mm2 agar plugs from the leading edge of an 8 day old
culture and inoculating fresh plates as required. When selection against antibiotic
resistance was required, PDA was infused with geneticin or hygromycin (Table 2.2) and
incubated as described above.
46
2.3.3 Lolium perenne L.
2.3.3.1 Surface sterilization of seeds
L. perenne L. seeds (Accession A11104) were immersed in 50% (v/v) sulphuric acid
(BDH ARISTAR® PLUS, VWR International, England) for 15 min and washed
thoroughly with water three times. The seeds were immersed in 10% (v/v) Janola
(commercial disinfectant, NaOCl~5%) solution for 15 min and washed again
thoroughly with sterile water three times under aseptic conditions. Washed seeds were
dried on sterile Whatman paper for 3 h inside a laminar hood and stored under sterile
conditions at room temperature (RT).
2.3.3.2 Seedling inoculation and plant growth conditions
Surface sterilised seeds were placed on 4% (w/v) water agar under aseptic conditions in
two rows of 8 seeds per petri plate, with all seeds oriented in the same direction. Plates
were placed upright (seed rachilla pointed down) and incubated at 22oC for 7 days under
dark conditions (covered with aluminium foil). After one week the seedlings were
inoculated in situ with the appropriate endophyte strain by making an incision into the
shoot apical meristem (SAM) and inserting a trace amount of fungal hyphae into the
wound site. After inoculation the plates were again placed upright and further incubated
for one week at 22oC in the dark. Thereafter, the seedlings were incubated for one more
week at 22oC under lights and transferred to plastic pots filled with standard potting mix
for acclimatization in a glasshouse. After 6 weeks the plants were tested for the
presence of the endophyte using a tissue print immunoassay (Section 2.10.1), and
infected plants were transferred into pots (7.5 X 10 cm) with standard potting mix and
grown under ambient conditions in a PC2 plant containment glasshouse.
47
To analyse endophyte colonization and its effect on plant phenotype, a randomised
block design of eight treatments, each with three plant replicates was used, and
seedlings were inoculated with each strain and acclimatized as described above. The
randomised design was followed from the seedling stage in axenic culture to mature
plants grown under glass house conditions. As a further control, seedlings taken through
the inoculation process and subsequent plant growth, but not inoculated with
endophytes, were also analysed.
2.4 DNA isolation and storage
2.4.1 Plasmid DNA isolation
E. coli bacterial broth cultures were grown overnight as described in Section 2.3.1.
Depending on the quantity of plasmid DNA required, 1.5-3 mL of bacterial culture was
used per cycle of extraction. Plasmid DNA extraction was performed through an
alkaline lysis method using the Geneaid High-speed Plasmid Mini Kit (Geneaid Biotech
Ltd , New Taipei City, Taiwan) according to the manufacturer’s guidelines. Pre-heated
elution buffer (50oC) was used to elute plasmid DNA from purification columns.
2.4.2 Isolation of high molecular weight genomic DNA from E. festucae
Fungal hyphae from the edge of an 8 day old colony was excised and homogenized in
1 mL of PDB using a bead basher (FastPrep®-24 homogenizer, MP Biomedicals, USA)
for 10 seconds at 4 m/s. Approximately 300 μL of the homogenate was spread onto
cellophane membranes placed onto PDA and grown for 4 to 5 days at 22oC. Thereafter,
approximately 75 mg (wet weight) of the mycelial film on the cellophane membranes
was homogenized into a fine powder with liquid N2 using a mortar and pestle. The
homogenate was then added to a sterile 1.5 mL tube (Eppendorf) and mixed with lysis
buffer provided with the ZR Fungal/Bacterial DNA extraction kit (Zymo Research
48
Corporation, CA, USA). When higher DNA yields were necessary, the lysate was left at
RT for 30 min with occasional mixing. Subsequent steps were performed using the ZR
Fungal/Bacterial DNA extraction kit according to manufacturer’s instructions.
2.4.3 Rapid isolation of genomic DNA from E. festucae
When small quantities with low molecular weight fungal genomic DNA was sufficient
for analysis, rapid DNA extraction was performed using fungal mycelia taken directly
from 8 day old colonies cultured on PDA plates. Hyphae (100 mg) from the edge of the
colony was scraped off the plate, avoiding solid growth media as much as possible, and
transferred to a ZR BashingBeadTM lysis tube provided with the ZR Fungal/Bacterial
DNA extraction kit (Zymo Research). Lysis solution (750 μL) was added and the
mixture homogenized using a bead basher for 40 sec at 4 m/s. Thereafter, genomic
DNA was extracted from the homogenate using the ZR Fungal/Bacterial DNA
extraction kit according to the manufacturer’s instructions.
2.4.4 DNA Storage
Genomic and plasmid DNA was stored at 4oC for short term storage (to be used within
24 h) or at -20oC for long term storage.
2.5 DNA manipulation
2.5.1 DNA quantification
The genomic or plasmid DNA concentration and purity was determined using a
NanoDrop 2000 UV-Vis spectrophotometer according to the manufacturer’s guidelines.
Where greater accuracy was necessary, DNA concentration and purity was re-confirmed
using the Invitrogen QubitTM fluorometer (CA, USA). The quantification procedure was
49
performed at RT using 2-4 μL of the DNA sample using the appropriate Invitrogen
Quant-iTTM assay kit and tubes according to the manufacturer’s instructions.
2.5.2 DNA concentration
Where the rapid concentration of genomic or plasmid DNA from low volumes was
required, the Thermo ScientificTM SavantTM SpeedVacTM (USA) system was used to
remove excess water/solvent. Alternatively ethanol precipitation was used to
concentrate larger volumes of genomic or plasmid DNA samples. To the DNA sample,
3 M NaOAc (pH 5) was added to a final concentration of 0.3 M, mixed thoroughly, and
the DNA precipitated by the addition of 2.5 volumes of 95% (v/v) ethanol. After
thorough mixing, the DNA was collected by centrifugation (10000 x g) at room
temperature. The supernatant was discarded and the pellet washed with 1 mL of 70%
(v/v) ethanol and re-centrifuged at RT at 10000 x g for 5 min. The supernatant discarded
and the pellet was lightly dried in a Thermo ScientificTM SavantTM SpeedVacTM to
remove residual ethanol. The pellet was re-dissolved in sterile water by incubation at
65oC for 20 min.
2.5.3 Agarose gel electrophoresis
Unless specified otherwise, 1% (w/v) agarose (UltraPure™, Invitrogen™) gels in Tris-
acetate-EDTA buffer (TAE, refer to Appendix 1 for composition) were used for DNA
electrophoresis. Ethidium bromide (UltraPure™, Invitrogen™) was added to the boiled
and cooled agarose solution (~600C) to achieve a final concentration of 1 μg/mL. DNA
samples were mixed with a bromophenol blue, xylene cyanol-based loading dye
(Appendix 1) and electrophoresed against a 1Kb plus DNA ladder (Invitrogen™) for 60
to 75 min between 80 to100 volts in TAE buffer using a Bio-Rad gel electrophoresis
apparatus ( CA, USA) according to manufacturer’s instructions. DNA was visualised

50
using a UV transilluminator gel documentation system (Gel Doc™, Bio-Rad,
CA, USA).
2.5.4 DNA recovery from agarose gels
Gel electrophoresis was performed as described in Section 2.5.3 and the DNA
visualised (using the preparative setting to avoid DNA shearing) using a Bio-Rad UV
transilluminator 2000 (CA, USA). The agarose containing the DNA was excised using a
scalpel blade, transferred to a 1.5 mL Eppendorf tube, and weighed. DNA extraction
from the agar block was performed using the PureLink® Quick Gel Extraction Kit
(Invitrogen™) according to manufacturer’s instructions. After extraction the DNA was
quantified and gel electrophoresis performed on a sub-sample to ascertain the integrity
of the recovered product.
2.5.5 DNA sequencing
DNA sequencing was performed using the BigDye® Terminator v3.1 Cycle Sequencing
Kit (Applied Biosystems, MA, USA). The cycle sequencing reactions were performed
according to manufacturer’s instructions in 10 μL of reaction volumes (Appendix 2). A
template quantity of 20-50 ng (depending on the template size) for PCR products and
200-300 ng/reaction for plasmid DNA was used per reaction. Each DNA fragment was
sequenced in both directions using forward and reverse primers for greater accuracy.
Cycle sequencing was performed over 25 cycles (Applied Biosystems, 2720 thermal
cycler) according to manufacturer’s instructions (PCR conditions Appendix 2) for
BigDye® Terminator v3.1, and the DNA products purified using ethanol/EDTA
precipitation according to manufacturer’s instructions. The sequencing products were
resuspended in 10 μL of Hi-Di™ Formaminde (Applied Biosystems) diluted 5:1 with

51
25 mM EDTA pH 8.0 and heated at 95oC for 2 min Capillary separation and detection
was carried out in an ABI13730 genetic analyser (Applied Biosystems) or a 3130X
genetic analyser (Applied Biosystems). Data analysis and sequence assembly were
performed using Vector NTI® (Invitrogen™) software.
2.5.6 Restriction endonuclease digestion
Unless otherwise specified, restriction endonuclease (RE) digestion was performed at
37oC (Unitek HB-130 heat block) with 10 units of RE per 1 μg of DNA. Ten microliter
reactions were used for DNA quantities ≤ 0.5 μg with an incubation time of 1 h, and
50 μL reactions with an incubation time of 3 h was used for DNA quantities ≥0.5 μg.
The optimum reaction buffer was selected according to manufacturer’s specifications
and the most compatible buffer for both enzymes was selected when performing double
digestions in one reaction. Reactions were terminated by heat inactivation according to
manufacturer’s specifications.
2.5.7 PCR amplification
2.5.7.1 Standard PCR
Platinum® Taq DNA Polymerase (InvitrogenTM) was used for all standard PCR reactions
in this study. A typical 50 μL reaction contained 5 μL of 10X PCR buffer (minus Mg2+),
0.6 μL of dNTP (25 mM), 1.5 μL of MgCl2 (50 mM), 0.75 μL each of forward and
reverse primers (10 μM), 10-20 ng of genomic DNA or 50 ng of plasmid DNA, 0.4 μL
Platinum® Taq DNA polymerase (10 U/μL) and deionised water up to 50 μL. Cycle
conditions were, 1 cycle at 94oC for 5 min, 30-35 cycles of 94oC for 30 sec, 53-58oC for
30 sec, 72oC for 1 min/1 Kb and final holding temperature of 4oC. Positive and negative
controls were used with each set of PCR reactions.
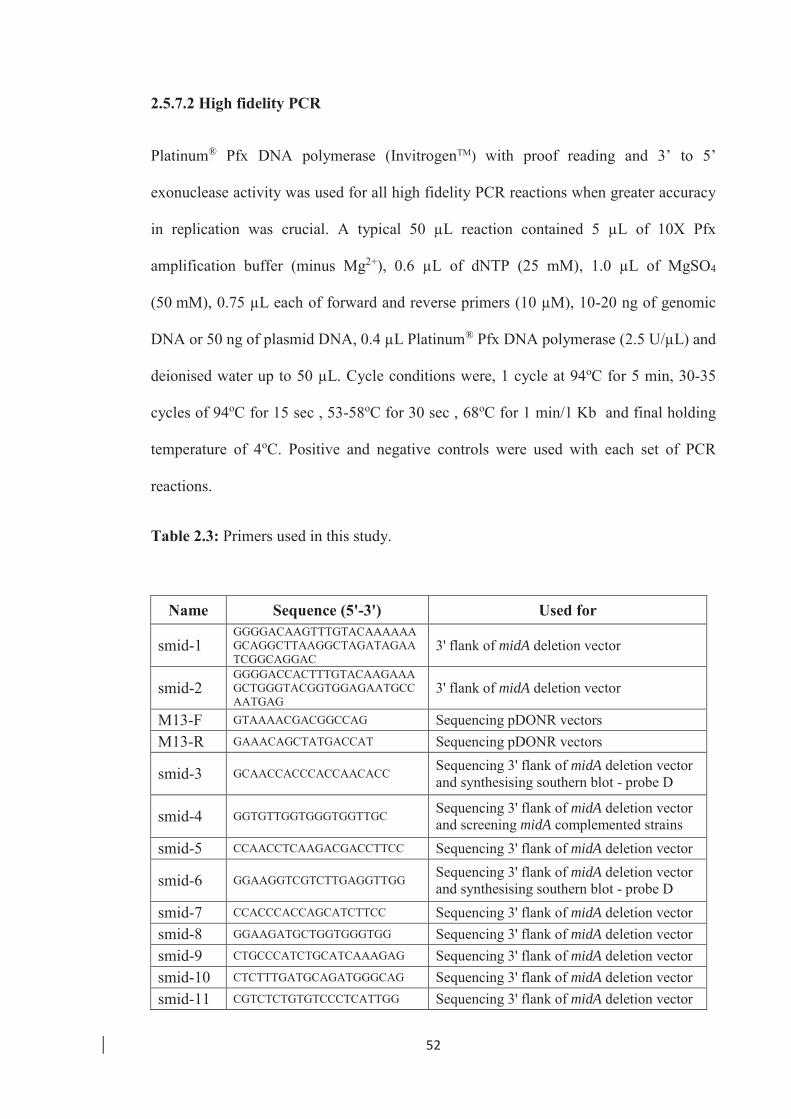
52
2.5.7.2 High fidelity PCR
Platinum® Pfx DNA polymerase (InvitrogenTM) with proof reading and 3’ to 5’
exonuclease activity was used for all high fidelity PCR reactions when greater accuracy
in replication was crucial. A typical 50 μL reaction contained 5 μL of 10X Pfx
amplification buffer (minus Mg2+), 0.6 μL of dNTP (25 mM), 1.0 μL of MgSO4
(50 mM), 0.75 μL each of forward and reverse primers (10 μM), 10-20 ng of genomic
DNA or 50 ng of plasmid DNA, 0.4 μL Platinum® Pfx DNA polymerase (2.5 U/μL) and
deionised water up to 50 μL. Cycle conditions were, 1 cycle at 94oC for 5 min, 30-35
cycles of 94oC for 15 sec , 53-58oC for 30 sec , 68oC for 1 min/1 Kb and final holding
temperature of 4oC. Positive and negative controls were used with each set of PCR
reactions.
Table 2.3: Primers used in this study.
Name Sequence (5'-3') Used for
smid-1 GGGGACAAGTTTGTACAAAAAAGCAGGCTTAAGGCTAGATAGAATCGGCAGGAC
3' flank of midA deletion vector
smid-2 GGGGACCACTTTGTACAAGAAAGCTGGGTACGGTGGAGAATGCCAATGAG
3' flank of midA deletion vector
M13-F GTAAAACGACGGCCAG Sequencing pDONR vectors M13-R GAAACAGCTATGACCAT Sequencing pDONR vectors
smid-3 GCAACCACCCACCAACACC Sequencing 3' flank of midA deletion vector and synthesising southern blot - probe D
smid-4 GGTGTTGGTGGGTGGTTGC Sequencing 3' flank of midA deletion vector and screening midA complemented strains
smid-5 CCAACCTCAAGACGACCTTCC Sequencing 3' flank of midA deletion vector
smid-6 GGAAGGTCGTCTTGAGGTTGG Sequencing 3' flank of midA deletion vector and synthesising southern blot - probe D
smid-7 CCACCCACCAGCATCTTCC Sequencing 3' flank of midA deletion vector smid-8 GGAAGATGCTGGTGGGTGG Sequencing 3' flank of midA deletion vector smid-9 CTGCCCATCTGCATCAAAGAG Sequencing 3' flank of midA deletion vector smid-10 CTCTTTGATGCAGATGGGCAG Sequencing 3' flank of midA deletion vector smid-11 CGTCTCTGTGTCCCTCATTGG Sequencing 3' flank of midA deletion vector
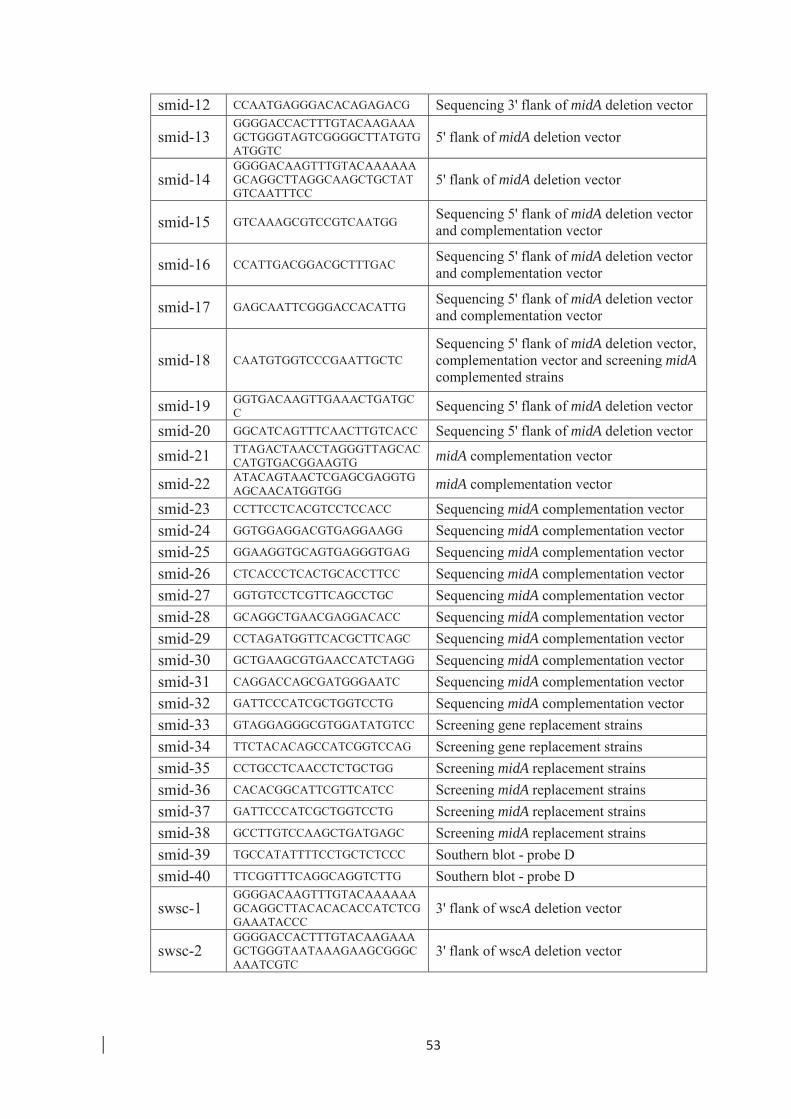
53
smid-12 CCAATGAGGGACACAGAGACG Sequencing 3' flank of midA deletion vector
smid-13 GGGGACCACTTTGTACAAGAAAGCTGGGTAGTCGGGGCTTATGTGATGGTC
5' flank of midA deletion vector
smid-14 GGGGACAAGTTTGTACAAAAAAGCAGGCTTAGGCAAGCTGCTATGTCAATTTCC
5' flank of midA deletion vector
smid-15 GTCAAAGCGTCCGTCAATGG Sequencing 5' flank of midA deletion vector and complementation vector
smid-16 CCATTGACGGACGCTTTGAC Sequencing 5' flank of midA deletion vector and complementation vector
smid-17 GAGCAATTCGGGACCACATTG Sequencing 5' flank of midA deletion vector and complementation vector
smid-18 CAATGTGGTCCCGAATTGCTC Sequencing 5' flank of midA deletion vector, complementation vector and screening midA complemented strains
smid-19 GGTGACAAGTTGAAACTGATGCC Sequencing 5' flank of midA deletion vector
smid-20 GGCATCAGTTTCAACTTGTCACC Sequencing 5' flank of midA deletion vector
smid-21 TTAGACTAACCTAGGGTTAGCACCATGTGACGGAAGTG midA complementation vector
smid-22 ATACAGTAACTCGAGCGAGGTGAGCAACATGGTGG midA complementation vector
smid-23 CCTTCCTCACGTCCTCCACC Sequencing midA complementation vector smid-24 GGTGGAGGACGTGAGGAAGG Sequencing midA complementation vector smid-25 GGAAGGTGCAGTGAGGGTGAG Sequencing midA complementation vector smid-26 CTCACCCTCACTGCACCTTCC Sequencing midA complementation vector smid-27 GGTGTCCTCGTTCAGCCTGC Sequencing midA complementation vector smid-28 GCAGGCTGAACGAGGACACC Sequencing midA complementation vector smid-29 CCTAGATGGTTCACGCTTCAGC Sequencing midA complementation vector smid-30 GCTGAAGCGTGAACCATCTAGG Sequencing midA complementation vector smid-31 CAGGACCAGCGATGGGAATC Sequencing midA complementation vector smid-32 GATTCCCATCGCTGGTCCTG Sequencing midA complementation vector smid-33 GTAGGAGGGCGTGGATATGTCC Screening gene replacement strains smid-34 TTCTACACAGCCATCGGTCCAG Screening gene replacement strains smid-35 CCTGCCTCAACCTCTGCTGG Screening midA replacement strains smid-36 CACACGGCATTCGTTCATCC Screening midA replacement strains smid-37 GATTCCCATCGCTGGTCCTG Screening midA replacement strains smid-38 GCCTTGTCCAAGCTGATGAGC Screening midA replacement strains smid-39 TGCCATATTTTCCTGCTCTCCC Southern blot - probe D smid-40 TTCGGTTTCAGGCAGGTCTTG Southern blot - probe D
swsc-1 GGGGACAAGTTTGTACAAAAAAGCAGGCTTACACACACCATCTCGGAAATACCC
3' flank of wscA deletion vector
swsc-2 GGGGACCACTTTGTACAAGAAAGCTGGGTAATAAAGAAGCGGGCAAATCGTC
3' flank of wscA deletion vector
54
swsc-3 CTCTCTCCCTCTTGACTCGGC Sequencing 3' flank of wscA deletion vector, wscA complementation vector and synthesising southern blot - probe A
swsc-4 GCCGAGTCAAGAGGGAGAGAG Sequencing 3' flank of wscA deletion vector and wscA complementation vector
swsc-5 GTGACCTTGGGCGATACTCTC Sequencing 3' flank of wscA deletion vector and wscA complementation vector
swsc-6 GAGAGTATCGCCCAAGGTCAC
Sequencing 3' flank of wscA deletion vector, wscA complementation vector, screening wscA complemented strains and synthesising southern blot - probe A
swsc-7 GCATGATTAAGCCAAGAGCG Sequencing 3' flank of wscA deletion vector swsc-8 CGCTCTTGGCTTAATCATGC Sequencing 3' flank of wscA deletion vector
swsc-9 GGGGACAAGTTTGTACAAAAAAGCAGGCTTAACGCAGCCAGTTTGAGAAACAG
5' flank of wscA deletion vector
swsc-10 GGGGACCACTTTGTACAAGAAAGCTGGGTAGTGGTGGTCAAATCGAGTACGG
5' flank of wscA deletion vector
swsc-11 CTCAAGATCGCTGCGTGTTG Sequencing 5' flank of wscA deletion vector, wscA complementation vector and wscA:egfp expression vector
swsc-12 CAACACGCAGCGATCTTGAG
Sequencing 5' flank of wscA deletion vector, wscA complementation vector, wscA:egfp expression vector and screening wscA complemented strains
swsc-13 CACCAAGCACACCACACAGC Sequencing 5' flank of wscA deletion vector and wscA complementation vector
swsc-14 GCTGTGTGGTGTGCTTGGTG Sequencing 5' flank of wscA deletion vector swsc-15 GATTCACGATTCACGCAAGG Sequencing 5' flank of wscA deletion vector swsc-16 CCTTGCGTGAATCGTGAATC Sequencing 5' flank of wscA deletion vector swsc-17 CCAGGTTCCTTCTTCCATGC Sequencing 5' flank of wscA deletion vector swsc-18 GCATGGAAGAAGGAACCTGG Sequencing 5' flank of wscA deletion vector swsc-19 CGTTGACTTGCCCAGATGAC Sequencing 5' flank of wscA deletion vector swsc-20 GTCATCTGGGCAAGTCAACG Sequencing 5' flank of wscA deletion vector
swsc-21 TTAGACTATTCTAGATGTGGTGTGCTTGGTGGTGTG wscA complementation vector
swsc-22 TAACATAAGAAGCTTGAGAGTATCGCCCAAGGTCACC wscA complementation vector
swsc-22 CAAACAACCCGCCCTTCAG Sequencing midA complementation vector and wscA:egfp and pTEF:wscA:egfp expression vector
swsc-23 CTGAAGGGCGGGTTGTTTG Sequencing midA complementation vector and wscA:egfp and pTEF:wscA:egfp expression vector
55
swsc-24 CCACAGCAACAACAACAACG Sequencing midA complementation vector and wscA:egfp and pTEF:wscA:egfp expression vector
swsc-25 CGTTGTTGTTGTTGCTGTGG Sequencing midA complementation vector and wscA:egfp and pTEF:wscA:egfp expression vector
swsc-26 CAGTGTCCGCCATCATTGTC Sequencing midA complementation vector and wscA:egfp and pTEF:wscA:egfp expression vector
swsc-28 GACAATGATGGCGGACACTG Sequencing midA complementation vector and wscA:egfp and pTEF:wscA:egfp expression vector
swsc-27 GTAGGAGGGCGTGGATATGTCC Screening gene replacement strains
swsc-29 AGCGTGCCTTGAGAATGATACG Screening wscA replacement strains swsc-30 GCCTCTCCCGACTATCCTTCAG Screening wscA replacement strains swsc-31 CCTGATAACGCCTTGAATGCC Screening wscA replacement strains swsc-32 TGAGCTGTGTCCGAGCCATG Screening wscA replacement strains swsc-33 CAAGGTCGTTGCGTCAGTCC Southern blot - probe B
swsc-34 GCAAAGTGCCGATAAACATAACG Southern blot - probe B
swsc-35 AAAAAGCAGGCTTATGCGATGCTATGGATTAGTTGGC wscA:egfp expression vector
swsc-36 AGAAAGCTGGGTACGCATTGGTGACCTGCAGAAG wscA:egfp expression vector
swsc-37 GGGGACAAGTTTGTACAAAAAAGCAGGCTNN wscA:egfp expression vector
swsc-38 GGGGACCACTTTGTACAAGAAAGCTGGGTN wscA:egfp expression vector
swsc-39 GGGGACAAGTTTGTACAAAAAAGCAGGCTTAATGAGATTATCAACAATCGCATTTGG
pTEF: wscA:egfp expression vector
swsc-40 GGGGACCACTTTGTACAAGAAAGCTGGGTACGCATTGGTGACCTGCAGAAG
pTEF: wscA:egfp expression vector
2.5.8 Ligation
The ligation of inserts into vectors was performed using T4 DNA ligase (Roche Applied
Sciences). Two different RE sites were used for each insert and vector to achieve
directional ligation. A typical 30 μL ligation reaction comprised the vector and insert in
a 2:1 molar ratio, 10X ligation buffer (3 μL), 2 μL of T4 DNA ligase (1 U/μL) and
56
deionised water. The reaction was incubated at 16oC overnight and 4 μL was used for
E. coli transformation (see Section 2.6.1).
2.6 Transformation
2.6.1 E. coli transformation
One Shot® TOP10 chemically competent cells (InvitrogenTM) or Subcloning
EfficiencyTM DH5αTM (InvitrogenTM) were used for plasmid transformation and
propagation in this study. One Shot® ccdB Survival™ 2 T1R Chemically Competent
Cells were used to transform and propagate unmodified Gateway® destination and
donor vectors plasmids containing the lethal ccdB gene used for negative selection in
Gateway recombination. Cells were subjected to heat shock transformation according
manufacturer’s instructions with pUC19 (InvitrogenTM) used as the positive control.
Transformed cells were spread onto pre-warmed LBA supplemented with the
appropriate antibiotic and incubated overnight. Resistant colonies were streaked for
single cells on the same medium and single colonies were transferred to LB liquid
culture prior to plasmid extraction as described above (Section 2.4.1).
2.6.2 E. festucae protoplast preparation
E. festucae protoplast preparation was carried out based on the method described by
Young et al.,(Young et al., 1998). The E. festucae strain was cultured on cellophane
membranes as described in Section 2.4.2. After 4-5 days of growth, fresh mycelia were
scraped off the cellophane membrane and macerated in 1 mL of PDB using a high speed
cell disrupter at 4 m/s for 30 seconds (FastPrep®-24 homogenizer, MP Biomedicals,
CA, USA). A further 500 μL of PDB was added to the macerate, mixed, and 200 μL
was used to inoculate each 250 mL flask containing 50 mL of PDB (8 flasks). The
cultures were incubated at 100 rpm on an orbital shaker at 22oC for 4 days. Mycelia
57
from all 8 flasks were harvested by filtration through 2 layers of 3M Whatman filter
papers in a Buchner funnel, and washed with 1 L of sterile water followed by a few
millilitres of OM buffer (Appendix 1). Thereafter, mycelia were scraped off the filter
paper and added to a flask containing 15 mg/mL of lysis enzyme (Sigma, MO, USA,
Lysing Enzymes from Trichoderma harzianum, L1412) in 30 mL of OM buffer for
digestion. The flasks were incubated for 4-5 hours at 30oC at 100 rpm on an orbital
shaker. The resulting protoplasts were harvested by filtration through 2 layers of
Miracloth (Calbiochem®, EMD MILLIPORE, MA, USA) into 15 mL falcon tubes
(about 5 mL each). The filtrates containing the protoplasts were overlaid carefully with
2 mL of ST buffer (Appendix 1) and centrifuged at 1008 x g for 15 min. Protoplasts at
the interface between the ST buffer and lysis enzyme solution were harvested (using a
cut pipette tip) and placed into fresh 15 mL Falcon tubes. Thereafter 10 mL of STC
buffer (Appendix 1) was added and the protoplasts collected by centrifugation at 1575 x
g for 5 min. The pellet was washed twice with 5 mL of STC buffer, centrifuged at 1575
x g and the washed pellet resuspended in 500 μL of STC buffer. The protoplast
concentration was calculated using a haemocytometer and the protoplasts diluted to
achieve a final concentration of approximately 1.25 X 10⁸ protoplasts/mL. For long
term storage, 80 μL of protoplast suspension was mixed with 20 μL of 40% (w/v) PEG
4000 and stored at -80oC.
2.6.3 Transformation of E. festucae protoplasts
The method used for transformation was adapted from two previous methods used for
transformation of Fulvia fulva (Oliver et al., 1987) and Neurospora crassa (Vollmer et
al., 1986). Freshly prepared protoplasts (80 μL of 1.25 X 10⁸ protoplast/mL) were used
to transform E. festucae with the linearised (RE digested) gene deletion or expression
58
vectors described below. For gene deletions, the entire coding region of the gene was
replaced with an expression cassette harbouring the hph gene (for hygromycin B
resistance).
To the protoplast solution 20 μL of 40% (w/v) PEG 4000 was added followed by 2 μL
of 50 mM spermidine (Sigma) and 5 μL of 5 mg/mL in STC heparin. After mixing
gently, approximately 5 μg of plasmid DNA from each vector was added and mixed
gently. The vectors were linearized by restriction digestion and gel purified in advance
to achieve higher transformation rates. Thereafter the protoplasts were incubated on ice
for 30 min. A further 900 μL of 40% (w/v) PEG 4000 solution was added and incubated
at room temperature for 20 min. The transformed protoplasts were plated on 1.5%
regeneration media (Section 2.2.3) by overlaying 200 μL of transformed protoplast
solution mixed with 4 mL of molten 0.8% regeneration media (Section 2.2.3) at 50oC.
The plates were incubated at 22oC overnight. After the overnight incubation, plates were
overlaid with 4 mL of 0.8% regeneration media at 50oC containing the appropriate
antibiotic for positive selection (Table 2.2). The overlaid plates were incubated at 22oC
for 15-20 days. At the end of the incubation period, colonies with antibiotic resistance
were selected for nuclear purification by three rounds of sub-culturing to obtain
homogeneous colonies (Section 2.8). Plasmid pPN1688 (Young et al., 2005), which
contains a hygromycin resistance gene, was used as the positive control, and water was
used for the negative control. To determine the viability of the protoplasts,
concentrations ranging from 102 to 104 protoplast/ mL in STC buffer were prepared and
100 μL of each dilution was mixed with 4 mL of 0.8% molten regeneration media and
poured on to 1% regeneration media plates. Protoplast viability was calculated by
counting the number of live colonies from each dilution.
59
2.7 Plasmid Construction
2.7.1 Overview of the Gateway cloning system
The MultiSite Gateway ® Three-Fragment Vector Construction Kit (InvitrogenTM) was
used to create the deletion, EGFP expression vectors used in this study. Gateway
cloning is based on recombination between phage and E. coli DNA via specific
recombination sequences denoted as att sites (Landy, 1989; Hartley et al., 2000).
Recombination occurs between different compatible att sites enabling the efficient
transfer of DNA between plasmids. In the Gateway cloning system, PCR fragments
created with primers flanked with attB sites are recombined into donor vectors
containing compatible attP sites to create entry clones with the desired DNA inserts via
a BP reaction catalysed by BP Clonase™. Thereafter the three entry vectors are
recombined with a destination vector in a single LR reaction catalysed by LR Clonase™
enzyme mix to create an expression vector containing the three elements within the att
sites of the entry clones, in the desired order, and in frame if required.
BP recombination reactions were performed by adding equimolar concentrations
(10 fmole) of purified attB-flanked PCR product and the pDONRTM vector (50 fmoles
each), 2 μL of BP ClonaseTM II enzyme and TE buffer pH 8.0 (Appendix 1) in 10 μL
reactions, and incubated overnight at 25oC on a heat block according to the
manufacturer’s instructions. The reaction was terminated by using 1 μL of Proteinase K,
and 3-4 μL of the reaction mix was used to transform E. coli (One Shot® TOP10 or
DH5αTM) list strain used) as described in Section 2.6.1.
LR recombination reactions were performed by combining equimolar concentrations of
each entry clone (10 fmole), and 20 fmoles of destination vector (pDESTTM R4-R3
vector II), 2 μL of LR ClonaseTM II plus enzyme and TE buffer (pH 8.0, Appendix 1) in
60
a 10 μL reaction mix, and incubated at 25oC overnight according to manufacturer’s
instructions. The reaction was terminated by adding 1 μL of Proteinase K and
incubating for 10 min at 37oC, and 4 μL was used for E. coli (One Shot® TOP10 or
DH5αTM) transformation.
2.7.2 Construction of E. festucae gene replacement vectors
2.7.2.1 Overview
Replacement vectors pSAM1, pSAM2, pSAM3and pSAM4 (Section 2.7.2.2 and
2.7.2.3) were constructed using the split marker strategy (Fairhead et al., 1996), based
on homologous recombination using MultiSite Gateway® technology (Invitrogen), to
generate vectors able to replace the entire coding region of the target gene. Primers
specific to the 5' and 3' flanking regions of the E. festucae target gene were designed,
and PCR amplified using high fidelity Platinum® Pfx DNA polymerase (InvitrogenTM).
PCR conditions were as described in Section 2.5.7.2. The purified PCR products
(Section 2.5.4) were cloned into donor vectors pDONR-SML and pDONR-SMR
(InvitrogenTM, Appendix 3, Fig 8.1) via a BP recombination (Section 2.7.1) and
transformed into Invitrogen One Shot® TOP10 cells (Section 2.6.1). Plasmid extraction
and restriction digestions (Section 2.4.1 and 2.5.6) were performed followed by
sequencing (Section 2.5.5) to confirm the correct clone. Replacement vectors were
linearised with NotI RE digestion before E. festucae protoplast transformation.
2.7.2.2 Construction of midA replacement vectors
The midA left and right replacement vectors (pSAM1 and pSAM2) were constructed
according to the procedure described above (Section 2.7.2.1). Primer pairs smid-
13/smid-14 and smid-1/smid-2 (Table 2.3) were used to amplify the 5' flank (1.5 kb)
and 3' flank (2.5 kb) respectively. The left flank was recombined into pDONR-SML to
61
generate plasmid pSAM1 (Appendix 3, Figure 8.2) and the right flank was recombined
to pDONR-SMR to generate plasmid pSAM2 (Appendix 3, Figure 8.2). Plasmid
pSAM1 was RE digested with Sal1 (Appendix 3, Figure 8.2) and sequenced with
primers M13-F, M13-R, smid-15, smid-16, smid-17, smid-18, smid-19 and smid-20
(Table 2.3). Plasmid pSAM2 was digested with Pst1 and Xba1(Appendix 3, Figure 8.2)
and sequenced with primers M13-F, M13-R, smid-3, smid-4, smid-5, smid-6, smid-7,
smid-8, smid-9, smid-10, smid-11 and smid-12 (Table 2.3).
2.7.2.3 Construction of wscA replacement vectors
The wscA replacement vectors (pSAM3 and pSAM4) were constructed according to the
procedure described in Section 2.7.2.1. Primer pairs swsc-9/swsc-10 and swsc-1/swsc-2
(Table 2.3) were used to amplify the 5' flank (1.5 kb) and 3' flank (2.5 kb) respectively.
The left flank was cloned to pDONR-SML to generate plasmid pSAM3 (Appendix 3,
Figure 8.3) and the right flank was cloned to pDONR-SMR to generate plasmid pSAM4
(Appendix 3, Figure 8.3). Plasmid pSAM3 was RE digested with Pst1 and Xho1
(Appendix 3, Figure 8.3) and sequenced with primers M13-F, M13-R, swsc-11, swsc-
12, swsc-13, swsc-14, swsc-15, swsc-16, swsc-17, swsc-18, swsc-19 and swsc-20 (Table
2.3). Plasmid pSAM3 was digested with Pst1 and Xba1 (Appendix 3, Figure 8.3) and
sequenced with primers M13-F, M13-R, swsc-3, swsc-4, swsc-5, swsc-6, swsc-7 and
swsc-8 (Table 2.3).
2.7.3 E. festucae complementation vector construction to complement ΔmidA and
ΔwscA
2.7.3.1 Overview
To generate the complementation vectors a fragment that spans upstream and
downstream of the target gene coding region was generated by high fidelity PCR
62
(Section 2.5.7.2 ) using forward and reverse primers with restriction sites for AvrII and
Xho1 respectively. The PCR product was purified via gel purification and quantified
(Sections 2.5.4 and 2.5.1). The purified product was double digested with AvrII and
Xho1 (Section 2.5.6) to generate the insert and gel purified and quantified again. The
insert was ligated to the restriction digested (with Xba1 and Xho1) and purified vector
pII99 (Appendix 3, Figure 8.4) (Namiki et al., 2001). Thereafter the clones were
transformed into Invitrogen DH5αTM E. coli (Section 2.5.1). Plasmid extraction,
restriction digestions and sequencing (Sections 2.5.6 and 2.5.5) were performed to
confirm the vectors were constructed as planned.
2.7.3.2 Construction of midA complementation vector
To construct the midA complementation vector (according to Section 2.7.3.1), a 3716 bp
DNA fragment that spans the region 989 bp upstream and 722 bp downstream of the
midA coding region was amplified using primer pair smid-21/smid-22 (Table 2.3) and
ligated into vector pII99 to generate the complementation vector pSAM5 (Appendix 3,
Figure 8.5). Plasmid pSAM5 was RE digested with EcoRI and HindIII (Appendix 3,
Figure 8.5) and sequenced with primers smid15, smid16, smid17, smid18, smid23,
smid24, smid25, smid26, smid27, smid28, smid29, smid30, smid31 and smid32 (Table
2.3).
2.7.3.3 Construction of wscA complementation vector
To generate the wscA complementation construct (according to Section 2.7.3.1), a
2622 bp fragment that spans the region 837 bp upstream and 879 bp downstream of the
wscA coding region was generated using primer pair swsc-21/swsc-22 (Table 2.3) and
ligated into vector pII99 to generate the complementation vector pSAM6 (Appendix 3,
Figure 8.6). Plasmid pSAM6 was RE digested with EcoRI and Xba1 (Appendix 3,

63
Figure 8.6) and sequenced with primers swsc-22, swsc-23, swsc-24, swsc-25, swsc-26,
swsc-27, swsc-3, swsc-4, swsc-5 and swsc-6 (Table 2.3).
2.7.4 E. festucae expression vector construction
MultiSite Gateway® technology (Invitrogen, Section 2.7.1), was used to generate
expression vectors with either the native promoter (Section 2.7.4.1) of the target gene or
a constitutive promoter (Section 2.7.4.2).
2.7.4.1 Construction of the wscA:egfp expression vector with the native promoter
Expression constructs with the native promoter were created by in-frame fusion of
EGFP to the C terminal of the gene of interest with its native promoter. A fragment
harbouring the entire coding region of the target gene (excluding the stop codon) and
989 bp upstream of the coding was generated by high fidelity PCR (Section 2.5.7.2)
using primer pair swsc-35/swsc-36 (Table 2.3) with half attB site adaptors. The PCR
product was gel purified (Section 2.5.4) and high fidelity PCR amplified using full attB
adaptors (primer pair swsc-37/swsc-38, Table 2.3) as primers to generate the full attB
PCR product. The resulting PCR product was gel purified again and cloned into vector
pDONR-Zeo (InvitrogenTM,Appendix 3, Figure 8.7) via BP recombination (Section
2.7.1) to generate the vector pSAM7 (Appendix 3, Figure 8.8). The clones were
transformed into Invitrogen One Shot® TOP10 cells (Section 2.6.1), plasmid extracted
(Section 2.4.1) and digested with REs EcoRI and NcoI (Section, Appendix 3, Figure
8.8) to confirm the correct clone. The pSAM7 vector was then recombined into the
destination vector pFPLGh (Appendix 3, Figure 8.9, contains the EGFP coding region
and hygromycin resistant gene) (Gong et al., 2015) via LR recombination (Section
2.7.1) to generate the expression clone pSAM8 (Appendix 3, Figure 8.10). The clones
were transformed into Invitrogen One Shot® TOP10 cells followed by plasmid
64
extraction, restriction digestion with EcoRI and sequencing with primers M13-F, M13-
R, swsc-11, swsc-12, swsc-22, swsc-23, swsc-24, swsc-25, swsc-26 and swsc-27 (Table
2.3).
2.7.4.2 Construction of Ptef: wscA:egfp expression vector
To generate Ptef:wscA:egfp construct, the open reading frame (ORF) of the wscA gene
(without the stop codon) was PCR amplified with a high fidelity polymerase (Section
2.5.7.2) using the primer pair swsc-39/swsc-40 flanked with attB1 and attB2 sites
(Table 2.3). The PCR product was gel purified and recombined into pDONRTM
221(Appendix 3, Figure 8.11) using BP Clonase II (Section 2.7.1) to create the entry
clone pSAM9 (Appendix 3, Figure 8.12). The entry clone was confirmed by RE
digestion with EcoRI and EcorV (Appendix 3, Figure 8.12) and sequenced using
primers M13-F, M13-R, swsc-22, swsc-23, swsc-24, swsc-25, swsc-26 and swsc-27
(Table 2.3). The 5' and 3' Gateway Multisite entry clones were available in the
laboratory from a previous study (unpublished). The 5' entry clone, pDONR-TEF
(Appendix 3, Figure 8.13) contained the tef2 promoter from Aureobasidium pullulans
(Vanden et al., 1997) and the 3' entry clone, pDONR-EGFP (Appendix 3, Figure 8.14)
contained the EGFP open reading frame (including stop codon) in donor vectors
pDONRTM P4-P1R (InvitrogenTM) and pDONRTM P2R-P3 (InvitrogenTM) respectively.
The three entry clones were recombined into destination vector pDEST R3-R4
(InvitrogenTM) using LR Clonase plus (Section 2.7.1) to create expression vector
pSAM10 (Appendix 3, Figure 8.15). The expression clones were transformed into
Invitrogen One Shot® TOP10 cells, followed by plasmid extraction, restriction digestion
with HindIII and ApaLI (Appendix 3, Figure 8.15) to confirm the correct clone.
65
2.8 Purification of E. festucae Fl1 transformants
The apex of an individual hypha from each colony was sub-cultured serially 3 times on
PDA containing the relevant antibiotic to obtain genetically homogenous colonies.
When E. festucae protoplasts were transformed with fluorescent fusion proteins,
putative transformants were analysed by epifluorescence microscopy using an Olympus
BX50 microscope, and independent purified transformants expressing the fusion
proteins at the appropriate level were selected at each round of sub culturing.
2.9 Southern blotting
To screen gene replacement strains, E. festucae wild type, four putative mutants
(already confirmed by PCR) and an ectopic strain were subjected to Southern blot
analysis. Approximately 3.5 μg of genomic DNA from each strain was digested
overnight with the relevant RE enzymes in 50 μL reactions (see Appendix 2 for reaction
conditions). In independent reactions, EcoRI and PstI were used to characterise midA
replacement strains, and for wscA replacement strains RE enzymes HindIII and EcoRI
were used. Agarose gel electrophoresis (Section 2.5.3) was conducted subsequent to
digestion, using approximately 100 ng of digested DNA from each reaction to ascertain
complete digestion. Thereafter digested genomic DNA of each strain was separated on a
0.8% agarose gel in TAE buffer overnight (16 h) at 40 volts. After obtaining the
necessary gel photographs along with the DNA ladder, separated DNA was transferred
onto a nylon membrane using the Invitrogen iBlot® Dry Blotting System apparatus
according to manufacturer’s instructions. The nylon membrane was infused with a
solution containing NaCl (1.5 M) and NaOH (0.5 M) for 10 min to denature the DNA
which was then cross-linked to the nylon membrane using the Statagene UV stratalinker
1800.

66
Two probes were designed for each gene replacement analysis. For wscA gene
replacement analysis, probe A was generated using primer pair swsc-3/swsc-6 (Table
2.3) and probe B using primer pair swsc-33/ swsc-34 (Table 2.3). Similarly for midA
gene replacement analysis, probe C was generated using primer pair smid-3/ smid-6
(Table 2.3) and probe D using primer pair smid-39/smid-40 (Table 2.3). The probes
were synthesized and tested using a PCR DIG Probe Synthesis Kit (Roche) according to
the protocol provided. Each probe was incubated independently with the hybridisation
membranes. Pre-hybridization was carried out using DIG Easy Hyb solution (Roche) at
42oC for 1 h. This was followed by hybridization using Roche DIG Easy Hyb solution
containing the relevant DIG-labelled denatured probe (2 μL of PCR-labelled probe per 1
mL of hybridization buffer) at 42oC overnight. Pre-hybridization and hybridizations
were carried out in a Thermo Hybaid Maxi14 hybridization chamber. Low stringency
washing was carried out using 2x SSC, 0.1% (w/v) SDS (Appendix 1) followed by high
stringency washing with 0.5x SSC, 0.1% SDS (Appendix 1) at 68oC for 30 min.
Hybridised probe was detected using the chemiluminescent substrate for alkaline
phosphatase, CDP-Star (Roche) according to the manufacturer’s instructions. The
membrane was then exposed to X-ray film for between 2 and 20 min until optimal
resolution had been achieved. The sizes of the luminescent DNA fragments were
estimated using the 1 Kb+ DNA ladder (InvitrogenTM) from the same gel.
2.10 Endophyte colonization in plants
2.10.1 Endophyte detection in plants by tissue print immunoassay
Plants were assayed for the presence of endophyte when inoculated seedlings were
approximately 7 weeks old (6 weeks post inoculation). Three tillers from each plant
were tested for endophyte by tissue print immuno-assay using an Epichloë-specific

67
polyclonal anti-serum method (Hahn et al., 2003). Tillers were transversely excised
5 mm from the crown of the plant, dead tissues were removed, and the cut end blotted
directly onto nitrocellulose membrane (NCM, 0.45 mm). Known endophyte positive
and negative tillers were used as positive and negative controls whenever possible.
NCMs were immersed in a solution of non-fat milk powder blocking solution for 2 h at
RT while shaking. Blocking solution (BS) was decanted and the membranes washed
twice with BS, and immersed again in 25 mL of BS containing 1:1000 diluted primary
antibody (specific to Epichloë endophytes). The membranes were incubated at room
temperature for 15 min with shaking, followed by incubation at 4oC overnight. The
primary antibody solution was decanted and the membranes washed twice with BS
before immersion in 25 mL of BS solution containing the secondary antibody (1:4000
dilution, goat anti-rabbit IgG-AP, Santa Cruz Biotechnology, USA). The membranes
were incubated at room temperature for 15 min followed by a further incubation at 4oC
for 5 h. The membrane was twice rinsed with BS and then immersed in the chromogen
with shaking for 15 min until development was complete. Further development was
halted by rinsing the membrane in reverse osmosis (RO) water.
2.10.2 Endophyte detection in plants via aniline blue staining
Epidermal peels were taken from the abaxial surface of a mature leaf sheath and
immersed in a drop of aniline blue (0.05% [w/v] aniline blue in lactic acid/
glycerol/water 1:2:1) on a glass slide, a cover slip was placed on top and the slide was
heated for few seconds by holding it over a small flame to remove air bubbles and
facilitate stain penetration. The stained tissue samples were observed using a light
microscope (Olympus BX50, Section 2.12.2).

68
2.11 Staining techniques
2.11.1 Calcofluor White staining
Fungal hyphae were stained with Calcofluor White (Sigma), which binds chitin, a
component of the fungal cell wall (Elorza et al., 1983), to visualise cell walls and septa
using fluorescence microscopy. To stain hyphae, a square block of the culture was
immersed in a solution of Calcofluor White (25 μM) for 2 min. Thereafter the block
was rinsed with water and mounted on a slide for microscopy. For time lapse live
imaging of cell wall and septa formation, the block of agar with hyphae was mounted
and retained on a diluted solution of Calcofluor White (4 μM) prepared with half
strength PDB. Low concentrations of CW minimise the effect of CW on cell wall
fidelity (Hickey et al., 2005).
2.11.2 FM4-64 staining
FM™ 4-64 (Invitrogen, Molecular Probes®) fluoresces intensely upon binding to the
outer layer of the plasma membrane and thus acts as a vital stain to visualise plasma
membranes. Fungal hyphae were stained with FM™ 4-64 by immersing a square block
of agar with hyphae (or on silicon membrane) in a solution of FM™ 4-64 (2 μg/mL in
water) on ice for 2 min and immediately mounting on a cover slip for confocal
microscopy (Section 2.12.3). Microscopy was performed within 20 min before the stain
permeated the cells via endocytosis.
2.12 Microscopy
2.12.1 Obtaining leaf and tiller tissue samples for microscopy
Longitudinal sections (4 mm x 10 mm) of whole leaf tissue from different parts of the
grass tiller were obtained by dissecting the tiller under a dissecting microscope. To
69
obtain transverse sections and longitudinal sections across the meristematic region,
tillers were embedded in melted 4% (w/v) agarose. The embedded tillers were dissected
manually in the appropriate orientation using a blade to obtain transverse or longitudinal
sections across the shoot meristematic zone manually using a blade. All sections were
mounted in water for confocal microscopy analysis.
2.12.2 Light, DIC and florescence microscopy
Light, differential interference contrast (DIC) and fluorescence microscopy was
conducted using an Olympus BX50 epiflorescence light microscope (Olympus UPlan
F1 10X, 20X objectives and Olympus UPlanFL N 40X objective) and images were
taken using a fitted Olympus Colourview III soft imaging system digital camera. DIC
images were taken using an Olympus–HGLGP5 DIC filter. The images were analysed
and processed further using Olympus AnalysisB software.
2.12.3 Confocal laser scanning microscopy
Confocal microscopy was conducted using an Olympus Fluoview FV10i–LIV self-
contained confocal laser scanning microscope. Two dimensional, Z-stack and time lapse
images were taken using 10X (numerical aperture 0.4, equivalent to UPLSAPO 10X) or
60X (numerical aperture 1.2, equivalent to UPLSAPO 60X) phase contrast objectives.
The microscope was operated according to manufacturer’s instructions and the laser
output, photomultiplier sensitivity, numerical aperture, scanning speed and image
resolution were adjusted accordingly. When comparisons between images were
necessary these parameters were kept constant between images. Images were analysed
and processed using Olympus confocal software FV10-ASWRS. For visualising EGFP
and YFP emission was detected at 490-540 nm (excitation 473 nm), Calcofluor White at
420-460 nm (excitation 405 nm) and FM™ 4-64 at 570-670 nm (excitation 473 nm). To
70
visualise EGFP labelled endophyte hyphae within plant tissues an image resolution of
1024*1025 pixels, numerical aperture of 2.5, laser transmissivity of 40% and laser
sensitivity of 54.5% were used for all imaging. To image EGFP tagged wscA
localization, an image resolution of 1024*1024 pixels, numerical aperture 2.5, laser
transmissivity of 45% and laser strength of 40% were used.
2.12.3.1 Calcium imaging using confocal laser scanning microcopy
To investigate Ca2+ distribution in E. festucae (expressing GCaMP5 Ca2+ sensor)
growing in culture, strains were cultured on PDA for 8 days at 22oC. For confocal laser
scanning microscopy, a square block of medium (1 cm2) from the edge of the culture
was inverted onto half-strength PDB (500 μL) on a cover glass (24X60, thickness-0.13
to 0.17mm). Time lapse imaging was performed using the 60X water-based objective
with excitation and emission wavelengths of 473 and 490-540 nm respectively. For all
imaging, the numerical aperture was maintained at 2.5, laser strength at 45%, sensitivity
at 54.5%, resolution at 512 x 512 and scanning speed at 2 sec 274 ms per frame.
Parameters were set to minimise photobleaching. A low resolution had to be maintained
to perform high speed scanning to capture rapid changes in fluorescence. Images were
acquired simultaneously from two channels, EGFP and phase contrast. Fluorescence
intensity with time graphs was obtained using the Olympus confocal software FV10-
ASWRS after background subtraction.
2.12.3.2 Visualising nuclear tagged hyphae using confocal laser scanning
microcopy
Agar blocks (1 cm2) containing nuclear tagged hyphae (transformed with pYH2a) from
the edge of 8 day old colonies were cut and inverted onto half-strength PDB (500 μL)
on a cover glass (24X60, thickness-0.13 to 0.17mm) for observation. When necessary,
71
hyphae were stained with Calcoflour White as described in Section 2.11.1, to visualise
cell walls and septa.
2.12.3.3 Hyphal apical growth rate determination using confocal microscopy
Blocks of PDA obtained from the edge of the colony were mounted in half-strength
standard PDB and phase contrast time lapse imaging was conducted for 5 min with an
imaging speed of 2.274 sec per image. Using time lapse phase contrast images, the
distance travelled by the tip of an individual hypha within 5 min was recorded (using
Olympus confocal FV10-ASWRS image processing software), and apical growth rate
was calculated by dividing the distance travelled by the time.
2.13 Radial colony growth rate determination
The radial growth rates of strains were determined on standard PDA (Potato Dextrose
Agar) media. The effect of altered conditions on growth rate was determined by adding
supplements to the standard PDA medium. Supplements were added and mixed
thoroughly before or after sterilization (media was cooled down to 50oC) depending on
the stability of the compound used. Twenty millilitres of media per Petri plate was used
for all analyses. To determine colony growth rate, 1 mm2 plugs from the edge of 8 day
old colonies of four test strains were cultured on each plate according to a randomized
block design plate assay. The cultures were incubated at 22oC under 16 h light. The
diameter of the colony was measured after 4 days and subsequently in 5 day intervals
until the colonies reached the edge of the Petri plate. The diameter of each colony was
measured at four equidistant points. The growth rate for each time interval was
determined by subtracting the previous diameter and dividing by the number of days. A
randomized block design was used with 3 biological replicates for each deletion strain,
with 5 clonal replicates each, and the results were analysed via ANOVA using Minitab
72
statistical software. For determination of colony morphology, 8 day old colonies of each
strain were photographed using an Olympus SZX12 dissecting microscope fitted with
an Olympus DP20 digital camera.
2.14 Statistics
The statistical significant difference (P<0.05) between two or more groups was analysed
using the student’s t-test or analysis of variance (ANOVA) using Minitab 16 statistical
analysis software. When necessary, P values for pair wise comparisons were derived
using Tukey's HSD post-hoc test. Pearson's linear correlation coefficient was calculated
to test whether there is a statistically significant correlation between two variables.
2.15 Bioinformatics
Sequences of mid1 and wsc1 genes of S. cerevisiae were obtained from SGD
(Saccharomyces Genome Database, http://www.yeastgenome.org/). Sequences of mid1
and wsc1orthologues in other fungi were obtained through a database search using the
Entrez cross database search tool of NCBI (http://www.ncbi.nlm.nih.gov/sites/gquery).
The putative orthologous midA and wscA genes of E. festucae were identified through
tBLASTn (Basic Local Alignment Search Tool) analyses against the E. festucae
genome (http://www.endophyte.uky.edu/, E. festucae Fl1, 2011-03 assembly, version 2)
(Schardl et al., 2013). Gene predictions and annotation models for putative midA and
wscA genes of E. festucae performed using the Maker and FGeneSH were obtained
through the Gbrowse interface provided in http://www.endophyte.uky.edu/, E. festucae
Fl1, 2011-03 assembly, version 2.
Multiple sequence alignment was performed using amino acid sequences of known
Mid1 and Wsc1 proteins using ClustalW (http://www.ebi.ac.uk/Tools/msa/clustalw2/)
with default settings (Larkin et al., 2007). The conceptual structural and functional
73
domains of MidA and WscA were identified via bioinformatics tools such as SignalP
(http://www.cbs.dtu.dk/services/SignalP/-to predict signal peptides) (Petersen et al.,
2011), TMHMM (http://www.cbs.dtu.dk/services/TMHMM/ - to predict
transmembrane helices) (Sonnhammer et al., 1998; Krogh et al., 2001), TMpred
(http://www.ch.embnet.org/software/TMPRED - to predict helices) (Hofman, 1993),
NetNGlyc (http://www.cbs.dtu.dk/services/NetNGlyc - to predict N-glycosylation
sites), WoLF PSORT (http://wolfpsort.org/- to predict localization) (Horton et al., 2007)
and InterProScan (http://www.ebi.ac.uk/Tools/pfa/iprscan/ - to predict conserved
functional domains) (Zdobnov et al., 2001).

74
Chapter 3: Characterisation of E. festucae
WscA and its role in intercalary growth
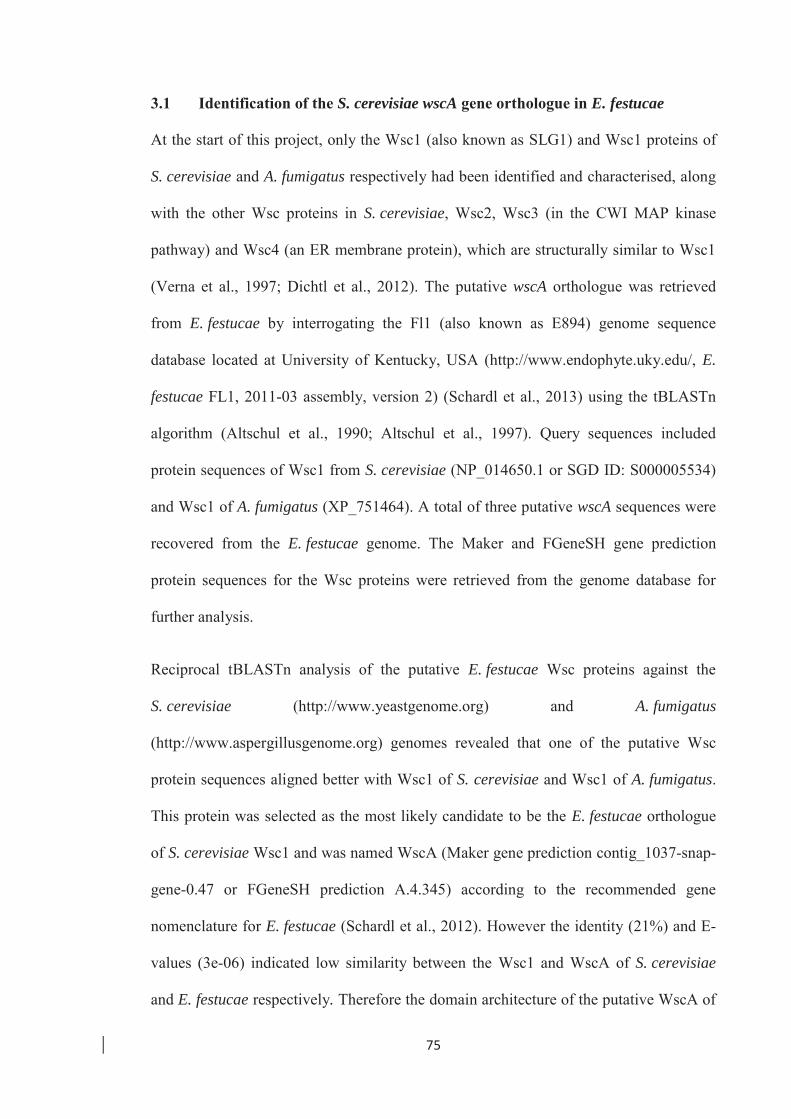
75
3.1 Identification of the S. cerevisiae wscA gene orthologue in E. festucae
At the start of this project, only the Wsc1 (also known as SLG1) and Wsc1 proteins of
S. cerevisiae and A. fumigatus respectively had been identified and characterised, along
with the other Wsc proteins in S. cerevisiae, Wsc2, Wsc3 (in the CWI MAP kinase
pathway) and Wsc4 (an ER membrane protein), which are structurally similar to Wsc1
(Verna et al., 1997; Dichtl et al., 2012). The putative wscA orthologue was retrieved
from E. festucae by interrogating the Fl1 (also known as E894) genome sequence
database located at University of Kentucky, USA (http://www.endophyte.uky.edu/, E.
festucae FL1, 2011-03 assembly, version 2) (Schardl et al., 2013) using the tBLASTn
algorithm (Altschul et al., 1990; Altschul et al., 1997). Query sequences included
protein sequences of Wsc1 from S. cerevisiae (NP_014650.1 or SGD ID: S000005534)
and Wsc1 of A. fumigatus (XP_751464). A total of three putative wscA sequences were
recovered from the E. festucae genome. The Maker and FGeneSH gene prediction
protein sequences for the Wsc proteins were retrieved from the genome database for
further analysis.
Reciprocal tBLASTn analysis of the putative E. festucae Wsc proteins against the
S. cerevisiae (http://www.yeastgenome.org) and A. fumigatus
(http://www.aspergillusgenome.org) genomes revealed that one of the putative Wsc
protein sequences aligned better with Wsc1 of S. cerevisiae and Wsc1 of A. fumigatus.
This protein was selected as the most likely candidate to be the E. festucae orthologue
of S. cerevisiae Wsc1 and was named WscA (Maker gene prediction contig_1037-snap-
gene-0.47 or FGeneSH prediction A.4.345) according to the recommended gene
nomenclature for E. festucae (Schardl et al., 2012). However the identity (21%) and E-
values (3e-06) indicated low similarity between the Wsc1 and WscA of S. cerevisiae
and E. festucae respectively. Therefore the domain architecture of the putative WscA of

76
E. festucae was further analysed to investigate the presence of functionally important
domains and conserved regions.
The conceptual E. festucae WscA protein contains 306 amino acids (Appendix 4).
Structural domain analysis using appropriate bioinformatics tools (Section 2.15)
revealed the presence of functionally important domains and conserved regions in
common with the yeast protein. E. festucae putative WscA protein consisted of the
WSC domain (carbohydrate binding domain) that contains eight conserved cysteine
residues (Pfam protein families database ID: PF01822 and InterProScan ID:
IPR002889). A similar WSC domain with eight conserved cysteine residues is found in
Wsc1 of S. cerevisiae (Fig 3.1). Further, the protein contained a signal peptide of 19
amino acids at the N-terminus and a transmembrane domain of 23 amino acids that
embeds the protein (a single pass through the membrane) into cell membranes. The N-
terminus extra-cellular domain consists of 212 amino acids and the highly conserved C-
terminus intracellular region has 71 amino acids. In addition a serine/threonine rich
region in the N-terminus, similar to the yeast Wsc1 (Fig 3.1) is also present.
As BLAST results indicated, the wscA gene identified in the E. festucae genome shared
very low homology with wsc1 of S. cerevisiae. Nevertheless the candidate selected
represented the most likely orthologue, given the available data at the time of analysis.
The other two putative E. festucae Wsc proteins identified aligned better with Wsc2
(CWI MAP kinase pathway) and Wsc4 (ER membrane protein) of S. cerevisiae, these
proteins were not characterised further in this study.
77
E.festucae ----MRLSTIAFGAIMAATGVHAQT------PKPKQPALQIPVDGISTSSGCYGSYGNMT 50 N.crassa -MKSISVLVTAFAANCAIATAHQPLGSLFVRDDPPWPTIEKPAFLQNTYHGCYNDSGTLK 59 A.fumigatus --------MKPFTARSAFTASVLLLT----------TNLPAVFAAEMVSQGCFSDSTPLV 42 S.cerevisiae MRPNKTSLLLALLSILSQAN-------------------------AYEYVNCFSSLPSDF 35 .: : : : .*:.. E.festucae MHKP-ISADKMS-------------TAACNNACKADG-FWLAAMHGG-QCLCGYALPPKK 94 N.crassa LFTTRMNTQQMMNFGNGLEKDLGVSSGLCFQWCKDNK-TTVAAMSQGDQCWCGTEYPPES 118 A.fumigatus DQGP--YTYQSN--------------GYCQQLCMKTSNNLVFALTKGSNCLCGNQLPAKS 86 S.cerevisiae SKADSYNWQSSS---------------HCNSECSAKG-ASYFALYNHSECYCGDTNPSGS 79 . * . * *: :* ** *. . E.festucae DLVEDSECNQPCPAYPPEACGGIDSYSIYNVGIQLQINRYEPSSSSTTGGSKTSAASPTP 154 N.crassa AQTDIQNCDITCSGYNLEYCGGADTWSVYNLGVPKVAN-SKPKVSSTSAAPSSTAAAKTS 177 A.fumigatus AKTADSDCNVKCAGWPDVMCGGQNTFSVYLTGLSSNVAYYHDDDASTSANANSSSTSTTN 146 S.cerevisiae ESTS-SSCNTYCFGYSSEMCGGEDAYSVYQLDSDTNSNSISSSDSSTESTSASSSTTSST 138 . ..*: * .: *** :::*:* . . :** . . ::::: : E.festucae TDTSSSTNTGGNNNNNHSNNNNNHSNNNNGGGGGTTVTQTS------------------- 195 N.crassa SISSAVSEP-------------------------TVTTTES------------------- 193 A.fumigatus GGSTVTTGSQGQ-----------VVTQGEQTVVVTAPAGNG------------------- 176 S.cerevisiae TSSTTSTTSSTTSSTTSSMASSSTVQNSPESTQAAASISTSQSSSTVTSESSLTSDTLAT 198 :: : . :. . E.festucae ----------------------------------------------VPTET---PKPEKS 206 N.crassa ----------------------------------------------ILPDD---SKKGKS 204 A.fumigatus ----------------------------------------------VGATNGLNEEKNKD 190 S.cerevisiae SSTSSQSQDATSIIYSTTFHTEGGSTIFVTNTITASAQNSGSATGTAGSDSTSGSKTHKK 258 . : *. E.festucae GPNVAGIAAGVVVGVFAAAAAIAGVFFYVRRKRNSEIEE-------------EHRRNAAV 253 N.crassa --NTAGIVAGTVVAVVVVLSAVGGVFLFMRRKRNKEIED-------------EHRRNAAV 249 A.fumigatus GPNTAAIAAGVVVGVVGFCSLVGAGFFLWRFRKRTNVRP-------------QYSNNAGA 237 S.cerevisiae KANVGAIVGGVVGGVVGAVAIALCILLIVRHINMKREQDRMEKEYQEAIKPVEYPDKLYA 318 *...*..*.* .*. : :: * . .. . :: : . E.festucae NAFISGSKPSSSHGSISMTDSRLD--PVMAHRRMSDGSIADNEDYSRR-ILRVTNA---- 306 N.crassa NAFVG--KPPSTSDGMSMADARLD--PVLVQRRLSDGSIADNQDYSRR-ILRVTNA---- 300 A.fumigatus TEHFG--KPMSQD---SMSDSRFDG-DFMAQRRQSNGSIDDDQDFSRR-ILQVRLFSSAL 290 S.cerevisiae SSFSSNHGPSSGSFEEEHTKGQTDINPFDDSRRISNGTFINGGPGGKNNVLTVVNPDEAD 378 . . . * * . :..: * . ** *:*:: :. .:. :* * E.festucae --- N.crassa --- A.fumigatus GIS 293 S.cerevisiae ---
Figure 3.1: Multiple sequence alignment between Wsc1 of S. cerevisiae (NP_014650.1) and
orthologues of E. festucae, N. crassa (XP_011395260) and A. fumigatus (XP_751464).
Highlighted grey - signal peptide. Underlined – WSC domain (Pfam ID: PF01822,
carbohydrate binding domain). Red letters - conserved cysteine residues, Green letters –
Serine/threonine rich region. Blue letters - transmembrane domain. Multiple sequence
alignment was performed using ClustalW2 from http://www.ebi.ac.uk.
78
3.2 Targeted deletion of the wscA gene in E. festucae
In order to determine the functional role of WscA in sensing mechanical stress and
stimulating hyphal growth, the wscA gene in E. festucae Fl1 was deleted by targeted
gene replacement using the split marker strategy based on homologous recombination
(Fairhead et al., 1996). Through gene replacement the entire coding region of wscA was
replaced with an expression cassette harbouring the gene hph. Linearised whole
replacement vectors, pSAM3 & pSAM4 (Appendix 3, Fig 8.3) were generated (Section
2.7.2 and 2.7.2.3) and E. festucae Fl1 protoplasts were transformed (Section 2.6.3) to
achieve a targeted gene replacement. Plasmid pPN1688 which contains the hygromycin-
resistant gene hph was used as the positive transformation control and water was used
for the negative control. Protoplast transformation resulted in around 70 hygromycin-
resistant colonies per 4 X 10⁶ protoplasts. There was no growth observed in the negative
control, while the positive control resulted in around 50 resistant colonies per 4 X 10⁶
protoplasts. The viability of the protoplasts was 11% (calculated using the number of
colonies formed against the number of protoplasts cultured on hygromycin-free
negative control regeneration plates). After sub culturing from hyphal tips three times to
generate homogenous lines (Section 2.8), DNA was isolated from resistant colonies and
PCR-screened to confirm replacement of wscA. Primers were designed to target the
wscA flanking regions (primer pair swsc-30/swsc-31) and regions beyond the 3´
flanking region (primer pair swsc-27/swsc-32) on either side to check whether the
deletion cassette had integrated at the correct locus to replace the WT copy of the gene
(Fig 3.2). PCR screening revealed that targeted replacement of wscA was successful in
nearly 30% of the total transformed colonies screened (Fig 3.2). Accordingly, strains
ΔwscA-5, 21, 26 and 36 were selected for Southern blotting for further confirmation.
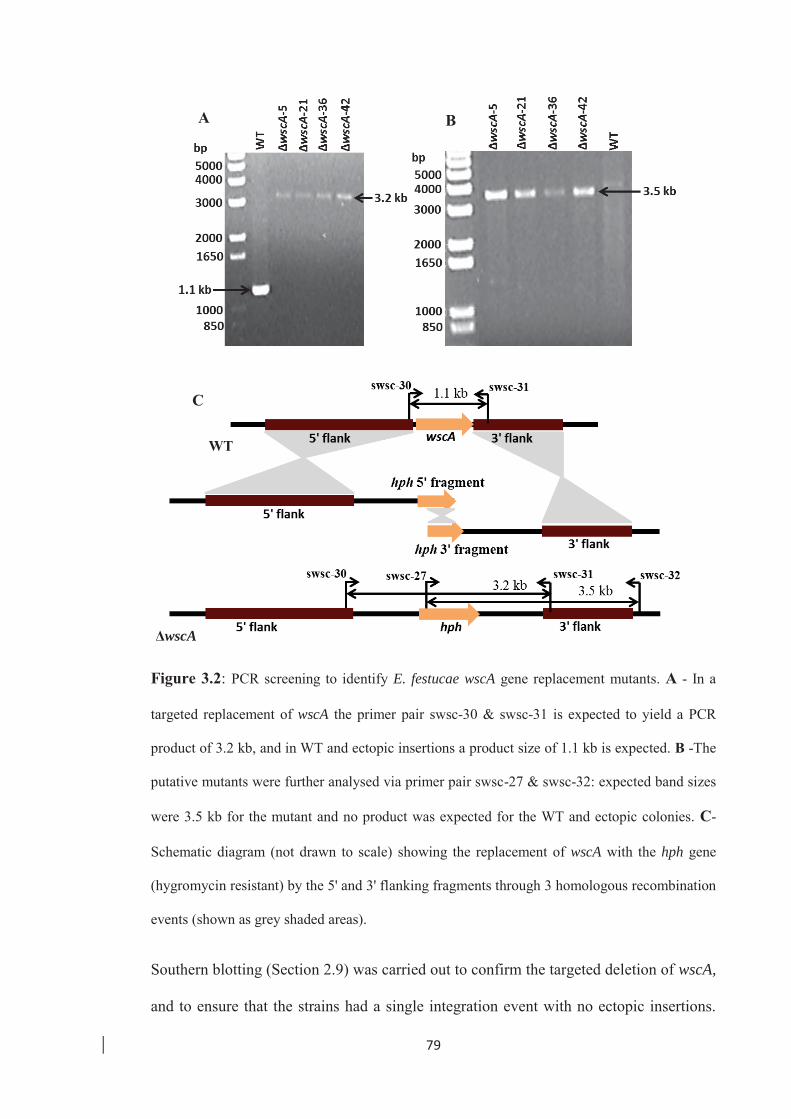
79
Figure 3.2: PCR screening to identify E. festucae wscA gene replacement mutants. A - In a
targeted replacement of wscA the primer pair swsc-30 & swsc-31 is expected to yield a PCR
product of 3.2 kb, and in WT and ectopic insertions a product size of 1.1 kb is expected. B -The
putative mutants were further analysed via primer pair swsc-27 & swsc-32: expected band sizes
were 3.5 kb for the mutant and no product was expected for the WT and ectopic colonies. C-
Schematic diagram (not drawn to scale) showing the replacement of wscA with the hph gene
(hygromycin resistant) by the 5' and 3' flanking fragments through 3 homologous recombination
events (shown as grey shaded areas).
Southern blotting (Section 2.9) was carried out to confirm the targeted deletion of wscA,
and to ensure that the strains had a single integration event with no ectopic insertions.
A B
C
ΔwscA
WT

80
Four PCR-confirmed putative wscA replacement strains (ΔwscA-5, 21, 36 and 42) were
selected along with strain Ect 8 containing a putative ectopic integration. As shown in
Fig 3.3, probes (A and B) were designed to detect deletion of the wscA coding region
and to confirm the absence of any ectopic or tandem integration. According to the
Southern hybridisation results obtained from both EcoRI and HindIII digested genomic
DNA it was clear that wscA replacement mutant strains 5 and 36 contained a single
integration event at the desired locus. Strains ΔwscA-21 and 42, when digested with
HindIII, both appeared to have the desired integration event at the wscA locus plus an
additional hybridising band. Because the size of the additional HindIII bands were
similar in both strains, and because no additional ectopic fragment was seen with an
EcoRI digest of ΔwscA-21 (Fig 3.3), the additional HindIII bands were taken to
represent a partially digested fragment common to both strains. Based on this, strain
ΔwscA-21 was also selected for further analysis (along with strains ΔwscA-21 and 42).
Consequently, strains ΔwscA-5, 21 and 36 were selected as the three biological replicate
deletion strains for all analyses.
As the phenotype of the wscA mutants were different to the wild type in axenic culture
(shown in Sections 3.3.1 and 3.3.3 along with the complemented strains), the mutant
phenotypes were complemented by ectopic integration of a single copy of the wscA
gene into the ΔwscA-5 strain using the PEG-mediated protoplast transformation
procedure (Section 2.6.3) with complementation vector pSAM6 (Geneticin® resistant,
Sections 2.7.3.3). To confirm the integration of the wscA gene, transformants were
PCR-screened using primers swsc-12 and swsc-6 (Table 2.3) that amplify a region of
the wscA coding region. Based on PCR results, three independent transformants (Comp-
2, 18 and 24) were selected for all studies.
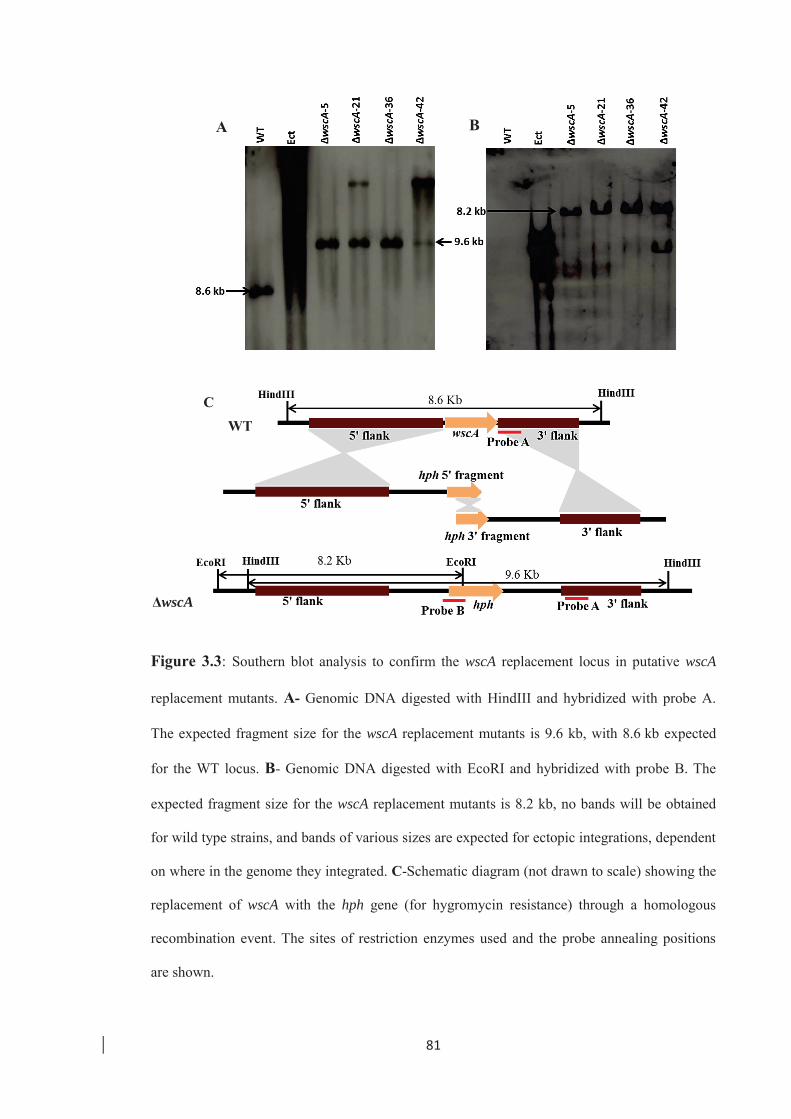
81
Figure 3.3: Southern blot analysis to confirm the wscA replacement locus in putative wscA
replacement mutants. A- Genomic DNA digested with HindIII and hybridized with probe A.
The expected fragment size for the wscA replacement mutants is 9.6 kb, with 8.6 kb expected
for the WT locus. B- Genomic DNA digested with EcoRI and hybridized with probe B. The
expected fragment size for the wscA replacement mutants is 8.2 kb, no bands will be obtained
for wild type strains, and bands of various sizes are expected for ectopic integrations, dependent
on where in the genome they integrated. C-Schematic diagram (not drawn to scale) showing the
replacement of wscA with the hph gene (for hygromycin resistance) through a homologous
recombination event. The sites of restriction enzymes used and the probe annealing positions
are shown.
A B
C
ΔwscA
WT
82
3.3 Functional characterisation of the E. festucae wscA gene during growth in
culture
3.3.1 Deletion of wscA in E. festucae affects radial growth and morphology in
axenic culture
The effect of wscA deletion on radial growth rate, colony morphology and hyphal
morphology was determined by growing mycelial plugs on a PDA medium (Section
2.2.2). The cultures were inoculated in a random block design and incubated at 22oC
under continuous light for 8 days. The radial growth rate was measured and the values
presented are the mean and standard deviation derived from 5 replicates. ANOVA was
performed using Minitab software. Images of colony morphology were obtained using
an Olympus SZX, and DIC and fluorescent images of hyphal morphology were taken
using an Olympus BX50 (Section 2.12.2).
The E. festucae wscA mutants, in comparison to the wild type, showed a significantly
(p<0.05) reduced vegetative radial colony growth rate (Fig 3.4). The radial colony
growth rates of mutants were approximately 40% lower than that of the WT. The colony
radial growth rates of the complemented strains (Comp-2 and 18) and the ectopic strain
were not significantly different to the WT (Fig 3.4). To better understand the reasons for
reduced colony radial growth, the apical growth rates of individual hyphae of the WT,
ΔwscA and complemented strains growing on PDA were analysed using a confocal laser
scanning microscope as described in Section 2.12.3.3. The data revealed that the apical
growth rate of the ΔwscA mutants was 0.79 ± 0.11 μm/min (mean ± SD of 12 individual
hyphae), significantly (p<0.05) lower than the apical growth rate of the WT hyphae
(1.29 ± 0.10 μm/min (mean ± SD of 12 individual hyphae). The complemented strains
showed a growth rate of 1.23 ± 0.07 μm/min (mean ± SD of 12 individual hypha) not
significantly (p<0.05) different from the WT confirming that disruption of wscA was the
cause of the reduction in apical growth rate observed. Other than the reduced apical

83
growth rate, no other aberrations in ΔwscA growth were observed (except for occasional
ruptured hyphal tips) within the time period analysed.
Figure 3.4: Comparison of E. festucae WT and ΔwscA radial growth rates in culture on the
PDA medium. All three ΔwscA mutants showed significantly (p<0.05, using ANOVA) reduced
growth rates compared to the WT, and the complemented strains had a radial colony growth rate
similar to the WT. WT- E. festucae WT strain; ΔwscA -5, ΔwscA -21 and ΔwscA -36 -
independent wscA deletion mutants; Comp-2 and Comp-18 - independent wscA strains
complemented with the full length wscA gene with its native promoter and termination region
ectopically restored; Ect - strain with an ectopic hph (hygromycin B phosphotransferase) gene
integration.
In addition to the reduced colony size, the colony morphology of all three wscA mutants
was different to the wild type, with a marked reduction in aerial growth of hyphae, and
darker colony centres that appeared to be undergoing senescence (Fig 3.5-A). Colony
morphology of the complemented strains and the ectopic strain appeared similar to the
WT, including the presence of aerial hyphae. Cross sections through mutant colonies
revealed no differences in the ability of mutant mycelia to penetrate the agar medium
(1.5%) in comparison to the WT (Fig 3.5-B). Visual microscopic observations of
mycelia growing at the edge of the colony revealed that ΔwscA mutants were hyper-
branched in comparison with the WT, and that the frequency of branching in
Rad
ial c
olon
y gr
owth
rat
e (m
m/d
ay)
WT ΔwscA-5 ΔwscA-21 ΔwscA-36 Comp-2 Comp-18 Ect
Strain

84
complemented strains was similar to the WT (Fig 3.5-C), demonstrating that the WscA
protein is involved in restricting hyphal branching in E. festucae during growth in
culture.
Figure 3.5: Aberrant colony morphology in E. festucae ΔwscA mutants. A- Comparison of the
colony morphology of E. festucae ΔwscA with the wild-type & complemented strain cultured on
PDA. B – Cross sections of the colonies comparing aerial hyphae production. C- DIC images
of WT, ΔwscA-5 and a complemented strain (Comp-2) showing the branching pattern (white
arrows) at the edges of the colony margin. Frequent branching was observed in ΔwscA hyphae.
White scale bar = 2 mm, black scale bar = 200 μm
When hyphae on PDA blocks, stained with CW (25 μM in half strength standard PDB),
were observed by fluorescence microscopy (Section 2.11.1), WT hyphae stained
uniformly except for regions very close to the hyphal tip, where one or two CW patches
A
B
C
WT ΔwscA-5 Comp-2
85
(2-4 μm in length and 3.5±0.20 μm in diameter) could be seen immediately behind the
tip (Fig 3.6-A). In sub-apical compartments and beyond, the cell walls were evenly
stained and hyphae had a uniform diameter of 3.25±0.20 μm (mean ± SD, n=10) over
the approximately 500 μm measured (Fig 3.6-A). However, in comparison, hyphae of
wscA mutants, when stained with CW, contained recurring cell wall aberrations with
globular swollen patches of CW accumulations (3-6 μm in length) along the cell walls
(Fig 3.6-A). The distance between two CW stained patches in mutant hyphae was on
average between 5-8 μm and were prevalent close to the apex (first 2-3 compartments)
and appeared to diminish as the hypha aged. Due to the occurrence of swollen
aberrations, the diameter of mutant hyphae was variable, with diameters of 3.4±0.6 μm
and 3.0 ±0.5 across swollen and septal regions respectively. Consequently, DIC images
revealed an uneven and coarse cell wall surface in mutant hyphae compared to the even
and smooth surface observed in the WT (Fig 3.6-B). Complementation of the wscA
deletion with the full length wscA gene restored the phenotype back to the WT with no
cell wall aberrations observed, indicating that this cell wall phenotype was due to
deletion of the wscA gene. Apart from the cell wall aberrations, a slight increase in
hyphal tip damage was observed in ΔwscA versus WT hyphae which further suggested
cell wall defects had occurred. Overall, these observations showed that wscA deletion
has a profound effect on apical growth and maintenance of cell wall integrity in
E. festucae.
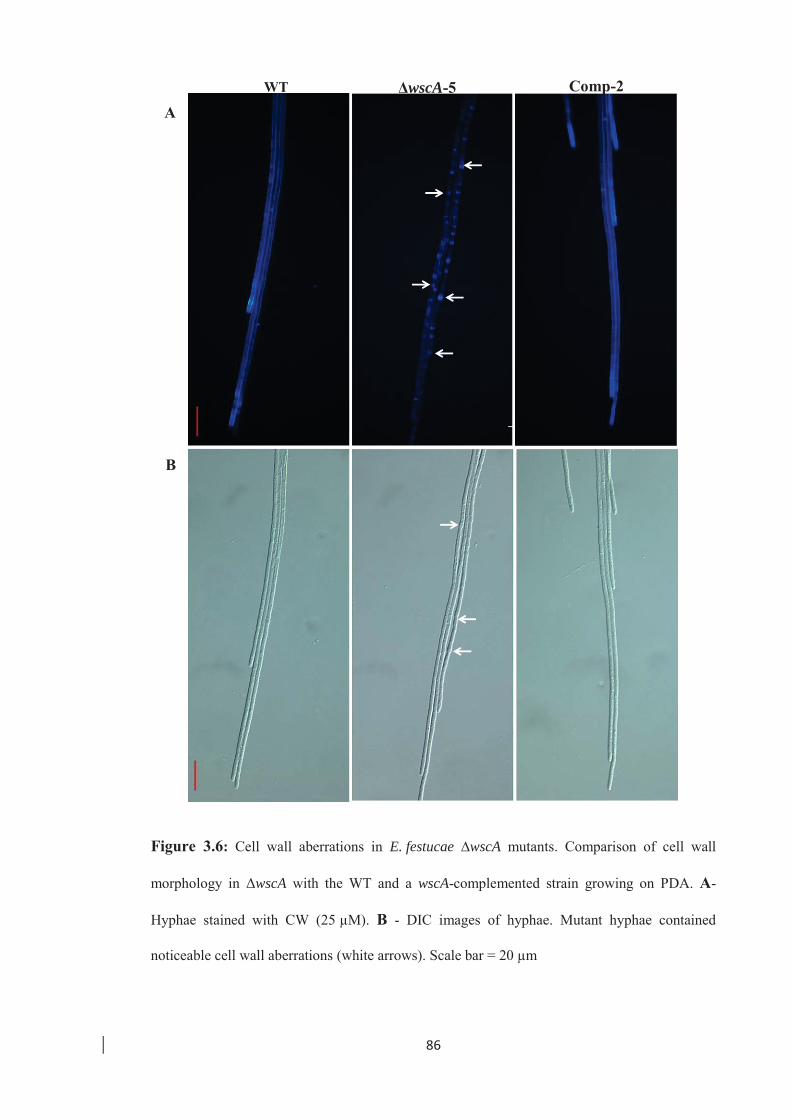
86
Figure 3.6: Cell wall aberrations in E. festucae ∆wscA mutants. Comparison of cell wall
morphology in ΔwscA with the WT and a wscA-complemented strain growing on PDA. A-
Hyphae stained with CW (25 μM). B - DIC images of hyphae. Mutant hyphae contained
noticeable cell wall aberrations (white arrows). Scale bar = 20 μm
A
B
WT ΔwscA-5 Comp-2
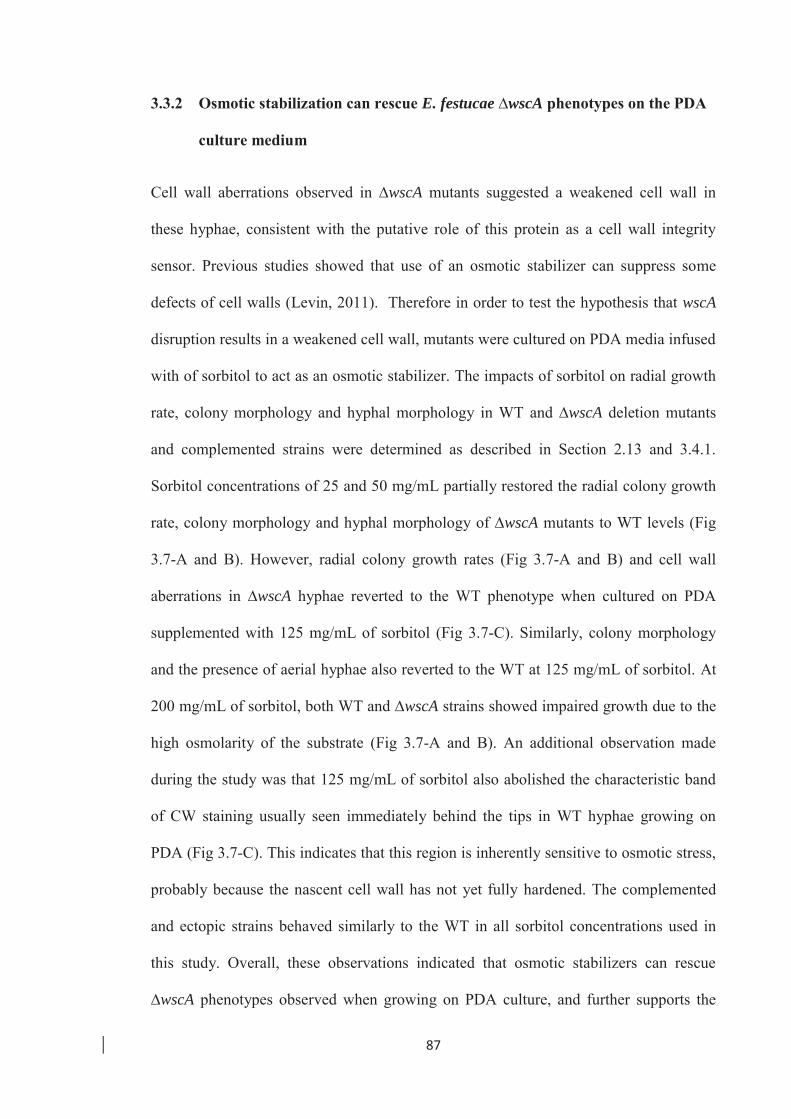
87
3.3.2 Osmotic stabilization can rescue E. festucae ∆wscA phenotypes on the PDA
culture medium
Cell wall aberrations observed in ∆wscA mutants suggested a weakened cell wall in
these hyphae, consistent with the putative role of this protein as a cell wall integrity
sensor. Previous studies showed that use of an osmotic stabilizer can suppress some
defects of cell walls (Levin, 2011). Therefore in order to test the hypothesis that wscA
disruption results in a weakened cell wall, mutants were cultured on PDA media infused
with of sorbitol to act as an osmotic stabilizer. The impacts of sorbitol on radial growth
rate, colony morphology and hyphal morphology in WT and ∆wscA deletion mutants
and complemented strains were determined as described in Section 2.13 and 3.4.1.
Sorbitol concentrations of 25 and 50 mg/mL partially restored the radial colony growth
rate, colony morphology and hyphal morphology of ∆wscA mutants to WT levels (Fig
3.7-A and B). However, radial colony growth rates (Fig 3.7-A and B) and cell wall
aberrations in ∆wscA hyphae reverted to the WT phenotype when cultured on PDA
supplemented with 125 mg/mL of sorbitol (Fig 3.7-C). Similarly, colony morphology
and the presence of aerial hyphae also reverted to the WT at 125 mg/mL of sorbitol. At
200 mg/mL of sorbitol, both WT and ∆wscA strains showed impaired growth due to the
high osmolarity of the substrate (Fig 3.7-A and B). An additional observation made
during the study was that 125 mg/mL of sorbitol also abolished the characteristic band
of CW staining usually seen immediately behind the tips in WT hyphae growing on
PDA (Fig 3.7-C). This indicates that this region is inherently sensitive to osmotic stress,
probably because the nascent cell wall has not yet fully hardened. The complemented
and ectopic strains behaved similarly to the WT in all sorbitol concentrations used in
this study. Overall, these observations indicated that osmotic stabilizers can rescue
∆wscA phenotypes observed when growing on PDA culture, and further supports the
88
microscopy evidence that the colony and hyphal growth defects of wscA mutants are
due to a substantial weakening of the cell wall. Together these data point towards a role
for E. festucae wscA in hyphal growth in culture, primarily in the regulation of cell wall
synthesis.
Rad
ial c
olon
y gr
owth
rat
e (m
m/d
ay)
A
B Sorb (mg/mL)
0 25 50 125 200
WT
∆w
scA
WT ΔwscA-5 ΔwscA-21 ΔwscA-36 Comp-2 Comp-18 Ect Strain

89
Figure 3.7: Effect of sorbitol concentration on the growth rate, colony morphology and hyphal
morphology of E .festucae WT and ∆wscA mutants.
A- Comparison of colony radial growth rates on PDA media supplemented with increasing
sorbitol concentration (25, 50, 125 and 200 mg/mL).
B- Colony morphologies of WT and ∆wscA on PDA infused with different sorbitol
concentrations (0, 25, 50, 125 and 200 mg/mL). Colony morphology of ∆wscA looks most
similar to that of WT at 125 mg/mL sorbitol in PDA. White scale bar = 3 mm.
C- Hyphal morphology of WT and ∆wscA on PDA and PDA+ sorbitol (125 mg/mL). Hyphae
are stained with CW (25 μM). Cell wall aberrations seen in ∆wscA (white arrows) on PDA are
absent on PDA+ sorbitol (125 mg/mL). The CW- stained band present at the tip of WT hyphae
(red arrows) are absent when grown on PDA+ sorbitol (125 mg/mL). Scale bar = 20 μm.
C
WT
∆w
scA
PDA PDA + Sorb
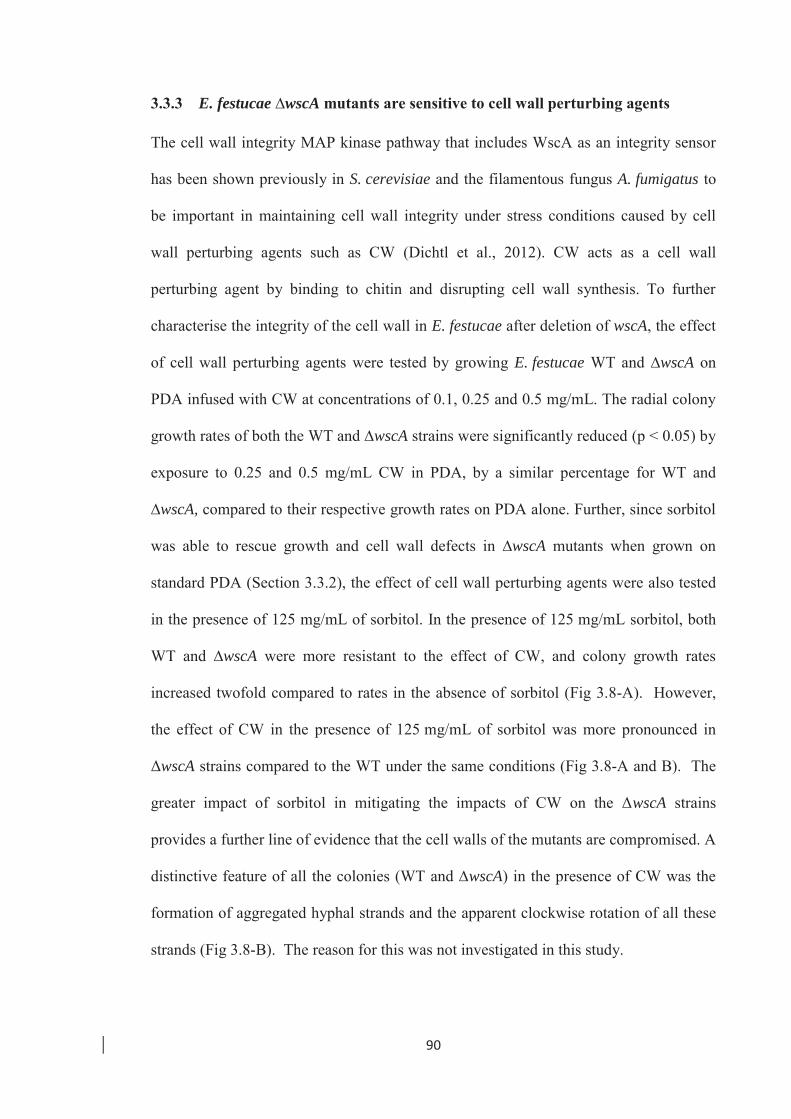
90
3.3.3 E. festucae ∆wscA mutants are sensitive to cell wall perturbing agents
The cell wall integrity MAP kinase pathway that includes WscA as an integrity sensor
has been shown previously in S. cerevisiae and the filamentous fungus A. fumigatus to
be important in maintaining cell wall integrity under stress conditions caused by cell
wall perturbing agents such as CW (Dichtl et al., 2012). CW acts as a cell wall
perturbing agent by binding to chitin and disrupting cell wall synthesis. To further
characterise the integrity of the cell wall in E. festucae after deletion of wscA, the effect
of cell wall perturbing agents were tested by growing E. festucae WT and ∆wscA on
PDA infused with CW at concentrations of 0.1, 0.25 and 0.5 mg/mL. The radial colony
growth rates of both the WT and ∆wscA strains were significantly reduced (p < 0.05) by
exposure to 0.25 and 0.5 mg/mL CW in PDA, by a similar percentage for WT and
∆wscA, compared to their respective growth rates on PDA alone. Further, since sorbitol
was able to rescue growth and cell wall defects in ∆wscA mutants when grown on
standard PDA (Section 3.3.2), the effect of cell wall perturbing agents were also tested
in the presence of 125 mg/mL of sorbitol. In the presence of 125 mg/mL sorbitol, both
WT and ∆wscA were more resistant to the effect of CW, and colony growth rates
increased twofold compared to rates in the absence of sorbitol (Fig 3.8-A). However,
the effect of CW in the presence of 125 mg/mL of sorbitol was more pronounced in
ΔwscA strains compared to the WT under the same conditions (Fig 3.8-A and B). The
greater impact of sorbitol in mitigating the impacts of CW on the ΔwscA strains
provides a further line of evidence that the cell walls of the mutants are compromised. A
distinctive feature of all the colonies (WT and ∆wscA) in the presence of CW was the
formation of aggregated hyphal strands and the apparent clockwise rotation of all these
strands (Fig 3.8-B). The reason for this was not investigated in this study.
91
Figure 3.8: Sorbitol mitigation of defects in radial growth rate and colony morphology caused
by Calcofluor White in E. festucae WT and ∆wscA.
A- Comparison of radial growth rates on PDA supplemented with CW (0.5 mg/mL) with and
without sorbitol (125 mg/mL).
B- Colony morphology of WT and ∆wscA on PDA and PDA infused with CW (0.5 mg/mL) in
the back ground of sorbitol (125 mg/mL, osmotic stabiliser). Effect of CW was reduced in the
presence of sorbitol. Clock wise-oriented hyphal strands in the presence of CW (white arrows).
Scale bar = 3 mm.
Rad
ial c
olon
y gr
owth
rat
e (m
m/d
ay)
WT
∆w
scA
PDA only CW Sorb + CW
A
B
WT ΔwscA-5 ΔwscA-21 ΔwscA-36 Comp-2 Comp-18 Ect Strain
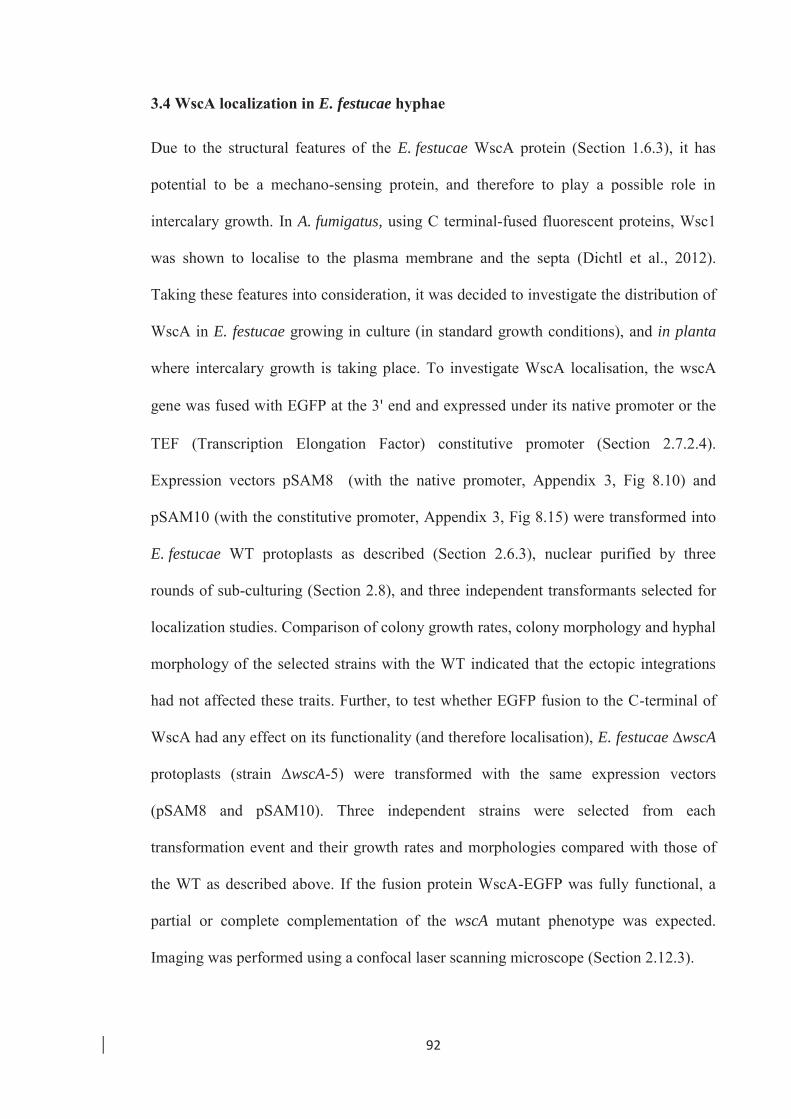
92
3.4 WscA localization in E. festucae hyphae
Due to the structural features of the E. festucae WscA protein (Section 1.6.3), it has
potential to be a mechano-sensing protein, and therefore to play a possible role in
intercalary growth. In A. fumigatus, using C terminal-fused fluorescent proteins, Wsc1
was shown to localise to the plasma membrane and the septa (Dichtl et al., 2012).
Taking these features into consideration, it was decided to investigate the distribution of
WscA in E. festucae growing in culture (in standard growth conditions), and in planta
where intercalary growth is taking place. To investigate WscA localisation, the wscA
gene was fused with EGFP at the 3' end and expressed under its native promoter or the
TEF (Transcription Elongation Factor) constitutive promoter (Section 2.7.2.4).
Expression vectors pSAM8 (with the native promoter, Appendix 3, Fig 8.10) and
pSAM10 (with the constitutive promoter, Appendix 3, Fig 8.15) were transformed into
E. festucae WT protoplasts as described (Section 2.6.3), nuclear purified by three
rounds of sub-culturing (Section 2.8), and three independent transformants selected for
localization studies. Comparison of colony growth rates, colony morphology and hyphal
morphology of the selected strains with the WT indicated that the ectopic integrations
had not affected these traits. Further, to test whether EGFP fusion to the C-terminal of
WscA had any effect on its functionality (and therefore localisation), E. festucae ∆wscA
protoplasts (strain ΔwscA-5) were transformed with the same expression vectors
(pSAM8 and pSAM10). Three independent strains were selected from each
transformation event and their growth rates and morphologies compared with those of
the WT as described above. If the fusion protein WscA-EGFP was fully functional, a
partial or complete complementation of the wscA mutant phenotype was expected.
Imaging was performed using a confocal laser scanning microscope (Section 2.12.3).
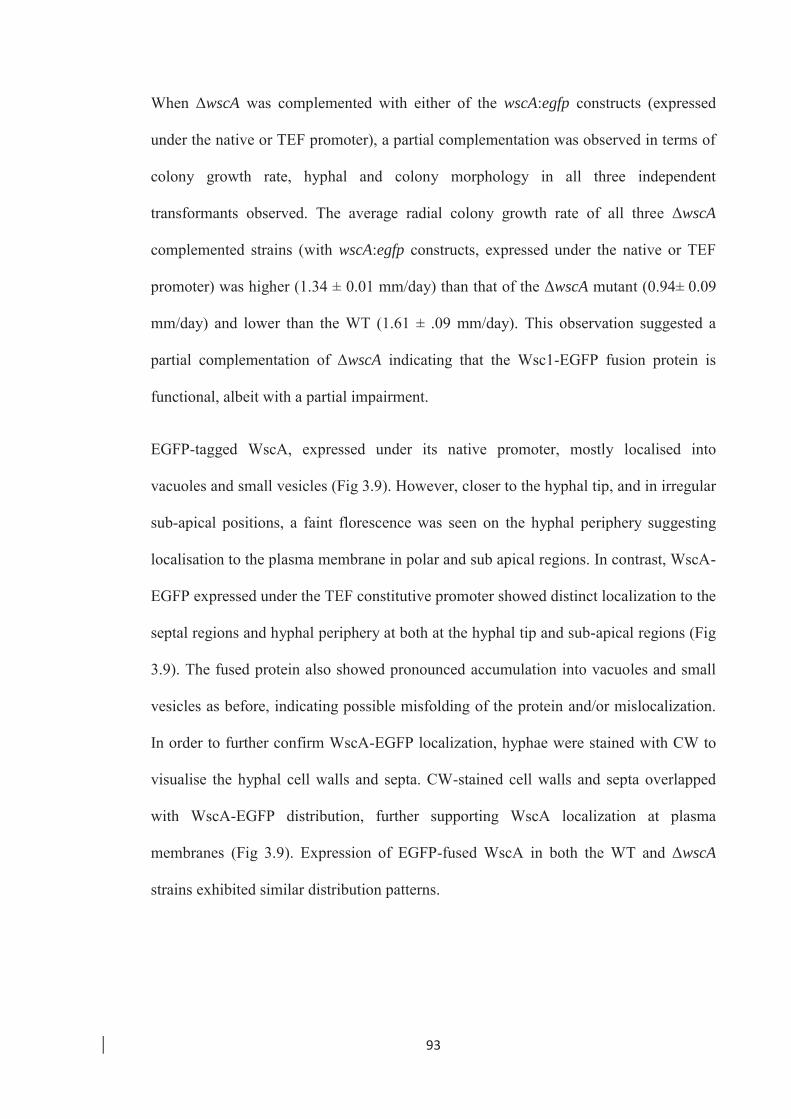
93
When ΔwscA was complemented with either of the wscA:egfp constructs (expressed
under the native or TEF promoter), a partial complementation was observed in terms of
colony growth rate, hyphal and colony morphology in all three independent
transformants observed. The average radial colony growth rate of all three ΔwscA
complemented strains (with wscA:egfp constructs, expressed under the native or TEF
promoter) was higher (1.34 ± 0.01 mm/day) than that of the ΔwscA mutant (0.94± 0.09
mm/day) and lower than the WT (1.61 ± .09 mm/day). This observation suggested a
partial complementation of ΔwscA indicating that the Wsc1-EGFP fusion protein is
functional, albeit with a partial impairment.
EGFP-tagged WscA, expressed under its native promoter, mostly localised into
vacuoles and small vesicles (Fig 3.9). However, closer to the hyphal tip, and in irregular
sub-apical positions, a faint florescence was seen on the hyphal periphery suggesting
localisation to the plasma membrane in polar and sub apical regions. In contrast, WscA-
EGFP expressed under the TEF constitutive promoter showed distinct localization to the
septal regions and hyphal periphery at both at the hyphal tip and sub-apical regions (Fig
3.9). The fused protein also showed pronounced accumulation into vacuoles and small
vesicles as before, indicating possible misfolding of the protein and/or mislocalization.
In order to further confirm WscA-EGFP localization, hyphae were stained with CW to
visualise the hyphal cell walls and septa. CW-stained cell walls and septa overlapped
with WscA-EGFP distribution, further supporting WscA localization at plasma
membranes (Fig 3.9). Expression of EGFP-fused WscA in both the WT and ΔwscA
strains exhibited similar distribution patterns.

94
A
B

95
Figure 3.9: Subcellular localization of WscA fused to EGFP expressing in E. festucae WT
hyphae . I-Phase contrast images with overlapping EGFP and CW fluorescence. II-Overlaid
EGFP and CW fluorescent images. III – Images showing only EGFP fluorescence.
A- WscA distribution close to the hyphal tip. WscA localization to the cell periphery is
observed when the fusion protein is expressed under the constitutive TEF promoter (Strain
EfwscATEFEGFP-08). B- WscA distribution in sub-apical compartments. WscA localises to the
cell periphery and septa when expressed under the constitutive TEF promoter. No distinct
localization of EGFP-fused WscA is discernable when the the fusion protein is expressed under
its native promoter (Strain EfwscAEGFP-5). White arrows – CW stained hyphal cell walls, Red
arrows – hyphal septa, Yellow arrow – WscA-EGFP localization to the cell periphery. Black
scale bar = 10 μm, White scale bar = 5 μm.
Epichloë fungi utilise different growth strategies to infect grass tissues at different
stages of host development. Hyphae that are colonising meristematic cells grow at the
tip, while those in the leaf elongation zone grow by intercalary extension. To investigate
whether WscA localization alters in hyphae during colonisation of different host tissues
(particularly in the meristematic, elongation and mature regions of a tiller), both WT
and ΔwscA strains expressing WscA-EGFP (under native or constitutive promoters)
were infected into perennial ryegrass seedlings. Tissue samples from 8 week old
endophyte-infected plants were examined using confocal laser scanning microscopy as
described above. Whole leaf tissues were used (1 cm X 2-3 mm) to minimise
disturbance to the endophyte, and imaging was conducted immediately after tissue
harvesting. Irrespective of the host tissue type or the strain of endophyte analysed, no
distinct WscA localization patterns could be observed in endophyte hyphae within host
tissues. In all hyphae observed within the different tissues, WscA-EGFP appeared to
localize into vacuoles, and no septal or plasma membrane localization could be seen
96
(Fig 3.10). It was therefore not possible to use these strains to investigate whether
WscA expression or localization altered during key stages of endophyte and host
development, such as the stage where host cell expansion begins and endophyte hyphae
switch from tip growth to intercalary growth.
Figure 3.10: Perennial ryegrass leaf sheath showing sub-cellular localization of WscA-EGFP
(expressed under the constitutive TEF promoter) in E. festucae WT hyphae (Strain
EfwscATEFEGFP-08) growing in planta. WscA-EGFP is concentrated into vacuoles and
vesicles and localization of WscA to cell membranes or septa is not observed. I-Phase contrast
image overlaid on EGFP fluorescence image. II- Image showing only EGFP fluorescence. A-
host cells, Red arrows – WscA-EGFP distribution within hyphae. Scale bar = 20 μm.
3.5 Impact of wscA deletion on colonization of plants by E. festucae
3.5.1 Deletion of wscA does not influence E. festucae colonization of its host (L. perenne)
E. festucae, as described previously, colonises the L. perenne shoot apical meristem
through apical growth, and then switches to a predominantly intercalary growth
mechanism when colonizing the elongation zone of the developing leaf. Thereafter,
further colonization of leaf tissues ceases as the leaf matures and stops growth. This
unique colonization pattern, synchronised with the host development, is hypothesised to
be triggered by mechanical stress imposed on hyphae by rapidly elongating host cells in
the leaf elongation zone. Given the potential for E. festucae WscA to be a
mechanosensor, it was decided to test whether deletion of wscA had any impact on the
I II
97
ability of E. festucae to colonise the host, particularly the expansion zone. E. festucae
WT, three independent ∆wscA deletion mutants, three independent ∆wscA
complemented strains and a strain with an ectopic hph integration (through ectopic
insertion of the original wscA deletion vector) were used (Section 2.3.3.2). All
inoculated plants survived the first eight week period after inoculation. Plants were
tested for the presence of endophyte both by tissue print immunoassay (Section 2.10.1)
and microscopy using aniline blue-stained epidermal peels (Section 2.10.2). Three
tillers were tested from each plant. A plant was considered endophyte positive if one or
more tillers tested positive for endophyte. The percentage of infection was calculated by
dividing the total number of infected plants by the total inoculated for each strain.
Results from tissue print immunoassay and microscopy revealed that wscA deletion had
no impact on infection and colonization of perennial ryegrass by E. festucae, as all
strains tested showed an infection rate of above 90%. Epidermal peels from the leaf
sheaths of infected plants, stained with aniline blue and observed under bright field
microscopy, did not show a visible difference in hyphal density between the WT and
∆wscA infected plants. However, aniline blue-stained epidermal peels do not provide a
comprehensive representation of the colonization pattern of endophytes within the plant.
To better understand impacts on colonization, the WT and one ∆wscA strain (∆wscA -5)
were labelled with EGFP (by co-transforming protoplasts with the constitutively-
expressed vector pTEFEGFP and pII99 to confer resistance against geneticin) (Vanden
et al., 1997). Three independent WT and ∆wscA isolates labelled with EGFP were
selected and the colony growth rates, plant infection rates and hyphal and colony
morphologies were compared with those of unlabelled WT and ∆wscA. The labelled
strains were similar to their unlabelled counterparts indicating that ectopic integration of
TEF-EGFP had not affected these traits. EGFP-labelled strains were inoculated into
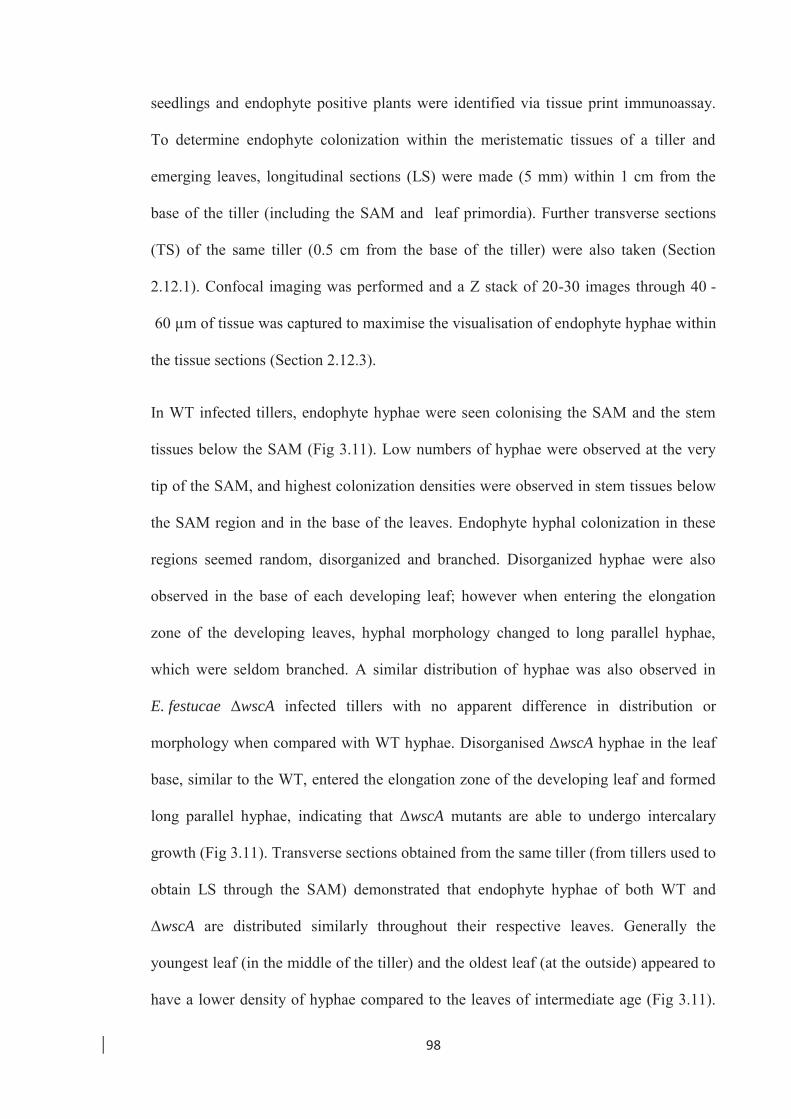
98
seedlings and endophyte positive plants were identified via tissue print immunoassay.
To determine endophyte colonization within the meristematic tissues of a tiller and
emerging leaves, longitudinal sections (LS) were made (5 mm) within 1 cm from the
base of the tiller (including the SAM and leaf primordia). Further transverse sections
(TS) of the same tiller (0.5 cm from the base of the tiller) were also taken (Section
2.12.1). Confocal imaging was performed and a Z stack of 20-30 images through 40 -
60 μm of tissue was captured to maximise the visualisation of endophyte hyphae within
the tissue sections (Section 2.12.3).
In WT infected tillers, endophyte hyphae were seen colonising the SAM and the stem
tissues below the SAM (Fig 3.11). Low numbers of hyphae were observed at the very
tip of the SAM, and highest colonization densities were observed in stem tissues below
the SAM region and in the base of the leaves. Endophyte hyphal colonization in these
regions seemed random, disorganized and branched. Disorganized hyphae were also
observed in the base of each developing leaf; however when entering the elongation
zone of the developing leaves, hyphal morphology changed to long parallel hyphae,
which were seldom branched. A similar distribution of hyphae was also observed in
E. festucae ΔwscA infected tillers with no apparent difference in distribution or
morphology when compared with WT hyphae. Disorganised ΔwscA hyphae in the leaf
base, similar to the WT, entered the elongation zone of the developing leaf and formed
long parallel hyphae, indicating that ΔwscA mutants are able to undergo intercalary
growth (Fig 3.11). Transverse sections obtained from the same tiller (from tillers used to
obtain LS through the SAM) demonstrated that endophyte hyphae of both WT and
ΔwscA are distributed similarly throughout their respective leaves. Generally the
youngest leaf (in the middle of the tiller) and the oldest leaf (at the outside) appeared to
have a lower density of hyphae compared to the leaves of intermediate age (Fig 3.11).

99
When longitudinal sections of the leaf sheath were observed, both WT and ΔwscA had
similarly dense, elongated, continuous and parallel arranged hyphae, evenly distributed
within the whole leaf. These observations indicated uniform entry of both WT and
ΔwscA hyphae into the elongation zone of the developing leaf and intercalary growth
thereafter to form long continuous strands of endophyte hyphae.
100
Figure 3.11: Comparison of hyphal colonization in L. perenne tillers infected with E. festucae
WT and wscA deletion mutants expressing EGFP. Longitudinal sections (LS) of meristem and
leaf and transverse sections (TS) were obtained from the same grass tiller. Fluorescent and
phase contrast images are compressed Z stack confocal images. Green strands and spots
represent endophyte hyphae (red arrow) in LS and TS respectively. Yellow arrows show auto
fluorescing vascular bundles A-Shoot Apical Meristem, B- developing leaves, C1, 2 & 3 are
concentrically arranged leaves in a grass tiller, from youngest to oldest respectively. Deletion of
wscA did not result in any apparent defects in colonization. Scale bar = 200 μm.
L.S –meristem T.S –Tiller L.S –Leaf
WT
∆w
scA
101
3.5.2 Deletion of wscA has no impact on the phenotype of the host
The eight week old plants used to investigate infection rate and colonization (section
above) were also used to determine the impact of ∆wscA deletion on the host plant
phenotype. The plants were assessed for visual appearance, number of tillers, tiller
height and leaf morphology. Colonization by ∆wscA mutants did not have a visible
impact on the host, however, due to the variations observed between plants infected
with the same strain; further investigations were conducted to confirm this conclusion.
3.6 Discussion
This study was undertaken with the primary objective of identifying putative
mechanosensors that are hypothesised to be involved in sensing mechanical stretch and
stimulating intercalary growth in E. festucae endophyte hyphae during host leaf
colonization (Christensen et al., 2008). Wsc1 of S. cerevisiae, and its orthologues
identified recently in a few other filamentous fungi, is a crucial sensory membrane
protein in the cell wall integrity (CWI) MAP-kinase pathway (Verna et al., 1997;
Futagami et al., 2011; Dichtl et al., 2012; Maddi et al., 2012). Primarily responsible for
sensing alterations in cell wall structure, shape and composition due to internal and
external stresses, Wsc1 activates the CWI MAP kinase signalling pathway that
subsequently coordinates cell wall biosynthesis for remodelling and maintenance of the
cell wall (Klis et al., 2006; Rodicio et al., 2010; Levin, 2011).
We hypothesised that mechanical stress imposed on E. festucae hyphae by rapidly
elongating host cells in the expansion zone of a developing leaf is sensed by mechanical
stress sensors located on the endophyte membrane (the endophyte is attached to
elongating host cells) that subsequently trigger intercalary growth. The ability of Wsc1
of S. cerevisiae to act as a nano-spring (Dupres et al., 2009) and its importance in

102
resistance against cell wall perturbing agents that interfere with the synthesis and
structure of the cell wall (Dichtl et al., 2012; Maddi et al., 2012) were further evidence
to support its role as a mechnosensor. Accordingly, E. festucae WscA was investigated
for its potential role as a mechanosensor that stimulates intercalary growth in response
to cell wall stress.
Characterization of the S. cerevisiae CWI MAP kinase pathway membrane sensors
Wsc1, Wsc2, Wsc3, and Mid2 and their orthologues in filamentous fungi indicate that,
although there is some functional redundancy among the sensors, in most cases Wsc1
and Mid2 play the leading roles in sensing cell wall stresses in fungi (Verna et al., 1997;
Futagami et al., 2011; Dichtl et al., 2012). Therefore, as the initial step in characterising
these CWI sensors in E. festucae, and their possible involvement in intercalary growth, I
decided to conduct a gene replacement study on WscA in E. festucae. Further, the
signalling components of the CWI MAP kinase pathway upstream of protein kinase C
have been characterised in only a few filamentous fungi before (Dichtl et al., 2012),
making this study important in providing new insights into CWI signalling in fungi in
general.
E. festucae WscA shares very low identity with Wsc1 of S. cerevisiae. Nevertheless, the
domain structure was mostly consistent with Wsc1 of S. cerevisiae and its characterised
orthologues in A. fumigatus and N. crassa (Fig 3.1) (Verna et al., 1997; Straede et al.,
2007; Dichtl et al., 2012; Maddi et al., 2012). Consistent with Wsc1 of S. cerevisiae, the
N- terminal extracellular domain of WscA of E. festucae had a serine/threonine rich
region that could be sites for O- and N-glycosylation (Lommel et al., 2004; Futagami et
al., 2011). The length of the serine/threonine region in WcsA is short compared to that
of the S. cerevisiae Wsc1, but similar in length to the characterised orthologous Wsc1 of
103
filamentous fungi (Fig 3.1). Glycosylation of the extracellular domain (catalysed by O-
mannosyltransferases) is crucial for WscA function which gives it the rod-like structure
required to sense cell wall stress (Lommel et al., 2004; Dupres et al., 2009;
Kriangkripipat et al., 2009). The eight conserve cysteine residues important for
clustering proteins/sensors and mediating non-covalent binding with cell wall glucans
(Heinisch et al., 2010) were also found in WscA of E. festucae. Multiple sequence
alignment of WscA with the orthologues from other fungi showed that the extracellular
domain is less conserved among fungi than other domains, highlighting potential
differences in their sensory functions (Fig 3.1) (Maddi et al., 2012). In contrast, the
intracellular WscA C-terminus shares a high level of homology with orthologues,
suggesting the common function of activating GTPase Rho1 through the GDP-GTP
exchange factor, Rom2 (Philip et al., 2001; Maddi et al., 2012) is also conserved in the
E. festucae gene. However since E. festucae WscA shared very low identity with Wsc1
of S. cerevisiae, complementation of the S. cerevisiae wsc1 deletion mutant with wscA
would also be required to verify this gene as the yeast orthologue.
During the analysis to find orthologues for Wsc1 of S. cerevisiae in E. festucae, two
further proteins that shared a similar domain structure to WscA were recovered from the
genome sequence which aligned independently with Wsc2 (CWI MAP kinase pathway)
and Wsc4 (ER membrane protein) of S. cerevisiae. Previous investigations have shown
that only two wsc family genes exist in the CWI MAP kinase pathway in the other
filamentous ascomycetes that have been studied so far (Futagami et al., 2011; Dichtl et
al., 2012). Consistent with these fungi, and with the bioinformatic analyses in this
project, it is likely that E. festucae harbours only two Wsc family genes in the CWI
MAP kinase pathway as well. Therefore, the other Wsc protein of E. festucae which
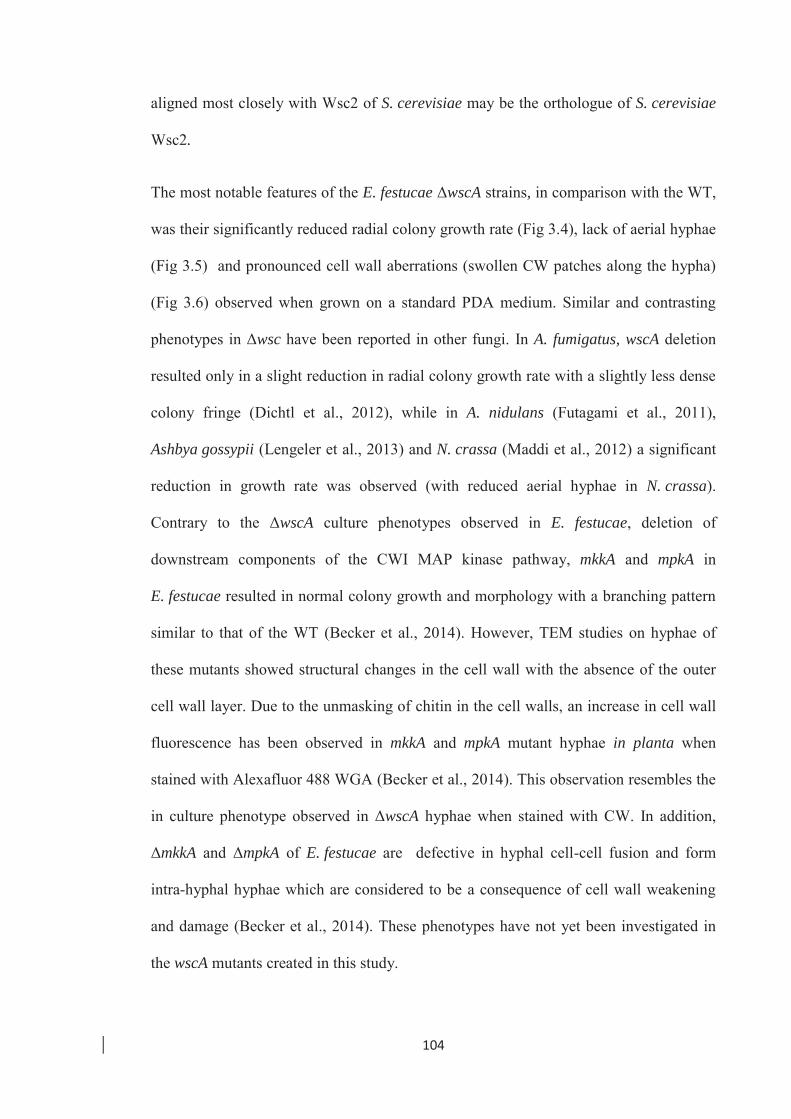
104
aligned most closely with Wsc2 of S. cerevisiae may be the orthologue of S. cerevisiae
Wsc2.
The most notable features of the E. festucae ΔwscA strains, in comparison with the WT,
was their significantly reduced radial colony growth rate (Fig 3.4), lack of aerial hyphae
(Fig 3.5) and pronounced cell wall aberrations (swollen CW patches along the hypha)
(Fig 3.6) observed when grown on a standard PDA medium. Similar and contrasting
phenotypes in Δwsc have been reported in other fungi. In A. fumigatus, wscA deletion
resulted only in a slight reduction in radial colony growth rate with a slightly less dense
colony fringe (Dichtl et al., 2012), while in A. nidulans (Futagami et al., 2011),
Ashbya gossypii (Lengeler et al., 2013) and N. crassa (Maddi et al., 2012) a significant
reduction in growth rate was observed (with reduced aerial hyphae in N. crassa).
Contrary to the ΔwscA culture phenotypes observed in E. festucae, deletion of
downstream components of the CWI MAP kinase pathway, mkkA and mpkA in
E. festucae resulted in normal colony growth and morphology with a branching pattern
similar to that of the WT (Becker et al., 2014). However, TEM studies on hyphae of
these mutants showed structural changes in the cell wall with the absence of the outer
cell wall layer. Due to the unmasking of chitin in the cell walls, an increase in cell wall
fluorescence has been observed in mkkA and mpkA mutant hyphae in planta when
stained with Alexafluor 488 WGA (Becker et al., 2014). This observation resembles the
in culture phenotype observed in ΔwscA hyphae when stained with CW. In addition,
ΔmkkA and ΔmpkA of E. festucae are defective in hyphal cell-cell fusion and form
intra-hyphal hyphae which are considered to be a consequence of cell wall weakening
and damage (Becker et al., 2014). These phenotypes have not yet been investigated in
the wscA mutants created in this study.
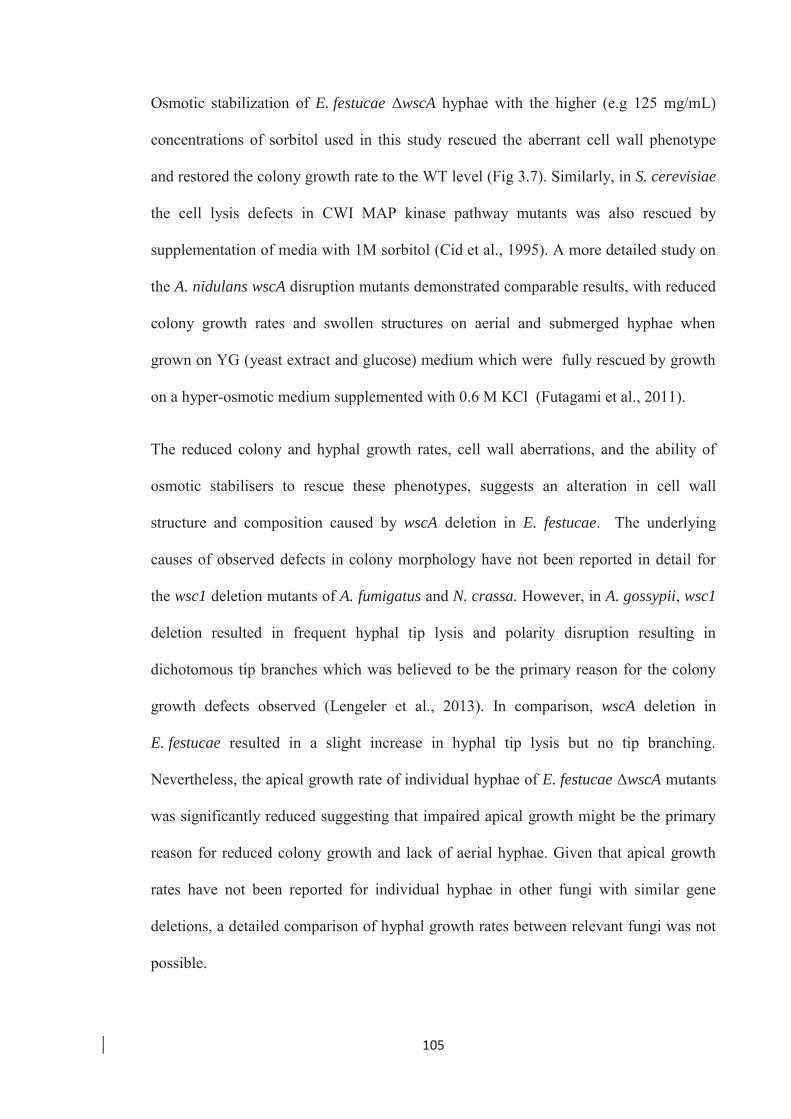
105
Osmotic stabilization of E. festucae ΔwscA hyphae with the higher (e.g 125 mg/mL)
concentrations of sorbitol used in this study rescued the aberrant cell wall phenotype
and restored the colony growth rate to the WT level (Fig 3.7). Similarly, in S. cerevisiae
the cell lysis defects in CWI MAP kinase pathway mutants was also rescued by
supplementation of media with 1M sorbitol (Cid et al., 1995). A more detailed study on
the A. nidulans wscA disruption mutants demonstrated comparable results, with reduced
colony growth rates and swollen structures on aerial and submerged hyphae when
grown on YG (yeast extract and glucose) medium which were fully rescued by growth
on a hyper-osmotic medium supplemented with 0.6 M KCl (Futagami et al., 2011).
The reduced colony and hyphal growth rates, cell wall aberrations, and the ability of
osmotic stabilisers to rescue these phenotypes, suggests an alteration in cell wall
structure and composition caused by wscA deletion in E. festucae. The underlying
causes of observed defects in colony morphology have not been reported in detail for
the wsc1 deletion mutants of A. fumigatus and N. crassa. However, in A. gossypii, wsc1
deletion resulted in frequent hyphal tip lysis and polarity disruption resulting in
dichotomous tip branches which was believed to be the primary reason for the colony
growth defects observed (Lengeler et al., 2013). In comparison, wscA deletion in
E. festucae resulted in a slight increase in hyphal tip lysis but no tip branching.
Nevertheless, the apical growth rate of individual hyphae of E. festucae ΔwscA mutants
was significantly reduced suggesting that impaired apical growth might be the primary
reason for reduced colony growth and lack of aerial hyphae. Given that apical growth
rates have not been reported for individual hyphae in other fungi with similar gene
deletions, a detailed comparison of hyphal growth rates between relevant fungi was not
possible.
106
To understand the defects in cell wall and hyphal growth in ΔwscA, it is important to
understand the link between the CWI MAP kinase pathway and cell wall synthesis. In
the CWI MAP kinase pathway of S. cerevisiae, Rho1 is a membrane-localized Ras-
related GTP-binding protein activated by CWI sensors including Wsc1 (Nonaka et al.,
1995). Rho1 activation leads to three processes involved in protecting cell wall
integrity. Firstly, by activating protein kinase C 1 (PKC1) (Nonaka et al., 1995) Rho1
stimulates synthesis of cell wall biosynthetic enzymes such as 1, 3-β-glucan synthase
via induction of transcription factors such as Rlm1 and Swi4/Swi6 (Jung et al., 1999;
Zu et al., 2001; Jung et al., 2002). Secondly, acting as a regulatory subunit of the 1, 3-β-
glucan synthase (GS) complex, Rho1 directly activates 1, 3-β-glucan synthase
(Drgonová et al., 1996; Qadota et al., 1996) and thirdly, Rho1 reorganizes the actin
cytoskeleton during growth via the Bni1 protein (Fujiwara et al., 1998). Performing a
similar role in other yeasts and filamentous fungi such as in C. albicans, A. fumigatus
and A. nidulans, Rho1 is essential for cell viability, radial growth, branching, and cell
wall synthesis (Smith et al., 2002; Guest et al., 2004; Dichtl et al., 2012). Moreover, a
study on A. nidulans indicated that wscA deletion also alters the expression of α-1,3-
glucan synthase genes (decreasing the transcription of agsA and increasing transcription
of agsB) while increasing the amount of α-glucan and alkali soluble β-1,3/1,6-glucan in
the cell wall when cultured on a YG medium (considered to be hypo-osmotic). In
contrast, when cultured on YG containing 0.6 M KCl, the transcription of cell wall
synthesis genes and cell wall composition of ΔwscA was similar to the WT. The chitin
content of the cell wall did not change in the ΔwscA compared to the WT under either
condition (Futagami et al., 2011). This indicated that under hypo-osmotic conditions
WscA in A. nidulans could be playing a crucial role in regulating cell wall synthesis, but
107
under hyper-osmotic conditions it is dispensable and another signalling pathway may
take over, possibly the HOG pathway.
Considering the high conservation in CWI MAP kinase pathways among filamentous
fungi, it is possible that the Rho1 orthologue in E. festucae performs a similar central
role, and deletion of wscA may affect cell wall synthesis causing changes in structure
and composition of the cell wall as demonstrated in other fungi. Hence, defective cell
wall synthesis in ΔwscA of E. festucae is a likely cause of reduced hyphal growth and
cell wall aberrations observed in culture, although this remains to be tested. One
possible explanation for the absence of certain in culture phenotypes (reduced growth
and cell wall aberrations) in the mkkA and mpkA mutants (presumed to be down stream
of ΔwscA in the CWI MAP kinase pathway) could be the existence of an alternate
signalling cascade in E. festucae that bypasses the MAPK cascade, possibly through
RhoA as mentioned before. One other possible candidate is the HOG MAP kinase
pathway as suggested for A. nidulans (Futagami et al., 2011). However, the ability of
osmotic stabilisers to reverse the ΔwscA mutant phenotypes (reduced growth and cell
wall aberrations) may also be due to the supportive effects of osmo-protectants on
weakened cell surfaces. In standard PDA the damaged cell wall can be seen as CW
accumulation in swollen patches, presumably as a result of internal turgor pressure
pushing on a weakened cell wall and greater stain penetration. Osmotic stabilization of
E. festucae ΔwscA hyphae allowed hyphae with weakened cell walls to grow and to
appear morphologically similar to the WT. Similarly, in WT hyphae growing on PDA,
CW mostly stains the wall at the nascent tip, where the cell wall is under stretch (due to
turgor pressure) and has not yet solidified. As the cell wall hardens away from the tip
CW penetration becomes less efficient.
108
In the presence of damaging concentrations of the cell wall perturbing agent CW, both
the E. festucae ΔwscA and WT strains showed sensitivity, however when exposed to
CW in the background of a osmotic stabiliser (sorbitol) the sensitivity of ΔwscA was
higher than the WT suggesting a role for WscA in resistance against cell wall
perturbation in E. festucae (Fig 3.8). Similar to E. festucae, Wsc1 is important in
resistance against cell wall perturbing agents in S. cerevisiae and N. crassa but not in
A. fumigatus and A. nidulans (Reinoso-Martín et al., 2003; Levin, 2005; Futagami et
al., 2011; Maddi et al., 2012). In A. fumigatus MidA (instead of WscA) is specifically
required for resistance against cell wall perturbing agents (Dichtl et al., 2012). These
observations again reveal the variation shown in the sensory roles of Wsc1 in different
fungi. Further, the mkkA and mpkA mutants of E. festucae did not show any increased
sensitivity to cell wall perturbing agents above the WT (Becker et al., 2014), again
suggesting an alternative to the PKC pathway downstream of WscA. Previous studies
have shown an increase in chitin content in the cell walls of various Candida species
when exposed to cell wall perturbing agents and WscA of E. festucae may have a
similar role (Walker et al., 2013). This remains to be determined.
Attempts to investigate the distribution of WscA in E. festucae indicated that C
terminal-tagged EGFP, expressed under its native promoter, did not show any distinct
localization, while the constitutively-expressed (TEF promoter) WscA tagged with
EGFP showed clear localization to the fungal surface (Fig 3.9). The WscA localization
pattern (when expressed under a constitutive promoter) clearly overlapped with the
CW-stained cell walls and septa (Fig 3.9), indicating that WscA in E. festucae could be
localising to the plasma membrane. A study in A. fumigatus showed a similar
localization pattern for WscA, where a clear localization to the cell periphery was
observed only when expressed under a constitutive promoter (Dichtl et al., 2012).
109
Failure of wscA-egfp constructs expressed under native or constitutive promoter to fully
complement the ΔwscA in terms of colony radial growth rate and hyphal morphology
revealed that the EGFP fusion to the C terminal of the WscA protein may have
compromised its functionality.
The main objective of wscA deletion in E. festucae was to investigate its role in
intercalary growth in plants. Investigations on the ability of ΔwscA to colonize the host
(L. perenne) revealed that the mutants are able to grow within all host plant tissues in a
similar manner to the WT without any major impairment, despite the significant growth
defects shown in culture (Fig 3.11). Hyphal densities in different plant tissues were
similar to the WT and no other apparent abnormalities were observed. In the elongation
zone of developing plant leaves where the endophyte switches from tip growth to
intercalary growth, mutant hyphae were elongated, arranged in parallel and seemed to
be synchronised with host cell elongation (the WT phenotype). In a situation where
intercalary growth only is impaired, the mutants would be expected to either fail to enter
the elongation zone of the developing leaf (as intercalary growth is a prerequisite for
growth in the elongation zone) or hyphae could be present, but heavily fractured as the
host cells would be expected to pull the attached endophyte hyphae apart. No such
observations were made suggesting that ΔwscA can undergo intercalary growth (Fig
3.11). However, it will be useful to further investigate the mechanosensing role of
WscA of E. festucae and its possible involvement in intercalary growth under in vitro
conditions, thus eliminating other potential influences in the complex plant
environment. During this study, a successful method was developed to apply
mechanical stress by stretching fungal hyphae under in vitro conditions (Section 5.3)
and this system should be used to test further the ability of WT and ΔwscA to sense
mechanical stress and undergo intercalary growth.

110
The ability of wscA mutants to colonize leaf tissue in a similar manner to WT, despite
the severe growth defect shown in culture, could be due to osmotic stabilization
provided by the apoplastic fluids which usually contain high concentrations of sugars,
amino acids and other solutes (Lohaus et al., 2001). Studies conducted before on ΔwscA
(discussed above) indicate that mutant growth defects (reduced colony growth rate and
aberrant cell walls) can be restored in culture using osmotic stabilisers such as sorbitol.
Further studies are required to determine whether the apoplastic fluid of perennial
ryegrass is able to support apparently normal hyphal growth of wscA mutants in plants.
Contrary to the normal colonization demonstrated by the WscA mutants, a study on
mkkA and mpkA mutants (downstream of the CWI MAP kinase pathway) of E. festucae
has revealed the importance of these genes in maintaining synchronised mutualistic
growth within L. perenne (Becker et al., 2014). Deletion of these genes resulted in
reduced infection rates, decreased seedling and plant survival rates, stunting of plants,
an increase in hyphal density within intercellular spaces, and colonization of vascular
bundles, indicating the loss of a synchronised symbiotic relationship with the host.
None of these phenotypes were evident in the ΔwscA mutant of E. festucae. This could
be due to overlapping functions in CWI sensors. Loss of WscA may be complemented
by other potential CWI sensors such as Wsc2. A preliminary analysis of the genome has
indicated the presence of WscB (orthologue of Wsc2 of S. cerevisiae) as well as a
Mid2-like protein (orthologue of Mid2 of S. cerevisiae) in E. festucae. It is therefore
possible that other CWI sensors may complement the loss of wscA. However, such
complementation of WscA loss is not observed in culture where wscA mutants show
severe defects in apical growth and maintenance of cell wall integrity. These complex
phenotypes imply that the CWI sensor in E. festucae not only shows differential

111
sensitivity to various stimuli but also may use different signalling cascades to transduce
signals for different stimuli.
In summary, based on the observations made so far, the WscA of E. festucae is a
membrane protein consisting of a serine/threonine rich region N-terminus (possibly
glycosylated), plus conserved cysteine residues (for possible clustering) and a C-
terminus that is possibly intracellular for signal transduction. It has a role in hyphal
apical growth, maintenance of cell wall integrity (cell wall synthesis) and resistance
against cell wall perturbing agents in culture, but is not essential for host colonization or
growth in the host expansion zone. The sensory role of WscA appears to differ among
fungi, possibly reflecting the high degree of variation shown in the extracellular N
terminal (Maddi et al., 2012). Further, considerable redundancy among the CWI sensors
in E. festucae could be expected as shown in other filamentous fungi. The ability of the
mutants to colonise plants in a similar manner to the WT may be due to the ability of
other CWI sensors to complement the loss of WscA. In most filamentous fungi such as
N. crassa, A.gossypii and A. fumigatus the phenotypes of mutants defective in Wsc
sensors of the CWI MAP kinase pathway most often overlapped with the phenotypes
(reduced radial growth, defective conidiation, sensitivity to cell wall perturbing agents)
of mutants defective in downstream components of the CWI MAP kinase (Park et al.,
2008; Valiante et al., 2009; Dirr et al., 2010; Maddi et al., 2012; Lengeler et al., 2013).
In E. festucae, no such resemblance between the phenotypes of wscA and the mkkA and
mpkA mutants in the CWI MAP kinase components was observed. Thus, in E. festucae,
signals emanating from WscA may be transduced through an alternative pathway to the
MAPK cascade. The ability of ΔwscA to colonise developing host leaf tissues indicated
that it is not individually essential for intercalary growth in the host environment.

112

113
Chapter 4: Characterisation of E. festucae MidA and its role in intercalary growth
114
4.1 Identification of the S. cerevisiae mid1 orthologue in E. festucae
The putative midA orthologue (Maker gene prediction contig_726-gene-0.103 or
FGeneSH prediction A.11.1486) was retrieved from E. festucae by interrogating the Fl1
(also known as E894) genome sequence database located at University of Kentucky,
USA (http://www.endophyte.uky.edu/, E. festucae FL1, 2011-03 assembly, version 2)
(Schardl et al., 2013) using the tBLASTn algorithm (Altschul et al., 1990; Altschul et
al., 1997). Mid1 from S. cerevisiae (AKB00818.1 or SGD ID- S000005235) and Mid1
proteins of Claviceps purpurea (CAU66903.1), Gibberella zeae (ESU13681) and
N. crassa (EAA31782.3) were used as query sequences. This putative orthologue for
mid1 of S. cerevisiae in E. festucae was named midA according to the recommended
gene nomenclature for E. festucae (Schardl et al., 2012). The putative MidA amino acid
sequence of E. festucae was very similar to those from filamentous fungi such as
C. purpurea (66% identity, E value-0.0) and G. zeae (46% identity, E value – e-141).
However, it was comparatively distantly related to S. cerevisiae mid1, with an E value
of 2e-32 and 31% identity. The mid1 genes of C. purpurea and G. zeae have been
functionally characterized (Bormann et al., 2009; Cavinder et al., 2011) providing some
supporting evidence that the putative orthologue identified in the E. festucae Fl1
genome is the orthologue of the mid1 gene in S. cerevisiae.
Reciprocal tBLASTn analysis of the E. festucae putative MidA protein against the
S. cerevisiae (http://www.yeastgenome.org) and N. crassa (http://www.broadinstitute.
org/annotation/genome/neurospora) genomes produced Mid1 as the top hit, and
reciprocal tBLASTn against the NCBI data base (http://www.ncbi.nlm.nih.gov/)
returned Mid1 of C. purpurea as the top hit. Further evidence to support the function of
the E. festucae mid1 gene was obtained by analysing the domain structure of the
predicted protein.
115
The conceptual E. festucae MidA protein contains 638 amino acids (see Appendix 4 for
sequence). According to available details, both C. purpurea (653 amino acids) and
S. cerevisiae (548 amino acids) Mid1 proteins contain a signal peptide and N-
glycosylation sites towards the N-terminus. The C-terminus consists of a cysteine rich
region with ten conserved cysteine residues (Iida et al., 1994; Ozeki-Miyawaki et al.,
2005; Bormann et al., 2009). Similarly MidA of A. fumigatus (642 amino acids)
contains an N-terminal signal peptide and 13 deduced N-glycosylation sites. MidA of
S. cerevisiae and C. purpurea contain 4 transmembrane domains while in A. fumigatus
4 or 6 transmembrane domains have been reported (Iida et al., 1994; de Castro et al.,
2014). Structural domain analysis of E. festucae MidA using bioinformatics tools
(Section 2.15) revealed the presence of functionally important domains and conserved
regions in common with Mid1 of yeast and other filamentous fungi.
Analysis using InterProScan revealed that the putative E. festucae MidA protein
belongs to the stretch-activated cation channel Mid1 (IPR024338) family. A signal
peptide is present (35 amino acids) at the N-terminus and a cysteine-rich region is
present close to the C-terminus with 10 conserved cysteine residues including the four
residues which are essential for its function (Fig 4.1). According to the N-glycosylation
site prediction tool NetNGlyc, MidA of E. festucae has 9 sites (with 3 more potential
sites) while a similar analysis in N. crassa, C. purpurea and G zeae showed 9, 9 and 8
sites respectively (Fig 4.1). Analysis of protein sequences for transmembrane domains
using the prediction tool TMpred returned two domains (Fig 4.1), whereas analysis with
TMHMM revealed only one transmembrane helix from Q7 to V29 overlapping with the
predicted signal peptide sequence. According to TMpred analysis N. crassa, G. zeae
and C. purpurea have 2, 2 and 3 transmembrane domains respectively. A previous
study has shown that most Mid1 proteins are GPI-anchored
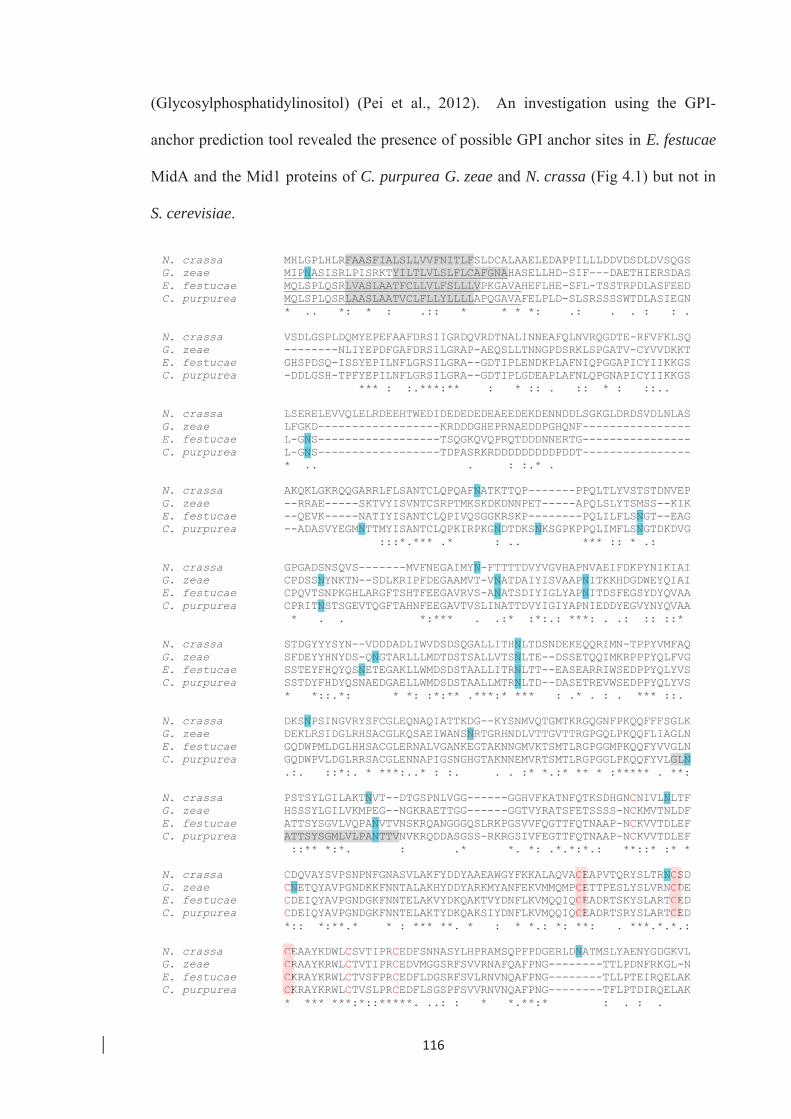
116
(Glycosylphosphatidylinositol) (Pei et al., 2012). An investigation using the GPI-
anchor prediction tool revealed the presence of possible GPI anchor sites in E. festucae
MidA and the Mid1 proteins of C. purpurea G. zeae and N. crassa (Fig 4.1) but not in
S. cerevisiae.
N. crassa MHLGPLHLRFAASFIALSLLVVFNITLFSLDCALAAELEDAPPILLLDDVDSDLDVSQGS G. zeae MIPNASISRLPISRKTYILTLVLSLFLCAFGNAHASELLHD-SIF---DAETHIERSDAS E. festucae MQLSPLQSRLVASLAATFCLLVLFSLLLVPKGAVAHEFLHE-SFL-TSSTRPDLASFEED C. purpurea MQLSPLQSRLAASLAATVCLFLLYLLLLAPQGAVAFELPLD-SLSRSSSSWTDLASIEGN * .. *: * : .:: * * * *: .: . . : : . N. crassa VSDLGSPLDQMYEPEFAAFDRSIIGRDQVRDTNALINNEAFQLNVRQGDTE-RFVFKLSQ G. zeae --------NLIYEPDFGAFDRSILGRAP-AEQSLLTNNGPDSRKLSPGATV-CYVVDKKT E. festucae GHSPDSQ-ISSYEPILNFLGRSILGRA--GDTIPLENDKPLAFNIQPGGAPICYIIKKGS C. purpurea -DDLGSH-TPFYEPILNFLGRSILGRA--GDTIPLGDEAPLAFNLQPGNAPICYIIKKGS *** : :.***:** : * :: . :: * : ::.. N. crassa LSERELEVVQLELRDEEHTWEDIDEDEDEDEAEEDEKDENNDDLSGKGLDRDSVDLNLAS G. zeae LFGKD------------------KRDDDGHEPRNAEDDPGHQNF---------------- E. festucae L-GNS------------------TSQGKQVQPRQTDDDNNERTG---------------- C. purpurea L-GNS------------------TDPASRKRDDDDDDDDDPDDT---------------- * .. . : :.* . N. crassa AKQKLGKRQQGARRLFLSANTCLQPQAFNATKTTQP-------PPQLTLYVSTSTDNVEP G. zeae --RRAE-----SKTVYISVNTCSRPTMKSKDKDNNPET-----APQLSLYTSMSS--KIK E. festucae --QEVK-----NATIYISANTCLQPIVQSGGKRSKP--------PQLILFLSNGT--EAG C. purpurea --ADASVYEGMNTTMYISANTCLQPKIRPKGNDTDKSNKSGPKPPQLIMFLSNGTDKDVG :::*.*** .* : .. *** :: * .: N. crassa GPGADSNSQVS-------MVFNEGAIMYN-FTTTTDVYVGVHAPNVAEIFDKPYNIKIAI G. zeae CPDSSNYNKTN--SDLKRIPFDEGAAMVT-VNATDAIYISVAAPNITKKHDGDWEYQIAI E. festucae CPQVTSNPKGHLARGFTSHTFEEGAVRVS-ANATSDIYIGLYAPNITDSFEGSYDYQVAA C. purpurea CPRITNSTSGEVTQGFTAHNFEEGAVTVSLINATTDVYIGIYAPNIEDDYEGVYNYQVAA * . . *:*** . .:* :*:.: ***: . .: :: ::* N. crassa STDGYYYSYN--VDDDADLIWVDSDSQGALLITHNLTDSNDEKEQQRIMN-TPPYVMFAQ G. zeae SFDEYYHNYDS-QNGTARLLLMDTDSTSALLVTSNLTE--DSSETQQIMKRPPPYQLFVG E. festucae SSTEYFHQYQSNETEGAKLLWMDSDSTAALLITRNLTT--EASEARRIWSEDPPYQLYVS C. purpurea SSTDYFHDYQSNAEDGAELLWMDSDSTAALLMTRNLTD--DASETREVWSEDPPYQLYVS * *::.*: * *: :*:** .***:* *** : .* . : . *** ::. N. crassa DKSNPSINGVRYSFCGLEQNAQIATTKDG--KYSNMVQTGMTKRGQGNFPKQQFFFSGLK G. zeae DEKLRSIDGLRHSACGLKQSAEIWANSNRTGRHNDLVTTGVTTRGPGQLPKQQFLIAGLN E. festucae GQDWPMLDGLHHSACGLERNALVGANKEGTAKNNGMVKTSMTLRGPGGMPKQQFYVVGLN C. purpurea GQDWPVLDGLRRSACGLENNAPIGSNGHGTAKNNEMVRTSMTLRGPGGLPKQQFYVLGLN .:. ::*:. * ***:..* : :. . . :* *.:* ** * :***** . **: N. crassa PSTSYLGILAKTNVT--DTGSPNLVGG------GGHVFKATNFQTKSDHGNCNIVLNLTF G. zeae HSSSYLGILVKMPEG--NGKRAETTGG------GGTVYRATSFETSSSS-NCKMVTNLDF E. festucae ATTSYSGVLVQPANVTVNSKRQANGGGQSLRKPGSVVFQGTTFQTNAAP-NCKVVTDLEF C. purpurea ATTSYSGMLVLPANTTVNVKRQDDASGSS-RKRGSIVFEGTTFQTNAAP-NCKVVTDLEF ::** *:*. : .* *. *: .*.*:*.: **::* :* * N. crassa CDQVAYSVPSNPNFGNASVLAKFYDDYAAEAWGYFKKALAQVACEAPVTQRYSLTRNCSD G. zeae CNETQYAVPGNDKKFNNTALAKHYDDYARKMYANFEKVMMQMPCETTPESLYSLVRNCDE E. festucae CDEIQYAVPGNDGKFNNTELAKVYDKQAKTVYDNFLKVMQQIQCEADRTSKYSLARTCED C. purpurea CDEIQYAVPGNDGKFNNTELAKTYDKQAKSIYDNFLKVMQQIQCEADRTSRYSLARTCED *:: *:**.* * : *** **. * : * *.: *: **: . ***.*.*.: N. crassa CEAAYKDWLCSVTIPRCEDFSNNASYLHPRAMSQPFPDGERLDNATMSLYAENYGDGKVL G. zeae CRAAYKRWLCTVTIPRCEDVMGGSRFSVVRNAFQAFPNG--------TTLPDNFRKGL-N E. festucae CKRAYKRWLCTVSFPRCEDFLDGSRFSVLRNVNQAFPNG--------TLLPTEIRQELAK C. purpurea CKRAYKRWLCTVSLPRCEDFLSGSPFSVVRNVNQAFPNG--------TFLPTDIRQELAK * *** ***:*::*****. ..: : * *.**:* : . : .
CECRCKCK
NCSNCDCECE
ACECECECE
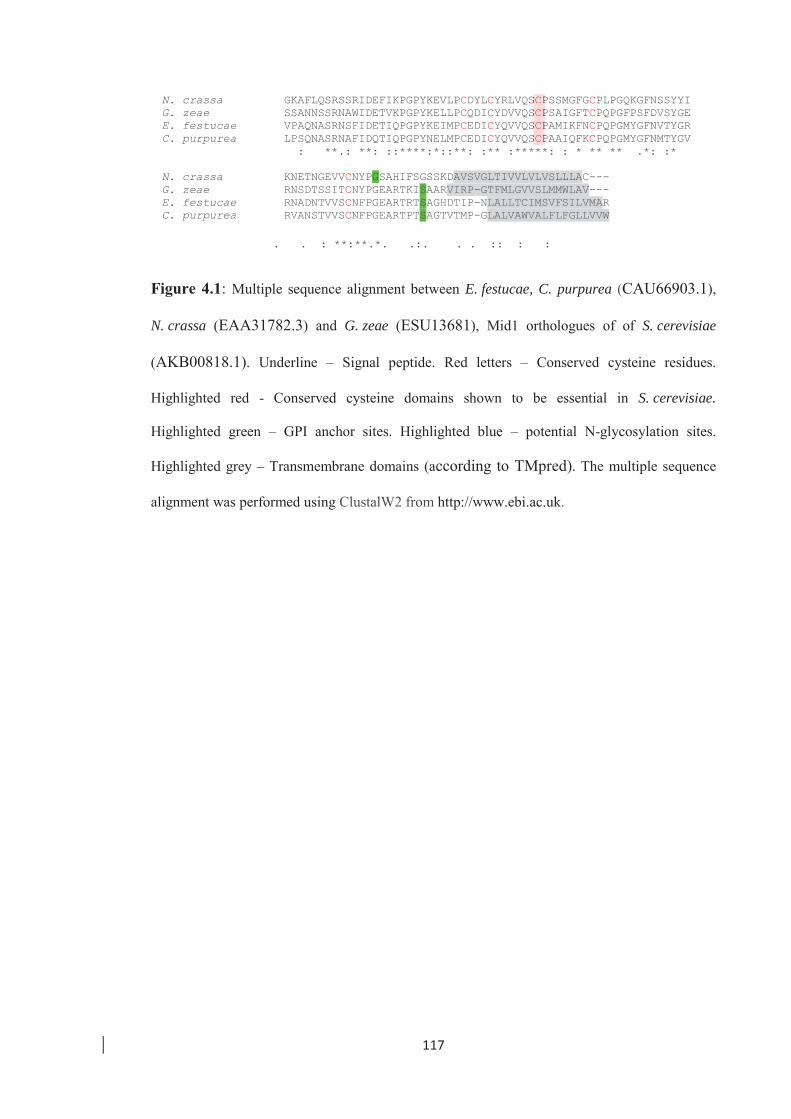
117
N. crassa GKAFLQSRSSRIDEFIKPGPYKEVLPCDYLCYRLVQSCPSSMGFGCPLPGQKGFNSSYYI G. zeae SSANNSSRNAWIDETVKPGPYKELLPCQDICYDVVQSCPSAIGFTCPQPGFPSFDVSYGE E. festucae VPAQNASRNSFIDETIQPGPYKEIMPCEDICYQVVQSCPAMIKFNCPQPGMYGFNVTYGR C. purpurea LPSQNASRNAFIDQTIQPGPYNELMPCEDICYQVVQSCPAAIQFKCPQPGMYGFNMTYGV : **.: **: ::****:*::**: :** :*****: : * ** ** .*: :* N. crassa KNETNGEVVCNYPGSAHIFSGSSKDAVSVGLTIVVLVLVSLLLAC--- G. zeae RNSDTSSITCNYPGEARTKISAARVIRP-GTFMLGVVSLMMWLAV--- E. festucae RNADNTVVSCNFPGEARTRTSAGHDTIP-NLALLTCIMSVFSILVMAR C. purpurea RVANSTVVSCNFPGEARTPTSAGTVTMP-GLALVAWVALFLFGLLVVW
. . : **:**.*. .:. . . :: : :
Figure 4.1: Multiple sequence alignment between E. festucae, C. purpurea (CAU66903.1),
N. crassa (EAA31782.3) and G. zeae (ESU13681), Mid1 orthologues of of S. cerevisiae
(AKB00818.1). Underline – Signal peptide. Red letters – Conserved cysteine residues.
Highlighted red - Conserved cysteine domains shown to be essential in S. cerevisiae.
Highlighted green – GPI anchor sites. Highlighted blue – potential N-glycosylation sites.
Highlighted grey – Transmembrane domains (according to TMpred). The multiple sequence
alignment was performed using ClustalW2 from http://www.ebi.ac.uk.
SCPSCPSCPSCP

118
4.2 Targeted deletion of the midA gene in E. festucae
To determine the functional role of MidA in sensing mechanical stress, stimulating
growth, and in general calcium homeostasis, the midA gene in E. festucae Fl1 was
replaced by targeted gene replacement using the split marker strategy (Section 2.7 &
2.7.2). Protoplast transformation with midA replacement vectors pSAM1 and pSAM2
(Appendix 3, Fig 8.2) resulted in 90 hygromycin-resistant colonies per 4.0 X 10⁶
protoplasts. There was no growth observed in the negative controls (water only), while
transformation with the positive control plasmid (pPN1688) resulted in 65 resistant
colonies per 4.0 X 10⁶ protoplasts. After hyphal tip purification genomic DNA was
isolated from individual colonies (Section 2.4.3 & 2.5.7.1) and PCR screened using
primer pair smid-36/smid-37 and smid-33/smid-38 (Table 2.3) to identify putative midA
replacement mutants (Fig 4.2). PCR screening revealed that targeted deletion of midA
was successful in nearly 36% of the total colonies screened. Based on PCR results,
strains ΔmidA-20, 28, 36 and 43 were selected for further confirmation by Southern
blotting.
119
Figure 4.2: PCR screening to identify E. festucae midA gene replacement mutants. A-In a
targeted replacement of midA the primer pair smid-36 and smid-37 is expected to yield a PCR
product of 3.1 kb, and for WT and ectopic insertion a product size of 2.1 kb is expected. B-The
putative mutants were further analysed via primer pair smid-33 and smid-38. Expected band
sizes were 4.4 kb for the mutants and no product for the WT and ectopic colonies. C- Schematic
diagram (not drawn to scale) showing the replacement of midA gene with the hph gene (for
hygromycin resistance) by the 5' and 3' flanking fragments through 3 homologous
recombination events shown as shaded areas.
A B
C
120
Similar to the strategy used for confirmation of wscA replacement mutants (Section
3.2), Southern blotting was carried out to confirm the targeted replacement of midA and
absence of ectopic insertions. Four PCR-confirmed putative midA deletion strains were
selected, along with a strain with an ectopic integration Ect 7. As shown in Fig 4.3
probes C and D were designed to confirm replacement of midA. According to the
Southern blotting results obtained from both EcoRI and PstI digested genomic DNA it
was clear that midA mutants 20, 36 and 43 did not have any ectopic integration or
tandem integrations in the midA locus. It is not clear whether the additional band present
in the EcoRI-digested ΔmidA-28 strain is due to an ectopic integration or partial
digestion of genomic DNA. Strains ΔmidA-20, 36 and 43 were selected for further
analyses on the basis of unambiguous Southern blotting results.
As the phenotype of the midA mutants were different to the wild type in axenic culture
(shown in Sections 4.3.1), the mutant phenotypes were complemented by ectopic
integration of a single copy of the midA gene into the ΔmidA-20 strain using the PEG-
mediated protoplast transformation procedure (Section 2.6.3) with complementation
vector pSAM5 (Geneticin® resistant, Sections 2.7.3.2). To confirm the integration of the
midA gene at the new locus, transformants were PCR screened using primer pair smid-
18/smid-4 (Table 2.3). Based on PCR results, three independent transformants were
selected as midA complemented strains (Comp-10, 20 and 32) for further analyses.

121
Figure 4.3: Southern blot analysis to confirm midA replacement and absence of ectopic
integration in putative E. festucae midA replacement mutants. A - Genomic DNA was digested
with EcoRI and hybridized with probe C. Expected band sizes for WT and midA replacement
mutants were 3.9 kb and 5 kb respectively. B - Genomic DNA was digested with PstI and
hybridized with probe D. Expected band size for the midA replacement mutants was 3.1 kb and
no bands were expected for the WT. The presence of additional bands of different sizes was
indicative of ectopic integration. C - Schematic diagram (not drawn to scale) showing the
replacement of the midA gene with the hph gene through homologous recombination events.
The sites of restriction enzymes used and the probe annealing positions are shown.
A B
C

122
4.3 Functional characterisation of the E. festucae midA gene during growth in
culture
4.3.1 Deletion of midA in E. festucae affects radial growth and morphology on
PDA
The effect of midA deletion on radial growth rate, colony morphology and hyphal
morphology was determined by growing mycelial plugs on a PDA medium (Section
2.13). Similar to the ΔwscA (Section 3.3.1), the E. festucae midA mutants also showed a
significantly (p<0.05) reduced vegetative radial growth rate (Fig. 4.4-A), a marked
reduction in aerial growth and darker colony centres in comparison to the wild type
(Fig. 4.4-B). No differences in branching pattern was observed in mutant hyphae within
the first 15 compartments and cross sections through midA mutant colonies revealed no
differences in the ability of mutant mycelia to penetrate the agar medium (1.5%) in
comparison to the WT (Fig. 4.4- C). Complementation of the midA deletion with the full
length midA gene restored radial colony growth rate and colony morphology to the level
of the WT with no significant (p<0.05) difference.
To better understand reduced colony radial growth shown by ΔmidA, the apical growth
rates of individual hyphae of the WT, ΔmidA and complemented strains growing on
PDA were analysed using an Olympus Fluoview FV10i–LIV confocal laser scanning
microscope as described in Section 2.12.3.3. Apical growth rate of the ΔmidA mutants,
1.17 ± 0.11 μm/min (mean ± SD of 12 individual hyphae), was not significantly
(p<0.05) different to the apical growth rate of the WT hyphae, 1.29 ± 0.10 μm/min
(mean ± SD of 12 individual hyphae) indicating that the reduced colony radial growth
rate shown by ΔmidA was not due to reduction in individual hyphal apical growth rate.
Observations revealed that the cell walls at the hyphal tips of ∆midA mutants appeared
weaker than WT as damaged hyphal tips were frequently observed by microscopy when

123
hyphal plugs were mounted in water or PDB (Fig. 4.5-A & C). Hyphal tip damage in
WT and complemented strains was rarely observed under similar conditions. Further, in
∆midA strains at the hyphal tip, some hyphae appeared to produce a branch immediately
behind the apex seemingly in response to tip damage (Fig. 4.5-B). These observations
suggested that reduced radial colony growth observed in ΔmidA was largely due to the
frequent hyphal tip damage halting apical growth and not due to a reduction in
individual hyphal apical growth.
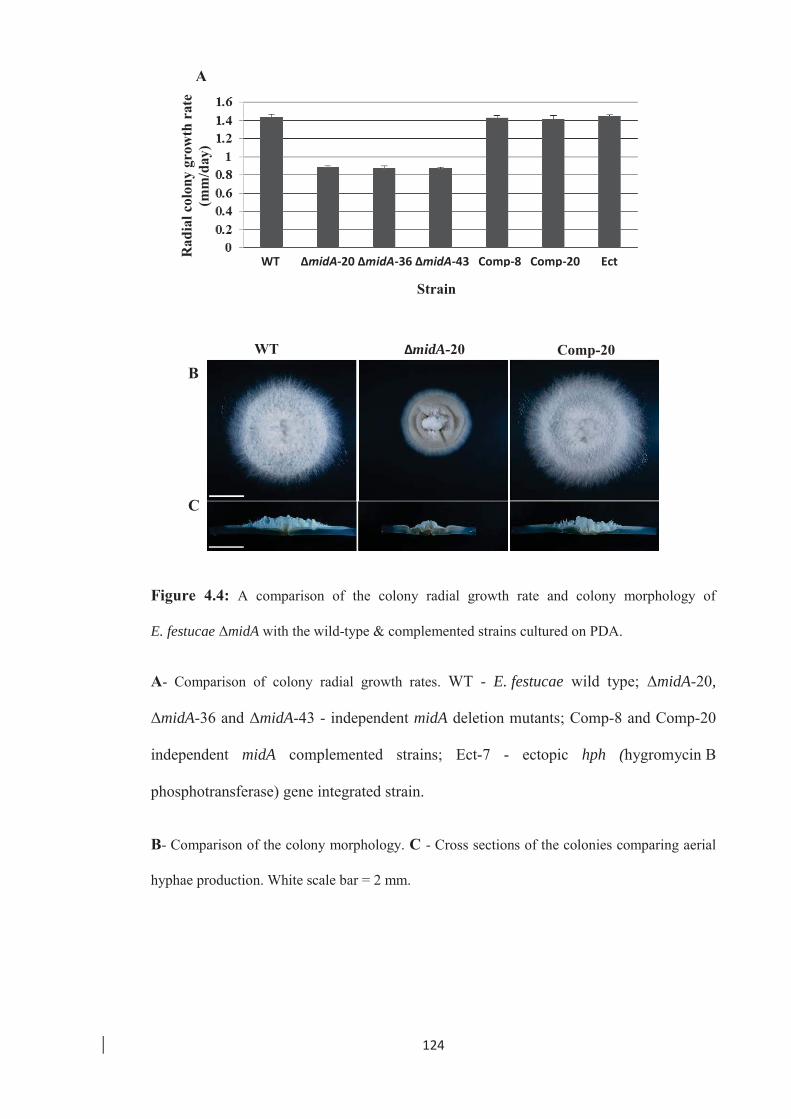
124
Figure 4.4: A comparison of the colony radial growth rate and colony morphology of
E. festucae ΔmidA with the wild-type & complemented strains cultured on PDA.
A- Comparison of colony radial growth rates. WT - E. festucae wild type; ΔmidA-20,
ΔmidA-36 and ΔmidA-43 - independent midA deletion mutants; Comp-8 and Comp-20
independent midA complemented strains; Ect-7 - ectopic hph (hygromycin B
phosphotransferase) gene integrated strain.
B- Comparison of the colony morphology. C - Cross sections of the colonies comparing aerial
hyphae production. White scale bar = 2 mm.
A
B
C
WT ΔmidA-20 Comp-20
Strain
WT ΔmidA-20 ΔmidA-36 ΔmidA-43 Comp-8 Comp-20 Ect
A
Rad
ial c
olon
y gr
owth
rat
e (m
m/d
ay)
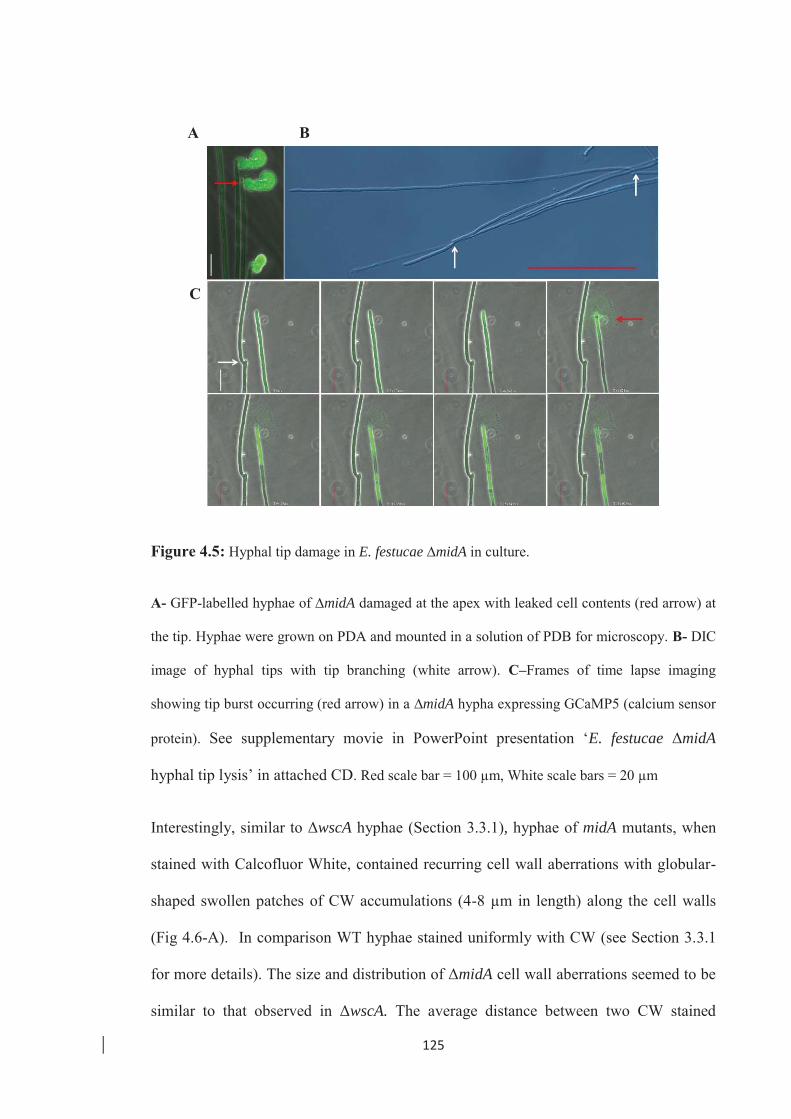
125
Figure 4.5: Hyphal tip damage in E. festucae ∆midA in culture.
A- GFP-labelled hyphae of ∆midA damaged at the apex with leaked cell contents (red arrow) at
the tip. Hyphae were grown on PDA and mounted in a solution of PDB for microscopy. B- DIC
image of hyphal tips with tip branching (white arrow). C–Frames of time lapse imaging
showing tip burst occurring (red arrow) in a ∆midA hypha expressing GCaMP5 (calcium sensor
protein). See supplementary movie in PowerPoint presentation ‘E. festucae ΔmidA
hyphal tip lysis’ in attached CD. Red scale bar = 100 μm, White scale bars = 20 μm
Interestingly, similar to ΔwscA hyphae (Section 3.3.1), hyphae of midA mutants, when
stained with Calcofluor White, contained recurring cell wall aberrations with globular-
shaped swollen patches of CW accumulations (4-8 μm in length) along the cell walls
(Fig 4.6-A). In comparison WT hyphae stained uniformly with CW (see Section 3.3.1
for more details). The size and distribution of ΔmidA cell wall aberrations seemed to be
similar to that observed in ΔwscA. The average distance between two CW stained
A
C
B

126
patches was between 6-10 μm and the patches were prevalent close to the apex and
appeared to diminish as the hypha aged. The average diameter of swollen patches was
3.6 ± 0.4 μm. As a result of these swollen patches, midA mutant hyphae had uneven and
coarse cell walls when observed using DIC microscopy (Fig 4.6-B). Complementation
of the midA deletion with the full length gene fully restored the cell wall defect (no cell
wall aberrations were observed in complemented strains) indicating a crucial role for the
putative stretch-activated calcium ion channel midA in maintenance of cell wall
integrity and general growth in E. festucae in axenic culture.

127
Figure 4.6: Comparison of the hyphal morphology of E. festucae ΔmidA (ΔmidA-20) mutant
with the WT & complemented strain (Comp-20) cultured on PDA. A- Fluorescent images of
CW stained hyphae. B -DIC images of the same hyphae. Mutant hyphae contained noticeable
cell wall aberrations (white arrows). Red scale bars = 20 μm
A
B
WT ΔmidA-20 Comp-20
128
4.3.2 Osmotic stabilization can rescue E. festucae ∆midA phenotypes on the PDA
culture medium
Cell wall aberrations and the frequent tip damage observed in ∆midA suggested a
weakened cell wall in these hyphae. As described earlier, previous studies have shown
that use of an osmotic stabilizer can suppress the defects of cell walls (Levin, 2011).
Further, use of sorbitol (125 mg/mL) in PDA as an osmotic stabilizer restored similar
cell wall defects in ΔwscA hyphae as shown in Section 3.3.2. Therefore, in order to test
whether sorbitol had a similar effect on defective ∆midA hyphae, ∆midA mutants were
cultured along with WT and complemented strains on PDA media infused with sorbitol
(Section 2.13).The impacts of sorbitol on radial growth rate, colony morphology and
hyphal morphology in WT and midA deletion mutants were determined as described in
Sections 2.12.2 & 2.13.
Sorbitol was able to restore ΔmidA radial colony growth rate, colony morphology
(presence of aerial hyphae) and hyphal morphology (absence of cell wall aberrations) to
WT levels on standard PDA with 125 mg/mL of sorbitol (Fig 4.7-A). With 125 mg/mL
of sorbitol, ∆midA colonies had aerial hyphae similar to WT colonies and cell wall
aberrations were completely absent in CW stained ∆midA hyphae (Fig 4.7-B & C). No
ruptured hyphal tips were observed at 125 mg/mL. At 200 mg/mL of sorbitol, both WT
and midA showed impaired growth due to the high osmolarity. Complemented strains
and the ectopic strain behaved similar to the WT at all sorbitol concentrations used in
this study. Similar to ΔwscA, the ability of osmotic stabilizers to restore cell wall defects
and prevent hyphal tip rupture suggested a substantial weakening of the cell wall in
∆midA.
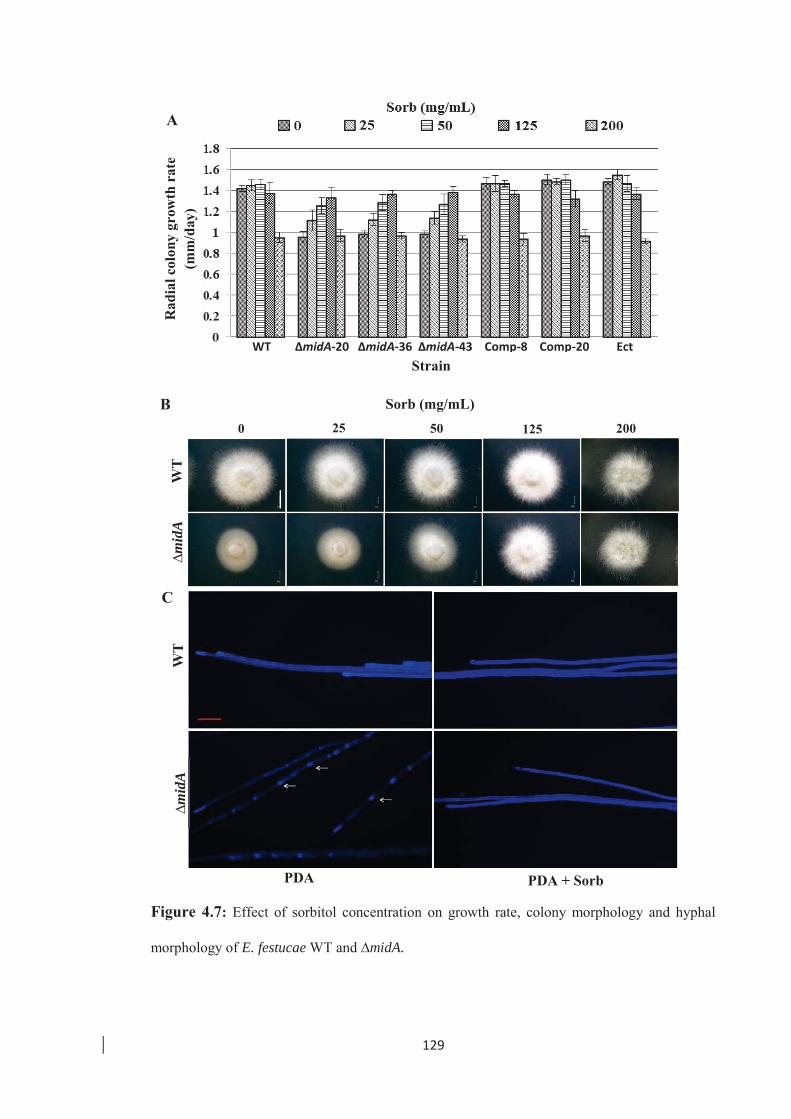
129
Figure 4.7: Effect of sorbitol concentration on growth rate, colony morphology and hyphal
morphology of E. festucae WT and ∆midA.
WT
∆m
idA
∆mid
A W
T
PDA PDA + Sorb
Sorb (mg/mL) 0 25 50 125 200
B
C
Rad
ial c
olon
y gr
owth
rat
e (m
m/d
ay)
A
Strain WT ΔmidA-20 ΔmidA-36 ΔmidA-43 Comp-8 Comp-20 Ect
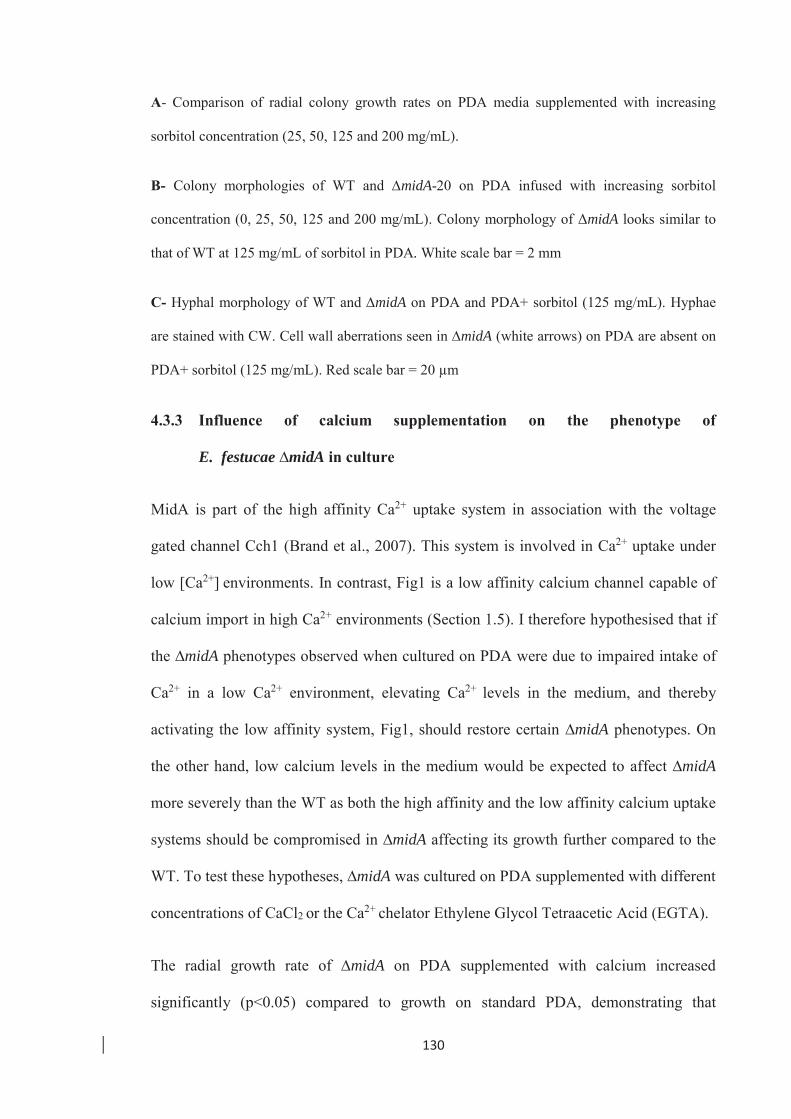
130
A- Comparison of radial colony growth rates on PDA media supplemented with increasing
sorbitol concentration (25, 50, 125 and 200 mg/mL).
B- Colony morphologies of WT and ∆midA-20 on PDA infused with increasing sorbitol
concentration (0, 25, 50, 125 and 200 mg/mL). Colony morphology of ΔmidA looks similar to
that of WT at 125 mg/mL of sorbitol in PDA. White scale bar = 2 mm
C- Hyphal morphology of WT and ∆midA on PDA and PDA+ sorbitol (125 mg/mL). Hyphae
are stained with CW. Cell wall aberrations seen in ∆midA (white arrows) on PDA are absent on
PDA+ sorbitol (125 mg/mL). Red scale bar = 20 μm
4.3.3 Influence of calcium supplementation on the phenotype of
E. festucae ∆midA in culture
MidA is part of the high affinity Ca2+ uptake system in association with the voltage
gated channel Cch1 (Brand et al., 2007). This system is involved in Ca2+ uptake under
low [Ca2+] environments. In contrast, Fig1 is a low affinity calcium channel capable of
calcium import in high Ca2+ environments (Section 1.5). I therefore hypothesised that if
the ∆midA phenotypes observed when cultured on PDA were due to impaired intake of
Ca2+ in a low Ca2+ environment, elevating Ca2+ levels in the medium, and thereby
activating the low affinity system, Fig1, should restore certain ∆midA phenotypes. On
the other hand, low calcium levels in the medium would be expected to affect ∆midA
more severely than the WT as both the high affinity and the low affinity calcium uptake
systems should be compromised in ∆midA affecting its growth further compared to the
WT. To test these hypotheses, ∆midA was cultured on PDA supplemented with different
concentrations of CaCl2 or the Ca2+ chelator Ethylene Glycol Tetraacetic Acid (EGTA).
The radial growth rate of ∆midA on PDA supplemented with calcium increased
significantly (p<0.05) compared to growth on standard PDA, demonstrating that
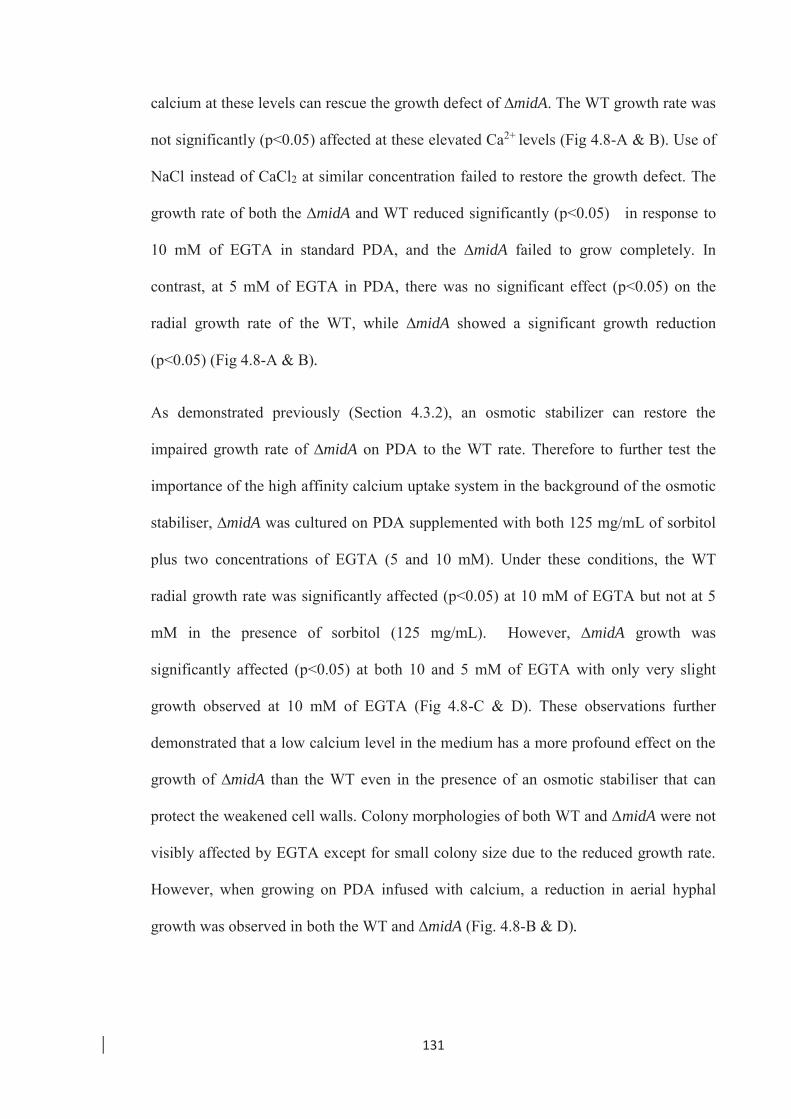
131
calcium at these levels can rescue the growth defect of ∆midA. The WT growth rate was
not significantly (p<0.05) affected at these elevated Ca2+ levels (Fig 4.8-A & B). Use of
NaCl instead of CaCl2 at similar concentration failed to restore the growth defect. The
growth rate of both the ∆midA and WT reduced significantly (p<0.05) in response to
10 mM of EGTA in standard PDA, and the ∆midA failed to grow completely. In
contrast, at 5 mM of EGTA in PDA, there was no significant effect (p<0.05) on the
radial growth rate of the WT, while ∆midA showed a significant growth reduction
(p<0.05) (Fig 4.8-A & B).
As demonstrated previously (Section 4.3.2), an osmotic stabilizer can restore the
impaired growth rate of ∆midA on PDA to the WT rate. Therefore to further test the
importance of the high affinity calcium uptake system in the background of the osmotic
stabiliser, ∆midA was cultured on PDA supplemented with both 125 mg/mL of sorbitol
plus two concentrations of EGTA (5 and 10 mM). Under these conditions, the WT
radial growth rate was significantly affected (p<0.05) at 10 mM of EGTA but not at 5
mM in the presence of sorbitol (125 mg/mL). However, ∆midA growth was
significantly affected (p<0.05) at both 10 and 5 mM of EGTA with only very slight
growth observed at 10 mM of EGTA (Fig 4.8-C & D). These observations further
demonstrated that a low calcium level in the medium has a more profound effect on the
growth of ∆midA than the WT even in the presence of an osmotic stabiliser that can
protect the weakened cell walls. Colony morphologies of both WT and ∆midA were not
visibly affected by EGTA except for small colony size due to the reduced growth rate.
However, when growing on PDA infused with calcium, a reduction in aerial hyphal
growth was observed in both the WT and ∆midA (Fig. 4.8-B & D).
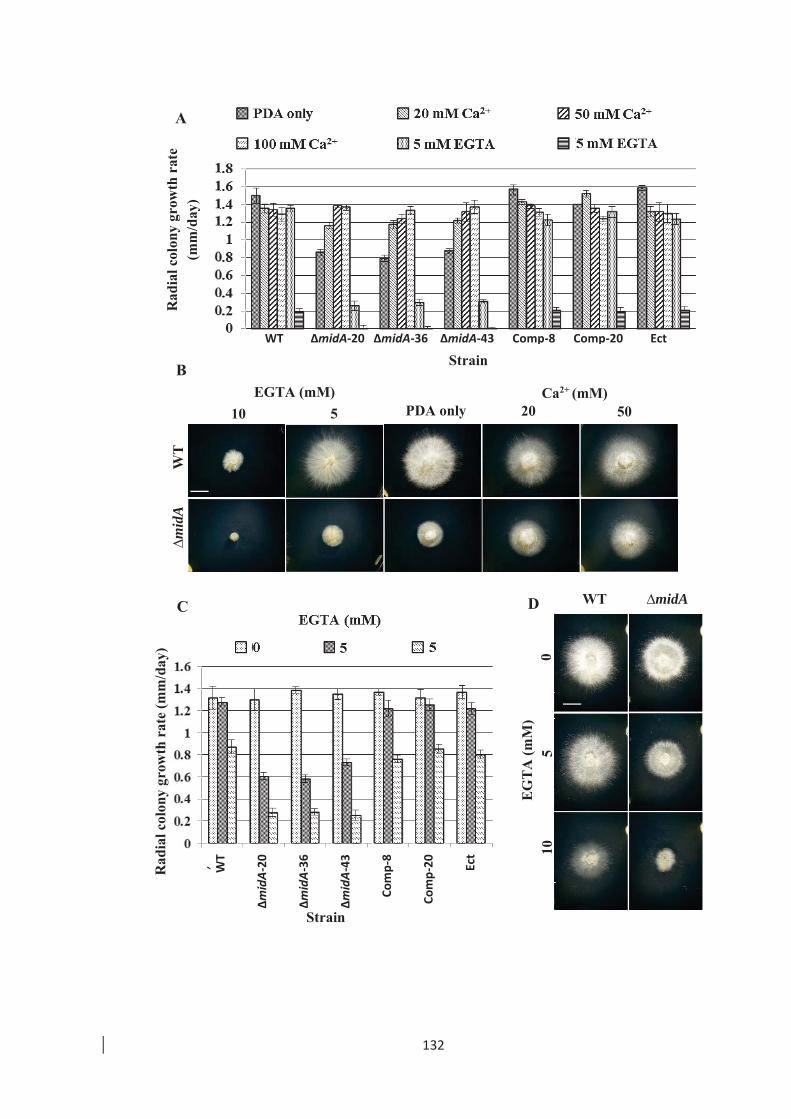
132
Rad
ial c
olon
y gr
owth
rat
e (m
m/d
ay)
WT ∆midA
WT
∆m
idA
Rad
ial c
olon
y gr
owth
rat
e (m
m/d
ay)
PDA only Ca2+ (mM) EGTA (mM)
20 50 5 10
EG
TA
(mM
) 0
5
10
A
B
C
Strain WT ΔmidA-20 ΔmidA-36 ΔmidA-43 Comp-8 Comp-20 Ect
WT
ΔmidA-
20
ΔmidA-
36
ΔmidA-
43
Com
p-8
Com
p-20
Ect
D
Strain
133
Figure 4.8: Analysis of E. festucae WT and ∆midA radial growth rate and colony morphology
on PDA with elevated Ca2+ or EGTA.
A & C- Comparison of radial growth rates on PDA media infused with different [Ca2+] and
[EGTA] (A), and PDA infused with both sorbitol (125 mg/mL) and different EGTA
concentrations (0, 5 and 10 mM) (C).
B- Colony morphologies of WT and ∆midA on PDA and PDA infused with different Ca2+
concentrations (20 and 5 mM) and EGTA concentrations (5 and 10 mM). Colony morphology
of ∆midA on Ca2+ (50 mM) is similar to WT.
D- Colony morphology WT and ∆midA on PDA infused with sorbitol (125 mg/mL) and
different EGTA concentrations (0, 5 and 10 mM). Depleted Ca2+ has a more severe effect on
∆midA colonies than on wild type. White scale bar = 2 mm.
Microscopy analysis of hyphal morphology of ∆midA on PDA infused with Ca2+ (50
and 100 mM) revealed that the cell wall aberrations seen when hyphae were growing on
PDA alone were no longer visible, and hyphal cell walls looked similar to the WT,
demonstrating that a high concentration of extracellular calcium can rescue the cell wall
defect of ∆midA (Fig 4.9-A & B). These data also showed that calcium is essential for
cell wall integrity. This observation was further supported by the effect of 10 mM
EGTA on WT hyphae which induced similar cell wall aberrations (such as CW stained
patches) and tip cell lysis that was usually seen in ∆midA on PDA alone. The cell wall
phenotype was further exacerbated when ∆midA was grown on PDA containing EGTA
(Fig 4.9-E). Hyper-branching of both WT and ∆midA was also observed, with ∆midA
always showing more severe branching than WT, on 5 or 10 mM of EGTA (Fig 4.9-C
& D), again demonstrating the importance of MidA in low calcium environments.

134
Figure 4.9: Analysis of hyphal morphology of E. festucae WT and ∆midA on PDA
supplemented with different [Ca2+] or [EGTA]. CW-stained hyphae on PDA (A) and PDA +
Ca2+ (50 mM) (B). Cell wall aberrations (white arrows) of ∆midA when growing on PDA alone
is absent in PDA + Ca2+ (50 mM). DIC images of WT and ∆midA hyphae on PDA (C) and PDA
infused with EGTA (WT in 10 mM and ΔmidA in 5 mM), with some hyper-branching in WT
and very intense hyper-branching in ∆midA (D). WT and ∆midA hyphae stained with CW
showing cell wall aberrations on PDA containing 10 mM and 5 mM of EGTA respectively (E).
Red scale bar = 20 μm
A
D
C
B
E
WT ∆midA

135
4.3.4 E. festucae ∆midA mutants are sensitive to cell wall perturbing agents
Calcofluor White (CW) and Congo red (CR) act as cell wall perturbation agents by
binding to chitin and disrupting cell wall synthesis. In C. purpurea both CW and CR
have a significant effect on the growth rate of ∆midA mutants (Bormann et al., 2009).
To further characterise the integrity of the cell wall in E. festucae after deletion of midA,
the effect of cell wall perturbing agents were tested by growing E. festucae WT and
∆midA on PDA infused with CW and CR at various concentrations. Further, as osmotic
stabilizers (sorbitol) and elevated exogenous calcium are able to rescue growth and cell
wall defects in ∆midA when grown on standard PDA (Section 4.3.2 & 4.3.3), the effect
of cell wall perturbing agents were also tested in the presence of 125 mg/mL sorbitol or
Ca2+ (50 mM).
The radial growth rate of WT and ∆midA strains was significantly reduced (p < 0.05) by
exposure to 0.25 and 0.5 mg/mL CW and 0.1 and 0.15 mg/mL of CR in PDA (Fig 4.10-
A & B). In contrast, in the presence of 125 mg/mL sorbitol the reduction in growth rate
in ∆midA at 0.25 and 0.5 mg/mL CW concentrations was significantly greater (p<0.05)
than the reduction observed in WT under similar conditions (Fig 4.10-A & C). This
demonstrated that CW has a more profound effect on growth of the ∆midA mutant than
on WT in the presence of an osmotic stabiliser.
Radial growth rates of ∆midA and WT were also measured on CR-infused PDA with 50
mM Ca2+. Elevated Ca2+ lessened the effect of CR on the radial growth rate of both WT
and ∆midA. In PDA + CR (0.15 mg/mL) both WT and ∆midA showed significantly
increased (p<0.05) growth rates in the presence of Ca2+ (50 mM) when compared to CR
in PDA without Ca2+ (Fig 4.10-B & C). This demonstrated that calcium increased the
resistance of both WT and ∆midA to the cell wall perturbing agent CR. The effect of

136
CW in the presence of Ca2+ could not be assessed as CW reacts with CaCl2 and
precipitated in the medium. A visible reaction or precipitate was not observed between
CR and Ca2+. Considering colony morphology, a notable feature of all the colonies (WT
and ∆midA) in the presence of CW and CR was the formation of aggregated hyphal
strands and the apparent clockwise rotation of all these strands (Fig 4.10-C). Colonies
on PDA infused with CR demonstrated a similar clockwise rotation of hyphal strands
but not as intense as on CW.
Rad
ial c
olon
y gr
owth
rat
e (m
m/d
ay)
Rad
ial c
olon
y gr
owth
rat
e (m
m/d
ay)
Strain
Strain
WT ΔmidA-20 ΔmidA-36 ΔmidA-43 Comp-8 Comp-20 Ect
WT ΔmidA-20 ΔmidA-36 ΔmidA-43 Comp-8 Comp-20 Ect
A
B
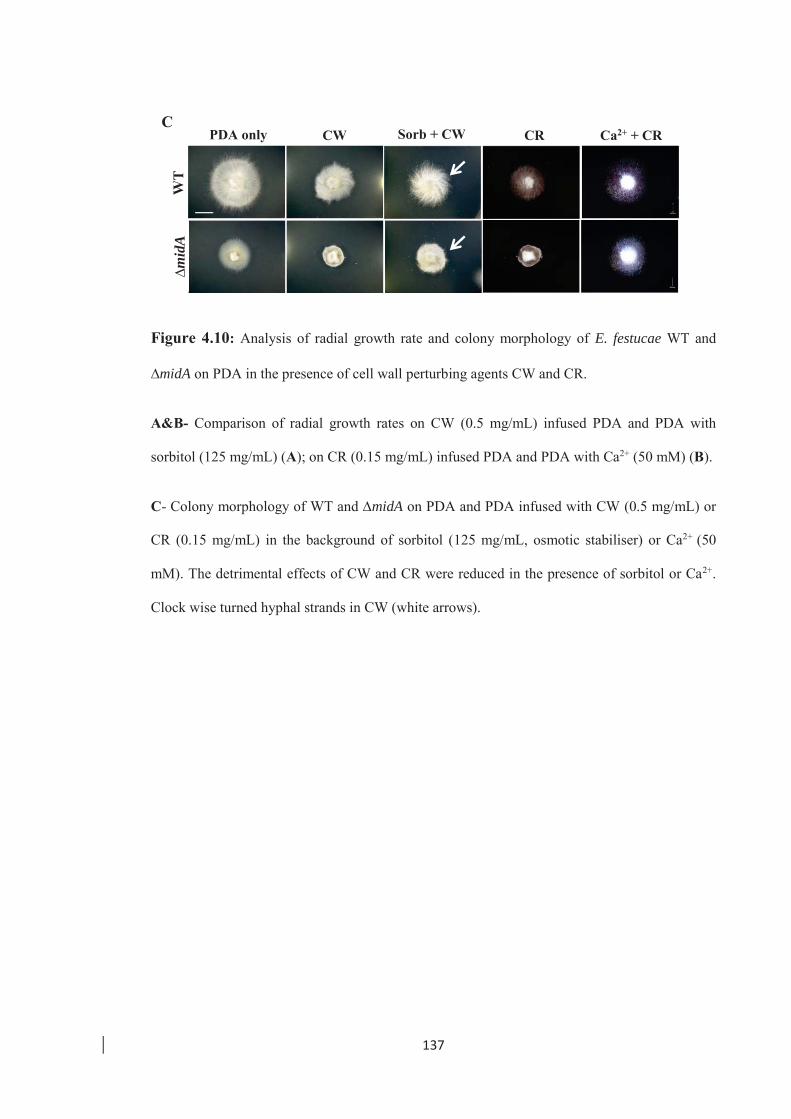
137
Figure 4.10: Analysis of radial growth rate and colony morphology of E. festucae WT and
∆midA on PDA in the presence of cell wall perturbing agents CW and CR.
A&B- Comparison of radial growth rates on CW (0.5 mg/mL) infused PDA and PDA with
sorbitol (125 mg/mL) (A); on CR (0.15 mg/mL) infused PDA and PDA with Ca2+ (50 mM) (B).
C- Colony morphology of WT and ∆midA on PDA and PDA infused with CW (0.5 mg/mL) or
CR (0.15 mg/mL) in the background of sorbitol (125 mg/mL, osmotic stabiliser) or Ca2+ (50
mM). The detrimental effects of CW and CR were reduced in the presence of sorbitol or Ca2+.
Clock wise turned hyphal strands in CW (white arrows).
WT
∆m
idA
PDA only CW Sorb + CW CR Ca2+ + CR C
138
4.4 Deletion of midA in E. festucae restricts hyphal entry into the host
intercalary growth zone
4.4.1 ∆midA host colonization
Similar to ΔwscA host colonization studies presented earlier (Section 3.5), the ability of
midA replacement mutants to infect and colonize host plants (L. perenne) was
investigated with the objective of testing whether midA has a role in hyphal intercalary
growth shown by E. festucae. Mid1 of S. cerevisiae and its homologues in other
filamentous fungi have been characterised as stretch-activated calcium channels that
function in association with Cch1 (Section 1.5.2). Hence, given my hypothesis that
mechanical stretching exerted by the elongating host cells on the attached hyphae
triggers intercalary growth, MidA appeared to be a very good candidate to test as a
potential sensor of mechanical stretch exerted on hyphal membranes. If MidA has a
pivotal role in intercalary growth, ΔmidA would be expected to be defective in host
colonization during the transition from apical growth in the host meristematic region to
intercalary growth in the elongation zone immediately above.
To determine the ability of midA deletion mutants to infect and colonize host plants
(L. perenne), seedlings were inoculated as described in Section 2.3.3. Seedlings were
inoculated with the WT strain, a strain with an ectopic integration of the midA deletion
vector, three independent strains with the ∆midA and two strains with the ∆midA
complemented with the midA gene. The ability of these strains to infect and colonize
L. perenne was analysed in a similar way to the ΔwscA colonization studies described in
Section 3.5.
All inoculated plants survived the first 8 week period after inoculation. Tissue print
immunoassay and microscopic observation of aniline-blue stained epidermal peels were
139
used to identify endophyte positive plants. When ∆midA inoculated plant tillers were
tested for the presence of endophyte in epidermal peels (stained with aniline blue) using
bright field microscopy, a difference in the density of hyphae between endophyte
positive plants and within tillers of the same endophyte positive plant was observed.
Leaf sheath tissues inoculated with midA mutants were sparsely colonised, if at all, and
hyphal distribution was usually confined to one or two regions of the sheath. The
variation within ∆midA infected plants ranged from complete absence of endophte
hyphae in leaves to highly dense regions similar to the WT. Conversely in plants
infected with WT, the ectopic strain or the complemented strains, epidermal peels
showed a uniform distribution of relatively densely colonising hyphae within all
endophyte positive tillers. This indicated that midA mutants are defective in their ability
to colonise host tissues uniformly and in the usual density and suggests that that calcium
influx is required for optimal hyphal colonisation of host plants.
Although ΔmidA showed variation in the ability to colonise host plants compared to WT
as mentioned above, it was difficult to calculate a specific inoculation rate for ΔmidA.
Since there is an infection defect in ΔmidA with respect to colonisation of the expansion
zone, the hyphae are not uniformly distributed and can be easily missed during
microscopic analysis. Hence for a more accurate calculation of ΔmidA inoculation rate,
the meristematic regions of all tillers needed to be checked for the presence of hyphae
which is time consuming.
As aniline blue-stained epidermal peels did not provide a comprehensive representation
of the colonization pattern, both the WT and ∆midA-20 strains were transformed with
plasmid pTEFEGFP to create strains capable of constitutive expression of EGFP
(Section 3.5). Three independent EGFP-expressing strains of both ∆midA-20 and the
140
WT were selected for further analysis. Selection of strains, inoculation of seedlings,
obtaining tissues for microcopy and confocal microscopy to analyse colonization
patterns were performed as described previously (Section 3.5).
In WT infected tillers, hyphae demonstrated the typical colonization pattern (Fig 4.11)
with randomly distributed hyphae in the meristematic regions and long parallel arranged
hyphae in the expansion zone of the leaf (see Section 3.5 for further details). In
comparison, in ∆midA infected tillers, endophyte hyphal colonization similar to the WT
was observed, with a similar density and organisation in the tissues surrounding the
shoot apex and the base of the developing leaf (Fig 4.11 & 4.12). This indicated that the
midA mutants had the ability to colonize the SAM in a similar manner to WT hyphae.
However, when transverse sections were obtained from the same tiller, a clear
difference in the colonization pattern between WT and ∆midA was visible. In transverse
sections, leaves infected with WT hyphae were evenly distributed indicating a uniform
entry of hyphae near the shoot apex into the primordia of developing leaves. Generally
the youngest (the leaf in the middle of the tiller) and the oldest leaf (at the outside)
appeared to have a lower density of hyphae compared to the leaves of intermediate age
(Fig 4.11). In comparison, transverse sections of leaves infected with ∆midA showed
variation in hyphal density and distribution while the total number of hyphae was
always lower than WT infected leaves (Fig 4.11 & 4.12). Hyphae were confined to
certain regions of the leaves but no preference for specific tissue types within the leaf
was observed. A comparison of hyphal colonisation in transverse and longitudinal
sections of the same tiller confirmed that ∆midA hyphal colonization in the region of the
shoot apex, and immediately below the expansion zone of the developing leaves, was
similar to that of WT, with the exception that hyphae were often unable to enter the
expansion zone of the leaves where intercalary growth takes place (Fig 4.12).

141
When longitudinal sections of leaf tissues were observed, ∆midA had hyphae
segregating to certain regions of the leaf coinciding with the hyphae distribution seen in
TS of the same tiller. However most of the hyphae were elongated and parallel arranged
similar to the WT and seemed continuous within the tissues observed indicating that
some hyphae were able to undergo intercalary growth. To better understand the
continuity of hyphae throughout the length of the leaf sheath, transverse sections were
taken at 1.5 cm intervals along the length of a single tiller covering 3 cm of the
pseudostem starting from the base (close to the SAM). As it was not possible to track
individual hyphae over this distance, arrangement of hyphal patches/regions was
observed for their consistency relative to other sections of the same tiller. Visual
observations indicated that the distribution of hyphae was consistent between transverse
sections indicating that the ∆midA hyphae are continuous within the leaves and that, if
the hyphae are able to get into the host expansion zone, they are able to grow by
intercalary growth (Fig 4.13).
Colonization by ∆midA complemented strains analysed via aniline blue staining
confirmed the colonization pattern is similar to that of the WT in the longitudinal
section of leaf peels and transverse section of tillers. Together these observations
suggested that ∆midA hyphae are able to colonise the SAM similar to the WT but may
encounter a hurdle in getting in to the elongation zone of developing leaves. Hyphae
that manage to enter the elongation zone of the leaf are capable of undergoing growth
similar to the WT.

142
Figure 4.11: Comparison of hyphal colonization in L. perenne tillers infected with WT and
midA deletion mutants expressing EGFP. Sections of meristem, tiller and leaf were obtained
from the same grass tiller. Florescence and phase contrast images are compressed z stack
confocal images. Green strands and spots represent endophyte hyphae (red arrow). Yellow
arrows show auto fluorescing vascular bundles A-Shoot apical meristem, B- Developing
leaves, L 1-3 -Concentrically arranged leaves in grass tiller. Scale bars-200 μm.
WT
∆m
idA
L.S –meristem T.S –Tiller L.S –Leaf
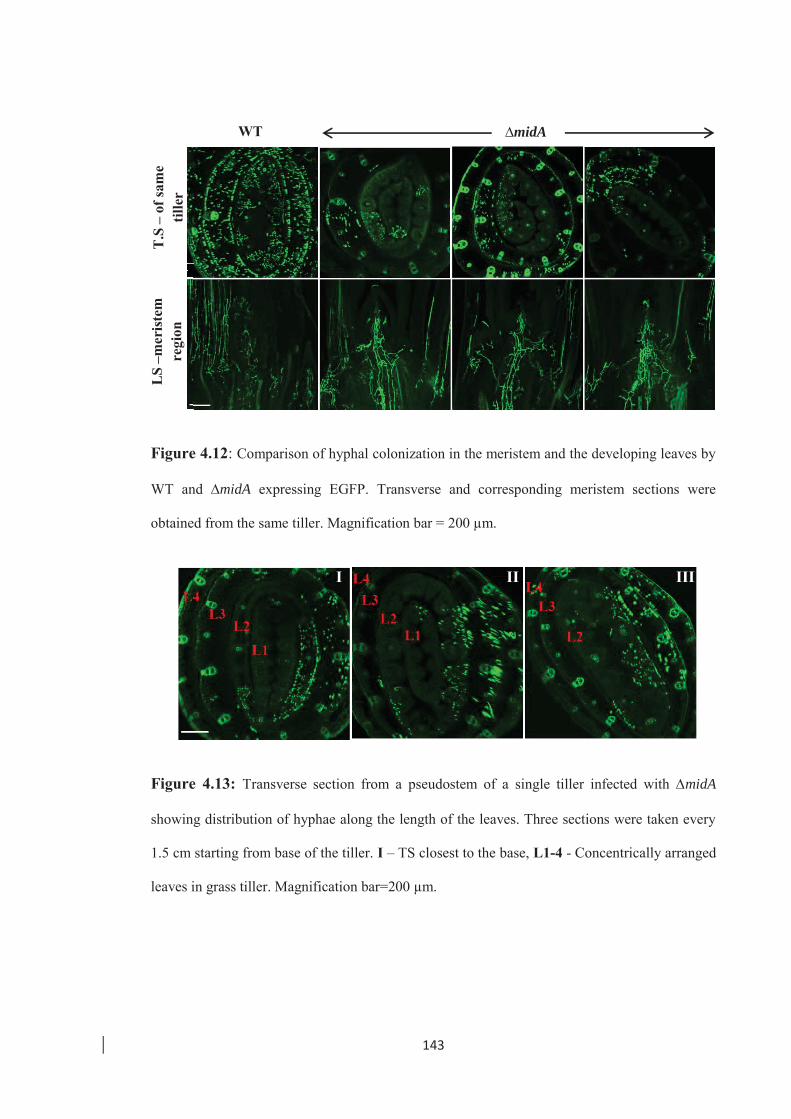
143
Figure 4.12: Comparison of hyphal colonization in the meristem and the developing leaves by
WT and ∆midA expressing EGFP. Transverse and corresponding meristem sections were
obtained from the same tiller. Magnification bar = 200 μm.
Figure 4.13: Transverse section from a pseudostem of a single tiller infected with ∆midA
showing distribution of hyphae along the length of the leaves. Three sections were taken every
1.5 cm starting from base of the tiller. I – TS closest to the base, L1-4 - Concentrically arranged
leaves in grass tiller. Magnification bar=200 μm.
LS
–mer
iste
m
regi
on
T.S
– o
f sam
e til
ler
WT ∆midA
I II III
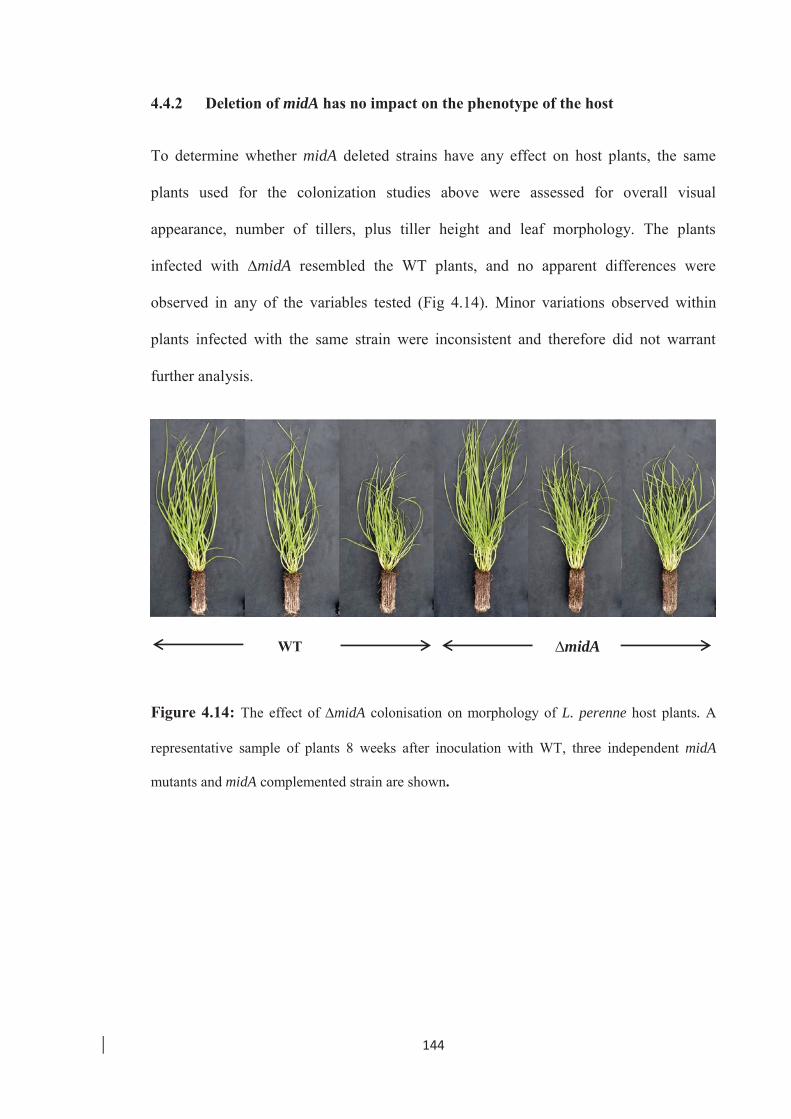
144
4.4.2 Deletion of midA has no impact on the phenotype of the host
To determine whether midA deleted strains have any effect on host plants, the same
plants used for the colonization studies above were assessed for overall visual
appearance, number of tillers, plus tiller height and leaf morphology. The plants
infected with ∆midA resembled the WT plants, and no apparent differences were
observed in any of the variables tested (Fig 4.14). Minor variations observed within
plants infected with the same strain were inconsistent and therefore did not warrant
further analysis.
Figure 4.14: The effect of ∆midA colonisation on morphology of L. perenne host plants. A
representative sample of plants 8 weeks after inoculation with WT, three independent midA
mutants and midA complemented strain are shown.
∆midA WT
145
4.5 Calcium distribution in E. festucae hyphae and the role of MidA in calcium
uptake
Calcium plays a major role as an intracellular signalling molecule (second messenger)
in translating external stimuli into various cellular responses. However, in filamentous
fungi, not much is understood about calcium due to the limitations in techniques to
measure calcium in living hyphae. In animal cells, Genetically Encoded Calcium
Indicators (GECI) which have the advantage of providing a non-invasive long-lasting
imaging method (Akerboom et al., 2012) have been used extensively. One such GECI is
the single wavelength sensor GCaMP (Nakai et al., 2001), for which a series of
improvements have been made, and several versions produced (Tian et al., 2009). The
latest of the series is a single wavelength sensor GCaMP5 (Akerboom et al., 2012). It is
composed of a circular permuted green fluorescent protein (cpGFP), calmodulin (CaM)
and the M13 peptide which is a Ca2+/CaM binding moiety. In the presence of Ca2+, CaM
binds to four Ca2+ molecules and interacts with the M13 peptide. This brings about the
conformational change required in the cpGFP for excitation and emission to occur. This
sensor has fast kinetics, and good sensitivity and photostability.
The GCaMP vector series, including one of the latest, GCamP5, have been optimised
and used in animal cells, in particular in neurons, to investigate Ca2+ signalling. To date
no reports have been published on the use of the GCaMP sensors in fungi. However,
considerable success has been achieved with them in A. fumigatus and N. crassa at the
University of Manchester, U.K., with two papers on their use in these species are ‘in
preparation' (Prof Nick Read, pers. comm). Taking this into consideration, an attempt
was made to investigate the possibility of using the GCaMP5 calcium sensor in E.
festucae. The initial objective was to determine whether the GCaMP5 sensor would
function in WT E. festucae hyphae. Subsequently, investigations were conducted to
146
understand the spatial and temporal Ca2+ signatures in E. festucae during both apical
and intercalary growth. The GCaMP5 sensor was also used to assess the effect of midA
deletion on Ca2+ distribution in E. festucae.
To determine calcium distribution within E. festucae WT hyphae, protoplasts were co-
transformed with vectors pAM13-9-GCaMP5 (harbours the genetically-encoded
calcium sensor GCaMP5) and pPN1688 (to confer hygromycin resistance) (Section
2.6.3), transformants selected using hygromycin resistance, nuclear purified by sub-
culturing (Section 2.8) and tested for expression of GCaMP5 using confocal laser
scanning microscopy. Then growth rate, colony and hyphal morphology and plant
colonization characteristics were compared with a WT strain to check that the ectopic
integrations had not altered these traits. Three independent transformed strains were
selected for further studies. Imaging was performed as mentioned in Section 2.12.3.1.
4.5.1 Calcium pulses in apical compartments of E. festucae during growth in
axenic culture
Time lapse live imaging of growing E. festucae hyphae expressing GCaMP5, using the
conditions described above, revealed high intensity pulsatile fluorescent signals
emanating from the hyphal tips (see supplementary movies 4.2-3 in PowerPoint
presentation ‘Calcium imaging in E. festucae’ in attached CD). These fluorescent pulses
were not observed in hyphae of the WT (without GCaMP5) or in those expressing
EGFP constitutively (transformed with pTEFEGFP) indicating that the fluorescent
pulses are representative of changes in cytoplasmic calcium concentration ([Ca2+]c) in
the hyphal apex. This observation demonstrated that the GCaMP5 calcium sensor is
functional within E. festucae and can be used to investigate Ca2+ dynamics within
actively growing hyphae. The pulsatile fluorescent signals at the hyphal tip correlated
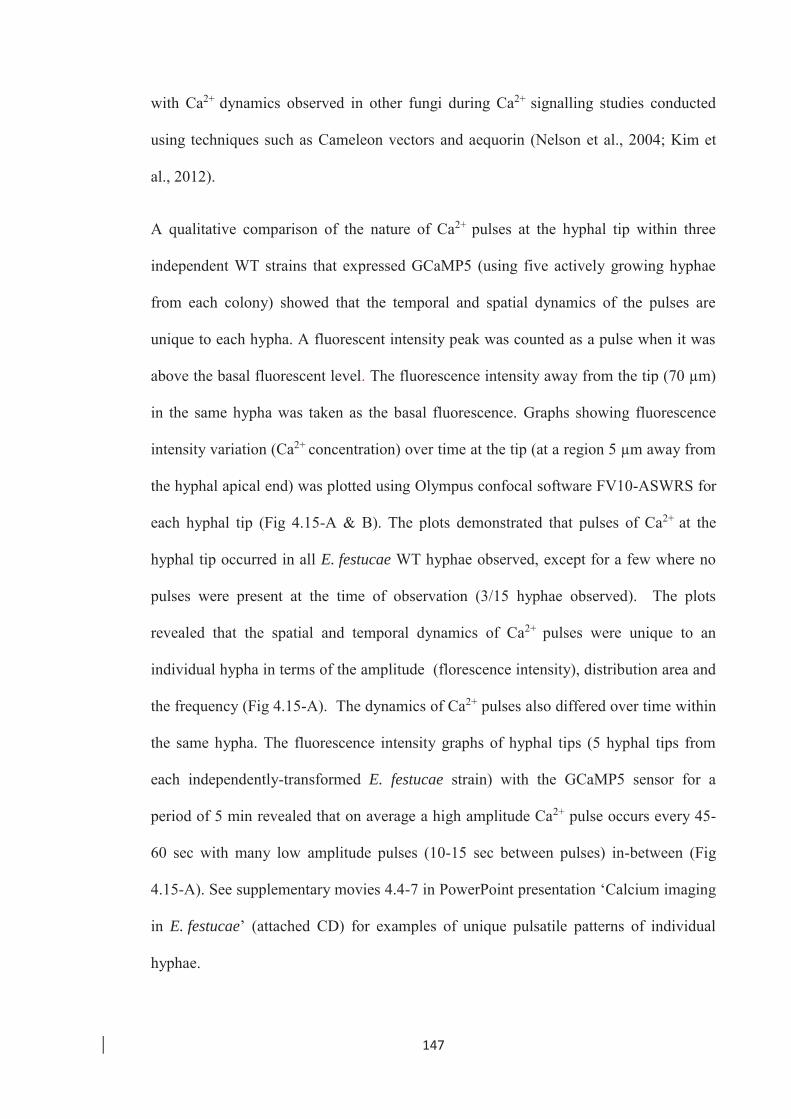
147
with Ca2+ dynamics observed in other fungi during Ca2+ signalling studies conducted
using techniques such as Cameleon vectors and aequorin (Nelson et al., 2004; Kim et
al., 2012).
A qualitative comparison of the nature of Ca2+ pulses at the hyphal tip within three
independent WT strains that expressed GCaMP5 (using five actively growing hyphae
from each colony) showed that the temporal and spatial dynamics of the pulses are
unique to each hypha. A fluorescent intensity peak was counted as a pulse when it was
above the basal fluorescent level. The fluorescence intensity away from the tip (70 μm)
in the same hypha was taken as the basal fluorescence. Graphs showing fluorescence
intensity variation (Ca2+ concentration) over time at the tip (at a region 5 μm away from
the hyphal apical end) was plotted using Olympus confocal software FV10-ASWRS for
each hyphal tip (Fig 4.15-A & B). The plots demonstrated that pulses of Ca2+ at the
hyphal tip occurred in all E. festucae WT hyphae observed, except for a few where no
pulses were present at the time of observation (3/15 hyphae observed). The plots
revealed that the spatial and temporal dynamics of Ca2+ pulses were unique to an
individual hypha in terms of the amplitude (florescence intensity), distribution area and
the frequency (Fig 4.15-A). The dynamics of Ca2+ pulses also differed over time within
the same hypha. The fluorescence intensity graphs of hyphal tips (5 hyphal tips from
each independently-transformed E. festucae strain) with the GCaMP5 sensor for a
period of 5 min revealed that on average a high amplitude Ca2+ pulse occurs every 45-
60 sec with many low amplitude pulses (10-15 sec between pulses) in-between (Fig
4.15-A). See supplementary movies 4.4-7 in PowerPoint presentation ‘Calcium imaging
in E. festucae’ (attached CD) for examples of unique pulsatile patterns of individual
hyphae.
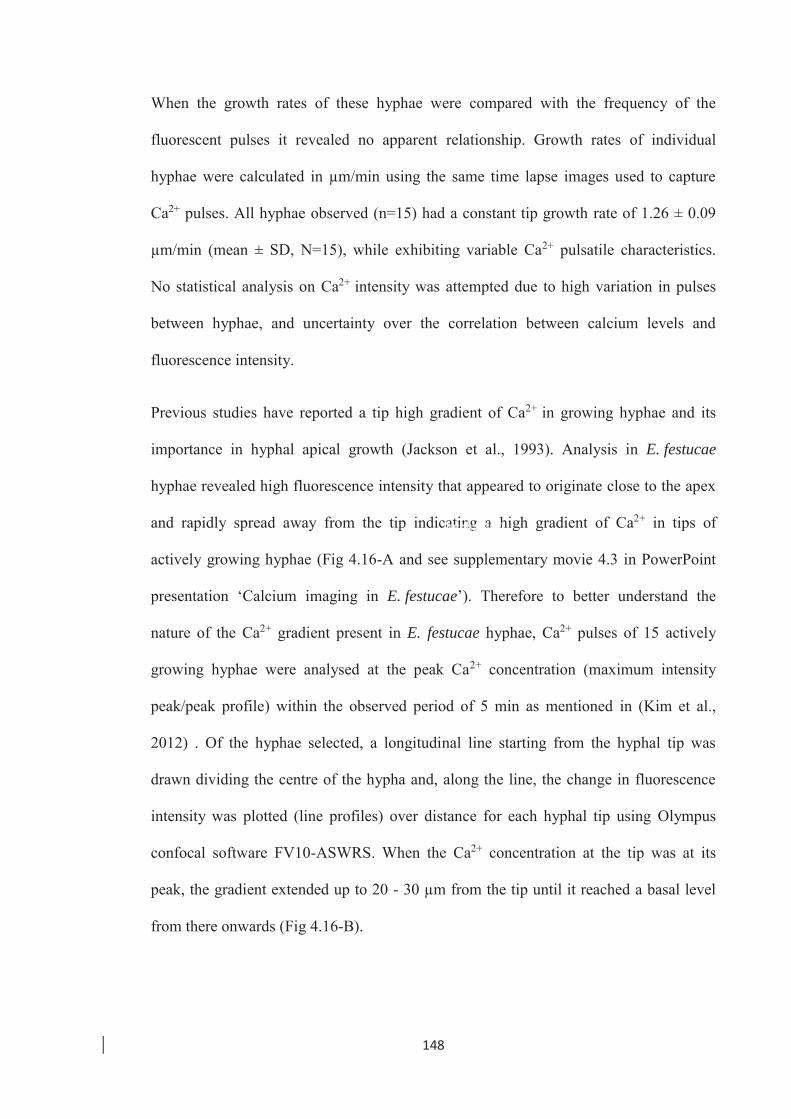
148
When the growth rates of these hyphae were compared with the frequency of the
fluorescent pulses it revealed no apparent relationship. Growth rates of individual
hyphae were calculated in μm/min using the same time lapse images used to capture
Ca2+ pulses. All hyphae observed (n=15) had a constant tip growth rate of 1.26 ± 0.09
μm/min (mean ± SD, N=15), while exhibiting variable Ca2+ pulsatile characteristics.
No statistical analysis on Ca2+ intensity was attempted due to high variation in pulses
between hyphae, and uncertainty over the correlation between calcium levels and
fluorescence intensity.
Previous studies have reported a tip high gradient of Ca2+ in growing hyphae and its
importance in hyphal apical growth (Jackson et al., 1993). Analysis in E. festucae
hyphae revealed high fluorescence intensity that appeared to originate close to the apex
and rapidly spread away from the tip indicating a high gradient of Ca2+ in tips of
actively growing hyphae (Fig 4.16-A and see supplementary movie 4.3 in PowerPoint
presentation ‘Calcium imaging in E. festucae’). Therefore to better understand the
nature of the Ca2+ gradient present in E. festucae hyphae, Ca2+ pulses of 15 actively
growing hyphae were analysed at the peak Ca2+ concentration (maximum intensity
peak/peak profile) within the observed period of 5 min as mentioned in (Kim et al.,
2012) . Of the hyphae selected, a longitudinal line starting from the hyphal tip was
drawn dividing the centre of the hypha and, along the line, the change in fluorescence
intensity was plotted (line profiles) over distance for each hyphal tip using Olympus
confocal software FV10-ASWRS. When the Ca2+ concentration at the tip was at its
peak, the gradient extended up to 20 - 30 μm from the tip until it reached a basal level
from there onwards (Fig 4.16-B).
Fluorescence intensity 5μm behind the hyphal tip
Basal intensity (70 μm behind the hyphal tip)
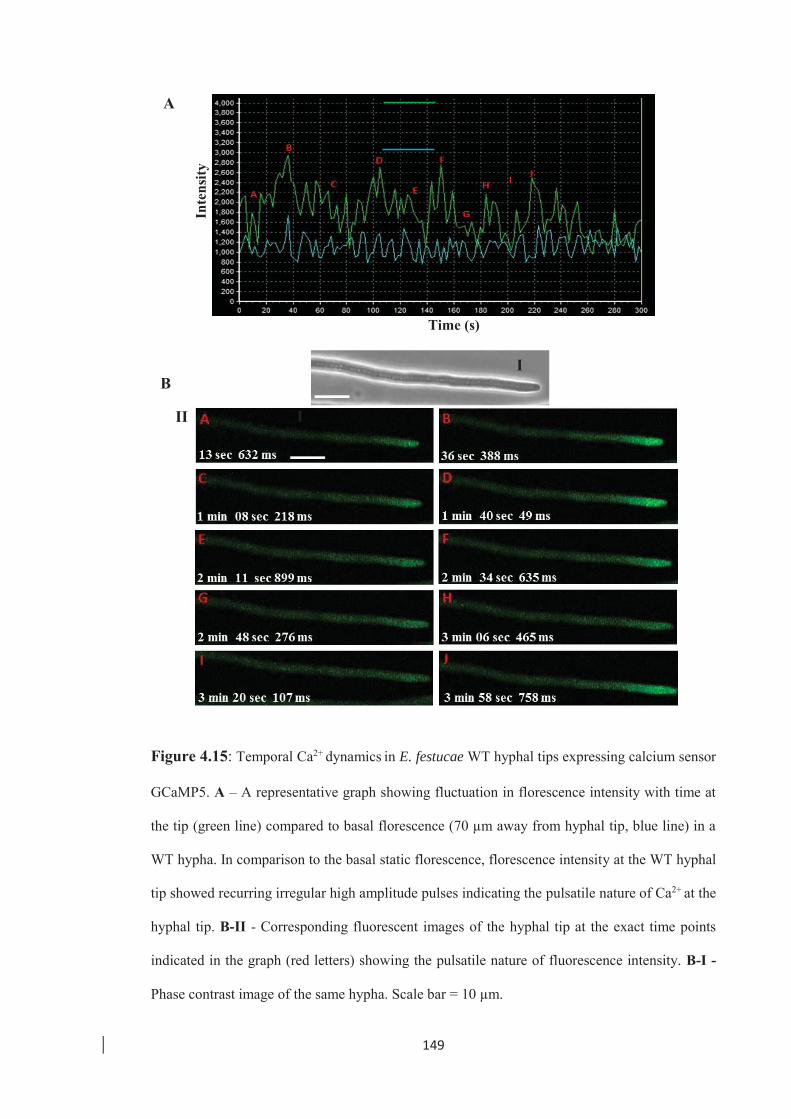
149
Figure 4.15: Temporal Ca2+ dynamics in E. festucae WT hyphal tips expressing calcium sensor
GCaMP5. A – A representative graph showing fluctuation in florescence intensity with time at
the tip (green line) compared to basal florescence (70 μm away from hyphal tip, blue line) in a
WT hypha. In comparison to the basal static florescence, florescence intensity at the WT hyphal
tip showed recurring irregular high amplitude pulses indicating the pulsatile nature of Ca2+ at the
hyphal tip. B-II - Corresponding fluorescent images of the hyphal tip at the exact time points
indicated in the graph (red letters) showing the pulsatile nature of fluorescence intensity. B-I -
Phase contrast image of the same hypha. Scale bar = 10 μm.
A
B
I II
I
Inte
nsity
Time (s)
150
Figure 4.16: Analysis of spatial distribution of Ca2+ at the E .festucae WT hyphal tip
expressing the GCaMP5 calcium sensor. A -Series of time lapse images (1-7 represent the time
sequence of images) showing the origin and distribution of a single Ca2+ pulse at the tip of a
representative WT hypha. The Ca2+ pulse is highest at the tip and reduces progressively to
background levels approximately 30 μm from the tip. A-I – Phase contrast image. B-I - Line
transecting the centre of the hypha. B-II- A representative intensity line profile at the hyphal tip
of WT hypha (expressing GCaMP5) transecting the centre of the hypha.
A
B I
II
I
Inte
nsity
Length (μm)
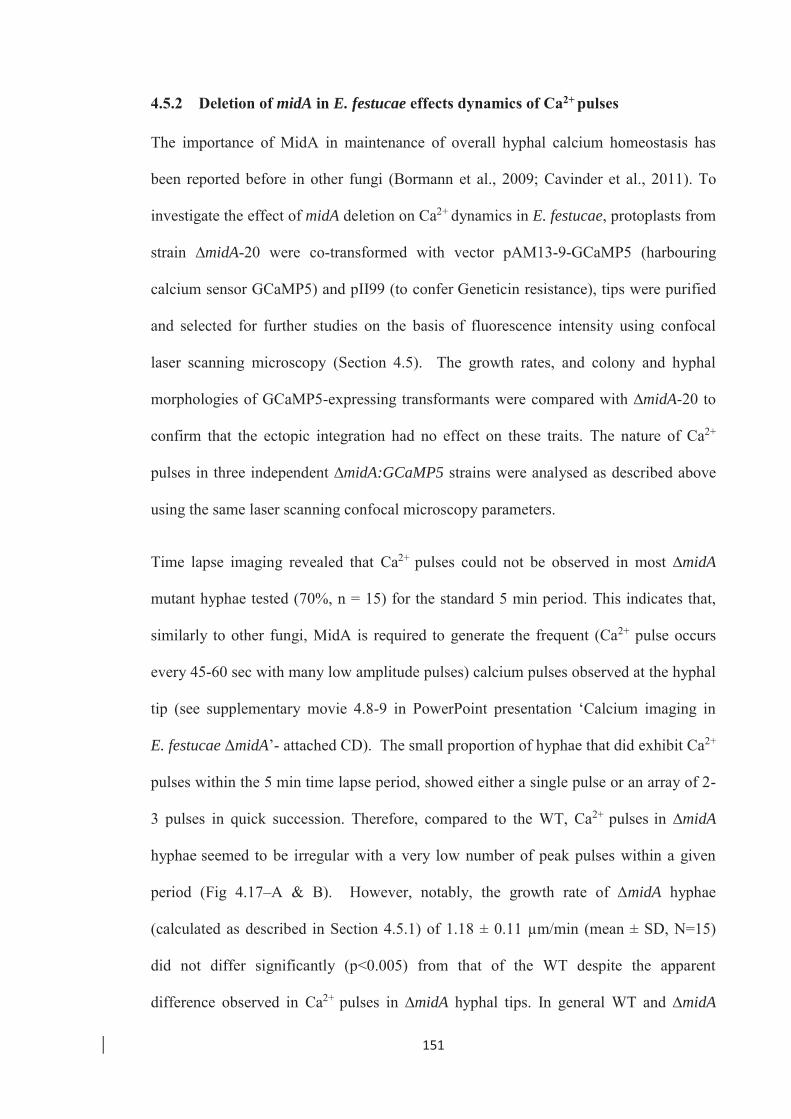
151
4.5.2 Deletion of midA in E. festucae effects dynamics of Ca2+ pulses
The importance of MidA in maintenance of overall hyphal calcium homeostasis has
been reported before in other fungi (Bormann et al., 2009; Cavinder et al., 2011). To
investigate the effect of midA deletion on Ca2+ dynamics in E. festucae, protoplasts from
strain ∆midA-20 were co-transformed with vector pAM13-9-GCaMP5 (harbouring
calcium sensor GCaMP5) and pII99 (to confer Geneticin resistance), tips were purified
and selected for further studies on the basis of fluorescence intensity using confocal
laser scanning microscopy (Section 4.5). The growth rates, and colony and hyphal
morphologies of GCaMP5-expressing transformants were compared with ∆midA-20 to
confirm that the ectopic integration had no effect on these traits. The nature of Ca2+
pulses in three independent ∆midA:GCaMP5 strains were analysed as described above
using the same laser scanning confocal microscopy parameters.
Time lapse imaging revealed that Ca2+ pulses could not be observed in most ∆midA
mutant hyphae tested (70%, n = 15) for the standard 5 min period. This indicates that,
similarly to other fungi, MidA is required to generate the frequent (Ca2+ pulse occurs
every 45-60 sec with many low amplitude pulses) calcium pulses observed at the hyphal
tip (see supplementary movie 4.8-9 in PowerPoint presentation ‘Calcium imaging in
E. festucae ΔmidA’- attached CD). The small proportion of hyphae that did exhibit Ca2+
pulses within the 5 min time lapse period, showed either a single pulse or an array of 2-
3 pulses in quick succession. Therefore, compared to the WT, Ca2+ pulses in ∆midA
hyphae seemed to be irregular with a very low number of peak pulses within a given
period (Fig 4.17–A & B). However, notably, the growth rate of ∆midA hyphae
(calculated as described in Section 4.5.1) of 1.18 ± 0.11 μm/min (mean ± SD, N=15)
did not differ significantly (p<0.005) from that of the WT despite the apparent
difference observed in Ca2+ pulses in ∆midA hyphal tips. In general WT and ∆midA
152
hyphae grew at a constant and similar rate regardless of the pattern of Ca2+ pulses. See
supplementary movies 4.10-14 in PowerPoint presentation ‘Calcium imaging in
E. festucae ΔmidA’ (attached CD) for examples of unique pulsatile patterns of
individual hyphae.
The spatial distribution of the Ca2+ gradient in ∆midA hyphal tips was analysed in a
similar way to that in the WT hyphal tips along a longitudinal line through the apical
compartment at a time of maximum Ca2+ intensity (Fig 4.18-A & B). In ∆midA, in
comparison to WT hyphae, extension of the maximum Ca2+ peak gradient was
significantly more variable and returned to basal levels within 25-70 μm from the tip,
whereas in WT hyphae the range was within 20-30 μm from the tip in all hyphae
observed (see supplementary movie 4.9 in PowerPoint presentation ‘Calcium imaging
in E. festucae ΔmidA’). To confirm that the observed differences in Ca2+ dynamics in
∆midA compared to the WT were due to absence of MidA functionality, protoplasts
from E. festucae ∆midA (∆midA-20) were simultaneously transformed with the midA
complementation vector pSAM5 and pAM13-9-GCaMP5 (harbouring the GCaMP5
calcium sensor). Geneticin-resistant transformants were tip-purified and checked for
ability to fluoresce. Colonies were further screened by PCR to confirm the presence of
complemented midA gene. Thereafter, growth rate, colony and hyphal morphology of
the selected complemented strains (with the GCaMP5 sensor) were compared with WT
and ∆midA complemented strains to ascertain that ectopic integration had not affected
these traits. In terms of the three main Ca2+ dynamics investigated above, frequency of
pulses, Ca2+ gradient distribution at the tip and growth rate, the ∆midA complemented
strains with GCaMP5 sensor were similar to the WT (Fig 4.19). This demonstrated that
the difference observed in Ca2+ dynamics at the hyphal tip between the E. festucae
∆midA and WT was due to the absence of MidA. See supplementary movies 4.15-16 in
153
PowerPoint presentation ‘Calcium imaging in E. festucae ΔmidA complemented’
(attached CD) for examples of unique pulsatile patterns of individual hyphae.
Figure 4.17: Temporal Ca2+ dynamics in E. festucae ∆midA hyphal tips expressing calcium
sensor GCaMP5. A – A representative graph showing fluctuation in florescence intensity with
time at the hyphal tip (green line) in comparison to basal florescence (70 μm behind the hyphal
tip, blue line). B-II - Corresponding fluorescent images of the hyphal tip at the time points
indicated in the graph A (red letters). B-I - Phase contrast image. Scale bar = 10 μm.
II
A
B I
II
Fluorescence intensity 5 μm behind the hyphal tip
Basal intensity at 70 μm behind the hyphal tip
Inte
nsity
Time (s)

154
Figure 4.18: Spatial distribution of Ca2+ at the hyphal tip of E. festucae ∆midA expressing the
GCaMP5 calcium sensor. A-Series of time lapse images (1-10 represent the time sequence of
images) showing the origin and distribution of a single Ca2+ pulse. A-I-phase contrast image B-
II – A representative line intensity profile at the hyphal tip of a ∆midA hypha. B-I–
Longitudinal line transecting the hyphal tip. A tip high gradient of Ca2+ could be seen that
spread to approximately 50 μm from the tip.
A
B
I II
I
I
Length (μm)
Inte
nsity
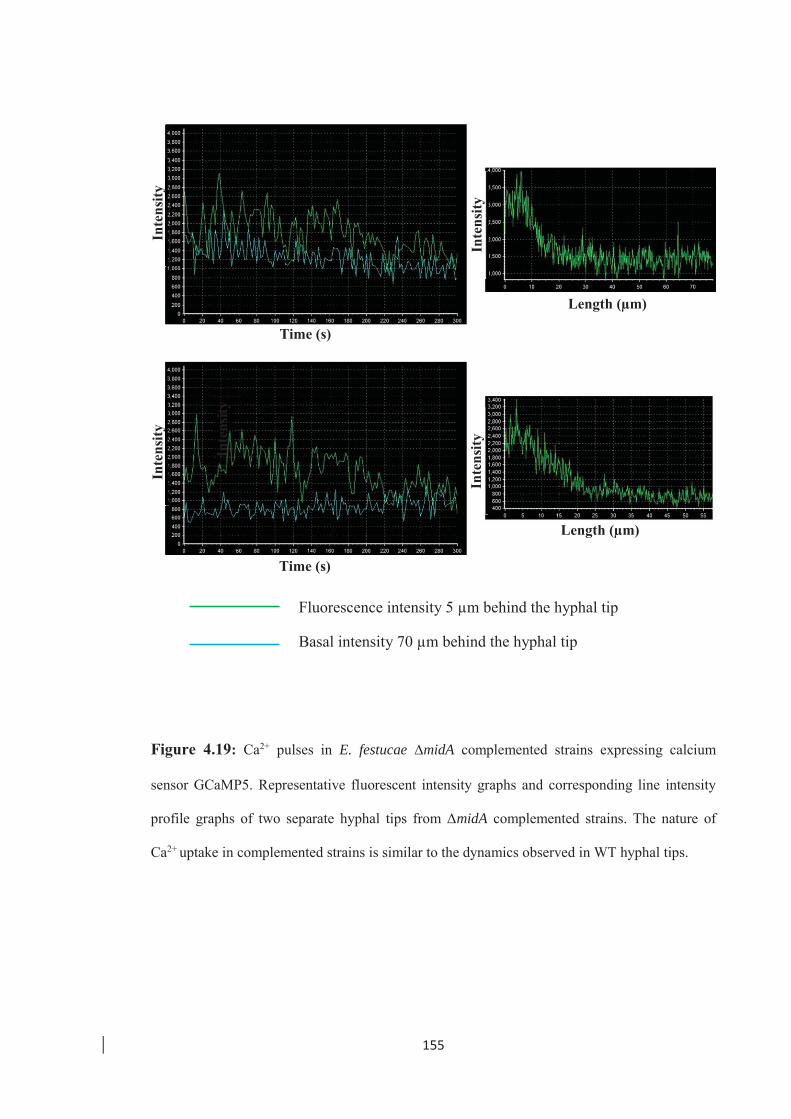
155
Figure 4.19: Ca2+ pulses in E. festucae ∆midA complemented strains expressing calcium
sensor GCaMP5. Representative fluorescent intensity graphs and corresponding line intensity
profile graphs of two separate hyphal tips from ΔmidA complemented strains. The nature of
Ca2+ uptake in complemented strains is similar to the dynamics observed in WT hyphal tips.
Fluorescence intensity 5 μm behind the hyphal tip
Basal intensity 70 μm behind the hyphal tip
Time (s)
Time (s)
Inte
nsity
Inte
nsity
In
tens
ity
Length (μm)
Length (μm)
Inte
nsity
In
tens
ity
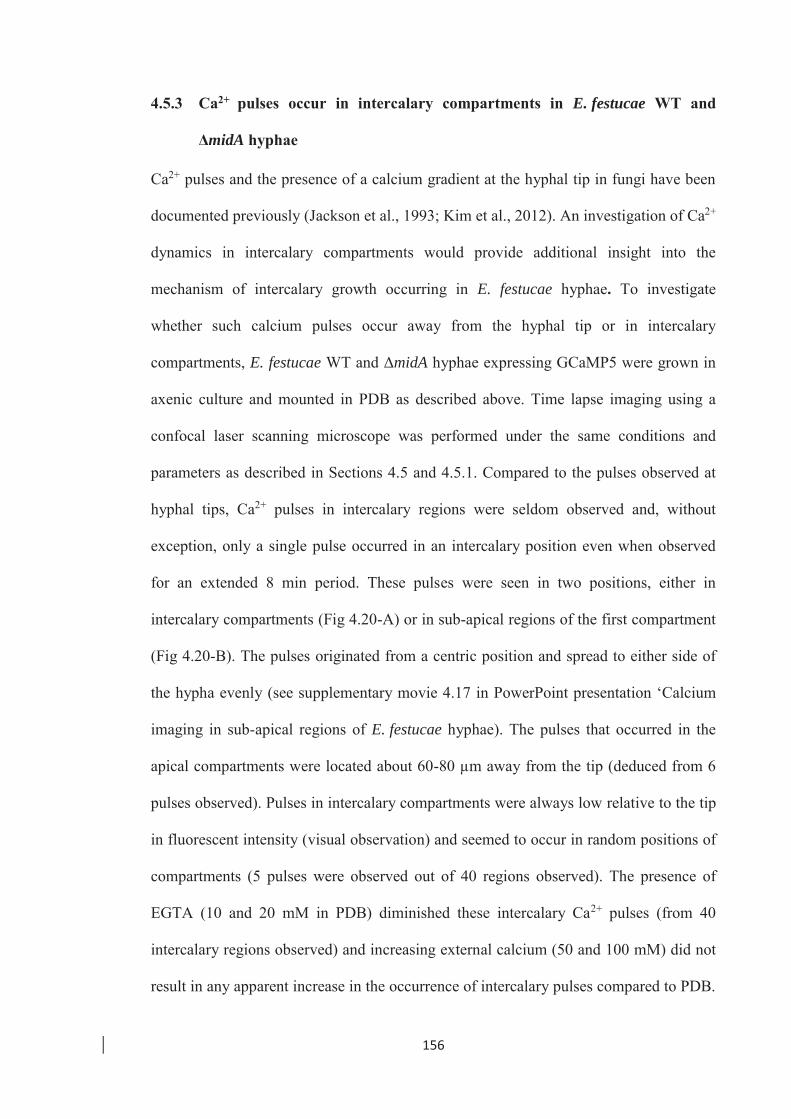
156
4.5.3 Ca2+ pulses occur in intercalary compartments in E. festucae WT and
ΔmidA hyphae
Ca2+ pulses and the presence of a calcium gradient at the hyphal tip in fungi have been
documented previously (Jackson et al., 1993; Kim et al., 2012). An investigation of Ca2+
dynamics in intercalary compartments would provide additional insight into the
mechanism of intercalary growth occurring in E. festucae hyphae. To investigate
whether such calcium pulses occur away from the hyphal tip or in intercalary
compartments, E. festucae WT and ΔmidA hyphae expressing GCaMP5 were grown in
axenic culture and mounted in PDB as described above. Time lapse imaging using a
confocal laser scanning microscope was performed under the same conditions and
parameters as described in Sections 4.5 and 4.5.1. Compared to the pulses observed at
hyphal tips, Ca2+ pulses in intercalary regions were seldom observed and, without
exception, only a single pulse occurred in an intercalary position even when observed
for an extended 8 min period. These pulses were seen in two positions, either in
intercalary compartments (Fig 4.20-A) or in sub-apical regions of the first compartment
(Fig 4.20-B). The pulses originated from a centric position and spread to either side of
the hypha evenly (see supplementary movie 4.17 in PowerPoint presentation ‘Calcium
imaging in sub-apical regions of E. festucae hyphae). The pulses that occurred in the
apical compartments were located about 60-80 μm away from the tip (deduced from 6
pulses observed). Pulses in intercalary compartments were always low relative to the tip
in fluorescent intensity (visual observation) and seemed to occur in random positions of
compartments (5 pulses were observed out of 40 regions observed). The presence of
EGTA (10 and 20 mM in PDB) diminished these intercalary Ca2+ pulses (from 40
intercalary regions observed) and increasing external calcium (50 and 100 mM) did not
result in any apparent increase in the occurrence of intercalary pulses compared to PDB.
157
However, due to randomness in position of pulses in intercalary regions, capturing these
pulses and assessing spatial and temporal nature was difficult. No discernible
differences were observed in the Ca2+ pulses of intercalary compartments in WT and
ΔmidA hyphae
.
Figure 4.20: Ca2+ pulses in an intercalary compartment and in a sub-apical region of
E. festucae hyphae. Time lapse phase contrast and fluorescent images (time series 1-4) of a Ca2+
pulse occurring in a sub-apical compartment (A) and away from the hyphal tip of the apical
compartment (B) of a WT hypha expressing GCaMP5. Ca2+ pulses in sub-apical compartments
are low in intensity compared to the pulses occurring in the apical compartment. Imaging time
was extended to 8 min to capture these rare sub-apical Ca2+ pulses. The white arrows indicate
the origins of Ca2+ pulses. Scale bar = 10 μm.
A B
158
4.5.4 Ca2+ pulses in E. festucae are due to influx of exogenous Ca2+
To determine whether the Ca2+ pulses observed in E. festucae hyphal tips and
intercalary compartments were due to influx of exogenous Ca2+ through the membrane,
or release of Ca2+ from internal storages (vacuoles and Golgi apparatus) or a
combination of both, mycelial PDA blocks of hyphae expressing the GCaMP5 sensor
were mounted in PDB infused with various concentrations of EGTA (Ca2+ chelator).
Fluorescence at the hyphal tips were observed as mentioned in Section 4.5 after 5 min
of incubation using same confocal laser scanning microscopy parameters. At least 10
hyphae were observed for each treatment. Due to the limitation in the confocal
microscope immediate effect of EGTA or Ca2+ addition was not possible to observe as
there was a time gap between addition of EGTA or Ca2+ and imaging.
Time lapse observation of WT hyphal tips revealed that Ca2+ pulses could be observed
in the presence of 5 and 10 mM of EGTA, but not in 20 and 30 mM of EGTA in PDB
within the 5 min period in all hyphae observed (Fig 4.21). Under similar conditions 5
mM EGTA did not show any effect on Ca2+ pulses in ΔmidA hyphae as the usual
frequency of pulses were observed (4/10 observed showed a pulse). In comparison,
under similar conditions, in 10 mM of EGTA, Ca2+ pulses were not seen in ΔmidA
hyphae within 5 min of observation. Therefore, lower levels of exogenous Ca2+ were
required to inhibit Ca2+ pulses altogether in the midA replacement mutants.
Additionally, in ΔmidA strains an occasional pulse occurred simultaneously with a
massive visible disturbance in the cytoplasm indicating hyphal tip rupture (3/11
observed), the pulse presumably occurred as a result of spilled cytoplasmic contents
coming into contact with residual Ca2+ in the media (see supplementary movie 4.18-19
in PowerPoint presentation ‘Calcium imaging in E. festucae hyphae in EGTA). No such
hyphal tip rupture was observed in WT hyphae indicating that calcium depletion
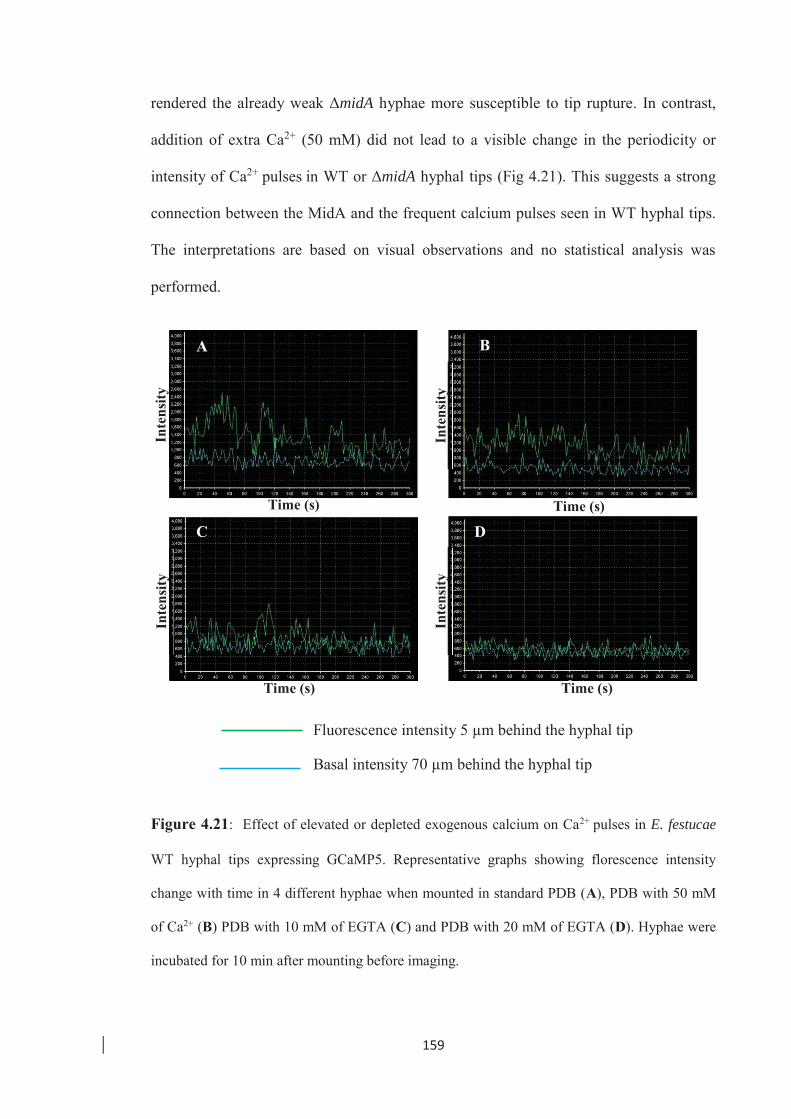
159
rendered the already weak ΔmidA hyphae more susceptible to tip rupture. In contrast,
addition of extra Ca2+ (50 mM) did not lead to a visible change in the periodicity or
intensity of Ca2+ pulses in WT or ΔmidA hyphal tips (Fig 4.21). This suggests a strong
connection between the MidA and the frequent calcium pulses seen in WT hyphal tips.
The interpretations are based on visual observations and no statistical analysis was
performed.
Figure 4.21: Effect of elevated or depleted exogenous calcium on Ca2+ pulses in E. festucae
WT hyphal tips expressing GCaMP5. Representative graphs showing florescence intensity
change with time in 4 different hyphae when mounted in standard PDB (A), PDB with 50 mM
of Ca2+ (B) PDB with 10 mM of EGTA (C) and PDB with 20 mM of EGTA (D). Hyphae were
incubated for 10 min after mounting before imaging.
A
Fluorescence intensity 5 μm behind the hyphal tip
Basal intensity 70 μm behind the hyphal tip
B
C D
Inte
nsity
Inte
nsity
Inte
nsity
Inte
nsity
Time (s) Time (s)
Time (s) Time (s)
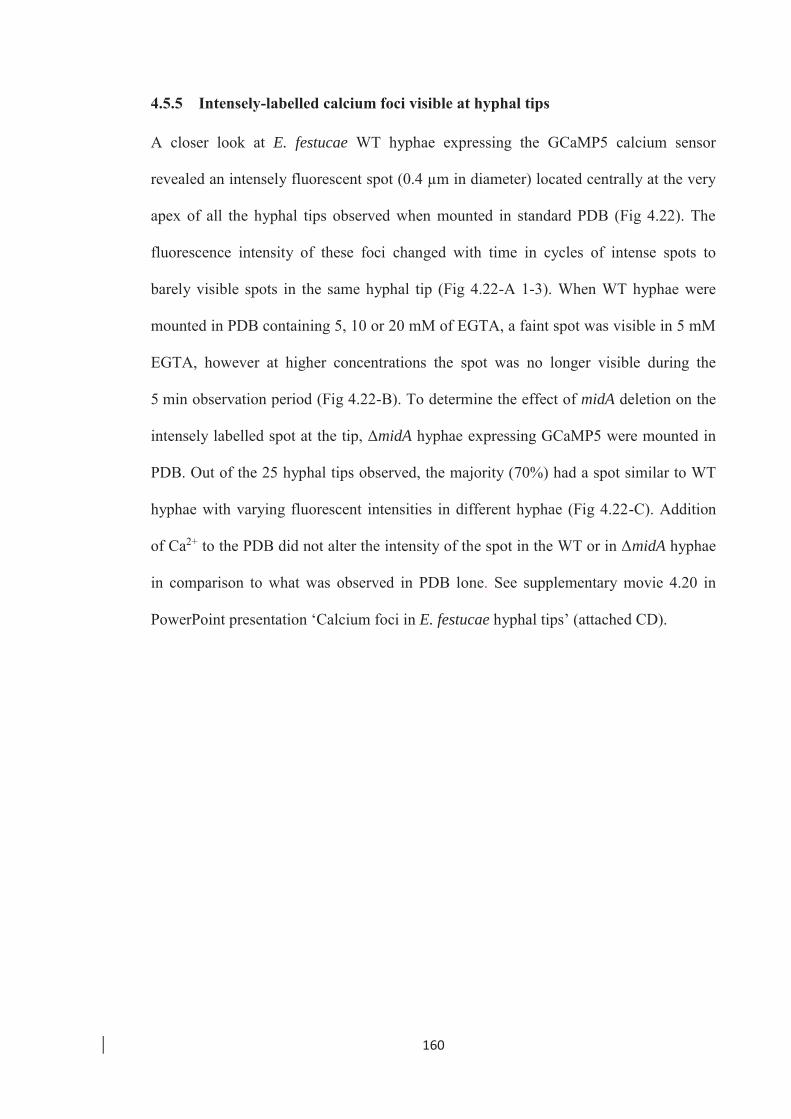
160
4.5.5 Intensely-labelled calcium foci visible at hyphal tips
A closer look at E. festucae WT hyphae expressing the GCaMP5 calcium sensor
revealed an intensely fluorescent spot (0.4 μm in diameter) located centrally at the very
apex of all the hyphal tips observed when mounted in standard PDB (Fig 4.22). The
fluorescence intensity of these foci changed with time in cycles of intense spots to
barely visible spots in the same hyphal tip (Fig 4.22-A 1-3). When WT hyphae were
mounted in PDB containing 5, 10 or 20 mM of EGTA, a faint spot was visible in 5 mM
EGTA, however at higher concentrations the spot was no longer visible during the
5 min observation period (Fig 4.22-B). To determine the effect of midA deletion on the
intensely labelled spot at the tip, ΔmidA hyphae expressing GCaMP5 were mounted in
PDB. Out of the 25 hyphal tips observed, the majority (70%) had a spot similar to WT
hyphae with varying fluorescent intensities in different hyphae (Fig 4.22-C). Addition
of Ca2+ to the PDB did not alter the intensity of the spot in the WT or in ΔmidA hyphae
in comparison to what was observed in PDB lone. See supplementary movie 4.20 in
PowerPoint presentation ‘Calcium foci in E. festucae hyphal tips’ (attached CD).
161
Figure 4.22: Fluorescent foci in E. festucae hyphal tips expressing the GCaMP5 calcium
sensor. A- Phase contrast (A-I) and fluorescent images overlaid, showing the intensely-labelled
spot (white arrow) present at the hyphal tip of WT hyphae mounted in standard PDB. Images
1-3 represent the fluctuation in intensity of the spot with time. Images were taken under similar
conditions and microscopy parameters. B-WT hyphae mounted on PDB containing 5 mM
EGTA (B-I) and 10 mM EGTA (B-II). The intensely-labelled spot at the tip is visible in 5 mM
EGTA but cannot be seen in 10 mM of EGTA. C- Intensely-labelled spot (white arrow) in
∆midA hyphal tips. Scale bar = 5 μm.
A
B
C
II
I
I
162
4.6 Discussion
Similar to WscA characterization, the investigation on MidA of E. festucae was
undertaken as part of a broad attempt to identify the underlying cellular mechanisms of
intercalary growth in E. festucae. In S. cerevisiae Mid1 has been functionally
characterised as a stretch-activated calcium-permeable non-selective cation channel
activated by cell membrane deformations (Iida et al., 1994; Ozeki-Miyawaki et al.,
2005). As we hypothesised that mechanical stretching (potentially causing membrane
deformation and stretching) of fungal hyphae trigger intercalary growth, MidA of
E. festucae (orthologue of Mid1 of S. cerevisiae) was considered as a suitable candidate
to be tested for its role in intercalary growth. Further, given the crucial role of Ca2+ as a
signalling molecule, we hypothesized that Ca2+ acts as a signalling molecule in
triggering intercalary growth. Hence along with MidA analysis, preliminary studies on
Ca2+ dynamics of E. festucae hyphae were initiated during this study.
Recent studies have shown that Mid1 forms a complex with Cch1 and acts as one unit
in regulating influx of Ca2+ (Brand et al., 2007). Cch1 is a voltage gated channel
sensitive to membrane potential (Harren et al., 2013). In this complex, Cch1 is
considered to be the channel responsible for Ca2+ influx, while Mid1 is believed to be
the activator of Cch1 under stimulatory or stress conditions and does not appear to
possess any independent channel activity (Hong et al., 2010; Hong et al., 2013). A co-
immunoprecipitation study conducted in S. cerevisiae indicated that Mid1 interacts with
Cch1 (Locke et al., 2000). Likewise, in A. nidulans the yeast two hybrid system also
confirmed the two proteins interact (Wang et al., 2012). A study in C. neoformans has
revealed that the C-terminal tail of Mid1 intrudes and modulates channel activity of
Cch1 (Hong et al., 2013). In S. cerevisiae, Mid1 and Cch1 are not essential for
vegetative growth, and deletion of cch1 and the double deletion of mid1 and cch1,
163
exhibited similar phenotypes (Fischer et al., 1997; Muller et al., 2001). Studies on
mutants of mid1 and cch1 conducted using filamentous fungi such as A. fumigatus (de
Castro et al., 2014), A. nidulans (Wang et al., 2012), B. cinerea (Harren et al., 2013) and
C. albicans (Yu et al., 2012) have resulted in common as well as unique phenotypes
supporting coordinated as well as unique functions for Mid1 and Cch1. Given the high
conservation of the calcium/calcineurin pathway in filamentous fungi, E. festucae MidA
and CchA may also function together as a complex and possess conserved or
independent roles for Mid1 and Cch1 during influx of calcium.
The most visible colony phenotype of ΔmidA was the reduced radial growth rate (by
40% of that of the WT) and lack of aerial hyphae on standard PDA medium (Fig 4.4). In
addition, ΔmidA hyphae contained cell wall aberrations and showed frequent tip lysis
when mounted in water or PDB (Fig 4.6). Also evident in E. festucae ΔmidA hyphae
were a phenomenon where the polar directional growth of hyphal tips would stop, and a
new branch would initiate and continue to grow (Fig 4.5). All these mutant phenotypes
were restored by osmotic stabilization indicating a severe cell wall defect that weakens
its integrity (Fig 4.7). These results suggested a crucial role for E. festucae MidA in
hyphal growth and morphology.
Similar to E. festucae, in C. albicans (Yu et al., 2012), A. fumigatus (de Castro et al.,
2014), B. cinerea (Harren et al., 2013), N. crassa (Lew et al., 2008) and Magnaporthe
oryzae (Nguyen et al., 2008), mid1 replacement mutants showed impaired colony
growth in axenic culture. Resembling the cell wall aberrations seen in E. festucae
ΔmidA hyphae, A. fumigatus mid1 mutants showed similar cell wall aberrations in the
presence of EGTA (Jiang et al., 2014). Further, A. nidulans ΔmidA had defects in cell
wall synthesis (Wang et al., 2012) and defects in hyphal maintenance in C. albicans
164
Δmid1 (Yu et al., 2012). A detailed study on C. purpurea mid1 showed that the mutants
displayed a significant reduction in growth rate while maintaining wild type colony
morphology with a normal polar growth and branching pattern in axenic cultures
(Bormann et al., 2009). Cell wall perturbing agents such as Congo Red and Calcofluor
White caused significant defects in growth in mid1 mutants including large aggregations
of cell wall polysaccharides (Bormann et al., 2009). In G. zeae the growth rate of the
mid1 and cch1 mutants was 50% of the wild type and the colonies showed a cottony
morphology (Cavinder et al., 2011). Although all Δmid1 mutants in filamentous fungi
have impaired colony growth and hyphal morphology, the severity of the deletions is
variable depending on the species.
Even though the E. festucae ΔmidA showed reduction in colony radial growth rate, the
individual hyphal apical growth was not significantly (p<0.05) different from that of the
WT indicating that even in the absence of MidA hyphal apical growth can continue.
Therefore the primary cause for reduced colony growth rate seen in ΔmidA appears to
be the frequent tip lysis and polarity disruption seen in individual hyphae which could
be due to an alteration in cell wall structure and composition caused by midA deletion in
E. festucae. Impaired cell wall polysaccharide synthesis and defective accumulation at
hyphal tip cell wall can cause a severe weakening in nascent cell wall. Results of mid1
deletion in C. purpurea (Bormann et al., 2009) and ehs1 (orthologue of mid1) deletion
in S. pombe (Carnero et al., 2000) has suggested such alteration in polysaccharide
composition in cell walls. Further, for proper cell wall formation during apical growth,
adequate transport and deposition of cell wall material is also important (Harris et al.,
2004).
165
MidA activation results in an influx of Ca2+ that triggers a signalling cascade through
calmodulin and calcineurin that dephosphorylates and activates Crz1 (a zinc finger
transcription factor)(Chin et al., 2000). This results in localization of Crz1 to the
nucleus and regulation of genes including cell wall-related genes (Yoshimoto et al.,
2002; Viladevall et al., 2004). Hence loss of MidA maybe expected to have a direct
impact on the integrity of cell walls of growing hyphae, resulting in hyphal lysis. In
addition, as was seen during this study, MidA is necessary to create pulsatile Ca2+
signatures at the hyphal tip. These Ca2+ signatures might have a crucial role in
organizing the morphogenetic machinery, cytoskeleton, vesicle transport, vesicle fusion
and enzyme activation at the hyphal tip, which when disrupted might cause severe
defects in the cell wall (discussed further in the subsequent sections).
The ability of exogenous CaCl2 (50 mM) but not NaCl at similar concentrations to
rescue the ∆midA phenotypes (colony radial growth rate and cell wall aberrations) in
E. festucae (Fig 4.8) clearly shows the presence of an alternative calcium uptake system
that gets activated (such as Fig1 of low affinity calcium uptake system) under high
calcium concentrations. The ability of high exogenous Ca2+ to restore mid1 replacement
mutant phenotypes in other filamentous fungi appears to be variable. In A. fumigatus (de
Castro et al., 2014) and B. cinerea (Harren et al., 2013) exogenous calcium was able to
rescue the growth rate defect as seen in E. festucae, while in N. crassa (Lew et al.,
2008) and C. purpurea (Bormann et al., 2009) external elevated calcium failed to
restore defects in vegetative growth. In G. zeae increasing intracellular Ca2+ with
ionophores had a slight effect on restoring mutant phenotypes to wild type, and
complementing the medium with Ca2+ (80 mM) partially restored the growth rate, while
supplementation with Mg2+ had no effect (Cavinder et al., 2011).
166
The inability of NaCl in E. festucae and Mg2+ in G. zeae to restore growth defects
similar to CaCl2 confirmed the importance of Ca2+ in colony growth. In addition to the
ability of exogenous Ca2+ to restore the growth defects due to influx of Ca2+, the
potential osmotic stability provided by very high CaCl2 concentrations (much higher
than in a standard growth medium) similar to high concentrations of sorbitol (50 mM
for E. festucae and 80 mM for G. zeae) cannot be ruled out. Depleted exogenous Ca2+
(using EGTA) resulted in defective WT hyphal growth and exacerbated the growth
defects of ΔmidA hyphae at a lower EGTA concentration than the WT (Fig 4.8). Even
in the presence of an osmotic stabiliser (where ΔmidA growth defects are restored),
ΔmidA showed higher sensitivity to EGTA than the WT, showing its important role in
Ca2+ uptake under low exogenous Ca2+ concentrations.
Investigation of the ability of ΔmidA to inoculate and colonise host plants revealed that
mutant hyphae were able to colonise the SAM and the stem tissues below the SAM,
similar to the WT (Fig 4.11). Nevertheless, transverse sections of tillers infected with
ΔmidA showed that hyphal density is lower than in WT infected leaves, and the ΔmidA
hyphae were confined to particular regions of leaves (Fig 4.12), suggesting that
competency for infection of the intercalary growth zone was determined by an unknown
factor in the SAM. Further analysis of longitudinal sections through such ΔmidA
infected regions revealed that the hyphae are continuous, elongated and not split into
segments (Fig 4.11 and 4.13). When all these results are combined, it appears that
ΔmidA can colonise the meristematic regions of a tiller similar to the WT, and to a
limited extent, the developing leaves, despite the severe growth defect displayed in
axenic culture. The ability of these mutants to grow within the host tissues may be due
to localised osmotic stabilization provided by apoplastic fluids which usually contain
high concentrations of sugars, amino acids and other solutes (Lohaus et al., 2001).

167
Interestingly, wscA mutants that displayed somewhat similar phenotypes (reduced
colony growth rate and aberrant and weak cell walls) in axenic culture were able to
colonise the host tissue similar to the WT. This indicates that MidA may have a crucial
role in host colonization as well beyond its role in hyphal growth and cell wall
synthesis.
The presence of elongated and continuous ΔmidA hyphae in leaf tissues including the
elongation zone indicated that some hyphae can undergo intercalary growth within the
developing leaf. If ΔmidA hyphae were defective in intercalary growth, the hyphae
might be expected to split due to mechanical stretch exerted on fungal compartments by
elongating host cells. The ΔmidA appears to be defective (low density and localised
hyphae in leaves) at the entry point between apical growth in the meristematic tissues
and intercalary growth when the host and endophyte cells start to elongate in the
expansion zone. Once the ΔmidA hyphae manage to enter the expansion zone, and
transit from apical to intercalary growth, they appear to be able to maintain intercalary
growth.
Based on these data I can hypothesise that when host cells start to elongate the attached
hyphae are stretched and membrane distortion stimulates the stretch-activated MidA to
facilitate influx of Ca2+, which initiates signalling pathways that regulate intercalary
growth. In the absence of MidA, influx of Ca2+ is attenuated which results in a defect in
transition from apical growth to intercalary growth. However since loss of MidA can be
complemented with high exogenous Ca2+, in regions of the developing leaf where there
is high Ca2+ this transition might still occur resulting in patches of ΔmidA hyphae in
leaves. Similarly high exogenous Ca2+ in leaf tissues may contribute to the intercalary
growth of ΔmidA in the expansion zone resulting in elongated hyphae similar to the

168
WT. As described before there are other mechanisms through which calcium may enter
the compartments such as the FigA of the low affinity calcium system. However LACS
is activated under high exogenous Ca2+ levels and no data is available on Ca2+ levels in
the grass leaf expansion zone yet to support this postulation. Also, the contribution of
the CchA component of the Ca2+ channel in E. festucae and other Ca2+ channels under
these conditions is not clear. We cannot rule out the possible presence of another
uncharacterised high affinity Ca2+ channel or the functioning of CchA independent of
MidA (CchA possesses the channel activity in the MidA-CchA complex) under these
conditions. The presence of Ca2+ pulses in ΔmidA hyphae expressing Ca2+ sensor
GCaMP5 also supports this notion. The technique developed during this study to apply
mechanical stretch (by stretching hyphae similar to the leaf expansion zone, presented
in Chapter 5) under in vitro conditions will allow the importance of exogenous Ca2+
during intercalary growth of ΔmidA to be tested in future.
Although extensive studies have been carried out to understand calcium signalling in
plants and animals, not much has been done in fungi until recently due to the lack of
suitable techniques to image spatial and temporal dynamics of cytoplasmic Ca2+
concentration ([Ca2+]c) (Kim et al., 2012). Dual wavelength fluorescent dyes such as
Indo-1 and Fura-2 have been used before in fungi. However leakage of loaded dye,
sequestration in organelles and conversion to membrane impermeable forms make them
unreliable to use (Read et al., 1992; Silverman-Gavrila et al., 2003). Subsequently,
genetically encoded aequorin has been used successfully to investigate [Ca2+]c dynamics
in cell populations (Nelson et al., 2004). This technique nevertheless has limitations in
the study of [Ca2+]c dynamics in individual cells as the signal produced by the
fluorescent protein is too weak. In the recent past, a FRET (Forster Resonance Energy
Transfer) based Ca2+ biosensor Cameleon (used in dual wavelength ratiometric
169
imaging) has been used successfully (Kim et al., 2012). In addition, currently attempts
are been made to use the genetically encoded single wavelength (single fluorescent
protein) Ca2+ biosensor GCaMP5 that offers better sensitivity and accuracy in fungal
systems; our study reports its first successful use in E. festucae (please refer to Section
4.5 for more details on GCaMP5).
The temporal and spatial dynamics (amplitude, distribution area and the frequency) of
the Ca2+ pulses at the hyphal tip were different and unique in each hypha and also
changed with time within an individual hyphal tip (Fig 4.15). In general a high
amplitude Ca2+ pulse occurred every 45-60 sec with many low amplitude pulses in-
between (about 10-15 sec apart). Pulses originated in a region within about 10 μm from
the tip and extended up to 20-30 μm from the tip until they reached a basal level (Fig
4.16). Hence Ca2+ pulses in growing E. festucae hyphal tips, corresponding to changes
in cytoplasmic Ca2+ concentration ([Ca2+]c) appeared to have a unique signature. A
similar study conducted using a FRET based Ca2+ biosensor, Cameleon, revealed
comparable results with similar pulsatile Ca2+ signatures in the actively growing hyphal
tips of M. oryzae, F. oxysporum and F. graminearum. An average of 28 and 15 sec
between pulses in F. oxysporum and F. graminearurm respectively has been observed,
with occasional high amplitude pulses (Kim et al., 2012). A high amplitude pulse
usually had the highest fluorescence in the region 10 μm from tip and a gradient that
spread 20-30 μm from the tip until it reached the basal level (Kim et al., 2012).
Further investigation indicated that these signatory Ca2+ pulses in E. festucae hyphal
tips were due to influx of Ca2+ from the external environment, and that MidA plays a
crucial role in maintaining these frequent pulses (Fig 4.17 and 4.21). Replacement of
midA resulted in absence of visible Ca2+ pulses in most hyphae, however an occasional
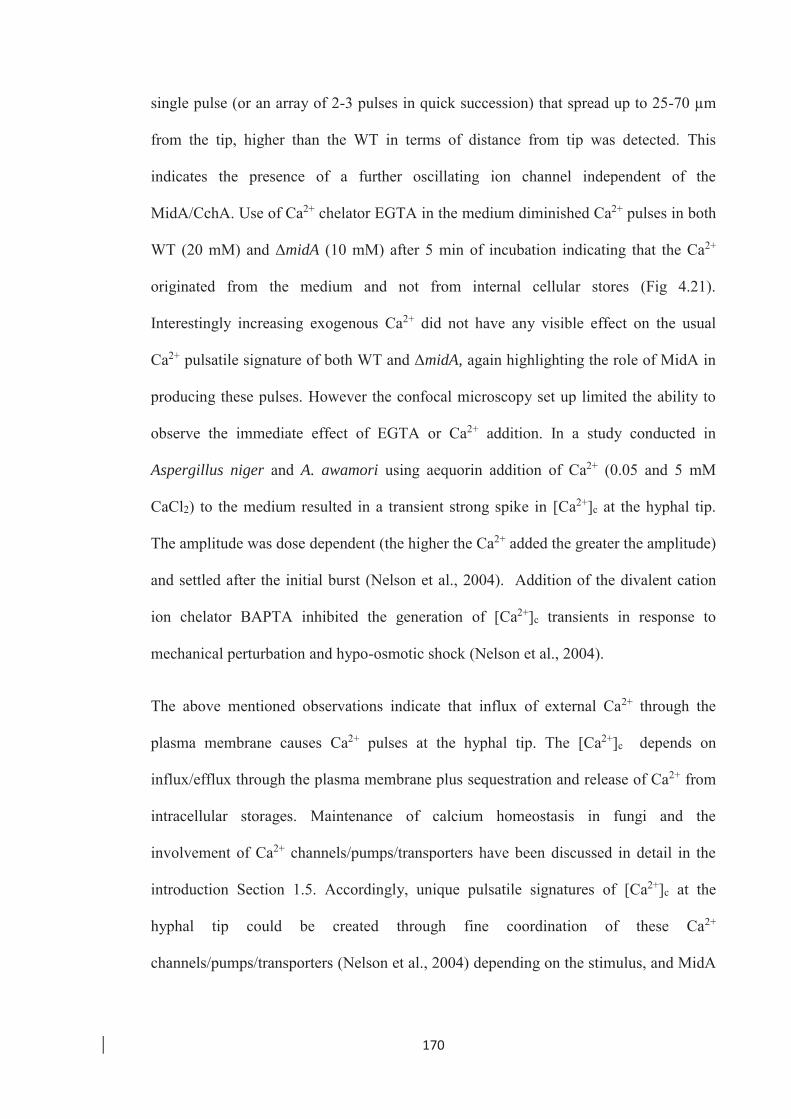
170
single pulse (or an array of 2-3 pulses in quick succession) that spread up to 25-70 μm
from the tip, higher than the WT in terms of distance from tip was detected. This
indicates the presence of a further oscillating ion channel independent of the
MidA/CchA. Use of Ca2+ chelator EGTA in the medium diminished Ca2+ pulses in both
WT (20 mM) and ΔmidA (10 mM) after 5 min of incubation indicating that the Ca2+
originated from the medium and not from internal cellular stores (Fig 4.21).
Interestingly increasing exogenous Ca2+ did not have any visible effect on the usual
Ca2+ pulsatile signature of both WT and ΔmidA, again highlighting the role of MidA in
producing these pulses. However the confocal microscopy set up limited the ability to
observe the immediate effect of EGTA or Ca2+ addition. In a study conducted in
Aspergillus niger and A. awamori using aequorin addition of Ca2+ (0.05 and 5 mM
CaCl2) to the medium resulted in a transient strong spike in [Ca2+]c at the hyphal tip.
The amplitude was dose dependent (the higher the Ca2+ added the greater the amplitude)
and settled after the initial burst (Nelson et al., 2004). Addition of the divalent cation
ion chelator BAPTA inhibited the generation of [Ca2+]c transients in response to
mechanical perturbation and hypo-osmotic shock (Nelson et al., 2004).
The above mentioned observations indicate that influx of external Ca2+ through the
plasma membrane causes Ca2+ pulses at the hyphal tip. The [Ca2+]c depends on
influx/efflux through the plasma membrane plus sequestration and release of Ca2+ from
intracellular storages. Maintenance of calcium homeostasis in fungi and the
involvement of Ca2+ channels/pumps/transporters have been discussed in detail in the
introduction Section 1.5. Accordingly, unique pulsatile signatures of [Ca2+]c at the
hyphal tip could be created through fine coordination of these Ca2+
channels/pumps/transporters (Nelson et al., 2004) depending on the stimulus, and MidA
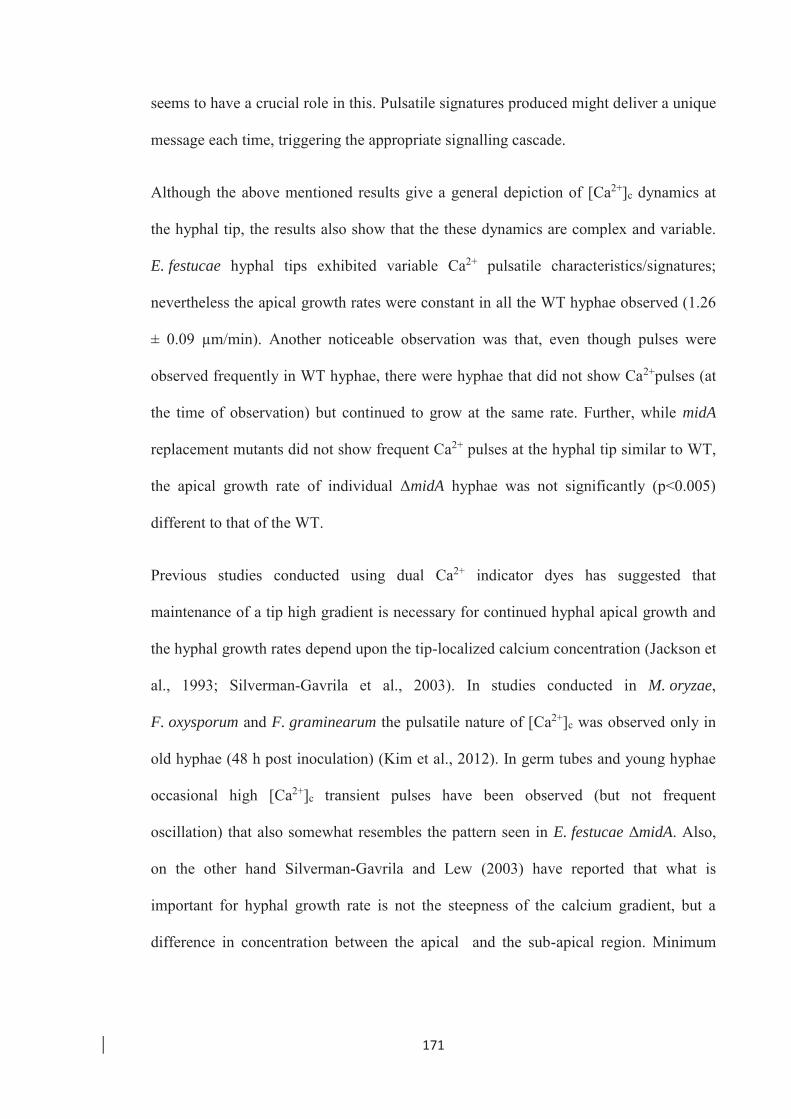
171
seems to have a crucial role in this. Pulsatile signatures produced might deliver a unique
message each time, triggering the appropriate signalling cascade.
Although the above mentioned results give a general depiction of [Ca2+]c dynamics at
the hyphal tip, the results also show that the these dynamics are complex and variable.
E. festucae hyphal tips exhibited variable Ca2+ pulsatile characteristics/signatures;
nevertheless the apical growth rates were constant in all the WT hyphae observed (1.26
± 0.09 μm/min). Another noticeable observation was that, even though pulses were
observed frequently in WT hyphae, there were hyphae that did not show Ca2+pulses (at
the time of observation) but continued to grow at the same rate. Further, while midA
replacement mutants did not show frequent Ca2+ pulses at the hyphal tip similar to WT,
the apical growth rate of individual ΔmidA hyphae was not significantly (p<0.005)
different to that of the WT.
Previous studies conducted using dual Ca2+ indicator dyes has suggested that
maintenance of a tip high gradient is necessary for continued hyphal apical growth and
the hyphal growth rates depend upon the tip-localized calcium concentration (Jackson et
al., 1993; Silverman-Gavrila et al., 2003). In studies conducted in M. oryzae,
F. oxysporum and F. graminearum the pulsatile nature of [Ca2+]c was observed only in
old hyphae (48 h post inoculation) (Kim et al., 2012). In germ tubes and young hyphae
occasional high [Ca2+]c transient pulses have been observed (but not frequent
oscillation) that also somewhat resembles the pattern seen in E. festucae ΔmidA. Also,
on the other hand Silverman-Gavrila and Lew (2003) have reported that what is
important for hyphal growth rate is not the steepness of the calcium gradient, but a
difference in concentration between the apical and the sub-apical region. Minimum
172
concentrations of 30 nM have been shown to be sufficient for apical growth to continue
(Silverman-Gavrila et al., 2003).
Overall these observations indicate that existence of a continuous oscillation in [Ca2+]c
at the tip, or a continuous steep tip high gradient may not be essential to maintain
hyphal apical growth rate. One explanation could be the existence of prolonged
intervals between two arrays of Ca2+ pulses (a resting phase). During hyphal apical
growth, since MidA is stretch-activated, as the hyphal tip grows forward through turgor
pressure, the stretching of the membrane at the tip may activate the MidA-CchA
complex allowing a sudden influx of Ca2+ which gives rise to frequent increases in
[Ca2+]c at the tip. When there is sufficient calcium a negative feedback loop might
inhibit MidA activity creating a resting phase until [Ca2+]c depletes and MidA is re-
activated. Hence, even though pulses are absent apical growth can continue. Previous
studies have shown that when [Ca2+]c is high, calcineurin can inhibit Cch1and Mid1
activity via a negative feedback loop (Muller et al., 2001; Muller et al., 2003). This
would also explain why high exogenous Ca2+ fails to affect the Ca2+oscillations in the
WT. Similarly, in ΔmidA, the occasional high intensity Ca2+ pulse may be the result of a
sudden influx of Ca2+ that is sufficient to replenish intracellular Ca2+. The sequestered
Ca2+ might be enough to maintain a minimum Ca2+ concentration difference between
the hyphal tip and sub-apical region for apical growth to continue between pulses.
Given that the existence of continuous Ca2+ pulses at the tip is not essential for apical
growth, a question arises about the exact role of these pulses. The pulses occur at the
very tip and studies have shown that the highest Ca2+ concentration is within the 10 μm
from the tip, which overlaps with the Spitzenkorper. The Spitzenkorper consists of
various vesicles, cytoskeletal components and proteins, and acts as a vesicle supply
173
centre (Harris et al., 2004; Harris et al., 2005); Ca2+ is involved in regulating the
structure and function of the actin network (Adamíková et al., 2004). Hence, the
function of these [Ca2+]c signatures, as suggested by Kim et al., (Kim et al., 2012), could
be the regulation of the actin network and other Spitzenkorper associated processes in
apical growth and cell wall synthesis. Accordingly, weakened cell walls with frequent
tip lysis, and branching at the tip seen in ΔmidA could be a result of disturbing the
pulsatile Ca2+ signature at hyphal tip.
Ca2+ pulses in sub-apical regions were observed randomly in sub-apical compartments
or in the sub-apical region of the first compartment and appeared to be due to influx of
Ca2+, as high concentrations of EGTA eliminated these pulses (Fig 4.20). In
F. oxysporum and M. oryzae Ca2+ pulses have been observed in sites of hyphal
branching (sporadic large Ca2+ transients) and septum formation confirming that Ca2+
pulses can occur in sub-apical regions (most probably in growth initiation sites) other
than at the hyphal tip (Kim et al., 2012). The presence of sub-apical Ca2+ pulses
indicates activity of Ca2+ channels in sub-apical regions and the potential involvement
of these pulses in intercalary growth and mechanical stretch requires further study.
A closer look at the E. festucae WT and ΔmidA hyphae expressing GCaMP5 calcium
sensor revealed an intensely fluorescent spot (0.4 μm in diameter) located centrally at
the very apex of all the hyphal tips observed when mounted on standard PDB (Fig 4.22)
which faded with high concentrations of EGTA but did not change with addition of
Ca2+. Due to time constrains no further tests were conducted to investigate its
association with any cellular structure. However, in the study conducted in
F. graminearum using Cameleon vectors a similar single large apical spot has been
observed at the hyphal tip that was shown to overlap with the Spitzenkorper actin core
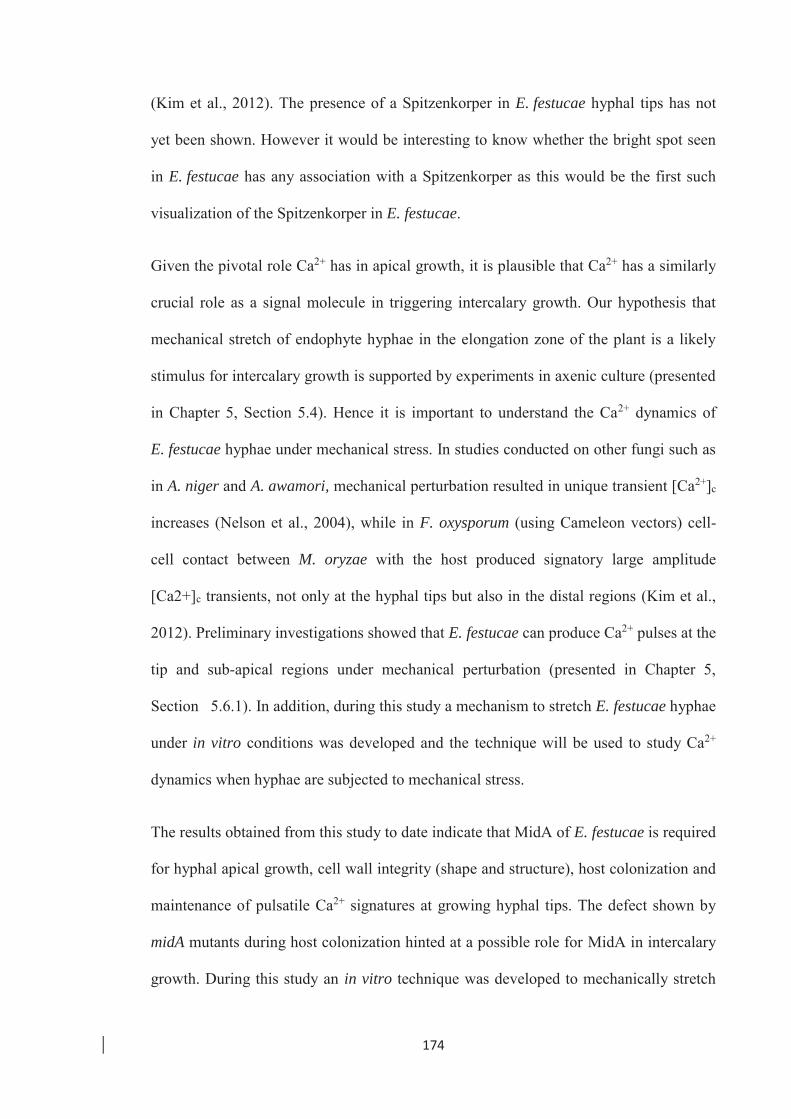
174
(Kim et al., 2012). The presence of a Spitzenkorper in E. festucae hyphal tips has not
yet been shown. However it would be interesting to know whether the bright spot seen
in E. festucae has any association with a Spitzenkorper as this would be the first such
visualization of the Spitzenkorper in E. festucae.
Given the pivotal role Ca2+ has in apical growth, it is plausible that Ca2+ has a similarly
crucial role as a signal molecule in triggering intercalary growth. Our hypothesis that
mechanical stretch of endophyte hyphae in the elongation zone of the plant is a likely
stimulus for intercalary growth is supported by experiments in axenic culture (presented
in Chapter 5, Section 5.4). Hence it is important to understand the Ca2+ dynamics of
E. festucae hyphae under mechanical stress. In studies conducted on other fungi such as
in A. niger and A. awamori, mechanical perturbation resulted in unique transient [Ca2+]c
increases (Nelson et al., 2004), while in F. oxysporum (using Cameleon vectors) cell-
cell contact between M. oryzae with the host produced signatory large amplitude
[Ca2+]c transients, not only at the hyphal tips but also in the distal regions (Kim et al.,
2012). Preliminary investigations showed that E. festucae can produce Ca2+ pulses at the
tip and sub-apical regions under mechanical perturbation (presented in Chapter 5,
Section 5.6.1). In addition, during this study a mechanism to stretch E. festucae hyphae
under in vitro conditions was developed and the technique will be used to study Ca2+
dynamics when hyphae are subjected to mechanical stress.
The results obtained from this study to date indicate that MidA of E. festucae is required
for hyphal apical growth, cell wall integrity (shape and structure), host colonization and
maintenance of pulsatile Ca2+ signatures at growing hyphal tips. The defect shown by
midA mutants during host colonization hinted at a possible role for MidA in intercalary
growth. During this study an in vitro technique was developed to mechanically stretch

175
fungal hyphae (discussed in next Chapter 5) to investigate the role of mechanical stretch
in initiating intercalary growth. This technique will be used in future to test the
importance of MidA in intercalary growth as a mechano-sensor and also to further study
Ca2+ dynamics during mechanical stretching of fungal hyphae.

176
Chapter 5: Intercalary growth in E. festucae
hyphae in culture
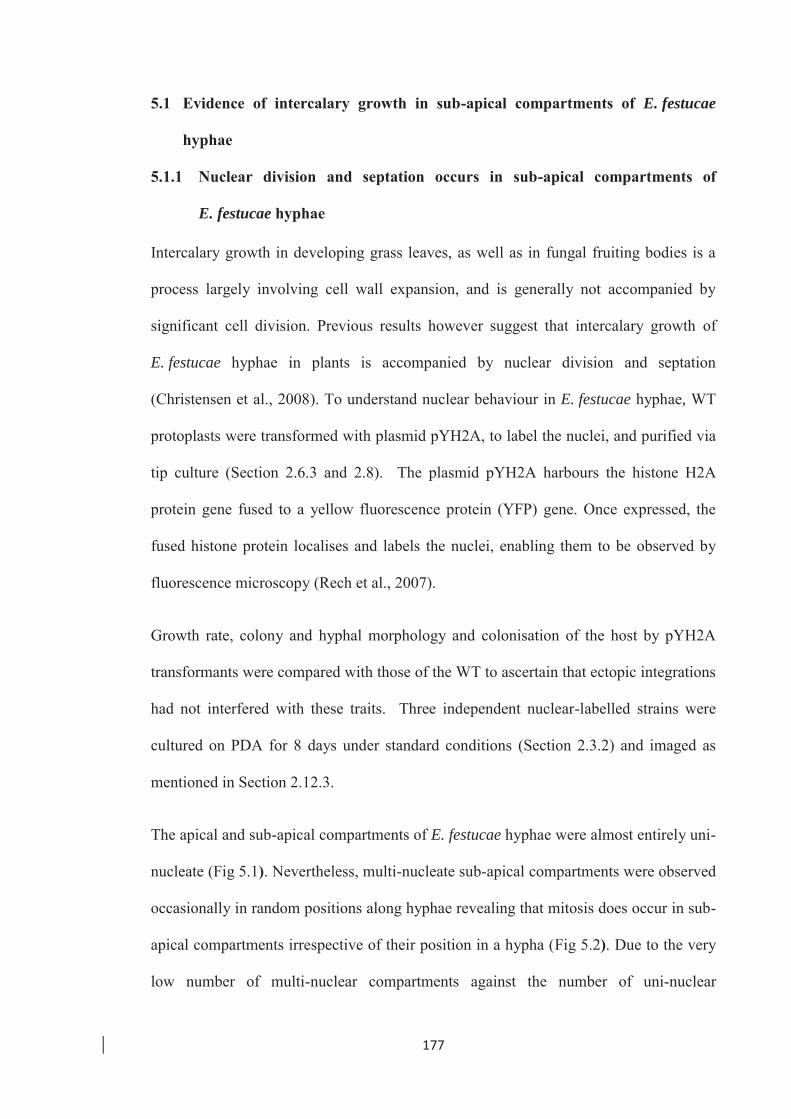
177
5.1 Evidence of intercalary growth in sub-apical compartments of E. festucae
hyphae
5.1.1 Nuclear division and septation occurs in sub-apical compartments of
E. festucae hyphae
Intercalary growth in developing grass leaves, as well as in fungal fruiting bodies is a
process largely involving cell wall expansion, and is generally not accompanied by
significant cell division. Previous results however suggest that intercalary growth of
E. festucae hyphae in plants is accompanied by nuclear division and septation
(Christensen et al., 2008). To understand nuclear behaviour in E. festucae hyphae, WT
protoplasts were transformed with plasmid pYH2A, to label the nuclei, and purified via
tip culture (Section 2.6.3 and 2.8). The plasmid pYH2A harbours the histone H2A
protein gene fused to a yellow fluorescence protein (YFP) gene. Once expressed, the
fused histone protein localises and labels the nuclei, enabling them to be observed by
fluorescence microscopy (Rech et al., 2007).
Growth rate, colony and hyphal morphology and colonisation of the host by pYH2A
transformants were compared with those of the WT to ascertain that ectopic integrations
had not interfered with these traits. Three independent nuclear-labelled strains were
cultured on PDA for 8 days under standard conditions (Section 2.3.2) and imaged as
mentioned in Section 2.12.3.
The apical and sub-apical compartments of E. festucae hyphae were almost entirely uni-
nucleate (Fig 5.1). Nevertheless, multi-nucleate sub-apical compartments were observed
occasionally in random positions along hyphae revealing that mitosis does occur in sub-
apical compartments irrespective of their position in a hypha (Fig 5.2). Due to the very
low number of multi-nuclear compartments against the number of uni-nuclear
178
compartments, no attempt was made to quantify the ratio. The number of nuclei
observed in multi-nuclear compartments ranged from 2-3 nuclei with 2 nuclei being the
most frequent. Nuclear division in sub-apical compartments seemed to occur before
branch initiation (as signs of branching could be seen in some multi-nuclear
compartments), or before division of an existing sub-apical compartment where nuclear
division was followed by septation as discussed later (Fig 5.2).
Figure 5.1: Phase contrast and florescence images of CW-stained (stains cell walls and septa)
and nuclear-labelled apical and sub-apical compartments of E. festucae WT hyphae grown on
PDA, showing typical nuclear shape, distribution and variation in compartment lengths. Pale
blue lines represent cell walls and septa. In general, the hyphae consist of uni-nuclear
compartments and the nuclear shape and compartment length differs along hyphae. White scale
bar = 20 μm.
Apical compartments Sub-apical compartments
179
Figure 5.2: Positions of nuclei relative to cell walls and septa in sub-apical compartments of
nuclear-tagged E. festucae hyphae (transformed with pYH2A) growing on PDA. Multi-nuclear
sub-apical compartments (white arrow) were present in hyphae at the time of observation (8th
and 11th compartment from the tip in the representative images shown). Some of the multi-
nuclear compartments showed signs of branching and nuclear migration (red arrows). Red scale
bar = 10 μm.
Nuclei in apical compartments and long intercalary compartments of E. festucae hyphae
appeared elongated compared to spherical shaped nuclei in small compartments. Hence,
an analysis was conducted to determine whether there is a relationship between
compartment length and the longitudinal length of the nuclei along the hypha axis.
Images of CW-stained (stains cell walls and septa) hyphae were taken from 8 day old
cultures of three independent nuclear-labelled WT strains growing on PDA (Section
2.12.3). Five hyphae were imaged from each strain starting from the hyphal tip to the
Multi-nucleate sub-apical compartments
t t
Multi-nucleate sub-apical compartments with branching

180
30th compartment. For each compartment, the nuclear longitudinal length along the
hyphal axis and the corresponding compartment length and width were measured. In
general, the apical compartment is the longest followed by the second compartment.
The compartment lengths further down the hyphae were highly variable (Fig 5.3-A). A
typical hypha is a mix of short (35-45 μm) and longer (>50 μm) sub-apical
compartments seemingly located in random order, although a trend towards shorter
compartments was seen in older regions of a hypha.
To test whether there is a statistically significant correlation between the compartment
length and the longitudinal nuclear length, Pearson's linear correlation coefficient was
calculated between the natural logarithms of compartment length and nuclear length (as
the measures were highly skewed, the coefficient was calculated between the logarithms
of the data). The analysis revealed that there is a strong, positive correlation between
compartment length and nuclear length which was statistically significant (r = 0.8634, n
= 150, p < 0.001, Fig 5.3-B). Given that the apical compartments are continuously
elongating and then dividing, elongated nuclei appeared to correlate with compartments
undergoing further compartmentalization (examined further in the following section).
Therefore, during investigations on intercalary growth, I hypothesised that the presence
of elongated nuclei in intercalary compartments is an indirect indication of their
readiness for further division/compartmentalization. The width of hyphal compartments
was uniform at around 2.87 ± 0.23 μm (mean ± SD) except in the apical compartments
where the hyphae tapered towards the tip.
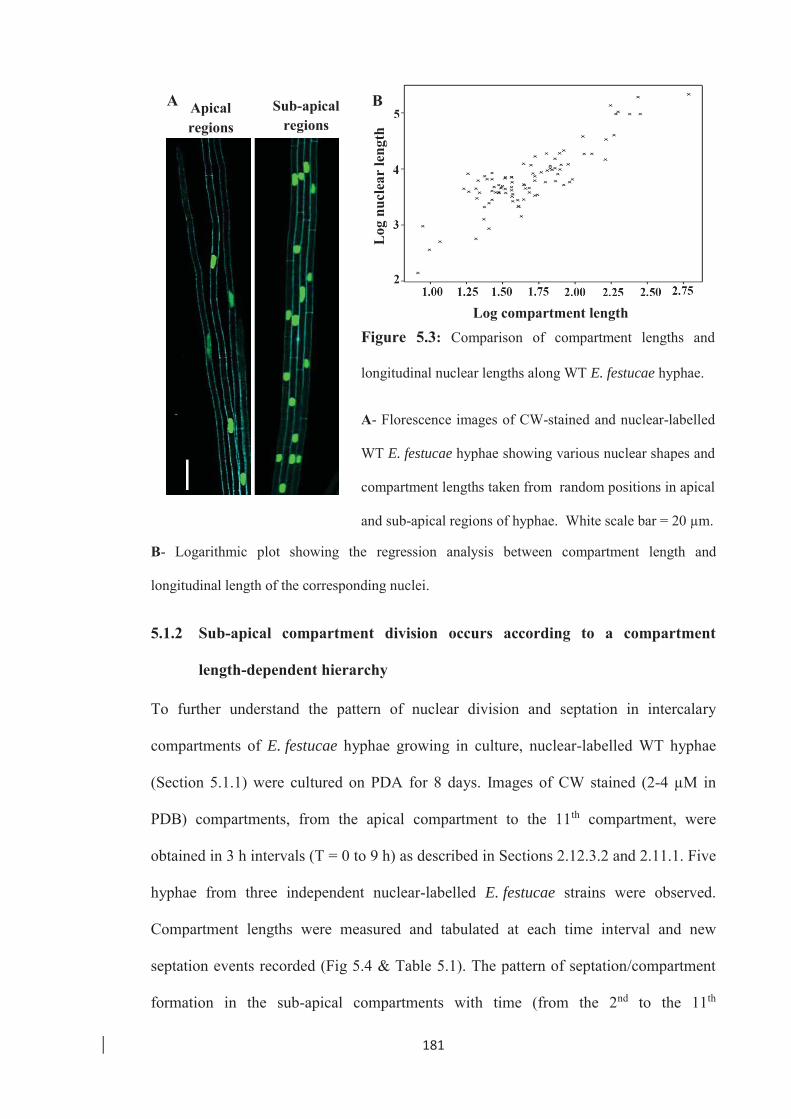
181
B- Logarithmic plot showing the regression analysis between compartment length and
longitudinal length of the corresponding nuclei.
5.1.2 Sub-apical compartment division occurs according to a compartment
length-dependent hierarchy
To further understand the pattern of nuclear division and septation in intercalary
compartments of E. festucae hyphae growing in culture, nuclear-labelled WT hyphae
(Section 5.1.1) were cultured on PDA for 8 days. Images of CW stained (2-4 μM in
PDB) compartments, from the apical compartment to the 11th compartment, were
obtained in 3 h intervals (T = 0 to 9 h) as described in Sections 2.12.3.2 and 2.11.1. Five
hyphae from three independent nuclear-labelled E. festucae strains were observed.
Compartment lengths were measured and tabulated at each time interval and new
septation events recorded (Fig 5.4 & Table 5.1). The pattern of septation/compartment
formation in the sub-apical compartments with time (from the 2nd to the 11th
Log
nuc
lear
leng
th
Log compartment length
Figure 5.3: Comparison of compartment lengths and
longitudinal nuclear lengths along WT E. festucae hyphae.
A- Florescence images of CW-stained and nuclear-labelled
WT E. festucae hyphae showing various nuclear shapes and
compartment lengths taken from random positions in apical
and sub-apical regions of hyphae. White scale bar = 20 μm.
A B Apical regions
Sub-apical regions
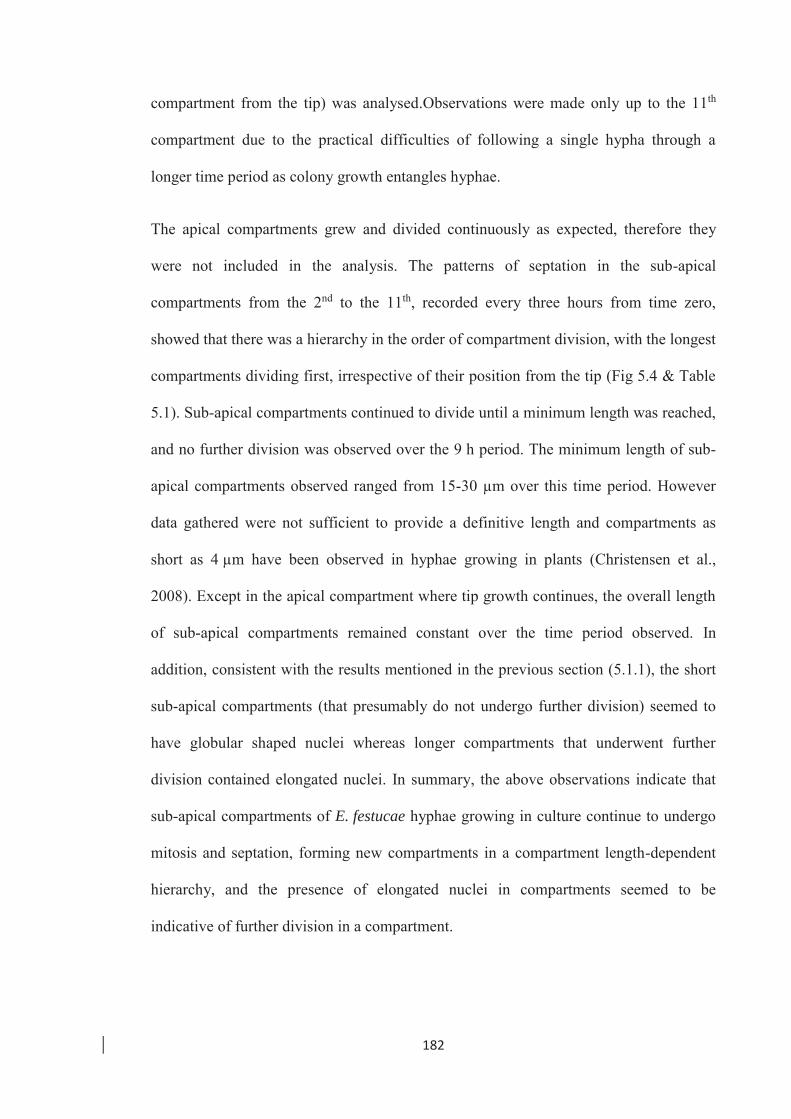
182
compartment from the tip) was analysed.Observations were made only up to the 11th
compartment due to the practical difficulties of following a single hypha through a
longer time period as colony growth entangles hyphae.
The apical compartments grew and divided continuously as expected, therefore they
were not included in the analysis. The patterns of septation in the sub-apical
compartments from the 2nd to the 11th, recorded every three hours from time zero,
showed that there was a hierarchy in the order of compartment division, with the longest
compartments dividing first, irrespective of their position from the tip (Fig 5.4 & Table
5.1). Sub-apical compartments continued to divide until a minimum length was reached,
and no further division was observed over the 9 h period. The minimum length of sub-
apical compartments observed ranged from 15-30 μm over this time period. However
data gathered were not sufficient to provide a definitive length and compartments as
short as 4 μm have been observed in hyphae growing in plants (Christensen et al.,
2008). Except in the apical compartment where tip growth continues, the overall length
of sub-apical compartments remained constant over the time period observed. In
addition, consistent with the results mentioned in the previous section (5.1.1), the short
sub-apical compartments (that presumably do not undergo further division) seemed to
have globular shaped nuclei whereas longer compartments that underwent further
division contained elongated nuclei. In summary, the above observations indicate that
sub-apical compartments of E. festucae hyphae growing in culture continue to undergo
mitosis and septation, forming new compartments in a compartment length-dependent
hierarchy, and the presence of elongated nuclei in compartments seemed to be
indicative of further division in a compartment.
183
Figure 5.4: Fluorescence images of a nuclear-tagged E. festucae WT hyphal segment (stained
with CW) showing compartmentalization in sub-apical compartments from the 2nd to 11th
compartment along the same hypha within 3 h (T = 0-3 h). C - Compartment position from tip
(apical compartment = C-1). White arrow - Positions of the septa at T = 0 h. Red arrows -
Positions of new septa formed within the 3 h period. The 2nd, 4th and 11th compartment at T =
0 h has further divided within 3 h but not compartments 3, 5, 6, 7, 8, 9 and 10.
T = 0 h
T = 3 h
T = 0 h
T = 3 h
T = 0 h
T = 3 h
T = 0 h
T = 3 h
Hyphal tip

184
Table 5.1: A representative table showing the division of sub-apical compartments with time
(in 3 h intervals) in a hypha from the 2nd to the 11th compartment growing on PDA
(measurements are not from same hypha shown in Fig 5.4).
aCompartment lengths (in μm) at each time point and the subsequent further division of each
compartment from the starting point to 9 h later. Vertical lines within the table indicate septa.
bCompartment position from the hyphal tip (apical compartment = Comp-1).
Figure 5.5: Analysis of compartmentalization in sub-apical compartments of nuclear tagged
E. festucae hyphae. Graph shows compartment lengths at the beginning of the 3 h time interval
and the status of further division within the next 3 h. 0 - Compartments with no division within
the time period. 1 - Compartments that divided within the time period. The data indicate a
length-dependent hierarchy in division of sub-apical compartments.
Time Comp-3 Comp-4 Comp-5T=0a 43.2 42.4 50.6
T=3 h 44.2 42.2 51.1T=6 h 33.5 49.7 50.0 60.9 43.7 41.4 50.2T=9 h 33.7 49.8 50.2 59.3 43.9 42.1 50.2 34.2 36.0
70.483.2 110.8 70.9
194.2 71.0Comp-2b Comp-6
Comp-7 Comp-8 Comp-9 Comp-1036.2 36.9 49.7 64.337.0 38.1 48.6 64.136.9 37.1 48.3 64.0 37.8 35.236.9 37.1 48.0 64.2 37.7 35.6
72.572.2
Comp-11
Com
part
men
t le
ngth
(μm
) at
the
beg
inni
ng o
f th
e 3
h tim
e in
terv
al
Status of further division within 3 h

185
5.2 Nuclear shape differs in different plant regions
As demonstrated in Section 5.1.1, in-culture analysis of the nuclear shape of hyphae
growing on PDA revealed that long sub-apical compartments (that have the potential to
undergo further division) appeared to have elongated nuclei, and older short sub-apical
compartments (that do not undergo further division) contained globular-shaped nuclei.
The same study also established that there is a compartment length-dependent hierarchy
in division of sub-apical compartments (Section 5.1.2). There is therefore a correlation
between the shape of the nucleus and the probability that the compartment will shortly
undergo further division. Extending this correlation to E. festucae colonization of
developing leaves, we would expect to find more elongated nuclei in the elongation
zone of the developing leaf where hyphal intercalary growth is taking place via
continuous compartment elongation, mitosis and septation, and more globular-shaped
nuclei in hyphae (no longer growing) in mature leaves. To test this hypothesis, leaf
tissues colonized by nuclear-tagged (YFP) E. festucae hyphae were imaged by Z stack
confocal laser scanning microscopy with a depth of between 15-20 μm and 1.5-2 μm
per slice, depending on the specimen under observation. Leaf tissues were obtained
from the meristematic region where the endophyte grows at the hyphal apex, the young
leaf where the endophyte grows via intercalary growth (within 2 cm from the base of
the inner most leaf) and the mature leaf sheath where the endophyte has ceased growing
(outer-most mature leaf). Using fluorescent images, longitudinal lengths of at least 75
nuclei were measured from each tissue, and analysis of variance was used to compare
the nuclear lengths for the three different tissues.
Significant differences between the mean lengths of nuclei in each region were clearly
demonstrated (P<0.01), with the highest mean longitudinal nuclear length observed in
the young leaf sheath tissue where intercalary growth was occurring (Fig 5.6 and 5.7).

186
In the meristematic region and the mature leaf tissues, endophyte nuclei were more
globular in shape. These observations support in-culture data where elongated nuclei
were present in longer and dividing compartments (Section 5.1.1), suggesting that the
presence of elongated nuclei in the elongation zone of the developing leaf is further
evidence for continuing mitosis and compartmentalization occurring in this region.
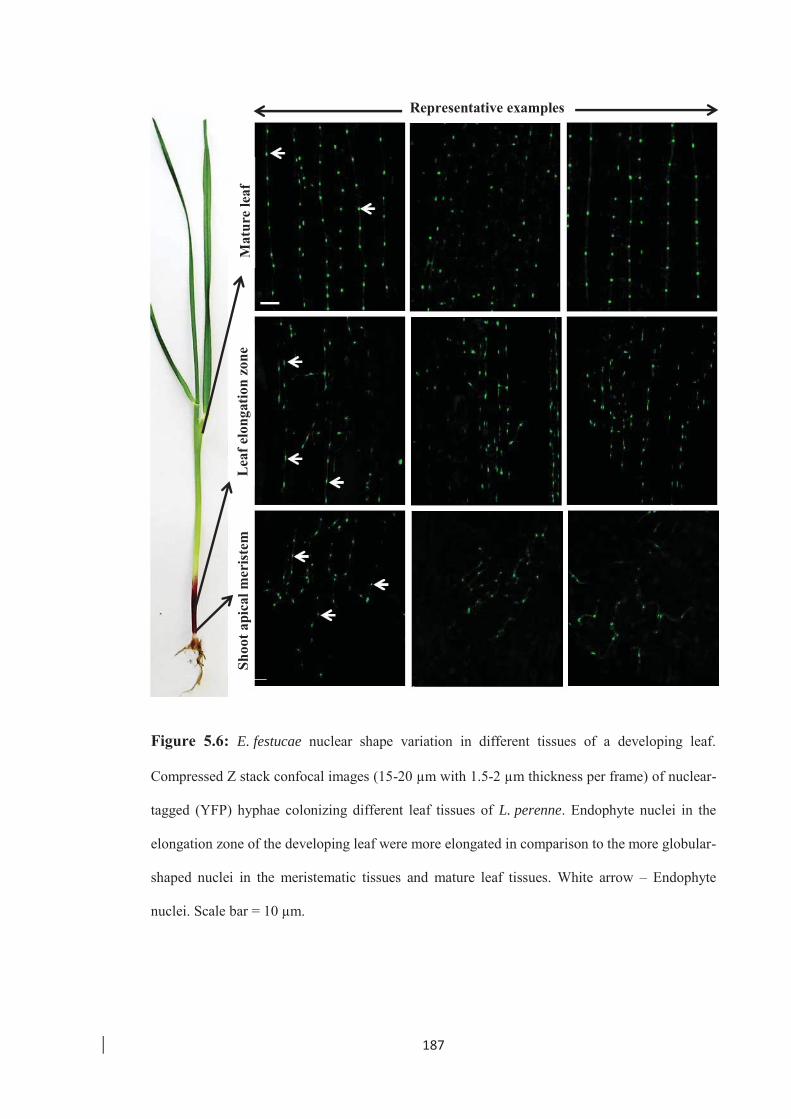
187
Figure 5.6: E. festucae nuclear shape variation in different tissues of a developing leaf.
Compressed Z stack confocal images (15-20 μm with 1.5-2 μm thickness per frame) of nuclear-
tagged (YFP) hyphae colonizing different leaf tissues of L. perenne. Endophyte nuclei in the
elongation zone of the developing leaf were more elongated in comparison to the more globular-
shaped nuclei in the meristematic tissues and mature leaf tissues. White arrow – Endophyte
nuclei. Scale bar = 10 μm.
Representative examples
Shoo
t api
cal m
eris
tem
L
eaf e
long
atio
n zo
ne
Mat
ure
leaf

188
Figure 5.7: Calculation of E. festucae longitudinal nuclear lengths in different growth zones
(meristematic, elongation and mature) of the developing leaf. Analysis of variance was used to
compare the nuclear lengths from the three different regions. Means were calculated from at
least 75 nuclei per region. The standard errors of differences of means is 0.1387, l.s.d is the least
significant differences of means (at the 5% level). The data demonstrated that nuclear lengths in
hyphae in the three regions differs significantly from each other with nuclei in the leaf
elongation zone having the highest mean longitudinal length.
5.3 Can mechanical stretching trigger intercalary growth in E. festucae hyphae?
Intercalary growth in E. festucae hyphae in the elongation zone of the developing leaf
has been experimentally shown using microscopic evidence of changes in hyphal length
between lateral branches (Christensen et al., 2008). At that time, it was hypothesised
that the factor responsible for intercalary growth in the elongation zone of the
developing leaf is mechanical stretch applied by rapidly elongating host cells, as
endophyte hyphae are attached to the walls of these elongating cells (Section 1.3.1). To
test this hypothesis it was necessary to separate the endophyte from the host and apply
Elongation Mature Meristem
Regions of the grass tiller from which tissues were obtained
Average l.s.d (5%)
Mea
n nu
clea
r le
ngth
(μm
)
4.5
4.0
3.5
3.0
2.5
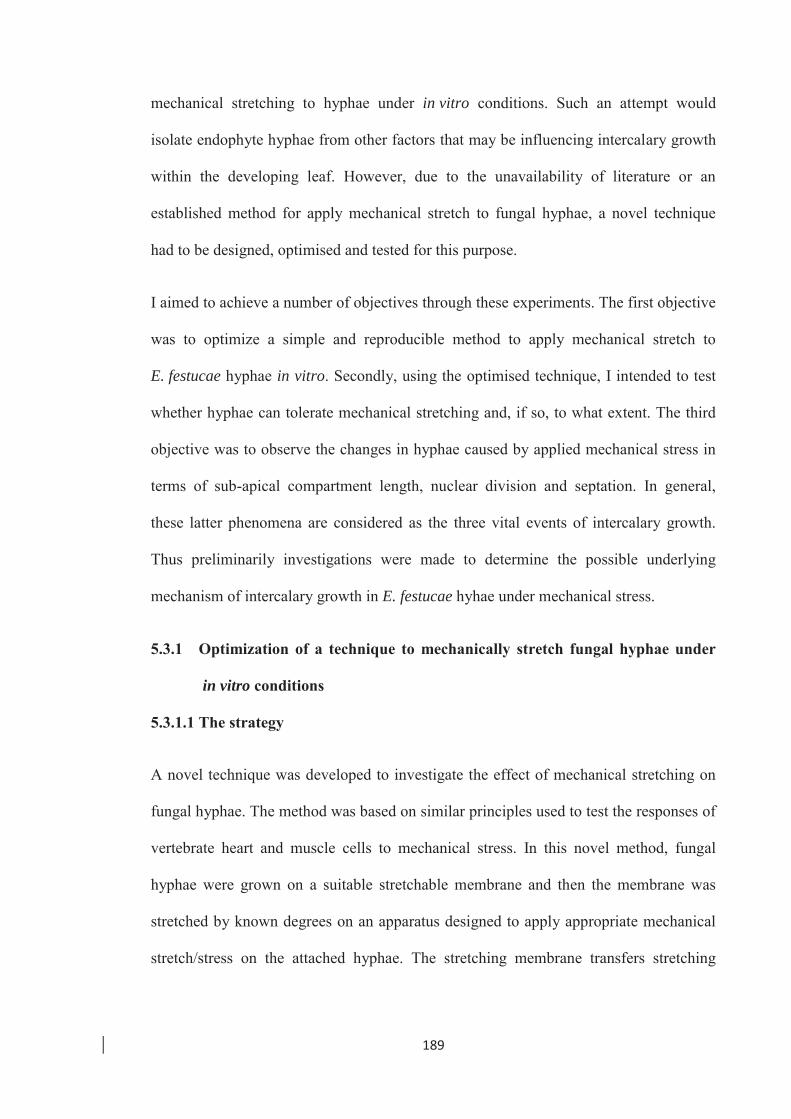
189
mechanical stretching to hyphae under in vitro conditions. Such an attempt would
isolate endophyte hyphae from other factors that may be influencing intercalary growth
within the developing leaf. However, due to the unavailability of literature or an
established method for apply mechanical stretch to fungal hyphae, a novel technique
had to be designed, optimised and tested for this purpose.
I aimed to achieve a number of objectives through these experiments. The first objective
was to optimize a simple and reproducible method to apply mechanical stretch to
E. festucae hyphae in vitro. Secondly, using the optimised technique, I intended to test
whether hyphae can tolerate mechanical stretching and, if so, to what extent. The third
objective was to observe the changes in hyphae caused by applied mechanical stress in
terms of sub-apical compartment length, nuclear division and septation. In general,
these latter phenomena are considered as the three vital events of intercalary growth.
Thus preliminarily investigations were made to determine the possible underlying
mechanism of intercalary growth in E. festucae hyhae under mechanical stress.
5.3.1 Optimization of a technique to mechanically stretch fungal hyphae under
in vitro conditions
5.3.1.1 The strategy
A novel technique was developed to investigate the effect of mechanical stretching on
fungal hyphae. The method was based on similar principles used to test the responses of
vertebrate heart and muscle cells to mechanical stress. In this novel method, fungal
hyphae were grown on a suitable stretchable membrane and then the membrane was
stretched by known degrees on an apparatus designed to apply appropriate mechanical
stretch/stress on the attached hyphae. The stretching membrane transfers stretching
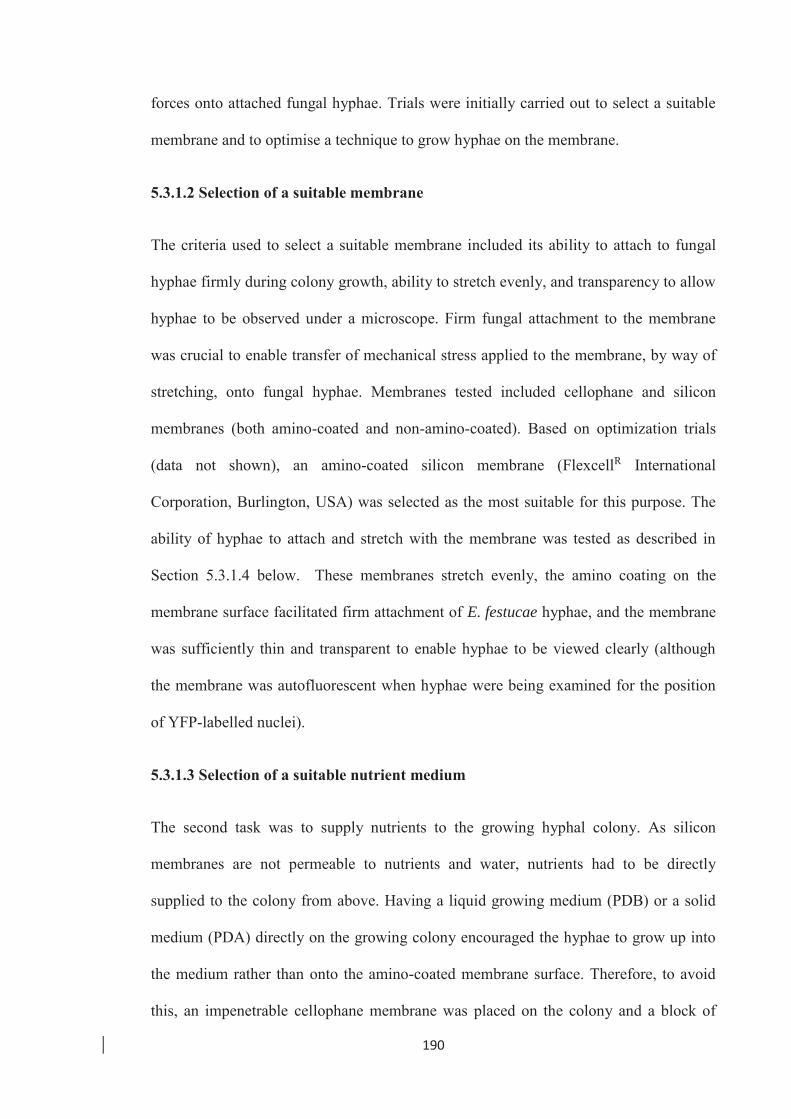
190
forces onto attached fungal hyphae. Trials were initially carried out to select a suitable
membrane and to optimise a technique to grow hyphae on the membrane.
5.3.1.2 Selection of a suitable membrane
The criteria used to select a suitable membrane included its ability to attach to fungal
hyphae firmly during colony growth, ability to stretch evenly, and transparency to allow
hyphae to be observed under a microscope. Firm fungal attachment to the membrane
was crucial to enable transfer of mechanical stress applied to the membrane, by way of
stretching, onto fungal hyphae. Membranes tested included cellophane and silicon
membranes (both amino-coated and non-amino-coated). Based on optimization trials
(data not shown), an amino-coated silicon membrane (FlexcellR International
Corporation, Burlington, USA) was selected as the most suitable for this purpose. The
ability of hyphae to attach and stretch with the membrane was tested as described in
Section 5.3.1.4 below. These membranes stretch evenly, the amino coating on the
membrane surface facilitated firm attachment of E. festucae hyphae, and the membrane
was sufficiently thin and transparent to enable hyphae to be viewed clearly (although
the membrane was autofluorescent when hyphae were being examined for the position
of YFP-labelled nuclei).
5.3.1.3 Selection of a suitable nutrient medium
The second task was to supply nutrients to the growing hyphal colony. As silicon
membranes are not permeable to nutrients and water, nutrients had to be directly
supplied to the colony from above. Having a liquid growing medium (PDB) or a solid
medium (PDA) directly on the growing colony encouraged the hyphae to grow up into
the medium rather than onto the amino-coated membrane surface. Therefore, to avoid
this, an impenetrable cellophane membrane was placed on the colony and a block of

191
solid nutrient medium placed on top (Fig 5.8). The block of medium provided nutrients
for hyphal growth through the permeable cellophane membrane. Further, this system
permitted the growth conditions to be altered by changing the composition of the
growth medium (e.g. calcium concentration) at the start of, or during, the experiment.
Tests conducted to find a suitable growth medium that promoted optimum E. festucae
hyphal growth under these altered conditions showed that elevated Ca2+ (50 mM) in
standard potato dextrose medium gave the best growth (Fig 5.9). Therefore, for initial
trials to optimise the system and see the effect of mechanical stress on intercalary
growth, it was decided to use this medium of standard potato dextrose with Ca2+ (50
mM). Agar (4% w/v) was used to solidify the medium.
Figure 5.8: Diagrammatic representation showing the arrangement of components used to
grow E. festucae hyphae on amino-coated silicon membranes. The nutrient medium on top of
the hyphal colony provided necessary moisture and nutrients via the permeable cellophane
membrane. The cellophane membrane also prevented the hyphae growing into the medium,
forcing them to grow in between the two membranes. This facilitated the attachment of hyphae
onto the amino coating of the silicon membrane. Not drawn to scale.
Cellophane membrane Cellophane meAmino coated silicon membrane
Fungal colony
Nutrient medium
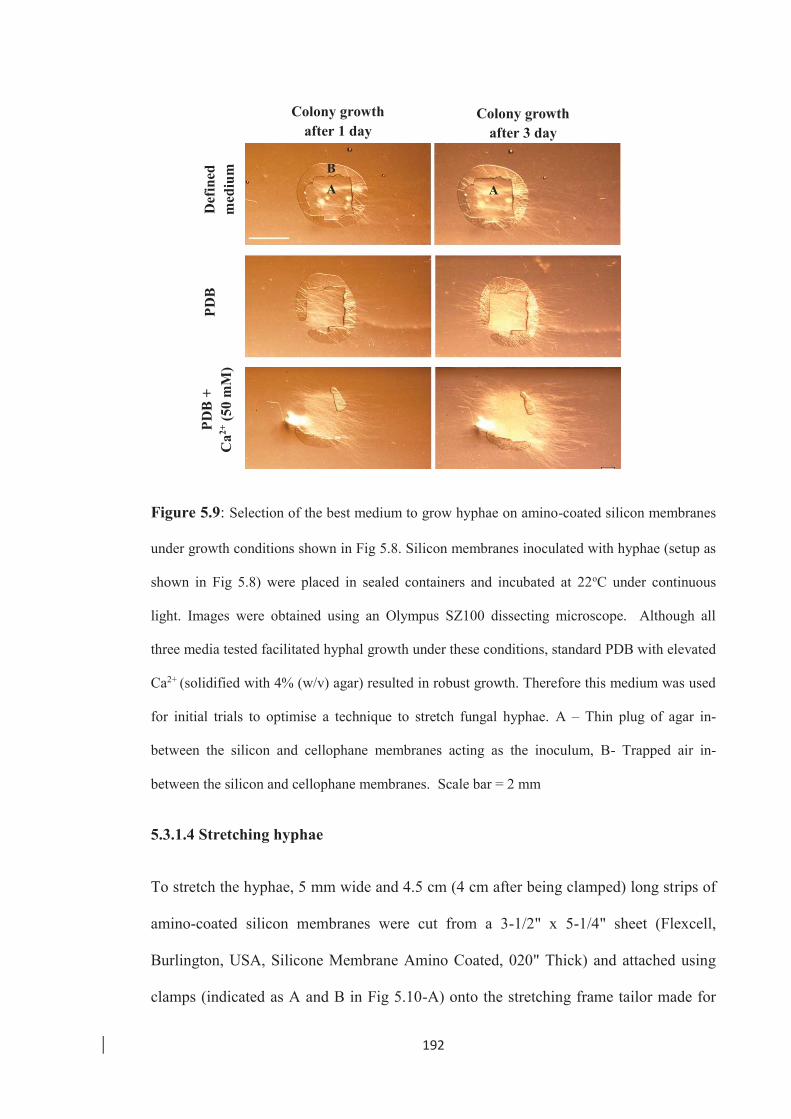
192
Figure 5.9: Selection of the best medium to grow hyphae on amino-coated silicon membranes
under growth conditions shown in Fig 5.8. Silicon membranes inoculated with hyphae (setup as
shown in Fig 5.8) were placed in sealed containers and incubated at 22oC under continuous
light. Images were obtained using an Olympus SZ100 dissecting microscope. Although all
three media tested facilitated hyphal growth under these conditions, standard PDB with elevated
Ca2+ (solidified with 4% (w/v) agar) resulted in robust growth. Therefore this medium was used
for initial trials to optimise a technique to stretch fungal hyphae. A – Thin plug of agar in-
between the silicon and cellophane membranes acting as the inoculum, B- Trapped air in-
between the silicon and cellophane membranes. Scale bar = 2 mm
5.3.1.4 Stretching hyphae
To stretch the hyphae, 5 mm wide and 4.5 cm (4 cm after being clamped) long strips of
amino-coated silicon membranes were cut from a 3-1/2" x 5-1/4" sheet (Flexcell,
Burlington, USA, Silicone Membrane Amino Coated, 020" Thick) and attached using
clamps (indicated as A and B in Fig 5.10-A) onto the stretching frame tailor made for
Colony growth after 1 day
Colony growth after 3 day
Def
ined
m
ediu
m
PDB
PD
B +
C
a2+ (5
0 m
M)
A A
B
193
this purpose. The attached membrane was slightly stretched and tightened using screws
(C and D in Fig 5.10-A) to form an even surface. To grow hyphae on the membrane, a
thin plug of mycelia (1 mm2) was placed in the middle of the membrane and, on top, a
block of growth medium (5 mm wide and 2 .5 cm long) was placed above, separated by
a cellophane membrane as shown in Fig 5.10-B. These steps were conducted under
aseptic conditions. To prevent contamination occurring during the experiment, the plug
of agar was infused with an antibiotic (hygromycin or geneticin) as appropriate for the
fungal strain (EfH2A-9) being used. The whole assembly was placed in a sealed plastic
container and incubated at 22oC for three days under continuous light. After three days
of incubation, a few well-separated hyphae were selected for observation under
stretching using bright field and fluorescence microscopy (Fig 5.10-C). Fungal strains
expressing the nuclear tag YH2A (Section 5.1.1) were used for easy identification of
nuclei and individual compartments (Fig 5. 10-D).

194
Figure 5.10: The apparatus used to stretch E. festucae hyphae under in vitro conditions.
A- Stretch frame with an amino-coated membrane attached by the clamps (A and B), and a
fungal colony growing in the middle of the membrane. Black scale bar = 1 cm
B- A diagrammatic representation showing the cross section of the arrangement used to grow
fungal hyphae on the silicon membrane and provide nutrients. Not drawn to scale.
C- A microscopic image of hyphae growing between the silicon and cellophane membranes for
3 days, while attached to the silicon membrane. White scale bar = 2 mm.
D- Bright field and fluorescent microscopic images of hyphae expressing a nuclear tag YH2A,
on silicon membrane showing septa (black arrows) and corresponding nuclei (white arrows) in
each compartment. Red scale bar = 100 μm
A
B
C
D
I
II
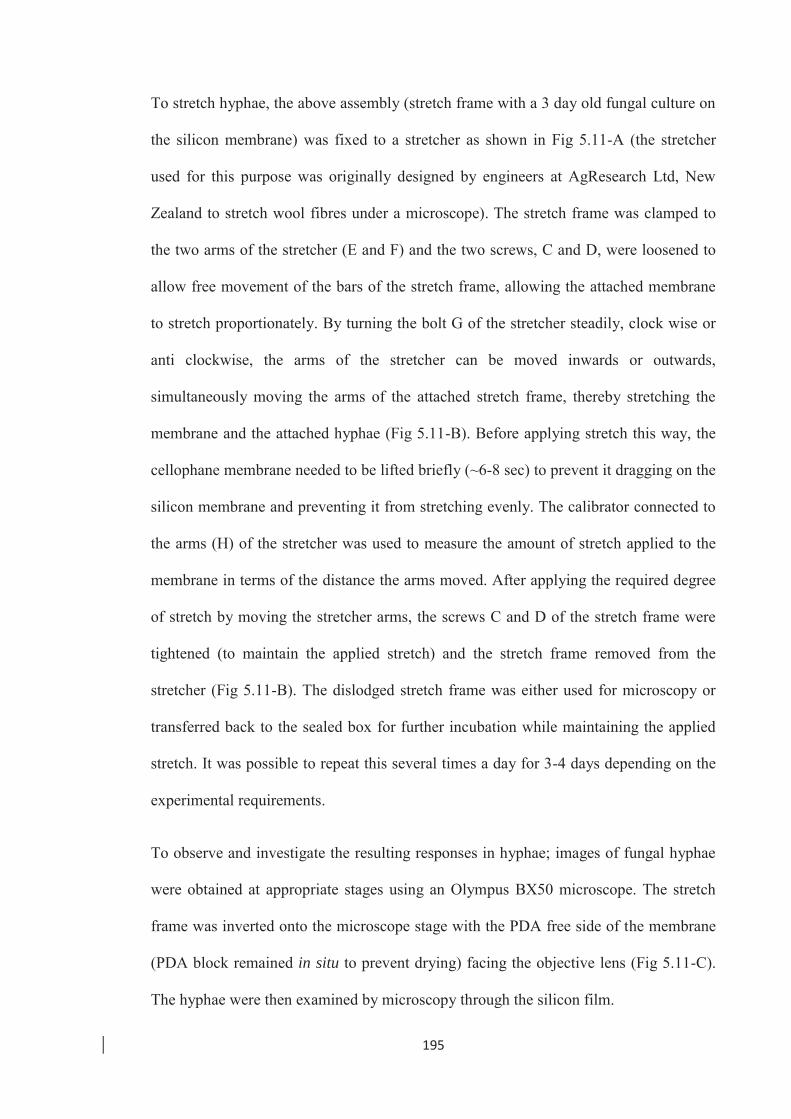
195
To stretch hyphae, the above assembly (stretch frame with a 3 day old fungal culture on
the silicon membrane) was fixed to a stretcher as shown in Fig 5.11-A (the stretcher
used for this purpose was originally designed by engineers at AgResearch Ltd, New
Zealand to stretch wool fibres under a microscope). The stretch frame was clamped to
the two arms of the stretcher (E and F) and the two screws, C and D, were loosened to
allow free movement of the bars of the stretch frame, allowing the attached membrane
to stretch proportionately. By turning the bolt G of the stretcher steadily, clock wise or
anti clockwise, the arms of the stretcher can be moved inwards or outwards,
simultaneously moving the arms of the attached stretch frame, thereby stretching the
membrane and the attached hyphae (Fig 5.11-B). Before applying stretch this way, the
cellophane membrane needed to be lifted briefly (~6-8 sec) to prevent it dragging on the
silicon membrane and preventing it from stretching evenly. The calibrator connected to
the arms (H) of the stretcher was used to measure the amount of stretch applied to the
membrane in terms of the distance the arms moved. After applying the required degree
of stretch by moving the stretcher arms, the screws C and D of the stretch frame were
tightened (to maintain the applied stretch) and the stretch frame removed from the
stretcher (Fig 5.11-B). The dislodged stretch frame was either used for microscopy or
transferred back to the sealed box for further incubation while maintaining the applied
stretch. It was possible to repeat this several times a day for 3-4 days depending on the
experimental requirements.
To observe and investigate the resulting responses in hyphae; images of fungal hyphae
were obtained at appropriate stages using an Olympus BX50 microscope. The stretch
frame was inverted onto the microscope stage with the PDA free side of the membrane
(PDA block remained in situ to prevent drying) facing the objective lens (Fig 5.11-C).
The hyphae were then examined by microscopy through the silicon film.
196
Figure 5.11: Fibre stretcher used to stretch fungal hyphae growing on a silicon membrane.
A – Image showing the apparatus (stretcher) with the loaded stretch frame. The stretch frame
was lodged on to the arms (E and F) of the stretcher, and using the screw (G) the stretch frame
could be moved apart, thereby stretching the attached silicon membrane. White scale bar = 3 cm
B – A diagrammatic representation showing how the silicon membrane was stretched when the
arms of the stretcher were moved apart using the screw G.
C – Image showing how the stretch frame was mounted on to the microscope stage (Olympus
BX50) for bright field and fluorescence imaging.
A
B
C
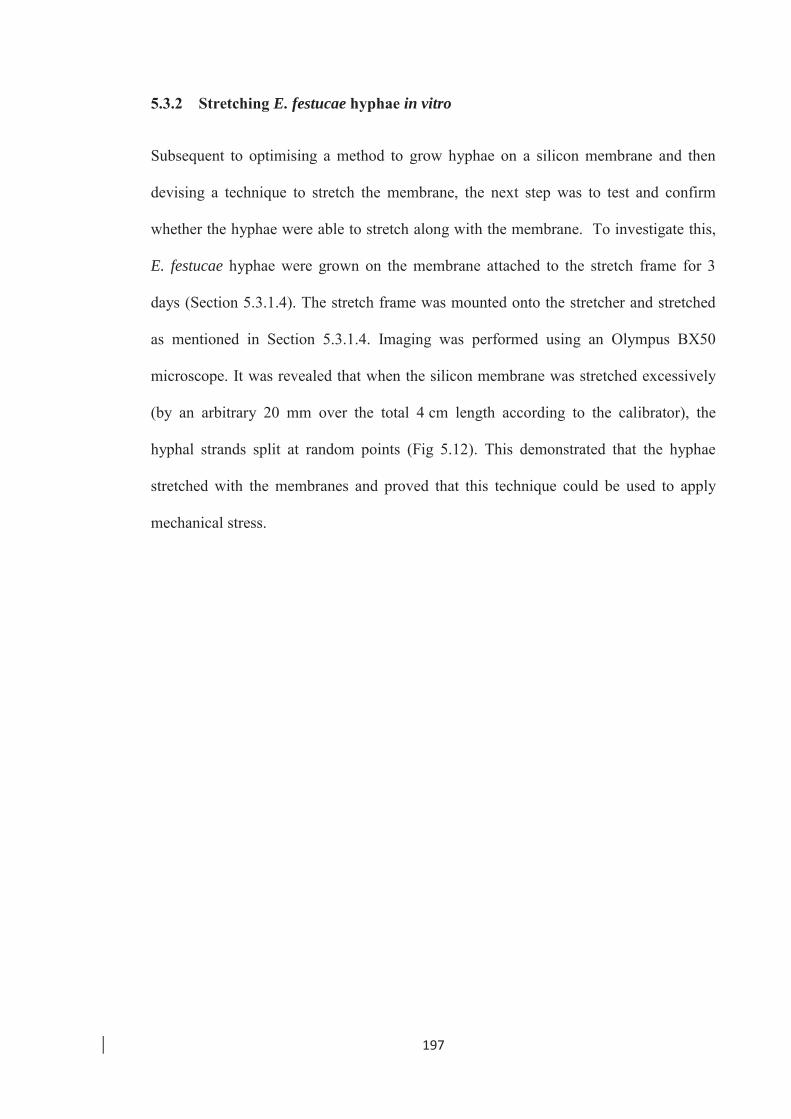
197
5.3.2 Stretching E. festucae hyphae in vitro
Subsequent to optimising a method to grow hyphae on a silicon membrane and then
devising a technique to stretch the membrane, the next step was to test and confirm
whether the hyphae were able to stretch along with the membrane. To investigate this,
E. festucae hyphae were grown on the membrane attached to the stretch frame for 3
days (Section 5.3.1.4). The stretch frame was mounted onto the stretcher and stretched
as mentioned in Section 5.3.1.4. Imaging was performed using an Olympus BX50
microscope. It was revealed that when the silicon membrane was stretched excessively
(by an arbitrary 20 mm over the total 4 cm length according to the calibrator), the
hyphal strands split at random points (Fig 5.12). This demonstrated that the hyphae
stretched with the membranes and proved that this technique could be used to apply
mechanical stress.
Before stretching
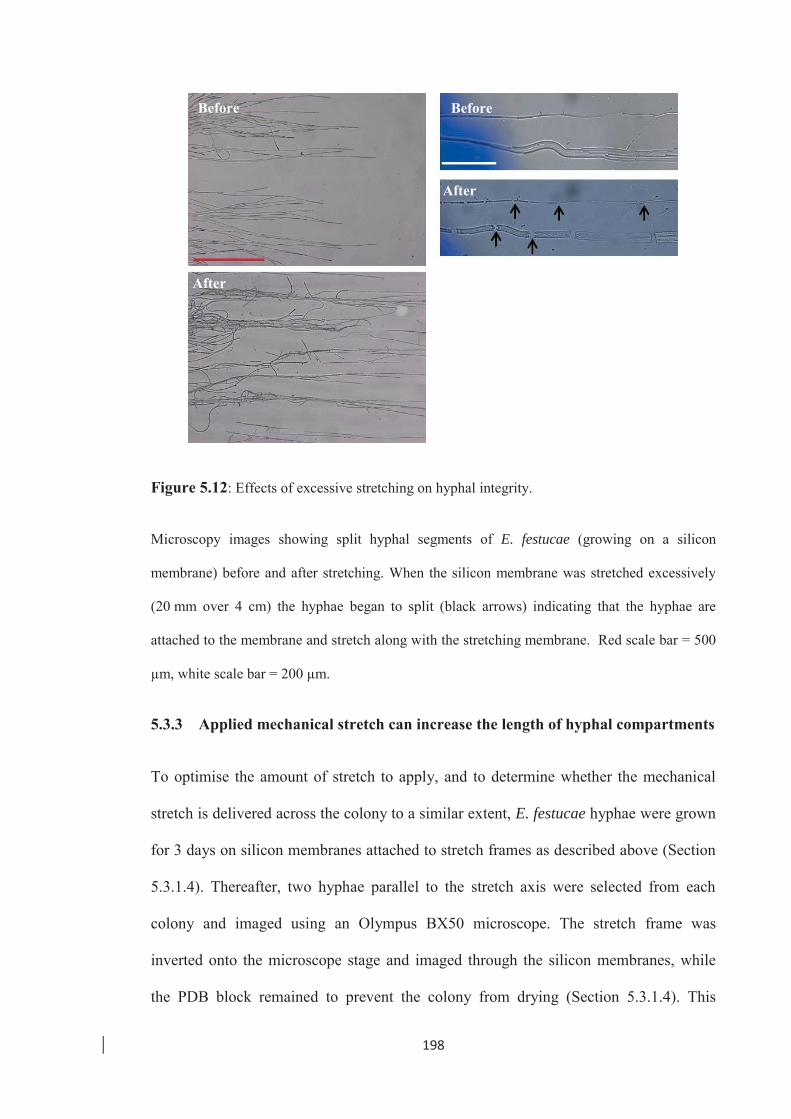
198
Figure 5.12: Effects of excessive stretching on hyphal integrity.
Microscopy images showing split hyphal segments of E. festucae (growing on a silicon
membrane) before and after stretching. When the silicon membrane was stretched excessively
(20 mm over 4 cm) the hyphae began to split (black arrows) indicating that the hyphae are
attached to the membrane and stretch along with the stretching membrane. Red scale bar = 500
μm, white scale bar = 200 μm.
5.3.3 Applied mechanical stretch can increase the length of hyphal compartments
To optimise the amount of stretch to apply, and to determine whether the mechanical
stretch is delivered across the colony to a similar extent, E. festucae hyphae were grown
for 3 days on silicon membranes attached to stretch frames as described above (Section
5.3.1.4). Thereafter, two hyphae parallel to the stretch axis were selected from each
colony and imaged using an Olympus BX50 microscope. The stretch frame was
inverted onto the microscope stage and imaged through the silicon membranes, while
the PDB block remained to prevent the colony from drying (Section 5.3.1.4). This
Before
After
After
Before
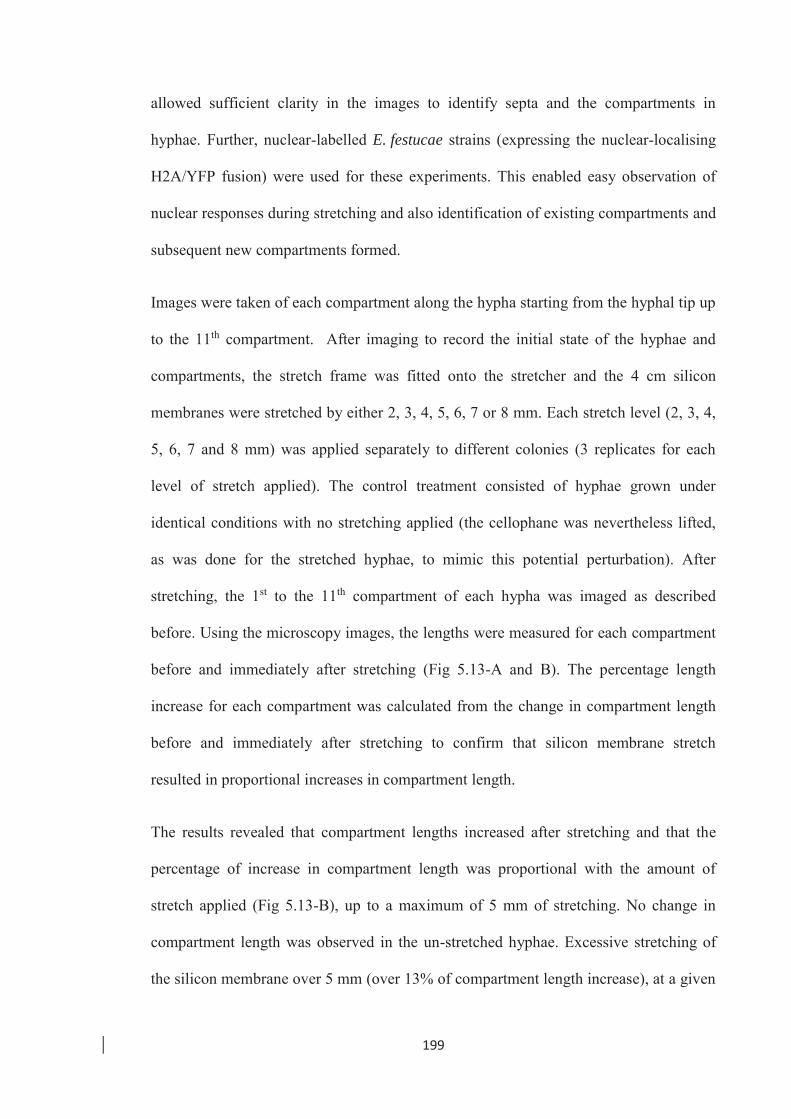
199
allowed sufficient clarity in the images to identify septa and the compartments in
hyphae. Further, nuclear-labelled E. festucae strains (expressing the nuclear-localising
H2A/YFP fusion) were used for these experiments. This enabled easy observation of
nuclear responses during stretching and also identification of existing compartments and
subsequent new compartments formed.
Images were taken of each compartment along the hypha starting from the hyphal tip up
to the 11th compartment. After imaging to record the initial state of the hyphae and
compartments, the stretch frame was fitted onto the stretcher and the 4 cm silicon
membranes were stretched by either 2, 3, 4, 5, 6, 7 or 8 mm. Each stretch level (2, 3, 4,
5, 6, 7 and 8 mm) was applied separately to different colonies (3 replicates for each
level of stretch applied). The control treatment consisted of hyphae grown under
identical conditions with no stretching applied (the cellophane was nevertheless lifted,
as was done for the stretched hyphae, to mimic this potential perturbation). After
stretching, the 1st to the 11th compartment of each hypha was imaged as described
before. Using the microscopy images, the lengths were measured for each compartment
before and immediately after stretching (Fig 5.13-A and B). The percentage length
increase for each compartment was calculated from the change in compartment length
before and immediately after stretching to confirm that silicon membrane stretch
resulted in proportional increases in compartment length.
The results revealed that compartment lengths increased after stretching and that the
percentage of increase in compartment length was proportional with the amount of
stretch applied (Fig 5.13-B), up to a maximum of 5 mm of stretching. No change in
compartment length was observed in the un-stretched hyphae. Excessive stretching of
the silicon membrane over 5 mm (over 13% of compartment length increase), at a given

200
time, damaged the hyphae, as split hyphae and abnormalities in hyphal morphology
(even when the cell wall was intact) were observed. It is likely that over-stretching
hyphal compartments damaged cellular membranes (although the cell wall was intact)
and therefore hyphae lost their viability.

201
Figure 5.13: Effect of mechanical stretching on compartment lengths in E. festucae hyphae.
A- Diagrammatic representation showing the stretch levels applied to the silicon membrane.
B- Bright field images of hyphae growing on silicon membrane before and after stretching.
Clearly visible septa (black arrows) were used to measure the compartment lengths at each
stage. Scale bar = 20 μm.
C- Mean percentage increase in compartment length in response to increasing membrane
stretch. Mean and SD were calculated from 30 compartments for each level of stretching.
Compartment lengths increased proportionally to the degree of stretch applied. * - The
compartment length increase was proportional to 6mm but the hyphae showed morphological
anomalies indicating damage.
Mea
n in
crea
se in
com
part
men
t len
gth
(%)
Amount of stretch applied to the silicon membrane (mm)
A
B
C
Hyphal tip
*
202
To test the effect of stretching on plasma membrane integrity (and therefore hyphal
vitality), un-stretched and stretched hyphae were stained with the lipophilic dye FM®4-
64 (Invitrogen, USA, stains cellular membranes), and observed using a confocal laser
scanning microscope. To stain with FM®4-64, silicon membranes with hyphae were
mounted in a solution of FM®4-64 (2 μg/mL) in standard PDB (Section 2.11.2).
Because it was not possible to use the stretch frame under a confocal microscope,
stretched membranes were glued on to a glass slide (while maintaining the applied
stretch) before mounting specimens in the FM4-64 solution for microscopy. This
limited the ability to observe the same hyphae in un-stretched and stretched conditions.
Observations were made immediately after staining to prevent the stain penetrating the
plasma membrane and entering the cells via endocytosis (within 10 min). If the plasma
membrane is damaged, FM®4-64 penetrates and stains the whole cell immediately after
staining instead of only the plasma membranes. Observations of stretched hyphae
revealed that a compartment stretch/length increase of over 10% of its original length at
a given time was detrimental to the integrity of the membranes as evidence of
membrane damage was observed in hyphae stretched beyond this limit (Fig 5.14).
203
Figure 5.14: Effect of mechanical stretching on the integrity of plasma membranes in nuclear
tagged (H2A/YFP) E. festucae hyphae. FM®4-64 stained the plasma membrane (red lines) and
did not penetrate the cells in un-stretched hyphae and hyphae on silicon membrane stretched by
3 mm (7% compartment length increase). Further, the nuclei seemed intact (white arrows). In
contrast, hyphae on silicon membranes stretched by 8 mm showed stain penetration, rupture of
nuclei and cell membrane damage. Scale bar = 20 μm.
5.4 Mechanical stretching applied in intervals can increase overall length of
hyphae while maintaining viability
The experiments outlined in Section 5.3.3 demonstrated that hyphal compartment
lengths can be increased by mechanical stretching without damaging cell integrity as
long as excessive stretching is avoided at a given time. This technique was therefore
deemed to be suitable for testing the hypothesis that mechanical stretching of
204
E. festucae hyphae is sufficient to induce sustained intercalary growth, with additional
compartmentation. The intention was to simulate the assumed mechanical stretching
applied by rapidly elongating leaf cells in the expansion zone of the developing leaf.
Although it was not possible to apply continuous stretching over a prolonged period
using this method (the stretcher is not motorised), as would be occurring in a developing
leaf, the system allowed for manual application of mechanical stretch at intervals over a
9 h time period. Hence, I believed that, as an initial step, this would be sufficient to test
whether E. festucae hyphae can tolerate applied mechanical stretching (while remaining
viable), and undergo sub-apical compartment elongation with compartmentalization
equating to intercalary growth under in vitro conditions. Depending on the outcome, a
mechanism could be designed in future to apply continuous stretching that would more
accurately simulate the mechanical stress assumed to be applied within the developing
leaf.
Taking previous stretching results into consideration (Section 5.3.3 and Figs 5.13 &
5.14), three consecutive stretches of 3 mm each, equivalent to a 7-8 % compartment
length increase, were applied at 3 h intervals to each colony. Nuclear YFP-tagged
E. festucae hyphae (Section 5.1.1) were used to facilitate easy identification of nuclei by
fluorescence microscopy, and hygromycin was used to prevent contamination during
the course of the experiment (the nutrient block was infused with 100 mg/mL
hygromycin). Hyphae were grown on silicon membranes attached to stretch frames for
3 days (Section 5.3.3) and 1 to 2 hyphae situated parallel to the stretch axis were
selected and imaged as described previously (Section 5.3.3). Each hyphal compartment,
from the 1st to the 11th was imaged independently using bright field and florescence
microscopy. Thereafter, the stretch frame was loaded into the stretcher and the silicon
membrane was stretched by 3 mm (which represented an approximate 7% increase in
205
compartment length, see Section 5.3.1.4). Immediately after stretching, the same hyphae
were imaged again (from 1st to the 11th) and transferred to a plastic box and incubated at
22oC. After 3 h of incubation, the same hyphae were imaged again, stretched by 3 mm
and immediately imaged again and transferred to the box for incubation. This was
repeated once more after 3 h of incubation, stretching the hyphae by a total of 9 mm (3
X 3 mm) within a time period of 6 h (at T = 0, 3 & 6 h.). The stretched hyphae were
further incubated for 3 h after the 3rd stretch and imaged (after 9 h since the 1st stretch)
for the final time. As the control, all the steps mentioned above were followed
(including imaging twice at each time interval) except for the stretching steps.
The bright field and fluorescent images of compartments obtained before and after
stretching at each step were used to measure the length of individual compartments and
position of nuclei at each stage. To identify an individual compartment, the position of
septa (using bright field images) and the presence of nuclei (using corresponding
fluorescence images) were used as markers. Each compartment was tracked from the
beginning (T0 h) to the end of the experiment (T9 h), noting down any nuclear division
or septation that occurred in individual compartments during the period. For analysis
purposes, the first compartment (compartment 1) at T0 h was considered to be the apical
compartment throughout the experiment, irrespective of whether new compartments
formed at the tip during the experiment. The 10 compartments behind the apical
compartment from 2 to 11 at the start of the experiment were considered to be sub-
apical compartments. New compartments formed due to sub-division of existing sub-
apical compartments (via new septa formation) within the 9 h period were recorded and
assigned a number related to the parent compartment. Thus, if compartment 2 divided,
the new compartments were labelled compartments 2A and 2B. This allowed changes in
206
each sub-apical compartment in terms of length, nuclear division and septation to be
tracked (Fig 5.15 and Table 5.2).
As expected, the apical compartments continued to grow in length via apical growth,
and to undergo nuclear division and septation forming new compartments at the tip,
both in control (un-stretched) and the stretched hyphae. However I did not measure the
fate of these compartments as the main objective was to investigate intercalary growth
occurring in the original sub-apical compartments.
Measurements of sub-apical compartment lengths at each step of stretching revealed
that the mean percentage increase in compartment length at each stretch (by 3 mm) was
7.3 ± 0.91 % (mean ± SD, n = 204). Further, it showed that the percentage increase in
the length of a compartment was consistent at each stretch and evenly distributed among
all the sub-apical compartments (sub-apical compartments increased in length by the
same proportion) along a hypha (Table 5.2 & Fig 5.16). Hence, collectively at the end
of the 3 stretching events (T9 h) the cumulative mean increase in length of a
compartment was on average 30% (n = 204) of its original length at T0 h. This resulted
in a cumulative length increase (total length from 2nd to the 11th compartment) of the
hypha by a similar percentage subsequent to stretching. In comparison, in the un-
stretched control, the sub-apical compartment lengths (2nd to the 11th compartment) did
not change, and the slight variations in length are attributed to measurement errors.
Thus no increase in cumulative length was observed in the sub-apical regions of the
control treatments (Table 5.2 & Fig 5.16).
De novo septation/compartmentalization in existing subapical compartments was
observed both in un-stretched (control) and stretched hyphae (Fig 5.15) within the 9 h
period. Each new sub-apical compartment formed contained a single nucleus which is
207
consistent with expectation in this largely mono-nucleate species. This indicates that the
compartmentalization process (mitosis followed by septation) is not confined to the
apical compartment, but continues in the sub-apical compartments in both the un-
stretched and stretched hyphae. This result also indicated that E. festucae hyphae can
tolerate stretching within certain limits and that this does not result in damage or loss of
viability in compartments, as such damage would be expected to halt any further
compartmentalization. The order of septation (compartmentalization) seemed to follow
the same size-dependent hierarchy described earlier (Section 5.1.2) where larger
compartments divided first, followed by the next larger compartments. Thus, these
observations collectively establish the fact that E. festucae hyphae can be mechanically
stretched, increasing compartment lengths (hence cumulative hyphal length) and that
the elongated compartments continue to undergo mitosis and septation.

208
Figure 5.15: Mitosis and septation in sub-apical compartments of un-stretched and stretched
hyphae.
Hyphal tip
T = 0 h
T = 0 h
T = 9 h
T = 9 h
T = 0 h
T = 0 h
T = 9 h
T = 9 h
Un-
stre
tche
d co
ntro
l St
retc
hed
by 3
mm
X 3
tim
es
A
B

209
Images are representative bright field and corresponding fluorescence images of sub-apical
compartments (compartments 3, 4, 5, 6 and 7 from tip at T = 0 h) with septa and nuclei in a
hyphal segment at T = 0 h and the same segment of hypha at T = 9 h. Black arrows represent the
septa that were present at T = 0 h and red arrows represent new septa formed within the 9 h
period. Letters (a to f) denote septa and a similar letter at T = 0 and T = 9 h represent the same
septa. White arrows show the nuclei present in each compartment.
A- The status of the sub-apical compartments in a segment of a control un-stretched hypha at
the beginning (T = 0 h) and end (T = 9 h) of the incubation period. Sub-apical compartment
lengths did not change within the 9 h period. Longer compartments present at T = 0 h
underwent septation. A nucleus was visible in each new compartment.
B - The status of sub-apical compartments in a segment of a stretched hypha (stretched by 3 mm
every 3 h) at the beginning (T = 0 h) and end (T =9 h) of the incubation period (this
approximately results in 7% compartment length increase at each stretch). Compartment lengths
increased compared to their original length at T = 0 h, followed by mitosis and septation.
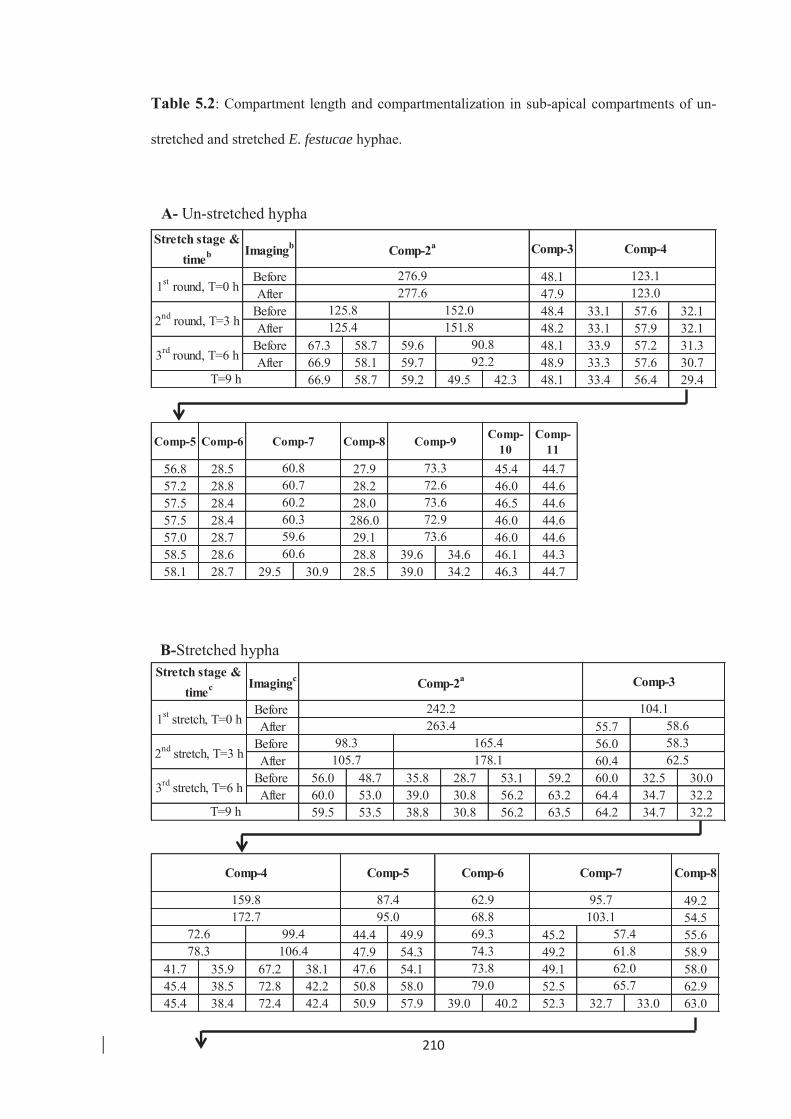
210
Table 5.2: Compartment length and compartmentalization in sub-apical compartments of un-
stretched and stretched E. festucae hyphae.
Stretch stage & timeb Imagingb Comp-3
Before 48.1After 47.9
Before 48.4 33.1 57.6 32.1After 48.2 33.1 57.9 32.1
Before 67.3 58.7 59.6 48.1 33.9 57.2 31.3After 66.9 58.1 59.7 48.9 33.3 57.6 30.7
66.9 58.7 59.2 49.5 42.3 48.1 33.4 56.4 29.4 T=9 h
90.892.2
1st round, T=0 h
3rd round, T=6 h
2nd round, T=3 h125.8 152.0125.4 151.8
277.6 123.0
Comp-2a Comp-4
276.9 123.1
Comp-5 Comp-6 Comp-8 Comp-10
Comp-11
56.8 28.5 27.9 45.4 44.757.2 28.8 28.2 46.0 44.657.5 28.4 28.0 46.5 44.657.5 28.4 286.0 46.0 44.657.0 28.7 29.1 46.0 44.658.5 28.6 28.8 39.6 34.6 46.1 44.358.1 28.7 29.5 30.9 28.5 39.0 34.2 46.3 44.7
Comp-7
60.760.260.359.660.6
72.973.6
73.6
73.372.6
Comp-9
60.8
Stretch stage & timec Imagingc
Before After 55.7
Before 56.0After 60.4
Before 56.0 48.7 35.8 28.7 53.1 59.2 60.0 32.5 30.0After 60.0 53.0 39.0 30.8 56.2 63.2 64.4 34.7 32.2
59.5 53.5 38.8 30.8 56.2 63.5 64.2 34.7 32.2T=9 h
3rd stretch, T=6 h
105.7 178.1 62.558.3
2nd stretch, T=3 h98.3 165.4
1st stretch, T=0 h242.2 104.1263.4 58.6
Comp-2a Comp-3
Comp-8
49.254.5
44.4 49.9 45.2 55.647.9 54.3 49.2 58.9
41.7 35.9 67.2 38.1 47.6 54.1 49.1 58.045.4 38.5 72.8 42.2 50.8 58.0 52.5 62.945.4 38.4 72.4 42.4 50.9 57.9 39.0 40.2 52.3 32.7 33.0 63.0
79.0 65.773.8 62.0
78.3 106.472.6 99.4 69.3 57.4
74.3
103.1159.8 87.4
61.8
172.7 95.0 68.862.9 95.7
Comp-7Comp-4 Comp-5 Comp-6
A- Un-stretched hypha
B-Stretched hypha
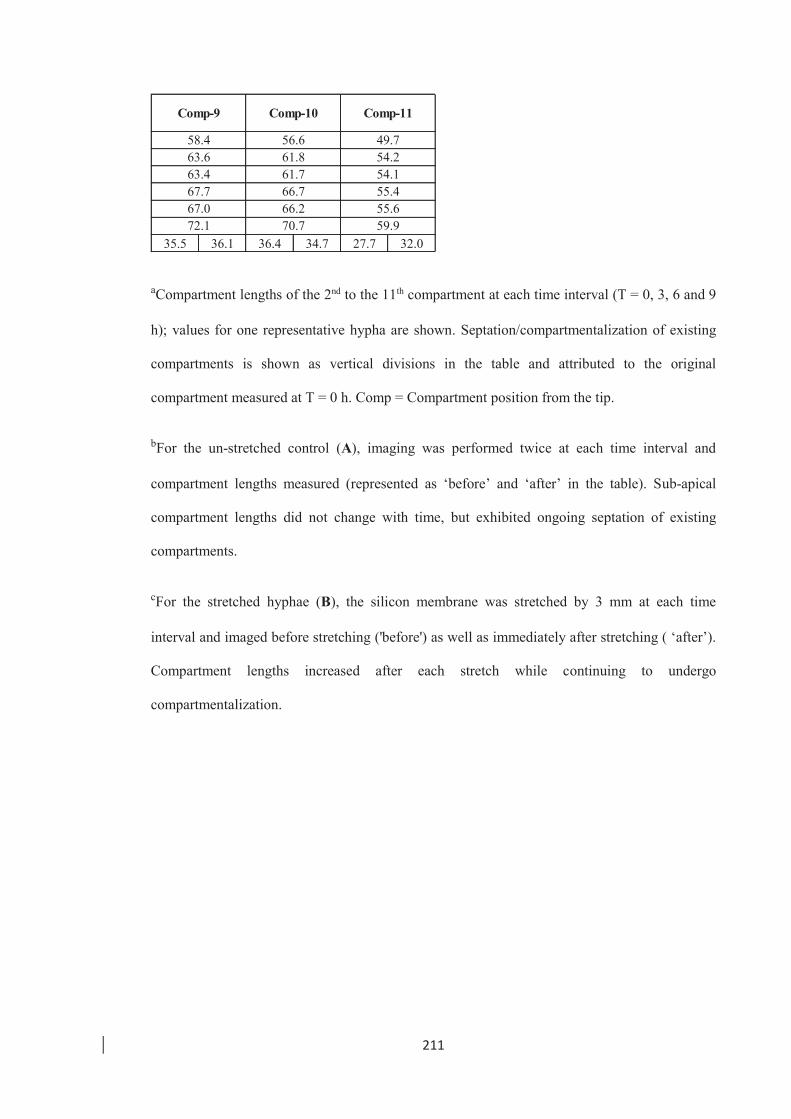
211
aCompartment lengths of the 2nd to the 11th compartment at each time interval (T = 0, 3, 6 and 9
h); values for one representative hypha are shown. Septation/compartmentalization of existing
compartments is shown as vertical divisions in the table and attributed to the original
compartment measured at T = 0 h. Comp = Compartment position from the tip.
bFor the un-stretched control (A), imaging was performed twice at each time interval and
compartment lengths measured (represented as ‘before’ and ‘after’ in the table). Sub-apical
compartment lengths did not change with time, but exhibited ongoing septation of existing
compartments.
cFor the stretched hyphae (B), the silicon membrane was stretched by 3 mm at each time
interval and imaged before stretching ('before') as well as immediately after stretching ( ‘after’).
Compartment lengths increased after each stretch while continuing to undergo
compartmentalization.
35.5 36.1 36.4 34.7 27.7 32.072.1 70.7 59.967.0
66.7 55.466.2 55.6
61.7 54.163.463.6
67.7
61.8 54.258.4 56.6 49.7
Comp-9 Comp-10 Comp-11
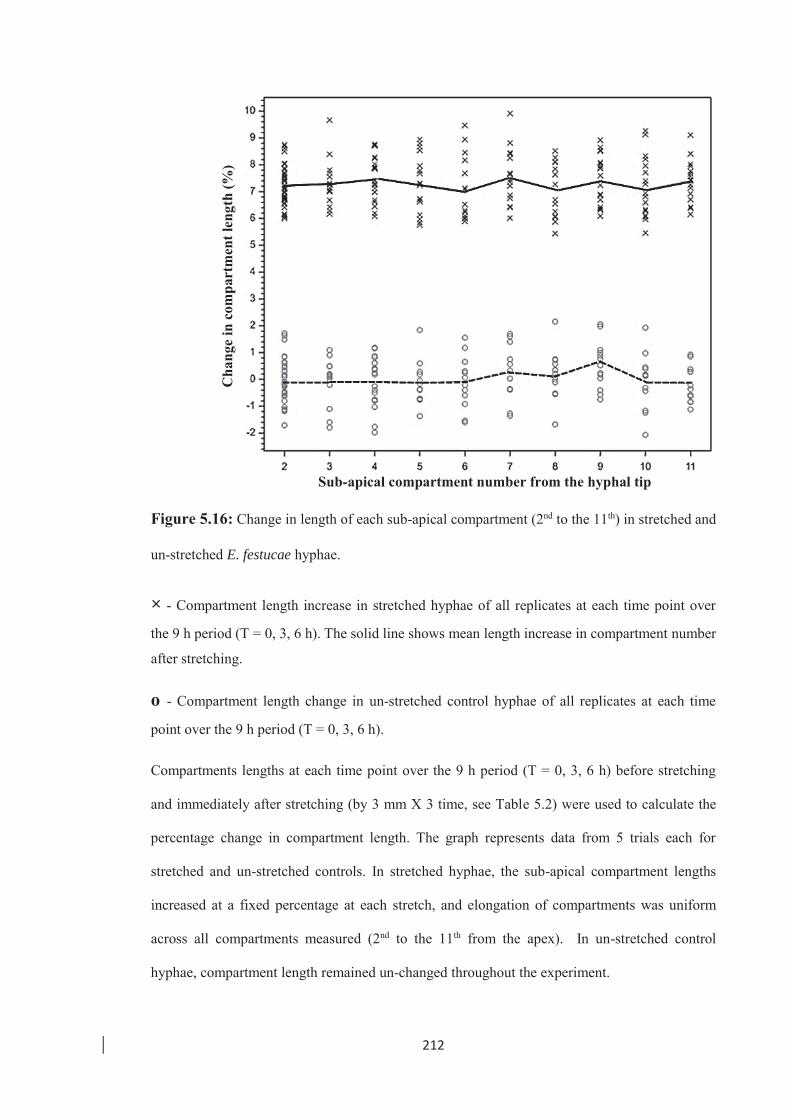
212
Figure 5.16: Change in length of each sub-apical compartment (2nd to the 11th) in stretched and
un-stretched E. festucae hyphae.
× - Compartment length increase in stretched hyphae of all replicates at each time point over
the 9 h period (T = 0, 3, 6 h). The solid line shows mean length increase in compartment number
after stretching.
o - Compartment length change in un-stretched control hyphae of all replicates at each time
point over the 9 h period (T = 0, 3, 6 h).
Compartments lengths at each time point over the 9 h period (T = 0, 3, 6 h) before stretching
and immediately after stretching (by 3 mm X 3 time, see Table 5.2) were used to calculate the
percentage change in compartment length. The graph represents data from 5 trials each for
stretched and un-stretched controls. In stretched hyphae, the sub-apical compartment lengths
increased at a fixed percentage at each stretch, and elongation of compartments was uniform
across all compartments measured (2nd to the 11th from the apex). In un-stretched control
hyphae, compartment length remained un-changed throughout the experiment.
Sub-apical compartment number from the hyphal tip
Cha
nge
in c
ompa
rtm
ent l
engt
h (%
)
213
5.5 E. festucae hyphae increase the rate of compartmentalization as a response to
sub-apical compartment elongation caused by mechanical stretching
Although septation in sub-apical compartments was observed both in un-stretched and
stretched hyphae as mentioned previously, a noticeable difference was observed in the
septation /compartment formation rate in sub-apical compartments between the two.
The number of new compartments formed in sub-apical compartments (2nd to the 11th)
over a given period was calculated as the percentage increase in numbers of
compartments per 100 μm of hyphal length above that at T = 0 h (see formula below).
As mentioned previously, the order of compartmentalization is dependent on the initial
volume/lengths of the existing compartments, with more frequent compartmentation
observed in the longest compartment within a given period. Hyphal compartment
lengths differ between hyphae and therefore have different potentials for sub-apical
septation/compartment formation. Therefore, to normalise the effect of initial
compartment lengths of hyphae (at T = 0 h.) between treatments, it was decided to
divide the number of compartments formed between compartments number 2 and 11
(inclusive) within a given period, by the cumulative length of the original compartments
present at T = 0 h. The formula used for this purpose is given below.
X Number of new compartments formed within a period per 100 μm of hyphal length at T = 0 h
Number of new compartments formed
within the period
(# comp at T = X h - # comp at T = 0 h)
Cumulative length of the
compartments at T = 0 h
= 100 μm
X = 3/6/9 h
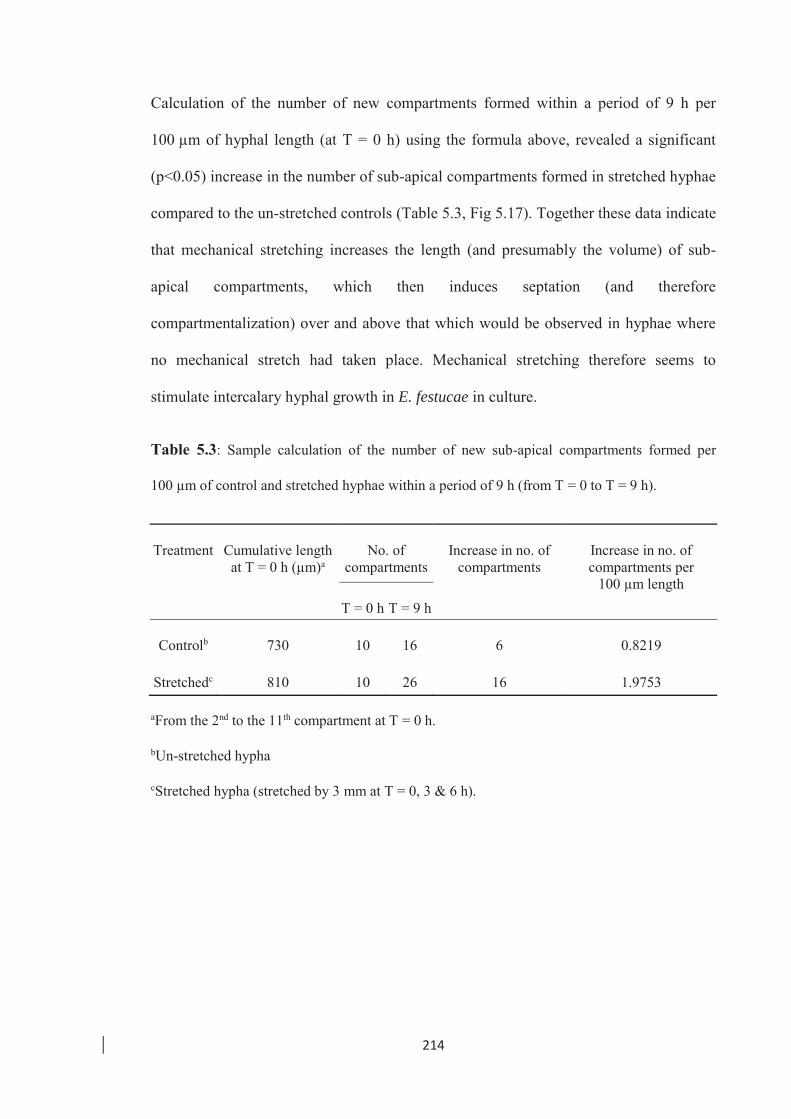
214
Calculation of the number of new compartments formed within a period of 9 h per
100 μm of hyphal length (at T = 0 h) using the formula above, revealed a significant
(p<0.05) increase in the number of sub-apical compartments formed in stretched hyphae
compared to the un-stretched controls (Table 5.3, Fig 5.17). Together these data indicate
that mechanical stretching increases the length (and presumably the volume) of sub-
apical compartments, which then induces septation (and therefore
compartmentalization) over and above that which would be observed in hyphae where
no mechanical stretch had taken place. Mechanical stretching therefore seems to
stimulate intercalary hyphal growth in E. festucae in culture.
Table 5.3: Sample calculation of the number of new sub-apical compartments formed per
100 μm of control and stretched hyphae within a period of 9 h (from T = 0 to T = 9 h).
Treatment Cumulative length at T = 0 h (μm)a
No. of compartments
Increase in no. of compartments
Increase in no. of compartments per
100 μm length T = 0 h T = 9 h
Controlb 730 10 16 6 0.8219 Stretchedc 810 10 26 16 1.9753
aFrom the 2nd to the 11th compartment at T = 0 h.
bUn-stretched hypha
cStretched hypha (stretched by 3 mm at T = 0, 3 & 6 h).
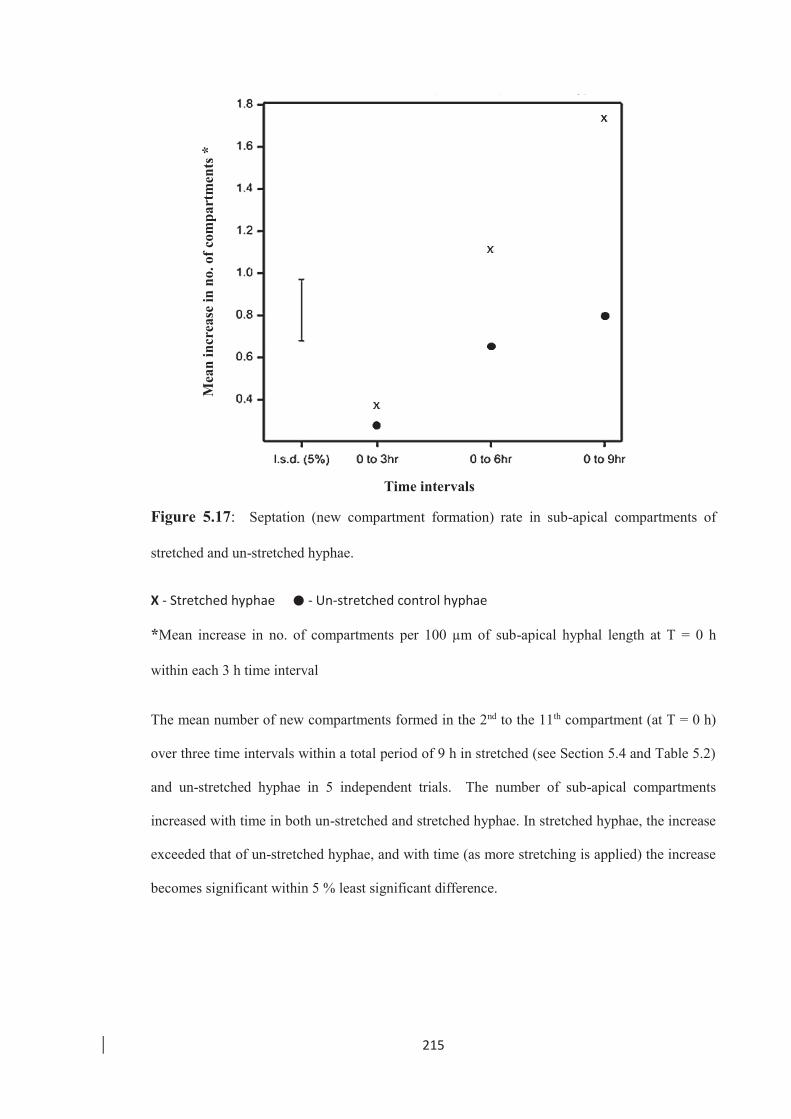
215
Figure 5.17: Septation (new compartment formation) rate in sub-apical compartments of
stretched and un-stretched hyphae.
X - Stretched hyphae - Un-stretched control hyphae
*Mean increase in no. of compartments per 100 μm of sub-apical hyphal length at T = 0 h
within each 3 h time interval
The mean number of new compartments formed in the 2nd to the 11th compartment (at T = 0 h)
over three time intervals within a total period of 9 h in stretched (see Section 5.4 and Table 5.2)
and un-stretched hyphae in 5 independent trials. The number of sub-apical compartments
increased with time in both un-stretched and stretched hyphae. In stretched hyphae, the increase
exceeded that of un-stretched hyphae, and with time (as more stretching is applied) the increase
becomes significant within 5 % least significant difference.
Mea
n in
crea
se in
no.
of c
ompa
rtm
ents
*
Time intervals
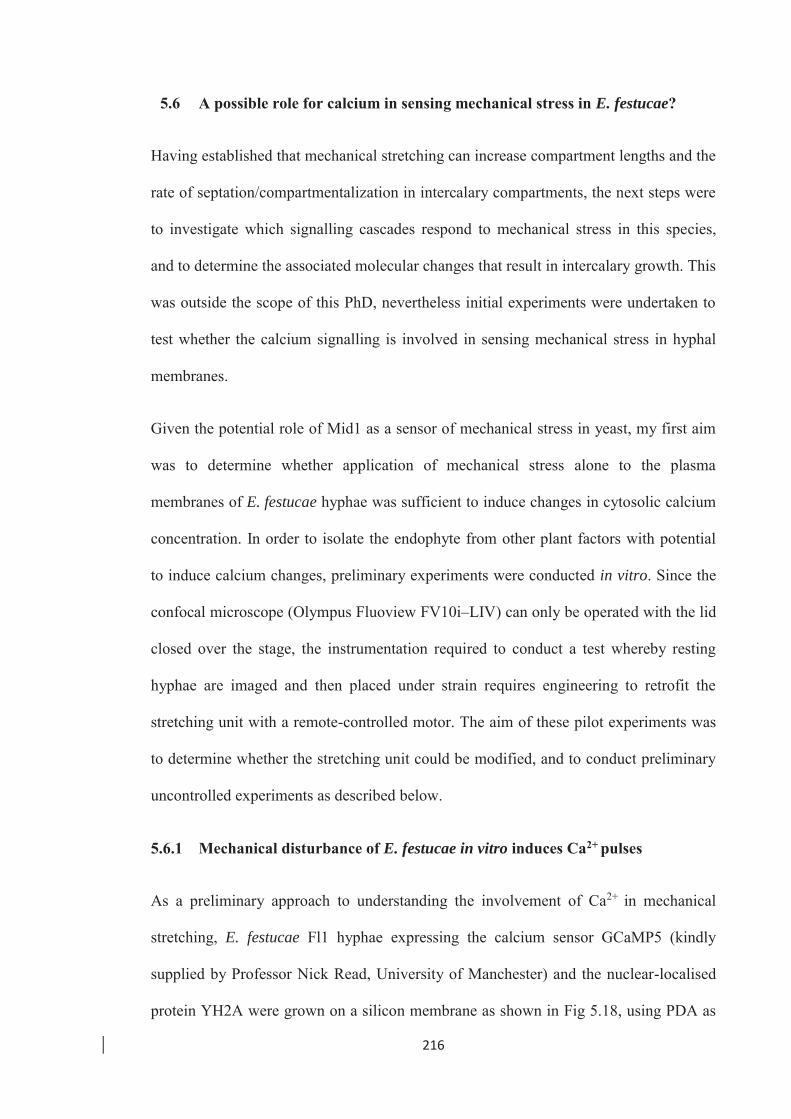
216
5.6 A possible role for calcium in sensing mechanical stress in E. festucae?
Having established that mechanical stretching can increase compartment lengths and the
rate of septation/compartmentalization in intercalary compartments, the next steps were
to investigate which signalling cascades respond to mechanical stress in this species,
and to determine the associated molecular changes that result in intercalary growth. This
was outside the scope of this PhD, nevertheless initial experiments were undertaken to
test whether the calcium signalling is involved in sensing mechanical stress in hyphal
membranes.
Given the potential role of Mid1 as a sensor of mechanical stress in yeast, my first aim
was to determine whether application of mechanical stress alone to the plasma
membranes of E. festucae hyphae was sufficient to induce changes in cytosolic calcium
concentration. In order to isolate the endophyte from other plant factors with potential
to induce calcium changes, preliminary experiments were conducted in vitro. Since the
confocal microscope (Olympus Fluoview FV10i–LIV) can only be operated with the lid
closed over the stage, the instrumentation required to conduct a test whereby resting
hyphae are imaged and then placed under strain requires engineering to retrofit the
stretching unit with a remote-controlled motor. The aim of these pilot experiments was
to determine whether the stretching unit could be modified, and to conduct preliminary
uncontrolled experiments as described below.
5.6.1 Mechanical disturbance of E. festucae in vitro induces Ca2+ pulses
As a preliminary approach to understanding the involvement of Ca2+ in mechanical
stretching, E. festucae Fl1 hyphae expressing the calcium sensor GCaMP5 (kindly
supplied by Professor Nick Read, University of Manchester) and the nuclear-localised
protein YH2A were grown on a silicon membrane as shown in Fig 5.18, using PDA as
217
the nutrient medium. Nuclear-tagged hyphae were used for easy identification of hyphal
compartments on the membrane. The hyphae on the silicon membranes were placed
inside petri-plates and incubated for 3 days at 22oC.
Figure 5.18: Diagrammatic representation showing the arrangement of components used to
grow E. festucae hyphae on amino-coated silicon membranes (see Section 5.3.1.3). Once
assembled the colony was placed in a petri plate and incubated for 3 days to allow hyphae to
grow between the two membranes.
After incubation, the nutrient block with the cellophane membrane was removed and the
silicon membranes with hyphae were mounted in PDB, a coverslip applied and then
inverted onto the stage of an Olympus Fluoview FV10i–LIV confocal laser scanning
microscope. A section of the colony was scanned and time lapse imaging was
conducted (for microscopy settings and parameters see Section 4.5) to record the pattern
of Ca2+ pulses occurring within a maximum period of 5 min. To apply mechanical
stretch to the plasma membranes of the attached hyphae, the silicon membrane was
lightly disturbed by placing pressure (using a glass rod) directly onto the silicon surface
adjacent to where the hyphal colony was located. It was assumed that the pressure
applied would be sufficient to cause localised distortions/stretching to hyphae on the
membrane, however the amount applied could not be verified using this method.
Immediately after applying pressure, time lapse imaging was again performed on the
same region for a maximum period of 5 min. There was a delay of approximately 30 sec
Cellophane membrane Cellophane meAmino-coated silicon membrane
Fungal colony
PDA medium
218
between the time the pressure was applied and the start of imaging due to the need to
refocus the microscope. In spite of this a visible increase in Ca2+ pulses in the apical and
sub-apical regions of hyphae was observed after hyphae were disturbed (in 5 out of 8
trails conducted). The pulses occurred at seemingly random points in sub-apical regions
and did not show a particular pattern in frequency. See supplementary movies in Power
Point presentation ‘Calcium pulses when disturbed’ in attached CD for impact of
mechanical stress on calcium influx in E. festucae These preliminary analyses indicated
that mechanical disturbances of E. festucae can cause an alteration in the Ca2+ dynamics
of the apical and sub-apical compartments of hyphae, and that calcium signalling may
be important in mediating growth responses to mechanical stretch. Further analyses
using an automated stretching device are required to confirm this finding, including (but
not limited to) testing of ΔmidA deletion strains for calcium influx in response to
mechanical stretch, and their ability thereafter to undergo intercalary growth.
Sequestration of calcium by BAPTA supplementation of the medium will also confirm
whether the pulses observed are due to release of calcium from cellular stores or due to
influx from the growth medium.
5.7 Discussion
The primary objective of this section of the study was to test the hypothesis that
mechanical stretching can trigger intercalary growth in E. festucae. Intercalary growth
in E. festucae hyphae is defined as the increase in sub-apical compartment lengths while
undergoing nuclear division and compartmentalization (dividing existing sub-apical
compartments through septation) (Christensen et al., 2008). Accordingly, a technique
was developed to mechanically stretch fungal hyphae and thereafter conduct
preliminary investigations to study the effect of mechanical stretching on hyphae and
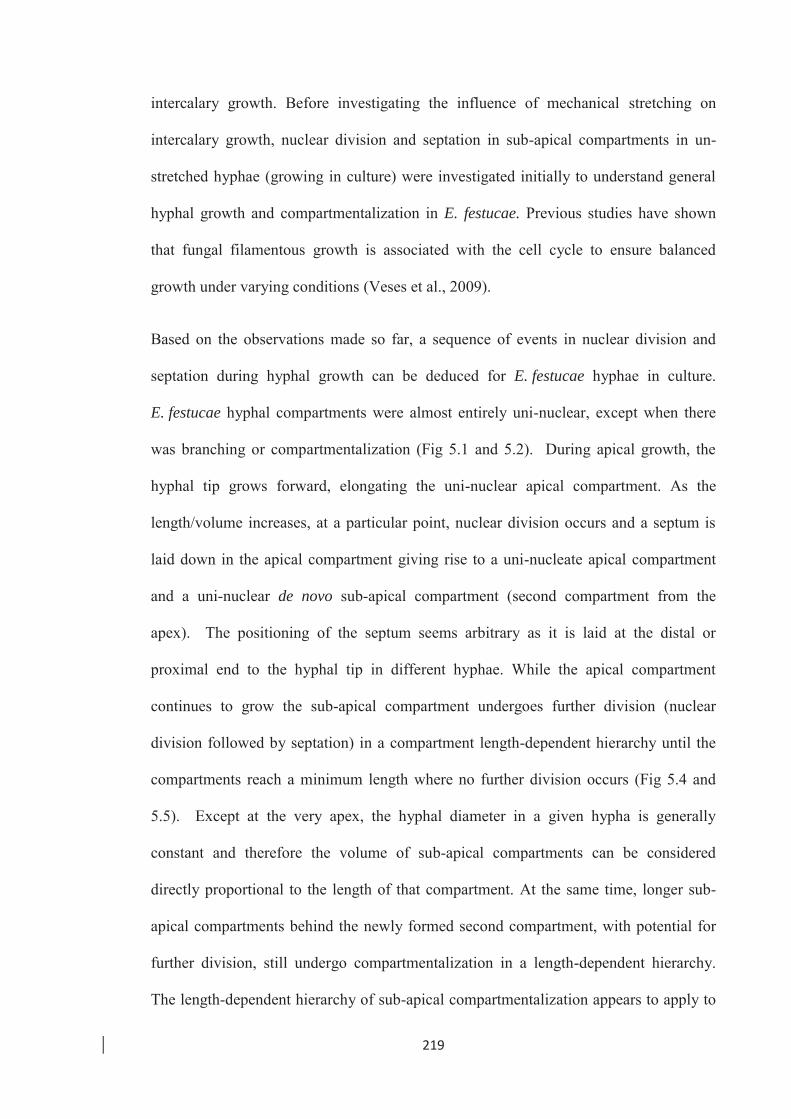
219
intercalary growth. Before investigating the influence of mechanical stretching on
intercalary growth, nuclear division and septation in sub-apical compartments in un-
stretched hyphae (growing in culture) were investigated initially to understand general
hyphal growth and compartmentalization in E. festucae. Previous studies have shown
that fungal filamentous growth is associated with the cell cycle to ensure balanced
growth under varying conditions (Veses et al., 2009).
Based on the observations made so far, a sequence of events in nuclear division and
septation during hyphal growth can be deduced for E. festucae hyphae in culture.
E. festucae hyphal compartments were almost entirely uni-nuclear, except when there
was branching or compartmentalization (Fig 5.1 and 5.2). During apical growth, the
hyphal tip grows forward, elongating the uni-nuclear apical compartment. As the
length/volume increases, at a particular point, nuclear division occurs and a septum is
laid down in the apical compartment giving rise to a uni-nucleate apical compartment
and a uni-nuclear de novo sub-apical compartment (second compartment from the
apex). The positioning of the septum seems arbitrary as it is laid at the distal or
proximal end to the hyphal tip in different hyphae. While the apical compartment
continues to grow the sub-apical compartment undergoes further division (nuclear
division followed by septation) in a compartment length-dependent hierarchy until the
compartments reach a minimum length where no further division occurs (Fig 5.4 and
5.5). Except at the very apex, the hyphal diameter in a given hypha is generally
constant and therefore the volume of sub-apical compartments can be considered
directly proportional to the length of that compartment. At the same time, longer sub-
apical compartments behind the newly formed second compartment, with potential for
further division, still undergo compartmentalization in a length-dependent hierarchy.
The length-dependent hierarchy of sub-apical compartmentalization appears to apply to
220
the whole hypha, as the longest compartment in the hypha divides first followed by the
next longest irrespective of the compartment position (within the observed limit) (Fig
5.19).
Nuclear division and septation pattern observed in E. festucae can be compared with
that of A. nidulans, in which nuclear division and septation have been studied
extensively, to further understand the volume-based initiation of nuclear division and
septation. In A. nidulans, during vegetative growth in the apical compartment,
successive parasynchronous waves of nuclear division occur, followed by rounds of
septation (Clutterbuck, 1970; Fiddy et al., 1976; Trinci et al., 1979; Wolkow et al.,
1996). The mean time between two successive cycles is the same as the organism’s
doubling time and septa are usually formed sequentially in groups with the septum
nearest to the tip formed last (Fiddy et al., 1976). Septation is triggered when the apical
compartment grows and reaches a critical ratio of cytoplasm per nucleus/genome and
the value for A. nidulans had been calculated as 57 μm3 (Clutterbuck, 1969; Fiddy et al.,
1976).
Although sufficient data on apical growth was not collected to deduce a similar
threshold limit for E. festucae during this study, observations implied volume-based
nuclear division and septation, and the possibility of the existence of a similar threshold
in E. festucae. For sub-apical compartments it was difficult to define a threshold for
cytoplasm volume that triggers further compartmentalization as the compartments
underwent division until they reached a minimum length. However, in E. festucae
growing in culture, sub-apical compartments lengths varied substantially, with the
smallest compartments approximately 18-20 μm in length, and report of compartments
as small as 4 μm observed in planta. In contrast, intercalary compartments in A.
221
nidulans had a constant length of 38 -39 μm (Trinci et al., 1979; Wolkow et al., 1996).
The influence of organelle volume on nuclear division and septation has been reported
in the filamentous phase of the dimorphic yeast C. albicans (Veses et al., 2009), and in
Basidiobolus ranarum, it has been shown that nuclear division occurs every time the
apical cell volume doubles (Robinow, 1963). In addition it has been shown that in
A. nidulans septum formation fails when mitosis is blocked, indicating that for septation
to occur both nuclear division and the critical ratio of cytoplasm to nuclei needs to be
achieved (Harris et al., 1994; Wolkow et al., 1996).
The observed correlation between compartment length and nuclear length agrees well
with the compartment length-dependent hierarchy seen during sub-apical
compartmentalization, as compartments undergoing further division contain elongated
nuclei. Observance of elongated nuclei in hyphae in the elongation zone of developing
host leaves also aligns with the proposed intercalary growth taking place in this region
(Christensen et al., 2008). The average nuclear length in compartments in the host
meristematic region is shorter than those in the elongation zone, but longer than those in
the mature zone (Fig 5.6 and 5.7). In the meristematic region, where hyphae are
extending predominantly through apical growth, further division of intercalary
compartments may still be occurring (as longer compartments divide) but this is likely
to be at a lower rate than the elongation zone where intercalary extension is occurring.
Hyphal compartments in the mature leaf are no longer extending, and in this region
nuclei are mostly spherical.
222
Figure 5.19: A model showing compartment length-dependent nuclear division and septation
in sub-apical compartments of E. festucae hyphae.
Sub-apical compartments undergo further compartmentalization based on a compartment
length/volume-dependent hierarchy where, at a given time, the longest compartment in the
hypha divide first followed by the next until they reach a minimum length. The septation pattern
shown is a model derived from interpretations of experimental data. A, B, C and D represent
new septa appearing at each time point T0, T1, T2 and T3 respectively. The hyphae and
compartments are not drawn to scale.
Having an understanding of how nuclear division and septation occur in E. festucae
hyphae in culture under un-stretched conditions, E. festucae hyphae were next subjected
to mechanical stretch to investigate its effect on sub-apical hyphal growth. As
hypothesised, in the elongation zone of a developing leaf, the host cells will be
elongating continuously (during the elongation period) and therefore the attached fungal
hyphae will be under continuous mechanical stretch (Schnyder et al., 1990; Durand et
al., 1999). The optimised stretching technique did not allow for mechanical stretch to be
Hyphal tip Colony centre
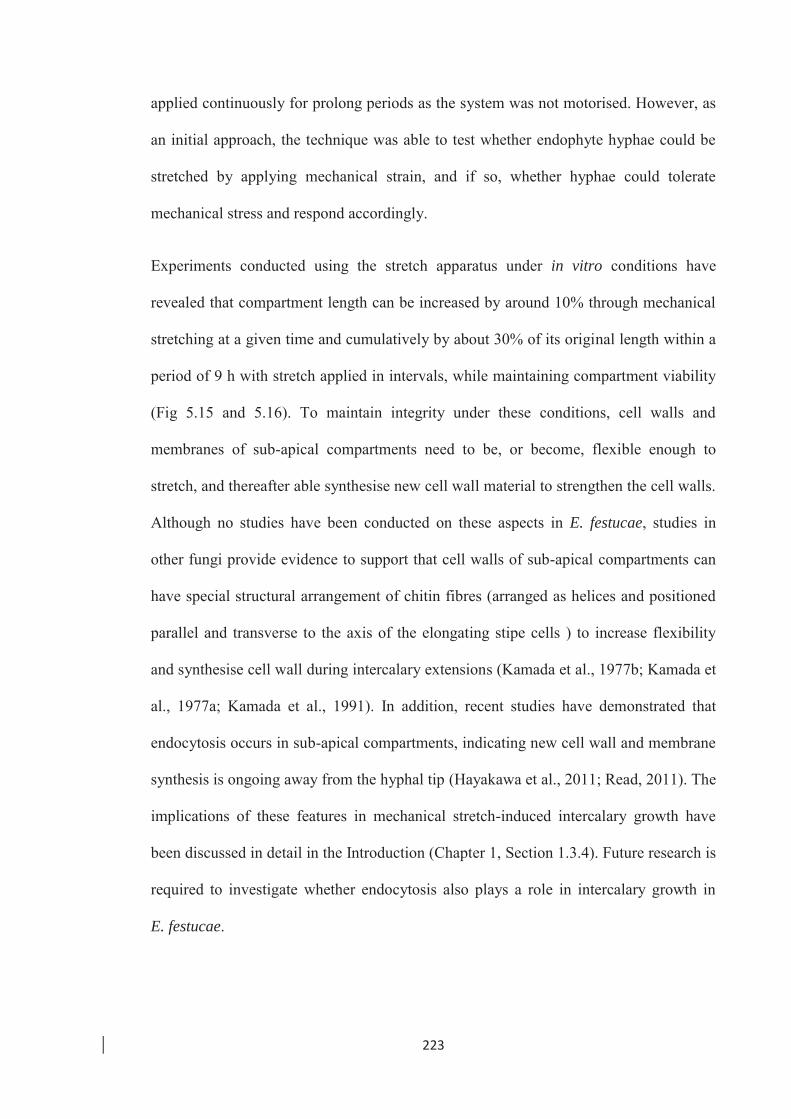
223
applied continuously for prolong periods as the system was not motorised. However, as
an initial approach, the technique was able to test whether endophyte hyphae could be
stretched by applying mechanical strain, and if so, whether hyphae could tolerate
mechanical stress and respond accordingly.
Experiments conducted using the stretch apparatus under in vitro conditions have
revealed that compartment length can be increased by around 10% through mechanical
stretching at a given time and cumulatively by about 30% of its original length within a
period of 9 h with stretch applied in intervals, while maintaining compartment viability
(Fig 5.15 and 5.16). To maintain integrity under these conditions, cell walls and
membranes of sub-apical compartments need to be, or become, flexible enough to
stretch, and thereafter able synthesise new cell wall material to strengthen the cell walls.
Although no studies have been conducted on these aspects in E. festucae, studies in
other fungi provide evidence to support that cell walls of sub-apical compartments can
have special structural arrangement of chitin fibres (arranged as helices and positioned
parallel and transverse to the axis of the elongating stipe cells ) to increase flexibility
and synthesise cell wall during intercalary extensions (Kamada et al., 1977b; Kamada et
al., 1977a; Kamada et al., 1991). In addition, recent studies have demonstrated that
endocytosis occurs in sub-apical compartments, indicating new cell wall and membrane
synthesis is ongoing away from the hyphal tip (Hayakawa et al., 2011; Read, 2011). The
implications of these features in mechanical stretch-induced intercalary growth have
been discussed in detail in the Introduction (Chapter 1, Section 1.3.4). Future research is
required to investigate whether endocytosis also plays a role in intercalary growth in
E. festucae.

224
Within the elongation zone of the host (L. perenne) developing leaf endophyte hyphae
are tightly attached to the surrounding host cells from all sides (Christensen et al.,
2008). Therefore, we assume that stretching forces are exerted on the endophyte hyphae
in proportion to the spatial and temporal behaviour of the elongation zone of the host
developing leaf. Studies on L. perenne leaf development show that the leaf elongation
zone is confined to the basal 20-30 mm of the leaf with growth stage dependent
maximum leaf elongation rate (LER) of 1.39 mmh-1 and the minimum of 0.51 mmh-1
(Schnyder et al., 1990). Within the elongation zone, the length of epidermal cells had
increased from 12 μm at the leaf base to a maximum of 550 μm at the distal end. The
maximum epidermal cell elongation rate of 28 μm cell-1 h-1 has been observed close to
the centre of the elongation zone, 13-18 mm from the base (Schnyder et al., 1990). Due
to the extremely varying cell elongation rates epidermal cell elongation could occur for
days until the final length is reached. Accordingly, it is clear that attached endophyte
hyphae can be subjected to extreme elongation (considering the epidermal cell length
increase of 12-550 μm) under varying degrees of stretch that change with time and the
position of the elongation zone. The stretch applied at a given time during this study
increased compartment lengths by 10% of their original length (while maintaining
viability), exceeding the overall leaf elongation rate (the elongation zone of 30 mm
increase at 1.39 mmh-1, about 4.6% of original length per hour) reported for the host.
Therefore this clearly indicates that the endophyte hyphae can handle the maximum
level of stretch that can be exerted by elongating host cells. However, the maximum
length a compartment can be elongated through mechanical stretching is not certain at
this stage (so far a cumulative 30% increase in length has been achieved by applying
stretch three fold in 3 h intervals). Applying mechanical stretch continuously
(mimicking the elongation zone) for a prolong period, as planned as the next step in this

225
study, will give a better indication of the maximum length hyphal compartments can be
elongated to match the maximum individual epidermal cell length increase seen in the
host (12 to 550 μm).
Observation of stretched hyphae under in vitro conditions (where compartment lengths
increased) clearly indicated that, similar to un-stretched hyphae, the sub-apical
compartments undergo mitosis and septation based on a compartment length-dependent
hierarchy. The only difference observed was an increase in the rate of septation/
compartmentalization in sub-apical compartments of stretched hyphae compared to un-
stretched hyphae under similar conditions (Fig 5.17). As explained in previous sections,
compartment volume plays a crucial role in initiating nuclear division and subsequent
septation in filamentous fungi (Fiddy et al., 1976; Veses et al., 2009). In stretched
hyphae increases in compartment length imply that compartment volumes are higher
than un-stretched hyphae under similar conditions. Compartments can be considered as
functionally distinct, separate units or cells with respect to nuclear division and
septation (Rosenberger et al., 1967) and it has been well established that in eukaryotic
cells, the cell cycle is initiated when the cells reach a critical cell size or threshold
(Rupeš, 2002; Cook et al., 2007).Therefore the observed increase in nuclear division
and septation rate in stretched hyphae (compared to un-stretched hyphae) may be a
direct response to the increased volume in individual compartments caused by
mechanical stretch, or alternative mechanisms associated with other responses to
compartment stretch.
Mechanically-stretched E. festucae hyphae under in vitro conditions during this study
demonstrated all the basic features of intercalary growth, including increases in sub-
apical compartment length (hence a cumulative increase in the hyphal segment) and
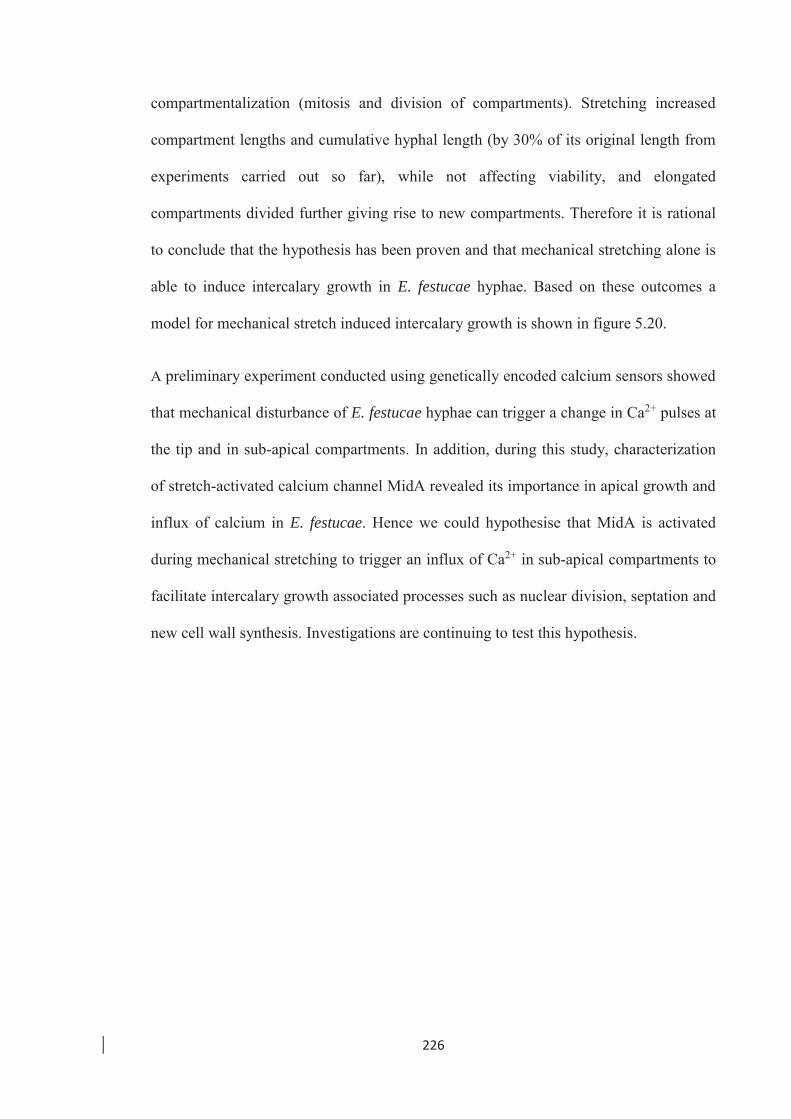
226
compartmentalization (mitosis and division of compartments). Stretching increased
compartment lengths and cumulative hyphal length (by 30% of its original length from
experiments carried out so far), while not affecting viability, and elongated
compartments divided further giving rise to new compartments. Therefore it is rational
to conclude that the hypothesis has been proven and that mechanical stretching alone is
able to induce intercalary growth in E. festucae hyphae. Based on these outcomes a
model for mechanical stretch induced intercalary growth is shown in figure 5.20.
A preliminary experiment conducted using genetically encoded calcium sensors showed
that mechanical disturbance of E. festucae hyphae can trigger a change in Ca2+ pulses at
the tip and in sub-apical compartments. In addition, during this study, characterization
of stretch-activated calcium channel MidA revealed its importance in apical growth and
influx of calcium in E. festucae. Hence we could hypothesise that MidA is activated
during mechanical stretching to trigger an influx of Ca2+ in sub-apical compartments to
facilitate intercalary growth associated processes such as nuclear division, septation and
new cell wall synthesis. Investigations are continuing to test this hypothesis.
227
Figure 5.20: A sketch of the proposed model for mechanical stretch induced intercalary
growth in sub-apical compartments of E. festucae hyphae.
Mechanical stretch increases the compartment length/volume, stretching the membranes and
triggering an influx of calcium through the stretch-activated calcium channel MidA. The
increased compartment volume results in an increase in compartmentalization (nuclear division
and septation) compared to an un-stretched hypha, facilitated by Ca2+ signalling. Yellow septum
– Septum that would be formed under both un-stretched and stretched conditions (as
compartment is large), Red septum - Septum formed only due to increased compartment length
at the same time point (as compartment expansion increases beyond the minimum threshold for
division), A & B - septa present at each time point, Blue rectangles – stretch-activated calcium
channel MidA. The hyphae and compartments are not drawn to scale.
Un-stretched hypha Stretched hypha with increased compartment length undergoing nuclear division and septation
228
Figure 5.21: A representative sketch comparing nuclear division and septation at 4 time points
between an un-stretched hypha and a stretched hypha.
When E. festucae hyphae are mechanically stretched within tolerable limits, the compartments
length/volume increases proportionally to the amount of stretch applied. The stretched
compartments undergo compartmentalization similar to un-stretched hyphae, however at a
higher rate to accommodate the increased compartment length/volume due to stretching.
Compartmentalization is based on a length-dependent hierarchy. The septation pattern shown is
a model based on interpretations of experimental data. A, B, C and D represent septa present at
each time point T0, T1, T2 and T3 respectively. The hyphae and compartments are not drawn to
scale.
Compartmentalisation in an un-stretched hypha at 4 time points
Compartmentalisation in the same hypha at 4 time points under stretched conditions

229
The same model can also be applied to intercalary hyphal growth in the elongation zone
of the developing leaf. Plant cells in the meristematic zone undergo rapid elongation in
the elongation zone. At the same time hyphae attached to host cells are subjected to
mechanical stretch as the host cells elongate. As a result, as seen in vitro, the sub-apical
compartments of attached hyphae increase in length in proportion to host cell
elongation, and start to undergo compartmentalization (at higher rate than un-stretched
hyphae), accommodating the added length. When host cell elongation ceases (in the
mature zones of the leaf) no further mechanical stretching occurs and therefore
intercalary growth too will cease. However it is possible that compartmentalization will
continue to occur (but no compartment elongation) in the mature zone for some time
until the compartments reach a minimum volume that stops further
compartmentalization.
The conditions in the apoplast of the elongation zone of the host developing leaf are
more complex than the in vitro conditions used during this study to demonstrate
intercalary growth in E. festucae hyphae. Potato dextrose in water was used as the basic
nutrient medium during this study. The apoplast environment in the elongation zone of
the developing leaf can have different levels of pH, reactive oxygen species (ROS),
Ca2+, sugars and other nutrients that may have a significant influence on intercalary
growth (Rayle et al., 1992; Cosgrove, 2000; Rodrı́guez et al., 2002). In grass species
such as Zea mays high levels of ROS have been found in the apoplast of the expansion
zone and shown to be necessary for cell wall loosening during leaf elongation
(Schweikert et al., 2000; Rodrı́guez et al., 2002). In addition, disruption of ROS
production via gene deletion in E. festucae results in breakdown of the usual symbiotic,
synchronised growth seen with the host L. perenne, indicating a possible role for ROS
in intercalary growth (Tanaka et al., 2006). According to the acid-growth hypothesis of
230
plant cell expansion, the activity of the plasma membrane-located proton pump reduces
the cell wall from pH 7.0 to as low as 4.5 (Rayle et al., 1970; Hager et al., 1991).
Whether similar conditions exist in the apoplast of the elongation zone of developing
grass leaves has not been reported. Although the influence of these factors have not
been tested during this study due to time constraints, the techniques developed will
allow the in vitro growth medium to be modified easily before or during the stretching
experiments (by replacing the growth medium above the cellophane membrane) to test
the effect of these factors in future.
This study is the first attempt to investigate intercalary growth under in vitro conditions
in fungi and examine the effect of mechanical stretching on fungal hyphae. Work so far
has managed to successfully optimise a technique to mechanically stretch E. festucae
fungal hyphae under in vitro conditions and demonstrate that hyphae can undergo
intercalary growth when subjected to mechanical stretch. This work provides the basis
for a broader investigation on intercalary growth and its associated phenomena. The
scope of the apparatus to stretch fungal hyphae developed during this study can be
further enhanced by motorising the stretch frame and replacing the impermeable silicon
membrane with a permeable membrane for nutrient and water. This will enable
applying mechanical stretch continuously with high degree of control to mimic the
exact conditions in the leaf elongation zone.
As mentioned earlier the plant apoplast is a complex environment, and the impact on
intercalary growth of some conditions (e.g. pH, ROS etc) could be tested in vitro using
this technique by changing the growth medium. Other important avenues that warrant
further research during mechanical stretch-driven intercalary growth are changes to the
cell wall, cell membranes and nuclear behaviour. Although intercalary growth has been
231
experimentally shown only in E. festucae, it is possible that it may be common
phenomenon in other filamentous fungi as well. The technique developed here could be
used to test this hypothesis on most filamentous fungi that grow well in culture. The
involvement of putative mechanosensors (WscA and MidA) in sensing mechanical
stress and intercalary growth has been only partially investigated during this study
(chapters 3 and 4) due to time constrains. In future, the mutant strains (ΔmidA and
ΔwscA) will be subjected to mechanical stretching using the stretch technique to test
their roles in mechanosensing and intercalary growth.

232
6. Summary, conclusions and future work
233
The aim of this PhD project was to determine whether mechanical stress was sufficient
to induce intercalary extension in E. festucae endophytes of grasses, and to identify the
proteins that sense and transduce the signal to initiate growth.
6.1 Stimulation of intercalary growth in E. festucae through mechanical stress
Colonisation of developing grass leaves by E. festucae hyphae requires a change in
development from a highly branched mycelium with lots of hyphal tips (in hyphae
colonising the host meristem), to long straight hyphae (in the intercalary growth zone)
that are seldom branched and grow primarily through intercalary extension. The major
objective of this project was to address whether intercalary extension in E. festucae is
initiated and sustained through mechanical stress which is placed on hyphae by
expansion of the host cells to which they are attached.
To test this hypothesis, a technique was developed to stretch fungal hyphae in vitro,
away from other plant factors that may be involved in stimulating hyphal intercalary
extension. Indirect evidence obtained previously suggested that intercalary growth in
E. festucae in plants is accompanied by mitosis and formation of septa. Therefore, the
first objective was to determine whether nuclear division and septation also occur in
sub-apical compartments of E. festucae under stretch. The following conclusions were
derived from the investigations conducted.
De novo compartmentalization in relaxed sub-apical compartments of
E. festucae hyphae occurs according to a compartment length-dependent
hierarchy.
E. festucae hyphae are, for the most part, uni-nucleate. Examination of division in apical
and sub-apical compartments of control hyphae extending at the tip during growth in
234
culture revealed that mitosis and septation occur in all compartments observed (10-15
compartments behind the apex) until a final compartment length of between 20-30 μm
is reached. Once at this length, compartments appeared to go into cell cycle arrest.
Whether this was permanent or temporary could not be discerned as other hyphae
rapidly overgrew these compartments. As in other fungi, it was clear that compartment
expansion was strictly confined to the apical compartment. Furthermore, the order of
division in sub-apical compartments was not related to their position from the apex, but
was dependent on compartment length. There was a hierarchy in compartment division,
with longest compartments dividing first.
A positive correlation exists between compartment length and longitudinal
length of the corresponding nuclei in a hypha.
Observations of fluorescent nuclei in hyphae growing in axenic culture indicated that
longer compartments appeared to have longitudinally elongated nuclei while, shorter
compartments contained more globular shaped nuclei. Since these longer compartments
divided first, the presence of elongated nuclei in long compartments was a sign of
imminent compartmentalization, possibly due to rearrangements of the cytoskeleton
prior to nuclear division.
E. festucae hyphal compartment lengths can be increased through mechanical
stretching while maintaining viability, provided that the stretch is within
tolerable limits.
Experiments that were conducted using the stretch apparatus under in vitro conditions
revealed that E. festucae compartment length can be increased by around 10% through
mechanical stretching at a given time, and cumulatively by about 30% of its original
length within a period of 9 h with stretch applied in intervals, while maintaining
235
compartment viability. All compartments along the lengths of hyphae examined
increased in length proportionally. E. festucae hyphae therefore tolerate quite significant
mechanical stress. This is clearly an important attribute, given their biotrophic life cycle
and requirement to colonise developing leaves (being seed-transmitted). Whether this is
an adaptation that is confined to Epichloë endophytes or is present in other biotrophs or
fungi in general is not known, as no attempts to stretch other fungi have yet been made.
This result therefore represents an important development in our understanding of how
Epichloë fungi grow, with possible broad implications for fungal growth in general
depending on the outcomes of future stretching experiments in other species.
The rate of septation/ compartmentalization in sub-apical compartments of
stretched hyphae is significantly higher than that of un-stretched hyphae
under similar conditions.
In mechanically-stretched hyphae (within tolerable limits) the sub-apical compartments
continue to undergo nuclear division and septation, demonstrating that the
compartments are still viable. As found in relaxed hyphae, division occurred according
to a compartment length-dependent hierarchy. Notably, the rate of new compartment
formation in stretched hyphae was significantly higher than that of the un-stretched
hyphae. This indicates that mechanical stretch, apart from increasing compartment
length, also stimulates the cell cycle. How this occurs is not yet known, but the simplest
explanation is that an increase in the length of shorter compartments (due to mechanical
stretching) tips these compartments over the minimum threshold for division, and this
stimulates the cell cycle in the same manner as is observed in control un-stretched
hyphae.
236
6.2 Putative sensors of mechanical stress in E. festucae
Investigations on WscA and MidA of E. festucae were undertaken with the main
objective of understanding their role in stimulating intercalary growth. However, as the
genes have not been characterised in E. festucae before, experiments were also
conducted to understand their primary functions as a basis to better understand their
possible roles in intercalary growth. The following conclusions were derived from the
investigations conducted.
E. festucae WscA is essential for hyphal apical growth and cell wall
construction during growth in culture.
Identification of the E. festucae orthologue of wsc1 of S. cerevisiae via bioinformatics
approaches was not straight forward as there is little homology between the cell wall
integrity Wsc proteins of yeast and filamentous fungi. The E. festucae wscA gene
identified here is the presumed orthologue of S. cerevisiae wsc1 at this time, but further
characterisation of the role of this protein is still required. Nevertheless, E. festucae
ΔwscA mutants exhibited reduced radial colony growth rate and hyphal apical growth,
but more cell wall aberrations and hyphal tip lysis compared to WT when growing in
standard PDA. This indicated an important role for WscA in E. festucae hyphal growth
in general and in cell wall construction. The ability of osmotic stabilisers to restore all
observed ΔwscA phenotypes to the WT further supports the argument that wscA deletion
results in an alterations in cell wall structure and composition, weakening the cell wall.
These results suggest a role for WscA in regulating cell wall synthesis, particularly
under hypo-osmotic conditions. The signalling pathway through which WscA exerts it
effects has not been elucidated in this study, but is likely to be through Rho1 and the
cell wall integrity MAP kinase pathway. In addition, the ability of osmotic stabilisers to
237
restore ΔwscA phenotypes suggests that another pathway (such as the HOG pathway)
may take over under hyper-osmotic conditions, making the CWI MAP kinase pathway
redundant under these conditions.
WscA is important in sensing and responding to cell wall perturbation.
E. festucae ΔwscA mutants exhibited significantly greater sensitivity than the WT in
response to the presence of cell wall perturbing agents such as CW and CR, even under
osmotically stabilised conditions. Inability of ΔwscA mutants to sense cell wall stress
and respond by inducing cell wall synthesis is the likely factor behind their enhanced
sensitivity to cell wall stress. These data lend support to the importance of the putative
E. festucae WscA in cell wall integrity, particularly when the cell wall is under stress.
WscA alone is not essential in infection and colonization of the host,
L. perenne.
E. festucae ΔwscA mutants were able to infect and colonise host plants in a similar
manner to WT strains. Hyphal colonization patterns and hyphal densities within the
meristematic tissue, expansion zone and mature leaf showed no difference to that of
plants inoculated with the WT.
WscA alone is not essential for E. festucae hyphal intercalary growth in planta.
The ability of E. festucae ΔwscA mutants to colonise and form long parallel hyphae
within the expansion zone of the developing leaf indicated that ΔwscA mutants can
undergo intercalary growth. It is possible that the overlapping functions of other sensory
proteins in the CWI MAP kinase pathway can complement the loss of WscA under
these conditions. Future studies are required to confirm whether ΔwscA mutants are able
to undergo intercalary growth in response to mechanical stretching under in vitro
238
conditions, and to delete further genes in the pathway that may be able to complement
its role as a sensor. Complementation of the S. cerevisiae wsc1 deletion mutant is also
required to verify this gene as the yeast orthologue.
MidA is essential in E. festucae cell wall construction during hyphal growth
under regular or low exogenous Ca2+ levels, but not essential to maintain
normal hyphal apical growth rate.
Hyphae of the E. festucae ΔmidA mutants exhibited cell wall aberrations, hyphal tip
branching and frequent hyphal tip lysis, indicating defective and weakened cell walls.
Osmotic stabilisers were able to restore these phenotypes, demonstrating that midA
deletion causes a major structural weakness in the cell walls. Under depleted Ca2+ levels
(in the presence of EGTA) these phenotypes were exacerbated. Despite defective cell
wall synthesis, the apical growth rate of individual ΔmidA hyphae was similar to that of
the WT. Therefore the reduced colony growth seen in ΔmidA colonies was attributed to
frequent hyphal tip lysis and tip branching, caused by weakened cell walls. In
E. festucae, Ca2+ influx through MidA appears to be essential for proper cell wall
synthesis (possibly through the activation of the transcription factor Crz1, as shown in
other fungi) under regular and low exogenous Ca2+ conditions.
E. festucae has alternative uptake systems, other than MidA, that uptake Ca2+
in high exogenous Ca2+ environments.
High exogenous Ca2+ was able to restore E. festucae ΔmidA phenotypes, including
reduced radial colony growth and cell wall defects (as observed through Calcofluor
White staining). This is likely partly due to the osmotic stability provided by high
concentrations of CaCl2 in the growth medium, and also through the activation of
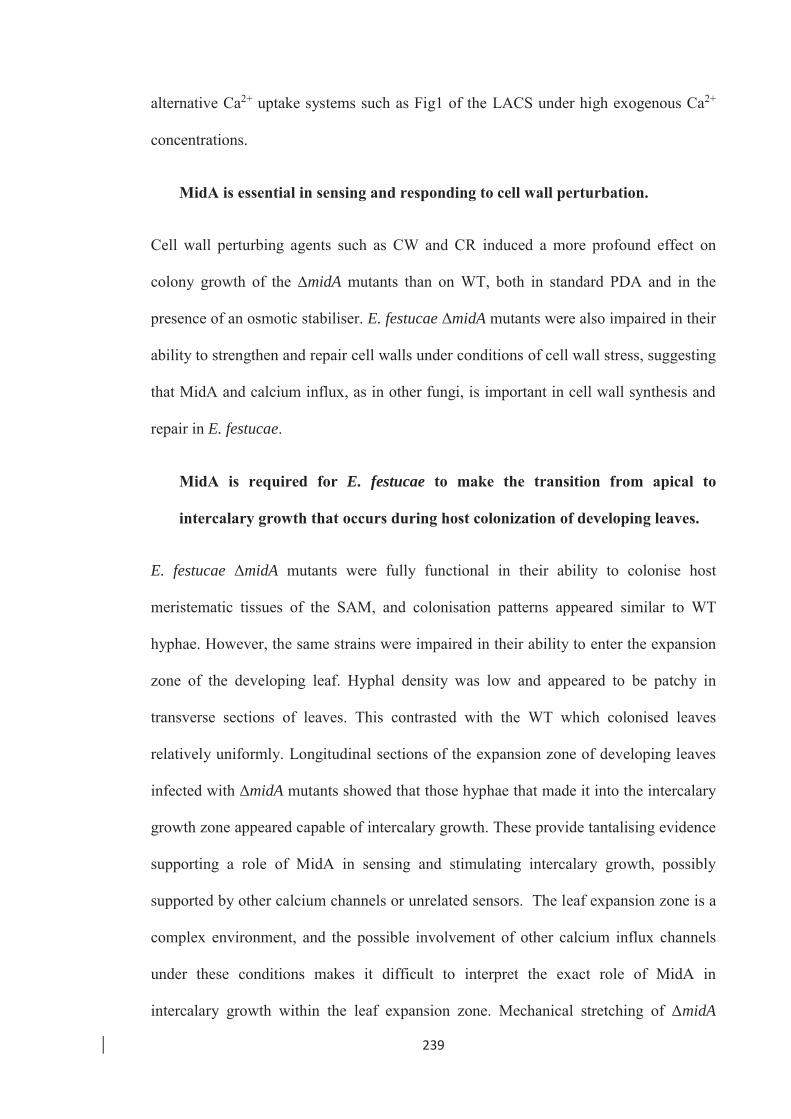
239
alternative Ca2+ uptake systems such as Fig1 of the LACS under high exogenous Ca2+
concentrations.
MidA is essential in sensing and responding to cell wall perturbation.
Cell wall perturbing agents such as CW and CR induced a more profound effect on
colony growth of the ∆midA mutants than on WT, both in standard PDA and in the
presence of an osmotic stabiliser. E. festucae ΔmidA mutants were also impaired in their
ability to strengthen and repair cell walls under conditions of cell wall stress, suggesting
that MidA and calcium influx, as in other fungi, is important in cell wall synthesis and
repair in E. festucae.
MidA is required for E. festucae to make the transition from apical to
intercalary growth that occurs during host colonization of developing leaves.
E. festucae ΔmidA mutants were fully functional in their ability to colonise host
meristematic tissues of the SAM, and colonisation patterns appeared similar to WT
hyphae. However, the same strains were impaired in their ability to enter the expansion
zone of the developing leaf. Hyphal density was low and appeared to be patchy in
transverse sections of leaves. This contrasted with the WT which colonised leaves
relatively uniformly. Longitudinal sections of the expansion zone of developing leaves
infected with ΔmidA mutants showed that those hyphae that made it into the intercalary
growth zone appeared capable of intercalary growth. These provide tantalising evidence
supporting a role of MidA in sensing and stimulating intercalary growth, possibly
supported by other calcium channels or unrelated sensors. The leaf expansion zone is a
complex environment, and the possible involvement of other calcium influx channels
under these conditions makes it difficult to interpret the exact role of MidA in
intercalary growth within the leaf expansion zone. Mechanical stretching of ΔmidA
240
hyphae under in vitro conditions is suggested in order to exclude other plant factors and
provide a conclusive understanding of the role of MidA alone, with and without
exogenous calcium in sensing mechanical stress and triggering intercalary growth.
Calcium concentration at the hyphal tips of E. festucae has a pulsatile nature
with unique spatial and temporal signatures.
Given the role of MidA in cell wall synthesis and host colonisation, we hypothesised
that calcium has a prominent role in hyphal growth in E. festucae. Hence a study was
undertaken to optimise a technique to study calcium distribution and signalling in
E. festucae with the intention of extending the study to intercalary growth.
Time lapse imaging of E. festucae hyphae transformed with the genetically encoded
calcium sensor GCaMP5 revealed frequent Ca2+ pulses at the hyphal tip. Each hypha of
the same strain under similar conditions displayed unique signatures of temporal and
spatial calcium dynamics (amplitude, distribution area and the frequency). The pulses
were mostly confined to the hyphal tips, although single Ca2+ pulses were occasionally
observed in sub-apical regions. Use of the calcium chelating agent EGTA in the
medium attenuated Ca2+ pulses at the hyphal tip, indicating that the Ca2+ pulses were
due to influx of external calcium, and not to calcium released from calcium stores.
MidA is responsible for generating the Ca2+ pulsatile signatures at the hyphal
tip.
Gene replacement studies of midA in E. festucae indicated that the regular Ca2+ pulses
present in most WT hyphae were not visible in the mutants. These calcium oscillations
are therefore mediated through MidA activity. However an alternative pulse, at times
higher than the WT pulses in terms of amplitude and distance from tip, was still
241
detectable. This indicates that there is either another channel through which calcium is
able to enter the hyphal tip or that the CchA channel is activated by more than one
regulator. This alternative entry mechanism for calcium has a different periodicity to the
MidA-regulated process, and may complement the MidA deletion to a certain extent,
possibly explaining the partial intercalary growth phenotype observed in ΔmidA mutants
in plants. The FigA of LACS provides a further mechanism which may explain the
residual calcium oscillation in the mutants. Complementing the ΔmidA mutant with full
length midA gene restored the Ca2+ pulsatile signature as seen in WT hyphae,
confirming that the primary calcium oscillations observed are due to MidA activity.
Ca2+ influx and a tip high gradient of Ca2+ may not be essential to maintain
E. festucae apical growth rate in culture.
Although Ca2+ pulses were a frequent occurrence in WT hyphae, there were hyphae that
did not show any visible pulses at the tip. Furthermore, the ΔmidA hyphae did not
display the frequent pulsatile nature of the WT hyphae, except for the occasional pulses
described above. The steep tip-high [Ca2+]c gradient was also not clearly visible in the
ΔmidA hyphae. However, measurements of hyphal apical growth rate in ΔmidA mutant
hyphae, or in WT hyphae that were not fluorescing, were not significantly different to
that of WT hyphae that demonstrated frequent Ca2+ pulses at the tip. This indicates that
hyphal tip extension can occur in the absence of rapid periodicity calcium pulses.
Nevertheless, the hyphae of the mutants were fragile as a result of cell wall weakness.
The reason behind the absence of calcium pulses in some growing WT hyphae is not
known.
242
Ca2+ uptake systems are active in sub-apical regions of E. festucae hyphae.
Calcium pulses were occasionally observed in sub-apical regions of hyphae at
seemingly random positions along a hypha, and appeared to be due to influx of Ca2+, as
the presence of EGTA eliminated these pulses. Interestingly, mechanical perturbation of
hyphae resulted in a visible increase in Ca2+ pulses in apical as well as sub-apical
regions, which confirmed the presence of active calcium uptake systems away from the
hyphal tip, and showed that the channels could be activated through mechanical
perturbations. These results provide preliminary evidence to support the possible
involvement of Ca2+ signalling in intercalary growth.
6.3 General conclusion
To conclude, mechanical stretching of hyphae increases E. festucae compartment
length, and the elongated compartments remain viable and undergo nuclear division and
septation, fulfilling the three basic requirements for intercalary growth. These results
indicate that mechanical stretching alone is sufficient to trigger intercalary growth and
that hyphae respond to increased compartment lengths by inducing nuclear division and
septation in sub-apical compartments. The first step in intercalary growth of endophytes
in plants is therefore likely to be the sensing of mechanical stress by proteins in the
Epichloë plasma membrane when compartments are subjected to strain during host cell
expansion. Compartment expansion is likely to be driven by host cell expansion and
may simply be a physical process of cell wall stretch. We cannot however rule out that
other plant factors are also involved. Nevertheless, expansion in compartments then
results in de novo cell division and new compartment formation.
Once mechanical stretch has occurred, we propose that sensors in fungal cell
membranes are stimulated to initiate cell wall synthesis. Deletion of the E. festucae
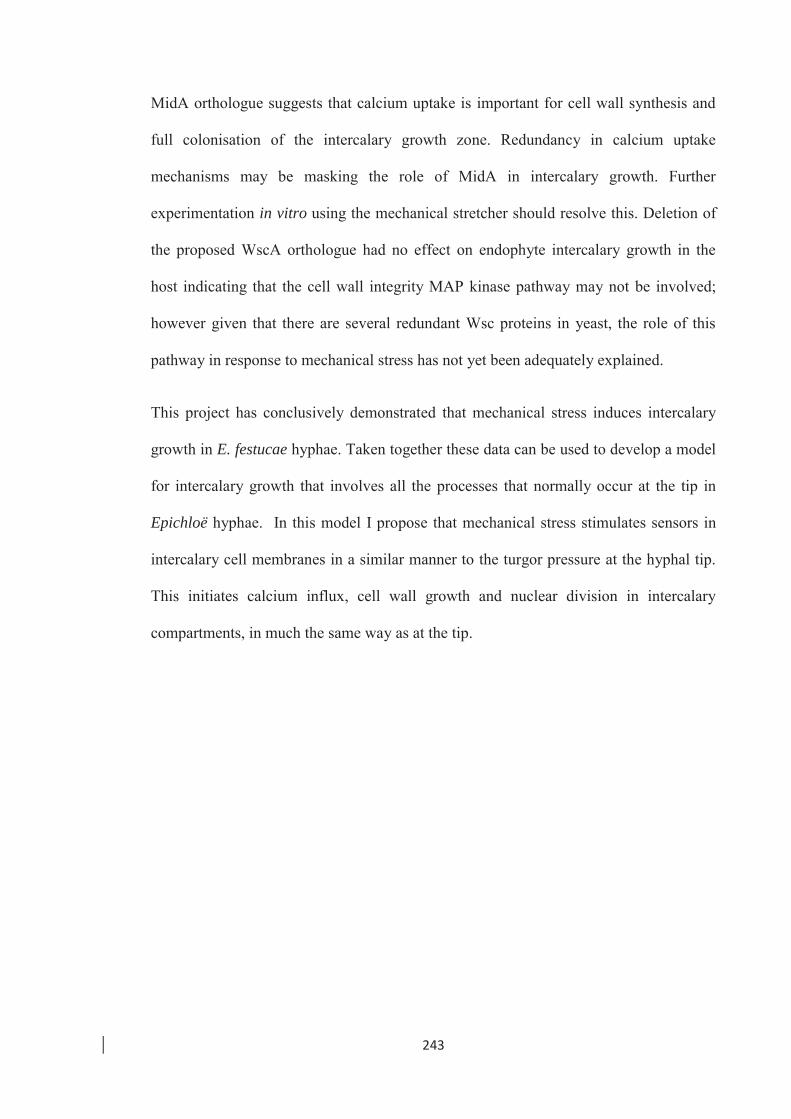
243
MidA orthologue suggests that calcium uptake is important for cell wall synthesis and
full colonisation of the intercalary growth zone. Redundancy in calcium uptake
mechanisms may be masking the role of MidA in intercalary growth. Further
experimentation in vitro using the mechanical stretcher should resolve this. Deletion of
the proposed WscA orthologue had no effect on endophyte intercalary growth in the
host indicating that the cell wall integrity MAP kinase pathway may not be involved;
however given that there are several redundant Wsc proteins in yeast, the role of this
pathway in response to mechanical stress has not yet been adequately explained.
This project has conclusively demonstrated that mechanical stress induces intercalary
growth in E. festucae hyphae. Taken together these data can be used to develop a model
for intercalary growth that involves all the processes that normally occur at the tip in
Epichloë hyphae. In this model I propose that mechanical stress stimulates sensors in
intercalary cell membranes in a similar manner to the turgor pressure at the hyphal tip.
This initiates calcium influx, cell wall growth and nuclear division in intercalary
compartments, in much the same way as at the tip.
244
7. References
Adamíková, L. U., Straube, A., Schulz, I. & Steinberg, G. 2004. Calcium signaling is involved in dynein-dependent microtubule organization. Molecular biology of the cell, 15, 1969-1980.
Akerboom, J., Chen, T.-W., Wardill, T. J., Tian, L., Marvin, J. S., Mutlu, S., Calderón, N. C., Esposti, F., Borghuis, B. G., Sun, X. R., Gordus, A., Orger, M. B., Portugues, R., Engert, F., Macklin, J. J., Filosa, A., Aggarwal, A., Kerr, R. A., Takagi, R., Kracun, S., Shigetomi, E., Khakh, B. S., Baier, H., Lagnado, L., Wang, S. S.-H., Bargmann, C. I., Kimmel, B. E., Jayaraman, V., Svoboda, K., Kim, D. S., Schreiter, E. R. & Looger, L. L. 2012. Optimization of a GCaMP Calcium Indicator for Neural Activity Imaging. The Journal of Neuroscience, 32, 13819-13840.
Altschul, S. F., Gish, W., Miller, W., Myers, E. W. & Lipman, D. J. 1990. Basic local alignment search tool. Journal of Molecular Biology, 215, 403-410.
Altschul, S. F., Madden, T. L., Schaffer, A. A., Zhang, J., Zhang, Z., Miller, W. & Lipman, D. J. 1997. Gapped BLAST and PSI-BLAST: a new generation of protein database search programs. Nucleic Acids Res, 25, 3389-402.
Antebi, A. & Fink, G. R. 1992. The yeast Ca (2+)-ATPase homologue, PMR1, is required for normal Golgi function and localizes in a novel Golgi-like distribution. Molecular biology of the cell, 3, 633-654.
Bartnicki-Garcia, S., Bartnicki, D. D., Gierz, G., López-Franco, R. A. & Bracker, C. E. 1995. Evidence That Spitzenkörper Behavior Determines the Shape of a Fungal Hypha: A Test of the Hyphoid Model. Experimental Mycology, 19, 153-159.
Bartnicki-Garcia, S., Hergert, F. & Gierz, G. 1989. Computer simulation of fungal morphogenesis and the mathematical basis for hyphal (tip) growth. Protoplasma, 153, 46-57.
Bartnicki-Garcia, S. & Lippman, E. 1969. Fungal Morphogenesis: Cell Wall Construction in Mucor rouxii. Science, 165, 302-304.
Becker, Y., Eaton, C. J., Brasell, E., May, K. J., Becker, M., Hassing, B., Cartwright, G. M., Reinhold, L. & Scott, B. 2014. The Fungal Cell-Wall Integrity MAPK Cascade Is Crucial for Hyphal Network Formation and Maintenance of Restrictive Growth of Epichloë festucae in Symbiosis With Lolium perenne. Molecular Plant-Microbe Interactions, 28, 69-85.
Benčina, M., Bagar, T., Lah, L. & Kraševec, N. 2009. A comparative genomic analysis of calcium and proton signaling/homeostasis in Aspergillus species. Fungal Genetics and Biology, 46, S93-S104.
Bonilla, M. & Cunningham, K. W. 2003. Mitogen-activated Protein Kinase Stimulation of Ca2+ Signaling Is Required for Survival of Endoplasmic Reticulum Stress in Yeast. Molecular Biology of the Cell, 14, 4296-4305.
Bormann, J. & Tudzynski, P. 2009. Deletion of Mid1, a putative stretch-activated calcium channel in Claviceps purpurea, affects vegetative growth, cell wall synthesis and virulence. Microbiology, 155, 3922-3933.
Bowman, B. J., Abreu, S., Johl, J. K. & Bowman, E. J. 2012. The pmr Gene, Encoding a Ca2+-ATPase, Is Required for Calcium and Manganese Homeostasis and Normal Development of Hyphae and Conidia in Neurospora crassa. Eukaryotic Cell, 11, 1362-1370.
Bowman, B. J., Abreu, S., Margolles-Clark, E., Draskovic, M. & Bowman, E. J. 2011. Role of Four Calcium Transport Proteins, Encoded by nca-1, nca-2, nca-3, and
245
cax, in Maintaining Intracellular Calcium Levels in Neurospora crassa. Eukaryotic Cell, 10, 654-661.
Bowman, B. J., Draskovic, M., Freitag, M. & Bowman, E. J. 2009. Structure and distribution of organelles and cellular location of calcium transporters in Neurospora crassa. Eukaryotic cell, 8, 1845-1855.
Brand, A. & Gow, N. a. R. 2009. Mechanisms of hypha orientation of fungi. Current Opinion in Microbiology, 12, 350-357.
Brand, A., Shanks, S., Duncan, V. M. S., Yang, M., Mackenzie, K. & Gow, N. 2007. Hyphal Orientation of Candida albicans Is Regulated by a Calcium-Dependent Mechanism. Current Biology, 17, 347-352.
Brem, D. & Leuchtmann, A. 1999. High prevalence of horizontal transmission of the fungal endophyte Epichloë sylvatica. Bull. Geobot. Inst. ETH, 65, 3-12.
Buehrer, B. M. & Errede, B. 1997. Coordination of the mating and cell integrity mitogen-activated protein kinase pathways in Saccharomyces cerevisiae. Molecular and cellular biology, 17, 6517-6525.
Carnero, E., Ribas, J. C., García, B., Durán, A. & Sánchez, Y. 2000. Schizosaccharomyces pombe ehs1p is involved in maintaining cell wall integrity and in calcium uptake. Molecular and General Genetics MGG, 264, 173-183.
Cavinder, B., Hamam, A., Lew, R. R. & Trail, F. 2011. Mid1, a Mechanosensitive Calcium Ion Channel, Affects Growth, Development, and Ascospore Discharge in the Filamentous Fungus Gibberella zeae. Eukaryotic Cell, 10, 832-841.
Cavinder, B. & Trail, F. 2012. Role of Fig1, a Component of the Low-Affinity Calcium Uptake System, in Growth and Sexual Development of Filamentous Fungi. Eukaryotic Cell, 11, 978-988.
Chenevert, J., Corrado, K., Bender, A., Pringle, J. & Herskowitz, I. 1992. A Yeast Gene (bem1) Necessary For Cell Polarization Whose Product Contains 2 Sh3 Domains.
Chin, D. & Means, A. R. 2000. Calmodulin: a prototypical calcium sensor. Trends in Cell Biology, 10, 322-328.
Christensen, M., Ball, O.-P., Bennett, R. & Schardl, C. 1997. Fungal and host genotype effects on compatibility and vascular colonization by Epichloë festucae. Mycological research, 101, 493-501.
Christensen, M. J., Bennett, R. J., Ansari, H. A., Koga, H., Johnson, R. D., Bryan, G. T., Simpson, W. R., Koolaard, J. P., Nickless, E. M. & Voisey, C. R. 2008. Epichloë endophytes grow by intercalary hyphal extension in elongating grass leaves. Fungal Genetics and Biology, 45, 84-93.
Christensen, M. J., Bennett, R. J. & Schmid, J. 2002. Growth of Epichloë/Neotyphodium and p-endophytes in leaves of Lolium and Festuca grasses. Mycological Research, 106, 93-106.
Chung, K.-R. & Schardl, C. 1997. Sexual cycle and horizontal transmission of the grass symbiont, Epichloë typhina. Mycological Research, 101, 295-301.
Cid, V. J., Durán, A., Del Rey, F., Snyder, M. P., Nombela, C. & Sánchez, M. 1995. Molecular basis of cell integrity and morphogenesis in Saccharomyces cerevisiae. Microbiological Reviews, 59, 345-86.
Cleary, A., Youatt, J. & O'brien, T. 1986. Hyphal emergence and outgrowth of Allomyces macrogynus in aerated cultures. Australian Journal of Biological Sciences, 39, 241-254.
Clutterbuck, A. 1969. Cell volume per nucleus in haploid and diploid strains of Aspergillus nidulans. Journal of general microbiology, 55, 291-299.
246
Clutterbuck, A. 1970. Synchronous nuclear division and septation in Aspergillus nidulans. Journal of general microbiology, 60, 133-135.
Cook, M. & Tyers, M. 2007. Size control goes global. Current Opinion in Biotechnology, 18, 341-350.
Cornelius, G. & Nakashima, H. 1987. Vacuoles play a decisive role in calcium homeostasis in Neurospora crassa. Journal of general microbiology, 133, 2341-2347.
Cosgrove, D. J. 2000. Loosening of plant cell walls by expansins. Nature, 407, 321-326. Craig, G. D., Gull, K. & Wood, D. A. 1977. Stipe Elongation in Agaricus bisporus.
Journal of General Microbiology, 102, 337-347. Craven, K., Hsiau, P., Leuchtmann, A., Hollin, W. & Schardl, C. 2001. Multigene
phylogeny of Epichloë species, fungal symbionts of grasses. Annals of the Missouri Botanical Garden, 14-34.
Cunningham, K. W. & Fink, G. R. 1994a. Ca2+ transport in Saccharomyces cerevisiae. Journal of Experimental Biology, 196, 157-66.
Cunningham, K. W. & Fink, G. R. 1994b. Calcineurin-dependent growth control in Saccharomyces cerevisiae mutants lacking PMC1, a homolog of plasma membrane Ca2+ ATPases. The Journal of Cell Biology, 124, 351-363.
Cunningham, K. W. & Fink, G. R. 1996. Calcineurin inhibits VCX1-dependent H+/Ca2+ exchange and induces Ca2+ ATPases in Saccharomyces cerevisiae. Molecular and Cellular Biology, 16, 2226-37.
Cyert, M. S. 2003. Calcineurin signaling in Saccharomyces cerevisiae: how yeast go crazy in response to stress. Biochemical and Biophysical Research Communications, 311, 1143-1150.
Davenport, K. R., Sohaskey, M., Kamada, Y., Levin, D. E. & Gustin, M. C. 1995. A second osmosensing signal transduction pathway in yeast hypotonic shock activates the PKC1 protein kinase-regulated cell integrity pathway. Journal of Biological Chemistry, 270, 30157-30161.
De Castro, P. A., Chiaratto, J., Winkelströter, L. K., Bom, V. L. P., Ramalho, L. N. Z., Goldman, M. H. S., Brown, N. A. & Goldman, G. H. 2014. The Involvement of the Mid1/Cch1/Yvc1 Calcium Channels in Aspergillus fumigatus Virulence. PLoS ONE, 9, e103957.
Denis, V. & Cyert, M. S. 2002. Internal Ca2+ release in yeast is triggered by hypertonic shock and mediated by a TRP channel homologue. The Journal of Cell Biology, 156, 29-34.
Dichtl, K., Helmschrott, C., Dirr, F. & Wagener, J. 2012. Deciphering cell wall integrity signalling in Aspergillus fumigatus: identification and functional characterization of cell wall stress sensors and relevant Rho GTPases. Molecular Microbiology, 83, 506-519.
Ding, X., Yu, Q., Xu, N., Wang, Y., Cheng, X., Qian, K., Zhao, Q., Zhang, B., Xing, L. & Li, M. 2013. Ecm7, a regulator of HACS, functions in calcium homeostasis maintenance, oxidative stress response and hyphal development in Candida albicans. Fungal Genetics and Biology, 57, 23-32.
Dirr, F., Echtenacher, B., Heesemann, J., Hoffmann, P., Ebel, F. & Wagener, J. 2010. AfMkk2 is required for cell wall integrity signaling, adhesion, and full virulence of the human pathogen Aspergillus fumigatus. International Journal of Medical Microbiology, 300, 496-502.
Drgonová, J., Tomás, D., Tanaka, K., Kollár, R., Chen, G.-C., Ford, R. A., Chan, C. S. M., Takai, Y. & Cabib, E. 1996. Rho1p, a Yeast Protein at the Interface Between Cell Polarization and Morphogenesis. Science, 272, 277-279.

247
Dunn, T., Gable, K. & Beeler, T. 1994. Regulation of cellular Ca2+ by yeast vacuoles. Journal of Biological Chemistry, 269, 7273-7278.
Dupres, V., Alsteens, D., Wilk, S., Hansen, B., Heinisch, J. J. & Dufrene, Y. F. 2009. The yeast Wsc1 cell surface sensor behaves like a nanospring in vivo. Nat Chem Biol, 5, 857-862.
Durand, J.-L., Schaufele, R. & Gastal, F. 1999. Grass leaf elongation rate as a function of developmental stage and temperature: morphological analysis and modelling. Annals of Botany, 83, 577-588.
Eaton, C. J., Cox, M. P., Ambrose, B., Becker, M., Hesse, U., Schardl, C. L. & Scott, B. 2010. Disruption of signaling in a fungal-grass symbiosis leads to pathogenesis. Plant Physiology, 153, 1780-1794.
Eaton, C. J., Cox, M. P. & Scott, B. 2011. What triggers grass endophytes to switch from mutualism to pathogenism? Plant science, 180, 190-195.
Eilam, Y., Lavi, H. & Grossowicz, N. 1985. Cytoplasmic Ca2+ homeostasis maintained by a vacuolar Ca2+ transport system in the yeast Saccharomyces cerevisiae. Journal of general microbiology, 131, 623-629.
Eilers, F. I. 1974. Growth regulation in Coprinus radiatus. Archives of Microbiology, 96, 353-364.
Elorza, M. V., Rico, H. & Sentandreu, R. 1983. Calcofluor white alters the assembly of chitin fibrils in Saccharomyces cerevisiae and Candida albicans cells. Journal of general microbiology, 129, 1577-1582.
Fairhead, C., Llorente, B., Denis, F., Soler, M. & Dujon, B. 1996. New vectors for combinatorial deletions in yeast chromosomes and for gap-repair cloning using ‘split-marker’recombination. Yeast, 12, 1439-1457.
Fiddy, C. & Trinci, A. 1976. Mitosis, septation, branching and the duplication cycle in Aspergillus nidulans. Journal of general microbiology, 97, 169-184.
Fischer, M., Schnell, N., Chattaway, J., Davies, P., Dixon, G. & Sanders, D. 1997. The Saccharomyces cerevisiae CCH1 gene is involved in calcium influx and mating. FEBS Letters, 419, 259-262.
Fuchs, B. B. & Mylonakis, E. 2009. Our Paths Might Cross: the Role of the Fungal Cell Wall Integrity Pathway in Stress Response and Cross Talk with Other Stress Response Pathways. Eukaryotic Cell, 8, 1616-1625.
Fuchs, U., Manns, I. & Steinberg, G. 2005. Microtubules Are Dispensable for the Initial Pathogenic Development but Required for Long-Distance Hyphal Growth in the Corn Smut Fungus Ustilago maydis. Molecular Biology of the Cell, 16, 2746-2758.
Fujiwara, T., Tanaka, K., Mino, A., Kikyo, M., Takahashi, K., Shimizu, K. & Takai, Y. 1998. Rho1p-Bni1p-Spa2p Interactions: Implication in Localization of Bni1p at the Bud Site and Regulation of the Actin Cytoskeleton in Saccharomyces cerevisiae. Molecular Biology of the Cell, 9, 1221-1233.
Futagami, T., Nakao, S., Kido, Y., Oka, T., Kajiwara, Y., Takashita, H., Omori, T., Furukawa, K. & Goto, M. 2011. Putative Stress Sensors WscA and WscB Are Involved in Hypo-Osmotic and Acidic pH Stress Tolerance in Aspergillus nidulans. Eukaryotic Cell, 10, 1504-1515.
García-Rodríguez, L. J., Valle, R., Durán, Á. & Roncero, C. 2005. Cell integrity signaling activation in response to hyperosmotic shock in yeast. FEBS letters, 579, 6186-6190.
Garrill, A., Jackson, S., Lew, R. & Heath, I. 1993. Ion channel activity and tip growth: tip-localized stretch-activated channels generate an essential Ca2+ gradient in the oomycete Saprolegnia ferax. European journal of cell biology, 60, 358-365.
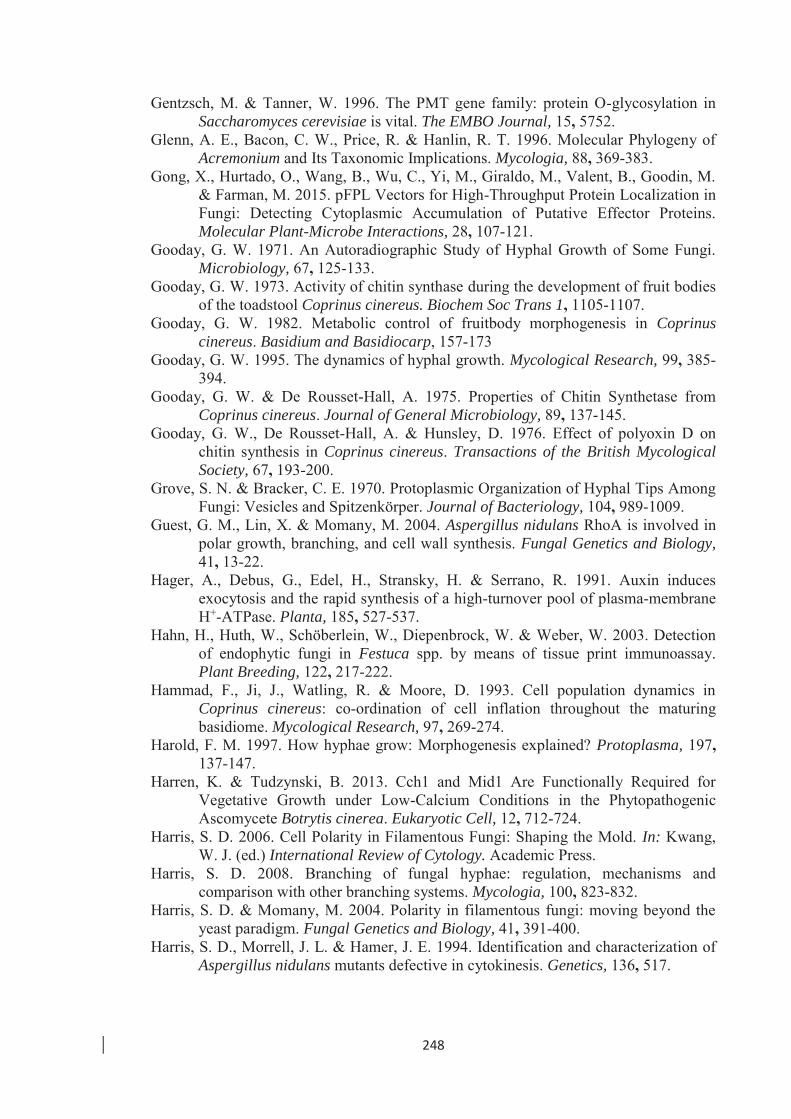
248
Gentzsch, M. & Tanner, W. 1996. The PMT gene family: protein O-glycosylation in Saccharomyces cerevisiae is vital. The EMBO Journal, 15, 5752.
Glenn, A. E., Bacon, C. W., Price, R. & Hanlin, R. T. 1996. Molecular Phylogeny of Acremonium and Its Taxonomic Implications. Mycologia, 88, 369-383.
Gong, X., Hurtado, O., Wang, B., Wu, C., Yi, M., Giraldo, M., Valent, B., Goodin, M. & Farman, M. 2015. pFPL Vectors for High-Throughput Protein Localization in Fungi: Detecting Cytoplasmic Accumulation of Putative Effector Proteins. Molecular Plant-Microbe Interactions, 28, 107-121.
Gooday, G. W. 1971. An Autoradiographic Study of Hyphal Growth of Some Fungi. Microbiology, 67, 125-133.
Gooday, G. W. 1973. Activity of chitin synthase during the development of fruit bodies of the toadstool Coprinus cinereus. Biochem Soc Trans 1, 1105-1107.
Gooday, G. W. 1982. Metabolic control of fruitbody morphogenesis in Coprinus cinereus. Basidium and Basidiocarp, 157-173
Gooday, G. W. 1995. The dynamics of hyphal growth. Mycological Research, 99, 385-394.
Gooday, G. W. & De Rousset-Hall, A. 1975. Properties of Chitin Synthetase from Coprinus cinereus. Journal of General Microbiology, 89, 137-145.
Gooday, G. W., De Rousset-Hall, A. & Hunsley, D. 1976. Effect of polyoxin D on chitin synthesis in Coprinus cinereus. Transactions of the British Mycological Society, 67, 193-200.
Grove, S. N. & Bracker, C. E. 1970. Protoplasmic Organization of Hyphal Tips Among Fungi: Vesicles and Spitzenkörper. Journal of Bacteriology, 104, 989-1009.
Guest, G. M., Lin, X. & Momany, M. 2004. Aspergillus nidulans RhoA is involved in polar growth, branching, and cell wall synthesis. Fungal Genetics and Biology, 41, 13-22.
Hager, A., Debus, G., Edel, H., Stransky, H. & Serrano, R. 1991. Auxin induces exocytosis and the rapid synthesis of a high-turnover pool of plasma-membrane H+-ATPase. Planta, 185, 527-537.
Hahn, H., Huth, W., Schöberlein, W., Diepenbrock, W. & Weber, W. 2003. Detection of endophytic fungi in Festuca spp. by means of tissue print immunoassay. Plant Breeding, 122, 217-222.
Hammad, F., Ji, J., Watling, R. & Moore, D. 1993. Cell population dynamics in Coprinus cinereus: co-ordination of cell inflation throughout the maturing basidiome. Mycological Research, 97, 269-274.
Harold, F. M. 1997. How hyphae grow: Morphogenesis explained? Protoplasma, 197, 137-147.
Harren, K. & Tudzynski, B. 2013. Cch1 and Mid1 Are Functionally Required for Vegetative Growth under Low-Calcium Conditions in the Phytopathogenic Ascomycete Botrytis cinerea. Eukaryotic Cell, 12, 712-724.
Harris, S. D. 2006. Cell Polarity in Filamentous Fungi: Shaping the Mold. In: Kwang, W. J. (ed.) International Review of Cytology. Academic Press.
Harris, S. D. 2008. Branching of fungal hyphae: regulation, mechanisms and comparison with other branching systems. Mycologia, 100, 823-832.
Harris, S. D. & Momany, M. 2004. Polarity in filamentous fungi: moving beyond the yeast paradigm. Fungal Genetics and Biology, 41, 391-400.
Harris, S. D., Morrell, J. L. & Hamer, J. E. 1994. Identification and characterization of Aspergillus nidulans mutants defective in cytokinesis. Genetics, 136, 517.
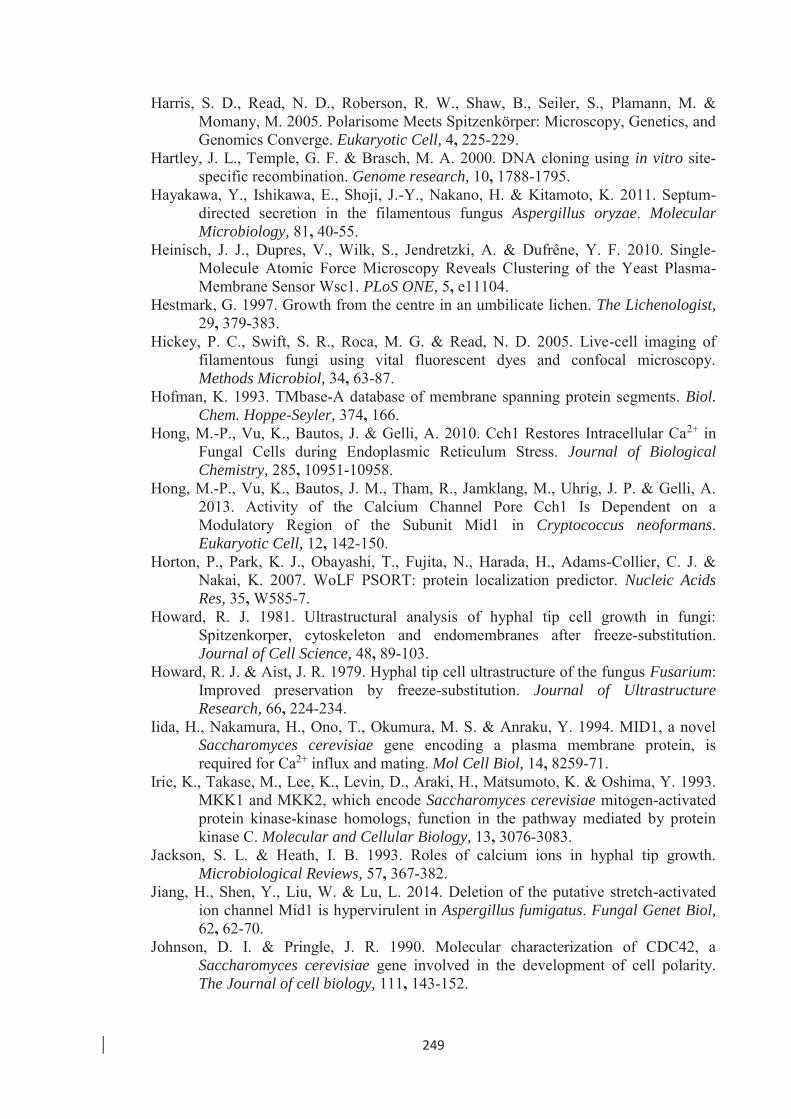
249
Harris, S. D., Read, N. D., Roberson, R. W., Shaw, B., Seiler, S., Plamann, M. & Momany, M. 2005. Polarisome Meets Spitzenkörper: Microscopy, Genetics, and Genomics Converge. Eukaryotic Cell, 4, 225-229.
Hartley, J. L., Temple, G. F. & Brasch, M. A. 2000. DNA cloning using in vitro site-specific recombination. Genome research, 10, 1788-1795.
Hayakawa, Y., Ishikawa, E., Shoji, J.-Y., Nakano, H. & Kitamoto, K. 2011. Septum-directed secretion in the filamentous fungus Aspergillus oryzae. Molecular Microbiology, 81, 40-55.
Heinisch, J. J., Dupres, V., Wilk, S., Jendretzki, A. & Dufrêne, Y. F. 2010. Single-Molecule Atomic Force Microscopy Reveals Clustering of the Yeast Plasma-Membrane Sensor Wsc1. PLoS ONE, 5, e11104.
Hestmark, G. 1997. Growth from the centre in an umbilicate lichen. The Lichenologist, 29, 379-383.
Hickey, P. C., Swift, S. R., Roca, M. G. & Read, N. D. 2005. Live-cell imaging of filamentous fungi using vital fluorescent dyes and confocal microscopy. Methods Microbiol, 34, 63-87.
Hofman, K. 1993. TMbase-A database of membrane spanning protein segments. Biol. Chem. Hoppe-Seyler, 374, 166.
Hong, M.-P., Vu, K., Bautos, J. & Gelli, A. 2010. Cch1 Restores Intracellular Ca2+ in Fungal Cells during Endoplasmic Reticulum Stress. Journal of Biological Chemistry, 285, 10951-10958.
Hong, M.-P., Vu, K., Bautos, J. M., Tham, R., Jamklang, M., Uhrig, J. P. & Gelli, A. 2013. Activity of the Calcium Channel Pore Cch1 Is Dependent on a Modulatory Region of the Subunit Mid1 in Cryptococcus neoformans. Eukaryotic Cell, 12, 142-150.
Horton, P., Park, K. J., Obayashi, T., Fujita, N., Harada, H., Adams-Collier, C. J. & Nakai, K. 2007. WoLF PSORT: protein localization predictor. Nucleic Acids Res, 35, W585-7.
Howard, R. J. 1981. Ultrastructural analysis of hyphal tip cell growth in fungi: Spitzenkorper, cytoskeleton and endomembranes after freeze-substitution. Journal of Cell Science, 48, 89-103.
Howard, R. J. & Aist, J. R. 1979. Hyphal tip cell ultrastructure of the fungus Fusarium: Improved preservation by freeze-substitution. Journal of Ultrastructure Research, 66, 224-234.
Iida, H., Nakamura, H., Ono, T., Okumura, M. S. & Anraku, Y. 1994. MID1, a novel Saccharomyces cerevisiae gene encoding a plasma membrane protein, is required for Ca2+ influx and mating. Mol Cell Biol, 14, 8259-71.
Irie, K., Takase, M., Lee, K., Levin, D., Araki, H., Matsumoto, K. & Oshima, Y. 1993. MKK1 and MKK2, which encode Saccharomyces cerevisiae mitogen-activated protein kinase-kinase homologs, function in the pathway mediated by protein kinase C. Molecular and Cellular Biology, 13, 3076-3083.
Jackson, S. L. & Heath, I. B. 1993. Roles of calcium ions in hyphal tip growth. Microbiological Reviews, 57, 367-382.
Jiang, H., Shen, Y., Liu, W. & Lu, L. 2014. Deletion of the putative stretch-activated ion channel Mid1 is hypervirulent in Aspergillus fumigatus. Fungal Genet Biol, 62, 62-70.
Johnson, D. I. & Pringle, J. R. 1990. Molecular characterization of CDC42, a Saccharomyces cerevisiae gene involved in the development of cell polarity. The Journal of cell biology, 111, 143-152.
250
Jung, U. S. & Levin, D. E. 1999. Genome-wide analysis of gene expression regulated by the yeast cell wall integrity signalling pathway. Molecular microbiology, 34, 1049-1057.
Jung, U. S., Sobering, A. K., Romeo, M. J. & Levin, D. E. 2002. Regulation of the yeast Rlm1 transcription factor by the Mpk1 cell wall integrity MAP kinase. Molecular microbiology, 46, 781-789.
Kamada, T. 1994. Stipe elongation in fruit bodies. Growth, Differentiation and Sexuality. Springer, 367-379.
Kamada, T., Fujii, T., Nakagawa, T. & Takemaru, T. 1985. Changes in (1→ 3)-β-glucanase activities during stipe elongation in Coprinus cinereus. Current Microbiology, 12, 257-259.
Kamada, T., Hamada, Y. & Takemaru, T. 1982. Autolysis in vitro of the stipe cell wall in Coprinus macrorhizus. Journal of General Microbiology, 128, 1041-1046.
Kamada, T. & Takemaru, T. 1977a. Stipe elongation during basidiocarp maturation in Coprinus macrorhizus: changes in polysaccharide composition of stipe cell wall during elongation. Plant and Cell Physiology, 18, 1291-1300.
Kamada, T. & Takemaru, T. 1977b. Stipe elongation during basidiocarp maturation in Coprinus macrorhizus: mechanical properties of stipe cell wall. Plant and cell physiology, 18, 831-840.
Kamada, T., Takemaru, T., Prosser, J. & Gooday, G. 1991. Right and left handed helicity of chitin microfibrils in stipe cells in Coprinus cinereus. Protoplasma, 165, 64-70.
Kamada, T. & Tsuru, M. 1993. The onset of the helical arrangement of chitin microfibrils in fruit-body development of Coprinus cinereus. Mycological research, 97, 884-888.
Kamada, Y., Jung, U. S., Piotrowski, J. & Levin, D. E. 1995. The protein kinase C-activated MAP kinase pathway of Saccharomyces cerevisiae mediates a novel aspect of the heat shock response. Genes & Development, 9, 1559-1571.
Kanzaki, M., Nagasawa, M., Kojima, I., Sato, C., Naruse, K., Sokabe, M. & Iida, H. 1999. Molecular identification of a eukaryotic, stretch-activated nonselective cation channel. Science, 285, 882-886.
Kayano, Y., Tanaka, A., Akano, F., Scott, B. & Takemoto, D. 2013. Differential roles of NADPH oxidases and associated regulators in polarized growth, conidiation and hyphal fusion in the symbiotic fungus Epichloë festucae. Fungal Genetics and Biology, 56, 87-97.
Ketela, T., Green, R. & Bussey, H. 1999. Saccharomyces cerevisiae Mid2p Is a Potential Cell Wall Stress Sensor and Upstream Activator of the PKC1-MPK1 Cell Integrity Pathway. Journal of bacteriology, 181, 3330-3340.
Kim, H.-S., Czymmek, K. J., Patel, A., Modla, S., Nohe, A., Duncan, R., Gilroy, S. & Kang, S. 2012. Expression of the Cameleon calcium biosensor in fungi reveals distinct Ca2+ signatures associated with polarized growth, development, and pathogenesis. Fungal Genetics and Biology, 49, 589-601.
Klis, F. M., Boorsma, A. & De Groot, P. W. J. 2006. Cell wall construction in Saccharomyces cerevisiae. Yeast, 23, 185-202.
Klis, F. M., Ram, A. F. J. & De Groot, P. W. J. 2007. A Molecular and Genomic View of the Fungal Cell Wall. In: Howard, R. & Gow, N. R. (eds.) Biology of the Fungal Cell. Springer Berlin Heidelberg.
Kloda, A., Petrov, E., Meyer, G. R., Nguyen, T., Hurst, A. C., Hool, L. & Martinac, B. 2008. Mechanosensitive channel of large conductance. The International Journal of Biochemistry & Cell Biology, 40, 164-169.
251
Kriangkripipat, T. & Momany, M. 2009. Aspergillus nidulans Protein O-Mannosyltransferases Play Roles in Cell Wall Integrity and Developmental Patterning. Eukaryotic Cell, 8, 1475-1485.
Krogh, A., Larsson, B., Von Heijne, G. & Sonnhammer, E. L. 2001. Predicting transmembrane protein topology with a hidden Markov model: application to complete genomes. Journal of molecular biology, 305, 567-580.
Kües, U. 2000. Life History and Developmental Processes in the Basidiomycete Coprinus cinereus. Microbiology and Molecular Biology Reviews, 64, 316-353.
Kües, U. & Liu, Y. 2000. Fruiting body production in basidiomycetes. Applied microbiology and biotechnology, 54, 141-152.
Kuldau, G. A., Liu, J.-S., White Jr, J. F., Siegel, M. R. & Schardl, C. L. 1997. Molecular systematics of Clavicipitaceae supporting monophyly of genus Epichloë and form genus Ephelis. Mycologia, 431-441.
Kumamoto, C. A. 2008. Molecular mechanisms of mechanosensing and their roles in fungal contact sensing. Nature Reviews Microbiology, 6, 667-673.
Landy, A. 1989. Dynamic, structural, and regulatory aspects of lambda site-specific recombination. Annual review of biochemistry, 58, 913-941.
Langer, R. H. M. 1979. How grasses grow. How grasses grow. Larkin, M. A., Blackshields, G., Brown, N. P., Chenna, R., Mcgettigan, P. A.,
Mcwilliam, H., Valentin, F., Wallace, I. M., Wilm, A., Lopez, R., Thompson, J. D., Gibson, T. J. & Higgins, D. G. 2007. Clustal W and Clustal X version 2.0. Bioinformatics, 23, 2947-2948.
Lee, K. S., Irie, K., Gotoh, Y., Watanabe, Y., Araki, H., Nishida, E., Matsumoto, K. & Levin, D. 1993. A yeast mitogen-activated protein kinase homolog (Mpk1p) mediates signalling by protein kinase C. Molecular and Cellular Biology, 13, 3067-3075.
Lee, K. S. & Levin, D. E. 1992. Dominant mutations in a gene encoding a putative protein kinase (BCK1) bypass the requirement for a Saccharomyces cerevisiae protein kinase C homolog. Molecular and Cellular Biology, 12, 172-182.
Lengeler, K. B., Wasserstrom, L., Walther, A. & Wendland, J. 2013. Analysis of the cell wall integrity pathway of Ashbya gossypii. Microbiological Research, 168, 607-614.
Leuchtmann, A., Bacon, C. W., Schardl, C. L., White, J. F. & Tadych, M. 2014. Nomenclatural realignment of Neotyphodium species with genus Epichloë. Mycologia, 106, 202-215.
Leuchtmann, A., Schardl, C. L. & Siegel, M. R. 1994. Sexual compatibility and taxonomy of a new species of Epichloë symbiotic with fine fescue grasses. Mycologia, 802-812.
Levin, D., Bowers, B., Chen, C., Kamada, Y. & Watanabe, M. 1993. Dissecting the protein kinase C/MAP kinase signalling pathway of Saccharomyces cerevisiae. Cellular & molecular biology research, 40, 229-239.
Levin, D. E. 2005. Cell Wall Integrity Signaling in Saccharomyces cerevisiae. Microbiology and Molecular Biology Reviews, 69, 262-291.
Levin, D. E. 2011. Regulation of Cell Wall Biogenesis in Saccharomyces cerevisiae: The Cell Wall Integrity Signaling Pathway. Genetics, 189, 1145-1175.
Lew, R. R., Abbas, Z., Anderca, M. I. & Free, S. J. 2008. Phenotype of a Mechanosensitive Channel Mutant, mid-1, in a Filamentous Fungus, Neurospora crassa. Eukaryotic Cell, 7, 647-655.

252
Liu, M., Du, P., Heinrich, G., Cox, G. M. & Gelli, A. 2006. Cch1 Mediates Calcium Entry in Cryptococcus neoformans and Is Essential in Low-Calcium Environments. Eukaryotic Cell, 5, 1788-1796.
Locke, E. G., Bonilla, M., Liang, L., Takita, Y. & Cunningham, K. W. 2000. A homolog of voltage-gated Ca2+ channels stimulated by depletion of secretory Ca2+ in yeast. Molecular and Cellular Biology, 20, 6686-6694.
Lodder, A. L., Lee, T. K. & Ballester, R. 1999. Characterization of the Wsc1 protein, a putative receptor in the stress response of Saccharomyces cerevisiae. Genetics, 152, 1487-1499.
Lohaus, G., Pennewiss, K., Sattelmacher, B., Hussmann, M. & Hermann Muehling, K. 2001. Is the infiltration-centrifugation technique appropriate for the isolation of apoplastic fluid? A critical evaluation with different plant species. Physiologia Plantarum, 111, 457-465.
Lommel, M., Bagnat, M. & Strahl, S. 2004. Aberrant Processing of the WSC Family and Mid2p Cell Surface Sensors Results in Cell Death of Saccharomyces cerevisiae O-Mannosylation Mutants. Molecular and Cellular Biology, 24, 46-57.
Macadam, J. W., Volenec, J. J. & Nelson, C. J. 1989. Effects of nitrogen on mesophyll cell division and epidermal cell elongation in tall fescue leaf blades. Plant Physiology, 89, 549-556.
Maddi, A., Dettman, A., Fu, C., Seiler, S. & Free, S. J. 2012. WSC-1 and HAM-7 Are MAK-1 MAP Kinase Pathway Sensors Required for Cell Wall Integrity and Hyphal Fusion in Neurospora crassa. PLoS ONE, 7, e42374.
Martin, D. C., Kim, H., Mackin, N. A., Maldonado-Báez, L., Evangelista, C. C., Beaudry, V. G., Dudgeon, D. D., Naiman, D. Q., Erdman, S. E. & Cunningham, K. W. 2011. New regulators of a high affinity Ca2+ influx system revealed through a genome-wide screen in yeast. Journal of Biological Chemistry, 286, 10744-10754.
Maruoka, T., Nagasoe, Y., Inoue, S., Mori, Y., Goto, J., Ikeda, M. & Iida, H. 2002. Essential hydrophilic carboxyl-terminal regions including cysteine residues of the yeast stretch-activated calcium-permeable channel Mid1. Journal of Biological Chemistry, 277, 11645-11652.
Matheos, D. P., Kingsbury, T. J., Ahsan, U. S. & Cunningham, K. W. 1997. Tcn1p/Crz1p, a calcineurin-dependent transcription factor that differentially regulates gene expression in Saccharomyces cerevisiae. Genes & Development, 11, 3445-3458.
Matthews, T. R. & Niederpruem, D. J. 1972. Differentiation in Coprinus lagopus. Archiv für Mikrobiologie, 87, 257-268.
Miller, A. J., Vogg, G. & Sanders, D. 1990. Cytosolic calcium homeostasis in fungi: roles of plasma membrane transport and intracellular sequestration of calcium. Proceedings of the National Academy of Sciences, 87, 9348-9352.
Momany, M. 2002. Polarity in filamentous fungi: establishment, maintenance and new axes. Current Opinion in Microbiology, 5, 580-585.
Moore, D. 1984. Developmental biology of the Coprinus cinereus carpophore: Metabolic regulation in relation to cap morphogenesis. Experimental Mycology, 8, 283-297.
Moore, D. 1996. Inside the developing mushroom–cells, tissues and tissue patterns. Patterns in fungal development, 1-36.

253
Mouriño-Pérez, R. R., Roberson, R. W. & Bartnicki-García, S. 2006. Microtubule dynamics and organization during hyphal growth and branching in Neurospora crassa. Fungal Genetics and Biology, 43, 389-400.
Muller, E. M., Locke, E. G. & Cunningham, K. W. 2001. Differential regulation of two Ca2+ influx systems by pheromone signaling in Saccharomyces cerevisiae. Genetics, 159, 1527-1538.
Muller, E. M., Mackin, N. A., Erdman, S. E. & Cunningham, K. W. 2003. Fig1p Facilitates Ca2+ Influx and Cell Fusion during Mating of Saccharomyces cerevisiae. Journal of Biological Chemistry, 278, 38461-38469.
Nakai, J., Ohkura, M. & Imoto, K. 2001. A high signal-to-noise Ca2+ probe composed of a single green fluorescent protein. Nat Biotech, 19, 137-141.
Namiki, F., Matsunaga, M., Okuda, M., Inoue, I., Nishi, K., Fujita, Y. & Tsuge, T. 2001. Mutation of an arginine biosynthesis gene causes reduced pathogenicity in Fusarium oxysporum f. sp. melonis. Molecular Plant-Microbe Interactions, 14, 580-584.
Nelson, G., Kozlova-Zwinderman, O., Collis, A. J., Knight, M. R., Fincham, J. R. S., Stanger, C. P., Renwick, A., Hessing, J. G. M., Punt, P. J., Van Den Hondel, C. a. M. J. J. & Read, N. D. 2004. Calcium measurement in living filamentous fungi expressing codon-optimized aequorin. Molecular Microbiology, 52, 1437-1450.
Nguyen, Q. B., Kadotani, N., Kasahara, S., Tosa, Y., Mayama, S. & Nakayashiki, H. 2008. Systematic functional analysis of calcium-signalling proteins in the genome of the rice-blast fungus, Magnaporthe oryzae, using a high-throughput RNA-silencing system. Molecular microbiology, 68, 1348-1365.
Nonaka, H., Tanaka, K., Hirano, H., Fujiwara, T., Kohno, H., Umikawa, M., Mino, A. & Takai, Y. 1995. A downstream target of RHO1 small GTP-binding protein is PKC1, a homolog of protein kinase C, which leads to activation of the MAP kinase cascade in Saccharomyces cerevisiae. The EMBO Journal, 14, 5931-5938.
Oliver, R. P., Roberts, I. N., Harling, R., Kenyon, L., Punt, P. J., Dingemanse, M. A. & Hondel, C. a. M. J. J. 1987. Transformation of Fulvia fulva; a fungal pathogen of tomato, to hygromycin B resistance. Current Genetics, 12, 231-233.
Ozaki, K., Tanaka, K., Imamura, H., Hihara, T., Kameyama, T., Nonaka, H., Hirano, H., Matsuura, Y. & Takai, Y. 1996. Rom1p and Rom2p are GDP/GTP exchange proteins (GEPs) for the Rho1p small GTP binding protein in Saccharomyces cerevisiae. The EMBO journal, 15, 2196.
Ozeki-Miyawaki, C., Moriya, Y., Tatsumi, H., Iida, H. & Sokabe, M. 2005. Identification of functional domains of Mid1, a stretch-activated channel component, necessary for localization to the plasma membrane and Ca2+ permeation. Experimental Cell Research, 311, 84-95.
Paidhungat, M. & Garrett, S. 1997. A homolog of mammalian, voltage-gated calcium channels mediates yeast pheromone-stimulated Ca2+ uptake and exacerbates the cdc1(Ts) growth defect. Molecular and Cellular Biology, 17, 6339-47.
Palmer, C. P., Zhou, X.-L., Lin, J., Loukin, S. H., Kung, C. & Saimi, Y. 2001. A TRP homolog in Saccharomyces cerevisiae forms an intracellular Ca2+-permeable channel in the yeast vacuolar membrane. Proceedings of the National Academy of Sciences, 98, 7801-7805.
Park, G., Pan, S. & Borkovich, K. A. 2008. Mitogen-Activated Protein Kinase Cascade Required for Regulation of Development and Secondary Metabolism in Neurospora crassa. Eukaryotic Cell, 7, 2113-2122.
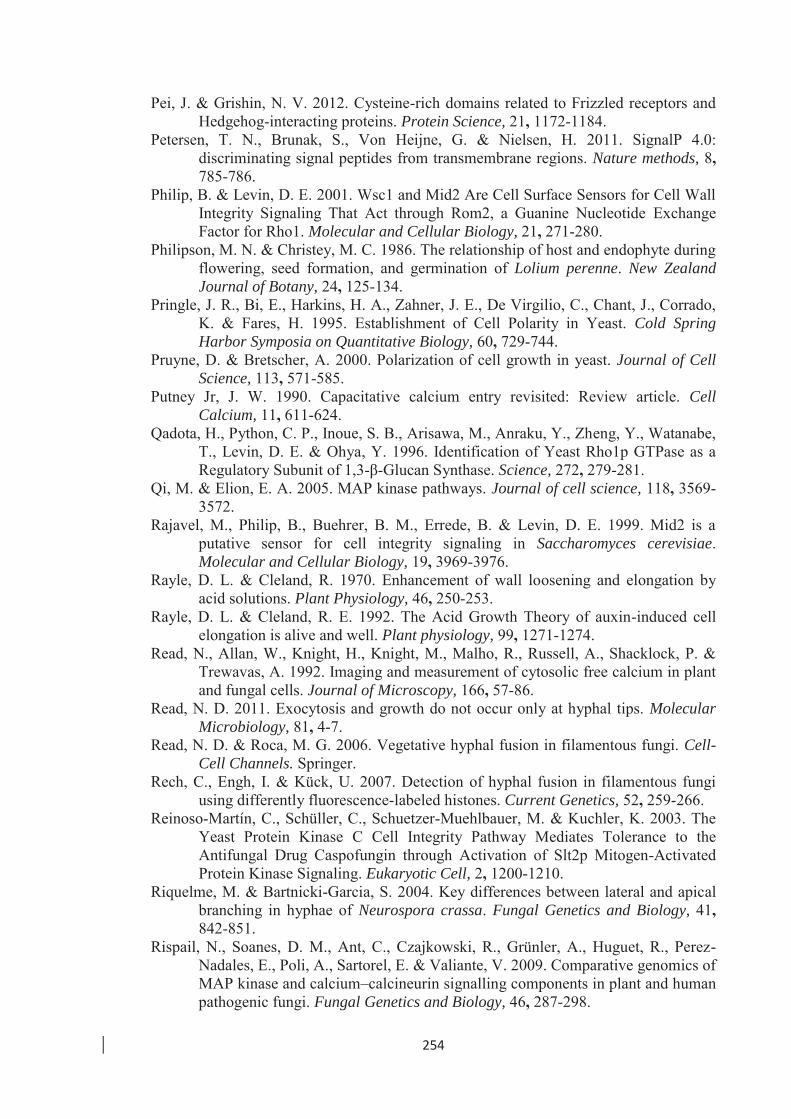
254
Pei, J. & Grishin, N. V. 2012. Cysteine-rich domains related to Frizzled receptors and Hedgehog-interacting proteins. Protein Science, 21, 1172-1184.
Petersen, T. N., Brunak, S., Von Heijne, G. & Nielsen, H. 2011. SignalP 4.0: discriminating signal peptides from transmembrane regions. Nature methods, 8, 785-786.
Philip, B. & Levin, D. E. 2001. Wsc1 and Mid2 Are Cell Surface Sensors for Cell Wall Integrity Signaling That Act through Rom2, a Guanine Nucleotide Exchange Factor for Rho1. Molecular and Cellular Biology, 21, 271-280.
Philipson, M. N. & Christey, M. C. 1986. The relationship of host and endophyte during flowering, seed formation, and germination of Lolium perenne. New Zealand Journal of Botany, 24, 125-134.
Pringle, J. R., Bi, E., Harkins, H. A., Zahner, J. E., De Virgilio, C., Chant, J., Corrado, K. & Fares, H. 1995. Establishment of Cell Polarity in Yeast. Cold Spring Harbor Symposia on Quantitative Biology, 60, 729-744.
Pruyne, D. & Bretscher, A. 2000. Polarization of cell growth in yeast. Journal of Cell Science, 113, 571-585.
Putney Jr, J. W. 1990. Capacitative calcium entry revisited: Review article. Cell Calcium, 11, 611-624.
Qadota, H., Python, C. P., Inoue, S. B., Arisawa, M., Anraku, Y., Zheng, Y., Watanabe, T., Levin, D. E. & Ohya, Y. 1996. Identification of Yeast Rho1p GTPase as a Regulatory Subunit of 1,3-β-Glucan Synthase. Science, 272, 279-281.
Qi, M. & Elion, E. A. 2005. MAP kinase pathways. Journal of cell science, 118, 3569-3572.
Rajavel, M., Philip, B., Buehrer, B. M., Errede, B. & Levin, D. E. 1999. Mid2 is a putative sensor for cell integrity signaling in Saccharomyces cerevisiae. Molecular and Cellular Biology, 19, 3969-3976.
Rayle, D. L. & Cleland, R. 1970. Enhancement of wall loosening and elongation by acid solutions. Plant Physiology, 46, 250-253.
Rayle, D. L. & Cleland, R. E. 1992. The Acid Growth Theory of auxin-induced cell elongation is alive and well. Plant physiology, 99, 1271-1274.
Read, N., Allan, W., Knight, H., Knight, M., Malho, R., Russell, A., Shacklock, P. & Trewavas, A. 1992. Imaging and measurement of cytosolic free calcium in plant and fungal cells. Journal of Microscopy, 166, 57-86.
Read, N. D. 2011. Exocytosis and growth do not occur only at hyphal tips. Molecular Microbiology, 81, 4-7.
Read, N. D. & Roca, M. G. 2006. Vegetative hyphal fusion in filamentous fungi. Cell-Cell Channels. Springer.
Rech, C., Engh, I. & Kück, U. 2007. Detection of hyphal fusion in filamentous fungi using differently fluorescence-labeled histones. Current Genetics, 52, 259-266.
Reinoso-Martín, C., Schüller, C., Schuetzer-Muehlbauer, M. & Kuchler, K. 2003. The Yeast Protein Kinase C Cell Integrity Pathway Mediates Tolerance to the Antifungal Drug Caspofungin through Activation of Slt2p Mitogen-Activated Protein Kinase Signaling. Eukaryotic Cell, 2, 1200-1210.
Riquelme, M. & Bartnicki-Garcia, S. 2004. Key differences between lateral and apical branching in hyphae of Neurospora crassa. Fungal Genetics and Biology, 41, 842-851.
Rispail, N., Soanes, D. M., Ant, C., Czajkowski, R., Grünler, A., Huguet, R., Perez-Nadales, E., Poli, A., Sartorel, E. & Valiante, V. 2009. Comparative genomics of MAP kinase and calcium–calcineurin signalling components in plant and human pathogenic fungi. Fungal Genetics and Biology, 46, 287-298.
255
Robinow, C. 1963. Observations on cell growth, mitosis, and division in the fungus Basidiobolus ranarum. The Journal of cell biology, 17, 123-152.
Rodicio, R. & Heinisch, J. J. 2010. Together we are strong—cell wall integrity sensors in yeasts. Yeast, 27, 531-540.
Rodrı́Guez, A. A., Grunberg, K. A. & Taleisnik, E. L. 2002. Reactive oxygen species in the elongation zone of maize leaves are necessary for leaf extension. Plant Physiology, 129, 1627-1632.
Rosenberger, R. F. & Kessel, M. 1967. Synchrony of Nuclear Replication in Individual Hyphae of Aspergillus nidulans. Journal of Bacteriology, 94, 1464-1469.
Rudolph, H. K., Antebi, A., Fink, G. R., Buckley, C. M., Dorman, T. E., Levitre, J., Davidow, L. S., Mao, J.-I. & Moir, D. T. 1989. The yeast secretory pathway is perturbed by mutations in PMR1, a member of a Ca2+ ATPase family. Cell, 58, 133-145.
Rupeš, I. 2002. Checking cell size in yeast. Trends in Genetics, 18, 479-485. Sanders, W. B. 2001. Lichens: The Interface between Mycology and Plant Morphology
Whereas most other fungi live as an absorptive mycelium inside their food substrate, the lichen fungi construct a plant-like body within which photosynthetic algal symbionts are cultivated. Bioscience, 51, 1025-1035.
Sanders, W. B. & Ascaso, C. 1995. Reiterative Production and Deformation of Cell Walls in Expanding Thallus Nets of the Lichen Ramalina menziesii (Lecanorales, Ascomycetes). American journal of botany, 1358-1366.
Schardl, C., Scott, B., Young, C., Aiken, G., Mcculley, R. & Strickland, J. Recommendations for gene nomenclature for Epichloë species and related Clavicipitaceae. Epichloae, endophytes of cool season grasses: implications, utilization and biology. Proceedings of the 7th International Symposium on Fungal Endophytes of Grasses, Lexington, Kentucky, USA, 28 June to 1 July 2010., 2012. Samuel Roberts Noble Foundation, 84-87.
Schardl, C. L., Grossman, R. B., Nagabhyru, P., Faulkner, J. R. & Mallik, U. P. 2007. Loline alkaloids: Currencies of mutualism. Phytochemistry, 68, 980-996.
Schardl, C. L., Leuchtmann, A. & Spiering, M. J. 2004. Symbioses of grasses with seedborne fungal endophytes. Annu. Rev. Plant Biol., 55, 315-340.
Schardl, C. L. & Phillips, T. D. 1997. Protective grass endophytes: where are they from and where are they going? Plant Disease, 81, 430-438.
Schardl, C. L., Young, C. A., Hesse, U., Amyotte, S. G., Andreeva, K., Calie, P. J., Fleetwood, D. J., Haws, D. C., Moore, N., Oeser, B., Panaccione, D. G., Schweri, K. K., Voisey, C. R., Farman, M. L., Jaromczyk, J. W., Roe, B. A., O'sullivan, D. M., Scott, B., Tudzynski, P., An, Z., Arnaoudova, E. G., Bullock, C. T., Charlton, N. D., Chen, L., Cox, M., Dinkins, R. D., Florea, S., Glenn, A. E., Gordon, A., Güldener, U., Harris, D. R., Hollin, W., Jaromczyk, J., Johnson, R. D., Khan, A. K., Leistner, E., Leuchtmann, A., Li, C., Liu, J., Liu, J., Liu, M., Mace, W., Machado, C., Nagabhyru, P., Pan, J., Schmid, J., Sugawara, K., Steiner, U., Takach, J. E., Tanaka, E., Webb, J. S., Wilson, E. V., Wiseman, J. L., Yoshida, R. & Zeng, Z. 2013. Plant-Symbiotic Fungi as Chemical Engineers: Multi-Genome Analysis of the Clavicipitaceae Reveals Dynamics of Alkaloid Loci. PLoS Genet, 9, e1003323.
Schäufele, R. & Schnyder, H. 2000. Cell growth analysis during steady and non-steady growth in leaves of perennial ryegrass (Lolium perenne L.) subject to defoliation. Plant, Cell & Environment, 23, 185-194.

256
Schmid, J., Spiering, M. J. & Christensen, M. J. 2000. Metabolic activity, distribution, and propagation of grass endophytes in planta: investigations using the GUS reporter gene system. Microbial Endophytes, 295-322.
Schnyder, H., Seo, S., Rademacher, I. F. & Kühbauch, W. 1990. Spatial distribution of growth rates and of epidermal cell lengths in the elongation zone during leaf development in Lolium perenne L. Planta, 181, 423-431.
Schuchardt, I., Aßmann, D., Thines, E., Schuberth, C. & Steinberg, G. 2005. Myosin-V, Kinesin-1, and Kinesin-3 Cooperate in Hyphal Growth of the Fungus Ustilago maydis. Molecular Biology of the Cell, 16, 5191-5201.
Schweikert, C., Liszkay, A. & Schopfer, P. 2000. Scission of polysaccharides by peroxidase-generated hydroxyl radicals. Phytochemistry, 53, 565-570.
Scott, B., Becker, Y., Becker, M. & Cartwright, G. 2012. Morphogenesis, Growth, and Development of the Grass Symbiont Epichlöe festucae. Morphogenesis and Pathogenicity in Fungi. Springer.
Scott, B. & Schardl, C. 1993. Fungal symbionts of grasses: evolutionary insights and agricultural potential. Trends in microbiology, 1, 196-200.
Sharpless, K. E. & Harris, S. D. 2002. Functional Characterization and Localization of the Aspergillus nidulans Formin SEPA. Molecular Biology of the Cell, 13, 469-479.
Sietsma, J. & Wessels, J. 2006. Apical wall biogenesis. Growth, Differentiation and Sexuality. Springer, 53-72 Silverman-Gavrila, L. B. & Lew, R. R. 2002. An IP3-activated Ca2+ channel regulates
fungal tip growth. Journal of Cell Science, 115, 5013-5025. Silverman-Gavrila, L. B. & Lew, R. R. 2003. Calcium gradient dependence of
Neurospora crassa hyphal growth. Microbiology, 149, 2475-2485. Smith, S. E., Csank, C., Reyes, G., Ghannoum, M. A. & Berlin, V. 2002. Candida
albicans RHO1 is required for cell viability in vitro and in vivo. FEMS yeast research, 2, 103-111.
Sonnhammer, E. L., Von Heijne, G. & Krogh, A. A hidden Markov model for predicting transmembrane helices in protein sequences. Ismb, 1998. 175-182.
Steinberg, G. 2007. Hyphal Growth: a Tale of Motors, Lipids, and the Spitzenkörper. Eukaryotic Cell, 6, 351-360.
Stephenson, N. & Gooday, G. 1984. Nuclear numbers in the stipe cells of Coprinus cinereus. Transactions of the British Mycological Society, 82, 531-534.
Straede, A. & Heinisch, J. J. 2007. Functional analyses of the extra-and intracellular domains of the yeast cell wall integrity sensors Mid2 and Wsc1. FEBS letters, 581, 4495-4500.
Sung, G.-H., Hywel-Jones, N. L., Sung, J.-M., Luangsa-Ard, J. J., Shrestha, B. & Spatafora, J. W. 2007. Phylogenetic classification of Cordyceps and the clavicipitaceous fungi. Studies in mycology, 57, 5-59.
Takemoto, D., Kamakura, S., Saikia, S., Becker, Y., Wrenn, R., Tanaka, A., Sumimoto, H. & Scott, B. 2011. Polarity proteins Bem1 and Cdc24 are components of the filamentous fungal NADPH oxidase complex. Proceedings of the National Academy of Sciences, 108, 2861-2866.
Takemoto, D., Tanaka, A. & Scott, B. 2006. A p67Phox-like regulator is recruited to control hyphal branching in a fungal–grass mutualistic symbiosis. The Plant Cell Online, 18, 2807-2821.
Tan, Y. Y., Spiering, M. J., Scott, V., Lane, G. A., Christensen, M. J. & Schmid, J. 2001. In Planta Regulation of Extension of an Endophytic Fungus and

257
Maintenance of High Metabolic Rates in Its Mycelium in the Absence of Apical Extension. Applied and Environmental Microbiology, 67, 5377-5383.
Tanaka, A., Cartwright, G. M., Saikia, S., Kayano, Y., Takemoto, D., Kato, M., Tsuge, T. & Scott, B. 2013. ProA, a transcriptional regulator of fungal fruiting body development, regulates leaf hyphal network development in the Epichloë festucae–Lolium perenne symbiosis. Molecular microbiology, 90, 551-568.
Tanaka, A., Christensen, M. J., Takemoto, D., Park, P. & Scott, B. 2006. Reactive Oxygen Species Play a Role in Regulating a Fungus–Perennial Ryegrass Mutualistic Interaction. The Plant Cell Online, 18, 1052-1066.
Tanaka, A., Takemoto, D., Hyon, G. S., Park, P. & Scott, B. 2008. NoxA activation by the small GTPase RacA is required to maintain a mutualistic symbiotic association between Epichloë festucae and perennial ryegrass. Molecular microbiology, 68, 1165-1178.
Tanaka, A., Tapper, B. A., Popay, A., Parker, E. J. & Scott, B. 2005. A symbiosis expressed non-ribosomal peptide synthetase from a mutualistic fungal endophyte of perennial ryegrass confers protection to the symbiotum from insect herbivory. Molecular Microbiology, 57, 1036-1050.
Tian, L., Hires, S. A., Mao, T., Huber, D., Chiappe, M. E., Chalasani, S. H., Petreanu, L., Akerboom, J., Mckinney, S. A., Schreiter, E. R., Bargmann, C. I., Jayaraman, V., Svoboda, K. & Looger, L. L. 2009. Imaging neural activity in worms, flies and mice with improved GCaMP calcium indicators. Nat Meth, 6, 875-881.
Torralba, S. & Heath, I. B. 2001. Cytoskeletal and Ca2+ regulation of hyphal tip growth and initiation. Current Topics in Developmental Biology. Academic Press,135-187.
Trinci, A. & Morris, N. 1979. Morphology and growth of a temperature-sensitive mutant of Aspergillus nidulans which forms aseptate mycelia at non-permissive temperatures. Journal of General Microbiology, 114, 53-59.
Valiante, V., Jain, R., Heinekamp, T. & Brakhage, A. A. 2009. The MpkA MAP kinase module regulates cell wall integrity signaling and pyomelanin formation in Aspergillus fumigatus. Fungal Genetics and Biology, 46, 909-918.
Valkonen, M., Kalkman, E. R., Saloheimo, M., Penttilä, M., Read, N. D. & Duncan, R. R. 2007. Spatially Segregated SNARE Protein Interactions in Living Fungal Cells. Journal of Biological Chemistry, 282, 22775-22785.
Vanden, W. A., Cullen, D., Spear, R., Schoenike, B. & Andrews, J. 1997. Expression of green fluorescent protein in Aureobasidium pullulans and quantification of the fungus on leaf surfaces. Biotechniques, 23, 686-690.
Vay, H. A., Philip, B. & Levin, D. E. 2004. Mutational analysis of the cytoplasmic domain of the Wsc1 cell wall stress sensor. Microbiology, 150, 3281-3288.
Vermeulen, C. & Wessels, J. 1984. Ultrastructural differences between wall apices of growing and non-growing hyphae of Schizophyllum commune. Protoplasma, 120, 123-131.
Verna, J., Lodder, A., Lee, K., Vagts, A. & Ballester, R. 1997. A family of genes required for maintenance of cell wall integrity and for the stress response in Saccharomyces cerevisiae. Proceedings of the National Academy of Sciences, 94, 13804-13809.
Veses, V., Richards, A. & Gow, N. A. 2009. Vacuole inheritance regulates cell size and branching frequency of Candida albicans hyphae. Molecular microbiology, 71, 505-519.
258
Viladevall, L., Serrano, R., Ruiz, A., Domenech, G., Giraldo, J., Barceló, A. & Ariño, J. 2004. Characterization of the calcium-mediated response to alkaline stress in Saccharomyces cerevisiae. Journal of Biological Chemistry, 279, 43614-43624.
Voisey, C. R. 2010. Intercalary growth in hyphae of filamentous fungi. Fungal Biology Reviews, 24, 123-131.
Vollmer, S. J. & Yanofsky, C. 1986. Efficient cloning of genes of Neurospora crassa. Proceedings of the National Academy of Sciences, 83, 4869-4873.
Walker, L. A., Gow, N. a. R. & Munro, C. A. 2013. Elevated Chitin Content Reduces the Susceptibility of Candida Species to Caspofungin. Antimicrobial Agents and Chemotherapy, 57, 146-154.
Wang, S., Cao, J., Liu, X., Hu, H., Shi, J., Zhang, S., Keller, N. P. & Lu, L. 2012. Putative Calcium Channels CchA and MidA Play the Important Roles in Conidiation, Hyphal Polarity and Cell Wall Components in Aspergillus nidulans. PLoS ONE, 7, e46564.
Ward, H. M. & Marshall-Ward, H. 1888. A lily-disease. Annals of Botany, 319-382. Watanabe, Y., Irie, K. & Matsumoto, K. 1995. Yeast RLM1 encodes a serum response
factor-like protein that may function downstream of the Mpk1 (Slt2) mitogen-activated protein kinase pathway. Molecular and Cellular Biology, 15, 5740-5749.
Watts, H., Veacute, A.-A., Perera, T., Davies, J. & Gow, N. 1998. Thigmotropism and stretch-activated channels in the pathogenic fungus Candida albicans. Microbiology, 144, 689-695.
Wessels, J. 1986. Cell wall synthesis in apical hyphal growth. Int. Rev. Cytol, 104, 37-79.
White Jr, J. F., Reddy, P. V. & Bacon, C. W. 2000. Biotrophic endophytes of grasses: a systematic appraisal. Microbial endophytes. New York: Marcel Dekker, Inc. p, 49-62.
Wilkinson, H. H., Siegel, M. R., Blankenship, J. D., Mallory, A. C., Bush, L. P. & Schardl, C. L. 2000. Contribution of Fungal Loline Alkaloids to Protection from Aphids in a Grass-Endophyte Mutualism. Molecular Plant-Microbe Interactions, 13, 1027-1033.
Wolkow, T. D., Harris, S. D. & Hamer, J. E. 1996. Cytokinesis in Aspergillus nidulans is controlled by cell size, nuclear positioning and mitosis. J Cell Sci, 109 ( Pt 8), 2179-88.
Wösten, H. a. B., Moukha, S. M., Sietsma, J. H. & Wessels, J. G. H. 1991. Localization of growth and secretion of proteins in Aspergillus niger. Journal of General Microbiology, 137, 2017-2023.
Yafetto, L., Davis, D. J. & Money, N. P. 2009. Biomechanics of invasive growth by Armillaria rhizomorphs. Fungal Genetics and Biology, 46, 688-694.
Yoshimoto, H., Saltsman, K., Gasch, A. P., Li, H. X., Ogawa, N., Botstein, D., Brown, P. O. & Cyert, M. S. 2002. Genome-wide analysis of gene expression regulated by the calcineurin/Crz1p signaling pathway in Saccharomyces cerevisiae. Journal of Biological Chemistry, 277, 31079-31088.
Yoshimura, H., Tada, T. & Iida, H. 2004. Subcellular localization and oligomeric structure of the yeast putative stretch-activated Ca2+ channel component Mid1. Experimental Cell Research, 293, 185-195.
Youatt, J. 1986. Oxygen and morphological changes in Allomyces macrogynus. Australian Journal of Biological Sciences, 39, 233-240.
Youatt, J., Gow, N. & Gooday, G. 1988. Bioelectric and biosynthetic aspects of cell polarity in Allomyces macrogynus. Protoplasma, 146, 118-126.
259
Young, C., Bryant, M., Christensen, M., Tapper, B., Bryan, G. & Scott, B. 2005. Molecular cloning and genetic analysis of a symbiosis-expressed gene cluster for lolitrem biosynthesis from a mutualistic endophyte of perennial ryegrass. Molecular Genetics and Genomics, 274, 13-29.
Young, C., Itoh, Y., Johnson, R., Garthwaite, I., Miles, C. O., Munday-Finch, S. C. & Scott, B. 1998. Paxilline-negative mutants of Penicillium paxilli generated by heterologous and homologous plasmid integration. Curr Genet, 33, 368-77.
Yu, Q., Wang, H., Cheng, X., Xu, N., Ding, X., Xing, L. & Li, M. 2012. Roles of Cch1 and Mid1 in Morphogenesis, Oxidative Stress Response and Virulence in Candida albicans. Mycopathologia, 174, 359-369.
Zdobnov, E. M. & Apweiler, R. 2001. InterProScan--an integration platform for the signature-recognition methods in InterPro. Bioinformatics (Oxford, England), 17, 847-848.
Zelter, A., Bencina, M., Bowman, B. J., Yarden, O. & Read, N. D. 2004. A comparative genomic analysis of the calcium signaling machinery in Neurospora crassa, Magnaporthe grisea, and Saccharomyces cerevisiae. Fungal Genetics and Biology, 41, 827-841.
Zheng, Y., Bender, A. & Cerione, R. A. 1995. Interactions among Proteins Involved in Bud-site Selection and Bud-site Assembly in Saccharomyces cerevisiae. Journal of Biological Chemistry, 270, 626-630.
Zu, T., Verna, J. & Ballester, R. 2001. Mutations in WSC genes for putative stress receptors result in sensitivity to multiple stress conditions and impairment of Rlm1-dependent gene expression in Saccharomyces cerevisiae. Molecular Genetics and Genomics, 266, 142-155.
260
8. Appendices
8.1 Appendix 1: Buffers used in this study TAE buffer
Stock solution (50x)
Tris base 242.0 g
Glacial acetic acid 57.1 mL
EDTA (pH 8.0) 100.0 mL from 0.5 M stock
Total 1000 mL
Working solution (1x) - Dilute stock solution 50:1
TE buffer pH 8.0
Stock solution (10x)
Tris-HCl pH 7.5 100 mL from 1 M stock
EDTA pH 8.0 20 mL from 500 mM stock
Total 1000 mL
Working solution (1x) - Dilute stock solution 10:1
Loading dye
Stock solution (6x)
Bromophenol blue 25 mg
Xylene cyanol FF 25 mg
Glycerol 3.3 mL
H2O 6.7 mL
Total 10.0 Ml
261
OM buffer
MgSO4.7H2O (1.2 M) 88.8 g
Na2HPO4 (10 mM) 30.0 mL from 1M stock
Total 300 mL
Add 100 mL of sterile water to dissolve the MgSO4 and heat if necessary. Add a few
drops of 100 mM NaH2PO4.H2O) until the pH reaches 5.8 (1.56 g/100 mL). Top up
to final volume (pH raises to ~6.3). Filter sterilized.
ST buffer
Sorbitol (0.6 M) 10.93 g
Tris-HCl (100 mM), pH 8.0 10.0 mL from 1 M stock
Total 100 mL
STC buffer
Sorbitol (1 M) 72.8 g
Tris-HCl (50 mM) pH 8.0 20.0 mL of 1M stock
CaCl2.6H2O 4.38 g
Total 400 mL
2x SSC, 0.1% (w/v) SDS
NaCl (3 M) 175.3 g
Na3C6H5O7.2H2O (300 mM) 88.2 g
Total 1000 mL (with deionized water), Adjust the pH to 7.0, add SDS 0.1% (w/v).
262
8.2 Appendix 2: PCR and restriction enzyme reaction mixtures and conditions
BigDye® Terminator v3.1 cycle sequencing reaction mix
ABI buffer 1.75 μL
Primer (2 μM) 0.80 μL
3.1 Big Dye 0.50 μL
PCR product/Plasmid 1.00 μL
Deionized water 5.95 μL
Total volume 10.00 μL
Cycle sequencing conditions for BigDye® Terminator v3.1
95oC 2 min X 1
95oC 30 sec
53.5-54oC 30 sec X 30
72 oC 32 sec
72 oC 7 min X 1
Restriction digestion of genomic DNA for southern blot
Buffer (10X) 10 μL
Genomic DNA (140 ng/ μL) 30 μL
RE enzyme (10 U/ μL) 6 μL (added in two steps)
Deionized water 54 μL
Total 100 μL
Digested overnight at 37oC
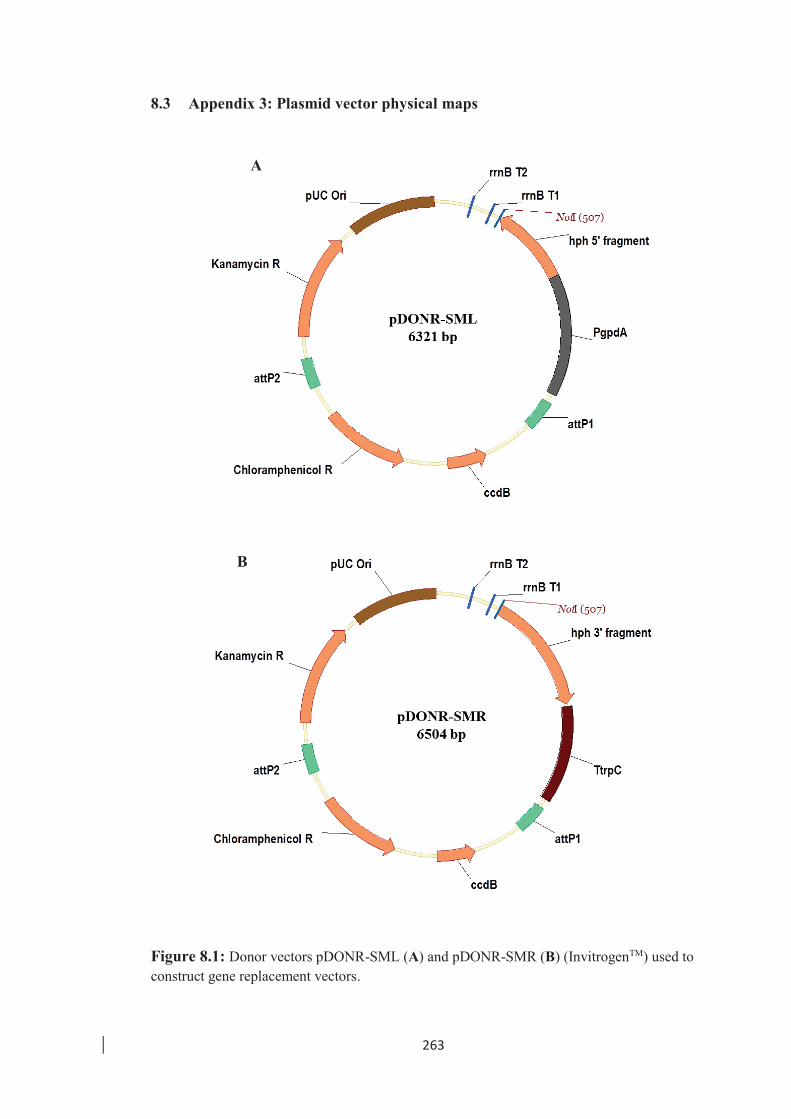
263
8.3 Appendix 3: Plasmid vector physical maps
Figure 8.1: Donor vectors pDONR-SML (A) and pDONR-SMR (B) (InvitrogenTM) used to construct gene replacement vectors.
A
B

264
Figure 8.2: Replacement vectors for midA harbouring the 5' flank pSAM1 (A) and 3' flank pSAM2 (B).
A
B
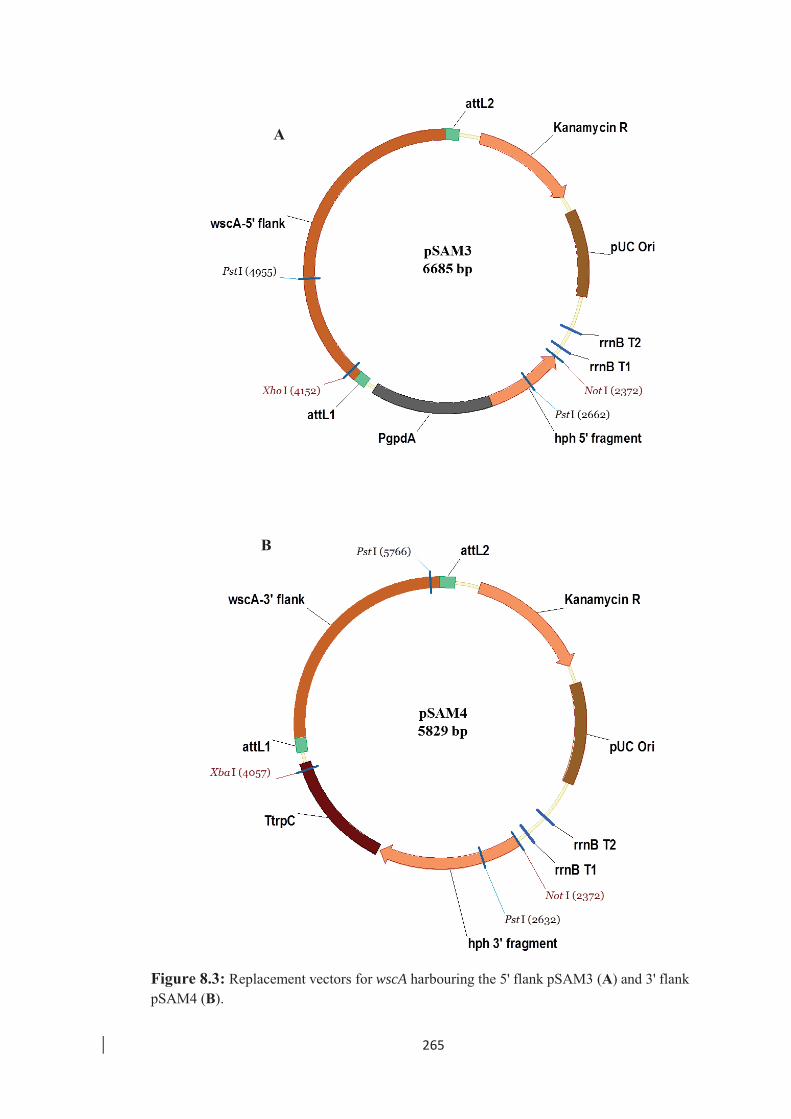
265
Figure 8.3: Replacement vectors for wscA harbouring the 5' flank pSAM3 (A) and 3' flank pSAM4 (B).
A
B

266
Figure 8.4: Vector pII99 used for complementation vector construction.
Figure 8.5: Vector pSAM5 for ΔmidA complementation.
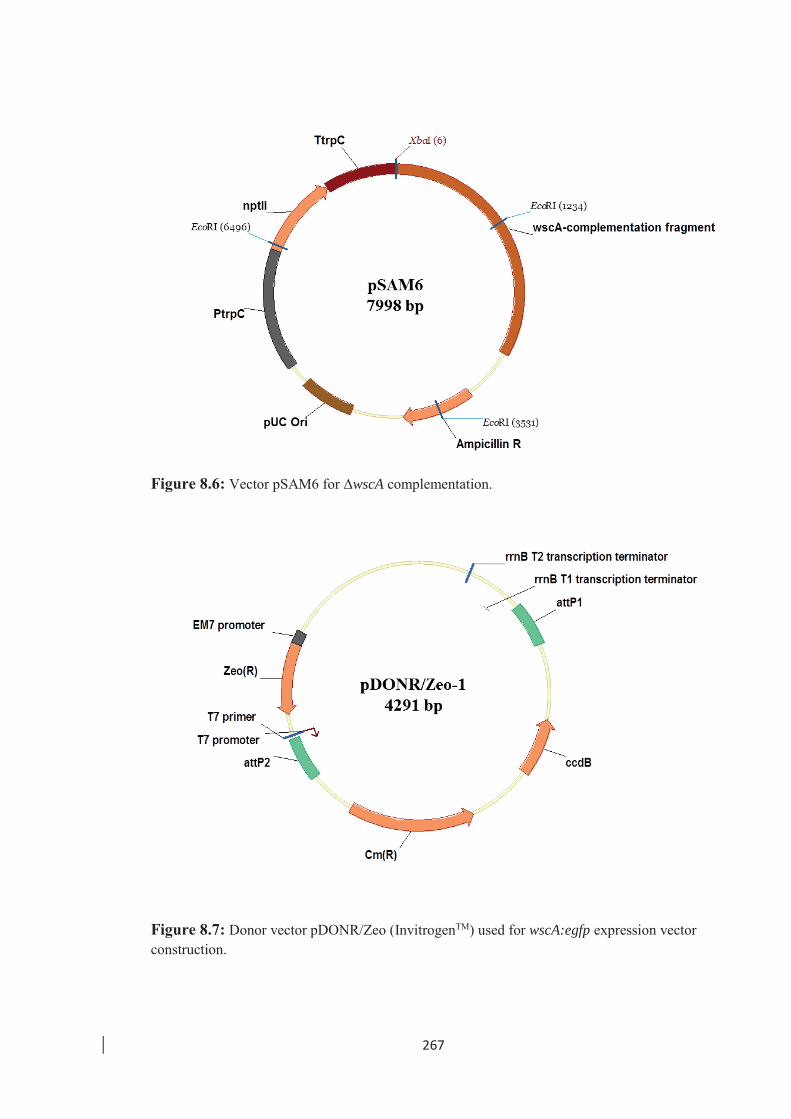
267
Figure 8.6: Vector pSAM6 for ΔwscA complementation.
Figure 8.7: Donor vector pDONR/Zeo (InvitrogenTM) used for wscA:egfp expression vector construction.
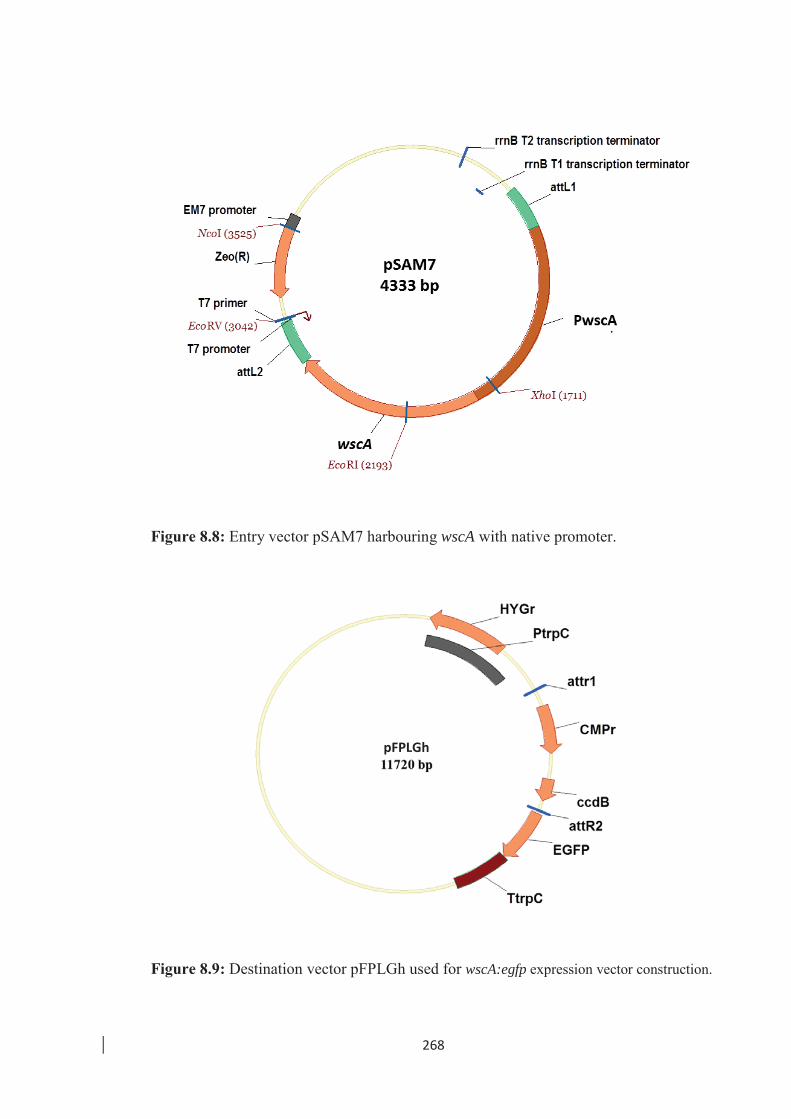
268
Figure 8.8: Entry vector pSAM7 harbouring wscA with native promoter.
Figure 8.9: Destination vector pFPLGh used for wscA:egfp expression vector construction.
pFPLGh
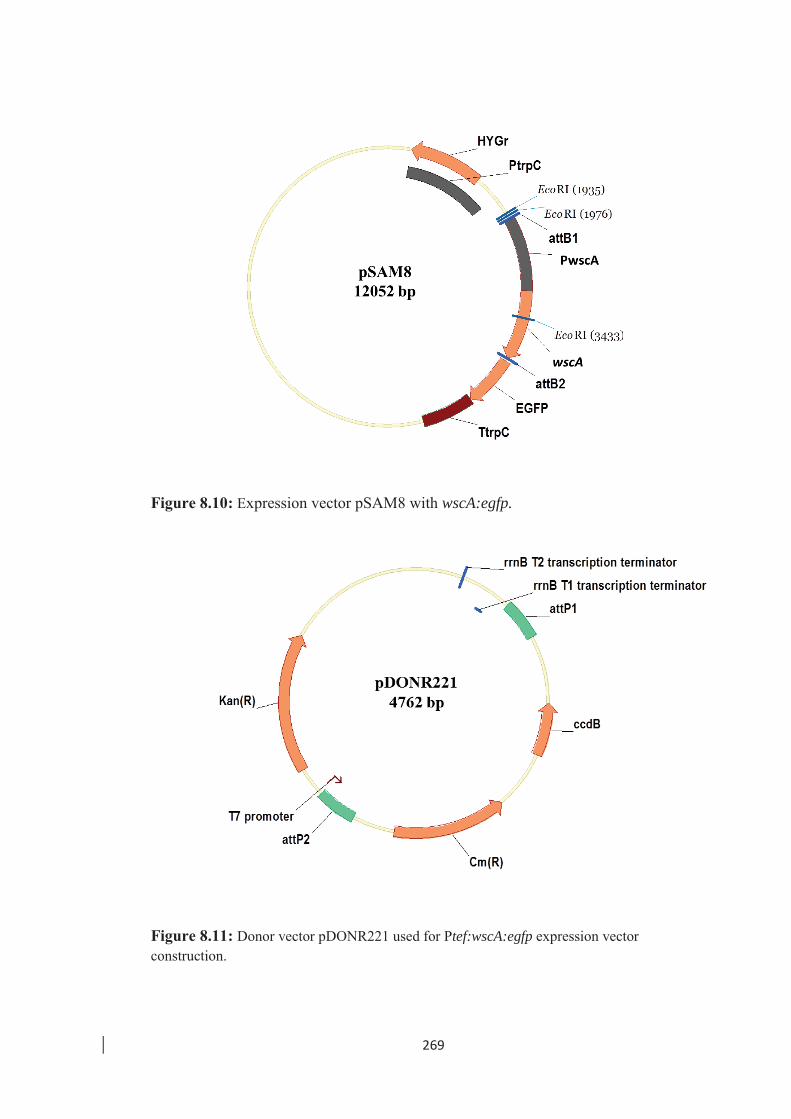
269
Figure 8.10: Expression vector pSAM8 with wscA:egfp.
Figure 8.11: Donor vector pDONR221 used for Ptef:wscA:egfp expression vector construction.

270
Figure 8.12: Entry vector pSAM7 harbouring wscA.
Figure 8.13: Entry vector pDONR-TEF harbouring tef2 promoter.

271
Figure 8.14: Entry vector pDONR-EGFP harbouring egfp.
Figure 8.15: Expression vector pSAM10 harbouring Ptef:wscA:egfp.

272
Appendix 4: MidA and WscA protein sequences
E. festucae MidA protein sequence
> MidA, E. festucae, fgenesh_masked-contig_726-abinit-gene-0.103(computed protein) MQLSPLQSRLVASLAATFCLLVLFSLLLVPKGAVAHEFLHESFLTSSTRPDLASFEEDGHSPDSQISSYEPILNFLGRSILGRAGDTIPLENDKPLAFNIQPGGAPICYIIKKGSLGNSTSQGKQVQPRQTDDDNNERTGQEVKNATIYISANTCLQPIVQSGGKRSKPPQLILFLSNGTEAGCPQVTSNPKGHLARGFTSHTFEEGAVRVSANATSDIYIGLYAPNITDSFEGSYDYQVAASSTEYFHQYQSNETEGAKLLWMDSDSTAALLITRNLTTEASEARRIWSEDPPYQLYVSGQDWPMLDGLHHSACGLERNALVGANKEGTAKNNGMVKTSMTLRGPGGMPKQQFYVVGLNATTSYSGVLVQPANVTVNSKRQANGGGQSLRKPGSVVFQGTTFQTNAAPNCKVVTDLEFCDEIQYAVPGNDGKFNNTELAKVYDKQAKTVYDNFLKVMQQIQCEADRTSKYSLARTCEDCKRAYKRWLCTVSFPRCEDFLDGSRFSVLRNVNQAFPNGTLLPTEIRQELAKVPAQNASRNSFIDETIQPGPYKEIMPCEDICYQVVQSCPAMIKFNCPQPGMYGFNVTYGRRNADNTVVSCNFPGEARTRTSAGHDTIPNLALLTCIMSVFSILVMAR
E. festucae WscA protein sequence
>WscA, E. festucae, maker-contig_1037-snap-gene-0.47(computed protein) MRLSTIAFGAIMAATGVHAQTPKPKQPALQIPVDGISTSSGCYGSYGNMTMHKPISADKMSTAACNNACKADGFWLAAMHGGQCLCGYALPPKKDLVEDSECNQPCPAYPPEACGGIDSYSIYNVGIQLQINRYEPSSSSTTGGSKTSAASPTPTDTSSSTNTGGNNNNNHSNNNNNHSNNNNGGGGGTTVTQTSVPTETPKPEKSGPNVAGIAAGVVVGVFAAAAAIAGVFFYVRRKRNSEIEEEHRRNAAVNAFISGSKPSSSHGSISMTDSRLDPVMAHRRMSDGSIADNEDYSRRILRVTNA
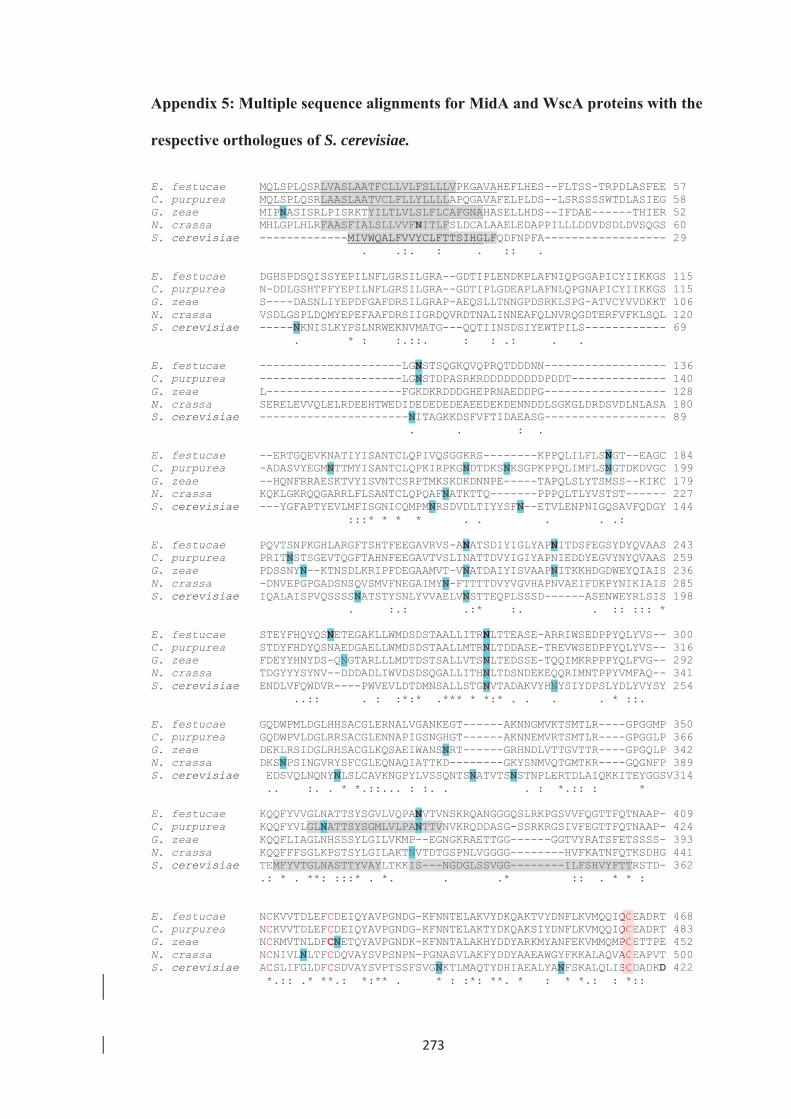
273
Appendix 5: Multiple sequence alignments for MidA and WscA proteins with the
respective orthologues of S. cerevisiae.
E. festucae MQLSPLQSRLVASLAATFCLLVLFSLLLVPKGAVAHEFLHES--FLTSS-TRPDLASFEE 57 C. purpurea MQLSPLQSRLAASLAATVCLFLLYLLLLAPQGAVAFELPLDS--LSRSSSSWTDLASIEG 58 G. zeae MIPNASISRLPISRKTYILTLVLSLFLCAFGNAHASELLHDS--IFDAE------THIER 52 N. crassa MHLGPLHLRFAASFIALSLLVVFNITLFSLDCALAAELEDAPPILLLDDVDSDLDVSQGS 60 S. cerevisiae -------------MIVWQALFVVYCLFTTSIHGLFQDFNPFA------------------ 29 . .:. : . :: . E. festucae DGHSPDSQISSYEPILNFLGRSILGRA--GDTIPLENDKPLAFNIQPGGAPICYIIKKGS 115 C. purpurea N-DDLGSHTPFYEPILNFLGRSILGRA--GDTIPLGDEAPLAFNLQPGNAPICYIIKKGS 115 G. zeae S----DASNLIYEPDFGAFDRSILGRAP-AEQSLLTNNGPDSRKLSPG-ATVCYVVDKKT 106 N. crassa VSDLGSPLDQMYEPEFAAFDRSIIGRDQVRDTNALINNEAFQLNVRQGDTERFVFKLSQL 120 S. cerevisiae -----NKNISLKYPSLNRWEKNVMATG---QQTIINSDSIYEWTPILS------------ 69 . * : :.::. : : .: . . E. festucae ---------------------LGNSTSQGKQVQPRQTDDDNN------------------ 136 C. purpurea ---------------------LGNSTDPASRKRDDDDDDDDDPDDT-------------- 140 G. zeae L--------------------FGKDKRDDDGHEPRNAEDDPG------------------ 128 N. crassa SERELEVVQLELRDEEHTWEDIDEDEDEDEAEEDEKDENNDDLSGKGLDRDSVDLNLASA 180 S. cerevisiae ----------------------NITAGKKDSFVFTIDAEASG------------------ 89 . . : . E. festucae --ERTGQEVKNATIYISANTCLQPIVQSGGKRS--------KPPQLILFLSNGT--EAGC 184 C. purpurea -ADASVYEGMNTTMYISANTCLQPKIRPKGNDTDKSNKSGPKPPQLIMFLSNGTDKDVGC 199 G. zeae --HQNFRRAESKTVYISVNTCSRPTMKSKDKDNNPE-----TAPQLSLYTSMSS--KIKC 179 N. crassa KQKLGKRQQGARRLFLSANTCLQPQAFNATKTTQ-------PPPQLTLYVSTST------ 227 S. cerevisiae ---YGFAPTYEVLMFISGNICQMPMNRSDVDLTIYYSFN--ETVLENPNIGQSAVFQDGY 144 :::* * * * . . . . .: E. festucae PQVTSNPKGHLARGFTSHTFEEGAVRVS-ANATSDIYIGLYAPNITDSFEGSYDYQVAAS 243 C. purpurea PRITNSTSGEVTQGFTAHNFEEGAVTVSLINATTDVYIGIYAPNIEDDYEGVYNYQVAAS 259 G. zeae PDSSNYN--KTNSDLKRIPFDEGAAMVT-VNATDAIYISVAAPNITKKHDGDWEYQIAIS 236 N. crassa -DNVEPGPGADSNSQVSMVFNEGAIMYN-FTTTTDVYVGVHAPNVAEIFDKPYNIKIAIS 285 S. cerevisiae IQALAISPVQSSSSNATSTYSNLYVVAELVNSTTEQPLSSSD------ASENWEYRLSIS 198 . :.: .:* :. . :: ::: * E. festucae STEYFHQYQSNETEGAKLLWMDSDSTAALLITRNLTTEASE-ARRIWSEDPPYQLYVS-- 300 C. purpurea STDYFHDYQSNAEDGAELLWMDSDSTAALLMTRNLTDDASE-TREVWSEDPPYQLYVS-- 316 G. zeae FDEYYHNYDS-QNGTARLLLMDTDSTSALLVTSNLTEDSSE-TQQIMKRPPPYQLFVG-- 292 N. crassa TDGYYYSYNV--DDDADLIWVDSDSQGALLITHNLTDSNDEKEQQRIMNTPPYVMFAQ-- 341 S. cerevisiae ENDLVFQWDVR----PWVEVLDTDMNSALLSTGNVTADAKVYHNYSIYDPSLYDLYVYSY 254 ..:: . : :*:* .*** * *:* . . . . * ::. E. festucae GQDWPMLDGLHHSACGLERNALVGANKEGT------AKNNGMVKTSMTLR----GPGGMP 350 C. purpurea GQDWPVLDGLRRSACGLENNAPIGSNGHGT------AKNNEMVRTSMTLR----GPGGLP 366 G. zeae DEKLRSIDGLRHSACGLKQSAEIWANSNRT------GRHNDLVTTGVTTR----GPGQLP 342 N. crassa DKSNPSINGVRYSFCGLEQNAQIATTKD--------GKYSNMVQTGMTKR----GQGNFP 389 S. cerevisiae EDSVQLNQNYNLSLCAVKNGPYLVSSQNTSNATVTSNSTNPLERTDLAIQKKITEYGGSV314 .. :. . * *.::... : :. . . : *.:: : * E. festucae KQQFYVVGLNATTSYSGVLVQPANVTVNSKRQANGGGQSLRKPGSVVFQGTTFQTNAAP- 409 C. purpurea KQQFYVLGLNATTSYSGMLVLPANTTVNVKRQDDASG-SSRKRGSIVFEGTTFQTNAAP- 424 G. zeae KQQFLIAGLNHSSSYLGILVKMP--EGNGKRAETTGG------GGTVYRATSFETSSSS- 393 N. crassa KQQFFFSGLKPSTSYLGILAKTNVTDTGSPNLVGGGG--------HVFKATNFQTKSDHG 441 S. cerevisiae TEMFYVTGLNASTTYVAYLTKKIS---NGDGLSSVGG--------ILFSHVYFTTRSTD- 362 .: * . **: :::* . *. . .* :: . * * : E. festucae NCKVVTDLEFCDEIQYAVPGNDG-KFNNTELAKVYDKQAKTVYDNFLKVMQQIQCEADRT 468 C. purpurea NCKVVTDLEFCDEIQYAVPGNDG-KFNNTELAKTYDKQAKSIYDNFLKVMQQIQCEADRT 483 G. zeae NCKMVTNLDFCNETQYAVPGNDK-KFNNTALAKHYDDYARKMYANFEKVMMQMPCETTPE 452 N. crassa NCNIVLNLTFCDQVAYSVPSNPN-FGNASVLAKFYDDYAAEAWGYFKKALAQVACEAPVT 500 S. cerevisiae ACSLIFGLDFCSDVAYSVPTSSFSVGNKTLMAQTYDHIAEALYANFSKALQLISCDADKD 422 *.:: .* **.: *:** . * : :*: **. * : * *.: : *::
QCEQCEPCEACESCD
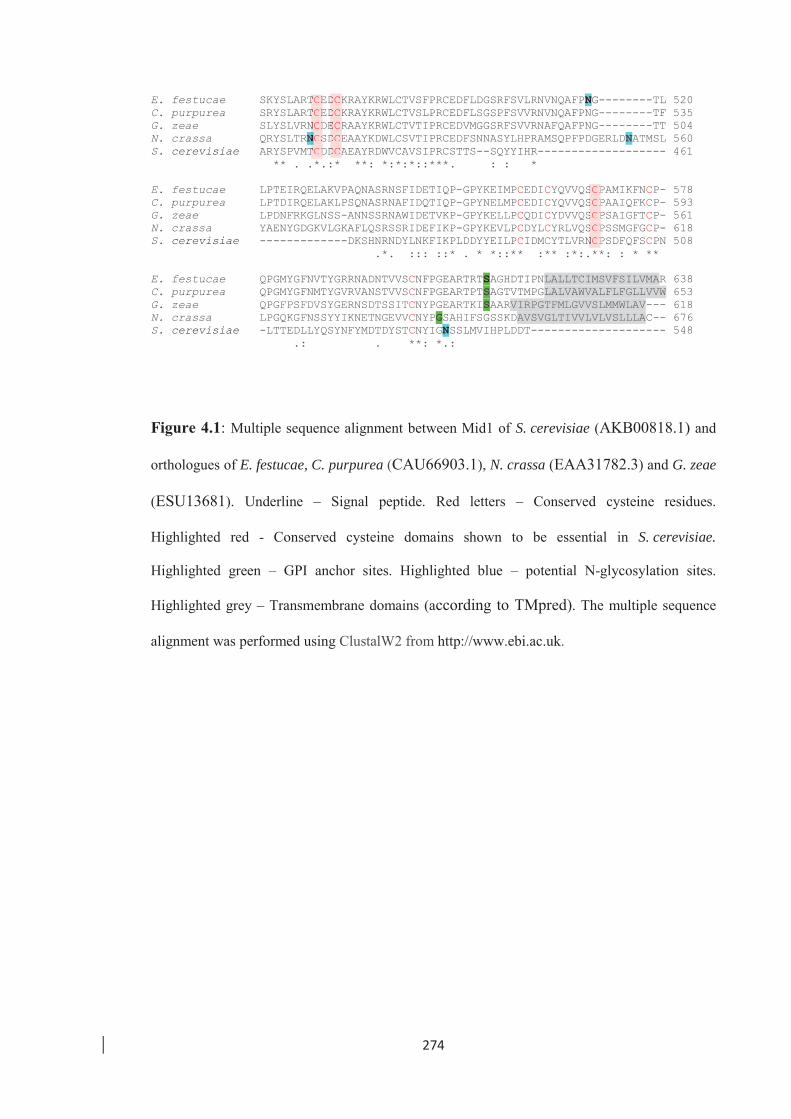
274
E. festucae SKYSLARTCEDCKRAYKRWLCTVSFPRCEDFLDGSRFSVLRNVNQAFPNG--------TL 520C. purpurea SRYSLARTCEDCKRAYKRWLCTVSLPRCEDFLSGSPFSVVRNVNQAFPNG--------TF 535 G. zeae SLYSLVRNCDECRAAYKRWLCTVTIPRCEDVMGGSRFSVVRNAFQAFPNG--------TT 504 N. crassa QRYSLTRNCSDCEAAYKDWLCSVTIPRCEDFSNNASYLHPRAMSQPFPDGERLDNATMSL 560 S. cerevisiae ARYSPVMTCDDCAEAYRDWVCAVSIPRCSTTS--SQYYIHR------------------- 461 ** . .*.:* **: *:*:*::***. : : * E. festucae LPTEIRQELAKVPAQNASRNSFIDETIQP-GPYKEIMPCEDICYQVVQSCPAMIKFNCP- 578 C. purpurea LPTDIRQELAKLPSQNASRNAFIDQTIQP-GPYNELMPCEDICYQVVQSCPAAIQFKCP- 593 G. zeae LPDNFRKGLNSS-ANNSSRNAWIDETVKP-GPYKELLPCQDICYDVVQSCPSAIGFTCP- 561 N. crassa YAENYGDGKVLGKAFLQSRSSRIDEFIKP-GPYKEVLPCDYLCYRLVQSCPSSMGFGCP- 618 S. cerevisiae -------------DKSHNRNDYLNKFIKPLDDYYEILPCIDMCYTLVRNCPSDFQFSCPN 508 .*. ::: ::* . * *::** :** :*:.**: : * ** E. festucae QPGMYGFNVTYGRRNADNTVVSCNFPGEARTRTSAGHDTIPNLALLTCIMSVFSILVMAR 638 C. purpurea QPGMYGFNMTYGVRVANSTVVSCNFPGEARTPTSAGTVTMPGLALVAWVALFLFGLLVVW 653 G. zeae QPGFPSFDVSYGERNSDTSSITCNYPGEARTKISAARVIRPGTFMLGVVSLMMWLAV--- 618 N. crassa LPGQKGFNSSYYIKNETNGEVVCNYPGSAHIFSGSSKDAVSVGLTIVVLVLVSLLLAC-- 676 S. cerevisiae -LTTEDLLYQSYNFYMDTDYSTCNYIGNSSLMVIHPLDDT-------------------- 548 .: . **: *.:
Figure 4.1: Multiple sequence alignment between Mid1 of S. cerevisiae (AKB00818.1) and
orthologues of E. festucae, C. purpurea (CAU66903.1), N. crassa (EAA31782.3) and G. zeae
(ESU13681). Underline – Signal peptide. Red letters – Conserved cysteine residues.
Highlighted red - Conserved cysteine domains shown to be essential in S. cerevisiae.
Highlighted green – GPI anchor sites. Highlighted blue – potential N-glycosylation sites.
Highlighted grey – Transmembrane domains (according to TMpred). The multiple sequence
alignment was performed using ClustalW2 from http://www.ebi.ac.uk.
SCPSCPSCPSCPNCP
DCKDCKECRDCEDCA
TCETCENCDNNCSTCD