Preclinical and clinical aspects of biomodulation of 5-fluorouracil
Upload
independentCategory
view
1download
0
MAGNETIC RESONANCE IN MEDICINE 22,47-56 ( 1991 )
Tumor Bioenergetics and Blood Flow in RIF-1 Murine Tumors Treated with 5-Fluorouracil
SHI-JIANG LI, *J JANNA P. WEHRLE, * JERRY D. GLICKSON, * NIRMAL KUMAR,? AND PAUL G. BRAUNSCHWEIGER?”
*Division of NMR Research, Department of Radiology and Radiological Sciences, The Johns Hopkins University School of Medicine, Baltimore, Maryland 21205; and ?Department of Experimental
Therapeutics, AMC Cancer Research Center, Denver Colorado 80214
Received April 23, 1990; revised September 11, 1990
Treatment of RIF-1 solid tumors with 5-fluorouracil (5-FU, 100 or 200 mg/kg, ip) caused substantial regression of the tumors, with regrowth initiated on Day 6 ( 100 mg/ kg) or Day 9 (200 mg/kg). Blood perfusion in the tumor, estimated by uptake of 86Rb+, was significantly increased after treatment with 5-FU, while Rb’ uptake in normal tissues (skin, muscle) was unaffected. The increase in tumor perfusion during the first few days following treatment was significantly greater in animals treated with the higher dose of 5- FU. Perfusion-dependent “Rb+ uptake returned to control levels by the 9th day after treatment with 100 mg/kg of 5-FU, but remained elevated on Days 9-12 after the higher dose. By the 1st day following treatment with 5-W, in vivo ”P NMR spectra of treated tumors indicated significantly higher ratios of phosphocreatine to Pi, higher pH, and lower ratios of Pi to nucleoside triphosphates compared to untreated age-matched controls. These changes persisted for 9 days following the lower 5-FU dose and for at least 12 days following the higher dose. Treatment with 5-FU induces profound, dose-dependent changes in tumor bioenergetics, which may result, at least in part, from changes in tumor perfusion after cytoreduction. 0 1991 Academic Press, Inc.
INTRODUCTION
The potential utility of in vivo NMR spectroscopy as a monitor of tumor response to chemotherapy has been demonstrated ( 1-4). Several different response patterns have been observed, and it is not clear to what extent they reflect tumor type, drug dose, drug mechanism, host toxicity, or physiological factors such as changes in tumor perfusion and cell density following cytotoxic therapy. We have demonstrated that in the RIF- 1 tumor model dose-dependent changes in tumor bioenergetics occur following cyclophosphamide treatment ( 5 , 6 ) . An increase in tumor pH which was maximal within 3 days after a single cyclophosphamide treatment coincides with post-treatment increases in tumor perfusion (7) . In the present study we have examined the time course and dose-dependence of changes in bioenergetics of the RIF- 1 tumor model after a single treatment with 5-fluorouracil( 5-FU). The bioenergetic response, indicated
’ Present address: Department of Radiology, Medical College of Wisconsin, Milwaukee, W1 53226. Present address: Department of Radiation Oncology, University of Miami School of Medicine, Miami,
FL 33101.
47 0740-3194191 $3.00 Copyright 0 1991 by Academic Press, Inc. All nghts of reproduction in any form reserved.
48 LI ET AL.
by 3’P NMR spectroscopy, has been compared with therapy-mediated changes in tumor blood perfusion as measured by uptake of 86Rb+ ( 8 ) .
MATERIALS AND METHODS
The RIF- 1 tumor line was obtained from the laboratory of Dr. Robert Kallman at Stanford University and maintained according to the protocol described by Twentyman et al. (9). RIF-1 tumors were produced in female C3H/HeN mice (Harlan Industries), by intradermal injection of 1 X lo5 cells in the right flank, as described previously (6). 5-Fluorouracil (Sigma Chemical Co., St. Louis, MO) was diluted in saline and administered by intraperitoneal injection 1 2 days after tumor cell implantation, when tumors had a mean wet weight of 0.33 -t 0.1 1 g. For NMR spectroscopy corresponding tumor volumes (calculated from caliper measurements using the formula V = (a/ 6)a2b, where a and b are the shorter and longer tumor axes, respectively) were ap- proximately 0.4 cm3. At this size little or no necrosis is observed in the RIF-1 tumor (9, 10). Tumor response to 5-FU treatment was assessed by determining the wet weight of freshly excised tumors at various intervals up to 12 days after administration of 100 or 200 mg/kg of 5-FU. Regrowth doubling times were calculated by least squares fit to a single exponential. The regrowth delay was defined as the time for tumor mass to reach pretreatment tumor size.
For spectroscopic examination mice were anesthetized with sodium pentobarbital ( 5 5 mg/kg, ip) approximately 20 min prior to NMR spectroscopy. To allow direct comparison of spectral changes induced by the two drugs, anesthesia and animal handling were identical to conditions of our previous study of cyclophosphamide (6). Spectra were measured on a Bruker AM 360-WB spectrometer (89 mm bore) interfaced to an Aspect 3000 computer. A homebuilt probe containing a three-turn solenoidal radiofrequency coil ( 11) doubly tuned to ‘H (360 MHz, for shimming) and 31P ( 145.8 MHz) was used, together with a Faraday shield to eliminate signals from outside the tumor (12). Coils (0.8-1.6 cm diameter) and Faraday shields were size-matched to the tumor. 31P spectra were obtained using a sweep width of 8064 Hz, 1K data points, 60” pulse, and 3 s repetition time. Spectra were generated from 200 scans and resolution was enhanced by the convolution difference method (13) using 20 and 1000 Hz line broadening.
31P NMR resonances of RIF- 1 have been assigned (14). Since the nucleoside tri- phosphate (NTP) pool of RIF-1 contains as much as 40% non-adenine nucleotides ( 1 4 ) , these resonances are referred to as a, @, and -yNTP, rather than ATP. Peak area integrals were determined by best fit to Lorentzian lines using the GLINFIT program (Bruker Users’ Group). Spectral comparisons were based on ratios of peak areas; levels of NTP were determined from the @-resonance of nucleoside triphosphates, which does not contain contributions from nucleoside diphosphates or other com- pounds. Chemical shifts are reported relative to external 88% H3P04 (IUPAC), using aNTP = -10.0 ppm as an internal reference. Tumor pH was calculated from the chemical-shift difference between PCr and Pi ( 1 5 ) .
Blood perfusion in tumor and normal tissues was estimated by the tracer fractional distribution method of Sapirstein (8), using “RbC1. This method has been validated for several experimental tumors by Zanelli and Fowler ( 1 6 ) and used in a variety of studies of RIF- 1 and other tumors ( 17, 18). Mice were sacrificed by cervical luxation
TUMOR BIOENERGETICS AND BLOOD FLOW AFTER 5-FU 49
45 s after intravenous administration of approximately 200,000 cpm 86RbC1 (NEN, Boston, MA). Tissue radioactivity, determined in a gamma-well spectrometer (Packard Instrument Co., Downers Grove, IL), was expressed as the fraction of the injected dose per gram of tumor tissue (%ID/gm) and reflects the fraction of the cardiac output delivered per gram (8). Tissue blood perfusion has been calculated as the 86Rb %ID/ gm multiplied by mouse body weight to correct for the influence of body weight on total cardiac output.
A total of 225 tumors were studied in five separate experiments. Fifty-one untreated control tumors were examined 7-8 tumors in each experiment as pretreatment controls and 7 age-matched untreated tumors on days corresponding to Day 6 and Day 12 after treatment. The remaining tumors were examined on various days following treat- ment with 5-FU. The results of all studies have been combined. Because several ex- periments were performed, each with its own pretreatment value, results are expressed as a fraction of the individual pretreatment levels.
Effects of treatment with 5-FU on 31P NMR spectra and blood perfusion were evaluated by analysis of variance. The significance of differences between group means was assessed by t test analysis using the Bonferroni correction for multiple comparisons, or using the Newman-Keuls multiple range test. The null hypothesis was rejected for P < 0.05.
RESULTS
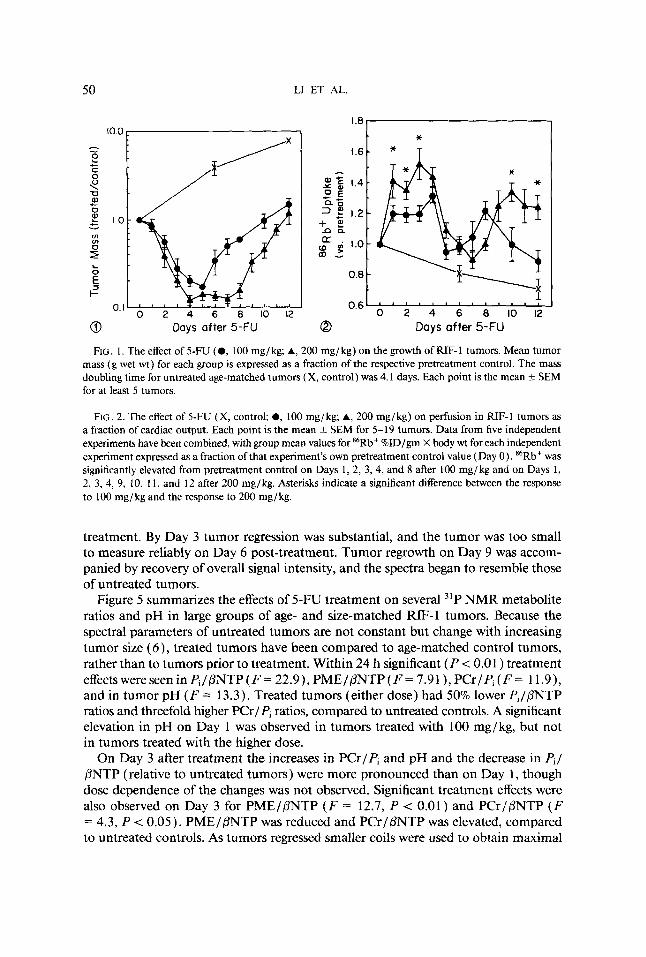
Response of RZF-1 to 5-FU. Treatment of RIF-1 with 100 or 200 mg/kg of 5-FU produced dramatic tumor regression and substantial regrowth delay (Fig. 1 ). Tumor mass was reduced by approximately 85% within 5 days at both 5-FU dose levels. Tumor regrowth was detected by Days 6 and 9 after 100 and 200 mg/kg doses, re- spectively. Tumor regrowth rates were also dose dependent; the mass doubling time for regrowing tumors after 100 mg/kg (2.5 days) was shorter than that for age-matched untreated tumors (4.1 days), and after 200 mg/kg it was reduced to 1.5 days.
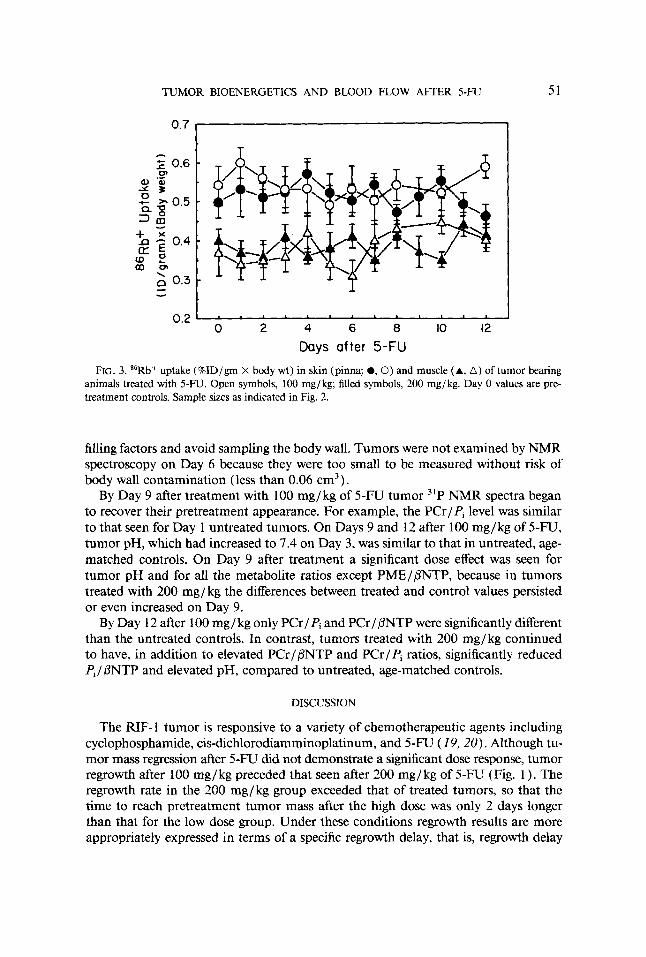
Eflect of 5-FU on tumor blood perfusion. Tumor perfusion after sham or 5-FU treatment was estimated by the uptake of 86Rb as described previously ( 7, 17, I S ) . In untreated tumors the weight-corrected 86RB+ %ID/g ranged from 0.5 to 0.6 for tumors size-matched to those used in the spectroscopy experiments. In untreated tumors a significant ( P c 0.05) decrease in 86Rb+ uptake was observed during progressive tumor growth (Fig. 2). Treatment with 5-FU produced highly significant effects on tumor 86Rb+ uptake ( F = 4.2, P < 0.001 after 100 mg/kg and F = 8.8, P + 0.001 after 200 mg/ kg). Significant dose-dependent increases in tumor 86Rb+ levels were noted on Days 1, 2, and 3 after treatment. At both dose levels 86Rb+ uptake was similar to pretreatment controls on Days 5-7 after treatment. A transient second increase in 86Rb+ uptake occurred on Day 8 after 100 mg/kg, and a sustained second increase was observed between Days 9 and 12 after 200 mg/kg. In contrast to its effect on tumor perfusion, 5-FU had no significant effect on 86Rb+ uptake in muscle or skin of the same animals (Fig. 3 ) .
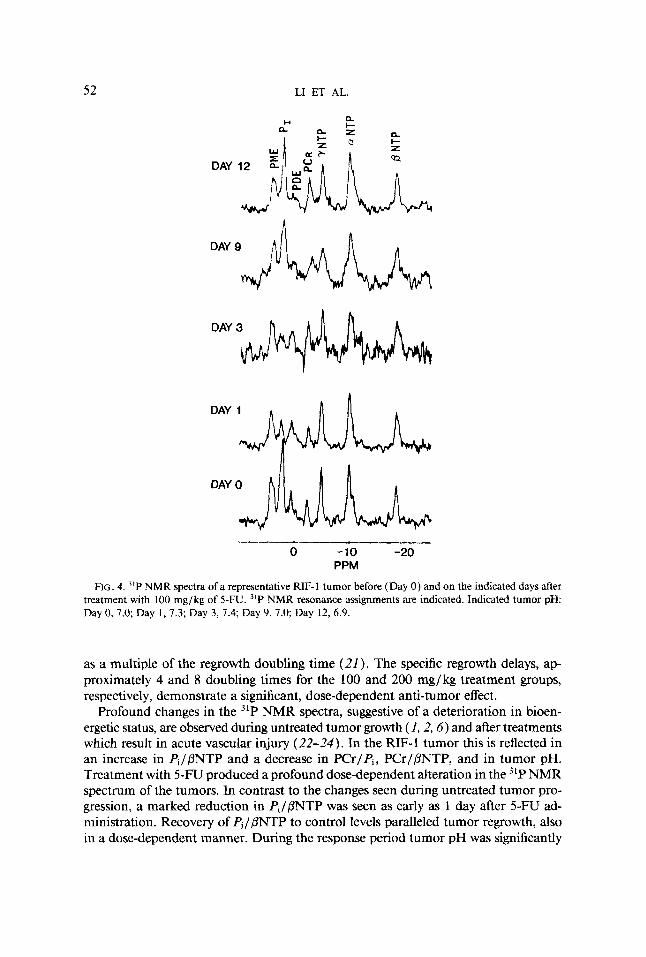
Eflect of 5-FU on the 31P NMR spectrum of RZF-1. The 31P NMR spectra of one representative tumor before and after treatment with 100 mg/kg of 5-FU are shown in Fig. 4. The most noticeable alterations in the spectrum were a decrease in the Pi resonance relative to other peaks and an alkaline shift in pH, as early as 24 h after
50 LI ET AL.
I .8 10.0 *
A - 2
<
c 1.0
c C 0
-0 0)
0 c
Y
m In
f 5 L 0
c 0.6 ' 1 ' ' 1 ' ' 1 ' ' ' 1 1
0 2 4 6 8 10 12 0 2 4 6 8 10 12 0. I
0 Days after 5-FU 0 Days after 5-FU
FIG. I. The effect of 5-FU (0, 100 mg/kg; A, 200 mg/kg) on the growth of RIF-I tumors. Mean tumor mass (g wet wt) for each group is expressed as a fraction of the respective pretreatment control. The mass doubling time for untreated age-matched tumors (X, control) was 4.1 days. Each point is the mean k SEM for at least 5 tumors.
FIG. 2. The effect of 5-FU (X, control; 0, 100 mg/kg; A, 200 mg/kg) on perfusion in RIF-1 tumors as a fraction of cardiac output. Each point is the mean f SEM for 5-19 tumors. Data from five independent experiments have been combined, with group mean values for "Rb+ %ID/gm X body wt for each independent experiment expressed as a fraction of that experiment's own pretreatment control value (Day 0) . 86Rb+ was significantly elevated from pretreatment control on Days 1, 2, 3, 4, and 8 after 100 mg/kg and on Days 1, 2, 3, 4, 9, 10, 11, and 12 after 200 mg/kg. Asterisks indicate a significant difference between the response to 100 mg/kg and the response to 200 mg/kg.
treatment. By Day 3 tumor regression was substantial, and the tumor was too small to measure reliably on Day 6 post-treatment. Tumor regrowth on Day 9 was accom- panied by recovery of overall signal intensity, and the spectra began to resemble those of untreated tumors.
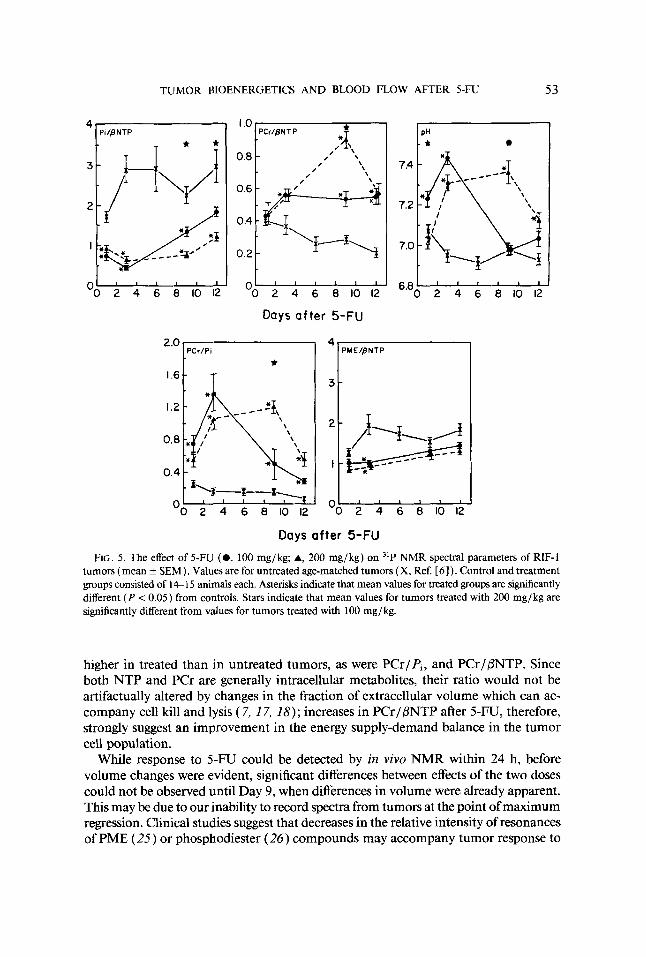
Figure 5 summarizes the effects of 5-FU treatment on several 31P NMR metabolite ratios and pH in large groups of age- and size-matched RIF-1 tumors. Because the spectral parameters of untreated tumors are not constant but change with increasing tumor size (6), treated tumors have been compared to age-matched control tumors, rather than to tumors prior to treatment. Within 24 h significant ( P < 0.01 ) treatment effects were seen in PJPNTP ( F = 22.9), PMEIPNTP ( F = 7.9 1 ), PCr/Pi ( F = 1 1.9), and in tumor pH ( F = 13.3). Treated tumors (either dose) had 50% lower Pi/PNTP ratios and threefold higher PCr/Pi ratios, compared to untreated controls. A significant elevation in pH on Day I was observed in tumors treated with 100 mgjkg, but not in tumors treated with the higher dose.
On Day 3 after treatment the increases in PCr/Pi and pH and the decrease in Pi/ PNTP (relative to untreated tumors) were more pronounced than on Day 1 , though dose dependence of the changes was not observed. Significant treatment effects were also observed on Day 3 for PME/PNTP ( F = 12.7, P < 0.01) and PCrlPNTP ( F = 4.3, P < 0.05). PME/PNTP was reduced and PCrIPNTP was elevated, compared to untreated controls. As tumors regressed smaller coils were used to obtain maximal
TUMOR BIOENERGETICS AND BLOOD FLOW AFTER 5-FU 51
0.7
T
0.6 CI,
0.3 - - - 0.2
0 2 4 6 8 10 12
Days after 5-FU FIG. 3. 86Rb+ uptake (%ID/gm X body wt) in skin (pinna; 0 , O ) and muscle (A, A ) of tumor bearing
animals treated with 5-FU. Open symbols, 100 mg/kg; filled symbols, 200 mg/kg. Day 0 values are pre- treatment controls. Sample sizes as indicated in Fig. 2.
filling factors and avoid sampling the body wall. Tumors were not examined by NMR spectroscopy on Day 6 because they were too small to be measured without risk of body wall contamination (less than 0.06 cm3).
By Day 9 after treatment with 100 mg/kg of 5-FU tumor 3'P NMR spectra began to recover their pretreatment appearance. For example, the PCr/Pi level was similar to that seen for Day 1 untreated tumors. On Days 9 and 12 after 100 mg/kg of 5 - W , tumor pH, which had increased to 7.4 on Day 3, was similar to that in untreated, age- matched controls. On Day 9 after treatment a significant dose effect was seen for tumor pH and for all the metabolite ratios except PMEIPNTP, because in tumors treated with 200 mg / kg the differences between treated and control values persisted or even increased on Day 9.
By Day 12 after 100 mg/ kg only PCr/Pi and PCr/,k?NTP were significantly different than the untreated controls. In contrast, tumors treated with 200 mg/kg continued to have, in addition to elevated PCr /PNTP and PCr /Pi ratios, significantly reduced Pi/ PNTP and elevated pH, compared to untreated, age-matched controls.
DISCUSSION
The RIF- 1 tumor is responsive to a variety of chemotherapeutic agents including cyclophosphamide, cis-dichlorodiamminoplatinum, and 5-FU ( 19, 20). Although tu- mor mass regression after 5-FU did not demonstrate a significant dose response, tumor regrowth after 100 mg/kg preceded that seen after 200 mg/ kg of 5-FU (Fig. 1 ). The regrowth rate in the 200 mg/kg group exceeded that of treated tumors, so that the time to reach pretreatment tumor mass after the high dose was only 2 days longer than that for the low dose group. Under these conditions regrowth results are more appropriately expressed in terms of a specific regrowth delay, that is, regrowth delay
52 LI ET AL.
DAY
0 -10 -20 PPM
FIG. 4. 3'P NMR spectra of a representative RIF- I tumor before (Day 0 ) and on the indicated days after treatment with 100 mg/kg of 5-FU. "P NMR resonance assignments are indicated. Indicated tumor pH: Day 0, 7 . 0 Day 1 , 7.3; Day 3 , 7.4; Day 9, 7.0; Day 12, 6.9.
as a multiple of the regrowth doubling time (21 ). The specific regrowth delays, ap- proximately 4 and 8 doubling times for the 100 and 200 mg/ kg treatment groups, respectively, demonstrate a significant, dose-dependent anti-tumor effect.
Profound changes in the 3'P NMR spectra, suggestive of a deterioration in bioen- ergetic status, are observed during untreated tumor growth ( I , 2 ,6) and after treatments which result in acute vascular injury (22-24). In the RIF- 1 tumor this is reflected in an increase in Pi//3NTP and a decrease in PCr/Pi, PCrIPNTP, and in tumor pH. Treatment with 5-FU produced a profound dose-dependent alteration in the 3LP NMR spectrum of the tumors. In contrast to the changes seen during untreated tumor pro- gression, a marked reduction in Pi//3NTP was seen as early as 1 day after 5-F'U ad- ministration. Recovery of Pi/PNTP to control levels paralleled tumor regrowth, also in a dose-dependent manner. During the response period tumor pH was significantly
TUMOR BIOENERGETICS AND BLOOD FLOW AFTER 5-FU 53
0.8
I Pi/BNTP PCr/BNTP
- /' \
' \
- '0 2 4 6 8 10 12
lp:
7.2
0 2 4 6 6 1 0 1 2 6.8
Days after 5-FU
FIG. 5. The effect of 5-FU (0, 100 mg/kg; A, 200 mg/kg) on "P NMR spectral parameters of RIF-I tumors (mean k SEM). Values are for untreated age-matched tumors (X, Ref. [ 6 ] ) . Control and treatment groups consisted of 14- 15 animals each. Asterisks indicate that mean values for treated groups are significantly different ( P < 0.05) from controls. Stars indicate that mean values for tumors treated with 200 mg/kg are significantly different from values for tumors treated with 100 mg/kg.
higher in treated than in untreated tumors, as were PCr/Pi, and PCrIPNTP. Since both NTP and PCr are generally intracellular metabolites, their ratio would not be artifactually altered by changes in the fraction of extracellular volume which can ac- company cell kill and lysis ( 7, 17, 18) ; increases in PCrIPNTP after 5-FU, therefore, strongly suggest an improvement in the energy supply-demand balance in the tumor cell population.
While response to 5-Fu could be detected by in vivo NMR within 24 h, before volume changes were evident, significant differences between effects of the two doses could not be observed until Day 9, when differences in volume were already apparent. This may be due to our inability to record spectra from tumors at the point of maximum regression. Clinical studies suggest that decreases in the relative intensity of resonances of PME ( 2 5 ) or phosphodiester (26) compounds may accompany tumor response to
54 LI ET AL.
therapy. In RIF- 1 treated with 5-FU a significant reduction in PME relative to PNTP was observed on only one of the days post-treatment (Day 3), and the magnitude of the change was not dose-dependent.
A strong correlation between the energy status of untreated RIF- 1 tumors as reflected in 31P NMR spectra and the degree of vascular perfusion, as indicated by " 0 2 washout, was established by Evelhoch et al. (27). The present study demonstrates that increases in tumor perfusion, indicated by increased levels of 86Rb+ uptake, occur during the period of improved bioenergetic status which follows 5-FU treatment. Although it does not measure absolute tumor blood flow, the tracer distribution method does measure the fraction of cardiac output to tissues during any time period in which the tissue extraction ratio equals the body extraction ratio, as indicated by time-independent tissue tracer levels (8). Although marked dose-dependent increases in 86Rb + levels were observed in RIF-1 tumors after treatment with 5-FU, little or no effect was seen in skin or muscle at either the 100 or 200 mg/kg dose levels, indicating that 5-FU does not alter the distribution of cardiac output to these normal tissues.
The time course of the increases in 86Rb+ uptake observed following treatment of RIF- 1 with 5-FU was consistent with the bioenergetic changes which could be observed, although NMR measurements could not be made at the nadir of tumor volume. The presence of two phases of blood flow elevation, which occurred at both doses of 5- FU, cannot at present be explained. However, it is quite clear that after the low dose of 5-FU, when perfusion returned to control levels by Day 9, tumor high energy phosphates were also declining by this time. Following the high dose of 200 mg/kg, which resulted in elevated perfusion on Days 9-12, 31P NMR spectra showed high energy phosphates elevated for this extended period. In contrast, on the first 3 days after treatment the dose responses of blood flow and bioenergetic changes were not the same. Perfusion was increased significantly more by 200 mg/kg than by 100 mg/ kg of 5-FU, while changes in ratios of NMR-visible phosphorus metabolites induced by the two 5-FU doses did not differ significantly. Although 86Rb+ uptake per gram of tumor did decrease with increasing tumor size during untreated growth, the im- provements in tumor perfusion after treatment with 5-FU were not exclusively due to the tumor volume reduction caused by the drug. For example, on Day 12 following 200 mg/ kg, tumor perfusion was significantly greater than in untreated tumors of a similar size.
Although administration of 5-FU results in substantial tumor cell killing, the cell population during response to 5-FU consistently appeared better energized than in age-matched untreated tumors. This pattern is not unique to 5-FU and has been observed in the RIF- 1 tumor treated with cyclophosphamide ( 7) or y-radiation (28 ) , in the 9L gliosarcoma treated with BCNU ( 1,3-bis( 2-chloroethy1)- 1-nitrosourea, Ref. ( 2 9 ) ) , in the Adriamycin-sensitive subline of the murine mammary 17 / A adenocar- cinoma treated with Adriamycin (30) , and in a variety of other tumors responding to chemotherapy. (For reviews, see Refs. (1-4, 3 1 ) ) .
Although chemotherapeutic agents may directly alter cellular biochemistry, therapy- mediated changes in tumor physiology can indirectly cause biochemical changes and must also be examined. Vascular perfusion in tumors is typically inadequate, due both to chronic deficiencies in vascular architecture (32) and to permanent and tran- sient collapse of existing blood vessels (33, 34) . Such vascular pathologies not only
TUMOR BIOENERGETICS AND BLOOD FLOW AFTER 5-FU 55
lead to a deterioration of tumor bioenergetics but also affect the efficacy of both systemic therapeutic modalities such as chemotherapy and localized modalities such as radio- therapy and hyperthermia.
The results presented here indicate a close temporal and perhaps causal relationship between post-treatment changes in tumor bioenergetics and post-treatment changes in tumor perfusion. Similar increases in tumor perfusion have been observed following treatment of RIF-1 with cyclophosphamide ( 7) and y-radiation (35), and in each case the 31P NMR spectra of the treated tumors exhibited changes similar to those reported here. Studies of isolated, perfused tumor cells are required to identify cellular biochemical components of the chemotherapeutic response. Our in viva results indicate that physiological changes such as altered blood flow, probably secondary to drug- induced cell death, may be important factors in NMR spectroscopic investigations of solid tumors. Our findings lend support to the hypothesis that in vivo 31P NMR spec- troscopy may be an extremely useful tool for monitoring therapeutic response and for the implementation of therapeutic strategies designed to exploit transient therapy- induced perturbations in tumor physiology.
ACKNOWLEDGMENTS
The skilled technical assistance of Ms. Penny Jenkins is gratefully acknowledged. We thank Ms. Maryanna Zahurak for assistance with statistical analysis. This work was supported in part by Grants CA-39960 and CA-44703 from the National Cancer Institute.
REFERENCES
1. W. T. EVANOCHKO, T. C. NG, AND J. D. GLICKSON, Magn. Reson. Med. 1,508 ( 1984). 2. J. P. WEHRLE AND J. D. GLICKSON, Cancer Biochn. Biophys. 8, 157-166 ( 1986). 3. P. F. DALY AND J. S. COHEN, Cancer Rex 49,770 ( 1989). 4. R. G. STEEN, Cancer Res. 49,4075 ( 1989). 5. L. M. SCHIFFER, P. B. BRAUNSCHWEIGER, J. D. GLICKSON, W. T. EVANOCHKO, AND T. C. NG, Ann.
6. S. J. LI, J. P. WEHRLE, S. S. RNAN, R. G. STEEN, J. D. GLICKSON, AND J . HILTON, Cuncer Rex 48,
7. P. G. BRAUNSCHWEIGER, Cancer Res. 48,4206 ( 1988). 8. L. A. SAPIRSTEIN, Am. J. Physiol. 193, 161 (1958). 9. P. R. TWENTYMAN, J. M. BROWN, J. W. GRAY, A. J. FRANKO, M. A. SCOLES, AND R. F. KALLMAN,
10. Z. M. BHUJWALLA, S. J. BLACKBAND, J. P. WEHRLE, S. GROSSMAN, s. ELLER, AND J. D. GLICKSON,
12. T. C. NG AND J. D. GLICKSON, Magn. Reson. Med. 2, 169 (1985). 12. T. C. NG, W. T. EVANOCHKO, AND J. D. GLICKSON, J. Magn. Reson. 49, 526 ( 1982). 13. I. D. CAMPBELL, C. M. DOBSON, R. J. P. WILLIAMS, AND A. V. XAVIER, J. Magn. Reson. 11, 172
(1973). 14. W. T. EVANOCHKO, T. T. SAKAI, T. C. NG, N. R. KRISHNA, H. D. KIM, R. B. ZEIDLER, V. K. CHANTA,
R. W. BROCKMAN, L. M. SCHIFFER, P. G. BRAUNSCHWEIGER, AND J. D. CLICKSON, Biochim. Biophys. Acra 805, 104 ( 1 984).
N.Y. Acad. Sci. 459, 270 ( 1985).
4736 (1988).
J. Natl. Cancer Inst. 64, 595 (1980).
NMR Biomed. 3,233 (1990).
IS. R. B. MOON AND J. H. RICHARDS, J. Biol. Chern. 246,7276 { 1973). 16. G. D. ZANELLI AND J. F. FOWLER, Cancer Res. 34, 1451 (1974). 17. P. B. BRAUNSCHWEIGER, L. SCHIFFER, AND P. FURMANSKI, Magn. Reson. Imaging 4,285 ( 1986). 18. P. G. BRAUNSCHWEIGER, L. M. SCHIFFER, AND P. FURMANSKI, Magn. Reson. Imaging4,335 (1986). 19. M. J. BROWN, P. R. TWENTYMAN, AND S. S. ZAMVIL, J. Natl. Cancer Inst. 64,605 ( 1980). 20. P. G. BRAUNSCHWEIGER, H. L. TING, AND L. M. SCHIFFER, Cancer Res. 43, 5801 ( 1983).
56 LI ET AL.
21. A. C. BEGG, in “Rodent Tumor Models in Experimental Cancer Therapy” (R. F. Kallman, Ed.), p.
22. I. C. CONSTANTINIDIS, P. B. BRAUNSCHWEIGER, J. P. WEHRLE, N. KUMAR, C. S. JOHNSON, P. FUR-
23. J. L. EVELHOCH, M.-C. BISSERY, G. G. CHABOT, N. E. SIMPSON, C. L. McCoy, L. K. HEILBRUN, AND
24. N. SHINE, M. A. PALLADINO, JR., J. S. PATTON, A. DEISSEROTH, G. S. KARCZMAR, G. B. MATSON,
114, Pergamon, New York, 1987.
MANSKI, AND J. D. GLICKSON, Cancer Res. 49,6379 ( 1989).
T. H. CORBETT, Cancer Res. 48,4749 ( 1988).
AND M. W. WEINER, Cancer Res. 49,2123 (1989).
CHANCE, N. Engl. J. Med. 312, 1500 (1985).
J. Radiat. Oncol. Biol. Phys. 13, 1545 (1987).
(1986).
25. J. M. MARIS, A. E. EVANS, A. C. MCLAUGHLIN, G. J. DANGIO, L. BOLINGER, H. MANOS, AND B.
26. T. C. NG, S. VIJAYAKUMAR, A. W. MAJORS, F. J. THOMAS, T. F. MEANEY, AND N. J. BALDWIN, Int.
27. J. L. EVELHOCH, S. A. SAPARETO, G. H. NUSSBAUM, AND J. J. H. ACKERMAN, Radiat. Res. 106, 122
28. S. S. W A N , J. P. WEHRLE, S.J. LI, R. G. STEEN, AND J. D. CLICKSON, NMR Biomed. 2, 165 ( 1989). 29. R. C. STEEN, R. J. TAMARGO, S. S. RAJAN, K. A. MCGOVERN, H. BREM, J. P. WEHRLE, AND J. D.
30. J. L. EVELHOCH, N. A. KELLER, AND T. H. CORBETT, Cancer Res. 47,3396 (1987). 31. J. D. GLICKSON, J. P. WEHRLE, S. S. RAJAN, S.-J. LI, AND R. G. STEEN, in “NMR: Principles and
Applications in Biomedical Research” (J. W. Pettegrew, Ed.), p. 93, Springer-Verlag, New York, 1989.
CLICKSON, Cancer Res. 48, 676 (1988).
32. R. H. THOMLINSON AND L. H. GRAY, Br. J. Cancer 9, 539 ( 1955). 33. E. H. COOPER, A. H. BEDFORD, AND T. E. KENNEY, Adv. Cancer Res. 21, 59 (1975). 34. D. J. CHAPLIN, P. L. OLIVE, AND R. E. DURAND, Cancer Res. 47, 597 ( 1987). 35. G. M. TOZER, Z. M. BHUJWALLA, J. R. GRIFFITHS, AND R. J. MAXWELL, Int. J. Radiat. Oncol. Biol.
Phys. 16, 155 (1989).
Copyright © 2022 FDOKUMEN