Nodal Signalling During Targeted Differentiation of Human ...
250
1 Nodal Signalling During Targeted Differentiation of Human Embryonic Stem Cells towards Definitive Endoderm A thesis submitted to the University of Manchester for the degree of Doctor of Philosophy (PhD) in the Faculty of Life Sciences 2012 Duncan Miller
-
Upload
khangminh22 -
Category
Documents
-
view
3 -
download
0
Transcript of Nodal Signalling During Targeted Differentiation of Human ...

1
Nodal Signalling During Targeted Differentiation of Human
Embryonic Stem Cells towards Definitive Endoderm
A thesis submitted to the University of Manchester for the degree of Doctor of Philosophy
(PhD) in the Faculty of Life Sciences
2012
Duncan Miller

2
CONTENTS
Tables and figures
Abbreviations
Abstract
Declaration
Copyright
Acknowledgements and Dedication
Chapter 1 Introduction
1.1 Transforming growth factor-beta (TGFβ) and Wnt signalling
1.1.1 Characteristics of TGFβ signalling
1.1.2 Smad2/3 signalling
1.1.3 Activin A, Nodal and Cripto
1.1.4 Wnt/β-catenin signalling
1.2 Early mouse embryo development and emergence of DE
1.2.1 The epiblast
1.2.2 Patterning the primitive streak and gastrulation
1.2.3 Regulating the DE
1.3 hESC culture and pluripotency
1.3.1 Derivation and culture of hESCs
1.3.2 Signalling pathways regulating pluripotency
1.3.3 Transcription factor networks
1.4 Generating DE from hESCs
1.4.1 Genetic profile of cells undergoing DE differentiation
1.4.2 Targeted differentiation protocols
1.4.3 Factors regulating DE differentiation
1.5 Hypothesis and aims
Chapter 2 Method and materials
2.1 Generating MEF feeder cells
2.1.1 Culturing
2.1.2 Preparing mitotically inactive MEFs
2.2 Freezing and thawing cells
7
9
10
11
11
12
13
13
13
14
15
18
20
20
21
25
28
28
30
32
33
33
34
36
40
42
42
42
42
42

3
2.3 Culturing hESCs using MEF feeder layers
2.3.1 Preparing MEF feeder layers
2.3.2 hESC seeding and maintenance
2.3.3 Manual passage of hESCs
2.3.4 Enzymatic passage of hESCs
2.4 Culturing hESCs in a feeder-free system
2.4.1 Maintenance of feeder-free hESCs
2.4.2 Passaging feeder-free hESCs
2.4.3 Transferring hESCs from MEFs onto feeder-free
2.5 Differentiation of feeder-free hESCs
2.6 293FT and HeLa cell culture
2.7 Lentivector cloning
2.7.1 General molecular cloning techniques
2.7.2 pLVCT Nodal shRNA vector generation
2.7.3 pLKO.1 Nodal shRNA vector generation
2.7.4 Smad-luciferase reporter cloning
2.8 Lentivirus generation and hESC transduction
2.8.1 Calcium phosphate transfection
2.8.2 Direct transduction of hESCs
2.8.3 Concentration of lentiviral particles
2.8.4 Assessment of lentiviral titre
2.8.5 Transduction using concentrated virus
2.9 Smad/Luciferase vector functional assays
2.9.1 pGL3-Smad/luciferase transfection into 293FTs
2.9.2 pLNT-CAGA12 transduction of 293FTs
2.10 Nodal shRNA vector functional assays
2.10.1 Transfection into HeLa cells
2.10.2 FACS of transfected HeLa cells
2.11 Cripto blocking antibody functional assays
2.11.1 HeLa Smad phosphorylation assay
2.11.2 Antibody immunostaining assay
2.12 PCR analysis and statistics
2.12.1 Cell collection
2.12.2 RNA preparation
43
43
43
43
45
45
45
46
46
46
48
48
48
50
54
55
58
58
58
59
59
60
60
60
61
61
61
62
62
62
63
63
63
63

4
2.12.3 Reverse transcription to cDNA
2.12.4 Primer design
2.12.5 Qualitative RT-PCR
2.12.6 Gel electrophoresis
2.12.7 Quantitative RT-PCR (qPCR)
2.12.8 Statistical analysis
2.13 Western blotting
2.13.1 Sample collection
2.13.2 BCA total protein assay
2.12.3 Western blot reagents
2.13.4 Running and analysis of western blots
2.14 Immunofluorescence staining and microscopy
2.14.1 Staining
2.14.2 Microscopy
2.15 Flow cytometry
2.16 Luciferase assay
2.16.1 Sample collection
2.16.2 Luminescence analysis
Chapter 3 Differentiation of hESCs towards definitive endoderm (DE)
using high Activin A
3.1 hESC culture system
3.1.1 Maintenance of hESC lines on MEFs
3.1.2 Feeder-free culture of hESCs
3.2 Effect of high Activin A-only treatment on hESCs
3.2.1 Initial qualitative assessment of transcript expression
3.2.2 Quantitative analysis of gene expression
3.2.3 Presence of TGFβ signalling components
3.2.4 Differentiation in the absence of Activin A
3.2.5 Changes in morphology and immunocytochemical profile
3.2.6 Quantitation of changes in NANOG and SOX17
3.3 Enhancing DE differentiation using Wnt3a
3.3.1 Identification of optimum temporal window for Wnt3a
3.3.2 Quantitative analysis of gene expression
64
64
64
65
65
68
68
68
68
69
69
71
71
74
74
75
75
75
76
76
76
77
79
79
82
87
91
94
100
106
106
107
5
3.3.3 Wnt and TGFβ signalling during differentiation
3.3.4 Immunostaining of pluripotency and DE markers
3.3.5 Quantitation of changes in NANOG and SOX17
3.4 Conclusions and discussion
Chapter 4 Activation of Smad3 during Activin A mediated
differentiation of hESCs towards DE
4.1 Functional analysis of Smad/Luciferase reporter plasmids
4.2 Generation of Smad/Luciferase reporter hESC lines
4.2.1 Generating Smad/Luciferase reporter lentivectors
4.2.2 Smad3/4 reporter lentivirus generation and hESC transduction
4.3 Smad3/4 reporter activation during Activin A treatment of hESCs
4.4 Conclusions and discussion
Chapter 5 Nodal short hairpin RNA (shRNA) knockdown in hESCs
during Activin A treatment
5.1 Generation of an inducible Nodal shRNA knockdown lentivirus
5.1.1 Designing and cloning lentivectors
5.1.2 Functional assay of pLV-Nodal lentivectors
5.1.3 Generating pLV-Nodal shRNA lentivirus
5.2 Generation of a constitutive Nodal shRNA knockdown lentivirus
5.3 Lentiviral mediated Nodal shRNA knockdown of hESCs
5.3.1 Generating cell lines
5.3.2 Effects of shRNA knockdown during Activin A treatment
5.3.3 Undirected differentiation of hESC following Nodal knockdown
5.4 Conclusions and discussion
Chapter 6 Role of Cripto during Activin A treatment of hESCs
6.1 Endocytosis of Nodal during Activin A treatment
6.2 Effect of antibody blockade of Cripto on Smad2 activation
6.3 Antibody blockade of Cripto during Activin A treatment of hESCs
6.3.1 Small scale pilot study
6.3.2 Determining the effect on DE differentiation
6.4 Conclusions and discussion
111
114
118
123
130
130
132
132
134
138
142
148
148
148
152
154
157
161
161
163
173
179
186
186
191
195
195
197
206

6
Chapter 7 General discussion
7.1 Overview of data from high Activin A treatment of hESCs
7.2 Assessment of the overall experimental approach
7.3 Dissecting TGFβ signalling in hESC differentiation
7.3.1 Transcriptional regulation by TGFβ signalling
7.3.2 Regulation of signalling by endocytosis
7.3.3 miRNA regulation of Nodal signalling and DE
7.4 Improving culture and characterisation of DE differentiation
References
Appendices
Word count: 82,389
214
214
216
219
219
220
223
225
230
249
7
TABLES and FIGURES
Chapter 1
Table 1.1 Targeted DE differentiation protocols
Figure 1.1 Overview of Nodal/Activin A signalling
Figure 1.2 Gastrulation in the mouse embryo
Chapter 2
Table 2.1 Culture media
Table 2.2 Supplements of differentiation medium
Table 2.3 DNA sequencing primers
Table 2.4 Primers for A) qualitative and B) quantitative PCR
Table 2.5 Primary antibodies
Table 2.6 Secondary antibodies
Figure 2.1 Overview of differentiation time course
Figure 2.2 Nodal shRNA lentivector maps
Figure 2.3 Smad/Luc and CMV/dsRed vector maps
Figure 2.4 Amplification and dissociation curves from qPCR
Figure 2.5 Semi-quantitative analysis of western blots
Chapter 3
Figure 3.1 Microscopy of pluripotent hESCs
Figure 3.2 Qualitative PCR of Activin A differentiation
Figure 3.3 No-RT control qPCR
Figure 3.4 qPCR analysis of Activin A differentiation (n=2+)
Figure 3.5 qPCR analysis of Activin A differentiation (n=1)
Figure 3.6 Western blot analysis of Activin A differentiation
Figure 3.7 Averages from western blot analysis of differentiation
Figure 3.8 Differentiation in the absence of Activin A
Figure 3.9 Daily phase contrast microscopy of differentiation
Figure 3.10 Fluorescence microscopy of Activin A differentiation
Figure 3.11 Flow cytometry analysis of Activin A differentiation
Figure 3.12 qPCR analysis of Wnt3a temporal windows
Figure 3.13 qPCR analysis of A+Wnt3a differentiation (n=2+)
36
16
23
44
47
55
66
70
73
47
52
56
66
72
78
81
83
84
85
89
91
93
95
97
102
107
109
8
Figure 3.14 qPCR analysis of of A+Wnt3a differentiation (n=1)
Figure 3.15 Western blot analysis of A+Wnt3a differentiation
Figure 3.16 Fluorescence microscopy of A +Wnt3a differentiation
Figure 3.17 Flow cytometry analysis of A +Wnt3a differentiation
Chapter 4
Figure 4.1 Smad/Luc reporter functional assay (293FT)
Figure 4.2 Molecular cloning of Smad/Luc lentivectors
Figure 4.3 Generation and direct transduction of CAGA12 lentivirus
Figure 4.4 Concentration and attempted transduction of lentivirus
Figure 4.5 CAGA12/Luc in hESCs during Activin A differentiation
Chapter 5
Figure 5.1 Molecular cloning of pLV-Nodal shRNA lentivector
Figure 5.2 pLV-Nodal shRNA functional assay (HeLa)
Figure 5.3 Generation and concentration of pLV- lentivirus
Figure 5.4 pLKO.1 Nodal shRNA functional assay (HeLa)
Figure 5.5 Generation and concentration of pLKO.1 lentivirus
Figure 5.6 Transduction and selection of hESCs
Figure 5.7 Activin A differentiation of Hues1N2
and Hues1N3
Figure 5.8 Activin A differentiation of Hues1N2N3
Figure 5.9 hESC morphology changes following N2N3 knockdown
Figure 5.10 Analysis of undirected differentiation of hESCs
Chapter 6
Figure 6.1 Confocal microscopy of Nodal endocytosis (hESCs)
Figure 6.2 Functional analysis of Cr blocking Ab (HeLa/293FT)
Figure 6.3 Pilot experiment using Cr blocking Ab (hESCs)
Figure 6.4 qPCR and western blot analysis during Cr blocking
Figure 6.5 Microscopy and flow cytometry following Cr blocking
Chapter 7
Figure 7.1 Overview of factors identified during differentiation
Figure 7.2 Proposed model of signalling regulating differentiation
111
114
117
121
131
133
135
137
141
150
153
156
158
160
162
165
168
174
176
188
192
196
199
203
215
221

9
Appendix
Figure A.1 Compiled Nanog/Sox17 flow cytometry data
Figure A.2 SOX17 immunostaining during Cr blockade
ABBREVIATIONS
Selected list of commonly used abbreviations
AR3 Smad2/4/FoxH1 responsive element
AVE Anterior visceral endoderm
BMP Bone morphogenetic protein
CAGA12 Smad3/4 responsive element
DE Definitive endoderm
EB Embryoid body
EGF-CFC Epidermal growth factor – Cripto/Frl1/Cryptic
EMT Epithelial-mesenchymal transition
ExE Extra embryonic ectoderm
FACS Fluorescence activated cell sorting
FBS/FCS Foetal bovine/calf serum
GFP Green fluorescent protein
GPI Glycosylphosphatidylinisotol
hESC Human embryonic stem cell
IU Infectious units
Luc Luciferase
MEF Mouse embryonic fibroblast
mESC Mouse embryonic stem cell
MOI Multiplicity of infection
PuroR Puromycin resistance
rh Recombinant human
RLU Relative light units
shRNA Short hairpin RNA
TGFβ Transforming growth factor-beta
Wnt Wingless homologue
249
250

10
ABSTRACT
University of Manchester
Duncan Miller
Thesis submission for the degree of PhD to the Faculty of Life Sciences
“Nodal Signalling during Targeted Differentiation of Human Embryonic Stem
Cells towards Definitive Endoderm”
September 2012
Targeted differentiation of human embryonic stem cells (hESCs) towards definitive
endoderm (DE) is the first step in generating hepatic or pancreatic cell types with
potential for clinical application. Characterisation and efficiency of DE differentiation is
improving, however the specific effects of the different exogenous growth factors used,
and the changing presence and activity of endogenous factors, are still not well
understood. One such endogenous factor, the TGFβ ligand Nodal, is known to drive
patterning and differentiation of the primitive streak and DE in the developing mouse
embryo. The effect of Nodal signalling during hESC DE differentiation is unknown,
and the common use of a related exogenous ligand Activin A may also serve to
upregulate rather than simply mimic it. In order to explore this, Activin A
differentiation of hESCs in defined culture conditions was analysed. The expression of
characteristic mesendoderm and DE markers increased during Activin A treatment,
which was significantly enhanced by the inclusion of exogenous Wnt3a. A maintained
presence of the pluripotency factor Nanog was observed in most cells expressing
markers of DE. The levels of Nodal and its co-receptor Cripto, which were raised during
the early stage of Activin A treatment, were also marginally enhanced by Wnt3a, and
evidence of Nodal endocytosis further suggested an active signalling presence. RNA
interference (RNAi) of Nodal negatively affected both pluripotency maintenance during
normal pluripotent culture, and the capacity to differentiate towards DE. Use of a Cripto
blocking antibody also inhibited differentiation towards DE. The results strongly
suggested the presence of Nodal signalling, as well as possible roles for Nanog, Wnt-
related signalling, and Nodal signalling during Activin A-mediated DE differentiation.
The results contribute to current understanding of how DE differentiation in hESCs is
regulated. They also identify clear targets for further investigation, which would lead to
improved characterisation and differentiation of DE from hESCs.

11
DECLARATION
No part of this thesis has been submitted in application of any other degree or
qualification to the University of Manchester or other institution, except for the data in
section 3.3.1 (including figure 3.12). This data has been submitted to the University of
Manchester as part of a Master of Research (MRes) thesis in 2011 by Matthew
Robinson. The MRes project and the work which generated the data in section 3.3.1
were carried out under my direct supervision and with my assistance. All applications
and conclusions from the data were personally derived.
COPYRIGHT STATEMENT
i. The author of this thesis (including any appendices and/or schedules to this thesis)
owns certain copyright or related rights in it (the “Copyright”) and s/he has given The
University of Manchester certain rights to use such Copyright, including for
administrative purposes.
ii. Copies of this thesis, either in full or in extracts and whether in hard or electronic
copy, may be made only in accordance with the Copyright, Designs and Patents Act
1988 (as amended) and regulations issued under it or, where appropriate, in accordance
with licensing agreements which the University has from time to time. This page must
form part of any such copies made.
iii. The ownership of certain Copyright, patents, designs, trade marks and other
intellectual property (the “Intellectual Property”) and any reproductions of copyright
works in the thesis, for example graphs and tables (“Reproductions”), which may be
described in this thesis, may not be owned by the author and may be owned by third
parties. Such Intellectual Property and Reproductions cannot and must not be made
available for use without the prior written permission of the owner(s) of the relevant
Intellectual Property and/or Reproductions.
iv. Further information on the conditions under which disclosure, publication and
commercialisation of this thesis, the Copyright and any Intellectual Property and/or
Reproductions described in it may take place is available in the University IP Policy
(http://www.campus.manchester.ac.uk/medialibrary/policies/intellectual-property.pdf),
in any relevant Thesis restriction declarations deposited in the University Library, The
University Library’s regulations (see
http://www.manchester.ac.uk/library/aboutus/regulations) and in The University’s
policy on presentation of Theses.

12
ACKNOWLEDGEMENTS
I would like to sincerely thank and acknowledge the assistance and provision of
expertise and materials from many people: Sue Kimber for overall supervision, support
and assistance throughout; Tristan McKay, for advice, training, perspective and
Smad/Luc reporter plasmids and other lentiviral vectors; Matthew Robinson, for
provision of the Wnt3a pilot experiment data; many members of the Kimber lab past
and present, Nicola Bates, Despina Soteriou and Banu Iskender to highlight a few, for
training, general support and camaraderie; Mike Jackson, for assistance and training
with flow cytometry and FACS; The University of Manchester Bioimaging facility, and
in particular Robert Fernandez, for provision of confocal microscopy equipment and
assistance; the lab of Didier Trono for acquisition (via Addgene) of the pLVCT and
pLVTHM vectors. I recognise and greatly appreciate the provision of many core
facilities and services by the University of Manchester and Faculty of Life Sciences, and
I would finally like to express my gratitude to the MRC for funding this project.
DEDICATION
This piece of work is a report on four years of research and investigation. I would like
this work to illustrate a worthy endeavour of scientific focus, and also to represent the
four years of life encompassing everything that surrounded it too. I dedicate it to the
experiences, and particularly the people, which have filled these four years to give them
context. I would like to dedicate it to San Francisco and Despina, to the fraternity of
those in the Kimber lab past and present, for the shared experience and empathy which
will make us close forever. To my modern family of Manchester, the brothers and
sisters with whom I have grown, broken bread, fallen down and gotten up again. To my
SBFs, Mum, Dad and brother, for their love and support, and for making home Home.
To my brother, who has come through so much in four years, and now like me can look
forward. To my grandparents, who will not see this. Finally, I would like to dedicate
this work to the future, to looking back on it and knowing how much it represents.
13
CHAPTER 1 Introduction
Research over the past decade and a half in the human embryonic stem cell (hESC) field
has contributed to our understanding of embryo development, and particularly our
aspirations for regenerative medicine. Targeted differentiation of stem cells to definitive
endoderm (DE) and lineages beyond has been the focus of much investigation.
Protocols for differentiation are predominated by the use of Activin A, a TGFβ ligand
closely related to Nodal. However, Nodal (amongst other factors including Wnt3) is
required for DE differentiation during early mouse development. Understanding the role
of Nodal during hESC differentiation will inform future research into targeted
differentiation protocols, contributing to better characterisation and application of stem
cell-derived DE cells. This chapter will review the literature that formed the background
to this research project. It will focus on what is known about the mechanisms
underpinning Activin A, Nodal and Wnt3 signalling. The mouse developmental model,
used as a basis for understanding DE differentiation, will be summarised. Stem cell
culture techniques and the key factors understood to regulate pluripotency will be
mentioned, and protocols and analysis of DE differentiation in hESC will be reviewed.
All this will be used to generate a hypothesis regarding the role of Nodal signalling
during Activin A mediated differentiation of hESCs towards DE. The implications of
this knowledge are then applied to lay out the specific aims and experimental approach
of this project.
1.1 Transforming growth factor-beta (TGFβ) and Wnt signalling
1.1.1 Characteristics of TGFβ signalling
The TGFβ superfamily is a large related group of secreted factors, receptors and
intracellular signalling molecules. Growth factors in the family include TGFβ1,
Activins (also known as Inhibins), Nodal and bone morphogenetic proteins (BMPs).
These act as ligands to membrane bound type I and type II receptor kinases (Shi and
Massagué, 2003). The different ligands function via different type I and II receptors
within the family. Nodal and Activins have been shown to signal via Activin receptor
type II-beta (ActRIIb) and activin receptor-like kinase 4 (Alk4) and 7, whereas TGFβ1
signals via TgfRIIb and Alk5 (Reissmann et al., 2001; Watanabe et al., 1999; Yamashita
et al., 1994). The ligands elicit signalling in cells by first binding to type II receptors.
This then allows the ligands to bind to the type I receptors. The mechanism for ligand
binding of type I receptors has been suggested as a conformational change in the ligand

14
following binding to type II receptor (Shi and Massagué, 2003). Formation of an active
receptor complex involves the ligand mediated association of receptor tetramers:
dimeric ligands bind to two type II then two type I receptors. This creates an active
tetrameric receptor complex (Massagué, 1998; Yamashita et al., 1994).
Intracellular signalling ensues from active receptor complexes through the
phosphorylation of type I receptors by type II receptors. The active type I receptor is
then able to phosphorylate intracellular signalling molecules (Attisano et al., 1996;
Massagué, 1998). These molecules are mothers against decapentaplegic homologues
(Smad), and are arranged into categories based on signalling function. Smads which are
phosphorylated by active type I receptors, also known as R-Smads, can be distinguished
by those responsive to TGFβ/activin/nodal, i.e. Smad2 and 3, and those responsive to
BMPs, i.e. SMADs 1, 5 and 8. Another Smad, Smad 4, acts as a common co-factor to
both categories of R-Smads once they are activated (Dennler et al., 1998; Lagna et al.,
1996). Two inhibitory Smads, Smad6 and Smad7, have also been identified. They
negatively regulate signalling by competing with R-Smads for phosphorylation by type
I receptors, by competitively associating with Smad4, or by targeting the receptor
complexes for degradation (Hayashi et al., 1997; Shi and Massagué, 2003). Successful
phosphorylation of the R-Smads and their subsequent association with Smad4 generates
active Smad complexes. These complexes then elicit signalling through translocation to
the nucleus and binding of promoter and enhancer regions of target DNA.
The multiple processes involved in TGFβ signalling, from ligand-receptor association to
Smad activation of gene expression, involve a huge range of factors. Those most
relevant to Activin and Nodal signalling are summarised in figure 1.1, and expanded
upon below.
1.1.2 Smad2/3 signalling
The Activin/Nodal/TGFβ associated signalling molecules Smad2 and Smad3 have a
similar structure. Both contain regions designated Mad homologue domain 1 (MH1)
towards the N-terminal, and MH2at the C-terminal, with a linker region in between
(Brown et al., 2007). Homologues of both Smads have been identified throughout
phylogeny from nematodes to mammals. Both can be phosphorylated by active Alk4
and Alk5 receptors, however Smad3 can only be phosphorylated by the active Alk7
receptor (Lagna et al., 1996; Reissmann et al., 2001; Watanabe et al., 1999; Zhang et al.,
1996). In addition to ligand binding and active receptor complex formation, activation
of Smad2/3 is also mediated by other key factors such as Smad anchor for receptor

15
activation (Sara). Sara is a membrane bound factor which colocalises with and binds
type I receptors. It also binds inactive Smad2/3, and mediates their activation by type I
receptors by localising them to the receptor. Upon activation of Smad2/3, Sara can then
release Smad2/3 (Tsukazaki et al., 1998). The C-terminal end of Smad2 or Smad3 is the
region phosphorylated by type I receptors. This activation permits association with
Smad4, allowing nuclear translocation and DNA binding (figure 1.1)(Brown et al.,
2007; Macías-Silva et al., 1996). Gene targets of active Smad2 and Smad3 complexes
are often shared, with a luciferase reporter upstream of the target gene Pai1 promoter
being strongly activated in the presence of either active Smad (Hayashi et al., 1997;
Keeton et al., 1991; Zhang et al., 1996). However, DNA binding by Smad2/4 and
Smad3/4 complexes is based on different motifs, and is also regulated by association
with various co-factors. Smad3/4 has been shown to bind a specific sequence on the
Pai1 promoter that is distinct from Smad2 activation (Dennler et al., 1998). Smad2/4
activation of target genes such as the Xenopus Mix.2 gene has been shown to require
association with a co-factor FoxH1. Using a luciferase reporter, a specific motif was
identified which was bound by Smad2/4 only in association with FoxH1 (Chen et al.,
1996, 1997). Thus, Smad2 and Smad3 have a high level of conservation in their
structure and function, and share a large amount of their activation and regulatory
mechanisms. However, although some of the nuances of their regulation and distinct
functions have been explored in the context of DE differentiation (see 1.2 below), some
of their complex function remains undefined.
1.1.3 Activin A, Nodal and Cripto
Activin A and Nodal are related and functionally similar growth factors. Both are found
present and signal as homodimers. Activin A is comprised from two mature Inhibinβ A
chains (Gray et al., 2000). Nodal forms a stable dimer from two chains of the pro-
peptide, linked via regions in the mature domain. As a mature peptide, Nodal appears to
be either highly unstable or is processed for degradation within cells very quickly
following proteolytic maturation at the cells surface. Either none, or sub-stoichiometric
amounts of the mature peptide relative to the propeptide are detected both in cell lysate
and medium conditioned with cells overexpressing Nodal (Constam and Robertson,
1999; Le Good et al., 2005). The process of Activin A and Nodal signalling begins with
their association with ActRIIb. Both have been shown to have the ability to then bind
Alk4 (Harrison et al., 2003; Yeo and Whitman, 2001), however Activin A has not be
shown to be able to signal through Alk7 (Reissmann et al., 2001). Nodal association

16
with and signalling via Alk4 predominantly relies on being bound to the EGF-CFC
protein Cripto (a.k.a. Tdgf1), which also potentiates (but is not required for) signalling
via Alk7 (figure 1.1)(Minchiotti et al., 2001; Reissmann et al., 2001; Yeo and Whitman,
2001).
Acting as a co-receptor for Nodal-Alk4 signalling, Cripto has been shown to function
both in a cell autonomous and cell non-autonomous fashion. The Cripto sequence
contains a GPI-anchoring domain that allows it to be membrane bound. However, it has
been shown to also function in a paracrine fashion, being able to mediate Alk4-Nodal
binding as a secreted soluble protein (Minchiotti et al., 2001; Yan et al., 2002). As
ligands, although Nodal and Activin A deviate in their ability to bind to Alk4, they
exhibit similarity in their binding to Cripto, both in terms of their affinity for it and
Figure 1.1 – Schematic
overview of Nodal and
Activin A signalling.
Binding of homodimer
ligands Activin A or Nodal
to cell surface membranes
is antagonised by Fst,
Lefty1/2 or Cer1. Nodal
binding predominantly
requires a co-receptor
Cripto. Ligands bind a
dimeric type II receptor
(ActRIIb), and associate
with type I receptors
(Alk4/7), creating active
receptor complexes which
can phosphorylate
intracellular Smad2/3.
These associate with
Smad4, and regulate target
gene transcription in the
nucleus.

17
which region of Cripto they associate with. The Cripto CFC region binds Alk4, and the
EGF region binds Activin A and Nodal (Adkins et al., 2003; Gray et al., 2003; Yeo and
Whitman, 2001). However, while binding to Cripto is an enabling feature of Nodal
signalling, it has been shown to be inhibitory to Activin A signalling. Activin A binds
Alk4 in the absence of Cripto, but with reduced affinity in the presence of it (Gray et al.,
2003; Kelber et al., 2008). Another crucial function for Cripto in regulating Nodal is
recruitment of protein convertases. Having bound Nodal on the cell membrane, Cripto
recruits the protein convertases Furin and PACE4. These then cleave Nodal into its
mature form, promoting its association with Alk4 and downstream signalling (Blanchet
et al., 2008a; Le Good et al., 2005). Cripto has also been shown to be fundamental in
localisation of Nodal to the membrane of endosomes, possibly enhancing Nodal binding
to Alk4 by doing so (Blanchet et al., 2008b). The effect and role of the endocytic
processes which regulate Nodal are not completely understood, however in addition to
membrane localisation, Cripto mediates endocytosis via flotillin-1 marked lipid rafts,
which is concomitant with greater Smad2 activation (Blanchet et al., 2008a). Cripto’s
activity therefore enhances Nodal proteolytic maturation, association with Alk4, and
downstream signalling. It is a fundamental part of the mechanism by which Nodal
signals, and the main point of deviation in the signalling network widely shared by
Activin A and Nodal.
There are several well characterised direct antagonists of Activin A and Nodal that
target their receptor binding. Lefty1 and Lefty2 have both been shown to bind directly
to the mature domain of Nodal, inhibiting its association with Cripto. However, Lefty1
has also been shown to bind directly to Cripto, competitively inhibiting Nodal
association with it, and thereby Alk4 (Chen and Shen, 2004; Cheng et al., 2004).
Another Nodal antagonist Cerberus1 (Cer1) has been shown to target Nodal
specifically, binding it directly to inhibit its association with Cripto/Alk4 in a non-cell-
autonomous way (Harms and Chang, 2003). Follistatin (Fst) has been identified as
responsible for inhibiting Activin A. It antagonises the growth factor by directly binding
it in the regions which bind ActRIIb (Harrison et al., 2006).
One final point of deviation between the two TGFβ growth factors Nodal and Activin A
is their function in vivo. Nodal is one of the fundamental drivers of early embryo
development, governing primitive streak formation and gastrulation, and has a wide
range of functions on many lineages (see section 1.2 below). Many functions for
Activin A have been identified, including in gonadal development, regulation of germ

18
line maturation, craniofacial, limb and renal development. However, knockout
phenotypes in mouse are not as severely disrupted compared to Nodal, with no
identified role in gastrulation or determining early lineages (Thompson et al., 2004).
1.1.4 Wnt/β-catenin signalling
The mammalian Wingless homologue (Wnt) family is comprised of 19 different
proteins. There are similarities in the structure and sequence across the family, and
many have homologues throughout vertebrates and other metazoa. They are secreted as
ligand growth factors. Due to lipid modification they are often found to be hydrophobic,
and frequently associate with the extra-cellular matrix (ECM) or cell membranes rather
than being detected at high levels in medium when analysed in vitro (Mikels and Nusse,
2006). Wnts bind to Frizzled (Frz) receptors. This group of receptors contains seven
transmembrane regions, and signals downstream via recruitment and activation of the
intracellular molecule Dishevelled (Dvl) (Bhanot et al., 1996; Rothbacher et al., 2000;
Theisen et al., 1994). Many members of the Frz receptor family have been identified,
and different combinations of ligand/receptor have been shown to exist with varying
potentials for downstream signalling activation. Binding of Wnt to Frz is mediated by
the lipid bound co-factors Lipoprotein receptor-related protein 5 and 6 (LRP5/6), with
LRP6 in particular shown to play an important role in many Wnt/Frz interactions
(Holmen et al., 2002). Other factors also regulate ligand/receptor binding and signalling,
such as the atypical membrane receptor kinase Ryk, shown to directly associate with
Wnt1/Frz. Its cytoplasmic portion also binds directly with Dvl, and was shown to be
required for Wnt3a mediated neurite outgrowth of cells in vitro, also being active and
mediating the process during mouse development (Lu et al., 2004). Antagonists to
ligand/receptor interactions are Dickkopf (DKK) and Frizzled-related proteins (FRPs).
Inhibition of Wnt signalling by DKK1 and 2 occurs via direct binding to LRP6,
preventing Wnt-Frz assembly (Mao et al., 2001).
The downstream mechanisms which effect Wnt signalling hinge on the function of one
factor in particular, β-catenin. Two divergent roles of β-catenin were established upon
the molecule’s initial identification. It was shown to bind to E-Cadherin (ECad) along
with α-catenin and γ-catenin in the cytoplasm at the point of cellular junctions,
mediating interaction of ECad with the cytoskeleton. However, it was also found that
cytoplasmic adenomatosis polyposis coli tumor suppressor (APC) competed for binding
at the same sites as ECad (Hülsken et al., 1994). Free β-catenin bound to APC in the
cytoplasm was shown to have an intracellular signalling role, which can be tightly

19
regulated by rapid degradation. Being bound by APC allows formation of a destruction
complex, together with glycogen synthase kinase 3 beta (GSK3β) and Axin. The kinase
activity of GSK3β leads to phosphorylation of β-catenin, thereby marking it for
degradation (Dajani et al., 2003). Binding of Wnt to Frz initiates complex and not
completely understood mechanisms which interfere with this process. Dvl recruitment
to Frz leads to association between Dvl and Axin. This then promotes the inhibition of
GSK3β activity, either through phosphorylation and subsequent deactivation of GSK3β,
or forced dissociation of GSK3β and Axin. This releases β-catenin from the destruction
complex, allowing cytoplasmic accumulation (Kimelman and Xu, 2006). This is
followed by nuclear translocation of β-catenin and association with T-cell factors
(TCFs) or lymphoid-enhancer binding factor1 (Lef1). Β-catenin itself is unable to bind
DNA, however association with TCF1-4 or Lef1 permits their binding to target motifs,
with β-catenin then acting as transcriptional activator (Städeli et al., 2006).
Interaction and crosstalk between other signalling networks and Wnt/β-catenin has been
widely investigated. A few pertinent examples involving TGFβ signalling are
highlighted here. Cripto and Nodal have both been shown to be direct targets promoted
by β-catenin/TCF signalling (Ben-Haim et al., 2006; Morkel et al., 2003). Enhancement
of Wnt/β-catenin mediated target gene activation by TGFβ signalling has also been
shown. It was found that both Smad2 and Smad3 can associate with Lef1, and that in
cellular assays co-transfection of either Smad along with Lef1 in both the absence and
particularly in the presence of exogenous TGFβ1 increased transcription of Wnt/β-
catenin reporters (Letamendia et al., 2001). Another example of direct crosstalk through
synergistic regulation of target genes is the association of β-catenin/TCF4 with
Smad3/4. The signalling constructs physically associated to synergistically promote
activation of a co-regulated mouse gene Gastrin. This was shown to occur directly on
both Smad3/4 and β-catenin/TCF4 responsive elements, again in the absence but
particularly in the presence of TGFβ1 (Lei et al., 2004). These examples of interaction
and direct crosstalk serve to highlight the possibilities of synergy and cooperation
between TGFβ and Wnt signalling. The potential for these interactions, as well as
overlapping temporal and/or spatial expression, highlight their cooperative roles during
early mouse development and stem cell differentiation. Some of the known roles and
interactions underpinning these are explored below (see 1.2.2 and 1.4).

20
1.2 Early mouse embryo development and emergence of DE
Although understanding human embryo development and hESC differentiation cannot
solely rely on knowledge from mouse embryo development, the mouse is an extremely
well defined and explored model. Investigating human development beyond
implantation is also much less accessible. Similar to the advent derivation and culture
based on mESCs (see 1.3), detailed knowledge of differentiation derived from mouse
development is extrapolated onto hESCs to inform investigation.
1.2.1 The epiblast
The inner cell mass (ICM) and the trophectoderm (TE) are the first lineages to appear in
the mouse peri-implantation blastocyst at embryonic day (E) 4.0-4.5. The TE forms an
epithelial layer surrounding the compacted cells of the ICM. Oct4 (a.k.a. Pou5f1) and
Nanog are expressed in the cells of the ICM and maintain them as pluripotent, allowing
them to contribute to all embryonic germ lineages (Mitsui et al., 2003; Nichols et al.,
1998). TE formation requires the down-regulation of Oct4 and Nanog through the
expression and action of Eomes and Cdx2 in the prospective TE cells (Strumpf et al.,
2005). Implantation of the mouse embryo occurs at E4.5, and the ICM forms an
epithelial layer known as the epiblast. At this stage the embryo is comprised of only the
epiblast, the TE, and a layer of cells surrounding the epiblast known as the primitive
endoderm. However, between E4.5 to E6.0, cell proliferation expands these regions, and
patterning of them by regulated signalling primes the epiblast for the process of
gastrulation.
The primitive endoderm becomes a thicker layer known as the visceral endoderm
surrounding the epiblast. This occurs concomitantly with an expansion of the region of
polar TE at the proximal end of the epiblast, to form the extra-embryonic ectoderm
(ExE)(Tam and Loebel, 2007). Nodal expression in the embryo precedes that of markers
of primitive streak and mesendoderm. It has an early role from E5 onwards to maintain
epiblast cells, driving expression of Oct4 and other markers of pluripotency. In Nodal
null embryos these markers disappear from the epiblast cells, although they are
maintained briefly in the neighbouring ExE (Mesnard et al., 2006). Maintenance of
these pluripotency associated factors may be the key mechanism preventing precocious
development of anterior and neural related structures in the epiblast, which becomes a
distinct feature in Nodal null embryos (Brennan et al., 2001; Camus et al., 2006). Nodal
is strongly expressed from E5.25 in the epiblast cells, demarcating them from the ExE.
Nodal and Cripto are both expressed fairly uniformly throughout this population of
21
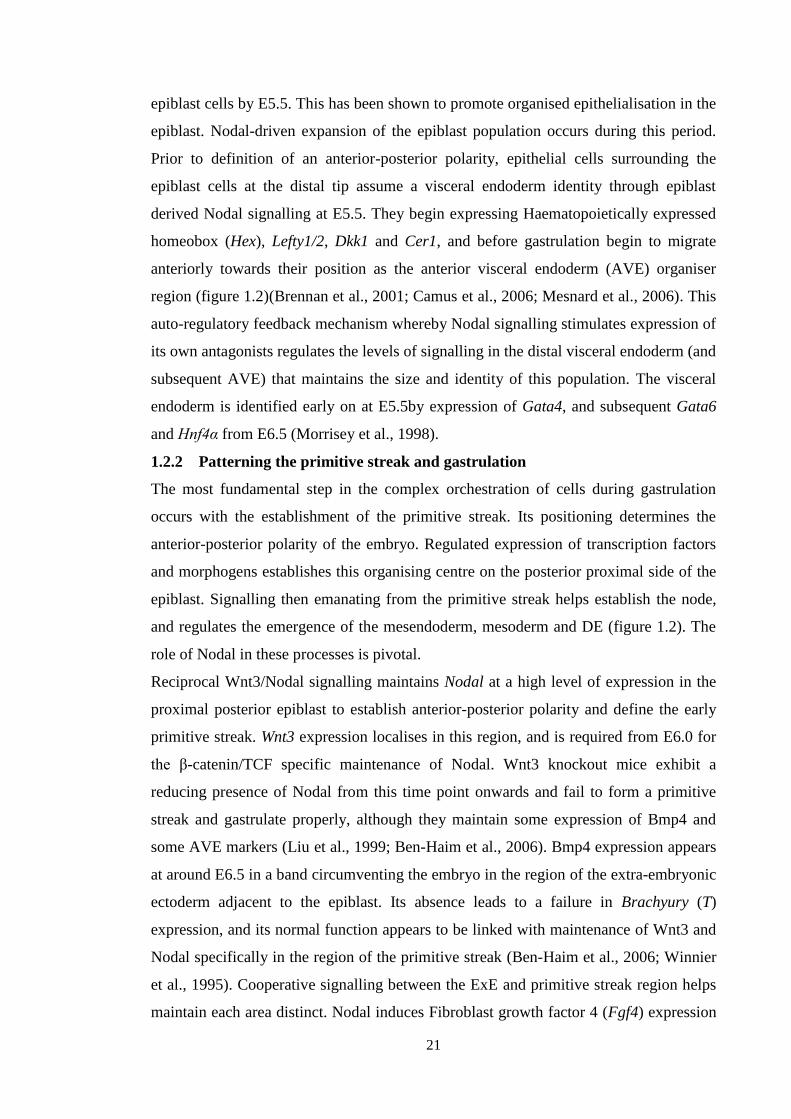
epiblast cells by E5.5. This has been shown to promote organised epithelialisation in the
epiblast. Nodal-driven expansion of the epiblast population occurs during this period.
Prior to definition of an anterior-posterior polarity, epithelial cells surrounding the
epiblast cells at the distal tip assume a visceral endoderm identity through epiblast
derived Nodal signalling at E5.5. They begin expressing Haematopoietically expressed
homeobox (Hex), Lefty1/2, Dkk1 and Cer1, and before gastrulation begin to migrate
anteriorly towards their position as the anterior visceral endoderm (AVE) organiser
region (figure 1.2)(Brennan et al., 2001; Camus et al., 2006; Mesnard et al., 2006). This
auto-regulatory feedback mechanism whereby Nodal signalling stimulates expression of
its own antagonists regulates the levels of signalling in the distal visceral endoderm (and
subsequent AVE) that maintains the size and identity of this population. The visceral
endoderm is identified early on at E5.5by expression of Gata4, and subsequent Gata6
and Hnf4α from E6.5 (Morrisey et al., 1998).
1.2.2 Patterning the primitive streak and gastrulation
The most fundamental step in the complex orchestration of cells during gastrulation
occurs with the establishment of the primitive streak. Its positioning determines the
anterior-posterior polarity of the embryo. Regulated expression of transcription factors
and morphogens establishes this organising centre on the posterior proximal side of the
epiblast. Signalling then emanating from the primitive streak helps establish the node,
and regulates the emergence of the mesendoderm, mesoderm and DE (figure 1.2). The
role of Nodal in these processes is pivotal.
Reciprocal Wnt3/Nodal signalling maintains Nodal at a high level of expression in the
proximal posterior epiblast to establish anterior-posterior polarity and define the early
primitive streak. Wnt3 expression localises in this region, and is required from E6.0 for
the β-catenin/TCF specific maintenance of Nodal. Wnt3 knockout mice exhibit a
reducing presence of Nodal from this time point onwards and fail to form a primitive
streak and gastrulate properly, although they maintain some expression of Bmp4 and
some AVE markers (Liu et al., 1999; Ben-Haim et al., 2006). Bmp4 expression appears
at around E6.5 in a band circumventing the embryo in the region of the extra-embryonic
ectoderm adjacent to the epiblast. Its absence leads to a failure in Brachyury (T)
expression, and its normal function appears to be linked with maintenance of Wnt3 and
Nodal specifically in the region of the primitive streak (Ben-Haim et al., 2006; Winnier
et al., 1995). Cooperative signalling between the ExE and primitive streak region helps
maintain each area distinct. Nodal induces Fibroblast growth factor 4 (Fgf4) expression

22
in the proximal posterior region of the epiblast. Fgf4 signalling across into the ExE then
maintains expression of Eomes and Cdx2. Nodal signalling from the epiblast into the
ExE also enhances their expression, as well as promoting expression and release of its
own protein convertases Furin and PACE4, which act in a paracrine fashion back in the
epiblast to augment Nodal signalling (Beck et al., 2002; Ben-Haim et al., 2006;
Guzman-Ayala et al., 2004).
T is used as the first transcription factor that identifies the primitive streak. T is
expressed under direct transcriptional regulation by Wnt3 via β-catenin/Lef1 (Arnold et
al., 2000), and is also absent in the absence of Bmp4 and Nodal. Appearing initially at
E5.5 in a band in the ExE adjacent to the epiblast (similar toBmp4), it is then expressed
in the primitive streak region from E6.0, and subsequently the majority of the posterior
cells of the epiblast. Its expression allows expansion of this mesendoderm cell
population which ultimately contribute to DE, notochord, and some paraxial and lateral
mesoderm fates (Clements et al., 1996; Rivera-Pérez and Magnuson, 2005). Goosecoid
(Gsc) and Mix-like 1 (Mixl1) are also key markers identifying mesendoderm cell fate,
both appearing ~E6.5. Mixl1, expressed along the primitive streak and distally to the
node, is required by cells to maintain a mesendodermal identity, rather than a committed
mesoderm fate. Null mutants exhibit distally expanded Nodal and T expression, with
disturbed node formation and subsequently have poor contribution of cells to the
endoderm and gut tube (Hart et al., 2002). Gsc is expressed from E6.4 in the epiblast
and marks mesendoderm cells from E6.6-8 in the node and as they emerge and migrate
anteriorly. While it does not lead to a failure in formation or migration of the
mesendodermal cell population in null mice, they exhibit later some axial mesoderm-
related defects in the midline and craniofacial deformities (Blum et al., 1992; Rivera-
Perez et al., 1995).
A key feature that becomes disrupted in the gastrulating embryo (gastrula) in the
absence of Nodal or Cripto function is patterning. By E6.5, T, Gsc and FoxA2
expression is still observed in null mutants of both, however expression regions are
reduced in size and no longer properly localised around and along the primitive streak.
Embryos even express anterior markers like Homeobox gene expressed in ES cells1
(Hesx1). Again however, expression doesn’t appear in the poorly defined reduced
visceral endoderm, and no egression of mesendoderm/DE from the epiblast occurs, nor
expansion anteriorly to displace visceral endoderm (Camus et al., 2006; Conlon et al.,
1994; Ding et al., 1998). Nodal null mice also no longer exhibit expression of many

23
Figure 1.2 – Diagram of important events between E6.0 and E7.0 during gastrulation
in the mouse embryo. Anterior-posterior polarity is established from E6.0 through
asymmetric expression of signalling and transcription factors in the region of the
primitive streak and AVE. The AVE maintains the anterior side of the embryo
through expression of signalling antagonists like Lefty1/2 and Dkk1. Inductive
morphogen signalling by Bmp4, Wnt3 and Nodal cause expression of
mesendodermal marker genes in posterior epiblast cells. At E6.5 these bipotential
cells undergo epithelial to mesenchymal transition (EMT), egressing through the
primitive streak and node. The visceral endoderm is displaced in doing so. From
E7.0 some cells migrate anteriorly, begin to express markers of DE, and go on to
contribute to the primitive gut tube and derivative organs.

24
Nodal-, Wnt- and early visceral endoderm related factors by E6.5. Although a very
similar disturbed phenotype is observed in Smad2 null mice, some such factors are still
expressed. Expression of Eomes, Wnt3 and Cripto still occurs but, as with the primitive
streak/mesendoderm markers in Nodal null mice, it is no longer correctly localised
(Brennan et al., 2001). Collectively this indicates that Nodal signalling contributes in
activating a primitive streak/mesendoderm gene program, as well as regulating the
spatio-temporal expression of mesendoderm related markers.
The amount of Nodal and the strength of its signalling across the embryo appear to be
fundamental to the proper progression and patterning of differentiation. Cripto’s
function as a Nodal co-receptor is required to enable its signalling, with Nodal
signalling in Cripto null mice insufficient to define the anterior-posterior axis and the
primitive streak. However, there is a slight improvement in this via removal of the
Nodal antagonist Cer1. Double Cer1/Cripto null mice still show incorrect localisation of
AVE and primitive streak marker expression, however there is a distinct improvement
compared to Cripto null mice, with some expression of markers towards their normal
respective anterior and posterior positions (Ding et al., 1998; Liguori et al., 2008).
Targeted removal of certain upstream and intronic enhancers of Nodal underlines the
spatial- and dose- specific expression required for its effectiveness. A proximal
enhancer 2.7kb upstream of the transcriptional start site is required for normal Nodal
expression in the node and more distal region of the gastrula, and an intronic enhancer
under the control of Smad2/FoxH1was found to enhance Nodal expression in the
primitive streak (Norris and Robertson, 1999; Norris et al., 2002). On top of acting in a
positive regulatory feedback loop with Nodal to maintain its expression, FoxH1 also
targets expression of specific factors by Nodal signalling in primitive streak and
mesendoderm cell populations. It is required for expansion and regulated migration of
cells through the primitive streak, via targeted maintenance of factors such as FoxA2. It
does not have an early role in establishing the AVE however, where FoxH1 null mice
exhibit no defects (Hoodless et al., 2001).
Another crucial event during gastrulation is the epithelial to mesenchymal transition
(EMT) of cells in the epiblast, and subsequent egression through regions of the
primitive streak and node. The node is the distal anterior part of the primitive streak,
and the region where mesendodermal cells egress and displace the visceral endoderm,
later assuming a DE or anterior mesoderm identity (figure 1.2). Donor explants of the
node can ectopically induce a second axis in recipients, generated from donor-derived

25
endoderm and host neurectoderm (Beddington, 1994). Normally, cells migrate
anteriorly from the node region and displace the visceral endoderm, ultimately
contributing to cells in the DE/gut tube as well as the notochord (Brennan et al., 2002;
Burtscher and Lickert, 2009). FoxA2 and Lhx1 (a.k.a. Lim1) expression cooperate to
maintain the movement and identity of cells through the node. Both FoxA2 and Lhx1 are
expressed throughout the visceral endoderm from E5.5, then concentrated to the
primitive streak and AVE by E6.5 (Ang and Rossant, 1994; Perea-Gomez et al., 1999).
FoxA2 is expressed in anterior embryonic and extra-embryonic regions from E6.5
onwards, required for expression of anterior mesendoderm/AVE transcription factors
like Otx2 and signalling factors such as Sonic hedge hog (Shh). Its absence leads to a
disruption in both endoderm/gut tube formation and anterior axial mesoderm/notochord
structures, indicating its role regulating the emergence and migration of mesendoderm
cells (Ang and Rossant, 1994; Jin et al., 2001). A role for it has been identified in
regulating epithelialisation of the mesendoderm. Between E6.5-E7.5, cells undergo
EMT, losing the cell-cell junctions identified by E-Cad localisation at the membrane,
and egress through the node and displace the visceral endoderm. They then form an
epithelial layer on the exterior of the epiblast (regaining E-Cad at adheren junctions)
and migrate anteriorly. At E6.5, cells in the posterior epiblast undergo EMT while
expressing FoxA2, with a greater concentration of cells towards the distal end showing
expression. Cells around the node then begin transiently expressing T as well as FoxA2.
This coexpression defines the early mesendoderm, the first cells of which to egress and
migrate form the anterior most structures of the DE and mesoderm/head process. More
proximal posterior primitive streak cells which contribute to the mesoderm only express
T. In chimeras where epiblast cells are FoxA2 null, the epiblast cells fail to egress,
displace the visceral endoderm and form an exterior epithelial layer with apical-basal
polarity around the node (Burtscher and Lickert, 2009).
1.2.3 Regulating the DE
Following emergence of mesendodermal cells through the node, cells migrate anteriorly
and displace the visceral endoderm, and from E7.0 onwards are identifiable as DE cells
which go on to generate the primitive gut tube. At E6.5, Nodal/Smad2 specific
signalling is required within the mesendoderm population for expansion and
contribution to the DE. It was found that chimeric embryos formed using wild type
embryos injected with Smad2 null mESCs had no contribution to DE lineages from
mESC derived cells (Tremblay et al., 2000). However, Nodal signalling needs to be

26
attenuated in the AVE by the action of related TGFβ antagonists Lefty1 and Cerberus.
Nodal dependent/FoxH1 independent expression of these antagonists initially
establishes the distinct regions of the distal visceral endoderm and subsequent AVE, and
maintains the AVE as the organising centre on the anterior side (Hoodless et al., 2001;
Perea-Gomez et al., 2002; Yamamoto et al., 2004). Autoregulation of Nodal around the
AVE and to a lesser extent the node is required to promote the correct level of
expansion and migration. Nodal/FoxH1 dependent Lefty1/2/Cer1 expression emanating
from the AVE is required to attenuate the effect of Nodal signalling in migrating DE
and mesoderm. Without Nodal antagonism, the regions expressing mesendoderm
markers expand, and AVE and anterior markers such as Hex are no longer localised to
the anterior. Later, left-right asymmetry is not properly established in the mesoderm
neighbouring the DE/gut tube (Meno et al., 2001; Perea-Gomez et al., 2002).
The population of cells that contributes to the DE and subsequent structures has been
established through fate mapping studies. It has been shown that the position of
prospective mesendoderm cells in the gastrula determines their contribution to the DE
and subsequent gut. Cells emerging first through the region of the node at the distal tip
contribute most to anterior and middle structures of the gut, whereas those emerging
later and slightly more posteriorly contribute more to the middle and hind gut structures
(Tam et al., 2004). From E7.5 onwards, patterning of the endoderm begins with the
formation of the gut tube. This occurs through invaginations forming at the anterior and
posterior ends which then close. Anterior-posterior and dorsal-ventral patterning
through the expression of different markers generates the progenitor cells of the DE
derived organs (Zorn and Wells, 2009).
Defining the genetic program and markers that identify the DE from neighbouring
visceral endoderm and paraxial mesoderm is not straightforward. Expression of factors
like Lhx1 is required from E6.5 for proper DE migration and specification. However its
role is more likely to be one of allowing cells to be responsive to signals to expand and
migrate, since explanted cells from Lhx1 null mice can still contribute to DE/gut
structures in normal mouse embryos (Tam et al., 2004). Certain core factors have
nonetheless been identified (some of which are annotated in figure 1.2). SRY-box
containing gene 17 (Sox17) has been identified as a core transcription factor in DE
lineage programs. However it is also expressed in the visceral endoderm. From E6.0 its
expression appears in the proximal visceral endoderm neighbouring the epiblast. By
E7.0 it appears in the epiblast around the node and then moves anteriorly, identifying
27
prospective DE cells. It is also still expressed in the AVE as well, along with a related
factor Sox7. The lack of expression of Sox7 in the emerging mesendoderm/DE
distinguishes it from the AVE and other visceral endoderm. Most crucially, cells
lacking Sox17 are unable to contribute to most fore- and all mid- and hind- gut
structures (Kanai-Azuma et al., 2002). Similarly to Sox17, FoxA2 has an expression
pattern in the visceral endoderm as well as in mesendodermal cells. Its maintained
expression in mesendoderm and DE cells is also required however, not just to mediate
emergence through the node, but continued migration and commitment to DE-lineage
fates (Dufort et al., 1998). Eomes has a crucial early role in differentiation of early TE,
however it is also expressed from E6.5 around the primitive streak and node, and
appears to comprise an important part of a DE gene program. In mice with an inducible
Eomes knockout, when Eomes expression is removed from all non-ExE cells, the AVE
and primitive streak regions are still specified by E6.5, but they show reduced regions
of respective marker expression such as Hex and T. By E7.5 there is a failure in the
migration of the mesendodermal/DE population, poor displacement of the visceral
endoderm, and failure to maintain visceral endoderm/DE factors such as FoxA2. Similar
to chimeric embryos generated with Smad2 and Sox17 deficient mESCs, Eomes
deficient mESC-derived cells showed very poor contribution to the DE lineage in
chimeras with wild type embryos (Arnold et al., 2008). The transcription factors Gata4
and Gata6, which prior to gastrulation mark the visceral endoderm, are also expressed
in DE cells during migration. Although their expression is still maintained in the
visceral endoderm during displacement, they have both been shown as necessary for
DE-derived organogenesis, including proper expansion of the liver bud and ventral
pancreatic bud (Watt et al., 2007). Other factors such as the chemokine receptor Cxcr4
further identify cells following gastrulation. Although Cxcr4 has later functions in
regulating cell migration during organogenesis of lung and vascular mesoderm, and
during haematopoietic and cardiac development, it is first prominent during
gastrulation. Between E7.2-7.8, its expression demarcates the DE as it migrates
anteriorly displacing the visceral endoderm, which lacks expression (McGrath et al.,
1999).The multiple factors involved in the expansion, migration, and regulation of the
DE individually are not definitive markers, all having functions in other cell lineages
during mouse development. However, establishing a cohort of such markers refines the
definition of the DE cells.
28
The hierarchy of factors determining the genetic program has been partly established in
the mouse. The core signalling networks which cooperate to initiate both the gene
program and patterning of mesendoderm/DE have been identified, with a preeminent
role for Nodal/Smad2, together with Wnt/β-catenin and an early involvement of Bmp4.
Transcription factors which play an important role in defining mesendoderm and DE
cells, and possibly functioning as part of a specific program are also known such as T,
MixL1, FoxA2, Eomes and Sox17. This knowledge is used to inform investigation in
ESCs.
1.3 hESC culture and pluripotency
1.3.1 Derivation and culture of hESCs
Embryonic stem cell science was initiated by experiments in mice. Cells were extracted
from the ICM of the blastocyst, and cultured long term in embryonal carcinoma-
conditioned medium on a gelatin substrate or a supportive layer of fibroblast feeder
cells. These mouse ESCs (mESCs) were capable of forming teratomas (a.k.a.
teratocarcinomas) when injected into immune-compromised mice, spontaneous tumour
formations containing representative tissue of all germ lineages (Evans and Kaufman,
1981; Martin, 1981). It was these properties, of being able to self-renew and exhibit
pluripotency that defined these cells as stem cells. The principle and techniques of
derivation, culture and assessment were eventually adapted and developed in human
embryos to generate hESCs. Six days after fertilisation of a human oocyte, the resulting
blastocysts were collected. The surrounding zona pellucida was enzymatically removed,
and TE cells immunosurgically lysed. The protocol for hESCs was founded using
mitotically inactivated mouse embryonic fibroblasts (MEFs) as a supportive layer for
derivation and culture. Cells of the blastocyst ICM are extracted onto MEFs and
allowed to proliferate, passaging by manual dissection, Ca/Mg2+
depletion/EDTA
treatment, or enzymatic dissociation (e.g. type IV collagenase). The hypothesis was that
MEFs provided an extracellular matrix (ECM) for adherence, and secreted certain
growth factors. Cells were initially grown in medium containing 20% foetal calf serum
(FCS) (Thomson et al., 1998; Reubinoff et al., 2000). Cell culture and identification of
the factors that support hESC pluripotency and self-renewal improved following
replacement of serum with a synthesized cocktail of growth factors (knock-out serum
replacement, KOSR) and supplementing with FGF2 (basic FGF, bFGF) (Amit et al.,
2000).

29
The principle definition of pluripotency and self-renewal in hESCs, similar to what had
been previously observed in human embryonal carcinoma cells, was established upon
those initial derivations: long term stable culture of clonally derived hESCs, teratoma
formation generating representatives of all 3 germ layers, high and maintained
telomerase activity, and expression of certain surface antigens (SSEA3/4, Tra-1 60/81)
and alkaline phosphatase (Thomson et al., 1998; Reubinoff et al., 2000; Amit et al.,
2000).
The method of culture first defined by Amit and colleagues is still currently employed.
Investigation into the complex array of factors present in the culture system has
elucidated much about how hESCs are maintained. Refinement of the culture system
has also led to a better understanding of the intrinsic signalling and transcription factor
networks involved in the process. It was found that the ECM component MEFs provide
could be replaced with the commercially available mouse sarcoma-derived gelatinous
ECM mixture Matrigel™, or purified laminin, and normal growth medium (KOSR
+bFGF) pre-conditioned by MEFs (MEF-conditioned medium, MEF-CM). This
allowed the first feeder-layer free culture of hESCs (Xu et al., 2001). This primed
further investigation into the critical components required to maintain hESCs.
Experiments in feeder-free cultures of hESCs identified important ECM interactions.
Fibronectin (Amit et al., 2004; Baxter et al., 2009), laminin (Xu et al., 2001), vitronectin
(Braam et al., 2008), and combinations of ECM molecules e.g. collagen IV, laminin,
fibronectin and vitronectin (Ludwig et al., 2006b) can maintain hESC pluripotency in
MEF-CM or more defined medium. Investigation into the role of components of culture
medium has honed in on several factors that have a key role in directly maintaining
hESCs. A key function of bFGF was identified via MEF regulation. Stimulation of
MEFs by bFGF elicits their expression and release of a cocktail of factors including
Activin A, TGFβ1, Grem1 and Bmp4 (Greber et al., 2007). However, direct stimulation
of hESCs by bFGF signalling has been shown as one of the overriding factors
maintaining cell proliferation, viability and pluripotency (Ludwig et al., 2006b; Baxter
et al., 2009). Development of feeder-free media has tended towards using chemically
defined commercially available basal media (e.g. RMPI or DMEM/F12) supplemented
with factors with diverse developmental and cellular functions, for example the
inclusion of bFGF and Activin A with growth supplement formulas known to maintain
neural cell lines such as N2 and B27 (containing an array of listed factors e.g. insulin,
transferrin, progesterone and corticosterone) (Baxter et al., 2009; Liu et al., 2006). This

30
is perhaps representative of the cocktail present during culture on feeders or using MEF-
CM, and the balanced signalling required to maintain the pluripotent state.
The development of defined media has been important in elucidating key factors
maintaining pluripotency, as well as making hESC culture and experimentation more
scalable and reproducible. The discovery of the presence of non-human sialic acid
Neu5Gc in animal derived serum, ECM and MEFs has instigated a move within the
field towards eliminating animal derived products. Neu5Gc is not synthesized by
hESCs, and it was shown that after metabolic incorporation of Neu5Gc by hESCs,
human immunoglobulins against Neu5Gc bound to these cells which would mark them
for destruction in vivo (Martin et al., 2005). The widely used mTeSR™ medium can be
used with cells on Matrigel or a combination of collagen IV, laminin, fibronectin and
vitronectin. Culturing cells in mTeSR on the latter following MEF-CM/Matrigel culture
was shown to eliminate the presence of Neu5Gc in hESCs (Ludwig et al., 2006b).
Although mTeSR is chemically defined, it is not xeno-free (Ludwig et al., 2006a).
Establishing xeno-free and tightly regulated good manufacturing practice- (GMP)
quality derivations and culture systems is the current state of the art, preparing hESC
and induced pluripotent stem cell (iPSC) advances for clinical translation.
1.3.2 Signalling pathways regulating pluripotency
Many signalling pathways interact and play complex roles in maintaining pluripotency
and self-renewal of hESCs. Analysis of the phospho-proteome of hESCs reveals a
diverse variety of receptor tyrosine kinases, intracellular signalling molecules and
transcriptional regulators which are active in undifferentiated hESCs. These include
PDGF-receptor, VEGF-receptor, EGF and insulin/IGF signalling components (Brill et
al., 2009). Certain canonical signalling pathways such as TGFβ/Smad, as well as more
broad signalling networks such as phosphoinositide-3 kinase (PI3K)/Akt and mitogen
activated protein kinase (MAPK), have been identified by multiple investigations as
regulating pluripotency.
The receptors (Alk4/5/7) and intracellular signalling molecules (Smad2/3) of
TGFβ1/Activin/Nodal are required for pluripotency in hESCs, since specific ablation
using the Alk4/5/7 inhibitor SB431542 rapidly induces differentiation. Activin A can
maintain and promote pluripotency at certain concentrations, however this effect
appears to be partially dependent on endogenous Nodal/Cripto signalling. A reduction
in the amount of cells expressing Tra-1 60 was observed in hESCs transfected with
Lefty2 expression plasmid, even in the presence of the exogenous factors Activin A and

31
bFGF (Vallier et al., 2005). Nodal overexpression in hESCs conferred a resistance to
non-specific differentiation during non-adherent culture of serum-induced embryoid
bodies (EBs), and Nodal specific blocking with Lefty2 and Cerberus also accelerated
the reduction of pluripotency marker expression in EBs (Smith et al., 2008; Vallier et
al., 2004). One mechanism by which active Smad2/3 maintains pluripotency is by direct
transcriptional regulation of NANOG. They have been shown to bind and positively
regulate its transcription, in contrast to Bmp4-activated Smad1/5/8, which also have
binding sites on the NANOG promoter and cause transcriptional repression (Xu et al.,
2008; Vallier et al., 2009a). As mentioned, bFGF has been identified as the most crucial
signalling factor. It has been suggested that it not only acts in parallel with TGFβ/Smad
signalling, but that it promotes it. HESCs in chemically defined medium (CDM) were
found to have greater CRIPTO expression in the presence of exogenous bFGF alone
compared to Activin A alone (Vallier et al., 2005).
The role of bFGF and its downstream signalling networks in hESC maintenance is
complex. Components of signalling cascades downstream, including phosphoinositide-3
kinase (PI3k)/Akt and ras/raf/mitogen activated protein kinase (/MAPK), lose activation
upon EB differentiation. Specific inhibition of PI3k with the LY294002 inhibitor, or
MAPK with the U0126 inhibitor, causes loss of pluripotency and cell death. The
PI3k/Akt pathway involves activation of isoform subunits of PI3k, which via PIP2/3
activate AKT, which inactivates genes like BAD to inhibit apoptosis (Armstrong et al.,
2006; Li et al., 2007). FGF2, and FGF receptors 1-4 (FGFR1-4) are enriched in
undifferentiated hESCs (Dvorak et al., 2005; Sato et al., 2003). FGF2 signalling by both
the exogenous and hESC-derived endogenous molecules present in hESC culture on
MEFs has been shown to contribute to activation of PI3k and MAPK. Maintenance of
AKT activation by FGF2 is required by hESCs, promoting cell survival, proliferation
and pluripotency. Inhibition of it using specific Fgf receptor inhibitor SU5402 causes
both apoptosis and differentiation (Eiselleova et al., 2009).
The question over the involvement of Wnt signalling in maintenance of hESC
pluripotency is divisive. The inhibition of GSK3 with a pharmacological inhibitor BIO
has been used to illustrate the role of Wnt/β-catenin signalling in regulating
pluripotency markers such as Nanog in hESCs (Sato et al., 2004). Experiments
analysing the effect of β-catenin and exogenous Wnt3a in hESCs over a longer period
also established that there is a basal level of β-catenin mediated transcription in
pluripotent hESCs. However, it is not enough to maintain pluripotency, and although it

32
may contribute to cell proliferation (as analysed by BrdU assay), higher levels lead to
expression of early differentiation markers such as BRACHYURY (Dravid et al., 2005).
1.3.3 Transcription factor networks
The steady state of pluripotency seems to require a regulated level achieved through a
balance within the crucial signalling pathways. High levels of growth factors, e.g.
NODAL or FGF2, and their transcriptional target antagonists, e.g. LEFTY1/2 or
SPROUTY2, are dually expressed and act in an autoregulatory manner (Sato et al.,
2003; Besser, 2004). The interactions of these pathways with each other, as well as
transcription factor regulatory networks, are vastly complex and still not completely
mapped and understood. However, core transcription factors and mechanisms have been
identified.
The main transcription factors that are used to identify pluripotent hESCs, Oct4, Nanog
and Sox2, were established as markers based on mESC work (Avilion et al., 2003;
Chambers et al., 2003; Nichols et al., 1998), and transcriptional regulation by them was
shown to be necessary to maintain hESCs (Matin et al., 2004; Zaehres et al., 2005). The
transcriptional network which they comprise has been the subject of much investigation.
To a large extent, they cooperate to regulate the expression of many genes. Using
chromatin immunoprecipitation (ChIP) followed by microarray, direct binding loci have
been identified, with all three found on the promoter/enhancer regions of 353 genes in
hESCs (Boyer et al., 2005). OCT4 and SOX2 form a heterodimer, with specific binding
sites on the promoters of many genes, including NANOG (Boyer et al., 2005; Xu et al.,
2008). A diverse array of genes has been identified as being positively regulated by the
action of Oct4, Sox2 and Nanog. These include transcription factors with identified
functions in regulating pluripotency, such as REX1 or DPPA4, TGFβ signalling
components and modulators such as LEFTY2, CRIPTO and SKIL, and genes which
regulate chromatin remodelling (Boyer et al., 2005). Regions near to many microRNA
(miRNA) transcript loci are also identifiable as bound by some or all of the three
transcription factors, and certain specific miRNAs linked with pluripotency have been
shown to be directly regulated by OCT/SOX, NANOG or REX1 (Barroso-delJesus et
al., 2008; Boyer et al., 2005; Card et al., 2008).
Genes which are occupied by OCT4, SOX2 and NANOG but are transcriptionally
inactive have also been identified, including homeobox transcription factors such as
GSC, HOXB1 and PAX6 (Boyer et al., 2005). Oct4 has been inferred as positively and
negatively regulating the expression of thousands of genes through microarray analysis

33
in short interfering RNA (siRNA) Oct4 knockdown cells. Genes which increased
expression upon Oct4 knockdown include factors governing differentiation, e.g. BMP4,
T, EOMES, GATA6, CDX2, DKK1 and FST (Babaie et al., 2007). Nanog has been
shown to directly associate with Smad2/3, which may comprise part of the mechanism
by which Nanog regulates Smad2/3 transcriptional activity, promoting expression of
pluripotency factors. Nanog has also been shown to negatively regulates factors
involved in the differentiation towards neurectoderm such as SOX1 and PAX6 (Boyer et
al., 2005; Vallier et al., 2009a). This negative regulation of factors that cause
differentiation to neurectoderm by Nanog may act to equilibrate positive regulation by
SOX2 and FGF signalling (Vallier et al., 2009a).
1.4 Generating DE from hESCs
1.4.1 Genetic profile of cells undergoing DE differentiation
The expression of a multitude of markers at the transcript and protein levels is used to
characterise and measure differentiation of ESCs towards DE. The exact markers which
define mesendoderm/DE differentiation, and the changes in their expression over time,
are the subject of many investigations. Some of this work reflects, and some advances,
the model of mouse early embryo development.
In mESC lines with T- or Gsc-promoter/GFP reporters, it was shown that during the
early period of Activin A differentiation, populations that were T+ or Gsc+ arose. As in
mouse development, these were shown to be bipotential mesendoderm cells that could
give rise to endodermal and mesodermal lineages (Kubo et al., 2004; Tada et al., 2005).
Gsc+ cells could be further delineated as having endodermal or mesodermal fates by
being ECad-positive/Pdgfrα-negative (ECad+/PdgfRα-) for the former and ECad-
/PdgfRα+ for the latter (Tada et al., 2005).
The variation in protocols for differentiating hESCs (see table 1.1 for some examples),
as well as the different time points and genetic markers which are analysed, mean there
is no consensus for what best characterises the process of differentiation. However, a
summation of what markers are used across different reports can give a fairly good idea.
Over five to six days, progressive changes in markers which positively discriminate DE
differentiation occur. Early markers which generally increase then decrease (or begin to
decrease) are typically T, GSC, MIXL1, EOMES, NCAD, SNAI1, WNT3, FGF4,
NODAL, and CRIPTO, all of which characterise early primitive streak/mesendoderm
differentiation and EMT. Subsequent and more maintained expression of markers such

34
as SOX17, FOXA2, GATA4/6, CXCR4, HHEX, OTX2, CER1 and LHX1 is then used to
confirm a more DE-like cell emerging from a mesendodermal population. Many reports
suggest that pluripotency factors decrease in their expression towards the end of
differentiation protocols; OCT4 and SOX2 in particular, NANOG less so. A lack of
increase or an identifiable decrease in certain factors which would suggest non-DE
differentiation is also required to illustrate mesendoderm/DE differentiation. These
include SOX7, α-fetoprotein (AFP), CDX2 to dismiss extra-embryonic differentiation,
PDGFRΑ, FLK1 (VEGFR), MEOX1 to dismiss mesoderm differentiation, and SOX1
and PAX6 to dismiss neurectoderm differentiation. Not all reports exhibit the exact
same characteristics in marker expression, with some indicating a many-fold difference
in increases of e.g. SOX17 and MIXL1, or decreases of OCT4 and SOX7. However, it is
useful to establish an overall trend by reviewing the literature (D’Amour et al., 2005;
Greber et al., 2008; McLean et al., 2007; Vallier et al., 2009c).
Using CXCR4 expression as a marker to define and quantify cells within differentiating
populations is often relied on to confirm DE differentiation vs. non-DE (particularly
visceral endoderm). While it has been shown that CXCR4+ populations generally have
high levels of SOX17 transcript and low levels of OCT4 and SOX7 (D’Amour et al.,
2005), Cxcr4 alone doesn’t discriminate between DE and mesoderm (McGrath et al.,
1999; Sumi et al., 2008). Analysis for PDGFRA expression has been employed to
determine this, which has been shown to be low in prospective DE cells but high in
prospective mesoderm cells in a mesendoderm population (Tada et al., 2005; Vallier et
al., 2009c). Ultimately however, characterisation of DE differentiation requires analysis
of many markers by PCR or microarray, with further definition provided by qualitative
and quantitative immunostaining analyses of multiple factors at the single cell level.
Improving characterisation is on-going work in the field.
1.4.2 Targeted differentiation protocols
Targeted differentiation protocols for generating DE and subsequent lineages use a
variety of different culture conditions and combinations of growth factors. The degree
of efficiency varies between different reports, in terms of marker gene expression and
quantitation of DE differentiation. The use of adherent monolayer cultures (as opposed
to EB formation) and Activin A predominates. Reviewing a selection of these protocols
begins to reveal the critical factors driving differentiation.
Two versions of a protocol published by D’Amour and colleagues have been used as an
early archetype for targeted differentiation to DE. HESCs on MEFs are stimulated to

35
differentiate by removal of pluripotency medium and treatment for one day with basal
medium containing 100ng/ml Activin A (from here “high Activin A”) and 25ng/ml
Wnt3a, followed by two days in high Activin A and 0.2% FCS. This leads to high levels
of SOX17 expressing cells which could be differentiated further towards pancreatic
cells (D’Amour et al., 2006). An earlier version of the protocol involved differentiating
cells for five days with high Activin A supplemented with 0%, 0.2% and 2% FCS on
days 0-1, 2-3, and 4-5 (respectively), again generating high levels of SOX17 expressing
cells, with the population quantified at 90% expressing CXCR4 by day 5 (D’Amour et
al., 2005) (table 1.1). Achieving highly efficient DE differentiation on MEFs has
drawbacks, despite being able to generate populations of pancreatic endoderm cells that
differentiate to pancreatic β-cells and shows glucose responsiveness in vivo (Kroon et
al., 2008). MEFs are unlikely to be compatible with clinical GMP conditions, and
feeders introduce complex and poorly defined culture conditions, meaning analysis or
improvement of differentiation is more difficult. Many groups have generated feeder-
free protocols. In a report by Zhou and colleagues, the five day D’Amour et al. 2005
protocol (with increasing FCS and without Wnt3a) was employed, generating cultures
with 85% and 79% SOX17 expression in cells on human and mouse feeders
respectively, however only 23% in cells on laminin (Zhou et al., 2008) (table 1.1). This
highlights the adaption required for feeder free differentiation, as well as hinting at what
factors might also contribute to differentiation, e.g. the ECM and growth
factors/inhibitors present in MEF-CM.
A protocol developed by Hay and colleagues to target differentiation of hESCs to
hepatic cells began with feeder free hESCs on Matrigel in MEF-CM. These were
differentiated over five days using RMPI supplemented with B27, 100ng/ml Activin A,
and sodium butyrate (NaB) at 1.0mM for days 0-2, and 0.5mM for days 3-5. The
protocol generates populations with 70% CXCR4 expression (table 1.1), with western
blotting indicating high levels of SOX17 and FOXA2. They had found that including
the short chain fatty acid NaB led to increased cell death, gave slightly reduced
expression of NANOG and SOX17, but led to higher proportions of hepatic-like cells
generated later in the protocol compared to Activin A-only (Hay et al., 2008b). The
underlying hypothesis was that NaB inhibited intracellular signalling pathways which
normally inhibit differentiation and apoptosis, aiding induction of cells towards DE.
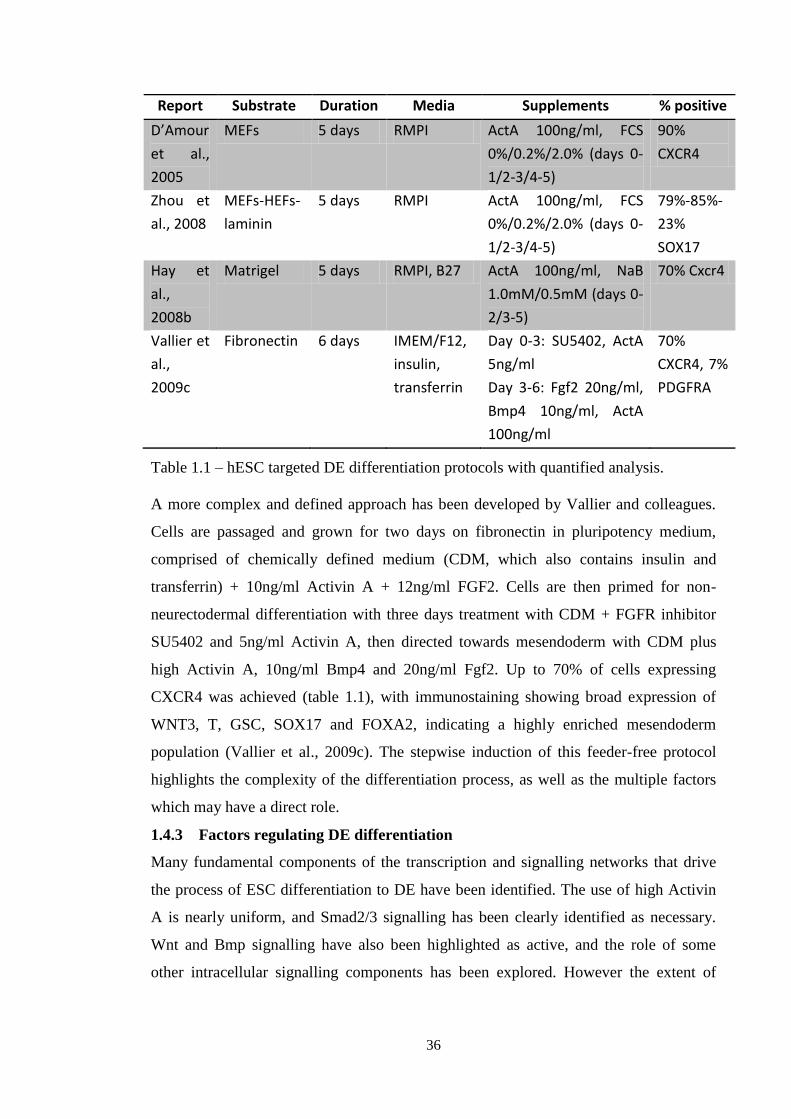
36
Report Substrate Duration Media Supplements % positive
D’Amour
et al.,
2005
MEFs 5 days RMPI ActA 100ng/ml, FCS
0%/0.2%/2.0% (days 0-
1/2-3/4-5)
90%
CXCR4
Zhou et
al., 2008
MEFs-HEFs-
laminin
5 days RMPI ActA 100ng/ml, FCS
0%/0.2%/2.0% (days 0-
1/2-3/4-5)
79%-85%-
23%
SOX17
Hay et
al.,
2008b
Matrigel 5 days RMPI, B27 ActA 100ng/ml, NaB
1.0mM/0.5mM (days 0-
2/3-5)
70% Cxcr4
Vallier et
al.,
2009c
Fibronectin 6 days IMEM/F12,
insulin,
transferrin
Day 0-3: SU5402, ActA
5ng/ml
Day 3-6: Fgf2 20ng/ml,
Bmp4 10ng/ml, ActA
100ng/ml
70%
CXCR4, 7%
PDGFRA
Table 1.1 – hESC targeted DE differentiation protocols with quantified analysis.
A more complex and defined approach has been developed by Vallier and colleagues.
Cells are passaged and grown for two days on fibronectin in pluripotency medium,
comprised of chemically defined medium (CDM, which also contains insulin and
transferrin) + 10ng/ml Activin A + 12ng/ml FGF2. Cells are then primed for non-
neurectodermal differentiation with three days treatment with CDM + FGFR inhibitor
SU5402 and 5ng/ml Activin A, then directed towards mesendoderm with CDM plus
high Activin A, 10ng/ml Bmp4 and 20ng/ml Fgf2. Up to 70% of cells expressing
CXCR4 was achieved (table 1.1), with immunostaining showing broad expression of
WNT3, T, GSC, SOX17 and FOXA2, indicating a highly enriched mesendoderm
population (Vallier et al., 2009c). The stepwise induction of this feeder-free protocol
highlights the complexity of the differentiation process, as well as the multiple factors
which may have a direct role.
1.4.3 Factors regulating DE differentiation
Many fundamental components of the transcription and signalling networks that drive
the process of ESC differentiation to DE have been identified. The use of high Activin
A is nearly uniform, and Smad2/3 signalling has been clearly identified as necessary.
Wnt and Bmp signalling have also been highlighted as active, and the role of some
other intracellular signalling components has been explored. However the extent of

37
regulation by the core networks, as well as what other factors may contribute to it, is
still the subject of investigation.
The progression and the hierarchy of some transcription factors known to have a role
during DE formation in the mouse embryo have been investigated in mESCs.
Differentiation with Activin A over six days led to T expression increasing until day 3,
then decreasing. Eomes, Mixl1 and Gata6 all increased progressively up until day 4.5,
then either maintained or (in the case of Gata6) slightly decreased. Targeted siRNA
knockdown revealed Eomes to have a significant role regulating mesendoderm
formation, required for the generation of Gsc+ cells and upstream of MixL1. Both
MixL1 and Eomes were required for generating Sox17+ cells, whereas T was less
crucial, and Gata6 superfluous (although Gata6 knockdown inhibited visceral endoderm
differentiation)(Izumi et al., 2007). Further work in mESCs has identified some of the
transcriptional network of Smad2/3. A transgenic line was induced to activate Smad2/3
through de-repression of a constitutively active Alk4 receptor, with the resulting gene
expression analysed by microarray. Many known markers of primitive
streak/mesendoderm showed at least modest induction to Smad2/3 signalling within 6
hours, including Dkk1, Foxa2, Gata5, Gata6, Hex, Id3, Lhx1, Otx1, Snail1, and Sox17.
Gene expression in the absence of protein synthesis was also analysed to glean which
targets predominantly relied on Smad2/3 only, which included Pitx2, Lefty1/2, Smad7,
SnoN and Nodal (Guzman-Ayala et al., 2009).
An investigation using a transgenic mESC line with tetracycline inducible Nodal
expression has highlighted a potential function for Nodal during the process of
mesendoderm differentiation. Overexpression of Nodal for ten days induced strong
expression of mesendoderm markers Gsc and FoxA2, expression of more mature
mesoderm and DE markers (e.g. PdgfRα and Pdx1, a pancreatic marker), and a lack of
expression of AVE and ectodermal markers (e.g. Otx2 and Sox1). Quantification of
Cxcr4 expression indicated the population as being 77% positive. This was more
effective than exogenous recombinant Nodal or high Activin A in direct comparison. It
was also shown that Nodal-containing medium conditioned by cells overexpressing the
transgenic Nodal was similarly capable of driving mesendoderm differentiation in wild
type mESCs (Takenaga et al., 2007). This clearly shows that Nodal in mESCs is capable
of driving mesendoderm differentiation, similar to its function in vivo. It also highlights
how Nodal expressed and secreted from cells may have a stronger mesendoderm
inducing effect than exogenous recombinant Nodal or Activin A. An experiment in
38
hESCs overexpressing Nodal during EB formation did not generate such clear induction
of mesendoderm. Compared to wild-type EBs, Nodal overexpression permitted the
prolonged maintenance of pluripotency factors NANOG and OCT4, and the increase in
expression of a mixture of visceral, extra-embryonic and definitive endoderm markers
such as OTX2, GATA4, AFP, HHEX, and FOXA2. Neurectordermal markers were
completely absent (Vallier et al., 2004). While the differentiating effect of Nodal in
hESCs in the Vallier report is not as convincing as that in mESCs in the Takenaga
report, both contain evidence suggesting that overexpressed Nodal induced some
mesendodermal differentiation. Specific Nodal inhibition using hESCs expressing
Lefty2 and Cer1 has also been shown to promote neurectodermal differentiation in EBs
(Smith et al., 2008). This highlights the dichotomy of TGFβ signalling. TGFβ/Smad
signalling in ESCs functions to maintain pluripotency/resist neurectodermal
differentiation in an apparently Nanog-mediated fashion (Vallier et al., 2009a). It also
directly mediates mesendoderm differentiation. Exogenous Activin A is applied to
ESCs at lower and higher doses specifically for these respective purposes. While
endogenous Nodal in ESCs has been shown to play some sort of role for the former (see
1.3.2), a function for Nodal in differentiating hESCs to DE is yet to be unequivocally
defined. Whether overexpressed transgenic Nodal under more permissive conditions
would be able to induce DE differentiation, or endogenous Nodal is required during
Activin A mediated targeted differentiation, is not clear. The 2004 report by Vallier
used mouse Nodal in hESCs, as well as investigating differentiation during EB
formation. These factors may have impeded any specific DE-inducing effect of high
levels of Nodal. Many of the features of DE differentiation involving the TGFβ/Smad
related network are still being uncovered.
Several reports indicate a function for Wnt/β-catenin signalling during ESC
differentiation to DE. In a simple adaption to the protocol by Hay in table 1.1, inclusion
of 50ng/ml Wnt3a with high Activin A for three days improved induction of DE
compared to NaB. Peak expression of T, SOX17 and FOXA2 occurred sooner, and cells
which were differentiated further formed more functional hepatocytes. Expression of
OCT4, NODAL and CRIPTO did not seem to be drastically affected (Hay et al., 2008a).
The mechanism by which Wnt/β-catenin might affect mesendoderm differentiation is
highlighted by an experiment using constitutively active β-catenin in hESCs. Induction
of constitutively active β-catenin in hESCs in a basal medium (DMEM/F12 +N2+B27)
led to rapid down-regulation of NANOG and OCT4, and an increase in expression of
39
mesendoderm markers (including T and GSC) within three days. After six days
however, concomitant with increasing BMP4 expression, cells lost expression of
mesendodermal markers and began assuming a more mesodermal identity, with
maintained CXCR4, VEGFR and NCAD expression (as well as other early cardiac
markers). Specific inhibition of Bmp signalling by inclusion of exogenous Noggin was
found to promote differentiation towards a more mesendoderm/DE like identity, with
greater expression of markers like GSC, MIXL1, SOX17, suppression of mesoderm
markers, and a high proportion of FOXA2+ cells emerging. These cells were also found
to have a high level of active Smad2 (Sumi et al., 2008). These data therefore suggest
that Wnt/β-catenin operates similarly during mesendoderm differentiation in hESCs as
during early embryo development in mouse, regulating expression of TGFβ, early
mesendoderm and EMT targets. A shift in the balance from Bmp-Smad1/5/8 to TGFβ-
Smad2/3 signalling was required for an endodermal fate. PI3k inhibition using
LY294002 was also found to reverse the DE-inducing effect of β-catenin + Bmp-
inhibition (Sumi et al., 2008). This is interesting as it conflicts with other reports in
hESCs. Protocols by Vallier and Bernado also include Bmp4 specifically to enhance
mesendoderm differentiation. In these reports, it is suggested that Bmp4 helps reduce
the expression of pluripotency factors and induces some expression of mesendoderm
markers (such as T), although only in the presence of TGFβ/Smad, since alone Bmp4
induces primitive endoderm/TE (Bernardo et al., 2009; Vallier et al., 2009c).
Paradoxically, both including Bmp4 and inhibiting it seem correct. The timing, dose and
interaction between TGFβ, Wnt and Bmp signalling therefore define which lineage
predominantly emerges. Also paradoxically, in a report by McLean and colleagues it
was shown that the activity of PI3k signalling blocks DE differentiation. They showed
strong induction of DE in hESCs grown on Matrigel in MEF-CM containing the PI3k
inhibitor LY294002. They also showed enhanced differentiation in non-conditioned
medium with a combination of Activin A and LY294002 vs. Activin A alone (McLean
et al., 2007). The DE-differentiation protocols of Vallier and Bernado include bFGF,
but (in a slight development from the earlier protocol in table 1.1) also LY294002. The
purported effect of including LY294002 is increased expression of mesendoderm
markers and reduced expression of pluripotency factors, without expression of extra-
embryonic endodermal factors increasing (Vallier et al., 2009b). The report by McLean
illustrated that the inclusion of insulin and IGF with Activin A in non-conditioned
medium did not induce expression of neurectodermal or extra-embryonic endodermal
40
markers, however was detrimental to the DE inductive effect of Activin A. Insulin is
included in the basal medium of many differentiation protocols including in the reports
by Bernado and Vallier, acting as a survival factor inhibiting apoptotic pathways. The
effect of signalling relating to bFGF, insulin, PI3k, MAPK and other associated
networks is therefore not clear, nor easy to define given the complexity of these
signalling networks.
1.5 Hypothesis and aims
Nodal signalling during mouse embryo development is required to establish the
primitive streak, and via Smad2 it significantly contributes to the mesendoderm gene
program. Nodal and Activin A share components of the same signalling pathway,
however they vary in certain key aspects. Nodal requires Cripto for proteolytic
maturation and to bind Alk4, whereas Activin A binding to Alk4 is inhibited by Cripto.
Activin A is used in both pluripotency medium and DE-differentiation protocols to
generate appropriate levels of Smad2/3 signalling required for these different
conditions. However, inhibition of Nodal in pluripotency medium has been shown to
have a slight negative effect on pluripotency marker expression even in the presence of
Activin A. Further examples exist in hESCs where exogenous factors signal directly as
well as stimulating endogenous signalling via an endogenous counterpart or relative e.g.
exogenous Fgf2 stimulation of endogenous FGF2 in pluripotent hESCs. This
mechanism may also operate during Activin A mediated differentiation of hESCs to
DE.
Hypothesis During targeted differentiation of hESCs towards DE, an important
direct effect of high Activin A may be to raise expression of endogenous Nodal. Nodal
may then have a fundamental role in parallel to the exogenously added Activin A in
stimulating Smad2/3 activation and downstream transcriptional regulation of a
mesendoderm/DE program. Signalling from Wnt/β-catenin may contribute to the
regulation of both endogenous Nodal/Smad signalling and mesendoderm differentiation.
Finally, given such a model whereby Nodal stimulates DE differentiation, Cripto may
have a crucial function in promoting the process.

41
Aims The specific aims of the project are as follows:
- Establish what effect high Activin A has on expression of mesendoderm and
TGFβ/Nodal targets in hESCs in a chemically defined differentiation system
- Determine whether exogenous Wnt3a signalling improves differentiation by
high Activin A and if so by what mechanism
- Identify the endogenous TGFβ/Nodal signalling components which are present
and active in hESCs undergoing DE differentiation
- Disrupt Nodal signalling during high Activin A treatment to establish whether it
has a non-redundant parallel function during differentiation
- Explore the mechanisms by which Nodal signalling may have a function during
differentiation, in particular the involvement of Cripto
- Suggest how insight into Nodal function can contribute to improvements in
targeted differentiation protocols
In order to achieve the aims, differentiation of hESCs using Activin A in a feeder free
chemically defined system was carried out. A system with as few factors as possible
was used. This was still capable of generating some DE-marker expressing cells, and
provided the clearest platform to analyse the effect of Activin A on gene expression and
Nodal signalling. It also facilitated identifying the effect of exogenously added Wnt3a
on downstream signalling and differentiation. Analysis of gene expression as well as
TGFβ signalling was carried out on a daily basis during differentiation to provide more
insightful data on the progression of differentiation. Qualitative and quantitative
analysis of the efficiency of differentiation was also performed using expression of key
markers of pluripotency and DE, e.g. Nanog and Sox17.
In order to interfere with Nodal-related signalling, two methods were chosen for
determining its potential role. Direct ablation of Nodal via shRNA was used to identify
whether its absence had a detrimental effect on differentiation. Interfering with Cripto
function by antibody blockade was also performed to disrupt any Cripto-specific
regulation of Nodal, identifying whether Cripto-dependant signalling is required during
DE differentiation. Some clear impressions of the role of Wnt3a and the presence of
Nodal signalling emerged, as well as inferences of the requirement and role of Nodal
and Cripto. The significance of the results, both in refining our understanding of the
regulation of hESC differentiation to DE (in concert with the most contemporary
research), and informing further investigation, are discussed.
42
CHAPTER 2 Method and Materials
2.1 Generating MEF feeder cells
2.1.1 Culturing
Culturing of MEFs and all other cells was performed HeraCell 240i incubator (Thermo
Scientific, USA) at 37oC 5% CO2, and any manipulation done in a Class II hood (unless
otherwise stated). Mitotically active MEFs were cultured in 75cm2 canted-neck vent cap
cell culture flasks (Corning, USA) in MEF medium (see table 2.1), which was changed
every 2-3 days.
2.1.2 Preparing mitotically inactive MEFs
Primary cell cultures of CD1 strain MEFs at passage 0 (p0) were generated in house by
dissociation of E13 mouse embryos with trypsin (PAA Laboratories Inc., Austria). Cell
cultures were then obtained following passage into fresh flasks in MEF medium at
passage 1 (p1). These were cultured for four to five days until 90% confluent. For
passaging, media was removed and the cells washed with 1x PBS with Ca+ or Mg+
(PBS+) (PAA laboratories), before being enzymatically dissociated and detached by
adding 3.5ml 1x TrypLE (Invitrogen, USA) to the flask and incubating at 37oC for 1-2
minutes. The cells were then collected in 8ml MEF medium into a 15ml tube and
centrifuged in a Universal 320R centrifuge (Sigma, USA) for 4 minutes at 600g. The
supernatant was aspirated and the pellet resuspended to a single cell suspension in MEF
medium by vigorous pipetting. The MEFs were then plated onto three 75cm2
flasks,
making them p2 and giving a 1:3 split. This was repeated until p4. For mitotic
inactivation, mitomycin-C (Sigma) was dissolved in 1x PBS- (without Ca2+
or Mg2+
) to
give a stock solution at 1mg/ml and was added to MEF medium at a final concentration
of 10µg/ml. Old medium was removed from confluent flasks of p4 MEFs, and 6.5ml of
mitomycin-C medium was added. The flasks were incubated at 37oC 5% CO2 for 2
hours. The mitomycin-C medium was then removed and the cells enzymatically
dissociated using TrypLE and centrifuged. These passage 4 inactive (p4i) cells were
then frozen (see 2.2).
2.2 Freezing and thawing cells
Following enzymatic dissociation and centrifugation, cells were resuspended in their
corresponding media with 50% v/v 2x ProFreeze-DMSO (Biowhittaker, USA) + 15%
dimethyl sulphoxide (DMSO) (Sigma), at a density of ~1 x 10⁶
cells/ml for
43
MEF/HeLa/293FT or ~1 x 10⁵ cells/ml hESCs. Cell counting to obtain density was done
using a Neubauer haemocytometer under an inverted light microscope (see 2.14.2). This
suspension was then aliquoted into 1ml Nunc™ Cryovials (Thermo Scientific), and
stored at -80oC overnight in insulating polystyrene to allow slow freezing. Cells were
then stored in liquid nitrogen.
For defrosting and seeding frozen cells, vials of cells were removed from liquid
nitrogen and dipped in and out of a 37oC waterbath until 80% thawed. They were
poured into a 15ml tube and appropriate medium was added slowly. The cells were then
centrifuged at 480g (or 600g for MEFs), the supernatant aspirated and plated on to pre-
prepared plates (dependent on the cell type) in their appropriate medium.
2.3 Culturing hESCs using MEF feeder layers
2.3.1 Preparing MEF feeder layers
Typically, 6 well plates (Corning) were used for hESC culture on MEFs. Dishes were
pre-incubated at 37oC for 30 minutes with gelatin (Sigma) dissolved in H20 to 0.1%
w/v. This was aspirated, and vials of p4i MEFs were thawed (as in 2.2), centrifuged for
4mins at 600g, resuspended and plated at a density of ~2.1 x 10⁴ cells/cm
2 (2 x 10
5
cells/ml using 2mls) in MEF medium. These were then incubated overnight.
2.3.2 hESC seeding and maintenance
All hESC lines used were those currently available and being used in-house, either
under licence (Hues1/3/7) or in-house derived (Man5/7). They were cultured using the
same techniques. When seeding cells from frozen, vials of hESCs were defrosted (as in
2.2) and centrifuged for 4mins at 480g. Meanwhile, MEF medium was removed from
the desired MEFs on pre-prepared wells, and the MEFs washed once in PBS+. After
centrifugation and removal of supernatant, hESCs were resuspended in the required
amount of hES medium (table 2.1). 2mls was then pipetted drop-wise onto each well of
MEF cells and incubated. hES medium was changed every other day. Typically, hESC
cultures were passaged when they reached 70-90% confluency, and split in a 1:4 to 1:6
ratio onto fresh plates.
2.3.3 Manual Passage of hESCs
Manual passaging was done in a bespoke class II hood on a Nikon SMZ 1000 stereo
dissecting microscope (Nikon, Japan). Fresh plates were seeded with MEFs the day
before (see 2.3.1), and these were prepared by removing MEF medium, washing in
PBS+ and adding 2mls of hES medium. For cutting colonies, the end of a glass pipette

44
Table 2.1 – Different culture media used for MEFs, 293FTs, HeLa cells and hESCs.
Percentages indicate a w/v or v/v amount.
was heated using a lighter, pulled when soft and broken off to make a sharp point. The
point was used to make cross-hatchings through large hESC colonies. Using a p200
micropipette, clumps of cells were dislodged from cross-hatched colonies by pipetting
up and down. All loose clumps were then collected up and pipetted onto the fresh
prepared plates, incubated, and maintained as in 2.3.2.
Medium Cell type Constituents, final concentration Company
MEF medium
(a.k.a. Growth
medium)
MEFs,
293FT, HeLa
F-DMEM
L-Glutamine, 2mM
Penicillin/Streptomycin (Pen/strep), 1%
Foetal bovine serum, 10%
Gibco
PAA
PAA
Gibco
hES medium hESCs (on
MEFs)
DMEM/F12
L-Glutamine, 2mM
Pen/strep, 1%
Non-essential amino acids (NEAA), 1%
2-mercaptoethanol, 0.09mM
CD Lipid supplement, 1%
Insulin/transferrin/selenium, 0.1%
Knock-out serum replacement (KOSR),
20%
PAA
PAA
PAA
PAA
Gibco
Gibco
Gibco
Gibco
Feeder-free
base medium
(FF base
medium)
hESCs
(differentiation)
Advanced DMEM/F12
L-Glutamine, 2mM
Pen/strep, 1%
Non-essential amino acids (NEAA), 1%
2-mercaptoethanol, 0.09mM
Lipid supplement, 1%
Bovine serum albumin (BSA), 0.1%
B27 supplement, 1x
Gibco
PAA
PAA
PAA
Gibco
Gibco
Gibco
Gibco
mTeSR
medium
hESCs
(feeder free)
mTeSR™1 medium
Pen/strep, 1%
Stem cell tech.
PAA

45
2.3.4 Enzymatic passage of hESCs
When performing enzymatic passage of hESCs, medium was removed from wells and
cells washed once in PBS+. For 6 well plate wells, 0.5ml of TrypLE was then added and
cells incubated at 37oC 5% CO2 for 1 minute. hESCs were then checked under the
microscope for initial dissociation within colonies, and washed off into a 15ml tube
using hES medium. Cells were spun at 480g for 4 minutes. Meanwhile, fresh plates
which had been seeded with MEFs the day before (see 2.3.1) were prepared by
removing MEF medium and washing once in PBS+. Following centrifugation of
hESCs, the supernatant was removed, and cells were resuspended in hES medium (2mls
per fresh well) and pipetted drop-wise onto fresh plates, incubated, and maintained as in
2.3.2.
2.4 Culturing hESCs in a feeder-free system
2.4.1 Maintenance of feeder-free hESCs
For routine feeder-free pluripotency culture, 6 and 12 well plates (Corning) were used.
They were coated overnight at 4oC with 50µg/ml fibronectin (Millipore, USA)
dissolved in PBS- before seeding hESCs. For pluripotency culture, cells were
maintained using mTeSR™1 complete medium (Stem Cell Technologies, Canada),
supplemented with addition 1% penicillin/streptomycin (see 2.1), with medium being
changed every other day.
2.4.2 Passaging feeder-free hESCs
Typically, hESCs were cultured until 100% confluent before passaging, being split at a
ratio of 1:3 or 1:4 onto fresh plates. For enzymatic passaging, medium was removed and
cells washed once in PBS+. TrypLE was then added corresponding to the size of plate
(0.5ml for 6 well plate), and cells incubated at 37oC 5% CO2 for 1 minute. Initial
dissociation of the hESC monolayer was then checked under the microscope. Cells were
washed off with mTeSR medium into a 15ml falcon tube, and centrifuged for 4 minutes
at 480g. Meanwhile, plates that had been coated overnight were prepared by removing
the fibronectin and warming up to 37oC in the incubator. After centrifugation of the
cells, the supernatant was removed, and the cells resuspended in mTeSR medium (2mls
per fresh well of a 6 well plate) and pipetted drop-wise onto the pre-prepared plates.
They were then incubated and maintained as in 2.4.1.
46
2.4.3 Transferring hESCs from MEFs onto feeder-free
When moving hESCs from MEFs to feeder free, cultures were passaged at a ratio of 1:1
or 1:2. Cultures that were 70-90% confluent were enzymatically dissociated as in 2.3.4,
ensuring that the colonies were thoroughly dissociated by pipetting off the plate. The
cells were then centrifuged as in 2.3.4, the supernatant removed and resuspended in
mTeSR medium. They were pipetted drop-wise onto plates pre-coated in fibronectin
and prepared as in 2.4.2. They were then maintained as in 2.4.1.
2.5 Differentiation of feeder-free hESCs
The overall format of the differentiation and sample collection methods was the same
for all hESC lines, with only the growth factors and other supplements varying (see 2. 2
and figure 2.1).
For differentiation, 6, 12 or 24 well plates or glass chamber slides (Thermo Scientific)
were pre-coated with fibronectin (as in 2.4.1). hESCs that had been cultured feeder-free
for between 2 to 8 passages (pp2 to pp8) were passaged when at 100% confluency using
TrypLE (as in 2.4.2). Once the pre-coated plates were prepared (as in 2.4.2), cells were
resuspended at a density of 6 x 10⁵cells/ml in mTeSR medium, and pipetted drop-wise
onto the fresh plates in the following volumes: 6 well – 2mls, 12 well – 0.8mls, 24
well/chamber slide – 0.4mls (per well of plate). This gave approximate cell densities of
~1.3 x 10⁵ cells/cm
2. Cells were then incubated. Differentiation medium was prepared
by adding growth factors or other supplements/inhibitors at the appropriate
concentration (see table 2.2) to feeder-free base medium (FF base, see table 2.1). This
was prepared fresh on each day of differentiation. On day 0 of the experiment, to begin
differentiation mTeSR medium was removed from hESCs, cells were washed once in
PBS+, then the appropriate volume of differentiation medium added dependant on the
type of plate (as above). Cells were then incubated overnight. The next day (day 1 of
differentiation), differentiation medium was removed from cells, fresh differentiation
medium added, and the cells incubated. The process was repeated with fresh
differentiation medium added daily until the end of the time course.
For analysis, samples were collected at days of the time-course dependent on the
experiment, with day 0 being the pluripotent control, and samples collected before fresh
medium was added for that day. Samples for RNA (see 2.12) and lysate (see 2.13 and
2.16) were collected from 12 and 24 well plates, immunostaining (see 2.14) from 24
well plates and chamber slides, and flow cytometry (see 2.15) from 6 well plates.

47
Experiment Growth factors Concentration
(ng/ml)
Days added
(0 – 6)
FF base-only - - 0 - 6
Activin A Activin A (Peprotech) 100 0 - 6
Activin A + Wnt3a Activin A 100 0 - 6
+ mouse Wnt3a (R&D) 25 0 - 2
Cripto blocking Activin A 100 0 - 6
+ Cripto blocking antibody
(mouse IgG) (R&D)
OR
+ isotype control antibody
(mouse IgG) (R&D)
1000
1000
0 - 6
0 - 6
Table 2.2 – Growth factors added to FF base medium (see table 2.1) for differentiation
experiments. Wnt3a and the IgG antibodies were added in addition to Activin A.
Figure 2.1 – Overview of differentiation experiments. Feeder-free hESCs were
passaged the day before the experiment into mTeSR (orange arrow). On day 0,
medium was removed and cells given differentiation medium. For Activin A and
Cripto blocking experiments, medium containing 100ng/ml Activin A, +/- Cripto
blocking Ab or mouse isotype control Ab was added daily (red arrow). For Activin
A + Wnt3a experiments, medium containing 100ng/ml Activin A +25ng/ml Wnt3a
was added for days 0 to 2, and then medium with just Activin A for days 2 to 6 (red
and green arrows). Samples were collected on different days of the time course
dependant on the experiment and sample type.

48
2.6 293FT and HeLa cell culture
293FT cells (Invitrogen, USA) and HeLa cells were routinely cultured in 75cm2 flasks
canted neck vent-cap flasks. They were cultured in growth medium (see table 2.1),
which was changed every two to three days. For passaging, the split ratio was generally
1:4 – 1:8 for both cell types. Medium was removed, the cells washed in PBS+ and 4mls
TrypLE added. Cells were incubated for 1 or 4 minutes (for 293FT or HeLa,
respectively), washed off in growth medium into 50ml falcon tubes and centrifuged at
480g for 4mins. The supernatant was removed, the pellet resuspended in sufficient
growth medium dependent on the number of flasks to be split into, and cells plated in
fresh flasks and incubated.
2.7 Lentivector cloning
2.7.1 General molecular cloning techniques
Unless otherwise stated, the following techniques and reagents were used to prepare
plasmids and vectors:
Restriction Digest All restriction enzymes and corresponding buffers were
from New England Biolabs (USA). Digests were carried out for between 4-12
hours at 37oC. The following reagents were used:
Single digest: vector - Xµl, buffer - 3µl, enzyme - 2µl, H2O – (25-X)µl
Double digest: vector - Xµl, buffer - 3µl, enzyme A – 1.25µl, enzyme B –
1.25µl, H2O – (24.5-X)µl
Dephosphorylation Phosphate groups were removed from sticky or blunt 5’
ends by adding up to 1µg DNA to a solution containing 2µl 10x phosphatase
buffer, 1 unit phosphatase (both from Roche, Switzerland), made up to 20µl with
H2O, incubating for 10mins at 37oC, then stopping the reaction by heating for
2mins at 75oC.
Ligation Ligations were carried out for 10-30mins at room temperature
using the Rapid DNA ligation kit (Roche, Germany) as follows: insert – Xµl, vector
- Yµl, H2O - 8-(X+Y)µl, dilution buffer – 2µl, ligation buffer – 10µl, ligase – 1µl.
A total amount of 50-200ng DNA and an insert:vector molar ratio of between 3:1 to
6:1 was used in reactions.
Transformation Typically, 3-5µl of vector was pipetted into a vial of
defrosted omniMAX™ 2 T1 or Stbl3 competent E.coli (Invitrogen) on ice. After 20

49
minutes (mins) the bacteria were heat shocked for 45 seconds (secs) at 45oC in a
water bath. After cooling, 500µl Super Optimal broth with Catabolite repression
(S.O.C) medium (Invitrogen) was added and the culture shaken for 45mins at 37oC.
100µl of this culture was then plated onto LB-agar plates which had been
inoculated with 100ug/ml ampicillin (Gibco). The plates were left overnight at
37oC. The next day, individual colonies were picked and grown in 5ml LB broth
with 100ug/ml ampicillin (LB+amp) shaken overnight. Following ensuing mini-
preps and analysis, leftover culture (1-2mls) was used to inoculate 250mls
LB+amp, which was grown overnight with shaking.
Plasmid mini- or midi-prep Overnight LB+amp E.coli cultures of 5mls
or 250mls were purified using the QIAprep Miniprep or the QIAGEN plasmid
midi-kit (Qiagen, USA) respectively.
For minipreps, 3mls overnight LB+amp culture was centrifuged at 6800g for 3mins
in a bench-top microfuge (Sigma), the supernatant was removed and pellet
resuspended in 250µl buffer P1. To lyse the cells, 250µl buffer P2 was then added,
the solution incubated for 2-3mins and neutralised with 350µl buffer N3. The
solution was centrifuged for 10mins at 16000g. The supernatant was applied to the
DNA binding columns provided, and centrifuged for 45secs at 16000g. The column
was washed first with 500µl buffer PB and second with 750µl buffer PE (each time
centrifuging for 45secs at 16000g), and vector DNA eluted by adding 40µl H2O,
incubating for 1min and centrifuging for 1min at 16000g.
For midi-preps, 250mls overnight LB+amp culture was centrifuged for 30 minutes
at 4600g at 4oC, the supernatant removed, and pellet resuspended in 10ml buffer
P1. 10ml buffer P2 was then added, incubated for 5mins, then neutralised with
10ml P3 and incubated again for 10mins on ice. The solution was centrifuged for
50mins at 4600g at 4oC, and the supernatant carefully passed through an
equilibrated DNA binding column (minimising transfer of cellular debris). The
column was washed with buffer QC, and the plasmid DNA eluted and collected
into a 50ml falcon tube by passing 15ml buffer QF through the column. The DNA
was precipitated by adding 10.5ml isopropanol and centrifuging for 60 minutes at
4600g at 4oC. The supernatant was removed, and the pellet washed in 1.5ml 70%
ethanol and transferred to a 1.5ml tube. The tube was then spun for 10mins at
15000g at room temperature, the supernatant removed, and the plasmid DNA
resuspended in 100-250µl H2O.

50
Gel extraction Following agarose gel electrophoresis (see 2.12.6), the band
corresponding to the desired DNA fragments were excised using a clean scalpel on
a UV-illuminated bed. The DNA was extracted using the QIAquick gel extraction
kit (Qiagen, USA), according to the conditions stipulated by the manufacturer.
PEG purification Small polymerase chain reaction (PCR) and restriction
digest fragments (<300 base pairs) were removed by polyethylene glycol (PEG)
purification: 75µl 1x TE pH8.0 was added to 25µl PCR/restriction digest product,
followed by 50µl 30% PEG 8000/MgCl2 30mM (Invitrogen, USA). The mixture
was vortexed and then centrifuged for 15mins at 10000g. The supernatant was
removed, and the pellet resuspended in 25µl H2O.
Sequencing 10µl H2O containing 300ng vector DNA and 1µM sequencing
primer were given to the sequencing unit at the University of Manchester. Briefly,
in an ABI 3100 sequencer, samples templates were replicated using
dideoxyribonucleic acid with different fluorescent labels for each nucleotide tri-
phosphate (A, T, C and G), and gels analysed for positions of NTPs. For
sequencing primers, see table 2.3.
Mapping and sequencing analysis Vector maps and sequencing data were
analysed using CLC DNA workbench 6 (CLC bio, Denmark).
2.7.2 pLVCT Nodal shRNA vector generation
2.7.2.1 shRNA design
To create short hairpin RNA (shRNA) oligonucleotides targeting Nodal and a
corresponding control scramble sequence for Nodal knockdown experiments, short
interfering RNA (siRNA) sequences were first generated using two methods.
To generate one Nodal siRNA and a scramble siRNA sequences, the human Nodal
mRNA coding sequence was copied from the NCBI database into the Genscript online
siRNA target finder (Genscript, USA: https://www.genscript.com/ssl-bin/app/rnai). This
generated a selection of 19 base pair (bp) siRNA sequences targeting Nodal mRNA, and
corresponding scramble sequences that were non-specific to Nodal or any other gene
target above 60-70%. The top rated sequences were double checked for specificity using
BLAST search on the NCBI website (http://blast.ncbi.nlm.nih.gov/Blast.cgi). The
following sequences were chosen: Nodal#1 – GCAGTACAACGCCTATCGC,
scramble – ACCACGACCGTAAGCCTTG.

51
To create a second Nodal siRNA sequence, the human Nodal mRNA coding sequence
was pasted into the Sfold online siRNA target accessibility and RNA duplex
thermodynamics program (Sfold, USA: http://sfold.wadsworth.org/License_info.html),
which generates a multitude of possible target gene (i.e. Nodal) secondary mRNA
configurations and corresponding siRNA sequence options. Sequences were ranked
based on target RNA accessibility, siRNA duplex stability, and siRNA specificity. The
top rated one was double checked using BLAST and found to be specific: Nodal#2 –
CCATGCATACATCCAGAGT.
DNA oligonucleotides containing the shRNA sequences were designed. Oligos were
designed with MluI and ClaI restriction sites at the 5 prime (5’) and 3’ ends
(respectively), the 19bp sense and reverse complementary antisense siRNA sequence, a
termination sequence for cellular processing, and a loop sequence to allow the hairpin to
form. A corresponding reverse complementary antisense oligo was then designed for
each shRNA:
Sense oligo (5’-3’):
Mlu I Cla I cgcgtC-Nodal1/2/scramble-TTCAAGAGA-Nodal1/2/scramble-TTTTTTCCAAat
| Sense | Loop | Antisense | Termination Signal
Antisense (reverse complementary) oligo (5’-3’):
ClaI MluI cgatTTGGAAAAAA-Nodal1/2/scramble-TCTCTTGAA-Nodal1/2/scramble-Ga
Termination Signal | Antisense | Loop | Sense |
2.7.2.2 Cloning of lentiviral vectors
The sense and corresponding antisense DNA oligonucleotides for the Nodal#1, Nodal#2
and scramble shRNA sequences were ordered from Invitrogen. Sense and antisense
oligonucleotides were annealed by adding 30µl of 50µM sense and antisense oligos to
15µl of 5x buffer Tris-NaCl pH8 (Tris - 250mM, NaCl - 500mM). This was heated for
2mins at 95oC, and allowed to anneal at room temperature for 1 hour. The 5’ ends of the
two DNA strands were then phosphorylated by adding 16ng of the annealed oligos to a
solution containing 15 units of T4 polynucleotide kinase (PNK), 1x PNK buffer (both
from Promega, USA), and 0.1mM adenosine triphosphate (ATP) (Millipore), made up
to 40µl with H2O. This was incubated for 30mins at 37oC, and the reaction stopped by
heating for 10mins at 65oC.

52
The vectors pLVTHM and pLVCT-tTR-KRAB (figure 2.2a-b) were ordered via
Addgene (plasmid 12247 and 11643) from the D.Trono (Szulc et al., 2006). Although
pLVTHM is also a lentivector, here it was used simply as the cloning entry vector. To
generate the pLVTHM vectors containing Nodal#1, #2 or scramble shRNA sequences
downstream of the H1 promoter under the control of tetO (present in the TRE, figure
2.2a), the vector was cut with MluI/ClaI, run on an agarose gel and the ~11kbp band
excised, extracted and the 5’ ends dephosphorylated (see 2.7.1). Phosphorylated
Nodal#1, #2 or scramble DNA oligos were ligated into the dephosphorylated pLVTHM
fragments using the MluI/ClaI sites, and the vectors transformed into Stbl3 bacteria (see
2.7.1). Minipreps of individual clones were sequenced and checked for the correct
insert, which were then cloned further and midipreps made (see 2.7.1).
To generate pLVCT-tTR-KRAB vectors with the shRNA knockdown inserts, referred
to as pLV-[shRNA], the protocol provided by D.Trono online was used
(http://www.addgene.org/11643/). pLVTHM-Nodal#1, -Nodal#2 or -scramble vectors
were cut using MscI/FspI, run on an agarose gel and the 2435bp bands excised and
extracted. Simultaneously, the pLVCT vector was cut using MscI/FspI, run on an
agarose gel (see 2.12.6) and the 10.8kbp band excised and extracted. This pLVCT
backbone was dephosphorylated, and ligated with the 2435bp pLVTHM- Nodal#1, -
Nodal#2 or- scramble fragments, generating pLVCT-tTR-KRAB-Nodal#1, -Nodal#2 or
–Scramble vectors (from here on demarcated as pLV-Nodal#1, -Nodal#2 or –Scramble)
(figure 2.2c). These vectors were transformed into Stbl3 bacteria, and individual
colonies picked and cloned. Minipreps of individual colonies were sequenced and
checked for the correct insert, which were then cloned further and midipreps made.
A

53
B C D

54
2.7.3 pLKO.1 Nodal shRNA vector generation
As an alternative to the pLVCT inducible shRNA system, a selection of Nodal shRNA
and a control beta-2 microglobulin (b2m) shRNA constructs in the lentivector pLKO.1
(fig 2.2d) were ordered from OpenBiosystems (USA). The vector and shRNA
sequences were taken from the RNAi consortium (TRC) library for Nodal knockdown
sequences. The vector contained the shRNA sequences downstream of the U6 promoter
(fig 2.2d), making it a constitutive knockdown system. Five Nodal (N1-5) and b2m
shRNA sequences and their TRC library codes were:
N1 - CCGGGCAGAACTGGACGTTTGCTTTCTCGAGAAAGCAAACGTCCAGTTCTGCTTTTTG
TRCN0000058698
N2 - CCGGGCGGTTTCAGATGGACCTATTCTCGAGAATAGGTCCATCTGAAACCGCTTTTTG
TRCN0000058699
N3 - CCGGGTGCTCCTAGATCACCATAAACTCGAGTTTATGGTGATCTAGGAGCACTTTTTG
TRCN0000058700
N4 - CCGGTGCCACCAATGTGCTCCTTATCTCGAGATAAGGAGCACATTGGTGGCATTTTTG
TRCN0000058701
N5 - CCGGCATAAAGACATGATCGTGGAACTCGAGTTCCACGATCATGTCTTTATGTTTTTG
TRCN0000058702
b2m - CCGGCCCAAGATAGTTAAGTGGGATCTCGAGATCCCACTTAACTATCTTGGGTTTTTG
TRCN0000057253
| Sense | Loop | Antisense | Termination Signal
The sequences were BLAST searched to check for specificity. The different pLKO.1
constructs were received already transformed into E.coli. These were streaked on LB-
agar +ampicillin plates, and individual colonies picked and cloned. Sequences of
minipreps from individual clones were confirmed, and further midipreps generated.
Figure 2.2 (previous two pages) – Nodal shRNA lentivector maps. A) The pLVTHM
vector used as the cloning entry vector (here, with Nodal#2). B-C) The pLVCT-tTR-
KRAB inducible shRNA vector, shown prior to cloning (B), and following insertion
of the Nodal#2 shRNA sequence (C, pLV-Nodal#2). D) The constitutive shRNA
vector pLKO.1 (here, with N2).
Abbreviations: LTR – latent transcribed region, cPPT – central polypurine tract,
RRE – Rev response element, WPRE - Woodchuck hepatitis regulatory element,
IRES – internal ribosome entry site, TRE – tetracycline response element, AmpR –
ampicillin resistance, PuroR – puromycin resistance.

55
Sequencing Primer Sequence (5’ – 3’)
H1 (pLVTHM) TCGCTATGTGTTCTGGGAAA
pLVCT seq. primer TCAGACGAGTCGGATCTCC
pLKO.1 seq. primer AAACCCAGGGCTGCCTTGGAAAAG
RVprimer3 (pGL3) TAGCAAAATAGGCTGTCCC
pLNT seq. primer CAGTGCAGGGGAAAGAATAG
Table 2.3 – Primers used for plasmid DNA sequencing reactions
2.7.4 Smad-luciferase reporter cloning
In order to insert the Smad3/4-luciferase reporter CAGA12/Luc (Dennler et al., 1998)
from the pGL3 plasmid (fig 2.3a) into the pLNT-MCS lentivector (fig. 2.3d), the pLNT
vector was first digested with EcoRI, then blunt-ended by adding two units of T4
polymerase, 6.5µl 5x T4 buffer (both from Roche), and 2µl 2mM dNTPs (Promega) to
25µl of digestion mixture. This was incubated 20mins at 12oC, and heat inactivated for
10mins at 70oC. The blunt-ended pLNT-MCS plasmid was then cut with BamHI, and
the small 90bp fragment removed by PEG purification. Meanwhile, pGL3-
CAGA12/Luc was cut using SmaI and BamHI, run on an agarose gel (see 2.12.6) and
the band corresponding to 2180bp excised and extracted. This was then ligated with the
PEG purified pLNT-MCS fragment, transformed into Omni-Max 2 T1 E.coli, and
individual colonies picked and cloned. Minipreps of individual colonies were sequenced
and checked for the correct insert (fig. 2.3b), which were then cloned further and
midipreps made.
In order to insert Smad2/4/FoxH1-luciferase reporter AR3/Luc (Chen et al., 1996) from
pGL3 (fig. 2.3c) into pLNT-MCS (fig. 2.3d), the pLNT vector was first cut with SpeI,
blunt-ended, then cut with PstI and the small 90bp fragment removed by PEG
purification. Meanwhile, pGL3-AR3/Luc was cut with NaeI and PstI, run on an agarose
gel and the band corresponding to 1920bp excised and extracted. This was ligated with
the PEG purified pLNT-MCS backbone, transformed into Omni-Max 2 T1 E.coli, and
individual colonies picked and cloned. Minipreps of individual colonies were cut with
KpnI and run on a gel, as well as being sequenced, to check for the correct insert. As an
alternative strategy, pLNT-MCS was cut with SmaI and dephosphorylated. Meanwhile,
pGL3-AR3/Luc was cut with SalI, run on a gel and the band corresponding to 2169bp
excised and extracted. This fragment was blunt ended, and ligated into the cut pLNT-

56
A
B
C

57
MCS, transformed into Omni-Max 2 T1 E.coli, and individual colonies picked and
cloned. Minipreps of individual colonies were cut with KpnI and run on an agarose gel,
as well as being sequenced, to check for the correct insert.
Figure 2.3 (including previous page) – Smad/luciferase reporter maps. A) pGL3-
CAGA12/Luc (Smad3/4) reporter. B) pLNT-CAGA12/Luc lentivector reporter. C)
pGL3-AR3/Luc (Smad2/4/FoxH1) reporter. D) Empty lentivector pLNT-MCS. E)
pK2-CMV/dsRed, referred to here as “pPRIME-CMV-dsRed” (Addgene plasmid
11658, image obtained via Addgene). Vectors kindly donated by T. McKay.
D
E

58
2.8 Lentivirus generation and hESC transduction
2.8.1 Calcium phosphate transfection and virus collection from packaging cells
The lentivirus system employed utilised a second generation system, whereby
sequences for viral packaging (gag/pol, tat and rev) and the viral envelope (Vesicular
Stomatitis Virus envelope glycoprotein, VSV-G) were contained on two other plasmids,
pCMVdeltaR8.2 and pMD2.G respectively (Addgene plasmids 12263 and 12259). The
day before transfection, 293FT cells were split (see 2.6) into one 75cm flask per
construct at a density of ~1 x 10⁵ cells/cm
2 (equivalent to 12.5mls of ~6 x10
5 cells/ml)
in growth medium. The next evening, 13.5µg of lentiviral vector (fig. 2.2 and 2.3) along
with 13.5µg of the pCMVdeltaR8.2 and 10µg of pMD2.G were added to DMEM (only)
containing 25mM Hepes (Gibco) at pH7.1, made up to a total volume of 1.29ml. 70µl
1M CaCl2 was then added and the medium incubated at room temperature for 20mins.
Meanwhile, DMEM containing 10% FCS and 25mM Hepes was adjusted to pH7.9
using NaOH. Growth medium was removed from the 293FT cells, and 5.5ml DMEM
FCS (pH7.9) added. The incubated plasmid DMEM (pH7.1) was then added to the cells
and mixed gently by swirling, and cells incubated overnight. The next morning the
transfection medium was removed and 10ml growth medium added. Following 8 hours
incubation this growth medium was removed from cells and 7ml FF base or mTeSR
medium added to collect the lentiviral particles. This was incubated overnight. The
following morning, the virus-containing medium was collected into 15ml tubes, which
were spun at 210g for 4mins, and the viral medium supernatant taken off and filtered
through a 0.45µm filter (Millipore) to remove cells or debris that had carried across, and
stored at 4oC. Meanwhile, cells were given a further 7ml fresh FF-base or mTeSR
medium, and incubated until the next day. At this point, if a vector containing a
fluorescent marker was being used, the transfection efficiency was checked using an
inverted fluorescent microscope (see 2.14.2). The subsequent morning, the second
volume of viral medium was collected from the cells, spun and filtered as before and
added to the first collection of viral medium. This viral medium was stored for up to 48
hours at 4oC.
2.8.2 Direct transduction of hESCs
In the case of pLV-Nodal and pLNT-CAGA12/luc, viral medium was used directly to
transduce hESCs. The day before transduction, feeder free hESCs at pp1 or higher were
split into 6 well plates at a density of 8.5 x 10⁴ cells/cm
2 (equivalent to 2mls of 4 x 10
5
cells/ml) in mTeSR medium. The next day, medium was removed from the cells, and
59
virus-containing mTeSR was mixed 3:2 with fresh mTeSR, polybrene (hexadimethrine
bromide, Sigma) added to a concentration of 6µg/ml, and this viral medium added to the
cells and incubated. The next day, the process was repeated. The following day, viral
medium was removed, cells were washed once in PBS+, normal mTeSR medium added
and hESC cultured feeder free as normal. Cultures were expanded until ready for
differentiation experiments.
2.8.3 Concentration of lentiviral particles
For concentration of lentiviral constructs, up to 13mls of the pooled viral medium was
transferred to a sterile 14ml polypropylene round-bottom tube (Thermo Scientific),
loaded into a Beckman SW40 rotor bucket (Beckman Coulter, USA), and sealed. Viral
medium was spun for 1hour 45mins at 28,500rpm or 25,200rpm at 4oC in a Beckman
Optima L-90 K ultracentrifuge (Beckman Coulter). The supernatant was poured off, and
130µl of PBS- with 1% BSA was added gently onto the viral pellet at the bottom of the
tube and left for 1 hour at 4oC. This effectively gave a ~100x concentrated viral
solution. This was then pipetted into aliquots and stored at -80oC.
2.8.4 Assessment of lentiviral titre
In order to assess the titre of concentrated lentiviruses which carried a selection marker
or fluorescence marker, 293FTs were split into 24 well plates at a density of ~1 x 10⁵
cells/cm2
(0.4mls of 5 x 10⁵ cells/ml) in growth medium. The next day, individual wells
were transduced by adding polybrene to a concentration of 6µg/ml then 2 or 4µl of virus
to the medium in the wells, giving a 1:200 or 1:100 dilution of virus. The next day viral
medium was removed, and if the virus contained a puromycin selection marker,
medium was replaced with normal growth medium +/- 1µg/ml puromycin (Sigma), and
in the case of a fluorescence marker cells were simply given growth medium. The next
day (48hours post infection), cell counts were taken of wells infected with virus
containing puromycin selection by aspirating and discarding the medium (therefore any
detached dead cells), washing in PBS+ and then dissociating using TrypLE and
counting in a Neubauer haemocytometer. Flow cytometry was performed for cells
infected with fluorescent markers (see 2.15). The viral titre was calculated with the
following formula (taken from Zaehres and Daley, 2006):
- (% positive transduced cells) x (total number cells plated) x (dilution factor) =
Infectious Units (IU)/ml
So if 50% of cells were transduced (according to puromycin survival or fluorescence) in
a well with a 1:100 dilution of lentivirus:

60
- 0.5 x (2 x 105 cells) x 100 = 1 x 10
7 IU/ml
N.B. This is assuming the 293FTs have a multiplicity of infection (MOI) of 1, i.e.
require 1 viral particle on average to stably transduce each cell.
2.8.5 Transduction using concentrated virus and puromycin selection
Having calculated the viral titre for batches of concentrated lentivirus, concentrated
virus was used to transduce hESCs. Generally, enough virus was used to transduce at
least 10-30% of the cells. The amount required assumes hESCs have an MOI of 50
(Zaehres and Daley, 2006). The day before transduction, feeder free hESCs at pp1 or
higher were split into 12 well plates at a density of 5.3 x 10⁴ cells/cm
2 (equivalent to
0.8mls of 2.5 x 10⁵ cells/ml) in mTeSR medium. This gave 2.0 x 10
5 cells per well.
Therefore transduction of e.g. 10% of cells (2.0 x 10⁴) with an MOI of 50 would require
1.0 x 10⁶ IU. The day after passaging, cells to be transduced had their medium removed
and replaced with mTeSR containing 6µg/ml polybrene. The volume of concentrated
lentivirus required was calculated based on the percentage transduction desired. This
volume was pipetted gently into individual wells, swirled to mix, and cells incubated.
The next day, viral medium was removed, cells washed in PBS+, and in the case of
constructs without puromycin resistance, mTeSR medium added and cells cultured
feeder free as normal. Cultures were expanded through passaging until ready for
differentiation experiments. For constructs with puromycin resistance, mTeSR
containing 0.1µg/ml puromycin was added, and cells incubated. The next day, medium
was removed and mTeSR containing 0.25µg/ml puromycin added, and cells incubated.
The subsequent changes of mTeSR medium increased the amount of puromycin to
0.5µg/ml then 1.0µg/ml, staggering the selection effect over time. Subsequent feeder
free culturing was continued with mTeSR containing 1.0µg/ml puromycin, with cultures
expanded until ready for experiments.
2.9 Smad/Luciferase vector functional assays
2.9.1 pGL3-Smad/luciferase transfection into 293FTs
The pGL3-CAGA12/Luc and -AR3/Luc reporters were assayed for their response to
Activin A treatment in 293FT cells. The day before transfection, 293FTs were passaged
into 10cm dishes (Corning) at a density of ~1 x 10⁵ cells/cm
2 (equivalent to ~9mls of ~6
x105 cells/ml). The next day, calcium phosphate transfection was performed (similar to
2.8.1). For –CAGA12, 10ug of vector was added to a DMEM (only) solution containing
25mM Hepes, pH7.1, made up to 950µl. For –AR3, the same was done along with the

61
extra addition of 2µg of a c-Myc-promoter/FoxH1 expression plasmid (courtesy of T.
McKay). 50µl of 1M CaCl2 was added to the solutions and incubated for 20mins at
room temperature. Meanwhile, DMEM containing 10% FCS and 25mM Hepes was
adjusted to pH7.9. Growth medium was removed from the 293FT cells, and 4mls
DMEM FCS (pH7.9) added. The incubated plasmid DMEM (pH7.1) was then added to
the cells and mixed gently by swirling. Cells were then incubated overnight. The next
morning, the transfection medium was removed and growth medium added to the cells.
That evening, transfected cells were split into 12 well plates at a density of ~1 x 10⁵
cells/cm2 (equivalent to ~0.8mls of ~5 x10
5 cells/ml) in growth medium and incubated.
The next day, growth medium was removed and replaced with FF base medium +/-
100ng/ml Activin A. Individual or duplicate lysate samples from the different
treatments were collected at 0, 1, 3, 6, 12 and 24 hour time points and analysed for
luciferase activity (see 2.16).
2.9.2 pLNT-CAGA12 transduction of 293FTs
Following generation of pLNT-CAGA12/Luc lentivirus and a control pK2-CMV/dsRed
lentivirus (Stegmeier et al., 2005)(figure 2.3e), the effectiveness of the viral construct
was assayed by direct transduction of 293FT cells. The day before transduction, 293FT
cells were passaged into 24 well plates at a density of ~1 x 10⁵ cells/cm
2 (equivalent to
~0.4mls of ~5 x10⁵ cells/ml) in growth medium. The next morning, medium was
removed and replaced with FF base-viral collection medium (see 2.8.1) either undiluted,
or 1:1 or 1:3 diluted with fresh FF base medium, and the cells incubated for 8 hours.
The viral medium was then removed and replaced with growth medium overnight. The
next day, growth medium was removed and replaced with FF base medium +/-
100ng/ml Activin A. Cells were incubated for 6 hours, then lysate collected and
analysed for luciferase activity (see 2.16).
2.10 Nodal shRNA vector functional assays
2.10.1 Transfection into HeLa cells
In order to test the functionality of the pLV-[shRNA] and pLKO.1 shRNA knockdown
vectors, their ability to knockdown NODAL in HeLa cells was analysed. HeLa cells
were passaged (see 2.6) into 6 well plates at a density of 3 x 10⁵ cells/well (~3.2 x 10
4
cells/cm2) in growth medium. The next day, 3µg vector and 9µl of FuGene®HD
(Promega) were added to DMEM (only) to a total volume of 150µl (per construct per
well), mixed and incubated for 5mins at room temperature. The transfection mixture
62
was then added to a well of HeLa cells, swirled to mix and incubated. The next day, in
the case of pLKO.1 shRNA constructs (including a control pK2-CMV/dsRed, fig. 2.2e),
the medium was removed from HeLa cells and replaced with normal growth medium.
In the case of pLV-[shRNA], the medium was changed and replaced with growth
medium +/- 6µg/ml doxycycline (Sigma). The next day, cells were checked by
microscopy, then lysed and NODAL analysed by western blotting (see 2.13).
2.10.2 FACS of transfected HeLa cells
In order to improve the efficiency of the functional assay for pLV-[shRNA] in HeLa
cells, following transfection (as above), GFP positive (GFP+) cells were sorted and
analysed 48 hours post transfection (24 hours following addition of medium +/-
doxycycline). Cells were dissociated from plates, centrifuged and resuspended in PBS-.
They were then analysed by flow assisted cell sorting (FACS) with a FACS Aria (BD
Biosciences) using a 480nm excitation laser and 530/30nm detection filter at the Flow
Cytometry facility in the University of Manchester, courtesy of Mike Jackson. Particles
representing the desired population of single whole cells were identified and gated
based on the laser forward and side scatter emission. Untransfected control HeLa cells
were then used to set the threshold for identification of the GFP+ population. pLV-
[shRNA] transfected cells +/- doxycycline were then sorted based on this gating, with
the GFP+ cells being collected in separate tubes in growth medium, centrifuged for
6mins at 1200g, supernatant removed and lysed for analysis by western blotting (see
2.13).
2.11 Cripto blocking antibody functional assays
2.11.1 HeLa Smad phosphorylation assay
In order to assess whether the Cripto blocking antibody (R&D systems, USA, cat:
mab2772) would affect Nodal/Activin A signalling by inhibiting the function of
CRIPTO (TGDF1), SMAD2 phosphorylation in HeLa cells was assayed. HeLa cells
were split into a 12 well plate at a density of ~1.3 x 10⁵ cells/cm
2 (0.8mls of 6 x 10
5
cells/ml) in growth medium and incubated overnight. The next day, the following media
were prepared: DMEM (only), DMEM + 1µg/ml recombinant human Nodal (rhNodal,
R&D), DMEM + 100ng/ml Activin A. HeLa cells had their growth medium removed,
they were washed once in PBS+, and were given one of the pre-prepared DMEM
media. Then, for each of the three types of DMEM, individual wells of cells were either
left untreated, or treated with +1µg/ml Cripto blocking antibody (Cr blocking Ab) or

63
10µM SB431542 inhibitor (Tocris, UK). The cells were then incubated overnight. The
next day, medium was removed, cells washed once in PBS+ and lysate collected and P-
SMAD2 analysed by western blot (see 2.13).
2.11.2 Antibody immunostaining assay
In order to assess the binding of the Cr blocking Ab to the cell surface, immunostaining
was performed. Either 293FT or HeLa cells were plated at a density of ~1.3 x 10⁵
cells/cm2 (0.8mls of 6 x 10
5 cells/ml) in growth medium and incubated. The next day,
medium was removed, the cells fixed and stained using the 500µg/ml Cr blocking Ab as
a primary antibody at a dilution of 1:25. A parallel staining control IgG and subsequent
secondary antibody staining were employed as normal (without triton X, see 2.14).
2.12 PCR analysis and statistics
2.12.1 Cell collection
Generally, cells cultured/differentiated in 12 well plates were used for mRNA sample
preparation (for PCR analysis). To collect the cells from individual wells, medium was
removed, the cells washed in PBS+, and 200µl TrypLE added. Cells were incubated at
37oC for 1min, checked under the microscope for detachment, and washed off into a
1.5ml eppendorf tube using 1ml PBS-. The cells were spun in a microfuge for 3mins at
1000g (at room temperature), the supernatant completely removed, and the pellet frozen
at -80oC
2.12.2 RNA preparation
Cell samples that had been collected and frozen were defrosted and RNA prepared
using the Qiagen RNeasy mini-kit (Qiagen). Cell pellets were disrupted using 350µl
buffer RLT supplemented with 1% β-mercaptoethanol and homogenized using
QIAshredder spin columns (Qiagen). 70% ethanol was added, and the samples were
passed through RNA spin columns, and washed using the RW1 and RPE buffers
provided with the kit (all according to the manufacturer’s instructions). RNA was eluted
using 35-50µl RNAse free H2O. To remove genomic DNA from the samples, RQ1
DNAse (Promega) was used: 4-5µl 5x buffer and 4-5µl RQ1 DNAse was added to the
whole RNA sample (dependent on the volume), and the samples incubated for 30mins
at 37oC. The reaction was stopped by adding 4-5µl stop solution, and incubating at 65
oC
for 10mins. The concentration of the RNA samples was then measured using Nanodrop
ND-1000 spectrophotometer (Thermo Scientific).

64
2.12.3 Reverse transcription to cDNA
To generate cDNA from RNA samples, 1μg of RNA was used for the reverse
transcription reaction as follows: 1μg RNA, 0.5μg random hexamer primers (Promega),
made up to 15μl with RNAse free H2O (Sigma). This was heated to 70oC for 5mins then
put on ice. The following reagents were then added: 1.25μl 10mM dNTPs (Roche), 5μl
M-MLV RT-buffer, 0.625µl RNasin® RNAse inhibitor, and 1μl M-MLV reverse
transcriptase (200units) (all from Promega), made up to 25μl with RNAse free H2O.
This was then incubated in a water bath at 37oC for 60mins.
2.12.4 Primer design
For qualitative RT-PCR, primers were designed using the NCBI nucleotide database.
For each gene, 18-30 base pair sequences were selected for forward and reverse (reverse
complementary) primers that spanned an 80-1000 base pair region within the coding
DNA sequence (CDS, non-intron spanning) with ~40-60% GC content, with an
annealing temperature of 50-63oC (table 2.4a). For quantitative RT-PCR (qPCR),
primer sequences were taken from previously published work, or were designed using
the online Universal ProbeFinder software (Roche) (table 2.4b). Gene transcripts were
uploaded and non-intron spanning primer pairs were searched for. Candidate primers of
17-29 base pairs with annealing temperatures of 59-60oC and an amplicon of ~70-110
base pairs were generated. All primers were checked for sequence specificity using
BLAST. All primers were purchased from Invitrogen, and reconstituted to a
concentration of 30µM.
2.12.5 Qualitative RT-PCR
For qualitative PCR, cDNA was used undiluted (at a concentration of ~40ng/µl).
Individual reaction mixtures were set up as follows: 2.5µl 10x buffer (15mM MgCl2),
2.5µl 2mM dNTPs (both from Roche), 1µl 30µM forward primer, 1µl 30µM reverse
primer, 1µl template, 16.5µl H2O, 0.5µl Taq polymerase (Roche). Template used was
cDNA, human genomic DNA (hgDNA), non-template control (NTC, i.e. H2O), or a no-
reverse transcription (no-RT) control RNA (at the same concentration as the cDNA).
Reactions were carried out in an Eppendorf mastercycler gradient (Eppendorf,
Germany) PCR machine. The reaction conditions were as follows: Initial denaturation –
1min 95oC, X cycles of [denaturation – 30secs 95
oC, annealing – 30secs X
oC,
elongation – 45secs 72oC], final elongation – 5 minutes 72
oC. For primer specific cycle
numbers and annealing temperature see table 2.4a.

65
2.12.6 Gel electrophoresis
Gel electrophoresis was performed on qualitative PCR and restriction digest products.
1.5-2% w/v agarose gels were made by heating agarose (Lonza, Switzerland) in 1x Tris-
acetate-EDTA (TAE) buffer (Gibco) until it dissolved. 10000x SybrSafe (Invitrogen)
was added to give a 1x concentration as it cooled. Generally, 12.5µl of sample was
loaded into wells: 10µl PCR/restriction product, 2.5µl 5x loading buffer (Bioline, USA).
5µl Hyperladder I, II or IV (Bioline) was used as a molecular weight marker.
Electrophoresis was carried out at 100v in 10 x 7 cm gel tray in a horizontal trough
(Wolf laboratories) with 1x TAE buffer covering the gel. Banding was visualised on an
ultra-violet (UV) illuminated bed.
2.12.7 Quantitative RT-PCR (qPCR)
For qPCR, 25µl individual reactions were set up as follows: 12.5µl 2x power
SYBRgreen (Applied Biosystems, USA), 2.5µl 3µM forward primer, 2.5µl 3µM
reverse primer (giving final concentrations of 300nM), 6.5µl H2O, and 1µl template
(cDNA, hgDNA, NTC or no-RT). Concentrations of the template samples added to the
reactions were as follows: cDNA - 16ng/µl, hgDNA - 25ng/µl, no-RT RNA control -
16ng/µl. Reactions were placed in 96 well optical read plates (Applied Biosystems), and
run in an Applied Biosystems 7300 PCR machine. The reaction conditions were the
optimal conditions stated by the manufacturer, as follows: Initial denaturation/enzyme
activation – 10mins 95oC, 40x cycles [denaturation – 95
oC 15secs, annealing/extension
– 60oC 1min], dissociation step (pre-programmed heating and cooling sequence).
In order to generate a cycle threshold (Ct) value for each sample, PCR product
(expressed in the Applied Biosystems software as delta Rn) plotted against cycle
number passed through an arbitrary delta Rn threshold set at 0.2, giving a precise cycle
number, which was taken as the Ct value (cycle threshold, figure 2.4a). Accepting Ct
values required several validation steps. Triplicate reactions per sample per gene were
run simultaneously on plates, and the Ct values for these reactions were checked for
consistency (within a value of 1.0 of each other). The NTC Ct values for primer sets
needed to be near 40 or “not detected”, and the hgDNA samples needed to be consistent
and around 19-25 Ct value (providing primers were non-intron spanning). Then,
dissociation curves were checked. Samples needed to have consistent single peaks that
were around 79/80oC or above (figure 2.4b-c), and similar to hgDNA peaks (again,
providing primers were non-intron spanning).

66
Triplicate Ct values were used to generate relative expression of genes using the
comparative cycle threshold (Ct) method (Schmittgen and Livak, 2008). This involved
generating triplicate Ct values for GAPDH, a “housekeeping” gene assumed to be
expressed consistently across all samples. This was then used to generate a ∆Ct value,
whereby for an individual sample, the average GAPDH Ct was taken away from the
average target gene Ct. In some cases, ∆∆Ct values were generated, expressing the fold
change in ∆Ct value from a control (e.g. day 0) sample. This was done by taking the
∆Ct value of the control sample away from the ∆Ct value of the experimental sample.
Finally, since Ct values are obtained during exponential increase of PCR product,
meaning relative Ct is not directly proportionate to relative product, ∆Ct or ∆∆Ct values
were expressed as a function to make them linear: 2-∆Ct
or 2-∆∆Ct
.
A Gene
Forward primer
Reverse primer
Anneal temp.
No. cycle
ACTRIIB TACTTCTGCTGCTGTGAAGGC AGGTTTCCCTGGCTCAAATCG 57oC 23
Β-ACTIN GACAGCAGTCGGTTGGACC CAGGTAAGCCCTGGCTGC 62oC 20
CRIPTO GGAATTTGCTCGTCCATCTCG GAAAGGCAGATGCCAACTAGC 57oC 20
LEFTY2 AAGCTGGTCCGCTTTGCCTC GCCAGCATTTCCTACTAGAGC 57oC 20
MIXL1 CCGGAGATTATCCTCAACCA TGAGTCCAGCTTTGAACCAA 62oC 23
NANOG AGCCTCTACTCTTCCTACCACC TCCAAAGCAGCCTCCAAGTC 57oC 20
SOX17 CCTGGGTTTTTGTTGTTGCT GAGGAAGCTGTTTTGGGACA 55oC 25
Figure 2.4 – A) Plot of delta Rn (Y axis) vs. PCR cycles (X axis), indicating dsDNA
product from several samples during qPCR. An Rn threshold of 0.2 has been set
(green line), which determines cycle threshold (Ct) value based on the point on the X
axis at which it is crossed by samples. B-C) Plot of dissociation curves for qPCR
products. If primer pairs and samples produced a discreet singular peak e.g. GAPDH
primers (B) then the Ct values were accepted, however if they produced double
peaks e.g. DKK4 (C), or an otherwise ill-defined profile, Ct values were rejected.
A B C

67
B Gene
Forward primer
Reverse Primer
Source
ALK4 AATTGAGGGGATGATTAAGCTG GATCTCCATGTGCAGGTGTG
ALK7 ACTTGTGCCATAGCGGACTT TTCTGAGGTATGTCGATAGTGTTCA
B2M TAGGAGGGCTGGCAACTTAG CCAAGATGTTGATGTTGGATAAGA
BMP2 ACCAGAAACGAGTGGGAAAA CCAACCTGGTGTCCAAAAGT
CER1 ACCACGATGCACTTGCCACT CCGTCTTCACCTTGCACTGG G
CRIPTO GTGATTTGGATCATGGCCATTTCTAAAGT GCTGTCATCTCTGAAGGCCAGGTA H
CXCR4 CGCCTGTTGGCTGCCTTA ACCCTTGCTTGATGATTTCCA
EOMES CGGCCTCTGTGGCTCAAA AAGGAAACATGCGCCTGC G
FGF4 AGACAAAACAAAAAACCAACTCTGACT GACAACTTTTGACAAGTTAAAGAAATCC
FLK1 TGATGCCAGCAAATGGGAAT CCACGGCCAAGAGGCTTA O
FOXA2 TTCAGGCCCGGCTAACTCT AGTCTCAACCCCCACTTGCT O
FOXH1 TTCCTCCAACCGATGCTT TGGGATCAGGCTCACGTC
GAPDH ATGGGGAAGGTGAAGGTCG TAAAAGCAGCCCTGGTGACC
GATA4 CCTCCTCTGCCTGGTAATGACT CGCTTCCCCTAACCAGATTG O
GSC GATGCTGCCCTACATGAACGT GACAGTGCAGCTGGTTGAGAAG O
HNF4A AGATGAGCCGGGTGTCCAT CGATCTGCAGCTCCTGGAA O
INHBA AGTGGTGGAGCGTGCAGAA TGACTTTGGTCCTGGTCCTGTT
LEFTY1 AATGTGTCATTGTTTACTTGTCCTGTC CAGGTCTTAGGTCCAGAGTGGTG G
LEFTY2 GTCCATCACCCATCCTAAGCAC GCCAGCATTTCCTACTAGAGCTCA G
MIXL1 AAGCCCCAGCTGCCTCTT CCCTCCAACCCCCTTTG O
NANOG CCTGTGATTTGTGGGCCTG GACAGTCTCCGTGTGAGGCAT G
NKX3-2 TGATTTGAAACGTGAAGGATTGG ACCCCCACCCTAGCTCTGA
NODAL AGAGCGGTTTCAGATGGACCTA TGCTGCCCAAGGAAAAGG
OCT4 AGACCATCTGCCGCTTTGAG GCAAGGGCCGCAGCTTA O
PDGFRB TGGCAGAAGAAGCCACGTT GGCCGTCAGAGCTCACAGA O
PECAM1 CACATACCCTCCTTCCACCAA TGCCCTGGATCTCCTCTTGT
SMAD2 CAGGCCTTTACAGCTTCTCTG GTGGCAATCCTTTTCGATG
SMAD3 GTCTGCAAGATCCCACCAG AGCCCTGGTTGACCGACT
SOX1 GCGGAGCTCGTCGCATT GCGGTAACAACTACAAAAAACTTGTAA O
SOX7 GCTGTCTCCCAGTGGAATGTTC CAAGTCTGTCCCCCCATTAGTT O
SOX17 TTCGTGTGCAAGCCTGAGATG GTCGGACACCACCGAGGAA G
T GGGTCCACAGCGCATGAT TGATAAGCAGTCACCGCTATGAA O
WNT3 TCCTCGCTGGCTACCCAAT CGGCAGAAGCGCAGTTG Ha
WNT3A GCCCGCTCAGCCATGA CCGTGGCACTTGCACTTGA Ha
WNT8A GGTGCTGTACGGTCAAGTGTGA GGGAGCGTGCGCAGTAA

68
2.12.8 Statistical analysis
Statistical analysis was performed using SPSS software (IBM, USA). Some data sets
from experiments differentiating hESCs with Activin A-only (qPCR, flow cytometry
and western blots) were found not to have a normal distribution using Shapiro-Wilk
test, with the p value lower than the test alpha value. These were therefore analysed
using the Wilcoxon or the Kruskal-Wallis tests. For some luciferase reporter data and
qPCR data comparing Activin A and Activin A +Wnt3a, a normal distribution was
found using the Kolmogorov-Smirnov test, with a p value = 0.05 or greater and a
normally distributed Q-Q plot. These were therefore analysed using two way ANOVA.
2.13 Western blotting
2.13.1 Sample collection
Generally, lysate samples that were collected for western blotting were taken from cells
in 12 well plates. To collect cell lysate, medium was removed and cells washed in
PBS+. Then, 110µl of ice cold RIPA lysis buffer (Sigma) containing 1x protease and 1x
phosphatase inhibitors (both from Roche) was added and swirled over the cells. The
cells were loosened and scraped off using the pipette tip, and then pipetted in the lysis
buffer into 0.5ml eppendorfs and frozen at -80oC. Following defrosting, cells were spun
in a microfuge for 6mins at 1500g, and the supernatant put in a fresh tube.
2.13.2 BCA total protein assay
The total protein content of lysate samples was determined using the BCA™ total
protein assay kit (Thermo Scientific). A series of BSA standards were made ranging
from 2000– 125µg/ml diluted in RIPA buffer or 1x lysis buffer (see 2.16.1) according to
the buffer used for samples. 7.5µl of sample lysate or BSA standard was added to a
1.5ml eppendorf tube, kit reagents A and B were mixed 50:1 (according to
manufacturer’s instructions), and 300µl mixed with the samples and incubated in the
dark for 30mins at 37oC. 100µl of each incubated solution were added to triplicate wells
Table 2.4 (previous two pages) - Tables of forward and reverse primer sequences
written 5’ - 3’. A) For qualitative RT-PCR, the annealing temperature and number of
cycles used in the reaction are given. All primers were bespoke designed. B) qPCR
primer sequences which were not bespoke designed but were taken from published
reports are indicated: G - (Greber et al., 2008), H - (Hentschke et al., 2006), Ha -
(Hay et al., 2008), O - (Oldershaw et al., 2010).

69
of a 96-well immuno-plate (Nunc), and the absorbance at 562nm read in a Biohit BP808
spectrophotometer (Northstar Scientific, UK). The total protein was calculated using a
standard curve generated by the BSA standards: x=(y – c)/m, where x is µg/ml protein,
y is the absorbance, c is the y-intersect of the graph, and m is the gradient of the graph.
2.12.3 Western blot reagents
Sample buffer 5x – 40% v/v 0.5M Tris (pH6.8), 45% v/v glycerol, 5% w/v
sodium dodecyl sulphate (SDS), 0.25% w/v bromophenol blue, 10% v/v β-
mercaptoethanol.
12% SDS poly-acrylamide running gel – 24% v/v 1.5M Tris (pH8.8), 33.3% v/v
acrylamide (37.5%), 41% v/v H2O, 0.1% w/v SDS, 0.1% w/v ammonium
persulphate (APS) , 0.1% v/v temed.
Running buffer 10x – 250mM Tris base, 1.92M glycine, 1% w/v SDS, in H2O,
pH8.3. Made to 1x with 90% v/v H2O.
Transfer buffer 10x - 250mM Tris base, 1.92M glycine, in H2O. Made into 1x
with 70% v/v H2O and 20% v/v methanol.
Ponceau stain – 10% v/v acetic acid, 90% v/v H2O, ~0.25-1% w/v ponceau.
Tris buffered saline + tween-20 10x (TBS-T) – 24.2g Tris base, 80g NaCl, 15ml
Tween-20, in H2O, pH 7.6. Made into 1x with 90% v/v H2O.
2.13.4 Running and analysis of western blots
Samples for western blots were prepared in an eppendorf tube as follows: 10-20µg
lysate protein (dependent on experiment, generally 10µg was used), 4µl 5x sample
buffer, made up to 20µl with PBS-. Samples were denatured at 95oC for 10mins, then
put on ice. Meanwhile, SDS poly-acrylamide gel electrophoresis (SDS PAGE)
apparatus (Bio-Rad, USA) was set up, with 1x running buffer added to the trough and
reservoir surrounding the 0.75-1.0mm 12% gel, pre-prepared containing 10 sample
wells at the top. Samples were loaded into the wells, with a 5µl full range molecular
weight marker (GE Healthcare, USA) generally loaded into the first well, and in some
cases 125ng rhNodal (R&D) added to the last well as a positive control. Gels were run
at 100v for 1hr 15-30mins to allow protein separation. To transfer protein to a
membrane, gels were removed from SDS PAGE apparatus and put into a transfer
sandwich containing a nitrocellulose membrane sheet (Thermo Scientific), and run in 1x
transfer buffer at 100v for 1hr 15mins. To initially confirm proper separation of protein

70
Target Company Use Species Ig Concentration Dilution Blocking
α-SMA Abcam IF rIgG 200µg/ml 1:200 10% serum
Alk4 R&D WB gIgG 100µg/ml 1:400 5% milk
β-Catenin SCBT WB mIgG 200µg/ml 1:500 5% milk
Cripto SCBT WB
IF
gIgG 200µg/ml 1:500,
1:200
5% milk,
10% serum
EEA1 SCBT IF gIgG 200µg/ml 1:200 10% serum
FoxA2 R&D IF gIgG 200µg/ml 1:20-40 10% serum
GAPDH-
HRP
Sigma WB mIgM 2000-
3000µg/ml
1:50000 1% milk
Nanog R&D IF gIgG 100µg/ml 1:50 10% serum
Nanog-
AF488
BD FC mIgG ? 1:10 0.5% BSA
Nodal Abnova WB
IF
mIgG 1000µg/ml 1:750
1:500
5%/2.5%
milk/BSA
10% serum
Oct4 BD IF mIgG 250µg/ml 1:100 10% serum
P-Smad2 Millipore WB rIgG 1000µg/ml 1:1000 5% milk
Smad2/3 Millipore WB rIgG 1000µg/ml 1:1000 5% milk
Sox17 R&D IF gIgG 200µg/ml 1:40 10% serum
Sox17-PE BD FC mIgG ? 1:50 0.5% BSA
Tra-1 60 Abcam IF mIgM 2000µg/ml 1:200 10% serum
goat iso. SCBT IF gIgG 400µg/ml x 10% serum
rabbit iso. SCBT IF rIgG 500µg/ml x 10% serum
mouse iso. SCBT IF mIgG 400µg/ml x 10% serum
mouse iso. SCBT IF mIgM 2000µg/ml 1:200 10% serum
mouse-
AF488 iso.
BD FC mIgG ? 1:50 0.5% BSA
mouse-PE
iso.
BD FC mIgG 200µg/ml 1:50 0.5% BSA
Cripto R&D Block mIgG 500µg/ml 1:500 -
mouse iso. R&D Block mIgG 500µg/ml 1:500 -

71
and effective transfer to membrane, ponceau stain was applied to membranes in a small
trough for 3mins, then washed off with water and banding observed.
For blotting, membranes were first washed in 1x TBST. Blocking solutions comprised
of 1x TBST with certain concentrations of powdered skimmed milk (Marvel, UK) or
BSA (dependent on primary antibody to be used, see table 2.5) were made up.
Membranes were washed in blocking solution for 1-4 hours at room temperature, then
primary antibodies in their respective blocking solutions added and incubated at 4oC
overnight (see table 2.5 for dilutions), except anti-GAPDH which was added at room
temperature for 1 hour. Membranes were washed three times in 1x TBST, and species-
specific horse radish peroxidase- (HRP-) linked secondary antibodies added at certain
dilutions (see table 2.6) in 1x TBST at room temperature for 1 hour. Membranes were
washed three times in 1x TBST, then incubated at room temperature for 4mins in
SupersSignal West Pico chemiluminescent substrate (Thermo Scientific). Banding was
visualised in a dark room using Kodak BioMax MR X-ray film.
In order to record bands and band intensity of X-ray film from western blotting,
developed films were scanned into digital images using a PC flatbed scanner. Semi-
quantitative analysis of band intensity was done using Image J (NIH, USA). Bands
corresponding to the correct predicted weight of the target protein were highlighted in
the image, and the band darkness and size measured as an area on a graph plot (figure
2.5). Target protein were then normalised to a corresponding control protein (either
GAPDH or SMAD2/3) to obtain the relative amount.
2.14 Immunofluorescence staining and microscopy
2.14.1 Staining
Cells that were to be analysed by immunostaining were cultured/differentiated in 24
well plates or in glass chamber slides. In order to fix the cells, medium was removed
and they were washed once in PBS+. 250µl 4% paraformaldehyde (PFA) was added
Table 2.5 (previous page) – Primary antibodies used for western blot (WB),
immunofluorescence (IF), flow cytometry (IF), and receptor function blocking
(block). For immunofluorescence, 10% serum blocking was performed using serum
of the animal the corresponding secondary antibody was raised in. Abbreviations: Ig
– immunoglobulin, g – goat, m – mouse, r – rabbit, iso. – isotype, BD – BD
Biosciences, SCBT – Santa Cruz Biotechnologies, GE – GE Healthcare

72
and left for 20mins at room temperature. PFA was then removed and cells were washed
three times in PBS-. Blocking solution was then made up using serum from the species
the secondary antibody was raised in (table 2.6): 10% serum (Invitrogen), 0.1% triton-X
(Sigma), dissolved in PBS- 0.05% tween. For cell surface staining, triton-X was
omitted. Blocking solution was centrifuged for 2mins at 14000g, and 150μl added to
cells and incubated for 1 hour at room temperature. Primary antibody solutions were
made up as follows: 1% serum, 0.1% triton-X, Xμl primary antibody (see table 2.5), in
PBS- 0.05% tween. For cell surface staining, triton-X was omitted. This was
centrifuged for 2mins at 14000g, blocking solution was removed and 100µl primary
antibody solution added to the cells and incubated overnight at 4oC. This was then
Figure 2.5 – Method of semi-quantitative analysis of western blot band intensity
using Image J. For target peptides, regions encompassing distinct bands running at
the correct predicted molecular weight were selected (yellow boxes). These were
then plotted as graphs, generating peaks based on size and intensity. Straight lines
were used to demarcate the peak from the background, and the area of this peak
measured. This was performed for target peptides NODAL, CRIPTO or P-SMAD2
(e.g. top and right images), and subsequently for their respective controls GAPDH or
total SMAD2/3 (bottom and left images), and the relative band intensity of the target
peptide normalised to the control.
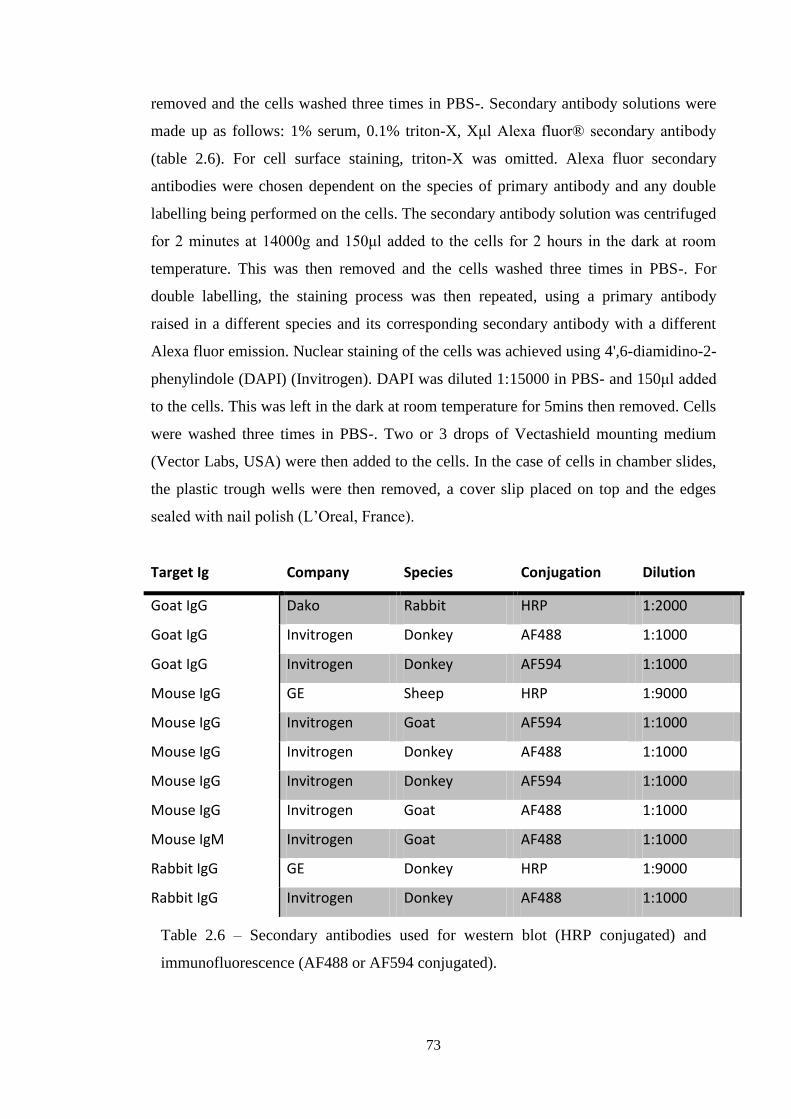
73
removed and the cells washed three times in PBS-. Secondary antibody solutions were
made up as follows: 1% serum, 0.1% triton-X, Xμl Alexa fluor® secondary antibody
(table 2.6). For cell surface staining, triton-X was omitted. Alexa fluor secondary
antibodies were chosen dependent on the species of primary antibody and any double
labelling being performed on the cells. The secondary antibody solution was centrifuged
for 2 minutes at 14000g and 150μl added to the cells for 2 hours in the dark at room
temperature. This was then removed and the cells washed three times in PBS-. For
double labelling, the staining process was then repeated, using a primary antibody
raised in a different species and its corresponding secondary antibody with a different
Alexa fluor emission. Nuclear staining of the cells was achieved using 4',6-diamidino-2-
phenylindole (DAPI) (Invitrogen). DAPI was diluted 1:15000 in PBS- and 150μl added
to the cells. This was left in the dark at room temperature for 5mins then removed. Cells
were washed three times in PBS-. Two or 3 drops of Vectashield mounting medium
(Vector Labs, USA) were then added to the cells. In the case of cells in chamber slides,
the plastic trough wells were then removed, a cover slip placed on top and the edges
sealed with nail polish (L’Oreal, France).
Target Ig Company Species Conjugation Dilution
Goat IgG Dako Rabbit HRP 1:2000
Goat IgG Invitrogen Donkey AF488 1:1000
Goat IgG Invitrogen Donkey AF594 1:1000
Mouse IgG GE Sheep HRP 1:9000
Mouse IgG Invitrogen Goat AF594 1:1000
Mouse IgG Invitrogen Donkey AF488 1:1000
Mouse IgG Invitrogen Donkey AF594 1:1000
Mouse IgG Invitrogen Goat AF488 1:1000
Mouse IgM Invitrogen Goat AF488 1:1000
Rabbit IgG GE Donkey HRP 1:9000
Rabbit IgG Invitrogen Donkey AF488 1:1000
Table 2.6 – Secondary antibodies used for western blot (HRP conjugated) and
immunofluorescence (AF488 or AF594 conjugated).
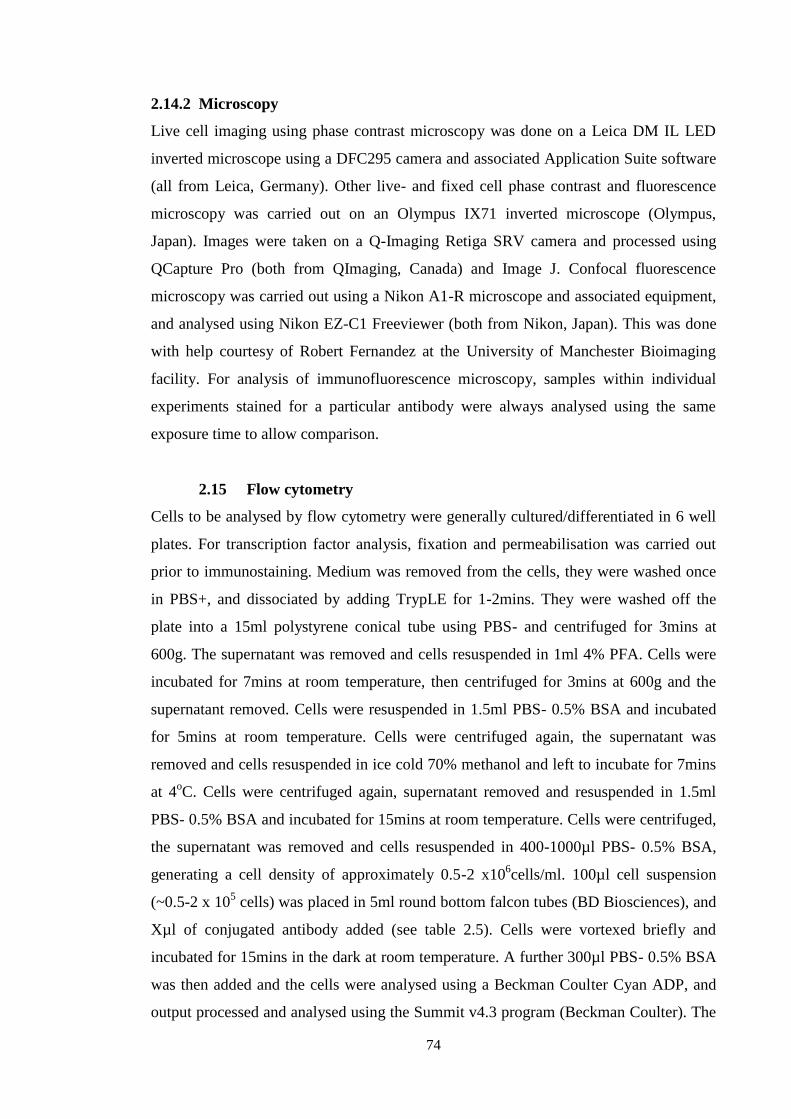
74
2.14.2 Microscopy
Live cell imaging using phase contrast microscopy was done on a Leica DM IL LED
inverted microscope using a DFC295 camera and associated Application Suite software
(all from Leica, Germany). Other live- and fixed cell phase contrast and fluorescence
microscopy was carried out on an Olympus IX71 inverted microscope (Olympus,
Japan). Images were taken on a Q-Imaging Retiga SRV camera and processed using
QCapture Pro (both from QImaging, Canada) and Image J. Confocal fluorescence
microscopy was carried out using a Nikon A1-R microscope and associated equipment,
and analysed using Nikon EZ-C1 Freeviewer (both from Nikon, Japan). This was done
with help courtesy of Robert Fernandez at the University of Manchester Bioimaging
facility. For analysis of immunofluorescence microscopy, samples within individual
experiments stained for a particular antibody were always analysed using the same
exposure time to allow comparison.
2.15 Flow cytometry
Cells to be analysed by flow cytometry were generally cultured/differentiated in 6 well
plates. For transcription factor analysis, fixation and permeabilisation was carried out
prior to immunostaining. Medium was removed from the cells, they were washed once
in PBS+, and dissociated by adding TrypLE for 1-2mins. They were washed off the
plate into a 15ml polystyrene conical tube using PBS- and centrifuged for 3mins at
600g. The supernatant was removed and cells resuspended in 1ml 4% PFA. Cells were
incubated for 7mins at room temperature, then centrifuged for 3mins at 600g and the
supernatant removed. Cells were resuspended in 1.5ml PBS- 0.5% BSA and incubated
for 5mins at room temperature. Cells were centrifuged again, the supernatant was
removed and cells resuspended in ice cold 70% methanol and left to incubate for 7mins
at 4oC. Cells were centrifuged again, supernatant removed and resuspended in 1.5ml
PBS- 0.5% BSA and incubated for 15mins at room temperature. Cells were centrifuged,
the supernatant was removed and cells resuspended in 400-1000µl PBS- 0.5% BSA,
generating a cell density of approximately 0.5-2 x10⁶cells/ml. 100µl cell suspension
(~0.5-2 x 10⁵ cells) was placed in 5ml round bottom falcon tubes (BD Biosciences), and
Xµl of conjugated antibody added (see table 2.5). Cells were vortexed briefly and
incubated for 15mins in the dark at room temperature. A further 300µl PBS- 0.5% BSA
was then added and the cells were analysed using a Beckman Coulter Cyan ADP, and
output processed and analysed using the Summit v4.3 program (Beckman Coulter). The

75
405nm laser was used for excitation, and the laser forward and side scatter emissions
were used to identify the desired whole single cell populations (excluding debris and
clusters). Detection filters for phycoerytherin (PE) or AF488 conjugated antibodies
were 575/25nm and 530/40nm respectively.
For cells that expressed fluorescent markers (such as dsRed), cells were simply
dissociated, centrifuged, resuspended (with the same conditions and densities as above)
and analysed live. Detection of live cells expressing dsRed used the 405nm laser and
575/25nm filter.
2.16 Luciferase assay
2.16.1 Sample collection
Cells containing luciferase reporters were generally cultured/differentiated in 24 well
plates. Medium was removed from cells, they were washed once in PBS+, and 100μl 1x
lysis buffer (part of luciferase assay kit, Promega) added and swirled over the cells.
Cells were scraped off using a pipette, and pipetted in lysis buffer into 0.5ml tubes and
frozen at –80oC. Following freezing and defrosting, lysate samples were spun for 6
minutes at 1500g, then the supernatant removed and put into fresh tubes to remove
cellular debris. Total protein for each sample was calculated using the BCA protein
assay (as in 2.13.2), except that the reducing agent compatible kit was used, which had
an additional step of adding 7.5μl compatibility reagent to 7.5μl of sample/BSA
standard and incubating at 37oC for 15mins, before addition of 300μl reagent A+B.
2.16.2 Luminescence analysis
To measure the luciferase content of lysate samples, 25µl was pipetted into a well of a
black 96-well plate (Nunc) and placed in a MicroLumatPlus LB 96v luminometer
(Berthold, USA). 100µl luciferase assay reagent, comprised of luciferase substrate and
luciferase assay buffer (from luciferase assay kit, Promega), was injected into each well
and the amount of light emitted over 2 seconds measured. This was given as the relative
luciferase units (RLU). The RLU of a blank sample (25µl of lysis buffer) was also
generated, and subtracted from lysate sample readings. Since plasmids/vectors
containing the firefly luciferase reporter constructs (CAGA12 and AR3, figure 2.3) did
not contain a constitutively expressed control renilla luciferase sequence, relative
quantification of RLU was done using total protein content of lysate samples. RLU was
simply divided by the total protein of the volume of lysate sample, giving the RLU/µg
protein.

76
CHAPTER 3 Differentiation of hESCs towards definitive endoderm (DE)
using high Activin A
In the past eight years many different protocols have been developed which target
differentiation of hESCs towards DE-like cells. They utilise a variety of culture systems
ranging from MEFs and serum to more chemically defined conditions (D’Amour et al.,
2005; Vallier et al., 2009c). The use of high Activin A predominates in these protocols,
and Activin A-mediated Smad2/3 activation is attributed as the core driver of
differentiation. However the exact mechanisms by which high Activin A elicits its
effect are not fully characterised. In particular, the effect on endogenous TFGβ
signalling, particularly Nodal signalling, has not been clarified. The full picture of
contribution and cooperation by other exogenous and endogenous factors requires
further clarification. A role for Wnt/β-catenin signalling in the process of differentiation
has been highlighted (Hay et al., 2008a; Sumi et al., 2008). However its effects on
mesendoderm gene expression and TGFβ signalling during hESC differentiation have
not been fully explored. This chapter aims to establish the feeder free, chemically
defined culture and differentiation system which will be used for analysis. The effect of
high Activin A treatment on gene expression, TGFβ signalling and DE differentiation
will then be investigated. Finally, the enhancing effect of Wnt signalling on DE
differentiation will be explored.
3.1 hESC culture system
3.1.1 Maintenance of hESC lines on MEFs
Various different hESC lines were cultured on MEFs using hES medium, including
Hues1, Hues3, Hues7, and an in-house line Man7. The culture system was used
routinely over multiple passages (five or more), beginning with cells ranging from p15
to p36, in order to expand and maintain cell lines (for method see chapter 2.3).
Although population doubling rates for the different lines were not empirically
measured, they appeared to vary, with Hues1 and Hues3 doubling every ~24hours, and
others doubling more slowly at around every ~36hours. Culturing on MEFs, as
expected, retained classic hESC cell morphology and colony appearance over many
passages (figure 3.1a-c). Mostly, enzymatic dissociation of colonies using TrypLE was
used for passaging, which in later passages of Hues1 seemed to lead to smaller colonies
that were less densely compacted compared to earlier passages.

77
3.1.2 Feeder-free culture of hESCs
Confluent and healthy looking hESC cultures on MEFs were moved into a defined
feeder-free system, comprised of fibronectin coated plates and mTeSR medium (see
chapter 2.4). The transition sometimes led to significant cell death and lack of cell
attachment to the fibronectin coated plate. A ROCK inhibitor added to medium during
passaging has been reported by various groups to overcome this problem, promoting
survival and adherence (Gauthaman et al., 2010; Kaganman, 2007). In the case of this
system however, it was omitted in order to keep the number of exogenously added
factors that may affect the differentiation of the cells to a minimum. Experiments were
also initially begun without having used it, hence it may have introduced inconsistencies
into the system if used later. When hESCs attached at a reasonable density, cultures
appeared healthy, with a more expanded cell morphology observed, forming
monolayers rather than colonies (figure 3.1d-f). Analysis by microscopy following
immunostaining (chapter 2.14) indicated cells stained positively for pluripotency factors
OCT4, NANOG, and TRA-1 60 (figure 3.1g-l). A small percentage of differentiated
cells was observed in many feeder free cultures, possibly as a result of the process of
transition between different media and extra-cellular matrices (ECM) in moving to the
feeder-free system. Populations of Hues1/3 expanded at a slightly increased rate
compared with cells on MEFs, and it was found better to keep the cells at a high density
when passaging as this promoted survival and increased attachment following
passaging. Man7 was cultured for several passages, however was found to proliferate
much slower than the Hues lines. Over multiple passages, in particular with Hues1, it
was found that cell death increased during passaging, leading to reduced attachment. As
a result, although cultures were maintained as far as pp12 or pp13 (pp indicating
number of passages since being moved onto the feeder free system), generally cells
were only used up to pp8 for differentiation experiments, as inconsistencies with
attachment affected cell density beyond what was deemed reasonable.
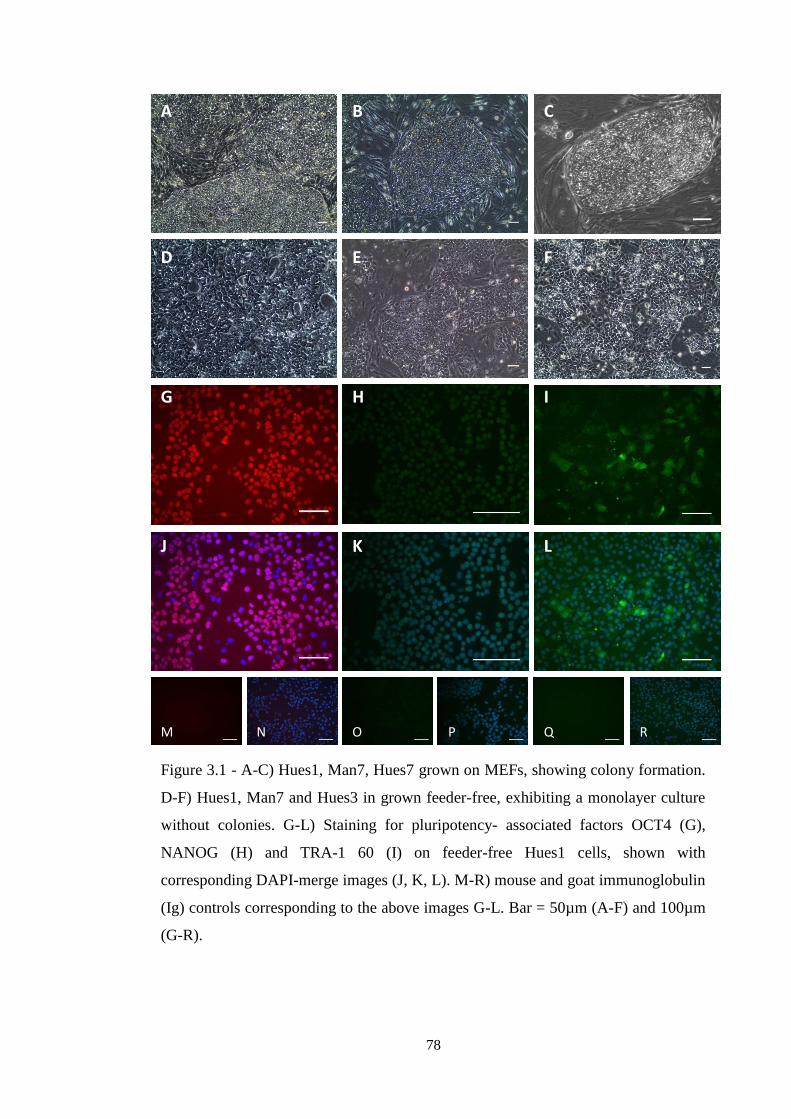
78
Figure 3.1 - A-C) Hues1, Man7, Hues7 grown on MEFs, showing colony formation.
D-F) Hues1, Man7 and Hues3 in grown feeder-free, exhibiting a monolayer culture
without colonies. G-L) Staining for pluripotency- associated factors OCT4 (G),
NANOG (H) and TRA-1 60 (I) on feeder-free Hues1 cells, shown with
corresponding DAPI-merge images (J, K, L). M-R) mouse and goat immunoglobulin
(Ig) controls corresponding to the above images G-L. Bar = 50µm (A-F) and 100µm
(G-R).
M N O P Q R
A B C
D E F
G H I
J K L

79
3.2 Effect of high Activin A-only treatment on hESCs
3.2.1 Initial qualitative assessment of transcript expression
In order to validate that high Activin A treatment in a chemically defined medium did
elicit gene expression characteristic of mesendoderm differentiation, a preliminary
experiment was performed with feeder-free Hues1 cells differentiated for 9 days in high
Activin A medium (FF-base medium with 100ng/ml Activin A, chapter 2.5 and table
2.1). Individual wells of a 12 well plate were used to collect a cell sample for each day
in the time course (day 1 – day 9), and these were used to generate RNA samples.
Primer pairs were designed for an assortment of target genes, comprised of pluripotency
and mesendoderm markers and TGFβ signalling components. cDNA samples were
generated from the RNA, and these were analysed by qualitative PCR and run on
agarose gels (chapter 2.12). Figure 3.2a shows different genes from day 2 – 9 samples,
with the corresponding non-reverse transcribed RNA (no-RT) PCRs shown below. This
was an early experiment and suffered from a lack of standardisation. Samples were
plated directly into differentiation medium (as opposed to mTeSR medium), meaning
there was no corresponding day 0 control sample available. The day 1 sample was also
somehow compromised when it was collected, generating RNA below a usable yield.
HgDNA positive controls for each PCR were not run with the samples but were run
separately later on, and are shown in figure 3.2b.
The lack of certain key controls makes it difficult to draw lots of robust conclusions
about the effect of Activin A on Hues1 in this system. The feeder-free culture system is
known to maintain the pluripotency of hESCs, however evidence of pluripotency-
associated transcripts such as NANOG in cells when the time course begins is important
to know for each experiment. The relative change of all target genes at stages of
differentiation compared to the control pluripotent stage is also useful information.
Nonetheless, some trends do appear from the day 2 - 9 samples that illustrate certain
key points. There was fairly consistent banding across the whole time course for
NANOG, which is consistent with literature indicating that, during endoderm
differentiation, pluripotency factors (particularly Nanog) do not completely disappear at
the transcript level for several days (Greber et al., 2008). There was a gradual steady
increase in LEFTY2 and CRIPTO, two TGFβ targets involved in Nodal signalling and
known targets of active Smad2/3. The mesendoderm marker MIXL1 showed increased
levels at days 2 and 3 which then reduced, and SOX17 was raised over days 3 – 5.
Transiently high MIXL1 and subsequently increasing SOX17 correlates with the pattern

80
of expression of mesendoderm/DE markers described during mouse development and
targeted hESC differentiation (see chapter 1.2 and 1.4). Hence, Hues1 cells in this
system seemed to react at the transcript level to Activin A treatment by expressing
differentiation markers tending towards DE, simultaneously maintaining or increasing
components of TGFβ signalling.
Although there was no day 0 pluripotent control, other controls that were included
indicated the samples and data were viable. No-RT PCR reactions were run for each
sample and gene set (fig 3.2a), giving no banding other than primer-dimer streaks,
eliminating the possibility of genomic DNA (or any other) contamination. The hgDNA
positive control samples that were run for each primer set corroborated that the
amplification of product was specific, since it gave banding at the correct predicted size
(figure 3.2b). Sox17 seemed to give some faint banding corresponding to a larger size
than the very clear and distinct banding at the correct size, however this non-specific
amplification does not affect the specific product at the correct size. Further expression
of other pertinent TGFβ and mesendoderm targets would have been analysed
qualitatively (e.g. NODAL, FOXA2 etc.). However, having confirmed an increase in
expression of some mesendoderm and Nodal-related targets, more thorough quantitative
analysis was deemed justified.
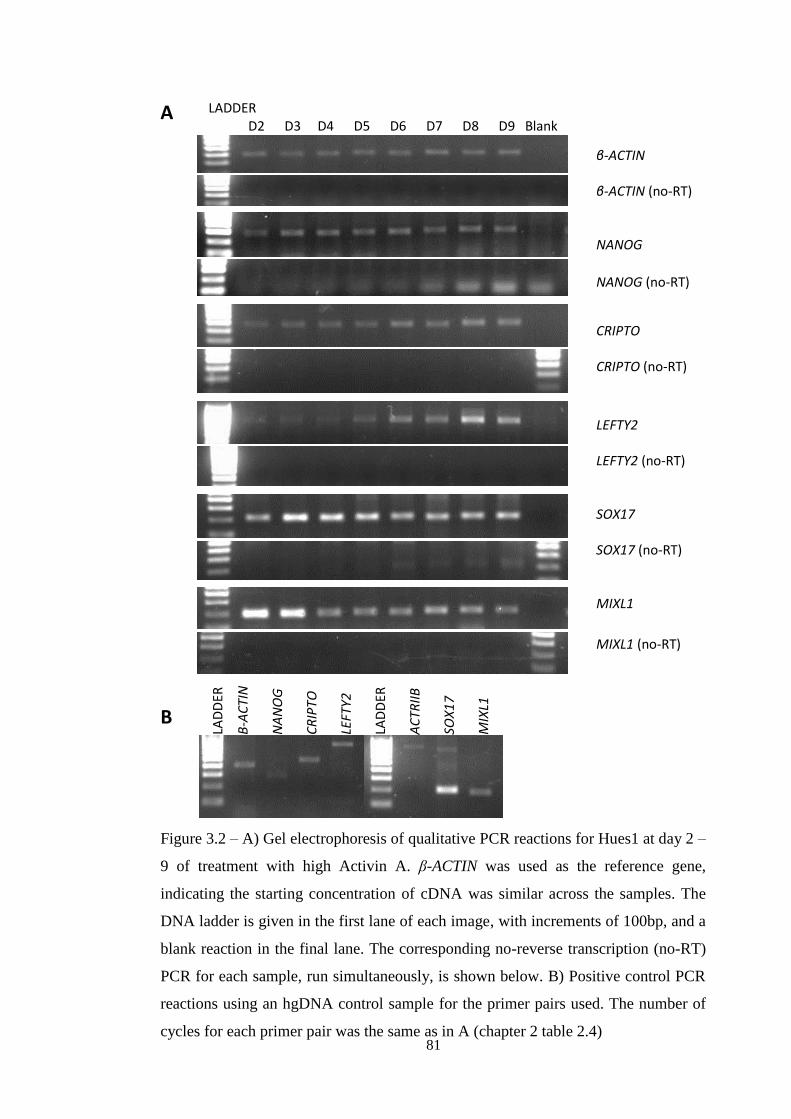
81
Figure 3.2 – A) Gel electrophoresis of qualitative PCR reactions for Hues1 at day 2 –
9 of treatment with high Activin A. β-ACTIN was used as the reference gene,
indicating the starting concentration of cDNA was similar across the samples. The
DNA ladder is given in the first lane of each image, with increments of 100bp, and a
blank reaction in the final lane. The corresponding no-reverse transcription (no-RT)
PCR for each sample, run simultaneously, is shown below. B) Positive control PCR
reactions using an hgDNA control sample for the primer pairs used. The number of
cycles for each primer pair was the same as in A (chapter 2 table 2.4)
LADDER D2 D3 D4 D5 D6 D7 D8 D9 Blank
A
B
β-ACTIN β-ACTIN (no-RT) NANOG
NANOG (no-RT)
CRIPTO CRIPTO (no-RT)
LEFTY2 LEFTY2 (no-RT) SOX17 SOX17 (no-RT) MIXL1
MIXL1 (no-RT)
LAD
DER
Β-A
CTI
N
NA
NO
G
CR
IPTO
LEFT
Y2
LAD
DER
AC
TRII
B
SOX
17
MIX
L1
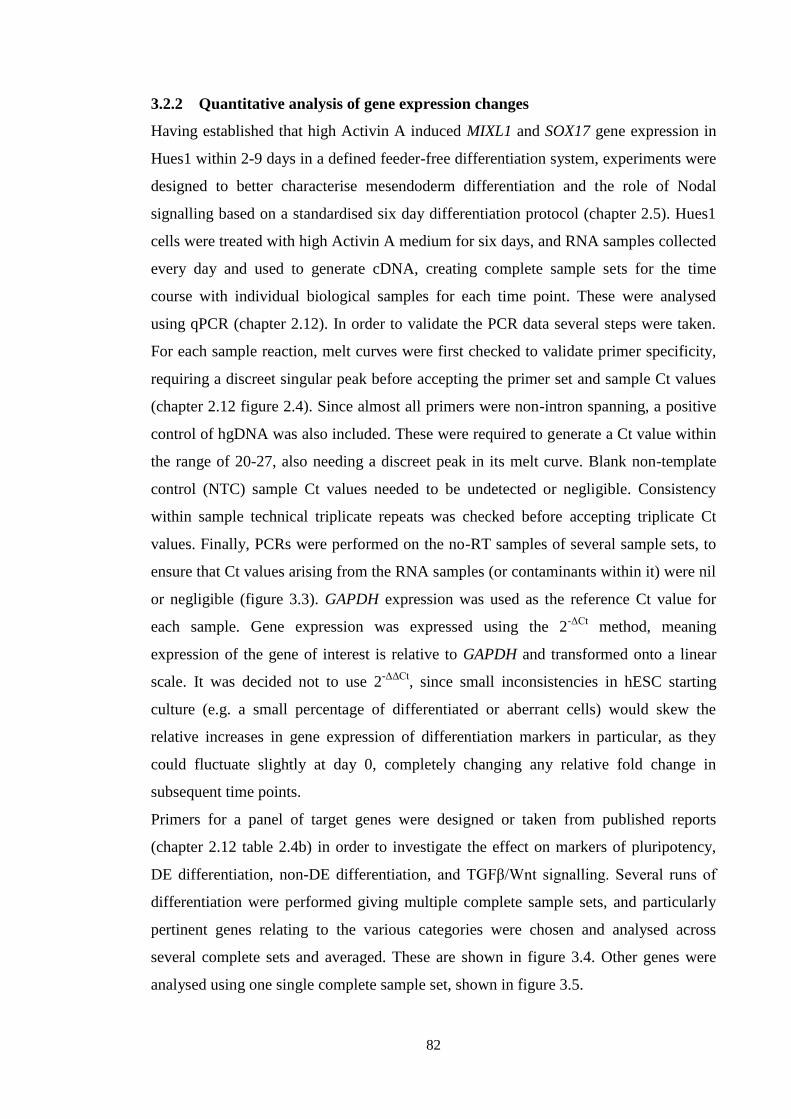
82
3.2.2 Quantitative analysis of gene expression changes
Having established that high Activin A induced MIXL1 and SOX17 gene expression in
Hues1 within 2-9 days in a defined feeder-free differentiation system, experiments were
designed to better characterise mesendoderm differentiation and the role of Nodal
signalling based on a standardised six day differentiation protocol (chapter 2.5). Hues1
cells were treated with high Activin A medium for six days, and RNA samples collected
every day and used to generate cDNA, creating complete sample sets for the time
course with individual biological samples for each time point. These were analysed
using qPCR (chapter 2.12). In order to validate the PCR data several steps were taken.
For each sample reaction, melt curves were first checked to validate primer specificity,
requiring a discreet singular peak before accepting the primer set and sample Ct values
(chapter 2.12 figure 2.4). Since almost all primers were non-intron spanning, a positive
control of hgDNA was also included. These were required to generate a Ct value within
the range of 20-27, also needing a discreet peak in its melt curve. Blank non-template
control (NTC) sample Ct values needed to be undetected or negligible. Consistency
within sample technical triplicate repeats was checked before accepting triplicate Ct
values. Finally, PCRs were performed on the no-RT samples of several sample sets, to
ensure that Ct values arising from the RNA samples (or contaminants within it) were nil
or negligible (figure 3.3). GAPDH expression was used as the reference Ct value for
each sample. Gene expression was expressed using the 2-ΔCt
method, meaning
expression of the gene of interest is relative to GAPDH and transformed onto a linear
scale. It was decided not to use 2-ΔΔCt
, since small inconsistencies in hESC starting
culture (e.g. a small percentage of differentiated or aberrant cells) would skew the
relative increases in gene expression of differentiation markers in particular, as they
could fluctuate slightly at day 0, completely changing any relative fold change in
subsequent time points.
Primers for a panel of target genes were designed or taken from published reports
(chapter 2.12 table 2.4b) in order to investigate the effect on markers of pluripotency,
DE differentiation, non-DE differentiation, and TGFβ/Wnt signalling. Several runs of
differentiation were performed giving multiple complete sample sets, and particularly
pertinent genes relating to the various categories were chosen and analysed across
several complete sets and averaged. These are shown in figure 3.4. Other genes were
analysed using one single complete sample set, shown in figure 3.5.

83
0
10
20
30
40
40
- C
t
SOX17 (cDNA)
0
10
20
30
40SOX17 (no-RT)
Well1
Well2
Well3
0
10
20
30
40
40
- C
t
NANOG (cDNA)
0
10
20
30
40 NANOG (no-RT) Well1
Well2
Well3
Figure 3.3 – The 40-Ct values of triplicate PCRs of a 6 day sample set of cDNA
and corresponding non-reverse transcribed (no-RT) RNA using SOX17 and
NANOG primers. Note the low and inconsistent values in the no-RT samples.
These samples also produced wildly varying and inconsistent melt curves. The Ct
values from no-RT samples therefore corresponded to slight background from
primer dimers and other reaction by-products, or negligible genomic DNA
contamination.
Figure 3.4 (overleaf) – qPCR analysis of gene expression of feeder-free Hues1
cells differentiated for 6 days using high Activin A. The day 0 (D0) samples were
the control pluripotent cells in mTeSR medium (mT). The 2-ΔCt
method was used
to show relative expression normalised to GAPDH. The graphs show mean data
from biological repeats from different experiments, with two (n=2, OCT4, FLK1,
SOX7), three (n=3, NANOG, MIXL1, GSC, NODAL, CRIPTO, LEFTY2) or four
(n=4, SOX17, FOXA2) complete sample sets used. Error bars represent the
standard error of the mean (s.e.m.). The increases in expression of the
mesendoderm maker GSC and the DE markers SOX17 and FOXA2 over the time
course was found to be significant using the Kruskal Wallis test (* = p≤0.05).

84
0
0.05
0.1
0.15
0.2
0.25
D0mT
D1 D2 D3 D4 D5 D6
Rel
ativ
e ex
pre
ssio
n
(no
rmal
ised
to
GA
PD
H)
NANOG
0
0.01
0.02
0.03
0.04
D0mT
D1 D2 D3 D4 D5 D6
OCT4
0
0.005
0.01
0.015
0.02
0.025
D0mT
D1 D2 D3 D4 D5 D6
Rel
ativ
e ex
pre
ssio
n
(no
rmal
ised
to
GA
PD
H)
MIXL1
0
0.002
0.004
0.006
0.008
D0mT
D1 D2 D3 D4 D5 D6
GSC *
0
0.005
0.01
0.015
0.02
0.025
D0mT
D1 D2 D3 D4 D5 D6
FOXA2 *
0
0.002
0.004
0.006
0.008
D0mT
D1 D2 D3 D4 D5 D6
Rel
ativ
e ex
pre
ssio
n
(no
rmal
ised
to
GA
PD
H)
SOX17 *
0
0.005
0.01
0.015
0.02
D0mT
D1 D2 D3 D4 D5 D6
FLK1
0
0.0005
0.001
0.0015
D0mT
D1 D2 D3 D4 D5 D6
Rel
ativ
e ex
pre
ssio
n
(no
rmal
ised
to
GA
PD
H)
SOX7
0
0.02
0.04
0.06
0.08
0.1
D0mT
D1 D2 D3 D4 D5 D6
Rel
ativ
e ex
pre
ssio
n
(no
rmal
ised
to
GA
PD
H)
NODAL
0
0.05
0.1
0.15
0.2
D0mT
D1 D2 D3 D4 D5 D6
CRIPTO
0
0.05
0.1
0.15
0.2
0.25
D0mT
D1 D2 D3 D4 D5 D6
Rel
ativ
e ex
pre
ssio
n
(no
rmal
ised
to
GA
PD
H)
LEFTY2

85
0
0.002
0.004
0.006
0.008
D0mT
D1 D2 D3 D4 D5 D6
Rel
ativ
e ex
pre
ssio
n
(no
rmal
ised
to
GA
PD
H)
T
0
0.001
0.002
0.003
0.004
0.005
0.006
D0mT
D1 D2 D3 D4 D5 D6
CXCR4
0
0.005
0.01
0.015
D0mT
D1 D2 D3 D4 D5 D6
GATA4
00.0010.0020.0030.0040.0050.0060.007
D0mT
D1 D2 D3 D4 D5 D6
Rel
ativ
e ex
pre
ssio
n
(no
rmal
ised
to
GA
PD
H)
HNF4A
0
0.001
0.002
0.003
0.004
D0mT
D1 D2 D3 D4 D5 D6
PDGFRB
0
0.00005
0.0001
0.00015
0.0002
D0mT
D1 D2 D3 D4 D5 D6
SOX1
0
0.02
0.04
0.06
0.08
0.1
0.12
D0mT
D1 D2 D3 D4 D5 D6
LEFTY1
0
0.0001
0.0002
0.0003
0.0004
0.0005
0.0006
D0mT
D1 D2 D3 D4 D5 D6
FOXH1
0
0.0001
0.0002
0.0003
0.0004
D0mT
D1 D2 D3 D4 D5 D6
Rel
ativ
e ex
pre
ssio
n
(no
rmal
ised
to
GA
PD
H)
ALK7
0
0.002
0.004
0.006
0.008
0.01
0.012
D0mT
D1 D2 D3 D4 D5 D6
Rel
ativ
e ex
pre
ssio
n
(no
rmal
ised
to
GA
PD
H)
ALK4
0
0.0002
0.0004
0.0006
0.0008
0.001
0.0012
D0mT
D1 D2 D3 D4 D5 D6
INHBA
0
0.05
0.1
0.15
0.2
0.25
D0mT
D1 D2 D3 D4 D5 D6
SMAD2
0
0.02
0.04
0.06
0.08
D0mT
D1 D2 D3 D4 D5 D6
Rel
ativ
e ex
pre
ssio
n
(no
rmal
ised
to
GA
PD
H)
SMAD3
0
0.05
0.1
0.15
0.2
D0mT
D1 D2 D3 D4 D5 D6
WNT3
0
0.0005
0.001
0.0015
0.002
0.0025
D0mT
D1 D2 D3 D4 D5 D6
WNT3A
Figure 3.5 – qPCR analysis of gene transcripts of cDNA samples from a single
run of Hues1 cells differentiated for 6 days with Activin A. Error bars represent
the s.e.m. of technical triplicate repeats of reactions. Samples for the final time
point (D6) for WNT3 and WNT3A were omitted due to lack of sufficient cDNA.

86
When looking at figure 3.4, the first striking trend was the maintained expression of
pluripotency factors over the six days. Indeed, OCT4 increased during the early stages
of differentiation. Over the time course, the expression of earlier mesendoderm markers
steadily increased, with MIXL1 and GSC both peaking at day 2 and 3 (respectively).
The later mesendoderm/DE markers SOX17 and FOXA2 also steadily increased over the
six days. This result indicated the induction of a mesendoderm/DE differentiation
program within the culture of hESCs as a result of Activin A. The increase in the
expression of GSC, SOX17 and FOXA2 was found to be statistically significant using
the Kruskal Wallis test (chapter 2.12). Transcripts of visceral endoderm (SOX7) and
mesoderm/vascular endothelium (FLK1) markers were not significantly increased nor
deviated greatly from their day 0 levels, suggesting that few cells were driven towards
these fates during Activin A treatment. Nodal, Lefty2 and Cripto are TGFβ components
that are known to have key roles in driving initial differentiation of the mesendoderm
and regulating gastrulation, and these transcripts appeared to increase as a result of
Activin A treatment, NODAL transcript being particularly raised in the early part of the
time course. This suggested that Nodal and its affiliated signalling network was
positively regulated by Activin A. Nodal and its antagonist Lefty2 are both known
targets of Smad2/3 signalling, so the expression of both was implicit of normal
autoregulatory feedback loops within the TGFβ signalling network.
The genes analysed in figure 3.5 are only representative of a single sample set (one of
those included in 3.4), but they still offer some insight into other markers and signalling
components. The discreet appearance then disappearance of the early mesendoderm
marker Brachyury (T), and the steady increases of the endodermal markers CXCR4,
GATA4, and the early gut-tube/hepatic marker HNF4α, was further evidence that high
Activin A was inducing mesendoderm/DE differentiation in cells. There was also little
change in the mesoderm marker PDGFRβ or neurectoderm marker SOX1. Nodal and
Activin A both signal through Smad2/3 and, via the shared receptors Alk4 and Alk7.
Confirmation of the maintained presence of all these transcripts except ALK7, which
showed very low expression, suggested the presence of TGFβ signalling. Activin A
(a.k.a. INHBA) was neither particularly highly expressed nor increased from day 0,
indicating that endogenous Activin A signalling is not activated in this system. Finally,
WNT3 and WNT3A were both increased during the early part of Activin A treatment. The
raised expression of these genes in the early part of the time-course suggested TGFβ-
mediated activation of WNT3 and WNT3A, re-enforcing a role for Wnt/β-catenin

87
signalling in targeted DE differentiation. In summary, gene expression data expanded
and further indicated the observation that high Activin A drove populations within the
hESC culture to activate a mesendoderm/DE gene program, as well as inducing
expression of Nodal and related signalling components at an early stage.
A high standard error at a few time points in figure 3.4 indicated some variation across
samples, and the factors influencing this need to be considered. The pattern of
expression of markers and the extent to which expression was induced by Activin A
varied slightly across differentiation runs. The state of the particular Hues1 culture used
in each experiment may have been a contributing factor in this. Things such as the
percentage pluripotency, level of senescence, and proliferation rate have been observed
to vary between different cultures of the same hESC line under the same conditions.
The passage number and karyotype of cultures, and any batch variation of culture
components (particularly Activin A and fibronectin), can also have effects on
differentiation. The sample sets used here derive from Hues1 cultures ranging from p28-
p40, and pp3-pp8. Therefore a degree of variation was always likely, in particular for
intermediary differentiation markers such as GSC and MIXL1. These are the most
sensitive to changes in the cultures themselves and component batch variability. Since
they are transient, a slight shift in the temporal window at which they are switched on or
off can affect the relative amounts at certain time points drastically. Karyotypic
abnormalities within the Hues1 cell line in our lab, shown to be the chromosome 17
derivative abnormality 46 XX, der(17)(q25->p13::q11.2-.q25), may also have
introduced slight instability and variability into the line, although this is a common
chromosomal change amongst stem cells (Lefort et al., 2009). Therefore, although the
standard error of some data seems large, these are likely to be representative of normal
hESC experimental variation, and gene expression changes or trends over the time
course were still easily distinguishable and in some cases significant.
3.2.3 Presence of TGFβ signalling components
To establish whether the increases in Nodal signalling component transcripts translated
to increases in their protein, as well as activation of the signalling network, western
blots were performed. Total cell lysates of individual wells of Hues1 cultures
differentiated using the standardised six day Activin A protocol were collected, run on
SDS gels and transferred to nitrocellulose membrane (chapter 2.13). Key TGFβ
components relating to Nodal and Activin A signalling were focussed on, in particular
Nodal, Cripto, and phospho-Smad2 (P-Smad2). Again, several complete lysate sample
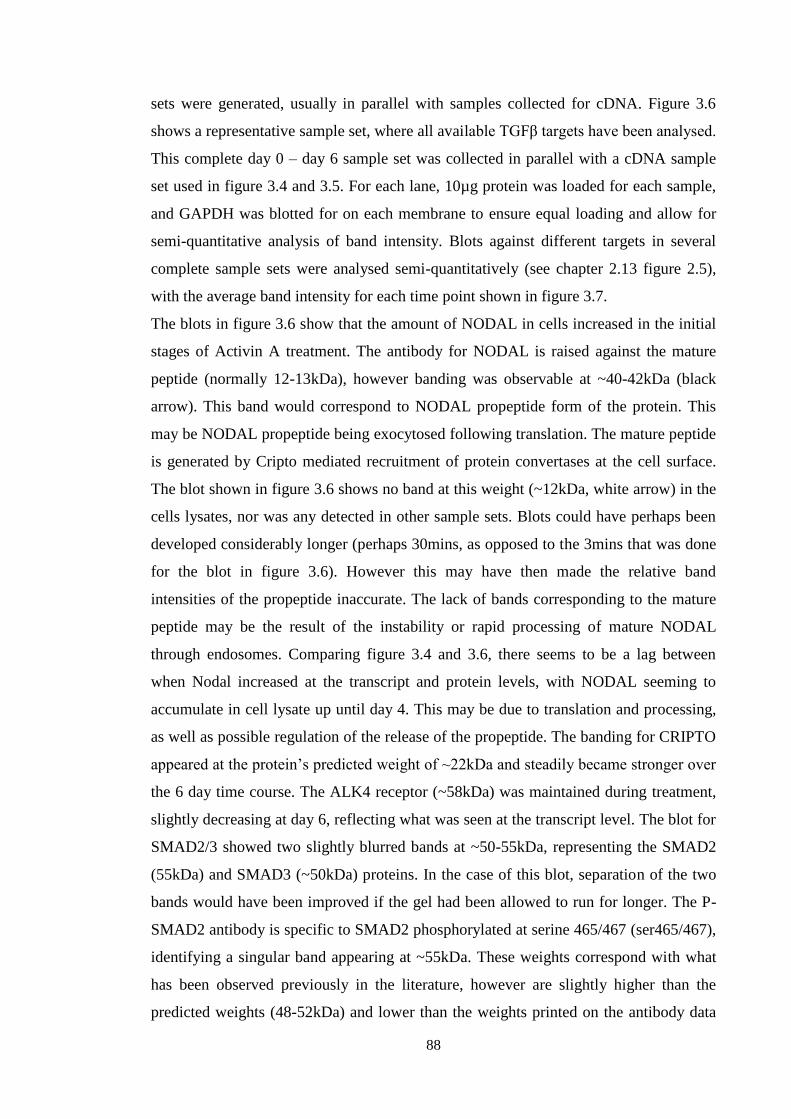
88
sets were generated, usually in parallel with samples collected for cDNA. Figure 3.6
shows a representative sample set, where all available TGFβ targets have been analysed.
This complete day 0 – day 6 sample set was collected in parallel with a cDNA sample
set used in figure 3.4 and 3.5. For each lane, 10µg protein was loaded for each sample,
and GAPDH was blotted for on each membrane to ensure equal loading and allow for
semi-quantitative analysis of band intensity. Blots against different targets in several
complete sample sets were analysed semi-quantitatively (see chapter 2.13 figure 2.5),
with the average band intensity for each time point shown in figure 3.7.
The blots in figure 3.6 show that the amount of NODAL in cells increased in the initial
stages of Activin A treatment. The antibody for NODAL is raised against the mature
peptide (normally 12-13kDa), however banding was observable at ~40-42kDa (black
arrow). This band would correspond to NODAL propeptide form of the protein. This
may be NODAL propeptide being exocytosed following translation. The mature peptide
is generated by Cripto mediated recruitment of protein convertases at the cell surface.
The blot shown in figure 3.6 shows no band at this weight (~12kDa, white arrow) in the
cells lysates, nor was any detected in other sample sets. Blots could have perhaps been
developed considerably longer (perhaps 30mins, as opposed to the 3mins that was done
for the blot in figure 3.6). However this may have then made the relative band
intensities of the propeptide inaccurate. The lack of bands corresponding to the mature
peptide may be the result of the instability or rapid processing of mature NODAL
through endosomes. Comparing figure 3.4 and 3.6, there seems to be a lag between
when Nodal increased at the transcript and protein levels, with NODAL seeming to
accumulate in cell lysate up until day 4. This may be due to translation and processing,
as well as possible regulation of the release of the propeptide. The banding for CRIPTO
appeared at the protein’s predicted weight of ~22kDa and steadily became stronger over
the 6 day time course. The ALK4 receptor (~58kDa) was maintained during treatment,
slightly decreasing at day 6, reflecting what was seen at the transcript level. The blot for
SMAD2/3 showed two slightly blurred bands at ~50-55kDa, representing the SMAD2
(55kDa) and SMAD3 (~50kDa) proteins. In the case of this blot, separation of the two
bands would have been improved if the gel had been allowed to run for longer. The P-
SMAD2 antibody is specific to SMAD2 phosphorylated at serine 465/467 (ser465/467),
identifying a singular band appearing at ~55kDa. These weights correspond with what
has been observed previously in the literature, however are slightly higher than the
predicted weights (48-52kDa) and lower than the weights printed on the antibody data

89
sheets (50-60kDa). The lack of a band for SMAD2/3 at day 3 was not generally
observed in other experiments so may be anomalous. SMAD2/3 itself did not vary
greatly during the time course (except at day 3), however the relative level of SMAD2
phosphorylation was raised over days 1-4 of the time-course (even in the case of the
anomalous day 3). This activation then diminished on days 5 – 6.
(Ladder) D0 (mT) D1 D2 D3 D4 D5 D6
NODAL CRIPTO
ALK4 P-SMAD2
SMAD2/3
GAPDH
Figure 3.6 – Western blots of a representative sample set of Hues1 differentiated for
6 days in high Activin A. The left hand lane had a molecular weight marker, some of
the points of which have been annotated in kilodaltons (kDa). The banding for each
protein roughly corresponded to its predicted or published weight. 10µg total protein
was loaded in each lane, with GAPDH used to indicate consistent loading. The black
and white arrows in the NODAL blot correspond to the pro- and mature-peptide
weights respectively. The banding on day 3 of this sample set seemed to be slightly
anomalous for SMAD2/3 and P-SMAD2, however this anomaly was not observed in
other experiments, and relative P-SMAD2 vs. total SMAD2/3 remained consistent
with other experiments.
kDa
58
46
30
17 7
30
23
17 80 58
46
80 58
46 80
58
46
(46)
(30)

90
For semi-quantitative analysis of blots, bands that identified the target proteins were
selected. These were then plotted as histograms, with the size and intensity of the band
equating to the size of area of the peaks was then measured (chapter 2.13 figure 2.5).
For NODAL and CRIPTO, this was performed on three complete sample sets, with
intensity relative to GAPDH calculated. This was then plotted in terms of fold change
vs. control day 0 expression, to try to correct for the different exposure times of X-ray
film used. For P-SMAD2, this was done on two complete sample sets, with P-SMAD2
relative to SMAD2/3 calculated, and again expressed in terms of fold change vs. control
day 0. The standard error of many of the time points is large. Again this may be a
reflection of the normal variation across samples in different runs. Precise
reproducibility of western blotting is also not easy, since it depends on multiple manual
processing steps and judging an appropriate level of exposure during X-ray film
development. In spite of this the data from different sample sets generated some clear
trends. NODAL propeptide in cells steadily increased over day 1 – 4 of Activin A
treatment. The amount of SMAD2 activation over the same period was three-fold higher
compared to pluripotent cells, and there was a steady increase of CRIPTO over the
whole time course. Interestingly Smad2 activation diminished by day 5 and 6 despite
continued Activin A treatment, concomitant with NODAL disappearance. The data for
these TGFβ components recapitulate the qualitative data in figure 3.6. They confirm the
presence of TGFβ signalling during the early part of differentiation to DE, as well as an
increasing presence of both Nodal and Cripto as a result of high Activin A treatment.
Further analyses of elements of Nodal and Activin A signalling were attempted but met
with problems. An antibody against P-SMAD3 (from Cell Signalling, USA) was tried
but found to be non-specific to total SMAD2/3. Activin A and ALK7 were not blotted
for since qPCR indicated they were not strongly expressed. One aspect of Nodal
signalling was investigated but never successful using several methods. NODAL protein
present in the medium was initially tested for using enzyme linked immunosorbent
assay (ELISA). A pair of matched antibodies from Abnova was tested in absorbent
plates. They were unable to detect concentrations of mature recombinant human (rh)
Nodal peptide, and when the same antibodies were tested on cell lysate in a western
blot, they seemed to be bind weakly and non-specifically. As a second approach, protein
in the medium was run directly using western blot. When no banding corresponding to
NODAL could be detected, medium was 10x concentrated and run but overloaded the
gel (possibly as a result of the enriched nature of stem cell medium). It was ultimately

91
0
5
10
15
20
25
D0mT
D1 D2 D3 D4 D5 D6
CRIPTO
Figure 3.7 – Semi-quantitative analysis
of western blot band intensity for
Hues1 cells differentiated for 6 days
with Activin A. NODAL and CRIPTO
blots are expressed relative to GAPDH,
and P-SMAD2 relative to total
SMAD2/3, all in terms of fold change
vs. day 0. Data corresponds to the
averages of biological repeats from two (n=2, P-SMAD2) or three (n=3, NODAL and
CRIPTO) independent experiments, with error bars showing the s.e.m.
attempted to concentrate the medium using columns which separate proteins within
specific kDa weight ranges, however this also yielded no clear banding and still led to
slight overloading of western blot gels. These problems allowed no clear insight into the
amount of NODAL present in the medium.
3.2.4 Differentiation in the absence of Activin A
Control experiments without Activin A were performed in order to validate whether
Activin A treatment was responsible for the increase in Nodal signalling components
and DE induction. Hues1 cells were differentiated using the same standardised 6 day
differentiation protocol, however no Activin A was added to the FF-base medium. This
was done in parallel with a normal differentiation run using Activin A. Cells were
collected between days 0 to 6 for RNA generation and analysis by qPCR, as well as at
day 0 and day 3 as lysate for analysis by western blotting. Figure 3.8a shows qPCR data
for key pluripotency, differentiation and TGFβ genes. For differentiation markers
(except SOX1) the scale on the Y-axis has been set to correspond with those in figures
3.4 and 3.5 for comparison.
0
2
4
6
8
10
12
D0mT
D1 D2 D3 D4 D5 D6
Fold
ch
ange
(vs
. d
ay 0
)
NODAL
0
1
2
3
4
5
D0mT
D1 D2 D3 D4 D5 D6
Fold
ch
ange
(vs
. d
ay 0
)
P-SMAD2

92
As expected, gene expression in the absence of Activin A was strikingly different from
that in the presence of Activin A. The first clear difference was the rapid disappearance
of pluripotency transcripts, which appear to be rapidly down-regulated in the absence of
Activin A in the medium. Somewhat expectedly, there was no increase in the presence
of mesendoderm or DE markers, however the vascular endothelial associated FLK1
(VEGFR2) also decreased here. SOX1 transcript, a neurectodermal marker, began at day
0 with a much higher level compared to the sample set used in figure 3.5. This anomaly
may be due to different Hues1 pluripotent cultures having variable expression of such
transcripts. Importantly however, there was no up- or downregulation of it here
throughout 6 days. The stark increase of TGFβ components observed in the presence of
Activin A was also was not apparent, with NODAL maintained at the same level as the
day 0 pluripotent control and LEFTY2 rapidly diminishing.
Figure 3.8b shows a western blot looking at the core Nodal/Activin A signalling
components. Parallel day 3 samples differentiated with and without Activin A were
included for comparison. Beginning by looking at Nodal, it is first important to note that
the strength of the signal and length of exposure on this particular blot was relatively
greater than that shown in figure 3.6, without there necessarily being more protein
present at day 0. The amount of NODAL by day 3 in the absence of Activin A appeared
to have been slightly obscured by a bubble, however inspection of the corresponding
band in the GAPH-probed blot below (which has a similar molecular weight) suggested
this was not the case. Therefore over three days culture in FF-base-only the amount to
NODAL in cells did not appear to have increased compared to day 0, and was much
lower than those differentiated with Activin A. Bands for CRIPTO appeared the same
across the differently treated day 3 samples, both slightly stronger compared to day 0.
The most striking difference between Activin A and FF-base treatment was the
phosphorylation of SMAD2, which was almost completely absent in the FF-base-only
sample.
The identity of the cells differentiated in FF-base-only was not clear. The change from
mTeSR medium (containing multiple factors including insulin, transferrin, TGFβ-1 and
bFGF) to FF-base medium, supplemented with only components present in B27 (which
also contained insulin, transferrin and selenium) induced a loss of pluripotency but no
clear directed differentiation towards any particular lineage. There was no increase in
early markers of endoderm, mesoderm m or neurectoderm. Nodal was not up-regulated
in FF-base medium compared to treatment with Activin A, however nor was it down-

93
0
0.05
0.1
0.15
0.2
0.25
D0mT
D1 D2 D3 D4 D5 D6
Rel
ativ
e ex
pre
ssio
n
(no
rmal
ised
to
GA
PD
H)
NANOG
0
0.01
0.02
0.03
D0mT
D1 D2 D3 D4 D5 D6
OCT4
0
0.005
0.01
0.015
0.02
0.025
D0(mT)
D1 D2 D3 D4 D5 D6
MIXL1
0
0.002
0.004
0.006
D0mT
D1 D2 D3 D4 D5 D6
Rel
ativ
e ex
pre
ssio
n
(no
rmal
ised
to
GA
PD
H)
GSC
0
0.002
0.004
0.006
D0(mT)
D1 D2 D3 D4 D5 D6
SOX17
0
0.02
0.04
0.06
0.08
D0mT
D1 D2 D3 D4 D5 D6
Rel
ativ
e ex
pre
ssio
n
(no
rmal
ised
to
GA
PD
H)
SOX1
0
0.005
0.01
0.015
0.02
D0mT
D1 D2 D3 D4 D5 D6
FLK1
0
0.001
0.002
0.003
0.004
0.005
D0(mT)
D1 D2 D3 D4 D5 D6
NODAL
0
0.002
0.004
0.006
0.008
0.01
D0mT
D1 D2 D3 D4 D5 D6
LEFTY2
Figure 3.8 – Hues1 cells
differentiated in the absence of
Activin A. A) qPCR analysis of
key pluripotency, differentiation
and TGFβ markers of a single
sample set. For each gene the
scales on the Y-axis have been
set to correspond with those in
figure 3.4 and 3.5. B) Western
blots of day 0 and day 3 samples
differentiated with Activin A
(ActA) and without (FF-base),
as well as recombinant Nodal
(mature peptide) as a control. A
relic of the banding for this is
visible in the CRIPTO blot.
B
kDa 52 38 31 24
38 31 24 76 52
38 76
52 38 52 38 31
NODAL CRIPTO P-SMAD2 SMAD2/3 GAPDH
D0 D3 D3 rh-
Ladder mT ActA FF-base Nodal
A

94
regulated. This indicated that components of FF-base medium in concert with
endogenous mechanisms were sufficient to maintain a low level of Nodal expression
and presence in cell lysates. Whether this NODAL was exocytosed by cells or generated
cell signalling is not known. Despite the presence of some NODAL and its co-receptor
CRIPTO, there was negligible activation of SMAD2 in FF-base medium. Therefore,
exogenous high Activin is necessary to elicit high levels of Smad2 activation, raise
endogenous Nodal expression, and initiate differentiation towards DE. Whether high
Activin A alone is sufficient for all these is unclear. Endogenous Nodal signalling may
also contribute to cell signalling, cooperating with Activin A to augment or regulate
Smad2 activation, which may be crucial if there are certain thresholds of activity that
determine differentiation.
3.2.5 Changes in morphology and immunocytochemical profile
To gain further insight into the effect of high Activin A treatment on Hues1 cells over
six days, microscopy and immunostaining were used to identify at a more cellular level
the nature and progression of differentiation.
Slight variability in terms of changes in cell morphology, proliferation and apoptosis
between different experiments, as well as wells of the same experiment, was observed.
Phase contrast images were taken during various experiments at each day of
differentiation. Images of two separate experiments with Hues1 are shown in figure 3.9.
Multiple images were taken without particular preference and selected to be
representative of the most commonly observed characteristics. Although the adherence
of cells following passaging, exact percentage of hESCs expressing pluripotency
factors, and rates of proliferation varied slightly between experiments, the changes in
morphology observed were similar given optimal reagents. Between days 0 to 2 cells
proliferated fairly rapidly, undergoing no obvious morphological deviation from normal
feeder free hESCs, with the exception of larger cells at the edges of the monolayers
which exhibited reduced cell-cell contact (which may have been mesenchymal cells that
had already differentiated slightly). Where populations became dense, cells were
smaller. Over days 3 to 4 there was a noticeable level of detachment of cells, more in
cultures with higher rates of proliferation. Certain regions also began exhibiting denser
clusters of cells. At day 5 or day 6, these denser regions began to form aggregates of
cells, with areas between them occupied by morphologically distinct expanded cells.
These less dense regions had some cells that were tightly arranged with neighbouring
cells (black arrows, figure 3.9), others with a less epithelial morphology,

95
Figure 3.9 – Phase contrast
microscopy of Hues1 cells
differentiated for 6 days using
activin A. For each day shown,
images are given from two
independent experiments. Bar
= 100µm.
During the six day time-course,
distinct changes occurred to
cells and to the culture as a
whole. The classic large
epithelial feeder free hESC
morphology was maintained
during days 1 and 2, with
proliferation creating denser
areas with smaller cells. Over
days 3 and 4 there were more
degraded or apoptotic cells
present, and cell populations
within the culture seemed
denser. By days 5 and 6 some
regions of aggregation were
noticeable, with cells tightly
compacted, surrounded by
areas of cells much less densely
arranged. These larger cells
still had large visible nuclei
containing nucleoli similar to
hESCs. but not as large. Many
of the cells in this region had
an epithelial appearance (black
arrows), with a few taking on a
more mesenchymal
morphology (white arrows).
Day 0 (mT)
Day 1
Day 2
Day 3
Day 4
Day 5
Day 6
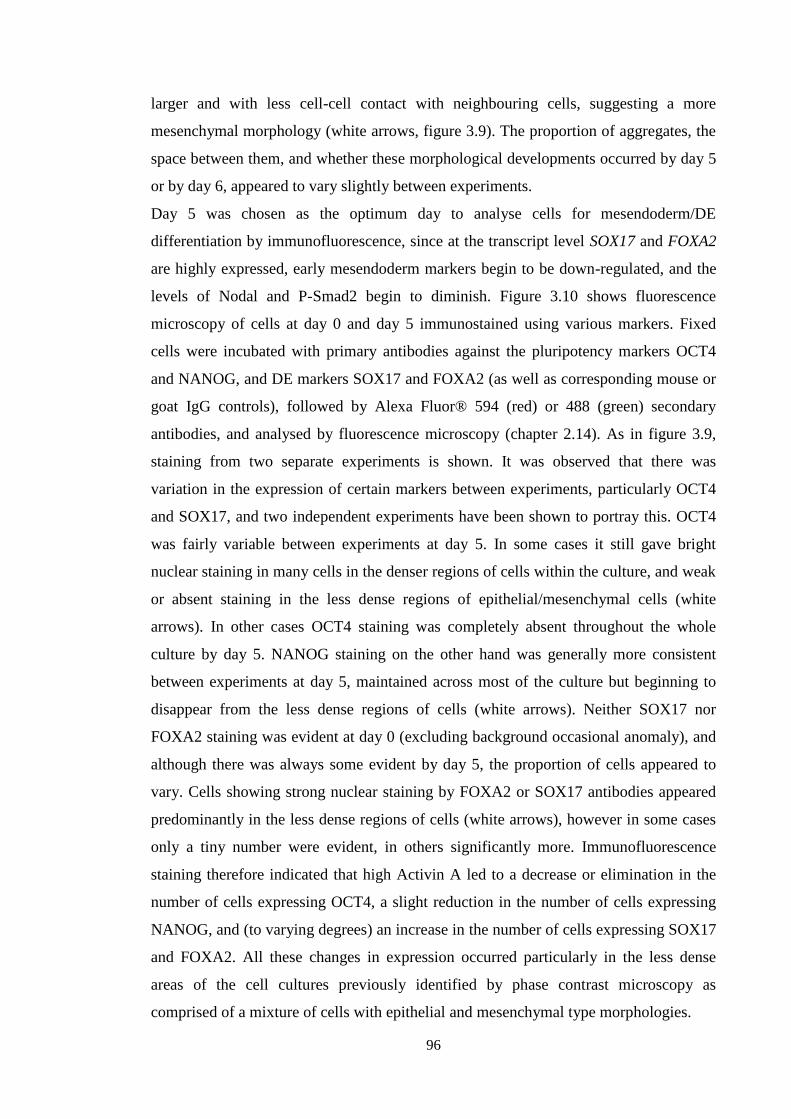
96
larger and with less cell-cell contact with neighbouring cells, suggesting a more
mesenchymal morphology (white arrows, figure 3.9). The proportion of aggregates, the
space between them, and whether these morphological developments occurred by day 5
or by day 6, appeared to vary slightly between experiments.
Day 5 was chosen as the optimum day to analyse cells for mesendoderm/DE
differentiation by immunofluorescence, since at the transcript level SOX17 and FOXA2
are highly expressed, early mesendoderm markers begin to be down-regulated, and the
levels of Nodal and P-Smad2 begin to diminish. Figure 3.10 shows fluorescence
microscopy of cells at day 0 and day 5 immunostained using various markers. Fixed
cells were incubated with primary antibodies against the pluripotency markers OCT4
and NANOG, and DE markers SOX17 and FOXA2 (as well as corresponding mouse or
goat IgG controls), followed by Alexa Fluor® 594 (red) or 488 (green) secondary
antibodies, and analysed by fluorescence microscopy (chapter 2.14). As in figure 3.9,
staining from two separate experiments is shown. It was observed that there was
variation in the expression of certain markers between experiments, particularly OCT4
and SOX17, and two independent experiments have been shown to portray this. OCT4
was fairly variable between experiments at day 5. In some cases it still gave bright
nuclear staining in many cells in the denser regions of cells within the culture, and weak
or absent staining in the less dense regions of epithelial/mesenchymal cells (white
arrows). In other cases OCT4 staining was completely absent throughout the whole
culture by day 5. NANOG staining on the other hand was generally more consistent
between experiments at day 5, maintained across most of the culture but beginning to
disappear from the less dense regions of cells (white arrows). Neither SOX17 nor
FOXA2 staining was evident at day 0 (excluding background occasional anomaly), and
although there was always some evident by day 5, the proportion of cells appeared to
vary. Cells showing strong nuclear staining by FOXA2 or SOX17 antibodies appeared
predominantly in the less dense regions of cells (white arrows), however in some cases
only a tiny number were evident, in others significantly more. Immunofluorescence
staining therefore indicated that high Activin A led to a decrease or elimination in the
number of cells expressing OCT4, a slight reduction in the number of cells expressing
NANOG, and (to varying degrees) an increase in the number of cells expressing SOX17
and FOXA2. All these changes in expression occurred particularly in the less dense
areas of the cell cultures previously identified by phase contrast microscopy as
comprised of a mixture of cells with epithelial and mesenchymal type morphologies.

97
OCT4
NANOG
SOX17
Day 0 Day 5 Day 0 Day 5

98
FOXA2
mIgG
gIgG
Day 0 Day 5 Day 0 Day 5
X
X

99
Although displaying images from day 0 and 5 of two different experiments is
cumbersome, it was deemed necessary to highlight the variability in expression of
OCT4, SOX17 and FOXA2. Part of this variation is likely to be down to variability
between hESC cultures themselves (as discussed in chapter 3.2.1 above). However,
batch variation within Activin A may have had an effect. The samples used for
immunostaining in figure 3.10 came from experiments run using different batches of
insect-cell derived Activin A (purchased from Peprotech). Slight differences in batch
activity may have led to some of the variation. Although this presented a slight
difficulty in reproducibility, nonetheless all batches of Activin A induced differentiation
and an increased level of SOX17 expression in hESCs over the time-course.
Immunostaining for other targets that would have further characterised the nature and
progression of differentiation were tried, in particular GSC and CXCR4, however no
antibodies were identified which showed selective and reliable staining.
The microscopy and immunostaining data put gene expression data in a clearer context.
Firstly, they illustrated the heterogeneity of cell cultures during differentiation. When
interpreting differentiation based on gene expression data (figure 3.4 and 3.5), it must
be borne in mind that the level of target transcript observed is an average of all cells.
Figure 3.10 (previous two pages) – Immunostaining and fluorescence microscopy of
fixed Hues1 cells at day 0 and day 5 of high Activin A treatment. Images from each
day of two independent experiments are shown. Primary antibodies against OCT4,
NANOG, SOX17 and FOXA2 and their corresponding control mouse or goat IgGs
have been applied, followed by Alexa Fluor® 594 (red) or 488 (green) secondary
antibodies. Fluorescence staining is shown in the top row and a DAPI-merge in the
bottom. Within each experiment, the exposure time between day 0 and day 5 was
the same for each antibody. Images were taken to be representative without bias. Bar
= 100µm.
It was found that by day 5, staining for OCT4 was sometimes persistent in some
areas of the culture, and sometimes totally absent. NANOG appeared in most cells
still by day 5, with less dense regions of cells exhibiting weaker staining. Where
SOX17 and FOXA2 staining was observed at day 0 it was generally weak non-
nuclear staining. Staining at day 5 for both gave a variable amount of cells with
bright nuclear staining. The amount cells varied greatly, however generally appeared
within regions of less dense cells.

100
Although expression at the transcript and protein levels may not completely correlate
(i.e. cells may have high levels of transcript but not yet have high levels of peptide), a
marker such as Sox17 was high at the transcript level but detected by immunostaining
in only a small number of cells at day 5. qPCR data may therefore often be
representative of some cells very highly expressing these markers and other cells not
expressing them at all. Secondly, the regions of the cultures with the less densely
arranged cells observed in figure 3.9 and 3.10 contained the cells that were either losing
pluripotency markers or beginning to express DE markers. This raised questions
regarding the relation of pluripotency factors to the mechanism of differentiation.
Particularly, whether cells undergo a DE program before or after losing markers like
OCT4 and NANOG, and whether these factors form a part of this program. Importantly,
day 5 seems to be a key tipping point where heterogeneity within the culture is high,
pluripotency is beginning to diminish, and DE-like cells are beginning to emerge.
3.2.6 Quantitation of changes in NANOG and SOX17
In order to quantify the differentiation of hESCs during high Activin A treatment,
analysis of NANOG and SOX17 expression by flow cytometry was performed on cells
at day 0 and 5. Since these are intracellular markers however, a protocol to effectively
fix and permeabilise hESCs had to be optimised. Various attempts were made using
different cell dissociation solutions, length and agents for fixation and permeabilisation
steps, as well as antibodies. A protocol was ultimately refined using normal TrypLE
dissociation, fixation with 4% paraformaldehyde and permeabilisation with 70%
methanol (for detailed protocol see chapter 2.15). A Nanog antibody conjugated with
aflexa fluor-488 (AF488) and a Sox17 antibody conjugated with phycoerythrin (PE)
became available from BD biosciences. These were used in preference to primary and
secondary antibodies used for immunofluorescence microscopy, avoiding multiple
antibody incubation/washing steps.
Analysis of samples at day 0 and 5 began with the identification of single whole cells
using the laser forward scatter (FS) and side scatter (SS) readings. The process of
dissociation, fixation and permeabilisation generated single whole cells, as well as a
large number of improperly dissociated clusters and cellular particles from ruptured and
compromised cells. Using a plot of FS vs. SS it is possible to identify the population of
whole cells from the rest. The forward scatter reading closely relates to the size of the
particles, whereas side scatter represents optical homogeneity. FS vs. SS plots for day 0
and day 5 differentiated cells are shown in figure 3.11a, with the whole cell population

101
gated by polygons. Red dots represent individual events (i.e. cells or particles). By day
5, there is an increase in the amount of events appearing low on either or both the FS
and SS axes, indicating an increase in the amount of fragments and debris in the
samples compared to day 0. This may reflect an increase in the number of cells which
are degraded or apoptosing during differentiation, possibly cells within the aggregates
observed by day 5 and 6 (figure 3.9).
The Nanog-AF488 antibody was validated for specificity using immunofluorescence
microscopy of fixed pluripotent hESCs (figure 3.11b), indicating the staining was
nuclear. Having gated the desired population of cells using FS vs. SS, the log AF488
(i.e. 530/40nm) emission readings of these cells were plotted as histograms. Figure
3.11c shows a plot from analysis of an individual experiment. Day 0 (grey) and day 5
(red) were then overlaid for comparison, and gating applied to delineate the relative
positive samples. Gating was applied based on the logic that at day 0, the large
pronounced peak that was higher on the AF488 scale represented cells that bound the
antibody more strongly and were positive for NANOG expression. The lesser peak that
formed a small shoulder to the larger one lower on the AF488 scale represented cells
that bound the antibody less strongly and were negative for NANOG. Placing a gate that
incorporated the majority of the big peak and excluded the majority of the lesser peak of
cells at day 0 therefore identified the positives. This method was based on the
assumption that cells that are negative for NANOG still weakly bind the antibody and
have a low level of background fluorescence. Cells which are unstained by any antibody
exhibit a peak between 100 and 10
1 on the AF488 scale (data not shown). However,
background signal is a common feature of antibody staining. Although placing a gate
that identifies the positives from the negatives in day 0 cells relies on human judgement,
this is then applied without bias to the day 5 cells, giving an accurate number of positive
cells relative to day 0. It was observed that the whole peak at day 5 had shifted slightly
to the left along the X-axis, indicating that some cells showed much lower expression of
NANOG compared to day 0, and that mean expression in most cells was slightly lower.
Gating (R8) on the peak at day 0 sample gave a Nanog-positive population of 83.5%.
This same gate identified only 73.1% of cells as positive by day 5. This indicated a 10%
reduction in cells expressing NANOG as a result of high Activin.
In order to validate the method of gating, a control IgG-AF488 conjugated antibody was
acquired and used in parallel to Nanog-AF488 on samples in a single experiment.
Figure 3.11d shows log AF488 emission of day 0 and day 5 samples, where the control
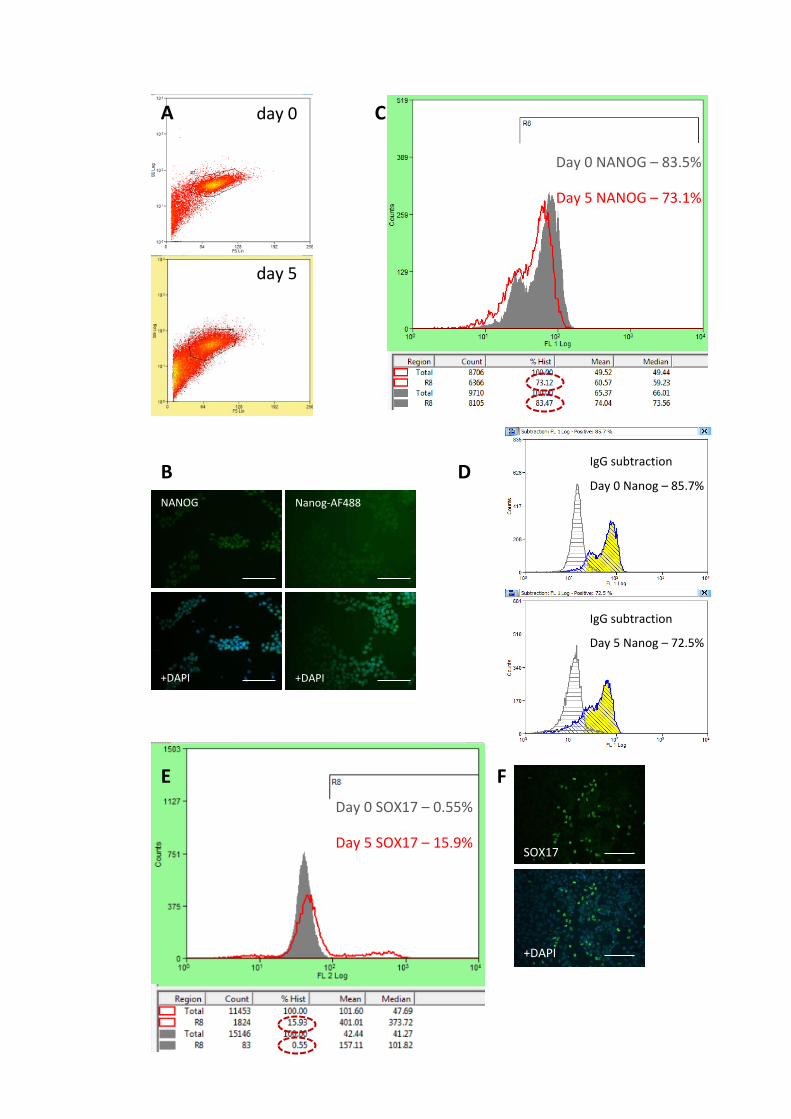
102
A day 0
day 5
B D
NANOG +DAPI
Nanog-AF488 +DAPI
Day 0 NANOG – 83.5%
Day 5 NANOG – 73.1%
IgG subtraction
Day 0 Nanog – 85.7%
IgG subtraction
Day 5 Nanog – 72.5%
C
Day 0 SOX17 – 0.55%
Day 5 SOX17 – 15.9% SOX17
+DAPI
E F
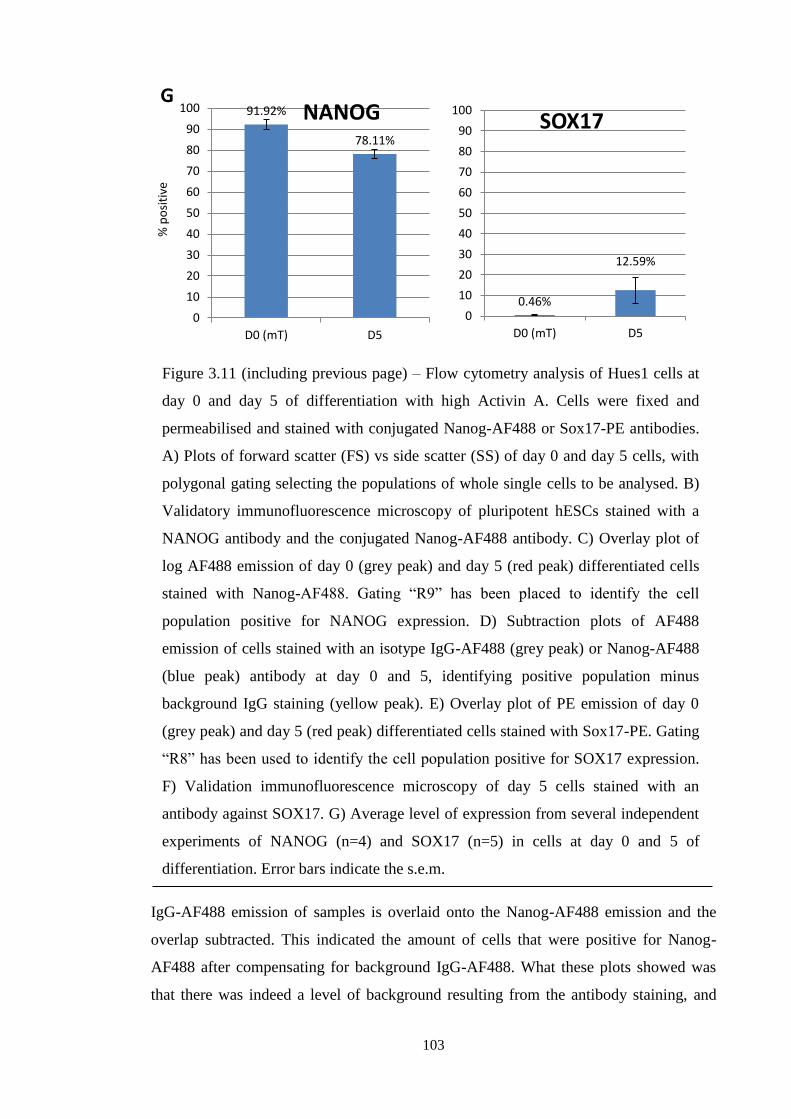
103
IgG-AF488 emission of samples is overlaid onto the Nanog-AF488 emission and the
overlap subtracted. This indicated the amount of cells that were positive for Nanog-
AF488 after compensating for background IgG-AF488. What these plots showed was
that there was indeed a level of background resulting from the antibody staining, and
91.92%
78.11%
0
10
20
30
40
50
60
70
80
90
100
D0 (mT) D5
% p
osi
tive
NANOG
0.46%
12.59%
0
10
20
30
40
50
60
70
80
90
100
D0 (mT) D5
SOX17
Figure 3.11 (including previous page) – Flow cytometry analysis of Hues1 cells at
day 0 and day 5 of differentiation with high Activin A. Cells were fixed and
permeabilised and stained with conjugated Nanog-AF488 or Sox17-PE antibodies.
A) Plots of forward scatter (FS) vs side scatter (SS) of day 0 and day 5 cells, with
polygonal gating selecting the populations of whole single cells to be analysed. B)
Validatory immunofluorescence microscopy of pluripotent hESCs stained with a
NANOG antibody and the conjugated Nanog-AF488 antibody. C) Overlay plot of
log AF488 emission of day 0 (grey peak) and day 5 (red peak) differentiated cells
stained with Nanog-AF488. Gating “R9” has been placed to identify the cell
population positive for NANOG expression. D) Subtraction plots of AF488
emission of cells stained with an isotype IgG-AF488 (grey peak) or Nanog-AF488
(blue peak) antibody at day 0 and 5, identifying positive population minus
background IgG staining (yellow peak). E) Overlay plot of PE emission of day 0
(grey peak) and day 5 (red peak) differentiated cells stained with Sox17-PE. Gating
“R8” has been used to identify the cell population positive for SOX17 expression.
F) Validation immunofluorescence microscopy of day 5 cells stained with an
antibody against SOX17. G) Average level of expression from several independent
experiments of NANOG (n=4) and SOX17 (n=5) in cells at day 0 and 5 of
differentiation. Error bars indicate the s.e.m.
G
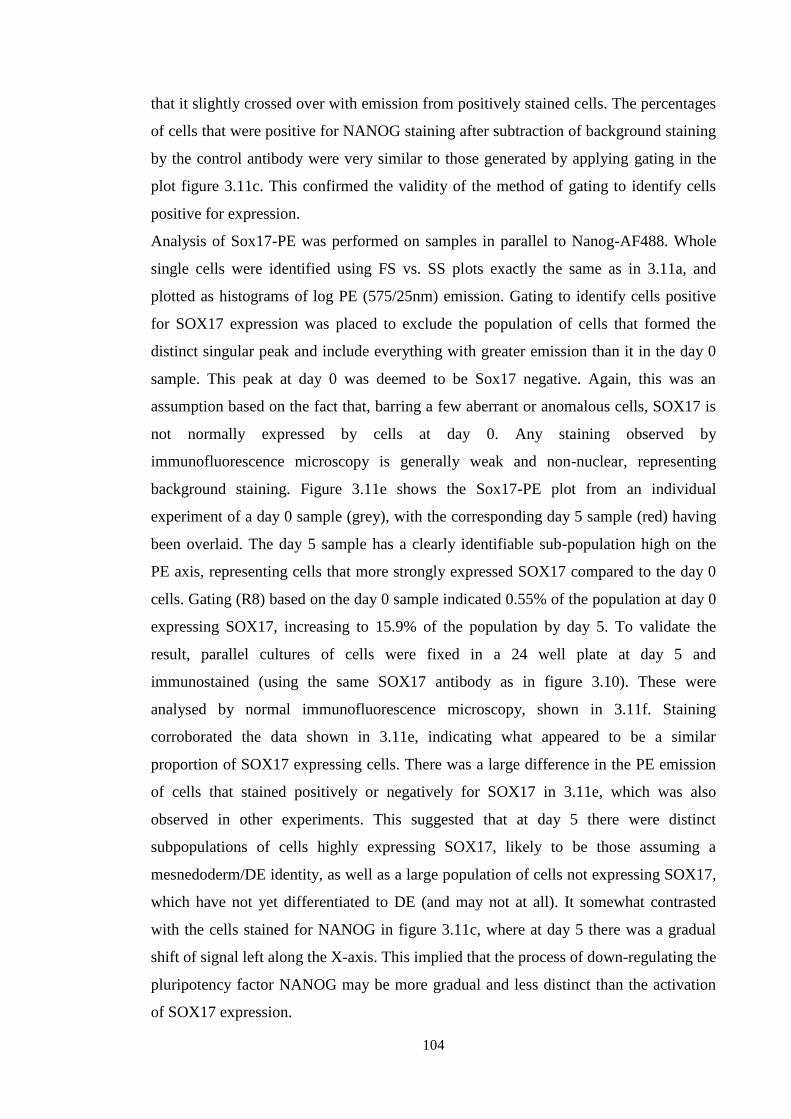
104
that it slightly crossed over with emission from positively stained cells. The percentages
of cells that were positive for NANOG staining after subtraction of background staining
by the control antibody were very similar to those generated by applying gating in the
plot figure 3.11c. This confirmed the validity of the method of gating to identify cells
positive for expression.
Analysis of Sox17-PE was performed on samples in parallel to Nanog-AF488. Whole
single cells were identified using FS vs. SS plots exactly the same as in 3.11a, and
plotted as histograms of log PE (575/25nm) emission. Gating to identify cells positive
for SOX17 expression was placed to exclude the population of cells that formed the
distinct singular peak and include everything with greater emission than it in the day 0
sample. This peak at day 0 was deemed to be Sox17 negative. Again, this was an
assumption based on the fact that, barring a few aberrant or anomalous cells, SOX17 is
not normally expressed by cells at day 0. Any staining observed by
immunofluorescence microscopy is generally weak and non-nuclear, representing
background staining. Figure 3.11e shows the Sox17-PE plot from an individual
experiment of a day 0 sample (grey), with the corresponding day 5 sample (red) having
been overlaid. The day 5 sample has a clearly identifiable sub-population high on the
PE axis, representing cells that more strongly expressed SOX17 compared to the day 0
cells. Gating (R8) based on the day 0 sample indicated 0.55% of the population at day 0
expressing SOX17, increasing to 15.9% of the population by day 5. To validate the
result, parallel cultures of cells were fixed in a 24 well plate at day 5 and
immunostained (using the same SOX17 antibody as in figure 3.10). These were
analysed by normal immunofluorescence microscopy, shown in 3.11f. Staining
corroborated the data shown in 3.11e, indicating what appeared to be a similar
proportion of SOX17 expressing cells. There was a large difference in the PE emission
of cells that stained positively or negatively for SOX17 in 3.11e, which was also
observed in other experiments. This suggested that at day 5 there were distinct
subpopulations of cells highly expressing SOX17, likely to be those assuming a
mesnedoderm/DE identity, as well as a large population of cells not expressing SOX17,
which have not yet differentiated to DE (and may not at all). It somewhat contrasted
with the cells stained for NANOG in figure 3.11c, where at day 5 there was a gradual
shift of signal left along the X-axis. This implied that the process of down-regulating the
pluripotency factor NANOG may be more gradual and less distinct than the activation
of SOX17 expression.

105
Figure 3.11g shows the combined data from several experiments for NANOG (n=4) and
SOX17 (n=5) expression (the raw data for which are shown in appendix A.1). Across
multiple experiments, NANOG expression reduced from an average of 92.2% to 78.2%,
and SOX17 expression increased from 0.5% to 12.6% over five days of high Activin A
treatment. The increase in SOX17 expression closely mirrored the decrease in NANOG
expression. This could suggest that the processes of inducing SOX17 expression and
down-regulating NANOG expression are directly linked. However, double labelling of
cells would be necessary to confirm this (investigated later, figure 3.17).
Scrutiny of the SOX17 expression data highlights nuances of the differentiation system
which need to be explored. The percentage of SOX17 expressing cells is relatively low
by day 5, implying the high Activin A-only medium is not efficient at driving cells
towards DE (certainly not by day 5). Nonetheless, a distinct level of induction of the DE
marker occurs. It is not unexpected that there should be a range of observations between
different experiments. However, a trend was noted between the levels of SOX17
expression elicited by batches of Activin A that were insect-cell derived and E.coli
derived. Both types were purchased from Peprotech, and given the same ED50 of
activity on datasheets (2ng/ml). Most experiments were run using insect-derived Activin
A, however some were run with E.coli derived. Of five differentiation experiments
analysed by flow cytometry for SOX17 expression, the three runs using insect derived
Activin A gave between 35% and 9.6%, whereas the two using E.coli derived Activin A
runs both gave 1.0%. There was no trend observed in the level of NANOG expression
between differently derived Activin A (see appendix A.1). Analyses of samples by flow
cytometry was often performed in tandem with collection of sample sets for cDNA and
lysate, and no particular correlation between levels or patterns of gene expression from
differently derived Activin A was observed. E.coli derived Activin A did elicit some
SOX17 expression in hESCs, however its activity was apparently very marginally lower
compared to insect derived Activin A. As discussed in section 3.3.5, this affected
comparison of the end-point of differentiation (i.e. SOX17 expression) between some
sets of experiments (particularly those investigating the effect of Wnt3a with other
experiments). However, it did not overtly affect the conclusions of those experiments or
project as a whole.

106
3.3 Enhancing DE differentiation using Wnt3a
3.3.1 Identification of optimum temporal window for Wnt3a
Wnt3 signalling is required during the Nodal-mediated emergence of the mesendoderm
during mouse development (chapter 1.2), and several targeted differentiation reports
include Wnt3a to enhance DE differentiation in hESCs (D’Amour et al., 2006; Hay et
al., 2008a). To investigate the enhancing effect of Wnt3a on DE differentiation and
effects on Nodal signalling in the chemically defined system established already, the
optimum temporal window had to be determined.
Initial data was obtained in collaboration with a Masters (MRes) student, Matthew
Robinson, who was under my supervision (see Declaration). Using the normal
differentiation system (chapter 2.5), cells were differentiated for 5 days in high Activin
A, or Activin A supplemented with 25ng/ml Wnt3a during 0-48 hours, 48-96 hours, or
0-96 hours. Cell samples were collected at day 0, 1, 3 and 5, used to generate cDNA and
analysed by qPCR. Figure 3.12 shows gene expression levels of several key genes. The
2-ΔΔCt
method has been used to calculate relative expression (chapter 2.12). Only a few
key genes and a single sample set were analysed by qPCR, however they give clear
indication about the temporal effectiveness of Wnt3a. Wnt3a supplementation at 0 – 48
hours led to a slight decrease in pluripotency transcripts OCT4 and NANOG at day 1,
and a slight increase at day 3 and 5 compared to other conditions. The variation in
expression between conditions was not particularly high however. The graphs for GSC
and SOX17 give a more vivid indication of the effect of Wnt3a and its timing on
mesendoderm induction. Similarly to OCT4 and NANOG, addition of Wnt3a at 0 – 48
hours led to a slightly lower expression of GSC and SOX17 at day 1. However, by days
3 and 5, both showed higher level of transcript when treated with Wnt3a at 0 – 48 hours
compared to all other conditions. SOX17 in particular was much higher in these cells
than those treated with just Activin A. These data therefore indicated that the 0 – 48
hour period at the start of differentiation is the optimum time in this differentiation
system for addition of exogenous Wnt3a. Exactly how it modulates and enhances the
effect of Activin A on differentiation, and to what extent (i.e. what percentage increase
of Sox17 positive cells) was not clear here. However, since this data was clear and
similar to previous observations by D’Amour and Hay, it was deemed to justify more
thorough investigation of differentiation, adding Wnt3a between 0 – 48 hours during
high Activin A treatment.

107
3.3.2 Quantitative analysis of gene expression
In order to investigate the specific effects of supplementing high Activin A with
25ng/ml Wnt3a during the first two days of the established differentiation protocol,
experiments were run differentiating Hues1 cells in parallel with high Activin A only,
or high Activin +Wnt3a for days 0 to 2. Cells were collected at each day time point and
analysed by qPCR.
Figure 3.12 – qPCR analysis of gene expression of a single experiment of Hues1
cells differentiated for 5 days using Activin A (red) or Activin A supplemented with
Wnt3a at 0-48 hours (green), 48-96 hours (purple), and 0-96 hours (light blue).
Samples were taken for analysis at day 0, 1, 3 and 5. Expression values were
calculated using the 2-ΔΔCt
method. Standard error bars show the s.e.m. of triplicate
technical repeats.
The different temporal windows of Wnt3a addition generated slight variation in the
expression of pluripotency markers OCT4 and NANOG. The mesendoderm/DE
markers GSC and SOX17 were both lower at day 1 but raised by day 3 and 5 in cells
treated with Wnt3a over 0 – 48 hours compared to other treatments. Graphs taken
from an MRes project submitted by Matthew Robinson.

108
Figure 3.13 shows gene expression data of key gene targets from two separate
experiments. In this case, as with data in figure 3.4, gene expression was processed
using the 2-ΔCt
method. In order to validate the data, the relative expression of
transcripts in cells differentiated in Activin A-only was compared to that observed in
previous experiments. The levels and pattern of expression of targets over the time-
course were found to be similar (figure 3.4 and 3.5). A relatively large standard error
was observed for some genes at certain time points. Some of this may have been due to
the limited number of sample sets acquired for this analysis. Despite this there were
some obvious and striking trends within the data. Most strikingly was the higher level of
transcript of mesendoderm/DE markers MIXL1, GSC, EOMES, FOXA2 and SOX17
upon supplementation with Wnt3a. In many cases, the pattern of expression of these
markers in Activin A +Wnt3a followed the pattern of expression in cells in Activin A-
only, however at a raised level. This indicated that possibly more cells in the culture
were being induced to express these markers and differentiate. Immunostaining would
be required to determine this characteristic (see chapter 3.3.4). Large error bars were
observed on the plot of average NODAL expression. In both of the individual
experiments, it had been observed that NODAL expression was higher at day 1 in cells
differentiated with Wnt3a compared to Activin A-only (data not shown). Although the
extent of this increase in expression was inconsistent, it nonetheless highlighted that
NODAL expression was raised at day 1 in cells differentiated with Wnt3a. Surprisingly,
there seemed to be no assertive change in the expression of CRIPTO as a result of
Wnt3a addition, with FOXH1 and WNT3 raised slightly on days 1 and 2. Statistical
analysis was done to determine whether any of these trends were significant (chapter
2.12). A Kolmogorov-Smirnov test was first used to determine whether the data were
parametric. In the case that they were, two way ANOVA was applied. It was found that
the increased expression of GSC, FOXA2 and SOX17 in hESCs as a result of Wnt3a was
statistically significant (p ≤ 0.02). Expression of NANOG in hESCs differentiated with
Wnt3a seemed very slightly but consistently lower than in cells in Activin A-only
throughout the time course except on day 1. This lower expression of NANOG was
found to be not significant (p = 0.057).
A complete sample set from one of the experiments was used to investigate further
markers of interest, shown in figure 3.14. In cells differentiated with additional Wnt3a,
the stark late increase in expression of the Nodal antagonist CER1 echoed the raised
expression of LEFTY2 in figure 3.13. A higher level of these suggested more progressed

109
and faithful mesendoderm/DE differentiation, since they are anterior markers that
appear in the AVE and DE later in gastrulation. The dynamic increase in FGF4 in cells
differentiated with Wnt3a over days 1 and 2 also supported a model of more rapid and
widespread progression through the stages of differentiation, since it is an early marker
of the primitive streak. Non-DE markers (FLK1 and SOX7) did not appear to be grossly
affected by the supplementation with Wnt3a. WNT8A expression also increased on day
1 with the addition of Wnt3a. Taken together, the data show that the effect of
supplementation with Wnt3a was an enhancement of high Activin A-mediated
mesendoderm/DE differentiation. Early markers of primitive streak and mesendoderm
increased during days 1 - 3, however still diminished in their expression after several
days. Pluripotency factors seemed slightly reduced compared to Activin A-only
treatment. Later markers of mesendoderm and DEincreased their expression over the
whole time course, significantly over and above the level observed in cells
differentiated in Activin A-only. The fact that cells differentiated using Activin A
+Wnt3a showed enhanced expression of early differentiation markers (e.g .MIXL1,
FGF4 or GSC) but maintained the same pattern of expression as cells in Activin A-only
suggested a more widespread differentiation throughout the culture. This could
therefore derive from cooperation or synergy between Activin A/Nodal and Wnt
signalling in individual cells activating a mesendoderm program.
0
0.05
0.1
0.15
0.2
0.25
D0(mT)
D1 D2 D3 D4 D5 D6
Re
lati
ve e
xpre
ssio
n
(no
rmal
ise
d t
o G
AP
DH
) NANOG †
0
0.02
0.04
0.06
0.08
D0(mT)
D1 D2 D3 D4 D5 D6
MIXL1 ActA
ActA+Wnt3a(D0-D2)
0
0.005
0.01
0.015
0.02
0.025
0.03
D0(mT)
D1 D2 D3 D4 D5 D6
Re
lati
ve e
xpre
ssio
n
(no
rmal
ise
d t
o G
AP
DH
)
GSC *
0
0.01
0.02
0.03
0.04
0.05
0.06
D0mT
D1 D2 D3 D4 D5 D6
EOMES ActA
ActA+Wnt3a(D0-2)

110
Figure 3.13 – qPCR analysis of
Hues1 differentiated with either
Activin A or Activin A +Wnt3a
(day 0 – 2). Data represents the
average of two independent
experiments (n=2). Expression
was calculated by normalising to
GAPDH and expressed using the 2-ΔCt
method, with error bars showing the s.e.m..
Statistical analysis was done by two way ANOVA, with the increase in GSC, SOX17
and FOXA2 as a result of Wnt3a found to be significant (*, p ≤ 0.02), and the reduced
expression of NANOG nearly significant (†, p = 0.057).
0
0.01
0.02
0.03
0.04
0.05
0.06
0.07
D0(mT)
D1 D2 D3 D4 D5 D6
Re
lati
ve e
xpre
ssio
n
(no
rmal
ise
d t
o G
AP
DH
) FOXA2 *
0
0.005
0.01
0.015
0.02
0.025
D0(mT)
D1 D2 D3 D4 D5 D6
SOX17 * ActA
ActA+Wnt3a(D0-D2)
0
0.02
0.04
0.06
0.08
0.1
D0(mT)
D1 D2 D3 D4 D5 D6
Re
lati
ve e
xpre
ssio
n
(no
rmal
ise
d t
o G
AP
DH
)
NODAL
0
0.2
0.4
0.6
0.8
1
1.2
D0(mT)
D1 D2 D3 D4 D5 D6
LEFTY2 ActA
ActA+Wnt3a(D0-D2)
0
0.05
0.1
0.15
0.2
D0(mT)
D1 D2 D3 D4 D5 D6
Re
lati
ve e
xpre
ssio
n
(no
rmal
ise
d t
o G
AP
DH
)
CRIPTO
0
0.01
0.02
0.03
0.04
0.05
D0mT
D1 D2 D3 D4 D5 D6
FOXH1 ActA
ActA+Wnt3a(D0-2)
0
0.01
0.02
0.03
0.04
0.05
D0(mT)
D1 D2 D3 D4 D5 D6
Re
lati
ve e
xpre
ssio
n
(no
rmal
ise
d t
o G
AP
DH
) WNT3 ActA
ActA+Wnt3a(D0-D2)
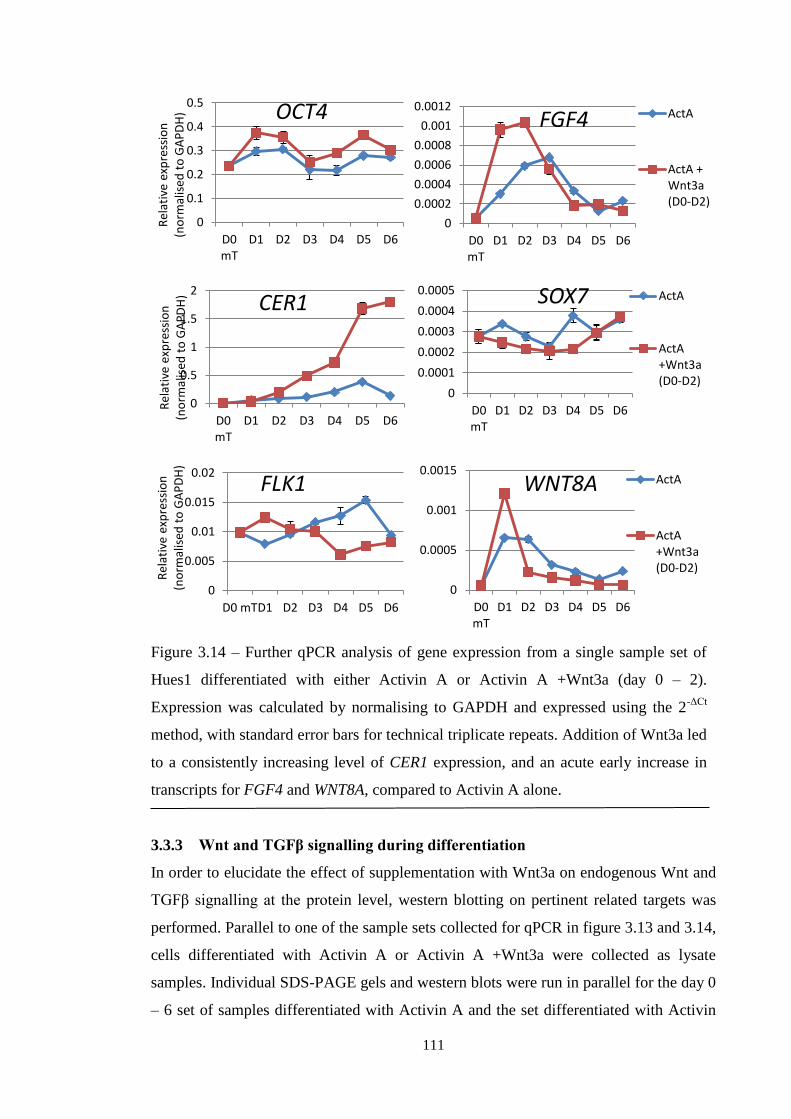
111
Figure 3.14 – Further qPCR analysis of gene expression from a single sample set of
Hues1 differentiated with either Activin A or Activin A +Wnt3a (day 0 – 2).
Expression was calculated by normalising to GAPDH and expressed using the 2-ΔCt
method, with standard error bars for technical triplicate repeats. Addition of Wnt3a led
to a consistently increasing level of CER1 expression, and an acute early increase in
transcripts for FGF4 and WNT8A, compared to Activin A alone.
3.3.3 Wnt and TGFβ signalling during differentiation
In order to elucidate the effect of supplementation with Wnt3a on endogenous Wnt and
TGFβ signalling at the protein level, western blotting on pertinent related targets was
performed. Parallel to one of the sample sets collected for qPCR in figure 3.13 and 3.14,
cells differentiated with Activin A or Activin A +Wnt3a were collected as lysate
samples. Individual SDS-PAGE gels and western blots were run in parallel for the day 0
– 6 set of samples differentiated with Activin A and the set differentiated with Activin
0
0.1
0.2
0.3
0.4
0.5
D0mT
D1 D2 D3 D4 D5 D6
Rel
ativ
e ex
pre
ssio
n
(no
rmal
ised
to
GA
PD
H) OCT4
0
0.0002
0.0004
0.0006
0.0008
0.001
0.0012
D0mT
D1 D2 D3 D4 D5 D6
FGF4 ActA
ActA +Wnt3a(D0-D2)
0
0.5
1
1.5
2
D0mT
D1 D2 D3 D4 D5 D6
Rel
ativ
e ex
pre
ssio
n
(no
rmal
ised
to
GA
PD
H) CER1
0
0.0001
0.0002
0.0003
0.0004
0.0005
D0mT
D1 D2 D3 D4 D5 D6
SOX7 ActA
ActA+Wnt3a(D0-D2)
0
0.005
0.01
0.015
0.02
D0 mTD1 D2 D3 D4 D5 D6
Rel
ativ
e ex
pre
ssio
n
(no
rmal
ised
to
GA
PD
H)
FLK1
0
0.0005
0.001
0.0015
D0mT
D1 D2 D3 D4 D5 D6
WNT8A ActA
ActA+Wnt3a(D0-D2)

112
A +Wnt3a, since they could not all fit on the same gel. The day 0 sample was the same
for both sets. The blots were then probed for various targets and processed
simultaneously. Banding was analysed for intensity using Image J. For banding
corresponding to NODAL, Β-CATENIN and CRIPTO, the GAPDH banding was used
as the loading control, and for P-SMAD2, total SMAD2/3 was used. The banding
intensity at each time point was compared by normalising to the relevant control and
plotted graphically.
Figure 3.15 shows each target blot for Activin A (ActA) and Activin A +Wnt3a
(A+Wnt3a) samples, with their corresponding control below. A graph with the relative
band intensity is shown to the right of the blots. Although the blots were done
simultaneously and developed together, bands in the GAPDH blot appeared to be
smaller in width and slightly weaker in the Activin A-only treated samples than Activin
A+Wnt3a. This would suggest that membrane transfer of the blot was not completely
equal for the two sample sets despite being done in parallel. Normally this would not be
a problem for comparing the relative band intensities between blots, however in blots
for some targets where there was a low level of protein at day 0 (e.g. NODAL or
CRIPTO), in the Activin A-only blot these bands were barely visible whereas they were
clearer on the Activin A +Wnt3a blot. This meant detecting the bands using ImageJ
became less accurate. With this borne in mind however, the blots allowed useful direct
comparison of the level of target proteins at key time points during differentiation. The
first notable difference between the two differentiation conditions was the increased
amount of Β-CATENIN when Wnt3a was added. The level in cells was distinctly
higher particularly on days 1 and 2 when Wnt3a was present, suggesting that the
primary direct effect of exogenous Wnt3a was to increase the level of B-CATENIN
accumulation in cells (as it is known to do). The amount of Β-CATENIN in cells
differentiated in Activin A-only also slightly increased during the time course, and
showed high levels particularly at days 4 and 6. This suggests that, even in the absence
of exogenous Wnt-ligand addition, high Activin A induces some B-CATENIN
accumulation, possibly via activation of endogenous Wnt3 signalling. Concomitant with
this raised level of B-CATENIN when Wnt3a was present during days 1 and 2 was a
raised level of NODAL and CRIPTO. Wnt3a treatment appeared to lead to a quickly
elevated level of these peptides followed by a more steady maintenance in the later part
of the time course. In comparison, Activin A-only treatment took until day 2 to raise
NODAL to the same level, which then subsequently diminished again after day 4.
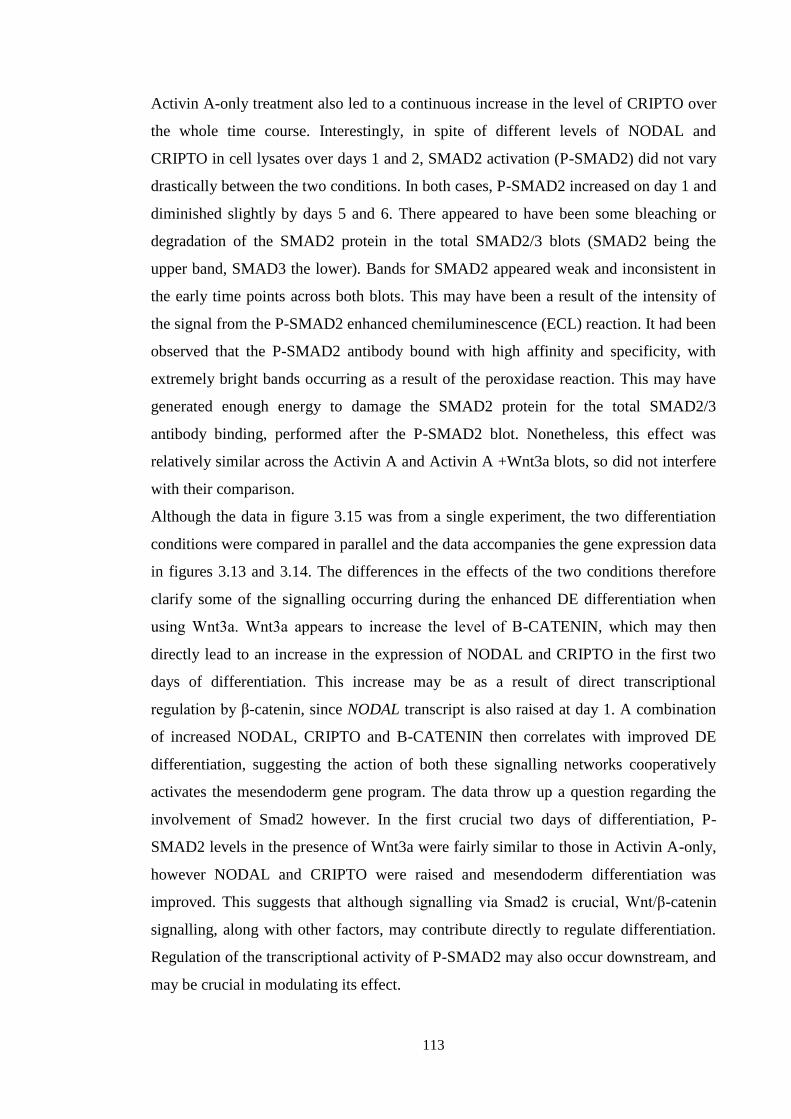
113
Activin A-only treatment also led to a continuous increase in the level of CRIPTO over
the whole time course. Interestingly, in spite of different levels of NODAL and
CRIPTO in cell lysates over days 1 and 2, SMAD2 activation (P-SMAD2) did not vary
drastically between the two conditions. In both cases, P-SMAD2 increased on day 1 and
diminished slightly by days 5 and 6. There appeared to have been some bleaching or
degradation of the SMAD2 protein in the total SMAD2/3 blots (SMAD2 being the
upper band, SMAD3 the lower). Bands for SMAD2 appeared weak and inconsistent in
the early time points across both blots. This may have been a result of the intensity of
the signal from the P-SMAD2 enhanced chemiluminescence (ECL) reaction. It had been
observed that the P-SMAD2 antibody bound with high affinity and specificity, with
extremely bright bands occurring as a result of the peroxidase reaction. This may have
generated enough energy to damage the SMAD2 protein for the total SMAD2/3
antibody binding, performed after the P-SMAD2 blot. Nonetheless, this effect was
relatively similar across the Activin A and Activin A +Wnt3a blots, so did not interfere
with their comparison.
Although the data in figure 3.15 was from a single experiment, the two differentiation
conditions were compared in parallel and the data accompanies the gene expression data
in figures 3.13 and 3.14. The differences in the effects of the two conditions therefore
clarify some of the signalling occurring during the enhanced DE differentiation when
using Wnt3a. Wnt3a appears to increase the level of Β-CATENIN, which may then
directly lead to an increase in the expression of NODAL and CRIPTO in the first two
days of differentiation. This increase may be as a result of direct transcriptional
regulation by β-catenin, since NODAL transcript is also raised at day 1. A combination
of increased NODAL, CRIPTO and B-CATENIN then correlates with improved DE
differentiation, suggesting the action of both these signalling networks cooperatively
activates the mesendoderm gene program. The data throw up a question regarding the
involvement of Smad2 however. In the first crucial two days of differentiation, P-
SMAD2 levels in the presence of Wnt3a were fairly similar to those in Activin A-only,
however NODAL and CRIPTO were raised and mesendoderm differentiation was
improved. This suggests that although signalling via Smad2 is crucial, Wnt/β-catenin
signalling, along with other factors, may contribute directly to regulate differentiation.
Regulation of the transcriptional activity of P-SMAD2 may also occur downstream, and
may be crucial in modulating its effect.
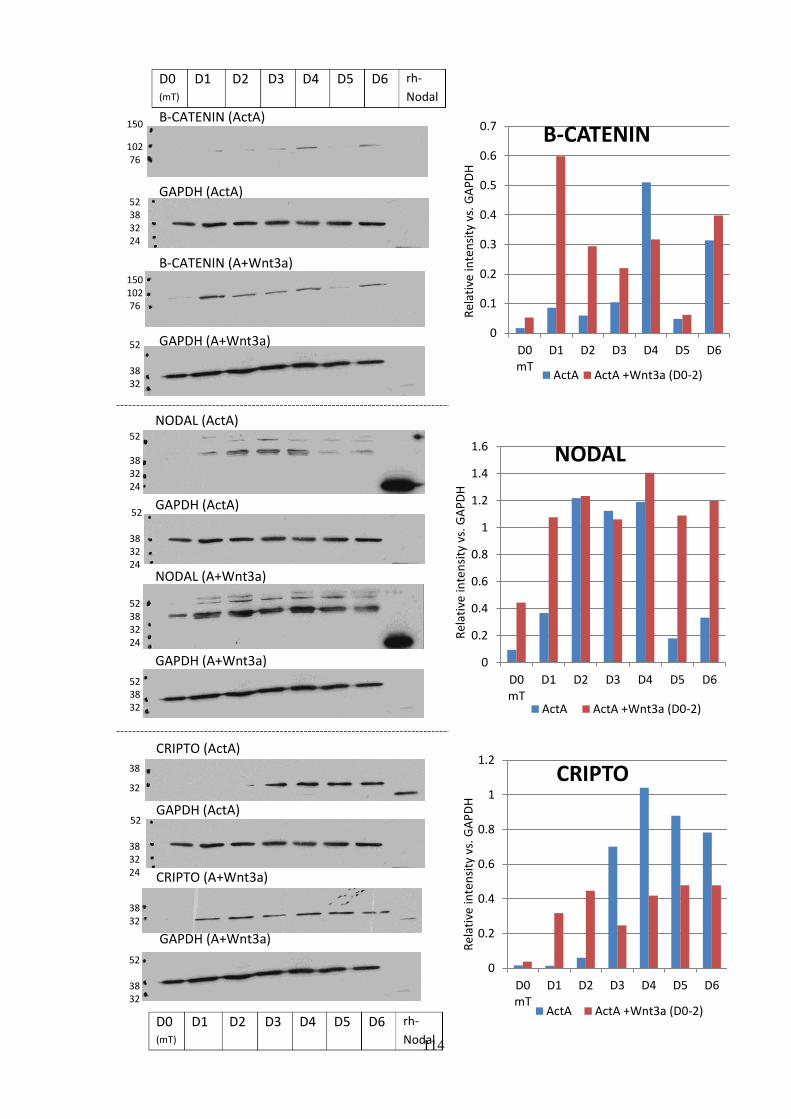
114
0
0.1
0.2
0.3
0.4
0.5
0.6
0.7
D0mT
D1 D2 D3 D4 D5 D6
Rel
ativ
e in
ten
sity
vs.
GA
PD
H
B-CATENIN
ActA ActA +Wnt3a (D0-2)
0
0.2
0.4
0.6
0.8
1
1.2
D0mT
D1 D2 D3 D4 D5 D6
Rel
ativ
e in
ten
sity
vs.
GA
PD
H
CRIPTO
ActA ActA +Wnt3a (D0-2)
D0 (mT)
D1 D2 D3 D4 D5 D6 rh-
Nodal
Β-CATENIN (ActA)
GAPDH (ActA) Β-CATENIN (A+Wnt3a)
GAPDH (A+Wnt3a)
NODAL (ActA) GAPDH (ActA) NODAL (A+Wnt3a)
GAPDH (A+Wnt3a)
150
102 76
52 38 32 24
150 102 76
52
38 32
52
38 32 24
52
38 32 24
52 38 32 24
52 38 32
CRIPTO (ActA)
GAPDH (ActA)
CRIPTO (A+Wnt3a)
GAPDH (A+Wnt3a)
D0 (mT)
D1 D2 D3 D4 D5 D6 rh-
Nodal
38
32
52
38 32 24
38 32 52
38 32
0
0.2
0.4
0.6
0.8
1
1.2
1.4
1.6
D0mT
D1 D2 D3 D4 D5 D6
Rel
ativ
e in
ten
sity
vs.
GA
PD
H
NODAL
ActA ActA +Wnt3a (D0-2)

115
3.3.4 Immunostaining of pluripotency and DE markers
Qualitative assessment of the enhancing effect of Wnt3a on high Activin A-mediated
differentiation was performed using immunofluorescence microscopy. Hues1 cells
differentiated in parallel with those used for analysis in figures 3.14 and 3.15 were fixed
at day 0 and day 5 of differentiation. Antibodies against OCT4, NANOG and SOX17
were used as in chapter 3.2
Figure 3.16 shows representative images from the experiment. In terms of expression of
the pluripotency factors, the cultures at day 0 stained fairly uniformly for OCT4 and
NANOG as expected. By day 5, both differentiation conditions showed greatly reduced
Figure 3.15 – Western blots of Hues1 cells differentiated for 6 days using Activin
A (ActA) or Activin A +Wnt3a for days 0 – 2 (A+Wnt3a) in parallel. The sample
sets of each different condition were run on separate blots and analysed in parallel.
The first lane contained a molecular weight markers, annotated on the left hand
side in kilodaltons (kDa), and the last lane contained mature recombinant NODAL.
Blots are shown with corresponding loading controls below. For blots Β-
CATENIN, NODAL and CRIPTO, the loading control used was GADPH, and for
P-SMAD2, total SMAD2/3 was used. Semi-quantitative analysis of band intensity
was performed on the blots and analysed using ImageJ. Band intensity was
expressed relative to the loading control, and illustrated graphically on the right
hand side.
76
52
38
76
52 38
76
52
38
76
52 38
P-SMAD2 (ActA)
SMAD2/3 (ActA)
P-SMAD2 (A+Wnt3a) SMAD2/3 (A+Wnt3a)
D0
(mT) D1 D2 D3 D4 D5 D6 rh-
Nodal
0
0.2
0.4
0.6
0.8
1
D0mT
D1 D2 D3 D4 D5 D6
Rel
ativ
e in
ten
sity
vs.
to
tal S
mad
2/3
P-SMAD2
ActA ActA +Wnt3a (D0-2)

116
staining for OCT4, and staining for NANOG seemed to have slightly reduced in
brightness and the number of cells it occurred in, as had been seen previously for cells
in Activin A-only (figure 3.10). The first difference observed when comparing the two
conditions at day 5, particularly when looking at images with DAPI-staining, was the
difference between the arrangement of cells in the cultures. When differentiation was
supplemented with Wnt3a, there seemed to be more areas of the culture which were less
dense, with more loosely arranged cells by day 5 (figure 3.16, white arrows), compared
to Activin A only. There were also more identifiable small dense clusters or aggregates
observable (striped arrows, low magnification images). While some of these features
were observed in day 5 culture differentiated with Activin A-only, they were much less
frequent, with the culture comprised of fairly densely and evenly arranged cells. This
was slightly disparate with what had been observed previously by day 5 for cells
differentiated with Activin A-only (figure 3.9 and 3.10). The batch of Activin A used
for this experiment was E.coli derived. As discussed in chapter 3.2.6, E.coli derived
Activin A did not seem to grossly affect the level of differentiation marker expression in
cells when analysed by qPCR (since expression of Activin A-only cells in figure 3.13
was not markedly different from that in 3.4), but led to markedly less cells staining for
SOX17 by day 5. This was frustrating, as comparing the proportion of SOX17
expression in cultures with previous experiments was therefore not valid. However, this
did not affect direct comparison of the differentiation conditions within this experiment.
There appeared to be a greatly increased proportion of cells staining positive for SOX17
as a result of the addition of Wnt3a. The areas of less dense loosely arranged cells in
Activin A +Wnt3a cultures (white arrows) were where the lowest incidence of NANOG
staining occurred, and the highest incidence of SOX17 staining (as had been observed
during differentiation in figure 3.9 and 3.10). These characteristics confirmed that
differentiation had been induced more effectively using Wnt3a. The lower
magnification image of SOX17 staining at day 5 has been included to allow a clearer
impression of the extent of expression. The observations in section 3.2.5, that the areas
of less dense more loosely arranged cells correlated with a higher incidence of
pluripotency marker down-regulation and DE marker up-regulation, is repeated here in
cells differentiated with Wnt3a. The effect of Wnt3a that leads to improved DE
differentiation may therefore relate to a function in regulating cell proliferation or EMT.

117
Day 0 (mT) Day 5 (ActA) Day 5 (A+Wnt3a)
OCT4
NANOG
SOX17

118
Day 5 (ActA) Day 5 (A+Wnt3a)
SOX17
IgG
Day 0 (mT) Day 5 (ActA) Day 5 (A+Wnt3a)
mIgG gIgG gIgG gIgG
Figure 3.16 – Fluorescence microscopy of Hues1 cells at day 0 and 5 following
differentiation with either Activin A (ActA) or Activin A +Wnt3a (A+Wnt3a).
Immunofluorescence staining for each target antibody is shown with a corresponding
+DAPI merge image below. NANOG and SOX17 antibodies were goat IgG (gIgG),
and OCT4 was a mouse IgG (mIgG), the day 0 control antibody stained being double
labelled for both. Low magnification images of SOX17 staining at day 5 are also
included, with the scale bar = 150µm. For the rest, bar = 100µm.

119
3.3.5 Quantitation of changes in NANOG and SOX17
In order to quantify the improved level of differentiation resulting from addition of
Wnt3a during the first two days, as well as investigate the correlation between changes
in SOX17 and NANOG expression, flow cytometry was performed. Two individual
runs of analysis from independent experiments were used, the first of which was done in
parallel with the samples in figures 3.14-16, the second at a later date. Cells at day 0 and
5 of differentiation were dissociated, fixed and permeabilised, and incubated with
conjugated Nanog-AF488 or Sox17-PE antibodies and analysed on a flow cytometer. In
the case of the first experiment, cells were also double labelled with Nanog-AF488 and
Sox17-PE.
Figure 3.17a shows example plots of FS vs. SS for day 0 and day 5. These were
generated for each sample analysis in order to identify the whole single cell population
which was gated, excluding cellular fragment, debris and aggregates. As had been
observed previously, there were higher amounts of debris and cell fragments present in
samples at day 5 than day 0. Comparing the two differentiation conditions at day 5,
there were also more debris and cell fragments observed in Activn A-only cells than
Activin A +Wnt3a cells (black arrows). As observed previously, differentiation seemed
to encourage more cell death or degradation in cultures, generating greater amounts of
cellular fragments and debris. However this effect was less evident when Wnt3a was
included. Wnt3a may therefore have a direct or indirect effect on cell viability, by
inhibiting apoptosis or promoting differentiation.
Figure 3.17b and 3.17c show overlaid plots from two individual experiments of cells at
day 0, day 5 ActA and A+Wnt3a stained with Nanog-AF488 or Sox17-PE antibody.
The samples collected and analysed in figure 3.17b were done so in parallel with those
samples used in the qPCR, western blot and immunofluorescence microscopy analyses
in figure 3.14-6. Gating to identify positives (R9 or R6) was applied using the same
approach outlined in section 3.2.6. Hues1 cells differentiated for five days with Activin
A or Activin A +Wnt3a showed a reduced percentage of cells positive for NANOG
expression compared to pluripotent day 0 cells. There seemed to be a gradual shift to the
left on the X-axis in the day 5 samples, indicating parts of the population were slowly
losing NANOG expression. By day 5, both experiments showed a slightly lower
percentage of cells positive for NANOG when treated with Wnt3a compared to Activin
A-only. Although there was slight discrepancy between the two experiments as to the
precise percentages, in both cases a clear shift along the X-axis and a less well defined
120
NANOG expressing population was evident in Wnt3a treated cells. This observation
supported the qPCR data in figure 3.13 showing a reduced level of NANOG transcript
throughout the time course compared to Activin A-only. It suggests that Wnt3a may
enhance differentiation by promoting the down-regulation of pluripotency factors such
as Nanog. Analysis of cells stained using Sox17-PE across the two experiments
indicated in both cases a modest increase in the percentage of cells positive for SOX17
expression when differentiated with Activin A-only (~1%), and a raised percentage
when supplemented with Wnt3a (3-15%). These observations recapitulated the
qualitative data in figure 3.16, quantitatively illustrating the enhanced DE-
differentiation in hESCs using Activin A +Wnt3a. As mentioned in chapter 3.2.6 and
3.3.4 above, the E.coli derived Activin A used for this experiment was identified as
eliciting less SOX17 expression in cells compared to insect-derived Activin A, and so
the percentages of SOX17 expression in the Activin A-only treatment in figure 3.17
were low (compare to figure 3.11). However, the relative positive effect of Wnt3a on
DE induction was clear in both these experiments. If the Activin A used had been from
the same batches that induced higher percentages of SOX17 expression in other Activin
A-only experiments (appendix A.1), it would have been interesting to know the extent
to which Wnt3a would have enhanced differentiation.
In order to investigate a link between the increase in SOX17 expression and decrease in
NANOG expression in cells by day 5, double labelling and analysis was performed on
samples. This was done in parallel with the samples analysed in figure 3.17b. The
emission spectrum of AF488 exceeds the 530/40nm filter and is picked up by the PE
detection filter (575/25nm). This requires compensation to be applied to the PE reading.
Figure 3.17d-g shows this process. Using cells at day 0, an unstained sample was
analysed for PE and AF488emission to establish the mean X- and Y-axis positions
without labelling (highlighted in red box). Then a Sox17-PE labelled sample was
analysed, causing a shift along the X-axis (PE) and only a negligible shift along the Y-
axis. A Nanog-AF488 labelled sample was then analysed, causing a shift along the Y-
axis (AF488) but also along the X-axis. Compensation was therefore applied to
reconcile the X-axis shift. This was then automatically applied to all double labelled
samples. Quadrant gating (R5-8) was then also established based on the individually
labelled day 0 samples. Figure 3.17h-j shows double labelled samples for day 0 (H), day
5 ActA (I) and day 5 A+Wnt3a (J). Visualising the data over 2 axes allowed the
different populations within the samples to become clearer. At day 0, the sample had a

121
A Day 0 (mT)
Day 5 (ActA)
Day5 (A+Wnt3)
B
C
Nanog-AF488 Sox17-PE
D0 (mT) – 93.0%
D5 (ActA) – 76.9%
D5 (A+Wnt3a)
- 75.1%
D0 (mT) – 0.31%
D5 (ActA) – 1.04%
D5 (A+Wnt3a)
- 15.2%
D0 (mT) – 83.5%
D5 (ActA) – 73.1%
D5 (A+Wnt3a)
- 67.2%
D0 (mT) – 0.34%
D5 (ActA) – 1.01%
D5 (A+Wnt3a)
- 3.27%
Nanog-AF488 Sox17-PE
D Unlabelled E SOX17 F NANOG G NANOG (compensate)
92.10% 0.17%
7.58% 0.14%
75.81% 1.00%
23.02% 0.16%
57.50% 14.97% 23.89% 3.64%
H Day 0 (mT) I Day 5 (ActA) J Day 5 (A+Wnt3a)
SOX17-PE NA
NO
G-A
F48
8

122
clearly identifiable NANOG/SOX17 +/- population (R5, 92.1%), and a straggling tail of
-/- cells (R7, 7.6%). In comparison, by day 5 of Activin A-only treatment, the -/-
population increased drastically to 23%. Importantly, the increase (although modest) in
SOX17 positive cells was observed in R6 (1%), cells which were also still positive for
NANOG expression (+/+). For cells differentiated in Activin A +Wnt3a, there was
comparatively no difference in the NANOG/SOX17 -/- population (R7, 23.9%) ,
however the big increase in SOX17 expression as a result of Wnt3a was mostly an
increase in the +/+ population (R6, 15%). A small population of -/+ cells were also just
beginning to emerge (R8, 3.6%), accounting for the overall slight reduction in the
expression of NANOG as a result of Wnt3a. These plots therefore portray some key
dynamics in the process of differentiation. The SOX17 expressing cells that emerged as
a result of treatment with Activin A (with or without Wnt3a) were still predominantly
expressing NANOG. Therefore, repression of Nanog may not be initially required to
Figure 3.17 (previous page) – Flow cytometry analysis of Hues1 cells differentiated
with either Activin A (ActA) or Activin A +Wnt3a (A+Wnt3a). Cells were analysed
using Nanog-AF488 or Sox17-PE conjugated antibodies at day 0 and 5 of
differentiation. A) Example plots of forward scatter (FS, X-axis) vs. side scatter (SS,
Y-axis) at day 0 and 5 of differentiation. The identifiable whole cell population has
been gated in each and used for further analysis. B - C) Plots of Nanog-AF488 and
Sox17-PE emission (X-axis) of two individual experiments at day 0 (grey peak) and
day 5 using ActA (red peak) and A+Wnt3a (green peak). Gating (R6 or R9) has been
applied to each plot to identify the relative positives, based on the day 0 control cells.
Tables below show the data, with the positives circled in red. D - J) Plots comparing
Sox17-PE (X-axis) and Nanog-AF488 (Y-axis) emission of samples. (D) A day 0
unstained control was used to establish the mean emission on both axes. (E) Day 0
Sox17-PE labelled cells gave negligible background in the AF488 sensor, however
day 0 Nanog-AF488 labelled cells (F) gave background in the PE sensor, causing a
shift along the X-axis (note the increased mean). (G) Compensation to the X-axis
(PE) of the day 0 Nanog-AF488 sample was applied based on the unstained control.
This compensation was then applied automatically to double labelled cells at day 0
(H), and day 5 differentiated with ActA (I) or A+Wnt3a (J). Quadrant gating was
established using the day 0 cells, identifying cell populations as NANOG/SOX17 -/-
(R7), +/- (R5), -/+ (R8), and +/+ (R6).

123
achieve a mesendoderm differentiation program in cells. Nanog may even have an early
role in regulating differentiation. However, given the eventual presence cells in the
SOX17 expressing population that no longer expressed NANOG, it is possible that DE
differentiation involves cells passing through stages of commitment, represented by the
status of NANOG expression. It seems likely given the spread of cells in figure 3.17j
that cells become first NANOG/SOX17 +/+, then become -/+. However since these
populations are not distinct separated cells may gradually shift from being the former to
being the latter. Finally, this progression through stages of differentiation towards a
Nanog-negative/Sox17-positive population as a result of Wnt3a addition may indicate
an improvement in efficiency and bona fide DE induction. Such cells may be more
representative of those DE cells that emerge during embryo differentiation. The initial
exposure to Wnt3a during the first two days of Activin A-mediated mesendoderm
differentiation of hESCs would therefore greatly enhance progression towards a mature
DE-like state, recapitulating the effect of Wnt3 during mouse embryo development.
3.4 Conclusions and discussion
Experiments performed in this chapter established an hESC differentiation system for
the investigation of TGFβ- and Wnt-signalling during Activin A-mediated
differentiation. Addition of high Activin A for six days in a chemically defined system
induced time-wise induction of markers indicative of primitive streak, mesendoderm
and DE lineages, as well as increased the amount of Nodal-signalling components.
Supplementation with Wnt3a over days 0 to 2 of the differentiation protocol enhanced
these features, leading to more widespread SOX17 expression throughout the culture.
Conclusions about the potential role of Nodal signalling during differentiation can
therefore be drawn. The data showing the enhanced differentiation observed with the
addition of Wnt3a contributes to what is currently understood about the function of
Wnt-signalling during DE differentiation. Finally, the presence of cells expressing both
the DE marker Sox17 whilst still expressing Nanog presents interesting evidence
pertaining to the regulation of DE differentiation in hESCs.
The effectiveness and limitations of the experimental system and results need to be
considered in order to validate the strength of its conclusions. Hues1 was deemed a
viable choice of stem cell line as it is fairly well established and has been used in
several publications (Braam et al., 2008; Brafman et al., 2010; Oldershaw et al., 2010).
It is known within our lab to have karyotypic abnormalities, however these may not

124
necessarily have an impact on the process of differentiation. Within our lab it has been
well adapted to enzymatic dissociation and feeder free culture, making it a useful line
for differentiation experiments with the system used here. It has been shown using
broad transcriptome analysis that different hESC lines have propensities towards certain
lineages of differentiation, with Hues1 shown have a medium to weak propensity to
enrich for DE-lineage transcripts during EB formation (Bock et al., 2011). However,
since this project is interested in the early stages of differentiation, and particularly the
mechanisms and signalling underpinning it, lack of a strong propensity is unlikely to be
detrimental. Validation of the key data in a second cell line, even just the expression
profile of a set of markers during Activin A treatment, would have been ideal. This was
in fact attempted, both in Man7 and Hues3, however different problems were
encountered with both. It was found difficult to expand Man7 cultures using the feeder
free culture system to usable quantities. The rate of doubling of this in-house line was
found to be slower compared to Hues lines, which was noticeably exacerbated when
cultured feeder free. Hues3 exhibited no such problem, and two differentiation
experiments were run within a brief time window of each other. However, the batch of
Activin A used, despite being insect-derived, was subsequently found to elicit almost no
effect on hESCs (an issue taken up with the manufacturer). Gene expression data for
Hues3 cells resembled that shown in figure 3.8 (in the absence of Activin A), and was
deemed unrepresentative. Time constraints then precluded a repeat experiment.
The chemically defined feeder free system for both pluripotency culture and
differentiation facilitated investigation into the effect of Activin A treatment. The
differentiation system used here contained similar components to that used for
pluripotency culture in the report by Baxter, as well as the differentiation system used
by Vallier (Baxter et al., 2009; Vallier et al., 2009c). This makes comparison of the data
with results from such reports using similar feeder-free culture/differentiation
conditions easier. The only other exogenous growth/signalling factors comprising the
system other than fibronectin and Activin A were those present in at low concentrations
in B27 supplement, including insulin amongst many others. The inclusion of such
factors to promote survival and viability is widespread in feeder-free differentiation
protocols (see table 1.1). As illustrated by the FF-base only control experiment, the
constituents of the differentiation system alone do not elicit discernible activation of
endogenous TGFβ signalling or differentiation towards any particular lineage. Although
their direct contribution during Activin A-mediated treatment is not known, they are

125
unlikely to have a drastically positive or negative impact on the initiation of a
mesendoderm differentiation program.
Using a defined system with very few components to investigate differentiation of
hESCs created a slight vulnerability to growth factor batch variation, as was observed
with the differently derived Activin A. Furthermore, addition of high Activin A-only is
relatively inefficient at targeting DE differentiation even when all conditions are
optimal, as has been observed previously (table 1.1)(Zhou et al., 2008). However, the
gene expression profiles of hESCs during six days of differentiation with high Activin
A-only reflected some of what has already been established during hESC differentiation
in previous reports. In a time-wise manner, induction of a gene program was observable
whereby expression of early primitive streak and mesendoderm genes increased then
decreased, DE markers steadily increased, and Nodal related components were up-
regulated early in the time-course (D’Amour et al., 2005; Greber et al., 2008; Vallier et
al., 2009c). Therefore, Activin A-only induced DE differentiation within the culture as
previously seen. Currently one of the most successful protocols reported by Touboul
and colleagues is an adaptation of the Vallier protocol in table 1.1, with the addition of
PI3k inhibitor LY294002 along with high Activin A, Bmp4 and Fgf2 (Touboul et al.,
2010). This induced up to 80% Cxcr4 positive cells, compared with an average of 12%
and a maximum of 38% Sox17 positive cells here. Investigating the role of endogenous
factors such as Nodal in DE differentiation in an inefficient system as here requires
conclusions relating to their role to be drawn tentatively, since any trend or function
observed might not be exactly the same in a more efficient system. However, the system
used here offered a benefit in identifying what endogenous factors may be present and
active during differentiation. Since the only exogenous factor added during
differentiation is Activin A, resulting differentiation relies on direct signalling by
Activin A as well as the function of the endogenous factors it induces e.g. Nodal, Wnt3,
Bmp4 etc. This then allows clearer identification of whether these factors are present
and, if disrupted or enhanced, whether they have a role. The effect of Wnt3a on
differentiation or signalling was also clear, since any enhancement or change during
differentiation only occurred as a direct or indirect result of its inclusion. With
inefficient differentiation, day 5 might be a slightly early time point to qualitatively and
quantitatively analyse differentiation, however it may also be the most insightful point
in terms of the underlying mechanisms regulating differentiation, representing a
commitment or tipping point.

126
The role of Nodal signalling during primitive streak and DE specification has been long
established during mouse development, and at the transcript level is shown to increase
early on in hESCs during targeted differentiation to DE (Brennan et al., 2001; D’Amour
et al., 2005). NODAL and CRIPTO peptide were increased in hESC lysate in the first
four days of differentiation during high Activin A treatment, and the amounts on days 1
and 2 raised even higher upon Wnt3a addition. This implied but did not confirm an
involvement in DE differentiation. Attempts to detect NODAL in the medium could not
confirm or dismiss its presence. This failure was due to a lack of a sufficiently sensitive
or refined method for detecting endogenously expressed levels of a growth factor
known to be unstable and/or rapidly endocytosed and processed by cells. It does not
preclude its presence there, although identifying it would have strengthened a case for
its role. The failure to confirm both its presence in the medium and the presence of the
mature peptide in cells means it is not known whether the increasing concentrations of
NODAL detected in cell lysates related to functionally signalling Nodal (although this
is very unlikely given data in chapter 5.3 and chapter 6). The increase in NODAL and
CRIPTO upon Wnt3a addition did not lead to a greatly enhanced activation of Smad2,
however again the sensitivity or application of the western blot system may have been
insufficient to detect a slight difference. Mechanisms by which Smad2 signalling might
be modulated, and how specific characteristics of Nodal and Cripto signalling may have
a direct role in the differentiation process in parallel to Activin A, are discussed in
chapters 5 and 6.
Wnt3a supplementation of high Activin A led to improved DE differentiation in Hues1.
Despite identifying a statistically significant increase in mesendoderm/DE marker gene
expression, more experiments could have been conducted to explore further the
enhancing effect. Repeated analyses of Nodal signalling components by western blot
and NANOG and SOX17 expression by flow cytometry may also have led to the
enhancing effects of Wnt3a being statistically certifiable. The addition of Wnt3a caused
some increase in the expression of WNT3 and WNT8A, and increased cytoplasmic B-
CATENIN. These data suggest that Wnt3a enhancement of differentiation occurred
through endogenous Wnt/β-catenin signalling. Whether the enhancing effect of Wnt3a
was indeed via the endogenous mechanisms could have been confirmed with the use of
specific inhibition during differentiation, e.g. using exogenous Dkk1.
Wnt-signalling has been identified as directly regulating Nodal (Ben-Haim et al., 2006),
and inferred as a key regulator of Cripto (Morkel et al., 2003), during mesendoderm

127
development in the mouse. To a certain extent this has been recapitulated in the data
here, with the levels of both peptides raised on day 1 as a result of Wnt3a addition.
Interestingly, there was no increase in the level of CRIPTO transcript above Activin A-
only treatment however, indicating transcriptional regulation of Cripto is not solely
dependent on β-catenin. If β-catenin has a direct role in regulating Cripto expression, it
may be in conjunction with other factors. Mechanisms by which Wnt-signalling might
enhance DE differentiation can be gleaned from array studies in β-catenin knockout
mice. The report by Morkel and another by Lickert and colleagues identify potential
direct roles for β-catenin positively regulating Nanog, Eomes, Cripto, T, Sox17, Fgfr1,
multiple other Wnt-signalling components, and negatively regulating Sox2 and Cer1
(amongst many other targets) (Lickert et al., 2005; Morkel et al., 2003). The observation
of increased B-CATENIN and enhanced expression of mesendoderm targets in Hues1
as a result of Wnt3a addition correlates with these examples from mouse data. The
exception would be the reduced expression of Nanog in Hues1 as a result of increased
Wnt-signalling. However, there may be other endogenous factors regulated by β-catenin
(e.g. Bmp4 and its downstream signalling) which subsequently negatively regulate
Nanog.
The data here expand on what was observed by Hay and colleagues in hESCs in terms
of the factors which are specifically affected by Wnt3a supplementation of high Activin
A, most critically GSC, Nodal, and Nanog. They also suggest mechanisms by which
differentiation is enhanced, through an increase in Nodal signalling components, and
more widespread differentiation of cells throughout the culture. A report by Jackson and
colleagues in mESCs similarly identified an early role for Wnt-signalling. The report
showed that Wnt3a positively regulated mesendoderm differentiation when added over
days 1.5 to 3 of differentiation (half a day before Activin A), and promoted expression
of Nodal (Jackson et al., 2010). The early temporal window of effectiveness for Wnt3a,
both shown here and by Jackson, further suggests that its role is direct transcriptional
regulation of early primitive streak and mesendoderm markers across cells in the
culture. B-catenin has been shown to be able to induce mesendoderm/DE differentiation
in hESCs, combining with endogenously activated TGFβ/Smad2 signalling (Sumi et al.,
2008). A report by Bone and colleagues recently used 1m, a novel small molecule
inhibitor of GSK3β (which normally promotes degradation of β-catenin), to elegantly
illustrate this cooperative relationship. 1m was found to specifically promote β-catenin
signalling, with the effect of inducing mesendoderm, mesoderm and DE marker gene
128
expression in hESCs in pluripotency culture. More efficient targeted differentiation
occurred when 1m was combined with high Activin A, inducing 61% CXCR4
expression and high levels of DE marker expression. This effect was shown to be
Smad2/3 dependent, and it was inferred by transcript data that a key mechanism was via
enhanced NODAL expression (Bone et al., 2011). The data in this chapter can be
combined with such findings by Sumi and Bone, and inferences from the mouse, to
generate a more detailed model for the activity of Wnt-signalling in hESC
differentiation. Wnt/β-catenin specifically enhances NODAL and its associated
signalling components, then either cooperates or synergises with Smad2/3 signalling at
the transcriptional level to positively regulate mesendoderm targets. It may then have
added direct or indirect functions negatively regulating pluripotency factors, and
promoting survival and EMT.
Co-factors that modulate Nodal/Smad signalling during DE specification in both mouse
and hESCs have been identified, such as FoxH1, Eomes and Nanog (Arnold et al.,
2008; Norris et al., 2002; Vallier et al., 2009a). Here, improved DE differentiation upon
Wnt3a addition appeared to be concomitant with an early increase in expression of
EOMES and FOXH1, and a slight but distinct reduction of Nanog at the transcript and
protein levels. Recent reports have shown Nanog can directly associate with active
Smad2/3 in hESCs to positively regulate pluripotency. Large overlaps in binding and
regulation of common gene targets in pluripotent cells by Smad2/3 and Nanog have
recently been identified (Brown et al., 2011). Previously, combined activity of Smad2/3
and Nanog was shown to allow mesendoderm differentiation but specifically inhibit DE
differentiation, since expression of more mature DE markers (e.g. Sox17) was inhibited
by Nanog overexpression (Vallier et al., 2009a). The role of Nanog and other
pluripotency factors during DE differentiation was explored in another report also from
the Vallier lab. Expanding their earlier findings, Teo and colleagues found that Nanog
(and Oct4) are coexpressed with Eomes and Brachyury in the first 24 hours of DE
differentiation, and that Nanog shRNA reduced expression of many mesendoderm and
DE markers (including SOX17). They showed that pluripotency factors directly regulate
Eomes expression, which forms a complex with Smad2/3 and shares binding sites of
over 3000 genes, together forming the core transcriptional regulators leading to DE
differentiation (Teo et al., 2011a). This suggests a Nanog-mediated Eomes-Smad2/3
dependent mechanism for mesendoderm differentiation. Immunofluorescence
microscopy data here showed a maintained presence of NANOG by day 5 even in cells

129
differentiated with Activin A +Wnt3a. The subsequent identification that a large
majority of differentiating hESCs co-express SOX17 and NANOG is novel evidence
that further supports a Nanog/Eomes dependent model of differentiation. The previous
observation that Nanog inhibits DE differentiation and Sox17 expression is slightly
disparate with this. However, Nanog may have a later role in negatively regulating DE
differentiation, e.g. maintained Nanog expression may prevent Sox17 expressing cells
from differentiating further along anterior DE cell lineages. The emergence of a
NANOG/SOX17 -/+ subpopulation during differentiation with Wnt3a may have
represented cells that had achieved such a later more anterior stage of commitment.
During embryo development in the mouse, the gradual disappearance of Nanog occurs
in an anterior to posterior gradient, expressed at low levels still by E7.5 (Hart et al.,
2004).
The expression profile amongst Sox17+ cells has been analysed specifically in a recent
study using FACS of a Sox17-eGFP expressing hESC line. Following differentiation to
DE and beyond towards pancreatic endoderm (using the protocol in D’Amour et al.,
2006), transcripts for Oct4 and Sox2 were very low in Sox17+ cells compared to Sox17-
cells and control pluripotent hESC. However, following targeted differentiation through
DE-stage and gut tube-stage (stages 1 and 2), Nanog transcript was only slightly lower
in Sox17+ compared to Sox17- cells, and was higher in both compared to pluripotent
control cells (Wang et al., 2011a). The double labelling of cells for NANOG and
SOX17 in this report therefore enhances recent data, highlighting a maintained presence
and possible role for Nanog as part of the early differentiation program, and as a
potential obstacle to later maturation of DE. FACS could be performed of double
labelled cells to further explore this, in order to separate the two populations
(NANOG/SOX17 +/+ and -/+) at the critical day 5 stage of differentiation. Investigating
the transcriptional profile of these two populations would lead to a clearer
understanding of Nanog’s function. Establishing hESC lines with Nanog and Sox17
expression reporters would allow further analysis, since FACS could be performed on
live cells and the two populations cultured further. Lineages resulting from directed and
non-directed differentiation of the two populations would reveal the different
populations’ propensity for different DE-lineages, and the role of Nanog in the context
of DE maturation and regulation.

130
CHAPTER 4 Activation of Smad3 during Activin A mediated
differentiation of hESCs towards DE
The TGFβ ligands Activin A and Nodal both induce activation of the intracellular
signalling molecules Smad2 and Smad3. The active forms of these molecules are the
effectors of signalling, translocating to the nucleus and regulating gene expression in
association with other factors. In the developing mouse embryo, Smad2 and Smad3
have been shown to be active following gastrulation, with Smad2 playing a crucial role
in specifying cells as mesendoderm and DE (Liu et al., 2004; Tremblay et al., 2000;
Vincent et al., 2003). The combined Smad2/3 network has recently been shown to
associate with a wide range of gene target promoters and enhancers in both pluripotent
and DE-differentiating hESCs (Brown et al., 2011; Kim et al., 2011). In chapter 3,
SMAD2 phosphorylation was observed during high Activin A treatment. In an attempt
to generate a clearer picture on the dynamic changes that occur in Smad2 and Smad3
activity during differentiation, assessment of their activation of luciferase reporters was
performed. Difficulties were experienced generating a Smad2 reporter line, however
data from a Smad3 reporter line suggested that during Activin A treatment, Smad3 is
not activated above the level observed in pluripotent hESCs. This supports the model
that Smad2 has a more prominent role during DE differentiation.
4.1 Functional analysis of Smad/Luciferase reporter plasmids
Analysis of the key DNA binding motifs of the active Smad signalling complexes has
led to the generation of two reporter constructs used frequently in literature. The AR3
reporter is activated through binding of the active Smad2/4/FoxH1 complex (Chen et
al., 1996, 1997; Hayashi et al., 1997), and the CAGA12 reporter through the binding of
the active Smad3/4 complex (Dennler et al., 1998). Both reporters were available
upstream of the luciferase gene, present in the Promega pGL3 vector (chapter 2.7 figure
2.3). These were available in house courtesy of T.McKay. Functional analysis of these
reporters was performed in 293FT cells. Ten micrograms of plasmid was transfected
into 293FT cells, and in the case of pGL3-AR3/Luc cells were cotransfected with 2µg
of a Myc-tagged FoxH1 expression plasmid containing Xenopus 6Myc-Fast1 (as used in
Chen et al., 1997). The next day cells were split into 12 well plates, and 24 hours later
cells were exposed to FF base medium +/- 100ng/ml Activin A (chapter 2.9). Cell
lysates were collected at time points over the next 24 hours and analysed for luciferase
activity by addition of luciferase substrate (chapter 2.16).

131
Figure 4.1 shows the luciferase activity of the cells transfected with the Smad reporters
over the 24 hour period. For this assay, it was not deemed necessary to normalise the
relative light units (RLU) emitted by lysate samples as a result of luciferase activity
(e.g. to total protein or control Renilla luciferase). Calcium phosphate transfection into
293FTs was frequently observed to be efficient (see figure 4.3a), cells were transfected
simultaneously in a single preparation then split equally into wells, and the time frame
for the experiment was short. Interestingly, the -AR3/Luc reporter did not exhibit stark
activation immediately following exposure to Activin A, but increased gradually over
24hours. The reporter also indicated increasing activation of Smad2/4/FoxH1 despite
the absence of Activin A. Although it has been previously observed that 293T cells do
not normally express Nodal or Cripto (Yan et al., 2002), weak endogenous TGFβ
signalling may have been induced by components of FF base medium (e.g. in B27). It
could also have occurred due to the Myc-FoxH1 expression plasmid eliciting weak
activation of the reporter. A control transfection without the 6Myc-Fast1 plasmid should
have been included. The -AR3/Luc reporter nonetheless indicated increased activation
of Smad2 over 24hours in the presence of Activin A. Similarly, the -CAGA12/Luc
reporter indicated strong activation of Smad3 as a result of Activin A treatment, with
activation observable within 3 hours following treatment (compared to FF base control)
and increasing up until 12 hours. There seemed to be no increases in activation of the -
CAGA12/Luc reporter in the absence of Activin A in the 24hour period. These data
therefore confirmed the reporters’ responsiveness to Smad2 and Smad3 activation.
0
50000
100000
150000
200000
0 3 6 9 12 15 18 21 24
RLU
Time (hours)
pGL3-AR3/Luc
0
50000
100000
150000
200000
0 3 6 9 12 15 18 21 24
Time (hours)
pGL3-CAGA12/Luc
+ ActA
- ActA
Figure 4.1 – Activation of pGL3-AR3/Luc (Smad2/4/FoxH1) and –CAGA12/Luc
(Smad3/4) reporters in FF base +/- 100ng/ml Activin A following transfection into
293FT cells. Error bars represent the s.e.m. of the mean of two biological samples
from an individual experiment. Luciferase activity was measured by analysis of the
relative light units (RLU) emitted following addition of substrate.

132
4.2 Generation of Smad/Luciferase reporter hESC lines
4.2.1 Generating Smad/Luciferase reporter lentivectors
In order to accurately quantify Smad2 and Smad3 activation in hESCs during high
Activin A differentiation, the use of cell lines stably transduced with the
Smad2/4/FoxH1 or Smad3/4 luciferase reporters was regarded as the most appropriate
method. Transfecting vectors into hESCs, e.g. using lipofection, would have led to
episomal expression of reporters. Cell expansion during the time period of the
differentiation protocol may have led to a reduction in signal. Cells would also require
repeated transfections for each experiment. Establishing a lentivirally transduced line
would mean reporter signal would not diminish as a result of cell expansion, and the
line could then be applied to a broader range of experiments.
The reporter constructs present in the pGL3 plasmid were cloned into the pLNT-MCS
lentivector (for method and maps, see chapter 2.7.4 and figure 2.3). Agarose gels
showing the products of restriction digests are shown in figure 4.2a-c. The pGL3-
CAGA12/Luc plasmid was digested with SmaI and BamHI, and the band corresponding
to 2180bp (figure 4.2a, green box) was extracted and ligated into the EcoRI/BamHI-
digested pLNT vector backbone. The pGL3-AR3/Luc plasmid was digested with NaeI
and PstI, the band corresponding to 1920bp (figure 4.2a, blue box) was extracted and
ligated into the SpeI/PstI-digested pLNT vector backbone. DNA preps of the cloned
vectors were then tested by restriction digest (figure 4.2b). Digestion of pLNT ligated
with –CAGA12/Luc with XhoI indicated one clone with a band corresponding to the
CAGA12/Luc insert 2025bp, plus the 8625bp backbone and small fragments (red box).
This clone corresponded to the predicted map for pLNT-CAGA12 (see figure 2.3b). It
was sequenced to determine if the insert was present in the correct orientation in the
pLNT vector, with the repeated AG(C/A)CAGACA Smad3/4 binding motif present
(figure 4.2d). Following digestion with KpnI of the pLNT clones ligated with the -
AR3/Luc insert, none were found with the insert present, despite 18 in total being tested
(figure 4.2b and not shown). A second strategy was attempted, involving digestion of
pGL3-AR3 with SalI, extraction of the band corresponding to 2169bp (figure 4.2c,
orange box) and ligation into the SmaI digested pLNT-MCS vector (yellow box).
Colonies of transformed E.coli appeared on agar plates for both the vector with insert
(57) and vector only control (34) ligations, despite dephosphorylation of the vector
before ligation. Sixteen colonies were prepped and checked by digestion with

133
KpnI, with several yielding bands smaller than just the pLNT vector but none with
bands corresponding to the correct size for the –AR3/Luc insert. Several clones were
sequenced to check for the –AR3/Luc insert but none were found (data not shown).
Figure 4.2 – Generation of pLNT lentivectors containing Smad/Luciferase reporters.
For agarose gels, a molecular weight marker from 200-10,000bp was included in
lane 1. A) Agarose gel showing DNA bands of pGL3-CAGA12 and pGL3-AR3
digests. The pGL3-CAGA12 plasmid was double digested with SmaI and BamHI
(lanes 2-3). The pGL3-AR3 plasmid was sequentially cut with NaeI (lane 4), then
PstI (lanes 5-6). The coloured boxes indicate bands at the size corresponding to the
reporter constructs, which were extracted and ligated into the lentivector pLNT. B)
Clones of pLNT-AR3 and -CAGA12 digested with KpnI and XhoI (respectively).
The red box indicates a pLNT-CAGA12 clone with bands corresponding to the
correct size of backbone and –CAGA12/Luc insert. None of the clones contained the
AR3 reporter construct. C) Agarose gel showing DNA bands of alternative strategy
to clone -AR3 into pLNT vector. Following digestion of pGL3-AR3 with SalI, the
AR3/Luc insert (orange box) was blunt-ended and ligated into SmaI-digested pLNT
(yellow box). D) Sequencing reaction of pLNT-CAGA12 clone highlighted in (B),
showing repeated AG(C/A)CAGACA binding motif present in pLNT vector.
pLNT pGL3-AR3
pLNT- [CAGA12] #1-5
A B
C D
pLNT- [AR3] #1-5

134
The precise nature of the problem with the two cloning strategies used for the -AR3/Luc
reporter, was not determined. The sequence of pGL3-AR3/Luc had been checked and
was correct (data not shown), and banding on agarose gels following digestion
corresponded to predicted sizes. Nonetheless it produced strange products following
ligation into pLNT vectors. This may have been due to mutation or degradation of the
various DNA fragments from some of the methods used during the cloning such as gel
extraction or blunt ending. As a result it was decided to abandon attempts to clone the -
AR3/Luc vector into pLNT.
4.2.2 Smad3/4 reporter lentivirus generation and hESC transduction
Lentivirus containing the Smad3/4 luciferase reporter was generated as described in
chapter 2.8. 293FT cells were transfected with one of the pLNT-CAGA12/Luc or pK2-
CMV/dsRed vectors (figure 2.3), along with the lentiviral packaging and envelope
plasmids. Fresh mTeSR or FF base medium was added to collect viral particles
produced 24-40hours and 40-64hours post transfection. This was performed in several
batches, the first of which was used for direct transduction without concentration. Two
subsequent batches were concentrated by ultracentrifugation. Since there was no
antibiotic selection or fluorescence marker on the pLNT vector, the successful
production of lentivirus was confirmed either by functional assay of Activin A
responsiveness on 293FTs infected with lentivirus, or by inference from the titre of the
pK2-CMV/dsRed lentivirus generated as a control in parallel.
Figure 4.3 shows generation of pK2-CMV/dsRed and pLNT-CAGA12/Luc lentivirus
followed by direct transduction of 293FTs and Hues1 with mTeSR viral collection
medium. The pK2-CMV/dsRed vector was used to estimate the transfection efficiency
of 293FTs, which was found to be high (estimated at ~95%, figure 4.3a). Following
collection of lentivirus, functionality of the virus was assayed in fresh 293FTs (chapter
2.9). Cells were plated in 12 well plates and exposed to different dilutions of lentiviral
collection medium for 8 hours. They were then left in growth medium overnight, and
the next day treated with FF base medium +/- 100ng/ml Activin A for 6 hours and
analysed for luciferase activity. Strong induction of luciferase was indicated by high
relative light units (RLU) detected in all the samples of transduced cells exposed to
Activin A (figure 4.3b). This indicated that the viral collection medium contained
functional CAGA12/Luc lentivirus. Viral collection medium was applied to feeder free
Hues1 cells in two rounds of transduction (chapter 2.8). Cells were plated at a low
density, and the next day a 3:2 mixture of lentiviral collection medium:fresh mTeSR

135
medium added, which was repeated with a freshly prepared mixture of the media the
next day, in both cases containing 6µg/ml polybrene. Cells were then cultured feeder
free as normal in mTeSR medium. This was done in parallel for the pLNT-
CAGA12/Luc and pK2-CMV/dsRed lentiviral constructs. Fluorescence microscopy was
Figure 4.3 – Generation and direct transduction of 293FTs and hESCs with pLNT-
CAGA12/Luc lentivirus. Virus was generated by transfection of lentivectors, along
with packaging and envelope plasmids, into 293FT cells. The vector pK2-
CMV/dsRed was used to generate lentivirus and transduce hESCs as a parallel
control. A) Fluorescence and merged phase contrast microscopy of pK2-CMV/dsRed
transfected into 293FTs, indicating a high transfection efficiency. Bar = 250µm. B)
Luciferase activity in 293FT cells 24 hours following direct transduction with
different dilutions of pLNT-CAGA12/Luc viral collection medium, or untransduced
(UTd). Following transduction, cells were given FF base medium +/- 100ng/ml
Activin A, then collected 6 hours later and analysed. Each time point represents two
biological samples from an individual experiment, with the s.e.m. given as error bars.
C) Fluorescence and merged phase contrast microscopy of Hues1 cells 96hours
following transduction with pK2-CMV/dsRed. Two exposures of viral medium were
performed on the cells, done in parallel with pLNT-CAGA12/dsRed. Bar = 100µm.
C
A
0200400600800
100012001400160018002000
1x 0.5x 0.25x UTd
RLU
Concentration of lentivirus medium
CAGA12/Luc transduced 293FTs
+ ActA
- ActA
B

136
performed on the CMV/dsRed transduced hESCs four days post transduction. Although
quantitation was not performed, it was estimated that the proportion of dsRed
expressing Hues1 was approximately ~10-15% (figure 4.3c). This was slightly low,
however it was hoped that a similar efficiency in the Hues1 cells transduced in parallel
with CAGA12/Luc would be sufficient to analyse reporter signal. These cells were
cultured and expanded as normal until enough were available for experimentation (see
4.3).
Since the transduction efficiency by direct application of lentiviral collection medium in
Hues1 seemed low, concentration of the lentiviral particles was attempted. Two
successive batches of lentivirus were generated and used to transduce hESCs. Again,
pK2-CMV/dsRed lentivirus was generated in parallel as a control. Initial transfection of
293FT cells was high based on pK2-CMV/dsRed fluorescence, similar to previously
seen in figure 4.3a (data not shown). Lentiviral particles were concentrated from the FF
base collection medium by ultra-centrifugation at 28,500rpm (144,000g) for 1 hour
45mins at 4oC, the supernatant removed and particles resuspended at 100x
concentration (chapter 2.8).
Figure 4.4 shows data from the lentiviral titre assessment in 293FTs and transduction of
Hues1. The lentiviral titre of the pK2-CMV/dsRed constructs was used as a basis to
assess the amount of pLNT-CAGA12/Luc. To assess titre of the concentrated lentivirus,
1.6 x 10⁵ cells were plated in a 24 well plate with 400µl medium, with 4µl concentrated
lentivirus added 24hours later (a 1:100 dilution of virus). Transduction efficiency was
checked over the next three days fluorescence microscopy, then quantified by flow
cytometry four days later, and the number of infectious units per ml (IU/ml) calculated
with the formula: IU/ml = % transduced cells x number cells (1.6 x 10⁵) x dilution factor
(100) (method and materials 2.8). Cells expressing CMV/dsRed were observed by
microscopy in both batch #2 and #3, with more observed from batch #3 (figure 4.4a,
batch #3). Analysis by flow cytometry revealed a very low percentage of transduced
cells arising from batch #2. The respective titres based on the percentages of batch #2
and batch #3 were 2.88 x 10⁵ and 2.77 x 10
6 IU/ml. These figures represent the lowest
possible titre, since the calculation assumes no cell proliferation between plating of
293FTs and infection 24hours later, and that the 293FT cells have a multiplicity of
infection (MOI) of 1, i.e. one infectious unit can generate a stably transduced cell.
Although these scenarios are unlikely, nonetheless the figure calculated for titre is a
good lower estimate guidline. These figures were therefore used as a basis for the pLNT

137
B
Lenti- batch CMV/dsRed +ive Titre (IU/ml)
#2 1.8% 2.88 x 10⁵
#3 17.32% 2.77 x 10⁶
-CAGA12/Luc titre. A target efficiency of over 20% transduction of hESCs was chosen,
since this was higher than the estimated transduction efficiency without lentivirus
concentration, increasing the likelihood of a sufficiently high Smad3/4 reporter signal. It
Figure 4.4 – Concentrated pK2-CMV/dsRed lentivirus titre assessment and
transduction of Hues1. Two batches (#2 and #3) were generated and concentrated by
ultracentrifugation. A) Fluorescence and merged phase contrast microscopy of
293FTs transduced with batch #3 lentivirus. Bar = 100µm. B) Analysis by flow
cytometry of 293FTs 96 hours post transduction with concentrated lentivirus from
batches #2 and #3. The percentage of cells expressing CMV/dsRed was analysed and
used to calculate the amount of infectious units per ml (IU/ml). C-D) Fluorescence
and merged phase contrast microscopy of feeder free Hues1 cells 96 hours post
transduction with batch #2 (C) or batch #3 (D) CMV/dsRed lentivirus. In both cases
a small percentage of cells expressed CMV/dsRed, indicating a low transduction
efficiency. Many cells observed expressing CMV/dsRed following transduction with
batch #3 had a differentiated cell morphology (D, right hand images). Bar = 100µm.
C D
A
138
was calculated that a 12-well plate well containing 2 x 10⁵ hESCs would require 2.0 x
106 IU for 20% transduction. In the cases of batches #2 and #3, particularly #2, the titres
were well below a useful threshold even for a single well of a 12 well plate based on
this criteria. Nonetheless, what virus had been produced was used to transduce Hues1
cells. Again, pK2-CMV/dsRed was used to transduce cells in parallel. For batch #2, all
the 130µl of concentrated virus was applied to a 12 well plate-well of cells. Cells were
analysed by microscopy 72 hours later for CMV/dsRed expression (figure 4.4c). Very
few cells in the culture appeared to express dsRed. Most cells in this culture and a
parallel untransduced culture also appeared to have lost some characteristics of classic
hESC morphology, being larger and with less clear nuclei and nucleoli, apparently
unrelated to transduction with the lentivirus. This attempt was abandoned as cells
appeared compromised and with a low percentage of transduction. For batch #3, all the
concentrated virus was applied to a well of cells. Cells were analysed by microscopy 96
hours later for CMV/dsRed expression (figure 4.4d). Again however, observation by
microscopy showed what appeared to be a low percentage of cells expressing
CMV/dsRed, indicating a low transduction efficiency. Interestingly, although a few
cells that had classic hESC morphology within the monolayers of the culture were
observed expressing CMV/dsRed (figure 4.4d, left hand images), the majority of the
small number of cells expressing CMV/dsRed were the cells with a more msenchymal
appearance that have previsouly been observed to occur in feeder free hESC cultures
(4.4d, right hand images). It is possible that these cells were transduced preferentialy, or
that they were expressing dsRed and it had been silenced in other cells. The latter
seemed unlikely within four days however, and the general impression was a low
transduction efficiency. This impression was extrapolated onto the culture transduced
with pLNT-CAGA12/Luc. It was deemed well below a reliably transgenic population
for Smad3/4 analysis, and was not used for experiments.
4.3 Smad3/4 activation during Activin A treatment of hESCs
Feeder free Hues1 cells that had been transduced with pLNT-CAGA12/Luc by direct
application of viral collection medium (figure 4.3c) were cultured and expanded for
several passages before being differentiated with Activin A. These cells were designated
Hues1CAGA12
. The stably transduced cells specifically report the level of active Smad3/4
complex following its binding to the repeated AG(C/A)CAGACA motif in the genome,
leading to transcription and translation of luciferase. Two independent experiments with

139
Hues1CAGA12
cells at two successive passages (pp7 and pp8) were run. Cells were split
into 24 well plates according to the standardised protocol (chapter 2.5) and
differentiated with 100ng/ml Activin A in FF base medium or maintained in mTeSR
medium (under normal pluripotent culture conditions). For the second experiment, an
additional set of cells was also treated with FF base medium without Activin A. Cell
lysate samples were collected at the normal time points on each day (0 – 6), with an
additional sample collected at 12 hours between days 0 and 1. For each condition, three
individual samples were collected for each time point. Luciferase activity was measured
by light emission (RLU) following addition of luciferase substrate (chapter 2.16). Since
there was no control constitutive Renilla luciferase construct accompanying the
CAGA12/Luc reporter, the total protein content of lysate samples was measured in
order to normalise any increase in luciferase signal as a result of cell proliferation. The
total protein content of an individual well or culture will increase as a result of cell
proliferation, although possibly not always in direct proportion with cell number. By
expressing the RLU of each sample relative to the amount of protein (RLU/µg protein),
the effect of cell proliferation on reporter signal is corrected to some degree.
Figure 4.5 shows the luciferase activity normalised to total protein (RLU/µg protein) of
the different treatments. For Activin A and mTeSR treated cells, the data represent the
combined averages of two experiments, and for FF base the data represent just the
averages of the three samples from a single experiment. Within the initial 12 hours of
Activin A treatment, cells showed an increase in the level of Smad3/4 compared to
those maintained in mTeSR or FF base medium. However, by 24 hours this high level
of Smad3 activity was no longer maintained, with levels decreasing from 48 hours
onwards, with activity by 96 hours similar to cells in FF base medium. Direct
comparisons of Smad3 activity cannot be made with the Smad2 activation data from
chapter 3, since there the level of P-Smad2 was analysed by western blot. The reporter
here indicated the amount of Smad3/4 signalling occurring, not simply P-Smad3.
Nonetheless, as a guideline for the profile of Smad3 activation, the data here indicated
that it did not exhibit the three-fold increase and maintained activation between days 1
to 4 of Activin A treatment, observed for Smad2 (see figure 3.7).
Interestingly, with the exception of the first 12 hour time point, the level of Smad3/4
was consistently lower in cells treated with Activin A than those maintained in mTeSR
medium. After an initial increase over the first 24 hour period, Smad3/4 appeared at a
fairly consistent level in mTeSR. This consistency is not surprising as these cells were
140
being maintained in pluripotency medium, indicating that Smad3 signalling is stable
within the pluripotent state. mTeSR contains TGFβ1, which signals through the Alk5
receptor to activate Smad2 and Smad3 (see chapter 1.1)(Ludwig et al., 2006a). The
increase in Smad3/4 between 0 and 24 hours may have been recovery from the general
disruption of cellular processes at 0 hours as a result of passaging the cells. The fact that
Smad3/4 was higher than in the cells treated with such a consistently high dose of
Activin A over the time course was surprising. The data were statistically analysed
(chapter 2.12). Initially, the Kolmogorov-Smirnov test was used to check for normal
distribution. This was confirmed, and two way ANOVA was applied to analyse the
differences between high Activin A and mTeSR treated cells. It was found that, across
the whole time course, Smad3/4 was significantly higher in cells in mTeSR than in
Activin A (p = 0.002).
Despite having only transduced what appeared to be ~10-15% of the population with
the reporter vector (figure 4.3c), it appeared that the Hues1CAGA12
cells gave a fair
reflection of the activation of Smad3 throughout the culture. The relative consistency of
the data across two experiments, particularly the maintained level of reporter in mTeSR
treated cells over two successive passages, was indicative of a stable transgenic
population within Hues1CAGA12
. Previously in 293FT cells transfected or transduced
with CAGA12/Luc reporter, it had been shown that Activin A induced a detectable high
level of Smad3/4 between 3 to 6 hours, peaking at 12 hours, and still high 24 hours after
treatment (figure 4.1 and 4.3b). For hESCs in high Activin A medium, the level of
Smad3/4 was raised at 12 hours, however by 24 hours this had reduced to below the
level at 0 hours. Unfortunately, there were large error bars at these time points in figure
4.5, particularly at 12 hours. It had been observed that during the individual
experiments, the level of Smad3/4 was higher at 12 hours than all other time points in
Activin A, however the extent to which varied. This pattern would suggest that after an
initial period of Smad3 activation by Activin A, processes in the hESCs regulating
Smad3 activation or downstream transcriptional activity lead it to diminish from 12
hours onwards. The significantly higher activity over the time course in cells cultured in
mTeSR would seem to suggest a stronger role for Smad3 in maintenance of
pluripotency than differentiation of cells to DE. It is still possible that active Smad3 has
some early role in the process of DE differentiation, since it is high at 12 hours, and

141
does not drastically reduce until after 72 hours. Nonetheless, given the lack of strong
maintained activation of Smad3 in the early period of the time course as has been
observed with Smad2, it would suggest that Smad3’s role in the DE differentiation
program is less important. Further repeats of the experiment may have led to the high
s.e.m. on several key time points being reduced. Some Hues1CAGA12
remained and were
frozen for use in later experiments. Further experiments could have been performed. For
example, investigating the effect of Activin A +Wnt3a on Smad3 activation may have
provided some insight into the effect of Wnt3a on Smad3 activation. However, given
the lack of activation of Smad3 during Activin A treatment, and the likelihood that
0
500
1000
1500
2000
2500
3000
3500
0 24 48 72 96 120 144
RLU
/ug
pro
tein
Time (hours)
CAGA12/Luciferase activation
ActA
mTeSR*
(FF base)
Figure 4.5 – Graph showing luciferase activity in the Smad3/4 reporter line
Hues1CAGA12
, treated over 6 days with high Activin A (ActA), mTeSR or FF base
medium. The relative light units (RLU) emitted by samples as a result of luciferase
activity was normalised to total protein (µg protein) for each sample. The standard
error represents the s.e.m. of the combined averages of two experiments for ActA
and mTeSR (n=2), and for FF base the averages of the three biological samples from
a single experiment. With the exception of the first 12hour time point, luciferase
activity, representing Smad3/4 activity, was higher in cells cultured in mTeSR than
Activin A. Using two way ANOVA it was found that the higher level of Smad3/4 in
mTeSR compared to ActA over the whole time course was statistically significant (*
p = 0.002).

142
Smad2 plays a more crucial role during DE differentiation, these experiments were not
attempted.
4.4 Conclusions and discussion
The specific transcriptional activity of Smad2 and Smad3 is something on which the
balance between maintenance of pluripotency and activation of differentiation programs
may hinge. The process of mesendoderm differentiation has been largely shown to
require Smad2 during mouse embryo development (Brennan et al., 2001). Smad2/3
signalling is required during hESC targeted differentiation to DE, and collectively
Smad2/3 have been shown to bind and regulate a large number of gene targets (Brown
et al., 2011; Vallier et al., 2009c). However, not much quantitative data on the activation
or activity of Smad3 exists, and data defining the roles of the individual Smads is not
extensive. The -AR3/Luc and -CAGA12/Luc reporters are ideal for studying Smad2 and
Smad3 transcriptional activity. The data generated on Smad3 activation has highlighted
a surprising lack of activity during DE differentiation, generating broad questions about
the regulation of Smad signalling and the assignment of specific roles in hESCs.
The lentivector system used here was comprised of the pLNT-MCS vector, a simple
lentivector with no selection markers or other features. It was not particularly large,
with useful cloning sites, although ease of cloning did not apply to the attempts to
generate an -AR3/Luc lentivector (as discussed in 4.2.1). Lacking a marker of any sort
made direct assessment of transduction efficiency difficult, however the parallel use of a
pK2-CMV/dsRed lentivector allowed an estimate to be obtained. The vector pK2-
CMV/dsRed is slightly smaller (8.6kb) than the pLNT-CAGA12/Luc vector (10.7kb),
meaning transfection into 293FTs may have been more efficient using the same
protocol. It has been reported that the CMV promoter is downregulated in hESCs over
a period of 50 days (Norrman et al., 2010). Although here CMV/dsRed expression was
used as a control to gauge transduction efficiency in hESCs, this was only ever assessed
during the first 72-96 hours, by which point (judging by data presented by Norrman et
al., 2010) there should still be at least 80% promoter activity. Ultimately, since it was a
similar (though not completely equivocal) size to the pLNT-CAGA12/Luc vector, and
was only used over brief time periods as a control, the pK2-CMV/dsRed provided a
sufficient estimate of lentiviral titre and transduction efficiency.
The low transduction efficiency of Hues1 cells with concentrated pK2-CMV/dsRed and
pLNT-CAGA12/Luc lentivirus seemed to be a result of the low titres generated. The
143
technique of concentration by ultracentrifugation was still being optimised during the
process of these experiments, as it had not been used within the lab or with these
vectors. Batch #2 was the first attempt and suffered from unknown problems. Batch #3
was run more successfully, possibly also being improved by the inclusion of 1% BSA in
the PBS used to resuspend the lentivirus (which was omitted in batch #2). There is some
literature which suggests other possible reasons for a low lentiviral titre following
concentration. A report by Al Yacoub and colleagues investigated how larger vector and
insert size leads to reduced yield following concentration, and that centrifugation speeds
from 90,000g to as low as 20,000g can enhance yield of lentivirus with large vectors (Al
Yacoub et al., 2007). Both the pK2-CMV/dsRed and pLNT-CAGA12/Luc vectors are
fairly small, with viral insert sizes of 6.0kb and 5.5kb (respectively). However, some of
these conditions could well have improved yield, particularly the speed of
ultracentrifugation. The speed of 28,500rpm used here equated to 144,000g, which is
much higher than the 90,000g it probably could have been. This was realised in
retrospect, the speed used clearly having been miscalculated. It may have been one of
the factors influencing the low yield of viral concentration. Although a cell line was
achieved using direct transduction of cells with viral collection medium, the protocol for
viral concentration could have been further optimised.
A Smad2/4/FoxH1 luciferase reporter hESC line would have contributed invaluable
data to the understanding of Smad2 transcriptional activity during high Activin A
treatment. It could also have been applied to other experiments, in parallel with the
Hues1CAGA12
, to clearly map the activity of both Smads under different conditions, e.g.
differentiation using Wnt3a (chapter 3.3), the effect on the two Smads during Nodal
shRNA knockdown (chapter 5), and during Cripto inhibition (chapter 6). Hues1CAGA12
alone however does not provide the most useful tool to draw conclusions about the role
of the two Smads and distinctions between them. It was thought that using lentiviral
reporters to transduce hESCs would have been the optimum method for generating
stable lines, so that they could have been expanded and applied to multiple experiments.
The problems encountered with -AR3/Luc were during cloning of into the pLNT vector.
Although the problem was not identified, further alternative approaches could have been
sought. Since the pLNT-MCS vector was successfully used with generating the -
CAGA12/Luc reporter, it seems unlikely to have been the source of the problem. A
different plasmid with -AR3/Luc could have been obtained as the starting material.
Alternatively, a transfection based strategy could have been applied. There are several

144
groups that use nucleofection or lipofection in hESCs. These can generate high
percentages of transiently transfected cells (the highest average 76%), and through
clonal culturing of cells using markers, stably transfected lines can be generated (Matin
et al., 2004; Zafarana et al., 2009; Hohenstein et al., 2008; Vallier et al., 2007). The
reporter vectors used here could feasibly have been applied to this approach.
Transfection by nucleofection or lipofection could have been done, possibly in parallel
with a control Renilla luciferase reporter. This might have normalised for the decrease
in reporter signal as a result of transient episomal expression during differentiation.
However, this would have required large scale transfection before each experiment. Use
of a different vector with a selection marker may have also allowed selection and clonal
expansion of stably transfected cells, although the cloning and selection process would
not have been without its own set of challenges. As a straightforward alternative, simple
transfection and transient expression could have provided some data on Smad2 activity
during the early time points of differentiation. The key roles played by Smad2 and
Smad3 are likely to be during this period, as western blot for Smad2 activation has
already suggested. As mentioned previously, a P-Smad3 antibody had been sought for
use in western blots, which would have allowed direct comparisons between the two
Smads on the level of phosphorylation. However, no such antibody was found that upon
testing was specific to P-Smad3.
The lack of high levels of Smad3/4 following high Activin A treatment (barring the first
12 hours), raises questions as to the function and regulation of Smad3. The disparity
with the level of Smad2 phosphorylation observed previously not only indicates that
Smad2 has a more fundamental role, but that activation of Smad2 is positively regulated
over Smad3. The two Smad molecules are both expressed during differentiation (see
figure 3.5 and 3.6), share close structural homology, and are activated by the same
subset of TGFβ receptors in a similar way (see chapter 1.1). The receptors crucial to
both Activin and Nodal signalling are Alk4 and ActRIIb. There are several possibilities
why Smad2 should be activated preferentially over Smad3. The reporters used here
relate to the active signalling complexes of Smad2 and Smad3 (Smad2/4/FoxH1 and
Smad3/4 respectively). Phosphorylation of both Smads by active receptor complexes
could be occurring, but there may be specific mechanisms in the differentiating cells
regulating the association of phosphorylated Smads with the other components of their
respective signalling complexes (e.g. Smad4), or translocation and import to the
nucleus. Confirmation of this by comparing the level of phosphorylation of both Smads

145
by western blot, followed by analysis of induction of their respective reporters, would
identify points in the regulation of their activity. A possible mechanism for preferential
association of Smad2 rather than Smad3 with Smad4 has been shown through the
function of Trap1-like protein (TLP). TLP associates with TGFβ receptors, and upon
activation of the receptor it associates with Smad4 as well. Without having any effect on
the phosphorylation of Smad2 or Smad3, TLP inhibits phosphorylated-Smad3
association with Smad4, thereby favouring Smad2/4/FoxH1 association and target
promoter activation (Felici et al., 2003). A similar mechanism has been observed as a
result of E1A-like inhibitor of differentiation 2 (EID2). EID2 has been shown to only
weakly associate with Smad2, however strongly associates with Smad3 and interferes
with active Smad3 association with Smad4 (Lee et al., 2004). Detection of transcripts
for either of these factors in hESCs, and particularly up-regulation during high Activin
A differentiation, would indicate a specific program of negative regulation of Smad3
signalling. Another cause of preferential Smad2 activation may be as a result of Alk7.
This TGFβ type I receptor serves Activin/Nodal signalling, but has been shown to
specifically activate Smad3 rather than Smad2 (Watanabe et al., 1999). However, it was
observed that Alk7 is not strongly expressed at all by Hues1 cells in the pluripotent state
or during Activin A treatment (figure 3.5), and Alk7 has been shown to be dispensable
to DE differentiation during mouse development (Jörnvall et al., 2004). These examples
suggest how cells in the context of DE differentiation may regulate preferential
activation of Smad2.
There is evidence for both divergent and shared functions of Smad2 and Smad3.
Evidence of a reduced level of Smad3/4 during mesendoderm differentiation fits with
previously identified examples where regulation of Smad2 and Smad3 signalling
diverges. Differential regulation of the mesendoderm marker Gsc by Smad2 and Smad3
has been shown. The FoxH1 mouse homologue Fast1 can bind a proximal region of the
Gsc promoter and weakly activate transcription. Transcription is drastically enhanced
by the formation of a complex with Smad2/4, whereby Smad4 binds enhancers
upstream. However, formation of a complex with Smad3/4 was shown to negatively
regulate Gsc. Smad3 competes with Smad4 for binding at the upstream site, inhibiting
the Fast1 mediated transcription of Gsc (Labbé et al., 1998).
In mESCs, one study has inferred the direct regulation of many gene targets by Smad2/3
signalling. This was achieved by regulating activation of Smad2/3 through an inducible
constitutively active Alk4 (without requiring ActRIIb or ligand binding) in the presence

146
of protein synthesis inhibition. Having generated lists from array data of those targets
that were directly regulated by Smad2/3, including many known (e.g. Nodal) and novel
targets, their sequences were analysed for putative binding motifs. Most had both
Smad2/4/FoxH1 and Smad3/4 motifs, with few only having one or the other (Guzman-
Ayala et al., 2009). While confirming the central role of Smad2/3 signalling in
positively regulating a large set of genes, redundancy in the roles of the individual
Smads was not highlighted. Data in this chapter indicated a reduced level of
transcriptionally active Smad3/4 during Activin A differentiation. However, activity
was still not reduced to nearly the level of cells in FF base until day 4, suggesting that
there could still have been an early role of Smad3 during differentiation. Further
ambiguity over the distinction in roles for Smads during DE differentiation comes from
mouse developmental data. Knockout experiments with both Smad2 and Smad3 have
led to a strong indication for a central role for Smad2, since its absence leads to failure
to gastrulate, poor specification of visceral endoderm, lack of cells contributing to the
DE lineage, and embryonic lethality (Brennan et al., 2001; Tremblay et al., 2000),
whereas Smad3 knockout still permits viable offspring (albeit with a host of immune
disorders and other problems) (see review, Goumans and Mummery, 2000). Partial
ablation of Nodal and Smad2 leads to poor specification and migration of DE. However
the phenotype is exacerbated by removal of one copy of Smad3 (Vincent et al., 2003).
Similarly, Smad2/Smad3 double heterozygotes with null alleles exhibited poor
migration and specification of DE which led to hepatic dysplasia as well as craniofacial
abnormalities and other anterior truncations (Liu et al., 2004). The phenotype of Smad2
null heterozygote has not been investigated, however these reports both indicate a
possible semi-redundant role for Smad3 during early embryo development.
Some distinct functions of the two Smads have begun to be investigated in hESCs.
There has been work on the conjoined Smad2/3 signalling network via chromatin
immunoprecipitation sequencing (ChIP-seq.) studies. Two studies have investigated the
target genes with promoter and enhancer regions bound by Smad2/3 in hESCs,
identifying a huge range and indicating a central role in pluripotency regulation. Some
of the genes whose promoter/enhancer regions were bound by Smad2/3 were found to
change during the process of DE differentiation, although 45-60% were shared in both
hESCs and DE-differentiating cells. Crucially, on top of targeting new genes during the
process of differentiation, the specific sites on the promoter regions of genes bound
already in hESCs changed during differentiation. Therefore not only the binding of

147
Smad2/3, but the specific position on certain promoters (e.g. MixL1, Eomes) was
shown to determine their function (Brown et al., 2011; Kim et al., 2011). Due to the use
of antibodies that were non-specific (i.e. detecting Smad2/3 rather than Smad2 or
Smad3) to perform ChIP, there was little distinction as to which Smad binds to which
promoter/enhancer. Brown et al., 2011 addressed this with the use of Smad2 and Smad3
knockdown. Smad2 shRNA knockdown in pluripotent hESCs led to reduced expression
of factors such as OCT4, NANOG, C-MYC and NODAL (amongst several others),
however Smad3 shRNA KD did not appear to affect expression of most markers looked
at, except C-MYC and NODAL. Furthermore, Smad2 or Smad3 shRNA in cells during a
three day differentiation protocol (similar to table 1.1) indicated that knockdown of
either Smad led to a reduced expression of MIXL1 and increase in WNT3. However,
only Smad2 shRNA reduced expression of EOMES, GSC, CER1, FOXA2 and SOX17
significantly, with Smad3 shRNA actually leading to increased FOXA2 transcript
(although not GSC as one might expect) (Brown et al., 2011). Again, this confirms a
more fundamental role for Smad2 in effecting DE differentiation, but does not rule out a
function of Smad3.
The data presented here, along with evidence from the literature, do not unequivocally
assign distinct roles for Smad2 and Smad3 during DE specification. It appears Smad2 is
preferentially activated during Activin A treatment, and plays a more central role during
the DE differentiation program. Smad3/4 activity is not maintained at a high level
during Activin A treatment, however it is not initially downregulated. It is possible that
Smad3 signalling has a semi-redundant early role in differentiation through regulating
NODAL and MIXL1 transcription. It is also possible that after the early stage of
differentiation (day 1), Smad3 signalling has a negative role during DE specification,
given that it can compete with Smad2 for Smad4 association, and has been shown to
inhibit Smad2/FoxH1 specific activation of Gsc, or lead to slight increases in FOXA2
when knocked down in hESCs. It would be useful to elucidate more clearly the distinct
activity and roles of the two Smads at specific time points during DE differentiation.
Parallel comparison of specific reporter activation of both Smads (as was attempted
here) followed up with more detailed analysis of the effect of Smad2 or Smad3 shRNA
at various time points during differentiation, would provide further clarification. ChIP-
qPCR or -sequencing using more specific antibodies would also reveal more about
possible distinct roles.
148
CHAPTER 5 Nodal short hairpin RNA (shRNA) knockdown in hESCs
during Activin A treatment
Nodal is known to be the crucial TGFβ ligand during early development of the mouse
embryo. It is necessary for primitive streak formation, the emergence of the
mesendoderm, and as a result normal gastrulation and the formation of DE (Brennan et
al., 2001; Conlon et al., 1994). Overexpression of it has been shown to induce
expression of mesendoderm, mesoderm and DE markers in mESCs (Takenaga et al.,
2007), however overexpression in hESCs during EB formation induced expression of
mesendoderm as well as extra-embryonic endodermal lineage markers (Vallier et al.,
2004). It was established in chapter 3 that levels of Nodal and Cripto increased in
hESCs during Activin A treatment. This chapter directly addresses whether Nodal has a
role alongside Activin A during targeted differentiation. Since Activin A and Nodal
share several key receptors and intracellular signalling molecules, knockdown of
endogenous Nodal using lentiviral mediated short hairpin RNA (shRNA) was chosen to
identify a distinct role for Nodal. Separate attempts were made to generate inducible and
constitutive shRNA hESC lines. An inducible shRNA line was never established,
however constitutive shRNA lines with a partial Nodal knockdown led to a reduction in
pluripotency markers during pluripotency culture and a reduced capacity to differentiate
towards DE during high Activin treatment. This strongly indicated a role for Nodal
during pluripotency maintenance, and a possible role during DE differentiation.
5.1 Generation of an inducible Nodal shRNA knockdown lentivirus
5.1.1 Designing and cloning lentivectors
To specifically inhibit Nodal signalling during Activin A mediated differentiation of
hESCs towards DE, lentivectors containing inducible shRNAs were designed. An
inducible system was chosen since TGFβ signalling is required to maintain
pluripotency, and pluripotent hESCs do express Nodal (figure 3.6 and 3.15). Knocking
down Nodal only at the start of differentiation would circumvent any possible effects on
hESC pluripotency. The pLVCT-tTR-KRAB vector from the lab of Dr. Didier Trono
was chosen (Szulc et al., 2006). The vector contains a constitutive GFP reporter. It has a
tetracycline repressor/KRAB fusion protein sequence (tTR-KRAB), which binds a
tetracycline operator (tetO) in the tetracycline response element (TRE) upstream of the
H1 promoter, blocking any downstream transcription (for map see chapter 2.7 figure
2.2). Addition of doxycycline (dox) inhibits tTR-KRAB binding to tetO, switching on
149
downstream shRNA transcripts, making it a dox-on/target gene-off system. The vector
system has been widely used (Rodriguez et al., 2011; Wang et al., 2011b; Kato et al.,
2010).
Designing two different Nodal short interfering RNA (siRNA) sequences and a control
scramble siRNA sequence utilised two online resources. Nineteen nucleotide (19nt)
siRNA sequences were selected from the Genscript online siRNA target finder
(Nodal#1 and scramble), and the Sfold online siRNA target accessibility and RNA
duplex thermodynamics program (Nodal#2) (see chapter 2.7.2). Figure 5.1 shows
agarose gels and sequencing data from the cloning process. Before cloning, the
pLVTHM and pLVCT vectors were sequenced to determine they matched their
published sequences (data not shown). DNA oligos were designed, combining the
sequences encoding the sense siRNA sequence with a two nucleotide 3’ overhang, their
reverse complement sequence seperated by a loop sequence to generate the hairpin, 3’
termination sequence, and MluI/ClaI restriction sites (chapter 2.7.2). Sense and reverse
complementary DNA oligonucleotides of these sequences were then hybridised (with
Nodal#1 run on an agarose gel, figure 5.1a). The pLVTHM vector was cut with
MluI/ClaI (figure 5.1a), and the hybridised oligos were ligated into the vector.
Sequencing of pLVTHM-Nodal#1, Nodal#2 and scramble clones showed the shRNA
sequences present and correctly orientated (data not shown). In order to clone the
pLVTHM shRNA sequences into the pLVCT vector backbone, pLVTHM-shRNA and
pLVCT vectors were cut with MscI/FspI and run on an agarose gel (figure 5.1b)(for
map see chapter 2.7 figure 2.2). Some extra banding at a low molecular weight was
observed in the pLVTHM-Nodal#1 and –Nodal#2 clones. Bands corresponding to the
MscI – FspI 2483bp pLVTHM fragment containing the shRNA region (green boxes)
were cloned into the digested pLVCT backbone (red box). The resulting pLVCT (pLV)
-Nodal#1, -Nodal#2 and –scramble clones were sequenced, indicating the shRNA
sequences were present and correct (figure 5.1c-e).

150
A B
C
D
E
Figure 5.1 – Molecular cloning of
pLV-shRNA lentivectors. A)
pLVTHM was cut with MluI/ClaI
and run on an agarose gel (along
with an example of the hybridised
dsDNA oligonucleotide for
Nodal#1). Digested pLVTHM was
then excised and dsDNA Nodal#1,
Nodal#2 or scramble oligos ligated
in. Vector clones were then verified
by sequencing. Molecular weight
markers in the first and second lanes
indicate 200-10,000 and 100-2000
bases pairs (bp) respectively. B)
pLVTHM-Nodal#1, -Nodal#2 and –
scramble clones, and pLVCT, were
digested with MscI/FspI and run on
an agarose gel. The bands
corresponding to the shRNA
containing region of the pLVTHM-
vectors (green boxes) were then
excised and cloned into the pLVCT
backbone (red box), to generate the
inducible shRNA knockdown
vectors pLV-Nodal#1, -Nodal#2 and
–scramble. Molecular weight
markers in the first lane indicate
200-10,000bp. C-E) Sequencing
reactions of pLV-Nodal#1 (C), -
Nodal#2 (D) and –scramble (E),
aligned with the corresponding
original shRNA oligonucleotide
sequences, verifying insertion into
pLV- and correct shRNA sequence.
151
5.1.2 Functional assay of pLV-Nodal lentivectors
Assessment of the functionality of the pLV-shRNA lentivectors was performed using
HeLa cells. HeLa is a human cell line derived from a cervical cancer, which is cultured
easily, proliferates rapidly and is known to express TGFβ signalling molecules such as
Nodal and Activin (Gray et al., 2006; Petraglia et al., 1998). This made it ideal for
testing the knockdown effect of the pLV-Nodal vectors (see chapter 2.10). HeLa cells
were transfected with pLV-Nodal#1, -Nodal#2 or –Scramble using FuGeneHD, and 24
hours later had transfection medium changed for growth medium +/- dox. Twenty four
hours after treatment, cell cultures were either harvested for lysate, or sorted using flow
assisted cell sorting (FACS) to collect the GFP positive (GFP+) cells, which were then
lysed. Lysates were then tested for Nodal by western blotting.
Figure 5.2a shows the transfection efficiency of the pLV-shRNA vectors into HeLa.
Efficiency appeared to be around 30-50%, which seemed low given the cell type and
transfection method. This may have been a result of the size of the lentivector (13.2kb).
Several earlier attempts to transfect the vectors into HeLa, one using
Lipofectamine2000 and another with a lower ratio of vector:FuGene (1:4 as opposed to
1:3 used in figure 5.2a), produced lower transfection efficiency (data not shown). It was
therefore hoped 30-50% would be enough to discern any knockdown effect by the
vector on the amounts of Nodal. Figure 5.2b shows a representative western blot for
NODAL (black arrow) in the transfected HeLa lysates. The complete assay (transfection
and blotting) was run twice, giving the same result. Some bands corresponding to a
molecular weight greater than NODAL were observed (white arrow). It had been
previously observed on most anti-Nodal blots, and was thought to be due to non-
specific binding of the anti-Nodal primary of anti-mouse secondary antibody to an
unidentified protein. There was no distinguishable difference between transfected or
untransfected (UT) lysates, Scramble or Nodal shRNA vectors, or between doxycycline
treatments. The Nodal blot shown in figure 5.2b appeared to have weaker banding
towards the right hand side, in the scramble and untransfected samples. However since
the untransfected sample in the far right lane was the same sample as the far left lane,
this was likely an aberrance arising from incomplete coverage of the primary or
secondary antibody solutions or ECL substrate on the membrane.
Since it was possible that the knockdown effect of pLV-Nodal#1 or -Nodal#2 in HeLa
cultures with 30-50% transfected cells was below the detectable threshold, cell sorting
was employed to collect the GFP+ cells. Figure 5.2c shows a table summarising the data

152
from FACS. The number of GFP+ cells collected is shown, with the percentage of
GFP+ cells in the overall population given in parenthesis. Untransfected cells acted as
the negative control, being used to set the threshold for detection and collection of
GFP+ cells (data not shown). Several hundred thousand untransfected GFP- cells were
also collected. The first observation from the data was that treatment with dox
consistently led to a decrease in the percentage of GPF+ cells in the population. Using a
paired samples t test, this reduction was found to be statistically significant (p=0.01).
Although evidence from microscopy had not indicated an obvious increase in cell death
as a result of dox treatment, induction of vector shRNA as a result of dox may have had
a lethal effect on some cells (regardless of whether it targeted Nodal or was the control
scramble). The reduced percentage of GFP+ cells may also have been a result of dox
modulating GFP expression somehow. Cells that had been collected were lysed for
western blotting, however an extremely low yield had been obtained that allowed only
2µg total protein to be loaded per sample for western blotting. Figure 5.2d shows the
western blot for NODAL and GAPDH. On top of only retrieving a low yield of protein,
the lysate samples seemed to have been inconsistent for GAPDH, suggesting either the
procedures of FACS, collection and processing may have somehow led to degradation
of protein, or measurements for the protein concentration were inaccurate. Even with a
long exposure time (25mins) of the blots following ECL substrate exposure, NODAL
could not be detected (black arrow), although some faint bands corresponding to a
molecular weight greater than NODAL were again visible (white arrow). This assay
could have been repeated on a larger scale with optimised techniques to improve the
yield and chance of a clear result on the western blot. However, due to time constraints
within the project, and parallel difficulties encountered during generation of the pLV-
Nodal knockdown lentivirus (see section 5.1.3 below), it was decided not to. It is
therefore unclear whether the pLV-Nodal vectors effectively knocked down Nodal in
HeLa cells, and whether they would have been effective in hESCs if successfully
transduced and cell sorted to a homogenous transgenic population.

153
Figure 5.2 – Transfection and functional assays of pLV-shRNA in HeLa cells. A)
Fluorescence and merged phase contrast microscopy showing GFP in HeLa cells,
indicating transfection efficiency of pLV-Nodal#1 (top), -Nodal#2 (middle) and -
Scramble (bottom). Bar = 100µm. B) Western blot for NODAL and GAPDH from
lysates of HeLa cultures, either untransfected (UT) or transfected with pLV-Nodal#1,
-Nodal#2 or –Scramble +/- dox. The weaker banding in the right hand lanes of
NODAL was likely due to poor coverage of the membrane with primary/secondary
antibodies or ECL, since the untransfected sample is the same sample used in the far
left lane. C) Table summarising data from FACS of transfected HeLa cells. The
number of cells collected is shown above, with the percentage of the population that
was GFP+ below in parenthesis. D) Western blot of GFP+ and control untransfected
HeLa cells after FACS. Only 2µg total protein was available to load per sample, and
long exposure times were used to develop the blots. The faint banding (white arrow)
corresponded to a molecular weight greater than NODAL (black arrow).
C FACS
GFP+ cells
- dox + dox
Untransfected -
(0.3%)
-
-
pLV-Nodal#1 91,400
(29.6%)
95,100
(20.6%)
pLV-Nodal#2 78,900
(21.1%)
56,600
(13.9%)
pLV-Scramble 50,400
(19.7%)
49,600
(13.3%)
A
B kDa
52 38 32 24 52 38 32 24
UT N#1 N#1 N#2 N#2 Sc Sc UT +dox +dox +dox
GA
PD
H
NO
DA
L
kDa
76
52 38 32
52
38 32
UT N#1 N#1 N#2 N#2 Sc Sc UT +dox +dox +dox
D
GA
PD
H
N
OD
AL
154
5.1.3 Generating pLV-Nodal shRNA lentivirus
To create a stably transduced pLV-shRNA hESC line that could be sorted by GFP
FACS to a homogeneous transgenic population, pLV- lentiviruses were first generated.
293FT cells were transfected with one of the pLV- vectors, along with the lentiviral
packaging and envelope plasmids, with FF base medium added to collect viral particles
produced 24-40 and 40-64 hours post transfection. The collection medium was pooled
and spun down by ultracentrifugation, then resuspended at 100x concentration. Several
batches of lentivirus were produced, with batches being tested on 293FT cells to assess
titre. 2 x 10⁵ cells were plated in a 24 well plate with 400µl medium, with 4µl
concentrated lentivirus added 24hours later (a 1:100 dilution of virus). Transduction
efficiency was analysed two days later by microscopy, then quantified by flow
cytometry after four to six days, and the number of infectious units per ml (IU/ml)
calculated (chapter 2.8).
Figure 5.3 shows the processes of lentivirus generation and titre assessment.
Transfection efficiencies of 293FTs were consistently very high, as indicated by GFP
expression (figure 5.3a). Following collection, centrifugation and resuspension, the
transduction efficiency seemed extremely low when tested on 293FT cell. Three batches
of lentivirus were produced. The first was spun at 28,500rpm, the second at the same
speed but with a 1.5ml 20% sucrose cushion added to the bottom of the centrifuge tube,
and the third without the sucrose cushion but at a lower speed of 25,200rpm. The
transduction efficiency from the third batch tested in 293FT cells is shown in 5.3b-c. All
batches generated comparatively low amounts of GFP+ cells, the third appearing to be
marginally better than the others, but with neither the different speed of centrifugation,
nor the sucrose gradient, having a particularly enhancing effect on the yield. Similar to
pLV- transfected HeLa cultures (figure 5.2c), the flow cytometry data of transduced
293FTs in 5.3c showed a slight reduction in the percentage of GFP+ cells following dox
treatment, indicating dox either negatively affected GFP expression or had some lethal
effect on transduced cells via shRNA induction. Taking the higher percentage figures
from this data (i.e. transfected cells not treated with dox) to calculate viral titre, figures
of 1.6 x 10⁵ IU/ml (-Nodal#1 and -Scramble) and 6.0 x 10
4 IU/ml (-Nodal#2) were
generated. Such calculations represent the lowest possible titre, since they assume no
cell proliferation between plating of 293FTs and infection 24 hours later, and that the
cells have a multiplicity of infection (MOI) of 1. Although these scenarios are unlikely,
nonetheless the figure calculated for titre is a good lower estimate guidline.

155
For transducing hESCs with lentivirus, an MOI of 50 is often quoted (Zaehres and
Daley, 2006). This would have meant the total amount of lentivirus generated across the
various batches would still not have been able to transduce a reasonable percentage of a
small culture of hESCs. A 12-well plate well containing 2 x 10⁵ hESCs would require
2.0 x 10⁶ IU for 20% transduction, which would have been over 10mls of concentrated
virus. To ensure the problem of such low yield had not been avoidable, some of the
excess viral collection medium from the third batch was tested without being
concentrated by direct application to hESCs (chapter 2.8), however gave no GFP+ cells
after several days (data not shown). The titre of concentrated virus was deemed too low
to be able to transduce a useful amount of hESCs that could then be sorted by FACS. A
report by Al Yacoub highlighted the decreased efficiency of lentivirus generation with
increased vector insert size. The pLVCT vector was also used in that report, and gave a
lower yield than all other vectors tested. A weight ratio of viral:packaging:envelope
plasmid 2:1:1 during transfection, and centrifugation at 90,000g, gave a yield of
between 4 – 6 x 10⁵IU/ml (Al Yacoub et al., 2007). In a different report also using
pLVCT, Szulc used a weight ratio of 4:3:1 during transfection, and a centrifugation at
122,000g, yielding 1-3 x 10⁶IU/ml (Szulc et al., 2006). Here, a ratio of 1.35:1.35:1 was
used, and centrifugation of 144,000g (28,500rpm) or 112,000g (25,200rpm), yielding a
maximum of 1.6 x 10⁵ IU/ml. The initial transfection weight ratio used here was taken
from the protocol used previously to generate lentivirus using the pLNT- and pK2-
CMV/dsRed vectors (chapter 4), and was clearly not optimal for this size of vector. The
initial use of a centrifugation speed of 28,500rpm, also used in the previous chapter, had
been a miscalculation. Having realised this, a centrifugation speed generating a
centrifugal force between those used in the reports by Szulc and Al Yacoub was
selected (25,200rpm). Since this still gave a low yield, it suggested the factor that most
influenced the yield of pLV- lentivirus here may have been the plasmid ratios during
transfection. Lower centrifugation may also have increased yield, although the titre of
lentivirus here was only a few fold lower than that in the Al Yacoub report. However,
further optimisation of the protocol may have generated a more useable titre of
concentrated lentivirus. Unfortunately, work done in parallel testing the pLV-shRNA in
HeLa cells had provided no clear indication of vector shRNA functionality (figure 5.2).
It is possible that given more consideration, optimisation and more time this system
may have resulted in generation of an inducible knockdown line. However, the

156
combination of uncertain functionality, low viral yield and diminshing time for
completion of the project led to an abandoment of the approach.
C GFP+ cells - dox + dox
Untransfected 0.00% -
pLV-Nodal#1 0.08% 0.04%
pLV-Nodal#2 0.03% 0.03%
pLV-Scramble 0.08% 0.06%
A
Figure 5.3 – pLV-Nodal lentivirus generation and transduction of 293FT cells for
titre assessment. A) Fluorescence and merged phase microscopy of lentivirus
generation in 293FT cells, 40hours following calcium phosphate transfection of
pLV- vectors along with packaging and envelope plasmids. pLV-Nodal#1 is shown
here, however the transfection efficiency was equally high (>95%) for all vectors.
Bar = 150µm. B-C) Titre assessment of a batch of concentrated lentivirus. 293FT
cells were transduced with 100x concentrated lentivirus, 4µl virus per well
containing 2 x 10⁵ cells. Fluoresence and merged phase contrast microscopy (B)
showed a very low percentage of transduction by pLV-Nodal#1 (top), -Nodal#2
(middle), and –Scramble (bottom). Bar = 100µm. Six days following transduction,
cells were treated with +/- dox, and 24hours later analysed by flow cytometry (C).
Similar results were obtained with several other batches.
B
157
5.2 Generation of a constitutive Nodal shRNA knockdown lentivirus
As a second approach to generating a Nodal knockdown hESC line, a constitutive
Nodal shRNA lentivector system was used. A series of Nodal shRNA sequences and a
control beta-2 microglobulin (B2m) shRNA sequence were purchased from
OpenBiosystems, a proprietary manufacturer of shRNA knockdown lentivectors. The
sequences were available in the pLKO.1 lentivector as part of the series of Nodal and
B2m shRNAs from the RNAi consortium (for map see figure 2.2). The vector is much
smaller (7kb) than the pLV-shRNA vectors (13.2kb), and shRNA has been performed
successfully with it in a wide variety of human cells (Moffat et al., 2006). Its puromycin
resistance (PuroR) gene is driven by the constitutive PGK promoter, shown to maintain
expression of downstream targets long term in hESCs (Norrman et al., 2010). B2m was
chosen as a control shRNA as it is a highly expressed transcript that has been shown to
have redundant function in hESCs, and has been used as an shRNA control previously
(Matin et al., 2004; Hohenstein et al., 2008).
Vectors were cloned and sequenced to check that the vector and shRNA sequences were
correct according to the published sequences. Figure 5.4a shows example alignments of
the sequenced N2 and N3 clones with their published sequences. N2 appeared to have a
couple of point mutations in the shRNA sense sequence. N3-5 and b2m clones matched
the published sequences, however sequencing for N1 did not extend beyond 100-150
nucleotides despite several attempts on three different clones. Vectors were then tested
for their ability to knockdown Nodal by transfection into HeLa cells. Twenty four hours
following passaging, HeLa cells were transfected with pLKO.1 N1-5. Since the pLKO.1
vector contains no fluorescence reporter, a control parallel transfection was performed
with the dsRed expression vector pK2-CMV/dsRed (for map see figure 2.3). Based on
fluorescence microscopy analysis of dsRed in the cells (figure 5.4b), the transfection
effeciency was estimated at ~50-60%. Twenty four hours following transfection, cells
were lysed and the levels of NODAL measured by western blotting. Figure 5.4c shows
the NODAL blot, along with the control GAPDH blot. There were observably weaker
bands for NODAL (black arrow) in lysates transfected with N2 and N3 compared to
untransfected cells.
It was decided to generate and asses lentiviruses using the pLKO.1 vectors N2 -5 and
b2m.Figure 5.5 shows the process of generating pLKO.1 lentivirus and titre assessment
following concentration. Again, a pK2-CMV/dsRed lentivirus was generated in parallel
to use as a control. Based on dsRed expression in 293FTs, the transfection efficiency

158
using calcium phophate transfection was again observed to be high (~95%, figure 5.5a).
Following collection of viral medium and concentration by ultracentrifugation at
25,200rpm, the titre of lentivirus was tested in 293FTs. As before, 2 x 10⁵ cells were
plated per well and transduced 24 hours later with virus at 1:100 dilution. The following
day, medium was removed and replaced with medium +/- 1.5µg/ml puromycin. The
following day, the effect of puromycin treatment was observed by microscopy (figure
5.5b). Cultures of untransduced cells which were treated with Puromycin exhibited a
Figure 5.4 – Testing pLKO.1 Nodal shRNA knockdown lentivector. A) Vectors were
cloned and sequenced to check that the shRNA sequences matched the published
sequences. N2 and N3 are shown, with a couple of point mutations present in the N2
clone. N1 failed to sequence fully despite several attempts and preps. N3-5 clone
sequences matched the published shRNA sequences. B-C) pLKO.1 N1-5 were tested
for their ability to knockdown Nodal by transfecting into HeLa cells. Since pLKO.1
contains no fluorescence marker, a control parallel transfection was done with pK2-
CMV/dsRed. DsRed fluorescence and merged phase microscopy (B) indicated a
transfection efficiency of ~50-60%. Bar = 150µm. Cultures were lysed and tested for
NODAL expression by western blotting (C), indicating that pLKO.1 N2 and N3
reduced expression compared to untransfected (UT) control cells.
A B C
kDa 52
38 32 24
52
38 32
GA
PD
H
N
OD
AL
UT N1 N2* N3* N4 N5 UT rhNodal

159
high level of degraded and detached cells. This assay was done seperately for N3/4 and
N2/b2m, with the untransduced puromycin treated cultures from each assay showing
slight variation in their extent of degradation. N5 transduced cells treated with
puromycin also appeared much the same as untransduced cells treated with puromycin.
Cells transduced with N2, N3, N4 and B2m appeared to be largely unaffected by
puromycin treatment. The effect of puromycin was quantified by cell counting (figure
5.5c). Percentage survival rates of untransduced (UTd) and transduced cultures were
generated by comparing puromycin treated and untreated. Cell counts were taken for
two puromycin treated and two puromycin untreated wells of the untransduced cells and
averaged, however unfortunately for the transduced cells it was not possible to generate
enough to perform this, with only one well for each condition per construct. In the case
of N3 and B2m cultures, more cells were present in the puromycin treated than
untreated well (giving over 100% survival). Given a high level of resistance conferred
by transduction, the slight variation that would normally exist across two wells of a
culture after 24 hours may have led to this. The percentage survival of transduced cells
over that of the untransduced control was then calculated and taken to indicate the
percentage of cells transduced, used to calculate IU/ml (as before in section 5.1.3).
Parallel transduction with pK2-CMV/dsRed was performed and analysed by flow
cytometry (data not shown), which indicated 91.9% and 82.5% red fluorescent cells for
the two runs of the assay (N3/4 and N2/b2m respectively). These figures gave a titre of
1.91 x 10⁷ and 1.86 x 10
7 IU/ml, corroborating with the data in figure 5.5c. Such titres
of concentrated virus were slightly low compared to Moffat et al (2006), which quotes 2
x 106 – 2 x 10
7 IU/ml for unconcentrated viral medium when tested in A549 lung cancer
cells using an automated and efficient system. However, the figures here were a lower
estimate (as mentioned in 5.1.3), and regarded to be within a useable range for
transduction of hESCs.

160
C Puro treated
293FTs % survival % survival
vs UTd IU/ml
UTd (N3, N4) 44.5 - -
N3 105.6 61.1 1.22 x 10⁷
N4 89.2 44.7 8.94 x 10⁶
UTd (N2, b2m) 20.1 - -
N2 89.1 69.0 1.38 x 10⁷
B2m 117.2 97.1 1.94 x 10⁷
A B UTd N3
- Puro
+ Puro
Figure 5.5 – Generation and titre assessment of pLKO.1 shRNA lentivirus. A)
Transfection of 293FT cells. A control transfection was performed with pK2-
CMV/dsRed. DsRed fluorescence and merged phase microscopy indicated a high
(>95%) transfection efficiency. Bar = 150µm. B-C) Titre assessment of pLKO.1
lentivirus following concentration. 293FTs were transduced with lentivirus for N2-5
or b2m, or left untransduced (UTd). Twenty four hours later cells were treated +/-
1.5µg Puromycin (Puro). B) Using phase contrast microscopy, a lethal effect was
observed 24 hours later in puromycin treated untransduced (or N5) cells, but not N2-
4 or B2m cells. Bar = 250µm. C) Table showing percentage survival of transduced
Puro treated 293FTs. Cell counts for N2/3/4/b2m +/-puro were the averages of four
measurements each from a single well, for UTd +/-puro from two wells. The assays
for N3/4 and N2/b2m were run on separate occasions, each with corresponding UTd.

161
5.3 Lentiviral mediated Nodal shRNA knockdown of hESCs
5.3.1 Generating cell lines
The amount of NODAL in HeLa cells transfected with N2 and N3 appeared reduced
compared to untransfected cells (figure 5.4), so it was decided to generate feeder free
Hues1 cell lines with constitutive shRNA knockdown using the lentiviruses from
pLKO.1-N2, -N3, a combination of -N2-N3, and the control -B2m. Testing of the
lentiviruses on 293FTs showed that puromycin resistance had been successfully
conferred to transduced cells, so selection by this method could be used. This meant that
it would be possible to transduce only a certain percentage of hESCs with lentivirus
initially then select for them. It was thought that 10-20% transduction would be a
minimum range to allow for selection without the quality of the culture being too
drastically affected; feeder-free Hues1 cultures seemed to require a high density,
maintaining cell-cell contact through large monolayers, in order to remain proliferative
and pluripotent (see chapter 3.1). Cells were plated at a density that corresponded to 2 x
105 cells per well of a 12 well plate. The next day mTeSR containing polybrene and
enough concentrated lentivirus was added to transduce 10% of cells based on an MOI of
50. For example, for pLKO.1-N2: 10% of 2 x 10⁵ was 2 x 10
4 cells, with an MOI of 50
requiring 1 x 10⁶ IU, which was 72µl (figure 5.5c). Following transduction, puromycin
was included in the medium at increasing concentrations on successive days, starting at
0.1µg/ml, then 0.25, 0.5 and 1.0µg/ml (chapter 2.8.5). The increase was staggered as it
was thought that even transduced cells may have received a shock by the sudden
presence of an antibiotic at a toxic concentration. The aim was also to pass more slowly
over whatever the lethal threshold of puromycin was in order to incur more staggered
cell death, allowing transduced cells to proliferate and expand in the culture to replace
the dead cells and maintain cell-cell contact.
Transduction of Hues1 cells with different Nodal (and parallel B2m) constructs was
performed in separate rounds. Figure 5.6 shows the puromycin selection process in cells
transduced with pLKO.1-N2 and -B2m. By the third day post transduction (pt), cells
had been treated for 24hours with 0.25µg/ml puromycin, which seemed to have a
negligible effect on viability on transduced or untransduced cells. However, by day 4,
with an increase to 0.5µg/ml puromycin, there was a clear increase in cell detachment
throughout untransduced cultures, and some in areas of transduced cultures. By day 5,
following 24hours of 1.0µg/ml puromycin treatment, there was total cell death in
untransduced cultures. This suggested that the Hues1 threshold for puromycin

162
toxicity was between 0.25 and 0.5µg/ml. By days 4 and 5, compared to untransduced
cultures that had not been treated with puromycin, there were clearly fewer cells present
in transduced cultures treated with puromycin. However there remained fairly large
patches of cells that had maintained hESC morphology, with areas between either
Figure 5.6 – Phase contrast microscopy of antibiotic selection of Hues1 cells
following transduction with pLKO.1 lentivirus. Each column indicates number of
days post transduction (pt). Untransduced (UTd) cells not treated with puromycin
(no puro) are shown in the top row. UTd, N2 and B2m cells were treated with
increasing concentrations of puromycin. Threshold for the lethal effect of puromycin
appeared to be above 0.25µg/ml, since minimal cell death occurred at this
concentration. Some cell death observed at 0.5µg/ml in N2 and B2m, and significant
cell death in UTd cells, by 1.0µg/ml leading to no cells remaining in the UTd, but
some large regions of morphologically normal hESCs in N2 and B2m. Transduced
cultures were maintained in mTeSR medium +1.0µg/ml puromycin. Bar = 100µm.
UTd (no puro) UTd N2 B2m
3 days pt 4 days pt 5 days pt
3 days pt (0.25µg/ml) 4 days pt (0.5µg/ml) 5 days pt (1.0µg/ml)

163
unoccupied or occupied by differentiated looking cells. Repetition of the process across
rounds of transduction with the different pLKO.1 constructs occurred with the same
effects. It seemed likely that the number of cells surviving at day 4 and day 5 in
transduced cultures compared to untransduced controls represented more than 10%,
confirming that the calculations of lentiviral titre (figure 5.5c) were fairly low estimates.
From day 5 onwards transduced cells were maintained feeder free as normal in mTeSR
medium but with the inclusion of 1µg/ml puromycin. Cells were cultured and expanded
through multiple passages (at least 3) in order to generate enough cells for
differentiation experiments. Maintenance over this period of time in puromycin implied
cells had undergone stable transduction.
Cell lines were generated in several rounds, beginning with an N2 line (Hues1N2
),
followed by an N3 (Hues1N3
) and then two separate co-transduced N2N3 (Hues1N2N3
)
lines, each time with a corresponding B2m control (Hues1B2m
). Transduction with a
combination of N2 and N3 involved infection with half the volume of each respective
lentivirus prep. Cells in these cultures were not clonally derived. This meant that while
they all contained genome integrated transgenes, the number and site of integrations
(and in the case of cells co-transduced with N2 and N3, the ratio of these) may have
varied, making them heterogeneous cell lines. Unfortunately, a significant part of
Hues1N2
and Hues1N3
cultures were lost as a result of fungal infections. A small amount
were salvaged unaffected and were sufficient to further expand and experiment on,
however the corresponding Hues1B2m
control lines for both were lost in the process. The
rate of proliferation and morphology for the Hues1N2
and Hues1N3
lines seemed
analogous to untransduced cells over several passages. The first Hues1N2N3
line
generated began to show slightly decreased proliferation compared to its parallel
untransduced and B2m control lines by the second passage post transduction. Cell
doublings were not empirically quantified, however it was judged to be 10-20% lower.
Its morphology did not deviate from the control Hues1B2m
(see figure 5.8). Both the
morphology and proliferation rate of the second line generated with N2N3 were clearly
affected compared to the parallel untransduced and B2m lines (investigated below, see
section 5.3.3).
5.3.2 Effects of shRNA knockdown during Activin A treatment
In order to analyse the effect the N2 or N3 shRNA constructs were having on the ability
of Hues1 to differentiate to DE, the standardised differentiation protocol of high Activin
A treatment over 6 days was used (chapter 2.5). It was thought that data from Nodal
164
shRNA lines needed to be compared directly with a control B2m shRNA line generated
and differentiated in parallel for every experiment. Otherwise the effect of selection and
the specificity of the shRNA construct could not be controlled for, and the normal range
of variation already observed across differentiation experiments (e.g. in gene
expression) would make it difficult to identify effects of any marginal knockdown.
Unfortunately, Hues1N2
and Hues1N3
no longer had their parallel control Hues1B2m
lines. However, differentiation experiments were nonetheless run to get an idea of
whether the Nodal knockdown was having a discernible effect compared to previous
differentiation data.
Figure 5.7 shows data from two separate differentiation experiments of Hues1N2
and
Hues1N3
. As mentioned in section 5.3.1, both maintained normal hESC morphology
during feeder free culture prior to differentiation (data not shown). Immunostaining for
pluripotency factors OCT4 and NANOG at day 0 of the experiments indicated a
maintained expression of both these factors in both lines (Figure 5.7c and not shown),
suggesting the shRNA constructs did not have an effect on pluripotency. Following
differentiation, Hues1N2
cDNA samples were analysed by qPCR (figure 5.7a). It
appeared that NODAL transcript was still present and increased over the time course to a
similar extent as observed in previous differentiation experiments (e.g. figure 3.13).
OCT4 and SOX17 also showed similar patterns of expression to previous differentiation
experiments, with SOX17 in fact being higher than previously seen (compare with
figure 3.4 and 3.13). Immunostaining at day 5 also indicated that SOX17 was robustly
expressed throughout the culture (figure 5.7c). To try and gauge whether the -N2
shRNA had had a knockdown effect on NODAL, a western blot was run of day 0 and
day 3 samples, together with samples from the Hues1N3
experiment and some
untransduced Hues1 samples from a separate experiment. Although the different
samples could not be directly compared, they could be used draw inferences about the
general pattern of NODAL expression. For Hues1N2
, bands corresponding to NODAL
indicated it was still expressed in cells at day 0, and had increased by day 3 of Activin A
treatment. The extent of this expression and the pattern was similar to untransduced
cells. This implied that if there had been a knockdown of Nodal in Hues1N2
it was very
slight, and detecting it would have required close comparison with parallel control
shRNA cultures. Both the qPCR and western blotting data for Hues1N3
(figure 5.7b, d)
indicated again that Nodal was expressed at the transcript and protein levels at day 0.
However, by day 3 it had failed to drastically increase upon treatment with Activin A

165
compared to Hues1N2
and previous experiments. Unfortunately cDNA samples for day 4
and 5 were not available as a result of low RNA yield. However based on the samples
available, the pattern of transcripts such as OCT4, SOX17 and FOXA2 over the time-
course was similar to previous differentiation data (see figure 3.4). The reason for low
RNA yield at day 4 and 5 was partly due to Hues1N3
cultures forming a single large
aggregate during the Activin A treatment. This characteristic was unique to this
experiment. Immunofluorescence microscopy of samples at day 5 indicated that
00.010.020.030.040.050.06
D0mT
D1 D2 D3 D4 D5 x
Rel
ativ
e ex
pre
ssio
n
(no
rmal
ised
to
GA
PD
H) Hues1N2 NODAL
0
0.1
0.2
0.3
D0mT
D1 D2 D3 D4 D5 x
Hues1N2 OCT4
0
0.02
0.04
0.06
0.08
0.1
D0mT
D1 D2 D3 D4 D5 x
Hues1N2 SOX17
0
0.01
0.02
0.03
0.04
0.05
0.06
D0mT
D1 D2 D3 x x D6
Rel
ativ
e ex
pre
ssio
n
(no
rmal
ised
to
GA
PD
H) Hues1N3 NODAL
0
0.1
0.2
0.3
D0mT
D1 D2 D3 x x D6
Hues1N3 OCT4
0
0.005
0.01
0.015
0.02
0.025
D0mT
D1 D2 D3 x x D6
Hues1N3 SOX17
0
0.05
0.1
0.15
0.2
0.25
D0mT
D1 D2 D3 x x D6
Rel
ativ
e ex
pre
ssio
n
(no
rmal
ised
to
GA
PD
H) Hues1N3 MIXL1
0
0.2
0.4
0.6
0.8
D0mT
D1 D2 D3 x x D6
Hues1N3 NANOG
0
0.01
0.02
0.03
0.04
D0mT
D1 D2 D3 x x D6
Hues1N3 FOXA2
GA
PD
H
N
OD
AL
52
38 32
24
38 32
D D0 D3 D0 D3 D0 D3 rhN
(UTd) (UTd) (N3) (N3) (N2) (N2)
C
Day 0 OCT4 Day 5 Sox17
A B

166
E Hues1N3 day 5: OCT4 NANOG SOX17
Figure 5.7 – Independent differentiation experiments with Hues1N2
or Hues1N3
Nodal
shRNA lines using high Activin A. A-B) Gene expression analysed by qPCR for
single experiments using Hues1N2
(A) or Hues1N3
(B), with error bars representing
the s.e.m. of technical triplicate repeats. In both cases, no parallel control Hues1B2m
shRNA line was available for comparison. For Hues1N3
an “x” on the X-axis
indicates a cDNA sample missing due to low RNA yield. In both cases, SOX17
expression was still high by day 5 or 6 compared to previous experiments (see figure
3.4 or 3.13). NODAL expression seemed marginally lower during high Activin A
treatment in Hues1N3
than Hues1N2
. C) Immunofluorescence microscopy of Hues1N2
stained for OCT4 at day 0 and SOX17 at day 5, indicating the maintained expression
of OCT4 in the line prior to differentiation, and widespread SOX17 expression upon
Activin A treatment. Bar = 100µm. D) Western blot for NODAL and GAPDH on
day 0 and day 3 lysate samples from the experiments with Hues1N3
and Hues1N2
,
performed on the same blot and with untransduced (UTd) samples from a separate
experiment included as a reference. NODAL was observed at day 0 in both Hues1N2
and Hues1N3
, however by day 3 seemed to have decreased in Hues1N3
and increased
in Hues1N2
. E) Hues1N3
cells at day 5 were analysed by low magnification
immunofluorescence microscopy. Very large aggregates of cells had been observed
forming during the differentiation time course. Immunostaining indicated some areas
of these cultures still expressed OCT4 and NANOG by day 5, as well as having
regions of SOX17 expression. Bar = 250µm.

167
regions surrounding each large aggregate contained some small clusters of cells, with
sparsely populated regions of cells in between these. At the periphery of the large
aggregate and the small clusters OCT4 and NANOG staining was evident, with some
cells staining positive for SOX17 at the edge of some of the clusters and in the less
dense areas of cells between (figure 5.7e). This large aggregation of cells during
differentiation was unique to Hues1N3
. It may have occurred as a result of the effect of
the N3 Nodal shRNA construct. However, Nodal did not appear to have been silenced
at the transcript or protein levels in day 0 cells, and although induction of Nodal was
weaker during Activin A treatment, induction of mesendoderm and DE markers had still
occurred. This indicated that the-N3 shRNA had not had a strong silencing effect on
Nodal, although it was possible that some slight effect had been exerted on Nodal
expression or non-specifically on other factors by the N3 construct, leading to
aggregation during differentiation.
Co-transduction of Hues1 was performed with N2 and N3 lentivirus, since individually
the constructs had not effectively knocked down Nodal. Figure 5.8 shows the data from
the differentiation of the initial Hues1N2N3
and parallel Hues1B2m
line to be generated.
Unfortunately due to a limited number of cells, only a single experiment was
successfully run, with samples collected only for qPCR and western blotting. Phase
contrast images recorded the changes in the culture during the time course, shown in
figure 5.8a. At day 0 the cells for both lines had the normal feeder free hESC
morphology seen during pluripotent culturing of Hues1. Upon Activin A treatment,
cells in both lines proliferated and condensed similarly up until days 4 to 5. From day 5,
Hues1B2m
cultures appeared similar to untransduced Hues1 at the same time point in
previous experiments (see figure 3.9), with areas of more densely packed clusters of
cells (black arrows), separated by regions containing less densely packed larger cells
(white arrows), some with a more mesenchymal morphology. In contrast, the Hues1N2N3
culture underwent no such change from day 5, with cells becoming uniformly more
dense and compact without regions of clustering or more loosely arranged cells
appearing. Gene expression analysis revealed further differences between the two lines
(figure 5.8b). Hues1N2N3
cells at day 0 (still in pluripotency conditions) showed lower
levels of transcript for OCT4, NANOG, NODAL, CRIPTO, FOXH1 and WNT3
compared to the Hues1B2m
line. B2M transcript was lower in Hues1B2m
than Hues1N2N3
.
The fact that differences between the lines existed indicated that each shRNA construct
was having a unique effect, and suggested that NODAL and B2M were possibly being

168
targeted by their respective shRNA constructs. The lower levels of pluripotency-,
Nodal- and Wnt-related transcripts in Hues1N2N3
indicated that there may have been a
subsequent effect to silencing Nodal on the pluripotent state in the Hues1 cells. During
high Activin A differentiation the expression of some genes in Hues1B2m
increased.
Early differentiation markers MIXL1, GSC, FGF4 and EOMES were raised in the early
part of the time course, and again at day 6. DE markers SOX17 and FOXA2 had also
increased by day 6. In Hues1B2m
, as had been seen in previous differentiation
experiments (figure 3.4), NODAL and WNT3 were increased on day 1, with FOXH1 and
CRIPTO being steadily maintained and LEFTY2 and CER1 increasing by day 6. The
similarity of the transcript data and morphology of the Hues1B2m
culture during Activin
A differentiation to previous experiments indicated that it differentiated similarly to
untransduced Hues1, therefore suggesting that the process of lentiviral transduction,
B
N2
N3
B
2m
A Day 0 …day 2 …day 5
0
0.05
0.1
0.15
0.2
0.25
D0mT
D1 D2 D3 D4 D5 D6
Rel
ativ
e ex
pre
ssio
n
(no
rmal
ised
to
GA
PD
H)
OCT4
0
0.05
0.1
0.15
0.2
0.25
D0mT
D1 D2 D3 D4 D5 D6
NANOG
B2m
N2N3
…day 6
N2
N3
B
2m

169
0
0.02
0.04
0.06
0.08
D0mT
D1 D2 D3 D4 D5 D6
Re
lati
ve e
xpre
ssio
n
(no
rmal
ise
d t
o G
AP
DH
) MIXL1
0
0.1
0.2
0.3
0.4
D0mT
D1 D2 D3 D4 D5 D6
LEFTY2
B2m
N2N3
0
0.001
0.002
0.003
0.004
D0mT
D1 D2 D3 D4 D5 D6
FGF4
B2m
N2N3
B (continued)
0
0.001
0.002
0.003
0.004
0.005
D0mT
D1 D2 D3 D4 D5 D6
WNT8A
0
0.005
0.01
0.015
D0mT
D1 D2 D3 D4 D5 D6
GSC
0
0.01
0.02
0.03
0.04
0.05
0.06
D0mT
D1 D2 D3 D4 D5 D6
EOMES
B2m
N2N3
0
0.002
0.004
0.006
0.008
0.01
0.012
D0mT
D1 D2 D3 D4 D5 D6
Re
lati
ve e
xpre
ssio
n
(no
rmal
ise
d t
o G
AP
DH
)
SOX17
0
0.005
0.01
0.015
D0mT
D1 D2 D3 D4 D5 D6
FOXA2
00.00010.00020.00030.00040.00050.00060.0007
D0mT
D1 D2 D3 D4 D5 D6
SOX7
B2m
N2N3
0
0.01
0.02
0.03
0.04
D0mT
D1 D2 D3 D4 D5 D6
Re
lati
ve e
xpre
ssio
n
(no
rmal
ise
d t
o G
AP
DH
)
B2M
00.010.020.030.040.050.060.07
D0mT
D1 D2 D3 D4 D5 D6
NODAL
0
0.02
0.04
0.06
0.08
0.1
0.12
D0mT
D1 D2 D3 D4 D5 D6
Re
lati
ve e
xpre
ssio
n
(no
rmal
ise
d t
o G
AP
DH
)
CRIPTO
0
0.02
0.04
0.06
0.08
0.1
D0mT
D1 D2 D3 D4 D5 D6
FOXH1
0
0.2
0.4
0.6
0.8
1
1.2
D0mT
D1 D2 D3 D4 D5 D6
CER1
B2m
N2N3
0
0.005
0.01
0.015
0.02
0.025
D0mT
D1 D2 D3 D4 D5 D6
Re
lati
ve e
xpre
ssio
n
(no
rmal
ise
d t
o G
AP
DH
)
WNT3
B2m =
0.0037
N2N3 =
0.00084
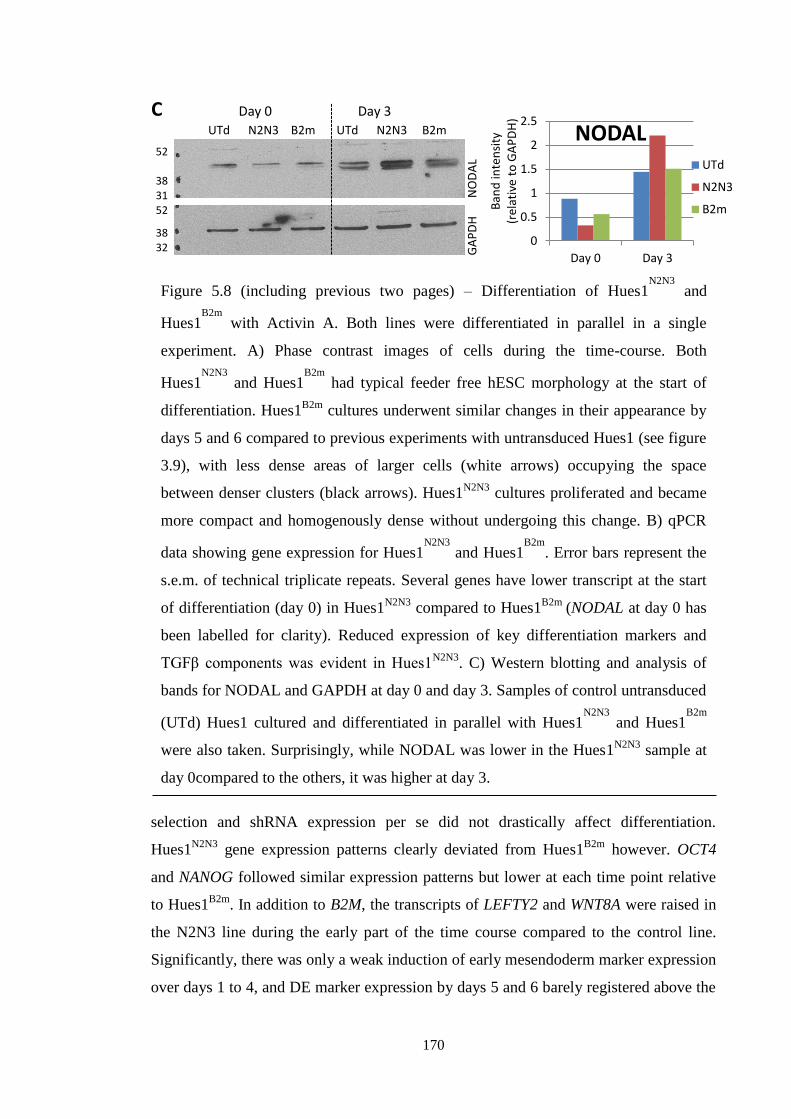
170
selection and shRNA expression per se did not drastically affect differentiation.
Hues1N2N3
gene expression patterns clearly deviated from Hues1B2m
however. OCT4
and NANOG followed similar expression patterns but lower at each time point relative
to Hues1B2m
. In addition to B2M, the transcripts of LEFTY2 and WNT8A were raised in
the N2N3 line during the early part of the time course compared to the control line.
Significantly, there was only a weak induction of early mesendoderm marker expression
over days 1 to 4, and DE marker expression by days 5 and 6 barely registered above the
C Day 0 Day 3
UTd N2N3 B2m UTd N2N3 B2m 52
38 31 52
38 32 G
AP
DH
NO
DA
L
Figure 5.8 (including previous two pages) – Differentiation of Hues1N2N3
and
Hues1B2m
with Activin A. Both lines were differentiated in parallel in a single
experiment. A) Phase contrast images of cells during the time-course. Both
Hues1N2N3
and Hues1B2m
had typical feeder free hESC morphology at the start of
differentiation. Hues1B2m
cultures underwent similar changes in their appearance by
days 5 and 6 compared to previous experiments with untransduced Hues1 (see figure
3.9), with less dense areas of larger cells (white arrows) occupying the space
between denser clusters (black arrows). Hues1N2N3
cultures proliferated and became
more compact and homogenously dense without undergoing this change. B) qPCR
data showing gene expression for Hues1N2N3
and Hues1B2m
. Error bars represent the
s.e.m. of technical triplicate repeats. Several genes have lower transcript at the start
of differentiation (day 0) in Hues1N2N3
compared to Hues1B2m
(NODAL at day 0 has
been labelled for clarity). Reduced expression of key differentiation markers and
TGFβ components was evident in Hues1N2N3
. C) Western blotting and analysis of
bands for NODAL and GAPDH at day 0 and day 3. Samples of control untransduced
(UTd) Hues1 cultured and differentiated in parallel with Hues1N2N3
and Hues1B2m
were also taken. Surprisingly, while NODAL was lower in the Hues1N2N3
sample at
day 0compared to the others, it was higher at day 3.
0
0.5
1
1.5
2
2.5
Day 0 Day 3
Ban
d in
ten
sity
(r
elat
ive
to G
AP
DH
)
NODAL UTd
N2N3
B2m

171
levels at day 0. NODAL, WNT3 and FGF4 levels all followed a similar pattern of
expression to that in Hues1B2m
over the time course but again simply lowered, with
NODAL expression greatly reduced at all time points compared to Hues1B2m
. This
strongly suggested that initiation of a mesendoderm gene program was greatly reduced
in Hues1N2N3
cells during high Activin A treatment as a result of the N2N3 Nodal
shRNA.
In order to further investigate whether the N2N3 shRNA constructs had a knockdown
effect on Nodal, lysate samples were taken at day 0 and day 3 from the N2N3 and B2m
lines, as well as an untransduced Hues1 cells which had been cultured and differentiated
in parallel. These were analysed for NODAL by western blot, and the band intensity
measured using Image J (figure 5.8c). The band intensity of NODAL in the
untransduced and B2m lines was similar at day 0, and similarly enhanced by day 3,
suggesting that the process of lentiviral transduction, selection and the presence of a
B2m shRNA construct did not particularly affect NODAL. The bands for NODAL in
the Hues1N2N3
samples indicated that it was reduced compared to the control lines at day
0, however by day 3 had increased and was clearly much greater than both these control
lines. This datum for Hues1N2N3
conflicted with the transcript data, which indicated a
lower level of NODAL compared to Hues1B2m
at day 0 and day 3. It suggested that
despite being knocked down in the undifferentiated cells at the start of the experiment,
NODAL increased dramatically throughout the culture upon Activin A differentiation.
This was a surprising finding. Judging by the consistent amount of GAPDH across
samples there had been no problem with sample loading of the western blot. The higher
level of NODAL on day 3 in Hues1N2N3
suggested it accumulated in cells during
Activin A treatment. Some expression on NODAL transcript was still occurring in
Hues1N2N3
cells (figure 5.8b). It is possible that somehow the exocytosis of NODAL
peptide was inhibited during Activin A treatment, or it became associated with other
proteins in the cytoplasm or the plasma membrane, and accumulated. The identity of
factors that might cause this is unknown. NODAL and CRIPTO are known to be able to
associate during processing and exocytosis from cells, which can cause NODAL to
localise with CRIPTO on cell membranes (Blanchet et al., 2008a). However, CRIPTO
expression was not raised in Hues1N2N3
compared to the control line.
Immunoprecipitation for NODAL followed by immunoblotting for associated proteins
could have revealed whether CRIPTO somehow sequestered and accumulated NODAL
in Hues1N2N3
. With such a reduced level of NODAL transcript in Hues1N2N3
cells,

172
meaning there was probably a reduced level of NODAL translation compared to the
control lines, and no increase in CRIPTO observed, it is difficult to see how this
mechanism could account for all the NODAL accumulation observed. Other factors
specifically upregulated in the Activin A treated Hues1N2N3
may also have sequestered
and accumulated NODAL. Golgi apparatus-associated factors could have been looked
for by immunoblotting of NODAL immunoprecipitate, to see if accumulation was
occurring there. However these analyses would not have been possible with the limited
amount of lysate sample available from this experiment.
The level of NODAL was reduced in HeLa cells over 24 hours upon transfection with
N2 and N3 constructs (figure 5.4c). Nodal transcript was greatly reduced throughout
differentiation in Hues1N2N3
compared to Hues1B2m
, and there was also less peptide at
day 0 (figure 5.8). Together these data suggest that Nodal knockdown occurred as a
result of N2N3 shRNA, and that during Activin A treatment of Hues1N2N3
, as a result of
reduced Nodal signalling, the processing and release of the small amount of NODAL
being translated was mis-regulated. This may have caused prolonged accumulation in
cells. Repetition of the experiment would be necessary to confirm whether this
unexpected high level of NODAL on day 3 was from an anomalous or representative
sample. If this unexpected result could have been resolved, and a lower level of Nodal
signalling occurring in Hues1N2N3
before and during differentiation then illustrated, the
data would have suggested a role for endogenous Nodal during maintenance of
pluripotency and to a certain extent DE differentiation of hESCs. However, due to a
lack of obvious reasons or further investigation as to how this unexpectedly high
NODAL might have occurred, it is difficult to confirm the Nodal knockdown effect
occurring in Hues1N2N3
, or the level of Nodal signalling occurring in the cells during
differentiation. Therefore the precise role of Nodal in this process was unclear.
Further investigation into differentiation in this Hues1N2N3
line was not possible. There
were insufficient cells to differentiate parallel cultures for immunostaining or flow
cytometry at the time of running this experiment. Reliable application of Hues1 cells for
differentiation experiments in the feeder free system was often found to be limited to
pp8 or pp9 before the cells began to adhere less well following passaging. This
Hues1N2N3
line, which was at pp8 in the experiment above, was also beginning to
proliferate more slowly. This made it difficult to expand reliably much further. Cells
were frozen down but did not recover well when attempts were made to establish the
line again and repeat the experiment. Two further attempts were made to generate an
173
N2N3 shRNA line (with a parallel B2m shRNA line). The first attempt failed due a
complete loss of all transduced and untransduced cells during the process (for unknown
reasons), and the second attempt led to a second line of Hues1N2N3
being generated but
did not result in a successfully run differentiation experiment (next section).
5.3.3 Undirected differentiation of hESC following Nodal knockdown
In an attempt to repeat the experiment in figure 5.8, feeder free Hues1 cells were co-
transduced with -N2 and -N3 lentivirus, transduced with the -B2m lentivirus, or left
untransduced (as described in 5.3.1). Figure 5.9 shows the results of the transduction
process. During antibiotic selection, the same staggered treatment with puromycin was
applied, causing a large amount of cell death by day 4 post transduction (at a
concentration of 0.5µg/ml puromycin), and survival of only transduced cells by day 5
(1.0µg/ml puromycin), similar to what was observed in figure 5.6. Figure 5.9 shows
antibiotic selection and culturing over 8 days. By day 5, cells in both the B2m and
N2N3 transduced cultures had been reduced in number, but retained patches of cells,
mostly maintaining hESC morphology similar to untransduced Hues1. However,
following day 5, as cells proliferated to fill the gaps left by antibiotic selection, some
cells appearing in the sparsely populated regions assumed a differentiated morphology
compared to the untransduced cells. By day 8, in the B2m cultures this amounted to just
cells at the edges of the monolayer, with most of the culture maintaining classic feeder
free morphology (see inset). However in the N2N3 cultures there were no cells that had
retained this morphology, with cells appearing heterogeneous and differently organised,
looking as if they had differentiated (see inset). Proliferation was also slower than the
control untransduced and B2m cultures. The disparity in cell morphology between
Hues1N2N3
and the control cells increased until day 11. At this point it was decided to
take samples and analyse what effect the N2N3 constructs had had on the cells.
Since it appeared the N2N3 construct had induced the Hues1 cells to differentiate,
analysis to see whether this may have arisen through knockdown of NODAL was
performed by western blotting (figure 5.10a-b). Compared to the control untransduced
and B2m lines, NODAL was reduced at least two fold in the N2N3 line. Related TGFβ
signalling molecules were also analysed. CRIPTO was much less strongly expressed,
and Smad2 phosphorylation (P-SMAD2) was lower in the N2N3 cells. These data
suggested that N2N3 had led to a reduced amount of NODAL, and that Nodal related
signalling components had also reduced as a result of this and the apparent
differentiation which had occurred.

174
Analysis by qPCR was performed to determine whether the N2N3 cells had
differentiated and if so towards what lineage (figure 5.10c). B2M transcript was lower in
the B2m cells than the N2N3 and untransduced cells, and NODAL was also lower in the
N2N3 cells than the untransduced and B2m cells. In both cases, the off-target transcript
of each respective construct was altered compared to the untransduced level. NODAL
was only marginally lower in B2m cells compared with untransduced cells. The
presence of a small percentage of differentiated cells in the B2m culture resulting from
the puromycin selection process is a possible candidate for causing this discrepancy.
The high expression of B2M in N2N3 cells may have been a result of some cells
B2
m
N
2N3
U
Td
2 days pt 5 days pt 8 days pt
Figure 5.9 - Phase contrast microscopy of Hues1 cells post transduction (pt) with N2
and N3 or B2m lentivirus, or left untransduced (UTd). Transduced cells were
selected for by increasing puromycin concentrations up to day 5, from 0.1µg/ml by
day 2, and 1.0µg/ml by day 5. Untransduced (UTd) cells were maintained in parallel
without puromycin. By day 8, large areas of B2m transduced cultures had
maintained classic feeder free hESC morphology, however the N2N3culture had not
maintained the compact homogeneous epithelial organisation, with cells no longer
exhibiting large nuclei and visible nucleoli (see enlarged insets). Bar = 100µm.

175
differentiating towards a lineage normally expressing high levels of it (e.g.
haematopoietic). If samples had been taken earlier (e.g. day 5 post transduction,
following selection), it may have given a clearer idea of the direct effect each shRNA
construct on their target and off-target transcripts. However, it nonetheless seemed that
the constructs were causing a knockdown effect on their destined targets. N2N3 cells
had greatly reduced levels of OCT4 and NANOG compared to the control lines, which
was not surprising given their morphology. Since some N2N3 cells appeared to have
taken on a mesenchymal morphology, with some seeming fibroblastic, a selection of
previously used differentiation markers and mesodermal lineage markers were chosen to
analyse the samples. In general, it was found that the untransduced and B2m cells
shared an expression profile, whereas N2N3 cells deviated. Markers which showed
particular disparity were the early mesodermal markers BRACHYURY (T) and FLK1,
which were lower in N2N3, and B2M, SOX7, PDGFRB, PECAM1 (CD31), and BMP2,
which showed large increases in N2N3 cells. SOX7 is expressed in the visceral
endoderm, and PDGFRB, PECAM1, and BMP2 are associated with various mesoderm
such as cardiac, haematopoietic and endothelial cell types. In addition to gene
expression data, cells were fixed at day 11 and analysed by immunostaining (figure
5.10d-e). Fluorescence microscopy indicated that the vast majority of untransduced cells
expressed OCT4 (as expected). Some small areas of the B2m cells had lost OCT4
expression (likely to be cells at the edges of the monolayers, as observed in figure 5.9),
and almost none of the N2N3 cells expressed OCT4. A marker for skeletal muscle,
smooth muscle actin alpha (α-SMA), was also was used to analyse the cells. All three
cultures seemed to exhibit slight nuclear staining using the antibody, likely to be non-
specific or background staining since α-SMA is a cyto-skeletal protein. However, clear
cytoplasmic staining of what appeared to be structural fibres (white arrows) occurred in
cells dotted throughout the N2N3 cultures.
Taken together, these data suggest that cells co-transduced by N2 and N3 lentiviral
constructs had a reduced level of Nodal and Nodal signalling, and as a result underwent
undirected differentiation despite being in mTeSR medium under normal pluripotent
conditions. Cells expressed mesodermal lineage markers, ranging through muscular
epithelial, cardiac and haematopoietic cell types. The population appeared to be
heterogeneous and continuing to differentiate. The unexpected undirected
differentiation prevented the N2N3 knockdown line being used to repeat the Activin A
differentiation experiment. However, it contributed some insight into the role of Nodal.

176
0
0.02
0.04
0.06
0.08
0.1
0.12
UTd N2N3 B2m
Re
lati
ve e
xpre
ssio
n
(no
rmal
ise
d t
o G
AP
DH
)
B2M
0
0.0005
0.001
0.0015
0.002
UTd N2N3 B2m
NODAL
0
0.02
0.04
0.06
0.08
0.1
0.12
UTd N2N3 B2m
OCT4
0
0.02
0.04
0.06
0.08
UTd N2N3 B2m
Re
lati
ve e
xpre
ssio
n
(no
rmal
ise
d t
o G
AP
DH
)
NANOG
0
0.00002
0.00004
0.00006
0.00008
UTd N2N3 B2m
T
0
0.00001
0.00002
0.00003
0.00004
UTd N2N3 B2m
GSC
0
0.001
0.002
0.003
0.004
0.005
UTd N2N3 B2m
Re
lati
ve e
xpre
ssio
n
(no
rmal
ise
d t
o G
AP
DH
)
SOX7
0
0.005
0.01
0.015
0.02
0.025
UTd N2N3 B2m
FLK1
0
0.005
0.01
0.015
0.02
0.025
0.03
UTd N2N3 B2m
PDGFRB
A Day 11: UTd N2N3 B2m B
NODAL
CRIPTO P-SMAD2 SMAD2/3 GAPDH
52
38 31
38 31 24 72
58
72
58
38 32
0
0.2
0.4
0.6
0.8
1
1.2
UTd N2N3 B2m
Ban
d in
ten
sity
(re
lati
ve t
o G
AP
DH
)
NODAL
C

177
0
0.002
0.004
0.006
0.008
UTd N2N3 B2m
Re
lati
ve e
xpre
ssio
n
(no
rmal
ise
d t
o G
AP
DH
) NKX3-2
0
0.0005
0.001
0.0015
0.002
UTd N2N3 B2m
PECAM1
0
0.005
0.01
0.015
UTd N2N3 B2m
SOX1
0
0.02
0.04
0.06
0.08
UTd N2N3 B2m
Re
lati
ve e
xpre
ssio
n
(no
rmal
ise
d t
o G
AP
DH
)
BMP2
0
0.001
0.002
0.003
0.004
0.005
UTd N2N3 B2m
LEFTY2
0
0.001
0.002
0.003
0.004
0.005
UTd N2N3 B2m
WNT3
D Day11: UTd N2N3 B2m
IgG
+DA
PI
O
CT4
C (continued)
E Day11: UTd N2N3 B2m
IgG
+DA
PI
α-S
MA
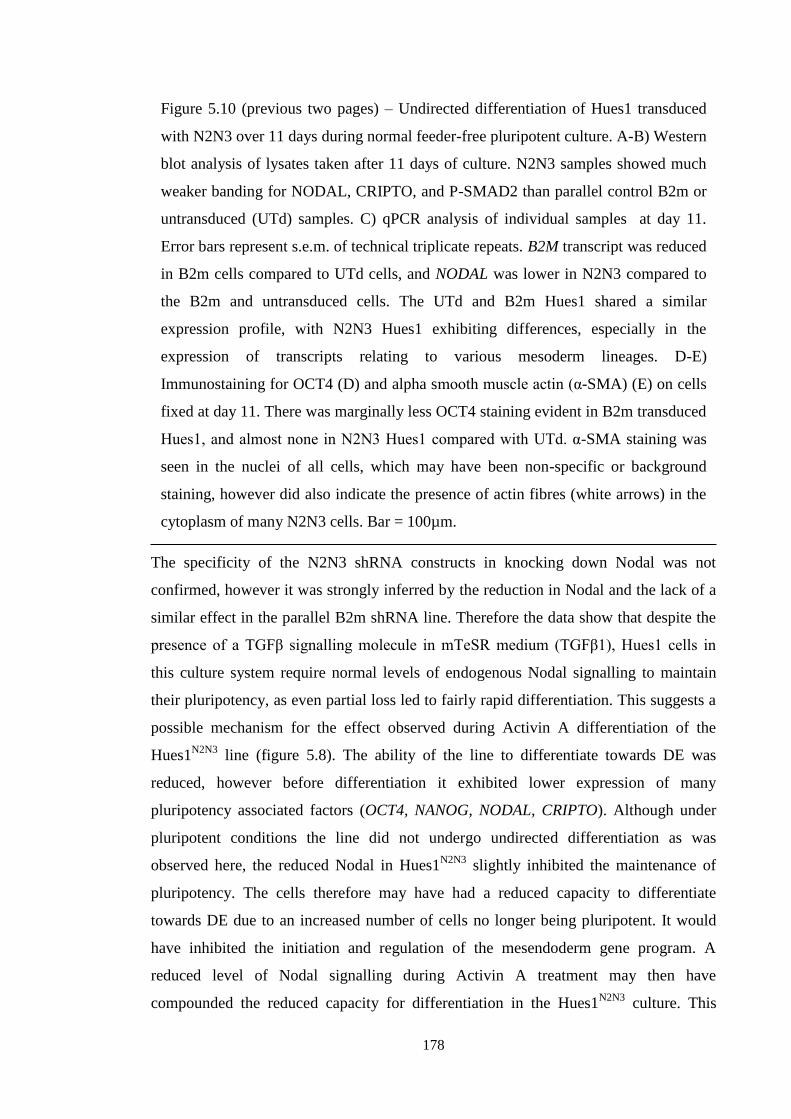
178
The specificity of the N2N3 shRNA constructs in knocking down Nodal was not
confirmed, however it was strongly inferred by the reduction in Nodal and the lack of a
similar effect in the parallel B2m shRNA line. Therefore the data show that despite the
presence of a TGFβ signalling molecule in mTeSR medium (TGFβ1), Hues1 cells in
this culture system require normal levels of endogenous Nodal signalling to maintain
their pluripotency, as even partial loss led to fairly rapid differentiation. This suggests a
possible mechanism for the effect observed during Activin A differentiation of the
Hues1N2N3
line (figure 5.8). The ability of the line to differentiate towards DE was
reduced, however before differentiation it exhibited lower expression of many
pluripotency associated factors (OCT4, NANOG, NODAL, CRIPTO). Although under
pluripotent conditions the line did not undergo undirected differentiation as was
observed here, the reduced Nodal in Hues1N2N3
slightly inhibited the maintenance of
pluripotency. The cells therefore may have had a reduced capacity to differentiate
towards DE due to an increased number of cells no longer being pluripotent. It would
have inhibited the initiation and regulation of the mesendoderm gene program. A
reduced level of Nodal signalling during Activin A treatment may then have
compounded the reduced capacity for differentiation in the Hues1N2N3
culture. This
Figure 5.10 (previous two pages) – Undirected differentiation of Hues1 transduced
with N2N3 over 11 days during normal feeder-free pluripotent culture. A-B) Western
blot analysis of lysates taken after 11 days of culture. N2N3 samples showed much
weaker banding for NODAL, CRIPTO, and P-SMAD2 than parallel control B2m or
untransduced (UTd) samples. C) qPCR analysis of individual samples at day 11.
Error bars represent s.e.m. of technical triplicate repeats. B2M transcript was reduced
in B2m cells compared to UTd cells, and NODAL was lower in N2N3 compared to
the B2m and untransduced cells. The UTd and B2m Hues1 shared a similar
expression profile, with N2N3 Hues1 exhibiting differences, especially in the
expression of transcripts relating to various mesoderm lineages. D-E)
Immunostaining for OCT4 (D) and alpha smooth muscle actin (α-SMA) (E) on cells
fixed at day 11. There was marginally less OCT4 staining evident in B2m transduced
Hues1, and almost none in N2N3 Hues1 compared with UTd. α-SMA staining was
seen in the nuclei of all cells, which may have been non-specific or background
staining, however did also indicate the presence of actin fibres (white arrows) in the
cytoplasm of many N2N3 cells. Bar = 100µm.
179
strongly suggests a role for Nodal during pluripotency maintenance of Hues1 in the
feeder free system. It seems probable that Nodal has a role during DE differentiation.
However, notwithstanding the difficulties already discussed with the unexpected result
in figure 5.8c, identifying role of Nodal during differentiation by comparing Hues1N2N3
and Hues1B2m
would have been difficult due to possible slight differences in the
pluripotency of the starting cultures. Verification of the knockdown, and repetition and
expansion of the experiments would have been conducted. However, this could not be
carried out due to time constraints.
5.4 Conclusions and discussion
The results presented here indicate that the combined constitutive N2 and N3 shRNA
constructs partially knocked down Nodal, which affected the pluripotency of Hues1. An
effect on the differentiation of Hues1 to DE was observed possibly as a result of this
effect and possibly as a result of reduced Nodal signalling during differentiation. There
are some key points with regard to the experimental approach, and analysis and
interpretation of the data obtained from the Hues1N2N3
line, which need to be considered
in order to evaluate the impact of the data and look to improve the experiment.
The difficulties experienced while attempting to generate an inducible Nodal shRNA
line using the pLVCT vector were unfortunate. The initial reasoning behind seeking a
constitutive Nodal shRNA knockdown system (i.e. to avoid affecting pluripotency) was
vindicated by the results in figures 5.8-10. As discussed in section 5.1, the combination
of poor yields from lentivirus preparation and undetermined Nodal shRNA knockdown
functionality made the successful application of the vectors seem very uncertain, which
became an increasing concern with the diminishing time to complete the project. As
discussed in section 5.1.3, there were possibilities for adjustment and optimisation of
the lentiviral generation and concentration processes. Given more time and confidence
these could have been undertaken. Alternatively, another constitutive shRNA
lentivector system could have been sought, however beginning the process of cloning
shRNA constructs into a vector again would have also limited the time frame for
running experiments.
The pLKO.1 constitutive shRNA with puromycin resistance system had some
advantages as an approach. It was more straightforward to assay the shRNA
functionality, generate lentivirus, and generate an hESC line to observe an effect. As an
experimental system there were some drawbacks to it, other than the lack of control of

180
the shRNA knockdown. Generating transgenic cultures large enough for differentiation
experiments involved several passages of expansion of cells. The characteristics of the
N2N3 co-transduced lines then exacerbated this requirement, since they seemed to lose
pluripotency and not proliferate well, meaning several rounds of transduction were
required to generate different lines. This amounted to increased time consuming and
labour intensive transduction and cell culture to get to the point of experimentation.
Ultimately this contributed to the lack of repeat experiments. An inducible knockdown
line could have assuaged some of these problems as culturing the cells without inducing
the shRNA would have been devoid of this effect on pluripotency and proliferation. If
transduction of the cells even with the pLKO.1 system could have been scaled up it
would also have made repeated experiments more achievable. Getting a stably
transduced Nodal shRNA line onto MEFs for long term culture and expansion could
also have avoided the need for repeated transduction and feeder free expansion.
Culturing on MEFs may have maintained hESCs with the N2N3 constitutive Nodal
knockdown, since MEF culture is more enriched than feeder free. This was attempted
after freezing and thawing cells from Hues1N2N3
, although without success.
The two successive co-transductions of Hues1 with N2 and N3 constructs generated
slightly different effects on the cells. This may have been due to varying levels of Nodal
knockdown across them. The cells were not clonally derived, so will have varied in the
integration sites of the transgene sequences, as well as the ratio of N2:N3 sequences
present in cells. Having varying levels of knockdown as a result of introducing two
shRNA constructs and having a heterogeneous population made control and
reproducibility of the system difficult. However it did not increase the chances that the
knockdown effect was non-specific to NODAL.
The use of a B2m shRNA line to control for the effect of the transduction and selection
process on the hESCs was successful. The B2m shRNA itself seemed to work, leading
to reduced amounts of B2M transcript. The line also indicated that the presence of an
shRNA sequence did not affect hESC pluripotency or differentiation per se. Co-
transduction with a second B2m shRNA construct would have slightly improved the
comparison of the line with the Hues1N2N3
however. B2m was selected as it has
previously been established in hESCs as an shRNA control, causing no observable
effect on pluripotency or differentiation, and it is known to be expressed in mouse DE
cells (Zafarana et al., 2009; Avery et al., 2010; Jaffe et al., 1991; Matin et al., 2004).
The B2m transduced cells in the experiment in section 5.3.3 exhibited a slight reduction
181
in expression of pluripotency factors compared to untransduced cells, and some cells in
the areas where large gaps had appeared as a result of puromycin selection had begun to
differentiate. Although this is a feature often observed on the edges of monolayers in
feeder free culture, it was marginally exacerbated as a result of the transduction and
selection process. It was therefore important to generate a B2m control line in parallel,
to ensure these effects were taken into account when analysing any target knockdown
effect. During differentiation experiments the amount of variability within gene
expression between different runs, as well as the occasional major problems with
Activin A batch variation, means it is useful to directly compare data of any knockdown
line with a control within each experiment. In the unfortunate case of the experiments
with Hues1N2
and Hues1N3
this was not possible, leading to the results being difficult to
interpret.
Given the transcript data for cells with Nodal or B2m shRNA it seemed likely that the
constructs each had a direct effect on their target transcripts. However further analysis
could have established whether the effects were completely specific. One way of
determining this would be through rescue experiments. With a Nodal knockdown, the
obvious solution would seem to be to add exogenous recombinant human Nodal
(rhNodal). This is generally available as the mature peptide, whereas endogenous Nodal
is usually released as a propeptide and cleaved upon binding with cell surface receptors
and Cripto. Regions in Nodal’s prodomain are then responsible for promoting
association with Cripto (Blanchet et al., 2008a). Recombinant mature Nodal has been
shown to elicit some weak activation of Smad2 (see chapter 6.2 figure 6.2e) and weak
activation of downstream targets in ESCs including pluripotency factors and DE
markers (Takenaga et al., 2007; Vallier et al., 2004). However, signalling is weak and
may be via a slightly different mechanism which would not make it a bona fide rescue
approach. Ideally, a plasmid or vector which expressed Nodal mRNA with silent
mutations that disrupted the binding of the shRNA sequences would have been
designed. Had these been available they could have been transfected into parallel
Hues1N2N3
control cultures prior to differentiation, although achieving the correct level
of Nodal in cells to illustrate a recovery may have been difficult.
When the Hues1N2N3
line underwent high Activin A treatment, induction of
differentiation markers was weak, indicating that it failed to strongly activate a
mesendoderm gene program in many cells. However before differentiation, Hues1N2N3
expressed lower levels of pluripotency associated genes, including NANOG and OCT4.

182
As discussed in chapter 3, Nanog and other pluripotency factors have been indicated as
having roles in the early part of differentiation towards DE via factors such as Eomes
(Arnold et al., 2008; Brown et al., 2011; Teo et al., 2011b). NANOG expression was
even observed still present in SOX17 expressing cells (figure 3.17). The expression at
the start of the experiment of other factors such as CRIPTO, FOXH1 and WNT3 that
have signalling or regulatory roles during both pluripotency and mesendoderm
differentiation was impaired. It seems likely that the expression profile of many genes
that may positively regulate differentiation was lower than usual in Hues1N2N3
. This
means that the Hues1N2N3
and Hues1B2m
cultures as a whole already differed slightly
before Activin A treatment. Therefore the state of the Hues1N2N3
cells before Activin A
treatment may have been a critical factor inhibiting differentiation. The effect of the
Nodal knockdown during differentiation, and therefore the specific role Nodal has
during Activin A treatment, is difficult to determine as a result.
In day 0 Hues1N2N3
prior to Activin A differentiation, NODAL was lower compared to
control cells. However, the level of Smad2 activation was not established, nor was it
investigated on day 3 where the surprisingly higher level of NODAL was detected.
Determining the presence of CRIPTO, and the level of SMAD2 activation, may have
indicated whether Smad2 signalling was somehow affected as a result of N2N3 before
and during differentiation. Given the unexpectedly high amount of the NODAL at day
3, and the potentially compromised pluripotency of the cells before differentiation, such
data still would not have clarified the role of Nodal during differentiation. However
failing to test for these in the sample lysates was an error, realised when lab facilities
were no longer accessible. Establishing the role of Nodal using this knockdown line
would have required significant further work. Repeat experiments and investigation into
how this accumulation of NODAL at day 3 might have occurred (if it was repeated)
would have been necessary to investigate what was occurring to Nodal processing in
Hues1N2N3
cells. A clearer idea of the levels of NODAL and the amount of Smad2
activation on each day (1 to 6) of differentiation in the knockdown line would have also
given a better idea of a specific role for Nodal.
In the differentiation system here, Nodal signalling via Cripto may serve to enhance the
levels of P-Smad2 elicited by Activin A. Nodal over-expression has been shown to
induce expression of mixtures of differentiation markers ranging from mesendoderm
and visceral endoderm in hESC EBs (Vallier et al., 2004), to mesendoderm, DE and
mesoderm in mESCs (Takenaga et al., 2007). In both cases, although exclusively DE
183
differentiation was not achieved, it was illustrated that Nodal is capable of driving
differentiation, in the latter case by activating Smad2 in a Cripto dependent manner.
Nanog has been shown to associate with active Smad2/3 directly (Brown et al., 2011;
Vallier et al., 2009a). A possible mechanism may exist, whereby thresholds of Smad2/3
activation are required to alter the interaction Smad2/3 has with factors like Nanog,
permitting the transcription and subsequent association with Eomes, causing further
effects on their transcriptional activity. These thresholds may be the initial mechanism
by which their transcriptional activity shifts from pluripotency regulation towards a
mesendoderm program. Investigation of the role of Nodal should be targeted at
establishing whether it has an effect in enhancing Smad2 activation during targeted
differentiation to achieve early specific thresholds. The levels of Smad2/3 activation at
early time points during high Activin A treatment could be compared in normal and
Nodal knockdown cells between 3 to 72 hours. Western blotting or transfection of cells
with the CAGA12 and AR3 reporters used in chapter 4 could be employed. Establishing
a stable and inducible knockdown line would make this targeted analysis more
amenable and accurate. It would be important to establish whether endogenous Nodal
signalling has such an enhancing role in more efficient differentiation systems. The
Vallier et al. 2009 protocol contains several other factors on top of Activin A (see table
1.1), however given the central role of TGFβ/Smad signalling in DE differentiation, it
seems likely that even in this enriched differentiation medium Nodal knockdown would
still reduce the capacity of cells to effectively activate a mesendoderm program. The
usefulness of an inducible Nodal knockdown line could extend beyond investigating its
function during DE differentiation. During high Activin A treatment, Smad2 activation
reduced towards the end of the six day protocol (figure 3.7). During mouse
development, following gastrulation Nodal signalling has a maintained role specifying
some endodermal lineages and lateral plate mesoderm, particularly anterior and left side
structures, but disappears during organogenesis of many DE derivatives (Arnold et al.,
2008; Brennan et al., 2002; Franklin et al., 2008; Norris et al., 2002). Indeed, it has been
shown by Takenaga that maintaining Nodal overexpression in differentiating mESCs
beyond ten days of differentiation (when mesoderm and DE markers were strongly
expressed already) impaired more mature endodermal lineages forming in vitro and in
vivo (Takenaga et al., 2007). Application of a Nodal knockdown hESC line could be
targeted to investigate the role of Nodal in differentiation beyond DE, and whether
enhancement of DE-lineage maturation occurs with Nodal knockdown.

184
In both experiments using the combined N2N3 shRNA constructs, there were variable
but clear effects on the regulation of pluripotency in Hues1 being maintained in the
defined feeder free pluripotency culture system. The results of the second transduction
of Hues1 with N2N3 constructs resemble some of the phenotypes seen during mouse
development. Disruption of Nodal has direct effects on the maintenance of pluripotency
markers in the epiblast, expansion of the epiblast, and major subsequent impacts on
gastrulation and DE emergence (see chapter 1.2.1)(Camus et al., 2006; Mesnard et al.,
2006). Nodal knockout mice are still capable of expressing some differentiation markers
however (although temporally and spatially mis-regulated)(Camus et al., 2006; Conlon
et al., 1994). Similarly, reduced Nodal in combined knockout heterozygotes for Eomes
and Nodal led to severely disrupted development, but nonetheless some expression of
endoderm markers (both visceral and definitive) and early mesoderm markers (Arnold
et al., 2008). Furthermore, double Smad2/Nodal null heterozygotes show disturbed
gastrulation but still specify axial mesodermal regions such as the notochord (Vincent et
al., 2003). Loss of pluripotency, proliferation, and a bias towards forming mesodermal
lineages were all recapitulated in the second experiment as a result of the reduced Nodal
signalling occurring in Hues1 N2N3 knockdown cells. This reflects data from the
mouse, confirming that Nodal signalling is required at the correct level, regardless of
the presence of other exogenous factors (such as TGFβ1 in mTeSR), to regulate
pluripotency. Perhaps Nodal knockdown during treatment with Activin A in the first
experiment with Hues1N2N3
also gave some bias towards mesodermal differentiation,
although this was not analysed. This result also expands on other observations in
hESCs. A report by Vallier showed that overexpression of Nodal in hESCs was able to
maintain a relatively high level of pluripotency in defined medium in the absence of
Activin A and FGF2 (Vallier et al., 2007). Furthermore, Lefty-expressing hESCs
showed a reduction in the expression of pluripotency markers even in the presence of
Activin A and bFGF (although Cerberus-expressing cells did not)(Vallier et al., 2005).
These reinforce the role for Nodal-specific signalling parallel with exogenous factors
during hESC pluripotency maintenance in defined feeder free conditions.
Certain protocols investigating mesoderm induction in ESCs illustrate how reduced
Nodal could lead to apparently undirected mesodermal differentiation. In serum free
conditions, SB treated hESC EBs increased expression of mesoderm markers, and
subsequent serum-treated outgrowths enriched for muscular and skeletal mesoderm
transcripts (Mahmood et al., 2010). Mild inhibition (although not complete ablation) of

185
Alk4/5/7 combined with bFGF has been shown to effectively induced cardiac
mesoderm (Yook et al., 2011). TGFβ1 and Bmp2 have been shown to combine in later
stages of differentiation of hESCs to generate chondrocytes (Gong et al., 2010), with
Bmp2 also associated with myocardial differentiation in mouse development (Uchimura
et al., 2009). Many of these conditions appear to have been present in the culture as a
result of the mTeSR components or effect of the N2N3 knockdown in cells. Controlled
effective knockdown or inhibition of Nodal in hESCs may therefore offer possible
improvements or even alternative approaches for investigating or targeting
differentiation of hESCs towards these lineages of mesoderm.
Slight shifts in the balance between Smad2/3, Smad1/5/8, and PI3k/Akt signalling
networks as a result of reduced Nodal signalling seem to have induced cells along a
mesodermal route. This suggests a system of regulation in hESCs whereby normally,
exogenous factors at certain levels stimulate endogenous signalling networks. These
then become balanced and autoregulate themselves in stable conditions, leading to a
maintenance of pluripotency. Endogenous signalling networks may then also be the
effectors of differentiation. Proposing the model for Nodal signalling during high
Activin A treatment, changes in exogenous factors are required to stimulate changes in
endogenous signalling networks, which then combine to generate appropriate thresholds
of signalling activity to induce differentiation. These mechanisms are undoubtedly
complexly regulated however. The thresholds of activation required to initiate changes
in gene programs and fates in hESCs may be narrow. Regulation of Smad2 activation or
downstream activity may also have an effect on the duration or targeting of its
signalling. The involvement of Cripto is likely to have a major role in these processes
(see chapter 6).

186
CHAPTER 6 Role of Cripto during Activin A treatment of hESCs
Previous chapters have highlighted the presence and a potential role of endogenous
Nodal signalling during Activin A mediated differentiation of hESCs. The EGF-CFC
protein Cripto, also identified as expressed and upregulated during Activin A treatment,
is known to have an important role during gastrulation and DE differentiation in the
developing mouse embryo (Ding et al., 1998). It is known to interact with both Nodal
and Activin A. However, it has divergent roles with respect to these, facilitating
proteolytic cleavage and association of Nodal with ActRIIb/Alk4, but inhibiting Activin
A signalling (Kelber et al., 2008). There have also been Cripto independent modes of
signalling identified for Nodal (Ben-Haim et al., 2006; Liguori et al., 2008). The aims of
this chapter were to establish whether some of the mechanisms of Nodal signalling
which Cripto is known to regulate occur during DE differentiation of hESCs, and
whether interference with Cripto’s function affected differentiation. It was found that
during differentiation Nodal was endocytosed and appeared to associate with the
membrane of early endosomes, a process known to be regulated by Cripto. Antibody
blockade of Cripto during Activin A treatment of hESCs also appeared to limit cells’
ability to differentiate to DE. This suggests an active presence of Cripto during Activin
A mediated DE differentiation possibly enhancing Nodal signalling.
6.1 Endocytosis of Nodal during Activin A treatment
A key feature of Nodal signalling that is regulated by Cripto is its association with the
receptor Alk4. It has been shown that both Nodal and Activin A are endocytosed by
cells in the absence of Cripto. However, in the presence of Cripto, Nodal becomes
localised to the membranes of endosomes as a result of Cripto, promoting binding with
Alk4 and subsequent Smad signalling (Blanchet et al., 2008b, 2008a). In order to
investigate the mechanisms of endogenous Nodal signalling during Activin A treatment
of hESCs, evidence of endocytosis of Nodal and membrane localisation was sought
using confocal microscopy. A marker that has been used previously to identify Nodal-
containing endosomes, early endosomal antigen 1 (EEA1) (Blanchet et al., 2008b), was
chosen to complement Nodal staining. Glass chamber slides were pre-coated with
fibronectin, onto which Hues1 cells were plated and treated with Activin A according to
the standardised differentiation protocol (as previously, see chapter 2.5). Day 3 was
chosen as an optimal time point to analyse, since previous protein analysis by western
blot had shown both NODAL and CRIPTO were highly expressed at this time point

187
(chapter 3.2, figure 3.7). Samples were fixed for staining using paraformaldehyde at day
0 and day 3 of differentiation. They were sequentially double labelled using antibodies
against Nodal and EEA1 (and their respective mouse IgG and goat IgG control
antibodies in parallel), with corresponding anti-mouse alexa fluor 596 (AF594) and
anti-goat AF488 secondary antibodies. Immunostaining was analysed by confocal
microscopy (chapter 2.14). Three representative fields for each time point were chosen
and images of optical sections (Z-axis) taken every 0.9µm. These were analysed for
colocalisation and association of red and green staining, corresponding to NODAL and
EEA1.
Figure 6.1 shows a selection of Hues1 cells double labelled for NODAL and EEA1 at
day 0 and day 3 of differentiation. In the selected fields analysed, some EEA1 staining
was observed in the day 0 samples, with a few foci distinguishable as circular vesicles,
however many appearing as small solid dots at the magnification used (figure 6.1a).
Some NODAL staining was also evident, being prominent in some cells and fairly
absent in others. There were some instances where EEA1 and NODAL staining
overlapped (white arrows, figure 6.1a). In comparison, a greater amount and more
prominent staining for both EEA1 and NODAL was observed in day 3 samples (figure
6.1b-c). Some EEA1 staining comprehensively marked small annular structures, and in
some cases partially marked larger annular structures. This pattern of staining suggested
the structures were endosomes. The frequency and size of these structures appeared
greater than in cells at day 0. The frequency and amount of NODAL staining also
seemed greater in day 3 cells. In some parts of cells, NODAL staining seemed to
identify large amorphous structures. There were also a great number of small foci
widely spread throughout most cells that indicated the presence of NODAL. There were
many instances where these foci colocalised with EEA1 staining (white arrows), or
where they appeared to align at the edges of the annular structures marked with EEA1
(striped arrows). The anti-Nodal antibody was raised against the mature region of the
peptide. It would therefore be indiscriminate in staining NODAL propeptide being
processed and exocytosed via the trans-golgi network, and pro- or mature NODAL
being endocytosed. The widespread staining for NODAL in the cells likely represented
a combination of both of these processes. At day 3, many endosomes stained with
EEA1 were small, although sometimes had identifiable lumens. Many did not have any
association with NODAL staining. This may reflect the large amount of other endocytic
processes occurring that involve molecules other than NODAL, possibly even Activin

188
A
D N
OD
AL/
EEA
1
E
EA1
N
OD
AL
NO
DA
L/EE
A1
EE
A1
N
OD
AL
B
mIgG gIgG
merge +DAPI

189
Figure 6.1 – Double labelling of Hues1 showing colocalisation or association of
NODAL with vesicles marked with EEA1 during Activin A treatment. Cells were
stained with antibodies raised against NODAL and EEA1 and corresponding mouse
AF594 and goat AF488 secondary antibodies. A-C) Confocal microscopy of cells from
different fields of view analysed at day0 (A) and day3 (B, C). Not many identifiable
vesicles were present in cells at day 0, however cells at day3 had a greater amount of
larger vesicular structures marked by EEA1 staining. Some examples of where this
staining either colocalised or closely associated with NODAL staining have been
highlighted with white arrows. Expanded views of the fields in A and B are indicated
by white boxes. Bar = 50µm. D) Fluorescence microscopy of isotype control staining
using mouse IgG (mIgG) and goat IgG (gIgG). Bar = 100µm
C
NO
DA
L/EE
A1
EEA
1
NO
DA
L

190
A endocytosis amongst others. However, there were many endosomes where NODAL
colocalised with the EEA1 staining, and in several cases there were endosomes where
NODAL appeared to be interspersed within the EEA1 staining marking the edge or the
annular structure. An investigation by Blanchet has reported the process of endocytosis
for Activin A and Nodal, both in the presence and absence of Cripto. However the
fundamental difference for Nodal in the presence of Cripto is localisation the membrane
of endosomes, rather than remaining in the luminal space (Blanchet et al., 2008b).
When trapped in the luminal space in the absence of Cripto it was suggested that Nodal
signalling is less effective and endosomes are sorted more rapidly for degradation. The
pH of the luminal space may also affect Nodal binding to ActRIIb/Alk4 (Blanchet et al.,
2008b). At the magnification used here, it was difficult to confirm that Nodal was being
localised to the membranes of the endosomes. It did not generally seem to be present in
the luminal spaces, however luminal spaces were often not large and easily identifiable.
The resolution of the images in figure 6.1b-c was the highest available with the quality
of immunostaining achieved and the data obtained from the confocal microscope.
Although in some cases it appeared that the EEA1-marked membrane was the site of
NODAL staining in the endosomes, it was difficult to confirm with the available
images. The EEA1 staining on day 3 appeared to demarcate endosomes that were much
larger than those at day 0. This correlated with previous observations of a higher level
of CRIPTO in cell lysates at this point (chapter 3, figure 3.7). In the report by Blanchet,
transfection with Cripto was shown to lead to larger endosomes marked by RAB4/5,
factors associated with early endosomes similarly to EEA1 (Blanchet et al., 2008b). The
result here would then appear to corroborate with previous data on the effect of Cripto
on endosomes. In summary, the immunofluorescence confocal microscopy gives strong
evidence as to the presence of Nodal signalling in hESCs during Activin A mediated
differentiation by showing Nodal endocytosis and sorting to early endosomes. It
tentatively suggests possible localisation of Nodal to the membrane of the endosomes,
which would indicate the presence of Cripto-regulated Nodal signalling. Repeated
staining with clearer and higher resolution images would be required to confirm this,
incorporating analysis of cells with disrupted Cripto expression or function to see
whether its known effects on endosomal size and Nodal localisation are occurring in
hESCs during differentiation.

191
6.2 Effect of antibody blockade of Cripto on Smad2 activation
To investigate the function of Cripto as a Nodal coreceptor that facilitates signalling
during hESC differentiation, a method to interfere specifically with this function had to
be devised. Small molecule and antibody blockade of Cripto performed in other
investigations have found blockade to promote Activin (A and B) and inhibit Nodal
signalling via Smad2 (Adkins et al., 2003; Takenaga et al., 2007; Lonardo et al., 2010).
The mode of inhibition in these reports was interference of the association of Cripto
with Alk4, which would largely but not completely ablate Nodal signalling. A Cripto
antibody was purchased from R&D which was sold as a blocking antibody (separate
from the one used for western blotting from SCBT, see table 2.5). It is raised against the
recombinant human mature peptide of Cripto (rhCripto, argenine 38 – tyrosine 188) and
reported on the manufacturer datasheet as being able to immobilise 50% association of
rhCripto to rhAlk4 in an ELISA at a concentration of 0.1-0.5µg/ml. In order to test the
antibody’s activity, functional assays were performed.
The ability of the Cripto blocking antibody (Cr blocking Ab) to bind to CRIPTO in
fixed cells was analysed by immunostaining. Figure 6.2a-b show immunofluorescence
images of 293FT cells and HeLa cells which had been cultured as normal in growth
medium, fixed with PFA and stained with Cr blocking Ab (or corresponding mouse IgG
control)(see chapter 2.11). 293FT and HeLa cells were chosen as they were readily
available, and it has been reported previously that 293FTs do not express certain TGFβ
signalling components including Cripto, whereas HeLa do (Petraglia et al., 1998; Gray
et al., 2006). This was later validated by western blotting of 293FT and HeLa lysates
(figure 6.2c). Observation of staining in both 293FT and HeLa cells was difficult, as
both at first appeared to have very faint staining. However, scrutiny of the cells and a
long image exposure time (1.5secs) allowed slight differences to be perceived. The
mouse IgG isotype control staining was negative in both cell types. Staining with the Cr
blocking Ab gave a very faint outline of the shape of 293FT cells, however the outline
of membranes or cellular projections were not identifiable, implying there had been
weak adherence of the antibody non-specifically to molecules within and around the
cell. For HeLa cells stained with Cr blocking Ab, again the impressions of cells were
visible but identifiably brighter. Closer inspection at higher magnification allowed
observation of a shadow where the nuclei of cells were. More defined outlines of
cellular projections across the solid culture surface were visible, as well as grainy foci
identifiable on the surface of the cells (see inset, figure6.2a-b). The staining in both was
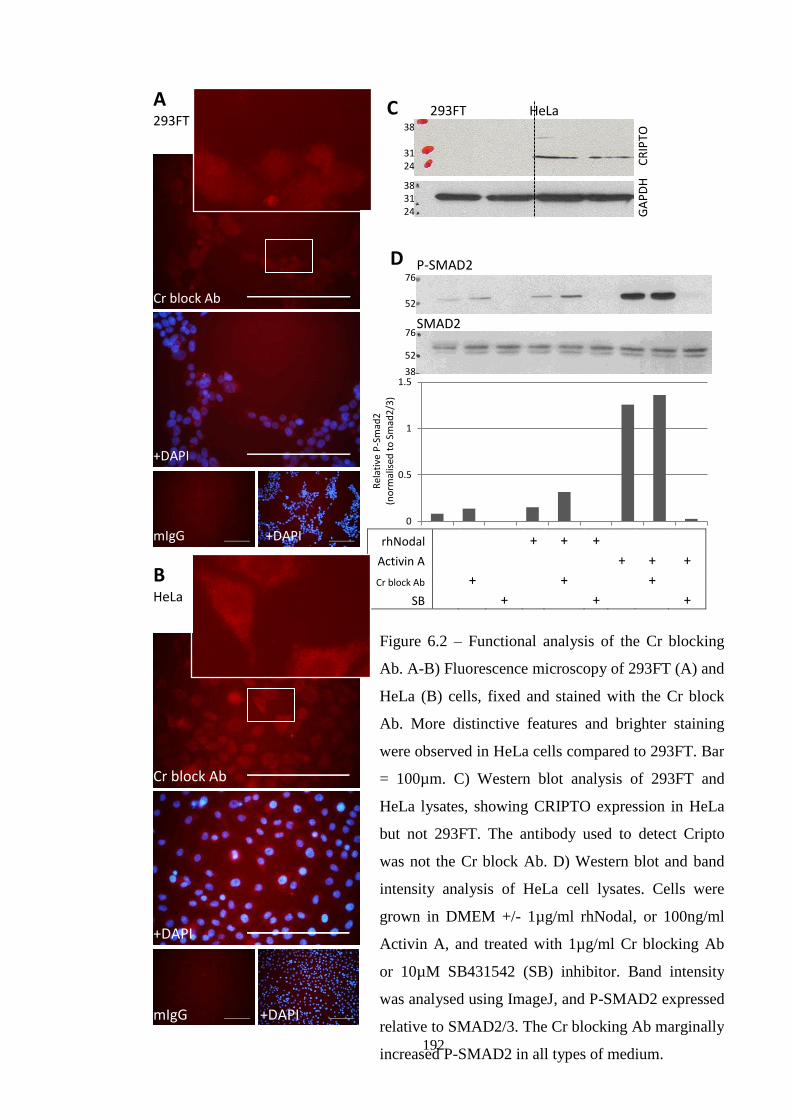
192
Figure 6.2 – Functional analysis of the Cr blocking
Ab. A-B) Fluorescence microscopy of 293FT (A) and
HeLa (B) cells, fixed and stained with the Cr block
Ab. More distinctive features and brighter staining
were observed in HeLa cells compared to 293FT. Bar
= 100µm. C) Western blot analysis of 293FT and
HeLa lysates, showing CRIPTO expression in HeLa
but not 293FT. The antibody used to detect Cripto
was not the Cr block Ab. D) Western blot and band
intensity analysis of HeLa cell lysates. Cells were
grown in DMEM +/- 1µg/ml rhNodal, or 100ng/ml
Activin A, and treated with 1µg/ml Cr blocking Ab
or 10µM SB431542 (SB) inhibitor. Band intensity
was analysed using ImageJ, and P-SMAD2 expressed
relative to SMAD2/3. The Cr blocking Ab marginally
increased P-SMAD2 in all types of medium.
rhNodal + + +
Activin A
+ + +
Cr block Ab
+
+
+
SB + + +
C 38
31 24
38 31 24
293FT HeLa
GA
PD
H
CR
IPTO
A 293FT
B HeLa
Cr block Ab
+DAPI
mIgG +DAPI
Cr block Ab
+DAPI
mIgG +DAPI
0
0.5
1
1.5R
elat
ive
P-S
mad
2
(no
rmal
ised
to
Sm
ad2
/3)
P-SMAD2
SMAD2
D 76
52
76
52
38
193
very weak, and in HeLa cells did not give a strong indication of binding specifically to a
predominantly cell surface molecule. However compared to 293FT cells the staining
appeared stronger and that it may have been slightly more specific. This suggested that
the antibody may have been binding to CRIPTO in the fixed HeLa cells.
In order to test the effect of the Cripto blocking antibody on Smad2 activation, analysis
was performed in HeLa cells (chapter 2.11). Cells were split into 12 well plates in
growth medium (DMEM containing 10% FCS), and the next day growth medium
removed and replaced with DMEM (only), DMEM +1µg/ml rhNodal, or DMEM
+100ng/ml Activin A. For each of these types of medium, individual wells were treated
with 1µg/ml Cr blocking Ab or 10µM SB431542 Alk4/5/7 inhibitor, as well as leaving
a control untreated well, and cells incubated until the next day. They were then lysed
and analysed by western blotting.
Figure 6.2d shows the western blot and band intensity analysis for P-SMAD2 in HeLa
samples with the different treatments. The long period of treatment (24 hours) allowed
any SMAD2 activation resulting from the initial period in growth medium (containing
serum) to have abated, meaning Smad2 activation observed was the result of
endogenous signalling and/or the effect of the specific exogenous factors and
treatments. Interestingly, the addition of the Cr blocking Ab to cells in DMEM-only
slightly raised SMAD2 activation. Inclusion of Activin A in the DMEM medium greatly
increased the level of P-SMAD2, and a slight increase of this as a result of the Cr
blocking Ab was also observed. The addition of rhNodal at a high concentration slightly
increased SMAD2 activation compared to DMEM-only, however surprisingly the
inclusion of the Cr blocking Ab enhanced this effect still further. The inclusion of the
SB inhibitor almost completely eliminated any Smad2 activation in all types of
treatment.
The result that the Cr blocking Ab seemed to slightly increase Smad2 activation in all
types of treatment may be down to the specific interactions of CRIPTO with rhNodal
and Activin A. HeLa cells are known to express NODAL (see chapter 5.2 figure 5.4),
but also other TGFβ ligands such as Activin A (Burges et al., 2011). Activin A is known
to be a much more efficacious ligand than Nodal in the absence of Cripto (Kelber et al.,
2008), so the presence of the Cr blocking Ab in cells in DMEM-only may have
promoted endogenous Activin A and inhibited endogenous Nodal, leading to the slight
increase in Smad2 activation overall. Exogenously added Activin A strongly induced
activation of Smad2, and the slight improvement by the Cr blocking Ab implied that the

194
antibody interfered with Cripto inhibition of Activin A. The cells treated with the SB
inhibitor were used to infer whether the effects of the Cripto blocking Ab were specific
to CRIPTO. Treatment with SB confirmed that signalling observed in all treatments was
Alk4/5/7 specific. Activin A only signals via Alk4 (see chapter 1.1), meaning that the
slightly improved SMAD2 activation in the presence of the Cr blocking Ab is likely to
have occurred through interference of CRIPTO association with ALK4, promoting
Activin A and ALK4 association and signalling. The improved SMAD2 activation by
rhNodal in the presence of the Cr blocking Ab was surprising. This may have been due
to the fact that the rhNodal used was a mature exogenous peptide. The mature peptide
has been shown to bind Cripto, and can be endocytosed in the presence and absence of
Cripto, however a specific region in the prodomain of Nodal greatly enhances Cripto
binding and downstream signalling (Blanchet et al., 2008b). Efficient signalling in the
presence of Cripto has been observed in cells expressing the mature form of Nodal only
(Le Good et al., 2005). It was not investigated in the report by Le Good whether mature-
Nodal signalling would have been stronger in the absence of Cripto. It is therefore not
known how well the mature Nodal peptide associates with Alk4/ActrIIb and signals in
the absence of Cripto. A possible reason for the improved signalling during Cripto
blockade may be that the E.coli derived exogenous rhNodal lacked N-glycosylation or
other post-translational features, meaning its interactions with Cripto and Alk4 were
altered. Although it was unclear what the underlying mechanism was here, it appeared
that the association of mature rhNodal with Alk4/ActrIIb was improved, leading to
increased Smad2 activation. Whether the Cr blocking Ab would have had the opposite
effect on the Nodal propeptide normally released by cells is unknown. Taken together, it
appeared that Cr blocking Ab enhanced activation of Smad2 by both exogenous mature
rhNodal and Activin A in an Alk4/5/7 dependent manner in HeLa cells.
Ideally, immunoprecipitation of Cripto from lysates of HeLa cell lysates that had been
cultured in the presence and absence of the Cr blocking Ab would have been performed,
followed by western blots to analyse for direct binding to Alk4, Nodal and Activin A.
This would have determined exactly the mode of inhibition elicited by the blocking
antibody. Although the results using the Cr blocking Ab with rhNodal were slightly
surprising, the antibody appeared to be having an effect on Smad2 activation via Cripto.
It was therefore deemed justifiable to use the antibody during differentiation of hESCs.

195
6.3 Antibody blockade of Cripto during Activin A treatment of hESCs
Through application of the Cripto blocking antibody during high Activin A treatment of
hESCs, it was hoped a clearer picture would be generated of the interactions and
functions of Cripto, Activin A and Nodal. Because of the overlap in signalling
machinery and downstream components used by Activin A and Nodal, the mechanism
by which Nodal might exert a DE inductive requires elucidation. By inhibiting the
function of Cripto, the aim was to shift the balance between exogenous Activin A and
endogenous Nodal signalling in favour of Activin A, specifically reducing the effect of
Nodal. It was hypothesized that this would show the importance of Cripto to Nodal
signalling, contributing to regulated Smad2 activation and target gene transcription.
6.3.1 Small scale pilot study
An initial experiment was performed in hESCs to follow up the observations of figure
6.2e, where 1µg/ml of Cripto block Ab slightly inhibited Activin A mediated Smad2
activation in HeLa cells. It had been previously observed that Cripto expression in
hESCs was relatively high and increased steadily during Activin A treatment (see figure
3.6). In order to establish what concentration of Cr blocking Ab exerted an effect on
differentiation of Hues1, cells were differentiated using the standardised differentiation
protocol (see chapter 2.5), in medium containing either Activin A, or Activin A
+1µg/ml or 2µg/ml Cr blocking Ab, or 2µg/ml control mouse IgG (from SCBT, table
2.5). Samples were taken at day 0 and day 4 for analysis by qPCR and western blotting.
During the experiment, it was observed that by day 2 cell cultures which had been
treated with Activin A +2µg/ml control mouse IgG were severely compromised. Only
small clumps and clusters were present, all of which appeared comprised of degraded or
apoptotic cells, with none of the normally observed changes to the culture or cell
morphology observed. Although degraded and apoptotic clusters persisted to day 4,
these samples were not analysed. The presence of a low concentration of sodium azide
as a preservative in the mouse IgG (normally used for immunostaining) appeared to
have been the cause.
Figure 6.3 shows analysis of the effect of Cripto blocking Ab. Cells were analysed for
expression of a handful of key markers by qPCR (figure 6.3a). It was found that
although NANOG expression did not vary greatly between different treatments at day 4,
MIXL1 was higher in cells treated with Activin A +1µg/ml Cripto block Ab and lower
when treated with +2µg/ml Cripto block Ab than Activin A-only cells. Furthermore,
both concentrations of Cr blocking Ab led to a reduced level of SOX17 compared to

196
Activin A-only. By only analysing at day 4, it is difficult to know whether MIXL1
expression was increasing or decreasing in the cell cultures of the different treatments. It
is possible that cells treated with 1µg/ml Cripto block Ab had higher MIXL1 expression
than Activin A-only cells due to differentiation being slowed by the action of the
antibody, and the progressive induction of its expression throughout cells in the culture
being delayed. The very low expression observed in the 2µg/ml Cripto antibody
treatment may illustrate an even greater inhibition of this induction of differentiation.
Figure 6.3 – Pilot experiment in Hues1 cells differentiated using Activin A, either
untreated or treated with 1µg/ml or 2µg/ml Cr blocking Ab (Cr). Samples were taken
at day 0 and day 4 for analysis. Cells differentiated with 2µg/ml control mouse IgG
were severely degraded and apoptotic, and were not included in analysis. A)
Expression of markers was analysed by qPCR, displayed as relative expression
normalised to GAPDH (2-ΔCt
). Error bars represent the s.e.m. of technical triplicate
repeats. Treatment with either +1µg/ml or +2µg/ml of Cripto blocking Ab caused
variation in the expression of NANOG and MIXL1, and reduced the amount of
SOX17 in cells by day 4, compared to Activin A-only treatment. B) The amount of
P-SMAD2 was analysed by western blot, with band intensity analysed by ImageJ
and normalised to total SMAD2/3, shown below.
0
0.05
0.1
0.15NANOG B
76
52
76
52
P-SMAD2
A
0
0.01
0.02MIXL1
0
0.005
0.01
0.015
0.02
D0 (mT) D4 ActA D4 A+Cr(1ug/ml)
D4 A+Cr(2ug/ml)
SOX17
0
0.5
1
1.5
2
2.5
D0 (mT) D4 A D4 A+Cr(1ug)
D4 A+Cr(2ug)
P-S
MA
D2
(re
lati
ve t
o
SMA
D2
/3)
P-SMAD2
A

197
Critically, the reduced SOX17 in both concentrations of Cr blocking Ab clearly
suggested an interference with the differentiation program. Analysis by western blot for
the level of P-SMAD2 in cells at day 4 gave no clear conclusions about the actions of
the antibody (figure 6.3b). P-SMAD2 in cells differentiated with Activin A-only was
slightly lower at day 4 than previously seen (see figure 3.7). Compared to this, cells
treated with Activin A +1µg/ml Cr blocking Ab had increased P-SMAD2, and cells
treated with +2µg/ml had a comparable level. Again, analysis at day 4 makes it difficult
to observe any dynamic change occurring in SMAD2 activation over the time course,
and in fact was not the optimal time point to have analysed the effect of the antibody.
SMAD2 activation is highest between days 1-3 of Activin A treatment, therefore any
effect the antibody was having would have been clearer then. The fact there was a slight
change in SMAD2 activation at day 4 with 1µg/ml Cripto blocking Ab indicated that
the antibody may have been having an effect on Activin A/Nodal signalling. Together,
these data suggested that the Cripto blocking Ab was interfering with differentiation of
the cells, with slightly varying degrees based on concentration. It was decided to
perform experiments for further analysis over more time points. Given that a lower
concentration of 1µg/ml elicited an effect, it was deemed sufficient for use and less
likely to elicit non-specific effects on the cells than a higher concentration.
6.3.2 Determining the effect on DE differentiation
Experiments were performed to analyse the effect of 1µg/ml Cripto blocking Ab on DE
differentiation in Hues1 cells during high Activin A treatment. A more appropriate
control mouse IgG antibody was sought. An antibody available from the same
manufacturer as the Cripto blocking Ab (R&D Systems, table 2.5), which was marketed
as a neutral control antibody with low reactivity to many recombinant peptides during
ELISAs, was used in parallel to the Cr blocking Ab. Hues1 cells were differentiated
using either Activin A-only, or Activin A plus 1µg/ml Cr blocking or control IgG Ab. In
order to determine the effect on SMAD2 activation, lysate samples of cells were taken
at day 0, 2 and 4, and cDNA samples for gene expression analysis were also taken at
day 0, 2 and 4. Qualitative and quantitative analysis of DE differentiation by SOX17
expression was undertaken by microscopy and flow cytometry at day 5. Two individual
runs of the experiment with cells at different passages (pp7 and pp3) were performed.
Figure 6.4 shows qPCR and western blot analysis of the two runs. For analysis of gene
expression, markers of pluripotency, differentiation, and TGFβ/Wnt signalling were
analysed (figure 6.4a-c). However, data generated from samples from the second run

198
(run 2) appeared atypical. The expression of transcripts in day 0 and Activin A-only
samples was used as a basis to validate whether the data followed normal trends. Many
markers of differentiation and TGFβ signalling were fairly raised at day 0, and failed to
increase by day 2 and day 4, compared to the extent normally seen in run 1and previous
data sets (see figure 3.4). Examples of MIXL1 and SOX17 are shown in figure 6.4a and
6.4b respectively. While conducting the experiment that generated these run 2 cDNA
samples, the morphology of cell in culture progressed during differentiation as
previously seen based on microscopy (data not shown), and immunofluorescence at day
0 indicated expression of OCT4 (figure 6.5a) and NANOG (not shown) throughout the
culture. Robust induction of SOX17 was also observed by day 5 in run 2 Activin A-only
treated cells (figure 6.5c-f). The gene expression data from the run 2 cDNA samples
therefore appeared completely anomalous and disparate from the immunostaining and
cell morphology observed during the experiment. The RNA preps from run 2 were
reprocessed (DNAsed, then reverse transcribed to cDNA) and analysed by qPCR again,
to assess whether there had been degradation or contamination issues with the initial
cDNA sample set. These cDNA samples gave very similar results (not shown). This
indicated that there had been a problem with all the original RNA samples of run 2, with
degradation or contamination of the RNA occurring during the collection or preparation
of samples. Since they were anomalous and disparate from their own corresponding
immunostaining data as well as previous data, it was decided not to include run 2 qPCR
results in the analysis. Inferences were therefore drawn from gene expression data from
a single sample set (run 1, figure 6.4a-c).
Compared to cells in Activin A-only or Activin A +control IgG, cells differentiated with
Activin A +Cr blocking Ab showed a reduced expression of mesendoderm
differentiation markers and signalling molecules at day 2. T, MIXL1, GSC, NODAL and
WNT3 were the most strongly affected by the Cr blocking Ab. By day 4, the variation
across most transcripts for the three different conditions was not particularly great.
Generally, the expression of most targets on days 2 and 4 in treatment with control IgG
was similar to that in Activin A-only. The expression of a few targets deviated slightly
at day 2 however, with a reduced amount of pluripotency marker transcripts observed,
as well as slightly lower T and higher FOXA2. The data therefore suggested that the
control IgG antibody slightly reduced expression of pluripotency markers in the early
part of the time course, and that the Cr blocking Ab had an inhibitory effect on the
induction of early mesendoderm markers during Activin A treatment.
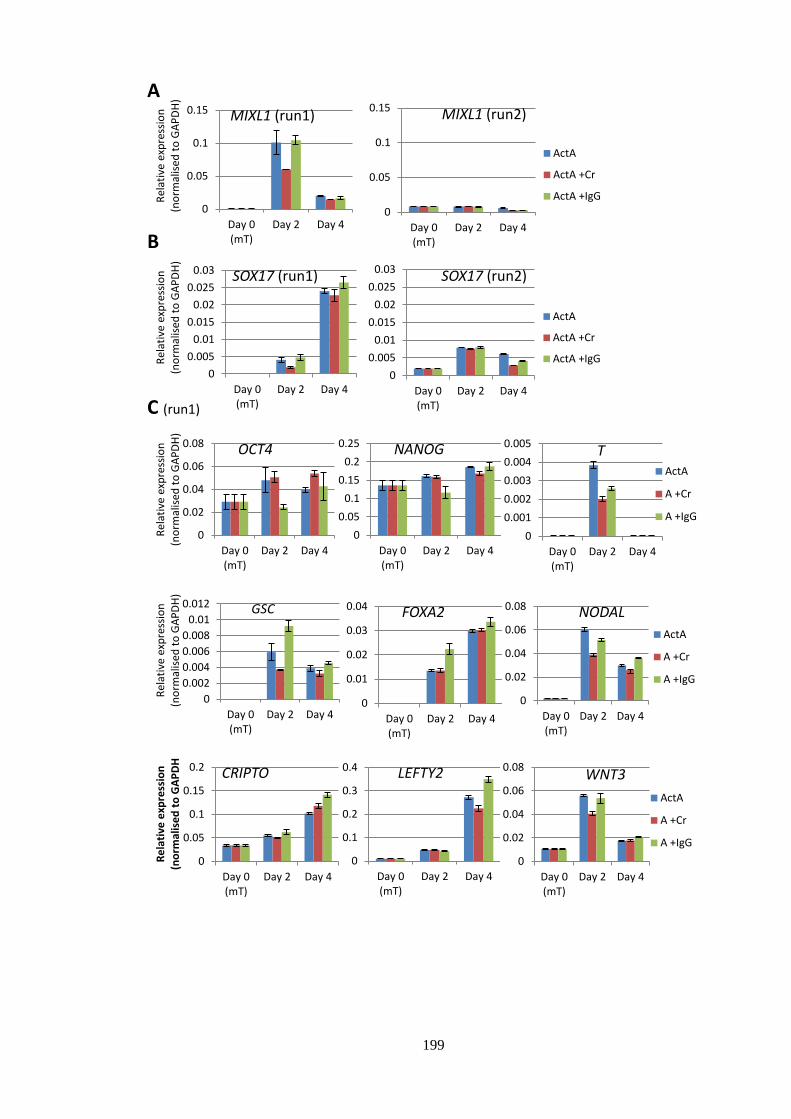
199
0
0.05
0.1
0.15
Day 0(mT)
Day 2 Day 4
Rel
ativ
e ex
pre
ssio
n
(no
rmal
ised
to
GA
PD
H)
MIXL1 (run1)
0
0.05
0.1
0.15
Day 0(mT)
Day 2 Day 4
MIXL1 (run2)
ActA
ActA +Cr
ActA +IgG
0
0.005
0.01
0.015
0.02
0.025
0.03
Day 0(mT)
Day 2 Day 4
Rel
ativ
e ex
pre
ssio
n
(no
rmal
ised
to
GA
PD
H)
SOX17 (run1)
0
0.005
0.01
0.015
0.02
0.025
0.03
Day 0(mT)
Day 2 Day 4
SOX17 (run2)
ActA
ActA +Cr
ActA +IgG
0
0.02
0.04
0.06
0.08
Day 0(mT)
Day 2 Day 4
Rel
ativ
e ex
pre
ssio
n
(no
rmal
ised
to
GA
PD
H)
OCT4
0
0.05
0.1
0.15
0.2
0.25
Day 0(mT)
Day 2 Day 4
NANOG
0
0.001
0.002
0.003
0.004
0.005
Day 0(mT)
Day 2 Day 4
T ActA
A +Cr
A +IgG
0
0.002
0.004
0.006
0.008
0.01
0.012
Day 0(mT)
Day 2 Day 4
Rel
ativ
e ex
pre
ssio
n
(no
rmal
ised
to
GA
PD
H)
GSC
0
0.01
0.02
0.03
0.04
Day 0(mT)
Day 2 Day 4
FOXA2
0
0.02
0.04
0.06
0.08
Day 0(mT)
Day 2 Day 4
NODAL
ActA
A +Cr
A +IgG
0
0.05
0.1
0.15
0.2
Day 0(mT)
Day 2 Day 4
Re
lati
ve e
xpre
ssio
n
(no
rmal
ise
d t
o G
AP
DH
CRIPTO
0
0.1
0.2
0.3
0.4
Day 0(mT)
Day 2 Day 4
LEFTY2
0
0.02
0.04
0.06
0.08
Day 0(mT)
Day 2 Day 4
WNT3
ActA
A +Cr
A +IgG
A
B
C (run1)
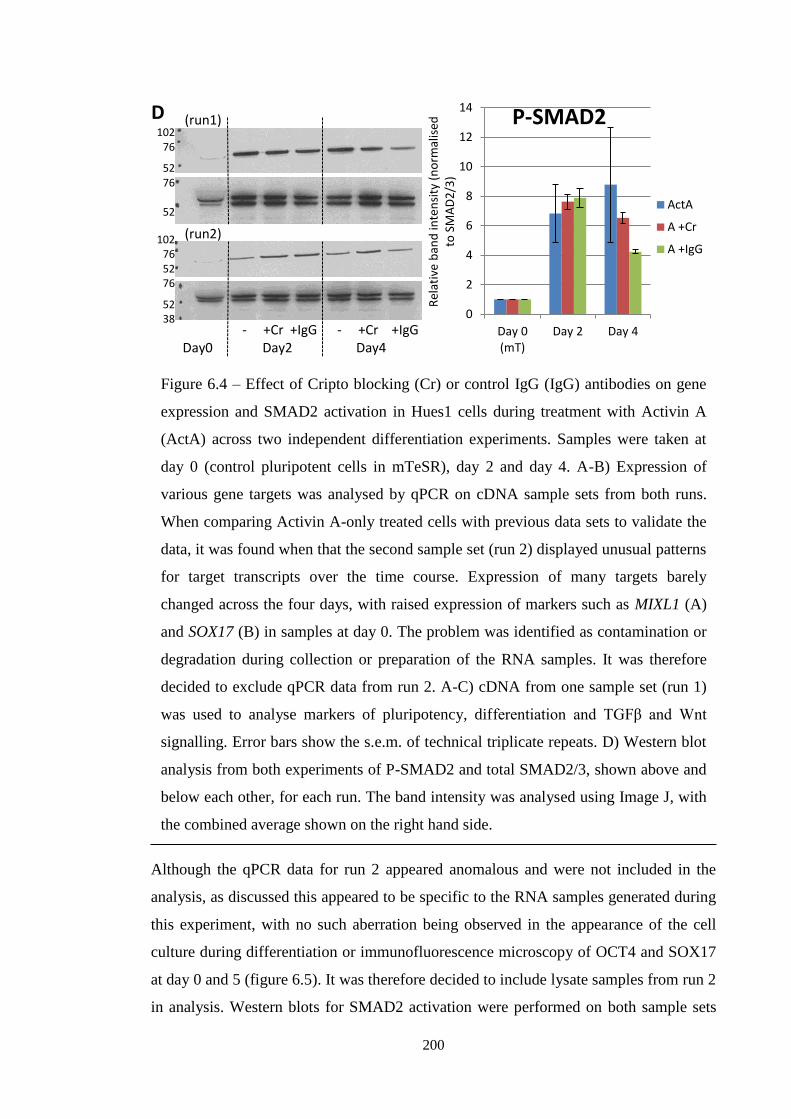
200
Although the qPCR data for run 2 appeared anomalous and were not included in the
analysis, as discussed this appeared to be specific to the RNA samples generated during
this experiment, with no such aberration being observed in the appearance of the cell
culture during differentiation or immunofluorescence microscopy of OCT4 and SOX17
at day 0 and 5 (figure 6.5). It was therefore decided to include lysate samples from run 2
in analysis. Western blots for SMAD2 activation were performed on both sample sets
0
2
4
6
8
10
12
14
Day 0(mT)
Day 2 Day 4
Rel
ativ
e b
and
inte
nsi
ty (
no
rmal
ised
to
SM
AD
2/3
)
P-SMAD2
ActA
A +Cr
A +IgG
D 102
76
52 76
52
102 76 52 76
52 38
(run1)
(run2)
- +Cr +IgG - +Cr +IgG Day0 Day2 Day4
Figure 6.4 – Effect of Cripto blocking (Cr) or control IgG (IgG) antibodies on gene
expression and SMAD2 activation in Hues1 cells during treatment with Activin A
(ActA) across two independent differentiation experiments. Samples were taken at
day 0 (control pluripotent cells in mTeSR), day 2 and day 4. A-B) Expression of
various gene targets was analysed by qPCR on cDNA sample sets from both runs.
When comparing Activin A-only treated cells with previous data sets to validate the
data, it was found when that the second sample set (run 2) displayed unusual patterns
for target transcripts over the time course. Expression of many targets barely
changed across the four days, with raised expression of markers such as MIXL1 (A)
and SOX17 (B) in samples at day 0. The problem was identified as contamination or
degradation during collection or preparation of the RNA samples. It was therefore
decided to exclude qPCR data from run 2. A-C) cDNA from one sample set (run 1)
was used to analyse markers of pluripotency, differentiation and TGFβ and Wnt
signalling. Error bars show the s.e.m. of technical triplicate repeats. D) Western blot
analysis from both experiments of P-SMAD2 and total SMAD2/3, shown above and
below each other, for each run. The band intensity was analysed using Image J, with
the combined average shown on the right hand side.

201
(figure 6.4d). The band intensity of P-SMAD2 was normalised to SMAD2/3 for both
runs using ImageJ. The relative levels of SMAD2 activation across the different
treatments seemed to vary slightly between the two runs. Cells treated with Activin A-
only showed a greater amount of SMAD2 activation in run 1, but a lower amount in run
2, compared to cells treated with Cr blocking Ab or control IgG. This meant that the
lowest level of SMAD2 activation in cells from run 1 occurred in control IgG treated
cells, whereas in run 2, SMAD2 activation of control IgG cells was similar to that of
cells in Activin A-only (as one would normally expect). Upon compiling averages of
these data, the variability made the effect of the different treatments difficult to
interpret. Western blots for GAPDH indicated equal loading of lysate samples, and blots
for CRIPTO indicated that it was expressed at the normal levels previously observed in
cells for these time points in all treatments (data not shown), giving no reason to believe
there was a problem with the lysate samples. Given the variation across the sample sets,
and the disparity in SMAD2 activation in Activin A-only treated cells, the specific
effect of the Cripto blocking Ab on Smad2 activation could not be determined.
As a result of the problem with one of the gene expression data sets, and the variability
of the SMAD2 activation during Activin A only treatment, it could not be confirmed
whether the Cr blocking Ab was having a strong effect on differentiation. Whether it
was indeed inhibiting differentiation, as was suggested by qPCR data of mesendoderm
markers from run 1, was further investigated by direct comparison of SOX17 expression
at day 5. Cells from both runs of the experiment were fixed at day 0 and 5 and
immunostained for OCT4, NANOG and SOX17 (and associated control IgG staining
antibodies), shown in figure 6.5a-c and appendix A.2. Immunofluorescence microscopy
indicated expression at day 0 throughout cells in both runs of pluripotency factors
OCT4 (figure 6.5a) and NANOG (data not shown). Using higher and lower
magnification microscopy (appendix A.2 and figure 6.5c respectively), the relative
amounts of SOX17 expression at day 5 was qualitatively determined. It was found that
the level of SOX17 induction in cultures treated with Activin A-only in both runs was
slightly higher than in some previous experiments (see figure 3.10). Comparison with
Activin A-only treated cells indicated that treatment with the control IgG Ab gave a
similar or slightly lower frequency of cells staining for SOX17. However, cells treated
with the Cripto blocking Ab had a clearly lower amount of cells which were positive for
SOX17 staining. Moreover, the cultures had a different appearance to those treated with
the control IgG or Activin A only. There were fewer identifiable regions with dense
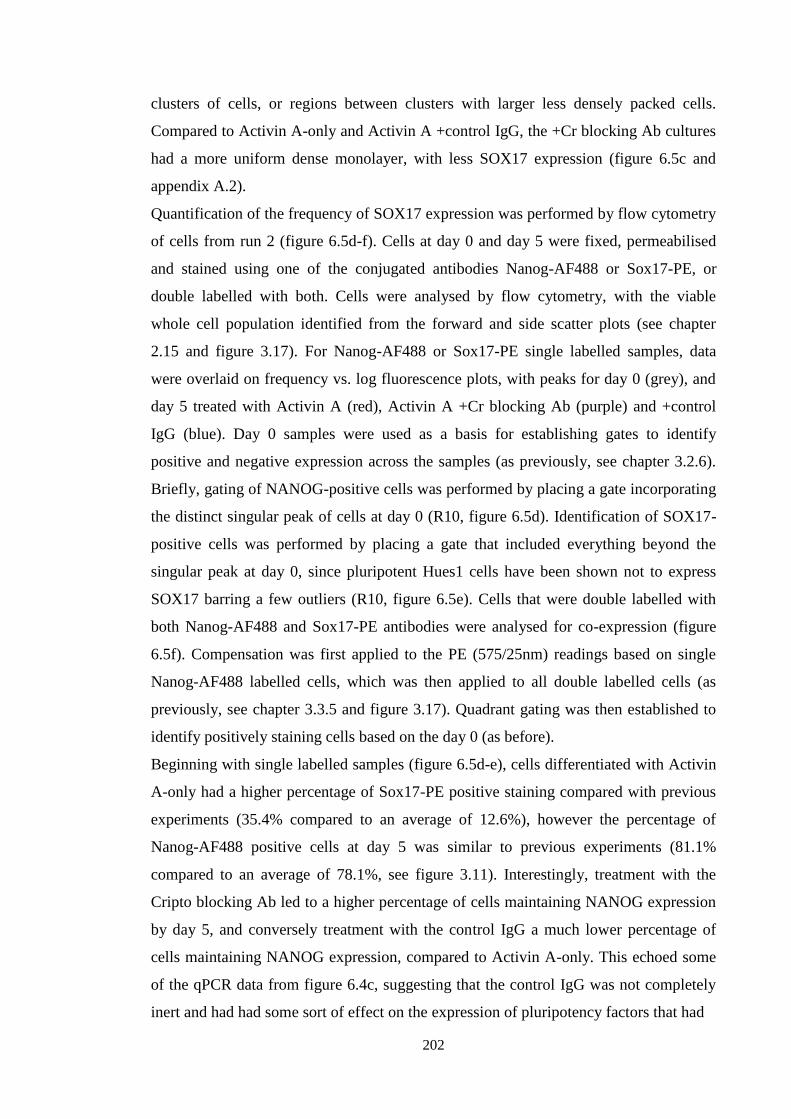
202
clusters of cells, or regions between clusters with larger less densely packed cells.
Compared to Activin A-only and Activin A +control IgG, the +Cr blocking Ab cultures
had a more uniform dense monolayer, with less SOX17 expression (figure 6.5c and
appendix A.2).
Quantification of the frequency of SOX17 expression was performed by flow cytometry
of cells from run 2 (figure 6.5d-f). Cells at day 0 and day 5 were fixed, permeabilised
and stained using one of the conjugated antibodies Nanog-AF488 or Sox17-PE, or
double labelled with both. Cells were analysed by flow cytometry, with the viable
whole cell population identified from the forward and side scatter plots (see chapter
2.15 and figure 3.17). For Nanog-AF488 or Sox17-PE single labelled samples, data
were overlaid on frequency vs. log fluorescence plots, with peaks for day 0 (grey), and
day 5 treated with Activin A (red), Activin A +Cr blocking Ab (purple) and +control
IgG (blue). Day 0 samples were used as a basis for establishing gates to identify
positive and negative expression across the samples (as previously, see chapter 3.2.6).
Briefly, gating of NANOG-positive cells was performed by placing a gate incorporating
the distinct singular peak of cells at day 0 (R10, figure 6.5d). Identification of SOX17-
positive cells was performed by placing a gate that included everything beyond the
singular peak at day 0, since pluripotent Hues1 cells have been shown not to express
SOX17 barring a few outliers (R10, figure 6.5e). Cells that were double labelled with
both Nanog-AF488 and Sox17-PE antibodies were analysed for co-expression (figure
6.5f). Compensation was first applied to the PE (575/25nm) readings based on single
Nanog-AF488 labelled cells, which was then applied to all double labelled cells (as
previously, see chapter 3.3.5 and figure 3.17). Quadrant gating was then established to
identify positively staining cells based on the day 0 (as before).
Beginning with single labelled samples (figure 6.5d-e), cells differentiated with Activin
A-only had a higher percentage of Sox17-PE positive staining compared with previous
experiments (35.4% compared to an average of 12.6%), however the percentage of
Nanog-AF488 positive cells at day 5 was similar to previous experiments (81.1%
compared to an average of 78.1%, see figure 3.11). Interestingly, treatment with the
Cripto blocking Ab led to a higher percentage of cells maintaining NANOG expression
by day 5, and conversely treatment with the control IgG a much lower percentage of
cells maintaining NANOG expression, compared to Activin A-only. This echoed some
of the qPCR data from figure 6.4c, suggesting that the control IgG was not completely
inert and had had some sort of effect on the expression of pluripotency factors that had

203
(SOX17, day5) ActA ActA+Cr ActA+IgG C (run1)
(run2)
A (OCT4, day 0) B (control gIgG stain, day 5 ActA)
(r
un
2)
(r
un
1)
(ru
n2
)
(ru
n1
)
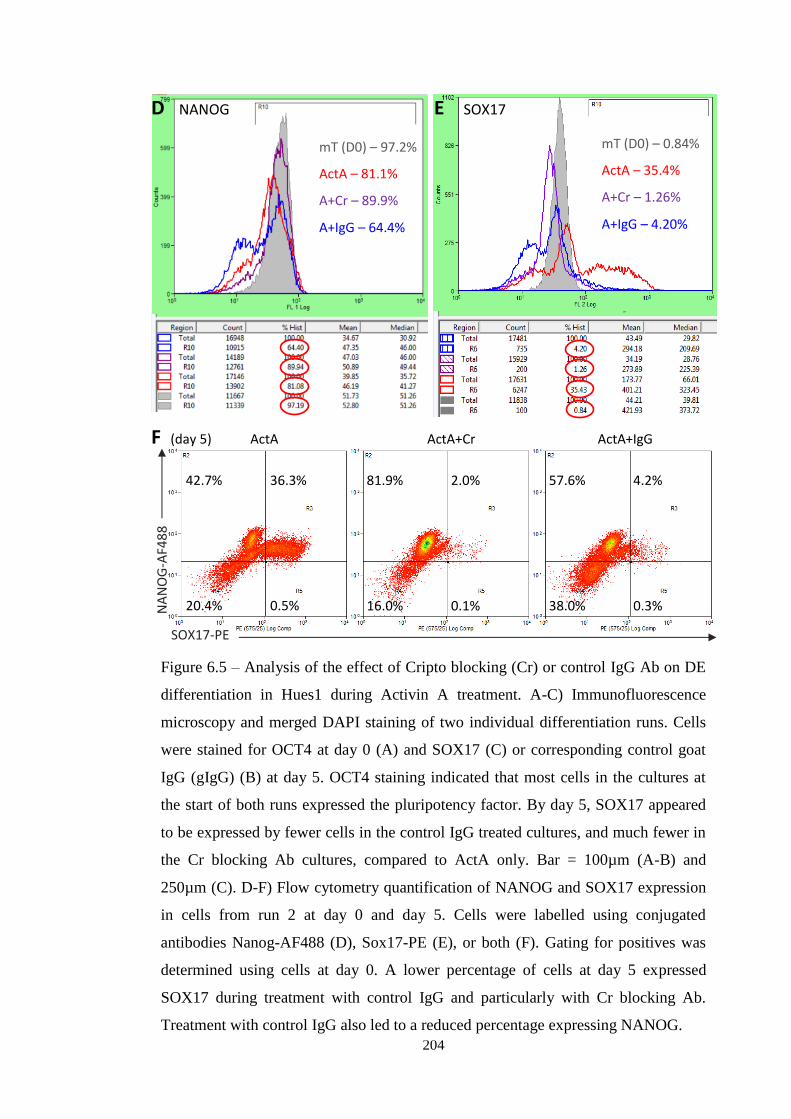
204
Figure 6.5 – Analysis of the effect of Cripto blocking (Cr) or control IgG Ab on DE
differentiation in Hues1 during Activin A treatment. A-C) Immunofluorescence
microscopy and merged DAPI staining of two individual differentiation runs. Cells
were stained for OCT4 at day 0 (A) and SOX17 (C) or corresponding control goat
IgG (gIgG) (B) at day 5. OCT4 staining indicated that most cells in the cultures at
the start of both runs expressed the pluripotency factor. By day 5, SOX17 appeared
to be expressed by fewer cells in the control IgG treated cultures, and much fewer in
the Cr blocking Ab cultures, compared to ActA only. Bar = 100µm (A-B) and
250µm (C). D-F) Flow cytometry quantification of NANOG and SOX17 expression
in cells from run 2 at day 0 and day 5. Cells were labelled using conjugated
antibodies Nanog-AF488 (D), Sox17-PE (E), or both (F). Gating for positives was
determined using cells at day 0. A lower percentage of cells at day 5 expressed
SOX17 during treatment with control IgG and particularly with Cr blocking Ab.
Treatment with control IgG also led to a reduced percentage expressing NANOG.
mT (D0) – 97.2%
ActA – 81.1%
A+Cr – 89.9%
A+IgG – 64.4%
mT (D0) – 0.84%
ActA – 35.4%
A+Cr – 1.26%
A+IgG – 4.20%
F (day 5) ActA ActA+Cr ActA+IgG
NA
NO
G-A
F48
8
SOX17-PE
D NANOG E SOX17
42.7% 36.3% 20.4% 0.5%
81.9% 2.0% 16.0% 0.1%
57.6% 4.2% 38.0% 0.3%

205
not been observed with the Cripto blocking Ab. The higher percentage of cells
maintaining NANOG when treated with Cripto blocking Ab compared with Activin A-
only was concomitant with a much lower percentage expressing SOX17. The
percentage was only marginally above the level of cells at day 0 (representing either
background or anomalous outliers), and much lower than in cells treated with control
IgG. The percentage of SOX17 expressing cells treated with the control IgG was still
several fold less than those with Activin A-only. Nonetheless, this indicated that the
control IgG did not seem to be having the same detrimental effect as the Cr blocking Ab
on SOX17 expression.
Analysis of the double labelled cells allowed further insight into the effect of the
different treatments on differentiation (figure 6.5f). In cells treated with Activin A-only,
the large induction of SOX17 expression was predominantly observed in cells also
maintaining expression of NANOG (NANOG+/SOX17
+). The decrease in the
percentage of cells expressing NANOG came as a result of emergence of cells that were
NANOG-/SOX17
-, as had been observed previously (figure 3.17). Both the Cr blocking
and control IgG treatments also induced SOX17 positive populations that were
predominantly NANOG positive. The large increase in cells that became NANOG-
/SOX17- when treated with control IgG further indicated the indeterminate negative
effect the control antibody was having on pluripotency factor expression of cells. For
cells treated with Cripto blocking Ab, there was a lower percentage that were NANOG-
/SOX17- and a lower percentage that were NANOG
+/SOX17
+ compared to the Activin
A only treatment, with most cells remaining NANOG+/SOX17
-. The population that
normally lost NANOG expression to become NANOG-/SOX17
- upon Activin A
treatment appeared to have been aided in maintaining expression of the pluripotency
factor. This suggested that treatment with the Cripto blocking Ab not only inhibited DE
induction, but led to cells resisting differentiation in general.
Microscopy indicated that there seemed to have been more cells staining positive for
SOX17 in run 1 compared to run 2 for all three types of treatment. This slight disparity
between the two may have been within the normal bounds of experimental variation.
Flow cytometry analysis of cells from run 1 would have been useful to increase the
quantitative assessment of the effect of the Cripto blocking Ab on DE differentiation,
and would have been performed if enough cells had been available at the time. As the
immunostaining data indicated, samples for run 2 seemed to have differentiated during
Activin A-only treatment similar to previous experiments, indicating that the qPCR data

206
was indeed unrepresentative, and that there was an adverse problem with the RNA
samples from this run. This unfortunate problem with the run 2 RNA samples and
subsequent lack of gene expression data made confirming the effect of the Cripto
blocking antibody more difficult. This was compounded by variability observed by
western blot with the level of Smad2 activation in cells across both runs of the
experiment. The control IgG Ab did not elicit the same negative effects on expression of
differentiation markers that the Cr blocking Ab did. This indicated that the effects of the
Cr blocking Ab were not simply non-specific antibody effects. Repeat experiments
would have been required to identify the statistically significant differences observed in
markers here, or clarify whether the Cripto blocking Ab was having an effect on the
downstream signalling. However, taking the available qPCR and immunostaining data
together, it appeared that the Cripto blocking Ab was inhibiting differentiation of hESCs
during Activin A treatment, leading to a reduction in mesendoderm related transcripts, a
slight maintenance of pluripotency factors and greatly reduced SOX17 expression.
6.4 Conclusions and discussion
The data in this chapter provide some evidence that Cripto functions during Activin A
treatment to promote DE differentiation in hESCs. Endocytosis of NODAL was
observed, and localisation of NODAL to the membrane of some endosomes seemed to
be occurring during Activin A treatment, implicit of Cripto regulation of endogenous
Nodal propeptide. There also appeared to be a negative effect on the expression of
mesendodermal marker transcripts and SOX17 expression during antibody blockade of
Cripto over the standard 6 day Activin A time course. Certain factors in both
experiments curtail the extent to which these conclusions can be drawn however. The
function of Cripto in various contexts has been the subject of much previous research.
How Cripto’s functions, particularly those which relates to Activin A and Nodal
signalling, might affect hESCs in the context of Activin A mediated DE differentiation
is discussed in light of the results here.
Confocal microscopy of hESCs double labelled with antibodies against NODAL and
EEA1 identified areas of colocalisation of the two proteins, as well as EEA1 marked
endosomes where NODAL appeared to be at the membrane. To verify that this had been
the case, the staining would have needed to have been clearer and at a higher resolution
to give better definition to structures. Including other markers of early endosomes or
Nodal receptors such as Rab5, Cripto or Alk4 in the analysis would have further

207
confirmed the process of Nodal endocytosis and membrane localisation in hESCs. The
identification of endocytosis of Nodal provides evidence that endogenous Nodal
signalling is occurring in parallel with exogenous signalling by Activin A. Activin A
itself has been shown to be endocytosed by cells (Hagemann et al., 2009; Blanchet et
al., 2008b). The report from Hagemann et al. (2009) used the technique of labelling
Activin A with AF488 to identify endocytosis of the molecule and colocalisation with
various endosome-related factors. This technique could have been effectively combined
with and compared to Nodal staining. The relative colocalisation and frequency of
endocytosis of the two different molecules in individual cells would provide insight into
the balance between their parallel roles. There would have been further application of
confocal microscopy to analyse the effect of Nodal knockdown or Cripto antibody
blockade on endocytosis given more time and optimisation of these experimental
approaches. Qualitative or quantitative analysis of reduction in the amount of NODAL
endocytosis and localisation to the membrane during such experiments would confirm
the central role of Cripto regulated Nodal signalling during DE differentiation.
Nonetheless, identifying endosomes with Nodal localised to the membrane provided
tentative evidence of Cripto regulated Nodal signalling during DE differentiation.
The loss of a complete sample set of RNA, meaning only a single data set was available
from qPCR analysis, put the experiment in a frustrating position, preventing statistical
analysis or confirmation of the gene expression trends observed and undermining the
overall conclusions. Two or more cDNA sample sets would have been ideal, hence an
additional run should have been performed. Nonetheless, what was observed with the
single set of gene expression data and across the immunofluorescence data from the two
independent runs suggested a role for Cripto in DE differentiation. The problem of the
indeterminate effect the control IgG Ab had on cells slightly undermined the strength of
conclusions about the specific effects of the Cripto blocking Ab. Since the control IgG
Ab seemed to have a negative effect on pluripotency factor expression, which the Cripto
blocking Ab did not, it seems likely that this effect was particular to the control IgG Ab,
and not something inherent to mouse IgG antibodies in general that would apply to the
Cripto blocking Ab. Resolving a problem like this would be difficult. Continuing to
search for a control IgG that was genuinely inert and unreactive on cells (rather than just
in ELISAs) would be one solution. Titration of the antibodies to a lower concentration
which still showed the effects of the Cripto blocking Ab but eliminated control IgG
effects would be another, although it is unlikely the effect of the Cripto blocking Ab
208
would have been observable much below the concentration of 1µg/ml used here.
Ultimately, identifying any non-specific functions of the Cripto blocking Ab was the
purpose of including a control IgG Ab. More thorough functional assays establishing
the specificity of the antibody’s binding would have strengthened conclusions about the
antibody’s function. In particular, immunoprecipitation of Cripto and then western
blotting for association with Nodal, Alk4, or Activin A, in the presence or absence of
the blocking antibody, would have confirmed this.
Immunostaining using the Cripto blocking Ab in HeLa and 293FTs cells suggested that
it may have been binding to CRIPTO present in the former. Increased P-SMAD2 in the
presence of the Cripto blocking Ab in HeLa cells identified an Alk4 mediated effect by
the Cripto blocking Ab, improving the effects of Activin A and mature rhNodal
signalling in the cells, implying specific interference of Cripto. However, an Alk4
independent function of Cripto signalling has also been identified. Cripto has been
shown to have a role in signalling via both the Smad2 signalling network and Scr/Akt
signalling network by its association with GRP78 (Bianco et al., 2003; Kelber et al.,
2009). Association of Cripto via its CFC region with the ER chaperone GRP78, which
can localise to the cell surface membrane to act as a receptor, induces downstream
MAPK activation. The report by Kelber showed that Cripto can function to activate Akt
and MAPK signalling, and that blockade of GRP78 or shRNA knockdown of Cripto or
GRP78 leads to ablation of this signalling (Kelber et al., 2009). If interference with this
aspect of Cripto signalling had been the primary effect of Cripto blockade in the
differentiating hESCs here, then reduced PI3k/Akt signalling would have enhanced DE
differentiation (McLean et al., 2007). In the DE differentiation system used here it is
unknown whether GRP78 or other elements of the PI3k/Akt network are highly
expressed or active. However, it seems unlikely that Cripto’s predominant role would
be signalling via this pathway during mesendoderm/DE differentiation in hESCs, given
the plethora of Activin/Nodal signalling. Attempts were made to assess whether the
Cripto blocking Ab had any secondary effect on Cripto signalling via this pathway in
hESCs during differentiation. Western blots on hESC lysates using the P-Akt antibody
available in house were not successful in producing any bands from samples
differentiated with or without the Cripto blocking Ab. Despite being unlikely, it is
therefore unknown if the Cripto blocking Ab had a secondary effect on PI3k/Akt
signalling.

209
The strongest trend displayed by the data from hESCs was that the Cripto blocking Ab
reduced the expression of mesendodermal marker and signalling transcripts at day 2,
and led to a reduced level of SOX17 expression and a maintained NANOG expression.
The Cripto blocking Ab appeared to have conferred a slight resistance to differentiation
during Activin A treatment. This suggested that normally, Cripto has a role in
promoting differentiation. By comparing with mouse developmental data on the role of
Cripto, the data here recapitulate the established model where Cripto dependent Nodal
signalling is essential for proper DE differentiation. Cripto null mice completely fail to
form a primitive streak, and show almost no proliferation or migration of the small
amount of mesendodermal cells that become specified at the posterior end. The process
of gastrulation is thus severely disrupted, and embryos mostly comprising of
neurectodermal cells arrest at E8.5-10.5 (Ding et al., 1998). Other groups have used
more subtle approaches than complete ablation of Cripto, to identify Nodal signalling
that is independent of some functions of Cripto. One of the functions of Cripto is
recruitment of protein convertases Furin and PACE4, which cause proteolytic cleavage
of the Nodal propeptide when bound to Cripto and Alk4 (Blanchet et al., 2008a). A
cleavage resistant form of Nodal, whereby this function of Cripto is redundant, has been
shown to induce some signalling factors (such as Bmp4 and Wnt3) in extra-embryonic
ectoderm, and even induce expression of some early mesendodermal markers like
Brachyury (T) during early mouse development. However the induction of the
mesendoderm, DE, anterior visceral endoderm, and subsequent specification of
respective derivatives is severely disrupted (Ben-Haim et al., 2006). A second approach
also identified a partial rescue of the Cripto null phenotype in mice by generating
Cripto/Cer1 double null mutants. These embryos developed with some specification of
anterior visceral endoderm and DE, although truncated and slightly delayed (Liguori et
al., 2008). Similarly, a mutant Cripto allele that is unable to bind Nodal but otherwise
functions normally was shown to lead to a similar phenotype in homozygous mice
(D’Andrea et al., 2008). While these experiments highlight the presence of some Cripto-
independent Nodal signalling, the failure of gastrulation and proper mesendoderm and
DE specification illustrates the fundamental role of Cripto in facilitating Nodal
signalling. Without Cripto, the signalling effect elicited by Nodal in the mouse appears
to be too weak to for the embryo to gastrulate fully and specify DE. Although in the
experiments in this chapter it was unknown whether the interference with Cripto had

210
Nodal-specific effects, Cripto blockade led to a similar reduced (but not ablated)
capacity to generate DE-like cells.
Interference with Cripto function during stem cell differentiation has been investigated
by several groups. In mESCs with inducible Nodal expression, DE differentiation was
enhanced by Nodal overexpression during undirected high-serum differentiation
treatment. However, antibody blockade of Cripto was shown to inhibit this effect.
Smad2 activation was reduced back to nearly the level in cells not overexpressing
Nodal, as was expression of endoderm and mesodermal markers Cxcr4, Vegfr2 and
Pdgfrβ (Takenaga et al., 2007). Cripto is required to allow differentiation of beating
cardiomyocytes during mESC EB formation. Cripto is expressed in the first 4 days of
EB differentiation, and Cripto knockout mESCs failed to form beating cardiomyocytes.
Rescue by addition of exogenous soluble Cripto could only occur when applied within
an early time frame, and the process was shown to be Alk4 dependent following rescue
with a constitutively active Alk4 (Parisi et al., 2003). Ablation of Cripto/Alk4 function
was shown to promote neuronal fate, which was recapitulated in another study whereby
Cripto-Alk4 association was specifically blocked by a small synthetic peptide,
promoting neuronal differentiation in mESC EBs (Lonardo et al., 2010). In both cases,
disrupting Cripto led to a failure in cardiac differentiation. However the investigations
omitted analysis of earlier stages. It seems likely that disruption of Cripto during stem
cell differentiation has a similar effect to that during mouse embryo development,
interfering with Nodal signalling, thereby mesendodermal specification and all
subsequent lineages (including cardiac).
Application of the Cripto blocking Ab to HeLa indicated it had an Alk4 specific effect,
slightly enhancing mature exogenous rhNodal and Activin A mediated activation of
Smad2. The effect of the Cripto blocking Ab on Smad2 activation in hESCs was not
clear. The two runs of differentiation in hESCs had either a slightly raised or lowered
amount of P-Smad2 compared with Activin A-only treatment. The inconsistency meant
that it was difficult to identify what difference was caused by the Cripto blocking Ab in
the activation of Smad2. However, there was no profound ablation or order-of-
magnitude increase in the level of P-Smad2 as a result of the Cripto block Ab. It seemed
that Smad2 activation was similar in the different treatments. This implied that the
effect of Cripto blockade on P-Smad2 was either weak, or caused a balancing promotion
of exogenous Activin A signalling and inhibition of endogenous Nodal signalling.
Although not enough evidence to confirm the latter possibility was generated by the

211
data, it is an attractive conclusion given the divergent role of Cripto in the signalling of
the Nodal and Activin A. The CFC region of Cripto, which is responsible for binding
Alk4 and Activin B, but not Activin A or Nodal (Adkins et al., 2003; Kelber et al.,
2008; Yeo and Whitman, 2001), is the region supposedly blocked by the Cripto
blocking Ab. In the absence of Cripto, Activin A has been shown to bind Alk4 and
ActRIIb, and is a highly efficacious activator of Smad2. In the presence of Cripto, the
association of Activin A with these receptors is not completely inhibited, and it even
forms complexes with them including Cripto, however with a diminished activation of
Smad2 (Kelber et al., 2008). Blockade of Cripto has been shown to promote Activin A
signalling via prevention of Cripto association with Alk4, promoting the Activin
A/Alk4/ActRIIb complex formation (Adkins et al., 2003). It has been suggested the
association of Cripto with Alk4 creates a complex with lower affinity for Activin A than
Alk4 alone (Kelber et al., 2008). In the case of hESC differentiation using Activin A,
such a mechanism of blockade would fit with the observed effect (or lack thereof) on
Smad2 activation. The improvement of Activin A/Alk4 association may be occurring
simultaneously to the direct inhibition of Nodal/Alk4/Cripto signalling complex
formation during Cripto blockade.
In the case of a balancing effect by Cripto blockade on Activin A and Nodal activation
of Smad2, the paradox of a reduced capacity for mesendoderm and DE differentiation
despite such similar levels of Smad activation would require explanation and
investigation. Delving further into the regulatory role that Cripto exerts on Nodal
reveals possible mechanisms for such a paradox. Cripto has been shown to be able to
promote Nodal signalling in an autocrine fashion, through the binding of the two
molecules during exocytosis from cells expressing them. Conversely, Cripto has also
been shown to promote paracrine signalling following association with Nodal by
recruitment of protein convertases released from other cells, promoting Nodal
maturation and endocytosis (Blanchet et al., 2008a). As a GPI anchored protein,
Cripto’s regulation of Nodal endocytosis and membrane localisation has been shown as
a key factor to enhancing its signalling. Without Cripto, Nodal is endocytosed but
remains in the luminal space of endosomes. In the presence of Cripto, Nodal
endocytosis is associated with the lipid raft marker Flotillin-1, and localisation of Nodal
to the membranes of early endosomes correlates with the association of other factors
required for Smad signalling including Alk4 and Sara (Blanchet et al., 2008b, 2008a). In
the absence of Cripto, Caveolin and Flotillin marked microdomains are less involved in

212
the endocytosis of Nodal, and it has been suggested that Nodal is more rapidly
trafficked for lysosomal degradation without effectively inducing Smad activation
(Constam, 2009; Blanchet et al., 2008a). While Activin A has been shown to be
endocytosed and localise to the limiting membrane of endosomes in the absence or
presence of Cripto (Blanchet et al., 2008b), another study has shown that the process of
endocytosis can be inhibited in Xenopus explants but not drastically alter the effect of
Activin A on Smad2 activation (Hagemann et al., 2009). This discrepancy is crucial in
how the function of Cripto diverges in the effect it has on Activin A and Nodal. Cripto
mediated processing and endocytosis promotes Nodal signalling, which allow it to
generate high levels of signalling in cells in an autocrine and paracrine manner. Activin
A has a high efficacy of Alk4 mediated Smad2 activation in the absence of Cripto.
However, high amounts of Cripto and Nodal in the hESC system may allow cells to
efficiently signal through autocrine and paracrine mechanisms, and maintain high levels
of Smad2 activation via endosomes. This better regulated and more consistent
activation of Smad2 within individual cells may be what is required for activation of the
mesendodermal and DE gene program.
Understanding the balance of Activin A and Nodal signalling in hESCs, and how it is
modulated by Cripto, requires further investigation. Repeated and more precise
measurements of the levels of Smad2 activation (perhaps even utilising the AR3
reporter) would establish whether Cripto blockade does balance signalling of the two
factors. Importantly, the regulation of Nodal signalling via endocytosis should be
investigated further in hESCs. Investigation of Activin A and Nodal endocytosis by
confocal microscopy during Cripto blockade or Nodal or Cripto shRNA knockdown
would reveal more about Cripto’s role in regulating the process. Given that multiple
roles for endocytosis in the complex hESC environment are likely to exist, targeted and
specific interference of endocytic processes would have to be investigated. Dissecting
the precise extent and duration of signalling by Activin A and Nodal individually during
hESC differentiation would inform more refined differentiation protocols. Nodal
shRNA knockdown hESCs showed reduced capacity for DE differentiation (see section
5.3.2 and figure 5.8). Some of the reduced capacity to differentiate may have arisen not
simply from reduced Nodal, but a subsequent effect of increased inhibition of Activin A
by Cripto. If so, then the application of the Cripto blocking Ab may have led to a partial
rescue of DE differentiation in the Nodal shRNA knockdown line. It would also have
confirmed the antagonistic effect of Cripto on Activin A. Effective DE differentiation in

213
hESCs appears to rely on Cripto regulated Nodal signalling in parallel with exogenous
Activin A signalling. The combination of the two allows cells to maintain the levels of
Smad2 activation and initiate a mesendodermal program. Enhancement of Nodal
signalling, e.g. through Cripto over-expression or addition of exogenous soluble Cripto
at a certain time window of differentiation (e.g. day1-3), could act as a gain of function
experiment. Cripto has been shown to be able to act without its GPI anchor as a soluble
protein, binding Nodal and promoting association with Alk4 (Minchiotti et al., 2001). If
the effect of increased Cripto-dependant Nodal signalling was improved DE
differentiation, it would confirm a primary function for Activin A in initiating
endogenous Nodal signalling, which then acts as the main driver of a mesendodermal
gene program.

214
CHAPTER 7 General Discussion
7.1 Overview of data from high Activin A treatment of hESCs
Data generated in chapters 3 to 6 of this project identified various characteristics in the
differentiation of hESCs towards DE in a defined feeder free system. There was
particular focus on identifying the presence and role of Nodal signalling. Evidence that
it occurs in hESCs and that it may function in a Cripto dependent manner during DE
differentiation was established. Combining this with expression data of important
markers, and the observations of Wnt/β-catenin and Smad2/3 signalling occurring,
generates a broader picture of the endogenous factors regulating DE differentiation in
this chemically defined feeder free system.
Figure 7.1 shows a schematic diagram summarising the key signalling and transcription
factors identified in chapters 3 to 6. The high Activin A-only differentiation system
used here was identified as an inefficient one, however through experiments where
differentiation was improved or impaired by various means, those factors which
positively contributed to the process were clearly identified. Both expression of
endogenous WNT3, as well as the raised level of B-CATENIN and improved
differentiation resulting from Wnt3a supplementation, identified a role for Wnt/β-
catenin during differentiation (chapter 3.3). Nodal signalling was required to maintain
hESCs in feeder free conditions even before differentiation (chapter 5.3). Nodal and
Cripto were then both highly expressed between days 1 to 4, particularly upon
supplementation with Wnt3a (chapter 3.3), and interference with both led to a reduced
capacity to induce expression of a mesendodermal gene program (chapter 4.3 and 5.3).
The diminishing presence of active Smad3 (SMAD3/4) upon Activin A treatment
indicated it had a less important role in DE differentiation than Smad2 (chapter 4.3).
SMAD2 activation increased on day 1 of differentiation and remained high until day 5
or 6 (chapter 3.2). Although the presence of early markers of mesendoderm (T, Eomes,
MixL1 and Gsc) were not investigated by immunostaining or western blotting, the time-
wise induction of their transcript expression strongly indicated their role in regulating
the progression of differentiation (chapter 3.3). The presence of Oct4 at the transcript
and sometimes the protein level persisted until days 5 or 6. At this point the levels of
FOXA2 and SOX17 had increased, indicating DE differentiation of cells within the
culture (chapter 3.2). The maintained expression of NANOG in cells also expressing

215
SOX17 at day 5 indicated a possible involvement in regulating the differentiation
program of hESCs (chapter 3.3).
Individually, many of the components in figure 7.1 have been previously identified as
present or involved in hESCs during differentiation to DE. However, detailed
qualitative and quantitative data on their relative temporal activity have not been
charted. A report by Greber et al. (2008) similarly investigated the time-wise induction
of many marker transcripts each day over four days using high Activin A-only treatment
in an analogous defined feeder free system, establishing similar trends with key
markers. Using western blotting, they showed the maintained presence of NANOG and
some OCT4 at day 4 in cultures with strong SOX17 expression, however without
Figure 7.1 – Schematic impression of key endogenous signalling and transcription
factors identified in chapters 3 to 6 investigating high Activin A differentiation of
hESCs. The timing and duration of factors during the six day differentiation protocol
has been indicated relative to the timescale. For intrinsic signalling and transcription
factors, the quantitative or qualitative observation of their activity or presence is also
inferred by shape and font size.
216
indicating co-expression as shown here. The activity of Nodal and Cripto or
contribution of Wnt/β-catenin signalling was also not investigated. Many reports
investigating differentiation of cells to DE and beyond use more complex differentiation
systems and analyse the end-point of differentiation, without necessarily fully
characterising the mechanisms underlying it. For example, although Hay and colleagues
identified Wnt3a addition as enhancing DE and eventual hepatic differentiation, they
did not show quantitative increases in SOX17, reduced NANOG or increases in
amounts of cellular B-CATENIN or NODAL/CRIPTO (Hay et al., 2008a). Recent
reports from the lab of Vallier have greatly improved chemically defined differentiation
to DE through illustrating the impact of several exogenous factors (e.g. Bmp4 and
LY294002) and exploring the downstream transcriptional targets of Smad2/3. However,
analysis of factors such as Nodal, Cripto, and Nanog was done at the transcript level,
and identification of activity and transcriptional targets of Smad2/3 is restricted to the
start and end points of DE differentiation (Brown et al., 2011; Touboul et al., 2010;
Vallier et al., 2009c).
The improved insight provided by the novel data here contributes to our understanding
of DE differentiation, and achieved some of the aims of the project. The compilation of
trends and activity of factors shown in figure 7.1 will be useful in targeting further
investigation as well as improvements to experimental approaches in the future (see
below). One of the key aims of the project was to determine whether Nodal and Cripto
related signalling contributed to DE differentiation, and investigate the mechanism by
which it might do so. Although Nodal and Cripto were identified as upregulated in the
early period of differentiation, and disrupting the function of both led to inhibition of
mesendoderm/DE differentiation, experiments did not conclusively determine their
specific activity and downstream effects, or the mechanisms by which they functioned.
However, the data indicating their presence, and inferences as to their function, can be
used to inform further investigation.
7.2 Assessment of the overall experimental approach
Some elements of the approach and design of experiments particularly assisted the
generation of insightful data, however there were some significant drawbacks in certain
aspects of the project.
Generating daily samples from differentiation experiments produced clear and detailed
expression data from the qPCR, luciferase reporter and western blot analyses, although

217
it was labour intensive and time consuming, requiring large hESC cultures. When
regarding the high Activin A-only chemically defined differentiation system per se,
differentiation to DE was too inefficient to draw broad conclusions about the factors
involved. However, it provided a simple and useful system to manipulate, so that
identification of changes and factors that positively or negatively influenced
differentiation was clear. A limited number of repeats from the hESC Nodal knockdown
and the Cr blocking Ab experiments also reduced the ability to determine significant
effects that Nodal and Cripto disruption had. The limited number of repeats could have
been addressed through initially streamlining experiments to analyse only a limited
number of days/time points, which may have saved some time and required fewer
hESCs. Experiments could have been expanded later if possible to include further time
points of differentiation. The time spent generating Smad2 and Smad3 reporter lines
using lentivirus might have been better spent investigating transfection methods to get
the reporters into hESCs. If a transfection method could have been established that was
effective with the hESCs, culture system, and experimental requirements (e.g. high
quantity of transfected cells), quantitative data of Smad2 and Smad3 activity during
high Activin A-only differentiation and other experiments (e.g. Nodal knockdown)
could potentially have been generated. This would have contributed very insightful data
as to the effect of Wnt and Nodal signalling during DE differentiation. Finally,
recapitulation of gene expression during high Activin A-only treatment in another line
(as was attempted) would have strengthened the conclusions drawn.
In reviewing the experimental approach, specific improvements as to how the aims were
addressed can be identified. Establishing an Activin A batch test assay in 293FTs would
have avoided some of the difficulties observed with non- or low-functioning batches
that impacted on experiments. Although the high Activin A-only protocol was useful,
the Activin A +Wnt3a protocol may have enhanced conclusions about factors regulating
DE differentiation. Experiments investigating Smad activation and Nodal/Cripto
function could have either begun or been extended to using this protocol. Given that it
has now been established that endogenous Nodal is required to maintain feeder free
hESCs, extra work to establish an inducible Nodal shRNA line could have been done to
avert affecting pluripotency. Several inducible lentivector systems with different
shRNA sequences could have been developed and assayed, and expertise with using
those vectors in hESCs could have been specifically sought to expedite generating a
line. Establishing such a line would then have greatly facilitated analysing the effect on

218
gene expression, Smad2 and Smad3 signalling and day 5 NANOG/SOX17 populations.
The effects on endocytosis during Nodal knockdown or the Cripto blockade would have
been analysed by confocal microscopy, to improve identification of whether the process
occurred and was required for effective signalling. The staining and analysis method
could also have been refined. In particular, a wider variety of markers could have been
included (e.g. Cripto, or endosome markers such as Rab5, Rab7, Rab11), use of
fluorescently labelled Activin A could have been attempted, washing/blocking and
other crucial processing steps could have been further optimised to generate clearer
samples, and higher resolution microscopy facilitating semi-quantitative analysis could
have been performed.
Use of a different means for Cripto blockade may have improved the results from those
experiments. Several publications have investigated blockade of the CFC region of
Cripto, specifically interfering association with Alk4 which would inhibit Nodal
signalling (Adkins et al., 2003; Lonardo et al., 2010). The antibody used here was also
sold as targeting Alk4 binding of Cripto, and appeared to be functional, slightly
enhancing Activin A activation of Smad2 in HeLa and having a negative effect on
mesendoderm differentiation in hESCs (chapter 6.2 and 6.3). However, use of a well
characterised and previously published inhibitor peptide (accompanied by a
complementary inert control peptide) such as the one used by Lonardo and colleagues
may have had a greater effect and given clearer results, as well as led to potential
collaborative efforts with wider applications of the research. Similarly, although the
data showing the positive effect of supplementation with Wnt3a was clear, this data
could have been enhanced or the conclusions about Wnt/β-catenin signalling confirmed
by performing parallel experiments using the GSK3β inhibitor 1m (described by Bone
et al., 2011). These would have confirmed the β-catenin dependent mechanism and may
have led to more enhanced and reproducible DE differentiation than using the
exogenous growth factor. In addition to the experiments analysing the effect of
inhibiting Nodal or Cripto, some gain of function experiments to validate the results
would ideally have been attempted in parallel. Addition of a Cripto recombinant protein
(as used in Minchiotti et al. 2001) or transfection of cells with a Nodal-expressing
plasmid (as used in Smith et al. 2008) may have enhanced DE differentiation, and
complemented the loss-of-function experiments to further illustrate their functions.
Assessment of the findings of Nodal knockdown or Cripto blockade in hESCs would
have finally been confirmed by investigating them in cells differentiated using more

219
enriched and efficient differentiation protocols, to see if they still impacted negatively
on differentiation while additional exogenous factors positively drive differentiation are
present. Ideally, investigating these factors could have extended to experiments using
iPSCs and protocols differentiating cells beyond DE towards a later lineage (e.g. using
protocols outlined in Vallier et al., 2009a; Touboul et al., 2010), to see what the impact
of these factors was in other closely related contexts.
Microarray analysis of samples from every day or every other day of DE differentiation
would have provided a useful tool, both for addressing the aims of this project and as a
resource for investigations that follow on from it. To focus it specifically to the
involvement of Nodal signalling, comparison of cells differentiated with Activin A
+Wnt3a with or without Nodal knocked down could have been used to map what
downstream effects might rely on Nodal-specific signalling. Generating this data would
have been a main focus after generating a stable line and establishing the effect of the
inducible knockdown. Such data could then have been a resource for identifying
possible factors such as miRNAs or regulators of Smad2/3 signalling or endocytosis,
that might regulate or be regulated by Nodal signalling during differentiation.
7.3 Dissecting TGFβ signalling in hESC differentiation
The data in this report suggested a function for Nodal and Cripto-related signalling in
hESCs during differentiation. Some data indicated the presence of mechanisms that may
have been regulating Nodal signalling, such as the activity of Cripto or the presence of
endocytosis. Consideration of these, as well as other factors contributing to Nodal/TGFβ
signalling in hESCs, highlights further targets for investigation.
7.3.1 Transcriptional regulation by TGFβ signalling
Compiling both findings in this report and evidence from the literature, a more detailed
model of Nodal signalling and mechanisms by which it regulates DE differentiation can
be proposed. Figure 7.2 illustrates such a model whereby Nodal signalling during
Activin A treatment of hESCs contributes to DE differentiation. During maintenance in
mTeSR medium, Nodal and exogenous TGFβ1 regulate transcription of pluripotency
regulated factors. Exogenous Activin A-activated Smad2 and Wnt3a/β-catenin
signalling then initiate an early shift from transcription of pluripotency related targets to
primitive streak and early mesendodermal targets, as well as increasing Nodal and
Cripto. Exogenous Activin A and Wnt3a may then combine with the endogenous
processes of Nodal signalling (exocytosis with Cripto, endocytosis, and recycling,

220
discussed below), leading to enhanced and regulated Smad2 activation, contributing to
the activation of the mesendoderm program. Nanog and Eomes have been highlighted in
figure 7.2 since they are key factors in regulating the switch between pluripotency and
mesendoderm differentiation. As discussed in chapter 3, Nanog may have a role during
initial DE differentiation but then antagonise further differentiation or maturation of DE
cells. The activity of NANOG and EOMES as co-factors or co-regulators with Smad2/3
may be influential in altering the promoter/enhancer positions and targets of Smad
signalling (Brown et al., 2011; Teo et al., 2011a). Identifying whether thresholds of
Smad2/3 activation might drive a change in their association with Nanog and Eomes
and downstream activity could be further investigated to extend the insight from the
reports by Brown and Teo. Detailed immunoprecipitation analysis of EOMES and
NANOG association with SMAD2 and SMAD3 at different time points in
differentiating populations would indicate the timing of any dynamic shift in
association. Double labelling of immunostained cells would also give insight into
whether thresholds are required to change these associations. Flow cytometry analysis
of P-SMAD2 with NANOG or EOMES should be able to indicate whether cells high or
low for P-SMAD2 tend to express one or the other at certain time points. This would
then indicate at the single cell level how transcriptional regulation by Nanog or Eomes
changes during differentiation.
7.3.2 Regulation of signalling by endocytosis
Some important nuances of Cripto-regulated Nodal signalling may be controlled by
endocytic processes, whose specific roles in TGFβ signalling are not fully understood.
Nodal was observed present in EEA1-marked endosomes, indicating endocytosis and
sorting to early endosomes. However, it is not known whether the NODAL detected
was the mature or the pro-peptide. Using western blotting, the mature peptide was never
detected in cell lysates, which may have been due to either rapid degradation of the
peptide in cells, or insufficient sensitivity or refinement of the western blot detection
method. However NODAL propeptide, undergoing either exocytosis or endocytosis, or
both, was detected in increasing concentrations during differentiation. Also, Cripto
transcript levels only very modestly increased during days 0 to 3 of differentiation
however peptide levels steadily rose over these time points (chapter 3.2 and 3.3). Both
these results suggest that recycling of CRIPTO and pro-NODAL may have been
occurring. Following recruitment of Furin and PACE4, conversion of Nodal to the
mature peptide leads to rapid endocytosis, high Smad2 activation and rapid degradation.

221
Figure 7.2 – Proposed model of TGFβ and Wnt signalling in hESCs during early
mesendoderm differentiation. A) Pluripotency of cells in mTeSR is regulated by
TGFβ1 and endogenous Nodal signalling. B) Initial addition of exogenous Wnt3a
and Activin A combines with Nodal to activate early mesendoderm markers and
promote Nodal signalling. C) A combination of Activin A, Wnt and enhanced Nodal
signalling continue to promote Smad2 dependent transcriptional regulation of
mesendoderm/DE markers (regulated by association with Eomes and Nanog).

222
Pro-Nodal on the other hand has been shown to be recycled by cells and released into
the medium again, accumulating in both medium and lysate over a more prolonged
period compared to the mature peptide (Le Good et al., 2005). As a GPI-anchored co-
receptor, Cripto has been shown to undergo endocytosis on flotillin-1 marked lipid rafts
(Blanchet et al., 2008a). Endocytosis via this mechanism has been shown to lead to
sorting of cargo to early endosomes, from where it may be possible for Cripto to be
recycled (Blanchet et al., 2008b; Kalia et al., 2006). If this process of recycling of
NODAL propeptide and CRIPTO were occurring in hESCs during the early stage of
differentiation, it would serve to raise the level of Nodal signalling components in the
system and maintain a high level of Smad2 activation. Further enhancement of Nodal
signalling may then occur as a result of GPI anchoring of Cripto to lipid rafts,
concentrating Nodal on the cell surface. This may lead to more efficient recruitment of
protein convertases, as well as improving efficiency of Nodal endocytosis and
trafficking to EEA1/Rab5 endosomes for signalling (Blanchet et al., 2008b, 2008a).
Nodal and Cripto have also been shown to associate following translation during
exocytosis, enhancing efficient autocrine signalling (Blanchet et al., 2008a). The
combination of these factors may specifically enhance Nodal signalling at an early stage
of mesendoderm differentiation, maintaining Smad2 activation in both autocrine and
paracrine fashions (see figure 7.2c).
Although Activin A has been shown as a highly efficacious activator of Smad2, it is
predominantly trafficked for degradation following endocytosis in Xenopus explants,
associating prominently with Rab7 indicating lysosomal shuttling (Hagemann et al.,
2009). Activin A is normally rapidly endocytosed by cells, however it has also been
shown to still elicit high Smad2 and target gene activation in the absence of clathrin and
dynamin-mediated endocytosis. The same high level of signalling still occurred even in
Rab5-null cells, indicating that cell membrane signalling is sufficient for Activin A
activity (Hagemann et al., 2009). Conflicting reports exist on the role of endocytosis in
TGFβ signalling, particularly clathrin-related endocytosis. It has been suggested that
dissociation of active P-Smad2 from Sara and TGFβRI requires the complex to be
localised on an early endosome rather than at the cell surface (Runyan et al., 2005).
However, in a thorough investigation by Chen and colleagues, it was found that
accumulation of TGFβ-receptor, Smad2 and Sara complexes could occur on
membranes of early type I clathrin coated pits, before endocytosis and sorting to early
endosomes. They then showed that specific inhibition of dynamin processing of these
223
clathrin coated buds into vesicles enhanced Smad2 activation, dissociation and target
gene transcription (Chen et al., 2009). This may indicate that the process of
clathrin/dynamin dependent endocytosis leads to poorer organisation of TGFβ
signalling complexes in cells, and possible changes in the downstream recycling of
ligands and receptors following endocytosis, making signalling less efficient.
Some important elements which regulate Nodal signalling were not identified in this
report but may be present during the DE differentiation of hESCs. Identifying the
presence and activity of Furin and PACE4, combined with the presence of mature
Nodal in either medium or lysate, would act as strong evidence of targeted Nodal
processing and signalling in the system. If Cripto-mediated flotillin-1 association during
endocytosis was required by Nodal during differentiation, then blocking palmitoylation
(and thereby lipid raft formation) using the inhibitor 2BP (as used by Blanchet et al.,
2008a) could identify whether blocking this process inhibited mesendoderm
differentiation. Analysis of colocalisation of NODAL and CRIPTO with endosomal
markers associated with cargo degradation (e.g. Rab7) or recycling (e.g. Rab11) could
indicate whether these were occurring and contributing to the maintenance of Nodal
signalling. Given the existence and function of specific endocytic mechanisms which
promote TGFβ signalling, enhancing them may then improve differentiation of hESCs.
The investigation by Chen and colleagues used a dynamin inhibitor Dynasore to
enhance TGFβ1-mediated Smad2 activation and transcription. This occurred due to a
suppression of clathrin coated pit endocytosis (while still allowing early clathrin pit
formation)(Chen et al., 2009). Application of this during Activin A treatment of hESCs
may act two-fold. It may inhibit endocytosis of Activin A, reducing degradation of it
and associated receptors, leading to more efficient and prolonged signalling. It may also
inhibit clathrin associated (i.e. non-Cripto mediated) endocytosis of Nodal, thereby
promoting Cripto association, endocytosis via flotillin-1 and enhancing signalling.
7.3.3 miRNA regulation of Nodal signalling and DE
Some of the regulation of pluripotency and differentiation for which miRNAs are
responsible has begun to be mapped in hESCs. There have been several miRNAs
identified as regulating Nodal signalling in certain contexts, some of which are
regulated by Wnt signalling. miR-15 and miR-16 have been identified as determining
the range of responsiveness to Nodal signalling in the developing Xenopus embryo.
They target the homologue for ActRII, acting in a ventral-dorsal gradient, opposing the
dorsal signalling by Nodal from the Spemann organiser. Maturation of the miRNA

224
transcripts from their pri-miRNA was found to be inhibited by Wnt/β-catenin signalling,
which was shown to occur on the dorsal side of the embryo. Direct inhibition of β-
catenin in the dorsal region led to an expanded presence of miR-15 and miR-16 into this
region (Martello et al., 2007). Another cluster of miRNAs, miR-302-376, has been
identified as regulating the pluripotent state in hESCs (Neveu et al., 2010). However, an
investigation into particular aspects of its activity has revealed that miR-302 targets
LEFTY1 and LEFTY2 transcript in pluripotent hESCs. The investigation then looked at
the effect of overexpressing miR-302-367 during EB formation, showing a decrease in
Lefty1/2, as well as prolonged maintenance of pluripotency factors (Barroso-delJesus et
al., 2011). The effect of the resultant Lefty1/2 decrease on Nodal signalling specifically
was not investigated, and miR-302-367 may have other targets that negatively regulate
differentiation which were not investigated. However, the report provides a clear
miRNA mechanism by which hESC might regulate Nodal signalling. Furthermore,
miR-302-367 has been identified as synergistically upregulated by Activin A and Wnt3a
in mESCs at day 3 of differentiation using the five day Hay differentiation protocol
(similar to table 1.1, with addition of 50ng/ml Wnt3a)(Fu et al., 2011). This strongly
suggests it is a candidate for a positive regulator or facilitator of Nodal signalling during
differentiation, via inhibition of Lefty1/2 at early stages. It may have been expressed
and active in Hues1 during Activin A +Wnt3a treatment.
Investigation of miRNAs that are present or upregulated during DE differentiation in
ESCs has been specifically investigated by several reports. These investigations have
also tentatively begun to map a few possible targets regulated by miRNAs. Some
miRNAs that have been shown to be upregulated specifically upon DE differentiation
include miR-122 and miR-375, with miR-302 found to be high in both pluripotent ESCs
and DE (Fu et al., 2011; Hinton et al., 2010; Tzur et al., 2008). In most cases, while
these miRNAs are shown to positively regulate DE differentiation, they cannot induce it
in ESCs. miR-122 overexpression enhanced expression of HHEX, CXCR4 and
maintained NANOG and OCT4 during undirected differentiation of hESCs, but did not
generate DE cells (Hinton et al., 2010). Identification of miRNAs synergistically
activated as a result of Activin A and Wnt3a in the report by Fu et al. 2011 found that
several of the miRNAs upregulated during differentiation had the putative targets of
histone deacetylases. They also found that Sox17 and FoxA2 were acetylated at H3K9
and H3K27 upon differentiation, and showed that inhibiting deacetylation marginally
improved their expression (Fu et al., 2011). The intracellular signalling and
225
transcription factors which target expression of these miRNAs have not been fully
mapped, although the particular exogenous factors that indirectly enhance miRNA
expression can be identified (as in the report by Fu). Clear identification of factors
regulating miRNAs may be difficult given the transitory nature of the mesendoderm/DE
cell type during differentiation, the heterogeneity of differentiating populations.
However, investigation of miRNAs which are present and change in hESCs during
differentiation by array and PCR, followed by enhancement or inhibition of identified
targets such as miR-302-367 or miR-15, would elucidate the miRNA network that
regulates Nodal during differentiation.
7.4 Improving culture and characterisation of DE differentiation
SOX17 expressing cells were shown to be generated even in the inefficient DE
differentiation system used here. These cells predominantly expressed NANOG, and a
slight improvement in the efficiency of SOX17 induction when using Wnt3a was
concomitant with some cells reducing their expression of NANOG. This raised
questions about the role of Nanog and the identity of cells in the differentiating culture.
Both improving the efficiency of DE differentiation, and improving the characterisation
of the desired DE cells with specific markers and factors, is the subject of several recent
reports.
The influence of the ECM is an aspect of the differentiation system not investigated
here or in many reports, with the impact of different ECM substrates on cells during
differentiation not being well understood. For adherent cultures, the use of fibronectin
or laminin has been favoured as a defined alternative to Matrigel or feeders, with both
shown to be relatively effective (Vallier et al., 2009c; Wong et al., 2010). In the report
by Wong, it was found that transcripts for integrins α5, αV and β5 were also
significantly increased in the DE differentiated cells on Matrigel or laminin. It has been
shown that while exogenous ECM molecules can promote initial attachment of cells,
expression and deposition of endogenous ECM molecules is required by hESCs for
survival and differentiation (Chen et al., 2007). Not much investigation has been
performed into ECM molecule and integrin expression profile and any cell signalling
that occurs during DE differentiation. Certain exogenous ECM molecules or mixtures
may act to promote specific integrin signalling that enhances DE differentiation. The
development of reproducible and defined GMP differentiation systems might also be
enhanced by the use of synthetic polymers. One such polymer used for pluripotency

226
maintenance of hESCs was shown to increase the expression of integrins α5 and αV, as
well as fibronectin (amongst other ECM molecules) after 72 hours in culture, suggesting
it encourages expression and deposition of these endogenous factors (Brafman et al.,
2010). Further investigation may elicit ECM conditions that enhance defined DE
differentiation.
Sox17 has been identified in mouse embryo development, mESCs and hESCs as the
most crucial marker of early DE fate (Izumi et al., 2007; Kanai-Azuma et al., 2002;
Séguin et al., 2008). Although it is required by DE cells it does not exclusively mark
cells destined for DE lineages. Sox17 overexpression in hESCs was shown to very
effectively induce mesendoderm differentiation even in cells maintained in pluripotent
conditions (on MEFs). However, cells were capable of differentiation not just to DE but
also some mesoderm lineages, as assessed by marker expression and teratoma
formation. They also still expressed NANOG and OCT4 (Séguin et al., 2008). Sox17
overexpression in mESCs during EB differentiation showed it to elicit increases in
markers of both DE and late visceral endoderm (e.g. Gatas, Hnf1b, Sox7, Afp). Nanog
overexpression was then found to inhibit expression of some of the non-DE markers in
the Sox17 overexpressing cells, e.g. Coup-Tf1, Gata4 and Ihh (Shimoda et al., 2007).
Furthermore, Nanog overexpressing hESCs were shown to resist neurectodermal
differentiation even in the absence of Smad2/3 signalling (Vallier et al., 2009a). These
reports contextualise the results from Activin A differentiation of Hues1, pointing to a
cooperation between Sox17 and Nanog to define mesendoderm and inhibit non-
mesendoderm differentiation. As previously mentioned, investigation into the
NANOG+/SOX17
+ and NANOG
-/SOX17
+ hESC populations would enhance
knowledge of the role of Nanog in DE maturation. Although the role of Nanog in
prospective DE cells is not resolved, some recent reports have used other markers to
characterise the populations that targeted DE differentiation generates. A report by
Wang defined three cell surface markers , CD49e, CD141 and CD238, that can be used
in addition to or in lieu of SOX17. They definitively indicated DE cells capable of
primitive gut tube (and subsequent) fates following differentiation with the D’Amour et
al. 2006 protocol, a stage after Cxcr4 expression can be used to demarcate the DE
population. These populations were enriched for endoderm and gut markers, with
teratomas absent of common neurectoderm, mesoderm and visceral endoderm lineage
markers (Wang et al., 2011a). Continued investigation into the subpopulations existing

227
following DE differentiation could provide improved selectivity and specificity in
targeted differentiation protocols.
The amount of variation in targeted differentiation protocols makes it difficult to
assuredly compare the role or effect of certain factors. In terms of growth factors,
although the use of high Activin A is common across all protocols, the inclusion of
others varies. In this investigation and many others, Wnt3a was included with beneficial
effect (Hay et al., 2008a; D’Amour et al., 2006), however Bmp4 was not. Bmp4 is
incorporated in many protocols, and its positive impact has been specifically
investigated in some reports. Slight activation of Smad1/5/8 during high Activin A
treatment has been observed (Greber et al., 2008), indicating the presence of some
endogenous Bmp signalling, and the inclusion of Bmp4 at low levels has been shown to
enhance expression of early mesendoderm markers and negatively regulate Nanog
(Jackson et al., 2010; Vallier et al., 2009c; Xu et al., 2008). In a report by Sumi et al.
2008, inhibition of Bmp signalling using Noggin during constitutive β-catenin
activation in hESCs was necessary to direct differentiation towards DE rather than
mesoderm, suggesting high and prolonged Bmp signalling occurring as a result of β-
catenin. However, as highlighted by Jackson, the levels and timing of signalling factors
dictates their positive effect on mesendoderm differentiation. There may be reciprocal
positive regulation between Bmp and Wnt signalling, meaning that only one exogenous
factor is required to positively enhance the other, leading to synergised mesendoderm
regulation. This is illustrated by the high level of WNT3 in cells differentiated with the
inclusion of low Bmp4 using the Vallier protocol (Vallier et al., 2009c). Transcriptional
reporters exist that are specific for Smad1/5/8 or β-catenin/Tcf/Lef signalling. Use of
these reporters in comparative studies investigating different protocols could begin to
determine the wider effects or advantages of one exogenous factor or the other.
Recently, protocols indicating very efficient and targeted differentiation have utilised
non-adherent culture to generate DE. The protocol of Nostro and colleagues uses EB
culture of hESCs in defined medium with one day of 10ng/ml Bmp4 treatment,
followed by three days with high Activin A, 0.25ng/ml Bmp4 and 2.5ng/ml bFGF,
followed by a day in 20ng/ml VEGF and 5ng/ml bFGF. The protocol generated 96%
Cxcr4 and 73% Sox17 expressing cells, and was used as a platform to meticulously
identify factors that generated modest levels of C-peptide expressing pancreatic β-cell-
like cells (Basford et al., 2012; Nostro et al., 2011). As they noted, the EB culture for
DE generation was not as quick as the D’Amour et al. 2006 protocol on MEFs but was

228
nonetheless targeted, efficient and defined, with an advantage in scalability compared to
adherent culture. The protocol by Touboul and colleagues targeting differentiation to
hepatic cells from hESCs used a similarly defined but adherent culture to generate high
levels of DE (similar to the Vallier protocol, table 1.1)(Touboul et al., 2010). In these
three examples, a high percentage of DE marker expression is coupled with low
expression of mesoderm and visceral endoderm markers, and relatively efficient
maturation to a later DE lineage. However, given the major differences in these
protocols, it may be possible that the cultures and cells at the DE stage are not
completely alike. Some of the protocols might generate DE cells with a preference or
tendency to progress along one particular endodermal lineage rather than others. The
effectiveness of the protocols on different stem cell lines may also vary. This was
highlighted in the report by Nostro, where different hESC and iPSC lines showed
varying capability to assume pancreatic rather than hepatic fates, and bespoke
adjustment of the protocol was required. More thorough definition of cells at the DE
stage may assist in this. To achieve this, broad comparisons of these different protocols
in different hESC and iPSC lines may be required. These could identify factors that are
universally effective in generating DE, as well as the characteristic markers (e.g. cell
surface markers, miRNA or transcription factor profiles) which can either confirm the
multipotency of DE cultures or be used to select the cells with lineage preferences for
subsequent differentiation. Assessment of teratoma formation of DE populations in vivo
should then always be used as a final indication of differentiation capacity. Such an
approach has been initiated by investigations such as Wang et al. 2011, and could
subsequently be broadened and further refined. Progressive characterisation and
dissection of cell cultures at the stage of DE differentiation can then feedback into our
understanding of DE development in the human embryo.
Closing remarks
Companies such as Viacyte (where the D’Amour protocols were developed) or groups
such as Nostro/Basford or Vallier and colleagues have refined highly efficient
techniques for targeting differentiation of hESCs to DE. However, to assuage safety
concerns and enable the necessary use of multiple hESC and iPSC lines in potential cell
replacement therapy, wider reproducibility and greater understanding and
characterisation of the mechanisms underpinning differentiation are required. The
nuances of Nodal signalling investigated here, as well as elucidation of the activity of

229
factors such as Wnt/β-catenin and Nanog, can contribute to this understanding. They
can also be used to target further investigation, clarifying and enhancing the activity of
Nodal signalling, as well as further characterising the cell populations that exist during
mesendoderm/DE differentiation. It is hoped that subsequent improved differentiation
and selection of DE cells will directly contribute to the successful application of hESCs
and iPSCs in clinical contexts.

230
REFERENCES
Adkins, H. B., Bianco, C., Schiffer, S. G., Rayhorn, P., Zafari, M., Cheung, A. E.,
Orozco, O., Olson, D., De Luca, A., Chen, L. L., et al. (2003). Antibody blockade
of the Cripto CFC domain suppresses tumor cell growth in vivo. Journal of
Clinical Investigation 112, 575–587.
Amit, M., Carpenter, M. K., Inokuma, M. S., Chiu, C. P., Harris, C. P., Waknitz, M. A.,
Itskovitz-Eldor, J., and Thomson, J. A. (2000). Clonally derived human embryonic
stem cell lines maintain pluripotency and proliferative potential for prolonged
periods of culture. Developmental biology 227, 271–278.
Amit, M., Shariki, C., Margulets, V., and Itskovitz-Eldor, J. (2004). Feeder Layer- and
Serum-Free Culture of Human Embryonic Stem Cells . Biology of Reproduction
70 , 837–845.
Ang, S. L., and Rossant, J. (1994). HNF-3b is essential for node and notochord
formation in mouse development. Cell 78, 561–574.
Armstrong, L., Hughes, O., Yung, S., Hyslop, L., Stewart, R., Wappler, I., Peters, H.,
Walter, T., Stojkovic, P., Evans, J., et al. (2006). The role of PI3K/AKT,
MAPK/ERK and NFκβ signalling in the maintenance of human embryonic stem
cell pluripotency and viability highlighted by transcriptional profiling and
functional analysis. Human Molecular Genetics 15, 1894–1913.
Arnold, S. J., Hofmann, U. K., Bikoff, E. K., and Robertson, E. J. (2008). Pivotal roles
for eomesodermin during axis formation, epithelium-to-mesenchyme transition and
endoderm specification in the mouse. Development (Cambridge, England) 135,
501–511.
Arnold, S. J., Stappert, J., Bauer, A., Kispert, A., Herrmann, B. G., and Kemler, R.
(2000). Brachyury is a target gene of the Wnt/beta-catenin signaling pathway.
Mechanisms of development 91, 249–258.
Attisano, L., Wrana, J. L., Montalvo, E., and Massagué, J. (1996). Activation of
signalling by the activin receptor complex. . Molecular and Cellular Biology 16 ,
1066–1073.
Avery, S., Zafarana, G., Gokhale, P. J., and Andrews, P. W. (2010). The Role of
SMAD4 in Human Embryonic Stem Cell Self-Renewal and Stem Cell Fate. STEM
CELLS 28, 863–873.
Avilion, A. A., Nicolis, S. K., Pevny, L. H., Perez, L., Vivian, N., and Lovell-Badge, R.
(2003). Multipotent cell lineages in early mouse development depend on SOX2
function . Genes & Development 17 , 126–140.
Babaie, Y., Herwig, R., Greber, B., Brink, T. C., Wruck, W., Groth, D., Lehrach, H.,
Burdon, T., and Adjaye, J. (2007). Analysis of Oct4-dependent transcriptional

231
networks regulating self-renewal and pluripotency in human embryonic stem cells.
Stem cells 25, 500–510.
Barroso-delJesus, A., Lucena-Aguilar, G., Sanchez, L., Ligero, G., Gutierrez-Aranda, I.,
and Menendez, P. (2011). The Nodal inhibitor Lefty is negatively modulated by
the microRNA miR-302 in human embryonic stem cells . The FASEB Journal 25 ,
1497–1508.
Barroso-delJesus, A., Romero-López, C., Lucena-Aguilar, G., Melen, G. J., Sanchez,
L., Ligero, G., Berzal-Herranz, A., and Menendez, P. (2008). Embryonic Stem
Cell-Specific miR302-367 Cluster: Human Gene Structure and Functional
Characterization of Its Core Promoter. Molecular and Cellular Biology 28, 6609–
6619.
Basford, C. L., Prentice, K. J., Hardy, a B., Sarangi, F., Micallef, S. J., Li, X., Guo, Q.,
Elefanty, a G., Stanley, E. G., Keller, G., et al. (2012). The functional and
molecular characterisation of human embryonic stem cell-derived insulin-positive
cells compared with adult pancreatic beta cells. Diabetologia 55, 358–371.
Baxter, M. A., Camarasa, M. V, Bates, N., Small, F., Murray, P., Edgar, D., and
Kimber, S. J. (2009). Analysis of the distinct functions of growth factors and tissue
culture substrates necessary for the long-term self-renewal of human embryonic
stem cell lines. Stem cell research 3, 28–38.
Beck, S., Le Good, J. A., Guzman, M., Haim, N. Ben, Roy, K., Beermann, F., and
Constam, D. B. (2002). Extraembryonic proteases regulate Nodal signalling during
gastrulation. Nat Cell Biol 4, 981–985.
Beddington, R. S. (1994). Induction of a second neural axis by the mouse node .
Development 120 , 613–620.
Ben-Haim, N., Lu, C., Guzman-Ayala, M., Pescatore, L., Mesnard, D., Bischofberger,
M., Naef, F., Robertson, E. J., and Constam, D. B. (2006). The nodal precursor
acting via activin receptors induces mesoderm by maintaining a source of its
convertases and BMP4. Developmental cell 11, 313–323.
Bernardo, A. S., Cho, C. H.-H., Mason, S., Docherty, H. M., Pedersen, R. A., Vallier,
L., and Docherty, K. (2009). Biphasic induction of Pdx1 in mouse and human
embryonic stem cells can mimic development of pancreatic beta-cells. Stem cells
27, 341–351.
Besser, D. (2004). Expression of Nodal, Lefty-A, and Lefty-B in Undifferentiated
Human Embryonic Stem Cells Requires Activation of Smad2/3 . Journal of
Biological Chemistry 279 , 45076–45084.
Bhanot, P., Brink, M., Samos, C. H., Hsieh, J.-C., Wang, Y., Macke, J. P., Andrew, D.,
Nathans, J., and Nusse, R. (1996). A new member of the frizzled family from
Drosophila functions as a Wingless receptor. Nature 382, 225–230.
232
Bianco, C., Strizzi, L., Rehman, A., Normanno, N., Wechselberger, C., Sun, Y., Khan,
N., Hirota, M., Adkins, H., Williams, K., et al. (2003). A Nodal- and ALK4-
independent Signaling Pathway Activated by Cripto-1 through Glypican-1 and c-
Src . Cancer Research 63 , 1192–1197.
Blanchet, M.-H., Le Good, J. A., Mesnard, D., Oorschot, V., Baflast, S., Minchiotti, G.,
Klumperman, J., and Constam, D. B. (2008a). Cripto recruits Furin and PACE4
and controls Nodal trafficking during proteolytic maturation. EMBO J 27, 2580–
2591.
Blanchet, M.-H., Le Good, J. A., Oorschot, V., Baflast, S., Minchiotti, G., Klumperman,
J., and Constam, D. B. (2008b). Cripto localizes Nodal at the limiting membrane of
early endosomes. Science signaling 1, ra13.
Blum, M., Gaunt, S. J., Cho, K. W., Steinbeisser, H., Blumberg, B., Bittner, D., and De
Robertis, E. M. (1992). Gastrulation in the mouse: the role of the homeobox gene
goosecoid. Cell 69, 1097–1106.
Bock, C., Kiskinis, E., Verstappen, G., Gu, H., Boulting, G., Smith, Z. D., Ziller, M.,
Croft, G. F., Amoroso, M. W., Oakley, D. H., et al. (2011). Reference Maps of
Human ES and iPS Cell Variation Enable High-Throughput Characterization of
Pluripotent Cell Lines. Cell 144, 439–452.
Bone, H. K., Nelson, A. S., Goldring, C. E., Tosh, D., and Welham, M. J. (2011). A
novel chemically directed route for the generation of definitive endoderm from
human embryonic stem cells based on inhibition of GSK-3 . Journal of Cell
Science 124 , 1992–2000.
Boyer, L. A., Lee, T. I., Cole, M. F., Johnstone, S. E., Levine, S. S., Zucker, J. P.,
Guenther, M. G., Kumar, R. M., Murray, H. L., Jenner, R. G., et al. (2005). Core
transcriptional regulatory circuitry in human embryonic stem cells. Cell 122, 947–
956.
Braam, S. R., Zeinstra, L., Litjens, S., Ward-van Oostwaard, D., Van den Brink, S., Van
Laake, L., Lebrin, F., Kats, P., Hochstenbach, R., Passier, R., et al. (2008).
Recombinant Vitronectin Is a Functionally Defined Substrate That Supports
Human Embryonic Stem Cell Self-Renewal via αVβ5 Integrin. STEM CELLS 26,
2257–2265.
Brafman, D. A., Chang, C. W., Fernandez, A., Willert, K., Varghese, S., and Chien, S.
(2010). Long-term human pluripotent stem cell self-renewal on synthetic polymer
surfaces. Biomaterials 31, 9135–9144.
Brennan, J., Lu, C. C., Norris, D. P., Rodriguez, T. A., Beddington, R. S. P., and
Robertson, E. J. (2001). Nodal signalling in the epiblast patterns the early mouse
embryo. Nature 411, 965–969.
Brennan, J., Norris, D. P., and Robertson, E. J. (2002). Nodal activity in the node
governs left-right asymmetry . Genes & Development 16 , 2339–2344.

233
Brill, L. M., Xiong, W., Lee, K.-B., Ficarro, S. B., Crain, A., Xu, Y., Terskikh, A.,
Snyder, E. Y., and Ding, S. (2009). Phosphoproteomic analysis of human
embryonic stem cells. Cell stem cell 5, 204–213.
Brown, K. a, Pietenpol, J. a, and Moses, H. L. (2007). A tale of two proteins:
differential roles and regulation of Smad2 and Smad3 in TGF-beta signaling.
Journal of cellular biochemistry 101, 9–33.
Brown, S., Teo, A., Pauklin, S., Hannan, N., Cho, C. H.-H., Lim, B., Vardy, L., Dunn,
N. R., Trotter, M., Pedersen, R., et al. (2011). Activin/Nodal Signaling Controls
Divergent Transcriptional Networks in Human Embryonic Stem Cells and in
Endoderm Progenitors. STEM CELLS 29, 1176–1185.
Burges, A., Shabani, N., Brüning, A., and Mylonas, I. (2011). Inhibin-betaA and -betaB
subunits in normal and malignant glandular epithelium of uterine cervix and HeLa
cervical cancer cell line. Archives of gynecology and obstetrics 284, 981–988.
Burtscher, I., and Lickert, H. (2009). Foxa2 regulates polarity and epithelialization in
the endoderm germ layer of the mouse embryo. Development (Cambridge,
England) 136, 1029–1038.
Camus, A., Perea-Gomez, A., Moreau, A., and Collignon, J. (2006). Absence of Nodal
signaling promotes precocious neural differentiation in the mouse embryo.
Developmental Biology 295, 743–755.
Card, D. A. G., Hebbar, P. B., Li, L., Trotter, K. W., Komatsu, Y., Mishina, Y., and
Archer, T. K. (2008). Oct4/Sox2-regulated miR-302 targets cyclin D1 in human
embryonic stem cells. Molecular and cellular biology 28, 6426–6438.
Chambers, I., Colby, D., Robertson, M., Nichols, J., Lee, S., Tweedie, S., and Smith, A.
G. (2003). Functional Expression Cloning of Nanog, a Pluripotency Sustaining
Factor in Embryonic Stem Cells. Cell 113, 643–655.
Chen, C., and Shen, M. M. (2004). Two Modes by which Lefty Proteins Inhibit Nodal
Signaling. Current 14, 618–624.
Chen, C.-L., Hou, W.-H., Liu, I.-H., Hsiao, G., Huang, S. S., and Huang, J. S. (2009).
Inhibitors of clathrin-dependent endocytosis enhance TGFβ signaling and
responses . Journal of Cell Science 122 , 1863–1871.
Chen, S. S., Fitzgerald, W., Zimmerberg, J., Kleinman, H. K., and Margolis, L. (2007).
Cell-Cell and Cell-Extracellular Matrix Interactions Regulate Embryonic Stem
Cell Differentiation. STEM CELLS 25, 553–561.
Chen, X., Rubock, M. J., and Whitman, M. (1996). A transcriptional partner for MAD
proteins in TGF-beta signalling. Nature 383, 691–696.
Chen, X., Weisberg, E., Fridmacher, V., Watanabe, M., Naco, G., and Whitman, M.
(1997). Smad4 and FAST-1 in the assembly of activin-responsive factor. Nature
389, 85–89.

234
Cheng, S. K., Olale, F., Brivanlou, A. H., and Schier, A. F. (2004). Lefty Blocks a
Subset of TGFβ Signals by Antagonizing EGF-CFC Coreceptors. PLoS Biol 2,
e30.
Clements, D., Taylor, H. C., Herrmann, B. G., and Stott, D. (1996). Distinct regulatory
control of the Brachyury gene in axial and non-axial mesoderm suggests separation
of mesoderm lineages early in mouse gastrulation. Mechanisms of development
56, 139–149.
Conlon, F. L., Lyons, K. M., Takaesu, N., Barth, K. S., Kispert, A., Herrmann, B., and
Robertson, E. J. (1994). A primary requirement for nodal in the formation and
maintenance of the primitive streak in the mouse . Development 120 , 1919–1928.
Constam, D. B. (2009). Riding Shotgun: A Dual Role for the Epidermal Growth Factor-
Cripto/FRL-1/Cryptic Protein Cripto in Nodal Trafficking. Traffic 10, 783–791.
Constam, D. B., and Robertson, E. J. (1999). Regulation of Bone Morphogenetic
Protein Activity by Pro Domains and Proprotein Convertases . The Journal of Cell
Biology 144 , 139–149.
Dajani, R., Fraser, E., Roe, S. M., Yeo, M., Good, V. M., Thompson, V., Dale, T. C.,
and Pearl, L. H. (2003). Structural basis for recruitment of glycogen synthase
kinase 3[beta] to the axin–APC scaffold complex. EMBO J 22, 494–501.
Dennler, S., Itoh, S., Vivien, D., Ten Dijke, P., Huet, S., and Gauthier, J. M. (1998).
Direct binding of Smad3 and Smad4 to critical TGF beta-inducible elements in the
promoter of human plasminogen activator inhibitor-type 1 gene. The EMBO
journal 17, 3091–3100.
Ding, J., Yang, L., Yan, Y.-T., Chen, A., Desai, N., Wynshaw-Boris, A., and Shen, M.
M. (1998). Cripto is required for correct orientation of the anterior-posterior axis in
the mouse embryo. Nature 395, 702–707.
Dravid, G., Ye, Z., Hammond, H., Chen, G., Pyle, A., Donovan, P., Yu, X., and Cheng,
L. (2005). Defining the role of Wnt/beta-catenin signaling in the survival,
proliferation, and self-renewal of human embryonic stem cells. Stem cells 23,
1489–1501.
Dufort, D., Schwartz, L., Harpal, K., and Rossant, J. (1998). The transcription factor
HNF3beta is required in visceral endoderm for normal primitive streak
morphogenesis . Development 125 , 3015–3025.
Dvorak, P., Dvorakova, D., Koskova, S., Vodinska, M., Najvirtova, M., Krekac, D., and
Hampl, A. (2005). Expression and potential role of fibroblast growth factor 2 and
its receptors in human embryonic stem cells. Stem cells 23, 1200–1211.
D’Amour, K. A., Agulnick, A. D., Eliazer, S., Kelly, O. G., Kroon, E., and Baetge, E. E.
(2005). Efficient differentiation of human embryonic stem cells to definitive
endoderm. Nature biotechnology 23, 1534–1541.

235
D’Amour, K. A., Bang, A. G., Eliazer, S., Kelly, O. G., Agulnick, A. D., Smart, N. G.,
Moorman, M. A., Kroon, E., Carpenter, M. K., and Baetge, E. E. (2006).
Production of pancreatic hormone-expressing endocrine cells from human
embryonic stem cells. Nat Biotech 24, 1392–1401.
D’Andrea, D., Liguori, G. L., Le Good, J. A., Lonardo, E., Andersson, O., Constam, D.
B., Persico, M. G., and Minchiotti, G. (2008). Cripto promotes A–P axis
specification independently of its stimulatory effect on Nodal autoinduction . The
Journal of Cell Biology 180 , 597–605.
Eiselleova, L., Matulka, K., Kriz, V., Kunova, M., Schmidtova, Z., Neradil, J., Tichy,
B., Dvorakova, D., Pospisilova, S., Hampl, A., et al. (2009). A Complex Role for
FGF-2 in Self-Renewal, Survival, and Adhesion of Human Embryonic Stem Cells.
Stem cells 27, 1847–1857.
Evans, M. J., and Kaufman, M. H. (1981). Establishment in culture of pluripotential
cells from mouse embryos. Nature 292, 154–156.
Felici, A., Wurthner, J. U., Parks, W. T., Ruh-yu Giam, L., Reiss, M., Karpova, T. S.,
McNally, J. G., and Roberts, A. B. (2003). TLP, a novel modulator of TGF-[beta]
signaling, has opposite effects on Smad2- and Smad3-dependent signaling. EMBO
J 22, 4465–4477.
Franklin, V., Khoo, P. L., Bildsoe, H., Wong, N., Lewis, S., and Tam, P. P. L. (2008).
Regionalisation of the endoderm progenitors and morphogenesis of the gut portals
of the mouse embryo. Mechanisms of Development 125, 587–600.
Fu, S., Fei, Q., Jiang, H., Chuai, S., Shi, S., Xiong, W., Jiang, L., Lu, C., Atadja, P., Li,
E., et al. (2011). Involvement of histone acetylation of Sox17 and Foxa2 promoters
during mouse definitive endoderm differentiation revealed by microRNA profiling.
PloS one 6, e27965.
Gauthaman, K., Fong, C.-Y., and Bongso, A. (2010). Effect of ROCK Inhibitor Y-
27632 on Normal and Variant Human Embryonic Stem Cells (hESCs) In Vitro: Its
Benefits in hESC Expansion. Stem Cell Reviews and Reports 6, 86–95.
Gong, G., Ferrari, D., Dealy, C. N., and Kosher, R. A. (2010). Direct and progressive
differentiation of human embryonic stem cells into the chondrogenic lineage.
Journal of Cellular Physiology 224, 664–671.
Le Good, J. A., Joubin, K., Giraldez, A. J., Ben-Haim, N., Beck, S., Chen, Y., Schier,
A. F., and Constam, D. B. (2005). Nodal stability determines signaling range.
Current Biology 15, 31–36.
Goumans, M. J., and Mummery, C. (2000). Functional analysis of the TGFbeta
receptor/Smad pathway through gene ablation in mice. The International journal of
developmental biology 44, 253–265.
Gray, P. C., Greenwald, J., Blount, A. L., Kunitake, K. S., Donaldson, C. J., Choe, S.,
and Vale, W. (2000). Identification of a Binding Site on the Type II Activin

236
Receptor for Activin and Inhibin . Journal of Biological Chemistry 275 , 3206–
3212.
Gray, P. C., Harrison, C. A., and Vale, W. (2003). Cripto forms a complex with activin
and type II activin receptors and can block activin signaling . Proceedings of the
National Academy of Sciences 100 , 5193–5198.
Gray, P. C., Shani, G., Aung, K., Kelber, J., and Vale, W. (2006). Cripto binds
transforming growth factor beta (TGF-beta) and inhibits TGF-beta signaling.
Molecular and cellular biology 26, 9268–9278.
Greber, B., Lehrach, H., and Adjaye, J. (2008). Control of early fate decisions in human
ES cells by distinct states of TGFbeta pathway activity. Stem cells and
development 17, 1065–1077.
Greber, B., Lehrach, H., and Adjaye, J. (2007). Fibroblast growth factor 2 modulates
transforming growth factor beta signaling in mouse embryonic fibroblasts and
human ESCs (hESCs) to support hESC self-renewal. Stem cells 25, 455–464.
Guzman-Ayala, M., Ben-Haim, N., Beck, S., and Constam, D. B. (2004). Nodal protein
processing and fibroblast growth factor 4 synergize to maintain a trophoblast stem
cell microenvironment . Proceedings of the National Academy of Sciences of the
United States of America 101 , 15656–15660.
Guzman-Ayala, M., Lee, K. L., Mavrakis, K. J., Goggolidou, P., Norris, D. P., and
Episkopou, V. (2009). Graded Smad2/3 Activation Is Converted Directly into
Levels of Target Gene Expression in Embryonic Stem Cells. PLoS ONE 4, e4268.
Hagemann, A. I., Xu, X., Nentwich, O., Hyvonen, M., and Smith, J. C. (2009). Rab5-
mediated endocytosis of activin is not required for gene activation or long-range
signalling in Xenopus. Development Cambridge England 136, 2803–2813.
Harms, P. W., and Chang, C. (2003). Tomoregulin-1 (TMEFF1) inhibits nodal signaling
through direct binding to the nodal coreceptor Cripto . Genes & Development 17 ,
2624–2629.
Harrison, C. A., Chan, K. L., and Robertson, D. M. (2006). Activin-A Binds Follistatin
and Type II Receptors through Overlapping Binding Sites: Generation of Mutants
with Isolated Binding Activities . Endocrinology 147 , 2744–2753.
Harrison, C. A., Gray, P. C., Koerber, S. C., Fischer, W., and Vale, W. (2003).
Identification of a Functional Binding Site for Activin on the Type I Receptor
ALK4 . Journal of Biological Chemistry 278 , 21129–21135.
Hart, A. H., Hartley, L., Ibrahim, M., and Robb, L. (2004). Identification, cloning and
expression analysis of the pluripotency promoting Nanog genes in mouse and
human. Developmental Dynamics 230, 187–198.
Hart, A. H., Hartley, L., Sourris, K., Stadler, E. S., Li, R., Stanley, E. G., Tam, P. P. L.,
Elefanty, A. G., and Robb, L. (2002). Mixl1 is required for axial mesendoderm

237
morphogenesis and patterning in the murine embryo . Development 129 , 3597–
3608.
Hay, D. C., Fletcher, J., Payne, C., Terrace, J. D., Gallagher, R. C. J., Snoeys, J., Black,
J. R., Wojtacha, D., Samuel, K., Hannoun, Z., et al. (2008a). Highly efficient
differentiation of hESCs to functional hepatic endoderm requires ActivinA and
Wnt3a signaling. Proceedings of the National Academy of Sciences of the United
States of America 105, 12301–12306.
Hay, D. C., Zhao, D., Fletcher, J., Hewitt, Z. A., McLean, D., Urruticoechea-Uriguen,
A., Black, J. R., Elcombe, C., Ross, J. A., Wolf, R., et al. (2008b). Efficient
Differentiation of Hepatocytes from Human Embryonic Stem Cells Exhibiting
Markers Recapitulating Liver Development In Vivo. STEM CELLS 26, 894–902.
Hayashi, H., Abdollah, S., Qiu, Y., Cai, J., Xu, Y. Y., Grinnell, B. W., Richardson, M.
A., Topper, J. N., Gimbrone, M. A., Wrana, J. L., et al. (1997). The MAD-related
protein Smad7 associates with the TGFbeta receptor and functions as an antagonist
of TGFbeta signaling. Cell 89, 1165–1173.
Hinton, A., Afrikanova, I., Wilson, M., King, C. C., Maurer, B., Yeo, G. W., Hayek, A.,
and Pasquinelli, A. E. (2010). A distinct microRNA signature for definitive
endoderm derived from human embryonic stem cells. Stem cells and development
19, 797–807.
Hohenstein, K. a, Pyle, A. D., Chern, J. Y., Lock, L. F., and Donovan, P. J. (2008).
Nucleofection mediates high-efficiency stable gene knockdown and transgene
expression in human embryonic stem cells. Stem cells (Dayton, Ohio) 26, 1436–
1443.
Holmen, S. L., Salic, A., Zylstra, C. R., Kirschner, M. W., and Williams, B. O. (2002).
A Novel Set of Wnt-Frizzled Fusion Proteins Identifies Receptor Components That
Activate β-Catenin-dependent Signaling . Journal of Biological Chemistry 277 ,
34727–34735.
Hoodless, P. A., Pye, M., Chazaud, C., Labbé, E., Attisano, L., Rossant, J., and Wrana,
J. L. (2001). FoxH1 (Fast) functions to specify the anterior primitive streak in the
mouse . Genes & Development 15 , 1257–1271.
Hülsken, J., Birchmeier, W., and Behrens, J. (1994). E-cadherin and APC compete for
the interaction with beta-catenin and the cytoskeleton. . The Journal of Cell
Biology 127 , 2061–2069.
Izumi, N., Era, T., Akimaru, H., Yasunaga, M., and Nishikawa, S.-I. (2007). Dissecting
the Molecular Hierarchy for Mesendoderm Differentiation Through a Combination
of Embryonic Stem Cell Culture and RNA Interference. STEM CELLS 25, 1664–
1674.
Jackson, S. A., Schiesser, J., Stanley, E. G., and Elefanty, A. G. (2010). Differentiating
Embryonic Stem Cells Pass through “Temporal Windows” That Mark

238
Responsiveness to Exogenous and Paracrine Mesendoderm Inducing Signals.
PLoS ONE 5, e10706.
Jaffe, L., Robertson, E. J., and Bikoff, E. K. (1991). DISTINCT PATTERNS OF
EXPRESSION OF MHC CLASS I AND ,& MICROGLOBULIN TRANSCRIPTS
AT EARLY STAGES OF MOUSE DEVELOPMENT ’ graft rejection are
composed of a 40- to 45-kDa H bryo . MHC class I transcripts were initially
detected. The Journal of Immunology 147.
Jin, O., Harpal, K., Ang, S. L., and Rossant, J. (2001). Otx2 and HNF3beta genetically
interact in anterior patterning. The International journal of developmental biology
45, 357–365.
Jörnvall, H., Reissmann, E., Andersson, O., Mehrkash, M., and Ibáñez, C. F. (2004).
ALK7, a Receptor for Nodal, Is Dispensable for Embryogenesis and Left-Right
Patterning in the Mouse . Molecular and Cellular Biology 24 , 9383–9389.
Kaganman, I. (2007). Throwing a ROCK inhibitor at a problem. Nat Meth 4, 544.
Kalia, M., Kumari, S., Chadda, R., Hill, M. M., Parton, R. G., and Mayor, S. (2006).
Arf6-independent GPI-anchored Protein-enriched Early Endosomal Compartments
Fuse with Sorting Endosomes via a Rab5/Phosphatidylinositol-3′-Kinase–
dependent Machinery . Molecular Biology of the Cell 17 , 3689–3704.
Kanai-Azuma, M., Kanai, Y., Gad, J. M., Tajima, Y., Taya, C., Kurohmaru, M., Sanai,
Y., Yonekawa, H., Yazaki, K., Tam, P. P. L., et al. (2002). Depletion of definitive
gut endoderm in Sox17-null mutant mice . Development 129 , 2367–2379.
Kato, K., Cui, S., Kuick, R., Mineishi, S., Hexner, E., Ferrara, J. L. M., Emerson, S. G.,
and Zhang, Y. (2010). Identification of stem cell transcriptional programs normally
expressed in embryonic and neural stem cells in alloreactive CD8+ T cells
mediating graft-versus-host disease. Biology of blood and marrow transplantation :
journal of the American Society for Blood and Marrow Transplantation 16, 751–
771.
Keeton, M. R., Curriden, S. A., Van Zonneveld, A. J., and Loskutoff, D. J. (1991).
Identification of regulatory sequences in the type 1 plasminogen activator inhibitor
gene responsive to transforming growth factor beta. . Journal of Biological
Chemistry 266 , 23048–23052.
Kelber, J. A., Panopoulos, A. D., Shani, G., Booker, E. C., Belmonte, J. C., Vale, W.
W., and Gray, P. C. (2009). Blockade of Cripto binding to cell surface GRP78
inhibits oncogenic Cripto signaling via MAPK/PI3K and Smad2/3 pathways.
Oncogene 28, 2324–2336.
Kelber, J. A., Shani, G., Booker, E. C., Vale, W. W., and Gray, P. C. (2008). Cripto Is a
Noncompetitive Activin Antagonist That Forms Analogous Signaling Complexes
with Activin and Nodal . Journal of Biological Chemistry 283 , 4490–4500.

239
Kim, S. W., Yoon, S.-J., Chuong, E., Oyolu, C., Wills, A. E., Gupta, R., and Baker, J.
(2011). Chromatin and transcriptional signatures for Nodal signaling during
endoderm formation in hESCs. Developmental Biology 357, 492–504.
Kimelman, D., and Xu, W. (2006). [beta]-Catenin destruction complex: insights and
questions from a structural perspective. Oncogene 25, 7482–7491.
Kroon, E., Martinson, L. A., Kadoya, K., Bang, A. G., Kelly, O. G., Eliazer, S., Young,
H., Richardson, M., Smart, N. G., Cunningham, J., et al. (2008). Pancreatic
endoderm derived from human embryonic stem cells generates glucose-responsive
insulin-secreting cells in vivo. Nat Biotech 26, 443–452.
Kubo, A., Shinozaki, K., Shannon, J. M., Kouskoff, V., Kennedy, M., Woo, S., Fehling,
H. J., and Keller, G. (2004). Development of definitive endoderm from embryonic
stem cells in culture . Development 131 , 1651–1662.
Labbé, E., Silvestri, C., Hoodless, P. a, Wrana, J. L., and Attisano, L. (1998). Smad2
and Smad3 positively and negatively regulate TGF beta-dependent transcription
through the forkhead DNA-binding protein FAST2. Molecular cell 2, 109–120.
Lagna, G., Hata, A., Hemmati-Brivanlou, A., and Massague, J. (1996). Partnership
between DPC4 and SMAD proteins in TGF-[beta] signalling pathways. Nature
383, 832–836.
Lee, H.-J., Lee, J. K., Miyake, S., and Kim, S.-J. (2004). A Novel E1A-like Inhibitor of
Differentiation (EID) Family Member, EID-2, Suppresses Transforming Growth
Factor (TGF)-β Signaling by Blocking TGF-β-induced Formation of Smad3-
Smad4 Complexes . Journal of Biological Chemistry 279 , 2666–2672.
Lefort, N., Perrier, A. L., Laâbi, Y., Varela, C., and Peschanski, M. (2009). Human
embryonic stem cells and genomic instability. Regenerative medicine 4, 899–909.
Lei, S., Dubeykovskiy, A., Chakladar, A., Wojtukiewicz, L., and Wang, T. C. (2004).
The Murine Gastrin Promoter Is Synergistically Activated by Transforming
Growth Factor-β/Smad and Wnt Signaling Pathways . Journal of Biological
Chemistry 279 , 42492–42502.
Letamendia, A., Labbé, E., and Attisano, L. (2001). Transcriptional Regulation by
Smads: Crosstalk between the TGF-β and Wnt Pathways. The Journal of Bone &
Joint Surgery 83, S31–S39.
Li, J., Wang, G., Wang, C., Zhao, Y., Zhang, H., Tan, Z., Song, Z., Ding, M., and Deng,
H. (2007). MEK/ERK signaling contributes to the maintenance of human
embryonic stem cell self-renewal. Differentiation 75, 299–307.
Lickert, H., Cox, B., Wehrle, C., Taketo, M. M., Kemler, R., and Rossant, J. (2005).
Dissecting Wnt/β-catenin signaling during gastrulation using RNA interference in
mouse embryos . Development 132 , 2599–2609.

240
Liguori, G. L., Borges, A. C., D’Andrea, D., Liguoro, A., Gonçalves, L., Salgueiro, A.
M., Persico, M. G., and Belo, J. A. (2008). Cripto-independent Nodal signaling
promotes positioning of the A-P axis in the early mouse embryo. Developmental
Biology 315, 280–289.
Liu, P., Wakamiya, M., Shea, M. J., Albrecht, U., Behringer, R. R., and Bradley, A.
(1999). Requirement for Wnt3 in vertebrate axis formation. Nat Genet 22, 361–
365.
Liu, Y., Festing, M., Thompson, J. C., Hester, M., Rankin, S., El-Hodiri, H. M., Zorn,
A. M., and Weinstein, M. (2004). Smad2 and Smad3 coordinately regulate
craniofacial and endodermal development. Developmental Biology 270, 411–426.
Liu, Y., Song, Z., Zhao, Y., Qin, H., Cai, J., Zhang, H., Yu, T., Jiang, S., Wang, G.,
Ding, M., et al. (2006). A novel chemical-defined medium with bFGF and N2B27
supplements supports undifferentiated growth in human embryonic stem cells.
Biochemical and biophysical research communications 346, 131–139.
Lonardo, E., Parish, C. L., Ponticelli, S., Marasco, D., Ribeiro, D., Ruvo, M., De Falco,
S., Arenas, E., and Minchiotti, G. (2010). A Small Synthetic Cripto Blocking
Peptide Improves Neural Induction, Dopaminergic Differentiation, and Functional
Integration of Mouse Embryonic Stem Cells in a Rat Model of Parkinson’s
Disease. STEM CELLS 28, 1326–1337.
Lu, W., Yamamoto, V., Ortega, B., and Baltimore, D. (2004). Mammalian Ryk is a Wnt
coreceptor required for stimulation of neurite outgrowth. Cell 119, 97–108.
Ludwig, T. E., Bergendahl, V., Levenstein, M. E., Yu, J., Probasco, M. D., and
Thomson, J. A. (2006a). Feeder-independent culture of human embryonic stem
cells. Nat Meth 3, 637–646.
Ludwig, T. E., Levenstein, M. E., Jones, J. M., Berggren, W. T., Mitchen, E. R., Frane,
J. L., Crandall, L. J., Daigh, C. A., Conard, K. R., Piekarczyk, M. S., et al. (2006b).
Derivation of human embryonic stem cells in defined conditions. Nat Biotech 24,
185–187.
Macías-Silva, M., Abdollah, S., Hoodless, P. a, Pirone, R., Attisano, L., and Wrana, J.
L. (1996). MADR2 is a substrate of the TGFbeta receptor and its phosphorylation
is required for nuclear accumulation and signaling. Cell 87, 1215–1224.
Mahmood, A., Harkness, L., Schrøder, H. D., Abdallah, B. M., and Kassem, M. (2010).
Enhanced differentiation of human embryonic stem cells to mesenchymal
progenitors by inhibition of TGF-β/activin/nodal signaling using SB-431542.
Journal of Bone and Mineral Research 25, 1216–1233.
Mao, B., Wu, W., Li, Y., Hoppe, D., Stannek, P., Glinka, A., and Niehrs, C. (2001).
LDL-receptor-related protein 6 is a receptor for Dickkopf proteins. Nature 411,
321–325.

241
Martello, G., Zacchigna, L., Inui, M., Montagner, M., Adorno, M., Mamidi, A., Morsut,
L., Soligo, S., Tran, U., Dupont, S., et al. (2007). MicroRNA control of Nodal
signalling. Nature 449, 183–188.
Martin, G. R. (1981). Isolation of a pluripotent cell line from early mouse embryos
cultured in medium conditioned by teratocarcinoma stem cells . Proceedings of the
National Academy of Sciences 78 , 7634–7638.
Martin, M. J., Muotri, A., Gage, F., and Varki, A. (2005). Human embryonic stem cells
express an immunogenic nonhuman sialic acid. Nat Med 11, 228–232.
Massagué, J. (1998). TGF-β SIGNAL TRANSDUCTION. Annual Review of
Biochemistry 67, 753–791.
Matin, M. M., Walsh, J. R., Gokhale, P. J., Draper, J. S., Bahrami, A. R., Morton, I.,
Moore, H. D., and Andrews, P. W. (2004). Specific knockdown of Oct4 and beta2-
microglobulin expression by RNA interference in human embryonic stem cells and
embryonic carcinoma cells. Stem Cells 22, 659–668.
McGrath, K. E., Koniski, A. D., Maltby, K. M., McGann, J. K., and Palis, J. (1999).
Embryonic expression and function of the chemokine SDF-1 and its receptor,
CXCR4. Developmental biology 213, 442–456.
McLean, A. B., D’Amour, K. A., Jones, K. L., Krishnamoorthy, M., Kulik, M. J.,
Reynolds, D. M., Sheppard, A. M., Liu, H., Xu, Y., Baetge, E. E., et al. (2007).
Activin A Efficiently Specifies Definitive Endoderm from Human Embryonic
Stem Cells Only When Phosphatidylinositol 3-Kinase Signaling Is Suppressed.
STEM CELLS 25, 29–38.
Meno, C., Takeuchi, J., Sakuma, R., Koshiba-Takeuchi, K., Ohishi, S., Saijoh, Y.,
Miyazaki, J., Ten Dijke, P., Ogura, T., and Hamada, H. (2001). Diffusion of nodal
signaling activity in the absence of the feedback inhibitor Lefty2. Developmental
cell 1, 127–138.
Mesnard, D., Guzman-Ayala, M., and Constam, D. B. (2006). Nodal specifies
embryonic visceral endoderm and sustains pluripotent cells in the epiblast before
overt axial patterning. Development.
Mikels, A. J., and Nusse, R. (2006). Wnts as ligands: processing, secretion and
reception. Oncogene 25, 7461–7468.
Minchiotti, G., Manco, G., Parisi, S., Lago, C. T., Rosa, F., and Persico, M. G. (2001).
Structure-function analysis of the EGF-CFC family member Cripto identifies
residues essential for nodal signalling . Development 128 , 4501–4510.
Mitsui, K., Tokuzawa, Y., Itoh, H., Segawa, K., Murakami, M., Takahashi, K.,
Maruyama, M., Maeda, M., and Yamanaka, S. (2003). The homeoprotein Nanog is
required for maintenance of pluripotency in mouse epiblast and ES cells. Cell 113,
631–642.
242
Moffat, J., Grueneberg, D. a, Yang, X., Kim, S. Y., Kloepfer, A. M., Hinkle, G., Piqani,
B., Eisenhaure, T. M., Luo, B., Grenier, J. K., et al. (2006). A lentiviral RNAi
library for human and mouse genes applied to an arrayed viral high-content screen.
Cell 124, 1283–1298.
Morkel, M., Huelsken, J., Wakamiya, M., Ding, J., Van de Wetering, M., Clevers, H.,
Taketo, M. M., Behringer, R. R., Shen, M. M., and Birchmeier, W. (2003). β-
Catenin regulates Cripto- and Wnt3-dependent gene expression programs in mouse
axis and mesoderm formation . Development 130 , 6283–6294.
Morrisey, E. E., Tang, Z., Sigrist, K., Lu, M. M., Jiang, F., Ip, H. S., and Parmacek, M.
S. (1998). GATA6 regulates HNF4 and is required for differentiation of visceral
endoderm in the mouse embryo . Genes & Development 12 , 3579–3590.
Neveu, P., Kye, M. J., Qi, S., Buchholz, D. E., Clegg, D. O., Sahin, M., Park, I.-H.,
Kim, K.-S., Daley, G. Q., Kornblum, H. I., et al. (2010). MicroRNA profiling
reveals two distinct p53-related human pluripotent stem cell states. Cell stem cell
7, 671–681.
Nichols, J., Zevnik, B., Anastassiadis, K., Niwa, H., Klewe-Nebenius, D., Chambers, I.,
Schöler, H., and Smith, A. (1998). Formation of pluripotent stem cells in the
mammalian embryo depends on the POU transcription factor Oct4. Cell 95, 379–
391.
Norris, D. P., Brennan, J., Bikoff, E. K., and Robertson, E. J. (2002). The Foxh1-
dependent autoregulatory enhancer controls the level of Nodal signals in the mouse
embryo . Development 129 , 3455–3468.
Norris, D. P., and Robertson, E. J. (1999). Asymmetric and node-specific nodal
expression patterns are controlled by two distinct cis-acting regulatory elements .
Genes & Development 13 , 1575–1588.
Norrman, K., Fischer, Y., Bonnamy, B., Wolfhagen Sand, F., Ravassard, P., and Semb,
H. (2010). Quantitative comparison of constitutive promoters in human ES cells.
PloS one 5, e12413.
Nostro, M. C., Sarangi, F., Ogawa, S., Holtzinger, A., Corneo, B., Li, X., Micallef, S. J.,
Park, I.-H., Basford, C., Wheeler, M. B., et al. (2011). Stage-specific signaling
through TGFβ family members and WNT regulates patterning and pancreatic
specification of human pluripotent stem cells . Development 138 , 861–871.
Oldershaw, R. A., Baxter, M. A., Lowe, E. T., Bates, N., Grady, L. M., Soncin, F.,
Brison, D. R., Hardingham, T. E., and Kimber, S. J. (2010). Directed
differentiation of human embryonic stem cells toward chondrocytes. Nat Biotech
28, 1187–1194.
Parisi, S., D’Andrea, D., Lago, C. T., Adamson, E. D., Persico, M. G., and Minchiotti,
G. (2003). Nodal-dependent Cripto signaling promotes cardiomyogenesis and
redirects the neural fate of embryonic stem cells . The Journal of Cell Biology 163
, 303–314.

243
Perea-Gomez, A., Shawlot, W., Sasaki, H., Behringer, R. R., and Ang, S. (1999).
HNF3beta and Lim1 interact in the visceral endoderm to regulate primitive streak
formation and anterior-posterior polarity in the mouse embryo . Development 126 ,
4499–4511.
Perea-Gomez, A., Vella, F. D. J., Shawlot, W., Oulad-Abdelghani, M., Chazaud, C.,
Meno, C., Pfister, V., Chen, L., Robertson, E., Hamada, H., et al. (2002). Nodal
antagonists in the anterior visceral endoderm prevent the formation of multiple
primitive streaks. Developmental Cell 3, 745–756.
Petraglia, F., Florio, P., Luisi, S., Gallo, R., Gadducci, a, Viganò, P., Di Blasio, a M.,
Genazzani, a R., and Vale, W. (1998). Expression and secretion of inhibin and
activin in normal and neoplastic uterine tissues. High levels of serum activin A in
women with endometrial and cervical carcinoma. The Journal of clinical
endocrinology and metabolism 83, 1194–1200.
Reissmann, E., Jörnvall, H., Blokzijl, A., Andersson, O., Chang, C., Minchiotti, G.,
Persico, M. G., Ibáñez, C. F., and Brivanlou, A. H. (2001). The orphan receptor
ALK7 and the Activin receptor ALK4 mediate signaling by Nodal proteins during
vertebrate development . Genes & Development 15 , 2010–2022.
Reubinoff, B. E., Pera, M. F., Fong, C.-Y., Trounson, A., and Bongso, A. (2000).
Embryonic stem cell lines from human blastocysts: somatic differentiation. Nat
Biotech 18, 399–404.
Rivera-Perez, J. A., Mallo, M., Gendron-Maguire, M., Gridley, T., and Behringer, R. R.
(1995). Goosecoid is not an essential component of the mouse gastrula organizer
but is required for craniofacial and rib development . Development 121 , 3005–
3012.
Rivera-Pérez, J. A., and Magnuson, T. (2005). Primitive streak formation in mice is
preceded by localized activation of Brachyury and Wnt3. Developmental biology
288, 363–371.
Rodriguez, R., Rubio, R., Gutierrez-Aranda, I., Melen, G. J., Elosua, C., García-Castro,
J., and Menendez, P. (2011). FUS-CHOP fusion protein expression coupled to p53
deficiency induces liposarcoma in mouse but not in human adipose-derived
mesenchymal stem/stromal cells. Stem cells (Dayton, Ohio) 29, 179–192.
Rothbacher, U., Laurent, M. N., Deardorff, M. A., Klein, P. S., Cho, K. W. Y., and
Fraser, S. E. (2000). Dishevelled phosphorylation, subcellular localization and
multimerization regulate its role in early embryogenesis. EMBO J 19, 1010–1022.
Runyan, C. E., Schnaper, H. W., and Poncelet, A.-C. (2005). The Role of Internalization
in Transforming Growth Factor β1-induced Smad2 Association with Smad Anchor
for Receptor Activation (SARA) and Smad2-dependent Signaling in Human
Mesangial Cells . Journal of Biological Chemistry 280 , 8300–8308.
Sato, N., Meijer, L., Skaltsounis, L., Greengard, P., and Brivanlou, A. H. (2004).
Maintenance of pluripotency in human and mouse embryonic stem cells through

244
activation of Wnt signaling by a pharmacological GSK-3-specific inhibitor. Nat
Med 10, 55–63.
Sato, N., Sanjuan, I. M., Heke, M., Uchida, M., Naef, F., and Brivanlou, A. H. (2003).
Molecular signature of human embryonic stem cells and its comparison with the
mouse. Developmental Biology 260, 404–413.
Schmittgen, T. D., and Livak, K. J. (2008). Analyzing real-time PCR data by the
comparative CT method. Nature Protocols 3, 1101–1108.
Shi, Y., and Massagué, J. (2003). Mechanisms of TGF-β Signaling from Cell
Membrane to the Nucleus. Cell 113, 685–700.
Shimoda, M., Kanai-Azuma, M., Hara, K., Miyazaki, S., Kanai, Y., Monden, M., and
Miyazaki, J. (2007). Sox17 plays a substantial role in late-stage differentiation of
the extraembryonic endoderm in vitro . Journal of Cell Science 120 , 3859–3869.
Smith, J. R., Vallier, L., Lupo, G., Alexander, M., Harris, W. A., and Pedersen, R. A.
(2008). Inhibition of Activin/Nodal signaling promotes specification of human
embryonic stem cells into neuroectoderm. Developmental Biology 313, 107–117.
Stegmeier, F., Hu, G., Rickles, R. J., Hannon, G. J., and Elledge, S. J. (2005). A
lentiviral microRNA-based system for single-copy polymerase II-regulated RNA
interference in mammalian cells . Proceedings of the National Academy of
Sciences of the United States of America 102 , 13212–13217.
Strumpf, D., Mao, C.-A., Yamanaka, Y., Ralston, A., Chawengsaksophak, K., Beck, F.,
and Rossant, J. (2005). Cdx2 is required for correct cell fate specification and
differentiation of trophectoderm in the mouse blastocyst . Development 132 ,
2093–2102.
Städeli, R., Hoffmans, R., and Basler, K. (2006). Transcription under the control of
nuclear Arm/beta-catenin. Current Biology 16, R378–R385.
Sumi, T., Tsuneyoshi, N., Nakatsuji, N., and Suemori, H. (2008). Defining early lineage
specification of human embryonic stem cells by the orchestrated balance of
canonical Wnt/β-catenin, Activin/Nodal and BMP signaling . Development 135 ,
2969–2979.
Szulc, J., Wiznerowicz, M., Sauvain, M., and Trono, D. (2006). A versatile tool for
conditional gene expression and knockdown. Nature methods 3.
Séguin, C. A., Draper, J. S., Nagy, A., and Rossant, J. (2008). Establishment of
endoderm progenitors by SOX transcription factor expression in human embryonic
stem cells. Cell stem cell 3, 182–195.
Tada, S., Era, T., Furusawa, C., Sakurai, H., Nishikawa, S., Kinoshita, M., Nakao, K.,
Chiba, T., and Nishikawa, S.-I. (2005). Characterization of mesendoderm: a
diverging point of the definitive endoderm and mesoderm in embryonic stem cell
differentiation culture . Development 132 , 4363–4374.
245
Takenaga, M., Fukumoto, M., and Hori, Y. (2007). Regulated Nodal signaling promotes
differentiation of the definitive endoderm and mesoderm from ES cells . Journal of
Cell Science 120 , 2078–2090.
Tam, P. P. L., Khoo, P.-L., Wong, N., Tsang, T. E., and Behringer, R. R. (2004).
Regionalization of cell fates and cell movement in the endoderm of the mouse
gastrula and the impact of loss of Lhx1(Lim1) function. Developmental biology
274, 171–187.
Tam, P. P. L., and Loebel, D. A. F. (2007). Gene function in mouse embryogenesis: get
set for gastrulation. Nat Rev Genet 8, 368–381.
Teo, A. K. K., Arnold, S. J., Trotter, M. W. B., Brown, S., Ang, L. T., Chng, Z.,
Robertson, E. J., Dunn, N. R., and Vallier, L. (2011a). Pluripotency factors
regulate definitive endoderm specification through eomesodermin . Genes &
Development 25 , 238–250.
Teo, A. K. K., Arnold, S. J., Trotter, M. W. B., Brown, S., Ang, L. T., Chng, Z.,
Robertson, E. J., Dunn, N. R., and Vallier, L. (2011b). Pluripotency factors
regulate definitive endoderm specification through eomesodermin. Genes &
development 25, 238–250.
Theisen, H., Purcell, J., Bennett, M., Kansagara, D., Syed, A., and Marsh, J. L. (1994).
dishevelled is required during wingless signaling to establish both cell polarity and
cell identity . Development 120 , 347–360.
Thompson, T. B., Cook, R. W., Chapman, S. C., Jardetzky, T. S., and Woodruff, T. K.
(2004). Beta A versus beta B: is it merely a matter of expression? Molecular and
Cellular Endocrinology 225, 9–17.
Thomson, J. A., Itskovitz-Eldor, J., Shapiro, S. S., Waknitz, M. A., Swiergiel, J. J.,
Marshall, V. S., and Jones, J. M. (1998). Embryonic Stem Cell Lines Derived from
Human Blastocysts . Science 282 , 1145–1147.
Touboul, T., Hannan, N. R. F., Corbineau, S., Martinez, A., Martinet, C., Branchereau,
S., Mainot, S., Strick-Marchand, H., Pedersen, R., Di Santo, J., et al. (2010).
Generation of functional hepatocytes from human embryonic stem cells under
chemically defined conditions that recapitulate liver development. Hepatology 51,
1754–1765.
Tremblay, K. D., Hoodless, P. A., Bikoff, E. K., and Robertson, E. J. (2000). Formation
of the definitive endoderm in mouse is a Smad2-dependent process . Development
127 , 3079–3090.
Tsukazaki, T., Chiang, T. A., Davison, A. F., Attisano, L., and Wrana, J. L. (1998).
SARA, a FYVE domain protein that recruits Smad2 to the TGFbeta receptor. Cell
95, 779–791.
Tzur, G., Levy, A., Meiri, E., Barad, O., Spector, Y., Bentwich, Z., Mizrahi, L.,
Katzenellenbogen, M., Ben-Shushan, E., Reubinoff, B. E., et al. (2008).

246
MicroRNA Expression Patterns and Function in Endodermal Differentiation of
Human Embryonic Stem Cells. PLoS ONE 3, e3726.
Uchimura, T., Komatsu, Y., Tanaka, M., McCann, K. L., and Mishina, Y. (2009). Bmp2
and Bmp4 genetically interact to support multiple aspects of mouse development
including functional heart development. genesis 47, 374–384.
Vallier, L., Alexander, M., and Pedersen, R. (2007). Conditional Gene Expression in
Human Embryonic Stem Cells. STEM CELLS 25, 1490–1497.
Vallier, L., Alexander, M., and Pedersen, R. A. (2005). Activin/Nodal and FGF
pathways cooperate to maintain pluripotency of human embryonic stem cells .
Journal of Cell Science 118 , 4495–4509.
Vallier, L., Mendjan, S., Brown, S., Chng, Z., Teo, A., Smithers, L. E., Trotter, M. W.
B., Cho, C. H.-H., Martinez, A., Rugg-Gunn, P., et al. (2009a). Activin/Nodal
signalling maintains pluripotency by controlling Nanog expression . Development
136 , 1339–1349.
Vallier, L., Reynolds, D., and Pedersen, R. A. (2004). Nodal inhibits differentiation of
human embryonic stem cells along the neuroectodermal default pathway.
Developmental Biology 275, 403–421.
Vallier, L., Touboul, T., Brown, S., Cho, C., Bilican, B., Alexander, M., Cedervall, J.,
Chandran, S., Ährlund-Richter, L., Weber, A., et al. (2009b). Signaling Pathways
Controlling Pluripotency and Early Cell Fate Decisions of Human Induced
Pluripotent Stem Cells. STEM CELLS 27, 2655–2666.
Vallier, L., Touboul, T., Chng, Z., Brimpari, M., Hannan, N., Millan, E., Smithers, L.
E., Trotter, M., Rugg-Gunn, P., Weber, A., et al. (2009c). Early Cell Fate
Decisions of Human Embryonic Stem Cells and Mouse Epiblast Stem Cells Are
Controlled by the Same Signalling Pathways. PLoS ONE 4, e6082.
Vincent, S. D., Dunn, N. R., Hayashi, S., Norris, D. P., and Robertson, E. J. (2003). Cell
fate decisions within the mouse organizer are governed by graded Nodal signals .
Genes & Development 17 , 1646–1662.
Wang, P., Rodriguez, R. T., Wang, J., Ghodasara, A., and Kim, S. K. (2011a). Targeting
SOX17 in human embryonic stem cells creates unique strategies for isolating and
analyzing developing endoderm. Cell stem cell 8, 335–346.
Wang, X., Lu, H., Urvalek, a M., Li, T., Yu, L., Lamar, J., DiPersio, C. M., Feustel, P.
J., and Zhao, J. (2011b). KLF8 promotes human breast cancer cell invasion and
metastasis by transcriptional activation of MMP9. Oncogene 30, 1901–1911.
Watanabe, R., Yamada, Y., Ihara, Y., Someya, Y., Kubota, A., Kagimoto, S., Kuroe, A.,
Iwakura, T., Shen, Z. P., Inada, A., et al. (1999). The MH1 domains of smad2 and
smad3 are involved in the regulation of the ALK7 signals. Biochemical and
Biophysical Research Communications 254, 707–712.

247
Watt, A. J., Zhao, R., Li, J., and Duncan, S. A. (2007). Development of the mammalian
liver and ventral pancreas is dependent on GATA4. BMC developmental biology
7, 37.
Winnier, G., Blessing, M., Labosky, P. A., and Hogan, B. L. (1995). Bone
morphogenetic protein-4 is required for mesoderm formation and patterning in the
mouse. . Genes & Development 9 , 2105–2116.
Wong, J. C. Y., Gao, S. Y., Lees, J. G., Best, M. B., Wang, R., and Tuch, B. E. (2010).
Definitive endoderm derived from human embryonic stem cells highly express the
integrin receptors αV and β5. celladhesion 4, 39–45.
Xu, C., Inokuma, M. S., Denham, J., Golds, K., Kundu, P., Gold, J. D., and Carpenter,
M. K. (2001). Feeder-free growth of undifferentiated human embryonic stem cells.
Nat Biotech 19, 971–974.
Xu, R.-H., Sampsell-Barron, T. L., Gu, F., Root, S., Peck, R. M., Pan, G., Yu, J.,
Antosiewicz-Bourget, J., Tian, S., Stewart, R., et al. (2008). NANOG Is a Direct
Target of TGFβ/Activin-Mediated SMAD Signaling in Human ESCs. Cell Stem
Cell 3, 196–206.
Al Yacoub, N., Romanowska, M., Haritonova, N., and Foerster, J. (2007). Optimized
production and concentration of lentiviral vectors containing large inserts. The
journal of gene medicine 6 Suppl 1, 579–584.
Yamamoto, M., Saijoh, Y., Perea-Gomez, A., Shawlot, W., Behringer, R. R., Ang, S.-
L., Hamada, H., and Meno, C. (2004). Nodal antagonists regulate formation of the
anteroposterior axis of the mouse embryo. Nature 428, 387–392.
Yamashita, H., Ten Dijke, P., Franzén, P., Miyazono, K., and Heldin, C. H. (1994).
Formation of hetero-oligomeric complexes of type I and type II receptors for
transforming growth factor-beta. . Journal of Biological Chemistry 269 , 20172–
20178.
Yan, Y., Liu, J., and Luo, Y. (2002). Dual roles of Cripto as a ligand and coreceptor in
the nodal signaling pathway. … and cellular biology 22, 4439–4449.
Yeo, C., and Whitman, M. (2001). Nodal signals to Smads through Cripto-dependent
and Cripto-independent mechanisms. Molecular Cell 7, 949–957.
Yook, J.-Y., Kim, M.-J., Son, M. J., Lee, S., Nam, Y., Han, Y.-M., and Cho, Y. S.
(2011). Combinatorial activin receptor-like kinase/Smad and basic fibroblast
growth factor signals stimulate the differentiation of human embryonic stem cells
into the cardiac lineage. Stem cells and development 20, 1479–1490.
Zaehres, H., and Daley, G. Q. (2006). Transgene expression and RNA interference in
embryonic stem cells. Methods in enzymology 420, 49–64.

248
Zaehres, H., Lensch, M. W., Daheron, L., Stewart, S. A., Itskovitz-Eldor, J., and Daley,
G. Q. (2005). High-efficiency RNA interference in human embryonic stem cells.
Stem cells 23, 299–305.
Zafarana, G., Avery, S. R., Avery, K., Moore, H. D., and Andrews, P. W. (2009).
Specific Knockdown of OCT4 in Human Embryonic Stem Cells by Inducible
Short Hairpin RNA Interference. STEM CELLS 27, 776–782.
Zhang, Y., Feng, X.-H., Wu, R.-Y., and Derynck, R. (1996). Receptor-associated Mad
homologues synergize as effectors of the TGF-[beta] response. Nature 383, 168–
172.
Zhou, J., Ou-Yang, Q., Li, J., Zhou, X.-Y., Lin, G., and Lu, G.-X. (2008). Human feeder
cells support establishment and definitive endoderm differentiation of human
embryonic stem cells. Stem cells and development 17, 737–749.
Zorn, A. M., and Wells, J. M. (2009). Vertebrate Endoderm Development and Organ
Formation. Annual Review of Cell and Developmental Biology 25, 221–251.

249
APPENDICES
A.1 Flow cytometry data
Table of data for NANOG and SOX17 expression in Hues1 cells analysed at day 0 and
5 of differentiation in Activin A (ActA) or ActA +Wnt3a. Experiments are numbered #1
- #5, with * indicating the use of E.coli derived Activin A. The others used insect-cell
derived Activin A. “nd” indicates not done.
NANOG Day 0 (mTeSR) Day 5 (ActA) Day 5 (A+Wnt3a)
#1 94.1% 80.7% nd
#2 nd nd nd
#3* 93.0% 76.9% 75.1%
#4* 83.5% 73.1% 67.2%
#5 97.3% 81.1% nd
Average 92.2% 78.1% -
s.e. 2.42 2.07 -
SOX17 Day 0 (mTeSR) Day 5 (ActA) Day 5 (A+Wnt3a)
#1 0.25% 9.55% nd
#2 0.55% 15.93% nd
#3* 0.31% 1.04% 15.19%
#4* 0.34% 1.01% 3.27%
#5 0.84% 35.43% nd
Average 0.46% 12.59% -
s.e. 0.11 6.36 -
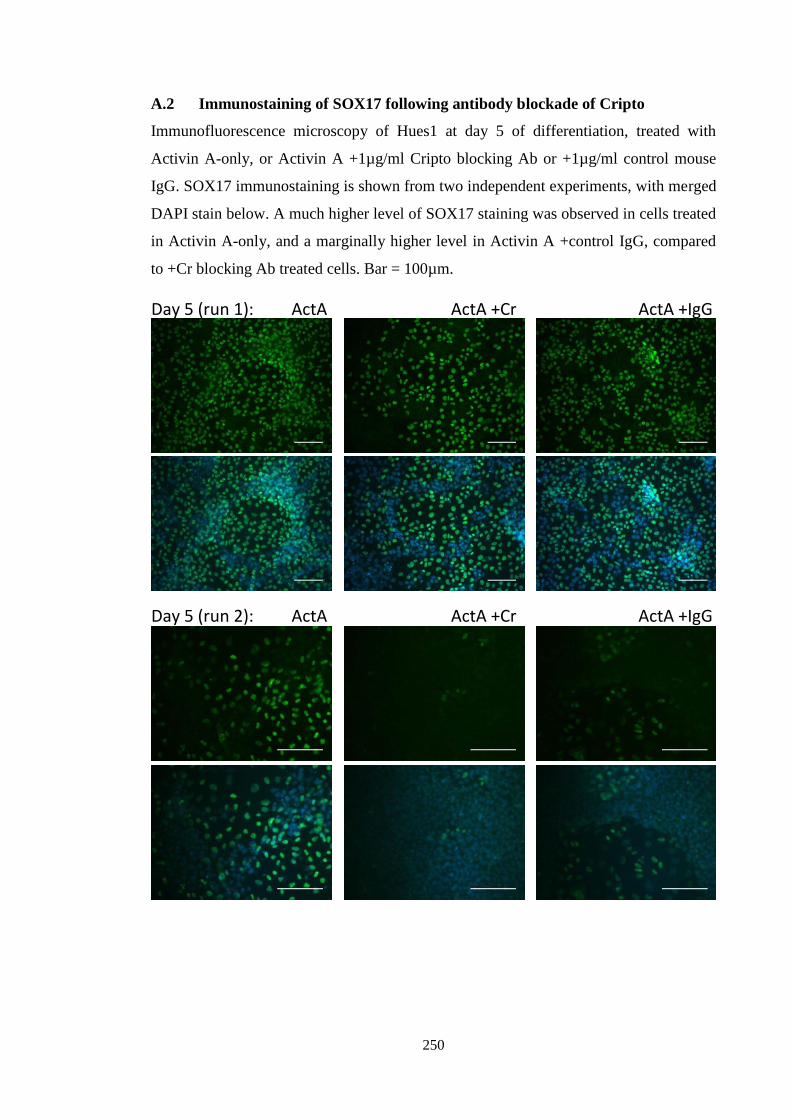
250
A.2 Immunostaining of SOX17 following antibody blockade of Cripto
Immunofluorescence microscopy of Hues1 at day 5 of differentiation, treated with
Activin A-only, or Activin A +1µg/ml Cripto blocking Ab or +1µg/ml control mouse
IgG. SOX17 immunostaining is shown from two independent experiments, with merged
DAPI stain below. A much higher level of SOX17 staining was observed in cells treated
in Activin A-only, and a marginally higher level in Activin A +control IgG, compared
to +Cr blocking Ab treated cells. Bar = 100µm.
Day 5 (run 1): ActA ActA +Cr ActA +IgG
Day 5 (run 2): ActA ActA +Cr ActA +IgG