Broad-band spectra of Cyg X-1 and correlations between spectral characteristics
16
Mon. Not. R. Astron. Soc. 362, 1435–1450 (2005) doi:10.1111/j.1365-2966.2005.09415.x Broad-band spectra of Cygnus X-1 and correlations between spectral characteristics Askar Ibragimov, 1,2 Juri Poutanen, 1 † Marat Gilfanov, 3,4 Andrzej A. Zdziarski 5 and Chris R. Shrader 6 1 Astronomy Division, PO Box 3000, FIN-90014 University of Oulu, Finland 2 Kazan State University, Astronomy Department, Kremlyovskaya 18, 420008 Kazan, Russia 3 Max-Planck-Institut f¨ ur Astrophysik, Karl-Schwarzschild-Str. 1, 85740 Garching, Germany 4 Space Research Institute, Russian Academy of Sciences, Profsoyuznaya 84/32, 117810 Moscow, Russia 5 Centrum Astronomiczne im. M. Kopernika, Bartycka 18, 00-716 Warszawa, Poland 6 Laboratory for High-Energy Astrophysics, NASA Goddard Space Flight Center, Greenbelt, MD 20771, USA Accepted 2005 July 6. Received 2005 May 24; in original form 2005 February 21 ABSTRACT We present the results of the spectral analysis of 42 simultaneous broad-band Ginga–OSSE and RXTE–OSSE observations of Cygnus X-1 carried out in 1991 and 1996–1999. The broad-band spectra from 3 to ∼1000 keV can be well described by the thermal Comptonization model with reflection from the cold disc, with an additional soft component visible below 10 keV. The relative contribution of this component to the total energy flux appears to be higher in the spectra with larger reflection amplitude and steeper photon index of the thermal Comptonized component. We consider a number of physically realistic models to describe the shape of the E 10 keV excess. The additional soft component can result from thermal Comptonization by electrons with a low Compton parameter, or can be a part of a non-thermal, power-law-like emission extending above 1 MeV. We study correlations between parameters obtained from the spectral fits with different models. We confirm a general correlation between the photon index and the amplitude of reflection R. We find that simple phenomenological models (such as power law plus Compton reflection) applied to the narrow band (3–20 keV) data overestimated the values of R and , although the simple models did rank correctly the spectra according to R and , as demonstrated in the original publications on this subject. The dynamic corona model provides a satisfactory description of the observed correlation, while the hot inner disc models have problems in reproducing it quantitatively. On the other hand, in the context of the dynamic corona model it is difficult to understand correlations with the timing characteristics, which seems natural in the hot disc scenario. We do not find significant correlation between the electron temperature and other spectral parameters, while the optical depth of the hot medium seems to decrease when the spectrum becomes softer. It is also shown that spectral parameters are well correlated with the timing characteristics of the source. Key words: accretion, accretion discs – black hole physics – stars: individual: Cygnus X-1 – gamma-rays: observations – X-rays: binaries. 1 INTRODUCTION Matter accreting on to a black hole, whether supermassive in Seyfert galaxies or stellar mass in Galactic X-ray binaries, releases most of E-mail: askar.ibragimov@oulu.fi (AI); juri.poutanen@oulu.fi (JP) †Corresponding Fellow, NORDITA, Copenhagen. its gravitational energy in the form of X-rays deep in the potential well. Accretion may proceed in a number of regimes. The accret- ing gas can approach the black hole in a disc-like configuration (Shakura & Sunyaev 1973) if the gravitational energy is effectively transported away in the form of radiation, or in the form of an almost spherical flow if the energy exchange mechanism between protons (carrying most of the energy) and electrons is inefficient (Shapiro, Lightman & Eardley 1976; Ichimaru 1977; Narayan, Mahadevan & C 2005 RAS
-
Upload
independent -
Category
Documents
-
view
3 -
download
0
Transcript of Broad-band spectra of Cyg X-1 and correlations between spectral characteristics

Mon. Not. R. Astron. Soc. 362, 1435–1450 (2005) doi:10.1111/j.1365-2966.2005.09415.x
Broad-band spectra of Cygnus X-1 and correlations betweenspectral characteristics
Askar Ibragimov,1,2� Juri Poutanen,1�† Marat Gilfanov,3,4 Andrzej A. Zdziarski5
and Chris R. Shrader6
1Astronomy Division, PO Box 3000, FIN-90014 University of Oulu, Finland2Kazan State University, Astronomy Department, Kremlyovskaya 18, 420008 Kazan, Russia3Max-Planck-Institut fur Astrophysik, Karl-Schwarzschild-Str. 1, 85740 Garching, Germany4Space Research Institute, Russian Academy of Sciences, Profsoyuznaya 84/32, 117810 Moscow, Russia5Centrum Astronomiczne im. M. Kopernika, Bartycka 18, 00-716 Warszawa, Poland6Laboratory for High-Energy Astrophysics, NASA Goddard Space Flight Center, Greenbelt, MD 20771, USA
Accepted 2005 July 6. Received 2005 May 24; in original form 2005 February 21
ABSTRACTWe present the results of the spectral analysis of 42 simultaneous broad-band Ginga–OSSE andRXTE–OSSE observations of Cygnus X-1 carried out in 1991 and 1996–1999. The broad-bandspectra from 3 to ∼1000 keV can be well described by the thermal Comptonization modelwith reflection from the cold disc, with an additional soft component visible below 10 keV.The relative contribution of this component to the total energy flux appears to be higher in thespectra with larger reflection amplitude and steeper photon index of the thermal Comptonizedcomponent. We consider a number of physically realistic models to describe the shape of theE � 10 keV excess. The additional soft component can result from thermal Comptonizationby electrons with a low Compton parameter, or can be a part of a non-thermal, power-law-likeemission extending above 1 MeV.
We study correlations between parameters obtained from the spectral fits with differentmodels. We confirm a general correlation between the photon index � and the amplitude ofreflection R. We find that simple phenomenological models (such as power law plus Comptonreflection) applied to the narrow band (3–20 keV) data overestimated the values of R and �,although the simple models did rank correctly the spectra according to R and �, as demonstratedin the original publications on this subject.
The dynamic corona model provides a satisfactory description of the observed correlation,while the hot inner disc models have problems in reproducing it quantitatively. On the otherhand, in the context of the dynamic corona model it is difficult to understand correlationswith the timing characteristics, which seems natural in the hot disc scenario. We do not findsignificant correlation between the electron temperature and other spectral parameters, whilethe optical depth of the hot medium seems to decrease when the spectrum becomes softer. Itis also shown that spectral parameters are well correlated with the timing characteristics of thesource.
Key words: accretion, accretion discs – black hole physics – stars: individual: Cygnus X-1 –gamma-rays: observations – X-rays: binaries.
1 I N T RO D U C T I O N
Matter accreting on to a black hole, whether supermassive in Seyfertgalaxies or stellar mass in Galactic X-ray binaries, releases most of
�E-mail: [email protected] (AI); [email protected] (JP)†Corresponding Fellow, NORDITA, Copenhagen.
its gravitational energy in the form of X-rays deep in the potentialwell. Accretion may proceed in a number of regimes. The accret-ing gas can approach the black hole in a disc-like configuration(Shakura & Sunyaev 1973) if the gravitational energy is effectivelytransported away in the form of radiation, or in the form of an almostspherical flow if the energy exchange mechanism between protons(carrying most of the energy) and electrons is inefficient (Shapiro,Lightman & Eardley 1976; Ichimaru 1977; Narayan, Mahadevan &
C© 2005 RAS

1436 A. Ibragimov et al.
Quataert 1998). Magnetic fields can play an important role trans-porting a large fraction of the total available energy and dissipatingit in a rarefied medium (corona) above the disc (Galeev, Rosner &Vaiana 1979; Tout & Pringle 1992; Svensson & Zdziarski 1994;Beloborodov 1999a; Miller & Stone 2000). However, every modelis based on a number of assumptions that include prescriptions forthe viscosity, the vertical distribution of the energy release throughthe flow, the energy transport mechanisms, etc. Given the difficul-ties in the accretion physics, observations should help in choosingamong the different possibilities as well as guiding theoreticians inthe right direction.
Cygnus X-1, one of the best studied black hole binaries (BHBs),has served as an accretion disc laboratory since the end of the 1960s.The most dramatic observed phenomena are the spectral state transi-tions occurring every few years, when the source, typically emittingmost of its energy at about 100 keV in the hard state, switchesto a soft state consisting of a prominent ∼1-keV blackbody and apower-law-like tail. The hard state spectrum was believed to origi-nate from thermal Comptonization in a hot electron cloud (Shapiroet al. 1976; Ichimaru 1977; Sunyaev & Trumper 1979; Sunyaev &Titarchuk 1980). The blackbody-looking soft-state spectrum was as-sociated with the optically thick accretion disc (Shakura & Sunyaev1973), while the origin of ∼100-keV emission in that state was notdiscussed much, because the detailed spectrum was not available.
During the last decade, the quality of the X/γ -spectra increaseddramatically improving our knowledge as well as producing manynew questions. In the hard state, the spectrum turns out to berather complicated containing a number of components. Thanksto the broad-band coverage by Ginga and CGRO (and later byASCA, RXTE and BeppoSAX), and advances in modelling of Comp-tonization at mildly relativistic temperatures (Coppi 1992; Poutanen& Svensson 1996), the parameters of the electron cloud whereComptonization takes place were determined to a high accuracy.In Cyg X-1, the electron temperature of kT e � 100 ± 50 keV andThomson optical depth of τ � 1–2 were found to be typical(Zdziarski et al. 1996, 1997; Gierlinski et al. 1997; Poutanen 1998;Di Salvo et al. 2001; Frontera et al. 2001; Zdziarski & Gierlinski2004). The Compton reflection bump, a signature of the pres-ence of cold matter in the vicinity of the X-ray emitting source,was discovered (Done et al. 1992; Ebisawa et al. 1996; Gierlinskiet al. 1997). The blackbody associated with the cooler accretiondisc (Balucinska & Hasinger 1991; Balucinska-Church et al. 1995;Ebisawa et al. 1996) and an additional soft excess at a few keV of un-known origin further complicate spectral decomposition (Di Salvoet al. 2001; Frontera et al. 2001). A high-energy excess at >500 keVdiscovered by CGRO (McConnell et al. 1994; Ling et al. 1997)gives some clues about the presence of non-thermal particles in thesource.
The X/γ -ray soft-state spectrum has been studied extensivelyby simultaneous observations with ASCA, RXTE, BeppoSAX andCGRO during the summer of 1996. In addition to the dominat-ing blackbody, a long power-law-like tail extending up to 10 MeVwas discovered (McConnell et al. 2002). The high-energy spectrumcould be well described by single Compton scattering off electronshaving a nearly power-law distribution (Poutanen 1998; Poutanen& Coppi 1998; Gierlinski et al. 1999, hereafter G99; Frontera et al.2001). The Compton reflection was stronger than in the hard state,which was interpreted as a change in the geometry of the system,from the hot inner flow in the hard state to the standard Shakura–Sunyaev disc with a non-thermal corona in the soft state (Bisnovatyi-Kogan & Blinnikov 1977; Ichimaru 1977; Poutanen, Krolik & Ryde1997; Li & Miller 1997; Esin et al. 1998; Poutanen & Coppi 1998).
Evaporation and condensation of the gas can provide a physicalbasis for the change of the transition radius between standard discand hot inner flow (Meyer, Liu & Meyer-Hofmeister 2000; Rozanska& Czerny 2000). A smaller reflection fraction in the hard state, how-ever, can be explained by a beaming of the primary emission awayfrom the disc due to mildly relativistic motion of the emitting plasma(ejection model; see Beloborodov 1999a,b; Malzac, Beloborodov &Poutanen 2001, hereafter MBP01). In order to distinguish amongdifferent possibilities, it is necessary to compare model predictionswith other observational facts.
A few, well separated in time, broad-band spectra do not giveus a good picture about relations between different components,such as, for example, Comptonized continuum and the reflectionbump. It is possible to study these relations on a larger data set ina narrower energy band. Zdziarski, Lubinski & Smith (1999, here-after ZLS99) and Gilfanov, Churazov & Revnivtsev (1999, hereafterGCR99) analysing data from Ginga and RXTE, respectively, haveshown that the photon spectral slope of the Comptonized emission,�, is strongly correlated with the amplitude of Compton reflectioncomponent, R = �/2π , where � is the solid angle the cool materialcovers as viewed from the source of primary X-rays. This correla-tion exists for individual BHBs and Seyfert galaxies as well as ina sample of sources (see also Gilfanov, Churazov & Revnivtsev2000; Revnivtsev, Gilfanov & Churazov 2001). Zdziarski et al.(2003) studied possible statistical and systematic effects and con-cluded that the correlation exists beyond any reasonable doubt. Sim-ilar correlation also exists for Fourier-frequency resolved spectra,i.e. those corresponding to the variability in a given range of Fourierfrequencies (Revnivtsev, Gilfanov & Churazov 1999).
The observed correlation provides extremely important clues tothe geometry of the accreting material and can be used for testing thetheoretical model. The fact that � and R are correlated is a naturalconsequence of coexistence of the cold media (accretion disc) anda hot Comptonizing gas in the vicinity of the black hole. The coldmaterial acts as a source of seed photons for Comptonization and, atthe same time, reflects and reprocesses the hard radiation producedin the hot gas.
The cold disc with the hot inner flow model naturally producesthe correlation if there is an overlap between hot and cold phases(Poutanen et al. 1997; ZLS99). However, the �–R dependence ob-served in BHBs can be quantitatively reproduced only if the ratioof the seed photon temperature, kT seed, to the electron temperatureis about 10−4 (ZLS99; Gilfanov et al. 2000). For kT e ∼ 100 keV,this gives kT seed ∼ 10 eV, which is an order of magnitude smallerthan the disc temperature in BHBs and closer to that expected fromSeyferts. For kT seed ∼ 300 eV, the spectra are too hard for the givenreflection fraction. In this model, the spectral slope is an extremelysteep function of the overlap between the corona and the disc, whilethe reflection varies very little (Beloborodov 2001). Intrinsic dissi-pation in the disc can make spectra softer for the given reflection,but then the spectral slope will be an even steeper function of theoverlap. Values of reflection larger than 1 sometimes observed inSeyferts also cannot be explained. On the other hand, all the datacan be well described by the ejection model with the correct kT seed
(Beloborodov 1999a,b; MBP01).The problem is that theoretical models try to reproduce the best-
fitting � and R, which are subject to a number of systematic effects.The photon index and, especially, the strength of the Compton re-flection depend crucially on the spectral shape of the underlyingcontinuum and description of the reflection physics (see detaileddiscussion in Zdziarski et al. 2003). All the papers above, wherethis correlation was studied, assumed the underlying spectrum to be
C© 2005 RAS, MNRAS 362, 1435–1450

Broad-band spectra of Cyg X-1 1437
a power law. Because the Comptonization spectrum has a cut-off athigh energies, it gives fewer incident photons that are available forreflection (Weaver, Krolik & Pier 1998; Malzac & Petrucci 2002;Perola et al. 2002), and thus the fitted R would be larger. Fitting anexponentially cut-off power law to the broad-band data (e.g. Matt2001; Perola et al. 2002) does not improve the situation, becausethis model does not reproduce well the shape of the Comptoniza-tion continuum (Malzac & Petrucci 2002; Zdziarski et al. 2003).The approximate treatment of ionization could be another source oferrors.
As discussed above, the spectra of BHBs are rather complexhaving a number of components, and it is not possible to resolvedifferent spectral components (e.g. thermal Comptonization andsoft excess) in the narrow energy range of an instrument such asRXTE/Proportional Counter Array (PCA) or Ginga/Large Area Pro-portional Counter (LAC). There is a danger that different compo-nents overlap in that energy band producing effectively a powerlaw of one index while in reality the slope of the primary emissioncould be rather different. The resulting reflection amplitude couldbe also influenced significantly. Thus, in order to obtain actual �
and R to be used in theoretical models, the analysis of broad-banddata with physical models (such as Comptonization) is absolutelynecessary.
Additional sources of information are the width of the fluores-cent Fe Kα line at 6.4 keV and the frequencies of the quasi-periodicoscillations (QPOs) that were also observed to correlate with thereflection fraction and the spectral slope (GCR99; Gilfanov et al.2000). This seems to be consistent with the variations of the innercold disc radius. Not much data exist on the variability of the elec-tron temperature and Thomson optical depth of the Comptonizingsource, which can provide information about the nature of the emit-ting plasma (electron–proton or electron–positron). It would be ofinterest to determine how the optical depth changes with the bolo-metric flux, because this can help in distinguishing the accretionmode the flow is in.
In this paper, we analyse a large set of simultaneous broad-band spectra. Four observations of Cyg X-1 by Ginga/LAC andCGRO/OSSE from 1991 as well as 38 observations by RXTE/PCA,RXTE/HEXTE and CGRO/OSSE from 1996–1999 are studied in de-tail. For the spectral analysis, we use physically motivated Comp-tonization models and study correlations between model param-eters such as the spectral slope of the primary Comptonizationcontinuum, the reflection amplitude, the width of the Fe line,the electron temperature of the hot gas, and its Thomson opticaldepth.
2 O B S E RVAT I O N S A N D DATA A NA LY S I S
The observation log is presented in Table 1. Data reduction for RXTEhas been carried out using LHEASOFT 5.3.1 software; PCA responseswere generated using PCARSP v. 10.1 and HEXTE responses wereused from 2000 May 26. In PCA data reduction, all five PCUs weretaken into account, when possible. If not all PCUs were turned on,we use PCUs 0, 2 and 3. Judging from the Crab data, these two PCUconfigurations produce similar spectral slopes. Systematic errors of0.5 per cent were added in quadrature to the PCA data. CGRO/OSSEspectra were prepared by adding per-orbit data (average exposure2–5 ks), with total exposure up to 12 h and contemporary PCAobservation in the middle of the period. The systematic error inOSSE spectra varies from 3 per cent at 50 keV to 0.3 per cent at300 keV. The stability of the OSSE spectra was checked using hard-ness ratios (154–282/52–154 keV) for per-orbit spectra being added.
If orbital spectra within 12 h were apparently different, we loweredthe total integration time to include only similar data.
We used PCA data from 3 to 20 keV, HEXTE data from20–25 to 200 keV and OSSE data from 50 to 1000 keV. In addition,four Ginga/LAC and OSSE simultaneous observations from 1991,previously studied by Gierlinski et al. (1997), were also analysed.The Ginga/LAC data are available from 1.7 keV, but we decided touse exactly the same energy interval as covered by the PCA. For thespectral analysis, we use XSPEC 11.3.1k (Arnaud 1996).
The spectra may be separated into two groups based on the dif-ference of their photon index (see Fig. 1). Spectra from 1991 and1997, represented by observation 6, have � ∼ 1.6 (usual for thehard state) and those from 1999 (observations 25 and 31) have� ∼ 1.8–2.2; hereafter, we call the corresponding state flat (be-cause the spectrum is nearly flat in the EFE plot). The spectra from1996 and 1998 are close to the hardest ones from 1999. We do notconsider here the broad-band soft-state spectra, for which a similaranalysis has been performed by G99 and Frontera et al. (2001).
3 S P E C T R A L A NA LY S I S
In order to describe the observed broad-band spectra, we use thefollowing models:
(0) power law (without or with an exponential cut-off) and Comp-ton reflection (PEXRAV model; Magdziarz & Zdziarski 1995);
(1) two thermal Comptonization models and reflection, with thesoft excess also modelled by thermal Comptonization;
(2) thermal Comptonization with reflection plus a non-thermalComptonization corresponding to the soft state spectrum.
We use the EQPAIR code (Coppi 1999; G99) for modelling thermaland non-thermal Comptonization. All models include also a Gaus-sian line at 6.4 keV and interstellar absorption with column densityN H, which we find often larger than the value of 0.6 × 1022 cm−2
(derived from the reddening towards the companion star; seeBalucinska-Church et al. 1995). To avoid unreasonably low val-ues of this parameter, its low limit was set to 0.5 × 1022 cm−2. Thepresented uncertainties are given at a 90 per cent confidence level fora single parameter (�χ2 = 2.71). Fluxes, unless stated otherwise,correspond to the range covering all the model emission.
3.1 Power law and reflection model in the 3–20 keV data
The spectra of Cyg X-1 clearly show correlations between reflec-tion amplitude and the spectral index (GCR99, ZLS99). Detailedanalysis confirms (Zdziarski et al. 2003) that the extent of correla-tion is much larger than typical errors in the best-fitting parameters.However, because the PCA spectrum falls in a quite narrow en-ergy interval, it is difficult to distinguish between various spectralcomponents that may form an ‘effective’ power law. Therefore, itis not certain that the values for � and R obtained from the simplepower-law/reflection fits indeed correspond to the actual physicalsituation.
Still, in order to compare our results with those of previous anal-ysis, we have performed fits similar to those presented in ZLS99and GCR99. We later compare them to the results obtained withmore physical models (see Section 4.4). We use the XSPEC modelPHABS*(PEXRAV+GAUSSIAN) (model 0), i.e. a power law with the pho-ton index, �, and Compton reflection with the relative strength, R(Magdziarz & Zdziarski 1995), accompanied by a Gaussian fluores-cence Fe Kα line (characterized by the relativistic smearing widthσ and the equivalent width), all absorbed by interstellar material of
C© 2005 RAS, MNRAS 362, 1435–1450
1438 A. Ibragimov et al.Table 1. Observation log.
No RXTE Ginga or PCA HEXTE Date Time (UT) CGRO OSSE Time (UT)ObsID exposurea (s) exposureb (s) VP exposure (s)
1991 hard stateG1 2304 June 6 00:18–02:10 02 4121 00:03–02:11G2 888 June 6 04:43–06:29 02 4040 04:29–06:51G3 2828 June 6 11:03–14:25 02 5975 10:43–14:32G4 1272 June 6 20:22–20:44 02 1629 20:02–20:33
1996 flat state1 10238-01-08-000 14 592 5083 March 26 10:12–17:36 516.5 17 538 07:22–20:012 10238-01-07-000 8446 2922 March 27 23:06–05:20 516.5 23 018 20:20–07:473 10238-01-06-00 11 455 3713 March 29 11:43–17:33 516.5 21 868 08:24–21:064 10238-01-05-000 10 397 3524 March 30 19:54–01:58c 516.5 24 153 16:51–04:12c
1997 hard state5 10239-01-01-00 9095 – Feb 2 20:13–02:03 612.5 47 864 16:53–04:52c
6 10238-01-03-00 6441 1938 Feb 3 19:30–22:06 612.5 44 530 14:38–02:36c
7 30158-01-01-00 1175 809 Dec 10 07:08–08:30 705 7552 02:55–12:468 30158-01-02-00 2012 823 Dec 11 07:06–08:45 705 12 004 04:11–14:059 30158-01-03-00 2027 706 Dec 14 08:48–10:20 705 11 599 03:09–11:3510 30158-01-05-00 2614 901 Dec 15 05:26–07:09 705 16 721 23:31–11:18c
11 30158-01-06-00 3210 941 Dec 17 00:40–02:05 706 13 017 20:13–07:32d
12 30157-01-02-00 2309 784 Dec 18 07:07–08:16 706 9924 01:49–08:4613 30158-01-07-00 2275 766 Dec 20 07:11–08:29 706 11 847 02:46–12:5214 30158-01-08-00 2581 878 Dec 21 05:28–07:05 706 14 924 00:51–12:31c
15 30157-01-03-00 2846 860 Dec 24 21:24–23:03 707 10 127 21:36–03:18c
16 30161-01-01-000 13 244 4136 Dec 28 13:56–21:03 707 13 717 11:33–00:24c
17 30158-01-12-00 2836 916 Dec 30 03:52–05:00 707 8979 23:49–07:57d
1998 flat state18 30155-01-01-020 10 027 3897 Dec 23 00:07–05:58 804 2957 21:52–09:00d
19 30155-01-02-00 9625 3399 Dec 28 01:40–07:09 804 5124 23:14–10:29d
20 30161-01-03-01 9863 3371 Dec 28 13:08–18:37 804 5289 11:50–21:3121 40100-01-04-00 8472 – Dec 29 01:37–05:57 804 5476 22:51–10:08d
22 40100-01-05-00 8476 – Dec 30 01:38–05:57 804 5288 22:30–09:46d
23 40100-01-06-00 7245 – Dec 31 03:12–07:11 804 5552 23:44–11:00d
1999 flat state24 40101-01-09-00 2405 665 Oct 5 18:39–19:45 831.5 29 605 15:04–01:12c
25 40101-01-11-00 731 165 Oct 6 19:22–20:03 831.5 25 960 14:39–00:50c
26 40101-01-12-00 865 – Oct 7 07:10–07:40 831.5 28 389 03:08–12:5527 40101-01-15-00 741 218 Oct 8 08:07–08:48 831.5 31 014 04:20–14:3528 40101-01-16-00 757 215 Oct 9 09:41–10:22 831.5 33 770 03:55–15:4829 40099-01-20-01 1228 354 Oct 12 17:33–19:56 831.5 37 186 12:11–01:23c
30 40100-01-11-01 4300 – Oct 28 10:46–15:12 832 19 559 06:16–17:4631 40099-01-22-00 1444 520 Nov 8 14:44–15:25 832 17 504 09:52–21:2832 40099-01-23-01 3084 1453 Nov 23 15:26–17:32 834.5 8734 15:14–21:5433 40100-01-13-01 770 – Nov 24 20:08–20:59 834.5 19 652 14:51–02:13c
34 40100-01-14-02 479 – Nov 25 20:05–20:56 834.5 16 683 14:24–01:47c
35 40100-01-15-03 1729 – Nov 26 21:40–22:32 834.5 24 372 17:11–04:33c
36 40100-01-16-02 1448 – Nov 27 19:59–20:50 834.5 19 063 15:13–02:34c
37 40100-01-17-03 1902 – Nov 28 21:32–22:27 834.5 10 309 19:19–00:28c
38 40100-01-18-03 1961 – Nov 29 21:29–22:25 834.5 19 999 16:03–03:19c
aThe deadtime-corrected exposure. bHEXTE cluster 0 exposure. Symbol ‘–’ means that no HEXTE data are available. cThe observation finished on thefollowing day. dThe observation started on the previous day.
column density N H. Hereafter, we assume the disc inclination ofi = 50◦ and neutral reflector.
The fit results are presented in Table 2. Only the low-energy3–20 keV (RXTE/PCA and Ginga/LAC) data were fitted, and there-fore we did not apply any high-energy cut-off to the power law. Wefind that the correlations between spectral parameters (see Fig. 2)are similar to the results of GCR99.
As shown in Section 3.2, there is a likely overlap of differentspectral components in the PCA energy range. Therefore, model 0
cannot represent a good approach for physical interpretations forthe spectra. Taking into account also the OSSE data and includ-ing an exponential cut-off in the model, we can model the jointdata only very roughly, with χ2/dof ∼2. This is likely to be due tothe shape of the exponential cut-off (which is assumed in PEXRAV)being substantially different from the shape of the cut-off of ther-mal Comptonization (see, for example, Zdziarski et al. 2003). Thisprovides an argument against utilizing simple phenomenologicalmodels in the analysis of BHB spectra.
C© 2005 RAS, MNRAS 362, 1435–1450

Broad-band spectra of Cyg X-1 1439
Figure 1. Broad-band spectra of Cyg X-1 as observed by RXTE and OSSE (with the respective observation number from Table 1) and the best-fitting models.Theoretical curves represent model 1 for observations 6, 25 and 31 (see Section 3). All of the figures are colour in the online version of the paper on Synergy.
3.2 Comptonization model and broad-band spectra
The hard-state spectra are well described by thermal Comptoniza-tion (Gierlinski et al. 1997; Poutanen 1998; Frontera et al. 2001),with a weak soft excess. To describe Comptonization we use theXSPEC model EQPAIR (see Coppi 1999; G99). The spectrum of seedphotons is from a pseudo-Newtonian accretion disc (see G99). Theparameters of emission are expressed through the compactness
� = LσT
Rmec3, (1)
where L is the source luminosity, R is the radius of the emittingspherical cloud, and σ T is the Thomson cross-section. We considerhere thermal plasma. The model is characterized by the followingparameters:�s is the compactness of soft seed photons (assumed hereto be 1); �h/�s is the ratio of the dimensionless energy dissipationrate in a hot cloud to �s; kT max is the maximal colour temperatureof the disc (at 9.5 gravitational radii, Rg = GM/c2, or at the innerradius of the disc, if it is cut-off at larger value); τ p is the Thomsonoptical depth corresponding to the ions; R is the reflection amplitude.Because there are large (∼25 per cent at 1σ ) errors on kT max, wedecided to fix it at the common value of 200 eV. The model computedthe coronal temperature, kT e, and the total optical depth, τ , fromthe background electrons and produced e± pairs self-consistentlyfrom the energy and pair balance. For the assumed compactness,pair production is negligible for all considered spectra, and thusthe resulting total optical depth τ = τ p. In the fits, we assume theinner disc radius of 6Rg (this parameter only has an effect on therelativistic smearing of the reflected component, which could hardlybe resolved with present energy resolution).
The normalization of EQPAIR, corresponding to the disc compo-nent, is fc M2cos i/(D2β c
4), where fc is the covering factor, M is theblack hole mass in units of the solar mass, D is the distance to thesource in units of kpc, and β c is the ratio of the colour temperatureto the effective temperature.
At low energies, the effect of the interstellar absorption is clearlyvisible. The addition of an additional soft component leads to furtherimprovement of the fits. Such soft excesses were observed in both thehard state by Di Salvo et al. (2001) and in a flat state (similar to thatanalysed here) by Frontera et al. (2001) in BeppoSAX data. However,this component, whose nature we address below, is relatively weak inthe case of 1991 and 1997 (observations G1–G4, 05–17) hard-state
data. The spectra observed in 1996, 1998 and 1999 (observations1–4, 18–38) appear similar in overall shape to those of the hard state,but are significantly softer (see Fig. 2). The soft excess in the flatstate is stronger.
We stress that the requirement of an additional soft excess isimplied only by the joint PCA/HEXTE/OSSE data, because the PCAdata cover a too narrow energy range. Even if the actual spectrumin the PCA 3–20 keV band is not a power law but is, for example,concave, a good fit with a power law plus reflection (model 0) canbe still achieved. However, the real strength of Compton reflectioncan be significantly different.
Because the data require an additional component only in a rela-tively narrow range (∼3–10 keV), the parameters of the soft excesscannot be constrained accurately. Below we consider a number ofphysically realistic scenarios of its nature. In each of the consideredmodels, we restrict the parameters controlling its spectral shape tovalues that make its flux significant only at low energies, and we fitonly its normalization. These fits allow us to completely describethe broad-band spectra and to constrain the parameters of maincontinuum.
3.2.1 High temperature of the optically thick disc
The additional component may, in principle, be emitted by thehottest part of the optically thick disc provided its temperature ishigh enough. We find that the spectra of the observations 1–4, 18–38 can be well fitted with kT max ∼ 1 keV. However, Di Salvo et al.(2001) have shown that the spectral decomposition of the BeppoSAXdata of Cyg X-1 in the hard state requires the presence of both thesoft blackbody disc photons (with kT max � 0.1–0.2 keV) and an ad-ditional soft excess component. Therefore, we consider this modelto be not appropriate.
3.2.2 Hybrid model
We also tried to apply hybrid thermal + non-thermal EQPAIR modelto the spectra. Most of the data require nearly non-thermal injectionand the resulting spectrum becomes a power law directed by thePCA part of the spectrum. Because the observed hard tail is not apower law, large reflection appears to mimic the cut-off region, butit is still not enough to describe both the soft excess below 10 keV
C© 2005 RAS, MNRAS 362, 1435–1450

1440 A. Ibragimov et al.
Table 2. The best-fitting parameters for model 0 (fitted to the low-energy Ginga and RXTE/PCA data only).
No. N H (1022 cm−2) � R σ (keV) EW (eV) χ2/dof
1991G1 0.5+1.2
−0 1.63+0.09−0.03 0.39+0.19
−0.08 0.46+0.81−0.46 134+47
−66 3/11
G2 0.5+1.2−0 1.62+0.09
−0.03 0.37+0.18−0.09 0.58+0.93
−0.58 152+54−73 4/11
G3 1.3+1.3−0.8 1.60+0.10
−0.07 0.26+0.17−0.13 0.60+0.95
−0.60 142+77−75 3/11
G4 1.4+1.2−0.9 1.69+0.09
−0.08 0.41+0.19−0.16 0.42+0.97
−0.42 82+36−60 5/12
199601 1.2 ± 0.2 1.80 ± 0.02 0.51 ± 0.05 0.68 ± 0.16 96 ± 19 24/4302 0.6 ± 0.2 1.79 ± 0.02 0.48 ± 0.05 0.80 ± 0.12 148 ± 20 20/4303 0.7 ± 0.2 1.80 ± 0.02 0.48 ± 0.04 0.72 ± 0.12 138 ± 19 20/4304 1.2 ± 0.2 1.89 ± 0.02 0.66 ± 0.05 0.87 ± 0.16 112 ± 19 24/43
199705 1.3 ± 0.3 1.65 ± 0.02 0.25 ± 0.04 0.40+0.22
−0.40 66 ± 20 19/39
06 1.2 ± 0.3 1.65 ± 0.02 0.24 ± 0.04 0.38+0.19−0.33 76 ± 20 27/39
07 1.0 ± 0.3 1.71 ± 0.02 0.35 ± 0.05 0.52+0.21−0.26 79 ± 22 16/39
08 1.0 ± 0.3 1.69 ± 0.02 0.29 ± 0.04 0.44+0.19−0.24 86 ± 21 35/39
09 1.2 ± 0.3 1.71 ± 0.02 0.36 ± 0.05 0.56+0.21−0.25 82 ± 22 26/39
10 1.2 ± 0.2 1.69 ± 0.02 0.32 ± 0.05 0.43+0.20−0.27 77 ± 20 22/39
11 1.2 ± 0.2 1.70 ± 0.02 0.32 ± 0.04 0.35+0.20−0.35 69 ± 19 15/39
12 3.1 ± 0.2 1.72 ± 0.02 0.38 ± 0.05 0+0.42−0 32 ± 12 23/39
13 2.1 ± 0.3 1.71 ± 0.02 0.37 ± 0.05 0.30+0.55−0.30 56 ± 19 21/39
14 1.1 ± 0.3 1.70 ± 0.02 0.37 ± 0.05 0.43+0.20−0.29 78 ± 21 21/39
15 2.1 ± 0.3 1.70 ± 0.02 0.35 ± 0.05 0.15+0.53−0.15 41 ± 18 17/39
16 2.1 ± 0.2 1.69 ± 0.02 0.41 ± 0.05 0.17+0.43−0.17 57 ± 16 22/39
17 2.7 ± 0.3 1.71 ± 0.02 0.36 ± 0.05 0.03+2.79−0.03 37 ± 17 19/39
199818 1.2 ± 0.2 1.87 ± 0.02 0.54 ± 0.05 0.73 ± 0.16 99 ± 20 19/3919 1.2 ± 0.2 1.84 ± 0.02 0.48 ± 0.05 0.71 ± 0.17 95 ± 20 19/3920 1.2 ± 0.2 1.85 ± 0.02 0.50 ± 0.05 0.71 ± 0.17 96 ± 20 17/3921 1.1 ± 0.2 1.83 ± 0.02 0.47 ± 0.05 0.71 ± 0.17 93 ± 20 14/3922 0.7 ± 0.2 1.83 ± 0.02 0.47 ± 0.05 0.69 ± 0.14 123 ± 21 20/3923 0.7 ± 0.2 1.82 ± 0.02 0.46 ± 0.05 0.72 ± 0.13 135 ± 21 17/39
199924 0.5+0.1
−0 2.09 ± 0.01 0.89 ± 0.07 0.93 ± 0.12 203 ± 23 28/33
25 0.5+0.1−0 2.30 ± 0.02 1.38 ± 0.16 1.12 ± 0.16 249 ± 34 48/33
26 0.5+0.1−0 2.23 ± 0.01 1.15 ± 0.10 1.09 ± 0.13 247 ± 27 43/33
27 0.5+0.2−0 2.05 ± 0.01 0.81 ± 0.08 0.95 ± 0.14 188 ± 25 14/33
28 0.7 ± 0.3 2.05 ± 0.03 0.84 ± 0.10 0.82 ± 0.15 161 ± 26 32/33
29 0.5+0.1−0 2.01 ± 0.01 0.74 ± 0.07 0.91 ± 0.15 185 ± 25 22/33
30 0.5+0.1−0 2.20 ± 0.01 1.07 ± 0.07 1.03 ± 0.11 237 ± 22 27/33
31 0.5+0.2−0 1.94 ± 0.02 0.61 ± 0.06 0.82 ± 0.13 170 ± 22 25/33
32 1.1 ± 0.3 1.85 ± 0.03 0.50 ± 0.06 0.54 ± 0.23 79 ± 22 20/33
33 0.7+0.3−0.2 1.87 ± 0.03 0.53 ± 0.07 0.63 ± 0.19 113 ± 26 30/33
34 0.6+0.3−0.1 1.86 ± 0.03 0.47 ± 0.08 0.61 ± 0.19 125 ± 28 14/33
35 0.5+0.2−0 1.88 ± 0.02 0.52 ± 0.05 0.65 ± 0.13 141 ± 18 25/33
36 0.5+0.2−0 1.88 ± 0.02 0.55 ± 0.06 0.72 ± 0.14 156 ± 22 25/33
37 1.2 ± 0.3 1.92 ± 0.03 0.62 ± 0.07 0.68 ± 0.18 109 ± 24 27/3338 1.2 ± 0.3 1.98 ± 0.03 0.77 ± 0.08 0.78 ± 0.16 125 ± 24 39/33
and the hard tail, in which the systematic difference between thedata and the model remains. Therefore, we ruled out this model.
3.2.3 Two thermal Comptonization components
The soft component can be described by additional thermal Comp-tonization (Di Salvo et al. 2001; Frontera et al. 2001). We use the
model 1, PHABS(COMPTT+EQPAIR+GAUSSIAN), where EQPAIR givesthe main Comptonization and COMPTT (Titarchuk 1994) the addi-tional soft component. Because the parameters of the soft excessare rather weakly constrained by our data, we fixed the parametersof COMPTT at kT e = 20 keV and τ = 1. Such a model producesa soft power law that does not extend to very high energies. Thismodel fitted to the data of observation 24 is shown in Fig. 3. In
C© 2005 RAS, MNRAS 362, 1435–1450

Broad-band spectra of Cyg X-1 1441
Figure 2. Correlations between parameters for model 0 (PEXRAV). (a) The reflection amplitude, R, versus the photon spectral index, �. (b) The relativisticsmearing Gaussian width σ versus reflection R. (c) The Fe Kα 6.4-keV line equivalent width versus R.
Figure 3. The model spectrum with two thermal Comptonization compo-nents (model 1, Section 3.2.3) fitted to the RXTE+OSSE observation 24(from 1999). The spectral components of the fit are shown by the dotted(green), dot-dashed (red) and dashed (blue) curves, which correspond tothe main thermal Comptonization continuum, the additional thermal Comp-tonization with kT e = 20 keV and τ = 1, and the Compton reflection in-cluding the Fe line, respectively. The solid (black) curve shows the totalspectrum. The lower panel shows the residuals of the fit.
spite of its simplicity, it yields a relatively good description of thedata.
The fit parameters are given in Table 3, and the dependencesbetween various model parameters are shown in Fig. 4. We alsoquote the values of the spectral index � of the power law obtainedfrom the least-squares fitting of the logarithm of the intrinsic modelflux at a logarithmic energy grid in the 2–10 keV range (chosen toenable comparison with the results of other papers).
The meaning of the normalization of EQPAIR has been described inSection 3.2. Substituting fc = 1, M = 10 M�, i = 50◦, D = 2.0 kpc(see references in G99; Frontera et al. 2001) and β c = 1.7 (Shimura& Takahara 1995), we expect the normalization of �1.92. The lowernormalization of the obtained fits (see Table 3) is caused either by alarger β c ∼ 1.77–1.98 or by a smaller covering factor fc. A slightlysmaller, than the assumed disc temperature of 200 eV, can also re-duce the normalization. On the other hand, some flat-state normal-izations are larger than the expected value of 1.92. This cannot beexplained by changing fc (a smaller covering factor can only reducethe normalization), but could be a result of somewhat larger inner
disc radius or larger temperature. The largest observed normaliza-tions correspond to kT max ∼ 220–245 eV.
We see that there is a clear anticorrelation between the strengthof the soft component and the hardness of spectrum expressed interms of �h/�s. There is also a correlation between τ and �h/�s.The reflection amplitude is correlated with the Fe line equivalentwidth and anticorrelated with �h/�s (while at high values of �h/�s
the anticorrelation possibly breaks down).The electron temperature kT e is a calculated parameter and no
errors on it can be obtained from fitting. However, we estimated its1σ limits using its extremal values within the uncertainties of theparameters controlling spectral shape, i.e. �h/�s and τ . This estima-tion gives us a possible conservative error on kT e of about 15 keVfor both models 1 and 2. Taking this into account, no correlationsbetween kT e–flux and kT e − �h/�s are apparent.
3.2.4 Thermal continuum and non-thermal Comptonizationcomponent
As an alternative to the second thermal Compton component, weconsider here addition of a non-thermal Comptonization compo-nent. We find that such a non-thermal component can describe boththe soft excess and the MeV non-thermal tail observed in hard statesby the Compton Telescope (COMPTEL; McConnell et al. 2002),while neither of these components can be described by the mainthermal Compton emission. This model fitted to the spectrum 24 isshown in Fig. 5. Note that the COMPTEL data are shown for illus-tration only and were not taken into account in the fitting. The usedmodel 2 consists of PHABS(EQPAIR+EQPAIR+GAUSSIAN), in which thesecond EQPAIR component produces the non-thermal spectrum. InEQPAIR, the available power is supplied in part into heating electronsand in part into their acceleration, with the resulting steady-stateelectron distribution calculated self-consistently. The compactnesscorresponding to the acceleration is hereafter denoted as �nth. Thenthe relative fraction of the input power going into the non-thermalacceleration is �nth/�h, where �h (as before) corresponds to the totalrate of energy dissipation in the plasma.
For that additional component, we assumed that all the availablepower goes into non-thermal acceleration, i.e. �nth/�h = 1. Note thatthe resulting self-consistent electron distribution is not purely non-thermal but hybrid, i.e. it does contain a low-energy Maxwellianheated by Compton and Coulomb interactions. We further assumeR = 0, the power-law index of the accelerated electrons of � inj =2.4 (see Poutanen & Coppi 1998; G99; Frontera et al. 2001;McConnell et al. 2002), the minimum and maximum Lorentz fac-tors of the power law of γ min = 1.3 and γ max = 1000, respectively,
C© 2005 RAS, MNRAS 362, 1435–1450

1442 A. Ibragimov et al.Table 3. The best-fitting parameters for model 1.
Obs. N aH �h/�s τ R σ EW Nb Fc
tot Fdadd kT e
e � f χ2/dof
G1 1.1+0.8−0.6 13.8+0.9
−0.7 1.39+0.07−0.08 0.38+0.04
−0.03 0.67+0.32−0.34 189+57
−51 1.36+0.05−0.06 5.32 0.11 90 1.62 49/73
G2 1.3 ± 0.8 15.6+1.3−0.8 1.58+0.12
−0.05 0.35+0.04−0.05 0.87+0.36
−0.31 235+75−63 1.63+0.06
−0.09 7.24 0.24 82 1.59 58/74
G3 1.4 ± 0.2 14.0+0.9−1.6 1.34+0.08
−0.20 0.26+0.06−0.04 0.60+0.92
−0.60 151+54−47 1.13+0.10
−0.04 4.18 0 94 1.62 53/73
G4 2.0+0.7−0.9 13.4 ± 1.8 1.36+0.29
−0.30 0.26+0.09−0.08 0.63+0.41
−0.31 132+57−48 1.04+0.14
−0.11 3.83 0.14 90 1.63 53/73
01 2.6 ± 0.2 10.3+0.4−0.1 1.31+0.06
−0.03 0.27+0.02−0.01 1.00+0.16
−0.13 173+26−20 1.99+0.03
−0.09 7.32 1.26 86 1.68 501/478
02 2.1 ± 0.3 9.76+0.18−0.24 1.32+0.02
−0.03 0.29+0.01−0.02 1.11+0.12
−0.13 240+25−27 2.50+0.06
−0.04 8.83 1.56 83 1.69 531/493
03 2.2+0.3−0.2 10.2+0.1
−0.2 1.47+0.05−0.03 0.26 ± 0.02 1.02+0.14
−0.13 227+28−29 2.18 ± 0.03 8.04 1.49 75 1.68 542/506
04 2.9 ± 0.2 8.77+0.18−0.14 1.38+0.03
−0.02 0.31 ± 0.01 1.12 ± 0.11 215+23−19 2.85+0.05
−0.07 10.0 2.44 77 1.71 529/493
05 1.6+0.4−0.3 11.8+1.2
−0.4 1.09+0.16−0.03 0.22 ± 0.02 0.48+0.22
−0.23 77+18−16 1.30+0.03
−0.09 4.46 0.08 110 1.65 61/73
06 1.8 ± 0.4 12.8+0.3−0.5 1.29+0.03
−0.08 0.19+0.02−0.01 0.54+0.19
−0.21 96 ± 19 1.05+0.04−0.02 3.99 0.19 95 1.64 374/402
07 1.9+0.3−0.4 12.0 ± 0.4 1.24+0.13
−0.07 0.22 ± 0.02 0.75+0.19−0.23 121+24
−27 1.54+0.04−0.06 5.80 0.52 96 1.65 367/415
08 2.0+0.3−0.4 11.9+0.3
−0.4 1.41+0.03−0.04 0.20+0.02
−0.01 0.68+0.19−0.21 118+21
−22 1.47+0.04−0.02 5.43 0.46 84 1.65 404/415
09 2.3 ± 0.3 12.0+0.4−0.2 1.41+0.03
−0.06 0.23 ± 0.02 0.85+0.20−0.18 131+26
−21 1.56+0.03−0.04 5.98 0.62 84 1.65 350/415
10 1.6+0.5−0.4 11.3+0.3
−0.4 1.18+0.08−0.05 0.24+0.02
−0.01 0.56+0.19−0.18 102+21
−18 1.43+0.02−0.04 4.92 0.25 99 1.66 301/334
11 4.1 ± 0.3 11.6+0.4−0.5 1.19+0.06
−0.03 0.23 ± 0.02 0.41+0.74−0.41 54+18
−17 1.53 ± 0.04 5.72 0.58 99 1.65 193/236
12 4.2 ± 0.3 11.8+0.6−0.5 1.20+0.10
−0.03 0.23+0.02−0.01 0.43+0.78
−0.41 55+20−17 1.52+0.04
−0.06 5.77 0.61 99 1.65 202/238
13 2.5+1.0−0.8 12.8 ± 0.4 1.45+0.05
−0.03 0.22 ± 0.02 0.58+0.24−0.18 106+19
−20 1.45+0.04−0.03 5.74 0.47 83 1.63 369/411
14 2.2 ± 0.3 12.4+0.4−0.3 1.34 ± 0.03 0.24 ± 0.02 0.74+0.19
−0.17 126+23−19 1.58+0.03
−0.04 6.25 0.63 90 1.64 397/415
15 3.2 ± 0.3 13.6 ± 0.5 1.26+0.11−0.04 0.19 ± 0.02 0.60+0.35
−0.30 75+27−19 1.29+0.03
−0.04 5.51 0.57 99 1.62 201/244
16 3.4 ± 0.3 13.7 ± 0.2 1.61 ± 0.04 0.24 ± 0.01 0.55+0.19−0.16 98+19
−14 1.47 ± 0.02 6.53 0.76 76 1.62 446/402
17 3.8 ± 0.3 12.9+0.6−0.4 1.33+0.15
−0.10 0.19+0.02−0.03 0.60+0.29
−0.38 73 ± 21 1.25+0.02−0.05 5.12 0.55 92 1.63 345/415
18 2.5 ± 0.3 8.13 ± 0.15 1.23+0.02−0.03 0.28+0.02
−0.01 0.98+0.13−0.11 182+23
−21 2.32 ± 0.04 7.09 1.41 84 1.73 512/489
19 2.7 ± 0.3 9.43+0.23−0.09 1.61+0.04
−0.03 0.21 ± 0.02 1.02+0.15−0.12 182+25
−21 1.67+0.02−0.03 5.87 1.29 66 1.69 457/502
20 2.6 ± 0.3 9.14+0.20−0.09 1.45+0.03
−0.06 0.24+0.01−0.02 1.00+0.15
−0.12 182+26−20 1.79+0.02
−0.03 6.11 1.29 73 1.70 472/502
21 2.6 ± 0.4 9.91+2.16−2.68 1.36+0.59
−0.43 0.20+0.11−0.14 0.94+0.18
−0.14 161+46−23 1.83+0.56
−0.42 6.52 1.28 81 1.68 46/73
22 2.1+0.3−0.4 8.96+2.38
−2.05 1.19+0.43−0.55 0.24+0.08
−0.13 0.90 ± 0.12 188+25−19 2.13+0.58
−0.55 6.86 1.21 90 1.71 45/73
23 2.0 ± 0.4 8.57+1.55−1.42 1.29+0.25
−0.65 0.26+0.14−0.09 0.89+0.12
−0.11 192+30−20 2.14+0.58
−0.16 6.57 1.10 81 1.72 43/73
24 1.6+0.3−0.2 5.43+0.68
−0.19 1.08+0.13−0.03 0.36 ± 0.03 0.99+0.09
−0.08 337+28−26 1.85+0.06
−0.27 4.71 1.46 83 1.82 389/409
25 1.5 ± 0.2 4.70+0.57−0.29 1.04+0.17
−0.06 0.36+0.04−0.06 0.98+0.08
−0.07 395+33−30 2.46+0.14
−0.24 6.51 2.71 81 1.85 355/409
26 1.3 ± 0.3 4.08+0.92−0.49 0.89+0.25
−0.14 0.40+0.08−0.09 1.01 ± 0.07 382+28
−28 2.54+0.29−0.42 5.44 1.92 90 1.89 48/67
27 1.8 ± 0.3 5.95 ± 0.30 1.10+0.05−0.06 0.33 ± 0.03 1.02 ± 0.10 305 ± 30 2.19+0.10
−0.09 5.92 1.81 84 1.80 386/409
28 1.7+0.2−0.3 5.75+0.35
−0.50 1.21+0.06−0.16 0.33+0.06
−0.04 0.98+0.09−0.08 335+31
−27 1.74 ± 0.16 4.71 1.52 75 1.81 389/409
29 1.6 ± 0.3 6.01+0.32−0.24 1.09+0.05
−0.04 0.33 ± 0.03 0.99+0.11−0.10 295+30
−29 1.98+0.07−0.09 5.06 1.28 85 1.80 394/409
30 0.9+0.2−0.3 2.71+1.06
−0.23 0.46+0.26−0.19 0.62+0.08
−0.05 0.97 ± 0.08 328+19−25 4.06+0.48
−0.15 5.67 1.46 141† 1.93 52/67
31 1.7 ± 0.3 6.74+0.32−0.39 1.09+0.06
−0.14 0.29+0.04−0.03 0.93 ± 0.11 253+27
−26 1.91+0.11−0.09 5.10 1.12 89 1.77 390/409
32 2.4 ± 0.3 9.38+0.37−0.40 1.37+0.10
−0.08 0.22+0.03−0.02 0.83 ± 0.15 151+22
−25 1.49 ± 0.06 5.08 1.01 79 1.70 393/409
33 2.1+0.2−0.6 7.94+0.56
−1.26 1.23+0.09−0.24 0.27+0.07
−0.02 0.83+0.15−0.19 179+33
−32 1.93+0.29−0.10 5.76 1.16 84 1.73 62/67
34 1.5+0.3−0.5 7.08+0.35
−0.89 1.08+0.13−0.19 0.29+0.07
−0.04 0.74+0.17−0.18 174 ± 31 1.83+0.25
−0.11 4.64 0.67 92 1.76 43/67
35 1.4+0.3−0.4 7.05+0.53
−0.73 1.08+0.11−0.16 0.30+0.06
−0.04 0.78 ± 0.11 206+25−23 2.03+0.19
−0.12 5.26 0.85 91 1.76 40/67
36 1.6+0.4−0.6 7.46+0.73
−1.24 1.07+0.15−0.20 0.32+0.06
−0.05 0.88+0.12−0.17 230+27
−39 1.92+0.30−0.14 5.35 0.96 94 1.75 62/64
37 3.3+1.3−1.3 6.52+1.11
−1.01 1.04+0.22−0.21 0.35+0.06
−0.07 0.98+0.26−0.23 179+31
−42 2.02+0.30−0.23 5.53 1.39 92 1.78 40/62
38 3.2+0.6−1.2 6.24+0.67
−0.72 0.96+0.14−0.13 0.37 ± 0.05 0.96+0.19
−0.18 199 ± 28 2.29+0.25−0.18 6.33 1.80 98 1.78 41/62
aHydrogen column density, in units of 1022 cm−2. bNormalization of the EQPAIR model component. cThe unabsorbed total model flux, in units of 10−8
erg cm−2 s−1. dThe unabsorbed model flux of the COMPTT component, in units of 10−8 erg cm−2 s−1. eTemperature of the emitting plasma in keV (for theEQPAIR component). f Photon spectral index of the EQPAIR component in the 2–10 keV range.
kT max equal to that of the main component, �h/�s = 1, and τ p =1. No pair production is required, and τ is found to be equalto τ p.
The best-fitting parameters are presented in Table 4 and correla-tions between them are shown in Figs 6 and 11. The normalizationof the thermal EQPAIR component corresponds to β c = 1.63–2.01,
values similar to those obtained with model 1. The strength of theadditional (non-thermal) component is again clearly anticorrelatedwith the spectral hardness. The anticorrelation between R and �h/�s
is apparent and corresponds to the R–� correlation that we discussin Section 4.4. The values of R and the Fe line equivalent widthare well correlated and can be approximated by a linear function
C© 2005 RAS, MNRAS 362, 1435–1450

Broad-band spectra of Cyg X-1 1443
Figure 4. Dependences of the spectral parameters for model 1 (Section 3.2.3) fitted to the 1991 and 1997 (blue filled circles) and the 1996, 1998 and 1999 data(red filled squares) on the Compton amplification factor of the main Comptonization component �h/�s. (a) The reflection fraction R; (b) the relativistic smearingGaussian width σ at 6.4 keV; (c) ratio of the additional thermal Comptonization flux to the total flux; (d) Thomson optical depth of the main Comptonizationcontinuum component τ ; (e) electron temperature of the main Comptonization component kT e; (f) total luminosity of the Comptonizing cloud (assumingD = 2 kpc).
Figure 5. The model spectrum with the thermal and non-thermal Comp-tonization components (model 2, Section 3.2.4) fitted to the RXTE+OSSEobservation 24 (from 1999) together with the COMPTEL (McConnell et al.2002) hard-state data (marked by squares). The spectral components of the fitare shown by the dotted (green), dot-dashed (red) and dashed (blue) curves,which correspond to the main thermal Comptonization continuum, the ad-ditional non-thermal Comptonization and the Compton reflection includingthe Fe line, respectively. The solid curve shows the total spectrum. The lowerpanel shows the residuals of the fit.
passing through zero (see Fig. 11c). Again, there is a correlationbetween τ and �h/�s. The electron temperature does not seeminglydepend on the hardness, but the spread becomes smaller at larger�h/�s where kT e ∼ 90 keV.
4 D I S C U S S I O N
4.1 Absorption
As noted in Section 3, the hydrogen column density N H was free inour fits. We find that our data require absorption significantly largerthan 0.6 ± 0.2 × 1022 cm−2, which is derived from the reddeningtowards the companion star (Balucinska-Church et al. 1995).
Cyg X-1 is known to show X-ray dips in its light curve, causedby obscuration by the stellar wind from the companion star. Duringdips, the absorption increases up to N H = 20 × 1022 cm−2. Theabsorption shows strong orbital phase dependence with maximalcolumn density around phase 0, when companion star is in front ofthe black hole (Balucinska-Church et al. 2000; Feng & Cui 2002).We plotted the fitted values of N H versus Cyg X-1 orbital phase (seeFig. 7), using the ephemeris with the time of the primary minimumat 50234.79 MJD and the period of 5.599829 d (LaSala et al. 1998;Brocksopp et al. 1999). We see a good correlation of N H with theorbital phase, which indicates that variable absorption can indeedbe caused by the companion’s wind obscuring the X-rays from theblack hole.
We note that because our models are relatively complicated inthe range of 3–10 keV (consisting of absorption, Comptonizationtogether with the seed photon emission and a soft excess), and alsothe PCA energy range is affected by absorption rather weakly, itis difficult to determine the exact values of N H, even though thederived values of the parameter are in the range quoted by otherauthors and its relative changes are quite remarkable.
4.2 Spectral variability patterns
Using CGRO/BATSE and RXTE/ASM data, Zdziarski et al. (2002)showed that Cyg X-1 has two types of variability: changes of
C© 2005 RAS, MNRAS 362, 1435–1450

1444 A. Ibragimov et al.
Table 4. The best-fitting parameters for model 2.
Obs. N Ha �h/�s τ R σ EW Nb Fc
tot Fdadd kT e
e � f χ2/dof
G1 0.9+0.5−0.4 14.2+1.1
−0.9 1.41 ± 0.08 0.40 ± 0.04 0.61+0.32−0.38 182+59
−52 1.29 ± 0.09 5.32 0.21 90 1.62 49/73
G2 1.0+0.5−0.6 16.4+2.1
−1.2 1.62+0.17−0.08 0.37 ± 0.05 0.78+0.34
−0.32 210+68−60 1.50+0.12
−0.20 8.23 0.93 81 1.58 56/74
G3 1.4+0.4−0.2 14.0+0.9
−1.7 1.35+0.08−0.21 0.26+0.07
−0.03 0.58+0.93−0.58 144+57
−50 1.12+0.10−0.06 4.19 0.01 93 1.62 53/73
G4 1.6+0.5−0.6 13.8+2.9
−1.9 1.37+0.34−0.30 0.30+0.09
−0.08 0.56+0.95−0.58 122+55
−48 0.97+0.13−0.15 3.81 0.23 91 1.62 53/73
01 2.0 ± 0.2 11.4 ± 0.3 1.39+0.02−0.04 0.34 ± 0.02 0.85+0.13
−0.14 148+19−21 1.63+0.07
−0.05 7.55 1.98 83 1.66 498/478
02 1.4 ± 0.2 10.5 ± 0.2 1.36 ± 0.02 0.35+0.02−0.01 0.95 ± 0.10 203+21
−19 2.12 ± 0.06 9.00 2.30 83 1.67 528/493
03 1.6+0.1−0.2 11.1+0.2
−0.1 1.55+0.03−0.04 0.32 ± 0.02 0.85 ± 0.11 182+22
−17 1.81+0.05−0.04 8.28 2.34 73 1.66 527/506
04 2.1+0.1−0.2 9.86+0.19
−0.24 1.49+0.03−0.07 0.41+0.02
−0.03 0.93 ± 0.12 167+23−17 2.16+0.09
−0.06 10.45 3.86 73 1.69 515/493
05 1.7+0.2−0.3 13.0+0.5
−0.6 1.21+0.05−0.04 0.21 ± 0.02 0.51+0.21
−0.23 81+18−17 1.17+0.05
−0.02 4.62 0.31 101 1.63 60/73
06 1.6 ± 0.2 13.0+0.4−0.5 1.29+0.03
−0.07 0.20 ± 0.01 0.47+0.18−0.20 90+18
−16 1.01+0.04−0.03 4.02 0.29 95 1.63 372/402
07 1.5+0.2−0.3 12.5 ± 0.4 1.27+0.13
−0.08 0.25 ± 0.02 0.64 ± 0.18 108 ± 21 1.42+0.06−0.08 5.85 0.76 95 1.64 366/415
08 1.6 ± 0.2 12.2+0.4−0.3 1.42 ± 0.03 0.23 ± 0.02 0.56+0.18
−0.19 106+20−19 1.37+0.04
−0.05 5.45 0.65 84 1.64 401/415
09 1.9+0.2−0.3 12.7+0.3
−0.2 1.44+0.03−0.07 0.27 ± 0.02 0.72+0.20
−0.19 110+27−18 1.40+0.06
−0.04 6.11 0.98 84 1.64 348/415
10 1.4+0.4−0.3 11.5+0.7
−0.4 1.17+0.13−0.03 0.26+0.02
−0.03 0.55+0.19−0.25 103+21
−26 1.37+0.05−0.08 4.97 0.40 101 1.66 301/334
11 3.7+0.1−0.3 12.3+0.4
−0.7 1.22+0.10−0.05 0.27+0.03
−0.02 0.07+0.56−0.07 43+19
−10 1.38+0.07−0.06 5.82 0.90 99 1.64 193/236
12 3.6+0.4−0.2 12.3+1.1
−0.4 1.22+0.18−0.04 0.27 ± 0.03 0.21+0.62
−0.21 46+21−12 1.38+0.04
−0.06 5.78 0.85 99 1.64 201/238
13 2.5 ± 0.8 13.4+0.6−0.5 1.47+0.06
−0.03 0.25 ± 0.02 0.50+0.21−0.22 88+21
−22 1.31+0.06−0.07 5.96 0.91 83 1.62 365/411
14 1.7 ± 0.2 13.0+0.5−0.4 1.37+0.13
−0.03 0.28 ± 0.02 0.61+0.18−0.19 109+20
−19 1.42+0.05−0.06 6.35 0.96 89 1.63 391/415
15 2.8+0.2−0.4 14.6+0.6
−0.8 1.32+0.09−0.08 0.23 ± 0.02 0.42+0.34
−0.40 62+27−17 1.14+0.07
−0.04 5.63 0.92 96 1.61 198/244
16 2.8 ± 0.2 14.0 ± 0.3 1.49+0.02−0.03 0.30+0.01
−0.02 0.41+0.17−0.22 85+16
−15 1.38 ± 0.04 6.67 1.02 84 1.62 436/402
17 3.3 ± 0.2 13.7 ± 0.5 1.42+0.08−0.13 0.22 ± 0.02 0.37+0.30
−0.37 58+19−15 1.11+0.05
−0.04 5.16 0.83 87 1.62 342/415
18 2.0+0.1−0.3 9.53+0.40
−0.23 1.59+0.04−0.03 0.33 ± 0.02 0.83+0.13
−0.12 150+32−16 1.70+0.07
−0.06 7.34 2.47 67 1.69 481/489
19 2.0+0.2−0.3 10.4+0.1
−0.3 1.66+0.01−0.05 0.29 ± 0.02 0.86+0.13
−0.15 148+22−21 1.34+0.06
−0.03 6.10 1.99 66 1.67 455/502
20 1.9 ± 0.2 9.93+0.43−0.18 1.49+0.03
−0.06 0.31+0.01−0.02 0.85 ± 0.13 151+19
−20 1.47+0.04−0.05 6.30 1.95 73 1.69 467/502
21 1.7 ± 0.2 9.73+2.14−1.38 1.31+0.25
−0.36 0.30+0.04−0.06 0.82 ± 0.14 139 ± 20 1.64+0.30
−0.46 6.47 1.73 84 1.69 47/73
22 1.3 ± 0.2 8.70+2.75−1.41 1.08+0.32
−0.26 0.34+0.05−0.06 0.76+0.13
−0.12 160+30−20 1.98+0.39
−0.47 6.82 1.59 99 1.71 44/73
23 1.2 ± 0.3 7.25+2.36−0.56 0.97+0.31
−0.42 0.39 ± 0.04 0.80 ± 0.12 171+22−21 2.29+0.34
−0.46 6.32 1.11 103 1.75 43/73
24 0.7+0.3−0.1 6.61+0.37
−0.31 1.42+0.09−0.05 0.49+0.06
−0.04 0.89+0.08−0.11 301+22
−39 1.15+0.06−0.09 5.03 2.55 66 1.78 379/409
25 0.5+0.2−0 6.06+0.73
−0.67 1.47+0.20−0.22 0.63+0.12
−0.09 0.88+0.08−0.07 346+26
−27 1.17+0.07−0.14 4.28 2.22 62 1.80 354/409
26 0.5+0.2−0 5.29+1.47
−1.15 1.30+0.38−0.29 0.59+0.08
−0.06 0.93 ± 0.07 348 ± 27 1.32+0.35−0.28 3.69 1.70 67 1.83 52/67
27 1.0+0.3−0.2 6.86+0.98
−0.78 1.28+0.23−0.17 0.46+0.06
−0.05 0.91+0.10−0.11 263+28
−29 1.48+0.21−0.14 4.21 1.39 76 1.77 380/409
28 0.8 ± 0.2 6.63+0.36−0.31 1.43+0.08
−0.05 0.50+0.05−0.04 0.90+0.08
−0.11 299+23−35 1.14+0.07
−0.09 3.31 1.20 66 1.78 379/409
29 0.9 ± 0.2 6.51+0.77−0.39 1.14+0.05
−0.06 0.47+0.04−0.05 0.91 ± 0.10 264 ± 27 1.51+0.13
−0.17 3.74 1.01 83 1.78 388/409
30 0.6 ± 0.1 3.68+0.81−0.79 0.86+0.49
−0.14 0.75+0.09−0.07 0.93+0.08
−0.07 324+26−23 2.17+0.65
−0.73 3.91 1.58 89 1.91 49/67
31 1.0 ± 0.2 7.26+0.47−0.41 1.15+0.14
−0.12 0.38 ± 0.04 0.85 ± 0.11 228+26−25 1.53+0.11
−0.15 3.86 0.84 87 1.75 388/409
32 1.8 ± 0.2 10.4+0.3−0.6 1.47+0.04
−0.13 0.29 ± 0.02 0.69+0.15−0.16 128+22
−21 1.19+0.11−0.04 4.03 0.75 76 1.67 388/409
33 1.4+0.2−0.4 8.26+1.38
−0.82 1.24+0.19−0.20 0.35+0.04
−0.05 0.69+0.18−0.15 151+38
−21 1.63 ± 0.21 4.44 0.81 83 1.72 62/67
34 1.0 ± 0.3 7.18+1.54−0.83 1.08+0.25
−0.16 0.34+0.03−0.05 0.66+0.17
−0.16 160+30−26 1.66+0.10
−0.30 3.65 0.46 92 1.75 42/67
35 0.9 ± 0.2 7.48+1.20−0.87 1.13+0.21
−0.15 0.36+0.05−0.04 0.70 ± 0.11 189+23
−22 1.74+0.23−0.24 4.15 0.63 89 1.75 41/67
36 1.1 ± 0.4 8.15+1.22−1.33 1.16+0.17
−0.29 0.38+0.07−0.05 0.78+0.12
−0.11 203+26−25 1.56+0.31
−0.21 4.21 0.74 89 1.73 58/64
37 2.3+1.0−0.9 7.27+2.05
−1.28 1.14+0.35−0.24 0.45+0.08
−0.06 0.79+0.19−0.18 149+29
−27 1.54+0.35−0.18 5.72 2.16 88 1.75 41/62
38 2.2 ± 0.9 7.26+1.12−1.02 1.11+0.20
−0.19 0.49+0.08−0.06 0.79+0.16
−0.13 169+25−24 1.60+0.34
−0.25 4.58 1.32 89 1.75 45/62
aHydrogen column density, in units of 1022 cm−2. bNormalization of the thermal EQPAIR model component. cThe unabsorbed total model flux (withoutreflection) in units of 10−8 erg cm−2 s−1. dThe unabsorbed model flux from the non-thermal component, in units of 10−8 erg cm−2 s−1. eTemperature of theemitting plasma in keV (for the thermal EQPAIR component). f Photon spectral index of the thermal EQPAIR component in the 2–10 keV range.
flux without spectral slope change and pivoting at ∼50 keV,which produces anticorrelation of the fluxes in the soft and hardparts of the spectrum. However, these instruments do not pro-vide detailed spectral information, giving fluxes only in some en-ergy intervals. The effective photon spectral indices using fluxes
in two energy bands and calculated in the wide (20–300 keV)energy interval, where real spectra experience a cut-off, shouldbe treated with caution. Now it is possible to check the re-sults of Zdziarski et al. (2002) using our set of observations, onwhich we have detailed spectral information in the wide energy
C© 2005 RAS, MNRAS 362, 1435–1450

Broad-band spectra of Cyg X-1 1445
Figure 6. Dependences of the spectral parameters for model 2 (Section 3.2.4) fitted to the 1991 and 1997 (blue filled circles) and the 1996, 1998 and 1999data (red filled squares) on the Compton amplification factor of the main Comptonization component �h/�s. The meaning of the axes is the same as in Fig. 4,except (c) the ratio of the additional non-thermal Comptonization flux in model 2 to the total flux.
Figure 7. (a) Fitted value of absorption column density N H for model 1versus orbital phase of the binary system. (b) Same, for model 2. Distributionsare repeated twice for clarity. N H is in units of 1022 cm−2.
range. For this purpose, we use the model spectra obtained frommodel 1.
In Fig. 8 we present the spectra related to different time periods.It is possible to see that 1991, 1996–1998 spectra only change theirnormalization. However, the spectral slope is different for various
Figure 8. Sample of the spectra from different periods. Lowest and highestspectra from each time period are shown: red solid lines, 1999; blue dottedlines, 1991 (the 1997 spectra are similar to them); black dashed lines, 1996and 1998. The 1991+1997 and 1996+1998 data form two groups withslightly different spectral slopes.
years and forms two groups: 1991 + 1997 and 1996 + 1998 spectra.In the 1999 data, we can again see normalization changes (see pairsof red solid curves) as well as pivoting behaviour.
The �–flux correlations are shown in Fig. 9. It is clearly seen thatthe 1991 and 1996–1998 data do not show dependence betweenflux and �. The 1999 data show clear anticorrelation between �
and flux at low energies (3–12 keV) and correlation at high energies(20–100, 100–300 keV), which indicates the pivoting behaviourwith the pivot energy between 12 and ∼50 keV. In Fig. 9(d) (seealso fig. 8 in Zdziarski et al. 2002), it can be seen that spectrafrom 1996 and 1998 are somewhat softer at high energies than thehard-state spectra from 1991 and 1997, but the fluxes in all en-ergy intervals generally correlate with each other. The 1999 spectrashow clearly different dependence: the high-energy fluxes are corre-
C© 2005 RAS, MNRAS 362, 1435–1450

1446 A. Ibragimov et al.
Figure 9. Flux–spectral index (3–12 keV) and flux–flux correlations. Respective energy intervals are indicated along the axis. The 1991 and 1997 data areindicated by blue filled circles, 1996 and 1998 by red filled squares, and 1999 by red open squares. All fluxes are in units of keV cm−2 s−1.
lated, but there is a clear anticorrelation between 3–12 and 100–300keV fluxes due to pivoting. The timing behaviour has also changedits nature in late 1998, as was pointed out by Pottschmidt et al.(2003).
4.3 Quasi-periodic oscillation frequencies
Among the data sets we have studied, there are timing data for 33 ob-servations available from the recent paper by Axelsson, Borgonovo& Larsson (2005). This allows us to check the relation betweenthe characteristic frequencies in the power density spectra and thespectral parameters. In the work of Axelsson et al. (2005), severalvalues of QPO frequencies νQPO might be determined during oneobservation, and for these data points we assume the averaged mid-dle frequency and consider the uncertainty from lower to higher ofobtained values. In agreement with the earlier results of GCR99, wefind a clear anticorrelation between the characteristic frequenciesof the aperiodic variability and �h/�s (Fig. 10), indicating an appar-ent connection between QPO frequencies and the parameters of theComptonizing region. This provides an argument (but not a proof)in favour of the presence of a hot inner corona and a variable innerradius of the surrounding disc.
The frequency–hardness correlation can be described by a powerlaw νQPO ∝ (�h/�s)−α with α = −1.48 ± 0.04. The best fit is shownby the solid curve in Fig. 10. A similar correlation was observed byPottschmidt et al. (2003) and Nowak, Wilms & Dove (2002).
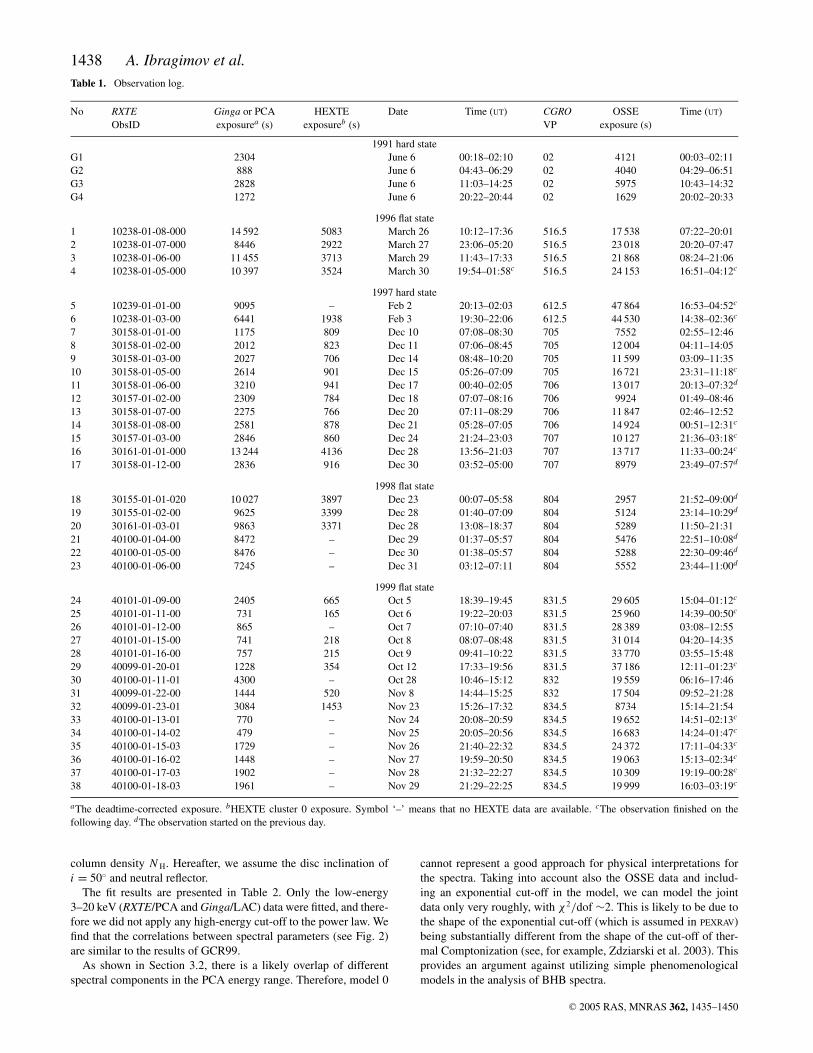
4.4 Comparison between phenomenological and physicalspectral models and R–Γ correlation
Fig. 11 compares the results obtained with the simple phenomeno-logical model of power law + reflection in the 3–20 keV en-ergy range (model 0) with those from our model 2 applied to the3–1000 keV range. More elaborate and physically justified modelsutilizing the full energy range of our data do not change the pic-
Figure 10. Dependence between QPO frequencies and �h/�s. The �h/�s
are best-fitting values from model 2. The QPO frequencies are fromAxelsson et al. (2005). The solid curve shows the best power-law fit νQPO ∝(�h/�s)−1.48.
ture qualitatively. On the quantitative level, we find that the simplepower law + reflection spectral fits to the 3–20 keV data overesti-mated the amplitude of the reflected component R and the slope � ofthe primary Comptonization continuum. We confirm, however, thatthe simple models did correctly rank the spectra according to thestrength of the reflected component and slope of the Comptonizedradiation, as demonstrated in the original publications on this sub-ject (GCR99; ZLS99). This is also illustrated by the lower threepanels of Fig. 11. The difference of the obtained parameters comesfrom the fact that, for wide-energy observations, the main thermal
C© 2005 RAS, MNRAS 362, 1435–1450
Broad-band spectra of Cyg X-1 1447
Figure 11. (a)–(c) Correlations obtained using model 0 (green open circles), model 1 (blue filled circles) and model 2 (red filled squares). (a) The spectralslope � versus reflection scaling factor R correlation. For model 0, � is a fitting parameter, for model 2 the index of a power-law fitted to the spectral modelin the 2–10 keV range. The solid curve shows the dependence predicted for the ejection model (Beloborodov 1999a; MBP01) with the parameters of i = 50◦,the albedo of 0.15, µs = 0.5 and τ = 2, the dotted curve shows the same for µs = 0.4. The dashed curve shows the dependence predicted by the model witha hot spherical corona and cold overlapping disc (Poutanen et al. 1997; ZLS99) with the blackbody temperature of 0.2 keV (see Section 4.4 for details). Thedot-dashed curve shows the same model with the dissipation effect taken into account (dissipation parameter L int = 1, L int/4π = 1 at r < 1; see Appendix Afor details). (b) The relativistic smearing Gaussian width σ at 6.4 keV versus R. (c) The equivalent width of the 6.4-keV line equivalent width versus R. Thestraight line is EW (eV) = 500R. (d)–(f) �, R and equivalent width obtained from model 2 versus those from model 0.
Comptonization component that describes well the hard energy tailmay lie well below the observed flux in the 2–10 keV range (seeFigs 3 and 5) and has a different slope in this band. The differenceis largest for 1996, 1998 and 1999 data, while in the 1991 and 1997cases the soft excess is weak and parameters obtained with the phys-ical models are similar to those obtained with the phenomenologicalmodels.
In Fig. 11(a), we see a clear correlation between � and R. Forcomparison, we also show the dependences predicted by the plasmaejection model of Beloborodov (1999a,b) and MBP01 (cylindricalgeometry with h/r = 2), using the geometric parameter of thatmodel of µs = 0.4 and 0.5, i = 50◦, the albedo of the reflectingmedium of 0.15 and τ = 2. We used the dependence between theamplification factor A of Comptonization and � from MBP01. Wealso compared our data with the dependence expected in the modelof ZLS99, assuming the blackbody temperature of 0.2 keV, appro-priate for Cyg X-1, with one minor change. In the original paper,all the reflection luminosity was assumed to reach the observer. Re-flection amplitude is an integral that consists of two parts, from thedisc inside the corona and from the outer part of it. We multipliedthe part of luminosity coming from the former part by e−τ , to ap-proximately take into account scattering of radiation in the corona(τ = 1 was chosen). We see that this model cannot quantitativelydescribe the presented data. Moreover, taking into account intrinsicdissipation in the disc (see Appendix A for details) will further in-crease the slope of the dependence, making the discrepancy larger.Intrinsic dissipation becomes important for a small inner disc radius(when reflection is relatively large) and the increase of the soft seedphoton flux in that case makes the spectrum softer (see Beloborodov2001).
4.5 Physical scenario
The hard spectral state of BHBs is commonly defined as the statein which the spectrum is dominated by the hard Comptonizationcomponent, without significant contribution of the blackbody-typeemission from the optically thick accretion disc. Naturally, the hardstate is not characterized by a single, uniquely defined spectrum,but rather includes a continuum of spectral shapes with the majorspectral parameters varying in a rather broad range. The diversityof the hard-state spectra reflects the position of the source with re-spect to the ‘bottom hard’ state and the soft state. Quantitatively,this position can be characterized by the strength of the reflectedcomponent (reflection scaling factor R or Fe line equivalent width)or properties of the main Comptonized component (Comptonizationparameter, or Compton amplification factor A = �h/�s, or the pho-ton index � in the low-energy limit) or characteristic frequencies ofthe aperiodic variability. The existence of good correlations betweenall these quantities suggests that they all are an equally good mea-sure of the source position within the hard state. The results foundin earlier work (GCR99; ZLS99; Gilfanov et al. 2000; Gilfanov,Churazov & Revnivtsev 2004) and presented in the previous sec-tions of this paper suggest the following pattern of spectral andtemporal variability. An increase of the strength of the reflectedcomponent is accompanied by an increase of the width of the Feline, an increase of the characteristic QPO frequencies and a soft-ening of the Comptonized component observed as an increase of itsphoton index � in the low-energy limit.
We find from our spectral analysis that in the ‘bottom hard’state the broad-band spectrum (3–1000 keV) is mostly describedby the single thermal Comptonization spectrum with superimposed
C© 2005 RAS, MNRAS 362, 1435–1450

1448 A. Ibragimov et al.
component due to reflection of the primary emission from relativelycool and neutral, or partly ionized, optically thick matter (the ac-cretion disc), with an additional relatively weak soft component.As the source moves towards the soft state, the strength of the re-flected component increases, and the soft component becomes moresignificant. Considering the 3–1000 keV energy range covered byour data, this spectral component reveals itself most clearly in theE �10 keV energy domain as the ‘soft excess’. Another independentindication of spectral complexity is the gamma-ray power-law taildetected at MeV energies by the COMPTEL telescope (McConnellet al. 2002).
From the point of view of the formal fit quality, the E � 10 keVexcess can be described equally well by an additional thermal Comp-tonization component due to low temperature, low Comptoniza-tion parameter plasma or by non-thermal Comptonization with thepower-law index of accelerated electrons � inj ∼ 2–3. Owing to thecomplex shape of the continuum at these energies defined by the su-perposition of several spectral components, these two possibilitiescannot be easily discriminated based solely on the low-energy data.The task is further complicated by the rather limited low-energy cov-erage provided by the PCA instrument, E > 3 keV. However, theabove possibilities predict very different behaviour in the ∼MeV en-ergy domain, where the main thermal Comptonization componentdiminishes and the power-law tail due to the non-thermal Comp-tonization should reveal itself. As the OSSE sensitivity and energyrange are insufficient to probe the existence of the MeV tail corre-lated with the E < 10 keV excess, we cannot, strictly speaking, givepreference to either of these two models.
There are however several additional considerations to be takeninto account. (i) COMPTEL detected a weak MeV tail in the aver-aged hard-state data for Cyg X-1 (McConnell et al. 2002). The slopeand amplitude of this tail are qualitatively consistent with the ex-trapolation of the non-thermal Comptonized component, requiredto explain the E � 10 keV excess (Fig. 5). (ii) In the soft state,the non-thermal power law is the dominant (the only) high-energycomponent. (iii) The E � 10 keV excess is more pronounced in thespectra characterized by large reflection and the rather steep slopeof the main Comptonized component, i.e. in those sufficiently closeto the soft state. Its strength seems to increase with the increase ofthe reflection. These arguments suggest that the non-thermal originof the E � 10 keV excess is more plausible. We note that the 1991and 1997 data show much weaker excess. This may be explainedby the lower relative luminosity of the non-thermal Comptonizationcomponent, which therefore reveals itself at lower energies, belowthe E = 3 keV threshold of the PCA instrument, but can be de-tected by instruments which have a response at lower energies, i.e.BeppoSAX (see Di Salvo et al. 2001; Frontera et al. 2001).
The overall qualitative picture can be outlined as follows. Theoverall geometry of the accretion flow is adequately representedby the truncated disc model with the inner radius of the stan-dard optically thick geometrically thin disc varying from ∼6Rg to∼ several tens of Rg. Inside this radius, the accretion flow proceedsvia quasi-spherical optically thin hot flow. The plausible mechanismgoverning the transition from the disc accretion to the coronal flowis the disc evaporation process as proposed by Meyer & Meyer-Hofmeister (1994). The geometrically thin disc gives rise to the softblackbody-type component. In addition, due to dynamo, solar-typemagnetic flares can be produced above the accretion disc (Galeevet al. 1979). The electrons there can be accelerated and form non-thermal distribution. Comptonization of the disc emission on theseelectrons results in the power-law-like Comptonized emission. Theinner optically thin flow gives rise to the thermal Comptonization
component. The relative contributions of non-thermal and thermalComptonized components are defined by the fractions of the gravi-tational energy released in the disc (i.e. outside Rin) and in the innerhot flow (inside Rin). The position of the transition radius is definedby the mass accretion rate and is modified by the irradiation-relatedeffects. The transition radius decreases as the mass accretion rateincreases.
The QPOs are due to some processes in the transition region nearRin and approximately scale with the Keplerian frequency and othercharacteristic time-scales of the coronal flow and standard accretiondisc in the transition region.
The configuration with the large inner disc radius, probablyR in � 50–100Rg, corresponds to the classical hard state. The mainfeatures of this ‘bottom hard’ state are low strength of the reflectedcontinuum, relatively narrow fluorescent Fe line of small equiva-lent width, large Comptonization parameter of the thermal Comp-tonized component (hard spectra with the low-energy photon index� ∼ 1.6), and low frequencies of QPOs. As only a small fraction ofthe gravitational energy is released in the disc, the contribution ofthe non-thermal component is small and the spectrum is adequatelydescribed by thermal Comptonization.
As the mass accretion rate increases, the transition radius de-creases, and the disc moves towards the compact object. This resultsin an increase of the reflection, broader fluorescent Fe line, largerQPO frequencies, and smaller �h/�s, i.e. a smaller Comptonizationparameter in the inner hot flow. The contribution of the non-thermalcomponent increases. The optical depth of the thermal plasma ofthe inner flow decreases due the shrinking of the inner hot flow asthe disc extends towards the compact object.
The classical soft state (we ignore all the complications and sub-states here) corresponds to the accretion disc extending all the waytowards the last stable orbit or very close to it. Correspondingly,the inner hot flow disappears and the dominant or the only hardcomponent is that due to non-thermal Comptonization of the discemission on the non-thermal electrons accelerated in the magneticloops/flares above the disc.
The behaviour of the temperature of the thermal Comptonizationcomponent is unclear. It seems relatively constant, which suggeststhe possible presence of electron–positron pairs (see MBP01).
The physical scenario qualitatively outlined above is based on thetruncated disc picture and on the assumption that the spectral evolu-tion is governed by the change of the transition radius between thestandard accretion disc and the hot inner flow. In this picture, manyof the observed correlations can be explained naturally. However,the R–� correlation is significantly better quantitatively explainedby the non-stationary corona model (MBP01), in which the gov-erning parameter is the velocity of the blobs of emitting plasmarelative to the accretion disc. We note that both models are geomet-rical in their nature and the predicted qualitative relations betweenthe physical parameters are obtained with a number of simplify-ing assumptions. Therefore, the results of quantitative comparisonof the model predictions with the observed pattern of the spectralvariability should be interpreted with caution and any conclusionsregarding the validity of either model based on such a comparisonwould be premature.
5 C O N C L U S I O N S
Based on the broad-band (3–1000 keV) data from simultaneousobservations by Ginga and CGRO/OSSE in 1991 and PCA andHEXTE instruments aboard RXTE and OSSE in 1996–1999 wehave studied the spectral variability of Cyg X-1.
C© 2005 RAS, MNRAS 362, 1435–1450

Broad-band spectra of Cyg X-1 1449
(i) We confirm earlier results on R–� correlation. Considering the3–20 keV data, we find very tight one-parameter relations betweenreflection, spectral index and the width of the Fe line.
(ii) More elaborate and physically justified models utilizing thefull energy range of our data do not change the picture qualita-tively. On the quantitative level, we find that the simple power law+ reflection spectral fits to the 3–20 keV data overestimated the am-plitude of the reflected component R and the slope � of the primaryComptonization continuum. We confirm, however, that the simplemodels did correctly rank the spectra according to the strength ofthe reflected component and slope of the Comptonized radiation, asdemonstrated in the original publications on this subject (GCR99;ZLS99).
(iii) Based on the analysis of the broad-band data, we found thatthe spectra in our sample can be adequately described by the thermalComptonized component with superposed reflection from the opti-cally thick disc and a soft excess. This excess is relatively weak in thecase of the hardest spectra of our sample (� ∼ 1.7). As the strength ofthe reflection increases, the excess becomes much more significant.The presence of this excess was the primary reason for the simplespectral approximations of the 3–20 keV data to overestimate bothR and �. The nature of this excess cannot be unambiguously deter-mined from our data. Based on the circumstantial evidence we sug-gest that it is the lower energy part of the non-thermal Comptonizedcomponent with the power-law index of accelerated electrons� inj ∼ 2–3. At higher energies, this non-thermal component revealsitself as a power law detected by COMPTEL at MeV energies in theaverage hard state spectrum of Cyg X-1.
(iv) We note the variability of the absorption correlated with thephase of binary system. These results confirm previous findings ofthe X-ray dips in the source.
(v) The overall pattern of spectral and temporal variability can besummarized as follows. An increase of the strength of the reflectedcomponent is accompanied by an increase of the width of the Fe line,an increase of the characteristic QPO frequencies and a softeningof the Comptonized component observed as an increase of its pho-ton index � in the low-energy limit or, equivalently, a decrease ofthe Compton amplification factor �h/�s. Simultaneously, the opticaldepth of the thermal Comptonization decreases and the fractionalcontribution of the non-thermal component to the total energy fluxincreases. The exact behaviour of the electron temperature in thehot inner flow is not constrained by our data.
(vi) We suggest a qualitative physical scenario naturally explain-ing the observed behaviour. In this scenario, the evolution of thespectral parameters is governed by the value of the transition ra-dius between the standard optically thick accretion disc and theinner quasi-spherical hot flow. The thermal Comptonized compo-nent originates in the inner hot flow as a result of Comptonization ofthe soft photons emitted by the accretion disc. The origin of the non-thermal component is related to the optically thick disc; for example,it can be produced due to non-thermal electrons accelerated near thesurface of the optically thick disc in the solar-type magnetic flares.The relative contributions of non-thermal and thermal componentsto the total energy flux depend on the fractions of the gravitationalenergy of accreting matter released in the optically thick disc andin the hot inner flow.
AC K N OW L E D G M E N T S
We are grateful to Bryan Irby (NASA/GSFC) for help with con-verting the Ginga data, and to Magnus Axelsson for sharing the
results of the timing analysis. This work was supported by the Cen-tre for International Mobility and the Vaisala foundation (AI), theAcademy of Finland grants 201079 and 204600 and the WihuriFoundation (JP), and the NORDITA Nordic project in High EnergyAstrophysics. AI was also supported by RFFI 02-02-17174 and thepresidential programme for support of leading scientific schoolsNSH-1789.2003.2. AAZ was supported by KBN grants PBZ-KBN-054/P03/2001, 1P03D01827 and 4T12E04727.
R E F E R E N C E S
Arnaud K. A., 1996, in Jakoby G. H., Barnes J., eds, ASP Conf. Ser.Vol. 101, Astronomical Data Analysis Software and Systems V. Astron.Soc. Pac., San Francisco, p. 17
Axelsson M., Borgonovo L., Larsson S., 2005, A&A, 438, 999Balucinska M., Hasinger G., 1991, A&A, 241, 439Balucinska-Church M., Belloni T., Church M. J., Hasinger G., 1995, A&A,
302, L5Balucinska-Church M., Church M. J., Charles P. A., Nagase F., LaSala J.,
Barnard R., 2000, MNRAS, 311, 861Beloborodov A., 1999a, ApJ, 510, L123Beloborodov A., 1999b, in Poutanen J., Svensson R., eds, ASP Conf. Ser.
Vol. 161, High Energy Processes in Accreting Black Holes. Astron. Soc.Pac., San Francisco, p. 295
Beloborodov A., 2001, Adv. Space Res., 28, 411Bisnovatyi-Kogan G. S., Blinnikov S. I., 1977, A&A, 59, 111Brocksopp C., Tarasov A. E., Lyuty V. M., Roche P., 1999, A&A, 343, 861Coppi P. S., 1992, ApJ, 258, 657Coppi P. S., 1999, in Poutanen J., Svensson R., eds, ASP Conf. Ser. Vol. 161,
High Energy Processes in Accreting Black Holes. Astron. Soc. Pac., SanFrancisco, p. 375
Di Salvo T., Done C., Zycki P. T., Burderi L., Robba N. R., 2001, ApJ, 547,1024
Done C., Mulchaey J. S., Mushotzky R. F., Arnaud K., 1992, ApJ, 395, 275Ebisawa K., Ueda Y., Inoue H., Tanaka Y., White N. E., 1996, ApJ, 467, 419Esin A. A., Narayan R., Cui W., Grove E. C., Zhang S.-N., 1998, ApJ, 505,
854Feng Y. X., Cui W., 2002, ApJ, 564, 953Frontera F. et al., 2001, ApJ, 546, 1027Galeev A. A., Rosner R., Vaiana G. S., 1979, ApJ, 229, 318Gierlinski M., Zdziarski A. A., Done C., Johnson W. N., Ebisawa K., Ueda
Y., Haardt F., Phlips B. F., 1997, MNRAS, 288, 958Gierlinski M., Zdziarski A. A., Poutanen J., Coppi P. S., Ebisawa K., Johnson
W. N., 1999, MNRAS, 309, 496 (G99)Gilfanov M., Churazov E., Revnivtsev M., 1999, A&A, 352, 182 (GCR99)Gilfanov M., Churazov E., Revnivtsev M., 2000, in Zhao G., Wang J-J.,
Qiu H. M., Boerner G., eds, SGSC Conference Series, Vol. 1, Proceed-ings of the 5th Sino-German Workshop on Astrophysics, p. 114 (astro-ph/0002415)
Gilfanov M., Churazov E., Revnivtsev M., 2004, in Kaaret P., Lamb F. K.,Swank J. H., eds, AIP Conf. Proc. 714, X-ray Timing: Rossi and Beyond.AIP, Melville, p. 97
Ichimaru S., 1977, ApJ, 214, 840LaSala J., Charles P. A., Smith R. A. D., Balucinska-Church M., Church M.
J., 1998, MNRAS, 301, 285Li H., Miller J. A., 1997, ApJ, 478, L67Ling J. C. et al., 1997, ApJ, 484, 375McConnell M. L. et al., 1994, ApJ, 424, 933McConnell M. L. et al., 2002, ApJ, 572, 984Magdziarz P., Zdziarski A. A., 1995, MNRAS, 273, 837Malzac J., Petrucci P.-O., 2002, MNRAS, 336, 1209Malzac J., Beloborodov A., Poutanen J., 2001, MNRAS, 326, 417 (MBP01)Matt G., 2001, in White N. E., Malaguti G., Palumbo G. G. C., eds, AIP
Conf. Proc. 599, X-ray Astronomy. Stellar Endpoints, AGNs and theDiffuse X-ray Background. AIP, Melville, p. 209
Meyer F., Meyer-Hofmeister E., 1994, A&A, 288, 175Meyer F., Liu B. F., Meyer-Hofmeister E., 2000, A&A, 354, L67
C© 2005 RAS, MNRAS 362, 1435–1450

1450 A. Ibragimov et al.
Miller K. A., Stone J. M., 2000, ApJ, 534, 398Narayan R., Mahadevan R., Quataert E., 1998, in Abramowicz M. A.,
Bjornsson G., Pringle J., eds, Theory of Black Hole Accretion Discs.Cambridge Univ. Press, Cambridge, p. 148
Nowak M. A., Wilms J., Dove J. B., 2002, MNRAS, 332, 856Perola G. C., Matt G., Cappi M., Fiore F., Guainazzi M., Maraschi L.,
Petrucci P.-O., Piro L., 2002, A&A, 389, 802Pottschmidt K. et al., 2003, A&A, 407, 1039Poutanen J., 1998, in Abramowicz M., Bjornsson G., Pringle J., eds, Theory
of Black Hole Accretion Discs. Cambridge Univ. Press, Cambridge,p. 100
Poutanen J., Coppi P., 1998, Phys. Scr., T77, 57Poutanen J., Svensson R., 1996, ApJ, 470, 249Poutanen J., Krolik J. H., Ryde F., 1997, MNRAS, 292, L21Revnivtsev M., Gilfanov M., Churazov E., 1999, A&A, 347, L23Revnivtsev M., Gilfanov M., Churazov E., 2001, A&A, 380, 520Rozanska A., Czerny B., 2000, A&A, 360, 1170Shakura N. I., Sunyaev R. A., 1973, A&A, 24, 337Shapiro S. L., Lightman A. P., Eardley D. M., 1976, ApJ, 204, 187Shimura T., Takahara F., 1995, ApJ, 445, 780Sunyaev R. A., Titarchuk L. G., 1980, A&A, 86, 121Sunyaev R. A., Trumper J., 1979, Nat, 279, 506Svensson R., Zdziarski A. A., 1994, ApJ, 436, 599Titarchuk L., 1994, ApJ, 434, 570Tout C. A., Pringle J. E., 1992, MNRAS, 259, 604Weaver K. A., Krolik J. H., Pier E. A., 1998, ApJ, 498, 213Zdziarski A. A., Gierlinski M., 2004, Progr. Theor. Phys. Suppl., 155, 99Zdziarski A. A., Gierlinski M., Gondek D., Magdziarz P., 1996, A&AS, 120,
553Zdziarski A. A., Johnson W. N., Poutanen J., Magdziarz P., Gierlinski M.,
1997, in Winkler C., Courvoisier T. J.-L., Durouchoux Ph., eds, SP-382, The Transparent Universe, Proc. 2nd INTEGRAL Workshop. ESAPublications Division, Noordwijk, p. 373
Zdziarski A. A., Lubinski P., Smith D. A., 1999, MNRAS, 303, L11 (ZLS99)Zdziarski A. A., Poutanen J., Paciesas W. S., Wen L., 2002, ApJ, 578, 357Zdziarski A. A., Lubinski P., Gilfanov M., Revnivtsev M., 2003, MNRAS,
342, 355
A P P E N D I X A : D I S S I PAT I O N A N DAT T E N UAT I O N I N T H E D I S C – H OTF L OW M O D E L
ZLS99 have considered an idealized geometrical model for thermalComptonization, reprocessing and reflection in an accretion flowconsisting of a central hot sphere surrounded by a flat cold disc (seefig. 2 in ZLS99). The sphere has a unit radius, and the inner radiusof the disc can assume any value, d. For d < 1, there is an overlapbetween the two components. The hot sphere Comptonizes soft seedphotons emitted by the disc. In the original model of ZLS99, thedisc reprocesses and re-emits only the photons emitted by the sphereincident on the disc.
Here, we generalize this model to include intrinsic dissipationin the cold disc (as expected in an accretion flow). Also, we takeinto account scattering of the Compton-reflected photons in the hotsphere, which was neglected in ZLS99. For completeness, we givehere the full set of relevant equations, but refer the reader to ZLS99for details of the derivation.
The hot sphere has a unit luminosity and emits isotropically. Thetotal flux incident on the disc at a radius, r, is then given by (ZLS99)
Finc(r ) = 3h(r )
16π2, (A1)
where
h(r ) = (4/3)
×{[
(2 − r−2)E(r 2) + (r−2 − 1)K (r 2)], r < 1,[
(2r − r−1)E(r−2) + 2(r−1 − r )K (r−2)], r � 1, (A2)
where E and K are complete elliptic integrals. The luminosity of thedisc due to re-emission of photons incident on it is
L inc(d) = 4π
∫ ∞
d
dr r Finc(r ). (A3)
This can be divided into the contributions to the integral from theparts of the disc at d � 1 and d > 1, L inc = L<
inc + L>inc, where the
first term is non-zero only for d < 1.Then, the relative strength of Compton reflection can be identified
(ZLS99) with the ratio of the luminosity of the disc due to irradiationto the fraction of the sphere luminosity that is not incident on thedisc. However, we correct here for attenuation of the reflection fromthe parts of the disc with d < 1 because of scattering by the hotelectrons in the sphere. For the radial optical depth of the sphere τ ,we can then write
R � e−τ L<inc + L>
inc
1 − L inc. (A4)
Another effect not included in the treatment of ZLS99 is theintrinsic dissipation in the disc. Far away from the centre (so anyeffect of the inner boundary condition is negligible), the dissipatedflux per unit area is ∝r−3, and we assume it for r > 1. On the otherhand, the dissipation in the part of the disc inside the hot sphere,r < 1, is reduced due to the transfer of the power to the hot plasma.We assume here that dissipation is either null or constant matchingthat of the outside disc
Fint(r ) = L int
4π
{0 or 1, r � 1,
r−3, r > 1,(A5)
where we parametrized the relative intrinsic dissipation by the di-mensionless factor, Lint, defined as the intrinsic luminosity of thedisc extending from r = 1 to infinity (regardless of the actual valueof d).
The power in seed photons scattered in the sphere from both thereprocessing and the intrinsic dissipation (assuming τ = 1) is then
L s(d) ≈ 3(1 − a)
4π2
∫ ∞
d
dr rh2(r ) + L int
π
∫ ∞
max(d,1)
drh(r )
r 2
+ L int
π
∫ 1
d
dr rh(r ), (A6)
where a is the albedo and the term given by the second line ofequation (A6) appears only in the case of non-zero dissipation withinthe sphere and when d < 1.
The amplification factor of the process of thermal Comptonizationis then A(d) ≡ 1/L s(d). It can be related to the spectral index of thepower-law part of the Comptonization spectrum using, for example,the formula of MBP01
� = C(A − 1)−δ, (A7)
where C = 2.19 and δ = 0.14 for BHBs with kT seed = 0.2 keV.
This paper has been typeset from a TEX/LATEX file prepared by the author.
C© 2005 RAS, MNRAS 362, 1435–1450