Features of the broad upshifted structure in stimulated electromagnetic emission spectra
16
Features of the broad upshifted structure in stimulated electromagnetic emission spectra V. L. Frolov, E. N. Ermakova, L. M. Kagan, G. P. Komrakov, and E. N. Sergeev Radiophysical Research Institute, Nizhny Novgorod, Russia P. Stubbe Max-Planck-Institut fu ¨r Aeronomie, Katlenburg-Lindau, Germany Abstract. We present experimental results concerning features of the broad upshifted structure (BUS) in stimulated electromagnetic emission spectra, generated in the ionospheric F region plasma by a powerful electromagnetic wave. The BUS is observed for pump frequencies far from electron cyclotron harmonics. Modification experiments, using O-mode HF pump waves, were conducted at the SURA heating facility (568N, 448E, Nizhny Novgorod, Russia). We investigated the BUS properties for pump frequencies ranging from the third to the sixth electron cyclotron harmonic, concentrating on the dependence of (1) the BUS spectral features on pump frequency and power and (2) the BUS temporal evolution under different ionospheric conditions with and without additional heating of the ionosphere by another pump wave. We find (1) that the frequency range of BUS generation depends on the gyroharmonic mode number, becoming narrower with increasing mode number, and (2) that the BUS is produced in the vicinity of the upper hybrid resonance layer, located typically a few kilometers below the pump wave reflection height. An important result is that small-scale striations, being produced concurrently with the upper hybrid plasma waves due to the thermal parametric instability, do not play a crucial role for the BUS evolution. A possible relationship of the BUS to gyroharmonic features is discussed. 1. Introduction Since the first observations of stimulated electromagnetic emissions (SEE), excited in the ionospheric F region by a powerful HF electromagnetic O-mode wave from a ground- based transmitter [Belikovich et al., 1981; Thide ´ et al., 1982], a variety of spectral structures has been distinguished in the sidebands of the reflected pump wave. The first classification of SEE features was given by Stubbe et al. [1984]. Results of succeeding experiments can be found in the work of Boiko et al. [1985], Leyser et al. [1990, 1993, 1994], Stubbe and Kopka [1990], Stubbe et al. [1994], and Frolov et al. [1994a, b, 1996, 1997c, d]. Up to date, more than 15 SEE components have been identified. It is generally believed that in the SEE generation processes the HF pump wave first excites, through parametric instabili- ties, both high-frequency (Langmuir, upper hybrid, and Bern- stein waves) and low-frequency (ion-acoustic waves, lower hy- brid waves, and small-scale field-aligned irregularities, striations) plasma turbulence in a region near the upper hybrid resonance layer or near the reflection height of the pump wave. The high-frequency electrostatic waves can then go through further nonlinear processes (cascading, scattering, and inter- action with low-frequency waves) to generate the stimulated electromagnetic emissions, downshifted and upshifted from the pump frequency by up to 6200 kHz. These secondary electromagnetic waves can then escape the disturbed iono- spheric volume and be observed on the ground. Once the generation mechanism of a SEE component is identified, one can obtain information on both the background state of the ionospheric plasma and the nonlinear processes in question by observing the SEE evolution and the variation of the SEE features under different conditions realized in the experi- ments. In this regard, the SEE may be employed as a useful diagnostic tool for probing space plasmas as well as laboratory plasmas. The major components on the downshifted side of the SEE spectra (i.e., at frequencies below the pump frequency f 0 ) are the “downshifted maximum” (DM) [Stubbe et al., 1984; Leyser et al., 1994], downshifted by approximately D f 2 . 9–15 kHz, the “broad continuum” (BC) [Leyser et al., 1993], extending up to D f 2 . 50–80 kHz below the DM, and the “narrow con- tinuum” (NC 2 )[Frolov et al., 1997d], occurring either in a frequency range between the DM and the pump frequency in the steady state of artificial ionospheric turbulence (AIT) de- velopment or at frequencies extending up to D f 2 . 60 kHz in the initial stage of AIT evolution, showing in both cases a rapid decrease of the intensity for higher D f 2 values after the initial excitation. (Here and below we use the notations D f 2 and D f 1 to denote negative and positive frequency shifts, respectively, in the SEE spectra relative to the pump frequency f 0 .) The “downshifted peak” (DP) [Stubbe et al., 1984, 1994; Stubbe, 1996] at about D f 2 . 1–3 kHz can also be resolved in SEE spectra. On the upshifted side the major spectral features are the “narrow continuum” (NC 1 )[Frolov et al., 1997d], observed in a frequency range up to a few tens of kilohertz above f 0 , the “upshifted maximum” (UM) [Stubbe et al., 1984; Frolov et al., 1994a, 1997c], which is a narrow peak at frequencies of about D f 1 . 7–12 kHz, and the “broad upshifted maximum” Copyright 2000 by the American Geophysical Union. Paper number 2000JA900038. 0148-0227/00/2000JA900038$09.00 JOURNAL OF GEOPHYSICAL RESEARCH, VOL. 105, NO. A9, PAGES 20,919 –20,933, SEPTEMBER 1, 2000 20,919
-
Upload
independent -
Category
Documents
-
view
3 -
download
0
Transcript of Features of the broad upshifted structure in stimulated electromagnetic emission spectra
Features of the broad upshifted structure in stimulatedelectromagnetic emission spectra
V. L. Frolov, E. N. Ermakova, L. M. Kagan, G. P. Komrakov, and E. N. SergeevRadiophysical Research Institute, Nizhny Novgorod, Russia
P. StubbeMax-Planck-Institut fur Aeronomie, Katlenburg-Lindau, Germany
Abstract. We present experimental results concerning features of the broad upshiftedstructure (BUS) in stimulated electromagnetic emission spectra, generated in theionospheric F region plasma by a powerful electromagnetic wave. The BUS is observedfor pump frequencies far from electron cyclotron harmonics. Modification experiments,using O-mode HF pump waves, were conducted at the SURA heating facility (568N, 448E,Nizhny Novgorod, Russia). We investigated the BUS properties for pump frequenciesranging from the third to the sixth electron cyclotron harmonic, concentrating on thedependence of (1) the BUS spectral features on pump frequency and power and (2) theBUS temporal evolution under different ionospheric conditions with and withoutadditional heating of the ionosphere by another pump wave. We find (1) that thefrequency range of BUS generation depends on the gyroharmonic mode number,becoming narrower with increasing mode number, and (2) that the BUS is produced inthe vicinity of the upper hybrid resonance layer, located typically a few kilometers belowthe pump wave reflection height. An important result is that small-scale striations, beingproduced concurrently with the upper hybrid plasma waves due to the thermal parametricinstability, do not play a crucial role for the BUS evolution. A possible relationship of theBUS to gyroharmonic features is discussed.
1. Introduction
Since the first observations of stimulated electromagneticemissions (SEE), excited in the ionospheric F region by apowerful HF electromagnetic O-mode wave from a ground-based transmitter [Belikovich et al., 1981; Thide et al., 1982], avariety of spectral structures has been distinguished in thesidebands of the reflected pump wave. The first classification ofSEE features was given by Stubbe et al. [1984]. Results ofsucceeding experiments can be found in the work of Boiko et al.[1985], Leyser et al. [1990, 1993, 1994], Stubbe and Kopka[1990], Stubbe et al. [1994], and Frolov et al. [1994a, b, 1996,1997c, d]. Up to date, more than 15 SEE components havebeen identified.
It is generally believed that in the SEE generation processesthe HF pump wave first excites, through parametric instabili-ties, both high-frequency (Langmuir, upper hybrid, and Bern-stein waves) and low-frequency (ion-acoustic waves, lower hy-brid waves, and small-scale field-aligned irregularities,striations) plasma turbulence in a region near the upper hybridresonance layer or near the reflection height of the pump wave.The high-frequency electrostatic waves can then go throughfurther nonlinear processes (cascading, scattering, and inter-action with low-frequency waves) to generate the stimulatedelectromagnetic emissions, downshifted and upshifted fromthe pump frequency by up to 6200 kHz. These secondaryelectromagnetic waves can then escape the disturbed iono-spheric volume and be observed on the ground. Once the
generation mechanism of a SEE component is identified, onecan obtain information on both the background state of theionospheric plasma and the nonlinear processes in question byobserving the SEE evolution and the variation of the SEEfeatures under different conditions realized in the experi-ments. In this regard, the SEE may be employed as a usefuldiagnostic tool for probing space plasmas as well as laboratoryplasmas.
The major components on the downshifted side of the SEEspectra (i.e., at frequencies below the pump frequency f0) arethe “downshifted maximum” (DM) [Stubbe et al., 1984; Leyseret al., 1994], downshifted by approximately Df2 . 9–15 kHz,the “broad continuum” (BC) [Leyser et al., 1993], extending upto Df2 . 50–80 kHz below the DM, and the “narrow con-tinuum” (NC2) [Frolov et al., 1997d], occurring either in afrequency range between the DM and the pump frequency inthe steady state of artificial ionospheric turbulence (AIT) de-velopment or at frequencies extending up to Df2 . 60 kHz inthe initial stage of AIT evolution, showing in both cases a rapiddecrease of the intensity for higher Df2 values after the initialexcitation. (Here and below we use the notations Df2 and Df1
to denote negative and positive frequency shifts, respectively,in the SEE spectra relative to the pump frequency f0.) The“downshifted peak” (DP) [Stubbe et al., 1984, 1994; Stubbe,1996] at about Df2 . 1–3 kHz can also be resolved in SEEspectra.
On the upshifted side the major spectral features are the“narrow continuum” (NC1) [Frolov et al., 1997d], observed ina frequency range up to a few tens of kilohertz above f0, the“upshifted maximum” (UM) [Stubbe et al., 1984; Frolov et al.,1994a, 1997c], which is a narrow peak at frequencies of aboutDf1 . 7–12 kHz, and the “broad upshifted maximum”
Copyright 2000 by the American Geophysical Union.
Paper number 2000JA900038.0148-0227/00/2000JA900038$09.00
JOURNAL OF GEOPHYSICAL RESEARCH, VOL. 105, NO. A9, PAGES 20,919–20,933, SEPTEMBER 1, 2000
20,919
(BUM) [Stubbe et al., 1984, 1994; Leyser et al., 1990, 1993;Frolov et al., 1996, 1998], occurring in the SEE spectra in afrequency range of about Df1 . 15–150 kHz. We can alsonote the “upshifted wideband emission” (UWE), which is ob-served on the upshifted side at offset frequencies Df1 . 50–500 kHz [Frolov, 1990].
An important characteristic of all SEE features is the crucialdependence of their properties on the pump frequency if thelatter is near a harmonic of the electron cyclotron frequency,f0 . nfce (in our experiments, fce . 1.35 MHz, and n is theharmonic mode number). One may distinguish “gyrofeatures”and “universal features” [Stubbe et al., 1994]. The gyrofeaturesare those which exist only if f0 . nfce, whereas the universalfeatures exist for all pump frequencies but change their prop-erties strongly for f0 . nfce. The major universal features arethe spectral continua, the DM and the UM, and the majorgyrofeatures are the BUM, the DP and the “broad symmetricalstructure” (BSS). The BSS, not mentioned thus far, consists oftwo spectral maxima symmetrically situated around f0 at offsetfrequencies Df1 . 15–30 kHz [Stubbe and Kopka, 1990]. It isassumed that the strong SEE emissions for f0 . nfce areconditioned by gyroharmonic effects, mainly due to the exci-tation of electron Bernstein waves [e.g., Huang and Kuo, 1994,and references therein].
The SEE properties also depend strongly on the ionosphericconditions and the pump power. Besides, artificial small-scalefield-aligned irregularities (FAI), also called striations, areknown to exert an essential influence on the SEE evolution.Striations are produced by the thermal (resonance) parametricinstability near the upper hybrid resonance level, a few kilo-meters below the pump wave reflection height [Vas’kov andGurevich, 1975; Grach et al., 1977; Das and Fejer, 1979; Mjøl-hus, 1993, 1997; Gurevich et al., 1995]; their influence on SEEgeneration is considered by Gurevich et al. [1997] and Mjølhus[1998]. There is experimental evidence that the striations, onthe one hand, stimulate the generation of such commonlyobserved SEE components as the DM and BC [Boiko et al.,1985; Leyser et al., 1994; Frolov, 1995; Grach et al., 1998] and,on the other hand, cause both the suppression of the pondero-motive part of the NC [Frolov et al., 1997d] and the absorptionof emission escaping the HF-disturbed ionosphere volume[Grach, 1985], due to anomalous absorption of O-mode waves[Utlaut, 1970; Belikovich et al., 1975; Stubbe et al., 1982; Stockeret al., 1993; Frolov et al., 1997a].
The correlations found between the SEE evolution and thedevelopment of striations provide a way to derive some of theFAI characteristics from SEE measurements [Frolov, 1991;Frolov et al., 1994b; Shvarts et al., 1994; Grach et al., 1998]. Theexperiments [Sergeev et al., 1994, 1997; Thide et al., 1995] haveshown that the SEE technique can also be used to study theevolution of HF-enhanced plasma waves and even has certainadvantages over the incoherent scatter technique, providing anew powerful tool for investigating nonlinear processes in plas-mas. Following this line of reasoning, we may directly use theSEE technique for probing both the low-frequency AIT (stri-ations and ion-acoustic and lower hybrid waves) and the high-frequency AIT (Langmuir, upper hybrid, and Bernsteinwaves). Taken together, the observations performed haveshown conclusively that many processes occur simultaneously inthe ionospheric plasma subjected to a powerful HF wave, whilethe SEE generation reflects the evolution of these processes.
In recent years, investigations of upshifted SEE featureshave played a dominant role, since these emission components
cannot be explained in the framework of common three-waveinteraction mechanisms. The goal of this paper is to presentnew experimental data pertaining to upshifted SEE featureswhen the pump frequency is outside the well-studied gyrohar-monic frequency ranges. The present work has been stimulatedby previous experimental results [Erukhimov et al., 1987a;Thide et al., 1989; Leyser et al., 1993; Stubbe et al., 1994; Frolovet al., 1995; Grach et al., 1995], showing the existence of anintensive wideband emission in the upper sideband of thepump for f0 far from a gyroharmonic. Later we have namedthis emission component the “broad upshifted structure”(BUS) [Frolov et al., 1997b]. Although an investigation into thephysical nature of the BUS would have been of great impor-tance for the theories of SEE generation, no detailed experi-mental studies of its properties have been performed prior tothe present work.
The SEE measurements to be presented in the followingwere carried out during three heating campaigns in 1996–1998at the SURA facility. Preliminary results of BUS measure-ments, obtained in September 1996 for pump frequencies be-tween the third and fourth gyroharmonic, were briefly reportedby Frolov et al. [1997b]. The present paper gives an extendedanalysis of all available experimental data, collected at pumpfrequencies ranging from f0 5 4.3 MHz to 8.1 MHz, therebycovering the range from the third to the sixth gyroharmonic. Itshould be mentioned that f0 5 4.3 MHz is the lowest possiblefrequency to be transmitted by the SURA facility. In the fre-quency range used, the maximum effective radiated power(ERP) ranges from Peff . 80 MW for the lowest to Peff . 240MW for the highest pump frequencies used. When the situa-tion requires, we take into account the power decrease byone-way wave absorption in the ionospheric D and E layersand determine a corrected power, denoted by Peff, which isappropriate for application to F region modification effects.The F2 layer critical frequency, f0F2
, and the natural level ofionospheric disturbances are monitored by ionograms support-ing the observations. An ionosonde is operated near the site ofthe heating transmitters, approximately every 15 min. The re-ceiving station, spaced ;1 km from the SURA facility, com-prises a wideband antenna array (16 crossed dipoles with afrequency band from 3 to 6 MHz, G . 30), eight HF receiverswith digital data recording by an AT-MIO-16-E2 multifunctionanalog, digital, and timing I/O board and a PC, a HP-3585Aspectrum analyzer operating in sweep mode, and various chartand tape recorders. The station is designed to investigate pumpwave self-interaction effects, to measure SEE spectra, and tostudy the SEE and anomalous absorption temporal evolution,with a time resolution of ;60 ms.
The organization of the paper is as follows. The experimentalresults are presented in section 2, where we consider the depen-dence of the BUS features on both the pump frequency (section2.1) and pump power (section 2.2), the temporal development ofthe BUS after the pump switch-on (section 2.3), the decay of theemission after the pump switch-off (section 2.4), the influenceon the BUS features of prior HF transmissions and of addi-tional heating (section 2.5), and the case of underdense heatingwhen f0 $ f0F2
(section 2.6). A discussion of the essentialexperimental findings and conclusions is given in section 3.
2. ObservationsThree experimental campaigns at the SURA station were
performed in September 1996, 1997, and 1998, all concentrat-
FROLOV ET AL.: SEE BROAD UPSHIFTED STRUCTURE20,920
ing on the BUS feature. In the first, the pump wave wasradiated in the frequency range f0 5 4.3–5.1 MHz, that is,between the third and fourth gyroharmonic. During these mea-surements the F2 critical frequency, f0F2
, was not higher than4.6–5.1 MHz, and the experiments were conducted under con-ditions when f0 was close to f0F2
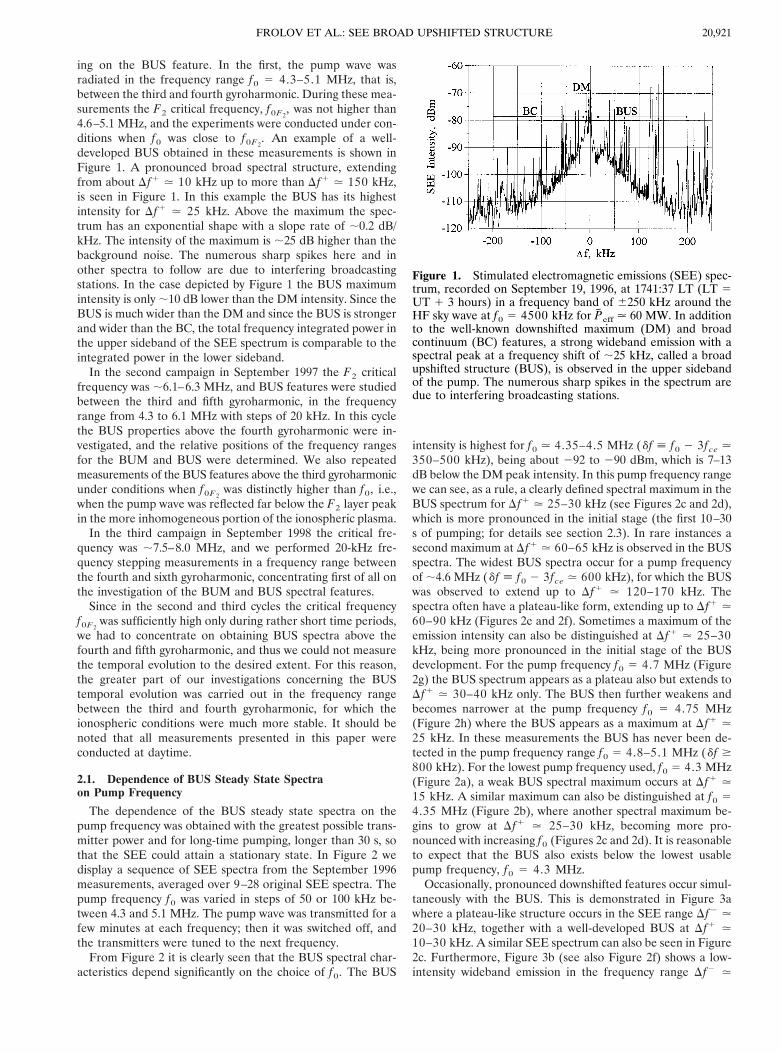
. An example of a well-developed BUS obtained in these measurements is shown inFigure 1. A pronounced broad spectral structure, extendingfrom about Df1 . 10 kHz up to more than Df1 . 150 kHz,is seen in Figure 1. In this example the BUS has its highestintensity for Df1 . 25 kHz. Above the maximum the spec-trum has an exponential shape with a slope rate of ;0.2 dB/kHz. The intensity of the maximum is ;25 dB higher than thebackground noise. The numerous sharp spikes here and inother spectra to follow are due to interfering broadcastingstations. In the case depicted by Figure 1 the BUS maximumintensity is only ;10 dB lower than the DM intensity. Since theBUS is much wider than the DM and since the BUS is strongerand wider than the BC, the total frequency integrated power inthe upper sideband of the SEE spectrum is comparable to theintegrated power in the lower sideband.
In the second campaign in September 1997 the F2 criticalfrequency was ;6.1–6.3 MHz, and BUS features were studiedbetween the third and fifth gyroharmonic, in the frequencyrange from 4.3 to 6.1 MHz with steps of 20 kHz. In this cyclethe BUS properties above the fourth gyroharmonic were in-vestigated, and the relative positions of the frequency rangesfor the BUM and BUS were determined. We also repeatedmeasurements of the BUS features above the third gyroharmonicunder conditions when f0F2
was distinctly higher than f0, i.e.,when the pump wave was reflected far below the F2 layer peakin the more inhomogeneous portion of the ionospheric plasma.
In the third campaign in September 1998 the critical fre-quency was ;7.5–8.0 MHz, and we performed 20-kHz fre-quency stepping measurements in a frequency range betweenthe fourth and sixth gyroharmonic, concentrating first of all onthe investigation of the BUM and BUS spectral features.
Since in the second and third cycles the critical frequencyf0F2
was sufficiently high only during rather short time periods,we had to concentrate on obtaining BUS spectra above thefourth and fifth gyroharmonic, and thus we could not measurethe temporal evolution to the desired extent. For this reason,the greater part of our investigations concerning the BUStemporal evolution was carried out in the frequency rangebetween the third and fourth gyroharmonic, for which theionospheric conditions were much more stable. It should benoted that all measurements presented in this paper wereconducted at daytime.
2.1. Dependence of BUS Steady State Spectraon Pump Frequency
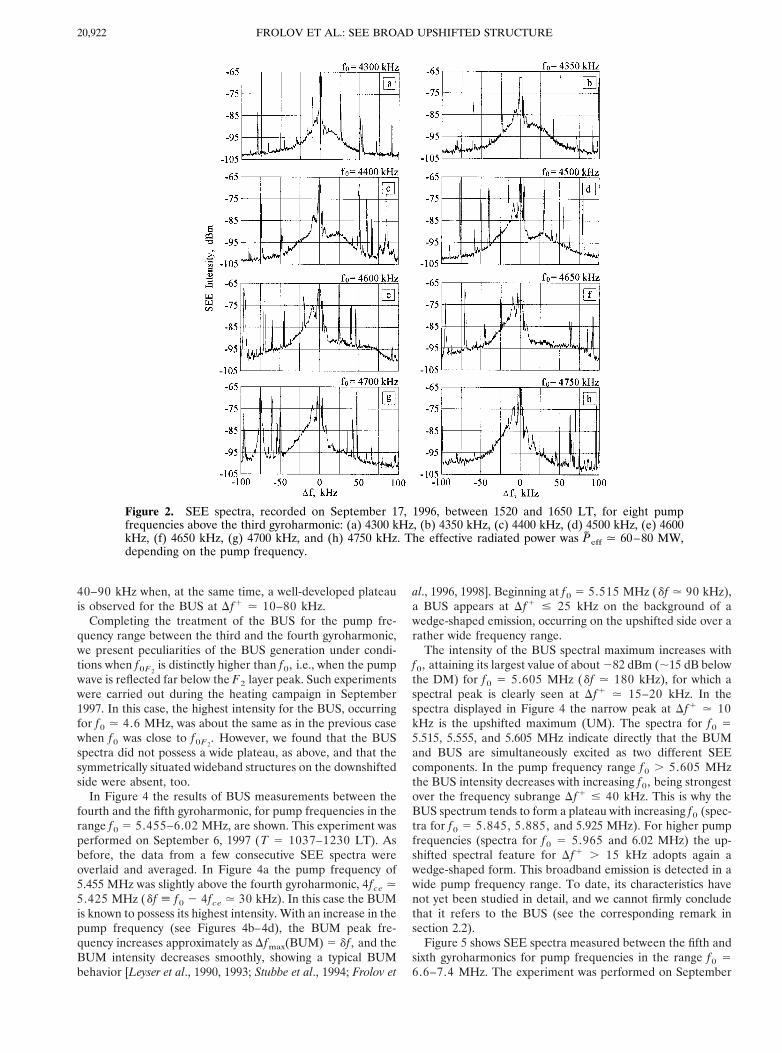
The dependence of the BUS steady state spectra on thepump frequency was obtained with the greatest possible trans-mitter power and for long-time pumping, longer than 30 s, sothat the SEE could attain a stationary state. In Figure 2 wedisplay a sequence of SEE spectra from the September 1996measurements, averaged over 9–28 original SEE spectra. Thepump frequency f0 was varied in steps of 50 or 100 kHz be-tween 4.3 and 5.1 MHz. The pump wave was transmitted for afew minutes at each frequency; then it was switched off, andthe transmitters were tuned to the next frequency.
From Figure 2 it is clearly seen that the BUS spectral char-acteristics depend significantly on the choice of f0. The BUS
intensity is highest for f0 . 4.35–4.5 MHz (df [ f0 2 3fce .350–500 kHz), being about 292 to 290 dBm, which is 7–13dB below the DM peak intensity. In this pump frequency rangewe can see, as a rule, a clearly defined spectral maximum in theBUS spectrum for Df1 . 25–30 kHz (see Figures 2c and 2d),which is more pronounced in the initial stage (the first 10–30s of pumping; for details see section 2.3). In rare instances asecond maximum at Df1 . 60–65 kHz is observed in the BUSspectra. The widest BUS spectra occur for a pump frequencyof ;4.6 MHz (df [ f0 2 3fce . 600 kHz), for which the BUSwas observed to extend up to Df1 . 120–170 kHz. Thespectra often have a plateau-like form, extending up to Df1 .60–90 kHz (Figures 2e and 2f). Sometimes a maximum of theemission intensity can also be distinguished at Df1 . 25–30kHz, being more pronounced in the initial stage of the BUSdevelopment. For the pump frequency f0 5 4.7 MHz (Figure2g) the BUS spectrum appears as a plateau also but extends toDf1 . 30–40 kHz only. The BUS then further weakens andbecomes narrower at the pump frequency f0 5 4.75 MHz(Figure 2h) where the BUS appears as a maximum at Df1 .25 kHz. In these measurements the BUS has never been de-tected in the pump frequency range f0 5 4.8–5.1 MHz (df $800 kHz). For the lowest pump frequency used, f0 5 4.3 MHz(Figure 2a), a weak BUS spectral maximum occurs at Df1 .15 kHz. A similar maximum can also be distinguished at f0 54.35 MHz (Figure 2b), where another spectral maximum be-gins to grow at Df1 . 25–30 kHz, becoming more pro-nounced with increasing f0 (Figures 2c and 2d). It is reasonableto expect that the BUS also exists below the lowest usablepump frequency, f0 5 4.3 MHz.
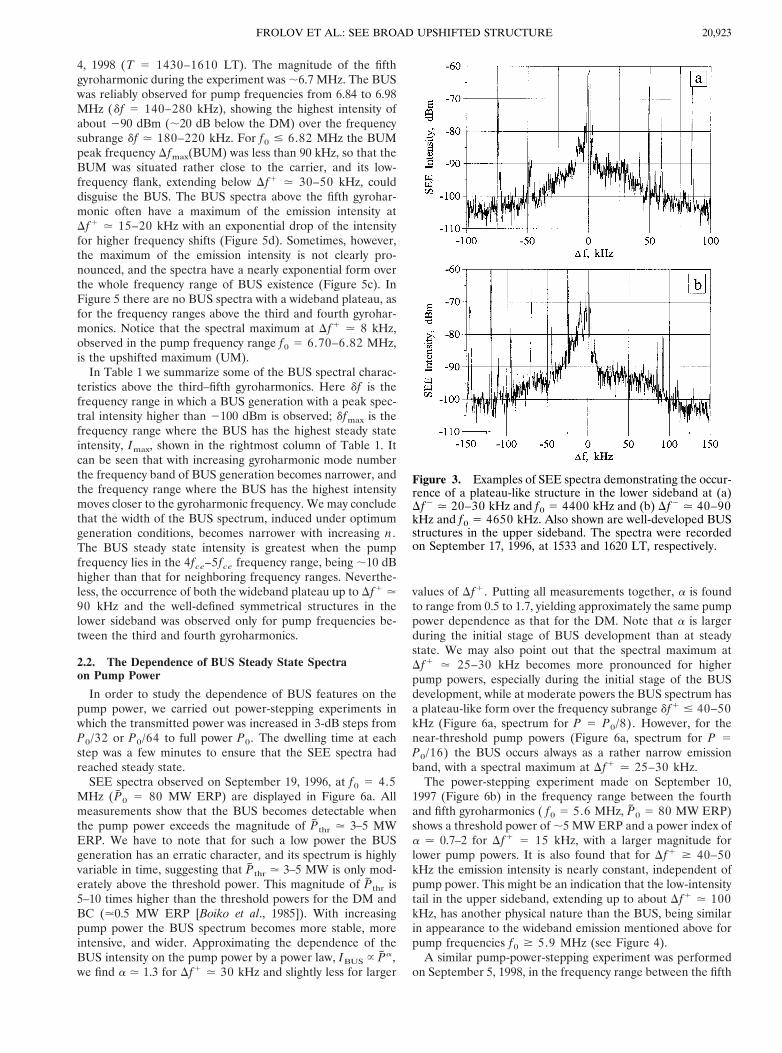
Occasionally, pronounced downshifted features occur simul-taneously with the BUS. This is demonstrated in Figure 3awhere a plateau-like structure occurs in the SEE range Df2 .20–30 kHz, together with a well-developed BUS at Df1 .10–30 kHz. A similar SEE spectrum can also be seen in Figure2c. Furthermore, Figure 3b (see also Figure 2f) shows a low-intensity wideband emission in the frequency range Df2 .
Figure 1. Stimulated electromagnetic emissions (SEE) spec-trum, recorded on September 19, 1996, at 1741:37 LT (LT 5UT 1 3 hours) in a frequency band of 6250 kHz around theHF sky wave at f0 5 4500 kHz for Peff . 60 MW. In additionto the well-known downshifted maximum (DM) and broadcontinuum (BC) features, a strong wideband emission with aspectral peak at a frequency shift of ;25 kHz, called a broadupshifted structure (BUS), is observed in the upper sidebandof the pump. The numerous sharp spikes in the spectrum aredue to interfering broadcasting stations.
20,921FROLOV ET AL.: SEE BROAD UPSHIFTED STRUCTURE
40–90 kHz when, at the same time, a well-developed plateauis observed for the BUS at Df1 . 10–80 kHz.
Completing the treatment of the BUS for the pump fre-quency range between the third and the fourth gyroharmonic,we present peculiarities of the BUS generation under condi-tions when f0F2
is distinctly higher than f0, i.e., when the pumpwave is reflected far below the F2 layer peak. Such experimentswere carried out during the heating campaign in September1997. In this case, the highest intensity for the BUS, occurringfor f0 . 4.6 MHz, was about the same as in the previous casewhen f0 was close to f0F2
. However, we found that the BUSspectra did not possess a wide plateau, as above, and that thesymmetrically situated wideband structures on the downshiftedside were absent, too.
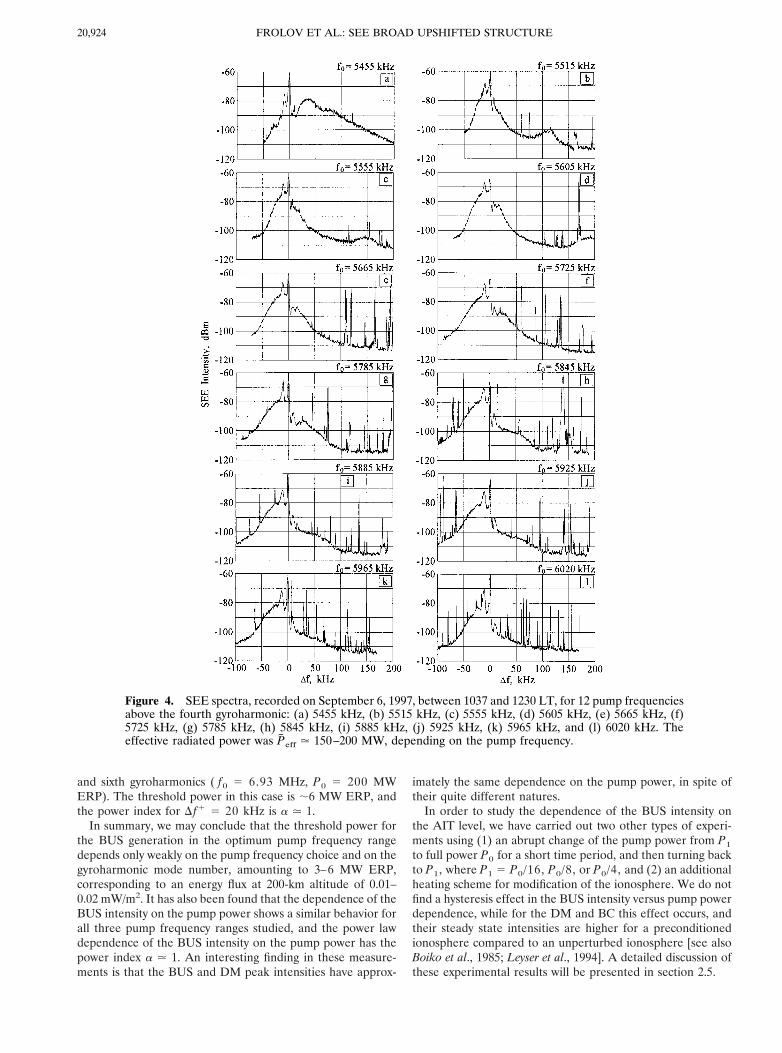
In Figure 4 the results of BUS measurements between thefourth and the fifth gyroharmonic, for pump frequencies in therange f0 5 5.455–6.02 MHz, are shown. This experiment wasperformed on September 6, 1997 (T 5 1037–1230 LT). Asbefore, the data from a few consecutive SEE spectra wereoverlaid and averaged. In Figure 4a the pump frequency of5.455 MHz was slightly above the fourth gyroharmonic, 4fce .5.425 MHz (df [ f0 2 4fce . 30 kHz). In this case the BUMis known to possess its highest intensity. With an increase in thepump frequency (see Figures 4b–4d), the BUM peak fre-quency increases approximately as Dfmax(BUM) 5 df , and theBUM intensity decreases smoothly, showing a typical BUMbehavior [Leyser et al., 1990, 1993; Stubbe et al., 1994; Frolov et
al., 1996, 1998]. Beginning at f0 5 5.515 MHz (df . 90 kHz),a BUS appears at Df1 # 25 kHz on the background of awedge-shaped emission, occurring on the upshifted side over arather wide frequency range.
The intensity of the BUS spectral maximum increases withf0, attaining its largest value of about 282 dBm (;15 dB belowthe DM) for f0 5 5.605 MHz (df . 180 kHz), for which aspectral peak is clearly seen at Df1 . 15–20 kHz. In thespectra displayed in Figure 4 the narrow peak at Df1 . 10kHz is the upshifted maximum (UM). The spectra for f0 55.515, 5.555, and 5.605 MHz indicate directly that the BUMand BUS are simultaneously excited as two different SEEcomponents. In the pump frequency range f0 . 5.605 MHzthe BUS intensity decreases with increasing f0, being strongestover the frequency subrange Df1 # 40 kHz. This is why theBUS spectrum tends to form a plateau with increasing f0 (spec-tra for f0 5 5.845, 5.885, and 5.925 MHz). For higher pumpfrequencies (spectra for f0 5 5.965 and 6.02 MHz) the up-shifted spectral feature for Df1 . 15 kHz adopts again awedge-shaped form. This broadband emission is detected in awide pump frequency range. To date, its characteristics havenot yet been studied in detail, and we cannot firmly concludethat it refers to the BUS (see the corresponding remark insection 2.2).
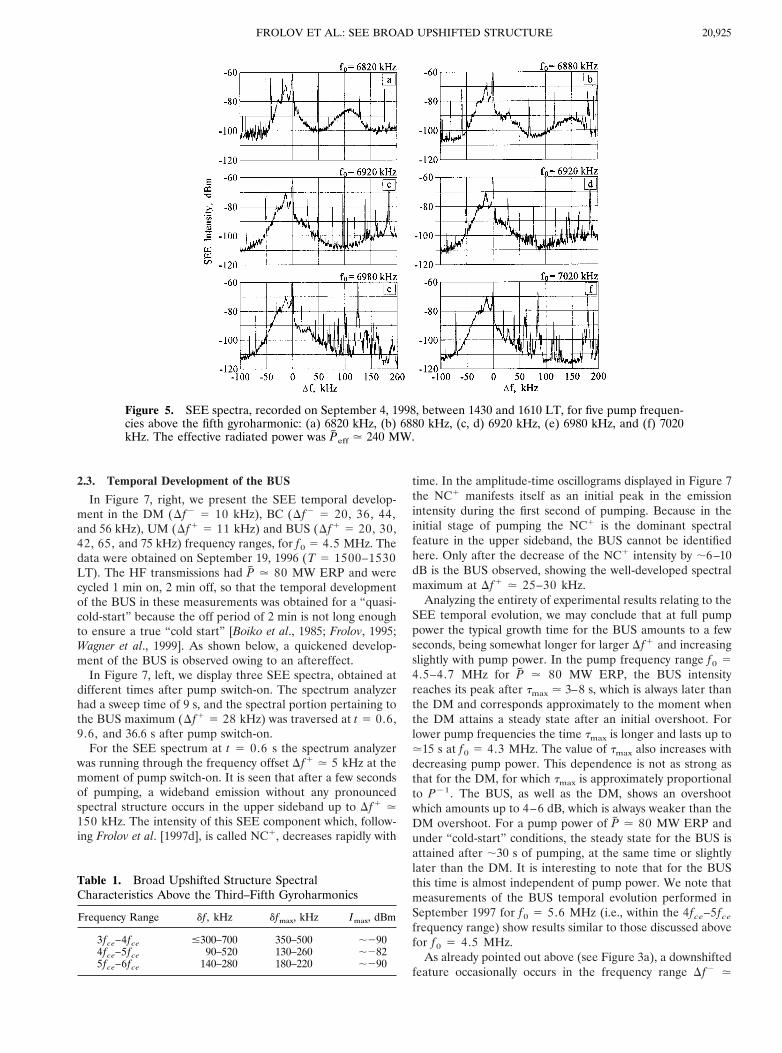
Figure 5 shows SEE spectra measured between the fifth andsixth gyroharmonics for pump frequencies in the range f0 56.6–7.4 MHz. The experiment was performed on September
Figure 2. SEE spectra, recorded on September 17, 1996, between 1520 and 1650 LT, for eight pumpfrequencies above the third gyroharmonic: (a) 4300 kHz, (b) 4350 kHz, (c) 4400 kHz, (d) 4500 kHz, (e) 4600kHz, (f) 4650 kHz, (g) 4700 kHz, and (h) 4750 kHz. The effective radiated power was Peff . 60–80 MW,depending on the pump frequency.
FROLOV ET AL.: SEE BROAD UPSHIFTED STRUCTURE20,922
4, 1998 (T 5 1430–1610 LT). The magnitude of the fifthgyroharmonic during the experiment was ;6.7 MHz. The BUSwas reliably observed for pump frequencies from 6.84 to 6.98MHz (df 5 140–280 kHz), showing the highest intensity ofabout 290 dBm (;20 dB below the DM) over the frequencysubrange df . 180–220 kHz. For f0 # 6.82 MHz the BUMpeak frequency Dfmax(BUM) was less than 90 kHz, so that theBUM was situated rather close to the carrier, and its low-frequency flank, extending below Df1 . 30–50 kHz, coulddisguise the BUS. The BUS spectra above the fifth gyrohar-monic often have a maximum of the emission intensity atDf1 . 15–20 kHz with an exponential drop of the intensityfor higher frequency shifts (Figure 5d). Sometimes, however,the maximum of the emission intensity is not clearly pro-nounced, and the spectra have a nearly exponential form overthe whole frequency range of BUS existence (Figure 5c). InFigure 5 there are no BUS spectra with a wideband plateau, asfor the frequency ranges above the third and fourth gyrohar-monics. Notice that the spectral maximum at Df1 . 8 kHz,observed in the pump frequency range f0 5 6.70–6.82 MHz,is the upshifted maximum (UM).
In Table 1 we summarize some of the BUS spectral charac-teristics above the third–fifth gyroharmonics. Here df is thefrequency range in which a BUS generation with a peak spec-tral intensity higher than 2100 dBm is observed; dfmax is thefrequency range where the BUS has the highest steady stateintensity, Imax, shown in the rightmost column of Table 1. Itcan be seen that with increasing gyroharmonic mode numberthe frequency band of BUS generation becomes narrower, andthe frequency range where the BUS has the highest intensitymoves closer to the gyroharmonic frequency. We may concludethat the width of the BUS spectrum, induced under optimumgeneration conditions, becomes narrower with increasing n .The BUS steady state intensity is greatest when the pumpfrequency lies in the 4fce–5fce frequency range, being ;10 dBhigher than that for neighboring frequency ranges. Neverthe-less, the occurrence of both the wideband plateau up to Df1 .90 kHz and the well-defined symmetrical structures in thelower sideband was observed only for pump frequencies be-tween the third and fourth gyroharmonics.
2.2. The Dependence of BUS Steady State Spectraon Pump Power
In order to study the dependence of BUS features on thepump power, we carried out power-stepping experiments inwhich the transmitted power was increased in 3-dB steps fromP0/32 or P0/64 to full power P0. The dwelling time at eachstep was a few minutes to ensure that the SEE spectra hadreached steady state.
SEE spectra observed on September 19, 1996, at f0 5 4.5MHz (P0 5 80 MW ERP) are displayed in Figure 6a. Allmeasurements show that the BUS becomes detectable whenthe pump power exceeds the magnitude of Pthr . 3–5 MWERP. We have to note that for such a low power the BUSgeneration has an erratic character, and its spectrum is highlyvariable in time, suggesting that Pthr . 3–5 MW is only mod-erately above the threshold power. This magnitude of Pthr is5–10 times higher than the threshold powers for the DM andBC (.0.5 MW ERP [Boiko et al., 1985]). With increasingpump power the BUS spectrum becomes more stable, moreintensive, and wider. Approximating the dependence of theBUS intensity on the pump power by a power law, IBUS } Pa,we find a . 1.3 for Df1 . 30 kHz and slightly less for larger
values of Df1. Putting all measurements together, a is foundto range from 0.5 to 1.7, yielding approximately the same pumppower dependence as that for the DM. Note that a is largerduring the initial stage of BUS development than at steadystate. We may also point out that the spectral maximum atDf1 . 25–30 kHz becomes more pronounced for higherpump powers, especially during the initial stage of the BUSdevelopment, while at moderate powers the BUS spectrum hasa plateau-like form over the frequency subrange df1 # 40–50kHz (Figure 6a, spectrum for P 5 P0/8). However, for thenear-threshold pump powers (Figure 6a, spectrum for P 5P0/16) the BUS occurs always as a rather narrow emissionband, with a spectral maximum at Df1 . 25–30 kHz.
The power-stepping experiment made on September 10,1997 (Figure 6b) in the frequency range between the fourthand fifth gyroharmonics ( f0 5 5.6 MHz, P0 5 80 MW ERP)shows a threshold power of ;5 MW ERP and a power index ofa . 0.7–2 for Df1 5 15 kHz, with a larger magnitude forlower pump powers. It is also found that for Df1 $ 40–50kHz the emission intensity is nearly constant, independent ofpump power. This might be an indication that the low-intensitytail in the upper sideband, extending up to about Df1 . 100kHz, has another physical nature than the BUS, being similarin appearance to the wideband emission mentioned above forpump frequencies f0 $ 5.9 MHz (see Figure 4).
A similar pump-power-stepping experiment was performedon September 5, 1998, in the frequency range between the fifth
Figure 3. Examples of SEE spectra demonstrating the occur-rence of a plateau-like structure in the lower sideband at (a)Df2 . 20–30 kHz and f0 5 4400 kHz and (b) Df2 . 40–90kHz and f0 5 4650 kHz. Also shown are well-developed BUSstructures in the upper sideband. The spectra were recordedon September 17, 1996, at 1533 and 1620 LT, respectively.
20,923FROLOV ET AL.: SEE BROAD UPSHIFTED STRUCTURE
and sixth gyroharmonics ( f0 5 6.93 MHz, P0 5 200 MWERP). The threshold power in this case is ;6 MW ERP, andthe power index for Df1 5 20 kHz is a . 1.
In summary, we may conclude that the threshold power forthe BUS generation in the optimum pump frequency rangedepends only weakly on the pump frequency choice and on thegyroharmonic mode number, amounting to 3–6 MW ERP,corresponding to an energy flux at 200-km altitude of 0.01–0.02 mW/m2. It has also been found that the dependence of theBUS intensity on the pump power shows a similar behavior forall three pump frequency ranges studied, and the power lawdependence of the BUS intensity on the pump power has thepower index a . 1. An interesting finding in these measure-ments is that the BUS and DM peak intensities have approx-
imately the same dependence on the pump power, in spite oftheir quite different natures.
In order to study the dependence of the BUS intensity onthe AIT level, we have carried out two other types of experi-ments using (1) an abrupt change of the pump power from P1
to full power P0 for a short time period, and then turning backto P1, where P1 5 P0/16, P0/8, or P0/4, and (2) an additionalheating scheme for modification of the ionosphere. We do notfind a hysteresis effect in the BUS intensity versus pump powerdependence, while for the DM and BC this effect occurs, andtheir steady state intensities are higher for a preconditionedionosphere compared to an unperturbed ionosphere [see alsoBoiko et al., 1985; Leyser et al., 1994]. A detailed discussion ofthese experimental results will be presented in section 2.5.
Figure 4. SEE spectra, recorded on September 6, 1997, between 1037 and 1230 LT, for 12 pump frequenciesabove the fourth gyroharmonic: (a) 5455 kHz, (b) 5515 kHz, (c) 5555 kHz, (d) 5605 kHz, (e) 5665 kHz, (f)5725 kHz, (g) 5785 kHz, (h) 5845 kHz, (i) 5885 kHz, (j) 5925 kHz, (k) 5965 kHz, and (l) 6020 kHz. Theeffective radiated power was Peff . 150–200 MW, depending on the pump frequency.
FROLOV ET AL.: SEE BROAD UPSHIFTED STRUCTURE20,924
2.3. Temporal Development of the BUS
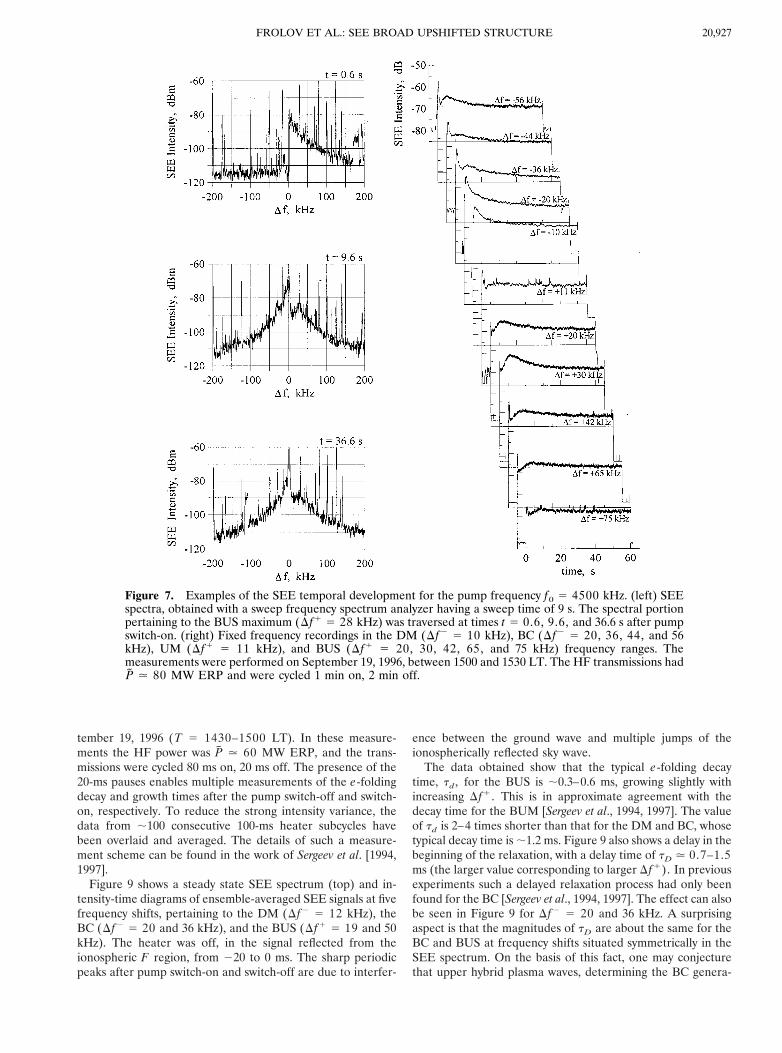
In Figure 7, right, we present the SEE temporal develop-ment in the DM (Df2 5 10 kHz), BC (Df2 5 20, 36, 44,and 56 kHz), UM (Df1 5 11 kHz) and BUS (Df1 5 20, 30,42, 65, and 75 kHz) frequency ranges, for f0 5 4.5 MHz. Thedata were obtained on September 19, 1996 (T 5 1500–1530LT). The HF transmissions had P . 80 MW ERP and werecycled 1 min on, 2 min off, so that the temporal developmentof the BUS in these measurements was obtained for a “quasi-cold-start” because the off period of 2 min is not long enoughto ensure a true “cold start” [Boiko et al., 1985; Frolov, 1995;Wagner et al., 1999]. As shown below, a quickened develop-ment of the BUS is observed owing to an aftereffect.
In Figure 7, left, we display three SEE spectra, obtained atdifferent times after pump switch-on. The spectrum analyzerhad a sweep time of 9 s, and the spectral portion pertaining tothe BUS maximum (Df1 5 28 kHz) was traversed at t 5 0.6,9.6, and 36.6 s after pump switch-on.
For the SEE spectrum at t 5 0.6 s the spectrum analyzerwas running through the frequency offset Df1 . 5 kHz at themoment of pump switch-on. It is seen that after a few secondsof pumping, a wideband emission without any pronouncedspectral structure occurs in the upper sideband up to Df1 .150 kHz. The intensity of this SEE component which, follow-ing Frolov et al. [1997d], is called NC1, decreases rapidly with
time. In the amplitude-time oscillograms displayed in Figure 7the NC1 manifests itself as an initial peak in the emissionintensity during the first second of pumping. Because in theinitial stage of pumping the NC1 is the dominant spectralfeature in the upper sideband, the BUS cannot be identifiedhere. Only after the decrease of the NC1 intensity by ;6–10dB is the BUS observed, showing the well-developed spectralmaximum at Df1 . 25–30 kHz.
Analyzing the entirety of experimental results relating to theSEE temporal evolution, we may conclude that at full pumppower the typical growth time for the BUS amounts to a fewseconds, being somewhat longer for larger Df1 and increasingslightly with pump power. In the pump frequency range f0 54.5–4.7 MHz for P . 80 MW ERP, the BUS intensityreaches its peak after tmax . 3–8 s, which is always later thanthe DM and corresponds approximately to the moment whenthe DM attains a steady state after an initial overshoot. Forlower pump frequencies the time tmax is longer and lasts up to.15 s at f0 5 4.3 MHz. The value of tmax also increases withdecreasing pump power. This dependence is not as strong asthat for the DM, for which tmax is approximately proportionalto P21. The BUS, as well as the DM, shows an overshootwhich amounts up to 4–6 dB, which is always weaker than theDM overshoot. For a pump power of P . 80 MW ERP andunder “cold-start” conditions, the steady state for the BUS isattained after ;30 s of pumping, at the same time or slightlylater than the DM. It is interesting to note that for the BUSthis time is almost independent of pump power. We note thatmeasurements of the BUS temporal evolution performed inSeptember 1997 for f0 5 5.6 MHz (i.e., within the 4fce–5fce
frequency range) show results similar to those discussed abovefor f0 5 4.5 MHz.
As already pointed out above (see Figure 3a), a downshiftedfeature occasionally occurs in the frequency range Df2 .
Figure 5. SEE spectra, recorded on September 4, 1998, between 1430 and 1610 LT, for five pump frequen-cies above the fifth gyroharmonic: (a) 6820 kHz, (b) 6880 kHz, (c, d) 6920 kHz, (e) 6980 kHz, and (f) 7020kHz. The effective radiated power was Peff . 240 MW.
Table 1. Broad Upshifted Structure SpectralCharacteristics Above the Third–Fifth Gyroharmonics
Frequency Range df, kHz dfmax, kHz Imax, dBm
3fce–4fce #300–700 350–500 ;2904fce–5fce 90–520 130–260 ;2825fce–6fce 140–280 180–220 ;290
20,925FROLOV ET AL.: SEE BROAD UPSHIFTED STRUCTURE
20–40 kHz. Its temporal evolution can be seen in Figure 7 atthe frequency shifts Df2 5 20, 36, and 44 kHz (most dis-tinctly at Df2 5 36 kHz) within the time interval t 5 5–15 s.The fact that this emission appears simultaneously with theBUS may be considered as evidence for a direct connectionbetween this downshifted feature and the BUS.
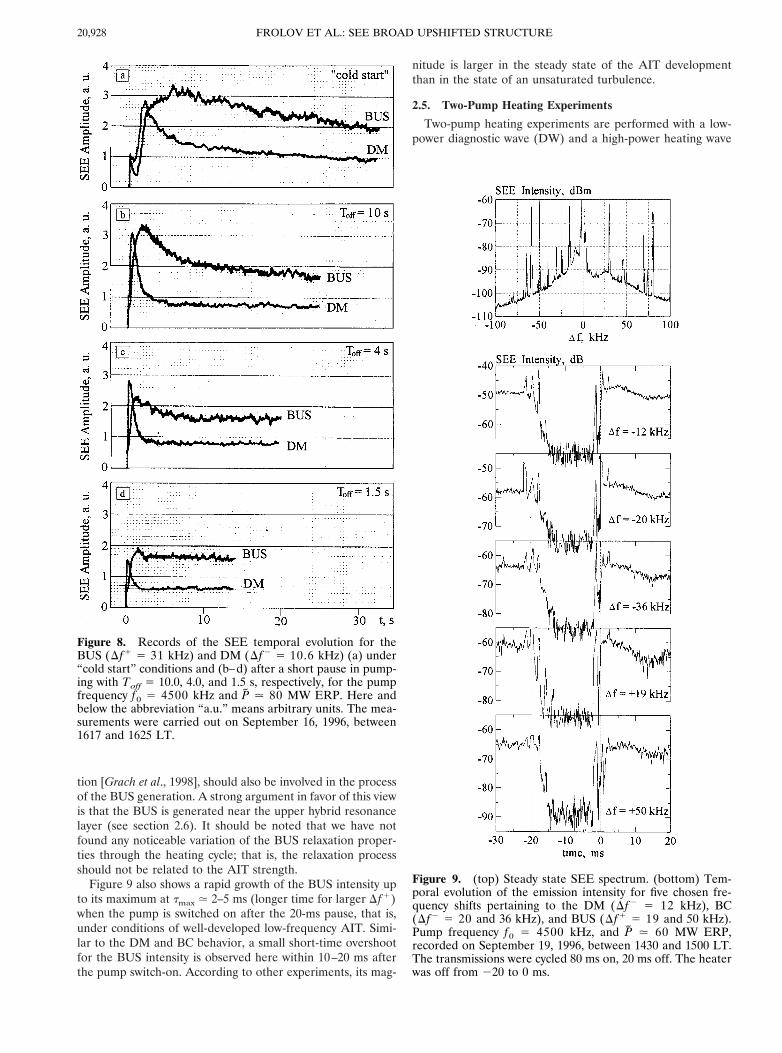
Figure 8 demonstrates in more detail the temporal behaviorof both the BUS (Df1 5 31 kHz) and the DM (Df2 5 10.6kHz) under “cold start” conditions (Figure 8a) and after ashort pause in pumping with Toff 5 10, 4, and 1.5 s. A precon-ditioning effect is clearly seen in the BUS and DM in the formof a strong dependence of the temporal development on thelength of the off period. The temporal evolution for the BUSand DM becomes faster for shorter Toff, both with regard tothe growth time and with regard to the time to reach the
overshoot maximum. It is important also that the magnitude ofthe BUS peak intensity and of the overshoot is smaller forshorter Toff. From the data obtained it can be concluded thatthe aftereffect lasts longer than 10 s. According to other data,the duration of the aftereffect is not less than 1–3 min. Figure8 is a pictorial example that shows that the BUS reaches itspeak intensity always later than the DM does, at the momentwhen the DM attains almost steady state after the initial over-shoot.
2.4. Decay of the BUS
A systematic investigation of the BUS relaxation after pumpwave switch-off has only been performed at f0 5 4.5 MHz(i.e., inside the frequency range from the third to the fourthgyroharmonic). The data in Figure 9 were obtained on Sep-
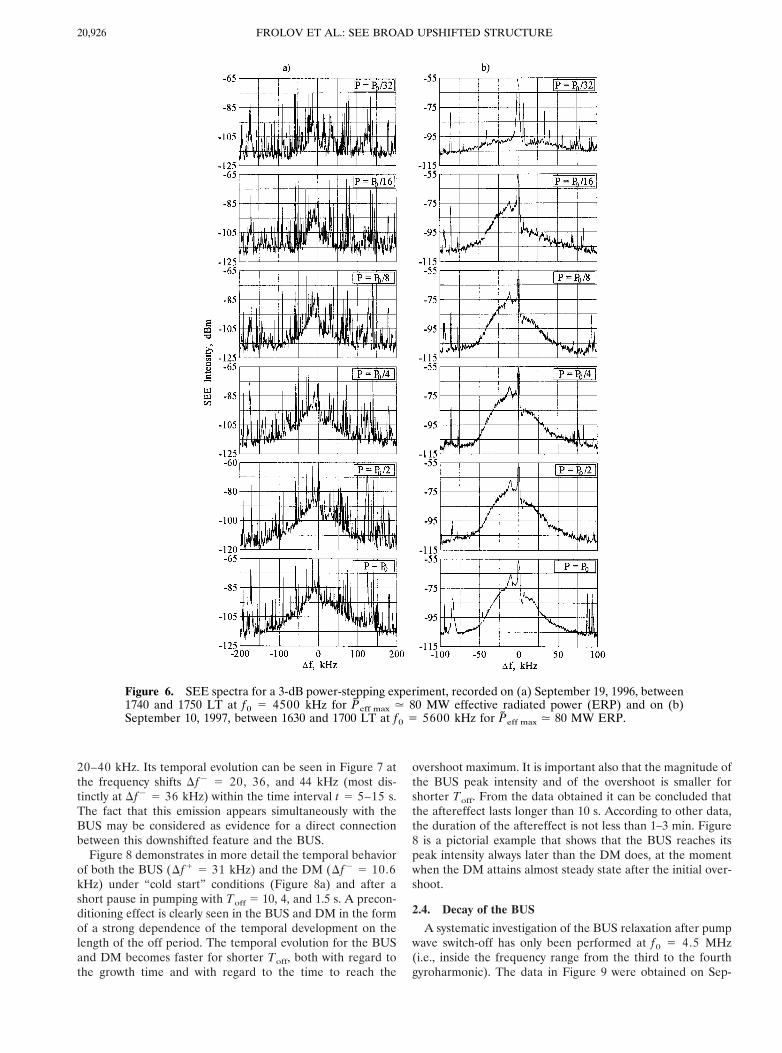
Figure 6. SEE spectra for a 3-dB power-stepping experiment, recorded on (a) September 19, 1996, between1740 and 1750 LT at f0 5 4500 kHz for Peff max . 80 MW effective radiated power (ERP) and on (b)September 10, 1997, between 1630 and 1700 LT at f0 5 5600 kHz for Peff max . 80 MW ERP.
FROLOV ET AL.: SEE BROAD UPSHIFTED STRUCTURE20,926
tember 19, 1996 (T 5 1430–1500 LT). In these measure-ments the HF power was P . 60 MW ERP, and the trans-missions were cycled 80 ms on, 20 ms off. The presence of the20-ms pauses enables multiple measurements of the e-foldingdecay and growth times after the pump switch-off and switch-on, respectively. To reduce the strong intensity variance, thedata from ;100 consecutive 100-ms heater subcycles havebeen overlaid and averaged. The details of such a measure-ment scheme can be found in the work of Sergeev et al. [1994,1997].
Figure 9 shows a steady state SEE spectrum (top) and in-tensity-time diagrams of ensemble-averaged SEE signals at fivefrequency shifts, pertaining to the DM (Df2 5 12 kHz), theBC (Df2 5 20 and 36 kHz), and the BUS (Df1 5 19 and 50kHz). The heater was off, in the signal reflected from theionospheric F region, from 220 to 0 ms. The sharp periodicpeaks after pump switch-on and switch-off are due to interfer-
ence between the ground wave and multiple jumps of theionospherically reflected sky wave.
The data obtained show that the typical e-folding decaytime, td, for the BUS is ;0.3–0.6 ms, growing slightly withincreasing Df1. This is in approximate agreement with thedecay time for the BUM [Sergeev et al., 1994, 1997]. The valueof td is 2–4 times shorter than that for the DM and BC, whosetypical decay time is ;1.2 ms. Figure 9 also shows a delay in thebeginning of the relaxation, with a delay time of tD . 0.7–1.5ms (the larger value corresponding to larger Df1). In previousexperiments such a delayed relaxation process had only beenfound for the BC [Sergeev et al., 1994, 1997]. The effect can alsobe seen in Figure 9 for Df2 5 20 and 36 kHz. A surprisingaspect is that the magnitudes of tD are about the same for theBC and BUS at frequency shifts situated symmetrically in theSEE spectrum. On the basis of this fact, one may conjecturethat upper hybrid plasma waves, determining the BC genera-
Figure 7. Examples of the SEE temporal development for the pump frequency f0 5 4500 kHz. (left) SEEspectra, obtained with a sweep frequency spectrum analyzer having a sweep time of 9 s. The spectral portionpertaining to the BUS maximum (Df1 5 28 kHz) was traversed at times t 5 0.6, 9.6, and 36.6 s after pumpswitch-on. (right) Fixed frequency recordings in the DM (Df2 5 10 kHz), BC (Df2 5 20, 36, 44, and 56kHz), UM (Df1 5 11 kHz), and BUS (Df1 5 20, 30, 42, 65, and 75 kHz) frequency ranges. Themeasurements were performed on September 19, 1996, between 1500 and 1530 LT. The HF transmissions hadP . 80 MW ERP and were cycled 1 min on, 2 min off.
20,927FROLOV ET AL.: SEE BROAD UPSHIFTED STRUCTURE
tion [Grach et al., 1998], should also be involved in the processof the BUS generation. A strong argument in favor of this viewis that the BUS is generated near the upper hybrid resonancelayer (see section 2.6). It should be noted that we have notfound any noticeable variation of the BUS relaxation proper-ties through the heating cycle; that is, the relaxation processshould not be related to the AIT strength.
Figure 9 also shows a rapid growth of the BUS intensity upto its maximum at tmax . 2–5 ms (longer time for larger Df1)when the pump is switched on after the 20-ms pause, that is,under conditions of well-developed low-frequency AIT. Simi-lar to the DM and BC behavior, a small short-time overshootfor the BUS intensity is observed here within 10–20 ms afterthe pump switch-on. According to other experiments, its mag-
nitude is larger in the steady state of the AIT developmentthan in the state of an unsaturated turbulence.
2.5. Two-Pump Heating Experiments
Two-pump heating experiments are performed with a low-power diagnostic wave (DW) and a high-power heating wave
Figure 8. Records of the SEE temporal evolution for theBUS (Df1 5 31 kHz) and DM (Df2 5 10.6 kHz) (a) under“cold start” conditions and (b–d) after a short pause in pump-ing with Toff 5 10.0, 4.0, and 1.5 s, respectively, for the pumpfrequency f0 5 4500 kHz and P . 80 MW ERP. Here andbelow the abbreviation “a.u.” means arbitrary units. The mea-surements were carried out on September 16, 1996, between1617 and 1625 LT.
Figure 9. (top) Steady state SEE spectrum. (bottom) Tem-poral evolution of the emission intensity for five chosen fre-quency shifts pertaining to the DM (Df2 5 12 kHz), BC(Df2 5 20 and 36 kHz), and BUS (Df1 5 19 and 50 kHz).Pump frequency f0 5 4500 kHz, and P . 60 MW ERP,recorded on September 19, 1996, between 1430 and 1500 LT.The transmissions were cycled 80 ms on, 20 ms off. The heaterwas off from 220 to 0 ms.
FROLOV ET AL.: SEE BROAD UPSHIFTED STRUCTURE20,928
(HW). The DW is used to stimulate the SEE, and its power isalways chosen low enough to induce an unsaturated turbulencelevel, thereby allowing a flexible response to external actions.The much more powerful HW is used to create additionalionospheric perturbations whose influence on the AIT evolu-tion is then monitored by the DW in the form of changes in theSEE features. Varying the power, frequency, polarization, andtiming of the HW, the two-pump heating scheme allows us toinvestigate the influence of such various factors as tempera-ture, large-scale plasma density perturbations, striations, andenergetic electrons [Frolov, 1995] on the SEE generation andevolution and, consequently, on the AIT.
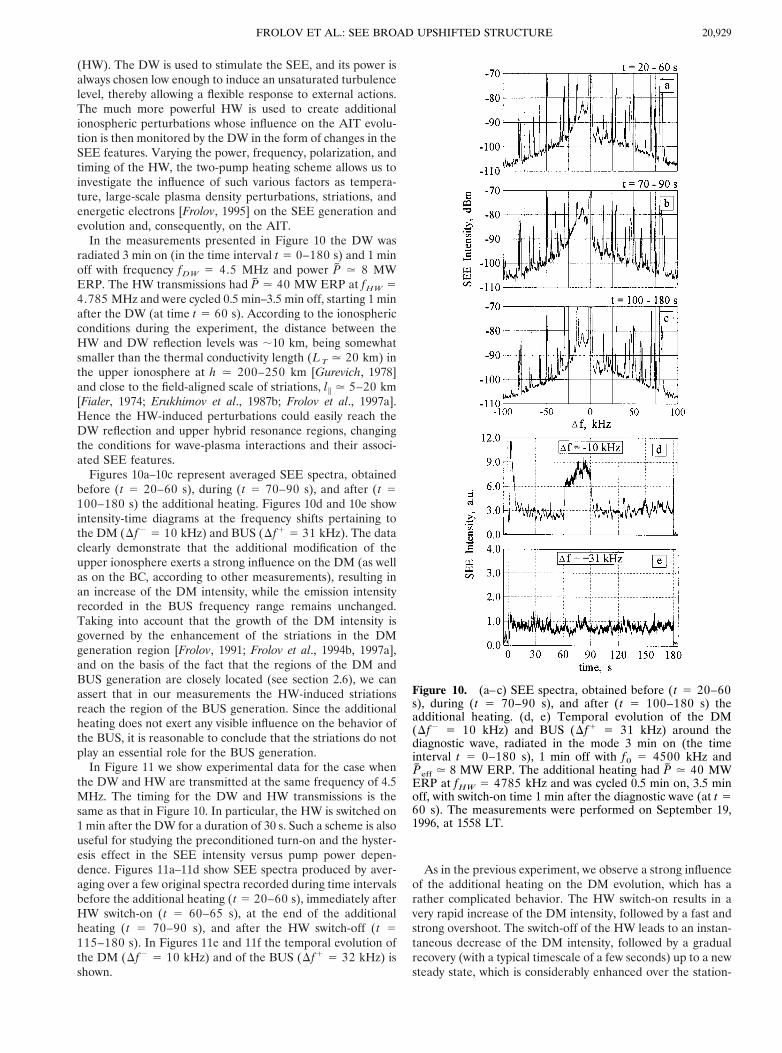
In the measurements presented in Figure 10 the DW wasradiated 3 min on (in the time interval t 5 0–180 s) and 1 minoff with frequency fDW 5 4.5 MHz and power P . 8 MWERP. The HW transmissions had P . 40 MW ERP at fHW 54.785 MHz and were cycled 0.5 min–3.5 min off, starting 1 minafter the DW (at time t 5 60 s). According to the ionosphericconditions during the experiment, the distance between theHW and DW reflection levels was ;10 km, being somewhatsmaller than the thermal conductivity length (LT . 20 km) inthe upper ionosphere at h . 200–250 km [Gurevich, 1978]and close to the field-aligned scale of striations, li . 5–20 km[Fialer, 1974; Erukhimov et al., 1987b; Frolov et al., 1997a].Hence the HW-induced perturbations could easily reach theDW reflection and upper hybrid resonance regions, changingthe conditions for wave-plasma interactions and their associ-ated SEE features.
Figures 10a–10c represent averaged SEE spectra, obtainedbefore (t 5 20–60 s), during (t 5 70–90 s), and after (t 5100–180 s) the additional heating. Figures 10d and 10e showintensity-time diagrams at the frequency shifts pertaining tothe DM (Df2 5 10 kHz) and BUS (Df1 5 31 kHz). The dataclearly demonstrate that the additional modification of theupper ionosphere exerts a strong influence on the DM (as wellas on the BC, according to other measurements), resulting inan increase of the DM intensity, while the emission intensityrecorded in the BUS frequency range remains unchanged.Taking into account that the growth of the DM intensity isgoverned by the enhancement of the striations in the DMgeneration region [Frolov, 1991; Frolov et al., 1994b, 1997a],and on the basis of the fact that the regions of the DM andBUS generation are closely located (see section 2.6), we canassert that in our measurements the HW-induced striationsreach the region of the BUS generation. Since the additionalheating does not exert any visible influence on the behavior ofthe BUS, it is reasonable to conclude that the striations do notplay an essential role for the BUS generation.
In Figure 11 we show experimental data for the case whenthe DW and HW are transmitted at the same frequency of 4.5MHz. The timing for the DW and HW transmissions is thesame as that in Figure 10. In particular, the HW is switched on1 min after the DW for a duration of 30 s. Such a scheme is alsouseful for studying the preconditioned turn-on and the hyster-esis effect in the SEE intensity versus pump power depen-dence. Figures 11a–11d show SEE spectra produced by aver-aging over a few original spectra recorded during time intervalsbefore the additional heating (t 5 20–60 s), immediately afterHW switch-on (t 5 60–65 s), at the end of the additionalheating (t 5 70–90 s), and after the HW switch-off (t 5115–180 s). In Figures 11e and 11f the temporal evolution ofthe DM (Df2 5 10 kHz) and of the BUS (Df1 5 32 kHz) isshown.
As in the previous experiment, we observe a strong influenceof the additional heating on the DM evolution, which has arather complicated behavior. The HW switch-on results in avery rapid increase of the DM intensity, followed by a fast andstrong overshoot. The switch-off of the HW leads to an instan-taneous decrease of the DM intensity, followed by a gradualrecovery (with a typical timescale of a few seconds) up to a newsteady state, which is considerably enhanced over the station-
Figure 10. (a–c) SEE spectra, obtained before (t 5 20–60s), during (t 5 70–90 s), and after (t 5 100–180 s) theadditional heating. (d, e) Temporal evolution of the DM(Df2 5 10 kHz) and BUS (Df1 5 31 kHz) around thediagnostic wave, radiated in the mode 3 min on (the timeinterval t 5 0–180 s), 1 min off with f0 5 4500 kHz andPeff . 8 MW ERP. The additional heating had P . 40 MWERP at fHW 5 4785 kHz and was cycled 0.5 min on, 3.5 minoff, with switch-on time 1 min after the diagnostic wave (at t 560 s). The measurements were performed on September 19,1996, at 1558 LT.
20,929FROLOV ET AL.: SEE BROAD UPSHIFTED STRUCTURE

ary level prior to the HW action but roughly the same as thestationary level for the HW pumping stage. According toGrach [1985], Frolov et al. [1994b], and Shvarts et al. [1994],such a temporal evolution of the DM is determined by theinfluence of striations on both the emission generation and theanomalous absorption (AA) of secondary electromagneticwaves (i.e., SEE) in the disturbed ionospheric volume. In thisdescription the switch-on of the HW results in an instanta-neous growth of the intensity of HF-induced upper hybridplasma waves which play a crucial role in the DM generation[Leyser et al., 1994] and, as a consequence, in a rapid increaseof the strength of the striations with scales of l' # 3 m [Frolovet al., 1997a] within less than 1 s. These factors lead to anintensification of the DM generation. During the next stage ofpump-plasma interaction the growth of both striations withfield-perpendicular scales l' $ 3 m and of the AA begins toplay an increasing role in the evolution of the emission, result-ing in the attenuation of emissions escaping the disturbedvolume and thereby being responsible for the overshoot of theDM. When the HW is switched off (at t 5 90 s in Figure 11),the intensity of the upper hybrid waves decreases abruptly (ona timescale of a few milliseconds [Sergeev et al., 1997]), and somay be responsible for the associated rapid and significantdamping of the DM, for the decrease in the striation strengthon a timescale of a few seconds [Erukhimov et al., 1987b; Frolovet al., 1997a], and consequently for the decrease of the AA.The latter, in turn, results in the growth of the received DMintensity up to a value well above the emission intensity for theprior lower power heating. The hysteresis in the DM intensityis explained in terms of the hysteresis effect in the dependenceof the striation intensity on the pump power found in earlierexperiments [Erukhimov et al., 1978; Jones et al., 1983]. Thusthe DM evolution reflects directly the variations in the striationintensity, both through the generation and the absorption ofthe emissions in the disturbed ionospheric volume. Since theDM is the dominant SEE feature, it is the one which is mostappropriate for diagnosing the striation properties.
Figure 11 shows that contrary to the DM response, theintensification of the BUS (see Figure 11f for Df1 5 32 kHz)occurs only during the HW heating, owing to the direct in-crease in the pump power. We see here neither a well-developed transition after the HW switch-off (during a fewseconds, corresponding to a transition of the striations inten-sity to a new steady state) nor a hysteresis effect. In someinstances the BUS intensity is even lower after the additionalheating than under “cold start” conditions, as a result of ahigher AA acting on the emissions escaping the disturbedvolume due to the hysteresis effect of the striations. The BUSbehavior found here gives reason to claim that striations arenot a dominant factor for the BUS generation. This confirmsour earlier conclusion.
In the cases when the ERP for the DW is rather low and theBUS is not detected on the background of other SEE compo-nents, an aftereffect of the low-power pumping is neverthelessobserved as a faster development of the BUS after the HWswitch-on, compared to “cold start” pumping. Such an after-effect has a threshold character and at f0 5 4.5 MHz occursfor P(DW) $ 2 MW ERP only. On the basis of these exper-imental results, we can conclude that a DW-excited artificialturbulence can exert an influence on the BUS evolution. Themost likely reason is an enhanced level of HF-excited upperand lower hybrid plasma waves.
It should also be emphasized that in the initial stage of HW
Figure 11. (a–d) SEE spectra, obtained before switch-on(t 5 20–60 s), immediately after switch-on (t 5 60–65 s), atthe end of the on-time (t 5 70–90 s), and after switch-off (t 5115–180 s) of the additional heating. (e, f) Temporal evolu-tion of the DM (Df2 5 10 kHz) and BUS (Df1 5 32 kHz)around the diagnostic wave, radiated in the mode 3 min on (thetime interval t 5 0–180 s), 1 min off with f0 5 4500 kHz andPeff . 2 MW ERP. The additional heating had P . 40 MWERP at fHW 5 f0 5 4500 kHz and was cycled 0.5 min on, 3.5min off, with switch-on time 1 min after the diagnostic wave (att 5 60 s). The measurements were performed on September19, 1996, at 1652 LT.
FROLOV ET AL.: SEE BROAD UPSHIFTED STRUCTURE20,930
pumping (see the spectrum for the time interval t 5 60–65 sin Figure 11) the BUS spectrum has a double-humped shapewith equidistant maxima at frequency shifts of ;30 and 60kHz. Under steady state conditions (see the spectrum for thetime interval t 5 70–90 s) the second maximum is not aspronounced, if distinguishable at all. As mentioned in section2.1, a clearly defined double-humped shape of the BUS spec-trum is a very rare event in “cold start” experiments.
2.6. Underdense Heating
In observations made on September 17, 1996, from 1700 to1830 LT, the pump frequency was set to f0 5 4.5 MHz undersunset conditions when the F2 layer critical frequency, f0F2
decreased from 4.7 to 4.2 MHz. The measurements showedthat both the DM and BUS are developed even for underdenseheating when f0 is up to 200 kHz above f0F2
. This frequencydifference approximately corresponds to the difference be-tween the upper hybrid resonance frequency and the plasmaresonance frequency. For the DM this phenomenon was firstreported by Leyser et al. [1990], with the conclusion that theDM is generated primarily near the upper hybrid resonancelayer for the pump wave. Our data allow us to conclude thatthe BUS is also generated in the vicinity of the upper hybridresonance layer. This result is of major importance for a theoryaiming at an explanation of the BUS generation.
3. Summary and ConclusionsWe have presented experimental data obtained in a wide
frequency range between the third and sixth electron cyclotronharmonic, and we have shown that for pump frequencies farfrom a gyroharmonic an intense upshifted wideband emission,called BUS, can be produced in the ionospheric F2 region,modified by a powerful HF O-mode wave. The basic findingsconcerning the BUS features may be summarized as follows:
1. The characteristics of the BUS show a pronounced de-pendence on the gyroharmonic mode number, nfce. Withgrowing n the frequency band of BUS generation becomesnarrower, mainly owing to a decrease of its upper frequencyfrom df . 700 kHz (.0.5fce) to .520 kHz (.0.4fce) andfurther to .280 kHz (.0.2fce) for the 3fce–4fce, 4fce–5fce,and 5fce–6fce frequency ranges, respectively. Along with thisfrequency band narrowing, the frequency subrange of the high-est BUS intensity moves closer to a gyroharmonic. These re-sults may be considered as a hint that the BUS is also agyroharmonic feature. The data presented in the paper (seeTable 1) show that the BUS steady state intensity is greatest forpump frequencies lying in the 4fce–5fce frequency range wherethe widest and most intense BC is also observed [Leyser et al.,1993]. However, one should take into account that the magni-tude of the BUS overshoot, similar to the DM and BC over-shoot, grows with decreasing pump frequency, especially forf0 , 5.5 MHz [Sergeev et al., 1999]. This fact could be partiallyresponsible for the weaker BUS steady state intensity in the3fce–4fce frequency range, in comparison with its intensityabove 4fce. It should be pointed out that the widest plateau(up to Df1 . 90 kHz) occurs in the 3fce–4fce frequencyrange, and a well-defined symmetrical structure in the lowersideband is only observed in the 3fce–4fce frequency range,too.
2. The BUS becomes detectable when the pump powerexceeds a threshold of Peff . 3–6 MW ERP, slightly increasingwith increasing gyroharmonic mode number. For the condi-
tions of our experiments this magnitude of Peff is ;5–10 timeshigher than the threshold power for the thermal parametricinstability and the associated DM and BC generation, whichamounts to ;0.5–1 MW ERP [Frolov, 1995; Boiko et al., 1985].The BUS intensity versus pump power dependence in steadystate is roughly the same for all three pump frequency rangesstudied, showing a power law dependence with a power indexof a . 1 on average. With growing pump power the BUSspectrum becomes wider, and its spectral maximum at Df1 .15–30 kHz becomes more pronounced, especially in the initialstage of the BUS development. For the BUS no hysteresiseffect in its intensity versus pump power dependence is found.
3. The growth time for the BUS is a few seconds, as for theDM whose temporal behavior is determined largely by thedevelopment of HF-induced small-scale striations [Frolov,1991, 1995; Leyser et al., 1994]. However, the BUS is fullydeveloped only after 15–30 s of pumping, while the DM hasalready attained a steady state following the overshoot. Similarto the DM, the BUS shows a preconditioning effect, i.e., adependence of its temporal evolution on the power and theintermediate off-time of a previous pumping. In a precondi-tioned ionosphere the BUS intensity grows much faster than itdoes under “cold start” conditions. Taking into account thatthe DM and the BUS are generated in the vicinity of the upperhybrid resonance layer, and that there exists some similaritybetween their temporal evolutions and their dependencies onpump power, one may assume that the striations exert aninfluence on the BUS evolution. On the other hand, the lack ofboth a hysteresis effect and a transition process after an abruptdecrease of the pump power leads us to the conclusion that thestriations do not play a role for the BUS generation as crucialas that for the DM and BC. An explanation for this apparentcontradiction has not been found yet.
4. The typical decay time for the BUS, tdBUS . 0.4–0.6 ms,
is in approximate agreement with tdBUM but 2–4 times shorter
than that for the DM and BC. We find that similar to the BC,the beginning of the BUS relaxation is delayed, with a delaytime of tD . 0.7–1.5 ms, the larger value corresponding tolarger Df1. The BC and BUS magnitudes of tD are approxi-mately the same at frequency shifts situated symmetrically inthe SEE spectrum.
5. The generation of the BUS and the BUM can be ob-served simultaneously, existing in the SEE spectra as two dif-ferent emission components. One should expect that becauseof its weaker intensity and closeness of its frequency range toa gyroharmonic frequency, the BUS can be masked by theBUM for the gyroharmonic mode number n $ 6.
6. Taking into account the experimental results concerningthe BUM properties [Leyser et al., 1990; Frolov et al., 1996,1998], we can conclude that the BUS and BUM have a numberof common features. Among the similarities are (1) closenessof their threshold powers, (2) their generation in the vicinity ofthe upper hybrid resonance layer, (3) the limited influence ofthe HF-induced small-scale striations on their evolution, (4)the absence of a hysteresis effect in the intensity versus pumppower dependence, (5) similar relaxation rates, which areshorter than that for the DM and BC, and (6) wide (up to a fewtens of kilohertz and more) and upshifted spectra. It is inter-esting to note also that the frequencies of the spectral maximafor the BUS, BSS, and one of two BUM components (BUM1
according to Frolov et al. [1998]) are approximately the same,15–30 kHz, showing a rather slow dependence on the pumpfrequency for all of them. Among the differences are (1) the
20,931FROLOV ET AL.: SEE BROAD UPSHIFTED STRUCTURE
generation of the BUM only when f0 is close to nfce, while thegeneration of the BUS occurs for f0 far from nfce, (2) theexistence of downshifted emissions, symmetrically situated tothe BUS, and (3) the existence of a BUS delay in the relaxationprocess, similar to that for the BC.
Up to now, no adequate theoretical interpretation of theBUS generation has been presented. It should be mentionedthat the theoretical work on SEE generation has concentratedon two limiting cases: (1) when f0 is close to a gyroharmonicfrequency, uf0 2 nfceu # 100–200 kHz [see, e.g., Rao andKaup, 1990; Tripathi and Liu, 1993; Grach et al., 1994; Leyser etal., 1994; Huang and Kuo, 1994; Zhou et al., 1994; Huang et al.,1995; Istomin and Leyser, 1995; Laxmi and Tripathi, 1997],explaining mainly the DM, BUM, and BSS properties in thegyroharmonic frequency ranges, and (2) when f0 is outside thisfrequency range without taking into account gyroeffects [see,e.g., Grach, 1985; Vas’kov and Puchkov, 1990; Mjølhus et al.,1995; Grach et al., 1998]. The results of the present paper haveshown that the influence of cyclotron resonance on the SEEfeatures can be spread over a much wider frequency range thannfce 6 (100–200) kHz.
Taking into account that the region of BUS generation isplaced in the vicinity of the upper hybrid resonance layer, it isreasonable to conclude that perpendicularly propagatingmodes such as the upper hybrid, electron Bernstein, and lowerhybrid waves, as well as small-scale striations, are strong can-didates for the mechanism of BUS generation. Grach [1998]shows that for f0 well above nfce the transformation of upperhybrid wave energy into the Bernstein mode is very weak, andthe pump wave energy is almost totally fed into upper hybridwaves, resulting in both very strong BC and BUS generation.However, a direct connection between the BC and BUS fea-tures is not confirmed by the available data concerning thespectral characteristics and the temporal evolution. Besides, itis worth noting that there is a pump frequency range a fewhundred kilohertz above the BUS generation range where ex-citation of the DM and the BC is not observed. This phenom-enon has not been considered yet and cannot be explained bythe suggested SEE models.
In general, putting all the observed and as yet unexplainedfeatures of the BUS, BUM, and BSS together, it is clear thatnew theoretical efforts are needed to achieve a more consistentdescription of the physical processes involved in the interactionof a powerful O-mode wave with the magnetized ionosphericplasma.
Acknowledgments. We gratefully acknowledge the technical sup-port from the staff of the SURA heating facility. We are very thankfulfor the financial support from the Max-Planck-Institut fur Aeronomie.This work has been supported by INTAS grant 95-IN/RU-434 and thegrants from the Russian Basic Research Foundation 97-02-16397, 98-05-64509, and 99-02-16479.
Michel Blanc thanks Michael T. Rietveld and another referee fortheir assistance in evaluating this paper.
ReferencesBelikovich, V. V., et al., New results of investigations of nonlinear
phenomena in the ionosphere, Radiophys. Quantum. Electron., Engl.Transl., 18, 516–526, 1975.
Belikovich, V. V., E. A. Benediktov, S. M. Grach, and G. I. Terina,Double transformation of waves by scattering from artificial iono-spheric irregularities, in The XIIIth All Soviet Union Conference ofRadiowave Propagation (in Russian), vol. 1, pp. 107–109, Nauka,Moscow, 1981.
Boiko, G. N., L. M. Erukhimov, V. A. Zyuzin, G. P. Komrakov, S. A.Metelev, N. A. Mityakov, V. A. Nikonov, V. A. Ryzhov, Y. V.Tokarev, and V. L. Frolov, Dynamic characteristics of stimulatedelectromagnetic emission from ionospheric plasma, Radiophys.Quantum Electron., Engl. Transl., 28, 259–268, 1985.
Das, A. S., and J. A. Fejer, Resonance instability of small-scale field-aligned irregularities, J. Geophys. Res., 84, 6701–6704, 1979.
Erukhimov, L. M., S. A. Metelev, N. A. Mityakov, and V. L. Frolov,Hysteresis phenomenon by artificial excitation of irregularities inionospheric plasma, Radiophys. Quantum. Electron., Engl. Transl.,21, 1209–1211, 1978.
Erukhimov, L. M., V. Y. Kovalev, E. N. Kurakin, S. F. Marchenko,L. N. Rubtsov, E. N. Sergeev, and V. L. Frolov, Investigation ofinteraction of powerful radiowave with ionospheric plasma at lowlatitudes, Geomagn. Aeron., 27, 758–763, 1987a.
Erukhimov, L. M., S. A. Metelev, E. N. Myasnikov, N. A. Mityakov,and V. L. Frolov, Artificial ionospheric turbulence (review), Radio-phys. Quantum. Electron., Engl. Transl., 30, 156–171, 1987b.
Fialer, P. A., Field-aligned scattering from a heated region of theionosphere: Observations at HF and VHF, Radio Sci., 9, 923–940,1974.
Frolov, V. L., A new component of stimulated electromagnetic emis-sion, Geomagn. Aeron., 30, 975–978, 1990.
Frolov, V. L., Some remarks on the dynamics of artificial ionosphericradio emission, paper presented at 3rd Suzdal URSI Symposium onModification of the Ionosphere by Powerful Radio Waves (ISIM-3),Inst. of Terr. Magn. Ionos. and Radiowave Propag., Moscow, 1991.
Frolov, V. L., Artificial plasma turbulence induced in the ionosphericF-region by powerful HF waves: Results of experimental investiga-tions (in Russian), D.Sc. dissertation, Radio Phys. Res. Inst., NizhnyNovgorod, Russia, 1995.
Frolov, V. L., B. Thide, and T. Carozzi, Some new observations of theupshifted maximum in stimulated electromagnetic emission spectra,paper presented at 4th Suzdal URSI Symposium on Artificial Mod-ification of the Ionosphere, Inst. of Terr. Magn. Ionos. and Radio-wave Propag., Uppsala, Sweden, 1994a.
Frolov, V. L., G. N. Boiko, S. A. Metelev, and E. N. Sergeev, On thestudy of artificial ionospheric turbulence by means of stimulatedelectromagnetic emission, Radiophys. Quantum. Electron., Engl.Transl., 37, 593–603, 1994b.
Frolov, V. L., P. A. Bernhardt, and E. N. Sergeev, Experimental resultsof the heating campaign at the SURA facility in March–April, 1995,report, Radio Phys. Res. Inst., Nizhny Novgorod, Russia, 1995.
Frolov, V. L., S. M. Grach, L. M. Erukhimov, G. P. Komrakov, E. N.Sergeev, B. Thide, and T. Carozzi, Investigation of the temporalevolution of the broad upshifted maximum (BUM), Radiophys.Quantum. Electron., Engl. Transl., 39, 241–254, 1996.
Frolov, V. L., L. M. Erukhimov, S. A. Metelev, and E. N. Sergeev,Temporal behavior of artificial small-scale irregularities: Review ofexperimental results, J. Atmos. Sol. Terr. Phys., 59, 2317–2333, 1997a.
Frolov, V. L., L. M. Erukhimov, E. N. Ermakova, G. P. Komrakov,E. N. Sergeev, and P. Stubbe, A new upshifted spectral stimulatedelectromagnetic emission structure, observed between electron cy-clotron harmonics, Geophys. Res. Lett., 24, 1647–1650, 1997b.
Frolov, V. L., E. N. Sergeev, P. Stubbe, B. Thide, and T. B. Leyser,Studies of DM and UM features in SEE spectra performed at theSURA heating facility, paper presented at 5th European HeatingSeminar, Univ. of Oulu, Sodankyla, Finland, 1997c.
Frolov, V. L., G. P. Komrakov, E. N. Sergeev, B. Thide, M. Waldenvik,and E. Veszelei, Experimental results of investigation of narrowcontinuum features in stimulated electromagnetic emission spectra,Radiophys. Quantum. Electron., Engl. Transl., 40, 731–744, 1997d.
Frolov, V. L., L. M. Erukhimov, L. M. Kagan, G. P. Komrakov, E. N.Sergeev, and P. Stubbe, Two-component nature of the broad up-shifted maximum in stimulated electromagnetic emission (SEE)spectra, Phys. Rev. Lett., 81, 1630–1633, 1998.
Grach, S. M., Electromagnetic radiation of artificial ionosphericplasma turbulence, Radiophys. Quantum. Electron., Engl. Transl., 28,470–477, 1985.
Grach, S. M., The thermal parametric instability in ionospheric plas-mas (in Russian), D.Sc. dissertation, Radio Phys. Res. Inst., NizhnyNovgorod, Russia, 1998.
Grach, S. M., A. N. Karashtin, N. A. Mityakov, V. O. Rapoport, andV. Y. Trakhtengertz, Parametric interaction between electromag-netic radiation and the ionospheric plasma, Radiophys. Quantum.Electron., Engl. Transl., 20, 1254–1258, 1977.
FROLOV ET AL.: SEE BROAD UPSHIFTED STRUCTURE20,932
Grach, S. M., B. Thide, and T. Leyser, Plasma waves near the doubleresonance layer in the ionosphere, Radiophys. Quantum. Electron.,Engl. Transl., 37, 392–402, 1994.
Grach, S. M., V. L. Frolov, E. N. Sergeev, G. P. Komrakov, B. Thide,and T. Carozzi, Some new results on the spectral structure of stim-ulated electromagnetic emission, paper presented at Second VolgaInternational Summer School on Space Plasma Physics, Radio Phys.Res. Inst., Nizhny Novgorod, Russia, June 1995.
Grach, S. M., M. M. Shvarts, E. N. Sergeev, and V. L. Frolov, Broadcontinuum feature of stimulated electromagnetic emission, J. Atmos.Sol. Terr. Phys., 60, 1233–1246, 1998.
Gurevich, A. V., Nonlinear Phenomena in the Ionosphere, Springer-Verlag, New York, 1978.
Gurevich, A. V., A. V. Lukyanov, and K. P. Zybin, Stationary state ofisolated striations developed during ionospheric modification, Phys.Lett. A, 206, 247–259, 1995.
Gurevich, A. V., H. Carlson, A. V. Lukyanov, and K. P. Zybin, Para-metric decay of upper hybrid plasma waves trapped inside densityirregularities in the ionosphere, Phys. Lett. A, 231, 97–108, 1997.
Huang, J., and S. P. Kuo, A theoretical model for the broad upshiftedmaximum in the stimulated electromagnetic emission spectrum, J.Geophys. Res., 99, 19,569–19,576, 1994.
Huang, J., S. P. Kuo, and H. L. Zhou, A theoretical study on the broadsymmetrical structure in the stimulated electromagnetic emissionspectrum, J. Geophys. Res., 100, 1639–1645, 1995.
Istomin, Y. N., and T. B. Leyser, Parametric decay of an electromag-netic wave near electron cyclotron harmonics, Phys. Plasmas, 2(6),2084–2097, 1995.
Jones, T. B., T. Robinson, P. Stubbe, and H. Kopka, A hysteresis effectin the generation of field-aligned irregularities by a high power radiowave, Radio Sci., 18, 835–839, 1983.
Laxmi, V. N., and V. K. Tripathi, Resonant decay of upper hybridwaves and electromagnetic emissions near cyclotron harmonics inthe ionosphere, J. Geophys. Res., 102, 2545–2550, 1997.
Leyser, T. B., B. Thide, H. Derblom, Å. Hedberg, B. Lundborg,P. Stubbe, and H. Kopka, Dependence of stimulated electromag-netic emission on the ionosphere and pump wave, J. Geophys. Res.,95, 17,233–17,244, 1990.
Leyser, T. B., B. Thide, M. Waldenvik, S. Goodman, V. L. Frolov,S. M. Grach, A. N. Karashtin, G. P. Komrakov, and D. S. Kotik,Spectral structure of stimulated electromagnetic emission betweenelectron cyclotron harmonics, J. Geophys. Res., 98, 17,597–17,606,1993.
Leyser, T. B., B. Thide, M. Waldenvik, E. Veszelei, V. L. Frolov, S. M.Grach, and G. P. Komrakov, Downshifted maximum features instimulated electromagnetic emission spectra, J. Geophys. Res., 99,19,555–19,568, 1994.
Mjølhus, E., On the small scale striation effect in ionospheric radiomodification experiments near harmonics of the electron gyrofre-quency, J. Atmos. Terr. Phys., 55, 907–918, 1993.
Mjølhus, E., Parametric instabilities of trapped upper-hybrid oscilla-tions, J. Plasma Phys., 58, 747–769, 1997.
Mjølhus, E., Theoretical model for long time stimulated electromag-netic emission generation in ionospheric radio modification experi-ments, J. Geophys. Res., 103, 14,711–14,729, 1998.
Mjølhus, E., A. Hanssen, and D. F. DuBois, Radiation from electro-magnetically driven Langmuir turbulence, J. Geophys. Res., 100,17,527–17,541, 1995.
Rao, N. N., and D. J. Kaup, Upper hybrid mode conversion andresonance excitation of Bernstein modes in ionospheric heating ex-periment, J. Geophys. Res., 95, 17,245–17,252, 1990.
Sergeev, E. N., G. N. Boiko, and V. L. Frolov, Investigation of thedynamics of the HF plasma turbulence by means of artificial iono-spheric radio emission, Radiophys. Quantum. Electron., Engl. Transl.,37, 495–506, 1994.
Sergeev, E. N., V. L. Frolov, G. P. Komrakov, B. Thide, andT. Carozzi, Temporal evolution of HF-excited plasma waves, mea-sured at different pump frequencies by stimulated electromagneticemission, J. Atmos. Sol. Terr. Phys., 59, 2383–2400, 1997.
Sergeev, E. N., V. L. Frolov, S. M. Grach, G. P. Komrakov, P. Stubbe,
B. Thide, T. B. Leyser, and T. Carozzi, Influence of small-scalestriations on features of overshoot phenomenon in SEE temporalevolution (in Russian), Radiophys. Quant. Electron., 12, 619–634,1999.
Shvarts, M. M., S. M. Grach, E. N. Sergeev, and V. L. Frolov, Mod-elling of wideband component of artificial radio emission of theionosphere, Radiophys. Quantum. Electron., Engl. Transl., 37, 412–431, 1994.
Stocker, A. J., F. Honary, T. R. Robinson, T. B. Jones, and P. Stubbe,Anomalous absorption during artificial modification at harmonics ofthe electron gyrofrequency, J. Geophys. Res., 98, 13,627–13,634,1993.
Stubbe, P., Review of ionospheric modification experiments atTromsø, J. Atmos. Terr. Phys., 58, 349–368, 1996.
Stubbe, P., H. Kopka, T. B. Jones, and T. Robinson, Wide bandattenuation of radio waves caused by powerful HF waves: Saturationand dependence on ionospheric variability, J. Geophys. Res., 87,1551–1555, 1982.
Stubbe, P., H. Kopka, B. Thide, and H. Derblom, Stimulated electro-magnetic emission: A new technique to study the parametric decayinstability in the ionosphere, J. Geophys. Res., 89, 7523–7536, 1984.
Stubbe, P., and H. Kopka, Stimulated electromagnetic emission in themagnetized plasma: A new symmetric spectral feature, Phys. Rev.Lett., 65, 183–186, 1990.
Stubbe, P., A. J. Stocker, F. Honary, T. R. Robinson, and T. B. Jones,Stimulated electromagnetic emission and anomalous HF wave ab-sorption near electron gyroharmonics, J. Geophys. Res., 99, 6233–6246, 1994.
Thide, B., H. Kopka, and P. Stubbe, Observations of stimulated scat-tering of a strong high-frequency radio wave in the ionosphere, Phys.Rev. Lett., 49, 1561–1564, 1982.
Thide, B., Å. Hedberg, J. A. Fejer, and M. P. Sulzer, First observationsof stimulated electromagnetic emission at Arecibo, Geophys. Res.Lett., 16, 369–372, 1989.
Thide, B., F. T. Djuth, T. B. Leyser, and H. M. Ierkic, Evolution ofLangmuir turbulence and stimulated electromagnetic emission ex-cited with a 3-MHz pump wave at Arecibo, J. Geophys. Res., 100,23,887–23,889, 1995.
Tripathi, V. K., and C. S. Liu, O mode decay and upshifted electro-magnetic emissions near cyclotron harmonics in the ionosphere, J.Geophys. Res., 98, 1719–1723, 1993.
Utlaut, W. F., An ionospheric modification experiment using very highpower, high frequency transmission, J. Geophys. Res., 75, 6402–6405,1970.
Vas’kov, V. V., and A. V. Gurevich, Nonlinear resonant instability ofa plasma in the field of an ordinary electromagnetic wave, Sov. Phys.JETP, Engl. Transl., 42, 91–97, 1975.
Vas’kov, V. V., and V. A. Puchkov, Generation of the stimulatedelectromagnetic emission in the ionosphere due to scattering ofplasma waves from small-scale cavitons (in Russian), Fis. Plasmy, 16,1359–1366, 1990.
Wagner, L. S., P. A. Bernhardt, J. A. Goldstein, C. A. Selcher, V. L.Frolov, and E. N. Sergeev, Effect of ionospheric self-conditioningand preconditioning on the broad upshifted maximum component ofstimulated electromagnetic emission, J. Geophys. Res., 104, 2573–2590, 1999.
Zhou, H. L., J. Huang, and S. P. Kuo, Cascading of the upper hybrid/electron Bernstein wave in ionospheric heating experiments, Phys.Plasmas, 1(9), 3044–3052, 1994.
E. N. Ermakova, V. L. Frolov, L. M. Kagan, G. P. Komrakov, andE. N. Sergeev, Radiophysical Research Institute, B. Pecherskaya 25,603600 Nizhny Novgorod, Russia.
P. Stubbe, Max-Planck-Institut fur Aeronomie, Postfach 20, Max-Planck Str. 2, D-37191 Katlenburg-Lindau, Germany. ([email protected])
(Received June 25, 1999; revised February 14, 2000;accepted February 21, 2000.)
20,933FROLOV ET AL.: SEE BROAD UPSHIFTED STRUCTURE

20,934