Menin Interacts with the AP1 Transcription Factor JunD and Represses JunD-Activated Transcription
RESEARCH ARTICLE
Brn3a Regulates the Transition fromNeurogenesis to Terminal Differentiation andRepresses Non-Neural Gene Expression in theTrigeminal GanglionJason Lanier,1,2 Iain M. Dykes,1,2 Stephanie Nissen,1 S. Raisa Eng,1,2 and Eric E. Turner1,2*
The POU-domain transcription factor Brn3a is expressed in developing sensory neurons at all levels ofthe neural axis, including the trigeminal ganglion, hindbrain sensory ganglia, and dorsal root ganglia.Changes in global gene expression in the trigeminal ganglion from E11.5 to E13.5 reflect the repression ofearly neurogenic genes, exit from the cell cycle, and initiation of the expression of definitive markers ofsensory function. A majority of these developmental changes are perturbed in the trigeminal ganglia ofBrn3a knockout mice. At E13.5, Brn3a2/2 trigeminal neurons fail to repress a battery of developmentalregulators that are highly expressed at E11.5 and are normally down-regulated as development pro-gresses, and also fail to appropriately activate a set of definitive sensory genes. Remarkably, developingBrn3a2/2 trigeminal neurons also ectopically express multiple regulatory genes associated with cardiacand/or cranial mesoderm development, although definitive myogenic programs are not activated. The ma-jority of these genes are not ectopically expressed in the dorsal root ganglia of Brn3a null mice, perhapsdue to redundant mechanisms of repression at spinal levels. These results underscore the importance ofgene repression in regulating neuronal development, and the need for unbiased screens in the determina-tion of developmental gene regulatory programs. Developmental Dynamics 238:3065–3079, 2009. VC 2009Wiley-Liss, Inc.
Key words: Brn3a; trigeminal ganglion; sensory ganglion
Accepted 24 September 2009
INTRODUCTION
Information about the external worldis conveyed to the vertebrate brainby special sense organs for vision,olfaction, and hearing, and by theperipheral sensory nervous systemmediating general somatic sensation.Somatic sensory neurons innervatethe skin and muscles throughout thebody, and produce specialized struc-tures and molecular receptors forsensory modalities including pain,
touch, temperature, and position. Attrunk levels, somatic sensory neu-rons reside in the dorsal root ganglia(DRG) associated with each spinalsegment, and innervate the corre-sponding dermatomes and myo-tomes, while at cranial levels they re-side primarily in the trigeminalganglion (TG) and innervate the fa-cial skin and musculature.
Numerous studies have focused onthe unique developmental origin of
sensory neurons. At trunk levels, theDRG are generated from neural crestprecursors, while the sensory gangliaassociated with the cranial nerves,such as the TG, include contributionsfrom the neural crest and neurogenicplacodes derived from surface ecto-derm (Baker and Bronner-Fraser,2001). The earliest-expressed genesknown to have an essential role inspecifying the sensory lineage are thebHLH factors neurogenin1 (Neurog1)
Dev
elop
men
tal D
ynam
ics
Additional Supporting Information may be found in the online version of this article.1Department of Psychiatry and University of California, San Diego, California2VA San Diego Healthcare System, San Diego, CaliforniaGrant sponsor: Department of Veterans Affairs; Grant sponsor: NIH; Grant numbers: HD33442 and MH065496.*Correspondence to: Eric E. Turner, Department of Psychiatry and University of California, San Diego, CA 92093-0603.E-mail: [email protected]
DOI 10.1002/dvdy.22145Published online 29 October 2009 in Wiley InterScience (www.interscience.wiley.com).
DEVELOPMENTAL DYNAMICS 238:3065–3079, 2009
VC 2009 Wiley-Liss, Inc.
and neurogenin2 (Neurog2), withNeurog1 playing a predominant rolein the TG and DRG and Neurog2 theprincipal factor in sensory gangliaderived from the epibranchial placo-des (Fode et al., 1998; Ma et al., 1998,1999). In all sensory neurons, expres-sion of these factors is followed by thebHLH factors Neurod1 (BETA2) andNeurod4 (Math3), which are depend-ent on the neurogenins (Fode et al.,1998; Ma et al., 1998; Sommer et al.,1996).
Following the neurogenic phaseof sensory development, coincidingapproximately with the time of exitfrom the cell cycle, sensory neurons ofthe DRG and cranial ganglia expressthe ‘‘pan sensory’’ homeodomain tran-scription factors Brn3a (product ofthe Pou4f1 gene) and Islet1 (Enget al., 2001; Sun et al., 2008). Bothfactors are required to terminate theexpression of the bHLH neurogenicfactors (Eng et al., 2004, 2007; Sunet al., 2008). Brn3a has been shownto bind directly to enhancer regionswithin the Neurod1 and Neurod4 loci(Lanier et al., 2007), and a to negativeautoregulatory region within thePou4f1 locus itself (Lanier et al.,2007; Trieu et al., 1999, 2003). Assensory maturation progresses, bothBrn3a�/� and Islet1�/� sensory neu-rons fail to correctly express numer-ous markers of terminal sensory dif-ferentiation and subtype specification(Eng et al., 2004; Sun et al., 2008),demonstrating that these factors alsohave a direct or indirect positive regu-latory role in determining sensoryphenotypes.
In the present study, we have exam-ined changes in global gene expres-sion in the trigeminal ganglion fromE11.5 to E13.5, a critical period dur-ing which a majority of trigeminalneurons exit the cell cycle and initiatethe expression of definitive sensorymarkers. In the absence of Brn3a,sensory neurons are delayed in exe-cuting the changes in gene expressioncharacteristic of this time period. Theexpression of factors associated withcell proliferation is somewhat pro-longed, but cell cycle exit is accom-plished by E13.5 in both control andBrn3a�/� ganglia. At E13.5, Brn3a�/�
TG neurons fail to repress a battery ofdevelopmental regulators that arehighly expressed at E11.5 and are
normally down-regulated as develop-ment progresses. Conversely, numer-ous genes associated with mature sen-sory phenotypes fail to be expressedat normal levels. Surprisingly, in theabsence of Brn3a, developing TG neu-rons abnormally express several regu-latory factors, including Nkx2.5 (tin-man), Ankrd1 (CARP), Zfpm2 (Fog2),Lmcd1 (dyxin), Fgf10, Figf (VegfD),and Angpt1, which are normally asso-ciated with differentiating cardiacmyocytes and/or cranial musclesrather than sensory neurons. Thisunexpected role for Brn3a in therepression of non-neural genes insensory neurons illustrates that thegene expression programs regulatedby transcriptional repressors may beoccult and unexpected, and thatunbiased screens for downstream tar-gets are indispensible to understand-ing their functions.
RESULTS
Gene Expression Changes in
Sensory Maturation
Brn3a is expressed in sensory neu-rons at all axial levels around thetime of their exit from the cell cycle,or ‘‘birthdate,’’ and its expression alsocoincides with the onset of expressionof many genes that relate to specificneural functions. Thus, the regula-tory role of Brn3a must be understoodin the context of normal developmen-tal changes in gene expression takingplace during this period. For this rea-son, we began the current studies byexamining global gene expression inthe developing trigeminal ganglion atE11.5 and E13.5, bracketing a periodduring which a large fraction of tri-geminal neurons are born.
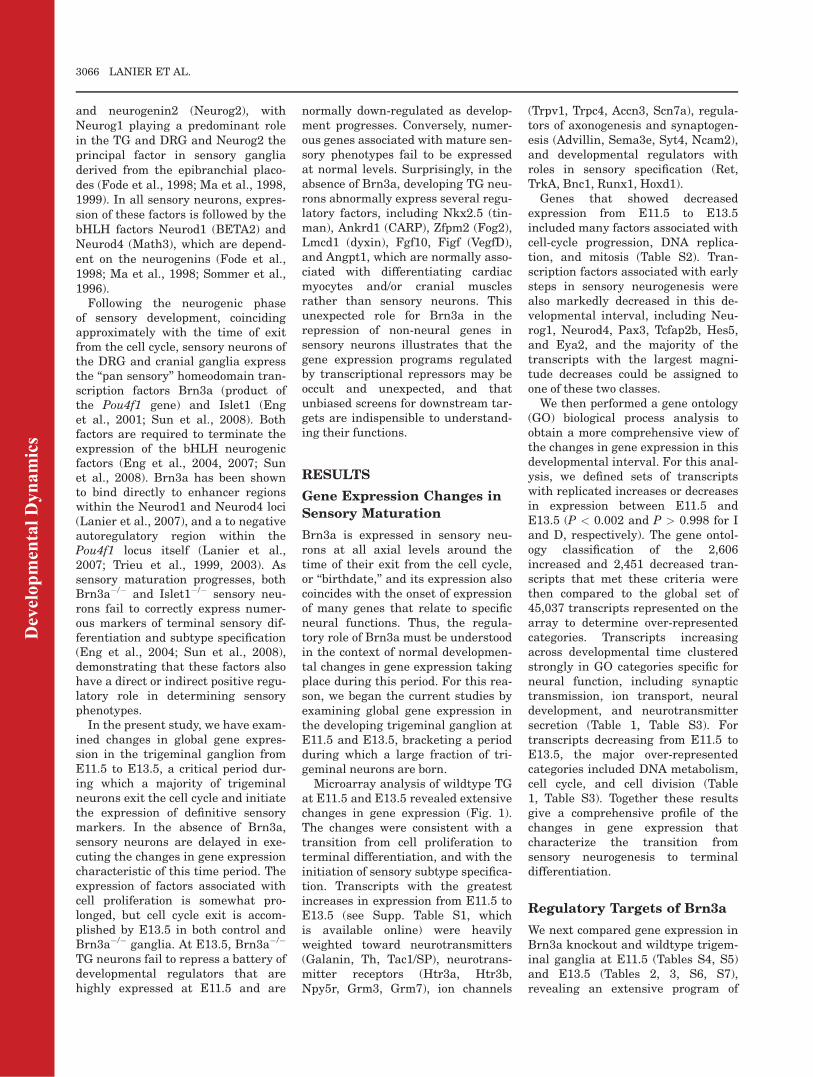
Microarray analysis of wildtype TGat E11.5 and E13.5 revealed extensivechanges in gene expression (Fig. 1).The changes were consistent with atransition from cell proliferation toterminal differentiation, and with theinitiation of sensory subtype specifica-tion. Transcripts with the greatestincreases in expression from E11.5 toE13.5 (see Supp. Table S1, whichis available online) were heavilyweighted toward neurotransmitters(Galanin, Th, Tac1/SP), neurotrans-mitter receptors (Htr3a, Htr3b,Npy5r, Grm3, Grm7), ion channels
(Trpv1, Trpc4, Accn3, Scn7a), regula-tors of axonogenesis and synaptogen-esis (Advillin, Sema3e, Syt4, Ncam2),and developmental regulators withroles in sensory specification (Ret,TrkA, Bnc1, Runx1, Hoxd1).Genes that showed decreased
expression from E11.5 to E13.5included many factors associated withcell-cycle progression, DNA replica-tion, and mitosis (Table S2). Tran-scription factors associated with earlysteps in sensory neurogenesis werealso markedly decreased in this de-velopmental interval, including Neu-rog1, Neurod4, Pax3, Tcfap2b, Hes5,and Eya2, and the majority of thetranscripts with the largest magni-tude decreases could be assigned toone of these two classes.We then performed a gene ontology
(GO) biological process analysis toobtain a more comprehensive view ofthe changes in gene expression in thisdevelopmental interval. For this anal-ysis, we defined sets of transcriptswith replicated increases or decreasesin expression between E11.5 andE13.5 (P < 0.002 and P > 0.998 for Iand D, respectively). The gene ontol-ogy classification of the 2,606increased and 2,451 decreased tran-scripts that met these criteria werethen compared to the global set of45,037 transcripts represented on thearray to determine over-representedcategories. Transcripts increasingacross developmental time clusteredstrongly in GO categories specific forneural function, including synaptictransmission, ion transport, neuraldevelopment, and neurotransmittersecretion (Table 1, Table S3). Fortranscripts decreasing from E11.5 toE13.5, the major over-representedcategories included DNA metabolism,cell cycle, and cell division (Table1, Table S3). Together these resultsgive a comprehensive profile of thechanges in gene expression thatcharacterize the transition fromsensory neurogenesis to terminaldifferentiation.
Regulatory Targets of Brn3a
We next compared gene expression inBrn3a knockout and wildtype trigem-inal ganglia at E11.5 (Tables S4, S5)and E13.5 (Tables 2, 3, S6, S7),revealing an extensive program of
Dev
elop
men
tal D
ynam
ics
3066 LANIER ET AL.
gene expression regulated by Brn3a.In general, the transcripts withaltered expression at E11.5 were asubset of those changed at E13.5,and the direction of change was con-sistent at both stages. Some of thesetranscripts have been previouslyidentified as downstream of Brn3a inthe developing TG (Eng et al., 2004)or DRG (Eng et al., 2007), but manynovel targets were identified due toimproved genomic coverage by thearrays used in the present study andprogress in annotation of the mousegenome.
A large fraction of the decreasedtranscripts in the Brn3a�/� TG repre-sent developmental signaling mole-cules or transcription factors known tobe associated with sensory subtypespecification. Some of these changes,such as decreased expression ofRunx3, TrkC, and Pou4f2/Brn3b, wereevident beginning at E11.5. Otherchanges, including decreased expres-
sion of Bnc1, Hmx1, HoxD1, andRunx1, were not observed until E13.5,due to the later developmental expres-sion of these factors. Loss of Brn3aalso resulted in markedly decreasedexpression of a large number of neu-ral-specific transcripts, including neu-rotransmitters (Gal, Adcyap1/Pacap,TH), receptors (Npy5r, Htr3b, Npy1r,Prokr1, Gpr149, Gpr64, Trpv1,Accn2), ion channels (Scn7a, Scn10a,Kcnab2, Kcna1), and cell surface mol-ecules that mediate cell survival,migration, and/or axon guidance(Ntrk3, Ntrk1, Rtn4rl2, Rtn4rl1).Many of these terminal differentiationgenes are not significantly expressedin E11.5 control ganglia, and thereforethe changes in Brn3a�/� ganglia werenoted mainly at E13.5.
The set of genes with increasedexpression in E13.5 Brn3a�/� TGincluded the abnormal persistence ofseveral transcription factors, whichare expressed in the early phases
of sensory development, includingNeurod1, Neurod4/Math3, Neurog1,Tcfap2b, Insm1, Six1, Eya1, andEya2. Also increased are several cell-cycle genes, including Cyclin B1,Cyclin D1, and Cdc20. However, theleast expected finding is a markedincrease in the expression of a set ofgenes normally associated with car-diac and cranial mesoderm develop-ment, which are examined in detailbelow.
An Interaction Between
Developmental Stage and
Brn3a Genotype
The abnormal persistence of multipleclasses of genes expressed in early de-velopment in the TG of Brn3a�/� miceled us to examine the global interac-tion between developmental changesin gene expression and Brn3a geno-type. A comparative GO analysis of thetranscripts altered in Brn3a�/� TG atE13.5 with changes in gene expressionfrom E11.5 to E13.5 confirmed such arelationship (Table S3). Transcriptswith decreased expression in the E13.5Brn3a�/� TG were associated with GOcategories including ion transport(including channels and receptors), cellcommunication (including signal trans-duction and neuropeptide signaling),and axonogenesis. Nearly all of thesecategories were also overrepresentedin the GO analysis of transcriptsincreasing from E11.5 to E13.5 (Table1, Table S3). Transcripts with in-creased expression in the E13.5Brn3a�/� TG were associated with GOcategories that included the cell cycle,cell division, DNA metabolism, andembryonic and neural development.The cell cycle–related categories werehighly correlated with the GO classifi-cation of transcripts decreasing fromE11.5 to E13.5 (Table 1, Table S3).We then performed a regression
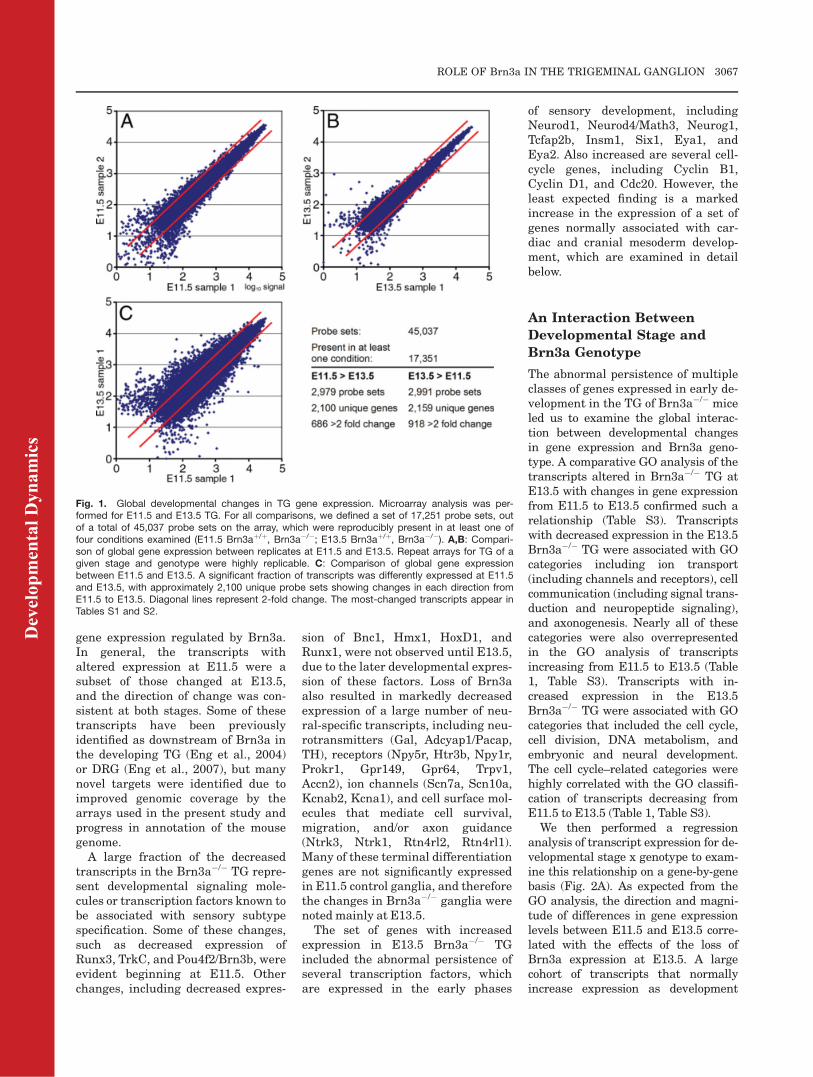
analysis of transcript expression for de-velopmental stage x genotype to exam-ine this relationship on a gene-by-genebasis (Fig. 2A). As expected from theGO analysis, the direction and magni-tude of differences in gene expressionlevels between E11.5 and E13.5 corre-lated with the effects of the loss ofBrn3a expression at E13.5. A largecohort of transcripts that normallyincrease expression as development
Fig. 1. Global developmental changes in TG gene expression. Microarray analysis was per-formed for E11.5 and E13.5 TG. For all comparisons, we defined a set of 17,251 probe sets, outof a total of 45,037 probe sets on the array, which were reproducibly present in at least one offour conditions examined (E11.5 Brn3aþ/þ, Brn3a�/�; E13.5 Brn3aþ/þ, Brn3a�/�). A,B: Compari-son of global gene expression between replicates at E11.5 and E13.5. Repeat arrays for TG of agiven stage and genotype were highly replicable. C: Comparison of global gene expressionbetween E11.5 and E13.5. A significant fraction of transcripts was differently expressed at E11.5and E13.5, with approximately 2,100 unique probe sets showing changes in each direction fromE11.5 to E13.5. Diagonal lines represent 2-fold change. The most-changed transcripts appear inTables S1 and S2.
Dev
elop
men
tal D
ynam
ics
ROLE OF Brn3a IN THE TRIGEMINAL GANGLION 3067
Fig. 2.
Dev
elop
men
tal D
ynam
ics
3068 LANIER ET AL.

progresses failed to reach normalexpression levels in the ganglia ofE13.5 Brn3a�/� mice, and, conversely,many transcripts that normallydecrease with developmental timewere increased at E13.5 in the knock-out (sectors designated ‘‘developmentaldelay,’’ Fig. 2A). The relationship of thefold change in transcript levels due to
developmental stage versus the loss ofBrn3a expression at E13.5 can bedescribed by a linear regression with aslope of �0.30 and R2 ¼ 0.26. Theseresults demonstrate a pervasive delayin the development of the Brn3a�/� TGat the transition from neurogenesisto neural differentiation. However, alarge majority of the developmentally
regulated genes exhibited less thantwofold changes in expression, suggest-ing that global developmental delaydoes not account for the large foldchanges observed for the most stronglyregulated transcripts.We then examined the relationship
between developmental changes ingene expression and Brn3a genotype
TABLE 1. Gene Ontology Analysis of Transcripts Increasing and Decreasing Between E11.5 and E13.5 in the
Developing Trigeminal Gangliona
Category
Total genes in
category
Changed genes in
category
PNumber Percent Number Percent
Increasing in development:Transmission of nerve impulse 341 1.4 57 3.8 4.39E-12Synaptic transmission 289 1.2 51 3.4 7.46E-12Cation transport 950 3.9 107 7.2 6.89E-10Nervous system development 1,089 4.5 117 7.9 1.81E-09Cell-cell signaling 485 2.0 65 4.4 2.39E-09Synaptic vesicle transport 51 0.2 16 1.1 3.38E-08Cell adhesion 1,209 5.0 120 8.1 1.02E-07Regulation of neurotransmitter levels 123 0.5 24 1.6 3.85E-07Potassium ion transport 322 1.3 44 3.0 5.22E-07Neurite morphogenesis 326 1.3 44 3.0 7.37E-07Cell development 639 2.6 70 4.7 1.77E-06Neurotransmitter secretion 90 0.4 19 1.3 1.78E-06Exocytosis 144 0.6 25 1.7 2.16E-06Cellular morphogenesis during differentiation 364 1.5 46 3.1 2.64E-06Axonogenesis 273 1.1 37 2.5 4.95E-06Synaptic vesicle exocytosis 19 0.1 8 0.5 8.02E-06Neurophysiological process 772 3.2 76 5.1 3.08E-05Calcium ion transport 203 0.8 28 1.9 0.000049
Decreasing in development:RNA metabolism 939 3.9 170 10.5 9.21E-34DNA metabolism 1,227 5.1 189 11.7 4.23E-28Cell cycle 1,424 5.9 194 12.0 3.16E-22Ribosome biogenesis and assembly 249 1.0 63 3.9 1.27E-20Cytoplasm organization and biogenesis 286 1.2 64 4.0 5.55E-18M phase 377 1.6 75 4.6 9.59E-18Cell division 430 1.8 79 4.9 1.55E-16DNA replication 299 1.2 62 3.8 8.78E-16DNA repair 392 1.6 73 4.5 1.07E-15Mitotic cell cycle 438 1.8 74 4.6 1.29E-13
aOf 45,037 probe sets on the array, 2,606 were reproducibly increased from E11.5 to E13.5 and 2,451 were decreased. SelectedGO categories are shown. Complete data appear in Supp. Table S3.
Fig. 2. Interaction of developmental stage and Brn3a genotype. A: Plot of the magnitude of developmental expression changes between E11.5and E13.5 in control TG, versus changes resulting from the knockout of Brn3a at E13.5. Data are shown for probe sets representing 4,194 identi-fied, unique genes significantly changed (change P < 0.002, P > 0.998) in one or both conditions. Changes in the Brn3a knockout TG are in mostcases inversely correlated with developmental changes in gene expression, such that loss of Brn3a expression partially prevents or delays thechanges in gene expression associated with sensory maturation. Dashed lines demarcate regions of the plot containing transcripts that tend tofollow this trend (‘‘developmental delay’’) and a much smaller number of transcripts for which loss of Brn3a exaggerates normal developmentalchange and which may represent the expansion or loss of a specific sub-populations of differentiated neurons (‘‘phenotypic switching’’). The sub-set of transcripts highlighted in red has known roles in cardiac development but not the trigeminal ganglion. B: Distinct classes of transcripts aredifferentially expressed during development and in Brn3a knockout TG. Mapped transcripts include 123 cell-cycle genes, 67 axon guidance/celladhesion genes, 105 transcription factors, and 46 neurotransmitter system genes (including receptors and receptor-channels) derived from GOannotation and a literature search. As expected, cell-cycle genes are decreased in development, and increased in the Brn3a knockout, while neu-rotransmitter system genes exhibit the opposite behavior. Axon guidance/cell adhesion genes and transcription factors have variable roles withrespect to developmental processes and show mixed patterns of expression changes.
Dev
elop
men
tal D
ynam
ics
ROLE OF Brn3a IN THE TRIGEMINAL GANGLION 3069

TABLE 2. Selected Transcripts Decreased in E13.5 TG of Brn3a Knockout Embryosa
Gene
symbol Gene title Class
Expression value
E13
WT/KO
E11
WT/KO
E13
WT/E11
WT
E13 DRG
WT/KO
TG
replicate 1
TG
replicate 2
E13
WT
E13
KO
E13
WT
E13
KO
Pou4f2 POU domain, class 4, factor2; Brn3b
tx 891 (11) 910 (27) 48.0 23.5 2.3 4.5
Pou4f1 POU domain, class 4, factor1; Brn3a
tx 5,789 304 5,847 241 21.4 27.5 0.8 5.4
Npy5r Neuropeptide Y receptor Y5 nt 433 (20) 454 (23) 20.5 1.7 14.3 absHtr3b 5-hydroxytryptamine recep-
tor 3Bnt 363 (27) 266 (13) 15.6 abs 44.6 abs
Pla2g7 Phospholipase A2, group VII st 2,479 172 2,515 149 15.5 1.1 3.8 4.0Bnc1 Basonuclin 1 tx 2,638 205 2,809 166 14.7 1.1 43.7 4.1Rgs10 Regulator of G-protein sig-
nalling 10st 5,164 382 5,931 458 13.2 7.1 2.4 3.7
Npy1r Neuropeptide Y receptor Y1 nt 915 (80) 1,073 (76) 12.7 abs 17.1 absAvil Advillin nt 5,647 538 6,384 621 10.4 7.5 14.2 3.8Prokr1 Prokineticin receptor 1 nt 680 60 675 73 10.2 1.7 3.2 2.3Scn7a Naþ channel, voltage-gated,
type VII, alphach 3,050 366 3,089 351 8.6 2.7 10.1 2.1
Hmx1 H6 homeo box 1 tx 1,766 209 1,661 206 8.3 1.8 1.9 1.3Runx3 Runt-related txn factor 3 tx 219 (28) 329 (40) 8.1 15.3 0.6 5.9Gal Galanin nt 8,851 1,288 9,107 1112 7.5 2.6 36.5 4.1Gpr64 G protein–coupled receptor
64nt 1,944 238 1,969 314 7.1 3.5 5.5 3.0
Kcnab2 Kþ voltage-gated channel,shaker-related subfamily,beta member 2
ch 2,509 374 2,868 422 6.8 1.8 4.7 3.4
Trpv1 Transient receptor potentialchannel, V1
ch 771 155 746 86 6.3 0.9 26.0 1.8
Runx1 Runt-related transcriptionfactor 1
tx 1,905 310 1,689 263 6.3 2.2 12.7 1.6
Hoxd1 Homeo box D1 tx 2,797 522 3,177 485 5.9 3.0 10.8 2.0Ptpn3 Protein tyrosine phospha-
tase, non-receptor type 3st 7,062 1,112 7,802 1539 5.6 4.3 3.4 2.2
Kcna1 Kþ channel, shaker-relatedsubfamily, member 1
ch 3,232 636 3,260 645 5.1 2.5 3.1 2.0
Accn2 Acid sensing Naþ channelASIC1a
ch 2,541 430 2,676 609 5.0 0.9 4.8 1.3
Pou4f3 POU domain, class 4, tran-scription factor 3
tx 305 72 212 (47) 4.3 1.8 1.1 2.3
Ntrk3 Neurotrophic tyrosine ki-nase, receptor, type 3
ax 1,064 263 1,131 258 4.2 5.3 1.4 0.9
Scn10a Naþ channel, voltage-gated,type X, alpha
ch 312 112 289 131 2.5 1.7 3.4 1.5
Lxn Latexin nt 5,857 2,688 6,703 2,491 2.4 1.3 3.6 2.0Ntrk1 Neurotrophic tyrosine ki-
nase, receptor, type 1;TrkA
ax 5,214 2,321 4,429 2,471 2.0 :0.5 6.7 1.1
Prph Peripherin ax 17,231 9,651 15,825 10,290 1.7 5.1 3.0 1.1
aMicroarray analysis was performed on duplicate samples for E13.5 TG, E11.5 TG, and E13.5 DRG from Brn3a WT and KOembryos. Complete data for the TG analysis appear in the Supplementary Tables S4–S7. DRG data are derived from a previ-ously published data set (Eng et al., 2007). Expression values associated with absent calls appear in parentheses. Transcriptsare ranked by the fold decrease in E13.5 KO TG compared to WT controls (bold). For the E13.5 TG WT to KO comparison, alltranscripts shown exhibited a significant D call (P > 0.998) in both replicates. For all other comparisons, transcripts with repli-cated I or D change calls are indicated with an underscore. For all comparisons, fold change values for assays with an absentcall in all conditions are not meaningful and are indicated by ‘‘abs.’’ Changes for the E11.5 TG WT to KO comparison are gener-ally concordant with the E13.5 results. However, several genes associated with sensory function were not yet expressed at E11.5and are thus unchanged in the knockout. Underscored values indicate a D call in both replicates, with the exception of TrkA,which showed increased expression in the KO at E11.5. Changes for the E11.5 WT to E13.5 WT comparison are expressed suchthat values represent the fold increase in expression from E11.5 to E13.5. Increasing developmental expression is highly corre-lated with decreased expression in E13.5 KO ganglia (Fig. 2). Changes for the DRG WT to KO comparison are frequently con-cordant with changes observed in the TG.
Dev
elop
men
tal D
ynam
ics
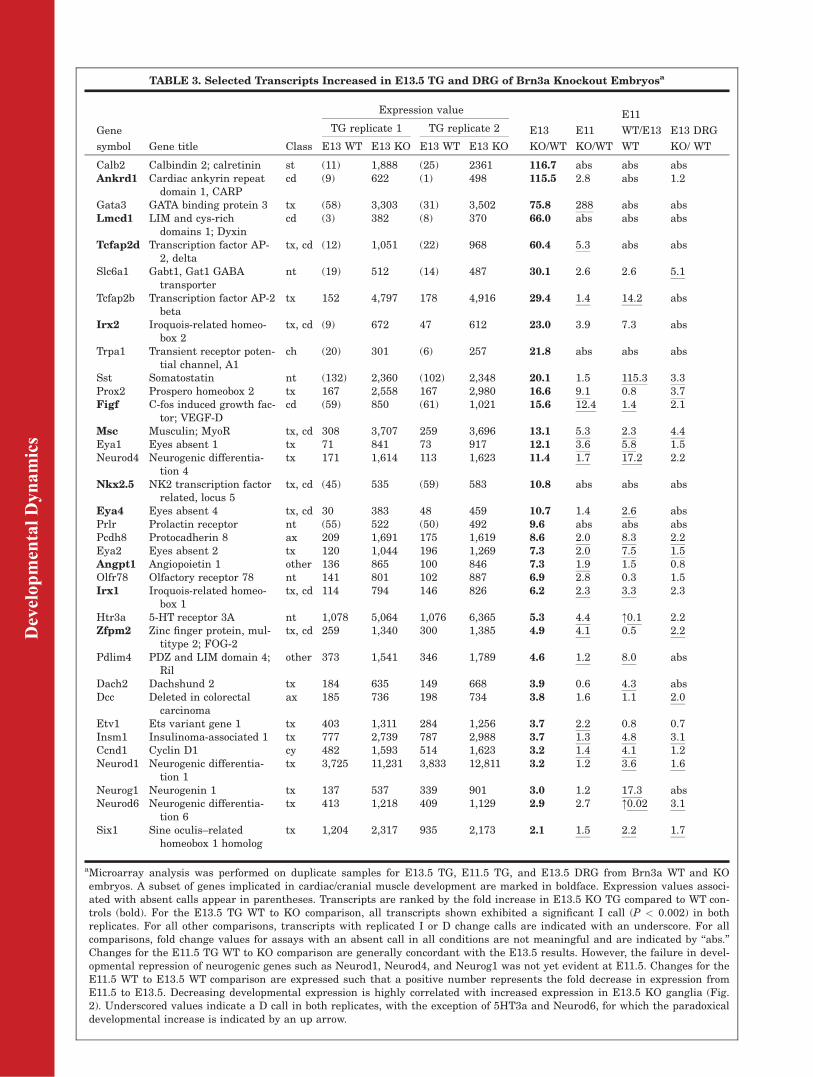
TABLE 3. Selected Transcripts Increased in E13.5 TG and DRG of Brn3a Knockout Embryosa
Gene
symbol Gene title Class
Expression value
E13
KO/WT
E11
KO/WT
E11
WT/E13
WT
E13 DRG
KO/ WT
TG replicate 1 TG replicate 2
E13 WT E13 KO E13 WT E13 KO
Calb2 Calbindin 2; calretinin st (11) 1,888 (25) 2361 116.7 abs abs absAnkrd1 Cardiac ankyrin repeat
domain 1, CARPcd (9) 622 (1) 498 115.5 2.8 abs 1.2
Gata3 GATA binding protein 3 tx (58) 3,303 (31) 3,502 75.8 288 abs absLmcd1 LIM and cys-rich
domains 1; Dyxincd (3) 382 (8) 370 66.0 abs abs abs
Tcfap2d Transcription factor AP-2, delta
tx, cd (12) 1,051 (22) 968 60.4 5.3 abs abs
Slc6a1 Gabt1, Gat1 GABAtransporter
nt (19) 512 (14) 487 30.1 2.6 2.6 5.1
Tcfap2b Transcription factor AP-2beta
tx 152 4,797 178 4,916 29.4 1.4 14.2 abs
Irx2 Iroquois-related homeo-box 2
tx, cd (9) 672 47 612 23.0 3.9 7.3 abs
Trpa1 Transient receptor poten-tial channel, A1
ch (20) 301 (6) 257 21.8 abs abs abs
Sst Somatostatin nt (132) 2,360 (102) 2,348 20.1 1.5 115.3 3.3Prox2 Prospero homeobox 2 tx 167 2,558 167 2,980 16.6 9.1 0.8 3.7Figf C-fos induced growth fac-
tor; VEGF-Dcd (59) 850 (61) 1,021 15.6 12.4 1.4 2.1
Msc Musculin; MyoR tx, cd 308 3,707 259 3,696 13.1 5.3 2.3 4.4Eya1 Eyes absent 1 tx 71 841 73 917 12.1 3.6 5.8 1.5Neurod4 Neurogenic differentia-
tion 4tx 171 1,614 113 1,623 11.4 1.7 17.2 2.2
Nkx2.5 NK2 transcription factorrelated, locus 5
tx, cd (45) 535 (59) 583 10.8 abs abs abs
Eya4 Eyes absent 4 tx, cd 30 383 48 459 10.7 1.4 2.6 absPrlr Prolactin receptor nt (55) 522 (50) 492 9.6 abs abs absPcdh8 Protocadherin 8 ax 209 1,691 175 1,619 8.6 2.0 8.3 2.2Eya2 Eyes absent 2 tx 120 1,044 196 1,269 7.3 2.0 7.5 1.5Angpt1 Angiopoietin 1 other 136 865 100 846 7.3 1.9 1.5 0.8Olfr78 Olfactory receptor 78 nt 141 801 102 887 6.9 2.8 0.3 1.5Irx1 Iroquois-related homeo-
box 1tx, cd 114 794 146 826 6.2 2.3 3.3 2.3
Htr3a 5-HT receptor 3A nt 1,078 5,064 1,076 6,365 5.3 4.4 :0.1 2.2Zfpm2 Zinc finger protein, mul-
titype 2; FOG-2tx, cd 259 1,340 300 1,385 4.9 4.1 0.5 2.2
Pdlim4 PDZ and LIM domain 4;Ril
other 373 1,541 346 1,789 4.6 1.2 8.0 abs
Dach2 Dachshund 2 tx 184 635 149 668 3.9 0.6 4.3 absDcc Deleted in colorectal
carcinomaax 185 736 198 734 3.8 1.6 1.1 2.0
Etv1 Ets variant gene 1 tx 403 1,311 284 1,256 3.7 2.2 0.8 0.7Insm1 Insulinoma-associated 1 tx 777 2,739 787 2,988 3.7 1.3 4.8 3.1Ccnd1 Cyclin D1 cy 482 1,593 514 1,623 3.2 1.4 4.1 1.2Neurod1 Neurogenic differentia-
tion 1tx 3,725 11,231 3,833 12,811 3.2 1.2 3.6 1.6
Neurog1 Neurogenin 1 tx 137 537 339 901 3.0 1.2 17.3 absNeurod6 Neurogenic differentia-
tion 6tx 413 1,218 409 1,129 2.9 2.7 :0.02 3.1
Six1 Sine oculis–relatedhomeobox 1 homolog
tx 1,204 2,317 935 2,173 2.1 1.5 2.2 1.7
aMicroarray analysis was performed on duplicate samples for E13.5 TG, E11.5 TG, and E13.5 DRG from Brn3a WT and KOembryos. A subset of genes implicated in cardiac/cranial muscle development are marked in boldface. Expression values associ-ated with absent calls appear in parentheses. Transcripts are ranked by the fold increase in E13.5 KO TG compared to WT con-trols (bold). For the E13.5 TG WT to KO comparison, all transcripts shown exhibited a significant I call (P < 0.002) in bothreplicates. For all other comparisons, transcripts with replicated I or D change calls are indicated with an underscore. For allcomparisons, fold change values for assays with an absent call in all conditions are not meaningful and are indicated by ‘‘abs.’’Changes for the E11.5 TG WT to KO comparison are generally concordant with the E13.5 results. However, the failure in devel-opmental repression of neurogenic genes such as Neurod1, Neurod4, and Neurog1 was not yet evident at E11.5. Changes for theE11.5 WT to E13.5 WT comparison are expressed such that a positive number represents the fold decrease in expression fromE11.5 to E13.5. Decreasing developmental expression is highly correlated with increased expression in E13.5 KO ganglia (Fig.2). Underscored values indicate a D call in both replicates, with the exception of 5HT3a and Neurod6, for which the paradoxicaldevelopmental increase is indicated by an up arrow.
Dev
elop
men
tal D
ynam
ics

for functional categories of genes,including regulators of the cell cycle(including mitosis and DNA replica-tion), mediators of axon growth andguidance, sequence-specific transcrip-tion factors, and neurotransmitters/receptors. Factors mediating cell-cycle progression and mitosis con-formed closely to the regression linethat describes the overall develop-mental delay in Brn3a�/� TG (Fig.2B), in that expression of genes medi-ating the cell cycle and DNA replica-tion decreased from E11.5 to E13.5and was increased in Brn3a�/� gan-glia, while genes mediating cell-cycleexit had the inverse relationship toboth conditions. Most mediators ofaxon growth and guidance hadincreased expression from E11.5 toE13.5, as expected in maturing neu-rons, and also generally conformed tothe linear relationship between devel-opmental stage and Brn3a genotype.
In contrast, many genes encodingtranscription factors and neurotrans-mitters do not conform to this linearrelationship between developmentalstage and Brn3a genotype. Thus,many of the observed changes inthese gene classes appear to represent‘‘phenotype switching’’ by Brn3a�/�
trigeminal neurons, which cannot besimply described as a failure to pro-gress on schedule down the expecteddevelopmental pathway. A significantnumber of these transcripts (Trkreceptors, Runx3, Ret, Trpa1, Hmx1)represent known markers of sensorysubtypes, and the role of Brn3a insensory subtype specification will beexamined in a separate report (I.Dykes, unpublished data). Finally, asubset of these transcripts encode fac-tors most strongly associated withcardiac and cranial mesoderm devel-opment (highlighted in red).
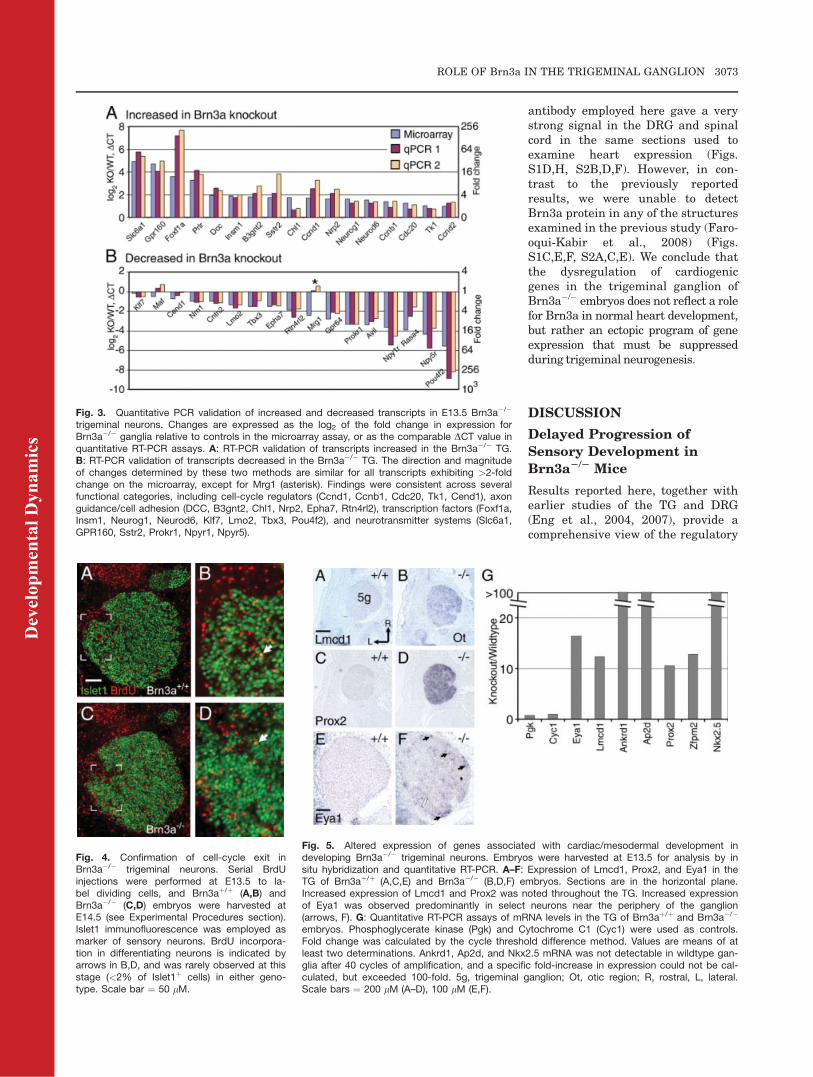
In order to test the reliability of thegene expression changes detected bymicroarray, we examined the expres-sion of 36 of the changed transcriptsby quantitative RT-PCR using inde-pendent samples of E13.5 knockoutand control TG tissue (Fig. 3). Inthese assays, all transcripts with >2-fold change on the microarray showeda similar direction and magnitude ofchange in the RT-PCR assay, includ-ing increased and decreased tran-scripts across all functional classes,with the exception of Mrg1, for which
the change observed on the microar-ray was not replicated.
Persistent expression of cell cycle–associated genes raises the questionof whether Brn3a�/� TG neurons exitthe cell cycle at the expected time.Arguing against significantly pro-longed cell division is the prior obser-vation that Brn3a knockout TG do nothave an increased cell number at anystage in development (Huang et al.,1999). Because the large majority oftrigeminal neurons leave the cellcycle by E13.5 (E14.5 in rat, Whiteet al., 1995), we employed BrdU label-ing at E13.5, followed by analysis atE14.5, to assess directly whether neu-rons were delayed in cell-cycle exit inBrn3a�/� ganglia (Fig. 4). Immunoflu-orescence for Islet1 was used to iden-tify differentiating sensory neurons inthe absence of Brn3a. Less than 2% ofTG neurons incorporated BrdU atE13.5 in either control or Brn3a�/�
knockout embryos, indicating thatcell-cycle exit is not significantlydelayed in the absence of Brn3a.
De-repression of a Cardiac
Gene Expression Program in
the Brn3a2/2 Trigeminal
Ganglion
This global analysis of gene expres-sion in E13.5 Brn3a�/� TG revealedthat a significant number of themost increased transcripts are notexpressed in control ganglia at eitherE11.5 or E13.5. Unexpectedly, severalof these genes are known to beexpressed in the developing heart,and in some cases structures derivedfrom cranial mesoderm, includingAnkrd1 (CARP), Lmcd1, Zfpm2(Fog2), Figf (VegfD), Tcfap2d, Irx2,Msc (MyoR), Nkx2-5 (tinman), andActc1 (cardiac muscle alpha actin 1).In addition, we have previouslyshown that expression of another reg-ulator of cardiac development, Fgf10,is markedly increased in the TG ofBrn3a�/� embryos. Fgf10 is notdetected by the microarrays used togenerate the current data set, due toa flaw in the design of the Fgf10 oligo-nucleotide probe set on the arraysused for these studies (Cox et al.,2006).
Increased expression of Irx2, Msc,and Fgf10 in the TG of Brn3a�/� mice
has been previously verified by in situhybridization (Cox et al., 2006; Enget al., 2004). The novel changes incardiac/mesoderm gene expressiondetected here were verified using insitu hybridization and RT-PCR withspecific primer sets (Fig. 5). In situanalysis of Lmcd1 and Prox2 revealedwidely distributed expression in theTG of Brn3a�/� embryos, while Eya1appeared restricted to a subset of neu-rons in the periphery of the ganglion.RT-PCR assays of these transcripts,as well as Ankrd1, Zfpm2, Tcfap2d,and Nkx2.5, generally revealedincreases in expression at least aslarge as in the microarray analysis.In order to understand the develop-
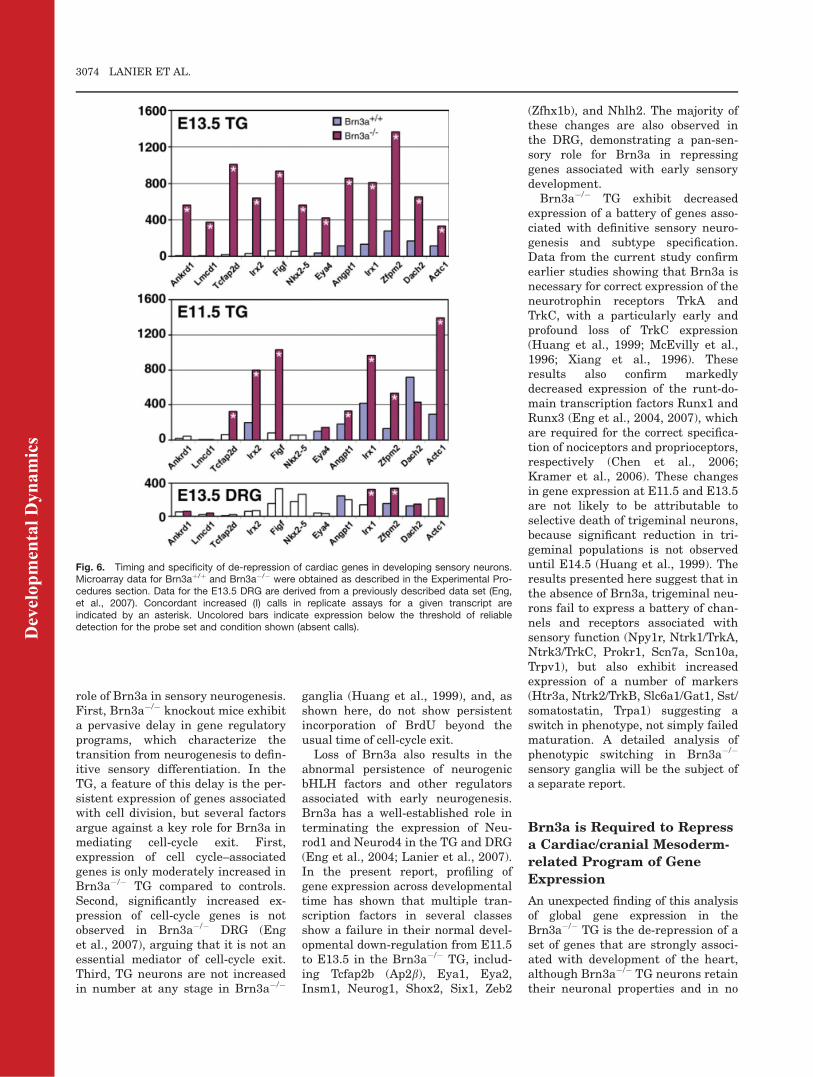
mental timing and tissue specificity ofthe de-repression of genes associatedwith cardiac/mesodermal developmentin Brn3a�/� embryos, we comparedresults for the E11.5 TG and E13.5DRG for this set of genes (Fig. 6,Tables S6, S7). Tcfap2d, Irx1, Irx2,Figf, Zfpm2, and Actc1 were all abnor-mally expressed by E11.5 in the TG,and these changes constitute some ofthe largest magnitude changesobserved at E11.5 (Table S5). However,increased expression of Ankrd1,Lmcd1, and Nkx2.5 was not observeduntil E13.5. In contrast, the expressionof cardiac-related transcripts in theE13.5 Brn3a�/� DRG was minimal,suggesting that only the TG retainsthe potential to express this set ofgenes during sensory neurogenesis.Recently, it has been reported that
Brn3a is expressed from �E10.5onward in the developing mouseheart (Farooqui-Kabir et al., 2008).Cell-specific expression was reportedfrom E13.0 in the atrio-ventricular(AV) valve cushions and leaflets, out-flow tract, epicardium, and cardiacganglia, and at E14.5 in the intraven-tricular septa and ventricular myo-cardium. Because these results mightrelate to the observed regulation ofcardiac genes by Brn3a in the TG, weexamined the developing heart forexpression of Brn3a protein (Figs. S1,S2). The antibody used for Brn3adetection in these studies (Fedtsovaand Turner, 1995) was generated to aregion immediately N-terminal to theDNA-binding POU domain, andshould recognize both the reported‘‘long’’ and ‘‘short’’ forms of Brn3a(Theil et al., 1993). The Brn3a
Dev
elop
men
tal D
ynam
ics
3072 LANIER ET AL.
antibody employed here gave a verystrong signal in the DRG and spinalcord in the same sections used toexamine heart expression (Figs.S1D,H, S2B,D,F). However, in con-trast to the previously reportedresults, we were unable to detectBrn3a protein in any of the structuresexamined in the previous study (Faro-oqui-Kabir et al., 2008) (Figs.S1C,E,F, S2A,C,E). We conclude thatthe dysregulation of cardiogenicgenes in the trigeminal ganglion ofBrn3a�/� embryos does not reflect a rolefor Brn3a in normal heart development,but rather an ectopic program of geneexpression that must be suppressedduring trigeminal neurogenesis.
DISCUSSION
Delayed Progression of
Sensory Development in
Brn3a2/2 Mice
Results reported here, together withearlier studies of the TG and DRG(Eng et al., 2004, 2007), provide acomprehensive view of the regulatory
Fig. 3. Quantitative PCR validation of increased and decreased transcripts in E13.5 Brn3a�/�
trigeminal neurons. Changes are expressed as the log2 of the fold change in expression forBrn3a�/� ganglia relative to controls in the microarray assay, or as the comparable DCT value inquantitative RT-PCR assays. A: RT-PCR validation of transcripts increased in the Brn3a�/� TG.B: RT-PCR validation of transcripts decreased in the Brn3a�/� TG. The direction and magnitudeof changes determined by these two methods are similar for all transcripts exhibiting >2-foldchange on the microarray, except for Mrg1 (asterisk). Findings were consistent across severalfunctional categories, including cell-cycle regulators (Ccnd1, Ccnb1, Cdc20, Tk1, Cend1), axonguidance/cell adhesion (DCC, B3gnt2, Chl1, Nrp2, Epha7, Rtn4rl2), transcription factors (Foxf1a,Insm1, Neurog1, Neurod6, Klf7, Lmo2, Tbx3, Pou4f2), and neurotransmitter systems (Slc6a1,GPR160, Sstr2, Prokr1, Npyr1, Npyr5).
Fig. 4. Confirmation of cell-cycle exit inBrn3a�/� trigeminal neurons. Serial BrdUinjections were performed at E13.5 to la-bel dividing cells, and Brn3aþ/þ (A,B) andBrn3a�/� (C,D) embryos were harvested atE14.5 (see Experimental Procedures section).Islet1 immunofluorescence was employed asmarker of sensory neurons. BrdU incorpora-tion in differentiating neurons is indicated byarrows in B,D, and was rarely observed at thisstage (<2% of Islet1þ cells) in either geno-type. Scale bar ¼ 50 lM.
Fig. 5. Altered expression of genes associated with cardiac/mesodermal development indeveloping Brn3a�/� trigeminal neurons. Embryos were harvested at E13.5 for analysis by insitu hybridization and quantitative RT-PCR. A–F: Expression of Lmcd1, Prox2, and Eya1 in theTG of Brn3aþ/þ (A,C,E) and Brn3a�/� (B,D,F) embryos. Sections are in the horizontal plane.Increased expression of Lmcd1 and Prox2 was noted throughout the TG. Increased expressionof Eya1 was observed predominantly in select neurons near the periphery of the ganglion(arrows, F). G: Quantitative RT-PCR assays of mRNA levels in the TG of Brn3aþ/þ and Brn3a�/�
embryos. Phosphoglycerate kinase (Pgk) and Cytochrome C1 (Cyc1) were used as controls.Fold change was calculated by the cycle threshold difference method. Values are means of atleast two determinations. Ankrd1, Ap2d, and Nkx2.5 mRNA was not detectable in wildtype gan-glia after 40 cycles of amplification, and a specific fold-increase in expression could not be cal-culated, but exceeded 100-fold. 5g, trigeminal ganglion; Ot, otic region; R, rostral, L, lateral.Scale bars ¼ 200 lM (A–D), 100 lM (E,F).
Dev
elop
men
tal D
ynam
ics
ROLE OF Brn3a IN THE TRIGEMINAL GANGLION 3073
role of Brn3a in sensory neurogenesis.First, Brn3a�/� knockout mice exhibita pervasive delay in gene regulatoryprograms, which characterize thetransition from neurogenesis to defin-itive sensory differentiation. In theTG, a feature of this delay is the per-sistent expression of genes associatedwith cell division, but several factorsargue against a key role for Brn3a inmediating cell-cycle exit. First,expression of cell cycle–associatedgenes is only moderately increased inBrn3a�/� TG compared to controls.Second, significantly increased ex-pression of cell-cycle genes is notobserved in Brn3a�/� DRG (Enget al., 2007), arguing that it is not anessential mediator of cell-cycle exit.Third, TG neurons are not increasedin number at any stage in Brn3a�/�
ganglia (Huang et al., 1999), and, asshown here, do not show persistentincorporation of BrdU beyond theusual time of cell-cycle exit.
Loss of Brn3a also results in theabnormal persistence of neurogenicbHLH factors and other regulatorsassociated with early neurogenesis.Brn3a has a well-established role interminating the expression of Neu-rod1 and Neurod4 in the TG and DRG(Eng et al., 2004; Lanier et al., 2007).In the present report, profiling ofgene expression across developmentaltime has shown that multiple tran-scription factors in several classesshow a failure in their normal devel-opmental down-regulation from E11.5to E13.5 in the Brn3a�/� TG, includ-ing Tcfap2b (Ap2b), Eya1, Eya2,Insm1, Neurog1, Shox2, Six1, Zeb2
(Zfhx1b), and Nhlh2. The majority ofthese changes are also observed inthe DRG, demonstrating a pan-sen-sory role for Brn3a in repressinggenes associated with early sensorydevelopment.Brn3a�/� TG exhibit decreased
expression of a battery of genes asso-ciated with definitive sensory neuro-genesis and subtype specification.Data from the current study confirmearlier studies showing that Brn3a isnecessary for correct expression of theneurotrophin receptors TrkA andTrkC, with a particularly early andprofound loss of TrkC expression(Huang et al., 1999; McEvilly et al.,1996; Xiang et al., 1996). Theseresults also confirm markedlydecreased expression of the runt-do-main transcription factors Runx1 andRunx3 (Eng et al., 2004, 2007), whichare required for the correct specifica-tion of nociceptors and proprioceptors,respectively (Chen et al., 2006;Kramer et al., 2006). These changesin gene expression at E11.5 and E13.5are not likely to be attributable toselective death of trigeminal neurons,because significant reduction in tri-geminal populations is not observeduntil E14.5 (Huang et al., 1999). Theresults presented here suggest that inthe absence of Brn3a, trigeminal neu-rons fail to express a battery of chan-nels and receptors associated withsensory function (Npy1r, Ntrk1/TrkA,Ntrk3/TrkC, Prokr1, Scn7a, Scn10a,Trpv1), but also exhibit increasedexpression of a number of markers(Htr3a, Ntrk2/TrkB, Slc6a1/Gat1, Sst/somatostatin, Trpa1) suggesting aswitch in phenotype, not simply failedmaturation. A detailed analysis ofphenotypic switching in Brn3a�/�
sensory ganglia will be the subject ofa separate report.
Brn3a is Required to Repress
a Cardiac/cranial Mesoderm-
related Program of Gene
Expression
An unexpected finding of this analysisof global gene expression in theBrn3a�/� TG is the de-repression of aset of genes that are strongly associ-ated with development of the heart,although Brn3a�/� TG neurons retaintheir neuronal properties and in no
Fig. 6. Timing and specificity of de-repression of cardiac genes in developing sensory neurons.Microarray data for Brn3aþ/þ and Brn3a�/� were obtained as described in the Experimental Pro-cedures section. Data for the E13.5 DRG are derived from a previously described data set (Eng,et al., 2007). Concordant increased (I) calls in replicate assays for a given transcript areindicated by an asterisk. Uncolored bars indicate expression below the threshold of reliabledetection for the probe set and condition shown (absent calls).D
evel
opm
enta
l Dyn
amic
s
3074 LANIER ET AL.
sense differentiate into cardiac cells.Detailed studies over the last decadehave elucidated the early morphologi-cal and molecular events of cardiacdevelopment that provide a contextfor these changes in gene expression.Bilateral cardiac progenitors arisewithin the splanchnic lateral meso-derm, condensing at the midline toform the heart tube. Early growth ofthe heart occurs by addition of pro-genitors to both anterior and poste-rior poles of the forming heart (vanden Berg et al., 2009). The source ofthese progenitors is known as the sec-ond heart field, which is located inpharyngeal mesoderm, including thatof the pharyngeal arches (Abu-Issaand Kirby, 2007; Buckingham et al.,2005; Eisenberg and Markwald,2004). Cardiac neural crest alsomigrates through the pharyngealarches to contribute to septation ofthe outflow tract and aortic archarteries (Hutson and Kirby, 2007).
Several of the genes exhibitingincreased expression in the Brn3a�/�
TG are associated with key events orcell populations in this developmentalpathway. The homeodomain tran-scription factor Nkx2.5 (tinman), isfirst expressed in the lateral platemesoderm, although loss of Nkx2.5function does not arrest cardiac devel-opment until the looping stage (Bibenand Harvey, 1997). Ankrd1 (originallydescribed as CARP, for cardiac adria-mycin responsive protein and alsocardiac ankyrin repeat protein) isexpressed in the heart tube at E8.5,and is downstream of Nkx2.5 (Jeya-seelan et al., 1997; Kuo et al., 1999).Ankrd1 is localized to the nucleus,and may be a transient repressor ofsome definitive cardiac muscle genes.
Zfpm2 (Fog2, friend of GATA 2) isa zinc-finger transcription factorexpressed in the cardiac primordiumfrom E8.5, and it is necessary for thedevelopment of both myocardium andcardiac vasculature (Tevosian et al.,2000). Zfpm2 interacts with Gata4(Svensson et al., 1999), which itself isnecessary for cardiac development(Kuo et al., 1997; Xin et al., 2006; Zeis-berg et al., 2005). None of the Gata4/5/6 factors expressed in the developingheart exhibited increased expression inthe Brn3a�/� TG, but a related factor,Gata3, was markedly increased.Because Zfpm2 can interact with
Gata3 as well as Gata4 (Tevosianet al., 1999), dysregulation of Gata3expression may intersect this pathway.Also potentially interacting with Gatasignaling is Lmcd1 (LIM and cysteine-rich domains 1, dyxin), which is a LIM-domain containing protein expressedrelatively late (E12.5) in the develop-ing myocardium. Lmcd1 can bind tomultiple GATA family proteins and isthought to repress GATA activity by analternate mechanism to Fog2 (Rathet al., 2005).
In a prior study, we have reportedthat Brn3a�/� TG exhibit markedlyincreased expression of anotherknown regulator of cardiac develop-ment, Fgf10 (Cox et al., 2006). Fgf10expression is not effectively assayedby the microarrays used in the pres-ent study (Affymetrix 430v2) due to adesign flaw in the probe set for thistranscript, but increased expressionwas detected on an earlier generationarray and confirmed by in situ hybrid-ization. Fgf10 is a marker of pharyn-geal mesoderm cells that contributeto the outflow tract of the heart (Kellyet al., 2001), although the cardiaceffects of Fgf10 ablation are subtleand may reflect redundancy of func-tion in the Fgf family (Marguerieet al., 2006). We have previously con-cluded that a local effect of Fgf10 de-repression is not likely to account forthe extensive program of altered geneexpression in the trigeminal ganglion,because the necessary receptors arenot expressed there (Cox et al., 2006).
Other cardiac transcripts areexpressed in Brn3a�/� TG, but there islittle data on their function. Irx1 andIrx2 have been identified in the ven-tricular septum (Christoffels et al.,2000). However, Irx2 knockouts do notexhibit a cardiac phenotype (Lebelet al., 2003), and Irx1 null mice havenot been reported. Tcfap2d (Ap2d) isexpressed in the myocardial primor-dium at E9.5–E10.5 (Zhao et al., 2003),but its function is unknown. Figf (c-fos-induced growth factor; VegfD, vascularendothelial growth factor D) isexpressed in the atrio-ventricularcushion at E12.5 (Avantaggiato et al.,1998). Loss of Figf alone has a minimalphenotype (Baldwin et al., 2005), andFigf, the closely related VegfC, andtheir principal receptor VEGFR-3appear to be involved primarily inangiogenesis and lymphangiogenesis
rather than cardiac development(Haiko et al., 2008).
Brn3a Represses Regulators
of Mesoderm Development
Some changes in gene expression inBrn3a�/� sensory ganglia may reflectthe de-repression of gene expressionprograms that are mesodermal ormyogenic but not specifically cardiac.This is consistent with recent workthat has established close develop-mental and molecular relationshipsbetween the cranial paraxial meso-derm, which gives rise to the cranialmusculature, and the splanchnic mes-oderm, which contributes to the heart(Tzahor, 2009). The bHLH transcrip-tion factor Msc (musculin, MyoR) isincreased in the TG of Brn3a�/� mice,but unlike the majority of cardiac-associated genes, it is also de-repressed in the DRG (Eng et al.,2007). Consistent with this, Msc isnormally expressed in cranial meso-derm and the anterior heart field(von Scheven et al., 2006), but is alsoexpressed in paraxial mesoderm anddeveloping muscles at trunk levels.Double knockouts of MyoR and therelated bHLH factor capsulin resultin specific loss of the muscles of masti-cation derived from the first branchialarch, but these mice survive untilbirth and cardiac abnormalities havenot been reported (Lu et al., 2002).Another functionally interactinggroup of transcription factors that areincreased in the Brn3a�/� TG includeDach2, the eyeless-related genesEya1, Eya2, and Eya4, and the sineoculis homologue Six1. These factorshave known roles in somitogenesisand skeletal myogenesis, where theyinteract with each other and withPax3 (Heanue et al., 1999). Together,these results suggest that in additionto repressing canonical regulators ofheart development, Brn3a represses agene expression program that relatesto general aspects of mesoderm devel-opment. However, we did not observeincreased expression of any of the ca-nonical regulators of definitive myo-genesis, including Myod1, Myf5, Myf6(MRF4), or Myog (myogenin), in theBrn3a�/� TG.Given the extensive network of
transcription factors regulated byBrn3a in sensory ganglia, it is
Dev
elop
men
tal D
ynam
ics
ROLE OF Brn3a IN THE TRIGEMINAL GANGLION 3075
difficult to predict whether any giventarget is regulated by direct Brn3abinding to cis-elements within thatgene locus. In prior work, we haveused chromatin immunoprecipitationin embryonic sensory ganglia to dem-onstrate direct repression of Neurod1and Neurod4 by Brn3a, but examina-tion of the Msc locus from �20 kb toþ20 kb relative to the start of tran-scription did not reveal Brn3a binding(Lanier et al., 2007). Similar examina-tions of the Gata3 and Fgf10 loci alsodid not reveal direct interactions inthe E13.5 TG (J. Lanier, unpublishedresults). Although this suggests indi-rect regulation of these targets, insome cases the relevant enhancersmay lie outside the regions examined.In principle, the direct targets ofBrn3a in embryonic sensory neuronscould be determined by genome-wideexamination of immunoprecipitatedchromatin using tiled arrays or high-throughput sequencing (ChIP-chip,ChIP-seq), but application of the cur-rent technologies is precluded by thesmall size of the available tissuesamples.
The de-repression of cardiac geneexpression in Brn3a�/� trigeminalneurons leads to the question of whatunderlying developmental processmay link the developing TG andheart. One explanation is suggestedby the observation that cells contrib-uting to the TG and the heart have acommon developmental origin in thecranial neural crest. Cardiac neuralcrest cells originate at hindbrain lev-els of the dorsal neural tube, contrib-ute to the aorticopulmonary septum,and have an indirect role in the exten-sion of the outflow tract by the sec-ondary heart field (Hutson and Kirby,2007). It is possible that Brn3a helpsto discriminate the crest-derived sen-sory neural lineage from the cardiaclineage by repressing a battery ofcardiac genes. However, the cardiacgenes that are de-repressed in theBrn3a�/� TG are not restricted to thecardiac structures derived from neu-ral crest, arguing for a more generalrole in the repression of cardiac/cra-nial mesoderm genes.
A second potential connectionbetween Brn3a and cardiac develop-ment may relate to the activity tran-scription factor Islet1, which is co-expressed with Brn3a in sensory gan-
glia (Fedtsova et al., 2003). Islet1 isexpressed extensively in the develop-ing heart (Cai et al., 2003), whereBrn3a is absent, and recent work hasshown that Islet1þ precursors alsocontribute to a subset of cranialmuscles (Nathan et al., 2008). Theregulatory targets of Islet1 in heartdevelopment are largely unknown,but it is possible that the repressor ac-tivity of Brn3a opposes the activity ofIslet1 on a set of cardiac/cranial mus-cle genes during trigeminal neurogen-esis. However, if this is the case, theremust be a redundant mechanism forrepression in the DRG, since Islet1 isalso expressed in DRG neurons, andloss of Brn3a is not sufficient to acti-vate ectopic expression of most of thedysregulated cardiac genes at trunklevels.
Understanding Occult
Targets of Transcriptional
Repression
Perhaps the most important general-ization derived from this study is thatit provides striking evidence for the im-portance of transcriptional repressionas a mechanism for generating correctneuronal phenotypes. Early models ofcell-specific gene regulation, basedlargely on viral systems, emphasizedtranscriptional activation (Ptashne,1988). Although such mechanisms areessential, it is now clear that to a largeextent neuronal phenotypes aredefined in development by overlappingpatterns of transcriptional repression(Muhr et al., 2001), whose effects maythen be stabilized by chromatin modifi-cations (Allen, 2008). Thus to a largeextent, neurons appear to be definedby what they are not, through progres-sive restriction of cell fate.
Targets of transcriptional repress-ors are occult by nature: they cannotnecessarily be predicted from thenormal program of gene expressionfor the target tissue, and are onlyrevealed in the absence of the repres-sing factor. The results presentedhere for Brn3a in the TG illustratethe kind of unexpected programs ofgene expression that may emergewhen these repressor functions aredisabled. Conceptually similar resultshave been recently obtained in thesensory ganglia of mouse embryos
lacking Islet1, which unexpectedlymis-express a set of spinal cord andhindbrain genes (Sun et al., 2008).Unbiased global assays of geneexpression are thus essential tounderstanding repressor function,and are likely to reveal many morehidden relationships between devel-oping cell types that may be impor-tant for applications such as themanipulation of stem cell fates.
EXPERIMENTAL
PROCEDURES
Animals, Matings, and
Tissue Collection
Mice heterozygous for a Brn3a null al-lele (Eng et al., 2001; Xiang et al.,1996) were maintained in a C57bl/6background. To generate tissue formicroarray analysis, timed matings ofBrn3a heterozygote animals were per-formed, and the embryos were har-vested at E11.5 or E13.5. TG wereremoved by blunt dissection and care-fully freed of adherent non-neural tis-sue with fine forceps. Dissected gan-glia were placed in RNase inhibitorsolution (RNAlater, Ambion, Austin,TX), and RNA was prepared usingthe RNeasy system (Qiagen, Valencia,CA). Embryos were genotyped forBrn3a alleles using real-time qPCRfrom a sample of tail or hind-limb tis-sue harvested at the time of gangliondissection, using PCR primer pairstargeting the POU-domain of theBrn3a gene or the neomycin resist-ance cassette targeted to the Brn3alocus, as previously described. Foranalysis of Brn3a knockout and con-trol ganglia, TG from five embryoswere sufficient to provide approxi-mately 5 lg of total RNA for a singlemicroarray analysis. The generationof cDNA, production of labeled cRNA,and hybridization to Affymetrix430v2 GeneChip arrays were all per-formed according to standard proto-cols provided by the manufacturer(Affymetrix, Santa Clara, CA).
Microarray and Real-Time
PCR Analysis
Microarray analysis of TG geneexpression was performed on two de-velopmental stages (E11.5, E13.5) andthree genotypes (Brn3a þ/þ, þ/�, and
Dev
elop
men
tal D
ynam
ics
3076 LANIER ET AL.

�/�) in duplicate for a total of 12analyses. Consistent with priorresults (Eng et al., 2004), gene expres-sion in heterozygotes correlatedstrongly with control ganglia and wasnot further analyzed. The primaryanalysis of microarray data, includingdetermination of the absence/pres-ence of the assayed transcripts, tran-script expression levels, and theprobability of change in transcriptexpression between samples (‘‘changeP’’) was performed with MicroarraySuite 5.0 (MAS5, Affymetrix). DefaultMAS5 parameters were used forincrease (I) and decrease (D) calls,which were P < 0.002 and P > 0.998for I and D, respectively. All array val-ues were scaled to a target value of500 using global scaling. Microarrayprobe sets were related to the corre-sponding mouse transcripts using theNetAffx database (Affymetrix), basedon the NCBI Build 36 annotation ofthe mouse genome.
For comparison of gene expressionchanges across developmental stagesand between genotypes, we identified17,351 probe sets from among the45,037 probe sets on the array, whichwere present in both samples of atleast one stage/genotype, and had amean expression value of at least 250(0.5 times the scaled target value) inat least one stage/genotype. Tran-scripts listed in the ranked lists ofchanged genes (Table S1,S2, S4–S7)showed concordant I or D calls in bothreplicates for a given comparison (E11WT x E13 WT, E11 WTxKO, E13WTxKO). In cases of multiple probesets identifying a single transcript,data are given for the probe set withthe highest mean expression in anycondition.
Classification of differentially ex-pressed genes by gene ontology (GO)was performed using GeneSpringsoftware version 9 (Silicon Genetics,Redwood City, CA). Four gene listswere created in GeneSpring with the"Arbitrary File Filter" based on signif-icant expression differences betweenstages or genotypes (expressionincreased in development from E11.5to E13.5, expression decreased in de-velopment from E11.5 to E13.5,expression increased in Brn3a knock-out at E13.5, expression decreased inBrn3a knockout at E13.5). Each cate-gory consisted of all transcripts that
exhibited concordant I or D calls inthe replicate assays for a given com-parison. Genes were organized intoGO categories based on biological pro-cess using GeneSpring’s GO browser,and GO categories enriched in ourgene lists were then compiled.
Real-time reverse transcription-PCR (RT-PCR) analysis was per-formed on samples of RNA from thetrigeminal ganglia of E13.5 Brn3aþ/þ
and Brn3a�/� embryos harvested asdescribed above. Samples for RT-PCRanalysis were harvested indepen-dently of those used for microarrayanalysis. First-strand cDNA synthe-sis was performed with a Thermo-script RT-PCR system for first-strandsynthesis (Invitrogen) using 1 lg oftotal RNA according to the manufac-turer’s instructions, and real-timePCR was performed using Power SybrGreen PCR Master Mix (Applied Bio-systems) and an ABI 7300 real-timePCR system. Results were analyzedaccording to the cycle threshold differ-ence method (Livak and Schmittgen,2001). Oligonucleotide primer setsused for RT-PCR appear in Table S8.
In Situ Hybridization and
Immunofluorescence
Embryos for in situ hybridization andimmunofluorescence studies weregenerated by timed matings asdescribed above. Embryos were fixedby immersion in 4% paraformalde-hyde for 30 min (E11.5) or 2 hr(E13.5). Tissue was embedded inNeg50 (Thermo Fisher Scientific Inc.,Waltham, MA) and 20-lM sectionswere cut on a cryostat. Rabbit andguinea pig primary antibodies toBrn3a have been previously described(Fedtsova and Turner, 1995; Quinaet al., 2005).
In situ hybridization was performedon cryostat sections using digoxigenin-labeled cRNA probes. Sections werepre-treated with a 10-min digestion in10 lg/ml proteinase K followed by 10min in 0.5% acetic anhydride, 0.1M tri-ethanolamine, before being hybridizedat 65�C overnight using 1–2 lg/ml ofprobe. Slides were washed at 65�Cunder stringent conditions, thenblocked in 10% sheep serum. Signalwas detected using an alkaline phos-phatase conjugated sheep anti-digoxi-genin antibody (Roche, Nutley, NJ) at
1:2,000 followed by staining in BMPurple AP Substrate (Roche). Plasmidscontaining cDNAs were obtained fromOpen Biosystems (Huntsville, AL). Alist of in situ probes used in this studyis provided in Table S8.
ACKNOWLEDGMENTSWe thank Dr. Sylvia Evans for helpfulcomments on the manuscript. We arealso indebted to Dr. William Wachs-man and Lutfunnessa Shireen of theUCSD/VA microarray core facility forassistance with microarray technol-ogy, and Gian Carlo Parico for tech-nical assistance. This work wassupported in part by the Departmentof Veterans Affairs MERIT funding,and NIH awards HD33442 andMH065496 (to E.E.T). E.E.T. is a NAR-SAD Investigator.
REFERENCES
Abu-Issa R, Kirby M. 2007. Heart field:from mesoderm to heart tube. AnnuRev Cell Dev Biol 23:45–68.
Allen ND. 2008. Temporal and epigeneticregulation of neurodevelopmental plas-ticity. Philos Trans R Soc Lond B BiolSci 363:23–38.
Avantaggiato V, Orlandini M, AcamporaD, Oliviero S, Simeone A. 1998. Embry-onic expression pattern of the murinefigf gene, a growth factor belonging toplatelet-derived growth factor/vascularendothelial growth factor family. MechDev 73:221–224.
Baker CV, Bronner-Fraser M. 2001. Verte-brate cranial placodes I. Embryonicinduction. Dev Biol 232:1–2361.
Baldwin ME, Halford MM, Roufail S, Wil-liams RA, Hibbs ML, Grail D, Kubo H,Stacker SA, Achen MG. 2005. Vascularendothelial growth factor D is dispensa-ble for development of the lymphaticsystem. Mol Cell Biol 25:2441–2449.
Biben C, Harvey RP. 1997. Homeodomainfactor Nkx2–5 controls left/right asym-metric expression of bHLH gene eHandduring murine heart development.Genes Dev 11:1357–1369.
Buckingham M, Meilhac S, Zaffran S.2005. Building the mammalian heartfrom two sources of myocardial cells.Nat Rev Genet 6:826–835.
Cai CL, Liang X, Shi Y, Chu PH, PfaffSL, Chen J, Evans S. 2003. Isl1 identi-fies a cardiac progenitor populationthat proliferates prior to differentiationand contributes a majority of cells tothe heart. Dev Cell 5:877–889.
Chen C-L, Broom DC, Liu Y, de Nooij JC,Li Z, Cen C, Samad OA, Jessell TM,Woolf CJ, Ma Q. 2006. Runx1 deter-mines nociceptive sensory neuron phe-notype and is required for thermal andneuropathic pain. Neuron 49:365–377.
Dev
elop
men
tal D
ynam
ics
ROLE OF Brn3a IN THE TRIGEMINAL GANGLION 3077

Christoffels V, Keijser A, Houweling A,Clout D, Moorman A. 2000. Patterningthe embryonic heart: identification offive mouse Iroquois homeobox genes inthe developing heart. Dev Biol 224:263–274.
Cox E, Lanier J, Quina L, Eng SR,Turner EE. 2006. Regulation of FGF10by POU transcription factor Brn3a inthe developing trigeminal ganglion. JNeurobiol 66:1075–1083.
Eisenberg L, Markwald R. 2004. Cellularrecruitment and the development of themyocardium. Dev Biol 274:225–232.
Eng S, Gratwick K, Rhee J, Fedtsova N,Gan L, Turner E. 2001. Defects in sen-sory axon growth precede neuronaldeath in Brn3a-deficient mice. J Neuro-sci 21:541–549.
Eng SR, Lanier J, Fedtsova N, TurnerEE. 2004. Coordinated regulation ofgene expression by Brn3a in developingsensory ganglia. Development 131:3859–3870.
Eng SR, Dykes IM, Lanier J, Fedtsova N,Turner EE. 2007. POU-domain factorBrn3a regulates both distinct and com-mon programs of gene expression in thespinal and trigeminal sensory ganglia.Neural Dev 2,3.
Farooqui-Kabir SR, Diss JK, HendersonD, Marber MS, Latchman DS, Budh-ram-Mahadeo V, Heads RJ. 2008. Car-diac expression of Brn-3a and Brn-3bPOU transcription factors and regula-tion of Hsp27 gene expression. CellStress Chaperones 13:297–312.
Fedtsova NG, Turner EE. 1995. Brn-3.0expression identifies early post-mitoticCNS neurons and sensory neural pre-cursors. Mech Dev 53:291–304.
Fedtsova N, Perris R, Turner EE. 2003.Sonic hedgehog regulates the positionof the trigeminal ganglia. Dev Biol 261:456–469.
Fode C, Gradwohl G, Morin X, Dierich A,LeMeur M, Goridis C, Guillemot F.1998. The bHLH protein Neurogenin2is a determination factor for epibran-chial placode-derived sensory neurons.Neuron 20:483–494.
Haiko P, Makinen T, Keskitalo S, TaipaleJ, Karkkainen MJ, Baldwin ME,Stacker SA, Achen MG, Alitalo K. 2008.Deletion of vascular endothelial growthfactor C (VEGF-C) and VEGF-D is notequivalent to VEGF receptor 3 deletionin mouse embryos. Mol Cell Biol 28:4843–4850.
Heanue TA, Reshef R, Davis RJ, MardonG, Oliver G, Tomarev S, Lassar AB,Tabin CJ. 1999. Synergistic regulationof vertebrate muscle development byDach2, Eya2, and Six1, homologs ofgenes required for Drosophila eye for-mation. Genes Dev 13:3231–3243.
Huang E, Zang K, Schmidt A, Saulys A,Xiang M, Reichardt L. 1999. POU do-main factor Brn-3a controls the differen-tiation and survival of trigeminalneurons by regulating Trk receptorexpression. Development 126:2869–2882.
Hutson MR, Kirby ML. 2007. Model sys-tems for the study of heart development
and disease. Cardiac neural crest andconotruncal malformations. Semin CellDev Biol 18:101–110.
Jeyaseelan R, Poizat C, Baker R,Abdishoo S, Isterabadi L, Lyons G,Kedes L. 1997. A novel cardiac-re-stricted target for doxorubicin. CARP, anuclear modulator of gene expression incardiac progenitor cells and cardiomyo-cytes. J Biol Chem 272:22800–22808.
Kelly RG, Brown NA, Buckingham ME.2001. The arterial pole of the mouseheart forms from Fgf10-expressing cellsin pharyngeal mesoderm. Dev Cell 1:435–440.
Kramer I, Sigrist M, de Nooij JC, Taniu-chi I, Jessell TM, Arber S. 2006. A rolefor Runx transcription factor signalingin dorsal root ganglion sensory neurondiversification. Neuron 49:379–393.
Kuo C, Morrisey E, Anandappa R, SigristK, Lu M, Parmacek M, Soudais C, Lei-den J. 1997. GATA4 transcription factoris required for ventral morphogenesisand heart tube formation. Genes Dev11:1048–1060.
Kuo H, Chen J, Ruiz-Lozano P, Zou Y,Nemer M, Chien K. 1999. Control of seg-mental expression of the cardiac-restrictedankyrin repeat protein gene by distinctregulatory pathways in murine cardiogen-esis. Development 126:4223–4234.
Lanier J, Quina LA, Eng SR, Cox E,Turner EE. 2007. Brn3a target generecognition in embryonic sensory neu-rons. Dev Biol 302:703–716.
Lebel M, Agarwal P, Cheng CW, KabirMG, Chan TY, Thanabalasingham VZhang X, Cohen DR, Husain M, ChengSH, et al. 2003. The Iroquois homeoboxgene Irx2 is not essential for normal de-velopment of the heart and midbrain-hindbrain boundary in mice. Mol CellBiol 23:8216–8225.
Livak KJ, Schmittgen TD. 2001. Analysisof relative gene expression data usingreal-time quantitative PCR and the2(-Delta Delta C(T)) method. Methods25:402–408.
Lu JR, Bassel-Duby R, Hawkins A, ChangP, Valdez R, Wu H, Gan L, Shelton JM,Richardson JA, Olson EN. 2002. Con-trol of facial muscle development byMyoR and capsulin. Science 298:2378–2381.
Ma Q, Chen Z, Barrantes I, de la PompaJ, Anderson D. 1998. Neurogenin1 isessential for the determination of neu-ronal precursors for proximal sensoryganglia. Neuron 20:469–482.
Ma Q, Fode C, Guillemot F, Anderson DJ.1999. Neurogenin1 and neurogenin2control two distinct waves of neurogen-esis in developing dorsal root ganglia.Genes Dev 13:1717–1728.
Marguerie A, Bajolle F, Zaffran S, BrownN, Dickson C, Buckingham M, Kelly R.2006. Congenital heart defects in Fgfr2-IIIb and Fgf10 mutant mice. CardiovascRes 71:50–60.
McEvilly RJ, Erkman L, Luo L, Saw-chenko PE, Ryan AF, Rosenfeld MG.1996. Requirement for Brn-3.0 in dif-ferentiation and survival of sensory
and motor neurons. Nature 384:574–577.
Muhr J, Andersson E, Persson M, JessellTM, Ericson J. 2001. Groucho-mediatedtranscriptional repression establishesprogenitor cell pattern and neuronalfate in the ventral neural tube. Cell104:861–873.
Nathan E, Monovich A, Tirosh-FinkelL, Harrelson Z, Rousso T, Rinon A,Harel I, Evans SM, Tzahor E. 2008.The contribution of Islet1-expressingsplanchnic mesoderm cells to distinctbranchiomeric muscles reveals signifi-cant heterogeneity in head muscle devel-opment. Development 135:647– 657.
Ptashne M. 1988. How eukaryotic tran-scriptional activators work. Nature 335:683–689.
Quina LA, Pak W, Lanier J, Banwait P,Gratwick K, Liu Y, Velasquez T,O’Leary DD, Goulding M, Turner EE.2005. Brn3a-expressing retinal ganglioncells project specifically to thalamocorti-cal and collicular visual pathways. JNeurosci 25:11595–11604.
Rath N, Wang Z, Lu M, Morrisey E. 2005.LMCD1/Dyxin is a novel transcriptionalcofactor that restricts GATA6 functionby inhibiting DNA binding. Mol CellBiol 25:8864–8873.
Sommer L, Ma Q, Anderson DJ. 1996.neurogenins, a novel family of atonal-related bHLH transcription factors, areputative mammalian neuronal determi-nation genes that reveal progenitor cellheterogeneity in the developing CNSand PNS. Mol Cell Neurosci 8:221–241.
Sun Y, Dykes IM, Liang X, Eng SR, EvansSM, Turner EE. 2008. A central role for Is-let1 in sensory neuron development link-ing sensory and spinal gene regulatoryprograms.NatNeurosci 11:1283–1293.
Svensson E, Tufts R, Polk C, Leiden J.1999. Molecular cloning of FOG-2: amodulator of transcription factor GATA-4 in cardiomyocytes. Proc Natl Acad SciUSA 96:956–961.
Tevosian S, Deconinck A, Cantor A, RieffH, Fujiwara Y, Corfas G, Orkin S. 1999.FOG-2: A novel GATA-family cofactorrelated to multitype zinc-finger proteinsFriend of GATA-1 and U-shaped. ProcNatl Acad Sci USA 96:950–955.
Tevosian S, Deconinck A, Tanaka M,Schinke M, Litovsky S, Izumo S, Fuji-wara Y, Orkin S. 2000. FOG-2, a cofac-tor for GATA transcription factors, isessential for heart morphogenesis anddevelopment of coronary vessels fromepicardium. Cell 101:729–739.
Theil T, McLean-Hunter S, Zornig M,Moroy T. 1993. Mouse Brn-3 family ofPOU transcription factors: a new ami-noterminal domain is crucial for the on-cogenic activity of Brn-3a. Nucleic AcidsRes 21:5921–5929.
Trieu M, Rhee J, Fedtsova N, Turner E.1999. Autoregulatory sequences arerevealed by complex stability screeningof the mouse brn-3.0 locus. J. Neuro-science 19:6549–6558.
Trieu M, Ma A, Eng SR, Fedtsova N,Turner EE. 2003. Direct autoregulation
Dev
elop
men
tal D
ynam
ics
3078 LANIER ET AL.
and gene dosage compensation by POU-domain transcription factor Brn3a. De-velopment 130:111–121.
Tzahor E. 2009. Heart and craniofacialmuscle development: a new develop-mental theme of distinct myogenicfields. Dev Biol 327:273–279.
van den Berg G, Abu-Issa R, de Boer BA,Hutson MR, de Boer PA, Soufan AT,Ruijter JM, Kirby ML, van den HoffMJ, Moorman AF. 2009. A caudal prolif-erating growth center contributes toboth poles of the forming heart tube.Circ Res 104:179–188.
von Scheven G, Bothe I, Ahmed M,Alvares L, Dietrich S. 2006. Proteinand genomic organisation of vertebrate
MyoR and Capsulin genes and theirexpression during avian development.Gene Expr Patterns 6:383–393.
White FA, Chiaia NL, Macdonald GJ,Rhoades RW. 1995. Birth dates andsurvival after axotomy of neurochemi-cally defined subsets of trigeminalganglion cells. J Comp Neurol 352:308–320.
Xiang M, Lin G, Zhou L, Klein WH,Nathans J. 1996. Targeted deletion ofthe mouse POU-domain gene Brn-3acauses a selective loss of neurons in thebrainstem and trigeminal ganglion,uncoordinated limb movement, andimpaired suckling. Proc Nat Acad Sci93:11950–11955.
Xin M, Davis C, Molkentin J, Lien C,Duncan S, Richardson J, Olson E. 2006.A threshold of GATA4 and GATA6expression is required for cardiovascu-lar development. Proc Natl Acad SciUSA 103:11189–11194.
Zeisberg E, Ma Q, Juraszek A, MosesK, Schwartz R, Izumo S, Pu W.2005. Morphogenesis of the rightventricle requires myocardial expres-sion of Gata4. J Clin Invest 115:1522–1531.
Zhao F, Lufkin T, Gelb BD. 2003. Expres-sion of Tfap2d, the gene encoding thetranscription factor Ap-2 delta, duringmouse embryogenesis. Gene Expr Pat-terns 3:213–217.
Dev
elop
men
tal D
ynam
ics
ROLE OF Brn3a IN THE TRIGEMINAL GANGLION 3079
Copyright © 2022 FDOKUMEN