BNY MELLON FUNDS TRUST Form N-CSRS Filed 2022-04-25
371
Business Address C/O BNY MELLON INVESTMENT ADVISER, INC. 240 GREENWICH STREET NEW YORK NY 10286 2129226400 Mailing Address C/O BNY MELLON INVESTMENT ADVISER, INC. 240 GREENWICH STREET NEW YORK NY 10286 SECURITIES AND EXCHANGE COMMISSION FORM N-CSRS Certified semi-annual shareholder report of registered management investment companies filed on Form N-CSR Filing Date: 2022-04-25 | Period of Report: 2022-02-28 SEC Accession No. 0001111565-22-000021 (HTML Version on secdatabase.com) FILER BNY MELLON FUNDS TRUST CIK:1111565| IRS No.: 134121547 Type: N-CSRS | Act: 40 | File No.: 811-09903 | Film No.: 22848722 Copyright © 2022 www.secdatabase.com . All Rights Reserved. Please Consider the Environment Before Printing This Document
-
Upload
khangminh22 -
Category
Documents
-
view
0 -
download
0
Transcript of BNY MELLON FUNDS TRUST Form N-CSRS Filed 2022-04-25
Business AddressC/O BNY MELLONINVESTMENT ADVISER, INC.240 GREENWICH STREETNEW YORK NY 102862129226400
Mailing AddressC/O BNY MELLONINVESTMENT ADVISER, INC.240 GREENWICH STREETNEW YORK NY 10286
SECURITIES AND EXCHANGE COMMISSION
FORM N-CSRSCertified semi-annual shareholder report of registered management investment companies filed
on Form N-CSR
Filing Date: 2022-04-25 | Period of Report: 2022-02-28SEC Accession No. 0001111565-22-000021
(HTML Version on secdatabase.com)
FILERBNY MELLON FUNDS TRUSTCIK:1111565| IRS No.: 134121547Type: N-CSRS | Act: 40 | File No.: 811-09903 | Film No.: 22848722
Copyright © 2022 www.secdatabase.com. All Rights Reserved.Please Consider the Environment Before Printing This Document
UNITED STATESSECURITIES AND EXCHANGE COMMISSION
Washington, D.C. 20549
FORM N-CSR
CERTIFIED SHAREHOLDER REPORT OF REGISTERED MANAGEMENTINVESTMENT COMPANIES
Investment Company Act file number 811-09903
BNY MELLON FUNDS TRUST(Exact name of Registrant as specified in charter)
c/o BNY Mellon Investment Adviser, Inc.240 Greenwich Street
New York, New York 10286(Address of principal executive offices) (Zip code)
Deirdre Cunnane, Esq.240 Greenwich Street
New York, New York 10286(Name and address of agent for service)
Registrant's telephone number, including area code: (212) 922-6400
Date of fiscal year end: 08/31
Date of reporting period: 02/28/2022
FORM N-CSR
Item 1. Reports to Stockholders.
The BNY Mellon FundsBNY Mellon Tax-Sensitive Large Cap Multi-Strategy FundBNY Mellon Income Stock Fund
Copyright © 2022 www.secdatabase.com. All Rights Reserved.Please Consider the Environment Before Printing This Document
BNY Mellon Mid Cap Multi-Strategy FundBNY Mellon Small Cap Multi-Strategy FundBNY Mellon Focused Equity Opportunities FundBNY Mellon International FundBNY Mellon Emerging Markets FundBNY Mellon International Equity Income FundBNY Mellon Asset Allocation FundSEMIANNUAL REPORT February 28, 2022
Copyright © 2022 www.secdatabase.com. All Rights Reserved.Please Consider the Environment Before Printing This Document

ContentsT H E F U N D S
Discussion of Funds’ Performance 2Understanding Your Fund’s Expenses 20Comparing Your Fund’s Expenses With Those of Other Funds 21Statements of Investments 22Statements of Assets and Liabilities 74Statements of Operations 78Statements of Changes in Net Assets 81Financial Highlights 87Notes to Financial Statements 109F O R M O R E I N F O R M AT I O N
Back Cover
Save time. Save paper. View your next shareholder report online as soon as it’s available. Log intowww.im.bnymellon.com and sign up for eCommunications. It’s simple and only takes a few minutes.
The views expressed herein are current to the date of this report. These views and the composition of thefunds’ portfolios are subject to change at any time based on market and other conditions.
Not FDIC-Insured • Not Bank-Guaranteed • May Lose Value
Copyright © 2022 www.secdatabase.com. All Rights Reserved.Please Consider the Environment Before Printing This Document
DISCUSSION OF FUND PERFORMANCE (Unaudited)For the period from September 1, 2021 through February 28, 2022, as provided by Alicia Levine, Primary Portfolio Manager
responsible for investment allocation decisionsMarket and Fund Performance OverviewFor the six-month period ended February 28, 2022, BNY Mellon Tax-Sensitive Large Cap Multi-Strategy Fund’s (the “fund”) Class M
shares produced a total return of -2.49%, and Investor shares produced a total return of -2.59%.1 In comparison, the S&P 500®
Index (the“Index”), the fund’s benchmark, produced a total return of -2.62% for the same period.2Large-cap stocks lost ground over the reporting period as investors took note of rising inflation and increasing geopolitical risk. The fundoutperformed the Index primarily due to favorable contributions from two underlying strategies.The Fund’s Investment ApproachThe fund seeks long-term capital appreciation. To pursue its goal, the fund normally invests at least 80% of its net assets, plus anyborrowings for investment purposes, in equity securities of large-cap companies. The fund currently considers large-cap companies to bethose companies with total market capitalizations of $5 billion or more at the time of purchase. The fund normally allocates its assetsamong multiple investment strategies employed by BNY Mellon Investment Adviser, Inc. or its affiliates that invest primarily in equitysecurities issued by large-cap companies. The fund is designed to provide exposure to various large-cap equity portfolio managers andinvestment strategies and styles, and uses tax-sensitive strategies to reduce the impact of federal and state income taxes on the fund’safter-tax returns.The fund allocates its assets among some or all of the following: the Large Cap Core Strategy, Large Cap Tax-Sensitive Strategy, FocusedEquity Strategy, U.S. Large Cap Equity Strategy, Dynamic Large Cap Value Strategy, Large Cap Growth Strategy, U.S. Large Cap GrowthStrategy, Income Stock Strategy, Appreciation Strategy, and Large Cap Dividend Strategy—all of which are more fully described in thefund’s prospectus. The fund invests directly in securities or in other mutual funds as advised by the fund’s investment adviser or itsaffiliates, referred to as underlying funds.BNY Mellon Investment Adviser, Inc. has the discretion to change the investment strategies, including whether to implement a strategyby investing directly in securities or through an underlying fund, as well as the target allocations and ranges when the investment adviserdeems it appropriate.Inflation and Geopolitical Concerns Weigh on MarketsStocks gained ground during the period but were hindered by concerns about inflation and geopolitical events. Value stocks, as measured
by the Russell 1000®
Value Index, outperformed growth stocks, as measured by the Russell 1000®
Growth Index.While the waning of the pandemic and reopening of global economies supported markets early in the reporting period, supply-chainproblems hindered sales in some industries. These bottlenecks, combined with loose monetary policy and massive government spending,caused inflation to rise to multi-decade highs in the U.S.The Federal Reserve initially called pricing pressures “transitory” but acknowledged late in the period that pricing pressures were morepermanent. Officials signaled that in addition to tapering bond purchases late in 2021, they were likely to hike interest rates in 2022.While growth stocks dominated the market earlier in 2021, value stocks gained favor at times during the period. When concerns about theeconomy rose, the market favored growth stocks, but when positive news on the pandemic emerged, value and more cyclically orientedstocks benefited.Late in the reporting period, markets experienced increased volatility. While the economy continued to show strength, especially in thelabor market, higher-than-expected inflation weighed on returns, and rising Treasury yields led to depressed stock valuations, especiallyamong high-growth companies. In addition, geopolitical risks also came to the fore as the conflict in Ukraine intensified.Fund Performance Aided by Underlying StrategiesThe fund’s relative return benefited primarily from the performance of two of the six underlying strategies. The Dynamic Large Cap Value
Strategy significantly outperformed its benchmark, the Russell 1000®
Value Index. In addition, the Income Stock Strategy outperformedits benchmark, the Dow Jones U.S. Select Dividend Index. The Large Cap Tax-Sensitive Strategy also added to relative performance.On a less positive note, the fund’s performance was hindered primarily by the performance of the growth-oriented category, which lagged
its benchmark, the Russell 1000®
Growth Index, by a substantial amount. Other categories that underperformed included the U.S. LargeCap Equity Strategy and the Focused Equity Strategy.An Uncertain OutlookOur base case remains constructive, but downside risk has increased. We expect positive but lower growth and moderating but still-elevated inflation. However, the outlook has become increasingly uncertain, and higher volatility will likely persist throughout 2022.Supply-chain bottlenecks, tight labor markets, elevated food and energy prices, and the impact of geopolitical tensions between Ukraineand Russia—including how long the conflict will last—have increased the potential range of outcomes for growth, inflation, monetarypolicy and earnings. Diversification across asset classes may position the fund
2
Copyright © 2022 www.secdatabase.com. All Rights Reserved.Please Consider the Environment Before Printing This Document

for a wide range of possible outcomes and help mitigate risk against increased volatility.March 15, 20221 Total return includes reinvestment of dividends and any capital gains paid. Past performance is no guarantee of future results. Share price and investment return
fluctuate such that upon redemption, fund shares may be worth more or less than their original cost.2 Source: Lipper Inc. — The S&P 500
®Index is widely regarded as the best single gauge of large-cap U.S. equities. The index includes 500 leading companies and
captures approximately 80% coverage of available market capitalization. Investors cannot invest directly in any index.Equities are subject generally to market, market sector, market liquidity, issuer and investment style risks, among other factors, to varying degrees, all of which are morefully described in the fund’s prospectus.The underlying funds’ underlying strategies may use derivative instruments. A small investment in derivatives could have a potentially large impact on the fund’sperformance. The use of derivatives involves risks different from, or possibly greater than, the risks associated with investing directly in the underlying assets.Recent market risks include pandemic risks related to COVID-19. The effects of COVID-19 have contributed to increased volatility in global markets and will likely affectcertain countries, companies, industries and market sectors more dramatically than others. To the extent the fund may overweight its investments in certain countries,companies, industries or market sectors, such positions will increase the fund’s exposure to risk of loss from adverse developments affecting those countries, companies,industries or sectors.
3
Copyright © 2022 www.secdatabase.com. All Rights Reserved.Please Consider the Environment Before Printing This Document
DISCUSSION OF FUND PERFORMANCE (Unaudited) (continued)For the period of September 1, 2021 through February 28, 2022 as provided by portfolio managers John C. Bailer, Brian C. Ferguson,David S. Intoppa and Keith Howell of Newton Investment Management North America, LLC, Sub-AdviserMarket and Fund Performance OverviewFor the six-month period ended February 28, 2022, BNY Mellon Income Stock Fund’s (the “fund”) Class M shares produced a total returnof 8.18%, Investor shares produced a total return of 8.00%, Class A shares produced a total return of 8.09%, Class C shares produced atotal return of 7.62%, Class I shares produced a total return of 8.24% and Class Y shares produced a total return of 8.18%.1 In comparison,the fund’s benchmark, the Dow Jones U.S. Select Dividend™ Index (the “Index”), produced a total return of 6.02% for the same period.2Stocks gained ground as government-mandated lockdowns were lifted, and the global economy continued to recover. The fundoutperformed the Index due to favorable asset allocation and security selection.The Fund’s Investment ApproachThe fund seeks total return (consisting of capital appreciation and income). To pursue its goal, the fund normally invests at least 80%of its net assets, plus any borrowings for investment purposes, in stocks. The fund seeks to focus on dividend-paying stocks and otherinvestment techniques that produce income. We choose stocks through a disciplined investment process that combines quantitativemodeling techniques, fundamental analysis and risk management. The fund emphasizes those stocks with value characteristics, althoughit may also purchase growth stocks. The fund may invest in the stocks of companies of any size, although it focuses on large-capcompanies. The fund’s investment process is designed to provide investors with investment exposure to sector weightings and riskcharacteristics generally similar to those of the Index.Inflation and Geopolitical Concerns Weigh on MarketsStocks gained ground during the period but were hindered by concerns about inflation and geopolitical events. Value stocks, as measured
by the Russell 1000®
Value Index, outperformed growth stocks, as measured by the Russell 1000®
Growth Index.While the waning of the pandemic and reopening of global economies supported markets early in the reporting period, supply-chainproblems hindered sales in some industries. These bottlenecks, combined with loose monetary policy and massive government spending,caused inflation to rise to multi-decade highs in the U.S.The Federal Reserve (the “Fed”) initially called pricing pressures “transitory” but acknowledged late in the period that pricing pressureswere more persistent. Officials signaled that they were likely to hike interest rates multiple times in 2022, in addition to tapering bondpurchases.While growth stocks dominated the market earlier in 2021, value stocks gained favor at times during the period. When concerns about theeconomy rose, the market favored growth stocks, but when positive news on the pandemic emerged, value and more cyclically orientedstocks benefited.Late in the reporting period, markets experienced increased volatility. While the economy continued to show strength, especially in thelabor market, higher-than-expected inflation weighed on market sentiment, and rising Treasury yields led to declining stock valuations,especially among high-growth companies. In addition, geopolitical risks also came to the fore as the conflict in Ukraine intensified.Performance Helped by the Energy and Materials SectorsThe fund’s outperformance versus the Index was driven primarily by stock selections in the energy and materials sectors. In the energysector, shares of two exploration and production companies, Devon Energy and Hess, drove returns. Devon Energy has implemented abase dividend, supplemented by a variable dividend, which will depend on free cash flows and is likely to remain attractive against afavorable fundamental business backdrop for the group. Earnings at Hess are benefiting from a recently developed oil field in Guyana,where production is coming online this year. Stock selection in the materials sector also was a leading contributor, with a position inCF Industries Holdings, a fertilizer manufacturer, rising 80%. Shares of Freeport-McMoRan, a copper mining company, also contributedpositively, rising nearly 30% on strong demand and higher copper prices.On a less positive note, the performance of the fund relative to the Index was hindered primarily by positions in the financials andindustrials sectors. In the financials sector, the fund’s selections were detrimental, especially in the banking industry. Shares of JPMorganChase & Co. detracted from returns as recent financial performance was disappointing due largely to higher salaries and investments intechnology. In addition, the fund’s decision to avoid First Horizon, a regional bank based in Tennessee, detracted from returns. Sharesrose 46% when the bank received a buyout offer from Toronto-Dominion Bank, a large Canadian financial institution. In the industrialssector, shares of Hubbell, a maker of electrical components, declined 13%, primarily due to geopolitical events that hurt its financialoutlook.A Cloudy OutlookA number of factors are combining to present investors with an uncertain outlook. With the war in Ukraine, geopolitical risk hasincreased. This conflict could be prolonged and is likely to impact global economic growth, primarily in Europe. Prices for energy andother commodities have risen, and inflation is also at decades-long highs in the U.S. Higher input prices are likely to weigh on economicgrowth, though the lag effect of fiscal stimulus and high levels of savings could offset that somewhat. The Fed is likely to continue withits stated intention of raising the Fed Funds rate, though it may proceed at a more measured pace to avoid hindering economic growth.We are more optimistic in the near term about the U.S. economy, where
4
Copyright © 2022 www.secdatabase.com. All Rights Reserved.Please Consider the Environment Before Printing This Document
wages are rising and the labor market is strong, than we are about the rest of the global economy.March 15, 20221 Total return includes reinvestment of dividends and any capital gains paid. Past performance is no guarantee of future results. Share price and investment return
fluctuate such that upon redemption, fund shares may be worth more or less than their original cost. The fund’s returns reflect the absorption of certain fund expensesby BNY Mellon Investment Adviser, Inc. pursuant to an agreement in effect through December 31, 2022, for class A shares, Class C shares, Class I shares and Class Yshares, at which time it may be extended, terminated or modified. Had these expenses not been absorbed, the fund’s returns for those share classes would have beenlower.
2 Source: Lipper Inc. – The Dow Jones U.S. Select Dividend™ Index is defined as all dividend-paying companies in the Dow Jones U.S. Index, excluding REITs, that havea non-negative, historical, five-year dividend-per-share growth rate, a five-year average dividend coverage ratio of greater than or equal to 167%, paid dividends ineach of the previous five years, non-negative, trailing 12-month earnings-per-share (EPS), a float-adjusted market capitalization of at least U.S. $1 billion, and athree-month average daily trading volume of 200,000 shares. Investors cannot invest directly in any index.
Equities are subject generally to market, market sector, market liquidity, issuer and investment style risks, among other factors, to varying degrees, all of which are morefully described in the fund’s prospectus.Investing in foreign denominated and/or domiciled securities involves special risks, including changes in currency exchange rates, political, economic, and socialinstability, limited company information, differing auditing and legal standards, and less market liquidity. These risks generally are greater with emerging marketcountries.The fund may, but is not required to, use derivative instruments. A small investment in derivatives could have a potentially large impact on the fund’s performance. The
use of derivatives involves risks different from, or possibly greater than, the risks associated with investing directly in the underlying assets. The securities discussedshould not be considered recommendations to buy or sell a particular security.Recent market risks include pandemic risks related to COVID-19. The effects of COVID-19 have contributed to increased volatility in global markets and will likely affectcertain countries, companies, industries and market sectors more dramatically than others. To the extent the fund may overweight its investments in certain countries,companies, industries or market sectors, such positions will increase the fund’s exposure to risk of loss from adverse developments affecting those countries, companies,industries or sectors.
5
Copyright © 2022 www.secdatabase.com. All Rights Reserved.Please Consider the Environment Before Printing This Document
DISCUSSION OF FUND PERFORMANCE (Unaudited) (continued)For the period from September 1, 2021 through February 28, 2022, as provided by Alicia Levine, Primary Portfolio Managerresponsible for investment allocation decisionsMarket and Fund Performance OverviewFor the six-month period ended February 28, 2022, BNY Mellon Mid Cap Multi-Strategy Fund’s (the “fund”) Class M shares produced a
total return of -7.56%, and Investor shares produced a total return of -7.68%.1 In comparison, the fund’s benchmark, the Russell Midcap®
Index (the “Index”), produced a total return of -6.15% for the reporting period.2 The Russell Midcap®
Value Index and Russell Midcap®
Growth Index, the fund’s secondary benchmarks, produced total returns of -0.39% and -15.80%, respectively, for the same period.3,4
Mid-cap stocks lost ground over the reporting period as investors took note of rising inflation and growing geopolitical risk. The fundlagged the Index due to underperformance by the growth-oriented category.The Fund’s Investment ApproachThe fund seeks capital appreciation. The fund pursues its goal by normally investing at least 80% of its net assets, plus any borrowingsfor investment purposes, in equity securities of mid-cap companies. The fund considers mid-cap companies to be those companies withmarket capitalizations that are within the market-capitalization range of companies comprising the Index. Furthermore, the fund normallyallocates assets across multiple investment strategies employed by BNY Mellon Investment Adviser, Inc. and affiliated and unaffiliatedsub-advisers that invest primarily in equity securities issued by mid-cap companies. BNY Mellon Investment Adviser, Inc. determinesthe investment strategies and sets target allocations and ranges. The fund is designed to provide exposure to various investment strategiesand styles, including the Mid Cap Tax-Sensitive Core Strategy, Opportunistic Mid Cap Value Strategy, Mid Cap Growth Strategy, BostonPartners Mid Cap Value Strategy, and Geneva Mid Cap Growth Strategy, all as more particularly described in the fund’s prospectus.Inflation and Geopolitical Concerns Weigh on MarketsStocks gained ground during the period but were hindered by concerns about inflation and geopolitical events. Value stocks, as measured
by the Russell 1000®
Value Index, outperformed growth stocks, as measured by the Russell 1000®
Growth Index.While the waning of the pandemic and reopening of global economies supported markets early in the reporting period, supply-chainproblems hindered sales in some industries. These bottlenecks, combined with loose monetary policy and massive government spending,caused inflation to rise to multi-decade highs in the U.S.The Federal Reserve initially called pricing pressures “transitory” but acknowledged late in the period that pricing pressures were morepermanent. Officials signaled that in addition to tapering bond purchases late in 2021, they were likely to hike interest rates in 2022.While growth stocks dominated the market earlier in 2021, value stocks gained favor at times during the period. When concerns about theeconomy rose, the market favored growth stocks, but when positive news on the pandemic emerged, value and more cyclically orientedstocks benefited.Late in the reporting period, markets experienced increased volatility. While the economy continued to show strength, especially in thelabor market, higher-than-expected inflation weighed on returns, and rising Treasury yields led to depressed stock valuations, especiallyamong high-growth companies. In addition, geopolitical risks also came to the fore as the conflict in Ukraine intensified.Growth-Oriented Strategies UnderperformedThe fund’s relative performance was hindered primarily by underperformance in two underlying funds. In the mid-cap, growth-orientedcategory, the Geneva Mid Cap Growth Strategy outperformed the Russell Mid Cap Growth Index, a secondary benchmark, but thiscategory lagged the Index, declining 15.80%. The Mid Cap Growth Strategy underperformed to a greater extent, lagging the Russell MidCap Growth Index, which lagged the Index.On a more positive note, three underlying funds made positive contributions. In the value-oriented category, the Opportunistic Mid CapValue Strategy exceeded its benchmark. The Mid Cap Tax-Sensitive Core Strategy also contributed positively to performance.An Uncertain OutlookOur base case remains constructive, but downside risk has increased. We expect positive but lower growth and moderating but still-elevated inflation. However, the outlook has become increasingly uncertain, and higher volatility will likely persist throughout 2022.Supply-chain bottlenecks, tight labor markets, elevated food and energy prices, and the impact of geopolitical tensions between Ukraineand Russia—including how long the conflict will last—have increased the potential range of outcomes for growth, inflation, monetarypolicy and earnings. Diversification across asset classes may position the fund
6
Copyright © 2022 www.secdatabase.com. All Rights Reserved.Please Consider the Environment Before Printing This Document
for a wide range of possible outcomes and help mitigate risk against increased volatility.March 15, 20221 Total return includes reinvestment of dividends and any capital gains paid. Past performance is no guarantee of future results. Share price and investment return
fluctuate such that upon redemption, fund shares may be worth more or less than their original cost.2 Source: Lipper Inc. — The Russell Midcap
®Index measures the performance of the mid-cap segment of the U.S. equity universe. The Russell Midcap
®Index is a subset
of the Russell 1000®
Index. It includes approximately 800 of the smallest securities based on a combination of their market cap and current index membership. The
Russell Midcap®
Index represents approximately 31% of the total market capitalization of the Russell 1000 companies. The Russell Midcap®
Index is constructed to
provide a comprehensive and unbiased barometer for the mid-cap segment. The Index is completely reconstituted annually to ensure larger stocks do not distort the
performance and characteristics of the true midcap opportunity set. Investors cannot invest directly in any index.3 Source: Lipper Inc. — The Russell Midcap
®Value Index measures the performance of the mid-cap value segment of the U.S. equity universe. It includes those Russell
Midcap®
Index companies that are considered more value-oriented relative to the overall market as defined by Russell’s leading style methodology. The Russell
Midcap Value®
Index is constructed to provide a comprehensive and unbiased barometer of the mid-cap value market. The Russell Midcap®
Value Index is completelyreconstituted annually to ensure larger stocks do not distort the performance and characteristics of the true mid-cap value market. Investors cannot invest directly inany index.
4 Source: Lipper Inc. — The Russell Midcap®
Growth Index measures the performance of the mid-cap growth segment of the U.S. equity universe. It includes those
Russell Midcap®
Index companies with higher growth earning potential as defined by Russell’s leading style methodology. The Russell Midcap®
Growth Index is
constructed to provide a comprehensive and unbiased barometer of the mid-cap growth market. The Russell Midcap®
Growth Index is completely reconstitutedannually to ensure larger stocks do not distort the performance and characteristics of the true mid-cap growth market. Investors cannot invest directly in any index.
Equities are subject generally to market, market sector, market liquidity, issuer and investment style risks, among other factors, to varying degrees, all of which are morefully described in the fund’s prospectus.Stocks of small- and/or mid-cap companies often experience sharper price fluctuations than stocks of large-cap companies.Recent market risks include pandemic risks related to COVID-19. The effects of COVID-19 have contributed to increased volatility in global markets and will likely affectcertain countries, companies, industries and market sectors more dramatically than others. To the extent the fund may overweight its investments in certain countries,companies, industries or market sectors, such positions will increase the fund’s exposure to risk of loss from adverse developments affecting those countries, companies,industries or sectors.
7
Copyright © 2022 www.secdatabase.com. All Rights Reserved.Please Consider the Environment Before Printing This Document
DISCUSSION OF FUND PERFORMANCE (Unaudited) (continued)For the period of September 1, 2021 through February 28, 2022, as provided by Alicia Levine, Primary Portfolio Manager responsiblefor investment allocation decisionsFund and Market Performance OverviewFor the six-month period ended February 28, 2022, BNY Mellon Small Cap Multi-Strategy Fund’s (the “fund”) Class M shares produceda total return of -6.33%, and Investor shares produced a total return of -6.44%.1 In comparison, the fund’s primary benchmark, the Russell
2000®
Index (the “Index”), produced a total return of -9.46% for the same period.2 The Russell 2000®
Growth Index and Russell 2000®
Value Index, the fund’s secondary benchmarks, produced total returns of -16.35% and -2.10%, respectively, for the same period.3,4
Small-cap stocks lost ground over the reporting period as investors took note of rising inflation and increasing geopolitical risk. The fundoutperformed the Index due to positive contributions from two of the fund’s underlying strategies.The Fund’s Investment ApproachThe fund seeks capital appreciation. The fund pursues its goal by normally investing at least 80% of its net assets, plus any borrowingsfor investment purposes, in equity securities of small-cap companies. The fund currently considers small-cap companies to be thosecompanies with market capitalizations that are equal to or less than the market capitalization of the largest company included in the Index.Furthermore, the fund normally allocates assets across multiple investment strategies employed by BNY Mellon Investment Adviser, Inc.that invest primarily in equity securities issued by small-cap companies. BNY Mellon Investment Adviser, Inc. determines the investmentstrategies and sets target allocations and ranges. The fund is designed to provide exposure to various investment strategies and styles,including the Opportunistic Small Cap Strategy, the Small Cap Value Strategy and the Small Cap Growth Strategy—all of which are morefully described in the fund’s prospectus.Inflation and Geopolitical Concerns Weigh on MarketsStocks gained ground during the period but were hindered by concerns about inflation and geopolitical events. Value stocks, as measured
by the Russell 1000®
Value Index, outperformed growth stocks, as measured by the Russell 1000®
Growth Index.While the waning of the pandemic and reopening of global economies supported markets early in the reporting period, supply-chainproblems hindered sales in some industries. These bottlenecks, combined with loose monetary policy and massive government spending,caused inflation to rise to multi-decade highs in the U.S.The Federal Reserve initially called pricing pressures “transitory” but acknowledged late in the period that pricing pressures were morepermanent. Officials signaled that in addition to tapering bond purchases late in 2021, they were likely to hike interest rates in 2022.While growth stocks dominated the market earlier in 2021, value stocks gained favor at times during the period. When concerns about theeconomy rose, the market favored growth stocks, but when positive news on the pandemic emerged, value and more cyclically orientedstocks benefited.Late in the reporting period, markets experienced increased volatility. While the economy continued to show strength, especially in thelabor market, higher-than-expected inflation weighed on returns, and rising Treasury yields led to depressed stock valuations, especiallyamong high-growth companies. In addition, geopolitical risks also came to the fore as the conflict in Ukraine intensified.Value-Oriented Strategy Aided PerformanceThe primary positive contributor to the fund’s returns versus the Index was the value-oriented category. The category outperformed
the overall Index (the Russell 2000®
Index), and the underlying strategy in this category outperformed the Russell 2000®
Value Index(a secondary benchmark). In addition, a large overweight to this underlying strategy also added to performance. A relatively strongperformance by the underlying Opportunistic Small Cap Strategy benefited relative performance as well.The fund’s returns relative to the Index were hindered primarily by the underperformance in the growth-oriented category. The growth-
oriented category lagged the overall Index, and the fund’s growth-oriented strategy lagged the Russell 2000®
Growth Index (a secondarybenchmark) slightly. An underweight to the underlying growth strategy helped offset the decline somewhat.An Uncertain OutlookOur base case remains constructive, but downside risk has increased. We expect positive but lower growth and moderating but still-elevated inflation. However, the outlook has become increasingly uncertain, and higher volatility will likely persist throughout 2022.Supply-chain bottlenecks, tight labor markets, elevated food and energy prices, and the impact of geopolitical tensions between Ukraineand Russia—including how long the conflict will last—have increased the potential range of outcomes for growth, inflation, monetarypolicy and earnings. Diversification across asset classes may position the fund
8
Copyright © 2022 www.secdatabase.com. All Rights Reserved.Please Consider the Environment Before Printing This Document
for a wide range of possible outcomes and help mitigate risk against increased volatility.March 15, 20221 Total return includes reinvestment of dividends and any capital gains paid. Past performance is no guarantee of future results. Share price and investment return
fluctuate such that upon redemption, fund shares may be worth more or less than their original cost.2 Source: Lipper Inc. — The Russell 2000
®Index measures the performance of the small-cap segment of the U.S. equity universe. The Russell 2000
®Index is a subset of
the Russell 3000®
Index representing approximately 10% of the total market capitalization of that index. It includes approximately 2,000 of the smallest securities
based on a combination of their market cap and current index membership. The Russell 2000®
Index is constructed to provide a comprehensive and unbiased small-cap barometer and is completely reconstituted annually to ensure larger stocks do not distort the performance and characteristics of the true small-cap opportunityset. Investors cannot invest directly in any index.
3 Source: Lipper Inc. — The Russell 2000®
Growth Index measures the performance of the small-cap growth segment of the U.S. equity universe. It includes those Russell
2000 companies with higher growth earning potential as defined by Russell’s leading style methodology. The Russell 2000®
Growth Index is constructed to provide a
comprehensive and unbiased barometer for the small-cap growth segment. The Russell 2000®
Growth Index is completely reconstituted annually to ensure largerstocks do not distort the performance and characteristics of the true small-cap opportunity set, and that the represented companies continue to reflect growthcharacteristics. Investors cannot invest directly in any index.
4 Source: Lipper Inc. — The Russell 2000®
Value Index measures the performance of the small-cap value segment of the U.S. equity universe. It includes those Russell
2000 companies that are considered more value-oriented relative to the overall market as defined by Russell’s leading style methodology. The Russell 2000®
Value
Index is constructed to provide a comprehensive and unbiased barometer for the small-cap value segment. The Russell 2000®
Value Index is completely reconstitutedannually to ensure larger stocks do not distort the performance and characteristics of the true small-cap opportunity set, and that the represented companies continueto reflect value characteristics. Investors cannot invest directly in any index.
Equities are subject generally to market, market sector, market liquidity, issuer and investment style risks, among other factors, to varying degrees, all of which are morefully described in the fund’s prospectus.Stocks of small- and/or mid-cap companies often experience sharper price fluctuations than stocks of large-cap companies.Recent market risks include pandemic risks related to COVID-19. The effects of COVID-19 have contributed to increased volatility in global markets and will likely affectcertain countries, companies, industries and market sectors more dramatically than others. To the extent the fund may overweight its investments in certain countries,companies, industries or market sectors, such positions will increase the fund’s exposure to risk of loss from adverse developments affecting those countries, companies,industries or sectors.
9
Copyright © 2022 www.secdatabase.com. All Rights Reserved.Please Consider the Environment Before Printing This Document
DISCUSSION OF FUND PERFORMANCE (Unaudited) (continued)For the period from September 1, 2021 through February 28, 2022, as provided by Donald Sauber and Thomas Lee, PortfolioManagersMarket and Fund Performance OverviewFor the six-month period ended February 28, 2022, BNY Mellon Focused Equity Opportunities Fund’s (the “fund”) Class M shares
produced a total return of −3.58%, and Investor shares produced a total return of −3.69%.1 In comparison, the S&P 500®
Index (the“Index”), the fund’s benchmark, produced a total return of −2.62% for the same period.2Large-cap stocks generally lost ground during the period under pressure from increasing inflationary pressures, rising interest rates andheightened geopolitical tensions. The fund underperformed the Index for the period, largely due to disappointing issue selection in thecommunication services, consumer discretionary and information technology sectors.The Fund’s Investment ApproachThe fund seeks capital appreciation. To pursue its goal, the fund normally invests at least 80% of its net assets, plus any borrowingsfor investment purposes, in equity securities. The fund invests, under normal circumstances, in approximately 25-30 companies that areconsidered by BNY Mellon Investment Adviser, Inc. to be positioned for long-term earnings growth. The fund may hold growth or valuestocks or a blend of both. The fund may invest in the stocks of companies of any size, although it focuses on large-cap companies. Thefund invests primarily in equity securities of U.S. issuers but may invest up to 25% of its assets in the equity securities of foreign issuers,including those in emerging market countries.The portfolio managers monitor sector and security weightings and regularly evaluates the fund’s risk-adjusted returns to manage the riskprofile of the fund’s portfolio. The portfolio managers adjust exposure limits, as necessary.Risk Assets Retreat on Inflationary PressuresThe reporting period began amid increasing inflationary pressures due to rising energy and commodity prices and global supply-chaindisruptions. The U.S. Federal Reserve (the “Fed”), which expressed increasingly hawkish sentiments prior to the start of the period,indicated in September 2021 a willingness to consider reducing accommodative policies sooner rather than later due to the unexpectedlevel and persistence of inflationary forces affecting the economy. As inflationary pressures continued to mount, Fed rhetoric grewincreasingly emphatic. In November 2021, the Fed dropped the word “transitory” when describing inflation. At the same time, the Fedforecast a possible end to their asset purchase program as early as June 2022, thereby increasing the likelihood of one or more rate hikeslater that year. In December 2021, the Fed again revised their estimate of an end to quantitative easing to March 2022, leading the marketto widely anticipate multiple hikes in 2022. Increasing tensions between Russia and Ukraine in early 2022 and the eventual invasion ofUkraine by its larger neighbor further undermined investor sentiment and pressured international credit markets.Stock prices declined under pressure from increasingly risk-off sentiment, with small-cap issues significantly underperforming theirlarge-cap counterparts, and growth-oriented stocks underperforming value-oriented shares. From a global perspective, U.S.-based issuestended to maintain their value better than international equities, while emerging markets trailed developed markets. Regarding sectors,energy stocks significantly outperformed on rising petroleum and natural gas prices. The traditionally defensive investment area ofconsumer staples produced modestly positive returns, while utilities and financials outperformed market averages as well. Notably weaksectors included communication services, followed by industrials, consumer discretionary and health care.Stock Selections Detract from Relative ReturnsAlthough the fund added value during the six-month period through allocation decisions, individual stock selection undermined relativereturns to an even greater degree. Specifically, in communication services, social media giant Meta Platforms, the parent company ofFacebook, lost ground due to the negative impact on revenues of changes to Apple’s privacy policies in mid-2021. In the consumerdiscretionary sector, shares in vehicle maker General Motors slumped as investor sentiment shifted away from early cyclical areas, suchas housing and automotive, causing GM’s valuation multiple to compress despite the company’s positive earnings. In the informationtechnology sector, payment processors, including Block, PayPal Holdings and Visa, were negatively affected by slowing economicgrowth and decelerating growth in international and online commerce.On the positive side, relative performance benefited from the fund’s exposure to Costco Wholesale in the consumer staples space, at a timewhen investors favor companies positioned to benefit from stable consumer demand over discretionary spending. In energy, overweightsector exposure enhanced returns, led by holdings in integrated oil and gas company Chevron and independent oil and gas explorationand production company Pioneer Natural Resources. Among financials, top holdings included bank Truist Financial, which rose withother banking institutions on rising interest rates; insurer American International Group, which also benefited from rising rates along withstrong insurance pricing; and futures and options exchange CME Group, which saw increased trading volume as the Fed moved closerto tightening rates. In health care, shares in drug maker AbbVie climbed as the company launched new products in the cosmetic anddermatology areas.Positioned Cautiously in a Challenging EnvironmentClearly, risks and uncertainties remain embedded in prevailing inflationary trends, the likelihood of central bank tightening and risinggeopolitical tensions. We believe these forces are likely to restrain economic growth in the near term, despite strong underlying U.Seconomic fundamentals, which include better-than-expected corporate earnings, robust consumer demand and positive employmentnumbers. Accordingly, we have positioned the fund for slower growth and a range-bound market as the economy shifts to the later partof the economic cycle.
Copyright © 2022 www.secdatabase.com. All Rights Reserved.Please Consider the Environment Before Printing This Document

As of February 28, 2022, the fund holds overweight exposure to industrials, largely driven by attractive, company-specific investmentopportunities such as agricultural equipment maker Deere & Co. The fund also holds overweight exposure to
10
Copyright © 2022 www.secdatabase.com. All Rights Reserved.Please Consider the Environment Before Printing This Document

energy, where a supply/demand imbalance appears likely to persist for some time, and health care, a defensive sector that appears wellpositioned given prevailing economic conditions. Conversely, the fund holds no exposure to utilities, which we judge to be unattractivelyvalued. The fund maintains significantly underweighted exposure to the consumer discretionary sector, where both margins and demandmay prove vulnerable to inflationary pressures.March 15, 20221 Share price and investment return fluctuate such that upon redemption, fund shares may be worth more or less than their original cost.2 Source: Lipper Inc. — The S&P 500
®Index is widely regarded as the best single gauge of large-cap U.S. equities. The index includes 500 leading companies and
captures approximately 80% coverage of available market capitalization. Investors cannot invest directly in any index.Please note: the position in any security highlighted with italicized typeface was sold during the reporting period.Equities are subject generally to market, market sector, market liquidity, issuer and investment style risks, among other factors, to varying degrees, all of which are morefully described in the fund’s prospectus.Recent market risks include pandemic risks related to COVID-19. The effects of COVID-19 have contributed to increased volatility in global markets and will likely affectcertain countries, companies, industries and market sectors more dramatically than others. To the extent the fund may overweight its investments in certain countries,companies, industries or market sectors, such positions will increase the fund’s exposure to risk of loss from adverse developments affecting those countries, companies,industries or sectors.The fund is non-diversified, which means that a relatively high percentage of the fund’s assets may be invested in a limited number of issuers. Therefore, the fund’sperformance may be more vulnerable to changes in the market value of a single issuer or group of issuers and more susceptible to risks associated with a singleeconomic, political or regulatory occurrence than a diversified fund.Investing in foreign denominated and/or domiciled securities involves special risks, including changes in currency exchange rates, political, economic, and socialinstability, limited company information, differing auditing or legal standards, and less market liquidity. These risks generally are greater with emerging market countries.
11
Copyright © 2022 www.secdatabase.com. All Rights Reserved.Please Consider the Environment Before Printing This Document
DISCUSSION OF FUND PERFORMANCE (Unaudited) (continued)For the period of September 1, 2021 through February 28, 2022, as provided by portfolio manager James A. Lydotes of NewtonInvestment Management North America, LLC, Sub-AdviserMarket and Fund Performance OverviewFor the six-month period ended February 28, 2022, BNY Mellon International Fund’s (the “fund”) Class M shares produced a total returnof -6.15%, and Investor shares produced a total return of -6.25%.1 In comparison, the fund’s benchmark, the MSCI EAFE Index (the“Index”), produced a total return of-6.78% for the same period.2International equity markets largely lost ground as investors took note of rising inflation and increased geopolitical risk. The fundoutperformed the Index primarily due to favorable stock selections in the health care and communication services sectors.The Fund’s Investment ApproachThe fund seeks long-term capital growth. To pursue this goal, the fund normally invests at least 65% of its total assets in equity securitiesof foreign issuers. Foreign issuers are companies, organized under the laws of a foreign country, whose principal trading market is in aforeign country or with a majority of their assets or business outside the United States. The fund may invest in companies of any size.Though not specifically limited, the fund ordinarily will invest in a broad range of (and in any case at least five different) countries. Thefund will limit its investments in any single company to no more than 5% of the fund’s assets at the time of purchase.The stocks purchased may have value and/or growth characteristics. The portfolio manager employs a “bottom-up” investment approach,which emphasizes individual stock selection. The stock selection process is designed to produce a diversified portfolio that, relative tothe Index, has a below-average price/earnings ratio and an above-average earnings growth trend.Inflation and Geopolitical Concerns Weigh on MarketsThis reporting period was a continuation of a pattern that began early in 2021: value stocks performed well, and growth stocks generallylagged. This led to a stronger market performance in the financials and energy sectors. While the market was generally down, the energysector was the only one to show a positive return, gaining more than 20% over the period.While the waning of the pandemic and reopening of global economies supported markets early in the reporting period, supply-chainproblems hindered sales in some industries. These bottlenecks, combined with loose monetary policy and massive government spending,caused inflation to rise to multi-decade highs.The Federal Reserve initially called pricing pressures “transitory.” But it acknowledged late in the period that pricing pressures weremore permanent and signaled that in addition to tapering its bond purchases late in 2021, it was likely to hike interest rates in 2022.While growth stocks had dominated the market earlier in 2021, value stocks gained favor at times during the period. When concernsabout the economy rose, the market favored growth stocks, but when positive news on the pandemic emerged, value and more cyclicallyoriented stocks benefited.Late in the reporting period, markets experienced increased volatility. While the economy continued to show strength, especially in thelabor market, higher-than-expected inflation weighed on returns, and rising Treasury yields led to depressed stock valuations, especiallyamong high-growth companies. In addition, geopolitical risks also came to the fore as the conflict in Ukraine intensified.Stock Selections Contributed PositivelyThe fund’s sector allocations hindered relative performance, but stock selections made a positive contribution, leading to outperformanceover the period. The fund’s best-performing sector was health care. A large position in GlaxoSmithKline, a British pharmaceuticalcompany, was advantageous as shares benefited from the market’s enthusiasm for an announced spin-off of its consumer health business,scheduled for later in 2022. Selections in the communication services sector also contributed positively, with a position in NipponTelegraph & Telephone, a Japanese telecom, holding up well in a down market. Telstra, an Australian telecommunications company, alsowas advantageous. The company has posted strong results as they have continued to monetize their tower network. An announced sharebuyback program also boosted the shares’ performance. In the consumer discretionary sector, luxury goods held up well in a choppymarket, and our large position in LVMH, a France-based multinational conglomerate, contributed positively to returns. At the countrylevel, Japan was the strongest performer for the fund over the period, largely related to our overweight position in the financials sector.On a less positive note, sector allocation decisions detracted from relative performance, with underweight positions in the materialsand energy sectors being the leading detractors. In addition, in the materials sector, our position in HeidelbergCement weighed onperformance, as concerns around raw input costs led to investor concerns for the world’s largest aggregates producer (and world’s second-largest cement producer). In the energy sector, while the holdings in the fund gained more than 10% over the period, they lagged thesector’s 20%-plus gain in the benchmark. The weakest selection was a position in OMV, an Austrian petrochemical company, whichlowered their free cash flow guidance for 2022, an unusual occurrence among European integrated chemicals companies, given thestrong commodities backdrop. At the country level, Switzerland was the worst performer, due to the fund’s large position in LogitechInternational, an information technology accessories manufacturer. This business benefited dramatically from the pandemic during thefirst year of the lockdown, but it has had difficulty matching that performance more recently.Maintaining a Favorable OutlookWe remain fairly balanced in the fund and are not looking to make a large bet on the macroeconomic backdrop. In light of the increasedtensions on the European continent over the last
12
Copyright © 2022 www.secdatabase.com. All Rights Reserved.Please Consider the Environment Before Printing This Document
few weeks, we have adjusted the fund’s allocations at the margin, but generally the changes have been minor.March 15, 20221 Total return includes reinvestment of dividends and any capital gains paid. Past performance is no guarantee of future results. Share price and investment return
fluctuate such that upon redemption, fund shares may be worth more or less than their original cost.2 Source: Lipper Inc. — Reflects reinvestment of net dividends and, where applicable, capital gain distributions. The MSCI EAFE Index (Europe, Australasia, Far East) is
a free float-adjusted, market capitalization-weighted index that is designed to measure the equity market performance of developed markets, excluding the U.S. andCanada. Investors cannot invest directly in any index.
Equities are subject generally to market, market sector, market liquidity, issuer and investment style risks, among other factors, to varying degrees, all of which are morefully described in the fund’s prospectus.The fund’s performance will be influenced by political, social and economic factors affecting investments in foreign companies. Special risks associated with investmentsin foreign companies include exposure to currency fluctuations, less liquidity, less developed or less efficient trading markets, lack of comprehensive companyinformation, political instability and differing auditing and legal standards. These risks are enhanced in emerging market countries.The fund may, but is not required to, use derivative instruments. A small investment in derivatives could have a potentially large impact on the fund’s performance. Theuse of derivatives involves risks different from, or possibly greater than, the risks associated with investing directly in the underlying assets.Recent market risks include pandemic risks related to COVID-19. The effects of COVID-19 have contributed to increased volatility in global markets and will likely affectcertain countries, companies, industries and market sectors more dramatically than others. To the extent the fund may overweight its investments in certain countries,companies, industries or market sectors, such positions will increase the fund’s exposure to risk of loss from adverse developments affecting those countries, companies,industries or sectors.
13
Copyright © 2022 www.secdatabase.com. All Rights Reserved.Please Consider the Environment Before Printing This Document

DISCUSSION OF FUND PERFORMANCE (Unaudited) (continued)For the period of September 1, 2021 through February 28, 2022, as provided by portfolio manager Julianne McHugh of NewtonInvestment Management North America, LLC, Sub-AdviserMarket and Fund Performance OverviewFor the six-month period ended February 28, 2022, BNY Mellon Emerging Markets Fund’s (the “fund”) Class M shares produced a totalreturn of -8.38%, and Investor shares produced a total return of -8.50%.1 In comparison, the fund’s benchmark, the MSCI EmergingMarkets Index (the “Index”), produced a total return of -9.81% for the same period.2Stocks in emerging markets lost ground as concerns about inflation, higher interest rates, and geopolitical risk weighed on returns. Thefund outperformed the Index, mainly due to positions in the energy and health care sectors.The Fund’s Investment ApproachThe fund seeks long-term capital growth. To pursue its goal, the fund invests at least 80% of its net assets, plus any borrowings forinvestment purposes, in equity securities of companies organized, or with a majority of assets or operations, in countries considered to beemerging markets. Emerging market countries generally include all countries represented by the Index. The fund may invest in companiesof any size.Normally, the fund will invest in a broad range of (and in any case at least five different) emerging market countries. The stocks purchasedmay have value and/or growth characteristics. The portfolio manager employs a “bottom-up” investment approach, which emphasizesindividual stock selection. The stock selection process is designed to produce a diversified portfolio that, relative to the Index, has abelow-average price/earnings ratio and an above-average earnings growth trend.Inflation and Geopolitical Concerns Weigh on MarketsStocks lost ground during the period due to concerns about inflation and geopolitical events. While the waning of the pandemic andreopening of global economies supported markets early in the reporting period, supply chain problems hindered sales in some industries.These bottlenecks, combined with loose monetary policy and massive government spending, caused inflation to rise to multi-decadehighs.The Federal Reserve initially called pricing pressures “transitory.” But it acknowledged late in the period that pricing pressures weremore permanent and signaled that in addition to tapering its bond purchases late in 2021, it was likely to hike interest rate hikes in 2022.While growth stocks had dominated the market earlier in 2021, value stocks gained favor at times during the period. When concernsabout the economy rose, the market favored growth stocks, but when positive news on the pandemic emerged, value and more cyclicallyoriented stocks benefited.Late in the reporting period, markets experienced increased volatility. While the economy continued to show strength, especially in thelabor market, higher-than-expected inflation weighed on returns, and rising Treasury yields led to depressed stock valuations, especiallyamong high-growth companies. In addition, geopolitical risks also came to the fore as the conflict in Ukraine intensified.Selections in the Energy and Health Care Sectors Aided PerformanceThe strategy’s strong relative performance during the period was driven by positive stock selection, especially in the energy and healthcare sectors. In the energy sector, Brazilian integrated oil company Petroleo Brasileiro, ADR rallied over 46% with the surge in fuel pricesand increased production, which should result in improved cash flow generation and higher dividend payouts. Relative performance wasfurther supported by our holding in China Resources Sanjiu Medical & Pharmaceutical, the largest manufacturer of non-prescriptiondrugs in China. The company’s strong, underlying, over-the-counter demand was augmented by policy announcements during the periodthat support traditional Chinese medicine development.This strength was partially offset by holdings in Russia. The country’s war in Ukraine and resulting sanctions by the U.S. and Europeresulted in massive selling pressure. The value of our holding in majority state-owned banking and financial services company, Sberbank,ADR, was eradicated following the rollout of sanctions and banning of its access to the SWIFT international payments system. Similarly,shares of consumer staples discount retail operator, X5 Retail Group, also came under pressure amid the frantic sell-off in Russia asoperating risks rose.Valuations Still Attractive Versus Developed MarketsWe expect the conflict in Russia and Ukraine to have implications beyond those two countries, particularly with regard to higher gasprices and further inflationary pressures. If Ukraine becomes highly destabilized, Poland, Hungary, Czech Republic and Slovakia mayface some direct challenges, especially if refugee flows become an issue. The highest level of sanctions that the U.S. and European Unionwill apply on Moscow means that Russia will become a virtual pariah to western countries. Commodities may be the one area wheredecoupling with the West will not fully materialize, but in most other areas of trade, investment, capital and human capital flows, Russiawill move closer to China.We remain focused on stock fundamentals. We focus on high-quality companies that are displaying strong relative momentum trends asevidenced in earnings revisions that are attractively valued. On the margin, we have been finding opportunities to
14
Copyright © 2022 www.secdatabase.com. All Rights Reserved.Please Consider the Environment Before Printing This Document
cut our underweight position in China and add incrementally to our weight in South Africa.March 15, 20221 Total return includes reinvestment of dividends and any capital gains paid. Past performance is no guarantee of future results. Share price and investment return
fluctuate such that upon redemption, fund shares may be worth more or less than their original cost.2 Source: Lipper Inc. — Reflects reinvestment of net dividends and, where applicable, capital gain distributions. The MSCI Emerging Markets Index is a free float-
adjusted, market capitalization-weighted index that is designed to measure equity market performance of emerging markets. Investors cannot invest directly in anyindex.
Equities are subject generally to market, market sector, market liquidity, issuer and investment style risks, among other factors, to varying degrees, all of which are morefully described in the fund’s prospectus.The fund’s performance will be influenced by political, social and economic factors affecting investments in foreign companies. Special risks associated with investmentsin foreign companies include exposure to currency fluctuations, less liquidity, less developed, or less efficient trading markets, lack of comprehensive companyinformation, political instability and differing auditing and legal standards. These risks are enhanced in emerging market countries.The fund may, but is not required to, use derivative instruments. A small investment in derivatives could have a potentially large impact on the fund’s performance. Theuse of derivatives involves risks different from, or possibly greater than, the risks associated with investing directly in the underlying assets.Recent market risks include pandemic risks related to COVID-19. The effects of COVID-19 have contributed to increased volatility in global markets and will likely affectcertain countries, companies, industries and market sectors more dramatically than others. To the extent the fund may overweight its investments in certain countries,companies, industries or market sectors, such positions will increase the fund’s exposure to risk of loss from adverse developments affecting those countries, companies,industries or sectors.
15
Copyright © 2022 www.secdatabase.com. All Rights Reserved.Please Consider the Environment Before Printing This Document

DISCUSSION OF FUND PERFORMANCE (Unaudited) (continued)For the period from September 1, 2021 through February 28, 2022, as provided by portfolio managers Peter D. Goslin, CFA and TaoWang of Newton Investment Management North America, LLC, Sub-AdviserMarket and Fund Performance OverviewFor the six-month period ended February 28, 2022, BNY Mellon International Equity Income Fund Fund’s (the “fund”) Class M sharesproduced a total return of −1.22%, and Investor shares produced a total return of −1.33%.1 In comparison, the fund’s benchmark, theMSCI ACWI ex USA Index (the “Index”), produced a total return of −6.95% for the same period.2Large-cap stocks generally lost ground during the period under pressure from increasing inflationary pressures, rising interest rates andheightened geopolitical tensions. The fund outperformed the Index for the period, largely due to its emphasis on high-dividend-payingstocks, which were favored by the market.The Fund’s Investment ApproachThe fund seeks total return (consisting of capital appreciation and income). To pursue its goal, the fund normally invests at least 80% ofits net assets, plus any borrowings for investment purposes, in equity securities. The fund focuses on dividend-paying stocks of foreigncompanies, including those of emerging market countries. The fund normally invests substantially all of its assets in the equity securitiesof issuers located outside the United States and diversifies broadly among developed and emerging market countries. The fund may investin the stocks of companies of any market capitalization.We select stocks through a disciplined investment process using proprietary, quantitative computer models that analyze a diverse setof characteristics to identify and rank stocks according to earnings quality. Based on this analysis, we generally select from the higherranked, dividend-paying securities those stocks that we believe will continue to pay above-average dividends. We seek to overweighthigher dividend-paying stocks, while maintaining country and sector weights generally similar to those of the Index.Risk Assets Retreat on Inflationary PressuresThe reporting period began amid increasing inflationary pressures due to rising energy and commodity prices and global supply-chaindisruptions. The U.S. Federal Reserve (the “Fed”), which expressed increasingly hawkish sentiments prior to the start of the period,indicated in September 2021 a willingness to consider reducing accommodative policies sooner rather than later due to the unexpectedlevel and persistence of inflationary forces affecting the economy. As inflationary pressures continued to mount, Fed rhetoric grewincreasingly emphatic. In November 2021, the Fed dropped the word “transitory” when describing inflation. At the same time, the Fedforecast a possible end to their asset purchase program as early as June 2022, thereby increasing the likelihood of one or more rate hikeslater that year. In December 2021, the Fed again revised their estimate of an end to quantitative easing to March 2022, leading the marketto widely anticipate multiple hikes in 2022. Increasing tensions between Russia and Ukraine in early 2022 and the eventual invasion ofUkraine by its larger neighbor further undermined investor sentiment and pressured international credit markets.Stock prices declined under pressure from increasingly risk-off sentiment, with small-cap issues significantly underperforming theirlarge-cap counterparts, and growth-oriented stocks underperforming value-oriented shares. Within the Index, high-dividend-payingstocks sharply outperformed low-dividend-paying issues. From a global perspective, emerging markets trailed developed markets.Regarding sectors, energy stocks significantly outperformed on rising petroleum and natural gas prices, while financial stocks benefitedfrom the rising interest-rate environment. The traditional growth-oriented sectors of consumer discretionary and technologyunderperformed.Benefiting from the Investor Preference for Dividend YieldThe fund’s focus on dividend yield positioned it to perform relatively well amid the risk-off sentiment that prevailed during the six-monthperiod. Returns relative to the Index further benefited from good stock selection in energy, the best-performing benchmark sector, wherestocks were bolstered by rising oil and gas prices. Two of the fund’s top three performers were energy companies: Canadian NationalResources and Italy-based Eni. Among financials, another leading benchmark sector, returns were bolstered by holdings in The Toronto-Dominion Bank, which was rewarded by the market for beating earnings expectations and announcing its acquisition of First Horizonto expand the company’s footprint in the southeast United States. Good stock selection in the relatively weak technology sector furtherenhanced the fund’s performance compared to the Index, while disappointing selection in materials and real estate detracted. Notablyunderperforming holdings included Finnish utility company Fortum, which lists Russia as its largest area of service, and diversifiedAustralian firm Wesfarmers, which faced headwinds from pandemic-related lockdowns and store closures, rising labor costs, and supply-chain disruptions.From a country perspective, the fund saw strong returns from positions in the United Arab Emirates and Qatar, while shares in Russia andPoland lagged. Stock selection proved particularly favorable in Japan and Canada, while selection underperformed in Finland and SaudiArabia. As the period progressed, the fund added to its exposure in the United Kingdom and Japan, while trimming exposure in Finlandand Singapore. Sector changes included increased exposure to energy and communications services, and reduced exposure to materials.Maintaining a Diversified, Dividend-Focused PortfolioThe risks and uncertainties that weighed on equities during the past six months are likely to persist as central banks come to grips withinflationary forces, and as geopolitical conflicts remain untamed. In this environment, we believe the fund is well positioned to provideinvestors with diversified access to international, high-dividend-paying stocks that reflect the geographic, sector and market capitalizationcharacteristics of the Index. While the fund maintains weightings similar to those of the Index, it does hold modest overweights andunderweights in some areas. As of February 28, 2022, sector overweights included energy, financials and utilities, while underweights
16
Copyright © 2022 www.secdatabase.com. All Rights Reserved.Please Consider the Environment Before Printing This Document

included materials and consumer discretionary. Country overweights included the United Kingdom, Taiwan and Finland, withunderweights in China and Germany, and zero exposure to Russia.March 15, 20221 Total return includes reinvestment of dividends and any capital gains paid. Past performance is no guarantee of future results. Share price and investment return
fluctuate such that upon redemption, fund shares may be worth more or less than their original cost.2 Source: Lipper Inc. — Reflects reinvestment of net dividends and, where applicable, capital gain distributions. The MSCI ACWI ex USA Index captures large- and mid-
cap representation across developed market (DM) countries (excluding the U.S.) and emerging market (EM) countries. Investors cannot invest directly in any index.Equities are subject generally to market, market sector, market liquidity, issuer and investment style risks, among other factors, to varying degrees, all of which are morefully described in the fund’s prospectus.Recent market risks include pandemic risks related to COVID-19. The effects of COVID-19 have contributed to increased volatility in global markets and will likely affectcertain countries, companies, industries and market sectors more dramatically than others. To the extent the fund may overweight its investments in certain countries,companies, industries or market sectors, such positions will increase the fund’s exposure to risk of loss from adverse developments affecting those countries, companies,industries or sectors.The fund may, but is not required to, use derivative instruments. A small investment in derivatives could have a potentially large impact on the fund’s performance. Theuse of derivatives involves risks different from, or possibly greater than, the risks associated with investing directly in the underlying assets.
17
Copyright © 2022 www.secdatabase.com. All Rights Reserved.Please Consider the Environment Before Printing This Document
DISCUSSION OF FUND PERFORMANCE (Unaudited) (continued)For the period of September 1, 2021 through February 28, 2022, as provided by Jeffrey M. Mortimer, Primary Portfolio Managerresponsible for investment allocation decisionsMarket and Fund Performance OverviewFor the six-month period ended February 28, 2022, BNY Mellon Asset Allocation Fund’s (the “fund”) Class M shares produced atotal return of −4.00%, and Investor shares produced a total return of −4.14%.1 In comparison, the fund’s benchmark, the MorningstarModerate Target Risk Index (the “Index”), produced a total return of −4.60% for the same period.2Stocks and bonds generally lost ground during the period under pressure from increasing inflationary pressures, rising interest rates andheightened geopolitical tensions. The fund outperformed the Index, driven largely by exposure to large-cap, value-oriented equities.The Fund’s Investment ApproachThe fund seeks long-term growth of principal in conjunction with current income. The fund may invest in both individual securitiesand other investment companies, including other series of BNY Mellon Funds Trust, funds in the BNY Mellon Family of Funds andunaffiliated open-end funds, closed-end funds, and exchange-traded funds (collectively, the “underlying funds”). To pursue its goal, thefund currently intends to allocate its assets, directly and/or through investment in the underlying funds, to gain investment exposureto the following asset classes: Large-Cap Equities, Small-Cap and Mid-Cap Equities, Developed International and Global Equities,Emerging Market Equities, Investment-Grade Bonds, High Yield Bonds, Emerging Markets Debt, Diversifying Strategies and MoneyMarket Instruments.BNY Mellon Investment Adviser, Inc. (BNYM Investment Adviser) allocates the fund’s investments (directly and/or through investmentin the underlying funds) among these asset classes using fundamental and quantitative analysis and its outlook for the economyand financial markets. The underlying funds are selected by BNYM Investment Adviser based on their investment objectives andmanagement policies, portfolio holdings, risk/reward profiles, historical performance and other factors, including the correlation andcovariance among the underlying funds.Risk Assets Retreat on Inflationary PressuresThe reporting period began amid increasing inflationary pressures due to rising energy and commodity prices and global supply-chaindisruptions. The U.S. Federal Reserve (the “Fed”), which expressed increasingly hawkish sentiments prior to the start of the period,indicated in September 2021 a willingness to consider reducing accommodative policies sooner rather than later due to the unexpectedlevel and persistence of inflationary forces affecting the economy. As inflationary pressures continued to mount, Fed rhetoric grewincreasingly emphatic. In November 2021, the Fed dropped the word “transitory” when describing inflation. At the same time, the Fedforecast a possible end to their asset purchase program as early as June 2022, thereby increasing the likelihood of one or more rate hikeslater that year. In December 2021, the Fed again revised their estimate of an end to quantitative easing to March 2022, leading the marketto widely anticipate multiple hikes in 2022. Increasing tensions between Russia and Ukraine in early 2022 and the eventual invasion ofUkraine by its larger neighbor further undermined investor sentiment and pressured international credit markets.Stock prices declined under pressure from increasingly risk-off sentiment, with small-cap issues significantly underperforming theirlarge-cap counterparts, and growth-oriented stocks underperforming value-oriented shares. From a global perspective, U.S.-based issuestended to maintain their value better than international equities, while emerging markets trailed developed markets. Bond prices trendedlower as well as spreads widened and yields crept higher, with short-term rates rising faster than long-term rates. Corporate bondsunderperformed government-issued securities and securitized instruments in a flight to safety, particularly during the final two months ofthe period. Floating-rate bonds and Treasury Inflation-Protected Securities (TIPS) performed relatively well, as both asset classes offer adegree of protection from rising interest rates. Short-duration instruments tended to outperform their longer-duration counterparts, whilehigher-rated, higher-quality issues tended to outperform lower-rated bonds.Equity Exposure Drives OutperformanceThe fund benefited from overweight exposure to some of the better-performing asset classes during the period, including U.S. large-cap stocks, value-oriented stocks and floating-rate loans. Some of that exposure came through investments in underlying funds, and
some through direct investments in a selection of stocks designed to track the performance of the S&P 500®
Index, a widely recognizedbenchmark of large-cap U.S. equities. Performance also benefited from the fund’s sale of its holdings in BNY Mellon InternationalSmall Cap Fund in November 2021, signaling a modest shift toward a more defensive posture and a reduction in international small-capexposure. However, the fund continued to hold significant international exposure through other holdings, which detracted from relativeperformance.From a manager selection standpoint, performance was mixed, with some funds outperforming their respective benchmarks while otherslagged. Leading contributors to relative performance included BNY Mellon Income Stock Fund, BNY Mellon High Yield Fund and BNYMellon Select Managers Small Cap Value Fund. Detractors included BNY Mellon International Equity Fund and BNY Mellon ResearchGrowth Fund.Positioned Cautiously in a Challenging EnvironmentDespite the risk-off sentiment that has predominated in recent months, economic fundamentals remain strong, particularly in U.S.markets where we see strong corporate earnings, robust consumer demand and positive employment numbers. Clearly, risks anduncertainties remain embedded in inflationary trends, the likelihood of central bank tightening and rising geopolitical tensions.Nevertheless, in our opinion, the chance of an imminent recession remains low. We have taken steps to rebalance the fund to reduce itsexposure to risk, moving closer to benchmark equity and fixed-income allocations in recognition
Copyright © 2022 www.secdatabase.com. All Rights Reserved.Please Consider the Environment Before Printing This Document

18
Copyright © 2022 www.secdatabase.com. All Rights Reserved.Please Consider the Environment Before Printing This Document

of current market challenges. As of February 28, 2022, we believe the fund is well positioned given prevailing conditions.March 15, 20221 Total return includes reinvestment of dividends and any capital gains paid. Past performance is no guarantee of future results. Share price and investment return
fluctuate such that upon redemption, fund shares may be worth more or less than their original cost. The fund’s return reflects the absorption of certain fund expensesby BNY Mellon Investment Adviser, Inc. pursuant to an agreement in effect through December 31, 2022, at which time it may be extended, modified or terminated. Hadthese expenses not been absorbed, returns would have been lower.
2 Source: Morningstar Inc. — Morningstar Moderate Target Risk Index serves as a benchmark to help with target-risk, mutual fund selection and evaluation by offeringan objective yardstick for moderate performance comparison. Investors cannot invest directly in any index.
Equities are subject generally to market, market sector, market liquidity, issuer and investment style risks, among other factors, to varying degrees, all of which are morefully described in the fund’s prospectus.Bonds are subject generally to interest-rate, credit, liquidity and market risks, to varying degrees, all of which are more fully described in the fund’s prospectus. Generally,all other factors being equal, bond prices are inversely related to interest-rate changes, and rate increases can cause price declines.Recent market risks include pandemic risks related to COVID-19. The effects of COVID19 have contributed to increased volatility in global markets and will likely affectcertain countries, companies, industries and market sectors more dramatically than others. To the extent the fund may overweight its investments in certain countries,companies, industries or market sectors, such positions will increase the fund’s exposure to risk of loss from adverse developments affecting those countries, companies,industries or sectors.The underlying funds’ underlying strategies may use derivative instruments. A small investment in derivatives could have a potentially large impact on the fund’sperformance. The use of derivatives involves risks different from, or possibly greater than, the risks associated with investing directly in the underlying assets.
19
Copyright © 2022 www.secdatabase.com. All Rights Reserved.Please Consider the Environment Before Printing This Document
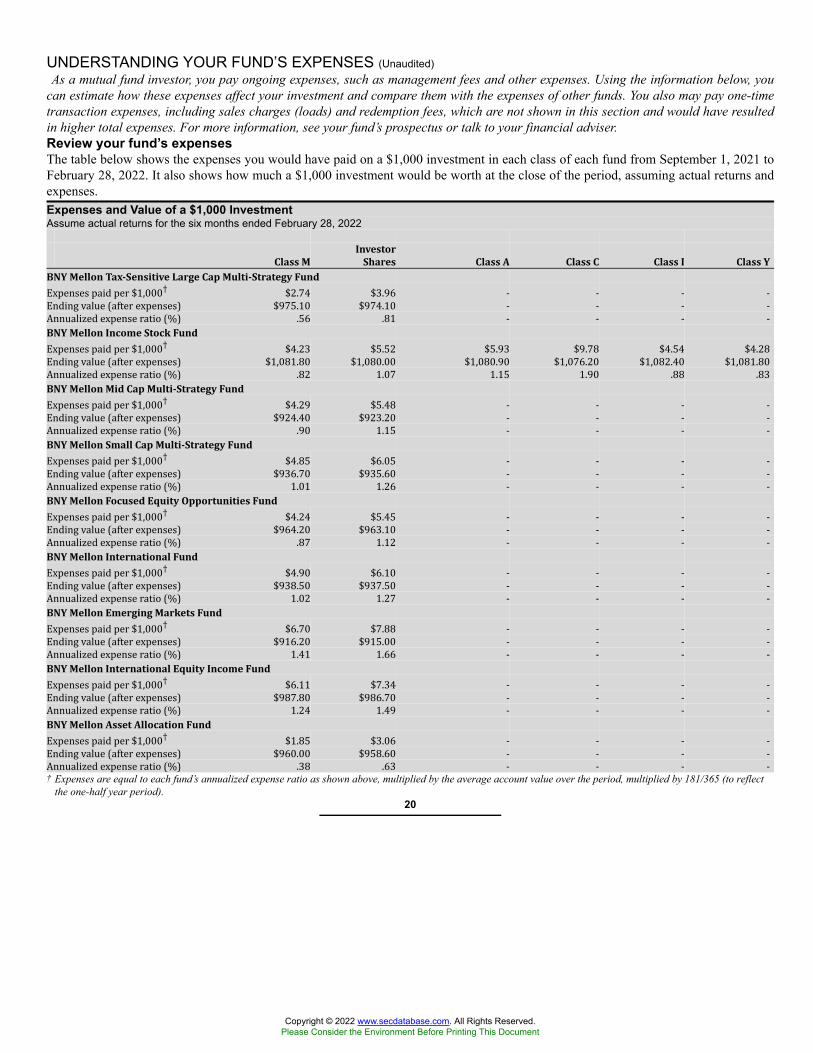
UNDERSTANDING YOUR FUND’S EXPENSES (Unaudited)As a mutual fund investor, you pay ongoing expenses, such as management fees and other expenses. Using the information below, you
can estimate how these expenses affect your investment and compare them with the expenses of other funds. You also may pay one-timetransaction expenses, including sales charges (loads) and redemption fees, which are not shown in this section and would have resultedin higher total expenses. For more information, see your fund’s prospectus or talk to your financial adviser.Review your fund’s expensesThe table below shows the expenses you would have paid on a $1,000 investment in each class of each fund from September 1, 2021 toFebruary 28, 2022. It also shows how much a $1,000 investment would be worth at the close of the period, assuming actual returns andexpenses.Expenses and Value of a $1,000 InvestmentAssume actual returns for the six months ended February 28, 2022
Class MInvestor
Shares Class A Class C Class I Class YBNY Mellon Tax-Sensitive Large Cap Multi-Strategy FundExpenses paid per $1,000† $2.74 $3.96 - - - -Ending value (after expenses) $975.10 $974.10 - - - -Annualized expense ratio (%) .56 .81 - - - -BNY Mellon Income Stock FundExpenses paid per $1,000† $4.23 $5.52 $5.93 $9.78 $4.54 $4.28Ending value (after expenses) $1,081.80 $1,080.00 $1,080.90 $1,076.20 $1,082.40 $1,081.80Annualized expense ratio (%) .82 1.07 1.15 1.90 .88 .83BNY Mellon Mid Cap Multi-Strategy FundExpenses paid per $1,000† $4.29 $5.48 - - - -Ending value (after expenses) $924.40 $923.20 - - - -Annualized expense ratio (%) .90 1.15 - - - -BNY Mellon Small Cap Multi-Strategy FundExpenses paid per $1,000† $4.85 $6.05 - - - -Ending value (after expenses) $936.70 $935.60 - - - -Annualized expense ratio (%) 1.01 1.26 - - - -BNY Mellon Focused Equity Opportunities FundExpenses paid per $1,000† $4.24 $5.45 - - - -Ending value (after expenses) $964.20 $963.10 - - - -Annualized expense ratio (%) .87 1.12 - - - -BNY Mellon International FundExpenses paid per $1,000† $4.90 $6.10 - - - -Ending value (after expenses) $938.50 $937.50 - - - -Annualized expense ratio (%) 1.02 1.27 - - - -BNY Mellon Emerging Markets FundExpenses paid per $1,000† $6.70 $7.88 - - - -Ending value (after expenses) $916.20 $915.00 - - - -Annualized expense ratio (%) 1.41 1.66 - - - -BNY Mellon International Equity Income FundExpenses paid per $1,000† $6.11 $7.34 - - - -Ending value (after expenses) $987.80 $986.70 - - - -Annualized expense ratio (%) 1.24 1.49 - - - -BNY Mellon Asset Allocation FundExpenses paid per $1,000† $1.85 $3.06 - - - -Ending value (after expenses) $960.00 $958.60 - - - -Annualized expense ratio (%) .38 .63 - - - -† Expenses are equal to each fund’s annualized expense ratio as shown above, multiplied by the average account value over the period, multiplied by 181/365 (to reflect
the one-half year period).20
Copyright © 2022 www.secdatabase.com. All Rights Reserved.Please Consider the Environment Before Printing This Document

COMPARING YOUR FUND’S EXPENSESWITH THOSE OF OTHER FUNDS (Unaudited)Using the SEC’s method to compare expensesThe Securities and Exchange Commission (“SEC”) has established guidelines to help investors assess fund expenses. Per theseguidelines, the table below shows your fund’s expenses based on a $1,000 investment, assuming a hypothetical 5% annualized return.You can use this information to compare the ongoing expenses (but not transaction expenses or total cost) of investing in the fund withthose of other funds. All mutual fund shareholder reports will provide this information to help you make this comparison. Please note thatyou cannot use this information to estimate your actual ending account balance and expenses paid during the period.Expenses and Value of a $1,000 InvestmentAssuming a hypothetical 5% annualized return for the six months ended February 28, 2022
Class MInvestor
Shares Class A Class C Class I Class YBNY Mellon Tax-Sensitive Large Cap Multi-Strategy FundExpenses paid per $1,000† $2.81 $4.06 - - - -Ending value (after expenses) $1,022.02 $1,020.78 - - - -Annualized expense ratio (%) .56 .81 - - - -BNY Mellon Income Stock FundExpenses paid per $1,000† $4.11 $5.36 $5.76 $9.49 $4.41 $4.16Ending value (after expenses) $1,020.73 $1,019.49 $1,019.09 $1,015.37 $1,020.43 $1,020.68Annualized expense ratio (%) .82 1.07 1.15 1.90 .88 .83BNY Mellon Mid Cap Multi-Strategy FundExpenses paid per $1,000† $4.51 $5.76 - - - -Ending value (after expenses) $1,020.33 $1,019.09 - - - -Annualized expense ratio (%) .90 1.15 - - - -BNY Mellon Small Cap Multi-Strategy FundExpenses paid per $1,000† $5.06 $6.31 - - - -Ending value (after expenses) $1,019.79 $1,018.55 - - - -Annualized expense ratio (%) 1.01 1.26 - - - -BNY Mellon Focused Equity Opportunities FundExpenses paid per $1,000† $4.36 $5.61 - - - -Ending value (after expenses) $1,020.48 $1,019.24 - - - -Annualized expense ratio (%) .87 1.12 - - - -BNY Mellon International FundExpenses paid per $1,000† $5.11 $6.36 - - - -Ending value (after expenses) $1,019.74 $1,018.50 - - - -Annualized expense ratio (%) 1.02 1.27 - - - -BNY Mellon Emerging Markets FundExpenses paid per $1,000† $7.05 $8.30 - - - -Ending value (after expenses) $1,017.80 $1,016.56 - - - -Annualized expense ratio (%) 1.41 1.66 - - - -BNY Mellon International Equity Income FundExpenses paid per $1,000† $6.21 $7.45 - - - -Ending value (after expenses) $1,018.65 $1,017.41 - - - -Annualized expense ratio (%) 1.24 1.49 - - - -BNY Mellon Asset Allocation FundExpenses paid per $1,000† $1.91 $3.16 - - - -Ending value (after expenses) $1,022.91 $1,021.67 - - - -Annualized expense ratio (%) .38 .63 - - - -† Expenses are equal to each fund’s annualized expense ratio as shown above, multiplied by the average account value over the period, multiplied by 181/365 (to reflect
the one-half year period).21
Copyright © 2022 www.secdatabase.com. All Rights Reserved.Please Consider the Environment Before Printing This Document
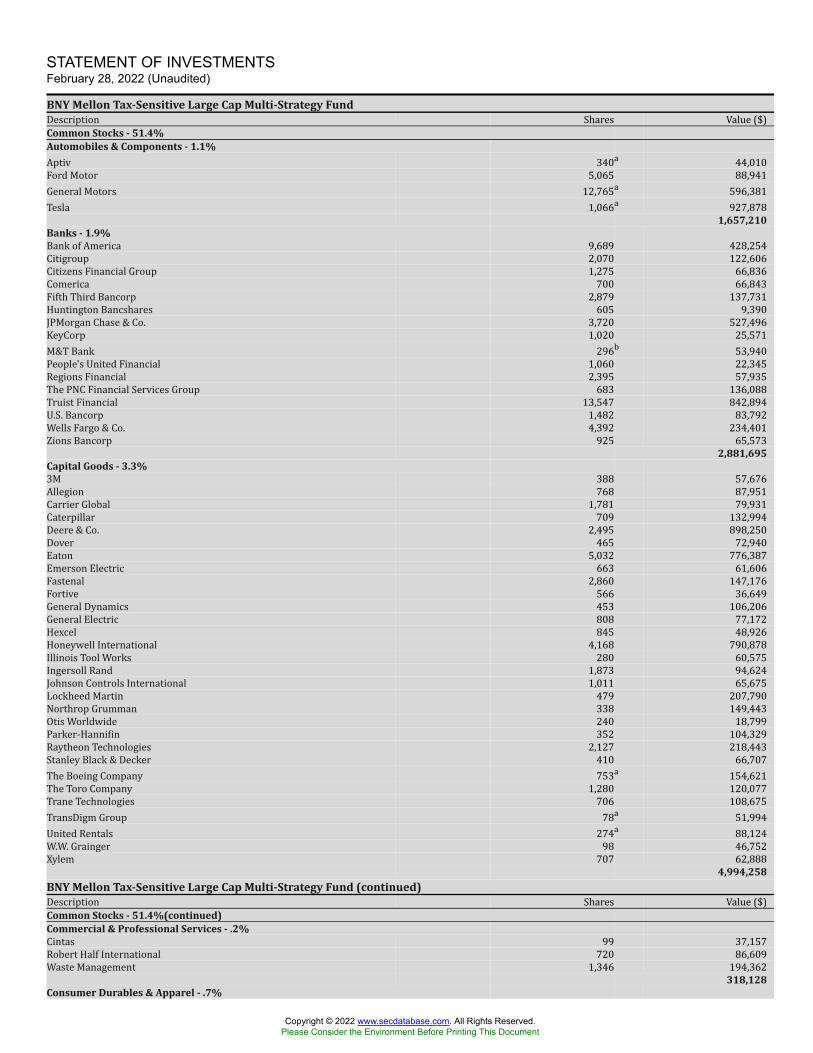
STATEMENT OF INVESTMENTSFebruary 28, 2022 (Unaudited)
BNY Mellon Tax-Sensitive Large Cap Multi-Strategy FundDescription Shares Value ($)Common Stocks - 51.4%Automobiles & Components - 1.1%Aptiv 340a 44,010Ford Motor 5,065 88,941General Motors 12,765a 596,381Tesla 1,066a 927,878
1,657,210Banks - 1.9%Bank of America 9,689 428,254Citigroup 2,070 122,606Citizens Financial Group 1,275 66,836Comerica 700 66,843Fifth Third Bancorp 2,879 137,731Huntington Bancshares 605 9,390JPMorgan Chase & Co. 3,720 527,496KeyCorp 1,020 25,571M&T Bank 296b 53,940People's United Financial 1,060 22,345Regions Financial 2,395 57,935The PNC Financial Services Group 683 136,088Truist Financial 13,547 842,894U.S. Bancorp 1,482 83,792Wells Fargo & Co. 4,392 234,401Zions Bancorp 925 65,573
2,881,695Capital Goods - 3.3%3M 388 57,676Allegion 768 87,951Carrier Global 1,781 79,931Caterpillar 709 132,994Deere & Co. 2,495 898,250Dover 465 72,940Eaton 5,032 776,387Emerson Electric 663 61,606Fastenal 2,860 147,176Fortive 566 36,649General Dynamics 453 106,206General Electric 808 77,172Hexcel 845 48,926Honeywell International 4,168 790,878Illinois Tool Works 280 60,575Ingersoll Rand 1,873 94,624Johnson Controls International 1,011 65,675Lockheed Martin 479 207,790Northrop Grumman 338 149,443Otis Worldwide 240 18,799Parker-Hannifin 352 104,329Raytheon Technologies 2,127 218,443Stanley Black & Decker 410 66,707The Boeing Company 753a 154,621The Toro Company 1,280 120,077Trane Technologies 706 108,675TransDigm Group 78a 51,994United Rentals 274a 88,124W.W. Grainger 98 46,752Xylem 707 62,888
4,994,258BNY Mellon Tax-Sensitive Large Cap Multi-Strategy Fund (continued)Description Shares Value ($)Common Stocks - 51.4%(continued)Commercial & Professional Services - .2%Cintas 99 37,157Robert Half International 720 86,609Waste Management 1,346 194,362
318,128Consumer Durables & Apparel - .7%
Copyright © 2022 www.secdatabase.com. All Rights Reserved.Please Consider the Environment Before Printing This Document

Lennar, Cl. A 1,020 91,678NIKE, Cl. B 6,090 831,589VF 580 33,652Whirlpool 220 44,2791,001,198
Consumer Services - 1.1%Booking Holdings 116a 251,981Darden Restaurants 367 53,296Expedia Group 89a 17,454Marriott International, Cl. A 552a 93,917McDonald's 1,316 322,117MGM Resorts International 1,380 61,120Royal Caribbean Cruises 6,321a 510,231Starbucks 2,118 194,411Wynn Resorts 203a 17,564Yum! Brands 598 73,3031,595,394
Diversified Financials - 2.4%American Express 978 190,260Ameriprise Financial 372 111,522Berkshire Hathaway, Cl. B 2,161a 694,653BlackRock 220 163,656Capital One Financial 750 114,952CME Group 3,534 835,897Discover Financial Services 817 100,850Intercontinental Exchange 2,123 271,999Invesco 930 19,753Moody's 817 263,099Morgan Stanley 2,153 195,363S&P Global 557b 209,114State Street 639 54,526The Charles Schwab 2,261 190,964The Goldman Sachs Group 450 153,5803,570,188
Energy - 1.9%APA 1,055 37,590Baker Hughes 1,220 35,844Chevron 1,832 263,808ConocoPhillips 1,487 141,057Coterra Energy 730 17,031Devon Energy 1,345 80,095Diamondback Energy 391 53,997EOG Resources 795 91,361Exxon Mobil 4,429 347,322Halliburton 2,710 90,866Hess 545 55,078Marathon Oil 3,250 73,320Marathon Petroleum 1,191 92,743Occidental Petroleum 1,490 65,15822
Copyright © 2022 www.secdatabase.com. All Rights Reserved.Please Consider the Environment Before Printing This Document
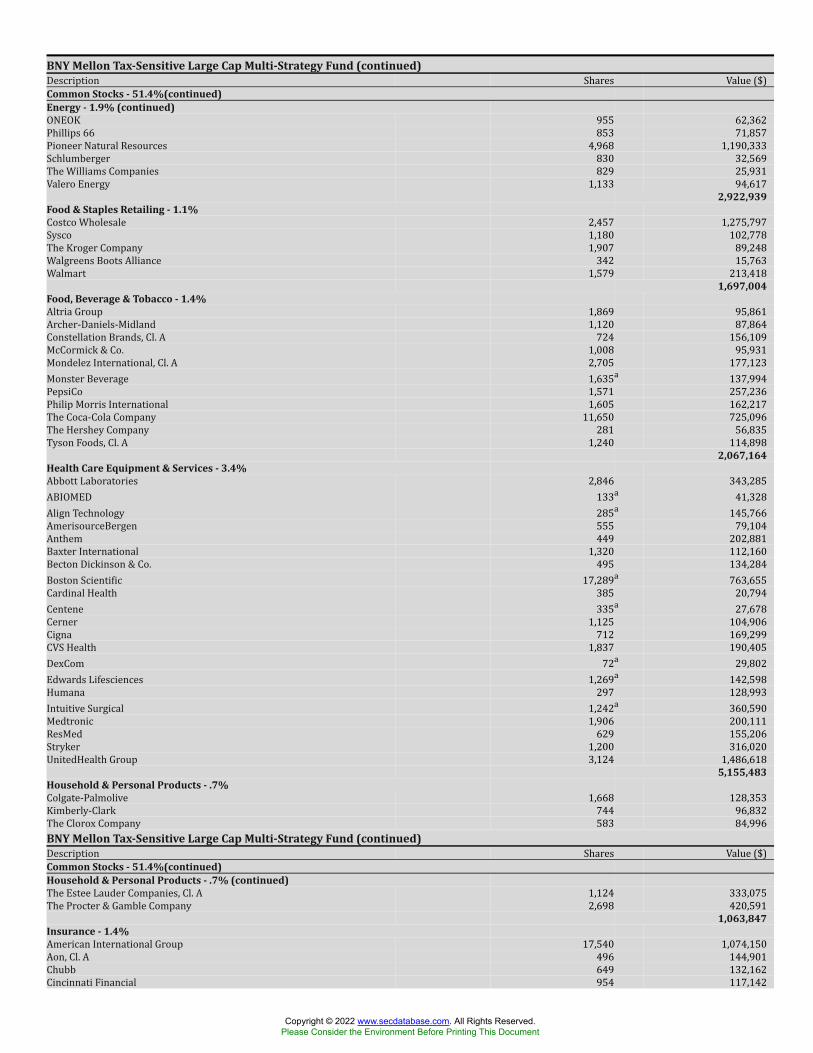
BNY Mellon Tax-Sensitive Large Cap Multi-Strategy Fund (continued)Description Shares Value ($)Common Stocks - 51.4%(continued)Energy - 1.9% (continued)ONEOK 955 62,362Phillips 66 853 71,857Pioneer Natural Resources 4,968 1,190,333Schlumberger 830 32,569The Williams Companies 829 25,931Valero Energy 1,133 94,617
2,922,939Food & Staples Retailing - 1.1%Costco Wholesale 2,457 1,275,797Sysco 1,180 102,778The Kroger Company 1,907 89,248Walgreens Boots Alliance 342 15,763Walmart 1,579 213,418
1,697,004Food, Beverage & Tobacco - 1.4%Altria Group 1,869 95,861Archer-Daniels-Midland 1,120 87,864Constellation Brands, Cl. A 724 156,109McCormick & Co. 1,008 95,931Mondelez International, Cl. A 2,705 177,123Monster Beverage 1,635a 137,994PepsiCo 1,571 257,236Philip Morris International 1,605 162,217The Coca-Cola Company 11,650 725,096The Hershey Company 281 56,835Tyson Foods, Cl. A 1,240 114,898
2,067,164Health Care Equipment & Services - 3.4%Abbott Laboratories 2,846 343,285ABIOMED 133a 41,328Align Technology 285a 145,766AmerisourceBergen 555 79,104Anthem 449 202,881Baxter International 1,320 112,160Becton Dickinson & Co. 495 134,284Boston Scientific 17,289a 763,655Cardinal Health 385 20,794Centene 335a 27,678Cerner 1,125 104,906Cigna 712 169,299CVS Health 1,837 190,405DexCom 72a 29,802Edwards Lifesciences 1,269a 142,598Humana 297 128,993Intuitive Surgical 1,242a 360,590Medtronic 1,906 200,111ResMed 629 155,206Stryker 1,200 316,020UnitedHealth Group 3,124 1,486,618
5,155,483Household & Personal Products - .7%Colgate-Palmolive 1,668 128,353Kimberly-Clark 744 96,832The Clorox Company 583 84,996BNY Mellon Tax-Sensitive Large Cap Multi-Strategy Fund (continued)Description Shares Value ($)Common Stocks - 51.4%(continued)Household & Personal Products - .7% (continued)The Estee Lauder Companies, Cl. A 1,124 333,075The Procter & Gamble Company 2,698 420,591
1,063,847Insurance - 1.4%American International Group 17,540 1,074,150Aon, Cl. A 496 144,901Chubb 649 132,162Cincinnati Financial 954 117,142
Copyright © 2022 www.secdatabase.com. All Rights Reserved.Please Consider the Environment Before Printing This Document
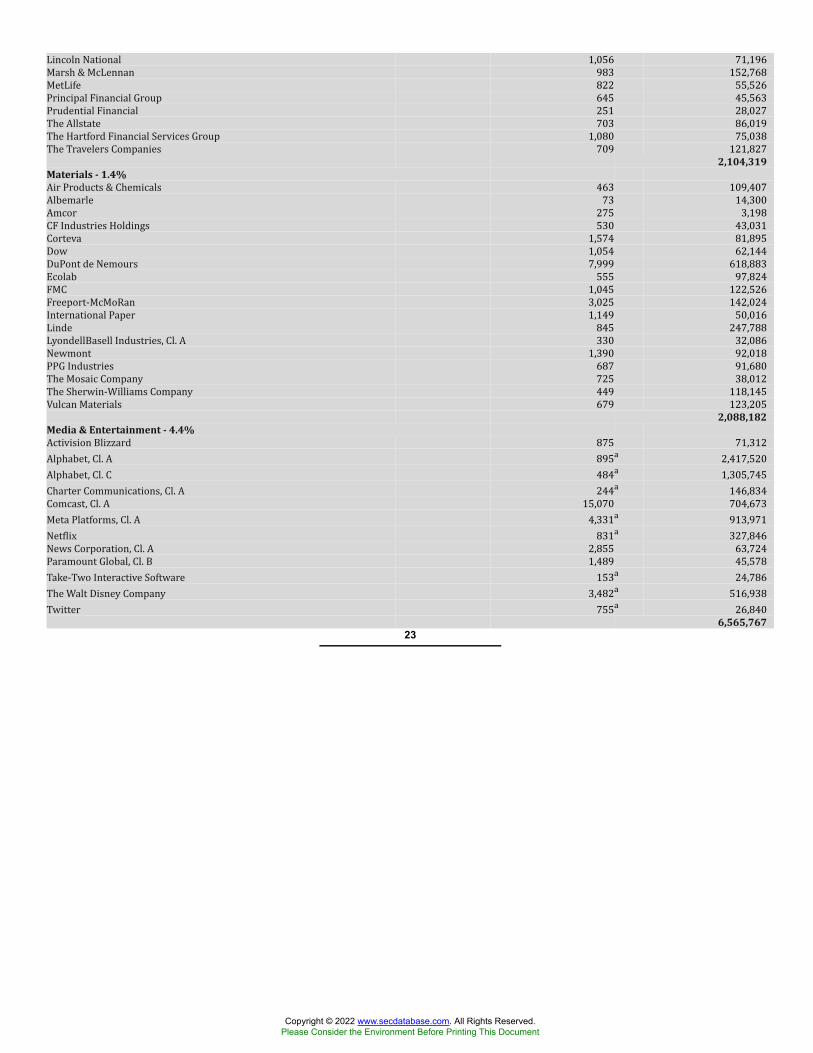
Lincoln National 1,056 71,196Marsh & McLennan 983 152,768MetLife 822 55,526Principal Financial Group 645 45,563Prudential Financial 251 28,027The Allstate 703 86,019The Hartford Financial Services Group 1,080 75,038The Travelers Companies 709 121,8272,104,319
Materials - 1.4%Air Products & Chemicals 463 109,407Albemarle 73 14,300Amcor 275 3,198CF Industries Holdings 530 43,031Corteva 1,574 81,895Dow 1,054 62,144DuPont de Nemours 7,999 618,883Ecolab 555 97,824FMC 1,045 122,526Freeport-McMoRan 3,025 142,024International Paper 1,149 50,016Linde 845 247,788LyondellBasell Industries, Cl. A 330 32,086Newmont 1,390 92,018PPG Industries 687 91,680The Mosaic Company 725 38,012The Sherwin-Williams Company 449 118,145Vulcan Materials 679 123,2052,088,182
Media & Entertainment - 4.4%Activision Blizzard 875 71,312Alphabet, Cl. A 895a 2,417,520Alphabet, Cl. C 484a 1,305,745Charter Communications, Cl. A 244a 146,834Comcast, Cl. A 15,070 704,673Meta Platforms, Cl. A 4,331a 913,971Netflix 831a 327,846News Corporation, Cl. A 2,855 63,724Paramount Global, Cl. B 1,489 45,578Take-Two Interactive Software 153a 24,786The Walt Disney Company 3,482a 516,938Twitter 755a 26,8406,565,767
23
Copyright © 2022 www.secdatabase.com. All Rights Reserved.Please Consider the Environment Before Printing This Document
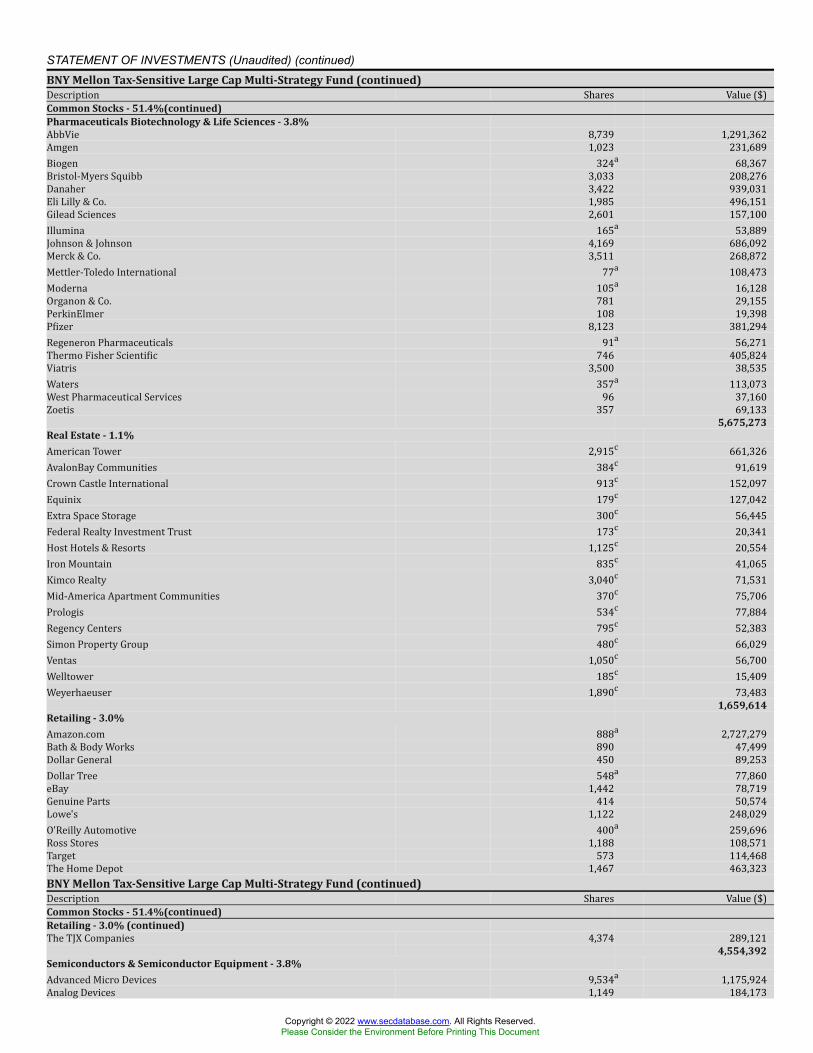
STATEMENT OF INVESTMENTS (Unaudited) (continued)BNY Mellon Tax-Sensitive Large Cap Multi-Strategy Fund (continued)Description Shares Value ($)Common Stocks - 51.4%(continued)Pharmaceuticals Biotechnology & Life Sciences - 3.8%AbbVie 8,739 1,291,362Amgen 1,023 231,689Biogen 324a 68,367Bristol-Myers Squibb 3,033 208,276Danaher 3,422 939,031Eli Lilly & Co. 1,985 496,151Gilead Sciences 2,601 157,100Illumina 165a 53,889Johnson & Johnson 4,169 686,092Merck & Co. 3,511 268,872Mettler-Toledo International 77a 108,473Moderna 105a 16,128Organon & Co. 781 29,155PerkinElmer 108 19,398Pfizer 8,123 381,294Regeneron Pharmaceuticals 91a 56,271Thermo Fisher Scientific 746 405,824Viatris 3,500 38,535Waters 357a 113,073West Pharmaceutical Services 96 37,160Zoetis 357 69,133
5,675,273Real Estate - 1.1%American Tower 2,915c 661,326AvalonBay Communities 384c 91,619Crown Castle International 913c 152,097Equinix 179c 127,042Extra Space Storage 300c 56,445Federal Realty Investment Trust 173c 20,341Host Hotels & Resorts 1,125c 20,554Iron Mountain 835c 41,065Kimco Realty 3,040c 71,531Mid-America Apartment Communities 370c 75,706Prologis 534c 77,884Regency Centers 795c 52,383Simon Property Group 480c 66,029Ventas 1,050c 56,700Welltower 185c 15,409Weyerhaeuser 1,890c 73,483
1,659,614Retailing - 3.0%Amazon.com 888a 2,727,279Bath & Body Works 890 47,499Dollar General 450 89,253Dollar Tree 548a 77,860eBay 1,442 78,719Genuine Parts 414 50,574Lowe's 1,122 248,029O'Reilly Automotive 400a 259,696Ross Stores 1,188 108,571Target 573 114,468The Home Depot 1,467 463,323BNY Mellon Tax-Sensitive Large Cap Multi-Strategy Fund (continued)Description Shares Value ($)Common Stocks - 51.4%(continued)Retailing - 3.0% (continued)The TJX Companies 4,374 289,121
4,554,392Semiconductors & Semiconductor Equipment - 3.8%Advanced Micro Devices 9,534a 1,175,924Analog Devices 1,149 184,173
Copyright © 2022 www.secdatabase.com. All Rights Reserved.Please Consider the Environment Before Printing This Document
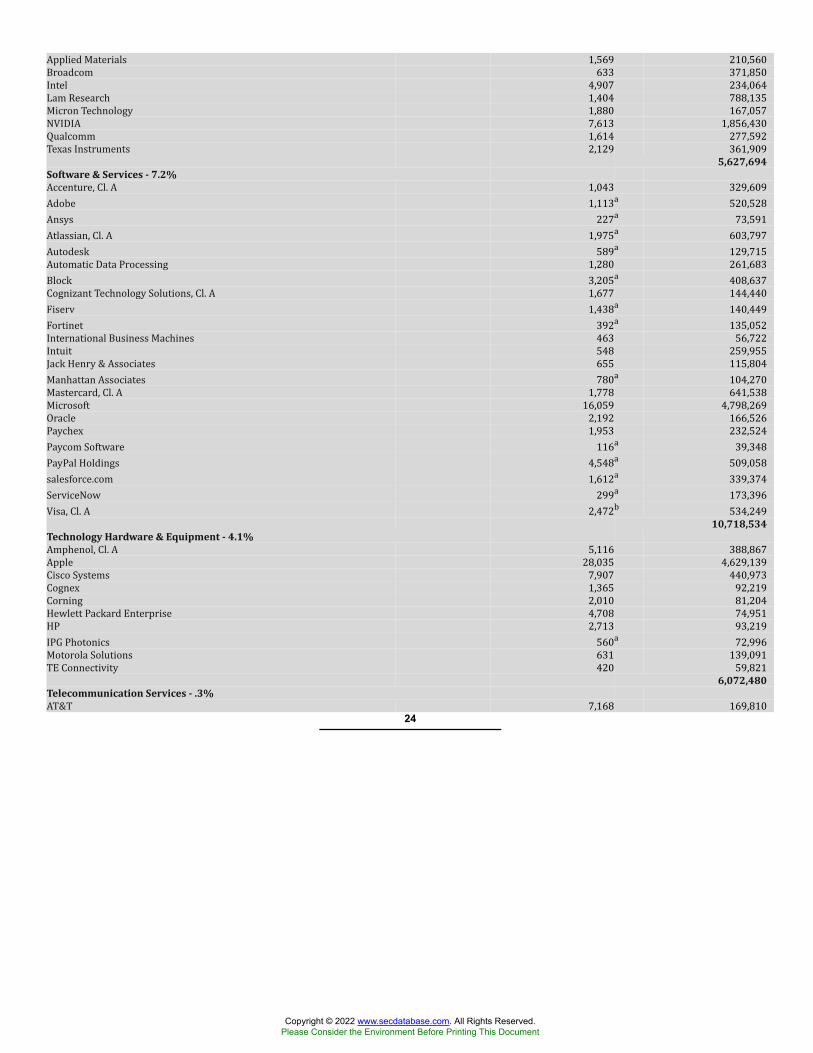
Applied Materials 1,569 210,560Broadcom 633 371,850Intel 4,907 234,064Lam Research 1,404 788,135Micron Technology 1,880 167,057NVIDIA 7,613 1,856,430Qualcomm 1,614 277,592Texas Instruments 2,129 361,9095,627,694
Software & Services - 7.2%Accenture, Cl. A 1,043 329,609Adobe 1,113a 520,528Ansys 227a 73,591Atlassian, Cl. A 1,975a 603,797Autodesk 589a 129,715Automatic Data Processing 1,280 261,683Block 3,205a 408,637Cognizant Technology Solutions, Cl. A 1,677 144,440Fiserv 1,438a 140,449Fortinet 392a 135,052International Business Machines 463 56,722Intuit 548 259,955Jack Henry & Associates 655 115,804Manhattan Associates 780a 104,270Mastercard, Cl. A 1,778 641,538Microsoft 16,059 4,798,269Oracle 2,192 166,526Paychex 1,953 232,524Paycom Software 116a 39,348PayPal Holdings 4,548a 509,058salesforce.com 1,612a 339,374ServiceNow 299a 173,396Visa, Cl. A 2,472b 534,24910,718,534
Technology Hardware & Equipment - 4.1%Amphenol, Cl. A 5,116 388,867Apple 28,035 4,629,139Cisco Systems 7,907 440,973Cognex 1,365 92,219Corning 2,010 81,204Hewlett Packard Enterprise 4,708 74,951HP 2,713 93,219IPG Photonics 560a 72,996Motorola Solutions 631 139,091TE Connectivity 420 59,8216,072,480
Telecommunication Services - .3%AT&T 7,168 169,81024
Copyright © 2022 www.secdatabase.com. All Rights Reserved.Please Consider the Environment Before Printing This Document
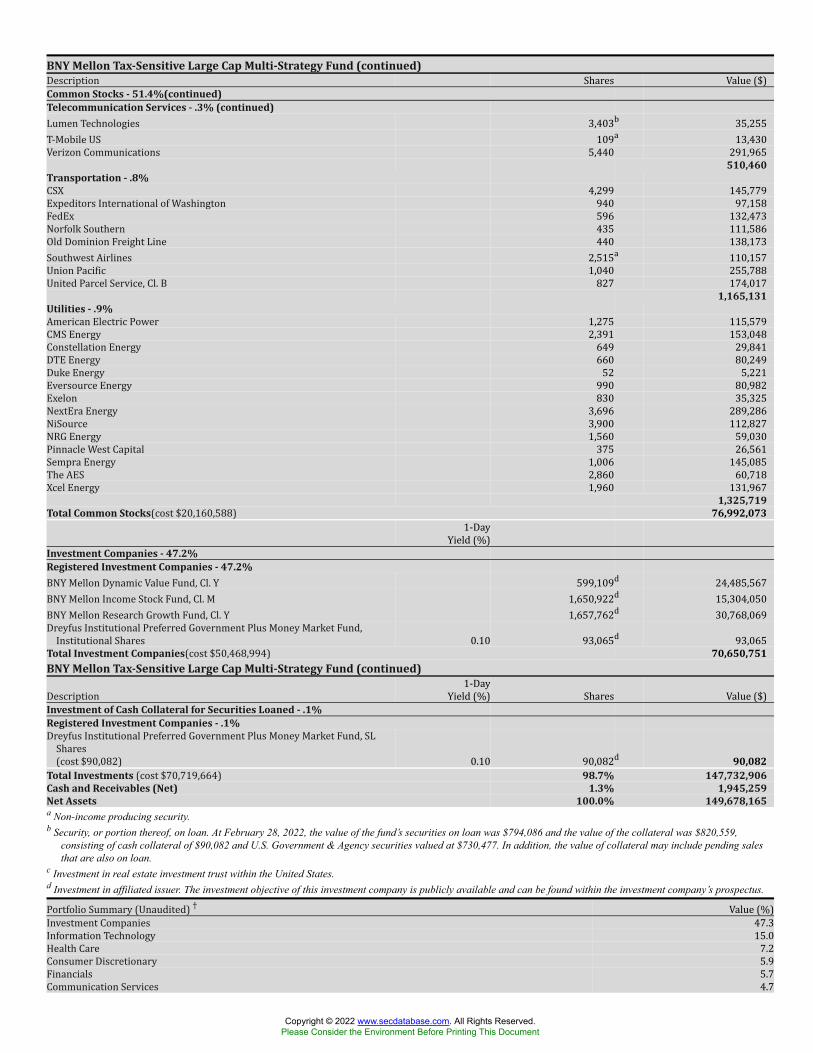
BNY Mellon Tax-Sensitive Large Cap Multi-Strategy Fund (continued)Description Shares Value ($)Common Stocks - 51.4%(continued)Telecommunication Services - .3% (continued)Lumen Technologies 3,403b 35,255T-Mobile US 109a 13,430Verizon Communications 5,440 291,965
510,460Transportation - .8%CSX 4,299 145,779Expeditors International of Washington 940 97,158FedEx 596 132,473Norfolk Southern 435 111,586Old Dominion Freight Line 440 138,173Southwest Airlines 2,515a 110,157Union Pacific 1,040 255,788United Parcel Service, Cl. B 827 174,017
1,165,131Utilities - .9%American Electric Power 1,275 115,579CMS Energy 2,391 153,048Constellation Energy 649 29,841DTE Energy 660 80,249Duke Energy 52 5,221Eversource Energy 990 80,982Exelon 830 35,325NextEra Energy 3,696 289,286NiSource 3,900 112,827NRG Energy 1,560 59,030Pinnacle West Capital 375 26,561Sempra Energy 1,006 145,085The AES 2,860 60,718Xcel Energy 1,960 131,967
1,325,719Total Common Stocks(cost $20,160,588) 76,992,0731-DayYield (%)Investment Companies - 47.2%Registered Investment Companies - 47.2%BNY Mellon Dynamic Value Fund, Cl. Y 599,109d 24,485,567BNY Mellon Income Stock Fund, Cl. M 1,650,922d 15,304,050BNY Mellon Research Growth Fund, Cl. Y 1,657,762d 30,768,069Dreyfus Institutional Preferred Government Plus Money Market Fund,Institutional Shares 0.10 93,065d 93,065Total Investment Companies(cost $50,468,994) 70,650,751BNY Mellon Tax-Sensitive Large Cap Multi-Strategy Fund (continued)Description 1-DayYield (%) Shares Value ($)Investment of Cash Collateral for Securities Loaned - .1%Registered Investment Companies - .1%Dreyfus Institutional Preferred Government Plus Money Market Fund, SLShares(cost $90,082) 0.10 90,082d 90,082Total Investments (cost $70,719,664) 98.7% 147,732,906Cash and Receivables (Net) 1.3% 1,945,259Net Assets 100.0% 149,678,165a Non-income producing security.b Security, or portion thereof, on loan. At February 28, 2022, the value of the fund’s securities on loan was $794,086 and the value of the collateral was $820,559,
consisting of cash collateral of $90,082 and U.S. Government & Agency securities valued at $730,477. In addition, the value of collateral may include pending salesthat are also on loan.
c Investment in real estate investment trust within the United States.d Investment in affiliated issuer. The investment objective of this investment company is publicly available and can be found within the investment company’s prospectus.Portfolio Summary (Unaudited) † Value (%)Investment Companies 47.3Information Technology 15.0Health Care 7.2Consumer Discretionary 5.9Financials 5.7Communication Services 4.7
Copyright © 2022 www.secdatabase.com. All Rights Reserved.Please Consider the Environment Before Printing This Document

Industrials 4.3Consumer Staples 3.2Energy 2.0Materials 1.4Real Estate 1.1Utilities .998.7
† Based on net assets.See notes to financial statements.
25
Copyright © 2022 www.secdatabase.com. All Rights Reserved.Please Consider the Environment Before Printing This Document
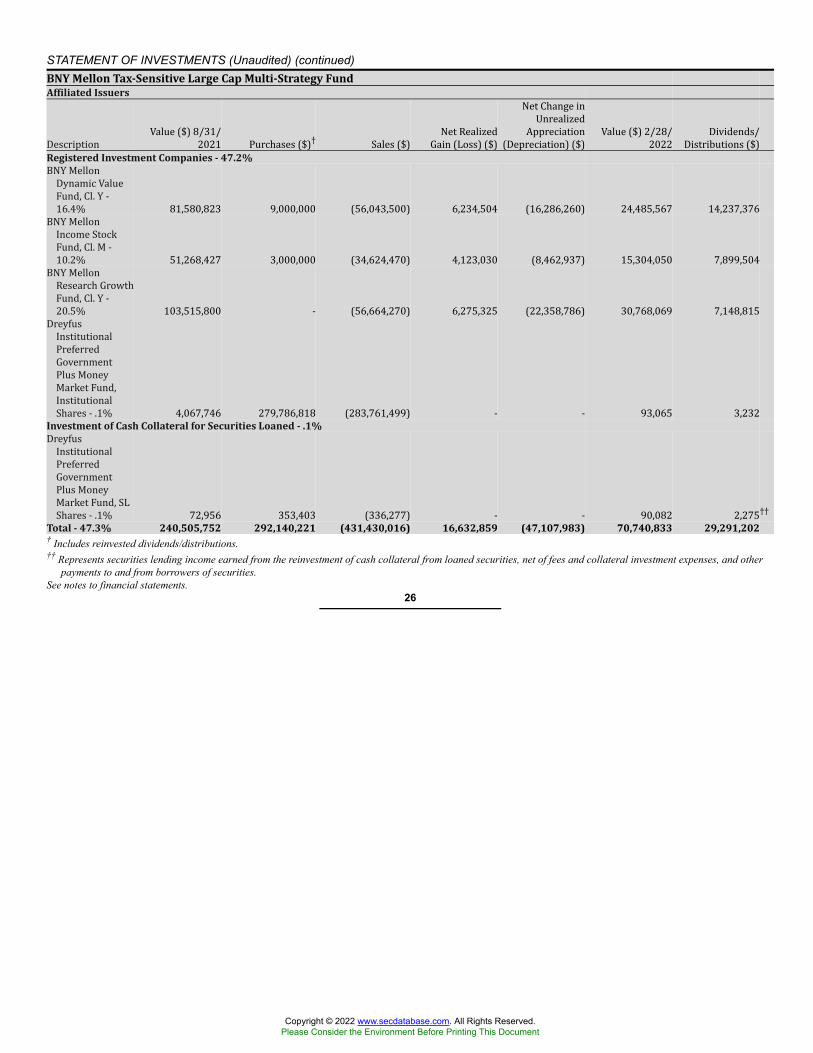
STATEMENT OF INVESTMENTS (Unaudited) (continued)BNY Mellon Tax-Sensitive Large Cap Multi-Strategy FundAffiliated Issuers
Description Value ($) 8/31/2021 Purchases ($)† Sales ($) Net RealizedGain (Loss) ($)Net Change inUnrealizedAppreciation(Depreciation) ($) Value ($) 2/28/2022 Dividends/Distributions ($)
Registered Investment Companies - 47.2%BNY MellonDynamic ValueFund, Cl. Y -16.4% 81,580,823 9,000,000 (56,043,500) 6,234,504 (16,286,260) 24,485,567 14,237,376BNY MellonIncome StockFund, Cl. M -10.2% 51,268,427 3,000,000 (34,624,470) 4,123,030 (8,462,937) 15,304,050 7,899,504BNY MellonResearch GrowthFund, Cl. Y -20.5% 103,515,800 - (56,664,270) 6,275,325 (22,358,786) 30,768,069 7,148,815DreyfusInstitutionalPreferredGovernmentPlus MoneyMarket Fund,InstitutionalShares - .1% 4,067,746 279,786,818 (283,761,499) - - 93,065 3,232Investment of Cash Collateral for Securities Loaned - .1%DreyfusInstitutionalPreferredGovernmentPlus MoneyMarket Fund, SLShares - .1% 72,956 353,403 (336,277) - - 90,082 2,275††Total - 47.3% 240,505,752 292,140,221 (431,430,016) 16,632,859 (47,107,983) 70,740,833 29,291,202† Includes reinvested dividends/distributions.†† Represents securities lending income earned from the reinvestment of cash collateral from loaned securities, net of fees and collateral investment expenses, and other
payments to and from borrowers of securities.See notes to financial statements.
26
Copyright © 2022 www.secdatabase.com. All Rights Reserved.Please Consider the Environment Before Printing This Document
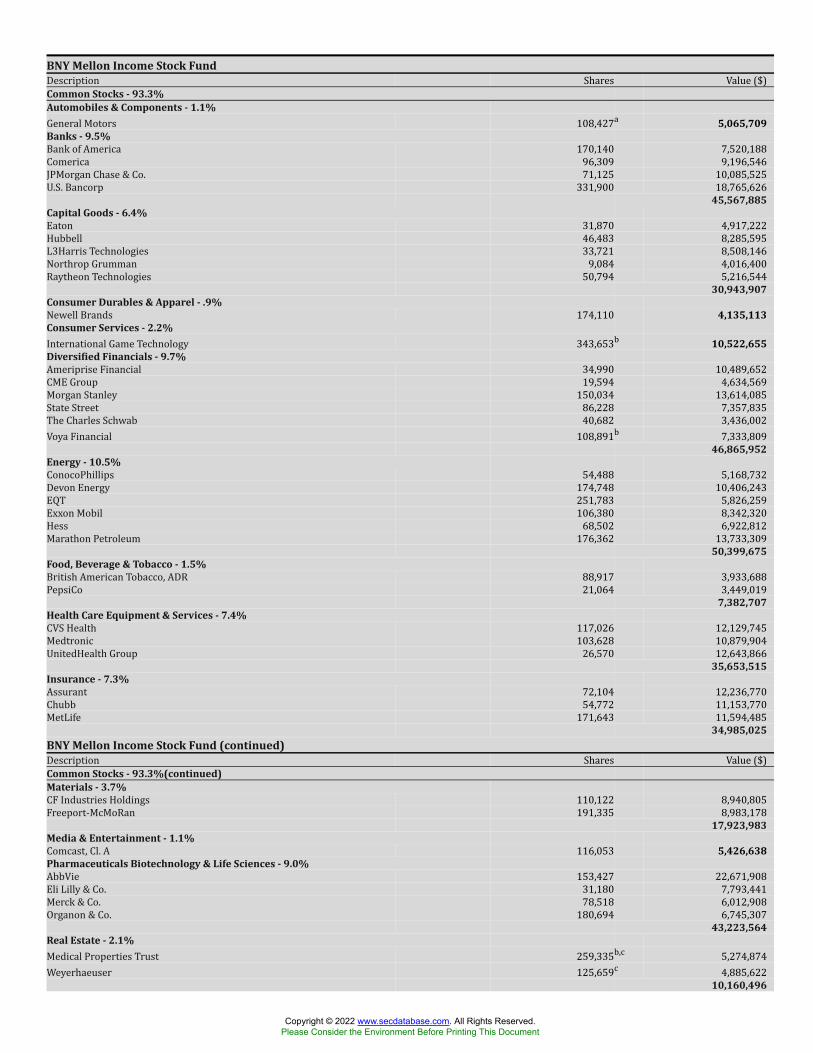
BNY Mellon Income Stock FundDescription Shares Value ($)Common Stocks - 93.3%Automobiles & Components - 1.1%General Motors 108,427a 5,065,709Banks - 9.5%Bank of America 170,140 7,520,188Comerica 96,309 9,196,546JPMorgan Chase & Co. 71,125 10,085,525U.S. Bancorp 331,900 18,765,626
45,567,885Capital Goods - 6.4%Eaton 31,870 4,917,222Hubbell 46,483 8,285,595L3Harris Technologies 33,721 8,508,146Northrop Grumman 9,084 4,016,400Raytheon Technologies 50,794 5,216,544
30,943,907Consumer Durables & Apparel - .9%Newell Brands 174,110 4,135,113Consumer Services - 2.2%International Game Technology 343,653b 10,522,655Diversified Financials - 9.7%Ameriprise Financial 34,990 10,489,652CME Group 19,594 4,634,569Morgan Stanley 150,034 13,614,085State Street 86,228 7,357,835The Charles Schwab 40,682 3,436,002Voya Financial 108,891b 7,333,809
46,865,952Energy - 10.5%ConocoPhillips 54,488 5,168,732Devon Energy 174,748 10,406,243EQT 251,783 5,826,259Exxon Mobil 106,380 8,342,320Hess 68,502 6,922,812Marathon Petroleum 176,362 13,733,309
50,399,675Food, Beverage & Tobacco - 1.5%British American Tobacco, ADR 88,917 3,933,688PepsiCo 21,064 3,449,019
7,382,707Health Care Equipment & Services - 7.4%CVS Health 117,026 12,129,745Medtronic 103,628 10,879,904UnitedHealth Group 26,570 12,643,866
35,653,515Insurance - 7.3%Assurant 72,104 12,236,770Chubb 54,772 11,153,770MetLife 171,643 11,594,485
34,985,025BNY Mellon Income Stock Fund (continued)Description Shares Value ($)Common Stocks - 93.3%(continued)Materials - 3.7%CF Industries Holdings 110,122 8,940,805Freeport-McMoRan 191,335 8,983,178
17,923,983Media & Entertainment - 1.1%Comcast, Cl. A 116,053 5,426,638Pharmaceuticals Biotechnology & Life Sciences - 9.0%AbbVie 153,427 22,671,908Eli Lilly & Co. 31,180 7,793,441Merck & Co. 78,518 6,012,908Organon & Co. 180,694 6,745,307
43,223,564Real Estate - 2.1%Medical Properties Trust 259,335b,c 5,274,874Weyerhaeuser 125,659c 4,885,622
10,160,496
Copyright © 2022 www.secdatabase.com. All Rights Reserved.Please Consider the Environment Before Printing This Document
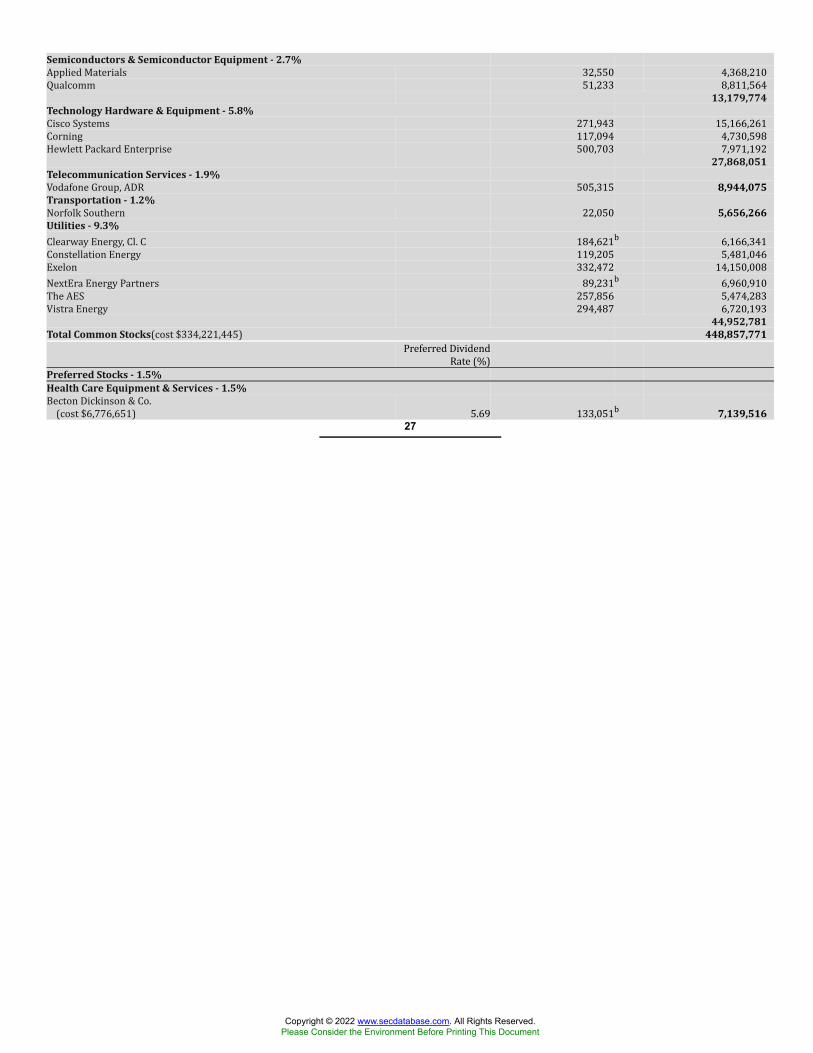
Semiconductors & Semiconductor Equipment - 2.7%Applied Materials 32,550 4,368,210Qualcomm 51,233 8,811,56413,179,774
Technology Hardware & Equipment - 5.8%Cisco Systems 271,943 15,166,261Corning 117,094 4,730,598Hewlett Packard Enterprise 500,703 7,971,19227,868,051
Telecommunication Services - 1.9%Vodafone Group, ADR 505,315 8,944,075Transportation - 1.2%Norfolk Southern 22,050 5,656,266Utilities - 9.3%Clearway Energy, Cl. C 184,621b 6,166,341Constellation Energy 119,205 5,481,046Exelon 332,472 14,150,008NextEra Energy Partners 89,231b 6,960,910The AES 257,856 5,474,283Vistra Energy 294,487 6,720,193
44,952,781Total Common Stocks(cost $334,221,445) 448,857,771Preferred DividendRate (%)Preferred Stocks - 1.5%Health Care Equipment & Services - 1.5%Becton Dickinson & Co.(cost $6,776,651) 5.69 133,051b 7,139,516
27
Copyright © 2022 www.secdatabase.com. All Rights Reserved.Please Consider the Environment Before Printing This Document
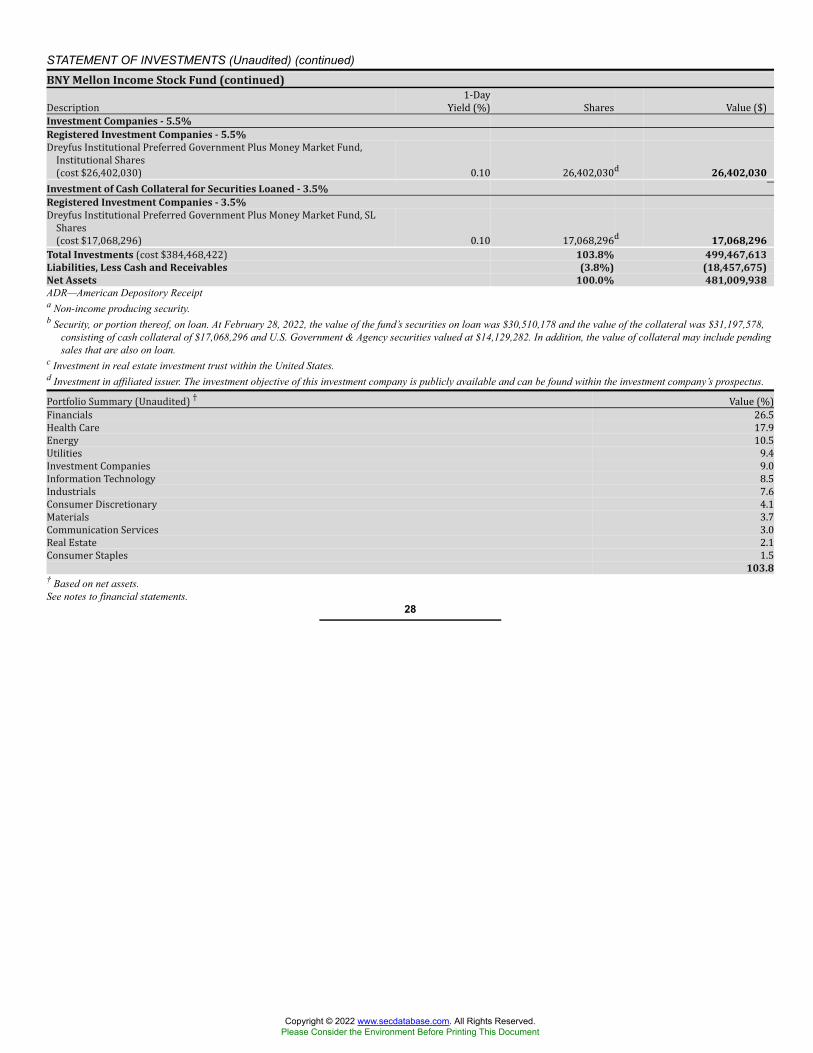
STATEMENT OF INVESTMENTS (Unaudited) (continued)BNY Mellon Income Stock Fund (continued)Description 1-DayYield (%) Shares Value ($)Investment Companies - 5.5%Registered Investment Companies - 5.5%Dreyfus Institutional Preferred Government Plus Money Market Fund,Institutional Shares(cost $26,402,030) 0.10 26,402,030d 26,402,030Investment of Cash Collateral for Securities Loaned - 3.5%Registered Investment Companies - 3.5%Dreyfus Institutional Preferred Government Plus Money Market Fund, SLShares(cost $17,068,296) 0.10 17,068,296d 17,068,296Total Investments (cost $384,468,422) 103.8% 499,467,613Liabilities, Less Cash and Receivables (3.8%) (18,457,675)Net Assets 100.0% 481,009,938ADR—American Depository Receipta Non-income producing security.b Security, or portion thereof, on loan. At February 28, 2022, the value of the fund’s securities on loan was $30,510,178 and the value of the collateral was $31,197,578,
consisting of cash collateral of $17,068,296 and U.S. Government & Agency securities valued at $14,129,282. In addition, the value of collateral may include pendingsales that are also on loan.
c Investment in real estate investment trust within the United States.d Investment in affiliated issuer. The investment objective of this investment company is publicly available and can be found within the investment company’s prospectus.Portfolio Summary (Unaudited) † Value (%)Financials 26.5Health Care 17.9Energy 10.5Utilities 9.4Investment Companies 9.0Information Technology 8.5Industrials 7.6Consumer Discretionary 4.1Materials 3.7Communication Services 3.0Real Estate 2.1Consumer Staples 1.5
103.8† Based on net assets.See notes to financial statements.
28
Copyright © 2022 www.secdatabase.com. All Rights Reserved.Please Consider the Environment Before Printing This Document
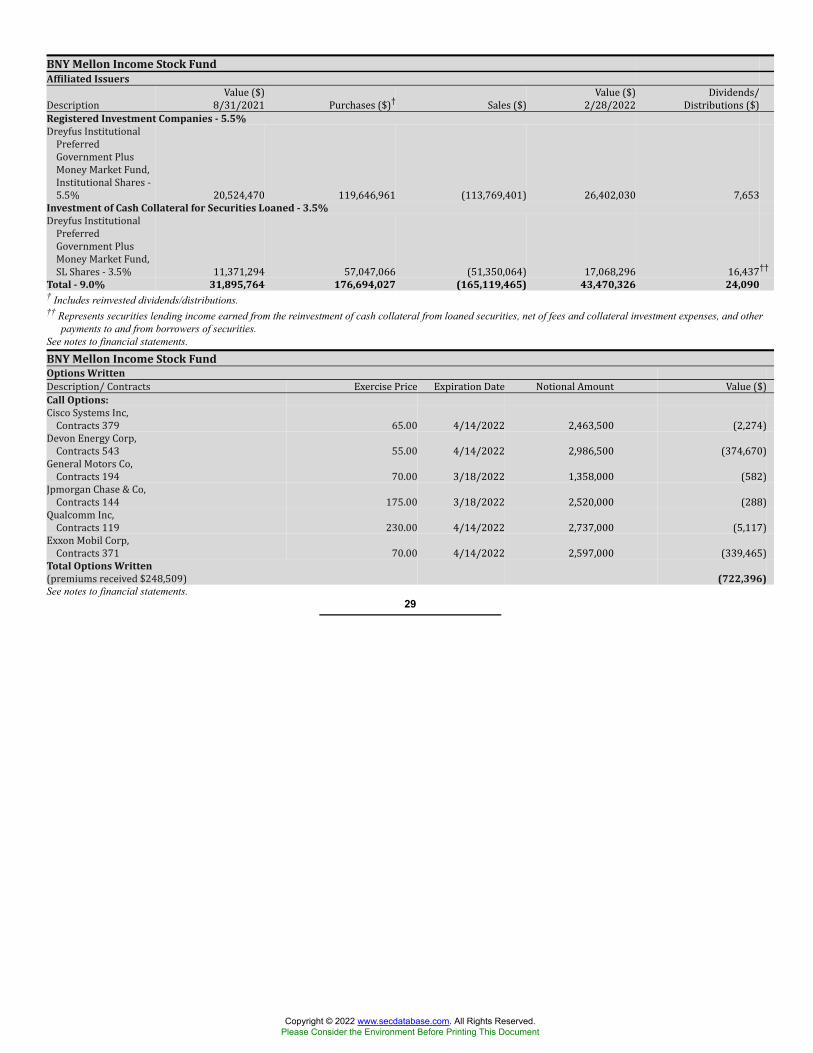
BNY Mellon Income Stock FundAffiliated IssuersDescription Value ($)8/31/2021 Purchases ($)† Sales ($) Value ($)2/28/2022 Dividends/Distributions ($)Registered Investment Companies - 5.5%Dreyfus InstitutionalPreferredGovernment PlusMoney Market Fund,Institutional Shares -5.5% 20,524,470 119,646,961 (113,769,401) 26,402,030 7,653Investment of Cash Collateral for Securities Loaned - 3.5%Dreyfus InstitutionalPreferredGovernment PlusMoney Market Fund,SL Shares - 3.5% 11,371,294 57,047,066 (51,350,064) 17,068,296 16,437††Total - 9.0% 31,895,764 176,694,027 (165,119,465) 43,470,326 24,090† Includes reinvested dividends/distributions.†† Represents securities lending income earned from the reinvestment of cash collateral from loaned securities, net of fees and collateral investment expenses, and other
payments to and from borrowers of securities.See notes to financial statements.
BNY Mellon Income Stock FundOptions WrittenDescription/ Contracts Exercise Price Expiration Date Notional Amount Value ($)Call Options:Cisco Systems Inc,Contracts 379 65.00 4/14/2022 2,463,500 (2,274)Devon Energy Corp,Contracts 543 55.00 4/14/2022 2,986,500 (374,670)General Motors Co,Contracts 194 70.00 3/18/2022 1,358,000 (582)Jpmorgan Chase & Co,Contracts 144 175.00 3/18/2022 2,520,000 (288)Qualcomm Inc,Contracts 119 230.00 4/14/2022 2,737,000 (5,117)Exxon Mobil Corp,Contracts 371 70.00 4/14/2022 2,597,000 (339,465)Total Options Written(premiums received $248,509) (722,396)See notes to financial statements.
29
Copyright © 2022 www.secdatabase.com. All Rights Reserved.Please Consider the Environment Before Printing This Document
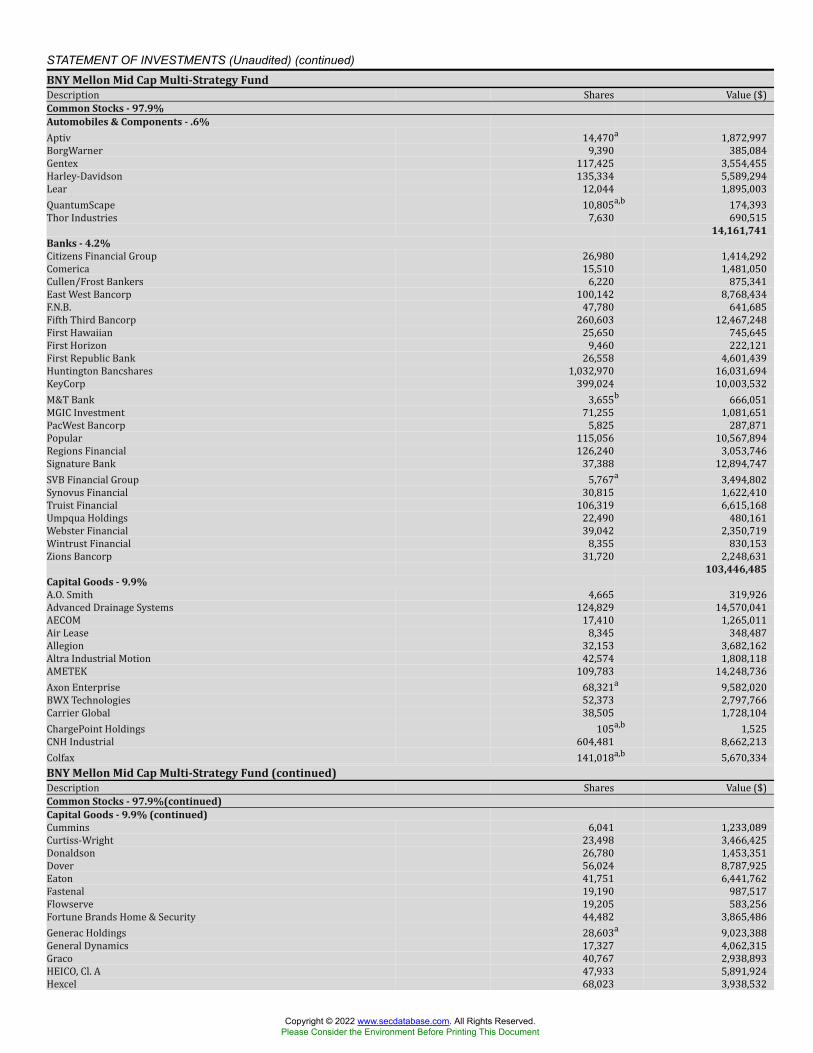
STATEMENT OF INVESTMENTS (Unaudited) (continued)BNY Mellon Mid Cap Multi-Strategy FundDescription Shares Value ($)Common Stocks - 97.9%Automobiles & Components - .6%Aptiv 14,470a 1,872,997BorgWarner 9,390 385,084Gentex 117,425 3,554,455Harley-Davidson 135,334 5,589,294Lear 12,044 1,895,003QuantumScape 10,805a,b 174,393Thor Industries 7,630 690,515
14,161,741Banks - 4.2%Citizens Financial Group 26,980 1,414,292Comerica 15,510 1,481,050Cullen/Frost Bankers 6,220 875,341East West Bancorp 100,142 8,768,434F.N.B. 47,780 641,685Fifth Third Bancorp 260,603 12,467,248First Hawaiian 25,650 745,645First Horizon 9,460 222,121First Republic Bank 26,558 4,601,439Huntington Bancshares 1,032,970 16,031,694KeyCorp 399,024 10,003,532M&T Bank 3,655b 666,051MGIC Investment 71,255 1,081,651PacWest Bancorp 5,825 287,871Popular 115,056 10,567,894Regions Financial 126,240 3,053,746Signature Bank 37,388 12,894,747SVB Financial Group 5,767a 3,494,802Synovus Financial 30,815 1,622,410Truist Financial 106,319 6,615,168Umpqua Holdings 22,490 480,161Webster Financial 39,042 2,350,719Wintrust Financial 8,355 830,153Zions Bancorp 31,720 2,248,631
103,446,485Capital Goods - 9.9%A.O. Smith 4,665 319,926Advanced Drainage Systems 124,829 14,570,041AECOM 17,410 1,265,011Air Lease 8,345 348,487Allegion 32,153 3,682,162Altra Industrial Motion 42,574 1,808,118AMETEK 109,783 14,248,736Axon Enterprise 68,321a 9,582,020BWX Technologies 52,373 2,797,766Carrier Global 38,505 1,728,104ChargePoint Holdings 105a,b 1,525CNH Industrial 604,481 8,662,213Colfax 141,018a,b 5,670,334BNY Mellon Mid Cap Multi-Strategy Fund (continued)Description Shares Value ($)Common Stocks - 97.9%(continued)Capital Goods - 9.9% (continued)Cummins 6,041 1,233,089Curtiss-Wright 23,498 3,466,425Donaldson 26,780 1,453,351Dover 56,024 8,787,925Eaton 41,751 6,441,762Fastenal 19,190 987,517Flowserve 19,205 583,256Fortune Brands Home & Security 44,482 3,865,486Generac Holdings 28,603a 9,023,388General Dynamics 17,327 4,062,315Graco 40,767 2,938,893HEICO, Cl. A 47,933 5,891,924Hexcel 68,023 3,938,532
Copyright © 2022 www.secdatabase.com. All Rights Reserved.Please Consider the Environment Before Printing This Document
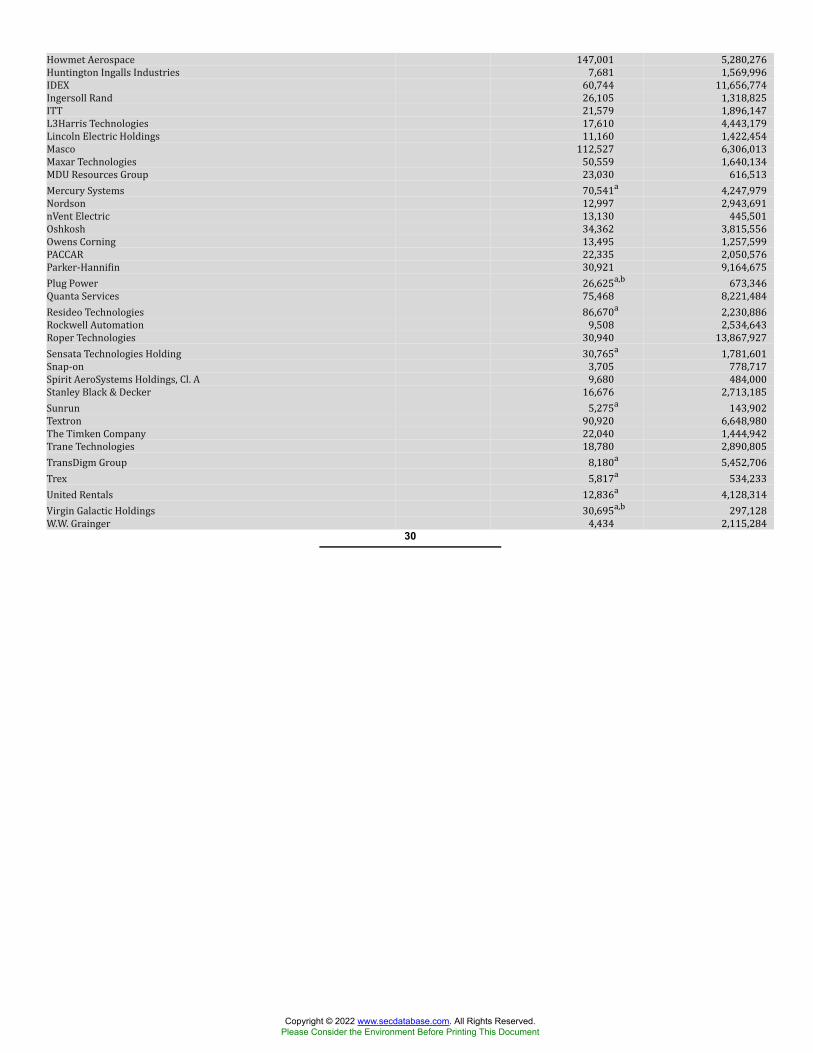
Howmet Aerospace 147,001 5,280,276Huntington Ingalls Industries 7,681 1,569,996IDEX 60,744 11,656,774Ingersoll Rand 26,105 1,318,825ITT 21,579 1,896,147L3Harris Technologies 17,610 4,443,179Lincoln Electric Holdings 11,160 1,422,454Masco 112,527 6,306,013Maxar Technologies 50,559 1,640,134MDU Resources Group 23,030 616,513Mercury Systems 70,541a 4,247,979Nordson 12,997 2,943,691nVent Electric 13,130 445,501Oshkosh 34,362 3,815,556Owens Corning 13,495 1,257,599PACCAR 22,335 2,050,576Parker-Hannifin 30,921 9,164,675Plug Power 26,625a,b 673,346Quanta Services 75,468 8,221,484Resideo Technologies 86,670a 2,230,886Rockwell Automation 9,508 2,534,643Roper Technologies 30,940 13,867,927Sensata Technologies Holding 30,765a 1,781,601Snap-on 3,705 778,717Spirit AeroSystems Holdings, Cl. A 9,680 484,000Stanley Black & Decker 16,676 2,713,185Sunrun 5,275a 143,902Textron 90,920 6,648,980The Timken Company 22,040 1,444,942Trane Technologies 18,780 2,890,805TransDigm Group 8,180a 5,452,706Trex 5,817a 534,233United Rentals 12,836a 4,128,314Virgin Galactic Holdings 30,695a,b 297,128W.W. Grainger 4,434 2,115,28430
Copyright © 2022 www.secdatabase.com. All Rights Reserved.Please Consider the Environment Before Printing This Document
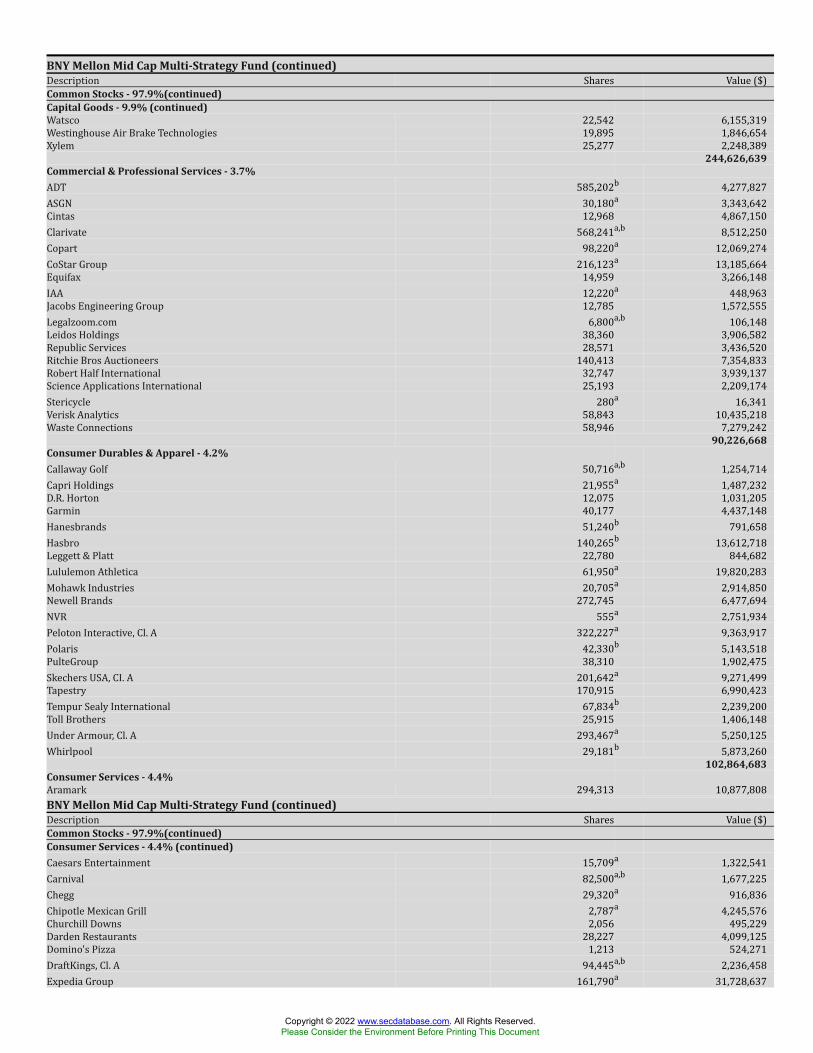
BNY Mellon Mid Cap Multi-Strategy Fund (continued)Description Shares Value ($)Common Stocks - 97.9%(continued)Capital Goods - 9.9% (continued)Watsco 22,542 6,155,319Westinghouse Air Brake Technologies 19,895 1,846,654Xylem 25,277 2,248,389
244,626,639Commercial & Professional Services - 3.7%ADT 585,202b 4,277,827ASGN 30,180a 3,343,642Cintas 12,968 4,867,150Clarivate 568,241a,b 8,512,250Copart 98,220a 12,069,274CoStar Group 216,123a 13,185,664Equifax 14,959 3,266,148IAA 12,220a 448,963Jacobs Engineering Group 12,785 1,572,555Legalzoom.com 6,800a,b 106,148Leidos Holdings 38,360 3,906,582Republic Services 28,571 3,436,520Ritchie Bros Auctioneers 140,413 7,354,833Robert Half International 32,747 3,939,137Science Applications International 25,193 2,209,174Stericycle 280a 16,341Verisk Analytics 58,843 10,435,218Waste Connections 58,946 7,279,242
90,226,668Consumer Durables & Apparel - 4.2%Callaway Golf 50,716a,b 1,254,714Capri Holdings 21,955a 1,487,232D.R. Horton 12,075 1,031,205Garmin 40,177 4,437,148Hanesbrands 51,240b 791,658Hasbro 140,265b 13,612,718Leggett & Platt 22,780 844,682Lululemon Athletica 61,950a 19,820,283Mohawk Industries 20,705a 2,914,850Newell Brands 272,745 6,477,694NVR 555a 2,751,934Peloton Interactive, Cl. A 322,227a 9,363,917Polaris 42,330b 5,143,518PulteGroup 38,310 1,902,475Skechers USA, CI. A 201,642a 9,271,499Tapestry 170,915 6,990,423Tempur Sealy International 67,834b 2,239,200Toll Brothers 25,915 1,406,148Under Armour, Cl. A 293,467a 5,250,125Whirlpool 29,181b 5,873,260
102,864,683Consumer Services - 4.4%Aramark 294,313 10,877,808BNY Mellon Mid Cap Multi-Strategy Fund (continued)Description Shares Value ($)Common Stocks - 97.9%(continued)Consumer Services - 4.4% (continued)Caesars Entertainment 15,709a 1,322,541Carnival 82,500a,b 1,677,225Chegg 29,320a 916,836Chipotle Mexican Grill 2,787a 4,245,576Churchill Downs 2,056 495,229Darden Restaurants 28,227 4,099,125Domino's Pizza 1,213 524,271DraftKings, Cl. A 94,445a,b 2,236,458Expedia Group 161,790a 31,728,637
Copyright © 2022 www.secdatabase.com. All Rights Reserved.Please Consider the Environment Before Printing This Document
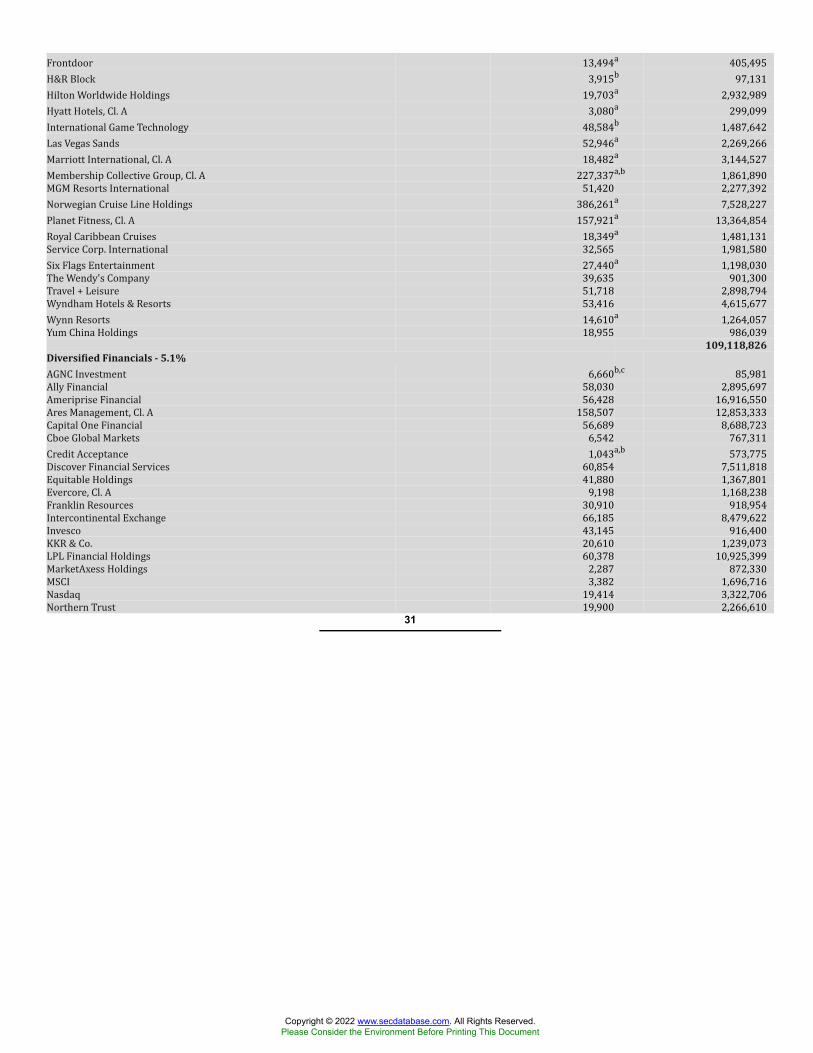
Frontdoor 13,494a 405,495H&R Block 3,915b 97,131Hilton Worldwide Holdings 19,703a 2,932,989Hyatt Hotels, Cl. A 3,080a 299,099International Game Technology 48,584b 1,487,642Las Vegas Sands 52,946a 2,269,266Marriott International, Cl. A 18,482a 3,144,527Membership Collective Group, Cl. A 227,337a,b 1,861,890MGM Resorts International 51,420 2,277,392Norwegian Cruise Line Holdings 386,261a 7,528,227Planet Fitness, Cl. A 157,921a 13,364,854Royal Caribbean Cruises 18,349a 1,481,131Service Corp. International 32,565 1,981,580Six Flags Entertainment 27,440a 1,198,030The Wendy's Company 39,635 901,300Travel + Leisure 51,718 2,898,794Wyndham Hotels & Resorts 53,416 4,615,677Wynn Resorts 14,610a 1,264,057Yum China Holdings 18,955 986,039109,118,826
Diversified Financials - 5.1%AGNC Investment 6,660b,c 85,981Ally Financial 58,030 2,895,697Ameriprise Financial 56,428 16,916,550Ares Management, Cl. A 158,507 12,853,333Capital One Financial 56,689 8,688,723Cboe Global Markets 6,542 767,311Credit Acceptance 1,043a,b 573,775Discover Financial Services 60,854 7,511,818Equitable Holdings 41,880 1,367,801Evercore, Cl. A 9,198 1,168,238Franklin Resources 30,910 918,954Intercontinental Exchange 66,185 8,479,622Invesco 43,145 916,400KKR & Co. 20,610 1,239,073LPL Financial Holdings 60,378 10,925,399MarketAxess Holdings 2,287 872,330MSCI 3,382 1,696,716Nasdaq 19,414 3,322,706Northern Trust 19,900 2,266,61031
Copyright © 2022 www.secdatabase.com. All Rights Reserved.Please Consider the Environment Before Printing This Document
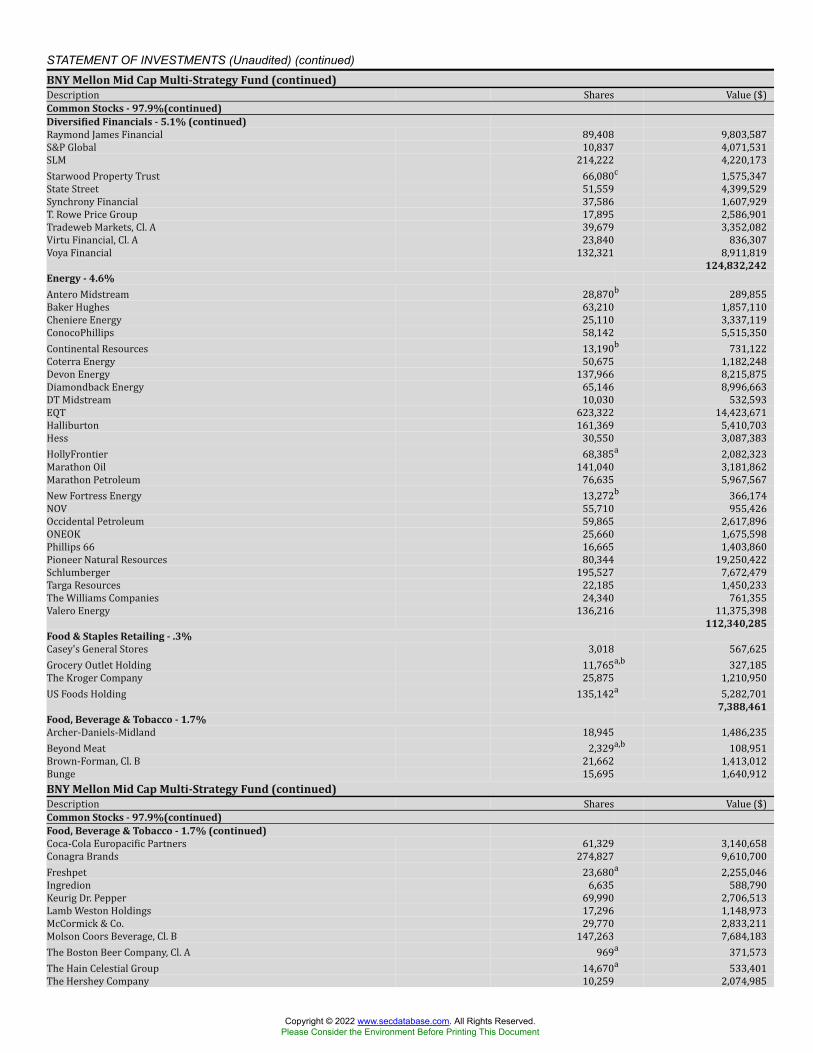
STATEMENT OF INVESTMENTS (Unaudited) (continued)BNY Mellon Mid Cap Multi-Strategy Fund (continued)Description Shares Value ($)Common Stocks - 97.9%(continued)Diversified Financials - 5.1% (continued)Raymond James Financial 89,408 9,803,587S&P Global 10,837 4,071,531SLM 214,222 4,220,173Starwood Property Trust 66,080c 1,575,347State Street 51,559 4,399,529Synchrony Financial 37,586 1,607,929T. Rowe Price Group 17,895 2,586,901Tradeweb Markets, Cl. A 39,679 3,352,082Virtu Financial, Cl. A 23,840 836,307Voya Financial 132,321 8,911,819
124,832,242Energy - 4.6%Antero Midstream 28,870b 289,855Baker Hughes 63,210 1,857,110Cheniere Energy 25,110 3,337,119ConocoPhillips 58,142 5,515,350Continental Resources 13,190b 731,122Coterra Energy 50,675 1,182,248Devon Energy 137,966 8,215,875Diamondback Energy 65,146 8,996,663DT Midstream 10,030 532,593EQT 623,322 14,423,671Halliburton 161,369 5,410,703Hess 30,550 3,087,383HollyFrontier 68,385a 2,082,323Marathon Oil 141,040 3,181,862Marathon Petroleum 76,635 5,967,567New Fortress Energy 13,272b 366,174NOV 55,710 955,426Occidental Petroleum 59,865 2,617,896ONEOK 25,660 1,675,598Phillips 66 16,665 1,403,860Pioneer Natural Resources 80,344 19,250,422Schlumberger 195,527 7,672,479Targa Resources 22,185 1,450,233The Williams Companies 24,340 761,355Valero Energy 136,216 11,375,398
112,340,285Food & Staples Retailing - .3%Casey's General Stores 3,018 567,625Grocery Outlet Holding 11,765a,b 327,185The Kroger Company 25,875 1,210,950US Foods Holding 135,142a 5,282,701
7,388,461Food, Beverage & Tobacco - 1.7%Archer-Daniels-Midland 18,945 1,486,235Beyond Meat 2,329a,b 108,951Brown-Forman, Cl. B 21,662 1,413,012Bunge 15,695 1,640,912BNY Mellon Mid Cap Multi-Strategy Fund (continued)Description Shares Value ($)Common Stocks - 97.9%(continued)Food, Beverage & Tobacco - 1.7% (continued)Coca-Cola Europacific Partners 61,329 3,140,658Conagra Brands 274,827 9,610,700Freshpet 23,680a 2,255,046Ingredion 6,635 588,790Keurig Dr. Pepper 69,990 2,706,513Lamb Weston Holdings 17,296 1,148,973McCormick & Co. 29,770 2,833,211Molson Coors Beverage, Cl. B 147,263 7,684,183The Boston Beer Company, Cl. A 969a 371,573The Hain Celestial Group 14,670a 533,401The Hershey Company 10,259 2,074,985
Copyright © 2022 www.secdatabase.com. All Rights Reserved.Please Consider the Environment Before Printing This Document
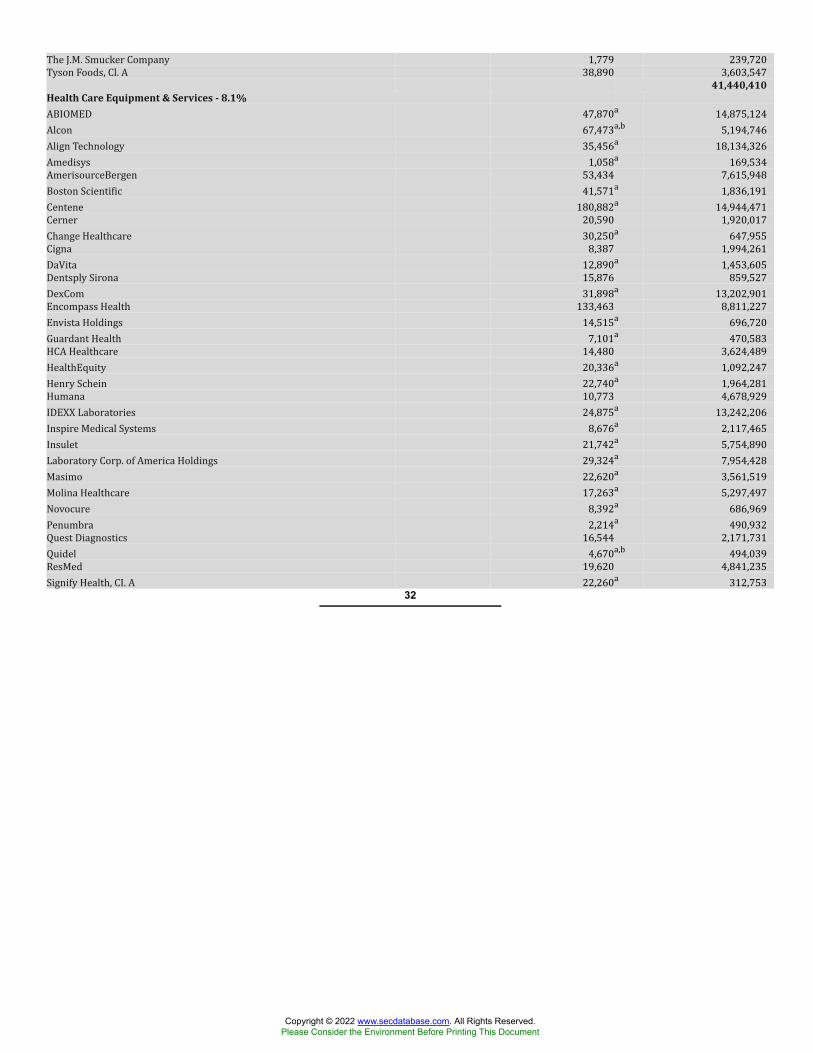
The J.M. Smucker Company 1,779 239,720Tyson Foods, Cl. A 38,890 3,603,54741,440,410
Health Care Equipment & Services - 8.1%ABIOMED 47,870a 14,875,124Alcon 67,473a,b 5,194,746Align Technology 35,456a 18,134,326Amedisys 1,058a 169,534AmerisourceBergen 53,434 7,615,948Boston Scientific 41,571a 1,836,191Centene 180,882a 14,944,471Cerner 20,590 1,920,017Change Healthcare 30,250a 647,955Cigna 8,387 1,994,261DaVita 12,890a 1,453,605Dentsply Sirona 15,876 859,527DexCom 31,898a 13,202,901Encompass Health 133,463 8,811,227Envista Holdings 14,515a 696,720Guardant Health 7,101a 470,583HCA Healthcare 14,480 3,624,489HealthEquity 20,336a 1,092,247Henry Schein 22,740a 1,964,281Humana 10,773 4,678,929IDEXX Laboratories 24,875a 13,242,206Inspire Medical Systems 8,676a 2,117,465Insulet 21,742a 5,754,890Laboratory Corp. of America Holdings 29,324a 7,954,428Masimo 22,620a 3,561,519Molina Healthcare 17,263a 5,297,497Novocure 8,392a 686,969Penumbra 2,214a 490,932Quest Diagnostics 16,544 2,171,731Quidel 4,670a,b 494,039ResMed 19,620 4,841,235Signify Health, CI. A 22,260a 312,75332
Copyright © 2022 www.secdatabase.com. All Rights Reserved.Please Consider the Environment Before Printing This Document
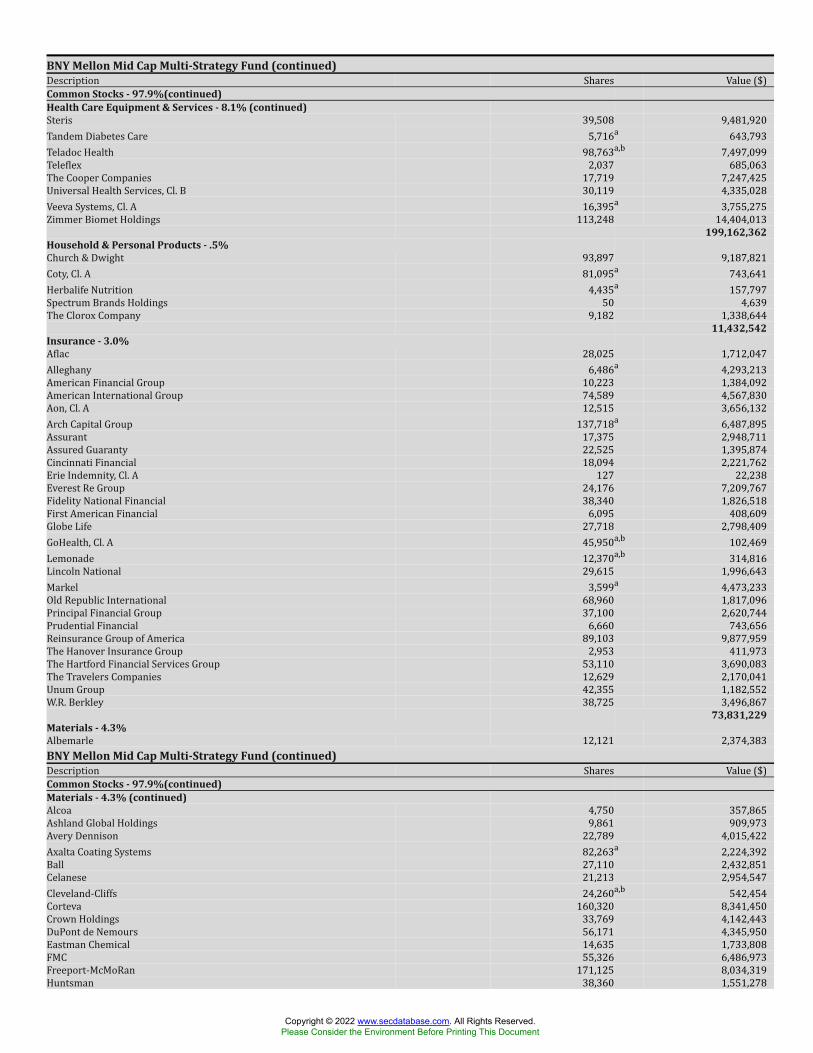
BNY Mellon Mid Cap Multi-Strategy Fund (continued)Description Shares Value ($)Common Stocks - 97.9%(continued)Health Care Equipment & Services - 8.1% (continued)Steris 39,508 9,481,920Tandem Diabetes Care 5,716a 643,793Teladoc Health 98,763a,b 7,497,099Teleflex 2,037 685,063The Cooper Companies 17,719 7,247,425Universal Health Services, Cl. B 30,119 4,335,028Veeva Systems, Cl. A 16,395a 3,755,275Zimmer Biomet Holdings 113,248 14,404,013
199,162,362Household & Personal Products - .5%Church & Dwight 93,897 9,187,821Coty, Cl. A 81,095a 743,641Herbalife Nutrition 4,435a 157,797Spectrum Brands Holdings 50 4,639The Clorox Company 9,182 1,338,644
11,432,542Insurance - 3.0%Aflac 28,025 1,712,047Alleghany 6,486a 4,293,213American Financial Group 10,223 1,384,092American International Group 74,589 4,567,830Aon, Cl. A 12,515 3,656,132Arch Capital Group 137,718a 6,487,895Assurant 17,375 2,948,711Assured Guaranty 22,525 1,395,874Cincinnati Financial 18,094 2,221,762Erie Indemnity, Cl. A 127 22,238Everest Re Group 24,176 7,209,767Fidelity National Financial 38,340 1,826,518First American Financial 6,095 408,609Globe Life 27,718 2,798,409GoHealth, Cl. A 45,950a,b 102,469Lemonade 12,370a,b 314,816Lincoln National 29,615 1,996,643Markel 3,599a 4,473,233Old Republic International 68,960 1,817,096Principal Financial Group 37,100 2,620,744Prudential Financial 6,660 743,656Reinsurance Group of America 89,103 9,877,959The Hanover Insurance Group 2,953 411,973The Hartford Financial Services Group 53,110 3,690,083The Travelers Companies 12,629 2,170,041Unum Group 42,355 1,182,552W.R. Berkley 38,725 3,496,867
73,831,229Materials - 4.3%Albemarle 12,121 2,374,383BNY Mellon Mid Cap Multi-Strategy Fund (continued)Description Shares Value ($)Common Stocks - 97.9%(continued)Materials - 4.3% (continued)Alcoa 4,750 357,865Ashland Global Holdings 9,861 909,973Avery Dennison 22,789 4,015,422Axalta Coating Systems 82,263a 2,224,392Ball 27,110 2,432,851Celanese 21,213 2,954,547Cleveland-Cliffs 24,260a,b 542,454Corteva 160,320 8,341,450Crown Holdings 33,769 4,142,443DuPont de Nemours 56,171 4,345,950Eastman Chemical 14,635 1,733,808FMC 55,326 6,486,973Freeport-McMoRan 171,125 8,034,319Huntsman 38,360 1,551,278
Copyright © 2022 www.secdatabase.com. All Rights Reserved.Please Consider the Environment Before Printing This Document
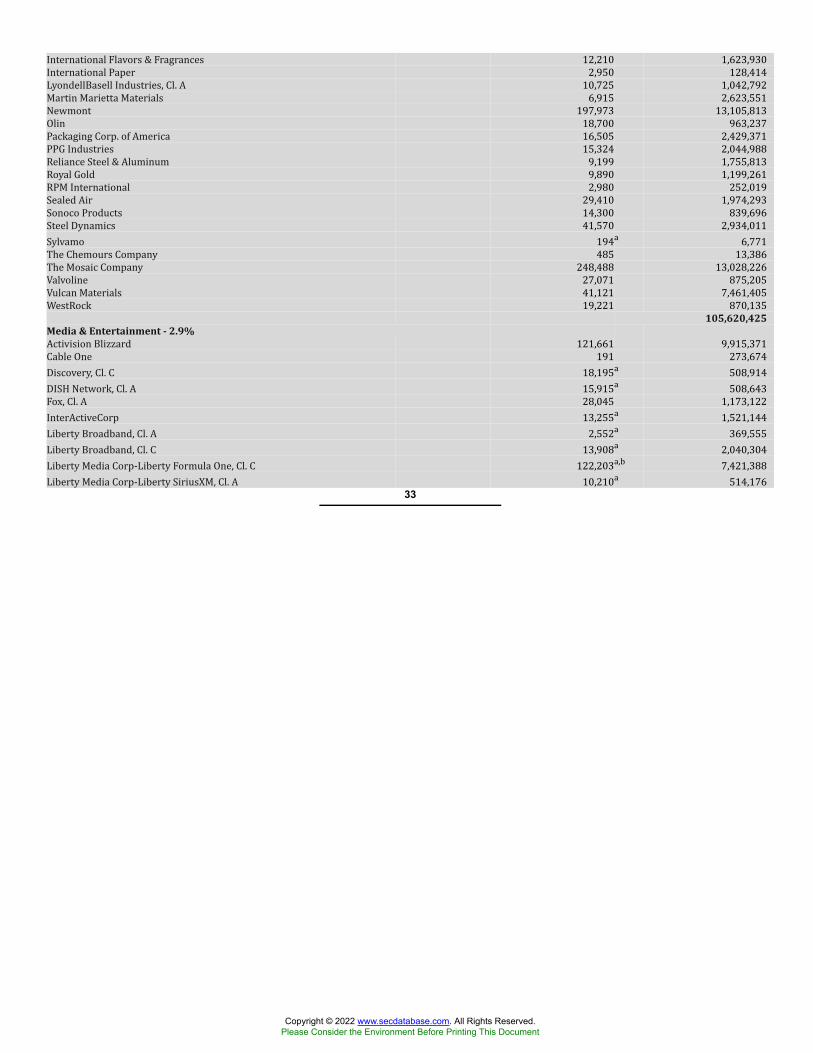
International Flavors & Fragrances 12,210 1,623,930International Paper 2,950 128,414LyondellBasell Industries, Cl. A 10,725 1,042,792Martin Marietta Materials 6,915 2,623,551Newmont 197,973 13,105,813Olin 18,700 963,237Packaging Corp. of America 16,505 2,429,371PPG Industries 15,324 2,044,988Reliance Steel & Aluminum 9,199 1,755,813Royal Gold 9,890 1,199,261RPM International 2,980 252,019Sealed Air 29,410 1,974,293Sonoco Products 14,300 839,696Steel Dynamics 41,570 2,934,011Sylvamo 194a 6,771The Chemours Company 485 13,386The Mosaic Company 248,488 13,028,226Valvoline 27,071 875,205Vulcan Materials 41,121 7,461,405WestRock 19,221 870,135105,620,425
Media & Entertainment - 2.9%Activision Blizzard 121,661 9,915,371Cable One 191 273,674Discovery, Cl. C 18,195a 508,914DISH Network, Cl. A 15,915a 508,643Fox, Cl. A 28,045 1,173,122InterActiveCorp 13,255a 1,521,144Liberty Broadband, Cl. A 2,552a 369,555Liberty Broadband, Cl. C 13,908a 2,040,304Liberty Media Corp-Liberty Formula One, Cl. C 122,203a,b 7,421,388Liberty Media Corp-Liberty SiriusXM, Cl. A 10,210a 514,17633
Copyright © 2022 www.secdatabase.com. All Rights Reserved.Please Consider the Environment Before Printing This Document
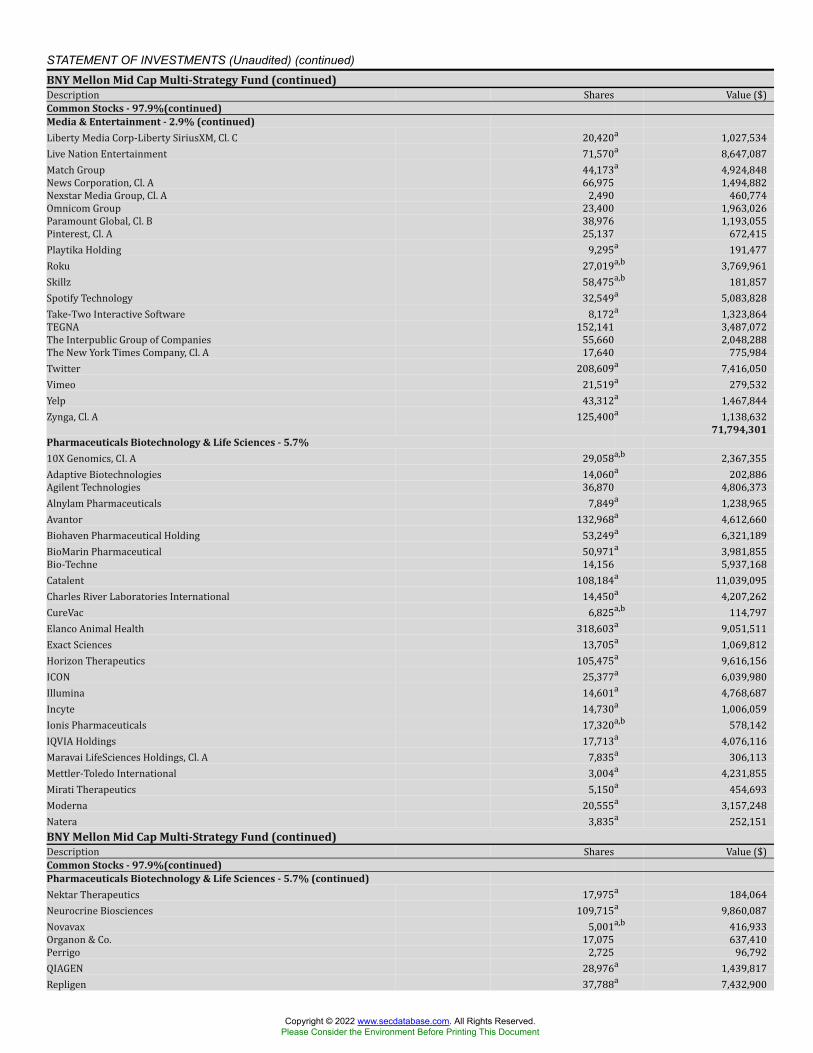
STATEMENT OF INVESTMENTS (Unaudited) (continued)BNY Mellon Mid Cap Multi-Strategy Fund (continued)Description Shares Value ($)Common Stocks - 97.9%(continued)Media & Entertainment - 2.9% (continued)Liberty Media Corp-Liberty SiriusXM, Cl. C 20,420a 1,027,534Live Nation Entertainment 71,570a 8,647,087Match Group 44,173a 4,924,848News Corporation, Cl. A 66,975 1,494,882Nexstar Media Group, Cl. A 2,490 460,774Omnicom Group 23,400 1,963,026Paramount Global, Cl. B 38,976 1,193,055Pinterest, Cl. A 25,137 672,415Playtika Holding 9,295a 191,477Roku 27,019a,b 3,769,961Skillz 58,475a,b 181,857Spotify Technology 32,549a 5,083,828Take-Two Interactive Software 8,172a 1,323,864TEGNA 152,141 3,487,072The Interpublic Group of Companies 55,660 2,048,288The New York Times Company, Cl. A 17,640 775,984Twitter 208,609a 7,416,050Vimeo 21,519a 279,532Yelp 43,312a 1,467,844Zynga, Cl. A 125,400a 1,138,632
71,794,301Pharmaceuticals Biotechnology & Life Sciences - 5.7%10X Genomics, CI. A 29,058a,b 2,367,355Adaptive Biotechnologies 14,060a 202,886Agilent Technologies 36,870 4,806,373Alnylam Pharmaceuticals 7,849a 1,238,965Avantor 132,968a 4,612,660Biohaven Pharmaceutical Holding 53,249a 6,321,189BioMarin Pharmaceutical 50,971a 3,981,855Bio-Techne 14,156 5,937,168Catalent 108,184a 11,039,095Charles River Laboratories International 14,450a 4,207,262CureVac 6,825a,b 114,797Elanco Animal Health 318,603a 9,051,511Exact Sciences 13,705a 1,069,812Horizon Therapeutics 105,475a 9,616,156ICON 25,377a 6,039,980Illumina 14,601a 4,768,687Incyte 14,730a 1,006,059Ionis Pharmaceuticals 17,320a,b 578,142IQVIA Holdings 17,713a 4,076,116Maravai LifeSciences Holdings, Cl. A 7,835a 306,113Mettler-Toledo International 3,004a 4,231,855Mirati Therapeutics 5,150a 454,693Moderna 20,555a 3,157,248Natera 3,835a 252,151BNY Mellon Mid Cap Multi-Strategy Fund (continued)Description Shares Value ($)Common Stocks - 97.9%(continued)Pharmaceuticals Biotechnology & Life Sciences - 5.7% (continued)Nektar Therapeutics 17,975a 184,064Neurocrine Biosciences 109,715a 9,860,087Novavax 5,001a,b 416,933Organon & Co. 17,075 637,410Perrigo 2,725 96,792QIAGEN 28,976a 1,439,817Repligen 37,788a 7,432,900
Copyright © 2022 www.secdatabase.com. All Rights Reserved.Please Consider the Environment Before Printing This Document
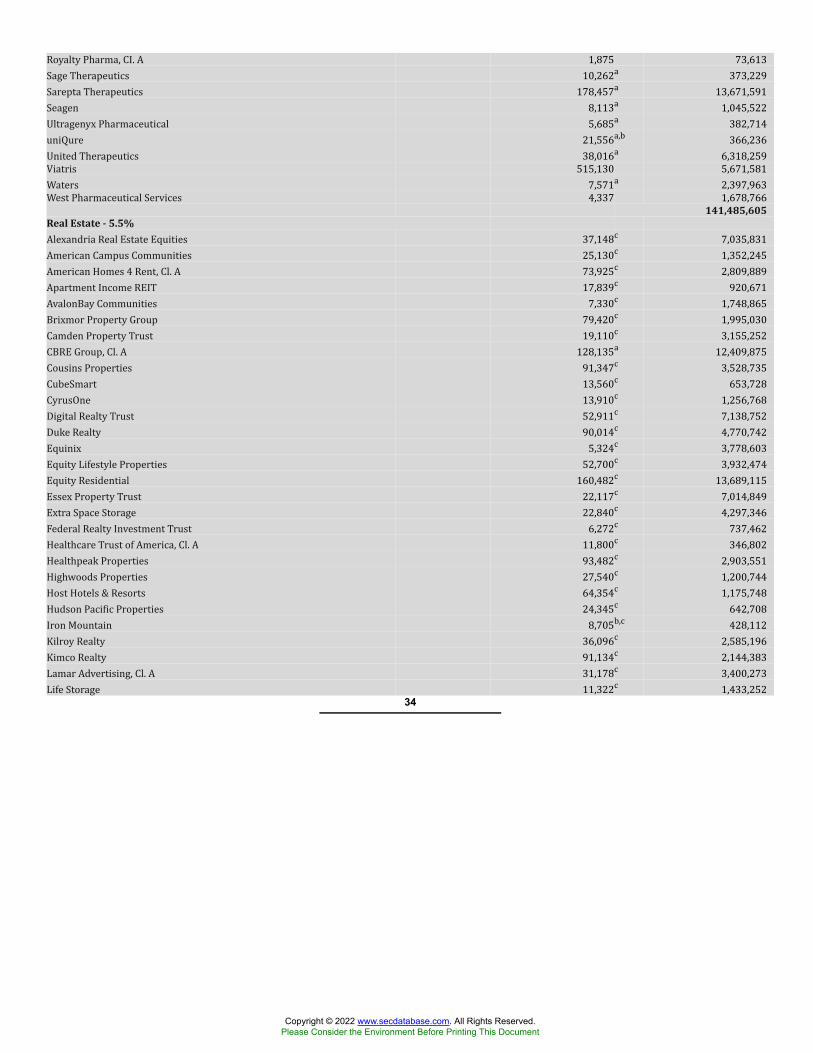
Royalty Pharma, CI. A 1,875 73,613Sage Therapeutics 10,262a 373,229Sarepta Therapeutics 178,457a 13,671,591Seagen 8,113a 1,045,522Ultragenyx Pharmaceutical 5,685a 382,714uniQure 21,556a,b 366,236United Therapeutics 38,016a 6,318,259Viatris 515,130 5,671,581Waters 7,571a 2,397,963West Pharmaceutical Services 4,337 1,678,766141,485,605
Real Estate - 5.5%Alexandria Real Estate Equities 37,148c 7,035,831American Campus Communities 25,130c 1,352,245American Homes 4 Rent, Cl. A 73,925c 2,809,889Apartment Income REIT 17,839c 920,671AvalonBay Communities 7,330c 1,748,865Brixmor Property Group 79,420c 1,995,030Camden Property Trust 19,110c 3,155,252CBRE Group, Cl. A 128,135a 12,409,875Cousins Properties 91,347c 3,528,735CubeSmart 13,560c 653,728CyrusOne 13,910c 1,256,768Digital Realty Trust 52,911c 7,138,752Duke Realty 90,014c 4,770,742Equinix 5,324c 3,778,603Equity Lifestyle Properties 52,700c 3,932,474Equity Residential 160,482c 13,689,115Essex Property Trust 22,117c 7,014,849Extra Space Storage 22,840c 4,297,346Federal Realty Investment Trust 6,272c 737,462Healthcare Trust of America, Cl. A 11,800c 346,802Healthpeak Properties 93,482c 2,903,551Highwoods Properties 27,540c 1,200,744Host Hotels & Resorts 64,354c 1,175,748Hudson Pacific Properties 24,345c 642,708Iron Mountain 8,705b,c 428,112Kilroy Realty 36,096c 2,585,196Kimco Realty 91,134c 2,144,383Lamar Advertising, Cl. A 31,178c 3,400,273Life Storage 11,322c 1,433,25234
Copyright © 2022 www.secdatabase.com. All Rights Reserved.Please Consider the Environment Before Printing This Document
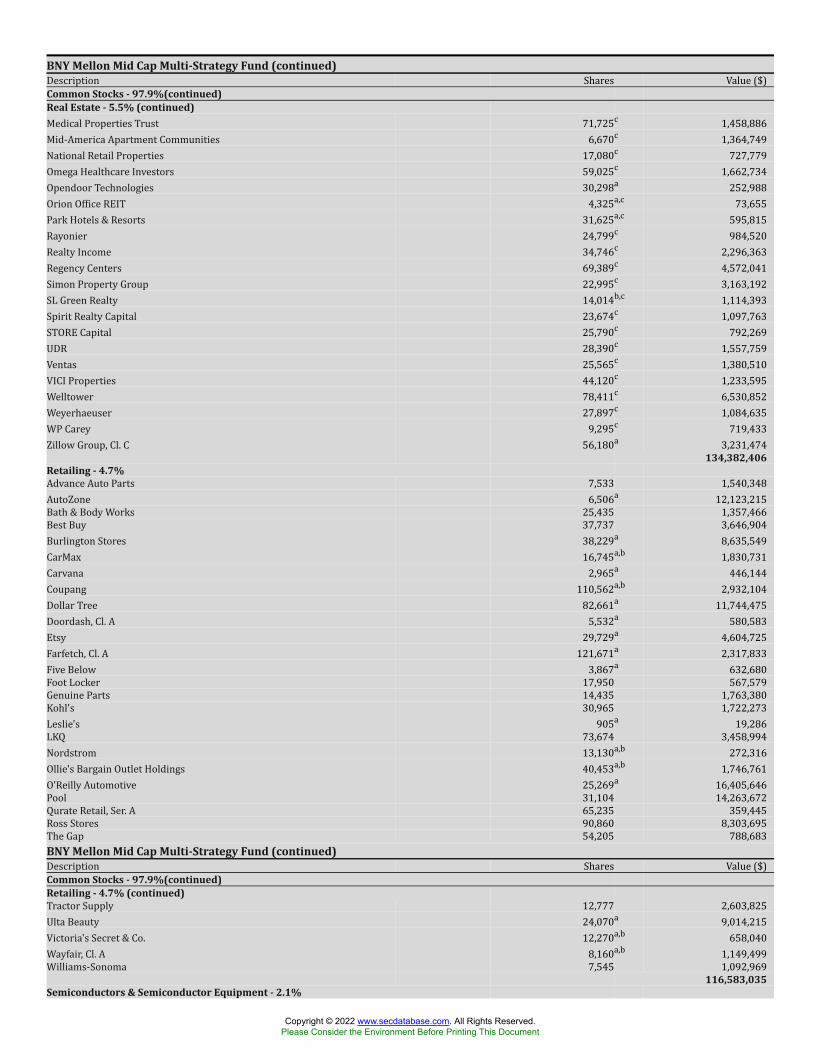
BNY Mellon Mid Cap Multi-Strategy Fund (continued)Description Shares Value ($)Common Stocks - 97.9%(continued)Real Estate - 5.5% (continued)Medical Properties Trust 71,725c 1,458,886Mid-America Apartment Communities 6,670c 1,364,749National Retail Properties 17,080c 727,779Omega Healthcare Investors 59,025c 1,662,734Opendoor Technologies 30,298a 252,988Orion Office REIT 4,325a,c 73,655Park Hotels & Resorts 31,625a,c 595,815Rayonier 24,799c 984,520Realty Income 34,746c 2,296,363Regency Centers 69,389c 4,572,041Simon Property Group 22,995c 3,163,192SL Green Realty 14,014b,c 1,114,393Spirit Realty Capital 23,674c 1,097,763STORE Capital 25,790c 792,269UDR 28,390c 1,557,759Ventas 25,565c 1,380,510VICI Properties 44,120c 1,233,595Welltower 78,411c 6,530,852Weyerhaeuser 27,897c 1,084,635WP Carey 9,295c 719,433Zillow Group, Cl. C 56,180a 3,231,474
134,382,406Retailing - 4.7%Advance Auto Parts 7,533 1,540,348AutoZone 6,506a 12,123,215Bath & Body Works 25,435 1,357,466Best Buy 37,737 3,646,904Burlington Stores 38,229a 8,635,549CarMax 16,745a,b 1,830,731Carvana 2,965a 446,144Coupang 110,562a,b 2,932,104Dollar Tree 82,661a 11,744,475Doordash, Cl. A 5,532a 580,583Etsy 29,729a 4,604,725Farfetch, Cl. A 121,671a 2,317,833Five Below 3,867a 632,680Foot Locker 17,950 567,579Genuine Parts 14,435 1,763,380Kohl's 30,965 1,722,273Leslie's 905a 19,286LKQ 73,674 3,458,994Nordstrom 13,130a,b 272,316Ollie's Bargain Outlet Holdings 40,453a,b 1,746,761O'Reilly Automotive 25,269a 16,405,646Pool 31,104 14,263,672Qurate Retail, Ser. A 65,235 359,445Ross Stores 90,860 8,303,695The Gap 54,205 788,683BNY Mellon Mid Cap Multi-Strategy Fund (continued)Description Shares Value ($)Common Stocks - 97.9%(continued)Retailing - 4.7% (continued)Tractor Supply 12,777 2,603,825Ulta Beauty 24,070a 9,014,215Victoria's Secret & Co. 12,270a,b 658,040Wayfair, Cl. A 8,160a,b 1,149,499Williams-Sonoma 7,545 1,092,969
116,583,035Semiconductors & Semiconductor Equipment - 2.1%
Copyright © 2022 www.secdatabase.com. All Rights Reserved.Please Consider the Environment Before Printing This Document
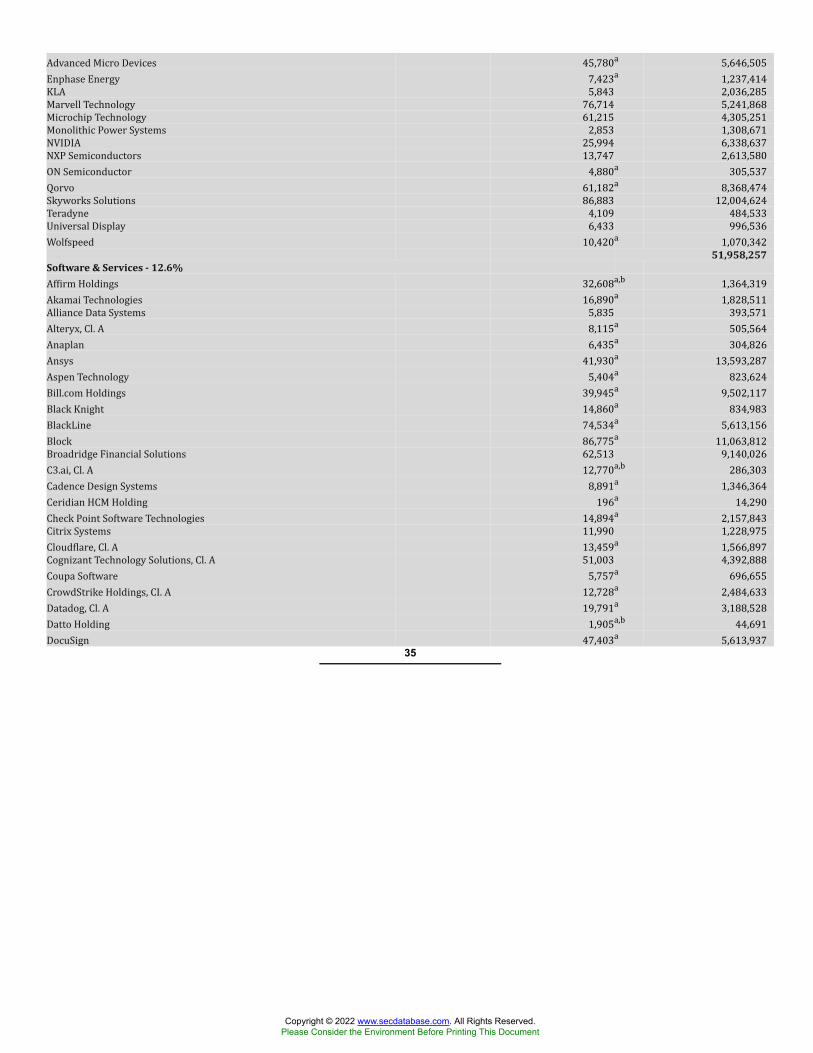
Advanced Micro Devices 45,780a 5,646,505Enphase Energy 7,423a 1,237,414KLA 5,843 2,036,285Marvell Technology 76,714 5,241,868Microchip Technology 61,215 4,305,251Monolithic Power Systems 2,853 1,308,671NVIDIA 25,994 6,338,637NXP Semiconductors 13,747 2,613,580ON Semiconductor 4,880a 305,537Qorvo 61,182a 8,368,474Skyworks Solutions 86,883 12,004,624Teradyne 4,109 484,533Universal Display 6,433 996,536Wolfspeed 10,420a 1,070,34251,958,257
Software & Services - 12.6%Affirm Holdings 32,608a,b 1,364,319Akamai Technologies 16,890a 1,828,511Alliance Data Systems 5,835 393,571Alteryx, Cl. A 8,115a 505,564Anaplan 6,435a 304,826Ansys 41,930a 13,593,287Aspen Technology 5,404a 823,624Bill.com Holdings 39,945a 9,502,117Black Knight 14,860a 834,983BlackLine 74,534a 5,613,156Block 86,775a 11,063,812Broadridge Financial Solutions 62,513 9,140,026C3.ai, Cl. A 12,770a,b 286,303Cadence Design Systems 8,891a 1,346,364Ceridian HCM Holding 196a 14,290Check Point Software Technologies 14,894a 2,157,843Citrix Systems 11,990 1,228,975Cloudflare, Cl. A 13,459a 1,566,897Cognizant Technology Solutions, Cl. A 51,003 4,392,888Coupa Software 5,757a 696,655CrowdStrike Holdings, CI. A 12,728a 2,484,633Datadog, Cl. A 19,791a 3,188,528Datto Holding 1,905a,b 44,691DocuSign 47,403a 5,613,93735
Copyright © 2022 www.secdatabase.com. All Rights Reserved.Please Consider the Environment Before Printing This Document
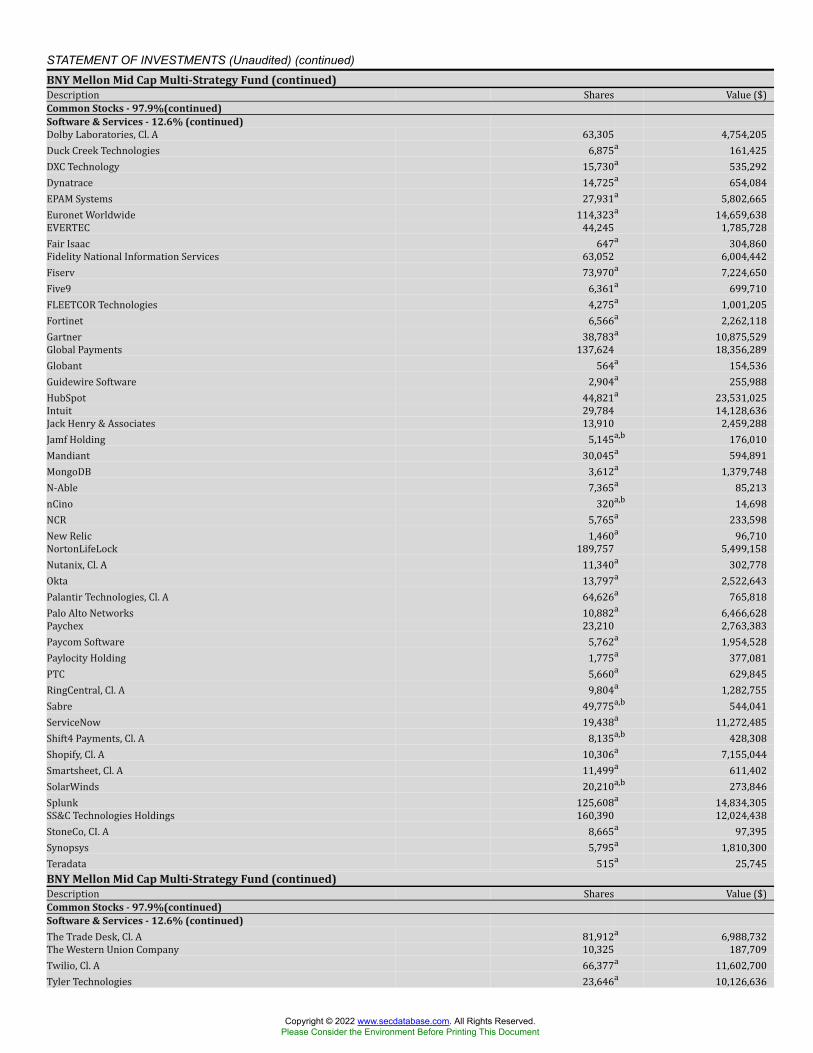
STATEMENT OF INVESTMENTS (Unaudited) (continued)BNY Mellon Mid Cap Multi-Strategy Fund (continued)Description Shares Value ($)Common Stocks - 97.9%(continued)Software & Services - 12.6% (continued)Dolby Laboratories, Cl. A 63,305 4,754,205Duck Creek Technologies 6,875a 161,425DXC Technology 15,730a 535,292Dynatrace 14,725a 654,084EPAM Systems 27,931a 5,802,665Euronet Worldwide 114,323a 14,659,638EVERTEC 44,245 1,785,728Fair Isaac 647a 304,860Fidelity National Information Services 63,052 6,004,442Fiserv 73,970a 7,224,650Five9 6,361a 699,710FLEETCOR Technologies 4,275a 1,001,205Fortinet 6,566a 2,262,118Gartner 38,783a 10,875,529Global Payments 137,624 18,356,289Globant 564a 154,536Guidewire Software 2,904a 255,988HubSpot 44,821a 23,531,025Intuit 29,784 14,128,636Jack Henry & Associates 13,910 2,459,288Jamf Holding 5,145a,b 176,010Mandiant 30,045a 594,891MongoDB 3,612a 1,379,748N-Able 7,365a 85,213nCino 320a,b 14,698NCR 5,765a 233,598New Relic 1,460a 96,710NortonLifeLock 189,757 5,499,158Nutanix, Cl. A 11,340a 302,778Okta 13,797a 2,522,643Palantir Technologies, Cl. A 64,626a 765,818Palo Alto Networks 10,882a 6,466,628Paychex 23,210 2,763,383Paycom Software 5,762a 1,954,528Paylocity Holding 1,775a 377,081PTC 5,660a 629,845RingCentral, Cl. A 9,804a 1,282,755Sabre 49,775a,b 544,041ServiceNow 19,438a 11,272,485Shift4 Payments, Cl. A 8,135a,b 428,308Shopify, Cl. A 10,306a 7,155,044Smartsheet, Cl. A 11,499a 611,402SolarWinds 20,210a,b 273,846Splunk 125,608a 14,834,305SS&C Technologies Holdings 160,390 12,024,438StoneCo, CI. A 8,665a 97,395Synopsys 5,795a 1,810,300Teradata 515a 25,745BNY Mellon Mid Cap Multi-Strategy Fund (continued)Description Shares Value ($)Common Stocks - 97.9%(continued)Software & Services - 12.6% (continued)The Trade Desk, Cl. A 81,912a 6,988,732The Western Union Company 10,325 187,709Twilio, Cl. A 66,377a 11,602,700Tyler Technologies 23,646a 10,126,636
Copyright © 2022 www.secdatabase.com. All Rights Reserved.Please Consider the Environment Before Printing This Document
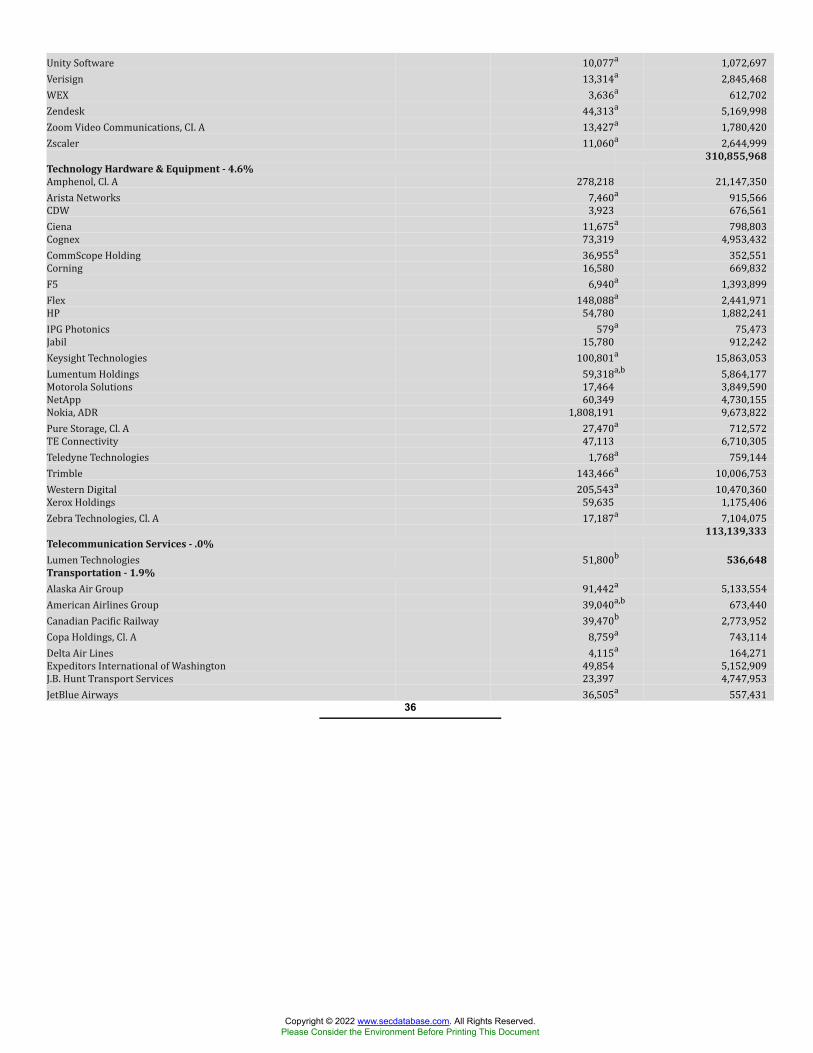
Unity Software 10,077a 1,072,697Verisign 13,314a 2,845,468WEX 3,636a 612,702Zendesk 44,313a 5,169,998Zoom Video Communications, CI. A 13,427a 1,780,420Zscaler 11,060a 2,644,999310,855,968
Technology Hardware & Equipment - 4.6%Amphenol, Cl. A 278,218 21,147,350Arista Networks 7,460a 915,566CDW 3,923 676,561Ciena 11,675a 798,803Cognex 73,319 4,953,432CommScope Holding 36,955a 352,551Corning 16,580 669,832F5 6,940a 1,393,899Flex 148,088a 2,441,971HP 54,780 1,882,241IPG Photonics 579a 75,473Jabil 15,780 912,242Keysight Technologies 100,801a 15,863,053Lumentum Holdings 59,318a,b 5,864,177Motorola Solutions 17,464 3,849,590NetApp 60,349 4,730,155Nokia, ADR 1,808,191 9,673,822Pure Storage, Cl. A 27,470a 712,572TE Connectivity 47,113 6,710,305Teledyne Technologies 1,768a 759,144Trimble 143,466a 10,006,753Western Digital 205,543a 10,470,360Xerox Holdings 59,635 1,175,406Zebra Technologies, Cl. A 17,187a 7,104,075113,139,333
Telecommunication Services - .0%Lumen Technologies 51,800b 536,648Transportation - 1.9%Alaska Air Group 91,442a 5,133,554American Airlines Group 39,040a,b 673,440Canadian Pacific Railway 39,470b 2,773,952Copa Holdings, Cl. A 8,759a 743,114Delta Air Lines 4,115a 164,271Expeditors International of Washington 49,854 5,152,909J.B. Hunt Transport Services 23,397 4,747,953JetBlue Airways 36,505a 557,431
36
Copyright © 2022 www.secdatabase.com. All Rights Reserved.Please Consider the Environment Before Printing This Document
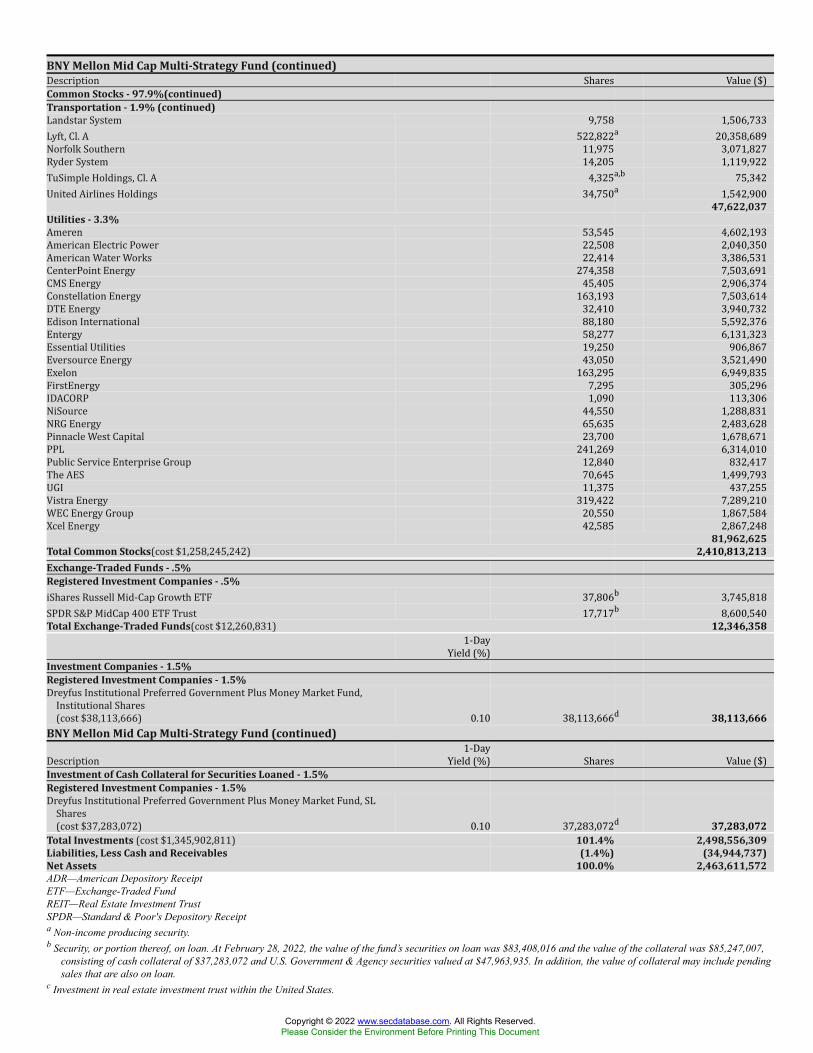
BNY Mellon Mid Cap Multi-Strategy Fund (continued)Description Shares Value ($)Common Stocks - 97.9%(continued)Transportation - 1.9% (continued)Landstar System 9,758 1,506,733Lyft, Cl. A 522,822a 20,358,689Norfolk Southern 11,975 3,071,827Ryder System 14,205 1,119,922TuSimple Holdings, Cl. A 4,325a,b 75,342United Airlines Holdings 34,750a 1,542,900
47,622,037Utilities - 3.3%Ameren 53,545 4,602,193American Electric Power 22,508 2,040,350American Water Works 22,414 3,386,531CenterPoint Energy 274,358 7,503,691CMS Energy 45,405 2,906,374Constellation Energy 163,193 7,503,614DTE Energy 32,410 3,940,732Edison International 88,180 5,592,376Entergy 58,277 6,131,323Essential Utilities 19,250 906,867Eversource Energy 43,050 3,521,490Exelon 163,295 6,949,835FirstEnergy 7,295 305,296IDACORP 1,090 113,306NiSource 44,550 1,288,831NRG Energy 65,635 2,483,628Pinnacle West Capital 23,700 1,678,671PPL 241,269 6,314,010Public Service Enterprise Group 12,840 832,417The AES 70,645 1,499,793UGI 11,375 437,255Vistra Energy 319,422 7,289,210WEC Energy Group 20,550 1,867,584Xcel Energy 42,585 2,867,248
81,962,625Total Common Stocks(cost $1,258,245,242) 2,410,813,213Exchange-Traded Funds - .5%Registered Investment Companies - .5%iShares Russell Mid-Cap Growth ETF 37,806b 3,745,818SPDR S&P MidCap 400 ETF Trust 17,717b 8,600,540Total Exchange-Traded Funds(cost $12,260,831) 12,346,3581-DayYield (%)Investment Companies - 1.5%Registered Investment Companies - 1.5%Dreyfus Institutional Preferred Government Plus Money Market Fund,Institutional Shares(cost $38,113,666) 0.10 38,113,666d 38,113,666BNY Mellon Mid Cap Multi-Strategy Fund (continued)Description 1-DayYield (%) Shares Value ($)Investment of Cash Collateral for Securities Loaned - 1.5%Registered Investment Companies - 1.5%Dreyfus Institutional Preferred Government Plus Money Market Fund, SLShares(cost $37,283,072) 0.10 37,283,072d 37,283,072Total Investments (cost $1,345,902,811) 101.4% 2,498,556,309Liabilities, Less Cash and Receivables (1.4%) (34,944,737)Net Assets 100.0% 2,463,611,572ADR—American Depository ReceiptETF—Exchange-Traded FundREIT—Real Estate Investment TrustSPDR—Standard & Poor's Depository Receipta Non-income producing security.b Security, or portion thereof, on loan. At February 28, 2022, the value of the fund’s securities on loan was $83,408,016 and the value of the collateral was $85,247,007,
consisting of cash collateral of $37,283,072 and U.S. Government & Agency securities valued at $47,963,935. In addition, the value of collateral may include pendingsales that are also on loan.
c Investment in real estate investment trust within the United States.
Copyright © 2022 www.secdatabase.com. All Rights Reserved.Please Consider the Environment Before Printing This Document
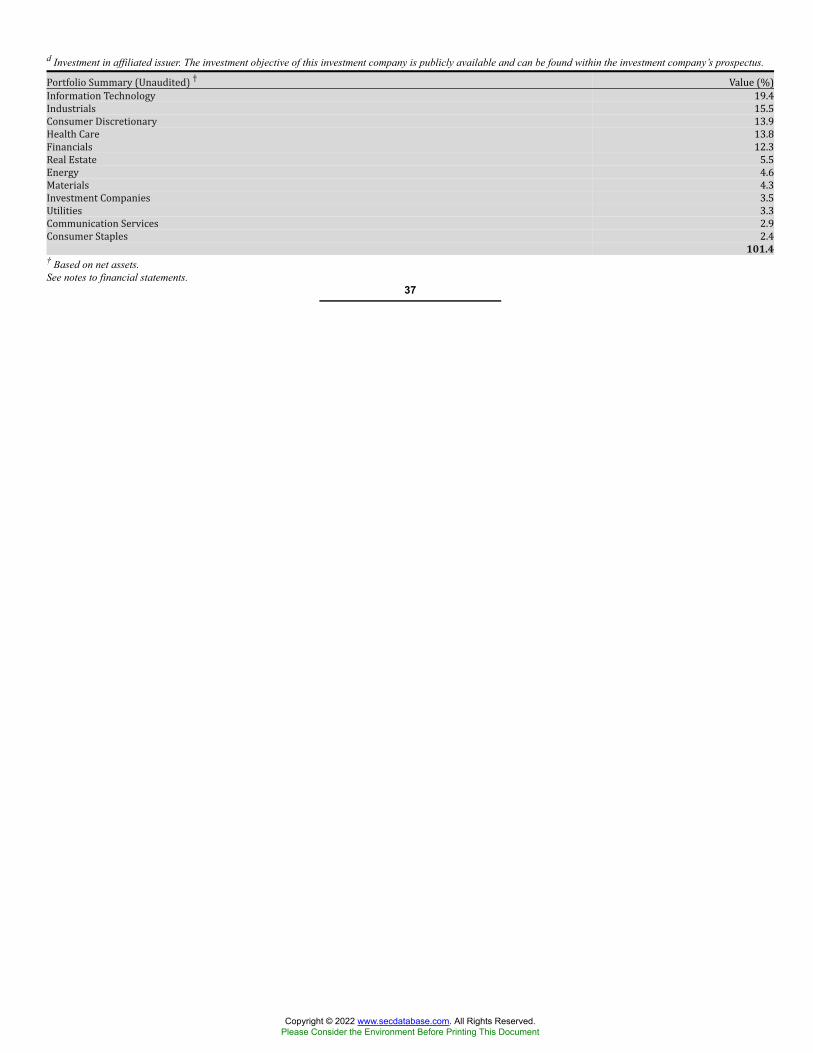
d Investment in affiliated issuer. The investment objective of this investment company is publicly available and can be found within the investment company’s prospectus.Portfolio Summary (Unaudited) † Value (%)Information Technology 19.4Industrials 15.5Consumer Discretionary 13.9Health Care 13.8Financials 12.3Real Estate 5.5Energy 4.6Materials 4.3Investment Companies 3.5Utilities 3.3Communication Services 2.9Consumer Staples 2.4101.4
† Based on net assets.See notes to financial statements.
37
Copyright © 2022 www.secdatabase.com. All Rights Reserved.Please Consider the Environment Before Printing This Document
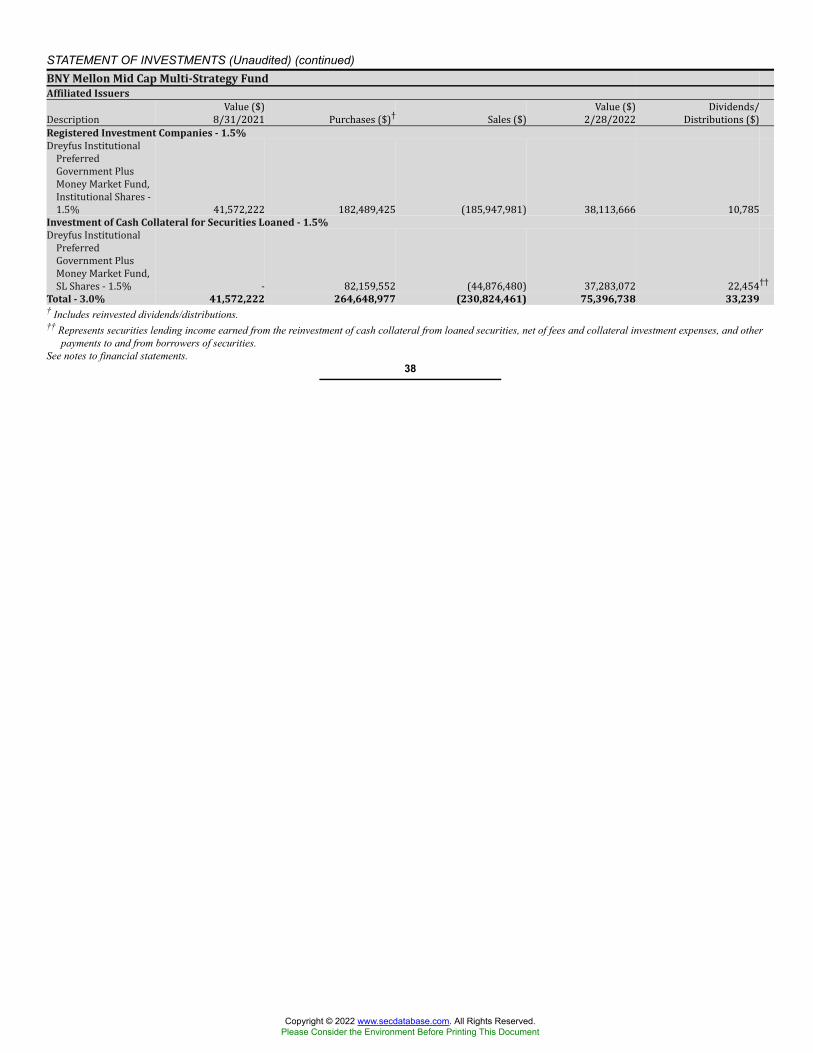
STATEMENT OF INVESTMENTS (Unaudited) (continued)BNY Mellon Mid Cap Multi-Strategy FundAffiliated IssuersDescription Value ($)8/31/2021 Purchases ($)† Sales ($) Value ($)2/28/2022 Dividends/Distributions ($)Registered Investment Companies - 1.5%Dreyfus InstitutionalPreferredGovernment PlusMoney Market Fund,Institutional Shares -1.5% 41,572,222 182,489,425 (185,947,981) 38,113,666 10,785Investment of Cash Collateral for Securities Loaned - 1.5%Dreyfus InstitutionalPreferredGovernment PlusMoney Market Fund,SL Shares - 1.5% - 82,159,552 (44,876,480) 37,283,072 22,454††Total - 3.0% 41,572,222 264,648,977 (230,824,461) 75,396,738 33,239† Includes reinvested dividends/distributions.†† Represents securities lending income earned from the reinvestment of cash collateral from loaned securities, net of fees and collateral investment expenses, and other
payments to and from borrowers of securities.See notes to financial statements.
38
Copyright © 2022 www.secdatabase.com. All Rights Reserved.Please Consider the Environment Before Printing This Document
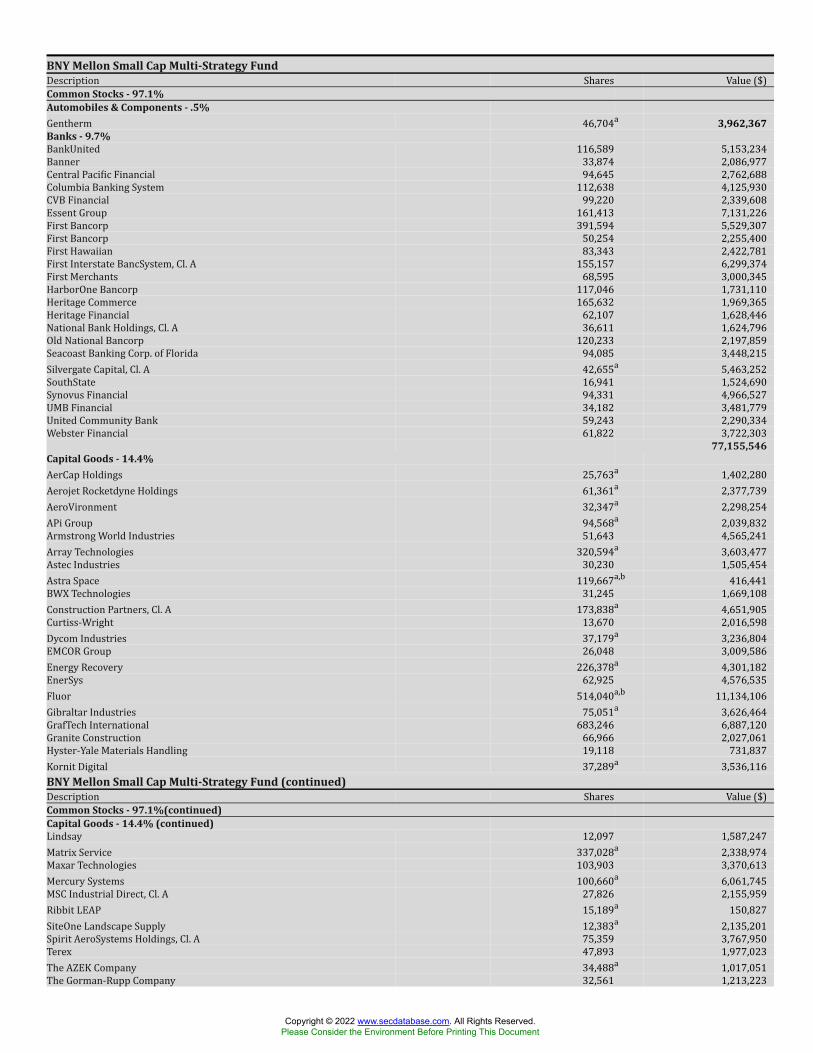
BNY Mellon Small Cap Multi-Strategy FundDescription Shares Value ($)Common Stocks - 97.1%Automobiles & Components - .5%Gentherm 46,704a 3,962,367Banks - 9.7%BankUnited 116,589 5,153,234Banner 33,874 2,086,977Central Pacific Financial 94,645 2,762,688Columbia Banking System 112,638 4,125,930CVB Financial 99,220 2,339,608Essent Group 161,413 7,131,226First Bancorp 391,594 5,529,307First Bancorp 50,254 2,255,400First Hawaiian 83,343 2,422,781First Interstate BancSystem, Cl. A 155,157 6,299,374First Merchants 68,595 3,000,345HarborOne Bancorp 117,046 1,731,110Heritage Commerce 165,632 1,969,365Heritage Financial 62,107 1,628,446National Bank Holdings, Cl. A 36,611 1,624,796Old National Bancorp 120,233 2,197,859Seacoast Banking Corp. of Florida 94,085 3,448,215Silvergate Capital, Cl. A 42,655a 5,463,252SouthState 16,941 1,524,690Synovus Financial 94,331 4,966,527UMB Financial 34,182 3,481,779United Community Bank 59,243 2,290,334Webster Financial 61,822 3,722,303
77,155,546Capital Goods - 14.4%AerCap Holdings 25,763a 1,402,280Aerojet Rocketdyne Holdings 61,361a 2,377,739AeroVironment 32,347a 2,298,254APi Group 94,568a 2,039,832Armstrong World Industries 51,643 4,565,241Array Technologies 320,594a 3,603,477Astec Industries 30,230 1,505,454Astra Space 119,667a,b 416,441BWX Technologies 31,245 1,669,108Construction Partners, Cl. A 173,838a 4,651,905Curtiss-Wright 13,670 2,016,598Dycom Industries 37,179a 3,236,804EMCOR Group 26,048 3,009,586Energy Recovery 226,378a 4,301,182EnerSys 62,925 4,576,535Fluor 514,040a,b 11,134,106Gibraltar Industries 75,051a 3,626,464GrafTech International 683,246 6,887,120Granite Construction 66,966 2,027,061Hyster-Yale Materials Handling 19,118 731,837Kornit Digital 37,289a 3,536,116BNY Mellon Small Cap Multi-Strategy Fund (continued)Description Shares Value ($)Common Stocks - 97.1%(continued)Capital Goods - 14.4% (continued)Lindsay 12,097 1,587,247Matrix Service 337,028a 2,338,974Maxar Technologies 103,903 3,370,613Mercury Systems 100,660a 6,061,745MSC Industrial Direct, Cl. A 27,826 2,155,959Ribbit LEAP 15,189a 150,827SiteOne Landscape Supply 12,383a 2,135,201Spirit AeroSystems Holdings, Cl. A 75,359 3,767,950Terex 47,893 1,977,023The AZEK Company 34,488a 1,017,051The Gorman-Rupp Company 32,561 1,213,223
Copyright © 2022 www.secdatabase.com. All Rights Reserved.Please Consider the Environment Before Printing This Document
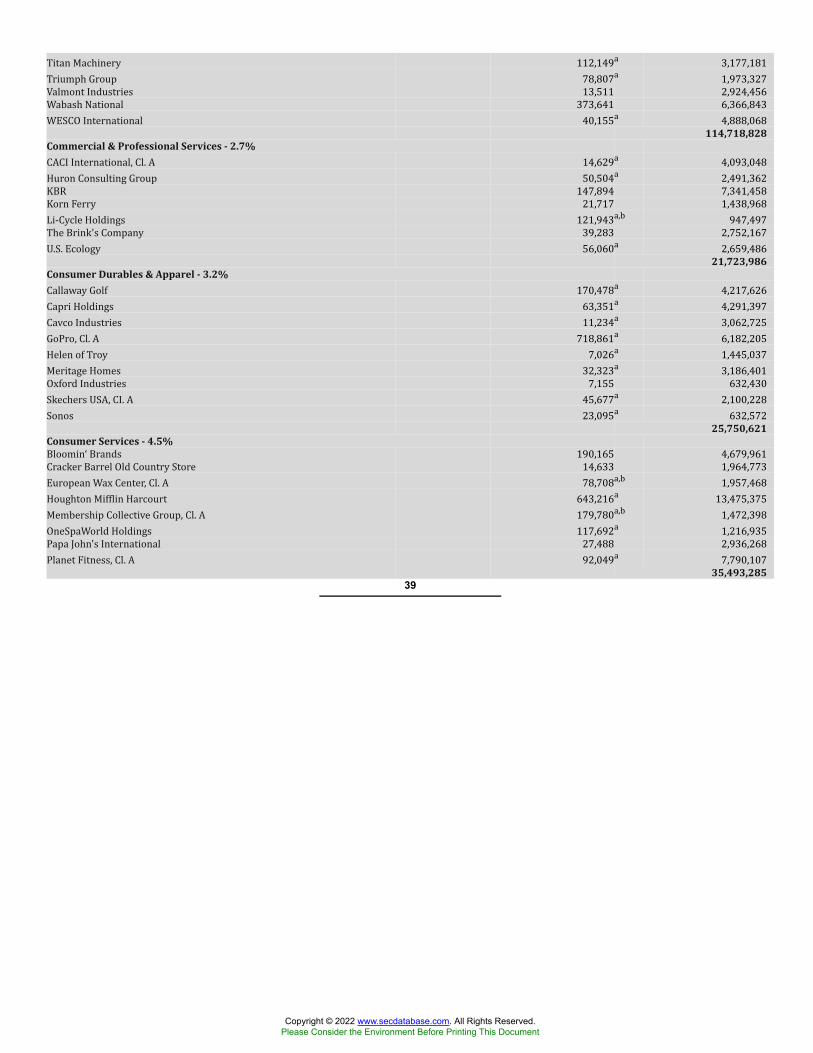
Titan Machinery 112,149a 3,177,181Triumph Group 78,807a 1,973,327Valmont Industries 13,511 2,924,456Wabash National 373,641 6,366,843WESCO International 40,155a 4,888,068114,718,828
Commercial & Professional Services - 2.7%CACI International, Cl. A 14,629a 4,093,048Huron Consulting Group 50,504a 2,491,362KBR 147,894 7,341,458Korn Ferry 21,717 1,438,968Li-Cycle Holdings 121,943a,b 947,497The Brink's Company 39,283 2,752,167U.S. Ecology 56,060a 2,659,48621,723,986
Consumer Durables & Apparel - 3.2%Callaway Golf 170,478a 4,217,626Capri Holdings 63,351a 4,291,397Cavco Industries 11,234a 3,062,725GoPro, Cl. A 718,861a 6,182,205Helen of Troy 7,026a 1,445,037Meritage Homes 32,323a 3,186,401Oxford Industries 7,155 632,430Skechers USA, CI. A 45,677a 2,100,228Sonos 23,095a 632,57225,750,621
Consumer Services - 4.5%Bloomin‘ Brands 190,165 4,679,961Cracker Barrel Old Country Store 14,633 1,964,773European Wax Center, Cl. A 78,708a,b 1,957,468Houghton Mifflin Harcourt 643,216a 13,475,375Membership Collective Group, Cl. A 179,780a,b 1,472,398OneSpaWorld Holdings 117,692a 1,216,935Papa John's International 27,488 2,936,268Planet Fitness, Cl. A 92,049a 7,790,10735,493,285
39
Copyright © 2022 www.secdatabase.com. All Rights Reserved.Please Consider the Environment Before Printing This Document
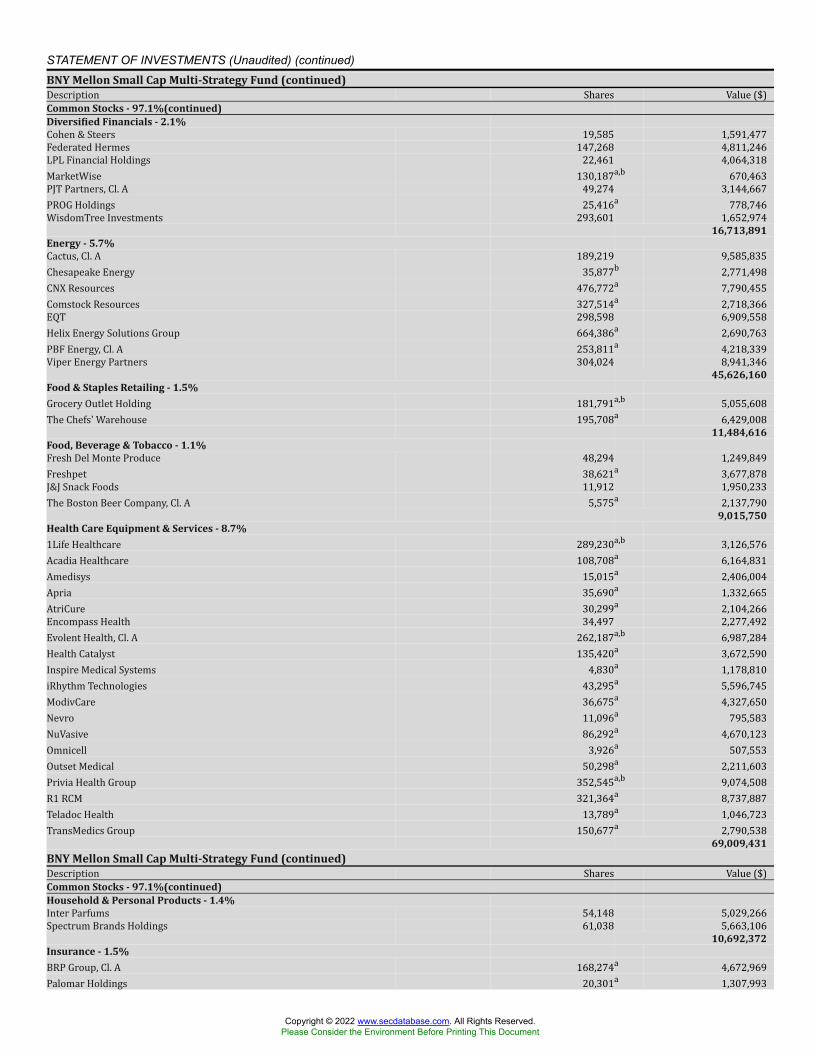
STATEMENT OF INVESTMENTS (Unaudited) (continued)BNY Mellon Small Cap Multi-Strategy Fund (continued)Description Shares Value ($)Common Stocks - 97.1%(continued)Diversified Financials - 2.1%Cohen & Steers 19,585 1,591,477Federated Hermes 147,268 4,811,246LPL Financial Holdings 22,461 4,064,318MarketWise 130,187a,b 670,463PJT Partners, Cl. A 49,274 3,144,667PROG Holdings 25,416a 778,746WisdomTree Investments 293,601 1,652,974
16,713,891Energy - 5.7%Cactus, Cl. A 189,219 9,585,835Chesapeake Energy 35,877b 2,771,498CNX Resources 476,772a 7,790,455Comstock Resources 327,514a 2,718,366EQT 298,598 6,909,558Helix Energy Solutions Group 664,386a 2,690,763PBF Energy, Cl. A 253,811a 4,218,339Viper Energy Partners 304,024 8,941,346
45,626,160Food & Staples Retailing - 1.5%Grocery Outlet Holding 181,791a,b 5,055,608The Chefs' Warehouse 195,708a 6,429,008
11,484,616Food, Beverage & Tobacco - 1.1%Fresh Del Monte Produce 48,294 1,249,849Freshpet 38,621a 3,677,878J&J Snack Foods 11,912 1,950,233The Boston Beer Company, Cl. A 5,575a 2,137,790
9,015,750Health Care Equipment & Services - 8.7%1Life Healthcare 289,230a,b 3,126,576Acadia Healthcare 108,708a 6,164,831Amedisys 15,015a 2,406,004Apria 35,690a 1,332,665AtriCure 30,299a 2,104,266Encompass Health 34,497 2,277,492Evolent Health, Cl. A 262,187a,b 6,987,284Health Catalyst 135,420a 3,672,590Inspire Medical Systems 4,830a 1,178,810iRhythm Technologies 43,295a 5,596,745ModivCare 36,675a 4,327,650Nevro 11,096a 795,583NuVasive 86,292a 4,670,123Omnicell 3,926a 507,553Outset Medical 50,298a 2,211,603Privia Health Group 352,545a,b 9,074,508R1 RCM 321,364a 8,737,887Teladoc Health 13,789a 1,046,723TransMedics Group 150,677a 2,790,538
69,009,431BNY Mellon Small Cap Multi-Strategy Fund (continued)Description Shares Value ($)Common Stocks - 97.1%(continued)Household & Personal Products - 1.4%Inter Parfums 54,148 5,029,266Spectrum Brands Holdings 61,038 5,663,106
10,692,372Insurance - 1.5%BRP Group, Cl. A 168,274a 4,672,969Palomar Holdings 20,301a 1,307,993
Copyright © 2022 www.secdatabase.com. All Rights Reserved.Please Consider the Environment Before Printing This Document
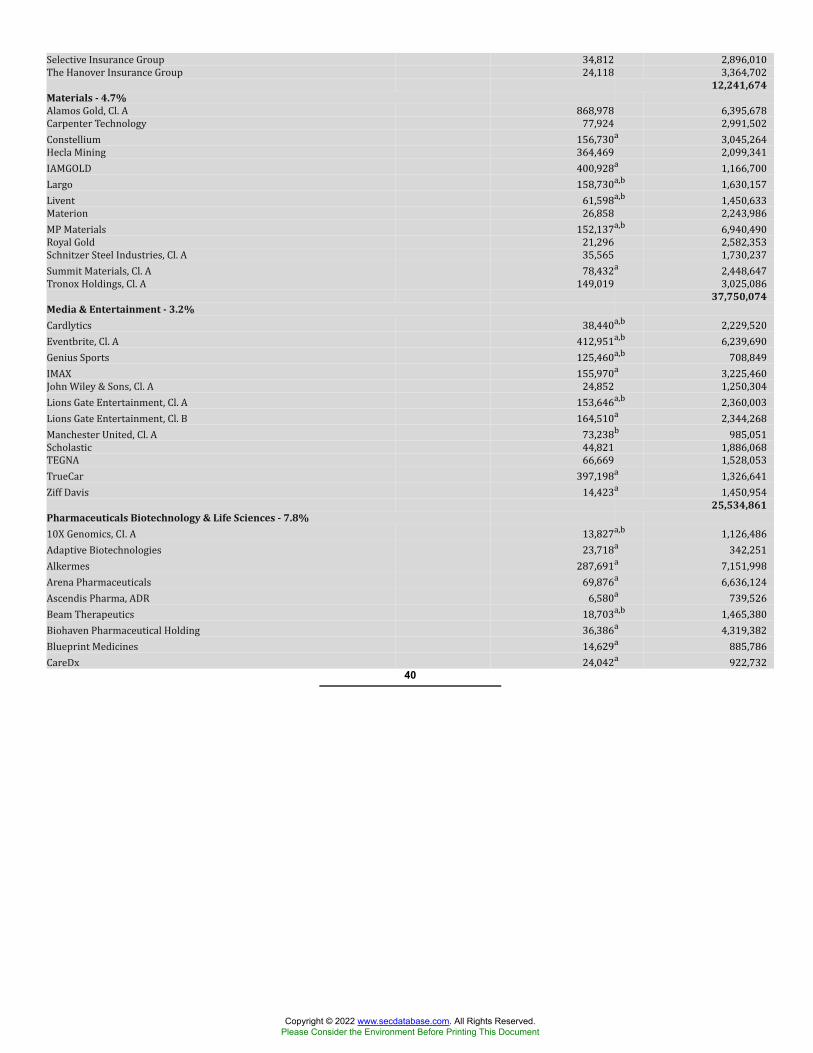
Selective Insurance Group 34,812 2,896,010The Hanover Insurance Group 24,118 3,364,70212,241,674
Materials - 4.7%Alamos Gold, Cl. A 868,978 6,395,678Carpenter Technology 77,924 2,991,502Constellium 156,730a 3,045,264Hecla Mining 364,469 2,099,341IAMGOLD 400,928a 1,166,700Largo 158,730a,b 1,630,157Livent 61,598a,b 1,450,633Materion 26,858 2,243,986MP Materials 152,137a,b 6,940,490Royal Gold 21,296 2,582,353Schnitzer Steel Industries, Cl. A 35,565 1,730,237Summit Materials, Cl. A 78,432a 2,448,647Tronox Holdings, Cl. A 149,019 3,025,08637,750,074
Media & Entertainment - 3.2%Cardlytics 38,440a,b 2,229,520Eventbrite, Cl. A 412,951a,b 6,239,690Genius Sports 125,460a,b 708,849IMAX 155,970a 3,225,460John Wiley & Sons, Cl. A 24,852 1,250,304Lions Gate Entertainment, Cl. A 153,646a,b 2,360,003Lions Gate Entertainment, Cl. B 164,510a 2,344,268Manchester United, Cl. A 73,238b 985,051Scholastic 44,821 1,886,068TEGNA 66,669 1,528,053TrueCar 397,198a 1,326,641Ziff Davis 14,423a 1,450,95425,534,861
Pharmaceuticals Biotechnology & Life Sciences - 7.8%10X Genomics, CI. A 13,827a,b 1,126,486Adaptive Biotechnologies 23,718a 342,251Alkermes 287,691a 7,151,998Arena Pharmaceuticals 69,876a 6,636,124Ascendis Pharma, ADR 6,580a 739,526Beam Therapeutics 18,703a,b 1,465,380Biohaven Pharmaceutical Holding 36,386a 4,319,382Blueprint Medicines 14,629a 885,786CareDx 24,042a 922,73240
Copyright © 2022 www.secdatabase.com. All Rights Reserved.Please Consider the Environment Before Printing This Document
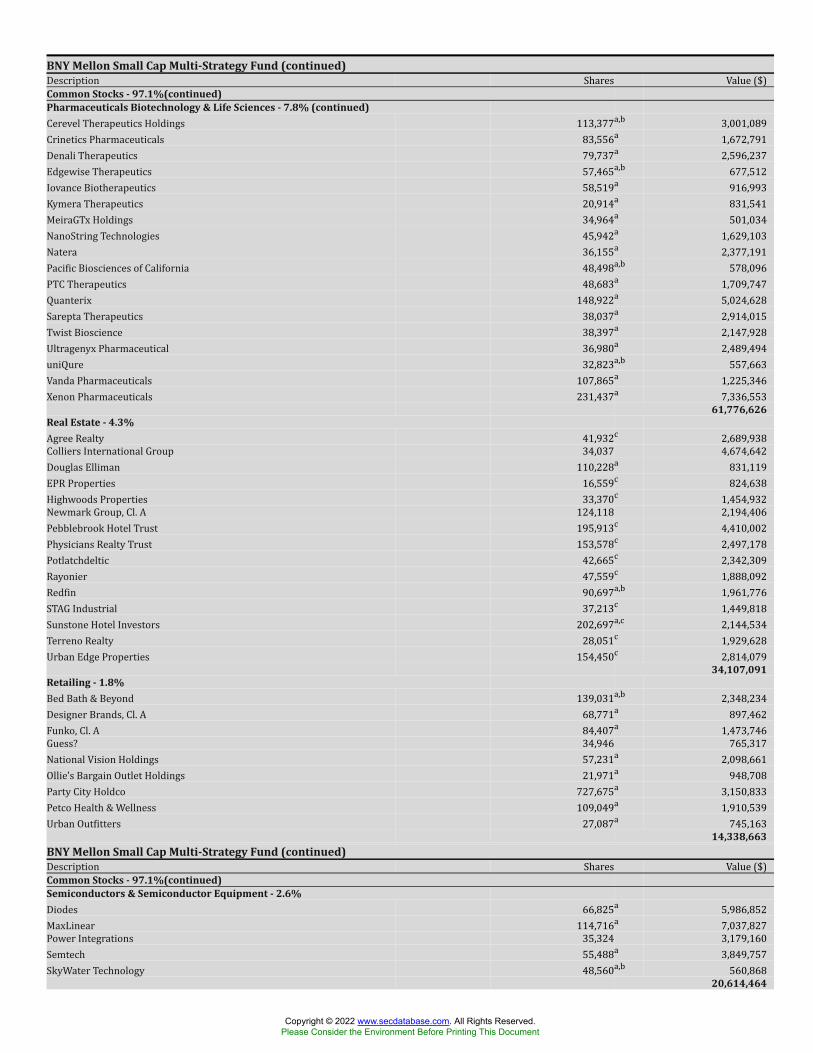
BNY Mellon Small Cap Multi-Strategy Fund (continued)Description Shares Value ($)Common Stocks - 97.1%(continued)Pharmaceuticals Biotechnology & Life Sciences - 7.8% (continued)Cerevel Therapeutics Holdings 113,377a,b 3,001,089Crinetics Pharmaceuticals 83,556a 1,672,791Denali Therapeutics 79,737a 2,596,237Edgewise Therapeutics 57,465a,b 677,512Iovance Biotherapeutics 58,519a 916,993Kymera Therapeutics 20,914a 831,541MeiraGTx Holdings 34,964a 501,034NanoString Technologies 45,942a 1,629,103Natera 36,155a 2,377,191Pacific Biosciences of California 48,498a,b 578,096PTC Therapeutics 48,683a 1,709,747Quanterix 148,922a 5,024,628Sarepta Therapeutics 38,037a 2,914,015Twist Bioscience 38,397a 2,147,928Ultragenyx Pharmaceutical 36,980a 2,489,494uniQure 32,823a,b 557,663Vanda Pharmaceuticals 107,865a 1,225,346Xenon Pharmaceuticals 231,437a 7,336,553
61,776,626Real Estate - 4.3%Agree Realty 41,932c 2,689,938Colliers International Group 34,037 4,674,642Douglas Elliman 110,228a 831,119EPR Properties 16,559c 824,638Highwoods Properties 33,370c 1,454,932Newmark Group, Cl. A 124,118 2,194,406Pebblebrook Hotel Trust 195,913c 4,410,002Physicians Realty Trust 153,578c 2,497,178Potlatchdeltic 42,665c 2,342,309Rayonier 47,559c 1,888,092Redfin 90,697a,b 1,961,776STAG Industrial 37,213c 1,449,818Sunstone Hotel Investors 202,697a,c 2,144,534Terreno Realty 28,051c 1,929,628Urban Edge Properties 154,450c 2,814,079
34,107,091Retailing - 1.8%Bed Bath & Beyond 139,031a,b 2,348,234Designer Brands, Cl. A 68,771a 897,462Funko, Cl. A 84,407a 1,473,746Guess? 34,946 765,317National Vision Holdings 57,231a 2,098,661Ollie's Bargain Outlet Holdings 21,971a 948,708Party City Holdco 727,675a 3,150,833Petco Health & Wellness 109,049a 1,910,539Urban Outfitters 27,087a 745,163
14,338,663BNY Mellon Small Cap Multi-Strategy Fund (continued)Description Shares Value ($)Common Stocks - 97.1%(continued)Semiconductors & Semiconductor Equipment - 2.6%Diodes 66,825a 5,986,852MaxLinear 114,716a 7,037,827Power Integrations 35,324 3,179,160Semtech 55,488a 3,849,757SkyWater Technology 48,560a,b 560,868
20,614,464
Copyright © 2022 www.secdatabase.com. All Rights Reserved.Please Consider the Environment Before Printing This Document
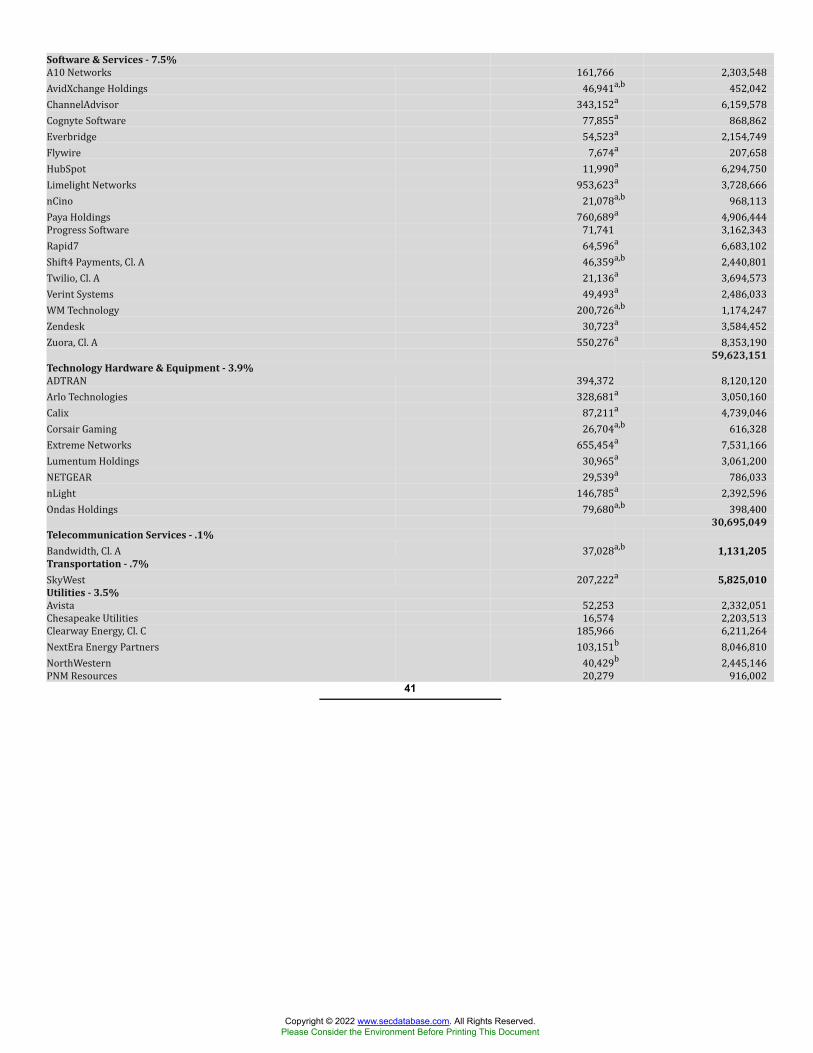
Software & Services - 7.5%A10 Networks 161,766 2,303,548AvidXchange Holdings 46,941a,b 452,042ChannelAdvisor 343,152a 6,159,578Cognyte Software 77,855a 868,862Everbridge 54,523a 2,154,749Flywire 7,674a 207,658HubSpot 11,990a 6,294,750Limelight Networks 953,623a 3,728,666nCino 21,078a,b 968,113Paya Holdings 760,689a 4,906,444Progress Software 71,741 3,162,343Rapid7 64,596a 6,683,102Shift4 Payments, Cl. A 46,359a,b 2,440,801Twilio, Cl. A 21,136a 3,694,573Verint Systems 49,493a 2,486,033WM Technology 200,726a,b 1,174,247Zendesk 30,723a 3,584,452Zuora, Cl. A 550,276a 8,353,19059,623,151
Technology Hardware & Equipment - 3.9%ADTRAN 394,372 8,120,120Arlo Technologies 328,681a 3,050,160Calix 87,211a 4,739,046Corsair Gaming 26,704a,b 616,328Extreme Networks 655,454a 7,531,166Lumentum Holdings 30,965a 3,061,200NETGEAR 29,539a 786,033nLight 146,785a 2,392,596Ondas Holdings 79,680a,b 398,40030,695,049
Telecommunication Services - .1%Bandwidth, Cl. A 37,028a,b 1,131,205Transportation - .7%SkyWest 207,222a 5,825,010Utilities - 3.5%Avista 52,253 2,332,051Chesapeake Utilities 16,574 2,203,513Clearway Energy, Cl. C 185,966 6,211,264NextEra Energy Partners 103,151b 8,046,810NorthWestern 40,429b 2,445,146PNM Resources 20,279 916,002
41
Copyright © 2022 www.secdatabase.com. All Rights Reserved.Please Consider the Environment Before Printing This Document
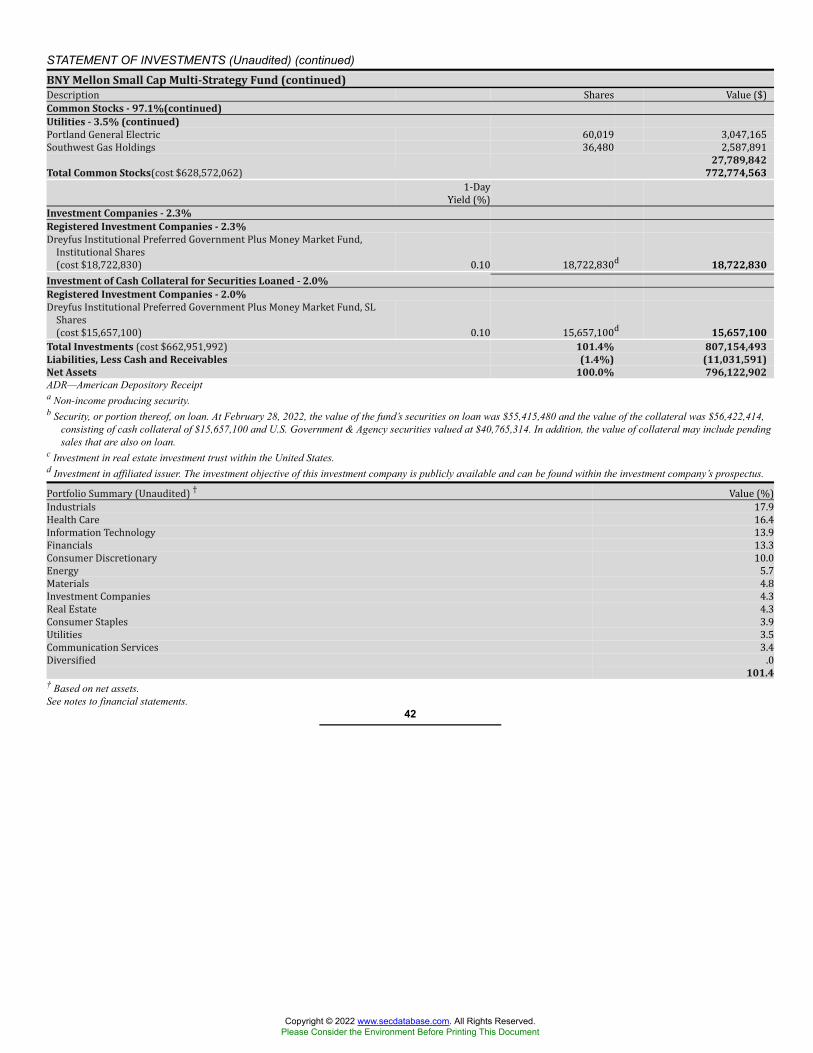
STATEMENT OF INVESTMENTS (Unaudited) (continued)BNY Mellon Small Cap Multi-Strategy Fund (continued)Description Shares Value ($)Common Stocks - 97.1%(continued)Utilities - 3.5% (continued)Portland General Electric 60,019 3,047,165Southwest Gas Holdings 36,480 2,587,891
27,789,842Total Common Stocks(cost $628,572,062) 772,774,5631-DayYield (%)Investment Companies - 2.3%Registered Investment Companies - 2.3%Dreyfus Institutional Preferred Government Plus Money Market Fund,Institutional Shares(cost $18,722,830) 0.10 18,722,830d 18,722,830Investment of Cash Collateral for Securities Loaned - 2.0%Registered Investment Companies - 2.0%Dreyfus Institutional Preferred Government Plus Money Market Fund, SLShares(cost $15,657,100) 0.10 15,657,100d 15,657,100Total Investments (cost $662,951,992) 101.4% 807,154,493Liabilities, Less Cash and Receivables (1.4%) (11,031,591)Net Assets 100.0% 796,122,902ADR—American Depository Receipta Non-income producing security.b Security, or portion thereof, on loan. At February 28, 2022, the value of the fund’s securities on loan was $55,415,480 and the value of the collateral was $56,422,414,
consisting of cash collateral of $15,657,100 and U.S. Government & Agency securities valued at $40,765,314. In addition, the value of collateral may include pendingsales that are also on loan.
c Investment in real estate investment trust within the United States.d Investment in affiliated issuer. The investment objective of this investment company is publicly available and can be found within the investment company’s prospectus.Portfolio Summary (Unaudited) † Value (%)Industrials 17.9Health Care 16.4Information Technology 13.9Financials 13.3Consumer Discretionary 10.0Energy 5.7Materials 4.8Investment Companies 4.3Real Estate 4.3Consumer Staples 3.9Utilities 3.5Communication Services 3.4Diversified .0
101.4† Based on net assets.See notes to financial statements.
42
Copyright © 2022 www.secdatabase.com. All Rights Reserved.Please Consider the Environment Before Printing This Document
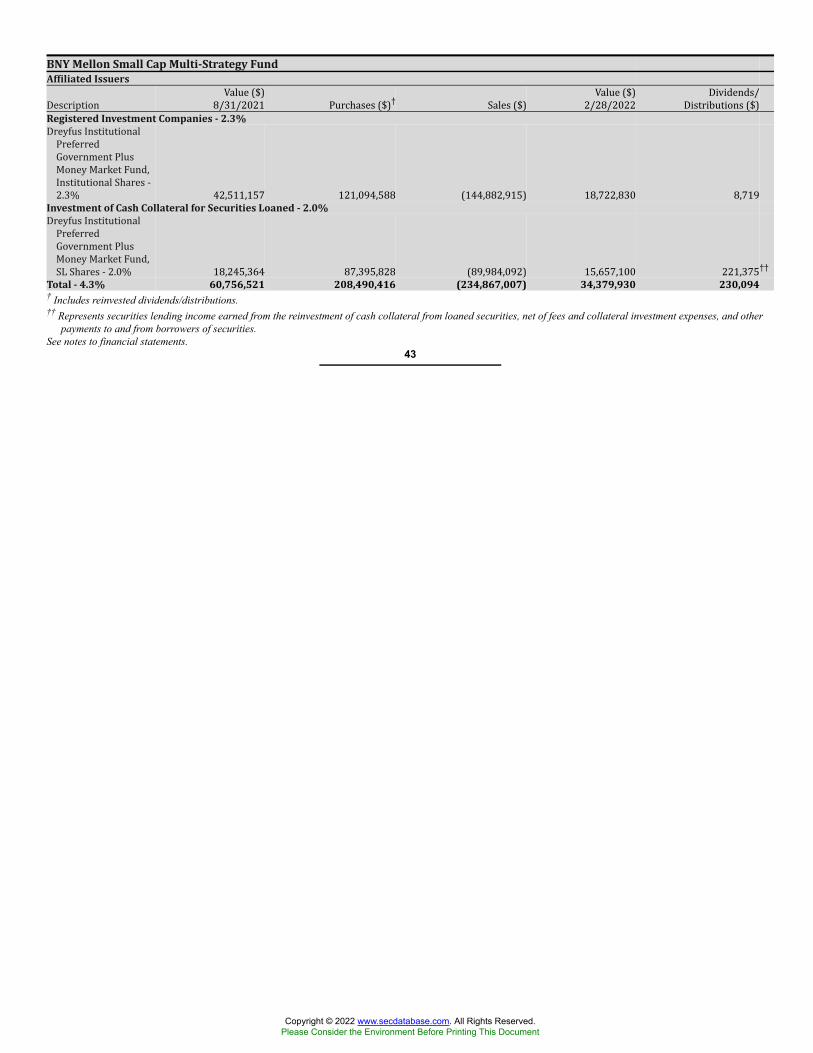
BNY Mellon Small Cap Multi-Strategy FundAffiliated IssuersDescription Value ($)8/31/2021 Purchases ($)† Sales ($) Value ($)2/28/2022 Dividends/Distributions ($)Registered Investment Companies - 2.3%Dreyfus InstitutionalPreferredGovernment PlusMoney Market Fund,Institutional Shares -2.3% 42,511,157 121,094,588 (144,882,915) 18,722,830 8,719Investment of Cash Collateral for Securities Loaned - 2.0%Dreyfus InstitutionalPreferredGovernment PlusMoney Market Fund,SL Shares - 2.0% 18,245,364 87,395,828 (89,984,092) 15,657,100 221,375††Total - 4.3% 60,756,521 208,490,416 (234,867,007) 34,379,930 230,094† Includes reinvested dividends/distributions.†† Represents securities lending income earned from the reinvestment of cash collateral from loaned securities, net of fees and collateral investment expenses, and other
payments to and from borrowers of securities.See notes to financial statements.
43
Copyright © 2022 www.secdatabase.com. All Rights Reserved.Please Consider the Environment Before Printing This Document

STATEMENT OF INVESTMENTS (Unaudited) (continued)BNY Mellon Focused Equity Opportunities FundDescription Shares Value ($)Common Stocks - 96.9%Automobiles & Components - 2.2%General Motors 212,142a 9,911,274Banks - 3.2%Truist Financial 226,688 14,104,527Capital Goods - 8.3%Deere & Co. 40,657 14,637,333Eaton 75,712 11,681,605Honeywell International 54,375 10,317,656
36,636,594Consumer Durables & Apparel - 1.9%NIKE, Cl. B 62,053 8,473,337Consumer Services - 2.1%Royal Caribbean Cruises 116,120a 9,373,206Diversified Financials - 3.2%CME Group 58,766 13,899,922Energy - 5.0%Pioneer Natural Resources 91,892 22,017,323Food & Staples Retailing - 3.4%Costco Wholesale 28,948 15,031,249Food, Beverage & Tobacco - 2.3%The Coca-Cola Company 163,105 10,151,655Health Care Equipment & Services - 6.6%Boston Scientific 282,215a 12,465,437UnitedHealth Group 34,633 16,480,806
28,946,243Insurance - 4.9%American International Group 354,551 21,712,703Materials - 2.6%DuPont de Nemours 149,900 11,597,763Media & Entertainment - 8.8%Alphabet, Cl. A 9,842a 26,584,620Comcast, Cl. A 168,255 7,867,604Meta Platforms, Cl. A 20,977a 4,426,776
38,879,000Pharmaceuticals Biotechnology & Life Sciences - 6.6%AbbVie 121,678 17,980,358Danaher 40,348 11,071,895
29,052,253Real Estate - 2.1%American Tower 39,992b 9,072,985Retailing - 4.4%Amazon.com 6,245a 19,180,019Semiconductors & Semiconductor Equipment - 11.3%Advanced Micro Devices 136,363a 16,819,012Lam Research 22,048 12,376,645NVIDIA 83,905 20,460,234
49,655,891BNY Mellon Focused Equity Opportunities Fund (continued)Description Shares Value ($)Common Stocks - 96.9%(continued)Software & Services - 12.6%Atlassian, Cl. A 40,024a 12,236,137Block 64,943a 8,280,233Microsoft 100,192 29,936,368PayPal Holdings 44,647a 4,997,339
55,450,077Technology Hardware & Equipment - 5.4%Apple 143,287 23,659,550Total Common Stocks(cost $282,565,586) 426,805,5711-DayYield (%)Investment Companies - 3.0%Registered Investment Companies - 3.0%
Copyright © 2022 www.secdatabase.com. All Rights Reserved.Please Consider the Environment Before Printing This Document
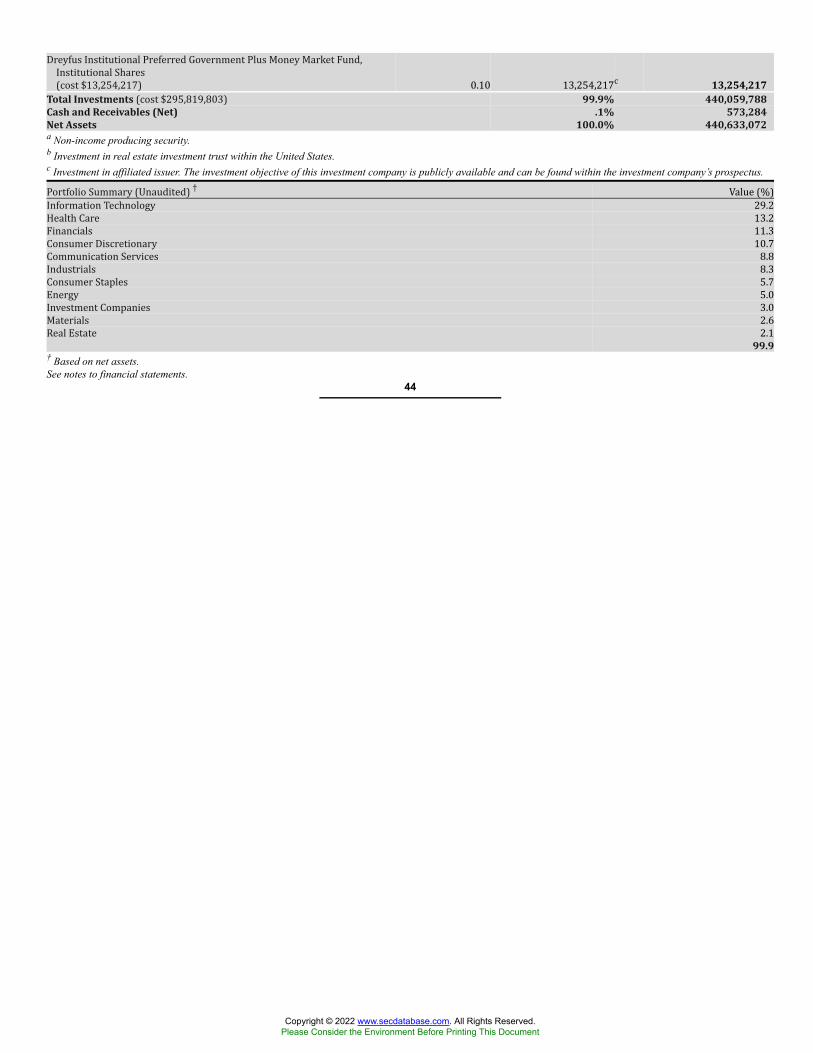
Dreyfus Institutional Preferred Government Plus Money Market Fund,Institutional Shares(cost $13,254,217) 0.10 13,254,217c 13,254,217Total Investments (cost $295,819,803) 99.9% 440,059,788Cash and Receivables (Net) .1% 573,284Net Assets 100.0% 440,633,072a Non-income producing security.b Investment in real estate investment trust within the United States.c Investment in affiliated issuer. The investment objective of this investment company is publicly available and can be found within the investment company’s prospectus.Portfolio Summary (Unaudited) † Value (%)Information Technology 29.2Health Care 13.2Financials 11.3Consumer Discretionary 10.7Communication Services 8.8Industrials 8.3Consumer Staples 5.7Energy 5.0Investment Companies 3.0Materials 2.6Real Estate 2.1
99.9† Based on net assets.See notes to financial statements.
44
Copyright © 2022 www.secdatabase.com. All Rights Reserved.Please Consider the Environment Before Printing This Document
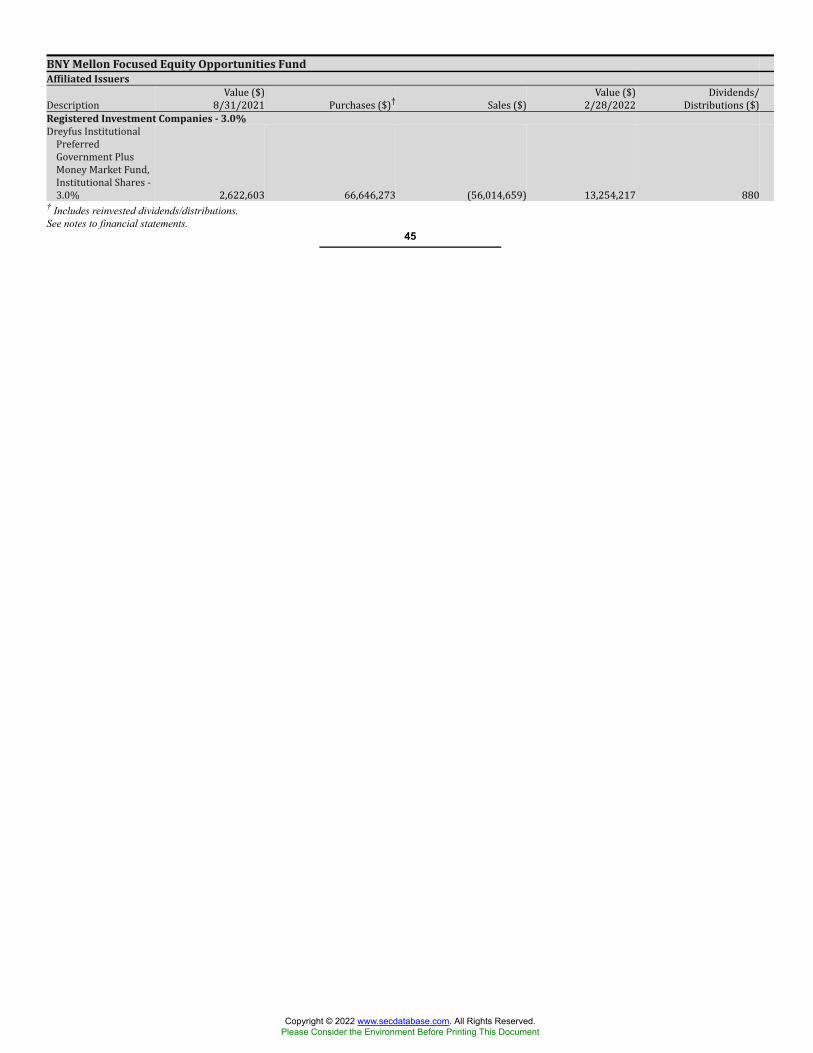
BNY Mellon Focused Equity Opportunities FundAffiliated IssuersDescription Value ($)8/31/2021 Purchases ($)† Sales ($) Value ($)2/28/2022 Dividends/Distributions ($)Registered Investment Companies - 3.0%Dreyfus InstitutionalPreferredGovernment PlusMoney Market Fund,Institutional Shares -3.0% 2,622,603 66,646,273 (56,014,659) 13,254,217 880† Includes reinvested dividends/distributions.See notes to financial statements.
45
Copyright © 2022 www.secdatabase.com. All Rights Reserved.Please Consider the Environment Before Printing This Document

STATEMENT OF INVESTMENTS (Unaudited) (continued)BNY Mellon International FundDescription Shares Value ($)Common Stocks - 95.9%Australia - 9.0%AGL Energy 1,472,945 8,044,896Aristocrat Leisure 86,585 2,343,787ASX 226,833a 13,563,769Brambles 703,106 5,055,592Fortescue Metals Group 151,296 1,994,436Macquarie Group 58,073 7,625,015Telstra 3,946,563 11,350,899
49,978,394Austria - 1.1%OMV 127,375b 6,052,679Denmark - .8%AP Moller - Maersk, Cl. B 1,375 4,357,380France - 14.0%BNP Paribas 250,866 14,770,197Cie Generale des Etablissements Michelin 70,517 9,804,331Klepierre 353,191 10,161,755LVMH 36,380 26,918,030Sanofi 98,918 10,366,927Teleperformance 16,696 6,213,297
78,234,537Germany - 7.2%Allianz 39,719 9,053,951Daimler Truck Holding 82,757b 2,522,067Deutsche Post 245,952b 12,453,939Evonik Industries 286,984b 8,652,686HeidelbergCement 31,061b 2,024,850Mercedes-Benz Group 67,034 5,274,109
39,981,602Hong Kong - .4%Sun Hung Kai Properties 172,500 2,006,533Ireland - .4%ICON 8,753b 2,083,302Italy - 3.2%Enel 1,462,703 10,822,728Eni 448,811 6,960,668
17,783,396Japan - 21.4%Advantest 43,000 3,392,424Casio Computer 348,800a 4,080,685FUJIFILM Holdings 77,900 4,920,713Fujitsu 28,500 4,106,489ITOCHU 274,900 8,950,121Mitsubishi Electric 338,300 4,065,250Mizuho Financial Group 161,300 2,139,629Nintendo 13,400 6,762,650Nippon Telegraph & Telephone 473,900 13,574,155Recruit Holdings 159,500 6,685,778BNY Mellon International Fund (continued)Description Shares Value ($)Common Stocks - 95.9%(continued)Japan - 21.4% (continued)Renesas Electronics 364,500b 4,248,510Seven & i Holdings 45,000 2,188,449Shionogi & Co. 150,300 9,989,495Sony Group 110,300 11,330,779Sumitomo Mitsui Financial Group 420,200 15,062,360Tokyo Electron 10,900 5,287,635Trend Micro 192,500 10,716,305West Japan Railway 43,400 1,869,411
119,370,838Netherlands - 7.9%ASML Holding 28,477 19,122,779ING Groep 339,455 3,995,685Koninklijke Ahold Delhaize 676,239b 20,836,242
43,954,706
Copyright © 2022 www.secdatabase.com. All Rights Reserved.Please Consider the Environment Before Printing This Document

Norway - .8%Yara International 83,910 4,264,126Singapore - 1.2%Singapore Exchange 273,300 1,882,881United Overseas Bank 218,300 4,816,223
6,699,104Spain - .6%ACS Actividades de Construccion y Servicios 138,154 3,380,031Sweden - .4%Swedish Match 344,755 2,523,747Switzerland - 10.8%Kuehne + Nagel International 27,845b 7,633,010Logitech International 178,138a 13,383,173Novartis 69,948 6,127,600Roche Holding 61,988 23,646,823Sonova Holding 16,836b 6,553,759STMicroelectronics 70,463 2,997,512
60,341,877United Kingdom - 16.7%Ashtead Group 173,882 11,373,890BAE Systems 648,069 6,256,091BP 491,931 2,399,159Bunzl 60,719 2,418,385Centrica 2,896,107b 3,002,427Diageo 170,123 8,501,195Ferguson 67,238 10,296,305GlaxoSmithKline 615,297 12,756,055Imperial Brands 103,406 2,273,607Legal & General Group 1,047,245b 3,894,325Melrose Industries 1,284,128 2,553,840Rio Tinto 70,405 5,469,501Shell 169,789 4,491,663Tate & Lyle 250,542 2,531,521
46
Copyright © 2022 www.secdatabase.com. All Rights Reserved.Please Consider the Environment Before Printing This Document

BNY Mellon International Fund (continued)Description Shares Value ($)Common Stocks - 95.9%(continued)United Kingdom - 16.7% (continued)Unilever 43,144 2,168,387Vodafone Group 2,705,506 4,770,531WPP 549,855 7,800,442
92,957,324Total Common Stocks(cost $518,478,954) 533,969,576Exchange-Traded Funds - 1.2%United States - 1.2%iShares MSCI EAFE ETF(cost $6,637,039) 89,666a 6,565,345Preferred DividendRate (%)Preferred Stocks - 1.3%Germany - 1.3%Volkswagen(cost $9,790,554) 3.11 35,862b 7,159,0361-DayYield (%)Investment Companies - .7%Registered Investment Companies - .7%Dreyfus Institutional Preferred Government Plus Money Market Fund,Institutional Shares(cost $3,722,868) 0.10 3,722,868c 3,722,868Investment of Cash Collateral for Securities Loaned - 2.2%Registered Investment Companies - 2.2%Dreyfus Institutional Preferred Government Plus Money Market Fund, SLShares(cost $12,609,939) 0.10 12,609,939c 12,609,939Total Investments (cost $551,239,354) 101.3% 564,026,764Liabilities, Less Cash and Receivables (1.3%) (7,445,823)Net Assets 100.0% 556,580,941ETF—Exchange-Traded Funda Security, or portion thereof, on loan. At February 28, 2022, the value of the fund’s securities on loan was $11,924,166 and the value of the collateral was $12,609,939.
In addition, the value of collateral may include pending sales that are also on loan.b Non-income producing security.c Investment in affiliated issuer. The investment objective of this investment company is publicly available and can be found within the investment company’s prospectus.Portfolio Summary (Unaudited) † Value (%)Pharmaceuticals Biotechnology & Life Sciences 11.7Capital Goods 9.3Consumer Durables & Apparel 7.6Banks 7.3Semiconductors & Semiconductor Equipment 6.3Telecommunication Services 5.3Transportation 4.7Diversified Financials 4.2Food & Staples Retailing 4.1Investment Companies 4.1Materials 4.0Automobiles & Components 4.0Utilities 3.9Energy 3.6Technology Hardware & Equipment 3.3Commercial & Professional Services 3.2Food, Beverage & Tobacco 2.9Software & Services 2.7Media & Entertainment 2.6Insurance 2.3Real Estate 2.2Health Care Equipment & Services 1.2Consumer Services .4Household & Personal Products .4
101.3† Based on net assets.See notes to financial statements.
47
Copyright © 2022 www.secdatabase.com. All Rights Reserved.Please Consider the Environment Before Printing This Document
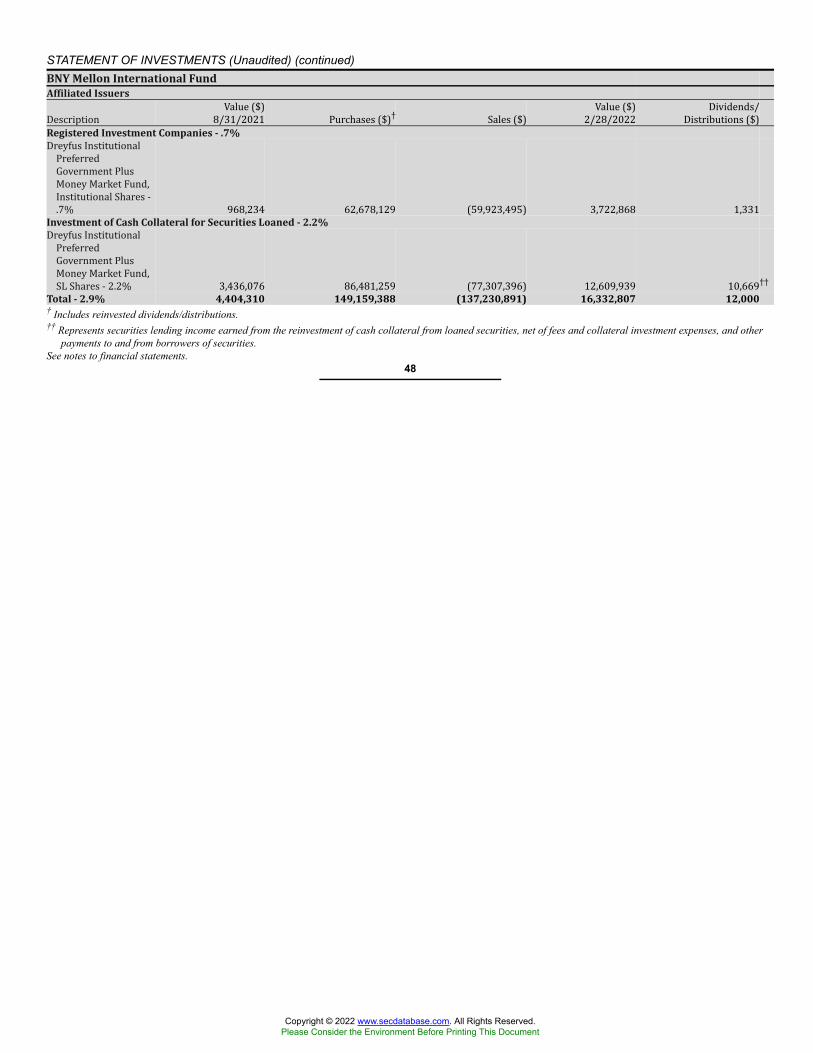
STATEMENT OF INVESTMENTS (Unaudited) (continued)BNY Mellon International FundAffiliated IssuersDescription Value ($)8/31/2021 Purchases ($)† Sales ($) Value ($)2/28/2022 Dividends/Distributions ($)Registered Investment Companies - .7%Dreyfus InstitutionalPreferredGovernment PlusMoney Market Fund,Institutional Shares -.7% 968,234 62,678,129 (59,923,495) 3,722,868 1,331Investment of Cash Collateral for Securities Loaned - 2.2%Dreyfus InstitutionalPreferredGovernment PlusMoney Market Fund,SL Shares - 2.2% 3,436,076 86,481,259 (77,307,396) 12,609,939 10,669††Total - 2.9% 4,404,310 149,159,388 (137,230,891) 16,332,807 12,000† Includes reinvested dividends/distributions.†† Represents securities lending income earned from the reinvestment of cash collateral from loaned securities, net of fees and collateral investment expenses, and other
payments to and from borrowers of securities.See notes to financial statements.
48
Copyright © 2022 www.secdatabase.com. All Rights Reserved.Please Consider the Environment Before Printing This Document
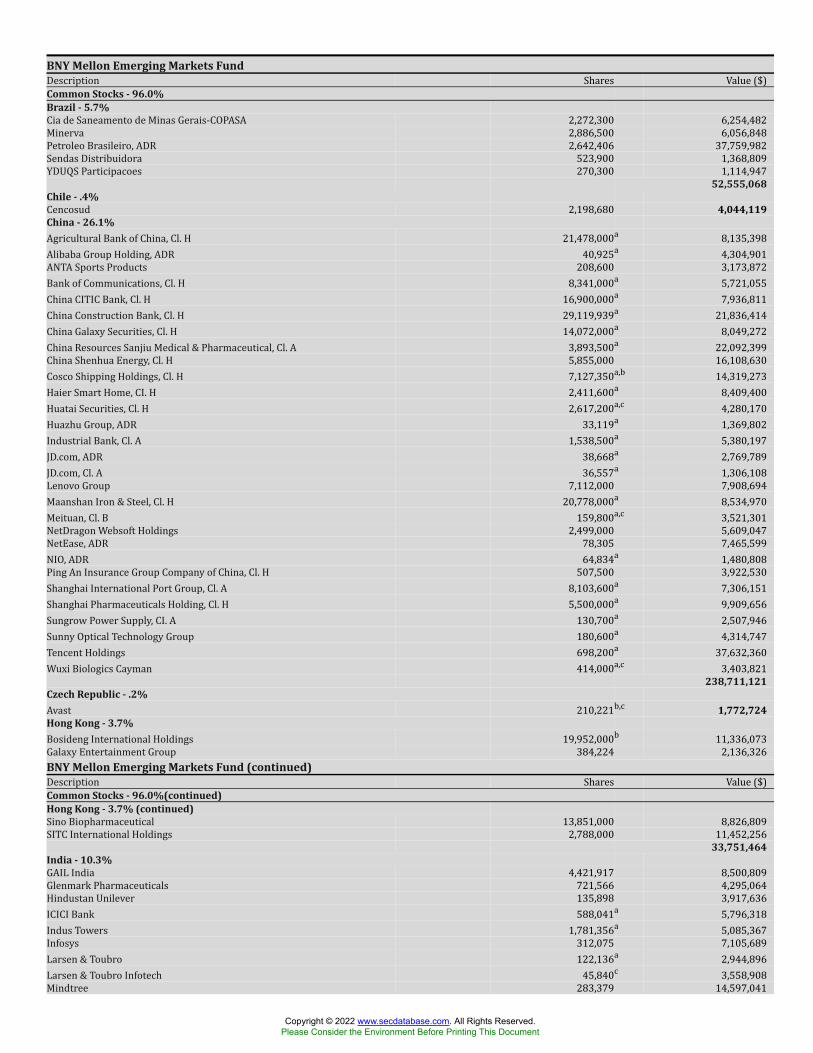
BNY Mellon Emerging Markets FundDescription Shares Value ($)Common Stocks - 96.0%Brazil - 5.7%Cia de Saneamento de Minas Gerais-COPASA 2,272,300 6,254,482Minerva 2,886,500 6,056,848Petroleo Brasileiro, ADR 2,642,406 37,759,982Sendas Distribuidora 523,900 1,368,809YDUQS Participacoes 270,300 1,114,947
52,555,068Chile - .4%Cencosud 2,198,680 4,044,119China - 26.1%Agricultural Bank of China, Cl. H 21,478,000a 8,135,398Alibaba Group Holding, ADR 40,925a 4,304,901ANTA Sports Products 208,600 3,173,872Bank of Communications, Cl. H 8,341,000a 5,721,055China CITIC Bank, Cl. H 16,900,000a 7,936,811China Construction Bank, Cl. H 29,119,939a 21,836,414China Galaxy Securities, Cl. H 14,072,000a 8,049,272China Resources Sanjiu Medical & Pharmaceutical, Cl. A 3,893,500a 22,092,399China Shenhua Energy, Cl. H 5,855,000 16,108,630Cosco Shipping Holdings, Cl. H 7,127,350a,b 14,319,273Haier Smart Home, CI. H 2,411,600a 8,409,400Huatai Securities, Cl. H 2,617,200a,c 4,280,170Huazhu Group, ADR 33,119a 1,369,802Industrial Bank, Cl. A 1,538,500a 5,380,197JD.com, ADR 38,668a 2,769,789JD.com, Cl. A 36,557a 1,306,108Lenovo Group 7,112,000 7,908,694Maanshan Iron & Steel, Cl. H 20,778,000a 8,534,970Meituan, Cl. B 159,800a,c 3,521,301NetDragon Websoft Holdings 2,499,000 5,609,047NetEase, ADR 78,305 7,465,599NIO, ADR 64,834a 1,480,808Ping An Insurance Group Company of China, Cl. H 507,500 3,922,530Shanghai International Port Group, Cl. A 8,103,600a 7,306,151Shanghai Pharmaceuticals Holding, Cl. H 5,500,000a 9,909,656Sungrow Power Supply, CI. A 130,700a 2,507,946Sunny Optical Technology Group 180,600a 4,314,747Tencent Holdings 698,200a 37,632,360Wuxi Biologics Cayman 414,000a,c 3,403,821
238,711,121Czech Republic - .2%Avast 210,221b,c 1,772,724Hong Kong - 3.7%Bosideng International Holdings 19,952,000b 11,336,073Galaxy Entertainment Group 384,224 2,136,326BNY Mellon Emerging Markets Fund (continued)Description Shares Value ($)Common Stocks - 96.0%(continued)Hong Kong - 3.7% (continued)Sino Biopharmaceutical 13,851,000 8,826,809SITC International Holdings 2,788,000 11,452,256
33,751,464India - 10.3%GAIL India 4,421,917 8,500,809Glenmark Pharmaceuticals 721,566 4,295,064Hindustan Unilever 135,898 3,917,636ICICI Bank 588,041a 5,796,318Indus Towers 1,781,356a 5,085,367Infosys 312,075 7,105,689Larsen & Toubro 122,136a 2,944,896Larsen & Toubro Infotech 45,840c 3,558,908Mindtree 283,379 14,597,041
Copyright © 2022 www.secdatabase.com. All Rights Reserved.Please Consider the Environment Before Printing This Document
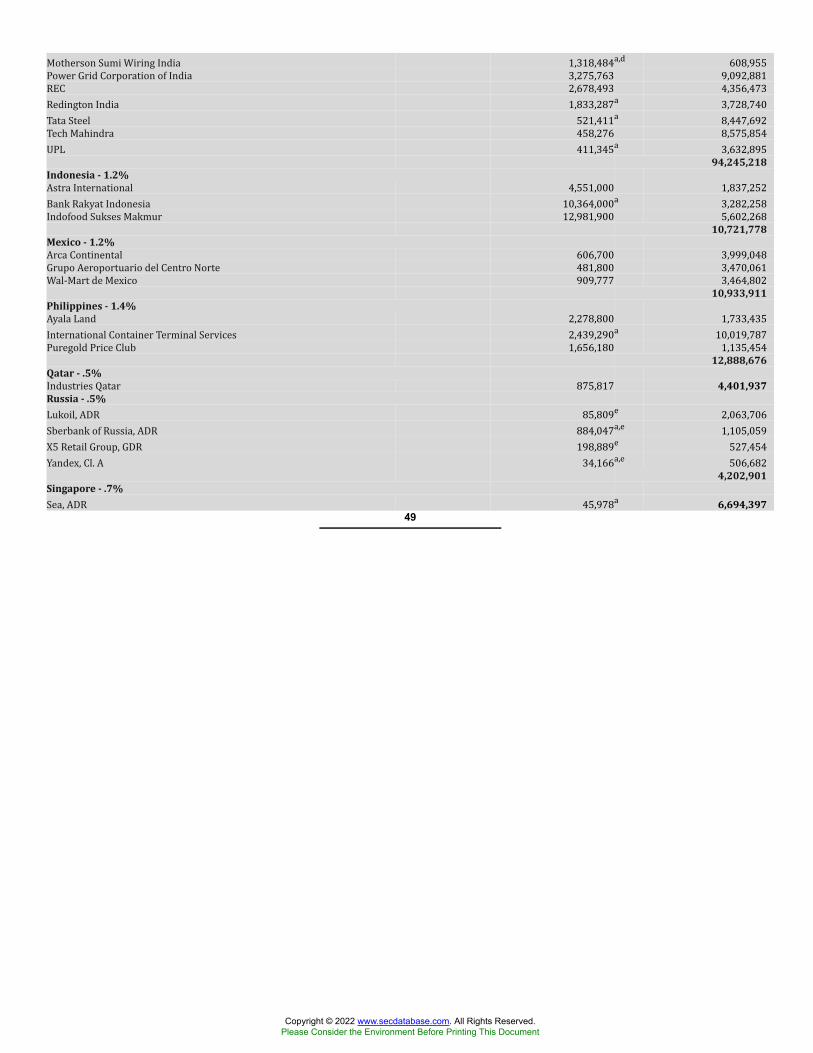
Motherson Sumi Wiring India 1,318,484a,d 608,955Power Grid Corporation of India 3,275,763 9,092,881REC 2,678,493 4,356,473Redington India 1,833,287a 3,728,740Tata Steel 521,411a 8,447,692Tech Mahindra 458,276 8,575,854UPL 411,345a 3,632,89594,245,218
Indonesia - 1.2%Astra International 4,551,000 1,837,252Bank Rakyat Indonesia 10,364,000a 3,282,258Indofood Sukses Makmur 12,981,900 5,602,26810,721,778
Mexico - 1.2%Arca Continental 606,700 3,999,048Grupo Aeroportuario del Centro Norte 481,800 3,470,061Wal-Mart de Mexico 909,777 3,464,80210,933,911
Philippines - 1.4%Ayala Land 2,278,800 1,733,435International Container Terminal Services 2,439,290a 10,019,787Puregold Price Club 1,656,180 1,135,45412,888,676
Qatar - .5%Industries Qatar 875,817 4,401,937Russia - .5%Lukoil, ADR 85,809e 2,063,706Sberbank of Russia, ADR 884,047a,e 1,105,059X5 Retail Group, GDR 198,889e 527,454Yandex, Cl. A 34,166a,e 506,682
4,202,901Singapore - .7%Sea, ADR 45,978a 6,694,397
49
Copyright © 2022 www.secdatabase.com. All Rights Reserved.Please Consider the Environment Before Printing This Document
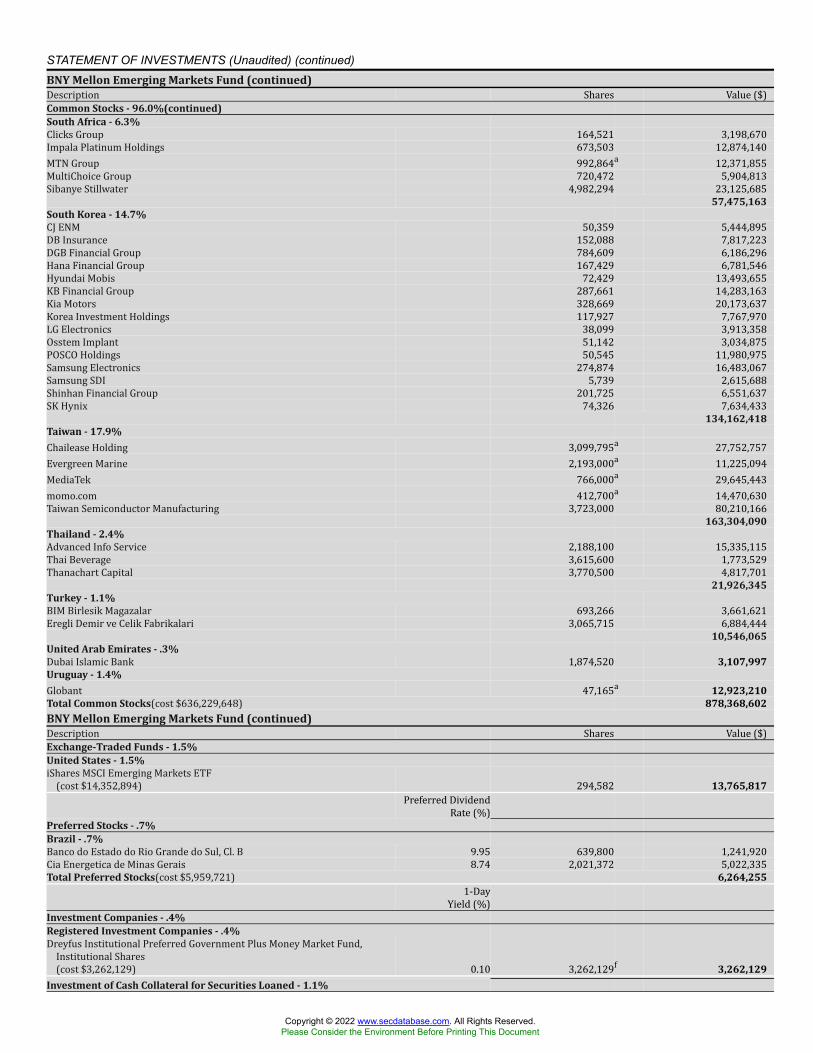
STATEMENT OF INVESTMENTS (Unaudited) (continued)BNY Mellon Emerging Markets Fund (continued)Description Shares Value ($)Common Stocks - 96.0%(continued)South Africa - 6.3%Clicks Group 164,521 3,198,670Impala Platinum Holdings 673,503 12,874,140MTN Group 992,864a 12,371,855MultiChoice Group 720,472 5,904,813Sibanye Stillwater 4,982,294 23,125,685
57,475,163South Korea - 14.7%CJ ENM 50,359 5,444,895DB Insurance 152,088 7,817,223DGB Financial Group 784,609 6,186,296Hana Financial Group 167,429 6,781,546Hyundai Mobis 72,429 13,493,655KB Financial Group 287,661 14,283,163Kia Motors 328,669 20,173,637Korea Investment Holdings 117,927 7,767,970LG Electronics 38,099 3,913,358Osstem Implant 51,142 3,034,875POSCO Holdings 50,545 11,980,975Samsung Electronics 274,874 16,483,067Samsung SDI 5,739 2,615,688Shinhan Financial Group 201,725 6,551,637SK Hynix 74,326 7,634,433
134,162,418Taiwan - 17.9%Chailease Holding 3,099,795a 27,752,757Evergreen Marine 2,193,000a 11,225,094MediaTek 766,000a 29,645,443momo.com 412,700a 14,470,630Taiwan Semiconductor Manufacturing 3,723,000 80,210,166
163,304,090Thailand - 2.4%Advanced Info Service 2,188,100 15,335,115Thai Beverage 3,615,600 1,773,529Thanachart Capital 3,770,500 4,817,701
21,926,345Turkey - 1.1%BIM Birlesik Magazalar 693,266 3,661,621Eregli Demir ve Celik Fabrikalari 3,065,715 6,884,444
10,546,065United Arab Emirates - .3%Dubai Islamic Bank 1,874,520 3,107,997Uruguay - 1.4%Globant 47,165a 12,923,210Total Common Stocks(cost $636,229,648) 878,368,602BNY Mellon Emerging Markets Fund (continued)Description Shares Value ($)Exchange-Traded Funds - 1.5%United States - 1.5%iShares MSCI Emerging Markets ETF(cost $14,352,894) 294,582 13,765,817Preferred DividendRate (%)Preferred Stocks - .7%Brazil - .7%Banco do Estado do Rio Grande do Sul, Cl. B 9.95 639,800 1,241,920Cia Energetica de Minas Gerais 8.74 2,021,372 5,022,335Total Preferred Stocks(cost $5,959,721) 6,264,2551-DayYield (%)Investment Companies - .4%Registered Investment Companies - .4%Dreyfus Institutional Preferred Government Plus Money Market Fund,Institutional Shares(cost $3,262,129) 0.10 3,262,129f 3,262,129Investment of Cash Collateral for Securities Loaned - 1.1%
Copyright © 2022 www.secdatabase.com. All Rights Reserved.Please Consider the Environment Before Printing This Document
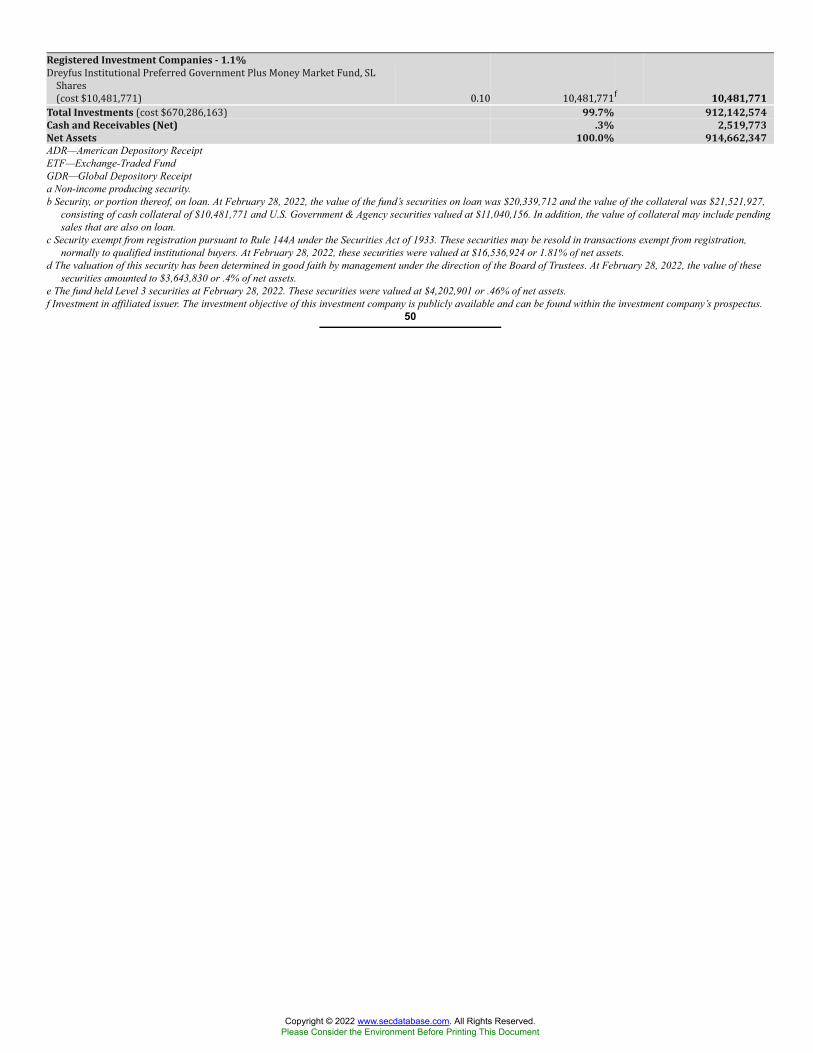
Registered Investment Companies - 1.1%Dreyfus Institutional Preferred Government Plus Money Market Fund, SLShares(cost $10,481,771) 0.10 10,481,771f 10,481,771Total Investments (cost $670,286,163) 99.7% 912,142,574Cash and Receivables (Net) .3% 2,519,773Net Assets 100.0% 914,662,347ADR—American Depository ReceiptETF—Exchange-Traded FundGDR—Global Depository Receipta Non-income producing security.b Security, or portion thereof, on loan. At February 28, 2022, the value of the fund’s securities on loan was $20,339,712 and the value of the collateral was $21,521,927,
consisting of cash collateral of $10,481,771 and U.S. Government & Agency securities valued at $11,040,156. In addition, the value of collateral may include pendingsales that are also on loan.
c Security exempt from registration pursuant to Rule 144A under the Securities Act of 1933. These securities may be resold in transactions exempt from registration,normally to qualified institutional buyers. At February 28, 2022, these securities were valued at $16,536,924 or 1.81% of net assets.
d The valuation of this security has been determined in good faith by management under the direction of the Board of Trustees. At February 28, 2022, the value of thesesecurities amounted to $3,643,830 or .4% of net assets.
e The fund held Level 3 securities at February 28, 2022. These securities were valued at $4,202,901 or .46% of net assets.f Investment in affiliated issuer. The investment objective of this investment company is publicly available and can be found within the investment company’s prospectus.
50
Copyright © 2022 www.secdatabase.com. All Rights Reserved.Please Consider the Environment Before Printing This Document
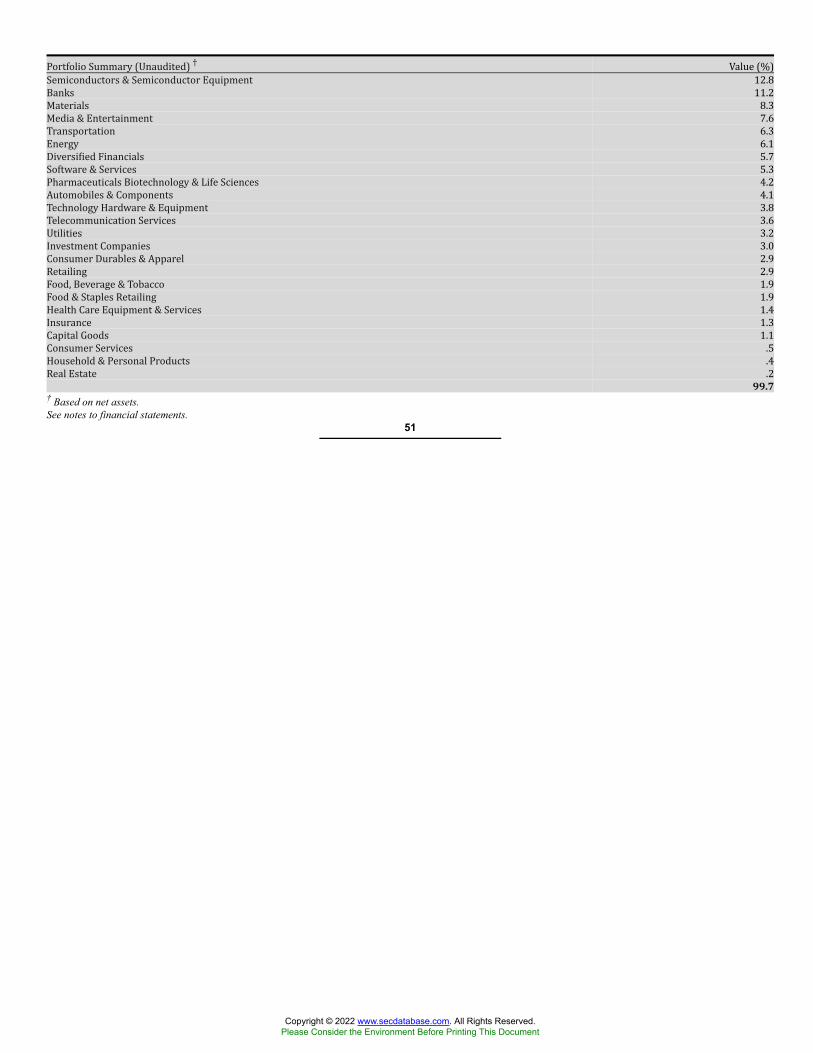
Portfolio Summary (Unaudited) † Value (%)Semiconductors & Semiconductor Equipment 12.8Banks 11.2Materials 8.3Media & Entertainment 7.6Transportation 6.3Energy 6.1Diversified Financials 5.7Software & Services 5.3Pharmaceuticals Biotechnology & Life Sciences 4.2Automobiles & Components 4.1Technology Hardware & Equipment 3.8Telecommunication Services 3.6Utilities 3.2Investment Companies 3.0Consumer Durables & Apparel 2.9Retailing 2.9Food, Beverage & Tobacco 1.9Food & Staples Retailing 1.9Health Care Equipment & Services 1.4Insurance 1.3Capital Goods 1.1Consumer Services .5Household & Personal Products .4Real Estate .299.7
† Based on net assets.See notes to financial statements.
51
Copyright © 2022 www.secdatabase.com. All Rights Reserved.Please Consider the Environment Before Printing This Document

STATEMENT OF INVESTMENTS (Unaudited) (continued)BNY Mellon Emerging Markets FundAffiliated IssuersDescription Value ($)8/31/2021 Purchases ($)† Sales ($) Value ($)2/28/2022 Dividends/Distributions ($)Registered Investment Companies - .4%Dreyfus InstitutionalPreferredGovernment PlusMoney Market Fund,Institutional Shares -.4% 7,580,677 116,296,391 (120,614,939) 3,262,129 1,824Investment of Cash Collateral for Securities Loaned - 1.1%Dreyfus InstitutionalPreferredGovernment PlusMoney Market Fund,SL Shares - 1.1% 3,266,196 72,911,217 (65,695,642) 10,481,771 40,865††Total - 1.5% 10,846,873 189,207,608 (186,310,581) 13,743,900 42,689† Includes reinvested dividends/distributions.†† Represents securities lending income earned from the reinvestment of cash collateral from loaned securities, net of fees and collateral investment expenses, and other
payments to and from borrowers of securities.See notes to financial statements.
52
Copyright © 2022 www.secdatabase.com. All Rights Reserved.Please Consider the Environment Before Printing This Document
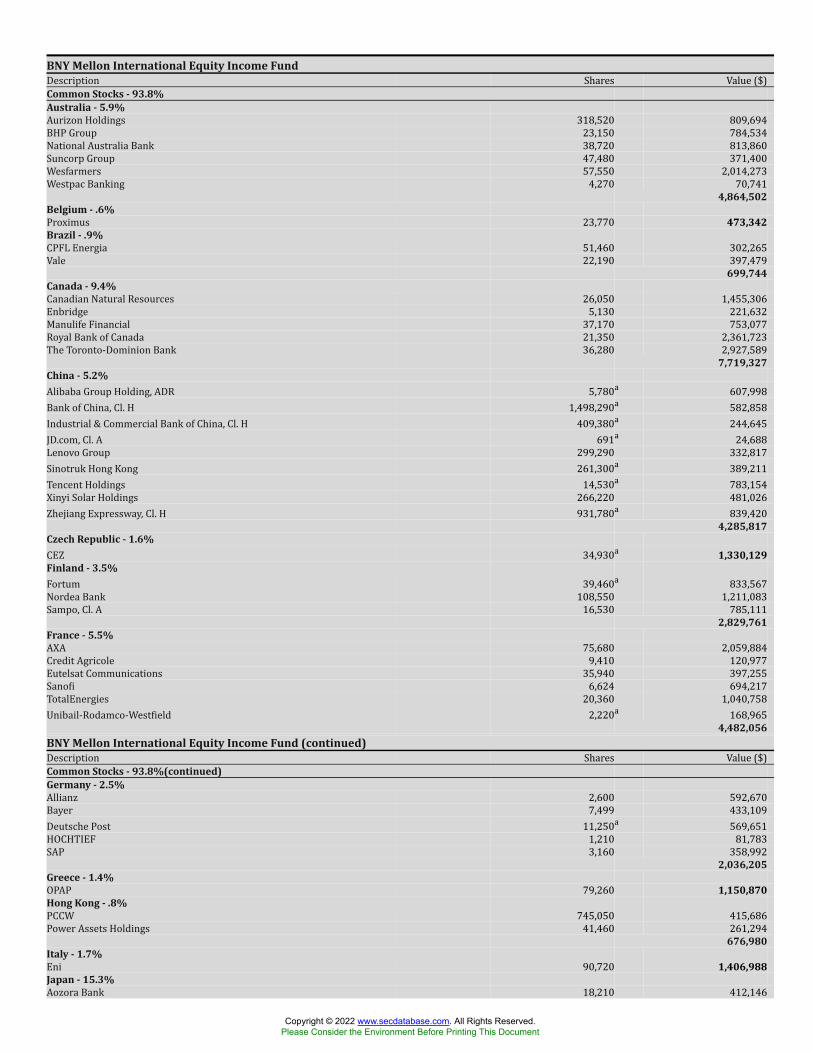
BNY Mellon International Equity Income FundDescription Shares Value ($)Common Stocks - 93.8%Australia - 5.9%Aurizon Holdings 318,520 809,694BHP Group 23,150 784,534National Australia Bank 38,720 813,860Suncorp Group 47,480 371,400Wesfarmers 57,550 2,014,273Westpac Banking 4,270 70,741
4,864,502Belgium - .6%Proximus 23,770 473,342Brazil - .9%CPFL Energia 51,460 302,265Vale 22,190 397,479
699,744Canada - 9.4%Canadian Natural Resources 26,050 1,455,306Enbridge 5,130 221,632Manulife Financial 37,170 753,077Royal Bank of Canada 21,350 2,361,723The Toronto-Dominion Bank 36,280 2,927,589
7,719,327China - 5.2%Alibaba Group Holding, ADR 5,780a 607,998Bank of China, Cl. H 1,498,290a 582,858Industrial & Commercial Bank of China, Cl. H 409,380a 244,645JD.com, Cl. A 691a 24,688Lenovo Group 299,290 332,817Sinotruk Hong Kong 261,300a 389,211Tencent Holdings 14,530a 783,154Xinyi Solar Holdings 266,220 481,026Zhejiang Expressway, Cl. H 931,780a 839,420
4,285,817Czech Republic - 1.6%CEZ 34,930a 1,330,129Finland - 3.5%Fortum 39,460a 833,567Nordea Bank 108,550 1,211,083Sampo, Cl. A 16,530 785,111
2,829,761France - 5.5%AXA 75,680 2,059,884Credit Agricole 9,410 120,977Eutelsat Communications 35,940 397,255Sanofi 6,624 694,217TotalEnergies 20,360 1,040,758Unibail-Rodamco-Westfield 2,220a 168,965
4,482,056BNY Mellon International Equity Income Fund (continued)Description Shares Value ($)Common Stocks - 93.8%(continued)Germany - 2.5%Allianz 2,600 592,670Bayer 7,499 433,109Deutsche Post 11,250a 569,651HOCHTIEF 1,210 81,783SAP 3,160 358,992
2,036,205Greece - 1.4%OPAP 79,260 1,150,870Hong Kong - .8%PCCW 745,050 415,686Power Assets Holdings 41,460 261,294
676,980Italy - 1.7%Eni 90,720 1,406,988Japan - 15.3%Aozora Bank 18,210 412,146
Copyright © 2022 www.secdatabase.com. All Rights Reserved.Please Consider the Environment Before Printing This Document
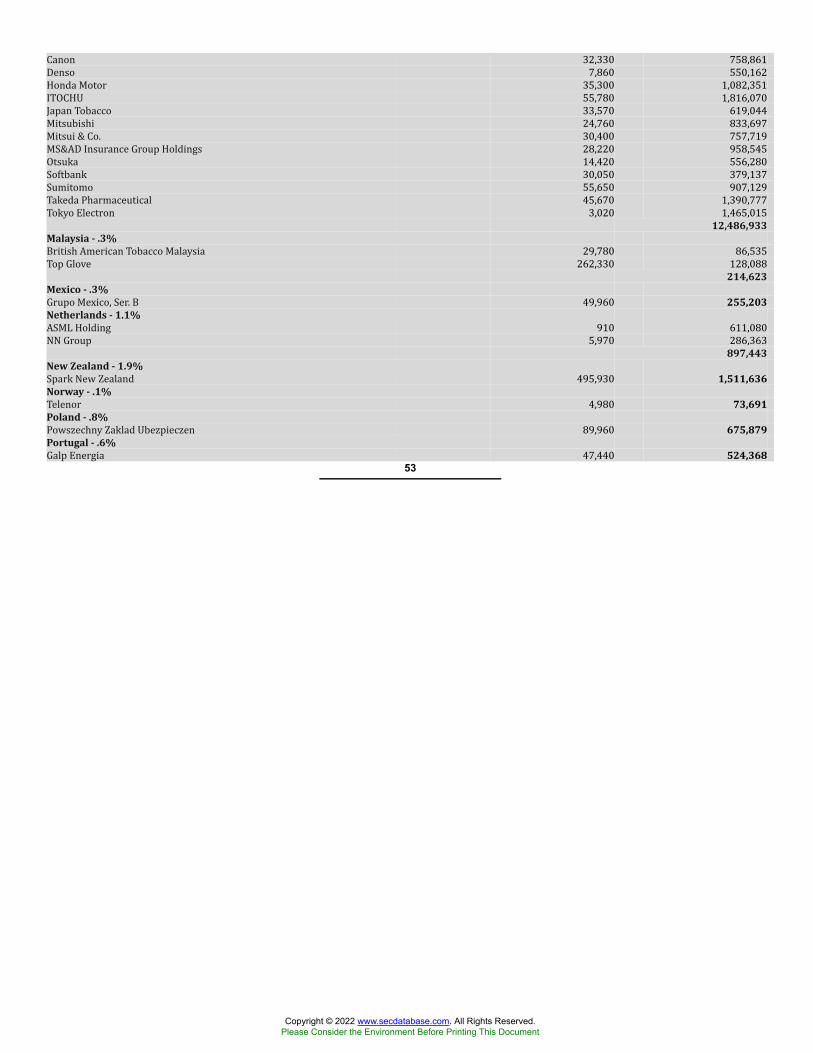
Canon 32,330 758,861Denso 7,860 550,162Honda Motor 35,300 1,082,351ITOCHU 55,780 1,816,070Japan Tobacco 33,570 619,044Mitsubishi 24,760 833,697Mitsui & Co. 30,400 757,719MS&AD Insurance Group Holdings 28,220 958,545Otsuka 14,420 556,280Softbank 30,050 379,137Sumitomo 55,650 907,129Takeda Pharmaceutical 45,670 1,390,777Tokyo Electron 3,020 1,465,01512,486,933
Malaysia - .3%British American Tobacco Malaysia 29,780 86,535Top Glove 262,330 128,088214,623
Mexico - .3%Grupo Mexico, Ser. B 49,960 255,203Netherlands - 1.1%ASML Holding 910 611,080NN Group 5,970 286,363
897,443New Zealand - 1.9%Spark New Zealand 495,930 1,511,636Norway - .1%Telenor 4,980 73,691Poland - .8%Powszechny Zaklad Ubezpieczen 89,960 675,879Portugal - .6%Galp Energia 47,440 524,368
53
Copyright © 2022 www.secdatabase.com. All Rights Reserved.Please Consider the Environment Before Printing This Document
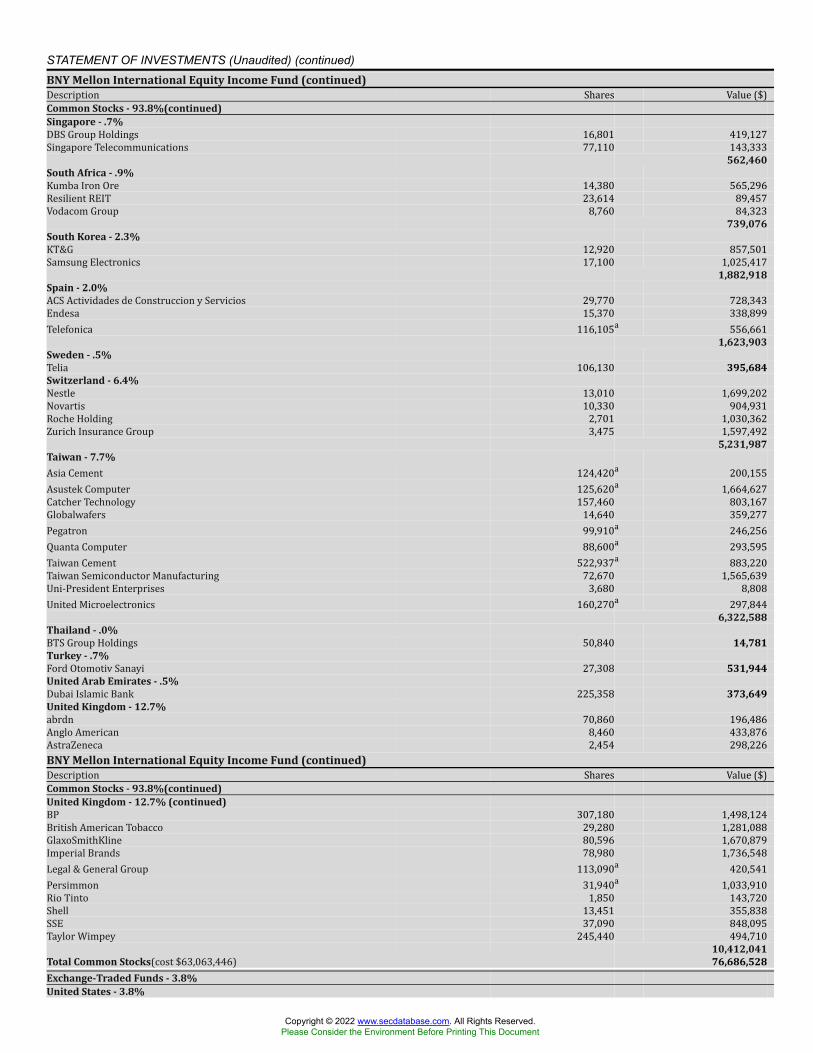
STATEMENT OF INVESTMENTS (Unaudited) (continued)BNY Mellon International Equity Income Fund (continued)Description Shares Value ($)Common Stocks - 93.8%(continued)Singapore - .7%DBS Group Holdings 16,801 419,127Singapore Telecommunications 77,110 143,333
562,460South Africa - .9%Kumba Iron Ore 14,380 565,296Resilient REIT 23,614 89,457Vodacom Group 8,760 84,323
739,076South Korea - 2.3%KT&G 12,920 857,501Samsung Electronics 17,100 1,025,417
1,882,918Spain - 2.0%ACS Actividades de Construccion y Servicios 29,770 728,343Endesa 15,370 338,899Telefonica 116,105a 556,661
1,623,903Sweden - .5%Telia 106,130 395,684Switzerland - 6.4%Nestle 13,010 1,699,202Novartis 10,330 904,931Roche Holding 2,701 1,030,362Zurich Insurance Group 3,475 1,597,492
5,231,987Taiwan - 7.7%Asia Cement 124,420a 200,155Asustek Computer 125,620a 1,664,627Catcher Technology 157,460 803,167Globalwafers 14,640 359,277Pegatron 99,910a 246,256Quanta Computer 88,600a 293,595Taiwan Cement 522,937a 883,220Taiwan Semiconductor Manufacturing 72,670 1,565,639Uni-President Enterprises 3,680 8,808United Microelectronics 160,270a 297,844
6,322,588Thailand - .0%BTS Group Holdings 50,840 14,781Turkey - .7%Ford Otomotiv Sanayi 27,308 531,944United Arab Emirates - .5%Dubai Islamic Bank 225,358 373,649United Kingdom - 12.7%abrdn 70,860 196,486Anglo American 8,460 433,876AstraZeneca 2,454 298,226BNY Mellon International Equity Income Fund (continued)Description Shares Value ($)Common Stocks - 93.8%(continued)United Kingdom - 12.7% (continued)BP 307,180 1,498,124British American Tobacco 29,280 1,281,088GlaxoSmithKline 80,596 1,670,879Imperial Brands 78,980 1,736,548Legal & General Group 113,090a 420,541Persimmon 31,940a 1,033,910Rio Tinto 1,850 143,720Shell 13,451 355,838SSE 37,090 848,095Taylor Wimpey 245,440 494,710
10,412,041Total Common Stocks(cost $63,063,446) 76,686,528Exchange-Traded Funds - 3.8%United States - 3.8%
Copyright © 2022 www.secdatabase.com. All Rights Reserved.Please Consider the Environment Before Printing This Document
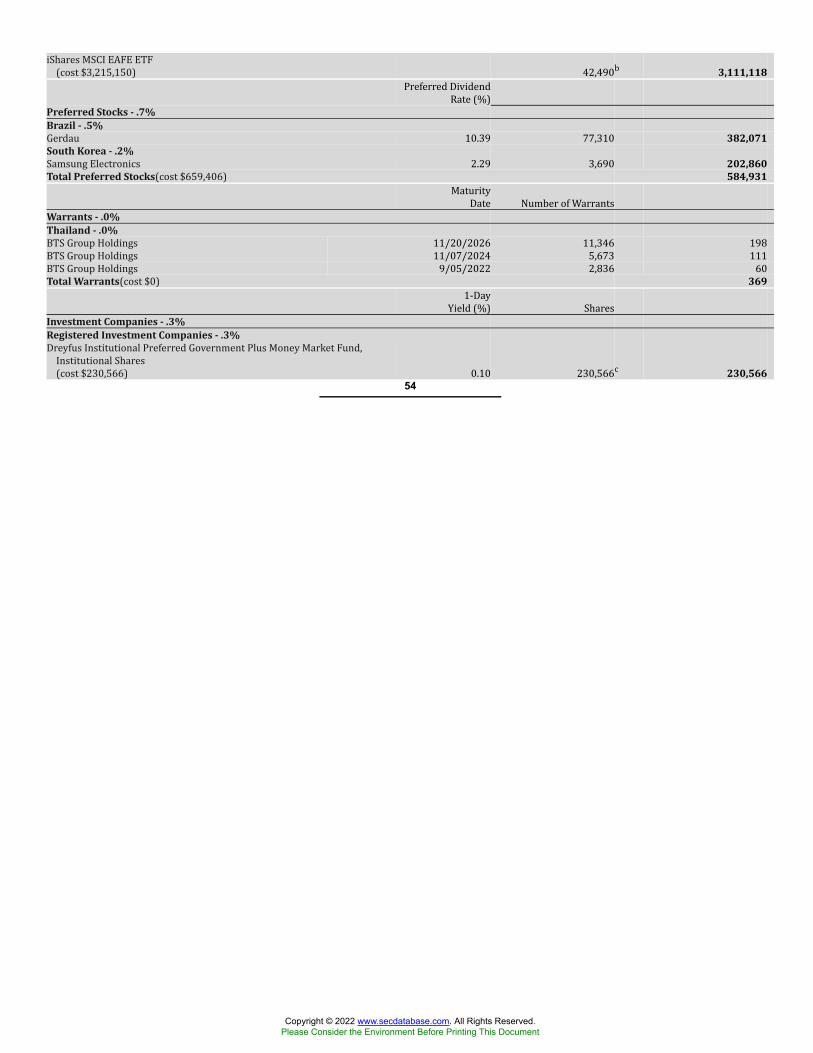
iShares MSCI EAFE ETF(cost $3,215,150) 42,490b 3,111,118Preferred DividendRate (%)Preferred Stocks - .7%Brazil - .5%Gerdau 10.39 77,310 382,071South Korea - .2%Samsung Electronics 2.29 3,690 202,860Total Preferred Stocks(cost $659,406) 584,931MaturityDate Number of WarrantsWarrants - .0%Thailand - .0%BTS Group Holdings 11/20/2026 11,346 198BTS Group Holdings 11/07/2024 5,673 111BTS Group Holdings 9/05/2022 2,836 60Total Warrants(cost $0) 3691-DayYield (%) SharesInvestment Companies - .3%Registered Investment Companies - .3%Dreyfus Institutional Preferred Government Plus Money Market Fund,Institutional Shares(cost $230,566) 0.10 230,566c 230,566
54
Copyright © 2022 www.secdatabase.com. All Rights Reserved.Please Consider the Environment Before Printing This Document
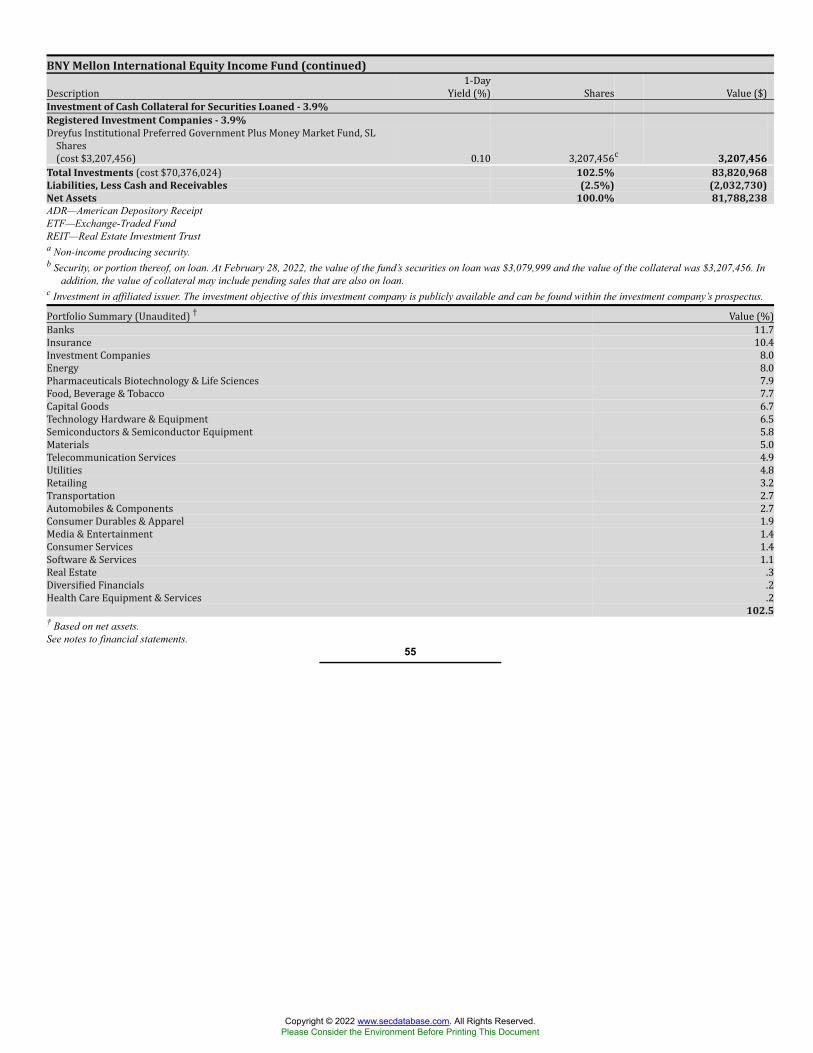
BNY Mellon International Equity Income Fund (continued)Description 1-DayYield (%) Shares Value ($)Investment of Cash Collateral for Securities Loaned - 3.9%Registered Investment Companies - 3.9%Dreyfus Institutional Preferred Government Plus Money Market Fund, SLShares(cost $3,207,456) 0.10 3,207,456c 3,207,456Total Investments (cost $70,376,024) 102.5% 83,820,968Liabilities, Less Cash and Receivables (2.5%) (2,032,730)Net Assets 100.0% 81,788,238ADR—American Depository ReceiptETF—Exchange-Traded FundREIT—Real Estate Investment Trusta Non-income producing security.b Security, or portion thereof, on loan. At February 28, 2022, the value of the fund’s securities on loan was $3,079,999 and the value of the collateral was $3,207,456. In
addition, the value of collateral may include pending sales that are also on loan.c Investment in affiliated issuer. The investment objective of this investment company is publicly available and can be found within the investment company’s prospectus.Portfolio Summary (Unaudited) † Value (%)Banks 11.7Insurance 10.4Investment Companies 8.0Energy 8.0Pharmaceuticals Biotechnology & Life Sciences 7.9Food, Beverage & Tobacco 7.7Capital Goods 6.7Technology Hardware & Equipment 6.5Semiconductors & Semiconductor Equipment 5.8Materials 5.0Telecommunication Services 4.9Utilities 4.8Retailing 3.2Transportation 2.7Automobiles & Components 2.7Consumer Durables & Apparel 1.9Media & Entertainment 1.4Consumer Services 1.4Software & Services 1.1Real Estate .3Diversified Financials .2Health Care Equipment & Services .2
102.5† Based on net assets.See notes to financial statements.
55
Copyright © 2022 www.secdatabase.com. All Rights Reserved.Please Consider the Environment Before Printing This Document

STATEMENT OF INVESTMENTS (Unaudited) (continued)BNY Mellon International Equity Income FundAffiliated IssuersDescription Value ($)8/31/2021 Purchases ($)† Sales ($) Value ($)2/28/2022 Dividends/Distributions ($)Registered Investment Companies - .3%Dreyfus InstitutionalPreferredGovernment PlusMoney Market Fund,Institutional Shares -.3% 223,898 8,903,479 (8,896,811) 230,566 99Investment of Cash Collateral for Securities Loaned - 3.9%Dreyfus InstitutionalPreferredGovernment PlusMoney Market Fund,SL Shares - 3.9% - 15,003,030 (11,795,574) 3,207,456 1,093††Total - 4.2% 223,898 23,906,509 (20,692,385) 3,438,022 1,192† Includes reinvested dividends/distributions.†† Represents securities lending income earned from the reinvestment of cash collateral from loaned securities, net of fees and collateral investment expenses, and other
payments to and from borrowers of securities.See notes to financial statements.
56
Copyright © 2022 www.secdatabase.com. All Rights Reserved.Please Consider the Environment Before Printing This Document
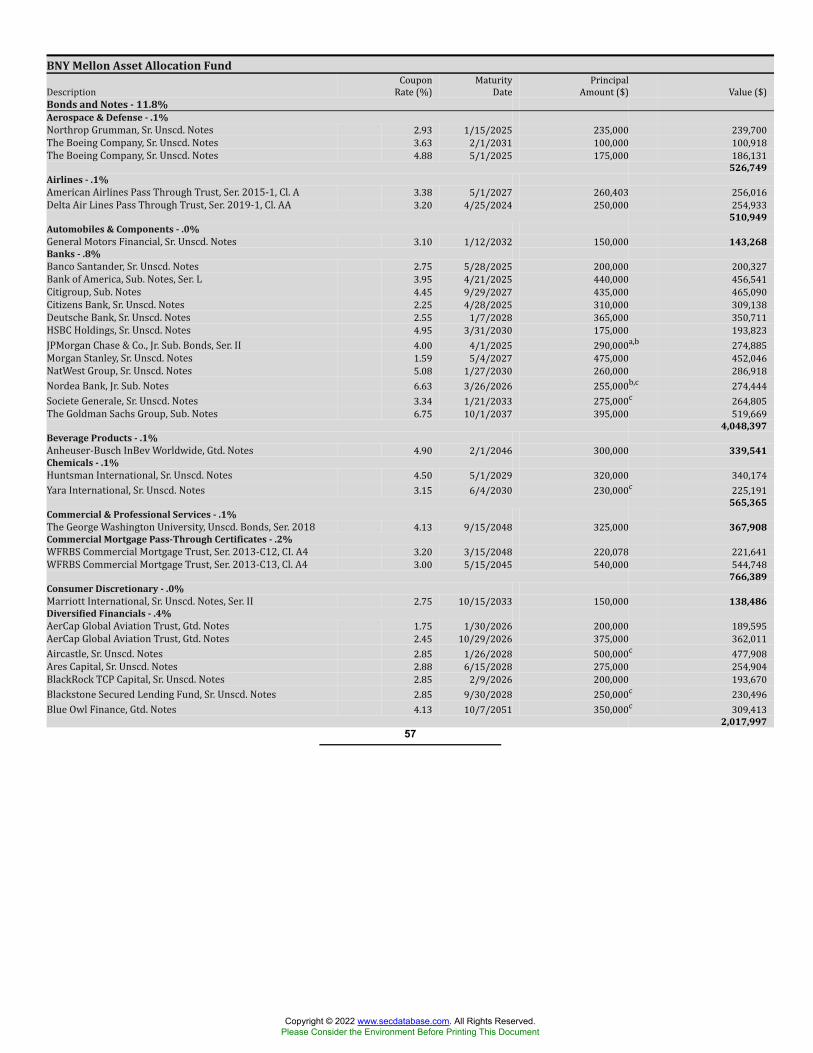
BNY Mellon Asset Allocation FundDescription CouponRate (%) MaturityDate PrincipalAmount ($) Value ($)Bonds and Notes - 11.8%Aerospace & Defense - .1%Northrop Grumman, Sr. Unscd. Notes 2.93 1/15/2025 235,000 239,700The Boeing Company, Sr. Unscd. Notes 3.63 2/1/2031 100,000 100,918The Boeing Company, Sr. Unscd. Notes 4.88 5/1/2025 175,000 186,131
526,749Airlines - .1%American Airlines Pass Through Trust, Ser. 2015-1, Cl. A 3.38 5/1/2027 260,403 256,016Delta Air Lines Pass Through Trust, Ser. 2019-1, Cl. AA 3.20 4/25/2024 250,000 254,933
510,949Automobiles & Components - .0%General Motors Financial, Sr. Unscd. Notes 3.10 1/12/2032 150,000 143,268Banks - .8%Banco Santander, Sr. Unscd. Notes 2.75 5/28/2025 200,000 200,327Bank of America, Sub. Notes, Ser. L 3.95 4/21/2025 440,000 456,541Citigroup, Sub. Notes 4.45 9/29/2027 435,000 465,090Citizens Bank, Sr. Unscd. Notes 2.25 4/28/2025 310,000 309,138Deutsche Bank, Sr. Unscd. Notes 2.55 1/7/2028 365,000 350,711HSBC Holdings, Sr. Unscd. Notes 4.95 3/31/2030 175,000 193,823JPMorgan Chase & Co., Jr. Sub. Bonds, Ser. II 4.00 4/1/2025 290,000a,b 274,885Morgan Stanley, Sr. Unscd. Notes 1.59 5/4/2027 475,000 452,046NatWest Group, Sr. Unscd. Notes 5.08 1/27/2030 260,000 286,918Nordea Bank, Jr. Sub. Notes 6.63 3/26/2026 255,000b,c 274,444Societe Generale, Sr. Unscd. Notes 3.34 1/21/2033 275,000c 264,805The Goldman Sachs Group, Sub. Notes 6.75 10/1/2037 395,000 519,669
4,048,397Beverage Products - .1%Anheuser-Busch InBev Worldwide, Gtd. Notes 4.90 2/1/2046 300,000 339,541Chemicals - .1%Huntsman International, Sr. Unscd. Notes 4.50 5/1/2029 320,000 340,174Yara International, Sr. Unscd. Notes 3.15 6/4/2030 230,000c 225,191
565,365Commercial & Professional Services - .1%The George Washington University, Unscd. Bonds, Ser. 2018 4.13 9/15/2048 325,000 367,908Commercial Mortgage Pass-Through Certificates - .2%WFRBS Commercial Mortgage Trust, Ser. 2013-C12, CI. A4 3.20 3/15/2048 220,078 221,641WFRBS Commercial Mortgage Trust, Ser. 2013-C13, Cl. A4 3.00 5/15/2045 540,000 544,748
766,389Consumer Discretionary - .0%Marriott International, Sr. Unscd. Notes, Ser. II 2.75 10/15/2033 150,000 138,486Diversified Financials - .4%AerCap Global Aviation Trust, Gtd. Notes 1.75 1/30/2026 200,000 189,595AerCap Global Aviation Trust, Gtd. Notes 2.45 10/29/2026 375,000 362,011Aircastle, Sr. Unscd. Notes 2.85 1/26/2028 500,000c 477,908Ares Capital, Sr. Unscd. Notes 2.88 6/15/2028 275,000 254,904BlackRock TCP Capital, Sr. Unscd. Notes 2.85 2/9/2026 200,000 193,670Blackstone Secured Lending Fund, Sr. Unscd. Notes 2.85 9/30/2028 250,000c 230,496Blue Owl Finance, Gtd. Notes 4.13 10/7/2051 350,000c 309,413
2,017,99757
Copyright © 2022 www.secdatabase.com. All Rights Reserved.Please Consider the Environment Before Printing This Document
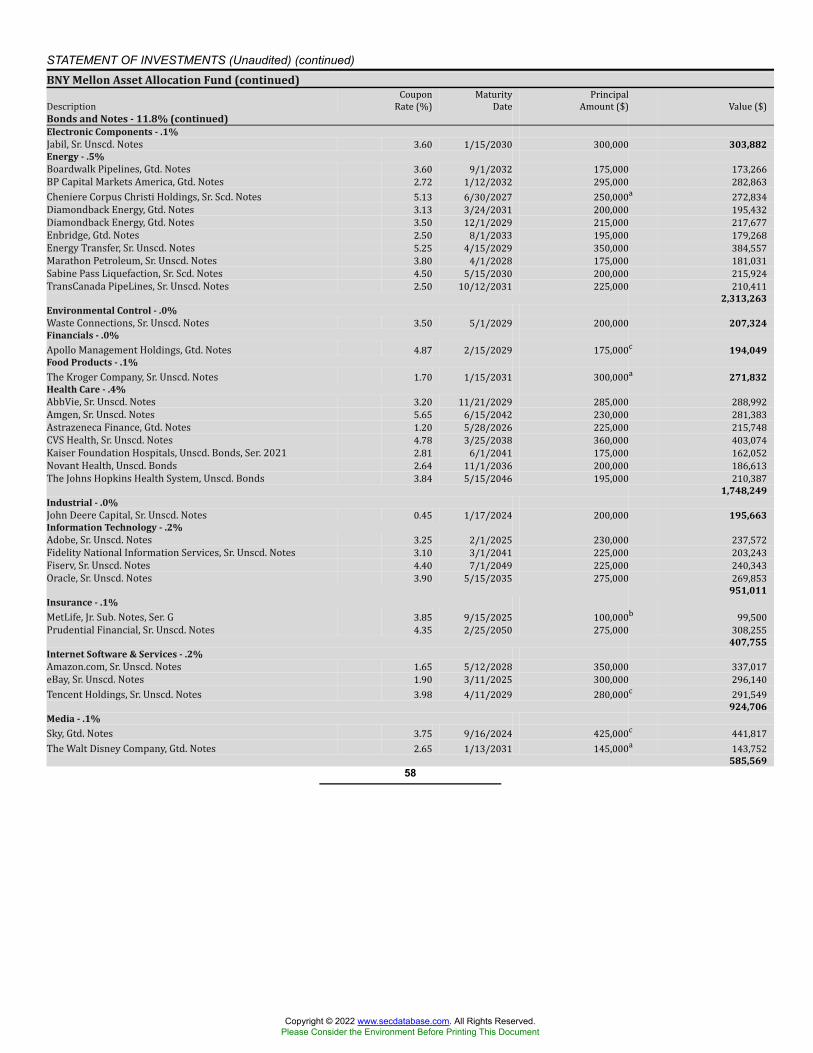
STATEMENT OF INVESTMENTS (Unaudited) (continued)BNY Mellon Asset Allocation Fund (continued)Description CouponRate (%) MaturityDate PrincipalAmount ($) Value ($)Bonds and Notes - 11.8% (continued)Electronic Components - .1%Jabil, Sr. Unscd. Notes 3.60 1/15/2030 300,000 303,882Energy - .5%Boardwalk Pipelines, Gtd. Notes 3.60 9/1/2032 175,000 173,266BP Capital Markets America, Gtd. Notes 2.72 1/12/2032 295,000 282,863Cheniere Corpus Christi Holdings, Sr. Scd. Notes 5.13 6/30/2027 250,000a 272,834Diamondback Energy, Gtd. Notes 3.13 3/24/2031 200,000 195,432Diamondback Energy, Gtd. Notes 3.50 12/1/2029 215,000 217,677Enbridge, Gtd. Notes 2.50 8/1/2033 195,000 179,268Energy Transfer, Sr. Unscd. Notes 5.25 4/15/2029 350,000 384,557Marathon Petroleum, Sr. Unscd. Notes 3.80 4/1/2028 175,000 181,031Sabine Pass Liquefaction, Sr. Scd. Notes 4.50 5/15/2030 200,000 215,924TransCanada PipeLines, Sr. Unscd. Notes 2.50 10/12/2031 225,000 210,411
2,313,263Environmental Control - .0%Waste Connections, Sr. Unscd. Notes 3.50 5/1/2029 200,000 207,324Financials - .0%Apollo Management Holdings, Gtd. Notes 4.87 2/15/2029 175,000c 194,049Food Products - .1%The Kroger Company, Sr. Unscd. Notes 1.70 1/15/2031 300,000a 271,832Health Care - .4%AbbVie, Sr. Unscd. Notes 3.20 11/21/2029 285,000 288,992Amgen, Sr. Unscd. Notes 5.65 6/15/2042 230,000 281,383Astrazeneca Finance, Gtd. Notes 1.20 5/28/2026 225,000 215,748CVS Health, Sr. Unscd. Notes 4.78 3/25/2038 360,000 403,074Kaiser Foundation Hospitals, Unscd. Bonds, Ser. 2021 2.81 6/1/2041 175,000 162,052Novant Health, Unscd. Bonds 2.64 11/1/2036 200,000 186,613The Johns Hopkins Health System, Unscd. Bonds 3.84 5/15/2046 195,000 210,387
1,748,249Industrial - .0%John Deere Capital, Sr. Unscd. Notes 0.45 1/17/2024 200,000 195,663Information Technology - .2%Adobe, Sr. Unscd. Notes 3.25 2/1/2025 230,000 237,572Fidelity National Information Services, Sr. Unscd. Notes 3.10 3/1/2041 225,000 203,243Fiserv, Sr. Unscd. Notes 4.40 7/1/2049 225,000 240,343Oracle, Sr. Unscd. Notes 3.90 5/15/2035 275,000 269,853
951,011Insurance - .1%MetLife, Jr. Sub. Notes, Ser. G 3.85 9/15/2025 100,000b 99,500Prudential Financial, Sr. Unscd. Notes 4.35 2/25/2050 275,000 308,255
407,755Internet Software & Services - .2%Amazon.com, Sr. Unscd. Notes 1.65 5/12/2028 350,000 337,017eBay, Sr. Unscd. Notes 1.90 3/11/2025 300,000 296,140Tencent Holdings, Sr. Unscd. Notes 3.98 4/11/2029 280,000c 291,549
924,706Media - .1%Sky, Gtd. Notes 3.75 9/16/2024 425,000c 441,817The Walt Disney Company, Gtd. Notes 2.65 1/13/2031 145,000a 143,752
585,56958
Copyright © 2022 www.secdatabase.com. All Rights Reserved.Please Consider the Environment Before Printing This Document

BNY Mellon Asset Allocation Fund (continued)Description CouponRate (%) MaturityDate PrincipalAmount ($) Value ($)Bonds and Notes - 11.8% (continued)Metals & Mining - .0%Glencore Funding, Gtd. Notes 2.63 9/23/2031 225,000c 206,895Municipal Securities - .7%California, GO 3.38 4/1/2025 175,000 182,956California Educational Facilities Authority, Revenue Bonds,Refunding (The Leland Stanford Junior University) Ser. U2 5.00 10/1/2032 375,000 496,333JobsOhio Beverage System, Revenue Bonds, Refunding, Ser. A 2.83 1/1/2038 150,000 146,881Massachusetts, GO (Build America Bonds) 4.91 5/1/2029 325,000 376,689New Jersey Transportation Trust Fund Authority, RevenueBonds, Refunding 4.13 6/15/2042 310,000 321,471New Jersey Turnpike Authority, Revenue Bonds, Refunding, Ser.B 1.48 1/1/2028 200,000 191,731New York City, GO, Refunding Ser. D 1.92 8/1/2031 175,000 164,969Ohio Turnpike & Infrastructure Commission, Cl. A, RevenueBonds, Refunding, Ser. A 3.22 2/15/2048 250,000 245,101Port Authority of New York & New Jersey, Revenue Bonds, Ser.AAA 1.09 7/1/2023 255,000 254,126State Board of Administration Finance Corp., Revenue Bonds,Ser. A 2.15 7/1/2030 280,000 271,971Texas Private Activity Bond Surface Transportation Corp.,Revenue Bonds, Ser. B 3.92 12/31/2049 250,000 252,023Texas Public Finance Authority, Revenue Bonds 8.25 7/1/2024 210,000 212,252University of California, Revenue Bonds, Refunding (LimitedProject) Ser. J 4.13 5/15/2045 340,000 373,878University of California, Revenue Bonds, Ser. BG 1.61 5/15/2030 160,000 148,548
3,638,929Real Estate - .4%Alexandria Real Estate Equities, Gtd. Notes 2.95 3/15/2034 225,000 220,183American Homes 4 Rent, Sr. Unscd. Notes 4.90 2/15/2029 400,000 442,008Duke Realty, Sr. Unscd. Notes 2.25 1/15/2032 175,000 163,306Hudson Pacific Properties, Gtd. Notes 3.25 1/15/2030 265,000 264,640Kimco Realty, Sr. Unscd. Notes 3.20 4/1/2032 200,000 200,396Life Storage, Gtd. Notes 4.00 6/15/2029 160,000 170,480Simon Property Group, Sr. Unscd. Notes 2.65 2/1/2032 200,000 192,873Spirit Realty, Gtd. Notes 2.10 3/15/2028 225,000 212,136
1,866,022Retailing - .2%7-Eleven, Sr. Unscd. Notes 1.80 2/10/2031 275,000c 245,448Genuine Parts, Sr. Unscd. Notes 2.75 2/1/2032 225,000 215,509Ross Stores, Sr. Unscd. Notes 4.60 4/15/2025 225,000 240,195The Home Depot, Sr. Unscd. Notes 1.38 3/15/2031 280,000 250,992
952,144Semiconductors & Semiconductor Equipment - .3%Broadcom, Gtd. Notes 2.45 2/15/2031 175,000c 161,777Broadcom, Sr. Unscd. Notes 3.19 11/15/2036 300,000c 278,908KLA, Sr. Unscd. Notes 4.10 3/15/2029 225,000 242,970Microchip Technology, Sr. Scd. Notes 0.97 2/15/2024 310,000 302,268Microchip Technology, Sr. Scd. Notes 0.98 9/1/2024 115,000c 110,737NXP Funding, Gtd. Notes 2.70 5/1/2025 100,000c 100,620
1,197,28059
Copyright © 2022 www.secdatabase.com. All Rights Reserved.Please Consider the Environment Before Printing This Document
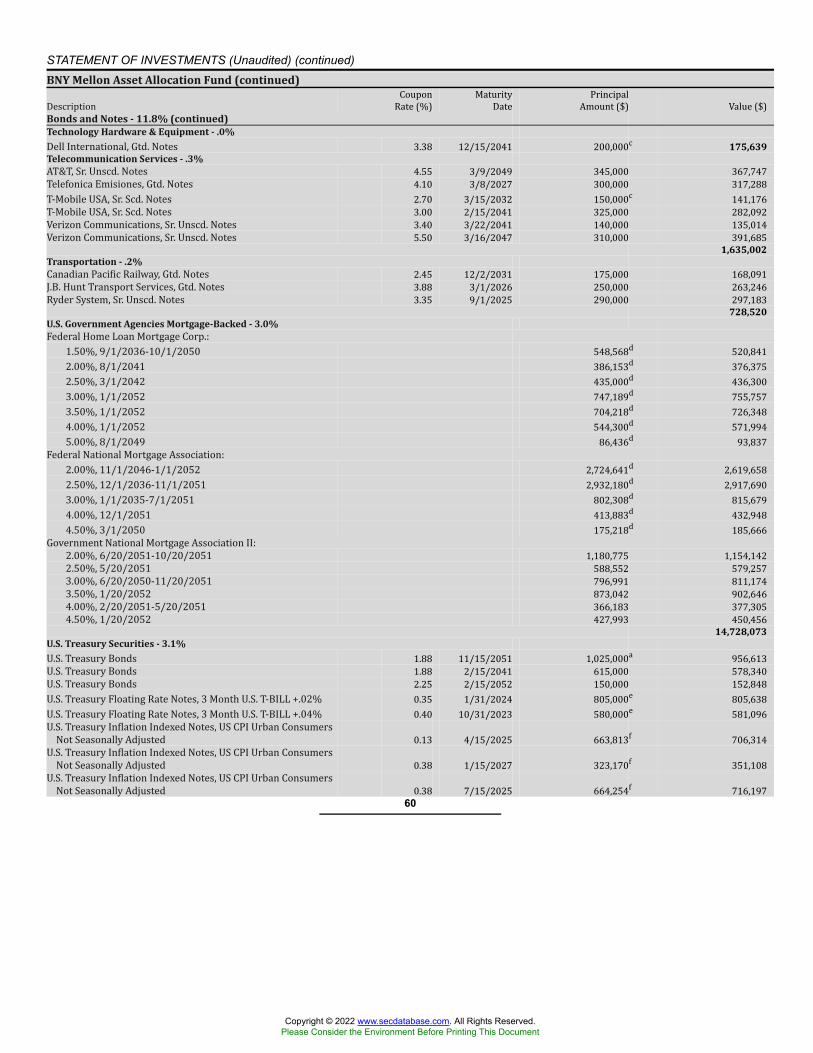
STATEMENT OF INVESTMENTS (Unaudited) (continued)BNY Mellon Asset Allocation Fund (continued)Description CouponRate (%) MaturityDate PrincipalAmount ($) Value ($)Bonds and Notes - 11.8% (continued)Technology Hardware & Equipment - .0%Dell International, Gtd. Notes 3.38 12/15/2041 200,000c 175,639Telecommunication Services - .3%AT&T, Sr. Unscd. Notes 4.55 3/9/2049 345,000 367,747Telefonica Emisiones, Gtd. Notes 4.10 3/8/2027 300,000 317,288T-Mobile USA, Sr. Scd. Notes 2.70 3/15/2032 150,000c 141,176T-Mobile USA, Sr. Scd. Notes 3.00 2/15/2041 325,000 282,092Verizon Communications, Sr. Unscd. Notes 3.40 3/22/2041 140,000 135,014Verizon Communications, Sr. Unscd. Notes 5.50 3/16/2047 310,000 391,685
1,635,002Transportation - .2%Canadian Pacific Railway, Gtd. Notes 2.45 12/2/2031 175,000 168,091J.B. Hunt Transport Services, Gtd. Notes 3.88 3/1/2026 250,000 263,246Ryder System, Sr. Unscd. Notes 3.35 9/1/2025 290,000 297,183
728,520U.S. Government Agencies Mortgage-Backed - 3.0%Federal Home Loan Mortgage Corp.:1.50%, 9/1/2036-10/1/2050 548,568d 520,8412.00%, 8/1/2041 386,153d 376,3752.50%, 3/1/2042 435,000d 436,3003.00%, 1/1/2052 747,189d 755,7573.50%, 1/1/2052 704,218d 726,3484.00%, 1/1/2052 544,300d 571,9945.00%, 8/1/2049 86,436d 93,837Federal National Mortgage Association:2.00%, 11/1/2046-1/1/2052 2,724,641d 2,619,6582.50%, 12/1/2036-11/1/2051 2,932,180d 2,917,6903.00%, 1/1/2035-7/1/2051 802,308d 815,6794.00%, 12/1/2051 413,883d 432,9484.50%, 3/1/2050 175,218d 185,666Government National Mortgage Association II:2.00%, 6/20/2051-10/20/2051 1,180,775 1,154,1422.50%, 5/20/2051 588,552 579,2573.00%, 6/20/2050-11/20/2051 796,991 811,1743.50%, 1/20/2052 873,042 902,6464.00%, 2/20/2051-5/20/2051 366,183 377,3054.50%, 1/20/2052 427,993 450,456
14,728,073U.S. Treasury Securities - 3.1%U.S. Treasury Bonds 1.88 11/15/2051 1,025,000a 956,613U.S. Treasury Bonds 1.88 2/15/2041 615,000 578,340U.S. Treasury Bonds 2.25 2/15/2052 150,000 152,848U.S. Treasury Floating Rate Notes, 3 Month U.S. T-BILL +.02% 0.35 1/31/2024 805,000e 805,638U.S. Treasury Floating Rate Notes, 3 Month U.S. T-BILL +.04% 0.40 10/31/2023 580,000e 581,096U.S. Treasury Inflation Indexed Notes, US CPI Urban ConsumersNot Seasonally Adjusted 0.13 4/15/2025 663,813f 706,314U.S. Treasury Inflation Indexed Notes, US CPI Urban ConsumersNot Seasonally Adjusted 0.38 1/15/2027 323,170f 351,108U.S. Treasury Inflation Indexed Notes, US CPI Urban ConsumersNot Seasonally Adjusted 0.38 7/15/2025 664,254f 716,197
60
Copyright © 2022 www.secdatabase.com. All Rights Reserved.Please Consider the Environment Before Printing This Document
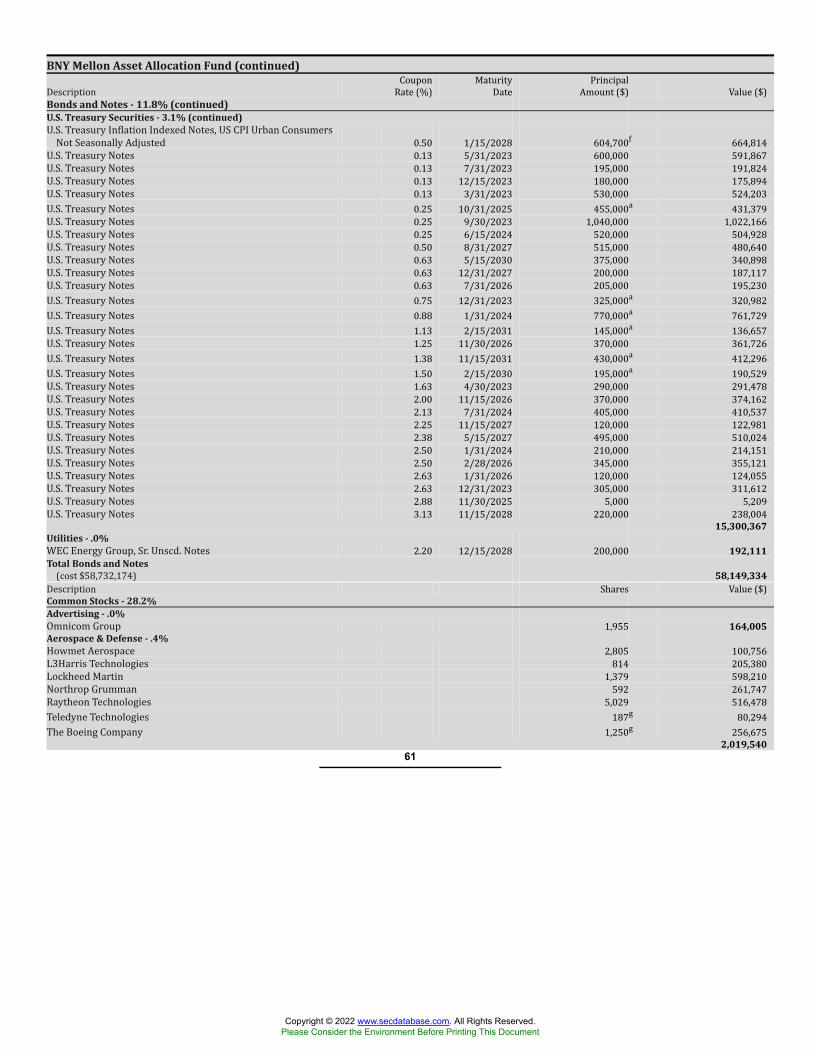
BNY Mellon Asset Allocation Fund (continued)Description CouponRate (%) MaturityDate PrincipalAmount ($) Value ($)Bonds and Notes - 11.8% (continued)U.S. Treasury Securities - 3.1% (continued)U.S. Treasury Inflation Indexed Notes, US CPI Urban ConsumersNot Seasonally Adjusted 0.50 1/15/2028 604,700f 664,814U.S. Treasury Notes 0.13 5/31/2023 600,000 591,867U.S. Treasury Notes 0.13 7/31/2023 195,000 191,824U.S. Treasury Notes 0.13 12/15/2023 180,000 175,894U.S. Treasury Notes 0.13 3/31/2023 530,000 524,203U.S. Treasury Notes 0.25 10/31/2025 455,000a 431,379U.S. Treasury Notes 0.25 9/30/2023 1,040,000 1,022,166U.S. Treasury Notes 0.25 6/15/2024 520,000 504,928U.S. Treasury Notes 0.50 8/31/2027 515,000 480,640U.S. Treasury Notes 0.63 5/15/2030 375,000 340,898U.S. Treasury Notes 0.63 12/31/2027 200,000 187,117U.S. Treasury Notes 0.63 7/31/2026 205,000 195,230U.S. Treasury Notes 0.75 12/31/2023 325,000a 320,982U.S. Treasury Notes 0.88 1/31/2024 770,000a 761,729U.S. Treasury Notes 1.13 2/15/2031 145,000a 136,657U.S. Treasury Notes 1.25 11/30/2026 370,000 361,726U.S. Treasury Notes 1.38 11/15/2031 430,000a 412,296U.S. Treasury Notes 1.50 2/15/2030 195,000a 190,529U.S. Treasury Notes 1.63 4/30/2023 290,000 291,478U.S. Treasury Notes 2.00 11/15/2026 370,000 374,162U.S. Treasury Notes 2.13 7/31/2024 405,000 410,537U.S. Treasury Notes 2.25 11/15/2027 120,000 122,981U.S. Treasury Notes 2.38 5/15/2027 495,000 510,024U.S. Treasury Notes 2.50 1/31/2024 210,000 214,151U.S. Treasury Notes 2.50 2/28/2026 345,000 355,121U.S. Treasury Notes 2.63 1/31/2026 120,000 124,055U.S. Treasury Notes 2.63 12/31/2023 305,000 311,612U.S. Treasury Notes 2.88 11/30/2025 5,000 5,209U.S. Treasury Notes 3.13 11/15/2028 220,000 238,004
15,300,367Utilities - .0%WEC Energy Group, Sr. Unscd. Notes 2.20 12/15/2028 200,000 192,111Total Bonds and Notes(cost $58,732,174) 58,149,334Description Shares Value ($)Common Stocks - 28.2%Advertising - .0%Omnicom Group 1,955 164,005Aerospace & Defense - .4%Howmet Aerospace 2,805 100,756L3Harris Technologies 814 205,380Lockheed Martin 1,379 598,210Northrop Grumman 592 261,747Raytheon Technologies 5,029 516,478Teledyne Technologies 187g 80,294The Boeing Company 1,250g 256,675
2,019,54061
Copyright © 2022 www.secdatabase.com. All Rights Reserved.Please Consider the Environment Before Printing This Document
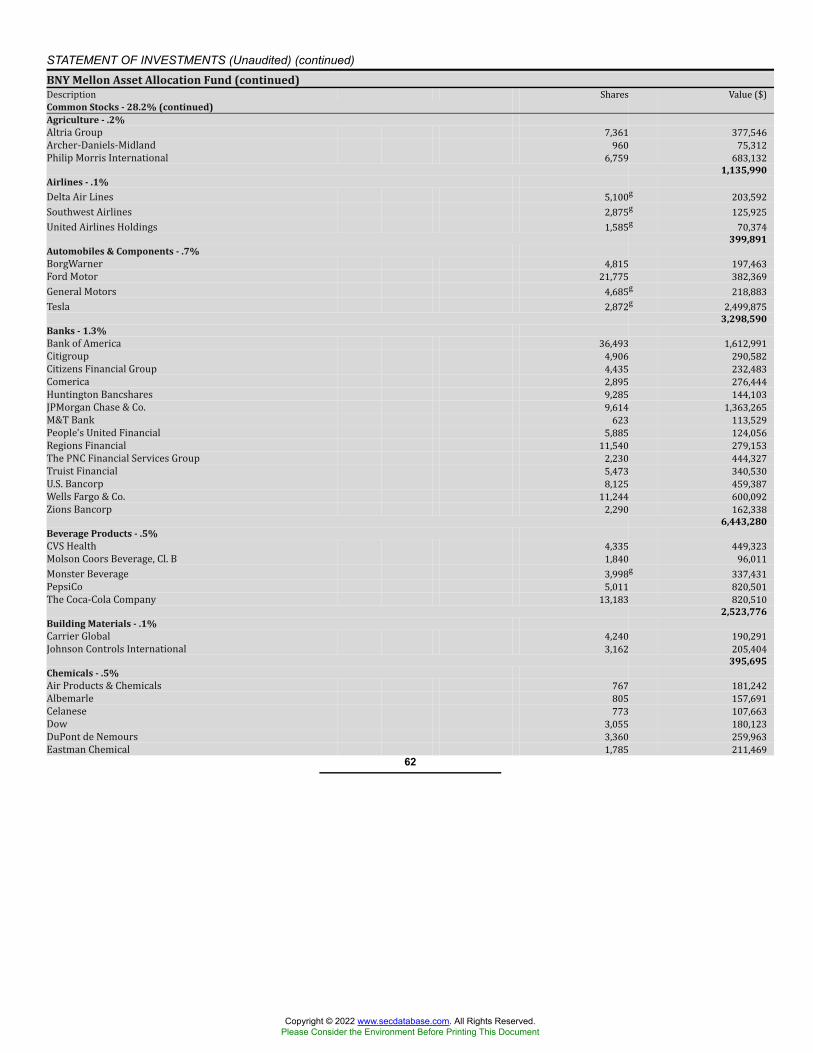
STATEMENT OF INVESTMENTS (Unaudited) (continued)BNY Mellon Asset Allocation Fund (continued)Description Shares Value ($)Common Stocks - 28.2% (continued)Agriculture - .2%Altria Group 7,361 377,546Archer-Daniels-Midland 960 75,312Philip Morris International 6,759 683,132
1,135,990Airlines - .1%Delta Air Lines 5,100g 203,592Southwest Airlines 2,875g 125,925United Airlines Holdings 1,585g 70,374
399,891Automobiles & Components - .7%BorgWarner 4,815 197,463Ford Motor 21,775 382,369General Motors 4,685g 218,883Tesla 2,872g 2,499,875
3,298,590Banks - 1.3%Bank of America 36,493 1,612,991Citigroup 4,906 290,582Citizens Financial Group 4,435 232,483Comerica 2,895 276,444Huntington Bancshares 9,285 144,103JPMorgan Chase & Co. 9,614 1,363,265M&T Bank 623 113,529People's United Financial 5,885 124,056Regions Financial 11,540 279,153The PNC Financial Services Group 2,230 444,327Truist Financial 5,473 340,530U.S. Bancorp 8,125 459,387Wells Fargo & Co. 11,244 600,092Zions Bancorp 2,290 162,338
6,443,280Beverage Products - .5%CVS Health 4,335 449,323Molson Coors Beverage, Cl. B 1,840 96,011Monster Beverage 3,998g 337,431PepsiCo 5,011 820,501The Coca-Cola Company 13,183 820,510
2,523,776Building Materials - .1%Carrier Global 4,240 190,291Johnson Controls International 3,162 205,404
395,695Chemicals - .5%Air Products & Chemicals 767 181,242Albemarle 805 157,691Celanese 773 107,663Dow 3,055 180,123DuPont de Nemours 3,360 259,963Eastman Chemical 1,785 211,469
62
Copyright © 2022 www.secdatabase.com. All Rights Reserved.Please Consider the Environment Before Printing This Document
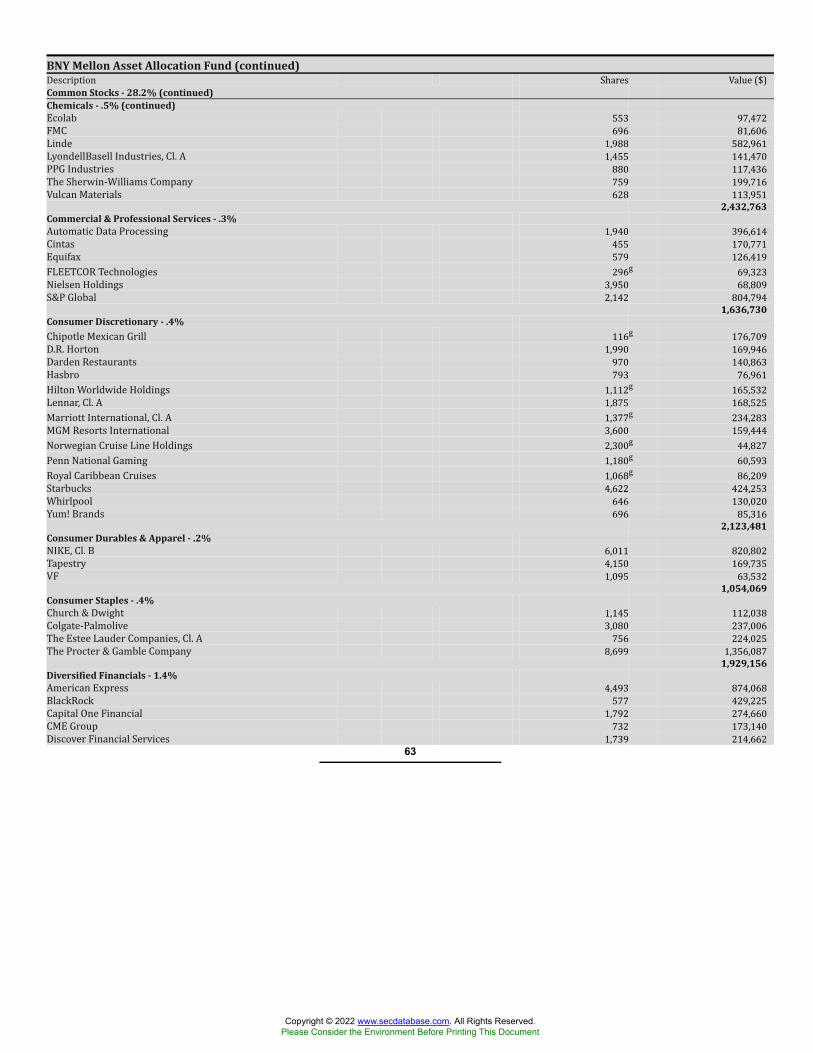
BNY Mellon Asset Allocation Fund (continued)Description Shares Value ($)Common Stocks - 28.2% (continued)Chemicals - .5% (continued)Ecolab 553 97,472FMC 696 81,606Linde 1,988 582,961LyondellBasell Industries, Cl. A 1,455 141,470PPG Industries 880 117,436The Sherwin-Williams Company 759 199,716Vulcan Materials 628 113,951
2,432,763Commercial & Professional Services - .3%Automatic Data Processing 1,940 396,614Cintas 455 170,771Equifax 579 126,419FLEETCOR Technologies 296g 69,323Nielsen Holdings 3,950 68,809S&P Global 2,142 804,794
1,636,730Consumer Discretionary - .4%Chipotle Mexican Grill 116g 176,709D.R. Horton 1,990 169,946Darden Restaurants 970 140,863Hasbro 793 76,961Hilton Worldwide Holdings 1,112g 165,532Lennar, Cl. A 1,875 168,525Marriott International, Cl. A 1,377g 234,283MGM Resorts International 3,600 159,444Norwegian Cruise Line Holdings 2,300g 44,827Penn National Gaming 1,180g 60,593Royal Caribbean Cruises 1,068g 86,209Starbucks 4,622 424,253Whirlpool 646 130,020Yum! Brands 696 85,316
2,123,481Consumer Durables & Apparel - .2%NIKE, Cl. B 6,011 820,802Tapestry 4,150 169,735VF 1,095 63,532
1,054,069Consumer Staples - .4%Church & Dwight 1,145 112,038Colgate-Palmolive 3,080 237,006The Estee Lauder Companies, Cl. A 756 224,025The Procter & Gamble Company 8,699 1,356,087
1,929,156Diversified Financials - 1.4%American Express 4,493 874,068BlackRock 577 429,225Capital One Financial 1,792 274,660CME Group 732 173,140Discover Financial Services 1,739 214,662
63
Copyright © 2022 www.secdatabase.com. All Rights Reserved.Please Consider the Environment Before Printing This Document
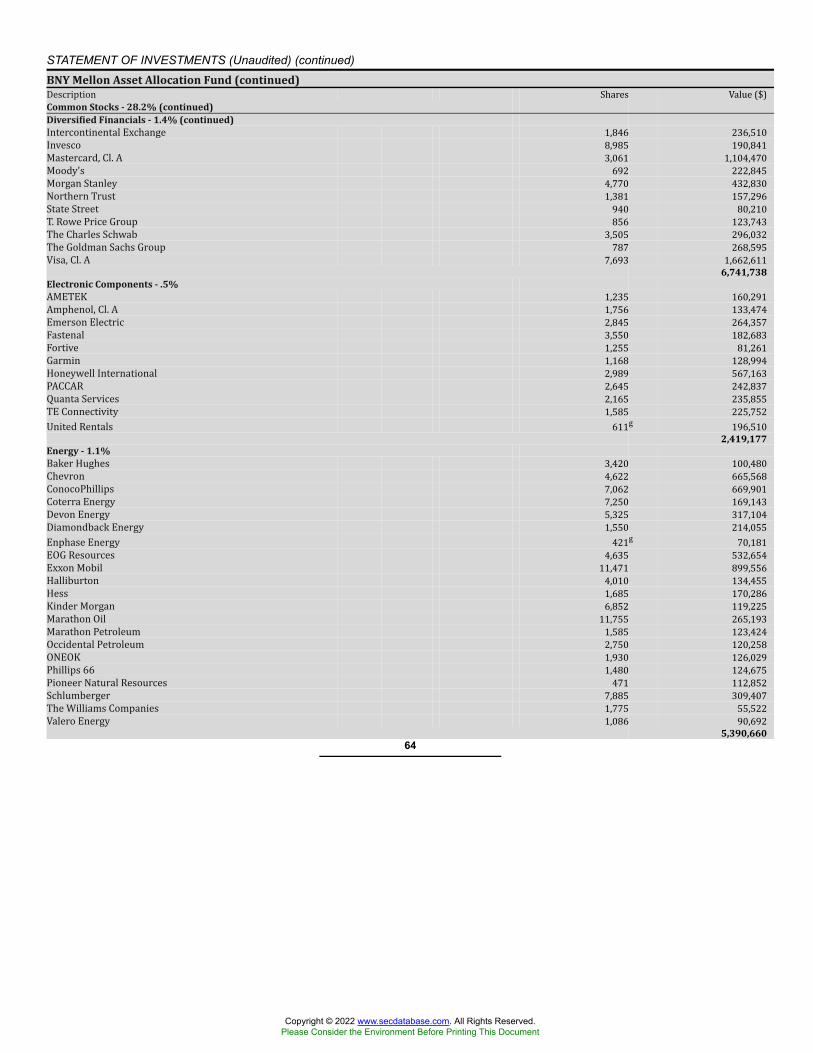
STATEMENT OF INVESTMENTS (Unaudited) (continued)BNY Mellon Asset Allocation Fund (continued)Description Shares Value ($)Common Stocks - 28.2% (continued)Diversified Financials - 1.4% (continued)Intercontinental Exchange 1,846 236,510Invesco 8,985 190,841Mastercard, Cl. A 3,061 1,104,470Moody's 692 222,845Morgan Stanley 4,770 432,830Northern Trust 1,381 157,296State Street 940 80,210T. Rowe Price Group 856 123,743The Charles Schwab 3,505 296,032The Goldman Sachs Group 787 268,595Visa, Cl. A 7,693 1,662,611
6,741,738Electronic Components - .5%AMETEK 1,235 160,291Amphenol, Cl. A 1,756 133,474Emerson Electric 2,845 264,357Fastenal 3,550 182,683Fortive 1,255 81,261Garmin 1,168 128,994Honeywell International 2,989 567,163PACCAR 2,645 242,837Quanta Services 2,165 235,855TE Connectivity 1,585 225,752United Rentals 611g 196,510
2,419,177Energy - 1.1%Baker Hughes 3,420 100,480Chevron 4,622 665,568ConocoPhillips 7,062 669,901Coterra Energy 7,250 169,143Devon Energy 5,325 317,104Diamondback Energy 1,550 214,055Enphase Energy 421g 70,181EOG Resources 4,635 532,654Exxon Mobil 11,471 899,556Halliburton 4,010 134,455Hess 1,685 170,286Kinder Morgan 6,852 119,225Marathon Oil 11,755 265,193Marathon Petroleum 1,585 123,424Occidental Petroleum 2,750 120,258ONEOK 1,930 126,029Phillips 66 1,480 124,675Pioneer Natural Resources 471 112,852Schlumberger 7,885 309,407The Williams Companies 1,775 55,522Valero Energy 1,086 90,692
5,390,66064
Copyright © 2022 www.secdatabase.com. All Rights Reserved.Please Consider the Environment Before Printing This Document
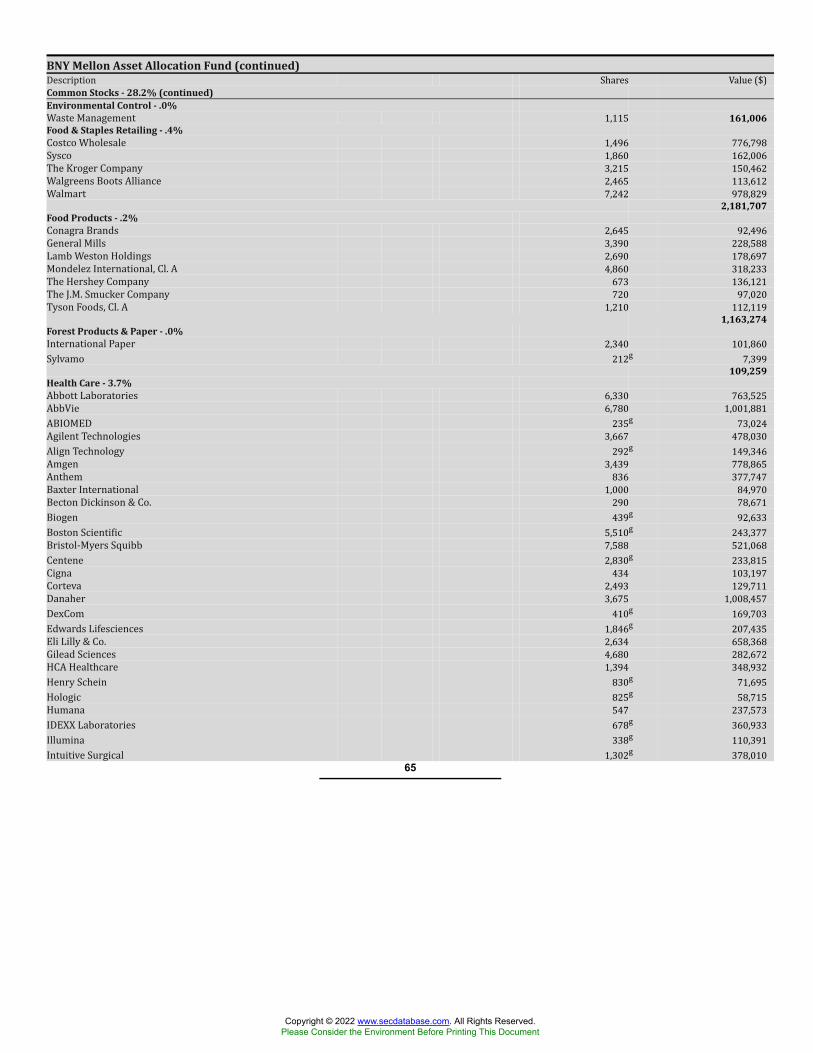
BNY Mellon Asset Allocation Fund (continued)Description Shares Value ($)Common Stocks - 28.2% (continued)Environmental Control - .0%Waste Management 1,115 161,006Food & Staples Retailing - .4%Costco Wholesale 1,496 776,798Sysco 1,860 162,006The Kroger Company 3,215 150,462Walgreens Boots Alliance 2,465 113,612Walmart 7,242 978,829
2,181,707Food Products - .2%Conagra Brands 2,645 92,496General Mills 3,390 228,588Lamb Weston Holdings 2,690 178,697Mondelez International, Cl. A 4,860 318,233The Hershey Company 673 136,121The J.M. Smucker Company 720 97,020Tyson Foods, Cl. A 1,210 112,119
1,163,274Forest Products & Paper - .0%International Paper 2,340 101,860Sylvamo 212g 7,399
109,259Health Care - 3.7%Abbott Laboratories 6,330 763,525AbbVie 6,780 1,001,881ABIOMED 235g 73,024Agilent Technologies 3,667 478,030Align Technology 292g 149,346Amgen 3,439 778,865Anthem 836 377,747Baxter International 1,000 84,970Becton Dickinson & Co. 290 78,671Biogen 439g 92,633Boston Scientific 5,510g 243,377Bristol-Myers Squibb 7,588 521,068Centene 2,830g 233,815Cigna 434 103,197Corteva 2,493 129,711Danaher 3,675 1,008,457DexCom 410g 169,703Edwards Lifesciences 1,846g 207,435Eli Lilly & Co. 2,634 658,368Gilead Sciences 4,680 282,672HCA Healthcare 1,394 348,932Henry Schein 830g 71,695Hologic 825g 58,715Humana 547 237,573IDEXX Laboratories 678g 360,933Illumina 338g 110,391Intuitive Surgical 1,302g 378,010
65
Copyright © 2022 www.secdatabase.com. All Rights Reserved.Please Consider the Environment Before Printing This Document
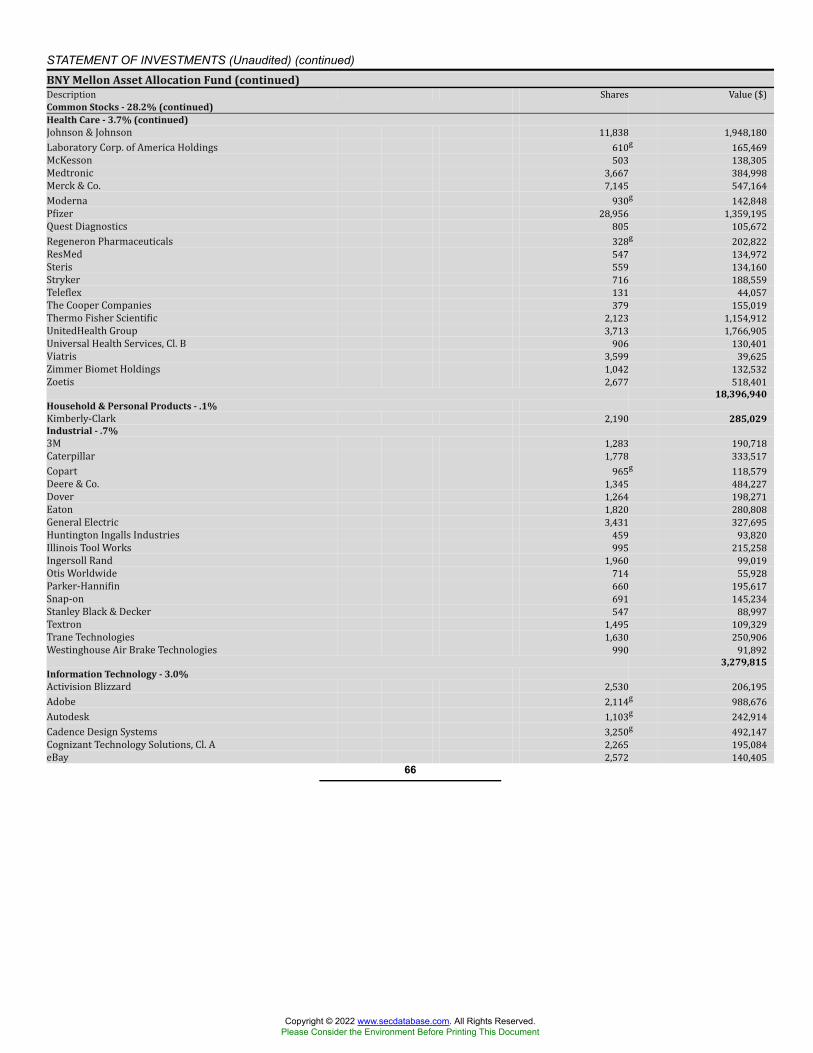
STATEMENT OF INVESTMENTS (Unaudited) (continued)BNY Mellon Asset Allocation Fund (continued)Description Shares Value ($)Common Stocks - 28.2% (continued)Health Care - 3.7% (continued)Johnson & Johnson 11,838 1,948,180Laboratory Corp. of America Holdings 610g 165,469McKesson 503 138,305Medtronic 3,667 384,998Merck & Co. 7,145 547,164Moderna 930g 142,848Pfizer 28,956 1,359,195Quest Diagnostics 805 105,672Regeneron Pharmaceuticals 328g 202,822ResMed 547 134,972Steris 559 134,160Stryker 716 188,559Teleflex 131 44,057The Cooper Companies 379 155,019Thermo Fisher Scientific 2,123 1,154,912UnitedHealth Group 3,713 1,766,905Universal Health Services, Cl. B 906 130,401Viatris 3,599 39,625Zimmer Biomet Holdings 1,042 132,532Zoetis 2,677 518,401
18,396,940Household & Personal Products - .1%Kimberly-Clark 2,190 285,029Industrial - .7%3M 1,283 190,718Caterpillar 1,778 333,517Copart 965g 118,579Deere & Co. 1,345 484,227Dover 1,264 198,271Eaton 1,820 280,808General Electric 3,431 327,695Huntington Ingalls Industries 459 93,820Illinois Tool Works 995 215,258Ingersoll Rand 1,960 99,019Otis Worldwide 714 55,928Parker-Hannifin 660 195,617Snap-on 691 145,234Stanley Black & Decker 547 88,997Textron 1,495 109,329Trane Technologies 1,630 250,906Westinghouse Air Brake Technologies 990 91,892
3,279,815Information Technology - 3.0%Activision Blizzard 2,530 206,195Adobe 2,114g 988,676Autodesk 1,103g 242,914Cadence Design Systems 3,250g 492,147Cognizant Technology Solutions, Cl. A 2,265 195,084eBay 2,572 140,405
66
Copyright © 2022 www.secdatabase.com. All Rights Reserved.Please Consider the Environment Before Printing This Document
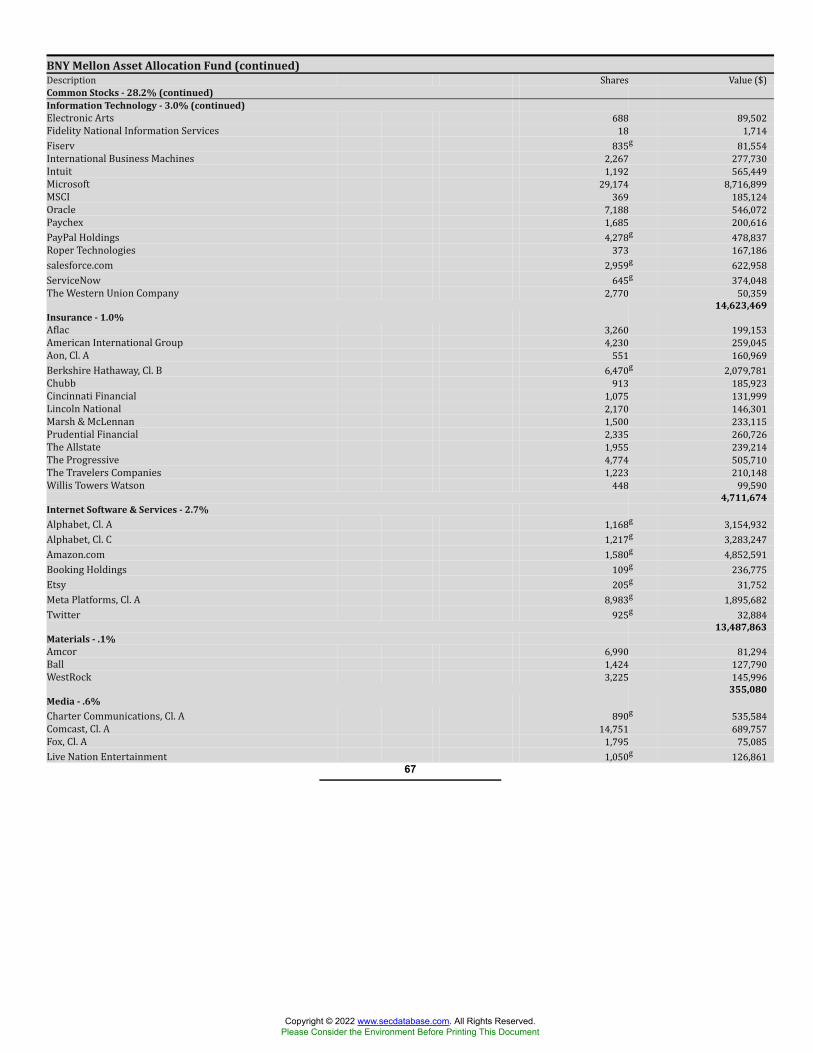
BNY Mellon Asset Allocation Fund (continued)Description Shares Value ($)Common Stocks - 28.2% (continued)Information Technology - 3.0% (continued)Electronic Arts 688 89,502Fidelity National Information Services 18 1,714Fiserv 835g 81,554International Business Machines 2,267 277,730Intuit 1,192 565,449Microsoft 29,174 8,716,899MSCI 369 185,124Oracle 7,188 546,072Paychex 1,685 200,616PayPal Holdings 4,278g 478,837Roper Technologies 373 167,186salesforce.com 2,959g 622,958ServiceNow 645g 374,048The Western Union Company 2,770 50,359
14,623,469Insurance - 1.0%Aflac 3,260 199,153American International Group 4,230 259,045Aon, Cl. A 551 160,969Berkshire Hathaway, Cl. B 6,470g 2,079,781Chubb 913 185,923Cincinnati Financial 1,075 131,999Lincoln National 2,170 146,301Marsh & McLennan 1,500 233,115Prudential Financial 2,335 260,726The Allstate 1,955 239,214The Progressive 4,774 505,710The Travelers Companies 1,223 210,148Willis Towers Watson 448 99,590
4,711,674Internet Software & Services - 2.7%Alphabet, Cl. A 1,168g 3,154,932Alphabet, Cl. C 1,217g 3,283,247Amazon.com 1,580g 4,852,591Booking Holdings 109g 236,775Etsy 205g 31,752Meta Platforms, Cl. A 8,983g 1,895,682Twitter 925g 32,884
13,487,863Materials - .1%Amcor 6,990 81,294Ball 1,424 127,790WestRock 3,225 145,996
355,080Media - .6%Charter Communications, Cl. A 890g 535,584Comcast, Cl. A 14,751 689,757Fox, Cl. A 1,795 75,085Live Nation Entertainment 1,050g 126,861
67
Copyright © 2022 www.secdatabase.com. All Rights Reserved.Please Consider the Environment Before Printing This Document
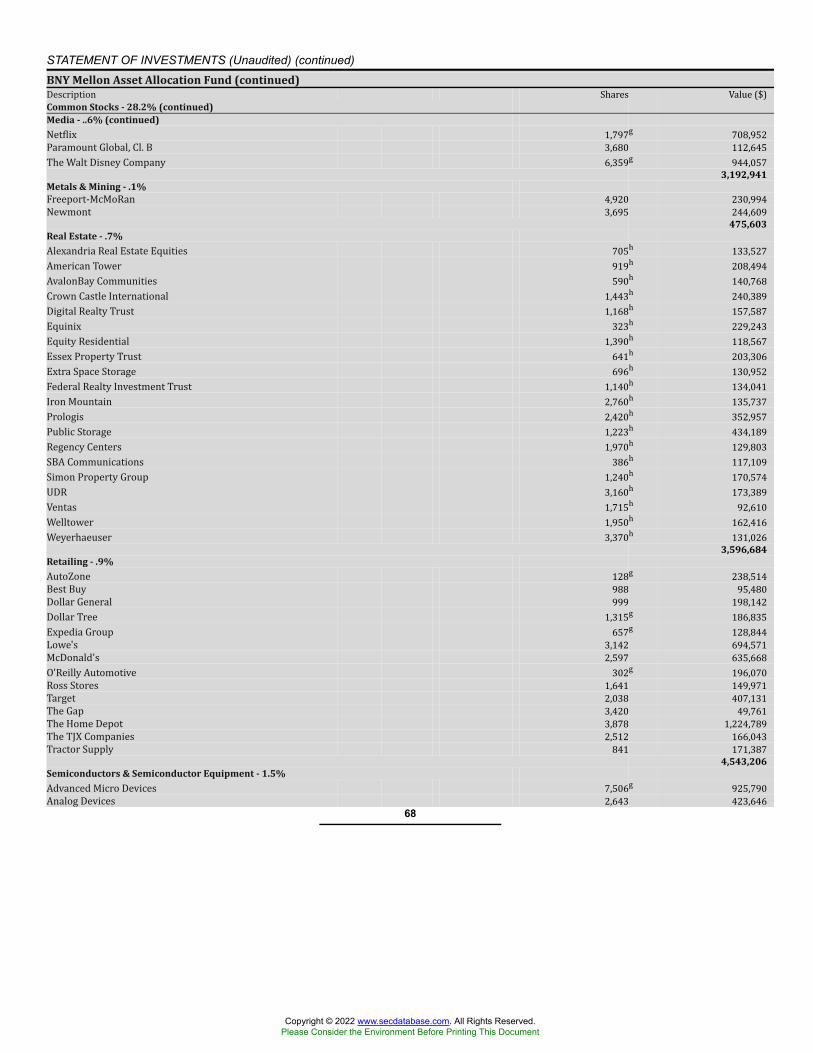
STATEMENT OF INVESTMENTS (Unaudited) (continued)BNY Mellon Asset Allocation Fund (continued)Description Shares Value ($)Common Stocks - 28.2% (continued)Media - ..6% (continued)Netflix 1,797g 708,952Paramount Global, Cl. B 3,680 112,645The Walt Disney Company 6,359g 944,057
3,192,941Metals & Mining - .1%Freeport-McMoRan 4,920 230,994Newmont 3,695 244,609
475,603Real Estate - .7%Alexandria Real Estate Equities 705h 133,527American Tower 919h 208,494AvalonBay Communities 590h 140,768Crown Castle International 1,443h 240,389Digital Realty Trust 1,168h 157,587Equinix 323h 229,243Equity Residential 1,390h 118,567Essex Property Trust 641h 203,306Extra Space Storage 696h 130,952Federal Realty Investment Trust 1,140h 134,041Iron Mountain 2,760h 135,737Prologis 2,420h 352,957Public Storage 1,223h 434,189Regency Centers 1,970h 129,803SBA Communications 386h 117,109Simon Property Group 1,240h 170,574UDR 3,160h 173,389Ventas 1,715h 92,610Welltower 1,950h 162,416Weyerhaeuser 3,370h 131,026
3,596,684Retailing - .9%AutoZone 128g 238,514Best Buy 988 95,480Dollar General 999 198,142Dollar Tree 1,315g 186,835Expedia Group 657g 128,844Lowe's 3,142 694,571McDonald's 2,597 635,668O'Reilly Automotive 302g 196,070Ross Stores 1,641 149,971Target 2,038 407,131The Gap 3,420 49,761The Home Depot 3,878 1,224,789The TJX Companies 2,512 166,043Tractor Supply 841 171,387
4,543,206Semiconductors & Semiconductor Equipment - 1.5%Advanced Micro Devices 7,506g 925,790Analog Devices 2,643 423,646
68
Copyright © 2022 www.secdatabase.com. All Rights Reserved.Please Consider the Environment Before Printing This Document
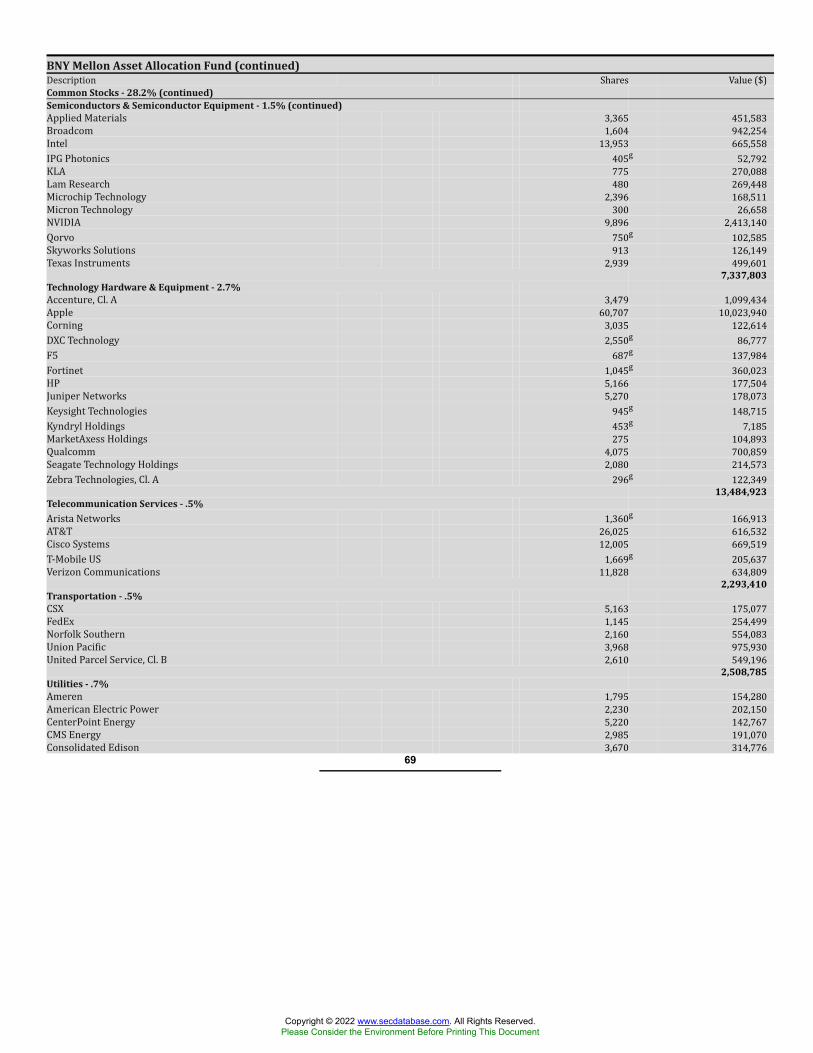
BNY Mellon Asset Allocation Fund (continued)Description Shares Value ($)Common Stocks - 28.2% (continued)Semiconductors & Semiconductor Equipment - 1.5% (continued)Applied Materials 3,365 451,583Broadcom 1,604 942,254Intel 13,953 665,558IPG Photonics 405g 52,792KLA 775 270,088Lam Research 480 269,448Microchip Technology 2,396 168,511Micron Technology 300 26,658NVIDIA 9,896 2,413,140Qorvo 750g 102,585Skyworks Solutions 913 126,149Texas Instruments 2,939 499,601
7,337,803Technology Hardware & Equipment - 2.7%Accenture, Cl. A 3,479 1,099,434Apple 60,707 10,023,940Corning 3,035 122,614DXC Technology 2,550g 86,777F5 687g 137,984Fortinet 1,045g 360,023HP 5,166 177,504Juniper Networks 5,270 178,073Keysight Technologies 945g 148,715Kyndryl Holdings 453g 7,185MarketAxess Holdings 275 104,893Qualcomm 4,075 700,859Seagate Technology Holdings 2,080 214,573Zebra Technologies, Cl. A 296g 122,349
13,484,923Telecommunication Services - .5%Arista Networks 1,360g 166,913AT&T 26,025 616,532Cisco Systems 12,005 669,519T-Mobile US 1,669g 205,637Verizon Communications 11,828 634,809
2,293,410Transportation - .5%CSX 5,163 175,077FedEx 1,145 254,499Norfolk Southern 2,160 554,083Union Pacific 3,968 975,930United Parcel Service, Cl. B 2,610 549,196
2,508,785Utilities - .7%Ameren 1,795 154,280American Electric Power 2,230 202,150CenterPoint Energy 5,220 142,767CMS Energy 2,985 191,070Consolidated Edison 3,670 314,776
69
Copyright © 2022 www.secdatabase.com. All Rights Reserved.Please Consider the Environment Before Printing This Document
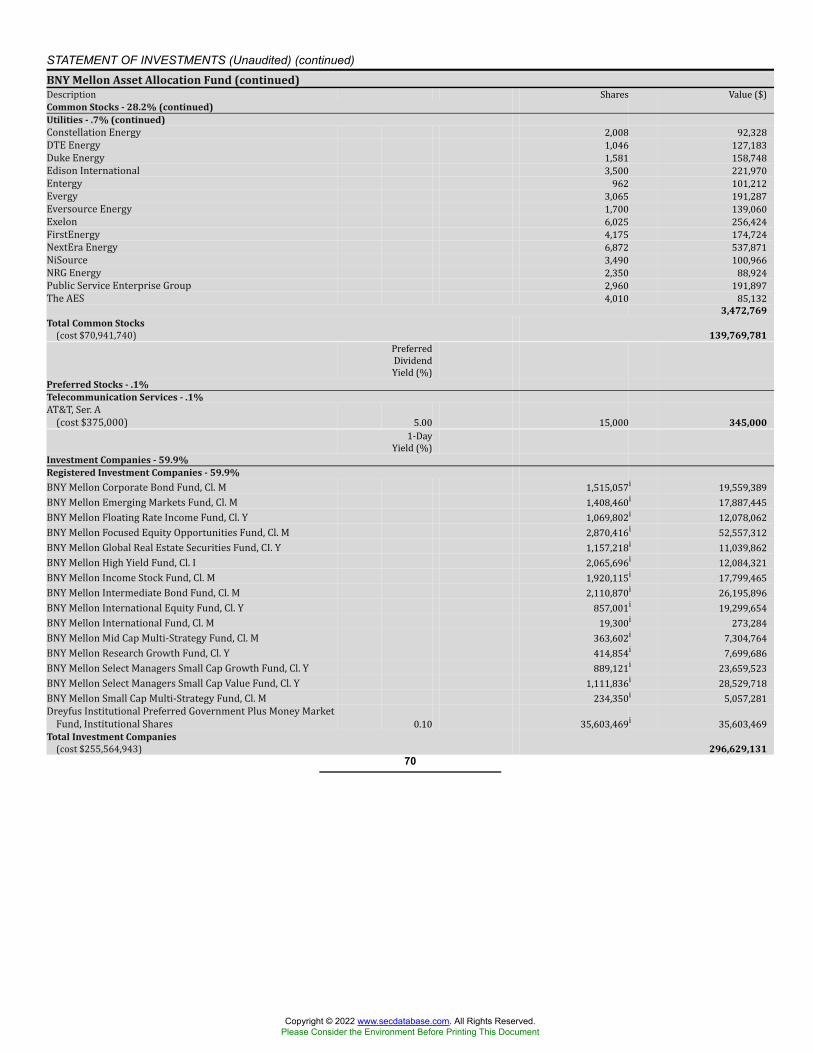
STATEMENT OF INVESTMENTS (Unaudited) (continued)BNY Mellon Asset Allocation Fund (continued)Description Shares Value ($)Common Stocks - 28.2% (continued)Utilities - .7% (continued)Constellation Energy 2,008 92,328DTE Energy 1,046 127,183Duke Energy 1,581 158,748Edison International 3,500 221,970Entergy 962 101,212Evergy 3,065 191,287Eversource Energy 1,700 139,060Exelon 6,025 256,424FirstEnergy 4,175 174,724NextEra Energy 6,872 537,871NiSource 3,490 100,966NRG Energy 2,350 88,924Public Service Enterprise Group 2,960 191,897The AES 4,010 85,132
3,472,769Total Common Stocks(cost $70,941,740) 139,769,781PreferredDividendYield (%)Preferred Stocks - .1%Telecommunication Services - .1%AT&T, Ser. A(cost $375,000) 5.00 15,000 345,0001-DayYield (%)Investment Companies - 59.9%Registered Investment Companies - 59.9%BNY Mellon Corporate Bond Fund, Cl. M 1,515,057i 19,559,389BNY Mellon Emerging Markets Fund, Cl. M 1,408,460i 17,887,445BNY Mellon Floating Rate Income Fund, Cl. Y 1,069,802i 12,078,062BNY Mellon Focused Equity Opportunities Fund, Cl. M 2,870,416i 52,557,312BNY Mellon Global Real Estate Securities Fund, CI. Y 1,157,218i 11,039,862BNY Mellon High Yield Fund, Cl. I 2,065,696i 12,084,321BNY Mellon Income Stock Fund, Cl. M 1,920,115i 17,799,465BNY Mellon Intermediate Bond Fund, Cl. M 2,110,870i 26,195,896BNY Mellon International Equity Fund, Cl. Y 857,001i 19,299,654BNY Mellon International Fund, Cl. M 19,300i 273,284BNY Mellon Mid Cap Multi-Strategy Fund, Cl. M 363,602i 7,304,764BNY Mellon Research Growth Fund, Cl. Y 414,854i 7,699,686BNY Mellon Select Managers Small Cap Growth Fund, Cl. Y 889,121i 23,659,523BNY Mellon Select Managers Small Cap Value Fund, Cl. Y 1,111,836i 28,529,718BNY Mellon Small Cap Multi-Strategy Fund, Cl. M 234,350i 5,057,281Dreyfus Institutional Preferred Government Plus Money MarketFund, Institutional Shares 0.10 35,603,469i 35,603,469Total Investment Companies(cost $255,564,943) 296,629,131
70
Copyright © 2022 www.secdatabase.com. All Rights Reserved.Please Consider the Environment Before Printing This Document
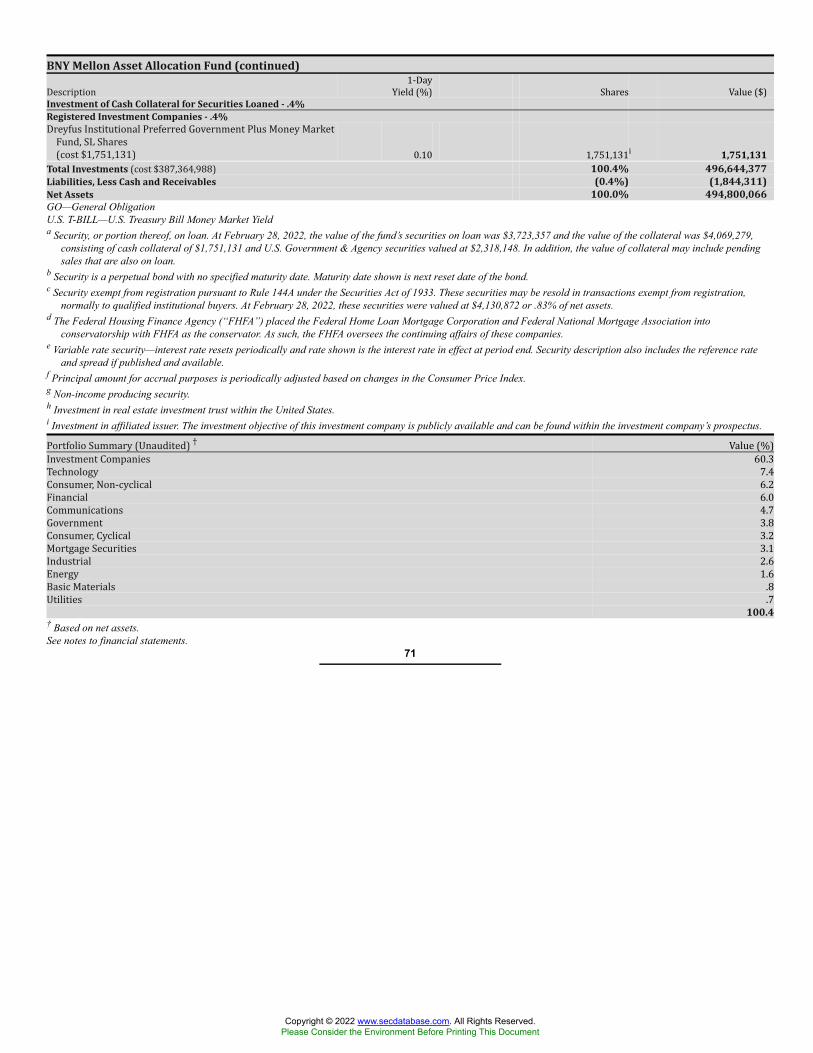
BNY Mellon Asset Allocation Fund (continued)Description 1-DayYield (%) Shares Value ($)Investment of Cash Collateral for Securities Loaned - .4%Registered Investment Companies - .4%Dreyfus Institutional Preferred Government Plus Money MarketFund, SL Shares(cost $1,751,131) 0.10 1,751,131i 1,751,131Total Investments (cost $387,364,988) 100.4% 496,644,377Liabilities, Less Cash and Receivables (0.4%) (1,844,311)Net Assets 100.0% 494,800,066GO—General ObligationU.S. T-BILL—U.S. Treasury Bill Money Market Yielda Security, or portion thereof, on loan. At February 28, 2022, the value of the fund’s securities on loan was $3,723,357 and the value of the collateral was $4,069,279,
consisting of cash collateral of $1,751,131 and U.S. Government & Agency securities valued at $2,318,148. In addition, the value of collateral may include pendingsales that are also on loan.
b Security is a perpetual bond with no specified maturity date. Maturity date shown is next reset date of the bond.c Security exempt from registration pursuant to Rule 144A under the Securities Act of 1933. These securities may be resold in transactions exempt from registration,
normally to qualified institutional buyers. At February 28, 2022, these securities were valued at $4,130,872 or .83% of net assets.d The Federal Housing Finance Agency (“FHFA”) placed the Federal Home Loan Mortgage Corporation and Federal National Mortgage Association into
conservatorship with FHFA as the conservator. As such, the FHFA oversees the continuing affairs of these companies.e Variable rate security—interest rate resets periodically and rate shown is the interest rate in effect at period end. Security description also includes the reference rate
and spread if published and available.f Principal amount for accrual purposes is periodically adjusted based on changes in the Consumer Price Index.g Non-income producing security.h Investment in real estate investment trust within the United States.i Investment in affiliated issuer. The investment objective of this investment company is publicly available and can be found within the investment company’s prospectus.Portfolio Summary (Unaudited) † Value (%)Investment Companies 60.3Technology 7.4Consumer, Non-cyclical 6.2Financial 6.0Communications 4.7Government 3.8Consumer, Cyclical 3.2Mortgage Securities 3.1Industrial 2.6Energy 1.6Basic Materials .8Utilities .7
100.4† Based on net assets.See notes to financial statements.
71
Copyright © 2022 www.secdatabase.com. All Rights Reserved.Please Consider the Environment Before Printing This Document
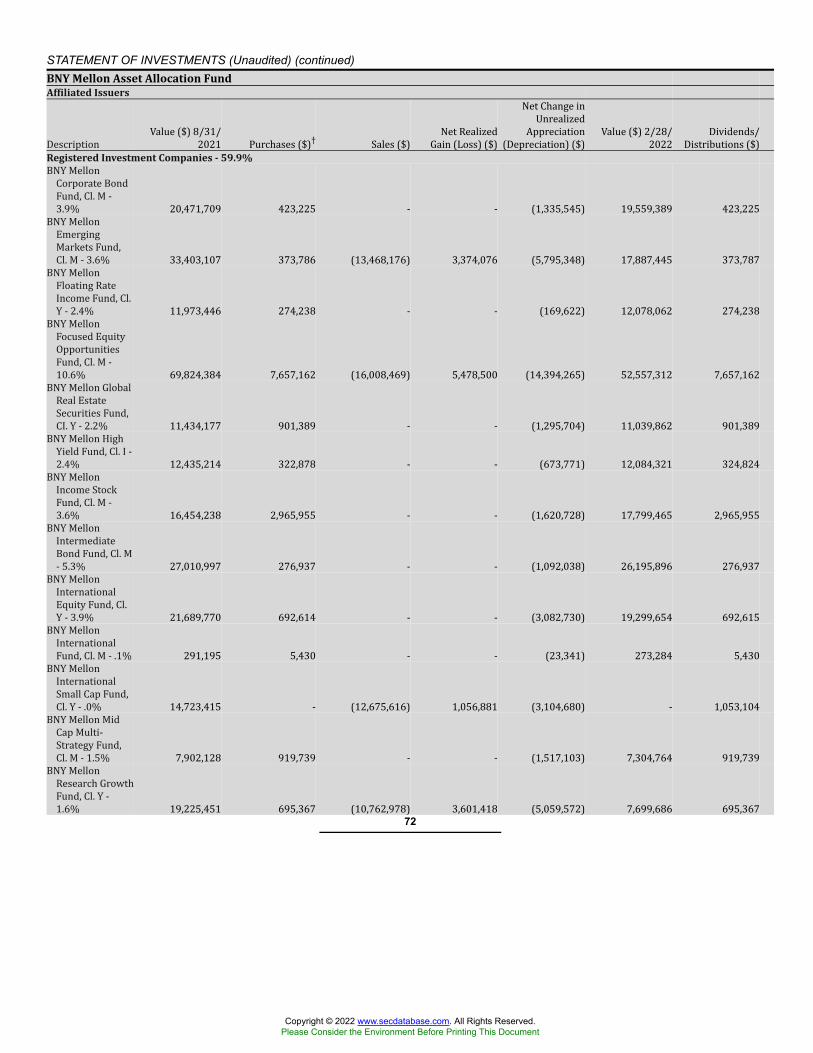
STATEMENT OF INVESTMENTS (Unaudited) (continued)BNY Mellon Asset Allocation FundAffiliated Issuers
Description Value ($) 8/31/2021 Purchases ($)† Sales ($) Net RealizedGain (Loss) ($)Net Change inUnrealizedAppreciation(Depreciation) ($) Value ($) 2/28/2022 Dividends/Distributions ($)
Registered Investment Companies - 59.9%BNY MellonCorporate BondFund, Cl. M -3.9% 20,471,709 423,225 - - (1,335,545) 19,559,389 423,225BNY MellonEmergingMarkets Fund,Cl. M - 3.6% 33,403,107 373,786 (13,468,176) 3,374,076 (5,795,348) 17,887,445 373,787BNY MellonFloating RateIncome Fund, Cl.Y - 2.4% 11,973,446 274,238 - - (169,622) 12,078,062 274,238BNY MellonFocused EquityOpportunitiesFund, Cl. M -10.6% 69,824,384 7,657,162 (16,008,469) 5,478,500 (14,394,265) 52,557,312 7,657,162BNY Mellon GlobalReal EstateSecurities Fund,CI. Y - 2.2% 11,434,177 901,389 - - (1,295,704) 11,039,862 901,389BNY Mellon HighYield Fund, Cl. I -2.4% 12,435,214 322,878 - - (673,771) 12,084,321 324,824BNY MellonIncome StockFund, Cl. M -3.6% 16,454,238 2,965,955 - - (1,620,728) 17,799,465 2,965,955BNY MellonIntermediateBond Fund, Cl. M- 5.3% 27,010,997 276,937 - - (1,092,038) 26,195,896 276,937BNY MellonInternationalEquity Fund, Cl.Y - 3.9% 21,689,770 692,614 - - (3,082,730) 19,299,654 692,615BNY MellonInternationalFund, Cl. M - .1% 291,195 5,430 - - (23,341) 273,284 5,430BNY MellonInternationalSmall Cap Fund,Cl. Y - .0% 14,723,415 - (12,675,616) 1,056,881 (3,104,680) - 1,053,104BNY Mellon MidCap Multi-Strategy Fund,Cl. M - 1.5% 7,902,128 919,739 - - (1,517,103) 7,304,764 919,739BNY MellonResearch GrowthFund, Cl. Y -1.6% 19,225,451 695,367 (10,762,978) 3,601,418 (5,059,572) 7,699,686 695,36772
Copyright © 2022 www.secdatabase.com. All Rights Reserved.Please Consider the Environment Before Printing This Document
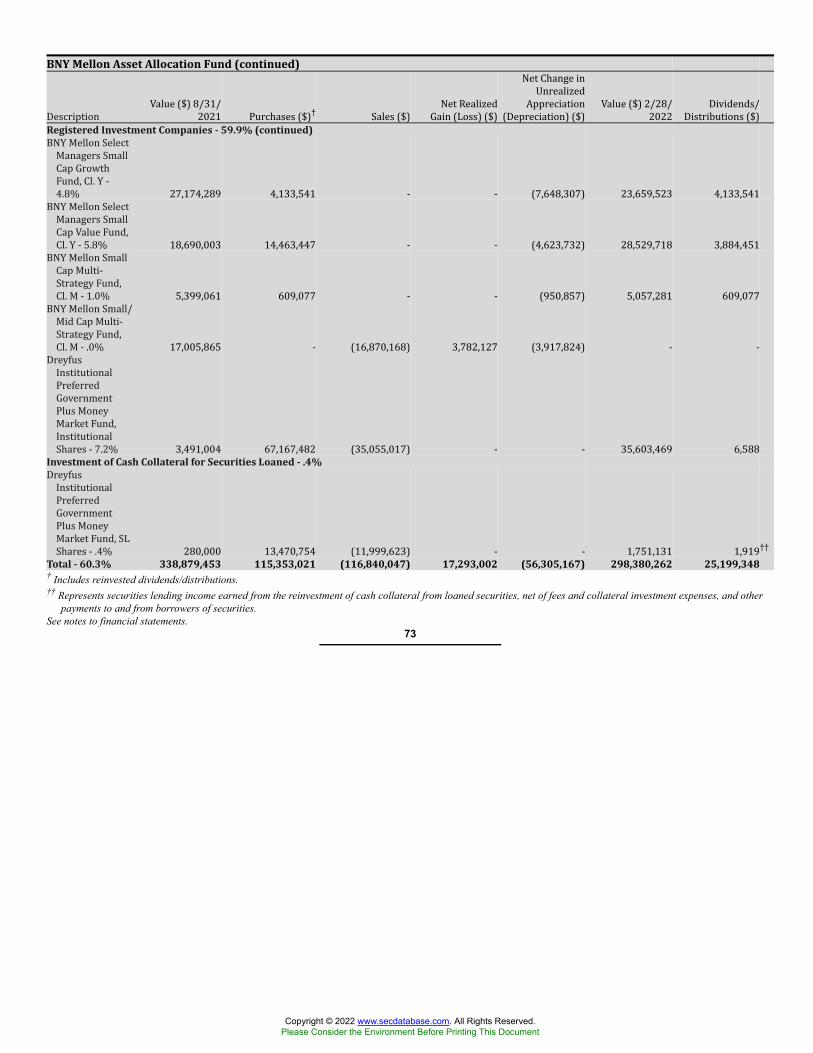
BNY Mellon Asset Allocation Fund (continued)
Description Value ($) 8/31/2021 Purchases ($)† Sales ($) Net RealizedGain (Loss) ($)Net Change inUnrealizedAppreciation(Depreciation) ($) Value ($) 2/28/2022 Dividends/Distributions ($)
Registered Investment Companies - 59.9% (continued)BNY Mellon SelectManagers SmallCap GrowthFund, Cl. Y -4.8% 27,174,289 4,133,541 - - (7,648,307) 23,659,523 4,133,541BNY Mellon SelectManagers SmallCap Value Fund,Cl. Y - 5.8% 18,690,003 14,463,447 - - (4,623,732) 28,529,718 3,884,451BNY Mellon SmallCap Multi-Strategy Fund,Cl. M - 1.0% 5,399,061 609,077 - - (950,857) 5,057,281 609,077BNY Mellon Small/Mid Cap Multi-Strategy Fund,Cl. M - .0% 17,005,865 - (16,870,168) 3,782,127 (3,917,824) - -DreyfusInstitutionalPreferredGovernmentPlus MoneyMarket Fund,InstitutionalShares - 7.2% 3,491,004 67,167,482 (35,055,017) - - 35,603,469 6,588Investment of Cash Collateral for Securities Loaned - .4%DreyfusInstitutionalPreferredGovernmentPlus MoneyMarket Fund, SLShares - .4% 280,000 13,470,754 (11,999,623) - - 1,751,131 1,919††Total - 60.3% 338,879,453 115,353,021 (116,840,047) 17,293,002 (56,305,167) 298,380,262 25,199,348† Includes reinvested dividends/distributions.†† Represents securities lending income earned from the reinvestment of cash collateral from loaned securities, net of fees and collateral investment expenses, and other
payments to and from borrowers of securities.See notes to financial statements.
73
Copyright © 2022 www.secdatabase.com. All Rights Reserved.Please Consider the Environment Before Printing This Document
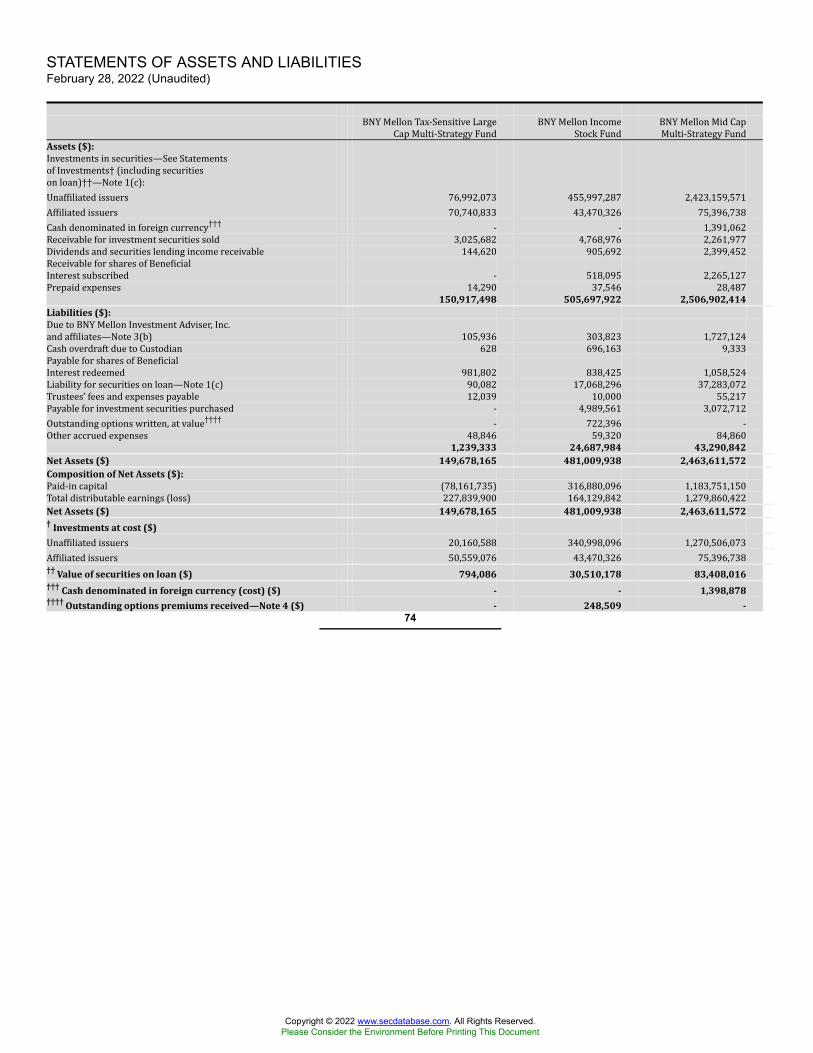
STATEMENTS OF ASSETS AND LIABILITIESFebruary 28, 2022 (Unaudited)
BNY Mellon Tax-Sensitive LargeCap Multi-Strategy Fund BNY Mellon IncomeStock Fund BNY Mellon Mid CapMulti-Strategy FundAssets ($):Investments in securities—See Statementsof Investments† (including securitieson loan)††—Note 1(c):Unaffiliated issuers 76,992,073 455,997,287 2,423,159,571Affiliated issuers 70,740,833 43,470,326 75,396,738Cash denominated in foreign currency††† - - 1,391,062Receivable for investment securities sold 3,025,682 4,768,976 2,261,977Dividends and securities lending income receivable 144,620 905,692 2,399,452Receivable for shares of BeneficialInterest subscribed - 518,095 2,265,127Prepaid expenses 14,290 37,546 28,487
150,917,498 505,697,922 2,506,902,414Liabilities ($):Due to BNY Mellon Investment Adviser, Inc.and affiliates—Note 3(b) 105,936 303,823 1,727,124Cash overdraft due to Custodian 628 696,163 9,333Payable for shares of BeneficialInterest redeemed 981,802 838,425 1,058,524Liability for securities on loan—Note 1(c) 90,082 17,068,296 37,283,072Trustees’ fees and expenses payable 12,039 10,000 55,217Payable for investment securities purchased - 4,989,561 3,072,712Outstanding options written, at value†††† - 722,396 -Other accrued expenses 48,846 59,320 84,860
1,239,333 24,687,984 43,290,842Net Assets ($) 149,678,165 481,009,938 2,463,611,572Composition of Net Assets ($):Paid-in capital (78,161,735) 316,880,096 1,183,751,150Total distributable earnings (loss) 227,839,900 164,129,842 1,279,860,422Net Assets ($) 149,678,165 481,009,938 2,463,611,572† Investments at cost ($)Unaffiliated issuers 20,160,588 340,998,096 1,270,506,073Affiliated issuers 50,559,076 43,470,326 75,396,738†† Value of securities on loan ($) 794,086 30,510,178 83,408,016††† Cash denominated in foreign currency (cost) ($) - - 1,398,878†††† Outstanding options premiums received—Note 4 ($) - 248,509 -
74
Copyright © 2022 www.secdatabase.com. All Rights Reserved.Please Consider the Environment Before Printing This Document
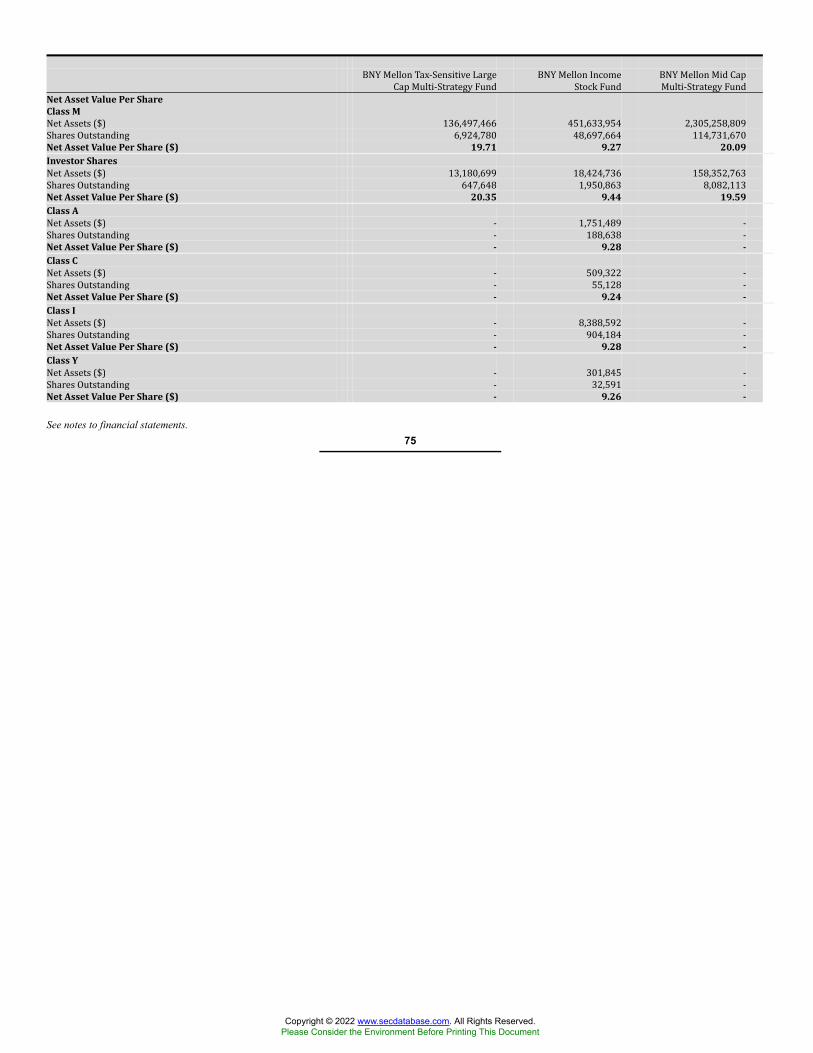
BNY Mellon Tax-Sensitive LargeCap Multi-Strategy Fund BNY Mellon IncomeStock Fund BNY Mellon Mid CapMulti-Strategy FundNet Asset Value Per ShareClass MNet Assets ($) 136,497,466 451,633,954 2,305,258,809Shares Outstanding 6,924,780 48,697,664 114,731,670Net Asset Value Per Share ($) 19.71 9.27 20.09Investor SharesNet Assets ($) 13,180,699 18,424,736 158,352,763Shares Outstanding 647,648 1,950,863 8,082,113Net Asset Value Per Share ($) 20.35 9.44 19.59Class ANet Assets ($) - 1,751,489 -Shares Outstanding - 188,638 -Net Asset Value Per Share ($) - 9.28 -Class CNet Assets ($) - 509,322 -Shares Outstanding - 55,128 -Net Asset Value Per Share ($) - 9.24 -Class INet Assets ($) - 8,388,592 -Shares Outstanding - 904,184 -Net Asset Value Per Share ($) - 9.28 -Class YNet Assets ($) - 301,845 -Shares Outstanding - 32,591 -Net Asset Value Per Share ($) - 9.26 -
See notes to financial statements.75
Copyright © 2022 www.secdatabase.com. All Rights Reserved.Please Consider the Environment Before Printing This Document
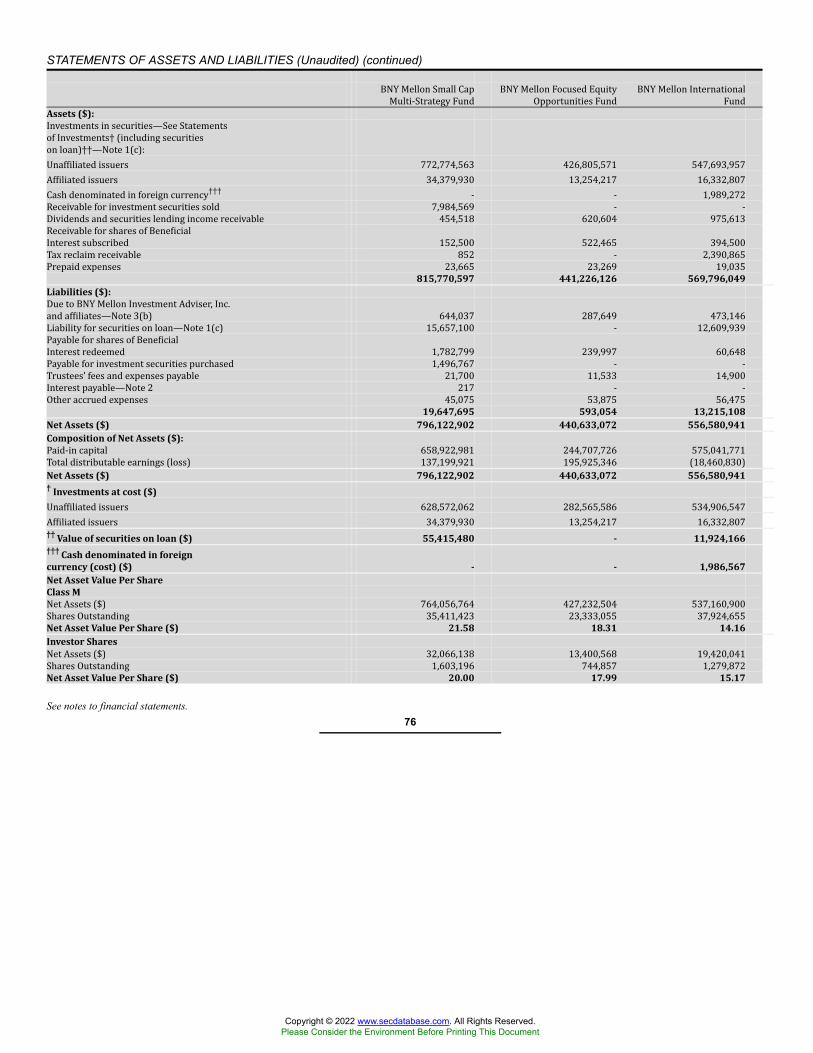
STATEMENTS OF ASSETS AND LIABILITIES (Unaudited) (continued)
BNY Mellon Small CapMulti-Strategy Fund BNY Mellon Focused EquityOpportunities Fund BNY Mellon InternationalFundAssets ($):Investments in securities—See Statementsof Investments† (including securitieson loan)††—Note 1(c):Unaffiliated issuers 772,774,563 426,805,571 547,693,957Affiliated issuers 34,379,930 13,254,217 16,332,807Cash denominated in foreign currency††† - - 1,989,272Receivable for investment securities sold 7,984,569 - -Dividends and securities lending income receivable 454,518 620,604 975,613Receivable for shares of BeneficialInterest subscribed 152,500 522,465 394,500Tax reclaim receivable 852 - 2,390,865Prepaid expenses 23,665 23,269 19,035
815,770,597 441,226,126 569,796,049Liabilities ($):Due to BNY Mellon Investment Adviser, Inc.and affiliates—Note 3(b) 644,037 287,649 473,146Liability for securities on loan—Note 1(c) 15,657,100 - 12,609,939Payable for shares of BeneficialInterest redeemed 1,782,799 239,997 60,648Payable for investment securities purchased 1,496,767 - -Trustees’ fees and expenses payable 21,700 11,533 14,900Interest payable—Note 2 217 - -Other accrued expenses 45,075 53,875 56,475
19,647,695 593,054 13,215,108Net Assets ($) 796,122,902 440,633,072 556,580,941Composition of Net Assets ($):Paid-in capital 658,922,981 244,707,726 575,041,771Total distributable earnings (loss) 137,199,921 195,925,346 (18,460,830)Net Assets ($) 796,122,902 440,633,072 556,580,941† Investments at cost ($)Unaffiliated issuers 628,572,062 282,565,586 534,906,547Affiliated issuers 34,379,930 13,254,217 16,332,807†† Value of securities on loan ($) 55,415,480 - 11,924,166††† Cash denominated in foreigncurrency (cost) ($) - - 1,986,567Net Asset Value Per ShareClass MNet Assets ($) 764,056,764 427,232,504 537,160,900Shares Outstanding 35,411,423 23,333,055 37,924,655Net Asset Value Per Share ($) 21.58 18.31 14.16Investor SharesNet Assets ($) 32,066,138 13,400,568 19,420,041Shares Outstanding 1,603,196 744,857 1,279,872Net Asset Value Per Share ($) 20.00 17.99 15.17
See notes to financial statements.76
Copyright © 2022 www.secdatabase.com. All Rights Reserved.Please Consider the Environment Before Printing This Document
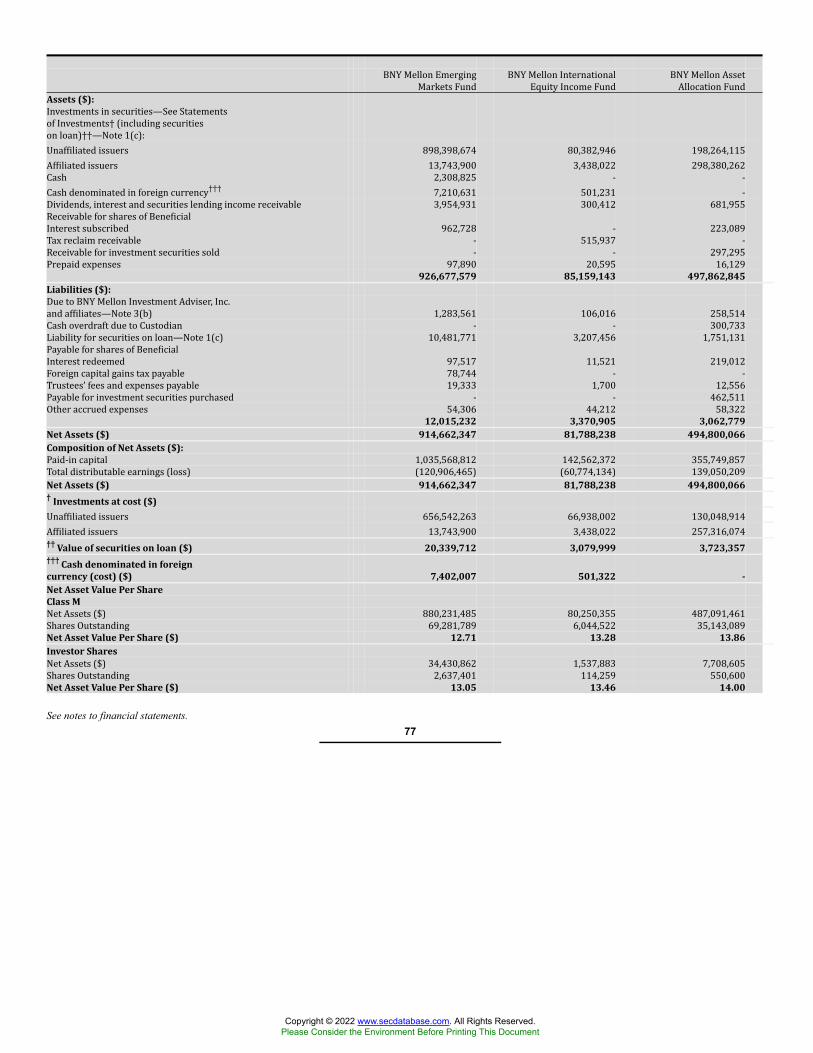
BNY Mellon EmergingMarkets Fund BNY Mellon InternationalEquity Income Fund BNY Mellon AssetAllocation FundAssets ($):Investments in securities—See Statementsof Investments† (including securitieson loan)††—Note 1(c):Unaffiliated issuers 898,398,674 80,382,946 198,264,115Affiliated issuers 13,743,900 3,438,022 298,380,262Cash 2,308,825 - -Cash denominated in foreign currency††† 7,210,631 501,231 -Dividends, interest and securities lending income receivable 3,954,931 300,412 681,955Receivable for shares of BeneficialInterest subscribed 962,728 - 223,089Tax reclaim receivable - 515,937 -Receivable for investment securities sold - - 297,295Prepaid expenses 97,890 20,595 16,129
926,677,579 85,159,143 497,862,845Liabilities ($):Due to BNY Mellon Investment Adviser, Inc.and affiliates—Note 3(b) 1,283,561 106,016 258,514Cash overdraft due to Custodian - - 300,733Liability for securities on loan—Note 1(c) 10,481,771 3,207,456 1,751,131Payable for shares of BeneficialInterest redeemed 97,517 11,521 219,012Foreign capital gains tax payable 78,744 - -Trustees’ fees and expenses payable 19,333 1,700 12,556Payable for investment securities purchased - - 462,511Other accrued expenses 54,306 44,212 58,322
12,015,232 3,370,905 3,062,779Net Assets ($) 914,662,347 81,788,238 494,800,066Composition of Net Assets ($):Paid-in capital 1,035,568,812 142,562,372 355,749,857Total distributable earnings (loss) (120,906,465) (60,774,134) 139,050,209Net Assets ($) 914,662,347 81,788,238 494,800,066† Investments at cost ($)Unaffiliated issuers 656,542,263 66,938,002 130,048,914Affiliated issuers 13,743,900 3,438,022 257,316,074†† Value of securities on loan ($) 20,339,712 3,079,999 3,723,357††† Cash denominated in foreigncurrency (cost) ($) 7,402,007 501,322 -Net Asset Value Per ShareClass MNet Assets ($) 880,231,485 80,250,355 487,091,461Shares Outstanding 69,281,789 6,044,522 35,143,089Net Asset Value Per Share ($) 12.71 13.28 13.86Investor SharesNet Assets ($) 34,430,862 1,537,883 7,708,605Shares Outstanding 2,637,401 114,259 550,600Net Asset Value Per Share ($) 13.05 13.46 14.00
See notes to financial statements.77
Copyright © 2022 www.secdatabase.com. All Rights Reserved.Please Consider the Environment Before Printing This Document
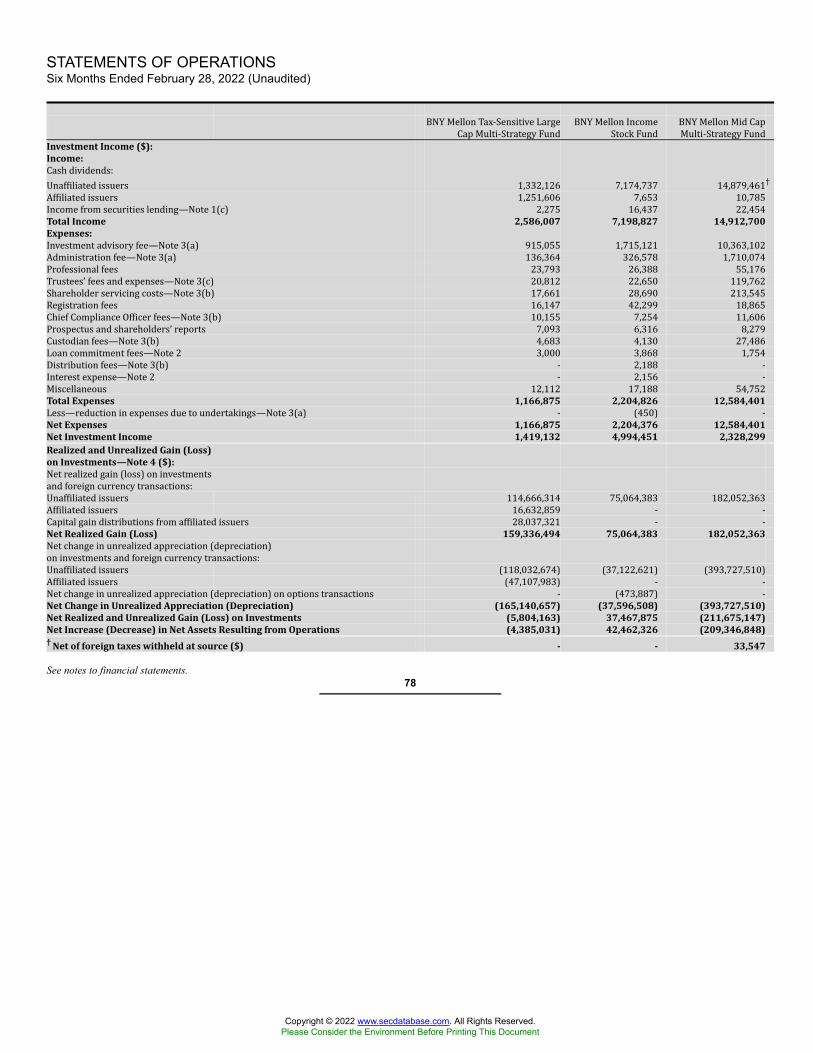
STATEMENTS OF OPERATIONSSix Months Ended February 28, 2022 (Unaudited)
BNY Mellon Tax-Sensitive LargeCap Multi-Strategy Fund BNY Mellon IncomeStock Fund BNY Mellon Mid CapMulti-Strategy FundInvestment Income ($):Income:Cash dividends:Unaffiliated issuers 1,332,126 7,174,737 14,879,461†Affiliated issuers 1,251,606 7,653 10,785Income from securities lending—Note 1(c) 2,275 16,437 22,454Total Income 2,586,007 7,198,827 14,912,700Expenses:Investment advisory fee—Note 3(a) 915,055 1,715,121 10,363,102Administration fee—Note 3(a) 136,364 326,578 1,710,074Professional fees 23,793 26,388 55,176Trustees’ fees and expenses—Note 3(c) 20,812 22,650 119,762Shareholder servicing costs—Note 3(b) 17,661 28,690 213,545Registration fees 16,147 42,299 18,865Chief Compliance Officer fees—Note 3(b) 10,155 7,254 11,606Prospectus and shareholders’ reports 7,093 6,316 8,279Custodian fees—Note 3(b) 4,683 4,130 27,486Loan commitment fees—Note 2 3,000 3,868 1,754Distribution fees—Note 3(b) - 2,188 -Interest expense—Note 2 - 2,156 -Miscellaneous 12,112 17,188 54,752Total Expenses 1,166,875 2,204,826 12,584,401Less—reduction in expenses due to undertakings—Note 3(a) - (450) -Net Expenses 1,166,875 2,204,376 12,584,401Net Investment Income 1,419,132 4,994,451 2,328,299Realized and Unrealized Gain (Loss)on Investments—Note 4 ($):Net realized gain (loss) on investmentsand foreign currency transactions:Unaffiliated issuers 114,666,314 75,064,383 182,052,363Affiliated issuers 16,632,859 - -Capital gain distributions from affiliated issuers 28,037,321 - -Net Realized Gain (Loss) 159,336,494 75,064,383 182,052,363Net change in unrealized appreciation (depreciation)on investments and foreign currency transactions:Unaffiliated issuers (118,032,674) (37,122,621) (393,727,510)Affiliated issuers (47,107,983) - -Net change in unrealized appreciation (depreciation) on options transactions - (473,887) -Net Change in Unrealized Appreciation (Depreciation) (165,140,657) (37,596,508) (393,727,510)Net Realized and Unrealized Gain (Loss) on Investments (5,804,163) 37,467,875 (211,675,147)Net Increase (Decrease) in Net Assets Resulting from Operations (4,385,031) 42,462,326 (209,346,848)† Net of foreign taxes withheld at source ($) - - 33,547
See notes to financial statements.78
Copyright © 2022 www.secdatabase.com. All Rights Reserved.Please Consider the Environment Before Printing This Document
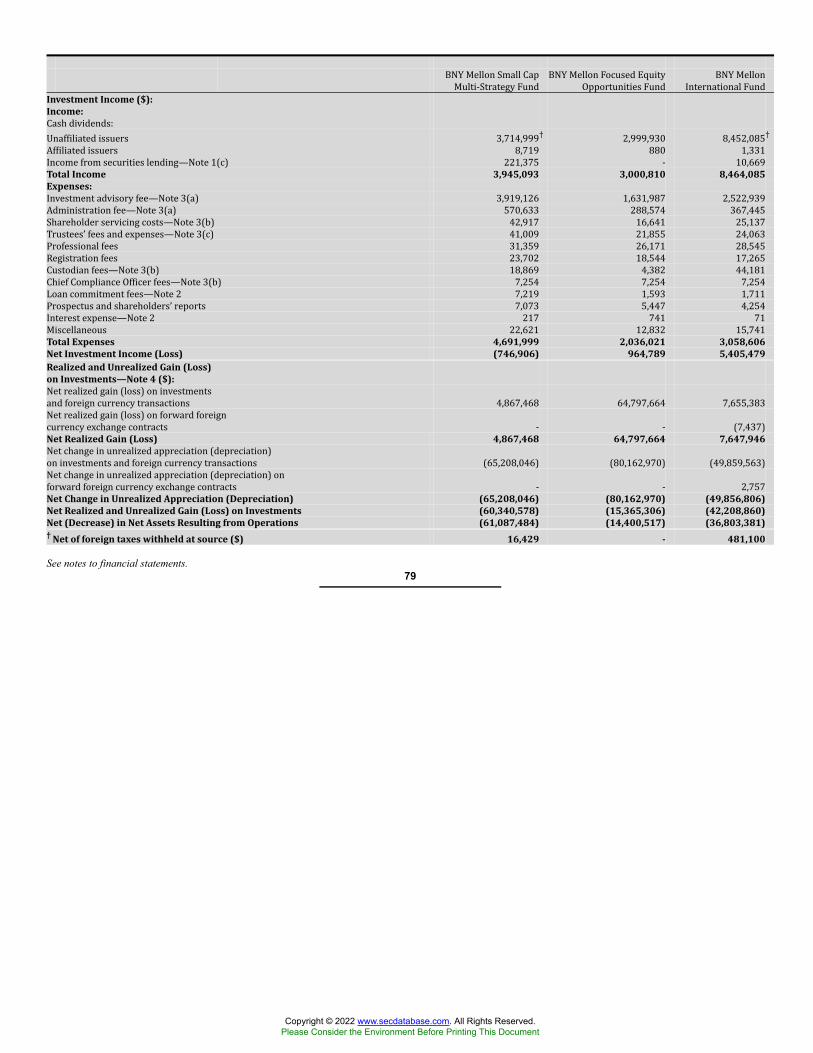
BNY Mellon Small CapMulti-Strategy Fund BNY Mellon Focused EquityOpportunities Fund BNY MellonInternational FundInvestment Income ($):Income:Cash dividends:Unaffiliated issuers 3,714,999† 2,999,930 8,452,085†Affiliated issuers 8,719 880 1,331Income from securities lending—Note 1(c) 221,375 - 10,669Total Income 3,945,093 3,000,810 8,464,085Expenses:Investment advisory fee—Note 3(a) 3,919,126 1,631,987 2,522,939Administration fee—Note 3(a) 570,633 288,574 367,445Shareholder servicing costs—Note 3(b) 42,917 16,641 25,137Trustees’ fees and expenses—Note 3(c) 41,009 21,855 24,063Professional fees 31,359 26,171 28,545Registration fees 23,702 18,544 17,265Custodian fees—Note 3(b) 18,869 4,382 44,181Chief Compliance Officer fees—Note 3(b) 7,254 7,254 7,254Loan commitment fees—Note 2 7,219 1,593 1,711Prospectus and shareholders’ reports 7,073 5,447 4,254Interest expense—Note 2 217 741 71Miscellaneous 22,621 12,832 15,741Total Expenses 4,691,999 2,036,021 3,058,606Net Investment Income (Loss) (746,906) 964,789 5,405,479Realized and Unrealized Gain (Loss)on Investments—Note 4 ($):Net realized gain (loss) on investmentsand foreign currency transactions 4,867,468 64,797,664 7,655,383Net realized gain (loss) on forward foreigncurrency exchange contracts - - (7,437)Net Realized Gain (Loss) 4,867,468 64,797,664 7,647,946Net change in unrealized appreciation (depreciation)on investments and foreign currency transactions (65,208,046) (80,162,970) (49,859,563)Net change in unrealized appreciation (depreciation) onforward foreign currency exchange contracts - - 2,757Net Change in Unrealized Appreciation (Depreciation) (65,208,046) (80,162,970) (49,856,806)Net Realized and Unrealized Gain (Loss) on Investments (60,340,578) (15,365,306) (42,208,860)Net (Decrease) in Net Assets Resulting from Operations (61,087,484) (14,400,517) (36,803,381)† Net of foreign taxes withheld at source ($) 16,429 - 481,100
See notes to financial statements.79
Copyright © 2022 www.secdatabase.com. All Rights Reserved.Please Consider the Environment Before Printing This Document
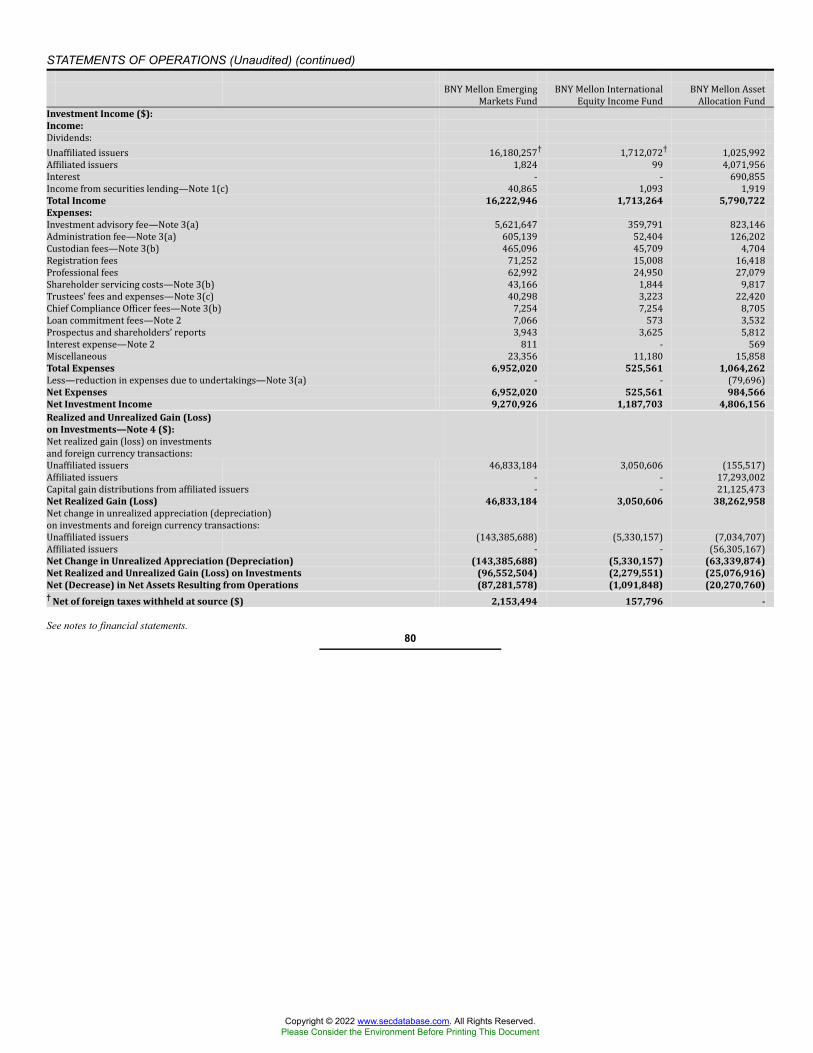
STATEMENTS OF OPERATIONS (Unaudited) (continued)
BNY Mellon EmergingMarkets Fund BNY Mellon InternationalEquity Income Fund BNY Mellon AssetAllocation FundInvestment Income ($):Income:Dividends:Unaffiliated issuers 16,180,257† 1,712,072† 1,025,992Affiliated issuers 1,824 99 4,071,956Interest - - 690,855Income from securities lending—Note 1(c) 40,865 1,093 1,919Total Income 16,222,946 1,713,264 5,790,722Expenses:Investment advisory fee—Note 3(a) 5,621,647 359,791 823,146Administration fee—Note 3(a) 605,139 52,404 126,202Custodian fees—Note 3(b) 465,096 45,709 4,704Registration fees 71,252 15,008 16,418Professional fees 62,992 24,950 27,079Shareholder servicing costs—Note 3(b) 43,166 1,844 9,817Trustees’ fees and expenses—Note 3(c) 40,298 3,223 22,420Chief Compliance Officer fees—Note 3(b) 7,254 7,254 8,705Loan commitment fees—Note 2 7,066 573 3,532Prospectus and shareholders’ reports 3,943 3,625 5,812Interest expense—Note 2 811 - 569Miscellaneous 23,356 11,180 15,858Total Expenses 6,952,020 525,561 1,064,262Less—reduction in expenses due to undertakings—Note 3(a) - - (79,696)Net Expenses 6,952,020 525,561 984,566Net Investment Income 9,270,926 1,187,703 4,806,156Realized and Unrealized Gain (Loss)on Investments—Note 4 ($):Net realized gain (loss) on investmentsand foreign currency transactions:Unaffiliated issuers 46,833,184 3,050,606 (155,517)Affiliated issuers - - 17,293,002Capital gain distributions from affiliated issuers - - 21,125,473Net Realized Gain (Loss) 46,833,184 3,050,606 38,262,958Net change in unrealized appreciation (depreciation)on investments and foreign currency transactions:Unaffiliated issuers (143,385,688) (5,330,157) (7,034,707)Affiliated issuers - - (56,305,167)Net Change in Unrealized Appreciation (Depreciation) (143,385,688) (5,330,157) (63,339,874)Net Realized and Unrealized Gain (Loss) on Investments (96,552,504) (2,279,551) (25,076,916)Net (Decrease) in Net Assets Resulting from Operations (87,281,578) (1,091,848) (20,270,760)† Net of foreign taxes withheld at source ($) 2,153,494 157,796 -
See notes to financial statements.80
Copyright © 2022 www.secdatabase.com. All Rights Reserved.Please Consider the Environment Before Printing This Document
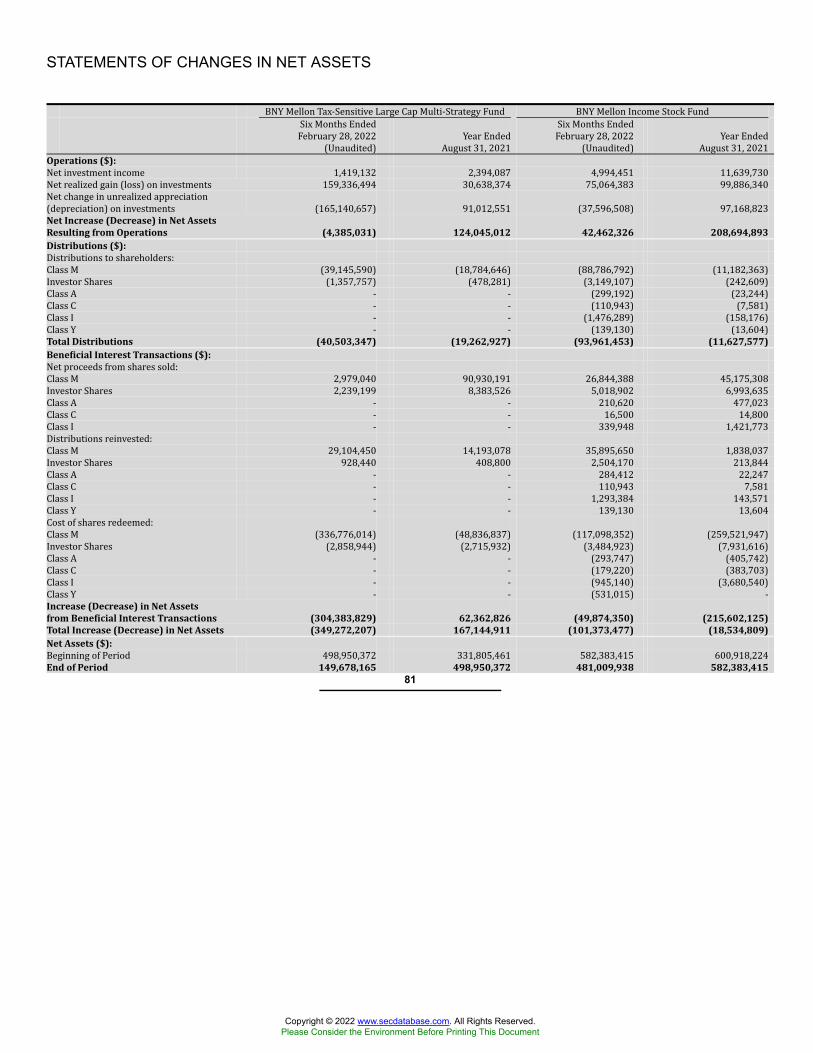
STATEMENTS OF CHANGES IN NET ASSETS
BNY Mellon Tax-Sensitive Large Cap Multi-Strategy Fund BNY Mellon Income Stock FundSix Months EndedFebruary 28, 2022(Unaudited) Year EndedAugust 31, 2021 Six Months EndedFebruary 28, 2022(Unaudited) Year EndedAugust 31, 2021Operations ($):Net investment income 1,419,132 2,394,087 4,994,451 11,639,730Net realized gain (loss) on investments 159,336,494 30,638,374 75,064,383 99,886,340Net change in unrealized appreciation(depreciation) on investments (165,140,657) 91,012,551 (37,596,508) 97,168,823Net Increase (Decrease) in Net AssetsResulting from Operations (4,385,031) 124,045,012 42,462,326 208,694,893Distributions ($):Distributions to shareholders:Class M (39,145,590) (18,784,646) (88,786,792) (11,182,363)Investor Shares (1,357,757) (478,281) (3,149,107) (242,609)Class A - - (299,192) (23,244)Class C - - (110,943) (7,581)Class I - - (1,476,289) (158,176)Class Y - - (139,130) (13,604)Total Distributions (40,503,347) (19,262,927) (93,961,453) (11,627,577)Beneficial Interest Transactions ($):Net proceeds from shares sold:Class M 2,979,040 90,930,191 26,844,388 45,175,308Investor Shares 2,239,199 8,383,526 5,018,902 6,993,635Class A - - 210,620 477,023Class C - - 16,500 14,800Class I - - 339,948 1,421,773Distributions reinvested:Class M 29,104,450 14,193,078 35,895,650 1,838,037Investor Shares 928,440 408,800 2,504,170 213,844Class A - - 284,412 22,247Class C - - 110,943 7,581Class I - - 1,293,384 143,571Class Y - - 139,130 13,604Cost of shares redeemed:Class M (336,776,014) (48,836,837) (117,098,352) (259,521,947)Investor Shares (2,858,944) (2,715,932) (3,484,923) (7,931,616)Class A - - (293,747) (405,742)Class C - - (179,220) (383,703)Class I - - (945,140) (3,680,540)Class Y - - (531,015) -Increase (Decrease) in Net Assetsfrom Beneficial Interest Transactions (304,383,829) 62,362,826 (49,874,350) (215,602,125)Total Increase (Decrease) in Net Assets (349,272,207) 167,144,911 (101,373,477) (18,534,809)Net Assets ($):Beginning of Period 498,950,372 331,805,461 582,383,415 600,918,224End of Period 149,678,165 498,950,372 481,009,938 582,383,415
81
Copyright © 2022 www.secdatabase.com. All Rights Reserved.Please Consider the Environment Before Printing This Document
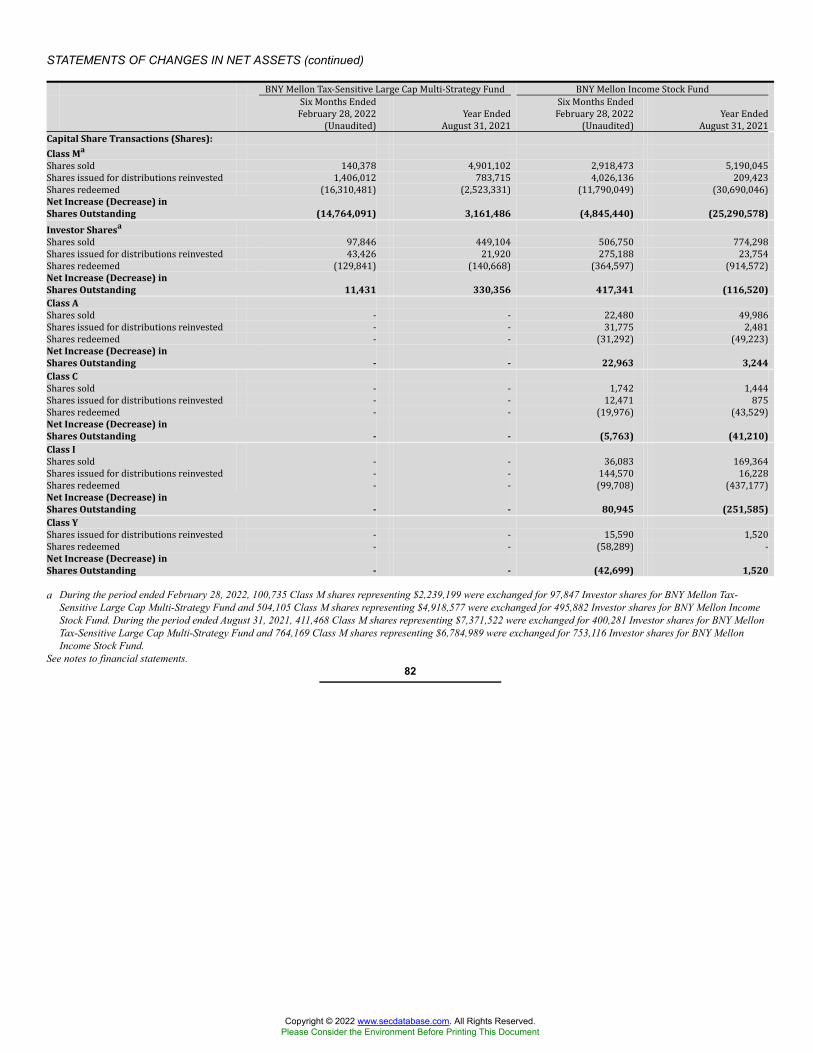
STATEMENTS OF CHANGES IN NET ASSETS (continued)
BNY Mellon Tax-Sensitive Large Cap Multi-Strategy Fund BNY Mellon Income Stock FundSix Months EndedFebruary 28, 2022(Unaudited) Year EndedAugust 31, 2021 Six Months EndedFebruary 28, 2022(Unaudited) Year EndedAugust 31, 2021Capital Share Transactions (Shares):Class MaShares sold 140,378 4,901,102 2,918,473 5,190,045Shares issued for distributions reinvested 1,406,012 783,715 4,026,136 209,423Shares redeemed (16,310,481) (2,523,331) (11,790,049) (30,690,046)Net Increase (Decrease) inShares Outstanding (14,764,091) 3,161,486 (4,845,440) (25,290,578)Investor SharesaShares sold 97,846 449,104 506,750 774,298Shares issued for distributions reinvested 43,426 21,920 275,188 23,754Shares redeemed (129,841) (140,668) (364,597) (914,572)Net Increase (Decrease) inShares Outstanding 11,431 330,356 417,341 (116,520)Class AShares sold - - 22,480 49,986Shares issued for distributions reinvested - - 31,775 2,481Shares redeemed - - (31,292) (49,223)Net Increase (Decrease) inShares Outstanding - - 22,963 3,244Class CShares sold - - 1,742 1,444Shares issued for distributions reinvested - - 12,471 875Shares redeemed - - (19,976) (43,529)Net Increase (Decrease) inShares Outstanding - - (5,763) (41,210)Class IShares sold - - 36,083 169,364Shares issued for distributions reinvested - - 144,570 16,228Shares redeemed - - (99,708) (437,177)Net Increase (Decrease) inShares Outstanding - - 80,945 (251,585)Class YShares issued for distributions reinvested - - 15,590 1,520Shares redeemed - - (58,289) -Net Increase (Decrease) inShares Outstanding - - (42,699) 1,520
a During the period ended February 28, 2022, 100,735 Class M shares representing $2,239,199 were exchanged for 97,847 Investor shares for BNY Mellon Tax-Sensitive Large Cap Multi-Strategy Fund and 504,105 Class M shares representing $4,918,577 were exchanged for 495,882 Investor shares for BNY Mellon IncomeStock Fund. During the period ended August 31, 2021, 411,468 Class M shares representing $7,371,522 were exchanged for 400,281 Investor shares for BNY MellonTax-Sensitive Large Cap Multi-Strategy Fund and 764,169 Class M shares representing $6,784,989 were exchanged for 753,116 Investor shares for BNY MellonIncome Stock Fund.
See notes to financial statements.82
Copyright © 2022 www.secdatabase.com. All Rights Reserved.Please Consider the Environment Before Printing This Document
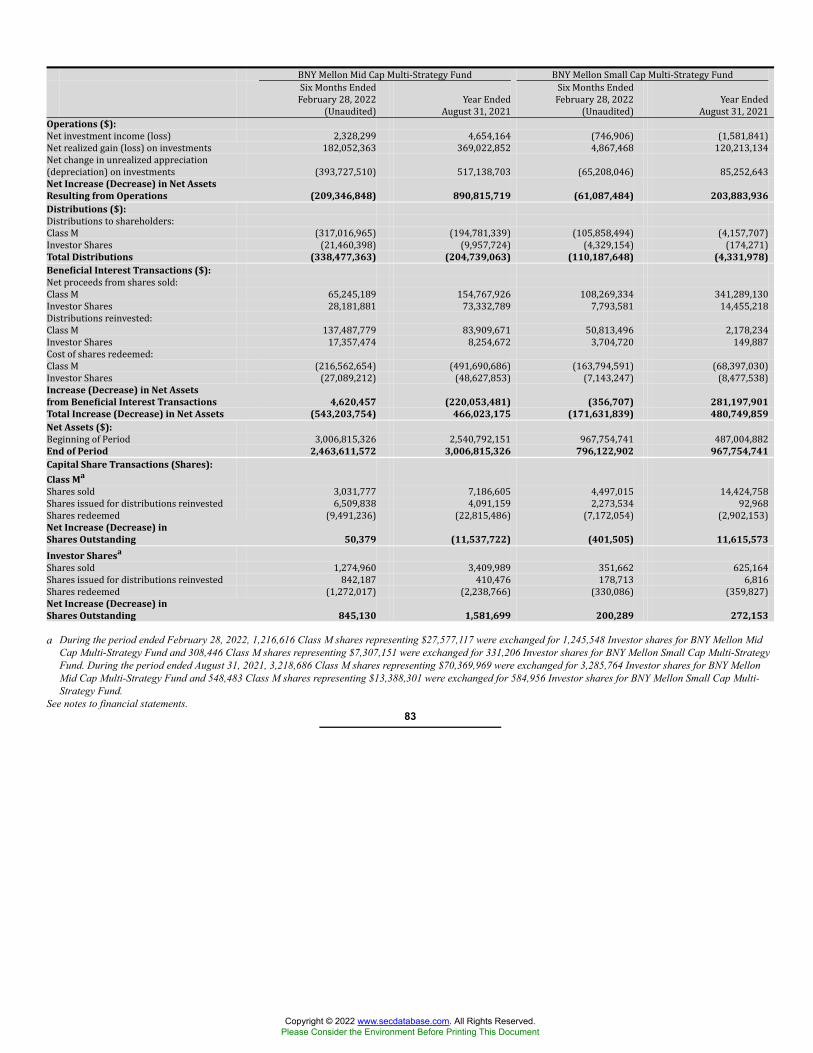
BNY Mellon Mid Cap Multi-Strategy Fund BNY Mellon Small Cap Multi-Strategy FundSix Months EndedFebruary 28, 2022(Unaudited) Year EndedAugust 31, 2021 Six Months EndedFebruary 28, 2022(Unaudited) Year EndedAugust 31, 2021Operations ($):Net investment income (loss) 2,328,299 4,654,164 (746,906) (1,581,841)Net realized gain (loss) on investments 182,052,363 369,022,852 4,867,468 120,213,134Net change in unrealized appreciation(depreciation) on investments (393,727,510) 517,138,703 (65,208,046) 85,252,643Net Increase (Decrease) in Net AssetsResulting from Operations (209,346,848) 890,815,719 (61,087,484) 203,883,936Distributions ($):Distributions to shareholders:Class M (317,016,965) (194,781,339) (105,858,494) (4,157,707)Investor Shares (21,460,398) (9,957,724) (4,329,154) (174,271)Total Distributions (338,477,363) (204,739,063) (110,187,648) (4,331,978)Beneficial Interest Transactions ($):Net proceeds from shares sold:Class M 65,245,189 154,767,926 108,269,334 341,289,130Investor Shares 28,181,881 73,332,789 7,793,581 14,455,218Distributions reinvested:Class M 137,487,779 83,909,671 50,813,496 2,178,234Investor Shares 17,357,474 8,254,672 3,704,720 149,887Cost of shares redeemed:Class M (216,562,654) (491,690,686) (163,794,591) (68,397,030)Investor Shares (27,089,212) (48,627,853) (7,143,247) (8,477,538)Increase (Decrease) in Net Assetsfrom Beneficial Interest Transactions 4,620,457 (220,053,481) (356,707) 281,197,901Total Increase (Decrease) in Net Assets (543,203,754) 466,023,175 (171,631,839) 480,749,859Net Assets ($):Beginning of Period 3,006,815,326 2,540,792,151 967,754,741 487,004,882End of Period 2,463,611,572 3,006,815,326 796,122,902 967,754,741Capital Share Transactions (Shares):Class MaShares sold 3,031,777 7,186,605 4,497,015 14,424,758Shares issued for distributions reinvested 6,509,838 4,091,159 2,273,534 92,968Shares redeemed (9,491,236) (22,815,486) (7,172,054) (2,902,153)Net Increase (Decrease) inShares Outstanding 50,379 (11,537,722) (401,505) 11,615,573Investor SharesaShares sold 1,274,960 3,409,989 351,662 625,164Shares issued for distributions reinvested 842,187 410,476 178,713 6,816Shares redeemed (1,272,017) (2,238,766) (330,086) (359,827)Net Increase (Decrease) inShares Outstanding 845,130 1,581,699 200,289 272,153
a During the period ended February 28, 2022, 1,216,616 Class M shares representing $27,577,117 were exchanged for 1,245,548 Investor shares for BNY Mellon MidCap Multi-Strategy Fund and 308,446 Class M shares representing $7,307,151 were exchanged for 331,206 Investor shares for BNY Mellon Small Cap Multi-StrategyFund. During the period ended August 31, 2021, 3,218,686 Class M shares representing $70,369,969 were exchanged for 3,285,764 Investor shares for BNY MellonMid Cap Multi-Strategy Fund and 548,483 Class M shares representing $13,388,301 were exchanged for 584,956 Investor shares for BNY Mellon Small Cap Multi-Strategy Fund.
See notes to financial statements.83
Copyright © 2022 www.secdatabase.com. All Rights Reserved.Please Consider the Environment Before Printing This Document
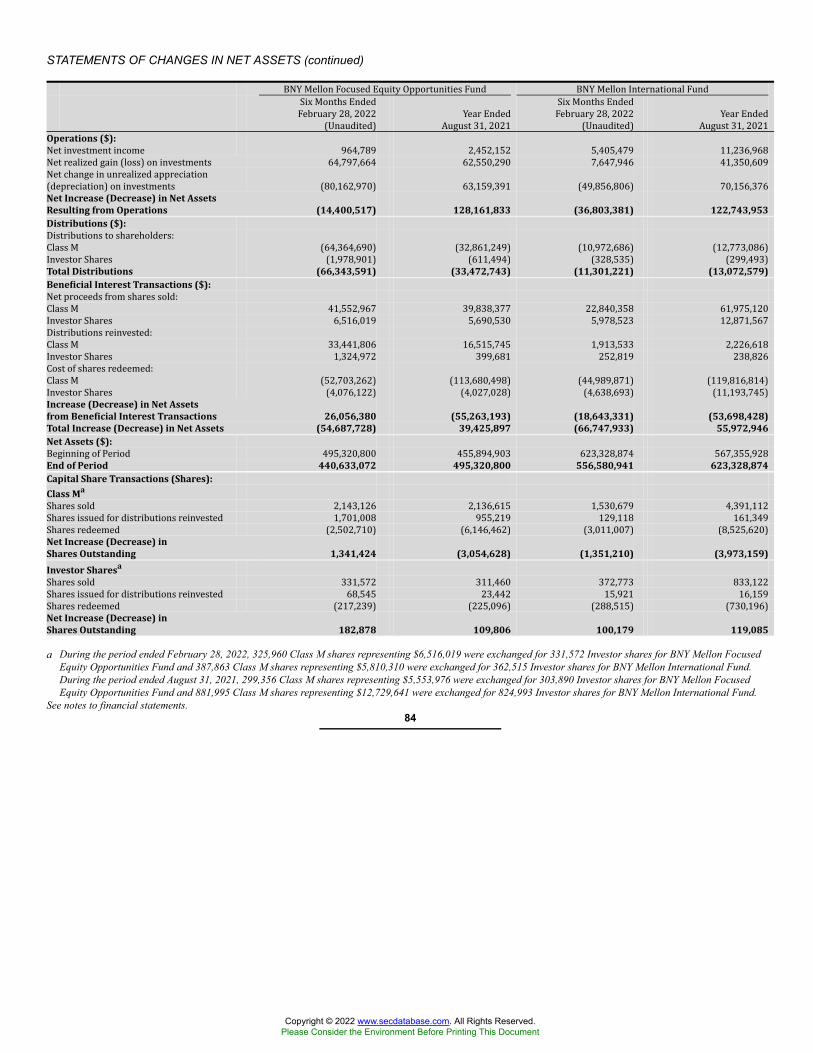
STATEMENTS OF CHANGES IN NET ASSETS (continued)
BNY Mellon Focused Equity Opportunities Fund BNY Mellon International FundSix Months EndedFebruary 28, 2022(Unaudited) Year EndedAugust 31, 2021 Six Months EndedFebruary 28, 2022(Unaudited) Year EndedAugust 31, 2021Operations ($):Net investment income 964,789 2,452,152 5,405,479 11,236,968Net realized gain (loss) on investments 64,797,664 62,550,290 7,647,946 41,350,609Net change in unrealized appreciation(depreciation) on investments (80,162,970) 63,159,391 (49,856,806) 70,156,376Net Increase (Decrease) in Net AssetsResulting from Operations (14,400,517) 128,161,833 (36,803,381) 122,743,953Distributions ($):Distributions to shareholders:Class M (64,364,690) (32,861,249) (10,972,686) (12,773,086)Investor Shares (1,978,901) (611,494) (328,535) (299,493)Total Distributions (66,343,591) (33,472,743) (11,301,221) (13,072,579)Beneficial Interest Transactions ($):Net proceeds from shares sold:Class M 41,552,967 39,838,377 22,840,358 61,975,120Investor Shares 6,516,019 5,690,530 5,978,523 12,871,567Distributions reinvested:Class M 33,441,806 16,515,745 1,913,533 2,226,618Investor Shares 1,324,972 399,681 252,819 238,826Cost of shares redeemed:Class M (52,703,262) (113,680,498) (44,989,871) (119,816,814)Investor Shares (4,076,122) (4,027,028) (4,638,693) (11,193,745)Increase (Decrease) in Net Assetsfrom Beneficial Interest Transactions 26,056,380 (55,263,193) (18,643,331) (53,698,428)Total Increase (Decrease) in Net Assets (54,687,728) 39,425,897 (66,747,933) 55,972,946Net Assets ($):Beginning of Period 495,320,800 455,894,903 623,328,874 567,355,928End of Period 440,633,072 495,320,800 556,580,941 623,328,874Capital Share Transactions (Shares):Class MaShares sold 2,143,126 2,136,615 1,530,679 4,391,112Shares issued for distributions reinvested 1,701,008 955,219 129,118 161,349Shares redeemed (2,502,710) (6,146,462) (3,011,007) (8,525,620)Net Increase (Decrease) inShares Outstanding 1,341,424 (3,054,628) (1,351,210) (3,973,159)Investor SharesaShares sold 331,572 311,460 372,773 833,122Shares issued for distributions reinvested 68,545 23,442 15,921 16,159Shares redeemed (217,239) (225,096) (288,515) (730,196)Net Increase (Decrease) inShares Outstanding 182,878 109,806 100,179 119,085
a During the period ended February 28, 2022, 325,960 Class M shares representing $6,516,019 were exchanged for 331,572 Investor shares for BNY Mellon FocusedEquity Opportunities Fund and 387,863 Class M shares representing $5,810,310 were exchanged for 362,515 Investor shares for BNY Mellon International Fund.During the period ended August 31, 2021, 299,356 Class M shares representing $5,553,976 were exchanged for 303,890 Investor shares for BNY Mellon FocusedEquity Opportunities Fund and 881,995 Class M shares representing $12,729,641 were exchanged for 824,993 Investor shares for BNY Mellon International Fund.
See notes to financial statements.84
Copyright © 2022 www.secdatabase.com. All Rights Reserved.Please Consider the Environment Before Printing This Document
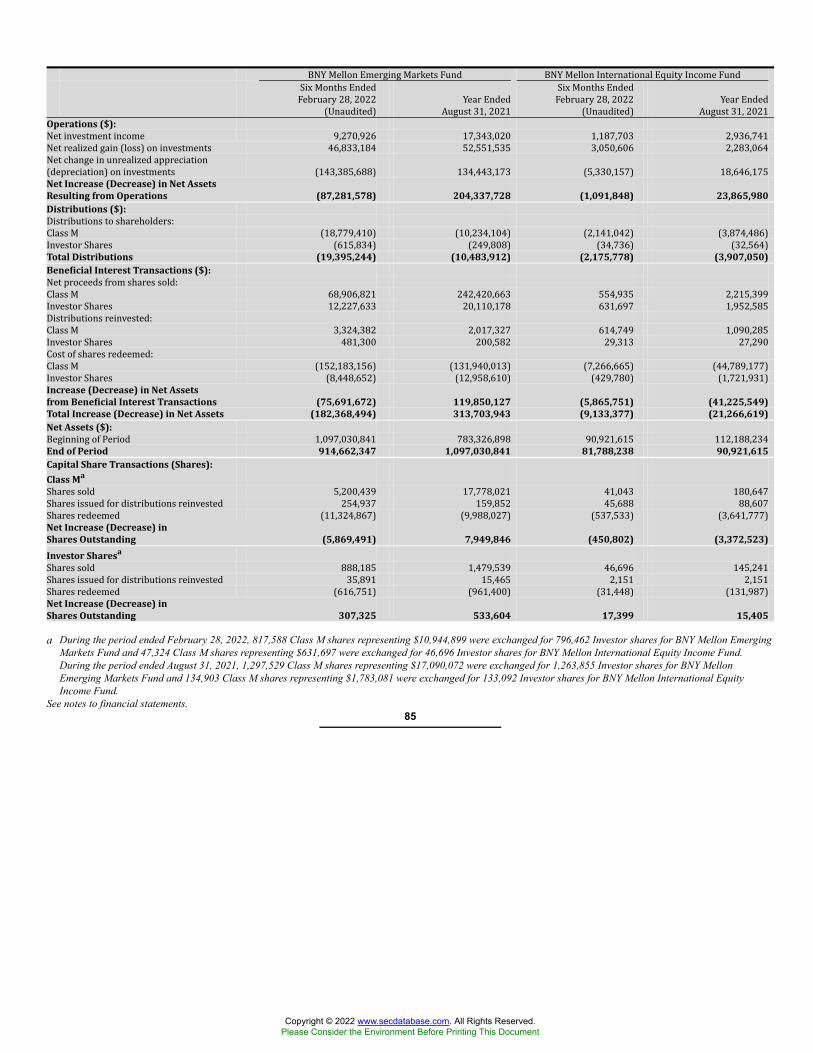
BNY Mellon Emerging Markets Fund BNY Mellon International Equity Income FundSix Months EndedFebruary 28, 2022(Unaudited) Year EndedAugust 31, 2021 Six Months EndedFebruary 28, 2022(Unaudited) Year EndedAugust 31, 2021Operations ($):Net investment income 9,270,926 17,343,020 1,187,703 2,936,741Net realized gain (loss) on investments 46,833,184 52,551,535 3,050,606 2,283,064Net change in unrealized appreciation(depreciation) on investments (143,385,688) 134,443,173 (5,330,157) 18,646,175Net Increase (Decrease) in Net AssetsResulting from Operations (87,281,578) 204,337,728 (1,091,848) 23,865,980Distributions ($):Distributions to shareholders:Class M (18,779,410) (10,234,104) (2,141,042) (3,874,486)Investor Shares (615,834) (249,808) (34,736) (32,564)Total Distributions (19,395,244) (10,483,912) (2,175,778) (3,907,050)Beneficial Interest Transactions ($):Net proceeds from shares sold:Class M 68,906,821 242,420,663 554,935 2,215,399Investor Shares 12,227,633 20,110,178 631,697 1,952,585Distributions reinvested:Class M 3,324,382 2,017,327 614,749 1,090,285Investor Shares 481,300 200,582 29,313 27,290Cost of shares redeemed:Class M (152,183,156) (131,940,013) (7,266,665) (44,789,177)Investor Shares (8,448,652) (12,958,610) (429,780) (1,721,931)Increase (Decrease) in Net Assetsfrom Beneficial Interest Transactions (75,691,672) 119,850,127 (5,865,751) (41,225,549)Total Increase (Decrease) in Net Assets (182,368,494) 313,703,943 (9,133,377) (21,266,619)Net Assets ($):Beginning of Period 1,097,030,841 783,326,898 90,921,615 112,188,234End of Period 914,662,347 1,097,030,841 81,788,238 90,921,615Capital Share Transactions (Shares):Class MaShares sold 5,200,439 17,778,021 41,043 180,647Shares issued for distributions reinvested 254,937 159,852 45,688 88,607Shares redeemed (11,324,867) (9,988,027) (537,533) (3,641,777)Net Increase (Decrease) inShares Outstanding (5,869,491) 7,949,846 (450,802) (3,372,523)Investor SharesaShares sold 888,185 1,479,539 46,696 145,241Shares issued for distributions reinvested 35,891 15,465 2,151 2,151Shares redeemed (616,751) (961,400) (31,448) (131,987)Net Increase (Decrease) inShares Outstanding 307,325 533,604 17,399 15,405
a During the period ended February 28, 2022, 817,588 Class M shares representing $10,944,899 were exchanged for 796,462 Investor shares for BNY Mellon EmergingMarkets Fund and 47,324 Class M shares representing $631,697 were exchanged for 46,696 Investor shares for BNY Mellon International Equity Income Fund.During the period ended August 31, 2021, 1,297,529 Class M shares representing $17,090,072 were exchanged for 1,263,855 Investor shares for BNY MellonEmerging Markets Fund and 134,903 Class M shares representing $1,783,081 were exchanged for 133,092 Investor shares for BNY Mellon International EquityIncome Fund.
See notes to financial statements.85
Copyright © 2022 www.secdatabase.com. All Rights Reserved.Please Consider the Environment Before Printing This Document
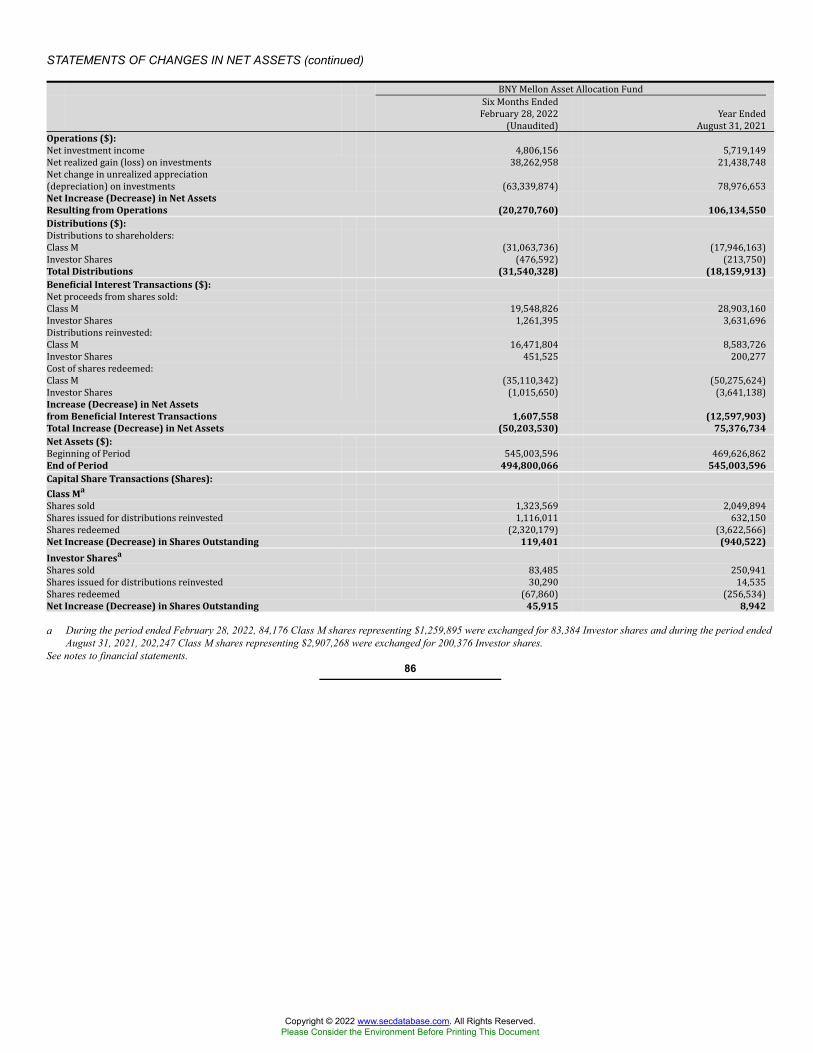
STATEMENTS OF CHANGES IN NET ASSETS (continued)
BNY Mellon Asset Allocation FundSix Months EndedFebruary 28, 2022(Unaudited) Year EndedAugust 31, 2021Operations ($):Net investment income 4,806,156 5,719,149Net realized gain (loss) on investments 38,262,958 21,438,748Net change in unrealized appreciation(depreciation) on investments (63,339,874) 78,976,653Net Increase (Decrease) in Net AssetsResulting from Operations (20,270,760) 106,134,550Distributions ($):Distributions to shareholders:Class M (31,063,736) (17,946,163)Investor Shares (476,592) (213,750)Total Distributions (31,540,328) (18,159,913)Beneficial Interest Transactions ($):Net proceeds from shares sold:Class M 19,548,826 28,903,160Investor Shares 1,261,395 3,631,696Distributions reinvested:Class M 16,471,804 8,583,726Investor Shares 451,525 200,277Cost of shares redeemed:Class M (35,110,342) (50,275,624)Investor Shares (1,015,650) (3,641,138)Increase (Decrease) in Net Assetsfrom Beneficial Interest Transactions 1,607,558 (12,597,903)Total Increase (Decrease) in Net Assets (50,203,530) 75,376,734Net Assets ($):Beginning of Period 545,003,596 469,626,862End of Period 494,800,066 545,003,596Capital Share Transactions (Shares):Class MaShares sold 1,323,569 2,049,894Shares issued for distributions reinvested 1,116,011 632,150Shares redeemed (2,320,179) (3,622,566)Net Increase (Decrease) in Shares Outstanding 119,401 (940,522)Investor SharesaShares sold 83,485 250,941Shares issued for distributions reinvested 30,290 14,535Shares redeemed (67,860) (256,534)Net Increase (Decrease) in Shares Outstanding 45,915 8,942
a During the period ended February 28, 2022, 84,176 Class M shares representing $1,259,895 were exchanged for 83,384 Investor shares and during the period endedAugust 31, 2021, 202,247 Class M shares representing $2,907,268 were exchanged for 200,376 Investor shares.
See notes to financial statements.86
Copyright © 2022 www.secdatabase.com. All Rights Reserved.Please Consider the Environment Before Printing This Document
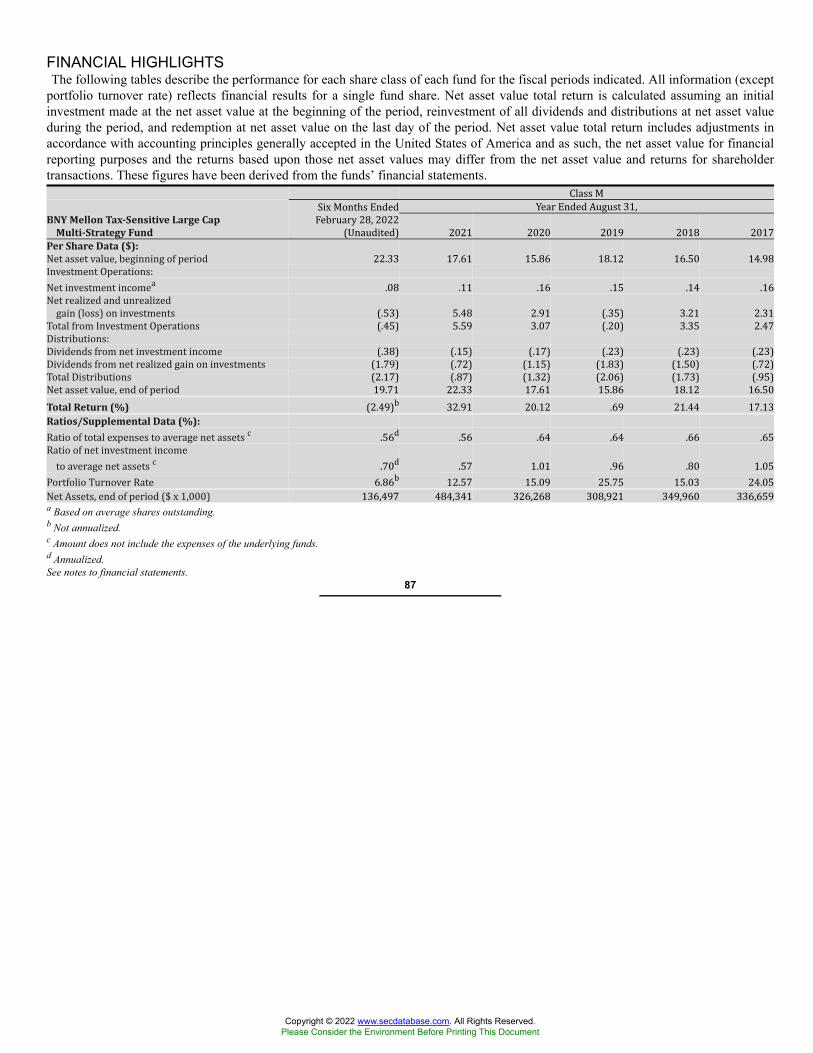
FINANCIAL HIGHLIGHTSThe following tables describe the performance for each share class of each fund for the fiscal periods indicated. All information (except
portfolio turnover rate) reflects financial results for a single fund share. Net asset value total return is calculated assuming an initialinvestment made at the net asset value at the beginning of the period, reinvestment of all dividends and distributions at net asset valueduring the period, and redemption at net asset value on the last day of the period. Net asset value total return includes adjustments inaccordance with accounting principles generally accepted in the United States of America and as such, the net asset value for financialreporting purposes and the returns based upon those net asset values may differ from the net asset value and returns for shareholdertransactions. These figures have been derived from the funds’ financial statements. Class MSix Months Ended Year Ended August 31,BNY Mellon Tax-Sensitive Large Cap
Multi-Strategy FundFebruary 28, 2022(Unaudited) 2021 2020 2019 2018 2017
Per Share Data ($):Net asset value, beginning of period 22.33 17.61 15.86 18.12 16.50 14.98Investment Operations:Net investment incomea .08 .11 .16 .15 .14 .16Net realized and unrealizedgain (loss) on investments (.53) 5.48 2.91 (.35) 3.21 2.31Total from Investment Operations (.45) 5.59 3.07 (.20) 3.35 2.47Distributions:Dividends from net investment income (.38) (.15) (.17) (.23) (.23) (.23)Dividends from net realized gain on investments (1.79) (.72) (1.15) (1.83) (1.50) (.72)Total Distributions (2.17) (.87) (1.32) (2.06) (1.73) (.95)Net asset value, end of period 19.71 22.33 17.61 15.86 18.12 16.50Total Return (%) (2.49)b 32.91 20.12 .69 21.44 17.13Ratios/Supplemental Data (%):Ratio of total expenses to average net assets c .56d .56 .64 .64 .66 .65Ratio of net investment incometo average net assets c .70d .57 1.01 .96 .80 1.05Portfolio Turnover Rate 6.86b 12.57 15.09 25.75 15.03 24.05Net Assets, end of period ($ x 1,000) 136,497 484,341 326,268 308,921 349,960 336,659a Based on average shares outstanding.b Not annualized.c Amount does not include the expenses of the underlying funds.d Annualized.See notes to financial statements.
87
Copyright © 2022 www.secdatabase.com. All Rights Reserved.Please Consider the Environment Before Printing This Document
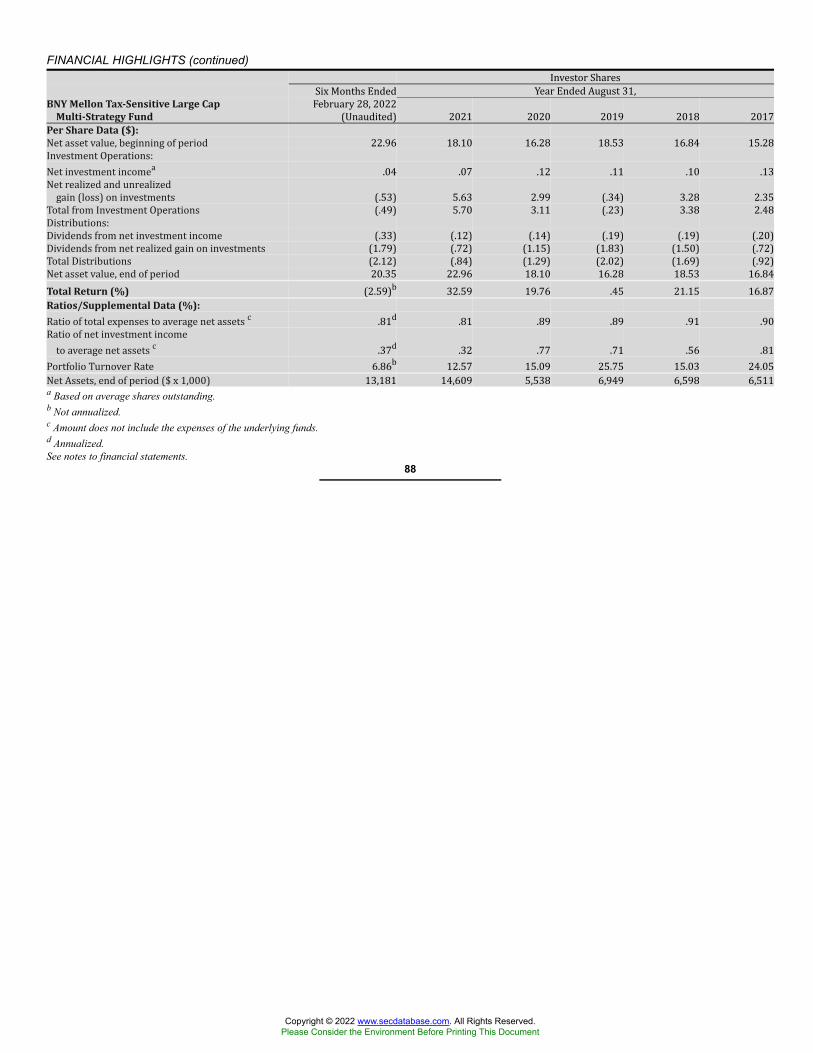
FINANCIAL HIGHLIGHTS (continued) Investor SharesSix Months Ended Year Ended August 31,BNY Mellon Tax-Sensitive Large Cap
Multi-Strategy FundFebruary 28, 2022(Unaudited) 2021 2020 2019 2018 2017
Per Share Data ($):Net asset value, beginning of period 22.96 18.10 16.28 18.53 16.84 15.28Investment Operations:Net investment incomea .04 .07 .12 .11 .10 .13Net realized and unrealizedgain (loss) on investments (.53) 5.63 2.99 (.34) 3.28 2.35Total from Investment Operations (.49) 5.70 3.11 (.23) 3.38 2.48Distributions:Dividends from net investment income (.33) (.12) (.14) (.19) (.19) (.20)Dividends from net realized gain on investments (1.79) (.72) (1.15) (1.83) (1.50) (.72)Total Distributions (2.12) (.84) (1.29) (2.02) (1.69) (.92)Net asset value, end of period 20.35 22.96 18.10 16.28 18.53 16.84Total Return (%) (2.59)b 32.59 19.76 .45 21.15 16.87Ratios/Supplemental Data (%):Ratio of total expenses to average net assets c .81d .81 .89 .89 .91 .90Ratio of net investment incometo average net assets c .37d .32 .77 .71 .56 .81Portfolio Turnover Rate 6.86b 12.57 15.09 25.75 15.03 24.05Net Assets, end of period ($ x 1,000) 13,181 14,609 5,538 6,949 6,598 6,511a Based on average shares outstanding.b Not annualized.c Amount does not include the expenses of the underlying funds.d Annualized.See notes to financial statements.
88
Copyright © 2022 www.secdatabase.com. All Rights Reserved.Please Consider the Environment Before Printing This Document
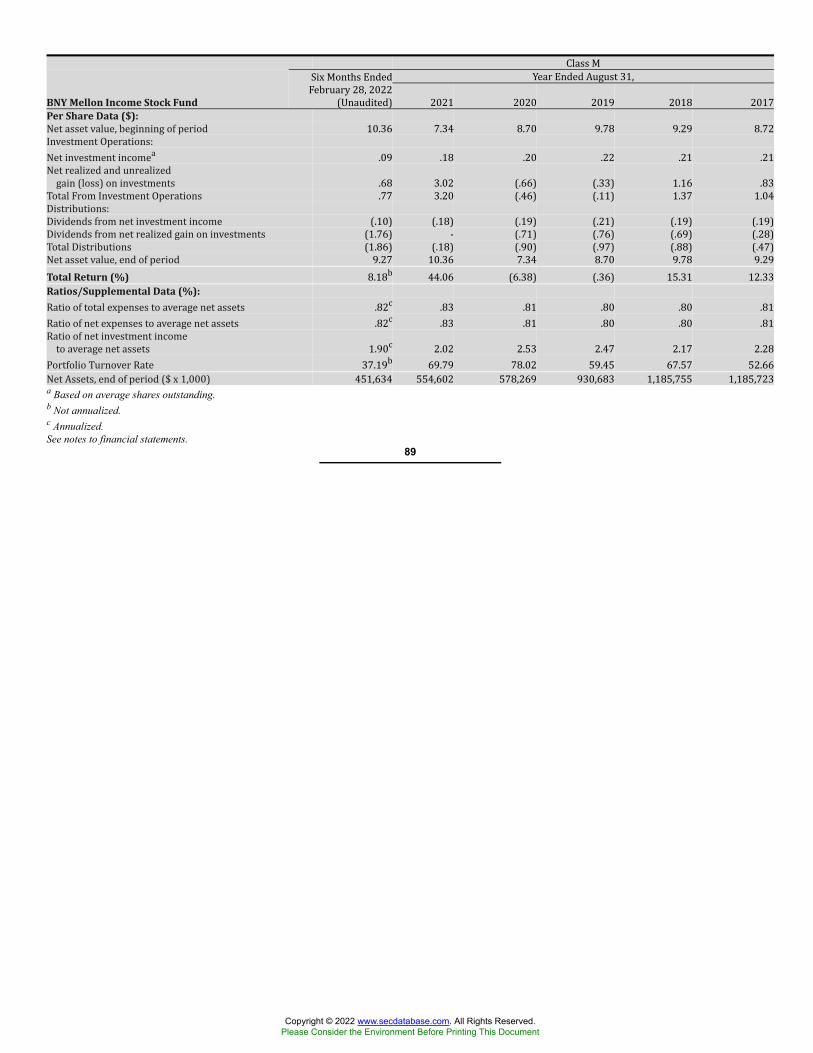
Class MSix Months Ended Year Ended August 31,BNY Mellon Income Stock Fund
February 28, 2022(Unaudited) 2021 2020 2019 2018 2017Per Share Data ($):Net asset value, beginning of period 10.36 7.34 8.70 9.78 9.29 8.72Investment Operations:Net investment incomea .09 .18 .20 .22 .21 .21Net realized and unrealizedgain (loss) on investments .68 3.02 (.66) (.33) 1.16 .83Total From Investment Operations .77 3.20 (.46) (.11) 1.37 1.04Distributions:Dividends from net investment income (.10) (.18) (.19) (.21) (.19) (.19)Dividends from net realized gain on investments (1.76) - (.71) (.76) (.69) (.28)Total Distributions (1.86) (.18) (.90) (.97) (.88) (.47)Net asset value, end of period 9.27 10.36 7.34 8.70 9.78 9.29Total Return (%) 8.18b 44.06 (6.38) (.36) 15.31 12.33Ratios/Supplemental Data (%):Ratio of total expenses to average net assets .82c .83 .81 .80 .80 .81Ratio of net expenses to average net assets .82c .83 .81 .80 .80 .81Ratio of net investment incometo average net assets 1.90c 2.02 2.53 2.47 2.17 2.28Portfolio Turnover Rate 37.19b 69.79 78.02 59.45 67.57 52.66Net Assets, end of period ($ x 1,000) 451,634 554,602 578,269 930,683 1,185,755 1,185,723a Based on average shares outstanding.b Not annualized.c Annualized.See notes to financial statements.
89
Copyright © 2022 www.secdatabase.com. All Rights Reserved.Please Consider the Environment Before Printing This Document
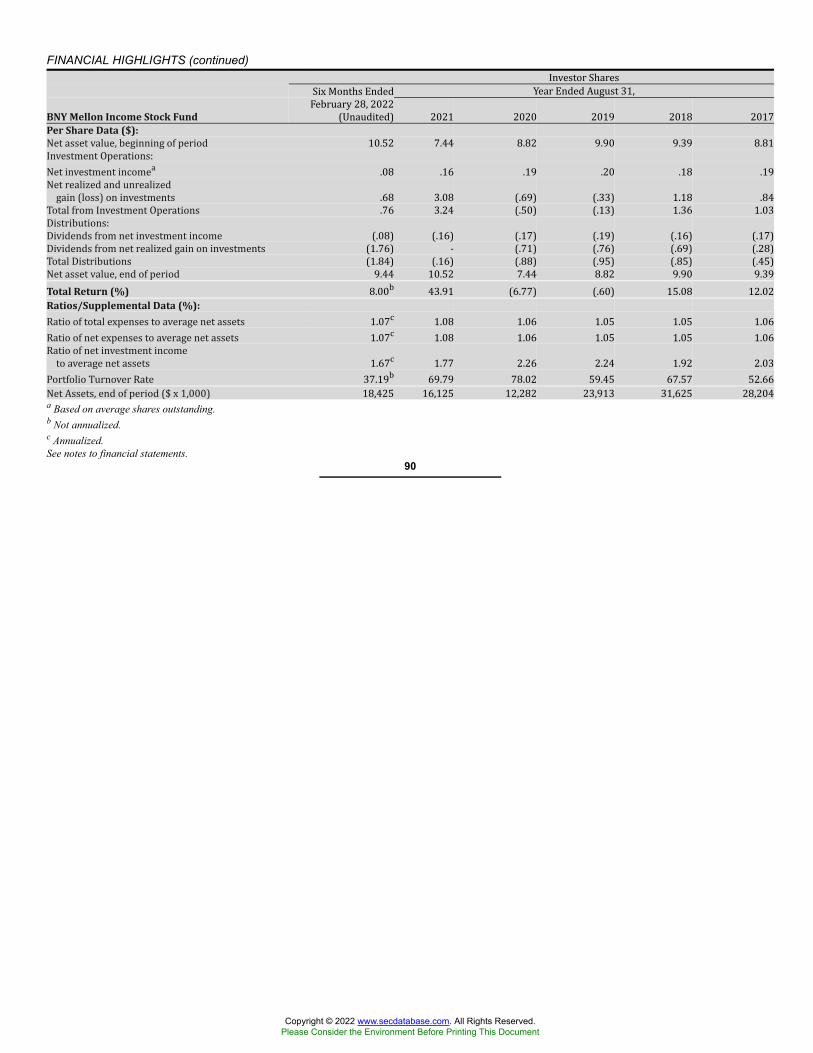
FINANCIAL HIGHLIGHTS (continued) Investor SharesSix Months Ended Year Ended August 31,BNY Mellon Income Stock Fund
February 28, 2022(Unaudited) 2021 2020 2019 2018 2017Per Share Data ($):Net asset value, beginning of period 10.52 7.44 8.82 9.90 9.39 8.81Investment Operations:Net investment incomea .08 .16 .19 .20 .18 .19Net realized and unrealizedgain (loss) on investments .68 3.08 (.69) (.33) 1.18 .84Total from Investment Operations .76 3.24 (.50) (.13) 1.36 1.03Distributions:Dividends from net investment income (.08) (.16) (.17) (.19) (.16) (.17)Dividends from net realized gain on investments (1.76) - (.71) (.76) (.69) (.28)Total Distributions (1.84) (.16) (.88) (.95) (.85) (.45)Net asset value, end of period 9.44 10.52 7.44 8.82 9.90 9.39Total Return (%) 8.00b 43.91 (6.77) (.60) 15.08 12.02Ratios/Supplemental Data (%):Ratio of total expenses to average net assets 1.07c 1.08 1.06 1.05 1.05 1.06Ratio of net expenses to average net assets 1.07c 1.08 1.06 1.05 1.05 1.06Ratio of net investment incometo average net assets 1.67c 1.77 2.26 2.24 1.92 2.03Portfolio Turnover Rate 37.19b 69.79 78.02 59.45 67.57 52.66Net Assets, end of period ($ x 1,000) 18,425 16,125 12,282 23,913 31,625 28,204a Based on average shares outstanding.b Not annualized.c Annualized.See notes to financial statements.
90
Copyright © 2022 www.secdatabase.com. All Rights Reserved.Please Consider the Environment Before Printing This Document
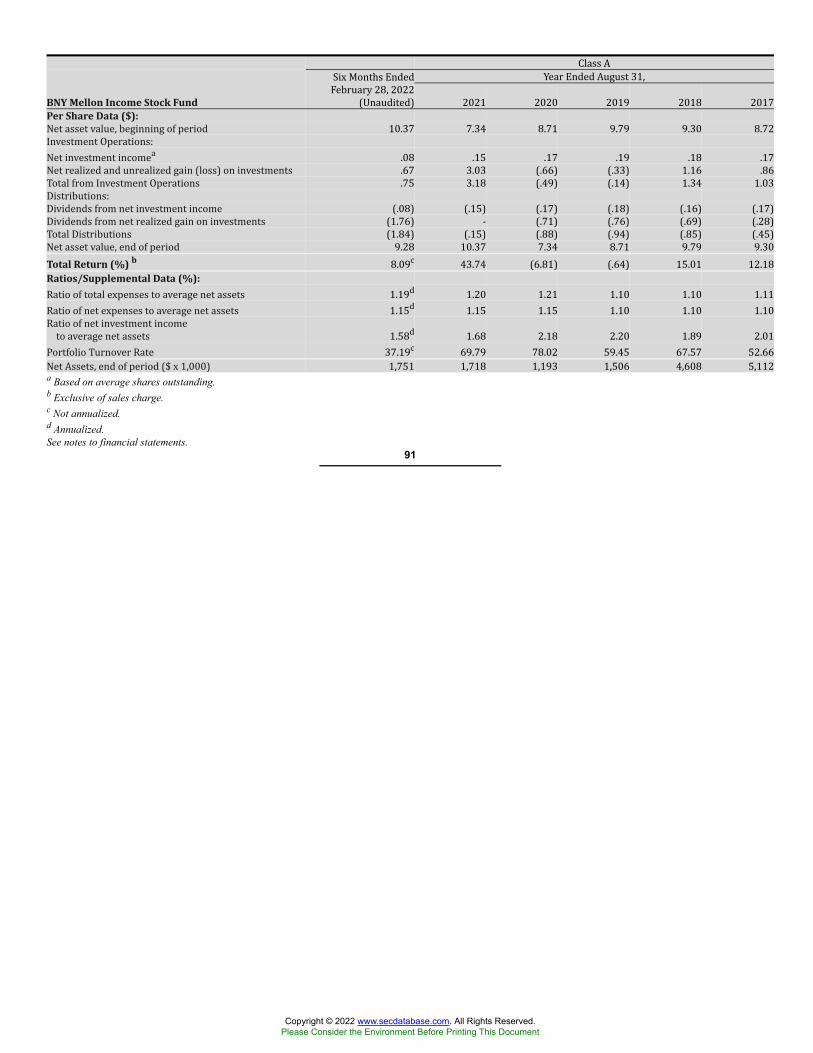
Class ASix Months Ended Year Ended August 31,BNY Mellon Income Stock Fund
February 28, 2022(Unaudited) 2021 2020 2019 2018 2017Per Share Data ($):Net asset value, beginning of period 10.37 7.34 8.71 9.79 9.30 8.72Investment Operations:Net investment incomea .08 .15 .17 .19 .18 .17Net realized and unrealized gain (loss) on investments .67 3.03 (.66) (.33) 1.16 .86Total from Investment Operations .75 3.18 (.49) (.14) 1.34 1.03Distributions:Dividends from net investment income (.08) (.15) (.17) (.18) (.16) (.17)Dividends from net realized gain on investments (1.76) - (.71) (.76) (.69) (.28)Total Distributions (1.84) (.15) (.88) (.94) (.85) (.45)Net asset value, end of period 9.28 10.37 7.34 8.71 9.79 9.30Total Return (%) b 8.09c 43.74 (6.81) (.64) 15.01 12.18Ratios/Supplemental Data (%):Ratio of total expenses to average net assets 1.19d 1.20 1.21 1.10 1.10 1.11Ratio of net expenses to average net assets 1.15d 1.15 1.15 1.10 1.10 1.10Ratio of net investment incometo average net assets 1.58d 1.68 2.18 2.20 1.89 2.01Portfolio Turnover Rate 37.19c 69.79 78.02 59.45 67.57 52.66Net Assets, end of period ($ x 1,000) 1,751 1,718 1,193 1,506 4,608 5,112a Based on average shares outstanding.b Exclusive of sales charge.c Not annualized.d Annualized.See notes to financial statements.
91
Copyright © 2022 www.secdatabase.com. All Rights Reserved.Please Consider the Environment Before Printing This Document

FINANCIAL HIGHLIGHTS (continued) Class CSix Months Ended Year Ended August 31,BNY Mellon Income Stock Fund
February 28, 2022(Unaudited) 2021 2020 2019 2018 2017Per Share Data ($):Net asset value, beginning of period 10.33 7.32 8.68 9.76 9.28 8.72Investment Operations:Net investment incomea .04 .09 .11 .12 .10 .12Net realized and unrealized gain (loss) on investments .67 3.01 (.65) (.33) 1.16 .83Total from Investment Operations .71 3.10 (.54) (.21) 1.26 .95Distributions:Dividends from net investment income (.04) (.09) (.11) (.11) (.09) (.11)Dividends from net realized gain on investments (1.76) - (.71) (.76) (.69) (.28)Total Distributions (1.80) (.09) (.82) (.87) (.78) (.39)Net asset value, end of period 9.24 10.33 7.32 8.68 9.76 9.28Total Return (%) b 7.62c 42.59 (7.44) (1.43) 14.07 11.22Ratios/Supplemental Data (%):Ratio of total expenses to average net assets 1.94d 1.93 1.91 1.88 1.88 1.85Ratio of net expenses to average net assets 1.90d 1.90 1.90 1.88 1.88 1.81Ratio of net investment incometo average net assets .86d .96 1.43 1.36 1.08 1.30Portfolio Turnover Rate 37.19c 69.79 78.02 59.45 67.57 52.66Net Assets, end of period ($ x 1,000) 509 629 747 1,158 826 1,143a Based on average shares outstanding.b Exclusive of sales charge.c Not annualized.d Annualized.See notes to financial statements.
92
Copyright © 2022 www.secdatabase.com. All Rights Reserved.Please Consider the Environment Before Printing This Document

Class ISix Months Ended Year Ended August 31,BNY Mellon Income Stock Fund
February 28, 2022(Unaudited) 2021 2020 2019 2018 2017Per Share Data ($):Net asset value, beginning of period 10.36 7.34 8.71 9.78 9.30 8.72Investment Operations:Net investment incomea .09 .17 .20 .22 .20 .21Net realized and unrealized gain (loss) on investments .68 3.03 (.67) (.33) 1.16 .84Total from Investment Operations .77 3.20 (.47) (.11) 1.36 1.05Distributions:Dividends from net investment income (.09) (.18) (.19) (.20) (.19) (.19)Dividends from net realized gain on investments (1.76) - (.71) (.76) (.69) (.28)Total Distributions (1.85) (.18) (.90) (.96) (.88) (.47)Net asset value, end of period 9.28 10.36 7.34 8.71 9.78 9.30Total Return (%) 8.24b 43.96 (6.54) (.28) 15.18 12.44Ratios/Supplemental Data (%):Ratio of total expenses to average net assets .88c .89 .87 .84 .83 .85Ratio of net expenses to average net assets .88c .89 .87 .84 .83 .85Ratio of net investment incometo average net assets 1.86c 1.96 2.51 2.41 2.13 2.30Portfolio Turnover Rate 37.19b 69.79 78.02 59.45 67.57 52.66Net Assets, end of period ($ x 1,000) 8,389 8,530 7,887 10,135 12,491 6,068a Based on average shares outstanding.b Not annualized.c Annualized.See notes to financial statements.
93
Copyright © 2022 www.secdatabase.com. All Rights Reserved.Please Consider the Environment Before Printing This Document

FINANCIAL HIGHLIGHTS (continued) Class YSix Months Ended Year Ended August 31,BNY Mellon Income Stock Fund
February 28, 2022(Unaudited) 2021 2020 2019 2018 2017Per Share Data ($):Net asset value, beginning of period 10.35 7.33 8.70 9.78 9.29 8.72Investment Operations:Net investment incomea .11 .18 .20 .22 .20 .21Net realized and unrealized gain (loss) on investments .65 3.02 (.67) (.33) 1.17 .83Total from Investment Operations .76 3.20 (.47) (.11) 1.37 1.04Distributions:Dividends from net investment income (.09) (.18) (.19) (.21) (.19) (.19)Dividends from net realized gain on investments (1.76) - (.71) (.76) (.69) (.28)Total Distributions (1.85) (.18) (.90) (.97) (.88) (.47)Net asset value, end of period 9.26 10.35 7.33 8.70 9.78 9.29Total Return (%) 8.18b 44.11 (6.51) (.36) 15.31 12.33Ratios/Supplemental Data (%):Ratio of total expenses to average net assets .83c .83 .83 .82 .80 .81Ratio of net expenses to average net assets .83c .83 .83 .82 .80 .81Ratio of net investment incometo average net assets 1.95c 2.01 2.63 2.43 2.17 2.27Portfolio Turnover Rate 37.19b 69.79 78.02 59.45 67.57 52.66Net Assets, end of period ($ x 1,000) 302 779 541 382 12 11a Based on average shares outstanding.b Not annualized.c Annualized.See notes to financial statements.
94
Copyright © 2022 www.secdatabase.com. All Rights Reserved.Please Consider the Environment Before Printing This Document

Class MSix Months Ended Year Ended August 31,BNY Mellon Mid Cap Multi-Strategy Fund
February 28, 2022(Unaudited) 2021 2020 2019 2018 2017Per Share Data ($):Net asset value, beginning of period 24.69 19.28 17.45 19.24 16.72 15.03Investment Operations:Net investment incomea .02 .04 .09 .08 .05 .07Net realized and unrealizedgain (loss) on investments (1.74) 6.99 2.36 (.63) 3.28 1.88Total from Investment Operations (1.72) 7.03 2.45 (.55) 3.33 1.95Distributions:Dividends from net investment income (.02) (.08) (.04) (.05) (.04) (.10)Dividends from net realized gain on investments (2.86) (1.54) (.58) (1.19) (.77) (.16)Total Distributions (2.88) (1.62) (.62) (1.24) (.81) (.26)Net asset value, end of period 20.09 24.69 19.28 17.45 19.24 16.72Total Return (%) (7.56)b 38.15 14.24 (1.54) 20.48 13.12Ratios/Supplemental Data (%):Ratio of total expenses to average net assets .90c .90 .90 .89 .89 .90Ratio of net investment incometo average net assets .18c .18 .50 .45 .30 .45Portfolio Turnover Rate 9.46b 31.74 41.86 44.44 50.53 62.81Net Assets, end of period ($ x 1,000) 2,305,259 2,831,948 2,433,885 2,610,739 3,358,399 2,788,133a Based on average shares outstanding.b Not annualized.c Annualized.See notes to financial statements.
95
Copyright © 2022 www.secdatabase.com. All Rights Reserved.Please Consider the Environment Before Printing This Document
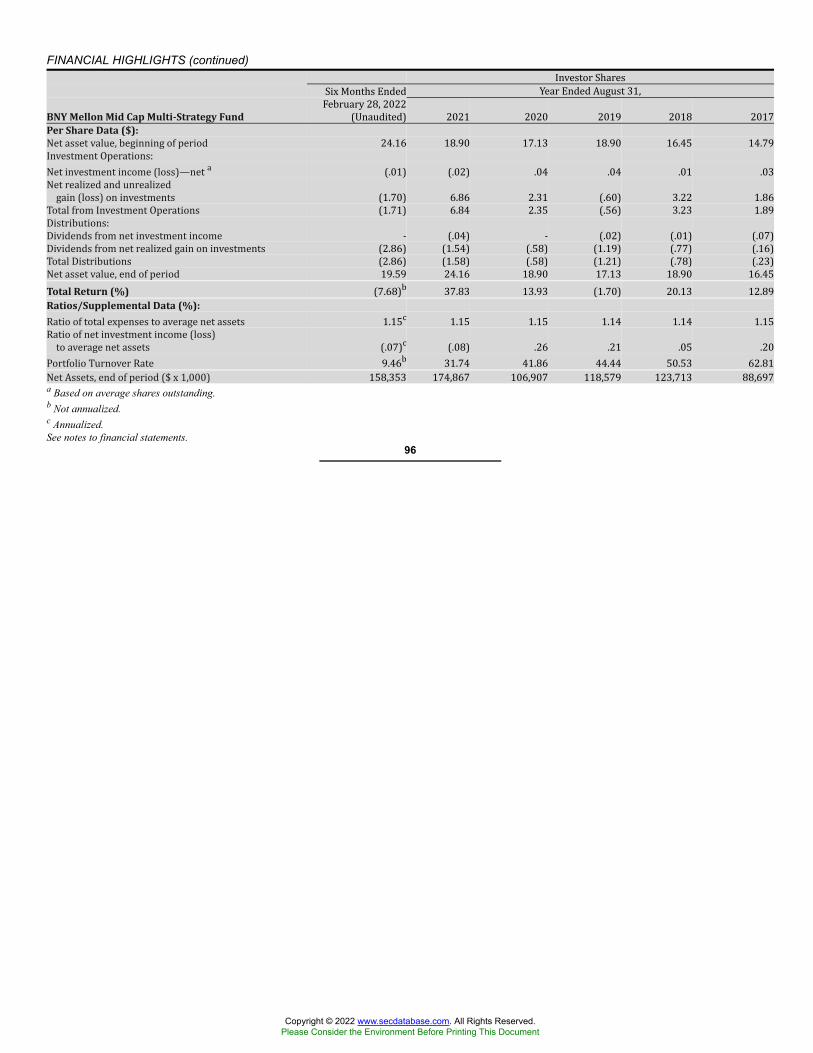
FINANCIAL HIGHLIGHTS (continued) Investor SharesSix Months Ended Year Ended August 31,BNY Mellon Mid Cap Multi-Strategy Fund
February 28, 2022(Unaudited) 2021 2020 2019 2018 2017Per Share Data ($):Net asset value, beginning of period 24.16 18.90 17.13 18.90 16.45 14.79Investment Operations:Net investment income (loss)—net a (.01) (.02) .04 .04 .01 .03Net realized and unrealizedgain (loss) on investments (1.70) 6.86 2.31 (.60) 3.22 1.86Total from Investment Operations (1.71) 6.84 2.35 (.56) 3.23 1.89Distributions:Dividends from net investment income - (.04) - (.02) (.01) (.07)Dividends from net realized gain on investments (2.86) (1.54) (.58) (1.19) (.77) (.16)Total Distributions (2.86) (1.58) (.58) (1.21) (.78) (.23)Net asset value, end of period 19.59 24.16 18.90 17.13 18.90 16.45Total Return (%) (7.68)b 37.83 13.93 (1.70) 20.13 12.89Ratios/Supplemental Data (%):Ratio of total expenses to average net assets 1.15c 1.15 1.15 1.14 1.14 1.15Ratio of net investment income (loss)to average net assets (.07)c (.08) .26 .21 .05 .20Portfolio Turnover Rate 9.46b 31.74 41.86 44.44 50.53 62.81Net Assets, end of period ($ x 1,000) 158,353 174,867 106,907 118,579 123,713 88,697a Based on average shares outstanding.b Not annualized.c Annualized.See notes to financial statements.
96
Copyright © 2022 www.secdatabase.com. All Rights Reserved.Please Consider the Environment Before Printing This Document
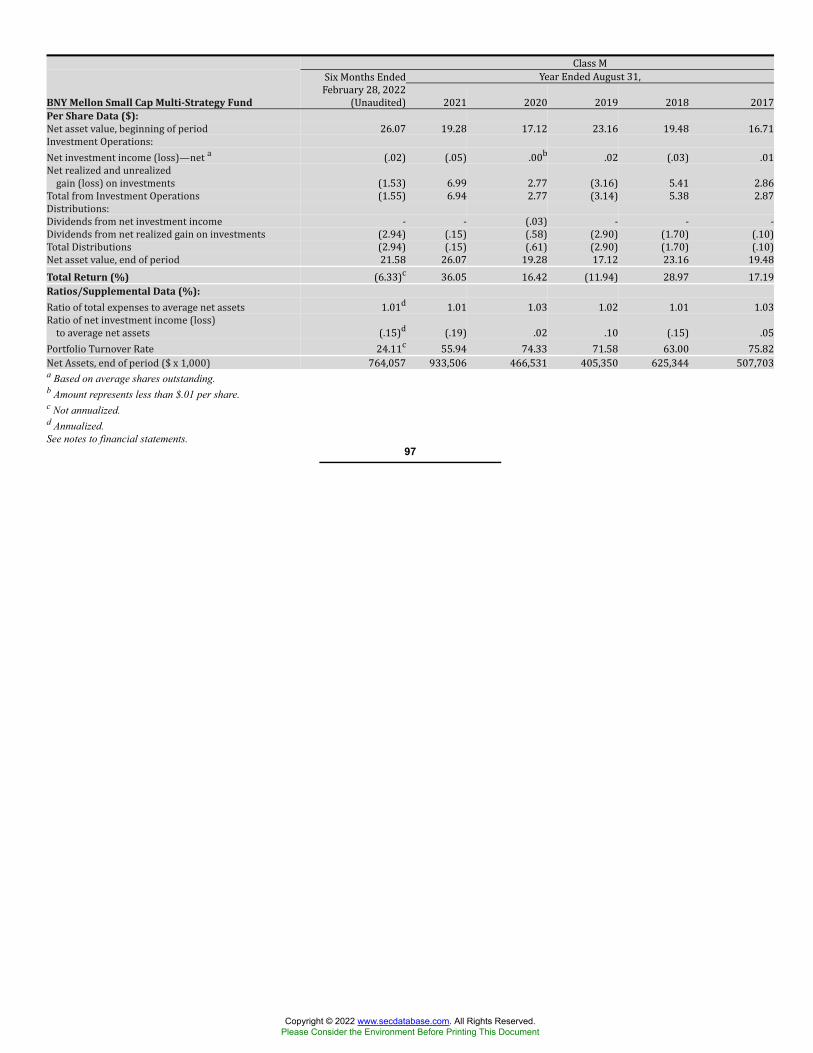
Class MSix Months Ended Year Ended August 31,BNY Mellon Small Cap Multi-Strategy Fund
February 28, 2022(Unaudited) 2021 2020 2019 2018 2017Per Share Data ($):Net asset value, beginning of period 26.07 19.28 17.12 23.16 19.48 16.71Investment Operations:Net investment income (loss)—net a (.02) (.05) .00b .02 (.03) .01Net realized and unrealizedgain (loss) on investments (1.53) 6.99 2.77 (3.16) 5.41 2.86Total from Investment Operations (1.55) 6.94 2.77 (3.14) 5.38 2.87Distributions:Dividends from net investment income - - (.03) - - -Dividends from net realized gain on investments (2.94) (.15) (.58) (2.90) (1.70) (.10)Total Distributions (2.94) (.15) (.61) (2.90) (1.70) (.10)Net asset value, end of period 21.58 26.07 19.28 17.12 23.16 19.48Total Return (%) (6.33)c 36.05 16.42 (11.94) 28.97 17.19Ratios/Supplemental Data (%):Ratio of total expenses to average net assets 1.01d 1.01 1.03 1.02 1.01 1.03Ratio of net investment income (loss)to average net assets (.15)d (.19) .02 .10 (.15) .05Portfolio Turnover Rate 24.11c 55.94 74.33 71.58 63.00 75.82Net Assets, end of period ($ x 1,000) 764,057 933,506 466,531 405,350 625,344 507,703a Based on average shares outstanding.b Amount represents less than $.01 per share.c Not annualized.d Annualized.See notes to financial statements.
97
Copyright © 2022 www.secdatabase.com. All Rights Reserved.Please Consider the Environment Before Printing This Document
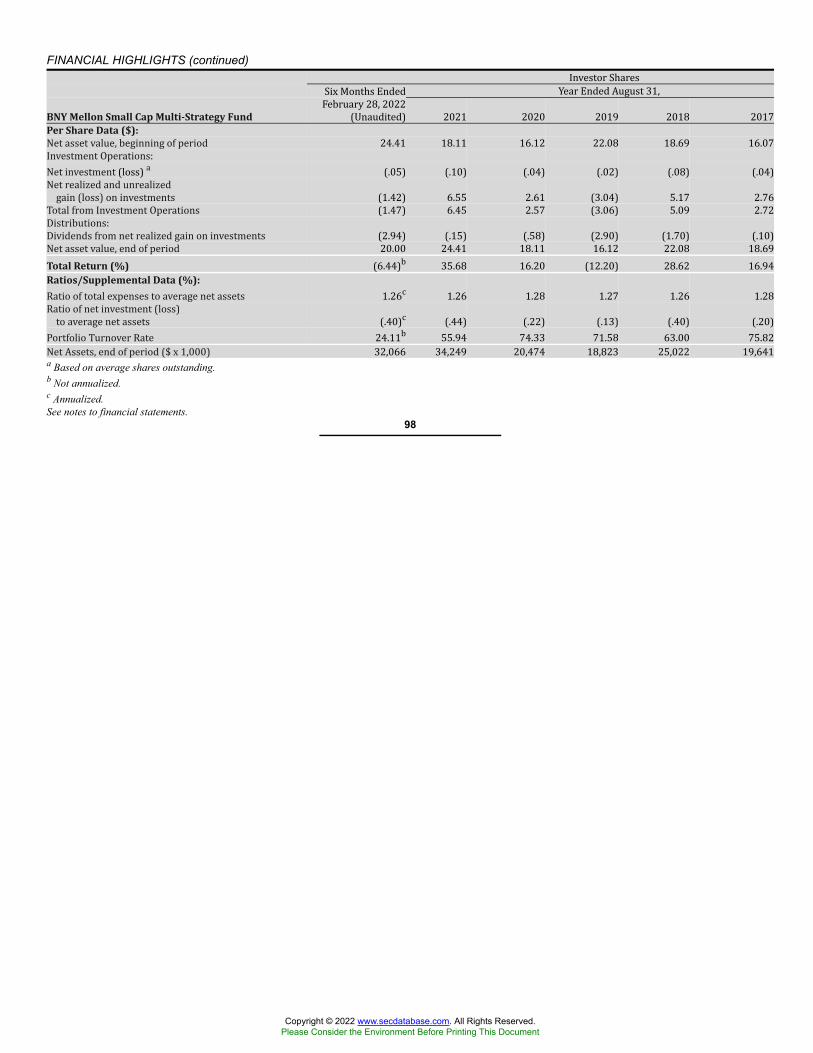
FINANCIAL HIGHLIGHTS (continued) Investor SharesSix Months Ended Year Ended August 31,BNY Mellon Small Cap Multi-Strategy Fund
February 28, 2022(Unaudited) 2021 2020 2019 2018 2017Per Share Data ($):Net asset value, beginning of period 24.41 18.11 16.12 22.08 18.69 16.07Investment Operations:Net investment (loss) a (.05) (.10) (.04) (.02) (.08) (.04)Net realized and unrealizedgain (loss) on investments (1.42) 6.55 2.61 (3.04) 5.17 2.76Total from Investment Operations (1.47) 6.45 2.57 (3.06) 5.09 2.72Distributions:Dividends from net realized gain on investments (2.94) (.15) (.58) (2.90) (1.70) (.10)Net asset value, end of period 20.00 24.41 18.11 16.12 22.08 18.69Total Return (%) (6.44)b 35.68 16.20 (12.20) 28.62 16.94Ratios/Supplemental Data (%):Ratio of total expenses to average net assets 1.26c 1.26 1.28 1.27 1.26 1.28Ratio of net investment (loss)to average net assets (.40)c (.44) (.22) (.13) (.40) (.20)Portfolio Turnover Rate 24.11b 55.94 74.33 71.58 63.00 75.82Net Assets, end of period ($ x 1,000) 32,066 34,249 20,474 18,823 25,022 19,641a Based on average shares outstanding.b Not annualized.c Annualized.See notes to financial statements.
98
Copyright © 2022 www.secdatabase.com. All Rights Reserved.Please Consider the Environment Before Printing This Document

Class MSix Months Ended Year Ended August 31,BNY Mellon Focused Equity Opportunities Fund
February 28, 2022(Unaudited) 2021 2020 2019 2018 2017Per Share Data ($):Net asset value, beginning of period 21.97 17.88 15.57 18.63 16.96 14.63Investment Operations:Net investment incomea .04 .10 .14 .10 .09 .11Net realized and unrealizedgain (loss) on investments (.61) 5.38 3.29 (.53) 3.51 3.56Total from Investment Operations (.57) 5.48 3.43 (.43) 3.60 3.67Distributions:Dividends from net investment income (.09) (.15) (.13) (.12) (.07) (.19)Dividends from net realized gain on investments (3.00) (1.24) (.99) (2.51) (1.86) (1.15)Total Distributions (3.09) (1.39) (1.12) (2.63) (1.93) (1.34)Net asset value, end of period 18.31 21.97 17.88 15.57 18.63 16.96Total Return (%) (3.58)b 32.72 23.11 (.59) 22.62 27.04Ratios/Supplemental Data (%):Ratio of total expenses to average net assets .87c .87 .87 .86 .86 .87Ratio of net investment incometo average net assets .42c .55 .90 .66 .53 .72Portfolio Turnover Rate 20.77b 29.38 43.62 78.12 45.29 62.39Net Assets, end of period ($ x 1,000) 427,233 483,169 447,927 430,597 577,906 485,040a Based on average shares outstanding.b Not annualized.c Annualized.See notes to financial statements.
99
Copyright © 2022 www.secdatabase.com. All Rights Reserved.Please Consider the Environment Before Printing This Document
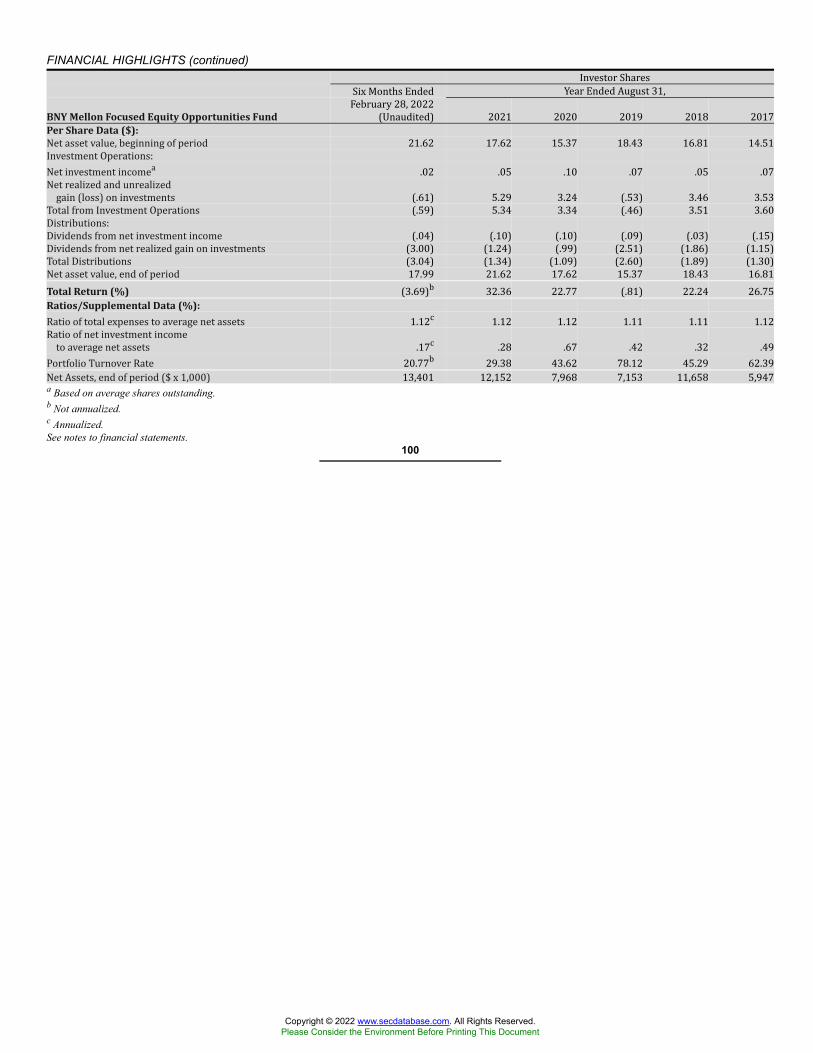
FINANCIAL HIGHLIGHTS (continued) Investor SharesSix Months Ended Year Ended August 31,BNY Mellon Focused Equity Opportunities Fund
February 28, 2022(Unaudited) 2021 2020 2019 2018 2017Per Share Data ($):Net asset value, beginning of period 21.62 17.62 15.37 18.43 16.81 14.51Investment Operations:Net investment incomea .02 .05 .10 .07 .05 .07Net realized and unrealizedgain (loss) on investments (.61) 5.29 3.24 (.53) 3.46 3.53Total from Investment Operations (.59) 5.34 3.34 (.46) 3.51 3.60Distributions:Dividends from net investment income (.04) (.10) (.10) (.09) (.03) (.15)Dividends from net realized gain on investments (3.00) (1.24) (.99) (2.51) (1.86) (1.15)Total Distributions (3.04) (1.34) (1.09) (2.60) (1.89) (1.30)Net asset value, end of period 17.99 21.62 17.62 15.37 18.43 16.81Total Return (%) (3.69)b 32.36 22.77 (.81) 22.24 26.75Ratios/Supplemental Data (%):Ratio of total expenses to average net assets 1.12c 1.12 1.12 1.11 1.11 1.12Ratio of net investment incometo average net assets .17c .28 .67 .42 .32 .49Portfolio Turnover Rate 20.77b 29.38 43.62 78.12 45.29 62.39Net Assets, end of period ($ x 1,000) 13,401 12,152 7,968 7,153 11,658 5,947a Based on average shares outstanding.b Not annualized.c Annualized.See notes to financial statements.
100
Copyright © 2022 www.secdatabase.com. All Rights Reserved.Please Consider the Environment Before Printing This Document

Class MSix Months Ended Year Ended August 31,BNY Mellon International Fund
February 28, 2022(Unaudited) 2021 2020 2019 2018 2017Per Share Data ($):Net asset value, beginning of period 15.38 12.78 12.31 13.45 13.17 11.22Investment Operations:Net investment incomea .14 .27 .21 .31 .23 .19Net realized and unrealizedgain (loss) on investments (1.07) 2.64 .60 (1.20) .26 1.98Total from Investment Operations (.93) 2.91 .81 (.89) .49 2.17Distributions:Dividends from net investment income (.29) (.31) (.34) (.25) (.21) (.22)Net asset value, end of period 14.16 15.38 12.78 12.31 13.45 13.17Total Return (%) (6.15)b 23.04 6.47 (6.50) 3.68 19.80Ratios/Supplemental Data (%):Ratio of total expenses to average net assets 1.02c 1.03 1.03 1.02 1.02 1.04Ratio of net investment incometo average net assets 1.83c 1.86 1.67 2.47 1.68 1.64Portfolio Turnover Rate 36.78b 56.01 66.41 59.03 54.87 81.88Net Assets, end of period ($ x 1,000) 537,161 603,937 552,883 897,080 1,124,632 1,076,444a Based on average shares outstanding.b Not annualized.c Annualized.See notes to financial statements.
101
Copyright © 2022 www.secdatabase.com. All Rights Reserved.Please Consider the Environment Before Printing This Document
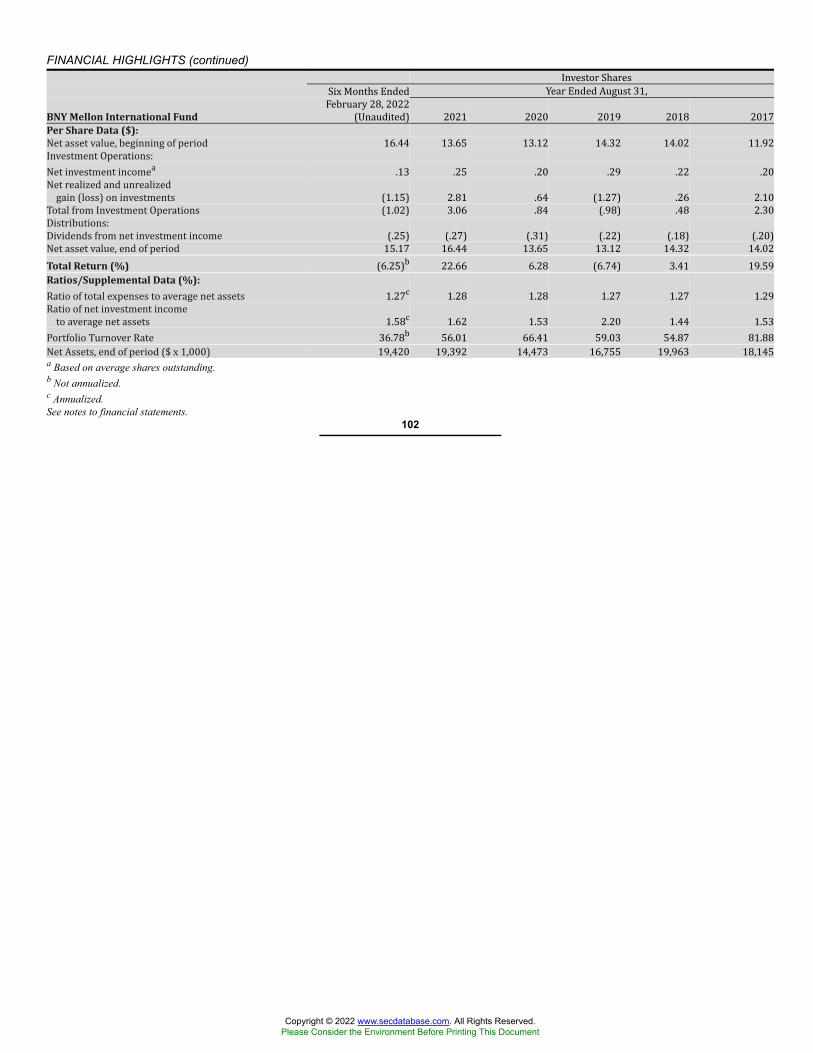
FINANCIAL HIGHLIGHTS (continued) Investor SharesSix Months Ended Year Ended August 31,BNY Mellon International Fund
February 28, 2022(Unaudited) 2021 2020 2019 2018 2017Per Share Data ($):Net asset value, beginning of period 16.44 13.65 13.12 14.32 14.02 11.92Investment Operations:Net investment incomea .13 .25 .20 .29 .22 .20Net realized and unrealizedgain (loss) on investments (1.15) 2.81 .64 (1.27) .26 2.10Total from Investment Operations (1.02) 3.06 .84 (.98) .48 2.30Distributions:Dividends from net investment income (.25) (.27) (.31) (.22) (.18) (.20)Net asset value, end of period 15.17 16.44 13.65 13.12 14.32 14.02Total Return (%) (6.25)b 22.66 6.28 (6.74) 3.41 19.59Ratios/Supplemental Data (%):Ratio of total expenses to average net assets 1.27c 1.28 1.28 1.27 1.27 1.29Ratio of net investment incometo average net assets 1.58c 1.62 1.53 2.20 1.44 1.53Portfolio Turnover Rate 36.78b 56.01 66.41 59.03 54.87 81.88Net Assets, end of period ($ x 1,000) 19,420 19,392 14,473 16,755 19,963 18,145a Based on average shares outstanding.b Not annualized.c Annualized.See notes to financial statements.
102
Copyright © 2022 www.secdatabase.com. All Rights Reserved.Please Consider the Environment Before Printing This Document

Class MSix Months Ended Year Ended August 31,BNY Mellon Emerging Markets Fund
February 28, 2022(Unaudited) 2021 2020 2019 2018 2017Per Share Data ($):Net asset value, beginning of period 14.15 11.35 10.14 10.72 11.23 8.96Investment Operations:Net investment incomea .13 .24 .07 .14 .11 .08Net realized and unrealizedgain (loss) on investments (1.30) 2.71 1.27 (.64) (.53) 2.26Total from Investment Operations (1.17) 2.95 1.34 (.50) (.42) 2.34Distributions:Dividends from net investment income (.27) (.15) (.13) (.08) (.09) (.07)Net asset value, end of period 12.71 14.15 11.35 10.14 10.72 11.23Total Return (%) (8.38)b 26.19 13.24 (4.68) (3.76) 26.36Ratios/Supplemental Data (%):Ratio of total expenses to average net assets 1.41c 1.39 1.39 1.39 1.39 1.40Ratio of net investment incometo average net assets 1.90c 1.78 .71 1.37 .96 .84Portfolio Turnover Rate 27.41b 63.29 34.44 90.09 80.86 91.81Net Assets, end of period ($ x 1,000) 880,231 1,063,203 762,408 819,164 922,117 904,774a Based on average shares outstanding.b Not annualized.c Annualized.See notes to financial statements.
103
Copyright © 2022 www.secdatabase.com. All Rights Reserved.Please Consider the Environment Before Printing This Document

FINANCIAL HIGHLIGHTS (continued) Investor SharesSix Months Ended Year Ended August 31,BNY Mellon Emerging Markets Fund
February 28, 2022(Unaudited) 2021 2020 2019 2018 2017Per Share Data ($):Net asset value, beginning of period 14.52 11.64 10.41 11.01 11.53 9.20Investment Operations:Net investment incomea .11 .21 .04 .12 .09 .07Net realized and unrealizedgain (loss) on investments (1.34) 2.80 1.30 (.67) (.54) 2.31Total from Investment Operations (1.23) 3.01 1.34 (.55) (.45) 2.38Distributions:Dividends from net investment income (.24) (.13) (.11) (.05) (.07) (.05)Net asset value, end of period 13.05 14.52 11.64 10.41 11.01 11.53Total Return (%) (8.50)b 25.97 12.85 (4.99) (3.93) 26.05Ratios/Supplemental Data (%):Ratio of total expenses to average net assets 1.66c 1.64 1.64 1.64 1.64 1.65Ratio of net investment incometo average net assets 1.68c 1.53 .36 1.10 .74 .69Portfolio Turnover Rate 27.41b 63.29 34.44 90.09 80.86 91.81Net Assets, end of period ($ x 1,000) 34,431 33,827 20,919 20,970 20,257 17,970a Based on average shares outstanding.b Not annualized.c Annualized.See notes to financial statements.
104
Copyright © 2022 www.secdatabase.com. All Rights Reserved.Please Consider the Environment Before Printing This Document

Class MSix Months Ended Year Ended August 31,BNY Mellon International Equity Income Fund
February 28, 2022(Unaudited) 2021 2020 2019 2018 2017Per Share Data ($):Net asset value, beginning of period 13.79 11.27 12.20 13.86 14.20 12.35Investment Operations:Net investment incomea .19 .37 .37 .59 .57 .42Net realized and unrealizedgain (loss) on investments (.36) 2.62 (.82) (1.69) (.32) 1.84Total from Investment Operations (.17) 2.99 (.45) (1.10) .25 2.26Distributions:Dividends from net investment income (.34) (.47) (.48) (.56) (.59) (.41)Net asset value, end of period 13.28 13.79 11.27 12.20 13.86 14.20Total Return (%) (1.22)b 27.02 (3.94) (7.98) 1.63 18.72Ratios/Supplemental Data (%):Ratio of total expenses to average net assets 1.24c 1.20 1.14 1.07 1.08 1.09Ratio of net investment incometo average net assets 2.81c 2.95 3.05 4.53 3.92 3.27Portfolio Turnover Rate 19.45b 44.35 55.03 45.49 54.20 46.42Net Assets, end of period ($ x 1,000) 80,250 89,568 111,258 282,061 360,816 367,829a Based on average shares outstanding.b Not annualized.c Annualized.See notes to financial statements.
105
Copyright © 2022 www.secdatabase.com. All Rights Reserved.Please Consider the Environment Before Printing This Document
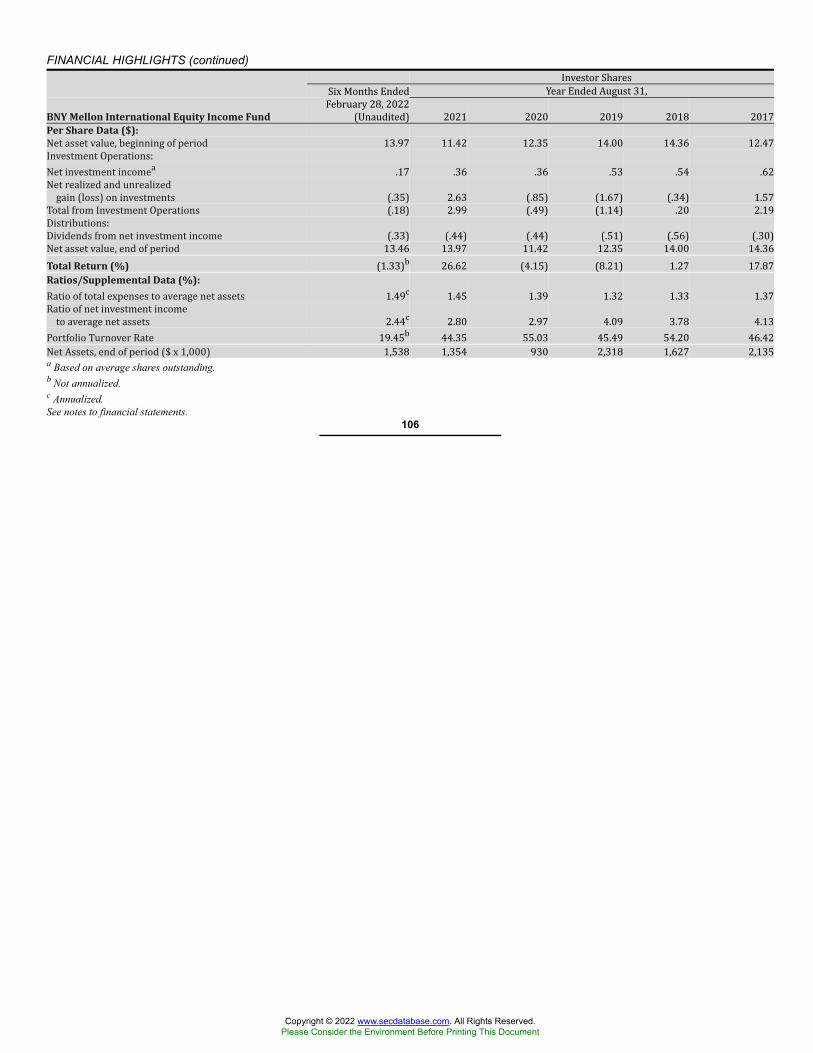
FINANCIAL HIGHLIGHTS (continued) Investor SharesSix Months Ended Year Ended August 31,BNY Mellon International Equity Income Fund
February 28, 2022(Unaudited) 2021 2020 2019 2018 2017Per Share Data ($):Net asset value, beginning of period 13.97 11.42 12.35 14.00 14.36 12.47Investment Operations:Net investment incomea .17 .36 .36 .53 .54 .62Net realized and unrealizedgain (loss) on investments (.35) 2.63 (.85) (1.67) (.34) 1.57Total from Investment Operations (.18) 2.99 (.49) (1.14) .20 2.19Distributions:Dividends from net investment income (.33) (.44) (.44) (.51) (.56) (.30)Net asset value, end of period 13.46 13.97 11.42 12.35 14.00 14.36Total Return (%) (1.33)b 26.62 (4.15) (8.21) 1.27 17.87Ratios/Supplemental Data (%):Ratio of total expenses to average net assets 1.49c 1.45 1.39 1.32 1.33 1.37Ratio of net investment incometo average net assets 2.44c 2.80 2.97 4.09 3.78 4.13Portfolio Turnover Rate 19.45b 44.35 55.03 45.49 54.20 46.42Net Assets, end of period ($ x 1,000) 1,538 1,354 930 2,318 1,627 2,135a Based on average shares outstanding.b Not annualized.c Annualized.See notes to financial statements.
106
Copyright © 2022 www.secdatabase.com. All Rights Reserved.Please Consider the Environment Before Printing This Document
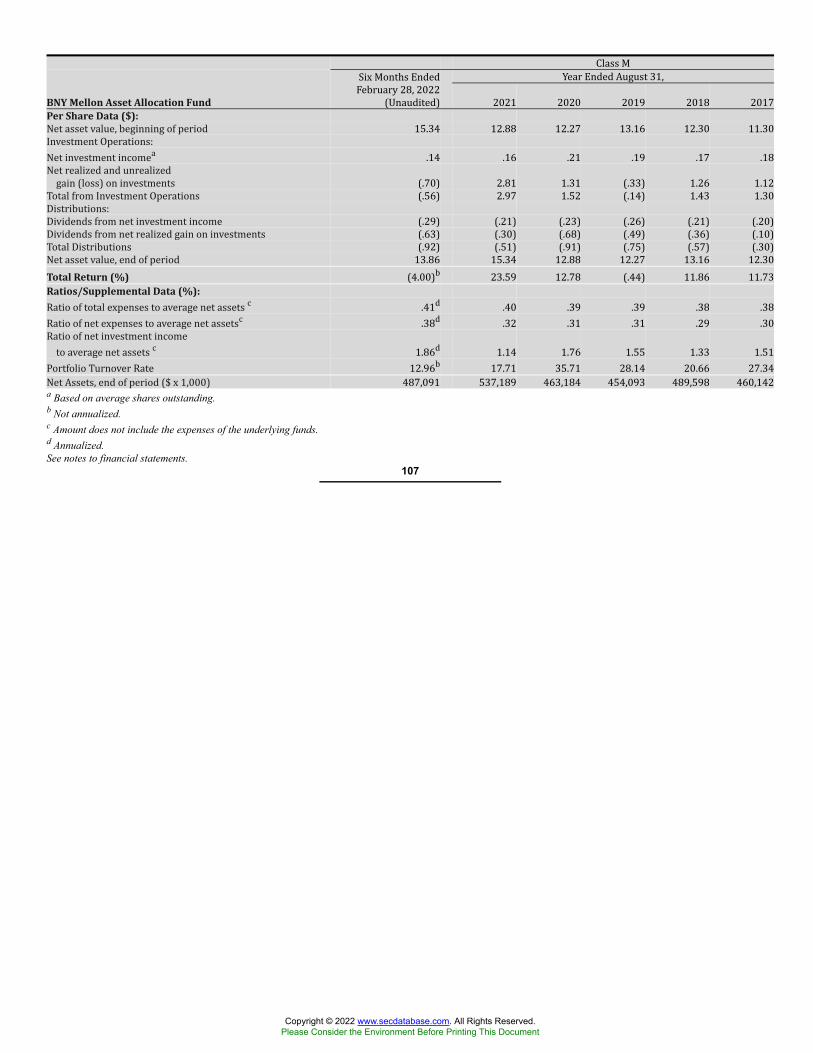
Class MSix Months Ended Year Ended August 31,BNY Mellon Asset Allocation Fund
February 28, 2022(Unaudited) 2021 2020 2019 2018 2017Per Share Data ($):Net asset value, beginning of period 15.34 12.88 12.27 13.16 12.30 11.30Investment Operations:Net investment incomea .14 .16 .21 .19 .17 .18Net realized and unrealizedgain (loss) on investments (.70) 2.81 1.31 (.33) 1.26 1.12Total from Investment Operations (.56) 2.97 1.52 (.14) 1.43 1.30Distributions:Dividends from net investment income (.29) (.21) (.23) (.26) (.21) (.20)Dividends from net realized gain on investments (.63) (.30) (.68) (.49) (.36) (.10)Total Distributions (.92) (.51) (.91) (.75) (.57) (.30)Net asset value, end of period 13.86 15.34 12.88 12.27 13.16 12.30Total Return (%) (4.00)b 23.59 12.78 (.44) 11.86 11.73Ratios/Supplemental Data (%):Ratio of total expenses to average net assets c .41d .40 .39 .39 .38 .38Ratio of net expenses to average net assetsc .38d .32 .31 .31 .29 .30Ratio of net investment incometo average net assets c 1.86d 1.14 1.76 1.55 1.33 1.51Portfolio Turnover Rate 12.96b 17.71 35.71 28.14 20.66 27.34Net Assets, end of period ($ x 1,000) 487,091 537,189 463,184 454,093 489,598 460,142a Based on average shares outstanding.b Not annualized.c Amount does not include the expenses of the underlying funds.d Annualized.See notes to financial statements.
107
Copyright © 2022 www.secdatabase.com. All Rights Reserved.Please Consider the Environment Before Printing This Document

FINANCIAL HIGHLIGHTS (continued) Investor SharesSix Months Ended Year Ended August 31,BNY Mellon Asset Allocation Fund
February 28, 2022(Unaudited) 2021 2020 2019 2018 2017Per Share Data ($):Net asset value, beginning of period 15.48 13.00 12.37 13.25 12.39 11.38Investment Operations:Net investment incomea .12 .12 .18 .13 .14 .15Net realized and unrealizedgain (loss) on investments (.70) 2.83 1.32 (.29) 1.26 1.14Total from Investment Operations (.58) 2.95 1.50 (.16) 1.40 1.29Distributions:Dividends from net investment income (.27) (.17) (.19) (.23) (.18) (.18)Dividends from net realized gain on investments (.63) (.30) (.68) (.49) (.36) (.10)Total Distributions (.90) (.47) (.87) (.72) (.54) (.28)Net asset value, end of period 14.00 15.48 13.00 12.37 13.25 12.39Total Return (%) (4.14)b 23.29 12.51 (.63) 11.50 11.49Ratios/Supplemental Data (%):Ratio of total expenses to average net assets c .66d .65 .64 .64 .63 .63Ratio of net expenses to average net assets c .63d .57 .56 .56 .54 .55Ratio of net investment incometo average net assets c 1.62d .86 1.52 1.09 1.06 1.22Portfolio Turnover Rate 12.96b 17.71 35.71 28.14 20.66 27.34Net Assets, end of period ($ x 1,000) 7,709 7,815 6,443 7,083 6,959 6,745a Based on average shares outstanding.b Not annualized.c Amount does not include the expenses of the underlying funds.d Annualized.See notes to financial statements.
108
Copyright © 2022 www.secdatabase.com. All Rights Reserved.Please Consider the Environment Before Printing This Document
NOTES TO FINANCIAL STATEMENTS (Unaudited)NOTE 1—Significant Accounting Policies:
BNY Mellon Funds Trust (the “Trust”), a Massachusetts business trust that is registered under the Investment Company Act of1940, as amended (the “Act”), as an open-end management investment company, operates as a series company currently consistingof twenty-one series, including the following diversified funds: BNY Mellon Tax-Sensitive Large Cap Multi-Strategy Fund, BNYMellon Income Stock Fund, BNY Mellon Mid Cap Multi-Strategy Fund, BNY Mellon Small Cap Multi-Strategy Fund, BNYMellon International Fund, BNY Mellon Emerging Markets Fund, BNY Mellon International Equity Income Fund and BNYMellon Asset Allocation Fund and the following non-diversified fund: BNY Mellon Focused Equity Opportunities Fund (each, a“fund” and collectively, the “funds”). The objectives of the funds are as follows: BNY Mellon Mid Cap Multi-Strategy Fund,BNY Mellon Small Cap Multi-Strategy Fund and BNY Mellon Focused Equity Opportunities Fund seek capital appreciation.BNY Mellon Income Stock Fund and BNY Mellon International Equity Income Fund seek total return (consisting of capitalappreciation and income). BNY Mellon International Fund and BNY Mellon Emerging Markets Fund seek long-term capitalgrowth. BNY Mellon Tax-Sensitive Large Cap Multi-Strategy Fund seeks long-term capital appreciation. BNY Mellon AssetAllocation Fund seeks long-term growth of principal in conjunction with current income.BNY Mellon Investment Adviser, Inc. (the “Adviser”), a wholly-owned subsidiary of The Bank of New York Mellon Corporation(“BNY Mellon”), serves as each fund’s investment adviser. BNY Mellon, serves as administrator for the funds pursuant to anAdministration Agreement with the Trust (the “Administration Agreement”). BNY Mellon has entered into a Sub-AdministrationAgreement with the Adviser pursuant to which BNY Mellon pays the Adviser for performing certain administrative services.Walter Scott & Partners Limited (“Walter Scott”), also a wholly-owned subsidiary of BNY Mellon and an affiliate of the Adviser,serves as the BNY Mellon Tax-Sensitive Large Cap Multi-Strategy Fund’s sub-investment adviser with respect to the U.S. LargeCap Equity Strategy of the fund. Boston Partners Global Investors, Inc. (“Boston Partners”), and Geneva Capital Management LLC(“Geneva”), serve as BNY Mellon Mid Cap Multi-Strategy Fund’s sub-investment adviser with respect to the Boston Partners MidCap Value Strategy and the Geneva Mid Cap Growth Strategy, respectively. Newton Investment Management North America, LLC(“NIMNA”), also a wholly-owned subsidiary of BNY Mellon and an affiliate of the Adviser serves as a sub-investment adviserof (i) BNY Mellon Tax-Sensitive Large Cap Multi-Strategy Fund responsible for the portions of the fund’s assets allocated to theDynamic Large Cap Value Strategy and the U.S. Large Cap Growth Strategy; (ii) BNY Mellon Income Stock Fund; (iii) BNYMellon Mid Cap Multi-Strategy Fund responsible for the portions of the fund’s assets allocated to the Opportunistic Mid CapValue Strategy and the Mid Cap Growth Strategy; (iv) BNY Mellon Small Cap Multi-Strategy Fund responsible for the portionsof the fund’s assets allocated to the Opportunistic Small Cap Strategy, the Small Cap Value Strategy and the Small Cap GrowthStrategy; (v) BNY Mellon International Fund; (vi) BNY Mellon Emerging Markets Fund; and (vii) BNY Mellon InternationalEquity Income Fund. NIMNA, subject to the Adviser’s supervision and approval, provides investment advisory assistance andresearch and the day-to-day management of the respective fund’s assets or the portion of the respective fund’s assets allocated tothe strategies described above. BNY Mellon Securities Corporation (the “Distributor”), a wholly-owned subsidiary of the Adviser,is the distributor of each fund’s shares.Each fund is authorized to issue an unlimited number of $.001 par value shares of Beneficial Interest in each of the followingclasses of shares: Class M and Investor and for BNY Mellon Income Stock Fund only Class A, Class C, Class I and Class Y. ClassA and Class C shares are sold primarily to retail investors through financial intermediaries and bear Distribution and/or ShareholderServices Plan fees. Class A shares generally are subject to a sales charge imposed at the time of purchase. Class A shares boughtwithout an initial sales charge as part of an investment of $1 million or more may be charged a contingent deferred sales charge(“CDSC”) of 1.00% if redeemed within one year. Class C shares are subject to a CDSC imposed on Class C shares redeemedwithin one year of purchase. Class C shares automatically convert to Class A shares eight years after the date of purchase, withoutthe imposition of a sales charge. Class I shares are sold primarily to bank trust departments and other financial service providers(including BNY Mellon), acting on behalf of customers having a qualified trust or an investment account or relationship at suchinstitution, and bear no Distribution or Shareholder Services Plan fees. Class Y shares are sold at net asset value per share generallyto institutional investors, and bear no Distribution or Shareholder Services Plan fees. Class I and Class Y shares are offered withouta front-end sales charge or CDSC. Other differences between the classes include the services offered to and the expenses borne byeach class, the allocation of certain transfer agency costs, and certain voting rights. Income, expenses (other than
109
Copyright © 2022 www.secdatabase.com. All Rights Reserved.Please Consider the Environment Before Printing This Document
NOTES TO FINANCIAL STATEMENTS (Unaudited) (continued)expenses attributable to a specific class), and realized and unrealized gains or losses on investments are allocated to each class ofshares based on its relative net assets.The Trust accounts separately for the assets, liabilities and operations of each series. Expenses directly attributable to each seriesare charged to that series’ operations; expenses which are applicable to all series are allocated among them on a pro rata basis.The Financial Accounting Standards Board (“FASB”) Accounting Standards Codification (“ASC”) is the exclusive reference ofauthoritative U.S. generally accepted accounting principles (“GAAP”) recognized by the FASB to be applied by nongovernmentalentities. Rules and interpretive releases of the SEC under authority of federal laws are also sources of authoritative GAAP for SECregistrants. Each fund is an investment company and applies the accounting and reporting guidance of the FASB ASC Topic 946Financial Services-Investment Companies. Each fund’s financial statements are prepared in accordance with GAAP, which mayrequire the use of management estimates and assumptions. Actual results could differ from those estimates.The Trust enter into contracts that contain a variety of indemnifications. The funds’ maximum exposure under these arrangementsis unknown. The funds do not anticipate recognizing any loss related to these arrangements.(a) Portfolio valuation: The fair value of a financial instrument is the amount that would be received to sell an asset or paidto transfer a liability in an orderly transaction between market participants at the measurement date (i.e., the exit price). GAAPestablishes a fair value hierarchy that prioritizes the inputs of valuation techniques used to measure fair value. This hierarchy givesthe highest priority to unadjusted quoted prices in active markets for identical assets or liabilities (Level 1 measurements) and thelowest priority to unobservable inputs (Level 3 measurements).Additionally, GAAP provides guidance on determining whether the volume and activity in a market has decreased significantlyand whether such a decrease in activity results in transactions that are not orderly. GAAP requires enhanced disclosures aroundvaluation inputs and techniques used during annual and interim periods.Various inputs are used in determining the value of each fund’s investments relating to fair value measurements. These inputs aresummarized in the three broad levels listed below:
Level 1—unadjusted quoted prices in active markets for identical investments.Level 2—other significant observable inputs (including quoted prices for similar investments, interest rates, prepaymentspeeds, credit risk, etc.).Level 3—significant unobservable inputs (including the funds’ own assumptions in determining the fair value of investments).
The inputs or methodology used for valuing securities are not necessarily an indication of the risk associated with investing inthose securities.Changes in valuation techniques may result in transfers in or out of an assigned level within the disclosure hierarchy. Valuationtechniques used to value each fund’s investments are as follows:BNY Mellon Asset Allocation Fund: Investments in debt securities excluding short-term investments (other than U.S. TreasuryBills), are valued each business day by one or more independent pricing services (each, a “Service”) approved by the Trust’s Boardof Trustees (the “Board”). Investments for which quoted bid prices are readily available and are representative of the bid side of themarket in the judgment of a Service are valued at the mean between the quoted bid prices (as obtained by a Service from dealers insuch securities) and asked prices (as calculated by a Service based upon its evaluation of the market for such securities). Securitiesare valued as determined by a Service, based on methods which include consideration of the following: yields or prices of securitiesof comparable quality, coupon, maturity and type; indications as to values from dealers; and general market conditions. Thesesecurities are generally categorized within Level 2 of the fair value hierarchy.Investments in equity securities are valued at the last sales price on the securities exchange or national securities market on whichsuch securities are primarily traded. Securities listed on the National Market System for which market quotations are available arevalued at the official closing price or, if there is no official closing price that day, at the last sales price. For open short positions,asked prices are used for valuation purposes. Bid price is used when no asked price is available. Registered investment companiesthat are not traded on an exchange are valued at their net asset value. All of the preceding securities are generally categorizedwithin Level 1 of the fair value hierarchy.Securities not listed on an exchange or the national securities market, or securities for which there were no transactions, are valuedat the average of the most recent bid and asked prices. U.S Treasury Bills are valued at the mean price between quoted prices andasked prices by the Service. These
110
Copyright © 2022 www.secdatabase.com. All Rights Reserved.Please Consider the Environment Before Printing This Document
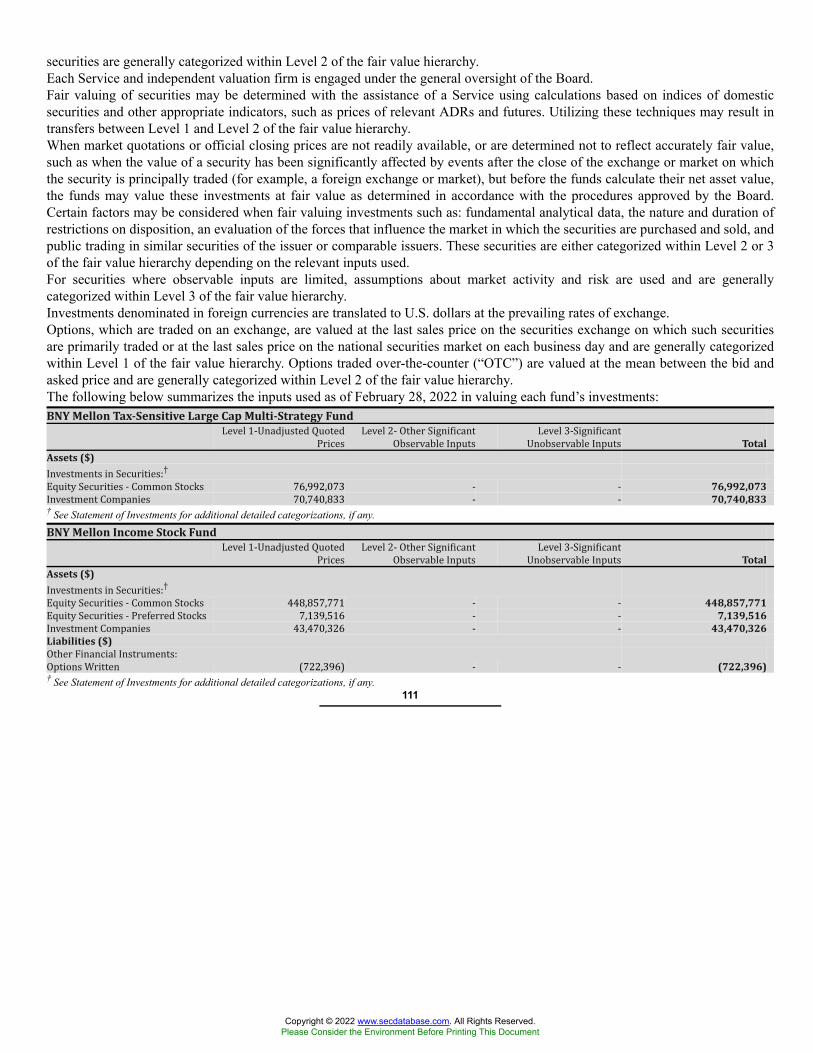
securities are generally categorized within Level 2 of the fair value hierarchy.Each Service and independent valuation firm is engaged under the general oversight of the Board.Fair valuing of securities may be determined with the assistance of a Service using calculations based on indices of domesticsecurities and other appropriate indicators, such as prices of relevant ADRs and futures. Utilizing these techniques may result intransfers between Level 1 and Level 2 of the fair value hierarchy.When market quotations or official closing prices are not readily available, or are determined not to reflect accurately fair value,such as when the value of a security has been significantly affected by events after the close of the exchange or market on whichthe security is principally traded (for example, a foreign exchange or market), but before the funds calculate their net asset value,the funds may value these investments at fair value as determined in accordance with the procedures approved by the Board.Certain factors may be considered when fair valuing investments such as: fundamental analytical data, the nature and duration ofrestrictions on disposition, an evaluation of the forces that influence the market in which the securities are purchased and sold, andpublic trading in similar securities of the issuer or comparable issuers. These securities are either categorized within Level 2 or 3of the fair value hierarchy depending on the relevant inputs used.For securities where observable inputs are limited, assumptions about market activity and risk are used and are generallycategorized within Level 3 of the fair value hierarchy.Investments denominated in foreign currencies are translated to U.S. dollars at the prevailing rates of exchange.Options, which are traded on an exchange, are valued at the last sales price on the securities exchange on which such securitiesare primarily traded or at the last sales price on the national securities market on each business day and are generally categorizedwithin Level 1 of the fair value hierarchy. Options traded over-the-counter (“OTC”) are valued at the mean between the bid andasked price and are generally categorized within Level 2 of the fair value hierarchy.The following below summarizes the inputs used as of February 28, 2022 in valuing each fund’s investments:BNY Mellon Tax-Sensitive Large Cap Multi-Strategy FundLevel 1-Unadjusted QuotedPrices Level 2- Other SignificantObservable Inputs Level 3-SignificantUnobservable Inputs TotalAssets ($)Investments in Securities:†Equity Securities - Common Stocks 76,992,073 - - 76,992,073Investment Companies 70,740,833 - - 70,740,833† See Statement of Investments for additional detailed categorizations, if any.
BNY Mellon Income Stock Fund Level 1-Unadjusted QuotedPrices Level 2- Other SignificantObservable Inputs Level 3-SignificantUnobservable Inputs TotalAssets ($)Investments in Securities:†Equity Securities - Common Stocks 448,857,771 - - 448,857,771Equity Securities - Preferred Stocks 7,139,516 - - 7,139,516Investment Companies 43,470,326 - - 43,470,326Liabilities ($)Other Financial Instruments:Options Written (722,396) - - (722,396)† See Statement of Investments for additional detailed categorizations, if any.
111
Copyright © 2022 www.secdatabase.com. All Rights Reserved.Please Consider the Environment Before Printing This Document
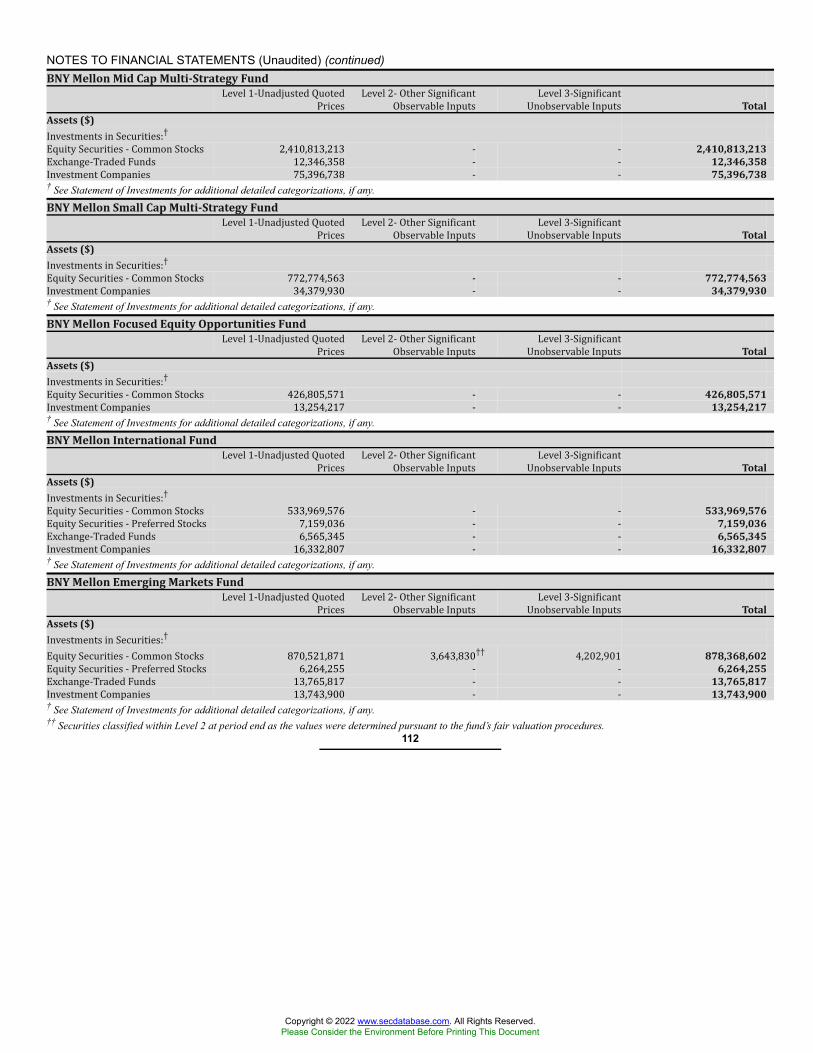
NOTES TO FINANCIAL STATEMENTS (Unaudited) (continued)BNY Mellon Mid Cap Multi-Strategy FundLevel 1-Unadjusted QuotedPrices Level 2- Other SignificantObservable Inputs Level 3-SignificantUnobservable Inputs TotalAssets ($)Investments in Securities:†Equity Securities - Common Stocks 2,410,813,213 - - 2,410,813,213Exchange-Traded Funds 12,346,358 - - 12,346,358Investment Companies 75,396,738 - - 75,396,738† See Statement of Investments for additional detailed categorizations, if any.
BNY Mellon Small Cap Multi-Strategy FundLevel 1-Unadjusted QuotedPrices Level 2- Other SignificantObservable Inputs Level 3-SignificantUnobservable Inputs TotalAssets ($)Investments in Securities:†Equity Securities - Common Stocks 772,774,563 - - 772,774,563Investment Companies 34,379,930 - - 34,379,930† See Statement of Investments for additional detailed categorizations, if any.
BNY Mellon Focused Equity Opportunities FundLevel 1-Unadjusted QuotedPrices Level 2- Other SignificantObservable Inputs Level 3-SignificantUnobservable Inputs TotalAssets ($)Investments in Securities:†Equity Securities - Common Stocks 426,805,571 - - 426,805,571Investment Companies 13,254,217 - - 13,254,217† See Statement of Investments for additional detailed categorizations, if any.
BNY Mellon International Fund Level 1-Unadjusted QuotedPrices Level 2- Other SignificantObservable Inputs Level 3-SignificantUnobservable Inputs TotalAssets ($)Investments in Securities:†Equity Securities - Common Stocks 533,969,576 - - 533,969,576Equity Securities - Preferred Stocks 7,159,036 - - 7,159,036Exchange-Traded Funds 6,565,345 - - 6,565,345Investment Companies 16,332,807 - - 16,332,807† See Statement of Investments for additional detailed categorizations, if any.
BNY Mellon Emerging Markets FundLevel 1-Unadjusted QuotedPrices Level 2- Other SignificantObservable Inputs Level 3-SignificantUnobservable Inputs TotalAssets ($)Investments in Securities:†Equity Securities - Common Stocks 870,521,871 3,643,830†† 4,202,901 878,368,602Equity Securities - Preferred Stocks 6,264,255 - - 6,264,255Exchange-Traded Funds 13,765,817 - - 13,765,817Investment Companies 13,743,900 - - 13,743,900† See Statement of Investments for additional detailed categorizations, if any.†† Securities classified within Level 2 at period end as the values were determined pursuant to the fund’s fair valuation procedures.
112
Copyright © 2022 www.secdatabase.com. All Rights Reserved.Please Consider the Environment Before Printing This Document
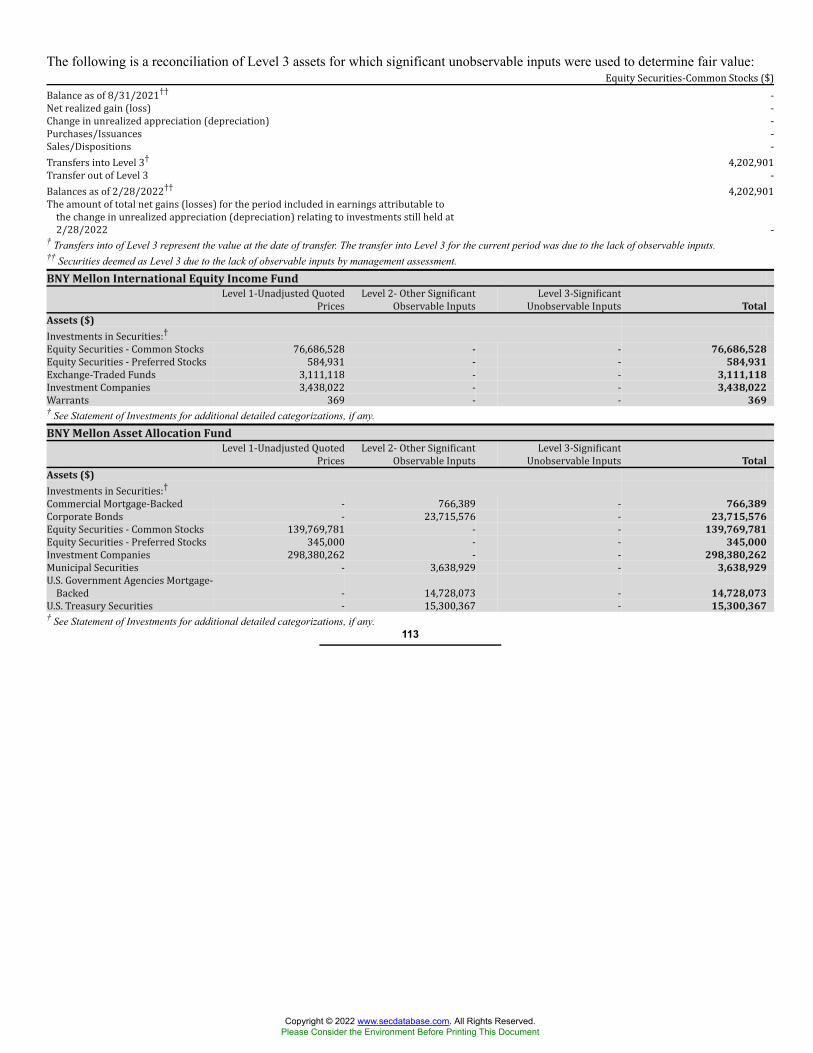
The following is a reconciliation of Level 3 assets for which significant unobservable inputs were used to determine fair value:Equity Securities-Common Stocks ($)Balance as of 8/31/2021†† -Net realized gain (loss) -Change in unrealized appreciation (depreciation) -Purchases/Issuances -Sales/Dispositions -Transfers into Level 3† 4,202,901Transfer out of Level 3 -Balances as of 2/28/2022†† 4,202,901The amount of total net gains (losses) for the period included in earnings attributable tothe change in unrealized appreciation (depreciation) relating to investments still held at2/28/2022 -† Transfers into of Level 3 represent the value at the date of transfer. The transfer into Level 3 for the current period was due to the lack of observable inputs.†† Securities deemed as Level 3 due to the lack of observable inputs by management assessment.
BNY Mellon International Equity Income FundLevel 1-Unadjusted QuotedPrices Level 2- Other SignificantObservable Inputs Level 3-SignificantUnobservable Inputs TotalAssets ($)Investments in Securities:†Equity Securities - Common Stocks 76,686,528 - - 76,686,528Equity Securities - Preferred Stocks 584,931 - - 584,931Exchange-Traded Funds 3,111,118 - - 3,111,118Investment Companies 3,438,022 - - 3,438,022Warrants 369 - - 369† See Statement of Investments for additional detailed categorizations, if any.
BNY Mellon Asset Allocation FundLevel 1-Unadjusted QuotedPrices Level 2- Other SignificantObservable Inputs Level 3-SignificantUnobservable Inputs TotalAssets ($)Investments in Securities:†Commercial Mortgage-Backed - 766,389 - 766,389Corporate Bonds - 23,715,576 - 23,715,576Equity Securities - Common Stocks 139,769,781 - - 139,769,781Equity Securities - Preferred Stocks 345,000 - - 345,000Investment Companies 298,380,262 - - 298,380,262Municipal Securities - 3,638,929 - 3,638,929U.S. Government Agencies Mortgage-Backed - 14,728,073 - 14,728,073U.S. Treasury Securities - 15,300,367 - 15,300,367† See Statement of Investments for additional detailed categorizations, if any.
113
Copyright © 2022 www.secdatabase.com. All Rights Reserved.Please Consider the Environment Before Printing This Document
NOTES TO FINANCIAL STATEMENTS (Unaudited) (continued)(b) Foreign currency transactions: Each relevant fund do not isolate that portion of the results of operations resulting fromchanges in foreign exchange rates on investments from the fluctuations arising from changes in the market prices of securities held.Such fluctuations are included with the net realized and unrealized gain or loss on investments.Net realized foreign exchange gains or losses arise from sales of foreign currencies, currency gains or losses realized on securitiestransactions between trade and settlement date, and the difference between the amounts of dividends, interest and foreignwithholding taxes recorded on the funds’ books and the U.S. dollar equivalent of the amounts actually received or paid. Netunrealized foreign exchange gains and losses arise from changes in the value of assets and liabilities other than investmentsresulting from changes in exchange rates. Foreign currency gains and losses on foreign currency transactions are also included withnet realized and unrealized gain or loss on investments.Foreign taxes: Each relevant fund may be subject to foreign taxes (a portion of which may be reclaimable) on income, stockdividends, realized and unrealized capital gains on investments or certain foreign currency transactions. Foreign taxes are recordedin accordance with the funds’ understanding of the applicable foreign tax regulations and rates that exist in the foreign jurisdictionsin which the funds invest. These foreign taxes, if any, are paid by the funds and are reflected in the Statements of Operations, ifapplicable. Foreign taxes payable or deferred as of February 28, 2022, if any, are disclosed in the funds’ Statements of Assets andLiabilities.(c) Securities transactions and investment income: Securities transactions are recorded on a trade date basis. Realized gains andlosses from securities transactions are recorded on the identified cost basis. Dividend income is recognized on the ex-dividend dateand interest income, including, where applicable, accretion of discount and amortization of premium on investments, is recognizedon the accrual basis.Pursuant to a securities lending agreement with BNY Mellon, the funds may lend securities to qualified institutions. It is the funds’policy that, at origination, all loans are secured by collateral of at least 102% of the value of U.S. securities loaned and 105% ofthe value of foreign securities loaned. Collateral equivalent to at least 100% of the market value of securities on loan is maintainedat all times. Collateral is either in the form of cash, which can be invested in certain money market mutual funds managed by theAdviser, or U.S. Government and Agency securities. The funds are entitled to receive all dividends, interest and distributions onsecurities loaned, in addition to income earned as a result of the lending transaction. Should a borrower fail to return the securitiesin a timely manner, BNY Mellon is required to replace the securities for the benefit of the funds or credit the funds with the marketvalue of the unreturned securities and is subrogated to the funds’ rights against the borrower and the collateral. Additionally, thecontractual maturity of security lending transactions are on an overnight and continuous basis. Table 1 summarizes the amountBNY Mellon earned from each fund from lending portfolio securities, pursuant to the securities lending agreement during theperiod ended February 28, 2022.Table 1—Securities Lending AgreementBNY Mellon Tax-Sensitive Large Cap Multi-Strategy Fund $ 310BNY Mellon Income Stock Fund 2,240BNY Mellon Mid Cap Multi-Strategy Fund 3,395BNY Mellon Small Cap Multi-Strategy Fund 30,181BNY Mellon International Fund 1,454BNY Mellon Emerging Markets Fund 5,572BNY Mellon International Equity Income Fund 149BNY Mellon Asset Allocation Fund 261(d) Affiliated issuers: Investments in other investment companies advised by the Adviser are defined as “affiliated” under the Act.(e) Risk: Certain events particular to the industries in which BNY Mellon Tax-Sensitive Large Cap Multi-Strategy Fund, BNYMellon Income Stock Fund, BNY Mellon Mid Cap Multi-Strategy Fund, BNY Mellon Small Cap Multi-Strategy Fund, BNYMellon Focused Equity Opportunities Fund and BNY Mellon Asset Allocation Fund investments conduct their operations, as wellas general economic, political and public health conditions, may have a significant negative impact on the investee’s operationsand profitability. BNY Mellon International Fund, BNY Mellon Emerging Markets Fund and BNY Mellon International EquityIncome Fund invest in foreign markets which may involve special risks and considerations not typically associated with investingin the U.S. These risks include revaluation of currencies, high rates of inflation, repatriation restrictions on income and capital,and adverse political and economic developments. Moreover, securities issued in these markets may be less liquid, subject togovernment ownership controls and delayed settlements, and their prices may be more volatile than those of comparable securitiesin the U.S. In addition, turbulence in financial markets and reduced liquidity in equity, credit and/or fixed income markets maynegatively affect many
114
Copyright © 2022 www.secdatabase.com. All Rights Reserved.Please Consider the Environment Before Printing This Document
issuers, which could adversely affect the fund. Global economies and financial markets are becoming increasingly interconnected,and conditions and events in one country, region or financial market may adversely impact issuers in a different country, regionor financial market. These risks may be magnified if certain events or developments adversely interrupt the global supply chain;in these and other circumstances, such risks might affect companies world-wide. Recent examples include pandemic risks relatedto COVID-19 and aggressive measures taken world-wide in response by governments, including closing borders, restrictinginternational and domestic travel, and the imposition of prolonged quarantines of large populations, and by businesses, includingchanges to operations and reducing staff. To the extent each fund may overweight its investments in certain countries, companies,industries or market sectors, such positions will increase each fund’s exposure to risk of loss from adverse developments affectingthose countries, companies, industries or sectors.BNY Mellon Asset Allocation Fund invests in debt securities. Failure of an issuer of the debt securities to make timely interest orprincipal payments, or a decline or the perception of a decline in the credit quality of a debt security, can cause the debt security’sprice to fall, potentially lowering the fund’s share price. In addition, the value of debt securities may decline due to general marketconditions that are not specifically related to a particular issuer, such as real or perceived adverse economic conditions, changes inoutlook for corporate earnings, changes in interest or currency rates or adverse investor sentiment. They may also decline becauseof factors that affect a particular industry.BNY Mellon Focused Equity Opportunities Fund is non-diversified, which means that a relatively high percentage of the fund’sassets may be invested in a limited number of issuers. Therefore, the fund’s performance may be vulnerable to changes in marketvalue of a single issuer or group of issuers and more susceptible to risks associated with a single economic, political or regulatoryoccurrence than a diversified fund.(f) Dividends and distributions to shareholders: Dividends and distributions payable to shareholders are recorded by eachfund on the ex-dividend date. BNY Mellon Income Stock Fund and BNY Mellon Asset Allocation Fund normally declare andpay dividends from net investment income monthly. BNY Mellon International Equity Income Fund normally declares and paysdividends from net investment income quarterly. BNY Mellon Tax-Sensitive Large Cap Multi-Strategy Fund, BNY Mellon MidCap Multi-Strategy Fund, BNY Mellon Small Cap Multi-Strategy Fund, BNY Mellon Focused Equity Opportunities Fund, BNYMellon International Fund and BNY Mellon Emerging Markets Fund normally declare and pay dividends from net investmentincome annually. Dividends from net realized capital gains, if any, are normally declared and paid annually, but each fund maymake distributions on a more frequent basis to comply with the distribution requirements of the Internal Revenue Code of 1986,as amended (the “Code”). To the extent that net realized capital gains can be offset by capital loss carryovers of a fund, it is thepolicy of each fund not to distribute such gains. Income and capital gain distributions are determined in accordance with incometax regulations, which may differ from GAAP.(g) Federal income taxes: It is the policy of each fund to continue to qualify as a regulated investment company, if suchqualification is in the best interests of its shareholders, by complying with the applicable provisions of the Code, and to makedistributions of taxable income sufficient to relieve it from substantially all federal income and excise taxes. For federal incometax purposes, each fund is treated as a separate entity for the purpose of determining such qualification.As of and during the period ended February 28, 2022, the funds did not have any liabilities for any uncertain tax positions.Each fund recognizes interest and penalties, if any, related to uncertain tax positions as income tax expense in the Statements ofOperations. During the period ended February 28, 2022, the funds did not incur any interest or penalties.Each tax year in the three-year period ended August 31, 2021 remains subject to examination by the Internal Revenue Service andstate taxing authorities.Under the Regulated Investment Company Modernization Act of 2010, each fund is permitted to carry forward capital losses foran unlimited period. Furthermore, capital loss carryovers retain their character as either short-term or long-term capital losses.Table 2 summarizes each relevant fund’s unused capital loss carryover available for federal income tax purposes to be appliedagainst future net realized capital gains, realized subsequent to August 31, 2021.Table 3 summarizes each fund’s tax character of distributions paid to shareholders during the fiscal year ended August 31, 2021.The tax character of current year distributions will be determined at the end of the current fiscal year.
115
Copyright © 2022 www.secdatabase.com. All Rights Reserved.Please Consider the Environment Before Printing This Document
NOTES TO FINANCIAL STATEMENTS (Unaudited)Table 2—Capital Loss Carryover Short-TermLosses ($)† Long-TermLosses ($)† Total ($)BNY Mellon International Fund 29,214,316 14,823,314 44,037,630BNY Mellon Emerging Markets Fund 265,940,409 146,106,987 412,047,396BNY Mellon International Equity Income Fund 35,832,581 40,546,205 76,378,786† These capital losses can be carried forward for an unlimited period.Table 3— Tax Character of Distributions Paid 2021Ordinary Income ($) Long-TermCapital Gains ($)BNY Mellon Tax-Sensitive Large Cap Multi-Strategy Fund 3,402,600 15,860,327BNY Mellon Income Stock Fund 11,627,577 -BNY Mellon Mid Cap Multi-Strategy Fund 13,631,523 191,107,540BNY Mellon Small Cap Multi-Strategy Fund - 4,331,978BNY Mellon Focused Equity Opportunities Fund 5,151,064 28,321,679BNY Mellon International Fund 13,072,579 -BNY Mellon Emerging Markets Fund 10,483,912 -BNY Mellon International Equity Income Fund 3,907,050 -BNY Mellon Asset Allocation Fund 7,448,909 10,711,004(h) New accounting pronouncements: In March 2020, the FASB issued Accounting Standards Update 2020-04, ReferenceRate Reform (Topic 848): Facilitation of the Effects of Reference Rate Reform on Financial Reporting (“ASU 2020-04”), andin January 2021, the FASB issued Accounting Standards Update 2021-01, Reference Rate Reform (Topic 848): Scope (“ASU2021-01”), which provides optional, temporary relief with respect to the financial reporting of contracts subject to certain typesof modifications due to the planned discontinuation of the London Interbank Offered Rate (“LIBOR”) and other interbank offeredrates as of the end of 2021. The temporary relief provided by ASU 2020-04 and ASU 2021-01 is effective for certain referencerate-related contract modifications that occur during the period from March 12, 2020 through December 31, 2022. Management isevaluating the impact of ASU 2020-04 and ASU 2021-01 on BNY Mellon Asset Allocation fund’s investments, derivatives, debtand other contracts that will undergo reference rate-related modifications as a result of the reference rate reform. Management isalso currently actively working with other financial institutions and counterparties to modify contracts as required by applicableregulation and within the regulatory deadlines.NOTE 2—Bank Lines of Credit:The funds participate with other long-term open-end funds managed by the Adviser in a $823.5 million unsecured credit facilityled by Citibank, N.A. (the “Citibank Credit Facility”) and a $300 million unsecured credit facility provided by BNY Mellon(the “BNYM Credit Facility”), each to be utilized primarily for temporary or emergency purposes, including the financing ofredemptions (each, a “Facility”). The Citibank Credit Facility is available in two tranches: (i) Tranche A is in an amount equal to$688.5 million and is available to all long-term open-ended funds, including the funds, and (ii) Tranche B is in amount equal to$135 million and is available only to the BNY Mellon Floating Rate Income Fund, a series of BNY Mellon Investment Funds IV,Inc. In connection therewith, each fund has agreed to pay its pro rata portion of commitment fees for Tranche A of the CitibankCredit Facility and the BNYM Credit Facility. Interest is charged to the funds based on rates determined pursuant to the terms ofthe respective Facility at the time of borrowing. During the period ended February 28, 2022, BNY Mellon Tax-Sensitive LargeCap Multi-Strategy Fund, BNY Mellon Mid Cap Multi-Strategy Fund and BNY Mellon International Equity Income Fund did notborrow under the Facilities.The average amount of borrowings outstanding under the Facilities during the period ended February 28, 2022 for BNY MellonIncome Stock Fund was approximately $422,652, with a related weighted average annualized interest rate of 1.03%.The average amount of borrowings outstanding under the Facilities during the period ended February 28, 2022 for BNY
116
Copyright © 2022 www.secdatabase.com. All Rights Reserved.Please Consider the Environment Before Printing This Document
Mellon Small Cap Multi-Strategy Fund was approximately $42,541, with a related weighted average annualized interest rate of1.03%.The average amount of borrowings outstanding under the Facilities during the period ended February 28, 2022 for BNY MellonFocused Equity Opportunities Fund was approximately $145,304, with a related weighted average annualized interest rate of1.03%.The average amount of borrowings outstanding under the Facilities during the period ended February 28, 2022 for BNY MellonInternational Fund was approximately $12,707, with a related weighted average annualized interest rate of 1.12%.The average amount of borrowings outstanding under the Facilities during the period ended February 28, 2022 for BNY MellonEmerging Markets Fund was approximately $147,514, with a related weighted average annualized interest rate of 1.11%.The average amount of borrowings outstanding under the Facilities during the period ended February 28, 2022 for BNY MellonAsset Allocation Fund was approximately $95,580, with a related weighted average annualized interest rate of 1.20%.NOTE 3—Investment Advisory Fee, Administration Fee, Sub-Investment Advisory Fee and Other Transactions withAffiliates:(a) Fees payable by the funds pursuant to the provisions of an investment advisory agreement with the Adviser are payablemonthly, computed on the average daily value of each fund’s net assets at the following annual rates: 0.70% (direct investment insecurities) and 0.15% (other underlying funds, which may consist of affiliated funds and unaffiliated open-end funds, closed-endfunds and exchange traded funds) of BNY Mellon Tax-Sensitive Large Cap Multi-Strategy Fund, 0.65% of BNY Mellon IncomeStock Fund, 0.75% of BNY Mellon Mid Cap Multi-Strategy Fund, 0.85% of BNY Mellon Small Cap Multi-Strategy Fund, 0.70%of BNY Mellon Focused Equity Opportunities Fund, 0.85% of BNY Mellon International Fund, 1.15% of BNY Mellon EmergingMarkets Fund, 0.85% of BNY Mellon International Equity Income Fund and 0.65% (equity securities), 0.40% (debt securities)and 0.15% (money market instruments and other underlying funds, which may consist of affiliated funds and unaffiliated open-endfunds, closed-end funds and exchange traded funds) of BNY Mellon Asset Allocation Fund.For BNY Mellon Income Stock Fund, the Adviser has contractually agreed, from September 1, 2021 through December 31, 2022,to waive receipt of its fees and/or assume the direct expenses of the fund, so that the direct expenses of Class A, Class C, Class Iand Class Y shares (excluding Rule 12b-1 Distribution Plan fees, Shareholder Services Plan fees, taxes, interest expense, brokeragecommissions, commitment fees on borrowings and extraordinary expenses) do not exceed 0.90% of the value of the fund’s averagedaily net assets. On or after December 31, 2022, the Adviser may terminate this expense limitation agreement at any time. Thereduction in expenses, pursuant to the undertaking, amounted to $450 during the period ended February 28, 2022.For BNY Mellon Asset Allocation Fund, the Adviser has contractually agreed, from September 1, 2021 through December 31,2022, to waive receipt of its fees and/or assume the direct expenses of the fund, so that the total annual fund operating expensesof neither class (including indirect fees, and expense of the underlying funds, but excluding Shareholder Services Plan fees, taxes,interest expense, brokerage commissions, commitment fees on borrowings and extraordinary expenses) do not exceed 0.87% ofthe value of the fund’s average daily net assets. On or after December 31, 2022, the Adviser may terminate this expense limitationagreement at any time. The reduction in expenses, pursuant to the undertaking, amounted to $79,696 during the period endedFebruary 28, 2022.Pursuant to the Administration Agreement, BNY Mellon provides or arranges for fund accounting, transfer agency and other fundadministration services and receives a fee based on the total net assets of the Trust based on the following rates:
0 up to $6 billion 0.15%$6 billion up to $12 billion 0.12%In excess of $12 billion 0.10%
No administration fee is applied to assets held by BNY Mellon Tax-Sensitive Large Cap Multi-Strategy Fund which are investedin shares of other underlying funds.No administration fee is applied to assets held by BNY Mellon Asset Allocation Fund which are invested in cash or money marketinstruments or shares of other underlying funds.Pursuant to a sub-investment advisory agreement between the Adviser and Walter Scott, the Adviser pays Walter Scott a monthlyfee at an annual rate of 0.41% of BNY Mellon Tax-Sensitive Large Cap Multi-Strategy Fund’s average daily net assets allocatedto the U.S. Large Cap Equity Strategy.Pursuant to a sub-investment advisory agreement between the Adviser and NIMNA, the Adviser pays NIMNA a monthly fee at anannual rate set forth below in Table 4 of
117
Copyright © 2022 www.secdatabase.com. All Rights Reserved.Please Consider the Environment Before Printing This Document
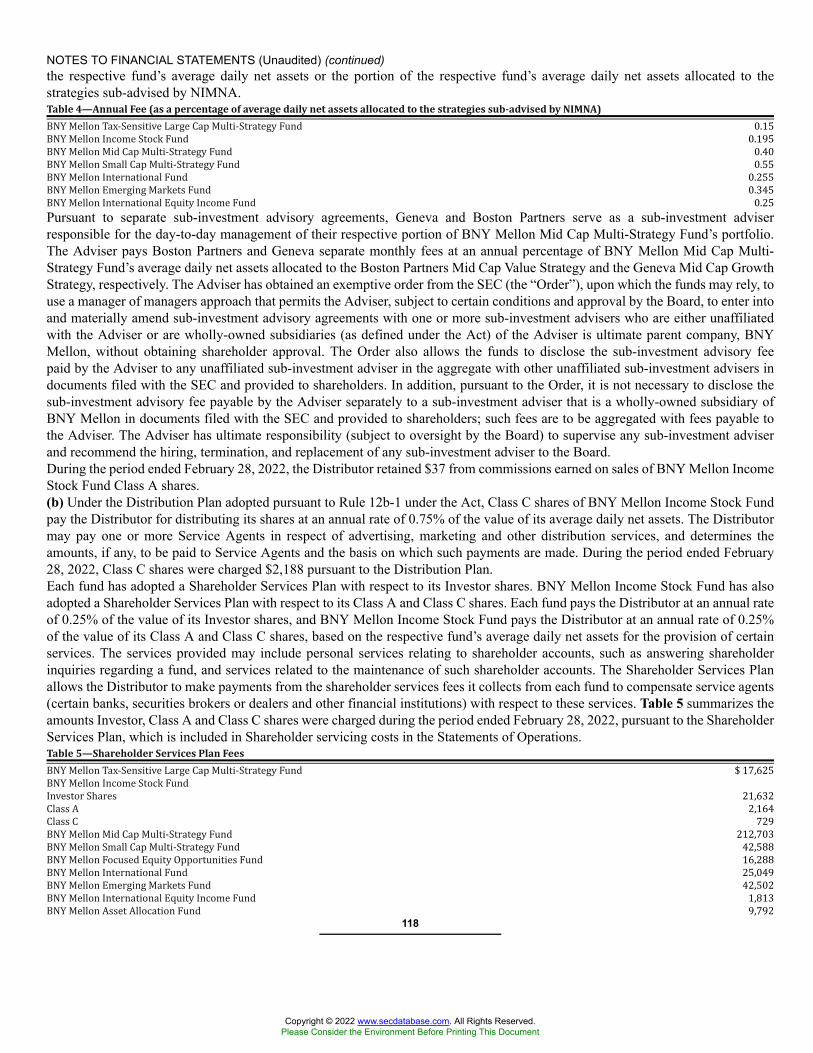
NOTES TO FINANCIAL STATEMENTS (Unaudited) (continued)the respective fund’s average daily net assets or the portion of the respective fund’s average daily net assets allocated to thestrategies sub-advised by NIMNA.Table 4—Annual Fee (as a percentage of average daily net assets allocated to the strategies sub-advised by NIMNA)BNY Mellon Tax-Sensitive Large Cap Multi-Strategy Fund 0.15BNY Mellon Income Stock Fund 0.195BNY Mellon Mid Cap Multi-Strategy Fund 0.40BNY Mellon Small Cap Multi-Strategy Fund 0.55BNY Mellon International Fund 0.255BNY Mellon Emerging Markets Fund 0.345BNY Mellon International Equity Income Fund 0.25Pursuant to separate sub-investment advisory agreements, Geneva and Boston Partners serve as a sub-investment adviserresponsible for the day-to-day management of their respective portion of BNY Mellon Mid Cap Multi-Strategy Fund’s portfolio.The Adviser pays Boston Partners and Geneva separate monthly fees at an annual percentage of BNY Mellon Mid Cap Multi-Strategy Fund’s average daily net assets allocated to the Boston Partners Mid Cap Value Strategy and the Geneva Mid Cap GrowthStrategy, respectively. The Adviser has obtained an exemptive order from the SEC (the “Order”), upon which the funds may rely, touse a manager of managers approach that permits the Adviser, subject to certain conditions and approval by the Board, to enter intoand materially amend sub-investment advisory agreements with one or more sub-investment advisers who are either unaffiliatedwith the Adviser or are wholly-owned subsidiaries (as defined under the Act) of the Adviser is ultimate parent company, BNYMellon, without obtaining shareholder approval. The Order also allows the funds to disclose the sub-investment advisory feepaid by the Adviser to any unaffiliated sub-investment adviser in the aggregate with other unaffiliated sub-investment advisers indocuments filed with the SEC and provided to shareholders. In addition, pursuant to the Order, it is not necessary to disclose thesub-investment advisory fee payable by the Adviser separately to a sub-investment adviser that is a wholly-owned subsidiary ofBNY Mellon in documents filed with the SEC and provided to shareholders; such fees are to be aggregated with fees payable tothe Adviser. The Adviser has ultimate responsibility (subject to oversight by the Board) to supervise any sub-investment adviserand recommend the hiring, termination, and replacement of any sub-investment adviser to the Board.During the period ended February 28, 2022, the Distributor retained $37 from commissions earned on sales of BNY Mellon IncomeStock Fund Class A shares.(b) Under the Distribution Plan adopted pursuant to Rule 12b-1 under the Act, Class C shares of BNY Mellon Income Stock Fundpay the Distributor for distributing its shares at an annual rate of 0.75% of the value of its average daily net assets. The Distributormay pay one or more Service Agents in respect of advertising, marketing and other distribution services, and determines theamounts, if any, to be paid to Service Agents and the basis on which such payments are made. During the period ended February28, 2022, Class C shares were charged $2,188 pursuant to the Distribution Plan.Each fund has adopted a Shareholder Services Plan with respect to its Investor shares. BNY Mellon Income Stock Fund has alsoadopted a Shareholder Services Plan with respect to its Class A and Class C shares. Each fund pays the Distributor at an annual rateof 0.25% of the value of its Investor shares, and BNY Mellon Income Stock Fund pays the Distributor at an annual rate of 0.25%of the value of its Class A and Class C shares, based on the respective fund’s average daily net assets for the provision of certainservices. The services provided may include personal services relating to shareholder accounts, such as answering shareholderinquiries regarding a fund, and services related to the maintenance of such shareholder accounts. The Shareholder Services Planallows the Distributor to make payments from the shareholder services fees it collects from each fund to compensate service agents(certain banks, securities brokers or dealers and other financial institutions) with respect to these services. Table 5 summarizes theamounts Investor, Class A and Class C shares were charged during the period ended February 28, 2022, pursuant to the ShareholderServices Plan, which is included in Shareholder servicing costs in the Statements of Operations.Table 5—Shareholder Services Plan FeesBNY Mellon Tax-Sensitive Large Cap Multi-Strategy Fund $ 17,625BNY Mellon Income Stock FundInvestor Shares 21,632Class A 2,164Class C 729BNY Mellon Mid Cap Multi-Strategy Fund 212,703BNY Mellon Small Cap Multi-Strategy Fund 42,588BNY Mellon Focused Equity Opportunities Fund 16,288BNY Mellon International Fund 25,049BNY Mellon Emerging Markets Fund 42,502BNY Mellon International Equity Income Fund 1,813BNY Mellon Asset Allocation Fund 9,792
118
Copyright © 2022 www.secdatabase.com. All Rights Reserved.Please Consider the Environment Before Printing This Document
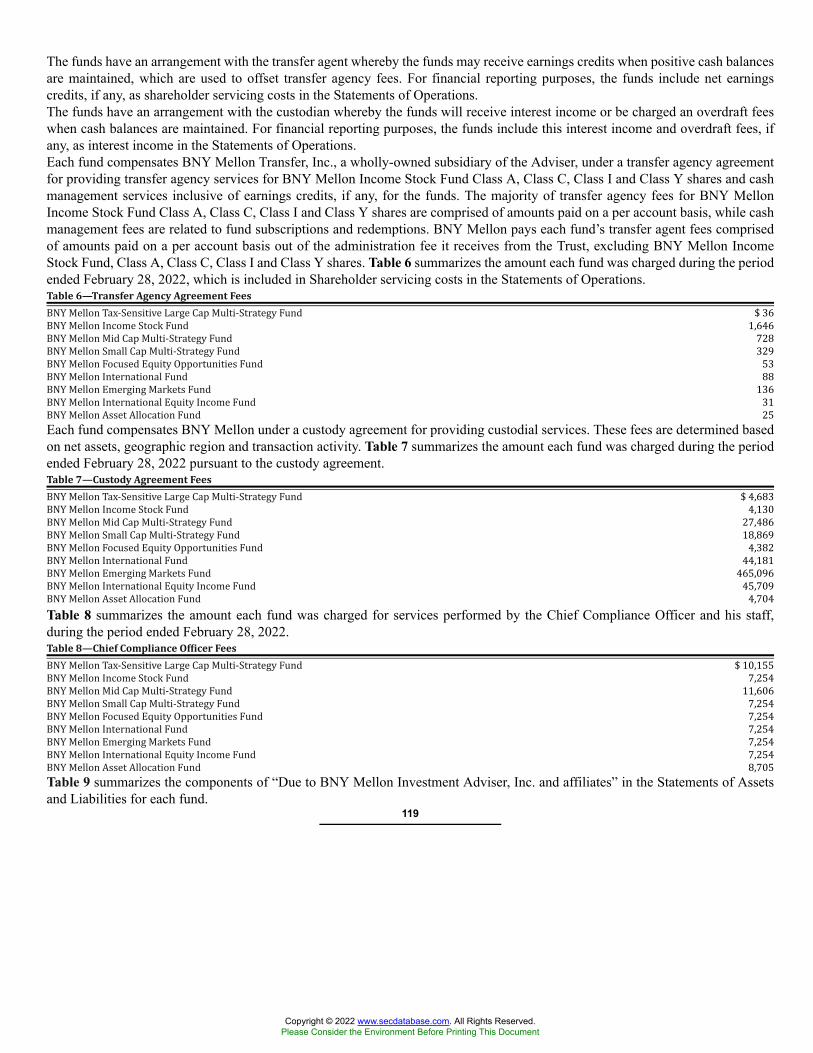
The funds have an arrangement with the transfer agent whereby the funds may receive earnings credits when positive cash balancesare maintained, which are used to offset transfer agency fees. For financial reporting purposes, the funds include net earningscredits, if any, as shareholder servicing costs in the Statements of Operations.The funds have an arrangement with the custodian whereby the funds will receive interest income or be charged an overdraft feeswhen cash balances are maintained. For financial reporting purposes, the funds include this interest income and overdraft fees, ifany, as interest income in the Statements of Operations.Each fund compensates BNY Mellon Transfer, Inc., a wholly-owned subsidiary of the Adviser, under a transfer agency agreementfor providing transfer agency services for BNY Mellon Income Stock Fund Class A, Class C, Class I and Class Y shares and cashmanagement services inclusive of earnings credits, if any, for the funds. The majority of transfer agency fees for BNY MellonIncome Stock Fund Class A, Class C, Class I and Class Y shares are comprised of amounts paid on a per account basis, while cashmanagement fees are related to fund subscriptions and redemptions. BNY Mellon pays each fund’s transfer agent fees comprisedof amounts paid on a per account basis out of the administration fee it receives from the Trust, excluding BNY Mellon IncomeStock Fund, Class A, Class C, Class I and Class Y shares. Table 6 summarizes the amount each fund was charged during the periodended February 28, 2022, which is included in Shareholder servicing costs in the Statements of Operations.Table 6—Transfer Agency Agreement FeesBNY Mellon Tax-Sensitive Large Cap Multi-Strategy Fund $ 36BNY Mellon Income Stock Fund 1,646BNY Mellon Mid Cap Multi-Strategy Fund 728BNY Mellon Small Cap Multi-Strategy Fund 329BNY Mellon Focused Equity Opportunities Fund 53BNY Mellon International Fund 88BNY Mellon Emerging Markets Fund 136BNY Mellon International Equity Income Fund 31BNY Mellon Asset Allocation Fund 25Each fund compensates BNY Mellon under a custody agreement for providing custodial services. These fees are determined basedon net assets, geographic region and transaction activity. Table 7 summarizes the amount each fund was charged during the periodended February 28, 2022 pursuant to the custody agreement.Table 7—Custody Agreement FeesBNY Mellon Tax-Sensitive Large Cap Multi-Strategy Fund $ 4,683BNY Mellon Income Stock Fund 4,130BNY Mellon Mid Cap Multi-Strategy Fund 27,486BNY Mellon Small Cap Multi-Strategy Fund 18,869BNY Mellon Focused Equity Opportunities Fund 4,382BNY Mellon International Fund 44,181BNY Mellon Emerging Markets Fund 465,096BNY Mellon International Equity Income Fund 45,709BNY Mellon Asset Allocation Fund 4,704Table 8 summarizes the amount each fund was charged for services performed by the Chief Compliance Officer and his staff,during the period ended February 28, 2022.Table 8—Chief Compliance Officer FeesBNY Mellon Tax-Sensitive Large Cap Multi-Strategy Fund $ 10,155BNY Mellon Income Stock Fund 7,254BNY Mellon Mid Cap Multi-Strategy Fund 11,606BNY Mellon Small Cap Multi-Strategy Fund 7,254BNY Mellon Focused Equity Opportunities Fund 7,254BNY Mellon International Fund 7,254BNY Mellon Emerging Markets Fund 7,254BNY Mellon International Equity Income Fund 7,254BNY Mellon Asset Allocation Fund 8,705Table 9 summarizes the components of “Due to BNY Mellon Investment Adviser, Inc. and affiliates” in the Statements of Assetsand Liabilities for each fund.
119
Copyright © 2022 www.secdatabase.com. All Rights Reserved.Please Consider the Environment Before Printing This Document
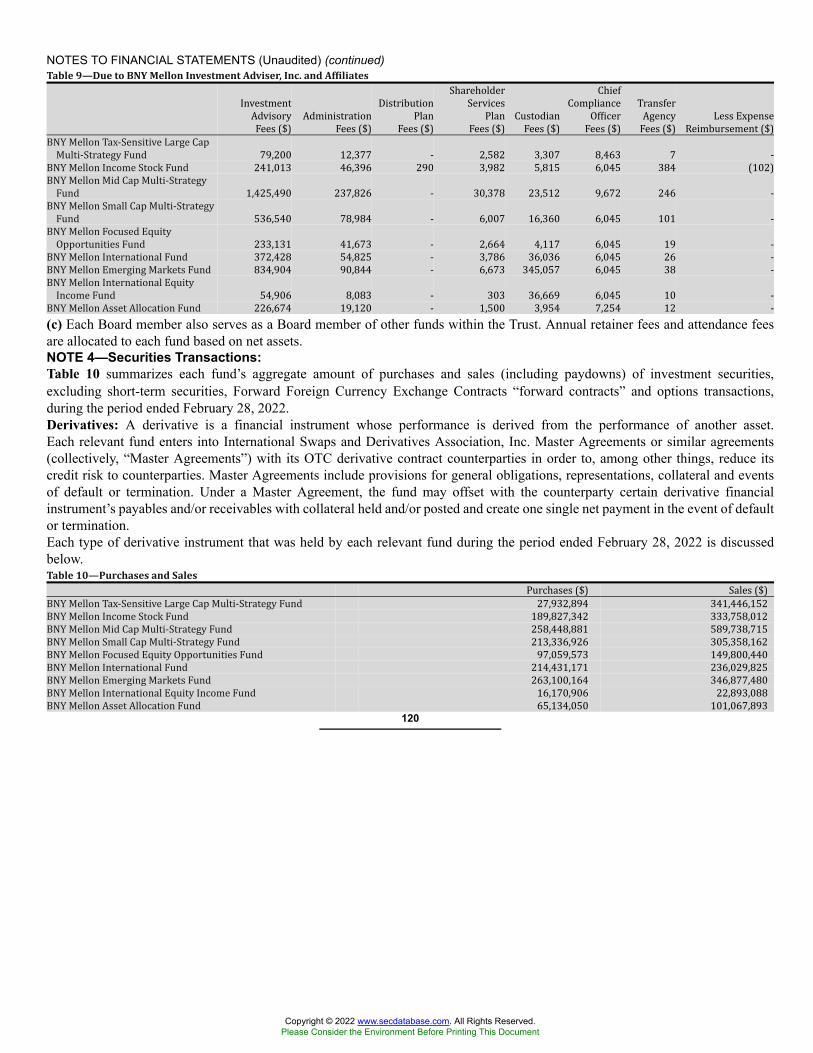
NOTES TO FINANCIAL STATEMENTS (Unaudited) (continued)Table 9—Due to BNY Mellon Investment Adviser, Inc. and AffiliatesInvestmentAdvisoryFees ($) AdministrationFees ($) DistributionPlanFees ($)
ShareholderServicesPlanFees ($) CustodianFees ($)ChiefComplianceOfficerFees ($) TransferAgencyFees ($) Less ExpenseReimbursement ($)BNY Mellon Tax-Sensitive Large CapMulti-Strategy Fund 79,200 12,377 - 2,582 3,307 8,463 7 -BNY Mellon Income Stock Fund 241,013 46,396 290 3,982 5,815 6,045 384 (102)BNY Mellon Mid Cap Multi-StrategyFund 1,425,490 237,826 - 30,378 23,512 9,672 246 -BNY Mellon Small Cap Multi-StrategyFund 536,540 78,984 - 6,007 16,360 6,045 101 -BNY Mellon Focused EquityOpportunities Fund 233,131 41,673 - 2,664 4,117 6,045 19 -BNY Mellon International Fund 372,428 54,825 - 3,786 36,036 6,045 26 -BNY Mellon Emerging Markets Fund 834,904 90,844 - 6,673 345,057 6,045 38 -BNY Mellon International EquityIncome Fund 54,906 8,083 - 303 36,669 6,045 10 -BNY Mellon Asset Allocation Fund 226,674 19,120 - 1,500 3,954 7,254 12 -
(c) Each Board member also serves as a Board member of other funds within the Trust. Annual retainer fees and attendance feesare allocated to each fund based on net assets.NOTE 4—Securities Transactions:Table 10 summarizes each fund’s aggregate amount of purchases and sales (including paydowns) of investment securities,excluding short-term securities, Forward Foreign Currency Exchange Contracts “forward contracts” and options transactions,during the period ended February 28, 2022.Derivatives: A derivative is a financial instrument whose performance is derived from the performance of another asset.Each relevant fund enters into International Swaps and Derivatives Association, Inc. Master Agreements or similar agreements(collectively, “Master Agreements”) with its OTC derivative contract counterparties in order to, among other things, reduce itscredit risk to counterparties. Master Agreements include provisions for general obligations, representations, collateral and eventsof default or termination. Under a Master Agreement, the fund may offset with the counterparty certain derivative financialinstrument’s payables and/or receivables with collateral held and/or posted and create one single net payment in the event of defaultor termination.Each type of derivative instrument that was held by each relevant fund during the period ended February 28, 2022 is discussedbelow.Table 10—Purchases and Sales Purchases ($) Sales ($)BNY Mellon Tax-Sensitive Large Cap Multi-Strategy Fund 27,932,894 341,446,152BNY Mellon Income Stock Fund 189,827,342 333,758,012BNY Mellon Mid Cap Multi-Strategy Fund 258,448,881 589,738,715BNY Mellon Small Cap Multi-Strategy Fund 213,336,926 305,358,162BNY Mellon Focused Equity Opportunities Fund 97,059,573 149,800,440BNY Mellon International Fund 214,431,171 236,029,825BNY Mellon Emerging Markets Fund 263,100,164 346,877,480BNY Mellon International Equity Income Fund 16,170,906 22,893,088BNY Mellon Asset Allocation Fund 65,134,050 101,067,893
120
Copyright © 2022 www.secdatabase.com. All Rights Reserved.Please Consider the Environment Before Printing This Document
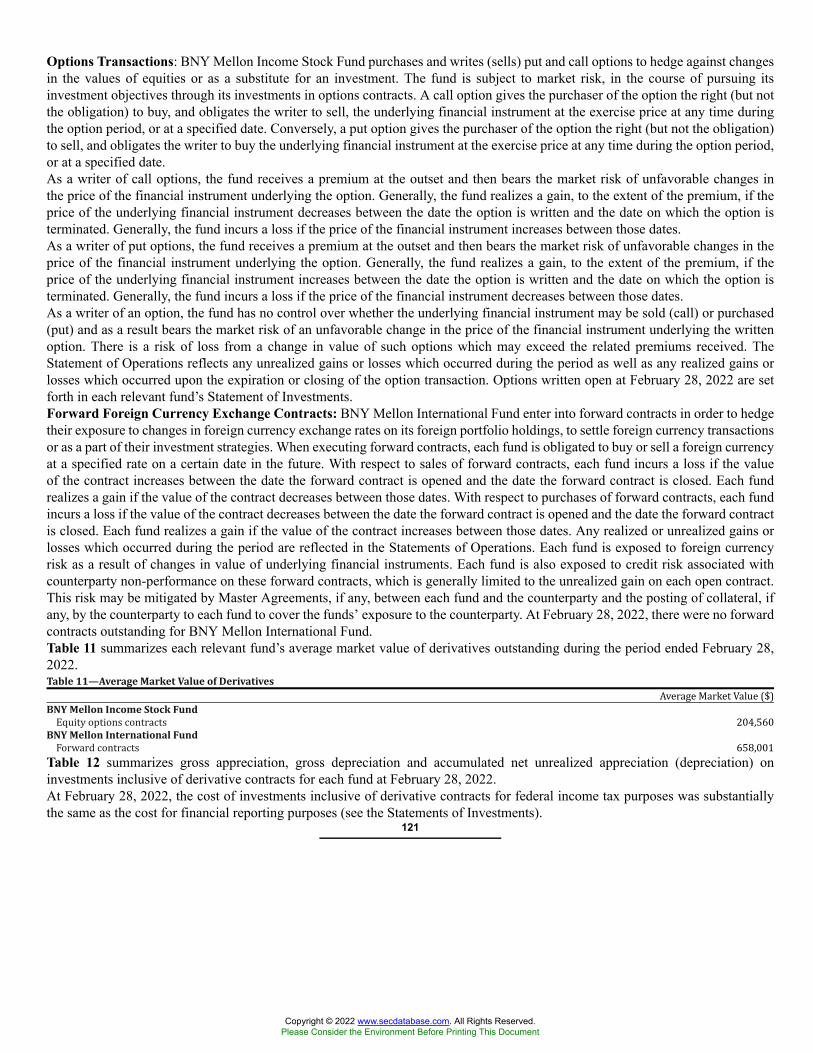
Options Transactions: BNY Mellon Income Stock Fund purchases and writes (sells) put and call options to hedge against changesin the values of equities or as a substitute for an investment. The fund is subject to market risk, in the course of pursuing itsinvestment objectives through its investments in options contracts. A call option gives the purchaser of the option the right (but notthe obligation) to buy, and obligates the writer to sell, the underlying financial instrument at the exercise price at any time duringthe option period, or at a specified date. Conversely, a put option gives the purchaser of the option the right (but not the obligation)to sell, and obligates the writer to buy the underlying financial instrument at the exercise price at any time during the option period,or at a specified date.As a writer of call options, the fund receives a premium at the outset and then bears the market risk of unfavorable changes inthe price of the financial instrument underlying the option. Generally, the fund realizes a gain, to the extent of the premium, if theprice of the underlying financial instrument decreases between the date the option is written and the date on which the option isterminated. Generally, the fund incurs a loss if the price of the financial instrument increases between those dates.As a writer of put options, the fund receives a premium at the outset and then bears the market risk of unfavorable changes in theprice of the financial instrument underlying the option. Generally, the fund realizes a gain, to the extent of the premium, if theprice of the underlying financial instrument increases between the date the option is written and the date on which the option isterminated. Generally, the fund incurs a loss if the price of the financial instrument decreases between those dates.As a writer of an option, the fund has no control over whether the underlying financial instrument may be sold (call) or purchased(put) and as a result bears the market risk of an unfavorable change in the price of the financial instrument underlying the writtenoption. There is a risk of loss from a change in value of such options which may exceed the related premiums received. TheStatement of Operations reflects any unrealized gains or losses which occurred during the period as well as any realized gains orlosses which occurred upon the expiration or closing of the option transaction. Options written open at February 28, 2022 are setforth in each relevant fund’s Statement of Investments.Forward Foreign Currency Exchange Contracts: BNY Mellon International Fund enter into forward contracts in order to hedgetheir exposure to changes in foreign currency exchange rates on its foreign portfolio holdings, to settle foreign currency transactionsor as a part of their investment strategies. When executing forward contracts, each fund is obligated to buy or sell a foreign currencyat a specified rate on a certain date in the future. With respect to sales of forward contracts, each fund incurs a loss if the valueof the contract increases between the date the forward contract is opened and the date the forward contract is closed. Each fundrealizes a gain if the value of the contract decreases between those dates. With respect to purchases of forward contracts, each fundincurs a loss if the value of the contract decreases between the date the forward contract is opened and the date the forward contractis closed. Each fund realizes a gain if the value of the contract increases between those dates. Any realized or unrealized gains orlosses which occurred during the period are reflected in the Statements of Operations. Each fund is exposed to foreign currencyrisk as a result of changes in value of underlying financial instruments. Each fund is also exposed to credit risk associated withcounterparty non-performance on these forward contracts, which is generally limited to the unrealized gain on each open contract.This risk may be mitigated by Master Agreements, if any, between each fund and the counterparty and the posting of collateral, ifany, by the counterparty to each fund to cover the funds’ exposure to the counterparty. At February 28, 2022, there were no forwardcontracts outstanding for BNY Mellon International Fund.Table 11 summarizes each relevant fund’s average market value of derivatives outstanding during the period ended February 28,2022.Table 11—Average Market Value of Derivatives Average Market Value ($)BNY Mellon Income Stock FundEquity options contracts 204,560BNY Mellon International FundForward contracts 658,001Table 12 summarizes gross appreciation, gross depreciation and accumulated net unrealized appreciation (depreciation) oninvestments inclusive of derivative contracts for each fund at February 28, 2022.At February 28, 2022, the cost of investments inclusive of derivative contracts for federal income tax purposes was substantiallythe same as the cost for financial reporting purposes (see the Statements of Investments).
121
Copyright © 2022 www.secdatabase.com. All Rights Reserved.Please Consider the Environment Before Printing This Document
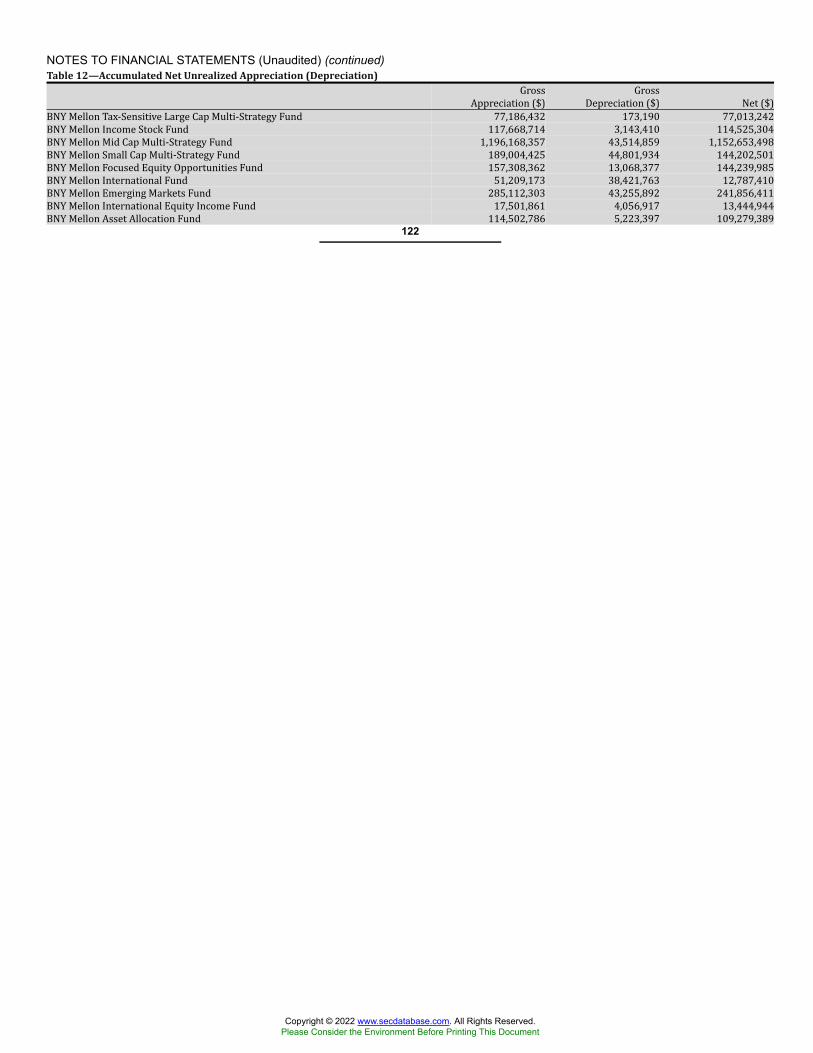
NOTES TO FINANCIAL STATEMENTS (Unaudited) (continued)Table 12—Accumulated Net Unrealized Appreciation (Depreciation) GrossAppreciation ($) GrossDepreciation ($) Net ($)BNY Mellon Tax-Sensitive Large Cap Multi-Strategy Fund 77,186,432 173,190 77,013,242BNY Mellon Income Stock Fund 117,668,714 3,143,410 114,525,304BNY Mellon Mid Cap Multi-Strategy Fund 1,196,168,357 43,514,859 1,152,653,498BNY Mellon Small Cap Multi-Strategy Fund 189,004,425 44,801,934 144,202,501BNY Mellon Focused Equity Opportunities Fund 157,308,362 13,068,377 144,239,985BNY Mellon International Fund 51,209,173 38,421,763 12,787,410BNY Mellon Emerging Markets Fund 285,112,303 43,255,892 241,856,411BNY Mellon International Equity Income Fund 17,501,861 4,056,917 13,444,944BNY Mellon Asset Allocation Fund 114,502,786 5,223,397 109,279,389
122
Copyright © 2022 www.secdatabase.com. All Rights Reserved.Please Consider the Environment Before Printing This Document

For More InformationThe BNY Mellon Fundsc/o BNY Mellon Investment Adviser, Inc.240 Greenwich StreetNew York, NY 10286AdviserBNY Mellon Investment Adviser, Inc.240 Greenwich StreetNew York, NY 10286
Sub-AdviserNewton Investment ManagementNorth America, LLCBNY Mellon Center201 Washington StreetBoston, MA 02108Walter Scott & Partners LimitedOne Charlotte SquareEdinburgh, Scotland, UKGeneva Capital Management LLC411 East Wisconsin AvenueSuite 2320,Milwaukee, WI 53202Boston Partners Global Investors, Inc.One Grand Central Place60 East 42nd Street – Suite 1550New York, NY 10165AdministratorThe Bank of New York Mellon240 Greenwich StreetNew York, NY 10286Sub-AdministratorBNY Mellon Investment Adviser, Inc.240 Greenwich StreetNew York, NY 10286CustodianThe Bank of New York Mellon240 Greenwich StreetNew York, NY 10286Transfer Agent &Dividend Disbursing AgentBNY Mellon Transfer, Inc.240 Greenwich StreetNew York, NY 10286DistributorBNY Mellon Securities Corporation240 Greenwich StreetNew York, NY 10286
Ticker Symbols:BNY Mellon Tax-Sensitive Large Cap Multi-Strategy Fund Class M: MTSMX Investor: MTSIXBNY Mellon Income Stock Fund Class M: MPISX Investor: MIISX Class A:BMIAX Class C: BMISX Class I:BMIIX Class Y: BMIYXBNY Mellon Mid Cap Multi-Strategy Fund Class M: MPMCX Investor:MIMSXBNY Mellon Small Cap Multi-Strategy Fund Class M: MPSSX Investor: MISCXBNY Mellon Focused Equity Opportunities Fund Class M: MFOMX Investor: MFOIXCopyright © 2022 www.secdatabase.com. All Rights Reserved.
Please Consider the Environment Before Printing This Document
BNY Mellon International Fund Class M: MPITX Investor: MIINXBNY Mellon Emerging Markets Fund Class M: MEMKX Investor: MIEGXBNY Mellon International Equity Income Fund Class M: MLIMX Investor: MLIIXBNY Mellon Asset Allocation Fund Class M: MPBLX Investor: MIBLXTelephone Wealth Management (WM) Clients, please contact your Account Officer or call 1-866-804-5023. Brokerage Clients of BNYMellon Wealth Advisors (BNYMWA), please contact your financial representative or call 1-800-830-0549, Option 2 for BNY MellonWealth Management Direct or 1-800-843-5466 for former brokerage clients of BNY Mellon Wealth Advisors whose accounts are nowheld by BNY Mellon Brokerage Services. Individual Account holders, please call BNY Mellon Investment Advisers at 1-800-373-9387.Mail WM clients, write to your Account Officer, c/o The Bank of New York Mellon, One Mellon Bank Center, Pittsburgh, PA 15258BNYMWA Brokerage Clients, write to your financial representative, P.O. Box 9012, Hicksville, NY 11802-9012Individual Account Holders, write to: BNY Mellon Funds, P.O. Box 9879, Providence, RI 02940-8079Each fund files its complete schedule of portfolio holdings with the Securities and Exchange Commission (“SEC”) for the first and thirdquarters of each fiscal year on Form N-PORT. The fund’s Forms N-PORT are available on the SEC’s website at http://www.sec.gov.A description of the policies and procedures that the fund uses to determine how to vote proxies relating to portfolio securities, andinformation regarding how the fund voted these proxies for the most recent 12-month period ended June 30 is available at http://www.im.bnymellon.com and on the SEC’s website at http://www.sec.gov. The description of the policies and procedures is alsoavailable without charge, upon request, by calling 1-800-373-9387.© 2022 BNY Mellon Securities Corporation MFTSA0222-EQ
The BNY Mellon FundsBNY Mellon Bond FundBNY Mellon Intermediate Bond FundBNY Mellon Corporate Bond FundBNY Mellon Short-Term U.S. Government Securities FundSEMIANNUAL REPORT February 28, 2022
Copyright © 2022 www.secdatabase.com. All Rights Reserved.Please Consider the Environment Before Printing This Document

ContentsT H E F U N D S
Discussion of Funds’ Performance 2Understanding Your Fund’s Expenses 6Comparing Your Fund’s Expenses With Those of Other Funds 7Statements of Investments 8Statements of Assets and Liabilities 31Statements of Operations 32Statements of Changes in Net Assets 33Financial Highlights 35Notes to Financial Statements 43F O R M O R E I N F O R M AT I O N
Back Cover
Save time. Save paper. View your next shareholder report online as soon as it’s available. Log intowww.im.bnymellon.com and sign up for eCommunications. It’s simple and only takes a few minutes.
The views expressed herein are current to the date of this report. These views and the composition of thefunds’ portfolios are subject to change at any time based on market and other conditions.
Not FDIC-Insured • Not Bank-Guaranteed • May Lose Value
Copyright © 2022 www.secdatabase.com. All Rights Reserved.Please Consider the Environment Before Printing This Document
DISCUSSION OF FUND PERFORMANCE (Unaudited)For the period of September 1, 2021 through February 28, 2022, as provided by John F. Flahive, CFA, Portfolio ManagerMarket and Fund Performance OverviewFor the six-month period ended February 28, 2022, BNY Mellon Bond Fund’s (the “fund”) Class M shares produced a total return of −4.61%, and Investor sharesproduced a total return of −4.75%.1 In comparison, the fund’s benchmark, the Bloomberg U.S. Aggregate Bond Index (the “Index”), produced a total return of−4.07% for the same period.2Bonds prices declined over the six months under pressure from rising interest rates and increasingly hawkish rhetoric from the U.S. Federal Reserve (the “Fed”).The fund underperformed the Index, largely due to the negative impact of an overweight allocation to corporate bonds.The Fund’s Investment ApproachThe fund seeks total return (consisting of capital appreciation and current income). To pursue its goal, the fund normally invests at least 80% of its net assets,plus any borrowings for investment purposes, in bonds. BNY Mellon Investment Adviser, Inc. actively manages the fund’s bond market and maturity exposureand credit profile and uses a disciplined process to select bonds and manage risks. The fund’s investments in bonds must be rated investment grade (i.e., Baa/BBB or higher) at the time of purchase or, if unrated, deemed of comparable quality by BNY Mellon Investment Adviser, Inc.3 Investments in bonds may includegovernment securities, corporate bonds, mortgage-related securities and municipal securities. Generally, the average effective duration of the fund’s portfolio willnot exceed eight years.Risk Assets Retreat on Inflationary PressuresThe reporting period began amid increasing inflationary pressures due to rising energy and commodity prices and global supply-chain disruptions. The Fed,which expressed increasingly hawkish sentiments prior to the start of the period, indicated in September 2021 a willingness to consider reducing accommodativepolicies sooner rather than later due to the unexpected level and persistence of inflationary forces affecting the economy. As inflationary pressures continuedto mount, Fed rhetoric grew increasingly emphatic. In November 2021, the Fed dropped the word “transitory” when describing inflation. At the same time, theFed forecast a possible end to their asset purchase program as early as June 2022, thereby increasing the likelihood of one or more rate hikes later that year. InDecember, the Fed again revised their estimate of an end to quantitative easing to March 2022, leading the market to widely anticipate multiple hikes in 2022.Increasing tensions between Russia and Ukraine in early 2022 and the eventual invasion of Ukraine by its larger neighbor further undermined investor sentimentand pressured international credit markets.U.S. bond prices trended lower, spreads widened and yields crept higher as interest rates rose throughout the period, with short-term rates rising faster than long-term rates. These trends were most pronounced during the latter two months of the period. Corporate bonds underperformed government-issued securities andsecuritized instruments in a flight to safety, particularly during the final two months of the period. Conversely, floating-rate bonds and Treasury Inflation-ProtectedSecurities (TIPS) performed relatively well, as both asset classes offer a degree of protection from rising interest rates. Not surprisingly, given the pressure onbond prices, short-duration instruments tended to outperform their longer-duration counterparts. From a credit ratings perspective, higher-rated, higher-qualityissues tended to outperform lower-rated bonds, reflective of the market’s prevailing risk-off sentiment.Corporate Bond Exposure Detracted from Relative ReturnsIn a reversal from the prior reporting period, when the fund outperformed the Index largely due to overweight allocations to corporate bonds and underweightallocations to Treasuries, those same allocations detracted from relative performance during the current period. Significantly overweight exposure to corporatebonds, largely in the industrials and financials sectors, was responsible for most of the fund’s relative underperformance. Within the corporate sector, selectionproved relatively strong, with the positive impact of a shorter average duration among the fund’s corporate holdings mitigating the negative impact of a tilttoward bonds with lower credit ratings. Nevertheless, overweight corporate allocation, which reflected our efforts to enhance the fund’s yield at a time of strongcorporate fundamentals, low default rates and better-than-expected earnings reports, remained the primary driver of the fund’s underperformance. Underweightexposure to Treasury bonds further detracted from the fund’s relative performance, although the shorter duration of the fund’s Treasury holdings again easedthe sector-allocation impact. Among Treasury holdings, the fund’s relative performance benefited from a small, out-of-benchmark position in TIPS, as TIPS areindexed to inflation to provide investors with protection against rising rates. Among securitized holdings, the fund performed roughly in line with the Index,slightly outperforming due to modestly shorter duration.Positioned for Rising RatesDespite the widening of spreads seen during the period, we expect this trend to moderate over time. Although risks associated with increasing inflation andgeopolitical conflict are clearly present, in our opinion, underlying U.S. economic fundamentals remain strong, supported by better-than-expected corporateearnings, robust consumer demand and positive employment numbers. Accordingly, we continue to take a cautious investment approach, seeking to enhance yieldwhile dampening the fund’s interest-rate sensitivity.As of the end of the reporting period, the fund continues to hold substantially overweighted exposure to corporate bonds, while maintaining a tilt toward lower-credit-quality corporate bonds that provide relatively high yields. At the same time, in recognition of increased inflationary pressures and the likelihood ofincreasing interest rates, we continue to shorten the fund’s average duration to reduce interest-rate sensitivity. In addition, the fund continues to hold underweightexposure to Treasury obligations. Among Treasury holdings, we have modestly increased the fund’s exposure to TIPS in an effort to further insulate the fundfrom the impact of rising rates.March 15, 20221 Total return includes reinvestment of dividends and any capital gains paid. Past performance is no guarantee of future results. Share price, yield and investment return
fluctuate such that upon redemption, fund shares may be worth more or less than their original cost.² Source: Lipper Inc. — The Bloomberg U.S. Aggregate Bond Index is a broad-based flagship benchmark that measures the investment-grade, U.S. dollar-denominated,
fixed-rate, taxable bond market. The Index includes Treasuries, government-related and corporate securities, MBS (agency fixed-rate and hybrid ARM pass-throughs),ABS and CMBS (agency and nonagency). Investors cannot invest directly in any index.
3 The fund may continue to own investment-grade bonds (at the time of purchase), which are subsequently downgraded to below investment grade.Bond funds are subject generally to interest-rate, credit, liquidity and market risks, to varying degrees, all of which are more fully described in the fund’s prospectus.Generally, all other factors being equal, bond prices are inversely related to interest-rate changes, and rate increases can cause price declines.Recent market risks include pandemic risks related to COVID-19. The effects of COVID-19 have contributed to increased volatility in global markets and will likely affectcertain countries, companies, industries and market sectors more dramatically than others. To the extent the fund may overweight its investments in certain countries,companies, industries or market sectors, such positions will increase the fund's exposure to risk of loss from adverse developments affecting those countries, companies,industries or sectors.Investing in foreign denominated and/or domiciled securities involves special risks, including changes in currency exchange rates, political, economic, and socialinstability, limited company information, differing auditing and legal standards, and less market liquidity. These risks generally are greater with emerging marketcountries.
2
Copyright © 2022 www.secdatabase.com. All Rights Reserved.Please Consider the Environment Before Printing This Document
For the period of September 1, 2021 through February 28, 2022, as provided by John F. Flahive, CFA, Portfolio ManagerMarket and Fund Performance OverviewFor the six-month period ended February 28, 2022, BNY Mellon Intermediate Bond Fund’s (the “fund”) Class M shares produced a total return of −3.02%,and Investor shares produced a total return of −3.07%.1 In comparison, the fund’s benchmark, the Bloomberg U.S. Intermediate Government/Credit Index (the“Index”), produced a total return of −3.23% for the same period.2Intermediate-term bond prices declined over the six months under pressure from rising interest rates and increasingly hawkish rhetoric from the U.S. FederalReserve (the “Fed”). The fund outperformed the Index, largely due to the negative impact of an overweight allocation to corporate bonds, substantially offset bythe positive impact of the fund’s relatively short duration.The Fund’s Investment ApproachThe fund seeks total return (consisting of capital appreciation and current income). To pursue its goal, the fund normally invests at least 80% of its net assets, plusany borrowings for investment purposes, in bonds. BNY Mellon Investment Adviser, Inc. actively manages bond market and maturity exposure and credit profileand uses a disciplined process to select bonds and manage risk.Investments in bonds may include government securities, corporate bonds and municipal bonds. The fund’s investments in bonds must be rated investment grade(i.e., Baa/BBB or higher) at the time of purchase or, if unrated, deemed of comparable quality by BNY Mellon Investment Adviser, Inc.3 Generally, the fund’saverage effective portfolio maturity will be between three and 10 years, and the average effective duration of the fund’s portfolio will be between 2.5 and 5.5years. When managing the fund, we use a disciplined process to select bonds and manage risk. We generally choose bonds based on yield, credit quality, the levelof interest rates and inflation, general economic and financial trends, and our outlook for the securities markets. Our management process also includes computermodeling and scenario testing of possible changes in market conditions.Risk Assets Retreat on Inflationary PressuresThe reporting period began amid increasing inflationary pressures due to rising energy and commodity prices and global supply-chain disruptions. The Fed,which expressed increasingly hawkish sentiments prior to the start of the period, indicated in September 2021 a willingness to consider reducing accommodativepolicies sooner rather than later due to the unexpected level and persistence of inflationary forces affecting the economy. As inflationary pressures continuedto mount, Fed rhetoric grew increasingly emphatic. In November 2021, the Fed dropped the word “transitory” when describing inflation. At the same time, theFed forecast a possible end to their asset purchase program as early as June 2022, thereby increasing the likelihood of one or more rate hikes later that year. InDecember, the Fed again revised their estimate of an end to quantitative easing to March 2022, leading the market to widely anticipate multiple hikes in 2022.Increasing tensions between Russia and Ukraine in early 2022 and the eventual invasion of Ukraine by its larger neighbor further undermined investor sentimentand pressured international credit markets.U.S. bond prices trended lower, spreads widened and yields crept higher as interest rates rose throughout the period, with short-term rates rising faster than long-term rates. These trends were most pronounced during the latter two months of the period. Corporate bonds underperformed government-issued securities andsecuritized instruments in a flight to safety, particularly during the final two months of the period. Conversely, floating-rate bonds and Treasury Inflation-ProtectedSecurities (TIPS) performed relatively well, as both asset classes offer a degree of protection from rising interest rates. Not surprisingly, given the pressure onbond prices, short-duration instruments tended to outperform their longer-duration counterparts. From a credit ratings perspective, higher-rated, higher-qualityissues tended to outperform lower-rated bonds, reflective of the market’s prevailing risk-off sentiment.Corporate Bond Exposure Detracted from Relative ReturnsIn a reversal from the prior reporting period, when the fund outperformed the Index largely due to overweight allocations to corporate bonds and underweightallocations to Treasuries, those same allocations detracted from relative performance during the current period. Significantly overweight exposure to corporatebonds, largely in the industrials and financials sectors, was responsible for most of the fund’s relative underperformance. Within the corporate sector, selectionproved relatively strong, with the positive impact of a shorter average duration among the fund’s corporate holdings mitigating the negative impact of a tilt towardbonds with lower credit ratings. Nevertheless, overweight corporate allocation, which reflected our efforts to enhance the fund’s yield at a time of strong corporatefundamentals, low default rates and better-than-expected earnings reports, remained the primary driver of the fund’s underperformance. Underweight exposureto Treasury bonds further detracted from the fund’s relative performance, although the shorter duration of the fund’s Treasury holdings again eased the sector-allocation impact. Among Treasury holdings, the fund’s relative performance benefited from a small, out-of-benchmark position in TIPS, as TIPS are indexedto inflation to provide investors with protection against rising rates. A small out-of-benchmark position in mortgage-backed securities delivered positive returns,modestly bolstering the fund’s performance.Positioned for Rising RatesDespite the widening of spreads seen during the period, we expect this trend to moderate over time. Although risks associated with increasing inflation andgeopolitical conflict are clearly present, in our opinion, underlying U.S. economic fundamentals remain strong, supported by better-than-expected corporateearnings, robust consumer demand and positive employment numbers. Accordingly, we continue to take a cautious investment approach, seeking to enhance yieldwhile dampening the fund’s interest-rate sensitivity.As of the end of the reporting period, the fund continues to hold substantially overweighted exposure to corporate bonds, while maintaining a tilt toward lowercredit-quality corporate bonds that provide relatively high yields. At the same time, in recognition of increased inflationary pressures and the likelihood ofincreasing interest rates, we continue to shorten the fund’s average duration to reduce interest-rate sensitivity. In addition, the fund continues to hold underweightexposure to Treasury obligations. Among Treasury holdings, we have modestly increased the fund’s exposure to short-duration TIPS in an effort to further insulatethe fund from the impact of rising rates.March 15, 20221 Total return includes reinvestment of dividends and any capital gains paid. Past performance is no guarantee of future results. Share price, yield and investment return
fluctuate such that upon redemption, fund shares may be worth more or less than their original cost.² Source: Lipper Inc. – The Bloomberg U.S. Intermediate Government/Credit Index is a broad-based, flagship benchmark that measures the non-securitized component of
the Bloomberg U.S. Aggregate Bond Index. Investors cannot invest directly in any index.3 The fund may continue to own investment-grade bonds (at the time of purchase), which are subsequently downgraded to below investment grade.Bond funds are subject generally to interest-rate, credit, liquidity and market risks, to varying degrees, all of which are more fully described in the fund’s prospectus.Generally, all other factors being equal, bond prices are inversely related to interest-rate changes, and rate increases can cause price declines.Recent market risks include pandemic risks related to COVID-19. The effects of COVID-19 have contributed to increased volatility in global markets and will likely affectcertain countries, companies, industries and market sectors more dramatically than others. To the extent the fund may overweight its investments in certain countries,companies, industries or market sectors, such positions will increase the fund’s exposure to risk of loss from adverse developments affecting those countries, companies,industries or sectors.
3
Copyright © 2022 www.secdatabase.com. All Rights Reserved.Please Consider the Environment Before Printing This Document
DISCUSSION OF FUND PERFORMANCE (Unaudited) (continued)For the period of September 1, 2021 through February 28, 2022, as provided by John F. Flahive, CFA, Portfolio ManagerMarket and Fund Performance OverviewFor the six-month period ended February 28, 2022, BNY Mellon Corporate Bond Fund’s (the “fund”) Class M shares produced a total return of −4.46%, andInvestor shares produced a total return of −4.58%.1 In comparison, the fund’s benchmark, the Bloomberg U.S. Intermediate Credit Index (the “Index”), produceda total return of −3.84%, and the Bloomberg U.S. Credit Index, the fund’s secondary benchmark, produced a total return of −5.84% for the same period.2,3
Investment grade, corporate-backed bond prices declined over the six months under pressure from rising interest rates and increasingly hawkish rhetoric fromthe U.S. Federal Reserve (the “Fed”). The fund underperformed the Index, largely due to the negative impact of an overweight allocation to corporate bonds andunderweight exposure to government-related issues.The Fund’s Investment ApproachThe fund seeks total return (consisting of capital appreciation and current income). To pursue its goal, the fund normally invests at least 80% of its net assets, plusany borrowings for investment purposes, in corporate bonds, which include U.S. dollar-denominated bonds issued by U.S. and foreign corporations. Althoughnot a principal investment strategy, the remainder of the fund’s assets may be invested in U.S. government and agency bonds, mortgage-related securities,including commercial mortgage-backed securities, asset-backed securities, foreign corporate bonds denominated in foreign currencies, foreign government bonds,municipal bonds and commercial paper, and other money market instruments. Although not a principal investment strategy, for additional yield, the fund mayinvest up to 20% of its assets in fixed-income securities rated below investment grade (“high yield” or “junk” bonds) or the unrated equivalent as determinedby the investment adviser, but no lower than Ba-/BB- (or the unrated equivalent as determined by the investment adviser) in the case of mortgage-related andasset-backed securities.BNY Mellon Investment Adviser, Inc. uses a disciplined process to select bonds and manage risk. The investment adviser chooses bonds based on yield, creditquality, the level of interest rates and inflation, general economic and financial trends, and its outlook for the securities markets. In selecting corporate bonds forinvestment, the fund’s portfolio managers analyze fundamental metrics, including the issuer’s cash flow, leverage and operating margins, as well as its businessstrategy and operating performance, and macroeconomic factors.Risk Assets Retreat on Inflationary PressuresThe reporting period began amid increasing inflationary pressures due to rising energy and commodity prices and global supply-chain disruptions. The Fed,which expressed increasingly hawkish sentiments prior to the start of the period, indicated in September 2021 a willingness to consider reducing accommodativepolicies sooner rather than later due to the unexpected level and persistence of inflationary forces affecting the economy. As inflationary pressures continuedto mount, Fed rhetoric grew increasingly emphatic. In November 2021, the Fed dropped the word “transitory” when describing inflation. At the same time, theFed forecast a possible end to their asset purchase program as early as June 2022, thereby increasing the likelihood of one or more rate hikes later that year. InDecember, the Fed again revised their estimate of an end to quantitative easing to March 2022, leading the market to widely anticipate multiple hikes in 2022.Increasing tensions between Russia and Ukraine in early 2022 and the eventual invasion of Ukraine by its larger neighbor further undermined investor sentimentand pressured international credit markets.U.S. bond prices trended lower, spreads widened and yields crept higher as interest rates rose throughout the period, with short-term rates rising faster thanlong-term rates. These trends were most pronounced during the latter two months of the period. Corporate bonds underperformed government-issued securities,government-related securities and securitized instruments in a flight to safety, particularly during the final two months of the period. Conversely, floating-ratebonds and Treasury Inflation-Protected Securities (TIPS) performed relatively well, as both asset classes offer a degree of protection from rising interest rates.Not surprisingly, given the pressure on bond prices, short-duration instruments tended to outperform their longer-duration counterparts. From a credit ratingsperspective, higher-rated, higher-quality issues tended to outperform lower-rated bonds, reflective of the market’s prevailing risk-off sentiment.Allocation and Duration Detract from Relative ReturnsUnlike the Index, which includes a significant allocation to government-related issues, including agencies, local authorities, sovereigns and supranationals, thefund held relatively little exposure outside of corporate bonds. As government-related securities, on average, outperformed the corporate bond sector duringthe reporting period, the fund’s underweighted exposure to government-related issues detracted from relative performance. By the same logic, the fund’soverweighted exposure to corporate bonds detracted as well. Within the corporate sector, where holdings were concentrated in the industrial and finance areas,the fund’s relatively long duration further undermined relative returns. Returns also suffered due to the negative impact from the fund’s tilt toward bonds withlower credit ratings at a time when investors favored higher-quality issues.Positioned for Rising RatesDespite the widening of spreads seen during the period, we expect this trend to moderate over time. Although risks associated with increasing inflation andgeopolitical conflict are clearly present, in our opinion, underlying U.S. economic fundamentals remain strong, supported by better-than-expected corporateearnings, robust consumer demand and positive employment numbers. Accordingly, we continue to take a cautious investment approach, seeking to enhance yieldby adopting moderately long positions in corporate securities that appear well supported given prevailing economic conditions.March 15, 20221 Total return includes reinvestment of dividends and any capital gains paid. Past performance is no guarantee of future results. Share price, yield and investment return
fluctuate such that upon redemption, fund shares may be worth more or less than their original cost.2 Source: Lipper Inc. – The Bloomberg U.S. Intermediate Credit Index measures the investment-grade, U.S. dollar-denominated, fixed-rate, taxable corporate and
government-related bond markets with a maturity greater than 1 year and less than 10 years. It is composed of the U.S. Corporate Index and a non-corporatecomponent that includes non-U.S. agencies, sovereigns, supranationals and local authorities constrained by maturity. The U.S. Intermediate Credit Index is a subset ofthe U.S. Credit Index, which feeds into the U.S. Government/Credit Index and U.S. Aggregate Index. Investors cannot invest directly in any index.
3 Source: Lipper Inc. – The Bloomberg U.S. Credit Index measures the investment-grade, U.S. dollar-denominated, fixed-rate, taxable corporate and government-relatedbond markets. It is composed of the U.S. Corporate Index and a non-corporate component that includes non-U.S. agencies sovereigns, supranationals and localauthorities. Investors cannot invest directly in any index.
Bonds are subject generally to interest-rate, credit, liquidity and market risks, to varying degrees, all of which are more fully described in the fund’s prospectus. Generally,all other factors being equal, bond prices are inversely related to interest-rate changes, and rate increases can cause price declines.Recent market risks include pandemic risks related to COVID-19. The effects of COVID-19 have contributed to increased volatility in global markets and will likely affectcertain countries, companies, industries and market sectors more dramatically than others. To the extent the fund may overweight its investments in certain countries,companies, industries or market sectors, such positions will increase the fund’s exposure to risk of loss from adverse developments affecting those countries, companies,industries or sectors.
4
Copyright © 2022 www.secdatabase.com. All Rights Reserved.Please Consider the Environment Before Printing This Document
For the period from September 1, 2021 through February 28, 2022, as provided by Lawrence R. Dunn, CFA, Portfolio ManagerMarket and Fund Performance OverviewFor the six-month period ended February 28, 2022, BNY Mellon Short-Term U.S. Government Securities Fund’s (the “fund”) Class M shares produced a totalreturn of −1.74%, and Investor shares produced a total return of −1.81%.1 In comparison, the Bloomberg U.S. Government 1-3 Year Bond Index (the “Index”),the fund’s benchmark, produced a total return of −1.78% for the same period.2Short-term U.S. government bond prices declined over the six months under pressure from rising interest rates and increasingly hawkish rhetoric from the U.S.Federal Reserve (the “Fed”). The fund performed roughly in line with its benchmark with relatively positive returns from non-Treasury exposure balanced by thenegative effects of Treasury holdings.The Fund’s Investment ApproachThe fund seeks to provide as high a level of current income as is consistent with the preservation of capital. To pursue this goal, the fund normally investsat least 80% of its net assets, plus any borrowings for investment purposes, in securities issued or guaranteed by the U.S. government or its agencies orinstrumentalities, and in repurchase agreements in respect to such securities. The fund may invest in mortgage-related securities issued by U.S. governmentagencies or instrumentalities, such as mortgage pass-through securities issued by the Government National Mortgage Association, the Federal National MortgageAssociation, and the Federal Home Loan Mortgage Corporation. The fund may also invest in collateralized mortgage obligations, including stripped mortgage-backed securities. Generally, the fund’s average effective portfolio maturity and the average effective duration of the fund’s portfolio will be less than three years.When choosing securities, we typically first examine U.S. and global economic conditions and other market factors to estimate long- and short-term interest rates.Using a research-driven investment process, generally we then seek to identify what we believe are potentially profitable sectors before they are widely perceivedas such by the market. We also seek to identify underpriced or mispriced securities that appear likely to perform well over time.Risk Assets Retreat on Inflationary PressuresThe reporting period began amid increasing inflationary pressures due to rising energy and commodity prices and global supply-chain disruptions. The Fed,which expressed increasingly hawkish sentiments prior to the start of the period, indicated in September 2021 a willingness to consider reducing accommodativepolicies sooner rather than later due to the unexpected level and persistence of inflationary forces affecting the economy. As inflationary pressures continuedto mount, Fed rhetoric grew increasingly emphatic. In November 2021, the Fed dropped the word “transitory” when describing inflation. At the same time, theFed forecast a possible end to their asset purchase program as early as June 2022, thereby increasing the likelihood of one or more rate hikes later that year. InDecember, the Fed again revised their estimate of an end to quantitative easing to March 2022, leading the market to widely anticipate multiple hikes in 2022.Increasing tensions between Russia and Ukraine in early 2022 and the eventual invasion of Ukraine by its larger neighbor further undermined investor sentimentand pressured international credit markets.U.S. bond prices trended lower, spreads widened and yields crept higher as interest rates rose throughout the period, with short-term rates rising faster thanlong-term rates. From the beginning to the end of the 6-month period, the 2-year Treasury yield rose from 21 basis points to 143 basis points (a basis pointis one one-hundredth of a percentage point). These trends were most pronounced during the latter two months of the period. As yields rose, prices suffered,driving negative total return for short-term Treasury bonds. Corporate bonds underperformed government-issued securities and securitized instruments in a flightto safety, particularly during the final two months of the period. Conversely, floating-rate bonds and Treasury Inflation-Protected Securities (TIPS) performedrelatively well, as both asset classes offer a degree of protection from rising interest rates. Not surprisingly, given the pressure on bond prices, short-durationinstruments tended to outperform their longer-duration counterparts. From a credit ratings perspective, higher-rated, higher-quality issues tended to outperformlower-rated bonds, reflective of the market’s prevailing risk-off sentiment.Credit, Geographic and Sector Factors DetractApproximately 70% of the fund’s assets were invested short-term agency mortgage instruments during the period, most of them backed by government-sponsoredenterprises. These investments afforded yield advantage compared to Treasury securities of similar duration. The relatively short duration of the fund’s holdingsin the agency mortgage area further bolstered relative returns. The fund also derived a degree of yield advantage through modest investments in taxable municipalbonds. Exposure to direct agency debt provided a slight additional tailwind to performance. Conversely, the fund’s exposure to Treasury securities in the2-to-3-year part of the yield curve detracted from relative returns, largely due to duration effects.Positioned for Rising RatesDespite the widening of spreads seen during the period, we expect this trend to moderate over time. Although risks associated with increasing inflation andgeopolitical conflict are clearly present, in our opinion, underlying U.S. economic fundamentals remain strong, supported by better-than-expected corporateearnings, robust consumer demand and positive employment numbers. Accordingly, we continue to take a cautious investment approach, seeking to enhance yieldwhile dampening the fund’s interest-rate sensitivity. As of the end of the period, the fund has allocated 70.3% of asset to agency mortgages, with the remainderin taxable municipal bonds and Treasury securities. Our bias remains toward market-neutral duration, although we have shortened the fund’s duration from anaverage of 1.71 years throughout the reporting period to 1.54 years as of February 28, 2022, in response to the market’s flight to quality in the wake of Russia’sinvasion of Ukraine. In comparison, the Index average duration stood at 1.95 years as of the end of the period.March 15, 20221 Total return includes reinvestment of dividends and any capital gains paid. Past performance is no guarantee of future results. Share price, yield and investment return
fluctuate such that upon redemption, fund shares may be worth more or less than their original cost. Income may be subject to state and local taxes, and some incomemay be subject to the federal alternative minimum tax (AMT) for certain investors. Capital gains, if any, are fully taxable. The fund’s return reflects the absorption ofcertain fund expenses by BNY Mellon Investment Adviser, Inc. pursuant to an agreement in effect through December 31, 2022, at which time it may be extended,modified or terminated. Had these expenses not been absorbed, returns would have been lower.
2 Source: Lipper Inc. – The Bloomberg U.S. Government 1-3 Year Bond Index comprises the U.S. Treasury and U.S. Agency Indices. The index includes U.S. dollar-denominated, fixed-rate, nominal U.S. Treasuries and U.S. agency debentures, which reach maturity in 1-3 years. Investors cannot invest directly in any index.
Bonds are subject generally to interest-rate, credit, liquidity and market risks, to varying degrees, all of which are more fully described in the fund’s prospectus. Generally,all other factors being equal, bond prices are inversely related to interest-rate changes, and rate increases can cause price declines. Municipal income may be subject tostate and local taxes. Capital gains, if any, are taxable.Recent market risks include pandemic risks related to COVID-19. The effects of COVID-19 have contributed to increased volatility in global markets and will likely affectcertain countries, companies, industries and market sectors more dramatically than others. To the extent the fund may overweight its investments in certain countries,companies, industries or market sectors, such positions will increase the fund’s exposure to risk of loss from adverse developments affecting those countries, companies,industries or sectors.
5
Copyright © 2022 www.secdatabase.com. All Rights Reserved.Please Consider the Environment Before Printing This Document

UNDERSTANDING YOUR FUND’S EXPENSES (Unaudited)As a mutual fund investor, you pay ongoing expenses, such as management fees and other expenses. Using the information below, youcan estimate how these expenses affect your investment and compare them with the expenses of other funds. You also may pay one-timetransaction expenses, including sales charges (loads) and redemption fees, which are not shown in this section and would have resultedin higher total expenses. For more information, see your fund’s prospectus or talk to your financial adviser.Review your fund’s expensesThe table below shows the expenses you would have paid on a $1,000 investment in each class of each fund from September 1, 2021 toFebruary 28, 2022. It also shows how much a $1,000 investment would be worth at the close of the period, assuming actual returns andexpenses.Expenses and Value of a $1,000 InvestmentAssume actual returns for the six months ended February 28, 2022
Class M Investor SharesBNY Mellon Bond FundExpenses paid per $1,000† $2.66 $3.87Ending value (after expenses) $953.90 $952.50Annualized expense ratio (%) .55 .80BNY Mellon Intermediate Bond FundExpenses paid per $1,000† $2.74 $3.96Ending value (after expenses) $969.80 $969.30Annualized expense ratio (%) .56 .81BNY Mellon Corporate Bond FundExpenses paid per $1,000† $2.72 $3.92Ending value (after expenses) $955.40 $954.20Annualized expense ratio (%) .56 .81BNY Mellon Short-Term U.S. Government Securities FundExpenses paid per $1,000† $2.46 $3.69Ending value (after expenses) $982.60 $981.90Annualized expense ratio (%) .50 .75† Expenses are equal to each fund’s annualized expense ratio as shown above, multiplied by the average account value over the period, multiplied by 181/365 (to reflect
the one-half year period).6
Copyright © 2022 www.secdatabase.com. All Rights Reserved.Please Consider the Environment Before Printing This Document
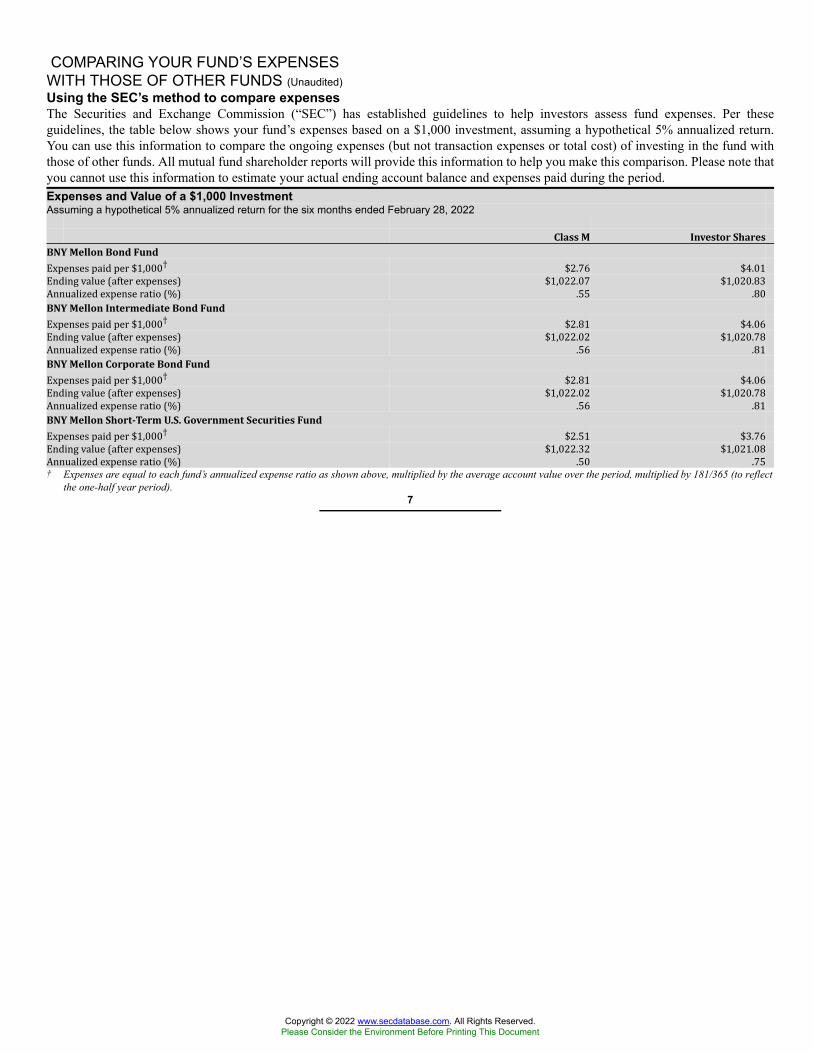
COMPARING YOUR FUND’S EXPENSESWITH THOSE OF OTHER FUNDS (Unaudited)Using the SEC’s method to compare expensesThe Securities and Exchange Commission (“SEC”) has established guidelines to help investors assess fund expenses. Per theseguidelines, the table below shows your fund’s expenses based on a $1,000 investment, assuming a hypothetical 5% annualized return.You can use this information to compare the ongoing expenses (but not transaction expenses or total cost) of investing in the fund withthose of other funds. All mutual fund shareholder reports will provide this information to help you make this comparison. Please note thatyou cannot use this information to estimate your actual ending account balance and expenses paid during the period.Expenses and Value of a $1,000 InvestmentAssuming a hypothetical 5% annualized return for the six months ended February 28, 2022
Class M Investor SharesBNY Mellon Bond FundExpenses paid per $1,000† $2.76 $4.01Ending value (after expenses) $1,022.07 $1,020.83Annualized expense ratio (%) .55 .80BNY Mellon Intermediate Bond FundExpenses paid per $1,000† $2.81 $4.06Ending value (after expenses) $1,022.02 $1,020.78Annualized expense ratio (%) .56 .81BNY Mellon Corporate Bond FundExpenses paid per $1,000† $2.81 $4.06Ending value (after expenses) $1,022.02 $1,020.78Annualized expense ratio (%) .56 .81BNY Mellon Short-Term U.S. Government Securities FundExpenses paid per $1,000† $2.51 $3.76Ending value (after expenses) $1,022.32 $1,021.08Annualized expense ratio (%) .50 .75† Expenses are equal to each fund’s annualized expense ratio as shown above, multiplied by the average account value over the period, multiplied by 181/365 (to reflect
the one-half year period).7
Copyright © 2022 www.secdatabase.com. All Rights Reserved.Please Consider the Environment Before Printing This Document
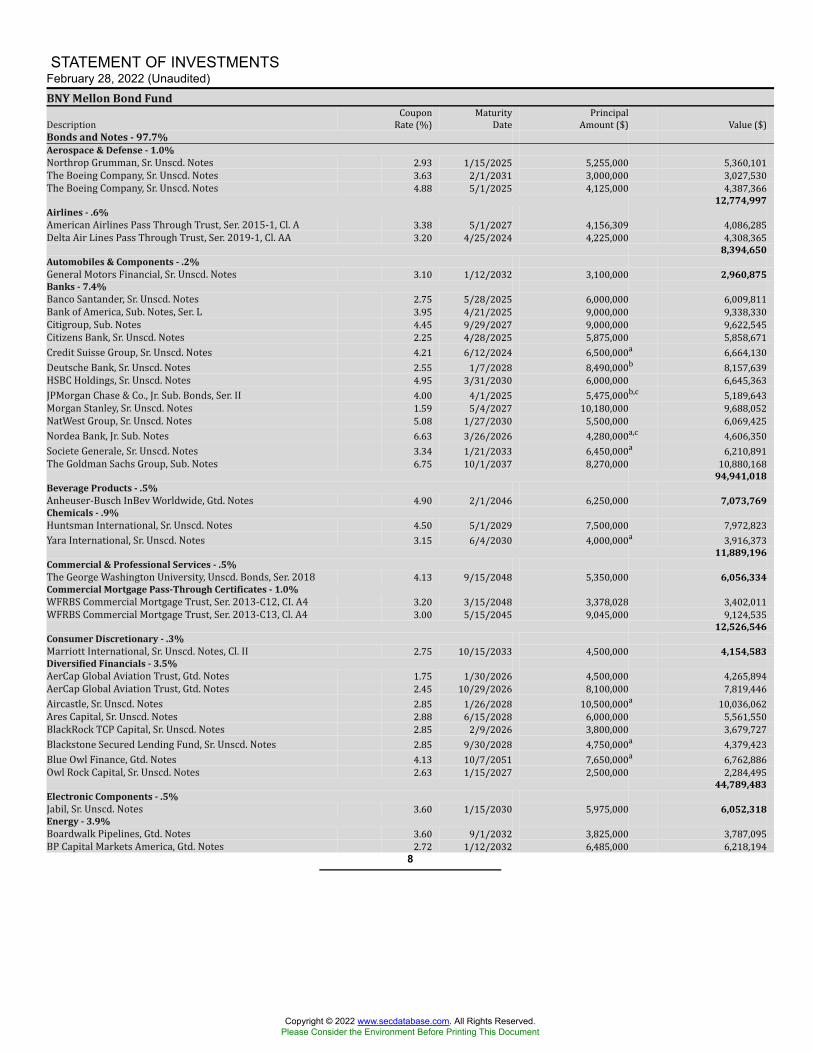
STATEMENT OF INVESTMENTSFebruary 28, 2022 (Unaudited)BNY Mellon Bond FundDescription CouponRate (%) MaturityDate PrincipalAmount ($) Value ($)Bonds and Notes - 97.7%Aerospace & Defense - 1.0%Northrop Grumman, Sr. Unscd. Notes 2.93 1/15/2025 5,255,000 5,360,101The Boeing Company, Sr. Unscd. Notes 3.63 2/1/2031 3,000,000 3,027,530The Boeing Company, Sr. Unscd. Notes 4.88 5/1/2025 4,125,000 4,387,366
12,774,997Airlines - .6%American Airlines Pass Through Trust, Ser. 2015-1, Cl. A 3.38 5/1/2027 4,156,309 4,086,285Delta Air Lines Pass Through Trust, Ser. 2019-1, Cl. AA 3.20 4/25/2024 4,225,000 4,308,365
8,394,650Automobiles & Components - .2%General Motors Financial, Sr. Unscd. Notes 3.10 1/12/2032 3,100,000 2,960,875Banks - 7.4%Banco Santander, Sr. Unscd. Notes 2.75 5/28/2025 6,000,000 6,009,811Bank of America, Sub. Notes, Ser. L 3.95 4/21/2025 9,000,000 9,338,330Citigroup, Sub. Notes 4.45 9/29/2027 9,000,000 9,622,545Citizens Bank, Sr. Unscd. Notes 2.25 4/28/2025 5,875,000 5,858,671Credit Suisse Group, Sr. Unscd. Notes 4.21 6/12/2024 6,500,000a 6,664,130Deutsche Bank, Sr. Unscd. Notes 2.55 1/7/2028 8,490,000b 8,157,639HSBC Holdings, Sr. Unscd. Notes 4.95 3/31/2030 6,000,000 6,645,363JPMorgan Chase & Co., Jr. Sub. Bonds, Ser. II 4.00 4/1/2025 5,475,000b,c 5,189,643Morgan Stanley, Sr. Unscd. Notes 1.59 5/4/2027 10,180,000 9,688,052NatWest Group, Sr. Unscd. Notes 5.08 1/27/2030 5,500,000 6,069,425Nordea Bank, Jr. Sub. Notes 6.63 3/26/2026 4,280,000a,c 4,606,350Societe Generale, Sr. Unscd. Notes 3.34 1/21/2033 6,450,000a 6,210,891The Goldman Sachs Group, Sub. Notes 6.75 10/1/2037 8,270,000 10,880,168
94,941,018Beverage Products - .5%Anheuser-Busch InBev Worldwide, Gtd. Notes 4.90 2/1/2046 6,250,000 7,073,769Chemicals - .9%Huntsman International, Sr. Unscd. Notes 4.50 5/1/2029 7,500,000 7,972,823Yara International, Sr. Unscd. Notes 3.15 6/4/2030 4,000,000a 3,916,373
11,889,196Commercial & Professional Services - .5%The George Washington University, Unscd. Bonds, Ser. 2018 4.13 9/15/2048 5,350,000 6,056,334Commercial Mortgage Pass-Through Certificates - 1.0%WFRBS Commercial Mortgage Trust, Ser. 2013-C12, CI. A4 3.20 3/15/2048 3,378,028 3,402,011WFRBS Commercial Mortgage Trust, Ser. 2013-C13, Cl. A4 3.00 5/15/2045 9,045,000 9,124,535
12,526,546Consumer Discretionary - .3%Marriott International, Sr. Unscd. Notes, Cl. II 2.75 10/15/2033 4,500,000 4,154,583Diversified Financials - 3.5%AerCap Global Aviation Trust, Gtd. Notes 1.75 1/30/2026 4,500,000 4,265,894AerCap Global Aviation Trust, Gtd. Notes 2.45 10/29/2026 8,100,000 7,819,446Aircastle, Sr. Unscd. Notes 2.85 1/26/2028 10,500,000a 10,036,062Ares Capital, Sr. Unscd. Notes 2.88 6/15/2028 6,000,000 5,561,550BlackRock TCP Capital, Sr. Unscd. Notes 2.85 2/9/2026 3,800,000 3,679,727Blackstone Secured Lending Fund, Sr. Unscd. Notes 2.85 9/30/2028 4,750,000a 4,379,423Blue Owl Finance, Gtd. Notes 4.13 10/7/2051 7,650,000a 6,762,886Owl Rock Capital, Sr. Unscd. Notes 2.63 1/15/2027 2,500,000 2,284,495
44,789,483Electronic Components - .5%Jabil, Sr. Unscd. Notes 3.60 1/15/2030 5,975,000 6,052,318Energy - 3.9%Boardwalk Pipelines, Gtd. Notes 3.60 9/1/2032 3,825,000 3,787,095BP Capital Markets America, Gtd. Notes 2.72 1/12/2032 6,485,000 6,218,194
8
Copyright © 2022 www.secdatabase.com. All Rights Reserved.Please Consider the Environment Before Printing This Document
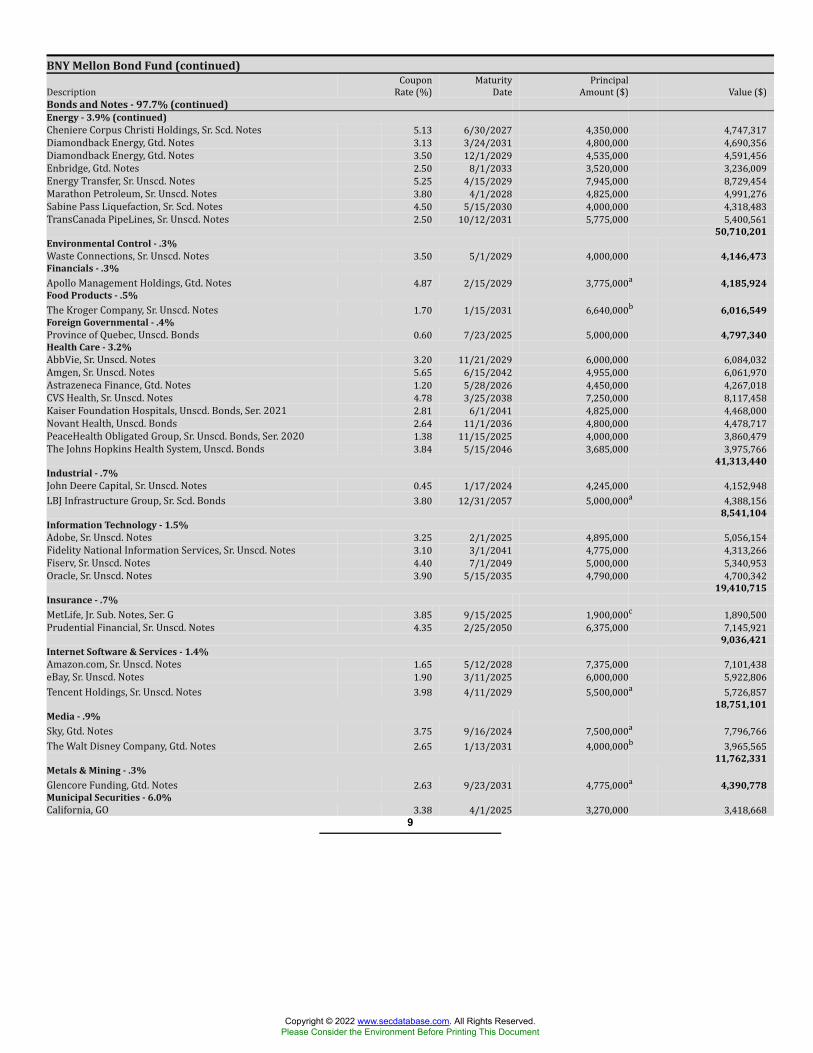
BNY Mellon Bond Fund (continued)Description CouponRate (%) MaturityDate PrincipalAmount ($) Value ($)Bonds and Notes - 97.7% (continued)Energy - 3.9% (continued)Cheniere Corpus Christi Holdings, Sr. Scd. Notes 5.13 6/30/2027 4,350,000 4,747,317Diamondback Energy, Gtd. Notes 3.13 3/24/2031 4,800,000 4,690,356Diamondback Energy, Gtd. Notes 3.50 12/1/2029 4,535,000 4,591,456Enbridge, Gtd. Notes 2.50 8/1/2033 3,520,000 3,236,009Energy Transfer, Sr. Unscd. Notes 5.25 4/15/2029 7,945,000 8,729,454Marathon Petroleum, Sr. Unscd. Notes 3.80 4/1/2028 4,825,000 4,991,276Sabine Pass Liquefaction, Sr. Scd. Notes 4.50 5/15/2030 4,000,000 4,318,483TransCanada PipeLines, Sr. Unscd. Notes 2.50 10/12/2031 5,775,000 5,400,561
50,710,201Environmental Control - .3%Waste Connections, Sr. Unscd. Notes 3.50 5/1/2029 4,000,000 4,146,473Financials - .3%Apollo Management Holdings, Gtd. Notes 4.87 2/15/2029 3,775,000a 4,185,924Food Products - .5%The Kroger Company, Sr. Unscd. Notes 1.70 1/15/2031 6,640,000b 6,016,549Foreign Governmental - .4%Province of Quebec, Unscd. Bonds 0.60 7/23/2025 5,000,000 4,797,340Health Care - 3.2%AbbVie, Sr. Unscd. Notes 3.20 11/21/2029 6,000,000 6,084,032Amgen, Sr. Unscd. Notes 5.65 6/15/2042 4,955,000 6,061,970Astrazeneca Finance, Gtd. Notes 1.20 5/28/2026 4,450,000 4,267,018CVS Health, Sr. Unscd. Notes 4.78 3/25/2038 7,250,000 8,117,458Kaiser Foundation Hospitals, Unscd. Bonds, Ser. 2021 2.81 6/1/2041 4,825,000 4,468,000Novant Health, Unscd. Bonds 2.64 11/1/2036 4,800,000 4,478,717PeaceHealth Obligated Group, Sr. Unscd. Bonds, Ser. 2020 1.38 11/15/2025 4,000,000 3,860,479The Johns Hopkins Health System, Unscd. Bonds 3.84 5/15/2046 3,685,000 3,975,766
41,313,440Industrial - .7%John Deere Capital, Sr. Unscd. Notes 0.45 1/17/2024 4,245,000 4,152,948LBJ Infrastructure Group, Sr. Scd. Bonds 3.80 12/31/2057 5,000,000a 4,388,156
8,541,104Information Technology - 1.5%Adobe, Sr. Unscd. Notes 3.25 2/1/2025 4,895,000 5,056,154Fidelity National Information Services, Sr. Unscd. Notes 3.10 3/1/2041 4,775,000 4,313,266Fiserv, Sr. Unscd. Notes 4.40 7/1/2049 5,000,000 5,340,953Oracle, Sr. Unscd. Notes 3.90 5/15/2035 4,790,000 4,700,342
19,410,715Insurance - .7%MetLife, Jr. Sub. Notes, Ser. G 3.85 9/15/2025 1,900,000c 1,890,500Prudential Financial, Sr. Unscd. Notes 4.35 2/25/2050 6,375,000 7,145,921
9,036,421Internet Software & Services - 1.4%Amazon.com, Sr. Unscd. Notes 1.65 5/12/2028 7,375,000 7,101,438eBay, Sr. Unscd. Notes 1.90 3/11/2025 6,000,000 5,922,806Tencent Holdings, Sr. Unscd. Notes 3.98 4/11/2029 5,500,000a 5,726,857
18,751,101Media - .9%Sky, Gtd. Notes 3.75 9/16/2024 7,500,000a 7,796,766The Walt Disney Company, Gtd. Notes 2.65 1/13/2031 4,000,000b 3,965,565
11,762,331Metals & Mining - .3%Glencore Funding, Gtd. Notes 2.63 9/23/2031 4,775,000a 4,390,778Municipal Securities - 6.0%California, GO 3.38 4/1/2025 3,270,000 3,418,668
9
Copyright © 2022 www.secdatabase.com. All Rights Reserved.Please Consider the Environment Before Printing This Document
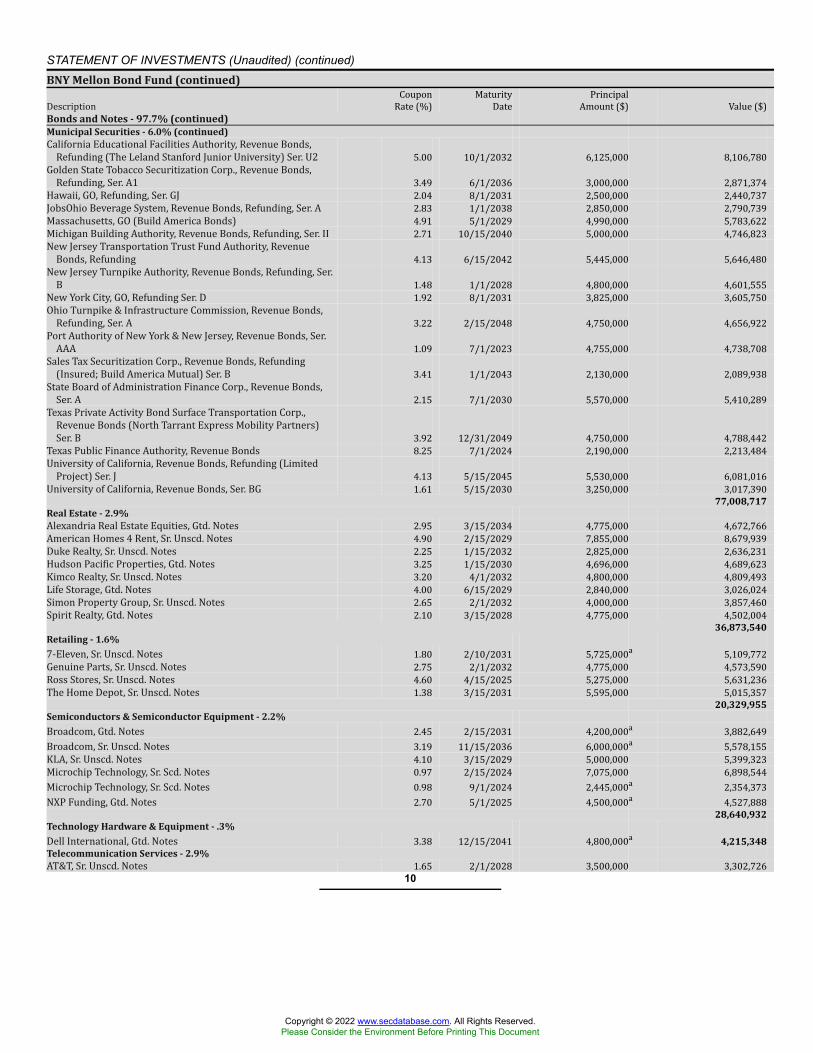
STATEMENT OF INVESTMENTS (Unaudited) (continued)BNY Mellon Bond Fund (continued)Description CouponRate (%) MaturityDate PrincipalAmount ($) Value ($)Bonds and Notes - 97.7% (continued)Municipal Securities - 6.0% (continued)California Educational Facilities Authority, Revenue Bonds,Refunding (The Leland Stanford Junior University) Ser. U2 5.00 10/1/2032 6,125,000 8,106,780Golden State Tobacco Securitization Corp., Revenue Bonds,Refunding, Ser. A1 3.49 6/1/2036 3,000,000 2,871,374Hawaii, GO, Refunding, Ser. GJ 2.04 8/1/2031 2,500,000 2,440,737JobsOhio Beverage System, Revenue Bonds, Refunding, Ser. A 2.83 1/1/2038 2,850,000 2,790,739Massachusetts, GO (Build America Bonds) 4.91 5/1/2029 4,990,000 5,783,622Michigan Building Authority, Revenue Bonds, Refunding, Ser. II 2.71 10/15/2040 5,000,000 4,746,823New Jersey Transportation Trust Fund Authority, RevenueBonds, Refunding 4.13 6/15/2042 5,445,000 5,646,480New Jersey Turnpike Authority, Revenue Bonds, Refunding, Ser.B 1.48 1/1/2028 4,800,000 4,601,555New York City, GO, Refunding Ser. D 1.92 8/1/2031 3,825,000 3,605,750Ohio Turnpike & Infrastructure Commission, Revenue Bonds,Refunding, Ser. A 3.22 2/15/2048 4,750,000 4,656,922Port Authority of New York & New Jersey, Revenue Bonds, Ser.AAA 1.09 7/1/2023 4,755,000 4,738,708Sales Tax Securitization Corp., Revenue Bonds, Refunding(Insured; Build America Mutual) Ser. B 3.41 1/1/2043 2,130,000 2,089,938State Board of Administration Finance Corp., Revenue Bonds,Ser. A 2.15 7/1/2030 5,570,000 5,410,289Texas Private Activity Bond Surface Transportation Corp.,Revenue Bonds (North Tarrant Express Mobility Partners)Ser. B 3.92 12/31/2049 4,750,000 4,788,442Texas Public Finance Authority, Revenue Bonds 8.25 7/1/2024 2,190,000 2,213,484University of California, Revenue Bonds, Refunding (LimitedProject) Ser. J 4.13 5/15/2045 5,530,000 6,081,016University of California, Revenue Bonds, Ser. BG 1.61 5/15/2030 3,250,000 3,017,390
77,008,717Real Estate - 2.9%Alexandria Real Estate Equities, Gtd. Notes 2.95 3/15/2034 4,775,000 4,672,766American Homes 4 Rent, Sr. Unscd. Notes 4.90 2/15/2029 7,855,000 8,679,939Duke Realty, Sr. Unscd. Notes 2.25 1/15/2032 2,825,000 2,636,231Hudson Pacific Properties, Gtd. Notes 3.25 1/15/2030 4,696,000 4,689,623Kimco Realty, Sr. Unscd. Notes 3.20 4/1/2032 4,800,000 4,809,493Life Storage, Gtd. Notes 4.00 6/15/2029 2,840,000 3,026,024Simon Property Group, Sr. Unscd. Notes 2.65 2/1/2032 4,000,000 3,857,460Spirit Realty, Gtd. Notes 2.10 3/15/2028 4,775,000 4,502,004
36,873,540Retailing - 1.6%7-Eleven, Sr. Unscd. Notes 1.80 2/10/2031 5,725,000a 5,109,772Genuine Parts, Sr. Unscd. Notes 2.75 2/1/2032 4,775,000 4,573,590Ross Stores, Sr. Unscd. Notes 4.60 4/15/2025 5,275,000 5,631,236The Home Depot, Sr. Unscd. Notes 1.38 3/15/2031 5,595,000 5,015,357
20,329,955Semiconductors & Semiconductor Equipment - 2.2%Broadcom, Gtd. Notes 2.45 2/15/2031 4,200,000a 3,882,649Broadcom, Sr. Unscd. Notes 3.19 11/15/2036 6,000,000a 5,578,155KLA, Sr. Unscd. Notes 4.10 3/15/2029 5,000,000 5,399,323Microchip Technology, Sr. Scd. Notes 0.97 2/15/2024 7,075,000 6,898,544Microchip Technology, Sr. Scd. Notes 0.98 9/1/2024 2,445,000a 2,354,373NXP Funding, Gtd. Notes 2.70 5/1/2025 4,500,000a 4,527,888
28,640,932Technology Hardware & Equipment - .3%Dell International, Gtd. Notes 3.38 12/15/2041 4,800,000a 4,215,348Telecommunication Services - 2.9%AT&T, Sr. Unscd. Notes 1.65 2/1/2028 3,500,000 3,302,726
10
Copyright © 2022 www.secdatabase.com. All Rights Reserved.Please Consider the Environment Before Printing This Document
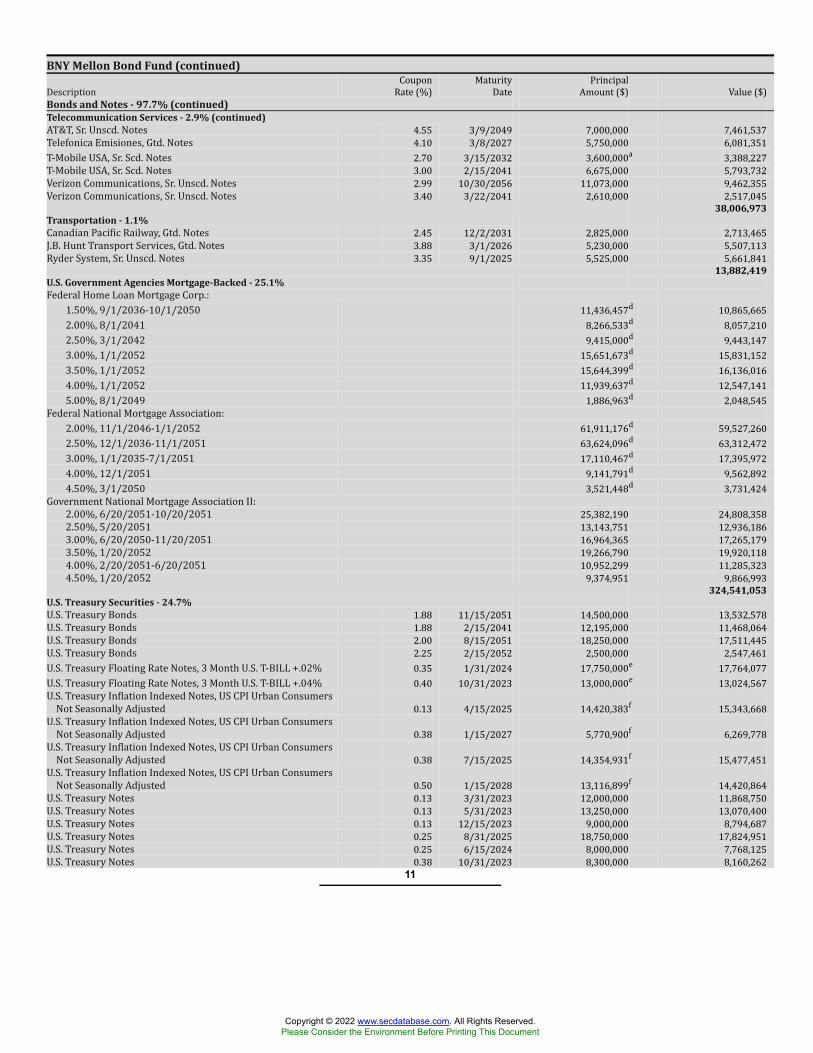
BNY Mellon Bond Fund (continued)Description CouponRate (%) MaturityDate PrincipalAmount ($) Value ($)Bonds and Notes - 97.7% (continued)Telecommunication Services - 2.9% (continued)AT&T, Sr. Unscd. Notes 4.55 3/9/2049 7,000,000 7,461,537Telefonica Emisiones, Gtd. Notes 4.10 3/8/2027 5,750,000 6,081,351T-Mobile USA, Sr. Scd. Notes 2.70 3/15/2032 3,600,000a 3,388,227T-Mobile USA, Sr. Scd. Notes 3.00 2/15/2041 6,675,000 5,793,732Verizon Communications, Sr. Unscd. Notes 2.99 10/30/2056 11,073,000 9,462,355Verizon Communications, Sr. Unscd. Notes 3.40 3/22/2041 2,610,000 2,517,045
38,006,973Transportation - 1.1%Canadian Pacific Railway, Gtd. Notes 2.45 12/2/2031 2,825,000 2,713,465J.B. Hunt Transport Services, Gtd. Notes 3.88 3/1/2026 5,230,000 5,507,113Ryder System, Sr. Unscd. Notes 3.35 9/1/2025 5,525,000 5,661,841
13,882,419U.S. Government Agencies Mortgage-Backed - 25.1%Federal Home Loan Mortgage Corp.:1.50%, 9/1/2036-10/1/2050 11,436,457d 10,865,6652.00%, 8/1/2041 8,266,533d 8,057,2102.50%, 3/1/2042 9,415,000d 9,443,1473.00%, 1/1/2052 15,651,673d 15,831,1523.50%, 1/1/2052 15,644,399d 16,136,0164.00%, 1/1/2052 11,939,637d 12,547,1415.00%, 8/1/2049 1,886,963d 2,048,545Federal National Mortgage Association:2.00%, 11/1/2046-1/1/2052 61,911,176d 59,527,2602.50%, 12/1/2036-11/1/2051 63,624,096d 63,312,4723.00%, 1/1/2035-7/1/2051 17,110,467d 17,395,9724.00%, 12/1/2051 9,141,791d 9,562,8924.50%, 3/1/2050 3,521,448d 3,731,424Government National Mortgage Association II:2.00%, 6/20/2051-10/20/2051 25,382,190 24,808,3582.50%, 5/20/2051 13,143,751 12,936,1863.00%, 6/20/2050-11/20/2051 16,964,365 17,265,1793.50%, 1/20/2052 19,266,790 19,920,1184.00%, 2/20/2051-6/20/2051 10,952,299 11,285,3234.50%, 1/20/2052 9,374,951 9,866,993
324,541,053U.S. Treasury Securities - 24.7%U.S. Treasury Bonds 1.88 11/15/2051 14,500,000 13,532,578U.S. Treasury Bonds 1.88 2/15/2041 12,195,000 11,468,064U.S. Treasury Bonds 2.00 8/15/2051 18,250,000 17,511,445U.S. Treasury Bonds 2.25 2/15/2052 2,500,000 2,547,461U.S. Treasury Floating Rate Notes, 3 Month U.S. T-BILL +.02% 0.35 1/31/2024 17,750,000e 17,764,077U.S. Treasury Floating Rate Notes, 3 Month U.S. T-BILL +.04% 0.40 10/31/2023 13,000,000e 13,024,567U.S. Treasury Inflation Indexed Notes, US CPI Urban ConsumersNot Seasonally Adjusted 0.13 4/15/2025 14,420,383f 15,343,668U.S. Treasury Inflation Indexed Notes, US CPI Urban ConsumersNot Seasonally Adjusted 0.38 1/15/2027 5,770,900f 6,269,778U.S. Treasury Inflation Indexed Notes, US CPI Urban ConsumersNot Seasonally Adjusted 0.38 7/15/2025 14,354,931f 15,477,451U.S. Treasury Inflation Indexed Notes, US CPI Urban ConsumersNot Seasonally Adjusted 0.50 1/15/2028 13,116,899f 14,420,864U.S. Treasury Notes 0.13 3/31/2023 12,000,000 11,868,750U.S. Treasury Notes 0.13 5/31/2023 13,250,000 13,070,400U.S. Treasury Notes 0.13 12/15/2023 9,000,000 8,794,687U.S. Treasury Notes 0.25 8/31/2025 18,750,000 17,824,951U.S. Treasury Notes 0.25 6/15/2024 8,000,000 7,768,125U.S. Treasury Notes 0.38 10/31/2023 8,300,000 8,160,262
11
Copyright © 2022 www.secdatabase.com. All Rights Reserved.Please Consider the Environment Before Printing This Document
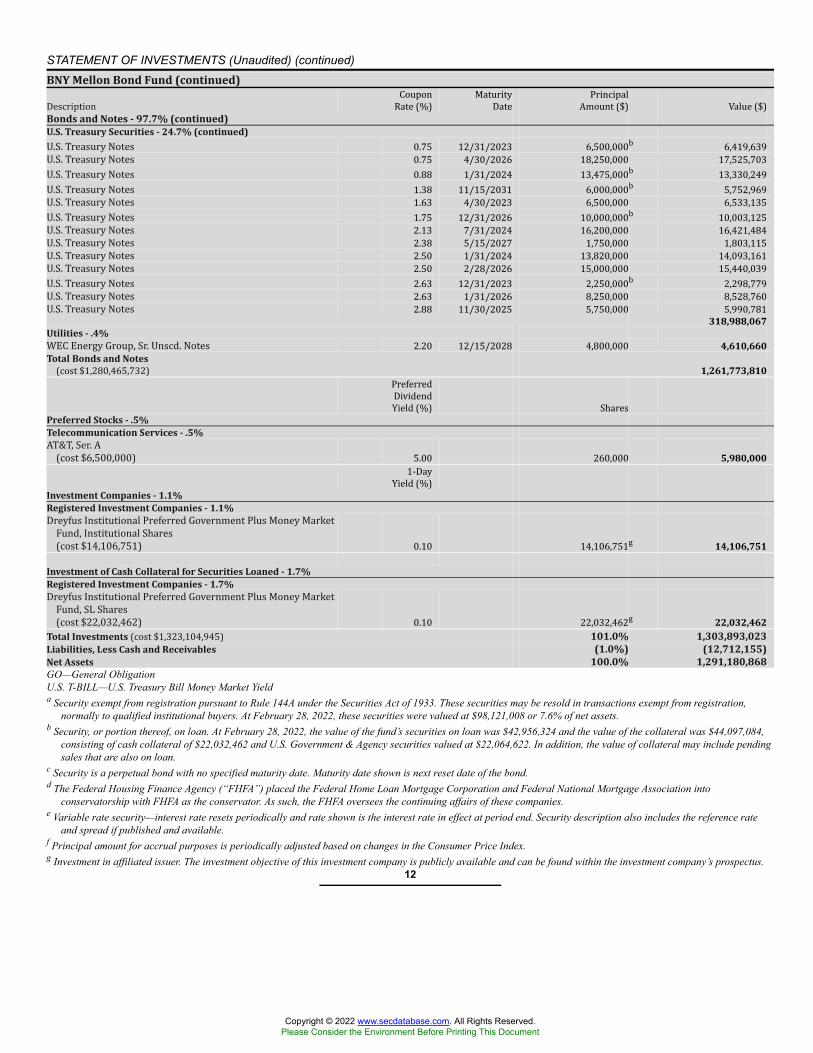
STATEMENT OF INVESTMENTS (Unaudited) (continued)BNY Mellon Bond Fund (continued)Description CouponRate (%) MaturityDate PrincipalAmount ($) Value ($)Bonds and Notes - 97.7% (continued)U.S. Treasury Securities - 24.7% (continued)U.S. Treasury Notes 0.75 12/31/2023 6,500,000b 6,419,639U.S. Treasury Notes 0.75 4/30/2026 18,250,000 17,525,703U.S. Treasury Notes 0.88 1/31/2024 13,475,000b 13,330,249U.S. Treasury Notes 1.38 11/15/2031 6,000,000b 5,752,969U.S. Treasury Notes 1.63 4/30/2023 6,500,000 6,533,135U.S. Treasury Notes 1.75 12/31/2026 10,000,000b 10,003,125U.S. Treasury Notes 2.13 7/31/2024 16,200,000 16,421,484U.S. Treasury Notes 2.38 5/15/2027 1,750,000 1,803,115U.S. Treasury Notes 2.50 1/31/2024 13,820,000 14,093,161U.S. Treasury Notes 2.50 2/28/2026 15,000,000 15,440,039U.S. Treasury Notes 2.63 12/31/2023 2,250,000b 2,298,779U.S. Treasury Notes 2.63 1/31/2026 8,250,000 8,528,760U.S. Treasury Notes 2.88 11/30/2025 5,750,000 5,990,781
318,988,067Utilities - .4%WEC Energy Group, Sr. Unscd. Notes 2.20 12/15/2028 4,800,000 4,610,660Total Bonds and Notes(cost $1,280,465,732) 1,261,773,810PreferredDividendYield (%) SharesPreferred Stocks - .5%Telecommunication Services - .5%AT&T, Ser. A(cost $6,500,000) 5.00 260,000 5,980,0001-DayYield (%)Investment Companies - 1.1%Registered Investment Companies - 1.1%Dreyfus Institutional Preferred Government Plus Money MarketFund, Institutional Shares(cost $14,106,751) 0.10 14,106,751g 14,106,751
Investment of Cash Collateral for Securities Loaned - 1.7%Registered Investment Companies - 1.7%Dreyfus Institutional Preferred Government Plus Money MarketFund, SL Shares(cost $22,032,462) 0.10 22,032,462g 22,032,462Total Investments (cost $1,323,104,945) 101.0% 1,303,893,023Liabilities, Less Cash and Receivables (1.0%) (12,712,155)Net Assets 100.0% 1,291,180,868GO—General ObligationU.S. T-BILL—U.S. Treasury Bill Money Market Yielda Security exempt from registration pursuant to Rule 144A under the Securities Act of 1933. These securities may be resold in transactions exempt from registration,
normally to qualified institutional buyers. At February 28, 2022, these securities were valued at $98,121,008 or 7.6% of net assets.b Security, or portion thereof, on loan. At February 28, 2022, the value of the fund’s securities on loan was $42,956,324 and the value of the collateral was $44,097,084,
consisting of cash collateral of $22,032,462 and U.S. Government & Agency securities valued at $22,064,622. In addition, the value of collateral may include pendingsales that are also on loan.
c Security is a perpetual bond with no specified maturity date. Maturity date shown is next reset date of the bond.d The Federal Housing Finance Agency (“FHFA”) placed the Federal Home Loan Mortgage Corporation and Federal National Mortgage Association into
conservatorship with FHFA as the conservator. As such, the FHFA oversees the continuing affairs of these companies.e Variable rate security—interest rate resets periodically and rate shown is the interest rate in effect at period end. Security description also includes the reference rate
and spread if published and available.f Principal amount for accrual purposes is periodically adjusted based on changes in the Consumer Price Index.g Investment in affiliated issuer. The investment objective of this investment company is publicly available and can be found within the investment company’s prospectus.
12
Copyright © 2022 www.secdatabase.com. All Rights Reserved.Please Consider the Environment Before Printing This Document
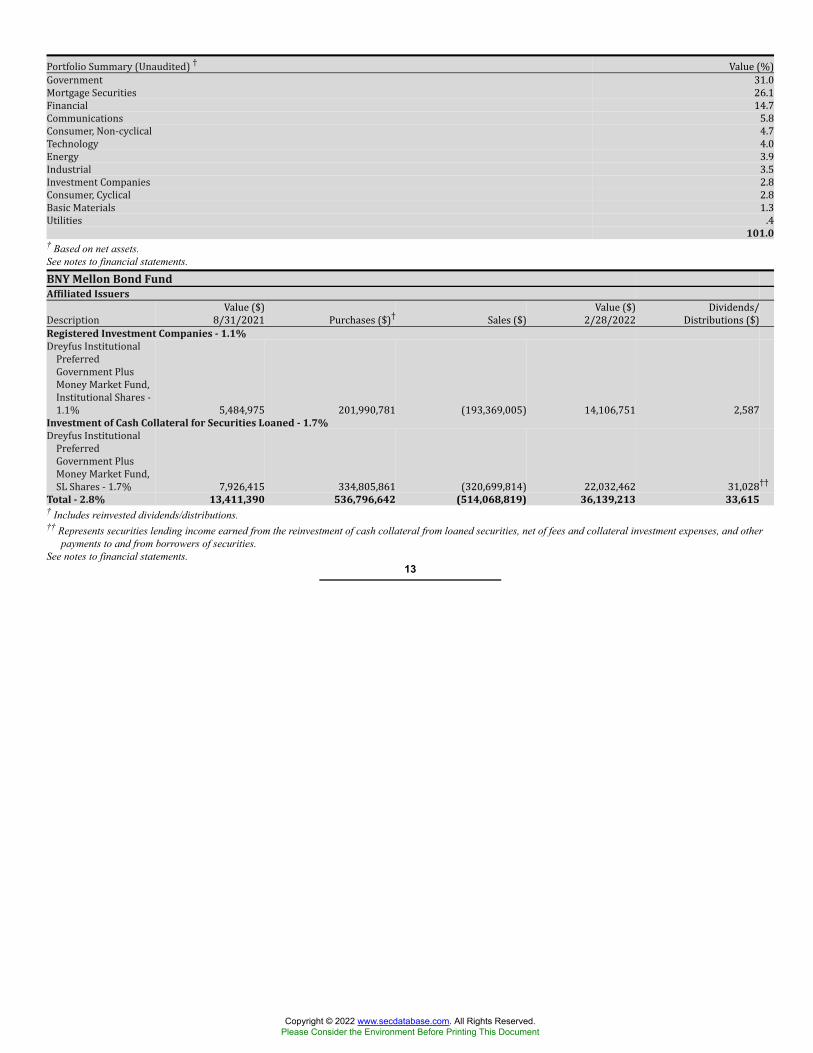
Portfolio Summary (Unaudited) † Value (%)Government 31.0Mortgage Securities 26.1Financial 14.7Communications 5.8Consumer, Non-cyclical 4.7Technology 4.0Energy 3.9Industrial 3.5Investment Companies 2.8Consumer, Cyclical 2.8Basic Materials 1.3Utilities .4101.0
† Based on net assets.See notes to financial statements.
BNY Mellon Bond FundAffiliated IssuersDescription Value ($)8/31/2021 Purchases ($)† Sales ($) Value ($)2/28/2022 Dividends/Distributions ($)Registered Investment Companies - 1.1%Dreyfus InstitutionalPreferredGovernment PlusMoney Market Fund,Institutional Shares -1.1% 5,484,975 201,990,781 (193,369,005) 14,106,751 2,587Investment of Cash Collateral for Securities Loaned - 1.7%Dreyfus InstitutionalPreferredGovernment PlusMoney Market Fund,SL Shares - 1.7% 7,926,415 334,805,861 (320,699,814) 22,032,462 31,028††Total - 2.8% 13,411,390 536,796,642 (514,068,819) 36,139,213 33,615† Includes reinvested dividends/distributions.†† Represents securities lending income earned from the reinvestment of cash collateral from loaned securities, net of fees and collateral investment expenses, and other
payments to and from borrowers of securities.See notes to financial statements.
13
Copyright © 2022 www.secdatabase.com. All Rights Reserved.Please Consider the Environment Before Printing This Document
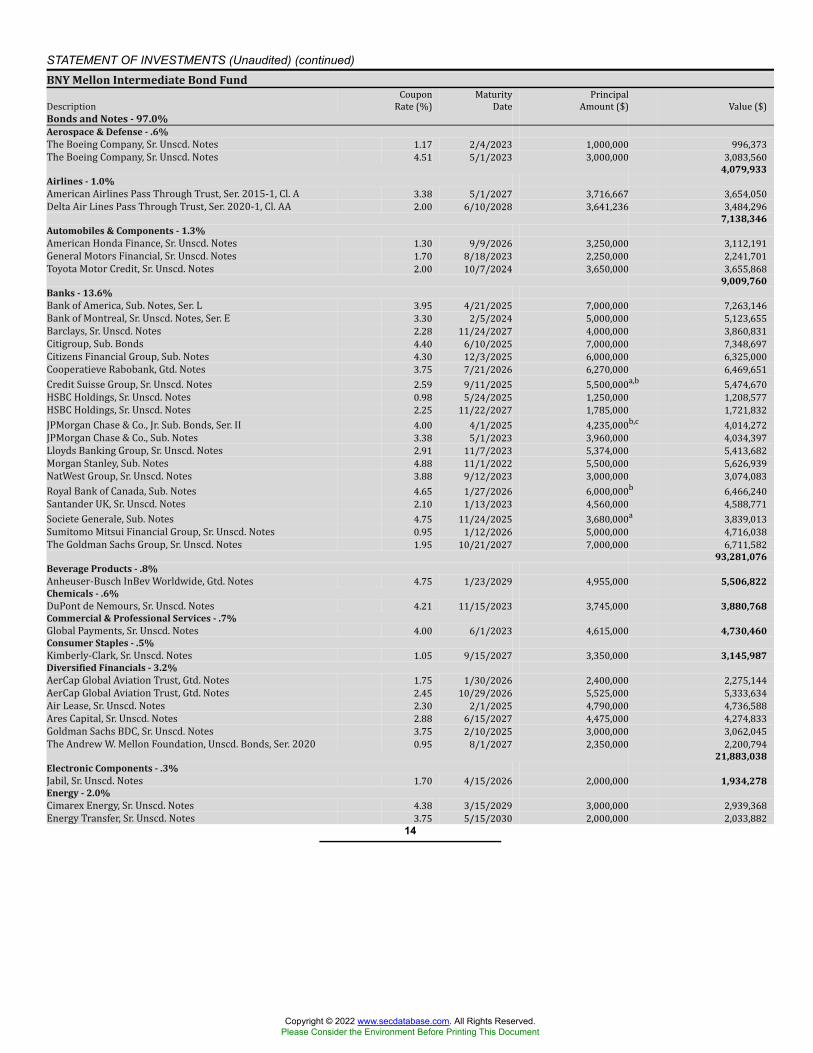
STATEMENT OF INVESTMENTS (Unaudited) (continued)BNY Mellon Intermediate Bond FundDescription CouponRate (%) MaturityDate PrincipalAmount ($) Value ($)Bonds and Notes - 97.0%Aerospace & Defense - .6%The Boeing Company, Sr. Unscd. Notes 1.17 2/4/2023 1,000,000 996,373The Boeing Company, Sr. Unscd. Notes 4.51 5/1/2023 3,000,000 3,083,560
4,079,933Airlines - 1.0%American Airlines Pass Through Trust, Ser. 2015-1, Cl. A 3.38 5/1/2027 3,716,667 3,654,050Delta Air Lines Pass Through Trust, Ser. 2020-1, Cl. AA 2.00 6/10/2028 3,641,236 3,484,296
7,138,346Automobiles & Components - 1.3%American Honda Finance, Sr. Unscd. Notes 1.30 9/9/2026 3,250,000 3,112,191General Motors Financial, Sr. Unscd. Notes 1.70 8/18/2023 2,250,000 2,241,701Toyota Motor Credit, Sr. Unscd. Notes 2.00 10/7/2024 3,650,000 3,655,868
9,009,760Banks - 13.6%Bank of America, Sub. Notes, Ser. L 3.95 4/21/2025 7,000,000 7,263,146Bank of Montreal, Sr. Unscd. Notes, Ser. E 3.30 2/5/2024 5,000,000 5,123,655Barclays, Sr. Unscd. Notes 2.28 11/24/2027 4,000,000 3,860,831Citigroup, Sub. Bonds 4.40 6/10/2025 7,000,000 7,348,697Citizens Financial Group, Sub. Notes 4.30 12/3/2025 6,000,000 6,325,000Cooperatieve Rabobank, Gtd. Notes 3.75 7/21/2026 6,270,000 6,469,651Credit Suisse Group, Sr. Unscd. Notes 2.59 9/11/2025 5,500,000a,b 5,474,670HSBC Holdings, Sr. Unscd. Notes 0.98 5/24/2025 1,250,000 1,208,577HSBC Holdings, Sr. Unscd. Notes 2.25 11/22/2027 1,785,000 1,721,832JPMorgan Chase & Co., Jr. Sub. Bonds, Ser. II 4.00 4/1/2025 4,235,000b,c 4,014,272JPMorgan Chase & Co., Sub. Notes 3.38 5/1/2023 3,960,000 4,034,397Lloyds Banking Group, Sr. Unscd. Notes 2.91 11/7/2023 5,374,000 5,413,682Morgan Stanley, Sub. Notes 4.88 11/1/2022 5,500,000 5,626,939NatWest Group, Sr. Unscd. Notes 3.88 9/12/2023 3,000,000 3,074,083Royal Bank of Canada, Sub. Notes 4.65 1/27/2026 6,000,000b 6,466,240Santander UK, Sr. Unscd. Notes 2.10 1/13/2023 4,560,000 4,588,771Societe Generale, Sub. Notes 4.75 11/24/2025 3,680,000a 3,839,013Sumitomo Mitsui Financial Group, Sr. Unscd. Notes 0.95 1/12/2026 5,000,000 4,716,038The Goldman Sachs Group, Sr. Unscd. Notes 1.95 10/21/2027 7,000,000 6,711,582
93,281,076Beverage Products - .8%Anheuser-Busch InBev Worldwide, Gtd. Notes 4.75 1/23/2029 4,955,000 5,506,822Chemicals - .6%DuPont de Nemours, Sr. Unscd. Notes 4.21 11/15/2023 3,745,000 3,880,768Commercial & Professional Services - .7%Global Payments, Sr. Unscd. Notes 4.00 6/1/2023 4,615,000 4,730,460Consumer Staples - .5%Kimberly-Clark, Sr. Unscd. Notes 1.05 9/15/2027 3,350,000 3,145,987Diversified Financials - 3.2%AerCap Global Aviation Trust, Gtd. Notes 1.75 1/30/2026 2,400,000 2,275,144AerCap Global Aviation Trust, Gtd. Notes 2.45 10/29/2026 5,525,000 5,333,634Air Lease, Sr. Unscd. Notes 2.30 2/1/2025 4,790,000 4,736,588Ares Capital, Sr. Unscd. Notes 2.88 6/15/2027 4,475,000 4,274,833Goldman Sachs BDC, Sr. Unscd. Notes 3.75 2/10/2025 3,000,000 3,062,045The Andrew W. Mellon Foundation, Unscd. Bonds, Ser. 2020 0.95 8/1/2027 2,350,000 2,200,794
21,883,038Electronic Components - .3%Jabil, Sr. Unscd. Notes 1.70 4/15/2026 2,000,000 1,934,278Energy - 2.0%Cimarex Energy, Sr. Unscd. Notes 4.38 3/15/2029 3,000,000 2,939,368Energy Transfer, Sr. Unscd. Notes 3.75 5/15/2030 2,000,000 2,033,882
14
Copyright © 2022 www.secdatabase.com. All Rights Reserved.Please Consider the Environment Before Printing This Document
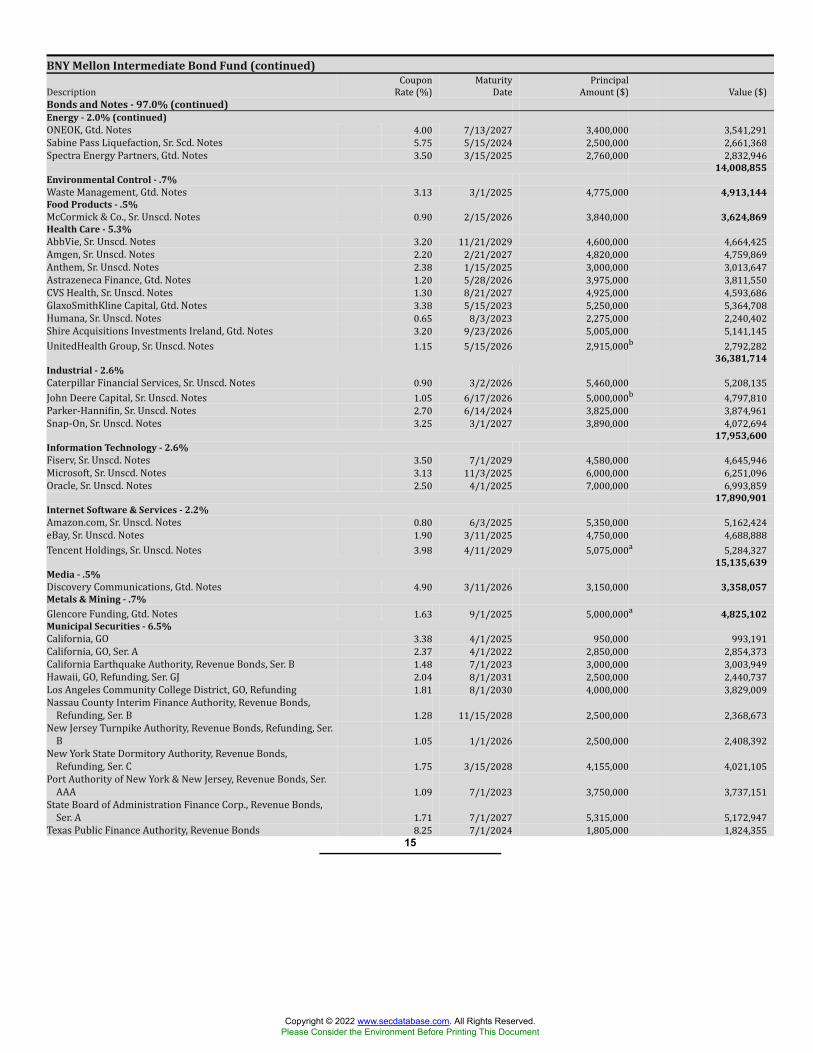
BNY Mellon Intermediate Bond Fund (continued)Description CouponRate (%) MaturityDate PrincipalAmount ($) Value ($)Bonds and Notes - 97.0% (continued)Energy - 2.0% (continued)ONEOK, Gtd. Notes 4.00 7/13/2027 3,400,000 3,541,291Sabine Pass Liquefaction, Sr. Scd. Notes 5.75 5/15/2024 2,500,000 2,661,368Spectra Energy Partners, Gtd. Notes 3.50 3/15/2025 2,760,000 2,832,946
14,008,855Environmental Control - .7%Waste Management, Gtd. Notes 3.13 3/1/2025 4,775,000 4,913,144Food Products - .5%McCormick & Co., Sr. Unscd. Notes 0.90 2/15/2026 3,840,000 3,624,869Health Care - 5.3%AbbVie, Sr. Unscd. Notes 3.20 11/21/2029 4,600,000 4,664,425Amgen, Sr. Unscd. Notes 2.20 2/21/2027 4,820,000 4,759,869Anthem, Sr. Unscd. Notes 2.38 1/15/2025 3,000,000 3,013,647Astrazeneca Finance, Gtd. Notes 1.20 5/28/2026 3,975,000 3,811,550CVS Health, Sr. Unscd. Notes 1.30 8/21/2027 4,925,000 4,593,686GlaxoSmithKline Capital, Gtd. Notes 3.38 5/15/2023 5,250,000 5,364,708Humana, Sr. Unscd. Notes 0.65 8/3/2023 2,275,000 2,240,402Shire Acquisitions Investments Ireland, Gtd. Notes 3.20 9/23/2026 5,005,000 5,141,145UnitedHealth Group, Sr. Unscd. Notes 1.15 5/15/2026 2,915,000b 2,792,282
36,381,714Industrial - 2.6%Caterpillar Financial Services, Sr. Unscd. Notes 0.90 3/2/2026 5,460,000 5,208,135John Deere Capital, Sr. Unscd. Notes 1.05 6/17/2026 5,000,000b 4,797,810Parker-Hannifin, Sr. Unscd. Notes 2.70 6/14/2024 3,825,000 3,874,961Snap-On, Sr. Unscd. Notes 3.25 3/1/2027 3,890,000 4,072,694
17,953,600Information Technology - 2.6%Fiserv, Sr. Unscd. Notes 3.50 7/1/2029 4,580,000 4,645,946Microsoft, Sr. Unscd. Notes 3.13 11/3/2025 6,000,000 6,251,096Oracle, Sr. Unscd. Notes 2.50 4/1/2025 7,000,000 6,993,859
17,890,901Internet Software & Services - 2.2%Amazon.com, Sr. Unscd. Notes 0.80 6/3/2025 5,350,000 5,162,424eBay, Sr. Unscd. Notes 1.90 3/11/2025 4,750,000 4,688,888Tencent Holdings, Sr. Unscd. Notes 3.98 4/11/2029 5,075,000a 5,284,327
15,135,639Media - .5%Discovery Communications, Gtd. Notes 4.90 3/11/2026 3,150,000 3,358,057Metals & Mining - .7%Glencore Funding, Gtd. Notes 1.63 9/1/2025 5,000,000a 4,825,102Municipal Securities - 6.5%California, GO 3.38 4/1/2025 950,000 993,191California, GO, Ser. A 2.37 4/1/2022 2,850,000 2,854,373California Earthquake Authority, Revenue Bonds, Ser. B 1.48 7/1/2023 3,000,000 3,003,949Hawaii, GO, Refunding, Ser. GJ 2.04 8/1/2031 2,500,000 2,440,737Los Angeles Community College District, GO, Refunding 1.81 8/1/2030 4,000,000 3,829,009Nassau County Interim Finance Authority, Revenue Bonds,Refunding, Ser. B 1.28 11/15/2028 2,500,000 2,368,673New Jersey Turnpike Authority, Revenue Bonds, Refunding, Ser.B 1.05 1/1/2026 2,500,000 2,408,392New York State Dormitory Authority, Revenue Bonds,Refunding, Ser. C 1.75 3/15/2028 4,155,000 4,021,105Port Authority of New York & New Jersey, Revenue Bonds, Ser.AAA 1.09 7/1/2023 3,750,000 3,737,151State Board of Administration Finance Corp., Revenue Bonds,Ser. A 1.71 7/1/2027 5,315,000 5,172,947Texas Public Finance Authority, Revenue Bonds 8.25 7/1/2024 1,805,000 1,824,355
15
Copyright © 2022 www.secdatabase.com. All Rights Reserved.Please Consider the Environment Before Printing This Document
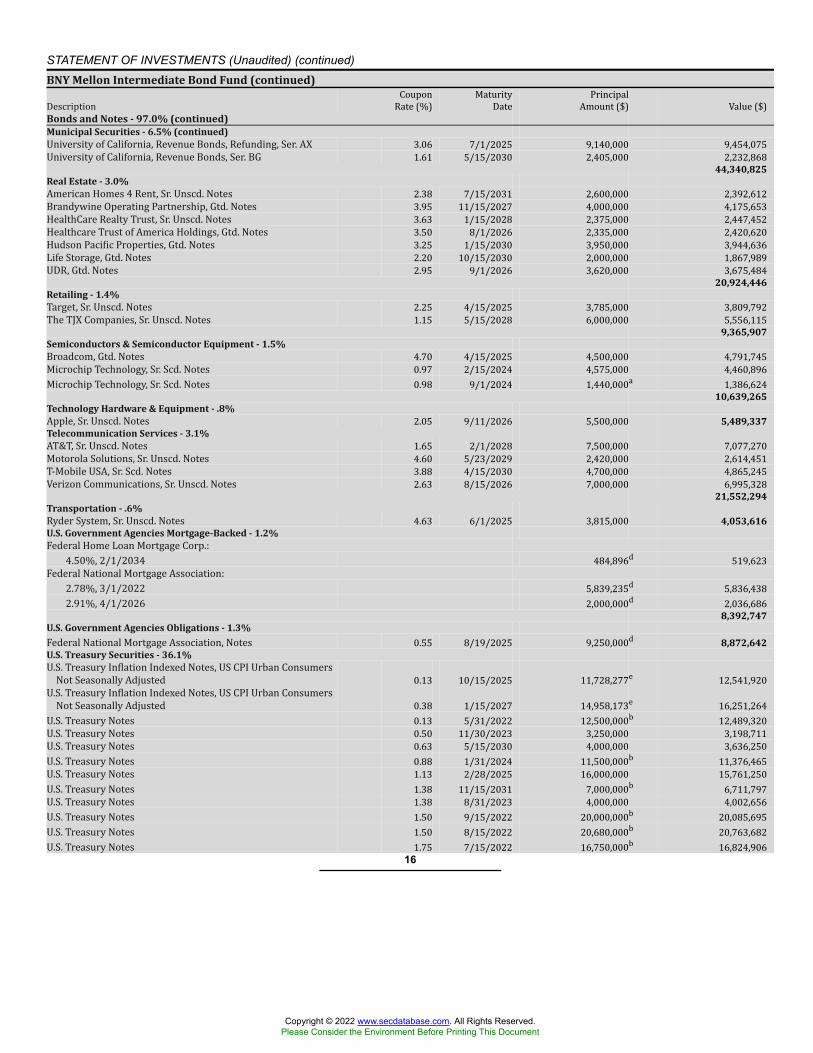
STATEMENT OF INVESTMENTS (Unaudited) (continued)BNY Mellon Intermediate Bond Fund (continued)Description CouponRate (%) MaturityDate PrincipalAmount ($) Value ($)Bonds and Notes - 97.0% (continued)Municipal Securities - 6.5% (continued)University of California, Revenue Bonds, Refunding, Ser. AX 3.06 7/1/2025 9,140,000 9,454,075University of California, Revenue Bonds, Ser. BG 1.61 5/15/2030 2,405,000 2,232,868
44,340,825Real Estate - 3.0%American Homes 4 Rent, Sr. Unscd. Notes 2.38 7/15/2031 2,600,000 2,392,612Brandywine Operating Partnership, Gtd. Notes 3.95 11/15/2027 4,000,000 4,175,653HealthCare Realty Trust, Sr. Unscd. Notes 3.63 1/15/2028 2,375,000 2,447,452Healthcare Trust of America Holdings, Gtd. Notes 3.50 8/1/2026 2,335,000 2,420,620Hudson Pacific Properties, Gtd. Notes 3.25 1/15/2030 3,950,000 3,944,636Life Storage, Gtd. Notes 2.20 10/15/2030 2,000,000 1,867,989UDR, Gtd. Notes 2.95 9/1/2026 3,620,000 3,675,484
20,924,446Retailing - 1.4%Target, Sr. Unscd. Notes 2.25 4/15/2025 3,785,000 3,809,792The TJX Companies, Sr. Unscd. Notes 1.15 5/15/2028 6,000,000 5,556,115
9,365,907Semiconductors & Semiconductor Equipment - 1.5%Broadcom, Gtd. Notes 4.70 4/15/2025 4,500,000 4,791,745Microchip Technology, Sr. Scd. Notes 0.97 2/15/2024 4,575,000 4,460,896Microchip Technology, Sr. Scd. Notes 0.98 9/1/2024 1,440,000a 1,386,624
10,639,265Technology Hardware & Equipment - .8%Apple, Sr. Unscd. Notes 2.05 9/11/2026 5,500,000 5,489,337Telecommunication Services - 3.1%AT&T, Sr. Unscd. Notes 1.65 2/1/2028 7,500,000 7,077,270Motorola Solutions, Sr. Unscd. Notes 4.60 5/23/2029 2,420,000 2,614,451T-Mobile USA, Sr. Scd. Notes 3.88 4/15/2030 4,700,000 4,865,245Verizon Communications, Sr. Unscd. Notes 2.63 8/15/2026 7,000,000 6,995,328
21,552,294Transportation - .6%Ryder System, Sr. Unscd. Notes 4.63 6/1/2025 3,815,000 4,053,616U.S. Government Agencies Mortgage-Backed - 1.2%Federal Home Loan Mortgage Corp.:4.50%, 2/1/2034 484,896d 519,623Federal National Mortgage Association:2.78%, 3/1/2022 5,839,235d 5,836,4382.91%, 4/1/2026 2,000,000d 2,036,686
8,392,747U.S. Government Agencies Obligations - 1.3%Federal National Mortgage Association, Notes 0.55 8/19/2025 9,250,000d 8,872,642U.S. Treasury Securities - 36.1%U.S. Treasury Inflation Indexed Notes, US CPI Urban ConsumersNot Seasonally Adjusted 0.13 10/15/2025 11,728,277e 12,541,920U.S. Treasury Inflation Indexed Notes, US CPI Urban ConsumersNot Seasonally Adjusted 0.38 1/15/2027 14,958,173e 16,251,264U.S. Treasury Notes 0.13 5/31/2022 12,500,000b 12,489,320U.S. Treasury Notes 0.50 11/30/2023 3,250,000 3,198,711U.S. Treasury Notes 0.63 5/15/2030 4,000,000 3,636,250U.S. Treasury Notes 0.88 1/31/2024 11,500,000b 11,376,465U.S. Treasury Notes 1.13 2/28/2025 16,000,000 15,761,250U.S. Treasury Notes 1.38 11/15/2031 7,000,000b 6,711,797U.S. Treasury Notes 1.38 8/31/2023 4,000,000 4,002,656U.S. Treasury Notes 1.50 9/15/2022 20,000,000b 20,085,695U.S. Treasury Notes 1.50 8/15/2022 20,680,000b 20,763,682U.S. Treasury Notes 1.75 7/15/2022 16,750,000b 16,824,906
16
Copyright © 2022 www.secdatabase.com. All Rights Reserved.Please Consider the Environment Before Printing This Document
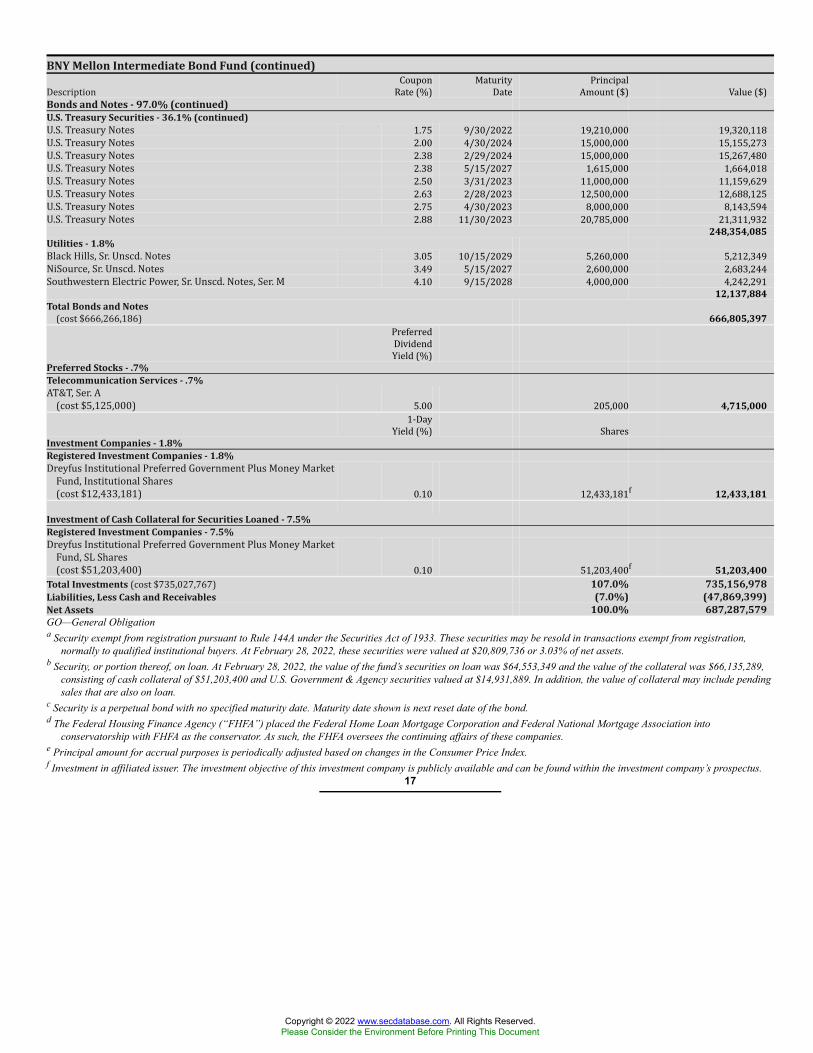
BNY Mellon Intermediate Bond Fund (continued)Description CouponRate (%) MaturityDate PrincipalAmount ($) Value ($)Bonds and Notes - 97.0% (continued)U.S. Treasury Securities - 36.1% (continued)U.S. Treasury Notes 1.75 9/30/2022 19,210,000 19,320,118U.S. Treasury Notes 2.00 4/30/2024 15,000,000 15,155,273U.S. Treasury Notes 2.38 2/29/2024 15,000,000 15,267,480U.S. Treasury Notes 2.38 5/15/2027 1,615,000 1,664,018U.S. Treasury Notes 2.50 3/31/2023 11,000,000 11,159,629U.S. Treasury Notes 2.63 2/28/2023 12,500,000 12,688,125U.S. Treasury Notes 2.75 4/30/2023 8,000,000 8,143,594U.S. Treasury Notes 2.88 11/30/2023 20,785,000 21,311,932
248,354,085Utilities - 1.8%Black Hills, Sr. Unscd. Notes 3.05 10/15/2029 5,260,000 5,212,349NiSource, Sr. Unscd. Notes 3.49 5/15/2027 2,600,000 2,683,244Southwestern Electric Power, Sr. Unscd. Notes, Ser. M 4.10 9/15/2028 4,000,000 4,242,291
12,137,884Total Bonds and Notes(cost $666,266,186) 666,805,397PreferredDividendYield (%)Preferred Stocks - .7%Telecommunication Services - .7%AT&T, Ser. A(cost $5,125,000) 5.00 205,000 4,715,0001-DayYield (%) SharesInvestment Companies - 1.8%Registered Investment Companies - 1.8%Dreyfus Institutional Preferred Government Plus Money MarketFund, Institutional Shares(cost $12,433,181) 0.10 12,433,181f 12,433,181
Investment of Cash Collateral for Securities Loaned - 7.5%Registered Investment Companies - 7.5%Dreyfus Institutional Preferred Government Plus Money MarketFund, SL Shares(cost $51,203,400) 0.10 51,203,400f 51,203,400Total Investments (cost $735,027,767) 107.0% 735,156,978Liabilities, Less Cash and Receivables (7.0%) (47,869,399)Net Assets 100.0% 687,287,579GO—General Obligationa Security exempt from registration pursuant to Rule 144A under the Securities Act of 1933. These securities may be resold in transactions exempt from registration,
normally to qualified institutional buyers. At February 28, 2022, these securities were valued at $20,809,736 or 3.03% of net assets.b Security, or portion thereof, on loan. At February 28, 2022, the value of the fund’s securities on loan was $64,553,349 and the value of the collateral was $66,135,289,
consisting of cash collateral of $51,203,400 and U.S. Government & Agency securities valued at $14,931,889. In addition, the value of collateral may include pendingsales that are also on loan.
c Security is a perpetual bond with no specified maturity date. Maturity date shown is next reset date of the bond.d The Federal Housing Finance Agency (“FHFA”) placed the Federal Home Loan Mortgage Corporation and Federal National Mortgage Association into
conservatorship with FHFA as the conservator. As such, the FHFA oversees the continuing affairs of these companies.e Principal amount for accrual purposes is periodically adjusted based on changes in the Consumer Price Index.f Investment in affiliated issuer. The investment objective of this investment company is publicly available and can be found within the investment company’s prospectus.
17
Copyright © 2022 www.secdatabase.com. All Rights Reserved.Please Consider the Environment Before Printing This Document
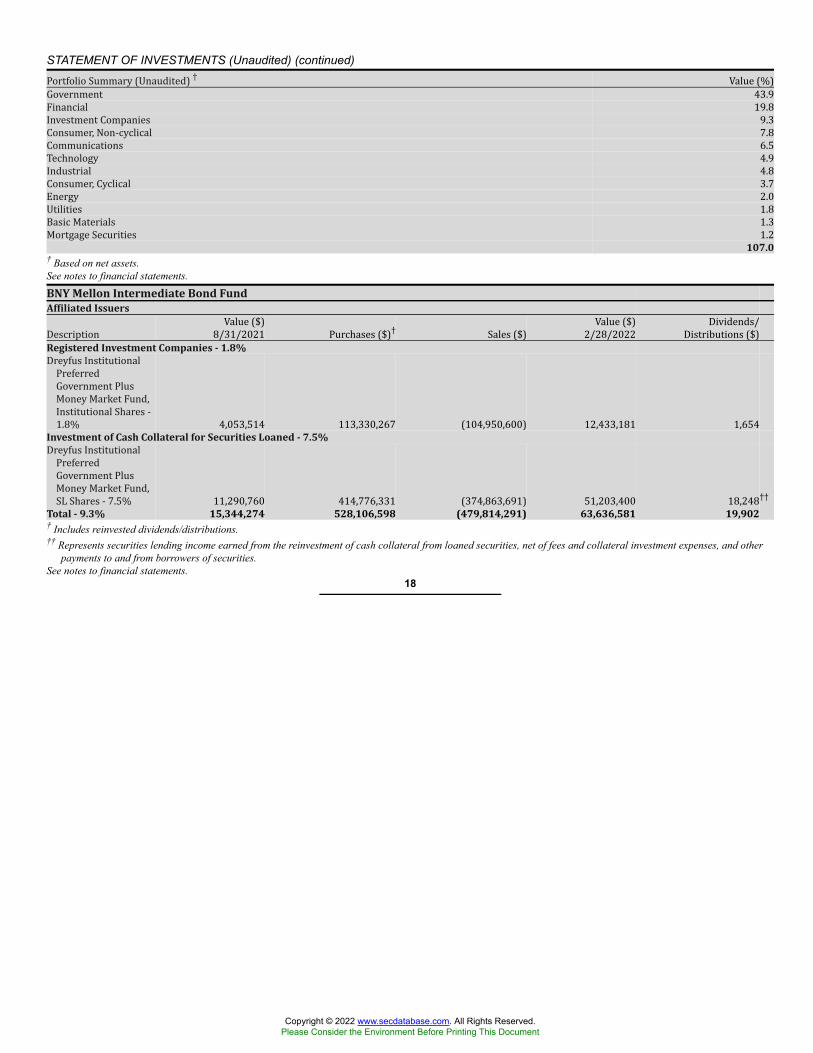
STATEMENT OF INVESTMENTS (Unaudited) (continued)Portfolio Summary (Unaudited) † Value (%)Government 43.9Financial 19.8Investment Companies 9.3Consumer, Non-cyclical 7.8Communications 6.5Technology 4.9Industrial 4.8Consumer, Cyclical 3.7Energy 2.0Utilities 1.8Basic Materials 1.3Mortgage Securities 1.2107.0
† Based on net assets.See notes to financial statements.
BNY Mellon Intermediate Bond FundAffiliated IssuersDescription Value ($)8/31/2021 Purchases ($)† Sales ($) Value ($)2/28/2022 Dividends/Distributions ($)Registered Investment Companies - 1.8%Dreyfus InstitutionalPreferredGovernment PlusMoney Market Fund,Institutional Shares -1.8% 4,053,514 113,330,267 (104,950,600) 12,433,181 1,654Investment of Cash Collateral for Securities Loaned - 7.5%Dreyfus InstitutionalPreferredGovernment PlusMoney Market Fund,SL Shares - 7.5% 11,290,760 414,776,331 (374,863,691) 51,203,400 18,248††Total - 9.3% 15,344,274 528,106,598 (479,814,291) 63,636,581 19,902† Includes reinvested dividends/distributions.†† Represents securities lending income earned from the reinvestment of cash collateral from loaned securities, net of fees and collateral investment expenses, and other
payments to and from borrowers of securities.See notes to financial statements.
18
Copyright © 2022 www.secdatabase.com. All Rights Reserved.Please Consider the Environment Before Printing This Document
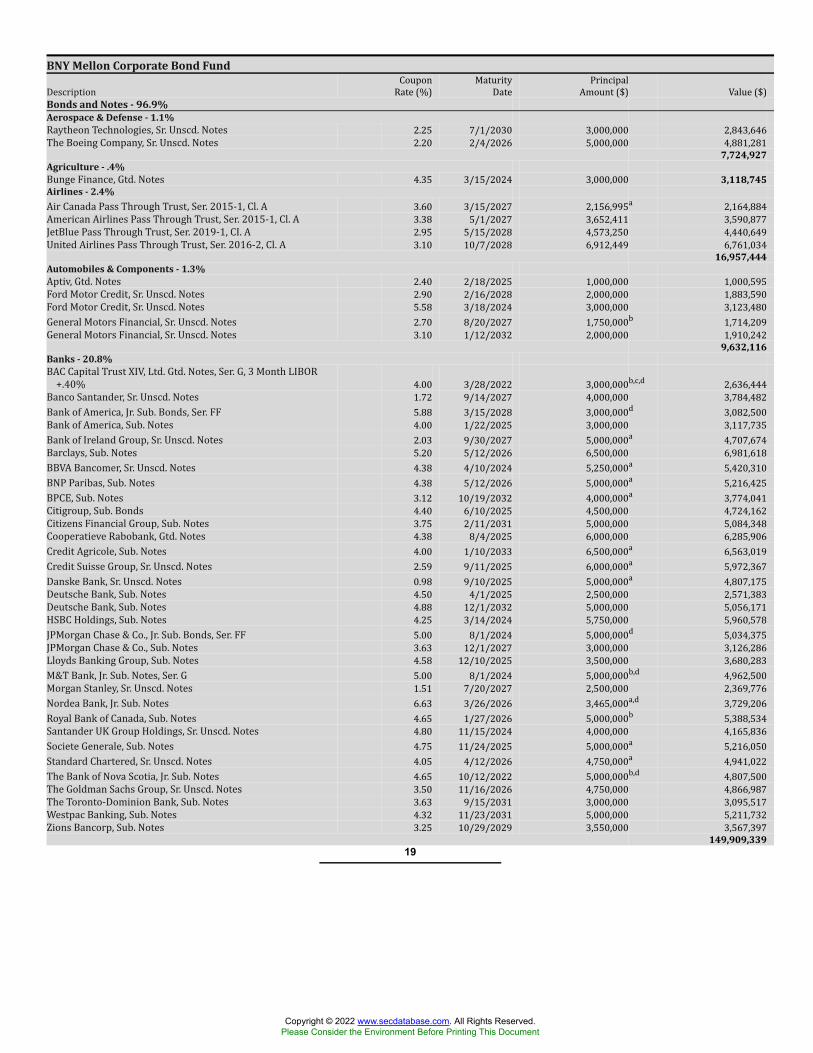
BNY Mellon Corporate Bond FundDescription CouponRate (%) MaturityDate PrincipalAmount ($) Value ($)Bonds and Notes - 96.9%Aerospace & Defense - 1.1%Raytheon Technologies, Sr. Unscd. Notes 2.25 7/1/2030 3,000,000 2,843,646The Boeing Company, Sr. Unscd. Notes 2.20 2/4/2026 5,000,000 4,881,281
7,724,927Agriculture - .4%Bunge Finance, Gtd. Notes 4.35 3/15/2024 3,000,000 3,118,745Airlines - 2.4%Air Canada Pass Through Trust, Ser. 2015-1, Cl. A 3.60 3/15/2027 2,156,995a 2,164,884American Airlines Pass Through Trust, Ser. 2015-1, Cl. A 3.38 5/1/2027 3,652,411 3,590,877JetBlue Pass Through Trust, Ser. 2019-1, CI. A 2.95 5/15/2028 4,573,250 4,440,649United Airlines Pass Through Trust, Ser. 2016-2, Cl. A 3.10 10/7/2028 6,912,449 6,761,034
16,957,444Automobiles & Components - 1.3%Aptiv, Gtd. Notes 2.40 2/18/2025 1,000,000 1,000,595Ford Motor Credit, Sr. Unscd. Notes 2.90 2/16/2028 2,000,000 1,883,590Ford Motor Credit, Sr. Unscd. Notes 5.58 3/18/2024 3,000,000 3,123,480General Motors Financial, Sr. Unscd. Notes 2.70 8/20/2027 1,750,000b 1,714,209General Motors Financial, Sr. Unscd. Notes 3.10 1/12/2032 2,000,000 1,910,242
9,632,116Banks - 20.8%BAC Capital Trust XIV, Ltd. Gtd. Notes, Ser. G, 3 Month LIBOR+.40% 4.00 3/28/2022 3,000,000b,c,d 2,636,444Banco Santander, Sr. Unscd. Notes 1.72 9/14/2027 4,000,000 3,784,482Bank of America, Jr. Sub. Bonds, Ser. FF 5.88 3/15/2028 3,000,000d 3,082,500Bank of America, Sub. Notes 4.00 1/22/2025 3,000,000 3,117,735Bank of Ireland Group, Sr. Unscd. Notes 2.03 9/30/2027 5,000,000a 4,707,674Barclays, Sub. Notes 5.20 5/12/2026 6,500,000 6,981,618BBVA Bancomer, Sr. Unscd. Notes 4.38 4/10/2024 5,250,000a 5,420,310BNP Paribas, Sub. Notes 4.38 5/12/2026 5,000,000a 5,216,425BPCE, Sub. Notes 3.12 10/19/2032 4,000,000a 3,774,041Citigroup, Sub. Bonds 4.40 6/10/2025 4,500,000 4,724,162Citizens Financial Group, Sub. Notes 3.75 2/11/2031 5,000,000 5,084,348Cooperatieve Rabobank, Gtd. Notes 4.38 8/4/2025 6,000,000 6,285,906Credit Agricole, Sub. Notes 4.00 1/10/2033 6,500,000a 6,563,019Credit Suisse Group, Sr. Unscd. Notes 2.59 9/11/2025 6,000,000a 5,972,367Danske Bank, Sr. Unscd. Notes 0.98 9/10/2025 5,000,000a 4,807,175Deutsche Bank, Sub. Notes 4.50 4/1/2025 2,500,000 2,571,383Deutsche Bank, Sub. Notes 4.88 12/1/2032 5,000,000 5,056,171HSBC Holdings, Sub. Notes 4.25 3/14/2024 5,750,000 5,960,578JPMorgan Chase & Co., Jr. Sub. Bonds, Ser. FF 5.00 8/1/2024 5,000,000d 5,034,375JPMorgan Chase & Co., Sub. Notes 3.63 12/1/2027 3,000,000 3,126,286Lloyds Banking Group, Sub. Notes 4.58 12/10/2025 3,500,000 3,680,283M&T Bank, Jr. Sub. Notes, Ser. G 5.00 8/1/2024 5,000,000b,d 4,962,500Morgan Stanley, Sr. Unscd. Notes 1.51 7/20/2027 2,500,000 2,369,776Nordea Bank, Jr. Sub. Notes 6.63 3/26/2026 3,465,000a,d 3,729,206Royal Bank of Canada, Sub. Notes 4.65 1/27/2026 5,000,000b 5,388,534Santander UK Group Holdings, Sr. Unscd. Notes 4.80 11/15/2024 4,000,000 4,165,836Societe Generale, Sub. Notes 4.75 11/24/2025 5,000,000a 5,216,050Standard Chartered, Sr. Unscd. Notes 4.05 4/12/2026 4,750,000a 4,941,022The Bank of Nova Scotia, Jr. Sub. Notes 4.65 10/12/2022 5,000,000b,d 4,807,500The Goldman Sachs Group, Sr. Unscd. Notes 3.50 11/16/2026 4,750,000 4,866,987The Toronto-Dominion Bank, Sub. Notes 3.63 9/15/2031 3,000,000 3,095,517Westpac Banking, Sub. Notes 4.32 11/23/2031 5,000,000 5,211,732Zions Bancorp, Sub. Notes 3.25 10/29/2029 3,550,000 3,567,397
149,909,33919
Copyright © 2022 www.secdatabase.com. All Rights Reserved.Please Consider the Environment Before Printing This Document
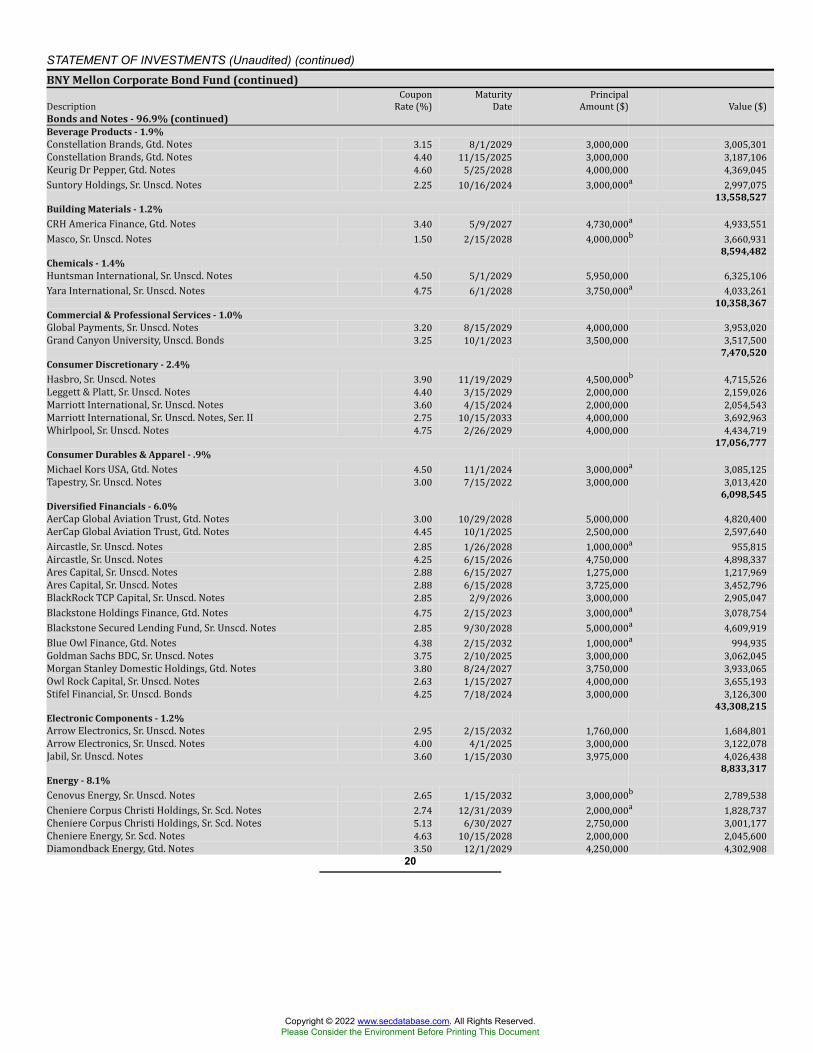
STATEMENT OF INVESTMENTS (Unaudited) (continued)BNY Mellon Corporate Bond Fund (continued)Description CouponRate (%) MaturityDate PrincipalAmount ($) Value ($)Bonds and Notes - 96.9% (continued)Beverage Products - 1.9%Constellation Brands, Gtd. Notes 3.15 8/1/2029 3,000,000 3,005,301Constellation Brands, Gtd. Notes 4.40 11/15/2025 3,000,000 3,187,106Keurig Dr Pepper, Gtd. Notes 4.60 5/25/2028 4,000,000 4,369,045Suntory Holdings, Sr. Unscd. Notes 2.25 10/16/2024 3,000,000a 2,997,075
13,558,527Building Materials - 1.2%CRH America Finance, Gtd. Notes 3.40 5/9/2027 4,730,000a 4,933,551Masco, Sr. Unscd. Notes 1.50 2/15/2028 4,000,000b 3,660,931
8,594,482Chemicals - 1.4%Huntsman International, Sr. Unscd. Notes 4.50 5/1/2029 5,950,000 6,325,106Yara International, Sr. Unscd. Notes 4.75 6/1/2028 3,750,000a 4,033,261
10,358,367Commercial & Professional Services - 1.0%Global Payments, Sr. Unscd. Notes 3.20 8/15/2029 4,000,000 3,953,020Grand Canyon University, Unscd. Bonds 3.25 10/1/2023 3,500,000 3,517,500
7,470,520Consumer Discretionary - 2.4%Hasbro, Sr. Unscd. Notes 3.90 11/19/2029 4,500,000b 4,715,526Leggett & Platt, Sr. Unscd. Notes 4.40 3/15/2029 2,000,000 2,159,026Marriott International, Sr. Unscd. Notes 3.60 4/15/2024 2,000,000 2,054,543Marriott International, Sr. Unscd. Notes, Ser. II 2.75 10/15/2033 4,000,000 3,692,963Whirlpool, Sr. Unscd. Notes 4.75 2/26/2029 4,000,000 4,434,719
17,056,777Consumer Durables & Apparel - .9%Michael Kors USA, Gtd. Notes 4.50 11/1/2024 3,000,000a 3,085,125Tapestry, Sr. Unscd. Notes 3.00 7/15/2022 3,000,000 3,013,420
6,098,545Diversified Financials - 6.0%AerCap Global Aviation Trust, Gtd. Notes 3.00 10/29/2028 5,000,000 4,820,400AerCap Global Aviation Trust, Gtd. Notes 4.45 10/1/2025 2,500,000 2,597,640Aircastle, Sr. Unscd. Notes 2.85 1/26/2028 1,000,000a 955,815Aircastle, Sr. Unscd. Notes 4.25 6/15/2026 4,750,000 4,898,337Ares Capital, Sr. Unscd. Notes 2.88 6/15/2027 1,275,000 1,217,969Ares Capital, Sr. Unscd. Notes 2.88 6/15/2028 3,725,000 3,452,796BlackRock TCP Capital, Sr. Unscd. Notes 2.85 2/9/2026 3,000,000 2,905,047Blackstone Holdings Finance, Gtd. Notes 4.75 2/15/2023 3,000,000a 3,078,754Blackstone Secured Lending Fund, Sr. Unscd. Notes 2.85 9/30/2028 5,000,000a 4,609,919Blue Owl Finance, Gtd. Notes 4.38 2/15/2032 1,000,000a 994,935Goldman Sachs BDC, Sr. Unscd. Notes 3.75 2/10/2025 3,000,000 3,062,045Morgan Stanley Domestic Holdings, Gtd. Notes 3.80 8/24/2027 3,750,000 3,933,065Owl Rock Capital, Sr. Unscd. Notes 2.63 1/15/2027 4,000,000 3,655,193Stifel Financial, Sr. Unscd. Bonds 4.25 7/18/2024 3,000,000 3,126,300
43,308,215Electronic Components - 1.2%Arrow Electronics, Sr. Unscd. Notes 2.95 2/15/2032 1,760,000 1,684,801Arrow Electronics, Sr. Unscd. Notes 4.00 4/1/2025 3,000,000 3,122,078Jabil, Sr. Unscd. Notes 3.60 1/15/2030 3,975,000 4,026,438
8,833,317Energy - 8.1%Cenovus Energy, Sr. Unscd. Notes 2.65 1/15/2032 3,000,000b 2,789,538Cheniere Corpus Christi Holdings, Sr. Scd. Notes 2.74 12/31/2039 2,000,000a 1,828,737Cheniere Corpus Christi Holdings, Sr. Scd. Notes 5.13 6/30/2027 2,750,000 3,001,177Cheniere Energy, Sr. Scd. Notes 4.63 10/15/2028 2,000,000 2,045,600Diamondback Energy, Gtd. Notes 3.50 12/1/2029 4,250,000 4,302,908
20
Copyright © 2022 www.secdatabase.com. All Rights Reserved.Please Consider the Environment Before Printing This Document
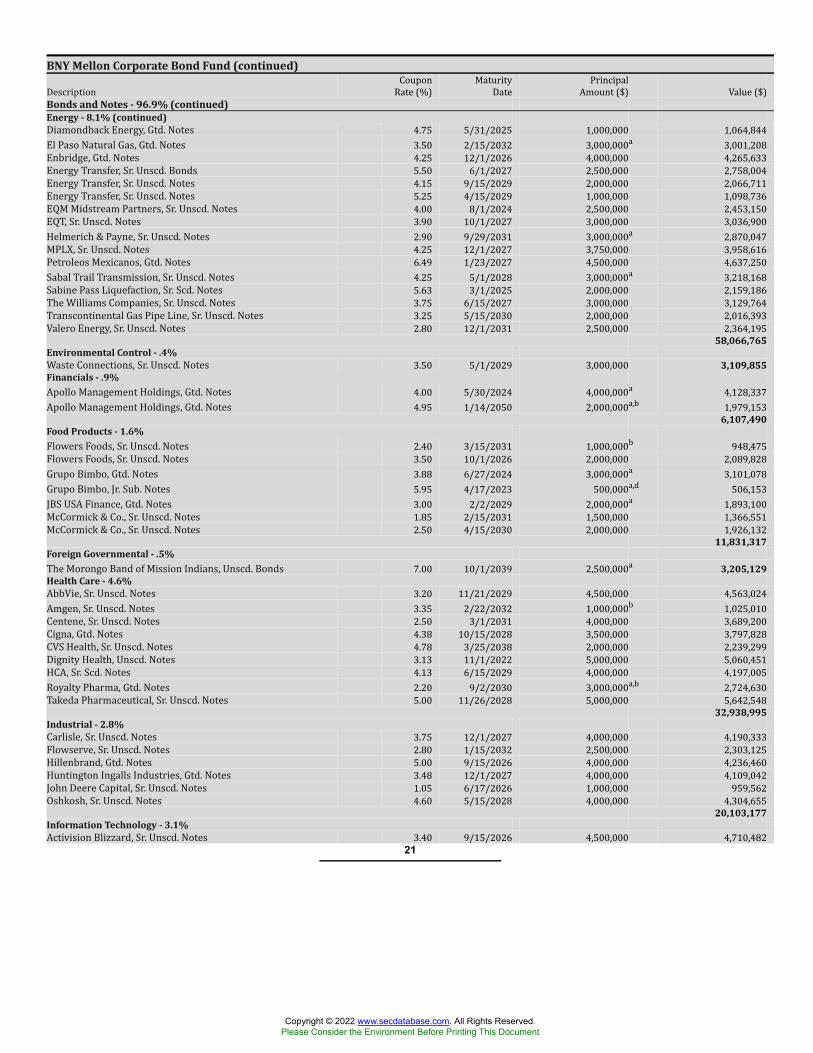
BNY Mellon Corporate Bond Fund (continued)Description CouponRate (%) MaturityDate PrincipalAmount ($) Value ($)Bonds and Notes - 96.9% (continued)Energy - 8.1% (continued)Diamondback Energy, Gtd. Notes 4.75 5/31/2025 1,000,000 1,064,844El Paso Natural Gas, Gtd. Notes 3.50 2/15/2032 3,000,000a 3,001,208Enbridge, Gtd. Notes 4.25 12/1/2026 4,000,000 4,265,633Energy Transfer, Sr. Unscd. Bonds 5.50 6/1/2027 2,500,000 2,758,004Energy Transfer, Sr. Unscd. Notes 4.15 9/15/2029 2,000,000 2,066,711Energy Transfer, Sr. Unscd. Notes 5.25 4/15/2029 1,000,000 1,098,736EQM Midstream Partners, Sr. Unscd. Notes 4.00 8/1/2024 2,500,000 2,453,150EQT, Sr. Unscd. Notes 3.90 10/1/2027 3,000,000 3,036,900Helmerich & Payne, Sr. Unscd. Notes 2.90 9/29/2031 3,000,000a 2,870,047MPLX, Sr. Unscd. Notes 4.25 12/1/2027 3,750,000 3,958,616Petroleos Mexicanos, Gtd. Notes 6.49 1/23/2027 4,500,000 4,637,250Sabal Trail Transmission, Sr. Unscd. Notes 4.25 5/1/2028 3,000,000a 3,218,168Sabine Pass Liquefaction, Sr. Scd. Notes 5.63 3/1/2025 2,000,000 2,159,186The Williams Companies, Sr. Unscd. Notes 3.75 6/15/2027 3,000,000 3,129,764Transcontinental Gas Pipe Line, Sr. Unscd. Notes 3.25 5/15/2030 2,000,000 2,016,393Valero Energy, Sr. Unscd. Notes 2.80 12/1/2031 2,500,000 2,364,195
58,066,765Environmental Control - .4%Waste Connections, Sr. Unscd. Notes 3.50 5/1/2029 3,000,000 3,109,855Financials - .9%Apollo Management Holdings, Gtd. Notes 4.00 5/30/2024 4,000,000a 4,128,337Apollo Management Holdings, Gtd. Notes 4.95 1/14/2050 2,000,000a,b 1,979,153
6,107,490Food Products - 1.6%Flowers Foods, Sr. Unscd. Notes 2.40 3/15/2031 1,000,000b 948,475Flowers Foods, Sr. Unscd. Notes 3.50 10/1/2026 2,000,000 2,089,828Grupo Bimbo, Gtd. Notes 3.88 6/27/2024 3,000,000a 3,101,078Grupo Bimbo, Jr. Sub. Notes 5.95 4/17/2023 500,000a,d 506,153JBS USA Finance, Gtd. Notes 3.00 2/2/2029 2,000,000a 1,893,100McCormick & Co., Sr. Unscd. Notes 1.85 2/15/2031 1,500,000 1,366,551McCormick & Co., Sr. Unscd. Notes 2.50 4/15/2030 2,000,000 1,926,132
11,831,317Foreign Governmental - .5%The Morongo Band of Mission Indians, Unscd. Bonds 7.00 10/1/2039 2,500,000a 3,205,129Health Care - 4.6%AbbVie, Sr. Unscd. Notes 3.20 11/21/2029 4,500,000 4,563,024Amgen, Sr. Unscd. Notes 3.35 2/22/2032 1,000,000b 1,025,010Centene, Sr. Unscd. Notes 2.50 3/1/2031 4,000,000 3,689,200Cigna, Gtd. Notes 4.38 10/15/2028 3,500,000 3,797,828CVS Health, Sr. Unscd. Notes 4.78 3/25/2038 2,000,000 2,239,299Dignity Health, Unscd. Notes 3.13 11/1/2022 5,000,000 5,060,451HCA, Sr. Scd. Notes 4.13 6/15/2029 4,000,000 4,197,005Royalty Pharma, Gtd. Notes 2.20 9/2/2030 3,000,000a,b 2,724,630Takeda Pharmaceutical, Sr. Unscd. Notes 5.00 11/26/2028 5,000,000 5,642,548
32,938,995Industrial - 2.8%Carlisle, Sr. Unscd. Notes 3.75 12/1/2027 4,000,000 4,190,333Flowserve, Sr. Unscd. Notes 2.80 1/15/2032 2,500,000 2,303,125Hillenbrand, Gtd. Notes 5.00 9/15/2026 4,000,000 4,236,460Huntington Ingalls Industries, Gtd. Notes 3.48 12/1/2027 4,000,000 4,109,042John Deere Capital, Sr. Unscd. Notes 1.05 6/17/2026 1,000,000 959,562Oshkosh, Sr. Unscd. Notes 4.60 5/15/2028 4,000,000 4,304,655
20,103,177Information Technology - 3.1%Activision Blizzard, Sr. Unscd. Notes 3.40 9/15/2026 4,500,000 4,710,482
21
Copyright © 2022 www.secdatabase.com. All Rights Reserved.Please Consider the Environment Before Printing This Document
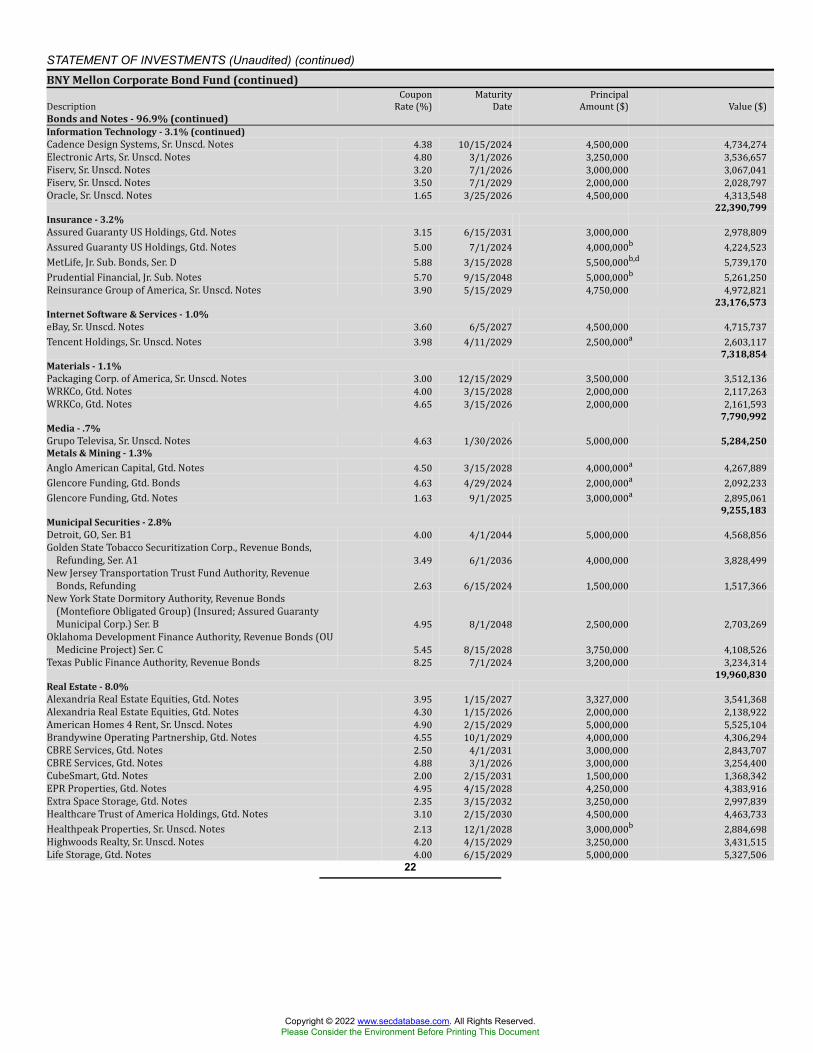
STATEMENT OF INVESTMENTS (Unaudited) (continued)BNY Mellon Corporate Bond Fund (continued)Description CouponRate (%) MaturityDate PrincipalAmount ($) Value ($)Bonds and Notes - 96.9% (continued)Information Technology - 3.1% (continued)Cadence Design Systems, Sr. Unscd. Notes 4.38 10/15/2024 4,500,000 4,734,274Electronic Arts, Sr. Unscd. Notes 4.80 3/1/2026 3,250,000 3,536,657Fiserv, Sr. Unscd. Notes 3.20 7/1/2026 3,000,000 3,067,041Fiserv, Sr. Unscd. Notes 3.50 7/1/2029 2,000,000 2,028,797Oracle, Sr. Unscd. Notes 1.65 3/25/2026 4,500,000 4,313,548
22,390,799Insurance - 3.2%Assured Guaranty US Holdings, Gtd. Notes 3.15 6/15/2031 3,000,000 2,978,809Assured Guaranty US Holdings, Gtd. Notes 5.00 7/1/2024 4,000,000b 4,224,523MetLife, Jr. Sub. Bonds, Ser. D 5.88 3/15/2028 5,500,000b,d 5,739,170Prudential Financial, Jr. Sub. Notes 5.70 9/15/2048 5,000,000b 5,261,250Reinsurance Group of America, Sr. Unscd. Notes 3.90 5/15/2029 4,750,000 4,972,821
23,176,573Internet Software & Services - 1.0%eBay, Sr. Unscd. Notes 3.60 6/5/2027 4,500,000 4,715,737Tencent Holdings, Sr. Unscd. Notes 3.98 4/11/2029 2,500,000a 2,603,117
7,318,854Materials - 1.1%Packaging Corp. of America, Sr. Unscd. Notes 3.00 12/15/2029 3,500,000 3,512,136WRKCo, Gtd. Notes 4.00 3/15/2028 2,000,000 2,117,263WRKCo, Gtd. Notes 4.65 3/15/2026 2,000,000 2,161,593
7,790,992Media - .7%Grupo Televisa, Sr. Unscd. Notes 4.63 1/30/2026 5,000,000 5,284,250Metals & Mining - 1.3%Anglo American Capital, Gtd. Notes 4.50 3/15/2028 4,000,000a 4,267,889Glencore Funding, Gtd. Bonds 4.63 4/29/2024 2,000,000a 2,092,233Glencore Funding, Gtd. Notes 1.63 9/1/2025 3,000,000a 2,895,061
9,255,183Municipal Securities - 2.8%Detroit, GO, Ser. B1 4.00 4/1/2044 5,000,000 4,568,856Golden State Tobacco Securitization Corp., Revenue Bonds,Refunding, Ser. A1 3.49 6/1/2036 4,000,000 3,828,499New Jersey Transportation Trust Fund Authority, RevenueBonds, Refunding 2.63 6/15/2024 1,500,000 1,517,366New York State Dormitory Authority, Revenue Bonds(Montefiore Obligated Group) (Insured; Assured GuarantyMunicipal Corp.) Ser. B 4.95 8/1/2048 2,500,000 2,703,269Oklahoma Development Finance Authority, Revenue Bonds (OUMedicine Project) Ser. C 5.45 8/15/2028 3,750,000 4,108,526Texas Public Finance Authority, Revenue Bonds 8.25 7/1/2024 3,200,000 3,234,314
19,960,830Real Estate - 8.0%Alexandria Real Estate Equities, Gtd. Notes 3.95 1/15/2027 3,327,000 3,541,368Alexandria Real Estate Equities, Gtd. Notes 4.30 1/15/2026 2,000,000 2,138,922American Homes 4 Rent, Sr. Unscd. Notes 4.90 2/15/2029 5,000,000 5,525,104Brandywine Operating Partnership, Gtd. Notes 4.55 10/1/2029 4,000,000 4,306,294CBRE Services, Gtd. Notes 2.50 4/1/2031 3,000,000 2,843,707CBRE Services, Gtd. Notes 4.88 3/1/2026 3,000,000 3,254,400CubeSmart, Gtd. Notes 2.00 2/15/2031 1,500,000 1,368,342EPR Properties, Gtd. Notes 4.95 4/15/2028 4,250,000 4,383,916Extra Space Storage, Gtd. Notes 2.35 3/15/2032 3,250,000 2,997,839Healthcare Trust of America Holdings, Gtd. Notes 3.10 2/15/2030 4,500,000 4,463,733Healthpeak Properties, Sr. Unscd. Notes 2.13 12/1/2028 3,000,000b 2,884,698Highwoods Realty, Sr. Unscd. Notes 4.20 4/15/2029 3,250,000 3,431,515Life Storage, Gtd. Notes 4.00 6/15/2029 5,000,000 5,327,506
22
Copyright © 2022 www.secdatabase.com. All Rights Reserved.Please Consider the Environment Before Printing This Document
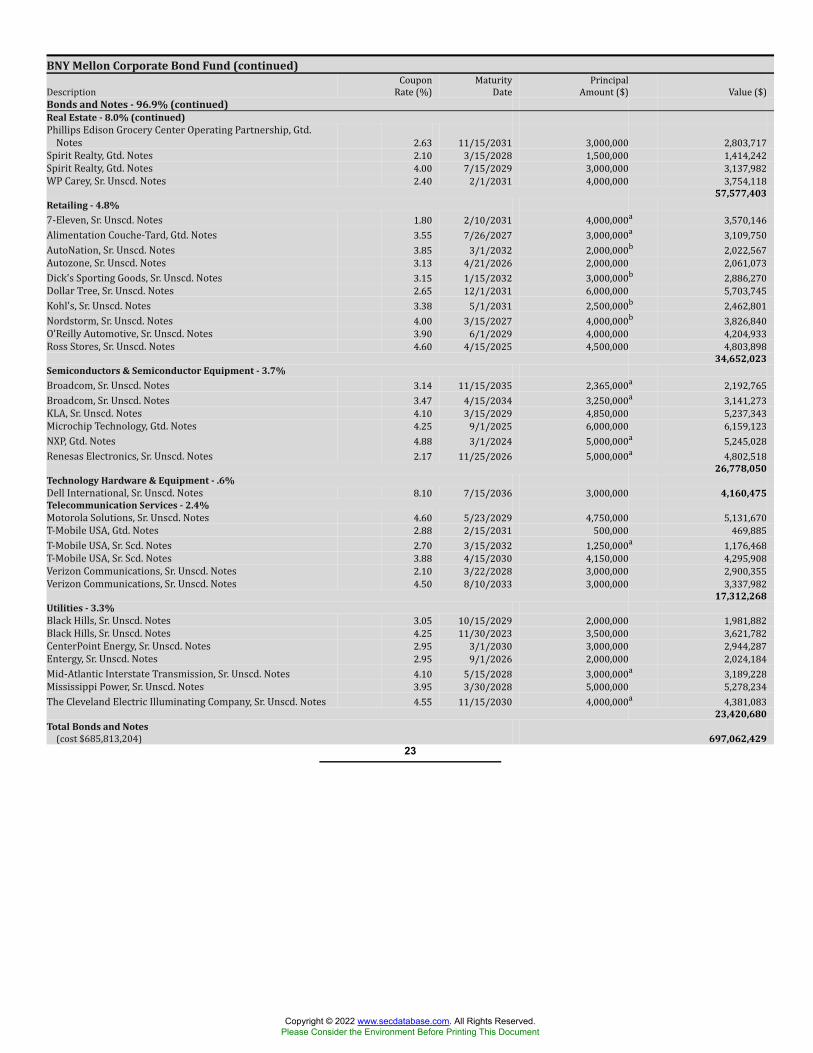
BNY Mellon Corporate Bond Fund (continued)Description CouponRate (%) MaturityDate PrincipalAmount ($) Value ($)Bonds and Notes - 96.9% (continued)Real Estate - 8.0% (continued)Phillips Edison Grocery Center Operating Partnership, Gtd.Notes 2.63 11/15/2031 3,000,000 2,803,717Spirit Realty, Gtd. Notes 2.10 3/15/2028 1,500,000 1,414,242Spirit Realty, Gtd. Notes 4.00 7/15/2029 3,000,000 3,137,982WP Carey, Sr. Unscd. Notes 2.40 2/1/2031 4,000,000 3,754,118
57,577,403Retailing - 4.8%7-Eleven, Sr. Unscd. Notes 1.80 2/10/2031 4,000,000a 3,570,146Alimentation Couche-Tard, Gtd. Notes 3.55 7/26/2027 3,000,000a 3,109,750AutoNation, Sr. Unscd. Notes 3.85 3/1/2032 2,000,000b 2,022,567Autozone, Sr. Unscd. Notes 3.13 4/21/2026 2,000,000 2,061,073Dick's Sporting Goods, Sr. Unscd. Notes 3.15 1/15/2032 3,000,000b 2,886,270Dollar Tree, Sr. Unscd. Notes 2.65 12/1/2031 6,000,000 5,703,745Kohl's, Sr. Unscd. Notes 3.38 5/1/2031 2,500,000b 2,462,801Nordstorm, Sr. Unscd. Notes 4.00 3/15/2027 4,000,000b 3,826,840O'Reilly Automotive, Sr. Unscd. Notes 3.90 6/1/2029 4,000,000 4,204,933Ross Stores, Sr. Unscd. Notes 4.60 4/15/2025 4,500,000 4,803,898
34,652,023Semiconductors & Semiconductor Equipment - 3.7%Broadcom, Sr. Unscd. Notes 3.14 11/15/2035 2,365,000a 2,192,765Broadcom, Sr. Unscd. Notes 3.47 4/15/2034 3,250,000a 3,141,273KLA, Sr. Unscd. Notes 4.10 3/15/2029 4,850,000 5,237,343Microchip Technology, Gtd. Notes 4.25 9/1/2025 6,000,000 6,159,123NXP, Gtd. Notes 4.88 3/1/2024 5,000,000a 5,245,028Renesas Electronics, Sr. Unscd. Notes 2.17 11/25/2026 5,000,000a 4,802,518
26,778,050Technology Hardware & Equipment - .6%Dell International, Sr. Unscd. Notes 8.10 7/15/2036 3,000,000 4,160,475Telecommunication Services - 2.4%Motorola Solutions, Sr. Unscd. Notes 4.60 5/23/2029 4,750,000 5,131,670T-Mobile USA, Gtd. Notes 2.88 2/15/2031 500,000 469,885T-Mobile USA, Sr. Scd. Notes 2.70 3/15/2032 1,250,000a 1,176,468T-Mobile USA, Sr. Scd. Notes 3.88 4/15/2030 4,150,000 4,295,908Verizon Communications, Sr. Unscd. Notes 2.10 3/22/2028 3,000,000 2,900,355Verizon Communications, Sr. Unscd. Notes 4.50 8/10/2033 3,000,000 3,337,982
17,312,268Utilities - 3.3%Black Hills, Sr. Unscd. Notes 3.05 10/15/2029 2,000,000 1,981,882Black Hills, Sr. Unscd. Notes 4.25 11/30/2023 3,500,000 3,621,782CenterPoint Energy, Sr. Unscd. Notes 2.95 3/1/2030 3,000,000 2,944,287Entergy, Sr. Unscd. Notes 2.95 9/1/2026 2,000,000 2,024,184Mid-Atlantic Interstate Transmission, Sr. Unscd. Notes 4.10 5/15/2028 3,000,000a 3,189,228Mississippi Power, Sr. Unscd. Notes 3.95 3/30/2028 5,000,000 5,278,234The Cleveland Electric Illuminating Company, Sr. Unscd. Notes 4.55 11/15/2030 4,000,000a 4,381,083
23,420,680Total Bonds and Notes(cost $685,813,204) 697,062,429
23
Copyright © 2022 www.secdatabase.com. All Rights Reserved.Please Consider the Environment Before Printing This Document
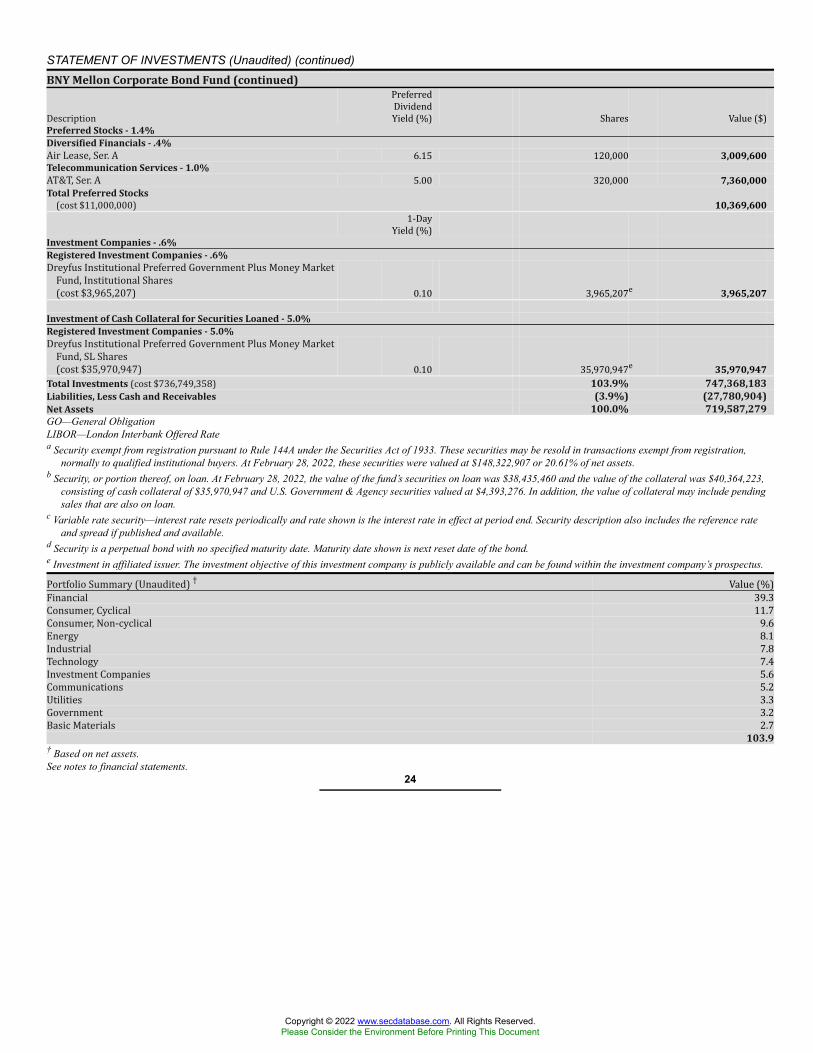
STATEMENT OF INVESTMENTS (Unaudited) (continued)BNY Mellon Corporate Bond Fund (continued)
Description PreferredDividendYield (%) Shares Value ($)Preferred Stocks - 1.4%Diversified Financials - .4%Air Lease, Ser. A 6.15 120,000 3,009,600Telecommunication Services - 1.0%AT&T, Ser. A 5.00 320,000 7,360,000Total Preferred Stocks(cost $11,000,000) 10,369,6001-DayYield (%)Investment Companies - .6%Registered Investment Companies - .6%Dreyfus Institutional Preferred Government Plus Money MarketFund, Institutional Shares(cost $3,965,207) 0.10 3,965,207e 3,965,207
Investment of Cash Collateral for Securities Loaned - 5.0%Registered Investment Companies - 5.0%Dreyfus Institutional Preferred Government Plus Money MarketFund, SL Shares(cost $35,970,947) 0.10 35,970,947e 35,970,947Total Investments (cost $736,749,358) 103.9% 747,368,183Liabilities, Less Cash and Receivables (3.9%) (27,780,904)Net Assets 100.0% 719,587,279GO—General ObligationLIBOR—London Interbank Offered Ratea Security exempt from registration pursuant to Rule 144A under the Securities Act of 1933. These securities may be resold in transactions exempt from registration,
normally to qualified institutional buyers. At February 28, 2022, these securities were valued at $148,322,907 or 20.61% of net assets.b Security, or portion thereof, on loan. At February 28, 2022, the value of the fund’s securities on loan was $38,435,460 and the value of the collateral was $40,364,223,
consisting of cash collateral of $35,970,947 and U.S. Government & Agency securities valued at $4,393,276. In addition, the value of collateral may include pendingsales that are also on loan.
c Variable rate security—interest rate resets periodically and rate shown is the interest rate in effect at period end. Security description also includes the reference rateand spread if published and available.
d Security is a perpetual bond with no specified maturity date. Maturity date shown is next reset date of the bond.e Investment in affiliated issuer. The investment objective of this investment company is publicly available and can be found within the investment company’s prospectus.Portfolio Summary (Unaudited) † Value (%)Financial 39.3Consumer, Cyclical 11.7Consumer, Non-cyclical 9.6Energy 8.1Industrial 7.8Technology 7.4Investment Companies 5.6Communications 5.2Utilities 3.3Government 3.2Basic Materials 2.7
103.9† Based on net assets.See notes to financial statements.
24
Copyright © 2022 www.secdatabase.com. All Rights Reserved.Please Consider the Environment Before Printing This Document
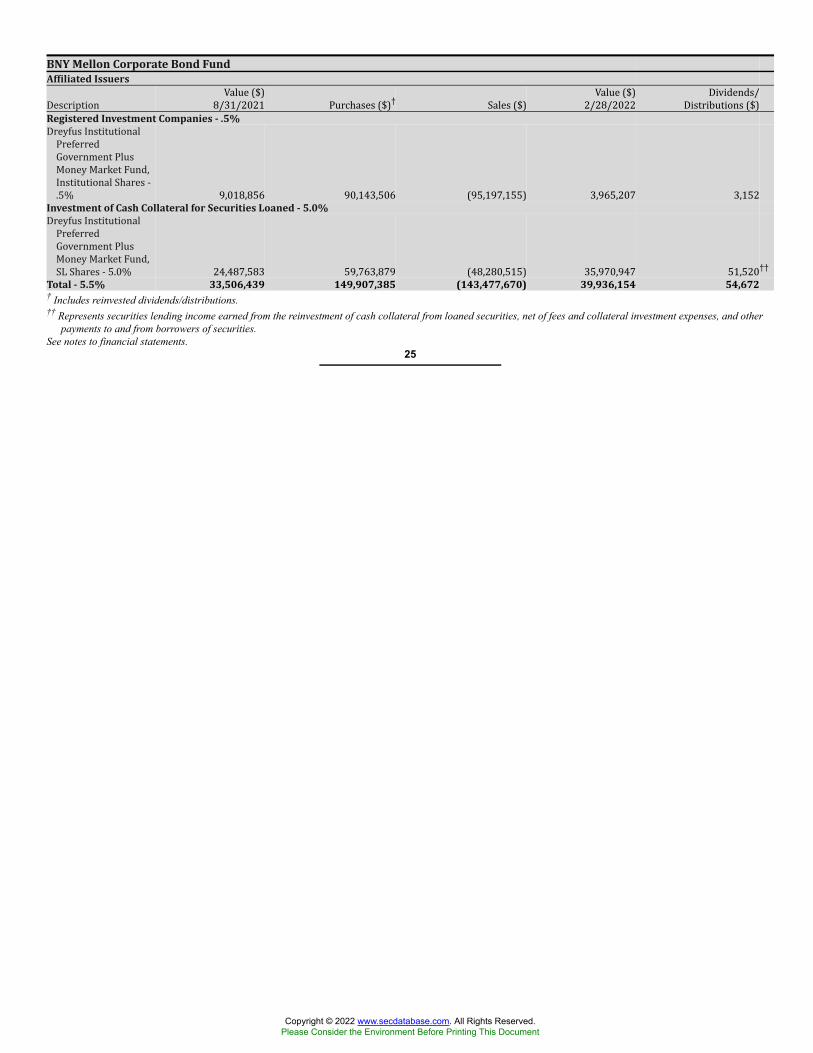
BNY Mellon Corporate Bond FundAffiliated IssuersDescription Value ($)8/31/2021 Purchases ($)† Sales ($) Value ($)2/28/2022 Dividends/Distributions ($)Registered Investment Companies - .5%Dreyfus InstitutionalPreferredGovernment PlusMoney Market Fund,Institutional Shares -.5% 9,018,856 90,143,506 (95,197,155) 3,965,207 3,152Investment of Cash Collateral for Securities Loaned - 5.0%Dreyfus InstitutionalPreferredGovernment PlusMoney Market Fund,SL Shares - 5.0% 24,487,583 59,763,879 (48,280,515) 35,970,947 51,520††Total - 5.5% 33,506,439 149,907,385 (143,477,670) 39,936,154 54,672† Includes reinvested dividends/distributions.†† Represents securities lending income earned from the reinvestment of cash collateral from loaned securities, net of fees and collateral investment expenses, and other
payments to and from borrowers of securities.See notes to financial statements.
25
Copyright © 2022 www.secdatabase.com. All Rights Reserved.Please Consider the Environment Before Printing This Document
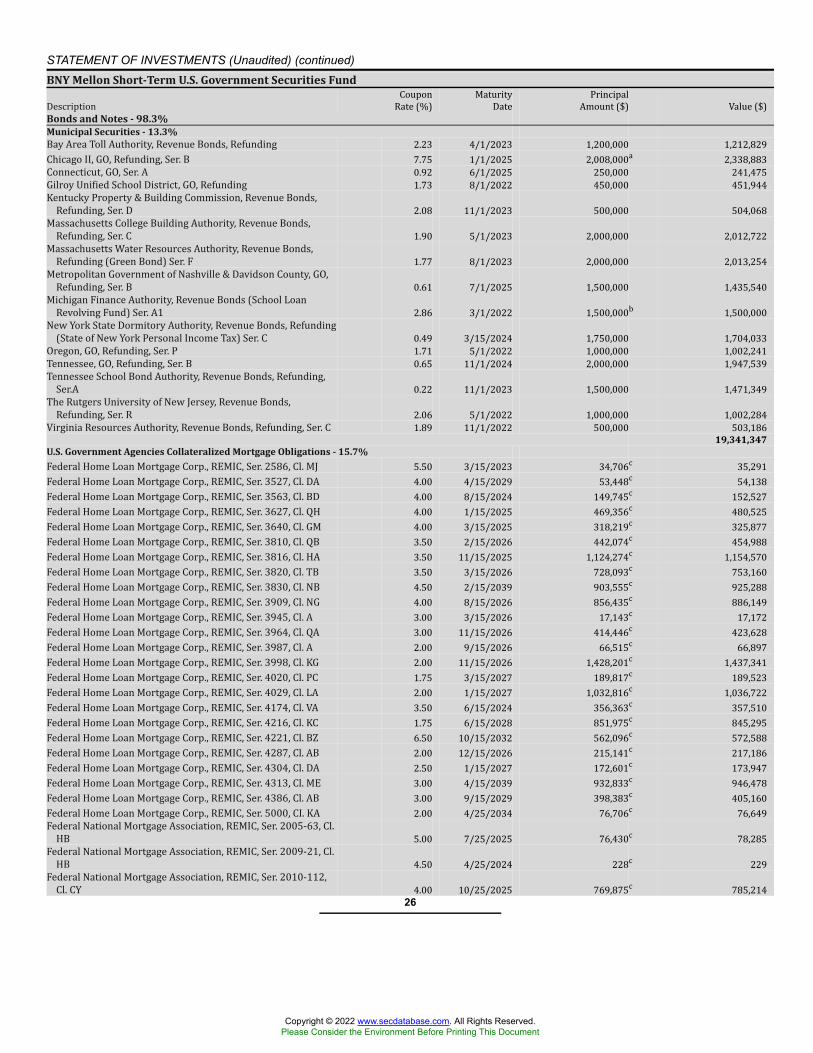
STATEMENT OF INVESTMENTS (Unaudited) (continued)BNY Mellon Short-Term U.S. Government Securities FundDescription CouponRate (%) MaturityDate PrincipalAmount ($) Value ($)Bonds and Notes - 98.3%Municipal Securities - 13.3%Bay Area Toll Authority, Revenue Bonds, Refunding 2.23 4/1/2023 1,200,000 1,212,829Chicago II, GO, Refunding, Ser. B 7.75 1/1/2025 2,008,000a 2,338,883Connecticut, GO, Ser. A 0.92 6/1/2025 250,000 241,475Gilroy Unified School District, GO, Refunding 1.73 8/1/2022 450,000 451,944Kentucky Property & Building Commission, Revenue Bonds,Refunding, Ser. D 2.08 11/1/2023 500,000 504,068Massachusetts College Building Authority, Revenue Bonds,Refunding, Ser. C 1.90 5/1/2023 2,000,000 2,012,722Massachusetts Water Resources Authority, Revenue Bonds,Refunding (Green Bond) Ser. F 1.77 8/1/2023 2,000,000 2,013,254Metropolitan Government of Nashville & Davidson County, GO,Refunding, Ser. B 0.61 7/1/2025 1,500,000 1,435,540Michigan Finance Authority, Revenue Bonds (School LoanRevolving Fund) Ser. A1 2.86 3/1/2022 1,500,000b 1,500,000New York State Dormitory Authority, Revenue Bonds, Refunding(State of New York Personal Income Tax) Ser. C 0.49 3/15/2024 1,750,000 1,704,033Oregon, GO, Refunding, Ser. P 1.71 5/1/2022 1,000,000 1,002,241Tennessee, GO, Refunding, Ser. B 0.65 11/1/2024 2,000,000 1,947,539Tennessee School Bond Authority, Revenue Bonds, Refunding,Ser.A 0.22 11/1/2023 1,500,000 1,471,349The Rutgers University of New Jersey, Revenue Bonds,Refunding, Ser. R 2.06 5/1/2022 1,000,000 1,002,284Virginia Resources Authority, Revenue Bonds, Refunding, Ser. C 1.89 11/1/2022 500,000 503,186
19,341,347U.S. Government Agencies Collateralized Mortgage Obligations - 15.7%Federal Home Loan Mortgage Corp., REMIC, Ser. 2586, Cl. MJ 5.50 3/15/2023 34,706c 35,291Federal Home Loan Mortgage Corp., REMIC, Ser. 3527, Cl. DA 4.00 4/15/2029 53,448c 54,138Federal Home Loan Mortgage Corp., REMIC, Ser. 3563, Cl. BD 4.00 8/15/2024 149,745c 152,527Federal Home Loan Mortgage Corp., REMIC, Ser. 3627, Cl. QH 4.00 1/15/2025 469,356c 480,525Federal Home Loan Mortgage Corp., REMIC, Ser. 3640, Cl. GM 4.00 3/15/2025 318,219c 325,877Federal Home Loan Mortgage Corp., REMIC, Ser. 3810, Cl. QB 3.50 2/15/2026 442,074c 454,988Federal Home Loan Mortgage Corp., REMIC, Ser. 3816, Cl. HA 3.50 11/15/2025 1,124,274c 1,154,570Federal Home Loan Mortgage Corp., REMIC, Ser. 3820, Cl. TB 3.50 3/15/2026 728,093c 753,160Federal Home Loan Mortgage Corp., REMIC, Ser. 3830, Cl. NB 4.50 2/15/2039 903,555c 925,288Federal Home Loan Mortgage Corp., REMIC, Ser. 3909, Cl. NG 4.00 8/15/2026 856,435c 886,149Federal Home Loan Mortgage Corp., REMIC, Ser. 3945, Cl. A 3.00 3/15/2026 17,143c 17,172Federal Home Loan Mortgage Corp., REMIC, Ser. 3964, Cl. QA 3.00 11/15/2026 414,446c 423,628Federal Home Loan Mortgage Corp., REMIC, Ser. 3987, Cl. A 2.00 9/15/2026 66,515c 66,897Federal Home Loan Mortgage Corp., REMIC, Ser. 3998, Cl. KG 2.00 11/15/2026 1,428,201c 1,437,341Federal Home Loan Mortgage Corp., REMIC, Ser. 4020, Cl. PC 1.75 3/15/2027 189,817c 189,523Federal Home Loan Mortgage Corp., REMIC, Ser. 4029, Cl. LA 2.00 1/15/2027 1,032,816c 1,036,722Federal Home Loan Mortgage Corp., REMIC, Ser. 4174, Cl. VA 3.50 6/15/2024 356,363c 357,510Federal Home Loan Mortgage Corp., REMIC, Ser. 4216, Cl. KC 1.75 6/15/2028 851,975c 845,295Federal Home Loan Mortgage Corp., REMIC, Ser. 4221, Cl. BZ 6.50 10/15/2032 562,096c 572,588Federal Home Loan Mortgage Corp., REMIC, Ser. 4287, Cl. AB 2.00 12/15/2026 215,141c 217,186Federal Home Loan Mortgage Corp., REMIC, Ser. 4304, Cl. DA 2.50 1/15/2027 172,601c 173,947Federal Home Loan Mortgage Corp., REMIC, Ser. 4313, Cl. ME 3.00 4/15/2039 932,833c 946,478Federal Home Loan Mortgage Corp., REMIC, Ser. 4386, Cl. AB 3.00 9/15/2029 398,383c 405,160Federal Home Loan Mortgage Corp., REMIC, Ser. 5000, CI. KA 2.00 4/25/2034 76,706c 76,649Federal National Mortgage Association, REMIC, Ser. 2005-63, Cl.HB 5.00 7/25/2025 76,430c 78,285Federal National Mortgage Association, REMIC, Ser. 2009-21, Cl.HB 4.50 4/25/2024 228c 229Federal National Mortgage Association, REMIC, Ser. 2010-112,Cl. CY 4.00 10/25/2025 769,875c 785,214
26
Copyright © 2022 www.secdatabase.com. All Rights Reserved.Please Consider the Environment Before Printing This Document
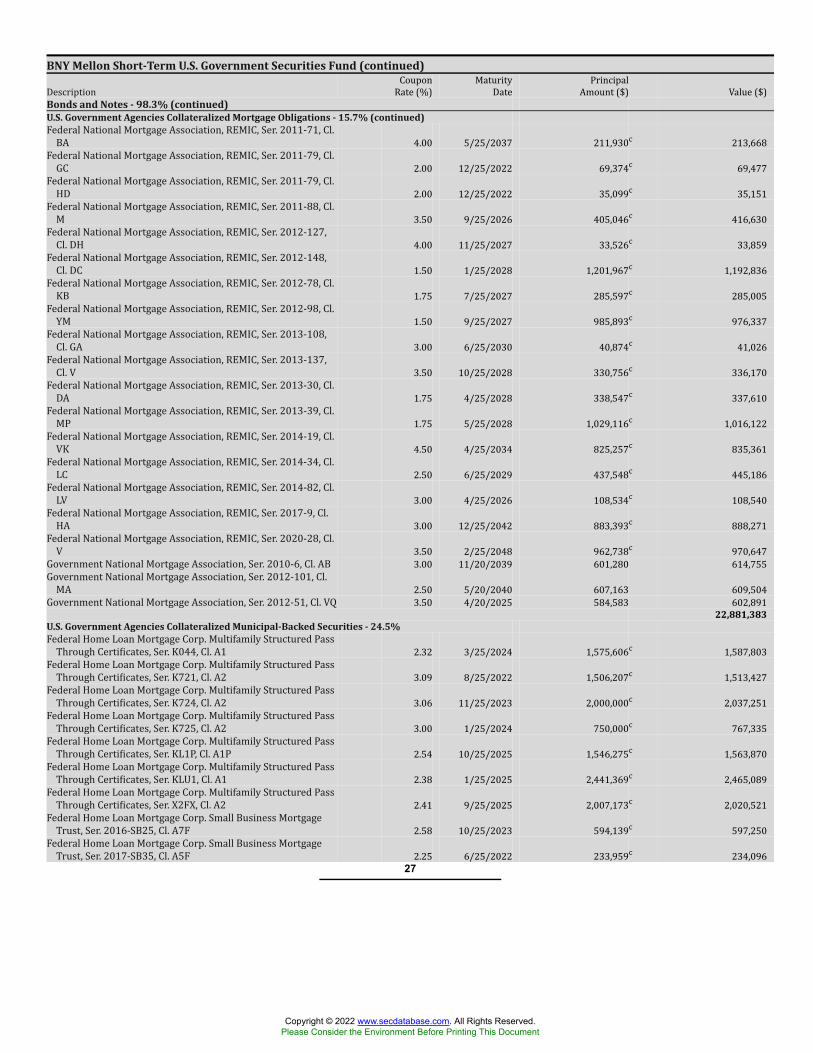
BNY Mellon Short-Term U.S. Government Securities Fund (continued)Description CouponRate (%) MaturityDate PrincipalAmount ($) Value ($)Bonds and Notes - 98.3% (continued)U.S. Government Agencies Collateralized Mortgage Obligations - 15.7% (continued)Federal National Mortgage Association, REMIC, Ser. 2011-71, Cl.BA 4.00 5/25/2037 211,930c 213,668Federal National Mortgage Association, REMIC, Ser. 2011-79, Cl.GC 2.00 12/25/2022 69,374c 69,477Federal National Mortgage Association, REMIC, Ser. 2011-79, Cl.HD 2.00 12/25/2022 35,099c 35,151Federal National Mortgage Association, REMIC, Ser. 2011-88, Cl.M 3.50 9/25/2026 405,046c 416,630Federal National Mortgage Association, REMIC, Ser. 2012-127,Cl. DH 4.00 11/25/2027 33,526c 33,859Federal National Mortgage Association, REMIC, Ser. 2012-148,Cl. DC 1.50 1/25/2028 1,201,967c 1,192,836Federal National Mortgage Association, REMIC, Ser. 2012-78, Cl.KB 1.75 7/25/2027 285,597c 285,005Federal National Mortgage Association, REMIC, Ser. 2012-98, Cl.YM 1.50 9/25/2027 985,893c 976,337Federal National Mortgage Association, REMIC, Ser. 2013-108,Cl. GA 3.00 6/25/2030 40,874c 41,026Federal National Mortgage Association, REMIC, Ser. 2013-137,Cl. V 3.50 10/25/2028 330,756c 336,170Federal National Mortgage Association, REMIC, Ser. 2013-30, Cl.DA 1.75 4/25/2028 338,547c 337,610Federal National Mortgage Association, REMIC, Ser. 2013-39, Cl.MP 1.75 5/25/2028 1,029,116c 1,016,122Federal National Mortgage Association, REMIC, Ser. 2014-19, Cl.VK 4.50 4/25/2034 825,257c 835,361Federal National Mortgage Association, REMIC, Ser. 2014-34, Cl.LC 2.50 6/25/2029 437,548c 445,186Federal National Mortgage Association, REMIC, Ser. 2014-82, Cl.LV 3.00 4/25/2026 108,534c 108,540Federal National Mortgage Association, REMIC, Ser. 2017-9, Cl.HA 3.00 12/25/2042 883,393c 888,271Federal National Mortgage Association, REMIC, Ser. 2020-28, Cl.V 3.50 2/25/2048 962,738c 970,647Government National Mortgage Association, Ser. 2010-6, Cl. AB 3.00 11/20/2039 601,280 614,755Government National Mortgage Association, Ser. 2012-101, Cl.MA 2.50 5/20/2040 607,163 609,504Government National Mortgage Association, Ser. 2012-51, Cl. VQ 3.50 4/20/2025 584,583 602,891
22,881,383U.S. Government Agencies Collateralized Municipal-Backed Securities - 24.5%Federal Home Loan Mortgage Corp. Multifamily Structured PassThrough Certificates, Ser. K044, Cl. A1 2.32 3/25/2024 1,575,606c 1,587,803Federal Home Loan Mortgage Corp. Multifamily Structured PassThrough Certificates, Ser. K721, Cl. A2 3.09 8/25/2022 1,506,207c 1,513,427Federal Home Loan Mortgage Corp. Multifamily Structured PassThrough Certificates, Ser. K724, Cl. A2 3.06 11/25/2023 2,000,000c 2,037,251Federal Home Loan Mortgage Corp. Multifamily Structured PassThrough Certificates, Ser. K725, Cl. A2 3.00 1/25/2024 750,000c 767,335Federal Home Loan Mortgage Corp. Multifamily Structured PassThrough Certificates, Ser. KL1P, Cl. A1P 2.54 10/25/2025 1,546,275c 1,563,870Federal Home Loan Mortgage Corp. Multifamily Structured PassThrough Certificates, Ser. KLU1, Cl. A1 2.38 1/25/2025 2,441,369c 2,465,089Federal Home Loan Mortgage Corp. Multifamily Structured PassThrough Certificates, Ser. X2FX, Cl. A2 2.41 9/25/2025 2,007,173c 2,020,521Federal Home Loan Mortgage Corp. Small Business MortgageTrust, Ser. 2016-SB25, Cl. A7F 2.58 10/25/2023 594,139c 597,250Federal Home Loan Mortgage Corp. Small Business MortgageTrust, Ser. 2017-SB35, Cl. A5F 2.25 6/25/2022 233,959c 234,096
27
Copyright © 2022 www.secdatabase.com. All Rights Reserved.Please Consider the Environment Before Printing This Document
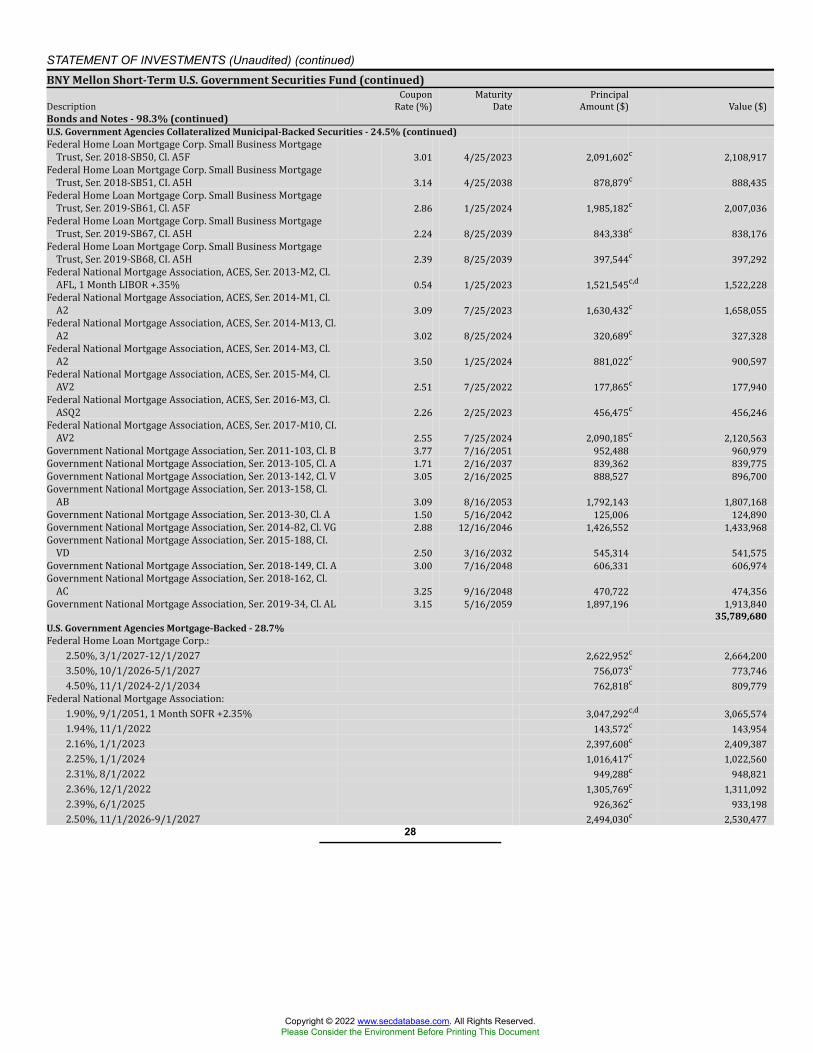
STATEMENT OF INVESTMENTS (Unaudited) (continued)BNY Mellon Short-Term U.S. Government Securities Fund (continued)Description CouponRate (%) MaturityDate PrincipalAmount ($) Value ($)Bonds and Notes - 98.3% (continued)U.S. Government Agencies Collateralized Municipal-Backed Securities - 24.5% (continued)Federal Home Loan Mortgage Corp. Small Business MortgageTrust, Ser. 2018-SB50, Cl. A5F 3.01 4/25/2023 2,091,602c 2,108,917Federal Home Loan Mortgage Corp. Small Business MortgageTrust, Ser. 2018-SB51, CI. A5H 3.14 4/25/2038 878,879c 888,435Federal Home Loan Mortgage Corp. Small Business MortgageTrust, Ser. 2019-SB61, Cl. A5F 2.86 1/25/2024 1,985,182c 2,007,036Federal Home Loan Mortgage Corp. Small Business MortgageTrust, Ser. 2019-SB67, CI. A5H 2.24 8/25/2039 843,338c 838,176Federal Home Loan Mortgage Corp. Small Business MortgageTrust, Ser. 2019-SB68, CI. A5H 2.39 8/25/2039 397,544c 397,292Federal National Mortgage Association, ACES, Ser. 2013-M2, Cl.AFL, 1 Month LIBOR +.35% 0.54 1/25/2023 1,521,545c,d 1,522,228Federal National Mortgage Association, ACES, Ser. 2014-M1, Cl.A2 3.09 7/25/2023 1,630,432c 1,658,055Federal National Mortgage Association, ACES, Ser. 2014-M13, Cl.A2 3.02 8/25/2024 320,689c 327,328Federal National Mortgage Association, ACES, Ser. 2014-M3, Cl.A2 3.50 1/25/2024 881,022c 900,597Federal National Mortgage Association, ACES, Ser. 2015-M4, Cl.AV2 2.51 7/25/2022 177,865c 177,940Federal National Mortgage Association, ACES, Ser. 2016-M3, Cl.ASQ2 2.26 2/25/2023 456,475c 456,246Federal National Mortgage Association, ACES, Ser. 2017-M10, CI.AV2 2.55 7/25/2024 2,090,185c 2,120,563Government National Mortgage Association, Ser. 2011-103, Cl. B 3.77 7/16/2051 952,488 960,979Government National Mortgage Association, Ser. 2013-105, Cl. A 1.71 2/16/2037 839,362 839,775Government National Mortgage Association, Ser. 2013-142, Cl. V 3.05 2/16/2025 888,527 896,700Government National Mortgage Association, Ser. 2013-158, Cl.AB 3.09 8/16/2053 1,792,143 1,807,168Government National Mortgage Association, Ser. 2013-30, Cl. A 1.50 5/16/2042 125,006 124,890Government National Mortgage Association, Ser. 2014-82, Cl. VG 2.88 12/16/2046 1,426,552 1,433,968Government National Mortgage Association, Ser. 2015-188, CI.VD 2.50 3/16/2032 545,314 541,575Government National Mortgage Association, Ser. 2018-149, CI. A 3.00 7/16/2048 606,331 606,974Government National Mortgage Association, Ser. 2018-162, Cl.AC 3.25 9/16/2048 470,722 474,356Government National Mortgage Association, Ser. 2019-34, Cl. AL 3.15 5/16/2059 1,897,196 1,913,840
35,789,680U.S. Government Agencies Mortgage-Backed - 28.7%Federal Home Loan Mortgage Corp.:2.50%, 3/1/2027-12/1/2027 2,622,952c 2,664,2003.50%, 10/1/2026-5/1/2027 756,073c 773,7464.50%, 11/1/2024-2/1/2034 762,818c 809,779Federal National Mortgage Association:1.90%, 9/1/2051, 1 Month SOFR +2.35% 3,047,292c,d 3,065,5741.94%, 11/1/2022 143,572c 143,9542.16%, 1/1/2023 2,397,608c 2,409,3872.25%, 1/1/2024 1,016,417c 1,022,5602.31%, 8/1/2022 949,288c 948,8212.36%, 12/1/2022 1,305,769c 1,311,0922.39%, 6/1/2025 926,362c 933,1982.50%, 11/1/2026-9/1/2027 2,494,030c 2,530,477
28
Copyright © 2022 www.secdatabase.com. All Rights Reserved.Please Consider the Environment Before Printing This Document
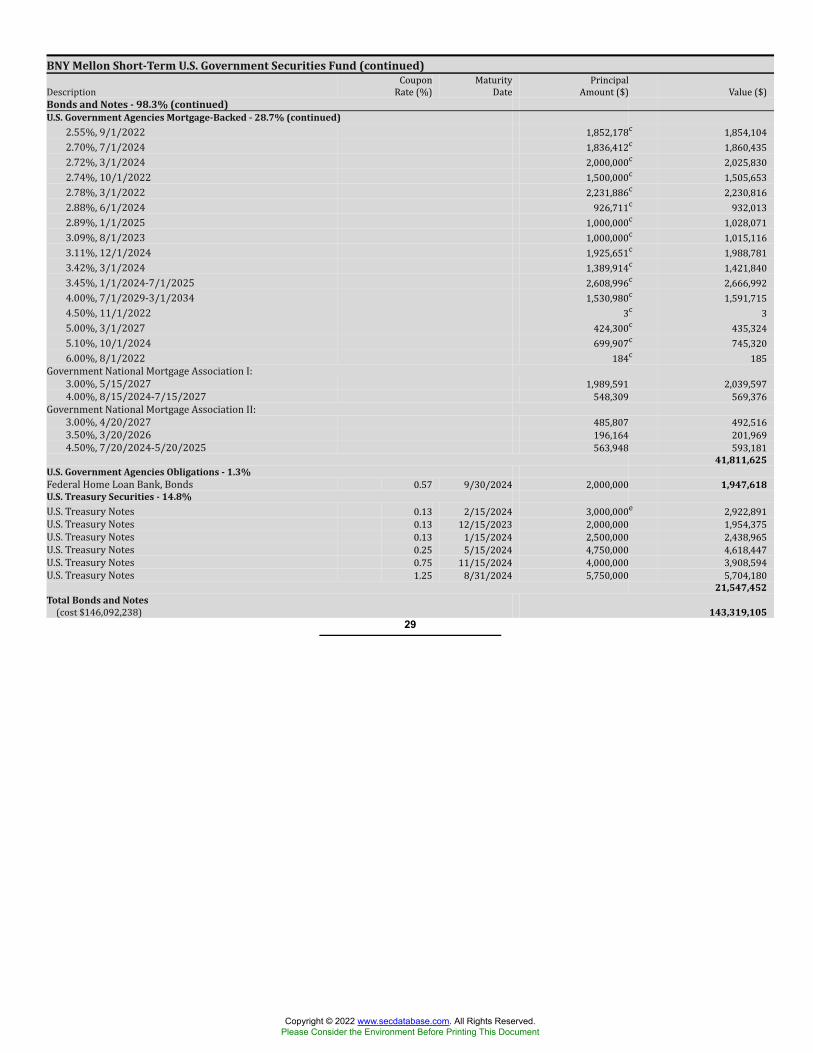
BNY Mellon Short-Term U.S. Government Securities Fund (continued)Description CouponRate (%) MaturityDate PrincipalAmount ($) Value ($)Bonds and Notes - 98.3% (continued)U.S. Government Agencies Mortgage-Backed - 28.7% (continued)2.55%, 9/1/2022 1,852,178c 1,854,1042.70%, 7/1/2024 1,836,412c 1,860,4352.72%, 3/1/2024 2,000,000c 2,025,8302.74%, 10/1/2022 1,500,000c 1,505,6532.78%, 3/1/2022 2,231,886c 2,230,8162.88%, 6/1/2024 926,711c 932,0132.89%, 1/1/2025 1,000,000c 1,028,0713.09%, 8/1/2023 1,000,000c 1,015,1163.11%, 12/1/2024 1,925,651c 1,988,7813.42%, 3/1/2024 1,389,914c 1,421,8403.45%, 1/1/2024-7/1/2025 2,608,996c 2,666,9924.00%, 7/1/2029-3/1/2034 1,530,980c 1,591,7154.50%, 11/1/2022 3c 35.00%, 3/1/2027 424,300c 435,3245.10%, 10/1/2024 699,907c 745,3206.00%, 8/1/2022 184c 185Government National Mortgage Association I:3.00%, 5/15/2027 1,989,591 2,039,5974.00%, 8/15/2024-7/15/2027 548,309 569,376Government National Mortgage Association II:3.00%, 4/20/2027 485,807 492,5163.50%, 3/20/2026 196,164 201,9694.50%, 7/20/2024-5/20/2025 563,948 593,181
41,811,625U.S. Government Agencies Obligations - 1.3%Federal Home Loan Bank, Bonds 0.57 9/30/2024 2,000,000 1,947,618U.S. Treasury Securities - 14.8%U.S. Treasury Notes 0.13 2/15/2024 3,000,000e 2,922,891U.S. Treasury Notes 0.13 12/15/2023 2,000,000 1,954,375U.S. Treasury Notes 0.13 1/15/2024 2,500,000 2,438,965U.S. Treasury Notes 0.25 5/15/2024 4,750,000 4,618,447U.S. Treasury Notes 0.75 11/15/2024 4,000,000 3,908,594U.S. Treasury Notes 1.25 8/31/2024 5,750,000 5,704,180
21,547,452Total Bonds and Notes(cost $146,092,238) 143,319,105
29
Copyright © 2022 www.secdatabase.com. All Rights Reserved.Please Consider the Environment Before Printing This Document
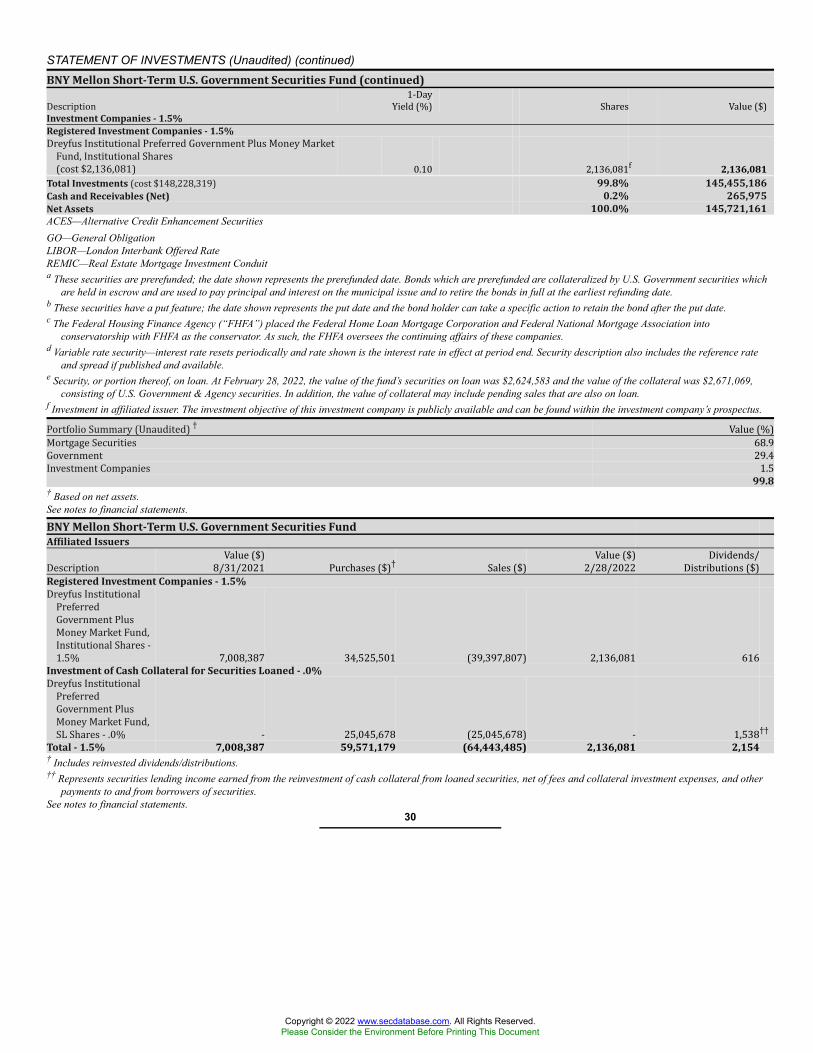
STATEMENT OF INVESTMENTS (Unaudited) (continued)BNY Mellon Short-Term U.S. Government Securities Fund (continued)Description 1-DayYield (%) Shares Value ($)Investment Companies - 1.5%Registered Investment Companies - 1.5%Dreyfus Institutional Preferred Government Plus Money MarketFund, Institutional Shares(cost $2,136,081) 0.10 2,136,081f 2,136,081Total Investments (cost $148,228,319) 99.8% 145,455,186Cash and Receivables (Net) 0.2% 265,975Net Assets 100.0% 145,721,161ACES—Alternative Credit Enhancement SecuritiesGO—General ObligationLIBOR—London Interbank Offered RateREMIC—Real Estate Mortgage Investment Conduita These securities are prerefunded; the date shown represents the prerefunded date. Bonds which are prerefunded are collateralized by U.S. Government securities which
are held in escrow and are used to pay principal and interest on the municipal issue and to retire the bonds in full at the earliest refunding date.b These securities have a put feature; the date shown represents the put date and the bond holder can take a specific action to retain the bond after the put date.c The Federal Housing Finance Agency (“FHFA”) placed the Federal Home Loan Mortgage Corporation and Federal National Mortgage Association into
conservatorship with FHFA as the conservator. As such, the FHFA oversees the continuing affairs of these companies.d Variable rate security—interest rate resets periodically and rate shown is the interest rate in effect at period end. Security description also includes the reference rate
and spread if published and available.e Security, or portion thereof, on loan. At February 28, 2022, the value of the fund’s securities on loan was $2,624,583 and the value of the collateral was $2,671,069,
consisting of U.S. Government & Agency securities. In addition, the value of collateral may include pending sales that are also on loan.f Investment in affiliated issuer. The investment objective of this investment company is publicly available and can be found within the investment company’s prospectus.Portfolio Summary (Unaudited) † Value (%)Mortgage Securities 68.9Government 29.4Investment Companies 1.5
99.8† Based on net assets.See notes to financial statements.
BNY Mellon Short-Term U.S. Government Securities FundAffiliated IssuersDescription Value ($)8/31/2021 Purchases ($)† Sales ($) Value ($)2/28/2022 Dividends/Distributions ($)Registered Investment Companies - 1.5%Dreyfus InstitutionalPreferredGovernment PlusMoney Market Fund,Institutional Shares -1.5% 7,008,387 34,525,501 (39,397,807) 2,136,081 616Investment of Cash Collateral for Securities Loaned - .0%Dreyfus InstitutionalPreferredGovernment PlusMoney Market Fund,SL Shares - .0% - 25,045,678 (25,045,678) - 1,538††Total - 1.5% 7,008,387 59,571,179 (64,443,485) 2,136,081 2,154† Includes reinvested dividends/distributions.†† Represents securities lending income earned from the reinvestment of cash collateral from loaned securities, net of fees and collateral investment expenses, and other
payments to and from borrowers of securities.See notes to financial statements.
30
Copyright © 2022 www.secdatabase.com. All Rights Reserved.Please Consider the Environment Before Printing This Document
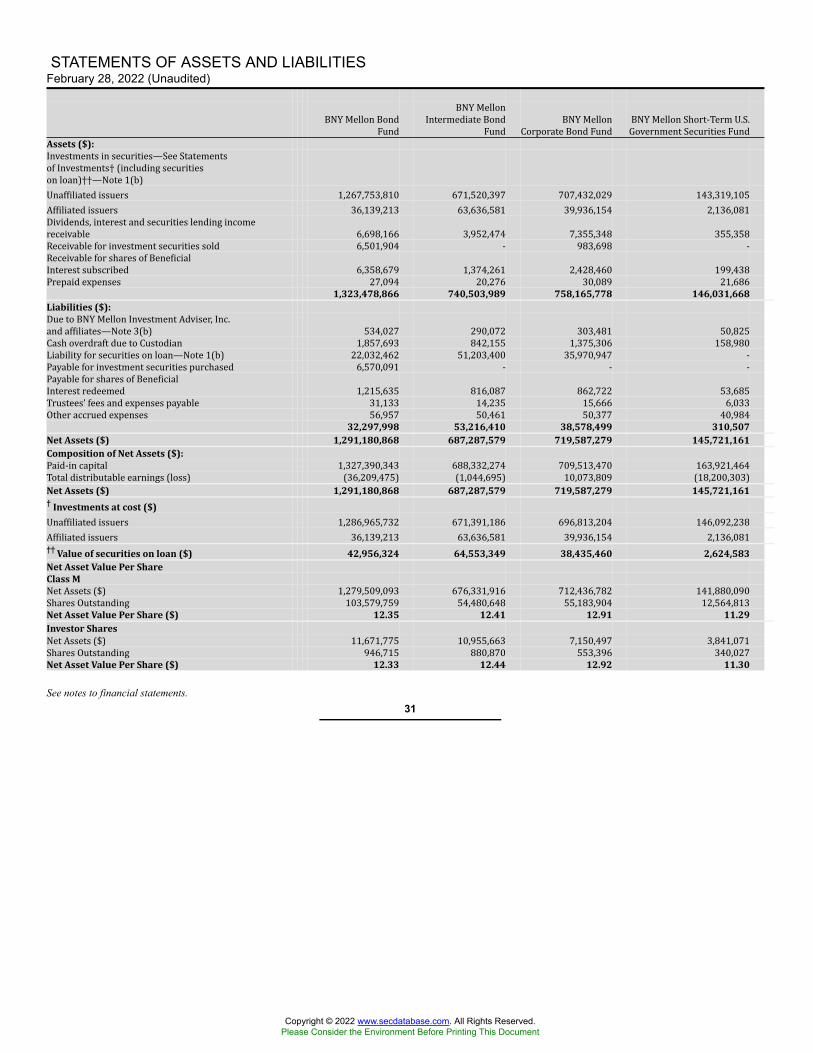
STATEMENTS OF ASSETS AND LIABILITIESFebruary 28, 2022 (Unaudited)
BNY Mellon BondFund BNY MellonIntermediate BondFund BNY MellonCorporate Bond Fund BNY Mellon Short-Term U.S.Government Securities FundAssets ($):Investments in securities—See Statementsof Investments† (including securitieson loan)††—Note 1(b)Unaffiliated issuers 1,267,753,810 671,520,397 707,432,029 143,319,105Affiliated issuers 36,139,213 63,636,581 39,936,154 2,136,081Dividends, interest and securities lending incomereceivable 6,698,166 3,952,474 7,355,348 355,358Receivable for investment securities sold 6,501,904 - 983,698 -Receivable for shares of BeneficialInterest subscribed 6,358,679 1,374,261 2,428,460 199,438Prepaid expenses 27,094 20,276 30,089 21,686
1,323,478,866 740,503,989 758,165,778 146,031,668Liabilities ($):Due to BNY Mellon Investment Adviser, Inc.and affiliates—Note 3(b) 534,027 290,072 303,481 50,825Cash overdraft due to Custodian 1,857,693 842,155 1,375,306 158,980Liability for securities on loan—Note 1(b) 22,032,462 51,203,400 35,970,947 -Payable for investment securities purchased 6,570,091 - - -Payable for shares of BeneficialInterest redeemed 1,215,635 816,087 862,722 53,685Trustees’ fees and expenses payable 31,133 14,235 15,666 6,033Other accrued expenses 56,957 50,461 50,377 40,984
32,297,998 53,216,410 38,578,499 310,507Net Assets ($) 1,291,180,868 687,287,579 719,587,279 145,721,161Composition of Net Assets ($):Paid-in capital 1,327,390,343 688,332,274 709,513,470 163,921,464Total distributable earnings (loss) (36,209,475) (1,044,695) 10,073,809 (18,200,303)Net Assets ($) 1,291,180,868 687,287,579 719,587,279 145,721,161† Investments at cost ($)Unaffiliated issuers 1,286,965,732 671,391,186 696,813,204 146,092,238Affiliated issuers 36,139,213 63,636,581 39,936,154 2,136,081†† Value of securities on loan ($) 42,956,324 64,553,349 38,435,460 2,624,583Net Asset Value Per ShareClass MNet Assets ($) 1,279,509,093 676,331,916 712,436,782 141,880,090Shares Outstanding 103,579,759 54,480,648 55,183,904 12,564,813Net Asset Value Per Share ($) 12.35 12.41 12.91 11.29Investor SharesNet Assets ($) 11,671,775 10,955,663 7,150,497 3,841,071Shares Outstanding 946,715 880,870 553,396 340,027Net Asset Value Per Share ($) 12.33 12.44 12.92 11.30
See notes to financial statements.31
Copyright © 2022 www.secdatabase.com. All Rights Reserved.Please Consider the Environment Before Printing This Document
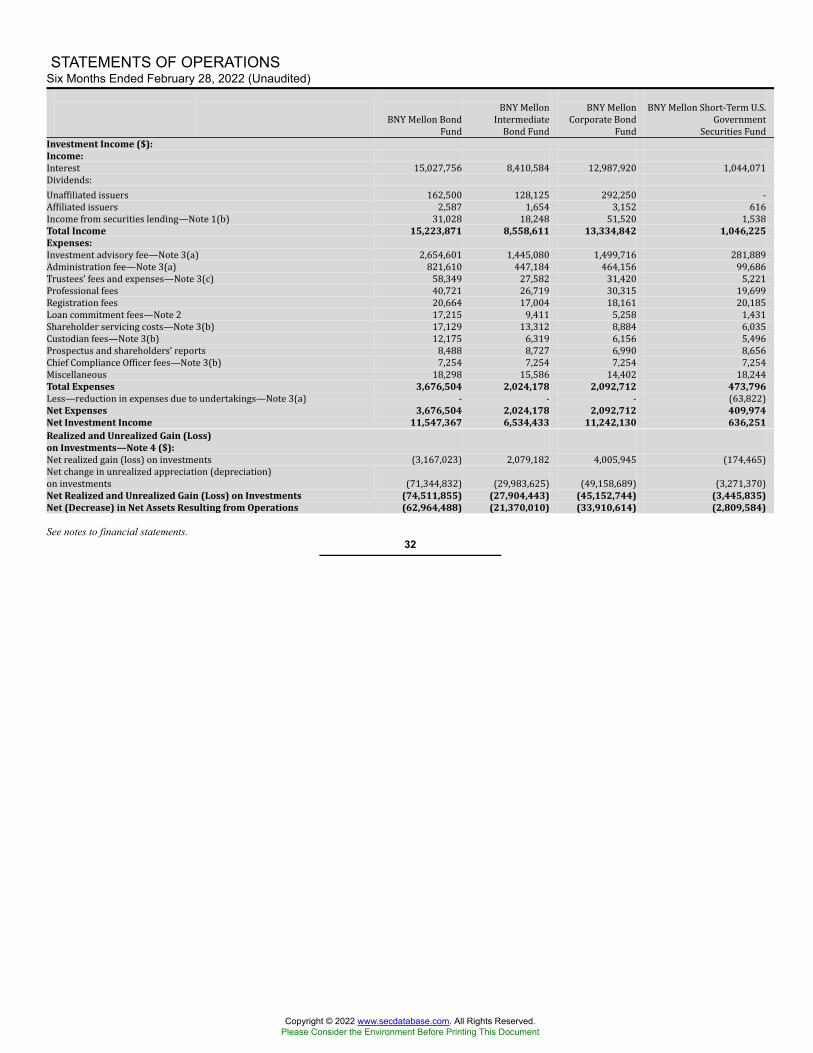
STATEMENTS OF OPERATIONSSix Months Ended February 28, 2022 (Unaudited)
BNY Mellon BondFund BNY MellonIntermediateBond Fund BNY MellonCorporate BondFund BNY Mellon Short-Term U.S.GovernmentSecurities FundInvestment Income ($):Income:Interest 15,027,756 8,410,584 12,987,920 1,044,071Dividends:Unaffiliated issuers 162,500 128,125 292,250 -Affiliated issuers 2,587 1,654 3,152 616Income from securities lending—Note 1(b) 31,028 18,248 51,520 1,538Total Income 15,223,871 8,558,611 13,334,842 1,046,225Expenses:Investment advisory fee—Note 3(a) 2,654,601 1,445,080 1,499,716 281,889Administration fee—Note 3(a) 821,610 447,184 464,156 99,686Trustees’ fees and expenses—Note 3(c) 58,349 27,582 31,420 5,221Professional fees 40,721 26,719 30,315 19,699Registration fees 20,664 17,004 18,161 20,185Loan commitment fees—Note 2 17,215 9,411 5,258 1,431Shareholder servicing costs—Note 3(b) 17,129 13,312 8,884 6,035Custodian fees—Note 3(b) 12,175 6,319 6,156 5,496Prospectus and shareholders’ reports 8,488 8,727 6,990 8,656Chief Compliance Officer fees—Note 3(b) 7,254 7,254 7,254 7,254Miscellaneous 18,298 15,586 14,402 18,244Total Expenses 3,676,504 2,024,178 2,092,712 473,796Less—reduction in expenses due to undertakings—Note 3(a) - - - (63,822)Net Expenses 3,676,504 2,024,178 2,092,712 409,974Net Investment Income 11,547,367 6,534,433 11,242,130 636,251Realized and Unrealized Gain (Loss)on Investments—Note 4 ($):Net realized gain (loss) on investments (3,167,023) 2,079,182 4,005,945 (174,465)Net change in unrealized appreciation (depreciation)on investments (71,344,832) (29,983,625) (49,158,689) (3,271,370)Net Realized and Unrealized Gain (Loss) on Investments (74,511,855) (27,904,443) (45,152,744) (3,445,835)Net (Decrease) in Net Assets Resulting from Operations (62,964,488) (21,370,010) (33,910,614) (2,809,584)
See notes to financial statements.32
Copyright © 2022 www.secdatabase.com. All Rights Reserved.Please Consider the Environment Before Printing This Document
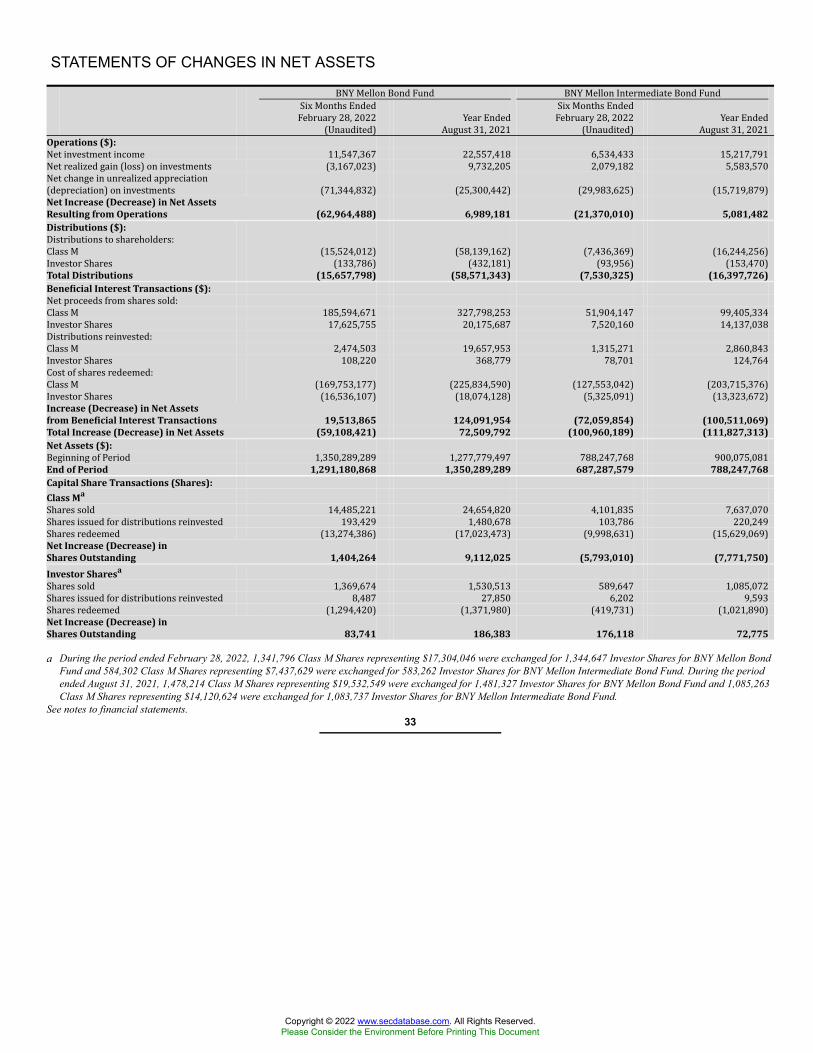
STATEMENTS OF CHANGES IN NET ASSETS
BNY Mellon Bond Fund BNY Mellon Intermediate Bond FundSix Months EndedFebruary 28, 2022(Unaudited) Year EndedAugust 31, 2021 Six Months EndedFebruary 28, 2022(Unaudited) Year EndedAugust 31, 2021Operations ($):Net investment income 11,547,367 22,557,418 6,534,433 15,217,791Net realized gain (loss) on investments (3,167,023) 9,732,205 2,079,182 5,583,570Net change in unrealized appreciation(depreciation) on investments (71,344,832) (25,300,442) (29,983,625) (15,719,879)Net Increase (Decrease) in Net AssetsResulting from Operations (62,964,488) 6,989,181 (21,370,010) 5,081,482Distributions ($):Distributions to shareholders:Class M (15,524,012) (58,139,162) (7,436,369) (16,244,256)Investor Shares (133,786) (432,181) (93,956) (153,470)Total Distributions (15,657,798) (58,571,343) (7,530,325) (16,397,726)Beneficial Interest Transactions ($):Net proceeds from shares sold:Class M 185,594,671 327,798,253 51,904,147 99,405,334Investor Shares 17,625,755 20,175,687 7,520,160 14,137,038Distributions reinvested:Class M 2,474,503 19,657,953 1,315,271 2,860,843Investor Shares 108,220 368,779 78,701 124,764Cost of shares redeemed:Class M (169,753,177) (225,834,590) (127,553,042) (203,715,376)Investor Shares (16,536,107) (18,074,128) (5,325,091) (13,323,672)Increase (Decrease) in Net Assetsfrom Beneficial Interest Transactions 19,513,865 124,091,954 (72,059,854) (100,511,069)Total Increase (Decrease) in Net Assets (59,108,421) 72,509,792 (100,960,189) (111,827,313)Net Assets ($):Beginning of Period 1,350,289,289 1,277,779,497 788,247,768 900,075,081End of Period 1,291,180,868 1,350,289,289 687,287,579 788,247,768Capital Share Transactions (Shares):Class MaShares sold 14,485,221 24,654,820 4,101,835 7,637,070Shares issued for distributions reinvested 193,429 1,480,678 103,786 220,249Shares redeemed (13,274,386) (17,023,473) (9,998,631) (15,629,069)Net Increase (Decrease) inShares Outstanding 1,404,264 9,112,025 (5,793,010) (7,771,750)Investor SharesaShares sold 1,369,674 1,530,513 589,647 1,085,072Shares issued for distributions reinvested 8,487 27,850 6,202 9,593Shares redeemed (1,294,420) (1,371,980) (419,731) (1,021,890)Net Increase (Decrease) inShares Outstanding 83,741 186,383 176,118 72,775
a During the period ended February 28, 2022, 1,341,796 Class M Shares representing $17,304,046 were exchanged for 1,344,647 Investor Shares for BNY Mellon BondFund and 584,302 Class M Shares representing $7,437,629 were exchanged for 583,262 Investor Shares for BNY Mellon Intermediate Bond Fund. During the periodended August 31, 2021, 1,478,214 Class M Shares representing $19,532,549 were exchanged for 1,481,327 Investor Shares for BNY Mellon Bond Fund and 1,085,263Class M Shares representing $14,120,624 were exchanged for 1,083,737 Investor Shares for BNY Mellon Intermediate Bond Fund.
See notes to financial statements.33
Copyright © 2022 www.secdatabase.com. All Rights Reserved.Please Consider the Environment Before Printing This Document
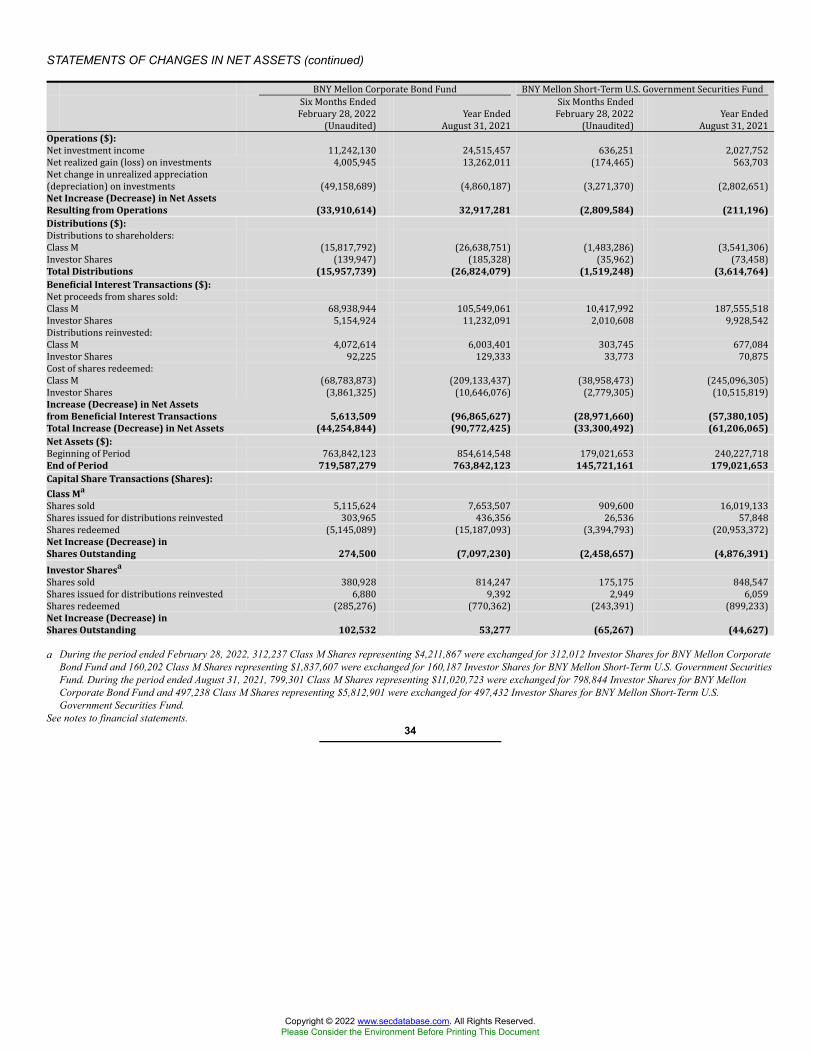
STATEMENTS OF CHANGES IN NET ASSETS (continued)
BNY Mellon Corporate Bond Fund BNY Mellon Short-Term U.S. Government Securities FundSix Months EndedFebruary 28, 2022(Unaudited) Year EndedAugust 31, 2021 Six Months EndedFebruary 28, 2022(Unaudited) Year EndedAugust 31, 2021Operations ($):Net investment income 11,242,130 24,515,457 636,251 2,027,752Net realized gain (loss) on investments 4,005,945 13,262,011 (174,465) 563,703Net change in unrealized appreciation(depreciation) on investments (49,158,689) (4,860,187) (3,271,370) (2,802,651)Net Increase (Decrease) in Net AssetsResulting from Operations (33,910,614) 32,917,281 (2,809,584) (211,196)Distributions ($):Distributions to shareholders:Class M (15,817,792) (26,638,751) (1,483,286) (3,541,306)Investor Shares (139,947) (185,328) (35,962) (73,458)Total Distributions (15,957,739) (26,824,079) (1,519,248) (3,614,764)Beneficial Interest Transactions ($):Net proceeds from shares sold:Class M 68,938,944 105,549,061 10,417,992 187,555,518Investor Shares 5,154,924 11,232,091 2,010,608 9,928,542Distributions reinvested:Class M 4,072,614 6,003,401 303,745 677,084Investor Shares 92,225 129,333 33,773 70,875Cost of shares redeemed:Class M (68,783,873) (209,133,437) (38,958,473) (245,096,305)Investor Shares (3,861,325) (10,646,076) (2,779,305) (10,515,819)Increase (Decrease) in Net Assetsfrom Beneficial Interest Transactions 5,613,509 (96,865,627) (28,971,660) (57,380,105)Total Increase (Decrease) in Net Assets (44,254,844) (90,772,425) (33,300,492) (61,206,065)Net Assets ($):Beginning of Period 763,842,123 854,614,548 179,021,653 240,227,718End of Period 719,587,279 763,842,123 145,721,161 179,021,653Capital Share Transactions (Shares):Class MaShares sold 5,115,624 7,653,507 909,600 16,019,133Shares issued for distributions reinvested 303,965 436,356 26,536 57,848Shares redeemed (5,145,089) (15,187,093) (3,394,793) (20,953,372)Net Increase (Decrease) inShares Outstanding 274,500 (7,097,230) (2,458,657) (4,876,391)Investor SharesaShares sold 380,928 814,247 175,175 848,547Shares issued for distributions reinvested 6,880 9,392 2,949 6,059Shares redeemed (285,276) (770,362) (243,391) (899,233)Net Increase (Decrease) inShares Outstanding 102,532 53,277 (65,267) (44,627)
a During the period ended February 28, 2022, 312,237 Class M Shares representing $4,211,867 were exchanged for 312,012 Investor Shares for BNY Mellon CorporateBond Fund and 160,202 Class M Shares representing $1,837,607 were exchanged for 160,187 Investor Shares for BNY Mellon Short-Term U.S. Government SecuritiesFund. During the period ended August 31, 2021, 799,301 Class M Shares representing $11,020,723 were exchanged for 798,844 Investor Shares for BNY MellonCorporate Bond Fund and 497,238 Class M Shares representing $5,812,901 were exchanged for 497,432 Investor Shares for BNY Mellon Short-Term U.S.Government Securities Fund.
See notes to financial statements.34
Copyright © 2022 www.secdatabase.com. All Rights Reserved.Please Consider the Environment Before Printing This Document
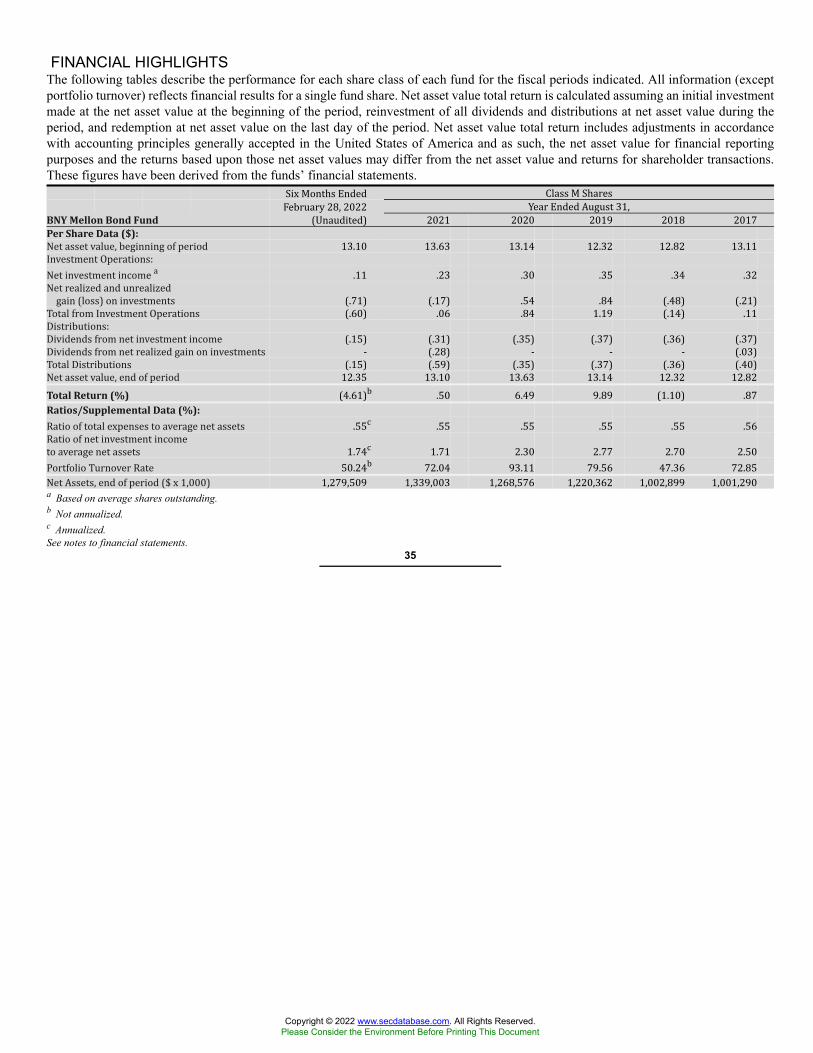
FINANCIAL HIGHLIGHTSThe following tables describe the performance for each share class of each fund for the fiscal periods indicated. All information (exceptportfolio turnover) reflects financial results for a single fund share. Net asset value total return is calculated assuming an initial investmentmade at the net asset value at the beginning of the period, reinvestment of all dividends and distributions at net asset value during theperiod, and redemption at net asset value on the last day of the period. Net asset value total return includes adjustments in accordancewith accounting principles generally accepted in the United States of America and as such, the net asset value for financial reportingpurposes and the returns based upon those net asset values may differ from the net asset value and returns for shareholder transactions.These figures have been derived from the funds’ financial statements.Six Months Ended Class M SharesFebruary 28, 2022 Year Ended August 31,BNY Mellon Bond Fund (Unaudited) 2021 2020 2019 2018 2017Per Share Data ($):Net asset value, beginning of period 13.10 13.63 13.14 12.32 12.82 13.11Investment Operations:Net investment income a .11 .23 .30 .35 .34 .32Net realized and unrealizedgain (loss) on investments (.71) (.17) .54 .84 (.48) (.21)Total from Investment Operations (.60) .06 .84 1.19 (.14) .11Distributions:Dividends from net investment income (.15) (.31) (.35) (.37) (.36) (.37)Dividends from net realized gain on investments - (.28) - - - (.03)Total Distributions (.15) (.59) (.35) (.37) (.36) (.40)Net asset value, end of period 12.35 13.10 13.63 13.14 12.32 12.82Total Return (%) (4.61)b .50 6.49 9.89 (1.10) .87Ratios/Supplemental Data (%):Ratio of total expenses to average net assets .55c .55 .55 .55 .55 .56Ratio of net investment incometo average net assets 1.74c 1.71 2.30 2.77 2.70 2.50Portfolio Turnover Rate 50.24b 72.04 93.11 79.56 47.36 72.85Net Assets, end of period ($ x 1,000) 1,279,509 1,339,003 1,268,576 1,220,362 1,002,899 1,001,290a Based on average shares outstanding.b Not annualized.c Annualized.See notes to financial statements.
35
Copyright © 2022 www.secdatabase.com. All Rights Reserved.Please Consider the Environment Before Printing This Document

FINANCIAL HIGHLIGHTS (continued) Six Months Ended Investor SharesFebruary 28, 2022 Year Ended August 31,BNY Mellon Bond Fund (Unaudited) 2021 2020 2019 2018 2017Per Share Data ($):Net asset value, beginning of period 13.08 13.60 13.11 12.29 12.79 13.08Investment Operations:Net investment income a .10 .20 .28 .32 .31 .28Net realized and unrealizedgain (loss) on investments (.72) (.16) .52 .84 (.48) (.21)Total from Investment Operations (.62) .04 .80 1.16 (.17) .07Distributions:Dividends from net investment income (.13) (.28) (.31) (.34) (.33) (.33)Dividends from net realized gain on investments - (.28) - - - (.03)Total Distributions (.13) (.56) (.31) (.34) (.33) (.36)Net asset value, end of period 12.33 13.08 13.60 13.11 12.29 12.79Total Return (%) (4.75)b .30 6.22 9.60 (1.35) .63Ratios/Supplemental Data (%):Ratio of total expenses to average net assets .80c .80 .80 .80 .80 .81Ratio of net investment incometo average net assets 1.49c 1.46 2.08 2.47 2.46 2.24Portfolio Turnover Rate 50.24b 72.04 93.11 79.56 47.36 72.85Net Assets, end of period ($ x 1,000) 11,672 11,286 9,204 8,697 6,944 9,613a Based on average shares outstanding.b Not annualized.c Annualized.See notes to financial statements.
36
Copyright © 2022 www.secdatabase.com. All Rights Reserved.Please Consider the Environment Before Printing This Document
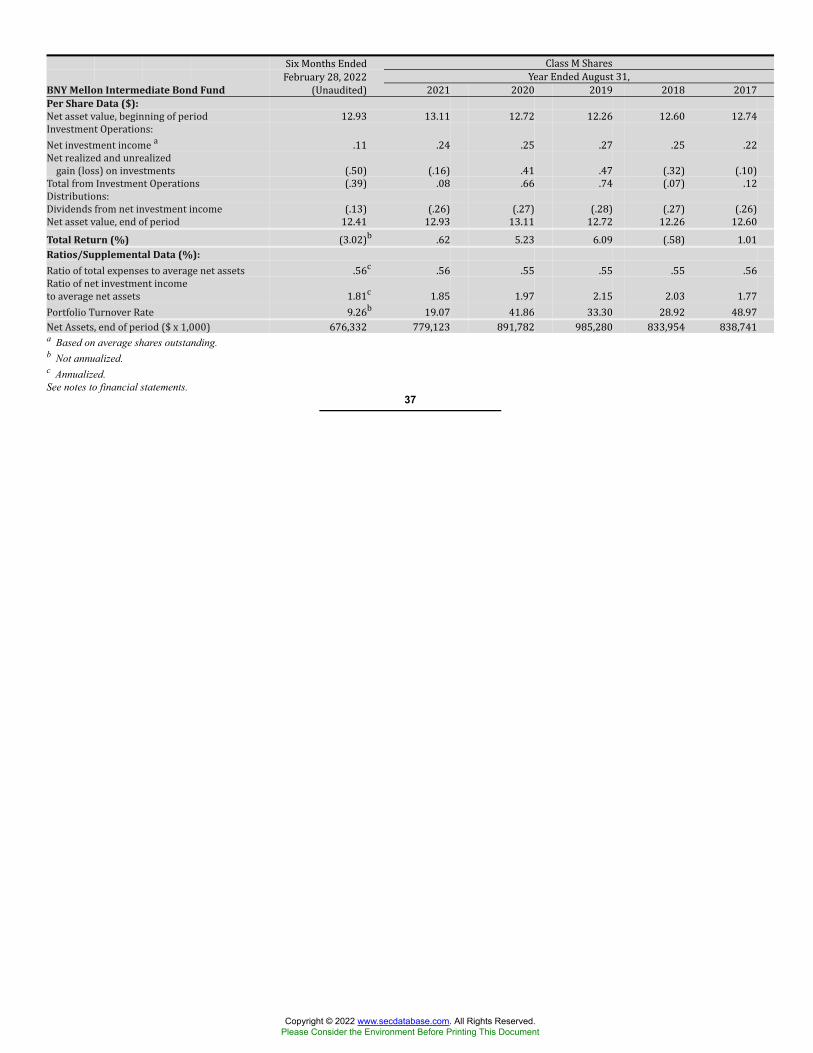
Six Months Ended Class M SharesFebruary 28, 2022 Year Ended August 31,BNY Mellon Intermediate Bond Fund (Unaudited) 2021 2020 2019 2018 2017Per Share Data ($):Net asset value, beginning of period 12.93 13.11 12.72 12.26 12.60 12.74Investment Operations:Net investment income a .11 .24 .25 .27 .25 .22Net realized and unrealizedgain (loss) on investments (.50) (.16) .41 .47 (.32) (.10)Total from Investment Operations (.39) .08 .66 .74 (.07) .12Distributions:Dividends from net investment income (.13) (.26) (.27) (.28) (.27) (.26)Net asset value, end of period 12.41 12.93 13.11 12.72 12.26 12.60Total Return (%) (3.02)b .62 5.23 6.09 (.58) 1.01Ratios/Supplemental Data (%):Ratio of total expenses to average net assets .56c .56 .55 .55 .55 .56Ratio of net investment incometo average net assets 1.81c 1.85 1.97 2.15 2.03 1.77Portfolio Turnover Rate 9.26b 19.07 41.86 33.30 28.92 48.97Net Assets, end of period ($ x 1,000) 676,332 779,123 891,782 985,280 833,954 838,741a Based on average shares outstanding.b Not annualized.c Annualized.See notes to financial statements.
37
Copyright © 2022 www.secdatabase.com. All Rights Reserved.Please Consider the Environment Before Printing This Document
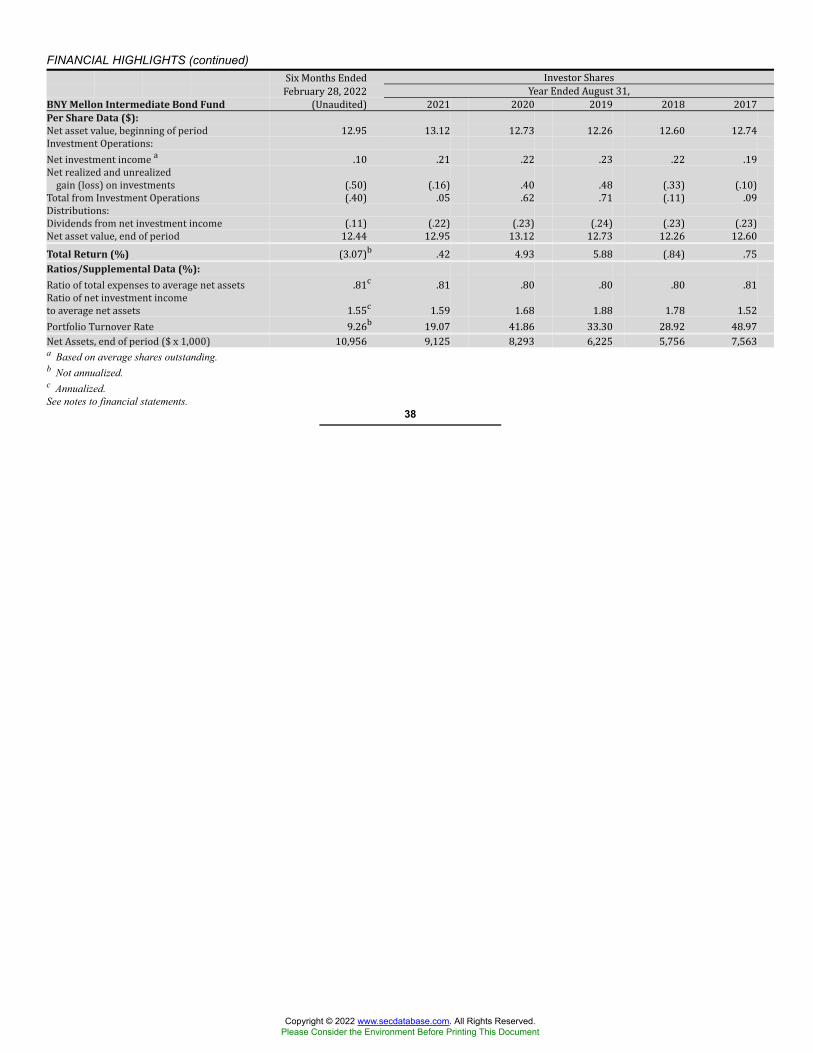
FINANCIAL HIGHLIGHTS (continued) Six Months Ended Investor SharesFebruary 28, 2022 Year Ended August 31,BNY Mellon Intermediate Bond Fund (Unaudited) 2021 2020 2019 2018 2017Per Share Data ($):Net asset value, beginning of period 12.95 13.12 12.73 12.26 12.60 12.74Investment Operations:Net investment income a .10 .21 .22 .23 .22 .19Net realized and unrealizedgain (loss) on investments (.50) (.16) .40 .48 (.33) (.10)Total from Investment Operations (.40) .05 .62 .71 (.11) .09Distributions:Dividends from net investment income (.11) (.22) (.23) (.24) (.23) (.23)Net asset value, end of period 12.44 12.95 13.12 12.73 12.26 12.60Total Return (%) (3.07)b .42 4.93 5.88 (.84) .75Ratios/Supplemental Data (%):Ratio of total expenses to average net assets .81c .81 .80 .80 .80 .81Ratio of net investment incometo average net assets 1.55c 1.59 1.68 1.88 1.78 1.52Portfolio Turnover Rate 9.26b 19.07 41.86 33.30 28.92 48.97Net Assets, end of period ($ x 1,000) 10,956 9,125 8,293 6,225 5,756 7,563a Based on average shares outstanding.b Not annualized.c Annualized.See notes to financial statements.
38
Copyright © 2022 www.secdatabase.com. All Rights Reserved.Please Consider the Environment Before Printing This Document

Six Months Ended Class M SharesFebruary 28, 2022 Year Ended August 31,BNY Mellon Corporate Bond Fund (Unaudited) 2021 2020 2019 2018 2017Per Share Data ($):Net asset value, beginning of period 13.80 13.69 13.36 12.52 13.06 13.07Investment Operations:Net investment income a .20 .43 .45 .46 .44 .42Net realized and unrealizedgain (loss) on investments (.80) .15 .35 .86 (.50) .05Total from Investment Operations (.60) .58 .80 1.32 (.06) .47Distributions:Dividends from net investment income (.22) (.47) (.47) (.48) (.48) (.48)Dividends fromnet realized gain on investments (.07) - - - - -Total Distributions (.29) (.47) (.47) (.48) (.48) (.48)Net asset value, end of period 12.91 13.80 13.69 13.36 12.52 13.06Total Return (%) (4.46)b 4.29 6.16 10.81 (.48) 3.67Ratios/Supplemental Data (%):Ratio of total expenses to average net assets .56c .56 .56 .56 .55 .56Ratio of net investment incometo average net assets 3.00c 3.10 3.39 3.65 3.43 3.29Portfolio Turnover Rate 16.28b 18.34 25.67 30.95 33.36 33.05Net Assets, end of period ($ x 1,000) 712,437 757,617 849,166 907,433 776,480 784,237a Based on average shares outstanding.b Not annualized.c Annualized.See notes to financial statements.
39
Copyright © 2022 www.secdatabase.com. All Rights Reserved.Please Consider the Environment Before Printing This Document
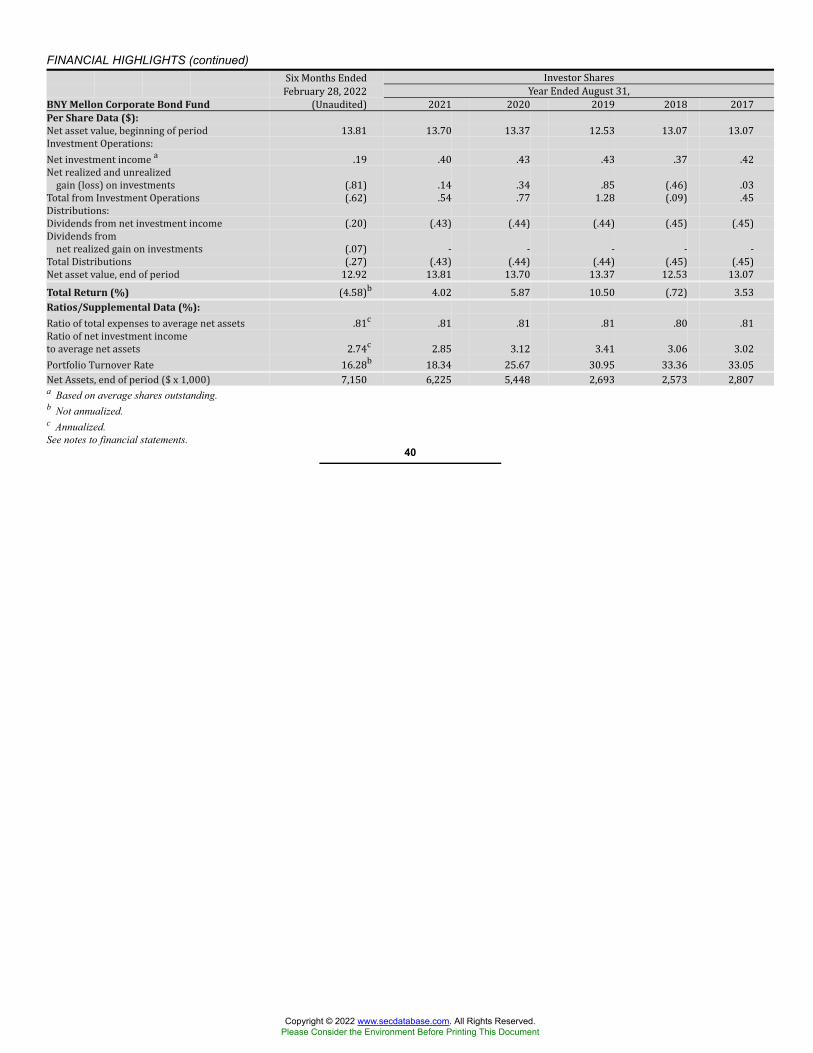
FINANCIAL HIGHLIGHTS (continued) Six Months Ended Investor SharesFebruary 28, 2022 Year Ended August 31,BNY Mellon Corporate Bond Fund (Unaudited) 2021 2020 2019 2018 2017Per Share Data ($):Net asset value, beginning of period 13.81 13.70 13.37 12.53 13.07 13.07Investment Operations:Net investment income a .19 .40 .43 .43 .37 .42Net realized and unrealizedgain (loss) on investments (.81) .14 .34 .85 (.46) .03Total from Investment Operations (.62) .54 .77 1.28 (.09) .45Distributions:Dividends from net investment income (.20) (.43) (.44) (.44) (.45) (.45)Dividends fromnet realized gain on investments (.07) - - - - -Total Distributions (.27) (.43) (.44) (.44) (.45) (.45)Net asset value, end of period 12.92 13.81 13.70 13.37 12.53 13.07Total Return (%) (4.58)b 4.02 5.87 10.50 (.72) 3.53Ratios/Supplemental Data (%):Ratio of total expenses to average net assets .81c .81 .81 .81 .80 .81Ratio of net investment incometo average net assets 2.74c 2.85 3.12 3.41 3.06 3.02Portfolio Turnover Rate 16.28b 18.34 25.67 30.95 33.36 33.05Net Assets, end of period ($ x 1,000) 7,150 6,225 5,448 2,693 2,573 2,807a Based on average shares outstanding.b Not annualized.c Annualized.See notes to financial statements.
40
Copyright © 2022 www.secdatabase.com. All Rights Reserved.Please Consider the Environment Before Printing This Document
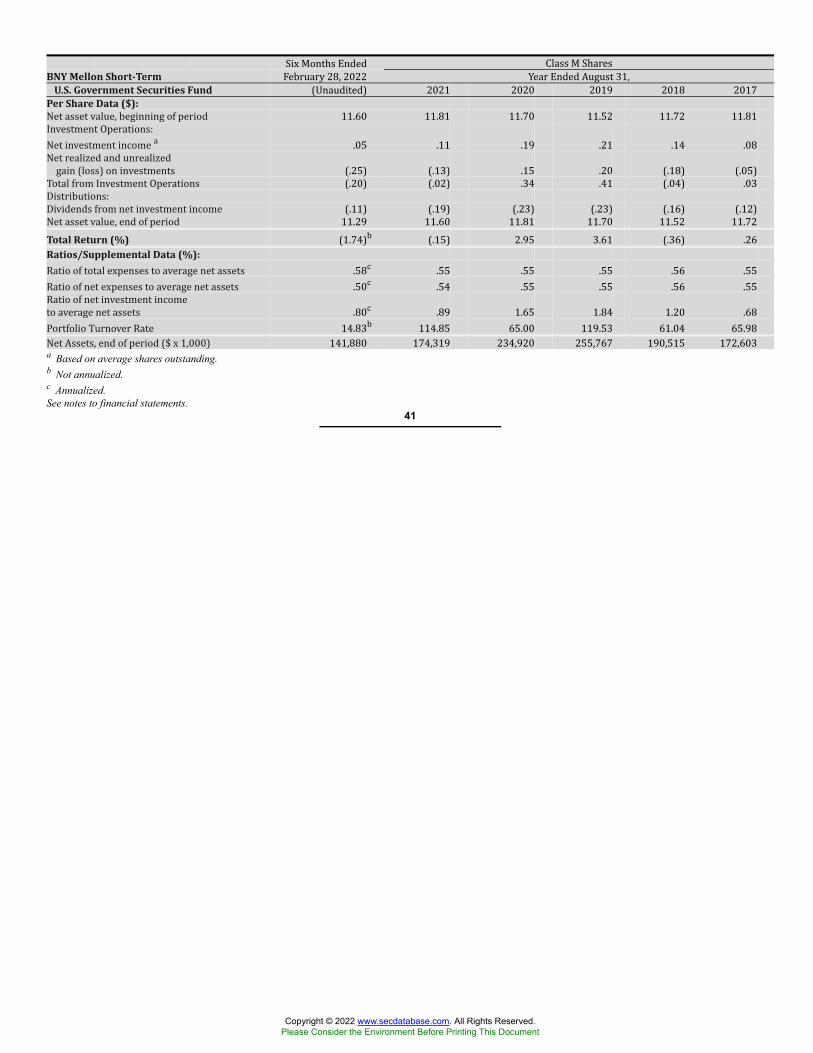
Six Months Ended Class M SharesBNY Mellon Short-Term February 28, 2022 Year Ended August 31,
U.S. Government Securities Fund (Unaudited) 2021 2020 2019 2018 2017Per Share Data ($):Net asset value, beginning of period 11.60 11.81 11.70 11.52 11.72 11.81Investment Operations:Net investment income a .05 .11 .19 .21 .14 .08Net realized and unrealizedgain (loss) on investments (.25) (.13) .15 .20 (.18) (.05)Total from Investment Operations (.20) (.02) .34 .41 (.04) .03Distributions:Dividends from net investment income (.11) (.19) (.23) (.23) (.16) (.12)Net asset value, end of period 11.29 11.60 11.81 11.70 11.52 11.72Total Return (%) (1.74)b (.15) 2.95 3.61 (.36) .26Ratios/Supplemental Data (%):Ratio of total expenses to average net assets .58c .55 .55 .55 .56 .55Ratio of net expenses to average net assets .50c .54 .55 .55 .56 .55Ratio of net investment incometo average net assets .80c .89 1.65 1.84 1.20 .68Portfolio Turnover Rate 14.83b 114.85 65.00 119.53 61.04 65.98Net Assets, end of period ($ x 1,000) 141,880 174,319 234,920 255,767 190,515 172,603a Based on average shares outstanding.b Not annualized.c Annualized.See notes to financial statements.
41
Copyright © 2022 www.secdatabase.com. All Rights Reserved.Please Consider the Environment Before Printing This Document
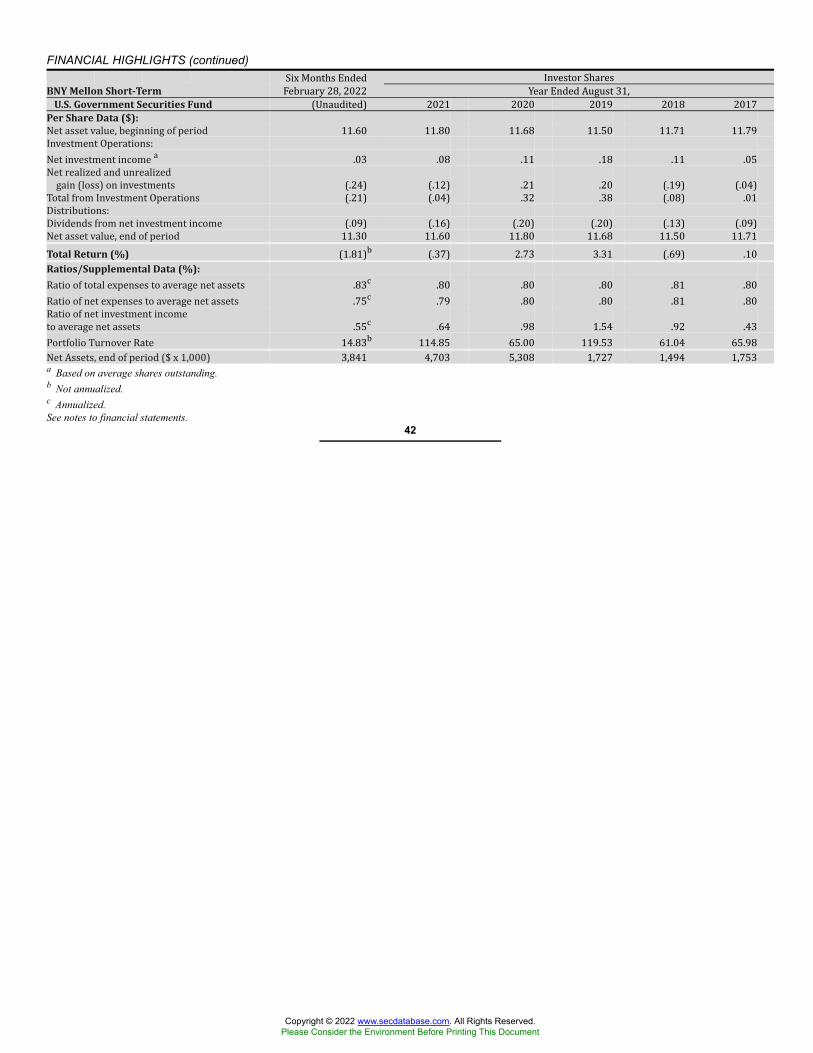
FINANCIAL HIGHLIGHTS (continued) Six Months Ended Investor SharesBNY Mellon Short-Term February 28, 2022 Year Ended August 31,
U.S. Government Securities Fund (Unaudited) 2021 2020 2019 2018 2017Per Share Data ($):Net asset value, beginning of period 11.60 11.80 11.68 11.50 11.71 11.79Investment Operations:Net investment income a .03 .08 .11 .18 .11 .05Net realized and unrealizedgain (loss) on investments (.24) (.12) .21 .20 (.19) (.04)Total from Investment Operations (.21) (.04) .32 .38 (.08) .01Distributions:Dividends from net investment income (.09) (.16) (.20) (.20) (.13) (.09)Net asset value, end of period 11.30 11.60 11.80 11.68 11.50 11.71Total Return (%) (1.81)b (.37) 2.73 3.31 (.69) .10Ratios/Supplemental Data (%):Ratio of total expenses to average net assets .83c .80 .80 .80 .81 .80Ratio of net expenses to average net assets .75c .79 .80 .80 .81 .80Ratio of net investment incometo average net assets .55c .64 .98 1.54 .92 .43Portfolio Turnover Rate 14.83b 114.85 65.00 119.53 61.04 65.98Net Assets, end of period ($ x 1,000) 3,841 4,703 5,308 1,727 1,494 1,753a Based on average shares outstanding.b Not annualized.c Annualized.See notes to financial statements.
42
Copyright © 2022 www.secdatabase.com. All Rights Reserved.Please Consider the Environment Before Printing This Document
NOTES TO FINANCIAL STATEMENTS (Unaudited)NOTE 1—Significant Accounting Policies:BNY Mellon Funds Trust (the “Trust”), a Massachusetts business trust that is registered under the Investment Company Actof 1940, as amended (the “Act”), as an open-end management investment company, operates as a series company currentlyconsisting of twenty-one series, including the following diversified funds: BNY Mellon Bond Fund, BNY Mellon IntermediateBond Fund, BNY Mellon Corporate Bond Fund and BNY Mellon Short-Term U.S. Government Securities Fund (each, a “fund”and collectively, the “funds”). The objectives of the funds are as follows: BNY Mellon Bond Fund, BNY Mellon IntermediateBond Fund and BNY Mellon Corporate Bond Fund seek total return (consisting of capital appreciation and current income).BNY Mellon Short-Term U.S. Government Securities Fund seeks to provide as high a level of current income as is consistentwith the preservation of capital.BNY Mellon Investment Adviser, Inc. (the “Adviser”), a wholly-owned subsidiary of The Bank of New York Mellon Corporation(“BNY Mellon”), serves as each fund’s investment adviser. BNY Mellon, serves as administrator for the funds pursuant to anAdministration Agreement with the Trust (the “Administration Agreement”). BNY Mellon has entered into a Sub-AdministrationAgreement with the Adviser pursuant to which BNY Mellon pays the Adviser for performing certain administrative services. BNYMellon Securities Corporation (the “Distributor”), a wholly-owned subsidiary of the Adviser, is the distributor of each fund’sshares, which are sold without a sales charge.Each fund is authorized to issue an unlimited number of $.001 par value shares of Beneficial Interest in each of the followingclasses of shares: Class M and Investor. Each class of shares has identical rights and privileges, except with respect to theShareholder Service Plan and the expenses borne by each class, the allocation of certain transfer agency costs, and certain votingrights. Income, expenses (other than expenses attributable to a specific class), and realized and unrealized gains or losses oninvestments are allocated to each class of shares based on its relative net assets.The Trust accounts separately for the assets, liabilities and operations of each series. Expenses directly attributable to each seriesare charged to that series’ operations; expenses which are applicable to all series are allocated among them on a pro rata basis.The Financial Accounting Standards Board (“FASB”) Accounting Standards Codification (“ASC”) is the exclusive reference ofauthoritative U.S. generally accepted accounting principles (“GAAP”) recognized by the FASB to be applied by nongovernmentalentities. Rules and interpretive releases of the SEC under authority of federal laws are also sources of authoritative GAAP for SECregistrants. Each fund is an investment company and applies the accounting and reporting guidance of the FASB ASC Topic 946Financial Services-Investment Companies. Each fund’s financial statements are prepared in accordance with GAAP, which mayrequire the use of management estimates and assumptions. Actual results could differ from those estimates.The Trust enter into contracts that contain a variety of indemnifications. The funds’ maximum exposure under these arrangementsis unknown. The funds do not anticipate recognizing any loss related to these arrangements.(a) Portfolio valuation: The fair value of a financial instrument is the amount that would be received to sell an asset or paidto transfer a liability in an orderly transaction between market participants at the measurement date (i.e., the exit price). GAAPestablishes a fair value hierarchy that prioritizes the inputs of valuation techniques used to measure fair value. This hierarchy givesthe highest priority to unadjusted quoted prices in active markets for identical assets or liabilities (Level 1 measurements) and thelowest priority to unobservable inputs (Level 3 measurements).Additionally, GAAP provides guidance on determining whether the volume and activity in a market has decreased significantlyand whether such a decrease in activity results in transactions that are not orderly. GAAP requires enhanced disclosures aroundvaluation inputs and techniques used during annual and interim periods.Various inputs are used in determining the value of each fund’s investments relating to fair value measurements. These inputs aresummarized in the three broad levels listed below:
Level 1—unadjusted quoted prices in active markets for identical investments.Level 2—other significant observable inputs (including quoted prices for similar investments, interest rates, prepaymentspeeds, credit risk, etc.).Level 3—significant unobservable inputs (including the funds’ own assumptions in determining the fair value of investments).
The inputs or methodology used for valuing securities are not necessarily an indication of the risk associated with investing inthose securities.Changes in valuation techniques may result in transfers in or out of an assigned level within the disclosure hierarchy.
43
Copyright © 2022 www.secdatabase.com. All Rights Reserved.Please Consider the Environment Before Printing This Document
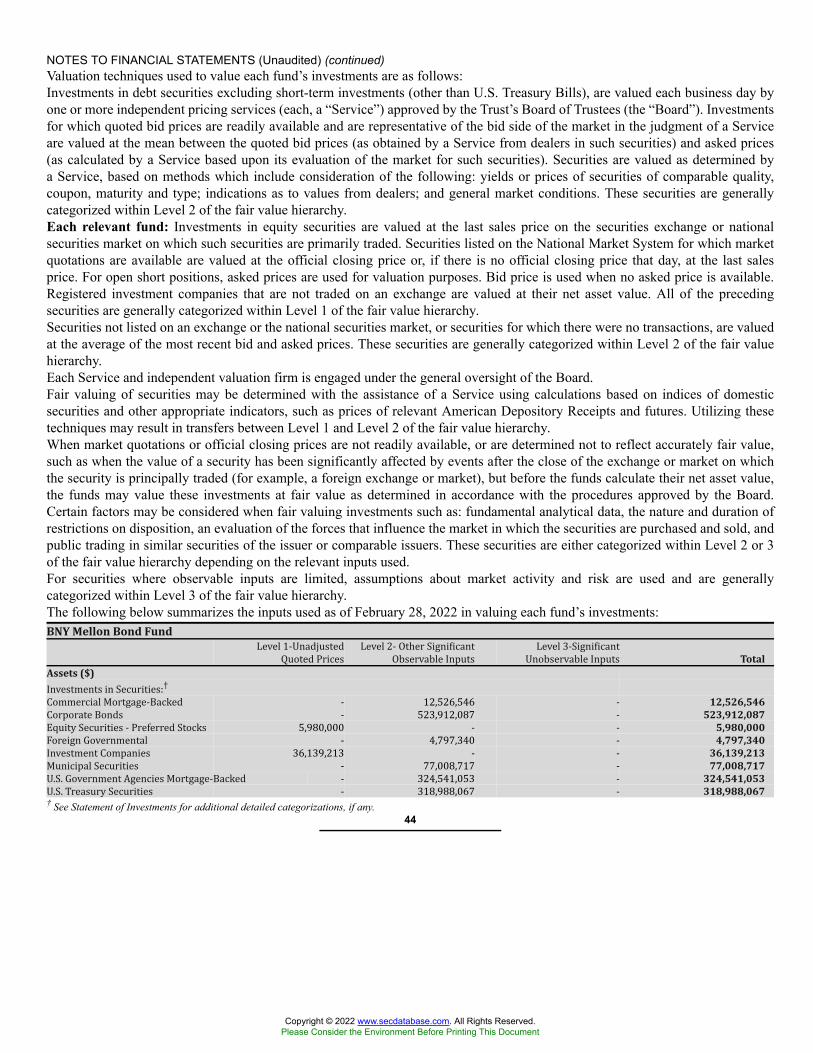
NOTES TO FINANCIAL STATEMENTS (Unaudited) (continued)Valuation techniques used to value each fund’s investments are as follows:Investments in debt securities excluding short-term investments (other than U.S. Treasury Bills), are valued each business day byone or more independent pricing services (each, a “Service”) approved by the Trust’s Board of Trustees (the “Board”). Investmentsfor which quoted bid prices are readily available and are representative of the bid side of the market in the judgment of a Serviceare valued at the mean between the quoted bid prices (as obtained by a Service from dealers in such securities) and asked prices(as calculated by a Service based upon its evaluation of the market for such securities). Securities are valued as determined bya Service, based on methods which include consideration of the following: yields or prices of securities of comparable quality,coupon, maturity and type; indications as to values from dealers; and general market conditions. These securities are generallycategorized within Level 2 of the fair value hierarchy.Each relevant fund: Investments in equity securities are valued at the last sales price on the securities exchange or nationalsecurities market on which such securities are primarily traded. Securities listed on the National Market System for which marketquotations are available are valued at the official closing price or, if there is no official closing price that day, at the last salesprice. For open short positions, asked prices are used for valuation purposes. Bid price is used when no asked price is available.Registered investment companies that are not traded on an exchange are valued at their net asset value. All of the precedingsecurities are generally categorized within Level 1 of the fair value hierarchy.Securities not listed on an exchange or the national securities market, or securities for which there were no transactions, are valuedat the average of the most recent bid and asked prices. These securities are generally categorized within Level 2 of the fair valuehierarchy.Each Service and independent valuation firm is engaged under the general oversight of the Board.Fair valuing of securities may be determined with the assistance of a Service using calculations based on indices of domesticsecurities and other appropriate indicators, such as prices of relevant American Depository Receipts and futures. Utilizing thesetechniques may result in transfers between Level 1 and Level 2 of the fair value hierarchy.When market quotations or official closing prices are not readily available, or are determined not to reflect accurately fair value,such as when the value of a security has been significantly affected by events after the close of the exchange or market on whichthe security is principally traded (for example, a foreign exchange or market), but before the funds calculate their net asset value,the funds may value these investments at fair value as determined in accordance with the procedures approved by the Board.Certain factors may be considered when fair valuing investments such as: fundamental analytical data, the nature and duration ofrestrictions on disposition, an evaluation of the forces that influence the market in which the securities are purchased and sold, andpublic trading in similar securities of the issuer or comparable issuers. These securities are either categorized within Level 2 or 3of the fair value hierarchy depending on the relevant inputs used.For securities where observable inputs are limited, assumptions about market activity and risk are used and are generallycategorized within Level 3 of the fair value hierarchy.The following below summarizes the inputs used as of February 28, 2022 in valuing each fund’s investments:BNY Mellon Bond Fund Level 1-UnadjustedQuoted Prices Level 2- Other SignificantObservable Inputs Level 3-SignificantUnobservable Inputs TotalAssets ($)Investments in Securities:†Commercial Mortgage-Backed - 12,526,546 - 12,526,546Corporate Bonds - 523,912,087 - 523,912,087Equity Securities - Preferred Stocks 5,980,000 - - 5,980,000Foreign Governmental - 4,797,340 - 4,797,340Investment Companies 36,139,213 - - 36,139,213Municipal Securities - 77,008,717 - 77,008,717U.S. Government Agencies Mortgage-Backed - 324,541,053 - 324,541,053U.S. Treasury Securities - 318,988,067 - 318,988,067† See Statement of Investments for additional detailed categorizations, if any.
44
Copyright © 2022 www.secdatabase.com. All Rights Reserved.Please Consider the Environment Before Printing This Document
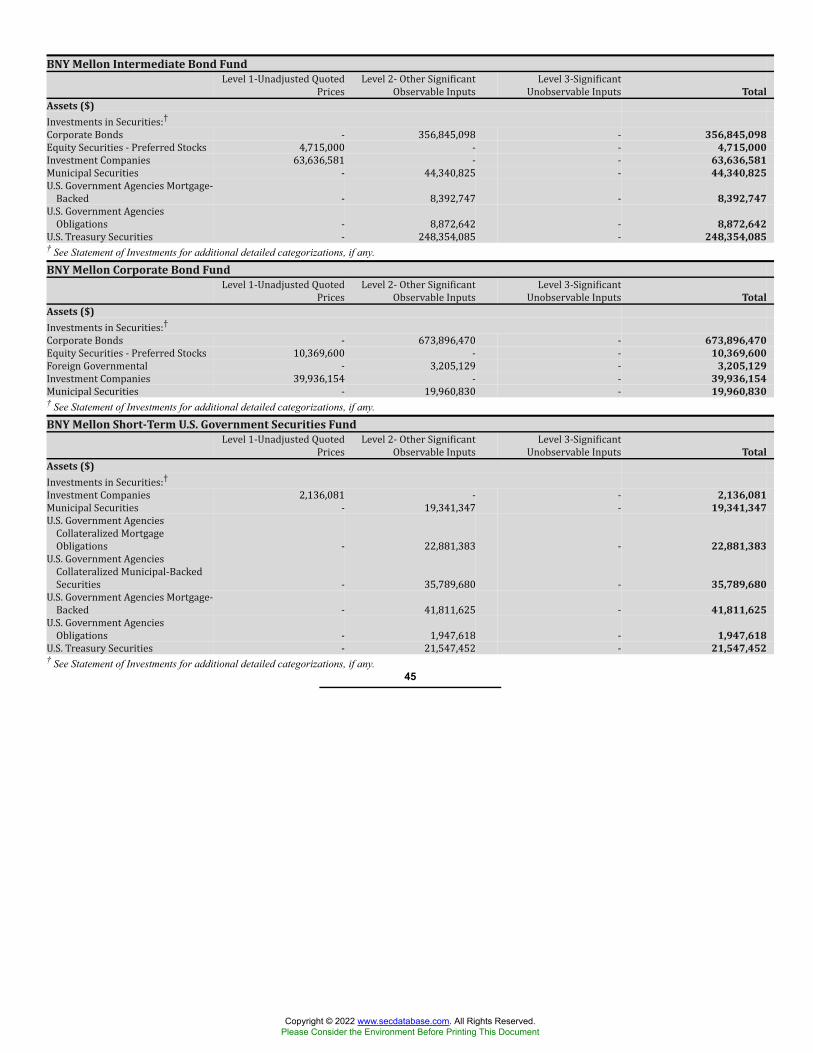
BNY Mellon Intermediate Bond FundLevel 1-Unadjusted QuotedPrices Level 2- Other SignificantObservable Inputs Level 3-SignificantUnobservable Inputs TotalAssets ($)Investments in Securities:†Corporate Bonds - 356,845,098 - 356,845,098Equity Securities - Preferred Stocks 4,715,000 - - 4,715,000Investment Companies 63,636,581 - - 63,636,581Municipal Securities - 44,340,825 - 44,340,825U.S. Government Agencies Mortgage-Backed - 8,392,747 - 8,392,747U.S. Government AgenciesObligations - 8,872,642 - 8,872,642U.S. Treasury Securities - 248,354,085 - 248,354,085† See Statement of Investments for additional detailed categorizations, if any.
BNY Mellon Corporate Bond FundLevel 1-Unadjusted QuotedPrices Level 2- Other SignificantObservable Inputs Level 3-SignificantUnobservable Inputs TotalAssets ($)Investments in Securities:†Corporate Bonds - 673,896,470 - 673,896,470Equity Securities - Preferred Stocks 10,369,600 - - 10,369,600Foreign Governmental - 3,205,129 - 3,205,129Investment Companies 39,936,154 - - 39,936,154Municipal Securities - 19,960,830 - 19,960,830† See Statement of Investments for additional detailed categorizations, if any.
BNY Mellon Short-Term U.S. Government Securities FundLevel 1-Unadjusted QuotedPrices Level 2- Other SignificantObservable Inputs Level 3-SignificantUnobservable Inputs TotalAssets ($)Investments in Securities:†Investment Companies 2,136,081 - - 2,136,081Municipal Securities - 19,341,347 - 19,341,347U.S. Government AgenciesCollateralized MortgageObligations - 22,881,383 - 22,881,383U.S. Government AgenciesCollateralized Municipal-BackedSecurities - 35,789,680 - 35,789,680U.S. Government Agencies Mortgage-Backed - 41,811,625 - 41,811,625U.S. Government AgenciesObligations - 1,947,618 - 1,947,618U.S. Treasury Securities - 21,547,452 - 21,547,452† See Statement of Investments for additional detailed categorizations, if any.
45
Copyright © 2022 www.secdatabase.com. All Rights Reserved.Please Consider the Environment Before Printing This Document
NOTES TO FINANCIAL STATEMENTS (Unaudited) (continued)(b) Securities transactions and investment income: Securities transactions are recorded on a trade date basis. Realized gains andlosses from securities transactions are recorded on the identified cost basis. Dividend income is recognized on the ex-dividend dateand interest income, including, where applicable, accretion of discount and amortization of premium on investments, is recognizedon the accrual basis.Pursuant to a securities lending agreement with BNY Mellon, the funds may lend securities to qualified institutions. It is the funds’policy that, at origination, all loans are secured by collateral of at least 102% of the value of U.S. securities loaned and 105% ofthe value of foreign securities loaned. Collateral equivalent to at least 100% of the market value of securities on loan is maintainedat all times. Collateral is either in the form of cash, which can be invested in certain money market mutual funds managed by theAdviser, or U.S. Government and Agency securities. The funds are entitled to receive all dividends, interest and distributions onsecurities loaned, in addition to income earned as a result of the lending transaction. Should a borrower fail to return the securitiesin a timely manner, BNY Mellon is required to replace the securities for the benefit of the funds or credit the funds with the marketvalue of the unreturned securities and is subrogated to the funds’ rights against the borrower and the collateral. Additionally, thecontractual maturity of security lending transactions are on an overnight and continuous basis. Table 1 summarizes the amountBNY Mellon earned from each fund from lending portfolio securities, pursuant to the securities lending agreement during theperiod ended February 28, 2022.Table 1—Securities Lending AgreementBNY Mellon Bond Fund $ 4,229BNY Mellon Intermediate Bond Fund 2,487BNY Mellon Corporate Bond Fund 7,024BNY Mellon Short-Term U.S. Government Securities Fund 210(c) Affiliated issuers: Investments in other investment companies advised by the Adviser are defined as “affiliated” under the Act.(d) Risk: Certain events particular to the industries in which each fund’s investments conduct their operations, as well asgeneral economic, political and public health conditions, may have a significant negative impact on the investee’s operations andprofitability. In addition, turbulence in financial markets and reduced liquidity in equity, credit and/or fixed income markets maynegatively affect many issuers, which could adversely affect the fund. Global economies and financial markets are becomingincreasingly interconnected, and conditions and events in one country, region or financial market may adversely impact issuers ina different country, region or financial market. These risks may be magnified if certain events or developments adversely interruptthe global supply chain; in these and other circumstances, such risks might affect companies world-wide. Recent examples includepandemic risks related to COVID-19 and aggressive measures taken world-wide in response by governments, including closingborders, restricting international and domestic travel, and the imposition of prolonged quarantines of large populations, and bybusinesses, including changes to operations and reducing staff. The effects of COVID-19 have contributed to increased volatilityin global markets and will likely affect certain countries, companies, industries and market sectors more dramatically than others.The COVID-19 pandemic has had, and any other outbreak of an infectious disease or other serious public health concern couldhave, a significant negative impact on economic and market conditions and could trigger a prolonged period of global economicslowdown. To the extent the fund may overweight its investments in certain countries, companies, industries or market sectors,such positions will increase the fund’s exposure to risk of loss from adverse developments affecting those countries, companies,industries or sectors.The funds invest primarily in debt securities. Failure of an issuer of the debt securities to make timely interest or principalpayments, or a decline or the perception of a decline in the credit quality of a debt security, can cause the debt security’s priceto fall, potentially lowering each fund’s share price. In addition, the value of debt securities may decline due to general marketconditions that are not specifically related to a particular issuer, such as real or perceived adverse economic conditions, changes inoutlook for corporate earnings, changes in interest or currency rates or adverse investor sentiment. They may also decline becauseof factors that affect a particular industry.(e) Dividends and distributions to shareholders: Dividends and distributions payable to shareholders are recorded by each fundon the ex-dividend date. The funds normally declare and pay dividends from net investment income monthly. Dividends from netrealized capital gains, if any, are normally declared and paid annually, but each fund may make distributions on a more frequentbasis to comply with the distribution requirements of the Internal Revenue Code of 1986, as amended (the “Code”). To the extentthat net realized capital gains can be offset by capital loss carryovers of a fund, it is the policy of each fund not to
46
Copyright © 2022 www.secdatabase.com. All Rights Reserved.Please Consider the Environment Before Printing This Document
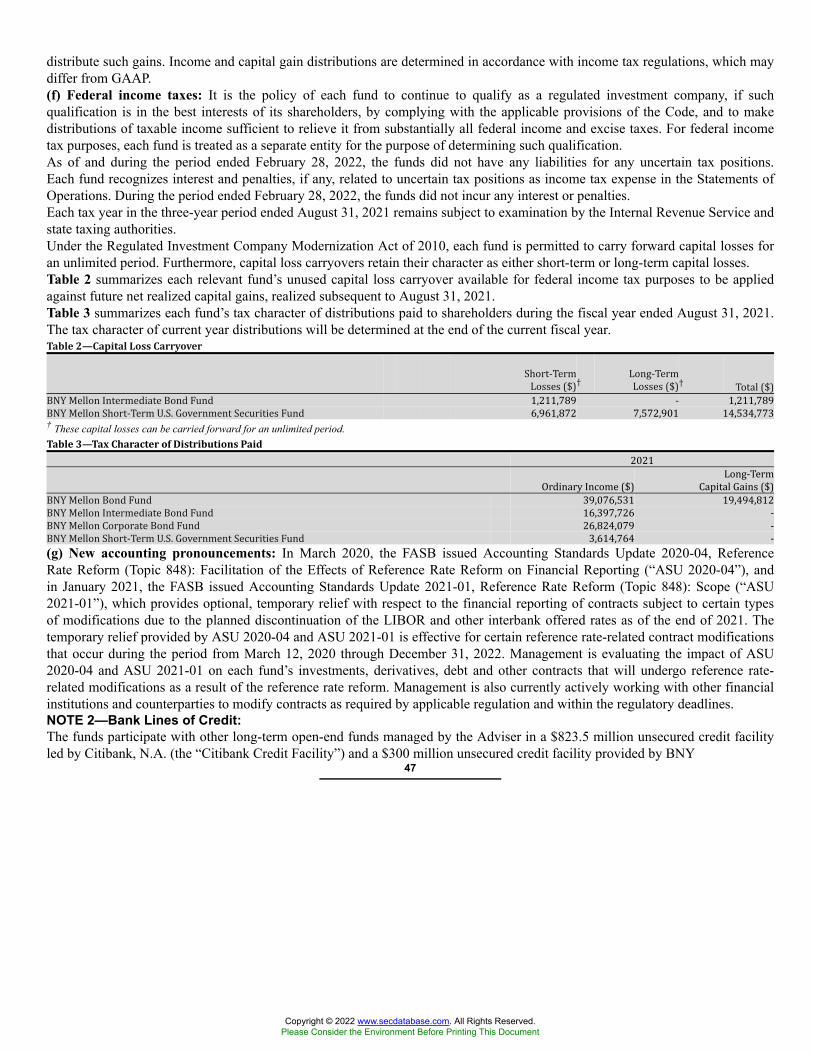
distribute such gains. Income and capital gain distributions are determined in accordance with income tax regulations, which maydiffer from GAAP.(f) Federal income taxes: It is the policy of each fund to continue to qualify as a regulated investment company, if suchqualification is in the best interests of its shareholders, by complying with the applicable provisions of the Code, and to makedistributions of taxable income sufficient to relieve it from substantially all federal income and excise taxes. For federal incometax purposes, each fund is treated as a separate entity for the purpose of determining such qualification.As of and during the period ended February 28, 2022, the funds did not have any liabilities for any uncertain tax positions.Each fund recognizes interest and penalties, if any, related to uncertain tax positions as income tax expense in the Statements ofOperations. During the period ended February 28, 2022, the funds did not incur any interest or penalties.Each tax year in the three-year period ended August 31, 2021 remains subject to examination by the Internal Revenue Service andstate taxing authorities.Under the Regulated Investment Company Modernization Act of 2010, each fund is permitted to carry forward capital losses foran unlimited period. Furthermore, capital loss carryovers retain their character as either short-term or long-term capital losses.Table 2 summarizes each relevant fund’s unused capital loss carryover available for federal income tax purposes to be appliedagainst future net realized capital gains, realized subsequent to August 31, 2021.Table 3 summarizes each fund’s tax character of distributions paid to shareholders during the fiscal year ended August 31, 2021.The tax character of current year distributions will be determined at the end of the current fiscal year.Table 2—Capital Loss Carryover Short-TermLosses ($)† Long-TermLosses ($)† Total ($)BNY Mellon Intermediate Bond Fund 1,211,789 - 1,211,789BNY Mellon Short-Term U.S. Government Securities Fund 6,961,872 7,572,901 14,534,773† These capital losses can be carried forward for an unlimited period.Table 3—Tax Character of Distributions Paid 2021Ordinary Income ($) Long-TermCapital Gains ($)BNY Mellon Bond Fund 39,076,531 19,494,812BNY Mellon Intermediate Bond Fund 16,397,726 -BNY Mellon Corporate Bond Fund 26,824,079 -BNY Mellon Short-Term U.S. Government Securities Fund 3,614,764 -(g) New accounting pronouncements: In March 2020, the FASB issued Accounting Standards Update 2020-04, ReferenceRate Reform (Topic 848): Facilitation of the Effects of Reference Rate Reform on Financial Reporting (“ASU 2020-04”), andin January 2021, the FASB issued Accounting Standards Update 2021-01, Reference Rate Reform (Topic 848): Scope (“ASU2021-01”), which provides optional, temporary relief with respect to the financial reporting of contracts subject to certain typesof modifications due to the planned discontinuation of the LIBOR and other interbank offered rates as of the end of 2021. Thetemporary relief provided by ASU 2020-04 and ASU 2021-01 is effective for certain reference rate-related contract modificationsthat occur during the period from March 12, 2020 through December 31, 2022. Management is evaluating the impact of ASU2020-04 and ASU 2021-01 on each fund’s investments, derivatives, debt and other contracts that will undergo reference rate-related modifications as a result of the reference rate reform. Management is also currently actively working with other financialinstitutions and counterparties to modify contracts as required by applicable regulation and within the regulatory deadlines.NOTE 2—Bank Lines of Credit:The funds participate with other long-term open-end funds managed by the Adviser in a $823.5 million unsecured credit facilityled by Citibank, N.A. (the “Citibank Credit Facility”) and a $300 million unsecured credit facility provided by BNY
47
Copyright © 2022 www.secdatabase.com. All Rights Reserved.Please Consider the Environment Before Printing This Document
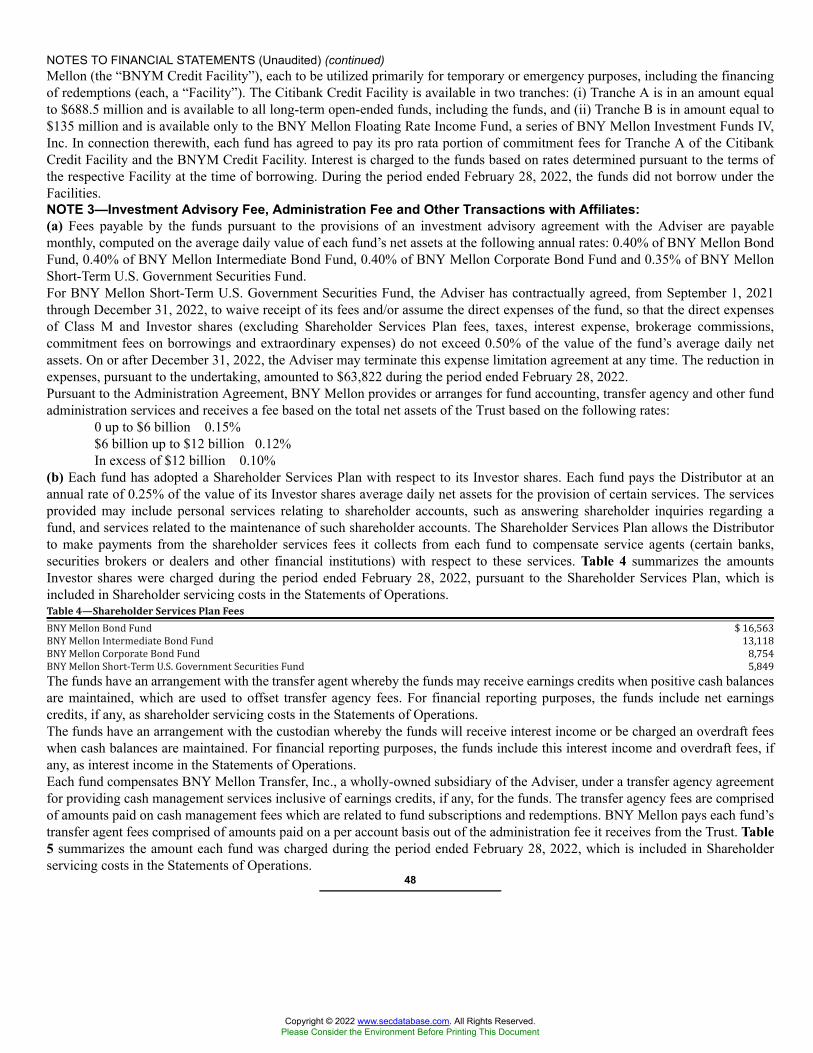
NOTES TO FINANCIAL STATEMENTS (Unaudited) (continued)Mellon (the “BNYM Credit Facility”), each to be utilized primarily for temporary or emergency purposes, including the financingof redemptions (each, a “Facility”). The Citibank Credit Facility is available in two tranches: (i) Tranche A is in an amount equalto $688.5 million and is available to all long-term open-ended funds, including the funds, and (ii) Tranche B is in amount equal to$135 million and is available only to the BNY Mellon Floating Rate Income Fund, a series of BNY Mellon Investment Funds IV,Inc. In connection therewith, each fund has agreed to pay its pro rata portion of commitment fees for Tranche A of the CitibankCredit Facility and the BNYM Credit Facility. Interest is charged to the funds based on rates determined pursuant to the terms ofthe respective Facility at the time of borrowing. During the period ended February 28, 2022, the funds did not borrow under theFacilities.NOTE 3—Investment Advisory Fee, Administration Fee and Other Transactions with Affiliates:(a) Fees payable by the funds pursuant to the provisions of an investment advisory agreement with the Adviser are payablemonthly, computed on the average daily value of each fund’s net assets at the following annual rates: 0.40% of BNY Mellon BondFund, 0.40% of BNY Mellon Intermediate Bond Fund, 0.40% of BNY Mellon Corporate Bond Fund and 0.35% of BNY MellonShort-Term U.S. Government Securities Fund.For BNY Mellon Short-Term U.S. Government Securities Fund, the Adviser has contractually agreed, from September 1, 2021through December 31, 2022, to waive receipt of its fees and/or assume the direct expenses of the fund, so that the direct expensesof Class M and Investor shares (excluding Shareholder Services Plan fees, taxes, interest expense, brokerage commissions,commitment fees on borrowings and extraordinary expenses) do not exceed 0.50% of the value of the fund’s average daily netassets. On or after December 31, 2022, the Adviser may terminate this expense limitation agreement at any time. The reduction inexpenses, pursuant to the undertaking, amounted to $63,822 during the period ended February 28, 2022.Pursuant to the Administration Agreement, BNY Mellon provides or arranges for fund accounting, transfer agency and other fundadministration services and receives a fee based on the total net assets of the Trust based on the following rates:
0 up to $6 billion 0.15%$6 billion up to $12 billion 0.12%In excess of $12 billion 0.10%
(b) Each fund has adopted a Shareholder Services Plan with respect to its Investor shares. Each fund pays the Distributor at anannual rate of 0.25% of the value of its Investor shares average daily net assets for the provision of certain services. The servicesprovided may include personal services relating to shareholder accounts, such as answering shareholder inquiries regarding afund, and services related to the maintenance of such shareholder accounts. The Shareholder Services Plan allows the Distributorto make payments from the shareholder services fees it collects from each fund to compensate service agents (certain banks,securities brokers or dealers and other financial institutions) with respect to these services. Table 4 summarizes the amountsInvestor shares were charged during the period ended February 28, 2022, pursuant to the Shareholder Services Plan, which isincluded in Shareholder servicing costs in the Statements of Operations.Table 4—Shareholder Services Plan FeesBNY Mellon Bond Fund $ 16,563BNY Mellon Intermediate Bond Fund 13,118BNY Mellon Corporate Bond Fund 8,754BNY Mellon Short-Term U.S. Government Securities Fund 5,849The funds have an arrangement with the transfer agent whereby the funds may receive earnings credits when positive cash balancesare maintained, which are used to offset transfer agency fees. For financial reporting purposes, the funds include net earningscredits, if any, as shareholder servicing costs in the Statements of Operations.The funds have an arrangement with the custodian whereby the funds will receive interest income or be charged an overdraft feeswhen cash balances are maintained. For financial reporting purposes, the funds include this interest income and overdraft fees, ifany, as interest income in the Statements of Operations.Each fund compensates BNY Mellon Transfer, Inc., a wholly-owned subsidiary of the Adviser, under a transfer agency agreementfor providing cash management services inclusive of earnings credits, if any, for the funds. The transfer agency fees are comprisedof amounts paid on cash management fees which are related to fund subscriptions and redemptions. BNY Mellon pays each fund’stransfer agent fees comprised of amounts paid on a per account basis out of the administration fee it receives from the Trust. Table5 summarizes the amount each fund was charged during the period ended February 28, 2022, which is included in Shareholderservicing costs in the Statements of Operations.
48
Copyright © 2022 www.secdatabase.com. All Rights Reserved.Please Consider the Environment Before Printing This Document
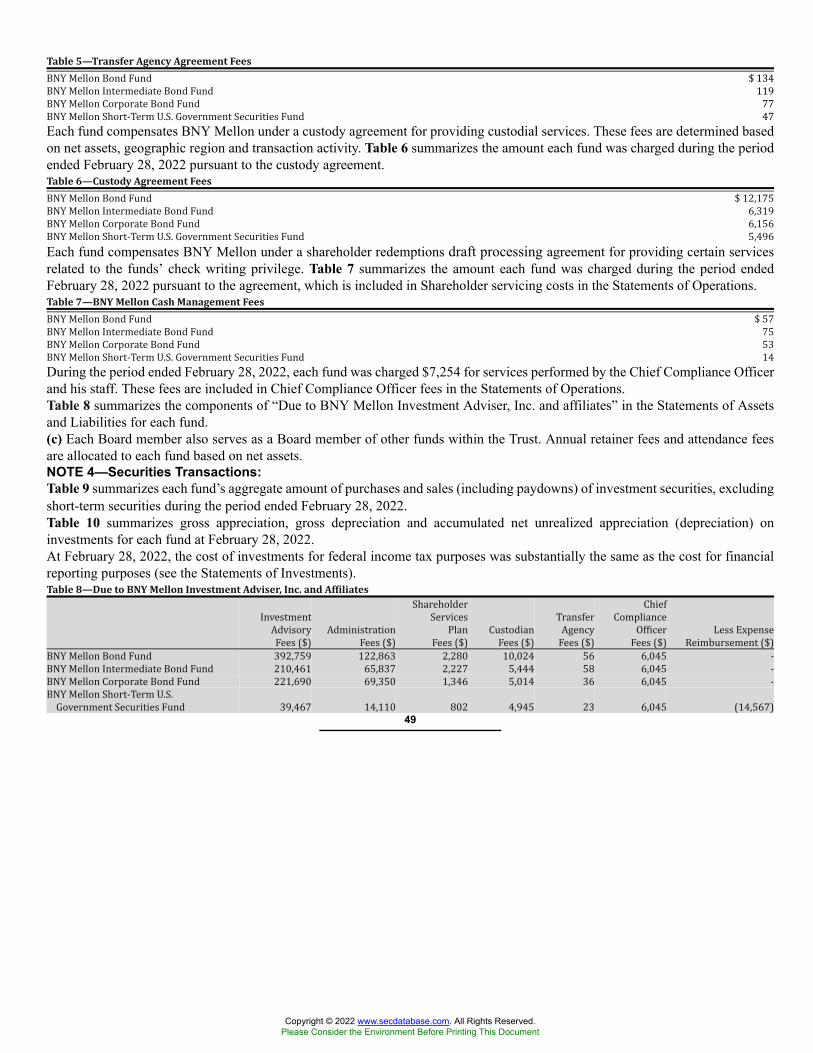
Table 5—Transfer Agency Agreement FeesBNY Mellon Bond Fund $ 134BNY Mellon Intermediate Bond Fund 119BNY Mellon Corporate Bond Fund 77BNY Mellon Short-Term U.S. Government Securities Fund 47Each fund compensates BNY Mellon under a custody agreement for providing custodial services. These fees are determined basedon net assets, geographic region and transaction activity. Table 6 summarizes the amount each fund was charged during the periodended February 28, 2022 pursuant to the custody agreement.Table 6—Custody Agreement FeesBNY Mellon Bond Fund $ 12,175BNY Mellon Intermediate Bond Fund 6,319BNY Mellon Corporate Bond Fund 6,156BNY Mellon Short-Term U.S. Government Securities Fund 5,496Each fund compensates BNY Mellon under a shareholder redemptions draft processing agreement for providing certain servicesrelated to the funds’ check writing privilege. Table 7 summarizes the amount each fund was charged during the period endedFebruary 28, 2022 pursuant to the agreement, which is included in Shareholder servicing costs in the Statements of Operations.Table 7—BNY Mellon Cash Management FeesBNY Mellon Bond Fund $ 57BNY Mellon Intermediate Bond Fund 75BNY Mellon Corporate Bond Fund 53BNY Mellon Short-Term U.S. Government Securities Fund 14During the period ended February 28, 2022, each fund was charged $7,254 for services performed by the Chief Compliance Officerand his staff. These fees are included in Chief Compliance Officer fees in the Statements of Operations.Table 8 summarizes the components of “Due to BNY Mellon Investment Adviser, Inc. and affiliates” in the Statements of Assetsand Liabilities for each fund.(c) Each Board member also serves as a Board member of other funds within the Trust. Annual retainer fees and attendance feesare allocated to each fund based on net assets.NOTE 4—Securities Transactions:Table 9 summarizes each fund’s aggregate amount of purchases and sales (including paydowns) of investment securities, excludingshort-term securities during the period ended February 28, 2022.Table 10 summarizes gross appreciation, gross depreciation and accumulated net unrealized appreciation (depreciation) oninvestments for each fund at February 28, 2022.At February 28, 2022, the cost of investments for federal income tax purposes was substantially the same as the cost for financialreporting purposes (see the Statements of Investments).Table 8—Due to BNY Mellon Investment Adviser, Inc. and AffiliatesInvestmentAdvisoryFees ($) AdministrationFees ($)
ShareholderServicesPlanFees ($) CustodianFees ($) TransferAgencyFees ($)ChiefComplianceOfficerFees ($) Less ExpenseReimbursement ($)BNY Mellon Bond Fund 392,759 122,863 2,280 10,024 56 6,045 -BNY Mellon Intermediate Bond Fund 210,461 65,837 2,227 5,444 58 6,045 -BNY Mellon Corporate Bond Fund 221,690 69,350 1,346 5,014 36 6,045 -BNY Mellon Short-Term U.S.Government Securities Fund 39,467 14,110 802 4,945 23 6,045 (14,567)
49
Copyright © 2022 www.secdatabase.com. All Rights Reserved.Please Consider the Environment Before Printing This Document
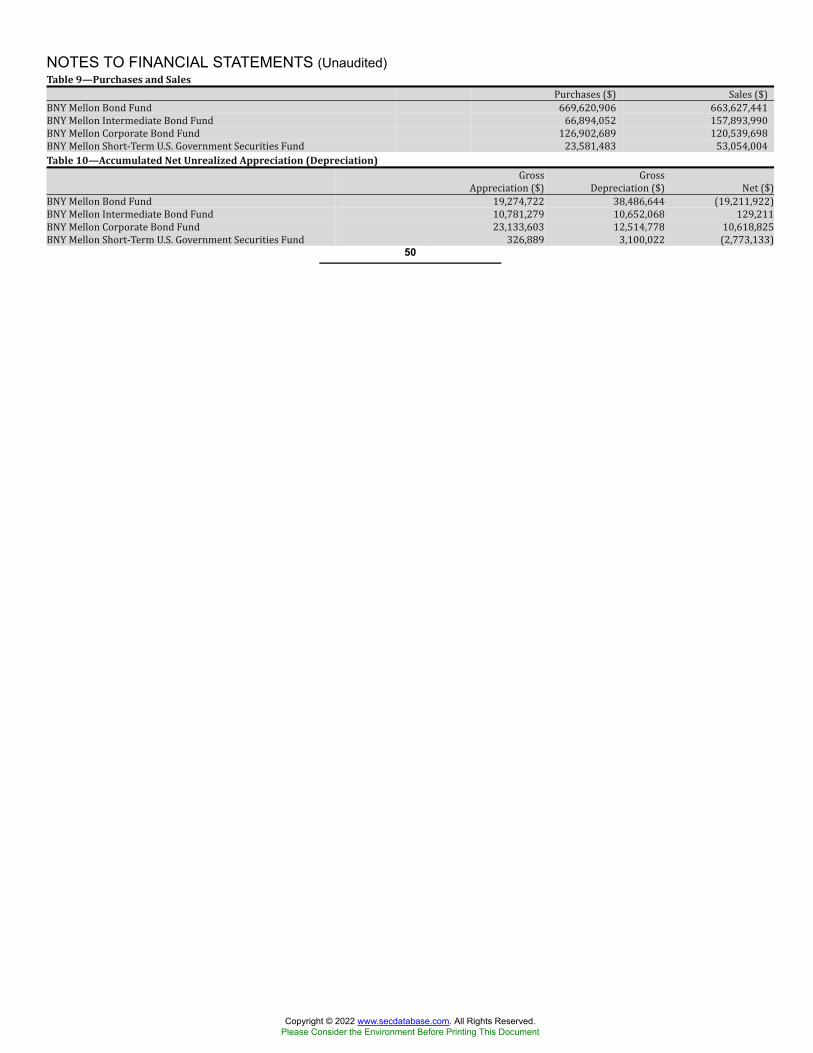
NOTES TO FINANCIAL STATEMENTS (Unaudited)Table 9—Purchases and Sales Purchases ($) Sales ($)BNY Mellon Bond Fund 669,620,906 663,627,441BNY Mellon Intermediate Bond Fund 66,894,052 157,893,990BNY Mellon Corporate Bond Fund 126,902,689 120,539,698BNY Mellon Short-Term U.S. Government Securities Fund 23,581,483 53,054,004Table 10—Accumulated Net Unrealized Appreciation (Depreciation) GrossAppreciation ($) GrossDepreciation ($) Net ($)BNY Mellon Bond Fund 19,274,722 38,486,644 (19,211,922)BNY Mellon Intermediate Bond Fund 10,781,279 10,652,068 129,211BNY Mellon Corporate Bond Fund 23,133,603 12,514,778 10,618,825BNY Mellon Short-Term U.S. Government Securities Fund 326,889 3,100,022 (2,773,133)
50
Copyright © 2022 www.secdatabase.com. All Rights Reserved.Please Consider the Environment Before Printing This Document
For More InformationThe BNY Mellon Fundsc/o BNY Mellon Investment Adviser, Inc.240 Greenwich StreetNew York, NY 10286AdviserBNY Mellon Investment Adviser, Inc.240 Greenwich StreetNew York, NY 10286AdministratorThe Bank of New York Mellon240 Greenwich StreetNew York, NY 10286Sub-AdministratorBNY Mellon Investment Adviser, Inc.240 Greenwich StreetNew York, NY 10286CustodianThe Bank of New York Mellon240 Greenwich StreetNew York, NY 10286Transfer Agent &Dividend Disbursing AgentBNY Mellon Transfer, Inc.240 Greenwich StreetNew York, NY 10286DistributorBNY Mellon Securities Corporation240 Greenwich StreetNew York, NY 10286
Ticker Symbols:BNY Mellon Bond Fund Class M: MPBFX Investor: MIBDXBNY Mellon Intermediate Bond Fund Class M: MPIBX Investor: MIIDXBNY Mellon Corporate Bond Fund Class M: BYMMX Investor: BYMIXBNY Mellon Short-Term U.S. Government Securities Fund Class M: MPSUX Investor: MISTXTelephone Wealth Management (WM) Clients, please contact your Account Officer or call 1-866-804-5023. Brokerage Clients of BNYMellon Wealth Advisors (BNYMWA), please contact your financial representative or call 1-800-830-0549, Option 2 for BNY MellonWealth Management Direct or 1-800-843-5466 for former brokerage clients of BNY Mellon Wealth Advisors whose accounts are nowheld by BNY Mellon Brokerage Services. Individual Account holders, please call BNY Mellon Investment Advisers at 1-800-373-9387.Mail WM clients, write to your Account Officer, c/o The Bank of New York Mellon, One Mellon Bank Center, Pittsburgh, PA 15258BNYMWA Brokerage Clients, write to your financial representative, P.O. Box 9012, Hicksville, NY 11802-9012Individual Account Holders, write to: BNY Mellon Funds, P.O. Box 9879, Providence, RI 02940-8079Each fund files its complete schedule of portfolio holdings with the Securities and Exchange Commission (“SEC”) for the first and thirdquarters of each fiscal year on Form N-PORT. The fund’s Forms N-PORT are available on the SEC’s website at http://www.sec.gov.A description of the policies and procedures that the fund uses to determine how to vote proxies relating to portfolio securities, andinformation regarding how the fund voted these proxies for the most recent 12-month period ended June 30 is available at http://www.im.bnymellon.com and on the SEC’s website at http://www.sec.gov. The description of the policies and procedures is alsoavailable without charge, upon request, by calling 1-800-373-9387.© 2022 BNY Mellon Securities Corporation MFTSA0222-TB
The BNY Mellon FundsBNY Mellon Government Money Market Fund
Copyright © 2022 www.secdatabase.com. All Rights Reserved.Please Consider the Environment Before Printing This Document
BNY Mellon National Municipal Money Market FundSEMIANNUAL REPORT February 28, 2022
Copyright © 2022 www.secdatabase.com. All Rights Reserved.Please Consider the Environment Before Printing This Document
ContentsT H E F U N D S
Understanding Your Fund’s Expenses 2Comparing Your Fund’s Expenses With Those of Other Funds 2Statements of Investments 3Statements of Assets and Liabilities 12Statements of Operations 13Statements of Changes in Net Assets 14Financial Highlights 15Notes to Financial Statements 19F O R M O R E I N F O R M AT I O N
Back Cover
Save time. Save paper. View your next shareholder report online as soon as it’s available. Log intowww.im.bnymellon.com and sign up for eCommunications. It’s simple and only takes a few minutes.
The views expressed herein are current to the date of this report. These views and the composition of thefunds’ portfolios are subject to change at any time based on market and other conditions.
Not FDIC-Insured • Not Bank-Guaranteed • May Lose Value
Copyright © 2022 www.secdatabase.com. All Rights Reserved.Please Consider the Environment Before Printing This Document
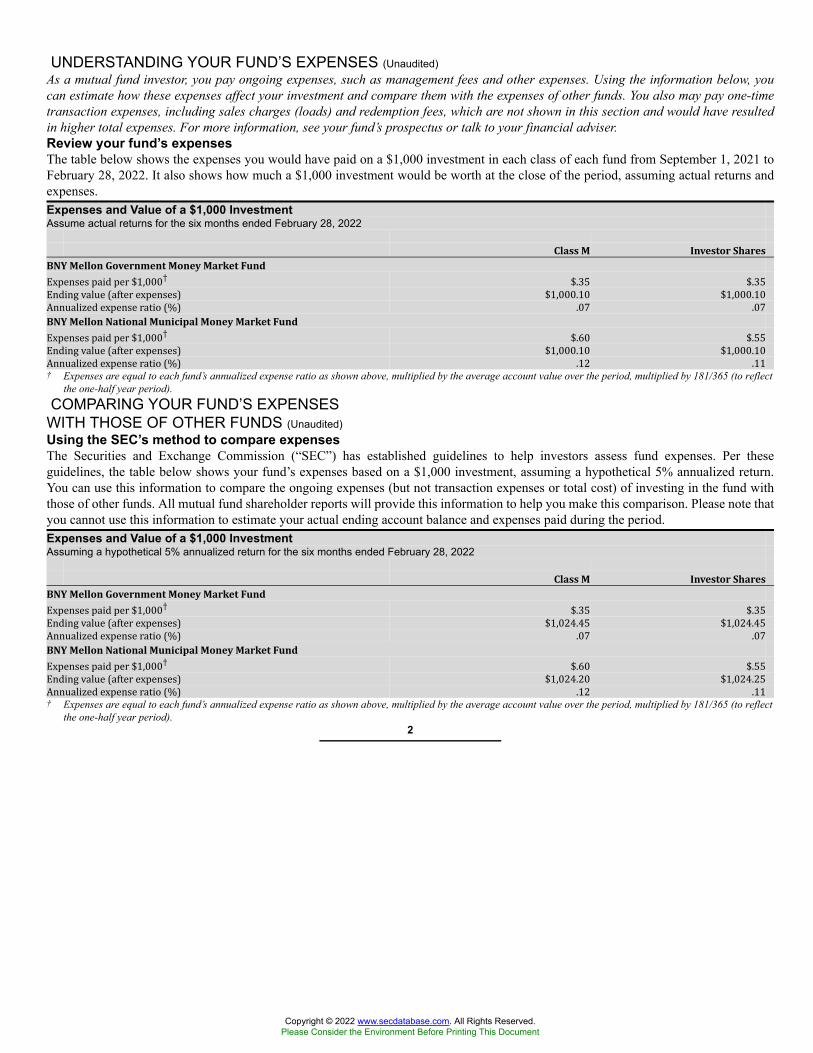
UNDERSTANDING YOUR FUND’S EXPENSES (Unaudited)As a mutual fund investor, you pay ongoing expenses, such as management fees and other expenses. Using the information below, youcan estimate how these expenses affect your investment and compare them with the expenses of other funds. You also may pay one-timetransaction expenses, including sales charges (loads) and redemption fees, which are not shown in this section and would have resultedin higher total expenses. For more information, see your fund’s prospectus or talk to your financial adviser.Review your fund’s expensesThe table below shows the expenses you would have paid on a $1,000 investment in each class of each fund from September 1, 2021 toFebruary 28, 2022. It also shows how much a $1,000 investment would be worth at the close of the period, assuming actual returns andexpenses.Expenses and Value of a $1,000 InvestmentAssume actual returns for the six months ended February 28, 2022
Class M Investor SharesBNY Mellon Government Money Market FundExpenses paid per $1,000† $.35 $.35Ending value (after expenses) $1,000.10 $1,000.10Annualized expense ratio (%) .07 .07BNY Mellon National Municipal Money Market FundExpenses paid per $1,000† $.60 $.55Ending value (after expenses) $1,000.10 $1,000.10Annualized expense ratio (%) .12 .11† Expenses are equal to each fund’s annualized expense ratio as shown above, multiplied by the average account value over the period, multiplied by 181/365 (to reflect
the one-half year period).COMPARING YOUR FUND’S EXPENSES
WITH THOSE OF OTHER FUNDS (Unaudited)Using the SEC’s method to compare expensesThe Securities and Exchange Commission (“SEC”) has established guidelines to help investors assess fund expenses. Per theseguidelines, the table below shows your fund’s expenses based on a $1,000 investment, assuming a hypothetical 5% annualized return.You can use this information to compare the ongoing expenses (but not transaction expenses or total cost) of investing in the fund withthose of other funds. All mutual fund shareholder reports will provide this information to help you make this comparison. Please note thatyou cannot use this information to estimate your actual ending account balance and expenses paid during the period.Expenses and Value of a $1,000 InvestmentAssuming a hypothetical 5% annualized return for the six months ended February 28, 2022
Class M Investor SharesBNY Mellon Government Money Market FundExpenses paid per $1,000† $.35 $.35Ending value (after expenses) $1,024.45 $1,024.45Annualized expense ratio (%) .07 .07BNY Mellon National Municipal Money Market FundExpenses paid per $1,000† $.60 $.55Ending value (after expenses) $1,024.20 $1,024.25Annualized expense ratio (%) .12 .11† Expenses are equal to each fund’s annualized expense ratio as shown above, multiplied by the average account value over the period, multiplied by 181/365 (to reflect
the one-half year period).2
Copyright © 2022 www.secdatabase.com. All Rights Reserved.Please Consider the Environment Before Printing This Document
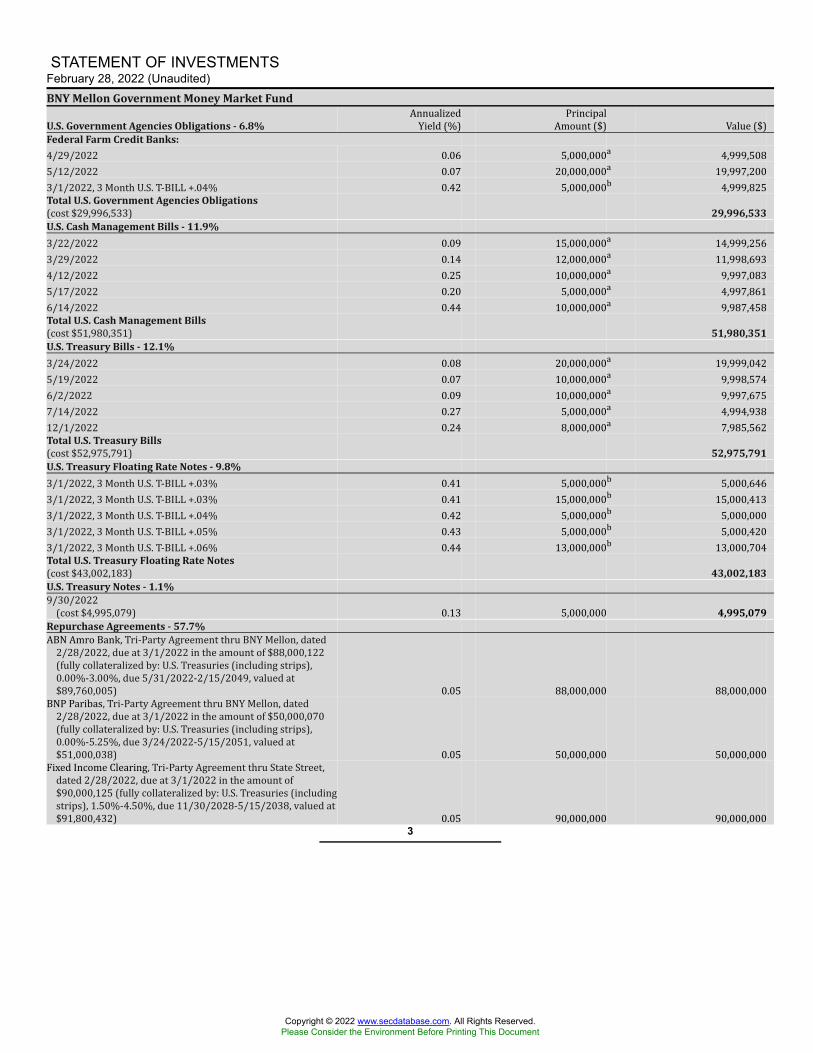
STATEMENT OF INVESTMENTSFebruary 28, 2022 (Unaudited)BNY Mellon Government Money Market Fund
U.S. Government Agencies Obligations - 6.8%AnnualizedYield (%) PrincipalAmount ($) Value ($)
Federal Farm Credit Banks:4/29/2022 0.06 5,000,000a 4,999,5085/12/2022 0.07 20,000,000a 19,997,2003/1/2022, 3 Month U.S. T-BILL +.04% 0.42 5,000,000b 4,999,825Total U.S. Government Agencies Obligations(cost $29,996,533) 29,996,533U.S. Cash Management Bills - 11.9%3/22/2022 0.09 15,000,000a 14,999,2563/29/2022 0.14 12,000,000a 11,998,6934/12/2022 0.25 10,000,000a 9,997,0835/17/2022 0.20 5,000,000a 4,997,8616/14/2022 0.44 10,000,000a 9,987,458Total U.S. Cash Management Bills(cost $51,980,351) 51,980,351U.S. Treasury Bills - 12.1%3/24/2022 0.08 20,000,000a 19,999,0425/19/2022 0.07 10,000,000a 9,998,5746/2/2022 0.09 10,000,000a 9,997,6757/14/2022 0.27 5,000,000a 4,994,93812/1/2022 0.24 8,000,000a 7,985,562Total U.S. Treasury Bills(cost $52,975,791) 52,975,791U.S. Treasury Floating Rate Notes - 9.8%3/1/2022, 3 Month U.S. T-BILL +.03% 0.41 5,000,000b 5,000,6463/1/2022, 3 Month U.S. T-BILL +.03% 0.41 15,000,000b 15,000,4133/1/2022, 3 Month U.S. T-BILL +.04% 0.42 5,000,000b 5,000,0003/1/2022, 3 Month U.S. T-BILL +.05% 0.43 5,000,000b 5,000,4203/1/2022, 3 Month U.S. T-BILL +.06% 0.44 13,000,000b 13,000,704Total U.S. Treasury Floating Rate Notes(cost $43,002,183) 43,002,183U.S. Treasury Notes - 1.1%9/30/2022(cost $4,995,079) 0.13 5,000,000 4,995,079Repurchase Agreements - 57.7%ABN Amro Bank, Tri-Party Agreement thru BNY Mellon, dated2/28/2022, due at 3/1/2022 in the amount of $88,000,122(fully collateralized by: U.S. Treasuries (including strips),0.00%-3.00%, due 5/31/2022-2/15/2049, valued at$89,760,005) 0.05 88,000,000 88,000,000BNP Paribas, Tri-Party Agreement thru BNY Mellon, dated2/28/2022, due at 3/1/2022 in the amount of $50,000,070(fully collateralized by: U.S. Treasuries (including strips),0.00%-5.25%, due 3/24/2022-5/15/2051, valued at$51,000,038) 0.05 50,000,000 50,000,000Fixed Income Clearing, Tri-Party Agreement thru State Street,dated 2/28/2022, due at 3/1/2022 in the amount of$90,000,125 (fully collateralized by: U.S. Treasuries (includingstrips), 1.50%-4.50%, due 11/30/2028-5/15/2038, valued at$91,800,432) 0.05 90,000,000 90,000,000
3
Copyright © 2022 www.secdatabase.com. All Rights Reserved.Please Consider the Environment Before Printing This Document
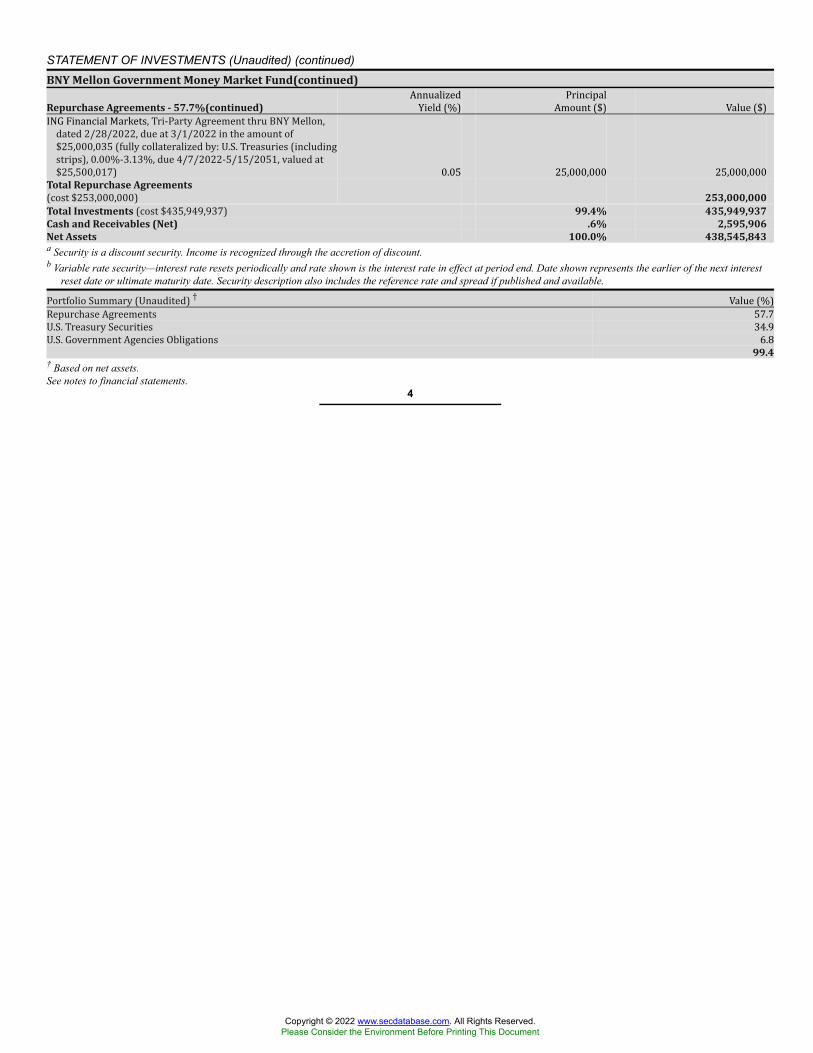
STATEMENT OF INVESTMENTS (Unaudited) (continued)BNY Mellon Government Money Market Fund(continued)
Repurchase Agreements - 57.7%(continued)AnnualizedYield (%) PrincipalAmount ($) Value ($)ING Financial Markets, Tri-Party Agreement thru BNY Mellon,dated 2/28/2022, due at 3/1/2022 in the amount of$25,000,035 (fully collateralized by: U.S. Treasuries (includingstrips), 0.00%-3.13%, due 4/7/2022-5/15/2051, valued at$25,500,017) 0.05 25,000,000 25,000,000
Total Repurchase Agreements(cost $253,000,000) 253,000,000Total Investments (cost $435,949,937) 99.4% 435,949,937Cash and Receivables (Net) .6% 2,595,906Net Assets 100.0% 438,545,843a Security is a discount security. Income is recognized through the accretion of discount.b Variable rate security—interest rate resets periodically and rate shown is the interest rate in effect at period end. Date shown represents the earlier of the next interest
reset date or ultimate maturity date. Security description also includes the reference rate and spread if published and available.Portfolio Summary (Unaudited) † Value (%)Repurchase Agreements 57.7U.S. Treasury Securities 34.9U.S. Government Agencies Obligations 6.899.4
† Based on net assets.See notes to financial statements.
4
Copyright © 2022 www.secdatabase.com. All Rights Reserved.Please Consider the Environment Before Printing This Document
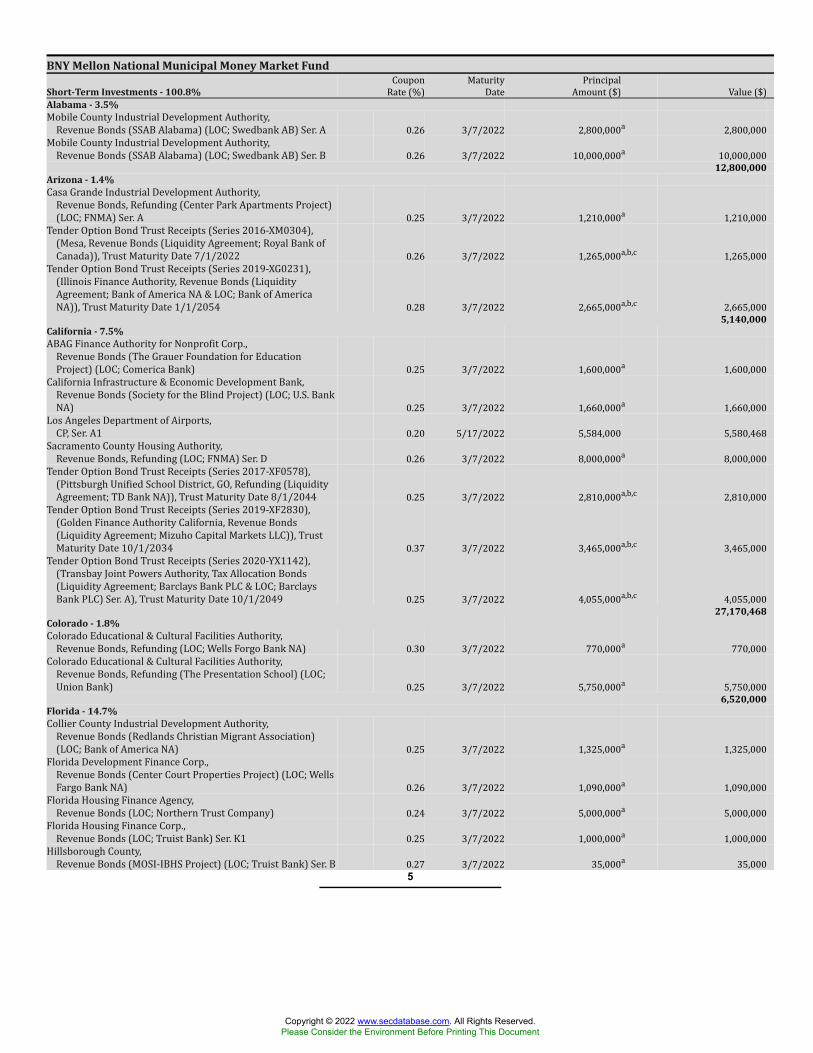
BNY Mellon National Municipal Money Market Fund
Short-Term Investments - 100.8%CouponRate (%) MaturityDate PrincipalAmount ($) Value ($)
Alabama - 3.5%Mobile County Industrial Development Authority,Revenue Bonds (SSAB Alabama) (LOC; Swedbank AB) Ser. A 0.26 3/7/2022 2,800,000a 2,800,000Mobile County Industrial Development Authority,Revenue Bonds (SSAB Alabama) (LOC; Swedbank AB) Ser. B 0.26 3/7/2022 10,000,000a 10,000,00012,800,000
Arizona - 1.4%Casa Grande Industrial Development Authority,Revenue Bonds, Refunding (Center Park Apartments Project)(LOC; FNMA) Ser. A 0.25 3/7/2022 1,210,000a 1,210,000Tender Option Bond Trust Receipts (Series 2016-XM0304),(Mesa, Revenue Bonds (Liquidity Agreement; Royal Bank ofCanada)), Trust Maturity Date 7/1/2022 0.26 3/7/2022 1,265,000a,b,c 1,265,000Tender Option Bond Trust Receipts (Series 2019-XG0231),(Illinois Finance Authority, Revenue Bonds (LiquidityAgreement; Bank of America NA & LOC; Bank of AmericaNA)), Trust Maturity Date 1/1/2054 0.28 3/7/2022 2,665,000a,b,c 2,665,0005,140,000
California - 7.5%ABAG Finance Authority for Nonprofit Corp.,Revenue Bonds (The Grauer Foundation for EducationProject) (LOC; Comerica Bank) 0.25 3/7/2022 1,600,000a 1,600,000California Infrastructure & Economic Development Bank,Revenue Bonds (Society for the Blind Project) (LOC; U.S. BankNA) 0.25 3/7/2022 1,660,000a 1,660,000Los Angeles Department of Airports,CP, Ser. A1 0.20 5/17/2022 5,584,000 5,580,468Sacramento County Housing Authority,Revenue Bonds, Refunding (LOC; FNMA) Ser. D 0.26 3/7/2022 8,000,000a 8,000,000Tender Option Bond Trust Receipts (Series 2017-XF0578),(Pittsburgh Unified School District, GO, Refunding (LiquidityAgreement; TD Bank NA)), Trust Maturity Date 8/1/2044 0.25 3/7/2022 2,810,000a,b,c 2,810,000Tender Option Bond Trust Receipts (Series 2019-XF2830),(Golden Finance Authority California, Revenue Bonds(Liquidity Agreement; Mizuho Capital Markets LLC)), TrustMaturity Date 10/1/2034 0.37 3/7/2022 3,465,000a,b,c 3,465,000Tender Option Bond Trust Receipts (Series 2020-YX1142),(Transbay Joint Powers Authority, Tax Allocation Bonds(Liquidity Agreement; Barclays Bank PLC & LOC; BarclaysBank PLC) Ser. A), Trust Maturity Date 10/1/2049 0.25 3/7/2022 4,055,000a,b,c 4,055,00027,170,468
Colorado - 1.8%Colorado Educational & Cultural Facilities Authority,Revenue Bonds, Refunding (LOC; Wells Forgo Bank NA) 0.30 3/7/2022 770,000a 770,000Colorado Educational & Cultural Facilities Authority,Revenue Bonds, Refunding (The Presentation School) (LOC;Union Bank) 0.25 3/7/2022 5,750,000a 5,750,0006,520,000
Florida - 14.7%Collier County Industrial Development Authority,Revenue Bonds (Redlands Christian Migrant Association)(LOC; Bank of America NA) 0.25 3/7/2022 1,325,000a 1,325,000Florida Development Finance Corp.,Revenue Bonds (Center Court Properties Project) (LOC; WellsFargo Bank NA) 0.26 3/7/2022 1,090,000a 1,090,000Florida Housing Finance Agency,Revenue Bonds (LOC; Northern Trust Company) 0.24 3/7/2022 5,000,000a 5,000,000Florida Housing Finance Corp.,Revenue Bonds (LOC; Truist Bank) Ser. K1 0.25 3/7/2022 1,000,000a 1,000,000Hillsborough County,Revenue Bonds (MOSI-IBHS Project) (LOC; Truist Bank) Ser. B 0.27 3/7/2022 35,000a 35,0005
Copyright © 2022 www.secdatabase.com. All Rights Reserved.Please Consider the Environment Before Printing This Document
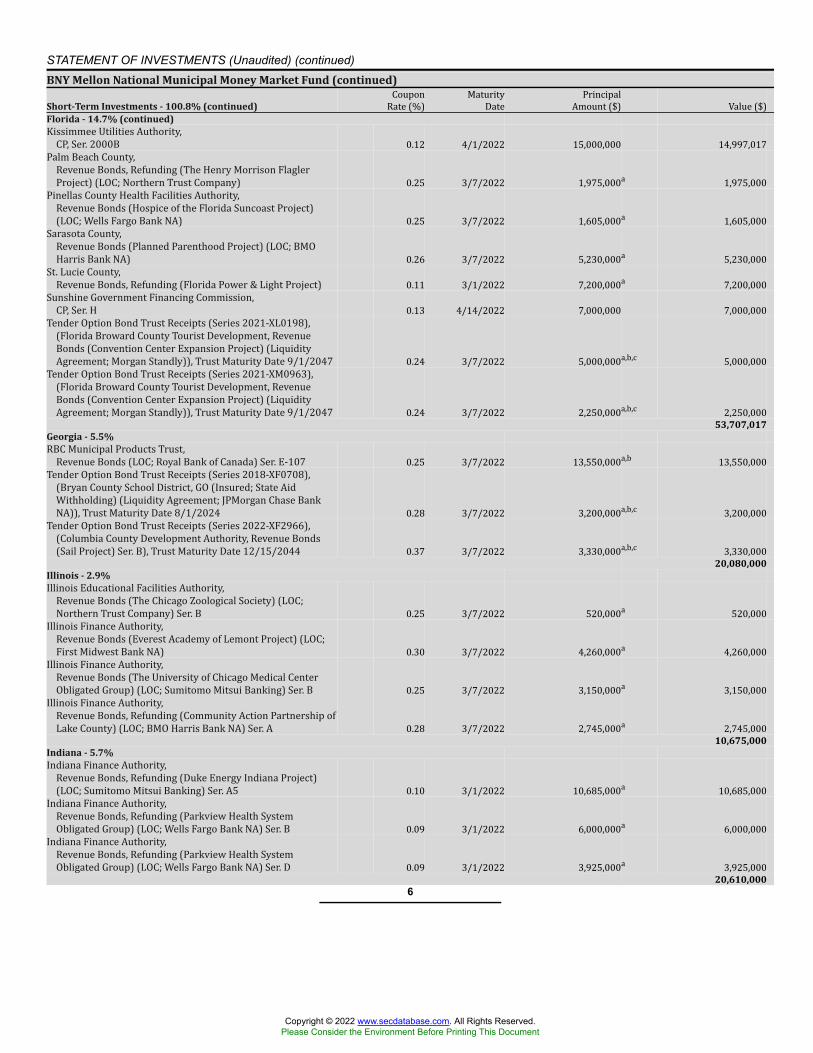
STATEMENT OF INVESTMENTS (Unaudited) (continued)BNY Mellon National Municipal Money Market Fund (continued)
Short-Term Investments - 100.8% (continued)CouponRate (%) MaturityDate PrincipalAmount ($) Value ($)
Florida - 14.7% (continued)Kissimmee Utilities Authority,CP, Ser. 2000B 0.12 4/1/2022 15,000,000 14,997,017Palm Beach County,Revenue Bonds, Refunding (The Henry Morrison FlaglerProject) (LOC; Northern Trust Company) 0.25 3/7/2022 1,975,000a 1,975,000Pinellas County Health Facilities Authority,Revenue Bonds (Hospice of the Florida Suncoast Project)(LOC; Wells Fargo Bank NA) 0.25 3/7/2022 1,605,000a 1,605,000Sarasota County,Revenue Bonds (Planned Parenthood Project) (LOC; BMOHarris Bank NA) 0.26 3/7/2022 5,230,000a 5,230,000St. Lucie County,Revenue Bonds, Refunding (Florida Power & Light Project) 0.11 3/1/2022 7,200,000a 7,200,000Sunshine Government Financing Commission,CP, Ser. H 0.13 4/14/2022 7,000,000 7,000,000Tender Option Bond Trust Receipts (Series 2021-XL0198),(Florida Broward County Tourist Development, RevenueBonds (Convention Center Expansion Project) (LiquidityAgreement; Morgan Standly)), Trust Maturity Date 9/1/2047 0.24 3/7/2022 5,000,000a,b,c 5,000,000Tender Option Bond Trust Receipts (Series 2021-XM0963),(Florida Broward County Tourist Development, RevenueBonds (Convention Center Expansion Project) (LiquidityAgreement; Morgan Standly)), Trust Maturity Date 9/1/2047 0.24 3/7/2022 2,250,000a,b,c 2,250,00053,707,017
Georgia - 5.5%RBC Municipal Products Trust,Revenue Bonds (LOC; Royal Bank of Canada) Ser. E-107 0.25 3/7/2022 13,550,000a,b 13,550,000Tender Option Bond Trust Receipts (Series 2018-XF0708),(Bryan County School District, GO (Insured; State AidWithholding) (Liquidity Agreement; JPMorgan Chase BankNA)), Trust Maturity Date 8/1/2024 0.28 3/7/2022 3,200,000a,b,c 3,200,000Tender Option Bond Trust Receipts (Series 2022-XF2966),(Columbia County Development Authority, Revenue Bonds(Sail Project) Ser. B), Trust Maturity Date 12/15/2044 0.37 3/7/2022 3,330,000a,b,c 3,330,00020,080,000
Illinois - 2.9%Illinois Educational Facilities Authority,Revenue Bonds (The Chicago Zoological Society) (LOC;Northern Trust Company) Ser. B 0.25 3/7/2022 520,000a 520,000Illinois Finance Authority,Revenue Bonds (Everest Academy of Lemont Project) (LOC;First Midwest Bank NA) 0.30 3/7/2022 4,260,000a 4,260,000Illinois Finance Authority,Revenue Bonds (The University of Chicago Medical CenterObligated Group) (LOC; Sumitomo Mitsui Banking) Ser. B 0.25 3/7/2022 3,150,000a 3,150,000Illinois Finance Authority,Revenue Bonds, Refunding (Community Action Partnership ofLake County) (LOC; BMO Harris Bank NA) Ser. A 0.28 3/7/2022 2,745,000a 2,745,00010,675,000
Indiana - 5.7%Indiana Finance Authority,Revenue Bonds, Refunding (Duke Energy Indiana Project)(LOC; Sumitomo Mitsui Banking) Ser. A5 0.10 3/1/2022 10,685,000a 10,685,000Indiana Finance Authority,Revenue Bonds, Refunding (Parkview Health SystemObligated Group) (LOC; Wells Fargo Bank NA) Ser. B 0.09 3/1/2022 6,000,000a 6,000,000Indiana Finance Authority,Revenue Bonds, Refunding (Parkview Health SystemObligated Group) (LOC; Wells Fargo Bank NA) Ser. D 0.09 3/1/2022 3,925,000a 3,925,00020,610,000
6
Copyright © 2022 www.secdatabase.com. All Rights Reserved.Please Consider the Environment Before Printing This Document
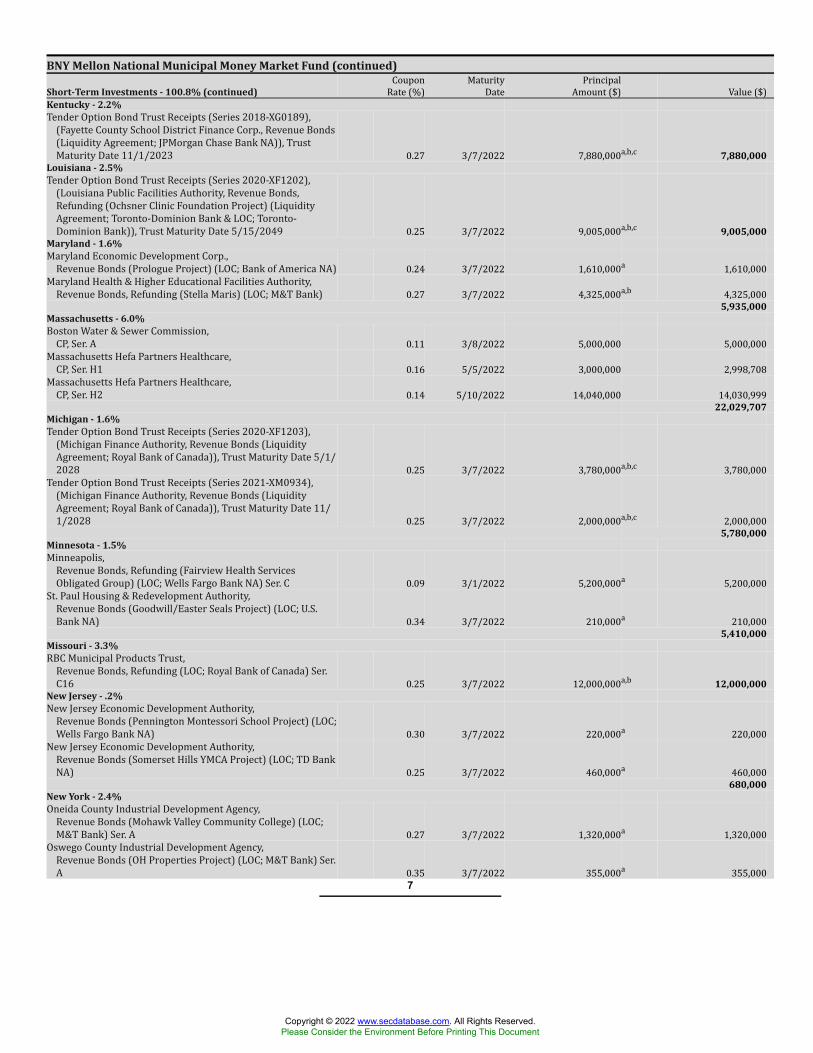
BNY Mellon National Municipal Money Market Fund (continued)
Short-Term Investments - 100.8% (continued)CouponRate (%) MaturityDate PrincipalAmount ($) Value ($)
Kentucky - 2.2%Tender Option Bond Trust Receipts (Series 2018-XG0189),(Fayette County School District Finance Corp., Revenue Bonds(Liquidity Agreement; JPMorgan Chase Bank NA)), TrustMaturity Date 11/1/2023 0.27 3/7/2022 7,880,000a,b,c 7,880,000Louisiana - 2.5%Tender Option Bond Trust Receipts (Series 2020-XF1202),(Louisiana Public Facilities Authority, Revenue Bonds,Refunding (Ochsner Clinic Foundation Project) (LiquidityAgreement; Toronto-Dominion Bank & LOC; Toronto-Dominion Bank)), Trust Maturity Date 5/15/2049 0.25 3/7/2022 9,005,000a,b,c 9,005,000Maryland - 1.6%Maryland Economic Development Corp.,Revenue Bonds (Prologue Project) (LOC; Bank of America NA) 0.24 3/7/2022 1,610,000a 1,610,000Maryland Health & Higher Educational Facilities Authority,Revenue Bonds, Refunding (Stella Maris) (LOC; M&T Bank) 0.27 3/7/2022 4,325,000a,b 4,325,000
5,935,000Massachusetts - 6.0%Boston Water & Sewer Commission,CP, Ser. A 0.11 3/8/2022 5,000,000 5,000,000Massachusetts Hefa Partners Healthcare,CP, Ser. H1 0.16 5/5/2022 3,000,000 2,998,708Massachusetts Hefa Partners Healthcare,CP, Ser. H2 0.14 5/10/2022 14,040,000 14,030,999
22,029,707Michigan - 1.6%Tender Option Bond Trust Receipts (Series 2020-XF1203),(Michigan Finance Authority, Revenue Bonds (LiquidityAgreement; Royal Bank of Canada)), Trust Maturity Date 5/1/2028 0.25 3/7/2022 3,780,000a,b,c 3,780,000Tender Option Bond Trust Receipts (Series 2021-XM0934),(Michigan Finance Authority, Revenue Bonds (LiquidityAgreement; Royal Bank of Canada)), Trust Maturity Date 11/1/2028 0.25 3/7/2022 2,000,000a,b,c 2,000,000
5,780,000Minnesota - 1.5%Minneapolis,Revenue Bonds, Refunding (Fairview Health ServicesObligated Group) (LOC; Wells Fargo Bank NA) Ser. C 0.09 3/1/2022 5,200,000a 5,200,000St. Paul Housing & Redevelopment Authority,Revenue Bonds (Goodwill/Easter Seals Project) (LOC; U.S.Bank NA) 0.34 3/7/2022 210,000a 210,000
5,410,000Missouri - 3.3%RBC Municipal Products Trust,Revenue Bonds, Refunding (LOC; Royal Bank of Canada) Ser.C16 0.25 3/7/2022 12,000,000a,b 12,000,000New Jersey - .2%New Jersey Economic Development Authority,Revenue Bonds (Pennington Montessori School Project) (LOC;Wells Fargo Bank NA) 0.30 3/7/2022 220,000a 220,000New Jersey Economic Development Authority,Revenue Bonds (Somerset Hills YMCA Project) (LOC; TD BankNA) 0.25 3/7/2022 460,000a 460,000
680,000New York - 2.4%Oneida County Industrial Development Agency,Revenue Bonds (Mohawk Valley Community College) (LOC;M&T Bank) Ser. A 0.27 3/7/2022 1,320,000a 1,320,000Oswego County Industrial Development Agency,Revenue Bonds (OH Properties Project) (LOC; M&T Bank) Ser.A 0.35 3/7/2022 355,000a 355,000
7
Copyright © 2022 www.secdatabase.com. All Rights Reserved.Please Consider the Environment Before Printing This Document
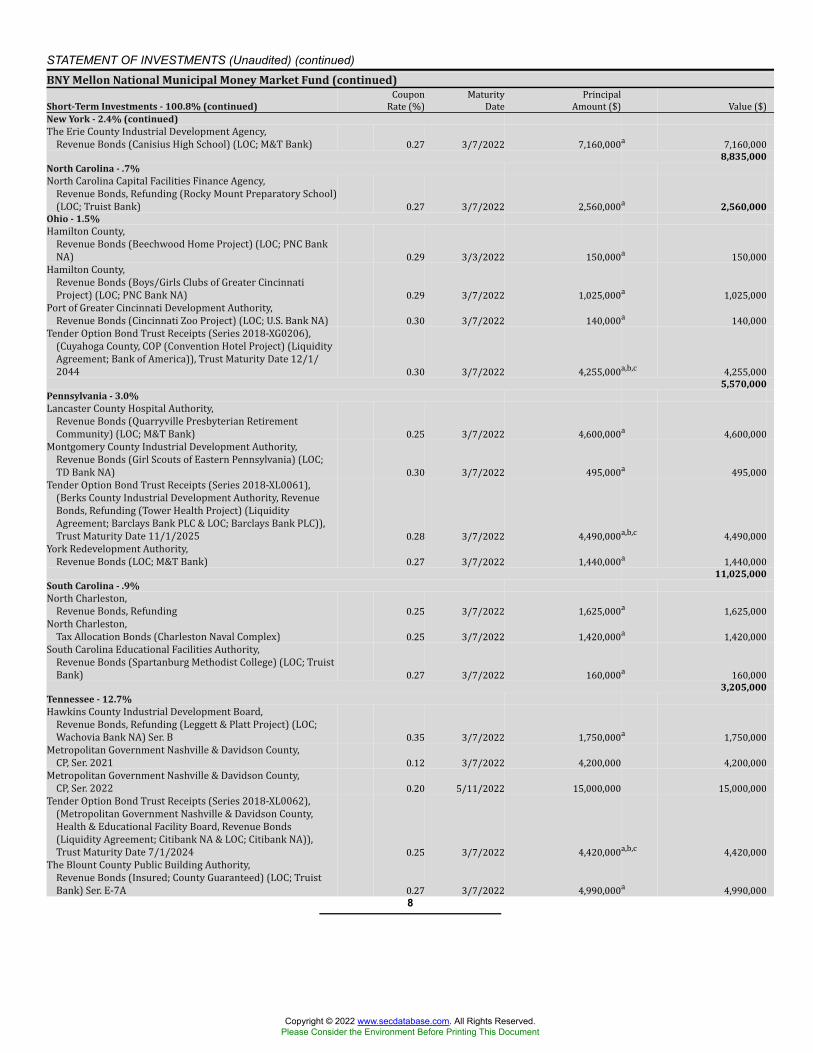
STATEMENT OF INVESTMENTS (Unaudited) (continued)BNY Mellon National Municipal Money Market Fund (continued)
Short-Term Investments - 100.8% (continued)CouponRate (%) MaturityDate PrincipalAmount ($) Value ($)
New York - 2.4% (continued)The Erie County Industrial Development Agency,Revenue Bonds (Canisius High School) (LOC; M&T Bank) 0.27 3/7/2022 7,160,000a 7,160,0008,835,000
North Carolina - .7%North Carolina Capital Facilities Finance Agency,Revenue Bonds, Refunding (Rocky Mount Preparatory School)(LOC; Truist Bank) 0.27 3/7/2022 2,560,000a 2,560,000Ohio - 1.5%Hamilton County,Revenue Bonds (Beechwood Home Project) (LOC; PNC BankNA) 0.29 3/3/2022 150,000a 150,000Hamilton County,Revenue Bonds (Boys/Girls Clubs of Greater CincinnatiProject) (LOC; PNC Bank NA) 0.29 3/7/2022 1,025,000a 1,025,000Port of Greater Cincinnati Development Authority,Revenue Bonds (Cincinnati Zoo Project) (LOC; U.S. Bank NA) 0.30 3/7/2022 140,000a 140,000Tender Option Bond Trust Receipts (Series 2018-XG0206),(Cuyahoga County, COP (Convention Hotel Project) (LiquidityAgreement; Bank of America)), Trust Maturity Date 12/1/2044 0.30 3/7/2022 4,255,000a,b,c 4,255,000
5,570,000Pennsylvania - 3.0%Lancaster County Hospital Authority,Revenue Bonds (Quarryville Presbyterian RetirementCommunity) (LOC; M&T Bank) 0.25 3/7/2022 4,600,000a 4,600,000Montgomery County Industrial Development Authority,Revenue Bonds (Girl Scouts of Eastern Pennsylvania) (LOC;TD Bank NA) 0.30 3/7/2022 495,000a 495,000Tender Option Bond Trust Receipts (Series 2018-XL0061),(Berks County Industrial Development Authority, RevenueBonds, Refunding (Tower Health Project) (LiquidityAgreement; Barclays Bank PLC & LOC; Barclays Bank PLC)),Trust Maturity Date 11/1/2025 0.28 3/7/2022 4,490,000a,b,c 4,490,000York Redevelopment Authority,Revenue Bonds (LOC; M&T Bank) 0.27 3/7/2022 1,440,000a 1,440,000
11,025,000South Carolina - .9%North Charleston,Revenue Bonds, Refunding 0.25 3/7/2022 1,625,000a 1,625,000North Charleston,Tax Allocation Bonds (Charleston Naval Complex) 0.25 3/7/2022 1,420,000a 1,420,000South Carolina Educational Facilities Authority,Revenue Bonds (Spartanburg Methodist College) (LOC; TruistBank) 0.27 3/7/2022 160,000a 160,000
3,205,000Tennessee - 12.7%Hawkins County Industrial Development Board,Revenue Bonds, Refunding (Leggett & Platt Project) (LOC;Wachovia Bank NA) Ser. B 0.35 3/7/2022 1,750,000a 1,750,000Metropolitan Government Nashville & Davidson County,CP, Ser. 2021 0.12 3/7/2022 4,200,000 4,200,000Metropolitan Government Nashville & Davidson County,CP, Ser. 2022 0.20 5/11/2022 15,000,000 15,000,000Tender Option Bond Trust Receipts (Series 2018-XL0062),(Metropolitan Government Nashville & Davidson County,Health & Educational Facility Board, Revenue Bonds(Liquidity Agreement; Citibank NA & LOC; Citibank NA)),Trust Maturity Date 7/1/2024 0.25 3/7/2022 4,420,000a,b,c 4,420,000The Blount County Public Building Authority,Revenue Bonds (Insured; County Guaranteed) (LOC; TruistBank) Ser. E-7A 0.27 3/7/2022 4,990,000a 4,990,000
8
Copyright © 2022 www.secdatabase.com. All Rights Reserved.Please Consider the Environment Before Printing This Document

BNY Mellon National Municipal Money Market Fund (continued)
Short-Term Investments - 100.8% (continued)CouponRate (%) MaturityDate PrincipalAmount ($) Value ($)
Tennessee - 12.7% (continued)The Blount County Public Building Authority,Revenue Bonds (Insured; County Guaranteed) Ser. C-1A 0.27 3/7/2022 2,295,000a 2,295,000The Blount County Public Building Authority,Revenue Bonds, Refunding (Insured; County Guaranteed)(LOC; Truist Bank) Ser. 6A 0.27 3/7/2022 4,650,000a 4,650,000The Sevier County Public Building Authority,Revenue Bonds (Insured; County Guaranteed) Ser. 6-A1 0.27 3/7/2022 4,125,000a 4,125,000The Sevier County Public Building Authority,Revenue Bonds (LOC; Truist Bank) Ser. V-B1 0.27 3/7/2022 5,025,000a 5,025,00046,455,000
Texas - 8.5%Dallas Texas Waterworks & Sewer System,CP, Ser. G 0.17 4/12/2022 4,900,000 4,900,000Harris County Texas Metropolitan Transportation Authority,CP, Ser. A1 0.17 3/22/2022 2,500,000 2,500,000Harris County Texas Metropolitan Transportation Authority,CP, Ser. A1 0.21 3/21/2022 4,715,000 4,714,511Houston Texas,GO, Ser. G2 0.25 4/4/2022 9,000,000 8,999,126Lower Colorado River Authority,CP 0.22 3/23/2022 2,500,000 2,500,000North East Independent School District,CP, Ser. A 0.16 3/16/2022 5,000,000 5,000,000San Antonio Texas Water & Sewer System,CP, Ser. A1 0.37 3/29/2022 2,500,000 2,500,00031,113,637
Utah - .1%Salt Lake County,Revenue Bonds (Community Foundation Disabled Project) 0.35 3/7/2022 200,000a 200,000Vermont - .0%Vermont Educational & Health Buildings Financing Agency,Revenue Bonds (LOC; People's United Bank) Ser. 1 0.84 3/7/2022 100,000a 100,000Virginia - 4.0%Alexandria Industrial Development Authority,Revenue Bonds (Young Men's Christian Association ofMetuchen) (LOC; First National Bank of MD) 0.26 3/7/2022 560,000a 560,000Lynchburg Economic Development Authority,Revenue Bonds, Refunding (Centra Health Obligated Group)(LOC; Truist Bank) Ser. C 0.27 3/7/2022 365,000a 365,000Virginia College Building Authority,Revenue Bonds, Refunding (University of Richmond Project) 0.10 3/1/2022 13,645,000a 13,645,000
14,570,000West Virginia - .7%West Virginia Hospital Finance Authority,Revenue Bonds, Refunding (Cabell Huntington Hospital)(LOC; Truist Bank) Ser. A 0.27 3/7/2022 1,450,000a 1,450,000West Virginia Hospital Finance Authority,Revenue Bonds, Refunding (Cabell Huntington Hospital)(LOC; Truist Bank) Ser. B 0.27 3/7/2022 1,060,000a 1,060,000
2,510,000Wisconsin - 4.4%Kimberly,Revenue Bonds (Fox Cities YMCA Project) (LOC; Marshall &Ilsley Trust) 0.30 3/7/2022 130,000a 130,000Tender Option Bond Trust Receipts (Series 2018-XF0609),(Wisconsin Health & Educational Facilities Authority, RevenueBonds (Marshfield Clinic Health System) (LiquidityAgreement; JPMorgan Chase Bank NA & LOC; JPMorgan ChaseBank NA)), Trust Maturity Date 2/15/2024 0.27 3/7/2022 3,600,000a,b,c 3,600,000
9
Copyright © 2022 www.secdatabase.com. All Rights Reserved.Please Consider the Environment Before Printing This Document
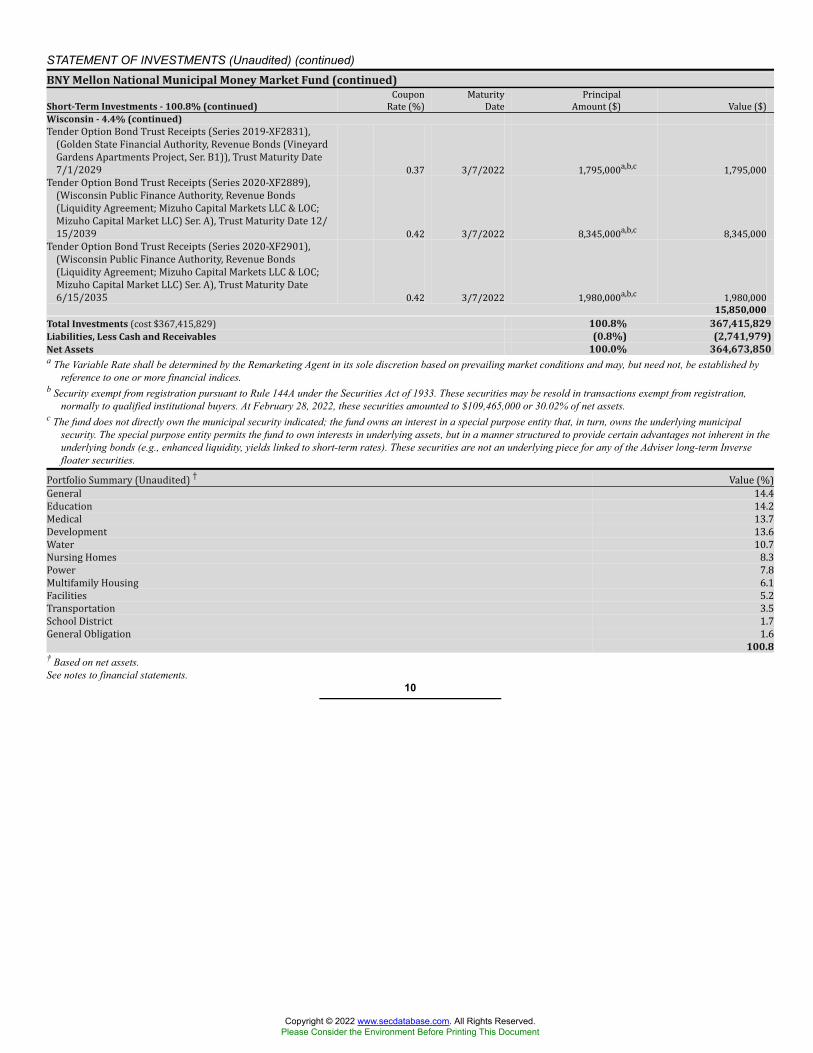
STATEMENT OF INVESTMENTS (Unaudited) (continued)BNY Mellon National Municipal Money Market Fund (continued)
Short-Term Investments - 100.8% (continued)CouponRate (%) MaturityDate PrincipalAmount ($) Value ($)
Wisconsin - 4.4% (continued)Tender Option Bond Trust Receipts (Series 2019-XF2831),(Golden State Financial Authority, Revenue Bonds (VineyardGardens Apartments Project, Ser. B1)), Trust Maturity Date7/1/2029 0.37 3/7/2022 1,795,000a,b,c 1,795,000Tender Option Bond Trust Receipts (Series 2020-XF2889),(Wisconsin Public Finance Authority, Revenue Bonds(Liquidity Agreement; Mizuho Capital Markets LLC & LOC;Mizuho Capital Market LLC) Ser. A), Trust Maturity Date 12/15/2039 0.42 3/7/2022 8,345,000a,b,c 8,345,000Tender Option Bond Trust Receipts (Series 2020-XF2901),(Wisconsin Public Finance Authority, Revenue Bonds(Liquidity Agreement; Mizuho Capital Markets LLC & LOC;Mizuho Capital Market LLC) Ser. A), Trust Maturity Date6/15/2035 0.42 3/7/2022 1,980,000a,b,c 1,980,00015,850,000
Total Investments (cost $367,415,829) 100.8% 367,415,829Liabilities, Less Cash and Receivables (0.8%) (2,741,979)Net Assets 100.0% 364,673,850a The Variable Rate shall be determined by the Remarketing Agent in its sole discretion based on prevailing market conditions and may, but need not, be established by
reference to one or more financial indices.b Security exempt from registration pursuant to Rule 144A under the Securities Act of 1933. These securities may be resold in transactions exempt from registration,
normally to qualified institutional buyers. At February 28, 2022, these securities amounted to $109,465,000 or 30.02% of net assets.c The fund does not directly own the municipal security indicated; the fund owns an interest in a special purpose entity that, in turn, owns the underlying municipal
security. The special purpose entity permits the fund to own interests in underlying assets, but in a manner structured to provide certain advantages not inherent in theunderlying bonds (e.g., enhanced liquidity, yields linked to short-term rates). These securities are not an underlying piece for any of the Adviser long-term Inversefloater securities.Portfolio Summary (Unaudited) † Value (%)General 14.4Education 14.2Medical 13.7Development 13.6Water 10.7Nursing Homes 8.3Power 7.8Multifamily Housing 6.1Facilities 5.2Transportation 3.5School District 1.7General Obligation 1.6
100.8† Based on net assets.See notes to financial statements.
10
Copyright © 2022 www.secdatabase.com. All Rights Reserved.Please Consider the Environment Before Printing This Document
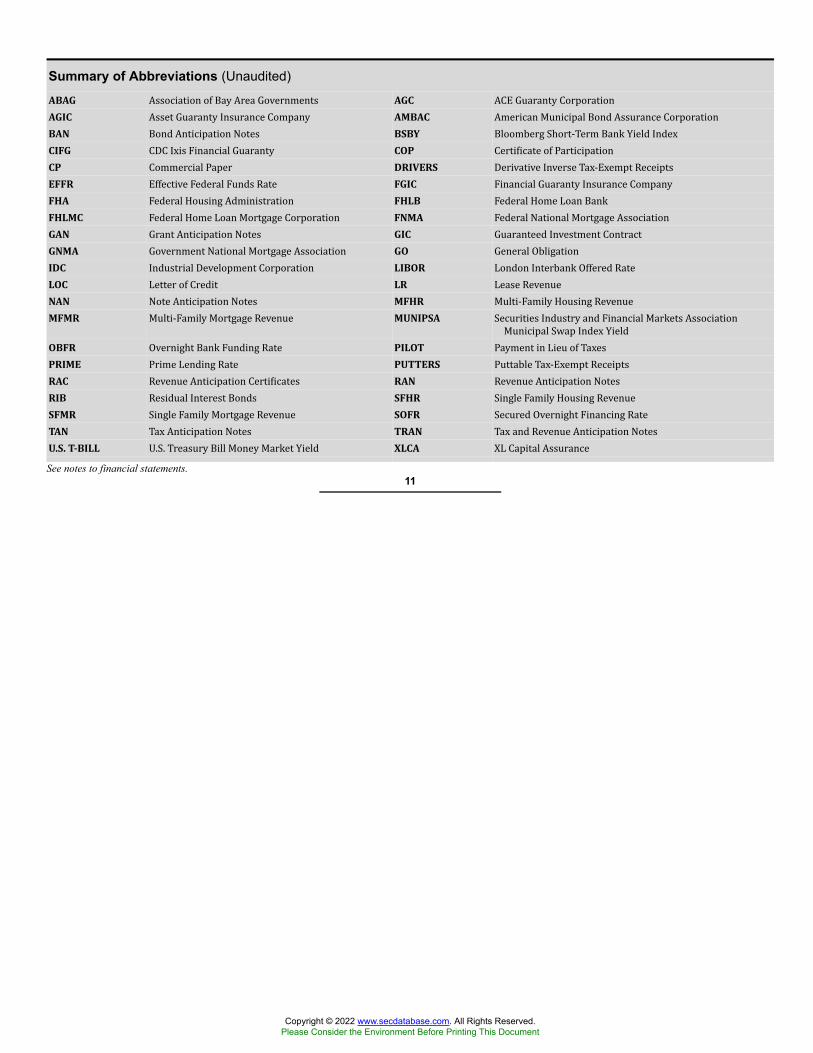
Summary of Abbreviations (Unaudited)
ABAG Association of Bay Area Governments AGC ACE Guaranty CorporationAGIC Asset Guaranty Insurance Company AMBAC American Municipal Bond Assurance CorporationBAN Bond Anticipation Notes BSBY Bloomberg Short-Term Bank Yield IndexCIFG CDC Ixis Financial Guaranty COP Certificate of ParticipationCP Commercial Paper DRIVERS Derivative Inverse Tax-Exempt ReceiptsEFFR Effective Federal Funds Rate FGIC Financial Guaranty Insurance CompanyFHA Federal Housing Administration FHLB Federal Home Loan BankFHLMC Federal Home Loan Mortgage Corporation FNMA Federal National Mortgage AssociationGAN Grant Anticipation Notes GIC Guaranteed Investment ContractGNMA Government National Mortgage Association GO General ObligationIDC Industrial Development Corporation LIBOR London Interbank Offered RateLOC Letter of Credit LR Lease RevenueNAN Note Anticipation Notes MFHR Multi-Family Housing RevenueMFMR Multi-Family Mortgage Revenue MUNIPSA Securities Industry and Financial Markets AssociationMunicipal Swap Index YieldOBFR Overnight Bank Funding Rate PILOT Payment in Lieu of TaxesPRIME Prime Lending Rate PUTTERS Puttable Tax-Exempt ReceiptsRAC Revenue Anticipation Certificates RAN Revenue Anticipation NotesRIB Residual Interest Bonds SFHR Single Family Housing RevenueSFMR Single Family Mortgage Revenue SOFR Secured Overnight Financing RateTAN Tax Anticipation Notes TRAN Tax and Revenue Anticipation NotesU.S. T-BILL U.S. Treasury Bill Money Market Yield XLCA XL Capital AssuranceSee notes to financial statements.
11
Copyright © 2022 www.secdatabase.com. All Rights Reserved.Please Consider the Environment Before Printing This Document
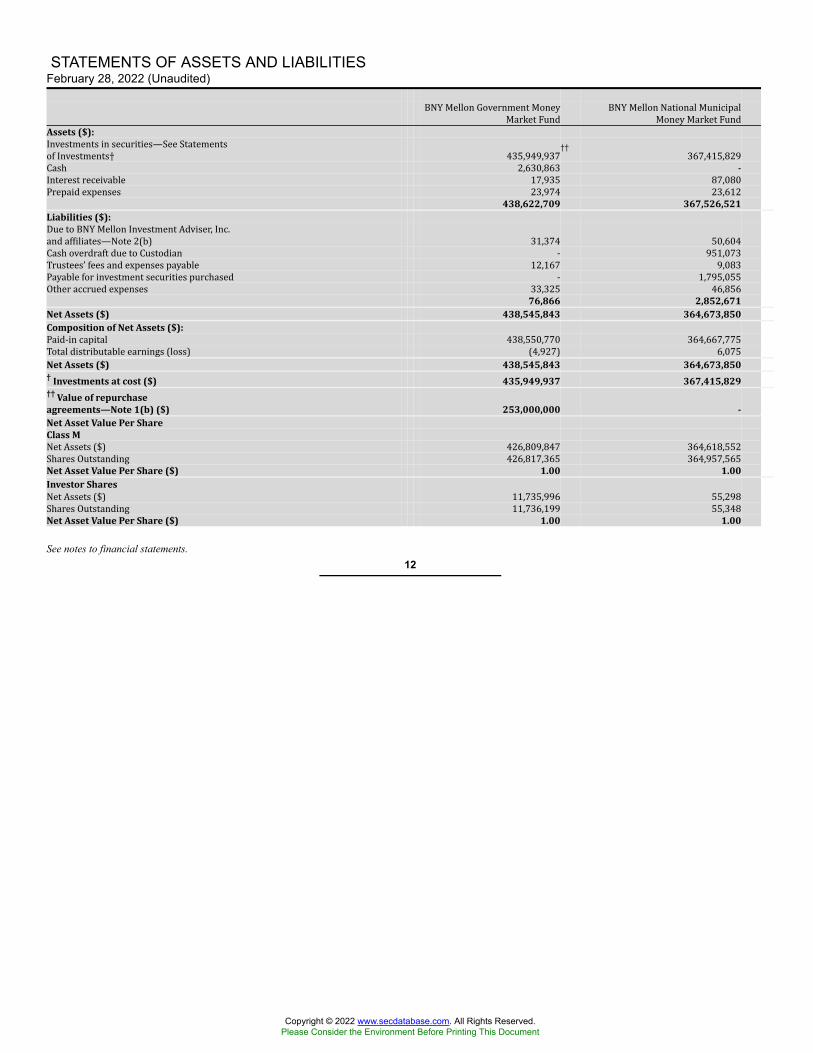
STATEMENTS OF ASSETS AND LIABILITIESFebruary 28, 2022 (Unaudited)
BNY Mellon Government MoneyMarket Fund BNY Mellon National MunicipalMoney Market FundAssets ($):Investments in securities—See Statementsof Investments† 435,949,937†† 367,415,829Cash 2,630,863 -Interest receivable 17,935 87,080Prepaid expenses 23,974 23,612
438,622,709 367,526,521Liabilities ($):Due to BNY Mellon Investment Adviser, Inc.and affiliates—Note 2(b) 31,374 50,604Cash overdraft due to Custodian - 951,073Trustees’ fees and expenses payable 12,167 9,083Payable for investment securities purchased - 1,795,055Other accrued expenses 33,325 46,856
76,866 2,852,671Net Assets ($) 438,545,843 364,673,850Composition of Net Assets ($):Paid-in capital 438,550,770 364,667,775Total distributable earnings (loss) (4,927) 6,075Net Assets ($) 438,545,843 364,673,850† Investments at cost ($) 435,949,937 367,415,829†† Value of repurchaseagreements—Note 1(b) ($) 253,000,000 -Net Asset Value Per ShareClass MNet Assets ($) 426,809,847 364,618,552Shares Outstanding 426,817,365 364,957,565Net Asset Value Per Share ($) 1.00 1.00Investor SharesNet Assets ($) 11,735,996 55,298Shares Outstanding 11,736,199 55,348Net Asset Value Per Share ($) 1.00 1.00
See notes to financial statements.12
Copyright © 2022 www.secdatabase.com. All Rights Reserved.Please Consider the Environment Before Printing This Document
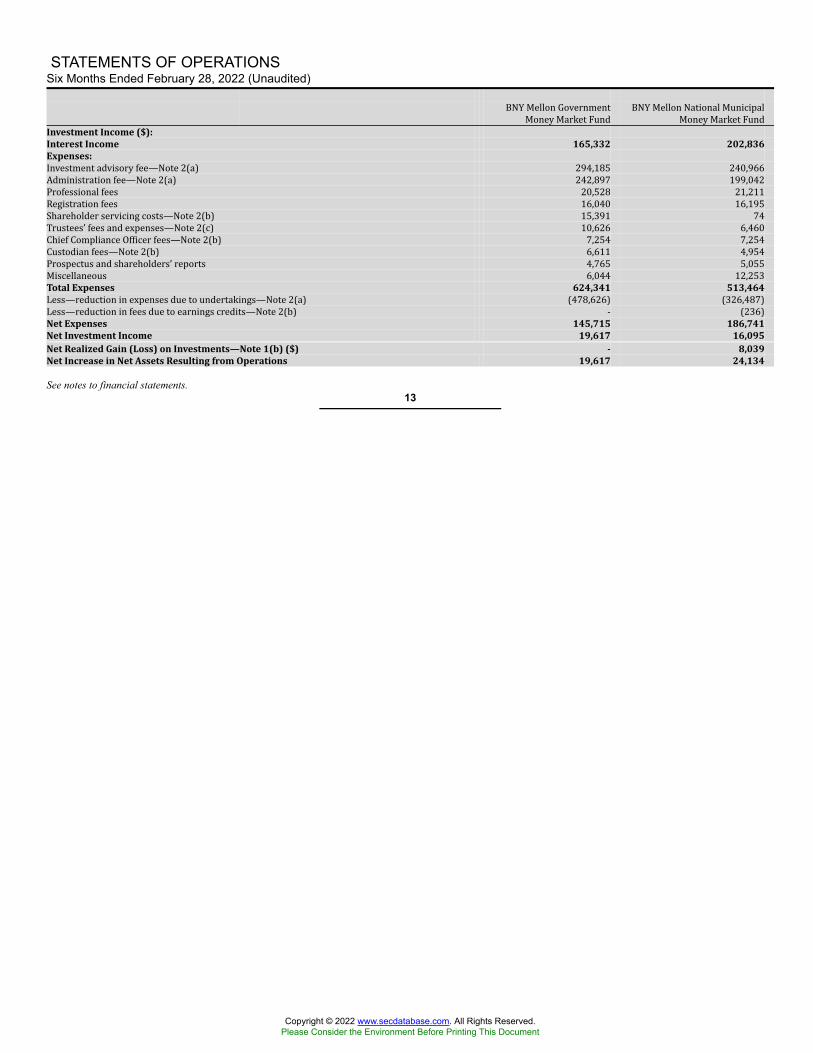
STATEMENTS OF OPERATIONSSix Months Ended February 28, 2022 (Unaudited)
BNY Mellon GovernmentMoney Market Fund BNY Mellon National MunicipalMoney Market FundInvestment Income ($):Interest Income 165,332 202,836Expenses:Investment advisory fee—Note 2(a) 294,185 240,966Administration fee—Note 2(a) 242,897 199,042Professional fees 20,528 21,211Registration fees 16,040 16,195Shareholder servicing costs—Note 2(b) 15,391 74Trustees’ fees and expenses—Note 2(c) 10,626 6,460Chief Compliance Officer fees—Note 2(b) 7,254 7,254Custodian fees—Note 2(b) 6,611 4,954Prospectus and shareholders’ reports 4,765 5,055Miscellaneous 6,044 12,253Total Expenses 624,341 513,464Less—reduction in expenses due to undertakings—Note 2(a) (478,626) (326,487)Less—reduction in fees due to earnings credits—Note 2(b) - (236)Net Expenses 145,715 186,741Net Investment Income 19,617 16,095Net Realized Gain (Loss) on Investments—Note 1(b) ($) - 8,039Net Increase in Net Assets Resulting from Operations 19,617 24,134
See notes to financial statements.13
Copyright © 2022 www.secdatabase.com. All Rights Reserved.Please Consider the Environment Before Printing This Document
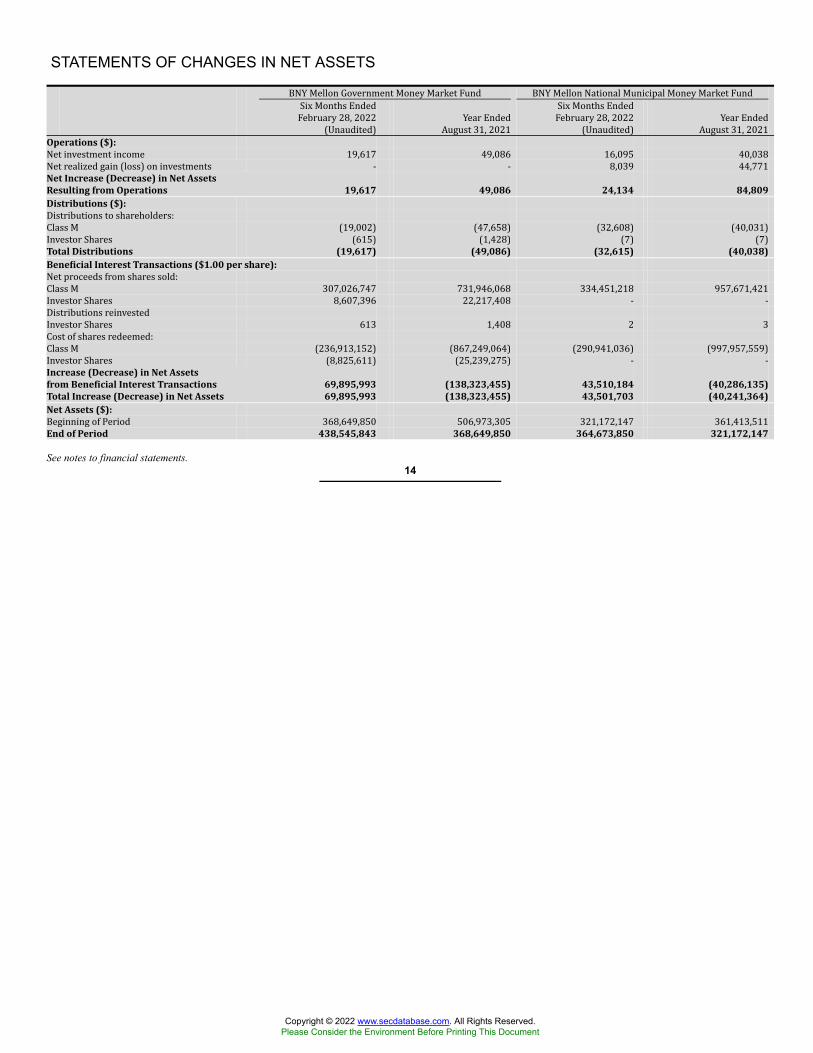
STATEMENTS OF CHANGES IN NET ASSETS
BNY Mellon Government Money Market Fund BNY Mellon National Municipal Money Market FundSix Months EndedFebruary 28, 2022(Unaudited) Year EndedAugust 31, 2021 Six Months EndedFebruary 28, 2022(Unaudited) Year EndedAugust 31, 2021Operations ($):Net investment income 19,617 49,086 16,095 40,038Net realized gain (loss) on investments - - 8,039 44,771Net Increase (Decrease) in Net AssetsResulting from Operations 19,617 49,086 24,134 84,809Distributions ($):Distributions to shareholders:Class M (19,002) (47,658) (32,608) (40,031)Investor Shares (615) (1,428) (7) (7)Total Distributions (19,617) (49,086) (32,615) (40,038)Beneficial Interest Transactions ($1.00 per share):Net proceeds from shares sold:Class M 307,026,747 731,946,068 334,451,218 957,671,421Investor Shares 8,607,396 22,217,408 - -Distributions reinvestedInvestor Shares 613 1,408 2 3Cost of shares redeemed:Class M (236,913,152) (867,249,064) (290,941,036) (997,957,559)Investor Shares (8,825,611) (25,239,275) - -Increase (Decrease) in Net Assetsfrom Beneficial Interest Transactions 69,895,993 (138,323,455) 43,510,184 (40,286,135)Total Increase (Decrease) in Net Assets 69,895,993 (138,323,455) 43,501,703 (40,241,364)Net Assets ($):Beginning of Period 368,649,850 506,973,305 321,172,147 361,413,511End of Period 438,545,843 368,649,850 364,673,850 321,172,147
See notes to financial statements.14
Copyright © 2022 www.secdatabase.com. All Rights Reserved.Please Consider the Environment Before Printing This Document
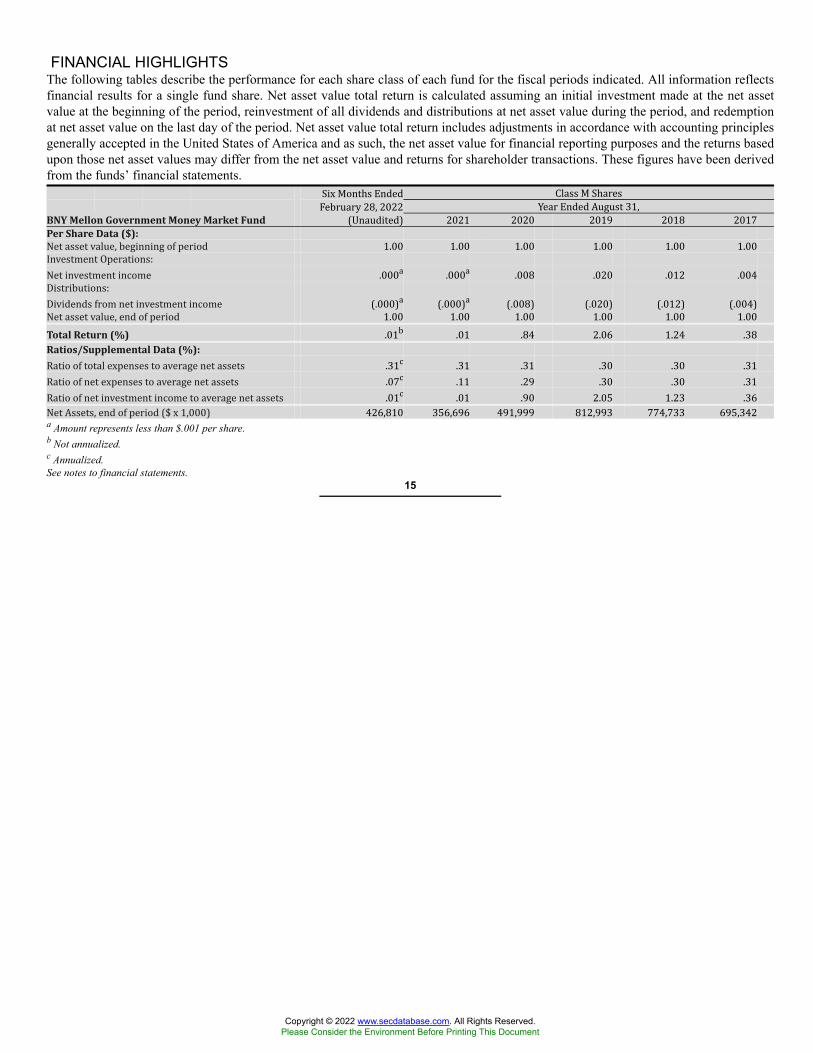
FINANCIAL HIGHLIGHTSThe following tables describe the performance for each share class of each fund for the fiscal periods indicated. All information reflectsfinancial results for a single fund share. Net asset value total return is calculated assuming an initial investment made at the net assetvalue at the beginning of the period, reinvestment of all dividends and distributions at net asset value during the period, and redemptionat net asset value on the last day of the period. Net asset value total return includes adjustments in accordance with accounting principlesgenerally accepted in the United States of America and as such, the net asset value for financial reporting purposes and the returns basedupon those net asset values may differ from the net asset value and returns for shareholder transactions. These figures have been derivedfrom the funds’ financial statements. Six Months Ended Class M SharesFebruary 28, 2022 Year Ended August 31,BNY Mellon Government Money Market Fund (Unaudited) 2021 2020 2019 2018 2017Per Share Data ($):Net asset value, beginning of period 1.00 1.00 1.00 1.00 1.00 1.00Investment Operations:Net investment income .000a .000a .008 .020 .012 .004Distributions:Dividends from net investment income (.000)a (.000)a (.008) (.020) (.012) (.004)Net asset value, end of period 1.00 1.00 1.00 1.00 1.00 1.00Total Return (%) .01b .01 .84 2.06 1.24 .38Ratios/Supplemental Data (%):Ratio of total expenses to average net assets .31c .31 .31 .30 .30 .31Ratio of net expenses to average net assets .07c .11 .29 .30 .30 .31Ratio of net investment income to average net assets .01c .01 .90 2.05 1.23 .36Net Assets, end of period ($ x 1,000) 426,810 356,696 491,999 812,993 774,733 695,342a Amount represents less than $.001 per share.b Not annualized.c Annualized.See notes to financial statements.
15
Copyright © 2022 www.secdatabase.com. All Rights Reserved.Please Consider the Environment Before Printing This Document

FINANCIAL HIGHLIGHTS (continued) Six Months Ended Investor SharesFebruary 28, 2022 Year Ended August 31,BNY Mellon Government Money Market Fund (Unaudited) 2021 2020 2019 2018 2017Per Share Data ($):Net asset value, beginning of period 1.00 1.00 1.00 1.00 1.00 1.00Investment Operations:Net investment income .000a .000a .007 .018 .010 .002Distributions:Dividends from net investment income (.000)a (.000)a (.007) (.018) (.010) (.002)Net asset value, end of period 1.00 1.00 1.00 1.00 1.00 1.00Total Return (%) .01b .01 .68 1.80 .98 .18Ratios/Supplemental Data (%):Ratio of total expenses to average net assets .56c .56 .56 .55 .55 .56Ratio of net expenses to average net assets .07c .11 .46 .55 .55 .52Ratio of net investment income to average net assets .01c .01 .70 1.79 .94 .20Net Assets, end of period ($ x 1,000) 11,736 11,954 14,974 17,152 16,904 20,368a Amount represents less than $.001 per share.b Not annualized.c Annualized.See notes to financial statements.
16
Copyright © 2022 www.secdatabase.com. All Rights Reserved.Please Consider the Environment Before Printing This Document
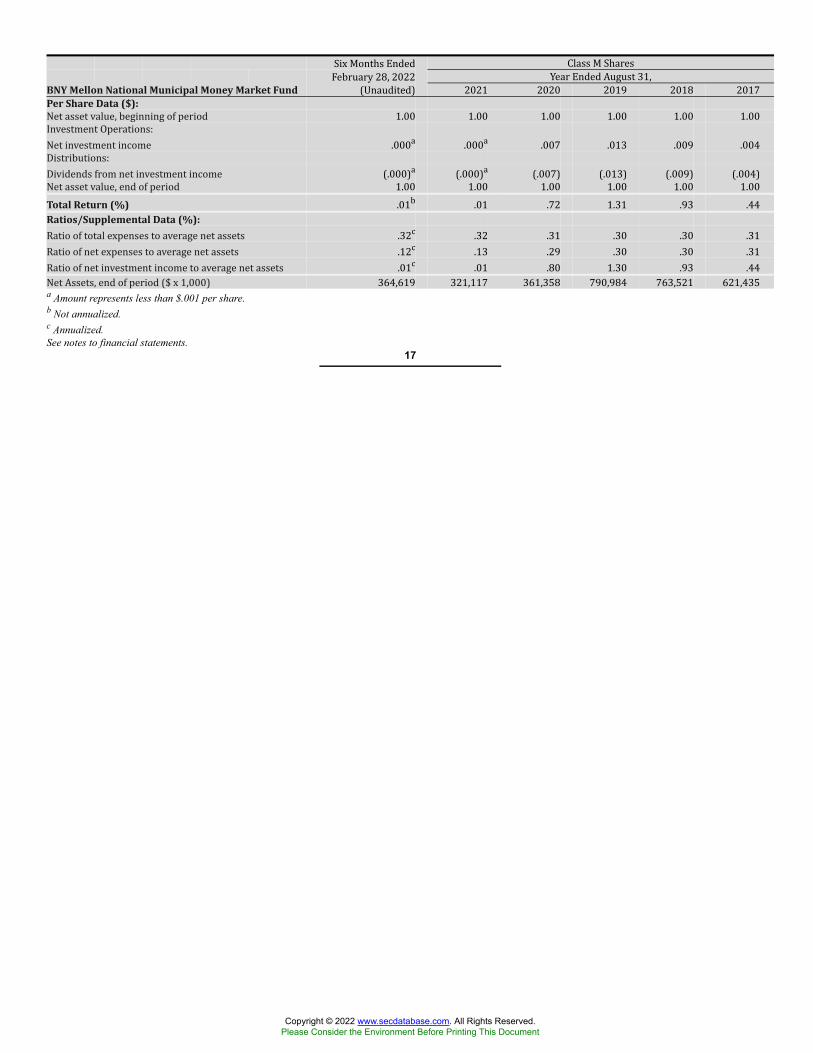
Six Months Ended Class M SharesFebruary 28, 2022 Year Ended August 31,BNY Mellon National Municipal Money Market Fund (Unaudited) 2021 2020 2019 2018 2017Per Share Data ($):Net asset value, beginning of period 1.00 1.00 1.00 1.00 1.00 1.00Investment Operations:Net investment income .000a .000a .007 .013 .009 .004Distributions:Dividends from net investment income (.000)a (.000)a (.007) (.013) (.009) (.004)Net asset value, end of period 1.00 1.00 1.00 1.00 1.00 1.00Total Return (%) .01b .01 .72 1.31 .93 .44Ratios/Supplemental Data (%):Ratio of total expenses to average net assets .32c .32 .31 .30 .30 .31Ratio of net expenses to average net assets .12c .13 .29 .30 .30 .31Ratio of net investment income to average net assets .01c .01 .80 1.30 .93 .44Net Assets, end of period ($ x 1,000) 364,619 321,117 361,358 790,984 763,521 621,435a Amount represents less than $.001 per share.b Not annualized.c Annualized.See notes to financial statements.
17
Copyright © 2022 www.secdatabase.com. All Rights Reserved.Please Consider the Environment Before Printing This Document
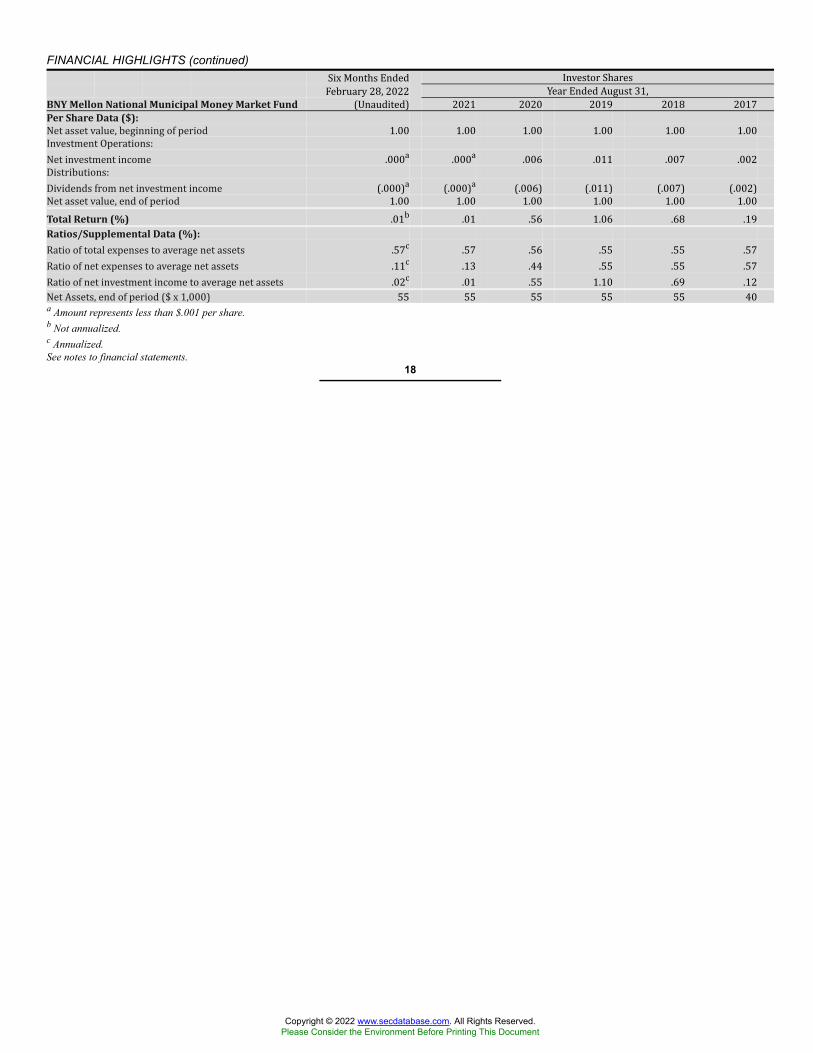
FINANCIAL HIGHLIGHTS (continued) Six Months Ended Investor SharesFebruary 28, 2022 Year Ended August 31,BNY Mellon National Municipal Money Market Fund (Unaudited) 2021 2020 2019 2018 2017Per Share Data ($):Net asset value, beginning of period 1.00 1.00 1.00 1.00 1.00 1.00Investment Operations:Net investment income .000a .000a .006 .011 .007 .002Distributions:Dividends from net investment income (.000)a (.000)a (.006) (.011) (.007) (.002)Net asset value, end of period 1.00 1.00 1.00 1.00 1.00 1.00Total Return (%) .01b .01 .56 1.06 .68 .19Ratios/Supplemental Data (%):Ratio of total expenses to average net assets .57c .57 .56 .55 .55 .57Ratio of net expenses to average net assets .11c .13 .44 .55 .55 .57Ratio of net investment income to average net assets .02c .01 .55 1.10 .69 .12Net Assets, end of period ($ x 1,000) 55 55 55 55 55 40a Amount represents less than $.001 per share.b Not annualized.c Annualized.See notes to financial statements.
18
Copyright © 2022 www.secdatabase.com. All Rights Reserved.Please Consider the Environment Before Printing This Document
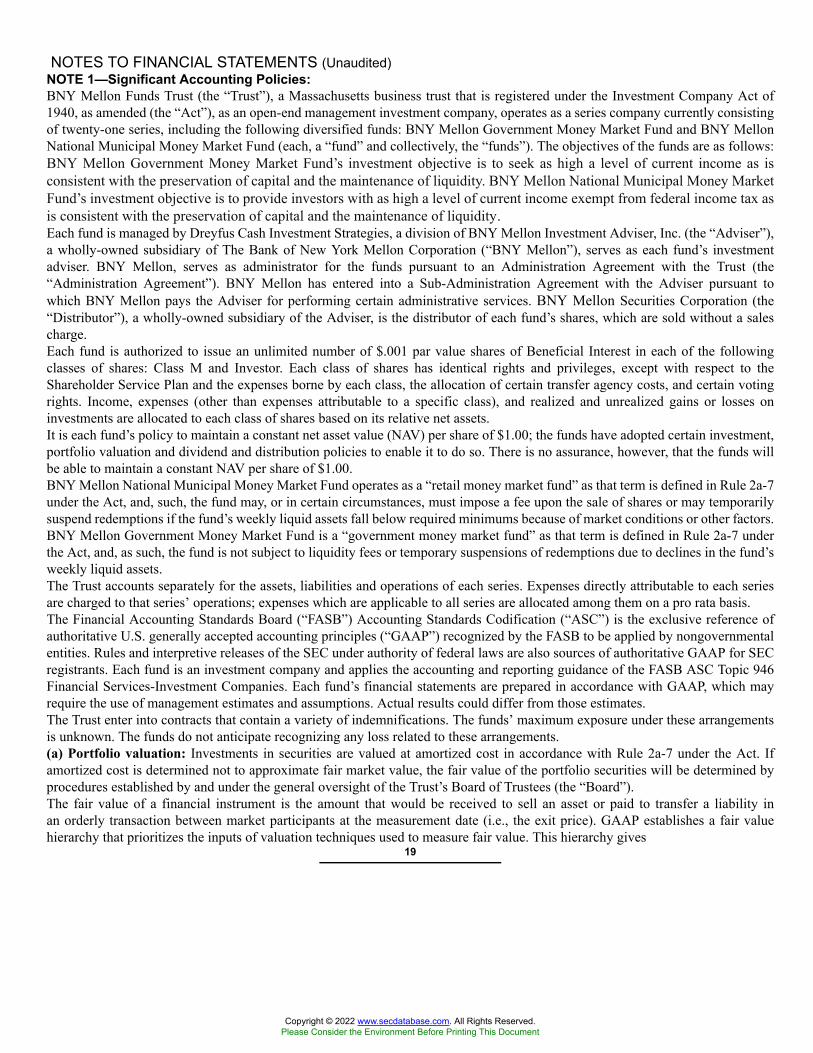
NOTES TO FINANCIAL STATEMENTS (Unaudited)NOTE 1—Significant Accounting Policies:BNY Mellon Funds Trust (the “Trust”), a Massachusetts business trust that is registered under the Investment Company Act of1940, as amended (the “Act”), as an open-end management investment company, operates as a series company currently consistingof twenty-one series, including the following diversified funds: BNY Mellon Government Money Market Fund and BNY MellonNational Municipal Money Market Fund (each, a “fund” and collectively, the “funds”). The objectives of the funds are as follows:BNY Mellon Government Money Market Fund’s investment objective is to seek as high a level of current income as isconsistent with the preservation of capital and the maintenance of liquidity. BNY Mellon National Municipal Money MarketFund’s investment objective is to provide investors with as high a level of current income exempt from federal income tax asis consistent with the preservation of capital and the maintenance of liquidity.Each fund is managed by Dreyfus Cash Investment Strategies, a division of BNY Mellon Investment Adviser, Inc. (the “Adviser”),a wholly-owned subsidiary of The Bank of New York Mellon Corporation (“BNY Mellon”), serves as each fund’s investmentadviser. BNY Mellon, serves as administrator for the funds pursuant to an Administration Agreement with the Trust (the“Administration Agreement”). BNY Mellon has entered into a Sub-Administration Agreement with the Adviser pursuant towhich BNY Mellon pays the Adviser for performing certain administrative services. BNY Mellon Securities Corporation (the“Distributor”), a wholly-owned subsidiary of the Adviser, is the distributor of each fund’s shares, which are sold without a salescharge.Each fund is authorized to issue an unlimited number of $.001 par value shares of Beneficial Interest in each of the followingclasses of shares: Class M and Investor. Each class of shares has identical rights and privileges, except with respect to theShareholder Service Plan and the expenses borne by each class, the allocation of certain transfer agency costs, and certain votingrights. Income, expenses (other than expenses attributable to a specific class), and realized and unrealized gains or losses oninvestments are allocated to each class of shares based on its relative net assets.It is each fund’s policy to maintain a constant net asset value (NAV) per share of $1.00; the funds have adopted certain investment,portfolio valuation and dividend and distribution policies to enable it to do so. There is no assurance, however, that the funds willbe able to maintain a constant NAV per share of $1.00.BNY Mellon National Municipal Money Market Fund operates as a “retail money market fund” as that term is defined in Rule 2a-7under the Act, and, such, the fund may, or in certain circumstances, must impose a fee upon the sale of shares or may temporarilysuspend redemptions if the fund’s weekly liquid assets fall below required minimums because of market conditions or other factors.BNY Mellon Government Money Market Fund is a “government money market fund” as that term is defined in Rule 2a-7 underthe Act, and, as such, the fund is not subject to liquidity fees or temporary suspensions of redemptions due to declines in the fund’sweekly liquid assets.The Trust accounts separately for the assets, liabilities and operations of each series. Expenses directly attributable to each seriesare charged to that series’ operations; expenses which are applicable to all series are allocated among them on a pro rata basis.The Financial Accounting Standards Board (“FASB”) Accounting Standards Codification (“ASC”) is the exclusive reference ofauthoritative U.S. generally accepted accounting principles (“GAAP”) recognized by the FASB to be applied by nongovernmentalentities. Rules and interpretive releases of the SEC under authority of federal laws are also sources of authoritative GAAP for SECregistrants. Each fund is an investment company and applies the accounting and reporting guidance of the FASB ASC Topic 946Financial Services-Investment Companies. Each fund’s financial statements are prepared in accordance with GAAP, which mayrequire the use of management estimates and assumptions. Actual results could differ from those estimates.The Trust enter into contracts that contain a variety of indemnifications. The funds’ maximum exposure under these arrangementsis unknown. The funds do not anticipate recognizing any loss related to these arrangements.(a) Portfolio valuation: Investments in securities are valued at amortized cost in accordance with Rule 2a-7 under the Act. Ifamortized cost is determined not to approximate fair market value, the fair value of the portfolio securities will be determined byprocedures established by and under the general oversight of the Trust’s Board of Trustees (the “Board”).The fair value of a financial instrument is the amount that would be received to sell an asset or paid to transfer a liability inan orderly transaction between market participants at the measurement date (i.e., the exit price). GAAP establishes a fair valuehierarchy that prioritizes the inputs of valuation techniques used to measure fair value. This hierarchy gives
19
Copyright © 2022 www.secdatabase.com. All Rights Reserved.Please Consider the Environment Before Printing This Document
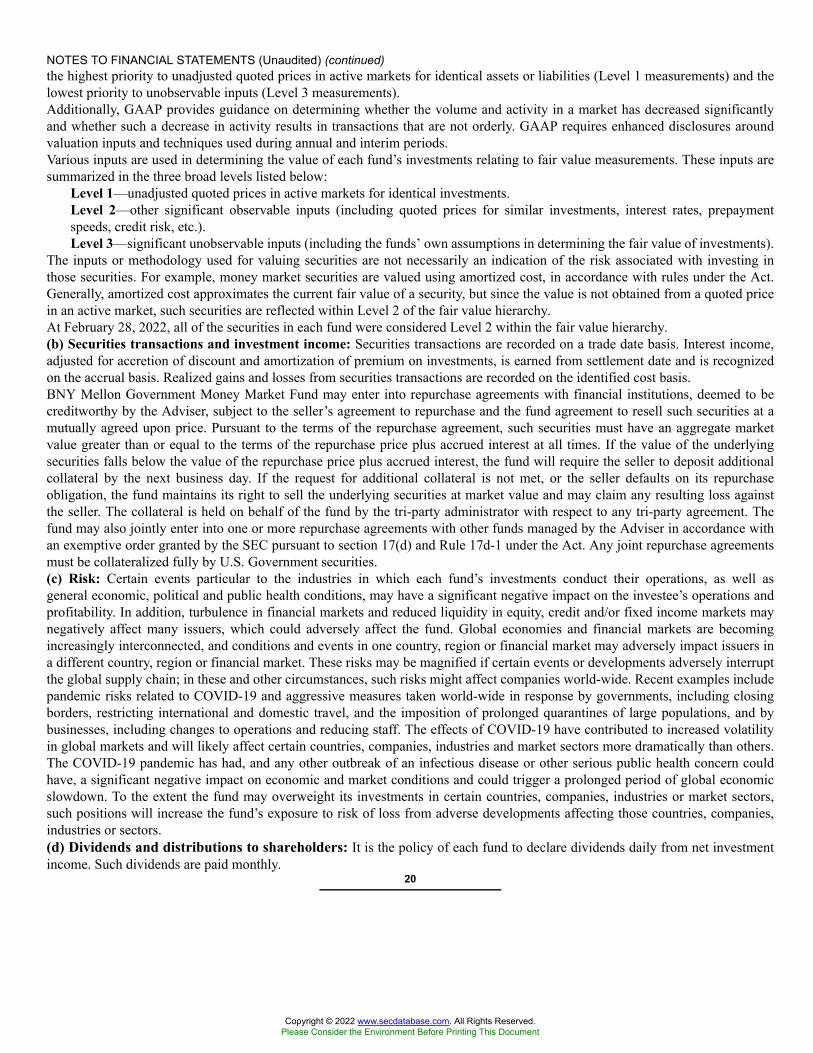
NOTES TO FINANCIAL STATEMENTS (Unaudited) (continued)the highest priority to unadjusted quoted prices in active markets for identical assets or liabilities (Level 1 measurements) and thelowest priority to unobservable inputs (Level 3 measurements).Additionally, GAAP provides guidance on determining whether the volume and activity in a market has decreased significantlyand whether such a decrease in activity results in transactions that are not orderly. GAAP requires enhanced disclosures aroundvaluation inputs and techniques used during annual and interim periods.Various inputs are used in determining the value of each fund’s investments relating to fair value measurements. These inputs aresummarized in the three broad levels listed below:
Level 1—unadjusted quoted prices in active markets for identical investments.Level 2—other significant observable inputs (including quoted prices for similar investments, interest rates, prepaymentspeeds, credit risk, etc.).Level 3—significant unobservable inputs (including the funds’ own assumptions in determining the fair value of investments).
The inputs or methodology used for valuing securities are not necessarily an indication of the risk associated with investing inthose securities. For example, money market securities are valued using amortized cost, in accordance with rules under the Act.Generally, amortized cost approximates the current fair value of a security, but since the value is not obtained from a quoted pricein an active market, such securities are reflected within Level 2 of the fair value hierarchy.At February 28, 2022, all of the securities in each fund were considered Level 2 within the fair value hierarchy.(b) Securities transactions and investment income: Securities transactions are recorded on a trade date basis. Interest income,adjusted for accretion of discount and amortization of premium on investments, is earned from settlement date and is recognizedon the accrual basis. Realized gains and losses from securities transactions are recorded on the identified cost basis.BNY Mellon Government Money Market Fund may enter into repurchase agreements with financial institutions, deemed to becreditworthy by the Adviser, subject to the seller’s agreement to repurchase and the fund agreement to resell such securities at amutually agreed upon price. Pursuant to the terms of the repurchase agreement, such securities must have an aggregate marketvalue greater than or equal to the terms of the repurchase price plus accrued interest at all times. If the value of the underlyingsecurities falls below the value of the repurchase price plus accrued interest, the fund will require the seller to deposit additionalcollateral by the next business day. If the request for additional collateral is not met, or the seller defaults on its repurchaseobligation, the fund maintains its right to sell the underlying securities at market value and may claim any resulting loss againstthe seller. The collateral is held on behalf of the fund by the tri-party administrator with respect to any tri-party agreement. Thefund may also jointly enter into one or more repurchase agreements with other funds managed by the Adviser in accordance withan exemptive order granted by the SEC pursuant to section 17(d) and Rule 17d-1 under the Act. Any joint repurchase agreementsmust be collateralized fully by U.S. Government securities.(c) Risk: Certain events particular to the industries in which each fund’s investments conduct their operations, as well asgeneral economic, political and public health conditions, may have a significant negative impact on the investee’s operations andprofitability. In addition, turbulence in financial markets and reduced liquidity in equity, credit and/or fixed income markets maynegatively affect many issuers, which could adversely affect the fund. Global economies and financial markets are becomingincreasingly interconnected, and conditions and events in one country, region or financial market may adversely impact issuers ina different country, region or financial market. These risks may be magnified if certain events or developments adversely interruptthe global supply chain; in these and other circumstances, such risks might affect companies world-wide. Recent examples includepandemic risks related to COVID-19 and aggressive measures taken world-wide in response by governments, including closingborders, restricting international and domestic travel, and the imposition of prolonged quarantines of large populations, and bybusinesses, including changes to operations and reducing staff. The effects of COVID-19 have contributed to increased volatilityin global markets and will likely affect certain countries, companies, industries and market sectors more dramatically than others.The COVID-19 pandemic has had, and any other outbreak of an infectious disease or other serious public health concern couldhave, a significant negative impact on economic and market conditions and could trigger a prolonged period of global economicslowdown. To the extent the fund may overweight its investments in certain countries, companies, industries or market sectors,such positions will increase the fund’s exposure to risk of loss from adverse developments affecting those countries, companies,industries or sectors.(d) Dividends and distributions to shareholders: It is the policy of each fund to declare dividends daily from net investmentincome. Such dividends are paid monthly.
20
Copyright © 2022 www.secdatabase.com. All Rights Reserved.Please Consider the Environment Before Printing This Document
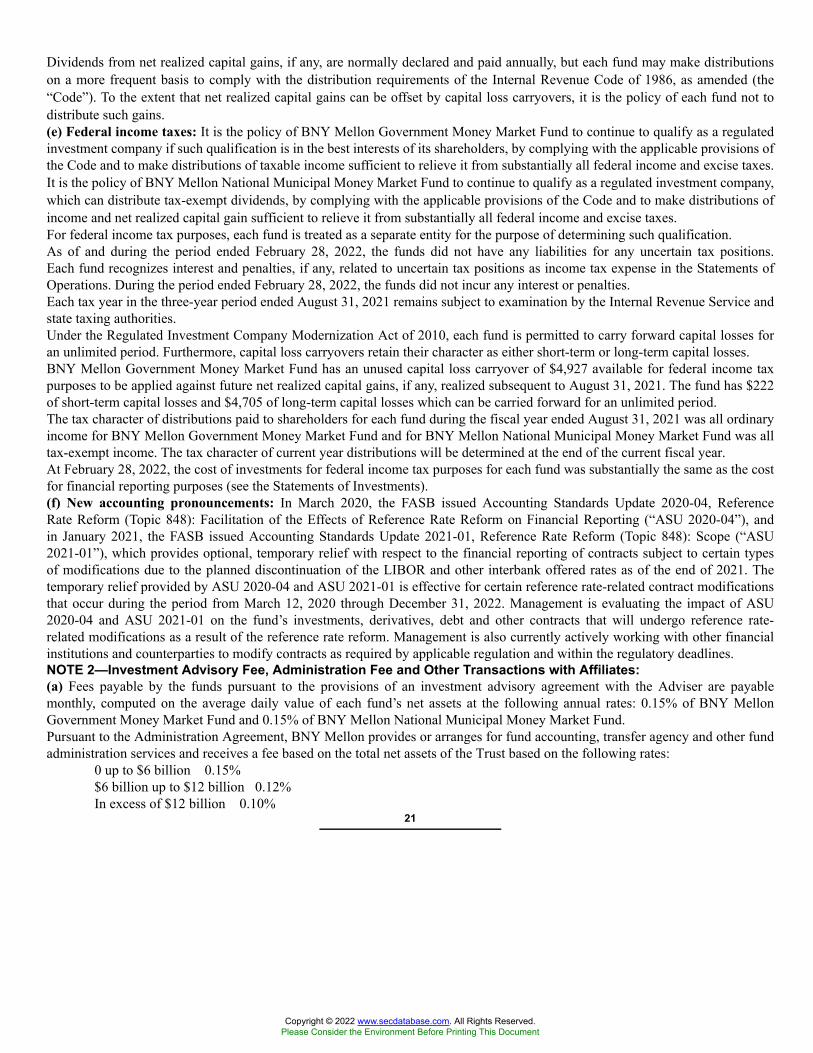
Dividends from net realized capital gains, if any, are normally declared and paid annually, but each fund may make distributionson a more frequent basis to comply with the distribution requirements of the Internal Revenue Code of 1986, as amended (the“Code”). To the extent that net realized capital gains can be offset by capital loss carryovers, it is the policy of each fund not todistribute such gains.(e) Federal income taxes: It is the policy of BNY Mellon Government Money Market Fund to continue to qualify as a regulatedinvestment company if such qualification is in the best interests of its shareholders, by complying with the applicable provisions ofthe Code and to make distributions of taxable income sufficient to relieve it from substantially all federal income and excise taxes.It is the policy of BNY Mellon National Municipal Money Market Fund to continue to qualify as a regulated investment company,which can distribute tax-exempt dividends, by complying with the applicable provisions of the Code and to make distributions ofincome and net realized capital gain sufficient to relieve it from substantially all federal income and excise taxes.For federal income tax purposes, each fund is treated as a separate entity for the purpose of determining such qualification.As of and during the period ended February 28, 2022, the funds did not have any liabilities for any uncertain tax positions.Each fund recognizes interest and penalties, if any, related to uncertain tax positions as income tax expense in the Statements ofOperations. During the period ended February 28, 2022, the funds did not incur any interest or penalties.Each tax year in the three-year period ended August 31, 2021 remains subject to examination by the Internal Revenue Service andstate taxing authorities.Under the Regulated Investment Company Modernization Act of 2010, each fund is permitted to carry forward capital losses foran unlimited period. Furthermore, capital loss carryovers retain their character as either short-term or long-term capital losses.BNY Mellon Government Money Market Fund has an unused capital loss carryover of $4,927 available for federal income taxpurposes to be applied against future net realized capital gains, if any, realized subsequent to August 31, 2021. The fund has $222of short-term capital losses and $4,705 of long-term capital losses which can be carried forward for an unlimited period.The tax character of distributions paid to shareholders for each fund during the fiscal year ended August 31, 2021 was all ordinaryincome for BNY Mellon Government Money Market Fund and for BNY Mellon National Municipal Money Market Fund was alltax-exempt income. The tax character of current year distributions will be determined at the end of the current fiscal year.At February 28, 2022, the cost of investments for federal income tax purposes for each fund was substantially the same as the costfor financial reporting purposes (see the Statements of Investments).(f) New accounting pronouncements: In March 2020, the FASB issued Accounting Standards Update 2020-04, ReferenceRate Reform (Topic 848): Facilitation of the Effects of Reference Rate Reform on Financial Reporting (“ASU 2020-04”), andin January 2021, the FASB issued Accounting Standards Update 2021-01, Reference Rate Reform (Topic 848): Scope (“ASU2021-01”), which provides optional, temporary relief with respect to the financial reporting of contracts subject to certain typesof modifications due to the planned discontinuation of the LIBOR and other interbank offered rates as of the end of 2021. Thetemporary relief provided by ASU 2020-04 and ASU 2021-01 is effective for certain reference rate-related contract modificationsthat occur during the period from March 12, 2020 through December 31, 2022. Management is evaluating the impact of ASU2020-04 and ASU 2021-01 on the fund’s investments, derivatives, debt and other contracts that will undergo reference rate-related modifications as a result of the reference rate reform. Management is also currently actively working with other financialinstitutions and counterparties to modify contracts as required by applicable regulation and within the regulatory deadlines.NOTE 2—Investment Advisory Fee, Administration Fee and Other Transactions with Affiliates:(a) Fees payable by the funds pursuant to the provisions of an investment advisory agreement with the Adviser are payablemonthly, computed on the average daily value of each fund’s net assets at the following annual rates: 0.15% of BNY MellonGovernment Money Market Fund and 0.15% of BNY Mellon National Municipal Money Market Fund.Pursuant to the Administration Agreement, BNY Mellon provides or arranges for fund accounting, transfer agency and other fundadministration services and receives a fee based on the total net assets of the Trust based on the following rates:
0 up to $6 billion 0.15%$6 billion up to $12 billion 0.12%In excess of $12 billion 0.10%
21
Copyright © 2022 www.secdatabase.com. All Rights Reserved.Please Consider the Environment Before Printing This Document
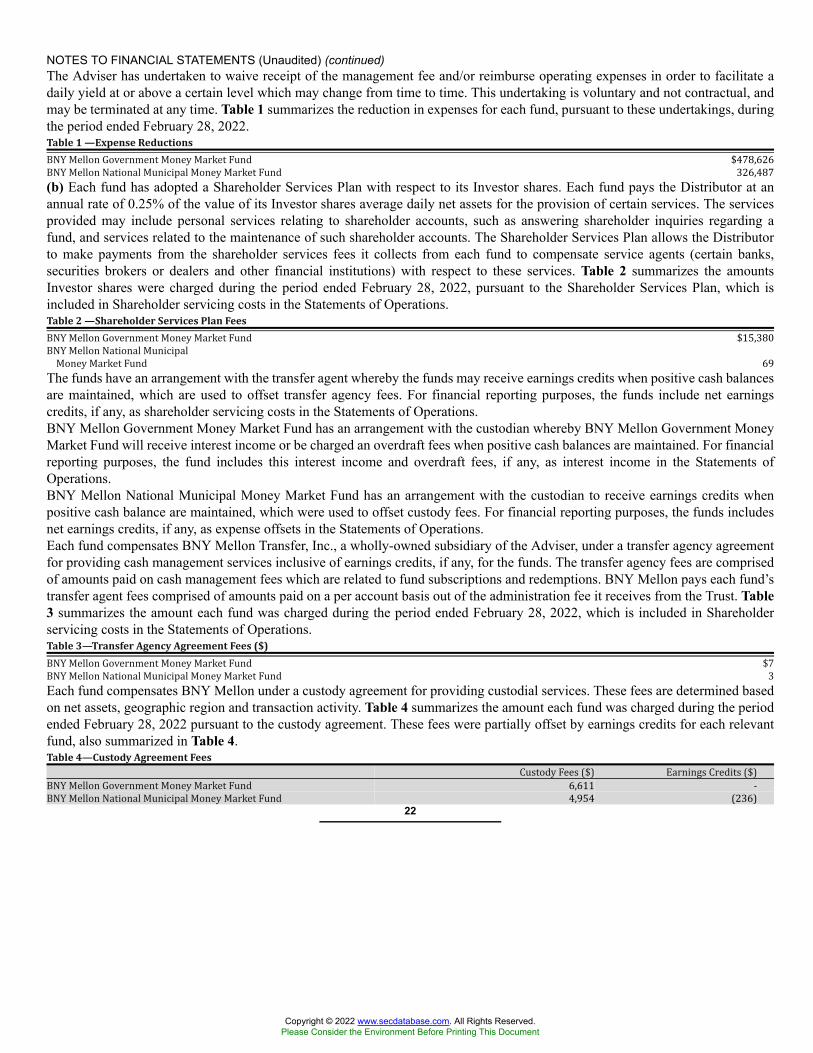
NOTES TO FINANCIAL STATEMENTS (Unaudited) (continued)The Adviser has undertaken to waive receipt of the management fee and/or reimburse operating expenses in order to facilitate adaily yield at or above a certain level which may change from time to time. This undertaking is voluntary and not contractual, andmay be terminated at any time. Table 1 summarizes the reduction in expenses for each fund, pursuant to these undertakings, duringthe period ended February 28, 2022.Table 1 —Expense ReductionsBNY Mellon Government Money Market Fund $478,626BNY Mellon National Municipal Money Market Fund 326,487(b) Each fund has adopted a Shareholder Services Plan with respect to its Investor shares. Each fund pays the Distributor at anannual rate of 0.25% of the value of its Investor shares average daily net assets for the provision of certain services. The servicesprovided may include personal services relating to shareholder accounts, such as answering shareholder inquiries regarding afund, and services related to the maintenance of such shareholder accounts. The Shareholder Services Plan allows the Distributorto make payments from the shareholder services fees it collects from each fund to compensate service agents (certain banks,securities brokers or dealers and other financial institutions) with respect to these services. Table 2 summarizes the amountsInvestor shares were charged during the period ended February 28, 2022, pursuant to the Shareholder Services Plan, which isincluded in Shareholder servicing costs in the Statements of Operations.Table 2 —Shareholder Services Plan FeesBNY Mellon Government Money Market Fund $15,380BNY Mellon National MunicipalMoney Market Fund 69The funds have an arrangement with the transfer agent whereby the funds may receive earnings credits when positive cash balancesare maintained, which are used to offset transfer agency fees. For financial reporting purposes, the funds include net earningscredits, if any, as shareholder servicing costs in the Statements of Operations.BNY Mellon Government Money Market Fund has an arrangement with the custodian whereby BNY Mellon Government MoneyMarket Fund will receive interest income or be charged an overdraft fees when positive cash balances are maintained. For financialreporting purposes, the fund includes this interest income and overdraft fees, if any, as interest income in the Statements ofOperations.BNY Mellon National Municipal Money Market Fund has an arrangement with the custodian to receive earnings credits whenpositive cash balance are maintained, which were used to offset custody fees. For financial reporting purposes, the funds includesnet earnings credits, if any, as expense offsets in the Statements of Operations.Each fund compensates BNY Mellon Transfer, Inc., a wholly-owned subsidiary of the Adviser, under a transfer agency agreementfor providing cash management services inclusive of earnings credits, if any, for the funds. The transfer agency fees are comprisedof amounts paid on cash management fees which are related to fund subscriptions and redemptions. BNY Mellon pays each fund’stransfer agent fees comprised of amounts paid on a per account basis out of the administration fee it receives from the Trust. Table3 summarizes the amount each fund was charged during the period ended February 28, 2022, which is included in Shareholderservicing costs in the Statements of Operations.Table 3—Transfer Agency Agreement Fees ($)BNY Mellon Government Money Market Fund $7BNY Mellon National Municipal Money Market Fund 3Each fund compensates BNY Mellon under a custody agreement for providing custodial services. These fees are determined basedon net assets, geographic region and transaction activity. Table 4 summarizes the amount each fund was charged during the periodended February 28, 2022 pursuant to the custody agreement. These fees were partially offset by earnings credits for each relevantfund, also summarized in Table 4.Table 4—Custody Agreement Fees Custody Fees ($) Earnings Credits ($)BNY Mellon Government Money Market Fund 6,611 -BNY Mellon National Municipal Money Market Fund 4,954 (236)
22
Copyright © 2022 www.secdatabase.com. All Rights Reserved.Please Consider the Environment Before Printing This Document
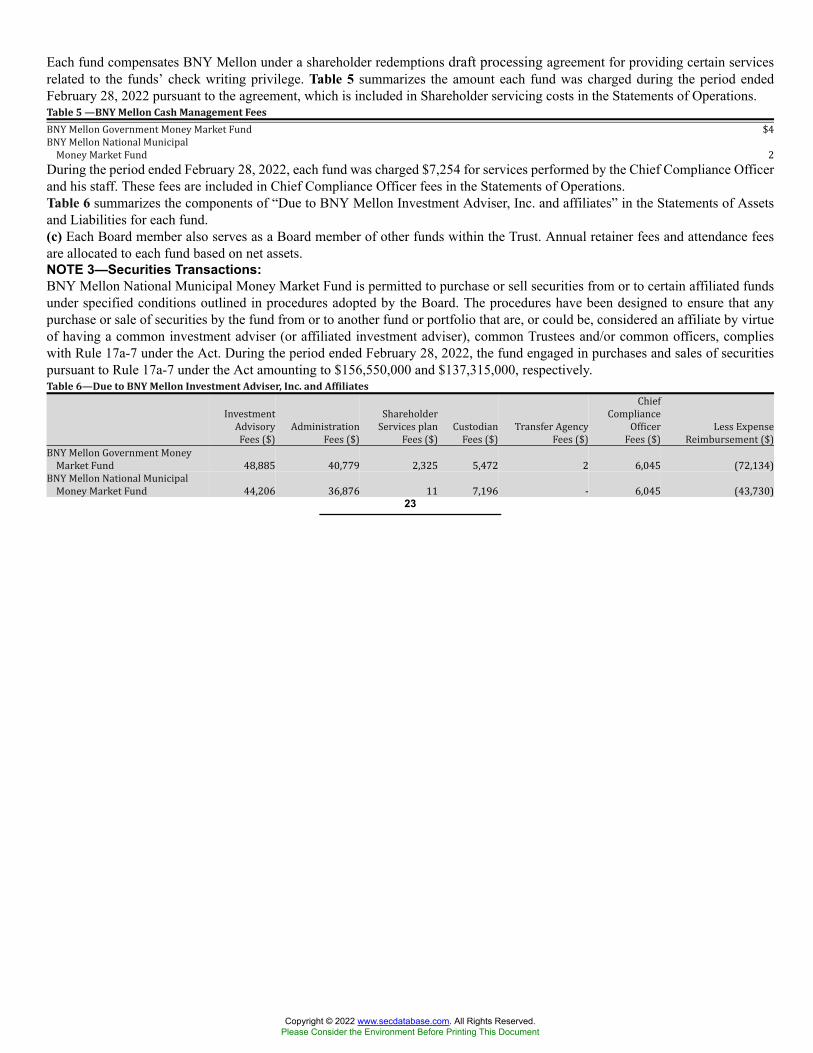
Each fund compensates BNY Mellon under a shareholder redemptions draft processing agreement for providing certain servicesrelated to the funds’ check writing privilege. Table 5 summarizes the amount each fund was charged during the period endedFebruary 28, 2022 pursuant to the agreement, which is included in Shareholder servicing costs in the Statements of Operations.Table 5 —BNY Mellon Cash Management FeesBNY Mellon Government Money Market Fund $4BNY Mellon National MunicipalMoney Market Fund 2During the period ended February 28, 2022, each fund was charged $7,254 for services performed by the Chief Compliance Officerand his staff. These fees are included in Chief Compliance Officer fees in the Statements of Operations.Table 6 summarizes the components of “Due to BNY Mellon Investment Adviser, Inc. and affiliates” in the Statements of Assetsand Liabilities for each fund.(c) Each Board member also serves as a Board member of other funds within the Trust. Annual retainer fees and attendance feesare allocated to each fund based on net assets.NOTE 3—Securities Transactions:BNY Mellon National Municipal Money Market Fund is permitted to purchase or sell securities from or to certain affiliated fundsunder specified conditions outlined in procedures adopted by the Board. The procedures have been designed to ensure that anypurchase or sale of securities by the fund from or to another fund or portfolio that are, or could be, considered an affiliate by virtueof having a common investment adviser (or affiliated investment adviser), common Trustees and/or common officers, complieswith Rule 17a-7 under the Act. During the period ended February 28, 2022, the fund engaged in purchases and sales of securitiespursuant to Rule 17a-7 under the Act amounting to $156,550,000 and $137,315,000, respectively.Table 6—Due to BNY Mellon Investment Adviser, Inc. and AffiliatesInvestmentAdvisoryFees ($) AdministrationFees ($) ShareholderServices planFees ($) CustodianFees ($) Transfer AgencyFees ($)
ChiefComplianceOfficerFees ($) Less ExpenseReimbursement ($)BNY Mellon Government MoneyMarket Fund 48,885 40,779 2,325 5,472 2 6,045 (72,134)BNY Mellon National MunicipalMoney Market Fund 44,206 36,876 11 7,196 - 6,045 (43,730)23
Copyright © 2022 www.secdatabase.com. All Rights Reserved.Please Consider the Environment Before Printing This Document

This page intentionally left blank.24
Copyright © 2022 www.secdatabase.com. All Rights Reserved.Please Consider the Environment Before Printing This Document

This page intentionally left blank.25
Copyright © 2022 www.secdatabase.com. All Rights Reserved.Please Consider the Environment Before Printing This Document

This page intentionally left blank.26
Copyright © 2022 www.secdatabase.com. All Rights Reserved.Please Consider the Environment Before Printing This Document
For More InformationThe BNY Mellon Fundsc/o BNY Mellon Investment Adviser, Inc.240 Greenwich StreetNew York, NY 10286AdviserBNY Mellon Investment Adviser, Inc.240 Greenwich StreetNew York, NY 10286AdministratorThe Bank of New York Mellon240 Greenwich StreetNew York, NY 10286Sub-AdministratorBNY Mellon Investment Adviser, Inc.240 Greenwich StreetNew York, NY 10286CustodianThe Bank of New York Mellon240 Greenwich StreetNew York, NY 10286Transfer Agent &Dividend Disbursing AgentBNY Mellon Transfer, Inc.240 Greenwich StreetNew York, NY 10286DistributorBNY Mellon Securities Corporation240 Greenwich StreetNew York, NY 10286Ticker Symbols:BNY Mellon Government Money Market Fund Class M: MLMXX Investor: MLOXXBNY Mellon National Municipal Money Market Fund Class M: MOMXX Investor: MNTXXTelephone Wealth Management (WM) Clients, please contact your Account Officer or call 1-866-804-5023. Brokerage Clients of BNYMellon Wealth Advisors (BNYMWA), please contact your financial representative or call 1-800-830-0549, Option 2 for BNY MellonWealth Management Direct or 1-800-843-5466 for former brokerage clients of BNY Mellon Wealth Advisors whose accounts are nowheld by BNY Mellon Brokerage Services. Individual Account holders, please call BNY Mellon Investment Advisers at 1-800-373-9387.Mail WM clients, write to your Account Officer, c/o The Bank of New York Mellon, One Mellon Bank Center, Pittsburgh, PA 15258BNYMWA Brokerage Clients, write to your financial representative, P.O. Box 9012, Hicksville, NY 11802-9012Individual Account Holders, write to: BNY Mellon Funds, P.O. Box 9879, Providence, RI 02940-8079Each fund will disclose daily, on www.bnymellonim.com/us, the fund’s complete schedule of holdings as of the end of the previousbusiness day. The schedule of holdings will remain on the website for a period of five months. The fund files a monthly schedule ofportfolio holdings with the Securities and Exchange Commission (“SEC”) on Form N-MFP. The fund’s Forms N-MFP are available onthe SEC’s website at www.sec.gov.A description of the policies and procedures that the fund uses to determine how to vote proxies relating to portfolio securities, andinformation regarding how the fund voted these proxies for the most recent 12-month period ended June 30 is available at http://www.im.bnymellon.com and on the SEC’s website at http://www.sec.gov. The description of the policies and procedures is alsoavailable without charge, upon request, by calling 1-800-373-9387.© 2022 BNY Mellon Securities Corporation MFTSA0222-MM
The BNY Mellon FundsBNY Mellon National Intermediate Municipal Bond Fund
Copyright © 2022 www.secdatabase.com. All Rights Reserved.Please Consider the Environment Before Printing This Document
BNY Mellon National Short-Term Municipal Bond FundBNY Mellon Pennsylvania Intermediate Municipal Bond FundBNY Mellon Massachusetts Intermediate Municipal Bond FundBNY Mellon New York Intermediate Tax-Exempt Bond FundBNY Mellon Municipal Opportunities FundSEMIANNUAL REPORT February 28, 2022
Copyright © 2022 www.secdatabase.com. All Rights Reserved.Please Consider the Environment Before Printing This Document
ContentsT H E F U N D S
Discussion of Funds’ Performance 2Understanding Your Fund’s Expenses 8Comparing Your Fund’s Expenses With Those of Other Funds 9Statements of Investments 10Statements of Assets and Liabilities 100Statements of Operations 102Statements of Changes in Net Assets 104Financial Highlights 107Notes to Financial Statements 119F O R M O R E I N F O R M AT I O N
Back Cover
Save time. Save paper. View your next shareholder report online as soon as it’s available. Log intowww.im.bnymellon.com and sign up for eCommunications. It’s simple and only takes a few minutes.
The views expressed herein are current to the date of this report. These views and the composition of thefunds’ portfolios are subject to change at any time based on market and other conditions.
Not FDIC-Insured • Not Bank-Guaranteed • May Lose Value
Copyright © 2022 www.secdatabase.com. All Rights Reserved.Please Consider the Environment Before Printing This Document

DISCUSSION OF FUND PERFORMANCE (Unaudited)For the period from September 1, 2021 through February 28, 2022, as provided by John F. Flahive and Mary Collette O’Brien, Portfolio ManagersMarket and Fund Performance OverviewFor the six-month period ended February 28, 2022, BNY Mellon National Intermediate Municipal Bond Fund’s (the “fund”) Class M shares produced a totalreturn of −3.56%, and Investor shares produced a total return of −3.76%.1 In comparison, the fund’s benchmark, the S&P Municipal Bond Investment GradeIntermediate Index (the “Index”), produced a total return of −3.21% and the fund’s former benchmark, the S&P Municipal Bond Intermediate Index, produced atotal return of −3.16% for the same period.2,3,4
Intermediate municipal bond prices declined over the six months under pressure from rising interest rates and increasingly hawkish rhetoric from the U.S. FederalReserve (the “Fed”). The fund underperformed the Index, largely due to the negative impact of credit, geographic and sector allocations.The Fund’s Investment ApproachThe fund seeks to maximize current income exempt from federal income tax to the extent consistent with the preservation of capital. To pursue its goal, the fundnormally invests at least 80% of its net assets, plus any borrowings for investment purposes, in municipal bonds that provide income exempt from federal incometax. The fund’s investments in municipal and taxable bonds must be rated investment grade (i.e., Baa/BBB or higher) at the time of purchase or, if unrated,deemed of comparable quality by BNY Mellon Investment Adviser, Inc.5 Generally, the fund’s average effective portfolio maturity will be between three and tenyears, and the average effective duration of the fund’s portfolio will not exceed eight years.Risk Assets Retreat on Inflationary PressuresThe reporting period began amid increasing inflationary pressures due to rising energy and commodity prices and global supply-chain disruptions. The Fed,which expressed increasingly hawkish sentiments prior to the start of the period, indicated in September 2021 a willingness to consider reducing accommodativepolicies sooner rather than later due to the unexpected level and persistence of inflationary forces affecting the economy. As inflationary pressures continuedto mount, Fed rhetoric grew increasingly emphatic. In November, the Fed dropped the word “transitory” when describing inflation. At the same time, the Fedforecast a possible end to their asset purchase program as early as June 2022, thereby increasing the likelihood of one or more rate hikes later that year. InDecember, the Fed again revised their estimate of an end to quantitative easing to March 2022, leading the market to widely anticipate multiple hikes in 2022.Increasing tensions between Russia and Ukraine in early 2022 and the eventual invasion of Ukraine by its larger neighbor further undermined investor sentimentand pressured international credit markets.U.S. bond prices trended lower, spreads widened and yields crept higher as interest rates rose throughout the period, with short-term rates rising faster thanlong-term rates. These trends were most pronounced during the latter two months of the period. Corporate bonds underperformed government-issued securitiesand securitized instruments in a flight to safety, particularly during the final two months of the period. Conversely, floating-rate bonds and Treasury Inflation-Protected Securities (TIPS) performed relatively well, as both asset classes offer a degree of protection from rising interest rates. Municipal bonds generallymirrored the declines in other fixed-income sectors, although state and local governments continued to benefit from rebounding tax revenues and federal fiscalsupport. Not surprisingly, given the pressure on bond prices, short-duration instruments tended to outperform their longer-duration counterparts. From a creditratings perspective, higher-rated, higher-quality issues tended to outperform lower-rated bonds, reflective of the market’s prevailing risk-off sentiment.Credit, Geographic and Sector Factors DetractThe fund’s performance lagged the Index due to the cumulative effect of slightly negative relative returns in several areas. From a credit quality perspective, thefund generally held overweight exposure to lower-quality BBB and A rated credits, a position that detracted from relative performance during the flight to qualitythat characterized the latter part of the period. However, issue-specific effects within various credit baskets had a more substantial impact on relative performance,with the fund’s A rated holdings notably undermining performance. In terms of geographic exposure, overweight positions and duration effects significantlyundermined returns in New York and New Jersey holdings. Among municipal bond sectors, a mixture of allocation and duration effects weakened returns, mostnotably in the local general obligation, health care and transportation areas. Conversely, the fund saw positive effects from a few geographic positions, includingMaryland and Puerto Rico holdings. Investments in the pre-refunded/ETM (escrowed to maturity) sector produced positive returns, as did the fund’s housingexposure, particularly in the multi-family subsector. The fund’s Treasury hedges and cash position also contributed positively to relative performance.Positioned for Rising RatesDespite the widening of spreads seen during the period, we expect this trend to moderate over time. Although risks associated with increasing inflation andgeopolitical conflict are clearly present, in our opinion, underlying U.S. economic fundamentals remain strong, supported by better-than-expected corporateearnings, robust consumer demand and positive employment numbers, all of which bode well for state and local tax revenues. Accordingly, we continue to take acautious investment approach, seeking to enhance yield while dampening the fund’s interest-rate sensitivity.March 15, 20221 Total return includes reinvestment of dividends and any capital gains paid. Past performance is no guarantee of future results. Share price, yield and investment return
fluctuate such that upon redemption, fund shares may be worth more or less than their original cost. Income may be subject to state and local taxes, and some incomemay be subject to the federal alternative minimum tax (AMT) for certain investors. Capital gains, if any, are fully taxable.
2 Source: FactSet. — The S&P Municipal Bond Investment Grade Intermediate Index consists of bonds in the S&P Municipal Bond Index that are rated at least BBB- byStandard & Poor’s, Baa3 by Moody’s or BBB- by Fitch Ratings. All bonds must also have a minimum maturity of 3 years and a maximum maturity of up to, but notincluding, 15 years as measured from the rebalancing date. Investors cannot invest directly in any index.
3 The S&P Municipal Bond Investment Grade Intermediate Index was first calculated on March 19, 2013. Accordingly, the fund will continue to report the performance ofthe S&P Municipal Bond Intermediate Index until the S&P Municipal Bond Investment Grade Intermediate Index has been calculated for a 10-year period.
4 Source: Lipper Inc.— The S&P Municipal Bond Intermediate Index consists of bonds in the S&P Municipal Bond Index with a minimum maturity of 3 years and amaximum maturity of up to, but not including, 15 years as measured from the rebalancing date. Investors cannot invest directly in any index.
5 The fund may continue to own investment grade bonds (at the time of purchase), which are subsequently downgraded to below investment grade.Bonds are subject generally to interest-rate, credit, liquidity and market risks, to varying degrees, all of which are more fully described in the fund’s prospectus. Generally,all other factors being equal, bond prices are inversely related to interest-rate changes, and rate increases can cause price declines. Municipal income may be subject tostate and local taxes. Capital gains, if any, are taxable.Recent market risks include pandemic risks related to COVID-19. The effects of COVID-19 have contributed to increased volatility in global markets and will likely affectcertain countries, companies, industries and market sectors more dramatically than others. To the extent the fund may overweight its investments in certain countries,companies, industries or market sectors, such positions will increase the fund’s exposure to risk of loss from adverse developments affecting those countries, companies,industries or sectors.The fund may, but is not required to, use derivative instruments. A small investment in derivatives could have a potentially large impact on the fund’s performance. Theuse of derivatives involves risks different from, or possibly greater than, the risks associated with investing directly in the underlying assets.
2
Copyright © 2022 www.secdatabase.com. All Rights Reserved.Please Consider the Environment Before Printing This Document
For the period from September 1, 2021 through February 28, 2022, as provided by John F. Flahive, Portfolio ManagerMarket and Fund Performance OverviewFor the six-month period ended February 28, 2022, BNY Mellon National Short-Term Municipal Bond Fund’s (the “fund”) Class M shares produced a total returnof −1.75%, and Investor shares produced a total return of −1.87%.1 In comparison, the fund’s benchmark index, the S&P Municipal Bond Investment GradeShort Index2 (the “Index”), produced a total return of −1.50% and the fund’s former benchmark, the S&P Municipal Bond Short Index, produced a total return of−1.46% for the same period.3,4
Short-term municipal bond prices declined over the six months under pressure from rising interest rates and increasingly hawkish rhetoric from the U.S. FederalReserve (the “Fed”). The fund underperformed the Index, largely due to the mildly negative impact of credit, geographic and sector allocations.The Fund’s Investment ApproachThe fund seeks to maximize current income exempt from federal income tax to the extent consistent with the preservation of capital. To pursue its goal, the fundnormally invests at least 80% of its net assets, plus any borrowings for investment purposes, in municipal bonds that provide income exempt from federal incometax. The fund’s investments in municipal and taxable bonds must be rated investment grade (i.e., Baa/BBB or higher) at the time of purchase or, if unrated,deemed of comparable quality by BNY Mellon Investment Adviser, Inc.5 Generally, the average effective portfolio maturity and the average effective portfolioduration of the fund’s portfolio will be less than three years.Risk Assets Retreat on Inflationary PressuresThe reporting period began amid increasing inflationary pressures due to rising energy and commodity prices and global supply-chain disruptions. The Fed,which expressed increasingly hawkish sentiments prior to the start of the period, indicated in September 2021 a willingness to consider reducing accommodativepolicies sooner rather than later due to the unexpected level and persistence of inflationary forces affecting the economy. As inflationary pressures continuedto mount, Fed rhetoric grew increasingly emphatic. In November 2021, the Fed dropped the word “transitory” when describing inflation. At the same time, theFed forecast a possible end to their asset purchase program as early as June 2022, thereby increasing the likelihood of one or more rate hikes later that year. InDecember, the Fed again revised their estimate of an end to quantitative easing to March 2022, leading the market to widely anticipate multiple hikes in 2022.Increasing tensions between Russia and Ukraine in early 2022 and the eventual invasion of Ukraine by its larger neighbor further undermined investor sentimentand pressured international credit markets.U.S. bond prices trended lower, spreads widened and yields crept higher as interest rates rose throughout the period, with short-term rates rising faster thanlong-term rates. These trends were most pronounced during the latter two months of the period. Corporate bonds underperformed government-issued securitiesand securitized instruments in a flight to safety, particularly during the final two months of the period. Conversely, floating-rate bonds and Treasury Inflation-Protected Securities (TIPS) performed relatively well, as both asset classes offer a degree of protection from rising interest rates. Municipal bonds generallymirrored the declines in other fixed-income sectors, although state and local governments continued to benefit from rebounding tax revenues and federal fiscalsupport. Not surprisingly, given the pressure on bond prices, short-duration instruments tended to outperform their longer-duration counterparts. From a creditratings perspective, higher-rated, higher-quality issues tended to outperform lower-rated bonds, reflective of the market’s prevailing risk-off sentiment.Credit, Geographic and Sector Factors DetractThe fund’s performance lagged the Index due to the cumulative effect of slightly negative relative returns in several areas. From a credit quality perspective,the fund generally held overweight exposure to lower-quality BBB and A rated credits, a position that detracted from relative performance during the flight toquality that characterized the latter part of the period. However, income-related effects within various credit baskets had a more substantial impact on relativeperformance, with the fund’s A rated holdings notably undermining performance. Among municipal bond sectors, a mixture of duration and issue effectsweakened returns in the single-family housing area, and to a lesser extent in the utility sector. Conversely, the fund saw positive effects from investments in thetax-supported local general obligation, higher education, hospital and other subsectors.Positioned for Rising RatesDespite the widening of spreads seen during the period, we expect this trend to moderate over time. Although risks associated with increasing inflation andgeopolitical conflict are clearly present, in our opinion, underlying U.S. economic fundamentals remain strong, supported by better-than-expected corporateearnings, robust consumer demand and positive employment numbers, all of which bode well for state and local tax revenues. Accordingly, we continue to take acautious investment approach, seeking to enhance yield while limiting the fund’s interest-rate sensitivity.March 15, 20221 Total return includes reinvestment of dividends and any capital gains paid. Past performance is no guarantee of future results. Share price, yield and investment return
fluctuate such that upon redemption, fund shares may be worth more or less than their original cost. Income may be subject to state and local taxes, and some incomemay be subject to the federal alternative minimum tax (AMT) for certain investors. Capital gains, if any, are fully taxable. The fund’s return reflects the absorption ofcertain fund expenses by BNY Mellon Investment Adviser, Inc. pursuant to an agreement in effect through December 31, 2022, at which time it may be extended,modified or terminated. Had these expenses not been absorbed, returns would have been lower.
2 Source: FactSet — The S&P Municipal Bond Investment Grade Short Index consists of bonds in the S&P Municipal Bond Index that are rated at least BBB- by Standard&Poor’s, Baa3 by Moody’s or BBB- by Fitch Ratings. All bonds must also have a minimum maturity of six months and a maximum maturity of up to, but not including,four years as measured from the rebalancing date. Investors cannot invest directly in any index.
3 The S&P Municipal Bond Investment Grade Short Index was first calculated on March 19, 2013. Accordingly, the fund will continue to report the performance of theS&P Municipal Bond Short Index until the S&P Municipal Bond Investment Grade Short Index has been calculated for a 10-year period.
4 Source: Lipper Inc. — The S&P Municipal Bond Short Index consists of bonds in the S&P Municipal Bond Index with a minimum maturity of six months and amaximum maturity of up to, but not including, four years as measured from the rebalancing date. Investors cannot invest directly in any index.
5 The fund may continue to own investment-grade bonds (at the time of purchase), which are subsequently downgraded to below investment grade.Bonds are subject generally to interest-rate, credit, liquidity and market risks, to varying degrees, all of which are more fully described in the fund’s prospectus. Generally,all other factors being equal, bond prices are inversely related to interest-rate changes, and rate increases can cause price declines. Municipal bonds may be subject tostate and local taxes. Capital gains, if any, are taxable.Recent market risks include pandemic risks related to COVID-19. The effects of COVID-19 have contributed to increased volatility in global markets and will likely affectcertain countries, companies, industries and market sectors more dramatically than others. To the extent the fund may overweight its investments in certain countries,companies, industries or market sectors, such positions will increase the fund's exposure to risk of loss from adverse developments affecting those countries, companies,industries or sectors.
3
Copyright © 2022 www.secdatabase.com. All Rights Reserved.Please Consider the Environment Before Printing This Document
DISCUSSION OF FUND PERFORMANCE (Unaudited) (continued)For the period from September 1, 2021 through February 28, 2022, as provided by Gregory J. Conant and Mary Collette O’Brien, Portfolio ManagersMarket and Fund Performance OverviewFor the six-month period ended February 28, 2022, BNY Mellon Pennsylvania Intermediate Municipal Bond Fund’s (the “fund”) Class M shares produced a total returnof −3.31%, and Investor shares produced a total return of −3.44%.1 In comparison, the fund’s benchmark, the S&P Municipal Bond Investment Grade Intermediate Index(the “Index”), produced a total return of −3.21%, and the fund’s former benchmark, the S&P Municipal Bond Intermediate Index, produced a total return of −3.16% for thesame period. 2,3,4
Intermediate municipal bond prices declined over the six months under pressure from rising interest rates and increasingly hawkish rhetoric from the U.S. Federal Reserve(the “Fed”). The fund underperformed the Index, largely due to the negative impact of credit and sector positions.The Fund’s Investment ApproachThe fund seeks as high a level of income exempt from federal and Pennsylvania state income taxes as is consistent with the preservation of capital. To pursue its goal,the fund normally invests at least 80% of its net assets, plus any borrowings for investment purposes, in municipal bonds that provide income exempt from federal andPennsylvania state personal income taxes. These municipal bonds include those issued by the Commonwealth of Pennsylvania as well as those issued by territories andpossessions of the United States and the District of Columbia and their political subdivisions, agencies and instrumentalities, or multistate agencies and authorities, andcertain other specified securities. The fund’s investments in municipal and taxable bonds must be rated investment grade (i.e., Baa/BBB or higher) at the time of purchaseor, if unrated, deemed of comparable quality by BNY Mellon Investment Adviser, Inc.5 Generally, the fund’s average effective portfolio maturity will be between three andten years, and the average effective duration of the fund’s portfolio will not exceed eight years.Risk Assets Retreat on Inflationary PressuresThe reporting period began amid increasing inflationary pressures due to rising energy and commodity prices and global supply-chain disruptions. The Fed, which expressedincreasingly hawkish sentiments prior to the start of the period, indicated in September 2021 a willingness to consider reducing accommodative policies sooner rather thanlater due to the unexpected level and persistence of inflationary forces affecting the economy. As inflationary pressures continued to mount, Fed rhetoric grew increasinglyemphatic. In November, the Fed dropped the word “transitory” when describing inflation. At the same time, the Fed forecast a possible end to their asset purchase programas early as June 2022, thereby increasing the likelihood of one or more rate hikes later that year. In December, the Fed again revised their estimate of an end to quantitativeeasing to March 2022, leading the market to widely anticipate multiple hikes in 2022. Increasing tensions between Russia and Ukraine in early 2022 and the eventualinvasion of Ukraine by its larger neighbor further undermined investor sentiment and pressured international credit markets.U.S. bond prices trended lower, spreads widened and yields crept higher as interest rates rose throughout the period, with short-term rates rising faster than long-termrates. These trends were most pronounced during the latter two months of the period. Corporate bonds underperformed government-issued securities and securitizedinstruments in a flight to safety, particularly during the final two months of the period. Conversely, floating-rate bonds and Treasury Inflation-Protected Securities (TIPS)performed relatively well, as both asset classes offer a degree of protection from rising interest rates. Municipal bonds generally mirrored the declines in other fixed-incomesectors, although state and local governments continued to benefit from rebounding tax revenues and federal fiscal support. Not surprisingly, given the pressure on bondprices, short-duration instruments tended to outperform their longer-duration counterparts. From a credit ratings perspective, higher-rated, higher-quality issues tended tooutperform lower-rated bonds, reflective of the market’s prevailing risk-off sentiment.Credit and Sector Factors DetractThe fund’s performance lagged the Index due to the cumulative effect of slightly negative relative returns in several areas. From a credit quality perspective, the fundgenerally held overweight exposure to lower-quality AA rated credits, a position that detracted from relative performance during the flight to quality that characterized thelatter part of the period. However, duration and issue selection effects within various credit baskets had a more substantial impact on relative performance. Specifically, therelatively long duration of the fund’s A rated holdings undermined performance compared to the Index, while the relatively short duration of the fund’s BB rated holdingscontributed positively. Issue-related effects among the fund’s AA rated holdings also bolstered relative returns. In terms of sector exposure, allocation, issue and durationeffects weakened returns most notably in education, particularly higher education, as well as health care, tobacco, and to a slight degree utility. Conversely, the fund sawsignificantly positive effects from positions in pre-refunded/ETM (escrowed to maturity), IDR/PCR (industrial development revenue/pollution control revenue), generallocal obligations, dedicated tax, housing and transportation. From an overall duration perspective, the fund maintained a slightly shorter average duration than the Index,which proved accretive to relative performance. The fund’s Treasury hedges and cash position also contributed marginally to relative returns.Positioned for Rising RatesDespite the widening of spreads seen during the period, we expect this trend to moderate over time. Although risks associated with increasing inflation and geopoliticalconflict are clearly present, in our opinion, underlying U.S. economic fundamentals remain strong, supported by better-than-expected corporate earnings, robust consumerdemand and positive employment numbers, all of which bode well for state and local tax revenues. Accordingly, we continue to take a cautious investment approach,seeking to enhance yield while dampening the fund’s interest-rate sensitivity.March 15, 20221 Total return includes reinvestment of dividends and any capital gains paid. Past performance is no guarantee of future results. Share price, yield and investment return
fluctuate such that upon redemption, fund shares may be worth more or less than their original cost. Income may be subject to state and local taxes for non-Pennsylvania residents, and some income may be subject to the federal alternative minimum tax (AMT) for certain investors. Capital gains, if any, are fully taxable.The fund’s return reflects the absorption of certain fund expenses by BNY Mellon Investment Adviser, Inc. pursuant to an agreement in effect through December 31,2022, at which time it may be extended, modified or terminated. Had these expenses not been absorbed, returns would have been lower.
2 Source: FactSet — The S&P Municipal Bond Investment Grade Intermediate Index consists of bonds in the S&P Municipal Bond Index that are rated at least BBB- byStandard & Poor’s, Baa3 by Moody’s or BBB- by Fitch Ratings. All bonds must also have a minimum maturity of three years and a maximum maturity of up to, but notincluding, 15 years as measured from the rebalancing date. Unlike a mutual fund, the index is not subject to charges, fees and other expenses and is not limited toinvestments principally in Pennsylvania municipal obligations. Investors cannot invest directly in any index.
3 The S&P Municipal Bond Investment Grade Intermediate Index was first calculated on March 19, 2013. Accordingly, the fund will continue to report the performance ofthe S&P Municipal Bond Intermediate Index until the S&P Municipal Bond Investment Grade Intermediate Index has been calculated for a 10-year period.
4 Source: Lipper Inc.— The S&P Municipal Bond Intermediate Index consists of bonds in the S&P Municipal Bond Index with a minimum maturity of 3 years and amaximum maturity of up to, but not including, 15 years as measured from the rebalancing date. Investors cannot invest directly in any index.
5 The fund may continue to own investment-grade bonds (at the time of purchase), which are subsequently downgraded to below investment grade.Bonds are subject generally to interest-rate, credit, liquidity and market risks, to varying degrees, all of which are more fully described in the fund’s prospectus. Generally,all other factors being equal, bond prices are inversely related to interest-rate changes, and rate increases can cause price declines. Municipal income may be subject tostate and local taxes. Capital gains, if any, are fully taxable.Recent market risks include pandemic risks related to COVID-19. The effects of COVID-19 have contributed to increased volatility in global markets and will likely affectcertain countries, companies, industries and market sectors more dramatically than others. To the extent the fund may overweight its investments in certain countries,companies, industries or market sectors, such positions will increase the fund’s exposure to risk of loss from adverse developments affecting those countries, companies,industries or sectors.The fund may, but is not required to, use derivative instruments. A small investment in derivatives could have a potentially large impact on the fund’s performance. Theuse of derivatives involves risks different from, or possibly greater than, the risks associated with investing directly in the underlying assets.
4
Copyright © 2022 www.secdatabase.com. All Rights Reserved.Please Consider the Environment Before Printing This Document

Copyright © 2022 www.secdatabase.com. All Rights Reserved.Please Consider the Environment Before Printing This Document
For the period from September 1, 2021 through February 28, 2022, as provided by Mary Collette O’Brien and Stephen J. O’Brien, Portfolio ManagersMarket and Fund Performance OverviewFor the six-month period ended February 28, 2022, BNY Mellon Massachusetts Intermediate Municipal Bond Fund’s (the “fund”) Class M shares produced atotal return of −3.31%, and Investor shares produced a total return of −3.36%.1 In comparison, the fund’s benchmark, the S&P Municipal Bond Investment GradeIntermediate Index (the “Index”), produced a total return of −3.21%, and the fund’s former benchmark, the S&P Municipal Bond Intermediate Index, produced atotal return of −3.16% for the same period. 2,3,4
Intermediate municipal bond prices declined over the six months under pressure from rising interest rates and increasingly hawkish rhetoric from the U.S. FederalReserve (the “Fed”). The fund underperformed the Index, largely due to the negative impact of credit and sector positions.The Fund’s Investment ApproachThe fund seeks as high a level of income exempt from federal and Massachusetts state income taxes as is consistent with the preservation of capital. To pursue itsgoal, the fund normally invests at least 80% of its net assets, plus any borrowings for investment purposes, in municipal bonds that provide income exempt fromfederal and Massachusetts state personal income taxes. The fund’s investments in municipal and taxable bonds must be rated investment grade (i.e., Baa/BBB orhigher) at the time of purchase or, if unrated, deemed of comparable quality by the BNY Mellon Investment Adviser, Inc.5 Generally, the fund’s average effectiveportfolio maturity will be between three and ten years, and the average effective duration of the fund’s portfolio will not exceed eight years.Risk Assets Retreat on Inflationary PressuresThe reporting period began amid increasing inflationary pressures due to rising energy and commodity prices and global supply-chain disruptions. The Fed,which expressed increasingly hawkish sentiments prior to the start of the period, indicated in September 2021 a willingness to consider reducing accommodativepolicies sooner rather than later due to the unexpected level and persistence of inflationary forces affecting the economy. As inflationary pressures continuedto mount, Fed rhetoric grew increasingly emphatic. In November, the Fed dropped the word “transitory” when describing inflation. At the same time, the Fedforecast a possible end to their asset purchase program as early as June 2022, thereby increasing the likelihood of one or more rate hikes later that year. InDecember, the Fed again revised their estimate of an end to quantitative easing to March 2022, leading the market to widely anticipate multiple hikes in 2022.Increasing tensions between Russia and Ukraine in early 2022 and the eventual invasion of Ukraine by its larger neighbor further undermined investor sentimentand pressured international credit markets.U.S. bond prices trended lower, spreads widened and yields crept higher as interest rates rose throughout the period, with short-term rates rising faster thanlong-term rates. These trends were most pronounced during the latter two months of the period. Corporate bonds underperformed government-issued securitiesand securitized instruments in a flight to safety, particularly during the final two months of the period. Conversely, floating-rate bonds and Treasury Inflation-Protected Securities (TIPS) performed relatively well, as both asset classes offer a degree of protection from rising interest rates. Municipal bonds generallymirrored the declines in other fixed-income sectors, although state and local governments continued to benefit from rebounding tax revenues and federal fiscalsupport. Not surprisingly, given the pressure on bond prices, short-duration instruments tended to outperform their longer-duration counterparts. From a creditratings perspective, higher-rated, higher-quality issues tended to outperform lower-rated bonds, reflective of the market’s prevailing risk-off sentiment.Credit and Sector Factors DetractThe fund’s performance lagged the Index due to the cumulative effect of slightly negative relative returns in several areas. From a credit quality perspective, thefund held overweight exposure to BBB rated credits, an allocation that detracted from relative performance during the flight to quality characterizing the latter partof the period. However, duration and issue selection effects within various credit baskets also had an impact on relative performance. Specifically, issue-relatedeffects and the relatively long duration associated with the fund’s AA rated holdings detracted from relative returns. Meanwhile, the relatively short duration ofthe fund’s BBB rated holdings contributed positively. In terms of sector exposure, combinations of allocation, issue and duration effects weakened returns mostnotably in the tax-supported area of local general obligation bonds, with lesser negative effects in the state general obligation, dedicated tax and appropriationareas. Other sectors detracting from relative performance included tobacco and utilities. Conversely, the fund saw significant positive effects from positions inthe higher education, transportation, and IDR/PCR (industrial development revenue/pollution control revenue) sectors. From an overall duration perspective, thefund maintained a slightly shorter average duration than the Index, which proved mildly additive to relative performance. The fund’s Treasury hedges and smallcash position also contributed positively to relative returns.Positioned for Rising RatesDespite the widening of spreads seen during the period, we expect this trend to moderate over time. Although risks associated with increasing inflation andgeopolitical conflict are clearly present, in our opinion, underlying U.S. economic fundamentals remain strong, supported by better-than-expected corporateearnings, robust consumer demand and positive employment numbers, all of which bode well for state and local tax revenues. Accordingly, we continue to take acautious investment approach, seeking to enhance yield while dampening the fund’s interest-rate sensitivity.March 15, 20221 Total return includes reinvestment of dividends and any capital gains paid. Past performance is no guarantee of future results. Share price, yield and investment return
fluctuate such that upon redemption, fund shares may be worth more or less than their original cost. Income may be subject to state and local taxes, and some incomemay be subject to the federal alternative minimum tax (AMT) for certain investors. Capital gains, if any, are fully taxable.
2 Source: FactSet — The S&P Municipal Bond Investment Grade Intermediate Index consists of bonds in the S&P Municipal Bond Index that are rated at least BBB- byStandard & Poor’s, Baa3 by Moody’s or BBB- by Fitch Ratings. All bonds must also have a minimum maturity of 3 years and a maximum maturity of up to, but notincluding, 15 years as measured from the rebalancing date. Investors cannot invest directly in any index.
3 The S&P Municipal Bond Investment Grade Intermediate Index was first calculated on March 19, 2013. Accordingly, the fund will continue to report the performance ofthe S&P Municipal Bond Intermediate Index until the S&P Municipal Bond Investment Grade Intermediate Index has been calculated for a 10-year period.
4 Source: Lipper Inc. — The S&P Municipal Bond Intermediate Index consists of bonds in the S&P Municipal Bond Index with a minimum maturity of 3 years and amaximum maturity of up to, but not including, 15 years as measured from the rebalancing date. Investors cannot invest directly in any index.
5 The fund may continue to own investment-grade bonds (at the time of purchase), which are subsequently downgraded to below investment grade.Bonds are subject generally to interest-rate, credit, liquidity and market risks, to varying degrees, all of which are more fully described in the fund’s prospectus. Generally,all other factors being equal, bond prices are inversely related to interest-rate changes, and rate increases can cause price declines. The amount of public informationavailable about municipal bonds is generally less than that for corporate equities or bonds. Special factors, such as legislative changes, and state and local economic andbusiness developments, may adversely affect the yield and/or value of the fund’s investments in municipal bonds. Other factors include the general conditions of themunicipal bond market, the size of the particular offering, the maturity of the obligation and the rating of the issue. Changes in economic, business or political conditionsrelating to a particular municipal project, municipality, or state in which the fund invests may have an impact on the fund’s share price.Recent market risks include pandemic risks related to COVID-19. The effects of COVID-19 have contributed to increased volatility in global markets and will likely affectcertain countries, companies, industries and market sectors more dramatically than others. To the extent the fund may overweight its investments in certain countries,companies, industries or market sectors, such positions will increase the fund’s exposure to risk of loss from adverse developments affecting those countries, companies,industries or sectors.
Copyright © 2022 www.secdatabase.com. All Rights Reserved.Please Consider the Environment Before Printing This Document

The fund may, but is not required to, use derivative instruments. A small investment in derivatives could have a potentially large impact on the fund’s performance. Theuse of derivatives involves risks different from, or possibly greater than, the risks associated with investing directly in the underlying assets.
5
Copyright © 2022 www.secdatabase.com. All Rights Reserved.Please Consider the Environment Before Printing This Document
DISCUSSION OF FUND PERFORMANCE (Unaudited) (continued)For the period from September 1, 2021 through February 28, 2022, as provided by John F. Flahive and Gregory J. Conant, Portfolio ManagersMarket and Fund Performance OverviewFor the six-month period ended February 28, 2022, BNY Mellon New York Intermediate Tax-Exempt Bond Fund’s (the “fund”) Class M shares produced a totalreturn of −3.47%, and Investor shares produced a total return of −3.68%.1 In comparison, the fund’s benchmark, the S&P Municipal Bond Investment GradeIntermediate Index (the “Index”), produced a total return of −3.21%, and the fund’s former benchmark, the S&P Municipal Bond Intermediate Index, produced atotal return of −3.16% for the same period. 2,3,4
Intermediate municipal bond prices declined over the six months under pressure from rising interest rates and increasingly hawkish rhetoric from the U.S. FederalReserve (the “Fed”). The fund underperformed the Index, largely due to the negative impact of credit and sector positions.The Fund’s Investment ApproachThe fund seeks as high a level of income exempt from federal, New York State and New York City income taxes as is consistent with the preservation of capital.To pursue its goal, the fund normally invests at least 80% of its net assets, plus any borrowings for investment purposes, in municipal bonds that provide incomeexempt from federal, New York State and New York City personal income taxes. These municipal bonds include those issued by New York State and New YorkCity, as well as those issued by U.S. territories and possessions of the United States and the District of Columbia and their political subdivisions, agencies andinstrumentalities, or multistate agencies and authorities, and certain other specified securities. Generally, the fund’s average effective portfolio maturity will bebetween three and ten years.Risk Assets Retreat on Inflationary PressuresThe reporting period began amid increasing inflationary pressures due to rising energy and commodity prices and global supply-chain disruptions. The Fed,which expressed increasingly hawkish sentiments prior to the start of the period, indicated in September 2021 a willingness to consider reducing accommodativepolicies sooner rather than later due to the unexpected level and persistence of inflationary forces affecting the economy. As inflationary pressures continuedto mount, Fed rhetoric grew increasingly emphatic. In November, the Fed dropped the word “transitory” when describing inflation. At the same time, the Fedforecast a possible end to their asset purchase program as early as June 2022, thereby increasing the likelihood of one or more rate hikes later that year. InDecember, the Fed again revised their estimate of an end to quantitative easing to March 2022, leading the market to widely anticipate multiple hikes in 2022.Increasing tensions between Russia and Ukraine in early 2022 and the eventual invasion of Ukraine by its larger neighbor further undermined investor sentimentand pressured international credit markets.U.S. bond prices trended lower, spreads widened and yields crept higher as interest rates rose throughout the period, with short-term rates rising faster thanlong-term rates. These trends were most pronounced during the latter two months of the period. Corporate bonds underperformed government-issued securitiesand securitized instruments in a flight to safety, particularly during the final two months of the period. Conversely, floating-rate bonds and Treasury Inflation-Protected Securities (TIPS) performed relatively well, as both asset classes offer a degree of protection from rising interest rates. Municipal bonds generallymirrored the declines in other fixed-income sectors, although state and local governments continued to benefit from rebounding tax revenues and federal fiscalsupport. Not surprisingly, given the pressure on bond prices, short-duration instruments tended to outperform their longer-duration counterparts. From a creditratings perspective, higher-rated, higher-quality issues tended to outperform lower-rated bonds, reflective of the market’s prevailing risk-off sentiment.Credit and Sector Factors DetractThe fund’s performance lagged the Index due to the cumulative effect of slightly negative relative returns in several areas. From a credit quality perspective, thefund generally held overweight exposure to lower-quality BBB and A rated credits, a position that detracted from relative performance during the flight to qualitythat characterized the latter part of the period. However, duration effects within various credit baskets had a more substantial impact on relative performance,with the relatively long duration of the Fund’s AA rated holdings undermining performance compared to the Index, while the relatively short duration of thefund’s A rated holdings contributed positively. In terms of sector exposure, allocation, issue and duration effects weakened returns most notably in the tax-supported areas of state general obligation, local general obligation and dedicated tax. Other sectors detracting from relative performance included education,health care, tobacco, utility, and IDR/PCR (industrial development revenue/pollution control revenue). Conversely, the fund saw significantly positive effectsfrom positions in housing, particularly in the multi-family subsector, as well as the pre-refunded/ETM (escrowed to maturity) and transportation sectors. From aduration perspective, the fund maintained a slightly shorter average duration than the Index, which proved mildly accretive to relative performance. The fund’sTreasury hedges and cash position also contributed positively to relative returns.Positioned for Rising RatesDespite the widening of spreads seen during the period, we expect this trend to moderate over time. Although risks associated with increasing inflation andgeopolitical conflict are clearly present, in our opinion, underlying U.S. economic fundamentals remain strong, supported by better-than-expected corporateearnings, robust consumer demand and positive employment numbers, all of which bode well for state and local tax revenues. Accordingly, we continue to take acautious investment approach, seeking to enhance yield while dampening the fund’s interest-rate sensitivity.March 15, 20221 Total return includes reinvestment of dividends and any capital gains paid. Past performance is no guarantee of future results. Share price, yield and investment return
fluctuate such that upon redemption, fund shares may be worth more or less than their original cost. Income may be subject to state and local taxes, and some incomemay be subject to the federal alternative minimum tax (AMT) for certain investors. Capital gains, if any, are fully taxable. The fund’s return reflects the absorption ofcertain fund expenses by BNY Mellon Investment Adviser, Inc. pursuant to an agreement in effect through December 31, 2022, at which time it may be extended,modified or terminated. Had these expenses not been absorbed, returns would have been lower
2 Source: FactSet — The S&P Municipal Bond Investment Grade Intermediate Index consists of bonds in the S&P Municipal Bond Index that are rated at least BBB- byStandard & Poor’s, Baa3 by Moody’s or BBB- by Fitch Ratings. All bonds must also have a minimum maturity of 3 years and a maximum maturity of up to, but notincluding, 15 years as measured from the rebalancing date. Investors cannot invest directly in any index.
3 The S&P Municipal Bond Investment Grade Intermediate Index was first calculated on March 19, 2013. Accordingly, the fund will continue to report the performance ofthe S&P Municipal Bond Intermediate Index until the S&P Municipal Bond Investment Grade Intermediate Index has been calculated for a 10-year period.
4 Source: Lipper Inc.— The S&P Municipal Bond Intermediate Index consists of bonds in the S&P Municipal Bond Index with a minimum maturity of 3 years and amaximum maturity of up to, but not including, 15 years as measured from the rebalancing date. Investors cannot invest directly in any index.
Bonds are subject generally to interest-rate, credit, liquidity and market risks, to varying degrees, all of which are more fully described in the fund’s prospectus. Generally,all other factors being equal, bond prices are inversely related to interest-rate changes, and rate increases can cause price declines. Municipal income may be subject tostate and local taxes. Capital gains, if any, are taxable.Recent market risks include pandemic risks related to COVID-19. The effects of COVID-19 have contributed to increased volatility in global markets and will likely affectcertain countries, companies, industries and market sectors more dramatically than others. To the extent the fund may overweight its investments in certain countries,companies, industries or market sectors, such positions will increase the fund’s exposure to risk of loss from adverse developments affecting those countries, companies,industries or sectors.
Copyright © 2022 www.secdatabase.com. All Rights Reserved.Please Consider the Environment Before Printing This Document

The fund may, but is not required to, use derivative instruments. A small investment in derivatives could have a potentially large impact on the fund’s performance. Theuse of derivatives involves risks different from, or possibly greater than, the risks associated with investing directly in the underlying assets.
6
Copyright © 2022 www.secdatabase.com. All Rights Reserved.Please Consider the Environment Before Printing This Document
For the period from September 1, 2021 through February 28, 2022, as provided by John F. Flahive, Portfolio ManagerMarket and Fund Performance OverviewFor the six-month period ended February 28, 2022, BNY Mellon Municipal Opportunities Fund’s (the “fund”) Class M shares produced a total return of −3.65%,and Investor shares produced a total return of −3.77%.1 In comparison, the fund’s benchmark, the Bloomberg U.S. Municipal Bond Index (the “Index”), produceda total return of −3.09% for the same period.2Municipal bond prices declined over the six months under pressure from rising interest rates and increasingly hawkish rhetoric from the U.S. Federal Reserve(the “Fed”). The fund underperformed the Index, largely due to the negative impact of credit, geographic and sector allocations.The Fund’s Investment ApproachThe fund seeks to maximize total return consisting of high current income exempt from federal income tax and capital appreciation. To pursue its goal, the fundnormally invests at least 80% of its net assets, plus any borrowings for investment purposes, in U.S. dollar-denominated, fixed-income securities that provideincome exempt from federal income tax (municipal bonds). Municipal bonds are debt securities or other obligations issued by states, territories and possessionsof the United States and the District of Columbia and their political subdivisions, agencies and instrumentalities, or multistate agencies and authorities, andcertain other specific securities. While the fund typically invests in a diversified portfolio of municipal bonds, it may invest up to 20% of its assets in taxablefixed-income securities, including taxable municipal bonds and non-U.S. dollar-denominated, foreign-debt securities, such as Brady bonds and sovereign-debtobligations.We seek to deliver value-added, excess returns (“alpha”) by applying an investment approach designed to identify and exploit relative value opportunities withinthe municipal bond market. Although the fund seeks to be diversified by geography and sector, it may at times invest a significant portion of its assets in aparticular state or region or in a particular sector due to market conditions.Risk Assets Retreat on Inflationary PressuresThe reporting period began amid increasing inflationary pressures due to rising energy and commodity prices and global supply-chain disruptions. The Fed,which expressed increasingly hawkish sentiments prior to the start of the period, indicated in September 2021 a willingness to consider reducing accommodativepolicies sooner rather than later due to the unexpected level and persistence of inflationary forces affecting the economy. As inflationary pressures continuedto mount, Fed rhetoric grew increasingly emphatic. In November, the Fed dropped the word “transitory” when describing inflation. At the same time, the Fedforecast a possible end to their asset purchase program as early as June 2022, thereby increasing the likelihood of one or more rate hikes later that year. InDecember, the Fed again revised their estimate of an end to quantitative easing to March 2022, leading the market to widely anticipate multiple hikes in 2022.Increasing tensions between Russia and Ukraine in early 2022 and the eventual invasion of Ukraine by its larger neighbor further undermined investor sentimentand pressured international credit markets.U.S. bond prices trended lower, spreads widened and yields crept higher as interest rates rose throughout the period, with short-term rates rising faster thanlong-term rates. These trends were most pronounced during the latter two months of the period. Corporate bonds underperformed government-issued securitiesand securitized instruments in a flight to safety, particularly during the final two months of the period. Conversely, floating-rate bonds and Treasury Inflation-Protected Securities (TIPS) performed relatively well, as both asset classes offer a degree of protection from rising interest rates. Municipal bonds generallymirrored the declines in other fixed-income sectors, although state and local governments continued to benefit from rebounding tax revenues and federal fiscalsupport. Not surprisingly, given the pressure on bond prices, short-duration instruments tended to outperform their longer-duration counterparts. From a creditratings perspective, higher-rated, higher-quality issues tended to outperform lower-rated bonds, reflective of the market’s prevailing risk-off sentiment.Credit, Geographic and Sector Factors DetractThe fund’s performance lagged the Index due to the cumulative effect of mildly negative relative returns in several areas. From a credit quality perspective,the fund generally held overweight exposure to lower-quality BBB and A rated credits, a position that detracted from relative performance during the flight toquality that characterized the latter part of the period. However, duration and issue selection effects within various credit baskets had a more substantial impacton relative performance. Specifically, the relatively long duration of the fund’s AA rated holdings significantly undermined performance compared to the Index,an effect only partly mitigated by relatively strong, issue-specific performance. In terms of geographic exposure, the fund’s California position detracted notablyfrom relative returns, due primarily to long duration, as well as overweight exposure and issue-related effects. The fund’s New York position underperformed toa lesser degree, followed by holdings in Pennsylvania and New Jersey. On the other hand, holdings in Puerto Rico enhanced the fund’s performance, largely dueto issue-related effects. The fund’s hedging activities, using futures to insulate performance against the risk of rising interest rates, also contributed positively torelative performance, as did the fund’s cash position.Positioned for Rising RatesDespite the widening of spreads seen during the period, we expect this trend to moderate over time. Although risks associated with increasing inflation andgeopolitical conflict are clearly present, in our opinion, underlying U.S. economic fundamentals remain strong, supported by better-than-expected corporateearnings, robust consumer demand and positive employment numbers, all of which bode well for state and local tax revenues. Accordingly, we continue to take acautious investment approach, seeking to enhance yield while hedging to control the fund’s interest-rate sensitivity.March 15, 20221 Total return includes reinvestment of dividends and any capital gains paid. Past performance is no guarantee of future results. Share price, yield and investment return
fluctuate such that upon redemption, fund shares may be worth more or less than their original cost. Income may be subject to state and local taxes, and some incomemay be subject to the federal alternative minimum tax (AMT) for certain investors. Capital gains, if any, are fully taxable.
2 Source: Lipper Inc. — The Bloomberg U.S. Municipal Bond Index covers the USD denominated, long-term, tax-exempt bond market. Investors cannot invest directly inany index.
Bonds are subject generally to interest-rate, credit, liquidity and market risks, to varying degrees, all of which are more fully described in the fund’s prospectus. Generally,all other factors being equal, bond prices are inversely related to interest-rate changes, and rate increases can cause price declines. Municipal income may be subject tostate and local taxes. Capital gains, if any, are taxable.Recent market risks include pandemic risks related to COVID-19. The effects of COVID-19 have contributed to increased volatility in global markets and will likely affectcertain countries, companies, industries and market sectors more dramatically than others. To the extent the fund may overweight its investments in certain countries,companies, industries or market sectors, such positions will increase the fund’s exposure to risk of loss from adverse developments affecting those countries, companies,industries or sectors.The fund may, but is not required to, use derivative instruments. A small investment in derivatives could have a potentially large impact on the fund’s performance. Theuse of derivatives involves risks different from, or possibly greater than, the risks associated with investing directly in the underlying assets.
7
Copyright © 2022 www.secdatabase.com. All Rights Reserved.Please Consider the Environment Before Printing This Document
UNDERSTANDING YOUR FUND’S EXPENSES (Unaudited)As a mutual fund investor, you pay ongoing expenses, such as management fees and other expenses. Using the information below, youcan estimate how these expenses affect your investment and compare them with the expenses of other funds. You also may pay one-timetransaction expenses, including sales charges (loads) and redemption fees, which are not shown in this section and would have resultedin higher total expenses. For more information, see your fund’s prospectus or talk to your financial adviser.Review your fund’s expensesThe table below shows the expenses you would have paid on a $1,000 investment in each class of each fund from September 1, 2021 toFebruary 28, 2022. It also shows how much a $1,000 investment would be worth at the close of the period, assuming actual returns andexpenses.Expenses and Value of a $1,000 InvestmentAssume actual returns for the six months ended February 28, 2022
Class M Investor SharesBNY Mellon National Intermediate Municipal Bond FundExpenses paid per $1,000† $2.44 $3.65Ending value (after expenses) $964.40 $962.40Annualized expense ratio (%) .50 .75BNY Mellon National Short-Term Municipal Bond FundExpenses paid per $1,000† $2.16 $3.39Ending value (after expenses) $982.50 $981.30Annualized expense ratio (%) .44 .69BNY Mellon Pennsylvania Intermediate Municipal Bond FundExpenses paid per $1,000† $2.88 $4.09Ending value (after expenses) $966.90 $965.60Annualized expense ratio (%) .59 .84BNY Mellon Massachusetts Intermediate Municipal Bond FundExpenses paid per $1,000† $2.58 $3.80Ending value (after expenses) $966.90 $966.40Annualized expense ratio (%) .53 .78BNY Mellon New York Intermediate Tax-Exempt Bond FundExpenses paid per $1,000† $2.88 $4.09Ending value (after expenses) $965.30 $963.20Annualized expense ratio (%) .59 .84BNY Mellon Municipal Opportunities FundExpenses paid per $1,000† $3.16 $4.38Ending value (after expenses) $963.50 $962.30Annualized expense ratio (%) .65 .90† Expenses are equal to each fund’s annualized expense ratio as shown above, multiplied by the average account value over the period, multiplied by 181/365 (to reflect
the one-half year period).8
Copyright © 2022 www.secdatabase.com. All Rights Reserved.Please Consider the Environment Before Printing This Document

COMPARING YOUR FUND’S EXPENSESWITH THOSE OF OTHER FUNDS (Unaudited)Using the SEC’s method to compare expensesThe Securities and Exchange Commission (“SEC”) has established guidelines to help investors assess fund expenses. Per theseguidelines, the table below shows your fund’s expenses based on a $1,000 investment, assuming a hypothetical 5% annualized return.You can use this information to compare the ongoing expenses (but not transaction expenses or total cost) of investing in the fund withthose of other funds. All mutual fund shareholder reports will provide this information to help you make this comparison. Please note thatyou cannot use this information to estimate your actual ending account balance and expenses paid during the period.Expenses and Value of a $1,000 InvestmentAssuming a hypothetical 5% annualized return for the six months ended February 28, 2022
Class M Investor SharesBNY Mellon National Intermediate Municipal Bond FundExpenses paid per $1,000† $2.51 $3.76Ending value (after expenses) $1,022.32 $1,021.08Annualized expense ratio (%) .50 .75BNY Mellon National Short-Term Municipal Bond FundExpenses paid per $1,000† $2.21 $3.46Ending value (after expenses) $1,022.61 $1,021.37Annualized expense ratio (%) .44 .69BNY Mellon Pennsylvania Intermediate Municipal Bond FundExpenses paid per $1,000† $2.96 $4.21Ending value (after expenses) $1,021.87 $1,020.63Annualized expense ratio (%) .59 .84BNY Mellon Massachusetts Intermediate Municipal Bond FundExpenses paid per $1,000† $2.66 $3.91Ending value (after expenses) $1,022.17 $1,020.93Annualized expense ratio (%) .53 .78BNY Mellon New York Intermediate Tax-Exempt Bond FundExpenses paid per $1,000† $2.96 $4.21Ending value (after expenses) $1,021.87 $1,020.63Annualized expense ratio (%) .59 .84BNY Mellon Municipal Opportunities FundExpenses paid per $1,000† $3.26 $4.51Ending value (after expenses) $1,021.57 $1,020.33Annualized expense ratio (%) .65 .90† Expenses are equal to each fund’s annualized expense ratio as shown above, multiplied by the average account value over the period, multiplied by 181/365 (to reflect
the one-half year period).9
Copyright © 2022 www.secdatabase.com. All Rights Reserved.Please Consider the Environment Before Printing This Document
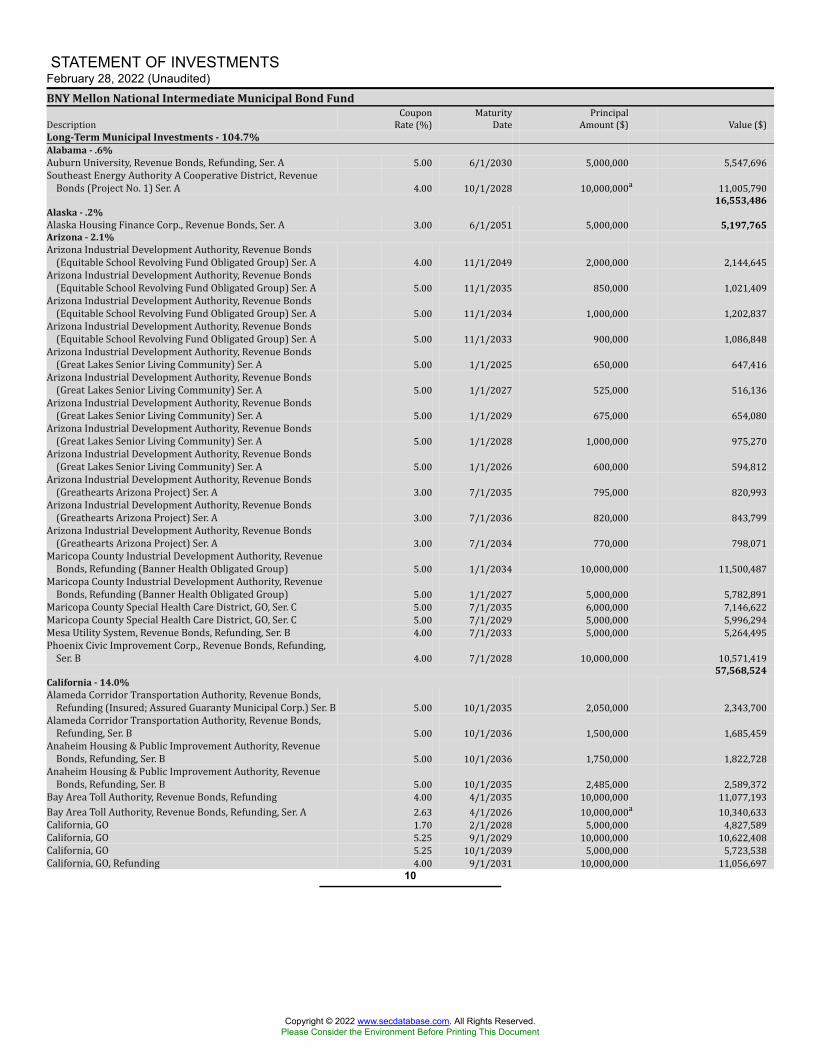
STATEMENT OF INVESTMENTSFebruary 28, 2022 (Unaudited)BNY Mellon National Intermediate Municipal Bond FundDescription CouponRate (%) MaturityDate PrincipalAmount ($) Value ($)Long-Term Municipal Investments - 104.7%Alabama - .6%Auburn University, Revenue Bonds, Refunding, Ser. A 5.00 6/1/2030 5,000,000 5,547,696Southeast Energy Authority A Cooperative District, RevenueBonds (Project No. 1) Ser. A 4.00 10/1/2028 10,000,000a 11,005,790
16,553,486Alaska - .2%Alaska Housing Finance Corp., Revenue Bonds, Ser. A 3.00 6/1/2051 5,000,000 5,197,765Arizona - 2.1%Arizona Industrial Development Authority, Revenue Bonds(Equitable School Revolving Fund Obligated Group) Ser. A 4.00 11/1/2049 2,000,000 2,144,645Arizona Industrial Development Authority, Revenue Bonds(Equitable School Revolving Fund Obligated Group) Ser. A 5.00 11/1/2035 850,000 1,021,409Arizona Industrial Development Authority, Revenue Bonds(Equitable School Revolving Fund Obligated Group) Ser. A 5.00 11/1/2034 1,000,000 1,202,837Arizona Industrial Development Authority, Revenue Bonds(Equitable School Revolving Fund Obligated Group) Ser. A 5.00 11/1/2033 900,000 1,086,848Arizona Industrial Development Authority, Revenue Bonds(Great Lakes Senior Living Community) Ser. A 5.00 1/1/2025 650,000 647,416Arizona Industrial Development Authority, Revenue Bonds(Great Lakes Senior Living Community) Ser. A 5.00 1/1/2027 525,000 516,136Arizona Industrial Development Authority, Revenue Bonds(Great Lakes Senior Living Community) Ser. A 5.00 1/1/2029 675,000 654,080Arizona Industrial Development Authority, Revenue Bonds(Great Lakes Senior Living Community) Ser. A 5.00 1/1/2028 1,000,000 975,270Arizona Industrial Development Authority, Revenue Bonds(Great Lakes Senior Living Community) Ser. A 5.00 1/1/2026 600,000 594,812Arizona Industrial Development Authority, Revenue Bonds(Greathearts Arizona Project) Ser. A 3.00 7/1/2035 795,000 820,993Arizona Industrial Development Authority, Revenue Bonds(Greathearts Arizona Project) Ser. A 3.00 7/1/2036 820,000 843,799Arizona Industrial Development Authority, Revenue Bonds(Greathearts Arizona Project) Ser. A 3.00 7/1/2034 770,000 798,071Maricopa County Industrial Development Authority, RevenueBonds, Refunding (Banner Health Obligated Group) 5.00 1/1/2034 10,000,000 11,500,487Maricopa County Industrial Development Authority, RevenueBonds, Refunding (Banner Health Obligated Group) 5.00 1/1/2027 5,000,000 5,782,891Maricopa County Special Health Care District, GO, Ser. C 5.00 7/1/2035 6,000,000 7,146,622Maricopa County Special Health Care District, GO, Ser. C 5.00 7/1/2029 5,000,000 5,996,294Mesa Utility System, Revenue Bonds, Refunding, Ser. B 4.00 7/1/2033 5,000,000 5,264,495Phoenix Civic Improvement Corp., Revenue Bonds, Refunding,Ser. B 4.00 7/1/2028 10,000,000 10,571,419
57,568,524California - 14.0%Alameda Corridor Transportation Authority, Revenue Bonds,Refunding (Insured; Assured Guaranty Municipal Corp.) Ser. B 5.00 10/1/2035 2,050,000 2,343,700Alameda Corridor Transportation Authority, Revenue Bonds,Refunding, Ser. B 5.00 10/1/2036 1,500,000 1,685,459Anaheim Housing & Public Improvement Authority, RevenueBonds, Refunding, Ser. B 5.00 10/1/2036 1,750,000 1,822,728Anaheim Housing & Public Improvement Authority, RevenueBonds, Refunding, Ser. B 5.00 10/1/2035 2,485,000 2,589,372Bay Area Toll Authority, Revenue Bonds, Refunding 4.00 4/1/2035 10,000,000 11,077,193Bay Area Toll Authority, Revenue Bonds, Refunding, Ser. A 2.63 4/1/2026 10,000,000a 10,340,633California, GO 1.70 2/1/2028 5,000,000 4,827,589California, GO 5.25 9/1/2029 10,000,000 10,622,408California, GO 5.25 10/1/2039 5,000,000 5,723,538California, GO, Refunding 4.00 9/1/2031 10,000,000 11,056,697
10
Copyright © 2022 www.secdatabase.com. All Rights Reserved.Please Consider the Environment Before Printing This Document
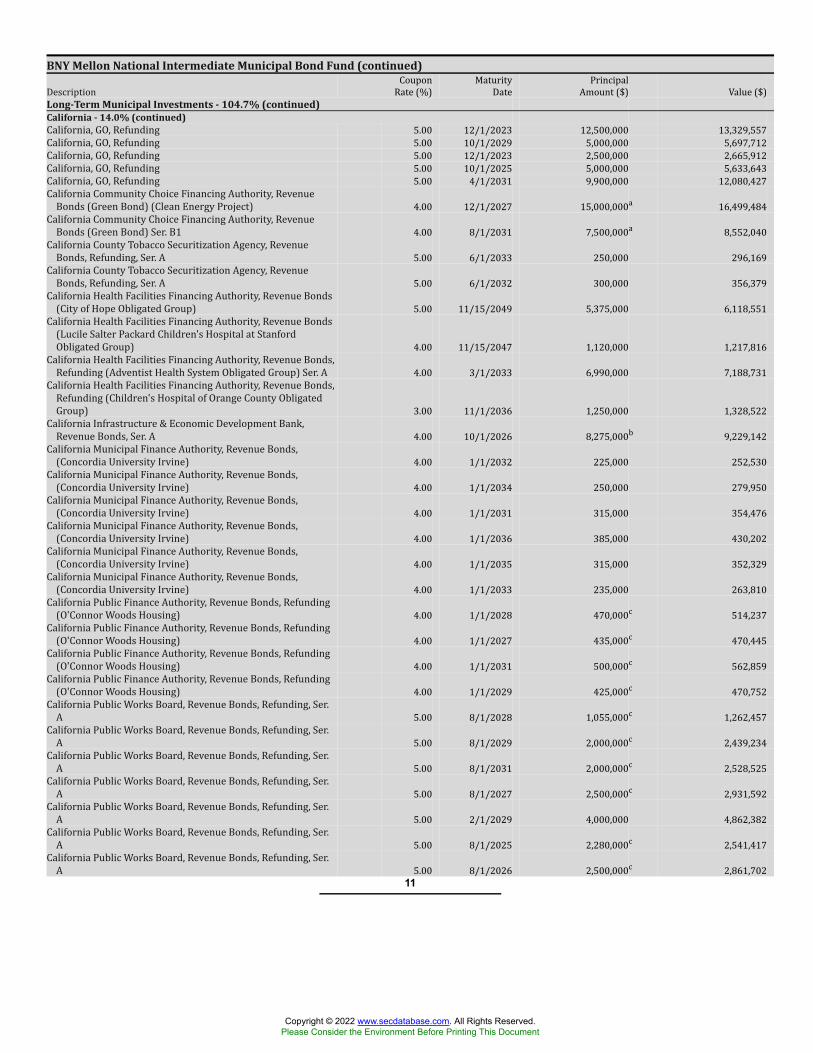
BNY Mellon National Intermediate Municipal Bond Fund (continued)Description CouponRate (%) MaturityDate PrincipalAmount ($) Value ($)Long-Term Municipal Investments - 104.7% (continued)California - 14.0% (continued)California, GO, Refunding 5.00 12/1/2023 12,500,000 13,329,557California, GO, Refunding 5.00 10/1/2029 5,000,000 5,697,712California, GO, Refunding 5.00 12/1/2023 2,500,000 2,665,912California, GO, Refunding 5.00 10/1/2025 5,000,000 5,633,643California, GO, Refunding 5.00 4/1/2031 9,900,000 12,080,427California Community Choice Financing Authority, RevenueBonds (Green Bond) (Clean Energy Project) 4.00 12/1/2027 15,000,000a 16,499,484California Community Choice Financing Authority, RevenueBonds (Green Bond) Ser. B1 4.00 8/1/2031 7,500,000a 8,552,040California County Tobacco Securitization Agency, RevenueBonds, Refunding, Ser. A 5.00 6/1/2033 250,000 296,169California County Tobacco Securitization Agency, RevenueBonds, Refunding, Ser. A 5.00 6/1/2032 300,000 356,379California Health Facilities Financing Authority, Revenue Bonds(City of Hope Obligated Group) 5.00 11/15/2049 5,375,000 6,118,551California Health Facilities Financing Authority, Revenue Bonds(Lucile Salter Packard Children's Hospital at StanfordObligated Group) 4.00 11/15/2047 1,120,000 1,217,816California Health Facilities Financing Authority, Revenue Bonds,Refunding (Adventist Health System Obligated Group) Ser. A 4.00 3/1/2033 6,990,000 7,188,731California Health Facilities Financing Authority, Revenue Bonds,Refunding (Children's Hospital of Orange County ObligatedGroup) 3.00 11/1/2036 1,250,000 1,328,522California Infrastructure & Economic Development Bank,Revenue Bonds, Ser. A 4.00 10/1/2026 8,275,000b 9,229,142California Municipal Finance Authority, Revenue Bonds,(Concordia University Irvine) 4.00 1/1/2032 225,000 252,530California Municipal Finance Authority, Revenue Bonds,(Concordia University Irvine) 4.00 1/1/2034 250,000 279,950California Municipal Finance Authority, Revenue Bonds,(Concordia University Irvine) 4.00 1/1/2031 315,000 354,476California Municipal Finance Authority, Revenue Bonds,(Concordia University Irvine) 4.00 1/1/2036 385,000 430,202California Municipal Finance Authority, Revenue Bonds,(Concordia University Irvine) 4.00 1/1/2035 315,000 352,329California Municipal Finance Authority, Revenue Bonds,(Concordia University Irvine) 4.00 1/1/2033 235,000 263,810California Public Finance Authority, Revenue Bonds, Refunding(O'Connor Woods Housing) 4.00 1/1/2028 470,000c 514,237California Public Finance Authority, Revenue Bonds, Refunding(O'Connor Woods Housing) 4.00 1/1/2027 435,000c 470,445California Public Finance Authority, Revenue Bonds, Refunding(O'Connor Woods Housing) 4.00 1/1/2031 500,000c 562,859California Public Finance Authority, Revenue Bonds, Refunding(O'Connor Woods Housing) 4.00 1/1/2029 425,000c 470,752California Public Works Board, Revenue Bonds, Refunding, Ser.A 5.00 8/1/2028 1,055,000c 1,262,457California Public Works Board, Revenue Bonds, Refunding, Ser.A 5.00 8/1/2029 2,000,000c 2,439,234California Public Works Board, Revenue Bonds, Refunding, Ser.A 5.00 8/1/2031 2,000,000c 2,528,525California Public Works Board, Revenue Bonds, Refunding, Ser.A 5.00 8/1/2027 2,500,000c 2,931,592California Public Works Board, Revenue Bonds, Refunding, Ser.A 5.00 2/1/2029 4,000,000 4,862,382California Public Works Board, Revenue Bonds, Refunding, Ser.A 5.00 8/1/2025 2,280,000c 2,541,417California Public Works Board, Revenue Bonds, Refunding, Ser.A 5.00 8/1/2026 2,500,000c 2,861,702
11
Copyright © 2022 www.secdatabase.com. All Rights Reserved.Please Consider the Environment Before Printing This Document
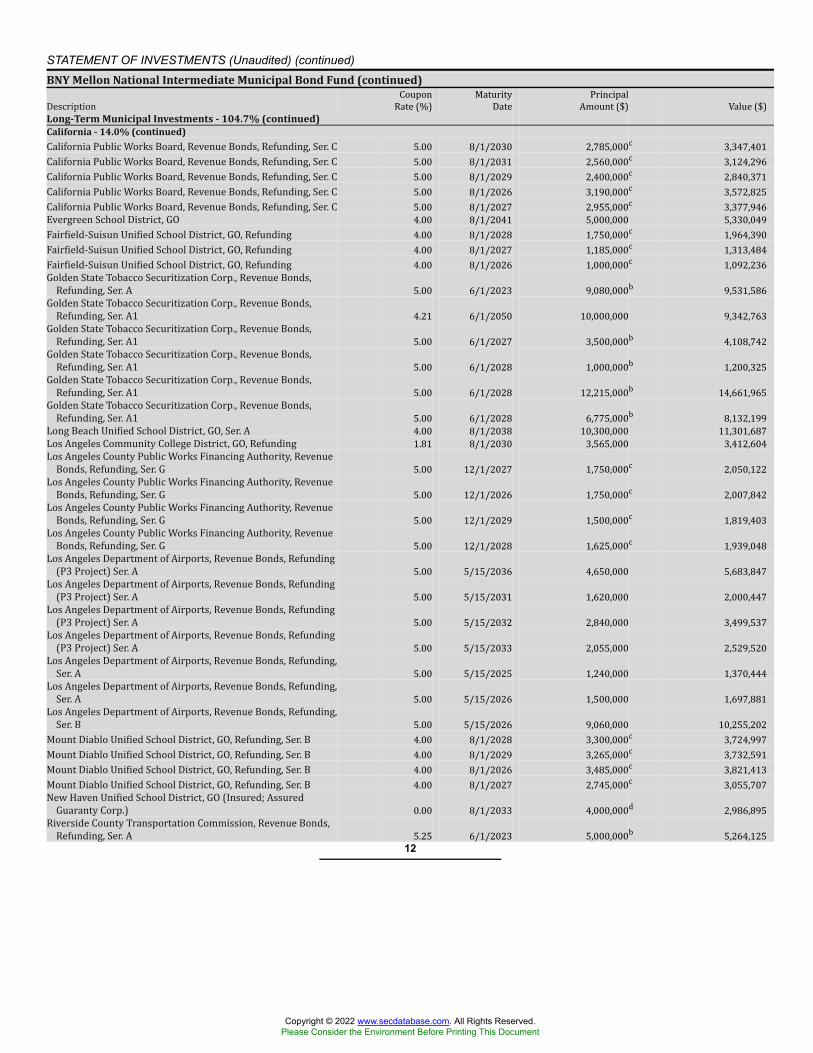
STATEMENT OF INVESTMENTS (Unaudited) (continued)BNY Mellon National Intermediate Municipal Bond Fund (continued)Description CouponRate (%) MaturityDate PrincipalAmount ($) Value ($)Long-Term Municipal Investments - 104.7% (continued)California - 14.0% (continued)California Public Works Board, Revenue Bonds, Refunding, Ser. C 5.00 8/1/2030 2,785,000c 3,347,401California Public Works Board, Revenue Bonds, Refunding, Ser. C 5.00 8/1/2031 2,560,000c 3,124,296California Public Works Board, Revenue Bonds, Refunding, Ser. C 5.00 8/1/2029 2,400,000c 2,840,371California Public Works Board, Revenue Bonds, Refunding, Ser. C 5.00 8/1/2026 3,190,000c 3,572,825California Public Works Board, Revenue Bonds, Refunding, Ser. C 5.00 8/1/2027 2,955,000c 3,377,946Evergreen School District, GO 4.00 8/1/2041 5,000,000 5,330,049Fairfield-Suisun Unified School District, GO, Refunding 4.00 8/1/2028 1,750,000c 1,964,390Fairfield-Suisun Unified School District, GO, Refunding 4.00 8/1/2027 1,185,000c 1,313,484Fairfield-Suisun Unified School District, GO, Refunding 4.00 8/1/2026 1,000,000c 1,092,236Golden State Tobacco Securitization Corp., Revenue Bonds,Refunding, Ser. A 5.00 6/1/2023 9,080,000b 9,531,586Golden State Tobacco Securitization Corp., Revenue Bonds,Refunding, Ser. A1 4.21 6/1/2050 10,000,000 9,342,763Golden State Tobacco Securitization Corp., Revenue Bonds,Refunding, Ser. A1 5.00 6/1/2027 3,500,000b 4,108,742Golden State Tobacco Securitization Corp., Revenue Bonds,Refunding, Ser. A1 5.00 6/1/2028 1,000,000b 1,200,325Golden State Tobacco Securitization Corp., Revenue Bonds,Refunding, Ser. A1 5.00 6/1/2028 12,215,000b 14,661,965Golden State Tobacco Securitization Corp., Revenue Bonds,Refunding, Ser. A1 5.00 6/1/2028 6,775,000b 8,132,199Long Beach Unified School District, GO, Ser. A 4.00 8/1/2038 10,300,000 11,301,687Los Angeles Community College District, GO, Refunding 1.81 8/1/2030 3,565,000 3,412,604Los Angeles County Public Works Financing Authority, RevenueBonds, Refunding, Ser. G 5.00 12/1/2027 1,750,000c 2,050,122Los Angeles County Public Works Financing Authority, RevenueBonds, Refunding, Ser. G 5.00 12/1/2026 1,750,000c 2,007,842Los Angeles County Public Works Financing Authority, RevenueBonds, Refunding, Ser. G 5.00 12/1/2029 1,500,000c 1,819,403Los Angeles County Public Works Financing Authority, RevenueBonds, Refunding, Ser. G 5.00 12/1/2028 1,625,000c 1,939,048Los Angeles Department of Airports, Revenue Bonds, Refunding(P3 Project) Ser. A 5.00 5/15/2036 4,650,000 5,683,847Los Angeles Department of Airports, Revenue Bonds, Refunding(P3 Project) Ser. A 5.00 5/15/2031 1,620,000 2,000,447Los Angeles Department of Airports, Revenue Bonds, Refunding(P3 Project) Ser. A 5.00 5/15/2032 2,840,000 3,499,537Los Angeles Department of Airports, Revenue Bonds, Refunding(P3 Project) Ser. A 5.00 5/15/2033 2,055,000 2,529,520Los Angeles Department of Airports, Revenue Bonds, Refunding,Ser. A 5.00 5/15/2025 1,240,000 1,370,444Los Angeles Department of Airports, Revenue Bonds, Refunding,Ser. A 5.00 5/15/2026 1,500,000 1,697,881Los Angeles Department of Airports, Revenue Bonds, Refunding,Ser. B 5.00 5/15/2026 9,060,000 10,255,202Mount Diablo Unified School District, GO, Refunding, Ser. B 4.00 8/1/2028 3,300,000c 3,724,997Mount Diablo Unified School District, GO, Refunding, Ser. B 4.00 8/1/2029 3,265,000c 3,732,591Mount Diablo Unified School District, GO, Refunding, Ser. B 4.00 8/1/2026 3,485,000c 3,821,413Mount Diablo Unified School District, GO, Refunding, Ser. B 4.00 8/1/2027 2,745,000c 3,055,707New Haven Unified School District, GO (Insured; AssuredGuaranty Corp.) 0.00 8/1/2033 4,000,000d 2,986,895Riverside County Transportation Commission, Revenue Bonds,Refunding, Ser. A 5.25 6/1/2023 5,000,000b 5,264,125
12
Copyright © 2022 www.secdatabase.com. All Rights Reserved.Please Consider the Environment Before Printing This Document
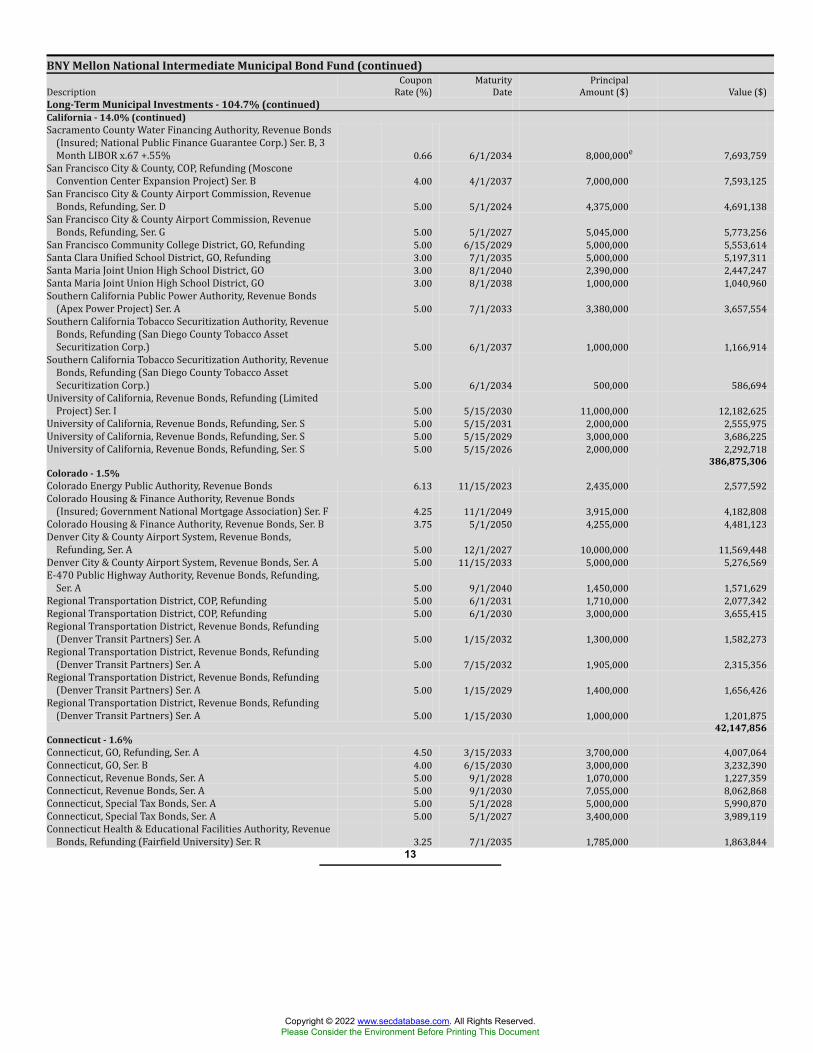
BNY Mellon National Intermediate Municipal Bond Fund (continued)Description CouponRate (%) MaturityDate PrincipalAmount ($) Value ($)Long-Term Municipal Investments - 104.7% (continued)California - 14.0% (continued)Sacramento County Water Financing Authority, Revenue Bonds(Insured; National Public Finance Guarantee Corp.) Ser. B, 3Month LIBOR x.67 +.55% 0.66 6/1/2034 8,000,000e 7,693,759San Francisco City & County, COP, Refunding (MosconeConvention Center Expansion Project) Ser. B 4.00 4/1/2037 7,000,000 7,593,125San Francisco City & County Airport Commission, RevenueBonds, Refunding, Ser. D 5.00 5/1/2024 4,375,000 4,691,138San Francisco City & County Airport Commission, RevenueBonds, Refunding, Ser. G 5.00 5/1/2027 5,045,000 5,773,256San Francisco Community College District, GO, Refunding 5.00 6/15/2029 5,000,000 5,553,614Santa Clara Unified School District, GO, Refunding 3.00 7/1/2035 5,000,000 5,197,311Santa Maria Joint Union High School District, GO 3.00 8/1/2040 2,390,000 2,447,247Santa Maria Joint Union High School District, GO 3.00 8/1/2038 1,000,000 1,040,960Southern California Public Power Authority, Revenue Bonds(Apex Power Project) Ser. A 5.00 7/1/2033 3,380,000 3,657,554Southern California Tobacco Securitization Authority, RevenueBonds, Refunding (San Diego County Tobacco AssetSecuritization Corp.) 5.00 6/1/2037 1,000,000 1,166,914Southern California Tobacco Securitization Authority, RevenueBonds, Refunding (San Diego County Tobacco AssetSecuritization Corp.) 5.00 6/1/2034 500,000 586,694University of California, Revenue Bonds, Refunding (LimitedProject) Ser. I 5.00 5/15/2030 11,000,000 12,182,625University of California, Revenue Bonds, Refunding, Ser. S 5.00 5/15/2031 2,000,000 2,555,975University of California, Revenue Bonds, Refunding, Ser. S 5.00 5/15/2029 3,000,000 3,686,225University of California, Revenue Bonds, Refunding, Ser. S 5.00 5/15/2026 2,000,000 2,292,718
386,875,306Colorado - 1.5%Colorado Energy Public Authority, Revenue Bonds 6.13 11/15/2023 2,435,000 2,577,592Colorado Housing & Finance Authority, Revenue Bonds(Insured; Government National Mortgage Association) Ser. F 4.25 11/1/2049 3,915,000 4,182,808Colorado Housing & Finance Authority, Revenue Bonds, Ser. B 3.75 5/1/2050 4,255,000 4,481,123Denver City & County Airport System, Revenue Bonds,Refunding, Ser. A 5.00 12/1/2027 10,000,000 11,569,448Denver City & County Airport System, Revenue Bonds, Ser. A 5.00 11/15/2033 5,000,000 5,276,569E-470 Public Highway Authority, Revenue Bonds, Refunding,Ser. A 5.00 9/1/2040 1,450,000 1,571,629Regional Transportation District, COP, Refunding 5.00 6/1/2031 1,710,000 2,077,342Regional Transportation District, COP, Refunding 5.00 6/1/2030 3,000,000 3,655,415Regional Transportation District, Revenue Bonds, Refunding(Denver Transit Partners) Ser. A 5.00 1/15/2032 1,300,000 1,582,273Regional Transportation District, Revenue Bonds, Refunding(Denver Transit Partners) Ser. A 5.00 7/15/2032 1,905,000 2,315,356Regional Transportation District, Revenue Bonds, Refunding(Denver Transit Partners) Ser. A 5.00 1/15/2029 1,400,000 1,656,426Regional Transportation District, Revenue Bonds, Refunding(Denver Transit Partners) Ser. A 5.00 1/15/2030 1,000,000 1,201,875
42,147,856Connecticut - 1.6%Connecticut, GO, Refunding, Ser. A 4.50 3/15/2033 3,700,000 4,007,064Connecticut, GO, Ser. B 4.00 6/15/2030 3,000,000 3,232,390Connecticut, Revenue Bonds, Ser. A 5.00 9/1/2028 1,070,000 1,227,359Connecticut, Revenue Bonds, Ser. A 5.00 9/1/2030 7,055,000 8,062,868Connecticut, Special Tax Bonds, Ser. A 5.00 5/1/2028 5,000,000 5,990,870Connecticut, Special Tax Bonds, Ser. A 5.00 5/1/2027 3,400,000 3,989,119Connecticut Health & Educational Facilities Authority, RevenueBonds, Refunding (Fairfield University) Ser. R 3.25 7/1/2035 1,785,000 1,863,844
13
Copyright © 2022 www.secdatabase.com. All Rights Reserved.Please Consider the Environment Before Printing This Document
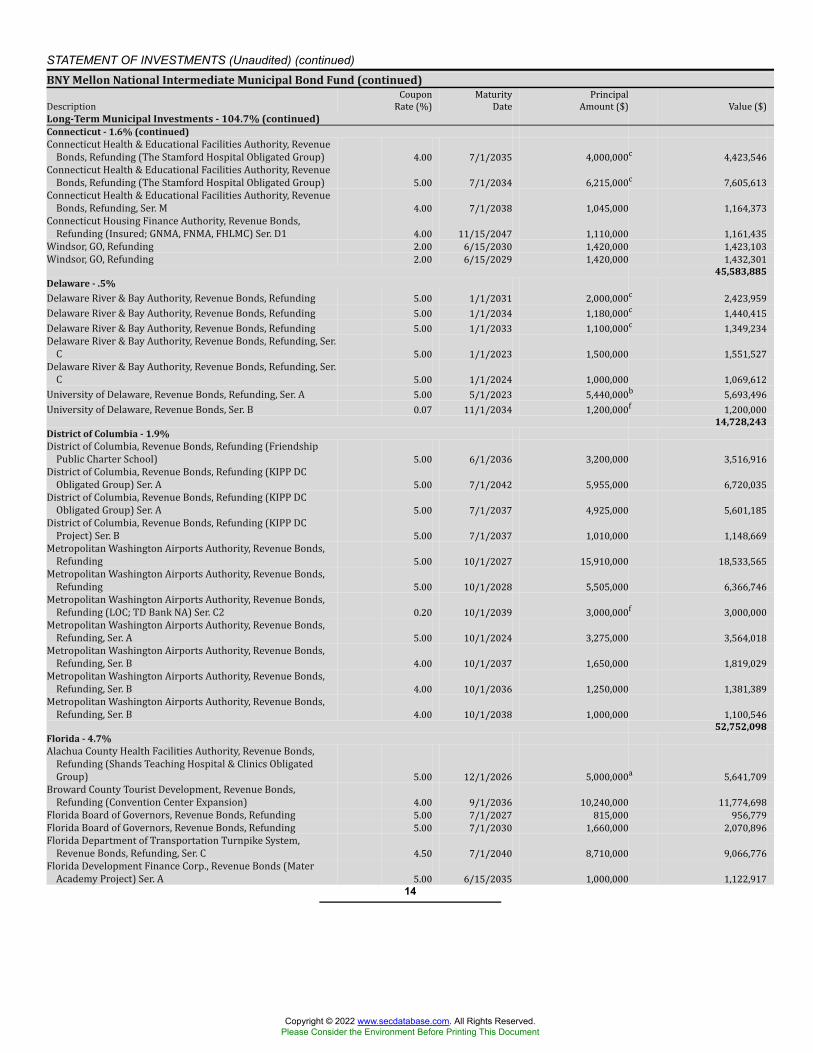
STATEMENT OF INVESTMENTS (Unaudited) (continued)BNY Mellon National Intermediate Municipal Bond Fund (continued)Description CouponRate (%) MaturityDate PrincipalAmount ($) Value ($)Long-Term Municipal Investments - 104.7% (continued)Connecticut - 1.6% (continued)Connecticut Health & Educational Facilities Authority, RevenueBonds, Refunding (The Stamford Hospital Obligated Group) 4.00 7/1/2035 4,000,000c 4,423,546Connecticut Health & Educational Facilities Authority, RevenueBonds, Refunding (The Stamford Hospital Obligated Group) 5.00 7/1/2034 6,215,000c 7,605,613Connecticut Health & Educational Facilities Authority, RevenueBonds, Refunding, Ser. M 4.00 7/1/2038 1,045,000 1,164,373Connecticut Housing Finance Authority, Revenue Bonds,Refunding (Insured; GNMA, FNMA, FHLMC) Ser. D1 4.00 11/15/2047 1,110,000 1,161,435Windsor, GO, Refunding 2.00 6/15/2030 1,420,000 1,423,103Windsor, GO, Refunding 2.00 6/15/2029 1,420,000 1,432,301
45,583,885Delaware - .5%Delaware River & Bay Authority, Revenue Bonds, Refunding 5.00 1/1/2031 2,000,000c 2,423,959Delaware River & Bay Authority, Revenue Bonds, Refunding 5.00 1/1/2034 1,180,000c 1,440,415Delaware River & Bay Authority, Revenue Bonds, Refunding 5.00 1/1/2033 1,100,000c 1,349,234Delaware River & Bay Authority, Revenue Bonds, Refunding, Ser.C 5.00 1/1/2023 1,500,000 1,551,527Delaware River & Bay Authority, Revenue Bonds, Refunding, Ser.C 5.00 1/1/2024 1,000,000 1,069,612University of Delaware, Revenue Bonds, Refunding, Ser. A 5.00 5/1/2023 5,440,000b 5,693,496University of Delaware, Revenue Bonds, Ser. B 0.07 11/1/2034 1,200,000f 1,200,000
14,728,243District of Columbia - 1.9%District of Columbia, Revenue Bonds, Refunding (FriendshipPublic Charter School) 5.00 6/1/2036 3,200,000 3,516,916District of Columbia, Revenue Bonds, Refunding (KIPP DCObligated Group) Ser. A 5.00 7/1/2042 5,955,000 6,720,035District of Columbia, Revenue Bonds, Refunding (KIPP DCObligated Group) Ser. A 5.00 7/1/2037 4,925,000 5,601,185District of Columbia, Revenue Bonds, Refunding (KIPP DCProject) Ser. B 5.00 7/1/2037 1,010,000 1,148,669Metropolitan Washington Airports Authority, Revenue Bonds,Refunding 5.00 10/1/2027 15,910,000 18,533,565Metropolitan Washington Airports Authority, Revenue Bonds,Refunding 5.00 10/1/2028 5,505,000 6,366,746Metropolitan Washington Airports Authority, Revenue Bonds,Refunding (LOC; TD Bank NA) Ser. C2 0.20 10/1/2039 3,000,000f 3,000,000Metropolitan Washington Airports Authority, Revenue Bonds,Refunding, Ser. A 5.00 10/1/2024 3,275,000 3,564,018Metropolitan Washington Airports Authority, Revenue Bonds,Refunding, Ser. B 4.00 10/1/2037 1,650,000 1,819,029Metropolitan Washington Airports Authority, Revenue Bonds,Refunding, Ser. B 4.00 10/1/2036 1,250,000 1,381,389Metropolitan Washington Airports Authority, Revenue Bonds,Refunding, Ser. B 4.00 10/1/2038 1,000,000 1,100,546
52,752,098Florida - 4.7%Alachua County Health Facilities Authority, Revenue Bonds,Refunding (Shands Teaching Hospital & Clinics ObligatedGroup) 5.00 12/1/2026 5,000,000a 5,641,709Broward County Tourist Development, Revenue Bonds,Refunding (Convention Center Expansion) 4.00 9/1/2036 10,240,000 11,774,698Florida Board of Governors, Revenue Bonds, Refunding 5.00 7/1/2027 815,000 956,779Florida Board of Governors, Revenue Bonds, Refunding 5.00 7/1/2030 1,660,000 2,070,896Florida Department of Transportation Turnpike System,Revenue Bonds, Refunding, Ser. C 4.50 7/1/2040 8,710,000 9,066,776Florida Development Finance Corp., Revenue Bonds (MaterAcademy Project) Ser. A 5.00 6/15/2035 1,000,000 1,122,917
14
Copyright © 2022 www.secdatabase.com. All Rights Reserved.Please Consider the Environment Before Printing This Document
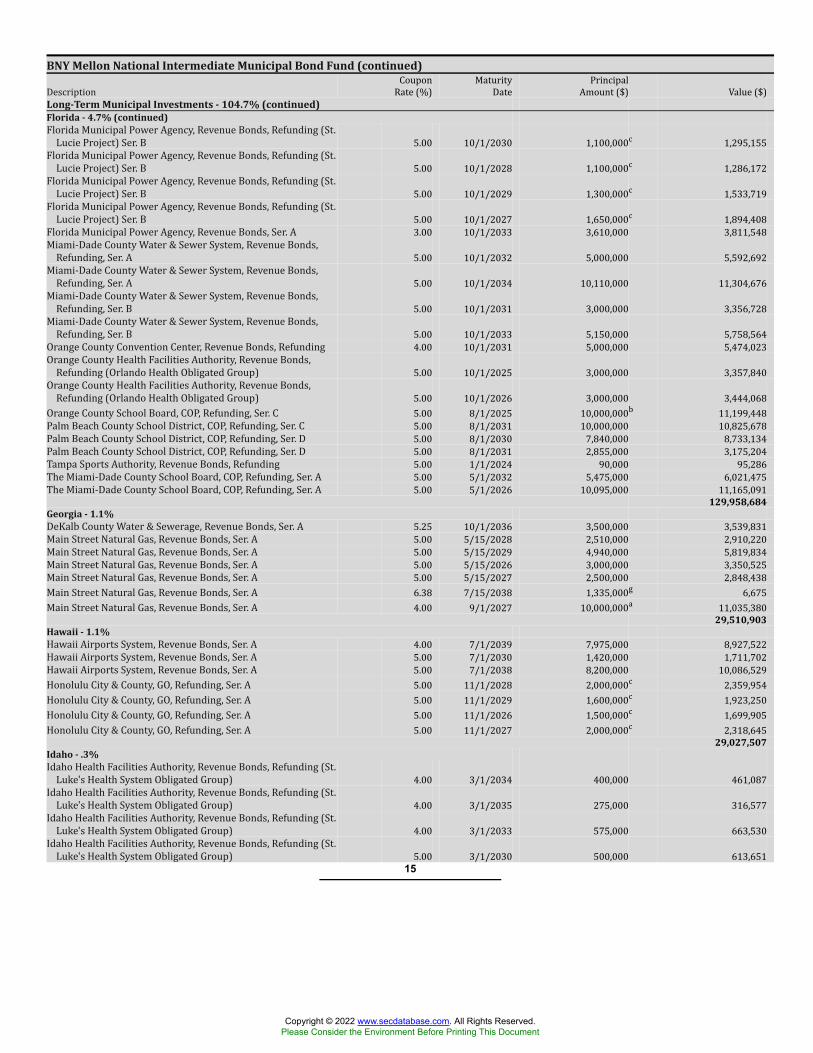
BNY Mellon National Intermediate Municipal Bond Fund (continued)Description CouponRate (%) MaturityDate PrincipalAmount ($) Value ($)Long-Term Municipal Investments - 104.7% (continued)Florida - 4.7% (continued)Florida Municipal Power Agency, Revenue Bonds, Refunding (St.Lucie Project) Ser. B 5.00 10/1/2030 1,100,000c 1,295,155Florida Municipal Power Agency, Revenue Bonds, Refunding (St.Lucie Project) Ser. B 5.00 10/1/2028 1,100,000c 1,286,172Florida Municipal Power Agency, Revenue Bonds, Refunding (St.Lucie Project) Ser. B 5.00 10/1/2029 1,300,000c 1,533,719Florida Municipal Power Agency, Revenue Bonds, Refunding (St.Lucie Project) Ser. B 5.00 10/1/2027 1,650,000c 1,894,408Florida Municipal Power Agency, Revenue Bonds, Ser. A 3.00 10/1/2033 3,610,000 3,811,548Miami-Dade County Water & Sewer System, Revenue Bonds,Refunding, Ser. A 5.00 10/1/2032 5,000,000 5,592,692Miami-Dade County Water & Sewer System, Revenue Bonds,Refunding, Ser. A 5.00 10/1/2034 10,110,000 11,304,676Miami-Dade County Water & Sewer System, Revenue Bonds,Refunding, Ser. B 5.00 10/1/2031 3,000,000 3,356,728Miami-Dade County Water & Sewer System, Revenue Bonds,Refunding, Ser. B 5.00 10/1/2033 5,150,000 5,758,564Orange County Convention Center, Revenue Bonds, Refunding 4.00 10/1/2031 5,000,000 5,474,023Orange County Health Facilities Authority, Revenue Bonds,Refunding (Orlando Health Obligated Group) 5.00 10/1/2025 3,000,000 3,357,840Orange County Health Facilities Authority, Revenue Bonds,Refunding (Orlando Health Obligated Group) 5.00 10/1/2026 3,000,000 3,444,068Orange County School Board, COP, Refunding, Ser. C 5.00 8/1/2025 10,000,000b 11,199,448Palm Beach County School District, COP, Refunding, Ser. C 5.00 8/1/2031 10,000,000 10,825,678Palm Beach County School District, COP, Refunding, Ser. D 5.00 8/1/2030 7,840,000 8,733,134Palm Beach County School District, COP, Refunding, Ser. D 5.00 8/1/2031 2,855,000 3,175,204Tampa Sports Authority, Revenue Bonds, Refunding 5.00 1/1/2024 90,000 95,286The Miami-Dade County School Board, COP, Refunding, Ser. A 5.00 5/1/2032 5,475,000 6,021,475The Miami-Dade County School Board, COP, Refunding, Ser. A 5.00 5/1/2026 10,095,000 11,165,091
129,958,684Georgia - 1.1%DeKalb County Water & Sewerage, Revenue Bonds, Ser. A 5.25 10/1/2036 3,500,000 3,539,831Main Street Natural Gas, Revenue Bonds, Ser. A 5.00 5/15/2028 2,510,000 2,910,220Main Street Natural Gas, Revenue Bonds, Ser. A 5.00 5/15/2029 4,940,000 5,819,834Main Street Natural Gas, Revenue Bonds, Ser. A 5.00 5/15/2026 3,000,000 3,350,525Main Street Natural Gas, Revenue Bonds, Ser. A 5.00 5/15/2027 2,500,000 2,848,438Main Street Natural Gas, Revenue Bonds, Ser. A 6.38 7/15/2038 1,335,000g 6,675Main Street Natural Gas, Revenue Bonds, Ser. A 4.00 9/1/2027 10,000,000a 11,035,380
29,510,903Hawaii - 1.1%Hawaii Airports System, Revenue Bonds, Ser. A 4.00 7/1/2039 7,975,000 8,927,522Hawaii Airports System, Revenue Bonds, Ser. A 5.00 7/1/2030 1,420,000 1,711,702Hawaii Airports System, Revenue Bonds, Ser. A 5.00 7/1/2038 8,200,000 10,086,529Honolulu City & County, GO, Refunding, Ser. A 5.00 11/1/2028 2,000,000c 2,359,954Honolulu City & County, GO, Refunding, Ser. A 5.00 11/1/2029 1,600,000c 1,923,250Honolulu City & County, GO, Refunding, Ser. A 5.00 11/1/2026 1,500,000c 1,699,905Honolulu City & County, GO, Refunding, Ser. A 5.00 11/1/2027 2,000,000c 2,318,645
29,027,507Idaho - .3%Idaho Health Facilities Authority, Revenue Bonds, Refunding (St.Luke's Health System Obligated Group) 4.00 3/1/2034 400,000 461,087Idaho Health Facilities Authority, Revenue Bonds, Refunding (St.Luke's Health System Obligated Group) 4.00 3/1/2035 275,000 316,577Idaho Health Facilities Authority, Revenue Bonds, Refunding (St.Luke's Health System Obligated Group) 4.00 3/1/2033 575,000 663,530Idaho Health Facilities Authority, Revenue Bonds, Refunding (St.Luke's Health System Obligated Group) 5.00 3/1/2030 500,000 613,651
15
Copyright © 2022 www.secdatabase.com. All Rights Reserved.Please Consider the Environment Before Printing This Document
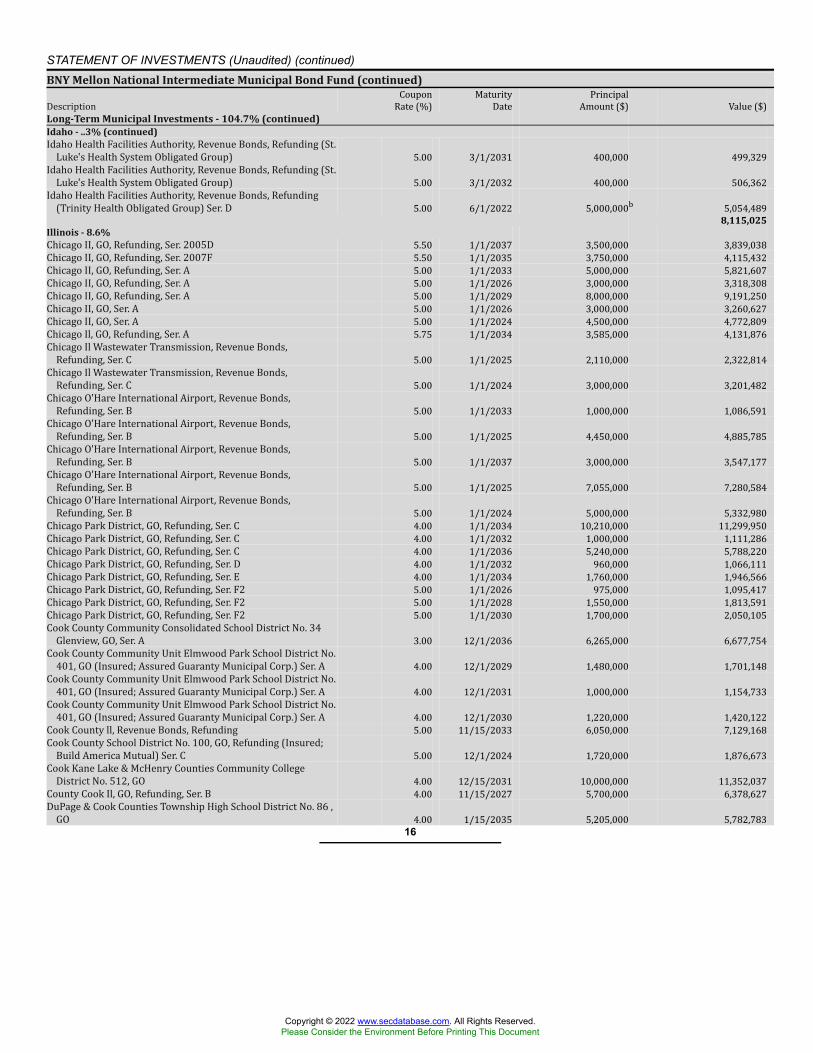
STATEMENT OF INVESTMENTS (Unaudited) (continued)BNY Mellon National Intermediate Municipal Bond Fund (continued)Description CouponRate (%) MaturityDate PrincipalAmount ($) Value ($)Long-Term Municipal Investments - 104.7% (continued)Idaho - ..3% (continued)Idaho Health Facilities Authority, Revenue Bonds, Refunding (St.Luke's Health System Obligated Group) 5.00 3/1/2031 400,000 499,329Idaho Health Facilities Authority, Revenue Bonds, Refunding (St.Luke's Health System Obligated Group) 5.00 3/1/2032 400,000 506,362Idaho Health Facilities Authority, Revenue Bonds, Refunding(Trinity Health Obligated Group) Ser. D 5.00 6/1/2022 5,000,000b 5,054,489
8,115,025Illinois - 8.6%Chicago II, GO, Refunding, Ser. 2005D 5.50 1/1/2037 3,500,000 3,839,038Chicago II, GO, Refunding, Ser. 2007F 5.50 1/1/2035 3,750,000 4,115,432Chicago II, GO, Refunding, Ser. A 5.00 1/1/2033 5,000,000 5,821,607Chicago II, GO, Refunding, Ser. A 5.00 1/1/2026 3,000,000 3,318,308Chicago II, GO, Refunding, Ser. A 5.00 1/1/2029 8,000,000 9,191,250Chicago II, GO, Ser. A 5.00 1/1/2026 3,000,000 3,260,627Chicago II, GO, Ser. A 5.00 1/1/2024 4,500,000 4,772,809Chicago Il, GO, Refunding, Ser. A 5.75 1/1/2034 3,585,000 4,131,876Chicago Il Wastewater Transmission, Revenue Bonds,Refunding, Ser. C 5.00 1/1/2025 2,110,000 2,322,814Chicago Il Wastewater Transmission, Revenue Bonds,Refunding, Ser. C 5.00 1/1/2024 3,000,000 3,201,482Chicago O'Hare International Airport, Revenue Bonds,Refunding, Ser. B 5.00 1/1/2033 1,000,000 1,086,591Chicago O'Hare International Airport, Revenue Bonds,Refunding, Ser. B 5.00 1/1/2025 4,450,000 4,885,785Chicago O'Hare International Airport, Revenue Bonds,Refunding, Ser. B 5.00 1/1/2037 3,000,000 3,547,177Chicago O'Hare International Airport, Revenue Bonds,Refunding, Ser. B 5.00 1/1/2025 7,055,000 7,280,584Chicago O'Hare International Airport, Revenue Bonds,Refunding, Ser. B 5.00 1/1/2024 5,000,000 5,332,980Chicago Park District, GO, Refunding, Ser. C 4.00 1/1/2034 10,210,000 11,299,950Chicago Park District, GO, Refunding, Ser. C 4.00 1/1/2032 1,000,000 1,111,286Chicago Park District, GO, Refunding, Ser. C 4.00 1/1/2036 5,240,000 5,788,220Chicago Park District, GO, Refunding, Ser. D 4.00 1/1/2032 960,000 1,066,111Chicago Park District, GO, Refunding, Ser. E 4.00 1/1/2034 1,760,000 1,946,566Chicago Park District, GO, Refunding, Ser. F2 5.00 1/1/2026 975,000 1,095,417Chicago Park District, GO, Refunding, Ser. F2 5.00 1/1/2028 1,550,000 1,813,591Chicago Park District, GO, Refunding, Ser. F2 5.00 1/1/2030 1,700,000 2,050,105Cook County Community Consolidated School District No. 34Glenview, GO, Ser. A 3.00 12/1/2036 6,265,000 6,677,754Cook County Community Unit Elmwood Park School District No.401, GO (Insured; Assured Guaranty Municipal Corp.) Ser. A 4.00 12/1/2029 1,480,000 1,701,148Cook County Community Unit Elmwood Park School District No.401, GO (Insured; Assured Guaranty Municipal Corp.) Ser. A 4.00 12/1/2031 1,000,000 1,154,733Cook County Community Unit Elmwood Park School District No.401, GO (Insured; Assured Guaranty Municipal Corp.) Ser. A 4.00 12/1/2030 1,220,000 1,420,122Cook County ll, Revenue Bonds, Refunding 5.00 11/15/2033 6,050,000 7,129,168Cook County School District No. 100, GO, Refunding (Insured;Build America Mutual) Ser. C 5.00 12/1/2024 1,720,000 1,876,673Cook Kane Lake & McHenry Counties Community CollegeDistrict No. 512, GO 4.00 12/15/2031 10,000,000 11,352,037County Cook Il, GO, Refunding, Ser. B 4.00 11/15/2027 5,700,000 6,378,627DuPage & Cook Counties Township High School District No. 86 ,GO 4.00 1/15/2035 5,205,000 5,782,783
16
Copyright © 2022 www.secdatabase.com. All Rights Reserved.Please Consider the Environment Before Printing This Document
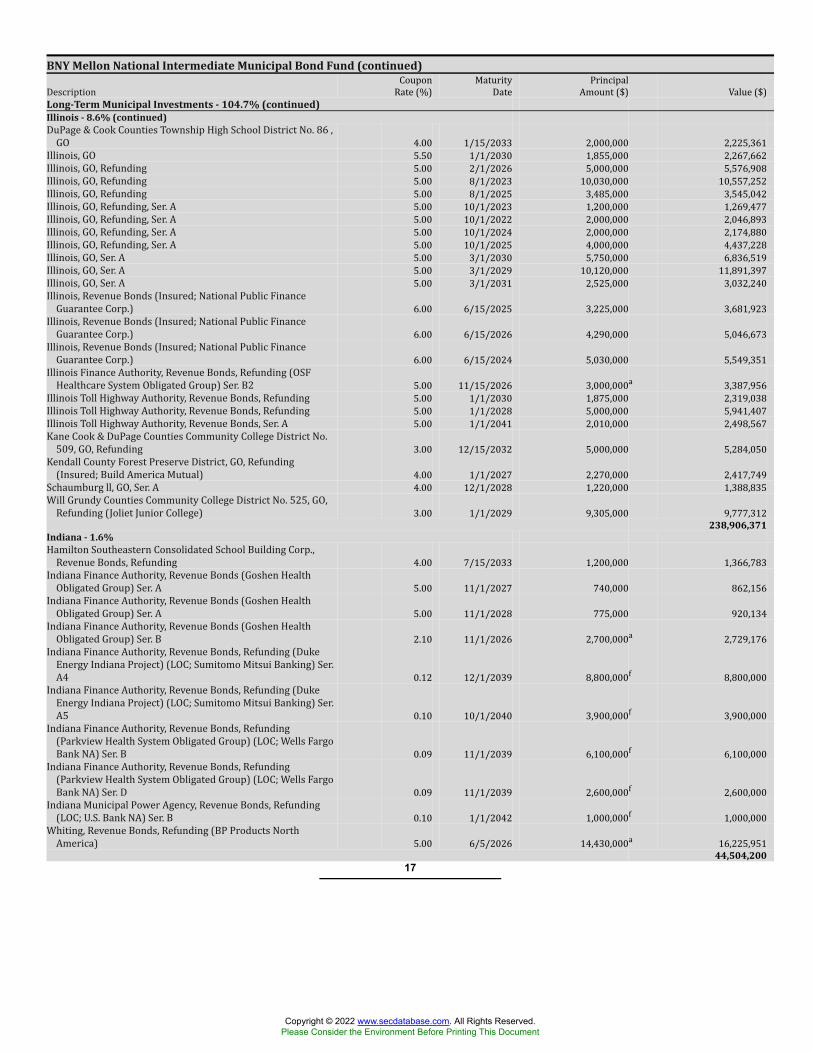
BNY Mellon National Intermediate Municipal Bond Fund (continued)Description CouponRate (%) MaturityDate PrincipalAmount ($) Value ($)Long-Term Municipal Investments - 104.7% (continued)Illinois - 8.6% (continued)DuPage & Cook Counties Township High School District No. 86 ,GO 4.00 1/15/2033 2,000,000 2,225,361Illinois, GO 5.50 1/1/2030 1,855,000 2,267,662Illinois, GO, Refunding 5.00 2/1/2026 5,000,000 5,576,908Illinois, GO, Refunding 5.00 8/1/2023 10,030,000 10,557,252Illinois, GO, Refunding 5.00 8/1/2025 3,485,000 3,545,042Illinois, GO, Refunding, Ser. A 5.00 10/1/2023 1,200,000 1,269,477Illinois, GO, Refunding, Ser. A 5.00 10/1/2022 2,000,000 2,046,893Illinois, GO, Refunding, Ser. A 5.00 10/1/2024 2,000,000 2,174,880Illinois, GO, Refunding, Ser. A 5.00 10/1/2025 4,000,000 4,437,228Illinois, GO, Ser. A 5.00 3/1/2030 5,750,000 6,836,519Illinois, GO, Ser. A 5.00 3/1/2029 10,120,000 11,891,397Illinois, GO, Ser. A 5.00 3/1/2031 2,525,000 3,032,240Illinois, Revenue Bonds (Insured; National Public FinanceGuarantee Corp.) 6.00 6/15/2025 3,225,000 3,681,923Illinois, Revenue Bonds (Insured; National Public FinanceGuarantee Corp.) 6.00 6/15/2026 4,290,000 5,046,673Illinois, Revenue Bonds (Insured; National Public FinanceGuarantee Corp.) 6.00 6/15/2024 5,030,000 5,549,351Illinois Finance Authority, Revenue Bonds, Refunding (OSFHealthcare System Obligated Group) Ser. B2 5.00 11/15/2026 3,000,000a 3,387,956Illinois Toll Highway Authority, Revenue Bonds, Refunding 5.00 1/1/2030 1,875,000 2,319,038Illinois Toll Highway Authority, Revenue Bonds, Refunding 5.00 1/1/2028 5,000,000 5,941,407Illinois Toll Highway Authority, Revenue Bonds, Ser. A 5.00 1/1/2041 2,010,000 2,498,567Kane Cook & DuPage Counties Community College District No.509, GO, Refunding 3.00 12/15/2032 5,000,000 5,284,050Kendall County Forest Preserve District, GO, Refunding(Insured; Build America Mutual) 4.00 1/1/2027 2,270,000 2,417,749Schaumburg ll, GO, Ser. A 4.00 12/1/2028 1,220,000 1,388,835Will Grundy Counties Community College District No. 525, GO,Refunding (Joliet Junior College) 3.00 1/1/2029 9,305,000 9,777,312
238,906,371Indiana - 1.6%Hamilton Southeastern Consolidated School Building Corp.,Revenue Bonds, Refunding 4.00 7/15/2033 1,200,000 1,366,783Indiana Finance Authority, Revenue Bonds (Goshen HealthObligated Group) Ser. A 5.00 11/1/2027 740,000 862,156Indiana Finance Authority, Revenue Bonds (Goshen HealthObligated Group) Ser. A 5.00 11/1/2028 775,000 920,134Indiana Finance Authority, Revenue Bonds (Goshen HealthObligated Group) Ser. B 2.10 11/1/2026 2,700,000a 2,729,176Indiana Finance Authority, Revenue Bonds, Refunding (DukeEnergy Indiana Project) (LOC; Sumitomo Mitsui Banking) Ser.A4 0.12 12/1/2039 8,800,000f 8,800,000Indiana Finance Authority, Revenue Bonds, Refunding (DukeEnergy Indiana Project) (LOC; Sumitomo Mitsui Banking) Ser.A5 0.10 10/1/2040 3,900,000f 3,900,000Indiana Finance Authority, Revenue Bonds, Refunding(Parkview Health System Obligated Group) (LOC; Wells FargoBank NA) Ser. B 0.09 11/1/2039 6,100,000f 6,100,000Indiana Finance Authority, Revenue Bonds, Refunding(Parkview Health System Obligated Group) (LOC; Wells FargoBank NA) Ser. D 0.09 11/1/2039 2,600,000f 2,600,000Indiana Municipal Power Agency, Revenue Bonds, Refunding(LOC; U.S. Bank NA) Ser. B 0.10 1/1/2042 1,000,000f 1,000,000Whiting, Revenue Bonds, Refunding (BP Products NorthAmerica) 5.00 6/5/2026 14,430,000a 16,225,951
44,504,20017
Copyright © 2022 www.secdatabase.com. All Rights Reserved.Please Consider the Environment Before Printing This Document
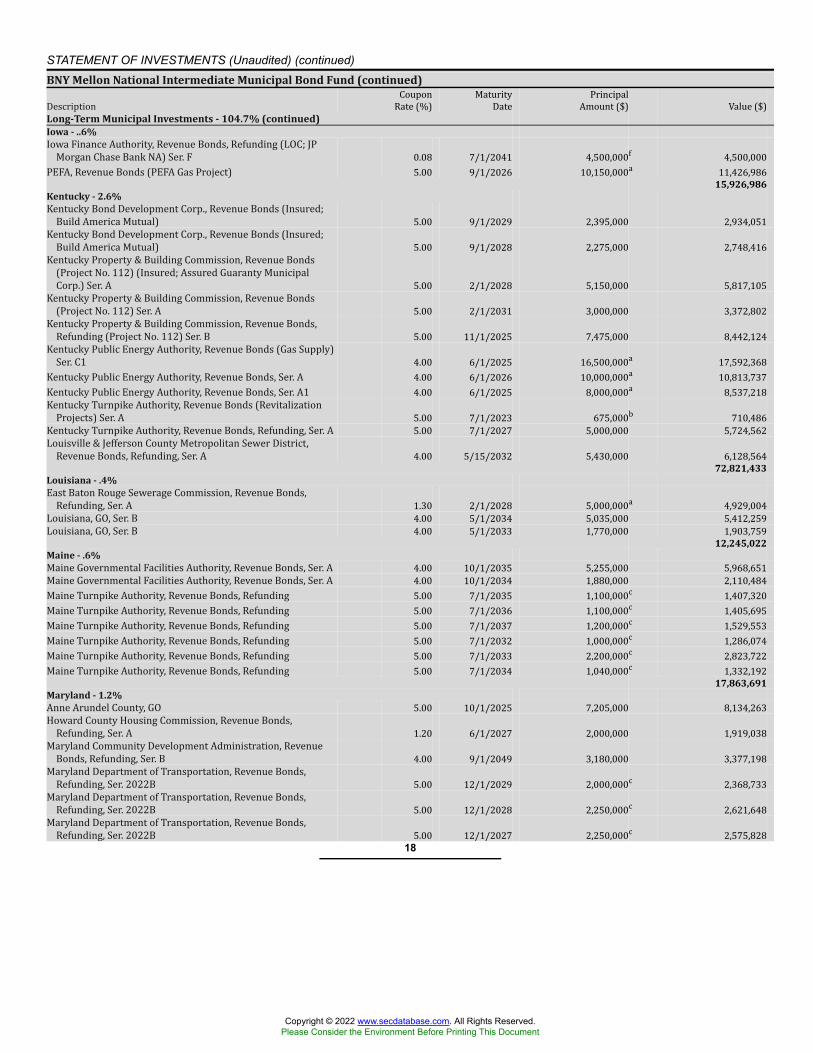
STATEMENT OF INVESTMENTS (Unaudited) (continued)BNY Mellon National Intermediate Municipal Bond Fund (continued)Description CouponRate (%) MaturityDate PrincipalAmount ($) Value ($)Long-Term Municipal Investments - 104.7% (continued)Iowa - ..6%Iowa Finance Authority, Revenue Bonds, Refunding (LOC; JPMorgan Chase Bank NA) Ser. F 0.08 7/1/2041 4,500,000f 4,500,000PEFA, Revenue Bonds (PEFA Gas Project) 5.00 9/1/2026 10,150,000a 11,426,986
15,926,986Kentucky - 2.6%Kentucky Bond Development Corp., Revenue Bonds (Insured;Build America Mutual) 5.00 9/1/2029 2,395,000 2,934,051Kentucky Bond Development Corp., Revenue Bonds (Insured;Build America Mutual) 5.00 9/1/2028 2,275,000 2,748,416Kentucky Property & Building Commission, Revenue Bonds(Project No. 112) (Insured; Assured Guaranty MunicipalCorp.) Ser. A 5.00 2/1/2028 5,150,000 5,817,105Kentucky Property & Building Commission, Revenue Bonds(Project No. 112) Ser. A 5.00 2/1/2031 3,000,000 3,372,802Kentucky Property & Building Commission, Revenue Bonds,Refunding (Project No. 112) Ser. B 5.00 11/1/2025 7,475,000 8,442,124Kentucky Public Energy Authority, Revenue Bonds (Gas Supply)Ser. C1 4.00 6/1/2025 16,500,000a 17,592,368Kentucky Public Energy Authority, Revenue Bonds, Ser. A 4.00 6/1/2026 10,000,000a 10,813,737Kentucky Public Energy Authority, Revenue Bonds, Ser. A1 4.00 6/1/2025 8,000,000a 8,537,218Kentucky Turnpike Authority, Revenue Bonds (RevitalizationProjects) Ser. A 5.00 7/1/2023 675,000b 710,486Kentucky Turnpike Authority, Revenue Bonds, Refunding, Ser. A 5.00 7/1/2027 5,000,000 5,724,562Louisville & Jefferson County Metropolitan Sewer District,Revenue Bonds, Refunding, Ser. A 4.00 5/15/2032 5,430,000 6,128,564
72,821,433Louisiana - .4%East Baton Rouge Sewerage Commission, Revenue Bonds,Refunding, Ser. A 1.30 2/1/2028 5,000,000a 4,929,004Louisiana, GO, Ser. B 4.00 5/1/2034 5,035,000 5,412,259Louisiana, GO, Ser. B 4.00 5/1/2033 1,770,000 1,903,759
12,245,022Maine - .6%Maine Governmental Facilities Authority, Revenue Bonds, Ser. A 4.00 10/1/2035 5,255,000 5,968,651Maine Governmental Facilities Authority, Revenue Bonds, Ser. A 4.00 10/1/2034 1,880,000 2,110,484Maine Turnpike Authority, Revenue Bonds, Refunding 5.00 7/1/2035 1,100,000c 1,407,320Maine Turnpike Authority, Revenue Bonds, Refunding 5.00 7/1/2036 1,100,000c 1,405,695Maine Turnpike Authority, Revenue Bonds, Refunding 5.00 7/1/2037 1,200,000c 1,529,553Maine Turnpike Authority, Revenue Bonds, Refunding 5.00 7/1/2032 1,000,000c 1,286,074Maine Turnpike Authority, Revenue Bonds, Refunding 5.00 7/1/2033 2,200,000c 2,823,722Maine Turnpike Authority, Revenue Bonds, Refunding 5.00 7/1/2034 1,040,000c 1,332,192
17,863,691Maryland - 1.2%Anne Arundel County, GO 5.00 10/1/2025 7,205,000 8,134,263Howard County Housing Commission, Revenue Bonds,Refunding, Ser. A 1.20 6/1/2027 2,000,000 1,919,038Maryland Community Development Administration, RevenueBonds, Refunding, Ser. B 4.00 9/1/2049 3,180,000 3,377,198Maryland Department of Transportation, Revenue Bonds,Refunding, Ser. 2022B 5.00 12/1/2029 2,000,000c 2,368,733Maryland Department of Transportation, Revenue Bonds,Refunding, Ser. 2022B 5.00 12/1/2028 2,250,000c 2,621,648Maryland Department of Transportation, Revenue Bonds,Refunding, Ser. 2022B 5.00 12/1/2027 2,250,000c 2,575,828
18
Copyright © 2022 www.secdatabase.com. All Rights Reserved.Please Consider the Environment Before Printing This Document
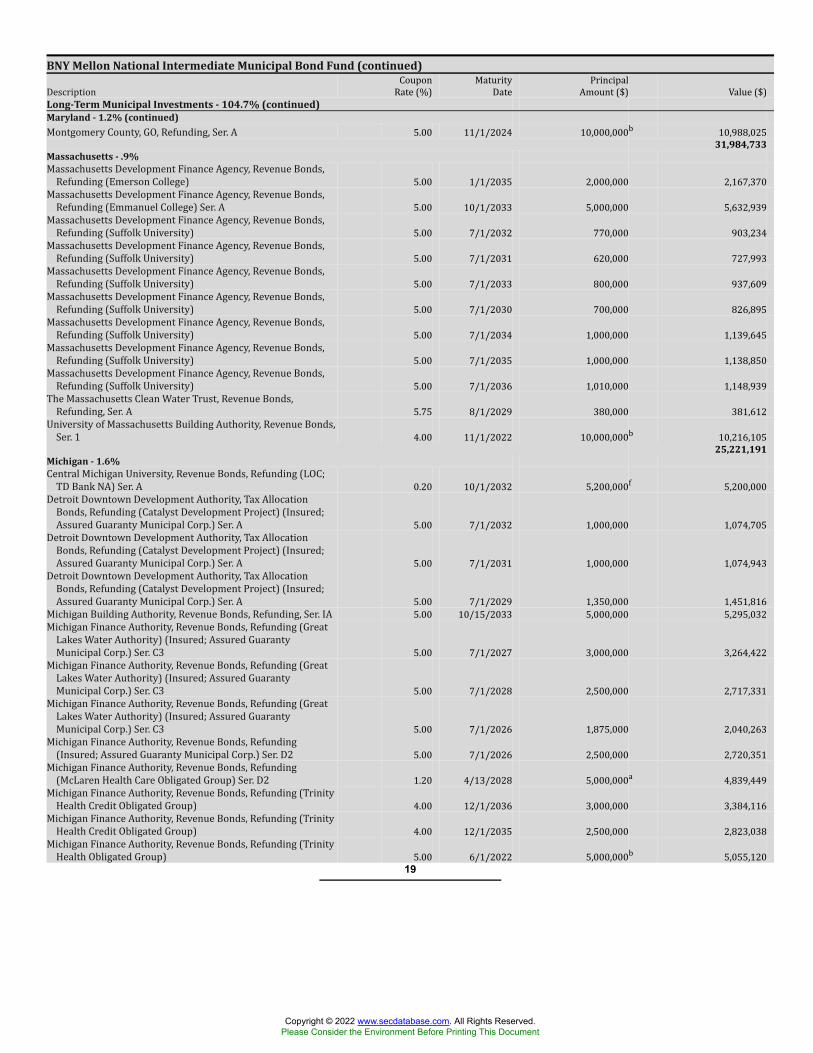
BNY Mellon National Intermediate Municipal Bond Fund (continued)Description CouponRate (%) MaturityDate PrincipalAmount ($) Value ($)Long-Term Municipal Investments - 104.7% (continued)Maryland - 1.2% (continued)Montgomery County, GO, Refunding, Ser. A 5.00 11/1/2024 10,000,000b 10,988,025
31,984,733Massachusetts - .9%Massachusetts Development Finance Agency, Revenue Bonds,Refunding (Emerson College) 5.00 1/1/2035 2,000,000 2,167,370Massachusetts Development Finance Agency, Revenue Bonds,Refunding (Emmanuel College) Ser. A 5.00 10/1/2033 5,000,000 5,632,939Massachusetts Development Finance Agency, Revenue Bonds,Refunding (Suffolk University) 5.00 7/1/2032 770,000 903,234Massachusetts Development Finance Agency, Revenue Bonds,Refunding (Suffolk University) 5.00 7/1/2031 620,000 727,993Massachusetts Development Finance Agency, Revenue Bonds,Refunding (Suffolk University) 5.00 7/1/2033 800,000 937,609Massachusetts Development Finance Agency, Revenue Bonds,Refunding (Suffolk University) 5.00 7/1/2030 700,000 826,895Massachusetts Development Finance Agency, Revenue Bonds,Refunding (Suffolk University) 5.00 7/1/2034 1,000,000 1,139,645Massachusetts Development Finance Agency, Revenue Bonds,Refunding (Suffolk University) 5.00 7/1/2035 1,000,000 1,138,850Massachusetts Development Finance Agency, Revenue Bonds,Refunding (Suffolk University) 5.00 7/1/2036 1,010,000 1,148,939The Massachusetts Clean Water Trust, Revenue Bonds,Refunding, Ser. A 5.75 8/1/2029 380,000 381,612University of Massachusetts Building Authority, Revenue Bonds,Ser. 1 4.00 11/1/2022 10,000,000b 10,216,105
25,221,191Michigan - 1.6%Central Michigan University, Revenue Bonds, Refunding (LOC;TD Bank NA) Ser. A 0.20 10/1/2032 5,200,000f 5,200,000Detroit Downtown Development Authority, Tax AllocationBonds, Refunding (Catalyst Development Project) (Insured;Assured Guaranty Municipal Corp.) Ser. A 5.00 7/1/2032 1,000,000 1,074,705Detroit Downtown Development Authority, Tax AllocationBonds, Refunding (Catalyst Development Project) (Insured;Assured Guaranty Municipal Corp.) Ser. A 5.00 7/1/2031 1,000,000 1,074,943Detroit Downtown Development Authority, Tax AllocationBonds, Refunding (Catalyst Development Project) (Insured;Assured Guaranty Municipal Corp.) Ser. A 5.00 7/1/2029 1,350,000 1,451,816Michigan Building Authority, Revenue Bonds, Refunding, Ser. IA 5.00 10/15/2033 5,000,000 5,295,032Michigan Finance Authority, Revenue Bonds, Refunding (GreatLakes Water Authority) (Insured; Assured GuarantyMunicipal Corp.) Ser. C3 5.00 7/1/2027 3,000,000 3,264,422Michigan Finance Authority, Revenue Bonds, Refunding (GreatLakes Water Authority) (Insured; Assured GuarantyMunicipal Corp.) Ser. C3 5.00 7/1/2028 2,500,000 2,717,331Michigan Finance Authority, Revenue Bonds, Refunding (GreatLakes Water Authority) (Insured; Assured GuarantyMunicipal Corp.) Ser. C3 5.00 7/1/2026 1,875,000 2,040,263Michigan Finance Authority, Revenue Bonds, Refunding(Insured; Assured Guaranty Municipal Corp.) Ser. D2 5.00 7/1/2026 2,500,000 2,720,351Michigan Finance Authority, Revenue Bonds, Refunding(McLaren Health Care Obligated Group) Ser. D2 1.20 4/13/2028 5,000,000a 4,839,449Michigan Finance Authority, Revenue Bonds, Refunding (TrinityHealth Credit Obligated Group) 4.00 12/1/2036 3,000,000 3,384,116Michigan Finance Authority, Revenue Bonds, Refunding (TrinityHealth Credit Obligated Group) 4.00 12/1/2035 2,500,000 2,823,038Michigan Finance Authority, Revenue Bonds, Refunding (TrinityHealth Obligated Group) 5.00 6/1/2022 5,000,000b 5,055,120
19
Copyright © 2022 www.secdatabase.com. All Rights Reserved.Please Consider the Environment Before Printing This Document
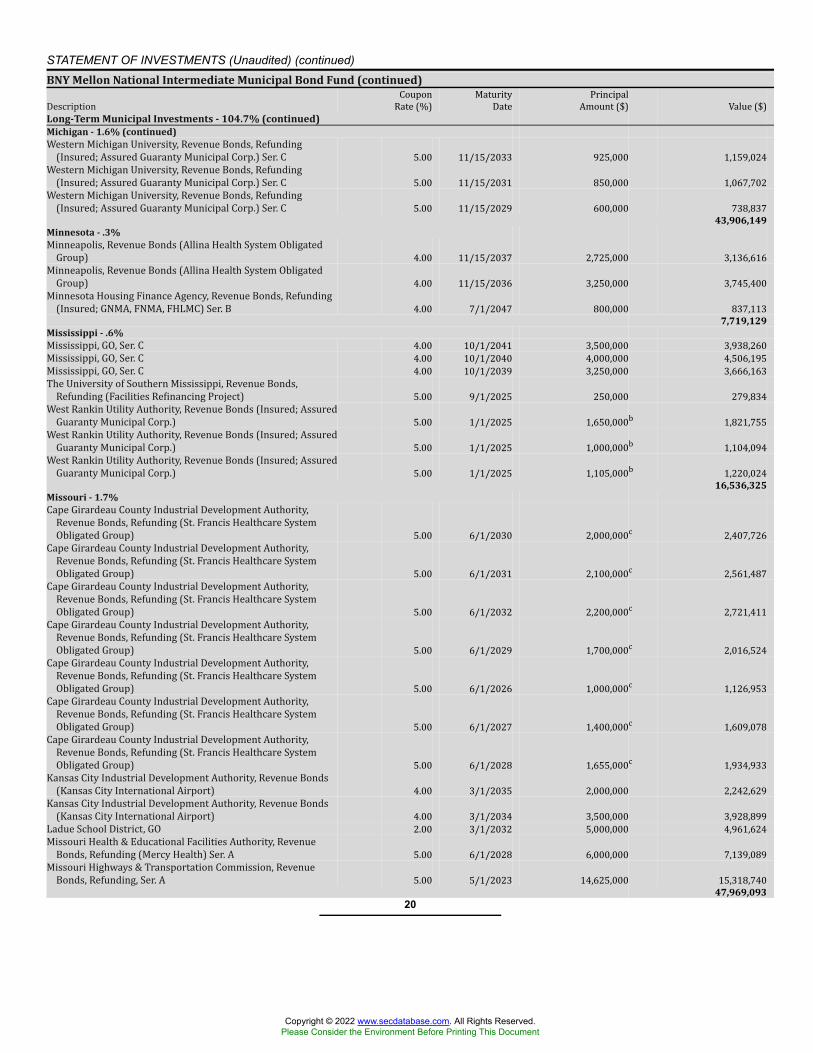
STATEMENT OF INVESTMENTS (Unaudited) (continued)BNY Mellon National Intermediate Municipal Bond Fund (continued)Description CouponRate (%) MaturityDate PrincipalAmount ($) Value ($)Long-Term Municipal Investments - 104.7% (continued)Michigan - 1.6% (continued)Western Michigan University, Revenue Bonds, Refunding(Insured; Assured Guaranty Municipal Corp.) Ser. C 5.00 11/15/2033 925,000 1,159,024Western Michigan University, Revenue Bonds, Refunding(Insured; Assured Guaranty Municipal Corp.) Ser. C 5.00 11/15/2031 850,000 1,067,702Western Michigan University, Revenue Bonds, Refunding(Insured; Assured Guaranty Municipal Corp.) Ser. C 5.00 11/15/2029 600,000 738,837
43,906,149Minnesota - .3%Minneapolis, Revenue Bonds (Allina Health System ObligatedGroup) 4.00 11/15/2037 2,725,000 3,136,616Minneapolis, Revenue Bonds (Allina Health System ObligatedGroup) 4.00 11/15/2036 3,250,000 3,745,400Minnesota Housing Finance Agency, Revenue Bonds, Refunding(Insured; GNMA, FNMA, FHLMC) Ser. B 4.00 7/1/2047 800,000 837,113
7,719,129Mississippi - .6%Mississippi, GO, Ser. C 4.00 10/1/2041 3,500,000 3,938,260Mississippi, GO, Ser. C 4.00 10/1/2040 4,000,000 4,506,195Mississippi, GO, Ser. C 4.00 10/1/2039 3,250,000 3,666,163The University of Southern Mississippi, Revenue Bonds,Refunding (Facilities Refinancing Project) 5.00 9/1/2025 250,000 279,834West Rankin Utility Authority, Revenue Bonds (Insured; AssuredGuaranty Municipal Corp.) 5.00 1/1/2025 1,650,000b 1,821,755West Rankin Utility Authority, Revenue Bonds (Insured; AssuredGuaranty Municipal Corp.) 5.00 1/1/2025 1,000,000b 1,104,094West Rankin Utility Authority, Revenue Bonds (Insured; AssuredGuaranty Municipal Corp.) 5.00 1/1/2025 1,105,000b 1,220,024
16,536,325Missouri - 1.7%Cape Girardeau County Industrial Development Authority,Revenue Bonds, Refunding (St. Francis Healthcare SystemObligated Group) 5.00 6/1/2030 2,000,000c 2,407,726Cape Girardeau County Industrial Development Authority,Revenue Bonds, Refunding (St. Francis Healthcare SystemObligated Group) 5.00 6/1/2031 2,100,000c 2,561,487Cape Girardeau County Industrial Development Authority,Revenue Bonds, Refunding (St. Francis Healthcare SystemObligated Group) 5.00 6/1/2032 2,200,000c 2,721,411Cape Girardeau County Industrial Development Authority,Revenue Bonds, Refunding (St. Francis Healthcare SystemObligated Group) 5.00 6/1/2029 1,700,000c 2,016,524Cape Girardeau County Industrial Development Authority,Revenue Bonds, Refunding (St. Francis Healthcare SystemObligated Group) 5.00 6/1/2026 1,000,000c 1,126,953Cape Girardeau County Industrial Development Authority,Revenue Bonds, Refunding (St. Francis Healthcare SystemObligated Group) 5.00 6/1/2027 1,400,000c 1,609,078Cape Girardeau County Industrial Development Authority,Revenue Bonds, Refunding (St. Francis Healthcare SystemObligated Group) 5.00 6/1/2028 1,655,000c 1,934,933Kansas City Industrial Development Authority, Revenue Bonds(Kansas City International Airport) 4.00 3/1/2035 2,000,000 2,242,629Kansas City Industrial Development Authority, Revenue Bonds(Kansas City International Airport) 4.00 3/1/2034 3,500,000 3,928,899Ladue School District, GO 2.00 3/1/2032 5,000,000 4,961,624Missouri Health & Educational Facilities Authority, RevenueBonds, Refunding (Mercy Health) Ser. A 5.00 6/1/2028 6,000,000 7,139,089Missouri Highways & Transportation Commission, RevenueBonds, Refunding, Ser. A 5.00 5/1/2023 14,625,000 15,318,740
47,969,09320
Copyright © 2022 www.secdatabase.com. All Rights Reserved.Please Consider the Environment Before Printing This Document
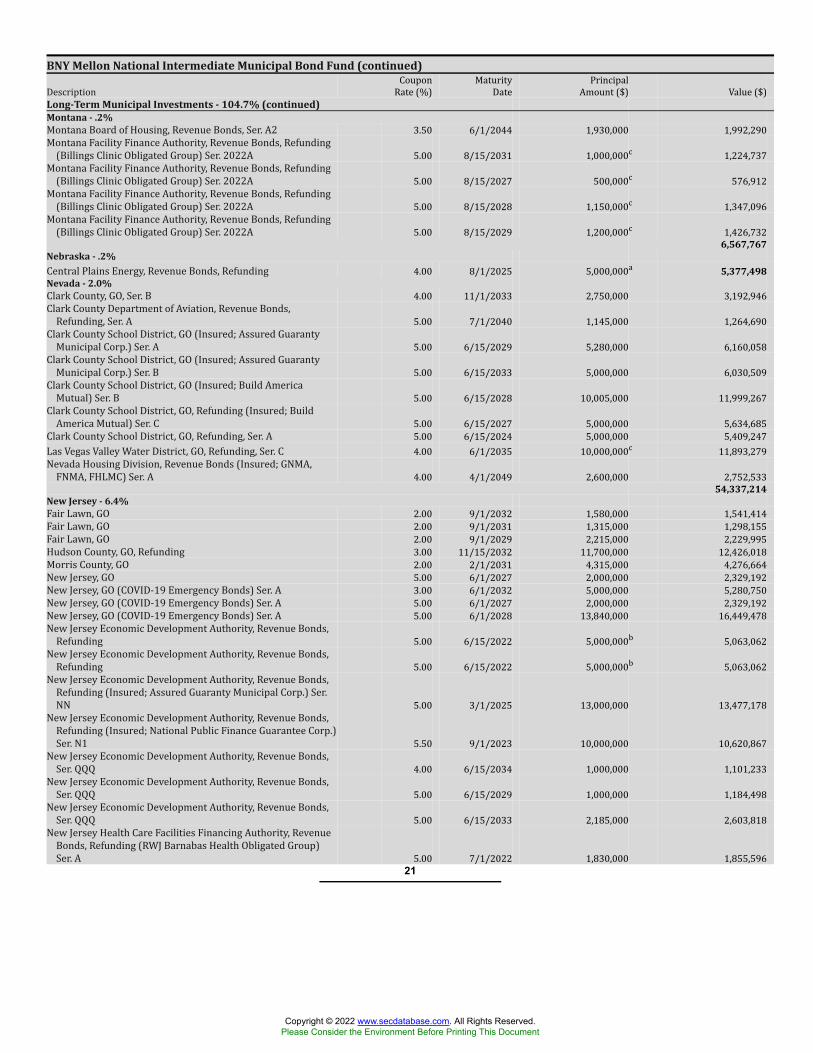
BNY Mellon National Intermediate Municipal Bond Fund (continued)Description CouponRate (%) MaturityDate PrincipalAmount ($) Value ($)Long-Term Municipal Investments - 104.7% (continued)Montana - .2%Montana Board of Housing, Revenue Bonds, Ser. A2 3.50 6/1/2044 1,930,000 1,992,290Montana Facility Finance Authority, Revenue Bonds, Refunding(Billings Clinic Obligated Group) Ser. 2022A 5.00 8/15/2031 1,000,000c 1,224,737Montana Facility Finance Authority, Revenue Bonds, Refunding(Billings Clinic Obligated Group) Ser. 2022A 5.00 8/15/2027 500,000c 576,912Montana Facility Finance Authority, Revenue Bonds, Refunding(Billings Clinic Obligated Group) Ser. 2022A 5.00 8/15/2028 1,150,000c 1,347,096Montana Facility Finance Authority, Revenue Bonds, Refunding(Billings Clinic Obligated Group) Ser. 2022A 5.00 8/15/2029 1,200,000c 1,426,732
6,567,767Nebraska - .2%Central Plains Energy, Revenue Bonds, Refunding 4.00 8/1/2025 5,000,000a 5,377,498Nevada - 2.0%Clark County, GO, Ser. B 4.00 11/1/2033 2,750,000 3,192,946Clark County Department of Aviation, Revenue Bonds,Refunding, Ser. A 5.00 7/1/2040 1,145,000 1,264,690Clark County School District, GO (Insured; Assured GuarantyMunicipal Corp.) Ser. A 5.00 6/15/2029 5,280,000 6,160,058Clark County School District, GO (Insured; Assured GuarantyMunicipal Corp.) Ser. B 5.00 6/15/2033 5,000,000 6,030,509Clark County School District, GO (Insured; Build AmericaMutual) Ser. B 5.00 6/15/2028 10,005,000 11,999,267Clark County School District, GO, Refunding (Insured; BuildAmerica Mutual) Ser. C 5.00 6/15/2027 5,000,000 5,634,685Clark County School District, GO, Refunding, Ser. A 5.00 6/15/2024 5,000,000 5,409,247Las Vegas Valley Water District, GO, Refunding, Ser. C 4.00 6/1/2035 10,000,000c 11,893,279Nevada Housing Division, Revenue Bonds (Insured; GNMA,FNMA, FHLMC) Ser. A 4.00 4/1/2049 2,600,000 2,752,533
54,337,214New Jersey - 6.4%Fair Lawn, GO 2.00 9/1/2032 1,580,000 1,541,414Fair Lawn, GO 2.00 9/1/2031 1,315,000 1,298,155Fair Lawn, GO 2.00 9/1/2029 2,215,000 2,229,995Hudson County, GO, Refunding 3.00 11/15/2032 11,700,000 12,426,018Morris County, GO 2.00 2/1/2031 4,315,000 4,276,664New Jersey, GO 5.00 6/1/2027 2,000,000 2,329,192New Jersey, GO (COVID-19 Emergency Bonds) Ser. A 3.00 6/1/2032 5,000,000 5,280,750New Jersey, GO (COVID-19 Emergency Bonds) Ser. A 5.00 6/1/2027 2,000,000 2,329,192New Jersey, GO (COVID-19 Emergency Bonds) Ser. A 5.00 6/1/2028 13,840,000 16,449,478New Jersey Economic Development Authority, Revenue Bonds,Refunding 5.00 6/15/2022 5,000,000b 5,063,062New Jersey Economic Development Authority, Revenue Bonds,Refunding 5.00 6/15/2022 5,000,000b 5,063,062New Jersey Economic Development Authority, Revenue Bonds,Refunding (Insured; Assured Guaranty Municipal Corp.) Ser.NN 5.00 3/1/2025 13,000,000 13,477,178New Jersey Economic Development Authority, Revenue Bonds,Refunding (Insured; National Public Finance Guarantee Corp.)Ser. N1 5.50 9/1/2023 10,000,000 10,620,867New Jersey Economic Development Authority, Revenue Bonds,Ser. QQQ 4.00 6/15/2034 1,000,000 1,101,233New Jersey Economic Development Authority, Revenue Bonds,Ser. QQQ 5.00 6/15/2029 1,000,000 1,184,498New Jersey Economic Development Authority, Revenue Bonds,Ser. QQQ 5.00 6/15/2033 2,185,000 2,603,818New Jersey Health Care Facilities Financing Authority, RevenueBonds, Refunding (RWJ Barnabas Health Obligated Group)Ser. A 5.00 7/1/2022 1,830,000 1,855,596
21
Copyright © 2022 www.secdatabase.com. All Rights Reserved.Please Consider the Environment Before Printing This Document
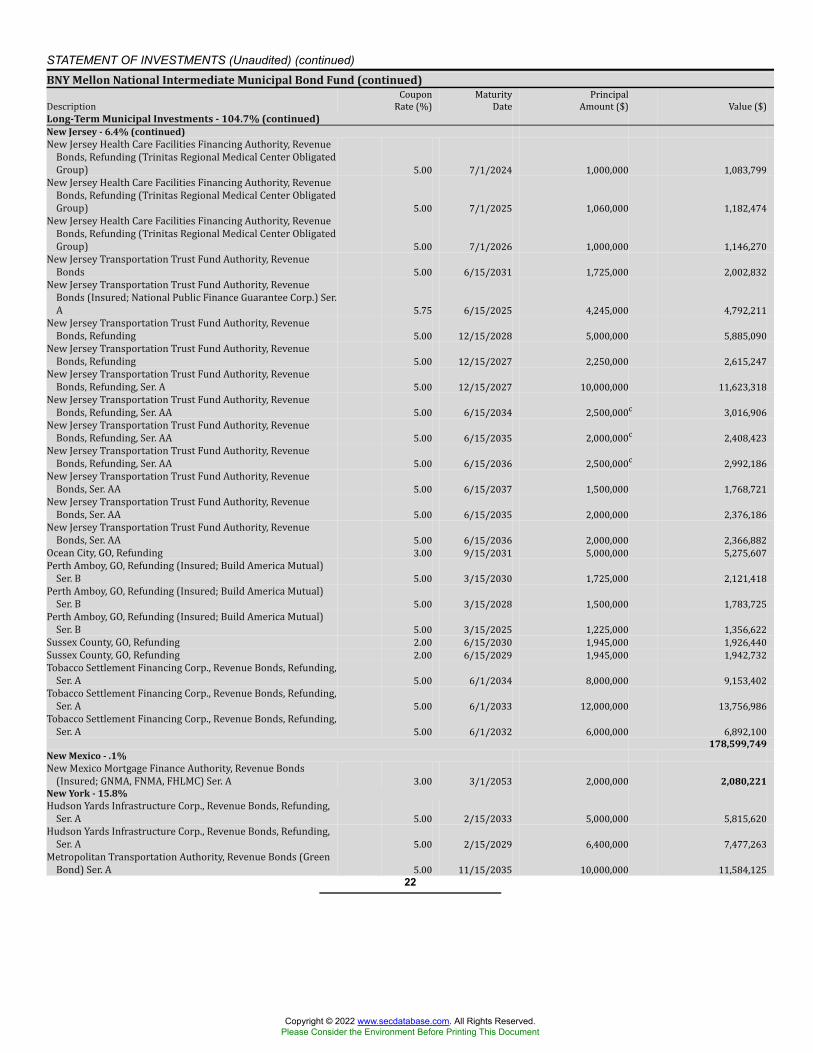
STATEMENT OF INVESTMENTS (Unaudited) (continued)BNY Mellon National Intermediate Municipal Bond Fund (continued)Description CouponRate (%) MaturityDate PrincipalAmount ($) Value ($)Long-Term Municipal Investments - 104.7% (continued)New Jersey - 6.4% (continued)New Jersey Health Care Facilities Financing Authority, RevenueBonds, Refunding (Trinitas Regional Medical Center ObligatedGroup) 5.00 7/1/2024 1,000,000 1,083,799New Jersey Health Care Facilities Financing Authority, RevenueBonds, Refunding (Trinitas Regional Medical Center ObligatedGroup) 5.00 7/1/2025 1,060,000 1,182,474New Jersey Health Care Facilities Financing Authority, RevenueBonds, Refunding (Trinitas Regional Medical Center ObligatedGroup) 5.00 7/1/2026 1,000,000 1,146,270New Jersey Transportation Trust Fund Authority, RevenueBonds 5.00 6/15/2031 1,725,000 2,002,832New Jersey Transportation Trust Fund Authority, RevenueBonds (Insured; National Public Finance Guarantee Corp.) Ser.A 5.75 6/15/2025 4,245,000 4,792,211New Jersey Transportation Trust Fund Authority, RevenueBonds, Refunding 5.00 12/15/2028 5,000,000 5,885,090New Jersey Transportation Trust Fund Authority, RevenueBonds, Refunding 5.00 12/15/2027 2,250,000 2,615,247New Jersey Transportation Trust Fund Authority, RevenueBonds, Refunding, Ser. A 5.00 12/15/2027 10,000,000 11,623,318New Jersey Transportation Trust Fund Authority, RevenueBonds, Refunding, Ser. AA 5.00 6/15/2034 2,500,000c 3,016,906New Jersey Transportation Trust Fund Authority, RevenueBonds, Refunding, Ser. AA 5.00 6/15/2035 2,000,000c 2,408,423New Jersey Transportation Trust Fund Authority, RevenueBonds, Refunding, Ser. AA 5.00 6/15/2036 2,500,000c 2,992,186New Jersey Transportation Trust Fund Authority, RevenueBonds, Ser. AA 5.00 6/15/2037 1,500,000 1,768,721New Jersey Transportation Trust Fund Authority, RevenueBonds, Ser. AA 5.00 6/15/2035 2,000,000 2,376,186New Jersey Transportation Trust Fund Authority, RevenueBonds, Ser. AA 5.00 6/15/2036 2,000,000 2,366,882Ocean City, GO, Refunding 3.00 9/15/2031 5,000,000 5,275,607Perth Amboy, GO, Refunding (Insured; Build America Mutual)Ser. B 5.00 3/15/2030 1,725,000 2,121,418Perth Amboy, GO, Refunding (Insured; Build America Mutual)Ser. B 5.00 3/15/2028 1,500,000 1,783,725Perth Amboy, GO, Refunding (Insured; Build America Mutual)Ser. B 5.00 3/15/2025 1,225,000 1,356,622Sussex County, GO, Refunding 2.00 6/15/2030 1,945,000 1,926,440Sussex County, GO, Refunding 2.00 6/15/2029 1,945,000 1,942,732Tobacco Settlement Financing Corp., Revenue Bonds, Refunding,Ser. A 5.00 6/1/2034 8,000,000 9,153,402Tobacco Settlement Financing Corp., Revenue Bonds, Refunding,Ser. A 5.00 6/1/2033 12,000,000 13,756,986Tobacco Settlement Financing Corp., Revenue Bonds, Refunding,Ser. A 5.00 6/1/2032 6,000,000 6,892,100
178,599,749New Mexico - .1%New Mexico Mortgage Finance Authority, Revenue Bonds(Insured; GNMA, FNMA, FHLMC) Ser. A 3.00 3/1/2053 2,000,000 2,080,221New York - 15.8%Hudson Yards Infrastructure Corp., Revenue Bonds, Refunding,Ser. A 5.00 2/15/2033 5,000,000 5,815,620Hudson Yards Infrastructure Corp., Revenue Bonds, Refunding,Ser. A 5.00 2/15/2029 6,400,000 7,477,263Metropolitan Transportation Authority, Revenue Bonds (GreenBond) Ser. A 5.00 11/15/2035 10,000,000 11,584,125
22
Copyright © 2022 www.secdatabase.com. All Rights Reserved.Please Consider the Environment Before Printing This Document
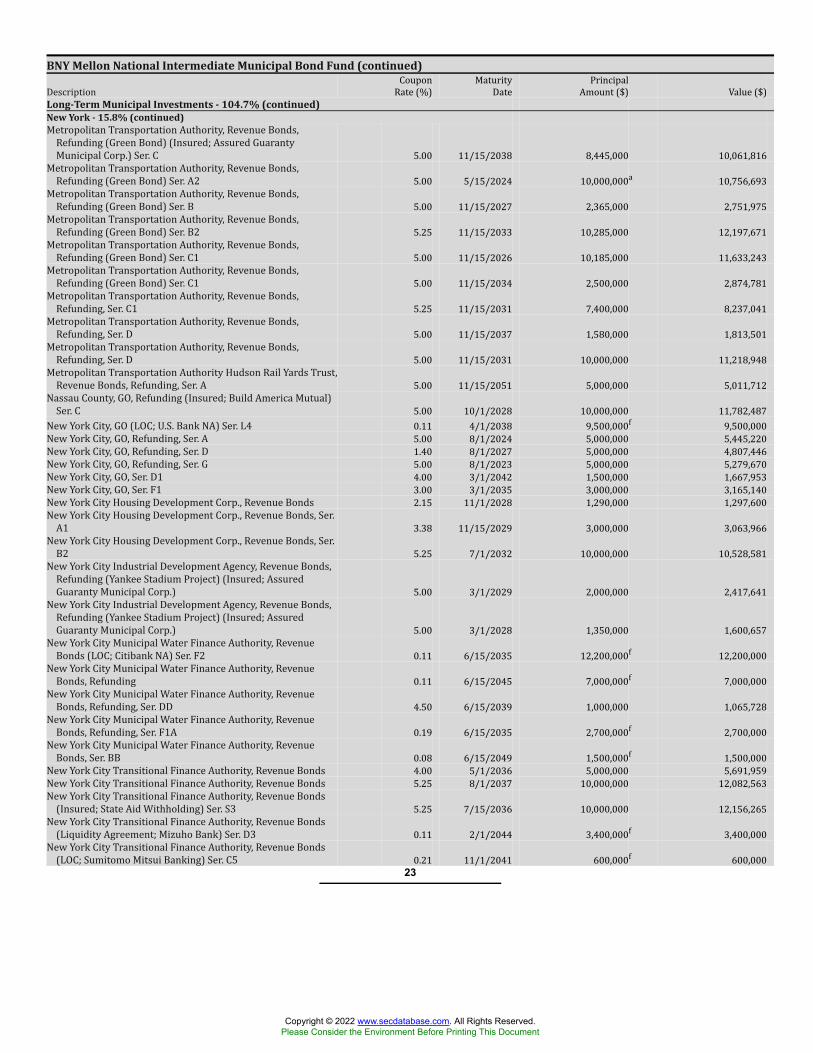
BNY Mellon National Intermediate Municipal Bond Fund (continued)Description CouponRate (%) MaturityDate PrincipalAmount ($) Value ($)Long-Term Municipal Investments - 104.7% (continued)New York - 15.8% (continued)Metropolitan Transportation Authority, Revenue Bonds,Refunding (Green Bond) (Insured; Assured GuarantyMunicipal Corp.) Ser. C 5.00 11/15/2038 8,445,000 10,061,816Metropolitan Transportation Authority, Revenue Bonds,Refunding (Green Bond) Ser. A2 5.00 5/15/2024 10,000,000a 10,756,693Metropolitan Transportation Authority, Revenue Bonds,Refunding (Green Bond) Ser. B 5.00 11/15/2027 2,365,000 2,751,975Metropolitan Transportation Authority, Revenue Bonds,Refunding (Green Bond) Ser. B2 5.25 11/15/2033 10,285,000 12,197,671Metropolitan Transportation Authority, Revenue Bonds,Refunding (Green Bond) Ser. C1 5.00 11/15/2026 10,185,000 11,633,243Metropolitan Transportation Authority, Revenue Bonds,Refunding (Green Bond) Ser. C1 5.00 11/15/2034 2,500,000 2,874,781Metropolitan Transportation Authority, Revenue Bonds,Refunding, Ser. C1 5.25 11/15/2031 7,400,000 8,237,041Metropolitan Transportation Authority, Revenue Bonds,Refunding, Ser. D 5.00 11/15/2037 1,580,000 1,813,501Metropolitan Transportation Authority, Revenue Bonds,Refunding, Ser. D 5.00 11/15/2031 10,000,000 11,218,948Metropolitan Transportation Authority Hudson Rail Yards Trust,Revenue Bonds, Refunding, Ser. A 5.00 11/15/2051 5,000,000 5,011,712Nassau County, GO, Refunding (Insured; Build America Mutual)Ser. C 5.00 10/1/2028 10,000,000 11,782,487New York City, GO (LOC; U.S. Bank NA) Ser. L4 0.11 4/1/2038 9,500,000f 9,500,000New York City, GO, Refunding, Ser. A 5.00 8/1/2024 5,000,000 5,445,220New York City, GO, Refunding, Ser. D 1.40 8/1/2027 5,000,000 4,807,446New York City, GO, Refunding, Ser. G 5.00 8/1/2023 5,000,000 5,279,670New York City, GO, Ser. D1 4.00 3/1/2042 1,500,000 1,667,953New York City, GO, Ser. F1 3.00 3/1/2035 3,000,000 3,165,140New York City Housing Development Corp., Revenue Bonds 2.15 11/1/2028 1,290,000 1,297,600New York City Housing Development Corp., Revenue Bonds, Ser.A1 3.38 11/15/2029 3,000,000 3,063,966New York City Housing Development Corp., Revenue Bonds, Ser.B2 5.25 7/1/2032 10,000,000 10,528,581New York City Industrial Development Agency, Revenue Bonds,Refunding (Yankee Stadium Project) (Insured; AssuredGuaranty Municipal Corp.) 5.00 3/1/2029 2,000,000 2,417,641New York City Industrial Development Agency, Revenue Bonds,Refunding (Yankee Stadium Project) (Insured; AssuredGuaranty Municipal Corp.) 5.00 3/1/2028 1,350,000 1,600,657New York City Municipal Water Finance Authority, RevenueBonds (LOC; Citibank NA) Ser. F2 0.11 6/15/2035 12,200,000f 12,200,000New York City Municipal Water Finance Authority, RevenueBonds, Refunding 0.11 6/15/2045 7,000,000f 7,000,000New York City Municipal Water Finance Authority, RevenueBonds, Refunding, Ser. DD 4.50 6/15/2039 1,000,000 1,065,728New York City Municipal Water Finance Authority, RevenueBonds, Refunding, Ser. F1A 0.19 6/15/2035 2,700,000f 2,700,000New York City Municipal Water Finance Authority, RevenueBonds, Ser. BB 0.08 6/15/2049 1,500,000f 1,500,000New York City Transitional Finance Authority, Revenue Bonds 4.00 5/1/2036 5,000,000 5,691,959New York City Transitional Finance Authority, Revenue Bonds 5.25 8/1/2037 10,000,000 12,082,563New York City Transitional Finance Authority, Revenue Bonds(Insured; State Aid Withholding) Ser. S3 5.25 7/15/2036 10,000,000 12,156,265New York City Transitional Finance Authority, Revenue Bonds(Liquidity Agreement; Mizuho Bank) Ser. D3 0.11 2/1/2044 3,400,000f 3,400,000New York City Transitional Finance Authority, Revenue Bonds(LOC; Sumitomo Mitsui Banking) Ser. C5 0.21 11/1/2041 600,000f 600,000
23
Copyright © 2022 www.secdatabase.com. All Rights Reserved.Please Consider the Environment Before Printing This Document
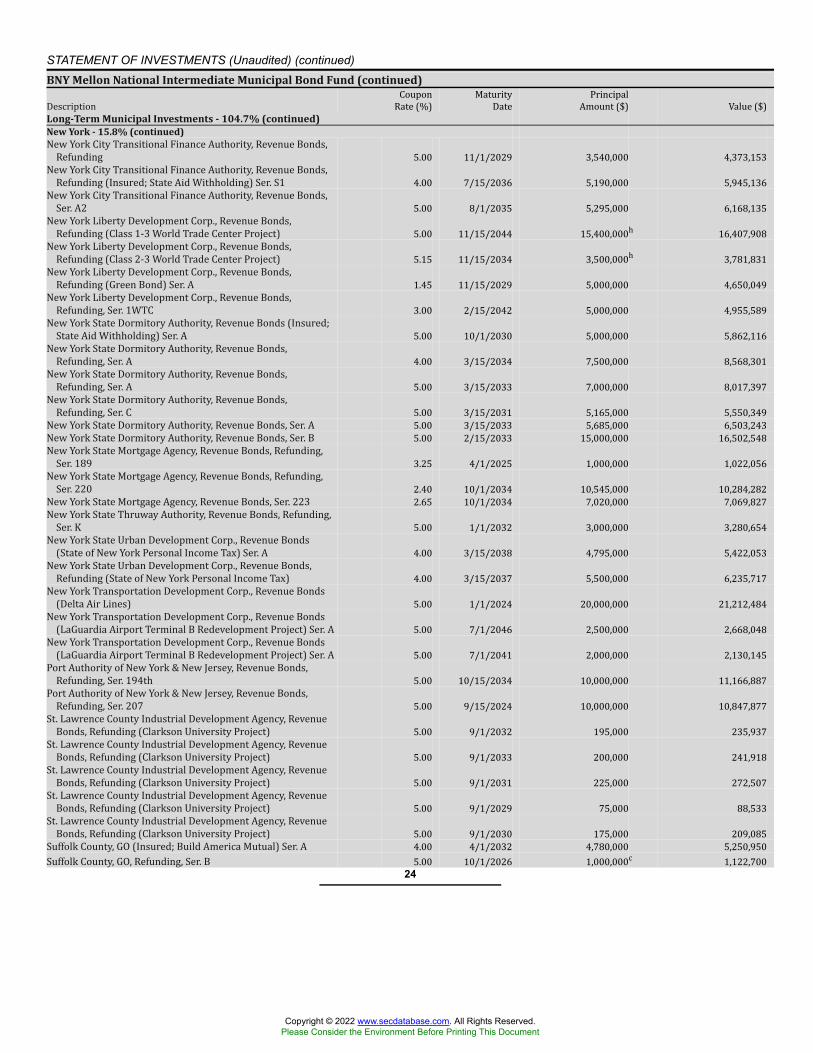
STATEMENT OF INVESTMENTS (Unaudited) (continued)BNY Mellon National Intermediate Municipal Bond Fund (continued)Description CouponRate (%) MaturityDate PrincipalAmount ($) Value ($)Long-Term Municipal Investments - 104.7% (continued)New York - 15.8% (continued)New York City Transitional Finance Authority, Revenue Bonds,Refunding 5.00 11/1/2029 3,540,000 4,373,153New York City Transitional Finance Authority, Revenue Bonds,Refunding (Insured; State Aid Withholding) Ser. S1 4.00 7/15/2036 5,190,000 5,945,136New York City Transitional Finance Authority, Revenue Bonds,Ser. A2 5.00 8/1/2035 5,295,000 6,168,135New York Liberty Development Corp., Revenue Bonds,Refunding (Class 1-3 World Trade Center Project) 5.00 11/15/2044 15,400,000h 16,407,908New York Liberty Development Corp., Revenue Bonds,Refunding (Class 2-3 World Trade Center Project) 5.15 11/15/2034 3,500,000h 3,781,831New York Liberty Development Corp., Revenue Bonds,Refunding (Green Bond) Ser. A 1.45 11/15/2029 5,000,000 4,650,049New York Liberty Development Corp., Revenue Bonds,Refunding, Ser. 1WTC 3.00 2/15/2042 5,000,000 4,955,589New York State Dormitory Authority, Revenue Bonds (Insured;State Aid Withholding) Ser. A 5.00 10/1/2030 5,000,000 5,862,116New York State Dormitory Authority, Revenue Bonds,Refunding, Ser. A 4.00 3/15/2034 7,500,000 8,568,301New York State Dormitory Authority, Revenue Bonds,Refunding, Ser. A 5.00 3/15/2033 7,000,000 8,017,397New York State Dormitory Authority, Revenue Bonds,Refunding, Ser. C 5.00 3/15/2031 5,165,000 5,550,349New York State Dormitory Authority, Revenue Bonds, Ser. A 5.00 3/15/2033 5,685,000 6,503,243New York State Dormitory Authority, Revenue Bonds, Ser. B 5.00 2/15/2033 15,000,000 16,502,548New York State Mortgage Agency, Revenue Bonds, Refunding,Ser. 189 3.25 4/1/2025 1,000,000 1,022,056New York State Mortgage Agency, Revenue Bonds, Refunding,Ser. 220 2.40 10/1/2034 10,545,000 10,284,282New York State Mortgage Agency, Revenue Bonds, Ser. 223 2.65 10/1/2034 7,020,000 7,069,827New York State Thruway Authority, Revenue Bonds, Refunding,Ser. K 5.00 1/1/2032 3,000,000 3,280,654New York State Urban Development Corp., Revenue Bonds(State of New York Personal Income Tax) Ser. A 4.00 3/15/2038 4,795,000 5,422,053New York State Urban Development Corp., Revenue Bonds,Refunding (State of New York Personal Income Tax) 4.00 3/15/2037 5,500,000 6,235,717New York Transportation Development Corp., Revenue Bonds(Delta Air Lines) 5.00 1/1/2024 20,000,000 21,212,484New York Transportation Development Corp., Revenue Bonds(LaGuardia Airport Terminal B Redevelopment Project) Ser. A 5.00 7/1/2046 2,500,000 2,668,048New York Transportation Development Corp., Revenue Bonds(LaGuardia Airport Terminal B Redevelopment Project) Ser. A 5.00 7/1/2041 2,000,000 2,130,145Port Authority of New York & New Jersey, Revenue Bonds,Refunding, Ser. 194th 5.00 10/15/2034 10,000,000 11,166,887Port Authority of New York & New Jersey, Revenue Bonds,Refunding, Ser. 207 5.00 9/15/2024 10,000,000 10,847,877St. Lawrence County Industrial Development Agency, RevenueBonds, Refunding (Clarkson University Project) 5.00 9/1/2032 195,000 235,937St. Lawrence County Industrial Development Agency, RevenueBonds, Refunding (Clarkson University Project) 5.00 9/1/2033 200,000 241,918St. Lawrence County Industrial Development Agency, RevenueBonds, Refunding (Clarkson University Project) 5.00 9/1/2031 225,000 272,507St. Lawrence County Industrial Development Agency, RevenueBonds, Refunding (Clarkson University Project) 5.00 9/1/2029 75,000 88,533St. Lawrence County Industrial Development Agency, RevenueBonds, Refunding (Clarkson University Project) 5.00 9/1/2030 175,000 209,085Suffolk County, GO (Insured; Build America Mutual) Ser. A 4.00 4/1/2032 4,780,000 5,250,950Suffolk County, GO, Refunding, Ser. B 5.00 10/1/2026 1,000,000c 1,122,700
24
Copyright © 2022 www.secdatabase.com. All Rights Reserved.Please Consider the Environment Before Printing This Document
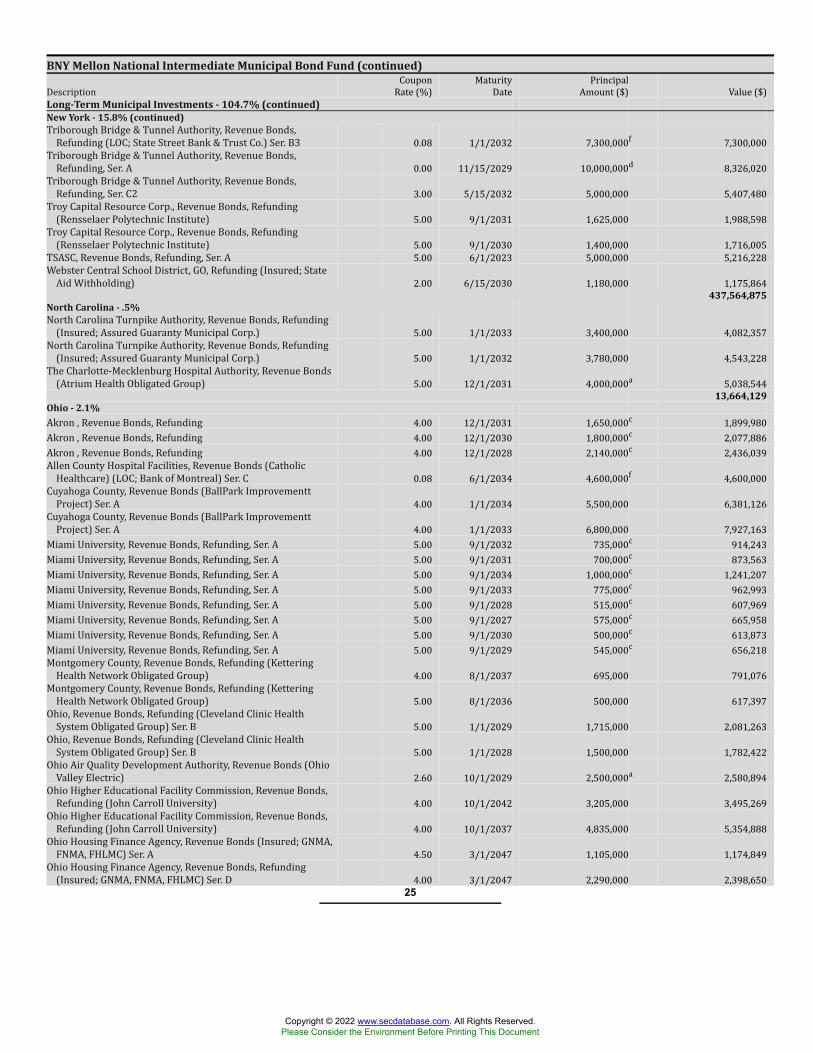
BNY Mellon National Intermediate Municipal Bond Fund (continued)Description CouponRate (%) MaturityDate PrincipalAmount ($) Value ($)Long-Term Municipal Investments - 104.7% (continued)New York - 15.8% (continued)Triborough Bridge & Tunnel Authority, Revenue Bonds,Refunding (LOC; State Street Bank & Trust Co.) Ser. B3 0.08 1/1/2032 7,300,000f 7,300,000Triborough Bridge & Tunnel Authority, Revenue Bonds,Refunding, Ser. A 0.00 11/15/2029 10,000,000d 8,326,020Triborough Bridge & Tunnel Authority, Revenue Bonds,Refunding, Ser. C2 3.00 5/15/2032 5,000,000 5,407,480Troy Capital Resource Corp., Revenue Bonds, Refunding(Rensselaer Polytechnic Institute) 5.00 9/1/2031 1,625,000 1,988,598Troy Capital Resource Corp., Revenue Bonds, Refunding(Rensselaer Polytechnic Institute) 5.00 9/1/2030 1,400,000 1,716,005TSASC, Revenue Bonds, Refunding, Ser. A 5.00 6/1/2023 5,000,000 5,216,228Webster Central School District, GO, Refunding (Insured; StateAid Withholding) 2.00 6/15/2030 1,180,000 1,175,864
437,564,875North Carolina - .5%North Carolina Turnpike Authority, Revenue Bonds, Refunding(Insured; Assured Guaranty Municipal Corp.) 5.00 1/1/2033 3,400,000 4,082,357North Carolina Turnpike Authority, Revenue Bonds, Refunding(Insured; Assured Guaranty Municipal Corp.) 5.00 1/1/2032 3,780,000 4,543,228The Charlotte-Mecklenburg Hospital Authority, Revenue Bonds(Atrium Health Obligated Group) 5.00 12/1/2031 4,000,000a 5,038,544
13,664,129Ohio - 2.1%Akron , Revenue Bonds, Refunding 4.00 12/1/2031 1,650,000c 1,899,980Akron , Revenue Bonds, Refunding 4.00 12/1/2030 1,800,000c 2,077,886Akron , Revenue Bonds, Refunding 4.00 12/1/2028 2,140,000c 2,436,039Allen County Hospital Facilities, Revenue Bonds (CatholicHealthcare) (LOC; Bank of Montreal) Ser. C 0.08 6/1/2034 4,600,000f 4,600,000Cuyahoga County, Revenue Bonds (BallPark ImprovementtProject) Ser. A 4.00 1/1/2034 5,500,000 6,381,126Cuyahoga County, Revenue Bonds (BallPark ImprovementtProject) Ser. A 4.00 1/1/2033 6,800,000 7,927,163Miami University, Revenue Bonds, Refunding, Ser. A 5.00 9/1/2032 735,000c 914,243Miami University, Revenue Bonds, Refunding, Ser. A 5.00 9/1/2031 700,000c 873,563Miami University, Revenue Bonds, Refunding, Ser. A 5.00 9/1/2034 1,000,000c 1,241,207Miami University, Revenue Bonds, Refunding, Ser. A 5.00 9/1/2033 775,000c 962,993Miami University, Revenue Bonds, Refunding, Ser. A 5.00 9/1/2028 515,000c 607,969Miami University, Revenue Bonds, Refunding, Ser. A 5.00 9/1/2027 575,000c 665,958Miami University, Revenue Bonds, Refunding, Ser. A 5.00 9/1/2030 500,000c 613,873Miami University, Revenue Bonds, Refunding, Ser. A 5.00 9/1/2029 545,000c 656,218Montgomery County, Revenue Bonds, Refunding (KetteringHealth Network Obligated Group) 4.00 8/1/2037 695,000 791,076Montgomery County, Revenue Bonds, Refunding (KetteringHealth Network Obligated Group) 5.00 8/1/2036 500,000 617,397Ohio, Revenue Bonds, Refunding (Cleveland Clinic HealthSystem Obligated Group) Ser. B 5.00 1/1/2029 1,715,000 2,081,263Ohio, Revenue Bonds, Refunding (Cleveland Clinic HealthSystem Obligated Group) Ser. B 5.00 1/1/2028 1,500,000 1,782,422Ohio Air Quality Development Authority, Revenue Bonds (OhioValley Electric) 2.60 10/1/2029 2,500,000a 2,580,894Ohio Higher Educational Facility Commission, Revenue Bonds,Refunding (John Carroll University) 4.00 10/1/2042 3,205,000 3,495,269Ohio Higher Educational Facility Commission, Revenue Bonds,Refunding (John Carroll University) 4.00 10/1/2037 4,835,000 5,354,888Ohio Housing Finance Agency, Revenue Bonds (Insured; GNMA,FNMA, FHLMC) Ser. A 4.50 3/1/2047 1,105,000 1,174,849Ohio Housing Finance Agency, Revenue Bonds, Refunding(Insured; GNMA, FNMA, FHLMC) Ser. D 4.00 3/1/2047 2,290,000 2,398,650
25
Copyright © 2022 www.secdatabase.com. All Rights Reserved.Please Consider the Environment Before Printing This Document
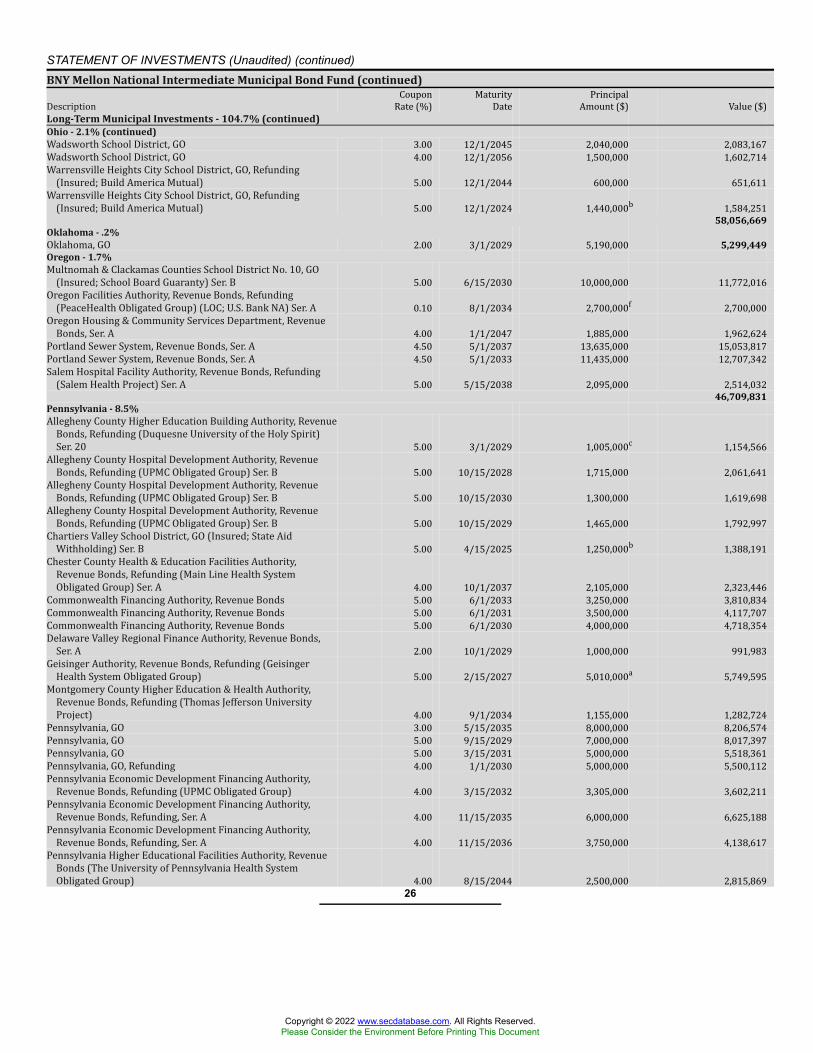
STATEMENT OF INVESTMENTS (Unaudited) (continued)BNY Mellon National Intermediate Municipal Bond Fund (continued)Description CouponRate (%) MaturityDate PrincipalAmount ($) Value ($)Long-Term Municipal Investments - 104.7% (continued)Ohio - 2.1% (continued)Wadsworth School District, GO 3.00 12/1/2045 2,040,000 2,083,167Wadsworth School District, GO 4.00 12/1/2056 1,500,000 1,602,714Warrensville Heights City School District, GO, Refunding(Insured; Build America Mutual) 5.00 12/1/2044 600,000 651,611Warrensville Heights City School District, GO, Refunding(Insured; Build America Mutual) 5.00 12/1/2024 1,440,000b 1,584,251
58,056,669Oklahoma - .2%Oklahoma, GO 2.00 3/1/2029 5,190,000 5,299,449Oregon - 1.7%Multnomah & Clackamas Counties School District No. 10, GO(Insured; School Board Guaranty) Ser. B 5.00 6/15/2030 10,000,000 11,772,016Oregon Facilities Authority, Revenue Bonds, Refunding(PeaceHealth Obligated Group) (LOC; U.S. Bank NA) Ser. A 0.10 8/1/2034 2,700,000f 2,700,000Oregon Housing & Community Services Department, RevenueBonds, Ser. A 4.00 1/1/2047 1,885,000 1,962,624Portland Sewer System, Revenue Bonds, Ser. A 4.50 5/1/2037 13,635,000 15,053,817Portland Sewer System, Revenue Bonds, Ser. A 4.50 5/1/2033 11,435,000 12,707,342Salem Hospital Facility Authority, Revenue Bonds, Refunding(Salem Health Project) Ser. A 5.00 5/15/2038 2,095,000 2,514,032
46,709,831Pennsylvania - 8.5%Allegheny County Higher Education Building Authority, RevenueBonds, Refunding (Duquesne University of the Holy Spirit)Ser. 20 5.00 3/1/2029 1,005,000c 1,154,566Allegheny County Hospital Development Authority, RevenueBonds, Refunding (UPMC Obligated Group) Ser. B 5.00 10/15/2028 1,715,000 2,061,641Allegheny County Hospital Development Authority, RevenueBonds, Refunding (UPMC Obligated Group) Ser. B 5.00 10/15/2030 1,300,000 1,619,698Allegheny County Hospital Development Authority, RevenueBonds, Refunding (UPMC Obligated Group) Ser. B 5.00 10/15/2029 1,465,000 1,792,997Chartiers Valley School District, GO (Insured; State AidWithholding) Ser. B 5.00 4/15/2025 1,250,000b 1,388,191Chester County Health & Education Facilities Authority,Revenue Bonds, Refunding (Main Line Health SystemObligated Group) Ser. A 4.00 10/1/2037 2,105,000 2,323,446Commonwealth Financing Authority, Revenue Bonds 5.00 6/1/2033 3,250,000 3,810,834Commonwealth Financing Authority, Revenue Bonds 5.00 6/1/2031 3,500,000 4,117,707Commonwealth Financing Authority, Revenue Bonds 5.00 6/1/2030 4,000,000 4,718,354Delaware Valley Regional Finance Authority, Revenue Bonds,Ser. A 2.00 10/1/2029 1,000,000 991,983Geisinger Authority, Revenue Bonds, Refunding (GeisingerHealth System Obligated Group) 5.00 2/15/2027 5,010,000a 5,749,595Montgomery County Higher Education & Health Authority,Revenue Bonds, Refunding (Thomas Jefferson UniversityProject) 4.00 9/1/2034 1,155,000 1,282,724Pennsylvania, GO 3.00 5/15/2035 8,000,000 8,206,574Pennsylvania, GO 5.00 9/15/2029 7,000,000 8,017,397Pennsylvania, GO 5.00 3/15/2031 5,000,000 5,518,361Pennsylvania, GO, Refunding 4.00 1/1/2030 5,000,000 5,500,112Pennsylvania Economic Development Financing Authority,Revenue Bonds, Refunding (UPMC Obligated Group) 4.00 3/15/2032 3,305,000 3,602,211Pennsylvania Economic Development Financing Authority,Revenue Bonds, Refunding, Ser. A 4.00 11/15/2035 6,000,000 6,625,188Pennsylvania Economic Development Financing Authority,Revenue Bonds, Refunding, Ser. A 4.00 11/15/2036 3,750,000 4,138,617Pennsylvania Higher Educational Facilities Authority, RevenueBonds (The University of Pennsylvania Health SystemObligated Group) 4.00 8/15/2044 2,500,000 2,815,869
26
Copyright © 2022 www.secdatabase.com. All Rights Reserved.Please Consider the Environment Before Printing This Document
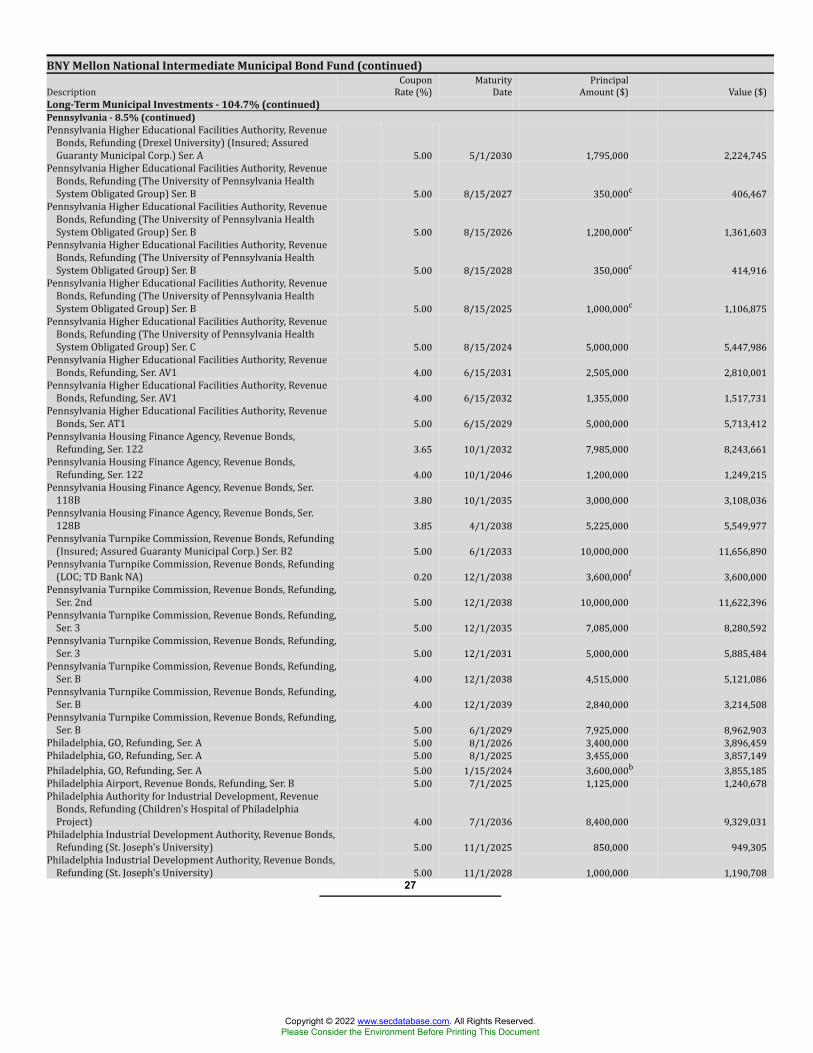
BNY Mellon National Intermediate Municipal Bond Fund (continued)Description CouponRate (%) MaturityDate PrincipalAmount ($) Value ($)Long-Term Municipal Investments - 104.7% (continued)Pennsylvania - 8.5% (continued)Pennsylvania Higher Educational Facilities Authority, RevenueBonds, Refunding (Drexel University) (Insured; AssuredGuaranty Municipal Corp.) Ser. A 5.00 5/1/2030 1,795,000 2,224,745Pennsylvania Higher Educational Facilities Authority, RevenueBonds, Refunding (The University of Pennsylvania HealthSystem Obligated Group) Ser. B 5.00 8/15/2027 350,000c 406,467Pennsylvania Higher Educational Facilities Authority, RevenueBonds, Refunding (The University of Pennsylvania HealthSystem Obligated Group) Ser. B 5.00 8/15/2026 1,200,000c 1,361,603Pennsylvania Higher Educational Facilities Authority, RevenueBonds, Refunding (The University of Pennsylvania HealthSystem Obligated Group) Ser. B 5.00 8/15/2028 350,000c 414,916Pennsylvania Higher Educational Facilities Authority, RevenueBonds, Refunding (The University of Pennsylvania HealthSystem Obligated Group) Ser. B 5.00 8/15/2025 1,000,000c 1,106,875Pennsylvania Higher Educational Facilities Authority, RevenueBonds, Refunding (The University of Pennsylvania HealthSystem Obligated Group) Ser. C 5.00 8/15/2024 5,000,000 5,447,986Pennsylvania Higher Educational Facilities Authority, RevenueBonds, Refunding, Ser. AV1 4.00 6/15/2031 2,505,000 2,810,001Pennsylvania Higher Educational Facilities Authority, RevenueBonds, Refunding, Ser. AV1 4.00 6/15/2032 1,355,000 1,517,731Pennsylvania Higher Educational Facilities Authority, RevenueBonds, Ser. AT1 5.00 6/15/2029 5,000,000 5,713,412Pennsylvania Housing Finance Agency, Revenue Bonds,Refunding, Ser. 122 3.65 10/1/2032 7,985,000 8,243,661Pennsylvania Housing Finance Agency, Revenue Bonds,Refunding, Ser. 122 4.00 10/1/2046 1,200,000 1,249,215Pennsylvania Housing Finance Agency, Revenue Bonds, Ser.118B 3.80 10/1/2035 3,000,000 3,108,036Pennsylvania Housing Finance Agency, Revenue Bonds, Ser.128B 3.85 4/1/2038 5,225,000 5,549,977Pennsylvania Turnpike Commission, Revenue Bonds, Refunding(Insured; Assured Guaranty Municipal Corp.) Ser. B2 5.00 6/1/2033 10,000,000 11,656,890Pennsylvania Turnpike Commission, Revenue Bonds, Refunding(LOC; TD Bank NA) 0.20 12/1/2038 3,600,000f 3,600,000Pennsylvania Turnpike Commission, Revenue Bonds, Refunding,Ser. 2nd 5.00 12/1/2038 10,000,000 11,622,396Pennsylvania Turnpike Commission, Revenue Bonds, Refunding,Ser. 3 5.00 12/1/2035 7,085,000 8,280,592Pennsylvania Turnpike Commission, Revenue Bonds, Refunding,Ser. 3 5.00 12/1/2031 5,000,000 5,885,484Pennsylvania Turnpike Commission, Revenue Bonds, Refunding,Ser. B 4.00 12/1/2038 4,515,000 5,121,086Pennsylvania Turnpike Commission, Revenue Bonds, Refunding,Ser. B 4.00 12/1/2039 2,840,000 3,214,508Pennsylvania Turnpike Commission, Revenue Bonds, Refunding,Ser. B 5.00 6/1/2029 7,925,000 8,962,903Philadelphia, GO, Refunding, Ser. A 5.00 8/1/2026 3,400,000 3,896,459Philadelphia, GO, Refunding, Ser. A 5.00 8/1/2025 3,455,000 3,857,149Philadelphia, GO, Refunding, Ser. A 5.00 1/15/2024 3,600,000b 3,855,185Philadelphia Airport, Revenue Bonds, Refunding, Ser. B 5.00 7/1/2025 1,125,000 1,240,678Philadelphia Authority for Industrial Development, RevenueBonds, Refunding (Children's Hospital of PhiladelphiaProject) 4.00 7/1/2036 8,400,000 9,329,031Philadelphia Industrial Development Authority, Revenue Bonds,Refunding (St. Joseph's University) 5.00 11/1/2025 850,000 949,305Philadelphia Industrial Development Authority, Revenue Bonds,Refunding (St. Joseph's University) 5.00 11/1/2028 1,000,000 1,190,708
27
Copyright © 2022 www.secdatabase.com. All Rights Reserved.Please Consider the Environment Before Printing This Document
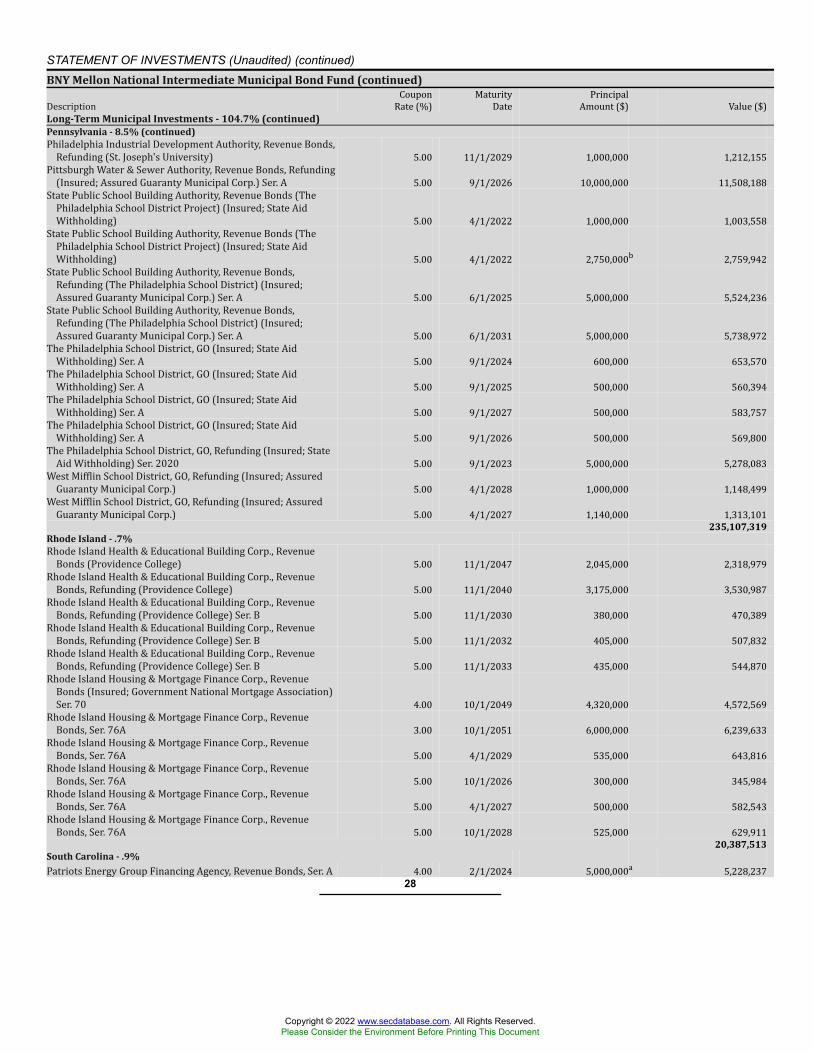
STATEMENT OF INVESTMENTS (Unaudited) (continued)BNY Mellon National Intermediate Municipal Bond Fund (continued)Description CouponRate (%) MaturityDate PrincipalAmount ($) Value ($)Long-Term Municipal Investments - 104.7% (continued)Pennsylvania - 8.5% (continued)Philadelphia Industrial Development Authority, Revenue Bonds,Refunding (St. Joseph's University) 5.00 11/1/2029 1,000,000 1,212,155Pittsburgh Water & Sewer Authority, Revenue Bonds, Refunding(Insured; Assured Guaranty Municipal Corp.) Ser. A 5.00 9/1/2026 10,000,000 11,508,188State Public School Building Authority, Revenue Bonds (ThePhiladelphia School District Project) (Insured; State AidWithholding) 5.00 4/1/2022 1,000,000 1,003,558State Public School Building Authority, Revenue Bonds (ThePhiladelphia School District Project) (Insured; State AidWithholding) 5.00 4/1/2022 2,750,000b 2,759,942State Public School Building Authority, Revenue Bonds,Refunding (The Philadelphia School District) (Insured;Assured Guaranty Municipal Corp.) Ser. A 5.00 6/1/2025 5,000,000 5,524,236State Public School Building Authority, Revenue Bonds,Refunding (The Philadelphia School District) (Insured;Assured Guaranty Municipal Corp.) Ser. A 5.00 6/1/2031 5,000,000 5,738,972The Philadelphia School District, GO (Insured; State AidWithholding) Ser. A 5.00 9/1/2024 600,000 653,570The Philadelphia School District, GO (Insured; State AidWithholding) Ser. A 5.00 9/1/2025 500,000 560,394The Philadelphia School District, GO (Insured; State AidWithholding) Ser. A 5.00 9/1/2027 500,000 583,757The Philadelphia School District, GO (Insured; State AidWithholding) Ser. A 5.00 9/1/2026 500,000 569,800The Philadelphia School District, GO, Refunding (Insured; StateAid Withholding) Ser. 2020 5.00 9/1/2023 5,000,000 5,278,083West Mifflin School District, GO, Refunding (Insured; AssuredGuaranty Municipal Corp.) 5.00 4/1/2028 1,000,000 1,148,499West Mifflin School District, GO, Refunding (Insured; AssuredGuaranty Municipal Corp.) 5.00 4/1/2027 1,140,000 1,313,101
235,107,319Rhode Island - .7%Rhode Island Health & Educational Building Corp., RevenueBonds (Providence College) 5.00 11/1/2047 2,045,000 2,318,979Rhode Island Health & Educational Building Corp., RevenueBonds, Refunding (Providence College) 5.00 11/1/2040 3,175,000 3,530,987Rhode Island Health & Educational Building Corp., RevenueBonds, Refunding (Providence College) Ser. B 5.00 11/1/2030 380,000 470,389Rhode Island Health & Educational Building Corp., RevenueBonds, Refunding (Providence College) Ser. B 5.00 11/1/2032 405,000 507,832Rhode Island Health & Educational Building Corp., RevenueBonds, Refunding (Providence College) Ser. B 5.00 11/1/2033 435,000 544,870Rhode Island Housing & Mortgage Finance Corp., RevenueBonds (Insured; Government National Mortgage Association)Ser. 70 4.00 10/1/2049 4,320,000 4,572,569Rhode Island Housing & Mortgage Finance Corp., RevenueBonds, Ser. 76A 3.00 10/1/2051 6,000,000 6,239,633Rhode Island Housing & Mortgage Finance Corp., RevenueBonds, Ser. 76A 5.00 4/1/2029 535,000 643,816Rhode Island Housing & Mortgage Finance Corp., RevenueBonds, Ser. 76A 5.00 10/1/2026 300,000 345,984Rhode Island Housing & Mortgage Finance Corp., RevenueBonds, Ser. 76A 5.00 4/1/2027 500,000 582,543Rhode Island Housing & Mortgage Finance Corp., RevenueBonds, Ser. 76A 5.00 10/1/2028 525,000 629,911
20,387,513South Carolina - .9%Patriots Energy Group Financing Agency, Revenue Bonds, Ser. A 4.00 2/1/2024 5,000,000a 5,228,237
28
Copyright © 2022 www.secdatabase.com. All Rights Reserved.Please Consider the Environment Before Printing This Document
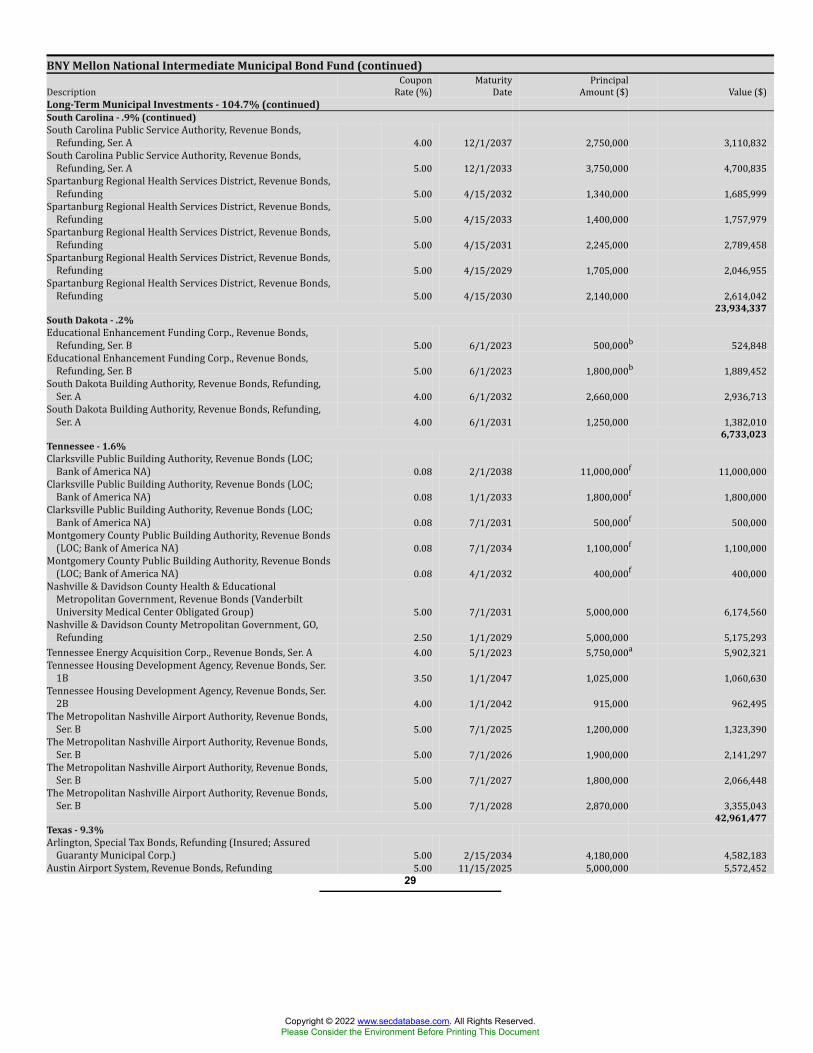
BNY Mellon National Intermediate Municipal Bond Fund (continued)Description CouponRate (%) MaturityDate PrincipalAmount ($) Value ($)Long-Term Municipal Investments - 104.7% (continued)South Carolina - .9% (continued)South Carolina Public Service Authority, Revenue Bonds,Refunding, Ser. A 4.00 12/1/2037 2,750,000 3,110,832South Carolina Public Service Authority, Revenue Bonds,Refunding, Ser. A 5.00 12/1/2033 3,750,000 4,700,835Spartanburg Regional Health Services District, Revenue Bonds,Refunding 5.00 4/15/2032 1,340,000 1,685,999Spartanburg Regional Health Services District, Revenue Bonds,Refunding 5.00 4/15/2033 1,400,000 1,757,979Spartanburg Regional Health Services District, Revenue Bonds,Refunding 5.00 4/15/2031 2,245,000 2,789,458Spartanburg Regional Health Services District, Revenue Bonds,Refunding 5.00 4/15/2029 1,705,000 2,046,955Spartanburg Regional Health Services District, Revenue Bonds,Refunding 5.00 4/15/2030 2,140,000 2,614,042
23,934,337South Dakota - .2%Educational Enhancement Funding Corp., Revenue Bonds,Refunding, Ser. B 5.00 6/1/2023 500,000b 524,848Educational Enhancement Funding Corp., Revenue Bonds,Refunding, Ser. B 5.00 6/1/2023 1,800,000b 1,889,452South Dakota Building Authority, Revenue Bonds, Refunding,Ser. A 4.00 6/1/2032 2,660,000 2,936,713South Dakota Building Authority, Revenue Bonds, Refunding,Ser. A 4.00 6/1/2031 1,250,000 1,382,010
6,733,023Tennessee - 1.6%Clarksville Public Building Authority, Revenue Bonds (LOC;Bank of America NA) 0.08 2/1/2038 11,000,000f 11,000,000Clarksville Public Building Authority, Revenue Bonds (LOC;Bank of America NA) 0.08 1/1/2033 1,800,000f 1,800,000Clarksville Public Building Authority, Revenue Bonds (LOC;Bank of America NA) 0.08 7/1/2031 500,000f 500,000Montgomery County Public Building Authority, Revenue Bonds(LOC; Bank of America NA) 0.08 7/1/2034 1,100,000f 1,100,000Montgomery County Public Building Authority, Revenue Bonds(LOC; Bank of America NA) 0.08 4/1/2032 400,000f 400,000Nashville & Davidson County Health & EducationalMetropolitan Government, Revenue Bonds (VanderbiltUniversity Medical Center Obligated Group) 5.00 7/1/2031 5,000,000 6,174,560Nashville & Davidson County Metropolitan Government, GO,Refunding 2.50 1/1/2029 5,000,000 5,175,293Tennessee Energy Acquisition Corp., Revenue Bonds, Ser. A 4.00 5/1/2023 5,750,000a 5,902,321Tennessee Housing Development Agency, Revenue Bonds, Ser.1B 3.50 1/1/2047 1,025,000 1,060,630Tennessee Housing Development Agency, Revenue Bonds, Ser.2B 4.00 1/1/2042 915,000 962,495The Metropolitan Nashville Airport Authority, Revenue Bonds,Ser. B 5.00 7/1/2025 1,200,000 1,323,390The Metropolitan Nashville Airport Authority, Revenue Bonds,Ser. B 5.00 7/1/2026 1,900,000 2,141,297The Metropolitan Nashville Airport Authority, Revenue Bonds,Ser. B 5.00 7/1/2027 1,800,000 2,066,448The Metropolitan Nashville Airport Authority, Revenue Bonds,Ser. B 5.00 7/1/2028 2,870,000 3,355,043
42,961,477Texas - 9.3%Arlington, Special Tax Bonds, Refunding (Insured; AssuredGuaranty Municipal Corp.) 5.00 2/15/2034 4,180,000 4,582,183Austin Airport System, Revenue Bonds, Refunding 5.00 11/15/2025 5,000,000 5,572,452
29
Copyright © 2022 www.secdatabase.com. All Rights Reserved.Please Consider the Environment Before Printing This Document
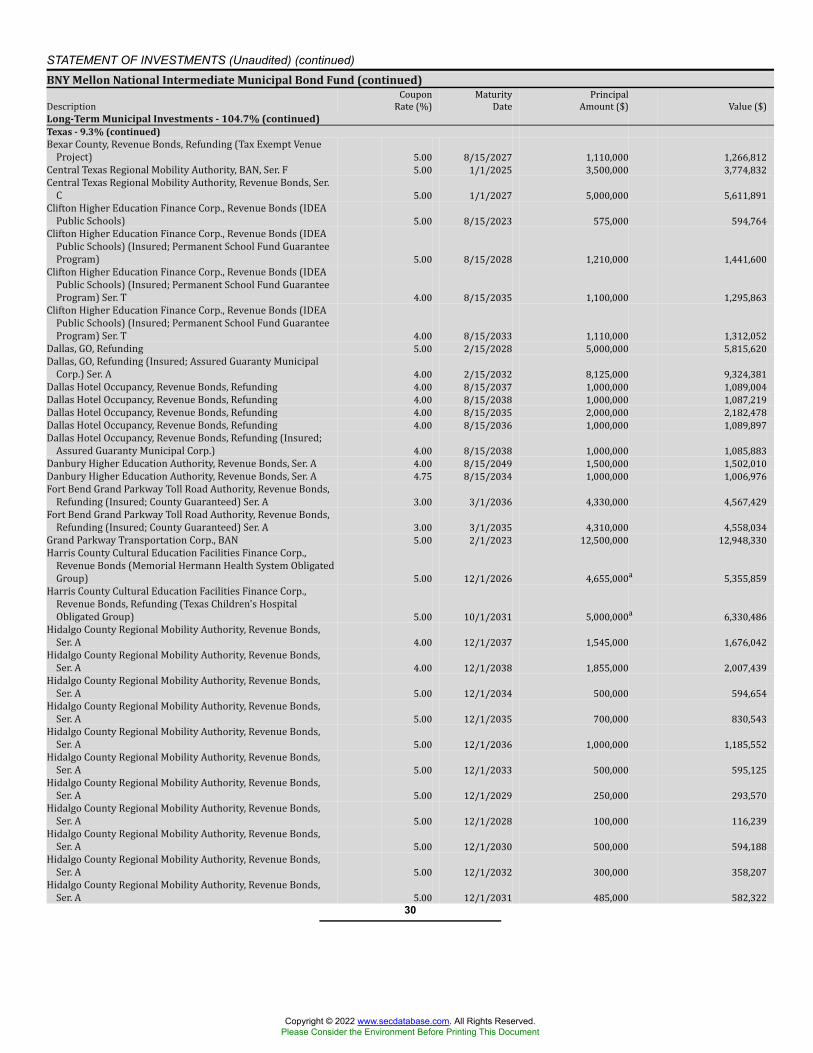
STATEMENT OF INVESTMENTS (Unaudited) (continued)BNY Mellon National Intermediate Municipal Bond Fund (continued)Description CouponRate (%) MaturityDate PrincipalAmount ($) Value ($)Long-Term Municipal Investments - 104.7% (continued)Texas - 9.3% (continued)Bexar County, Revenue Bonds, Refunding (Tax Exempt VenueProject) 5.00 8/15/2027 1,110,000 1,266,812Central Texas Regional Mobility Authority, BAN, Ser. F 5.00 1/1/2025 3,500,000 3,774,832Central Texas Regional Mobility Authority, Revenue Bonds, Ser.C 5.00 1/1/2027 5,000,000 5,611,891Clifton Higher Education Finance Corp., Revenue Bonds (IDEAPublic Schools) 5.00 8/15/2023 575,000 594,764Clifton Higher Education Finance Corp., Revenue Bonds (IDEAPublic Schools) (Insured; Permanent School Fund GuaranteeProgram) 5.00 8/15/2028 1,210,000 1,441,600Clifton Higher Education Finance Corp., Revenue Bonds (IDEAPublic Schools) (Insured; Permanent School Fund GuaranteeProgram) Ser. T 4.00 8/15/2035 1,100,000 1,295,863Clifton Higher Education Finance Corp., Revenue Bonds (IDEAPublic Schools) (Insured; Permanent School Fund GuaranteeProgram) Ser. T 4.00 8/15/2033 1,110,000 1,312,052Dallas, GO, Refunding 5.00 2/15/2028 5,000,000 5,815,620Dallas, GO, Refunding (Insured; Assured Guaranty MunicipalCorp.) Ser. A 4.00 2/15/2032 8,125,000 9,324,381Dallas Hotel Occupancy, Revenue Bonds, Refunding 4.00 8/15/2037 1,000,000 1,089,004Dallas Hotel Occupancy, Revenue Bonds, Refunding 4.00 8/15/2038 1,000,000 1,087,219Dallas Hotel Occupancy, Revenue Bonds, Refunding 4.00 8/15/2035 2,000,000 2,182,478Dallas Hotel Occupancy, Revenue Bonds, Refunding 4.00 8/15/2036 1,000,000 1,089,897Dallas Hotel Occupancy, Revenue Bonds, Refunding (Insured;Assured Guaranty Municipal Corp.) 4.00 8/15/2038 1,000,000 1,085,883Danbury Higher Education Authority, Revenue Bonds, Ser. A 4.00 8/15/2049 1,500,000 1,502,010Danbury Higher Education Authority, Revenue Bonds, Ser. A 4.75 8/15/2034 1,000,000 1,006,976Fort Bend Grand Parkway Toll Road Authority, Revenue Bonds,Refunding (Insured; County Guaranteed) Ser. A 3.00 3/1/2036 4,330,000 4,567,429Fort Bend Grand Parkway Toll Road Authority, Revenue Bonds,Refunding (Insured; County Guaranteed) Ser. A 3.00 3/1/2035 4,310,000 4,558,034Grand Parkway Transportation Corp., BAN 5.00 2/1/2023 12,500,000 12,948,330Harris County Cultural Education Facilities Finance Corp.,Revenue Bonds (Memorial Hermann Health System ObligatedGroup) 5.00 12/1/2026 4,655,000a 5,355,859Harris County Cultural Education Facilities Finance Corp.,Revenue Bonds, Refunding (Texas Children's HospitalObligated Group) 5.00 10/1/2031 5,000,000a 6,330,486Hidalgo County Regional Mobility Authority, Revenue Bonds,Ser. A 4.00 12/1/2037 1,545,000 1,676,042Hidalgo County Regional Mobility Authority, Revenue Bonds,Ser. A 4.00 12/1/2038 1,855,000 2,007,439Hidalgo County Regional Mobility Authority, Revenue Bonds,Ser. A 5.00 12/1/2034 500,000 594,654Hidalgo County Regional Mobility Authority, Revenue Bonds,Ser. A 5.00 12/1/2035 700,000 830,543Hidalgo County Regional Mobility Authority, Revenue Bonds,Ser. A 5.00 12/1/2036 1,000,000 1,185,552Hidalgo County Regional Mobility Authority, Revenue Bonds,Ser. A 5.00 12/1/2033 500,000 595,125Hidalgo County Regional Mobility Authority, Revenue Bonds,Ser. A 5.00 12/1/2029 250,000 293,570Hidalgo County Regional Mobility Authority, Revenue Bonds,Ser. A 5.00 12/1/2028 100,000 116,239Hidalgo County Regional Mobility Authority, Revenue Bonds,Ser. A 5.00 12/1/2030 500,000 594,188Hidalgo County Regional Mobility Authority, Revenue Bonds,Ser. A 5.00 12/1/2032 300,000 358,207Hidalgo County Regional Mobility Authority, Revenue Bonds,Ser. A 5.00 12/1/2031 485,000 582,322
30
Copyright © 2022 www.secdatabase.com. All Rights Reserved.Please Consider the Environment Before Printing This Document
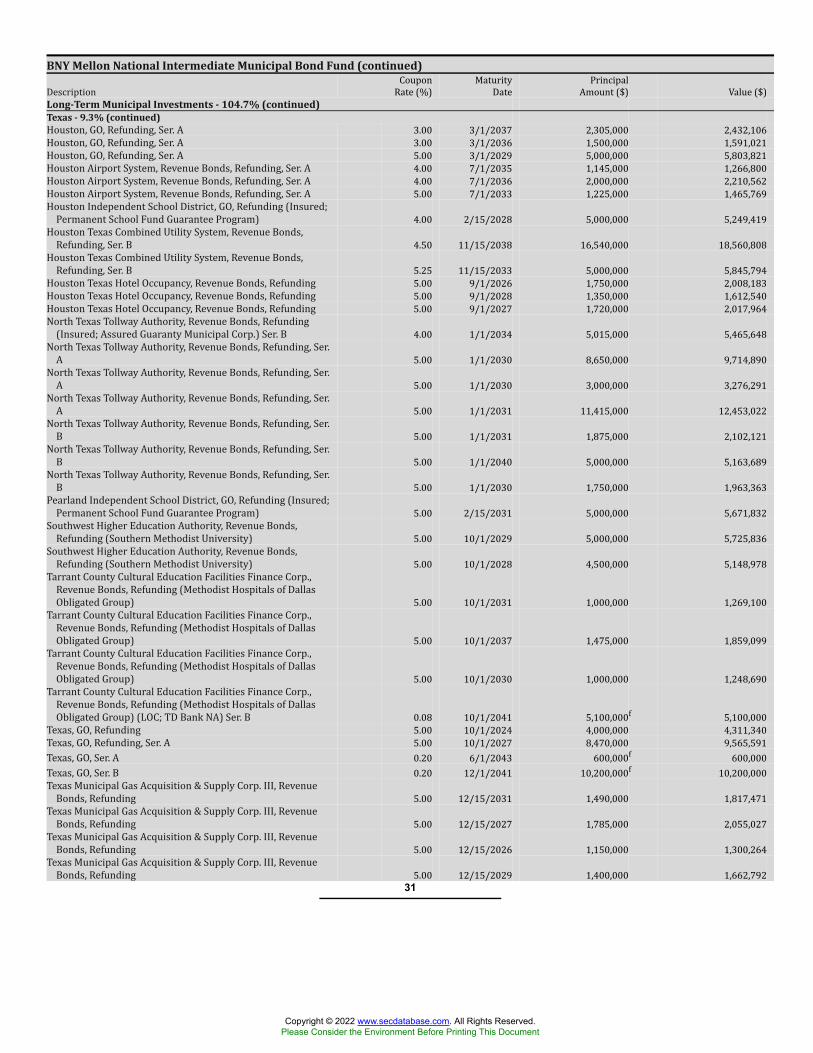
BNY Mellon National Intermediate Municipal Bond Fund (continued)Description CouponRate (%) MaturityDate PrincipalAmount ($) Value ($)Long-Term Municipal Investments - 104.7% (continued)Texas - 9.3% (continued)Houston, GO, Refunding, Ser. A 3.00 3/1/2037 2,305,000 2,432,106Houston, GO, Refunding, Ser. A 3.00 3/1/2036 1,500,000 1,591,021Houston, GO, Refunding, Ser. A 5.00 3/1/2029 5,000,000 5,803,821Houston Airport System, Revenue Bonds, Refunding, Ser. A 4.00 7/1/2035 1,145,000 1,266,800Houston Airport System, Revenue Bonds, Refunding, Ser. A 4.00 7/1/2036 2,000,000 2,210,562Houston Airport System, Revenue Bonds, Refunding, Ser. A 5.00 7/1/2033 1,225,000 1,465,769Houston Independent School District, GO, Refunding (Insured;Permanent School Fund Guarantee Program) 4.00 2/15/2028 5,000,000 5,249,419Houston Texas Combined Utility System, Revenue Bonds,Refunding, Ser. B 4.50 11/15/2038 16,540,000 18,560,808Houston Texas Combined Utility System, Revenue Bonds,Refunding, Ser. B 5.25 11/15/2033 5,000,000 5,845,794Houston Texas Hotel Occupancy, Revenue Bonds, Refunding 5.00 9/1/2026 1,750,000 2,008,183Houston Texas Hotel Occupancy, Revenue Bonds, Refunding 5.00 9/1/2028 1,350,000 1,612,540Houston Texas Hotel Occupancy, Revenue Bonds, Refunding 5.00 9/1/2027 1,720,000 2,017,964North Texas Tollway Authority, Revenue Bonds, Refunding(Insured; Assured Guaranty Municipal Corp.) Ser. B 4.00 1/1/2034 5,015,000 5,465,648North Texas Tollway Authority, Revenue Bonds, Refunding, Ser.A 5.00 1/1/2030 8,650,000 9,714,890North Texas Tollway Authority, Revenue Bonds, Refunding, Ser.A 5.00 1/1/2030 3,000,000 3,276,291North Texas Tollway Authority, Revenue Bonds, Refunding, Ser.A 5.00 1/1/2031 11,415,000 12,453,022North Texas Tollway Authority, Revenue Bonds, Refunding, Ser.B 5.00 1/1/2031 1,875,000 2,102,121North Texas Tollway Authority, Revenue Bonds, Refunding, Ser.B 5.00 1/1/2040 5,000,000 5,163,689North Texas Tollway Authority, Revenue Bonds, Refunding, Ser.B 5.00 1/1/2030 1,750,000 1,963,363Pearland Independent School District, GO, Refunding (Insured;Permanent School Fund Guarantee Program) 5.00 2/15/2031 5,000,000 5,671,832Southwest Higher Education Authority, Revenue Bonds,Refunding (Southern Methodist University) 5.00 10/1/2029 5,000,000 5,725,836Southwest Higher Education Authority, Revenue Bonds,Refunding (Southern Methodist University) 5.00 10/1/2028 4,500,000 5,148,978Tarrant County Cultural Education Facilities Finance Corp.,Revenue Bonds, Refunding (Methodist Hospitals of DallasObligated Group) 5.00 10/1/2031 1,000,000 1,269,100Tarrant County Cultural Education Facilities Finance Corp.,Revenue Bonds, Refunding (Methodist Hospitals of DallasObligated Group) 5.00 10/1/2037 1,475,000 1,859,099Tarrant County Cultural Education Facilities Finance Corp.,Revenue Bonds, Refunding (Methodist Hospitals of DallasObligated Group) 5.00 10/1/2030 1,000,000 1,248,690Tarrant County Cultural Education Facilities Finance Corp.,Revenue Bonds, Refunding (Methodist Hospitals of DallasObligated Group) (LOC; TD Bank NA) Ser. B 0.08 10/1/2041 5,100,000f 5,100,000Texas, GO, Refunding 5.00 10/1/2024 4,000,000 4,311,340Texas, GO, Refunding, Ser. A 5.00 10/1/2027 8,470,000 9,565,591Texas, GO, Ser. A 0.20 6/1/2043 600,000f 600,000Texas, GO, Ser. B 0.20 12/1/2041 10,200,000f 10,200,000Texas Municipal Gas Acquisition & Supply Corp. III, RevenueBonds, Refunding 5.00 12/15/2031 1,490,000 1,817,471Texas Municipal Gas Acquisition & Supply Corp. III, RevenueBonds, Refunding 5.00 12/15/2027 1,785,000 2,055,027Texas Municipal Gas Acquisition & Supply Corp. III, RevenueBonds, Refunding 5.00 12/15/2026 1,150,000 1,300,264Texas Municipal Gas Acquisition & Supply Corp. III, RevenueBonds, Refunding 5.00 12/15/2029 1,400,000 1,662,792
31
Copyright © 2022 www.secdatabase.com. All Rights Reserved.Please Consider the Environment Before Printing This Document
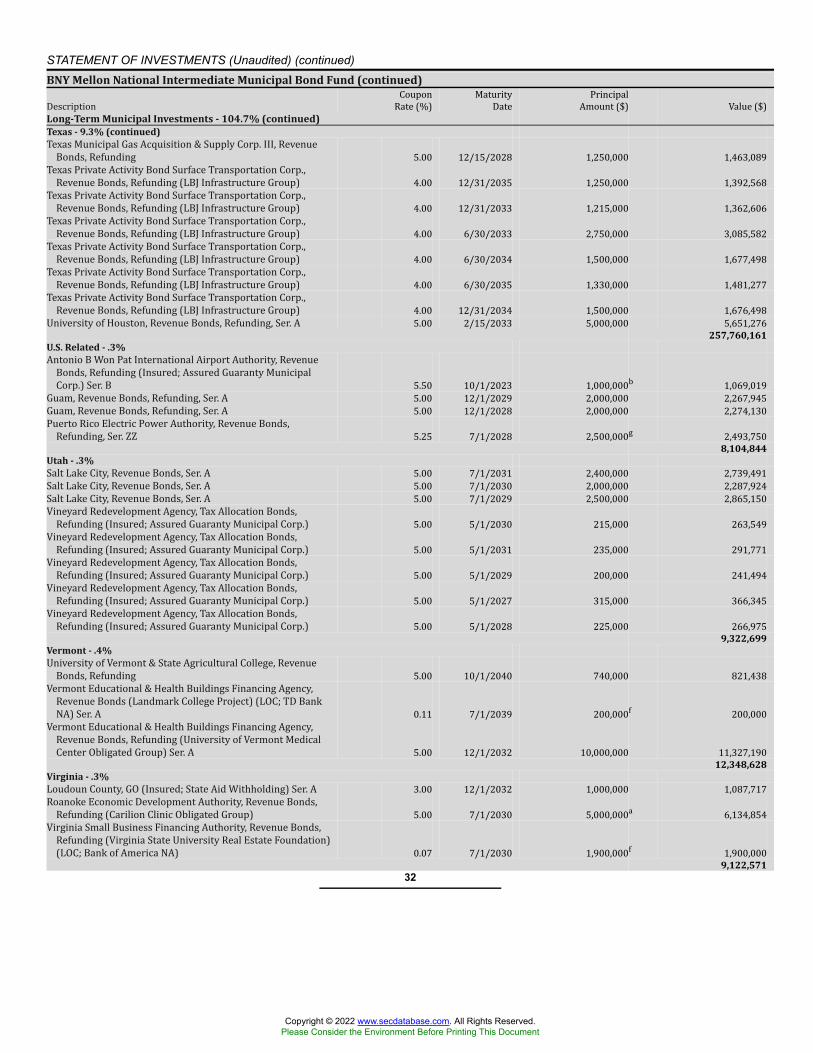
STATEMENT OF INVESTMENTS (Unaudited) (continued)BNY Mellon National Intermediate Municipal Bond Fund (continued)Description CouponRate (%) MaturityDate PrincipalAmount ($) Value ($)Long-Term Municipal Investments - 104.7% (continued)Texas - 9.3% (continued)Texas Municipal Gas Acquisition & Supply Corp. III, RevenueBonds, Refunding 5.00 12/15/2028 1,250,000 1,463,089Texas Private Activity Bond Surface Transportation Corp.,Revenue Bonds, Refunding (LBJ Infrastructure Group) 4.00 12/31/2035 1,250,000 1,392,568Texas Private Activity Bond Surface Transportation Corp.,Revenue Bonds, Refunding (LBJ Infrastructure Group) 4.00 12/31/2033 1,215,000 1,362,606Texas Private Activity Bond Surface Transportation Corp.,Revenue Bonds, Refunding (LBJ Infrastructure Group) 4.00 6/30/2033 2,750,000 3,085,582Texas Private Activity Bond Surface Transportation Corp.,Revenue Bonds, Refunding (LBJ Infrastructure Group) 4.00 6/30/2034 1,500,000 1,677,498Texas Private Activity Bond Surface Transportation Corp.,Revenue Bonds, Refunding (LBJ Infrastructure Group) 4.00 6/30/2035 1,330,000 1,481,277Texas Private Activity Bond Surface Transportation Corp.,Revenue Bonds, Refunding (LBJ Infrastructure Group) 4.00 12/31/2034 1,500,000 1,676,498University of Houston, Revenue Bonds, Refunding, Ser. A 5.00 2/15/2033 5,000,000 5,651,276
257,760,161U.S. Related - .3%Antonio B Won Pat International Airport Authority, RevenueBonds, Refunding (Insured; Assured Guaranty MunicipalCorp.) Ser. B 5.50 10/1/2023 1,000,000b 1,069,019Guam, Revenue Bonds, Refunding, Ser. A 5.00 12/1/2029 2,000,000 2,267,945Guam, Revenue Bonds, Refunding, Ser. A 5.00 12/1/2028 2,000,000 2,274,130Puerto Rico Electric Power Authority, Revenue Bonds,Refunding, Ser. ZZ 5.25 7/1/2028 2,500,000g 2,493,750
8,104,844Utah - .3%Salt Lake City, Revenue Bonds, Ser. A 5.00 7/1/2031 2,400,000 2,739,491Salt Lake City, Revenue Bonds, Ser. A 5.00 7/1/2030 2,000,000 2,287,924Salt Lake City, Revenue Bonds, Ser. A 5.00 7/1/2029 2,500,000 2,865,150Vineyard Redevelopment Agency, Tax Allocation Bonds,Refunding (Insured; Assured Guaranty Municipal Corp.) 5.00 5/1/2030 215,000 263,549Vineyard Redevelopment Agency, Tax Allocation Bonds,Refunding (Insured; Assured Guaranty Municipal Corp.) 5.00 5/1/2031 235,000 291,771Vineyard Redevelopment Agency, Tax Allocation Bonds,Refunding (Insured; Assured Guaranty Municipal Corp.) 5.00 5/1/2029 200,000 241,494Vineyard Redevelopment Agency, Tax Allocation Bonds,Refunding (Insured; Assured Guaranty Municipal Corp.) 5.00 5/1/2027 315,000 366,345Vineyard Redevelopment Agency, Tax Allocation Bonds,Refunding (Insured; Assured Guaranty Municipal Corp.) 5.00 5/1/2028 225,000 266,975
9,322,699Vermont - .4%University of Vermont & State Agricultural College, RevenueBonds, Refunding 5.00 10/1/2040 740,000 821,438Vermont Educational & Health Buildings Financing Agency,Revenue Bonds (Landmark College Project) (LOC; TD BankNA) Ser. A 0.11 7/1/2039 200,000f 200,000Vermont Educational & Health Buildings Financing Agency,Revenue Bonds, Refunding (University of Vermont MedicalCenter Obligated Group) Ser. A 5.00 12/1/2032 10,000,000 11,327,190
12,348,628Virginia - .3%Loudoun County, GO (Insured; State Aid Withholding) Ser. A 3.00 12/1/2032 1,000,000 1,087,717Roanoke Economic Development Authority, Revenue Bonds,Refunding (Carilion Clinic Obligated Group) 5.00 7/1/2030 5,000,000a 6,134,854Virginia Small Business Financing Authority, Revenue Bonds,Refunding (Virginia State University Real Estate Foundation)(LOC; Bank of America NA) 0.07 7/1/2030 1,900,000f 1,900,000
9,122,57132
Copyright © 2022 www.secdatabase.com. All Rights Reserved.Please Consider the Environment Before Printing This Document
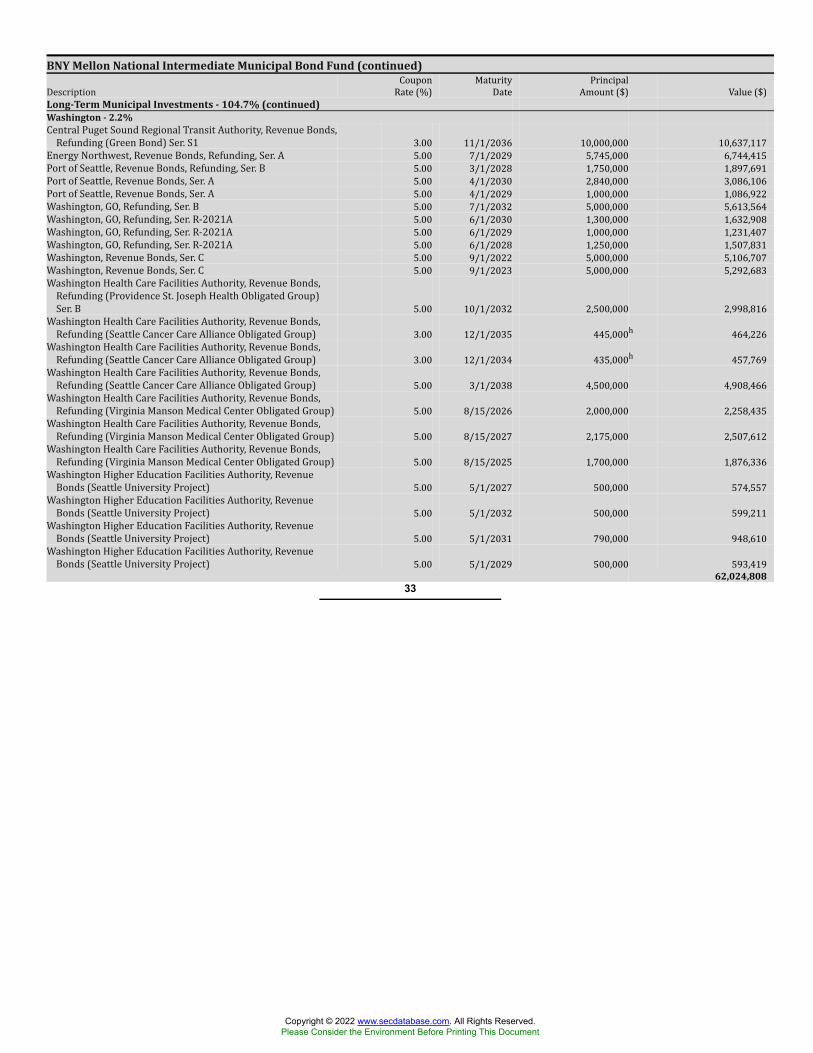
BNY Mellon National Intermediate Municipal Bond Fund (continued)Description CouponRate (%) MaturityDate PrincipalAmount ($) Value ($)Long-Term Municipal Investments - 104.7% (continued)Washington - 2.2%Central Puget Sound Regional Transit Authority, Revenue Bonds,Refunding (Green Bond) Ser. S1 3.00 11/1/2036 10,000,000 10,637,117Energy Northwest, Revenue Bonds, Refunding, Ser. A 5.00 7/1/2029 5,745,000 6,744,415Port of Seattle, Revenue Bonds, Refunding, Ser. B 5.00 3/1/2028 1,750,000 1,897,691Port of Seattle, Revenue Bonds, Ser. A 5.00 4/1/2030 2,840,000 3,086,106Port of Seattle, Revenue Bonds, Ser. A 5.00 4/1/2029 1,000,000 1,086,922Washington, GO, Refunding, Ser. B 5.00 7/1/2032 5,000,000 5,613,564Washington, GO, Refunding, Ser. R-2021A 5.00 6/1/2030 1,300,000 1,632,908Washington, GO, Refunding, Ser. R-2021A 5.00 6/1/2029 1,000,000 1,231,407Washington, GO, Refunding, Ser. R-2021A 5.00 6/1/2028 1,250,000 1,507,831Washington, Revenue Bonds, Ser. C 5.00 9/1/2022 5,000,000 5,106,707Washington, Revenue Bonds, Ser. C 5.00 9/1/2023 5,000,000 5,292,683Washington Health Care Facilities Authority, Revenue Bonds,Refunding (Providence St. Joseph Health Obligated Group)Ser. B 5.00 10/1/2032 2,500,000 2,998,816Washington Health Care Facilities Authority, Revenue Bonds,Refunding (Seattle Cancer Care Alliance Obligated Group) 3.00 12/1/2035 445,000h 464,226Washington Health Care Facilities Authority, Revenue Bonds,Refunding (Seattle Cancer Care Alliance Obligated Group) 3.00 12/1/2034 435,000h 457,769Washington Health Care Facilities Authority, Revenue Bonds,Refunding (Seattle Cancer Care Alliance Obligated Group) 5.00 3/1/2038 4,500,000 4,908,466Washington Health Care Facilities Authority, Revenue Bonds,Refunding (Virginia Manson Medical Center Obligated Group) 5.00 8/15/2026 2,000,000 2,258,435Washington Health Care Facilities Authority, Revenue Bonds,Refunding (Virginia Manson Medical Center Obligated Group) 5.00 8/15/2027 2,175,000 2,507,612Washington Health Care Facilities Authority, Revenue Bonds,Refunding (Virginia Manson Medical Center Obligated Group) 5.00 8/15/2025 1,700,000 1,876,336Washington Higher Education Facilities Authority, RevenueBonds (Seattle University Project) 5.00 5/1/2027 500,000 574,557Washington Higher Education Facilities Authority, RevenueBonds (Seattle University Project) 5.00 5/1/2032 500,000 599,211Washington Higher Education Facilities Authority, RevenueBonds (Seattle University Project) 5.00 5/1/2031 790,000 948,610Washington Higher Education Facilities Authority, RevenueBonds (Seattle University Project) 5.00 5/1/2029 500,000 593,419
62,024,80833
Copyright © 2022 www.secdatabase.com. All Rights Reserved.Please Consider the Environment Before Printing This Document
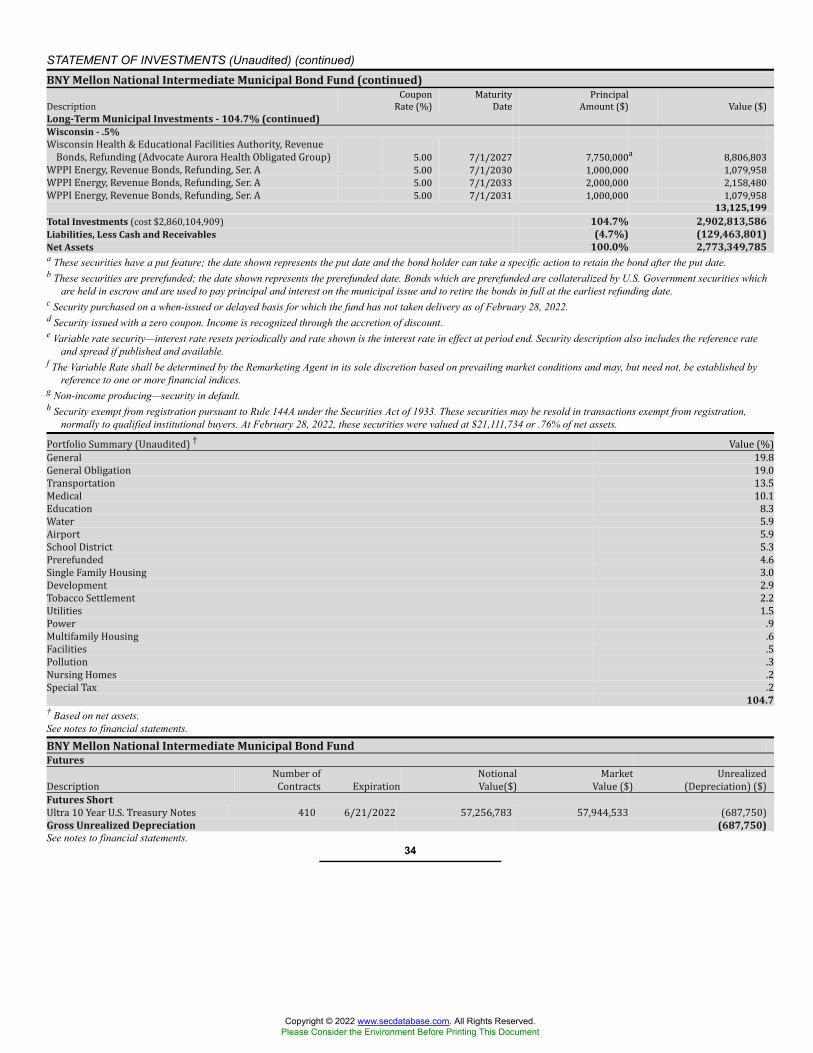
STATEMENT OF INVESTMENTS (Unaudited) (continued)BNY Mellon National Intermediate Municipal Bond Fund (continued)Description CouponRate (%) MaturityDate PrincipalAmount ($) Value ($)Long-Term Municipal Investments - 104.7% (continued)Wisconsin - .5%Wisconsin Health & Educational Facilities Authority, RevenueBonds, Refunding (Advocate Aurora Health Obligated Group) 5.00 7/1/2027 7,750,000a 8,806,803WPPI Energy, Revenue Bonds, Refunding, Ser. A 5.00 7/1/2030 1,000,000 1,079,958WPPI Energy, Revenue Bonds, Refunding, Ser. A 5.00 7/1/2033 2,000,000 2,158,480WPPI Energy, Revenue Bonds, Refunding, Ser. A 5.00 7/1/2031 1,000,000 1,079,958
13,125,199Total Investments (cost $2,860,104,909) 104.7% 2,902,813,586Liabilities, Less Cash and Receivables (4.7%) (129,463,801)Net Assets 100.0% 2,773,349,785a These securities have a put feature; the date shown represents the put date and the bond holder can take a specific action to retain the bond after the put date.b These securities are prerefunded; the date shown represents the prerefunded date. Bonds which are prerefunded are collateralized by U.S. Government securities which
are held in escrow and are used to pay principal and interest on the municipal issue and to retire the bonds in full at the earliest refunding date.c Security purchased on a when-issued or delayed basis for which the fund has not taken delivery as of February 28, 2022.d Security issued with a zero coupon. Income is recognized through the accretion of discount.e Variable rate security—interest rate resets periodically and rate shown is the interest rate in effect at period end. Security description also includes the reference rate
and spread if published and available.f The Variable Rate shall be determined by the Remarketing Agent in its sole discretion based on prevailing market conditions and may, but need not, be established by
reference to one or more financial indices.g Non-income producing—security in default.h Security exempt from registration pursuant to Rule 144A under the Securities Act of 1933. These securities may be resold in transactions exempt from registration,
normally to qualified institutional buyers. At February 28, 2022, these securities were valued at $21,111,734 or .76% of net assets.Portfolio Summary (Unaudited) † Value (%)General 19.8General Obligation 19.0Transportation 13.5Medical 10.1Education 8.3Water 5.9Airport 5.9School District 5.3Prerefunded 4.6Single Family Housing 3.0Development 2.9Tobacco Settlement 2.2Utilities 1.5Power .9Multifamily Housing .6Facilities .5Pollution .3Nursing Homes .2Special Tax .2104.7
† Based on net assets.See notes to financial statements.
BNY Mellon National Intermediate Municipal Bond FundFuturesDescription Number ofContracts Expiration NotionalValue($) MarketValue ($) Unrealized(Depreciation) ($)Futures ShortUltra 10 Year U.S. Treasury Notes 410 6/21/2022 57,256,783 57,944,533 (687,750)Gross Unrealized Depreciation (687,750)See notes to financial statements.
34
Copyright © 2022 www.secdatabase.com. All Rights Reserved.Please Consider the Environment Before Printing This Document
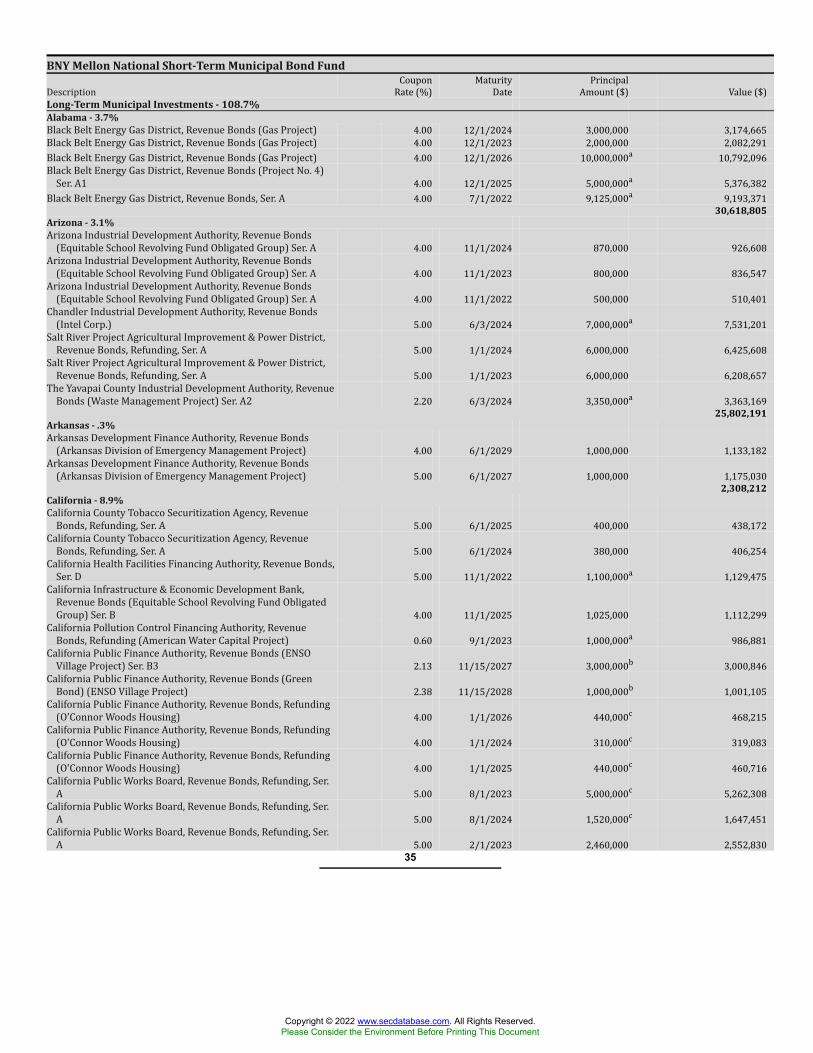
BNY Mellon National Short-Term Municipal Bond FundDescription CouponRate (%) MaturityDate PrincipalAmount ($) Value ($)Long-Term Municipal Investments - 108.7%Alabama - 3.7%Black Belt Energy Gas District, Revenue Bonds (Gas Project) 4.00 12/1/2024 3,000,000 3,174,665Black Belt Energy Gas District, Revenue Bonds (Gas Project) 4.00 12/1/2023 2,000,000 2,082,291Black Belt Energy Gas District, Revenue Bonds (Gas Project) 4.00 12/1/2026 10,000,000a 10,792,096Black Belt Energy Gas District, Revenue Bonds (Project No. 4)Ser. A1 4.00 12/1/2025 5,000,000a 5,376,382Black Belt Energy Gas District, Revenue Bonds, Ser. A 4.00 7/1/2022 9,125,000a 9,193,371
30,618,805Arizona - 3.1%Arizona Industrial Development Authority, Revenue Bonds(Equitable School Revolving Fund Obligated Group) Ser. A 4.00 11/1/2024 870,000 926,608Arizona Industrial Development Authority, Revenue Bonds(Equitable School Revolving Fund Obligated Group) Ser. A 4.00 11/1/2023 800,000 836,547Arizona Industrial Development Authority, Revenue Bonds(Equitable School Revolving Fund Obligated Group) Ser. A 4.00 11/1/2022 500,000 510,401Chandler Industrial Development Authority, Revenue Bonds(Intel Corp.) 5.00 6/3/2024 7,000,000a 7,531,201Salt River Project Agricultural Improvement & Power District,Revenue Bonds, Refunding, Ser. A 5.00 1/1/2024 6,000,000 6,425,608Salt River Project Agricultural Improvement & Power District,Revenue Bonds, Refunding, Ser. A 5.00 1/1/2023 6,000,000 6,208,657The Yavapai County Industrial Development Authority, RevenueBonds (Waste Management Project) Ser. A2 2.20 6/3/2024 3,350,000a 3,363,169
25,802,191Arkansas - .3%Arkansas Development Finance Authority, Revenue Bonds(Arkansas Division of Emergency Management Project) 4.00 6/1/2029 1,000,000 1,133,182Arkansas Development Finance Authority, Revenue Bonds(Arkansas Division of Emergency Management Project) 5.00 6/1/2027 1,000,000 1,175,030
2,308,212California - 8.9%California County Tobacco Securitization Agency, RevenueBonds, Refunding, Ser. A 5.00 6/1/2025 400,000 438,172California County Tobacco Securitization Agency, RevenueBonds, Refunding, Ser. A 5.00 6/1/2024 380,000 406,254California Health Facilities Financing Authority, Revenue Bonds,Ser. D 5.00 11/1/2022 1,100,000a 1,129,475California Infrastructure & Economic Development Bank,Revenue Bonds (Equitable School Revolving Fund ObligatedGroup) Ser. B 4.00 11/1/2025 1,025,000 1,112,299California Pollution Control Financing Authority, RevenueBonds, Refunding (American Water Capital Project) 0.60 9/1/2023 1,000,000a 986,881California Public Finance Authority, Revenue Bonds (ENSOVillage Project) Ser. B3 2.13 11/15/2027 3,000,000b 3,000,846California Public Finance Authority, Revenue Bonds (GreenBond) (ENSO Village Project) 2.38 11/15/2028 1,000,000b 1,001,105California Public Finance Authority, Revenue Bonds, Refunding(O'Connor Woods Housing) 4.00 1/1/2026 440,000c 468,215California Public Finance Authority, Revenue Bonds, Refunding(O'Connor Woods Housing) 4.00 1/1/2024 310,000c 319,083California Public Finance Authority, Revenue Bonds, Refunding(O'Connor Woods Housing) 4.00 1/1/2025 440,000c 460,716California Public Works Board, Revenue Bonds, Refunding, Ser.A 5.00 8/1/2023 5,000,000c 5,262,308California Public Works Board, Revenue Bonds, Refunding, Ser.A 5.00 8/1/2024 1,520,000c 1,647,451California Public Works Board, Revenue Bonds, Refunding, Ser.A 5.00 2/1/2023 2,460,000 2,552,830
35
Copyright © 2022 www.secdatabase.com. All Rights Reserved.Please Consider the Environment Before Printing This Document
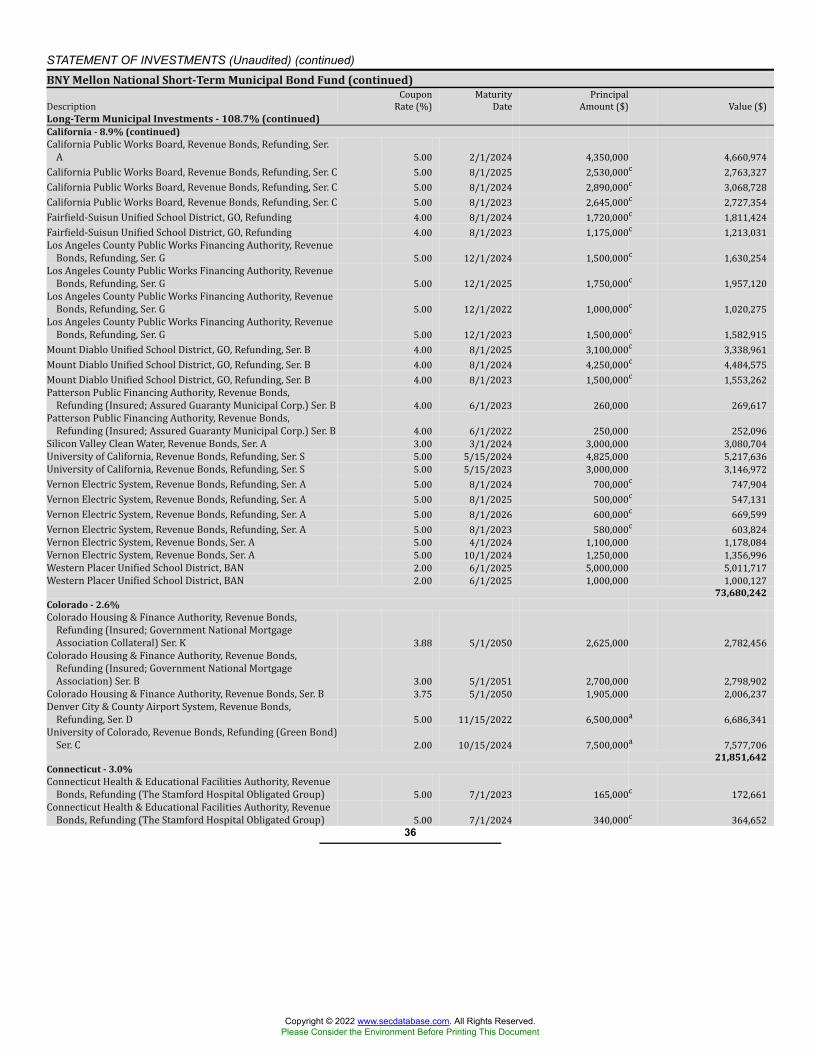
STATEMENT OF INVESTMENTS (Unaudited) (continued)BNY Mellon National Short-Term Municipal Bond Fund (continued)Description CouponRate (%) MaturityDate PrincipalAmount ($) Value ($)Long-Term Municipal Investments - 108.7% (continued)California - 8.9% (continued)California Public Works Board, Revenue Bonds, Refunding, Ser.A 5.00 2/1/2024 4,350,000 4,660,974California Public Works Board, Revenue Bonds, Refunding, Ser. C 5.00 8/1/2025 2,530,000c 2,763,327California Public Works Board, Revenue Bonds, Refunding, Ser. C 5.00 8/1/2024 2,890,000c 3,068,728California Public Works Board, Revenue Bonds, Refunding, Ser. C 5.00 8/1/2023 2,645,000c 2,727,354Fairfield-Suisun Unified School District, GO, Refunding 4.00 8/1/2024 1,720,000c 1,811,424Fairfield-Suisun Unified School District, GO, Refunding 4.00 8/1/2023 1,175,000c 1,213,031Los Angeles County Public Works Financing Authority, RevenueBonds, Refunding, Ser. G 5.00 12/1/2024 1,500,000c 1,630,254Los Angeles County Public Works Financing Authority, RevenueBonds, Refunding, Ser. G 5.00 12/1/2025 1,750,000c 1,957,120Los Angeles County Public Works Financing Authority, RevenueBonds, Refunding, Ser. G 5.00 12/1/2022 1,000,000c 1,020,275Los Angeles County Public Works Financing Authority, RevenueBonds, Refunding, Ser. G 5.00 12/1/2023 1,500,000c 1,582,915Mount Diablo Unified School District, GO, Refunding, Ser. B 4.00 8/1/2025 3,100,000c 3,338,961Mount Diablo Unified School District, GO, Refunding, Ser. B 4.00 8/1/2024 4,250,000c 4,484,575Mount Diablo Unified School District, GO, Refunding, Ser. B 4.00 8/1/2023 1,500,000c 1,553,262Patterson Public Financing Authority, Revenue Bonds,Refunding (Insured; Assured Guaranty Municipal Corp.) Ser. B 4.00 6/1/2023 260,000 269,617Patterson Public Financing Authority, Revenue Bonds,Refunding (Insured; Assured Guaranty Municipal Corp.) Ser. B 4.00 6/1/2022 250,000 252,096Silicon Valley Clean Water, Revenue Bonds, Ser. A 3.00 3/1/2024 3,000,000 3,080,704University of California, Revenue Bonds, Refunding, Ser. S 5.00 5/15/2024 4,825,000 5,217,636University of California, Revenue Bonds, Refunding, Ser. S 5.00 5/15/2023 3,000,000 3,146,972Vernon Electric System, Revenue Bonds, Refunding, Ser. A 5.00 8/1/2024 700,000c 747,904Vernon Electric System, Revenue Bonds, Refunding, Ser. A 5.00 8/1/2025 500,000c 547,131Vernon Electric System, Revenue Bonds, Refunding, Ser. A 5.00 8/1/2026 600,000c 669,599Vernon Electric System, Revenue Bonds, Refunding, Ser. A 5.00 8/1/2023 580,000c 603,824Vernon Electric System, Revenue Bonds, Ser. A 5.00 4/1/2024 1,100,000 1,178,084Vernon Electric System, Revenue Bonds, Ser. A 5.00 10/1/2024 1,250,000 1,356,996Western Placer Unified School District, BAN 2.00 6/1/2025 5,000,000 5,011,717Western Placer Unified School District, BAN 2.00 6/1/2025 1,000,000 1,000,127
73,680,242Colorado - 2.6%Colorado Housing & Finance Authority, Revenue Bonds,Refunding (Insured; Government National MortgageAssociation Collateral) Ser. K 3.88 5/1/2050 2,625,000 2,782,456Colorado Housing & Finance Authority, Revenue Bonds,Refunding (Insured; Government National MortgageAssociation) Ser. B 3.00 5/1/2051 2,700,000 2,798,902Colorado Housing & Finance Authority, Revenue Bonds, Ser. B 3.75 5/1/2050 1,905,000 2,006,237Denver City & County Airport System, Revenue Bonds,Refunding, Ser. D 5.00 11/15/2022 6,500,000a 6,686,341University of Colorado, Revenue Bonds, Refunding (Green Bond)Ser. C 2.00 10/15/2024 7,500,000a 7,577,706
21,851,642Connecticut - 3.0%Connecticut Health & Educational Facilities Authority, RevenueBonds, Refunding (The Stamford Hospital Obligated Group) 5.00 7/1/2023 165,000c 172,661Connecticut Health & Educational Facilities Authority, RevenueBonds, Refunding (The Stamford Hospital Obligated Group) 5.00 7/1/2024 340,000c 364,652
36
Copyright © 2022 www.secdatabase.com. All Rights Reserved.Please Consider the Environment Before Printing This Document
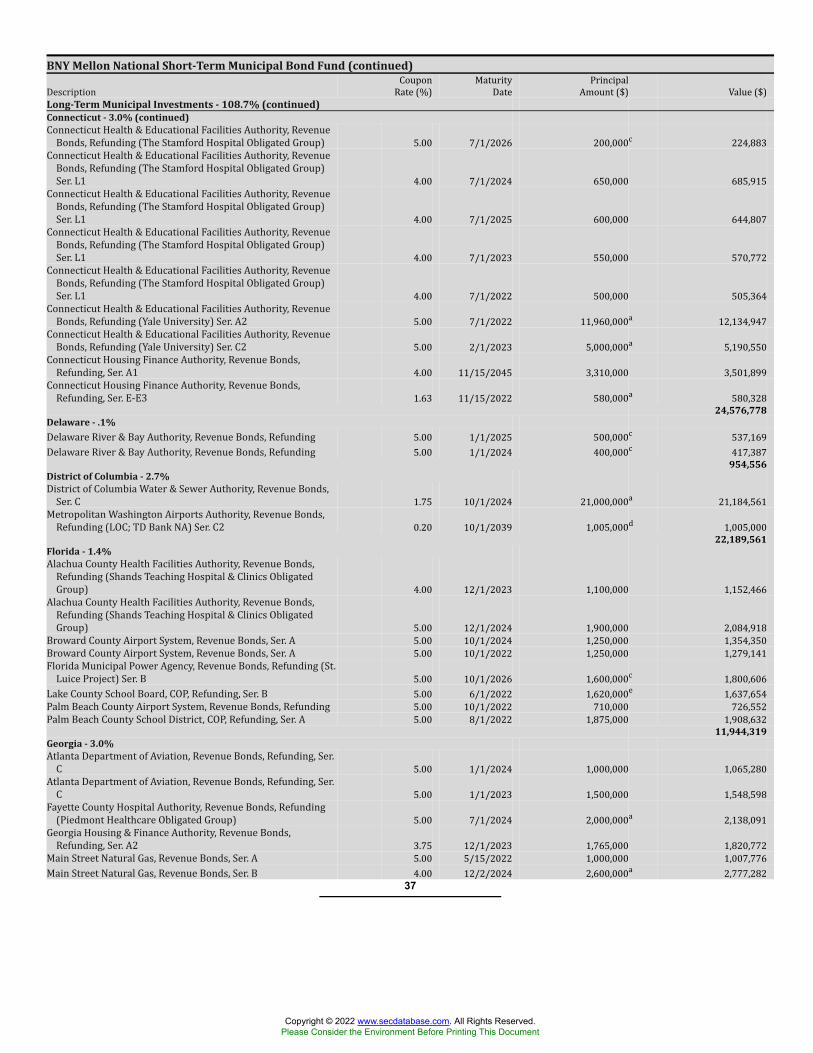
BNY Mellon National Short-Term Municipal Bond Fund (continued)Description CouponRate (%) MaturityDate PrincipalAmount ($) Value ($)Long-Term Municipal Investments - 108.7% (continued)Connecticut - 3.0% (continued)Connecticut Health & Educational Facilities Authority, RevenueBonds, Refunding (The Stamford Hospital Obligated Group) 5.00 7/1/2026 200,000c 224,883Connecticut Health & Educational Facilities Authority, RevenueBonds, Refunding (The Stamford Hospital Obligated Group)Ser. L1 4.00 7/1/2024 650,000 685,915Connecticut Health & Educational Facilities Authority, RevenueBonds, Refunding (The Stamford Hospital Obligated Group)Ser. L1 4.00 7/1/2025 600,000 644,807Connecticut Health & Educational Facilities Authority, RevenueBonds, Refunding (The Stamford Hospital Obligated Group)Ser. L1 4.00 7/1/2023 550,000 570,772Connecticut Health & Educational Facilities Authority, RevenueBonds, Refunding (The Stamford Hospital Obligated Group)Ser. L1 4.00 7/1/2022 500,000 505,364Connecticut Health & Educational Facilities Authority, RevenueBonds, Refunding (Yale University) Ser. A2 5.00 7/1/2022 11,960,000a 12,134,947Connecticut Health & Educational Facilities Authority, RevenueBonds, Refunding (Yale University) Ser. C2 5.00 2/1/2023 5,000,000a 5,190,550Connecticut Housing Finance Authority, Revenue Bonds,Refunding, Ser. A1 4.00 11/15/2045 3,310,000 3,501,899Connecticut Housing Finance Authority, Revenue Bonds,Refunding, Ser. E-E3 1.63 11/15/2022 580,000a 580,328
24,576,778Delaware - .1%Delaware River & Bay Authority, Revenue Bonds, Refunding 5.00 1/1/2025 500,000c 537,169Delaware River & Bay Authority, Revenue Bonds, Refunding 5.00 1/1/2024 400,000c 417,387
954,556District of Columbia - 2.7%District of Columbia Water & Sewer Authority, Revenue Bonds,Ser. C 1.75 10/1/2024 21,000,000a 21,184,561Metropolitan Washington Airports Authority, Revenue Bonds,Refunding (LOC; TD Bank NA) Ser. C2 0.20 10/1/2039 1,005,000d 1,005,000
22,189,561Florida - 1.4%Alachua County Health Facilities Authority, Revenue Bonds,Refunding (Shands Teaching Hospital & Clinics ObligatedGroup) 4.00 12/1/2023 1,100,000 1,152,466Alachua County Health Facilities Authority, Revenue Bonds,Refunding (Shands Teaching Hospital & Clinics ObligatedGroup) 5.00 12/1/2024 1,900,000 2,084,918Broward County Airport System, Revenue Bonds, Ser. A 5.00 10/1/2024 1,250,000 1,354,350Broward County Airport System, Revenue Bonds, Ser. A 5.00 10/1/2022 1,250,000 1,279,141Florida Municipal Power Agency, Revenue Bonds, Refunding (St.Luice Project) Ser. B 5.00 10/1/2026 1,600,000c 1,800,606Lake County School Board, COP, Refunding, Ser. B 5.00 6/1/2022 1,620,000e 1,637,654Palm Beach County Airport System, Revenue Bonds, Refunding 5.00 10/1/2022 710,000 726,552Palm Beach County School District, COP, Refunding, Ser. A 5.00 8/1/2022 1,875,000 1,908,632
11,944,319Georgia - 3.0%Atlanta Department of Aviation, Revenue Bonds, Refunding, Ser.C 5.00 1/1/2024 1,000,000 1,065,280Atlanta Department of Aviation, Revenue Bonds, Refunding, Ser.C 5.00 1/1/2023 1,500,000 1,548,598Fayette County Hospital Authority, Revenue Bonds, Refunding(Piedmont Healthcare Obligated Group) 5.00 7/1/2024 2,000,000a 2,138,091Georgia Housing & Finance Authority, Revenue Bonds,Refunding, Ser. A2 3.75 12/1/2023 1,765,000 1,820,772Main Street Natural Gas, Revenue Bonds, Ser. A 5.00 5/15/2022 1,000,000 1,007,776Main Street Natural Gas, Revenue Bonds, Ser. B 4.00 12/2/2024 2,600,000a 2,777,282
37
Copyright © 2022 www.secdatabase.com. All Rights Reserved.Please Consider the Environment Before Printing This Document
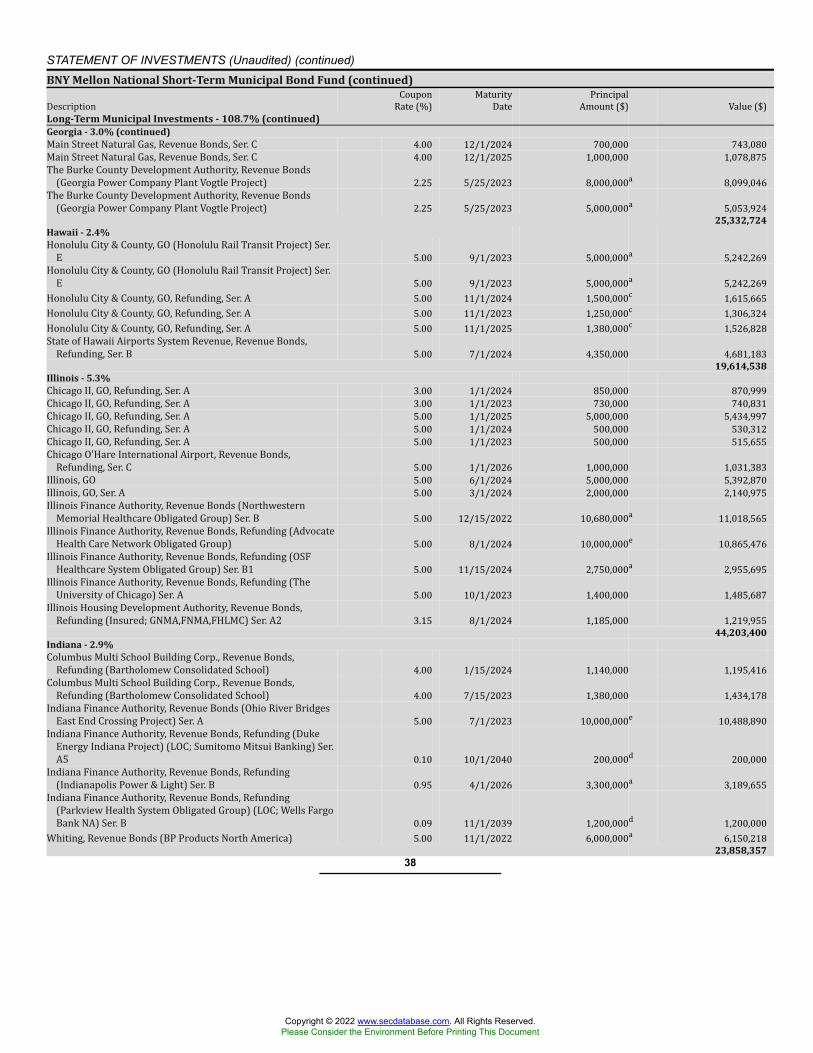
STATEMENT OF INVESTMENTS (Unaudited) (continued)BNY Mellon National Short-Term Municipal Bond Fund (continued)Description CouponRate (%) MaturityDate PrincipalAmount ($) Value ($)Long-Term Municipal Investments - 108.7% (continued)Georgia - 3.0% (continued)Main Street Natural Gas, Revenue Bonds, Ser. C 4.00 12/1/2024 700,000 743,080Main Street Natural Gas, Revenue Bonds, Ser. C 4.00 12/1/2025 1,000,000 1,078,875The Burke County Development Authority, Revenue Bonds(Georgia Power Company Plant Vogtle Project) 2.25 5/25/2023 8,000,000a 8,099,046The Burke County Development Authority, Revenue Bonds(Georgia Power Company Plant Vogtle Project) 2.25 5/25/2023 5,000,000a 5,053,924
25,332,724Hawaii - 2.4%Honolulu City & County, GO (Honolulu Rail Transit Project) Ser.E 5.00 9/1/2023 5,000,000a 5,242,269Honolulu City & County, GO (Honolulu Rail Transit Project) Ser.E 5.00 9/1/2023 5,000,000a 5,242,269Honolulu City & County, GO, Refunding, Ser. A 5.00 11/1/2024 1,500,000c 1,615,665Honolulu City & County, GO, Refunding, Ser. A 5.00 11/1/2023 1,250,000c 1,306,324Honolulu City & County, GO, Refunding, Ser. A 5.00 11/1/2025 1,380,000c 1,526,828State of Hawaii Airports System Revenue, Revenue Bonds,Refunding, Ser. B 5.00 7/1/2024 4,350,000 4,681,183
19,614,538Illinois - 5.3%Chicago II, GO, Refunding, Ser. A 3.00 1/1/2024 850,000 870,999Chicago II, GO, Refunding, Ser. A 3.00 1/1/2023 730,000 740,831Chicago II, GO, Refunding, Ser. A 5.00 1/1/2025 5,000,000 5,434,997Chicago II, GO, Refunding, Ser. A 5.00 1/1/2024 500,000 530,312Chicago II, GO, Refunding, Ser. A 5.00 1/1/2023 500,000 515,655Chicago O'Hare International Airport, Revenue Bonds,Refunding, Ser. C 5.00 1/1/2026 1,000,000 1,031,383Illinois, GO 5.00 6/1/2024 5,000,000 5,392,870Illinois, GO, Ser. A 5.00 3/1/2024 2,000,000 2,140,975Illinois Finance Authority, Revenue Bonds (NorthwesternMemorial Healthcare Obligated Group) Ser. B 5.00 12/15/2022 10,680,000a 11,018,565Illinois Finance Authority, Revenue Bonds, Refunding (AdvocateHealth Care Network Obligated Group) 5.00 8/1/2024 10,000,000e 10,865,476Illinois Finance Authority, Revenue Bonds, Refunding (OSFHealthcare System Obligated Group) Ser. B1 5.00 11/15/2024 2,750,000a 2,955,695Illinois Finance Authority, Revenue Bonds, Refunding (TheUniversity of Chicago) Ser. A 5.00 10/1/2023 1,400,000 1,485,687Illinois Housing Development Authority, Revenue Bonds,Refunding (Insured; GNMA,FNMA,FHLMC) Ser. A2 3.15 8/1/2024 1,185,000 1,219,955
44,203,400Indiana - 2.9%Columbus Multi School Building Corp., Revenue Bonds,Refunding (Bartholomew Consolidated School) 4.00 1/15/2024 1,140,000 1,195,416Columbus Multi School Building Corp., Revenue Bonds,Refunding (Bartholomew Consolidated School) 4.00 7/15/2023 1,380,000 1,434,178Indiana Finance Authority, Revenue Bonds (Ohio River BridgesEast End Crossing Project) Ser. A 5.00 7/1/2023 10,000,000e 10,488,890Indiana Finance Authority, Revenue Bonds, Refunding (DukeEnergy Indiana Project) (LOC; Sumitomo Mitsui Banking) Ser.A5 0.10 10/1/2040 200,000d 200,000Indiana Finance Authority, Revenue Bonds, Refunding(Indianapolis Power & Light) Ser. B 0.95 4/1/2026 3,300,000a 3,189,655Indiana Finance Authority, Revenue Bonds, Refunding(Parkview Health System Obligated Group) (LOC; Wells FargoBank NA) Ser. B 0.09 11/1/2039 1,200,000d 1,200,000Whiting, Revenue Bonds (BP Products North America) 5.00 11/1/2022 6,000,000a 6,150,218
23,858,35738
Copyright © 2022 www.secdatabase.com. All Rights Reserved.Please Consider the Environment Before Printing This Document
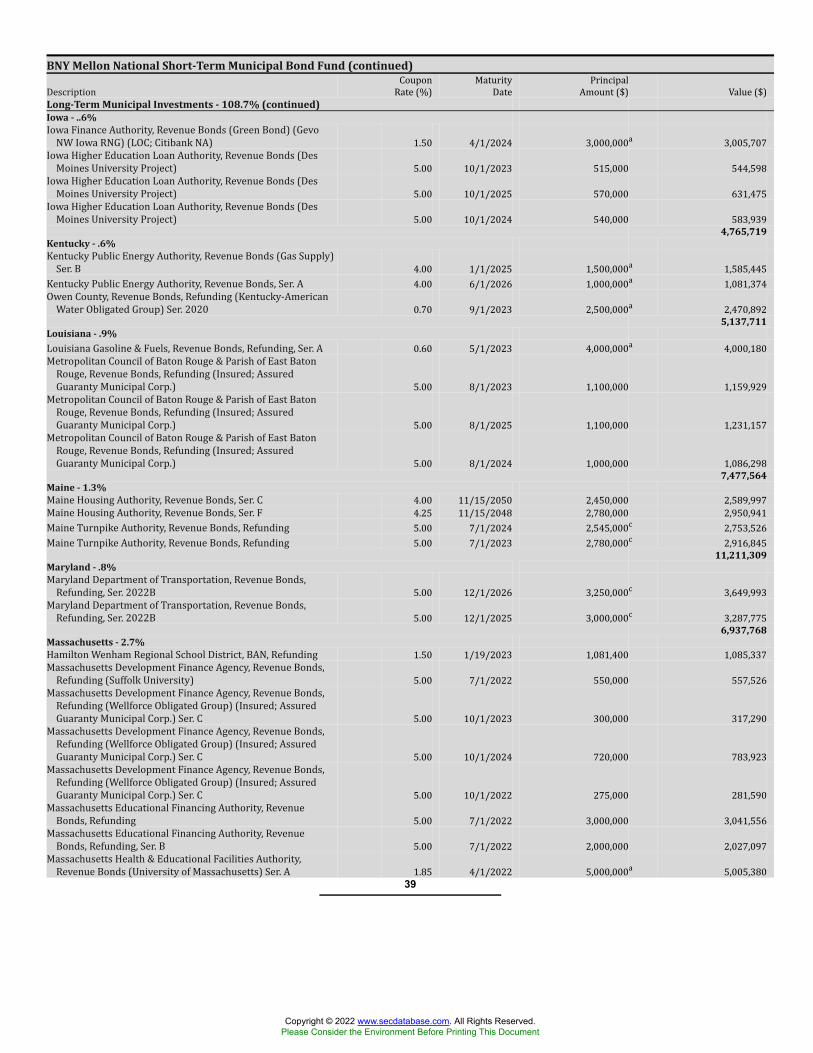
BNY Mellon National Short-Term Municipal Bond Fund (continued)Description CouponRate (%) MaturityDate PrincipalAmount ($) Value ($)Long-Term Municipal Investments - 108.7% (continued)Iowa - ..6%Iowa Finance Authority, Revenue Bonds (Green Bond) (GevoNW Iowa RNG) (LOC; Citibank NA) 1.50 4/1/2024 3,000,000a 3,005,707Iowa Higher Education Loan Authority, Revenue Bonds (DesMoines University Project) 5.00 10/1/2023 515,000 544,598Iowa Higher Education Loan Authority, Revenue Bonds (DesMoines University Project) 5.00 10/1/2025 570,000 631,475Iowa Higher Education Loan Authority, Revenue Bonds (DesMoines University Project) 5.00 10/1/2024 540,000 583,939
4,765,719Kentucky - .6%Kentucky Public Energy Authority, Revenue Bonds (Gas Supply)Ser. B 4.00 1/1/2025 1,500,000a 1,585,445Kentucky Public Energy Authority, Revenue Bonds, Ser. A 4.00 6/1/2026 1,000,000a 1,081,374Owen County, Revenue Bonds, Refunding (Kentucky-AmericanWater Obligated Group) Ser. 2020 0.70 9/1/2023 2,500,000a 2,470,892
5,137,711Louisiana - .9%Louisiana Gasoline & Fuels, Revenue Bonds, Refunding, Ser. A 0.60 5/1/2023 4,000,000a 4,000,180Metropolitan Council of Baton Rouge & Parish of East BatonRouge, Revenue Bonds, Refunding (Insured; AssuredGuaranty Municipal Corp.) 5.00 8/1/2023 1,100,000 1,159,929Metropolitan Council of Baton Rouge & Parish of East BatonRouge, Revenue Bonds, Refunding (Insured; AssuredGuaranty Municipal Corp.) 5.00 8/1/2025 1,100,000 1,231,157Metropolitan Council of Baton Rouge & Parish of East BatonRouge, Revenue Bonds, Refunding (Insured; AssuredGuaranty Municipal Corp.) 5.00 8/1/2024 1,000,000 1,086,298
7,477,564Maine - 1.3%Maine Housing Authority, Revenue Bonds, Ser. C 4.00 11/15/2050 2,450,000 2,589,997Maine Housing Authority, Revenue Bonds, Ser. F 4.25 11/15/2048 2,780,000 2,950,941Maine Turnpike Authority, Revenue Bonds, Refunding 5.00 7/1/2024 2,545,000c 2,753,526Maine Turnpike Authority, Revenue Bonds, Refunding 5.00 7/1/2023 2,780,000c 2,916,845
11,211,309Maryland - .8%Maryland Department of Transportation, Revenue Bonds,Refunding, Ser. 2022B 5.00 12/1/2026 3,250,000c 3,649,993Maryland Department of Transportation, Revenue Bonds,Refunding, Ser. 2022B 5.00 12/1/2025 3,000,000c 3,287,775
6,937,768Massachusetts - 2.7%Hamilton Wenham Regional School District, BAN, Refunding 1.50 1/19/2023 1,081,400 1,085,337Massachusetts Development Finance Agency, Revenue Bonds,Refunding (Suffolk University) 5.00 7/1/2022 550,000 557,526Massachusetts Development Finance Agency, Revenue Bonds,Refunding (Wellforce Obligated Group) (Insured; AssuredGuaranty Municipal Corp.) Ser. C 5.00 10/1/2023 300,000 317,290Massachusetts Development Finance Agency, Revenue Bonds,Refunding (Wellforce Obligated Group) (Insured; AssuredGuaranty Municipal Corp.) Ser. C 5.00 10/1/2024 720,000 783,923Massachusetts Development Finance Agency, Revenue Bonds,Refunding (Wellforce Obligated Group) (Insured; AssuredGuaranty Municipal Corp.) Ser. C 5.00 10/1/2022 275,000 281,590Massachusetts Educational Financing Authority, RevenueBonds, Refunding 5.00 7/1/2022 3,000,000 3,041,556Massachusetts Educational Financing Authority, RevenueBonds, Refunding, Ser. B 5.00 7/1/2022 2,000,000 2,027,097Massachusetts Health & Educational Facilities Authority,Revenue Bonds (University of Massachusetts) Ser. A 1.85 4/1/2022 5,000,000a 5,005,380
39
Copyright © 2022 www.secdatabase.com. All Rights Reserved.Please Consider the Environment Before Printing This Document
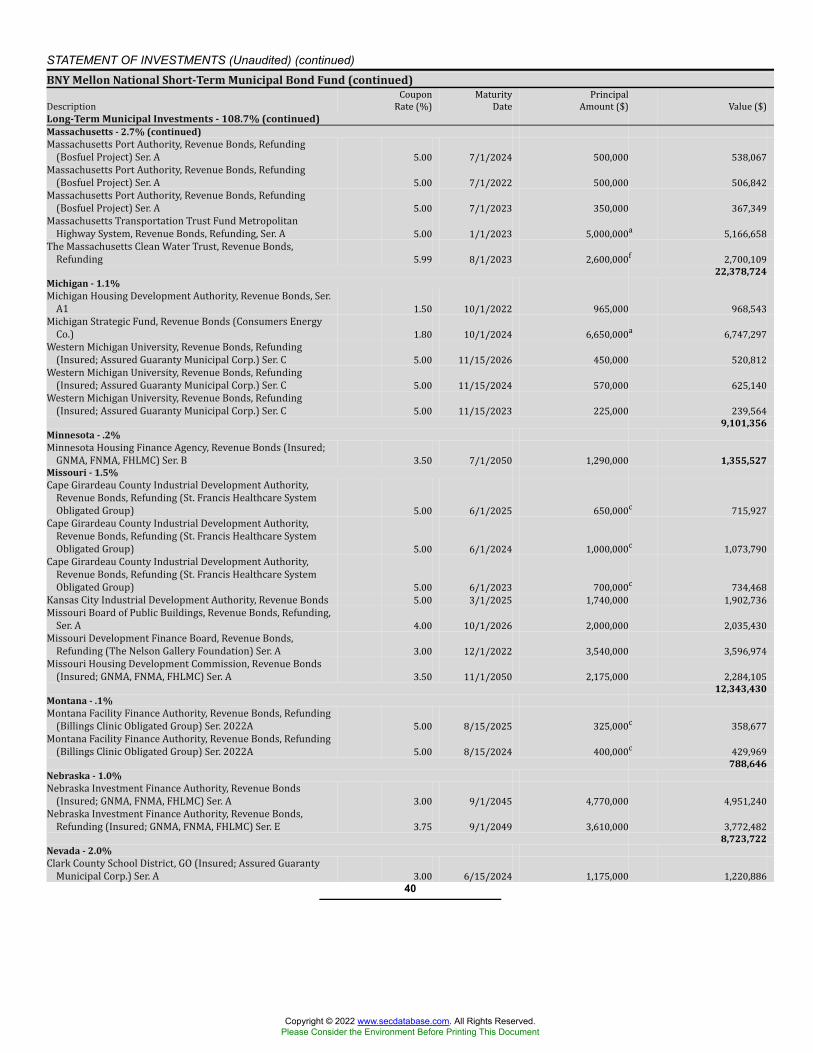
STATEMENT OF INVESTMENTS (Unaudited) (continued)BNY Mellon National Short-Term Municipal Bond Fund (continued)Description CouponRate (%) MaturityDate PrincipalAmount ($) Value ($)Long-Term Municipal Investments - 108.7% (continued)Massachusetts - 2.7% (continued)Massachusetts Port Authority, Revenue Bonds, Refunding(Bosfuel Project) Ser. A 5.00 7/1/2024 500,000 538,067Massachusetts Port Authority, Revenue Bonds, Refunding(Bosfuel Project) Ser. A 5.00 7/1/2022 500,000 506,842Massachusetts Port Authority, Revenue Bonds, Refunding(Bosfuel Project) Ser. A 5.00 7/1/2023 350,000 367,349Massachusetts Transportation Trust Fund MetropolitanHighway System, Revenue Bonds, Refunding, Ser. A 5.00 1/1/2023 5,000,000a 5,166,658The Massachusetts Clean Water Trust, Revenue Bonds,Refunding 5.99 8/1/2023 2,600,000f 2,700,109
22,378,724Michigan - 1.1%Michigan Housing Development Authority, Revenue Bonds, Ser.A1 1.50 10/1/2022 965,000 968,543Michigan Strategic Fund, Revenue Bonds (Consumers EnergyCo.) 1.80 10/1/2024 6,650,000a 6,747,297Western Michigan University, Revenue Bonds, Refunding(Insured; Assured Guaranty Municipal Corp.) Ser. C 5.00 11/15/2026 450,000 520,812Western Michigan University, Revenue Bonds, Refunding(Insured; Assured Guaranty Municipal Corp.) Ser. C 5.00 11/15/2024 570,000 625,140Western Michigan University, Revenue Bonds, Refunding(Insured; Assured Guaranty Municipal Corp.) Ser. C 5.00 11/15/2023 225,000 239,564
9,101,356Minnesota - .2%Minnesota Housing Finance Agency, Revenue Bonds (Insured;GNMA, FNMA, FHLMC) Ser. B 3.50 7/1/2050 1,290,000 1,355,527Missouri - 1.5%Cape Girardeau County Industrial Development Authority,Revenue Bonds, Refunding (St. Francis Healthcare SystemObligated Group) 5.00 6/1/2025 650,000c 715,927Cape Girardeau County Industrial Development Authority,Revenue Bonds, Refunding (St. Francis Healthcare SystemObligated Group) 5.00 6/1/2024 1,000,000c 1,073,790Cape Girardeau County Industrial Development Authority,Revenue Bonds, Refunding (St. Francis Healthcare SystemObligated Group) 5.00 6/1/2023 700,000c 734,468Kansas City Industrial Development Authority, Revenue Bonds 5.00 3/1/2025 1,740,000 1,902,736Missouri Board of Public Buildings, Revenue Bonds, Refunding,Ser. A 4.00 10/1/2026 2,000,000 2,035,430Missouri Development Finance Board, Revenue Bonds,Refunding (The Nelson Gallery Foundation) Ser. A 3.00 12/1/2022 3,540,000 3,596,974Missouri Housing Development Commission, Revenue Bonds(Insured; GNMA, FNMA, FHLMC) Ser. A 3.50 11/1/2050 2,175,000 2,284,105
12,343,430Montana - .1%Montana Facility Finance Authority, Revenue Bonds, Refunding(Billings Clinic Obligated Group) Ser. 2022A 5.00 8/15/2025 325,000c 358,677Montana Facility Finance Authority, Revenue Bonds, Refunding(Billings Clinic Obligated Group) Ser. 2022A 5.00 8/15/2024 400,000c 429,969
788,646Nebraska - 1.0%Nebraska Investment Finance Authority, Revenue Bonds(Insured; GNMA, FNMA, FHLMC) Ser. A 3.00 9/1/2045 4,770,000 4,951,240Nebraska Investment Finance Authority, Revenue Bonds,Refunding (Insured; GNMA, FNMA, FHLMC) Ser. E 3.75 9/1/2049 3,610,000 3,772,482
8,723,722Nevada - 2.0%Clark County School District, GO (Insured; Assured GuarantyMunicipal Corp.) Ser. A 3.00 6/15/2024 1,175,000 1,220,886
40
Copyright © 2022 www.secdatabase.com. All Rights Reserved.Please Consider the Environment Before Printing This Document

BNY Mellon National Short-Term Municipal Bond Fund (continued)Description CouponRate (%) MaturityDate PrincipalAmount ($) Value ($)Long-Term Municipal Investments - 108.7% (continued)Nevada - 2.0% (continued)Clark County School District, GO, Refunding, Ser. A 5.00 6/15/2022 8,220,000 8,321,469Washoe County, Revenue Bonds, Refunding (Sierra PacificPower Co.) 2.05 4/15/2022 7,500,000a 7,511,036
17,053,391New Hampshire - .7%New Hampshire Business Finance Authority, Revenue Bonds,Refunding (Waste Management) Ser. A3 2.15 7/1/2024 4,000,000a 4,010,526New Hampshire Business Finance Authority, Revenue Bonds,Refunding (Waste Management) Ser. A4 2.15 7/1/2024 2,000,000a 2,005,263
6,015,789New Jersey - 7.3%Eastern Camden County Regional School District Board ofEducation, GO 1.00 8/15/2023 2,335,000 2,330,741Margate, BAN, Refunding 1.25 12/14/2022 5,000,000 5,009,647New Jersey, GO (COVID-19 Emergency Bond) Ser. A 4.00 6/1/2023 5,000,000 5,173,538New Jersey, GO (COVID-19 Emergency Bond) Ser. A 5.00 6/1/2024 6,000,000 6,469,558New Jersey Economic Development Authority, Revenue Bonds,Refunding 5.00 6/15/2022 1,500,000e 1,518,918New Jersey Economic Development Authority, Revenue Bonds,Refunding (American Water Co.) Ser. B 1.20 6/1/2023 2,500,000a 2,495,146New Jersey Economic Development Authority, Revenue Bonds,Refunding (Insured; Assured Guaranty Municipal Corp.) Ser.N1 5.50 9/1/2025 1,250,000 1,415,617New Jersey Economic Development Authority, Revenue Bonds,Refunding, Ser. GGG 5.25 9/1/2024 10,000,000b 10,879,097New Jersey Economic Development Authority, Revenue Bonds,Ser. QQQ 5.00 6/15/2024 300,000 323,181New Jersey Economic Development Authority, Revenue Bonds,Ser. QQQ 5.00 6/15/2022 200,000 202,405New Jersey Economic Development Authority, Revenue Bonds,Ser. QQQ 5.00 6/15/2023 220,000 230,520New Jersey Economic Development Authority, Revenue Bonds,Ser. QQQ 5.00 6/15/2025 400,000 442,009New Jersey Housing & Mortgage Finance Agency, RevenueBonds, Ser. H 3.00 10/1/2052 5,000,000 5,208,886New Jersey Transportation Trust Fund Authority, RevenueBonds, Refunding 5.00 12/15/2024 1,750,000 1,911,666New Jersey Transportation Trust Fund Authority, RevenueBonds, Refunding, Ser. A 5.00 6/15/2022 10,000,000 10,122,273New Jersey Transportation Trust Fund Authority, RevenueBonds, Refunding, Ser. AA 5.00 6/15/2025 5,125,000c 5,638,450The Bergen County Improvement Authority, Revenue Bonds,Refunding (Insured; County Guaranteed) Ser. A 3.00 8/15/2022 1,000,000 1,009,386
60,381,038New Mexico - .7%New Mexico Municipal Energy Acquisition Authority, RevenueBonds, Refunding, Ser. A 5.00 5/1/2025 5,500,000a 6,057,313New York - 18.5%Albany County Airport Authority, Revenue Bonds, Refunding,Ser. B 5.00 12/15/2023 1,225,000 1,303,326Albany County Airport Authority, Revenue Bonds, Refunding,Ser. B 5.00 12/15/2022 875,000 901,965Irondequoit, BAN, Refunding, Ser. B 1.25 12/16/2022 7,500,000 7,515,058Long Island Power Authority, Revenue Bonds, Ser. B 1.65 9/1/2024 7,000,000a 7,042,348Metropolitan Transportation Authority, BAN, Ser. A 5.00 3/1/2022 10,000,000 10,000,000Metropolitan Transportation Authority, BAN, Ser. A1 5.00 2/1/2023 10,000,000 10,348,812Metropolitan Transportation Authority, BAN, Ser. D1 5.00 9/1/2022 5,000,000 5,101,782Metropolitan Transportation Authority, Revenue Bonds,Refunding (Green Bond) Ser. A2 5.00 5/15/2024 2,200,000a 2,366,472
41
Copyright © 2022 www.secdatabase.com. All Rights Reserved.Please Consider the Environment Before Printing This Document
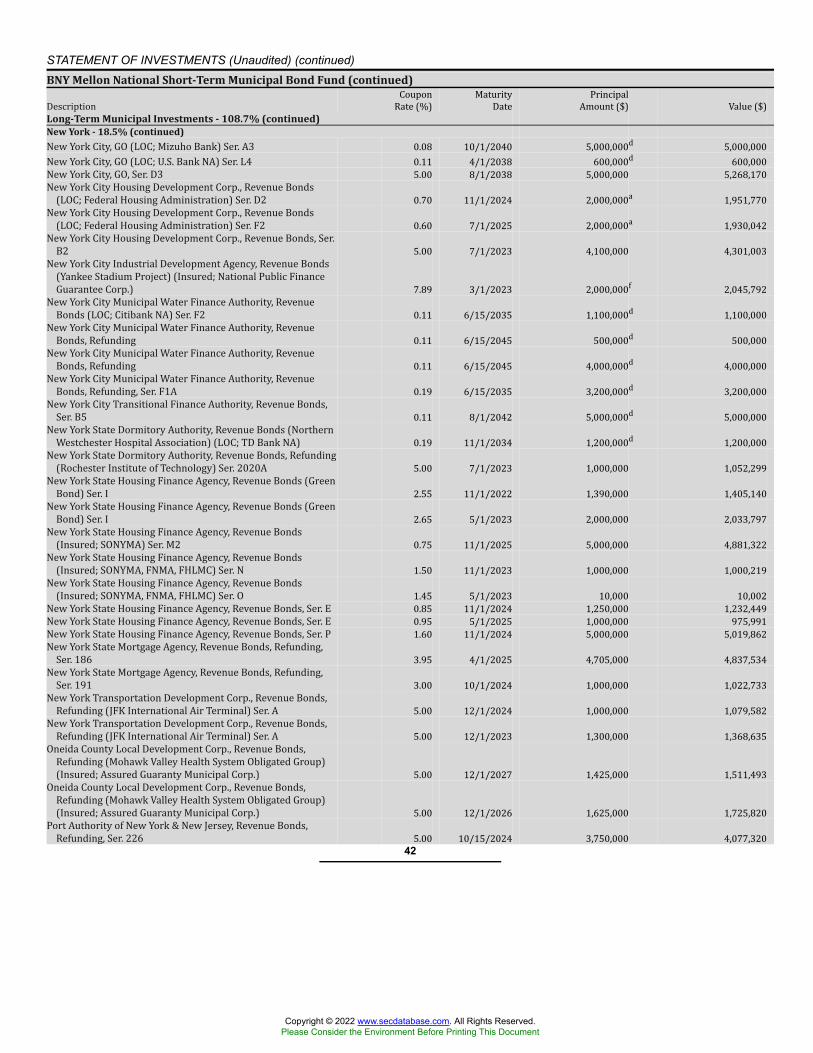
STATEMENT OF INVESTMENTS (Unaudited) (continued)BNY Mellon National Short-Term Municipal Bond Fund (continued)Description CouponRate (%) MaturityDate PrincipalAmount ($) Value ($)Long-Term Municipal Investments - 108.7% (continued)New York - 18.5% (continued)New York City, GO (LOC; Mizuho Bank) Ser. A3 0.08 10/1/2040 5,000,000d 5,000,000New York City, GO (LOC; U.S. Bank NA) Ser. L4 0.11 4/1/2038 600,000d 600,000New York City, GO, Ser. D3 5.00 8/1/2038 5,000,000 5,268,170New York City Housing Development Corp., Revenue Bonds(LOC; Federal Housing Administration) Ser. D2 0.70 11/1/2024 2,000,000a 1,951,770New York City Housing Development Corp., Revenue Bonds(LOC; Federal Housing Administration) Ser. F2 0.60 7/1/2025 2,000,000a 1,930,042New York City Housing Development Corp., Revenue Bonds, Ser.B2 5.00 7/1/2023 4,100,000 4,301,003New York City Industrial Development Agency, Revenue Bonds(Yankee Stadium Project) (Insured; National Public FinanceGuarantee Corp.) 7.89 3/1/2023 2,000,000f 2,045,792New York City Municipal Water Finance Authority, RevenueBonds (LOC; Citibank NA) Ser. F2 0.11 6/15/2035 1,100,000d 1,100,000New York City Municipal Water Finance Authority, RevenueBonds, Refunding 0.11 6/15/2045 500,000d 500,000New York City Municipal Water Finance Authority, RevenueBonds, Refunding 0.11 6/15/2045 4,000,000d 4,000,000New York City Municipal Water Finance Authority, RevenueBonds, Refunding, Ser. F1A 0.19 6/15/2035 3,200,000d 3,200,000New York City Transitional Finance Authority, Revenue Bonds,Ser. B5 0.11 8/1/2042 5,000,000d 5,000,000New York State Dormitory Authority, Revenue Bonds (NorthernWestchester Hospital Association) (LOC; TD Bank NA) 0.19 11/1/2034 1,200,000d 1,200,000New York State Dormitory Authority, Revenue Bonds, Refunding(Rochester Institute of Technology) Ser. 2020A 5.00 7/1/2023 1,000,000 1,052,299New York State Housing Finance Agency, Revenue Bonds (GreenBond) Ser. I 2.55 11/1/2022 1,390,000 1,405,140New York State Housing Finance Agency, Revenue Bonds (GreenBond) Ser. I 2.65 5/1/2023 2,000,000 2,033,797New York State Housing Finance Agency, Revenue Bonds(Insured; SONYMA) Ser. M2 0.75 11/1/2025 5,000,000 4,881,322New York State Housing Finance Agency, Revenue Bonds(Insured; SONYMA, FNMA, FHLMC) Ser. N 1.50 11/1/2023 1,000,000 1,000,219New York State Housing Finance Agency, Revenue Bonds(Insured; SONYMA, FNMA, FHLMC) Ser. O 1.45 5/1/2023 10,000 10,002New York State Housing Finance Agency, Revenue Bonds, Ser. E 0.85 11/1/2024 1,250,000 1,232,449New York State Housing Finance Agency, Revenue Bonds, Ser. E 0.95 5/1/2025 1,000,000 975,991New York State Housing Finance Agency, Revenue Bonds, Ser. P 1.60 11/1/2024 5,000,000 5,019,862New York State Mortgage Agency, Revenue Bonds, Refunding,Ser. 186 3.95 4/1/2025 4,705,000 4,837,534New York State Mortgage Agency, Revenue Bonds, Refunding,Ser. 191 3.00 10/1/2024 1,000,000 1,022,733New York Transportation Development Corp., Revenue Bonds,Refunding (JFK International Air Terminal) Ser. A 5.00 12/1/2024 1,000,000 1,079,582New York Transportation Development Corp., Revenue Bonds,Refunding (JFK International Air Terminal) Ser. A 5.00 12/1/2023 1,300,000 1,368,635Oneida County Local Development Corp., Revenue Bonds,Refunding (Mohawk Valley Health System Obligated Group)(Insured; Assured Guaranty Municipal Corp.) 5.00 12/1/2027 1,425,000 1,511,493Oneida County Local Development Corp., Revenue Bonds,Refunding (Mohawk Valley Health System Obligated Group)(Insured; Assured Guaranty Municipal Corp.) 5.00 12/1/2026 1,625,000 1,725,820Port Authority of New York & New Jersey, Revenue Bonds,Refunding, Ser. 226 5.00 10/15/2024 3,750,000 4,077,320
42
Copyright © 2022 www.secdatabase.com. All Rights Reserved.Please Consider the Environment Before Printing This Document

BNY Mellon National Short-Term Municipal Bond Fund (continued)Description CouponRate (%) MaturityDate PrincipalAmount ($) Value ($)Long-Term Municipal Investments - 108.7% (continued)New York - 18.5% (continued)Port Authority of New York & New Jersey, Revenue Bonds,Refunding, Ser. 226 5.00 10/15/2023 2,710,000 2,869,907Rochester, BAN, Refunding, Ser. I 2.50 3/1/2023 10,000,000c 10,148,983Suffolk County, GO, Refunding, Ser. B 5.00 10/1/2024 1,785,000c 1,913,339Suffolk County, GO, Refunding, Ser. B 5.00 10/1/2023 625,000c 652,238Triborough Bridge & Tunnel Authority, Revenue Bonds,Refunding (LOC; State Street Bank & Trust Co.) Ser. B3 0.08 1/1/2032 7,500,000d 7,500,000Triborough Bridge & Tunnel Authority, Revenue Bonds,Refunding (LOC; U.S. Bank NA) Ser. 2005B-4C 0.11 1/1/2031 2,000,000d 2,000,000Triborough Bridge & Tunnel Authority, Revenue Bonds,Refunding, Ser. A2 2.00 5/15/2024 14,375,000a 14,557,358
153,552,563Ohio - 2.2%Akron , Revenue Bonds, Refunding 4.00 12/1/2025 2,210,000c 2,411,026Akron , Revenue Bonds, Refunding 4.00 12/1/2023 3,100,000c 3,251,480Allen County Hospital Facilities, Revenue Bonds (Mercy Health)Ser. B 5.00 5/5/2022 3,000,000a 3,022,341American Municipal Power, Revenue Bonds, Refunding, Ser. A2 1.00 8/15/2024 2,000,000a 1,981,640Cincinnati School District, GO, Refunding (Insured; NationalPublic Finance Guarantee Corp.) 5.25 12/1/2025 1,000,000 1,141,913Miami University, Revenue Bonds, Refunding, Ser. A 5.00 9/1/2025 780,000c 862,037Miami University, Revenue Bonds, Refunding, Ser. A 5.00 9/1/2026 820,000c 927,621Miami University, Revenue Bonds, Refunding, Ser. A 5.00 9/1/2023 1,710,000c 1,789,732Miami University, Revenue Bonds, Refunding, Ser. A 5.00 9/1/2024 675,000c 727,117Ohio Housing Finance Agency, Revenue Bonds (Insured; GNMA,FNMA, FHLMC) Ser. B 3.25 3/1/2050 1,975,000 2,063,281
18,178,188Oklahoma - 1.7%The University of Oklahoma, Revenue Bonds, Refunding, Ser. A 5.00 7/1/2023 1,860,000 1,956,767The University of Oklahoma, Revenue Bonds, Refunding, Ser. A 5.00 7/1/2024 1,955,000 2,118,827Tulsa, GO 5.00 3/1/2023 5,000,000 5,199,236Tulsa County Independent School District No. 1, GO, Ser. B 2.00 8/1/2024 5,000,000 5,083,650
14,358,480Oregon - 1.3%Central Oregon Community College, GO, Refunding (Insured;School Board Guaranty) 4.00 6/15/2024 450,000 478,311Gilliam County, Revenue Bonds (Waste Management) Ser. A 2.40 5/2/2022 2,375,000a 2,378,626Gilliam County, Revenue Bonds (Waste Management) Ser. A 2.40 5/2/2022 2,500,000a 2,501,841Oregon Housing & Community Services Department, RevenueBonds, Ser. C 3.00 1/1/2052 2,240,000 2,320,301Oregon Housing & Community Services Department, RevenueBonds, Ser. D 4.75 1/1/2050 3,080,000 3,301,958
10,981,037Pennsylvania - 4.2%Allegheny County Higher Education Building Authority, RevenueBonds, Refunding (Duquesne University) Ser. 20 5.00 3/1/2024 500,000c 519,410Allegheny County Higher Education Building Authority, RevenueBonds, Refunding (Duquesne University) Ser. 20 5.00 3/1/2025 500,000c 533,150Allegheny County Higher Education Building Authority, RevenueBonds, Refunding (Duquesne University) Ser. 20 5.00 3/1/2026 1,660,000c 1,810,441Allegheny County Hospital Development Authority, RevenueBonds, Refunding (UPMC Obligated Group) Ser. B 5.00 10/15/2023 950,000 1,010,010Allegheny County Hospital Development Authority, RevenueBonds, Refunding (UPMC Obligated Group) Ser. B 5.00 10/15/2024 705,000 769,389Commonwealth Financing Authority, Revenue Bonds 5.00 6/1/2022 3,000,000 3,032,162Delaware Valley Regional Finance Authority, Revenue Bonds(LOC; TD BANK NA) Ser. A 0.19 5/1/2055 2,100,000d 2,100,000
43
Copyright © 2022 www.secdatabase.com. All Rights Reserved.Please Consider the Environment Before Printing This Document
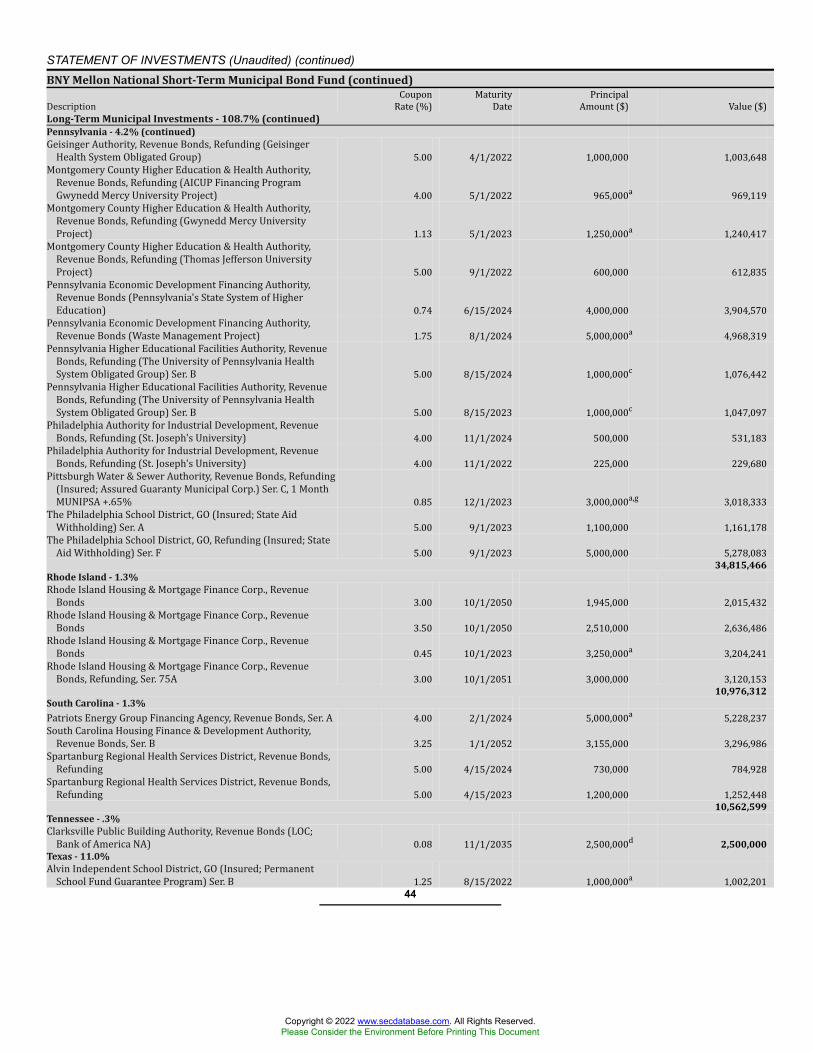
STATEMENT OF INVESTMENTS (Unaudited) (continued)BNY Mellon National Short-Term Municipal Bond Fund (continued)Description CouponRate (%) MaturityDate PrincipalAmount ($) Value ($)Long-Term Municipal Investments - 108.7% (continued)Pennsylvania - 4.2% (continued)Geisinger Authority, Revenue Bonds, Refunding (GeisingerHealth System Obligated Group) 5.00 4/1/2022 1,000,000 1,003,648Montgomery County Higher Education & Health Authority,Revenue Bonds, Refunding (AICUP Financing ProgramGwynedd Mercy University Project) 4.00 5/1/2022 965,000a 969,119Montgomery County Higher Education & Health Authority,Revenue Bonds, Refunding (Gwynedd Mercy UniversityProject) 1.13 5/1/2023 1,250,000a 1,240,417Montgomery County Higher Education & Health Authority,Revenue Bonds, Refunding (Thomas Jefferson UniversityProject) 5.00 9/1/2022 600,000 612,835Pennsylvania Economic Development Financing Authority,Revenue Bonds (Pennsylvania's State System of HigherEducation) 0.74 6/15/2024 4,000,000 3,904,570Pennsylvania Economic Development Financing Authority,Revenue Bonds (Waste Management Project) 1.75 8/1/2024 5,000,000a 4,968,319Pennsylvania Higher Educational Facilities Authority, RevenueBonds, Refunding (The University of Pennsylvania HealthSystem Obligated Group) Ser. B 5.00 8/15/2024 1,000,000c 1,076,442Pennsylvania Higher Educational Facilities Authority, RevenueBonds, Refunding (The University of Pennsylvania HealthSystem Obligated Group) Ser. B 5.00 8/15/2023 1,000,000c 1,047,097Philadelphia Authority for Industrial Development, RevenueBonds, Refunding (St. Joseph's University) 4.00 11/1/2024 500,000 531,183Philadelphia Authority for Industrial Development, RevenueBonds, Refunding (St. Joseph's University) 4.00 11/1/2022 225,000 229,680Pittsburgh Water & Sewer Authority, Revenue Bonds, Refunding(Insured; Assured Guaranty Municipal Corp.) Ser. C, 1 MonthMUNIPSA +.65% 0.85 12/1/2023 3,000,000a,g 3,018,333The Philadelphia School District, GO (Insured; State AidWithholding) Ser. A 5.00 9/1/2023 1,100,000 1,161,178The Philadelphia School District, GO, Refunding (Insured; StateAid Withholding) Ser. F 5.00 9/1/2023 5,000,000 5,278,083
34,815,466Rhode Island - 1.3%Rhode Island Housing & Mortgage Finance Corp., RevenueBonds 3.00 10/1/2050 1,945,000 2,015,432Rhode Island Housing & Mortgage Finance Corp., RevenueBonds 3.50 10/1/2050 2,510,000 2,636,486Rhode Island Housing & Mortgage Finance Corp., RevenueBonds 0.45 10/1/2023 3,250,000a 3,204,241Rhode Island Housing & Mortgage Finance Corp., RevenueBonds, Refunding, Ser. 75A 3.00 10/1/2051 3,000,000 3,120,153
10,976,312South Carolina - 1.3%Patriots Energy Group Financing Agency, Revenue Bonds, Ser. A 4.00 2/1/2024 5,000,000a 5,228,237South Carolina Housing Finance & Development Authority,Revenue Bonds, Ser. B 3.25 1/1/2052 3,155,000 3,296,986Spartanburg Regional Health Services District, Revenue Bonds,Refunding 5.00 4/15/2024 730,000 784,928Spartanburg Regional Health Services District, Revenue Bonds,Refunding 5.00 4/15/2023 1,200,000 1,252,448
10,562,599Tennessee - .3%Clarksville Public Building Authority, Revenue Bonds (LOC;Bank of America NA) 0.08 11/1/2035 2,500,000d 2,500,000Texas - 11.0%Alvin Independent School District, GO (Insured; PermanentSchool Fund Guarantee Program) Ser. B 1.25 8/15/2022 1,000,000a 1,002,201
44
Copyright © 2022 www.secdatabase.com. All Rights Reserved.Please Consider the Environment Before Printing This Document
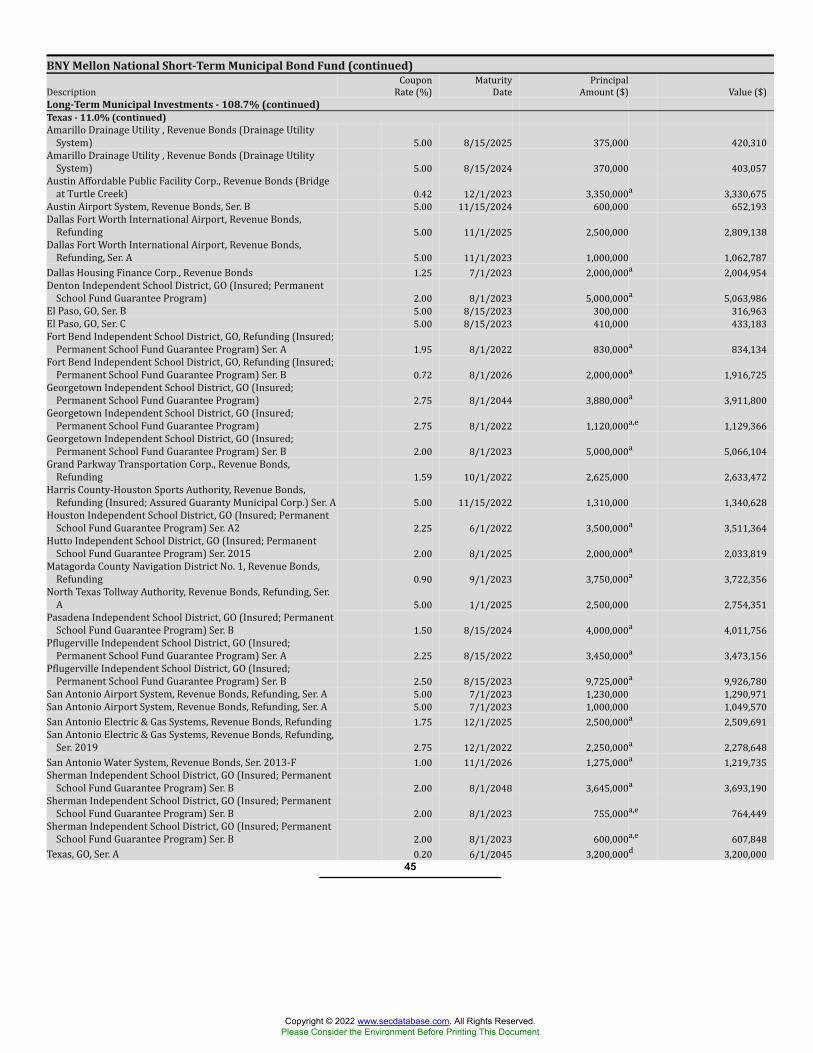
BNY Mellon National Short-Term Municipal Bond Fund (continued)Description CouponRate (%) MaturityDate PrincipalAmount ($) Value ($)Long-Term Municipal Investments - 108.7% (continued)Texas - 11.0% (continued)Amarillo Drainage Utility , Revenue Bonds (Drainage UtilitySystem) 5.00 8/15/2025 375,000 420,310Amarillo Drainage Utility , Revenue Bonds (Drainage UtilitySystem) 5.00 8/15/2024 370,000 403,057Austin Affordable Public Facility Corp., Revenue Bonds (Bridgeat Turtle Creek) 0.42 12/1/2023 3,350,000a 3,330,675Austin Airport System, Revenue Bonds, Ser. B 5.00 11/15/2024 600,000 652,193Dallas Fort Worth International Airport, Revenue Bonds,Refunding 5.00 11/1/2025 2,500,000 2,809,138Dallas Fort Worth International Airport, Revenue Bonds,Refunding, Ser. A 5.00 11/1/2023 1,000,000 1,062,787Dallas Housing Finance Corp., Revenue Bonds 1.25 7/1/2023 2,000,000a 2,004,954Denton Independent School District, GO (Insured; PermanentSchool Fund Guarantee Program) 2.00 8/1/2023 5,000,000a 5,063,986El Paso, GO, Ser. B 5.00 8/15/2023 300,000 316,963El Paso, GO, Ser. C 5.00 8/15/2023 410,000 433,183Fort Bend Independent School District, GO, Refunding (Insured;Permanent School Fund Guarantee Program) Ser. A 1.95 8/1/2022 830,000a 834,134Fort Bend Independent School District, GO, Refunding (Insured;Permanent School Fund Guarantee Program) Ser. B 0.72 8/1/2026 2,000,000a 1,916,725Georgetown Independent School District, GO (Insured;Permanent School Fund Guarantee Program) 2.75 8/1/2044 3,880,000a 3,911,800Georgetown Independent School District, GO (Insured;Permanent School Fund Guarantee Program) 2.75 8/1/2022 1,120,000a,e 1,129,366Georgetown Independent School District, GO (Insured;Permanent School Fund Guarantee Program) Ser. B 2.00 8/1/2023 5,000,000a 5,066,104Grand Parkway Transportation Corp., Revenue Bonds,Refunding 1.59 10/1/2022 2,625,000 2,633,472Harris County-Houston Sports Authority, Revenue Bonds,Refunding (Insured; Assured Guaranty Municipal Corp.) Ser. A 5.00 11/15/2022 1,310,000 1,340,628Houston Independent School District, GO (Insured; PermanentSchool Fund Guarantee Program) Ser. A2 2.25 6/1/2022 3,500,000a 3,511,364Hutto Independent School District, GO (Insured; PermanentSchool Fund Guarantee Program) Ser. 2015 2.00 8/1/2025 2,000,000a 2,033,819Matagorda County Navigation District No. 1, Revenue Bonds,Refunding 0.90 9/1/2023 3,750,000a 3,722,356North Texas Tollway Authority, Revenue Bonds, Refunding, Ser.A 5.00 1/1/2025 2,500,000 2,754,351Pasadena Independent School District, GO (Insured; PermanentSchool Fund Guarantee Program) Ser. B 1.50 8/15/2024 4,000,000a 4,011,756Pflugerville Independent School District, GO (Insured;Permanent School Fund Guarantee Program) Ser. A 2.25 8/15/2022 3,450,000a 3,473,156Pflugerville Independent School District, GO (Insured;Permanent School Fund Guarantee Program) Ser. B 2.50 8/15/2023 9,725,000a 9,926,780San Antonio Airport System, Revenue Bonds, Refunding, Ser. A 5.00 7/1/2023 1,230,000 1,290,971San Antonio Airport System, Revenue Bonds, Refunding, Ser. A 5.00 7/1/2023 1,000,000 1,049,570San Antonio Electric & Gas Systems, Revenue Bonds, Refunding 1.75 12/1/2025 2,500,000a 2,509,691San Antonio Electric & Gas Systems, Revenue Bonds, Refunding,Ser. 2019 2.75 12/1/2022 2,250,000a 2,278,648San Antonio Water System, Revenue Bonds, Ser. 2013-F 1.00 11/1/2026 1,275,000a 1,219,735Sherman Independent School District, GO (Insured; PermanentSchool Fund Guarantee Program) Ser. B 2.00 8/1/2048 3,645,000a 3,693,190Sherman Independent School District, GO (Insured; PermanentSchool Fund Guarantee Program) Ser. B 2.00 8/1/2023 755,000a,e 764,449Sherman Independent School District, GO (Insured; PermanentSchool Fund Guarantee Program) Ser. B 2.00 8/1/2023 600,000a,e 607,848Texas, GO, Ser. A 0.20 6/1/2045 3,200,000d 3,200,000
45
Copyright © 2022 www.secdatabase.com. All Rights Reserved.Please Consider the Environment Before Printing This Document
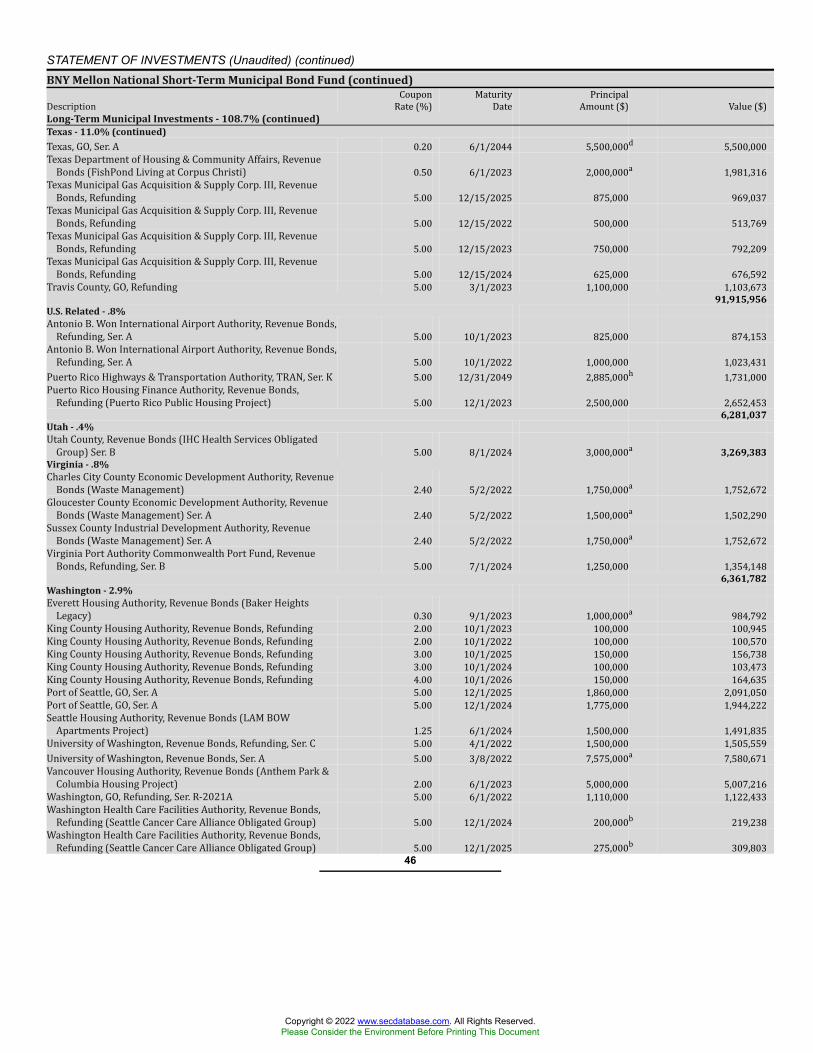
STATEMENT OF INVESTMENTS (Unaudited) (continued)BNY Mellon National Short-Term Municipal Bond Fund (continued)Description CouponRate (%) MaturityDate PrincipalAmount ($) Value ($)Long-Term Municipal Investments - 108.7% (continued)Texas - 11.0% (continued)Texas, GO, Ser. A 0.20 6/1/2044 5,500,000d 5,500,000Texas Department of Housing & Community Affairs, RevenueBonds (FishPond Living at Corpus Christi) 0.50 6/1/2023 2,000,000a 1,981,316Texas Municipal Gas Acquisition & Supply Corp. III, RevenueBonds, Refunding 5.00 12/15/2025 875,000 969,037Texas Municipal Gas Acquisition & Supply Corp. III, RevenueBonds, Refunding 5.00 12/15/2022 500,000 513,769Texas Municipal Gas Acquisition & Supply Corp. III, RevenueBonds, Refunding 5.00 12/15/2023 750,000 792,209Texas Municipal Gas Acquisition & Supply Corp. III, RevenueBonds, Refunding 5.00 12/15/2024 625,000 676,592Travis County, GO, Refunding 5.00 3/1/2023 1,100,000 1,103,673
91,915,956U.S. Related - .8%Antonio B. Won International Airport Authority, Revenue Bonds,Refunding, Ser. A 5.00 10/1/2023 825,000 874,153Antonio B. Won International Airport Authority, Revenue Bonds,Refunding, Ser. A 5.00 10/1/2022 1,000,000 1,023,431Puerto Rico Highways & Transportation Authority, TRAN, Ser. K 5.00 12/31/2049 2,885,000h 1,731,000Puerto Rico Housing Finance Authority, Revenue Bonds,Refunding (Puerto Rico Public Housing Project) 5.00 12/1/2023 2,500,000 2,652,453
6,281,037Utah - .4%Utah County, Revenue Bonds (IHC Health Services ObligatedGroup) Ser. B 5.00 8/1/2024 3,000,000a 3,269,383Virginia - .8%Charles City County Economic Development Authority, RevenueBonds (Waste Management) 2.40 5/2/2022 1,750,000a 1,752,672Gloucester County Economic Development Authority, RevenueBonds (Waste Management) Ser. A 2.40 5/2/2022 1,500,000a 1,502,290Sussex County Industrial Development Authority, RevenueBonds (Waste Management) Ser. A 2.40 5/2/2022 1,750,000a 1,752,672Virginia Port Authority Commonwealth Port Fund, RevenueBonds, Refunding, Ser. B 5.00 7/1/2024 1,250,000 1,354,148
6,361,782Washington - 2.9%Everett Housing Authority, Revenue Bonds (Baker HeightsLegacy) 0.30 9/1/2023 1,000,000a 984,792King County Housing Authority, Revenue Bonds, Refunding 2.00 10/1/2023 100,000 100,945King County Housing Authority, Revenue Bonds, Refunding 2.00 10/1/2022 100,000 100,570King County Housing Authority, Revenue Bonds, Refunding 3.00 10/1/2025 150,000 156,738King County Housing Authority, Revenue Bonds, Refunding 3.00 10/1/2024 100,000 103,473King County Housing Authority, Revenue Bonds, Refunding 4.00 10/1/2026 150,000 164,635Port of Seattle, GO, Ser. A 5.00 12/1/2025 1,860,000 2,091,050Port of Seattle, GO, Ser. A 5.00 12/1/2024 1,775,000 1,944,222Seattle Housing Authority, Revenue Bonds (LAM BOWApartments Project) 1.25 6/1/2024 1,500,000 1,491,835University of Washington, Revenue Bonds, Refunding, Ser. C 5.00 4/1/2022 1,500,000 1,505,559University of Washington, Revenue Bonds, Ser. A 5.00 3/8/2022 7,575,000a 7,580,671Vancouver Housing Authority, Revenue Bonds (Anthem Park &Columbia Housing Project) 2.00 6/1/2023 5,000,000 5,007,216Washington, GO, Refunding, Ser. R-2021A 5.00 6/1/2022 1,110,000 1,122,433Washington Health Care Facilities Authority, Revenue Bonds,Refunding (Seattle Cancer Care Alliance Obligated Group) 5.00 12/1/2024 200,000b 219,238Washington Health Care Facilities Authority, Revenue Bonds,Refunding (Seattle Cancer Care Alliance Obligated Group) 5.00 12/1/2025 275,000b 309,803
46
Copyright © 2022 www.secdatabase.com. All Rights Reserved.Please Consider the Environment Before Printing This Document
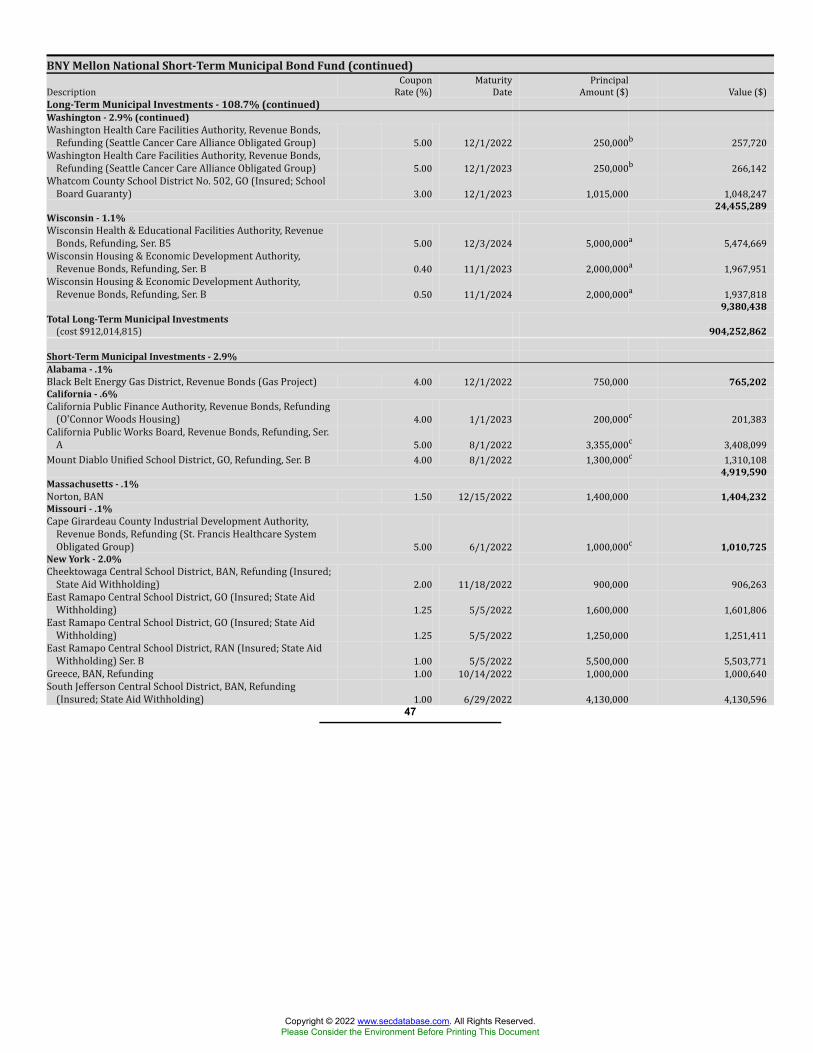
BNY Mellon National Short-Term Municipal Bond Fund (continued)Description CouponRate (%) MaturityDate PrincipalAmount ($) Value ($)Long-Term Municipal Investments - 108.7% (continued)Washington - 2.9% (continued)Washington Health Care Facilities Authority, Revenue Bonds,Refunding (Seattle Cancer Care Alliance Obligated Group) 5.00 12/1/2022 250,000b 257,720Washington Health Care Facilities Authority, Revenue Bonds,Refunding (Seattle Cancer Care Alliance Obligated Group) 5.00 12/1/2023 250,000b 266,142Whatcom County School District No. 502, GO (Insured; SchoolBoard Guaranty) 3.00 12/1/2023 1,015,000 1,048,247
24,455,289Wisconsin - 1.1%Wisconsin Health & Educational Facilities Authority, RevenueBonds, Refunding, Ser. B5 5.00 12/3/2024 5,000,000a 5,474,669Wisconsin Housing & Economic Development Authority,Revenue Bonds, Refunding, Ser. B 0.40 11/1/2023 2,000,000a 1,967,951Wisconsin Housing & Economic Development Authority,Revenue Bonds, Refunding, Ser. B 0.50 11/1/2024 2,000,000a 1,937,818
9,380,438Total Long-Term Municipal Investments(cost $912,014,815) 904,252,862
Short-Term Municipal Investments - 2.9%Alabama - .1%Black Belt Energy Gas District, Revenue Bonds (Gas Project) 4.00 12/1/2022 750,000 765,202California - .6%California Public Finance Authority, Revenue Bonds, Refunding(O'Connor Woods Housing) 4.00 1/1/2023 200,000c 201,383California Public Works Board, Revenue Bonds, Refunding, Ser.A 5.00 8/1/2022 3,355,000c 3,408,099Mount Diablo Unified School District, GO, Refunding, Ser. B 4.00 8/1/2022 1,300,000c 1,310,108
4,919,590Massachusetts - .1%Norton, BAN 1.50 12/15/2022 1,400,000 1,404,232Missouri - .1%Cape Girardeau County Industrial Development Authority,Revenue Bonds, Refunding (St. Francis Healthcare SystemObligated Group) 5.00 6/1/2022 1,000,000c 1,010,725New York - 2.0%Cheektowaga Central School District, BAN, Refunding (Insured;State Aid Withholding) 2.00 11/18/2022 900,000 906,263East Ramapo Central School District, GO (Insured; State AidWithholding) 1.25 5/5/2022 1,600,000 1,601,806East Ramapo Central School District, GO (Insured; State AidWithholding) 1.25 5/5/2022 1,250,000 1,251,411East Ramapo Central School District, RAN (Insured; State AidWithholding) Ser. B 1.00 5/5/2022 5,500,000 5,503,771Greece, BAN, Refunding 1.00 10/14/2022 1,000,000 1,000,640South Jefferson Central School District, BAN, Refunding(Insured; State Aid Withholding) 1.00 6/29/2022 4,130,000 4,130,596
47
Copyright © 2022 www.secdatabase.com. All Rights Reserved.Please Consider the Environment Before Printing This Document
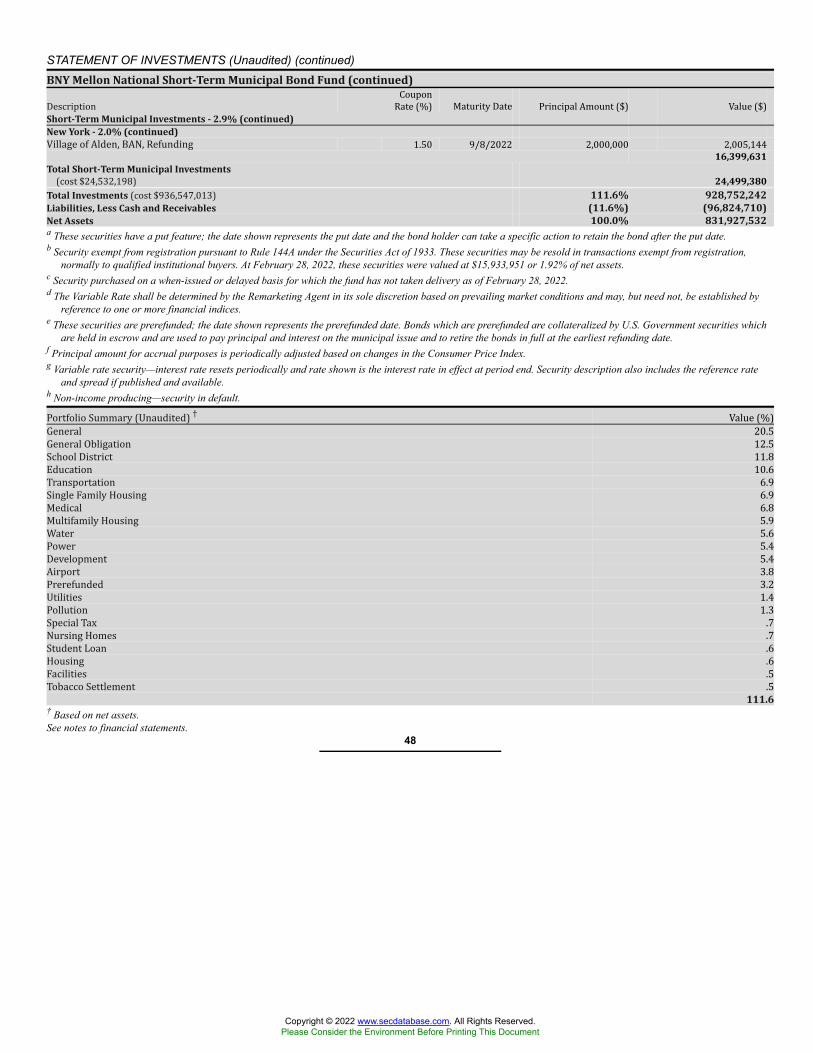
STATEMENT OF INVESTMENTS (Unaudited) (continued)BNY Mellon National Short-Term Municipal Bond Fund (continued)Description CouponRate (%) Maturity Date Principal Amount ($) Value ($)Short-Term Municipal Investments - 2.9% (continued)New York - 2.0% (continued)Village of Alden, BAN, Refunding 1.50 9/8/2022 2,000,000 2,005,144
16,399,631Total Short-Term Municipal Investments(cost $24,532,198) 24,499,380Total Investments (cost $936,547,013) 111.6% 928,752,242Liabilities, Less Cash and Receivables (11.6%) (96,824,710)Net Assets 100.0% 831,927,532a These securities have a put feature; the date shown represents the put date and the bond holder can take a specific action to retain the bond after the put date.b Security exempt from registration pursuant to Rule 144A under the Securities Act of 1933. These securities may be resold in transactions exempt from registration,
normally to qualified institutional buyers. At February 28, 2022, these securities were valued at $15,933,951 or 1.92% of net assets.c Security purchased on a when-issued or delayed basis for which the fund has not taken delivery as of February 28, 2022.d The Variable Rate shall be determined by the Remarketing Agent in its sole discretion based on prevailing market conditions and may, but need not, be established by
reference to one or more financial indices.e These securities are prerefunded; the date shown represents the prerefunded date. Bonds which are prerefunded are collateralized by U.S. Government securities which
are held in escrow and are used to pay principal and interest on the municipal issue and to retire the bonds in full at the earliest refunding date.f Principal amount for accrual purposes is periodically adjusted based on changes in the Consumer Price Index.g Variable rate security—interest rate resets periodically and rate shown is the interest rate in effect at period end. Security description also includes the reference rate
and spread if published and available.h Non-income producing—security in default.Portfolio Summary (Unaudited) † Value (%)General 20.5General Obligation 12.5School District 11.8Education 10.6Transportation 6.9Single Family Housing 6.9Medical 6.8Multifamily Housing 5.9Water 5.6Power 5.4Development 5.4Airport 3.8Prerefunded 3.2Utilities 1.4Pollution 1.3Special Tax .7Nursing Homes .7Student Loan .6Housing .6Facilities .5Tobacco Settlement .5
111.6† Based on net assets.See notes to financial statements.
48
Copyright © 2022 www.secdatabase.com. All Rights Reserved.Please Consider the Environment Before Printing This Document
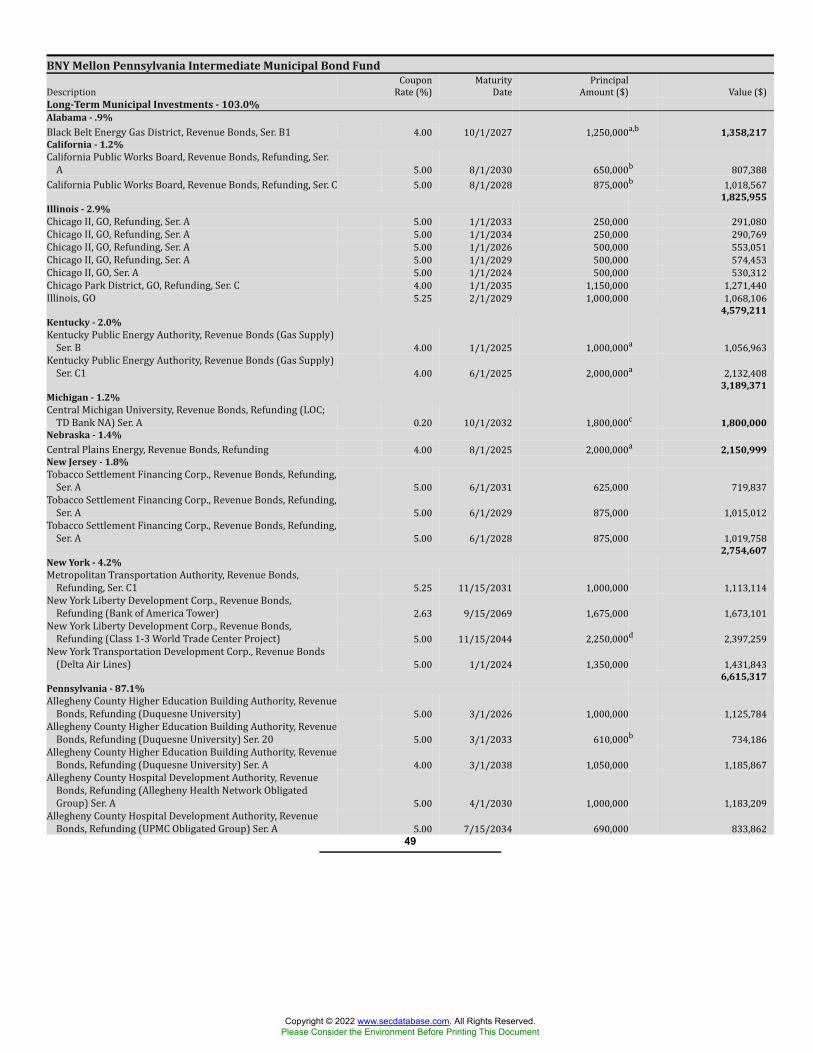
BNY Mellon Pennsylvania Intermediate Municipal Bond FundDescription CouponRate (%) MaturityDate PrincipalAmount ($) Value ($)Long-Term Municipal Investments - 103.0%Alabama - .9%Black Belt Energy Gas District, Revenue Bonds, Ser. B1 4.00 10/1/2027 1,250,000a,b 1,358,217California - 1.2%California Public Works Board, Revenue Bonds, Refunding, Ser.A 5.00 8/1/2030 650,000b 807,388California Public Works Board, Revenue Bonds, Refunding, Ser. C 5.00 8/1/2028 875,000b 1,018,567
1,825,955Illinois - 2.9%Chicago II, GO, Refunding, Ser. A 5.00 1/1/2033 250,000 291,080Chicago II, GO, Refunding, Ser. A 5.00 1/1/2034 250,000 290,769Chicago II, GO, Refunding, Ser. A 5.00 1/1/2026 500,000 553,051Chicago II, GO, Refunding, Ser. A 5.00 1/1/2029 500,000 574,453Chicago II, GO, Ser. A 5.00 1/1/2024 500,000 530,312Chicago Park District, GO, Refunding, Ser. C 4.00 1/1/2035 1,150,000 1,271,440Illinois, GO 5.25 2/1/2029 1,000,000 1,068,106
4,579,211Kentucky - 2.0%Kentucky Public Energy Authority, Revenue Bonds (Gas Supply)Ser. B 4.00 1/1/2025 1,000,000a 1,056,963Kentucky Public Energy Authority, Revenue Bonds (Gas Supply)Ser. C1 4.00 6/1/2025 2,000,000a 2,132,408
3,189,371Michigan - 1.2%Central Michigan University, Revenue Bonds, Refunding (LOC;TD Bank NA) Ser. A 0.20 10/1/2032 1,800,000c 1,800,000Nebraska - 1.4%Central Plains Energy, Revenue Bonds, Refunding 4.00 8/1/2025 2,000,000a 2,150,999New Jersey - 1.8%Tobacco Settlement Financing Corp., Revenue Bonds, Refunding,Ser. A 5.00 6/1/2031 625,000 719,837Tobacco Settlement Financing Corp., Revenue Bonds, Refunding,Ser. A 5.00 6/1/2029 875,000 1,015,012Tobacco Settlement Financing Corp., Revenue Bonds, Refunding,Ser. A 5.00 6/1/2028 875,000 1,019,758
2,754,607New York - 4.2%Metropolitan Transportation Authority, Revenue Bonds,Refunding, Ser. C1 5.25 11/15/2031 1,000,000 1,113,114New York Liberty Development Corp., Revenue Bonds,Refunding (Bank of America Tower) 2.63 9/15/2069 1,675,000 1,673,101New York Liberty Development Corp., Revenue Bonds,Refunding (Class 1-3 World Trade Center Project) 5.00 11/15/2044 2,250,000d 2,397,259New York Transportation Development Corp., Revenue Bonds(Delta Air Lines) 5.00 1/1/2024 1,350,000 1,431,843
6,615,317Pennsylvania - 87.1%Allegheny County Higher Education Building Authority, RevenueBonds, Refunding (Duquesne University) 5.00 3/1/2026 1,000,000 1,125,784Allegheny County Higher Education Building Authority, RevenueBonds, Refunding (Duquesne University) Ser. 20 5.00 3/1/2033 610,000b 734,186Allegheny County Higher Education Building Authority, RevenueBonds, Refunding (Duquesne University) Ser. A 4.00 3/1/2038 1,050,000 1,185,867Allegheny County Hospital Development Authority, RevenueBonds, Refunding (Allegheny Health Network ObligatedGroup) Ser. A 5.00 4/1/2030 1,000,000 1,183,209Allegheny County Hospital Development Authority, RevenueBonds, Refunding (UPMC Obligated Group) Ser. A 5.00 7/15/2034 690,000 833,862
49
Copyright © 2022 www.secdatabase.com. All Rights Reserved.Please Consider the Environment Before Printing This Document
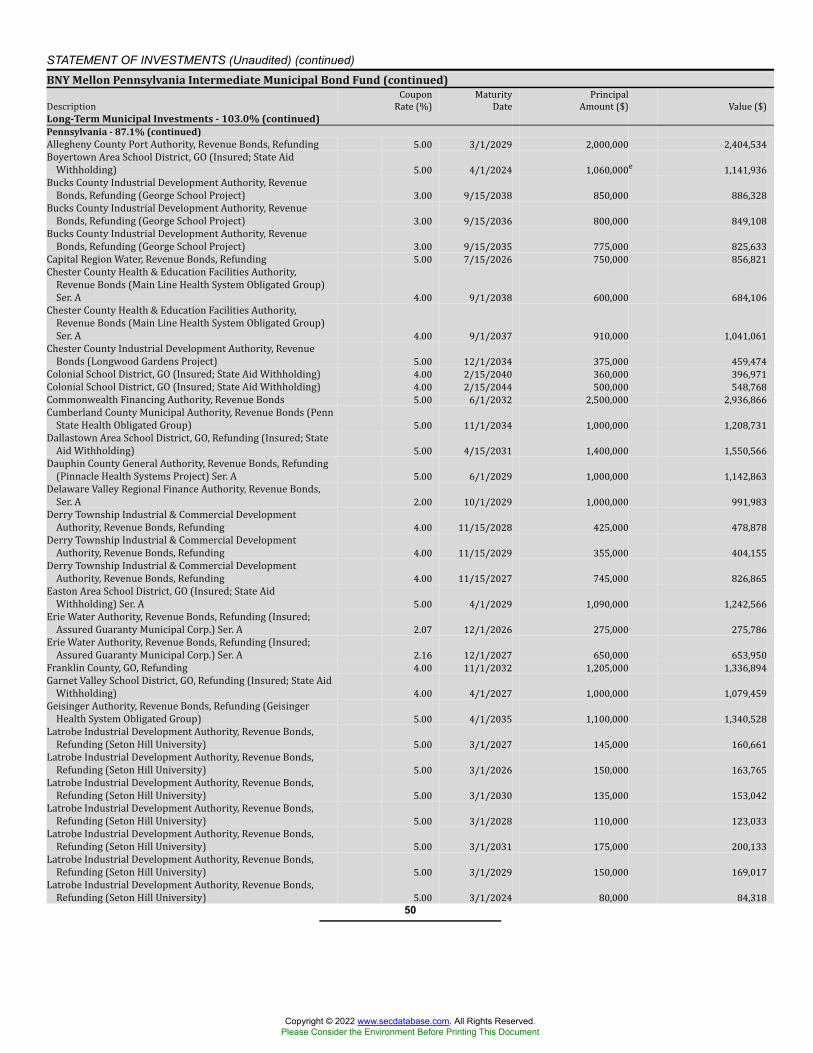
STATEMENT OF INVESTMENTS (Unaudited) (continued)BNY Mellon Pennsylvania Intermediate Municipal Bond Fund (continued)Description CouponRate (%) MaturityDate PrincipalAmount ($) Value ($)Long-Term Municipal Investments - 103.0% (continued)Pennsylvania - 87.1% (continued)Allegheny County Port Authority, Revenue Bonds, Refunding 5.00 3/1/2029 2,000,000 2,404,534Boyertown Area School District, GO (Insured; State AidWithholding) 5.00 4/1/2024 1,060,000e 1,141,936Bucks County Industrial Development Authority, RevenueBonds, Refunding (George School Project) 3.00 9/15/2038 850,000 886,328Bucks County Industrial Development Authority, RevenueBonds, Refunding (George School Project) 3.00 9/15/2036 800,000 849,108Bucks County Industrial Development Authority, RevenueBonds, Refunding (George School Project) 3.00 9/15/2035 775,000 825,633Capital Region Water, Revenue Bonds, Refunding 5.00 7/15/2026 750,000 856,821Chester County Health & Education Facilities Authority,Revenue Bonds (Main Line Health System Obligated Group)Ser. A 4.00 9/1/2038 600,000 684,106Chester County Health & Education Facilities Authority,Revenue Bonds (Main Line Health System Obligated Group)Ser. A 4.00 9/1/2037 910,000 1,041,061Chester County Industrial Development Authority, RevenueBonds (Longwood Gardens Project) 5.00 12/1/2034 375,000 459,474Colonial School District, GO (Insured; State Aid Withholding) 4.00 2/15/2040 360,000 396,971Colonial School District, GO (Insured; State Aid Withholding) 4.00 2/15/2044 500,000 548,768Commonwealth Financing Authority, Revenue Bonds 5.00 6/1/2032 2,500,000 2,936,866Cumberland County Municipal Authority, Revenue Bonds (PennState Health Obligated Group) 5.00 11/1/2034 1,000,000 1,208,731Dallastown Area School District, GO, Refunding (Insured; StateAid Withholding) 5.00 4/15/2031 1,400,000 1,550,566Dauphin County General Authority, Revenue Bonds, Refunding(Pinnacle Health Systems Project) Ser. A 5.00 6/1/2029 1,000,000 1,142,863Delaware Valley Regional Finance Authority, Revenue Bonds,Ser. A 2.00 10/1/2029 1,000,000 991,983Derry Township Industrial & Commercial DevelopmentAuthority, Revenue Bonds, Refunding 4.00 11/15/2028 425,000 478,878Derry Township Industrial & Commercial DevelopmentAuthority, Revenue Bonds, Refunding 4.00 11/15/2029 355,000 404,155Derry Township Industrial & Commercial DevelopmentAuthority, Revenue Bonds, Refunding 4.00 11/15/2027 745,000 826,865Easton Area School District, GO (Insured; State AidWithholding) Ser. A 5.00 4/1/2029 1,090,000 1,242,566Erie Water Authority, Revenue Bonds, Refunding (Insured;Assured Guaranty Municipal Corp.) Ser. A 2.07 12/1/2026 275,000 275,786Erie Water Authority, Revenue Bonds, Refunding (Insured;Assured Guaranty Municipal Corp.) Ser. A 2.16 12/1/2027 650,000 653,950Franklin County, GO, Refunding 4.00 11/1/2032 1,205,000 1,336,894Garnet Valley School District, GO, Refunding (Insured; State AidWithholding) 4.00 4/1/2027 1,000,000 1,079,459Geisinger Authority, Revenue Bonds, Refunding (GeisingerHealth System Obligated Group) 5.00 4/1/2035 1,100,000 1,340,528Latrobe Industrial Development Authority, Revenue Bonds,Refunding (Seton Hill University) 5.00 3/1/2027 145,000 160,661Latrobe Industrial Development Authority, Revenue Bonds,Refunding (Seton Hill University) 5.00 3/1/2026 150,000 163,765Latrobe Industrial Development Authority, Revenue Bonds,Refunding (Seton Hill University) 5.00 3/1/2030 135,000 153,042Latrobe Industrial Development Authority, Revenue Bonds,Refunding (Seton Hill University) 5.00 3/1/2028 110,000 123,033Latrobe Industrial Development Authority, Revenue Bonds,Refunding (Seton Hill University) 5.00 3/1/2031 175,000 200,133Latrobe Industrial Development Authority, Revenue Bonds,Refunding (Seton Hill University) 5.00 3/1/2029 150,000 169,017Latrobe Industrial Development Authority, Revenue Bonds,Refunding (Seton Hill University) 5.00 3/1/2024 80,000 84,318
50
Copyright © 2022 www.secdatabase.com. All Rights Reserved.Please Consider the Environment Before Printing This Document
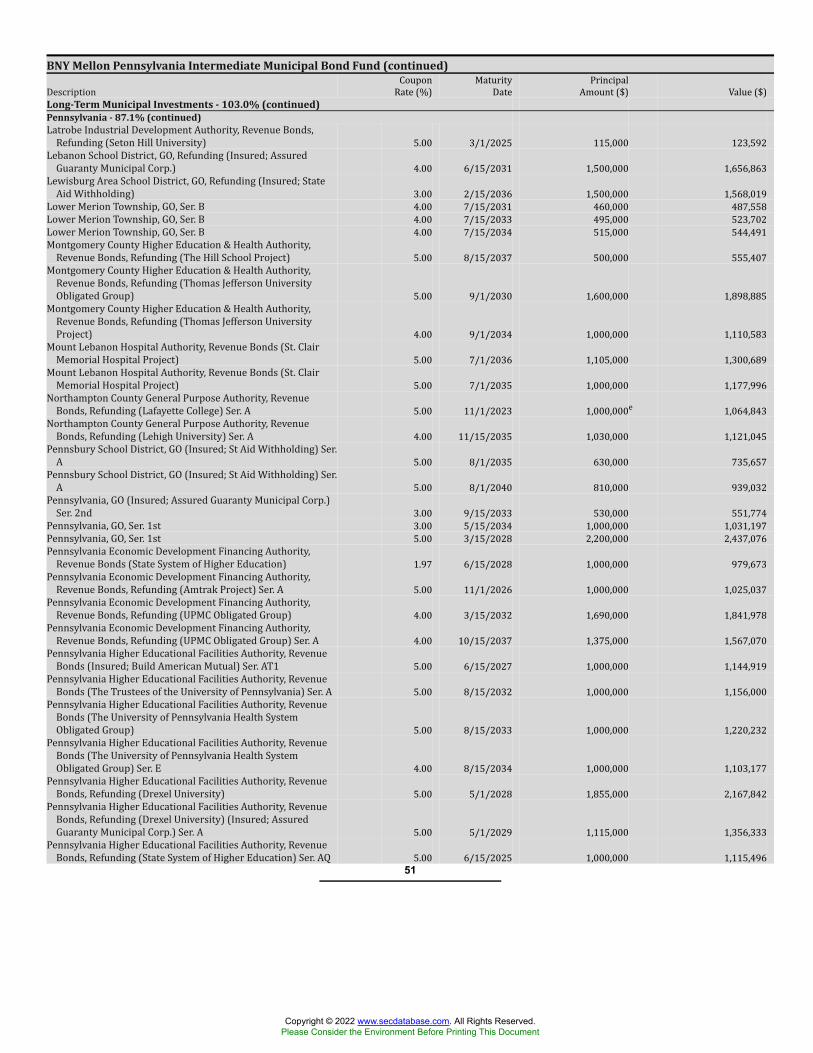
BNY Mellon Pennsylvania Intermediate Municipal Bond Fund (continued)Description CouponRate (%) MaturityDate PrincipalAmount ($) Value ($)Long-Term Municipal Investments - 103.0% (continued)Pennsylvania - 87.1% (continued)Latrobe Industrial Development Authority, Revenue Bonds,Refunding (Seton Hill University) 5.00 3/1/2025 115,000 123,592Lebanon School District, GO, Refunding (Insured; AssuredGuaranty Municipal Corp.) 4.00 6/15/2031 1,500,000 1,656,863Lewisburg Area School District, GO, Refunding (Insured; StateAid Withholding) 3.00 2/15/2036 1,500,000 1,568,019Lower Merion Township, GO, Ser. B 4.00 7/15/2031 460,000 487,558Lower Merion Township, GO, Ser. B 4.00 7/15/2033 495,000 523,702Lower Merion Township, GO, Ser. B 4.00 7/15/2034 515,000 544,491Montgomery County Higher Education & Health Authority,Revenue Bonds, Refunding (The Hill School Project) 5.00 8/15/2037 500,000 555,407Montgomery County Higher Education & Health Authority,Revenue Bonds, Refunding (Thomas Jefferson UniversityObligated Group) 5.00 9/1/2030 1,600,000 1,898,885Montgomery County Higher Education & Health Authority,Revenue Bonds, Refunding (Thomas Jefferson UniversityProject) 4.00 9/1/2034 1,000,000 1,110,583Mount Lebanon Hospital Authority, Revenue Bonds (St. ClairMemorial Hospital Project) 5.00 7/1/2036 1,105,000 1,300,689Mount Lebanon Hospital Authority, Revenue Bonds (St. ClairMemorial Hospital Project) 5.00 7/1/2035 1,000,000 1,177,996Northampton County General Purpose Authority, RevenueBonds, Refunding (Lafayette College) Ser. A 5.00 11/1/2023 1,000,000e 1,064,843Northampton County General Purpose Authority, RevenueBonds, Refunding (Lehigh University) Ser. A 4.00 11/15/2035 1,030,000 1,121,045Pennsbury School District, GO (Insured; St Aid Withholding) Ser.A 5.00 8/1/2035 630,000 735,657Pennsbury School District, GO (Insured; St Aid Withholding) Ser.A 5.00 8/1/2040 810,000 939,032Pennsylvania, GO (Insured; Assured Guaranty Municipal Corp.)Ser. 2nd 3.00 9/15/2033 530,000 551,774Pennsylvania, GO, Ser. 1st 3.00 5/15/2034 1,000,000 1,031,197Pennsylvania, GO, Ser. 1st 5.00 3/15/2028 2,200,000 2,437,076Pennsylvania Economic Development Financing Authority,Revenue Bonds (State System of Higher Education) 1.97 6/15/2028 1,000,000 979,673Pennsylvania Economic Development Financing Authority,Revenue Bonds, Refunding (Amtrak Project) Ser. A 5.00 11/1/2026 1,000,000 1,025,037Pennsylvania Economic Development Financing Authority,Revenue Bonds, Refunding (UPMC Obligated Group) 4.00 3/15/2032 1,690,000 1,841,978Pennsylvania Economic Development Financing Authority,Revenue Bonds, Refunding (UPMC Obligated Group) Ser. A 4.00 10/15/2037 1,375,000 1,567,070Pennsylvania Higher Educational Facilities Authority, RevenueBonds (Insured; Build American Mutual) Ser. AT1 5.00 6/15/2027 1,000,000 1,144,919Pennsylvania Higher Educational Facilities Authority, RevenueBonds (The Trustees of the University of Pennsylvania) Ser. A 5.00 8/15/2032 1,000,000 1,156,000Pennsylvania Higher Educational Facilities Authority, RevenueBonds (The University of Pennsylvania Health SystemObligated Group) 5.00 8/15/2033 1,000,000 1,220,232Pennsylvania Higher Educational Facilities Authority, RevenueBonds (The University of Pennsylvania Health SystemObligated Group) Ser. E 4.00 8/15/2034 1,000,000 1,103,177Pennsylvania Higher Educational Facilities Authority, RevenueBonds, Refunding (Drexel University) 5.00 5/1/2028 1,855,000 2,167,842Pennsylvania Higher Educational Facilities Authority, RevenueBonds, Refunding (Drexel University) (Insured; AssuredGuaranty Municipal Corp.) Ser. A 5.00 5/1/2029 1,115,000 1,356,333Pennsylvania Higher Educational Facilities Authority, RevenueBonds, Refunding (State System of Higher Education) Ser. AQ 5.00 6/15/2025 1,000,000 1,115,496
51
Copyright © 2022 www.secdatabase.com. All Rights Reserved.Please Consider the Environment Before Printing This Document
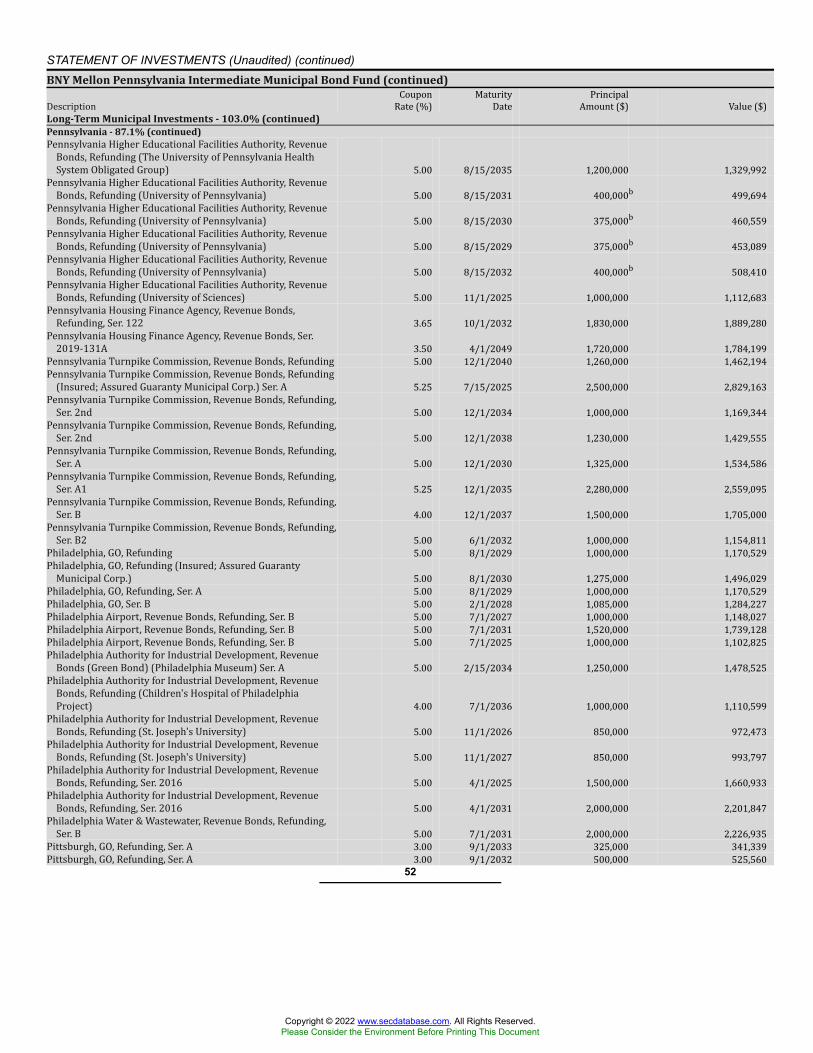
STATEMENT OF INVESTMENTS (Unaudited) (continued)BNY Mellon Pennsylvania Intermediate Municipal Bond Fund (continued)Description CouponRate (%) MaturityDate PrincipalAmount ($) Value ($)Long-Term Municipal Investments - 103.0% (continued)Pennsylvania - 87.1% (continued)Pennsylvania Higher Educational Facilities Authority, RevenueBonds, Refunding (The University of Pennsylvania HealthSystem Obligated Group) 5.00 8/15/2035 1,200,000 1,329,992Pennsylvania Higher Educational Facilities Authority, RevenueBonds, Refunding (University of Pennsylvania) 5.00 8/15/2031 400,000b 499,694Pennsylvania Higher Educational Facilities Authority, RevenueBonds, Refunding (University of Pennsylvania) 5.00 8/15/2030 375,000b 460,559Pennsylvania Higher Educational Facilities Authority, RevenueBonds, Refunding (University of Pennsylvania) 5.00 8/15/2029 375,000b 453,089Pennsylvania Higher Educational Facilities Authority, RevenueBonds, Refunding (University of Pennsylvania) 5.00 8/15/2032 400,000b 508,410Pennsylvania Higher Educational Facilities Authority, RevenueBonds, Refunding (University of Sciences) 5.00 11/1/2025 1,000,000 1,112,683Pennsylvania Housing Finance Agency, Revenue Bonds,Refunding, Ser. 122 3.65 10/1/2032 1,830,000 1,889,280Pennsylvania Housing Finance Agency, Revenue Bonds, Ser.2019-131A 3.50 4/1/2049 1,720,000 1,784,199Pennsylvania Turnpike Commission, Revenue Bonds, Refunding 5.00 12/1/2040 1,260,000 1,462,194Pennsylvania Turnpike Commission, Revenue Bonds, Refunding(Insured; Assured Guaranty Municipal Corp.) Ser. A 5.25 7/15/2025 2,500,000 2,829,163Pennsylvania Turnpike Commission, Revenue Bonds, Refunding,Ser. 2nd 5.00 12/1/2034 1,000,000 1,169,344Pennsylvania Turnpike Commission, Revenue Bonds, Refunding,Ser. 2nd 5.00 12/1/2038 1,230,000 1,429,555Pennsylvania Turnpike Commission, Revenue Bonds, Refunding,Ser. A 5.00 12/1/2030 1,325,000 1,534,586Pennsylvania Turnpike Commission, Revenue Bonds, Refunding,Ser. A1 5.25 12/1/2035 2,280,000 2,559,095Pennsylvania Turnpike Commission, Revenue Bonds, Refunding,Ser. B 4.00 12/1/2037 1,500,000 1,705,000Pennsylvania Turnpike Commission, Revenue Bonds, Refunding,Ser. B2 5.00 6/1/2032 1,000,000 1,154,811Philadelphia, GO, Refunding 5.00 8/1/2029 1,000,000 1,170,529Philadelphia, GO, Refunding (Insured; Assured GuarantyMunicipal Corp.) 5.00 8/1/2030 1,275,000 1,496,029Philadelphia, GO, Refunding, Ser. A 5.00 8/1/2029 1,000,000 1,170,529Philadelphia, GO, Ser. B 5.00 2/1/2028 1,085,000 1,284,227Philadelphia Airport, Revenue Bonds, Refunding, Ser. B 5.00 7/1/2027 1,000,000 1,148,027Philadelphia Airport, Revenue Bonds, Refunding, Ser. B 5.00 7/1/2031 1,520,000 1,739,128Philadelphia Airport, Revenue Bonds, Refunding, Ser. B 5.00 7/1/2025 1,000,000 1,102,825Philadelphia Authority for Industrial Development, RevenueBonds (Green Bond) (Philadelphia Museum) Ser. A 5.00 2/15/2034 1,250,000 1,478,525Philadelphia Authority for Industrial Development, RevenueBonds, Refunding (Children's Hospital of PhiladelphiaProject) 4.00 7/1/2036 1,000,000 1,110,599Philadelphia Authority for Industrial Development, RevenueBonds, Refunding (St. Joseph's University) 5.00 11/1/2026 850,000 972,473Philadelphia Authority for Industrial Development, RevenueBonds, Refunding (St. Joseph's University) 5.00 11/1/2027 850,000 993,797Philadelphia Authority for Industrial Development, RevenueBonds, Refunding, Ser. 2016 5.00 4/1/2025 1,500,000 1,660,933Philadelphia Authority for Industrial Development, RevenueBonds, Refunding, Ser. 2016 5.00 4/1/2031 2,000,000 2,201,847Philadelphia Water & Wastewater, Revenue Bonds, Refunding,Ser. B 5.00 7/1/2031 2,000,000 2,226,935Pittsburgh, GO, Refunding, Ser. A 3.00 9/1/2033 325,000 341,339Pittsburgh, GO, Refunding, Ser. A 3.00 9/1/2032 500,000 525,560
52
Copyright © 2022 www.secdatabase.com. All Rights Reserved.Please Consider the Environment Before Printing This Document
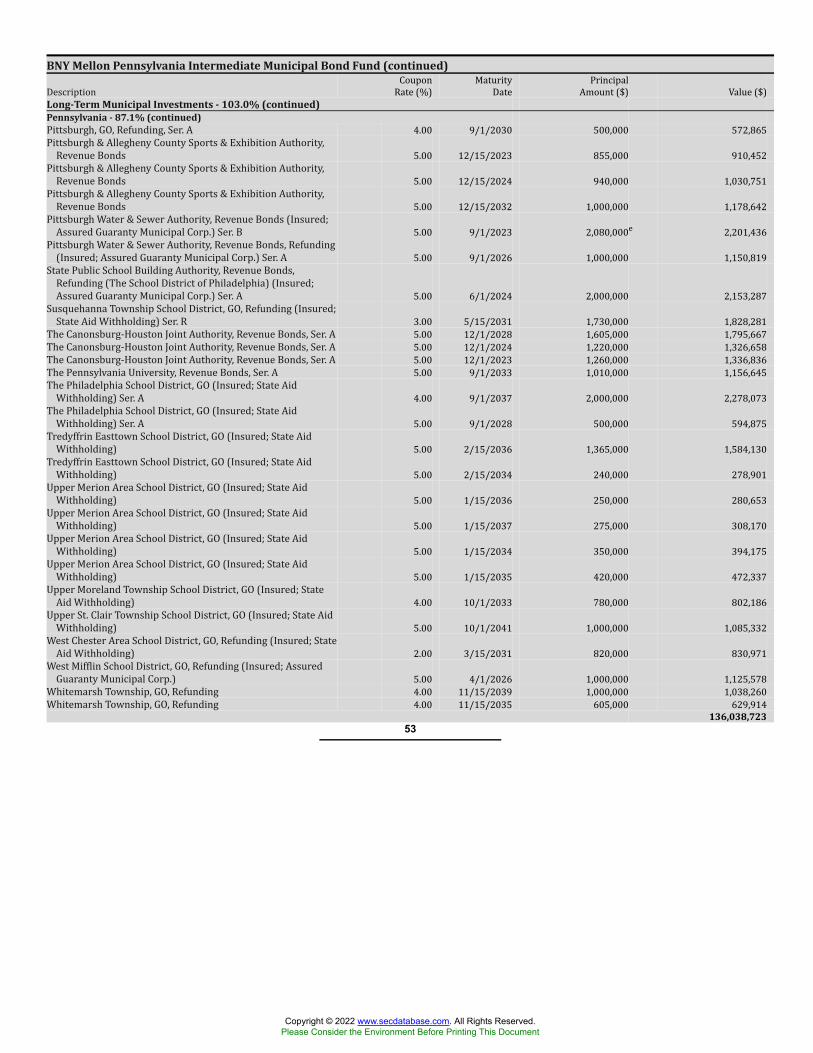
BNY Mellon Pennsylvania Intermediate Municipal Bond Fund (continued)Description CouponRate (%) MaturityDate PrincipalAmount ($) Value ($)Long-Term Municipal Investments - 103.0% (continued)Pennsylvania - 87.1% (continued)Pittsburgh, GO, Refunding, Ser. A 4.00 9/1/2030 500,000 572,865Pittsburgh & Allegheny County Sports & Exhibition Authority,Revenue Bonds 5.00 12/15/2023 855,000 910,452Pittsburgh & Allegheny County Sports & Exhibition Authority,Revenue Bonds 5.00 12/15/2024 940,000 1,030,751Pittsburgh & Allegheny County Sports & Exhibition Authority,Revenue Bonds 5.00 12/15/2032 1,000,000 1,178,642Pittsburgh Water & Sewer Authority, Revenue Bonds (Insured;Assured Guaranty Municipal Corp.) Ser. B 5.00 9/1/2023 2,080,000e 2,201,436Pittsburgh Water & Sewer Authority, Revenue Bonds, Refunding(Insured; Assured Guaranty Municipal Corp.) Ser. A 5.00 9/1/2026 1,000,000 1,150,819State Public School Building Authority, Revenue Bonds,Refunding (The School District of Philadelphia) (Insured;Assured Guaranty Municipal Corp.) Ser. A 5.00 6/1/2024 2,000,000 2,153,287Susquehanna Township School District, GO, Refunding (Insured;State Aid Withholding) Ser. R 3.00 5/15/2031 1,730,000 1,828,281The Canonsburg-Houston Joint Authority, Revenue Bonds, Ser. A 5.00 12/1/2028 1,605,000 1,795,667The Canonsburg-Houston Joint Authority, Revenue Bonds, Ser. A 5.00 12/1/2024 1,220,000 1,326,658The Canonsburg-Houston Joint Authority, Revenue Bonds, Ser. A 5.00 12/1/2023 1,260,000 1,336,836The Pennsylvania University, Revenue Bonds, Ser. A 5.00 9/1/2033 1,010,000 1,156,645The Philadelphia School District, GO (Insured; State AidWithholding) Ser. A 4.00 9/1/2037 2,000,000 2,278,073The Philadelphia School District, GO (Insured; State AidWithholding) Ser. A 5.00 9/1/2028 500,000 594,875Tredyffrin Easttown School District, GO (Insured; State AidWithholding) 5.00 2/15/2036 1,365,000 1,584,130Tredyffrin Easttown School District, GO (Insured; State AidWithholding) 5.00 2/15/2034 240,000 278,901Upper Merion Area School District, GO (Insured; State AidWithholding) 5.00 1/15/2036 250,000 280,653Upper Merion Area School District, GO (Insured; State AidWithholding) 5.00 1/15/2037 275,000 308,170Upper Merion Area School District, GO (Insured; State AidWithholding) 5.00 1/15/2034 350,000 394,175Upper Merion Area School District, GO (Insured; State AidWithholding) 5.00 1/15/2035 420,000 472,337Upper Moreland Township School District, GO (Insured; StateAid Withholding) 4.00 10/1/2033 780,000 802,186Upper St. Clair Township School District, GO (Insured; State AidWithholding) 5.00 10/1/2041 1,000,000 1,085,332West Chester Area School District, GO, Refunding (Insured; StateAid Withholding) 2.00 3/15/2031 820,000 830,971West Mifflin School District, GO, Refunding (Insured; AssuredGuaranty Municipal Corp.) 5.00 4/1/2026 1,000,000 1,125,578Whitemarsh Township, GO, Refunding 4.00 11/15/2039 1,000,000 1,038,260Whitemarsh Township, GO, Refunding 4.00 11/15/2035 605,000 629,914
136,038,72353
Copyright © 2022 www.secdatabase.com. All Rights Reserved.Please Consider the Environment Before Printing This Document
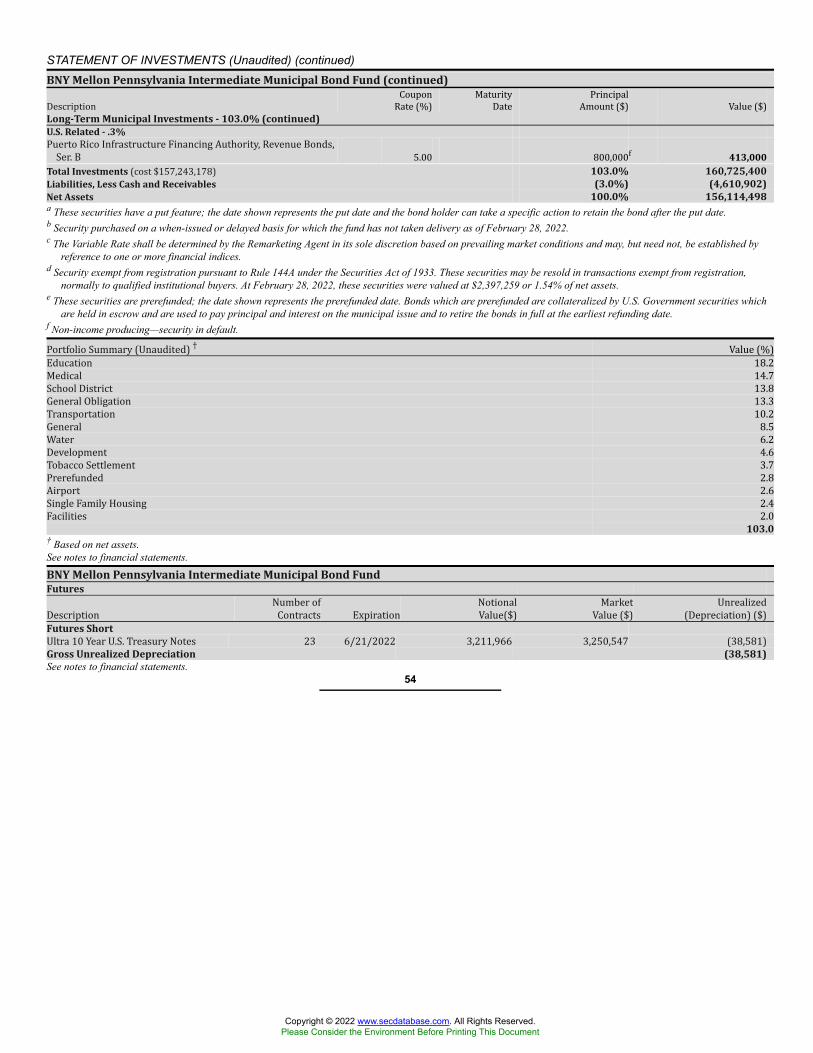
STATEMENT OF INVESTMENTS (Unaudited) (continued)BNY Mellon Pennsylvania Intermediate Municipal Bond Fund (continued)Description CouponRate (%) MaturityDate PrincipalAmount ($) Value ($)Long-Term Municipal Investments - 103.0% (continued)U.S. Related - .3%Puerto Rico Infrastructure Financing Authority, Revenue Bonds,Ser. B 5.00 800,000f 413,000Total Investments (cost $157,243,178) 103.0% 160,725,400Liabilities, Less Cash and Receivables (3.0%) (4,610,902)Net Assets 100.0% 156,114,498a These securities have a put feature; the date shown represents the put date and the bond holder can take a specific action to retain the bond after the put date.b Security purchased on a when-issued or delayed basis for which the fund has not taken delivery as of February 28, 2022.c The Variable Rate shall be determined by the Remarketing Agent in its sole discretion based on prevailing market conditions and may, but need not, be established by
reference to one or more financial indices.d Security exempt from registration pursuant to Rule 144A under the Securities Act of 1933. These securities may be resold in transactions exempt from registration,
normally to qualified institutional buyers. At February 28, 2022, these securities were valued at $2,397,259 or 1.54% of net assets.e These securities are prerefunded; the date shown represents the prerefunded date. Bonds which are prerefunded are collateralized by U.S. Government securities which
are held in escrow and are used to pay principal and interest on the municipal issue and to retire the bonds in full at the earliest refunding date.f Non-income producing—security in default.Portfolio Summary (Unaudited) † Value (%)Education 18.2Medical 14.7School District 13.8General Obligation 13.3Transportation 10.2General 8.5Water 6.2Development 4.6Tobacco Settlement 3.7Prerefunded 2.8Airport 2.6Single Family Housing 2.4Facilities 2.0
103.0† Based on net assets.See notes to financial statements.
BNY Mellon Pennsylvania Intermediate Municipal Bond FundFuturesDescription Number ofContracts Expiration NotionalValue($) MarketValue ($) Unrealized(Depreciation) ($)Futures ShortUltra 10 Year U.S. Treasury Notes 23 6/21/2022 3,211,966 3,250,547 (38,581)Gross Unrealized Depreciation (38,581)See notes to financial statements.
54
Copyright © 2022 www.secdatabase.com. All Rights Reserved.Please Consider the Environment Before Printing This Document
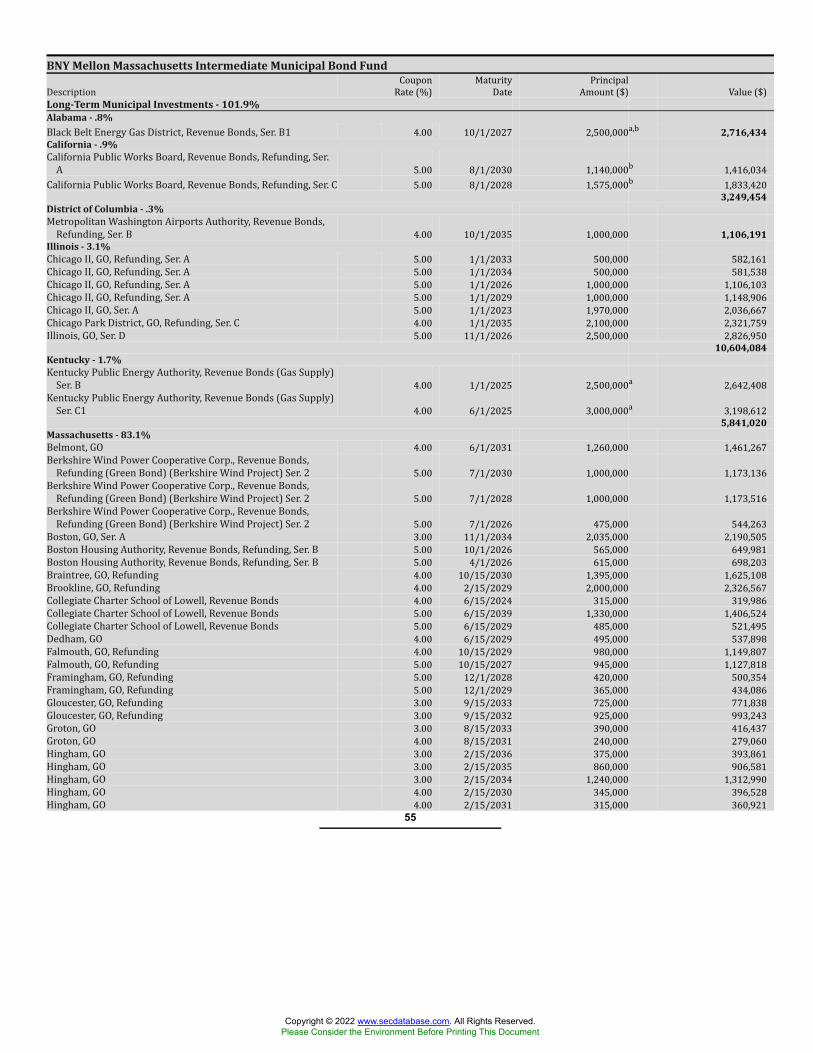
BNY Mellon Massachusetts Intermediate Municipal Bond FundDescription CouponRate (%) MaturityDate PrincipalAmount ($) Value ($)Long-Term Municipal Investments - 101.9%Alabama - .8%Black Belt Energy Gas District, Revenue Bonds, Ser. B1 4.00 10/1/2027 2,500,000a,b 2,716,434California - .9%California Public Works Board, Revenue Bonds, Refunding, Ser.A 5.00 8/1/2030 1,140,000b 1,416,034California Public Works Board, Revenue Bonds, Refunding, Ser. C 5.00 8/1/2028 1,575,000b 1,833,420
3,249,454District of Columbia - .3%Metropolitan Washington Airports Authority, Revenue Bonds,Refunding, Ser. B 4.00 10/1/2035 1,000,000 1,106,191Illinois - 3.1%Chicago II, GO, Refunding, Ser. A 5.00 1/1/2033 500,000 582,161Chicago II, GO, Refunding, Ser. A 5.00 1/1/2034 500,000 581,538Chicago II, GO, Refunding, Ser. A 5.00 1/1/2026 1,000,000 1,106,103Chicago II, GO, Refunding, Ser. A 5.00 1/1/2029 1,000,000 1,148,906Chicago II, GO, Ser. A 5.00 1/1/2023 1,970,000 2,036,667Chicago Park District, GO, Refunding, Ser. C 4.00 1/1/2035 2,100,000 2,321,759Illinois, GO, Ser. D 5.00 11/1/2026 2,500,000 2,826,950
10,604,084Kentucky - 1.7%Kentucky Public Energy Authority, Revenue Bonds (Gas Supply)Ser. B 4.00 1/1/2025 2,500,000a 2,642,408Kentucky Public Energy Authority, Revenue Bonds (Gas Supply)Ser. C1 4.00 6/1/2025 3,000,000a 3,198,612
5,841,020Massachusetts - 83.1%Belmont, GO 4.00 6/1/2031 1,260,000 1,461,267Berkshire Wind Power Cooperative Corp., Revenue Bonds,Refunding (Green Bond) (Berkshire Wind Project) Ser. 2 5.00 7/1/2030 1,000,000 1,173,136Berkshire Wind Power Cooperative Corp., Revenue Bonds,Refunding (Green Bond) (Berkshire Wind Project) Ser. 2 5.00 7/1/2028 1,000,000 1,173,516Berkshire Wind Power Cooperative Corp., Revenue Bonds,Refunding (Green Bond) (Berkshire Wind Project) Ser. 2 5.00 7/1/2026 475,000 544,263Boston, GO, Ser. A 3.00 11/1/2034 2,035,000 2,190,505Boston Housing Authority, Revenue Bonds, Refunding, Ser. B 5.00 10/1/2026 565,000 649,981Boston Housing Authority, Revenue Bonds, Refunding, Ser. B 5.00 4/1/2026 615,000 698,203Braintree, GO, Refunding 4.00 10/15/2030 1,395,000 1,625,108Brookline, GO, Refunding 4.00 2/15/2029 2,000,000 2,326,567Collegiate Charter School of Lowell, Revenue Bonds 4.00 6/15/2024 315,000 319,986Collegiate Charter School of Lowell, Revenue Bonds 5.00 6/15/2039 1,330,000 1,406,524Collegiate Charter School of Lowell, Revenue Bonds 5.00 6/15/2029 485,000 521,495Dedham, GO 4.00 6/15/2029 495,000 537,898Falmouth, GO, Refunding 4.00 10/15/2029 980,000 1,149,807Falmouth, GO, Refunding 5.00 10/15/2027 945,000 1,127,818Framingham, GO, Refunding 5.00 12/1/2028 420,000 500,354Framingham, GO, Refunding 5.00 12/1/2029 365,000 434,086Gloucester, GO, Refunding 3.00 9/15/2033 725,000 771,838Gloucester, GO, Refunding 3.00 9/15/2032 925,000 993,243Groton, GO 3.00 8/15/2033 390,000 416,437Groton, GO 4.00 8/15/2031 240,000 279,060Hingham, GO 3.00 2/15/2036 375,000 393,861Hingham, GO 3.00 2/15/2035 860,000 906,581Hingham, GO 3.00 2/15/2034 1,240,000 1,312,990Hingham, GO 4.00 2/15/2030 345,000 396,528Hingham, GO 4.00 2/15/2031 315,000 360,921
55
Copyright © 2022 www.secdatabase.com. All Rights Reserved.Please Consider the Environment Before Printing This Document
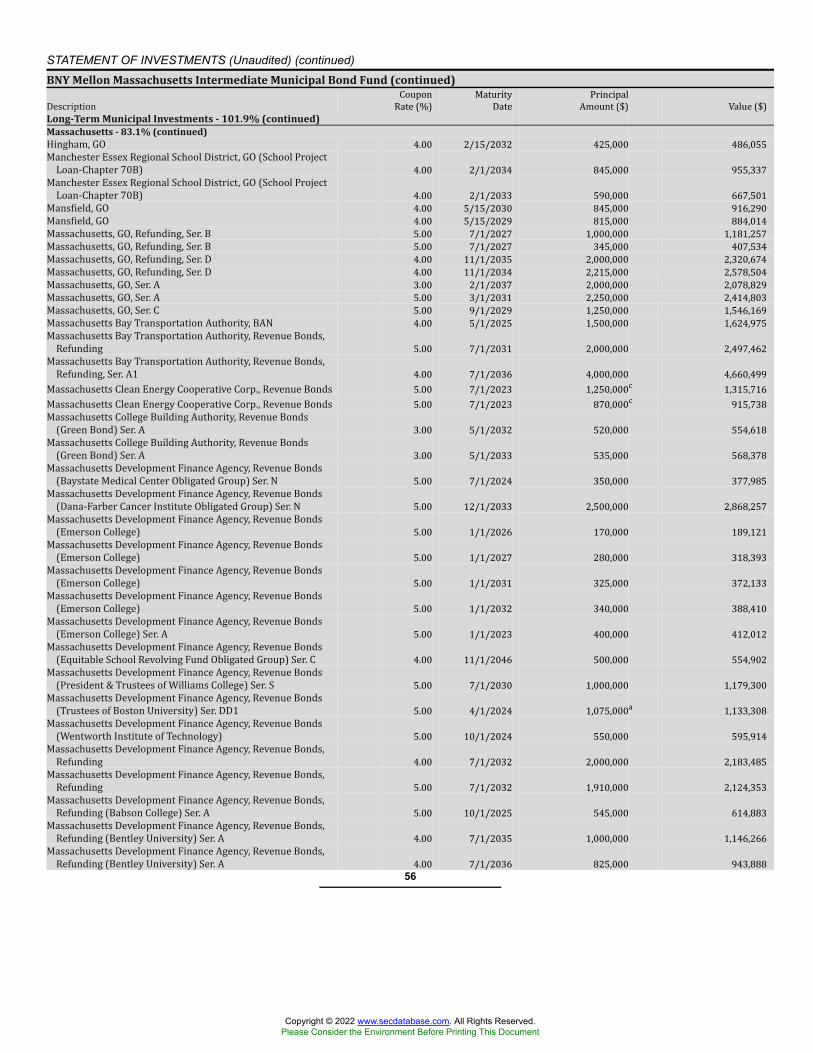
STATEMENT OF INVESTMENTS (Unaudited) (continued)BNY Mellon Massachusetts Intermediate Municipal Bond Fund (continued)Description CouponRate (%) MaturityDate PrincipalAmount ($) Value ($)Long-Term Municipal Investments - 101.9% (continued)Massachusetts - 83.1% (continued)Hingham, GO 4.00 2/15/2032 425,000 486,055Manchester Essex Regional School District, GO (School ProjectLoan-Chapter 70B) 4.00 2/1/2034 845,000 955,337Manchester Essex Regional School District, GO (School ProjectLoan-Chapter 70B) 4.00 2/1/2033 590,000 667,501Mansfield, GO 4.00 5/15/2030 845,000 916,290Mansfield, GO 4.00 5/15/2029 815,000 884,014Massachusetts, GO, Refunding, Ser. B 5.00 7/1/2027 1,000,000 1,181,257Massachusetts, GO, Refunding, Ser. B 5.00 7/1/2027 345,000 407,534Massachusetts, GO, Refunding, Ser. D 4.00 11/1/2035 2,000,000 2,320,674Massachusetts, GO, Refunding, Ser. D 4.00 11/1/2034 2,215,000 2,578,504Massachusetts, GO, Ser. A 3.00 2/1/2037 2,000,000 2,078,829Massachusetts, GO, Ser. A 5.00 3/1/2031 2,250,000 2,414,803Massachusetts, GO, Ser. C 5.00 9/1/2029 1,250,000 1,546,169Massachusetts Bay Transportation Authority, BAN 4.00 5/1/2025 1,500,000 1,624,975Massachusetts Bay Transportation Authority, Revenue Bonds,Refunding 5.00 7/1/2031 2,000,000 2,497,462Massachusetts Bay Transportation Authority, Revenue Bonds,Refunding, Ser. A1 4.00 7/1/2036 4,000,000 4,660,499Massachusetts Clean Energy Cooperative Corp., Revenue Bonds 5.00 7/1/2023 1,250,000c 1,315,716Massachusetts Clean Energy Cooperative Corp., Revenue Bonds 5.00 7/1/2023 870,000c 915,738Massachusetts College Building Authority, Revenue Bonds(Green Bond) Ser. A 3.00 5/1/2032 520,000 554,618Massachusetts College Building Authority, Revenue Bonds(Green Bond) Ser. A 3.00 5/1/2033 535,000 568,378Massachusetts Development Finance Agency, Revenue Bonds(Baystate Medical Center Obligated Group) Ser. N 5.00 7/1/2024 350,000 377,985Massachusetts Development Finance Agency, Revenue Bonds(Dana-Farber Cancer Institute Obligated Group) Ser. N 5.00 12/1/2033 2,500,000 2,868,257Massachusetts Development Finance Agency, Revenue Bonds(Emerson College) 5.00 1/1/2026 170,000 189,121Massachusetts Development Finance Agency, Revenue Bonds(Emerson College) 5.00 1/1/2027 280,000 318,393Massachusetts Development Finance Agency, Revenue Bonds(Emerson College) 5.00 1/1/2031 325,000 372,133Massachusetts Development Finance Agency, Revenue Bonds(Emerson College) 5.00 1/1/2032 340,000 388,410Massachusetts Development Finance Agency, Revenue Bonds(Emerson College) Ser. A 5.00 1/1/2023 400,000 412,012Massachusetts Development Finance Agency, Revenue Bonds(Equitable School Revolving Fund Obligated Group) Ser. C 4.00 11/1/2046 500,000 554,902Massachusetts Development Finance Agency, Revenue Bonds(President & Trustees of Williams College) Ser. S 5.00 7/1/2030 1,000,000 1,179,300Massachusetts Development Finance Agency, Revenue Bonds(Trustees of Boston University) Ser. DD1 5.00 4/1/2024 1,075,000a 1,133,308Massachusetts Development Finance Agency, Revenue Bonds(Wentworth Institute of Technology) 5.00 10/1/2024 550,000 595,914Massachusetts Development Finance Agency, Revenue Bonds,Refunding 4.00 7/1/2032 2,000,000 2,183,485Massachusetts Development Finance Agency, Revenue Bonds,Refunding 5.00 7/1/2032 1,910,000 2,124,353Massachusetts Development Finance Agency, Revenue Bonds,Refunding (Babson College) Ser. A 5.00 10/1/2025 545,000 614,883Massachusetts Development Finance Agency, Revenue Bonds,Refunding (Bentley University) Ser. A 4.00 7/1/2035 1,000,000 1,146,266Massachusetts Development Finance Agency, Revenue Bonds,Refunding (Bentley University) Ser. A 4.00 7/1/2036 825,000 943,888
56
Copyright © 2022 www.secdatabase.com. All Rights Reserved.Please Consider the Environment Before Printing This Document
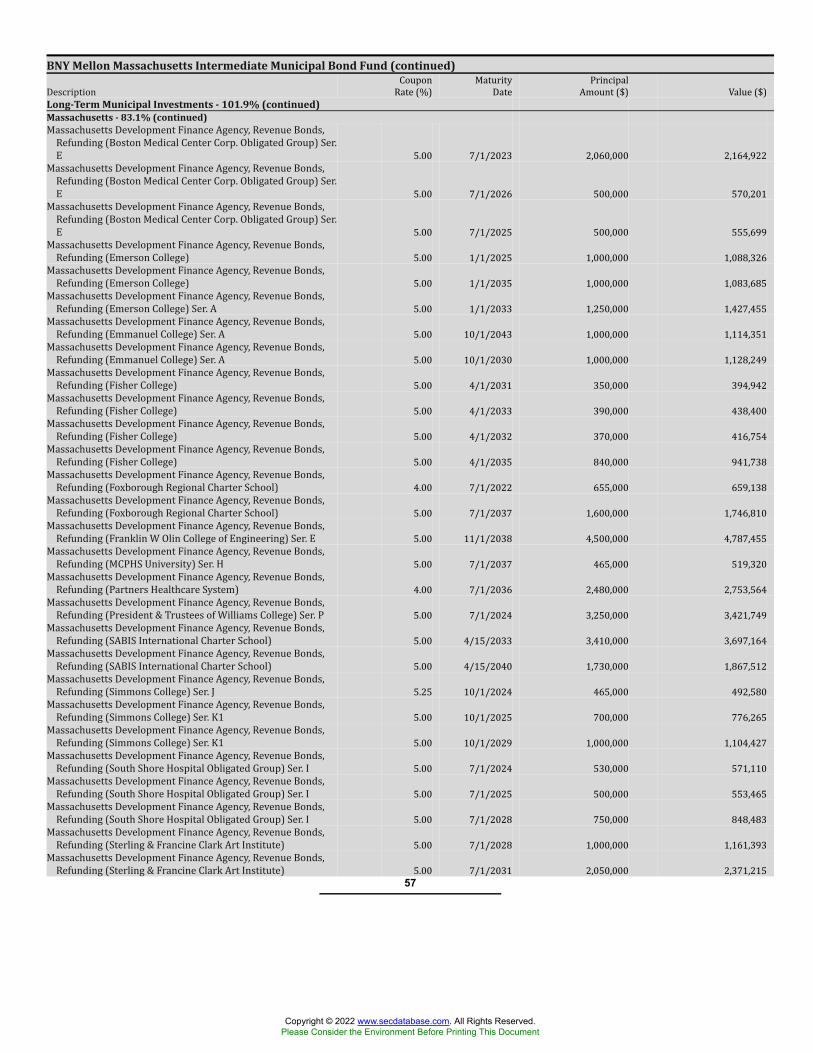
BNY Mellon Massachusetts Intermediate Municipal Bond Fund (continued)Description CouponRate (%) MaturityDate PrincipalAmount ($) Value ($)Long-Term Municipal Investments - 101.9% (continued)Massachusetts - 83.1% (continued)Massachusetts Development Finance Agency, Revenue Bonds,Refunding (Boston Medical Center Corp. Obligated Group) Ser.E 5.00 7/1/2023 2,060,000 2,164,922Massachusetts Development Finance Agency, Revenue Bonds,Refunding (Boston Medical Center Corp. Obligated Group) Ser.E 5.00 7/1/2026 500,000 570,201Massachusetts Development Finance Agency, Revenue Bonds,Refunding (Boston Medical Center Corp. Obligated Group) Ser.E 5.00 7/1/2025 500,000 555,699Massachusetts Development Finance Agency, Revenue Bonds,Refunding (Emerson College) 5.00 1/1/2025 1,000,000 1,088,326Massachusetts Development Finance Agency, Revenue Bonds,Refunding (Emerson College) 5.00 1/1/2035 1,000,000 1,083,685Massachusetts Development Finance Agency, Revenue Bonds,Refunding (Emerson College) Ser. A 5.00 1/1/2033 1,250,000 1,427,455Massachusetts Development Finance Agency, Revenue Bonds,Refunding (Emmanuel College) Ser. A 5.00 10/1/2043 1,000,000 1,114,351Massachusetts Development Finance Agency, Revenue Bonds,Refunding (Emmanuel College) Ser. A 5.00 10/1/2030 1,000,000 1,128,249Massachusetts Development Finance Agency, Revenue Bonds,Refunding (Fisher College) 5.00 4/1/2031 350,000 394,942Massachusetts Development Finance Agency, Revenue Bonds,Refunding (Fisher College) 5.00 4/1/2033 390,000 438,400Massachusetts Development Finance Agency, Revenue Bonds,Refunding (Fisher College) 5.00 4/1/2032 370,000 416,754Massachusetts Development Finance Agency, Revenue Bonds,Refunding (Fisher College) 5.00 4/1/2035 840,000 941,738Massachusetts Development Finance Agency, Revenue Bonds,Refunding (Foxborough Regional Charter School) 4.00 7/1/2022 655,000 659,138Massachusetts Development Finance Agency, Revenue Bonds,Refunding (Foxborough Regional Charter School) 5.00 7/1/2037 1,600,000 1,746,810Massachusetts Development Finance Agency, Revenue Bonds,Refunding (Franklin W Olin College of Engineering) Ser. E 5.00 11/1/2038 4,500,000 4,787,455Massachusetts Development Finance Agency, Revenue Bonds,Refunding (MCPHS University) Ser. H 5.00 7/1/2037 465,000 519,320Massachusetts Development Finance Agency, Revenue Bonds,Refunding (Partners Healthcare System) 4.00 7/1/2036 2,480,000 2,753,564Massachusetts Development Finance Agency, Revenue Bonds,Refunding (President & Trustees of Williams College) Ser. P 5.00 7/1/2024 3,250,000 3,421,749Massachusetts Development Finance Agency, Revenue Bonds,Refunding (SABIS International Charter School) 5.00 4/15/2033 3,410,000 3,697,164Massachusetts Development Finance Agency, Revenue Bonds,Refunding (SABIS International Charter School) 5.00 4/15/2040 1,730,000 1,867,512Massachusetts Development Finance Agency, Revenue Bonds,Refunding (Simmons College) Ser. J 5.25 10/1/2024 465,000 492,580Massachusetts Development Finance Agency, Revenue Bonds,Refunding (Simmons College) Ser. K1 5.00 10/1/2025 700,000 776,265Massachusetts Development Finance Agency, Revenue Bonds,Refunding (Simmons College) Ser. K1 5.00 10/1/2029 1,000,000 1,104,427Massachusetts Development Finance Agency, Revenue Bonds,Refunding (South Shore Hospital Obligated Group) Ser. I 5.00 7/1/2024 530,000 571,110Massachusetts Development Finance Agency, Revenue Bonds,Refunding (South Shore Hospital Obligated Group) Ser. I 5.00 7/1/2025 500,000 553,465Massachusetts Development Finance Agency, Revenue Bonds,Refunding (South Shore Hospital Obligated Group) Ser. I 5.00 7/1/2028 750,000 848,483Massachusetts Development Finance Agency, Revenue Bonds,Refunding (Sterling & Francine Clark Art Institute) 5.00 7/1/2028 1,000,000 1,161,393Massachusetts Development Finance Agency, Revenue Bonds,Refunding (Sterling & Francine Clark Art Institute) 5.00 7/1/2031 2,050,000 2,371,215
57
Copyright © 2022 www.secdatabase.com. All Rights Reserved.Please Consider the Environment Before Printing This Document
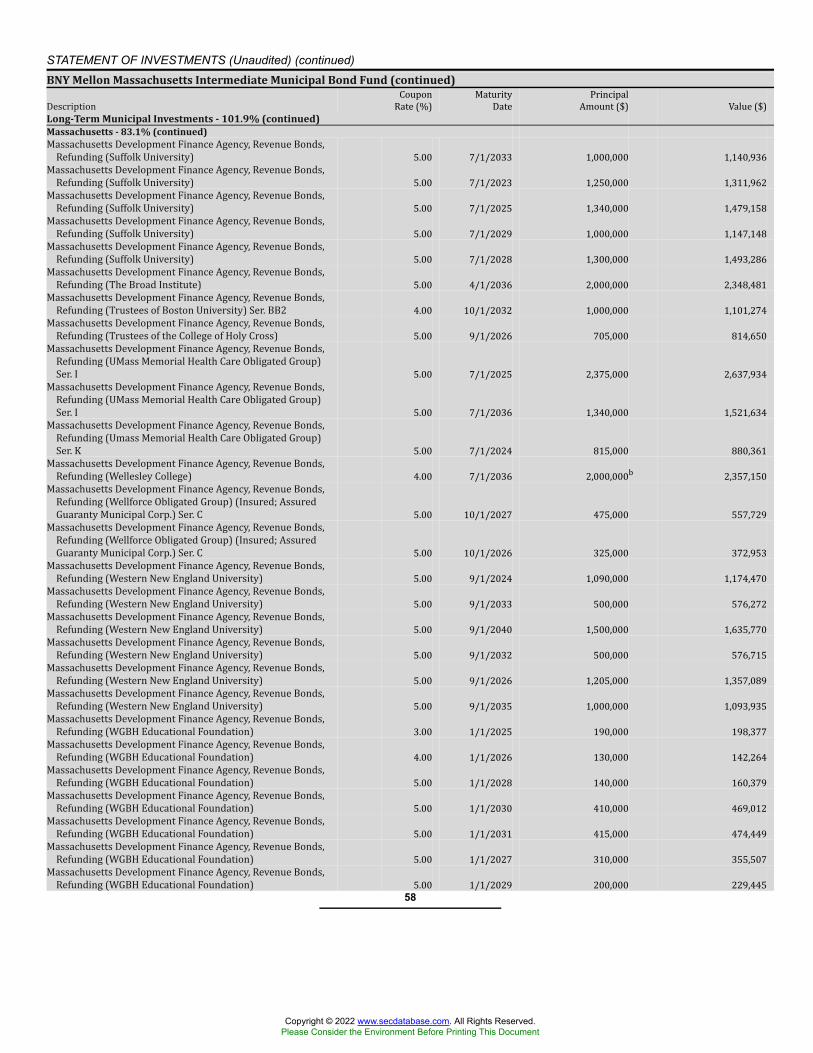
STATEMENT OF INVESTMENTS (Unaudited) (continued)BNY Mellon Massachusetts Intermediate Municipal Bond Fund (continued)Description CouponRate (%) MaturityDate PrincipalAmount ($) Value ($)Long-Term Municipal Investments - 101.9% (continued)Massachusetts - 83.1% (continued)Massachusetts Development Finance Agency, Revenue Bonds,Refunding (Suffolk University) 5.00 7/1/2033 1,000,000 1,140,936Massachusetts Development Finance Agency, Revenue Bonds,Refunding (Suffolk University) 5.00 7/1/2023 1,250,000 1,311,962Massachusetts Development Finance Agency, Revenue Bonds,Refunding (Suffolk University) 5.00 7/1/2025 1,340,000 1,479,158Massachusetts Development Finance Agency, Revenue Bonds,Refunding (Suffolk University) 5.00 7/1/2029 1,000,000 1,147,148Massachusetts Development Finance Agency, Revenue Bonds,Refunding (Suffolk University) 5.00 7/1/2028 1,300,000 1,493,286Massachusetts Development Finance Agency, Revenue Bonds,Refunding (The Broad Institute) 5.00 4/1/2036 2,000,000 2,348,481Massachusetts Development Finance Agency, Revenue Bonds,Refunding (Trustees of Boston University) Ser. BB2 4.00 10/1/2032 1,000,000 1,101,274Massachusetts Development Finance Agency, Revenue Bonds,Refunding (Trustees of the College of Holy Cross) 5.00 9/1/2026 705,000 814,650Massachusetts Development Finance Agency, Revenue Bonds,Refunding (UMass Memorial Health Care Obligated Group)Ser. I 5.00 7/1/2025 2,375,000 2,637,934Massachusetts Development Finance Agency, Revenue Bonds,Refunding (UMass Memorial Health Care Obligated Group)Ser. I 5.00 7/1/2036 1,340,000 1,521,634Massachusetts Development Finance Agency, Revenue Bonds,Refunding (Umass Memorial Health Care Obligated Group)Ser. K 5.00 7/1/2024 815,000 880,361Massachusetts Development Finance Agency, Revenue Bonds,Refunding (Wellesley College) 4.00 7/1/2036 2,000,000b 2,357,150Massachusetts Development Finance Agency, Revenue Bonds,Refunding (Wellforce Obligated Group) (Insured; AssuredGuaranty Municipal Corp.) Ser. C 5.00 10/1/2027 475,000 557,729Massachusetts Development Finance Agency, Revenue Bonds,Refunding (Wellforce Obligated Group) (Insured; AssuredGuaranty Municipal Corp.) Ser. C 5.00 10/1/2026 325,000 372,953Massachusetts Development Finance Agency, Revenue Bonds,Refunding (Western New England University) 5.00 9/1/2024 1,090,000 1,174,470Massachusetts Development Finance Agency, Revenue Bonds,Refunding (Western New England University) 5.00 9/1/2033 500,000 576,272Massachusetts Development Finance Agency, Revenue Bonds,Refunding (Western New England University) 5.00 9/1/2040 1,500,000 1,635,770Massachusetts Development Finance Agency, Revenue Bonds,Refunding (Western New England University) 5.00 9/1/2032 500,000 576,715Massachusetts Development Finance Agency, Revenue Bonds,Refunding (Western New England University) 5.00 9/1/2026 1,205,000 1,357,089Massachusetts Development Finance Agency, Revenue Bonds,Refunding (Western New England University) 5.00 9/1/2035 1,000,000 1,093,935Massachusetts Development Finance Agency, Revenue Bonds,Refunding (WGBH Educational Foundation) 3.00 1/1/2025 190,000 198,377Massachusetts Development Finance Agency, Revenue Bonds,Refunding (WGBH Educational Foundation) 4.00 1/1/2026 130,000 142,264Massachusetts Development Finance Agency, Revenue Bonds,Refunding (WGBH Educational Foundation) 5.00 1/1/2028 140,000 160,379Massachusetts Development Finance Agency, Revenue Bonds,Refunding (WGBH Educational Foundation) 5.00 1/1/2030 410,000 469,012Massachusetts Development Finance Agency, Revenue Bonds,Refunding (WGBH Educational Foundation) 5.00 1/1/2031 415,000 474,449Massachusetts Development Finance Agency, Revenue Bonds,Refunding (WGBH Educational Foundation) 5.00 1/1/2027 310,000 355,507Massachusetts Development Finance Agency, Revenue Bonds,Refunding (WGBH Educational Foundation) 5.00 1/1/2029 200,000 229,445
58
Copyright © 2022 www.secdatabase.com. All Rights Reserved.Please Consider the Environment Before Printing This Document
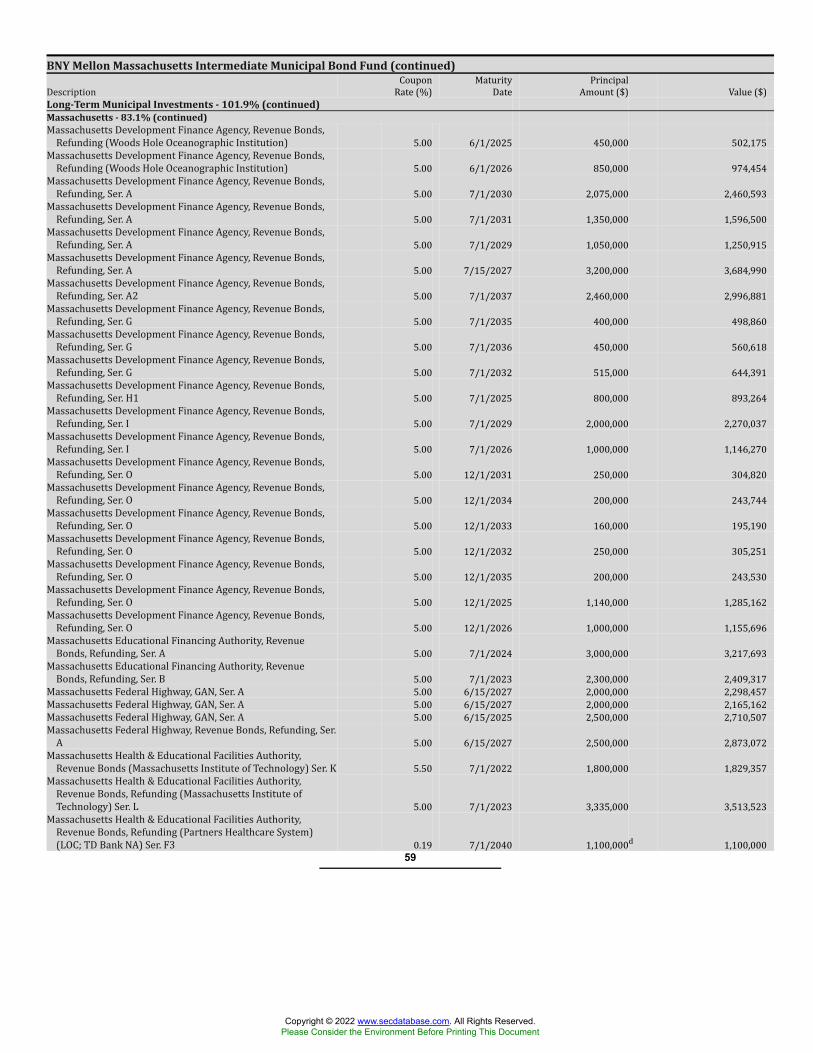
BNY Mellon Massachusetts Intermediate Municipal Bond Fund (continued)Description CouponRate (%) MaturityDate PrincipalAmount ($) Value ($)Long-Term Municipal Investments - 101.9% (continued)Massachusetts - 83.1% (continued)Massachusetts Development Finance Agency, Revenue Bonds,Refunding (Woods Hole Oceanographic Institution) 5.00 6/1/2025 450,000 502,175Massachusetts Development Finance Agency, Revenue Bonds,Refunding (Woods Hole Oceanographic Institution) 5.00 6/1/2026 850,000 974,454Massachusetts Development Finance Agency, Revenue Bonds,Refunding, Ser. A 5.00 7/1/2030 2,075,000 2,460,593Massachusetts Development Finance Agency, Revenue Bonds,Refunding, Ser. A 5.00 7/1/2031 1,350,000 1,596,500Massachusetts Development Finance Agency, Revenue Bonds,Refunding, Ser. A 5.00 7/1/2029 1,050,000 1,250,915Massachusetts Development Finance Agency, Revenue Bonds,Refunding, Ser. A 5.00 7/15/2027 3,200,000 3,684,990Massachusetts Development Finance Agency, Revenue Bonds,Refunding, Ser. A2 5.00 7/1/2037 2,460,000 2,996,881Massachusetts Development Finance Agency, Revenue Bonds,Refunding, Ser. G 5.00 7/1/2035 400,000 498,860Massachusetts Development Finance Agency, Revenue Bonds,Refunding, Ser. G 5.00 7/1/2036 450,000 560,618Massachusetts Development Finance Agency, Revenue Bonds,Refunding, Ser. G 5.00 7/1/2032 515,000 644,391Massachusetts Development Finance Agency, Revenue Bonds,Refunding, Ser. H1 5.00 7/1/2025 800,000 893,264Massachusetts Development Finance Agency, Revenue Bonds,Refunding, Ser. I 5.00 7/1/2029 2,000,000 2,270,037Massachusetts Development Finance Agency, Revenue Bonds,Refunding, Ser. I 5.00 7/1/2026 1,000,000 1,146,270Massachusetts Development Finance Agency, Revenue Bonds,Refunding, Ser. O 5.00 12/1/2031 250,000 304,820Massachusetts Development Finance Agency, Revenue Bonds,Refunding, Ser. O 5.00 12/1/2034 200,000 243,744Massachusetts Development Finance Agency, Revenue Bonds,Refunding, Ser. O 5.00 12/1/2033 160,000 195,190Massachusetts Development Finance Agency, Revenue Bonds,Refunding, Ser. O 5.00 12/1/2032 250,000 305,251Massachusetts Development Finance Agency, Revenue Bonds,Refunding, Ser. O 5.00 12/1/2035 200,000 243,530Massachusetts Development Finance Agency, Revenue Bonds,Refunding, Ser. O 5.00 12/1/2025 1,140,000 1,285,162Massachusetts Development Finance Agency, Revenue Bonds,Refunding, Ser. O 5.00 12/1/2026 1,000,000 1,155,696Massachusetts Educational Financing Authority, RevenueBonds, Refunding, Ser. A 5.00 7/1/2024 3,000,000 3,217,693Massachusetts Educational Financing Authority, RevenueBonds, Refunding, Ser. B 5.00 7/1/2023 2,300,000 2,409,317Massachusetts Federal Highway, GAN, Ser. A 5.00 6/15/2027 2,000,000 2,298,457Massachusetts Federal Highway, GAN, Ser. A 5.00 6/15/2027 2,000,000 2,165,162Massachusetts Federal Highway, GAN, Ser. A 5.00 6/15/2025 2,500,000 2,710,507Massachusetts Federal Highway, Revenue Bonds, Refunding, Ser.A 5.00 6/15/2027 2,500,000 2,873,072Massachusetts Health & Educational Facilities Authority,Revenue Bonds (Massachusetts Institute of Technology) Ser. K 5.50 7/1/2022 1,800,000 1,829,357Massachusetts Health & Educational Facilities Authority,Revenue Bonds, Refunding (Massachusetts Institute ofTechnology) Ser. L 5.00 7/1/2023 3,335,000 3,513,523Massachusetts Health & Educational Facilities Authority,Revenue Bonds, Refunding (Partners Healthcare System)(LOC; TD Bank NA) Ser. F3 0.19 7/1/2040 1,100,000d 1,100,000
59
Copyright © 2022 www.secdatabase.com. All Rights Reserved.Please Consider the Environment Before Printing This Document
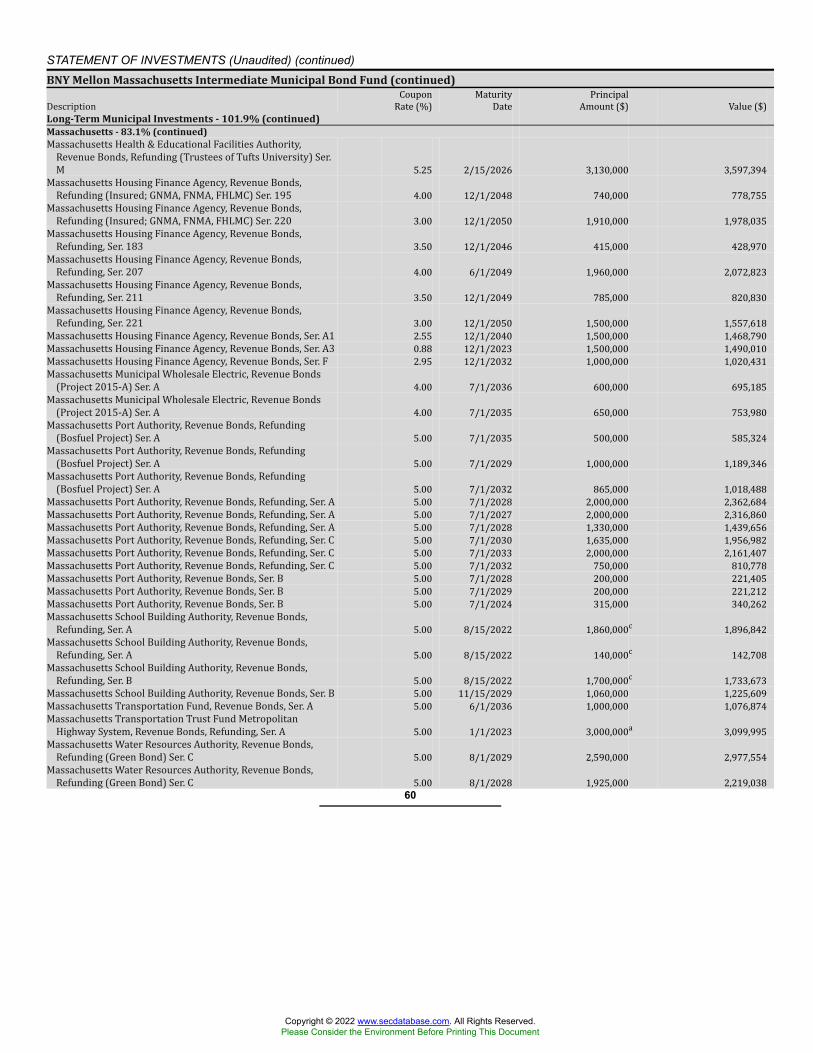
STATEMENT OF INVESTMENTS (Unaudited) (continued)BNY Mellon Massachusetts Intermediate Municipal Bond Fund (continued)Description CouponRate (%) MaturityDate PrincipalAmount ($) Value ($)Long-Term Municipal Investments - 101.9% (continued)Massachusetts - 83.1% (continued)Massachusetts Health & Educational Facilities Authority,Revenue Bonds, Refunding (Trustees of Tufts University) Ser.M 5.25 2/15/2026 3,130,000 3,597,394Massachusetts Housing Finance Agency, Revenue Bonds,Refunding (Insured; GNMA, FNMA, FHLMC) Ser. 195 4.00 12/1/2048 740,000 778,755Massachusetts Housing Finance Agency, Revenue Bonds,Refunding (Insured; GNMA, FNMA, FHLMC) Ser. 220 3.00 12/1/2050 1,910,000 1,978,035Massachusetts Housing Finance Agency, Revenue Bonds,Refunding, Ser. 183 3.50 12/1/2046 415,000 428,970Massachusetts Housing Finance Agency, Revenue Bonds,Refunding, Ser. 207 4.00 6/1/2049 1,960,000 2,072,823Massachusetts Housing Finance Agency, Revenue Bonds,Refunding, Ser. 211 3.50 12/1/2049 785,000 820,830Massachusetts Housing Finance Agency, Revenue Bonds,Refunding, Ser. 221 3.00 12/1/2050 1,500,000 1,557,618Massachusetts Housing Finance Agency, Revenue Bonds, Ser. A1 2.55 12/1/2040 1,500,000 1,468,790Massachusetts Housing Finance Agency, Revenue Bonds, Ser. A3 0.88 12/1/2023 1,500,000 1,490,010Massachusetts Housing Finance Agency, Revenue Bonds, Ser. F 2.95 12/1/2032 1,000,000 1,020,431Massachusetts Municipal Wholesale Electric, Revenue Bonds(Project 2015-A) Ser. A 4.00 7/1/2036 600,000 695,185Massachusetts Municipal Wholesale Electric, Revenue Bonds(Project 2015-A) Ser. A 4.00 7/1/2035 650,000 753,980Massachusetts Port Authority, Revenue Bonds, Refunding(Bosfuel Project) Ser. A 5.00 7/1/2035 500,000 585,324Massachusetts Port Authority, Revenue Bonds, Refunding(Bosfuel Project) Ser. A 5.00 7/1/2029 1,000,000 1,189,346Massachusetts Port Authority, Revenue Bonds, Refunding(Bosfuel Project) Ser. A 5.00 7/1/2032 865,000 1,018,488Massachusetts Port Authority, Revenue Bonds, Refunding, Ser. A 5.00 7/1/2028 2,000,000 2,362,684Massachusetts Port Authority, Revenue Bonds, Refunding, Ser. A 5.00 7/1/2027 2,000,000 2,316,860Massachusetts Port Authority, Revenue Bonds, Refunding, Ser. A 5.00 7/1/2028 1,330,000 1,439,656Massachusetts Port Authority, Revenue Bonds, Refunding, Ser. C 5.00 7/1/2030 1,635,000 1,956,982Massachusetts Port Authority, Revenue Bonds, Refunding, Ser. C 5.00 7/1/2033 2,000,000 2,161,407Massachusetts Port Authority, Revenue Bonds, Refunding, Ser. C 5.00 7/1/2032 750,000 810,778Massachusetts Port Authority, Revenue Bonds, Ser. B 5.00 7/1/2028 200,000 221,405Massachusetts Port Authority, Revenue Bonds, Ser. B 5.00 7/1/2029 200,000 221,212Massachusetts Port Authority, Revenue Bonds, Ser. B 5.00 7/1/2024 315,000 340,262Massachusetts School Building Authority, Revenue Bonds,Refunding, Ser. A 5.00 8/15/2022 1,860,000c 1,896,842Massachusetts School Building Authority, Revenue Bonds,Refunding, Ser. A 5.00 8/15/2022 140,000c 142,708Massachusetts School Building Authority, Revenue Bonds,Refunding, Ser. B 5.00 8/15/2022 1,700,000c 1,733,673Massachusetts School Building Authority, Revenue Bonds, Ser. B 5.00 11/15/2029 1,060,000 1,225,609Massachusetts Transportation Fund, Revenue Bonds, Ser. A 5.00 6/1/2036 1,000,000 1,076,874Massachusetts Transportation Trust Fund MetropolitanHighway System, Revenue Bonds, Refunding, Ser. A 5.00 1/1/2023 3,000,000a 3,099,995Massachusetts Water Resources Authority, Revenue Bonds,Refunding (Green Bond) Ser. C 5.00 8/1/2029 2,590,000 2,977,554Massachusetts Water Resources Authority, Revenue Bonds,Refunding (Green Bond) Ser. C 5.00 8/1/2028 1,925,000 2,219,038
60
Copyright © 2022 www.secdatabase.com. All Rights Reserved.Please Consider the Environment Before Printing This Document
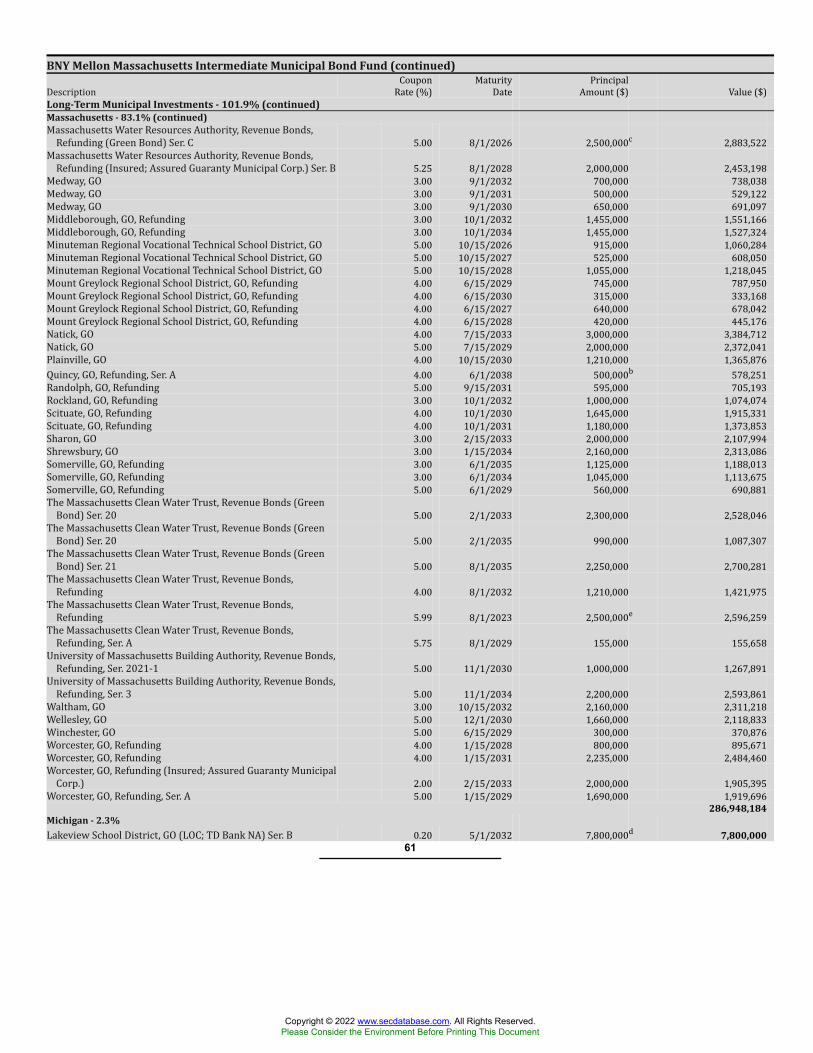
BNY Mellon Massachusetts Intermediate Municipal Bond Fund (continued)Description CouponRate (%) MaturityDate PrincipalAmount ($) Value ($)Long-Term Municipal Investments - 101.9% (continued)Massachusetts - 83.1% (continued)Massachusetts Water Resources Authority, Revenue Bonds,Refunding (Green Bond) Ser. C 5.00 8/1/2026 2,500,000c 2,883,522Massachusetts Water Resources Authority, Revenue Bonds,Refunding (Insured; Assured Guaranty Municipal Corp.) Ser. B 5.25 8/1/2028 2,000,000 2,453,198Medway, GO 3.00 9/1/2032 700,000 738,038Medway, GO 3.00 9/1/2031 500,000 529,122Medway, GO 3.00 9/1/2030 650,000 691,097Middleborough, GO, Refunding 3.00 10/1/2032 1,455,000 1,551,166Middleborough, GO, Refunding 3.00 10/1/2034 1,455,000 1,527,324Minuteman Regional Vocational Technical School District, GO 5.00 10/15/2026 915,000 1,060,284Minuteman Regional Vocational Technical School District, GO 5.00 10/15/2027 525,000 608,050Minuteman Regional Vocational Technical School District, GO 5.00 10/15/2028 1,055,000 1,218,045Mount Greylock Regional School District, GO, Refunding 4.00 6/15/2029 745,000 787,950Mount Greylock Regional School District, GO, Refunding 4.00 6/15/2030 315,000 333,168Mount Greylock Regional School District, GO, Refunding 4.00 6/15/2027 640,000 678,042Mount Greylock Regional School District, GO, Refunding 4.00 6/15/2028 420,000 445,176Natick, GO 4.00 7/15/2033 3,000,000 3,384,712Natick, GO 5.00 7/15/2029 2,000,000 2,372,041Plainville, GO 4.00 10/15/2030 1,210,000 1,365,876Quincy, GO, Refunding, Ser. A 4.00 6/1/2038 500,000b 578,251Randolph, GO, Refunding 5.00 9/15/2031 595,000 705,193Rockland, GO, Refunding 3.00 10/1/2032 1,000,000 1,074,074Scituate, GO, Refunding 4.00 10/1/2030 1,645,000 1,915,331Scituate, GO, Refunding 4.00 10/1/2031 1,180,000 1,373,853Sharon, GO 3.00 2/15/2033 2,000,000 2,107,994Shrewsbury, GO 3.00 1/15/2034 2,160,000 2,313,086Somerville, GO, Refunding 3.00 6/1/2035 1,125,000 1,188,013Somerville, GO, Refunding 3.00 6/1/2034 1,045,000 1,113,675Somerville, GO, Refunding 5.00 6/1/2029 560,000 690,881The Massachusetts Clean Water Trust, Revenue Bonds (GreenBond) Ser. 20 5.00 2/1/2033 2,300,000 2,528,046The Massachusetts Clean Water Trust, Revenue Bonds (GreenBond) Ser. 20 5.00 2/1/2035 990,000 1,087,307The Massachusetts Clean Water Trust, Revenue Bonds (GreenBond) Ser. 21 5.00 8/1/2035 2,250,000 2,700,281The Massachusetts Clean Water Trust, Revenue Bonds,Refunding 4.00 8/1/2032 1,210,000 1,421,975The Massachusetts Clean Water Trust, Revenue Bonds,Refunding 5.99 8/1/2023 2,500,000e 2,596,259The Massachusetts Clean Water Trust, Revenue Bonds,Refunding, Ser. A 5.75 8/1/2029 155,000 155,658University of Massachusetts Building Authority, Revenue Bonds,Refunding, Ser. 2021-1 5.00 11/1/2030 1,000,000 1,267,891University of Massachusetts Building Authority, Revenue Bonds,Refunding, Ser. 3 5.00 11/1/2034 2,200,000 2,593,861Waltham, GO 3.00 10/15/2032 2,160,000 2,311,218Wellesley, GO 5.00 12/1/2030 1,660,000 2,118,833Winchester, GO 5.00 6/15/2029 300,000 370,876Worcester, GO, Refunding 4.00 1/15/2028 800,000 895,671Worcester, GO, Refunding 4.00 1/15/2031 2,235,000 2,484,460Worcester, GO, Refunding (Insured; Assured Guaranty MunicipalCorp.) 2.00 2/15/2033 2,000,000 1,905,395Worcester, GO, Refunding, Ser. A 5.00 1/15/2029 1,690,000 1,919,696
286,948,184Michigan - 2.3%Lakeview School District, GO (LOC; TD Bank NA) Ser. B 0.20 5/1/2032 7,800,000d 7,800,000
61
Copyright © 2022 www.secdatabase.com. All Rights Reserved.Please Consider the Environment Before Printing This Document
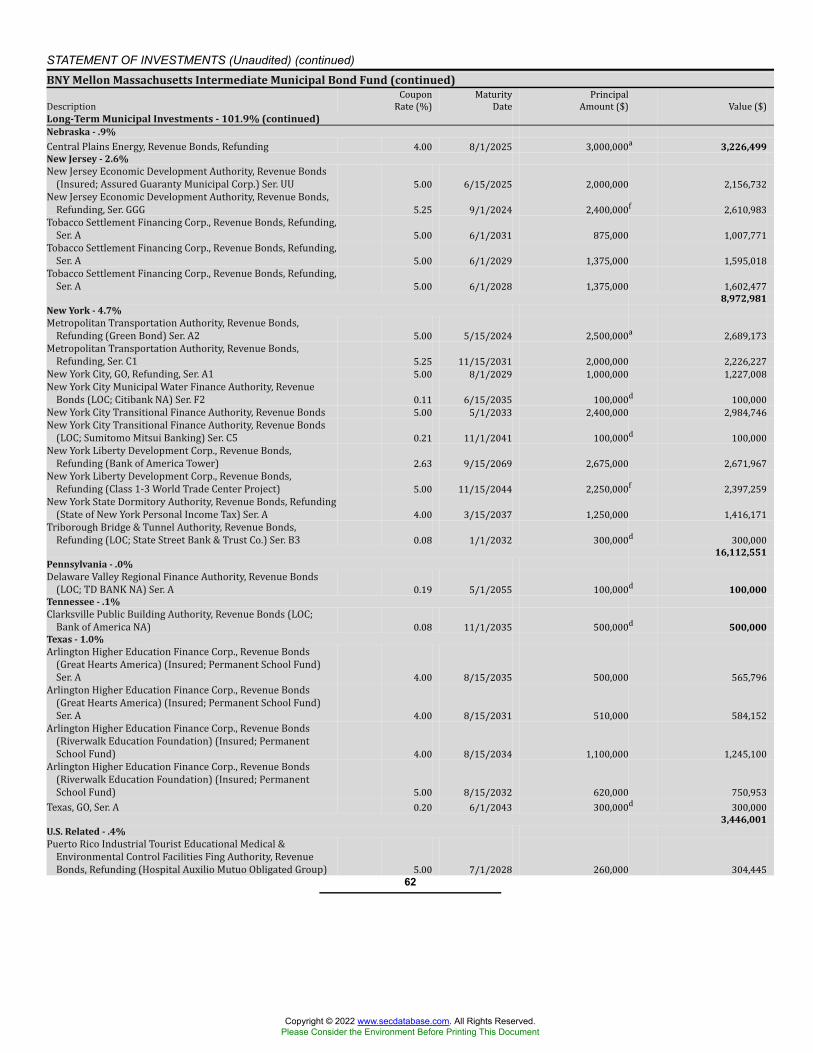
STATEMENT OF INVESTMENTS (Unaudited) (continued)BNY Mellon Massachusetts Intermediate Municipal Bond Fund (continued)Description CouponRate (%) MaturityDate PrincipalAmount ($) Value ($)Long-Term Municipal Investments - 101.9% (continued)Nebraska - .9%Central Plains Energy, Revenue Bonds, Refunding 4.00 8/1/2025 3,000,000a 3,226,499New Jersey - 2.6%New Jersey Economic Development Authority, Revenue Bonds(Insured; Assured Guaranty Municipal Corp.) Ser. UU 5.00 6/15/2025 2,000,000 2,156,732New Jersey Economic Development Authority, Revenue Bonds,Refunding, Ser. GGG 5.25 9/1/2024 2,400,000f 2,610,983Tobacco Settlement Financing Corp., Revenue Bonds, Refunding,Ser. A 5.00 6/1/2031 875,000 1,007,771Tobacco Settlement Financing Corp., Revenue Bonds, Refunding,Ser. A 5.00 6/1/2029 1,375,000 1,595,018Tobacco Settlement Financing Corp., Revenue Bonds, Refunding,Ser. A 5.00 6/1/2028 1,375,000 1,602,477
8,972,981New York - 4.7%Metropolitan Transportation Authority, Revenue Bonds,Refunding (Green Bond) Ser. A2 5.00 5/15/2024 2,500,000a 2,689,173Metropolitan Transportation Authority, Revenue Bonds,Refunding, Ser. C1 5.25 11/15/2031 2,000,000 2,226,227New York City, GO, Refunding, Ser. A1 5.00 8/1/2029 1,000,000 1,227,008New York City Municipal Water Finance Authority, RevenueBonds (LOC; Citibank NA) Ser. F2 0.11 6/15/2035 100,000d 100,000New York City Transitional Finance Authority, Revenue Bonds 5.00 5/1/2033 2,400,000 2,984,746New York City Transitional Finance Authority, Revenue Bonds(LOC; Sumitomo Mitsui Banking) Ser. C5 0.21 11/1/2041 100,000d 100,000New York Liberty Development Corp., Revenue Bonds,Refunding (Bank of America Tower) 2.63 9/15/2069 2,675,000 2,671,967New York Liberty Development Corp., Revenue Bonds,Refunding (Class 1-3 World Trade Center Project) 5.00 11/15/2044 2,250,000f 2,397,259New York State Dormitory Authority, Revenue Bonds, Refunding(State of New York Personal Income Tax) Ser. A 4.00 3/15/2037 1,250,000 1,416,171Triborough Bridge & Tunnel Authority, Revenue Bonds,Refunding (LOC; State Street Bank & Trust Co.) Ser. B3 0.08 1/1/2032 300,000d 300,000
16,112,551Pennsylvania - .0%Delaware Valley Regional Finance Authority, Revenue Bonds(LOC; TD BANK NA) Ser. A 0.19 5/1/2055 100,000d 100,000Tennessee - .1%Clarksville Public Building Authority, Revenue Bonds (LOC;Bank of America NA) 0.08 11/1/2035 500,000d 500,000Texas - 1.0%Arlington Higher Education Finance Corp., Revenue Bonds(Great Hearts America) (Insured; Permanent School Fund)Ser. A 4.00 8/15/2035 500,000 565,796Arlington Higher Education Finance Corp., Revenue Bonds(Great Hearts America) (Insured; Permanent School Fund)Ser. A 4.00 8/15/2031 510,000 584,152Arlington Higher Education Finance Corp., Revenue Bonds(Riverwalk Education Foundation) (Insured; PermanentSchool Fund) 4.00 8/15/2034 1,100,000 1,245,100Arlington Higher Education Finance Corp., Revenue Bonds(Riverwalk Education Foundation) (Insured; PermanentSchool Fund) 5.00 8/15/2032 620,000 750,953Texas, GO, Ser. A 0.20 6/1/2043 300,000d 300,000
3,446,001U.S. Related - .4%Puerto Rico Industrial Tourist Educational Medical &Environmental Control Facilities Fing Authority, RevenueBonds, Refunding (Hospital Auxilio Mutuo Obligated Group) 5.00 7/1/2028 260,000 304,445
62
Copyright © 2022 www.secdatabase.com. All Rights Reserved.Please Consider the Environment Before Printing This Document

BNY Mellon Massachusetts Intermediate Municipal Bond Fund (continued)Description CouponRate (%) MaturityDate PrincipalAmount ($) Value ($)Long-Term Municipal Investments - 101.9% (continued)U.S. Related - .4% (continued)Puerto Rico Industrial Tourist Educational Medical &Environmental Control Facilities Fing Authority, RevenueBonds, Refunding (Hospital Auxilio Mutuo Obligated Group) 5.00 7/1/2029 285,000 338,539Puerto Rico Industrial Tourist Educational Medical &Environmental Control Facilities Fing Authority, RevenueBonds, Refunding (Hospital Auxilio Mutuo Obligated Group) 5.00 7/1/2027 310,000 357,073Puerto Rico Infrastructure Financing Authority, Revenue Bonds,Ser. B 5.00 3/22/2022 650,000g 335,563
1,335,620Total Investments (cost $347,036,466) 101.9% 351,959,019Liabilities, Less Cash and Receivables (1.9%) (6,448,919)Net Assets 100.0% 345,510,100a These securities have a put feature; the date shown represents the put date and the bond holder can take a specific action to retain the bond after the put date.b Security purchased on a when-issued or delayed basis for which the fund has not taken delivery as of February 28, 2022.c These securities are prerefunded; the date shown represents the prerefunded date. Bonds which are prerefunded are collateralized by U.S. Government securities which
are held in escrow and are used to pay principal and interest on the municipal issue and to retire the bonds in full at the earliest refunding date.d The Variable Rate shall be determined by the Remarketing Agent in its sole discretion based on prevailing market conditions and may, but need not, be established by
reference to one or more financial indices.e Principal amount for accrual purposes is periodically adjusted based on changes in the Consumer Price Index.f Security exempt from registration pursuant to Rule 144A under the Securities Act of 1933. These securities may be resold in transactions exempt from registration,
normally to qualified institutional buyers. At February 28, 2022, these securities were valued at $5,008,242 or 1.45% of net assets.g Non-income producing—security in default.Portfolio Summary (Unaudited) † Value (%)Education 22.6General Obligation 18.6Medical 12.5General 12.0School District 9.1Transportation 6.0Water 5.3Airport 2.7Prerefunded 2.6Single Family Housing 2.2Development 2.2Student Loan 1.6Multifamily Housing 1.5Power 1.3Tobacco Settlement 1.2Housing .3Facilities .2
101.9† Based on net assets.See notes to financial statements.
BNY Mellon Massachusetts Intermediate Municipal Bond FundFuturesDescription Number ofContracts Expiration NotionalValue($) MarketValue ($) Unrealized(Depreciation) ($)Futures ShortUltra 10 Year U.S. Treasury Notes 49 6/21/2022 6,842,883 6,925,078 (82,195)Gross Unrealized Depreciation (82,195)See notes to financial statements.
63
Copyright © 2022 www.secdatabase.com. All Rights Reserved.Please Consider the Environment Before Printing This Document
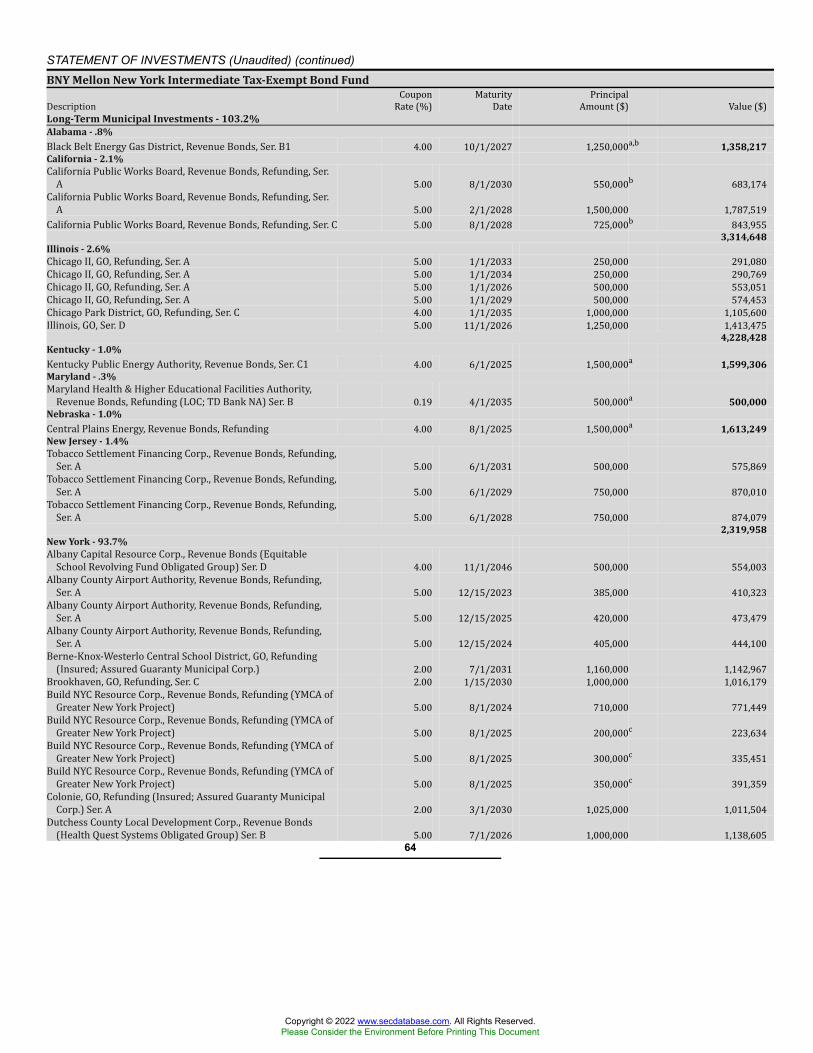
STATEMENT OF INVESTMENTS (Unaudited) (continued)BNY Mellon New York Intermediate Tax-Exempt Bond FundDescription CouponRate (%) MaturityDate PrincipalAmount ($) Value ($)Long-Term Municipal Investments - 103.2%Alabama - .8%Black Belt Energy Gas District, Revenue Bonds, Ser. B1 4.00 10/1/2027 1,250,000a,b 1,358,217California - 2.1%California Public Works Board, Revenue Bonds, Refunding, Ser.A 5.00 8/1/2030 550,000b 683,174California Public Works Board, Revenue Bonds, Refunding, Ser.A 5.00 2/1/2028 1,500,000 1,787,519California Public Works Board, Revenue Bonds, Refunding, Ser. C 5.00 8/1/2028 725,000b 843,955
3,314,648Illinois - 2.6%Chicago II, GO, Refunding, Ser. A 5.00 1/1/2033 250,000 291,080Chicago II, GO, Refunding, Ser. A 5.00 1/1/2034 250,000 290,769Chicago II, GO, Refunding, Ser. A 5.00 1/1/2026 500,000 553,051Chicago II, GO, Refunding, Ser. A 5.00 1/1/2029 500,000 574,453Chicago Park District, GO, Refunding, Ser. C 4.00 1/1/2035 1,000,000 1,105,600Illinois, GO, Ser. D 5.00 11/1/2026 1,250,000 1,413,475
4,228,428Kentucky - 1.0%Kentucky Public Energy Authority, Revenue Bonds, Ser. C1 4.00 6/1/2025 1,500,000a 1,599,306Maryland - .3%Maryland Health & Higher Educational Facilities Authority,Revenue Bonds, Refunding (LOC; TD Bank NA) Ser. B 0.19 4/1/2035 500,000a 500,000Nebraska - 1.0%Central Plains Energy, Revenue Bonds, Refunding 4.00 8/1/2025 1,500,000a 1,613,249New Jersey - 1.4%Tobacco Settlement Financing Corp., Revenue Bonds, Refunding,Ser. A 5.00 6/1/2031 500,000 575,869Tobacco Settlement Financing Corp., Revenue Bonds, Refunding,Ser. A 5.00 6/1/2029 750,000 870,010Tobacco Settlement Financing Corp., Revenue Bonds, Refunding,Ser. A 5.00 6/1/2028 750,000 874,079
2,319,958New York - 93.7%Albany Capital Resource Corp., Revenue Bonds (EquitableSchool Revolving Fund Obligated Group) Ser. D 4.00 11/1/2046 500,000 554,003Albany County Airport Authority, Revenue Bonds, Refunding,Ser. A 5.00 12/15/2023 385,000 410,323Albany County Airport Authority, Revenue Bonds, Refunding,Ser. A 5.00 12/15/2025 420,000 473,479Albany County Airport Authority, Revenue Bonds, Refunding,Ser. A 5.00 12/15/2024 405,000 444,100Berne-Knox-Westerlo Central School District, GO, Refunding(Insured; Assured Guaranty Municipal Corp.) 2.00 7/1/2031 1,160,000 1,142,967Brookhaven, GO, Refunding, Ser. C 2.00 1/15/2030 1,000,000 1,016,179Build NYC Resource Corp., Revenue Bonds, Refunding (YMCA ofGreater New York Project) 5.00 8/1/2024 710,000 771,449Build NYC Resource Corp., Revenue Bonds, Refunding (YMCA ofGreater New York Project) 5.00 8/1/2025 200,000c 223,634Build NYC Resource Corp., Revenue Bonds, Refunding (YMCA ofGreater New York Project) 5.00 8/1/2025 300,000c 335,451Build NYC Resource Corp., Revenue Bonds, Refunding (YMCA ofGreater New York Project) 5.00 8/1/2025 350,000c 391,359Colonie, GO, Refunding (Insured; Assured Guaranty MunicipalCorp.) Ser. A 2.00 3/1/2030 1,025,000 1,011,504Dutchess County Local Development Corp., Revenue Bonds(Health Quest Systems Obligated Group) Ser. B 5.00 7/1/2026 1,000,000 1,138,605
64
Copyright © 2022 www.secdatabase.com. All Rights Reserved.Please Consider the Environment Before Printing This Document
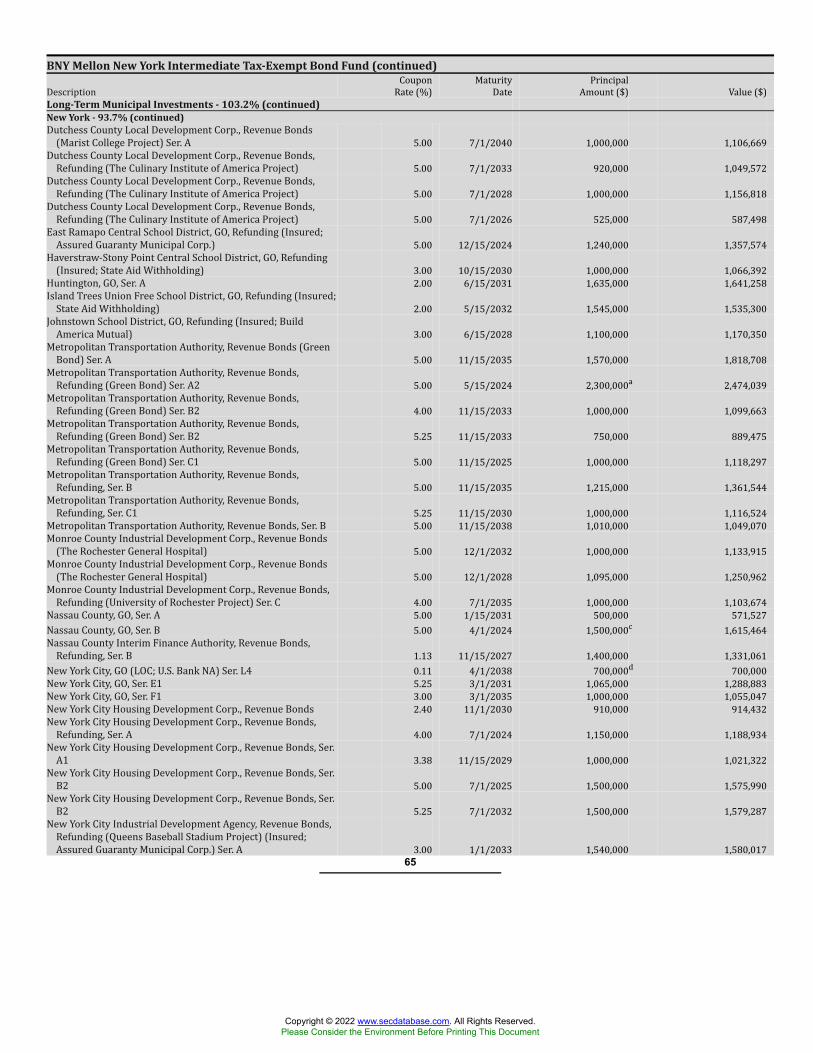
BNY Mellon New York Intermediate Tax-Exempt Bond Fund (continued)Description CouponRate (%) MaturityDate PrincipalAmount ($) Value ($)Long-Term Municipal Investments - 103.2% (continued)New York - 93.7% (continued)Dutchess County Local Development Corp., Revenue Bonds(Marist College Project) Ser. A 5.00 7/1/2040 1,000,000 1,106,669Dutchess County Local Development Corp., Revenue Bonds,Refunding (The Culinary Institute of America Project) 5.00 7/1/2033 920,000 1,049,572Dutchess County Local Development Corp., Revenue Bonds,Refunding (The Culinary Institute of America Project) 5.00 7/1/2028 1,000,000 1,156,818Dutchess County Local Development Corp., Revenue Bonds,Refunding (The Culinary Institute of America Project) 5.00 7/1/2026 525,000 587,498East Ramapo Central School District, GO, Refunding (Insured;Assured Guaranty Municipal Corp.) 5.00 12/15/2024 1,240,000 1,357,574Haverstraw-Stony Point Central School District, GO, Refunding(Insured; State Aid Withholding) 3.00 10/15/2030 1,000,000 1,066,392Huntington, GO, Ser. A 2.00 6/15/2031 1,635,000 1,641,258Island Trees Union Free School District, GO, Refunding (Insured;State Aid Withholding) 2.00 5/15/2032 1,545,000 1,535,300Johnstown School District, GO, Refunding (Insured; BuildAmerica Mutual) 3.00 6/15/2028 1,100,000 1,170,350Metropolitan Transportation Authority, Revenue Bonds (GreenBond) Ser. A 5.00 11/15/2035 1,570,000 1,818,708Metropolitan Transportation Authority, Revenue Bonds,Refunding (Green Bond) Ser. A2 5.00 5/15/2024 2,300,000a 2,474,039Metropolitan Transportation Authority, Revenue Bonds,Refunding (Green Bond) Ser. B2 4.00 11/15/2033 1,000,000 1,099,663Metropolitan Transportation Authority, Revenue Bonds,Refunding (Green Bond) Ser. B2 5.25 11/15/2033 750,000 889,475Metropolitan Transportation Authority, Revenue Bonds,Refunding (Green Bond) Ser. C1 5.00 11/15/2025 1,000,000 1,118,297Metropolitan Transportation Authority, Revenue Bonds,Refunding, Ser. B 5.00 11/15/2035 1,215,000 1,361,544Metropolitan Transportation Authority, Revenue Bonds,Refunding, Ser. C1 5.25 11/15/2030 1,000,000 1,116,524Metropolitan Transportation Authority, Revenue Bonds, Ser. B 5.00 11/15/2038 1,010,000 1,049,070Monroe County Industrial Development Corp., Revenue Bonds(The Rochester General Hospital) 5.00 12/1/2032 1,000,000 1,133,915Monroe County Industrial Development Corp., Revenue Bonds(The Rochester General Hospital) 5.00 12/1/2028 1,095,000 1,250,962Monroe County Industrial Development Corp., Revenue Bonds,Refunding (University of Rochester Project) Ser. C 4.00 7/1/2035 1,000,000 1,103,674Nassau County, GO, Ser. A 5.00 1/15/2031 500,000 571,527Nassau County, GO, Ser. B 5.00 4/1/2024 1,500,000c 1,615,464Nassau County Interim Finance Authority, Revenue Bonds,Refunding, Ser. B 1.13 11/15/2027 1,400,000 1,331,061New York City, GO (LOC; U.S. Bank NA) Ser. L4 0.11 4/1/2038 700,000d 700,000New York City, GO, Ser. E1 5.25 3/1/2031 1,065,000 1,288,883New York City, GO, Ser. F1 3.00 3/1/2035 1,000,000 1,055,047New York City Housing Development Corp., Revenue Bonds 2.40 11/1/2030 910,000 914,432New York City Housing Development Corp., Revenue Bonds,Refunding, Ser. A 4.00 7/1/2024 1,150,000 1,188,934New York City Housing Development Corp., Revenue Bonds, Ser.A1 3.38 11/15/2029 1,000,000 1,021,322New York City Housing Development Corp., Revenue Bonds, Ser.B2 5.00 7/1/2025 1,500,000 1,575,990New York City Housing Development Corp., Revenue Bonds, Ser.B2 5.25 7/1/2032 1,500,000 1,579,287New York City Industrial Development Agency, Revenue Bonds,Refunding (Queens Baseball Stadium Project) (Insured;Assured Guaranty Municipal Corp.) Ser. A 3.00 1/1/2033 1,540,000 1,580,017
65
Copyright © 2022 www.secdatabase.com. All Rights Reserved.Please Consider the Environment Before Printing This Document
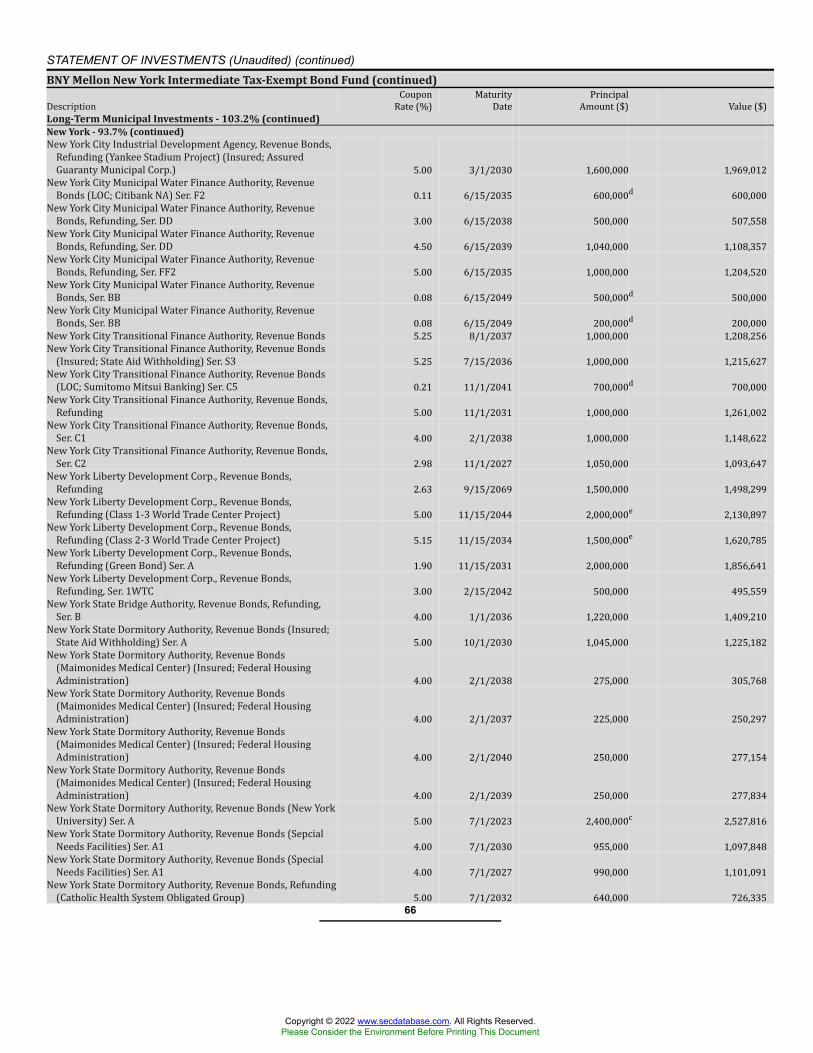
STATEMENT OF INVESTMENTS (Unaudited) (continued)BNY Mellon New York Intermediate Tax-Exempt Bond Fund (continued)Description CouponRate (%) MaturityDate PrincipalAmount ($) Value ($)Long-Term Municipal Investments - 103.2% (continued)New York - 93.7% (continued)New York City Industrial Development Agency, Revenue Bonds,Refunding (Yankee Stadium Project) (Insured; AssuredGuaranty Municipal Corp.) 5.00 3/1/2030 1,600,000 1,969,012New York City Municipal Water Finance Authority, RevenueBonds (LOC; Citibank NA) Ser. F2 0.11 6/15/2035 600,000d 600,000New York City Municipal Water Finance Authority, RevenueBonds, Refunding, Ser. DD 3.00 6/15/2038 500,000 507,558New York City Municipal Water Finance Authority, RevenueBonds, Refunding, Ser. DD 4.50 6/15/2039 1,040,000 1,108,357New York City Municipal Water Finance Authority, RevenueBonds, Refunding, Ser. FF2 5.00 6/15/2035 1,000,000 1,204,520New York City Municipal Water Finance Authority, RevenueBonds, Ser. BB 0.08 6/15/2049 500,000d 500,000New York City Municipal Water Finance Authority, RevenueBonds, Ser. BB 0.08 6/15/2049 200,000d 200,000New York City Transitional Finance Authority, Revenue Bonds 5.25 8/1/2037 1,000,000 1,208,256New York City Transitional Finance Authority, Revenue Bonds(Insured; State Aid Withholding) Ser. S3 5.25 7/15/2036 1,000,000 1,215,627New York City Transitional Finance Authority, Revenue Bonds(LOC; Sumitomo Mitsui Banking) Ser. C5 0.21 11/1/2041 700,000d 700,000New York City Transitional Finance Authority, Revenue Bonds,Refunding 5.00 11/1/2031 1,000,000 1,261,002New York City Transitional Finance Authority, Revenue Bonds,Ser. C1 4.00 2/1/2038 1,000,000 1,148,622New York City Transitional Finance Authority, Revenue Bonds,Ser. C2 2.98 11/1/2027 1,050,000 1,093,647New York Liberty Development Corp., Revenue Bonds,Refunding 2.63 9/15/2069 1,500,000 1,498,299New York Liberty Development Corp., Revenue Bonds,Refunding (Class 1-3 World Trade Center Project) 5.00 11/15/2044 2,000,000e 2,130,897New York Liberty Development Corp., Revenue Bonds,Refunding (Class 2-3 World Trade Center Project) 5.15 11/15/2034 1,500,000e 1,620,785New York Liberty Development Corp., Revenue Bonds,Refunding (Green Bond) Ser. A 1.90 11/15/2031 2,000,000 1,856,641New York Liberty Development Corp., Revenue Bonds,Refunding, Ser. 1WTC 3.00 2/15/2042 500,000 495,559New York State Bridge Authority, Revenue Bonds, Refunding,Ser. B 4.00 1/1/2036 1,220,000 1,409,210New York State Dormitory Authority, Revenue Bonds (Insured;State Aid Withholding) Ser. A 5.00 10/1/2030 1,045,000 1,225,182New York State Dormitory Authority, Revenue Bonds(Maimonides Medical Center) (Insured; Federal HousingAdministration) 4.00 2/1/2038 275,000 305,768New York State Dormitory Authority, Revenue Bonds(Maimonides Medical Center) (Insured; Federal HousingAdministration) 4.00 2/1/2037 225,000 250,297New York State Dormitory Authority, Revenue Bonds(Maimonides Medical Center) (Insured; Federal HousingAdministration) 4.00 2/1/2040 250,000 277,154New York State Dormitory Authority, Revenue Bonds(Maimonides Medical Center) (Insured; Federal HousingAdministration) 4.00 2/1/2039 250,000 277,834New York State Dormitory Authority, Revenue Bonds (New YorkUniversity) Ser. A 5.00 7/1/2023 2,400,000c 2,527,816New York State Dormitory Authority, Revenue Bonds (SepcialNeeds Facilities) Ser. A1 4.00 7/1/2030 955,000 1,097,848New York State Dormitory Authority, Revenue Bonds (SpecialNeeds Facilities) Ser. A1 4.00 7/1/2027 990,000 1,101,091New York State Dormitory Authority, Revenue Bonds, Refunding(Catholic Health System Obligated Group) 5.00 7/1/2032 640,000 726,335
66
Copyright © 2022 www.secdatabase.com. All Rights Reserved.Please Consider the Environment Before Printing This Document
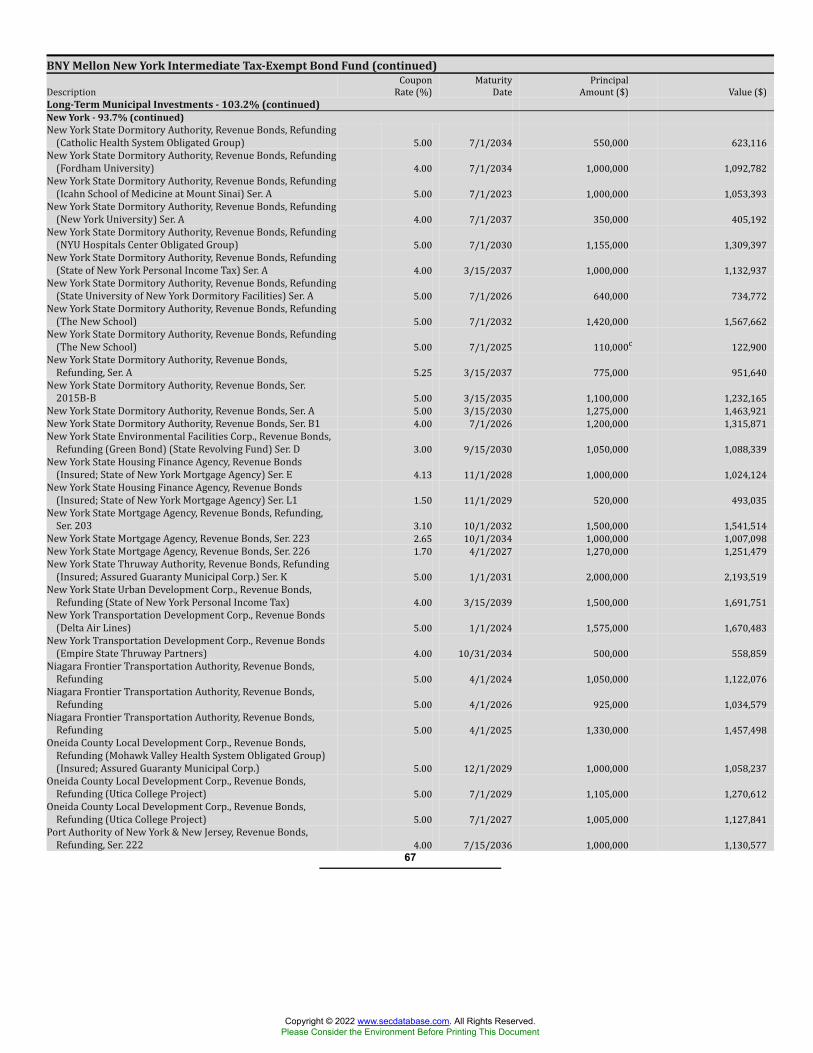
BNY Mellon New York Intermediate Tax-Exempt Bond Fund (continued)Description CouponRate (%) MaturityDate PrincipalAmount ($) Value ($)Long-Term Municipal Investments - 103.2% (continued)New York - 93.7% (continued)New York State Dormitory Authority, Revenue Bonds, Refunding(Catholic Health System Obligated Group) 5.00 7/1/2034 550,000 623,116New York State Dormitory Authority, Revenue Bonds, Refunding(Fordham University) 4.00 7/1/2034 1,000,000 1,092,782New York State Dormitory Authority, Revenue Bonds, Refunding(Icahn School of Medicine at Mount Sinai) Ser. A 5.00 7/1/2023 1,000,000 1,053,393New York State Dormitory Authority, Revenue Bonds, Refunding(New York University) Ser. A 4.00 7/1/2037 350,000 405,192New York State Dormitory Authority, Revenue Bonds, Refunding(NYU Hospitals Center Obligated Group) 5.00 7/1/2030 1,155,000 1,309,397New York State Dormitory Authority, Revenue Bonds, Refunding(State of New York Personal Income Tax) Ser. A 4.00 3/15/2037 1,000,000 1,132,937New York State Dormitory Authority, Revenue Bonds, Refunding(State University of New York Dormitory Facilities) Ser. A 5.00 7/1/2026 640,000 734,772New York State Dormitory Authority, Revenue Bonds, Refunding(The New School) 5.00 7/1/2032 1,420,000 1,567,662New York State Dormitory Authority, Revenue Bonds, Refunding(The New School) 5.00 7/1/2025 110,000c 122,900New York State Dormitory Authority, Revenue Bonds,Refunding, Ser. A 5.25 3/15/2037 775,000 951,640New York State Dormitory Authority, Revenue Bonds, Ser.2015B-B 5.00 3/15/2035 1,100,000 1,232,165New York State Dormitory Authority, Revenue Bonds, Ser. A 5.00 3/15/2030 1,275,000 1,463,921New York State Dormitory Authority, Revenue Bonds, Ser. B1 4.00 7/1/2026 1,200,000 1,315,871New York State Environmental Facilities Corp., Revenue Bonds,Refunding (Green Bond) (State Revolving Fund) Ser. D 3.00 9/15/2030 1,050,000 1,088,339New York State Housing Finance Agency, Revenue Bonds(Insured; State of New York Mortgage Agency) Ser. E 4.13 11/1/2028 1,000,000 1,024,124New York State Housing Finance Agency, Revenue Bonds(Insured; State of New York Mortgage Agency) Ser. L1 1.50 11/1/2029 520,000 493,035New York State Mortgage Agency, Revenue Bonds, Refunding,Ser. 203 3.10 10/1/2032 1,500,000 1,541,514New York State Mortgage Agency, Revenue Bonds, Ser. 223 2.65 10/1/2034 1,000,000 1,007,098New York State Mortgage Agency, Revenue Bonds, Ser. 226 1.70 4/1/2027 1,270,000 1,251,479New York State Thruway Authority, Revenue Bonds, Refunding(Insured; Assured Guaranty Municipal Corp.) Ser. K 5.00 1/1/2031 2,000,000 2,193,519New York State Urban Development Corp., Revenue Bonds,Refunding (State of New York Personal Income Tax) 4.00 3/15/2039 1,500,000 1,691,751New York Transportation Development Corp., Revenue Bonds(Delta Air Lines) 5.00 1/1/2024 1,575,000 1,670,483New York Transportation Development Corp., Revenue Bonds(Empire State Thruway Partners) 4.00 10/31/2034 500,000 558,859Niagara Frontier Transportation Authority, Revenue Bonds,Refunding 5.00 4/1/2024 1,050,000 1,122,076Niagara Frontier Transportation Authority, Revenue Bonds,Refunding 5.00 4/1/2026 925,000 1,034,579Niagara Frontier Transportation Authority, Revenue Bonds,Refunding 5.00 4/1/2025 1,330,000 1,457,498Oneida County Local Development Corp., Revenue Bonds,Refunding (Mohawk Valley Health System Obligated Group)(Insured; Assured Guaranty Municipal Corp.) 5.00 12/1/2029 1,000,000 1,058,237Oneida County Local Development Corp., Revenue Bonds,Refunding (Utica College Project) 5.00 7/1/2029 1,105,000 1,270,612Oneida County Local Development Corp., Revenue Bonds,Refunding (Utica College Project) 5.00 7/1/2027 1,005,000 1,127,841Port Authority of New York & New Jersey, Revenue Bonds,Refunding, Ser. 222 4.00 7/15/2036 1,000,000 1,130,577
67
Copyright © 2022 www.secdatabase.com. All Rights Reserved.Please Consider the Environment Before Printing This Document
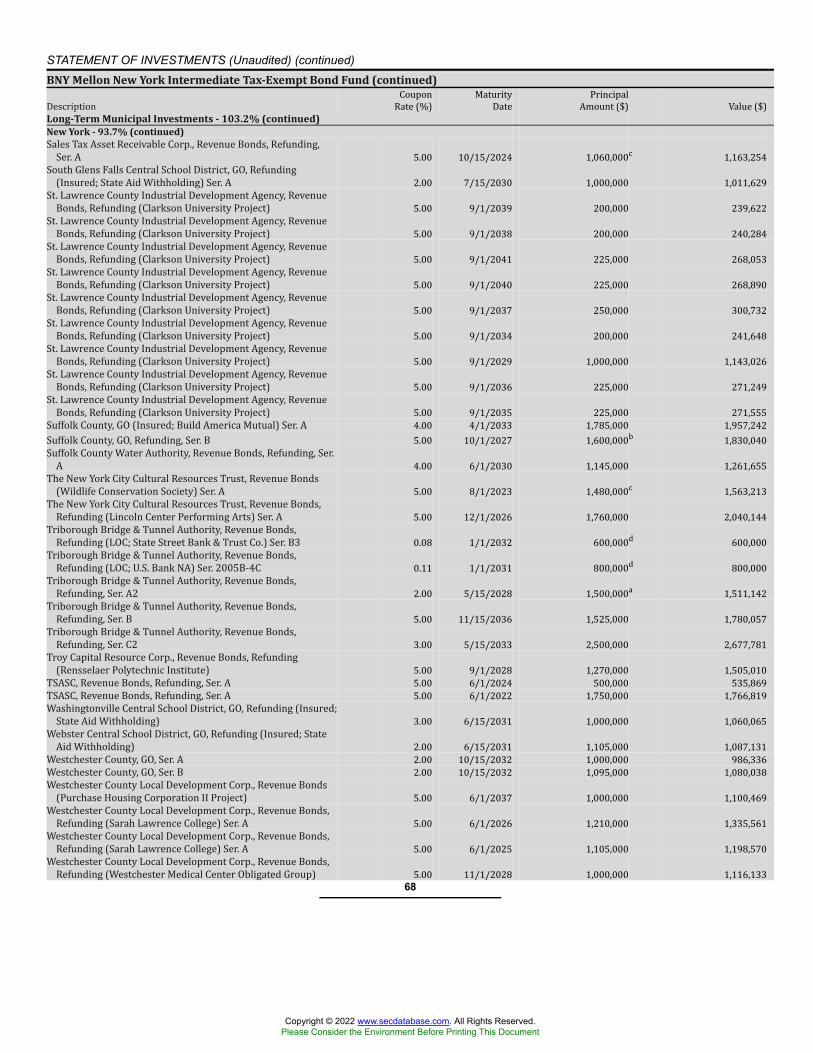
STATEMENT OF INVESTMENTS (Unaudited) (continued)BNY Mellon New York Intermediate Tax-Exempt Bond Fund (continued)Description CouponRate (%) MaturityDate PrincipalAmount ($) Value ($)Long-Term Municipal Investments - 103.2% (continued)New York - 93.7% (continued)Sales Tax Asset Receivable Corp., Revenue Bonds, Refunding,Ser. A 5.00 10/15/2024 1,060,000c 1,163,254South Glens Falls Central School District, GO, Refunding(Insured; State Aid Withholding) Ser. A 2.00 7/15/2030 1,000,000 1,011,629St. Lawrence County Industrial Development Agency, RevenueBonds, Refunding (Clarkson University Project) 5.00 9/1/2039 200,000 239,622St. Lawrence County Industrial Development Agency, RevenueBonds, Refunding (Clarkson University Project) 5.00 9/1/2038 200,000 240,284St. Lawrence County Industrial Development Agency, RevenueBonds, Refunding (Clarkson University Project) 5.00 9/1/2041 225,000 268,053St. Lawrence County Industrial Development Agency, RevenueBonds, Refunding (Clarkson University Project) 5.00 9/1/2040 225,000 268,890St. Lawrence County Industrial Development Agency, RevenueBonds, Refunding (Clarkson University Project) 5.00 9/1/2037 250,000 300,732St. Lawrence County Industrial Development Agency, RevenueBonds, Refunding (Clarkson University Project) 5.00 9/1/2034 200,000 241,648St. Lawrence County Industrial Development Agency, RevenueBonds, Refunding (Clarkson University Project) 5.00 9/1/2029 1,000,000 1,143,026St. Lawrence County Industrial Development Agency, RevenueBonds, Refunding (Clarkson University Project) 5.00 9/1/2036 225,000 271,249St. Lawrence County Industrial Development Agency, RevenueBonds, Refunding (Clarkson University Project) 5.00 9/1/2035 225,000 271,555Suffolk County, GO (Insured; Build America Mutual) Ser. A 4.00 4/1/2033 1,785,000 1,957,242Suffolk County, GO, Refunding, Ser. B 5.00 10/1/2027 1,600,000b 1,830,040Suffolk County Water Authority, Revenue Bonds, Refunding, Ser.A 4.00 6/1/2030 1,145,000 1,261,655The New York City Cultural Resources Trust, Revenue Bonds(Wildlife Conservation Society) Ser. A 5.00 8/1/2023 1,480,000c 1,563,213The New York City Cultural Resources Trust, Revenue Bonds,Refunding (Lincoln Center Performing Arts) Ser. A 5.00 12/1/2026 1,760,000 2,040,144Triborough Bridge & Tunnel Authority, Revenue Bonds,Refunding (LOC; State Street Bank & Trust Co.) Ser. B3 0.08 1/1/2032 600,000d 600,000Triborough Bridge & Tunnel Authority, Revenue Bonds,Refunding (LOC; U.S. Bank NA) Ser. 2005B-4C 0.11 1/1/2031 800,000d 800,000Triborough Bridge & Tunnel Authority, Revenue Bonds,Refunding, Ser. A2 2.00 5/15/2028 1,500,000a 1,511,142Triborough Bridge & Tunnel Authority, Revenue Bonds,Refunding, Ser. B 5.00 11/15/2036 1,525,000 1,780,057Triborough Bridge & Tunnel Authority, Revenue Bonds,Refunding, Ser. C2 3.00 5/15/2033 2,500,000 2,677,781Troy Capital Resource Corp., Revenue Bonds, Refunding(Rensselaer Polytechnic Institute) 5.00 9/1/2028 1,270,000 1,505,010TSASC, Revenue Bonds, Refunding, Ser. A 5.00 6/1/2024 500,000 535,869TSASC, Revenue Bonds, Refunding, Ser. A 5.00 6/1/2022 1,750,000 1,766,819Washingtonville Central School District, GO, Refunding (Insured;State Aid Withholding) 3.00 6/15/2031 1,000,000 1,060,065Webster Central School District, GO, Refunding (Insured; StateAid Withholding) 2.00 6/15/2031 1,105,000 1,087,131Westchester County, GO, Ser. A 2.00 10/15/2032 1,000,000 986,336Westchester County, GO, Ser. B 2.00 10/15/2032 1,095,000 1,080,038Westchester County Local Development Corp., Revenue Bonds(Purchase Housing Corporation II Project) 5.00 6/1/2037 1,000,000 1,100,469Westchester County Local Development Corp., Revenue Bonds,Refunding (Sarah Lawrence College) Ser. A 5.00 6/1/2026 1,210,000 1,335,561Westchester County Local Development Corp., Revenue Bonds,Refunding (Sarah Lawrence College) Ser. A 5.00 6/1/2025 1,105,000 1,198,570Westchester County Local Development Corp., Revenue Bonds,Refunding (Westchester Medical Center Obligated Group) 5.00 11/1/2028 1,000,000 1,116,133
68
Copyright © 2022 www.secdatabase.com. All Rights Reserved.Please Consider the Environment Before Printing This Document
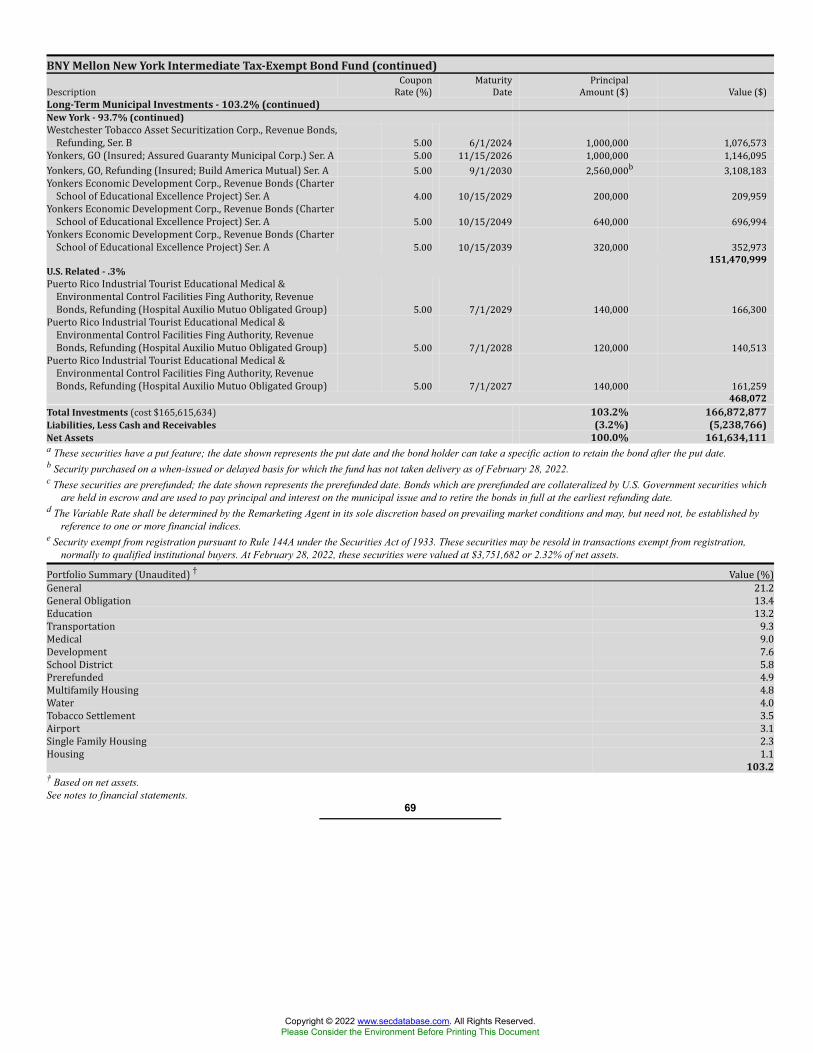
BNY Mellon New York Intermediate Tax-Exempt Bond Fund (continued)Description CouponRate (%) MaturityDate PrincipalAmount ($) Value ($)Long-Term Municipal Investments - 103.2% (continued)New York - 93.7% (continued)Westchester Tobacco Asset Securitization Corp., Revenue Bonds,Refunding, Ser. B 5.00 6/1/2024 1,000,000 1,076,573Yonkers, GO (Insured; Assured Guaranty Municipal Corp.) Ser. A 5.00 11/15/2026 1,000,000 1,146,095Yonkers, GO, Refunding (Insured; Build America Mutual) Ser. A 5.00 9/1/2030 2,560,000b 3,108,183Yonkers Economic Development Corp., Revenue Bonds (CharterSchool of Educational Excellence Project) Ser. A 4.00 10/15/2029 200,000 209,959Yonkers Economic Development Corp., Revenue Bonds (CharterSchool of Educational Excellence Project) Ser. A 5.00 10/15/2049 640,000 696,994Yonkers Economic Development Corp., Revenue Bonds (CharterSchool of Educational Excellence Project) Ser. A 5.00 10/15/2039 320,000 352,973
151,470,999U.S. Related - .3%Puerto Rico Industrial Tourist Educational Medical &Environmental Control Facilities Fing Authority, RevenueBonds, Refunding (Hospital Auxilio Mutuo Obligated Group) 5.00 7/1/2029 140,000 166,300Puerto Rico Industrial Tourist Educational Medical &Environmental Control Facilities Fing Authority, RevenueBonds, Refunding (Hospital Auxilio Mutuo Obligated Group) 5.00 7/1/2028 120,000 140,513Puerto Rico Industrial Tourist Educational Medical &Environmental Control Facilities Fing Authority, RevenueBonds, Refunding (Hospital Auxilio Mutuo Obligated Group) 5.00 7/1/2027 140,000 161,259
468,072Total Investments (cost $165,615,634) 103.2% 166,872,877Liabilities, Less Cash and Receivables (3.2%) (5,238,766)Net Assets 100.0% 161,634,111a These securities have a put feature; the date shown represents the put date and the bond holder can take a specific action to retain the bond after the put date.b Security purchased on a when-issued or delayed basis for which the fund has not taken delivery as of February 28, 2022.c These securities are prerefunded; the date shown represents the prerefunded date. Bonds which are prerefunded are collateralized by U.S. Government securities which
are held in escrow and are used to pay principal and interest on the municipal issue and to retire the bonds in full at the earliest refunding date.d The Variable Rate shall be determined by the Remarketing Agent in its sole discretion based on prevailing market conditions and may, but need not, be established by
reference to one or more financial indices.e Security exempt from registration pursuant to Rule 144A under the Securities Act of 1933. These securities may be resold in transactions exempt from registration,
normally to qualified institutional buyers. At February 28, 2022, these securities were valued at $3,751,682 or 2.32% of net assets.Portfolio Summary (Unaudited) † Value (%)General 21.2General Obligation 13.4Education 13.2Transportation 9.3Medical 9.0Development 7.6School District 5.8Prerefunded 4.9Multifamily Housing 4.8Water 4.0Tobacco Settlement 3.5Airport 3.1Single Family Housing 2.3Housing 1.1103.2
† Based on net assets.See notes to financial statements.
69
Copyright © 2022 www.secdatabase.com. All Rights Reserved.Please Consider the Environment Before Printing This Document

STATEMENT OF INVESTMENTS (Unaudited) (continued)BNY Mellon New York Intermediate Tax-Exempt Bond FundFuturesDescription Number ofContracts Expiration NotionalValue($) MarketValue ($) Unrealized(Depreciation) ($)Futures ShortUltra 10 Year U.S. Treasury Notes 24 6/21/2022 3,351,616 3,391,875 (40,259)Gross Unrealized Depreciation (40,259)See notes to financial statements.
70
Copyright © 2022 www.secdatabase.com. All Rights Reserved.Please Consider the Environment Before Printing This Document
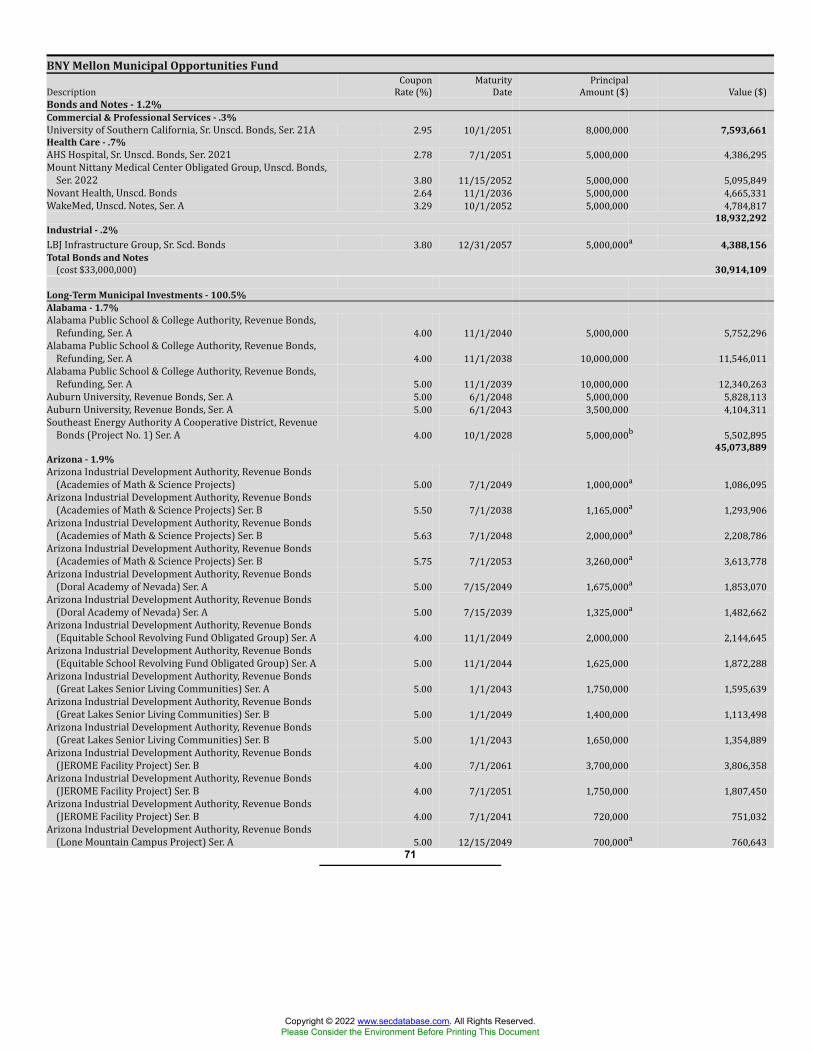
BNY Mellon Municipal Opportunities FundDescription CouponRate (%) MaturityDate PrincipalAmount ($) Value ($)Bonds and Notes - 1.2%Commercial & Professional Services - .3%University of Southern California, Sr. Unscd. Bonds, Ser. 21A 2.95 10/1/2051 8,000,000 7,593,661Health Care - .7%AHS Hospital, Sr. Unscd. Bonds, Ser. 2021 2.78 7/1/2051 5,000,000 4,386,295Mount Nittany Medical Center Obligated Group, Unscd. Bonds,Ser. 2022 3.80 11/15/2052 5,000,000 5,095,849Novant Health, Unscd. Bonds 2.64 11/1/2036 5,000,000 4,665,331WakeMed, Unscd. Notes, Ser. A 3.29 10/1/2052 5,000,000 4,784,817
18,932,292Industrial - .2%LBJ Infrastructure Group, Sr. Scd. Bonds 3.80 12/31/2057 5,000,000a 4,388,156Total Bonds and Notes(cost $33,000,000) 30,914,109
Long-Term Municipal Investments - 100.5%Alabama - 1.7%Alabama Public School & College Authority, Revenue Bonds,Refunding, Ser. A 4.00 11/1/2040 5,000,000 5,752,296Alabama Public School & College Authority, Revenue Bonds,Refunding, Ser. A 4.00 11/1/2038 10,000,000 11,546,011Alabama Public School & College Authority, Revenue Bonds,Refunding, Ser. A 5.00 11/1/2039 10,000,000 12,340,263Auburn University, Revenue Bonds, Ser. A 5.00 6/1/2048 5,000,000 5,828,113Auburn University, Revenue Bonds, Ser. A 5.00 6/1/2043 3,500,000 4,104,311Southeast Energy Authority A Cooperative District, RevenueBonds (Project No. 1) Ser. A 4.00 10/1/2028 5,000,000b 5,502,895
45,073,889Arizona - 1.9%Arizona Industrial Development Authority, Revenue Bonds(Academies of Math & Science Projects) 5.00 7/1/2049 1,000,000a 1,086,095Arizona Industrial Development Authority, Revenue Bonds(Academies of Math & Science Projects) Ser. B 5.50 7/1/2038 1,165,000a 1,293,906Arizona Industrial Development Authority, Revenue Bonds(Academies of Math & Science Projects) Ser. B 5.63 7/1/2048 2,000,000a 2,208,786Arizona Industrial Development Authority, Revenue Bonds(Academies of Math & Science Projects) Ser. B 5.75 7/1/2053 3,260,000a 3,613,778Arizona Industrial Development Authority, Revenue Bonds(Doral Academy of Nevada) Ser. A 5.00 7/15/2049 1,675,000a 1,853,070Arizona Industrial Development Authority, Revenue Bonds(Doral Academy of Nevada) Ser. A 5.00 7/15/2039 1,325,000a 1,482,662Arizona Industrial Development Authority, Revenue Bonds(Equitable School Revolving Fund Obligated Group) Ser. A 4.00 11/1/2049 2,000,000 2,144,645Arizona Industrial Development Authority, Revenue Bonds(Equitable School Revolving Fund Obligated Group) Ser. A 5.00 11/1/2044 1,625,000 1,872,288Arizona Industrial Development Authority, Revenue Bonds(Great Lakes Senior Living Communities) Ser. A 5.00 1/1/2043 1,750,000 1,595,639Arizona Industrial Development Authority, Revenue Bonds(Great Lakes Senior Living Communities) Ser. B 5.00 1/1/2049 1,400,000 1,113,498Arizona Industrial Development Authority, Revenue Bonds(Great Lakes Senior Living Communities) Ser. B 5.00 1/1/2043 1,650,000 1,354,889Arizona Industrial Development Authority, Revenue Bonds(JEROME Facility Project) Ser. B 4.00 7/1/2061 3,700,000 3,806,358Arizona Industrial Development Authority, Revenue Bonds(JEROME Facility Project) Ser. B 4.00 7/1/2051 1,750,000 1,807,450Arizona Industrial Development Authority, Revenue Bonds(JEROME Facility Project) Ser. B 4.00 7/1/2041 720,000 751,032Arizona Industrial Development Authority, Revenue Bonds(Lone Mountain Campus Project) Ser. A 5.00 12/15/2049 700,000a 760,643
71
Copyright © 2022 www.secdatabase.com. All Rights Reserved.Please Consider the Environment Before Printing This Document
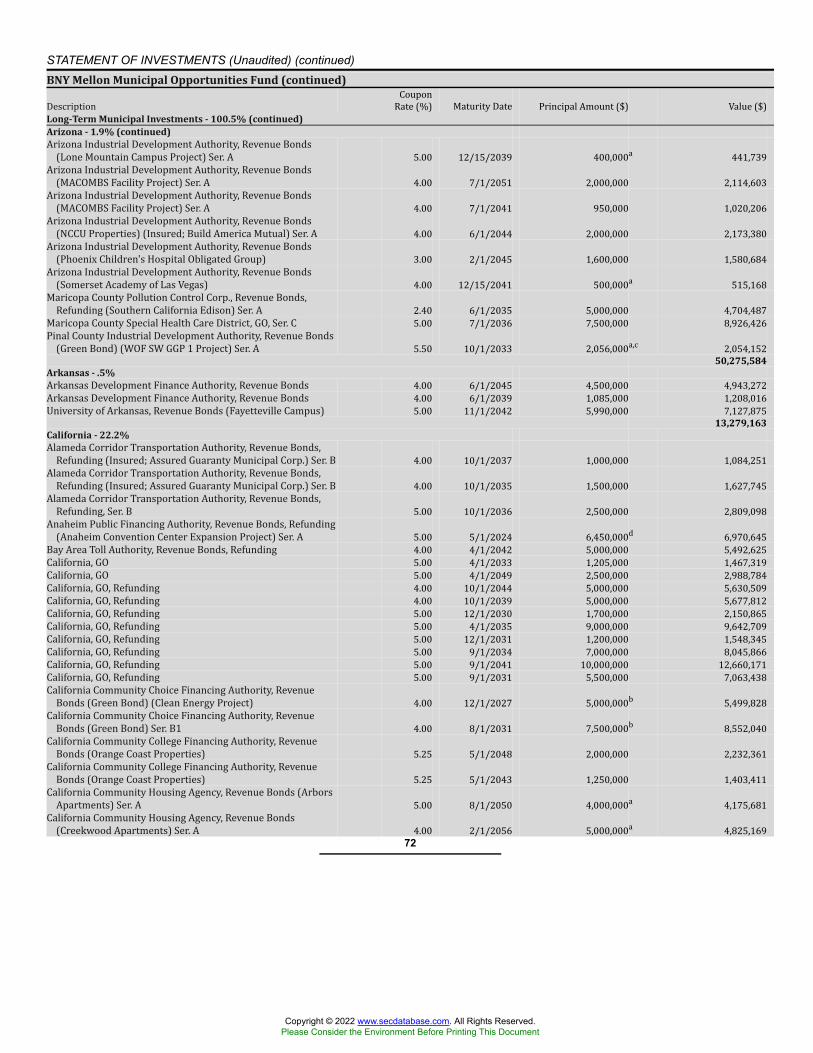
STATEMENT OF INVESTMENTS (Unaudited) (continued)BNY Mellon Municipal Opportunities Fund (continued)Description CouponRate (%) Maturity Date Principal Amount ($) Value ($)Long-Term Municipal Investments - 100.5% (continued)Arizona - 1.9% (continued)Arizona Industrial Development Authority, Revenue Bonds(Lone Mountain Campus Project) Ser. A 5.00 12/15/2039 400,000a 441,739Arizona Industrial Development Authority, Revenue Bonds(MACOMBS Facility Project) Ser. A 4.00 7/1/2051 2,000,000 2,114,603Arizona Industrial Development Authority, Revenue Bonds(MACOMBS Facility Project) Ser. A 4.00 7/1/2041 950,000 1,020,206Arizona Industrial Development Authority, Revenue Bonds(NCCU Properties) (Insured; Build America Mutual) Ser. A 4.00 6/1/2044 2,000,000 2,173,380Arizona Industrial Development Authority, Revenue Bonds(Phoenix Children's Hospital Obligated Group) 3.00 2/1/2045 1,600,000 1,580,684Arizona Industrial Development Authority, Revenue Bonds(Somerset Academy of Las Vegas) 4.00 12/15/2041 500,000a 515,168Maricopa County Pollution Control Corp., Revenue Bonds,Refunding (Southern California Edison) Ser. A 2.40 6/1/2035 5,000,000 4,704,487Maricopa County Special Health Care District, GO, Ser. C 5.00 7/1/2036 7,500,000 8,926,426Pinal County Industrial Development Authority, Revenue Bonds(Green Bond) (WOF SW GGP 1 Project) Ser. A 5.50 10/1/2033 2,056,000a,c 2,054,152
50,275,584Arkansas - .5%Arkansas Development Finance Authority, Revenue Bonds 4.00 6/1/2045 4,500,000 4,943,272Arkansas Development Finance Authority, Revenue Bonds 4.00 6/1/2039 1,085,000 1,208,016University of Arkansas, Revenue Bonds (Fayetteville Campus) 5.00 11/1/2042 5,990,000 7,127,875
13,279,163California - 22.2%Alameda Corridor Transportation Authority, Revenue Bonds,Refunding (Insured; Assured Guaranty Municipal Corp.) Ser. B 4.00 10/1/2037 1,000,000 1,084,251Alameda Corridor Transportation Authority, Revenue Bonds,Refunding (Insured; Assured Guaranty Municipal Corp.) Ser. B 4.00 10/1/2035 1,500,000 1,627,745Alameda Corridor Transportation Authority, Revenue Bonds,Refunding, Ser. B 5.00 10/1/2036 2,500,000 2,809,098Anaheim Public Financing Authority, Revenue Bonds, Refunding(Anaheim Convention Center Expansion Project) Ser. A 5.00 5/1/2024 6,450,000d 6,970,645Bay Area Toll Authority, Revenue Bonds, Refunding 4.00 4/1/2042 5,000,000 5,492,625California, GO 5.00 4/1/2033 1,205,000 1,467,319California, GO 5.00 4/1/2049 2,500,000 2,988,784California, GO, Refunding 4.00 10/1/2044 5,000,000 5,630,509California, GO, Refunding 4.00 10/1/2039 5,000,000 5,677,812California, GO, Refunding 5.00 12/1/2030 1,700,000 2,150,865California, GO, Refunding 5.00 4/1/2035 9,000,000 9,642,709California, GO, Refunding 5.00 12/1/2031 1,200,000 1,548,345California, GO, Refunding 5.00 9/1/2034 7,000,000 8,045,866California, GO, Refunding 5.00 9/1/2041 10,000,000 12,660,171California, GO, Refunding 5.00 9/1/2031 5,500,000 7,063,438California Community Choice Financing Authority, RevenueBonds (Green Bond) (Clean Energy Project) 4.00 12/1/2027 5,000,000b 5,499,828California Community Choice Financing Authority, RevenueBonds (Green Bond) Ser. B1 4.00 8/1/2031 7,500,000b 8,552,040California Community College Financing Authority, RevenueBonds (Orange Coast Properties) 5.25 5/1/2048 2,000,000 2,232,361California Community College Financing Authority, RevenueBonds (Orange Coast Properties) 5.25 5/1/2043 1,250,000 1,403,411California Community Housing Agency, Revenue Bonds (ArborsApartments) Ser. A 5.00 8/1/2050 4,000,000a 4,175,681California Community Housing Agency, Revenue Bonds(Creekwood Apartments) Ser. A 4.00 2/1/2056 5,000,000a 4,825,169
72
Copyright © 2022 www.secdatabase.com. All Rights Reserved.Please Consider the Environment Before Printing This Document
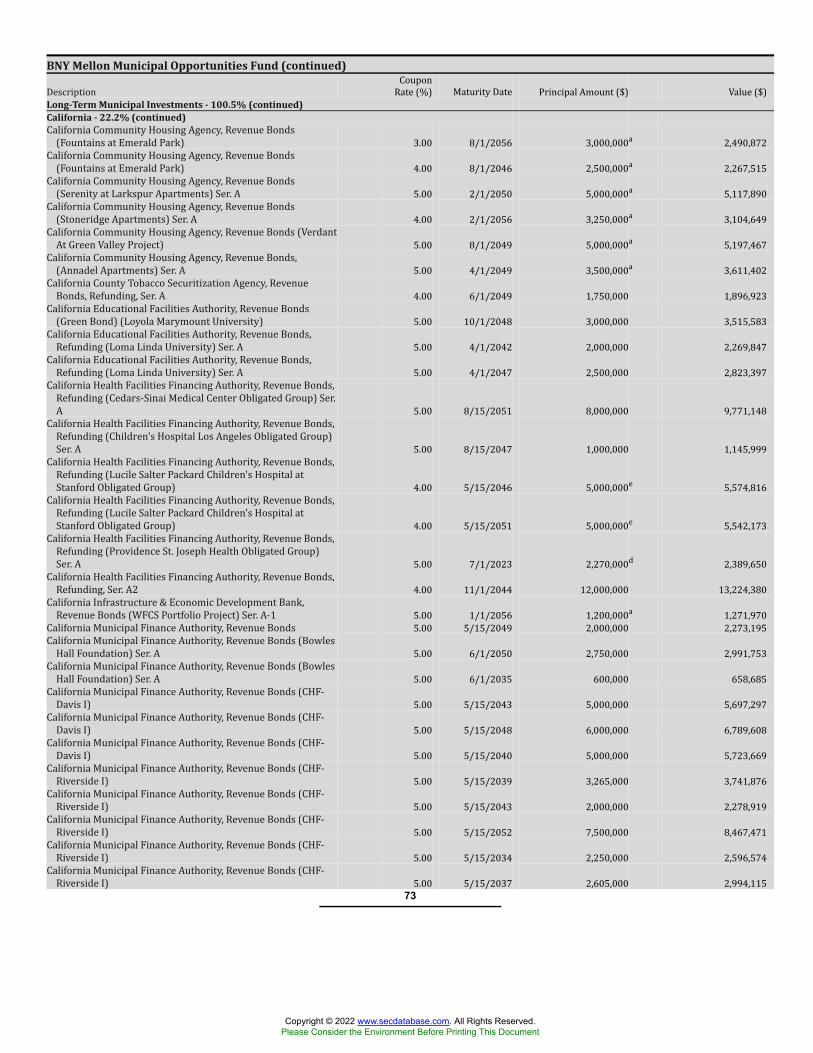
BNY Mellon Municipal Opportunities Fund (continued)Description CouponRate (%) Maturity Date Principal Amount ($) Value ($)Long-Term Municipal Investments - 100.5% (continued)California - 22.2% (continued)California Community Housing Agency, Revenue Bonds(Fountains at Emerald Park) 3.00 8/1/2056 3,000,000a 2,490,872California Community Housing Agency, Revenue Bonds(Fountains at Emerald Park) 4.00 8/1/2046 2,500,000a 2,267,515California Community Housing Agency, Revenue Bonds(Serenity at Larkspur Apartments) Ser. A 5.00 2/1/2050 5,000,000a 5,117,890California Community Housing Agency, Revenue Bonds(Stoneridge Apartments) Ser. A 4.00 2/1/2056 3,250,000a 3,104,649California Community Housing Agency, Revenue Bonds (VerdantAt Green Valley Project) 5.00 8/1/2049 5,000,000a 5,197,467California Community Housing Agency, Revenue Bonds,(Annadel Apartments) Ser. A 5.00 4/1/2049 3,500,000a 3,611,402California County Tobacco Securitization Agency, RevenueBonds, Refunding, Ser. A 4.00 6/1/2049 1,750,000 1,896,923California Educational Facilities Authority, Revenue Bonds(Green Bond) (Loyola Marymount University) 5.00 10/1/2048 3,000,000 3,515,583California Educational Facilities Authority, Revenue Bonds,Refunding (Loma Linda University) Ser. A 5.00 4/1/2042 2,000,000 2,269,847California Educational Facilities Authority, Revenue Bonds,Refunding (Loma Linda University) Ser. A 5.00 4/1/2047 2,500,000 2,823,397California Health Facilities Financing Authority, Revenue Bonds,Refunding (Cedars-Sinai Medical Center Obligated Group) Ser.A 5.00 8/15/2051 8,000,000 9,771,148California Health Facilities Financing Authority, Revenue Bonds,Refunding (Children's Hospital Los Angeles Obligated Group)Ser. A 5.00 8/15/2047 1,000,000 1,145,999California Health Facilities Financing Authority, Revenue Bonds,Refunding (Lucile Salter Packard Children's Hospital atStanford Obligated Group) 4.00 5/15/2046 5,000,000e 5,574,816California Health Facilities Financing Authority, Revenue Bonds,Refunding (Lucile Salter Packard Children's Hospital atStanford Obligated Group) 4.00 5/15/2051 5,000,000e 5,542,173California Health Facilities Financing Authority, Revenue Bonds,Refunding (Providence St. Joseph Health Obligated Group)Ser. A 5.00 7/1/2023 2,270,000d 2,389,650California Health Facilities Financing Authority, Revenue Bonds,Refunding, Ser. A2 4.00 11/1/2044 12,000,000 13,224,380California Infrastructure & Economic Development Bank,Revenue Bonds (WFCS Portfolio Project) Ser. A-1 5.00 1/1/2056 1,200,000a 1,271,970California Municipal Finance Authority, Revenue Bonds 5.00 5/15/2049 2,000,000 2,273,195California Municipal Finance Authority, Revenue Bonds (BowlesHall Foundation) Ser. A 5.00 6/1/2050 2,750,000 2,991,753California Municipal Finance Authority, Revenue Bonds (BowlesHall Foundation) Ser. A 5.00 6/1/2035 600,000 658,685California Municipal Finance Authority, Revenue Bonds (CHF-Davis I) 5.00 5/15/2043 5,000,000 5,697,297California Municipal Finance Authority, Revenue Bonds (CHF-Davis I) 5.00 5/15/2048 6,000,000 6,789,608California Municipal Finance Authority, Revenue Bonds (CHF-Davis I) 5.00 5/15/2040 5,000,000 5,723,669California Municipal Finance Authority, Revenue Bonds (CHF-Riverside I) 5.00 5/15/2039 3,265,000 3,741,876California Municipal Finance Authority, Revenue Bonds (CHF-Riverside I) 5.00 5/15/2043 2,000,000 2,278,919California Municipal Finance Authority, Revenue Bonds (CHF-Riverside I) 5.00 5/15/2052 7,500,000 8,467,471California Municipal Finance Authority, Revenue Bonds (CHF-Riverside I) 5.00 5/15/2034 2,250,000 2,596,574California Municipal Finance Authority, Revenue Bonds (CHF-Riverside I) 5.00 5/15/2037 2,605,000 2,994,115
73
Copyright © 2022 www.secdatabase.com. All Rights Reserved.Please Consider the Environment Before Printing This Document
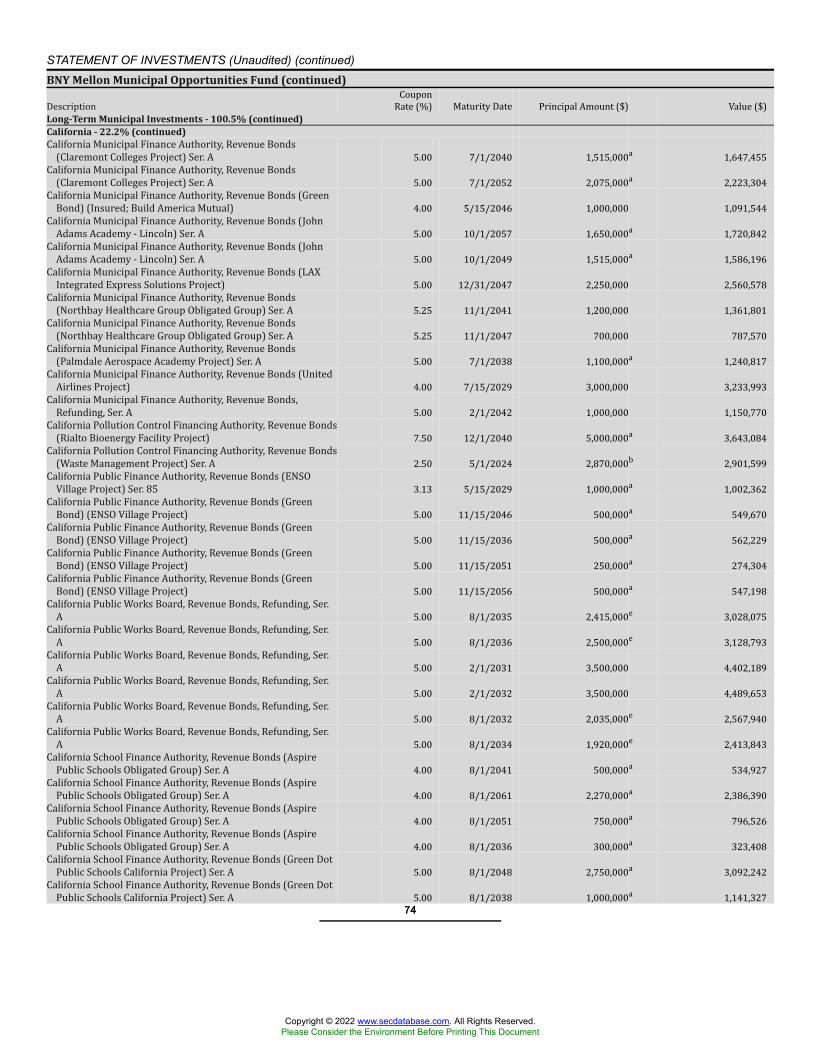
STATEMENT OF INVESTMENTS (Unaudited) (continued)BNY Mellon Municipal Opportunities Fund (continued)Description CouponRate (%) Maturity Date Principal Amount ($) Value ($)Long-Term Municipal Investments - 100.5% (continued)California - 22.2% (continued)California Municipal Finance Authority, Revenue Bonds(Claremont Colleges Project) Ser. A 5.00 7/1/2040 1,515,000a 1,647,455California Municipal Finance Authority, Revenue Bonds(Claremont Colleges Project) Ser. A 5.00 7/1/2052 2,075,000a 2,223,304California Municipal Finance Authority, Revenue Bonds (GreenBond) (Insured; Build America Mutual) 4.00 5/15/2046 1,000,000 1,091,544California Municipal Finance Authority, Revenue Bonds (JohnAdams Academy - Lincoln) Ser. A 5.00 10/1/2057 1,650,000a 1,720,842California Municipal Finance Authority, Revenue Bonds (JohnAdams Academy - Lincoln) Ser. A 5.00 10/1/2049 1,515,000a 1,586,196California Municipal Finance Authority, Revenue Bonds (LAXIntegrated Express Solutions Project) 5.00 12/31/2047 2,250,000 2,560,578California Municipal Finance Authority, Revenue Bonds(Northbay Healthcare Group Obligated Group) Ser. A 5.25 11/1/2041 1,200,000 1,361,801California Municipal Finance Authority, Revenue Bonds(Northbay Healthcare Group Obligated Group) Ser. A 5.25 11/1/2047 700,000 787,570California Municipal Finance Authority, Revenue Bonds(Palmdale Aerospace Academy Project) Ser. A 5.00 7/1/2038 1,100,000a 1,240,817California Municipal Finance Authority, Revenue Bonds (UnitedAirlines Project) 4.00 7/15/2029 3,000,000 3,233,993California Municipal Finance Authority, Revenue Bonds,Refunding, Ser. A 5.00 2/1/2042 1,000,000 1,150,770California Pollution Control Financing Authority, Revenue Bonds(Rialto Bioenergy Facility Project) 7.50 12/1/2040 5,000,000a 3,643,084California Pollution Control Financing Authority, Revenue Bonds(Waste Management Project) Ser. A 2.50 5/1/2024 2,870,000b 2,901,599California Public Finance Authority, Revenue Bonds (ENSOVillage Project) Ser. 85 3.13 5/15/2029 1,000,000a 1,002,362California Public Finance Authority, Revenue Bonds (GreenBond) (ENSO Village Project) 5.00 11/15/2046 500,000a 549,670California Public Finance Authority, Revenue Bonds (GreenBond) (ENSO Village Project) 5.00 11/15/2036 500,000a 562,229California Public Finance Authority, Revenue Bonds (GreenBond) (ENSO Village Project) 5.00 11/15/2051 250,000a 274,304California Public Finance Authority, Revenue Bonds (GreenBond) (ENSO Village Project) 5.00 11/15/2056 500,000a 547,198California Public Works Board, Revenue Bonds, Refunding, Ser.A 5.00 8/1/2035 2,415,000e 3,028,075California Public Works Board, Revenue Bonds, Refunding, Ser.A 5.00 8/1/2036 2,500,000e 3,128,793California Public Works Board, Revenue Bonds, Refunding, Ser.A 5.00 2/1/2031 3,500,000 4,402,189California Public Works Board, Revenue Bonds, Refunding, Ser.A 5.00 2/1/2032 3,500,000 4,489,653California Public Works Board, Revenue Bonds, Refunding, Ser.A 5.00 8/1/2032 2,035,000e 2,567,940California Public Works Board, Revenue Bonds, Refunding, Ser.A 5.00 8/1/2034 1,920,000e 2,413,843California School Finance Authority, Revenue Bonds (AspirePublic Schools Obligated Group) Ser. A 4.00 8/1/2041 500,000a 534,927California School Finance Authority, Revenue Bonds (AspirePublic Schools Obligated Group) Ser. A 4.00 8/1/2061 2,270,000a 2,386,390California School Finance Authority, Revenue Bonds (AspirePublic Schools Obligated Group) Ser. A 4.00 8/1/2051 750,000a 796,526California School Finance Authority, Revenue Bonds (AspirePublic Schools Obligated Group) Ser. A 4.00 8/1/2036 300,000a 323,408California School Finance Authority, Revenue Bonds (Green DotPublic Schools California Project) Ser. A 5.00 8/1/2048 2,750,000a 3,092,242California School Finance Authority, Revenue Bonds (Green DotPublic Schools California Project) Ser. A 5.00 8/1/2038 1,000,000a 1,141,327
74
Copyright © 2022 www.secdatabase.com. All Rights Reserved.Please Consider the Environment Before Printing This Document
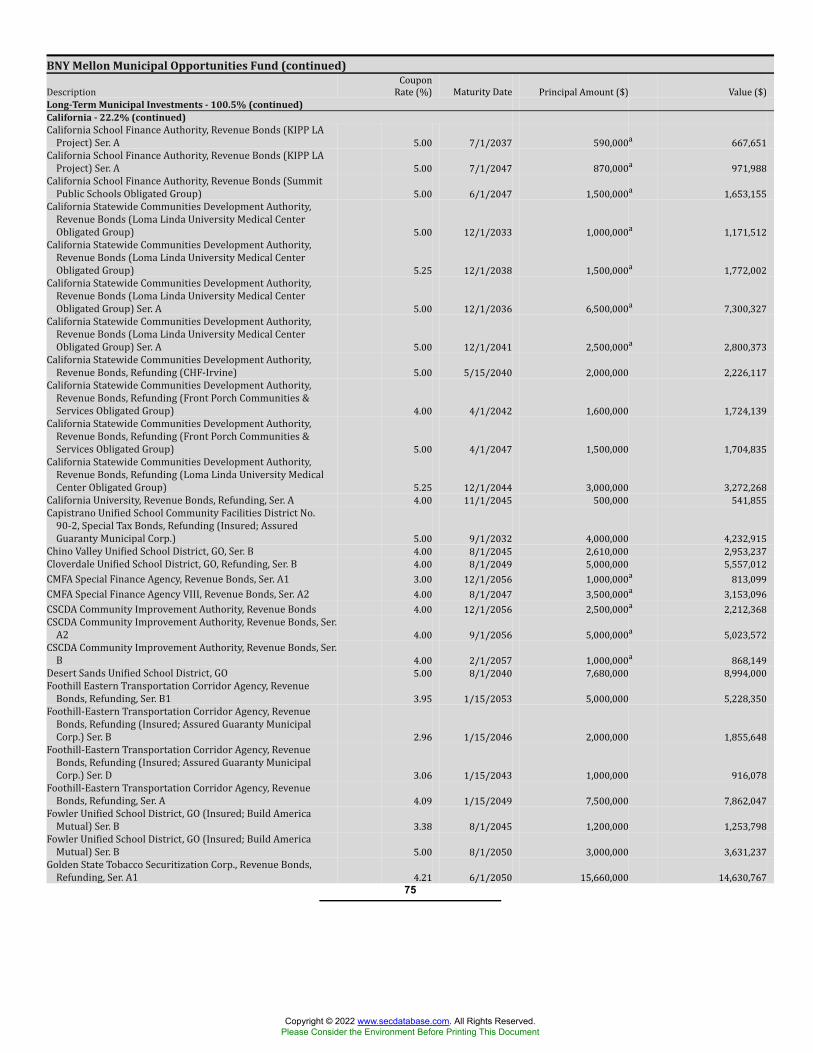
BNY Mellon Municipal Opportunities Fund (continued)Description CouponRate (%) Maturity Date Principal Amount ($) Value ($)Long-Term Municipal Investments - 100.5% (continued)California - 22.2% (continued)California School Finance Authority, Revenue Bonds (KIPP LAProject) Ser. A 5.00 7/1/2037 590,000a 667,651California School Finance Authority, Revenue Bonds (KIPP LAProject) Ser. A 5.00 7/1/2047 870,000a 971,988California School Finance Authority, Revenue Bonds (SummitPublic Schools Obligated Group) 5.00 6/1/2047 1,500,000a 1,653,155California Statewide Communities Development Authority,Revenue Bonds (Loma Linda University Medical CenterObligated Group) 5.00 12/1/2033 1,000,000a 1,171,512California Statewide Communities Development Authority,Revenue Bonds (Loma Linda University Medical CenterObligated Group) 5.25 12/1/2038 1,500,000a 1,772,002California Statewide Communities Development Authority,Revenue Bonds (Loma Linda University Medical CenterObligated Group) Ser. A 5.00 12/1/2036 6,500,000a 7,300,327California Statewide Communities Development Authority,Revenue Bonds (Loma Linda University Medical CenterObligated Group) Ser. A 5.00 12/1/2041 2,500,000a 2,800,373California Statewide Communities Development Authority,Revenue Bonds, Refunding (CHF-Irvine) 5.00 5/15/2040 2,000,000 2,226,117California Statewide Communities Development Authority,Revenue Bonds, Refunding (Front Porch Communities &Services Obligated Group) 4.00 4/1/2042 1,600,000 1,724,139California Statewide Communities Development Authority,Revenue Bonds, Refunding (Front Porch Communities &Services Obligated Group) 5.00 4/1/2047 1,500,000 1,704,835California Statewide Communities Development Authority,Revenue Bonds, Refunding (Loma Linda University MedicalCenter Obligated Group) 5.25 12/1/2044 3,000,000 3,272,268California University, Revenue Bonds, Refunding, Ser. A 4.00 11/1/2045 500,000 541,855Capistrano Unified School Community Facilities District No.90-2, Special Tax Bonds, Refunding (Insured; AssuredGuaranty Municipal Corp.) 5.00 9/1/2032 4,000,000 4,232,915Chino Valley Unified School District, GO, Ser. B 4.00 8/1/2045 2,610,000 2,953,237Cloverdale Unified School District, GO, Refunding, Ser. B 4.00 8/1/2049 5,000,000 5,557,012CMFA Special Finance Agency, Revenue Bonds, Ser. A1 3.00 12/1/2056 1,000,000a 813,099CMFA Special Finance Agency VIII, Revenue Bonds, Ser. A2 4.00 8/1/2047 3,500,000a 3,153,096CSCDA Community Improvement Authority, Revenue Bonds 4.00 12/1/2056 2,500,000a 2,212,368CSCDA Community Improvement Authority, Revenue Bonds, Ser.A2 4.00 9/1/2056 5,000,000a 5,023,572CSCDA Community Improvement Authority, Revenue Bonds, Ser.B 4.00 2/1/2057 1,000,000a 868,149Desert Sands Unified School District, GO 5.00 8/1/2040 7,680,000 8,994,000Foothill Eastern Transportation Corridor Agency, RevenueBonds, Refunding, Ser. B1 3.95 1/15/2053 5,000,000 5,228,350Foothill-Eastern Transportation Corridor Agency, RevenueBonds, Refunding (Insured; Assured Guaranty MunicipalCorp.) Ser. B 2.96 1/15/2046 2,000,000 1,855,648Foothill-Eastern Transportation Corridor Agency, RevenueBonds, Refunding (Insured; Assured Guaranty MunicipalCorp.) Ser. D 3.06 1/15/2043 1,000,000 916,078Foothill-Eastern Transportation Corridor Agency, RevenueBonds, Refunding, Ser. A 4.09 1/15/2049 7,500,000 7,862,047Fowler Unified School District, GO (Insured; Build AmericaMutual) Ser. B 3.38 8/1/2045 1,200,000 1,253,798Fowler Unified School District, GO (Insured; Build AmericaMutual) Ser. B 5.00 8/1/2050 3,000,000 3,631,237Golden State Tobacco Securitization Corp., Revenue Bonds,Refunding, Ser. A1 4.21 6/1/2050 15,660,000 14,630,767
75
Copyright © 2022 www.secdatabase.com. All Rights Reserved.Please Consider the Environment Before Printing This Document
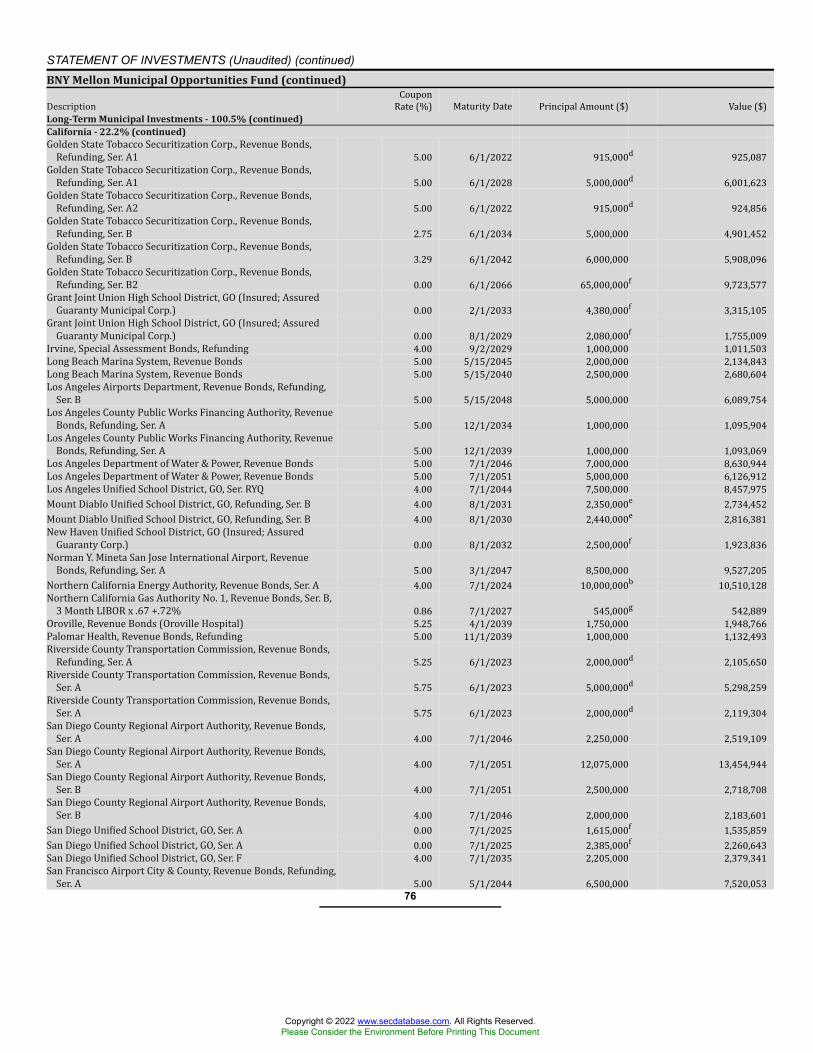
STATEMENT OF INVESTMENTS (Unaudited) (continued)BNY Mellon Municipal Opportunities Fund (continued)Description CouponRate (%) Maturity Date Principal Amount ($) Value ($)Long-Term Municipal Investments - 100.5% (continued)California - 22.2% (continued)Golden State Tobacco Securitization Corp., Revenue Bonds,Refunding, Ser. A1 5.00 6/1/2022 915,000d 925,087Golden State Tobacco Securitization Corp., Revenue Bonds,Refunding, Ser. A1 5.00 6/1/2028 5,000,000d 6,001,623Golden State Tobacco Securitization Corp., Revenue Bonds,Refunding, Ser. A2 5.00 6/1/2022 915,000d 924,856Golden State Tobacco Securitization Corp., Revenue Bonds,Refunding, Ser. B 2.75 6/1/2034 5,000,000 4,901,452Golden State Tobacco Securitization Corp., Revenue Bonds,Refunding, Ser. B 3.29 6/1/2042 6,000,000 5,908,096Golden State Tobacco Securitization Corp., Revenue Bonds,Refunding, Ser. B2 0.00 6/1/2066 65,000,000f 9,723,577Grant Joint Union High School District, GO (Insured; AssuredGuaranty Municipal Corp.) 0.00 2/1/2033 4,380,000f 3,315,105Grant Joint Union High School District, GO (Insured; AssuredGuaranty Municipal Corp.) 0.00 8/1/2029 2,080,000f 1,755,009Irvine, Special Assessment Bonds, Refunding 4.00 9/2/2029 1,000,000 1,011,503Long Beach Marina System, Revenue Bonds 5.00 5/15/2045 2,000,000 2,134,843Long Beach Marina System, Revenue Bonds 5.00 5/15/2040 2,500,000 2,680,604Los Angeles Airports Department, Revenue Bonds, Refunding,Ser. B 5.00 5/15/2048 5,000,000 6,089,754Los Angeles County Public Works Financing Authority, RevenueBonds, Refunding, Ser. A 5.00 12/1/2034 1,000,000 1,095,904Los Angeles County Public Works Financing Authority, RevenueBonds, Refunding, Ser. A 5.00 12/1/2039 1,000,000 1,093,069Los Angeles Department of Water & Power, Revenue Bonds 5.00 7/1/2046 7,000,000 8,630,944Los Angeles Department of Water & Power, Revenue Bonds 5.00 7/1/2051 5,000,000 6,126,912Los Angeles Unified School District, GO, Ser. RYQ 4.00 7/1/2044 7,500,000 8,457,975Mount Diablo Unified School District, GO, Refunding, Ser. B 4.00 8/1/2031 2,350,000e 2,734,452Mount Diablo Unified School District, GO, Refunding, Ser. B 4.00 8/1/2030 2,440,000e 2,816,381New Haven Unified School District, GO (Insured; AssuredGuaranty Corp.) 0.00 8/1/2032 2,500,000f 1,923,836Norman Y. Mineta San Jose International Airport, RevenueBonds, Refunding, Ser. A 5.00 3/1/2047 8,500,000 9,527,205Northern California Energy Authority, Revenue Bonds, Ser. A 4.00 7/1/2024 10,000,000b 10,510,128Northern California Gas Authority No. 1, Revenue Bonds, Ser. B,3 Month LIBOR x .67 +.72% 0.86 7/1/2027 545,000g 542,889Oroville, Revenue Bonds (Oroville Hospital) 5.25 4/1/2039 1,750,000 1,948,766Palomar Health, Revenue Bonds, Refunding 5.00 11/1/2039 1,000,000 1,132,493Riverside County Transportation Commission, Revenue Bonds,Refunding, Ser. A 5.25 6/1/2023 2,000,000d 2,105,650Riverside County Transportation Commission, Revenue Bonds,Ser. A 5.75 6/1/2023 5,000,000d 5,298,259Riverside County Transportation Commission, Revenue Bonds,Ser. A 5.75 6/1/2023 2,000,000d 2,119,304San Diego County Regional Airport Authority, Revenue Bonds,Ser. A 4.00 7/1/2046 2,250,000 2,519,109San Diego County Regional Airport Authority, Revenue Bonds,Ser. A 4.00 7/1/2051 12,075,000 13,454,944San Diego County Regional Airport Authority, Revenue Bonds,Ser. B 4.00 7/1/2051 2,500,000 2,718,708San Diego County Regional Airport Authority, Revenue Bonds,Ser. B 4.00 7/1/2046 2,000,000 2,183,601San Diego Unified School District, GO, Ser. A 0.00 7/1/2025 1,615,000f 1,535,859San Diego Unified School District, GO, Ser. A 0.00 7/1/2025 2,385,000f 2,260,643San Diego Unified School District, GO, Ser. F 4.00 7/1/2035 2,205,000 2,379,341San Francisco Airport City & County, Revenue Bonds, Refunding,Ser. A 5.00 5/1/2044 6,500,000 7,520,053
76
Copyright © 2022 www.secdatabase.com. All Rights Reserved.Please Consider the Environment Before Printing This Document
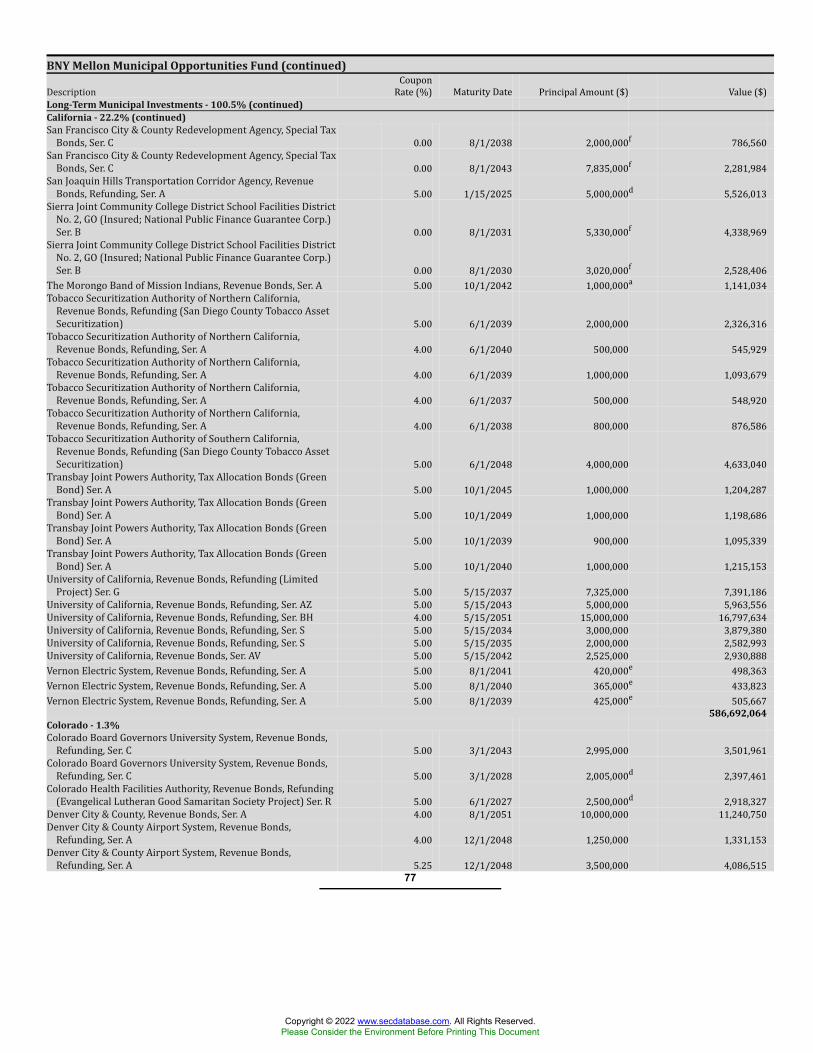
BNY Mellon Municipal Opportunities Fund (continued)Description CouponRate (%) Maturity Date Principal Amount ($) Value ($)Long-Term Municipal Investments - 100.5% (continued)California - 22.2% (continued)San Francisco City & County Redevelopment Agency, Special TaxBonds, Ser. C 0.00 8/1/2038 2,000,000f 786,560San Francisco City & County Redevelopment Agency, Special TaxBonds, Ser. C 0.00 8/1/2043 7,835,000f 2,281,984San Joaquin Hills Transportation Corridor Agency, RevenueBonds, Refunding, Ser. A 5.00 1/15/2025 5,000,000d 5,526,013Sierra Joint Community College District School Facilities DistrictNo. 2, GO (Insured; National Public Finance Guarantee Corp.)Ser. B 0.00 8/1/2031 5,330,000f 4,338,969Sierra Joint Community College District School Facilities DistrictNo. 2, GO (Insured; National Public Finance Guarantee Corp.)Ser. B 0.00 8/1/2030 3,020,000f 2,528,406The Morongo Band of Mission Indians, Revenue Bonds, Ser. A 5.00 10/1/2042 1,000,000a 1,141,034Tobacco Securitization Authority of Northern California,Revenue Bonds, Refunding (San Diego County Tobacco AssetSecuritization) 5.00 6/1/2039 2,000,000 2,326,316Tobacco Securitization Authority of Northern California,Revenue Bonds, Refunding, Ser. A 4.00 6/1/2040 500,000 545,929Tobacco Securitization Authority of Northern California,Revenue Bonds, Refunding, Ser. A 4.00 6/1/2039 1,000,000 1,093,679Tobacco Securitization Authority of Northern California,Revenue Bonds, Refunding, Ser. A 4.00 6/1/2037 500,000 548,920Tobacco Securitization Authority of Northern California,Revenue Bonds, Refunding, Ser. A 4.00 6/1/2038 800,000 876,586Tobacco Securitization Authority of Southern California,Revenue Bonds, Refunding (San Diego County Tobacco AssetSecuritization) 5.00 6/1/2048 4,000,000 4,633,040Transbay Joint Powers Authority, Tax Allocation Bonds (GreenBond) Ser. A 5.00 10/1/2045 1,000,000 1,204,287Transbay Joint Powers Authority, Tax Allocation Bonds (GreenBond) Ser. A 5.00 10/1/2049 1,000,000 1,198,686Transbay Joint Powers Authority, Tax Allocation Bonds (GreenBond) Ser. A 5.00 10/1/2039 900,000 1,095,339Transbay Joint Powers Authority, Tax Allocation Bonds (GreenBond) Ser. A 5.00 10/1/2040 1,000,000 1,215,153University of California, Revenue Bonds, Refunding (LimitedProject) Ser. G 5.00 5/15/2037 7,325,000 7,391,186University of California, Revenue Bonds, Refunding, Ser. AZ 5.00 5/15/2043 5,000,000 5,963,556University of California, Revenue Bonds, Refunding, Ser. BH 4.00 5/15/2051 15,000,000 16,797,634University of California, Revenue Bonds, Refunding, Ser. S 5.00 5/15/2034 3,000,000 3,879,380University of California, Revenue Bonds, Refunding, Ser. S 5.00 5/15/2035 2,000,000 2,582,993University of California, Revenue Bonds, Ser. AV 5.00 5/15/2042 2,525,000 2,930,888Vernon Electric System, Revenue Bonds, Refunding, Ser. A 5.00 8/1/2041 420,000e 498,363Vernon Electric System, Revenue Bonds, Refunding, Ser. A 5.00 8/1/2040 365,000e 433,823Vernon Electric System, Revenue Bonds, Refunding, Ser. A 5.00 8/1/2039 425,000e 505,667
586,692,064Colorado - 1.3%Colorado Board Governors University System, Revenue Bonds,Refunding, Ser. C 5.00 3/1/2043 2,995,000 3,501,961Colorado Board Governors University System, Revenue Bonds,Refunding, Ser. C 5.00 3/1/2028 2,005,000d 2,397,461Colorado Health Facilities Authority, Revenue Bonds, Refunding(Evangelical Lutheran Good Samaritan Society Project) Ser. R 5.00 6/1/2027 2,500,000d 2,918,327Denver City & County, Revenue Bonds, Ser. A 4.00 8/1/2051 10,000,000 11,240,750Denver City & County Airport System, Revenue Bonds,Refunding, Ser. A 4.00 12/1/2048 1,250,000 1,331,153Denver City & County Airport System, Revenue Bonds,Refunding, Ser. A 5.25 12/1/2048 3,500,000 4,086,515
77
Copyright © 2022 www.secdatabase.com. All Rights Reserved.Please Consider the Environment Before Printing This Document
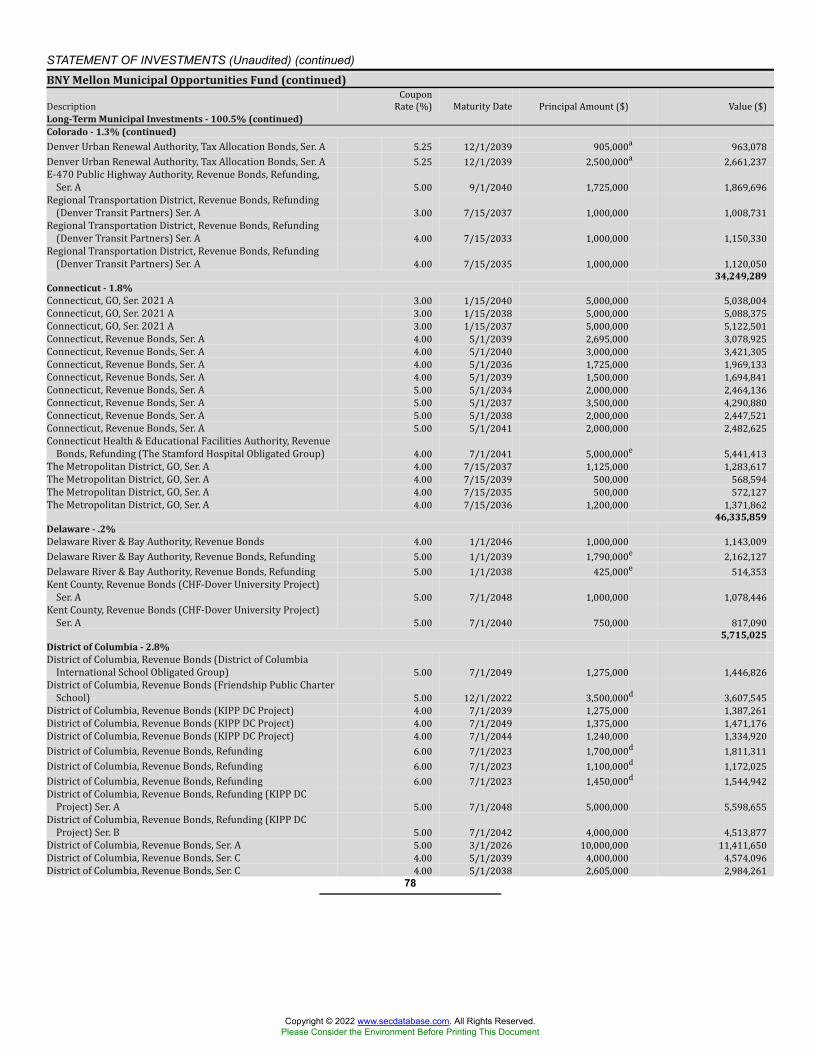
STATEMENT OF INVESTMENTS (Unaudited) (continued)BNY Mellon Municipal Opportunities Fund (continued)Description CouponRate (%) Maturity Date Principal Amount ($) Value ($)Long-Term Municipal Investments - 100.5% (continued)Colorado - 1.3% (continued)Denver Urban Renewal Authority, Tax Allocation Bonds, Ser. A 5.25 12/1/2039 905,000a 963,078Denver Urban Renewal Authority, Tax Allocation Bonds, Ser. A 5.25 12/1/2039 2,500,000a 2,661,237E-470 Public Highway Authority, Revenue Bonds, Refunding,Ser. A 5.00 9/1/2040 1,725,000 1,869,696Regional Transportation District, Revenue Bonds, Refunding(Denver Transit Partners) Ser. A 3.00 7/15/2037 1,000,000 1,008,731Regional Transportation District, Revenue Bonds, Refunding(Denver Transit Partners) Ser. A 4.00 7/15/2033 1,000,000 1,150,330Regional Transportation District, Revenue Bonds, Refunding(Denver Transit Partners) Ser. A 4.00 7/15/2035 1,000,000 1,120,050
34,249,289Connecticut - 1.8%Connecticut, GO, Ser. 2021 A 3.00 1/15/2040 5,000,000 5,038,004Connecticut, GO, Ser. 2021 A 3.00 1/15/2038 5,000,000 5,088,375Connecticut, GO, Ser. 2021 A 3.00 1/15/2037 5,000,000 5,122,501Connecticut, Revenue Bonds, Ser. A 4.00 5/1/2039 2,695,000 3,078,925Connecticut, Revenue Bonds, Ser. A 4.00 5/1/2040 3,000,000 3,421,305Connecticut, Revenue Bonds, Ser. A 4.00 5/1/2036 1,725,000 1,969,133Connecticut, Revenue Bonds, Ser. A 4.00 5/1/2039 1,500,000 1,694,841Connecticut, Revenue Bonds, Ser. A 5.00 5/1/2034 2,000,000 2,464,136Connecticut, Revenue Bonds, Ser. A 5.00 5/1/2037 3,500,000 4,290,880Connecticut, Revenue Bonds, Ser. A 5.00 5/1/2038 2,000,000 2,447,521Connecticut, Revenue Bonds, Ser. A 5.00 5/1/2041 2,000,000 2,482,625Connecticut Health & Educational Facilities Authority, RevenueBonds, Refunding (The Stamford Hospital Obligated Group) 4.00 7/1/2041 5,000,000e 5,441,413The Metropolitan District, GO, Ser. A 4.00 7/15/2037 1,125,000 1,283,617The Metropolitan District, GO, Ser. A 4.00 7/15/2039 500,000 568,594The Metropolitan District, GO, Ser. A 4.00 7/15/2035 500,000 572,127The Metropolitan District, GO, Ser. A 4.00 7/15/2036 1,200,000 1,371,862
46,335,859Delaware - .2%Delaware River & Bay Authority, Revenue Bonds 4.00 1/1/2046 1,000,000 1,143,009Delaware River & Bay Authority, Revenue Bonds, Refunding 5.00 1/1/2039 1,790,000e 2,162,127Delaware River & Bay Authority, Revenue Bonds, Refunding 5.00 1/1/2038 425,000e 514,353Kent County, Revenue Bonds (CHF-Dover University Project)Ser. A 5.00 7/1/2048 1,000,000 1,078,446Kent County, Revenue Bonds (CHF-Dover University Project)Ser. A 5.00 7/1/2040 750,000 817,090
5,715,025District of Columbia - 2.8%District of Columbia, Revenue Bonds (District of ColumbiaInternational School Obligated Group) 5.00 7/1/2049 1,275,000 1,446,826District of Columbia, Revenue Bonds (Friendship Public CharterSchool) 5.00 12/1/2022 3,500,000d 3,607,545District of Columbia, Revenue Bonds (KIPP DC Project) 4.00 7/1/2039 1,275,000 1,387,261District of Columbia, Revenue Bonds (KIPP DC Project) 4.00 7/1/2049 1,375,000 1,471,176District of Columbia, Revenue Bonds (KIPP DC Project) 4.00 7/1/2044 1,240,000 1,334,920District of Columbia, Revenue Bonds, Refunding 6.00 7/1/2023 1,700,000d 1,811,311District of Columbia, Revenue Bonds, Refunding 6.00 7/1/2023 1,100,000d 1,172,025District of Columbia, Revenue Bonds, Refunding 6.00 7/1/2023 1,450,000d 1,544,942District of Columbia, Revenue Bonds, Refunding (KIPP DCProject) Ser. A 5.00 7/1/2048 5,000,000 5,598,655District of Columbia, Revenue Bonds, Refunding (KIPP DCProject) Ser. B 5.00 7/1/2042 4,000,000 4,513,877District of Columbia, Revenue Bonds, Ser. A 5.00 3/1/2026 10,000,000 11,411,650District of Columbia, Revenue Bonds, Ser. C 4.00 5/1/2039 4,000,000 4,574,096District of Columbia, Revenue Bonds, Ser. C 4.00 5/1/2038 2,605,000 2,984,261
78
Copyright © 2022 www.secdatabase.com. All Rights Reserved.Please Consider the Environment Before Printing This Document
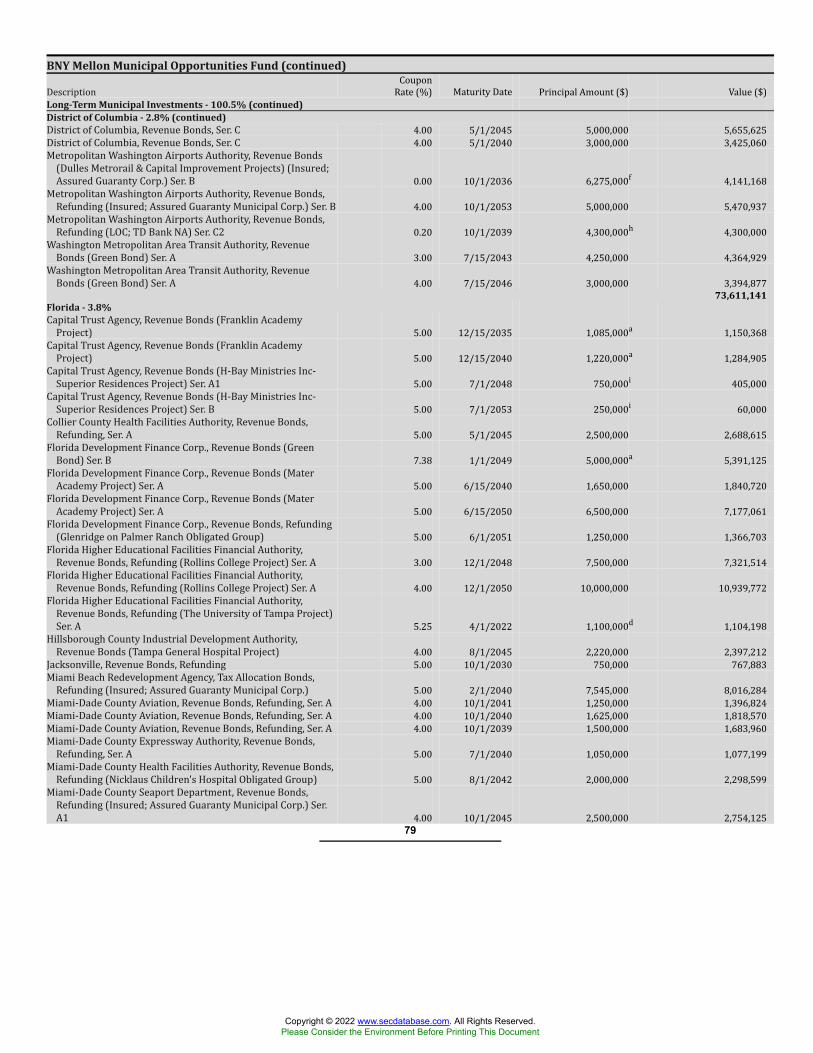
BNY Mellon Municipal Opportunities Fund (continued)Description CouponRate (%) Maturity Date Principal Amount ($) Value ($)Long-Term Municipal Investments - 100.5% (continued)District of Columbia - 2.8% (continued)District of Columbia, Revenue Bonds, Ser. C 4.00 5/1/2045 5,000,000 5,655,625District of Columbia, Revenue Bonds, Ser. C 4.00 5/1/2040 3,000,000 3,425,060Metropolitan Washington Airports Authority, Revenue Bonds(Dulles Metrorail & Capital Improvement Projects) (Insured;Assured Guaranty Corp.) Ser. B 0.00 10/1/2036 6,275,000f 4,141,168Metropolitan Washington Airports Authority, Revenue Bonds,Refunding (Insured; Assured Guaranty Municipal Corp.) Ser. B 4.00 10/1/2053 5,000,000 5,470,937Metropolitan Washington Airports Authority, Revenue Bonds,Refunding (LOC; TD Bank NA) Ser. C2 0.20 10/1/2039 4,300,000h 4,300,000Washington Metropolitan Area Transit Authority, RevenueBonds (Green Bond) Ser. A 3.00 7/15/2043 4,250,000 4,364,929Washington Metropolitan Area Transit Authority, RevenueBonds (Green Bond) Ser. A 4.00 7/15/2046 3,000,000 3,394,877
73,611,141Florida - 3.8%Capital Trust Agency, Revenue Bonds (Franklin AcademyProject) 5.00 12/15/2035 1,085,000a 1,150,368Capital Trust Agency, Revenue Bonds (Franklin AcademyProject) 5.00 12/15/2040 1,220,000a 1,284,905Capital Trust Agency, Revenue Bonds (H-Bay Ministries Inc-Superior Residences Project) Ser. A1 5.00 7/1/2048 750,000i 405,000Capital Trust Agency, Revenue Bonds (H-Bay Ministries Inc-Superior Residences Project) Ser. B 5.00 7/1/2053 250,000i 60,000Collier County Health Facilities Authority, Revenue Bonds,Refunding, Ser. A 5.00 5/1/2045 2,500,000 2,688,615Florida Development Finance Corp., Revenue Bonds (GreenBond) Ser. B 7.38 1/1/2049 5,000,000a 5,391,125Florida Development Finance Corp., Revenue Bonds (MaterAcademy Project) Ser. A 5.00 6/15/2040 1,650,000 1,840,720Florida Development Finance Corp., Revenue Bonds (MaterAcademy Project) Ser. A 5.00 6/15/2050 6,500,000 7,177,061Florida Development Finance Corp., Revenue Bonds, Refunding(Glenridge on Palmer Ranch Obligated Group) 5.00 6/1/2051 1,250,000 1,366,703Florida Higher Educational Facilities Financial Authority,Revenue Bonds, Refunding (Rollins College Project) Ser. A 3.00 12/1/2048 7,500,000 7,321,514Florida Higher Educational Facilities Financial Authority,Revenue Bonds, Refunding (Rollins College Project) Ser. A 4.00 12/1/2050 10,000,000 10,939,772Florida Higher Educational Facilities Financial Authority,Revenue Bonds, Refunding (The University of Tampa Project)Ser. A 5.25 4/1/2022 1,100,000d 1,104,198Hillsborough County Industrial Development Authority,Revenue Bonds (Tampa General Hospital Project) 4.00 8/1/2045 2,220,000 2,397,212Jacksonville, Revenue Bonds, Refunding 5.00 10/1/2030 750,000 767,883Miami Beach Redevelopment Agency, Tax Allocation Bonds,Refunding (Insured; Assured Guaranty Municipal Corp.) 5.00 2/1/2040 7,545,000 8,016,284Miami-Dade County Aviation, Revenue Bonds, Refunding, Ser. A 4.00 10/1/2041 1,250,000 1,396,824Miami-Dade County Aviation, Revenue Bonds, Refunding, Ser. A 4.00 10/1/2040 1,625,000 1,818,570Miami-Dade County Aviation, Revenue Bonds, Refunding, Ser. A 4.00 10/1/2039 1,500,000 1,683,960Miami-Dade County Expressway Authority, Revenue Bonds,Refunding, Ser. A 5.00 7/1/2040 1,050,000 1,077,199Miami-Dade County Health Facilities Authority, Revenue Bonds,Refunding (Nicklaus Children's Hospital Obligated Group) 5.00 8/1/2042 2,000,000 2,298,599Miami-Dade County Seaport Department, Revenue Bonds,Refunding (Insured; Assured Guaranty Municipal Corp.) Ser.A1 4.00 10/1/2045 2,500,000 2,754,125
79
Copyright © 2022 www.secdatabase.com. All Rights Reserved.Please Consider the Environment Before Printing This Document
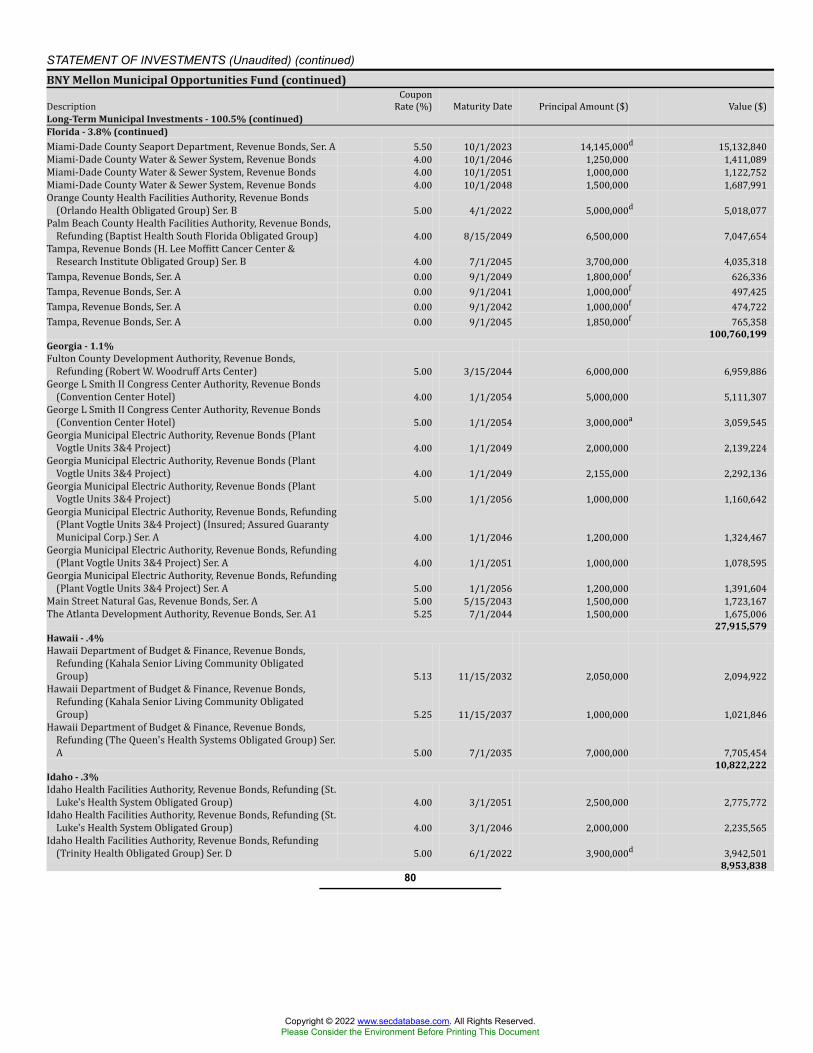
STATEMENT OF INVESTMENTS (Unaudited) (continued)BNY Mellon Municipal Opportunities Fund (continued)Description CouponRate (%) Maturity Date Principal Amount ($) Value ($)Long-Term Municipal Investments - 100.5% (continued)Florida - 3.8% (continued)Miami-Dade County Seaport Department, Revenue Bonds, Ser. A 5.50 10/1/2023 14,145,000d 15,132,840Miami-Dade County Water & Sewer System, Revenue Bonds 4.00 10/1/2046 1,250,000 1,411,089Miami-Dade County Water & Sewer System, Revenue Bonds 4.00 10/1/2051 1,000,000 1,122,752Miami-Dade County Water & Sewer System, Revenue Bonds 4.00 10/1/2048 1,500,000 1,687,991Orange County Health Facilities Authority, Revenue Bonds(Orlando Health Obligated Group) Ser. B 5.00 4/1/2022 5,000,000d 5,018,077Palm Beach County Health Facilities Authority, Revenue Bonds,Refunding (Baptist Health South Florida Obligated Group) 4.00 8/15/2049 6,500,000 7,047,654Tampa, Revenue Bonds (H. Lee Moffitt Cancer Center &Research Institute Obligated Group) Ser. B 4.00 7/1/2045 3,700,000 4,035,318Tampa, Revenue Bonds, Ser. A 0.00 9/1/2049 1,800,000f 626,336Tampa, Revenue Bonds, Ser. A 0.00 9/1/2041 1,000,000f 497,425Tampa, Revenue Bonds, Ser. A 0.00 9/1/2042 1,000,000f 474,722Tampa, Revenue Bonds, Ser. A 0.00 9/1/2045 1,850,000f 765,358
100,760,199Georgia - 1.1%Fulton County Development Authority, Revenue Bonds,Refunding (Robert W. Woodruff Arts Center) 5.00 3/15/2044 6,000,000 6,959,886George L Smith II Congress Center Authority, Revenue Bonds(Convention Center Hotel) 4.00 1/1/2054 5,000,000 5,111,307George L Smith II Congress Center Authority, Revenue Bonds(Convention Center Hotel) 5.00 1/1/2054 3,000,000a 3,059,545Georgia Municipal Electric Authority, Revenue Bonds (PlantVogtle Units 3&4 Project) 4.00 1/1/2049 2,000,000 2,139,224Georgia Municipal Electric Authority, Revenue Bonds (PlantVogtle Units 3&4 Project) 4.00 1/1/2049 2,155,000 2,292,136Georgia Municipal Electric Authority, Revenue Bonds (PlantVogtle Units 3&4 Project) 5.00 1/1/2056 1,000,000 1,160,642Georgia Municipal Electric Authority, Revenue Bonds, Refunding(Plant Vogtle Units 3&4 Project) (Insured; Assured GuarantyMunicipal Corp.) Ser. A 4.00 1/1/2046 1,200,000 1,324,467Georgia Municipal Electric Authority, Revenue Bonds, Refunding(Plant Vogtle Units 3&4 Project) Ser. A 4.00 1/1/2051 1,000,000 1,078,595Georgia Municipal Electric Authority, Revenue Bonds, Refunding(Plant Vogtle Units 3&4 Project) Ser. A 5.00 1/1/2056 1,200,000 1,391,604Main Street Natural Gas, Revenue Bonds, Ser. A 5.00 5/15/2043 1,500,000 1,723,167The Atlanta Development Authority, Revenue Bonds, Ser. A1 5.25 7/1/2044 1,500,000 1,675,006
27,915,579Hawaii - .4%Hawaii Department of Budget & Finance, Revenue Bonds,Refunding (Kahala Senior Living Community ObligatedGroup) 5.13 11/15/2032 2,050,000 2,094,922Hawaii Department of Budget & Finance, Revenue Bonds,Refunding (Kahala Senior Living Community ObligatedGroup) 5.25 11/15/2037 1,000,000 1,021,846Hawaii Department of Budget & Finance, Revenue Bonds,Refunding (The Queen's Health Systems Obligated Group) Ser.A 5.00 7/1/2035 7,000,000 7,705,454
10,822,222Idaho - .3%Idaho Health Facilities Authority, Revenue Bonds, Refunding (St.Luke's Health System Obligated Group) 4.00 3/1/2051 2,500,000 2,775,772Idaho Health Facilities Authority, Revenue Bonds, Refunding (St.Luke's Health System Obligated Group) 4.00 3/1/2046 2,000,000 2,235,565Idaho Health Facilities Authority, Revenue Bonds, Refunding(Trinity Health Obligated Group) Ser. D 5.00 6/1/2022 3,900,000d 3,942,501
8,953,83880
Copyright © 2022 www.secdatabase.com. All Rights Reserved.Please Consider the Environment Before Printing This Document
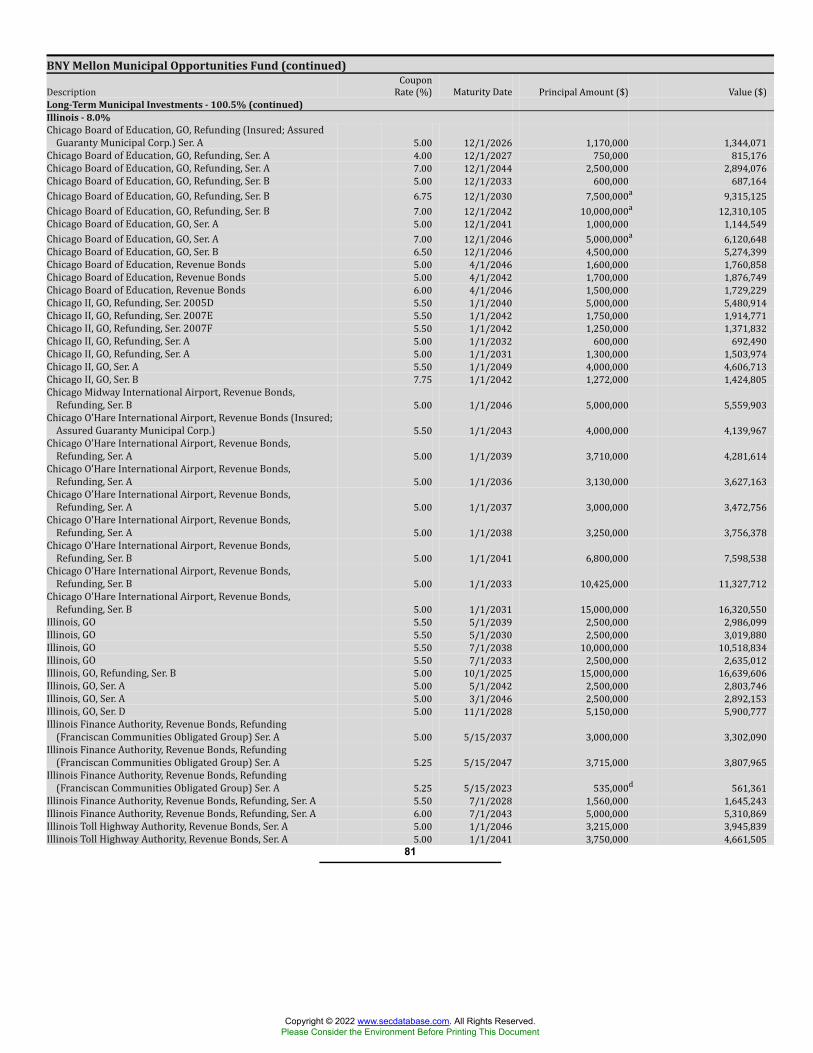
BNY Mellon Municipal Opportunities Fund (continued)Description CouponRate (%) Maturity Date Principal Amount ($) Value ($)Long-Term Municipal Investments - 100.5% (continued)Illinois - 8.0%Chicago Board of Education, GO, Refunding (Insured; AssuredGuaranty Municipal Corp.) Ser. A 5.00 12/1/2026 1,170,000 1,344,071Chicago Board of Education, GO, Refunding, Ser. A 4.00 12/1/2027 750,000 815,176Chicago Board of Education, GO, Refunding, Ser. A 7.00 12/1/2044 2,500,000 2,894,076Chicago Board of Education, GO, Refunding, Ser. B 5.00 12/1/2033 600,000 687,164Chicago Board of Education, GO, Refunding, Ser. B 6.75 12/1/2030 7,500,000a 9,315,125Chicago Board of Education, GO, Refunding, Ser. B 7.00 12/1/2042 10,000,000a 12,310,105Chicago Board of Education, GO, Ser. A 5.00 12/1/2041 1,000,000 1,144,549Chicago Board of Education, GO, Ser. A 7.00 12/1/2046 5,000,000a 6,120,648Chicago Board of Education, GO, Ser. B 6.50 12/1/2046 4,500,000 5,274,399Chicago Board of Education, Revenue Bonds 5.00 4/1/2046 1,600,000 1,760,858Chicago Board of Education, Revenue Bonds 5.00 4/1/2042 1,700,000 1,876,749Chicago Board of Education, Revenue Bonds 6.00 4/1/2046 1,500,000 1,729,229Chicago II, GO, Refunding, Ser. 2005D 5.50 1/1/2040 5,000,000 5,480,914Chicago II, GO, Refunding, Ser. 2007E 5.50 1/1/2042 1,750,000 1,914,771Chicago II, GO, Refunding, Ser. 2007F 5.50 1/1/2042 1,250,000 1,371,832Chicago II, GO, Refunding, Ser. A 5.00 1/1/2032 600,000 692,490Chicago II, GO, Refunding, Ser. A 5.00 1/1/2031 1,300,000 1,503,974Chicago II, GO, Ser. A 5.50 1/1/2049 4,000,000 4,606,713Chicago II, GO, Ser. B 7.75 1/1/2042 1,272,000 1,424,805Chicago Midway International Airport, Revenue Bonds,Refunding, Ser. B 5.00 1/1/2046 5,000,000 5,559,903Chicago O'Hare International Airport, Revenue Bonds (Insured;Assured Guaranty Municipal Corp.) 5.50 1/1/2043 4,000,000 4,139,967Chicago O'Hare International Airport, Revenue Bonds,Refunding, Ser. A 5.00 1/1/2039 3,710,000 4,281,614Chicago O'Hare International Airport, Revenue Bonds,Refunding, Ser. A 5.00 1/1/2036 3,130,000 3,627,163Chicago O'Hare International Airport, Revenue Bonds,Refunding, Ser. A 5.00 1/1/2037 3,000,000 3,472,756Chicago O'Hare International Airport, Revenue Bonds,Refunding, Ser. A 5.00 1/1/2038 3,250,000 3,756,378Chicago O'Hare International Airport, Revenue Bonds,Refunding, Ser. B 5.00 1/1/2041 6,800,000 7,598,538Chicago O'Hare International Airport, Revenue Bonds,Refunding, Ser. B 5.00 1/1/2033 10,425,000 11,327,712Chicago O'Hare International Airport, Revenue Bonds,Refunding, Ser. B 5.00 1/1/2031 15,000,000 16,320,550Illinois, GO 5.50 5/1/2039 2,500,000 2,986,099Illinois, GO 5.50 5/1/2030 2,500,000 3,019,880Illinois, GO 5.50 7/1/2038 10,000,000 10,518,834Illinois, GO 5.50 7/1/2033 2,500,000 2,635,012Illinois, GO, Refunding, Ser. B 5.00 10/1/2025 15,000,000 16,639,606Illinois, GO, Ser. A 5.00 5/1/2042 2,500,000 2,803,746Illinois, GO, Ser. A 5.00 3/1/2046 2,500,000 2,892,153Illinois, GO, Ser. D 5.00 11/1/2028 5,150,000 5,900,777Illinois Finance Authority, Revenue Bonds, Refunding(Franciscan Communities Obligated Group) Ser. A 5.00 5/15/2037 3,000,000 3,302,090Illinois Finance Authority, Revenue Bonds, Refunding(Franciscan Communities Obligated Group) Ser. A 5.25 5/15/2047 3,715,000 3,807,965Illinois Finance Authority, Revenue Bonds, Refunding(Franciscan Communities Obligated Group) Ser. A 5.25 5/15/2023 535,000d 561,361Illinois Finance Authority, Revenue Bonds, Refunding, Ser. A 5.50 7/1/2028 1,560,000 1,645,243Illinois Finance Authority, Revenue Bonds, Refunding, Ser. A 6.00 7/1/2043 5,000,000 5,310,869Illinois Toll Highway Authority, Revenue Bonds, Ser. A 5.00 1/1/2046 3,215,000 3,945,839Illinois Toll Highway Authority, Revenue Bonds, Ser. A 5.00 1/1/2041 3,750,000 4,661,505
81
Copyright © 2022 www.secdatabase.com. All Rights Reserved.Please Consider the Environment Before Printing This Document
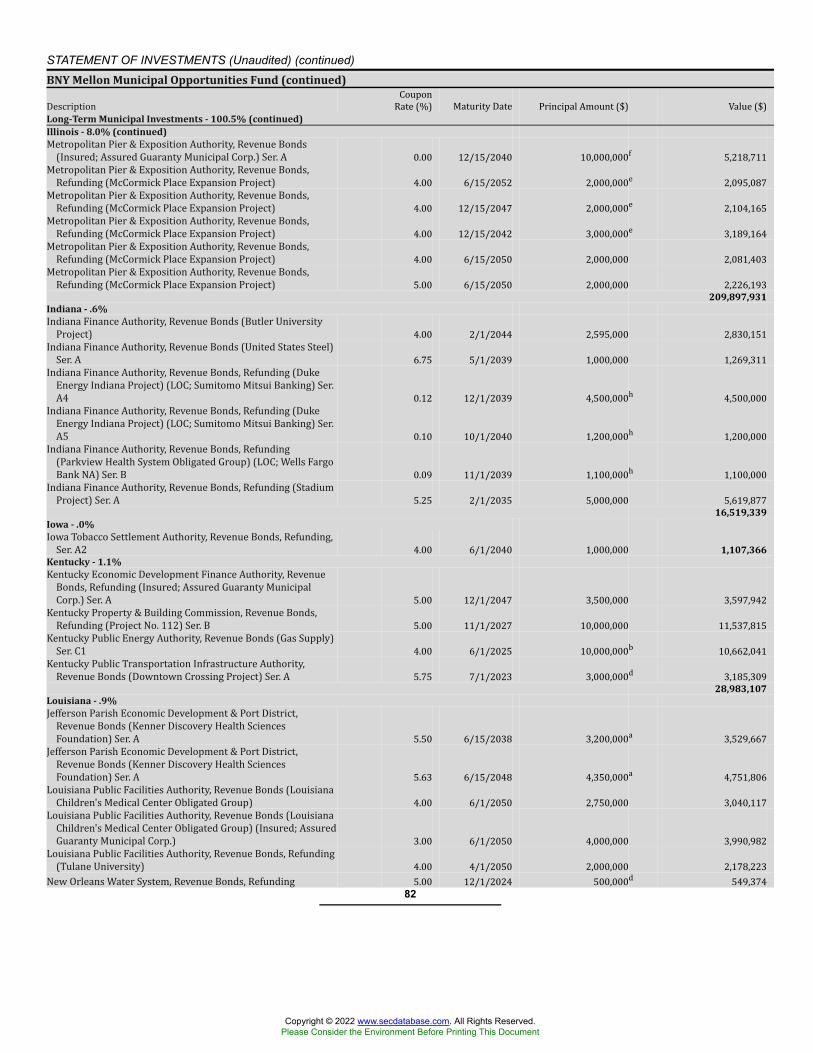
STATEMENT OF INVESTMENTS (Unaudited) (continued)BNY Mellon Municipal Opportunities Fund (continued)Description CouponRate (%) Maturity Date Principal Amount ($) Value ($)Long-Term Municipal Investments - 100.5% (continued)Illinois - 8.0% (continued)Metropolitan Pier & Exposition Authority, Revenue Bonds(Insured; Assured Guaranty Municipal Corp.) Ser. A 0.00 12/15/2040 10,000,000f 5,218,711Metropolitan Pier & Exposition Authority, Revenue Bonds,Refunding (McCormick Place Expansion Project) 4.00 6/15/2052 2,000,000e 2,095,087Metropolitan Pier & Exposition Authority, Revenue Bonds,Refunding (McCormick Place Expansion Project) 4.00 12/15/2047 2,000,000e 2,104,165Metropolitan Pier & Exposition Authority, Revenue Bonds,Refunding (McCormick Place Expansion Project) 4.00 12/15/2042 3,000,000e 3,189,164Metropolitan Pier & Exposition Authority, Revenue Bonds,Refunding (McCormick Place Expansion Project) 4.00 6/15/2050 2,000,000 2,081,403Metropolitan Pier & Exposition Authority, Revenue Bonds,Refunding (McCormick Place Expansion Project) 5.00 6/15/2050 2,000,000 2,226,193
209,897,931Indiana - .6%Indiana Finance Authority, Revenue Bonds (Butler UniversityProject) 4.00 2/1/2044 2,595,000 2,830,151Indiana Finance Authority, Revenue Bonds (United States Steel)Ser. A 6.75 5/1/2039 1,000,000 1,269,311Indiana Finance Authority, Revenue Bonds, Refunding (DukeEnergy Indiana Project) (LOC; Sumitomo Mitsui Banking) Ser.A4 0.12 12/1/2039 4,500,000h 4,500,000Indiana Finance Authority, Revenue Bonds, Refunding (DukeEnergy Indiana Project) (LOC; Sumitomo Mitsui Banking) Ser.A5 0.10 10/1/2040 1,200,000h 1,200,000Indiana Finance Authority, Revenue Bonds, Refunding(Parkview Health System Obligated Group) (LOC; Wells FargoBank NA) Ser. B 0.09 11/1/2039 1,100,000h 1,100,000Indiana Finance Authority, Revenue Bonds, Refunding (StadiumProject) Ser. A 5.25 2/1/2035 5,000,000 5,619,877
16,519,339Iowa - .0%Iowa Tobacco Settlement Authority, Revenue Bonds, Refunding,Ser. A2 4.00 6/1/2040 1,000,000 1,107,366Kentucky - 1.1%Kentucky Economic Development Finance Authority, RevenueBonds, Refunding (Insured; Assured Guaranty MunicipalCorp.) Ser. A 5.00 12/1/2047 3,500,000 3,597,942Kentucky Property & Building Commission, Revenue Bonds,Refunding (Project No. 112) Ser. B 5.00 11/1/2027 10,000,000 11,537,815Kentucky Public Energy Authority, Revenue Bonds (Gas Supply)Ser. C1 4.00 6/1/2025 10,000,000b 10,662,041Kentucky Public Transportation Infrastructure Authority,Revenue Bonds (Downtown Crossing Project) Ser. A 5.75 7/1/2023 3,000,000d 3,185,309
28,983,107Louisiana - .9%Jefferson Parish Economic Development & Port District,Revenue Bonds (Kenner Discovery Health SciencesFoundation) Ser. A 5.50 6/15/2038 3,200,000a 3,529,667Jefferson Parish Economic Development & Port District,Revenue Bonds (Kenner Discovery Health SciencesFoundation) Ser. A 5.63 6/15/2048 4,350,000a 4,751,806Louisiana Public Facilities Authority, Revenue Bonds (LouisianaChildren's Medical Center Obligated Group) 4.00 6/1/2050 2,750,000 3,040,117Louisiana Public Facilities Authority, Revenue Bonds (LouisianaChildren's Medical Center Obligated Group) (Insured; AssuredGuaranty Municipal Corp.) 3.00 6/1/2050 4,000,000 3,990,982Louisiana Public Facilities Authority, Revenue Bonds, Refunding(Tulane University) 4.00 4/1/2050 2,000,000 2,178,223New Orleans Water System, Revenue Bonds, Refunding 5.00 12/1/2024 500,000d 549,374
82
Copyright © 2022 www.secdatabase.com. All Rights Reserved.Please Consider the Environment Before Printing This Document
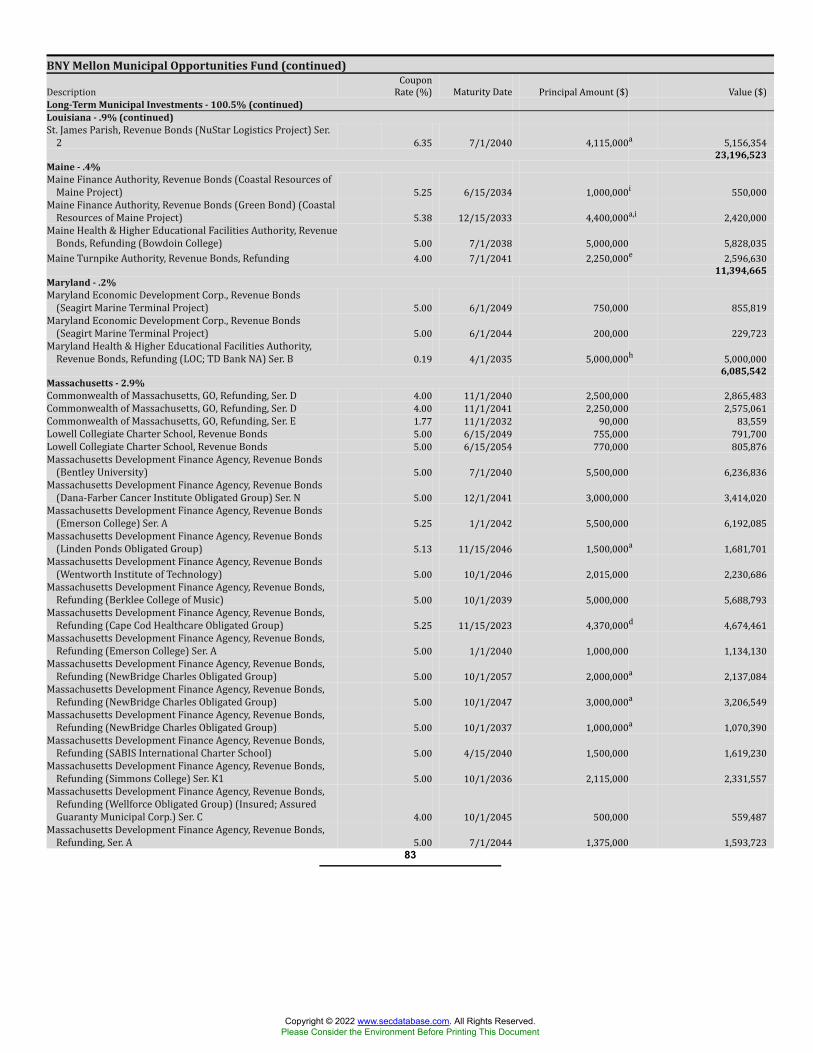
BNY Mellon Municipal Opportunities Fund (continued)Description CouponRate (%) Maturity Date Principal Amount ($) Value ($)Long-Term Municipal Investments - 100.5% (continued)Louisiana - .9% (continued)St. James Parish, Revenue Bonds (NuStar Logistics Project) Ser.2 6.35 7/1/2040 4,115,000a 5,156,354
23,196,523Maine - .4%Maine Finance Authority, Revenue Bonds (Coastal Resources ofMaine Project) 5.25 6/15/2034 1,000,000i 550,000Maine Finance Authority, Revenue Bonds (Green Bond) (CoastalResources of Maine Project) 5.38 12/15/2033 4,400,000a,i 2,420,000Maine Health & Higher Educational Facilities Authority, RevenueBonds, Refunding (Bowdoin College) 5.00 7/1/2038 5,000,000 5,828,035Maine Turnpike Authority, Revenue Bonds, Refunding 4.00 7/1/2041 2,250,000e 2,596,630
11,394,665Maryland - .2%Maryland Economic Development Corp., Revenue Bonds(Seagirt Marine Terminal Project) 5.00 6/1/2049 750,000 855,819Maryland Economic Development Corp., Revenue Bonds(Seagirt Marine Terminal Project) 5.00 6/1/2044 200,000 229,723Maryland Health & Higher Educational Facilities Authority,Revenue Bonds, Refunding (LOC; TD Bank NA) Ser. B 0.19 4/1/2035 5,000,000h 5,000,000
6,085,542Massachusetts - 2.9%Commonwealth of Massachusetts, GO, Refunding, Ser. D 4.00 11/1/2040 2,500,000 2,865,483Commonwealth of Massachusetts, GO, Refunding, Ser. D 4.00 11/1/2041 2,250,000 2,575,061Commonwealth of Massachusetts, GO, Refunding, Ser. E 1.77 11/1/2032 90,000 83,559Lowell Collegiate Charter School, Revenue Bonds 5.00 6/15/2049 755,000 791,700Lowell Collegiate Charter School, Revenue Bonds 5.00 6/15/2054 770,000 805,876Massachusetts Development Finance Agency, Revenue Bonds(Bentley University) 5.00 7/1/2040 5,500,000 6,236,836Massachusetts Development Finance Agency, Revenue Bonds(Dana-Farber Cancer Institute Obligated Group) Ser. N 5.00 12/1/2041 3,000,000 3,414,020Massachusetts Development Finance Agency, Revenue Bonds(Emerson College) Ser. A 5.25 1/1/2042 5,500,000 6,192,085Massachusetts Development Finance Agency, Revenue Bonds(Linden Ponds Obligated Group) 5.13 11/15/2046 1,500,000a 1,681,701Massachusetts Development Finance Agency, Revenue Bonds(Wentworth Institute of Technology) 5.00 10/1/2046 2,015,000 2,230,686Massachusetts Development Finance Agency, Revenue Bonds,Refunding (Berklee College of Music) 5.00 10/1/2039 5,000,000 5,688,793Massachusetts Development Finance Agency, Revenue Bonds,Refunding (Cape Cod Healthcare Obligated Group) 5.25 11/15/2023 4,370,000d 4,674,461Massachusetts Development Finance Agency, Revenue Bonds,Refunding (Emerson College) Ser. A 5.00 1/1/2040 1,000,000 1,134,130Massachusetts Development Finance Agency, Revenue Bonds,Refunding (NewBridge Charles Obligated Group) 5.00 10/1/2057 2,000,000a 2,137,084Massachusetts Development Finance Agency, Revenue Bonds,Refunding (NewBridge Charles Obligated Group) 5.00 10/1/2047 3,000,000a 3,206,549Massachusetts Development Finance Agency, Revenue Bonds,Refunding (NewBridge Charles Obligated Group) 5.00 10/1/2037 1,000,000a 1,070,390Massachusetts Development Finance Agency, Revenue Bonds,Refunding (SABIS International Charter School) 5.00 4/15/2040 1,500,000 1,619,230Massachusetts Development Finance Agency, Revenue Bonds,Refunding (Simmons College) Ser. K1 5.00 10/1/2036 2,115,000 2,331,557Massachusetts Development Finance Agency, Revenue Bonds,Refunding (Wellforce Obligated Group) (Insured; AssuredGuaranty Municipal Corp.) Ser. C 4.00 10/1/2045 500,000 559,487Massachusetts Development Finance Agency, Revenue Bonds,Refunding, Ser. A 5.00 7/1/2044 1,375,000 1,593,723
83
Copyright © 2022 www.secdatabase.com. All Rights Reserved.Please Consider the Environment Before Printing This Document
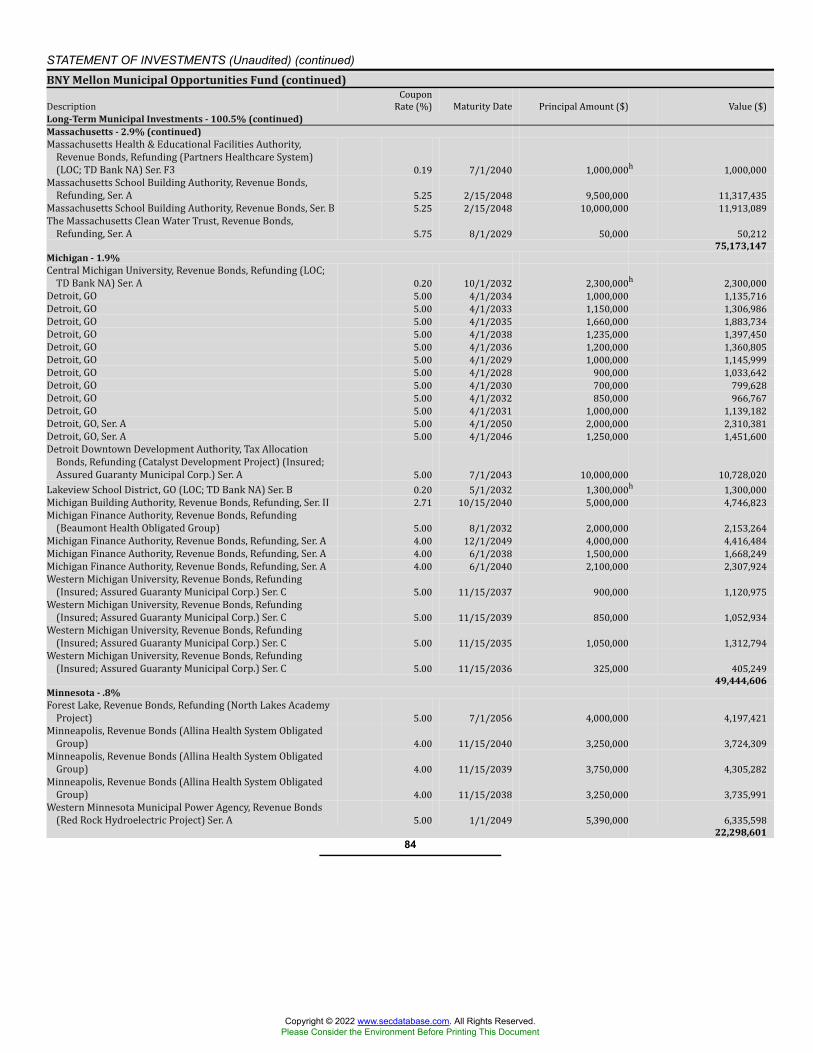
STATEMENT OF INVESTMENTS (Unaudited) (continued)BNY Mellon Municipal Opportunities Fund (continued)Description CouponRate (%) Maturity Date Principal Amount ($) Value ($)Long-Term Municipal Investments - 100.5% (continued)Massachusetts - 2.9% (continued)Massachusetts Health & Educational Facilities Authority,Revenue Bonds, Refunding (Partners Healthcare System)(LOC; TD Bank NA) Ser. F3 0.19 7/1/2040 1,000,000h 1,000,000Massachusetts School Building Authority, Revenue Bonds,Refunding, Ser. A 5.25 2/15/2048 9,500,000 11,317,435Massachusetts School Building Authority, Revenue Bonds, Ser. B 5.25 2/15/2048 10,000,000 11,913,089The Massachusetts Clean Water Trust, Revenue Bonds,Refunding, Ser. A 5.75 8/1/2029 50,000 50,212
75,173,147Michigan - 1.9%Central Michigan University, Revenue Bonds, Refunding (LOC;TD Bank NA) Ser. A 0.20 10/1/2032 2,300,000h 2,300,000Detroit, GO 5.00 4/1/2034 1,000,000 1,135,716Detroit, GO 5.00 4/1/2033 1,150,000 1,306,986Detroit, GO 5.00 4/1/2035 1,660,000 1,883,734Detroit, GO 5.00 4/1/2038 1,235,000 1,397,450Detroit, GO 5.00 4/1/2036 1,200,000 1,360,805Detroit, GO 5.00 4/1/2029 1,000,000 1,145,999Detroit, GO 5.00 4/1/2028 900,000 1,033,642Detroit, GO 5.00 4/1/2030 700,000 799,628Detroit, GO 5.00 4/1/2032 850,000 966,767Detroit, GO 5.00 4/1/2031 1,000,000 1,139,182Detroit, GO, Ser. A 5.00 4/1/2050 2,000,000 2,310,381Detroit, GO, Ser. A 5.00 4/1/2046 1,250,000 1,451,600Detroit Downtown Development Authority, Tax AllocationBonds, Refunding (Catalyst Development Project) (Insured;Assured Guaranty Municipal Corp.) Ser. A 5.00 7/1/2043 10,000,000 10,728,020Lakeview School District, GO (LOC; TD Bank NA) Ser. B 0.20 5/1/2032 1,300,000h 1,300,000Michigan Building Authority, Revenue Bonds, Refunding, Ser. II 2.71 10/15/2040 5,000,000 4,746,823Michigan Finance Authority, Revenue Bonds, Refunding(Beaumont Health Obligated Group) 5.00 8/1/2032 2,000,000 2,153,264Michigan Finance Authority, Revenue Bonds, Refunding, Ser. A 4.00 12/1/2049 4,000,000 4,416,484Michigan Finance Authority, Revenue Bonds, Refunding, Ser. A 4.00 6/1/2038 1,500,000 1,668,249Michigan Finance Authority, Revenue Bonds, Refunding, Ser. A 4.00 6/1/2040 2,100,000 2,307,924Western Michigan University, Revenue Bonds, Refunding(Insured; Assured Guaranty Municipal Corp.) Ser. C 5.00 11/15/2037 900,000 1,120,975Western Michigan University, Revenue Bonds, Refunding(Insured; Assured Guaranty Municipal Corp.) Ser. C 5.00 11/15/2039 850,000 1,052,934Western Michigan University, Revenue Bonds, Refunding(Insured; Assured Guaranty Municipal Corp.) Ser. C 5.00 11/15/2035 1,050,000 1,312,794Western Michigan University, Revenue Bonds, Refunding(Insured; Assured Guaranty Municipal Corp.) Ser. C 5.00 11/15/2036 325,000 405,249
49,444,606Minnesota - .8%Forest Lake, Revenue Bonds, Refunding (North Lakes AcademyProject) 5.00 7/1/2056 4,000,000 4,197,421Minneapolis, Revenue Bonds (Allina Health System ObligatedGroup) 4.00 11/15/2040 3,250,000 3,724,309Minneapolis, Revenue Bonds (Allina Health System ObligatedGroup) 4.00 11/15/2039 3,750,000 4,305,282Minneapolis, Revenue Bonds (Allina Health System ObligatedGroup) 4.00 11/15/2038 3,250,000 3,735,991Western Minnesota Municipal Power Agency, Revenue Bonds(Red Rock Hydroelectric Project) Ser. A 5.00 1/1/2049 5,390,000 6,335,598
22,298,60184
Copyright © 2022 www.secdatabase.com. All Rights Reserved.Please Consider the Environment Before Printing This Document
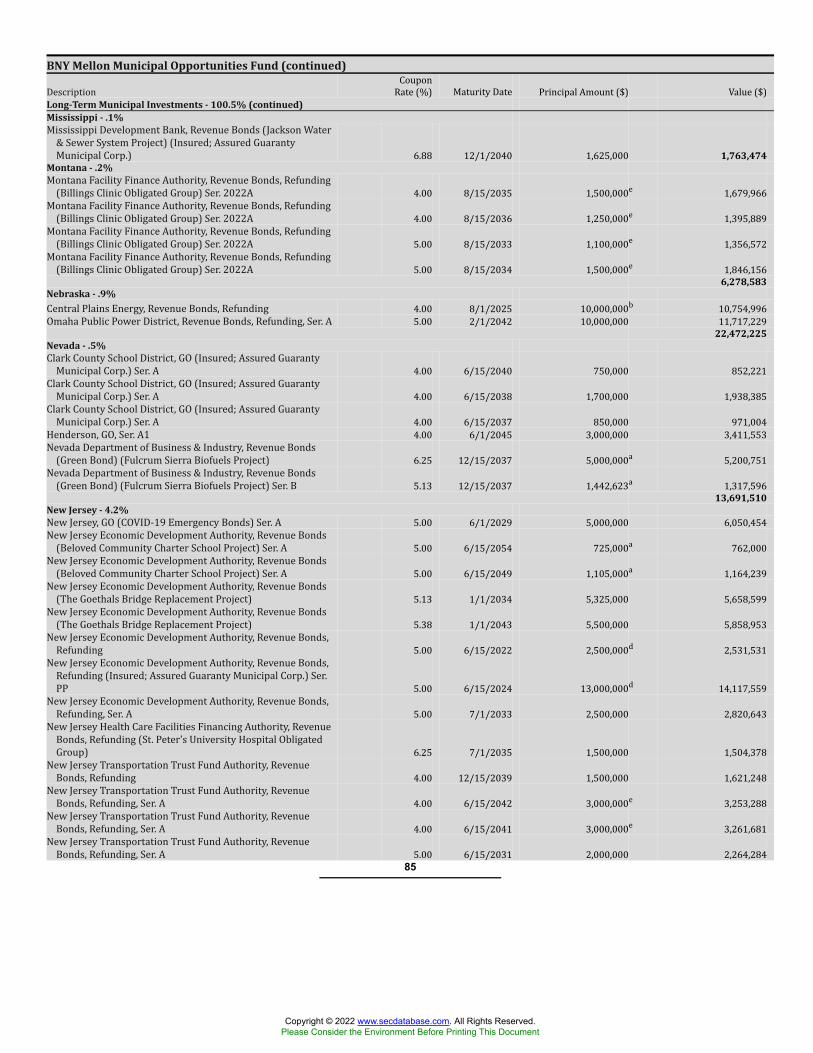
BNY Mellon Municipal Opportunities Fund (continued)Description CouponRate (%) Maturity Date Principal Amount ($) Value ($)Long-Term Municipal Investments - 100.5% (continued)Mississippi - .1%Mississippi Development Bank, Revenue Bonds (Jackson Water& Sewer System Project) (Insured; Assured GuarantyMunicipal Corp.) 6.88 12/1/2040 1,625,000 1,763,474Montana - .2%Montana Facility Finance Authority, Revenue Bonds, Refunding(Billings Clinic Obligated Group) Ser. 2022A 4.00 8/15/2035 1,500,000e 1,679,966Montana Facility Finance Authority, Revenue Bonds, Refunding(Billings Clinic Obligated Group) Ser. 2022A 4.00 8/15/2036 1,250,000e 1,395,889Montana Facility Finance Authority, Revenue Bonds, Refunding(Billings Clinic Obligated Group) Ser. 2022A 5.00 8/15/2033 1,100,000e 1,356,572Montana Facility Finance Authority, Revenue Bonds, Refunding(Billings Clinic Obligated Group) Ser. 2022A 5.00 8/15/2034 1,500,000e 1,846,156
6,278,583Nebraska - .9%Central Plains Energy, Revenue Bonds, Refunding 4.00 8/1/2025 10,000,000b 10,754,996Omaha Public Power District, Revenue Bonds, Refunding, Ser. A 5.00 2/1/2042 10,000,000 11,717,229
22,472,225Nevada - .5%Clark County School District, GO (Insured; Assured GuarantyMunicipal Corp.) Ser. A 4.00 6/15/2040 750,000 852,221Clark County School District, GO (Insured; Assured GuarantyMunicipal Corp.) Ser. A 4.00 6/15/2038 1,700,000 1,938,385Clark County School District, GO (Insured; Assured GuarantyMunicipal Corp.) Ser. A 4.00 6/15/2037 850,000 971,004Henderson, GO, Ser. A1 4.00 6/1/2045 3,000,000 3,411,553Nevada Department of Business & Industry, Revenue Bonds(Green Bond) (Fulcrum Sierra Biofuels Project) 6.25 12/15/2037 5,000,000a 5,200,751Nevada Department of Business & Industry, Revenue Bonds(Green Bond) (Fulcrum Sierra Biofuels Project) Ser. B 5.13 12/15/2037 1,442,623a 1,317,596
13,691,510New Jersey - 4.2%New Jersey, GO (COVID-19 Emergency Bonds) Ser. A 5.00 6/1/2029 5,000,000 6,050,454New Jersey Economic Development Authority, Revenue Bonds(Beloved Community Charter School Project) Ser. A 5.00 6/15/2054 725,000a 762,000New Jersey Economic Development Authority, Revenue Bonds(Beloved Community Charter School Project) Ser. A 5.00 6/15/2049 1,105,000a 1,164,239New Jersey Economic Development Authority, Revenue Bonds(The Goethals Bridge Replacement Project) 5.13 1/1/2034 5,325,000 5,658,599New Jersey Economic Development Authority, Revenue Bonds(The Goethals Bridge Replacement Project) 5.38 1/1/2043 5,500,000 5,858,953New Jersey Economic Development Authority, Revenue Bonds,Refunding 5.00 6/15/2022 2,500,000d 2,531,531New Jersey Economic Development Authority, Revenue Bonds,Refunding (Insured; Assured Guaranty Municipal Corp.) Ser.PP 5.00 6/15/2024 13,000,000d 14,117,559New Jersey Economic Development Authority, Revenue Bonds,Refunding, Ser. A 5.00 7/1/2033 2,500,000 2,820,643New Jersey Health Care Facilities Financing Authority, RevenueBonds, Refunding (St. Peter's University Hospital ObligatedGroup) 6.25 7/1/2035 1,500,000 1,504,378New Jersey Transportation Trust Fund Authority, RevenueBonds, Refunding 4.00 12/15/2039 1,500,000 1,621,248New Jersey Transportation Trust Fund Authority, RevenueBonds, Refunding, Ser. A 4.00 6/15/2042 3,000,000e 3,253,288New Jersey Transportation Trust Fund Authority, RevenueBonds, Refunding, Ser. A 4.00 6/15/2041 3,000,000e 3,261,681New Jersey Transportation Trust Fund Authority, RevenueBonds, Refunding, Ser. A 5.00 6/15/2031 2,000,000 2,264,284
85
Copyright © 2022 www.secdatabase.com. All Rights Reserved.Please Consider the Environment Before Printing This Document
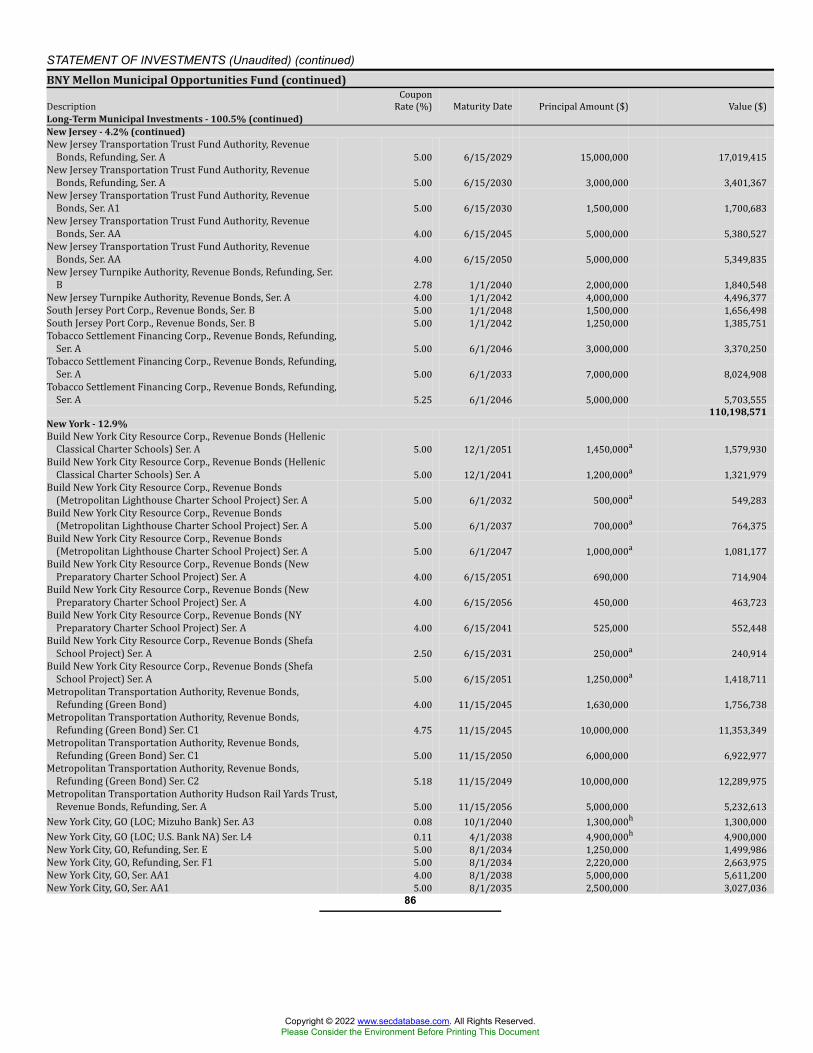
STATEMENT OF INVESTMENTS (Unaudited) (continued)BNY Mellon Municipal Opportunities Fund (continued)Description CouponRate (%) Maturity Date Principal Amount ($) Value ($)Long-Term Municipal Investments - 100.5% (continued)New Jersey - 4.2% (continued)New Jersey Transportation Trust Fund Authority, RevenueBonds, Refunding, Ser. A 5.00 6/15/2029 15,000,000 17,019,415New Jersey Transportation Trust Fund Authority, RevenueBonds, Refunding, Ser. A 5.00 6/15/2030 3,000,000 3,401,367New Jersey Transportation Trust Fund Authority, RevenueBonds, Ser. A1 5.00 6/15/2030 1,500,000 1,700,683New Jersey Transportation Trust Fund Authority, RevenueBonds, Ser. AA 4.00 6/15/2045 5,000,000 5,380,527New Jersey Transportation Trust Fund Authority, RevenueBonds, Ser. AA 4.00 6/15/2050 5,000,000 5,349,835New Jersey Turnpike Authority, Revenue Bonds, Refunding, Ser.B 2.78 1/1/2040 2,000,000 1,840,548New Jersey Turnpike Authority, Revenue Bonds, Ser. A 4.00 1/1/2042 4,000,000 4,496,377South Jersey Port Corp., Revenue Bonds, Ser. B 5.00 1/1/2048 1,500,000 1,656,498South Jersey Port Corp., Revenue Bonds, Ser. B 5.00 1/1/2042 1,250,000 1,385,751Tobacco Settlement Financing Corp., Revenue Bonds, Refunding,Ser. A 5.00 6/1/2046 3,000,000 3,370,250Tobacco Settlement Financing Corp., Revenue Bonds, Refunding,Ser. A 5.00 6/1/2033 7,000,000 8,024,908Tobacco Settlement Financing Corp., Revenue Bonds, Refunding,Ser. A 5.25 6/1/2046 5,000,000 5,703,555
110,198,571New York - 12.9%Build New York City Resource Corp., Revenue Bonds (HellenicClassical Charter Schools) Ser. A 5.00 12/1/2051 1,450,000a 1,579,930Build New York City Resource Corp., Revenue Bonds (HellenicClassical Charter Schools) Ser. A 5.00 12/1/2041 1,200,000a 1,321,979Build New York City Resource Corp., Revenue Bonds(Metropolitan Lighthouse Charter School Project) Ser. A 5.00 6/1/2032 500,000a 549,283Build New York City Resource Corp., Revenue Bonds(Metropolitan Lighthouse Charter School Project) Ser. A 5.00 6/1/2037 700,000a 764,375Build New York City Resource Corp., Revenue Bonds(Metropolitan Lighthouse Charter School Project) Ser. A 5.00 6/1/2047 1,000,000a 1,081,177Build New York City Resource Corp., Revenue Bonds (NewPreparatory Charter School Project) Ser. A 4.00 6/15/2051 690,000 714,904Build New York City Resource Corp., Revenue Bonds (NewPreparatory Charter School Project) Ser. A 4.00 6/15/2056 450,000 463,723Build New York City Resource Corp., Revenue Bonds (NYPreparatory Charter School Project) Ser. A 4.00 6/15/2041 525,000 552,448Build New York City Resource Corp., Revenue Bonds (ShefaSchool Project) Ser. A 2.50 6/15/2031 250,000a 240,914Build New York City Resource Corp., Revenue Bonds (ShefaSchool Project) Ser. A 5.00 6/15/2051 1,250,000a 1,418,711Metropolitan Transportation Authority, Revenue Bonds,Refunding (Green Bond) 4.00 11/15/2045 1,630,000 1,756,738Metropolitan Transportation Authority, Revenue Bonds,Refunding (Green Bond) Ser. C1 4.75 11/15/2045 10,000,000 11,353,349Metropolitan Transportation Authority, Revenue Bonds,Refunding (Green Bond) Ser. C1 5.00 11/15/2050 6,000,000 6,922,977Metropolitan Transportation Authority, Revenue Bonds,Refunding (Green Bond) Ser. C2 5.18 11/15/2049 10,000,000 12,289,975Metropolitan Transportation Authority Hudson Rail Yards Trust,Revenue Bonds, Refunding, Ser. A 5.00 11/15/2056 5,000,000 5,232,613New York City, GO (LOC; Mizuho Bank) Ser. A3 0.08 10/1/2040 1,300,000h 1,300,000New York City, GO (LOC; U.S. Bank NA) Ser. L4 0.11 4/1/2038 4,900,000h 4,900,000New York City, GO, Refunding, Ser. E 5.00 8/1/2034 1,250,000 1,499,986New York City, GO, Refunding, Ser. F1 5.00 8/1/2034 2,220,000 2,663,975New York City, GO, Ser. AA1 4.00 8/1/2038 5,000,000 5,611,200New York City, GO, Ser. AA1 5.00 8/1/2035 2,500,000 3,027,036
86
Copyright © 2022 www.secdatabase.com. All Rights Reserved.Please Consider the Environment Before Printing This Document
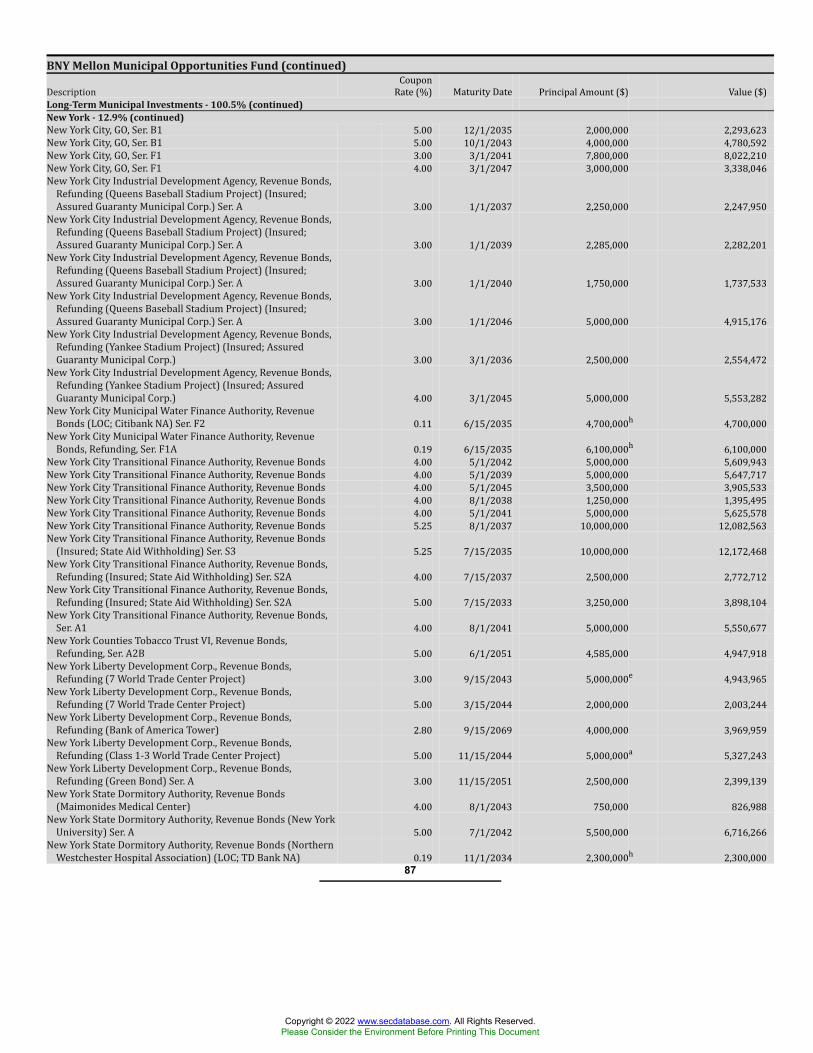
BNY Mellon Municipal Opportunities Fund (continued)Description CouponRate (%) Maturity Date Principal Amount ($) Value ($)Long-Term Municipal Investments - 100.5% (continued)New York - 12.9% (continued)New York City, GO, Ser. B1 5.00 12/1/2035 2,000,000 2,293,623New York City, GO, Ser. B1 5.00 10/1/2043 4,000,000 4,780,592New York City, GO, Ser. F1 3.00 3/1/2041 7,800,000 8,022,210New York City, GO, Ser. F1 4.00 3/1/2047 3,000,000 3,338,046New York City Industrial Development Agency, Revenue Bonds,Refunding (Queens Baseball Stadium Project) (Insured;Assured Guaranty Municipal Corp.) Ser. A 3.00 1/1/2037 2,250,000 2,247,950New York City Industrial Development Agency, Revenue Bonds,Refunding (Queens Baseball Stadium Project) (Insured;Assured Guaranty Municipal Corp.) Ser. A 3.00 1/1/2039 2,285,000 2,282,201New York City Industrial Development Agency, Revenue Bonds,Refunding (Queens Baseball Stadium Project) (Insured;Assured Guaranty Municipal Corp.) Ser. A 3.00 1/1/2040 1,750,000 1,737,533New York City Industrial Development Agency, Revenue Bonds,Refunding (Queens Baseball Stadium Project) (Insured;Assured Guaranty Municipal Corp.) Ser. A 3.00 1/1/2046 5,000,000 4,915,176New York City Industrial Development Agency, Revenue Bonds,Refunding (Yankee Stadium Project) (Insured; AssuredGuaranty Municipal Corp.) 3.00 3/1/2036 2,500,000 2,554,472New York City Industrial Development Agency, Revenue Bonds,Refunding (Yankee Stadium Project) (Insured; AssuredGuaranty Municipal Corp.) 4.00 3/1/2045 5,000,000 5,553,282New York City Municipal Water Finance Authority, RevenueBonds (LOC; Citibank NA) Ser. F2 0.11 6/15/2035 4,700,000h 4,700,000New York City Municipal Water Finance Authority, RevenueBonds, Refunding, Ser. F1A 0.19 6/15/2035 6,100,000h 6,100,000New York City Transitional Finance Authority, Revenue Bonds 4.00 5/1/2042 5,000,000 5,609,943New York City Transitional Finance Authority, Revenue Bonds 4.00 5/1/2039 5,000,000 5,647,717New York City Transitional Finance Authority, Revenue Bonds 4.00 5/1/2045 3,500,000 3,905,533New York City Transitional Finance Authority, Revenue Bonds 4.00 8/1/2038 1,250,000 1,395,495New York City Transitional Finance Authority, Revenue Bonds 4.00 5/1/2041 5,000,000 5,625,578New York City Transitional Finance Authority, Revenue Bonds 5.25 8/1/2037 10,000,000 12,082,563New York City Transitional Finance Authority, Revenue Bonds(Insured; State Aid Withholding) Ser. S3 5.25 7/15/2035 10,000,000 12,172,468New York City Transitional Finance Authority, Revenue Bonds,Refunding (Insured; State Aid Withholding) Ser. S2A 4.00 7/15/2037 2,500,000 2,772,712New York City Transitional Finance Authority, Revenue Bonds,Refunding (Insured; State Aid Withholding) Ser. S2A 5.00 7/15/2033 3,250,000 3,898,104New York City Transitional Finance Authority, Revenue Bonds,Ser. A1 4.00 8/1/2041 5,000,000 5,550,677New York Counties Tobacco Trust VI, Revenue Bonds,Refunding, Ser. A2B 5.00 6/1/2051 4,585,000 4,947,918New York Liberty Development Corp., Revenue Bonds,Refunding (7 World Trade Center Project) 3.00 9/15/2043 5,000,000e 4,943,965New York Liberty Development Corp., Revenue Bonds,Refunding (7 World Trade Center Project) 5.00 3/15/2044 2,000,000 2,003,244New York Liberty Development Corp., Revenue Bonds,Refunding (Bank of America Tower) 2.80 9/15/2069 4,000,000 3,969,959New York Liberty Development Corp., Revenue Bonds,Refunding (Class 1-3 World Trade Center Project) 5.00 11/15/2044 5,000,000a 5,327,243New York Liberty Development Corp., Revenue Bonds,Refunding (Green Bond) Ser. A 3.00 11/15/2051 2,500,000 2,399,139New York State Dormitory Authority, Revenue Bonds(Maimonides Medical Center) 4.00 8/1/2043 750,000 826,988New York State Dormitory Authority, Revenue Bonds (New YorkUniversity) Ser. A 5.00 7/1/2042 5,500,000 6,716,266New York State Dormitory Authority, Revenue Bonds (NorthernWestchester Hospital Association) (LOC; TD Bank NA) 0.19 11/1/2034 2,300,000h 2,300,000
87
Copyright © 2022 www.secdatabase.com. All Rights Reserved.Please Consider the Environment Before Printing This Document
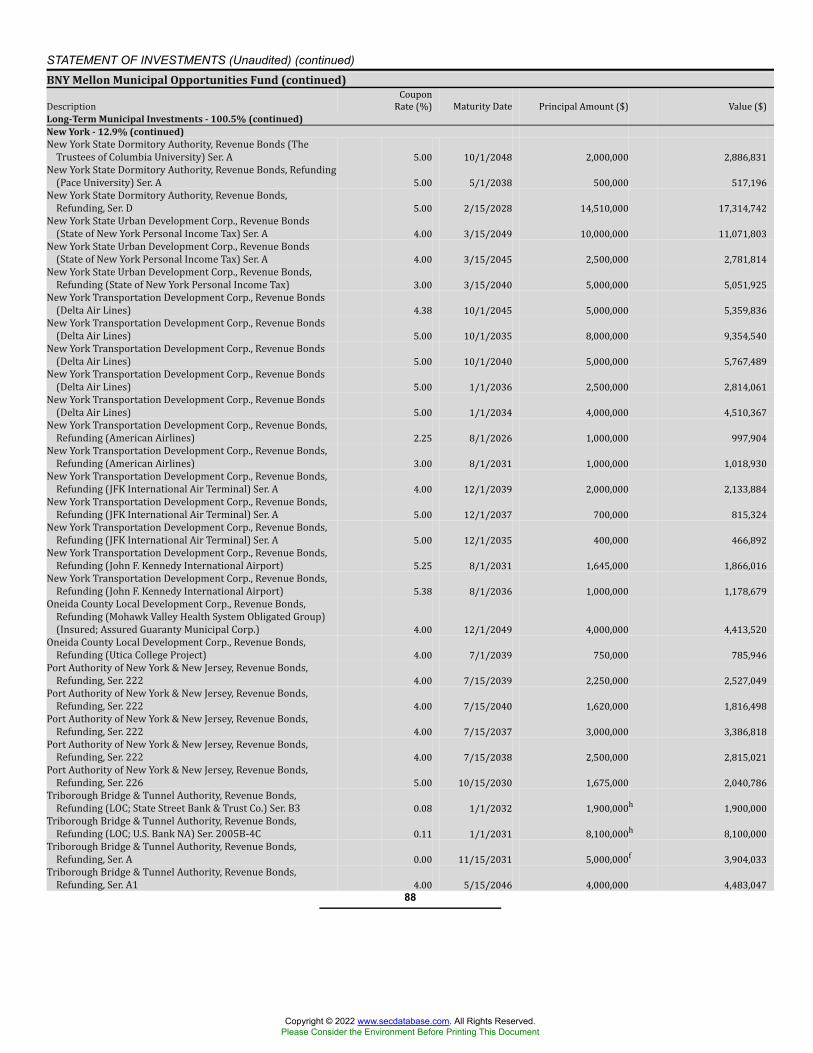
STATEMENT OF INVESTMENTS (Unaudited) (continued)BNY Mellon Municipal Opportunities Fund (continued)Description CouponRate (%) Maturity Date Principal Amount ($) Value ($)Long-Term Municipal Investments - 100.5% (continued)New York - 12.9% (continued)New York State Dormitory Authority, Revenue Bonds (TheTrustees of Columbia University) Ser. A 5.00 10/1/2048 2,000,000 2,886,831New York State Dormitory Authority, Revenue Bonds, Refunding(Pace University) Ser. A 5.00 5/1/2038 500,000 517,196New York State Dormitory Authority, Revenue Bonds,Refunding, Ser. D 5.00 2/15/2028 14,510,000 17,314,742New York State Urban Development Corp., Revenue Bonds(State of New York Personal Income Tax) Ser. A 4.00 3/15/2049 10,000,000 11,071,803New York State Urban Development Corp., Revenue Bonds(State of New York Personal Income Tax) Ser. A 4.00 3/15/2045 2,500,000 2,781,814New York State Urban Development Corp., Revenue Bonds,Refunding (State of New York Personal Income Tax) 3.00 3/15/2040 5,000,000 5,051,925New York Transportation Development Corp., Revenue Bonds(Delta Air Lines) 4.38 10/1/2045 5,000,000 5,359,836New York Transportation Development Corp., Revenue Bonds(Delta Air Lines) 5.00 10/1/2035 8,000,000 9,354,540New York Transportation Development Corp., Revenue Bonds(Delta Air Lines) 5.00 10/1/2040 5,000,000 5,767,489New York Transportation Development Corp., Revenue Bonds(Delta Air Lines) 5.00 1/1/2036 2,500,000 2,814,061New York Transportation Development Corp., Revenue Bonds(Delta Air Lines) 5.00 1/1/2034 4,000,000 4,510,367New York Transportation Development Corp., Revenue Bonds,Refunding (American Airlines) 2.25 8/1/2026 1,000,000 997,904New York Transportation Development Corp., Revenue Bonds,Refunding (American Airlines) 3.00 8/1/2031 1,000,000 1,018,930New York Transportation Development Corp., Revenue Bonds,Refunding (JFK International Air Terminal) Ser. A 4.00 12/1/2039 2,000,000 2,133,884New York Transportation Development Corp., Revenue Bonds,Refunding (JFK International Air Terminal) Ser. A 5.00 12/1/2037 700,000 815,324New York Transportation Development Corp., Revenue Bonds,Refunding (JFK International Air Terminal) Ser. A 5.00 12/1/2035 400,000 466,892New York Transportation Development Corp., Revenue Bonds,Refunding (John F. Kennedy International Airport) 5.25 8/1/2031 1,645,000 1,866,016New York Transportation Development Corp., Revenue Bonds,Refunding (John F. Kennedy International Airport) 5.38 8/1/2036 1,000,000 1,178,679Oneida County Local Development Corp., Revenue Bonds,Refunding (Mohawk Valley Health System Obligated Group)(Insured; Assured Guaranty Municipal Corp.) 4.00 12/1/2049 4,000,000 4,413,520Oneida County Local Development Corp., Revenue Bonds,Refunding (Utica College Project) 4.00 7/1/2039 750,000 785,946Port Authority of New York & New Jersey, Revenue Bonds,Refunding, Ser. 222 4.00 7/15/2039 2,250,000 2,527,049Port Authority of New York & New Jersey, Revenue Bonds,Refunding, Ser. 222 4.00 7/15/2040 1,620,000 1,816,498Port Authority of New York & New Jersey, Revenue Bonds,Refunding, Ser. 222 4.00 7/15/2037 3,000,000 3,386,818Port Authority of New York & New Jersey, Revenue Bonds,Refunding, Ser. 222 4.00 7/15/2038 2,500,000 2,815,021Port Authority of New York & New Jersey, Revenue Bonds,Refunding, Ser. 226 5.00 10/15/2030 1,675,000 2,040,786Triborough Bridge & Tunnel Authority, Revenue Bonds,Refunding (LOC; State Street Bank & Trust Co.) Ser. B3 0.08 1/1/2032 1,900,000h 1,900,000Triborough Bridge & Tunnel Authority, Revenue Bonds,Refunding (LOC; U.S. Bank NA) Ser. 2005B-4C 0.11 1/1/2031 8,100,000h 8,100,000Triborough Bridge & Tunnel Authority, Revenue Bonds,Refunding, Ser. A 0.00 11/15/2031 5,000,000f 3,904,033Triborough Bridge & Tunnel Authority, Revenue Bonds,Refunding, Ser. A1 4.00 5/15/2046 4,000,000 4,483,047
88
Copyright © 2022 www.secdatabase.com. All Rights Reserved.Please Consider the Environment Before Printing This Document
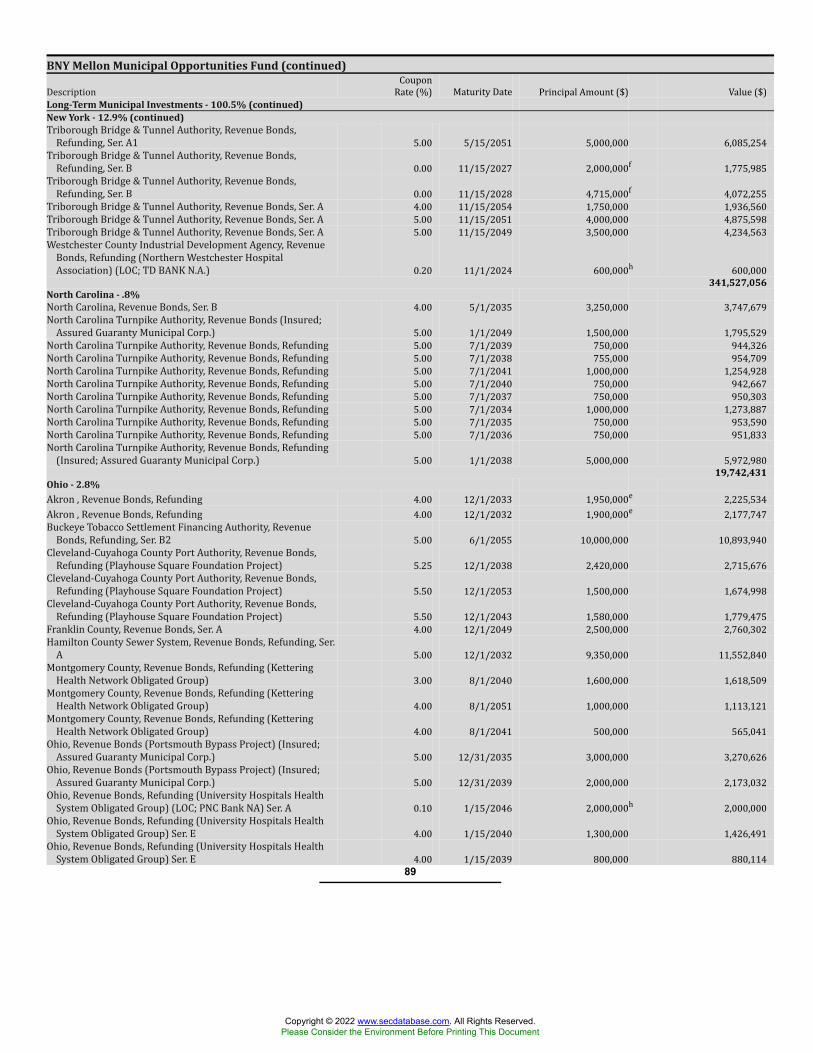
BNY Mellon Municipal Opportunities Fund (continued)Description CouponRate (%) Maturity Date Principal Amount ($) Value ($)Long-Term Municipal Investments - 100.5% (continued)New York - 12.9% (continued)Triborough Bridge & Tunnel Authority, Revenue Bonds,Refunding, Ser. A1 5.00 5/15/2051 5,000,000 6,085,254Triborough Bridge & Tunnel Authority, Revenue Bonds,Refunding, Ser. B 0.00 11/15/2027 2,000,000f 1,775,985Triborough Bridge & Tunnel Authority, Revenue Bonds,Refunding, Ser. B 0.00 11/15/2028 4,715,000f 4,072,255Triborough Bridge & Tunnel Authority, Revenue Bonds, Ser. A 4.00 11/15/2054 1,750,000 1,936,560Triborough Bridge & Tunnel Authority, Revenue Bonds, Ser. A 5.00 11/15/2051 4,000,000 4,875,598Triborough Bridge & Tunnel Authority, Revenue Bonds, Ser. A 5.00 11/15/2049 3,500,000 4,234,563Westchester County Industrial Development Agency, RevenueBonds, Refunding (Northern Westchester HospitalAssociation) (LOC; TD BANK N.A.) 0.20 11/1/2024 600,000h 600,000
341,527,056North Carolina - .8%North Carolina, Revenue Bonds, Ser. B 4.00 5/1/2035 3,250,000 3,747,679North Carolina Turnpike Authority, Revenue Bonds (Insured;Assured Guaranty Municipal Corp.) 5.00 1/1/2049 1,500,000 1,795,529North Carolina Turnpike Authority, Revenue Bonds, Refunding 5.00 7/1/2039 750,000 944,326North Carolina Turnpike Authority, Revenue Bonds, Refunding 5.00 7/1/2038 755,000 954,709North Carolina Turnpike Authority, Revenue Bonds, Refunding 5.00 7/1/2041 1,000,000 1,254,928North Carolina Turnpike Authority, Revenue Bonds, Refunding 5.00 7/1/2040 750,000 942,667North Carolina Turnpike Authority, Revenue Bonds, Refunding 5.00 7/1/2037 750,000 950,303North Carolina Turnpike Authority, Revenue Bonds, Refunding 5.00 7/1/2034 1,000,000 1,273,887North Carolina Turnpike Authority, Revenue Bonds, Refunding 5.00 7/1/2035 750,000 953,590North Carolina Turnpike Authority, Revenue Bonds, Refunding 5.00 7/1/2036 750,000 951,833North Carolina Turnpike Authority, Revenue Bonds, Refunding(Insured; Assured Guaranty Municipal Corp.) 5.00 1/1/2038 5,000,000 5,972,980
19,742,431Ohio - 2.8%Akron , Revenue Bonds, Refunding 4.00 12/1/2033 1,950,000e 2,225,534Akron , Revenue Bonds, Refunding 4.00 12/1/2032 1,900,000e 2,177,747Buckeye Tobacco Settlement Financing Authority, RevenueBonds, Refunding, Ser. B2 5.00 6/1/2055 10,000,000 10,893,940Cleveland-Cuyahoga County Port Authority, Revenue Bonds,Refunding (Playhouse Square Foundation Project) 5.25 12/1/2038 2,420,000 2,715,676Cleveland-Cuyahoga County Port Authority, Revenue Bonds,Refunding (Playhouse Square Foundation Project) 5.50 12/1/2053 1,500,000 1,674,998Cleveland-Cuyahoga County Port Authority, Revenue Bonds,Refunding (Playhouse Square Foundation Project) 5.50 12/1/2043 1,580,000 1,779,475Franklin County, Revenue Bonds, Ser. A 4.00 12/1/2049 2,500,000 2,760,302Hamilton County Sewer System, Revenue Bonds, Refunding, Ser.A 5.00 12/1/2032 9,350,000 11,552,840Montgomery County, Revenue Bonds, Refunding (KetteringHealth Network Obligated Group) 3.00 8/1/2040 1,600,000 1,618,509Montgomery County, Revenue Bonds, Refunding (KetteringHealth Network Obligated Group) 4.00 8/1/2051 1,000,000 1,113,121Montgomery County, Revenue Bonds, Refunding (KetteringHealth Network Obligated Group) 4.00 8/1/2041 500,000 565,041Ohio, Revenue Bonds (Portsmouth Bypass Project) (Insured;Assured Guaranty Municipal Corp.) 5.00 12/31/2035 3,000,000 3,270,626Ohio, Revenue Bonds (Portsmouth Bypass Project) (Insured;Assured Guaranty Municipal Corp.) 5.00 12/31/2039 2,000,000 2,173,032Ohio, Revenue Bonds, Refunding (University Hospitals HealthSystem Obligated Group) (LOC; PNC Bank NA) Ser. A 0.10 1/15/2046 2,000,000h 2,000,000Ohio, Revenue Bonds, Refunding (University Hospitals HealthSystem Obligated Group) Ser. E 4.00 1/15/2040 1,300,000 1,426,491Ohio, Revenue Bonds, Refunding (University Hospitals HealthSystem Obligated Group) Ser. E 4.00 1/15/2039 800,000 880,114
89
Copyright © 2022 www.secdatabase.com. All Rights Reserved.Please Consider the Environment Before Printing This Document
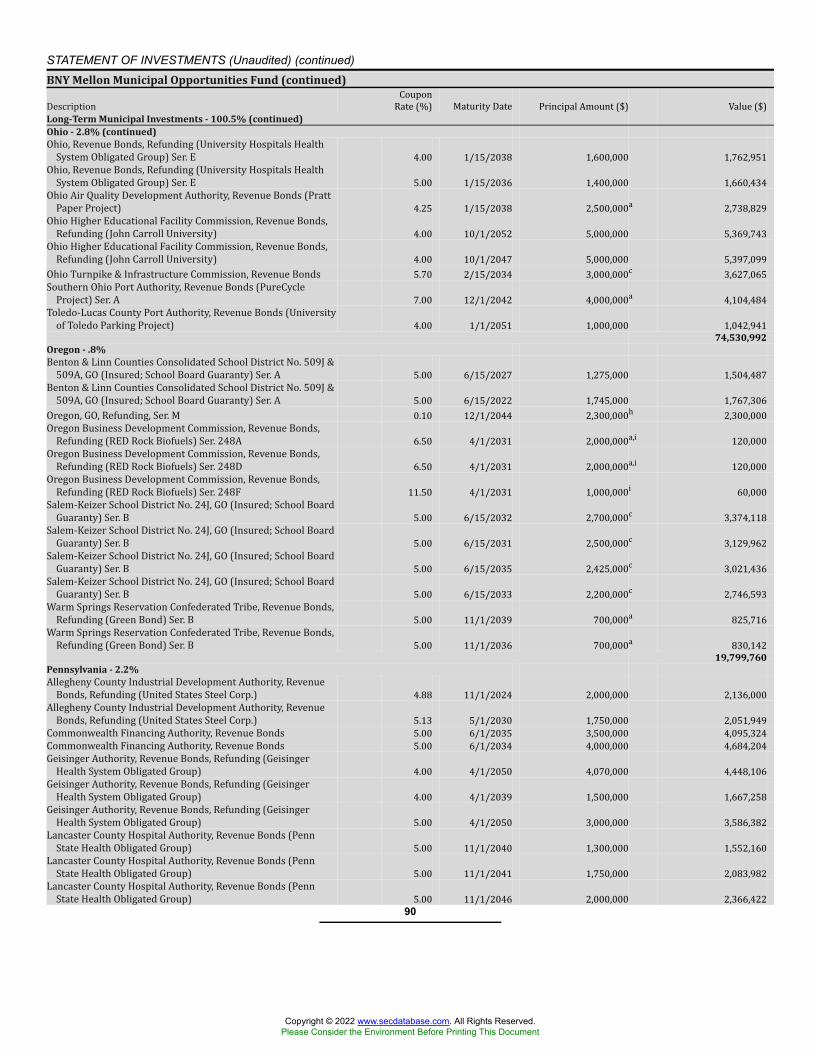
STATEMENT OF INVESTMENTS (Unaudited) (continued)BNY Mellon Municipal Opportunities Fund (continued)Description CouponRate (%) Maturity Date Principal Amount ($) Value ($)Long-Term Municipal Investments - 100.5% (continued)Ohio - 2.8% (continued)Ohio, Revenue Bonds, Refunding (University Hospitals HealthSystem Obligated Group) Ser. E 4.00 1/15/2038 1,600,000 1,762,951Ohio, Revenue Bonds, Refunding (University Hospitals HealthSystem Obligated Group) Ser. E 5.00 1/15/2036 1,400,000 1,660,434Ohio Air Quality Development Authority, Revenue Bonds (PrattPaper Project) 4.25 1/15/2038 2,500,000a 2,738,829Ohio Higher Educational Facility Commission, Revenue Bonds,Refunding (John Carroll University) 4.00 10/1/2052 5,000,000 5,369,743Ohio Higher Educational Facility Commission, Revenue Bonds,Refunding (John Carroll University) 4.00 10/1/2047 5,000,000 5,397,099Ohio Turnpike & Infrastructure Commission, Revenue Bonds 5.70 2/15/2034 3,000,000c 3,627,065Southern Ohio Port Authority, Revenue Bonds (PureCycleProject) Ser. A 7.00 12/1/2042 4,000,000a 4,104,484Toledo-Lucas County Port Authority, Revenue Bonds (Universityof Toledo Parking Project) 4.00 1/1/2051 1,000,000 1,042,941
74,530,992Oregon - .8%Benton & Linn Counties Consolidated School District No. 509J &509A, GO (Insured; School Board Guaranty) Ser. A 5.00 6/15/2027 1,275,000 1,504,487Benton & Linn Counties Consolidated School District No. 509J &509A, GO (Insured; School Board Guaranty) Ser. A 5.00 6/15/2022 1,745,000 1,767,306Oregon, GO, Refunding, Ser. M 0.10 12/1/2044 2,300,000h 2,300,000Oregon Business Development Commission, Revenue Bonds,Refunding (RED Rock Biofuels) Ser. 248A 6.50 4/1/2031 2,000,000a,i 120,000Oregon Business Development Commission, Revenue Bonds,Refunding (RED Rock Biofuels) Ser. 248D 6.50 4/1/2031 2,000,000a,i 120,000Oregon Business Development Commission, Revenue Bonds,Refunding (RED Rock Biofuels) Ser. 248F 11.50 4/1/2031 1,000,000i 60,000Salem-Keizer School District No. 24J, GO (Insured; School BoardGuaranty) Ser. B 5.00 6/15/2032 2,700,000c 3,374,118Salem-Keizer School District No. 24J, GO (Insured; School BoardGuaranty) Ser. B 5.00 6/15/2031 2,500,000c 3,129,962Salem-Keizer School District No. 24J, GO (Insured; School BoardGuaranty) Ser. B 5.00 6/15/2035 2,425,000c 3,021,436Salem-Keizer School District No. 24J, GO (Insured; School BoardGuaranty) Ser. B 5.00 6/15/2033 2,200,000c 2,746,593Warm Springs Reservation Confederated Tribe, Revenue Bonds,Refunding (Green Bond) Ser. B 5.00 11/1/2039 700,000a 825,716Warm Springs Reservation Confederated Tribe, Revenue Bonds,Refunding (Green Bond) Ser. B 5.00 11/1/2036 700,000a 830,142
19,799,760Pennsylvania - 2.2%Allegheny County Industrial Development Authority, RevenueBonds, Refunding (United States Steel Corp.) 4.88 11/1/2024 2,000,000 2,136,000Allegheny County Industrial Development Authority, RevenueBonds, Refunding (United States Steel Corp.) 5.13 5/1/2030 1,750,000 2,051,949Commonwealth Financing Authority, Revenue Bonds 5.00 6/1/2035 3,500,000 4,095,324Commonwealth Financing Authority, Revenue Bonds 5.00 6/1/2034 4,000,000 4,684,204Geisinger Authority, Revenue Bonds, Refunding (GeisingerHealth System Obligated Group) 4.00 4/1/2050 4,070,000 4,448,106Geisinger Authority, Revenue Bonds, Refunding (GeisingerHealth System Obligated Group) 4.00 4/1/2039 1,500,000 1,667,258Geisinger Authority, Revenue Bonds, Refunding (GeisingerHealth System Obligated Group) 5.00 4/1/2050 3,000,000 3,586,382Lancaster County Hospital Authority, Revenue Bonds (PennState Health Obligated Group) 5.00 11/1/2040 1,300,000 1,552,160Lancaster County Hospital Authority, Revenue Bonds (PennState Health Obligated Group) 5.00 11/1/2041 1,750,000 2,083,982Lancaster County Hospital Authority, Revenue Bonds (PennState Health Obligated Group) 5.00 11/1/2046 2,000,000 2,366,422
90
Copyright © 2022 www.secdatabase.com. All Rights Reserved.Please Consider the Environment Before Printing This Document

BNY Mellon Municipal Opportunities Fund (continued)Description CouponRate (%) Maturity Date Principal Amount ($) Value ($)Long-Term Municipal Investments - 100.5% (continued)Pennsylvania - 2.2% (continued)Lancaster County Hospital Authority, Revenue Bonds (PennState Health Obligated Group) 5.00 11/1/2037 600,000 722,685Lancaster County Hospital Authority, Revenue Bonds (PennState Health Obligated Group) 5.00 11/1/2038 1,085,000 1,302,932Lancaster County Hospital Authority, Revenue Bonds (PennState Health Obligated Group) 5.00 11/1/2039 1,100,000 1,317,030Latrobe Industrial Development Authority, Revenue Bonds,Refunding (Seton Hill University) 4.00 3/1/2051 700,000 718,558Latrobe Industrial Development Authority, Revenue Bonds,Refunding (Seton Hill University) 4.00 3/1/2046 685,000 704,779Montgomery County Higher Education & Health Authority,Revenue Bonds, Refunding (Thomas Jefferson UniversityProject) 4.00 9/1/2044 1,750,000 1,916,458Pennsylvania Economic Development Financing Authority,Revenue Bonds, Refunding (Tapestry Moon Senior HousingProject) 6.50 12/1/2038 3,000,000a,i 1,200,000Pennsylvania Turnpike Commission, Revenue Bonds, Refunding,Ser. A 3.00 12/1/2051 8,000,000 7,997,242Pennsylvania Turnpike Commission, Revenue Bonds, Refunding,Ser. A 4.00 12/1/2051 8,000,000 8,979,407Pennsylvania Turnpike Commission, Revenue Bonds, Refunding,Ser. B 4.00 12/1/2051 5,000,000 5,548,369
59,079,247Rhode Island - .3%Rhode Island Health & Educational Building Corp., RevenueBonds 5.25 8/15/2043 1,000,000 1,197,720Rhode Island Health & Educational Building Corp., RevenueBonds, Refunding (Providence College) 5.00 11/1/2045 7,000,000 7,781,756
8,979,476South Carolina - .3%South Carolina Public Service Authority, Revenue Bonds,Refunding, Ser. A 5.00 12/1/2036 2,000,000 2,280,436Spartanburg Regional Health Services District, Revenue Bonds,Refunding (Health Services District) 4.00 4/15/2036 1,370,000 1,564,121Spartanburg Regional Health Services District, Revenue Bonds,Refunding (Health Services District) 4.00 4/15/2037 835,000 950,563Spartanburg Regional Health Services District, Revenue Bonds,Refunding (Health Services District) 5.00 4/15/2035 1,580,000 1,971,200Spartanburg Regional Health Services District, Revenue Bonds,Refunding (Health Services District) 5.00 4/15/2034 1,505,000 1,886,210
8,652,530Tennessee - .5%Clarksville Public Building Authority, Revenue Bonds (LOC;Bank of America NA) 0.08 11/1/2035 8,000,000h 8,000,000Clarksville Public Building Authority, Revenue Bonds (LOC;Bank of America NA) 0.08 7/1/2034 2,000,000h 2,000,000Montgomery County Public Building Authority, Revenue Bonds(LOC; Bank of America NA) 0.08 2/1/2036 1,100,000h 1,100,000New Memphis Arena Public Building Authority, Revenue Bonds 4.00 4/1/2031 750,000c 750,731New Memphis Arena Public Building Authority, Revenue Bonds(Memphis Project) 0.00 4/1/2032 775,000f 605,907
12,456,638Texas - 9.4%Arlington Higher Education Finance Corp., Revenue Bonds,Refunding (Uplift Education) Ser. A 5.00 12/1/2046 1,100,000 1,216,051Arlington Higher Education Finance Corp., Revenue Bonds,Refunding (Uplift Education) Ser. A 5.00 12/1/2036 1,315,000 1,472,289Arlington Higher Education Finance Corp., Revenue Bonds,Refunding, Ser. A 4.00 8/15/2046 860,000 860,374
91
Copyright © 2022 www.secdatabase.com. All Rights Reserved.Please Consider the Environment Before Printing This Document
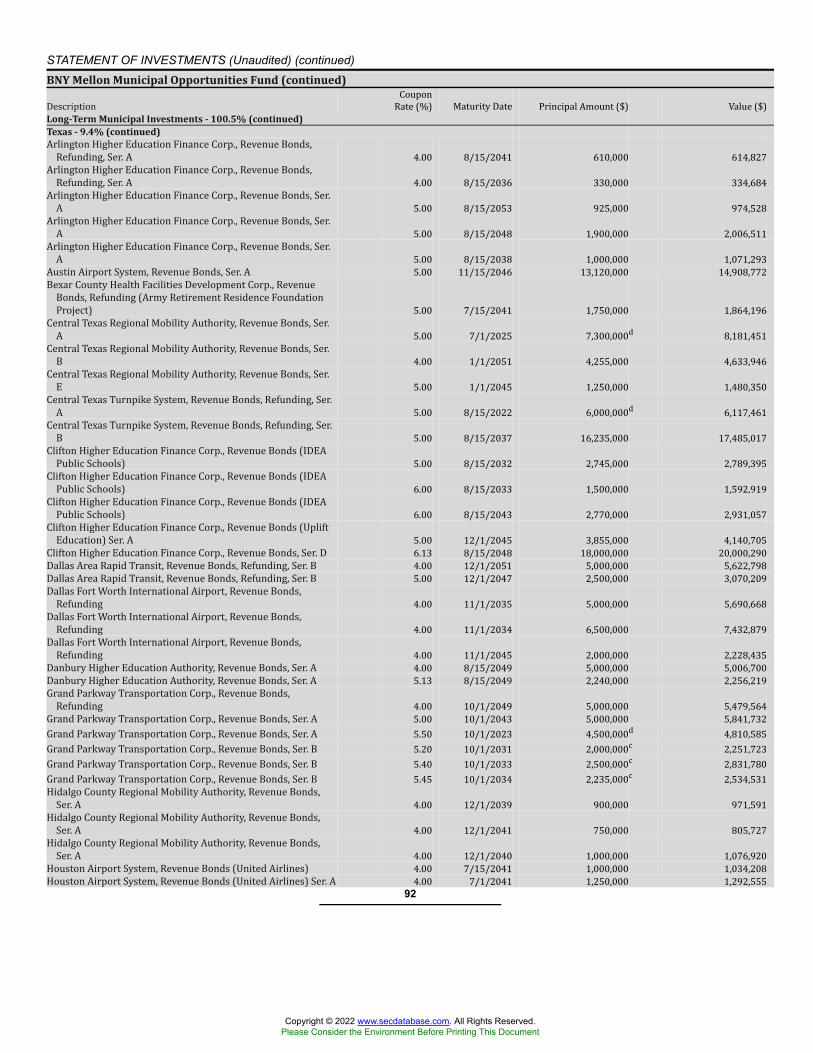
STATEMENT OF INVESTMENTS (Unaudited) (continued)BNY Mellon Municipal Opportunities Fund (continued)Description CouponRate (%) Maturity Date Principal Amount ($) Value ($)Long-Term Municipal Investments - 100.5% (continued)Texas - 9.4% (continued)Arlington Higher Education Finance Corp., Revenue Bonds,Refunding, Ser. A 4.00 8/15/2041 610,000 614,827Arlington Higher Education Finance Corp., Revenue Bonds,Refunding, Ser. A 4.00 8/15/2036 330,000 334,684Arlington Higher Education Finance Corp., Revenue Bonds, Ser.A 5.00 8/15/2053 925,000 974,528Arlington Higher Education Finance Corp., Revenue Bonds, Ser.A 5.00 8/15/2048 1,900,000 2,006,511Arlington Higher Education Finance Corp., Revenue Bonds, Ser.A 5.00 8/15/2038 1,000,000 1,071,293Austin Airport System, Revenue Bonds, Ser. A 5.00 11/15/2046 13,120,000 14,908,772Bexar County Health Facilities Development Corp., RevenueBonds, Refunding (Army Retirement Residence FoundationProject) 5.00 7/15/2041 1,750,000 1,864,196Central Texas Regional Mobility Authority, Revenue Bonds, Ser.A 5.00 7/1/2025 7,300,000d 8,181,451Central Texas Regional Mobility Authority, Revenue Bonds, Ser.B 4.00 1/1/2051 4,255,000 4,633,946Central Texas Regional Mobility Authority, Revenue Bonds, Ser.E 5.00 1/1/2045 1,250,000 1,480,350Central Texas Turnpike System, Revenue Bonds, Refunding, Ser.A 5.00 8/15/2022 6,000,000d 6,117,461Central Texas Turnpike System, Revenue Bonds, Refunding, Ser.B 5.00 8/15/2037 16,235,000 17,485,017Clifton Higher Education Finance Corp., Revenue Bonds (IDEAPublic Schools) 5.00 8/15/2032 2,745,000 2,789,395Clifton Higher Education Finance Corp., Revenue Bonds (IDEAPublic Schools) 6.00 8/15/2033 1,500,000 1,592,919Clifton Higher Education Finance Corp., Revenue Bonds (IDEAPublic Schools) 6.00 8/15/2043 2,770,000 2,931,057Clifton Higher Education Finance Corp., Revenue Bonds (UpliftEducation) Ser. A 5.00 12/1/2045 3,855,000 4,140,705Clifton Higher Education Finance Corp., Revenue Bonds, Ser. D 6.13 8/15/2048 18,000,000 20,000,290Dallas Area Rapid Transit, Revenue Bonds, Refunding, Ser. B 4.00 12/1/2051 5,000,000 5,622,798Dallas Area Rapid Transit, Revenue Bonds, Refunding, Ser. B 5.00 12/1/2047 2,500,000 3,070,209Dallas Fort Worth International Airport, Revenue Bonds,Refunding 4.00 11/1/2035 5,000,000 5,690,668Dallas Fort Worth International Airport, Revenue Bonds,Refunding 4.00 11/1/2034 6,500,000 7,432,879Dallas Fort Worth International Airport, Revenue Bonds,Refunding 4.00 11/1/2045 2,000,000 2,228,435Danbury Higher Education Authority, Revenue Bonds, Ser. A 4.00 8/15/2049 5,000,000 5,006,700Danbury Higher Education Authority, Revenue Bonds, Ser. A 5.13 8/15/2049 2,240,000 2,256,219Grand Parkway Transportation Corp., Revenue Bonds,Refunding 4.00 10/1/2049 5,000,000 5,479,564Grand Parkway Transportation Corp., Revenue Bonds, Ser. A 5.00 10/1/2043 5,000,000 5,841,732Grand Parkway Transportation Corp., Revenue Bonds, Ser. A 5.50 10/1/2023 4,500,000d 4,810,585Grand Parkway Transportation Corp., Revenue Bonds, Ser. B 5.20 10/1/2031 2,000,000c 2,251,723Grand Parkway Transportation Corp., Revenue Bonds, Ser. B 5.40 10/1/2033 2,500,000c 2,831,780Grand Parkway Transportation Corp., Revenue Bonds, Ser. B 5.45 10/1/2034 2,235,000c 2,534,531Hidalgo County Regional Mobility Authority, Revenue Bonds,Ser. A 4.00 12/1/2039 900,000 971,591Hidalgo County Regional Mobility Authority, Revenue Bonds,Ser. A 4.00 12/1/2041 750,000 805,727Hidalgo County Regional Mobility Authority, Revenue Bonds,Ser. A 4.00 12/1/2040 1,000,000 1,076,920Houston Airport System, Revenue Bonds (United Airlines) 4.00 7/15/2041 1,000,000 1,034,208Houston Airport System, Revenue Bonds (United Airlines) Ser. A 4.00 7/1/2041 1,250,000 1,292,555
92
Copyright © 2022 www.secdatabase.com. All Rights Reserved.Please Consider the Environment Before Printing This Document
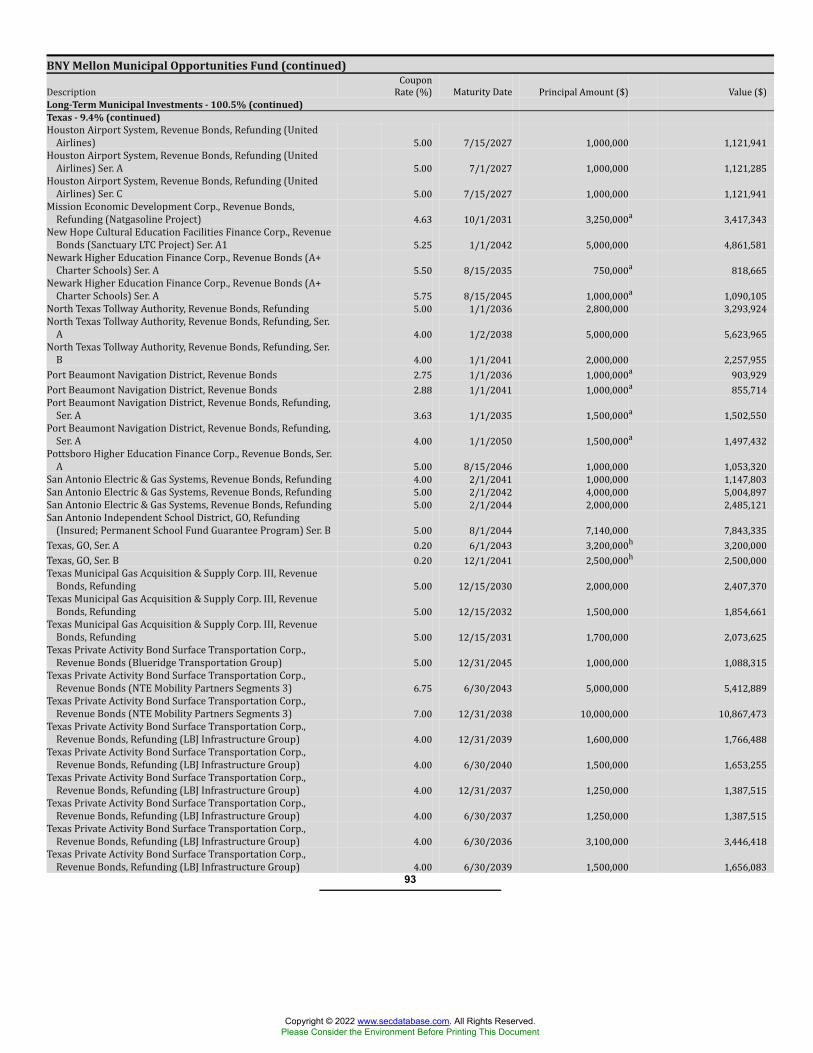
BNY Mellon Municipal Opportunities Fund (continued)Description CouponRate (%) Maturity Date Principal Amount ($) Value ($)Long-Term Municipal Investments - 100.5% (continued)Texas - 9.4% (continued)Houston Airport System, Revenue Bonds, Refunding (UnitedAirlines) 5.00 7/15/2027 1,000,000 1,121,941Houston Airport System, Revenue Bonds, Refunding (UnitedAirlines) Ser. A 5.00 7/1/2027 1,000,000 1,121,285Houston Airport System, Revenue Bonds, Refunding (UnitedAirlines) Ser. C 5.00 7/15/2027 1,000,000 1,121,941Mission Economic Development Corp., Revenue Bonds,Refunding (Natgasoline Project) 4.63 10/1/2031 3,250,000a 3,417,343New Hope Cultural Education Facilities Finance Corp., RevenueBonds (Sanctuary LTC Project) Ser. A1 5.25 1/1/2042 5,000,000 4,861,581Newark Higher Education Finance Corp., Revenue Bonds (A+Charter Schools) Ser. A 5.50 8/15/2035 750,000a 818,665Newark Higher Education Finance Corp., Revenue Bonds (A+Charter Schools) Ser. A 5.75 8/15/2045 1,000,000a 1,090,105North Texas Tollway Authority, Revenue Bonds, Refunding 5.00 1/1/2036 2,800,000 3,293,924North Texas Tollway Authority, Revenue Bonds, Refunding, Ser.A 4.00 1/2/2038 5,000,000 5,623,965North Texas Tollway Authority, Revenue Bonds, Refunding, Ser.B 4.00 1/1/2041 2,000,000 2,257,955Port Beaumont Navigation District, Revenue Bonds 2.75 1/1/2036 1,000,000a 903,929Port Beaumont Navigation District, Revenue Bonds 2.88 1/1/2041 1,000,000a 855,714Port Beaumont Navigation District, Revenue Bonds, Refunding,Ser. A 3.63 1/1/2035 1,500,000a 1,502,550Port Beaumont Navigation District, Revenue Bonds, Refunding,Ser. A 4.00 1/1/2050 1,500,000a 1,497,432Pottsboro Higher Education Finance Corp., Revenue Bonds, Ser.A 5.00 8/15/2046 1,000,000 1,053,320San Antonio Electric & Gas Systems, Revenue Bonds, Refunding 4.00 2/1/2041 1,000,000 1,147,803San Antonio Electric & Gas Systems, Revenue Bonds, Refunding 5.00 2/1/2042 4,000,000 5,004,897San Antonio Electric & Gas Systems, Revenue Bonds, Refunding 5.00 2/1/2044 2,000,000 2,485,121San Antonio Independent School District, GO, Refunding(Insured; Permanent School Fund Guarantee Program) Ser. B 5.00 8/1/2044 7,140,000 7,843,335Texas, GO, Ser. A 0.20 6/1/2043 3,200,000h 3,200,000Texas, GO, Ser. B 0.20 12/1/2041 2,500,000h 2,500,000Texas Municipal Gas Acquisition & Supply Corp. III, RevenueBonds, Refunding 5.00 12/15/2030 2,000,000 2,407,370Texas Municipal Gas Acquisition & Supply Corp. III, RevenueBonds, Refunding 5.00 12/15/2032 1,500,000 1,854,661Texas Municipal Gas Acquisition & Supply Corp. III, RevenueBonds, Refunding 5.00 12/15/2031 1,700,000 2,073,625Texas Private Activity Bond Surface Transportation Corp.,Revenue Bonds (Blueridge Transportation Group) 5.00 12/31/2045 1,000,000 1,088,315Texas Private Activity Bond Surface Transportation Corp.,Revenue Bonds (NTE Mobility Partners Segments 3) 6.75 6/30/2043 5,000,000 5,412,889Texas Private Activity Bond Surface Transportation Corp.,Revenue Bonds (NTE Mobility Partners Segments 3) 7.00 12/31/2038 10,000,000 10,867,473Texas Private Activity Bond Surface Transportation Corp.,Revenue Bonds, Refunding (LBJ Infrastructure Group) 4.00 12/31/2039 1,600,000 1,766,488Texas Private Activity Bond Surface Transportation Corp.,Revenue Bonds, Refunding (LBJ Infrastructure Group) 4.00 6/30/2040 1,500,000 1,653,255Texas Private Activity Bond Surface Transportation Corp.,Revenue Bonds, Refunding (LBJ Infrastructure Group) 4.00 12/31/2037 1,250,000 1,387,515Texas Private Activity Bond Surface Transportation Corp.,Revenue Bonds, Refunding (LBJ Infrastructure Group) 4.00 6/30/2037 1,250,000 1,387,515Texas Private Activity Bond Surface Transportation Corp.,Revenue Bonds, Refunding (LBJ Infrastructure Group) 4.00 6/30/2036 3,100,000 3,446,418Texas Private Activity Bond Surface Transportation Corp.,Revenue Bonds, Refunding (LBJ Infrastructure Group) 4.00 6/30/2039 1,500,000 1,656,083
93
Copyright © 2022 www.secdatabase.com. All Rights Reserved.Please Consider the Environment Before Printing This Document
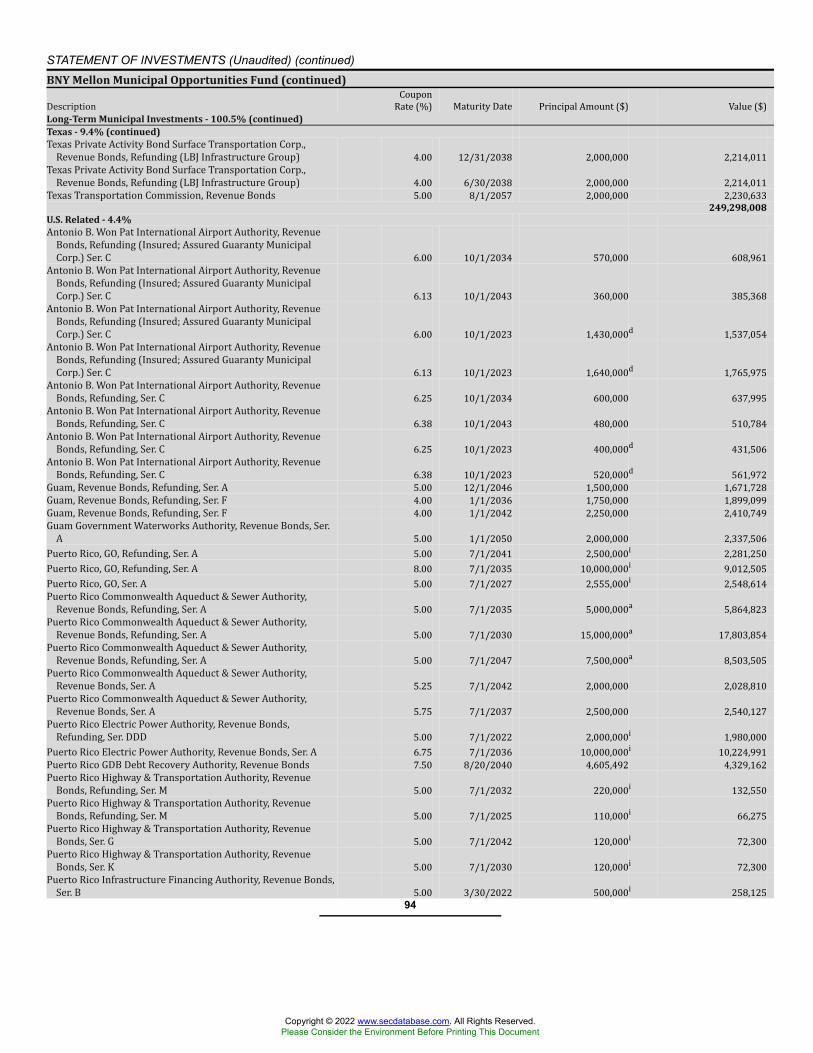
STATEMENT OF INVESTMENTS (Unaudited) (continued)BNY Mellon Municipal Opportunities Fund (continued)Description CouponRate (%) Maturity Date Principal Amount ($) Value ($)Long-Term Municipal Investments - 100.5% (continued)Texas - 9.4% (continued)Texas Private Activity Bond Surface Transportation Corp.,Revenue Bonds, Refunding (LBJ Infrastructure Group) 4.00 12/31/2038 2,000,000 2,214,011Texas Private Activity Bond Surface Transportation Corp.,Revenue Bonds, Refunding (LBJ Infrastructure Group) 4.00 6/30/2038 2,000,000 2,214,011Texas Transportation Commission, Revenue Bonds 5.00 8/1/2057 2,000,000 2,230,633
249,298,008U.S. Related - 4.4%Antonio B. Won Pat International Airport Authority, RevenueBonds, Refunding (Insured; Assured Guaranty MunicipalCorp.) Ser. C 6.00 10/1/2034 570,000 608,961Antonio B. Won Pat International Airport Authority, RevenueBonds, Refunding (Insured; Assured Guaranty MunicipalCorp.) Ser. C 6.13 10/1/2043 360,000 385,368Antonio B. Won Pat International Airport Authority, RevenueBonds, Refunding (Insured; Assured Guaranty MunicipalCorp.) Ser. C 6.00 10/1/2023 1,430,000d 1,537,054Antonio B. Won Pat International Airport Authority, RevenueBonds, Refunding (Insured; Assured Guaranty MunicipalCorp.) Ser. C 6.13 10/1/2023 1,640,000d 1,765,975Antonio B. Won Pat International Airport Authority, RevenueBonds, Refunding, Ser. C 6.25 10/1/2034 600,000 637,995Antonio B. Won Pat International Airport Authority, RevenueBonds, Refunding, Ser. C 6.38 10/1/2043 480,000 510,784Antonio B. Won Pat International Airport Authority, RevenueBonds, Refunding, Ser. C 6.25 10/1/2023 400,000d 431,506Antonio B. Won Pat International Airport Authority, RevenueBonds, Refunding, Ser. C 6.38 10/1/2023 520,000d 561,972Guam, Revenue Bonds, Refunding, Ser. A 5.00 12/1/2046 1,500,000 1,671,728Guam, Revenue Bonds, Refunding, Ser. F 4.00 1/1/2036 1,750,000 1,899,099Guam, Revenue Bonds, Refunding, Ser. F 4.00 1/1/2042 2,250,000 2,410,749Guam Government Waterworks Authority, Revenue Bonds, Ser.A 5.00 1/1/2050 2,000,000 2,337,506Puerto Rico, GO, Refunding, Ser. A 5.00 7/1/2041 2,500,000i 2,281,250Puerto Rico, GO, Refunding, Ser. A 8.00 7/1/2035 10,000,000i 9,012,505Puerto Rico, GO, Ser. A 5.00 7/1/2027 2,555,000i 2,548,614Puerto Rico Commonwealth Aqueduct & Sewer Authority,Revenue Bonds, Refunding, Ser. A 5.00 7/1/2035 5,000,000a 5,864,823Puerto Rico Commonwealth Aqueduct & Sewer Authority,Revenue Bonds, Refunding, Ser. A 5.00 7/1/2030 15,000,000a 17,803,854Puerto Rico Commonwealth Aqueduct & Sewer Authority,Revenue Bonds, Refunding, Ser. A 5.00 7/1/2047 7,500,000a 8,503,505Puerto Rico Commonwealth Aqueduct & Sewer Authority,Revenue Bonds, Ser. A 5.25 7/1/2042 2,000,000 2,028,810Puerto Rico Commonwealth Aqueduct & Sewer Authority,Revenue Bonds, Ser. A 5.75 7/1/2037 2,500,000 2,540,127Puerto Rico Electric Power Authority, Revenue Bonds,Refunding, Ser. DDD 5.00 7/1/2022 2,000,000i 1,980,000Puerto Rico Electric Power Authority, Revenue Bonds, Ser. A 6.75 7/1/2036 10,000,000i 10,224,991Puerto Rico GDB Debt Recovery Authority, Revenue Bonds 7.50 8/20/2040 4,605,492 4,329,162Puerto Rico Highway & Transportation Authority, RevenueBonds, Refunding, Ser. M 5.00 7/1/2032 220,000i 132,550Puerto Rico Highway & Transportation Authority, RevenueBonds, Refunding, Ser. M 5.00 7/1/2025 110,000i 66,275Puerto Rico Highway & Transportation Authority, RevenueBonds, Ser. G 5.00 7/1/2042 120,000i 72,300Puerto Rico Highway & Transportation Authority, RevenueBonds, Ser. K 5.00 7/1/2030 120,000i 72,300Puerto Rico Infrastructure Financing Authority, Revenue Bonds,Ser. B 5.00 3/30/2022 500,000i 258,125
94
Copyright © 2022 www.secdatabase.com. All Rights Reserved.Please Consider the Environment Before Printing This Document
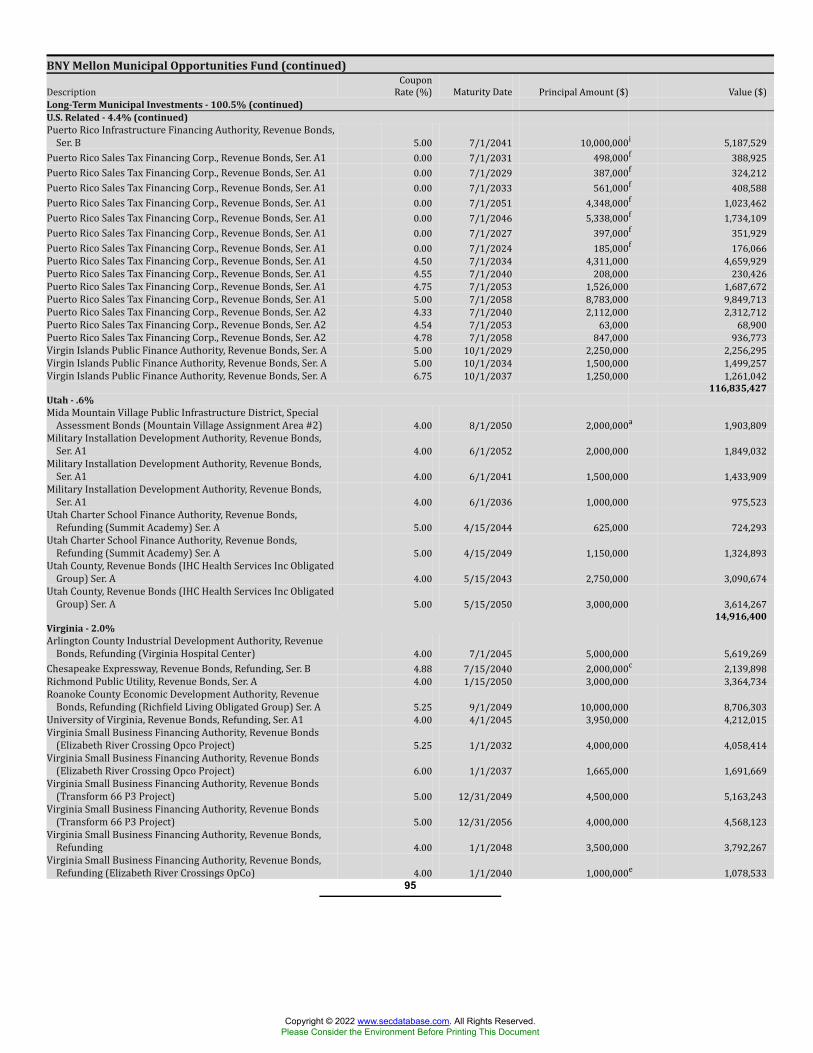
BNY Mellon Municipal Opportunities Fund (continued)Description CouponRate (%) Maturity Date Principal Amount ($) Value ($)Long-Term Municipal Investments - 100.5% (continued)U.S. Related - 4.4% (continued)Puerto Rico Infrastructure Financing Authority, Revenue Bonds,Ser. B 5.00 7/1/2041 10,000,000i 5,187,529Puerto Rico Sales Tax Financing Corp., Revenue Bonds, Ser. A1 0.00 7/1/2031 498,000f 388,925Puerto Rico Sales Tax Financing Corp., Revenue Bonds, Ser. A1 0.00 7/1/2029 387,000f 324,212Puerto Rico Sales Tax Financing Corp., Revenue Bonds, Ser. A1 0.00 7/1/2033 561,000f 408,588Puerto Rico Sales Tax Financing Corp., Revenue Bonds, Ser. A1 0.00 7/1/2051 4,348,000f 1,023,462Puerto Rico Sales Tax Financing Corp., Revenue Bonds, Ser. A1 0.00 7/1/2046 5,338,000f 1,734,109Puerto Rico Sales Tax Financing Corp., Revenue Bonds, Ser. A1 0.00 7/1/2027 397,000f 351,929Puerto Rico Sales Tax Financing Corp., Revenue Bonds, Ser. A1 0.00 7/1/2024 185,000f 176,066Puerto Rico Sales Tax Financing Corp., Revenue Bonds, Ser. A1 4.50 7/1/2034 4,311,000 4,659,929Puerto Rico Sales Tax Financing Corp., Revenue Bonds, Ser. A1 4.55 7/1/2040 208,000 230,426Puerto Rico Sales Tax Financing Corp., Revenue Bonds, Ser. A1 4.75 7/1/2053 1,526,000 1,687,672Puerto Rico Sales Tax Financing Corp., Revenue Bonds, Ser. A1 5.00 7/1/2058 8,783,000 9,849,713Puerto Rico Sales Tax Financing Corp., Revenue Bonds, Ser. A2 4.33 7/1/2040 2,112,000 2,312,712Puerto Rico Sales Tax Financing Corp., Revenue Bonds, Ser. A2 4.54 7/1/2053 63,000 68,900Puerto Rico Sales Tax Financing Corp., Revenue Bonds, Ser. A2 4.78 7/1/2058 847,000 936,773Virgin Islands Public Finance Authority, Revenue Bonds, Ser. A 5.00 10/1/2029 2,250,000 2,256,295Virgin Islands Public Finance Authority, Revenue Bonds, Ser. A 5.00 10/1/2034 1,500,000 1,499,257Virgin Islands Public Finance Authority, Revenue Bonds, Ser. A 6.75 10/1/2037 1,250,000 1,261,042
116,835,427Utah - .6%Mida Mountain Village Public Infrastructure District, SpecialAssessment Bonds (Mountain Village Assignment Area #2) 4.00 8/1/2050 2,000,000a 1,903,809Military Installation Development Authority, Revenue Bonds,Ser. A1 4.00 6/1/2052 2,000,000 1,849,032Military Installation Development Authority, Revenue Bonds,Ser. A1 4.00 6/1/2041 1,500,000 1,433,909Military Installation Development Authority, Revenue Bonds,Ser. A1 4.00 6/1/2036 1,000,000 975,523Utah Charter School Finance Authority, Revenue Bonds,Refunding (Summit Academy) Ser. A 5.00 4/15/2044 625,000 724,293Utah Charter School Finance Authority, Revenue Bonds,Refunding (Summit Academy) Ser. A 5.00 4/15/2049 1,150,000 1,324,893Utah County, Revenue Bonds (IHC Health Services Inc ObligatedGroup) Ser. A 4.00 5/15/2043 2,750,000 3,090,674Utah County, Revenue Bonds (IHC Health Services Inc ObligatedGroup) Ser. A 5.00 5/15/2050 3,000,000 3,614,267
14,916,400Virginia - 2.0%Arlington County Industrial Development Authority, RevenueBonds, Refunding (Virginia Hospital Center) 4.00 7/1/2045 5,000,000 5,619,269Chesapeake Expressway, Revenue Bonds, Refunding, Ser. B 4.88 7/15/2040 2,000,000c 2,139,898Richmond Public Utility, Revenue Bonds, Ser. A 4.00 1/15/2050 3,000,000 3,364,734Roanoke County Economic Development Authority, RevenueBonds, Refunding (Richfield Living Obligated Group) Ser. A 5.25 9/1/2049 10,000,000 8,706,303University of Virginia, Revenue Bonds, Refunding, Ser. A1 4.00 4/1/2045 3,950,000 4,212,015Virginia Small Business Financing Authority, Revenue Bonds(Elizabeth River Crossing Opco Project) 5.25 1/1/2032 4,000,000 4,058,414Virginia Small Business Financing Authority, Revenue Bonds(Elizabeth River Crossing Opco Project) 6.00 1/1/2037 1,665,000 1,691,669Virginia Small Business Financing Authority, Revenue Bonds(Transform 66 P3 Project) 5.00 12/31/2049 4,500,000 5,163,243Virginia Small Business Financing Authority, Revenue Bonds(Transform 66 P3 Project) 5.00 12/31/2056 4,000,000 4,568,123Virginia Small Business Financing Authority, Revenue Bonds,Refunding 4.00 1/1/2048 3,500,000 3,792,267Virginia Small Business Financing Authority, Revenue Bonds,Refunding (Elizabeth River Crossings OpCo) 4.00 1/1/2040 1,000,000e 1,078,533
95
Copyright © 2022 www.secdatabase.com. All Rights Reserved.Please Consider the Environment Before Printing This Document
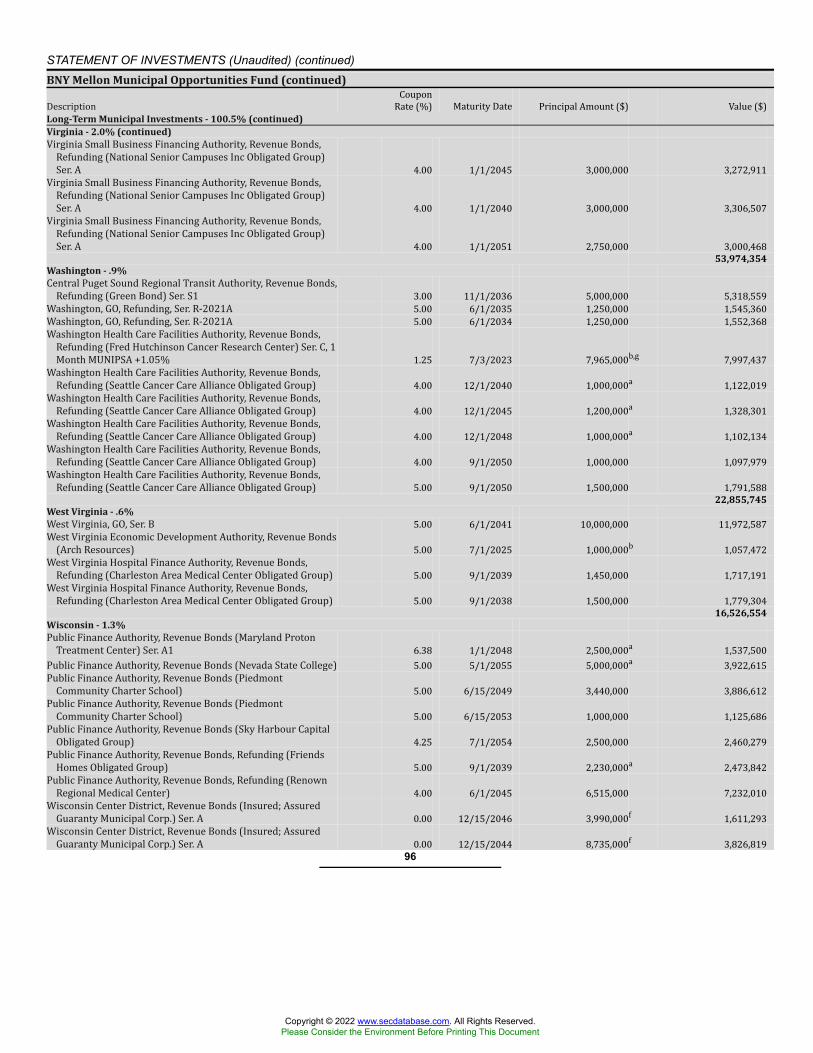
STATEMENT OF INVESTMENTS (Unaudited) (continued)BNY Mellon Municipal Opportunities Fund (continued)Description CouponRate (%) Maturity Date Principal Amount ($) Value ($)Long-Term Municipal Investments - 100.5% (continued)Virginia - 2.0% (continued)Virginia Small Business Financing Authority, Revenue Bonds,Refunding (National Senior Campuses Inc Obligated Group)Ser. A 4.00 1/1/2045 3,000,000 3,272,911Virginia Small Business Financing Authority, Revenue Bonds,Refunding (National Senior Campuses Inc Obligated Group)Ser. A 4.00 1/1/2040 3,000,000 3,306,507Virginia Small Business Financing Authority, Revenue Bonds,Refunding (National Senior Campuses Inc Obligated Group)Ser. A 4.00 1/1/2051 2,750,000 3,000,468
53,974,354Washington - .9%Central Puget Sound Regional Transit Authority, Revenue Bonds,Refunding (Green Bond) Ser. S1 3.00 11/1/2036 5,000,000 5,318,559Washington, GO, Refunding, Ser. R-2021A 5.00 6/1/2035 1,250,000 1,545,360Washington, GO, Refunding, Ser. R-2021A 5.00 6/1/2034 1,250,000 1,552,368Washington Health Care Facilities Authority, Revenue Bonds,Refunding (Fred Hutchinson Cancer Research Center) Ser. C, 1Month MUNIPSA +1.05% 1.25 7/3/2023 7,965,000b,g 7,997,437Washington Health Care Facilities Authority, Revenue Bonds,Refunding (Seattle Cancer Care Alliance Obligated Group) 4.00 12/1/2040 1,000,000a 1,122,019Washington Health Care Facilities Authority, Revenue Bonds,Refunding (Seattle Cancer Care Alliance Obligated Group) 4.00 12/1/2045 1,200,000a 1,328,301Washington Health Care Facilities Authority, Revenue Bonds,Refunding (Seattle Cancer Care Alliance Obligated Group) 4.00 12/1/2048 1,000,000a 1,102,134Washington Health Care Facilities Authority, Revenue Bonds,Refunding (Seattle Cancer Care Alliance Obligated Group) 4.00 9/1/2050 1,000,000 1,097,979Washington Health Care Facilities Authority, Revenue Bonds,Refunding (Seattle Cancer Care Alliance Obligated Group) 5.00 9/1/2050 1,500,000 1,791,588
22,855,745West Virginia - .6%West Virginia, GO, Ser. B 5.00 6/1/2041 10,000,000 11,972,587West Virginia Economic Development Authority, Revenue Bonds(Arch Resources) 5.00 7/1/2025 1,000,000b 1,057,472West Virginia Hospital Finance Authority, Revenue Bonds,Refunding (Charleston Area Medical Center Obligated Group) 5.00 9/1/2039 1,450,000 1,717,191West Virginia Hospital Finance Authority, Revenue Bonds,Refunding (Charleston Area Medical Center Obligated Group) 5.00 9/1/2038 1,500,000 1,779,304
16,526,554Wisconsin - 1.3%Public Finance Authority, Revenue Bonds (Maryland ProtonTreatment Center) Ser. A1 6.38 1/1/2048 2,500,000a 1,537,500Public Finance Authority, Revenue Bonds (Nevada State College) 5.00 5/1/2055 5,000,000a 3,922,615Public Finance Authority, Revenue Bonds (PiedmontCommunity Charter School) 5.00 6/15/2049 3,440,000 3,886,612Public Finance Authority, Revenue Bonds (PiedmontCommunity Charter School) 5.00 6/15/2053 1,000,000 1,125,686Public Finance Authority, Revenue Bonds (Sky Harbour CapitalObligated Group) 4.25 7/1/2054 2,500,000 2,460,279Public Finance Authority, Revenue Bonds, Refunding (FriendsHomes Obligated Group) 5.00 9/1/2039 2,230,000a 2,473,842Public Finance Authority, Revenue Bonds, Refunding (RenownRegional Medical Center) 4.00 6/1/2045 6,515,000 7,232,010Wisconsin Center District, Revenue Bonds (Insured; AssuredGuaranty Municipal Corp.) Ser. A 0.00 12/15/2046 3,990,000f 1,611,293Wisconsin Center District, Revenue Bonds (Insured; AssuredGuaranty Municipal Corp.) Ser. A 0.00 12/15/2044 8,735,000f 3,826,819
96
Copyright © 2022 www.secdatabase.com. All Rights Reserved.Please Consider the Environment Before Printing This Document
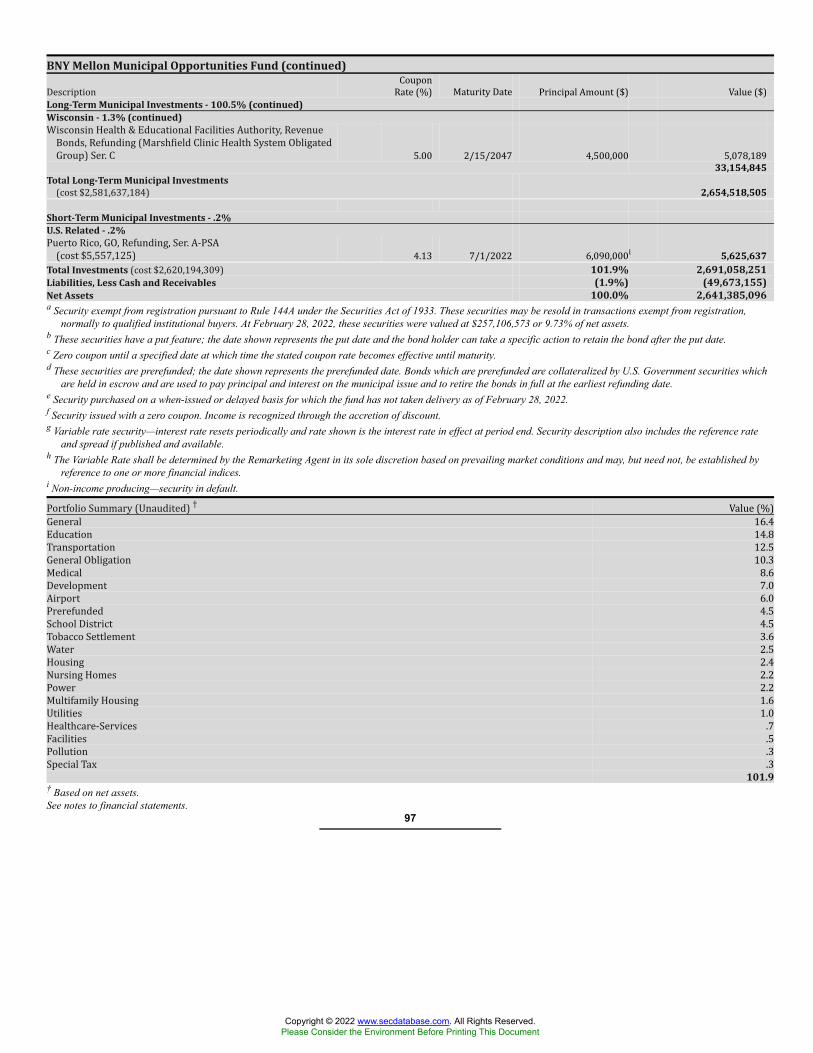
BNY Mellon Municipal Opportunities Fund (continued)Description CouponRate (%) Maturity Date Principal Amount ($) Value ($)Long-Term Municipal Investments - 100.5% (continued)Wisconsin - 1.3% (continued)Wisconsin Health & Educational Facilities Authority, RevenueBonds, Refunding (Marshfield Clinic Health System ObligatedGroup) Ser. C 5.00 2/15/2047 4,500,000 5,078,189
33,154,845Total Long-Term Municipal Investments(cost $2,581,637,184) 2,654,518,505
Short-Term Municipal Investments - .2%U.S. Related - .2%Puerto Rico, GO, Refunding, Ser. A-PSA(cost $5,557,125) 4.13 7/1/2022 6,090,000i 5,625,637Total Investments (cost $2,620,194,309) 101.9% 2,691,058,251Liabilities, Less Cash and Receivables (1.9%) (49,673,155)Net Assets 100.0% 2,641,385,096a Security exempt from registration pursuant to Rule 144A under the Securities Act of 1933. These securities may be resold in transactions exempt from registration,
normally to qualified institutional buyers. At February 28, 2022, these securities were valued at $257,106,573 or 9.73% of net assets.b These securities have a put feature; the date shown represents the put date and the bond holder can take a specific action to retain the bond after the put date.c Zero coupon until a specified date at which time the stated coupon rate becomes effective until maturity.d These securities are prerefunded; the date shown represents the prerefunded date. Bonds which are prerefunded are collateralized by U.S. Government securities which
are held in escrow and are used to pay principal and interest on the municipal issue and to retire the bonds in full at the earliest refunding date.e Security purchased on a when-issued or delayed basis for which the fund has not taken delivery as of February 28, 2022.f Security issued with a zero coupon. Income is recognized through the accretion of discount.g Variable rate security—interest rate resets periodically and rate shown is the interest rate in effect at period end. Security description also includes the reference rate
and spread if published and available.h The Variable Rate shall be determined by the Remarketing Agent in its sole discretion based on prevailing market conditions and may, but need not, be established by
reference to one or more financial indices.i Non-income producing—security in default.Portfolio Summary (Unaudited) † Value (%)General 16.4Education 14.8Transportation 12.5General Obligation 10.3Medical 8.6Development 7.0Airport 6.0Prerefunded 4.5School District 4.5Tobacco Settlement 3.6Water 2.5Housing 2.4Nursing Homes 2.2Power 2.2Multifamily Housing 1.6Utilities 1.0Healthcare-Services .7Facilities .5Pollution .3Special Tax .3
101.9† Based on net assets.See notes to financial statements.
97
Copyright © 2022 www.secdatabase.com. All Rights Reserved.Please Consider the Environment Before Printing This Document
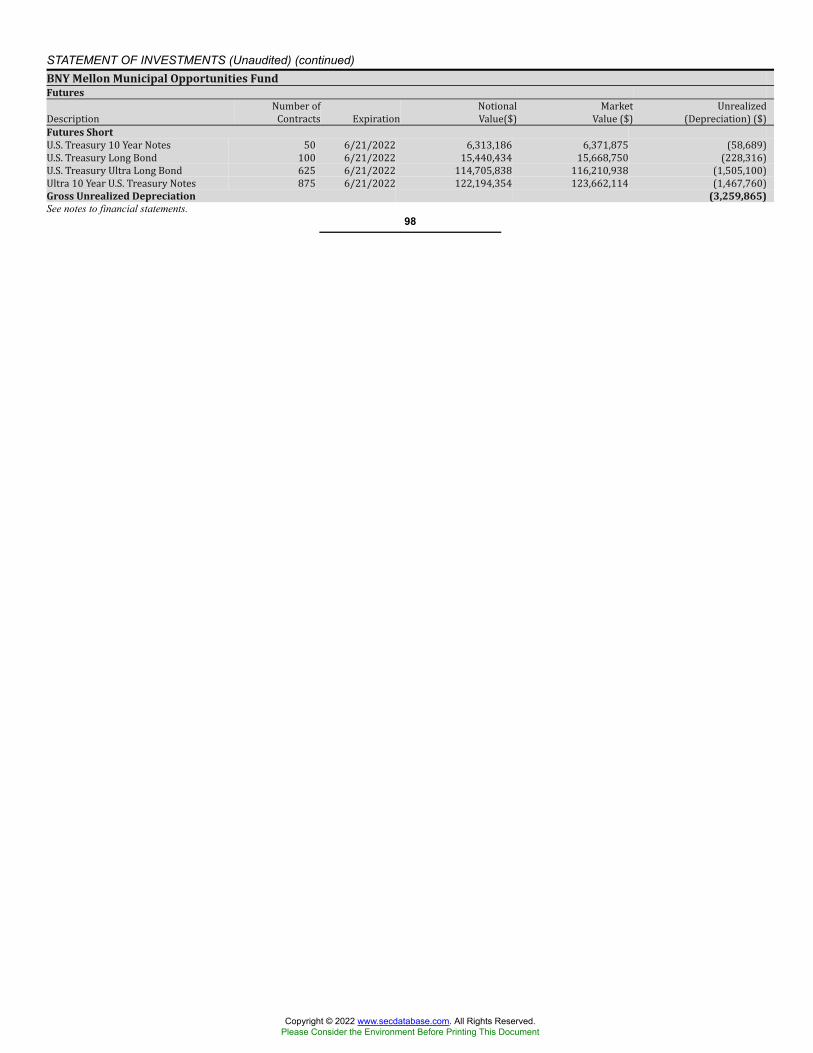
STATEMENT OF INVESTMENTS (Unaudited) (continued)BNY Mellon Municipal Opportunities FundFuturesDescription Number ofContracts Expiration NotionalValue($) MarketValue ($) Unrealized(Depreciation) ($)Futures ShortU.S. Treasury 10 Year Notes 50 6/21/2022 6,313,186 6,371,875 (58,689)U.S. Treasury Long Bond 100 6/21/2022 15,440,434 15,668,750 (228,316)U.S. Treasury Ultra Long Bond 625 6/21/2022 114,705,838 116,210,938 (1,505,100)Ultra 10 Year U.S. Treasury Notes 875 6/21/2022 122,194,354 123,662,114 (1,467,760)Gross Unrealized Depreciation (3,259,865)See notes to financial statements.
98
Copyright © 2022 www.secdatabase.com. All Rights Reserved.Please Consider the Environment Before Printing This Document

Summary of Abbreviations (Unaudited)
ABAG Association of Bay Area Governments AGC ACE Guaranty CorporationAGIC Asset Guaranty Insurance Company AMBAC American Municipal Bond Assurance CorporationBAN Bond Anticipation Notes BSBY Bloomberg Short-Term Bank Yield IndexCIFG CDC Ixis Financial Guaranty COP Certificate of ParticipationCP Commercial Paper DRIVERS Derivative Inverse Tax-Exempt ReceiptsEFFR Effective Federal Funds Rate FGIC Financial Guaranty Insurance CompanyFHA Federal Housing Administration FHLB Federal Home Loan BankFHLMC Federal Home Loan Mortgage Corporation FNMA Federal National Mortgage AssociationGAN Grant Anticipation Notes GIC Guaranteed Investment ContractGNMA Government National Mortgage Association GO General ObligationIDC Industrial Development Corporation LIBOR London Interbank Offered RateLOC Letter of Credit LR Lease RevenueNAN Note Anticipation Notes MFHR Multi-Family Housing RevenueMFMR Multi-Family Mortgage Revenue MUNIPSA Securities Industry and Financial Markets AssociationMunicipal Swap Index YieldOBFR Overnight Bank Funding Rate PILOT Payment in Lieu of TaxesPRIME Prime Lending Rate PUTTERS Puttable Tax-Exempt ReceiptsRAC Revenue Anticipation Certificates RAN Revenue Anticipation NotesRIB Residual Interest Bonds SFHR Single Family Housing RevenueSFMR Single Family Mortgage Revenue SOFR Secured Overnight Financing RateTAN Tax Anticipation Notes TRAN Tax and Revenue Anticipation NotesU.S. T-BILL U.S. Treasury Bill Money Market Yield XLCA XL Capital AssuranceSee notes to financial statements.
99
Copyright © 2022 www.secdatabase.com. All Rights Reserved.Please Consider the Environment Before Printing This Document
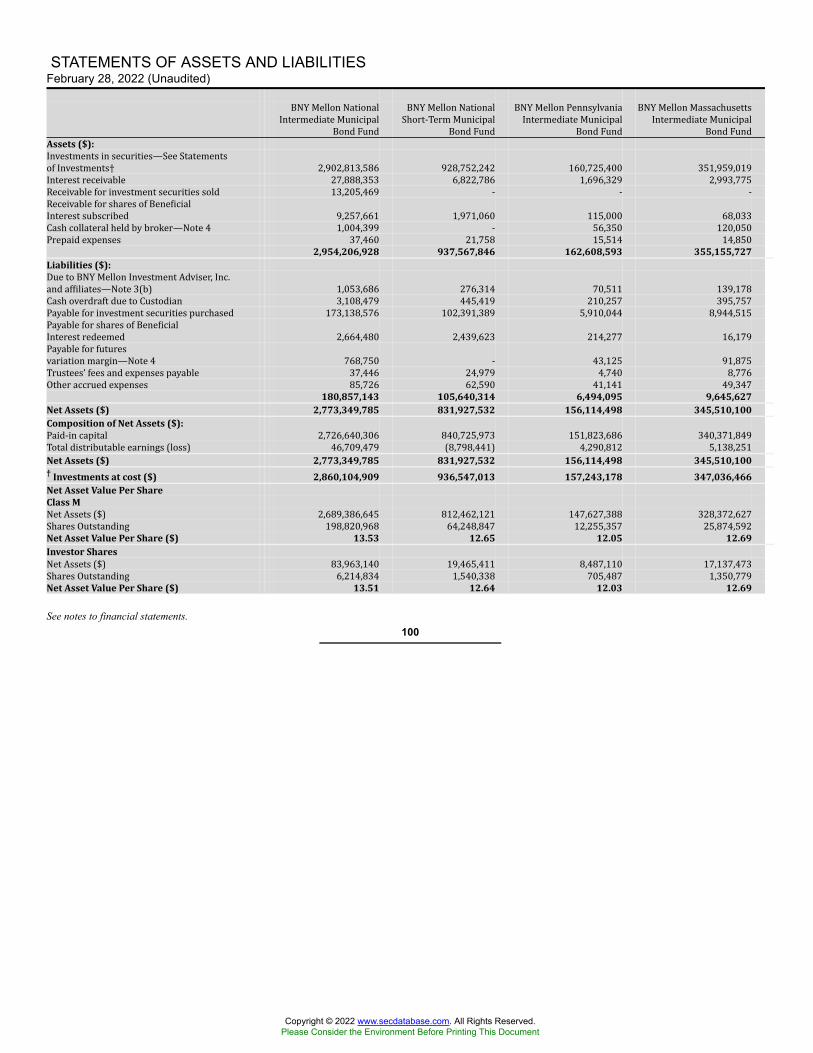
STATEMENTS OF ASSETS AND LIABILITIESFebruary 28, 2022 (Unaudited)
BNY Mellon NationalIntermediate MunicipalBond Fund BNY Mellon NationalShort-Term MunicipalBond Fund BNY Mellon PennsylvaniaIntermediate MunicipalBond Fund BNY Mellon MassachusettsIntermediate MunicipalBond FundAssets ($):Investments in securities—See Statementsof Investments† 2,902,813,586 928,752,242 160,725,400 351,959,019Interest receivable 27,888,353 6,822,786 1,696,329 2,993,775Receivable for investment securities sold 13,205,469 - - -Receivable for shares of BeneficialInterest subscribed 9,257,661 1,971,060 115,000 68,033Cash collateral held by broker—Note 4 1,004,399 - 56,350 120,050Prepaid expenses 37,460 21,758 15,514 14,850
2,954,206,928 937,567,846 162,608,593 355,155,727Liabilities ($):Due to BNY Mellon Investment Adviser, Inc.and affiliates—Note 3(b) 1,053,686 276,314 70,511 139,178Cash overdraft due to Custodian 3,108,479 445,419 210,257 395,757Payable for investment securities purchased 173,138,576 102,391,389 5,910,044 8,944,515Payable for shares of BeneficialInterest redeemed 2,664,480 2,439,623 214,277 16,179Payable for futuresvariation margin—Note 4 768,750 - 43,125 91,875Trustees’ fees and expenses payable 37,446 24,979 4,740 8,776Other accrued expenses 85,726 62,590 41,141 49,347
180,857,143 105,640,314 6,494,095 9,645,627Net Assets ($) 2,773,349,785 831,927,532 156,114,498 345,510,100Composition of Net Assets ($):Paid-in capital 2,726,640,306 840,725,973 151,823,686 340,371,849Total distributable earnings (loss) 46,709,479 (8,798,441) 4,290,812 5,138,251Net Assets ($) 2,773,349,785 831,927,532 156,114,498 345,510,100† Investments at cost ($) 2,860,104,909 936,547,013 157,243,178 347,036,466Net Asset Value Per ShareClass MNet Assets ($) 2,689,386,645 812,462,121 147,627,388 328,372,627Shares Outstanding 198,820,968 64,248,847 12,255,357 25,874,592Net Asset Value Per Share ($) 13.53 12.65 12.05 12.69Investor SharesNet Assets ($) 83,963,140 19,465,411 8,487,110 17,137,473Shares Outstanding 6,214,834 1,540,338 705,487 1,350,779Net Asset Value Per Share ($) 13.51 12.64 12.03 12.69
See notes to financial statements.100
Copyright © 2022 www.secdatabase.com. All Rights Reserved.Please Consider the Environment Before Printing This Document
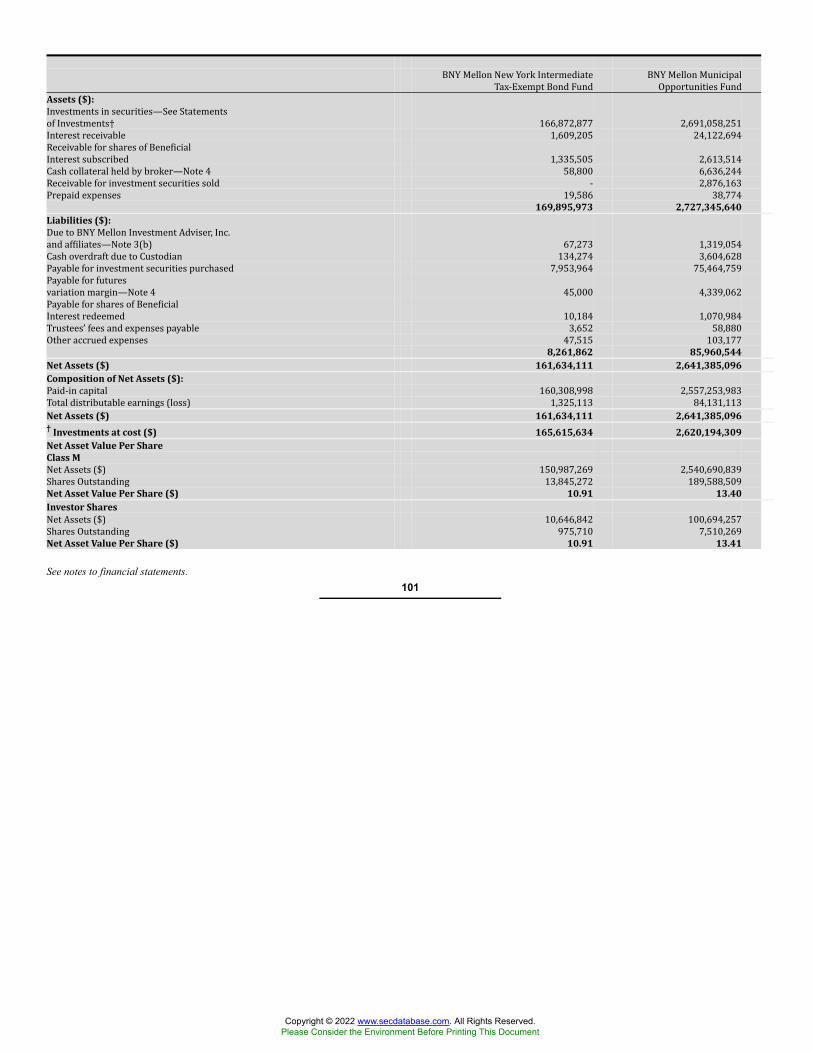
BNY Mellon New York IntermediateTax-Exempt Bond Fund BNY Mellon MunicipalOpportunities FundAssets ($):Investments in securities—See Statementsof Investments† 166,872,877 2,691,058,251Interest receivable 1,609,205 24,122,694Receivable for shares of BeneficialInterest subscribed 1,335,505 2,613,514Cash collateral held by broker—Note 4 58,800 6,636,244Receivable for investment securities sold - 2,876,163Prepaid expenses 19,586 38,774
169,895,973 2,727,345,640Liabilities ($):Due to BNY Mellon Investment Adviser, Inc.and affiliates—Note 3(b) 67,273 1,319,054Cash overdraft due to Custodian 134,274 3,604,628Payable for investment securities purchased 7,953,964 75,464,759Payable for futuresvariation margin—Note 4 45,000 4,339,062Payable for shares of BeneficialInterest redeemed 10,184 1,070,984Trustees’ fees and expenses payable 3,652 58,880Other accrued expenses 47,515 103,177
8,261,862 85,960,544Net Assets ($) 161,634,111 2,641,385,096Composition of Net Assets ($):Paid-in capital 160,308,998 2,557,253,983Total distributable earnings (loss) 1,325,113 84,131,113Net Assets ($) 161,634,111 2,641,385,096† Investments at cost ($) 165,615,634 2,620,194,309Net Asset Value Per ShareClass MNet Assets ($) 150,987,269 2,540,690,839Shares Outstanding 13,845,272 189,588,509Net Asset Value Per Share ($) 10.91 13.40Investor SharesNet Assets ($) 10,646,842 100,694,257Shares Outstanding 975,710 7,510,269Net Asset Value Per Share ($) 10.91 13.41
See notes to financial statements.101
Copyright © 2022 www.secdatabase.com. All Rights Reserved.Please Consider the Environment Before Printing This Document
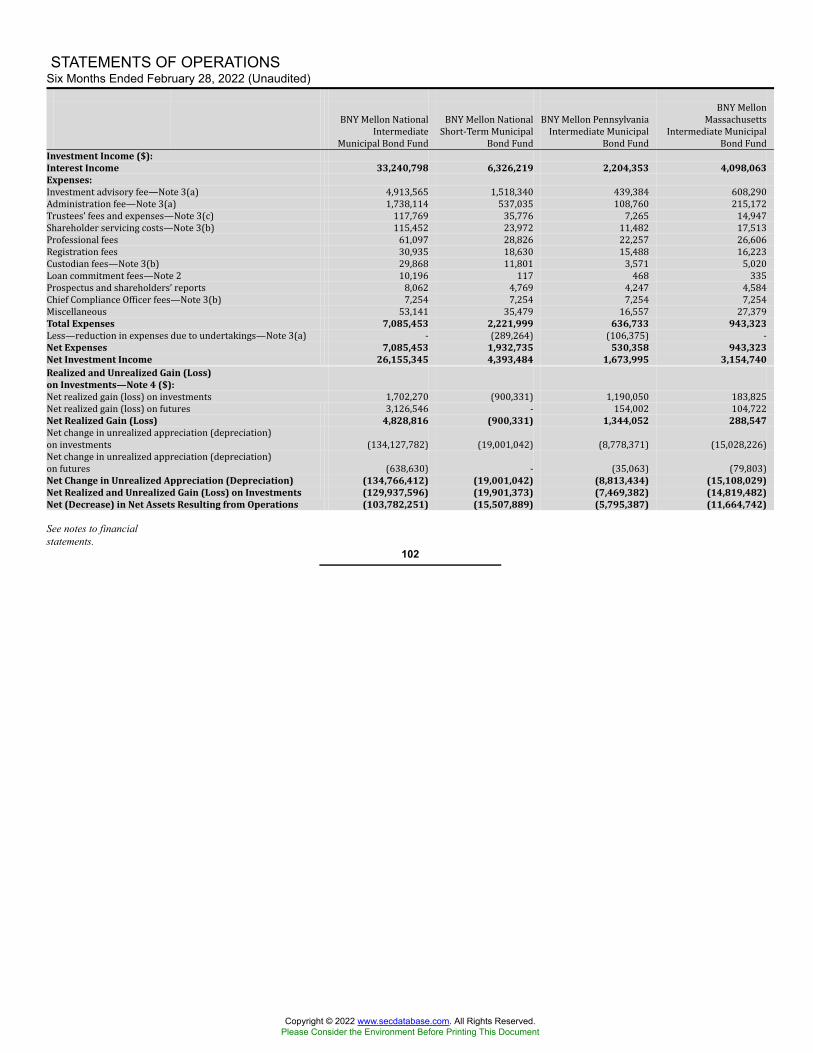
STATEMENTS OF OPERATIONSSix Months Ended February 28, 2022 (Unaudited)
BNY Mellon NationalIntermediateMunicipal Bond Fund BNY Mellon NationalShort-Term MunicipalBond Fund BNY Mellon PennsylvaniaIntermediate MunicipalBond FundBNY MellonMassachusettsIntermediate MunicipalBond Fund
Investment Income ($):Interest Income 33,240,798 6,326,219 2,204,353 4,098,063Expenses:Investment advisory fee—Note 3(a) 4,913,565 1,518,340 439,384 608,290Administration fee—Note 3(a) 1,738,114 537,035 108,760 215,172Trustees’ fees and expenses—Note 3(c) 117,769 35,776 7,265 14,947Shareholder servicing costs—Note 3(b) 115,452 23,972 11,482 17,513Professional fees 61,097 28,826 22,257 26,606Registration fees 30,935 18,630 15,488 16,223Custodian fees—Note 3(b) 29,868 11,801 3,571 5,020Loan commitment fees—Note 2 10,196 117 468 335Prospectus and shareholders’ reports 8,062 4,769 4,247 4,584Chief Compliance Officer fees—Note 3(b) 7,254 7,254 7,254 7,254Miscellaneous 53,141 35,479 16,557 27,379Total Expenses 7,085,453 2,221,999 636,733 943,323Less—reduction in expenses due to undertakings—Note 3(a) - (289,264) (106,375) -Net Expenses 7,085,453 1,932,735 530,358 943,323Net Investment Income 26,155,345 4,393,484 1,673,995 3,154,740Realized and Unrealized Gain (Loss)on Investments—Note 4 ($):Net realized gain (loss) on investments 1,702,270 (900,331) 1,190,050 183,825Net realized gain (loss) on futures 3,126,546 - 154,002 104,722Net Realized Gain (Loss) 4,828,816 (900,331) 1,344,052 288,547Net change in unrealized appreciation (depreciation)on investments (134,127,782) (19,001,042) (8,778,371) (15,028,226)Net change in unrealized appreciation (depreciation)on futures (638,630) - (35,063) (79,803)Net Change in Unrealized Appreciation (Depreciation) (134,766,412) (19,001,042) (8,813,434) (15,108,029)Net Realized and Unrealized Gain (Loss) on Investments (129,937,596) (19,901,373) (7,469,382) (14,819,482)Net (Decrease) in Net Assets Resulting from Operations (103,782,251) (15,507,889) (5,795,387) (11,664,742)
See notes to financialstatements.
102
Copyright © 2022 www.secdatabase.com. All Rights Reserved.Please Consider the Environment Before Printing This Document
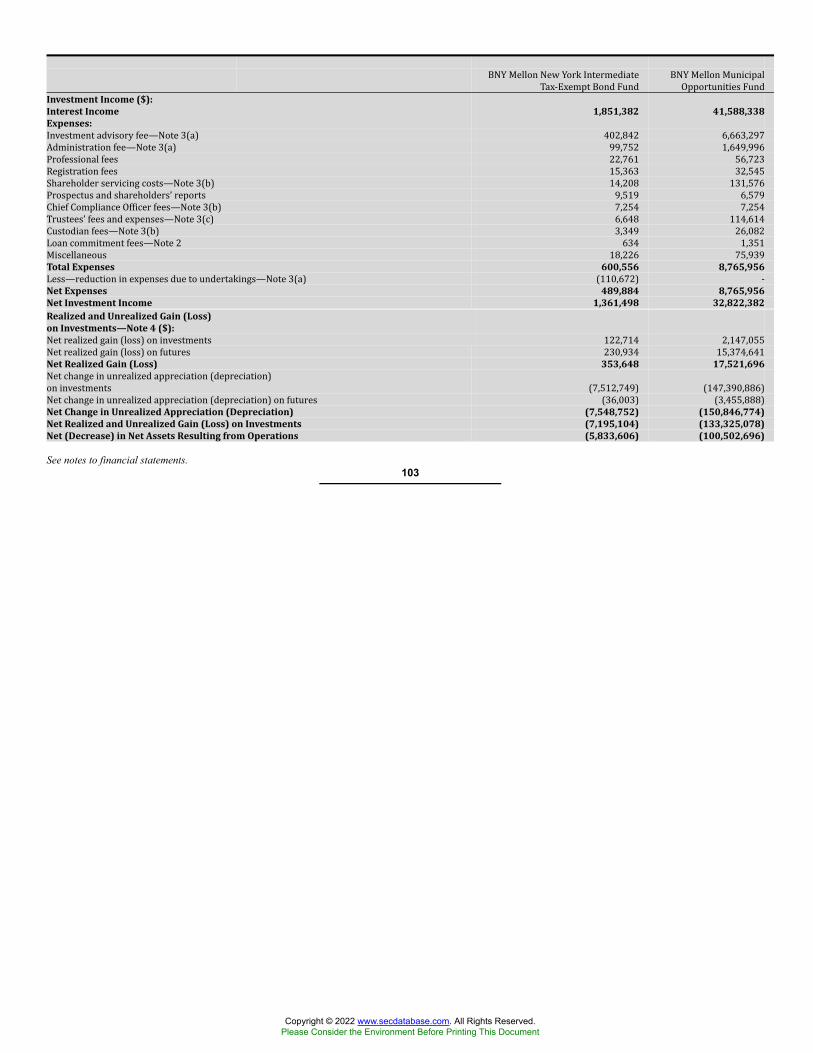
BNY Mellon New York IntermediateTax-Exempt Bond Fund BNY Mellon MunicipalOpportunities FundInvestment Income ($):Interest Income 1,851,382 41,588,338Expenses:Investment advisory fee—Note 3(a) 402,842 6,663,297Administration fee—Note 3(a) 99,752 1,649,996Professional fees 22,761 56,723Registration fees 15,363 32,545Shareholder servicing costs—Note 3(b) 14,208 131,576Prospectus and shareholders’ reports 9,519 6,579Chief Compliance Officer fees—Note 3(b) 7,254 7,254Trustees’ fees and expenses—Note 3(c) 6,648 114,614Custodian fees—Note 3(b) 3,349 26,082Loan commitment fees—Note 2 634 1,351Miscellaneous 18,226 75,939Total Expenses 600,556 8,765,956Less—reduction in expenses due to undertakings—Note 3(a) (110,672) -Net Expenses 489,884 8,765,956Net Investment Income 1,361,498 32,822,382Realized and Unrealized Gain (Loss)on Investments—Note 4 ($):Net realized gain (loss) on investments 122,714 2,147,055Net realized gain (loss) on futures 230,934 15,374,641Net Realized Gain (Loss) 353,648 17,521,696Net change in unrealized appreciation (depreciation)on investments (7,512,749) (147,390,886)Net change in unrealized appreciation (depreciation) on futures (36,003) (3,455,888)Net Change in Unrealized Appreciation (Depreciation) (7,548,752) (150,846,774)Net Realized and Unrealized Gain (Loss) on Investments (7,195,104) (133,325,078)Net (Decrease) in Net Assets Resulting from Operations (5,833,606) (100,502,696)
See notes to financial statements.103
Copyright © 2022 www.secdatabase.com. All Rights Reserved.Please Consider the Environment Before Printing This Document
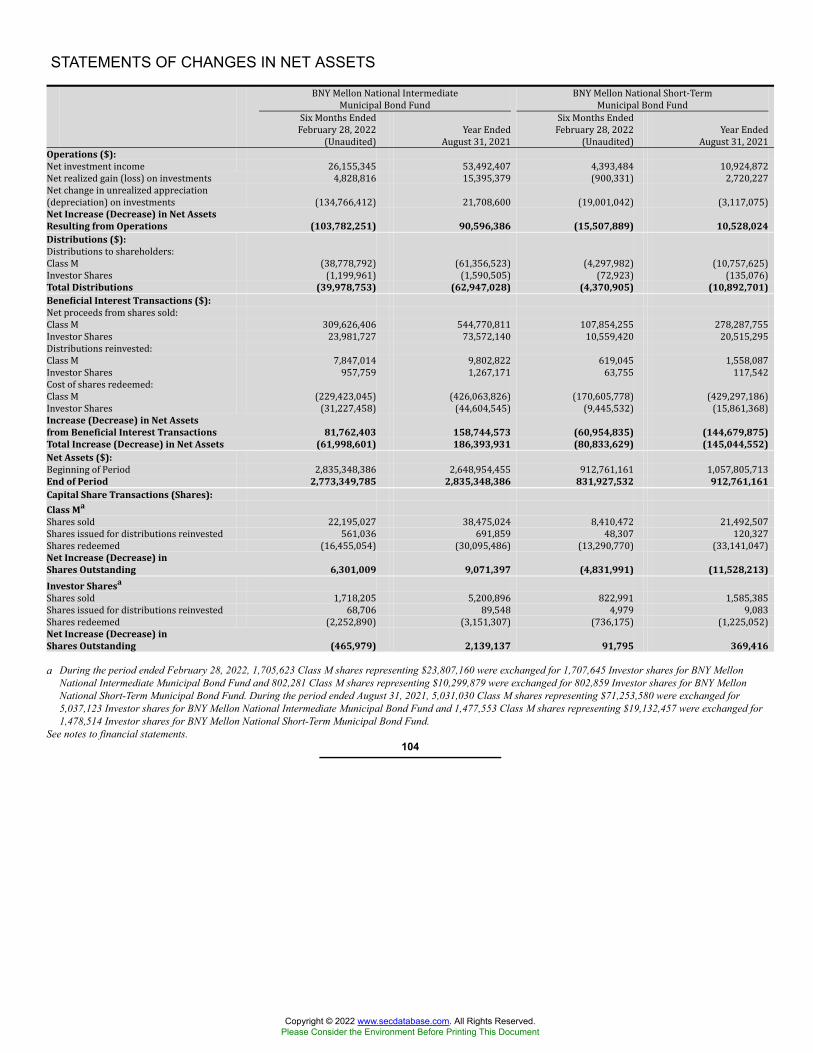
STATEMENTS OF CHANGES IN NET ASSETS
BNY Mellon National IntermediateMunicipal Bond Fund BNY Mellon National Short-TermMunicipal Bond FundSix Months EndedFebruary 28, 2022(Unaudited) Year EndedAugust 31, 2021 Six Months EndedFebruary 28, 2022(Unaudited) Year EndedAugust 31, 2021Operations ($):Net investment income 26,155,345 53,492,407 4,393,484 10,924,872Net realized gain (loss) on investments 4,828,816 15,395,379 (900,331) 2,720,227Net change in unrealized appreciation(depreciation) on investments (134,766,412) 21,708,600 (19,001,042) (3,117,075)Net Increase (Decrease) in Net AssetsResulting from Operations (103,782,251) 90,596,386 (15,507,889) 10,528,024Distributions ($):Distributions to shareholders:Class M (38,778,792) (61,356,523) (4,297,982) (10,757,625)Investor Shares (1,199,961) (1,590,505) (72,923) (135,076)Total Distributions (39,978,753) (62,947,028) (4,370,905) (10,892,701)Beneficial Interest Transactions ($):Net proceeds from shares sold:Class M 309,626,406 544,770,811 107,854,255 278,287,755Investor Shares 23,981,727 73,572,140 10,559,420 20,515,295Distributions reinvested:Class M 7,847,014 9,802,822 619,045 1,558,087Investor Shares 957,759 1,267,171 63,755 117,542Cost of shares redeemed:Class M (229,423,045) (426,063,826) (170,605,778) (429,297,186)Investor Shares (31,227,458) (44,604,545) (9,445,532) (15,861,368)Increase (Decrease) in Net Assetsfrom Beneficial Interest Transactions 81,762,403 158,744,573 (60,954,835) (144,679,875)Total Increase (Decrease) in Net Assets (61,998,601) 186,393,931 (80,833,629) (145,044,552)Net Assets ($):Beginning of Period 2,835,348,386 2,648,954,455 912,761,161 1,057,805,713End of Period 2,773,349,785 2,835,348,386 831,927,532 912,761,161Capital Share Transactions (Shares):Class MaShares sold 22,195,027 38,475,024 8,410,472 21,492,507Shares issued for distributions reinvested 561,036 691,859 48,307 120,327Shares redeemed (16,455,054) (30,095,486) (13,290,770) (33,141,047)Net Increase (Decrease) inShares Outstanding 6,301,009 9,071,397 (4,831,991) (11,528,213)Investor SharesaShares sold 1,718,205 5,200,896 822,991 1,585,385Shares issued for distributions reinvested 68,706 89,548 4,979 9,083Shares redeemed (2,252,890) (3,151,307) (736,175) (1,225,052)Net Increase (Decrease) inShares Outstanding (465,979) 2,139,137 91,795 369,416
a During the period ended February 28, 2022, 1,705,623 Class M shares representing $23,807,160 were exchanged for 1,707,645 Investor shares for BNY MellonNational Intermediate Municipal Bond Fund and 802,281 Class M shares representing $10,299,879 were exchanged for 802,859 Investor shares for BNY MellonNational Short-Term Municipal Bond Fund. During the period ended August 31, 2021, 5,031,030 Class M shares representing $71,253,580 were exchanged for5,037,123 Investor shares for BNY Mellon National Intermediate Municipal Bond Fund and 1,477,553 Class M shares representing $19,132,457 were exchanged for1,478,514 Investor shares for BNY Mellon National Short-Term Municipal Bond Fund.
See notes to financial statements.104
Copyright © 2022 www.secdatabase.com. All Rights Reserved.Please Consider the Environment Before Printing This Document
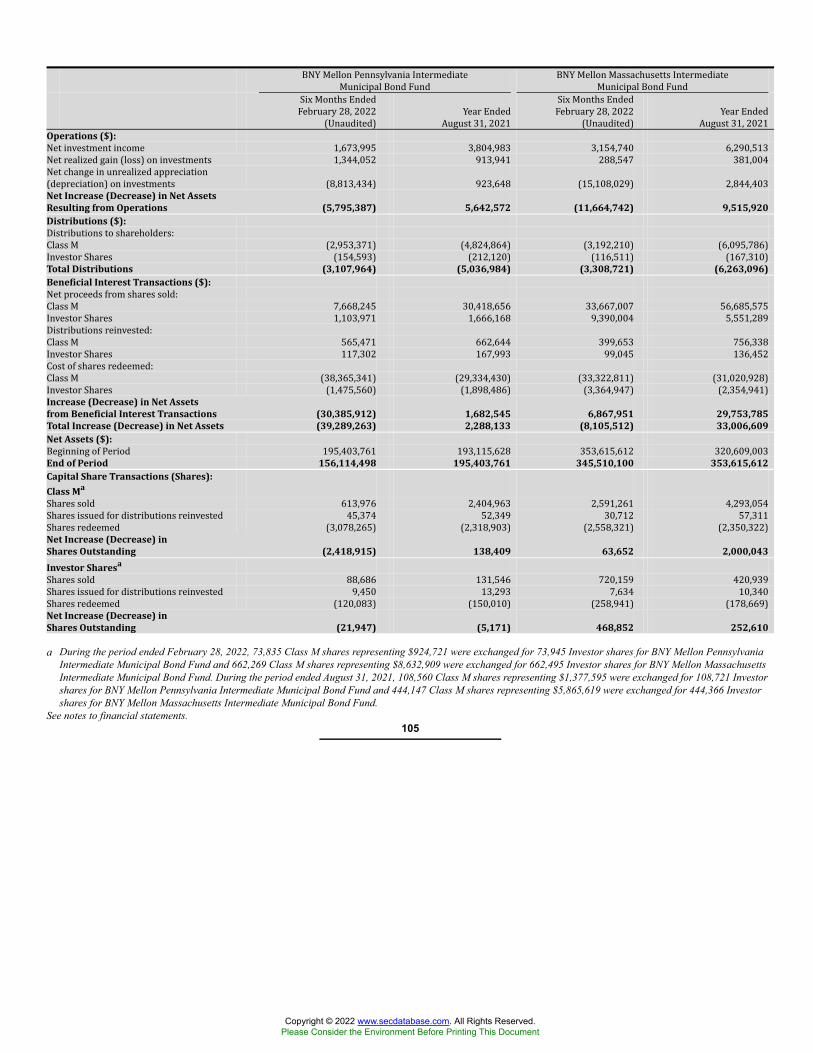
BNY Mellon Pennsylvania IntermediateMunicipal Bond Fund BNY Mellon Massachusetts IntermediateMunicipal Bond FundSix Months EndedFebruary 28, 2022(Unaudited) Year EndedAugust 31, 2021 Six Months EndedFebruary 28, 2022(Unaudited) Year EndedAugust 31, 2021Operations ($):Net investment income 1,673,995 3,804,983 3,154,740 6,290,513Net realized gain (loss) on investments 1,344,052 913,941 288,547 381,004Net change in unrealized appreciation(depreciation) on investments (8,813,434) 923,648 (15,108,029) 2,844,403Net Increase (Decrease) in Net AssetsResulting from Operations (5,795,387) 5,642,572 (11,664,742) 9,515,920Distributions ($):Distributions to shareholders:Class M (2,953,371) (4,824,864) (3,192,210) (6,095,786)Investor Shares (154,593) (212,120) (116,511) (167,310)Total Distributions (3,107,964) (5,036,984) (3,308,721) (6,263,096)Beneficial Interest Transactions ($):Net proceeds from shares sold:Class M 7,668,245 30,418,656 33,667,007 56,685,575Investor Shares 1,103,971 1,666,168 9,390,004 5,551,289Distributions reinvested:Class M 565,471 662,644 399,653 756,338Investor Shares 117,302 167,993 99,045 136,452Cost of shares redeemed:Class M (38,365,341) (29,334,430) (33,322,811) (31,020,928)Investor Shares (1,475,560) (1,898,486) (3,364,947) (2,354,941)Increase (Decrease) in Net Assetsfrom Beneficial Interest Transactions (30,385,912) 1,682,545 6,867,951 29,753,785Total Increase (Decrease) in Net Assets (39,289,263) 2,288,133 (8,105,512) 33,006,609Net Assets ($):Beginning of Period 195,403,761 193,115,628 353,615,612 320,609,003End of Period 156,114,498 195,403,761 345,510,100 353,615,612Capital Share Transactions (Shares):Class MaShares sold 613,976 2,404,963 2,591,261 4,293,054Shares issued for distributions reinvested 45,374 52,349 30,712 57,311Shares redeemed (3,078,265) (2,318,903) (2,558,321) (2,350,322)Net Increase (Decrease) inShares Outstanding (2,418,915) 138,409 63,652 2,000,043Investor SharesaShares sold 88,686 131,546 720,159 420,939Shares issued for distributions reinvested 9,450 13,293 7,634 10,340Shares redeemed (120,083) (150,010) (258,941) (178,669)Net Increase (Decrease) inShares Outstanding (21,947) (5,171) 468,852 252,610
a During the period ended February 28, 2022, 73,835 Class M shares representing $924,721 were exchanged for 73,945 Investor shares for BNY Mellon PennsylvaniaIntermediate Municipal Bond Fund and 662,269 Class M shares representing $8,632,909 were exchanged for 662,495 Investor shares for BNY Mellon MassachusettsIntermediate Municipal Bond Fund. During the period ended August 31, 2021, 108,560 Class M shares representing $1,377,595 were exchanged for 108,721 Investorshares for BNY Mellon Pennsylvania Intermediate Municipal Bond Fund and 444,147 Class M shares representing $5,865,619 were exchanged for 444,366 Investorshares for BNY Mellon Massachusetts Intermediate Municipal Bond Fund.
See notes to financial statements.105
Copyright © 2022 www.secdatabase.com. All Rights Reserved.Please Consider the Environment Before Printing This Document
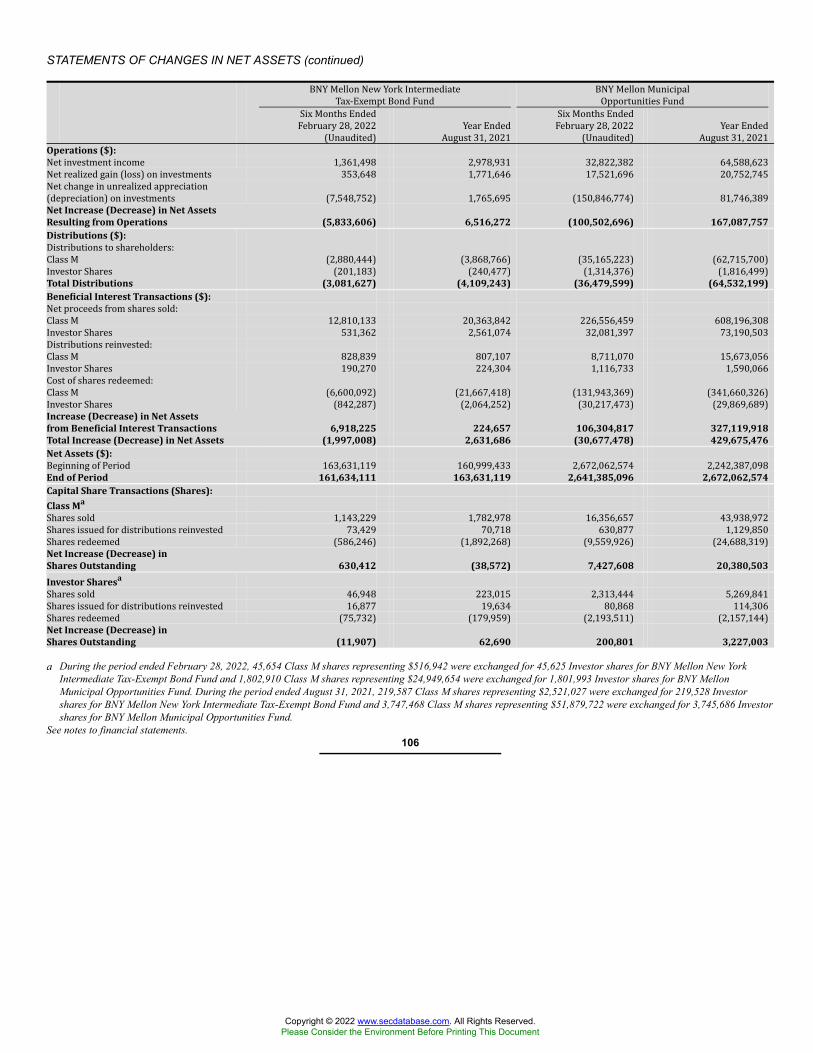
STATEMENTS OF CHANGES IN NET ASSETS (continued)
BNY Mellon New York IntermediateTax-Exempt Bond Fund BNY Mellon MunicipalOpportunities FundSix Months EndedFebruary 28, 2022(Unaudited) Year EndedAugust 31, 2021 Six Months EndedFebruary 28, 2022(Unaudited) Year EndedAugust 31, 2021Operations ($):Net investment income 1,361,498 2,978,931 32,822,382 64,588,623Net realized gain (loss) on investments 353,648 1,771,646 17,521,696 20,752,745Net change in unrealized appreciation(depreciation) on investments (7,548,752) 1,765,695 (150,846,774) 81,746,389Net Increase (Decrease) in Net AssetsResulting from Operations (5,833,606) 6,516,272 (100,502,696) 167,087,757Distributions ($):Distributions to shareholders:Class M (2,880,444) (3,868,766) (35,165,223) (62,715,700)Investor Shares (201,183) (240,477) (1,314,376) (1,816,499)Total Distributions (3,081,627) (4,109,243) (36,479,599) (64,532,199)Beneficial Interest Transactions ($):Net proceeds from shares sold:Class M 12,810,133 20,363,842 226,556,459 608,196,308Investor Shares 531,362 2,561,074 32,081,397 73,190,503Distributions reinvested:Class M 828,839 807,107 8,711,070 15,673,056Investor Shares 190,270 224,304 1,116,733 1,590,066Cost of shares redeemed:Class M (6,600,092) (21,667,418) (131,943,369) (341,660,326)Investor Shares (842,287) (2,064,252) (30,217,473) (29,869,689)Increase (Decrease) in Net Assetsfrom Beneficial Interest Transactions 6,918,225 224,657 106,304,817 327,119,918Total Increase (Decrease) in Net Assets (1,997,008) 2,631,686 (30,677,478) 429,675,476Net Assets ($):Beginning of Period 163,631,119 160,999,433 2,672,062,574 2,242,387,098End of Period 161,634,111 163,631,119 2,641,385,096 2,672,062,574Capital Share Transactions (Shares):Class MaShares sold 1,143,229 1,782,978 16,356,657 43,938,972Shares issued for distributions reinvested 73,429 70,718 630,877 1,129,850Shares redeemed (586,246) (1,892,268) (9,559,926) (24,688,319)Net Increase (Decrease) inShares Outstanding 630,412 (38,572) 7,427,608 20,380,503Investor SharesaShares sold 46,948 223,015 2,313,444 5,269,841Shares issued for distributions reinvested 16,877 19,634 80,868 114,306Shares redeemed (75,732) (179,959) (2,193,511) (2,157,144)Net Increase (Decrease) inShares Outstanding (11,907) 62,690 200,801 3,227,003
a During the period ended February 28, 2022, 45,654 Class M shares representing $516,942 were exchanged for 45,625 Investor shares for BNY Mellon New YorkIntermediate Tax-Exempt Bond Fund and 1,802,910 Class M shares representing $24,949,654 were exchanged for 1,801,993 Investor shares for BNY MellonMunicipal Opportunities Fund. During the period ended August 31, 2021, 219,587 Class M shares representing $2,521,027 were exchanged for 219,528 Investorshares for BNY Mellon New York Intermediate Tax-Exempt Bond Fund and 3,747,468 Class M shares representing $51,879,722 were exchanged for 3,745,686 Investorshares for BNY Mellon Municipal Opportunities Fund.
See notes to financial statements.106
Copyright © 2022 www.secdatabase.com. All Rights Reserved.Please Consider the Environment Before Printing This Document
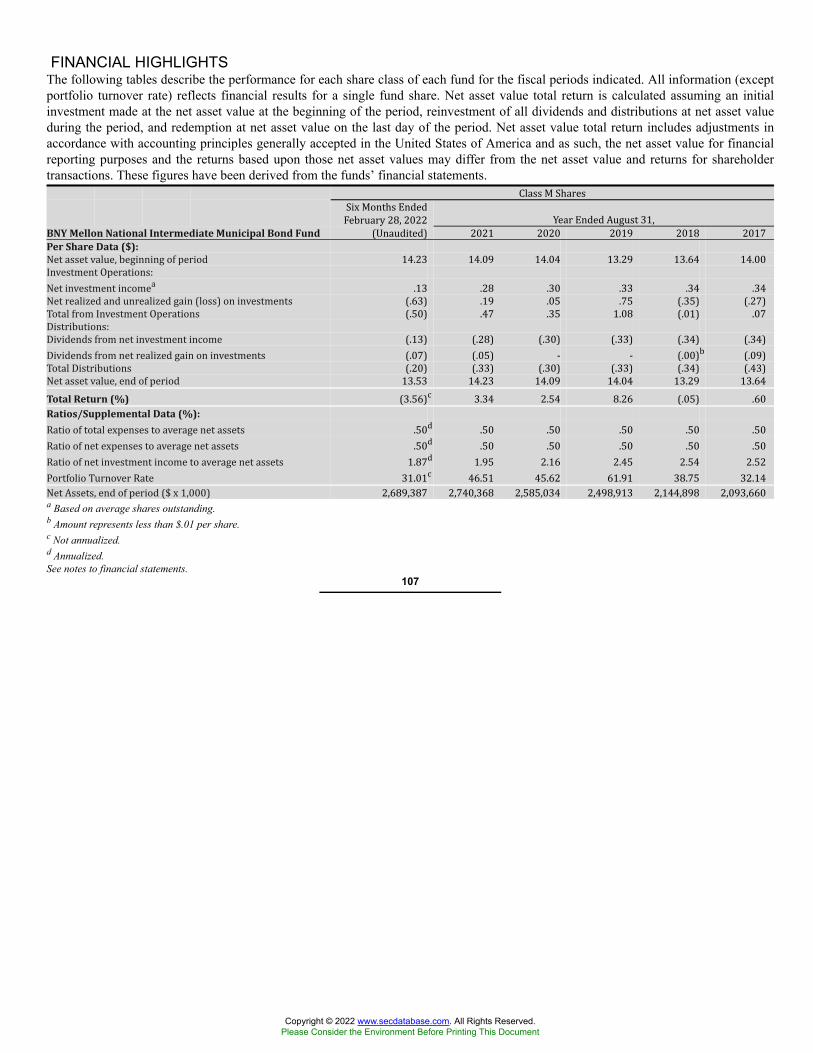
FINANCIAL HIGHLIGHTSThe following tables describe the performance for each share class of each fund for the fiscal periods indicated. All information (exceptportfolio turnover rate) reflects financial results for a single fund share. Net asset value total return is calculated assuming an initialinvestment made at the net asset value at the beginning of the period, reinvestment of all dividends and distributions at net asset valueduring the period, and redemption at net asset value on the last day of the period. Net asset value total return includes adjustments inaccordance with accounting principles generally accepted in the United States of America and as such, the net asset value for financialreporting purposes and the returns based upon those net asset values may differ from the net asset value and returns for shareholdertransactions. These figures have been derived from the funds’ financial statements. Class M SharesSix Months EndedFebruary 28, 2022 Year Ended August 31,BNY Mellon National Intermediate Municipal Bond Fund (Unaudited) 2021 2020 2019 2018 2017Per Share Data ($):Net asset value, beginning of period 14.23 14.09 14.04 13.29 13.64 14.00Investment Operations:Net investment incomea .13 .28 .30 .33 .34 .34Net realized and unrealized gain (loss) on investments (.63) .19 .05 .75 (.35) (.27)Total from Investment Operations (.50) .47 .35 1.08 (.01) .07Distributions:Dividends from net investment income (.13) (.28) (.30) (.33) (.34) (.34)Dividends from net realized gain on investments (.07) (.05) - - (.00)b (.09)Total Distributions (.20) (.33) (.30) (.33) (.34) (.43)Net asset value, end of period 13.53 14.23 14.09 14.04 13.29 13.64Total Return (%) (3.56)c 3.34 2.54 8.26 (.05) .60Ratios/Supplemental Data (%):Ratio of total expenses to average net assets .50d .50 .50 .50 .50 .50Ratio of net expenses to average net assets .50d .50 .50 .50 .50 .50Ratio of net investment income to average net assets 1.87d 1.95 2.16 2.45 2.54 2.52Portfolio Turnover Rate 31.01c 46.51 45.62 61.91 38.75 32.14Net Assets, end of period ($ x 1,000) 2,689,387 2,740,368 2,585,034 2,498,913 2,144,898 2,093,660a Based on average shares outstanding.b Amount represents less than $.01 per share.c Not annualized.d Annualized.See notes to financial statements.
107
Copyright © 2022 www.secdatabase.com. All Rights Reserved.Please Consider the Environment Before Printing This Document
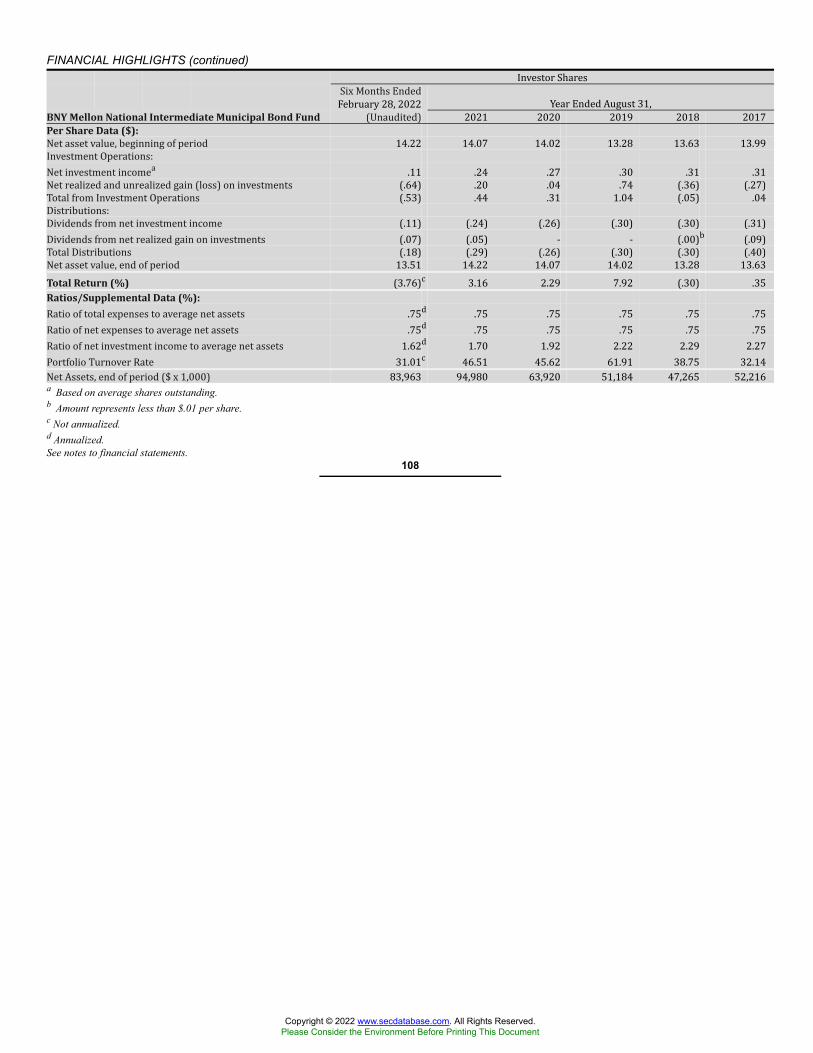
FINANCIAL HIGHLIGHTS (continued) Investor SharesSix Months EndedFebruary 28, 2022 Year Ended August 31,BNY Mellon National Intermediate Municipal Bond Fund (Unaudited) 2021 2020 2019 2018 2017Per Share Data ($):Net asset value, beginning of period 14.22 14.07 14.02 13.28 13.63 13.99Investment Operations:Net investment incomea .11 .24 .27 .30 .31 .31Net realized and unrealized gain (loss) on investments (.64) .20 .04 .74 (.36) (.27)Total from Investment Operations (.53) .44 .31 1.04 (.05) .04Distributions:Dividends from net investment income (.11) (.24) (.26) (.30) (.30) (.31)Dividends from net realized gain on investments (.07) (.05) - - (.00)b (.09)Total Distributions (.18) (.29) (.26) (.30) (.30) (.40)Net asset value, end of period 13.51 14.22 14.07 14.02 13.28 13.63Total Return (%) (3.76)c 3.16 2.29 7.92 (.30) .35Ratios/Supplemental Data (%):Ratio of total expenses to average net assets .75d .75 .75 .75 .75 .75Ratio of net expenses to average net assets .75d .75 .75 .75 .75 .75Ratio of net investment income to average net assets 1.62d 1.70 1.92 2.22 2.29 2.27Portfolio Turnover Rate 31.01c 46.51 45.62 61.91 38.75 32.14Net Assets, end of period ($ x 1,000) 83,963 94,980 63,920 51,184 47,265 52,216a Based on average shares outstanding.b Amount represents less than $.01 per share.c Not annualized.d Annualized.See notes to financial statements.
108
Copyright © 2022 www.secdatabase.com. All Rights Reserved.Please Consider the Environment Before Printing This Document
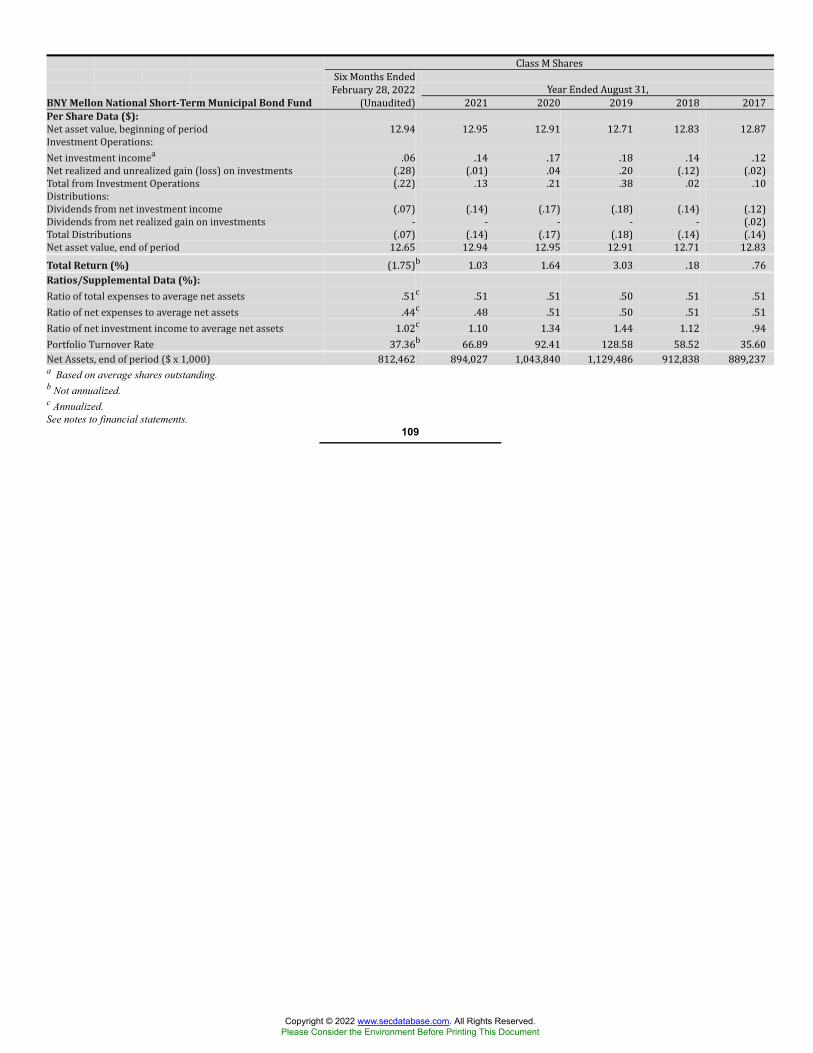
Class M SharesSix Months EndedFebruary 28, 2022 Year Ended August 31,BNY Mellon National Short-Term Municipal Bond Fund (Unaudited) 2021 2020 2019 2018 2017Per Share Data ($):Net asset value, beginning of period 12.94 12.95 12.91 12.71 12.83 12.87Investment Operations:Net investment incomea .06 .14 .17 .18 .14 .12Net realized and unrealized gain (loss) on investments (.28) (.01) .04 .20 (.12) (.02)Total from Investment Operations (.22) .13 .21 .38 .02 .10Distributions:Dividends from net investment income (.07) (.14) (.17) (.18) (.14) (.12)Dividends from net realized gain on investments - - - - - (.02)Total Distributions (.07) (.14) (.17) (.18) (.14) (.14)Net asset value, end of period 12.65 12.94 12.95 12.91 12.71 12.83Total Return (%) (1.75)b 1.03 1.64 3.03 .18 .76Ratios/Supplemental Data (%):Ratio of total expenses to average net assets .51c .51 .51 .50 .51 .51Ratio of net expenses to average net assets .44c .48 .51 .50 .51 .51Ratio of net investment income to average net assets 1.02c 1.10 1.34 1.44 1.12 .94Portfolio Turnover Rate 37.36b 66.89 92.41 128.58 58.52 35.60Net Assets, end of period ($ x 1,000) 812,462 894,027 1,043,840 1,129,486 912,838 889,237a Based on average shares outstanding.b Not annualized.c Annualized.See notes to financial statements.
109
Copyright © 2022 www.secdatabase.com. All Rights Reserved.Please Consider the Environment Before Printing This Document
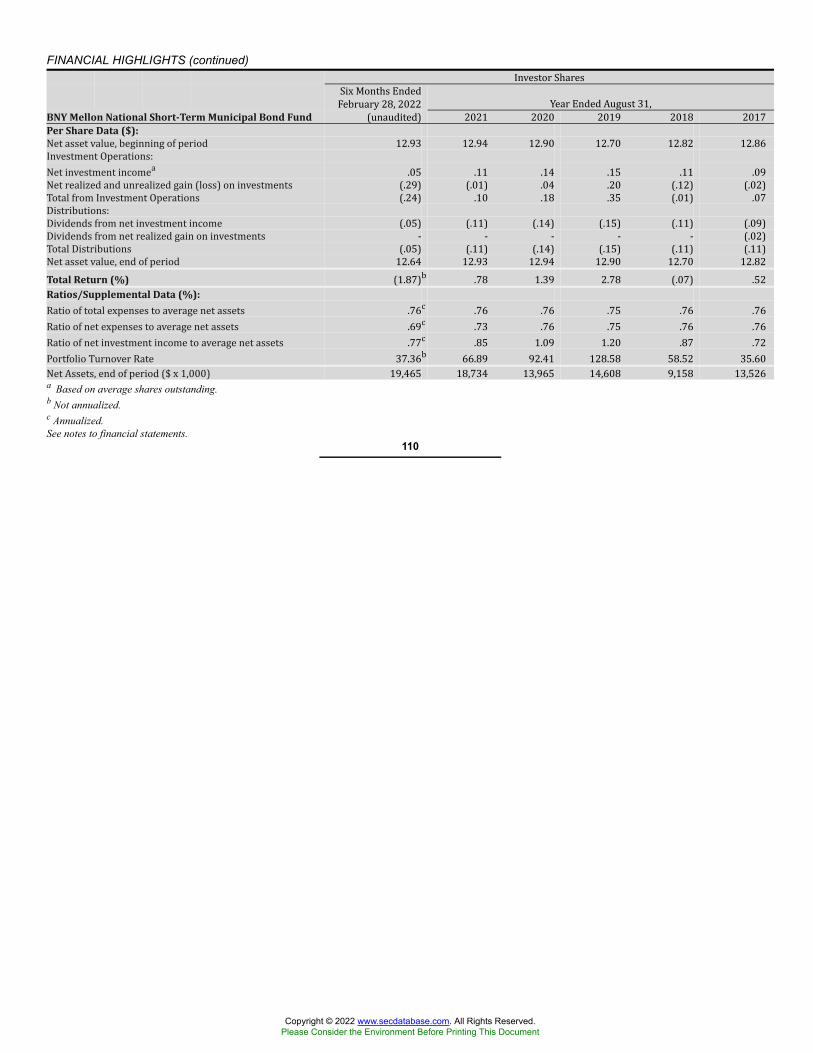
FINANCIAL HIGHLIGHTS (continued) Investor SharesSix Months EndedFebruary 28, 2022 Year Ended August 31,BNY Mellon National Short-Term Municipal Bond Fund (unaudited) 2021 2020 2019 2018 2017Per Share Data ($):Net asset value, beginning of period 12.93 12.94 12.90 12.70 12.82 12.86Investment Operations:Net investment incomea .05 .11 .14 .15 .11 .09Net realized and unrealized gain (loss) on investments (.29) (.01) .04 .20 (.12) (.02)Total from Investment Operations (.24) .10 .18 .35 (.01) .07Distributions:Dividends from net investment income (.05) (.11) (.14) (.15) (.11) (.09)Dividends from net realized gain on investments - - - - - (.02)Total Distributions (.05) (.11) (.14) (.15) (.11) (.11)Net asset value, end of period 12.64 12.93 12.94 12.90 12.70 12.82Total Return (%) (1.87)b .78 1.39 2.78 (.07) .52Ratios/Supplemental Data (%):Ratio of total expenses to average net assets .76c .76 .76 .75 .76 .76Ratio of net expenses to average net assets .69c .73 .76 .75 .76 .76Ratio of net investment income to average net assets .77c .85 1.09 1.20 .87 .72Portfolio Turnover Rate 37.36b 66.89 92.41 128.58 58.52 35.60Net Assets, end of period ($ x 1,000) 19,465 18,734 13,965 14,608 9,158 13,526a Based on average shares outstanding.b Not annualized.c Annualized.See notes to financial statements.
110
Copyright © 2022 www.secdatabase.com. All Rights Reserved.Please Consider the Environment Before Printing This Document

Class M SharesSix Months EndedFebruary 28, 2022 Year Ended August 31,BNY Mellon Pennsylvania Intermediate Municipal Bond Fund (Unaudited) 2021 2020 2019 2018 2017Per Share Data ($):Net asset value, beginning of period 12.69 12.65 12.61 11.95 12.24 12.68Investment Operations:Net investment incomea .12 .24 .27 .29 .29 .30Net realized and unrealized gain (loss) on investments (.53) .12 .06 .66 (.27) (.24)Total from Investment Operations (.41) .36 .33 .95 .02 .06Distributions:Dividends from net investment income (.12) (.24) (.27) (.29) (.29) (.30)Dividends from net realized gain on investments (.11) (.08) (.02) - (.02) (.20)Total Distributions (.23) (.32) (.29) (.29) (.31) (.50)Net asset value, end of period 12.05 12.69 12.65 12.61 11.95 12.24Total Return (%) (3.31)b 2.91 2.68 8.09 .22 .55Ratios/Supplemental Data (%):Ratio of total expenses to average net assets .71c .71 .72 .70 .70 .70Ratio of net expenses to average net assets .59c .66 .71 .70 .70 .70Ratio of net investment income to average net assets 1.92c 1.93 2.15 2.41 2.44 2.44Portfolio Turnover Rate 28.15b 47.09 51.36 69.91 38.13 20.07Net Assets, end of period ($ x 1,000) 147,627 186,186 183,861 191,702 184,216 209,457a Based on average shares outstanding.b Not annualized.c Annualized.See notes to financial statements.
111
Copyright © 2022 www.secdatabase.com. All Rights Reserved.Please Consider the Environment Before Printing This Document

FINANCIAL HIGHLIGHTS (continued) Investor SharesSix Months EndedFebruary 28, 2022 Year Ended August 31,BNY Mellon Pennsylvania Intermediate Municipal Bond Fund (Unaudited) 2021 2020 2019 2018 2017Per Share Data ($):Net asset value, beginning of period 12.67 12.63 12.59 11.93 12.23 12.67Investment Operations:Net investment incomea .10 .21 .24 .26 .27 .27Net realized and unrealized gain (loss) on investments (.53) .12 .06 .66 (.29) (.24)Total from Investment Operations (.43) .33 .30 .92 (.02) .03Distributions:Dividends from net investment income (.10) (.21) (.24) (.26) (.26) (.27)Dividends from net realized gain on investments (.11) (.08) (.02) - (.02) (.20)Total Distributions (.21) (.29) (.26) (.26) (.28) (.47)Net asset value, end of period 12.03 12.67 12.63 12.59 11.93 12.23Total Return (%) (3.44)b 2.65 2.43 7.83 (.12) .30Ratios/Supplemental Data (%):Ratio of total expenses to average net assets .96c .96 .97 .95 .95 .95Ratio of net expenses to average net assets .84c .91 .97 .95 .95 .95Ratio of net investment income to average net assets 1.67c 1.68 1.90 2.15 2.19 2.20Portfolio Turnover Rate 28.15b 47.09 51.36 69.91 38.13 20.07Net Assets, end of period ($ x 1,000) 8,487 9,218 9,255 8,063 5,473 5,043a Based on average shares outstanding.b Not annualized.c Annualized.See notes to financial statements.
112
Copyright © 2022 www.secdatabase.com. All Rights Reserved.Please Consider the Environment Before Printing This Document
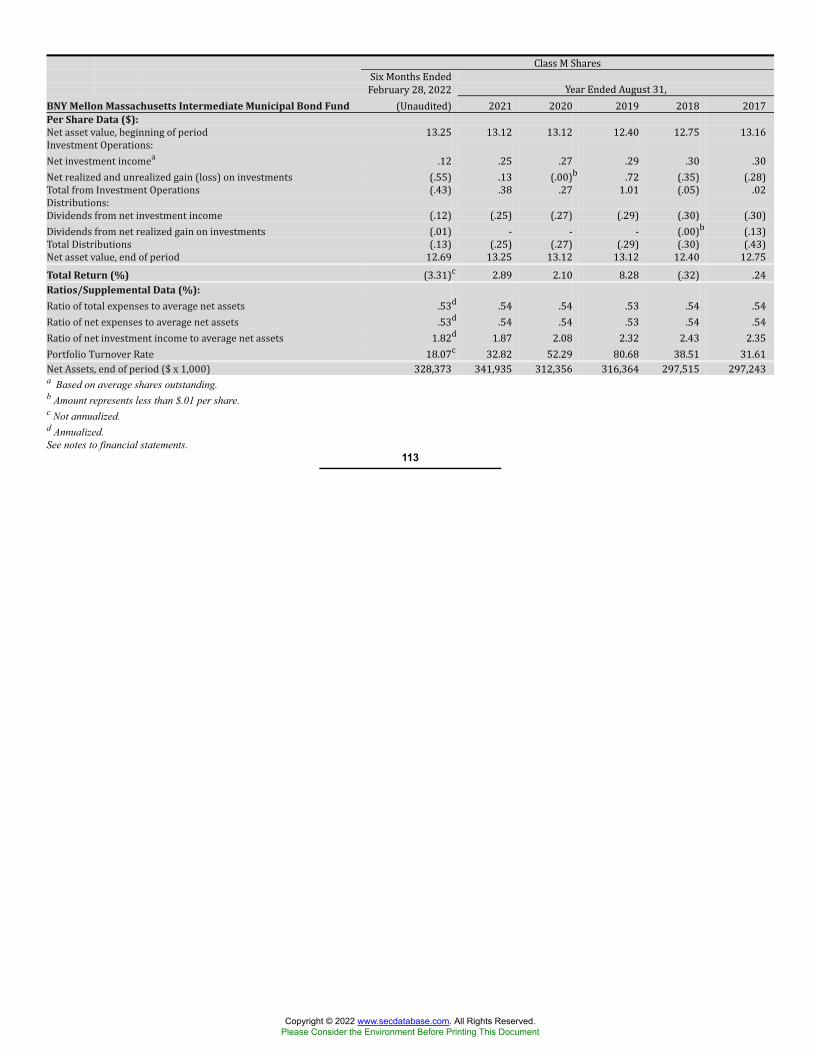
Class M SharesSix Months EndedFebruary 28, 2022 Year Ended August 31,BNY Mellon Massachusetts Intermediate Municipal Bond Fund (Unaudited) 2021 2020 2019 2018 2017Per Share Data ($):Net asset value, beginning of period 13.25 13.12 13.12 12.40 12.75 13.16Investment Operations:Net investment incomea .12 .25 .27 .29 .30 .30Net realized and unrealized gain (loss) on investments (.55) .13 (.00)b .72 (.35) (.28)Total from Investment Operations (.43) .38 .27 1.01 (.05) .02Distributions:Dividends from net investment income (.12) (.25) (.27) (.29) (.30) (.30)Dividends from net realized gain on investments (.01) - - - (.00)b (.13)Total Distributions (.13) (.25) (.27) (.29) (.30) (.43)Net asset value, end of period 12.69 13.25 13.12 13.12 12.40 12.75Total Return (%) (3.31)c 2.89 2.10 8.28 (.32) .24Ratios/Supplemental Data (%):Ratio of total expenses to average net assets .53d .54 .54 .53 .54 .54Ratio of net expenses to average net assets .53d .54 .54 .53 .54 .54Ratio of net investment income to average net assets 1.82d 1.87 2.08 2.32 2.43 2.35Portfolio Turnover Rate 18.07c 32.82 52.29 80.68 38.51 31.61Net Assets, end of period ($ x 1,000) 328,373 341,935 312,356 316,364 297,515 297,243a Based on average shares outstanding.b Amount represents less than $.01 per share.c Not annualized.d Annualized.See notes to financial statements.
113
Copyright © 2022 www.secdatabase.com. All Rights Reserved.Please Consider the Environment Before Printing This Document

FINANCIAL HIGHLIGHTS (continued) Investor SharesSix Months EndedFebruary 28, 2022 Year Ended August 31,BNY Mellon Massachusetts Intermediate Municipal Bond Fund (Unaudited) 2021 2020 2019 2018 2017Per Share Data ($):Net asset value, beginning of period 13.24 13.11 13.11 12.40 12.75 13.15Investment Operations:Net investment incomea .10 .21 .24 .26 .27 .27Net realized and unrealized gain (loss) on investments (.54) .13 (.00)b .71 (.35) (.27)Total from Investment Operations (.44) .34 .24 .97 (.08) -Distributions:Dividends from net investment income (.10) (.21) (.24) (.26) (.27) (.27)Dividends from net realized gain on investments (.01) - - - (.00)b (.13)Total Distributions (.11) (.21) (.24) (.26) (.27) (.40)Net asset value, end of period 12.69 13.24 13.11 13.11 12.40 12.75Total Return (%) (3.36)c 2.56 1.92 7.93 (.56) .06Ratios/Supplemental Data (%):Ratio of total expenses to average net assets .78d .79 .79 .78 .79 .79Ratio of net expenses to average net assets .78d .79 .79 .78 .79 .79Ratio of net investment income to average net assets 1.58d 1.62 1.83 2.08 2.18 2.12Portfolio Turnover Rate 18.07c 32.82 52.29 80.68 38.51 31.61Net Assets, end of period ($ x 1,000) 17,137 11,680 8,253 7,437 7,046 9,395a Based on average shares outstanding.b Amount represents less than $.01 per share.c Not annualized.d Annualized.See notes to financial statements.
114
Copyright © 2022 www.secdatabase.com. All Rights Reserved.Please Consider the Environment Before Printing This Document
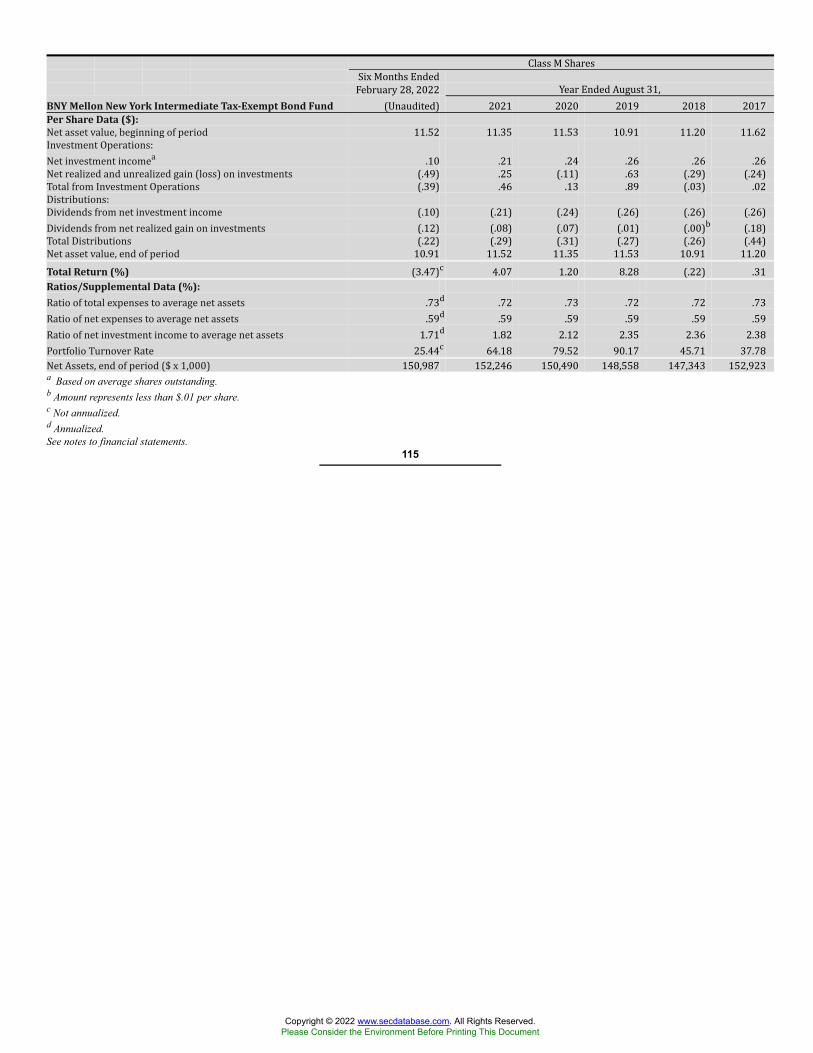
Class M SharesSix Months EndedFebruary 28, 2022 Year Ended August 31,BNY Mellon New York Intermediate Tax-Exempt Bond Fund (Unaudited) 2021 2020 2019 2018 2017Per Share Data ($):Net asset value, beginning of period 11.52 11.35 11.53 10.91 11.20 11.62Investment Operations:Net investment incomea .10 .21 .24 .26 .26 .26Net realized and unrealized gain (loss) on investments (.49) .25 (.11) .63 (.29) (.24)Total from Investment Operations (.39) .46 .13 .89 (.03) .02Distributions:Dividends from net investment income (.10) (.21) (.24) (.26) (.26) (.26)Dividends from net realized gain on investments (.12) (.08) (.07) (.01) (.00)b (.18)Total Distributions (.22) (.29) (.31) (.27) (.26) (.44)Net asset value, end of period 10.91 11.52 11.35 11.53 10.91 11.20Total Return (%) (3.47)c 4.07 1.20 8.28 (.22) .31Ratios/Supplemental Data (%):Ratio of total expenses to average net assets .73d .72 .73 .72 .72 .73Ratio of net expenses to average net assets .59d .59 .59 .59 .59 .59Ratio of net investment income to average net assets 1.71d 1.82 2.12 2.35 2.36 2.38Portfolio Turnover Rate 25.44c 64.18 79.52 90.17 45.71 37.78Net Assets, end of period ($ x 1,000) 150,987 152,246 150,490 148,558 147,343 152,923a Based on average shares outstanding.b Amount represents less than $.01 per share.c Not annualized.d Annualized.See notes to financial statements.
115
Copyright © 2022 www.secdatabase.com. All Rights Reserved.Please Consider the Environment Before Printing This Document
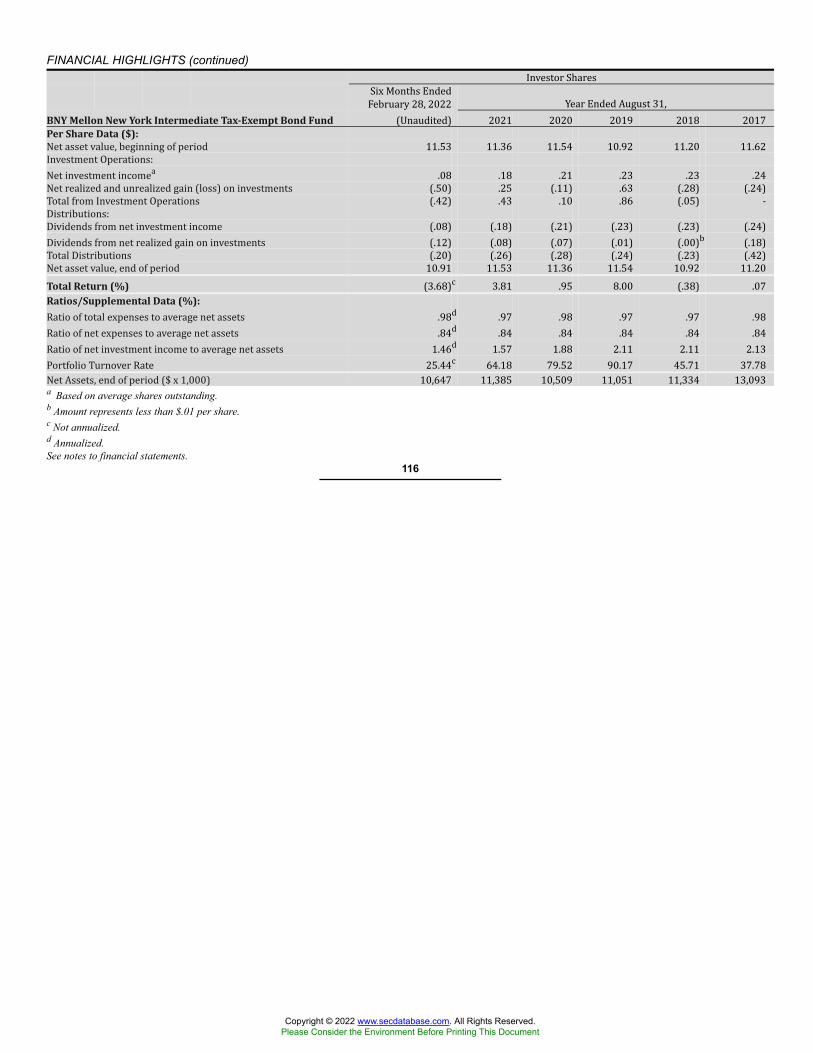
FINANCIAL HIGHLIGHTS (continued) Investor SharesSix Months EndedFebruary 28, 2022 Year Ended August 31,BNY Mellon New York Intermediate Tax-Exempt Bond Fund (Unaudited) 2021 2020 2019 2018 2017Per Share Data ($):Net asset value, beginning of period 11.53 11.36 11.54 10.92 11.20 11.62Investment Operations:Net investment incomea .08 .18 .21 .23 .23 .24Net realized and unrealized gain (loss) on investments (.50) .25 (.11) .63 (.28) (.24)Total from Investment Operations (.42) .43 .10 .86 (.05) -Distributions:Dividends from net investment income (.08) (.18) (.21) (.23) (.23) (.24)Dividends from net realized gain on investments (.12) (.08) (.07) (.01) (.00)b (.18)Total Distributions (.20) (.26) (.28) (.24) (.23) (.42)Net asset value, end of period 10.91 11.53 11.36 11.54 10.92 11.20Total Return (%) (3.68)c 3.81 .95 8.00 (.38) .07Ratios/Supplemental Data (%):Ratio of total expenses to average net assets .98d .97 .98 .97 .97 .98Ratio of net expenses to average net assets .84d .84 .84 .84 .84 .84Ratio of net investment income to average net assets 1.46d 1.57 1.88 2.11 2.11 2.13Portfolio Turnover Rate 25.44c 64.18 79.52 90.17 45.71 37.78Net Assets, end of period ($ x 1,000) 10,647 11,385 10,509 11,051 11,334 13,093a Based on average shares outstanding.b Amount represents less than $.01 per share.c Not annualized.d Annualized.See notes to financial statements.
116
Copyright © 2022 www.secdatabase.com. All Rights Reserved.Please Consider the Environment Before Printing This Document
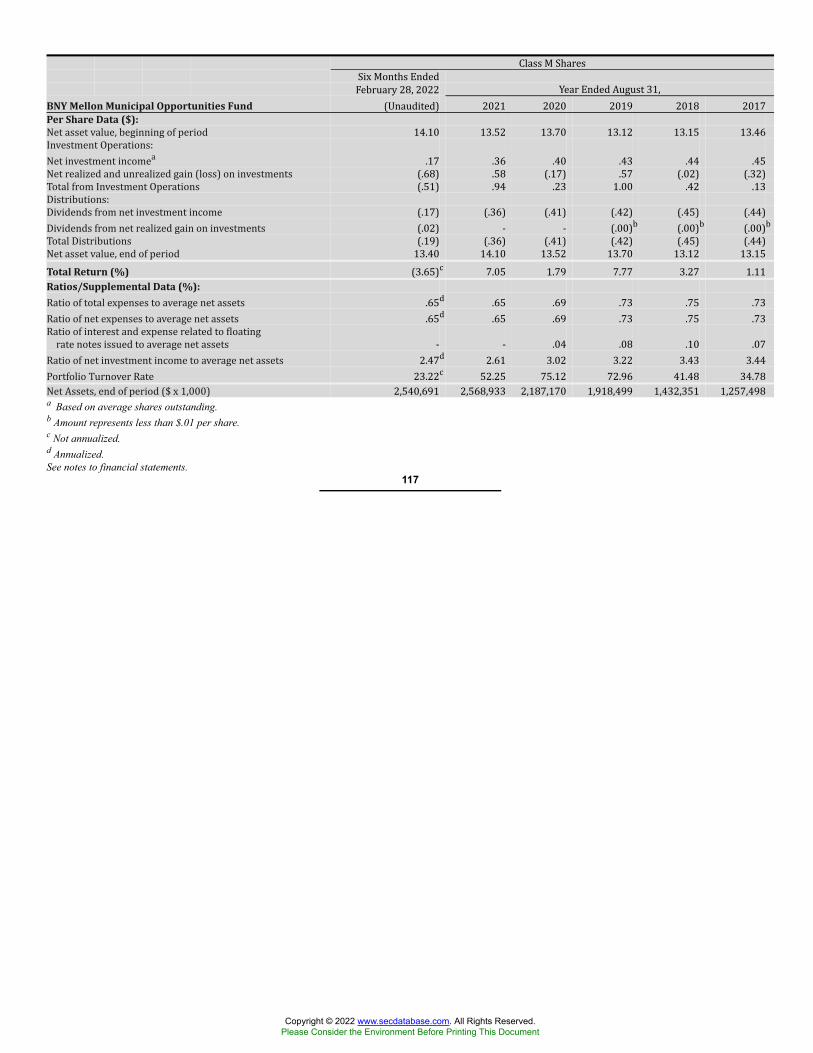
Class M SharesSix Months EndedFebruary 28, 2022 Year Ended August 31,BNY Mellon Municipal Opportunities Fund (Unaudited) 2021 2020 2019 2018 2017Per Share Data ($):Net asset value, beginning of period 14.10 13.52 13.70 13.12 13.15 13.46Investment Operations:Net investment incomea .17 .36 .40 .43 .44 .45Net realized and unrealized gain (loss) on investments (.68) .58 (.17) .57 (.02) (.32)Total from Investment Operations (.51) .94 .23 1.00 .42 .13Distributions:Dividends from net investment income (.17) (.36) (.41) (.42) (.45) (.44)Dividends from net realized gain on investments (.02) - - (.00)b (.00)b (.00)bTotal Distributions (.19) (.36) (.41) (.42) (.45) (.44)Net asset value, end of period 13.40 14.10 13.52 13.70 13.12 13.15Total Return (%) (3.65)c 7.05 1.79 7.77 3.27 1.11Ratios/Supplemental Data (%):Ratio of total expenses to average net assets .65d .65 .69 .73 .75 .73Ratio of net expenses to average net assets .65d .65 .69 .73 .75 .73Ratio of interest and expense related to floatingrate notes issued to average net assets - - .04 .08 .10 .07Ratio of net investment income to average net assets 2.47d 2.61 3.02 3.22 3.43 3.44Portfolio Turnover Rate 23.22c 52.25 75.12 72.96 41.48 34.78Net Assets, end of period ($ x 1,000) 2,540,691 2,568,933 2,187,170 1,918,499 1,432,351 1,257,498a Based on average shares outstanding.b Amount represents less than $.01 per share.c Not annualized.d Annualized.See notes to financial statements.
117
Copyright © 2022 www.secdatabase.com. All Rights Reserved.Please Consider the Environment Before Printing This Document
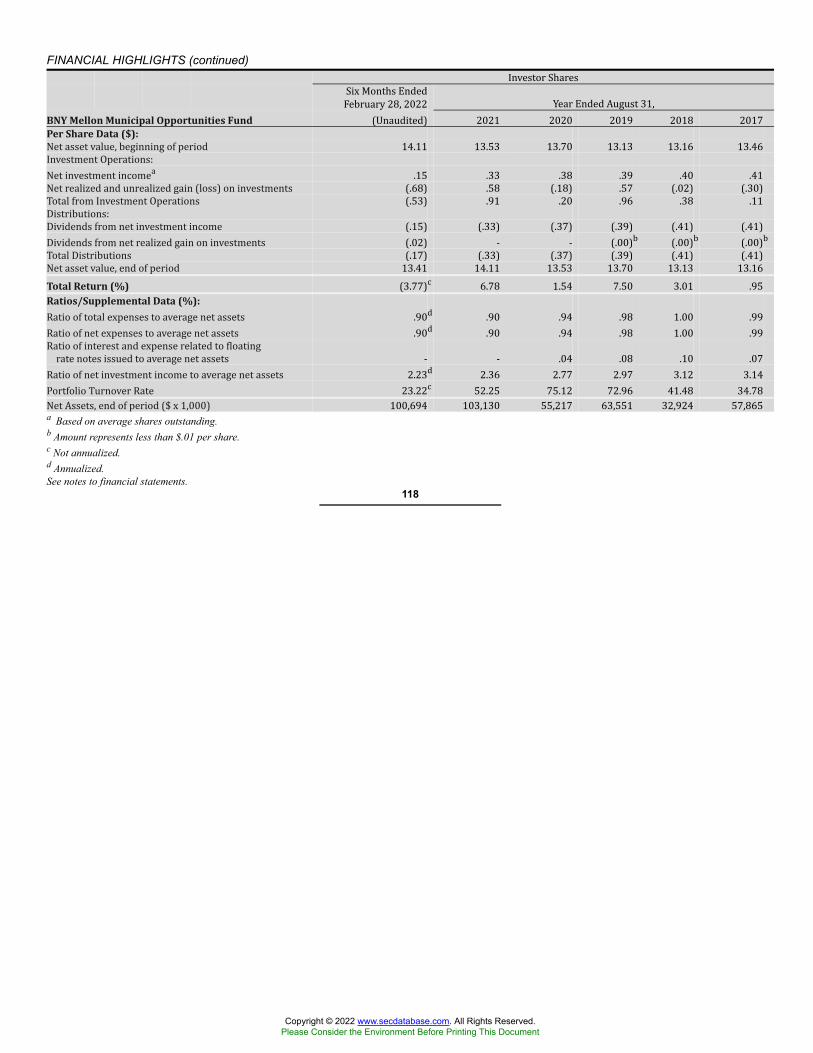
FINANCIAL HIGHLIGHTS (continued) Investor SharesSix Months EndedFebruary 28, 2022 Year Ended August 31,BNY Mellon Municipal Opportunities Fund (Unaudited) 2021 2020 2019 2018 2017Per Share Data ($):Net asset value, beginning of period 14.11 13.53 13.70 13.13 13.16 13.46Investment Operations:Net investment incomea .15 .33 .38 .39 .40 .41Net realized and unrealized gain (loss) on investments (.68) .58 (.18) .57 (.02) (.30)Total from Investment Operations (.53) .91 .20 .96 .38 .11Distributions:Dividends from net investment income (.15) (.33) (.37) (.39) (.41) (.41)Dividends from net realized gain on investments (.02) - - (.00)b (.00)b (.00)bTotal Distributions (.17) (.33) (.37) (.39) (.41) (.41)Net asset value, end of period 13.41 14.11 13.53 13.70 13.13 13.16Total Return (%) (3.77)c 6.78 1.54 7.50 3.01 .95Ratios/Supplemental Data (%):Ratio of total expenses to average net assets .90d .90 .94 .98 1.00 .99Ratio of net expenses to average net assets .90d .90 .94 .98 1.00 .99Ratio of interest and expense related to floatingrate notes issued to average net assets - - .04 .08 .10 .07Ratio of net investment income to average net assets 2.23d 2.36 2.77 2.97 3.12 3.14Portfolio Turnover Rate 23.22c 52.25 75.12 72.96 41.48 34.78Net Assets, end of period ($ x 1,000) 100,694 103,130 55,217 63,551 32,924 57,865a Based on average shares outstanding.b Amount represents less than $.01 per share.c Not annualized.d Annualized.See notes to financial statements.
118
Copyright © 2022 www.secdatabase.com. All Rights Reserved.Please Consider the Environment Before Printing This Document
NOTES TO FINANCIAL STATEMENTS (Unaudited)NOTE 1—Significant Accounting Policies:BNY Mellon Funds Trust (the “Trust”), a Massachusetts business trust that is registered under the Investment Company Actof 1940, as amended (the “Act”), as an open-end management investment company, operates as a series company currentlyconsisting of twenty-one series, including the following diversified funds: BNY Mellon National Intermediate Municipal BondFund, BNY Mellon National Short-Term Municipal Bond Fund, BNY Mellon Pennsylvania Intermediate Municipal Bond Fund,BNY Mellon Massachusetts Intermediate Municipal Bond Fund, BNY Mellon New York Intermediate Tax-Exempt Bond Fundand BNY Mellon Municipal Opportunities Fund (each, a “fund” and collectively, the “funds”). The objectives of the funds areas follows: BNY Mellon National Intermediate Municipal Bond Fund and BNY Mellon National Short-Term MunicipalBond Fund seek to maximize current income exempt from federal income tax to the extent consistent with the preservationof capital. BNY Mellon Pennsylvania Intermediate Municipal Bond Fund seeks as high a level of income exempt fromfederal and Pennsylvania state income taxes as is consistent with the preservation of capital. BNY Mellon MassachusettsIntermediate Municipal Bond Fund seeks as high a level of income exempt from federal and Massachusetts state incometaxes as is consistent with the preservation of capital. BNY Mellon New York Intermediate Tax-Exempt Bond Fund seeks ashigh a level of current income exempt from federal, New York state and New York city income taxes as is consistent with thepreservation of capital. BNY Mellon Municipal Opportunities Fund seeks to maximize total return consisting of high currentincome exempt from federal income tax and capital appreciation.BNY Mellon Investment Adviser, Inc. (the “Adviser”), a wholly-owned subsidiary of The Bank of New York Mellon Corporation(“BNY Mellon”), serves as each fund’s investment adviser. BNY Mellon, serves as administrator for the funds pursuant to anAdministration Agreement with the Trust (the “Administration Agreement”). BNY Mellon has entered into a Sub-AdministrationAgreement with the Adviser pursuant to which BNY Mellon pays the Adviser for performing certain administrative services. BNYMellon Securities Corporation (the “Distributor”), a wholly-owned subsidiary of the Adviser, is the distributor of each fund’sshares, which are sold without a sales charge.Each fund is authorized to issue an unlimited number of $.001 par value shares of Beneficial Interest in each of the followingclasses of shares: Class M and Investor. Each class of shares has identical rights and privileges, except with respect to theShareholder Service Plan and the expenses borne by each class, the allocation of certain transfer agency costs and certain votingrights. Income, expenses (other than expenses attributable to a specific class), and realized and unrealized gains or losses oninvestments are allocated to each class of shares based on its relative net assets.The Trust accounts separately for the assets, liabilities and operations of each series. Expenses directly attributable to each seriesare charged to that series’ operations; expenses which are applicable to all series are allocated among them on a pro rata basis.The Financial Accounting Standards Board (“FASB”) Accounting Standards Codification (“ASC”) is the exclusive reference ofauthoritative U.S. generally accepted accounting principles (“GAAP”) recognized by the FASB to be applied by nongovernmentalentities. Rules and interpretive releases of the SEC under authority of federal laws are also sources of authoritative GAAP for SECregistrants. Each fund is an investment company and applies the accounting and reporting guidance of the FASB ASC Topic 946Financial Services-Investment Companies. Each fund’s financial statements are prepared in accordance with GAAP, which mayrequire the use of management estimates and assumptions. Actual results could differ from those estimates.The Trust enter into contracts that contain a variety of indemnifications. The funds’ maximum exposure under these arrangementsis unknown. The funds do not anticipate recognizing any loss related to these arrangements.(a) Portfolio valuation: The fair value of a financial instrument is the amount that would be received to sell an asset or paidto transfer a liability in an orderly transaction between market participants at the measurement date (i.e., the exit price). GAAPestablishes a fair value hierarchy that prioritizes the inputs of valuation techniques used to measure fair value. This hierarchy givesthe highest priority to unadjusted quoted prices in active markets for identical assets or liabilities (Level 1 measurements) and thelowest priority to unobservable inputs (Level 3 measurements).Additionally, GAAP provides guidance on determining whether the volume and activity in a market has decreased significantlyand whether such a decrease in activity results in transactions that are not orderly. GAAP requires enhanced disclosures aroundvaluation inputs and techniques used during annual and interim periods.Various inputs are used in determining the value of each fund’s investments relating to fair value measurements. These inputs aresummarized in the three broad levels listed below:
119
Copyright © 2022 www.secdatabase.com. All Rights Reserved.Please Consider the Environment Before Printing This Document
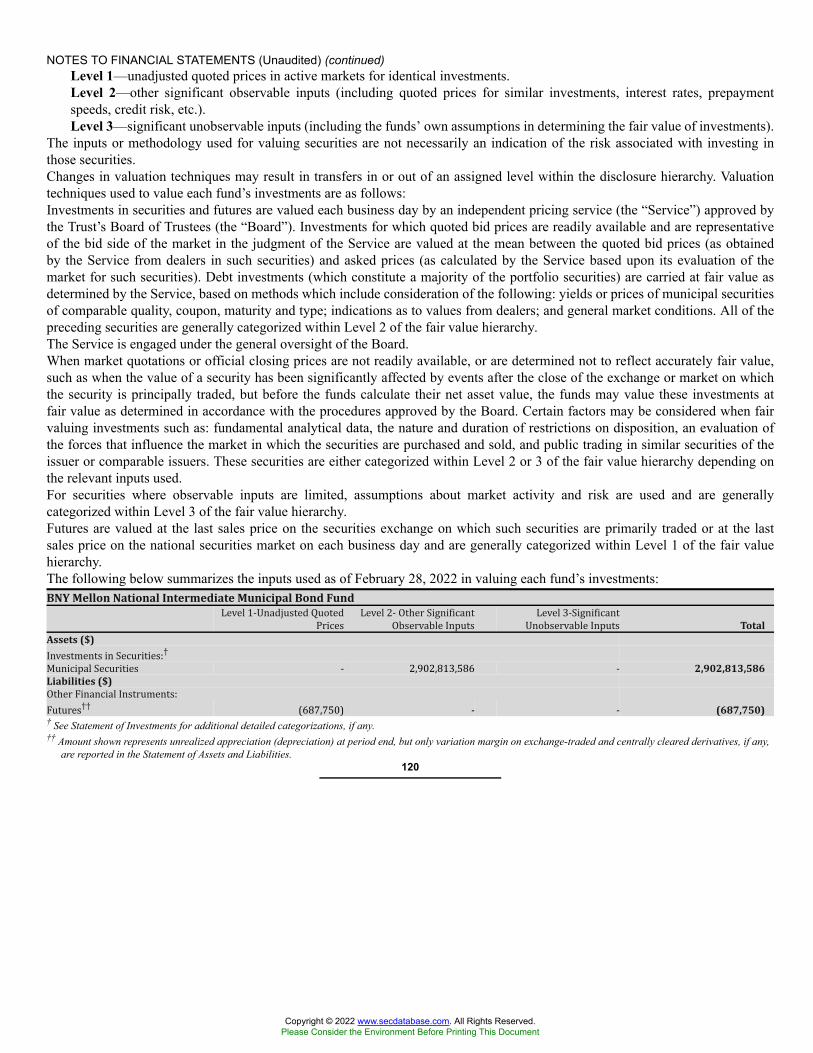
NOTES TO FINANCIAL STATEMENTS (Unaudited) (continued)Level 1—unadjusted quoted prices in active markets for identical investments.Level 2—other significant observable inputs (including quoted prices for similar investments, interest rates, prepaymentspeeds, credit risk, etc.).Level 3—significant unobservable inputs (including the funds’ own assumptions in determining the fair value of investments).
The inputs or methodology used for valuing securities are not necessarily an indication of the risk associated with investing inthose securities.Changes in valuation techniques may result in transfers in or out of an assigned level within the disclosure hierarchy. Valuationtechniques used to value each fund’s investments are as follows:Investments in securities and futures are valued each business day by an independent pricing service (the “Service”) approved bythe Trust’s Board of Trustees (the “Board”). Investments for which quoted bid prices are readily available and are representativeof the bid side of the market in the judgment of the Service are valued at the mean between the quoted bid prices (as obtainedby the Service from dealers in such securities) and asked prices (as calculated by the Service based upon its evaluation of themarket for such securities). Debt investments (which constitute a majority of the portfolio securities) are carried at fair value asdetermined by the Service, based on methods which include consideration of the following: yields or prices of municipal securitiesof comparable quality, coupon, maturity and type; indications as to values from dealers; and general market conditions. All of thepreceding securities are generally categorized within Level 2 of the fair value hierarchy.The Service is engaged under the general oversight of the Board.When market quotations or official closing prices are not readily available, or are determined not to reflect accurately fair value,such as when the value of a security has been significantly affected by events after the close of the exchange or market on whichthe security is principally traded, but before the funds calculate their net asset value, the funds may value these investments atfair value as determined in accordance with the procedures approved by the Board. Certain factors may be considered when fairvaluing investments such as: fundamental analytical data, the nature and duration of restrictions on disposition, an evaluation ofthe forces that influence the market in which the securities are purchased and sold, and public trading in similar securities of theissuer or comparable issuers. These securities are either categorized within Level 2 or 3 of the fair value hierarchy depending onthe relevant inputs used.For securities where observable inputs are limited, assumptions about market activity and risk are used and are generallycategorized within Level 3 of the fair value hierarchy.Futures are valued at the last sales price on the securities exchange on which such securities are primarily traded or at the lastsales price on the national securities market on each business day and are generally categorized within Level 1 of the fair valuehierarchy.The following below summarizes the inputs used as of February 28, 2022 in valuing each fund’s investments:BNY Mellon National Intermediate Municipal Bond FundLevel 1-Unadjusted QuotedPrices Level 2- Other SignificantObservable Inputs Level 3-SignificantUnobservable Inputs TotalAssets ($)Investments in Securities:†Municipal Securities - 2,902,813,586 - 2,902,813,586Liabilities ($)Other Financial Instruments:Futures†† (687,750) - - (687,750)† See Statement of Investments for additional detailed categorizations, if any.†† Amount shown represents unrealized appreciation (depreciation) at period end, but only variation margin on exchange-traded and centrally cleared derivatives, if any,
are reported in the Statement of Assets and Liabilities.120
Copyright © 2022 www.secdatabase.com. All Rights Reserved.Please Consider the Environment Before Printing This Document
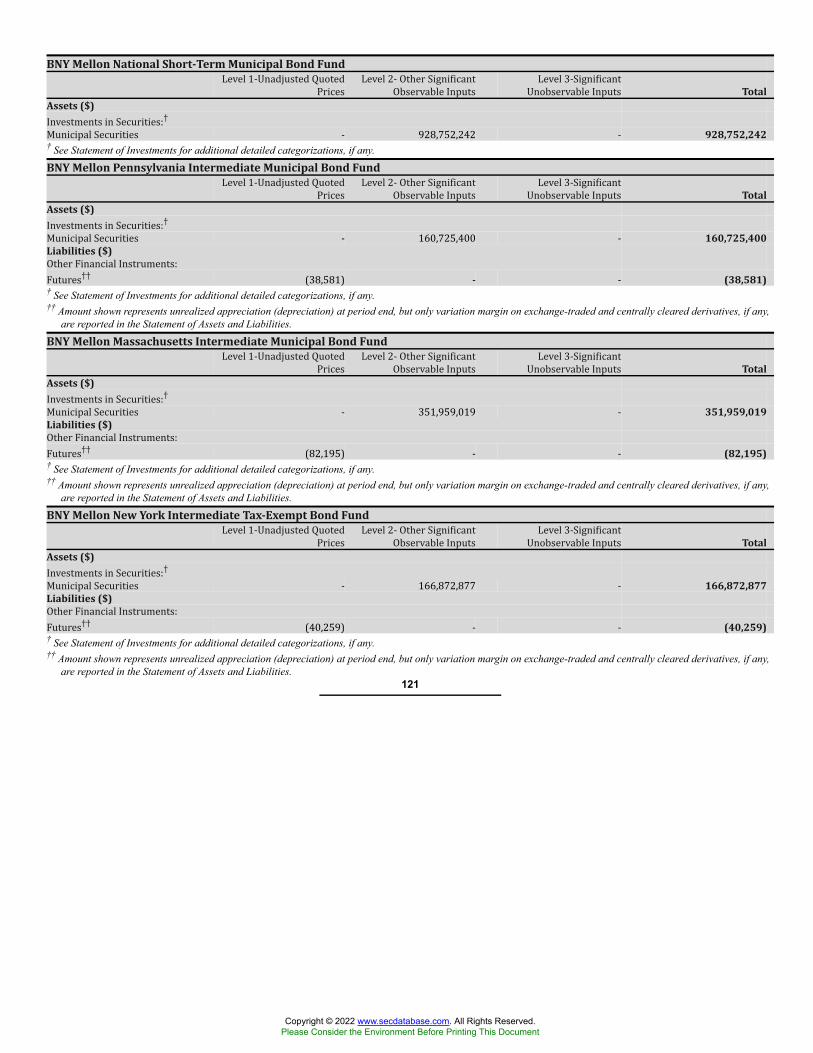
BNY Mellon National Short-Term Municipal Bond FundLevel 1-Unadjusted QuotedPrices Level 2- Other SignificantObservable Inputs Level 3-SignificantUnobservable Inputs TotalAssets ($)Investments in Securities:†Municipal Securities - 928,752,242 - 928,752,242† See Statement of Investments for additional detailed categorizations, if any.
BNY Mellon Pennsylvania Intermediate Municipal Bond FundLevel 1-Unadjusted QuotedPrices Level 2- Other SignificantObservable Inputs Level 3-SignificantUnobservable Inputs TotalAssets ($)Investments in Securities:†Municipal Securities - 160,725,400 - 160,725,400Liabilities ($)Other Financial Instruments:Futures†† (38,581) - - (38,581)† See Statement of Investments for additional detailed categorizations, if any.†† Amount shown represents unrealized appreciation (depreciation) at period end, but only variation margin on exchange-traded and centrally cleared derivatives, if any,
are reported in the Statement of Assets and Liabilities.
BNY Mellon Massachusetts Intermediate Municipal Bond FundLevel 1-Unadjusted QuotedPrices Level 2- Other SignificantObservable Inputs Level 3-SignificantUnobservable Inputs TotalAssets ($)Investments in Securities:†Municipal Securities - 351,959,019 - 351,959,019Liabilities ($)Other Financial Instruments:Futures†† (82,195) - - (82,195)† See Statement of Investments for additional detailed categorizations, if any.†† Amount shown represents unrealized appreciation (depreciation) at period end, but only variation margin on exchange-traded and centrally cleared derivatives, if any,
are reported in the Statement of Assets and Liabilities.
BNY Mellon New York Intermediate Tax-Exempt Bond FundLevel 1-Unadjusted QuotedPrices Level 2- Other SignificantObservable Inputs Level 3-SignificantUnobservable Inputs TotalAssets ($)Investments in Securities:†Municipal Securities - 166,872,877 - 166,872,877Liabilities ($)Other Financial Instruments:Futures†† (40,259) - - (40,259)† See Statement of Investments for additional detailed categorizations, if any.†† Amount shown represents unrealized appreciation (depreciation) at period end, but only variation margin on exchange-traded and centrally cleared derivatives, if any,
are reported in the Statement of Assets and Liabilities.121
Copyright © 2022 www.secdatabase.com. All Rights Reserved.Please Consider the Environment Before Printing This Document
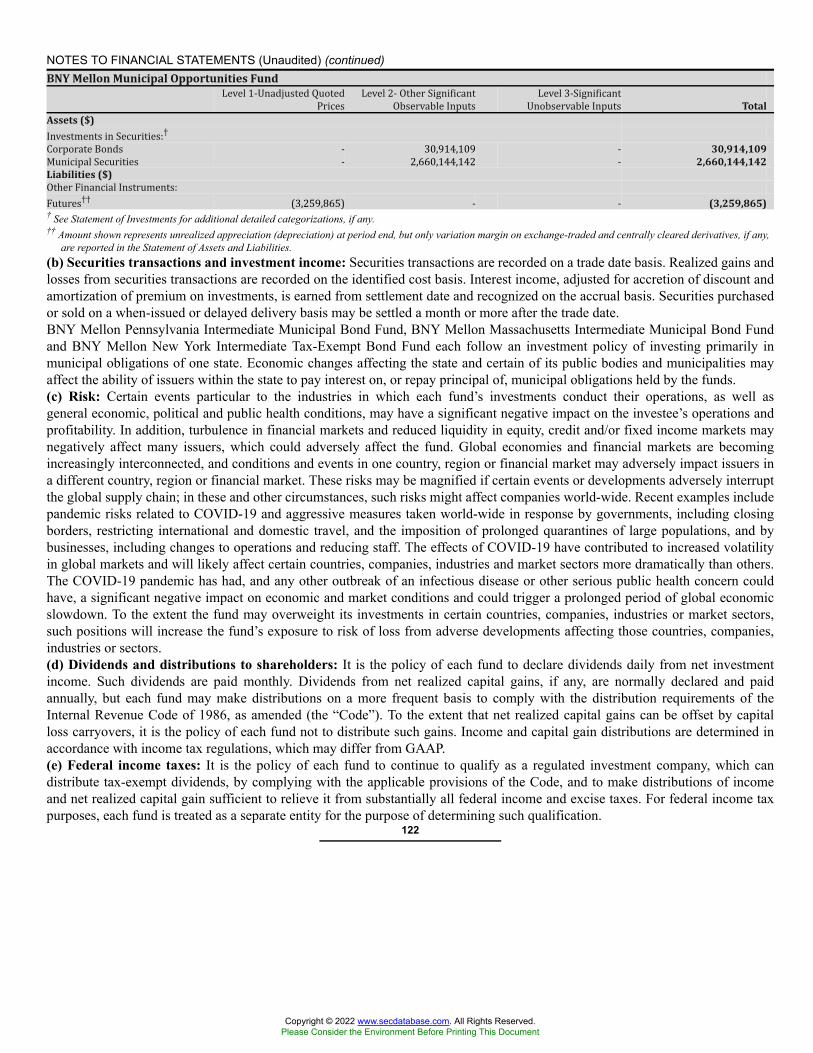
NOTES TO FINANCIAL STATEMENTS (Unaudited) (continued)BNY Mellon Municipal Opportunities FundLevel 1-Unadjusted QuotedPrices Level 2- Other SignificantObservable Inputs Level 3-SignificantUnobservable Inputs TotalAssets ($)Investments in Securities:†Corporate Bonds - 30,914,109 - 30,914,109Municipal Securities - 2,660,144,142 - 2,660,144,142Liabilities ($)Other Financial Instruments:Futures†† (3,259,865) - - (3,259,865)† See Statement of Investments for additional detailed categorizations, if any.†† Amount shown represents unrealized appreciation (depreciation) at period end, but only variation margin on exchange-traded and centrally cleared derivatives, if any,
are reported in the Statement of Assets and Liabilities.(b) Securities transactions and investment income: Securities transactions are recorded on a trade date basis. Realized gains andlosses from securities transactions are recorded on the identified cost basis. Interest income, adjusted for accretion of discount andamortization of premium on investments, is earned from settlement date and recognized on the accrual basis. Securities purchasedor sold on a when-issued or delayed delivery basis may be settled a month or more after the trade date.BNY Mellon Pennsylvania Intermediate Municipal Bond Fund, BNY Mellon Massachusetts Intermediate Municipal Bond Fundand BNY Mellon New York Intermediate Tax-Exempt Bond Fund each follow an investment policy of investing primarily inmunicipal obligations of one state. Economic changes affecting the state and certain of its public bodies and municipalities mayaffect the ability of issuers within the state to pay interest on, or repay principal of, municipal obligations held by the funds.(c) Risk: Certain events particular to the industries in which each fund’s investments conduct their operations, as well asgeneral economic, political and public health conditions, may have a significant negative impact on the investee’s operations andprofitability. In addition, turbulence in financial markets and reduced liquidity in equity, credit and/or fixed income markets maynegatively affect many issuers, which could adversely affect the fund. Global economies and financial markets are becomingincreasingly interconnected, and conditions and events in one country, region or financial market may adversely impact issuers ina different country, region or financial market. These risks may be magnified if certain events or developments adversely interruptthe global supply chain; in these and other circumstances, such risks might affect companies world-wide. Recent examples includepandemic risks related to COVID-19 and aggressive measures taken world-wide in response by governments, including closingborders, restricting international and domestic travel, and the imposition of prolonged quarantines of large populations, and bybusinesses, including changes to operations and reducing staff. The effects of COVID-19 have contributed to increased volatilityin global markets and will likely affect certain countries, companies, industries and market sectors more dramatically than others.The COVID-19 pandemic has had, and any other outbreak of an infectious disease or other serious public health concern couldhave, a significant negative impact on economic and market conditions and could trigger a prolonged period of global economicslowdown. To the extent the fund may overweight its investments in certain countries, companies, industries or market sectors,such positions will increase the fund’s exposure to risk of loss from adverse developments affecting those countries, companies,industries or sectors.(d) Dividends and distributions to shareholders: It is the policy of each fund to declare dividends daily from net investmentincome. Such dividends are paid monthly. Dividends from net realized capital gains, if any, are normally declared and paidannually, but each fund may make distributions on a more frequent basis to comply with the distribution requirements of theInternal Revenue Code of 1986, as amended (the “Code”). To the extent that net realized capital gains can be offset by capitalloss carryovers, it is the policy of each fund not to distribute such gains. Income and capital gain distributions are determined inaccordance with income tax regulations, which may differ from GAAP.(e) Federal income taxes: It is the policy of each fund to continue to qualify as a regulated investment company, which candistribute tax-exempt dividends, by complying with the applicable provisions of the Code, and to make distributions of incomeand net realized capital gain sufficient to relieve it from substantially all federal income and excise taxes. For federal income taxpurposes, each fund is treated as a separate entity for the purpose of determining such qualification.
122
Copyright © 2022 www.secdatabase.com. All Rights Reserved.Please Consider the Environment Before Printing This Document

As of and during the period ended February 28, 2022, the funds did not have any liabilities for any uncertain tax positions.Each fund recognizes interest and penalties, if any, related to uncertain tax positions as income tax expense in the Statements ofOperations. During the period ended February 28, 2022, the funds did not incur any interest or penalties.Each tax year in the three-year period ended August 31, 2021 remains subject to examination by the Internal Revenue Service andstate taxing authorities.Under the Regulated Investment Company Modernization Act of 2010, each fund is permitted to carry forward capital losses foran unlimited period. Furthermore, capital loss carryovers retain their character as either short-term or long-term capital losses.Table 1 summarizes each relevant fund’s unused capital loss carryover available for federal income tax purposes to be appliedagainst future net realized capital gains, realized subsequent to August 31, 2021.Table 2 summarizes each fund’s tax character of distributions paid to shareholders during the fiscal year ended August 31, 2021.The tax character of current year distributions will be determined at the end of the current fiscal year.Table 1—Capital Loss Carryover Short-Term Losses($)† Long-Term Losses($)† Total($)BNY Mellon National Short-Term Municipal Bond Fund 505,516 - 505,516† These capital losses can be carried forward for an unlimited period.Table 2—Tax Character of Distributions Paid 2021Tax-Exempt Income ($) Ordinary Income ($) Long-Term Capital Gains ($)BNY Mellon National Intermediate Municipal Bond Fund 53,285,282 306,722 9,355,024BNY Mellon National Short-Term Municipal Bond Fund 10,892,701 - -BNY Mellon Pennsylvania Intermediate Municipal Bond Fund 3,795,479 83,185 1,158,320BNY Mellon Massachusetts Intermediate Municipal Bond Fund 6,263,096 - -BNY Mellon New York Intermediate Tax-Exempt Bond Fund 2,975,278 304,798 829,167BNY Mellon Municipal Opportunities Fund 64,532,199 - -(f) New accounting pronouncements: In March 2020, the FASB issued Accounting Standards Update 2020-04, ReferenceRate Reform (Topic 848): Facilitation of the Effects of Reference Rate Reform on Financial Reporting (“ASU 2020-04”), andin January 2021, the FASB issued Accounting Standards Update 2021-01, Reference Rate Reform (Topic 848): Scope (“ASU2021-01”), which provides optional, temporary relief with respect to the financial reporting of contracts subject to certain typesof modifications due to the planned discontinuation of the LIBOR and other interbank offered rates as of the end of 2021. Thetemporary relief provided by ASU 2020-04 and ASU 2021-01 is effective for certain reference rate-related contract modificationsthat occur during the period from March 12, 2020 through December 31, 2022. Management is evaluating the impact of ASU2020-04 and ASU 2021-01 on each fund’s investments, derivatives, debt and other contracts that will undergo reference rate-related modifications as a result of the reference rate reform. Management is also currently actively working with other financialinstitutions and counterparties to modify contracts as required by applicable regulation and within the regulatory deadlines.NOTE 2—Bank Lines of Credit:The funds participate with other long-term open-end funds managed by the Adviser in a $823.5 million unsecured credit facilityled by Citibank, N.A. (the “Citibank Credit Facility”) and a $300 million unsecured credit facility provided by BNY Mellon(the “BNYM Credit Facility”), each to be utilized primarily for temporary or emergency purposes, including the financing ofredemptions (each, a “Facility”). The Citibank Credit Facility is available in two tranches: (i) Tranche A is in an amount equal to$688.5 million and is available to all long-term open-ended funds, including the funds, and (ii) Tranche B is in amount equal to$135 million and is available only to the BNY Mellon Floating Rate Income Fund, a series of BNY Mellon Investment Funds IV,Inc. In connection therewith, each fund has agreed to pay its pro rata portion of commitment fees for Tranche A of the CitibankCredit Facility and the BNYM Credit Facility. Interest is charged to the funds based on rates determined pursuant to the terms ofthe respective Facility at the time of borrowing. During the period ended February 28, 2022, the funds did not borrow under theFacilities.
123
Copyright © 2022 www.secdatabase.com. All Rights Reserved.Please Consider the Environment Before Printing This Document
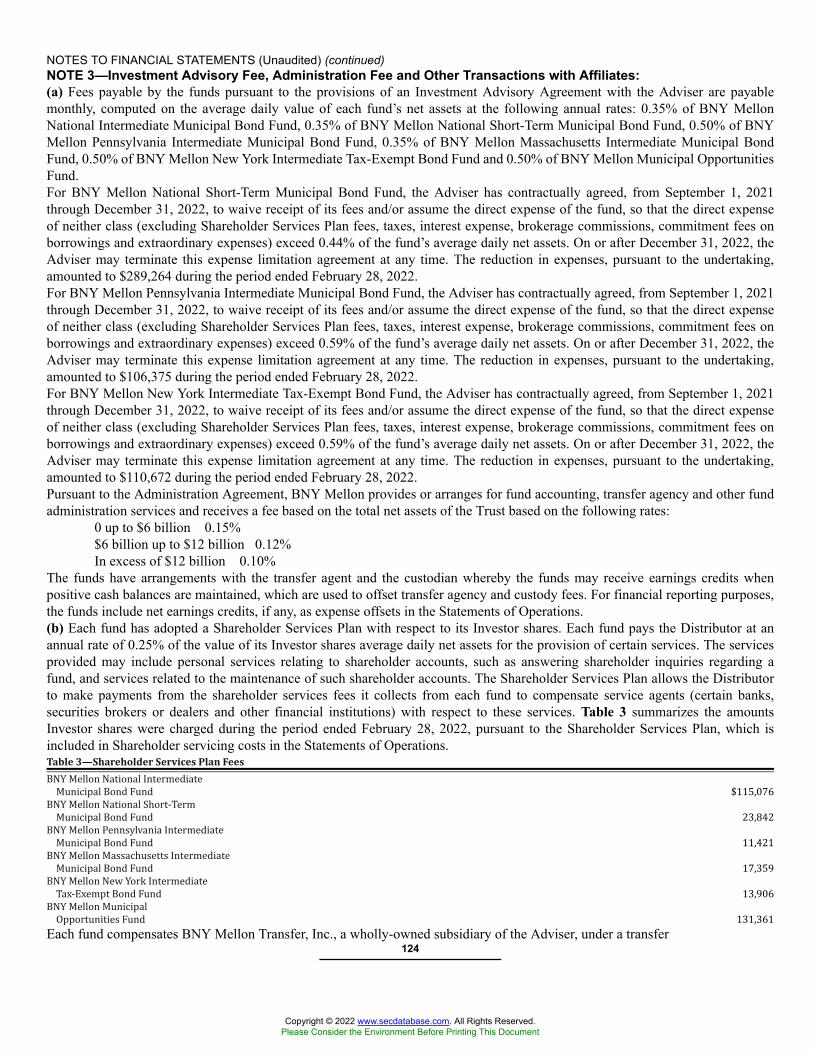
NOTES TO FINANCIAL STATEMENTS (Unaudited) (continued)NOTE 3—Investment Advisory Fee, Administration Fee and Other Transactions with Affiliates:(a) Fees payable by the funds pursuant to the provisions of an Investment Advisory Agreement with the Adviser are payablemonthly, computed on the average daily value of each fund’s net assets at the following annual rates: 0.35% of BNY MellonNational Intermediate Municipal Bond Fund, 0.35% of BNY Mellon National Short-Term Municipal Bond Fund, 0.50% of BNYMellon Pennsylvania Intermediate Municipal Bond Fund, 0.35% of BNY Mellon Massachusetts Intermediate Municipal BondFund, 0.50% of BNY Mellon New York Intermediate Tax-Exempt Bond Fund and 0.50% of BNY Mellon Municipal OpportunitiesFund.For BNY Mellon National Short-Term Municipal Bond Fund, the Adviser has contractually agreed, from September 1, 2021through December 31, 2022, to waive receipt of its fees and/or assume the direct expense of the fund, so that the direct expenseof neither class (excluding Shareholder Services Plan fees, taxes, interest expense, brokerage commissions, commitment fees onborrowings and extraordinary expenses) exceed 0.44% of the fund’s average daily net assets. On or after December 31, 2022, theAdviser may terminate this expense limitation agreement at any time. The reduction in expenses, pursuant to the undertaking,amounted to $289,264 during the period ended February 28, 2022.For BNY Mellon Pennsylvania Intermediate Municipal Bond Fund, the Adviser has contractually agreed, from September 1, 2021through December 31, 2022, to waive receipt of its fees and/or assume the direct expense of the fund, so that the direct expenseof neither class (excluding Shareholder Services Plan fees, taxes, interest expense, brokerage commissions, commitment fees onborrowings and extraordinary expenses) exceed 0.59% of the fund’s average daily net assets. On or after December 31, 2022, theAdviser may terminate this expense limitation agreement at any time. The reduction in expenses, pursuant to the undertaking,amounted to $106,375 during the period ended February 28, 2022.For BNY Mellon New York Intermediate Tax-Exempt Bond Fund, the Adviser has contractually agreed, from September 1, 2021through December 31, 2022, to waive receipt of its fees and/or assume the direct expense of the fund, so that the direct expenseof neither class (excluding Shareholder Services Plan fees, taxes, interest expense, brokerage commissions, commitment fees onborrowings and extraordinary expenses) exceed 0.59% of the fund’s average daily net assets. On or after December 31, 2022, theAdviser may terminate this expense limitation agreement at any time. The reduction in expenses, pursuant to the undertaking,amounted to $110,672 during the period ended February 28, 2022.Pursuant to the Administration Agreement, BNY Mellon provides or arranges for fund accounting, transfer agency and other fundadministration services and receives a fee based on the total net assets of the Trust based on the following rates:
0 up to $6 billion 0.15%$6 billion up to $12 billion 0.12%In excess of $12 billion 0.10%
The funds have arrangements with the transfer agent and the custodian whereby the funds may receive earnings credits whenpositive cash balances are maintained, which are used to offset transfer agency and custody fees. For financial reporting purposes,the funds include net earnings credits, if any, as expense offsets in the Statements of Operations.(b) Each fund has adopted a Shareholder Services Plan with respect to its Investor shares. Each fund pays the Distributor at anannual rate of 0.25% of the value of its Investor shares average daily net assets for the provision of certain services. The servicesprovided may include personal services relating to shareholder accounts, such as answering shareholder inquiries regarding afund, and services related to the maintenance of such shareholder accounts. The Shareholder Services Plan allows the Distributorto make payments from the shareholder services fees it collects from each fund to compensate service agents (certain banks,securities brokers or dealers and other financial institutions) with respect to these services. Table 3 summarizes the amountsInvestor shares were charged during the period ended February 28, 2022, pursuant to the Shareholder Services Plan, which isincluded in Shareholder servicing costs in the Statements of Operations.Table 3—Shareholder Services Plan FeesBNY Mellon National IntermediateMunicipal Bond Fund $115,076BNY Mellon National Short-TermMunicipal Bond Fund 23,842BNY Mellon Pennsylvania IntermediateMunicipal Bond Fund 11,421BNY Mellon Massachusetts IntermediateMunicipal Bond Fund 17,359BNY Mellon New York IntermediateTax-Exempt Bond Fund 13,906BNY Mellon MunicipalOpportunities Fund 131,361Each fund compensates BNY Mellon Transfer, Inc., a wholly-owned subsidiary of the Adviser, under a transfer
124
Copyright © 2022 www.secdatabase.com. All Rights Reserved.Please Consider the Environment Before Printing This Document
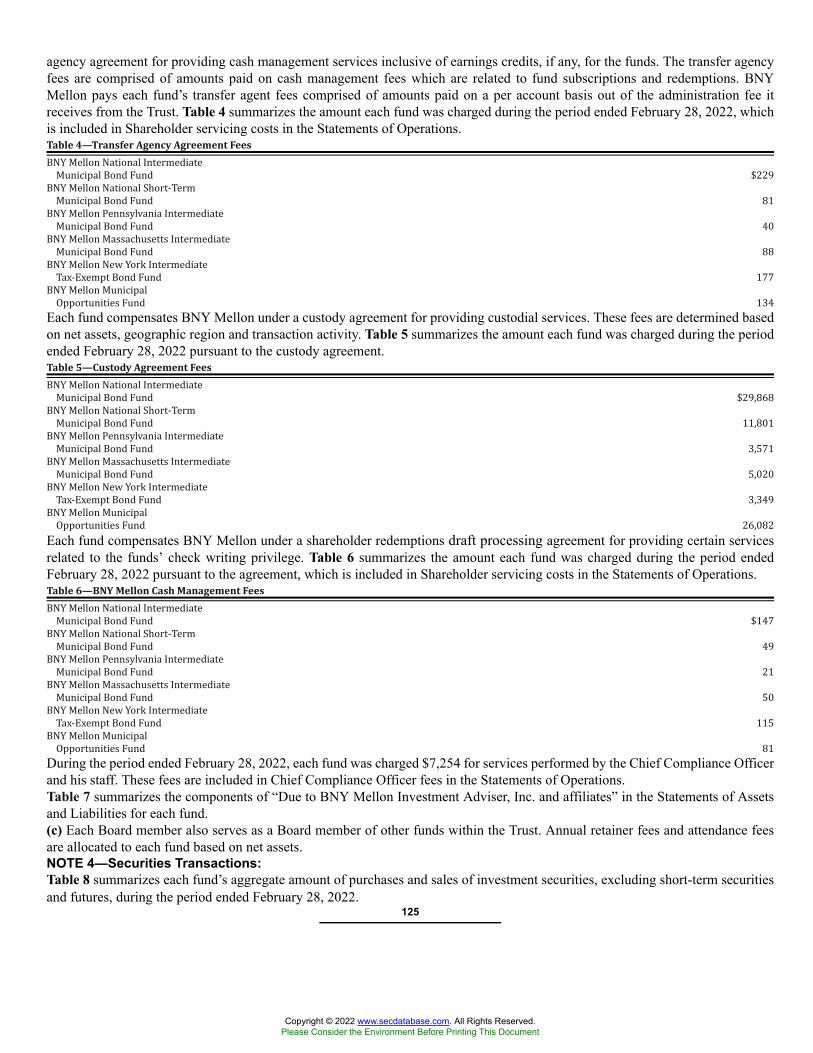
agency agreement for providing cash management services inclusive of earnings credits, if any, for the funds. The transfer agencyfees are comprised of amounts paid on cash management fees which are related to fund subscriptions and redemptions. BNYMellon pays each fund’s transfer agent fees comprised of amounts paid on a per account basis out of the administration fee itreceives from the Trust. Table 4 summarizes the amount each fund was charged during the period ended February 28, 2022, whichis included in Shareholder servicing costs in the Statements of Operations.Table 4—Transfer Agency Agreement FeesBNY Mellon National IntermediateMunicipal Bond Fund $229BNY Mellon National Short-TermMunicipal Bond Fund 81BNY Mellon Pennsylvania IntermediateMunicipal Bond Fund 40BNY Mellon Massachusetts IntermediateMunicipal Bond Fund 88BNY Mellon New York IntermediateTax-Exempt Bond Fund 177BNY Mellon MunicipalOpportunities Fund 134Each fund compensates BNY Mellon under a custody agreement for providing custodial services. These fees are determined basedon net assets, geographic region and transaction activity. Table 5 summarizes the amount each fund was charged during the periodended February 28, 2022 pursuant to the custody agreement.Table 5—Custody Agreement FeesBNY Mellon National IntermediateMunicipal Bond Fund $29,868BNY Mellon National Short-TermMunicipal Bond Fund 11,801BNY Mellon Pennsylvania IntermediateMunicipal Bond Fund 3,571BNY Mellon Massachusetts IntermediateMunicipal Bond Fund 5,020BNY Mellon New York IntermediateTax-Exempt Bond Fund 3,349BNY Mellon MunicipalOpportunities Fund 26,082Each fund compensates BNY Mellon under a shareholder redemptions draft processing agreement for providing certain servicesrelated to the funds’ check writing privilege. Table 6 summarizes the amount each fund was charged during the period endedFebruary 28, 2022 pursuant to the agreement, which is included in Shareholder servicing costs in the Statements of Operations.Table 6—BNY Mellon Cash Management FeesBNY Mellon National IntermediateMunicipal Bond Fund $147BNY Mellon National Short-TermMunicipal Bond Fund 49BNY Mellon Pennsylvania IntermediateMunicipal Bond Fund 21BNY Mellon Massachusetts IntermediateMunicipal Bond Fund 50BNY Mellon New York IntermediateTax-Exempt Bond Fund 115BNY Mellon MunicipalOpportunities Fund 81During the period ended February 28, 2022, each fund was charged $7,254 for services performed by the Chief Compliance Officerand his staff. These fees are included in Chief Compliance Officer fees in the Statements of Operations.Table 7 summarizes the components of “Due to BNY Mellon Investment Adviser, Inc. and affiliates” in the Statements of Assetsand Liabilities for each fund.(c) Each Board member also serves as a Board member of other funds within the Trust. Annual retainer fees and attendance feesare allocated to each fund based on net assets.NOTE 4—Securities Transactions:Table 8 summarizes each fund’s aggregate amount of purchases and sales of investment securities, excluding short-term securitiesand futures, during the period ended February 28, 2022.
125
Copyright © 2022 www.secdatabase.com. All Rights Reserved.Please Consider the Environment Before Printing This Document
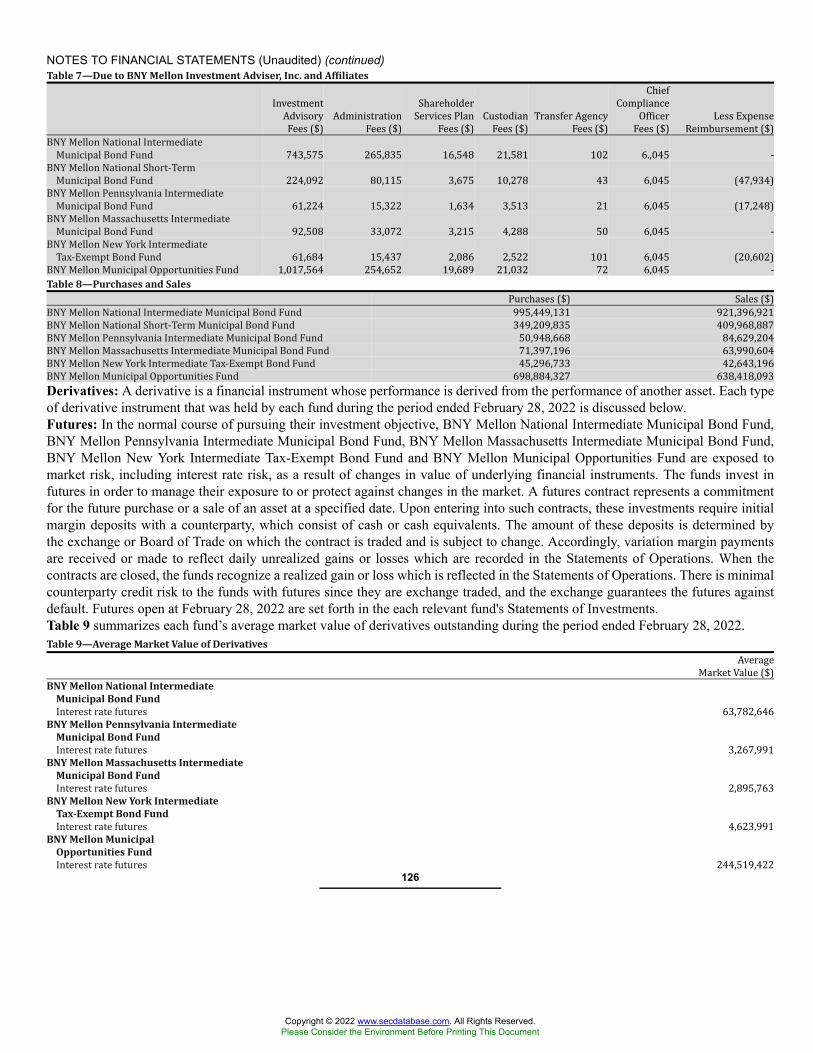
NOTES TO FINANCIAL STATEMENTS (Unaudited) (continued)Table 7—Due to BNY Mellon Investment Adviser, Inc. and AffiliatesInvestmentAdvisoryFees ($) AdministrationFees ($) ShareholderServices PlanFees ($) CustodianFees ($) Transfer AgencyFees ($)
ChiefComplianceOfficerFees ($) Less ExpenseReimbursement ($)BNY Mellon National IntermediateMunicipal Bond Fund 743,575 265,835 16,548 21,581 102 6.,045 -BNY Mellon National Short-TermMunicipal Bond Fund 224,092 80,115 3,675 10,278 43 6,045 (47,934)BNY Mellon Pennsylvania IntermediateMunicipal Bond Fund 61,224 15,322 1,634 3,513 21 6,045 (17,248)BNY Mellon Massachusetts IntermediateMunicipal Bond Fund 92,508 33,072 3,215 4,288 50 6,045 -BNY Mellon New York IntermediateTax-Exempt Bond Fund 61,684 15,437 2,086 2,522 101 6,045 (20,602)BNY Mellon Municipal Opportunities Fund 1,017,564 254,652 19,689 21,032 72 6,045 -Table 8—Purchases and Sales Purchases ($) Sales ($)BNY Mellon National Intermediate Municipal Bond Fund 995,449,131 921,396,921BNY Mellon National Short-Term Municipal Bond Fund 349,209,835 409,968,887BNY Mellon Pennsylvania Intermediate Municipal Bond Fund 50,948,668 84,629,204BNY Mellon Massachusetts Intermediate Municipal Bond Fund 71,397,196 63,990,604BNY Mellon New York Intermediate Tax-Exempt Bond Fund 45,296,733 42,643,196BNY Mellon Municipal Opportunities Fund 698,884,327 638,418,093Derivatives: A derivative is a financial instrument whose performance is derived from the performance of another asset. Each typeof derivative instrument that was held by each fund during the period ended February 28, 2022 is discussed below.Futures: In the normal course of pursuing their investment objective, BNY Mellon National Intermediate Municipal Bond Fund,BNY Mellon Pennsylvania Intermediate Municipal Bond Fund, BNY Mellon Massachusetts Intermediate Municipal Bond Fund,BNY Mellon New York Intermediate Tax-Exempt Bond Fund and BNY Mellon Municipal Opportunities Fund are exposed tomarket risk, including interest rate risk, as a result of changes in value of underlying financial instruments. The funds invest infutures in order to manage their exposure to or protect against changes in the market. A futures contract represents a commitmentfor the future purchase or a sale of an asset at a specified date. Upon entering into such contracts, these investments require initialmargin deposits with a counterparty, which consist of cash or cash equivalents. The amount of these deposits is determined bythe exchange or Board of Trade on which the contract is traded and is subject to change. Accordingly, variation margin paymentsare received or made to reflect daily unrealized gains or losses which are recorded in the Statements of Operations. When thecontracts are closed, the funds recognize a realized gain or loss which is reflected in the Statements of Operations. There is minimalcounterparty credit risk to the funds with futures since they are exchange traded, and the exchange guarantees the futures againstdefault. Futures open at February 28, 2022 are set forth in the each relevant fund's Statements of Investments.Table 9 summarizes each fund’s average market value of derivatives outstanding during the period ended February 28, 2022.Table 9—Average Market Value of Derivatives AverageMarket Value ($)BNY Mellon National Intermediate
Municipal Bond FundInterest rate futures 63,782,646BNY Mellon Pennsylvania Intermediate
Municipal Bond FundInterest rate futures 3,267,991BNY Mellon Massachusetts Intermediate
Municipal Bond FundInterest rate futures 2,895,763BNY Mellon New York Intermediate
Tax-Exempt Bond FundInterest rate futures 4,623,991BNY Mellon Municipal
Opportunities FundInterest rate futures 244,519,422126
Copyright © 2022 www.secdatabase.com. All Rights Reserved.Please Consider the Environment Before Printing This Document
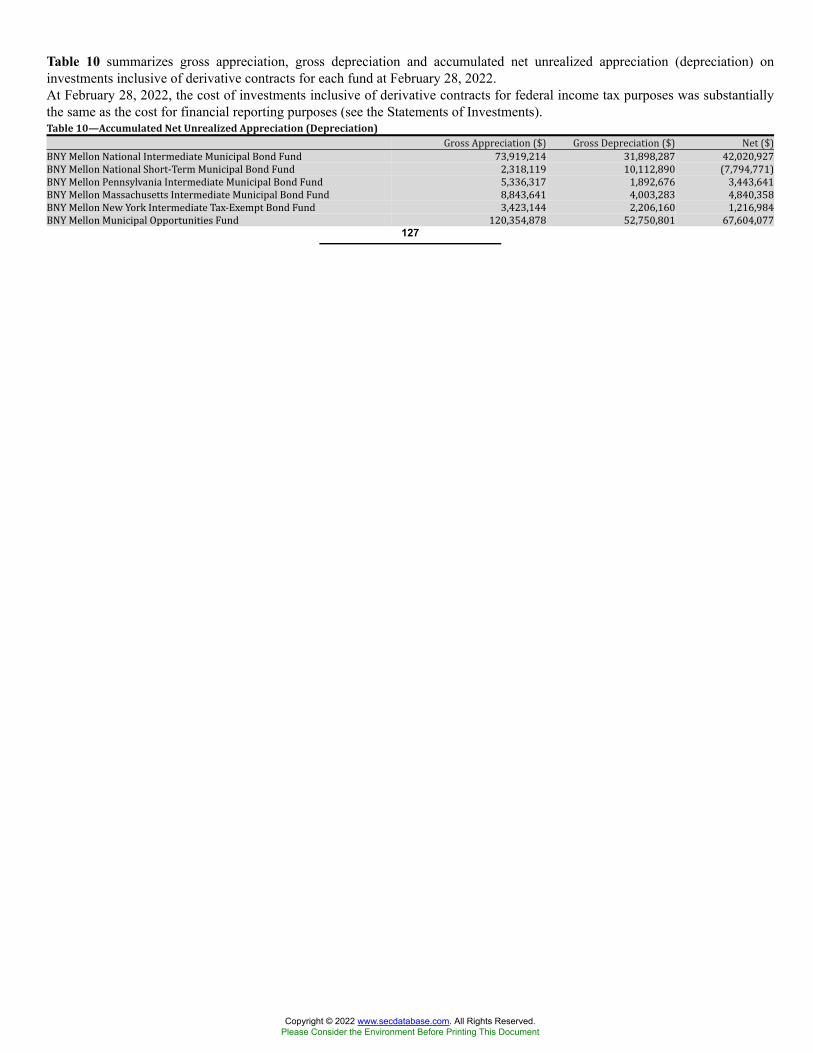
Table 10 summarizes gross appreciation, gross depreciation and accumulated net unrealized appreciation (depreciation) oninvestments inclusive of derivative contracts for each fund at February 28, 2022.At February 28, 2022, the cost of investments inclusive of derivative contracts for federal income tax purposes was substantiallythe same as the cost for financial reporting purposes (see the Statements of Investments).Table 10—Accumulated Net Unrealized Appreciation (Depreciation) Gross Appreciation ($) Gross Depreciation ($) Net ($)BNY Mellon National Intermediate Municipal Bond Fund 73,919,214 31,898,287 42,020,927BNY Mellon National Short-Term Municipal Bond Fund 2,318,119 10,112,890 (7,794,771)BNY Mellon Pennsylvania Intermediate Municipal Bond Fund 5,336,317 1,892,676 3,443,641BNY Mellon Massachusetts Intermediate Municipal Bond Fund 8,843,641 4,003,283 4,840,358BNY Mellon New York Intermediate Tax-Exempt Bond Fund 3,423,144 2,206,160 1,216,984BNY Mellon Municipal Opportunities Fund 120,354,878 52,750,801 67,604,077
127
Copyright © 2022 www.secdatabase.com. All Rights Reserved.Please Consider the Environment Before Printing This Document

This page intentionally left blank.128
Copyright © 2022 www.secdatabase.com. All Rights Reserved.Please Consider the Environment Before Printing This Document

This page intentionally left blank.129
Copyright © 2022 www.secdatabase.com. All Rights Reserved.Please Consider the Environment Before Printing This Document

This page intentionally left blank.130
Copyright © 2022 www.secdatabase.com. All Rights Reserved.Please Consider the Environment Before Printing This Document
For More InformationThe BNY Mellon Fundsc/o BNY Mellon Investment Adviser, Inc.240 Greenwich StreetNew York, NY 10286AdviserBNY Mellon Investment Adviser, Inc.240 Greenwich StreetNew York, NY 10286AdministratorThe Bank of New York Mellon240 Greenwich StreetNew York, NY 10286Sub-AdministratorBNY Mellon Investment Adviser, Inc.240 Greenwich StreetNew York, NY 10286CustodianThe Bank of New York Mellon240 Greenwich StreetNew York, NY 10286Transfer Agent &Dividend Disbursing AgentBNY Mellon Transfer, Inc.240 Greenwich StreetNew York, NY 10286DistributorBNY Mellon Securities Corporation240 Greenwich StreetNew York, NY 10286Ticker Symbols:BNY Mellon National Intermediate Municipal BondFund Class M: MPNIX Investor: MINMXBNY Mellon National Short-Term Municipal Bond Fund Class M: MPSTX Investor: MINSXBNY Mellon Pennsylvania Intermediate Municipal Bond Fund Class M: MPPIX Investor: MIPAXBNY Mellon Massachusetts Intermediate Municipal Bond Fund Class M: MMBMX Investor: MMBIXBNY Mellon New York Intermediate Tax-Exempt Bond Fund Class M: MNYMX Investor: MNYIXBNY Mellon Municipal Opportunities Fund Class M: MOTMX Investor: MOTIXTelephone Wealth Management (WM) Clients, please contact your Account Officer or call 1-866-804-5023. Brokerage Clients of BNYMellon Wealth Advisors (BNYMWA), please contact your financial representative or call 1-800-830-0549, Option 2 for BNY MellonWealth Management Direct or 1-800-843-5466 for former brokerage clients of BNY Mellon Wealth Advisors whose accounts are nowheld by BNY Mellon Brokerage Services. Individual Account holders, please call BNY Mellon Investment Advisers at 1-800-373-9387.Mail WM clients, write to your Account Officer, c/o The Bank of New York Mellon, One Mellon Bank Center, Pittsburgh, PA 15258BNYMWA Brokerage Clients, write to your financial representative, P.O. Box 9012, Hicksville, NY 11802-9012Individual Account Holders, write to: BNY Mellon Funds, P.O. Box 9879, Providence, RI 02940-8079Each fund files its complete schedule of portfolio holdings with the Securities and Exchange Commission (“SEC”) for the first and thirdquarters of each fiscal year on Form N-PORT. The fund’s Forms N-PORT are available on the SEC’s website at http://www.sec.gov.A description of the policies and procedures that the fund uses to determine how to vote proxies relating to portfolio securities, andinformation regarding how the fund voted these proxies for the most recent 12-month period ended June 30 is available at http://www.im.bnymellon.com and on the SEC’s website at http://www.sec.gov. The description of the policies and procedures is alsoavailable without charge, upon request, by calling 1-800-373-9387.© 2022 BNY Mellon Securities Corporation MFTSA0222-MB
Copyright © 2022 www.secdatabase.com. All Rights Reserved.Please Consider the Environment Before Printing This Document
Item 2. Code of Ethics.
Not applicable.
Item 3. Audit Committee Financial Expert.
Not applicable.
Item 4. Principal Accountant Fees and Services.
Not applicable.
Item 5. Audit Committee of Listed Registrants.
Not applicable.
Item 6. Investments.
(a) Not applicable.
Item 7. Disclosure of Proxy Voting Policies and Procedures for Closed-End Management Investment Companies.
Not applicable.
Item 8. Portfolio Managers of Closed-End Management Investment Companies.
Not applicable.
Item 9. Purchases of Equity Securities by Closed-End Management Investment Companies and Affiliated Purchasers.
Not applicable.
Item 10. Submission of Matters to a Vote of Security Holders.
There have been no material changes to the procedures applicable to Item 10.
Item 11. Controls and Procedures.
(a) The Registrant's principal executive and principal financial officers have concluded, based on their evaluation of the Registrant'sdisclosure controls and procedures as of a date within 90 days of the filing date of this report, that the Registrant's disclosure controls andprocedures are reasonably designed to ensure that information required to be disclosed by the Registrant on Form N-CSR is recorded,processed, summarized and reported within the required time periods and that information required to be disclosed by the Registrantin the reports that it files or submits on Form N-CSR is accumulated and communicated to the Registrant's management, including itsprincipal executive and principal financial officers, as appropriate to allow timely decisions regarding required disclosure.
(b) There were no changes to the Registrant's internal control over financial reporting that occurred during the period covered by thisreport that have materially affected, or are reasonably likely to materially affect, the Registrant's internal control over financial reporting.
Copyright © 2022 www.secdatabase.com. All Rights Reserved.Please Consider the Environment Before Printing This Document
Item 12. Disclosure of Securities Lending Activities for Closed-End Management Investment Companies.
Not applicable.
Item 13. Exhibits.
(a)(1) Not applicable.
(a)(2) Certifications of principal executive and principal financial officers as required by Rule 30a-2(a) under the Investment CompanyAct of 1940.
(a)(3) Not applicable.
(b) Certification of principal executive and principal financial officers as required by Rule 30a-2(b) under the Investment CompanyAct of 1940.
SIGNATURES
Pursuant to the requirements of the Securities Exchange Act of 1934 and the Investment Company Act of 1940, the Registrant has dulycaused this Report to be signed on its behalf by the undersigned, thereunto duly authorized.
BNY Mellon Funds Trust
By: /s/ Patrick T. CrowePatrick T. CrowePresident (Principal Executive Officer)
Date: April 21, 2022
Pursuant to the requirements of the Securities Exchange Act of 1934 and the Investment Company Act of 1940, this Report has beensigned below by the following persons on behalf of the Registrant and in the capacities and on the dates indicated.
By: /s/ Patrick T. CrowePatrick T. CrowePresident (Principal Executive Officer)
Date: April 21, 2022
By: /s/ James WindelsJames WindelsTreasurer (Principal Financial Officer)
Date: April 21, 2022
EXHIBIT INDEX
Copyright © 2022 www.secdatabase.com. All Rights Reserved.Please Consider the Environment Before Printing This Document

(a)(2) Certifications of principal executive and principal financial officers as required by Rule 30a-2(a) under the InvestmentCompany Act of 1940. (EX-99.CERT)
(b) Certification of principal executive and principal financial officers as required by Rule 30a-2(b) under the InvestmentCompany Act of 1940. (EX-99.906CERT)
Copyright © 2022 www.secdatabase.com. All Rights Reserved.Please Consider the Environment Before Printing This Document
[EX-99.CERT]—Exhibit (a)(2)SECTION 302 CERTIFICATION
I, Patrick T. Crowe, certify that:
1. I have reviewed this report on Form N-CSR of BNY Mellon Funds Trust;
2. Based on my knowledge, this report does not contain any untrue statement of a material fact or omit to state a material fact necessaryto make the statements made, in light of the circumstances under which such statements were made, not misleading with respect to theperiod covered by this report;
3. Based on my knowledge, the financial statements, and other financial information included in this report, fairly present in all materialrespects the financial condition, results of operations, changes in net assets, and cash flows (if the financial statements are required toinclude a statement of cash flows) of the registrant as of, and for, the periods presented in this report;
4. The registrant's other certifying officer(s) and I are responsible for establishing and maintaining disclosure controls and procedures (asdefined in Rule 30a-3(c) under the Investment Company Act of 1940) and internal control over financial reporting (as defined in Rule30a-3(d) under the Investment Company Act of 1940) for the registrant and have:
(a) Designed such disclosure controls and procedures, or caused such disclosure controls and procedures to be designed under oursupervision, to ensure that material information relating to the registrant, including its consolidated subsidiaries, is made known to usby others within those entities, particularly during the period in which this report is being prepared;
(b) Designed such internal control over financial reporting, or caused such internal control over financial reporting to be designedunder our supervision, to provide reasonable assurance regarding the reliability of financial reporting and the preparation of financialstatements for external purposes in accordance with generally accepted accounting principles;
(c) Evaluated the effectiveness of the registrant's disclosure controls and procedures and presented in this report our conclusions aboutthe effectiveness of the disclosure controls and procedures, as of a date within 90 days prior to the filing date of this report based onsuch evaluation; and
(d) Disclosed in this report any change in the registrant's internal control over financial reporting that occurred during the periodcovered by this report that has materially affected, or is reasonably likely to materially affect, the registrant's internal control overfinancial reporting; and
5. The registrant's other certifying officer(s) and I have disclosed to the registrant's auditors and the audit committee of the registrant'sboard of directors (or persons performing the equivalent functions):
(a) All significant deficiencies and material weaknesses in the design or operation of internal control over financial reporting whichare reasonably likely to adversely affect the registrant's ability to record, process, summarize, and report financial information; and
(b) Any fraud, whether or not material, that involves management or other employees who have a significant role in the registrant'sinternal control over financial reporting.
By: /s/ Patrick T. CrowePatrick T. CrowePresident (Principal Executive Officer)
Date: April 21, 2022
SECTION 302 CERTIFICATION
I, James Windels, certify that:
1. I have reviewed this report on Form N-CSR of BNY Mellon Funds Trust;
Copyright © 2022 www.secdatabase.com. All Rights Reserved.Please Consider the Environment Before Printing This Document
2. Based on my knowledge, this report does not contain any untrue statement of a material fact or omit to state a material fact necessaryto make the statements made, in light of the circumstances under which such statements were made, not misleading with respect to theperiod covered by this report;
3. Based on my knowledge, the financial statements, and other financial information included in this report, fairly present in all materialrespects the financial condition, results of operations, changes in net assets, and cash flows (if the financial statements are required toinclude a statement of cash flows) of the registrant as of, and for, the periods presented in this report;
4. The registrant's other certifying officer(s) and I are responsible for establishing and maintaining disclosure controls and procedures (asdefined in Rule 30a-3(c) under the Investment Company Act of 1940) and internal control over financial reporting (as defined in Rule30a-3(d) under the Investment Company Act of 1940) for the registrant and have:
(a) Designed such disclosure controls and procedures, or caused such disclosure controls and procedures to be designed under oursupervision, to ensure that material information relating to the registrant, including its consolidated subsidiaries, is made known to usby others within those entities, particularly during the period in which this report is being prepared;
(b) Designed such internal control over financial reporting, or caused such internal control over financial reporting to be designedunder our supervision, to provide reasonable assurance regarding the reliability of financial reporting and the preparation of financialstatements for external purposes in accordance with generally accepted accounting principles;
(c) Evaluated the effectiveness of the registrant's disclosure controls and procedures and presented in this report our conclusions aboutthe effectiveness of the disclosure controls and procedures, as of a date within 90 days prior to the filing date of this report based onsuch evaluation; and
(d) Disclosed in this report any change in the registrant's internal control over financial reporting that occurred during the periodcovered by this report that has materially affected, or is reasonably likely to materially affect, the registrant's internal control overfinancial reporting; and
5. The registrant's other certifying officer(s) and I have disclosed to the registrant's auditors and the audit committee of the registrant'sboard of directors (or persons performing the equivalent functions):
(a) All significant deficiencies and material weaknesses in the design or operation of internal control over financial reporting whichare reasonably likely to adversely affect the registrant's ability to record, process, summarize, and report financial information; and
(b) Any fraud, whether or not material, that involves management or other employees who have a significant role in the registrant'sinternal control over financial reporting.
By: /s/ James WindelsJames WindelsTreasurer (Principal Financial Officer)
Date: April 21, 2022
Copyright © 2022 www.secdatabase.com. All Rights Reserved.Please Consider the Environment Before Printing This Document
[EX-99.906CERT]Exhibit (b)
SECTION 906 CERTIFICATIONS
In connection with this report on Form N-CSR for the Registrant as furnished to the Securities and Exchange Commission onthe date hereof (the "Report"), the undersigned hereby certify, pursuant to Section 906 of the Sarbanes-Oxley Act of 2002, that:
(1) the Report fully complies with the requirements of Section 13(a) or 15(d) of the Securities Exchange Act of 1934, asapplicable; and
(2) the information contained in the Report fairly presents, in all material respects, the financial condition and results ofoperations of the Registrant.
By: /s/ Patrick T. CrowePatrick T. CrowePresident (Principal Executive Officer)
Date: April 21, 2022
By: /s/ James WindelsJames WindelsTreasurer (Principal Financial Officer)
Date: April 21, 2022
This certificate is furnished pursuant to the requirements of Form N-CSR and shall not be deemed "filed" for purposes of Section 18 ofthe Securities Exchange Act of 1934, or otherwise subject to the liability of that section, and shall not be deemed to be incorporated byreference into any filing under the Securities Act of 1933 or the Securities Exchange Act of 1934.
Copyright © 2022 www.secdatabase.com. All Rights Reserved.Please Consider the Environment Before Printing This Document