The 2005 eruption of Sierra Negra volcano, Galápagos, Ecuador
Upload
independentCategory
view
2download
0
BioMed CentralBMC Evolutionary Biology
ss
Open AcceResearch articleProgressive colonization and restricted gene flow shape island-dependent population structure in Galápagos marine iguanas (Amblyrhynchus cristatus)Sebastian Steinfartz*†1,2, Scott Glaberman†1, Deborah Lanterbecq1,3, Michael A Russello4, Sabrina Rosa1, Torrance C Hanley1, Cruz Marquez5, Howard L Snell6, Heidi M Snell6, Gabriele Gentile7, Giacomo Dell'Olmo8, Alessandro M Powell9 and Adalgisa Caccone1Address: 1Department of Ecology and Evolutionary Biology and Yale Institute for Biospheric Studies - Molecular Systematics and Conservation Genetics Laboratory, New Haven, Connecticut 06511, USA, 2Current address: Department of Animal Behaviour, University of Bielefeld, D-33501 Bielefeld, Germany, 3Current address: Marine Biology Laboratory, University of Mons-Hainaut, 7000 Mons, Belgium, 4Department of Biology, University of British Columbia Okanagan, Kelowna, British Columbia V1V 1V7, Canada, 5Galápagos National Park, Puerto Ayora, Galápagos, Ecuador, 6Museum of Southwestern Biology, Department of Biology, University of New Mexico, Albuquerque, New Mexico 87131, USA, 7Department of Biology, Tor Vergata University, 00133 Rome, Italy, 8Ornis italica, Piazza Crati 15, 00199 Rome, Italy and 936 Carew Rd, Hamden, CT 06517, USA
Email: Sebastian Steinfartz* - [email protected]; Scott Glaberman - [email protected]; Deborah Lanterbecq - [email protected]; Michael A Russello - [email protected]; Sabrina Rosa - [email protected]; Torrance C Hanley - [email protected]; Cruz Marquez - [email protected]; Howard L Snell - [email protected]; Heidi M Snell - [email protected]; Gabriele Gentile - [email protected]; Giacomo Dell'Olmo - [email protected]; Alessandro M Powell - [email protected]; Adalgisa Caccone - [email protected]
* Corresponding author †Equal contributors
AbstractBackground: Marine iguanas (Amblyrhynchus cristatus) inhabit the coastlines of large and smallislands throughout the Galápagos archipelago, providing a rich system to study the spatial andtemporal factors influencing the phylogeographic distribution and population structure of a species.Here, we analyze the microevolution of marine iguanas using the complete mitochondrial controlregion (CR) as well as 13 microsatellite loci representing more than 1200 individuals from 13islands.
Results: CR data show that marine iguanas occupy three general clades: one that is widelydistributed across the northern archipelago, and likely spread from east to west by way of theSouth Equatorial current, a second that is found mostly on the older eastern and central islands,and a third that is limited to the younger northern and western islands. Generally, the CR haplotypedistribution pattern supports the colonization of the archipelago from the older, eastern islands tothe younger, western islands. However, there are also signatures of recurrent, historical gene flowbetween islands after population establishment. Bayesian cluster analysis of microsatellitegenotypes indicates the existence of twenty distinct genetic clusters generally following a one-cluster-per-island pattern. However, two well-differentiated clusters were found on theeasternmost island of San Cristóbal, while nine distinct and highly intermixed clusters were foundon youngest, westernmost islands of Isabela and Fernandina. High mtDNA and microsatellite
Published: 22 December 2009
BMC Evolutionary Biology 2009, 9:297 doi:10.1186/1471-2148-9-297
Received: 5 August 2009Accepted: 22 December 2009
This article is available from: http://www.biomedcentral.com/1471-2148/9/297
© 2009 Steinfartz et al; licensee BioMed Central Ltd. This is an Open Access article distributed under the terms of the Creative Commons Attribution License (http://creativecommons.org/licenses/by/2.0), which permits unrestricted use, distribution, and reproduction in any medium, provided the original work is properly cited.
Page 1 of 18(page number not for citation purposes)
BMC Evolutionary Biology 2009, 9:297 http://www.biomedcentral.com/1471-2148/9/297
genetic diversity were observed for populations on Isabela and Fernandina that may be the resultof a recent population expansion and founder events from multiple sources.
Conclusions: While a past genetic study based on pure FST analysis suggested that marine iguanapopulations display high levels of nuclear (but not mitochondrial) gene flow due to male-biaseddispersal, the results of our sex-biased dispersal tests and the finding of strong geneticdifferentiation between islands do not support this view. Therefore, our study is a nice example ofhow recently developed analytical tools such as Bayesian clustering analysis and DNA sequence-based demographic analyses can overcome potential biases introduced by simply relying on FSTestimates from markers with different inheritance patterns.
BackgroundThe legacy of the Galápagos archipelago may be foreverattached to the development of Darwin's theory. Yet, theunique character of these islands have continued to makethem an ideal model for evolutionary study [1,2]. TheGalápagos archipelago is geographically isolated - approx-imately 1,000 km west of South America - and has neverbeen attached to any continental land mass [3]. Conse-quently, it is home to many endemic taxa that have colo-nized the islands either once [4-10] or very few times[9,11,12]. Such a system offers an opportunity to studythe radiation of species from a limited ancestral stockwithout the confounding signals of recurrent coloniza-tion. In addition, the islands vary significantly in size anddegree of isolation, providing a range of conditions underwhich to examine the interplay between evolutionarydiversification and different demographic processes[13,14]. Finally, the geologic history of the Galápagos iswell known, supplying a temporal framework uponwhich to reconstruct the biogeographic history of variousspecies. The islands were produced by a hotspot that liesbeneath the Nazca plate, which is traveling in an eastwarddirection. Consequently, island ages generally decreasefrom east to west [3,15-17], and the colonizationsequences of many organisms show a progression fromolder to younger islands (i.e. progression rule or "islandprogression hypothesis" sensu Wagner and Funk [18];reviewed in [2]).
Among the organisms that inhabit the Galápagos, one ofthe most amenable to evolutionary study is the marineiguana (Amblyrhynchus cristatus). This species is endemicto the archipelago and is frequently found along thecoasts of all the major islands as well as many smallerones. Marine iguanas exhibit a unique natural historyamong lizards, feeding almost exclusively on specificalgae species in the intertidal or subtidal zones, whilebreeding and nesting completely on land [19,20]. Theypossess physical attributes that enable them to negotiatethe marine environment, including a flattened tail forswimming and long, sharp nails for clinging to rocks inthe surf. The presence of marine iguana populations onislands throughout the archipelago provides a rich system
for examining the roles of island population size, age andisolation, as well as current flow, on patterns of migration,distribution, and long-term population history.
Morphological and genetic data have revealed that theclosest relative of Amblyrhynchus is the genus of terrestrialiguanas, Conolophus, which is also endemic to the Galápa-gos [8,21-23]. Molecular dating based on mitochondrialDNA (mtDNA) and immunological comparisons yieldeda divergence time estimate of 10-20 million years (myr)for the two genera [8,24], which is significantly moreancient than the 3-5 myr age estimate of the oldest islands[3,15,16]. A proposed explanation for these results is thatmarine and land iguanas diverged from each other onnow-sunken islands lying to the east of the present-dayarchipelago [8,24-26].
A comprehensive genetic study based on both mitochon-drial cytochrome b (cytb) data as well as nuclear-codedloci (three microsatellite and three minisatellite loci),traced back the microevolution of 22 population/subpop-ulations of marine iguanas from 15 islands in the archi-pelago [27]. Despite at least ten million years ofindependent evolutionary history on the Galápagos, thisstudy suggested that only one or a few related mtDNAhaplotypes were involved in the colonization of thepresent-day archipelago from now-submerged islands[27]. While the overall levels of genetic divergence at bothmtDNA and nuclear markers were low, these two markersrevealed different patterns of genetic structuring andmigration between island populations. Based on cytbdata, marine iguana populations were grouped into threemajor lineages: one occupying the older eastern and cen-tral islands, another found mostly in the geographicallydistant northern islands, and a third distributed across thenorthern and younger western islands. However, thisgenetic structuring was not supported by nuclear markers,which did not show any clear sign of population differen-tiation among islands. Based on these results, nucleargene flow was supposed to be high across the archipelagoand is mainly the result of male-biased dispersal as maleshave been observed to swim to different islands duringthe breeding season [27]. This was one of the first exam-
Page 2 of 18(page number not for citation purposes)

BMC Evolutionary Biology 2009, 9:297 http://www.biomedcentral.com/1471-2148/9/297
ples of male-biased dispersal based on molecular evi-dence and is still used in textbooks (e.g. p. 229 in [28]).
In this study, we revisit the population genetic structure ofmarine iguanas in order to lend insight into the patternsof gene flow, genetic diversity, and demographic historyof this species. Data is presented from over 1200 individ-uals from 23 populations sampled at two different timepoints using an increased number of nuclear markers(thirteen microsatellite loci) as well as the typically fast-evolving mtDNA control region (CR). We use this infor-mation to unravel patterns of past and current dispersal inmarine iguanas, and discuss results within the context ofthe island progression hypothesis and sex-biased disper-sal.
MethodsSampling and genetic data collectionMarine iguanas were sampled during two different timeperiods, 1991/1993 and 2004. Samples from 1991/93were a subset of those collected and analyzed from theRassmann et al. study [27]. The total sampling effortresulted in more than 1200 marine iguana specimensspanning 13 islands and 23 populations (Figure 1b; Table1). Eleven of these locations were sampled during bothtime periods to meet the objectives of a parallel studyexamining changes in genetic diversity due to an intenseEl Niño event [29].
Total genomic DNA was extracted from blood samples ina 96-well format using the QIAamp 96 DNA Blood Kit(QIAGEN Inc.) following the manufacturer's instructions.Complete mtDNA CR sequences (1183 bp) were gener-ated for 1203 marine iguana specimens using PCR proto-cols that are described elsewhere [29,30]. We genotypedthirteen microsatellite loci for 1225 individuals: locusAm(GT)4 from [27] and twelve loci from [31] followingthe same procedures as described before [29].
Phylogenetic analysis of CR sequencesCR sequences were edited in the program SEQUENCHERv4.2.2 [32] and aligned using the program MUSCLE v3.6[33]. Unique haplotypes were defined and numberedusing the program DNASP v4.20.2 [34]. The programMRMODELTEST v2 [35], which is based on code from theMODELTEST software [36], was used to evaluate the fit ofdifferent nucleotide substitution models to the data. TheHasegawa-Kishino-Yano model [37] with additionalparameters for gamma distribution and fraction of invari-able sites (HKY+G+I) provided the best fit to the haplo-type data according to both the hierarchical likelihoodratio test and the Akaike information criterion. This sub-stitution model was implemented in a Bayesian frame-work using the program MRBAYES v3.1.2 [38] with asearch of 2.5 × 10⁶ generations where the first 10% ofparameter samples were discarded as burn-in.
Since the point of branch connection between marineiguana mtDNA phylogroups and Galápagos land iguanashas previously been shown to be unclear due to the largedivergence between the two species [27], the root of themarine iguana phylogeny was inferred for CR sequencesusing a relaxed clock model implemented in the programBEAST v.1.4.7 [39]. As in the phylogenetic analysis, theHKY+G+I model of nucleotide substitution was applied.An evolutionary model was chosen where the substitutionrates among branches were uncorrelated, and an expan-sion growth prior was assumed since marine iguanasexhibit shallow divergence and are likely still in the proc-ess of reaching population genetic equilibrium in parts oftheir range. The analysis was run twice with 2 × 10⁶ gener-ations each, and the first 10% of parameter values werediscarded as burn-in. Adequate mixing was determined byexamining the effective sample size and parameter tracevalues as visualized in the program TRACER v1.4 [40] andthe two runs were combined to obtain an overall estimateof the posterior distribution of parameters.
CR analysis of genetic diversity and population structureThe number of haplotypes (h), haplotype diversity (Hd),nucleotide diversity ( ), and the average number of nucle-otide differences between sequences (K) were calculatedfor each population using DNASP. Data were generatedseparately for the two temporal samples (1993 and 2004)from Marchena island, as a previous study showed that abottleneck occurred in between samplings [29]. For allother populations, samples from the two time-pointswere combined. FST calculations based on Wright'sFST [41] and an analysis of molecular variance (AMOVA)were performed in the program ARLEQUIN v3.11 [42] inorder to determine the level of genetic differentiationwithin and between marine iguana populations and thefollowing major island groups: north (Pinta, Marchenaand Genovesa), west (Fernandina and Isabela), central(Santiago, Rábida, Pinzon, Santa Cruz, Floreana andSanta Fé) and east (Española and San Cristóbal).
We additionally tested for correlation of island age andmolecular distance by applying a Mantel test as imple-mented in the program ARLEQUIN v3.11 [42]. For thisFST differentiation was estimated by haplotype frequenciesbetween island populations and the corresponding agedifference between islands was estimated as the differenceof maximum island age as provided by Table 1. The signif-icane of test results were determined by performing10,000 randomizations.
Population structure based on microsatellite loci dataUsing microsatellite data, we employed a Bayesian-basedanalysis of population structure in order to identifygenetic clusters, patterns of migration, and gene flowwithin Amblyrhynchus without using any a priori samplinginformation. Starting from individual genotypes, the
Page 3 of 18(page number not for citation purposes)
Page
4 o
f 18
(pag
e nu
mbe
r not
for c
itatio
n pu
rpos
es)
chondrial Control Region (CR)
K Fs D
6 0.00193 2.271 2.65 -1.20
0 0.00281 3.311 -2.35 -0.80
6 0.00332 3.911 -11.40** -0.55
0 0.00328 3.872 -20.84** -1.48*
6 0.00423 4.983 0.98 0.18
4 0.00299 3.021 6.26 0.48
4 0.00367 4.324 -2.65 -0.49
8 0.00137 1.615 -0.58 -1.45
0 0.00364 4.286 -3.40* -1.05
4 0.00333 3.922 1.02 0.64
1 0.00078 0.914 -0.16 -1.72*
1 0.00337 3.969 3.42 0.62
5 0.00324 3.823 5.37 1.60
BM
C E
volu
tiona
ry B
iolo
gy 2
009,
9:2
97ht
tp://
ww
w.b
iom
edce
ntra
l.com
/147
1-21
48/9
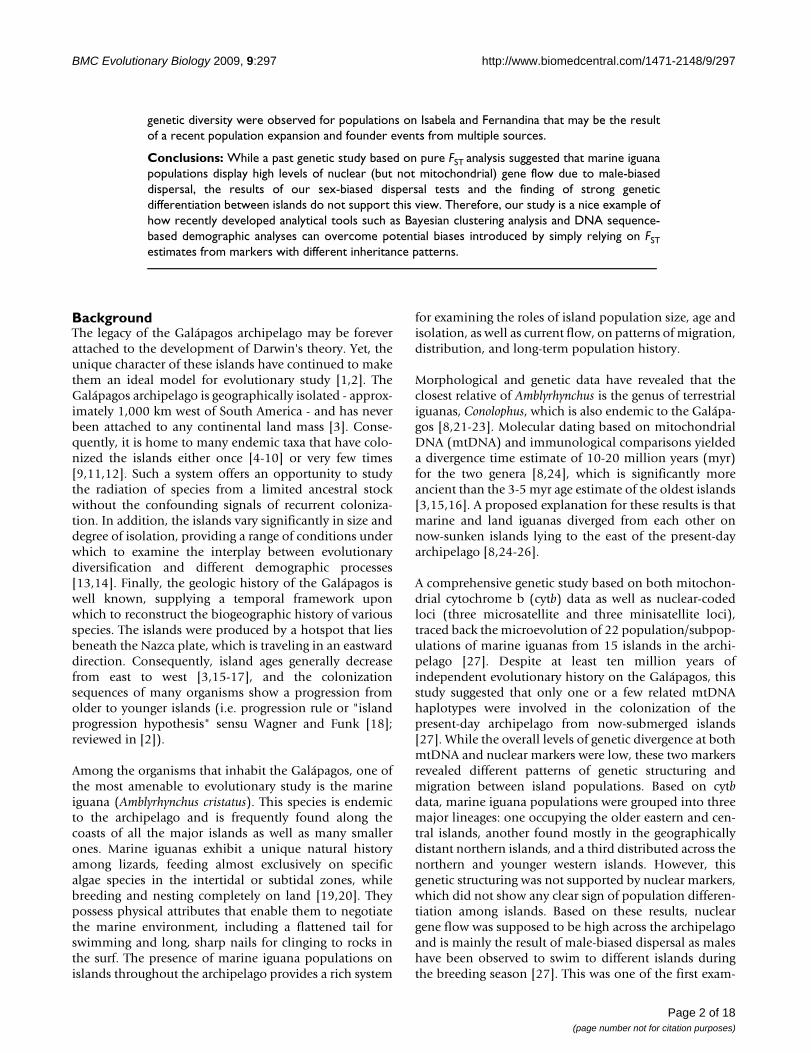
/297 Table 1: Information on Galápagos marine iguanas.
Island Island Age (Myr)
Population size estimates
Population Microsatellite loci Mito
N Nalleles Hobs k-test N H Hd
Española 3.31-3.54 1,700-21,000 EPC (Punta Cevallos)a,b
99 9.07 0.79 7 (p = 0.46)
98 6 0.65
Fernandina 0.04 15,000-120,000 FCH (Capo Hammond)a
28 9.5 0.72 9 (p = 0.11)
20 10 0.90
FPE (Punta Espinosa)a,b
99 11.6 0.78 8 (p = 0.25)
86 27 0.94
FPM (Punta Mangle)a,b
78 10.7 0.79 10* (p = 0.037)
73 32 0.95
Floreana 1.52-2.34 2,000-16,000 FMO (Punta Montura)a,b
51 8.7 0.78 6 (p = 0.67)
60 12 0.78
Genovesa 0.35 900-15,000 GCA (Campamente)a,b
92 6.7 0.70 6(p = 0.67)
81 5 0.57
Isabela 0.313-535 5,000-40,000 IBU (Bahia Urvina)b
17 8.9 0.79 8(p = 0.25)
15 10 0.92
IWE (Cabo West)b
- - - - 13 5 0.62
ICB (Caleta Black)a
- - - - 7 7 1.00
ICW (Caleta Webb)a,b
40 10 0.74 8(p = 0.25)
30 8 0.72
IBA (Cerro Ballena)b
22 9.1 0.76 8(p = 0.25)
21 4 0.27
IPA (Punta Albemarle)a,b
61 9.4 0.77 7(p = 0.46)
54 7 0.68
Marchena 0.56 1,000-10,000 MBN 1993 (Bahia Negra)
30 7.7 0.76 5(p = 0.84)
29 4 0.68

BM
C E
volu
tiona
ry B
iolo
gy 2
009,
9:2
97ht
tp://
ww
w.b
iom
edce
ntra
l.com
/147
1-21
48/9
/297
Page
5 o
f 18
(pag
e nu
mbe
r not
for c
itatio
n pu
rpos
es)
0.250 0.00212 2.500 8.57 0.33
0.431 0.00118 1.388 0.63 0.42
0.682 0.00084 0.985 -0.65 -0.90
0.473 0.00308 3.756 4.00 -0.14
0.616 0.00220 2.589 7.53 2.67
0.000 0.00000 0.000 NA NA
0.017 0.00007 0.086 -0.56 -1.89
0.587 0.00079 0.932 0.72 0.12
0.702 0.00283 3.341 4.53 2.18
0.643 0.00175 2.067 1.14 0.43
0.547 0.00607 7.160 18.49 3.81
e sources [3,17,82,86,87]. Estimates of population sizes heterozygosity; intra-locus k-test statistic, number of loci gion data: N, sample size for each population; H, number trality statistic [51]; D, Tajima's neutrality statistic [52]. For d/or 2004b.
MBN 2004 (Bahia Negra)
49 7.7 0.78 7(p = 0.46)
49 2
Pinta 0.70 800-6,000 PCI (Caleta Ibetson)a,b
94 6.1 0.64 6(p = 0.67)
94 6
Pinzón 1.40-1.73 200-900 PDL (Dumb Landing)a
9 5.9 0.76 7(p = 0.46)
12 4
Rábida 1.06-1.56 200-2,000 RAB (No name)b 10 5.1 0.71 7(p = 0.46)
11 3
San Cristóbal 2.35-4.04 50-400 SRL (Loberia)a,b 82 6.3 0.70 4(p = 0.94)
83 3
SRP (Punta Pitt)a 20 3.9 0.51 5(p = 0.84)
20 1
Santa Cruz 1.31-2.26 2,000-13,000 SCZ (Estacion/Camaño)a,b
135 9.5 0.80 7(p = 0.46)
116 2
Santa Fé 2.85 3,000-16,000 SFN (North)a 52 8.4 0.80 8(p = 0.25)
52 4
SFM (Miedo)a,b 82 8.5 0.75 9(p = 0.11)
82 6
SFX (Bahia Paraiso)b
24 8.4 0.80 7(p = 0.46)
25 5
Santiago 0.77-1.42 450-4,000 SJB (James Bay)a,b 51 7.7 0.76 10*(p = 0.037)
72 3
Overall 37,000-280,000 1225 1203 106
Population localities, sample sizes, island ages, and summary data for 13 microsatellite loci and the mitochondrial control region (CR).Island ages are in millions of years (myr) and were derived from plate velocity and potassium-argon (KAr) dating estimates from multiplwere compiled in [78]. Microsatellite loci data: N, sample size for each population; Nalleles, average number of alleles; Hobs, observedout of 13 loci that showed negative k values and the corresponding p value (specific k values are provided by suppl. table 3). Control Reof haplotypes; Hd, haplotype diversity;, nucleotide diversity; K, average number of nucleotide differences between sequences; FS, Fu's neuthe complete table: * and ** denote significance at the = 0.05 and = 0.01 levels respectively. Populations were sampled in 1991/1993aan
Table 1: Information on Galápagos marine iguanas. (Continued)
BMC Evolutionary Biology 2009, 9:297 http://www.biomedcentral.com/1471-2148/9/297
number of genetic clusters was inferred using the programSTRUCTURE v2.1 [43]. K (the number of inferred geneticclusters) ranged from 1 to 25 with 15 iterations for each K.The run length was set to 100,000 MCMC replicates aftera burn-in period of one million replicates. For the ancestrymodel, we chose the admixture model with ALPHA beinginferred from the data in combination with correlatedallele frequencies. Based on the log probability of theseruns, the true value of K was estimated using the approachof Evanno et al. [44]. The program DISTRUCT [45] wasthen used to graphically display the number of geneticclusters as well as genetic intermixing of individuals basedon the true value of K in STRUCTURE. The program BAPSv3.2 [46], which uses a slightly different Bayesianapproach than STRUCTURE to infer population differen-tiation, was also used to identify the optimal number ofgenetic clusters. The upper bound for the number of pop-ulations was set to the number of sampling locations inour dataset. This corresponded to 36 different samplinglocations/events when considering different time pointsfrom the same location as independent sampling events.The optimal number of clusters identified by BAPS3.2 wasselected from a list of the ten best visited partitionsaccording to their log(ml) values (see [46]). Genotypicassignment of individuals to populations was tested byapplying an individual-based self-assignment test usingthe program GENECLASS2 [47] and the implementedBayesian approach of Rannala and Mountain [48].
In order to allow a direct comparison between our resultsand those of the Rassmann et al. study [27], we calculatedoverall differentiation as Reynolds FST = -ln(1-Θ; [49])using the program MICROSAT [50]. Analysis of molecularvariance (AMOVA) was performed for the same sets ofpopulations and major island groups as done for theequivalent mitochondrial analysis (see above) in the pro-gram ARLEQUIN v3.11 [42].
In order to determine the correlation between island agevs genetic distance (FST) we used the same approach asdescribed for the D-loop sequences (see above). The cor-relation between possible dispersal distance of marineiguanas vs genetic distance (FST) was tested with a Manteltest as implemented in the program ARLEQUIN v3.11[42]. The significane of test results were determined byperforming 10,000 randomizations. Underlying dispersaldistances in the matrix (see Table S1 [see Additional file1]) were estimated under the assumption that iguanasfrom localities on different islands dispersed by drifting inthe ocean, meaning that distances are the closest straightlines around intervening islands between localities. Iflocalities were on the same island, the distances were theclosest "coastal" distances - assuming that iguanas dis-persed by either swimming or walking along the coastrather than walking across islands.
Analysis of population expansionTests of recent population expansion were conducted onthe combined population samples (i.e. 1991/93 and 2004samples; see Table 1) for the mitochondrial and microsat-ellite datasets separately. For CR sequences, we obtainedfrequency distributions of pairwise nucleotide differencesbetween sequences (mismatch distributions), Fu's Fs test[51], and Tajima's D statistic [52] using ARLEQUIN. Par-ticular focus was placed on marine iguana populations onthe comparatively young islands in the western (Fern-andina and western Isabela) and northern (Genovesa,Marchena, and Pinta) regions of the archipelago, whichmay have been host to recent expansions in both rangeand population size. Details on methods and parametersused for these analyses are provided in the additionalmaterial [see Additional file 2].
The distribution of alleles at microsatellite loci were exam-ined for signs of population expansion using the intra-locus k test as implemented in the Excel Macro KGTESTS[53]. Assuming a simple stepwise mutation model, locus-specific allele length distributions from constant-sizedpopulations should have several modes, whereas a singlemode is expected for expanding populations [54]. Theintra-locus k test examines differences in allele length dis-tributions for specific loci, where a negative k value isindicative of recent population expansion, as well aswhether the number of negative k values across all loci issignificant [55].
Tests of sex-biased dispersalBased on the results of the Rassmann et al. study [27] thatindicated male-biased dispersal in marine iguanas, weperformed four different tests of sex-biased dispersal forsets of adult individuals sampled in 1991/93 and 2004[56]: i) The FIS statistic describes how well genotype fre-quencies follow expectations under Hardy-WeinbergEquilibrium and assumes that the dispersing sex will be amixture of residents and immigrants resulting in a hetero-zygote deficiency and a positive FIS value; ii) FST valuesshould be lower for the dispersing sex because allele fre-quencies of the dispersing sex should be more similaracross populations; iii) Immigrants tend to have a lowerAssignment Index (AI; see [57] and [58] for details) thanresidents. Therefore, the dispersing sex should display, onaverage, a lower value of AI than the resident sex; iv) Sincemembers of the dispersing sex will include both residents(with common genotypes) and immigrants (with raregenotypes), the variance of AI should be larger for the dis-persing sex than for the resident sex. All tests were run inthe program FSTAT version 2.9.3.2 [59] and the signifi-cance of different test results were determined by perform-ing 10,000 randomizations.
Page 6 of 18(page number not for citation purposes)

BMC Evolutionary Biology 2009, 9:297 http://www.biomedcentral.com/1471-2148/9/297
Page 7 of 18(page number not for citation purposes)
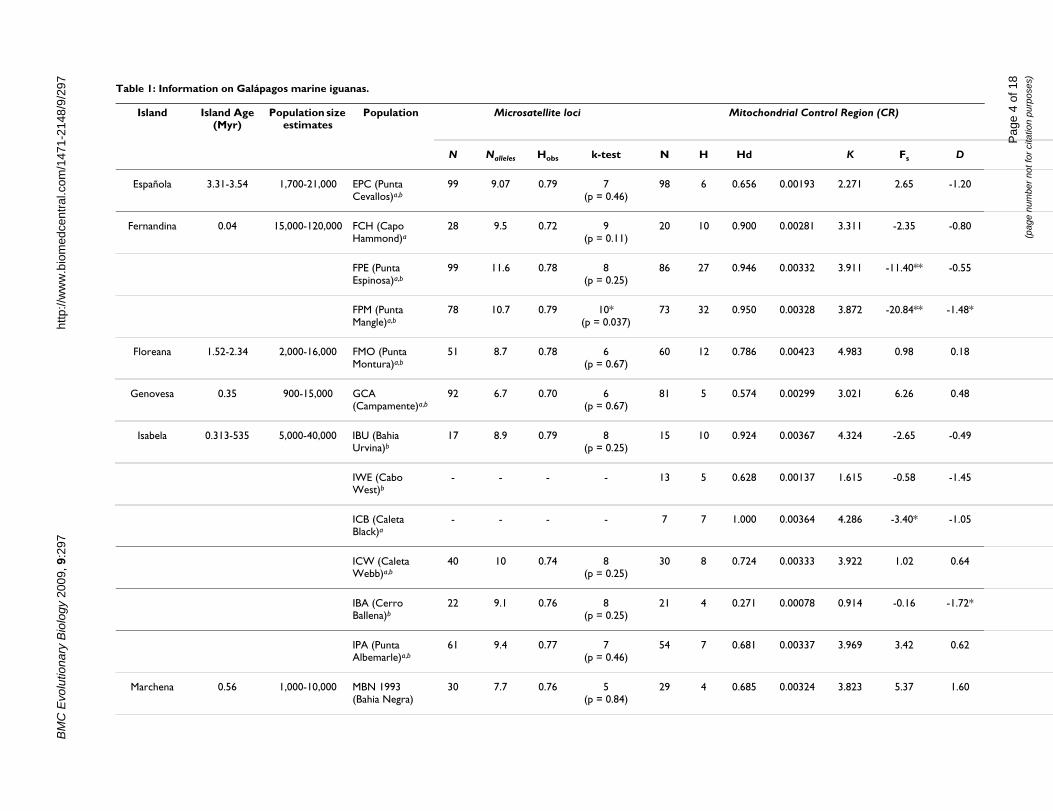
Bayesian-based phylogeny of Galápagos marine iguanas and distribution of mitochondrial clades based on mtDNA CR dataFigure 1Bayesian-based phylogeny of Galápagos marine iguanas and distribution of mitochondrial clades based on mtDNA CR data. a) The topology and branch lengths were inferred using the program MRBAYES, but the rooting shown here was inferred using the software BEAST (see Methods). Branch lengths are in number of substitutions per site. Bayesian posterior probability values from MRBAYES are shown supporting the three major clades. b) Map of the Galápagos islands detailing population locations and symbols (details in Table 1). Pie charts illustrate the geographic distribution of the mtDNA CR clades resulting from the analysis of 1203 marine iguanas.
BMC Evolutionary Biology 2009, 9:297 http://www.biomedcentral.com/1471-2148/9/297
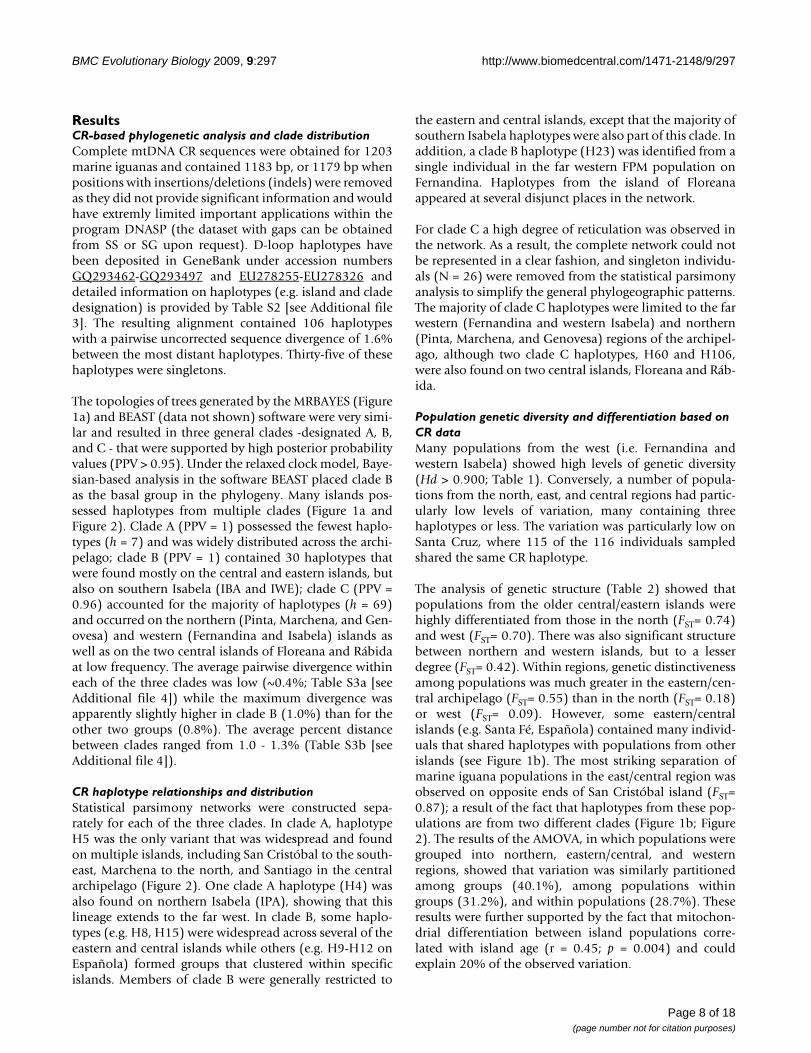
ResultsCR-based phylogenetic analysis and clade distributionComplete mtDNA CR sequences were obtained for 1203marine iguanas and contained 1183 bp, or 1179 bp whenpositions with insertions/deletions (indels) were removedas they did not provide significant information and wouldhave extremly limited important applications within theprogram DNASP (the dataset with gaps can be obtainedfrom SS or SG upon request). D-loop haplotypes havebeen deposited in GeneBank under accession numbersGQ293462-GQ293497 and EU278255-EU278326 anddetailed information on haplotypes (e.g. island and cladedesignation) is provided by Table S2 [see Additional file3]. The resulting alignment contained 106 haplotypeswith a pairwise uncorrected sequence divergence of 1.6%between the most distant haplotypes. Thirty-five of thesehaplotypes were singletons.
The topologies of trees generated by the MRBAYES (Figure1a) and BEAST (data not shown) software were very simi-lar and resulted in three general clades -designated A, B,and C - that were supported by high posterior probabilityvalues (PPV > 0.95). Under the relaxed clock model, Baye-sian-based analysis in the software BEAST placed clade Bas the basal group in the phylogeny. Many islands pos-sessed haplotypes from multiple clades (Figure 1a andFigure 2). Clade A (PPV = 1) possessed the fewest haplo-types (h = 7) and was widely distributed across the archi-pelago; clade B (PPV = 1) contained 30 haplotypes thatwere found mostly on the central and eastern islands, butalso on southern Isabela (IBA and IWE); clade C (PPV =0.96) accounted for the majority of haplotypes (h = 69)and occurred on the northern (Pinta, Marchena, and Gen-ovesa) and western (Fernandina and Isabela) islands aswell as on the two central islands of Floreana and Rábidaat low frequency. The average pairwise divergence withineach of the three clades was low (~0.4%; Table S3a [seeAdditional file 4]) while the maximum divergence wasapparently slightly higher in clade B (1.0%) than for theother two groups (0.8%). The average percent distancebetween clades ranged from 1.0 - 1.3% (Table S3b [seeAdditional file 4]).
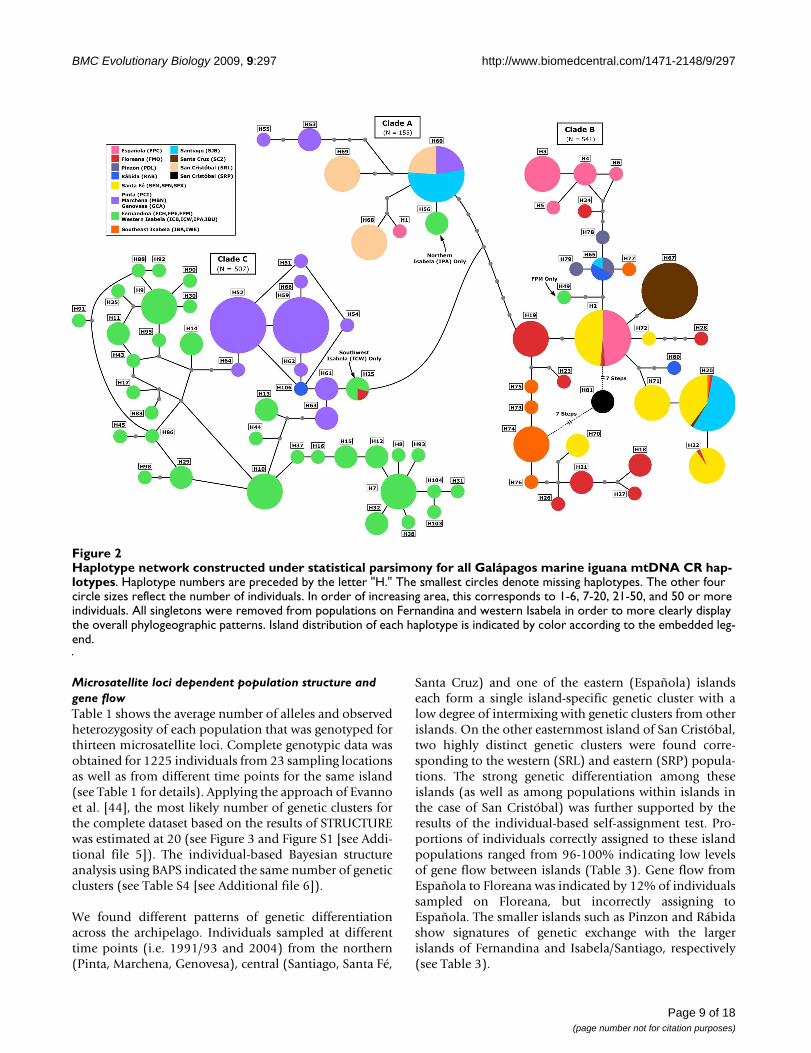
CR haplotype relationships and distributionStatistical parsimony networks were constructed sepa-rately for each of the three clades. In clade A, haplotypeH5 was the only variant that was widespread and foundon multiple islands, including San Cristóbal to the south-east, Marchena to the north, and Santiago in the centralarchipelago (Figure 2). One clade A haplotype (H4) wasalso found on northern Isabela (IPA), showing that thislineage extends to the far west. In clade B, some haplo-types (e.g. H8, H15) were widespread across several of theeastern and central islands while others (e.g. H9-H12 onEspañola) formed groups that clustered within specificislands. Members of clade B were generally restricted to
the eastern and central islands, except that the majority ofsouthern Isabela haplotypes were also part of this clade. Inaddition, a clade B haplotype (H23) was identified from asingle individual in the far western FPM population onFernandina. Haplotypes from the island of Floreanaappeared at several disjunct places in the network.
For clade C a high degree of reticulation was observed inthe network. As a result, the complete network could notbe represented in a clear fashion, and singleton individu-als (N = 26) were removed from the statistical parsimonyanalysis to simplify the general phylogeographic patterns.The majority of clade C haplotypes were limited to the farwestern (Fernandina and western Isabela) and northern(Pinta, Marchena, and Genovesa) regions of the archipel-ago, although two clade C haplotypes, H60 and H106,were also found on two central islands, Floreana and Ráb-ida.
Population genetic diversity and differentiation based on CR dataMany populations from the west (i.e. Fernandina andwestern Isabela) showed high levels of genetic diversity(Hd > 0.900; Table 1). Conversely, a number of popula-tions from the north, east, and central regions had partic-ularly low levels of variation, many containing threehaplotypes or less. The variation was particularly low onSanta Cruz, where 115 of the 116 individuals sampledshared the same CR haplotype.
The analysis of genetic structure (Table 2) showed thatpopulations from the older central/eastern islands werehighly differentiated from those in the north (FST= 0.74)and west (FST= 0.70). There was also significant structurebetween northern and western islands, but to a lesserdegree (FST= 0.42). Within regions, genetic distinctivenessamong populations was much greater in the eastern/cen-tral archipelago (FST= 0.55) than in the north (FST= 0.18)or west (FST= 0.09). However, some eastern/centralislands (e.g. Santa Fé, Española) contained many individ-uals that shared haplotypes with populations from otherislands (see Figure 1b). The most striking separation ofmarine iguana populations in the east/central region wasobserved on opposite ends of San Cristóbal island (FST=0.87); a result of the fact that haplotypes from these pop-ulations are from two different clades (Figure 1b; Figure2). The results of the AMOVA, in which populations weregrouped into northern, eastern/central, and westernregions, showed that variation was similarly partitionedamong groups (40.1%), among populations withingroups (31.2%), and within populations (28.7%). Theseresults were further supported by the fact that mitochon-drial differentiation between island populations corre-lated with island age (r = 0.45; p = 0.004) and couldexplain 20% of the observed variation.
Page 8 of 18(page number not for citation purposes)
BMC Evolutionary Biology 2009, 9:297 http://www.biomedcentral.com/1471-2148/9/297
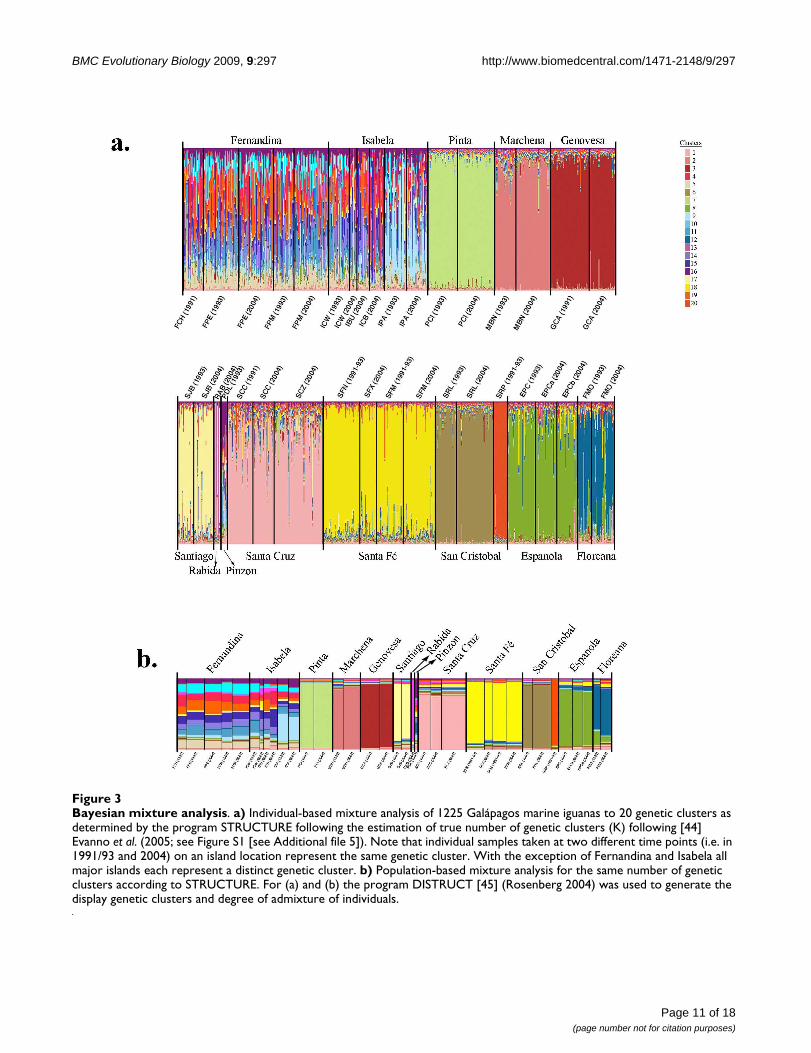
Microsatellite loci dependent population structure and gene flowTable 1 shows the average number of alleles and observedheterozygosity of each population that was genotyped forthirteen microsatellite loci. Complete genotypic data wasobtained for 1225 individuals from 23 sampling locationsas well as from different time points for the same island(see Table 1 for details). Applying the approach of Evannoet al. [44], the most likely number of genetic clusters forthe complete dataset based on the results of STRUCTUREwas estimated at 20 (see Figure 3 and Figure S1 [see Addi-tional file 5]). The individual-based Bayesian structureanalysis using BAPS indicated the same number of geneticclusters (see Table S4 [see Additional file 6]).
We found different patterns of genetic differentiationacross the archipelago. Individuals sampled at differenttime points (i.e. 1991/93 and 2004) from the northern(Pinta, Marchena, Genovesa), central (Santiago, Santa Fé,
Santa Cruz) and one of the eastern (Española) islandseach form a single island-specific genetic cluster with alow degree of intermixing with genetic clusters from otherislands. On the other easternmost island of San Cristóbal,two highly distinct genetic clusters were found corre-sponding to the western (SRL) and eastern (SRP) popula-tions. The strong genetic differentiation among theseislands (as well as among populations within islands inthe case of San Cristóbal) was further supported by theresults of the individual-based self-assignment test. Pro-portions of individuals correctly assigned to these islandpopulations ranged from 96-100% indicating low levelsof gene flow between islands (Table 3). Gene flow fromEspañola to Floreana was indicated by 12% of individualssampled on Floreana, but incorrectly assigning toEspañola. The smaller islands such as Pinzon and Rábidashow signatures of genetic exchange with the largerislands of Fernandina and Isabela/Santiago, respectively(see Table 3).
Haplotype network constructed under statistical parsimony for all Galápagos marine iguana mtDNA CR haplotypesFigure 2Haplotype network constructed under statistical parsimony for all Galápagos marine iguana mtDNA CR hap-lotypes. Haplotype numbers are preceded by the letter "H." The smallest circles denote missing haplotypes. The other four circle sizes reflect the number of individuals. In order of increasing area, this corresponds to 1-6, 7-20, 21-50, and 50 or more individuals. All singletons were removed from populations on Fernandina and western Isabela in order to more clearly display the overall phylogeographic patterns. Island distribution of each haplotype is indicated by color according to the embedded leg-end.
Page 9 of 18(page number not for citation purposes)
BMC Evolutionary Biology 2009, 9:297 http://www.biomedcentral.com/1471-2148/9/297
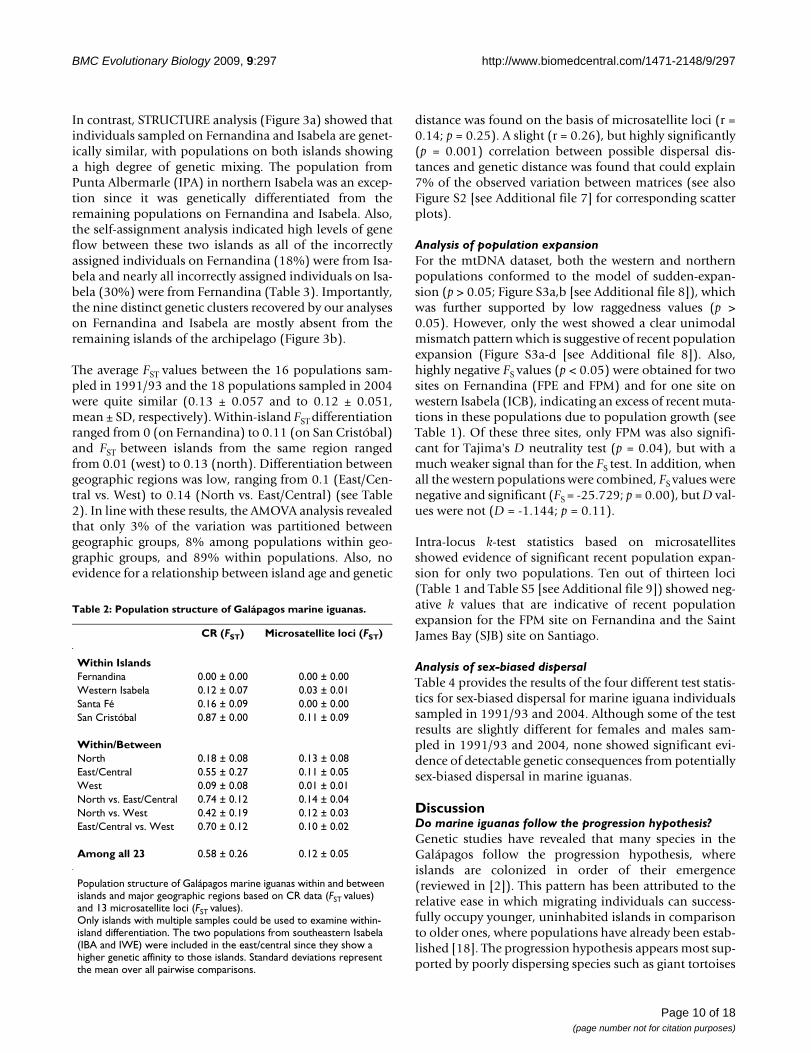
In contrast, STRUCTURE analysis (Figure 3a) showed thatindividuals sampled on Fernandina and Isabela are genet-ically similar, with populations on both islands showinga high degree of genetic mixing. The population fromPunta Albermarle (IPA) in northern Isabela was an excep-tion since it was genetically differentiated from theremaining populations on Fernandina and Isabela. Also,the self-assignment analysis indicated high levels of geneflow between these two islands as all of the incorrectlyassigned individuals on Fernandina (18%) were from Isa-bela and nearly all incorrectly assigned individuals on Isa-bela (30%) were from Fernandina (Table 3). Importantly,the nine distinct genetic clusters recovered by our analyseson Fernandina and Isabela are mostly absent from theremaining islands of the archipelago (Figure 3b).
The average FST values between the 16 populations sam-pled in 1991/93 and the 18 populations sampled in 2004were quite similar (0.13 ± 0.057 and to 0.12 ± 0.051,mean ± SD, respectively). Within-island FST differentiationranged from 0 (on Fernandina) to 0.11 (on San Cristóbal)and FST between islands from the same region rangedfrom 0.01 (west) to 0.13 (north). Differentiation betweengeographic regions was low, ranging from 0.1 (East/Cen-tral vs. West) to 0.14 (North vs. East/Central) (see Table2). In line with these results, the AMOVA analysis revealedthat only 3% of the variation was partitioned betweengeographic groups, 8% among populations within geo-graphic groups, and 89% within populations. Also, noevidence for a relationship between island age and genetic
distance was found on the basis of microsatellite loci (r =0.14; p = 0.25). A slight (r = 0.26), but highly significantly(p = 0.001) correlation between possible dispersal dis-tances and genetic distance was found that could explain7% of the observed variation between matrices (see alsoFigure S2 [see Additional file 7] for corresponding scatterplots).
Analysis of population expansionFor the mtDNA dataset, both the western and northernpopulations conformed to the model of sudden-expan-sion (p > 0.05; Figure S3a,b [see Additional file 8]), whichwas further supported by low raggedness values (p >0.05). However, only the west showed a clear unimodalmismatch pattern which is suggestive of recent populationexpansion (Figure S3a-d [see Additional file 8]). Also,highly negative FS values (p < 0.05) were obtained for twosites on Fernandina (FPE and FPM) and for one site onwestern Isabela (ICB), indicating an excess of recent muta-tions in these populations due to population growth (seeTable 1). Of these three sites, only FPM was also signifi-cant for Tajima's D neutrality test (p = 0.04), but with amuch weaker signal than for the FS test. In addition, whenall the western populations were combined, FS values werenegative and significant (FS = -25.729; p = 0.00), but D val-ues were not (D = -1.144; p = 0.11).
Intra-locus k-test statistics based on microsatellitesshowed evidence of significant recent population expan-sion for only two populations. Ten out of thirteen loci(Table 1 and Table S5 [see Additional file 9]) showed neg-ative k values that are indicative of recent populationexpansion for the FPM site on Fernandina and the SaintJames Bay (SJB) site on Santiago.
Analysis of sex-biased dispersalTable 4 provides the results of the four different test statis-tics for sex-biased dispersal for marine iguana individualssampled in 1991/93 and 2004. Although some of the testresults are slightly different for females and males sam-pled in 1991/93 and 2004, none showed significant evi-dence of detectable genetic consequences from potentiallysex-biased dispersal in marine iguanas.
DiscussionDo marine iguanas follow the progression hypothesis?Genetic studies have revealed that many species in theGalápagos follow the progression hypothesis, whereislands are colonized in order of their emergence(reviewed in [2]). This pattern has been attributed to therelative ease in which migrating individuals can success-fully occupy younger, uninhabited islands in comparisonto older ones, where populations have already been estab-lished [18]. The progression hypothesis appears most sup-ported by poorly dispersing species such as giant tortoises
Table 2: Population structure of Galápagos marine iguanas.
CR (FST) Microsatellite loci (FST)
Within IslandsFernandina 0.00 ± 0.00 0.00 ± 0.00Western Isabela 0.12 ± 0.07 0.03 ± 0.01Santa Fé 0.16 ± 0.09 0.00 ± 0.00San Cristóbal 0.87 ± 0.00 0.11 ± 0.09
Within/BetweenNorth 0.18 ± 0.08 0.13 ± 0.08East/Central 0.55 ± 0.27 0.11 ± 0.05West 0.09 ± 0.08 0.01 ± 0.01North vs. East/Central 0.74 ± 0.12 0.14 ± 0.04North vs. West 0.42 ± 0.19 0.12 ± 0.03East/Central vs. West 0.70 ± 0.12 0.10 ± 0.02
Among all 23 0.58 ± 0.26 0.12 ± 0.05
Population structure of Galápagos marine iguanas within and between islands and major geographic regions based on CR data (FST values) and 13 microsatellite loci (FST values).Only islands with multiple samples could be used to examine within-island differentiation. The two populations from southeastern Isabela (IBA and IWE) were included in the east/central since they show a higher genetic affinity to those islands. Standard deviations represent the mean over all pairwise comparisons.
Page 10 of 18(page number not for citation purposes)
BMC Evolutionary Biology 2009, 9:297 http://www.biomedcentral.com/1471-2148/9/297
Page 11 of 18(page number not for citation purposes)
Bayesian mixture analysisFigure 3Bayesian mixture analysis. a) Individual-based mixture analysis of 1225 Galápagos marine iguanas to 20 genetic clusters as determined by the program STRUCTURE following the estimation of true number of genetic clusters (K) following [44] Evanno et al. (2005; see Figure S1 [see Additional file 5]). Note that individual samples taken at two different time points (i.e. in 1991/93 and 2004) on an island location represent the same genetic cluster. With the exception of Fernandina and Isabela all major islands each represent a distinct genetic cluster. b) Population-based mixture analysis for the same number of genetic clusters according to STRUCTURE. For (a) and (b) the program DISTRUCT [45] (Rosenberg 2004) was used to generate the display genetic clusters and degree of admixture of individuals.

BMC Evolutionary Biology 2009, 9:297 http://www.biomedcentral.com/1471-2148/9/297
[60,61], lava lizards [62,63], land snails [7], and Galápa-gos land iguanas [64,65] since the probability of backmigration to older islands is low. Conversely, the phylo-geographic patterns of more mobile organisms such asDarwin finches ([1]; but see [4]), insects (e.g. weevils;[10]), sea lions [66] and hawks [67] do not always con-form to the geologic history of the islands. In the case ofGalápagos sea lions and hawks genetic data suggest thatpopulation structure was established and affected by quitedifferent factors after a rapid population expansion acrossthe whole archipelago: sea lions diverged according toecological differences in a western and eastern clade [66],whereas an island-dependent population structure due tolimited dispersal between islands was found for theGalápagos hawks [67].
Galápagos marine iguanas feed exclusively on aquaticalgae and are closely tied to the coastal environmentthroughout their lives [20,68,69]. Large individuals areeven known to forage offshore in the subtidal zone, swim-ming up to several hundred meters to reach feeding sites[20]. It is therefore reasonable to expect that these animalscan disperse easily - either actively or passively - and thattheir evolutionary history should not conform to the pro-gression hypothesis.
On a broad scale, the current study provides evidence thatthe progression hypothesis appears to hold true formarine iguanas. Our CR analyses, as well as the previouslypublished cytb study [27], suggest that clade B may bebasal to clades A and C (Figure 1a). Biogeographically,
this makes sense since clade B is found almost exclusivelyon the eastern and central islands (Figure 1b) that are con-sidered to be the oldest in the archipelago. Meanwhile, themajority of clade C haplotypes was identified on youngerislands in the north and west. The basal position of cladeB would be made stronger if Galápagos land iguanas - theacknowledged sister species of marine iguanas -could beused as an outgroup for phylogenetic analysis. However,when this was attempted using Bayesian-based phyloge-netic inference, independent runs failed to converge after1 × 107 generations. This outcome is likely due to the largedivergence between marine and land iguana CRsequences (approximately 10%) compared to the lowdivergence within marine iguanas (max. 1.6%), reflectingthe long timeframe in which the two species have inde-pendently evolved on both existing and submergedislands.
Due to the difficulty in rooting the marine iguana phylog-eny with CR data, frequency-based genetic informationprovides important additional support for the progressionhypothesis at the large scale. The genetic division betweenpopulations from the eastern/central archipelago andthose from the northern and western islands was evidentin the CR haplotype frequencies, which showed high lev-els of differentiation as expressed by rather high FST-valuesbetween regions (see Table 2). FST differentiation based onmicrosatellite loci for corresponding comparisons ismuch lower (Table 2) and not in line with the mitochon-drial data.
Table 3: Results of the self-assignment test.
Island population Proportion of correctly assigned individuals Proportion of non-correctly assigned individuals
Fernandina 0.82 0.18 (Isabela)San Christobal (SCR) 1.0 -San Christobal (SRP) 1.0 -Floreana 0.82 0.12 (Española)
0.06 (Santa Cruz)Genovesa 1.0 -Marchena 1.0 -Pinta 1.0 -Santiago 0.96 0.04 (Isabela)Santa Cruz 0.98 0.02 (Isabela)Española 0.96 0.04 (Floreana)Isabela 0.66 0.3 (Fernandina)
0.007 (Floreana)0.007 (Santa Cruz)0.007 (Santa Fé)
Rábida 0.8 0.1 (Isabela)0.1 (Santiago)
Pinzon 0.78 0.22 (Fernandina)Santa Fé 0.994 0.006 (Isabela)
Results of the self-assignment test of 1225 Galápagos marine iguana samples using the approach of Rannala and Mountain [48] as implemented in the program GENECLASS2 [47]. Proportion of "correctly" assigned individuals includes individuals that were assigned to their island of origin irrespective of the sampling period (i.e. sampled in 1991/93 or 2004; see Material and Methods for details), whereas the second column gives the proportion of individuals assigned to islands other than the island of origin.
Page 12 of 18(page number not for citation purposes)

BMC Evolutionary Biology 2009, 9:297 http://www.biomedcentral.com/1471-2148/9/297
One consequence of the progression hypothesis is thatlevels of genetic structure are higher among populationson older islands since these are more likely to be at equi-librium and to have undergone significant lineage sorting.For example, in Galápagos tortoises, mitochondrial hap-lotypes are largely endemic to specific islands in the east-ern archipelago while those in the west are often sharedbetween populations and depict an intricate history ofgenetic exchange [60,61]. A qualitatively similar pattern isalso seen for marine iguanas. Mitochondrial CR differen-tiation was much higher between populations from theolder eastern/central archipelago than among the youngerwestern and northern islands. Moreover, levels of geneticdifferentiation among populations on the youngest(~35,000-535,000 years) and westernmost islands ofFernandina and Isabela were not significantly differentfrom 0 (see Table 2).
There are some exceptions to the general east/west divi-sion of marine iguanas in the archipelago that are evidentfrom the CR data. While clade B haplotypes did predomi-nate in the eastern/central region in our study, they werealso in the majority on southeastern Isabela, suggestingthat this part of the island is biogeographically more con-nected to the east/central archipelago than to the west. Inaddition, a single clade B haplotype (H23) was also foundon the far-western island of Fernandina, demonstratingthe potential for rare long-distance dispersal from the east.Similarly, haplotypes from clade C, which were previouslyshown to be restricted to the north and west, were alsoidentified on two of the central islands, Floreana and Ráb-ida. A unique clade A haplotype was also identified onnorthern Isabela, showing that this lineage extends acrossthe entire northern archipelago. The ancestral haplotypein this clade (H5) was widely distributed, existing on SanCristóbal to the east, and Santiago and Marchena in thenorth-central archipelago. Since San Cristóbal is one ofthe two oldest islands in the Galápagos, clade A likelyradiated from there to the north and west, all the way tothe northern tip of Isabela. This fits well with the patternsof island age as well as the path of the prevailing Hum-
boldt current which approaches the archipelago from asoutheasterly direction [70] and is thought to have pro-duced similar east to west colonization patterns in otherGalápagos organisms [2,63].
While the progression hypothesis generally explains theoverall east/west division of marine iguanas, dispersal pat-terns have produced a more complicated history withinregions. Unlike tortoises and other Galápagos organismsthat exhibit complete genetic structuring among olderpopulations, many marine iguana CR haplotypes areshared between different islands in the eastern/centralregion (Figure 1b and Figure 2). For example, more thanhalf of the marine iguanas sampled on Santa Fé have CRhaplotypes in common with individuals from otherislands. In addition, the statistical parsimony analysis(Figure 2) shows that haplotypes restricted to several ofthe older islands in the eastern archipelago (e.g. Españolaand Santa Fé) are connected to other eastern/centralisland haplotypes via haplotypes from younger centralislands (e.g. Pinzón, Isabela), suggesting that migrationroutes have not proceeded strictly according to the age ofisland emergence. The appearance of Floreana haplotypesthroughout the network shows that this island has beensubject to continual genetic exchange with other islands.
Microsatellite loci based population structure - evidence for sex-biased dispersal in marine iguanas?Bayesian cluster analysis of microsatellite loci genotypesshows that most marine iguanas belong to highly distinctgenetic island clusters (Figure 3). This result was inde-pendently supported by the high assignment rate of indi-viduals to their island of origin for the majority of islands(Table 3). The Bayesian cluster analysis is especially con-vincing for two reasons. First, individuals sampled at dif-ferent time points (i.e. in 1991/93 and 2004) but at thesame sampling location were grouped together as onegenetic unit. Second, the same number of genetic clusterswas obtained by two different Bayesian clustering meth-ods (STRUCTURE and BAPS). The microsatellite loci datatherefore suggest that the structuring of marine iguana
Table 4: Test for sex-biased dispersal in Galápagos marine iguanas.
Sampling period FIS statistic FST statistic Mean AIc test Variance AIc test
1991/93 F = 0.023 F = 0.117 F = 0.124 F = 11.24M = 0.040 M = 0.115 M = -0.106 M = 12.07p = 0.11 p = 0.35 p = 0.22 p = 0.35
2004 F = 0.033 F = 0.106 F = -0.145 F = 14.49M = 0.007 M = 0.129 M = 0.136 M = 13.39p = 0.98 p = 0.82 p = 0.78 p = 0.77
The results of four tests (FIS test, FST test, corrected Mean Assignment Index test and variance of corrected assignment test; see material and methods and [56] for details) are shown for females (F) and males (M) as sampled in 1991/93 and 2004. Note that none of the tests for both sampling periods provide significant differences (p-value) concerning dispersal of sexes.
Page 13 of 18(page number not for citation purposes)

BMC Evolutionary Biology 2009, 9:297 http://www.biomedcentral.com/1471-2148/9/297
populations generally follows a pattern of one geneticunit per island. A similar pattern was also recently demon-strated for Galápagos lava lizards from the genus Microlo-phus [71].
Based on FSTanalyses of nuclear genetic data, high levels ofgene flow between islands and populations were reported[27]. The overall FST was approximately 0.1 for the 22marine iguana populations examined. Although the aver-age FST differentiation found in our study was in the samerange (FST= 0.13 and FST= 0.12, respectively, for 1991/93and 2004 samplings), the high level of genetic differenti-ation between islands indicated by Bayesian cluster anal-yses suggests that recent gene flow has been limited, andconsequently that FST values may provide little informa-tion about fine scale population structure (see reviews[72,73]). Another issue of microsatellite-based FST esti-mates is the underestimation of genetic structure due toallele size homoplasy. Such a pattern may result from thecharacteristically high mutation rates and allelic polymor-phism of microsatellite loci and may diminish theobserved genetic distance (reviewed in [74]). As an exam-ple, when microsatellite loci and sequences of the nuclearcoded internal transcribed spacer (ITS-1) were analysed inthe coral species Corallium rubrum across the western Med-iterranean, ITS-1 sequences revealed significant geneticstructure between different geographic regions while mic-rosatellite loci failed to show any correlation between FST-based estimates for geographic distances ranging from 30-2650 km [75]. In another study in the same organism,however, very fine scale structuring based on microsatel-lites was observed for distances of ten meters to one km[76] indicating that spatial genetic structure does exists inthis system but may not be detectable using microsatel-lite-based FST estimates over large distances and/or timeframes.
Since the study of Rassmann et al. found significant differ-entiation between islands and regions based on mater-nally inherited mtDNA markers but not on bi-parentallyinherited nuclear microsatellite and minisatellite loci,they concluded that male-mediated dispersal and geneflow was likely responsible for this discrepancy [27]. Sup-port for this hypothesis came from frequent field observa-tions in which male marine iguanas have been observedto swim to different islands during the breeding season -apparently to establish breeding territories (e.g. SantaCruz and Caamaño; [77]). After the breeding season theyreturn to the larger island where they "live". On the otherhand females have been observed swimming to someislands (e.g. Plaza Sur, Plaza Norte and "Devine's Bay" inAcademy Bay) during the breeding season and returned totheir resident island after oviposition (unpublished data).
In our study none of the four tests conducted showed sig-nificant evidence for sex-biased dispersal in marine igua-
nas (Table 4). Since the set of individuals analyzed in theRassman et al. study [27] for three microsatellite loci cor-responds to the 1991/93 samples analyzed for thirteenmicrosatellite loci in our study, it was possible to directlycompare of FST-based test statistics between the two stud-ies. In the former study [27] males displayed a signifi-cantly lower FST-value (FST= 0.09) than females (FST=0.12) suggesting that males disperse more than females.Conversely, FST estimates for the same set of males andfemales, which were genotyped at thirteen microsatelliteloci, were not significantly different (males, FST = 0.115;females, FST= 0.117; p = 0.35; Table 4). For individualssampled in 2004, we even found higher FST values formales (FST= 0.129) than for females (FST= 0.106), but alsonon-significant (p = 0.82). These findings suggest that theresults of the Rassman et al. study [27], which were basedonly on three microsatellite loci, should be approachedcautiously. Since sex bias has to be intense to be detectedby any of the applied test statistics [56], we cannot ruleout that such a bias might exist in the case of single dis-persers. However, we can exclude that this is a majordemographic characteristic of marine iguana populations,as previously suggested.
Beyond the results of the sex-biased dispersal tests, theobserved genetic patterns make high dispersal rates inmarine iguanas unlikely. Bayesian-based populationstructure analysis (Figure 3) indicates that, except in a fewcases (e.g. Isabela and Fernandina), recent migration andgene flow between islands is low. The fact that we recov-ered separate genetic units in the west (location SRL) andeast (location SRP) on San Cristóbal (also supported bythe mitochondrial data; see Figure 1b; Figure 2) as well asdetected population structure between populations onIsabela (IPA versus the rest of the Isabela; see Figure 3b)indicates that gene flow of marine iguanas can be limitedeven along the coasts of the same island. These findingsare not in line with expectations of high male-mediatedgene flow [27].
Evolution of high genetic diversity on Isabela and FernandinaMarine iguana populations on the westernmost islands ofIsabela and Fernandina are among the largest in theGalápagos, with Fernandina alone numbering in the hun-dreds of thousands [78]. Individuals from these popula-tions are also the largest in the archipelago with amaximum body mass of 12 kg for individuals in south-western Isabela [79]. Both large population size and indi-vidual body size have been attributed to the high marineproductivity generated by upwelling of the nutrient-richCromwell current along the western archipelago [19,80].The same region also harbors nearly 95% of the overallGalápagos penguin (Spheniscus mendiculus) population[81].
Page 14 of 18(page number not for citation purposes)

BMC Evolutionary Biology 2009, 9:297 http://www.biomedcentral.com/1471-2148/9/297
The western marine iguana populations also possess ahigh level of genetic diversity for both mitochondrial andmicrosatellite data, even though they occur on the twomost recently emerged islands. The emergence age of theoldest volcano on Isabela is less than 535,000 years, whilethe emergence age of Fernandina is estimated to be only35,000 years [82]. In contrast, central and southernislands of the archipelago are 1-4 million years old. Sixty-seven out of the total 106 mitochondrial control regionhaploytypes are found on Fernandina and Isabela with 65haplotypes being distinct to these islands (Figure 1 andFigure 2) resulting in high levels of haplotype diversity. Incontrast populations on the other islands showed signifi-cantly fewer haplotypes and lower levels of haplotypediversity. Also, at the level of microsatellite loci, up to ninedifferent genetic clusters were detected for Fernandina andIsabela (Figure 3b), whereas a single predominant clusteris found in populations from most other islands. Thesegenetic clusters are unique to the Isabela and Fernandinapopulations and therefore must have recently evolved onthese islands.
On a broad scale across all islands mitochondrial as wellas nuclear diversity indices did not correlate with islandsize (i.e. island perimeter; (see Figure S4 [see Additionalfile 10]). The most obvious explanation for the higherlevel of genetic diversity on the younger islands is thatlarge population sizes along with recent populationgrowth have resulted in many new mutations combinedwith decreased effects of genetic drift. Indeed, westernpopulations on Isabela and Fernandina show clear signsof sudden-expansion based on mtDNA data as evidencedby a clear unimodal mismatch pattern (Figure S3 [seeAdditional file 8]) and highly negative FS values for PuntaEspinosa and Punta Mangle on Fernandina (see Table 1)indicating an excess of recent mutations. The microsatel-lite loci-based k-test statistic showed significant supportfor recent population expansion for the Punta Manglepopulation on Fernandina (Table 1 and Table S5 [seeAdditional file 9]), but not for any of the other westernpopulations.
However, the analysis of CR haplotypes also shows thatwestern marine iguana populations possess mtDNA hap-lotypes typical of some central, northern, and southernpopulations. This variation could have been introducedinto the western populations through founder eventsfrom multiple sources. An increased variation within pop-ulations due to multiple recent colonizations has beenshown for the invasive brown anolis (Anolis sagrei; [83]. Inthis respect, the finding that mitochondrial CR haplotypesof marine iguanas from southern Isabela are connected to
haploytypes typical of the central islands (Santa Cruz andFloreana) - a similar picture that is seen also in Galápagostortoises [60,84,85] - underpins the colonization of Isa-bela from multiple sources. In the land iguana C. subcrista-tus, mitochondrial DNA sequence data indicate a singlefounder event of western islands from a single sourcelocated in the central islands [65]. Subsequently C. subc-ristatus seems to have dispersed in a south to north direc-tion on Isabela. However, the occurrence of an oldseparate lineage on Isabela (now recognized as a separatespecies; [65]) indicates that land iguanas have colonizedIsabela at least twice.
ConclusionsThis comprehensive analysis of the population structureof Galápagos marine iguanas both supports and trans-forms our previous knowledge about the microevolutionof this unique species. The detailed mtDNA analyses traceback migration routes in the evolutionary past and suggestthat colonization of islands progressed from geologicallyolder to younger islands in the archipelago. The existenceof highly differentiated genetic clusters among islands aswell as no specific support for sex-biased dispersal conflictwith the previously held view of high male gene flowamong islands. More generally, our study demonstrateshow the development of recent analytical tools such asBayesian clustering analysis and DNA sequence-baseddemographic analyses allow us to tease apart the role ofpast and present gene flow in shaping current patterns ofpopulation differentiation.
Authors' contributionsProject conception and design: SS SG AC HLS. Performedlaboratory work: SS SG DL TCH. Data analysis: SS SG DLTCH. Wrote the paper: SS SG AC MR. Figure design: DL SGSS. Field sampling: SS SG AC MR CM SR HMS GG GOAMP. All authors read and approved the final manuscript.
Additional material
Additional file 1Table S1: Possible dispersal distances of marine iguanas.Click here for file[http://www.biomedcentral.com/content/supplementary/1471-2148-9-297-S1.XLS]
Additional file 2Supporting information on mitochondrial CR analyses [88-93].Click here for file[http://www.biomedcentral.com/content/supplementary/1471-2148-9-297-S2.DOC]
Page 15 of 18(page number not for citation purposes)

BMC Evolutionary Biology 2009, 9:297 http://www.biomedcentral.com/1471-2148/9/297
AcknowledgementsThe authors thank the Servicio Parque Nacional Galápagos and the Charles Darwin Research Station for granting the sampling permits and for providing the necessary infrastructure, TAME airlines for providing reduced airfare from mainland Ecuador to the islands, Kornelia Rassmann, Fritz Trillmich,
Diethard Tautz, Martin Wikelski, Thomas Roedl and Maren Vitousek for providing blood samples of A. cristatus. Ryan Garrick provided valuable comments on an earlier version of the manuscript. The sample collection trip of the year 2004 was enabled through a grant from the National Geo-graphic Society (NGS 7589-04) to Adalgisa Caccone and Sebastian Stein-fartz. Sebastian Steinfartz has been supported by a fellowship (STE 1130/2-1 and 1130/2-2) of the German Research Community (DFG) and Deborah Lanterbecq by a postdoctoral fellowship of the Belgian American Educa-tional Foundation. The Yale Institute for Biospheric studies supported this project through funds to Adalgisa Caccone.
References1. Grant PR, Grant BR: How and why species multiply: the radia-
tion of Darwin's finches. Princeton: Princeton University Press;2008.
2. Parent CE, Caccone A, Petren K: Colonisation and diversificationof Galápagos terrestrial fauna: a phylogenetic and biogeo-graphical synthesis. Philos Trans Roy Soc B 2008, 363:3347-3361.
3. Cox A: Ages of the Galápagos Islands. In Patterns of Galápagosorganisms Edited by: Bowman RI, Berson M, Leviton AE. San Francisco:Pacific Division, AAAS; 1983:11-23.
4. Arbogast BS, Drovetski SV, Curry RL, Boag PT, Seutin G, Grant PR,Grant BR, Anderson DJ: The origin and diversification ofGalápagos mockingbirds. Evolution 2006, 60:370-382.
5. Bollmer JL, Kimball RT, Whiteman NK, Sarasola JH, Parker PG: Phy-logeography of the Galápagos hawk (Buteo galapagoensis):A recent arrival to the Galápagos Islands. Mol Phyl Evol 2006,39:237-247.
6. Caccone A, Gibbs JP, Ketmaier V, Suatoni E, Powell JR: Origin andevolutionary relationships of giant Galápagos tortoises. ProcNat Acad Sci USA 1999, 96:13223-13228.
7. Parent CE, Crespi BJ: Sequential colonization and diversifica-tion of Galápagos endemic land snail genus Bulimulus (Gas-tropoda, Stylommatophora). Evolution 2006, 60:2311-2328.
8. Rassmann K: Evolutionary age of the Galápagos iguanas pre-dates the age of the present Galápagos Islands. Mol Phyl Evol1997, 7:158-172.
9. Sato A, O'hUigin C, Figueroa F, Grant PR, Grant BR, Tichy H, Klein J:Phylogeny of Darwin's finches as revealed by mtDNAsequences. Proc Nat Acad Sci USA 1999, 96:5101-5106.
10. Sequeira AS, Lanteri AA, Albelo R, Bhattacharya S, Sijapati M: Colo-nization history, ecological shifts and diversification in theevolution of endemic Galápagos weevils. Mol Ecol 2008,17:1089-1107.
11. Kizirian D, Trager A, Donnelly MA, Wright JW: Evolution ofGalápagos Island Lava Lizards (Iguania: Tropiduridae: Micro-lophus). Mol Phyl Evol 2004, 32:761-769.
12. Wright JW: The evolution and biogeography of the lizards ofthe Galápagos archipelago: evolutionary genetics of Phyllo-dactylus and Tropidurus populations. In Patterns of evolution inGalápagos organisms Edited by: Bowman RI, Berson M, Leviton AE. SanFrancisco: Pacific Division, AAAS; 1983:123-155.
13. Beheregaray LB, Caccone A: Cryptic biodiversity in a changingworld. J Biol 2007, 6:9.
14. Beheregaray LB: Twenty years of phylogeography: the state ofthe field and the challenges for the Southern Hemisphere.Mol Ecol 2008, 17:3754-3774.
15. Hickman CS, Lipps JH: Geologic Youth of Galápagos IslandsConfirmed by Marine Stratigraphy and Paleontology. Science1985, 227:1578-1580.
16. Geist D: On the emergence and submergence of the Galápa-gos islands. Not Galápagos 1996, 56:5-9.
17. White WM, Mcbirney AR, Duncan RA: Petrology and Geochem-istry of the Galápagos-Islands - Portrait of a PathologicalMantle Plume. J Geophys Res-Sol Ea 1993, 98:19533-19563.
18. Wagner WL, Funk VA: Hawaiian biogeography: evolution on a hot spotarchipelago Washington: Smithsonian Institution Press; 1995.
19. Boersma PD: An ecological study of the Galápagos marineiguana. In Patterns of evolution in Galápagos organisms Edited by: Bow-man RI, Berson M, Leviton AE. San Francisco: Pacific Division, AAAS;1983:157-176.
20. Trillmich KGK, Trillmich F: Foraging Strategies of the marineiguana, Amblyrhynchus cristatus. Behav Ecol Sociobiol 1986,18:259-266.
Additional file 3Table S2: Detailed infromation on D-loop haplotypes.Click here for file[http://www.biomedcentral.com/content/supplementary/1471-2148-9-297-S3.PDF]
Additional file 4Table S3: General characteristics of the three mitochondrial clades of Galápagos marine iguanas.Click here for file[http://www.biomedcentral.com/content/supplementary/1471-2148-9-297-S4.DOC]
Additional file 5Figure S1: Estimation of genetic clusters according to Evanno et al.Click here for file[http://www.biomedcentral.com/content/supplementary/1471-2148-9-297-S5.PDF]
Additional file 6Table S4: Best found partitions according to BAPS v3.2.Click here for file[http://www.biomedcentral.com/content/supplementary/1471-2148-9-297-S6.DOC]
Additional file 7Figure S2: Scatter plot FST(based on microsatellite loci) versus possible dispersal distance.Click here for file[http://www.biomedcentral.com/content/supplementary/1471-2148-9-297-S7.PDF]
Additional file 8Figure S3: Mismatch distribution of Galápagos marine iguana D-loop haplotypes.Click here for file[http://www.biomedcentral.com/content/supplementary/1471-2148-9-297-S8.PDF]
Additional file 9Table S5: Intra locus specific k-values of thirteen microsatellite loci of Galápagos marine iguana populations.Click here for file[http://www.biomedcentral.com/content/supplementary/1471-2148-9-297-S9.DOC]
Additional file 10Figure S4: Scatter plot with regression analysis of island perimeter as measured by NOAA GIS resource (World Vector Coastline) vs genetic diversity values.Click here for file[http://www.biomedcentral.com/content/supplementary/1471-2148-9-297-S10.DOC]
Page 16 of 18(page number not for citation purposes)

BMC Evolutionary Biology 2009, 9:297 http://www.biomedcentral.com/1471-2148/9/297
21. de Queiroz K: Phylogenetic systematics of Iguanine lizards: acomparitive osteological study. Univ Cal Publs Zool 1987:118.
22. Sites JW, Davis SK, Guerra T, Iverson JB, Snell HL: Character con-gruence and phylogenetic signal in molecular and morpho-logical data sets: A case study in the living iguanas(Squamata, Iguanidae). Mol Biol Evol 1996, 13:1087-1105.
23. Wiens JJ, Hollingsworth BD: War of the iguanas: Conflictingmolecular and morphological phylogenies and long-branchattraction in iguanid lizards. Syst Biol 2000, 49:143-159.
24. Wyles JW, Sarich VM: Are the Galápagos iguanas older thanthe Galápagos? In Patterns of evolution in Galápagos organisms Editedby: Bowman RI, Berson M, Leviton AE. San Francisco: Pacific Division,AAAS; 1983:123-155.
25. Christie DM, Duncan RA, Mcbirney AR, Richards MA, White WM,Harpp KS, Fox CG: Drowned Islands Downstream from theGalápagos Hotspot Imply Extended Speciation Times.Nature 1992, 355:246-248.
26. Werner R, Hoernle K, Bogaard P van den, Ranero C, von Huene R:Drowned 14-m.y.-old Galápagos archipelago off the coast ofCosta Rica: Implications for tectonic and evolutionary mod-els. Geology 1999, 27:499-502.
27. Rassmann K, Tautz D, Trillmich F, Gliddon C: The microevolutionof the Galápagos marine iguana Amblyrhynchus cristatusassessed by nuclear and mitochondrial genetic analyses. MolEcol 1997, 6:437-452.
28. Freeland JR: Molecular Ecology Chichester: John Wiley & Sons; 2005. 29. Steinfartz S, Glaberman S, Lanterbecq D, Marquez C, Rassmann K,
Caccone A: Genetic Impact of a Severe El Nino Event onGalápagos Marine Iguanas (Amblyrhynchus cristatus). PLoSONE 2007, 2:e1285.
30. Hanley TC, Caccone A: Development of primers to character-ize the mitochondrial control region of Galápagos land andmarine iguanas (Conolophus and Amblyrhynchus). Mol EcolNotes 2005, 5:599-601.
31. Steinfartz S, Caccone A: A set of highly discriminating micros-atellite loci for the Galápagos marine iguana Amblyrhynchuscristatus. Mol Ecol Notes 2006, 6:927-929.
32. Gene Codes Corporation, Ann Arbor, MI, USA: .33. Edgar RC: MUSCLE: multiple sequence alignment with high
accuracy and high throughput. Nucleic Acids Res 2004,32:1792-1797.
34. Rozas J, Sanchez-DelBarrio JC, Messeguer X, Rozas R: DnaSP, DNApolymorphism analyses by the coalescent and other meth-ods. Bioinformatics 2003, 19:2496-2497.
35. Nylander JAA: MrModeltest v2. In Program distributed by the authorEvolutionary Biology Centre, Uppsala University; 2004.
36. Posada D, Crandall KA: MODELTEST: testing the model ofDNA substitution. Bioinformatics 1998, 14:817-818.
37. Hasegawa M, Kishino H, Yano T: Dating of the human-ape split-ting by a molecular clock of mitochondrial DNA. J Mol Evol1985, 22:160-74.
38. Ronquist F, Huelsenbeck JP: MrBayes 3: Bayesian phylogeneticinference under mixed models. Bioinformatics 2003,19:1572-1574.
39. Drummond AJ, Rambaut A: BEAST: Bayesian evolutionary anal-ysis by sampling trees. BMC Evol Biol 2007, 7:214.
40. Rambaut A, Drummond AJ: Tracer v1.4. 2007.41. Wright S: The Genetical Structure of Populations. Ann Eugenics
1951, 15:323-354.42. Schneider S, Roessli D, Excoffier L: Arlequin 2000 A software for
population genetics data analysis. Version 2.000. Version 2.0002000.
43. Pritchard JK, Stephens M, Donnelly P: Inference of populationstructure using multilocus genotype data. Genetics 2000,155:945-959.
44. Evanno G, Regnaut S, Goudet J: Detecting the number of clustersof individuals using the software STRUCTURE: a simulationstudy. Mol Ecol 2005, 14:2611-2620.
45. Rosenberg NA: DISTRUCT: a program for the graphical dis-play of population structure. Mol Ecol Notes 2004, 4:137-138.
46. Corander J, Waldmann P, Sillanpaa MJ: Bayesian analysis ofgenetic differentiation between populations. Genetics 2003,163:367-374.
47. Piry S, Alapetite A, Cornuet JM, Paetkau D, Baudouin L, Estoup A:geneclass2: a software for genetic assignment and firstgener-ation migrant detection. J Hered 2004, 95:536-539.
48. Rannala B, Mountain JL: Detecting immigration by using multi-locus genotypes. Proc Nat Acad Sci USA 1997, 94:9197-9221.
49. Reynolds J, Weir BS, Cockerham CC: Estimation of the co-ances-try coefficient - basis for a short-term genetic distance.Genetics 1983, 105:767-779.
50. Minch E, Ruiz-Linares A, Goldstein DB: Microsat (version 1.5d) a pro-gram for calculating statistics on microsatellite allele data 1995.
51. Fu YX: Statistical tests of neutrality of mutations against pop-ulation growth, hitchhiking and background selection. Genet-ics 1997, 147:915-925.
52. Tajima F: Statistical-Method for Testing the Neutral MutationHypothesis by DNA Polymorphism. Genetics 1989,123:585-595.
53. Bilgin R: Kgtests: a simple Excel Macro program to detect sig-natures of population expansion using microsatellites. MolEcol Notes 2007, 7:416-417.
54. Reich DE, Goldstein DB: Genetic evidence for a Paleolithichuman population expansion in Africa. Proc Nat Acad Sci USA1998, 95:8119-8123.
55. Reich DE, Feldman MW, Goldstein DB: Statistical Properties ofTwo Tests that Use Multilocus Data Sets to Detect Popula-tion Expansions. Mol Biol Evol 1999, 16:453-466.
56. Goudet J, Perrin N, Waser P: Tests for sex-biased dispersal usingbi-parentally inherited genetic markers. Mol Ecol 2002,11:1103-1114.
57. Paetkau D, Calvert W, Stirling I, Strobeck C: Microsatellite analy-sis of population structure in Canadian polar bears. Mol Ecol1995, 4:347-354.
58. Favre L, Balloux F, Goudet J, Perrin N: Female-biased dispersal inthe monogamous mammal Crocidura russula: evidence fromfield data and microsatellite patterns. P Roy Soc B-Biol Sci 1997,264:127-132.
59. Goudet J: FSTAT (version 1.2): A computer program to cal-culate F-statistics. J Hered 1995, 86:485-486.
60. Beheregaray LB, Gibbs JP, Havill N, Fritts TH, Powell JR, Caccone A:Giant tortoises are not so slow: rapid diversification and bio-geographic consensus in the Galápagos. Proc Nat Acad Sci USA2004, 101:6514-6519.
61. Ciofi C, Wilson GA, Beheregaray LB, Marquez C, Gibbs JP, Tapia W,Snell HL, Caccone A, Powell JR: Phylogeographic history andgene flow among giant Galápagos tortoises on southern Isa-bela Island. Genetics 2006, 172:1727-44.
62. Benavides E, Baum R, Mcclellan D, Sites JW Jr: Molecular phyloge-netics of the lizard genus microlophus (Squamata: Tropi-duridae): Aligning and retrieving indel signal from nuclearIntrons. Syst Biol 2007, 56:776-797.
63. Kizirian D, Trager A, Donnelly MA, Wright JW: Evolution ofGalápagos Island Lava Lizards (Iguania: Tropiduridae: Micro-lophus). Mol Phyl Evol 2004, 32:761-769.
64. Tzika AC, Rosa SFP, Fabiani A, Snell HL, Snell HM, Marquez C, TapiaW, Rassmann K, Gentile G, Milinkovitch MC: Population geneticsof Galápagos land iguana (genus Conolophus) remnant popu-lations. Mol Ecol 2008, 17:4943-4952.
65. Gentile G, Fabiani A, Marquez C, Snell HL, Snell HM, Tapia W, Sbor-doni V: An overlooked pink species of land iguana in theGalápagos. Proc Nat Acad Sci USA 2009, 106:507-511.
66. Wolf JBW, Harrod C, Brunner S, Salazar S, Trillmich F, Tautz D:Tracing early stages of species differentiation: Ecological,morphological and genetic divergence of Galápagos sea lionpopulations. BMC Evol Biol 2008, 8:150.
67. Bollmer JL, Kimball RT, Whiteman NK, Sarasola JH, Parker PG: Phy-logeography of the Galápagos hawk (Buteo galapagoensis):A recent arrival to the Galápagos islands. Mol Phyl Evol39:237-247.
68. Carpenter CC: The marine iguana of the Galápagos islands, itsbehavior and ecology. Proc Cal Acad Sci 1966, 34:329-376.
69. Wikelski M, Trillmich F: Foraging Strategies of the GalápagosMarine Iguana (Amblyrhynchus cristatus): Adapting Behavio-ral Rules to Ontogenic Size Change. Behaviour 1994,128:255-279.
70. Wyrtki K: Circulation and Water Masses in Eastern Equato-rial Pacific Ocean. Int J Oceanol Limnol 1967, 1:117.
71. Benavides E, Baum R, Snell HM, Snell HL, Sites JW Jr: Island bioge-ography of Galápagos lava lizards (Tropiduridae: Microlo-phus): species diversity and colonization of the archipelago.Evolution 2009, 63:1606-1626.
Page 17 of 18(page number not for citation purposes)

BMC Evolutionary Biology 2009, 9:297 http://www.biomedcentral.com/1471-2148/9/297
Publish with BioMed Central and every scientist can read your work free of charge
"BioMed Central will be the most significant development for disseminating the results of biomedical research in our lifetime."
Sir Paul Nurse, Cancer Research UK
Your research papers will be:
available free of charge to the entire biomedical community
peer reviewed and published immediately upon acceptance
cited in PubMed and archived on PubMed Central
yours — you keep the copyright
Submit your manuscript here:http://www.biomedcentral.com/info/publishing_adv.asp
BioMedcentral
72. Pearse DE, Crandall KA: Beyond F-ST: Analysis of populationgenetic data for conservation. Cons Gen 2004, 5:585-602.
73. Waples RS, Gaggiotti O: What is a population? An empiricalevaluation of some genetic methods for identifying thenumber of gene pools and their degree of connectivity. MolEcol 2006, 15:1419-1439.
74. Estoup A, Jarne P, Cornuet JM: Homoplasy and mutation modelat microsatellite loci and their consequences for populationgenetics analysis. Mol Ecol 2002, 9:1591-1604.
75. Constantini F, Fauvelot C, Abbiati M: Genetic structuring of thetemperate gorgonian coral (Corallium rubrum) across thewestern Mediterranean Sea revealed by microsatellites andnuclear sequences. Mol Ecol 2007, 16:5168-5182.
76. Costantini F, Fauvelot C, Abbiati M: Fine-scale genetic structur-ing in Corallium rubrum (L.): evidences of inbreeding andlimited effective larval dispersal. Mar Ecol-Prog Ser 2007,340:109-119.
77. Trillmich KGK: The mating system of the marine iguana(Amblyrhynchus cristatus). Z Tierpsychol 1983, 63:141-172.
78. Wikelski M, Nelson K: Conservation of Galápagos marine igua-nas (Amblyrhynchus cristatus). Iguana 2004, 11:191-197.
79. Wikelski M, Trillmich F: Body size and sexual size dimorphismin marine iguanas fluctuate as a result of opposing naturaland sexual selection: An island comparison. Evolution 1997,51:922-936.
80. Boersma PD: An ecological and behavioral study of theGalápagos Penguin. Living Bird 1977, 15:43-93.
81. Vargas H, Lougheed C, Snell H: Population size and trends of theGalápagos Penguin Spheniscus mendiculus. Ibis 2005,147:367-374.
82. Kurz MD, Rowland S, Curtice J, Saal A, Naumann T: Eruption ratesat Fernandina volcano, Galápagos archipelago, from cos-mogenic helium surficial laval flows. Fall Meeting Supplement2005.
83. Kolbe JJ, Glor RE, Schettino LRG, Lara AC, Larson A, Losos JB:Genetic variation increases during biological invasion by aCuban lizard. Nature 2004, 431:177-181.
84. Russello MA, Beheregaray LB, Gibbs JP, Fritts T, Havill N, Powell JR,Caccone A: Lonesome George is not alone among Galápagostortoises. Curr Biol 2007, 17:R317-R318.
85. Poulakakis N, Glaberman S, Russello M, Beheregaray LB, Ciofi C,Powell JR, Caccone A: Historical DNA analysis reveals livingdescendants of an extinct species of Galápagos tortoise. ProcNat Acad Sci USA 2008, 105:15464-15469.
86. Cullen A, Mcbirney AR: The Volcanic Geology and Petrology ofIsla Pinta, Galápagos Archipelago. Geol Soc Am Bull 1987,98:294-301.
87. Naumann T, Geist D: Physical volcanology and structural devel-opment of Cerro Azul Volcano, Isabela Island, Galápagos:implications for the development of Galápagos-type shieldvolcanoes. B Volcanol 2000, 61:497-514.
88. Richly E, Leister D: NUMTs in sequenced eukaryotic genomes.Mol Biol Evol 2004, 21:1081-1084.
89. Triant DA, Dewoody JA: The occurrence, detection, and avoid-ance of mitochondrial DNA translocations in mammaliansystematics and phylogeography. J Mammal 2007, 88:908-920.
90. Slatkin M, Hudson RR: Pairwise comparisons of mitochondrialDNA sequences in stable and exponentially growing popula-tions. Genetics 1991, 129:555-62.
91. Rogers AR, Harpending H: Population growth makes waves inthe distribution of pairwise genetic differences. Mol Biol Evol1992, 9:552-569.
92. Schneider S, Excoffier L: Estimation of past demographicparameters from the distribution of pairwise differenceswhen the mutation rates vary among sites: application tohuman mitochondrial DNA. Genetics 1999, 152:1079-89.
93. Harpending HC: Signature of ancient population growth in alow-resolution mitochondrial DNA mismatch distribution.Hum Biol 1994, 66:591-600.
Page 18 of 18(page number not for citation purposes)
Copyright © 2022 FDOKUMEN