Between Cultures and Markets: an Eclectic Analysis of Juvenile Gender Ratios in India
35
_____________________________________________________________________ CREDIT Research Paper No. 00/15 Between Cultures and Markets: An Eclectic Analysis of Juvenile Gender Ratios in India by I. Dasgupta, R. Palmer-Jones and A. Parikh _____________________________________________________________________ Centre for Research in Economic Development and International Trade, University of Nottingham
-
Upload
eastanglia -
Category
Documents
-
view
2 -
download
0
Transcript of Between Cultures and Markets: an Eclectic Analysis of Juvenile Gender Ratios in India
_____________________________________________________________________CREDIT Research Paper
No. 00/15
Between Cultures and Markets: AnEclectic Analysis of Juvenile Gender
Ratios in India
by
I. Dasgupta, R. Palmer-Jones and A. Parikh
_____________________________________________________________________
Centre for Research in Economic Development and International Trade,University of Nottingham
The Centre for Research in Economic Development and International Trade is based inthe School of Economics at the University of Nottingham. It aims to promote researchin all aspects of economic development and international trade on both a long term anda short term basis. To this end, CREDIT organises seminar series on DevelopmentEconomics, acts as a point for collaborative research with other UK and overseasinstitutions and publishes research papers on topics central to its interests. A list ofCREDIT Research Papers is given on the final page of this publication.
Authors who wish to submit a paper for publication should send their manuscript tothe Editor of the CREDIT Research Papers, Professor M F Bleaney, at:
Centre for Research in Economic Development and International Trade,School of Economics,University of Nottingham,University Park,Nottingham, NG7 2RD,UNITED KINGDOM
Telephone (0115) 951 5620Fax: (0115) 951 4159
CREDIT Research Papers are distributed free of charge to members of the Centre.Enquiries concerning copies of individual Research Papers or CREDIT membershipshould be addressed to the CREDIT Secretary at the above address.
_____________________________________________________________________CREDIT Research Paper
No. 00/15
Between Cultures and Markets: AnEclectic Analysis of Juvenile Gender
Ratios in India
by
I. Dasgupta, R. Palmer-Jones and A. Parikh
_____________________________________________________________________
Centre for Research in Economic Development and International Trade,University of Nottingham

The AuthorsIndraneel Dasgupta is Lecturer, School of Economics, University of Nottingham,Richard Palmer-Jones is Lecturer, School of Development Studies and Ashok Parikhis Professor, School of Economic and Social Studies, both at the University of EastAnglia.
____________________________________________________________ October 2000
Between Cultures and Markets:An Eclectic Analysis of Juvenile Gender Ratios in India
byI. Dasgupta, R. Palmer-Jones and A. Parikh
AbstractThere exist large variations in juvenile sex ratios across districts and social groups inIndia. Economic and cultural factors have been advanced as contending explanations forthese variations. We propose a household optimization model that integrates culturalexplanations with economic ones. Female literacy (FLIT) and female labour participation(FLP) together with culture are likely to determine perceived value of females, and toresult in regional variations in child survival and hence in sex ratios. We estimate thismodel using data from 1961, 1971 and 1981 censuses. We use cross section estimationwith and without restrictions, estimate and use first differencing to eliminate district(fixed) effects. We find that female labour force participation, female literacy, and thepredominance of the Indo-Aryan kinship system in a district account for much of thevariation in juvenile sex ratios. Although FLP and FLIT are significant explanatoryfactors, culture is also significant in determining the sex ratios, suggesting that policycould include explicit attempts to manipulate culture as well as to promote femaleemployment and literacy.
Outline1. Introduction2. Background3. The Analytical Framework4. Data and Variables5. Econometric Models and Results6. Summary and Conclusions

1
I INTRODUCTION
The proportion of females in India’s population as reported in the decennial censuses is
relatively low and reached its lowest level in 1991. The low ratio of women to men in
some groups and the reported decline in the female-male ratio (FMR) since censuses were
started in 1871 have generated extensive debate (Visaria, 1971). Sex ratios summarize
the relative cumulative life chances of the different sexes from even before birth through
to death. Relative deficiencies in the number of either sex constitute an important issue
for public policy. The large number of ‘missing women’, and the consequent population
imbalance, in India is one of the most extreme cases (Coale, 1991; Sen, 1992).
In recent years, both the low level and the decline in the sex ratio in South Asia have been
attributed to discrimination against girls and women, especially in nutrition and health
care. This, in turn, has been related to the either a cultural devaluation or an
unfavourable economic position of women1. The Indian sub-continent is characterised by
what can be crudely described as a north-south divide, with lower female-to-male ratios
in the north and more favourable to female ratios in the south. The cultural devaluation
view highlights the concentration of districts with low sex ratios in the north and west of
the Indian sub-continent, and attributes the anti-female bias to the predominant Indo-
Aryan culture of these regions. The less unfavourable ratios in the south are attributed to
the predominance of Dravidian culture (Dyson and Moore, 1983). The alternative,
‘economic’, account suggests that the low perceived economic contribution of women,
typically measured by Female Labour Participation (FLP), accounts for the their
devaluation and consequent neglect (Miller, 1981). Bardhan (1974) pointed out that rice
cultivation requires female labour for transplanting and weeding, while wheat cultivation
requires the plough which is almost exclusively handled by males in the Indian context.
Thus the demand for female labour is less in the northern wheat growing regions and
higher in southern rice areas. He traced the regional differences in gender ratios to this
difference in agricultural practices. Recent analyses have combined cultural and
economic accounts (Bardhan, 1986; Kishor, 1993; Agarwal, 1995; Agnihotri, 1997), and
1 A number of other explanations of the unfavourable to females sex ratio in South Asia have been disposed of inthe past. These include: sex discrepant migration (dealt with by using juvenile sex-ratios); under-enumeration offemales (of limited significance, as shown by Visaria (1971)); and exceptionally masculinised sex ratios at birth(Sudha and Rajan, (1999)).
2
extended the range of explanatory factors to include female literacy (Murthi, Guido, and
Dreze, 1995).
The existing literature has not developed integrated explanations that are explicitly
derived from a household optimization exercise. That is the analytical point of departure
for this paper. We propose a model that combines cultural factors with economic ones to
provide an integrated approach to the issue of missing girls based on a household
optimization framework. We then use panel data for 317 Indian districts, available from
Census Reports for 1961, 1971 and 1981, to derive the estimated effects of cultural
factors, female literacy rate and FLP rate on the female-male ratio for juvenile age
groups. The empirical contribution of this paper consists of the econometric evidence
presented, which suggests that declining FMRs may be due to declines in FLP and
increases in intensity of Indo-Aryan kinship patterns, perhaps related to processes of
Sanskritization (Srinivas, 1962), only partly offset by rising female literacy. Variations in
FMRs between districts are largely explained by variations in FLP, female literacy rates
and kinship norms. In policy terms this suggests attaching the cultural trend as well as, or
even as a precondition for advancing the economic and educational attainments of
women.
Section 2 of the paper presents the general background of the district level information
available in the Indian Census and reviews the factors that have been held responsible for
low levels and decline in FMRs. In section 3, we propose a household optimization
model to analyse the impact of female labour participation, female literacy rate, and
kinship relations on juvenile FMRs. In section 4 we discuss features of the data which
affect the choice of variables and their interpretation. The econometric analysis,
presented in section 5, uses a variety of econometric models to explore the validity of the
analytical model put forward. We use continuous and combined cross-section studies with
and without restrictions, and models when district effects are absent are estimated. Both
FLP and FMR are treated as endogenous variables in one of the models. These results
consistently show the importance of FLP, female literacy rate and kinship variables in
predicting juvenile FMRs and support the conclusions derived from the analytical model.
Section 6 summarizes and concludes our discussion.
3
II BACKGROUND
By the late 1980s two apparently contradictory strong lines of argument explained the sex
ratio disparities in the Indian population – kinship practices and the perceived economic
value of women (Kishore, 1993, Murthi et al. 1995, Malhotra et al, 1995). Agnihotri
(1997) sought to reconcile these conflicting accounts in terms of the entitlements
framework expounded by Amartya Sen (Sen, 1981 and 1985)2. This model suggested
that female survival relative to males was determined by both a culturally determined core
entitlement and an economic component affected by the perceived economic
contributions of women. Agnihotri also suggested several methodological advances
crucial to empirical examination of these issues using district level census information.
Following Miller and others, he emphasised the need to focus on juvenile sex ratios
because sex ratios of the whole population are biased by differential adult migration.
Furthermore, he drew attention for the first time in connection to this issue to the
differential effect of the level of infant mortality on males and females, and to the different
demographic features of different social groups in the Indian population.
A third feature is the spatially uneven distribution of the scheduled tribes (ST), which
have distinctly different demographic characteristics from the majority Hindu caste
population. The 1981 census provided data for the whole population and General Caste
(Hindu main castes), Scheduled Castes (SC - the former Hindu ‘Untouchable’ Castes)
and the Scheduled Tribes (ST)3. The General Castes are present in all districts and are
the overwhelming majority in most districts. The ST are a significant proportion of the
population in a number of districts4 and have quite different demographic characteristics
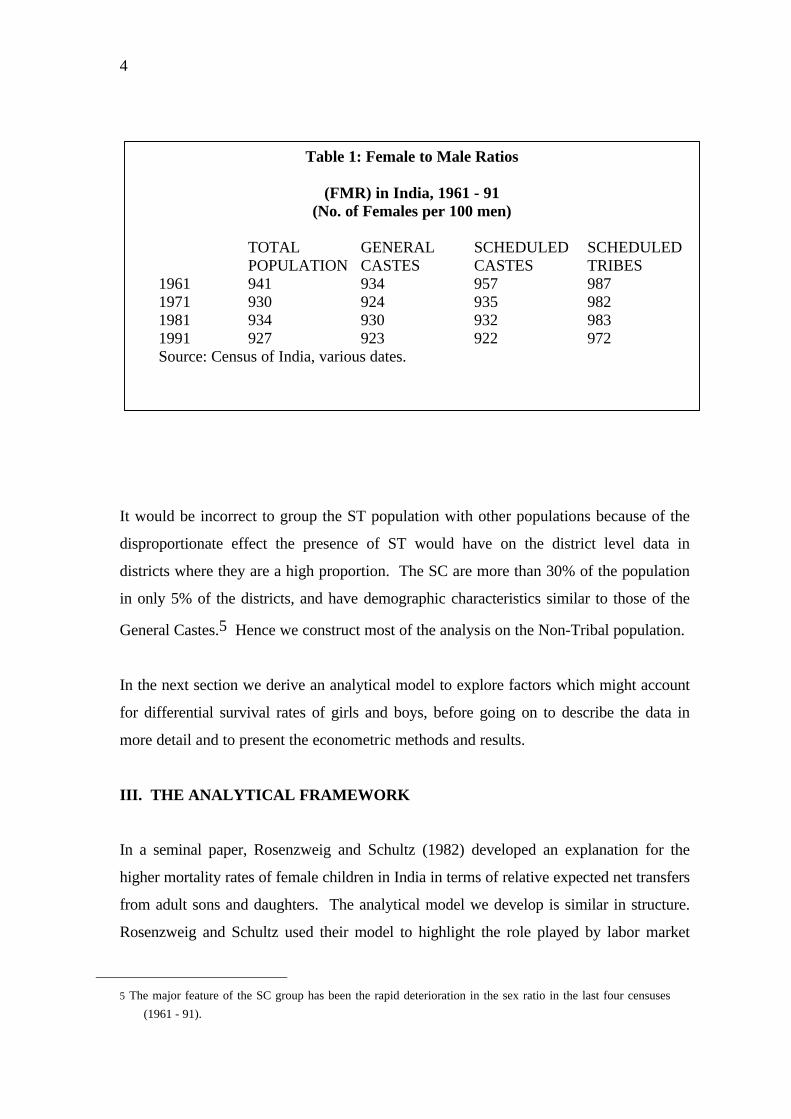
to the caste population, both General and Scheduled as shown in Table 1.
2 See also Agnihotri et al, 1998.
3 But not Muslims.
4 In 10% of the districts ST’s are more than 30% of the district population.
4
It would be incorrect to group the ST population with other populations because of the
disproportionate effect the presence of ST would have on the district level data in
districts where they are a high proportion. The SC are more than 30% of the population
in only 5% of the districts, and have demographic characteristics similar to those of the
General Castes.5 Hence we construct most of the analysis on the Non-Tribal population.
In the next section we derive an analytical model to explore factors which might account
for differential survival rates of girls and boys, before going on to describe the data in
more detail and to present the econometric methods and results.
III. THE ANALYTICAL FRAMEWORK
In a seminal paper, Rosenzweig and Schultz (1982) developed an explanation for the
higher mortality rates of female children in India in terms of relative expected net transfers
from adult sons and daughters. The analytical model we develop is similar in structure.
Rosenzweig and Schultz used their model to highlight the role played by labor market
5 The major feature of the SC group has been the rapid deterioration in the sex ratio in the last four censuses
(1961 - 91).
Table 1: Female to Male Ratios
(FMR) in India, 1961 - 91(No. of Females per 100 men)
TOTALPOPULATION
GENERALCASTES
SCHEDULEDCASTES
SCHEDULEDTRIBES
1961 941 934 957 9871971 930 924 935 9821981 934 930 932 9831991 927 923 922 972Source: Census of India, various dates.
5
opportunities for adult women in determining the level of resources a household would
allocate to girls. Our focus, however, is on explicitly integrating kinship structures and
social norms with labor market variables. As Agarwal (1994) points out, kinship norms
of Northern India imply that, ceteris paribus, parents in Northern India would typically
expect, and receive, lower net transfers, direct or indirect, from daughters, relative to
those in Southern India. A similar difference exists between Scheduled Tribe households
and non-tribal Hindu households. One would then expect differences in incentive
structures to translate into differences in allocation of resources to female children, a
point noted by Dasgupta (1993) in a related context. The model below formalizes this
argument.
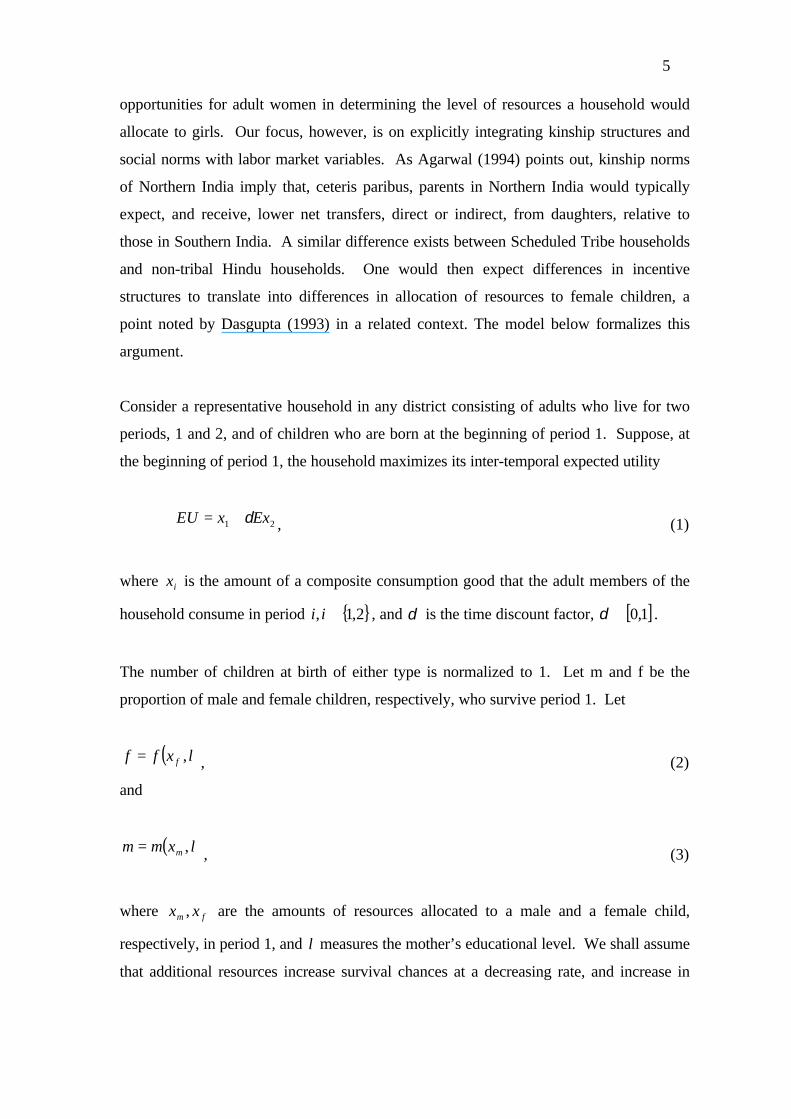
Consider a representative household in any district consisting of adults who live for two
periods, 1 and 2, and of children who are born at the beginning of period 1. Suppose, at
the beginning of period 1, the household maximizes its inter-temporal expected utility
21 ExxEU δ+= , (1)
where ix is the amount of a composite consumption good that the adult members of the
household consume in period { }2,1, ∈ii , and δ is the time discount factor, [ ]1,0∈δ .
The number of children at birth of either type is normalized to 1. Let m and f be the
proportion of male and female children, respectively, who survive period 1. Let
( )lxff f ,= , (2)
and
( )lxmm m ,= , (3)
where fm xx , are the amounts of resources allocated to a male and a female child,
respectively, in period 1, and l measures the mother’s educational level. We shall assume
that additional resources increase survival chances at a decreasing rate, and increase in
6
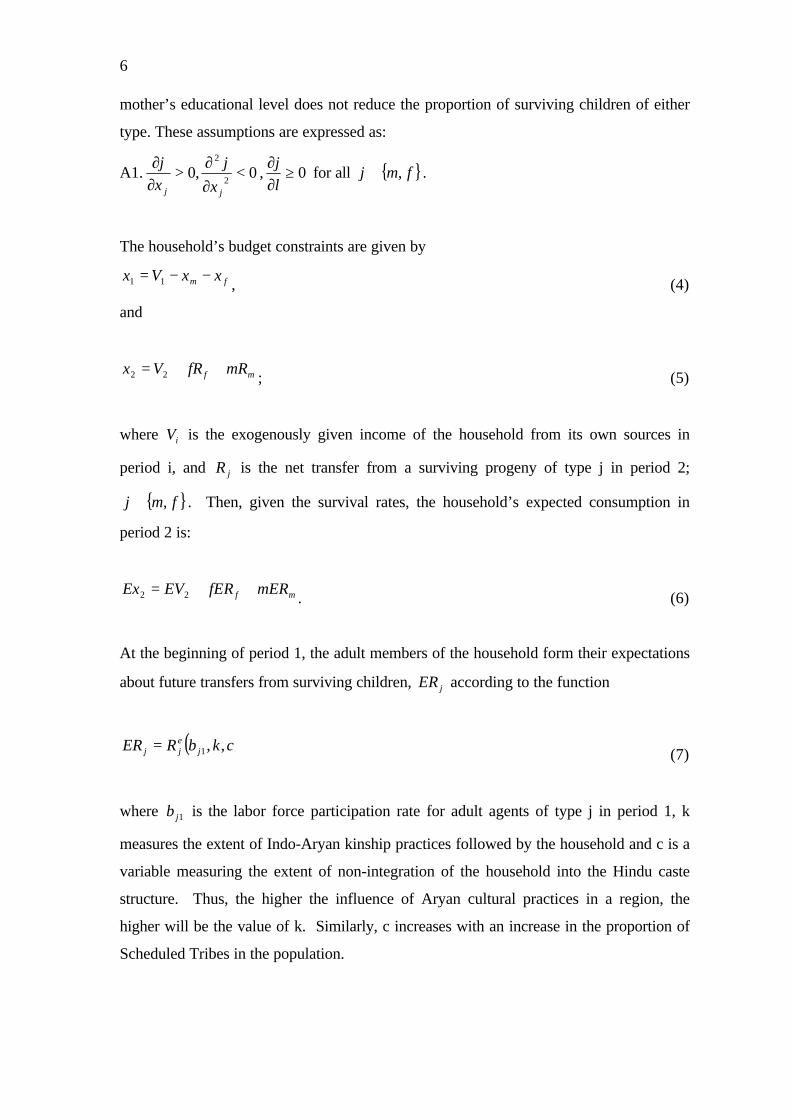
mother’s educational level does not reduce the proportion of surviving children of either
type. These assumptions are expressed as:
A1. 0,02
2
<∂∂
>∂∂
jj x
jxj
, 0≥∂∂lj
for all { }fmj ,∈ .
The household’s budget constraints are given by
fm xxVx −−= 11 , (4)
and
mf mRfRVx ++= 22 ; (5)
where iV is the exogenously given income of the household from its own sources in
period i, and jR is the net transfer from a surviving progeny of type j in period 2;
{ }fmj ,∈ . Then, given the survival rates, the household’s expected consumption in
period 2 is:
mf mERfEREVEx ++= 22 . (6)
At the beginning of period 1, the adult members of the household form their expectations
about future transfers from surviving children, jER according to the function
( )ckbRER jejj ,,1=
(7)
where 1jb is the labor force participation rate for adult agents of type j in period 1, k
measures the extent of Indo-Aryan kinship practices followed by the household and c is a
variable measuring the extent of non-integration of the household into the Hindu caste
structure. Thus, the higher the influence of Aryan cultural practices in a region, the
higher will be the value of k. Similarly, c increases with an increase in the proportion of
Scheduled Tribes in the population.
7
Expectations about the magnitude of net future transfers should, clearly, depend on
expectations about future earnings of children. Given that the rural Indian economy, as a
whole, has been changing relatively slowly over time, it is intuitively plausible that agent’s
expectations about future labor market conditions would be primarily determined by their
own labor market experiences. Assuming that average current labor income and the
current labor force participation rate are positively correlated, we can take the latter as a
proxy for the former.
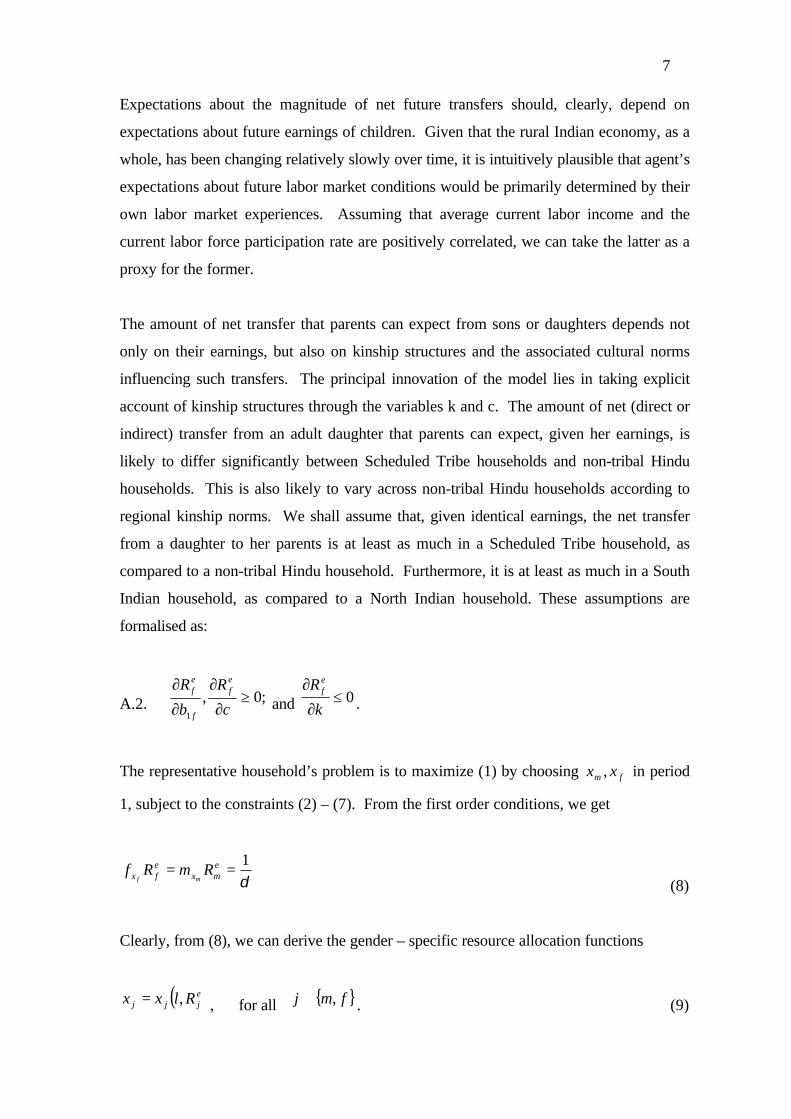
The amount of net transfer that parents can expect from sons or daughters depends not
only on their earnings, but also on kinship structures and the associated cultural norms
influencing such transfers. The principal innovation of the model lies in taking explicit
account of kinship structures through the variables k and c. The amount of net (direct or
indirect) transfer from an adult daughter that parents can expect, given her earnings, is
likely to differ significantly between Scheduled Tribe households and non-tribal Hindu
households. This is also likely to vary across non-tribal Hindu households according to
regional kinship norms. We shall assume that, given identical earnings, the net transfer
from a daughter to her parents is at least as much in a Scheduled Tribe household, as
compared to a non-tribal Hindu household. Furthermore, it is at least as much in a South
Indian household, as compared to a North Indian household. These assumptions are
formalised as:
A.2. ;0,1
≥∂
∂
∂
∂
c
R
b
R ef
f
ef
and 0≤∂
∂
k
R ef
.
The representative household’s problem is to maximize (1) by choosing fm xx , in period
1, subject to the constraints (2) – (7). From the first order conditions, we get
δ1
== emx
efx RmRf
mf
(8)
Clearly, from (8), we can derive the gender – specific resource allocation functions
( )ejjj Rlxx ,= , for all { }fmj ,∈ . (9)
8
Let fms = , a measure of the survival chances of boys relative to those of girls. Then,
taking a log transformation and using (2), (3) and (9), we get:
ef
fxe
f R
xf
fs
Rs
f ∂
∂
−=
∂∂
. (10)
Since, by assumption, survival probabilities increase with resource allocation, the sign of
the expression on the right-hand side depends on how the change in expected return from
girls affects the amount of resources allocated to them. It can be checked that, given A1,
(9) implies 0>∂
∂ef
f
R
x. Hence, from (10), we have
0<∂∂
efR
s(11)
Thus, survival probability of girls relative to that of boys rises if the expected transfer
from daughters is higher. Given A.2, (11) implies
0,0,1
≥∂∂
≤∂∂
∂∂
ks
cs
bs
f. (12)
The model therefore predicts the following. Ceteris paribus, the difference in survival
rates between boys and girls will be lower in districts with (a) a larger scheduled tribe
population, and (b) in districts which exhibit a higher female labor participation rate; and
(c) it will be higher in districts with patrilineal/patrilocal kinship norms. Furthermore,
∂
∂+
−
∂∂
+
=
∂∂
l
xff
fs
l
xmm
ms
ls f
xlm
xl fm
. (13)
The expression in (13) cannot be signed. An increase in female literacy may improve the
survival prospects of both types of children. Without further restrictions, however, it is
9
not possible to predict how the survival ratio will change. We shall test the restrictions
imposed in (12) and estimate ls
∂∂
.
IV. DATA AND VARIABLES
In this section we discuss features of the data which affect the choice of variables and
their interpretation, in addition to those mentioned above. As noted above, there are
several features of the data used in this analysis which are due to the specificities of the
data sources and of Indian demography. The uneven geographical distribution of factors
likely to confound the use of the whole district populations is the main problem. Thus, we
use juvenile sex ratios to eliminate differential sex-specific adult migration; we separate
the population of Scheduled Tribes from the caste (general Hindu castes and Scheduled
Castes) population; and we accommodate the spatially uneven distribution of excess male
infant mortality, which arises from biological factors rather than of sex-bias. Data for
Female Labour Force Participation and Female Literacy, and a dummy variable for the
kinship/cultural differences in the caste population (in addition to separation of the ST
population) introduced above, as well as other variables used in the analysis calculated
from the censuses, are described in the remaining section.
IV.i Excess Male Infant Mortality
The first two features have been discussed above. A major feature of this analysis is the
split of the juvenile population into the 0-4 and 5-9 age groups. Both these age ranges
are free from sex selective migration and both reflect the pattern of excess girl child
mortality in the 0-4 age group. Child mortality falls off significantly in subsequent years.
Excess male mortality during infancy is primarily a biological phenomenon. In western
societies more males than females die at all ages, and in most societies up to the age at
which maternal mortality becomes possible, more male children die than female children.
This is not the case in much of South Asia (and in China, the West Asia, the Middle East
and North Africa). In these regions, excess female child mortality is common from the
first year of birth, and, in extreme cases, occurs in the first year and even in the first
months after birth.
10
Female-Male Ratios in juvenile age groups represent the net outcome of these mortality
patterns. Ideally, one could separate out the ‘biological’ phenomenon of excess male
infant morality from socially influenced differentials in child mortality by comparing sex
ratios in the first year with sex ratios in subsequent year (i.e. comparing FMRs 0-1 and
FMRs 1-4, 5-9 etc.). However, the data published from the Indian Census does not
provide these age ranges, publishing data for 0-4 and 5-9 instead. FMRs in the age 0-4
and 5-9 age groups differ significantly due to the cumulative influence of differences in
child mortality by sex. A negative gap between FMR 5-9 and FMR 0-4 will indicate
excess female child mortality since one would generally expect a slight increase in this gap
due to excess male child mortality. The more severe the proportion of girls dropping out
during the second to fifth year, the lower will be the proportion entering the sixth year
and the lower will be the FMR in 5-9 age group as compared to FMR of 0-4 age range.
Low infant mortality combined with ‘natural excess male child mortality’ would result in
an increase in FMR 59 over FMR04.
Infant mortality and poverty are positively associated in the Indian districts. It may also
be that there is less discrimination against girls in poorer households and less migration
among poor resulting in higher FMRs. But, higher than normal infant mortality among
poorer families will yield higher male than female infant mortality due to the greater frailty
of the male infant, and this can result in higher FMRs for these groups producing the
same empirical result of higher FMRs. We do not have separate data on excess male
infant mortality for all the census years used in the study, so this issue is not covered here.
IV.ii Female Labour Participation and FMR
Female Labour Participation is defined as proportion of women who are classified as main
workers as a proportion to total female population above 10 years of age6. This is
converted to percentage terms. Higher female labour participation may raise the returns
to investment in girls directly as well as indirectly. Hence, an increase in female labour
participation may increase the Female-Male Ratios in developing societies. We use the
FLP as the explanatory variable to explain FMRs with the reservation that this itself could
be an endogenous variable and some of the structural and cultural variables could
11
determine the FLP decision. This aspect is considered in one of the econometric models
in section 5.
IV.iii Female Literacy Rate and FMR
Female literacy may be a major influence on both FLP and FMR. It is defined as:
FLIT = Total Literate Population Less Total Male Literate Population
Total Population Less Total Male Population
= Total Female Literates
Total Females
The above is defined in percentage terms.
IV.iv Kinship and Impact on FMR
The North-South divide in sex ratio pattern is basically linked to differences in kinship
systems in different regions. The Southern kinship system and norms of inheritance allow
a greater autonomy to women and hence a better decision making ability with respect to
personal affairs. The “Male Centred” kinship system in the North undervalues and
subordinates females while the Southern kinship system values them more and allows
them to retain ties with their natal kin (Agarwal, 1994).
The Indo-Aryan zone in the Northwest follows the Indo-Aryan practices. The Dravidian
customs are followed largely in the Southern region. In the intermediate zone, from
Gujarat in the West to Orissa in the East, both systems coexist. The Mundas in central
region follow a kinship system closer to Dravidian one as far as marriage rules are
concerned. In this study kinship variable is defined as zero-one variable. When district is
classed as predominantly Indo-Aryan, kinship = 1 and otherwise zero. The Indo-Aryan
district classification was based on the analysis of languages spoken in the district in 1961
and other variables such as caste, religion etc. (Agnihotri, 1997).
6 In some cases more than 100% of females above the age of 14 are classified as main workers.
12
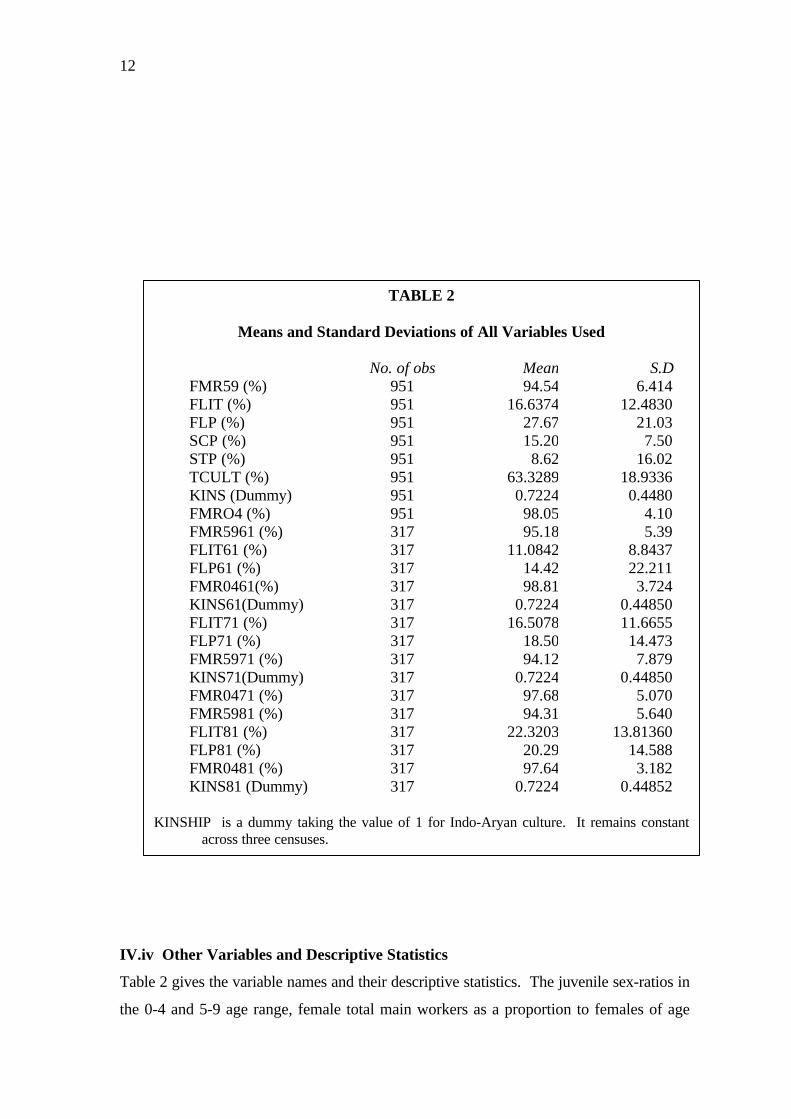
IV.iv Other Variables and Descriptive Statistics
Table 2 gives the variable names and their descriptive statistics. The juvenile sex-ratios in
the 0-4 and 5-9 age range, female total main workers as a proportion to females of age
TABLE 2
Means and Standard Deviations of All Variables Used
No. of obs Mean S.DFMR59 (%) 951 94.54 6.414FLIT (%) 951 16.6374 12.4830FLP (%) 951 27.67 21.03SCP (%) 951 15.20 7.50STP (%) 951 8.62 16.02TCULT (%) 951 63.3289 18.9336KINS (Dummy) 951 0.7224 0.4480FMRO4 (%) 951 98.05 4.10FMR5961 (%) 317 95.18 5.39FLIT61 (%) 317 11.0842 8.8437FLP61 (%) 317 14.42 22.211FMR0461(%) 317 98.81 3.724KINS61(Dummy) 317 0.7224 0.44850FLIT71 (%) 317 16.5078 11.6655FLP71 (%) 317 18.50 14.473FMR5971 (%) 317 94.12 7.879KINS71(Dummy) 317 0.7224 0.44850FMR0471 (%) 317 97.68 5.070FMR5981 (%) 317 94.31 5.640FLIT81 (%) 317 22.3203 13.81360FLP81 (%) 317 20.29 14.588FMR0481 (%) 317 97.64 3.182KINS81 (Dummy) 317 0.7224 0.44852
KINSHIP is a dummy taking the value of 1 for Indo-Aryan culture. It remains constantacross three censuses.
13
group above 14, female literacy rate as defined before, kinship, scheduled caste and
scheduled tribe proportions are shown in this table. Data on total cultivators as a
proportion to total main and marginal workers are also provided and used as an
instrument later in the study. Proportions of urban population (URBPCNT) and other
agricultural population proportions are also made use of in the instrumental variable
estimation of Female Labour Participation and FMR equations.
V. ECONOMETRIC MODELS AND RESULTS
The model developed above employs the household as the decision-making unit, but it is
to be estimated using data on sex ratios and other variables for Indian districts, rather
than data on individual households7. Disaggregated juvenile sex ratios are the dependent
variables, female labour force participation, female literacy, and culture/kinship are the
explanatory variables suggested by the analytical framework. Previous work relating sex
ratios to the variables of interest has employed single census year district data, mainly the
1981 data. The problems caused by the use of spatial aggregates in a single cross-section
analysis can be diagnosed and to some extent corrected using spatial econometric
methods (Anselin, 1990; Agnihotri et al, 1998). Here we use the information from three
census years as a panel data set, extending the econometric methods that have been
deployed to deal with these problems.
V.i Cross Section Analysis
In Table 3, we follow the cross section analysis for each census year to examine whether
the decline in female-male percentages are related to any of the changes in the exogenous
variables and whether structural relationship has changed. A simple Chow test using
three periods compared to pooled data suggests evidence of structural change.
Our model equation for cross-section regression is:
7 There have been many previous contributions to discussions about the sex ratio in Indian populations which
have used the Indian Census District level data (Miller, 1981, Kishor, 1993, Murthi et al., 1995, Malhotra
et al., 1995); our work seeks to contribute to these debates.
14
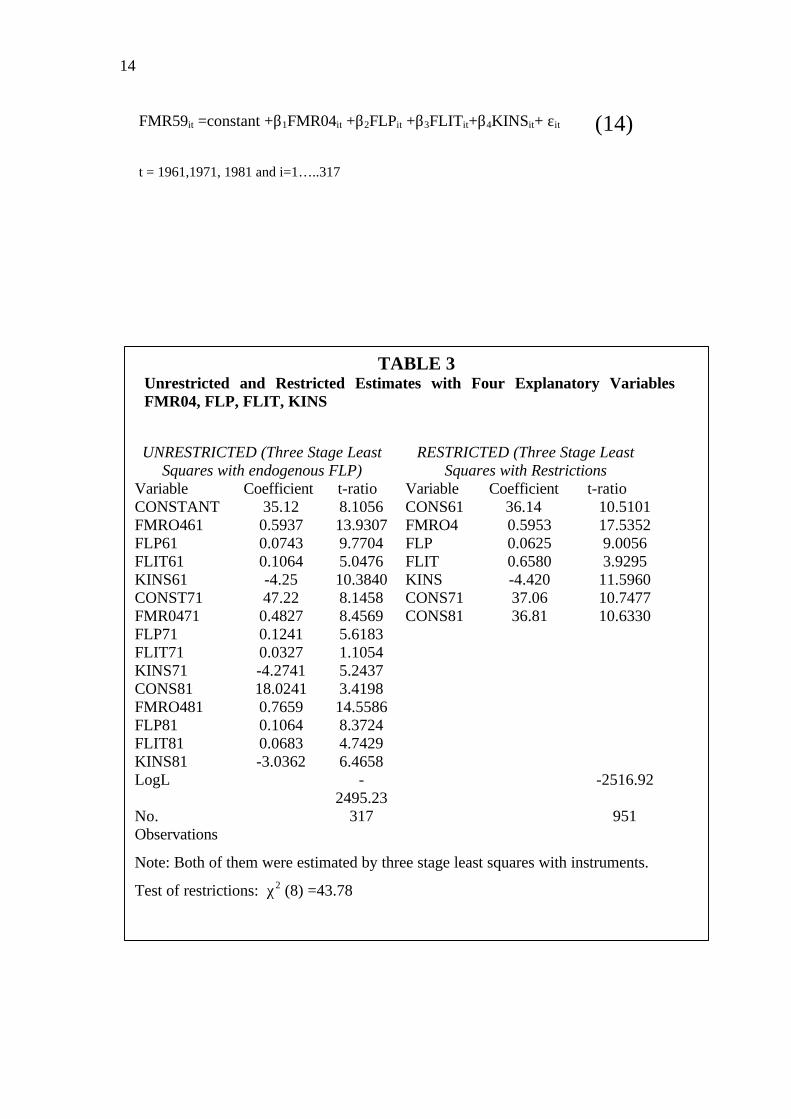
FMR59it =constant +β1FMR04it +β2FLPit +β3FLITit+β4KINSit+ εit (14)
t = 1961,1971, 1981 and i=1…..317
TABLE 3Unrestricted and Restricted Estimates with Four Explanatory VariablesFMR04, FLP, FLIT, KINS
UNRESTRICTED (Three Stage LeastSquares with endogenous FLP)
RESTRICTED (Three Stage LeastSquares with Restrictions
Variable Coefficient t-ratio Variable Coefficient t-ratioCONSTANT 35.12 8.1056 CONS61 36.14 10.5101FMRO461 0.5937 13.9307 FMRO4 0.5953 17.5352FLP61 0.0743 9.7704 FLP 0.0625 9.0056FLIT61 0.1064 5.0476 FLIT 0.6580 3.9295KINS61 -4.25 10.3840 KINS -4.420 11.5960CONST71 47.22 8.1458 CONS71 37.06 10.7477FMR0471 0.4827 8.4569 CONS81 36.81 10.6330FLP71 0.1241 5.6183FLIT71 0.0327 1.1054KINS71 -4.2741 5.2437CONS81 18.0241 3.4198FMRO481 0.7659 14.5586FLP81 0.1064 8.3724FLIT81 0.0683 4.7429KINS81 -3.0362 6.4658LogL -
2495.23-2516.92
No.Observations
317 951
Note: Both of them were estimated by three stage least squares with instruments.
Test of restrictions: χ2 (8) =43.78
15
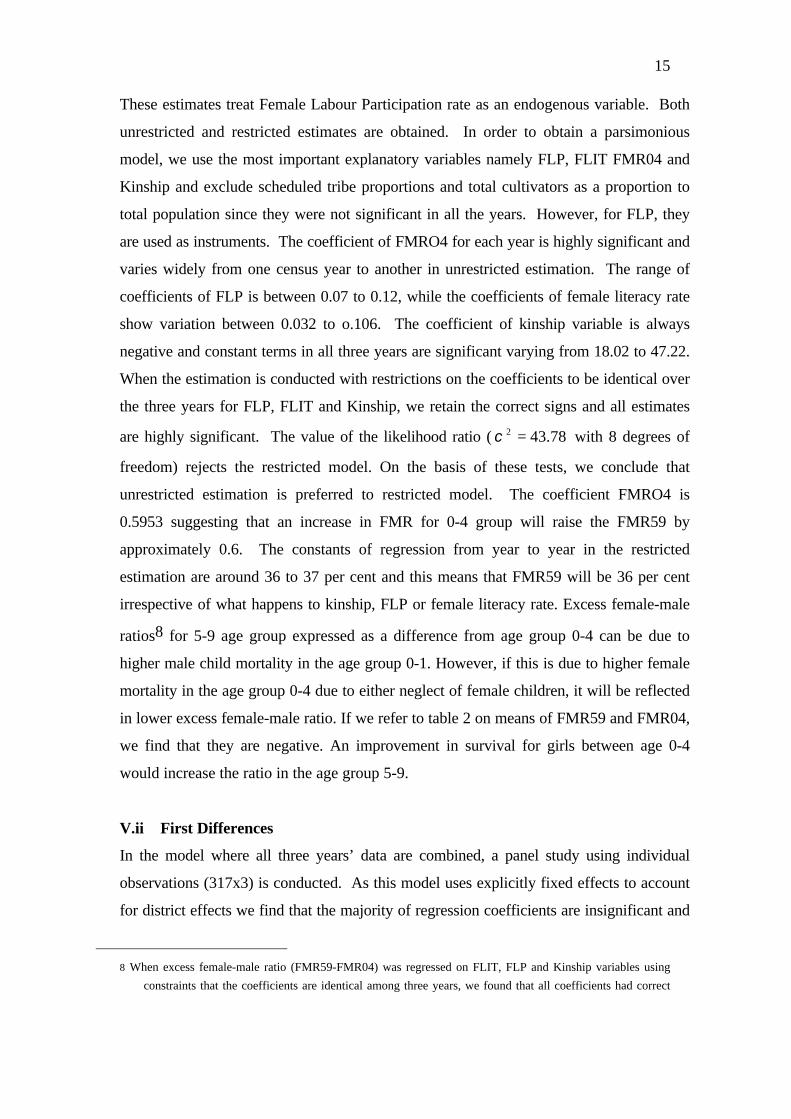
These estimates treat Female Labour Participation rate as an endogenous variable. Both
unrestricted and restricted estimates are obtained. In order to obtain a parsimonious
model, we use the most important explanatory variables namely FLP, FLIT FMR04 and
Kinship and exclude scheduled tribe proportions and total cultivators as a proportion to
total population since they were not significant in all the years. However, for FLP, they
are used as instruments. The coefficient of FMRO4 for each year is highly significant and
varies widely from one census year to another in unrestricted estimation. The range of
coefficients of FLP is between 0.07 to 0.12, while the coefficients of female literacy rate
show variation between 0.032 to o.106. The coefficient of kinship variable is always
negative and constant terms in all three years are significant varying from 18.02 to 47.22.
When the estimation is conducted with restrictions on the coefficients to be identical over
the three years for FLP, FLIT and Kinship, we retain the correct signs and all estimates
are highly significant. The value of the likelihood ratio ( 78.432 =χ with 8 degrees of
freedom) rejects the restricted model. On the basis of these tests, we conclude that
unrestricted estimation is preferred to restricted model. The coefficient FMRO4 is
0.5953 suggesting that an increase in FMR for 0-4 group will raise the FMR59 by
approximately 0.6. The constants of regression from year to year in the restricted
estimation are around 36 to 37 per cent and this means that FMR59 will be 36 per cent
irrespective of what happens to kinship, FLP or female literacy rate. Excess female-male
ratios8 for 5-9 age group expressed as a difference from age group 0-4 can be due to
higher male child mortality in the age group 0-1. However, if this is due to higher female
mortality in the age group 0-4 due to either neglect of female children, it will be reflected
in lower excess female-male ratio. If we refer to table 2 on means of FMR59 and FMR04,
we find that they are negative. An improvement in survival for girls between age 0-4
would increase the ratio in the age group 5-9.
V.ii First Differences
In the model where all three years’ data are combined, a panel study using individual
observations (317x3) is conducted. As this model uses explicitly fixed effects to account
for district effects we find that the majority of regression coefficients are insignificant and
8 When excess female-male ratio (FMR59-FMR04) was regressed on FLIT, FLP and Kinship variables using
constraints that the coefficients are identical among three years, we found that all coefficients had correct

16
this is due to the domination of district effects and the collinearity of district dummies
with kinship and other variables. The best way to account for this is to conduct the
analysis based on first differences for each period of specified variables and in this model,
both the fixed effects and kinship cancel out. This will permit us to measure the role of
FLP, FLIT and FMR04 explicitly after eliminating the fixed variables.
Consider a simple three-period model (t = 1, 2, 3).
yit = xit ββ + zi δδ + εεit (15)
x = a matrix of explanatory variables that varies across time and individual Districts
z = a matrix of variables observed that vary across individual Districts but for each
individual District they are constant across all three periods (e.g. kinship).
εεit = αi + nit
The above model implies that:
yit - yit-1 = (xit - xit -1 ) ββ + ( zi t - zi t -1) δδ+ (nit - nit-1 )
and
∆y = ∆x ββ+ ∆z δδ + ∆n. (16)
The time-invariant z (Kinship) terms cancel out and the model reduces to:
∆y = ∆xββ + ∆n (17)
The OLS on the transformed data yields unbiased estimates. In our terminology,
)(59
4459
11
144
133
122
111
−−
−
−
−
−
−++−+−+
−+−=
ttt
tt
tt
tt
ttt
nnFMR
KINSKINS
FLITFLIT
FLPFLP
FMROFMROFMR
ββββ
ββββ
(t = 1971, 1981) (18)
(the district symbol (i) is suppressed for clarity of notation)
signs and again restrictions were rejected. These results were similar excepting that it restricts the
coefficient of FMR04 to unity.
17
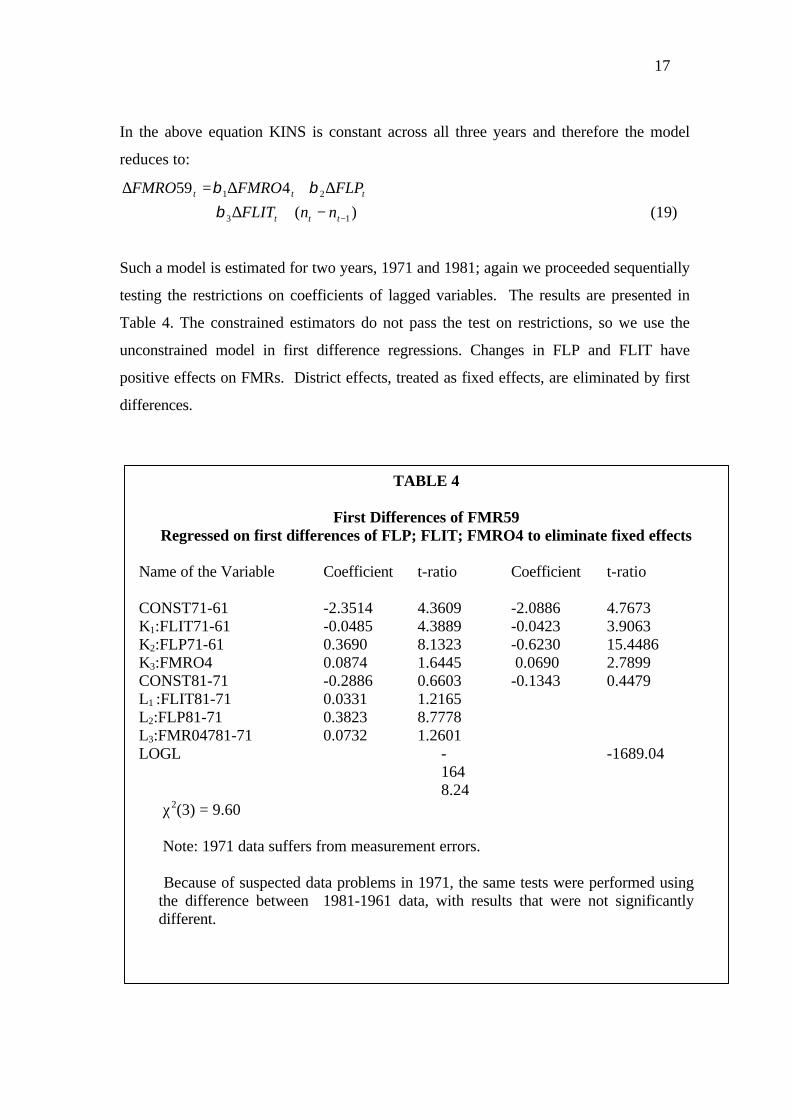
In the above equation KINS is constant across all three years and therefore the model
reduces to:
)(
459
13
21
−−+∆+∆+∆=∆
ttt
ttt
nnFLIT
FLPFMROFMRO
βββ
(19)
Such a model is estimated for two years, 1971 and 1981; again we proceeded sequentially
testing the restrictions on coefficients of lagged variables. The results are presented in
Table 4. The constrained estimators do not pass the test on restrictions, so we use the
unconstrained model in first difference regressions. Changes in FLP and FLIT have
positive effects on FMRs. District effects, treated as fixed effects, are eliminated by first
differences.
TABLE 4
First Differences of FMR59Regressed on first differences of FLP; FLIT; FMRO4 to eliminate fixed effects
Name of the Variable Coefficient t-ratio Coefficient t-ratio
CONST71-61 -2.3514 4.3609 -2.0886 4.7673 K1:FLIT71-61 -0.0485 4.3889 -0.0423 3.9063 K2:FLP71-61 0.3690 8.1323 -0.6230 15.4486 K3:FMRO4 0.0874 1.6445 0.0690 2.7899 CONST81-71 -0.2886 0.6603 -0.1343 0.4479 L1 :FLIT81-71 0.0331 1.2165 L2:FLP81-71 0.3823 8.7778 L3:FMR04781-71 0.0732 1.2601 LOGL -
1648.24
-1689.04
χ2(3) = 9.60
Note: 1971 data suffers from measurement errors.
Because of suspected data problems in 1971, the same tests were performed usingthe difference between 1981-1961 data, with results that were not significantlydifferent.
18
These tests supplemented by the three individual cross section analyses estimated jointly,
suggest that the hypothesis of identical coefficients across equations is rejected. Similar
conclusions are reached using the first difference model where fixed (District) effects are
eliminated through differencing. This implies that there is a significant difference in the
impact of female literacy rate, female labour participation rate and FMR04 rates between
three census years. Pooling the data in panel estimation with different stuctures did not
alter the conclusion from both cross-sections and first differences where the restrictions
are rejected. These can be obtained from the authors.
VI. SUMMARY AND CONCLUSIONS
Our empirical results confirm our theoretical expectations about Female-Male ratios in
India by highlighting the importance of FLP, FLIT and kinship factors. Variations in
FMRs between districts are largely explained by variations in FLP, FLIT and kinship.
Our study thus suggests that an increase in FLP, FLIT and a spread of Dravidian social
norms and practices could increase FMRs in Indian districts. Our results based on
combined cross-section studies confirm the importance of these variables even when FLP
is treated as endogenous.
Analysis based on the endogeneity of FLP, using year by year cross section data with
structural dependence of the error term (Table 3), concludes that the three variables FLP,
FLIT and Kinship, play a significant role in explaining inter-district variations in sex
ratios, consistent with the model put forward. When district effects are eliminated, by
taking first differences (Table 4), FLP and FLIT both have significant effects in explaining
sex ratios. However, the higher female literacy rate did not show a positive effect, which
could be due to the effect of data errors in the 1971 Census. When we use the first
difference model, the constraints across equations are rejected, so if we analyse the left
hand side of Table 4 we find that both FLP and FMR04 are highly significant. When we
look at the combined cross-section results (Table 3), the restrictions are rejected and we
find that FLP, FLIT, Kinship and FMR04 all appear with the correct sign and are highly
significant for majority of the census years.
It is expected that, a priori, an increase in female literacy rate could contribute towards
balanced sex-ratios in several ways; for example, through improvement in female labour
19
participation rates and improved nutrition and healthcare. The latter in particular could
lead to reduction in sex discrepant infant and child mortality over all households9.
However, if wealthy families choose the sex of unborn children through ultrasound and
amniocentesis procedures in urban areas, interactions of female literacy with other
variables may contribute negatively to FMRs at the margin.
FLP was associated with sex ratios, indicating that the demand for female labour might
improve the survival chances of females. However, the inclusion of neither the
proportion of cultivator households nor the proportion of agricultural labouring
households (TCULT or TAGLAB, might indicate demand for agricultural labour),
improved the results in our case. This supports to some extent the case against there
being any relationship between agricultural employment and higher FMRs10. Harriss and
Watson (1989) also concluded that the “agricultural determinant case does not stand up
the evidence”. Kinship was one of the most important ingredients of the determination of
FMRs. However, our ability to explore the influence of this variable more thoroughly is
limited by our inability to capture kinship in any other way than using a time invariant
(0,1) dummy variable. This is not a plausible assumption, since the constancy of kinship
over three census years belies changing social practices, such as changing dowry levels,
that are likely to have affected the relative expected returns to sons and daughters, and
could contribute to falling FMRs. This requires further investigation, although it is
unlikely that the census data provide suitable means.
This study has provided a suitable neoclassical model that predicts that in districts where
there is higher female labour participation and smaller role of Aryan norms, the greater
will be the female-male survival ratio. The model was put to an empirical test using the
Indian Census data of three decades. It was concluded by rigorous econometric tests that
9 Reduction in infant mortality would reduce male infant mortality more than female infant mortality. We are
suggesting that improved female literacy will improve child nutrition and health care and to the extent that
excess girl child mortality is due to poor nutrition and health care this will reduce their deaths relative to
male child deaths.
10 While the rice crop zone provided employment opportunities for women and we find that the FMRs are
higher in districts where rice is the predominant staple crop; the strongest effect was in districts where
wheat is a major crop. Employment opportunities for females have been limited in these regions, and
FMRs were significantly lower.
20
an increase in female labour participation rate, female literacy rate and non-Aryan kinship
status would contribute to an increase in female-male ratio for the juvenile age group.
We have not discussed policy prescriptions that have been derived in earlier studies, since
this would extend the paper considerably. However, the significance of the culture/kinship
variable suggests the importance of attempting to alter these practices. For example, the
content of education, for males as well as females, may have an important role to play, as
well as extending education and employment to women.
REFERENCES
Agarwal, B., 1994, A Field of One's Own: Gender and Land Rights in South Asia,
Cambridge, Cambridge University Press.
Agnihotri, S., 1996, Juvenile Sex Ratios in India: a Disaggregated Analysis, Economic
and Political Weekly, 28/12/96, 3369-82.
Agnihotri, S., 1997, Sex-ratios in India: a Disaggregated Analysis, Norwich, School of
Development Studies, unpublished Ph.D Dissertation.
Agnihotri, S.; Palmer-Jones, R. W., and Parikh, A., 1998, Missing Women in Indian
Districts: an Entitlements Approach, mimeo, School of Development Studies,
University of East Anglia.
Bardhan, P. K., 1986, On the Economic Geography of Sex Disparity in Child Survival
in India: a Note, Proceedings of SSRC on Sex Differentials in Mortality and
Health Care in South Asia, Dhaka, January..
Bardhan, P. K., 1974, On Life and Death Questions, Economic and Political Weekly,
9, 1293-1304.
Coale, A. J., 1991, Excess Female Mortality and the Balance of the Sexes: an Estimate
of the Number of Missing Females, Population and Development Review, 17,
517-23.
Dasgupta, P., 1993, An Inquiry into Well-being and Destitution, Oxford, Clarendon
Press.
Dyson, T. and Moore, M. P., 1983, On Kinship Structure, Female Autonomy and
Demographic Behaviour in India, Population and Development Review, 9, 35-
60.
Harriss B. and Watson E., 1987, The Sex Ratio in South Asia in Momsen J. and
Townsend J. (eds) The Geography of Gender, Hutchinson, London.
21
Kishor, S., 1993, May God give Sons to All: Gender and Child Mortality in India,
American Sociological Review, 58, 247-65.
Maddala G.S., 1971, The Use of Variance Components Models in Pooling Cross
Section and Time Series Data, Econometrica, 39, 341-358.
Malhotra, A., Vanneman, R., and Kishor, S., 1995, Fertility, Dimensions of Patriarcy,
and Development in India, Population and Development Review, 21, (2):218-
305.
Miller, B., 1981, The Endangered Sex: Neglect of Female Children in Rural North
India, Ithaca, Cornel University Press.
Murthi, M., Guido, A., and Dreze, J., 1995, Mortality, Fertiligy and Gender Bias in
India: a District Level Analysis, Population and Development Review, 21,
(4):745-82.
Rosenzweig, Mark R. and Schultz, T. Paul, Sep 1982, Market Opportunities, Genetic
Endowments, and Intrafamily Resource Distribution: Child Survival in Rural
India, American Economic Review, 72, (4): 803-815.
Saith, R. and Harriss-White, B., 1998, An Analysis of the Gender Sensitivity of
Convential Well-being Indicators, Geneva, UNRISD, Working Paper,
(forthcoming in Development and Change).
Sen, A. K., 1981, Poverty and Famines, An Essay on Entitlement and Deprivation,
Oxford, Clarendon Press.
Sen, A. K., 1985, Commodities and Capabilites, Amsterdam, North Holland.
Sen, A. K., 1992, Missing Women, British Medical Journal, 304, 587-588.
Srinivas, M.N., 1962, Caste in Modern India: and Other Essays, London, Asia
Publishing House.
Sudha, S. and Rajan, S. I., 1999, Female Demographic Disadvantage in India, 1981-
1991: Sex Selective Abortions and Female Infanticide, Development and
Change. 30(3):585-618
Visaria, P. M., 1971, The Sex Ratio of the Population of India, New Delhi, Office of
the Registrar General, Monograph 10, Census of India.

CREDIT PAPERS
98/1 Norman Gemmell and Mark McGillivray, “Aid and Tax Instability and theGovernment Budget Constraint in Developing Countries”
98/2 Susana Franco-Rodriguez, Mark McGillivray and Oliver Morrissey, “Aidand the Public Sector in Pakistan: Evidence with Endogenous Aid”
98/3 Norman Gemmell, Tim Lloyd and Marina Mathew, “Dynamic SectoralLinkages and Structural Change in a Developing Economy”
98/4 Andrew McKay, Oliver Morrissey and Charlotte Vaillant, “AggregateExport and Food Crop Supply Response in Tanzania”
98/5 Louise Grenier, Andrew McKay and Oliver Morrissey, “Determinants ofExports and Investment of Manufacturing Firms in Tanzania”
98/6 P.J. Lloyd, “A Generalisation of the Stolper-Samuelson Theorem withDiversified Households: A Tale of Two Matrices”
98/7 P.J. Lloyd, “Globalisation, International Factor Movements and Market
98/8 Ramesh Durbarry, Norman Gemmell and David Greenaway, “NewEvidence on the Impact of Foreign Aid on Economic Growth”
98/9 Michael Bleaney and David Greenaway, “External Disturbances andMacroeconomic Performance in Sub-Saharan Africa”
98/10 Tim Lloyd, Mark McGillivray, Oliver Morrissey and Robert Osei,“Investigating the Relationship Between Aid and Trade Flows”
98/11 A.K.M. Azhar, R.J.R. Eliott and C.R. Milner, “Analysing Changes in TradePatterns: A New Geometric Approach”
98/12 Oliver Morrissey and Nicodemus Rudaheranwa, “Ugandan Trade Policyand Export Performance in the 1990s”
98/13 Chris Milner, Oliver Morrissey and Nicodemus Rudaheranwa,“Protection, Trade Policy and Transport Costs: Effective Taxation of UgandanExporters”
99/1 Ewen Cummins, “Hey and Orme go to Gara Godo: Household RiskPreferences”
99/2 Louise Grenier, Andrew McKay and Oliver Morrissey, “Competition andBusiness Confidence in Manufacturing Enterprises in Tanzania”
99/3 Robert Lensink and Oliver Morrissey, “Uncertainty of Aid Inflows and theAid-Growth Relationship”
99/4 Michael Bleaney and David Fielding, “Exchange Rate Regimes, Inflationand Output Volatility in Developing Countries”
99/5 Indraneel Dasgupta, “Women’s Employment, Intra-Household Bargainingand Distribution: A Two-Sector Analysis”
99/6 Robert Lensink and Howard White, “Is there an Aid Laffer Curve?”99/7 David Fielding, “Income Inequality and Economic Development: A Structural
99/8 Christophe Muller, “The Spatial Association of Price Indices and Living
99/9 Christophe Muller, “The Measurement of Poverty with Geographical andIntertemporal Price Dispersion”
99/10 Henrik Hansen and Finn Tarp, “Aid Effectiveness Disputed”99/11 Christophe Muller, “Censored Quantile Regressions of Poverty in Rwanda”99/12 Michael Bleaney, Paul Mizen and Lesedi Senatla, “Portfolio Capital Flows
to Emerging Markets”99/13 Christophe Muller, “The Relative Prevalence of Diseases in a Population of
00/1 Robert Lensink, “Does Financial Development Mitigate Negative Effects ofPolicy Uncertainty on Economic Growth?”
00/2 Oliver Morrissey, “Investment and Competition Policy in DevelopingCountries: Implications of and for the WTO”
00/3 Jo-Ann Crawford and Sam Laird, “Regional Trade Agreements and the
00/4 Sam Laird, “Multilateral Market Access Negotiations in Goods and Services”00/5 Sam Laird, “The WTO Agenda and the Developing Countries”00/6 Josaphat P. Kweka and Oliver Morrissey, “Government Spending and
Economic Growth in Tanzania, 1965-1996”00/7 Henrik Hansen and Fin Tarp, “Aid and Growth Regressions”00/8 Andrew McKay, Chris Milner and Oliver Morrissey, “The Trade and
Welfare Effects of a Regional Economic Partnership Agreement”00/9 Mark McGillivray and Oliver Morrissey, “Aid Illusion and Public Sector
Fiscal Behaviour”00/10 C.W. Morgan, “Commodity Futures Markets in LDCs: A Review and
Prospects”00/11 Michael Bleaney and Akira Nishiyama, “Explaining Growth: A Contest
between Models”00/12 Christophe Muller, “Do Agricultural Outputs of Autarkic Peasants Affect
Their Health and Nutrition? Evidence from Rwanda”00/13 Paula K. Lorgelly, “Are There Gender-Separate Human Capital Effects on
Growth? A Review of the Recent Empirical Literature”00/14 Stephen Knowles and Arlene Garces, “Measuring Government Intervention
and Estimating its Effect on Output: With Reference to the High PerformingAsian Economies”
DEPARTMENT OF ECONOMICS DISCUSSION PAPERSIn addition to the CREDIT series of research papers the Department of Economicsproduces a discussion paper series dealing with more general aspects of economics.Below is a list of recent titles published in this series.
98/1 David Fielding, “Social and Economic Determinants of English Voter Choicein the 1997 General Election”
98/2 Darrin L. Baines, Nicola Cooper and David K. Whynes, “GeneralPractitioners’ Views on Current Changes in the UK Health Service”
98/3 Prasanta K. Pattanaik and Yongsheng Xu, “On Ranking Opportunity Setsin Economic Environments”
98/4 David Fielding and Paul Mizen, “Panel Data Evidence on the RelationshipBetween Relative Price Variability and Inflation in Europe”
98/5 John Creedy and Norman Gemmell, “The Built-In Flexibility of Taxation:Some Basic Analytics”
98/6 Walter Bossert, “Opportunity Sets and the Measurement of Information”98/7 Walter Bossert and Hans Peters, “Multi-Attribute Decision-Making in
Individual and Social Choice”98/8 Walter Bossert and Hans Peters, “Minimax Regret and Efficient Bargaining
under Uncertainty”98/9 Michael F. Bleaney and Stephen J. Leybourne, “Real Exchange Rate
Dynamics under the Current Float: A Re-Examination”98/10 Norman Gemmell, Oliver Morrissey and Abuzer Pinar, “Taxation, Fiscal
Illusion and the Demand for Government Expenditures in the UK: A Time-Series Analysis”
98/11 Matt Ayres, “Extensive Games of Imperfect Recall and Mind Perfection”98/12 Walter Bossert, Prasanta K. Pattanaik and Yongsheng Xu, “Choice Under
Complete Uncertainty: Axiomatic Characterizations of Some Decision Rules”98/13 T. A. Lloyd, C. W. Morgan and A. J. Rayner, “Policy Intervention and
Supply Response: the Potato Marketing Board in Retrospect”98/14 Richard Kneller, Michael Bleaney and Norman Gemmell, “Growth, Public
Policy and the Government Budget Constraint: Evidence from OECDCountries”
98/15 Charles Blackorby, Walter Bossert and David Donaldson, “The Value ofLimited Altruism”
98/16 Steven J. Humphrey, “The Common Consequence Effect: Testing a UnifiedExplanation of Recent Mixed Evidence”
98/17 Steven J. Humphrey, “Non-Transitive Choice: Event-Splitting Effects or
98/18 Richard Disney and Amanda Gosling, “Does It Pay to Work in the Public
98/19 Norman Gemmell, Oliver Morrissey and Abuzer Pinar, “Fiscal Illusion andthe Demand for Local Government Expenditures in England and Wales”
98/20 Richard Disney, “Crises in Public Pension Programmes in OECD: What Arethe Reform Options?”
98/21 Gwendolyn C. Morrison, “The Endowment Effect and Expected Utility”
98/22 G.C. Morrisson, A. Neilson and M. Malek, “Improving the Sensitivity of theTime Trade-Off Method: Results of an Experiment Using Chained TTOQuestions”
99/1 Indraneel Dasgupta, “Stochastic Production and the Law of Supply”99/2 Walter Bossert, “Intersection Quasi-Orderings: An Alternative Proof”99/3 Charles Blackorby, Walter Bossert and David Donaldson, “Rationalizable
Variable-Population Choice Functions”99/4 Charles Blackorby, Walter Bossert and David Donaldson, “Functional
Equations and Population Ethics”99/5 Christophe Muller, “A Global Concavity Condition for Decisions with
Several Constraints”99/6 Christophe Muller, “A Separability Condition for the Decentralisation of
Complex Behavioural Models”99/7 Zhihao Yu, “Environmental Protection and Free Trade: Indirect Competition
99/8 Zhihao Yu, “A Model of Substitution of Non-Tariff Barriers for Tariffs”99/9 Steven J. Humphrey, “Testing a Prescription for the Reduction of Non-
Transitive Choices”99/10 Richard Disney, Andrew Henley and Gary Stears, “Housing Costs, House
Price Shocks and Savings Behaviour Among Older Households in Britain”99/11 Yongsheng Xu, “Non-Discrimination and the Pareto Principle”99/12 Yongsheng Xu, “On Ranking Linear Budget Sets in Terms of Freedom of
99/13 Michael Bleaney, Stephen J. Leybourne and Paul Mizen, “Mean Reversionof Real Exchange Rates in High-Inflation Countries”
99/14 Chris Milner, Paul Mizen and Eric Pentecost, “A Cross-Country PanelAnalysis of Currency Substitution and Trade”
99/15 Steven J. Humphrey, “Are Event-splitting Effects Actually Boundary
99/16 Taradas Bandyopadhyay, Indraneel Dasgupta and Prasanta K.Pattanaik, “On the Equivalence of Some Properties of Stochastic Demand
99/17 Indraneel Dasgupta, Subodh Kumar and Prasanta K. Pattanaik,“Consistent Choice and Falsifiability of the Maximization Hypothesis”
99/18 David Fielding and Paul Mizen, “Relative Price Variability and Inflation in
99/19 Emmanuel Petrakis and Joanna Poyago-Theotoky, “Technology Policy inan Oligopoly with Spillovers and Pollution”
99/20 Indraneel Dasgupta, “Wage Subsidy, Cash Transfer and Individual Welfare ina Cournot Model of the Household”
99/21 Walter Bossert and Hans Peters, “Efficient Solutions to BargainingProblems with Uncertain Disagreement Points”
99/22 Yongsheng Xu, “Measuring the Standard of Living – An Axiomatic
99/23 Yongsheng Xu, “No-Envy and Equality of Economic Opportunity”
99/24 M. Conyon, S. Girma, S. Thompson and P. Wright, “The Impact ofMergers and Acquisitions on Profits and Employee Remuneration in the UnitedKingdom”
99/25 Robert Breunig and Indraneel Dasgupta, “Towards an Explanation of theCash-Out Puzzle in the US Food Stamps Program”
99/26 John Creedy and Norman Gemmell, “The Built-In Flexibility ofConsumption Taxes”
99/27 Richard Disney, “Declining Public Pensions in an Era of DemographicAgeing: Will Private Provision Fill the Gap?”
99/28 Indraneel Dasgupta, “Welfare Analysis in a Cournot Game with a Public
99/29 Taradas Bandyopadhyay, Indraneel Dasgupta and Prasanta K.Pattanaik, “A Stochastic Generalization of the Revealed Preference Approachto the Theory of Consumers’ Behavior”
99/30 Charles Blackorby, WalterBossert and David Donaldson, “Utilitarianismand the Theory of Justice”
99/31 Mariam Camarero and Javier Ordóñez, “Who is Ruling Europe? EmpiricalEvidence on the German Dominance Hypothesis”
99/32 Christophe Muller, “The Watts’ Poverty Index with Explicit Price
99/33 Paul Newbold, Tony Rayner, Christine Ennew and Emanuela Marrocu,“Testing Seasonality and Efficiency in Commodity Futures Markets”
99/34 Paul Newbold, Tony Rayner, Christine Ennew and Emanuela Marrocu,“Futures Markets Efficiency: Evidence from Unevenly Spaced Contracts”
99/35 Ciaran O’Neill and Zoe Phillips, “An Application of the Hedonic PricingTechnique to Cigarettes in the United Kingdom”
99/36 Christophe Muller, “The Properties of the Watts’ Poverty Index Under
99/37 Tae-Hwan Kim, Stephen J. Leybourne and Paul Newbold, “SpuriousRejections by Perron Tests in the Presence of a Misplaced or Second BreakUnder the Null”
00/1 Tae-Hwan Kim and Christophe Muller, “Two-Stage Quantile Regression”00/2 Spiros Bougheas, Panicos O. Demetrides and Edgar L.W. Morgenroth,
“International Aspects of Public Infrastructure Investment”00/3 Michael Bleaney, “Inflation as Taxation: Theory and Evidence”00/4 Michael Bleaney, “Financial Fragility and Currency Crises”00/5 Sourafel Girma, “A Quasi-Differencing Approach to Dynamic Modelling
from a Time Series of Independent Cross Sections”00/6 Spiros Bougheas and Paul Downward, “The Economics of Professional
Sports Leagues: A Bargaining Approach”00/7 Marta Aloi, Hans Jørgen Jacobsen and Teresa Lloyd-Braga, “Endogenous
Business Cycles and Stabilization Policies”00/8 A. Ghoshray, T.A. Lloyd and A.J. Rayner, “EU Wheat Prices and its
Relation with Other Major Wheat Export Prices”00/9 Christophe Muller, “Transient-Seasonal and Chronic Poverty of Peasants:
Evidence from Rwanda”
00/10 Gwendolyn C. Morrison, “Embedding and Substitution in Willingness to
00/11 Claudio Zoli, “Inverse Sequential Stochastic Dominance: Rank-DependentWelfare, Deprivation and Poverty Measurement”
00/12 Tae-Hwan Kim, Stephen Leybourne and Paul Newbold, “Unit Root TestsWith a Break in Variance”
00/13 Tae-Hwan Kim, Stephen Leybourne and Paul Newbold, “AsymptoticMean Squared Forecast Error When an Autoregression With Linear Trend isFitted to Data Generated by an I(0) or I(1) Process”
00/14 Michelle Haynes and Steve Thompson, “The Productivity Impact of ITDeployment: An Empirical Evaluation of ATM Introduction”
00/15 Michelle Haynes, Steve Thompson and Mike Wright, “The Determinants ofCorporate Divestment in the UK”
Members of the Centre
Director
Oliver Morrissey - aid policy, trade and agriculture
Research Fellows (Internal)
Adam Blake – CGE models of low-income countriesMike Bleaney - growth, international macroeconomicsIndraneel Dasgupta – development theoryNorman Gemmell – growth and public sector issuesKen Ingersent - agricultural tradeTim Lloyd – agricultural commodity marketsAndrew McKay - poverty, peasant households, agricultureChris Milner - trade and developmentWyn Morgan - futures markets, commodity marketsChristophe Muller – poverty, household panel econometricsTony Rayner - agricultural policy and trade
Research Fellows (External)
V.N. Balasubramanyam (University of Lancaster) – foreign direct investment and multinationalsDavid Fielding (Leicester University) - investment, monetary and fiscal policyGöte Hansson (Lund University) – trade, Ethiopian developmentRobert Lensink (University of Groningen) – aid, investment, macroeconomicsScott McDonald (Sheffield University) – CGE modelling, agricultureMark McGillivray (RMIT University) - aid allocation, human developmentJay Menon (ADB, Manila) - trade and exchange ratesDoug Nelson (Tulane University) - political economy of tradeDavid Sapsford (University of Lancaster) - commodity pricesFinn Tarp (University of Copenhagen) – aid, CGE modellingHoward White (IDS) - aid, poverty