Predicting vulnerable software components with dependency graphs
Upload
independentCategory
view
0download
0
International Journal of Economics and Finance; Vol. 4, No. 12; 2012ISSN 1916-971X E-ISSN 1916-9728
Published by Canadian Center of Science and Education
Demographic and Economic Dependency Ratios –Present and Perspectives
Mihail Titu1, Ilie Banu1 & Ioana-Madalina Banu1 1 Faculty of Economics, “Lucian Blaga” University of Sibiu, Sibiu, RomaniaCorrespondence: Ilie Banu, Faculty of Economics, “Lucian Blaga” Universityof Sibiu, Strandului Str. Nr. 29, ap. 4,B-dul Victoriei nr. 10, Romania.Tel: 40-74-047-0069. E-mail: [email protected], [email protected]
Received: July 24, 2012 Accepted: October 12, 2012 Online Published: October 23, 2012doi:10.5539/ijef.v4n12p214 URL: http://dx.doi.org/10.5539/ijef.v4n12p214
AbstractIn the present research article, we outline the distinction between thedemographic dependency ratio and the economic dependency ratio and presentits evolution in Romania within the European Union, but not restrictive tothe EU27. The evolution of demographic dependency ratio changed dramatically inRomania in the last 15 years comparing to the UE27. On the other hand, theevolution of economic dependency ratios is much more relevant because italso reflects the problems the economy is facing and should be brought tothe fore in the political debates and to decision makers.In the paper we present the factors that are leading to the increase of theeconomic dependency ratio and we conclude with the solutions which a statehas to adopt in order to prevent excessive public debt and structural gapsdue to long term rise in economic dependency ratio. Moreover, policy-makersmust face up the painful inter-temporal transfer choices that have to bedone. Our concern about Eastern-European Countries is strengthened by theglobal results reached by OECD through Minilink Model Study, IMF Study ofG7 and QUEST II Model that suggest the fall of the living standards overthe next 50 years due to economic dependency ratio. For Romania weconsidered two main solutions to this problem: increasing birth rate (longterm solution) and lowering the unemployment rate through investment and ahigh rate of EU funds absorption (medium term solution).Keywords: demographic dependency ratios, economic dependency ratios, public
214

www.ccsenet.org/ijefInternational Journal of Economics and Finance Vol. 4, No. 12;2012
debt, structural gap, living standards, Romania, European Union1. Introduction1.1 Introduce the Problem
In the current context of economic crisis and the prospect of having acrisis in “W” in Romania, due to the spread of the waves of crisis in otherEuropean countries and America, but also due to the lack of a set ofpolicies focused on sustainable development of public finance we want toperform a comparative analysis outlook on sustainability in case theeconomic dependency ratio will increase knowing that the ageing of thepopulation is one of the main challenges across Europe. Dependency ratio isdefined as a measure of the portion of a population which is composed ofdependents (people who are too young or too old to work). The dependencyratio is equal to the number of individuals aged below 15 or above 64divided by the number of individuals aged 15 to 64, expressed as apercentage. A rising dependency ratio is a concern in many countries whichare facing an aging population, since it becomes difficult for pension andsocial security systems to provide for a significantly older, non-workingpopulation. (www.investorwords.com/1409/dependency_ratio)We present here Roubini’s opinion that the second high recession will beganin 2013-2014, due to the fact that all the countries which facedifficulties try to delay their debts as long as possible. But we see thatthis method will not be a long-term one because of the lack of confidenceof the investors, as we can see nowadays if we look at the results of thestock-market. (Roubini, 2012)1.2 Explore Importance of the Problem
The OECD estimates that by 2050 there could be on average more than 70older and inactive people for every 100 workers in OECD countries (thefigure is currently at 38 in OECD countries). In Europe, this number mayeven approach 100. This fact would place enormous pressure on the publicfinances of countries. In addition, declining workforces and laborparticipation cause a reduction in labor supply in many European countries,putting upward pressure on wages. In 2007, the EU workforce numbered 194million workers. By 2050, there will be an estimated labor shortage of 32million workers. In Germany and Italy with workforces of 35 and 22 million,respectively, the labor shortage is estimated to reach 8 and 6 million, by2050. In France and the UK the problems are less critical with estimatedshortages of 1 and 0.5 million workers. Considering the emigration of whitecollars from East-Europe, including Romania, to better paid jobs indeveloped countries, the East-European countries will face serious problemsregarding this fact unless they will find a solution. It is inevitable that existing tax systems will be revised in response.
215

www.ccsenet.org/ijefInternational Journal of Economics and Finance Vol. 4, No. 12;2012
Favorable tax arrangements for early retirement and special taxarrangements for those already retired must be re-examined. It is alsocritical to bring more people into the workforce by removing disincentivesthat make it attractive for the unemployed to remain unemployed. Givencurrent forecasts on economic growth, government spending and tax revenues,today’s policies in most OECD countries are not sustainable and need to bechanged. (Vermeend, 2008) The conclusions of an OECD study outline the following: (Türk, 2011) - The ageing of the populations is one of the main challenges across Europe- A clear distinction has to be made between (Method of calculation theindicators):• DEMOGRAPHIC DEPENDENCY RATIOS - (Old Age) (people aged 65+ relative topeople aged 15-64) and Young Age (people aged <15 relative to people aged15-64)• ECONOMIC DEPENDENCY RATIOS (inactive persons relative to people inemployment)- The evolution of economic dependency ratios is much more relevant andshould be brought to the fore in the political debate1.3 State Hypotheses and Their Correspondence to Research Design
The purpose of this article is to identify factors leading to increase ineconomic dependence and to offer possible alternatives and solutions toavoid a galloping increase of dependence rate, which of course is notdesirable, but to some extent is difficult to avoid.Economic dependency ratio, not retirement age, will determine futurepension funding needs. "By far the most effective response to an ageingpopulation in Europe is to make full use of available employmentpotential", noted Leila Kurki, president of the Section for Employment,Social Affairs and Citizenship of the European Economic and SocialCommittee. If the aim was to rise the retirement age, it was necessary to ensure thatpeople were able and willing to work for longer. "Jobs must be designed sothat people are able to work at least up to the statutory retirement age."Kurki pointed out that this would entail radical changes in the workinglife.Work and management would have to be organized in a way that willaccommodate ageing at every stage of a person's career. Working conditionsand the working environment must be adapted to suit workers of differentages. Discrimination and negative value judgments against older workersmust be combated. Updating professional skills and preventive healthcareare of key importance. (European Economic and Social Committee, 2011)
216

www.ccsenet.org/ijefInternational Journal of Economics and Finance Vol. 4, No. 12;2012
2. Current Status and Perspectives of the RatiosDue to the the high novelty of the paper and the macroeconomic approach, wehad to use statistics and Eurostat databases, so the first assumption isthat the errors due to collecting the data are limited. We present thecurrent status of research, which is somehow limited in the field andcontinued with our assumptions based on forecasted figures presented byauthorities. Most of the countries are affected by changes in the structureof the population so the calculation methods of the two rates have to bewell understood and analyzed.2.1 Demographic Dependency Ratios
The population pyramid is a demographic instrument showing the agestructure of the population in a country at a particular time. It iscomposed of two side by side graphs containing the number of men and womenaccording to age.Ideal pyramid - the basis of the pyramid reflects a high fertility to alevel that ensures the smooth replacement of the population (2.1 childrenfor women). A well balanced middle area shows the existence of sufficientadults who contribute to the social security and pension system.We have presented in Figure 1 a forecast of Romania's population till 2050and how it should look as an ideal pyramid.(http://populatiaromanieiincotro.unfpa.ro/demografic)
Figure 1. The ideal pyramid vs. Romania's population nowadays vs. Romania’spopulation in 2050
217

www.ccsenet.org/ijefInternational Journal of Economics and Finance Vol. 4, No. 12;2012
The left graphic from Figure 1 represents the ideal pyramid and on theright side we have shown Romania’s population nowadays and the graph belowrepresents the forecast for Romania’s population in 2050. Speaking aboutthe right graph, the first period corresponds to the First World War, aperiod with an important birth decrease. The second period represented inthe right figure above represents the Second World War, where there wasanother birth decrease. The third birth decrease was during the 1956-1966due to free access to contraceptive methods and pregnancy abortion. Theforth period, between 1967 and 1989, when contraceptive methods andpregnancy abortion were forbidden, led to a “baby boom”. In the lastperiod, as a consequence of the revolution of 1989 population had againfree access to contraceptive methods and pregnancy abortion and as a resultthe number of births decreased a lot.But thinking of the period when the “baby boom” generation (1946-1956) willretire (2011-2020) the pressure on the social contributions budget willincrease. The increase will put an additional pressure on public debt andbudget deficit of many countries, especially on those that had already astructural problem. This problem can lead to the second wave of cries,facing structural problems regarding social security funds and health andproblems of financing the deficits and public debt.2.2 The Evolution of Romania’s Population
In 2006, the population of Romania was estimated at 21.6 million, had alarge mass of adults (10.5 million), and retired people (6 million) and fewchildren (5 million people under 18). Narrow base shows that fewer childrenare born (about 220,000, to 350,000, which would ensure populationreplacement). In 2011, the population decreased to 19.04 million people and was thehighest decrease from the UE27. (www.econtext.ro, 2012)The pyramid also includes more than 3 million Romanian legally residingabroad and those who are abroad illegally and whose number is unknown.According to EUROSTAT statistics Romania has another problem. For example,it is stated that in 2009 Romania had only 0.1 foreign citizens compared tothe EU27 average of 6.5. That means that only few people are coming andsettling in Romania whereas more than 10% are leaving for other countrieswhere they find better conditions. (Active ageing and solidarity betweengenerations, 2012) After the referendum organized at the end of 2011, the National Instituteof Statistics offered the following result: stabile population - 19.042.936.
218

www.ccsenet.org/ijefInternational Journal of Economics and Finance Vol. 4, No. 12;2012
Even considering the decreasing population in Romania, the total agedependency ratio (43%) is placed below compared to the average (49.3%) inEU27. The value of our country is close to countries like Poland, the CzechRepublic, Cyprus, Malta and Slovenia.
Table 1. Dependency ratio within the EU27 in 2010 (ascendant ordered) Median
age(years)
Young age dependency ratio (%)
Old age dependency ratio(%)
Total age dependency ratio(%)
Share of population aged80 or over(%)
Slovakia 36.9 21.2 16.9 38.1 2.7Poland 37.7 21.2 19.0 40.2 3.3Czech Republic 39.4 20.2 21.6 41.7 3.6Cyprus 36.2 24.1 18.6 42.7 2.9Romania 38.3 21.7 21.4 43.0 3.1Malta 39.2 22.4 21.2 43.6 3.3Slovenia 41.4 20.2 23.8 44.0 3.9Lithuania 39.2 21.8 23.3 45.0 3.6Bulgaria 41.4 19.7 25.4 45.1 3.8Latvia 40.0 20.0 25.2 45.1 3.9Hungary 39.8 21.5 24.2 45.7 3.9Luxembourg 38.9 26.0 20.4 46.4 3.6Spain 39.9 21.9 24.7 46.6 4.9Estonia 39.5 22.3 25.2 47.5 4.1Austria 41.7 22.0 26.1 48.1 4.8Ireland 34.3 31.7 16.8 48.5 2.8Netherlands 40.6 26.2 22.8 49.0 3.9EU-27 40.9 23.3 25.9 49.3 4.7
Portugal 40.7 22.7 26.7 49.4 4.5Greece 41.7 21.5 28.4 49.9 4.6Finland 42.0 25.0 25.6 50.6 4.6United Kingdom 39.6 26.4 24.9 51.3 4.6
Belgium 40.9 25.6 26.0 51.7 4.9Germany 44.2 20.5 31.4 51.8 5.1Italy 43.1 21.4 30.8 52.2 5.8Denmark 40.5 27.6 24.9 52.4 4.1Sweden 40.7 25.4 27.7 53.1 5.3France 39.8 28.6 25.6 54.2 5.2
Source: (Eurostat, europop 2012)
In order to study the correlation coefficient, according to Pearson, SASprogram uses the following formula (Dootz, 2000)
219

www.ccsenet.org/ijefInternational Journal of Economics and Finance Vol. 4, No. 12;2012
CORREL (X,Y)= ∑xi*yi – n* x*y
√(∑xi2−n∗¿x2)∗∑ yi
2−n∗y2 ¿ (1)
The correlation coefficient can take any value between [-1.1]. When thevalues are closer to 1, it means a strong relation. Regarding the influenceyoung age dependency ratio and old-age dependency ratio is having on thetotal age dependency ratio at the European level in 2010, we calculated thecorrelation coefficient. We have structured the results in the table 2:
220
www.ccsenet.org/ijefInternational Journal of Economics and Finance Vol. 4, No. 12;2012
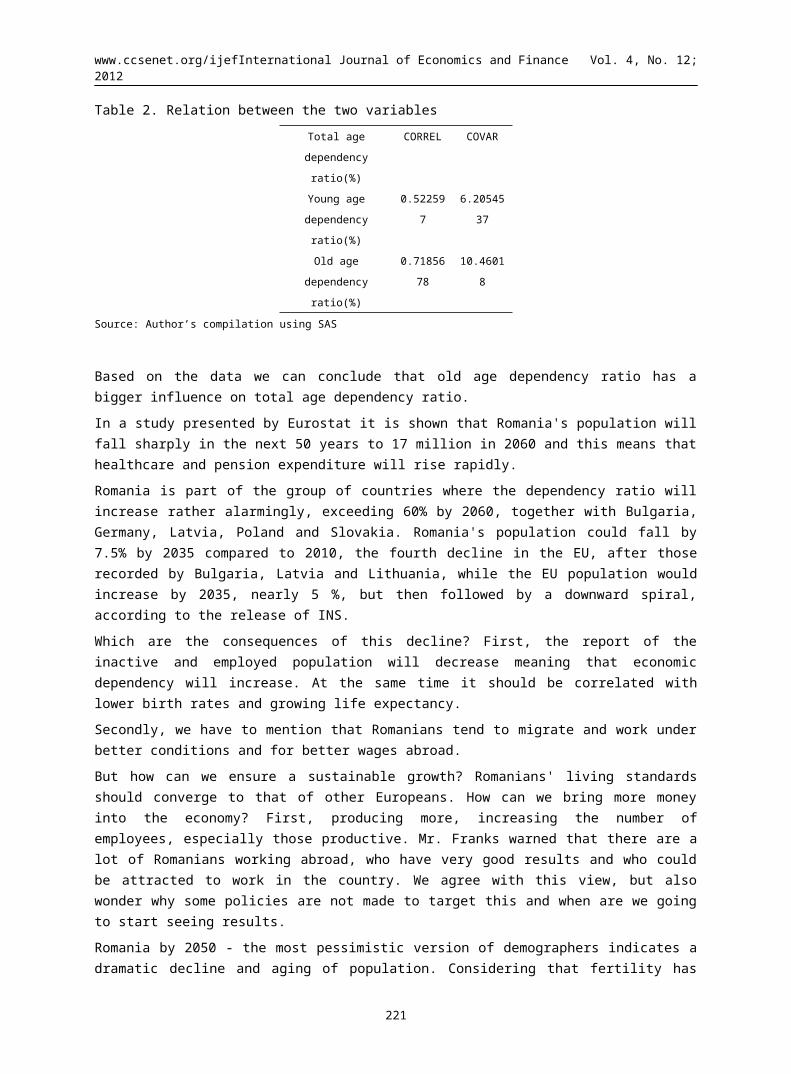
Table 2. Relation between the two variablesTotal agedependency ratio(%)
CORREL COVAR
Young agedependency ratio(%)
0.522597
6.2054537
Old agedependency ratio(%)
0.7185678
10.46018
Source: Author’s compilation using SAS
Based on the data we can conclude that old age dependency ratio has abigger influence on total age dependency ratio.In a study presented by Eurostat it is shown that Romania's population willfall sharply in the next 50 years to 17 million in 2060 and this means thathealthcare and pension expenditure will rise rapidly.Romania is part of the group of countries where the dependency ratio willincrease rather alarmingly, exceeding 60% by 2060, together with Bulgaria,Germany, Latvia, Poland and Slovakia. Romania's population could fall by7.5% by 2035 compared to 2010, the fourth decline in the EU, after thoserecorded by Bulgaria, Latvia and Lithuania, while the EU population wouldincrease by 2035, nearly 5 %, but then followed by a downward spiral,according to the release of INS.Which are the consequences of this decline? First, the report of theinactive and employed population will decrease meaning that economicdependency will increase. At the same time it should be correlated withlower birth rates and growing life expectancy.Secondly, we have to mention that Romanians tend to migrate and work underbetter conditions and for better wages abroad.But how can we ensure a sustainable growth? Romanians' living standardsshould converge to that of other Europeans. How can we bring more moneyinto the economy? First, producing more, increasing the number ofemployees, especially those productive. Mr. Franks warned that there are alot of Romanians working abroad, who have very good results and who couldbe attracted to work in the country. We agree with this view, but alsowonder why some policies are not made to target this and when are we goingto start seeing results.Romania by 2050 - the most pessimistic version of demographers indicates adramatic decline and aging of population. Considering that fertility has
221

www.ccsenet.org/ijefInternational Journal of Economics and Finance Vol. 4, No. 12;2012
remained at the same level, while the number of elderly continues to growwith increasing life expectancy, Romania's population will reach 16million. The number of active adults will be so small that the dependencyratio (age adults to support vulnerable groups: children and elderly) willbe increasing a lot. (Note 1)“Member States’ labor market survey statistics and results in early 2010show that almost 2.5 million Romanian and Bulgarian people worked in EU15countries. Out of these, 2.1 million people are Romanian, the majorityworking in Italy (890,000), Spain (825,000) and Germany (110,000)”, saidCristina Arigho, spokesperson for the department of Employment, SocialAffairs and the inclusion of the European Commission.Official statistics outline that the remaining 275,000 Romanians areworking in Austria, Belgium, Denmark, Finland, France, Greece, Ireland,Luxembourg, Netherlands, Portugal, Sweden and the UK. Ten of thesecountries (Belgium, Germany, Ireland, France, Italy, Luxembourg, Malta,Netherlands, Austria and Britain) have maintained some restrictions onRomania before its accession to the EU, among which the need of obtaining awork permit for certain qualifications.A percentage of the total population of immigrants varies from 0.1% inPoland to 7% in Italy and Britain and even reaches 43% in Luxembourg.Romania with 2.8 million immigrants recorded in the World Bank's report in2010 has a share of immigrants out of the total population of about 12.72%and the share of total population of Romania's population is 0.29%. WhileRomanian immigrants in the total share of immigrants in the world is 1.3%,that means that the average Romanian immigrants is four times higher thanthe world average. It is important to note the fact that about 12% of thetotal numbers of immigrants are people with higher qualifications andexperience.Taking into consideration the forecasted dependency ratio for Romania, weare going to present in Figure 2 the forecasts for EU27.
222

www.ccsenet.org/ijefInternational Journal of Economics and Finance Vol. 4, No. 12;2012
Figure 2. Comparative demographic dependency ratio in EU27 (Source: AK-Wien/ Dependency Ratio Calculator)
As we can see from the graphic presented in Figure 2, the demographicdependency ratio is forecasted to almost double in EU27 by 2050, but willnot grow so much in comparison with the forecasted ratios for Romania. Wehave to question whether the forecast for Romania is well approximated ornot and if the pessimistic version is not too pessimist? Next we present astudy which aims at evaluating the burden of the dependency ratio increaseand at answering the following question: “as the population grows older andthe young people are replaced by the elderly, how is this going to affectthe fiscal pressure for the employed persons with this demographic change?The results of the study show that even when the capacity of the employedpopulation with supporting the fiscal pressure generated by the dependentpopulation is not taken into consideration, the concerns regarding theincrease of the fiscal pressure under the conditions of the dependencyratio increase are exaggerated, yet the budgetary expenditures owed to thisimplication are rising. (Ruggeri Joe, 2010) But the conclusions are that there is actually a pressure on deficit grows,but even more there is the social problem that if there are fewer and fewerchildren, there will be fewer active persons that can support theexpenditures of the 65+ population. On the figure 3, we presented the agestructure in the left graph and the economic status of the peopleemployment rate on the right.
223

www.ccsenet.org/ijefInternational Journal of Economics and Finance Vol. 4, No. 12;2012
Figure 3. Demographic vs. Economic Dependency Ratio 2010 (EU-27)
2.3 Economic Dependency Ratios
In order to have a general overview, we have first presented the evolutionof the economic dependency rate in EU 15, the US and Japan.
Table 3. Evolution of economic dependency rate from 1960-2050Potential economic dependency Effective economic dependency
(0-14+65s+)/Active population (0-14+65s+)/Active employment
1960 1995 2000 2050 (f) 1960 1995 2000 2050 (f)EU15 0.85 0.75 0.75 1.09 0.88 0.85 0.85 1.24US 1.04 0.69 0.66 0.86 1.11 0.75 0.72 0.93
Japan 0.75 0.57 0.61 1.13 0.77 0.59 0.63 1.16Source: UN and Eurostat databases
Analyzing table 3 we can observe higher figures for effective economicdependency and that is because the active population will always be higherthan active employment, the difference being the unemployed persons. In ouropinion, it is better to look at effective economic dependency ratio whenformulating conclusions. As we can observe in EU15 the ratio has increasedby almost 41% from 1960 to 2050. In Japan we have also an increase by 50,6%regarding the same period but in the US we can observe a decrease by 17% inthe analyzed period.2.3 Figures for Romania
We considered statistical figures from the International Labor Office and
224

Total population (21.447 / 19.043)
Population of 15 years and over (18.200)
Active population
(9.965 / 9.793)
Unemployed (725 / 751)
Employed population (9.240 /9.042)
Other categories
Employees (6.062/n.a)
Ind. + const (2.397/n.a)
Services (3.520/n.a)
Agriculture (145/n.a)
Inactive Population of 15 years and over (8.235/n.a)
<15years (3.247/n.a)
www.ccsenet.org/ijefInternational Journal of Economics and Finance Vol. 4, No. 12;2012
Romanian Institute of Statistics and we take figures for granted eventhough errors can occur.
Figure 4. Population categories in 2010 vs. 2012Source: International Labor Office
225

www.ccsenet.org/ijefInternational Journal of Economics and Finance Vol. 4, No. 12;2012
The economic dependency report (the number of inactive and unemployedpersons which relate to 1000 employed persons) has been of 1321‰ in 2010,higher for the female gender (1666‰, as opposed to 1043‰ concerning themen) and for the urban environment (1340‰, compared to 1299‰ in the ruralenvironment). In the IVth quarter of 2011, the economic dependency report (the number ofinactive and unemployed persons which relate to 1000 employed persons) hasbeen of 1362‰. Practically, for each employed person in Romania, we have1.362 inactive and unemployed persons.The employment rate of the population aged 15-64 in the forth quarter of2011 has been of 57.9%, at a distance of 12.1 percentage points from thenational target of 70% established in the context of the European Strategy2020 while the unemployment rate has reached the 7.7% level.The employment rate of the population able to work (15-64 years) has beenof 57.9%. The occupancy has been higher amongst men (64.8% as opposed to51.1% for women); at the same time, the unemployment rate has reached the8.2% level for men, as opposed to 7.0% for women.The employment rate of youths (15-24 years) has been of 23.1% and theunemployment rate of 25.4%. In other words, one out of four youths wouldwant to work but cannot find a job. (Paul, 2012) In conclusion, we find it obvious that the trend of economic dependencyratio is an ascendant one, not only in Romania or European Union, but alsoacross the globe, as we have seen (US and Japan).3. Factors Leading to Increase in Economic Dependency RatioConsidering the formula:
Economic dependency rate = (Total inactive population + Unemployed)/ Employed people,
We can easily find the factors which affect the value of the economicdependency rate which considering the growing trend of the dependency rateare:- The decline of the total population, especially of that under 15 years,more than the increase of 65+ will lead to the increase of the totalinactive population- If unemployment rate is stable or growing the economic dependency ratewill growThe sole variant in which the growing trend can be slowed down is to lowerthe unemployment rate whereas employment rate increases, so as to lower theincrease of inactive population, especially the old age dependency ratio.We have to mention that lately there have been carried out several studies
226

www.ccsenet.org/ijefInternational Journal of Economics and Finance Vol. 4, No. 12;2012
which outlined somehow the same solution which is that fiscal policy haveto change. We will mention some studies such as:- OECD, MINILINK Model Study of global consequences of ageing- IMF STUDY OF G7 countries using the Multimodel MODEL- QUEST II ModelSimulations with the QUEST II model, which take explicit account of thelabor force and public finance implications of ageing, suggest per capitaliving standards are likely to fall significantly over the next 50 yearsdue to the direct influence of the ageing process in the EU, US and Japan.The effect of ageing populations in terms of slowing the rate of growth ofpotential output will also make the budgetary implications of ageing moredifficult for the individual economies to bear.Regarding the consequences of increasing economic dependency rate wemention:- First and foremost, policy-makers will need to increasingly address theconsequences of ageing for future living standards and face up to thepainful inter-temporal transfer choices to be made in this regard i.e. howmuch should the present generation transfer in terms of physical and humancapital in order to ensure that the retirement of the “baby boom”generation doesn't pose insurmountable problems. Recently, tax reforms leftless revenue for boomers benefits, but still boomers are an important shareof population which vote almost entirely, so political parties tend tooverprotect the generation. It is the case of Romania, too and thegovernment should take care on budget deficit and public debt.- Secondly, fiscal policy will need to be closely scrutinized in order tobe able to cater for the inevitable age related spending pressures whichwill emerge, without provoking the development of unsustainable deficit anddebt positions and significant disincentive effects in relation to workeffort and labor supply decisions. (Mcmorrow & Roeger, 2010)The results of a study conducted by the International Monetary Fund in 2011revealed that in US those aged 65 may receive $300 billion more in benefitsthan they pay in taxes, which represents an obligation 17 times larger thanthat likely to be left by those aged 25- Last but not least unemployment rate has strong relationships withimportant economic variables like budget deficit and public debt, economicgrowth, etc. Carmen Reinhart and Kenneth Rogoff, two Harvard economists,estimate that public debt above 90% of GDP can reduce average growth ratesby more than 1%. . (Economist, 2012)Regarding the last statement, the standard level of the unemployment ratein an economy is 5-6%. At a given unemployment rate the budget deficit can
227

www.ccsenet.org/ijefInternational Journal of Economics and Finance Vol. 4, No. 12;2012
be estimated. To this level the size of revenue and expenditure can beestimated corresponding to an employment rate of 94-95% from the activepopulation. For the U.S. economy it was estimated, for example, that eachpercentage point of increase in the unemployment rate increases the budgetdeficit to $ 30 billion. This growth deficit is due to the fluctuations inthe economic activity and the deficit is caused by the highest possibleoccupancy rate of the population, within a given budget year. After itsremoval, the remaining deficit reflects structural imbalance betweenrevenues and government expenditures. A deficit caused by unemployment ofmore than 4% of GDP was recorded during the war and in times of economicdownturn. (Hyman, 2007) We have to outline also the tax force to retire,speaking about social contributions that encourage people to retire ratherthan continue working and the unused labor force capacity which shouldlower the economic dependency rate. The policy makers should consider theseaspects too. (Wise, 2005)In our opinion government agencies should develop long term budgetprojections but in some east European countries there are not even mediumterm budget projections. This is extremely important, considering the agingpopulation and the increase in economic and demographic dependency ratios.Behavioral evidence suggests that people tend not always to make decisionsin far-sighted and rational ways. Individuals with inadequate retirementsavings are also more likely to draw on costly state benefit programmers inretirement. Encouraging them to save in a pension when young makes thisless likely. Today, policy changes should be undertaken in light of thissobering long-term outlook, but also with a full appreciation of the degreeof uncertainty about these pressures. We strongly believe that long termprojections should be made throw statistical model simulations. (Lee, 2005)We want to highlight that, even though there are agencies that are doingresearch in the field of aging (for example, The National Institute onAging in US, Aging Report conducted by EUROSTAT), when designing budgetsgovernments do not take into consideration all the limits that might occursuch as the effect on budgets of the aging population. (Suzman, 2005)4. Conclusions and DiscussionWhen optimal taxation is considered, the governments should consider theeffects of a fiscal policy aiming at redistributing the tax burden in sucha way to maintain per-capita debt unchanged. The latter tax reform impliesthat capital intensity and the population growth rate move in the samedirection as the change in the tax on population size, while consumptioncan move in either direction in the presence of convex childbearing costs.A solution can be increasing the tax on the family size and reducing thetaxes on capital income. (Spataro L., 2012) The economic consequences of
228

www.ccsenet.org/ijefInternational Journal of Economics and Finance Vol. 4, No. 12;2012
rising economic dependency ratio are severe and we have mentioned abovejust some of them. Although to some extent economic dependency ratio cannotbe avoided, a common strategy has to be adopted at the EU level in order tomaintain the ratio at a sustainable level. Although population dependencyratio can on long term be supported by stimulating birth grow, speakingabout economic dependency ratio the state has to stimulate job creation inorder to reduce unemployment. Austerity cannot be taken as a sole solution because the consolidationneeded would be too large. Another solution to shrink the public debt can be inflation but the boomersor those who have large savings and that are often in a decision makingposition will not agree upon this solution. We consider that inflationcannot solve the real problems of structural imbalances.A real opportunity for lowering the unemployment rate is investing and ahigh rate of EU funds absorption. Especially, for East European Countriesthe allocation is substantial but in some cases this opportunity is notvalued. This is the case of Romania, which has a rate of EU fundsabsorption of less than 10% and at the moment has its funds partiallyblocked by the European Commission for irregularities detected by theauditors. Considering the scenario that Romania would have absorbed 10billion euro, the demand wouldn’t have decreased whereas the economystimulated, the value added tax and the salaries in the public sector couldhave remained the same. (Anghel, 2012) In almost all reports that present the two ratios, especially the economicdependency ratio it is argued that the most effective strategy with whichcountries can prepare for population ageing is raising employment levels.(Demography Report, 2008)Regarding the conclusions, this study can be continued with an analysis oflabor force implications of a rise in dependency ratios.
5. Acknowledgements Research conducted within the POSDRU/CPP107/DMI1.5/S/76851 project, co-financed from the European Social Fund through the Human ResourcesDevelopment Sectorial Operational Program 2007-2013.ReferencesAnghel, A. M. (2012, October 26).
http://www.zf.ro/analiza/daca-zf-a-imaginat-un-exercitiu-in-care-in-loc-de-1-8-mld-euro-am-fi-luat-10-mld-euro-bani-europeni-10257897. Retrieved10 2012, 2012, from www.zf.ro:
229

www.ccsenet.org/ijefInternational Journal of Economics and Finance Vol. 4, No. 12;2012
http://www.zf.ro/analiza/daca-zf-a-imaginat-un-exercitiu-in-care-in-loc-de-1-8-mld-euro-am-fi-luat-10-mld-euro-bani-europeni-10257897
Dootz, R. (2000). Statistics assisted by SAS software, 165-170. Sibiu: TipotribPress.
Economist, T. (2012). The next crisis, Sponging boomers- The economic legacy left by thebaby-boomers is leading to a battle between generations. The Economist PublishingHouse
European Commission. (2008). Demography Report.European Economic and Social Committee. (2011, July 7). Press Release no
77/2011. http://populatiaromanieiincotro.unfpa.ro/demografic. (n.d.).Retrieved from populatiaromanieiincotro.unfpa.ro.
EUROSTAT Statistical Books. (2012). Active ageing and solidarity betweengenerations.
Hyman, D. N. (2007). Public Finance. (N. C. University, Ed.) The Dryden Press.Lee, R. (2005). Quantifying our ignorance: stochastic forecast of
population and public budgets. In L. Waite, Aging, Health, and public policy-demographic and economic perspectives (pp. 172-173), New York.
Mcmorrow, K., & Roeger, W. (2010). The economic consequences of aging population, acomparison of the EU, US and Japan, 65- 68.
Paul, A. (2012). Economic dependency ratio has worsened.
Roubini. (2012). www.roubini.com. Retrieved may 10, 2012, fromwww.roubini.com: http://roubini.com
Ruggeri Joe, Z. Y. (2010). The fiscal burden of rising dependency ratios, 192-195.http://dx.doi.org/10.1007%2Fs11113-007-9027-8
Spataro L. R. T. (2012). Optimal taxation, critical-level utilitarianism and economic growth,12. http://dx.doi.org/10.1016%2Fj.jpubeco.2012.05.001
Suzman, R. (2005). Research on Population Aging at NIA: Retrospect andProspect. In L. Waite, Aging, health, and public policy, 239-241), New York.
Türk, J. W. (2011). “Dependency Ratio Calculator” Simulation tool for theinterraction between demography, pensions, and the labor market. OECDSeries, 13.
Vermeend, R. V. (2008). Taxes and the economy: a survey on the impact of taxes on growth,employment, investment, consumption and the environment, 54-55. Edgar Publisher.
Wise, D. (2005). Social security provisions and older workers. In L. Waite,Aging, Health, and public policy- demographic and economic perspectives, 185-186. NewYork.
www.econtext.ro. (2012). Retrieved 2012, from www.econtext.ro.www.investorwords.com/1409/dependency_ratio. (n.d.). Retrieved may 13,
230

www.ccsenet.org/ijefInternational Journal of Economics and Finance Vol. 4, No. 12;2012
2012, from www.investorwords.com:http://www.investorwords.com/1409/dependency_ratio
NotesNote 1. The prognoses are done taking into consideration the current trend.Just as history has shown before, sociologists have done prognosis whichhad significant errors due to the significant change of this trend, and thelong term prognoses (40-50 years) have a high uncertainty degree.
231
Copyright © 2022 FDOKUMEN