Digital Value Dependency Framework for Digital Transformation
13
Digital Value Dependency Framework for Digital Transformation Suthamathy Sathananthan 1 , Dennis Gamrad 1 and Johanna Myrzik 2 1 Digital Solutions & Operations, Evonik Technology & Infrastructure GmbH, Essen, Germany 2 Institute for Automation Technology, University Bremen, Bremen, Germany Keywords: Digital Transformation, Business Value, Dependency, Digitalization, Benefits, Business Model, Framework, Value Network. Abstract: Knowing there is considerable value in digitalization, enterprises have started to transform their operations utilizing digital technologies. However, current methods used in estimating benefits are methods typically used in capital budgeting projects which do not consider the value interdependencies or uncertainties from digitalization into account. Therefore, a standardized yet comprehensive framework and a mathematical model have been developed to estimate and measure potential from digitalization. The framework and model together were applied in an industrial digital project where results show overall value of the project based on economic and qualitatively measured impacts, and value contribution of transformational elements such as technologies and organizational changes. The results have been used to form value networks which demonstrate shared values between multiple digital projects with respect to digital capabilities. These results bring transparency across projects for informed decision making and support in data-driven business model innovation. 1 INTRODUCTION According to World Economic Forum’s 2016 report on digital transformation across industries, upward of $100 Trillion potential value was estimated for industries and society combined for the next ten years (World Economic Forum, 2016). Such large potentials are believed on a very abstract level to be conceivable, but many industries have not tapped into the full potential yet. Due to the uncertainties that come with fast changing technologies, industries, especially non-digital industries, which earn majority of their profit through selling non-digital products or services, are very slow in actively adapting to these changes. Although many companies understand that they must move quickly to stay in the market and be competitive, the volatile nature of digital technology landscape makes it hard for them to decide if certain technologies can bring the potential they promise to deliver. For example, Industrial-Internet-of-Things (IIoT) platforms play an important role in automatization of production plants and in enabling flexible digitalization across businesses. In order to adapt to such platforms, brown-field plants must change their system landscape completely which requires a lot of commitment and trust financially. However, the value potential from such platforms are not completely transparent so are the costs and risks associated with it. Therefore, only small-scale projects are being done to test these technologies so that the financial commitment is also low. In order to estimate value from digital projects, many companies rely on market research reports which can be very different from industry to industry therefore susceptible to over or under estimation. The lack of common and concrete methodology to estimate potentials makes it even harder for companies to be agile. The value from digital products or solutions are attained through a complex network of value interdependencies, and these networks must be described in a formal way to be able to understand potentials from different projects. Therefore, value estimation in the digital era should look beyond single project and give the possibility to see value networks among different projects such that benefits and costs sharing can be planned and managed. There exists no standard methodology to assist business developers and project managers to formalize particularly potentials from digitalization in a comprehensive manner. Sathananthan, S., Gamrad, D. and Myrzik, J. Digital Value Dependency Framework for Digital Transformation. DOI: 10.5220/0009316106430655 In Proceedings of the 22nd International Conference on Enterprise Information Systems (ICEIS 2020) - Volume 2, pages 643-655 ISBN: 978-989-758-423-7 Copyright c 2020 by SCITEPRESS – Science and Technology Publications, Lda. All rights reserved 643
-
Upload
khangminh22 -
Category
Documents
-
view
0 -
download
0
Transcript of Digital Value Dependency Framework for Digital Transformation
Digital Value Dependency Framework for Digital Transformation
Suthamathy Sathananthan1, Dennis Gamrad1 and Johanna Myrzik2
1Digital Solutions & Operations, Evonik Technology & Infrastructure GmbH, Essen, Germany 2Institute for Automation Technology, University Bremen, Bremen, Germany
Keywords: Digital Transformation, Business Value, Dependency, Digitalization, Benefits, Business Model, Framework, Value Network.
Abstract: Knowing there is considerable value in digitalization, enterprises have started to transform their operations utilizing digital technologies. However, current methods used in estimating benefits are methods typically used in capital budgeting projects which do not consider the value interdependencies or uncertainties from digitalization into account. Therefore, a standardized yet comprehensive framework and a mathematical model have been developed to estimate and measure potential from digitalization. The framework and model together were applied in an industrial digital project where results show overall value of the project based on economic and qualitatively measured impacts, and value contribution of transformational elements such as technologies and organizational changes. The results have been used to form value networks which demonstrate shared values between multiple digital projects with respect to digital capabilities. These results bring transparency across projects for informed decision making and support in data-driven business model innovation.
1 INTRODUCTION
According to World Economic Forum’s 2016 report on digital transformation across industries, upward of $100 Trillion potential value was estimated for industries and society combined for the next ten years (World Economic Forum, 2016). Such large potentials are believed on a very abstract level to be conceivable, but many industries have not tapped into the full potential yet. Due to the uncertainties that come with fast changing technologies, industries, especially non-digital industries, which earn majority of their profit through selling non-digital products or services, are very slow in actively adapting to these changes.
Although many companies understand that they must move quickly to stay in the market and be competitive, the volatile nature of digital technology landscape makes it hard for them to decide if certain technologies can bring the potential they promise to deliver. For example, Industrial-Internet-of-Things (IIoT) platforms play an important role in automatization of production plants and in enabling flexible digitalization across businesses. In order to adapt to such platforms, brown-field plants must change their system landscape completely which
requires a lot of commitment and trust financially. However, the value potential from such platforms are not completely transparent so are the costs and risks associated with it. Therefore, only small-scale projects are being done to test these technologies so that the financial commitment is also low.
In order to estimate value from digital projects, many companies rely on market research reports which can be very different from industry to industry therefore susceptible to over or under estimation. The lack of common and concrete methodology to estimate potentials makes it even harder for companies to be agile.
The value from digital products or solutions are attained through a complex network of value interdependencies, and these networks must be described in a formal way to be able to understand potentials from different projects. Therefore, value estimation in the digital era should look beyond single project and give the possibility to see value networks among different projects such that benefits and costs sharing can be planned and managed. There exists no standard methodology to assist business developers and project managers to formalize particularly potentials from digitalization in a comprehensive manner.
Sathananthan, S., Gamrad, D. and Myrzik, J.Digital Value Dependency Framework for Digital Transformation.DOI: 10.5220/0009316106430655In Proceedings of the 22nd International Conference on Enterprise Information Systems (ICEIS 2020) - Volume 2, pages 643-655ISBN: 978-989-758-423-7Copyright c© 2020 by SCITEPRESS – Science and Technology Publications, Lda. All rights reserved
643

As described by Okhrimenko, 2019, digitalization is a complex process where scientific approaches in terms generalization and systemization are needed to simplify and understand the process in many industries and public sectors. As part of this study a standardized digital value dependency framework has been developed based on proven methodologies such as benefit dependency mapping and empirical findings of digitalization projects where digital capabilities and organizational changes were generalized. The framework and the model presented allow the estimation of benefits from digital projects in a systematic way and the network results that are digitally stored therefore giving the possibility to compare and understand value networks between different digital projects.
In the following sections, background on existing methods has been elaborated. Then the redefined BDN for digitalization called, Digital Value Dependency framework is introduced where each column in the framework is described in detail, then the procedure for using the framework is explained which is followed by the introduction to mathematical model. Finally, practical usage of the framework in industrial setting has been demonstrated with an example.
2 BACKGROUND
Benefit management has a strategic importance for companies where the ability to create above-normal value can lead organizations to sustainable competitive advantage (Gomes & Romão, 2014). Systematically planning and managing benefits especially from new technologies can be a very demanding task. In order to estimate benefits in general, organizations use different methods starting from referring to market research reports to using tools or techniques. One such tool is Benefit Dependency Network (BDN) that was first introduced in 1996 by Ward et al. in order to bring business objectives, benefits and Information System (IS)/Information Technology (IT) changes to realize those benefits together (Ward et al., 1996). Although there has many adaptation since, the most used BDN has five steps: IS/IT enablers, enabling changes, business changes, business benefits and investment objectives (Ward & Daniel, 2006).
The framework is completed either from right to left, starting from investment objectives to IS/IT enablers or from left to right (Chaves & Pedron, 2015). The most important aspect of this tool is that it brings enablers and changes together which guide in
estimating the benefits from those changes. For example, the organization will operate the same way when there are no changes and no additional benefits could be realized, but when changes are introduced or identified then estimating benefits from those changes are unpretentious. While utilizing this mapping tool, project owners brainstorm enablers and changes specific to their project and put them as the elements of the steps.
Although this activity supports the planning of individual projects, it lacks in two ways to make use of it in digital transformational projects. One is that every user defines their own enablers, changes and benefits within the tool to understand their potential outcomes, therefore results of the mappings from many projects cannot be compared for strategic planning of digital transformation because each mapping’s entries will be completely different from the other. Second is that although the steps help logically identify benefits, the network outcome itself are not stored or measured for better utilization of the results. In digital transformation however, digital projects show value interdependencies where benefits and costs are shared among digital projects and/or users of the end solution. Also, certain technologies, capabilities or organizational changes are more important than others in realizing the value, but currently there are no measurement system integrated into the BDN to understand and assess value contribution of these elements of a resulting network. Being able to measure how much value each technology, capability or organizational change contribute to the projects can help in prioritizing and managing them effectively. In order to easily compare, the dependency framework used in digital projects should have some consistency in its entries, and the resulting networks should have a measurement system and model so that the network elements can be measured and analysed.
Therefore, in this work these two points are addressed by redefining benefit dependency network suitable for digital transformation projects through generalizing elements in the framework that are specific for digitalization, and a web-tool and a mathematical model have been developed to store the estimated dependencies and then the value contributions of elements are analysed through the model. This framework not only helps individual projects to estimate benefits logically, but it also helps in strategic planning of digital transformation where resulting value networks from multiple projects can be compared and analysed.
ICEIS 2020 - 22nd International Conference on Enterprise Information Systems
644
3 DIGITAL VALUE DEPENDENCY FRAMEWORK
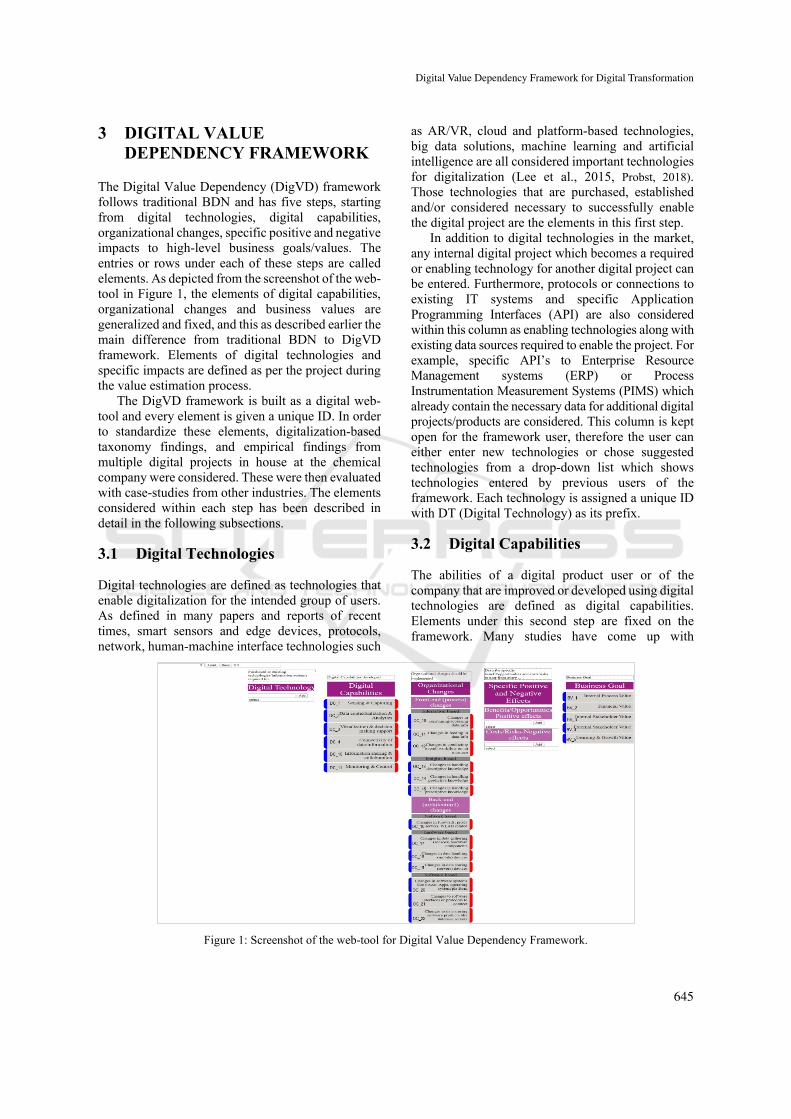
The Digital Value Dependency (DigVD) framework follows traditional BDN and has five steps, starting from digital technologies, digital capabilities, organizational changes, specific positive and negative impacts to high-level business goals/values. The entries or rows under each of these steps are called elements. As depicted from the screenshot of the web-tool in Figure 1, the elements of digital capabilities, organizational changes and business values are generalized and fixed, and this as described earlier the main difference from traditional BDN to DigVD framework. Elements of digital technologies and specific impacts are defined as per the project during the value estimation process.
The DigVD framework is built as a digital web-tool and every element is given a unique ID. In order to standardize these elements, digitalization-based taxonomy findings, and empirical findings from multiple digital projects in house at the chemical company were considered. These were then evaluated with case-studies from other industries. The elements considered within each step has been described in detail in the following subsections.
3.1 Digital Technologies
Digital technologies are defined as technologies that enable digitalization for the intended group of users. As defined in many papers and reports of recent times, smart sensors and edge devices, protocols, network, human-machine interface technologies such
as AR/VR, cloud and platform-based technologies, big data solutions, machine learning and artificial intelligence are all considered important technologies for digitalization (Lee et al., 2015, Probst, 2018). Those technologies that are purchased, established and/or considered necessary to successfully enable the digital project are the elements in this first step.
In addition to digital technologies in the market, any internal digital project which becomes a required or enabling technology for another digital project can be entered. Furthermore, protocols or connections to existing IT systems and specific Application Programming Interfaces (API) are also considered within this column as enabling technologies along with existing data sources required to enable the project. For example, specific API’s to Enterprise Resource Management systems (ERP) or Process Instrumentation Measurement Systems (PIMS) which already contain the necessary data for additional digital projects/products are considered. This column is kept open for the framework user, therefore the user can either enter new technologies or chose suggested technologies from a drop-down list which shows technologies entered by previous users of the framework. Each technology is assigned a unique ID with DT (Digital Technology) as its prefix.
3.2 Digital Capabilities
The abilities of a digital product user or of the company that are improved or developed using digital technologies are defined as digital capabilities. Elements under this second step are fixed on the framework. Many studies have come up with
Figure 1: Screenshot of the web-tool for Digital Value Dependency Framework.
Digital Value Dependency Framework for Digital Transformation
645
taxonomies or classifications of digital capabilities based on current and commonly considered digital technologies (Freitas Junior et al., 2016; Lenka et al., 2017; Cenamor et al., 2017; Rizk et al., 2018). These classifications from various findings were consolidated, and taxonomy-based research process was applied to classify them into appropriate categories and verified with their fit to existing projects.
According to this analysis and as illustrated on Figure 1, Sensing & capturing, Connectivity of data & information, Data contextualization & analytics, Information sharing & collaboration, Visualization & decisiveness, and Monitoring & control are capabilities distinctively defined as abilities developed or improved with current digital technologies. ‘Sensing & capturing’ is the ability to sense and capture the digital information where technologies like sensors and edge devices are used in realizing this capability. Secondly, ‘connectivity’ is defined as the ability to connect various data and information where the source of the data, interfaces, platforms, and cloud technologies are all considered in enabling this capability. ‘Data contextualization & analytics’ is defined as the capability to make sense of the connected data and information by structuring and analysing them, with the use of digital technologies such as data engineering tools, data modelling, databases, basic analytics and big data analytics.
The ‘Information sharing & collaboration’ is the ability to share information enabling the ability to work together using technologies such as mail clients, notifications, social media or other network related technologies specifically established for the product in consideration. Next is ‘Visualization & decision-making support’ and this capability allows the digital product user to visualize the data, information and knowledge with the use of dashboard technologies and events-based suggestions and alerts are integrated where decision making ability of the user has been made easy. Finally, the ‘Monitoring & control’ capability is defined as the ability to monitor and directly control the outcome through the product itself and alter the outcome, where the control function can be either fully automatically or semi-automatically embedded into product. These predefined elements on the digital capability step are given unique ID’s with DC as their prefixes.
3.3 Organizational Changes
Organizational changes are listed on the third step, where elements are fixed and categorized based on
empirical findings from in house digital projects, which were categorized based on taxonomy research methods and verified with findings in other studies (Mikusz, 2014; Cenamor et al., 2017; Gerber et al., 2017; Westermann & Dumitrescu, 2018). What changes will be influenced by the capabilities of the product to the organization on the frontend and on the backend during and after the implementation are defined as the elements as shown in Figure 1.
From these findings, it was evident that processes or workflows in an organization are changed primarily by digitalization in two ways. Firstly, certain processes are changed due to user’s direct interaction with data on the physical level using digital devices. Within this interaction-based changes there are three elements. 1. Changes in terms of consuming data and information, which means the user can now consume data from different sources easily therefore the current frontend process has to be changed. 2. Changes with regards to feeding in raw data and information. This means, user is now able to input data directly, for example instead of writing on a paper the user inputs the data into a digitally readable format which changes the current workflow. 3. Changes related to completing a workflow that does not have to do with consuming or feeding in data, but conducting the overall process with the use of digital devices. This means, with a digital tool/application extended work processes are changed and/or simplified.
Secondly, within the process related changes, the new knowledge and insights that are derived from raw data change the existing processes, where those insights from data help the user on an intellectual level. The elements within this category are separated by the type of insights possible with data. As mentioned in number of taxonomy-based studies, there are three types of insights possible and they are descriptive, predictive and prescriptive (Rizk et al., 2018). Descriptive insights are related to historical knowledge and reveals to the user what has happened in the past, changing the workflow to accommodate this new knowledge. Predictive insights are knowledge related to what will happen in the future, which can also change the existing process to accommodate the new predictive knowledge. Lastly, the prescriptive insights are knowledge about what should be done about something where it can also change the ways the current workflow is completed. When these types of insights are given to the user the current front-end processes must account for some changes and therefore considered within the frontend process related changes.
ICEIS 2020 - 22nd International Conference on Enterprise Information Systems
646

The second part of organizational changes are the backend architectural changes within its current infrastructure and system level which act as the backbone for frontend processes to take place. Under this category, three levels are identified. Network based changes, hardware-based changes and finally software-based changes. Within network-based changes, any changes in firewalls, proxy, and WLAN are considered together as one element. Under the hardware-based changes category, it has been split into three parts based on data gathering, data handling and data storing hardware. Changes in data gathering hardware components would be sensors and actuators, changes in data handling devices would be mobile devices, and changes in data storing devices would be server related hardware components. Within the software-based changes category, there are three elements, which are grouped based on the level of coding/programming would be required. First, changes with respect to software-as-a-service (SAAS) components or applications, platforms and operating system are grouped into one element as they all belong to system related software. Second element is software interfaces or protocols which are required to connect other data sources or systems. Third element is changes relevant to software within data storing servers. These fixed elements of the organizational changes step are given unique ID’s starting with OC as their prefixes.
3.4 Specific Impacts
The fourth step is to identify specific impacts or effects from the project due to the organizational changes identified in previous step. These impacts are estimated for the company through the product user perspective that is being considered. Impacts in this case are defined as any influence on a business’s values. These impacts could be positively or negatively influencing the business values. Therefore, this step is separated into positive impacts and negative impacts. Within positive impacts all financial or economically measurable benefits as well as soft or qualitative benefits and opportunities which are not measurable in economic terms are considered. Within the negative impacts, all financial or economically measurable costs and soft or qualitative costs and risks that are not economically defined are considered. This step is kept open therefore the framework user only enters specific benefits and costs of the digital product being evaluated. Every element in the impact step is also stored by unique IDs, with prefixes SI1 and SI2 for specific benefits and costs respectively.
3.5 Business Goals/Values
Business Goals/Values are defined as the high-level value categories that are important for the business. Based on the various benefits and costs from digital projects, five categories of business values are derived for this framework. These goals could be uniquely defined for each company’s own set of goals, but the goals here are more generically defined to be able to classify highly relevant impacts of digitalization. Mostly considered business value categories in BDN networks such as profitability, productivity and customer value were examined but certain impacts which could not be directly linked to these three major categories but have been rated as equally important by businesses, were grouped under two additional categories.
As part of the framework, profitability, producti-vity and customer value are listed as Financial Value, Internal Process Value and External Stakeholder Value respectively. Any specific impact that affects the return on investment, profit, revenue or costs and can be measurable in economic terms are linked to the Financial Value element. All other impacts that are not measurable in economic terms are connected to one of the other four business value categories and a qualitative impact level is chosen. Specific impacts relating to internal processes such as operations and administration processes or productivity improvement and efficiency gains or loss in the processes that are not measurable in economic terms are connected to Internal Process Value element. External stakeholder’s value which are not yet measurable in economic terms such as customer satisfaction is connected to External Stakeholder Value element.
Although every impact in a business hypothetically linked to Financial, Internal Process or External Stakeholder there are certain benefits from digitalization that can be classified into other categories due to uncertainty in when they will start impacting economically and some impacts’ qualitative nature in general. For example, safety is paramount in many industries. Digitalization plays an important role in enhancing safety value by allowing real-time sensing/monitoring of unsafe conditions and allowing businesses to act fast to avoid catastrophic incidents from occurring altogether. Such values are indirectly related to avoidance of losing productivity therefore profit, from which the safety impact can be economically measured. However, there is uncertainty to account for in this case, where ‘if and when’ the risk event is avoided should be considered in the benefit calculation and
Digital Value Dependency Framework for Digital Transformation
647

can be hard to estimate. Another way to look at this would be, it improves the safe operation of plants, therefore provides safe working conditions for employees. Therefore, such impact with a qualitative nature should be estimated as well. Similarly, employee satisfaction is one of the main benefits of digitalization where workflows are improved through digital products and such benefits are significantly important for businesses’ sustainability.
Although these impacts can indirectly influence the productivity of the business, it would not always be possible to translate it into an economic value due to its inherent qualitative nature. Such specific impacts have significant importance to the business and directly related to internal stakeholders, but when they cannot be economically defined just yet they should be connected to a category that relates to the internal stakeholders. Therefore, Internal Stakeholder Value has been introduced.
Furthermore, digitalization offers opportunities for growth and be innovative, which in the long run improves financial value. It is however not possible at early stages to predict with accuracy how much benefit such innovation related impacts will bring. For example, initiatives to deliver new digital tools, new ways of working or providing training using digital technologies such as AR, increase the learning and put the organization in the growth path.
Such futuristic impacts can be qualitatively described but they would not fit into the currently defined categories of business goals. Therefore, in order to classify innovation related impacts, Learning and Growth Value has been introduced. Each element in this step has a unique ID, indicated by FV, IPV, ESV, ISV and LGV for Financial Value, Internal Process Value, External Stakeholder Value, Internal Stakeholder Value, and Learning and Growth Value respectively as in Figure 1.
3.6 Procedure
The owner of a digital product/project and its stakeholders are the intended users of the DigVD
framework which helps them systematically determine the impacts of their digital product before development starts. A facilitator who is trained on the framework can conduct the estimation process in a one-on-one interview basis, when the product owner can estimate benefits and costs from all stakeholders’ perspectives. Otherwise, it can also be conducted as a facilitated workshop where product owner and stakeholders of the digital product/project are involved. The framework has been developed as a digital web-tool and this tool has been directly used in this estimation process. The results are saved in the database of the tool, such that the dependencies and elements can be queried and analyzed later.
At the beginning, the product owner identifies unique user groups in order to capture impacts from all user perspectives. User-groups here are the type of users of the digital product being developed. First, one user-perspective is chosen, then the framework elements are connected from left to right according to Figure 1, and the steps described in Figure 2 are followed.
In this process, mutually exclusive positive and negative impacts are considered and described, and these impacts are then connected to most fitting business goals. When this connection is established, the estimation of the impact must be entered. When an impact can be economically measurable, it will be connected to the Financial Value category and a calculated monetary value is entered together with an estimated probability percentage. When it is not possible to estimate an economic value the product owner estimates the impact qualitatively from a 5 level ratings from ‘Insignificant’ to ‘Extremely significant’, and the selected qualitative impact level is then converted to a score as described in section 3.7.1.
These steps are then repeated for every user perspective defined earlier for the digital project in question, and the results are saved and analyzed. When every element on the left-side step is connected to an element on the right-side step, user has the option to enter the influence weightage (defined
Figure 2: Dependency mapping procedure.
ICEIS 2020 - 22nd International Conference on Enterprise Information Systems
648

in Section 3.7.3) on the edge, otherwise it will be assumed to be equally influencing the adjacent element during analysis.
3.7 Mathematical Model
In order to measure and estimate the value contribution of every element in a network, a mathematical model has been developed and the terms, variables and equations used in the measurement system are explained in this section. Although the specific impact is estimated, this value gets passed onto and distributed to all elements that are connected on its left. Figure 6 summarizes the variables and equations used when the value of a successive element on the right side gets passed onto the predecessor element.
3.7.1 Value Weight of Specific Impact
Value Weight (VW) is defined as the measurable quantity of the impact. There are two types of value weights based on whether the impact’s economic value is measurable or can only be defined qualitatively. Economically measurable impacts are estimated for its corresponding economic value in euros and a probability (%) of occurrence is also entered. The qualitative impacts are based on ordinal levels where the significance of impact is selected along with a probability of occurrence. Impact levels are insignificant, minor, moderate, major and significant which range from 1 to 5 for positive impacts and -1 to -5 for negative impacts. Probability of occurrence starts from rare to very likely with 10% to 90% rating. Then using impact-probability matrix an impact score is given for every impact.
Therefore, an economic value or qualitative score, represented by € and Q respectively is stored for each impact. The positive and negative impacts are stored separately as well. Therefore, there are four types of value weights are possible, where positive impacts are stored as €+ and Q+, and negative impacts are stored as €- and Q-. Value Weights are specified by impact IDs on the subscript (i and j indicating elements within categories) and value weight types on superscript as below: 𝑉𝑊€ > 0 , 𝑉𝑊€ < 0 Economic Impacts 𝑉𝑊 > 0 , 𝑉𝑊 < 0 Qualitative Impacts
3.7.2 Value Weight of Business Value
Since only the economically measured impacts are connected to Financial Value (FV) category, all economic benefits (€+) and costs (€-) are summed up and positive and negative impacts are saved separately. On the other hand, those impacts that are not measured economically, gets a qualitative score as explained in previous section and these qualitative impact scores are connected to one of the qualitative business value categories (IPV, LGV, ISV, ESV) which are then averaged to estimate the overall qualitative impact of every business value category, as shown for IPV in (2).
Economic: 𝑉𝑊€ = ∑ (𝑉𝑊 →€ ) (1)
Qualitative Impact:
(2)
3.7.3 Influence Weightage
Influence weightage (µ) is defined as how much a predecessor element influences the successive element’s value. This weightage is either defined by the user by estimating the percentage of influence directly when edges are drawn, or calculated afterwards based on how many edges connect to a successive element, where every undefined edge that connects to the successor element is assumed equally influential as follows:
(3)
EWpi->sj = VWsi * µpi->sj (4)
The value weights of predecessor-elements (VWpi) are calculated by summing up every edge weight going from the predecessor element as follow.
VWpi = ∑ 𝐸𝑊 (j: successive elements dependent on pi) (5)
3.7.4 Edge Weight
Edge Weight (EW) is defined as the value weight of the edge from a predecessor element to a successive element. Using µ and VW of successive element, the Edge Weight is calculated as below. Since the VW of impacts are the starting point, VWsj=VWB.
Digital Value Dependency Framework for Digital Transformation
649

3.7.5 Value Weights of Step 3, 2, 1’s Elements
Value Weights of the specific impact elements are distributed backwards to other elements in each predecessor step according to edge weights that originated from the predecessor element. This is based on the logic that if predecessor element is influencing a successive element, the value weight of the successive element is distributed to the influencer.
The basic operations have been shown in Figure 3. The equation is applied to each value type separately. For qualitative value types, when scores are summed up to more than 4.5, then the maximum score of 4.5 is assigned to the element, since the score has a limit and that predecessor element has the maximum possible score to influence the successive element.
3.7.6 Value Contribution Fraction
Value Contribution Fraction (VCF) is defined as an element’s contribution percentage to the total value of
the project and calculated as follows:
VCFpi = VWpi/(Total VW of Project per value type) (6)
Similar to value weights, there will be four value contribution fractions to each element representing each value types of €+, €-, Q+, and Q-.
3.7.7 Value Share
Value Share (δ) is defined as how much importance the product owner estimates the economic impacts vs. qualitative impacts towards the project, where δ€+ + δQ+
= 100 and δ€-+ δQ-=100. If both economic and qualitative value types are equally important then it will be 50:50. Additionally, if total value weight of an impact type is zero then the other value type’s share becomes 100. (ie: = 0), then, δQ- = 0 and δ€- = 100.
3.7.8 Normalized Contribution
Normalized contribution (η) is the contribution of both economic value and qualitative score for every element per positive and negative impact. Since economic value and qualitative scores are on two different scales, they are both combined using the Value Share and Value Contribution Fractions for positive and negative impacts.
𝑉𝐶𝐹€ ∗ € 𝑉𝐶𝐹 ∗ (7)
𝑉𝐶𝐹€ ∗ € 𝑉𝐶𝐹 ∗ (8)
4 APPLICATION
4.1 Digital Project
In order to illustrate the applicability of the framework, a typical industrial digital project has been chosen. This is a test digital project within energy management for industrial plants. Among many user groups, a specific group of managers are expected to benefit the most from such a solution, therefore the results are only presented for this user group’s perspective in this paper. The network outcome from the framework mapping is shown in Figure 4 as a Sankey diagram.
Digital Capabilities, Org. Changes and Business Values had fixed elements as described in section 3.2, 3.3 and 3.5 respectively. The Digital technologies and Specific Impacts steps were left open and 13 digital technologies, 9 benefits and 3 costs were identified by following the process described in Section 3.6. The thickness of the links indicates the influence weightage % (µ) used in the calculation of edge weights (EW) of each link and therefore the value weights (VW) of elements.
Figure 3: Value Weight calculation of elements in steps OC, DC and DT.
ICEIS 2020 - 22nd International Conference on Enterprise Information Systems
650

Figure 4: DigVD network result for applied project.
Several digital technologies being considered for this project but on the network only their IDs are presented with respect to how it is saved in the tool’s database. These technologies ranged from smart devices, an application development environment, connectors to existing IT systems, interface protocols, an integration platform, databases, to data engineering and analytics technologies. The nine benefits are also specified on the network by their IDs and ranged from reducing process times, saving costs due to having quick access to data, better efficiency management, to employees and external stakeholder satisfactions due to the consolidation of data. Among the nine identified benefits, 3 are economic benefits (€+) and 6 are qualitative benefits (Q+). The user group not only makes use of the product, it also pays for the solution. Therefore, in terms of negative impacts 3 costs elements were identified which were all economic costs (€-) related to technology purchases and maintenance of the solution.
Furthermore, other industrial test projects from supply chain and site management are brought in to illustrate user group specific results and multi projects analysis possibilities of common elements.
This approach has helped in estimating actual impacts in terms of economic and qualitative values from the intended projects. However, on this paper, for publication consideration instead of their true economic values, the impacts and VW’s are represented as low to very high levels so that results from the framework can be illustrated.
4.2 Results and Discussion
From the estimated impacts, business values that are influenced with positive and negative impacts are identified according to their VWs (Figure 5). It becomes evident that in terms of economic impacts close to a very high-level benefits are estimated, and less than 25% of the estimated benefits has been estimated as costs. Furthermore, the estimation process with the tool enabled identification and recording of impacts which cannot be readily measurable in economic terms. In terms of such qualitative impacts, External Stakeholder Value, Internal Process Value, and Learning & Growth Value categories will be expected to have positive impacts, where the averages for each value has been calculated to be 1.9, 2.40, and 2.15 respectively out of maximum score of 4.5 that is possible with highest impact and highest probability. There were no negative qualitative impacts identified. Although the estimation is only for one year, when positive and negative value weights of Financial Value are added, the net is positive, indicating a positive turnover for the project. In addition, overall positive qualitative impact scores in the other three business values also hint that the project has an overall benefit to the business.
Now the importance of other elements such as organizational changes and digital capabilities of the dependency network with respect to the measured impacts have been calculated using the formulas in section 3.7. The economic value distribution across all organizational changes has been presented in Figure 6, and each change element’s benefit and cost
Digital Value Dependency Framework for Digital Transformation
651
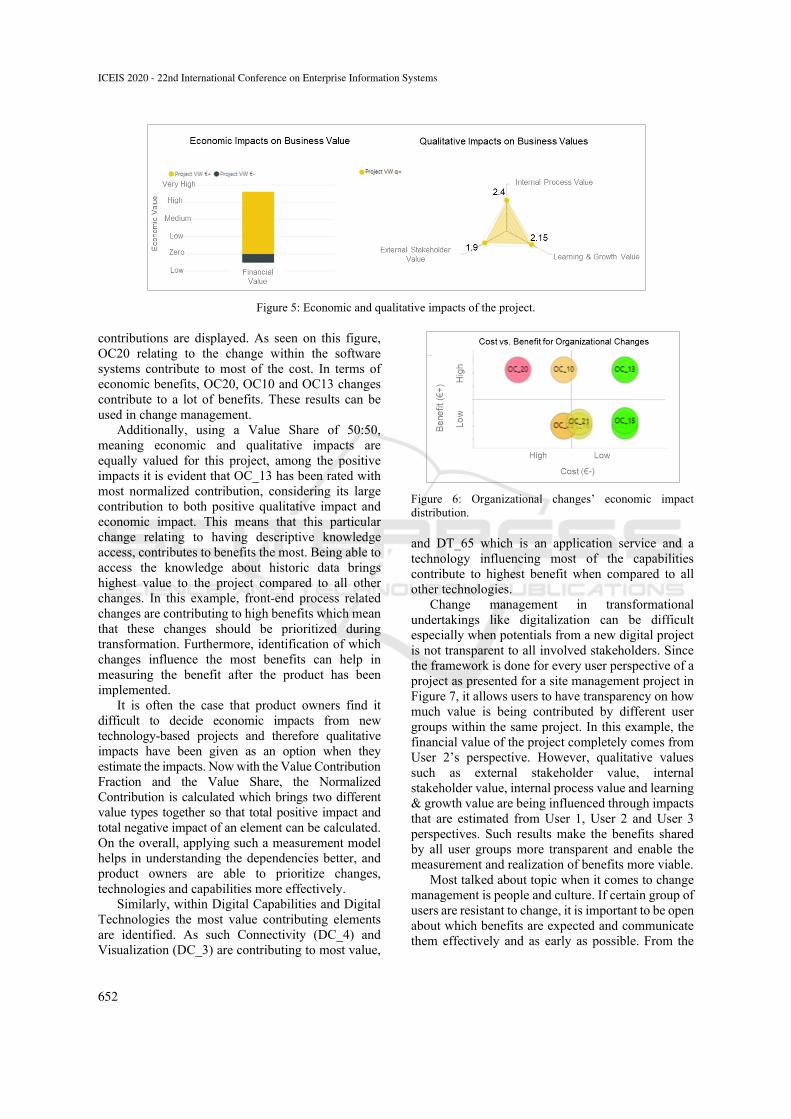
Figure 5: Economic and qualitative impacts of the project.
contributions are displayed. As seen on this figure, OC20 relating to the change within the software systems contribute to most of the cost. In terms of economic benefits, OC20, OC10 and OC13 changes contribute to a lot of benefits. These results can be used in change management.
Additionally, using a Value Share of 50:50, meaning economic and qualitative impacts are equally valued for this project, among the positive impacts it is evident that OC_13 has been rated with most normalized contribution, considering its large contribution to both positive qualitative impact and economic impact. This means that this particular change relating to having descriptive knowledge access, contributes to benefits the most. Being able to access the knowledge about historic data brings highest value to the project compared to all other changes. In this example, front-end process related changes are contributing to high benefits which mean that these changes should be prioritized during transformation. Furthermore, identification of which changes influence the most benefits can help in measuring the benefit after the product has been implemented.
It is often the case that product owners find it difficult to decide economic impacts from new technology-based projects and therefore qualitative impacts have been given as an option when they estimate the impacts. Now with the Value Contribution Fraction and the Value Share, the Normalized Contribution is calculated which brings two different value types together so that total positive impact and total negative impact of an element can be calculated. On the overall, applying such a measurement model helps in understanding the dependencies better, and product owners are able to prioritize changes, technologies and capabilities more effectively.
Similarly, within Digital Capabilities and Digital Technologies the most value contributing elements are identified. As such Connectivity (DC_4) and Visualization (DC_3) are contributing to most value,
Figure 6: Organizational changes’ economic impact distribution.
and DT_65 which is an application service and a technology influencing most of the capabilities contribute to highest benefit when compared to all other technologies.
Change management in transformational undertakings like digitalization can be difficult especially when potentials from a new digital project is not transparent to all involved stakeholders. Since the framework is done for every user perspective of a project as presented for a site management project in Figure 7, it allows users to have transparency on how much value is being contributed by different user groups within the same project. In this example, the financial value of the project completely comes from User 2’s perspective. However, qualitative values such as external stakeholder value, internal stakeholder value, internal process value and learning & growth value are being influenced through impacts that are estimated from User 1, User 2 and User 3 perspectives. Such results make the benefits shared by all user groups more transparent and enable the measurement and realization of benefits more viable.
Most talked about topic when it comes to change management is people and culture. If certain group of users are resistant to change, it is important to be open about which benefits are expected and communicate them effectively and as early as possible. From the
ICEIS 2020 - 22nd International Conference on Enterprise Information Systems
652

Figure 7: Impacts from different user perspectives.
results of DigVD such transparency is achievable. Although any benefit-cost analysis must consider user perspective in general, what is special about applying DigVD approach is that it brings more transparency onto the type of changes, capabilities and technologies utilized by the different user groups so that decisions can be made to maximize benefits based on the dependency results. When the kind of changes required for highest value realization is identified the right training for the specific user group can be decided to realize those dependent benefits in timely manner. Likewise, if benefits are not high from one user group’s perspective compared to other user groups, it can be explained why this is the case from the dependency mapping. Untapped organizational changes that can influence high benefit contribution can be initiated so that additional positive impacts for that user group become possible.
These results show the kind of analysis possible for single projects so that product owners can build business cases and manage project and changes effectively. Additionally, when benefit dependency framework’s results from multiple projects are put together, it brings additional transparency to the overall digital transformation of the business, where the results help in decision making. In this regard, digital capabilities being developed within the business can be brought together like in Figure 8, where benefit and cost from four projects that are influenced by the six digital capabilities’ of a business are displayed. From this, Visualization capability is contributing to high economic value and to high positive qualitative score as well. Following this, connectivity is the next digital capability contributing to high positive impact overall. On the other hand, when these four projects are considered together information sharing capability accounts for the highest cost followed by connectivity capability. From this result, it is also evident that monitoring and control capability has not been associated with values of the four projects yet, where this capability’s contribution to benefits and costs are very low.
Although this representation shows only four projects and not the right representation of the current capabi-lities mapping of the business, such results can tell which capabilities they can potentially invest in future to have a balanced digitalization effort in all areas.
Therefore, the DigVD framework and the model behind it take benefit dependency network to where the estimated outcome can be measured and compared for further understanding of value contribution and the development of business cases driven by data. These results demonstrate project-based analysis is possible where the results can help prioritize transformational changes. Being able to relate the projects values to other elements through value weights, value contribution fraction and normalized contribution open better understanding of how other elements are influencing the project. The framework applicability has been tested with four process industry projects with outcomes showing more impact estimations when it was done with the DigVD than it was done before for similar projects.
As future work, further tests on consistency of the resulting networks between similar projects are to be evaluated. Additionally, influence weightage has been assumed to be equal based on the number of lines connecting to an element so that the methodology can be studied. Since the methodology has been studied with positive outcomes, the actual influence weightages could be included but deciding on these influence weightages is a separate process on itself and must be evaluated together with product owners more extensively. One of the main advantages of this tools is that size of the project is not a limitation. Project that is expected to have a small return to large size projects with expected return in millions of euros can be evaluated. However, the way the tool is currently defined only one-year estimation of impacts is possible. However, how the project performs in the following years are important for product owners and therefore by extending this work and using the results from the current tool, calculation of values over number of years using real option valuation are being investigated.
Digital Value Dependency Framework for Digital Transformation
653
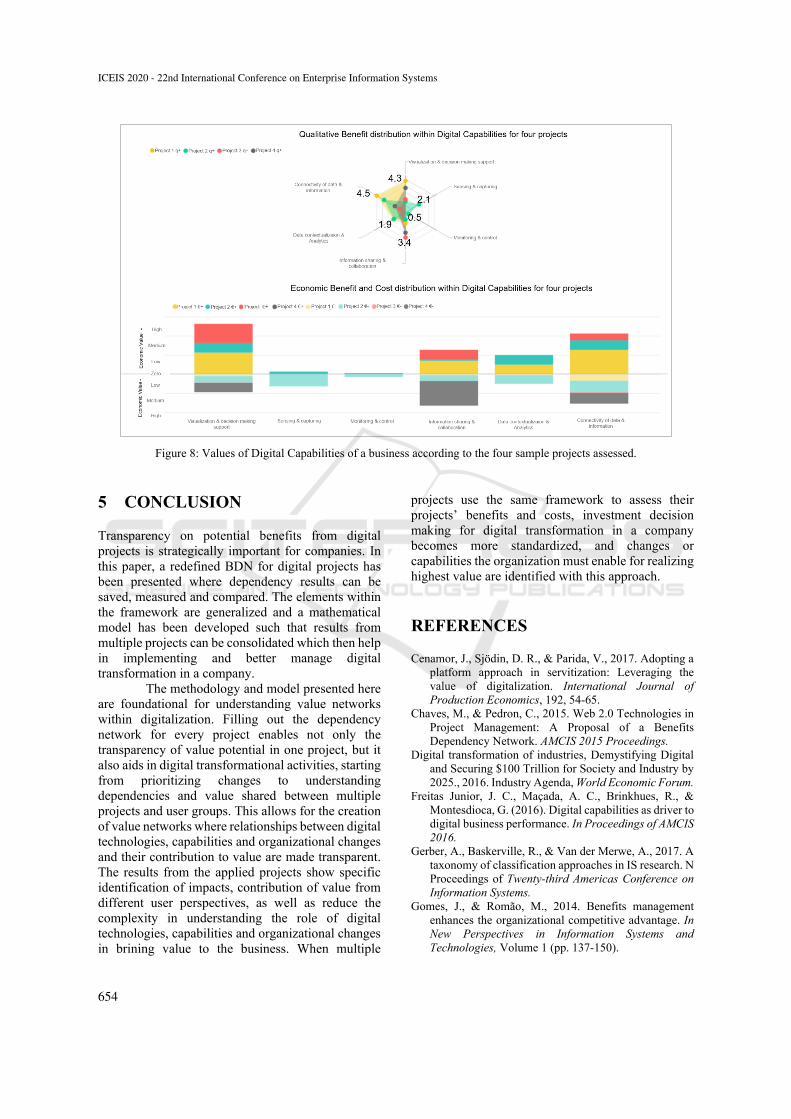
Figure 8: Values of Digital Capabilities of a business according to the four sample projects assessed.
5 CONCLUSION
Transparency on potential benefits from digital projects is strategically important for companies. In this paper, a redefined BDN for digital projects has been presented where dependency results can be saved, measured and compared. The elements within the framework are generalized and a mathematical model has been developed such that results from multiple projects can be consolidated which then help in implementing and better manage digital transformation in a company.
The methodology and model presented here are foundational for understanding value networks within digitalization. Filling out the dependency network for every project enables not only the transparency of value potential in one project, but it also aids in digital transformational activities, starting from prioritizing changes to understanding dependencies and value shared between multiple projects and user groups. This allows for the creation of value networks where relationships between digital technologies, capabilities and organizational changes and their contribution to value are made transparent. The results from the applied projects show specific identification of impacts, contribution of value from different user perspectives, as well as reduce the complexity in understanding the role of digital technologies, capabilities and organizational changes in brining value to the business. When multiple
projects use the same framework to assess their projects’ benefits and costs, investment decision making for digital transformation in a company becomes more standardized, and changes or capabilities the organization must enable for realizing highest value are identified with this approach.
REFERENCES
Cenamor, J., Sjödin, D. R., & Parida, V., 2017. Adopting a platform approach in servitization: Leveraging the value of digitalization. International Journal of Production Economics, 192, 54-65.
Chaves, M., & Pedron, C., 2015. Web 2.0 Technologies in Project Management: A Proposal of a Benefits Dependency Network. AMCIS 2015 Proceedings.
Digital transformation of industries, Demystifying Digital and Securing $100 Trillion for Society and Industry by 2025., 2016. Industry Agenda, World Economic Forum.
Freitas Junior, J. C., Maçada, A. C., Brinkhues, R., & Montesdioca, G. (2016). Digital capabilities as driver to digital business performance. In Proceedings of AMCIS 2016.
Gerber, A., Baskerville, R., & Van der Merwe, A., 2017. A taxonomy of classification approaches in IS research. N Proceedings of Twenty-third Americas Conference on Information Systems.
Gomes, J., & Romão, M., 2014. Benefits management enhances the organizational competitive advantage. In New Perspectives in Information Systems and Technologies, Volume 1 (pp. 137-150).
ICEIS 2020 - 22nd International Conference on Enterprise Information Systems
654

Lee, I., & Lee, K., 2015. The Internet of Things (IoT): Applications, investments, and challenges for enterprises. Business Horizons, 58(4), 431-440.
Lenka, S., Parida, V., & Wincent, J., 2017. Digitalization capabilities as enablers of value co ‐ creation in servitizing firms. Psychology & marketing, 34(1), 92-100.
Okhrimenko, I., Sovik, I., Pyankova, S., & Lukyanova, A., 2019. Digital transformation of the socio-economic system: prospects for digitalization in society. Revista ESPACIOS, 40(38).
Probst, L., Lefebvre. V., Martinez-Diaz. C., 2018. Digital Transformation Scoreboard 2018. EU businesses go digital: Opportunities, outcomes and uptake. Publications Office of the European Union, Luxembourg, DOI, 10(691861), 10-2826.
Mikusz, M., 2014. Towards an understanding of cyber-physical systems as industrial software-product-service systems. Procedia Cirp, 16(1), 385-389.
Rizk, A., Bergvall-Kåreborn, B., & Elragal, A., 2018. Towards a Taxonomy for Data-Driven Digital Services. In Proceedings of the 51st Hawaii International Conference on System Sciences.
Ward, J., Taylor, P., & Bond, P.,1996. Evaluation and realisation of IS/IT benefits: an empirical study of current practice. European Journal of Information Systems, 4(4), 214-225. doi:10.1057/ejis.1996.3
Ward. J, and Daniel. E., 2006. Benefits Management: Delivering Value from IS and IT Investments. John Wiley & Sons.
Westermann, T., & Dumitrescu, R., 2018. Maturity model-based planning of cyber-physical systems in the machinery and plant engineering industry. In DS 92: Proceedings of the DESIGN 2018 15th International Design Conference (pp. 3041-3052).
Digital Value Dependency Framework for Digital Transformation
655