broadcasters adapting to digital transformation in apac
98
BROADCASTERS ADAPTING TO DIGITAL TRANSFORMATION IN APAC December 2020
-
Upload
khangminh22 -
Category
Documents
-
view
6 -
download
0
Transcript of broadcasters adapting to digital transformation in apac

BROADCASTERS ADAPTING TO DIGITAL TRANSFORMATION IN APAC
December 2020

Frontier Economics Ltd is a member of the Frontier Economics network, which consists of two separate companies based in Europe (Frontier
Economics Ltd) and Australia (Frontier Economics Pty Ltd). Both companies are independently owned, and legal commitments entered into by
one company do not impose any obligations on the other company in the network. All views expressed in this document are the views of Frontier
Economics Ltd.

frontier economics
BROADCASTERS ADAPTING TO DIGITAL TRANSFORMATION IN APAC
CONTENTS
Executive Summary 4
1 Introduction 7
2 Trends in consumption and revenues of broadcasters in the APAC region 9 2.1 Introduction 9 2.2 Sector wide changes that have affected the broadcasting sector in APAC 10 2.3 Overall broadcasting sector trends 13 2.4 Trends in TV advertising revenues 18 2.5 Trends in Pay TV 20 2.6 Online video service providers 23 2.7 Profitability of broadcasters 26 2.8 Benchmarking the profitability of APAC broadcasters with other sectors 29 2.9 Analysis of broadcaster profitability 31 2.10 Conclusions and commentary 35
3 Broadcasters adapting to digital transformation 37 3.1 Using digital technologies to broaden content offering to consumers 38 3.2 Using digital technologies to deepen engagement with customers 40 3.3 Adapting their advertising proposition 42 3.4 Diversifying commercial offering 44
4 Regulatory and policy best practice in the broadcasting sector 45 4.1 Introduction 45 4.2 Public policy interventions in broadcasting sectors 45 4.3 Best practice on when to intervene 46 4.4 Examples of best practice in intervention 47 4.5 Conclusion 54
ANNEX A Online video service providers IN APAC 55
ANNEX B FTA broadcasters in APAC 56
ANNEX C Pay TV broadcasters in APAC 57
ANNEX D Measuring profitability 58
ANNEX E Profitability and sector trends by country 59
ANNEX F Case studies of broadcaster profitability 74
ANNEX G Case studies of broadcasters adapting to digital transformation 89

frontier economics 4
BROADCASTERS ADAPTING TO DIGITAL TRANSFORMATION IN APAC
EXECUTIVE SUMMARY
It is common for policy makers around the world to intervene in the broadcasting
sector to achieve cultural, social or economic objectives. In recent years, as online
video service providers (OVSPs) have entered into the video services sector,
traditional broadcasters have sometimes asked Governments and policy makers
to ‘take action’ or ‘intervene’ to try and reduce the claimed negative impacts from
the changing market dynamics. They often characterize these requests as an effort
to ‘level the playing field’—to ensure that OVSPs have the same regulatory
burdens as traditional broadcasters.
With a specific focus on APAC1 nations, Facebook has commissioned Frontier
Economics (Frontier) to assess the competitive interplay between traditional
broadcasters and online video service providers. The aim of our report is to:
1. Assess whether the arrival and growth of online video service providers has
materially affected traditional broadcasters.
2. Identify the factors that policy makers should consider before intervening.
With regards to the first aim, we find no consistent evidence of the growth of
online video service providers negatively affecting traditional broadcasters,
with a number of traditional broadcasters adapting to the challenges arising
from the growth of digital technologies. This suggests that there is no clear
overall case for further government intervention to ‘level the playing field’.
If, however, governments do consider intervening, we suggest a number of
principles they should follow to ensure their action is proportionate, targeted and
beneficial to viewers.
Country level EBITDA profit margins remain above
or close to 30% in most cases
For the countries included in this study, our review does not show any common
pattern on revenues and profits of the sector from the entry and growth of online
service providers. Subscription revenues for pay TV services, for example, have
generally grown across the APAC region (doubling in Vietnam and Sri Lanka), with
the exception of Malaysia and Thailand, where declines were recorded. There has
also been a mixed impact on TV advertising revenues, which have grown in
Indonesia, the Philippines and South Korea, stayed flat in Vietnam, and fallen in
Malaysia, Thailand and Taiwan.
Average profit margins of Free-To-Air (FTA) and Pay TV broadcasters at a country
level have been volatile. However, while there has been a modest decrease in
margins in some countries, EBITDA2 profit margins remain above or close to 30%
in most cases - with many companies adapting and maintaining profitability.
Broadcasters in some countries, such as Thailand, have experienced a more
persistent, downwards trend in profit margins over the past seven years. We find
1 This report considers the following countries: Indonesia, Malaysia, Pakistan, the Philippines, Taiwan, South Korea, Sri Lanka, Thailand and Vietnam.
2 EBITDA (Earnings Before Interest Tax Depreciation and Amortisation) is a measure of profit.

frontier economics 5
BROADCASTERS ADAPTING TO DIGITAL TRANSFORMATION IN APAC
that a range of factors is driving the change in profitability3, and, in some cases (for
example, Thailand), TV broadcasting profits were decreasing before the entrance
of online video service providers.
Broadcasters can, and have, adapted to digital transformation
Digital disruption has provided a challenge but has also provided an opportunity
for broadcasters to develop existing and build new strategies. Therefore, one of
the reasons OVSPs have had no consistent, clear impact on traditional
broadcasters is that a number of the latter have adapted to change. Our review
identified four main ways in which successful broadcasters have adapted to the
presence of new technology in the sector. They have:
1. Broadened their content offering, whether by expanding their channel
portfolio, offering content online, or investing in new and exclusive content. The
Pakistani FTA broadcaster HUM Network, for example, offers on-demand
content and live streaming via its website and mobile apps.
2. Deepened their engagement with consumers, through use of social
networks, offering clips, or partnering with video-sharing platforms. TrueVisions
in Thailand launched its own user-generated content platform, while MNC in
Indonesia offers voting for its talent shows on its app.
3. Adapted their advertising propositions by investing in targeted ads, which
are often deployed during on-demand programming. For example, Filipino
broadcaster GMA Network recently partnered with Singapore Media Exchange
(SMX), an advertising exchange that allows brands to target their advertising
based on various audience segments.
4. Offered new digital services, by licensing their content to independent
OVSPs (such as MNC licensing to iflix), or via a digital customer loyalty scheme
(such as TrueVisions’ TrueYou.)
OVSPs are different to traditional broadcasters. Policy makers should be sceptical of requests to “level the playing field” and any such efforts must be evidence-based and proportionate
Given the lack of clear impact that the arrival of OVSPs has had on traditional
broadcasters, the evidence we found does not support a general policy of
government intervention on behalf of the latter.
Policy makers should therefore be sceptical of requests to ‘level the playing field’,
especially when they seek to impose additional burdens on new entrants, rather
than reduce existing regulatory burden. Such claims may be motivated by a desire
3 Most important are macro-economic factors that affect advertising and the exchange rate also affect costs of licensing non-domestic content. Pay TV subscriptions can be affected by loss of TV rights (for example to high value sports) and in some countries piracy issues could also affect revenues – the main report provides more detail.

frontier economics 6
BROADCASTERS ADAPTING TO DIGITAL TRANSFORMATION IN APAC
to raise rivals’ costs, rather than to achieve public policy goals. Furthermore,
intervention without clear public interest could end up choking off investment,
dampening competition and restricting innovation, to the ultimate detriment of
consumers – whether through higher prices or less choice.
Where governments do contemplate intervention, any intervention should
ensure that the benefits exceed the costs, based on sound evidence and
analysis, and minimises unintended consequences. Regulations that might
have made sense for traditional broadcast may not make sense for OVSPs. This
is even more critical in fast moving markets, such as video services, which are
subject to rapid technological change and where many differentiated providers
offer services via a multitude of different business models. Where the intervention
is motivated by an objective to ‘level the playing field’, policy makers should
consider the possibility of easing some regulatory burdens on traditional providers,
rather than imposing additional burdens on new entrants (i.e., ‘levelling down’,
rather than ‘levelling up’).
Our report provides examples of best-practice policy making in broadcasting,
which take into account these principles. These examples highlight the risks and
trade-offs involved in interventions and demonstrate the importance of using a
rigorous structure in making policy intervention decisions.

frontier economics 7
BROADCASTERS ADAPTING TO DIGITAL TRANSFORMATION IN APAC
1 INTRODUCTION
Facebook has commissioned Frontier Economics to undertake an economic study
which considers the competitive dynamic between new online video service
providers and “traditional” broadcasters (including FTA and Pay TV broadcasters)
and the implications for public policy.
Digital disruption has affected many sectors, particularly creative and publishing
sectors whose output is “intangible” such as ideas, art and innovation. The
advances in communications networks, devices, apps and services as well as
production have rapidly changed how audio-visual content is both produced and
consumed, enabled entry from new suppliers4, and brought together new forms of
content that compete for our attention, offering the content either on an advertising
funded basis or a subscription (or mixed).
However, despite these shifts the fundamental business model of TV broadcasting
remains the same: broadcasters and online video services providers attract
audiences by creating (or acquiring) compelling content; and aggregating and
distributing that content in a way that engages audiences in an ongoing way.
This report examines broadcasting sectors in developing/middle economies, with
a focus on the APAC region, during this period of change. It focuses on the
following countries: Indonesia, Malaysia, Pakistan, the Philippines, Taiwan,
Thailand, South Korea, Vietnam, Sri Lanka.
The report considers the evolution of indicators of traditional broadcasters’
performance, and the extent to which competition from online video service
providers threatens traditional broadcasters. It assesses whether any challenges
to traditional broadcaster revenue or profitability are the result of wider trends in
advertising sectors or consumption of audio-visual content.
In this report we use the following terms:
“Traditional broadcaster” – meaning a broadcaster who derives most of its
value by distributing its content on linear channels over either terrestrial,
satellite or cable. Traditional broadcasters either adopt two broad strategies:
□ “FTA broadcasters” distribute content for free and rely solely on advertising
revenues;
□ “Pay TV broadcasters” supply bundles of channels in Pay TV subscription
packages.
“Online video service provider (OVSP)” – meaning a broadcaster who delivers
professionally produced, principally long form content via broadband
connections (such as Netflix or iflix). These are typically subscription based but
can also be advertising funded.
Video sharing platform – a platform which enables users to upload and publish
content, often short form and user generated content (such as YouTube).
These are distinguished from online video service providers and are out of
scope of this report.
4 Note that digital disruption has enabled new suppliers of both TV content, and advertising inventory.

frontier economics 8
BROADCASTERS ADAPTING TO DIGITAL TRANSFORMATION IN APAC
This report is structured as follows.
Section 2 summarises trends in broadcasting sectors in APAC. This includes:
□ Sector wide changes that have affected the broadcasting sectors (section
2.2);
□ Trends in revenues of ‘traditional’ FTA and Pay TV broadcasters, and online
video service providers in APAC emerging sectors (section 2.3 - 2.6);
□ Profitability of traditional broadcasters, including analysis of financial
viability (section 2.7 -2.8);
□ The profitability of the last five years of three broadcasters in more detail
(2.9).
□ Conclusions on the factors that have affected the broadcasting sector and
the profitability of the sector.
Section 3 provides examples of the strategies that have been adopted by
broadcasters adapting to digital transformation including broadcasters from the
APAC region as well as international examples.
Section 4 provides best practice guide for policy making / regulation in the
context of digital disruption.

frontier economics 9
BROADCASTERS ADAPTING TO DIGITAL TRANSFORMATION IN APAC
2 TRENDS IN CONSUMPTION AND REVENUES OF BROADCASTERS IN THE APAC REGION
2.1 Introduction
This section reviews how broadcasters’ business fundamentals (revenues,
subscribers and profit) have been affected during the period of “digital disruption”
in the countries of interest.
Online video service providers have entered the sector in the countries in this
report in the period 2016-2018 in most countries. The online video service
providers increase the range of services available to consumers by offering
additional choice alongside and consumed with the traditional Pay TV and FTA
service providers. They do this based on a different business model: they operate
often on a multi-national basis, they use broadband networks to distribute content,
and they provide a range of content on-demand for users to view, alongside
personalised recommendations.
However, as noted above, at the same time digital disruption has affected
traditional broadcasters in other ways. For example, technology has changed how
consumers, especially younger demographics, interact with TV content. It is now
common to access content via recommendations from social media on a hand-
held device, rather than via the Electronic Programme Guide (EPG). This has
caused the existing traditional broadcasters to invest in and adapt their businesses.
Furthermore, there are many country specific factors that are likely to affect the
business fundamentals. These are not just the macroeconomic issues (such as
how the state of the economy can affect outcomes) but sector-specific issues such
as broadcasting transmission standards. Therefore, caution should be exercised
in interpreting the trends observed.
Our review finds the following “high level” trends.
Broadcasting revenues and subscriptions continue to grow in most countries
across the APAC This is likely supported by ongoing transition to digital
television and increased broadband penetration.
In less developed economies, both Pay TV and online video service providers
are seeing strong growth in revenues and subscriptions. However online video
remains a smaller sector than Pay TV (measured by subscription revenues).
In more developed economies (like South Korea), online video service
providers are overtaking traditional Pay TV broadcasters in terms of numbers
of subscribers, though online subscription revenues remain below Pay TV
subscription revenues.

frontier economics 10
BROADCASTERS ADAPTING TO DIGITAL TRANSFORMATION IN APAC
2.2 Sector wide changes that have affected the broadcasting sector in APAC
There have been three structural factors that have shaped the broadcasting sector
and explain some of the variation observed in the different countries studied.
The transition to Digital Terrestrial Television
The increase in broadband penetration
The entry of new online video service providers.
Digital Terrestrial Television (DTT) transition
The last decade has seen investment in terrestrial transmission technologies. To
make more efficient use of valuable spectrum broadcasters have invested in
upgrading their transmission equipment to digital technology, while at the same
time consumers need to update their reception technology (purchasing new set top
boxes). Terrestrial transmission relies on a network of masts broadcasting to
aerials on houses or buildings. For the user it is cheap to install. These changes
mean broadcasters are able offer enhanced services (more channels, better
quality resolution and additional services such as text, radio or limited interactive
services).
Different APAC countries are at different stages of the transition to DTT, as
demonstrated in Figure 1. Some faster-moving countries such as South Korea and
Taiwan have already achieved the switch-off of analogue terrestrial television
transmissions (“analogue switch-off” or ASO). But other countries, which were
slower to launch the transition to DTT, or whose transition process has endured for
many years, are yet to reach ASO. For example, Vietnam is targeting ASO in 2020,
while the Philippines’ target is currently set for 2023.

frontier economics 11
BROADCASTERS ADAPTING TO DIGITAL TRANSFORMATION IN APAC
Figure 1 Digital Television Transition statuses in APAC
Country Year of launch Year of ASO Subsidies and Incentives
South Korea 2001 2012
Taiwan 2009 2012
Subsidies for set-top boxes and for broadcasters who do not enough funds to invest in digital content
Pakistan 2015 Not set
Malaysia 2016 2019
4.2 million poorer Malaysians given digital television decoders for free
Vietnam 2010 2020 Tax incentives for set top box and transmitter purchasing
Thailand 2014 2020
Indonesia 2012 2024
Philippines 2017 2023
Financial incentives for small scale broadcasters and financial subsidies for digital set top box purchases
Sri Lanka unknown Not set
Source: Launch: South Korea, Malaysia, Vietnam, Thailand, Indonesia, Philippines: ITU; Taiwan: Su, H. and Chang, S-C. (2015); Pakistan: ZTE (2017);
Note: DTT: Digital Television Transition; ASO: Analogue Switch-Off Post-2020 dates based on national targets. To our knowledge, no prospective ASO date has been set for Pakistan or Sri Lanka. Sri Lanka in 2008 initially decided to use the DVBT-2 standard used in Europe. But in 2014 the Government announced a change of course instead using the ISDB-T found in Japan, the Philippines and some Latin American countries. To date we are unaware of formal roll out of DTT in Sri Lanka.
Where countries have been slower to deploy digital terrestrial TV technologies
there is a greater likelihood that audiences will have migrated away from terrestrial
transmission towards other technologies. It is notable that a small number of
European countries (Belgium and Switzerland) have already started to switch off
their digital terrestrial service. The risk is that where ASO is delayed, then audience
viewing habits will be engrained in using alternative methods (including broadband
where it is available) meaning the benefits of launching a digital terrestrial
transmission platform will be lower where viewers have already migrated to new
platforms.
Broadband penetration has increased in all countries
A key driver of subscriptions to online video service providers in APAC will be
individual countries’ broadband penetration (the proportion of households with
access to broadband). As the penetration of broadband that can support TV
services (greater than 5Mbps-20Mbps5) increases, broadband networks can
increasingly be used to provide video services.
Fixed broadband penetration has been on an upwards trend across most of APAC,
as shown in Figure 2. While fixed broadband penetration is generally on the rise in
5 Typically, a video stream can be supported with a broadband speed of 2-5Mbps, however, with multiple users in household sharing a connection a faster speed would be required to provide a resilient service.

frontier economics 12
BROADCASTERS ADAPTING TO DIGITAL TRANSFORMATION IN APAC
APAC, there is a large disparity in progress between countries. For example,
Figure 2 shows several APAC countries, such as Pakistan, where broadband
penetration is growing, but is still low (less than 25% of households with access to
fixed broadband). Meanwhile other countries either have penetration levels which
are already high or have a faster growth in broadband penetration. For example,
Vietnam has seen an increase from just over 20% to almost 60% broadband
penetration since 2015.
Figure 2 Evolution of fixed broadband penetration since 2012 in APAC
Source: Frontier analysis of Telegeography data
Notes: Penetration calculated as total DSL, cable, and fibre/LAN subscriptions divided by number of households
This means that demand for online video service providers may be higher in
countries where broadband penetration is higher. However, the development of
mobile network services (increased coverage and capacity on 4G, and in the future
5G) may offer some growth opportunities for online video service providers.
Entry of online video service providers
The increase in coverage, take up and capability of broadband has reduced
barriers to entry for new content suppliers leading to the entry of many online video
service providers.
There are now many subscription online video service providers across the APAC
region. These include global brands such as Netflix and Amazon Prime, regionally
focused operators such as iflix, and a range of national focused providers. The two
biggest online providers in the APAC region are Netflix and iflix. Netflix entered all
APAC countries in 2016. iflix entry occurred in 2014 for Malaysia, the Philippines
and Thailand, in 2016 for Sri Lanka and Indonesia and in 2017 for Pakistan and
Vietnam. Other online video service providers are listed in ANNEX A. They include
Singapore’s Hooq, Indonesia’s Oona, Hong Kong’s Viu, and Vietnam’s VTC Now.
The sector is also offering mobile only plans which offer lower price subscriptions.
0%
20%
40%
60%
80%
100%
120%
2012 2013 2014 2015 2016 2017 2018 2019
Bro
adband p
enetr
ation
Indonesia Malaysia Pakistan
Philippines Korea Sri Lanka
Thailand Vietnam Taiwan

frontier economics 13
BROADCASTERS ADAPTING TO DIGITAL TRANSFORMATION IN APAC
Local online video services, whether specialist broadcasters or part of a traditional
broadcaster’s offering, date back further towards the beginning of the 2010s.
Various online video service providers across the region are also shifting their
business model from one of Subscription Video On Demand (SVOD) to
Advertising-based Video On Demand (AVOD). A notable example has been iflix
which has made the transition from a more SVOD-based model to a primarily
AVOD model (though premium, ad-free subscriptions are available).6 While survey
evidence found that 57% of subscribers said they would drop Netflix if it ever
introduced ads, iflix’s growth has continued despite its shift to AVOD.7 The shift
from SVOD to AVOD is likely to continue to unfold in APAC with more and more
online broadcasting services, such as Thailand’s Line TV, and Telekom
Indonesia’s online broadcasting service, OONA, finding success in with the AVOD
model.
2.3 Overall broadcasting sector trends
Total sector revenues have grown strongly in most countries
In most of the countries studied the overall sector revenues (subscriptions and
advertising) have grown, suggesting that the sector as a whole is healthy (see
Figure 3). TV sector revenues have grown by between 15% in the Philippines and
25% in South Korea. Revenues in Taiwan have been stable with Thailand, and to
a lesser degree Malaysia, showing a longer-term negative trend.
Figure 3 Evolution of revenues of Pay TV, online video, and Free-to-Air broadcasting services since 2015 in APAC
Source: Frontier analysis of Media Partners Asia data
6 Why AVOD Solutions Are Becoming Increasingly Attractive. Dror Mangel (Viaccess Orca). August 7, 2019. 7 New study: Netflix continues to dominate the streaming market. Rune Werliin (The Audience Project).
January 17, 2019

frontier economics 14
BROADCASTERS ADAPTING TO DIGITAL TRANSFORMATION IN APAC
Note: Overall broadcasting sector revenues calculated as the sum of advertising revenues of Free-to-Air and Pay TV broadcasters, and subscription revenues of Pay TV and online video service providers. Data for Sri Lanka and Pakistan do not contain subscription revenues for specialist online video service providers, and do not contain advertising revenues of Free-to-Air broadcasters and are therefore omitted. Pay TV defined as the distribution of TV channels for a subscription fee. Online Video is defined as a video service delivered over an open internet or broadband connection. Measurement of advertising revenues is stated in net terms (i.e. after discounts and excluding agency commission). Subscription revenues accrued by channel suppliers and content providers is a direct reflection of how providers spend on programming, based on fixed and variable fees.
Sector revenues of traditional (FTA and Pay TV broadcasters) show a similar
pattern given that OVSP subscription revenues make a relatively small contribution
to overall sector revenues.,.
There is significant variation in the balance between FTA advertising, Pay TV
advertising, Pay TV subscriptions and OVSP subscriptions (Figure 4). In Indonesia
and the Philippines FTA advertising dominates, whereas in Malaysia and Taiwan
Pay TV subscriptions dominate. In all countries the share of subscription revenues
captured by online video providers is low (below 6%).
Figure 4 Share of overall broadcasting sector revenues in 2019 by revenue source
Source: Frontier analysis of Media Partners Asia data
Note: Overall broadcasting sector revenues calculated as the sum of advertising revenues of Free-to-Air and Pay TV broadcasters, and subscription revenues of Pay TV and online video service providers. Data for subscription revenues for specialist online video service providers, and advertising revenues of Free-to-Air broadcasters for Sri Lanka and Pakistan were not available. Pay TV defined as the distribution of TV channels for a subscription fee. Online Video is defined as a video service delivered over an open internet or broadband connection. Measurement of advertising revenues is stated in net terms (i.e. after discounts and excluding agency commission). Subscription revenues accrued by channel suppliers and content providers is a direct reflection of how providers spend on programming, based on fixed and variable fees.
Thailand and Malaysia have seen declines in sector revenue in the last five years
There are several country specific reasons why Thailand and Malaysia have
experienced declines in revenues in the last five years. While the growth in
5%
10%
15%
39%
56%
61%
70%
26%
9%
24%
12%
3%
6%
2%
64%
78%
57%
48%
37%
28%
27%
5%
3%
4%
1%
4%
5%
2%
0% 20% 40% 60% 80% 100%
Taiwan
Malaysia
Korea
Vietnam
Thailand
Philippines
Indonesia
FTA advertising Pay-TV advertising
Pay-TV subscription Online video subscription

frontier economics 15
BROADCASTERS ADAPTING TO DIGITAL TRANSFORMATION IN APAC
availability of online video service providers may partially be a cause, the decline
in broadcaster revenues in Thailand can also be attributed to other sector-specific
drivers in the country.
Firstly, piracy is a problem in Thailand. In a 2018 survey by the Asia Video Industry
Association (AVIA), 45% respondents claimed to use devices to stream pirated
television and video content.8 Such streaming devices are boxes that connect to
the television and are used to stream Pay TV channels over the internet.9 While
these devices are popular across the region, Thai usage ranks the highest of all
the countries surveyed by the Asia Video Industry Association (AVIA), with others
ranging from 33% (Taiwan) to 15% (Singapore).10,11
Though also diverting viewing traffic away from FTA channels, the popularity of
such boxes poses a unique threat to Pay TV companies. 69% of Thai respondents
who purchased a box said they also cancelled some or all their television
subscriptions, with international subscription services affected the least. The boxes
are especially popular with those aged 18 to 24, who are also more likely to cancel
legitimate subscriptions having acquired one (77%).
Because these boxes require the internet, their usage is a recent phenomenon.
Figure 5 illustrates how such streaming devices grew in popularity during the
period from 2016 and 2017. The chart uses Google search trends for three popular
such streaming devices to illustrate user interest in the devices over time. The Thai
government has declared its intention to crack down on these devices/boxes.12
8 See: https://www.bangkokpost.com/thailand/general/1594410/nearly-half-of-people-stream-pirated-tv 9 According to AVIA the TV boxes, also known as illicit streaming devices (ISDs), allow users to access
hundreds of pirated TV channels and video-on-demand content, usually with a low annual fee. TV boxes often come pre-loaded with applications allowing "plug-and-play" access to pirated content.
10 See: https://www.devdiscourse.com/article/business/881759-33-of-taiwanese-consumers-access-streaming-piracy-on-video-services
11 See: https://marketingmagazine.com.my/15-in-singapore-use-illicit-streaming-devices-to-view-pirated-tv-channels-and-video-on-demand/
12 See: https://www.bangkokpost.com/thailand/general/1735571/ipd-plans-digital-piracy-crackdown

frontier economics 16
BROADCASTERS ADAPTING TO DIGITAL TRANSFORMATION IN APAC
Figure 5 Google search trends for three popular illicit streaming devices in Thailand since 2014
Source: Google Trends
The Thai Government and regulator13 have recently announced new website
blocking provisions for piracy sites which violate Section 20 (3) of the Computer
Crimes Act (CCA).14
Secondly, the rights to the English Premier League (EPL), which is popular in
Thailand, have also changed hands between broadcasters on several occasions
with TrueVisions losing the license to its competitor CTH from 2013 to 2015, before
regaining it initially through a sublicense in 2016, then fully in 201915 after CTH
shut down.16 This may have increased pay TV churn in the sector.
Thirdly, in 2013 Thailand auctioned licenses for Digital TV that many broadcasters
overpaid for. DTT channels dominate TV in Thailand accounting for 87% of TV
viewership. Twenty-four (24) Digital TV operators launched services in 2014,
however the fierce competition subsequently led to 9 of these stations shutting
down by 2019.
With regards to Malaysia, the country experienced a stronger economic downturn
than other Asian economies. Specifically, Malaysia’s GDP per capita fell 12%
between 2012 and 2016, a larger fall than any other country in the region. Declining
GDP can be expected to have a significant impact on FTA revenues, as advertising
revenues are particularly sensitive to the economic cycle.17
According to Media Partners Asia, Media Prima, which broadcasts four FTA
channels in Malaysia as the audience leader with a 21% audience share “is
13 The Department of Intellectual Property (DIP), the Ministry of Digital Economy and Society (DES) and the National Broadcasting and Telecommunications Commission (NBTC)
14 See: https://avia.org/thailands-department-of-intellectual-property-dip-and-the-ministry-of-digital-economy-and-society-des-launch-new-website-blocking-provisions-in-efforts-to-clamp-down-on-online-piracy/
15 See: https://www.nationthailand.com/news/30370947 16 See: https://www.commsupdate.com/articles/2016/08/05/thai-cable-group-cth-shutting-down-in-september/ 17 Bils, M., 1989. Pricing in a customer market. The Quarterly Journal of Economics, 104(4), pp. 709
0
20
40
60
80
100
120
2014 2015 2016 2017 2018 2019
searc
h tre
nds in T
haila
nd for
po
pu
lar
Illic
it s
tre
am
ing
se
rvic
es.
20
17
.07
, H
D P
layB
ox =
10
0
Mango TV HD Playbox U Play

frontier economics 17
BROADCASTERS ADAPTING TO DIGITAL TRANSFORMATION IN APAC
currently stuck in a negative feedback loop, with lower ad revenues leading to lower
content investment which discourages viewership”.18
Malaysia also faced problems with piracy with a reported 25% of households 2019
reporting using a TV box which can be used to stream pirated television and video
content.19 However, a recent report found that efforts of the Government had in
2020 succeeded in significantly reducing the use of piracy streaming websites or
torrent sites to view pirated content. In 2020, 22% of consumers reported using
such sites, though this was down significantly from 61% in 2019.20
Subscriptions have grown in most countries
Total broadcaster subscriptions (subscriptions to both Pay TV and online video
service providers) also suggest that the Pay TV sector is growing in most APAC
countries.
Figure 6 Evolution of the number of subscriptions to Pay TV and online video broadcasting services per 1000 households since 2015 in APAC
Source: Frontier analysis of Media Partners Asia data
Note: Data for Sri Lanka and Pakistan do not contain OVSP subscription Overall number of subscriptions calculated as total Pay TV subscriptions plus total OVSP subscriptions (multiple subscriptions allowed per household). Pay TV defined as the distribution of TV channels for a subscription fee. Online Video is defined as a video service delivered over an open internet or broadband connection.
Figure 6 shows how the overall number of subscriptions to Pay TV and OVSPs
has developed across APAC. In almost all countries observed (except for
Malaysia), the average number of households subscribing to a broadcasting
18 See: Asia Pacific Video Content Dynamics. Media Partners Asia. 2020 19 See: https://avia.org/new-survey-finds-that-one-in-four-malaysian-consumers-use-pirated-tv-boxes/ 20 See: https://avia.org/huge-decrease-in-levels-of-streaming-piracy-seen-in-malaysia-over-the-last-12-
months/
0
500
1000
1500
2000
2500
2015 2016 2017 2018 2019
Overa
ll bro
adcasting
secto
r su
bscrip
tion
s p
er
100
0 h
ou
seh
old
s
Indonesia Malaysia Pakistan
Philippines Korea Sri Lanka
Thailand Vietnam Taiwan

frontier economics 18
BROADCASTERS ADAPTING TO DIGITAL TRANSFORMATION IN APAC
service has been increasing steadily in recent years.21 There is significant variation
in the number of subscriptions per household which relates partly to the level of
wider economic outcomes. In the high-income economies of South Korea and
Taiwan the level of subscriptions per household is 2 and 1 respectively.
Malaysia’s declining subscribers to broadcasting services is likely to be partly
explained by its comparatively weak economic performance in recent years.
2.4 Trends in TV advertising revenues
Many broadcasters rely to some extent on advertising revenues as income. Free-
to-Air (FTA) broadcasters rely (almost) totally on advertising revenues as their
income. Pay TV broadcasters, who also generate revenues from subscription fees,
may rely mostly or only partly on advertising revenues as a form of income.
FTA broadcasters are a mix of public broadcasters and commercial broadcasters
(see ANNEX B), though Vietnam and Thailand are exceptions where all FTA
broadcasters are public.22
The trends in advertising revenues are mixed, with evidence of reductions in some
countries but also growth in others.
Figure 7 illustrates how the overall level of advertising revenues made by FTA and
Pay TV broadcasters in APAC has evolved in recent years. Some countries, such
as Indonesia, have seen a gradual rise in advertising revenues amongst
broadcasters. But others have witnessed a decline in advertising revenues in the
broadcasting sector. In particular, Thailand and Malaysia have seen several years
of decline.
21 Note that many households may “multi-home” (i.e. simultaneously access more than one subscription). 22 FTA channels are public and military in the case of Thailand

frontier economics 19
BROADCASTERS ADAPTING TO DIGITAL TRANSFORMATION IN APAC
Figure 7 Evolution of advertising revenues of Pay TV and Free-to-Air broadcasters since 2014 in APAC
Source: Frontier analysis of Media Partners Asia data
Note: Data for Sri Lanka and Pakistan do not contain Free-to-Air broadcaster advertising revenues; and are therefore omitted. Pay TV defined as the distribution of TV channels for a subscription fee. Measurement of advertising revenues is stated in net terms (i.e. after discounts and excluding agency commission).
FTA share of TV advertising has been eroded in some countries by Pay TV
providers, but not all (Figure 8). In Malaysia and South Korea, and to a much lesser
degree in Thailand and Vietnam, the share of TV advertising revenues has
declined more for FTA broadcasters in comparison to Pay TV broadcasters.

frontier economics 20
BROADCASTERS ADAPTING TO DIGITAL TRANSFORMATION IN APAC
Figure 8 Comparison of share of total broadcasting sector advertising revenues accounted for by FTA broadcasters in 2014 vs 2019 in APAC
Source: Frontier analysis of Media Partners Asia data
Note: Total broadcasting sector advertising revenues calculated as combined Pay TV and FTA broadcaster advertising revenues. Data for Sri Lanka and Pakistan do not contain Free-to-Air broadcaster advertising revenues; and are therefore omitted. Pay TV defined as the distribution of TV channels for a subscription fee. Measurement of advertising revenues is stated in net terms (i.e. after discounts and excluding agency commission).
2.5 Trends in Pay TV
The APAC region is served by a mix of cable, direct-to-home (DTH) satellite, and
internet protocol TV (IPTV) Pay TV broadcasters (see ANNEX C). While in some
countries like Taiwan, cable Pay TV operators are dominant, in other countries like
Indonesia, other forms of Pay TV transmission are more common.
Pay TV subscriptions
An increasing proportion of households in APAC are subscribing to Pay TV
broadcasters’ packages. This report defines “Pay TV” as distinct from OVSPs.23
Figure 9 shows that in almost all countries observed, the number of Pay TV
subscriptions per 1000 households has increased gradually since 2012.
Figure 9 exhibits some disparity between countries in both the overall number and
rate of increase of Pay TV subscriptions per 1000 households. South Korea and
Taiwan are countries with particularly high rates of subscription to Pay TV
packages. South Korea, in particular, demonstrates an increasing trend of
households subscribing to multiple Pay TV packages.
23 Pay TV providers supply access to bundles of channels broadcasting linear content, whereas online video providers supply access to a library of content on demand over broadband networks
0%
10%
20%
30%
40%
50%
60%
70%
80%
90%
100%
Indonesia Malaysia Philippines Korea Thailand Vietnam Taiwan
Shar
e o
f co
mb
ined
Pay
-TV
an
d F
TA
ad
vert
isin
g re
ven
ue
s
FTA share in 2014 FTA share in 2019

frontier economics 21
BROADCASTERS ADAPTING TO DIGITAL TRANSFORMATION IN APAC
While almost all countries observed exhibit a rising rate of subscription to Pay TV
services, in Malaysia subscription penetration has declined. In Malaysia, the
number of subscriptions to Pay TV broadcasters per 1000 households has fallen
from just over 500 subscriptions per 1000 households in 2012 to less than 400
subscriptions per 1000 households in 2019. For the reasons set out above the
decline in the number of Pay TV subscriptions per household in Malaysia may be
related to the economic conditions over the period or other factors such as piracy
or entry of OVSPs.
Figure 9 Evolution in number of Pay TV subscriptions since 2012 in APAC
Source: Frontier Analysis of Media Partners Asia and Telegeography data
Note: Pay TV defined as the distribution of TV channels for a subscription fee. Media Partners Asia data used for Pay TV subscription figures, Telegeography data used for number of household figures.
Pay TV revenues
As discussed above, Pay TV broadcasters may rely to different extents on both
advertising revenues and subscription revenues as a form of income. Advertising
revenue is increasing in some countries but decreasing in others.
Figure 10 shows how revenues from subscriptions for Pay TV broadcasters have
changed over recent years in APAC. In the majority of countries observed,
subscription revenues of Pay TV broadcasters have risen to varying degrees since
2012. But in Thailand and Malaysia, subscription revenues have also declined in
several years, conforming to the downward trend in overall Pay TV subscriptions
in these two countries.
Where Pay TV subscription revenues have grown (Figure 10), growth has
generally been stronger than in advertising revenues. For example, combined
FTA/Pay TV advertising revenues in the Philippines in 2019 had grown just under
16% compared to 2012 (Figure 7). But Pay TV subscription revenues in the
Philippines in 2019 had doubled compared to 2012.
0
200
400
600
800
1000
1200
1400
1600
1800
2000
2012 2013 2014 2015 2016 2017 2018 2019
Pay-
TV
subscriptions p
er
1000
household
s
Indonesia Malaysia Pakistan
Philippines Korea Sri Lanka
Thailand Vietnam Taiwan

frontier economics 22
BROADCASTERS ADAPTING TO DIGITAL TRANSFORMATION IN APAC
Figure 10 Evolution of Pay TV subscription revenues since 2012 in APAC
Source: Frontier analysis of Media Partners Asia data
Note: Pay TV defined as the distribution of TV channels for a subscription fee. Subscription revenues accrued by channel suppliers and content providers is a direct reflection of how providers spend on programming, based on fixed and variable fees
ARPU
Figure 11 shows the evolution of average revenue per user (ARPU) amongst Pay
TV broadcasters in APAC in recent years. ARPU for Pay TV provides vary both in
the level and the trajectory. Pay TV ARPU is highest in Malaysia and Taiwan at
US$24.48 and US$15.51 in 2019, respectively. It is lowest in Pakistan, Vietnam
and Sri Lanka. Pay TV APRU has declined in Indonesia, from a recent peak of
US$8.26 in 2015 to US$7.38 at the end of 2019.
This suggests that there is no clear trend in ARPUs across the APAC region. Some
countries such as Vietnam see growth, whilst others such as Pakistan see some
decline. In some countries (specifically Taiwan, Vietnam, South Korea and
Malaysia) ARPU has increased from its level as of 2012.
Pay TV APRU may be affected by the level of sector maturity. Later subscribers to
Pay TV services are likely to be more price sensitive, hence more likely to
subscribe to more basic Pay TV packages. The entry of OVSPs may have also led
Pay TV providers to offer entry packages which compete more directly with online
subscriptions. These trends may have expanded the market with some consumers
that did not subscribe to Pay TV before, taking up cheaper Pay TV subscriptions.
-50%
0%
50%
100%
150%
200%
250%
300%
2012 2013 2014 2015 2016 2017 2018 2019Pay-
TV
subscription r
evenues
com
pare
d to 2
012 b
ase
Indonesia Malaysia Pakistan
Philippines Korea Sri Lanka
Thailand Vietnam Taiwan

frontier economics 23
BROADCASTERS ADAPTING TO DIGITAL TRANSFORMATION IN APAC
Figure 11 Evolution of average revenue per user (ARPU) of Pay TV broadcasters since 2012 in APAC
Source: Frontier analysis of Media Partners Asia data
Note: Pay TV defined as the distribution of TV channels for a subscription fee. Average Revenue Per User (ARPU) is the monthly subscription revenue per user generated by a platform, based on an average subscriber number for the month.
2.6 Online video service providers
Subscriptions to OVSPs have grown rapidly from a small base
OVSPs have been able to enter in APAC countries and quickly build subscriptions,
especially where broadband penetration is high. The sharp rise of OVSP
subscriptions across APAC can be seen in Figure 12, which shows the number of
OVSP subscriptions per 1000 households.
There is a significant degree of variation in the number of online video subscriptions
in the countries covered. The lowest level of subscriptions was in Indonesian and
Vietnam (at around 10 subscriptions per 1000 households), followed by Thailand
and the Philippines (around 50 subscriptions per 1000 households) then Malaysia
(at 95 subscriptions per 1000 households). In the higher income countries of South
Korea and Taiwan have much higher levels of subscriptions at 300 and 200
subscriptions per 1000 households.
Figure 12 shows that in some APAC countries, OVSP subscriptions were relatively
rare in 2015. But in others such as South Korea and Taiwan, more local online
broadcasting services had been launched in 2015. Importantly, both Taiwan and
South Korea were shown to have higher broadband penetration than other
countries in Figure 2.
Although OVSPs appear to be quickly gaining subscribers across the APAC
region, it is difficult to precisely measure the impact this will have on Pay TV
broadcasters. Firstly, OVSPs may compete across different dimensions than Pay
0
5
10
15
20
25
30
2012 2013 2014 2015 2016 2017 2018 2019
Mo
nth
ly A
RP
U (
US
$)
Indonesia Malaysia Pakistan
Philippines Korea Sri Lanka
Thailand Vietnam Taiwan

frontier economics 24
BROADCASTERS ADAPTING TO DIGITAL TRANSFORMATION IN APAC
TV and FTA broadcasters, for example by focusing on specific kinds of
new/innovative content, or operating no-advertising business models.
Secondly, consumers may multi-home with several OVSPs: this means consumers
may subscribe to/consume content from a combination of FTA, Pay TV and
OVSPs. This consumer behaviour is becoming increasingly common in APAC
countries such as Vietnam, where some Pay TV broadcasters are still aspiring to
penetration levels of 70-80%, despite the entry of online video services.24 There
may also be a high rate of switching between different broadcasting services,
especially among online video services.25
Figure 12 Evolution of number of subscriptions to OVSPs per 1000 households since 2015 in APAC
Source: Frontier analysis of Media Partners Asia data
Note: Online Video is defined as a video service delivered over an open internet or broadband connection. Media Partners Asia data used for Pay TV subscription figures, Telegeography data used for number of household figures.
As online video subscriptions have grown so revenues have quickly grown from a
low base.
24 Vietnam in View. Asia Video Industry Association. September 2018. 25 Netflix: the rise of a new online streaming platform universe. Harvard Business School. March 4, 2018.

frontier economics 25
BROADCASTERS ADAPTING TO DIGITAL TRANSFORMATION IN APAC
Figure 13 Evolution of OVSP subscription revenues since 2017 in APAC
Source: Frontier analysis of Media Partners Asia data
Note: Given that the level of subscriptions was low in the period 2015 – 2016 we have indexed growth in subscriptions to 2017 = 1. Online Video is defined as a video service delivered over an open internet or broadband connection. Subscription revenues accrued by channel suppliers and content providers is a direct reflection of how providers spend on programming, based on fixed and variable fees.
However, as noted in Figure 4, for OVSPs the share of revenues is small in 2019
(on average less than 6% in the countries assessed in 2019).
ARPU is growing
OVSPs’ ARPUs have in general risen gradually in recent years in most APAC
countries, though from a relatively low level - see Figure 14. We note also that
ARPU grew in Indonesia prior to 2017, but has fallen since.

frontier economics 26
BROADCASTERS ADAPTING TO DIGITAL TRANSFORMATION IN APAC
Figure 14 Evolution of average revenue per user (ARPU) of OVSPs since 2015 in APAC
Source: Frontier analysis of Media Partners Asia data
Note: Online Video is defined as a video service delivered over an open internet or broadband connection. Average Revenue Per User (ARPU) is the monthly subscription revenue per user generated by a platform, based on an average subscriber number for the month. Direct SVOD ARPUs reflect average blended direct consumer spend on SVOD services, some of which may include TVOD (transaction VOD) components.
2.7 Profitability of broadcasters
We have examined trends in profitability of broadcasters in the sector. For each of
the broadcasters with available financial information, we gather data on EBITDA
margins and the Return on Capital Employed (ROCE) over the past ten years (see
ANNEX D for further information on the data availability).
EBITDA margins are a measure of profit (formally Earnings Before Interest, Taxes,
Depreciation and Amortization divided by total revenue). ROCE refers to earnings
before interest and tax (also known as operating income) divided by average
capital employed, where capital employed is total assets less total liabilities.
EBITDA margins reflect overall profitability of a company as share of revenues, but
do not account for capital invested in the business. ROCE is useful for comparing
the profitability of companies by taking into account the amount of capital used but
tends to be more volatile and less comparable across companies and especially
countries, reflecting potentially different accounting standards/application.

frontier economics 27
BROADCASTERS ADAPTING TO DIGITAL TRANSFORMATION IN APAC
2.7.1 Benchmarking the profitability of APAC TV broadcasters with other TV broadcasters
Profit margins of TV broadcasters within APAC are in line with, and often higher
than, profit margins of TV broadcasters in developed and middle-income countries
in North America, Latin America and Europe.
Figure 15 Average 2017-2019 EBITDA margins of TV broadcasters in APAC countries of interest compared to those in other APAC countries, North American, Latin American and Europe
Source: Bloomberg and Frontier Economics calculations
Note: APAC countries of interest are highlighted in red and the dotted line shows the average across all countries in this sample. Sample of countries includes developed and middle-income countries in APAC, North America, Latin America, and Europe with available data. Note the sample includes only broadcasters where there is publicly available data. In the case of Pakistan this relates to one broadcaster (HUM Network) in the case of Taiwan this relates to two broadcasters (Taiwan Television Enterprise and China Television Co). In the case of Thailand this relates to two broadcasters (Bangkok Entertainment Co.ltd, TrueVisions)
Figure 15 show that the country weighted average EBITDA margins in all countries,
with the exception of Taiwan and Pakistan, are the in the range 20% - 40% (though
individual broadcaster EBITDA margins vary as seen in ANNEX E). As shown in

frontier economics 28
BROADCASTERS ADAPTING TO DIGITAL TRANSFORMATION IN APAC
Figure 16, Indonesia, Malaysia, South Korea and Thailand have all seen small
reductions since 2015. HUM Network in Pakistan saw a fall in 2018 (described in
Section 2.9 and Annex F.4) which it related to increased costs due to the
investment to launch a new channel and macro-economic issues affecting the
advertising sector. Finally, the two broadcasters in Taiwan (Taiwan Television
Enterprise and China Television Co) have shown on average negative profitability.
In Thailand, profit margins have been decreasing since 2012, in line with a
decrease in FTA ad revenues and declining ARPU (as noted in Figure 11 Pay TV
APRU was ranked third highest of the countries studied in 2012 and has since
declined).
Figure 16 EBITDA margins of TV broadcasters in the APAC countries of interest
Source: Bloomberg and Frontier Calculations
Note: Profit margins are revenue weighted averages of EBITDA margins of TV broadcasters in each country of interest. The profitability trends by region only reflect the profitability of broadcasters where data is publicly available (see ANNEX D for further information). Where the companies included are TV broadcasters, they may have other activities that are captured in these high-level profitability metrics (such as radio broadcasting or print publishing). Note the sample includes only broadcasters where there is publicly available data. In the case of Pakistan this relates to one broadcaster (HUM Network) in the case of Taiwan this relates to two broadcasters (Taiwan Television Enterprise and China Television Co). In the case of Thailand this relates to two broadcasters (Bangkok Entertainment Co.ltd, TrueVisions)
What have been the causes for changes in profitability?
Many factors affect the profitability of TV broadcasters, which can fluctuate
substantially depending on both sector-specific and wider economic trends. We
explore several factors weighing on revenue growth over the past three years as
well as several cost pressures, which help explain the recent decline in TV
broadcasting profits at a country level.
In the financial statements of broadcasters in APAC countries, higher content costs
and lower levels of aggregate economic activity are cited as factors weighing on
profit margins. For example, some broadcasters, including Elang Makhota in
Indonesia and BEC World in Thailand, attribute the recent decline in profits to lower
economic activity which has constrained advertising budgets.26
26 See: Elang Makhota Teknologi 2018 Annual Report and BEC World 2019 Annual Report.
-20.0
-10.0
0.0
10.0
20.0
30.0
40.0
50.0
60.0
2012 2013 2014 2015 2016 2017 2018 2019
EB
ITD
A M
arg
in (
%)
Philippines Malaysia Thailand South Korea
Indonesia Taiwan Pakistan

frontier economics 29
BROADCASTERS ADAPTING TO DIGITAL TRANSFORMATION IN APAC
In addition to these pressure on revenues, TV broadcasters in the region may have
also faced increased cost pressures. Some broadcasters, including Intermedia
Capital TBK in Indonesia, attribute their decline in 2018 profitability to higher costs
related to developing local content.27
These trends are explored in more detail in Section 2.9 in the case of three broadcasters.
2.8 Benchmarking the profitability of APAC broadcasters with other sectors
Comparing profit margins across industries is complex, as different industries will
have different capital intensity, demand or cost risks, or investment cycles. More
generally it can be difficult to measure economic profit. Nonetheless, an
assessment of profit margins can in some cases provide helpful evidence on
whether there are concerns.
As shown in Figure 17, profit margins of TV broadcasters within APAC countries
are generally higher than in other aggregate sectors.
27 See Intermedia Capital TBK 2018 Annual Report, page 24.

frontier economics 30
BROADCASTERS ADAPTING TO DIGITAL TRANSFORMATION IN APAC
Figure 17 Average 2017-2019 EBITDA margins for TV broadcasters compared to other sectors
Source: Bloomberg and Frontier Economics Calculations
Note: TV Broadcasting sector is highlighted in red. This chart shows the EBITDA margin as weighted average across firms in a particular industry. The TV Broadcasting segment is based on manual classification verified with desk research and all other industries are based on the Global Industry Classification Standard (GICS), subgroups Cable & Satellite and Broadcasting. Note the sample includes only broadcasters where there is publicly available data. In the case of Pakistan this relates to one broadcaster (HUM Network) in the case of Taiwan this relates to two broadcasters (Taiwan

frontier economics 31
BROADCASTERS ADAPTING TO DIGITAL TRANSFORMATION IN APAC
Television Enterprise and China Television Co). In the case of Thailand this relates to two broadcasters (Bangkok Entertainment Co.ltd, TrueVisions)
2.9 Analysis of broadcaster profitability
To understand the factors that have affected broadcasters during the period of
adapting to the adoption of digital technologies this section conducts a more
detailed case study of three broadcasters from the region. The analysis reviews
what the broadcasters consider to be the key factors that affect profitability, costs,
revenues and opportunities in the period 2015 - 2020.
We have chosen broadcasters from the different countries in the region; with
different experiences and characteristics. The case studies are summarised below
and set out in full in ANNEX F.
It considers:
how the entry of new OVSPs has affected their businesses
how the broadcasters have positively responded to the opportunities of digital
disruption
what other factors have affected their business strategy.
The three APAC broadcasters have fared differently in the last five years.
MNC (Indonesia)
Media Nusantara Citra (MNC) is an Indonesian commercial advertising funded
broadcasting group. It has four Free-To-Air channels – RCTI, MNCTV, GTV, and
iNews – as well as 18 channels broadcast on Pay TV. RCTI is the most watched
and widely broadcasted FTA station in Indonesia.28 MNC has seen steady growth
in EBITDA margins since 2015. In 2019, the Company’s EBITDA margin reached
a record high of 44%.29
GMA (Philippines)
GMA Network is a free-to-air broadcaster in the Philippines. Its core channel
GMA-7 accounted for three quarters of revenue in 2018. GMA also offers
international cable channels including GMA Pinoy TV, GMA Life TV and GMA
News TV International. GMA Network’s EBITDA margin has fluctuated over the
past five years between 25% and 35%.30
HUM Network (Pakistan)
HUM Network is a global entertainment and news network, based in Pakistan, but
with a strong following across South Asia. HUM Network owns HUM TV (offering
a mix of content), HUM Sitaray (entertainment shows), HUM Masala (food channel)
and HUM NEWS. The HUM network’s profit margins have been fluctuating
28 MNC Annual Report 2019, p. 128 29 MNC Annual Report 2019, p. 48 30 See Annex F for annual data

frontier economics 32
BROADCASTERS ADAPTING TO DIGITAL TRANSFORMATION IN APAC
between 17% to 26% between 2010 to 2017 before falling to a loss of -2.5% in
2018 calendar year.
2.9.1 Broadcasters’ view on the impact of digital technologies in their business
Broadcasters recognise the threat of digital advertising and sometimes point to the threat of OVSPs
Broadcasters recognise the growth in digital advertising over the period, though do
not tend to identify it as a major concern.
HUM stated that there was “a major shift in total advertisement spend from TV to
Digital medium globally”.
MNC stated in its 2017 annual report, MNC identified internet advertising as having
a “remarkably steep growth curve, driven primarily by online videos”. In 2015 it
noted that “Gross rating points (GRPs) for the industry have softened in recent
years as eyeballs move to social media”.
GMA noted in 2018 that their international channels had been affected by the
“continuing global shift in content consumption from the traditional pay platforms
(Direct-to-Home/DTH and Cable) to OTT [OVSPs]”.31 GMA note that it “foresees”
this revenue stream decline correcting itself as they develop their digital offering
(though subscriber numbers did continue to decline in 2019).
However, other than these passing references in their Annual Reports the
broadcasters do not seem to ascribe fluctuation in revenues as being materially
caused by digital technologies.
However, broadcasters consider that OVSPs, and digital technologies more generally, offer opportunities to increase revenues
All broadcasters consider that digital technologies offer new opportunities to
monetise their content assets by licensing content for both domestic and
international audiences.
MNC considers itself well placed to meet audience demand for “local content
catering to the preference of majority of Indonesians who still prefer to watch local
content such as drama series.”32 It considers that “amid the emergence of OTT
players that push greater demand for local content, MNCN’s timing fits perfectly in
reaping the rewards through content monetization”.33, 34 By 2022, digital revenues
are targeted to represent 50% of the MNC’s revenue.35
31 GMA Annual Report 2018, p. 11 32 MNC Annual Report 2019, p. 109 33 MNC Annual Report 2019, p. 2 34 MNC recently reached a deal with iflix to license 10,000 hours of its content to the online video service
provider. See: https://blog.iflix.com/wp-content/uploads/2019/05/MNC-x-iflix-FINAL.pdf 35 MNC Annual Report, 2019, p. 189

frontier economics 33
BROADCASTERS ADAPTING TO DIGITAL TRANSFORMATION IN APAC
GMA has entered into content provisioning agreements with OVSPs HOOQ and
iflix, providing the company an extra revenue stream via the monetisation of
existing content.36
In 2015, HUM saw content monetisation in the digital space as “an avenue for high
growth”, and, that year, entered into a partnership with the Indian OVSP ErosNow
to licence its content.37 HUM made a similar agreement with iflix in 2016, with iflix
stating the purpose being to provide “some of the best Pakistani content to millions
of keen internet users across the globe”, and “introduce Pakistan’s popular soaps
to a new digital generation of South Asians globally”38, again showing how
traditional broadcasters view their library of local content as a crucial advantage
and opportunity within the digital space. In 2019 the company launched HUM News
in the UK.39
In 2018, HUM considered that “the consumer shift towards digital services” is a
sector wide trend HUM is “well positioned to take advantage of”. HUM Network
content is now available on the OVSPs Netflix, Iflix, and ErosNow,40 as well as
through channels on YouTube and Dailymotion.41
Similarly, digital technologies have supported advertising revenue growth. For
example, in 2018 MNC attributed its success in increasing advertising revenues to
digitalising and optimising unused slot inventory as well as developing new ad-
revenue streams (virtual ads, built-in, and digital).
2.9.2 Advertising revenues are driven by macro-economic factors
All broadcasters studied have had periods where their revenues have been
declined, or increased, but tend to ascribe the majority of these fluctuations to
macroeconomic factors.
Macroeconomic trends are the biggest drivers of revenues
Typically, the broadcasters noted that macro-economic factors were the biggest
contributors to reduction in advertising revenues. For example, Indonesia’s MNC
pointed to the exchange rate decline in 2015 affecting macroeconomic outcomes
which in turn affected advertising spend. It noted that:
“The advertising market was weak in 2015, declining by 3% in net terms. Much of
this weakness is pegged to macro issues and was exacerbated by currency
depreciation, …2015 was challenging year, as key sectors including FMCG,
telecoms and auto, largely driven by multinationals looking to protect margins in
the face of increasing production costs, reduced their advertising budgets.”
The Filipino company GMA noted that in 2018 there was a continued decline in
revenue, driven by an “industry-wide contraction in advertising spending”. GMA
36 GMA Annual Report 2018, p. 54 37 HUM Network Annual Report 2015, p. 15 38 See: https://blog.iflix.com/wp-content/uploads/2018/02/2016.12.27.IFLIX-SIGNS-MULTI-YEAR-DEAL-
WITH-PAKISTAN%E2%80%99S-TOP-NETWORKHUM-TV.pdf 39 HUM Network Annual Report 2019, p. 36 40 HUM Network Annual Report 2018, p. 40 41 HUM Network Annual Report 2018, p. 37

frontier economics 34
BROADCASTERS ADAPTING TO DIGITAL TRANSFORMATION IN APAC
points to the implementation of new tax measures as adversely impacting
advertising spending.
Pakistan’s HUM Network noted that revenues grew in the period to 2017 and fell
in 2018 and 2019. HUM attributes the decline in 2018 to “political and economic
instability”.42 It stated that “Ad Revenue shrunk by 30% - 35% owing to economic
instability due to dwindling foreign exchange reserves, low exports, high inflation,
growing fiscal deficit and current account deficit”.43
The political election cycle affects the advertising sector
MNC in Indonesia noted that the 2017 contraction in the advertising sector was
“expected to reverse and move upwards due to the forthcoming local and national
elections in 2018”.
GMA noted that “the drop in this year’s top line mainly due to the absence of the
non-recurring influx from the 2016 elections drove this year’s consolidated”
EBITDA margin.
2.9.3 Cost trends reflect investments to grow the business
All three broadcasters pointed to investments which have increased their costs
during their various investment cycles.
In 2016, MNC invested US$250 million to construct integrated studio buildings.
MNC claimed the investment meant “there will be no more significant capex for
many years to come”, and that it would leave MNC from 2017 with an “expanded
production capability”, and “high on-screen quality”. In 2018, MNC described the
outcome as having improved “operational synergy”, through the sharing of
infrastructure and facilities. MNC also increased its use of in-house production
capacity, enabling greater content production.44
In 2016 GMA’s high production costs were due to the production of a high-budget
fantasy soap opera, and election coverage.45
Pakistan’s HUM faced higher production costs in 2018 due to the launch of HUM
News, a new 24-hour news channel in Pakistan.46 This increase in costs (along
with the decline in advertising revenues) contributed to it making a loss in 2018.
However, it considered this investment strategy that created a cost “surge” was
nevertheless necessary to “compete and provide the best content for viewers”.47
2.9.4 Conclusion
Of the three broadcasters studied two were positively profitable for the whole
period studied since 2015, i.e. during the period of entry and growth of the OVSPs.
42 HUM Annual Report 2018, p. 35 43 See: https://www.humnetwork.tv/pdf_2019/Corporate%20Briefing%20Session%202019%20(Final).pdf, p.
18 44 MNC Annual Report 2018, p. 124 45 GMA Annual Report 2016, p. 45 46 HUM Annual Report 2018, p. 35 47 HUM Annual Report 2018, p. 35

frontier economics 35
BROADCASTERS ADAPTING TO DIGITAL TRANSFORMATION IN APAC
And one (HUM) was profitable for all the period except the most recent year where
it recorded a loss in 2018.
Analysis of the broadcasters’ statements suggest that the biggest drivers of
change in advertising revenues were macro-economic factors that affect
national advertising sectors.
All broadcasters have invested to grow their businesses (whether by investing
in content, or in facilities or new innovative services). While these investments
drive up costs in the short run, they also support future growth.
All broadcasters view digital technologies more as an opportunity than a threat.
Digital technologies offer opportunities to leverage their “local” content assets
to earn new revenues streams, or to improve their advertising proposition.
2.10 Conclusions and commentary
2.10.1 Sector wide issues have affected broadcasting providers
Growing broadband penetration has opened the sector to online entrants, but also
offered traditional broadcasters the opportunity to provide Video on Demand (VOD)
services to complement their linear service offering. However, in many countries
penetration of broadband is low, and the capabilities of broadband networks is
limited. As penetration of faster fixed broadband grows it would be expected that
the addressable customer base for VOD offerings (from both online service
providers and from traditional broadcasters) expands.
The switchover of terrestrial services from analogue to digital services has a
significant impact on FTA TV. Given the switch over requires consumers to
upgrade and purchase new equipment (or upgrade their aerial) there is a risk that
at switchover consumers instead migrate to Pay TV services offering more
channels, or to online services. Countries that have been able to achieve earlier
digital switchover will be better able to preserve their terrestrial TV base. Countries
that delay switch over may struggle to attract viewers (some European countries
such as Switzerland and Belgium) have already “switched off” their digital
terrestrial TV services due to lack of demand from viewers.
2.10.2 The size of TV sector has grown in most but not all countries
Overall, the TV sector in APAC region has shown strong growth. This has meant
that while new entrants have entered the sector and attract viewers and
subscribers, in most countries (but not all) other sectors, such as TV advertising or
Pay TV subscriptions have grown.
The trends in TV advertising revenues are mixed. Some countries, such as Sri
Lanka and Pakistan, have seen a gradual rise in TV advertising revenues amongst
broadcasters. But others have witnessed a decline in advertising revenues in the
broadcasting sector. In particular, Thailand and Malaysia have seen several years
of decline.

frontier economics 36
BROADCASTERS ADAPTING TO DIGITAL TRANSFORMATION IN APAC
Pay TV subscription revenues in the majority of countries observed have risen to
varying degrees since 2012. But in Thailand and Malaysia, subscription revenues
have also declined in several years.
2.10.3 Profit margins appear consistent with margins of broadcasters in other countries
The country weighted average EBITDA margins for the TV broadcasting sector in
all counties with the exception of Taiwan and Pakistan are the in the range 20% -
40% (though individual broadcaster EBITDA margins vary as seen in ANNEX E).
Indonesia, Malaysia, South Korea and Thailand have all seen small reductions
since 2015. Average profit margins of TV broadcasters at a country level have
been stable in most of the countries of interest, some with recent declines attributed
to higher content costs. Some countries, and in particular, Thailand, have
experienced a more persistent, downwards trend in profits over the past ten years
though average profit margin remain at 30% of revenues.
While benchmarking profit margins is complex, we observe that where TV
broadcasting profit margins have declined in APAC countries, they are still in line
with, or sometimes higher than profits of TV broadcasters in other developed or
middle-income countries. Further, margins of TV broadcasters are higher than
most aggregate industry average profit margins.
Macroeconomic factors have affected broadcast revenues. In particular in
Malaysia 2019 GDP per capita is only slightly above the level seen in 2012 and fell
in the period 2014-2015. These economy wide fundamentals will significantly affect
the advertising sector (which is “procyclical” in that it is influenced by the
macroeconomic change).

frontier economics 37
BROADCASTERS ADAPTING TO DIGITAL TRANSFORMATION IN APAC
3 BROADCASTERS ADAPTING TO DIGITAL TRANSFORMATION
While digital disruption is a challenge to broadcasters, it also offers opportunities
for “traditional” broadcasters. Traditional broadcasters can use broadband
networks to distribute their content, engage viewers, and consider/develop new
advertising propositions, as they are no longer limited by their distribution
technology (whether terrestrial transmission, satellite or cable) in providing content
to consumers.
We have identified several case studies of broadcasters that have adapted to
digital disruption in different ways. Of course, all broadcasters are different and not
all strategies will be appropriate for all. But what is clear is that broadcasters need
to revisit and adapt their strategies to reflect the changing consumer tastes and
habits, driven by technological advancement.
We have identified the following four case studies of broadcasters (identified below
in Figure 18) that have developed their strategies to reflect the technological
developments affecting the broadcasting sector – two from the region, and from
the UK. ANNEX F offers a full outline of the challenges faced by traditional
broadcasters and how our four case studies have responded.
Figure 18 Four case studies on broadcasters adapting to digital disruption
Broadcaster Country Description
Media Nusantara Citra (MNC)
Indonesia MNC is an Indonesian commercial advertising funded broadcasting group. It has 4 Free-To-Air channels – RCTI, MNCTV, GTV, and iNews – as well as 18 channels broadcast on Pay TV. RCTI is the most watched and widely broadcasted FTA station in Indonesia.48
TrueVisions Thailand TrueVisions is a cable and satellite television operator in Thailand owned by the True Corporation. It offers services both with and without monthly fees (the monthly fee grants access to extra channels).49
Channel 4 UK Channel 4 is a UK commercially funded publicly owned broadcaster. It has a public service remit that requires it “demonstrate innovation, experiment and creativity” and “exhibit a distinctive character” amongst other conditions
Sky UK Sky UK is a British broadcaster and telecommunications company, and is the largest Pay TV broadcaster in the UK, offering services through asset top box, and its service “Sky Q”
Source: Frontier
48 MNC Annual Report 2019, p. 128 49 See: https://www.bangkokpost.com/tech/289572/truevisions-launches-box

frontier economics 38
BROADCASTERS ADAPTING TO DIGITAL TRANSFORMATION IN APAC
Our case studies identified four trends in how successful broadcasters have
adapted.
Use of digital technologies to broaden their content offering to consumers
Use of digital technologies to deepen their engagement with consumers
Adapt their advertising proposition to compete with digital advertising
Diversify into offering new services
For each we set out below how digital disruption has challenged broadcasting and
then identify the strategies that have been adopted to mitigate the impacts.
3.1 Using digital technologies to broaden content offering to consumers
Traditional broadcasters have faced the entry of OVSPs who have the digital
means to provide a broad content offering. This challenges traditional broadcasters
in four key ways.
First, OVSPs offer instant access to a high volume of content, offering more
choice than can be found on linear schedules.
Second, compared to traditional broadcasting, OVSPs offer consumers more
choice over when to consume content through the ability to pause and replay.
Search capability enables consumers to find preferred shows and genres.
Third, OVSPs increasingly invest in the production and distribution of their own,
exclusive content. Netflix released 371 new TV series and movies in 2019.
Finally, OVSPs invest in new distribution technologies. Netflix offers Ultra-HD
quality in their premium edition.
We consider three key ways traditional broadcasters have responded to these
challenges.
Expand channel portfolio
Traditional broadcasters have expanded their channel range in order to meet rising
consumer’s expectations on breadth of content, by using the additional capacity
enabled by the switch to digital terrestrial transmission services to offer more
themed channels to viewers. These may be themed by genre, or a ‘timeshift’
variant to compete with the functionality offered by on demand. In this sense,
traditional broadcasters have responded to OTTs by expanding their offering using
the legacy distribution technology (terrestrial transmission) and the additional
capacity offered by DTT and capacity on satellite or cable platforms.
CASE STUDIES – BROADCASTERS EXPANDING CHANNEL PORTFOLIO

frontier economics 39
BROADCASTERS ADAPTING TO DIGITAL TRANSFORMATION IN APAC
Use distribution technologies to offer more choice on how content is viewed
Traditional broadcasters have adopted hybrid linear and online models of
distribution. They can compete directly with OVSPs by providing their content on-
demand, while at the same time maintaining the benefits of their linear schedule.
Many broadcasters now have a strategy of “everything everywhere” where they
offer their content on-demand (alongside their linear channels) on as many
platforms as possible.
Furthermore, traditional broadcasters have an important advantage relative to
OVSPs like Netflix and Amazon Prime. Unlike OVSPs, they have a large library of
local media content and can enter the online space with brand recognition.
CASE STUDIES – OFFERING ON DEMAND ALONG SIDE LINEAR
MNC claims it possesses around 40% of the total local content library in
Indonesia. By leveraging this, MNC’s on demand service RCTI+, which
launched on 23rd August grew to exceed 1 million monthly active users at the
end of September 2019, making it the fastest growing OVSP in the country. In
2020, the service is targeted to have more than 20 million MAU with an
estimated revenue of USD 30 million or 5 percent of total MNCN revenue. In
the next 4 years, digital revenues are targeted to represent 50% of the
company’s revenue. (This includes revenue earnt via YouTube as explored in
section 2.2).51
Thai broadcasting company, True Corporation’s digital media and internet
division, True Digital Group is responsible for overseeing the distribution of its
Pay TV broadcaster TrueVisions content to the digital space. They describe
their mission as “to drive innovation and capture growth opportunities arising
from the shift to the digital economy”.52 Since its launch, the TrueVisions
mobile app, TrueID, which offers live streaming of TrueVisions channels as
well as on-demand viewing, has become the most downloaded application in
its category, reaching 24.6 million monthly active users (MAU) by the end of
2019.53
The Pakistani FTA broadcaster HUM Network offers on-demand content and
live streaming via its website and mobile phone applications.
50 See Annex G for further detail on Channel 4’s channel expansion 51 See Annex G for figure sources here 52 True Annual Report 2019, p. 29 53 True Annual Report 2019, p. 8
Indonesian broadcaster MNC launched six new Pay TV channels in 2013,
expanding their total channel portfolio to 20 over Direct to Home (satellite)
platform.
Since 1998 the UK’s Channel 4 has expanded its channel portfolio to include
genre-specific, demographic-specific, and timeshifted channels.50

frontier economics 40
BROADCASTERS ADAPTING TO DIGITAL TRANSFORMATION IN APAC
Invest in content
As well as offering new channels and expansion into the digital space, traditional
broadcasters have responded to the increased breadth of content offered by
OVSPs through content investment. This has been particularly important given the
recent growth of OVSPs such as Netflix into content production/exclusive content.
In the APAC region, Netflix has invested in exclusive local film content. The
Indonesian movie “The Night Comes for Us” was released exclusively on Netflix in
Indonesia, and Netflix recently announced a partnership with the country’s Ministry
of Education and Culture to support the local film industry.54 The Filipino film
“Maria” was released exclusive on Netflix in the Philippines.
As noted above some broadcasters, including Intermedia Capital TBK in
Indonesia, attribute their decline in 2018 profitability to higher costs related to
developing local content.55 However, this investment benefits the Indonesian
broadcasting sector as a whole.
CASE STUDIES – INVESTING IN EXCLUSIVE HIGH QUALITY CONTENT
MNC has invested significant resources in broadcast and production facilities
that enable the company to produce programmes such as drama series,
animation (exported globally), and talent search shows like the Indonesian Idol,
The Voice, MasterChef, and Rising Star. This is the type of content that
traditional broadcasters have an advantage over OVSPs, due to the
large/universal reach/appeal of their offerings.
TrueVisions regained the rights to broadcast the English Premier League for
the 2019/20 and 2021/22 seasons.56
3.2 Using digital technologies to deepen engagement with customers
Digital disruption challenges traditional broadcasters as online video platforms use
digital technologies to deepen their engagement with customers. Consumers go
online to watch short-form content as an alternative to traditional broadcasters’
long-form content. These are increasingly popular amongst young people and
children in particular. Second, online video services allow for consumer interaction
such as through user-uploaded content, comments sections, and voting.
Traditional broadcasters innovate in content
Traditional broadcasters appeal to consumer of short-form content by creating clips
from their traditional long-form content and distributing them via their own on
demand services or YouTube.
54 See: https://e27.co/netflix-partners-with-indonesias-ministry-of-education-and-culture-to-boost-local-film-industry-20200109/
55 See: Intermedia Capital TBK 2018 Annual Report, page 24. 56 See: https://www.premierleague.com/news/1241698

frontier economics 41
BROADCASTERS ADAPTING TO DIGITAL TRANSFORMATION IN APAC
This short-form content serves a dual purpose of both earning revenue in its own
right and serving as a marketing tool to drive consumers both to the long-form
content, and to the broadcaster in general.
CASE STUDIES – OFFERING SHORT FORM CONTENT TO GROW REACH AND ENGAGEMENT
MNC operates a multi-channel network on YouTube which more than 2 billion
views generated every month. It has the fastest growing number of views and
subscribers in Indonesia. 5.5% of the total video viewership on YouTube in
Indonesia is MNC produced content.57
The TrueVisions YouTube channel has clips from TrueVisions shows and
currently stands at 2.3 million subscribers.58
Shows on Channel 4’s on-demand service All4 often feature a “Clips and Extras
tab” for shows where viewers can access short-form content taken from the
main show.
MNC’s on-demand service RCTI+ features behind the scenes, trailers, and
bloopers footage exclusive to the platform.
Offer interactive content
Traditional broadcasters use interactive functionality to create unique and
compelling content. This serves the purpose of enhancing the content of the core
program, as well as fostering greater consumer engagement, loyalty, and personal
attachment.
57 See: https://www.idx.co.id/StaticData/NewsAndAnnouncement/ANNOUNCEMENTSTOCK/From_EREP/201911/0648d12389_ab6d029fc2.pdf
58 See: https://www.youtube.com/user/TrueVisionsOfficial

frontier economics 42
BROADCASTERS ADAPTING TO DIGITAL TRANSFORMATION IN APAC
CASE STUDIES – OFFERING INTERACTIVE CONTENT
MNC’s on-demand service, RCTI+ has interactive content, a chat feature, quiz
voting, and live chat with “MNC talents”. It also features User Generated
Content features for talent search competitions such as Indonesian Idol, where
viewers can their upload audition tapes and vote on others’ performances. The
company’s User Generated Content platform MeTube currently has over 10
million monthly active users.59 Hence, the deep consumer interaction made
possible through digital technology may not just be complementary to, but
actually enhancing and made integral to longstanding traditional programming
such as talent search shows.
TrueID offers chat, voice, and video communication services.60
In 2019, TrueVisions launched TrueID In-Trend, a user-generated content
platform within TrueID. It promotes content created by Thai locals on topics
such as food, travel, fashion, and the latest news, categorised by regions. It
features 19,000 creators.61
Also, in 2019, TrueID launched TrueID Station, a 24-hour TV station available
on TrueID with original content and production, such as Influencer Live
Community where internet influencers give commentary on sports.62
TrueVisions partners with the personalisation, discovery, and
recommendations solution, ContentWise to power personalised
recommendations and discovery for the service, with the aim to increase
customer satisfaction and drive Pay TV revenues.63
Channel 4’s new reality TV show “Circle” has an app providing news alerts
about the show.
3.3 Adapting their advertising proposition
Traditional broadcasters rely on advertising either largely or wholly as their revenue
base. The rise of digital advertising has offered advertisers new channels to reach
consumers and importantly offers some benefits over other forms of display
advertising in terms of measurement and targeting. Broadcasters have invested to
offer “new value” added advertising propositions for advertisers. These can
combine the benefits of TV advertising (deep engagement with the viewer, broad
reach and allows advertisers to be associated with trusted TV brands).
59 See: https://www.idx.co.id/StaticData/NewsAndAnnouncement/ANNOUNCEMENTSTOCK/From_EREP/201911/0648d12389_ab6d029fc2.pdf We assume that “10 MAU” means 10 million MAU and that this is a mistake.
60 True Annual Report 2019, p. 29 61 True Annual Report 2019, p. 11 62 True Annual Report 2019, p. 11 63 See: https://www.multichannel.com/pr-feed/truevisions-chooses-contentwise-deliver-multiscreen-
personalization-thai-tv-viewers-391050

frontier economics 43
BROADCASTERS ADAPTING TO DIGITAL TRANSFORMATION IN APAC
CASE STUDIES - TARGETED ADVERTISING AND AUDIENCE MEASUREMENT
Filipino broadcaster GMA network recently partnered with Singapore Media
Exchange (SMX), a Singaporean advertising exchange that allows advertisers
to target their advertising based on audience segments, including
demographics such as interests such as “Travel”, “Finance”, and “Shopping”.64
In 2019, Channel 4 signed a deal with Sky to use their Ad Smart technology,
which targets ads to different customers watching the same program through
different TV cable terrestrial and satellite platforms. On All4, Channel 4’s
Project Agora allows advertisers to create their own customer audience
segments.
Sky’s AdSmart enables advertisers to place targeted advertising. The
technology inserts targeted advertising on set top boxes, live and pre-recorded
and during stream. In this way it can directly compete with online advertisers in
terms of the functionality of targeted advertising, whilst offering level of quality
and intensity made possible through its traditional medium.
Sky has invested in audience measurement and offers advertising products
which cross the linear and online inventory portfolio that it manages on behalf
of its own broadcast and third parties.
TV broadcasters are consolidating their advertising sales
In order to provide a more compelling proposition to advertisers, traditional
broadcasters are consolidating the sale of advertising with other broadcasters and
other related suppliers of advertising to offer more efficient advertising
opportunities.
CASE STUDIES - CONSOLIDATING ADVERTISING SALES
Filipino broadcasters GMA network recently partnered with Singapore Media
Exchange (SMX), a Singaporean advertising exchange that leverages the
content of multiple media companies across South-East Asia in their offer to
advertisers. GMA hopes the partnership will enable them to expand their reach
outside of the Philippines.65
Via 4sales, Channel 4 sells advertising on behalf of a number of other channels
(i.e. it consolidates advertising), including all UKTV Channels (Alibi, Dave,
Drama, Eden, Yesterday, Gold, and W), as well as HGTV, Really, BT Sport,
and The Box Plus Network. This gives the channel greater bargaining power
when competing for advertisers.
Sky sells advertising on behalf of a number of broadcasters including MTV,
Nickelodeon, and Comedy Central. Sky Advance enables advertisers to
leverage broadcasting and non-broadcast advertising.
64 See: https://smx.sg/segments 65 See: https://www.channelnewsasia.com/news/singapore/singapore-media-exchange-expands-to-include-
new-media-and-11406750

frontier economics 44
BROADCASTERS ADAPTING TO DIGITAL TRANSFORMATION IN APAC
3.4 Diversifying commercial offering
Finally, broadcasters have diversified into offering new commercial services which
use digital technologies. Successful broadcasters view digital disruption as an
opportunity to develop incremental revenue streams. Broadcasters can exploit
their competitive advantages for example in local content by licensing content to
international OVSPs to reach global audiences, or local online platforms for local
consumption.
CASE STUDIES – DIVERSIFYING COMMERCIAL OFFERING
In 2019, MNC reached a deal with iflix to license 10,000 hours of its content to
the OVSP.66
MNC signed an agreement67 with Facebook to obtain 55% of digital advertising
revenues from their content on the site. (Such an agreement is commonplace
for large YouTube content creators).68
GMA has entered into content provisioning agreements with OVSPs HOOQ
and iflix, providing the company an extra revenue stream via the monetisation
of existing content.69
In 2015, HUM saw content monetisation in the digital space as “an avenue for
high growth”, and, that year, entered into a partnership with the Indian OVSP
ErosNow to licence its content.70 HUM made a similar agreement with iflix in
2016, with iflix stating the purpose being to provide “some of the best Pakistani
content to millions of keen internet users across the globe”, and “introduce
Pakistan’s popular soaps to a new digital generation of South Asians
globally”.71
In 2019, TrueVisions launched a privilege and loyalty platform called TrueYou.
Customers can earn TruePoints to spend on deals in TrueID. True Corporation
comments that this has “greatly enhanced customer retention and quality
subscriber growth”.72
The UK’s Channel 4 offers 4+, an ad-free version of its SVOD service “All4” for
£4 a month (compared to £9 for Netflix Standard and £6 for Amazon Prime
Video).
66 See: https://blog.iflix.com/wp-content/uploads/2019/05/MNC-x-iflix-FINAL.pdf 67 See:
https://www.idnfinancials.com/news/34020/mnc-signs-agreement-facebook-digital-advertising-revenue 68 See: https://www.investopedia.com/articles/personal-finance/032615/how-youtube-ad-revenue-works.asp 69 GMA Annual Report 2018, p. 54 70 HUM Network Annual Report 2015, p. 15 71 See: https://blog.iflix.com/wp-content/uploads/2018/02/2016.12.27.IFLIX-SIGNS-MULTI-YEAR-DEAL-
WITH-PAKISTAN%E2%80%99S-TOP-NETWORKHUM-TV.pdf 72 True Annual Report 2019, p. 232

frontier economics 45
BROADCASTERS ADAPTING TO DIGITAL TRANSFORMATION IN APAC
4 REGULATORY AND POLICY BEST PRACTICE IN THE BROADCASTING SECTOR
4.1 Introduction
Under certain conditions, competitive dynamics steer markets towards efficient and
welfare maximising outcomes without the need for public intervention. Markets
characterised by low barriers to entry, low transaction costs and well-informed
consumers require typically limited interference from public bodies.
In practice, however, markets exist within a broad and dynamic spectrum of
competitive conditions. Government policy interventions on a market seek to
achieve a specific public policy objective, such as distributional objectives or the
promotion of social or cultural values.
We set out below:
Public policy interventions in broadcasting sectors
Best practice on when to intervene
Examples of best practice in assessing whether, and how, to intervene
4.2 Public policy interventions in broadcasting sectors
Policy restrictions on cultural content in broadcasting sectors can take many forms.
Policy makers use the restrictions to promote cultural policy or economic aims.
Different countries may consider different objectives when they set cultural policy
measures affecting local content production and distribution sectors. Therefore, a
range of different measures have been implemented. There are three broad types
of measures applied to national content production and distribution sectors.
Cultural protections
These measures aim to promote the local culture, or particular aspects of the local
culture through the production and distribution of audio-visual content. For
example, the local audio-visual authority may impose a minimum quota on the
proportion of locally produced/distributed content. Alternatively, a maximum quota
might be imposed on the share of foreign-produced programming which is aired by
domestic broadcasters.
Language protections
Language protections restrict the amount of audio-visual content produced and
distributed in foreign language, or to ensure a certain level of content is distributed
in a second language (such as French in Canada). Language protections can take
the form of quotas similar to those used for cultural protections. But language

frontier economics 46
BROADCASTERS ADAPTING TO DIGITAL TRANSFORMATION IN APAC
protections can be imposed in terms of requirements for foreign language content
to be dubbed in local language, or as taxes on hours of foreign language content
broadcasted on TV or the number of foreign films shown in cinemas.
Industrial policies
These measures are types of fiscal policy aimed at bolstering the local content
production and distribution sectors. For example, a government may grant
subsidies to local content producers and distributors to reduce their exposure to
foreign competitors with greater scale or resources, or to make local companies
more internationally competitive.
4.3 Best practice on when to intervene
The rationale for intervention relies on weighing its expected benefits against the
associated costs. From an economic theory perspective, intervention should be
limited to instances where the costs of a prevailing inefficient market outcome
outweigh the distortive effects of a proposed remedy. Possible unintended
consequences (both present and future) should also factor into this cost-benefit
analysis.
The rationale for government policy should be built upon a specific business case
such as a particular policy objective or to correct an inefficient market outcome (i.e.
market failure). UK government policy making follows the Five Case Model for
preparing business case for intervention proposals, as summarised in Figure 19.
Figure 19 The Five Case Model for government policy interventions
Dimension Assessment
Strategic What is the case for change, including the rationale for intervention?
What is the current situation? What is to be done? What outcomes are expected? How do these fit with wider government policies and objectives?
Economic What is the net value to society of the intervention compared to continuing with Business as Usual? What are the risks and their costs, and how are they best managed? Which option reflects the optimal net value to society?
Commercial Can a realistic and credible commercial deal be struck? Who will manage which risks?
Financial What is the impact of the proposal on the public sector budget in terms of the cost of both capital and revenue?
Management Are there realistic and robust delivery plans? How can the proposal be delivered?
Source: The Green Book, HM Treasury
Policy makers should seek to ensure their policies support competition but should
not design policies to “protect competitors”. Therefore, a goal to “level the playing
field” should not be an end in itself. Rather policy makers should seek to implement
their policy objectives in a way that is:
Effective: it achieves the objectives that it intends to, and avoids unintended
consequences, and supports competition;

frontier economics 47
BROADCASTERS ADAPTING TO DIGITAL TRANSFORMATION IN APAC
Efficient: it achieves the objectives either at lowest cost, or in a way that
efficiently weighs up the relative costs and benefits of different approaches; and
that the impacts are proportionate to the intended benefit; and,
Evidence based: it is based on sound evidence and industry stakeholders
have the opportunity to contribute to the decision-making process.
Any intervention will have costs (whether to taxpayers, consumers, or in the private
sector). Sometimes these may be direct costs (tax, higher prices, or higher
production costs). Though in other cases costs may be indirect. They may be costs
associated with lower competition (such as higher prices, less choice, or lower
quality), or a loss of incentives to invest and innovate. It is likely that interventions
that limit competition or supress investment will impose significant (indirect) costs.
In assessing the case for intervention, policy makers should therefore carefully
consider the costs of intervention (both direct and indirect), and the benefits. It is
inevitable that policy interventions will impose different costs on different sector
participants (depending on size, business strategy etc). Interventions that are
effective, proportionate, and preserve and promote competition, are likely to be
more appropriate than interventions which aim to impose uniform costs on all
sector participants (i.e. to level the playing field), regardless of the effectiveness or
proportionality or impact on competition.
4.4 Examples of best practice in intervention
There are several examples of tools that policy makers can use to ensure that their
interventions are effective, efficient, evidence based, and that they support
competition, (not designed to protect competitors). We have identified five
examples three from the UK and two from the Asia-Pacific region.
Example #1: Provide clarity on the process for assessing costs and
benefits of policy interventions - UK investment manual applied to all policy
makers
Example #2: Consider the costs of intervention (including costs of
unintended consequences) and consider non-intervention as an option -
Ofcom’s policy appraisal framework
Example #3: Review of the costs and benefits of public service
broadcasting obligations in changing market conditions Ofcom review of
Public Service Broadcasting
Example #4: Consider levelling down rather than levelling up, and apply
regulation proportionately - Hong Kong Commerce and Economic
Development Bureau Review of the Broadcasting Ordinance and the
Telecommunications Ordinance
Example #5: Apply regulation which is specific to the market context -
Malaysia Communications and Multimedia Commission Licensing Guidebook,
March 2018 Update

frontier economics 48
BROADCASTERS ADAPTING TO DIGITAL TRANSFORMATION IN APAC
4.4.1 Example #1: Provide clarity on the process for assessing costs and benefits of policy interventions - UK investment manual applied to all policy makers
Appraisal is the process of assessing the costs, benefits and risks of alternative
ways of meeting the objectives of the intervention. The UK Government publishes
a manual that all government ministries and other public sector bodies must follow
when implementing policy. This ensures the best practice is followed, that risks
and unintended consequences can be identified and mitigated, and that
stakeholders understand the process of policy making and the options for
engagement. It ensures that policy decisions are based on sound, rational and
evidenced based analysis.
UK GOVERNMENT INVESTMENT MANUAL
In the UK government policy interventions must go through a robust appraisal
process before a solution is implemented. This process with reference to The
Green Book. The Green Book provides detailed guidance that all parts of the UK
government must adhere to when implementing policy that has costs either for
taxpayers or costs imposed on industry.
Appraisal is the process of assessing the costs, benefits and risks of alternative
ways of meeting the objectives of the intervention. Figure 20 summarises each
step of the appraisal process within The Green Book’s best-practice policy-making
guidelines.

frontier economics 49
BROADCASTERS ADAPTING TO DIGITAL TRANSFORMATION IN APAC
Figure 20 Principles for effective government policy appraisal
Source: Frontier Economics, based on The Green Book.
4.4.2 Example #2: Consider the costs of intervention (including costs of unintended consequences) and consider non-intervention as an option - Ofcom’s policy appraisal framework
Ofcom’s (the UK broadcasting and telecoms regulator) regulatory principles73
include a ‘bias against intervention’, recognising that ‘the effects of regulation and
its unintended consequences may be worse than the effects of the imperfect
market’.
Ofcom has published guidelines on how it will assess policies that it implements.
Some of the guiding principles that Ofcom adopts in its impact assessments are
set out in the box below.
73 Ofcom’s Annual Plan 2005/6 Consultation document

frontier economics 50
BROADCASTERS ADAPTING TO DIGITAL TRANSFORMATION IN APAC
OFCOM’S APPROACH TO IMPACT ASSESSMENT
“The decisions which Ofcom makes can impose significant costs on our
stakeholders and it is important for us to think very carefully before adding to the
burden of regulation. One of our key regulatory principles is that we have a bias
against intervention. This means that a high hurdle must be overcome before we
regulate. If intervention is justified, we aim to choose the least intrusive means of
achieving our objectives, recognising the potential for regulation to reduce
competition. These guidelines explain how Impact Assessments will be used to
help us apply these principles in a transparent and justifiable way.
The option of not intervening…should always be seriously considered.
Sometimes the fact that a market is working imperfectly is used to justify taking
action. But no market ever works perfectly, while the effects of…regulation and
its unintended consequences, may be worse than the effects of the imperfect
market.
Impact Assessments form a key part of best practice policy making, which is
reflected in our statutory duty to carry them out. They provide a way of
considering different options for regulation and then selecting the best option. In
selecting and analysing options, the need to further the interests of citizens and
consumers is of paramount importance.
Impact Assessments are also useful tools for reviewing existing regulation. They
provide a framework for weighing up the costs and benefits of removing
regulation, as well as analysing other options.”
4.4.3 Example #3: Examples in the broadcasting sphere – Review of the costs and benefits of public service broadcasting obligations in changing market conditions
In the UK broadcasting sector, the Public Service Broadcasting (PSB) remit is an
intervention designed to require broadcasters to behave in ways that promote a
number of public policy goals.74 The UK broadcasting regulator has an obligation
to review the costs of the public policy obligations that are imposed on PSBs at
periodic intervals.
However, importantly Ofcom weighs up the benefits that accrue to PSB
broadcasters against the costs. In fulfilling PSB obligations (together with licencing
commitments), PSB channels receive a number of regulatory benefits including the
use of spectrum for transmission of their services (DTT) under preferential terms,
prominence on electronic programme guides (EPGs) and, in the BBC’s case,
licence fee revenues.
The UK regulator is required to periodically assess whether the benefits that the
PSB broadcasters receive are proportionate to the costs. In this way the regulator
can take account of changes in market conditions that affect broadcasters, to
74 Goals include media policy (provision of accurate news or children’s programming); social (serving all audiences including minorities); or economic (promoting independent producers). Private and public television channel broadcasters that contract into the PSB remit have a number of duties, see House of Lords Select Committee on Communications and Digital; ‘Public service broadcasting: as vital as ever’

frontier economics 51
BROADCASTERS ADAPTING TO DIGITAL TRANSFORMATION IN APAC
enable it to make rational and proportionate suggestions on how broadcasters can
undertake their PSB activities in such a way that the costs are proportionate to
benefits in a changing environment
In its latest five-year review75 (February 2020) Ofcom took a particular focus on
how the broadcasting sector has changed in the digital age and the challenges to
PSB continued effectiveness. The review found that the growth of global streaming
services has increased demand for high production value content which has, in
turn, increased cost pressures facing PSBs. In addition, younger audiences are
less connected to PSB’s live broadcast format and are accessing content that
contributes to PSB objectives through online streaming services.
4.4.4 Example #4: Consider levelling down rather than levelling up, and apply regulation proportionately - Hong Kong Commerce and Economic Development Bureau Review of the Broadcasting Ordinance and the Telecommunications Ordinance
Hong Kong’s Commerce and Economic Development Bureau (CEDB) conducted
a review of its television and sound broadcasting regulatory regime in 2018 as part
of a modernisation exercise in light of “infotainment evolution [the rise of the
internet and OVSPs as a substitute form of entertainment]”.76 As part of the review,
it sought the views of members of the public, the broadcasting industry, and other
stakeholders.77
The review considered the “Imbalance in Regulatory Regimes” between traditional
broadcasters and OVSPs.78 It considered that traditional broadcasters are subject
to “stringent controls under the existing regulatory regime”, the intention of which
is to “promote competition, encourage plurality of views and programming
diversity… to forestall concentration of media ownership and control, conflict of
interest and editorial uniformity across different media platforms.”79, 80
The CEDB concluded that “the imbalance in the regulatory regimes is self-
evident”81 and that this imbalance has hindered innovation, and deterred
newcomers.82
However, it considered two important factors. Firstly, to the extent that regulations
on traditional broadcasters are particularly stringent, the CEDB’s review makes
75 Small Screen: Big Debate – a five-year review of Public Service Broadcasting (2014-2018). 76 Hong Kong Commerce and Economic Development Bureau, Review of Television and Sound Broadcasting
Regulatory Regimes, Consultation Paper, at 15 (Feb. 2018). See: https://www.cedb.gov.hk/ccib/eng/paper/pdf/BOTOReview_1%28eng%29.pdf
77 Hong Kong Commerce and Economic Development Bureau, Review of Television and Sound Broadcasting Regulatory Regimes, Consultation Paper, at 15 (Feb. 2018), p. 1
78 Ibid, p. 13 79 Ibid, p. 20 80 Traditional broadcasters must fulfil conditions around channel line-up, broadcasting hours and language,
broadcast specified types of programme such as current affairs and news, investment plan on programming and capital expenditure, submission of audited accounts, etc. Comparatively, online video service providers are exempt from these regulations. Online video service providers face controls only against “repulsive content”, similar to books and movies. Ibid, p. 14
81 Ibid, p. 14 82 Ibid, p. 18

frontier economics 52
BROADCASTERS ADAPTING TO DIGITAL TRANSFORMATION IN APAC
clear its intention to ‘level down regulation’ rather than level up. In other words, the
review concludes that “internet TV and radio program services [OVSPs] should
remain not subject to the any of the controls that solely affect traditional
broadcasters” whilst there is “room for relaxation as regards individual restrictions
imposed on traditional broadcasters”. For example, relaxing foreign shareholding
restrictions in free TV licences.83
Further, the CEDB considers that the emergence of OVSPs has made it possible
for ownership regulations intended to prevent the monopolisation of traditional
broadcasting to be relaxed. They comment, “in the era of OTT infotainment, the
chances of having a single licensee monopolising the whole media market would
be slim”84, and so restrictions on the license holding should be “further adjusted to
encourage cross-sector fertilisation and enable economy of scale”.85
The review therefore does not recommend increased regulation on OVSPs.
Secondly, the CEDB concludes that, even accounting for the proposed relaxation
on traditional broadcasters, a general imbalance between regulatory regimes is
inevitable, and indeed desirable: “free TV services should be subject still to
relatively the most stringent control, to be followed by Pay TV and sound
broadcasting”.86 Importantly, as shown below in Figure 34 they set out their criteria
concerning the appropriate degree of control over different broadcasting content
across different mediums:
Figure 34 CEDB criteria for considering the appropriate degree of control over different broadcast content carried by different media
Dimension Assessment
Pervasiveness, Popularity, and Influence
Whether broadcast content is easily assessable by local
households and its degree of pervasiveness on the viewing
public
Impact on Minors Whether broadcast content can easily reach and influence
children and young people
Personalised Content for Viewers/Listeners
Whether individual viewers/listeners may choose to access
broadcast content of their choices anytime anywhere
Uniqueness/Presence of Alternatives
Whether the broadcasting service is unique and whether
there are alternatives to replace such services, and the
number/accessibility of such alternatives
The CEDB comments that,
“Generally speaking, the more pervasive (in terms of signal coverage and popularity), the more impactful, the more accessible (e.g. watchable by just turning on a TV set) and the more monopolised (in terms of the lack of alternative forms of infotainment/broadcasting) a service is, the higher the degree of control is warranted as the mass public, including children and young people, are more susceptible to its influence. Over the years, therefore, free TV services, as the major, unique sources of infotainment the reception of which is free and spontaneous upon installation of the
83 Ibid, p. 49 84 Ibid, p. 26 85 Ibid, p. 27 86 Ibid, p. 17

frontier economics 53
BROADCASTERS ADAPTING TO DIGITAL TRANSFORMATION IN APAC
equipment, are subject to the most stringent control, followed by Pay TV and sound broadcasting.”87
After scrutinising the existing regulatory regimes, they conclude that the existing
framework is “proportionate and reasonable”88, and that the difference in regulation
between traditional broadcasting and OVSPs is “commensurate with the
accessibility and impact of and influence commanded by each type of the
broadcasting services”.89
Hence, when considering intervention in broadcasting sectors, policy makers
should consider the qualitative differences between different forms of distribution,
and the implications this has for regulation.
4.4.5 Example #5: Apply regulation which is specific to the market context - Malaysia Communications and Multimedia Commission Licensing Guidebook, March 2018 Update
The Malaysia Communications and Multimedia Commission Licensing Guidebook
(MCMC) has explicitly exempted internet content applications services from its
licensing regime after considering the specific market context.90
Under the 1988 Communications and Multimedia Act, one of the four licensable
activities is “Content Applications Service Providers”. These represent “a special
subset of applications service providers such as television and radio broadcast
services, and services such as online publishing (currently exempt from licensing
restrictions) and the provisioning of information services”.
This is the licensable activity online service providers would fall into if they were
not exempt.91 Content application service providers can be regulated by MCMC
either as an individual licence – “requiring a high degree of regulatory control which
is for a specified person to conduct a specified activity and may include special
conditions” or a weaker class licence – “a ‘light-handed form of regulation which is
designed to promote industry growth and development with easy market access”.
Terrestrial free to air TV and satellite broadcasting amongst other services fall into
the individual licence category, whilst “a content applications service where the
content is remotely generated and distributed through a network service and
displayed on a screen” amongst other services falls into the class licence category.
“Internet content applications services”, however, which includes OVSPs, are
specifically exempt.
The MCMC therefore approaches regulation differently depending on the form of
distribution of media content. Also, like the CEDB, online video services providers
87 Ibid, p. 17 88 Ibid, p. 17 89 Ibid, p. 17 90 Malaysia Communications and Multimedia Commission Licensing Guidebook, March 2018 Update, p. 6,
https://www.mcmc.gov.my/skmmgovmy/media/General/pdf/Licensing_Guidelines_Mar2018.pdf 91 Ibid, p. 6

frontier economics 54
BROADCASTERS ADAPTING TO DIGITAL TRANSFORMATION IN APAC
are exempt from licensing conditions faced by traditional broadcasters, such as
restrictions on foreign ownership92 and transparency about financing.93
4.5 Conclusion
It is common for policy makers to wish to intervene in broadcasting sectors to
achieve a range of cultural, social or economic objectives. However, policy
interventions can be costly to taxpayers, consumers, and firms. Risks of
unintended consequences can be high, especially in fast moving sectors subject
to rapid technological change.
Therefore, it is best practice for policy makers to intervene cautiously. This does
not mean that policy makers should “surrender to the markets”. Rather it means
that policy makers should be required to clearly state the objectives of any
intervention, then to identify and assess the most proportionate, and cost-effective
approach to intervention. Our report highlights some examples of best practice in
policy making. These examples highlight the risks of intervention and impose
rigorous structure on policy makers in making policy assessments.
Policy makers should similarly be cautious of claims of sector participants to “level
the playing field”. Such claims can be motivated by sector participants’
(understandable) desire to raise rivals’ costs, rather than to achieve public policy
goals. Incautious intervention can choke off investment, competition and
innovation, and lead to unintended consequences (e.g. higher prices for
consumers to recover higher costs). Our two examples from the Asia-Pacific region
also highlight how the context in which OVSPs operate is different from that of
traditional media, and how this differing context may be relevant for determining
the correct regulatory requirements.
92 Ibid, p. 7 93 Ibid, p. 12

frontier economics 55
BROADCASTERS ADAPTING TO DIGITAL TRANSFORMATION IN APAC
ANNEX A ONLINE VIDEO SERVICE PROVIDERS IN APAC Figure 21 OVSPs by country
Country Key OVSPs Country Key OVSPs
Indonesia Amazon Prime Video
Genflix
HBO Go
Hooq
Iflix
MNCNow
Netflix
Viu
South Korea Amazon Prime Video
Kakao TV
Netflix
Wavve
Watcha Play
Malaysia Amazon Prime Video
Apple TV+
Dimsum
Eros Now
HBO Go
Iflix
Netflix
Njoi Now
Unifi Play TV
Viu
YuppTV
Taiwan Amazon Prime Video
Apple TV+
CatchPlay
ELTA OTT TV
Friday
Fox+
Hami Video
IQiyi
LiTV
Netflix
Pakistan Netflix
Icflix
Iflix
[others tbc]
Sri Lanka Netflix
Iflix
[others tbc]
Philippines Amazon Prime Video
Apple TV+
Fox+
HBO Go
Hooq
Iflix
IWant
Netflix
Viu
Thailand Amazon Prime Video
Apple TV+
Doonee
HBO Go
Hooq
Iflix
Netflix
Viu
Vietnam Amazon Prime Video
Clip TV
HBO Go
Iflix
IQiyi
Netflix
Source: Media Partners Asia

frontier economics 56
BROADCASTERS ADAPTING TO DIGITAL TRANSFORMATION IN APAC
ANNEX B FTA BROADCASTERS IN APAC Figure 22 Key Free-to-Air networks in the APAC region
Country Key FTA networks (ownership)
Country Key FTA networks (ownership)
Indonesia TVRI (public)
SCTV (commercial)
RCTI (commercial)
Indosiar (commercial)
MNCTV (commercial)
Trans 7 (commercial)
Metro TV (commercial)
Philippines ABS-CBN (commercial)
GMA Network (commercial)
ETC (commercial)
People’s Television (public)
South Korea
KBS (public)
MBC (public)
SBS (commercial)
EBS (commercial)
JTV (commercial)
Sri Lanka SLRC (public)
ITN (public)
TV Derana (commercial)
Hiru TV (commercial)
Sirasa TV (commercial)
TNL (commercial)
ART TV (commercial)
Swarnavahini (commercial)
Shakthi TV (commercial)
Malaysia RTM (public)
TV3 (commercial)
ntv7 (commercial)
8TV (commercial)
TV9 (commercial)
Taiwan CTV (commercial)
TTV (commercial)
FTV (commercial)
PTS (public)
Pakistan Pakistan TV Corporation Ltd (public)
Geo TV (commercial)
ARY Digital (commercial)
ATV (semi-commercial)
Aaj TV (commercial)
Indus TV (commercial)
Thailand Thai TV3 (public)
TV5 (military)
BBTV Channel 7 (military)
ModerNine (public)
TPBS (public)
Vietnam VTV (public)
Source: BBC Media Landscape

frontier economics 57
BROADCASTERS ADAPTING TO DIGITAL TRANSFORMATION IN APAC
ANNEX C PAY TV BROADCASTERS IN APAC
Figure 23 Key Pay TV networks in the APAC region
Country Key Pay TV networks (Satellite/ Cable/ IPTV/ Mix)
Country Key Pay TV networks
Indonesia MNC Vision (S)
Link Net (C)
Transvision (S)
IndiHome (I)
Philippines Cignal TV (S)
Converge ICT (C)
Globe Telecom (C)
PLDT (C)
SkyCable (M)
South Korea CJ Hello (C)
D’Live (C)
HCN (C)
Tbroad (C)
KT SkyLife (S)
KT (I)
SK Telecom (I)
LG U+ (I)
Sri Lanka Dialog TV (S)
Sri Lanka Telecom (I)
Malaysia Astro Malaysia (M)
Telekom Malaysia (I)
Taiwan CNS (C)
Kbro (C)
TBC (C)
Taiwan Mobile (C)
Chunghwa (I)
Pakistan PCTL (I)
WorldCall Telecom (C)
Thailand AIS (M)
Jasmine (C)
True Corp. (M)
Vietnam VSTV [aka K+] (S)
SCTV (C)
VTV Cable (C)
MobiTV (S)
MyTV (I)
VNPT (C)
FPT Telecom (I)
Viettel Telecom (M)
Source: Asia Pacific Pay TV Distribution 2020: The future of Pay TV & fixed broadband in Asia, Media Partners Asia, 2020.
Note: MPA defines Pay TV as the distribution of TV channels for a subscription fee, often combined with ancillary services, including high definition (HD) TV, video-on-demand (VOD), pay-per-view (PPV), near video-on-demand (NVOD) and digital video recorders (DVRs).
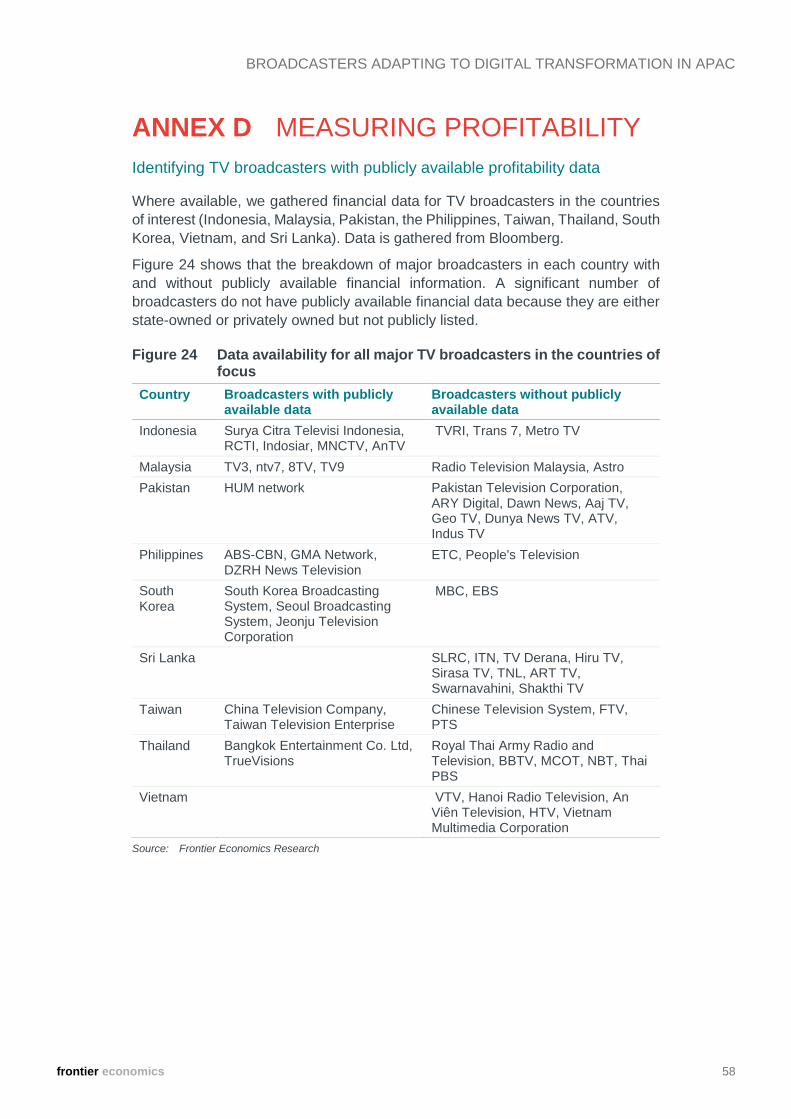
frontier economics 58
BROADCASTERS ADAPTING TO DIGITAL TRANSFORMATION IN APAC
ANNEX D MEASURING PROFITABILITY
Identifying TV broadcasters with publicly available profitability data
Where available, we gathered financial data for TV broadcasters in the countries
of interest (Indonesia, Malaysia, Pakistan, the Philippines, Taiwan, Thailand, South
Korea, Vietnam, and Sri Lanka). Data is gathered from Bloomberg.
Figure 24 shows that the breakdown of major broadcasters in each country with
and without publicly available financial information. A significant number of
broadcasters do not have publicly available financial data because they are either
state-owned or privately owned but not publicly listed.
Figure 24 Data availability for all major TV broadcasters in the countries of focus
Country Broadcasters with publicly available data
Broadcasters without publicly available data
Indonesia Surya Citra Televisi Indonesia, RCTI, Indosiar, MNCTV, AnTV
TVRI, Trans 7, Metro TV
Malaysia TV3, ntv7, 8TV, TV9 Radio Television Malaysia, Astro
Pakistan HUM network Pakistan Television Corporation, ARY Digital, Dawn News, Aaj TV, Geo TV, Dunya News TV, ATV, Indus TV
Philippines ABS-CBN, GMA Network, DZRH News Television
ETC, People's Television
South Korea
South Korea Broadcasting System, Seoul Broadcasting System, Jeonju Television Corporation
MBC, EBS
Sri Lanka
SLRC, ITN, TV Derana, Hiru TV, Sirasa TV, TNL, ART TV, Swarnavahini, Shakthi TV
Taiwan China Television Company, Taiwan Television Enterprise
Chinese Television System, FTV, PTS
Thailand Bangkok Entertainment Co. Ltd, TrueVisions
Royal Thai Army Radio and Television, BBTV, MCOT, NBT, Thai PBS
Vietnam
VTV, Hanoi Radio Television, An Viên Television, HTV, Vietnam Multimedia Corporation
Source: Frontier Economics Research

frontier economics 59
BROADCASTERS ADAPTING TO DIGITAL TRANSFORMATION IN APAC
ANNEX E PROFITABILITY AND SECTOR TRENDS BY COUNTRY We set out below data on the outcomes in APAC countries.
Section E.1 describes the broadcasting sector in Vietnam
Section E.2 describes the broadcasting sector in Pakistan
Section E.3 provides high level summary data for other APAC sectorS: Sri
Lanka, Indonesia, Malaysia, Philippines, Taiwan, Thailand, and South Korea.
E.1 Deep dive on Vietnam
Vietnam’s broadcasting sector beckons stronger competition
The broadcasting sector in Vietnam shows signs of increasing competition. This
comes in the wake of a prolonged period of steady, strong growth in GDP per
capita (see Figure 26), fast improving broadband penetration, and a recent ASO.
All three factors suggest that consumers may be more able and willing to watch
and subscribe to broadcasters.
But Vietnam’s broadcasting sector also faces challenges. Piracy of TV content is
prevalent, with the regulator recently being forced into action.94 And the sector
regulator, MIC, imposes tight restrictions on Pay TV broadcasters. For example,
any content subverting national, cultural or religious values is not allowed.95
In 2019 content investment declined from US$488 mil in 2018 to US$468 mil.
However, content investment remains higher than in 2017.96
Multiple OVSPs operate in Vietnam. This includes global players such as Netflix,
which entered in 2016. The regional OVSP, iflix, entered the country shortly after
in 2017. But several local players operate in Vietnam too, such as FPT Play and
ClipTV. Total subscriptions to OVSPs have risen 42% since 2015 but stand at only
10 subscriptions per 1000 households. Investment spend in the sector is estimated
at less than US$6 mil in 2019, with little content created specifically for OVSPs.97
Advertising revenues are strained for FTA broadcasters
Vietnam’s FTA sector, consisting of 131 channels, is made up solely of state-
owned broadcasters. The key broadcasters are Vietnam Television (VTV), which
broadcasts 6 TV channels with a combined audience share of 22%. HTV airs five
channels with a combined audience share of 13%. THVL airs 2 channels with a
combined audience share of 7%. They are tightly regulated by the government,
with advertising minutes capped at 5% of daily broadcast airtime. Broadcasters
use a mix of transmission systems.
94 Vietnam Tackles Online Piracy with More Assertive Regulation and Practice. Lexology. June, 2020. 95 Asia Pacific Pay TV distribution 2020. Media Partners Asia. 2020 96 Asia Pacific Video Content Dynamics. Media Partners Asia. 2020. 97 Asia Pacific Video Content Dynamics. Media Partners Asia. 2020

frontier economics 60
BROADCASTERS ADAPTING TO DIGITAL TRANSFORMATION IN APAC
Given that no Vietnamese FTA broadcasters are publicly listed, this report does
not investigate how their profitability has been affected as Pay TV operators grow,
and OVSPs enter the sector.
However, Figure 25 illustrates how overall advertising revenues of FTA
broadcasters in Vietnam have evolved since 2014. The trend in FTA advertising
revenues suggests that FTA broadcasters may have lost revenues as a result of
big OVSPs like Netflix entering the sector. Though even before the entry of Netflix
in 2016, FTA revenues from advertising looked to be stagnant. Furthermore, Pay
TV revenues from advertising exhibit a slightly different trend.
Vietnam’s Pay TV broadcasters are adjusting to online disruption
62% of Vietnamese television-owning households access Pay TV services, and
the audience shares of FTA and Pay TV split evenly between the two in 2019.98 In
key metropolitan areas including Ho Chi Minh City, Hanoi, and Danang Pay TV
penetration exceeds 80%.99 The two main Pay TV operators, VTVcab and SCTV
directly operate or sponsor most popular local Pay TV channels. VTVcab is the
Pay TV platform affiliate of VTV, whilst SCTV is owned by Saigon Tourist Holding
Company and VTV.
While advertising revenues have fallen amongst FTA broadcasters in Vietnam
advertising revenues have remained relatively flat amongst Pay TV broadcasters.
Pay TV subscription revenues are growing strongly and overtook FTA advertising
revenues in 2017. Moreover in 2019, where subscriptions to Pay TV broadcasters
showed signs of plateauing, revenues from subscriptions continued to grow,
suggesting some increase in profitability for Pay TV broadcasters. But growth in
both subscriptions and subscription revenues has slowed slightly in recent years.
Figure 25 Broadcasting revenues and subscribers in Vietnam
Source: Media Partners Asia
98 Asia Pacific Video Content Dynamics. Media Partners Asia. 2020. 99 Asia Pacific Video Content Dynamics. Media Partners Asia. 2020.

frontier economics 61
BROADCASTERS ADAPTING TO DIGITAL TRANSFORMATION IN APAC
Figure 26 GDP per capita in Vietnam
Source: Telegeography
E.2 Deep dive on Pakistan
Pakistan’s broadcasting sector is less developed than in other countries
Pakistan’s broadcasting sector lags others within the APAC region. This is primarily
because DTH Satellite penetration has been slow to launch amongst Pay TV
broadcasters, meaning 99% of pay TV connections are via cable.100 Additionally,
broadband penetration is low and stagnant. This means that IPTV Pay TV and
online video services have also been slow to launch and gain subscribers. Though
Netflix did enter in 2016, at the same time as it entered the other APAC countries.
And iflix entered in 2017.
Pakistan’s regulator, PEMRA, has started to grant DTH Satellite licences to
operators such as Mag Entertainment. And the rollout of 5G broadband is soon to
be launched. Pakistan launched its transition to DTT in 2015 to ASO in 2016.
It remains unclear whether a recent slump in GDP per capita, and strict cultural
regulations imposed on Pay TV operators by PEMRA (which has the power to
censor “anti-national or anti-state attitudes against basic cultural values, morality
and good manners”) continue to limit sector growth.101
Pakistan’s FTA broadcasters are unphased by online disruption
The FTA sector in Pakistan is made up by several networks, serving a variety of
languages.102 Unlike Pay TV providers, many of the FTA broadcasters operate
using DTH Satellite transmission (such as ARY Digital).
One leading FTA broadcaster is HUM Network Ltd., Pakistan’s only publicly listed
FTA network. Although we do not have access to FTA advertising revenues data
for Pakistan, we can see from Figure 29 that Hum’s margins do appear to have
been squeezed since the 2008 financial crisis.
100 Asia Pacific Pay TV distribution 2020. Media Partners Asia. 2020. 101 ibid 102 BBC Country Media Profile - Pakistan

frontier economics 62
BROADCASTERS ADAPTING TO DIGITAL TRANSFORMATION IN APAC
Another leading FTA broadcaster the state-owned Pakistan Television Corporation
(PTC). As can be seen from the net profit margin chart below, PTC was struggling
with declining and negative net profit prior to the entrance of Netflix and Iflix. After
the entrance of Netflix net profit began to increase. There is therefore no evidence
in the data available to us that Netflix has negatively affected the revenues of PTC,
although we do not have data post-2017.
Pay TV broadcaster revenues are rising steadily, despite online video entrants
Pakistan’s Pay TV sector comprises of two key players: PCTL and Worldcall
Telecom. Figure 27 exhibits the gradual increase in subscriptions and revenues of
Pakistan’s Pay TV broadcasters.
Subscriptions are the core driver of Pay TV sector revenues in Pakistan,
accounting for more than double the revenues Pay TV broadcasters receive from
advertising between 2012 and 2019.
The Recorder Television Network, which operates the Pay TV channels Aaj News,
Aaj Entertainment, and Play TV recorded increasing net profit between 2017 and
2018.
The entry of Netflix in 2016 appears to have had little impact on the growth of either
subscriptions or revenues of Pay TV broadcasters as of yet. Echoing the same
trend in FTA. Though Netflix has begun to offer concessions to Pakistani
consumers to attract them to subscribe. For example, the company has signed a
deal with PTCL and also allowed Pakistani users to pay in Rupees.103
Figure 27 Broadcasting revenues and subscribers in Pakistan
Source: Media Partners Asia
103 Where does Pakistan stand on Netflix chart? Usama Masood Ahmad (Global Village Space). January 4, 2019

frontier economics 63
BROADCASTERS ADAPTING TO DIGITAL TRANSFORMATION IN APAC
Figure 28 GDP per capita in Pakistan
Source: Telegeography
Note:
Figure 29 EBITDA margin for HUM Network in Pakistan
Source: Bloomberg

frontier economics 64
BROADCASTERS ADAPTING TO DIGITAL TRANSFORMATION IN APAC
Figure 30 Profit Margins for Pakistan Television Corporation and Recorder Television Network
Source: Pakistan Television Corporation data from Pakistan State Owned Entities Report. Recorder Television
Network data from Director’s Reports.
E.3 Profitability and sector trends amongst other APAC countries
We set out below broadcasting sector data for a number of countries covered in
this study where the data is available.
Indonesia
Malaysia
The Philippines
South Korea
Taiwan
Thailand
Sri Lanka
E.3.1 Indonesia
Broadcasting sector data for Indonesia.
-20.0%
-15.0%
-10.0%
-5.0%
0.0%
5.0%
10.0%
2013 2014 2015 2016 2017 2018 2019
Net
Pro
fit
Marg
in
Pakistan Television Corporation Recorder Television Network
Netflix entry iflix entry

frontier economics 65
BROADCASTERS ADAPTING TO DIGITAL TRANSFORMATION IN APAC
Figure 31 Broadcasting revenues and subscribers in Indonesia
Source: Media Partners Asia
Figure 32 GDP per capita in Indonesia
Source: Telegeography
Figure 33 EBITDA Margins for TV broadcasters in Indonesia
Source: Bloomberg

frontier economics 66
BROADCASTERS ADAPTING TO DIGITAL TRANSFORMATION IN APAC
E.3.2 Malaysia
Broadcasting sector data for Malaysia.
Figure 34 Broadcasting revenues and subscribers in Malaysia
Source: Media Partners Asia
Figure 35 GDP per capita in Malaysia
Source: Telegeography

frontier economics 67
BROADCASTERS ADAPTING TO DIGITAL TRANSFORMATION IN APAC
Figure 36 EBITDA Margins for TV broadcasters in Malaysia
Source: Bloomberg
E.3.3 The Philippines
Broadcasting sector data for The Philippines.
Figure 37 Broadcasting revenues and subscribers in the Philippines
Source: Media Partners Asia

frontier economics 68
BROADCASTERS ADAPTING TO DIGITAL TRANSFORMATION IN APAC
Figure 38 GDP per capita in the Philippines
Source: Telegeography
Figure 39 EBITDA Margins for TV broadcasters in the Philippines
Source: Bloomberg
E.3.4 South Korea
Broadcasting data for South Korea.

frontier economics 69
BROADCASTERS ADAPTING TO DIGITAL TRANSFORMATION IN APAC
Figure 40 Broadcasting revenues and subscribers in South Korea
Source: Media Partners Asia
Figure 41 GDP per capita in South Korea
Source: Telegeography
Figure 42 EBITDA Margins for TV broadcasters in South Korea
Source: Bloomberg

frontier economics 70
BROADCASTERS ADAPTING TO DIGITAL TRANSFORMATION IN APAC
E.3.5 Taiwan
Broadcasting sector data for Taiwan.
Figure 43 Broadcaster revenues and subscribers in Taiwan
Source: Media Partners Asia
Figure 44 GDP per capita in Taiwan
Source: Telegeography

frontier economics 71
BROADCASTERS ADAPTING TO DIGITAL TRANSFORMATION IN APAC
Figure 45 EBITDA margin for TV broadcasters in Taiwan
Source: Bloomberg
E.3.6 Thailand
Broadcasting sector data for Thailand.
Figure 46 Broadcaster revenues and subscribers in Thailand
Source: Media Partners Asia

frontier economics 72
BROADCASTERS ADAPTING TO DIGITAL TRANSFORMATION IN APAC
Figure 47 GDP per capita in Thailand
Source: Telegeography
Figure 48 EBITDA Margins for TV broadcasters in Thailand
Source: Bloomberg
E.3.7 Sri Lanka
Broadcasting sector data for Sri Lanka.

frontier economics 73
BROADCASTERS ADAPTING TO DIGITAL TRANSFORMATION IN APAC
Figure 49 Broadcaster revenues and subscribers in Sri Lanka
Source: Media Partners Asia
Figure 50 GDP per capita in Sri Lanka
Source: Telegeography

frontier economics 74
BROADCASTERS ADAPTING TO DIGITAL TRANSFORMATION IN APAC
ANNEX F CASE STUDIES OF BROADCASTER PROFITABILITY
F.1 Introduction To understand the factors that have affected broadcasters in the region during the
period of adapting to digital disruption this section conducts a more detailed case
study of three broadcasters from the region. The analysis reviews what the key
factors are that affect profitability, costs, revenues and opportunities for the
broadcasters in the period 2015 - 2020. We reviewed annual reports since 2015.
It considers:
how the entry of new OVSPs has affected their businesses
how the broadcasters have positively responded to the opportunities of digital
disruption
what other factors have affected their business strategy.
We have chosen three case studies to understand how digital trends have affected
their financial fundamentals.
MNC (Indonesia)
GMA Network (the Philippines)
HUM Network (Pakistan)
F.2 MNC
Media Nusantara Citra is an Indonesian commercial advertising funded
broadcasting group. It has four Free-To-Air channels – RCTI, MNCTV, GTV, and
iNews – as well as 18 channels broadcast on Pay TV. RCTI is the most watched
and widely broadcasted FTA station in Indonesia.104
Introduction
MNC has seen steady growth in EBITDA margins since 2015. In 2019, the
Company’s EBITDA margin reached a record high of 44%, shown in Figure 51.105
104 MNC Annual Report 2019, p. 128 105 MNC Annual Report 2019, p. 48

frontier economics 75
BROADCASTERS ADAPTING TO DIGITAL TRANSFORMATION IN APAC
Figure 51. MNC EBITDA Margin Figure 52. MNC ROCE
Source: Bloomberg
Note: Years in this chart refer to calendar years
Source: Bloomberg
Note: Years in this chart refer to calendar years
Revenues
MNC’s revenue increased gradually from 2015 to 2017, were flat from 2017-2018
and increased again from 2018 to 2019. Overall, there was a significant increase
in revenue across this period.
Advertising has always comprised the clear majority of MNC’s revenue (81% in
2019).106 Due to macroeconomic factors, this posed a challenge for MNC in 2015.
“The advertising market was weak in 2015, declining by 3% in net terms. Much of
this weakness is pegged to macro issues and was exacerbated by currency
depreciation, which crossed the Rp14,500 = 1US$ mark…2015 was challenging
year, as key sectors including FMCG, telecoms and auto, largely driven by
multinationals looking to protect margins in the face of increasing production costs,
reduced their advertising budgets.” 107
The advertising market remained a challenge in 2017, seeing a 2.3% FTA industry-
wide contraction.108 Nevertheless, MNC increased its advertising revenue by 5%
in 2017109 compared to 2016.
MNC’s advertising revenue increased again in 2018 by 8% compared to 2017.110
This was under more beneficial conditions, the 2017 contraction in the advertising
market was “expected to reverse and move upwards due to the forthcoming local
and national elections in 2018”.111
106 MNC Annual Report 2019, p. 110 107 MNC Annual Report 2015. p. 100 108 MNC Annual Report 2017, p. 116 109 MNC Annual Report 2017, p. 121 110 MNC Annual Report 2018, p. 124 111 MNC Annual Report 2017, p. 121

frontier economics 76
BROADCASTERS ADAPTING TO DIGITAL TRANSFORMATION IN APAC
MNC increased its advertising revenue again in 2019 by 11% compared to 2018.112
In 2019, MNC enjoyed 45% of the total television ad-spend.113 This was despite
macroeconomic factors negatively affecting advertising revenues in this year.114
MNC therefore consistently increased its main revenue stream throughout this
period despite varying macroeconomic conditions affecting the advertising
market.115
Figure 53 MNC Revenue
Source: Bloomberg
Note: Years in this chart refer to MNC’s financial year ending in December
Costs
MNC’s main costs throughout the 2015-2019 period were capex investment used
to increase content production quality and quantity.
In 2016, MNC invested US$250 million to construct integrated studio buildings.
MNC claimed the investment meant “there will be no more significant capex for
many years to come”, and that it would leave MNC from 2017 with an “expanded
production capability”, and “high on-screen quality”.
In 2018, MNC described the outcome as having improved “operational synergy”,
through the sharing of infrastructure and facilities. MNC also increased its use of
in-house production capacity, enabling greater content production.116
112 MNC Annual Report 2019, p. 110 113 MNC Annual Report 2019, p. 49 114 President Director Letter to shareholders “The world experienced a global economic slowdown in 2019
caused by the ongoing trade war between China and the USA which has dampened the global economic growth to as low as 2.9% compared to 3.6% in 2018. Such an event has triggered much volatility in the financial market, which negatively impacted business sentiment and advertisers confidence to spend on an advertising budget. Indonesia’s economy grew by 5.02% in 2019, which was the lowest recorded since 2015.” MNC Annual Report, 2019, p. 44
115 See section 3 for further discussion. 116 MNC Annual Report 2018, p. 124

frontier economics 77
BROADCASTERS ADAPTING TO DIGITAL TRANSFORMATION IN APAC
MNC’s foreign programming costs also increased by 8.8% in 2015 due to a weak
Indonesia Rupiah against the US dollar.117 This remained a concern in 2018.118
Figure 54 MNC Costs
Source: Bloomberg
Note: Years in this chart refer to MNC’s financial year ending in December. Cost of goods sold includes direct labour, direct materials and overhead costs related to the goods and services sold. Operating expenses refer to expenditures that are not directly tied to the production of goods or services, such as rent, utilities and legal costs. These cost categories are mutually exclusive.
Risks
Throughout the 2015-2019 period, MNC identified several factors that threatened
its revenues.
In 2015, MNC identified uncertainty over the transition to Digital Terrestrial
Television (DTT), stating “regulations governing DTT remain ambiguous, with little
clarity on when a law will be passed”. The transition has since started and planned
to be completed in 2024.119
MNC identify the growth in online advertising throughout the 2015-2019 period. In
MNC’s 2015 and 2016 reports, it described digital/online advertising as “growing
rapidly.”120, 121 In its 2017 annual report, MNC identified internet advertising as
having a “remarkably steep growth curve, driven primarily by online videos”122.
Opportunities & adapting to digital disruption
MNC’s strategy in response to digital disruption includes the following: Firstly, to
maintain its leading position in content library development; secondly, to leverage
117 MNC Annual Report 2015, p. 106 118 MNC Annual Report 2019, p. 120 119 Tempo.co (2019) 120 MNC Annual Report, 2016, p. 139 121 MNC Annual Report, 2015, p. 103 122 MNC Annual Report, 2017, p. 117

frontier economics 78
BROADCASTERS ADAPTING TO DIGITAL TRANSFORMATION IN APAC
this large volume of content (40% of the total content library in Indonesia)123 in the
digital space; and thirdly, to offer exclusive online content and innovations.
In terms of content library development, MNC’s content library was over 300,000
hours in 2019, to which it aims to add 18,000-20,000 hours of content annually.124
It considers itself well placed to meet audience demand on: “local content catering
to the preference of majority of Indonesians who still prefer to watch local content
such as drama series.”125 It notes that this means it is well placed to meet
competition from OVSPs. Indeed, the growth of OVSPs offer opportunities. It
considers that “amid the emergence of OTT players that push greater demand for
local content, MNCN’s timing fits perfectly in reaping the rewards through content
monetization”.126 MNC recently reached a deal with iflix to license 10,000 hours of
its content to the OVSP.127
MNC’s main channel, RCTI consistently achieved the most viewers of any
Indonesian channel throughout this period, achieving a 20% average prime-time
audience share in 2015128, 19.3% in 2016129, 21.7% in 2017130, 18.3% in 2018131
and 18.4% in 2019.132 MNCN’s 4 FTA channels achieved a combined prime-time
share of 36.3%133 in 2015, 38.3% in 2017134, 34.7% in 2018135, and 37.2% in
2019.136,137 It attributes this dominance to the continued popularity of “sponsorship-
based programs, such as talent shows, anniversary, and awards programs, and
musical concerts, all of which are managed and produced using the facilities
developed and operated by the Company, facilitated with recent capex investment.
MNC also recently expanded its Pay TV offering by launching 6 new channels.
In 2020, the Company aims to continue expanding its content offering, having
achieved exclusive broadcasting rights to the talent show “X-Factor”, and the 2020
Euros Football Tournament.138
In terms of leveraging their content, in 2019, MNC launched RCTI+, which
combines both Advertising Video on Demand (AVOD) and Subscription Video on
Demand (SVOD) services. MNC operates the most viewed YouTube channel in
Indonesia, with YouTube awarding them a Multi-Channel Network in mid-2019,
and signed a deal with Facebook to take 55% of advertising revenue from clips
shared on the site139 (such an agreement is standard for large YouTube content
123 MNC Annual Report, 2019, p. 109 124 Ibid 125 MNC Annual Report 2019, p. 109 126 MNC Annual Report 2019, p. 2 127 See: https://blog.iflix.com/wp-content/uploads/2019/05/MNC-x-iflix-FINAL.pdf 128 MNC Annual Report 2015, p. 39 129 MNC Annual Report 2016, p. 157 130 MNC Annual Report 2017, p. 60 131 MNC Annual Report 2018, p. 129 132 MNC Annual Report 2019, p. 115 133 MNC Annual Report 2015, p. 40 134 MNC Annual Report 2017, p. 58 135 MNC Annual Report 2018, p. 66 136 MNC Annual Report 2019, p. 49 137 There is no reference to the combined share in MNC’s 2016 Annual Report 138 Due to Covid-19 this did not go ahead, but remains indicative of MNC’s approach to expanding their content
offering 139 See:

frontier economics 79
BROADCASTERS ADAPTING TO DIGITAL TRANSFORMATION IN APAC
creators).140 It noted that “The Company also takes pride in highlighting MNCN’s
content presence in social media/online platforms, which generates over 2 billion
views every month, roughly equivalent to 5% of YouTube’s viewership in
Indonesia.”141
It will continue to leverage its content assets by licensing them to OVSPs and Pay
TV platforms: “MNCN owns the biggest content library with over 300,000 hours
and it has become one of the Company’s most valuable assets. Heading towards
2020, the Company will leverage on its strength in content by licensing to local and
international OTT and Pay TV platforms.”142 MNC also continues to monetise its
content library through the licensing of programs to local and overseas parties.
As regards to MNC’s exclusive online content, MNC operates three online portals:
okezone.com, iNews.di and sindonews.com.143 As explored in section 3.2, MNC
also offers interactive content related to its programming via RCTI+.
In 2016, it developed an “innovation centre” to look at potential growth strategies
in the digital space144, in particular “investing to scale its own video platforms going
forward to gain considerable share of the national online video advertising
revenue”.
In 2018 MNC attributed its success in increasing advertising revenues to
digitalising and optimising unused slot inventory as well as developing new ad-
revenue streams (virtual ads, built-in, and digital). For example, RCTI+, features
ads that align with user comments in the chat feature. In 2017145 and 2019146, it
claims these innovations are what increased its advertising revenues as a
percentage of total revenue over the last 5 years, as described in the Revenues
section above.
By 2022, digital revenues are targeted to represent 50% of the company’s
revenue.147 This includes revenue earnt via RCTI+, YouTube as well as the
company’s online portals. MNC aims to combine its expansion in the digital space
with exploiting its position in the traditional broadcasting space through an increase
in its FTA TV rate card by 25%, a decision driven by the growing number of brands
advertised on television every year in Indonesia.148
Conclusion
MNC has enjoyed success as OVSPs have entered the sector. As an advertising
funded broadcaster, it considers the biggest risk to its business model to be the
https://www.idnfinancials.com/news/34020/mnc-signs-agreement-facebook-digital-advertising-revenue 140 See: https://www.investopedia.com/articles/personal-finance/032615/how-youtube-ad-revenue-works.asp 141 MNC Annual Report 2019, p. 49 142 MNC Annual Report 2019, p. 189 143 The latter two portals are news sites and the former is a news and entertainment site. Currently, on the
Alexa rank, Okezone is the number one most visited portal from all portals in Indonesia, even higher than Google. See: https://www.mnc.co.id/contents/detail/en/570/terus-naik-digital-konten-akan-kuasai-40-pendapatan-mncn-pada-2022
144 MNC Annual Report 2016, p. 110 145 MNC Annual Report 2017, p. 121 146 MNC Annual Report 2019, p. 110 147 MNC Annual Report, 2019, p. 189 148 MNC Annual Report 2019, p. 52

frontier economics 80
BROADCASTERS ADAPTING TO DIGITAL TRANSFORMATION IN APAC
growth of digital advertising and OVSPs. It has responded with a wide-ranging
digital strategy, which seeks to harness a range of new revenue streams through
both partnerships with existing sites, and independent innovations. MNC’s success
here is made possible through continued investment in content production because
such content can be leveraged to grow rapidly within the digital space.
F.3 GMA Network
GMA Network is a free-to-air broadcaster in the Philippines. Core channel GMA-
7 accounted for three quarters of revenue in 2018. GMA also offers international
cable channels including GMA Pinoy TV, GMA Life TV and GMA News TV
International.
Introduction
GMA Network’s EBITDA margin has fluctuated over the past five years, increasing
in 2015 and 2016 as revenue grew, decreasing in 2017 in line with decreasing
revenues and decreasing in 2018 due to increasing costs. GMA’s EBITDA margin
then increased in 2019 as revenues increased. GMA Network’s ROCE has trended
similarly, with a recent fall due to higher costs.
Figure 55. GMA EBITDA Margin Figure 56. GMA ROCE
Source: Bloomberg
Note: Years in this chart refer to calendar years
Source: Bloomberg
Note: Years in this chart refer to calendar years
Revenues
GMA revenues have fluctuated around the US$ 300m over the last ten years.
Looking closer at the 2015-2019 period, which sees an upswing in 2016, a fall in
2017-2018, and another increase in 2019, there are number of factors that it
identifies as affecting its revenues, including political cycles, the increasing
significance of online advertising, and exchange rate fluctuations.

frontier economics 81
BROADCASTERS ADAPTING TO DIGITAL TRANSFORMATION IN APAC
GMA attributes their profitability decline in 2017 to the “absence of the non-
recurring influx from the 2016 elections”.149 In other words, the success of 2016,
as can be seen from the peaks in both the EBITDA and revenue charts was a
special case because of an “extra-ordinary election-related load” with both national
and local elections in the Philippines. Putting aside the election-related load,
“airtime revenues from regular advertisers ended at about the same level as last
year”.150
In 2018 there was a continued decline in revenue, driven by an “industry-wide
contraction in advertising spending”.151 GMA points to the implementation of new
tax measures as adversely impacting advertising spending.152
While core channel airtime sales declined in the 2017-2018 period, online
advertising revenue through the company’s digital subsidiary, GMA New Media
increased. GMA New Media operates GMA News Online and GMANetwork.com
as well as the broadcaster’s social media accounts and partnerships with OVSPs.
GMA New Media saw strong growth rates throughout the period.153
This has meant that revenues have gradually become less reliant on the core
channel, GMA-7, which comprised 81% of advertising revenues in 2017154, “over
three quarters” in 2018,155 and “over three quarters” again in 2019.156 GMA’s
remaining advertising revenue is generated from their other television channels,
radio channels and online platforms.
The overall revenue increase in 2019 was driven by a revival in advertising
revenue, with an increase of 10% compared to 2018.157 GMA considers advertising
revenues to be the “lifeblood of the company”, and in 2019 there was a slight
increase in its share of total revenue, from 91% to 92%.158
GMA’s remaining non-advertising revenue is predominantly comprised of
subscriptions income from international operations, the most important being GMA
Pinoy TV, an international Pay TV channel aimed at the Filipino diaspora. There
was growth in international operations and other businesses of 13% in 2017, owing
to the depreciation of the Philippine Peso against the US dollar (the vast majority
of the Filipino diaspora live in the U.S.159 In 2018, revenue from international
channels stayed flat as the depreciation of the Peso against the US dollar (less of
a drop than in 2017) was counteracted by an attrition in subscriber count.160 In
149 GMA Annual Report 2017, p. 41 150 GMA Annual Report 2017, p. 41 151 GMA Annual Report 2018, p. 13 152 GMA Annual Report 2018, p. 11 153 Growth rates of 50% in 2015 (GMA Annual Report 2015, p. 14), 42% in 2016 (GMA Annual Report 2016, p.
15), 34% in 2017 (GMA Annual Report 2017, p. 42), 53% in 2018 (GMA Annual Report 2018, p. 13). GMA states that “online advertisements grew by 78%” in 2019 (GMA Annual Report 2019, p. 11)
154 GMA Annual Report 2017, p. 42 155 GMA Annual Report 2018, p. 50 156 GMA Annual Report 2019, p. 53 157 GMA Annual Report 2019, p. 52 158 GMA Annual Report 2019, p. 52 159 GMA Annual Report 2017, p. 42 160 GMA Annual Report 2018, p. 51

frontier economics 82
BROADCASTERS ADAPTING TO DIGITAL TRANSFORMATION IN APAC
2019, there was a slight appreciation of the Peso against the US dollar, which
compounded a continued loss of subscribers of 9%.161
Figure 57 GMA Network Revenue
Source: Bloomberg
Note: Years in this chart refer to GMA’s financial years ending in December.
Costs
GMA’s total operating costs rose in the period 2009 to 2014, then fell slightly to
2018 before rising again sharply in 2019.
GMA’s operating costs comprise of production costs and non-production costs and
in 2019 split evenly between these two categories.162 This represents a slight
decline in production costs as a proportion of total operating costs.
Changes in production costs, which includes talent feels, and rentals and outside
services, are determined by which shows are produced in a given year. For
example, the particularly high share in 2016 (and 8% absolute increase) was due
to the production of a high-budget fantasy soap opera, and election coverage.163
Changes in non-production costs (GAEX – consolidated general and
administrative expenses) are primarily driven by changes in personnel costs. For
example, the increase in total operating costs seen in 2019 results from a 15%
“hike” in GAEX.164 (total production costs actually decrease by 1% this year), and
GMA attribute this increase to “non-recurring/one-time…appreciation bonuses” as
well as a “surge in provisions for pension liabilities”.165
161 GMA Annual Report 2019, p. 53 162 GMA Annual Report 2019, p. 52 163 GMA Annual Report 2016, p. 45 164 GMA Annual Report 2019, p. 54 165 GMA Annual Report 2019, p. 54

frontier economics 83
BROADCASTERS ADAPTING TO DIGITAL TRANSFORMATION IN APAC
Figure 58 GMA Network Costs
Source: Bloomberg
Note: Years in this chart refer to GMA’s financial years ending in December. Cost of goods sold includes direct labour, direct materials and overhead costs related to the goods and services sold. Operating expenses refer to expenditures that are not directly tied to the production of goods or services, such as rent, utilities and legal costs. These cost categories are mutually exclusive.
Risks
GMA notes their international channels have been most affected by the “continuing
global shift in content consumption from the traditional pay platforms (Direct-to-
Home/DTH and Cable) to OTT [OVSPs]”.166 GMA note that they “foresee” this
revenue stream decline correcting itself as they develop their digital offering
(though subscriber numbers did continue to decline in 2019).
Opportunities & adapting to digital disruption
GMA consider that the adaption to digital technologies offers opportunities. GMA
manages its digital offer through its subsidiary GMA New Media.
Throughout the period, GMA’s websites GMA Network.com and GMA News Online
have been a consistent source of revenue, helping to drive continually strong
revenue growth for GMA New Media, as analysed above in ‘Revenues’.
More recently, GMA has entered into content provisioning agreements with OVSPs
HOOQ and iflix, providing the company an extra revenue stream via the
monetisation of existing content.167
GMA considers that its content is now accessible to “audiences both locally and
internationally, through all available mass distribution platforms”, and stresses its
aim to be the “best source of local, Filipino News and Public Affairs
programming”.168 It also is notable that the 2015 iflix press release announcing
GMA’s partnership with the platform emphasises the broadcaster’s “extraordinary
library of Philippine TV programs, documentaries, and feature films [emphasis
166 GMA Annual Report 2018, p. 11 167 GMA Annual Report 2018, p. 54 168 GMA Annual Report 2017, p. 12

frontier economics 84
BROADCASTERS ADAPTING TO DIGITAL TRANSFORMATION IN APAC
added]”.169 As considered earlier, the broadcasting of Filipino content to the
diaspora abroad is not a new strategy, given GMA’s long-standing international
channel, Pinoy TV. What this reflects is an acknowledgment that Filipinos
internationally are increasingly better reached via online video streaming as
opposed to ‘traditional’ Pay TV. GMA’s app gives access to exclusive content,
games, and features on mobile.170
GMA Network has also partnered YouTube, and received an innovation funding
grant to produce a digital newscast for the site.171 Finally, GMA is using social
media to learn more about their audience and to consider the feasibility of
increasing the volume of its exclusive digital content in the future.172
Since 2017, there has been a focus on the digitalization of terrestrial television. By
2018, GMA invested US$20 million to complete the roll-out of Digital Terrestrial
Transmitters.173 GMA also signed a Technology, Content and Distribution
agreement in 2019 with the telecoms company PLDT-Smart which will further
extend the reach and availability of GMA-7 and GNTV while offering bundled
products of interest and value to the consumer.174
GMA has invested to supply branded set top boxes which support digital services
(the “GMA Affordabox”175). This digital television product is both a receiver for
digital television and a digital media set-top box, combines DTV and over-the-top
(OTT) media delivery (device turned the television into a smart TV capable of
playing on-demand content while simultaneously running chat applications). The
Affordabox also expands GMA’s channel range, including a new channel ‘Heart of
Asia’ that features South Korean, Chinese, and Thai dramas alongside GMA-
produced titles.176
Conclusion
GMA has adapted to digital disruption by licensing its content to other providers,
seeking to expand geographically into different markets, and aiming to harness its
specialisation in Filipino content for monetisation in the digital space. GMA has
also pursued technological innovation with the Affordabox, which seeks to harness
demand for digital terrestrial television generated by the Philippines’ ongoing
transition (due for completion in 2022)177 and for on-demand online streaming
content. Launched in June 2020, GMA has told shareholders the device has been
“selling like hot pandesal [a popular Filipino bread roll typically eaten for
breakfast]178”, though it does not provide any figures.179
169 See: https://blog.iflix.com/wp-content/uploads/2018/02/2015.08.17.GMA-CONTENT-NOW-AVAILABLE-ON-iflix-INTRODUCES-CATCH-UP-TV-.pdf
170 See: https://play.google.com/store/apps/details?id=com.gmanmi.entertainment.mobile&hl=en_GB 171 GMA Annual Report 2018, p. 7 172 GMA Annual Report 2018, p. 11 173 See: https://www.dailypedia.net/2019/03/gma-network-invests-20-million-for-digitization-upgrades/ 174 GMA Annual Report 2018, p. 12 175 See: https://www.gmanetwork.com/affordabox 176 See: https://www.bworldonline.com/gma-networks-affordabox-gets-overwhelming-public-response/ 177 See: https://technology.informa.com/591608/philippines-sets-target-for-switchover-to-digital-terrestrial-
television 178 See: https://www.lexico.com/definition/pan_de_sal 179 See: https://business.inquirer.net/302936/gmas-affordabox-selling-like-hot-pandesal

frontier economics 85
BROADCASTERS ADAPTING TO DIGITAL TRANSFORMATION IN APAC
Although there was been three consecutive annual declines in EBITDA since 2016,
GMA attribute the 2016-2017 and 2017-2018 revenue to a downturn in the political
cycle, and new tax measures, respectively. Notably, the 2018-2019 period saw an
uptick in revenue, which translates into a decelerating, but continuing, decline in
EBITDA, due to, according to GMA, one-off extraordinary personnel expenses, as
analysed in ‘costs’.
F.4 HUM Network HUM Network is a global entertainment and news network, based in Pakistan, but
with a strong following across South Asia. HUM Network owns HUM TV (offering
a mix of content), HUM Sitaray (entertainment shows), HUM Masala (food channel)
and HUM NEWS.
Introduction
The HUM network’s profit margins have been fluctuating between 17% to 26%
between 2010 to 2017 before falling to a loss of -2.5% in 2018 calendar year.
Figure 59. HUM EBITDA Margin Figure 60. HUM ROCE
Source: Bloomberg
Note: Years in this chart refer to calendar years
Source: Bloomberg
Note: Years in this chart refer to calendar years
Revenues
Revenues grew in the period to 2017 and fell in 2018 and 2019. HUM attributes
the decline in 2018 to “political and economic instability”180, though the decline in
core advertisement revenue was cushioned somewhat by an increase in film
distribution and subscription revenue. In 2019, revenue fell more sharply. HUM
attributes this to short-term uncertainty created by economic reforms dissuading
advertisers.181 It noted that there was “a major shift in total advertisement spend
from TV to Digital medium globally”. However, in commenting on its revenues it
stated that “Ad Revenue shrunk by 30% - 35% owing to economic instability due
180 HUM Annual Report 2018, p. 35 181 HUM Annual Report 2019, p. 6

frontier economics 86
BROADCASTERS ADAPTING TO DIGITAL TRANSFORMATION IN APAC
to dwindling foreign exchange reserves, low exports, high inflation, growing fiscal
deficit and current account deficit”.182
Figure 61 HUM Network Revenue
Source: Bloomberg
Note: Years in this chart refer to calendar years
Costs
HUM faced higher production costs in 2018 due to the initial launch of HUM News,
a new 24-hour news channel in Pakistan.183 This was part of an investment strategy
that created a cost “surge” but was nevertheless considered to be necessary by
HUM to “compete and provide the best content for viewers”.184 Going forward,
HUM is comments that is continuously making efforts to reduce costs and
implementing cost-minimizing strategy.185 This includes “better negotiations with
suppliers and better control on distribution spends”.
182 See: https://www.humnetwork.tv/pdf_2019/Corporate%20Briefing%20Session%202019%20(Final).pdf, p. 18
183 HUM Annual Report 2018, p. 35 184 HUM Annual Report 2018, p. 35 185 See: https://www.humnetwork.tv/pdf_2019/Corporate%20Briefing%20Session%202019%20(Final).pdf, p.
18

frontier economics 87
BROADCASTERS ADAPTING TO DIGITAL TRANSFORMATION IN APAC
Figure 62 HUM Network Costs
Source: Bloomberg
Note: Years in this chart refer to HUM financial years ending in June. Cost of goods sold includes direct labour, direct materials and overhead costs related to the goods and services sold. Operating expenses refer to expenditures that are not directly tied to the production of goods or services, such as rent, utilities and legal costs. These cost categories are mutually exclusive.
Risks
HUM notes that its increased investment, for example recently in HUM News, may
not necessarily result in sustained incremental viewership,186 though it considers
the incurring of high expenditure necessary from time to time in order to “compete
and provide the best content to viewers”.187
HUM has recently pursed what it considers to be a risk mitigation strategy, by
generating revenues from different avenues (diversification of revenue streams).
This includes the acquiring of MD Productions, a television and film production
company, and its venture into e-commerce through HUM Mart.188
Opportunities & adapting to digital disruption
HUM network has focused on several long term strategies in response to digital
disruption, seeking to leverage its competitive advantage as a producer of
Pakistani content.
In 2015, HUM saw content monetisation in the digital space as “an avenue for high
growth”, and, that year, entered into a partnership with the Indian OVSP ErosNow
to licence its content.189 HUM made a similar agreement with iflix in 2016, with iflix
stating the purpose being to provide “some of the best Pakistani content to millions
of keen internet users across the globe”, and “introduce Pakistan’s popular soaps
to a new digital generation of South Asians globally”190, again showing how
traditional broadcasters view their library of local content as a crucial advantage
186 HUM Network Annual Report 2019, p. 36 187 HUM Network Annual Report 2019, p. 35 188 HUM Network Annual Report 2019, p. 36 189 HUM Network Annual Report 2015, p. 15 190 See: https://blog.iflix.com/wp-content/uploads/2018/02/2016.12.27.IFLIX-SIGNS-MULTI-YEAR-DEAL-
WITH-PAKISTAN%E2%80%99S-TOP-NETWORKHUM-TV.pdf

frontier economics 88
BROADCASTERS ADAPTING TO DIGITAL TRANSFORMATION IN APAC
and opportunity within the digital space. In 2019 the company launched HUM News
in the UK.191
In 2018, HUM considered that “the consumer shift towards digital services” is an
economy wide trend HUM is “well positioned to take advantage of”. HUM Network
content is now available on the OVSPs Netflix, Iflix, and ErosNow192, as well as
through channels on YouTube and Dailymotion.193 In 2018, HUM launched an
exclusive web series “Chattkhara” last year, available on HUM’s YouTube channel.
HUM has also recently launched a new mobile app that allows users to live stream
HUM TV shows on demand as well as view trivia and other exclusive content
related to their most popular shows.194
Conclusion
HUM Network has recently faced declining revenue and EBITDA. It ascribes its
sudden decline in profitability in 2019 (making a loss for the first time) to a 30-35%
reduction in advertising revenues, whilst noting that advertising revenues in
Pakistan face difficult macroeconomic conditions. HUM has also experienced
rising costs related to new channel such the establishment of HUM News. Looking
to the future HUM considers that “macroeconomic stability in the country will have
a positive effect on the Company’s profitability”.195 HUM hopes to leverage its
advantage in local content in the digital space, and to continue expanding its offer
internationally, highlighting the opportunities provided by digital disruption. Another
aspect of their digital strategy is the reduction of risk through diversifying revenue
streams. HUM has pursued both a risk reduction and opportunity-centred response
to digital disruption.
191 HUM Network Annual Report 2019, p. 36 192 HUM Network Annual Report 2018, p. 40 193 HUM Network Annual Report 2018, p. 37 194 See: https://play.google.com/store/apps/details?id=tv.hum.navapp&hl=en_GB 195 HUM Annual Report 2019, p. 32

frontier economics 89
BROADCASTERS ADAPTING TO DIGITAL TRANSFORMATION IN APAC
ANNEX G CASE STUDIES OF BROADCASTERS ADAPTING TO DIGITAL TRANSFORMATION This annex outlines how the broadcasters in our four case studies have responded
to the challenges digital transformation.
Challenges from digital disruption come from both OTTs who compete with
traditional broadcasters directly for the consumption of video content, as well digital
media more broadly, which competes for consumers’ time. Figure 28 outlines
innovations enabled by the digital realm across four broad categories, with
examples of how these threaten the business model of traditional broadcasters.
Figure 63 The challenges to traditional broadcasters of digital disruption
Innovation How are traditional broadcasters challenged?
Broader content offering OVSPs offer a large library of content on an on-demand basis. Netflix offers 530 shows and 6,755 movies. Amazon Prime video offers 18,405 movies and 1,981 TV shows.
OVSPs offer their content online with on-demand functionality. Compared to traditional broadcasting, consumers have more choice over when to consume content. Consumers can pause and resume content throughout viewing. Search capability enables consumers to better identify programs that interest them, such as preferred genres and local content.
OVSPs invest in exclusive content on a global scale across film, high quality drama and comedy. Netflix released 371 new TV series and movies in 2019.
OVSPs invest in new distribution technologies. Netflix offers Ultra-HD quality in their premium edition. Netflix offers Ultra-HD quality in their Premium edition.
Deeper engagement with consumers made possible by digital technology
OVSPs are providing short-form content as an alternative to traditional broadcasters’ long-form content. These are increasingly popular amongst young people and children in particular Algorithms optimise site pages to promote shows based on the user’s viewing habits.
Online video services allow for consumer interaction such as through user-uploaded content, comments sections, and voting. This threatens traditional broadcasters with a more compelling product than “standard” media consumption.
Innovative and powerful advertising new propositions
Online advertising is highly targeted, offers significant functionality for advertisers, and offers more accurate measurement of audience reach.
Alternate commercial offering
OVSPs offer cheap monthly subscriptions with minimal contractual restrictions.
Source: Frontier

frontier economics 90
BROADCASTERS ADAPTING TO DIGITAL TRANSFORMATION IN APAC
Case Study 1: Channel 4
Channel 4 is a UK commercially-funded publicly
owned broadcaster. It has a public service remit
that requires it “demonstrate innovation,
experiment and creativity” and “exhibit a
distinctive character” amongst other conditions.
Channel 4’s channels include E4 (16-34-year
olds), More4 (35-60-year olds), Film4 (movies),
and 4music (music).
Channel 4’s response to the challenges of digital disruption
Response Channel 4
Use digital technologies to broaden their content offering to consumers
All4 is Channel 4’s on-demand online video service. It
offers 1564 shows including not just catch-up from recently
aired shows but back catalogue viewing, such as box-sets
of comedies particularly popular with the younger
demographic more likely to switch to OVSPs. Like Netflix,
All4 is offered on PlayStation and Xbox video game
consoles, as well as on Apple and Android phones as an
app. All4 launched in November 2006. It was the first of the
4 traditional UK broadcasters (BBC, ITV, Channel 4,
Channel 5) to do so, launching a year before BBC iPlayer.
All4 has 18 million registered users.
It has developed a portfolio of channels. Channel 4 offers Film4 (launched November 1998) – originally subscription based, free since July 2006 and currently the only film channel available free on digital terrestrial television. Channel 4 also offers E4 (aimed at ages 16-34), More4 (lifestyle at ages 35-60), 4Music (music videos), 4seven (catch up from all channels), and timeshift variants (“+1”) of all its channels except 4Music and 4seven. Channel 4 was the first UK terrestrial broadcaster to offer a time-shift variant of its main channel (in 2007).
Channel 4 invested £662m in originated and acquired
content in 2018, including £489m in originated content
alone. They invested £82m on originated and acquired
films. They license high quality US drama such Homeland.
In 2011, Sky launched Sky Atlantic, a channel dedicated to
US imports.
Channel 4’s public remit necessitates that it “demonstrate
innovation”, which has helped build its reputation as a
broadcaster “willing to take risks other broadcasters won’t”
and “pushing boundaries”, according to a 2017 market
research report . This gives Channel 4 a distinctive brand
advantage ready to compete against OTTs in the exclusive
content space.

frontier economics 91
BROADCASTERS ADAPTING TO DIGITAL TRANSFORMATION IN APAC
Source: Frontier
Channel 4 HD launched in December 2007 earlier than ITV HD and Channel 5 HD, and the same month as BBC HD. All4 is offered on PlayStation and Xbox video game consoles, as well as on Apple and Android phones as an app.
Use digital technologies to deepen their engagement with consumers
Channel 4 has integrated short form content into its demand programming. Channel 4 uses social media to generate and deepen interest in its TV including by offering clips of content.
Channel 4’s Facebook page has 2.6 million likes, the largest of all the traditional broadcasters.
Channel 4’s twitter account regularly tweets clips from its shows and news broadcasting in “viral” form with subtitles at the bottom of the video window and a sensationalised title in large text at the top.
Shows on Channel 4’s on-demand service All4 often feature a “Clips and Extras tab” for shows where viewers can access short-form content taken from the main show.
Shows on Channel 4’s on-demand service All4 often feature a “Clips and Extras tab” which have behind the scenes, trailers, blooper footage exclusive to the platform.
Channel 4’s new reality TV show “Circle” has an app providing news alerts about the show. This helps to build consumer engagement and excitement outside of the show’s airtime to drive viewing figures.
Online adverting offers greater functionality
In 2019, Channel 4 signed a deal with Sky to use their Ad Smart technology, which targets ads to different customers watching the same program through Sky and Virgin. On All4, Channel 4’s Project Agora allows advertisers to create their own customer audience segments.
4sales offers weekly and monthly viewing reports. Pre-roll advertising online cannot be skipped.
Via 4sales, Channel 4 sells advertising on behalf of a
number of other channels (i.e. it consolidates advertising),
including all UKTV Channels (Alibi, Dave, Drama, Eden,
Yesterday, Gold, and W), as well as HGTV, Really, BT
Sport, and The Box Plus Network. This gives the channel
greater bargaining power when competing for advertisers.
Diversify into offering new services
Channel 4 offers 4+, an ad-free version of All4 for £4 a month (compared to £9 for Netflix Standard and £6 for Amazon Prime Video).

frontier economics 92
BROADCASTERS ADAPTING TO DIGITAL TRANSFORMATION IN APAC
Case study 2 – Sky UK
Sky UK’s response to the challenges of digital disruption
Source: Frontier
Sky UK is a British broadcaster and
telecommunications company and is the largest Pay
TV broadcaster in the UK, offering services through
asset top box, and its service “Sky Q”. Sky’s channels
include Sky Sports (sports), Sky Atlantic (American
imports), Sky News (News), and Sky Cinema
(movies).
Response Sky UK
Use digital technologies to broaden their content offering to consumers
Sky’s satellite platform was initially was unable to offer “on demand” content (unlike cable or IP providers). However, it iteratively invested in its platform to offer ever greater on demand functionality in order to address competition from cable TV providers (and emerging IPTV services). It invested in its set top box to offer on demand capabilities (Sky Anytime launched in 2007). In 2010 it launched its true on demand service. From 2006 it launched Sky Go which enabled downloads to PC or mobile device. In 2012 it launched Now TV a standalone subscription on demand service.
Sky invested significantly in 3D broadcast technology. This ultimately did not take off – but is nonetheless illustrative of the investments and risks that broadcasters need to take to differentiate.
Sky invests significant amounts in (UK) exclusive “original” drama, comedy and entertainment which competes directly with Netflix (e.g. Chernobyl – a co-production with HBO).
Online adverting offers greater functionality
Sky’s AdSmart enables advertisers to place targeted advertising. The technology inserts targeted advertising on set top boxes, live and pre-recorded and during stream. In this way it can directly compete with online advertisers in terms of the functionality of targeted advertising, whilst offering level of quality and intensity made possible through its traditional medium.
Sky has invested in audience measurement and offers advertising products which cross the linear and online inventory portfolio that it manages on behalf of its own broadcast and third parties.
Sky sells advertising on behalf of a number of broadcasters including MTV, Nickelodeon, and Comedy Central. Sky Advance enables advertisers to leverage broadcasting and non-broadcast advertising.
Diversify into offering new services
Sky TV now comes bundled with Netflix and costs £25 a month. NowTV (provided by Sky) is supplied for £9 per month and offers on-demand viewing of Sky films, sports, and entertainment shows. Unlike Sky’s flagship satellite TV service, NowTV does not require a long-term contract.

frontier economics 93
BROADCASTERS ADAPTING TO DIGITAL TRANSFORMATION IN APAC
Case study 3 – Media Nusantara Citra TBK PT
Media Nusantara Citra is an Indonesian commercial advertising funded broadcasting
group. It operates 4 Free-To-Air channels as well as 18 channels broadcast on Pay TV.
MCN’s FTA Channels are RCTI (news, sports, and soap operas), MNCTV (quizzes,
soap operas, and reality TV shows), GTV (game shows and cartoons), and iNews
(news). RCTI is the most watched and widely broadcasted FTA station in Indonesia.196
Media Nusantara Citra’s response to the challenges of digital disruption
196 MNC Annual Report 2019, p. 189 197 MNC Annual Report 2019, p. 109 198 See: https://www.mncgroup.com/files/contents/1596508874_PR%20BHIT%201H2020.pdf 199 See:
https://www.idx.co.id/StaticData/NewsAndAnnouncement/ANNOUNCEMENTSTOCK/From_EREP/201910/a42af6b347_3f7c149743.pdf
200 See: https://www.mnc.co.id/contents/detail/en/570/terus-naik-digital-konten-akan-kuasai-40-pendapatan-mncn-pada-2022
Response Media Nusantara Citra
Use digital technologies to broaden their content offering to consumers
MNC possesses around 40% of the total local content library in Indonesia.197 By leveraging this, MNC’s on demand service RCTI+, which launched on 23rd August 2019 grew to exceed 1 million monthly active users at the by June 2020, making it the fastest growing OVSP in the country.198 In 2020, the service is targeted to have more than 20 million MAU with an estimated revenue of USD 30 million or 5 percent of total MNCN revenue.199 In the next 4 years, digital revenues are targeted to represent 50% of the company’s revenue. (This includes revenue earnt via YouTube).200
RCTI+ is available both in browsers and as a phone app. It features both live streaming app for their 4 FTA channels as on demand content.
MNC has invested significant resources in broadcast and
production facilities that enable the company to produce
programmes such as drama series, animation (exported
globally), and talent search shows like the Indonesian
Idol, The Voice, MasterChef, and Rising Star. This is the
type of content that traditional broadcasters have an
advantage over OVSPs, due to the large/universal
reach/appeal of their offerings.
MNC launched 6 new Pay TV channels in 2013, expanding their total channel portfolio to 20 over Direct to Home (satellite) platform.
Use digital technologies to deepen their engagement with consumers
RCTI+ has content exclusive to the online space, including short form clips and behind the scenes footage, a chat feature, quiz voting, live chat with “MNC talents” and User Generated Content features for talent search competitions such as Indonesian Idol, where viewers can their upload audition tapes and vote on others’

frontier economics 94
BROADCASTERS ADAPTING TO DIGITAL TRANSFORMATION IN APAC
Source: Frontier
201 See: https://www.idx.co.id/StaticData/NewsAndAnnouncement/ANNOUNCEMENTSTOCK/From_EREP/201911/0648d12389_ab6d029fc2.pdf We assume that “10 MAU” means 10 million MAU and that this is a mistake. 202 See:
https://www.idx.co.id/StaticData/NewsAndAnnouncement/ANNOUNCEMENTSTOCK/From_EREP/201911/0648d12389_ab6d029fc2.pdf
203 See: https://twitter.com/OfficialRCTI?ref_src=twsrc%5Egoogle%7Ctwcamp%5Eserp%7Ctwgr%5Eauthor 204 See:
https://www.mnc.co.id/contents/detail/en/570/terus-naik-digital-konten-akan-kuasai-40-pendapatan-mncn-pada-2022
205 See: https://blog.iflix.com/wp-content/uploads/2019/05/MNC-x-iflix-FINAL.pdf 206 See: https://www.idnfinancials.com/news/34020/mnc-signs-agreement-facebook-digital-advertising-revenue 207 See: https://www.investopedia.com/articles/personal-finance/032615/how-youtube-ad-revenue-works.asp
performances MNC intends to introduce a reward program to increase user engagement. The company’s User Generated Content platform MeTube currently has over 10 million monthly active users.201
MNC operates a multi-channel network on YouTube which more than 2 billion views generated every month. It has the fastest growing number of views and subscribers in Indonesia. 5.5% of the total video viewership on YouTube is on MNC produced content.202
MNC’s largest FTA channel RCTI has 3.3m followers on twitter and regularly shares short-form content from its programming.203
MNC operate three online portals: okezone.com, iNews.di and sindonews.com. The latter two portals are news sites and the former is a news and entertainment site. Currently, on the Alexa rank, Okezone is the number one most visited portal from all portals in Indonesia, even higher than Google.204
Online adverting offers greater functionality
MNC sells different forms of advertising from filler TVC, built-in, product placements and “squeezed-frame” advertising for the FTA channels.
They also sell a different form of digital ads, such as pre-rolls prior to video content, banner ads on apps and ads that align with user comments in the chat feature.
Diversify into offering new services
In 2019, MNC reached a deal with iflix to license 10,000 hours of its content to the OVSP.205
MNC signed an agreement206 with Facebook to obtain 55% of digital advertising revenues from their content on the site. (Such an agreement is commonplace for large YouTube content creators).207

frontier economics 95
BROADCASTERS ADAPTING TO DIGITAL TRANSFORMATION IN APAC
Case study 4 – TrueVisions
TrueVisions is a cable and satellite television operator in Thailand owned by the True
Corporation. It offers set-top boxes both with and without monthly fees (the monthly fee
grants access to extra channels).208 TrueVisions channels include TrueFilm (films),
TrueSport (sports), TrueSpark (children’s programming) and TNN (news). TrueVisions
faced declining subscriber rates in 2017209, and responded by increasing its digital offer
alongside other measures. It has since seen increasing subscriber growth.210
TrueVisions strategies to respond to digital disruption
208 See: https://www.bangkokpost.com/tech/289572/truevisions-launches-box 209 See: https://www.bangkokpost.com/business/1742489/screen-shake-out 210 See: https://www.thestorythailand.com/en/18/05/2020/1044/

frontier economics 96
BROADCASTERS ADAPTING TO DIGITAL TRANSFORMATION IN APAC
Challenge TrueVisions
Use digital technologies to broaden their content offering to consumers
True Corporation’s digital media and internet division, True
Digital Group is responsible for overseeing the distribution of
TrueVisions content to the digital space. They describe their
mission as “to drive innovation and capture growth opportunities
arising from the shift to the digital economy”.211
Since its launch, the TrueVisions mobile app, TrueID has
become the most downloaded application in its category,
reaching 24.6 million monthly active users (MAU) by the end of
2019212. It is available to all users, but TrueVisions customers
get the best benefits. It replaced the older app, TrueVisions
Anywhere, which launched in 2015
TrueVisions regained the rights to broadcast the English
Premiere League for the 2019/20 and 2021/22 seasons.213 This
is the type of content OVSPs find hard to compete with, given its
lack of substitutability, and the long-standing use of Pay TV
services in licensed venues such as pubs.
TrueID offers live streaming of TrueVisions channels, as well as
on-demand viewing.
Use digital technologies to deepen their engagement with consumers
The TrueVisions YouTube channel has clips from TrueVisions
shows and currently stands at 2.3 million subscribers.214
TrueID offers chat, voice, and video communication services.215
In 2019, TrueVisions launched TrueID In-Trend, a user-
generated content feature of TrueID. It promotes content
created by Thai locals on topics such as food, travel, fashion,
and the latest news, categorised by regions. It features 19,000
creators.216
Also in 2019, TrueID launched TrueID Station, a 24-hour TV
station available on TrueID with original content and production,
such as Influencer Live Community where internet influencers
give commentary on sports.217
TrueVisions partners with the personalisation, discovery, and
recommendations solution, ContentWise to power personalised
recommendations and discovery for the service, with the aim to
increase customer satisfaction and drive Pay TV revenues.218
Online adverting offers greater functionality
In 2019, TrueVisions began utilising virtual ads in in the Viz
Arena for volleyball games by collaborating with Virtz, who
provide image-based tracking technology. This allows
TrueVisions to insert ads onto and around the side of the court
without any actual physical disruption of intrusion in the
venue.219
211 True Annual Report 2019, p. 29 212 True Annual Report 2019, p. 8 213 See: https://www.premierleague.com/news/1241698 214 See: https://www.youtube.com/user/TrueVisionsOfficial 215 True Annual Report 2019, p. 29 216 True Annual Report 2019, p. 11

frontier economics 97
BROADCASTERS ADAPTING TO DIGITAL TRANSFORMATION IN APAC
Challenge TrueVisions
Diversify into offering new services
In 2012, TrueVisions launched a new set-top box that incurs no
monthly fee.220
In 2019, TrueVisions launched a privilege and loyalty platform
called TrueYou. Customers can earn TruePoints to sped on
deals in TrueID. True Corporation comments that this has
“greatly enhanced customer retention and quality subscriber
growth”.221
Source: Frontier
217 True Annual Report 2019, p. 11 218 See: https://www.multichannel.com/pr-feed/truevisions-chooses-contentwise-deliver-multiscreen-
personalization-thai-tv-viewers-391050 219 See: https://www.vizrt.com/sports/case-studies/true-vision-viz-arena-volleyball 220 See: https://www.bangkokpost.com/tech/289572/truevisions-launches-box 221 True Annual Report 2019, p. 232

frontier economics 98
BROADCASTERS ADAPTING TO DIGITAL TRANSFORMATION IN APAC
www.frontier-economics.com