The Future of Work is Now: Is APAC Ready? Autodesk ...
33
The Future of Work is Now: Is APAC Ready? Autodesk Foundation 2021
-
Upload
khangminh22 -
Category
Documents
-
view
3 -
download
0
Transcript of The Future of Work is Now: Is APAC Ready? Autodesk ...

The Future of Work is Now: Is APAC Ready? Autodesk Foundation2021
The Future of Work is Now: Is APAC Ready? | Autodesk FoundationThe Future of Work is Now: Is APAC Ready? | Autodesk Foundation
2 3
Contents
Glossary and definitions ........................................................................ v
Executive summary .................................................................................1
1. Accelerating automation in the Asia Pacific .....................................5
2. Who needs the most assistance? ......................................................9
3. Ready for impact ...............................................................................19
4. Filling the gaps ...................................................................................25
Appendix A: Impact Index ....................................................................37
Appendix B: Measuring preparedness ...............................................41
Appendix C: Current programs ...........................................................47
Contacts ..................................................................................................54
The Future of Work is Now: Is APAC Ready? | Autodesk Foundation
v
Acronym Full text
AI Artificial intelligence
APAC Asia Pacific
ASEAN Association of Southeast Asian Nations
BPM Business Program Management
GDP Gross Domestic Product
ILO International Labour Organization
R&D Research and Development
SMEs Small and Medium Enterprises
TVET Technical and Vocational Education and Training
Terminology Definition
Artificial intelligence The field of science devoted to making intelligent machines which have the ability to think, reason and learn.
Automation The creation and application of technological processes to complete tasks with minimal or no human input. Automation can be classified as basic automation, process automation, and integration automation which acknowledges the increasing complexity of the tasks undertaken by technology.
Industry 4.0 The Fourth Industrial Revolution. While definitions vary, the Fourth Industrial Revolution is often characterised as building on the widespread adoption of computers through the use of smart and autonomous digital technologies that are interacting and learning from other technology.
Glossary and definitions

The Future of Work is Now: Is APAC Ready? | Autodesk Foundation
vii
This study explores the potential adverse impacts of automation on workers in Asia Pacific, and strategies which can be employed to smooth the transition.
Digital change and automation are driving enormous productivity gains
in the world of work – gains which are helping to improve standards
of living across the globe.
But there can also be significant adjustment costs associated with automation, and often those costs are felt by workers who are least able to successfully transition to new roles.
Taking proactive steps to address the risks of automation, and harness the benefits, will lead to better outcomes for workers, business and society more broadly.
Increase awareness of the need to adapt.
Fund industry-specific programs for automation transformation.
Invest in learning programs to help disadvantaged workers and build resilience.
India, Bangladesh and Pakistan are the countries most at-risk and least prepared for automation.
The top three industries most at-risk of automation are:
TransportMiningConstruction
BangladeshPakistan
India
Japan, Singapore and Australia are the most prepared for the coming wave of automation, but country scores vary across several indicators of preparedness...
All workers and industries will be affected by digitisation and automation to some extent.
But which countries are most prepared?
Sources: Deloitte Access Economics based on the World Bank, Boston Consulting Group, World Economic Forum, and Economist Intelligence Unit.
Willingness to reskillProportion of workers willing to reskill
Japan
Least Prepared Most prepared
54% Pakistan 73%
Singapore
Least Prepared Most prepared
Time to start a businessAverage number of days
33 Philippines 2
Bangladesh Korea
Least Prepared Most prepared
Internet usersPercentage of households with access
7% 100%
Average years of schooling
Myanmar Australia
Least Prepared Most prepared
5 13

The Future of Work is Now: Is APAC Ready? | Autodesk Foundation
1
Executive summary
Automation creates opportunities for a better future of work. It helps to unlock new worker and business outcomes that would otherwise not have been possible, by reducing the need for humans to do jobs which are dirty, dangerous or dull, augment human effort to make work easier, and create new roles altogether.
This represents enormous potential for the Asia Pacific (APAC). APAC is home to 60% of the global workforce, and the world’s largest developing economies.i Across the region, the working poverty rate is 20.9%, and more than 1.1 million people die from occupational accidents or work-related diseases.ii Automation has the potential to address these problems. For example, it’s estimated that the use of collaborative robots can reduce up to 72% of common injuries in manufacturing jobs.iii
While technology creates more jobs than it destroys, it is undeniable that automation will be disruptive. As in previous industrial revolutions, changes from industry 4.0 will mean that some roles become redundant, while others thrive.
This does not mean that automation should be avoided. Being proactive and preparing for change can mean that individuals, businesses, industries and nations can share in the benefits of automation.
Deloitte was commissioned by Autodesk Foundation to help identify the labour markets most vulnerable to technological disruption in APAC. In identifying those most at risk, this report proposes interventions which can be scaled and adapted to different circumstances across APAC.
Many existing studies look to understand which roles are most likely to be automated. However, the true impact of automation will be determined not just by which roles are affected, but the extent of disadvantage faced by those who are affected. Individuals with lower education levels who are made redundant, as an example, are less likely to be able to find new roles.
To measure impact across industries, this report compiles data from a range of international sources. To determine the risk of automation, data has been collected on the level of routineness the extent of manual (versus cognitive) tasks, as well as the degree to which workers are currently engaging with technology in their role. The extent of disadvantage in an industry is captured by indicators on the age, education level, skills of workers, and the size of the informal workforce.
Chart i shows the results of this analysis. Relatively higher scores (i.e. closer to 1) denote an industry with a higher likelihood of automation or higher disadvantage.
Health and social work
Financial and insurance
Education
Mining and quarryingLogisitcsWholesale, retail and repairs
Manufacturing
Public admin and defence
Electricity and gas
Water and waste Construction
Agriculture
Chart i: Impact Index by industry
Source: Deloitte (2021).
0.30 0.45 0.600.40
0.50
0.60
Likelihood of automation
Exte
nt o
f dis
adva
ntag
e

The Future of Work is Now: Is APAC Ready? | Autodesk FoundationThe Future of Work is Now: Is APAC Ready? | Autodesk Foundation
2 3
Construction topped the list as the industry most likely to be hardest hit by the coming wave of automation. The construction industry had the highest proportion of routine, manual tasks, with a high potential for automation. Likelihood of automation was also high in mining, manufacturing and transport.
Other industries likely to face difficulty due to are goods-based sectors, like agriculture. Agricultural workers are generally paid less than other sectors, partly due to the seasonal nature of the work, and subsistence rural living which continues in many countries. The industry also tends to employ a relatively higher proportion of workers over 60 years old.
In comparison, service industries – like health, education and financial services – had a relatively lower impact score. While significant digital change is still occurring in these sectors, it is often complementary to existing skillsets (e.g. new modes of delivering services, rather than wholesale role changes).
How prepared are individuals, industries and countries for this change?
There is no single way that countries can, or should, prepare for automation. One part will be supporting disadvantaged workers, and those who are most likely to be negatively impacted by automation. However, equally important is having the readiness to take advantage of the opportunities afforded by automation. Having the right infrastructure and skills will mean that countries can create new roles, and transition workers into these roles with the adaptability and resilience required.
Deloitte has compiled data from a range of sources to indicate the level of preparedness for automation across countries. There are limitations to quantitatively comparing levels of preparedness. However, it can be useful to develop a framework and provide insights into opportunity areas.
One part of this framework has focused on understanding the level of support offered to disadvantaged workers. This is designed to capture the importance of creating safeguards – often through a country’s general welfare system – for individuals within industries that are likely going to be displaced or experience disruption due to automation.
Singapore
Prep
ared
ness
Inde
x
Chart ii: Potential impact of automation and preparedness by country
Source: Deloitte (2021).
0.35 0.600.30
0.80
Impact Index
Australia
Japan
KoreaThailand
Philippines
Indonesia
Bangladesh
Pakistan
India
Myanmar
Vietnam
0.55
0.47
However, equally important is having the readiness to take advantage of the opportunities afforded by automation. Twelve unique measures were collated to understand a country’s readiness to capitalise on automation, including data on the business and innovation environment, and the level of reskilling offered to workers within countries.
Overall, preparedness for automation is correlated with economic development. This means countries which face the biggest potential impact are also the least prepared. Without concerted action, this runs a risk of embedding disadvantage and creating larger gaps between countries.
Chart ii shows the results of this analysis. Relatively higher scores (i.e. closer to 1) on the Impact Index denote a country with a high likelihood of automation or high disadvantage, while relatively higher scores on the Preparedness Index denote a country is better equipped to manage the transition of workers due to automation.
But even developed countries still can do more to assist workers facing automation risk. There is no such thing as being too prepared.
What can countries do to proactively improve their level of preparedness?
Helping more businesses, industries and countries take advantage of the potential of automation is not just about upskilling workers.
It is equally important to consider demand for labour, as well as the underlying ecosystem and infrastructure.
To be in the best position to benefit from automation, individuals, businesses, countries and regions need to focus on the three key opportunity areas in Figure i - foresight and mindset, skills and learning, and access and inclusion. This framework promotes a more holistic approach to preparedness to avoid any potential gaps.
Figure i: Framework and initiatives for improving preparedness for automation
Foresight and mindsetAnticipating required skills and capabilities and inspiring a mindset of constant evolution and adaptation.
Skills and learningDeveloping the required skills and capabilities by ensuring work and learning tools are adaptive and resilient in an ever-changing world of perpetual disruption.
Access and inclusionEnsuring equitable access to learning and jobs for all, while encouraging diversity and participation in decision making.
Using this framework, this report identifies seven initiatives that can be applied to countries at varying levels of development and stages in their automation journey.
1. Establish a future of work taskforce. A future of work taskforce can play a coordination role in defining the vision for the future of work and harnessing the human and technology capabilities required to meet this vision. This includes realigning the skills and capabilities of the labour force to roles and industries expected to be in high demand.
2. Increase awareness of opportunities from automation. Automation is often associated with job losses rather than job creation and new opportunities. Informing individuals about potential opportunities from automation is necessary to encourage a more proactive relationship with the use of new technologies and learning.
3. Activate opportunity marketplaces. Opportunity marketplaces provide a virtual platform to connect existing skills and capabilities of the workforce with the current needs of businesses. Advanced opportunity marketplaces leverage AI to improve the relevance of information provided to workers, accelerating the transition to new growth industries.
4. Invest in learning programs to build adaptability and resilience. Promoting the uptake of reskilling or upskilling courses throughout a career will assist workers to continually reinvent themselves in an ever-evolving environment of perpetual disruption. This will provide the required attributes for individuals to respond positively to new technology in
ways that unleash human potential to drive new outcomes for workers, industries and society at large.
5. Develop appropriate safety nets to enable people to live and work. By developing appropriate safety nets, countries help to build their human capital and increase labour-force participation. Social protection helps people maintain an adequate standard of living and contributes to economic growth by improving the quality of the workforce and driving domestic demand.
6. Industry specific funded programs for automation transformation. Small and Medium Enterprises (SMEs) are often constrained from accessing new digital technologies. By providing SMEs with access to specific industry funding and access to resources required, industry groups and governments can play an instrumental role in accelerating automation usage and adoption.
7. Level the playing field through investing in local language content. The dominance of online content in English can disempower workers who do not natively speak English. Investing in local language content provides an opportunity to develop, access and engage a broader more diverse local labour market that has previously been untapped.
Implementation of these initiatives alongside others will smooth the transition to a more adaptable and resilient workforce to thrive in the future of work.

The Future of Work is Now: Is APAC Ready? | Autodesk FoundationThe Future of Work is Now: Is APAC Ready? | Autodesk Foundation
4 5
1. Accelerating automation in the Asia Pacific
From the first industrial revolution to the fourth, technology has helped people at work. Steam powered tools made manual tasks easier, while electricity and mass production meant that people could do more with less. More recently, information technology has improved communication and knowledge sharing.
The current revolution – called industry 4.0 for short – is increasingly being characterised by automation. Yet, every business, industry and country is on its own automation journey. Perhaps nowhere is this clearer than in the Asia Pacific (APAC). In some respects, APAC is leading the charge. For example, APAC is home to 64% of the world’s industrial robots.v Revenue from Artificial Intelligence (AI) platforms is forecast to grow twice as fast in APAC compared to the world between 2019 and 2024 (see Chart 1.1).
Chart 1.1: AI platform revenue 2019-2024
Source: GlobalData (2020)vi, Deloitte (2021).
AI p
latfo
rm re
venu
e (U
S$ b
illion
s)
GlobalAPAC
2019 2024
CAGR 26.8%
CAGR 13.2%
0
10
20
30
40
50
60
For many businesses, the automation journey is still beginning. More than two in five banks around the world still rely on manual processes and Excel for Know Your Customer (KYC) processes.vii And while many individuals are already engaging with smart technologies, others still don’t have access to the internet. In Pakistan for example, just 17% of the population use the internet, while in Myanmar less than one quarter (24%) use the internet.viii
Deloitte was commissioned by Autodesk Foundation to identify the labour markets most vulnerable to technological disruption in APAC. This is done by creating a new quantitative measure which considers the likelihood of automation by industry, as well as considering the extent of disadvantage of workers in that industry.
In identifying those most at risk, this report seeks to identify interventions which can be scaled and adapted to different circumstances across the region. This analysis also offers the opportunity to learn from labour markets at the forefront of leveraging automation technologies to overcome roadblocks – like an ageing population or stagnant productivity growth.
There’s never been a better time to reflect on the changing nature of work. COVID-19 is accelerating automation and has upended ways of working around the world. It’s estimated that close to half of all businesses intend to increase their adoption of robotic process automation over the next year.ix

The Future of Work is Now: Is APAC Ready? | Autodesk FoundationThe Future of Work is Now: Is APAC Ready? | Autodesk Foundation
6 7
While this brings some challenges, it also creates opportunities. Automation can generate significant economic benefits. Indeed, estimates suggest it could raise global productivity by as much as 1.4% annually.x In the context of a COVID-19 induced global recession, this potential productivity increase is well worth investing in.
There is a wealth of evidence about this. For instance, Australian workers that are frequent users of technology spend nearly seven hours less on administrative tasks than less frequent users, allowing them to focus on more valuable tasks.xi
Automation is far broader – and more widespread – than robots. Broadly, automation can be classified as basic automation, process automation, integration automation, and AI automation. Each classification represents an increasing complexity of repetitive tasks which are carried out or assisted by technology. It’s estimated that 91% of companies utilise some basic automation.xii
Some examples of automation technology include business process management (BPM) software, robots, and virtual assistants. Automation can also be applied to a wide range of industries with some examples below:
• Indian IT company Tata Consultancy Services is deploying its new AI software, IUX for Workplace Resilience, to create a smoother transition back to the office following the COVID-19 pandemic. This software calculates daily risk scores for employees and monitors compliance with workforce safety requirements, assisting administrators decide which employees can return to work safely.xiii
• Australian banks Bendigo and Adelaide Bank created an automated platform to harness omni-channel customer behaviour, enabling it to predict customers’ unique needs and in its delivery of a more customer-centric business strategy.xiv
• Japanese company Mitsubishi Electric has been developing MELFA ASSISTA cobots (collaborative robots) to deploy automation technology alongside humans in industries ranging from food and beverage to pharmaceuticals.xv These cobots can be taught different movements and are able to complete repetitive tasks to a high degree of accuracy.
As automation becomes more embedded in day to day work, it will change the tasks workers perform. This means new jobs and opportunities. This, in turn, will change the nature and requirements for the workforce and workplace. In India and Singapore for example, AI specialists are one of the fastest growing job categories according to LinkedIn between 2008 and 2017.xvi
While automation will help create jobs, it will also make some tasks and roles redundant and other tasks will be augmented by technology. Estimates of role losses caused by automation vary significantly across studies, ranging from as low as 5% to as high as 47%.xvii COVID-19 has accelerated these trends as physical restrictions have forced many businesses to switch to digital processes.
While the process creates more jobs than it replaces, some people find the transition to new roles more difficult.
Avoiding or delaying automation is not the solution. Adopting technology and successfully transitioning workforces means more meaningful, engaging and rewarding work for individuals, as well as more prosperous businesses and societies.
Of course, the challenge is to ensure that people, businesses, industries and nations are well prepared to adapt. APAC is home to 60% of the global workforce and the world’s largest developing economies, making the region a clear priority.xviii There are a raft of initiatives already underway to smooth the adjustment path for industries and societies in adopting new technologies. One area that is increasingly being prioritised by employers and employees alike is reskilling and upskilling. For example, telecommunications company AT&T collaborated with education provider, Udacity, to create technical training programs for its employees. This program has allowed 70% of its jobs to be filled internally by reskilled workers.xix Furthermore, Schneider Electric has created an ‘Open Talent Market’ for its employees in 2018, leveraging AI technology to help match staff with potential opportunities and reducing turnover.xx
Yet it’s impossible to do everything. Targeted approaches which are appropriately tailored to diverse needs and circumstances are best. Yet where to target, where to focus? There is a clear need to consider where you can have most impact to enable those most at risk are able to transition successfully.

The Future of Work is Now: Is APAC Ready? | Autodesk FoundationThe Future of Work is Now: Is APAC Ready? | Autodesk Foundation
8 9
2. Who needs the most assistance?
Figure 2.1: Overview of the Impact Index and its components
Source: Deloitte (2021).
Digital disruption to the way we live and work is inevitable. Previous waves of automation have seen a growing proportion of the workforce use technology to perform their role. Globalised supply chains, shifting demographics and changing consumer preferences mean that every business in every industry in every country faces continued pressures to adapt as technological change accelerates. The same is true for individuals.
This is not a bad thing. Automation brings opportunities for new meaningful and high-value-adding work, replacing mundane or repetitive manual tasks.
But not everyone is equally well placed to grasp these opportunities. Often those at highest risk of automation are those who are least likely to be able to seize the benefits.
Each country has its own unique circumstances which affect this. But there are also some common trends across industries and occupations. In a globalised economy, the skills and tasks required within industry sectors are becoming more normalised.
However, differences in demand for these workers – and therefore composition of the workforce – within each country and industry drives differences in the risk of automation.
This report constructs a new measure to understand where the impacts of automation are most likely to be felt, by industry. It goes beyond the likelihood of automation to provide a quantitative estimate of which industries will be affected the most.
The Impact IndexThis report compiles data from a range of international data sources to create an Impact Index which can be used to understand the likelihood of automation, as well as build a better understanding of the capacity of people to adapt. These two areas form the two main pillars of the Impact Index as shown in Figure 2.1.
Impact Index
Likelihood of automation Extent of disadvantage
• Spend time making repetitive motions
• Importance of repeating the same tasks
Routineness scoresO*NET data
• Thinking creatively
• Structured versus unstructured work
• Analysing data/information
Cognitive scoresO*NET data
• Interacting with computers
• Degree of automation
Use of technologyO*NET data
WagesInternational Labour Organisation data
Education levelOECD data
Transferability of skillsO*NET data
• Share of older workers ( >60)
• Share of younger workers ( <25)
AgeUN data
Informal sectorILO data

The Future of Work is Now: Is APAC Ready? | Autodesk FoundationThe Future of Work is Now: Is APAC Ready? | Autodesk Foundation
10 11
The likelihood of automation pillar focuses on the nature of work in an industry to assess the extent to which potential innovations could automate day-to-day tasks. The pillar is comprised of three sub-pillars: the level of routine tasks, the extent of manual (versus cognitive tasks), as well as the degree to which workers are currently engaging with technology in their role. The third sub-pillar is comprised of two distinct measures, including the degree to which workers are interacting with computers (a protective factor), and the degree of automation (a negative factor).
The extent of disadvantage in an industry is captured through five sub-pillars: covering the age, education level, wages, skill level, as well as the size of the informal workforce.1 More disadvantaged workers – those employed in low-wage and low-skilled occupations – are assumed to have lower capabilities to transition to other future proofed occupations and thus higher disadvantage.
Further details on indicators and the construction of the Impact Index are provided in Appendix A.
This is not the first index to measure automation risk. There are other examples – such as the OECD’s (2016) The Risk of Automation for Jobs in OECD Countries and McKinsey’s (2018) Skill shift: Automation and the future of the workforce. Importantly, these indices have primarily focused on more developed countries. In addition, they tend to focus primarily on how vulnerable industries are to automation, without exploring the consequential impacts on workers. To our knowledge, none consider this in tandem with the characteristics of workers in the industry to understand the likely impact of automation.
Chart 2.1 shows where each of the twelve industries modelled sits on the Impact Index. Relatively higher scores (i.e. closer to 100%) denote an industry with high likelihood of automation or high extend of disadvantage.
1 Higher shares of the population that are younger (18-21) and older (65 and older) were included in the index. Younger workers are less likely to have sufficient workplace experience to transition easily to new roles and less likely to have accumulated savings in case of unemployment. Meanwhile, older workers are more likely to have difficulty transitioning to roles with new technologies.
Financial and insurance
Public admin and defence
Education
Manufacturing
Construction
Mining and quarryingLogisitcs
Wholesale, retail and repairs
Health and social workElectricity and gas
Water and waste
Agriculture
Chart 2.1: Impact Index by industry
Source: Deloitte (2021).
0.30 0.45 0.600.40
0.50
0.60
Likelihood of automation
Exte
nt o
f dis
adva
ntag
e
The industries with the higher impact scores include agriculture, mining, and manufacturing. In comparison, service industries – like health, education and financial services – had a relatively lower impact score.
Because they deal with people, service industries comprise a larger proportion of non-routine and cognitive work, which makes the work they perform more difficult to automate difficult to automate. The workers, in turn, possess stronger people skills – like customer service, leadership and critical thinking – which are widely applicable across a range of sectors. For example, complex problem solving was the skill in-demand for the largest proportion of roles during 2020 out of nine core work-related skills (36%).xxi
Interestingly, there does not appear to be a strong correlation between the likelihood of automation within an industry and the extent of disadvantage. Industries like construction, logistics and mining stand out from others as being especially likely to be automated. Likewise, workers in agriculture and wholesale trade are the least capable of transitioning to different occupations or sectors.
Challenges facing ‘low risk’ industries
Chart 2.1 shows that some industries – such as education, financial and insurance services and human health and social work – face a relatively lower automation risk compared to other industries like construction.
Workers in these industries still face risk of being impacted from automation and will experience digital change to their role.For instance, workers in the education industry receive a likelihood of automation score of 0.37 which, while lower, is not insignificant. In fact, there is only 0.19 of a difference between the education industry and the construction industry, which is facing the highest risk.
For some industries, a relatively lower risk could reflect the fact that substantial technological change has already happened.For example, in Australia’s electricity, gas, water and waste services industry, employment grew by only 1.1% from November 2013 to November 2018, compared to an increase of 10.8% across all Australian industries.xxii This reflects the shift towards new technologies being deployed to reduce the amount of manual work required. One example is the increasing use of sensors on infrastructure by utility companies which reduces the need for routine maintenance checks.xxiii
Yet even industries which have low automation risk will still face significant digital disruption. Take the education industry as an example. Teaching has traditionally required lots of interpersonal skills such as empathy and communication, which are not amenable to automation. Yet there are many digital technologies changing administration and evaluation tasks undertaken by teachers.xxiv The reduction in time undertaking these manual tasks could potentially enable teachers to spend more time on student interaction, building a positive learning environment, and coaching students on a more personalised level. So while teachers are likely to experience digital change, their roles are likely to be augmented by technology rather than leading to holistic changes in daily tasks.
12 13
Spotlight on agriculture
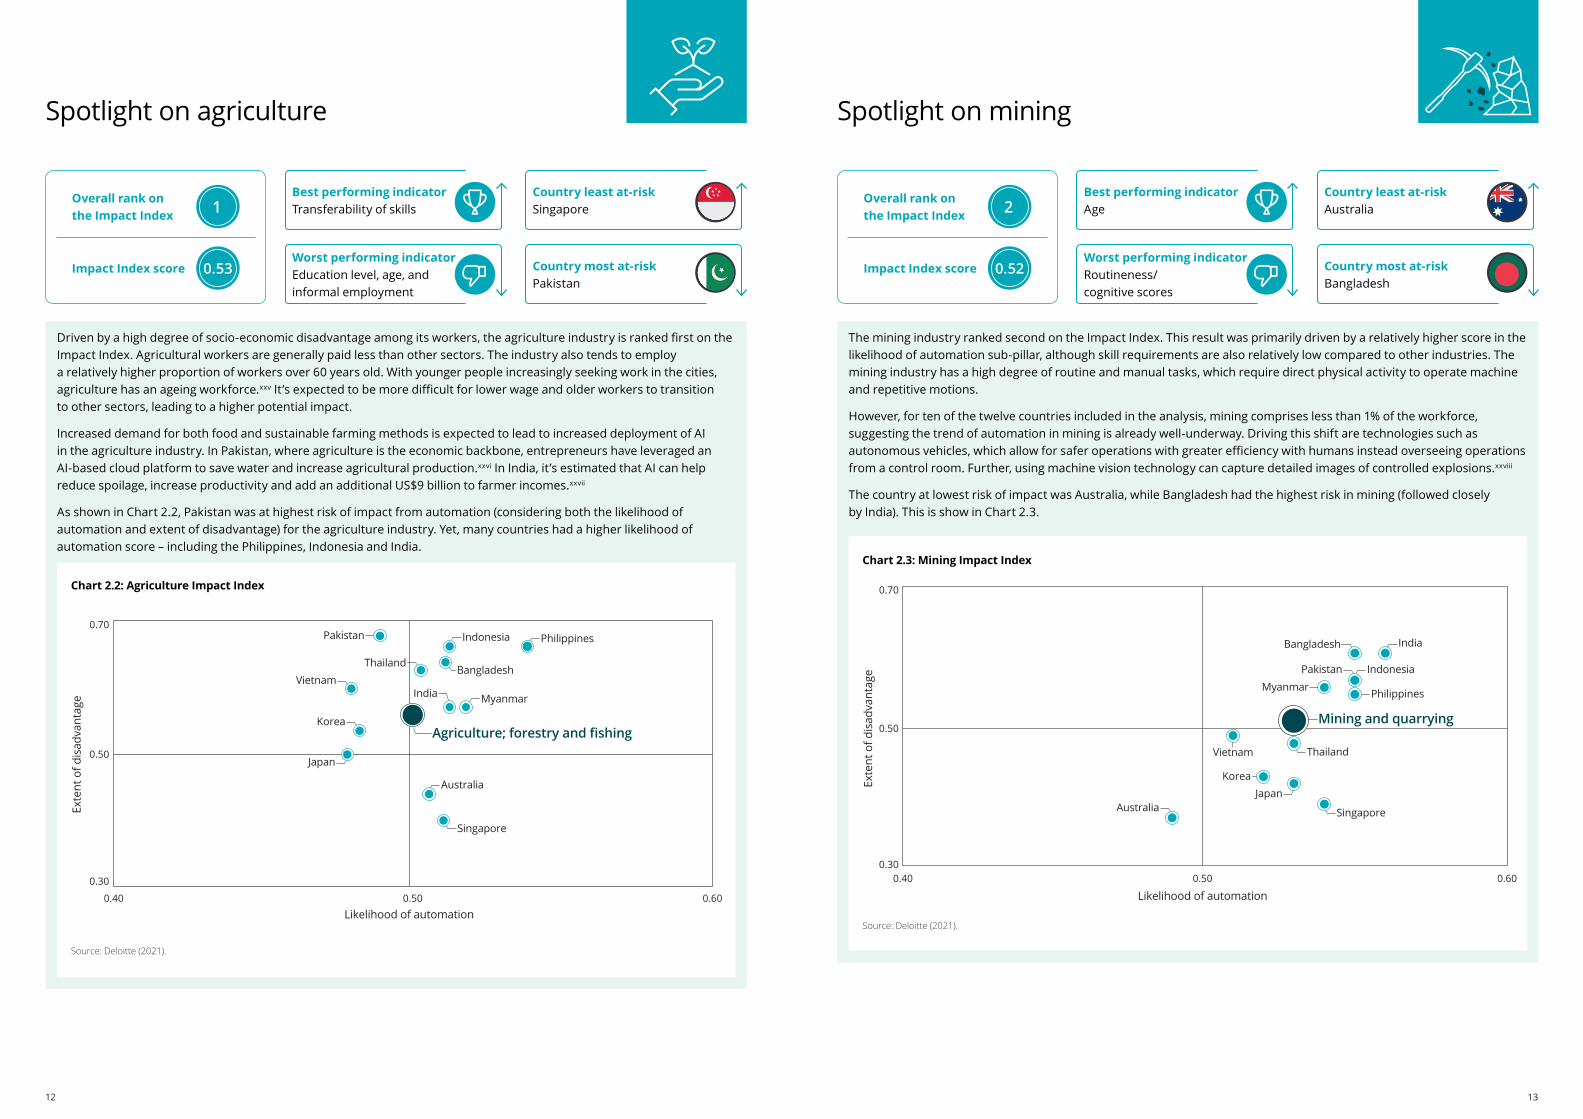
Country least at-riskSingapore
Country most at-riskPakistan
Best performing indicatorTransferability of skills
Worst performing indicatorEducation level, age, and informal employment
Driven by a high degree of socio-economic disadvantage among its workers, the agriculture industry is ranked first on the Impact Index. Agricultural workers are generally paid less than other sectors. The industry also tends to employ a relatively higher proportion of workers over 60 years old. With younger people increasingly seeking work in the cities, agriculture has an ageing workforce.xxv It’s expected to be more difficult for lower wage and older workers to transition to other sectors, leading to a higher potential impact.
Increased demand for both food and sustainable farming methods is expected to lead to increased deployment of AI in the agriculture industry. In Pakistan, where agriculture is the economic backbone, entrepreneurs have leveraged an AI-based cloud platform to save water and increase agricultural production.xxvi In India, it’s estimated that AI can help reduce spoilage, increase productivity and add an additional US$9 billion to farmer incomes.xxvii
As shown in Chart 2.2, Pakistan was at highest risk of impact from automation (considering both the likelihood of automation and extent of disadvantage) for the agriculture industry. Yet, many countries had a higher likelihood of automation score – including the Philippines, Indonesia and India.
0.40 0.50 0.60
0.30
0.50
0.70
Likelihood of automation
Exte
nt o
f dis
adva
ntag
e
Australia
Japan
Korea
Pakistan
Vietnam
Agriculture; forestry and fishing
PhilippinesIndonesia
BangladeshThailand
India Myanmar
Singapore
Chart 2.2: Agriculture Impact Index
Source: Deloitte (2021).
Overall rank on the Impact Index 1
Impact Index score 0.530.53
Spotlight on mining
Country least at-riskAustralia
Country most at-riskBangladesh
Best performing indicatorAge
Worst performing indicatorRoutineness/ cognitive scores
The mining industry ranked second on the Impact Index. This result was primarily driven by a relatively higher score in the likelihood of automation sub-pillar, although skill requirements are also relatively low compared to other industries. The mining industry has a high degree of routine and manual tasks, which require direct physical activity to operate machine and repetitive motions.
However, for ten of the twelve countries included in the analysis, mining comprises less than 1% of the workforce, suggesting the trend of automation in mining is already well-underway. Driving this shift are technologies such as autonomous vehicles, which allow for safer operations with greater efficiency with humans instead overseeing operations from a control room. Further, using machine vision technology can capture detailed images of controlled explosions.xxviii
The country at lowest risk of impact was Australia, while Bangladesh had the highest risk in mining (followed closely by India). This is show in Chart 2.3.
Overall rank on the Impact Index 2
Impact Index score 0.530.52
IndiaBangladesh
Vietnam
Korea
Singapore
Japan
Thailand
Myanmar Philippines
Pakistan Indonesia
Australia
Mining and quarrying
Chart 2.3: Mining Impact Index
Likelihood of automation
Exte
nt o
f dis
adva
ntag
e0.40 0.50 0.60
0.30
0.50
0.70
Source: Deloitte (2021).

14 15
Spotlight on construction
Best performing indicatorWages
Worst performing indicatorUse of technology
Construction is ranked third highest for risk of automation impact. The construction industry is characterised by a high proportion of routine and manual tasks as well as low productivity growth. Research suggests annual productivity growth in the construction industry globally averaged 1% over the past 20 years to 2017.xxix This leads to a high potential for automation in coming years.
Technology is expected to replace many of the roles typically done by workers in the construction industry. An example of this is the proliferation in use of standardised prefabricated building components that are increasingly being produced with the assistance of machines. To complement this, the application of Building Information Modelling (BIM) simulate an intelligent 3D model to visualise a building before it’s built, significantly enhancing the efficiency of the construction process.xxx
At the country level, Singapore was at the lowest risk of impact from automation in the construction, well ahead of the other countries. Australia, Korea and Japan also performed well. In contrast, Pakistan was at greatest risk of impact (see Chart 2.4).
Overall rank on the Impact Index 3
Impact Index score 0.530.52
Country least at-riskSingapore
Country most at-riskPakistan
Pakistan
Bangladesh
India
PhilippinesMyanmarConstruction
Vietnam
Japan
Korea
Thailand
Australia
Singapore
Indonesia
Chart 2.4: Construction Impact Index
Source: Deloitte (2021).
Likelihood of automation
Exte
nt o
f dis
adva
ntag
e
0.40 0.50 0.600.30
0.50
0.70
Spotlight on logistics
Best performing indicatorAge
Worst performing indicatorEducation and informal employment
Logistics has the fourth highest overall impact score, however, there is a high degree of variability across countries (see Chart 2.5). For example, workers in Indonesia are at low risk of automation but experience relatively higher levels of disadvantage. Logistics workers in Japan are at higher risk of their jobs being replaced, but are relatively less disadvantaged.
E-commerce is changing the nature of logistics globally. For every $100 in sales, it’s estimated that logistics units for online retailers collect $12-$20, as opposed to the $3-$5 gained in brick-and-mortar stores.xxxi According to the Global Retail E-Commerce Index, Australia, South Korea, Singapore and Japan all sit in the top 15 countries for e-commerce growth.xxxii This suggests digital transformation is already underway in more developed APAC nations, leading to lower automation risk.
Autonomous vehicles are likely to further reduce need for human drivers to transport people and goods. By 2035, the autonomous vehicle market is expected to be worth nearly $77 billion.xxxiii For bus drivers, freight and logistics managers, this means re-training and role changes to keep relevant in the new world of work.
Overall rank on the Impact Index 4
Impact Index score 0.530.52
Country least at-riskSingapore
Indonesia
Singapore
JapanKorea
Australia
ThailandVietnam
India
Myanmar
Bangladesh
Pakistan
LogisticsPhilippines
Chart 2.5: Logistics Impact Index
Source: Deloitte (2021).
Likelihood of automation
Exte
nt o
f dis
adva
ntag
e
0.40 0.50 0.600.30
0.50
0.70
Country most at-riskBangladesh

16 17
The Future of Work is Now: Is APAC Ready? | Autodesk Foundation
Spotlight on manufacturing
Best performing indicatorWages
Worst performing indicatorAge and informal employment
The manufacturing industry is ranked fifth on the Impact Index. The industry relies heavily on manual labour and has large proportions of its labour force in low-to medium-skilled occupations. These factors place it at higher risk of automation. Other studies have estimated that 16% of manufacturing jobs in southeast Asia are at risk of displacement, even after accounting for potential increases in demand for labour.xxxiv
Advances in digital technologies are changing the nature of the manufacturing industry. For example, the rise of the digital twin (a digital replica of physical assets) has dramatically reduced the risk of defects and increased the speed to market.xxxv Complementing this is the digital thread, which is a continuous stream of data that links each stage of the product life cycle and provides the data needed for the digital twin to execute its job. A real-life application of this widely applied in manufacturing is Autodesk’s computer-aided design (CAD) software AutoCAD, which help professionals create precise 2D and 3D drawings.xxxvi
Chart 2.6 shows that the risk of automation is highest in Pakistan, Indonesia, and Bangladesh. Workers in the manufacturing industry in these countries faces a high risk of automation and greater levels of disadvantage. In contrast, workers in manufacturing in Singapore, Australia and Korea are at much lower risk of impact. Workers in some countries, like Japan, face a relatively high risk of automation but low levels of disadvantage.
Overall rank on the Impact Index 5
Impact Index score 0.530.51
Country least at-riskSingapore
Country most at-riskPakistan
Myanmar
Vietnam
Australia
Singapore
IndonesiaBangladesh
Philippines
India
KoreaJapan
ManufacturingThailand
Pakistan
Likelihood of automation
Exte
nt o
f dis
adva
ntag
e
0.40 0.50 0.600.30
0.50
0.70
Chart 2.6: Manufacturing Impact Index
Source: Deloitte (2021).

The Future of Work is Now: Is APAC Ready? | Autodesk FoundationThe Future of Work is Now: Is APAC Ready? | Autodesk Foundation
18 19
3. Ready for impact
All workers and industries will be affected by digitisation and automation. For some, automation may mean changes in tasks, or using technology to augment their roles. In some instances, automation may make some roles redundant, or create entirely new roles.
While change is inevitable, the impact of change is not. Taking proactive steps to address the risks of automation, and harnessing the benefits, will lead to better outcomes for workers, business, industries, governments and societies. For example, improving digital literacy could mean that workers who are made redundant by automation could find new roles more easily; it could also support growth (and increased employment) in digital industries.
The frameworks and initiatives that underpin preparedness are often conceived and implemented at a national level. For example, while a national government might support growth industries or provide a safety net for workers who are affected by automation.
Likewise, the industrial structure of a country will affect the impact of automation. In countries with higher proportions of employment in high risk industries with disadvantaged workers, automation is likely to have a bigger (and more negative) impact, as shown in chapter 2.
How prepared are nations for the impact of automation? Countries in the bottom right of Figure 3.1 are likely to be more affected by automation and are relatively less prepared, while countries in the top left are likely to experience less disruption and are more prepared to harness the benefits of automation.
Singapore
Prep
ared
ness
sco
re
Figure 3.1: Potential impact of automation and preparedness by country
Source: Deloitte (2021).
0.35 0.600.30
0.80
Impact score
Australia
Japan
KoreaThailand
Philippines
Indonesia
Bangladesh
Pakistan
India
Myanmar
Vietnam
0.45
0.55
Of course, preparedness is difficult to objectively measure and compare between countries. For example, it may be possible to identify government policies which support growth industries – yet there are no measures of how effective these policies are likely to be.
Figure 3.1 provides a useful starting point for comparison. By delving deeper into each country, qualitative analysis helps to better understand which countries are most prepared.

The Future of Work is Now: Is APAC Ready? | Autodesk FoundationThe Future of Work is Now: Is APAC Ready? | Autodesk Foundation
20 21
Readiness to help disadvantaged workers
• Our world in data
• BCG
• Global innovation index
Figure 3.2: A framework for assessing preparedness
Source: Deloitte (2020).
Preparedness framework
Readiness to take advantage of automation
• Time to start a business
• International trade barriers
• Legal framework’s adaptability to digital business models
• World Bank
• International Trade Barriers Index
• WEF
Business environment
• R&D expenditure
• Internet users
• Intellectual property protection
• Companies embracing disruptive ideas
• Female share of management positions
• Digital skills among active population
• World Bank
• EIU
• WEF
• WEF
• ILO
• WEF
Innovation environment
• Mean years of schooling
• Willingness to reskill
• Firms offering formal training
Education
• Cost of redundancy dismissal
• Temporary employment
• Underutilisation
• Availability of national statistics
• Global innovation index
• ILO/OECD
• ILO
• ODI
Labour force
• Government health expenditure
• Population covered by social protection
• Social capital
• WHO
• ILO
• WEF
Welfare
Preparedness is about more than safety netsThere is no single way that countries can, or should, prepare for automation.
One part will be supporting disadvantaged workers, and those who are most likely to be negatively impacted by automation. For example, ensuring people who are made redundant have sufficient social protection.
However, equally important is having the readiness to take advantage of the opportunities afforded by automation. Having the right infrastructure and skills will mean that countries can create new roles, and transition workers into these roles.
The framework pictured in Figure 3.2 provides some indicators which can be used to examine the level of preparedness in each country.
Countries which have higher readiness to take advantage of automation have made more progress towards enabling the growth of new roles that utilise digital technologies. These new roles that are expected to be among the highest in demand globally include data analysts and scientists, digital marketing and strategy, software and application developers, and robotic engineers.xxxvii
To measure readiness to take advantage of automation, the framework considers the business environment, innovation environment and education.
• Having a flexible business environment with clear rules can create certainty, encourage adoption of digital technologies, and support entrepreneurship and new business creation.xxxviii
• Education significantly improves labour productivity. A skilled workforce, with the capacity to retrain, will provide businesses with access to talented people who can do the tasks and roles required. Modelling by Deloitte found that a 1% increase in PISA (Programme for International Student Assessment) scores can translate to a net present value of $13.4 billion, or equivalently, a $2.6 billion boost to GDP.xxxix
• An environment supportive of innovation helps businesses devise new ways to improve productivity and cut costs, thereby enhancing profitability and creating greater value-add. Studies find that firms which engaged in innovative activities earned approximately 10% higher profits than firms which did not innovate, holding other factors constant.xl
The second area of preparedness are the institutions or policies that help disadvantaged workers. This lessens negative impacts associated with automation.
• A strong labour force with rules that provide higher redundancy payments for dismissed workers means individuals can support themselves if are required to look for new roles, while low levels of underutilisation mean there will be a relatively lower level of competition for roles than if there is higher underutilisation.
• A well-developed welfare system allows individuals to be supported while out of work. Evidence suggests that higher unemployment benefits can extend the duration of unemployment but are more likely to find jobs that pay higher wages on average.xli More fundamentally, these types of social protections and welfare are crucial to support the ability of individuals to live and work.
This is designed to capture the importance of creating safeguards – often through a country’s general welfare system – for individuals within industries that are likely going to be displaced or experience disruption due to automation.
Further details on the framework and indicators used for measuring preparedness are available in Appendix B.
The Future of Work is Now: Is APAC Ready? | Autodesk FoundationThe Future of Work is Now: Is APAC Ready? | Autodesk Foundation
22 23
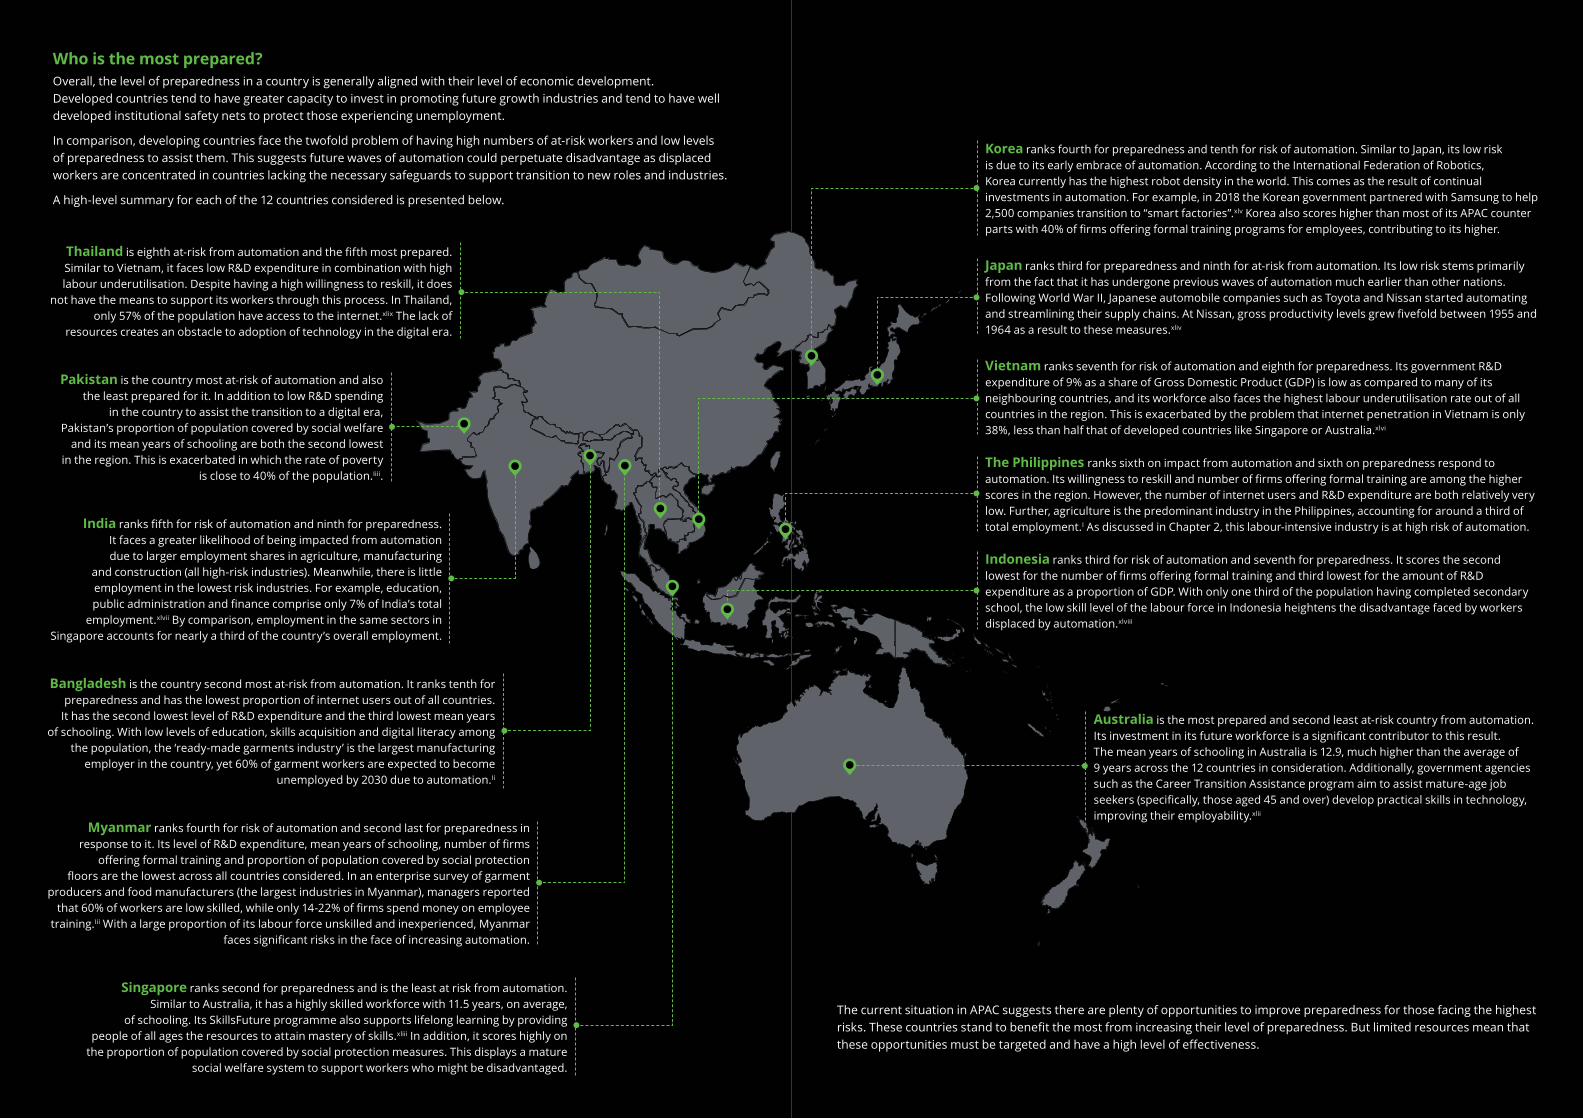
Who is the most prepared?Overall, the level of preparedness in a country is generally aligned with their level of economic development. Developed countries tend to have greater capacity to invest in promoting future growth industries and tend to have well developed institutional safety nets to protect those experiencing unemployment.
In comparison, developing countries face the twofold problem of having high numbers of at-risk workers and low levels of preparedness to assist them. This suggests future waves of automation could perpetuate disadvantage as displaced workers are concentrated in countries lacking the necessary safeguards to support transition to new roles and industries.
A high-level summary for each of the 12 countries considered is presented below.
Australia is the most prepared and second least at-risk country from automation. Its investment in its future workforce is a significant contributor to this result. The mean years of schooling in Australia is 12.9, much higher than the average of 9 years across the 12 countries in consideration. Additionally, government agencies such as the Career Transition Assistance program aim to assist mature-age job seekers (specifically, those aged 45 and over) develop practical skills in technology, improving their employability.xlii
Japan ranks third for preparedness and ninth for at-risk from automation. Its low risk stems primarily from the fact that it has undergone previous waves of automation much earlier than other nations. Following World War II, Japanese automobile companies such as Toyota and Nissan started automating and streamlining their supply chains. At Nissan, gross productivity levels grew fivefold between 1955 and 1964 as a result to these measures.xliv
Korea ranks fourth for preparedness and tenth for risk of automation. Similar to Japan, its low risk is due to its early embrace of automation. According to the International Federation of Robotics, Korea currently has the highest robot density in the world. This comes as the result of continual investments in automation. For example, in 2018 the Korean government partnered with Samsung to help 2,500 companies transition to “smart factories”.xlv Korea also scores higher than most of its APAC counter parts with 40% of firms offering formal training programs for employees, contributing to its higher.
The Philippines ranks sixth on impact from automation and sixth on preparedness respond to automation. Its willingness to reskill and number of firms offering formal training are among the higher scores in the region. However, the number of internet users and R&D expenditure are both relatively very low. Further, agriculture is the predominant industry in the Philippines, accounting for around a third of total employment.I As discussed in Chapter 2, this labour-intensive industry is at high risk of automation.
Vietnam ranks seventh for risk of automation and eighth for preparedness. Its government R&D expenditure of 9% as a share of Gross Domestic Product (GDP) is low as compared to many of its neighbouring countries, and its workforce also faces the highest labour underutilisation rate out of all countries in the region. This is exacerbated by the problem that internet penetration in Vietnam is only 38%, less than half that of developed countries like Singapore or Australia.xlvi
Indonesia ranks third for risk of automation and seventh for preparedness. It scores the second lowest for the number of firms offering formal training and third lowest for the amount of R&D expenditure as a proportion of GDP. With only one third of the population having completed secondary school, the low skill level of the labour force in Indonesia heightens the disadvantage faced by workers displaced by automation.xlviii
Singapore ranks second for preparedness and is the least at risk from automation. Similar to Australia, it has a highly skilled workforce with 11.5 years, on average,
of schooling. Its SkillsFuture programme also supports lifelong learning by providing people of all ages the resources to attain mastery of skills.xliii In addition, it scores highly on
the proportion of population covered by social protection measures. This displays a mature social welfare system to support workers who might be disadvantaged.
Thailand is eighth at-risk from automation and the fifth most prepared. Similar to Vietnam, it faces low R&D expenditure in combination with high labour underutilisation. Despite having a high willingness to reskill, it does
not have the means to support its workers through this process. In Thailand, only 57% of the population have access to the internet.xlix The lack of
resources creates an obstacle to adoption of technology in the digital era.
Pakistan is the country most at-risk of automation and also the least prepared for it. In addition to low R&D spending
in the country to assist the transition to a digital era, Pakistan’s proportion of population covered by social welfare
and its mean years of schooling are both the second lowest in the region. This is exacerbated in which the rate of poverty
is close to 40% of the population.Iiii.
India ranks fifth for risk of automation and ninth for preparedness. It faces a greater likelihood of being impacted from automation due to larger employment shares in agriculture, manufacturing
and construction (all high-risk industries). Meanwhile, there is little employment in the lowest risk industries. For example, education, public administration and finance comprise only 7% of India’s total
employment.xlvii By comparison, employment in the same sectors in Singapore accounts for nearly a third of the country’s overall employment.
Bangladesh is the country second most at-risk from automation. It ranks tenth for preparedness and has the lowest proportion of internet users out of all countries.
It has the second lowest level of R&D expenditure and the third lowest mean years of schooling. With low levels of education, skills acquisition and digital literacy among
the population, the ‘ready-made garments industry’ is the largest manufacturing employer in the country, yet 60% of garment workers are expected to become
unemployed by 2030 due to automation.Ii
Myanmar ranks fourth for risk of automation and second last for preparedness in response to it. Its level of R&D expenditure, mean years of schooling, number of firms
offering formal training and proportion of population covered by social protection floors are the lowest across all countries considered. In an enterprise survey of garment
producers and food manufacturers (the largest industries in Myanmar), managers reported that 60% of workers are low skilled, while only 14-22% of firms spend money on employee
training.Iii With a large proportion of its labour force unskilled and inexperienced, Myanmar faces significant risks in the face of increasing automation.
The current situation in APAC suggests there are plenty of opportunities to improve preparedness for those facing the highest risks. These countries stand to benefit the most from increasing their level of preparedness. But limited resources mean that these opportunities must be targeted and have a high level of effectiveness.

The Future of Work is Now: Is APAC Ready? | Autodesk FoundationThe Future of Work is Now: Is APAC Ready? | Autodesk Foundation
24 25
4. Filling the gaps
There is always more that can be done to prepare for automation. As with the future of work more broadly, there are three opportunity areas that can help drive preparedness: foresight and mindset, skills and learning, and access and inclusion, as shown in Figure 4.1. These three opportunity areas are based on Autodesk Foundation’s framework for trends in the future of work.
Figure 4.1: Key opportunity areas and underlying initiatives to drive preparedness
Foresight and mindset
• Future of Work Taskforce as Orchestrator
• Increase awareness of opportunities
Access and inclusion
• Level the playing field through investing in local language content
• Industry specific funded programs for automation transformation
Skills and learning
• Activate opportunity marketplaces
• Invest in learning programs to build adaptability and resilience
Source: Autodesk Foundation (2020),Iiv Deloitte (2021).
Individuals, organisations, industries, countries and regions can all take action – from a single person leaning about a new technology, to a region increasing trade openness. Currently, a lot of initiatives are already underway to drive preparedness among individuals, businesses and countries. Some illustrative examples are shown in Appendix C.
But which actions will be the most effective? There’s no one size fits all solution. Local context, industry characteristics and workforce features will be key for understanding what works and what doesn’t. As an example:
• increasing minimum wages or the cost of redundancy dismissal may not be effective in countries with a large informal workforce
• workers in technology industries are less likely to benefit from digital literacy training
• in economies with older workforces, formal training from an employer may be more effective; in economies with younger workforces, funding might be better targeted at the education system.
Despite these differences, the goal remains the same. This report identifies interventions which can be scaled and adapted to different circumstances across the region.
Foresight and mindsetThe future of work is volatile, uncertain, complex and ambiguous. Jobs that did not exist in the early 2000s have grown significantly in the past decade. For example, cloud computing specialists have grown by 1,700% between 2008 and 2017.lv

The Future of Work is Now: Is APAC Ready? | Autodesk FoundationThe Future of Work is Now: Is APAC Ready? | Autodesk Foundation
26 27
Foresight and mindset can help individuals, organisations and industries be better prepared to adapt. By anticipating a range of possible scenarios, governments and organisations can be more prepared to respond. The right mindset which is flexible and open provides individuals and industries with the ability to pivot and put plans in to action more quickly and effectively.
Initiative 1: Establish a future of work taskforce
Objective: Improve coordination between various actors in the labour market: including employees, businesses, industry associations, government, not-for-profits, and international organisations.
Taking a holistic view around the future of work is paramount for any strategy around labour force policy and structural change. A future of work taskforce can help define a common vision for future work outcomes and identify the human and technology capabilities that will be required to achieve this.
COVID-19 has meant that for the first time in recent years, more jobs are being lost than created. This has had a particularly profound impact on disadvantaged workers. At the same time, businesses have undergone a step change to more digital processes and products, creating new opportunities for workers. A future of work taskforce could help to realign the skills and capabilities of people with employers and improve access to reskilling and upskilling initiatives.
Some coordination between actors already takes place in most countries. The case studies below illustrate the benefits from actors working together. This initiative seeks to institutionalise the coordination at a holistic, ecosystem level.
Case study: IBPAP and TESDA’s targeted development programs In 2019, the private sector IT and Business Process Association of the Philippines (IBPAP) partnered with the government agency Technical Education and Skills Development Authority (TESDA) to deliver targeted talent development programs. The training was designed to train incumbent and future workforces. With only 54% of the workforce capable of performing mid-to high-value work in 2016, this joint initiative is projected to boost that proportion to 73% by 2022, substantially improving the match between skills supply and demand.lvi
Case study: International support for local solutionsInternational and philanthropic organisations can share resources to promote best practices around supporting workers. For example, the World Bank’s Systems Approach for Better Education Results Workforce Development Program is an initiative that collects and analyses comparative data across countries on their education policies and initiatives. The results are shared with the international community so countries benefit from others’ knowledge and experiences to improve skill mobility.lvii
Similarly, the International Labour Organization (ILO) has partnered with the Japanese Government to create a Skills and Employability Program for Asia and the Pacific, promoting the sharing of resources and technical expertise across countries to address skills development difficulties across members of the Asia Pacific region.lviii
Of course, the taskforce will take different forms depending on the country. Figure 4.2 shows how countries at different stages of the preparedness journey could work towards establishing the future of work taskforce. Each progression is designed to provide additional benefits from greater coordination.
To promote the power of automation in enabling and elevating human potential, it is necessary to change the narrative surrounding automation and workers’ relationships to it. Far too often, workers feel like passive agents being acted upon by waves of automation. For instance, in Deloitte’s 2020 Global Human Capital Trends Survey, 70% of respondents said that their organisations were exploring or using AI at some level, yet only 7% believed they are very ready to address the redesign of jobs to integrate AI technology.lix
This situation is very common with emerging technologies. Often workers feel unprepared for emerging technology and engaging with these tools. This can have broader impacts for the health of workers. For example, research has found that perceptions of poor job security due to a higher risk of automation are associated with worse health outcomes for workers.lx Instead, the narrative of automation should focus on how automation allows workers to focus on high value add activities. For example, frequent users of technology have been found to spend 6.8 hours less on administrative tasks.lxi
Case study: Raising awareness for lifelong learning in Malaysia In recognition that lifelong learning is an important pillar in human capital development, Malaysia aims to raise awareness and increase public involvement in its education system. The enculturation of lifelong learning was identified as a key strategy under its blueprint, which documents the present status of lifelong learning in Malaysia across the spectrums of formal learning, non-formal learning, and informal learning, with the goal of creating a more able and productive workforce.lxii
Case study: Education as a means to develop South Korea’s human resourcesIn response to a rising number of students seeking degrees and facing difficulties doing so, South Korea has in place the Academic Credit Bank System, which aims to support lifelong learning by allowing students to pool credits they have earned from various sources and count those towards one degree. This allows students to better understand the range of education providers available to them, as well as encourages students of all ages to continually re-skill and re-educate themselves in preparation for future workplace developments.lxiii
Initiative 2: Increase awareness of automation and the need to adapt
Objective: Change the narrative around the impact of automation for workers by helping to highlight the benefits it creates for workers.
Figure 4.2: Key principles for the future of work taskforce by stage of preparedness journey
Source: Deloitte (2021).
BeginnerIntermediate
Advanced
Get a holistic understanding of what’s happening by investing in the collection of national statistics. This can be used to help understand which segments are most vulnerable.
Know what’s happening
Partner with private institutions and other organisations to identify which roles are needed and where there is an opportunity for workers to re-skill.
Bring others along
Involve organisations – businesses, industry associations, education providers – in the design and delivery of training courses to ensure they are fit-for-purpose for the future of work as new skill needs emerge.
Train together
The Future of Work is Now: Is APAC Ready? | Autodesk FoundationThe Future of Work is Now: Is APAC Ready? | Autodesk Foundation
28 29
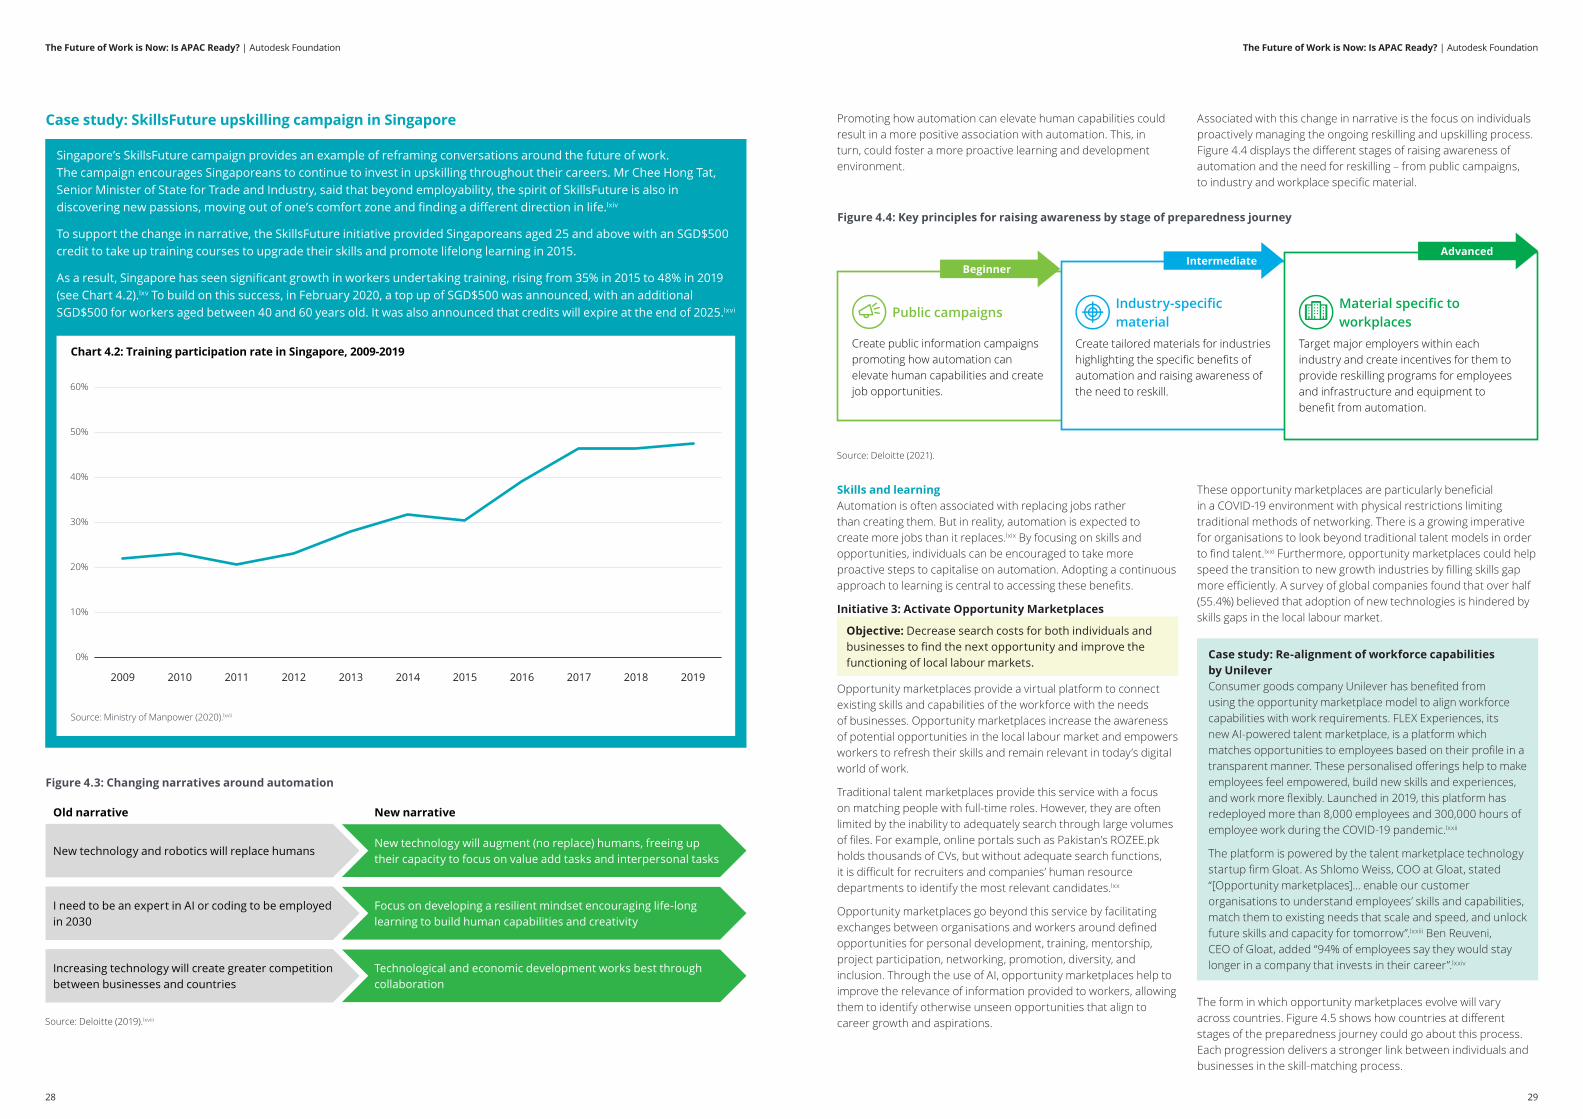
Singapore’s SkillsFuture campaign provides an example of reframing conversations around the future of work. The campaign encourages Singaporeans to continue to invest in upskilling throughout their careers. Mr Chee Hong Tat, Senior Minister of State for Trade and Industry, said that beyond employability, the spirit of SkillsFuture is also in discovering new passions, moving out of one’s comfort zone and finding a different direction in life.lxiv
To support the change in narrative, the SkillsFuture initiative provided Singaporeans aged 25 and above with an SGD$500 credit to take up training courses to upgrade their skills and promote lifelong learning in 2015.
As a result, Singapore has seen significant growth in workers undertaking training, rising from 35% in 2015 to 48% in 2019 (see Chart 4.2).lxv To build on this success, in February 2020, a top up of SGD$500 was announced, with an additional SGD$500 for workers aged between 40 and 60 years old. It was also announced that credits will expire at the end of 2025.lxvi
Case study: SkillsFuture upskilling campaign in Singapore
Chart 4.2: Training participation rate in Singapore, 2009-2019
Source: Ministry of Manpower (2020).lxvii
0%
20%
30%
40%
50%
60%
20192018201720162015201420132012201120102009
10%
Figure 4.3: Changing narratives around automation
Old narrative
Source: Deloitte (2019).lxviii
New narrative
New technology and robotics will replace humansNew technology will augment (no replace) humans, freeing up their capacity to focus on value add tasks and interpersonal tasks
I need to be an expert in AI or coding to be employed in 2030
Focus on developing a resilient mindset encouraging life-long learning to build human capabilities and creativity
Increasing technology will create greater competition between businesses and countries
Technological and economic development works best through collaboration
Promoting how automation can elevate human capabilities could result in a more positive association with automation. This, in turn, could foster a more proactive learning and development environment.
Associated with this change in narrative is the focus on individuals proactively managing the ongoing reskilling and upskilling process. Figure 4.4 displays the different stages of raising awareness of automation and the need for reskilling – from public campaigns, to industry and workplace specific material.
Skills and learningAutomation is often associated with replacing jobs rather than creating them. But in reality, automation is expected to create more jobs than it replaces.lxix By focusing on skills and opportunities, individuals can be encouraged to take more proactive steps to capitalise on automation. Adopting a continuous approach to learning is central to accessing these benefits.
Initiative 3: Activate Opportunity Marketplaces
Objective: Decrease search costs for both individuals and businesses to find the next opportunity and improve the functioning of local labour markets.
Opportunity marketplaces provide a virtual platform to connect existing skills and capabilities of the workforce with the needs of businesses. Opportunity marketplaces increase the awareness of potential opportunities in the local labour market and empowers workers to refresh their skills and remain relevant in today’s digital world of work.
Traditional talent marketplaces provide this service with a focus on matching people with full-time roles. However, they are often limited by the inability to adequately search through large volumes of files. For example, online portals such as Pakistan’s ROZEE.pk holds thousands of CVs, but without adequate search functions, it is difficult for recruiters and companies’ human resource departments to identify the most relevant candidates.lxx
Opportunity marketplaces go beyond this service by facilitating exchanges between organisations and workers around defined opportunities for personal development, training, mentorship, project participation, networking, promotion, diversity, and inclusion. Through the use of AI, opportunity marketplaces help to improve the relevance of information provided to workers, allowing them to identify otherwise unseen opportunities that align to career growth and aspirations.
These opportunity marketplaces are particularly beneficial in a COVID-19 environment with physical restrictions limiting traditional methods of networking. There is a growing imperative for organisations to look beyond traditional talent models in order to find talent.lxxi Furthermore, opportunity marketplaces could help speed the transition to new growth industries by filling skills gap more efficiently. A survey of global companies found that over half (55.4%) believed that adoption of new technologies is hindered by skills gaps in the local labour market.
Case study: Re-alignment of workforce capabilities by Unilever Consumer goods company Unilever has benefited from using the opportunity marketplace model to align workforce capabilities with work requirements. FLEX Experiences, its new AI-powered talent marketplace, is a platform which matches opportunities to employees based on their profile in a transparent manner. These personalised offerings help to make employees feel empowered, build new skills and experiences, and work more flexibly. Launched in 2019, this platform has redeployed more than 8,000 employees and 300,000 hours of employee work during the COVID-19 pandemic.lxxii
The platform is powered by the talent marketplace technology startup firm Gloat. As Shlomo Weiss, COO at Gloat, stated “[Opportunity marketplaces]… enable our customer organisations to understand employees’ skills and capabilities, match them to existing needs that scale and speed, and unlock future skills and capacity for tomorrow”.lxxiii Ben Reuveni, CEO of Gloat, added “94% of employees say they would stay longer in a company that invests in their career”.lxxiv
The form in which opportunity marketplaces evolve will vary across countries. Figure 4.5 shows how countries at different stages of the preparedness journey could go about this process. Each progression delivers a stronger link between individuals and businesses in the skill-matching process.
Figure 4.4: Key principles for raising awareness by stage of preparedness journey
Source: Deloitte (2021).
Create public information campaigns promoting how automation can elevate human capabilities and create job opportunities.
Public campaigns
Create tailored materials for industries highlighting the specific benefits of automation and raising awareness of the need to reskill.
Industry-specific material
BeginnerIntermediate
Advanced
Target major employers within each industry and create incentives for them to provide reskilling programs for employees and infrastructure and equipment to benefit from automation.
Material specific to workplaces

The Future of Work is Now: Is APAC Ready? | Autodesk FoundationThe Future of Work is Now: Is APAC Ready? | Autodesk Foundation
30 31
Initiative 4: Invest in learning programs to build adaptability and resilience
Objective: Upskill and reskill workers to create a resilient and flexible workforce.
Skills development in Industry 4.0 will need to go beyond developing only currently in demand technical skills and traditional delivery means. Learning needs to be designed to build capabilities in workforce – particularly resilience and adaptability – to empower workers to continually reinvent themselves to an uncertain and ever evolving digital world of work.
One successful example is Project Sangam, which is a collaboration between Microsoft and Linkedin that is focused in India. It involves delivering training through LinkedIn to functionaries and officers across India. Progress is automatically added to profiles so companies can shortlist candidates, as well as personalised job recommendations. While LinkedIn Learning typically offers content for professionals, Project Sangam sought to service non-professional workers.lxxv
Another example is ReGeneration, an initiative which aims to support mid-career workers who have become displaced due to automation or who are returning to the workforce after a period of non-work. Launched in 2019 in Singapore, Spain, and the USA, ReGeneration successfully placed 40-60% of participants in jobs, with 59% of them female.lxxvi
Case study: Punjab Skills Development Fund by the UK and Punjab GovernmentsThe Punjab Skills Development Fund (PSDF) is an initiative aimed at providing skills and vocational training opportunities to women in the four poorest districts of Punjab. It is a joint initiative between the UK Department for International Development and the Government of Punjab.lxxvii This initiative emerged as a result of a ‘low skills trap’ in Pakistan, whereby many individuals are employed in low-skilled occupations. To address this issue, Pakistan focused on improving the skills of workers that are at greater disadvantage – such as females, those in rural areas and youth. Indeed, recent labour force data suggests just one in five women (20%) are employed compared to four in five men (81%).lxxviii
The platform has been widely adopted, for example, a partnership with the Ministry of Housing and Urban Affairs led to 110,000 municipal functionaries being trained on best sanitation practices across 4,000 cities in India.lxxix
Case study: Grab for Good in Southeast AsiaTo bridge the technology skills gap in Southeast Asia, the local app Grab established a Grab for Good social impact program which provides upskilling and digital services. By 2025, Grab aims to improve digital inclusion and digital literacy, empower micro-entrepreneurs and small businesses, and build future-ready workforces. With 16% of ASEAN (Association of Southeast Asian Nations) youth hoping to work in the technology sector in the future, Grab for Good has the goal of educating 20,000 students to help them reach this objective and estimates it will make an economic contribution of $US5.8 billion by March 2019.lxxx
Case study: Enabling Boat project by Vietnamese organisationsIn 2017, the Enabling Boat program was launched as a joint initiative between Microsoft Vietnam, the Centre for Marinelife Conservation and Community Development, and other stakeholders. It aims to support Vietnamese youth living in fishing villages and remote coastal towns who lack access to digital learning facilities. 200 youth will be trained in ICT and computer science while also gaining knowledge about marine conservation, environmental protection, and climate change adaptation. In addition, 50,000 community members will be provided with access to information and learning opportunities.lxxxi
The level of reskilling will take different forms and will depend on the current level of skills among the workforce. Figure 4.6 shows how countries at different stages could help to upskill and reskill workers, helping to create a resilient and flexible labour-force.
Access and inclusionThe third key opportunity area focuses on promoting equitable access to the benefits of automation. We know that automation is likely to affect certain demographics more than others. Those employed in certain industries, in developing countries, women, younger and older workers, and rural residents are likely to find it harder to transition to new roles and have the necessary skills to thrive.
Supporting diversity and encouraging active participation in work, training and objectives by all people will help to ensure the benefits of automation are shared equally.
Initiative 5: Develop appropriate safety nets to enable people to live and work
Objective: Ensure people have access to basic necessities to live and work.
Social protections help all people maintain an adequate standard of living and health throughout their lives.lxxxii It plays a critical role in preventing poverty and reducing inequalities in society.lxxxiii
However, adequate social protections are also critical in enabling people to work. For example, free healthcare improves the health of workers, increasing productivity. Similarly, investments in children’s education can help prepare them for entry into the workforce and build a skilled labour-force.
By improving the quality of the workforce, social protection contributes to economic growth. Indeed, research suggests that there is a strong relationship between social spending and labour-market productivity.lxxxiv
It also enables workers to take more risks. For example, cash transfers can encourage poorer households to invest in higher risk (and higher return) income strategies.lxxxv This is because social protections provide some guarantee to workers that their basic needs will be covered in the event of failure.
Case study: Maharashtra Employment Guarantee Scheme in IndiaThe Maharashtra Employment Guarantee Scheme (MEGS) is the largest state sponsored public works program. It was initially implemented in response to a severe drought between 1970-73 in Maharashtra, India, and is focused on alleviating poverty by guaranteeing unskilled manual labour to all job seekers in the region.lxxxvi It’s estimated that 90% of participants had incomes below the poverty line.lxxxvii
As a result of this program, small-scale farmers in Maharashtra were found to have invested in riskier, yet higher yielding crops, compared to farmers in neighbouring states.lxxxviii It has also prevented households from implementing irreversible income strategies in order to survive, such as selling off land.lxxxix
Case study: Benazir Income Support Program in Pakistan In 2008, the Government of Pakistan introduced the Benazir Income Support Program (BISP), which distributes unconditional cash transfers to impoverished women in Pakistan.
The program was introduced in response to the global economic crisis and rapid food price inflation. Its aim was to prevent the onset of poverty and improve living standards. Along with a cash transfer, the program also provided interest-free loans to woman for starting their own business, child allowance for children aged five to 12, and health and life insurance. More than 15 million women have obtained a national identification card through the program.xc
Figure 4.6: Key principles for reskilling by stage of preparedness journey
Source: Deloitte (2021).
Subsidise learning, targeting the skills that are in the highest demand. Provide incentives to businesses to offer retraining for their employees.
Subsidised learning
Provide basic skilling to those who need it most. Focus on improving literacy, numeracy and digital literacy across the workforce.
Help disadvantaged workers
Provide accredited learning and training programs across the country, including work-integrated learning initiatives. Promote lifelong learning among workers. Accreditation could involve short-form courses and blended digital and physical lessons.
Lifelong learning
BeginnerIntermediate
Advanced
Figure 4.5: Key principles for opportunity marketplaces by stage of preparedness journey
Source: Deloitte (2021).
BeginnerIntermediate
Advanced
Decrease search costs for by providing a free platform that helps to connect businesses and individuals.
Match people with companies
Identify and record workers’ skills, abilities and interests in a talent portfolio. Use this to connect existing skills of employees with the needs of the business and external opportunities.
Create a talent portfolio
Improve the relevance of information provided to workers by leveraging AI. Promote personal development and training opportunities in addition to job opportunities.
Leverage AI
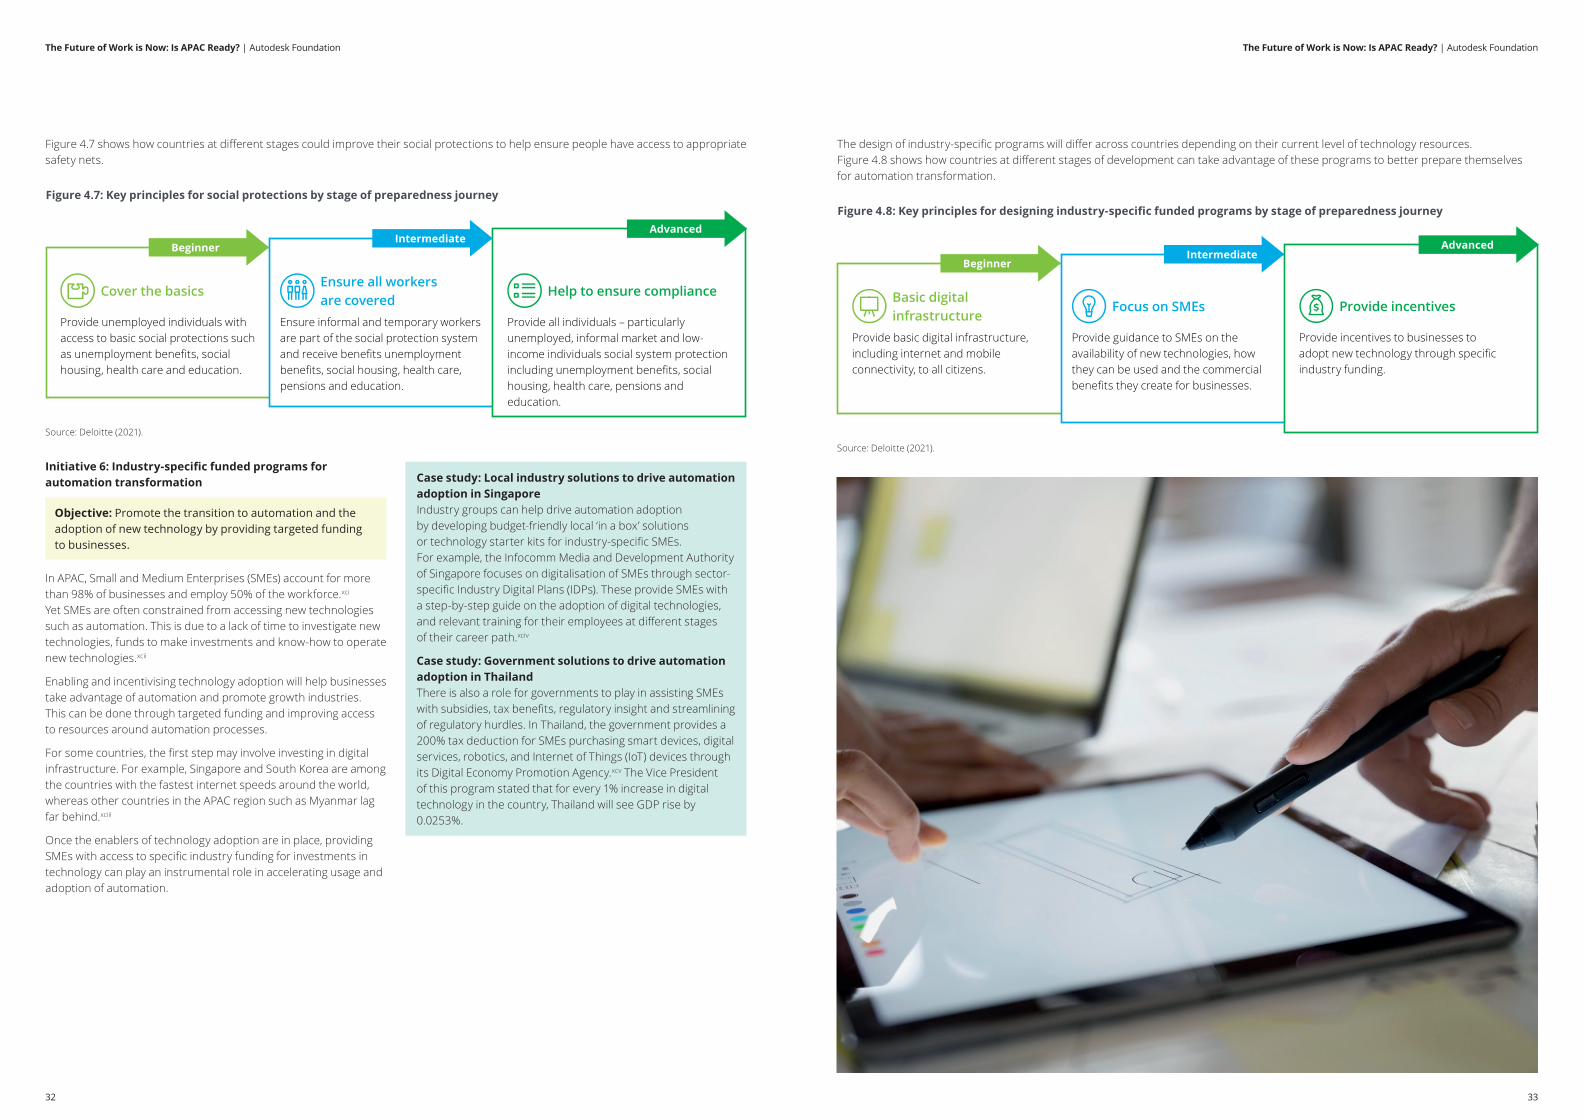
The Future of Work is Now: Is APAC Ready? | Autodesk FoundationThe Future of Work is Now: Is APAC Ready? | Autodesk Foundation
32 33
Figure 4.7 shows how countries at different stages could improve their social protections to help ensure people have access to appropriate safety nets.
Initiative 6: Industry-specific funded programs for automation transformation
Objective: Promote the transition to automation and the adoption of new technology by providing targeted funding to businesses.
In APAC, Small and Medium Enterprises (SMEs) account for more than 98% of businesses and employ 50% of the workforce.xci Yet SMEs are often constrained from accessing new technologies such as automation. This is due to a lack of time to investigate new technologies, funds to make investments and know-how to operate new technologies.xcii
Enabling and incentivising technology adoption will help businesses take advantage of automation and promote growth industries. This can be done through targeted funding and improving access to resources around automation processes.
For some countries, the first step may involve investing in digital infrastructure. For example, Singapore and South Korea are among the countries with the fastest internet speeds around the world, whereas other countries in the APAC region such as Myanmar lag far behind.xciii
Once the enablers of technology adoption are in place, providing SMEs with access to specific industry funding for investments in technology can play an instrumental role in accelerating usage and adoption of automation.
Case study: Local industry solutions to drive automation adoption in Singapore Industry groups can help drive automation adoption by developing budget-friendly local ‘in a box’ solutions or technology starter kits for industry-specific SMEs. For example, the Infocomm Media and Development Authority of Singapore focuses on digitalisation of SMEs through sector-specific Industry Digital Plans (IDPs). These provide SMEs with a step-by-step guide on the adoption of digital technologies, and relevant training for their employees at different stages of their career path.xciv
Case study: Government solutions to drive automation adoption in ThailandThere is also a role for governments to play in assisting SMEs with subsidies, tax benefits, regulatory insight and streamlining of regulatory hurdles. In Thailand, the government provides a 200% tax deduction for SMEs purchasing smart devices, digital services, robotics, and Internet of Things (IoT) devices through its Digital Economy Promotion Agency.xcv The Vice President of this program stated that for every 1% increase in digital technology in the country, Thailand will see GDP rise by 0.0253%.
The design of industry-specific programs will differ across countries depending on their current level of technology resources. Figure 4.8 shows how countries at different stages of development can take advantage of these programs to better prepare themselves for automation transformation.
Figure 4.8: Key principles for designing industry-specific funded programs by stage of preparedness journey
Source: Deloitte (2021).
Provide basic digital infrastructure, including internet and mobile connectivity, to all citizens.
Basic digital infrastructure
Provide guidance to SMEs on the availability of new technologies, how they can be used and the commercial benefits they create for businesses.
Focus on SMEs
Provide incentives to businesses to adopt new technology through specific industry funding.
Provide incentives
BeginnerIntermediate
Advanced
Figure 4.7: Key principles for social protections by stage of preparedness journey
Source: Deloitte (2021).
BeginnerIntermediate
Advanced
Provide unemployed individuals with access to basic social protections such as unemployment benefits, social housing, health care and education.
Cover the basics
Ensure informal and temporary workers are part of the social protection system and receive benefits unemployment benefits, social housing, health care, pensions and education.
Ensure all workers are covered
Provide all individuals – particularly unemployed, informal market and low-income individuals social system protection including unemployment benefits, social housing, health care, pensions and education.
Help to ensure compliance

The Future of Work is Now: Is APAC Ready? | Autodesk FoundationThe Future of Work is Now: Is APAC Ready? | Autodesk Foundation
34 35
Initiative 7: Level the playing field through investing in local language content
Objective: Ensure individuals have access to digital content in their local language.
A key challenge for the successful adoption of technology in APAC countries is that the majority of content available online is in English. Investing in local language content can help build the digital capabilities of local workers, benefitting the workforce more broadly.
The dominance of digital content in English can disempower workers who do not natively speak English. Chart 4.3 shows that over half of global digital content is in English, while only 4.8% of the global population are native English speakers. In comparison, Hindi is the native language for 3.7% of the world’s population but represents only 0.1% of content.
Chart 4.3: Share of language of websites and global native speakers
Source: GSMA (2020).xcvi
0% 10% 20% 30% 40% 50% 60%
Telugu
Lahnda
Bengali
Hindi
Korean
Arabic
Portugese
Chinese
French
Spanish
Japanese
Russian
German
English 55.7%
Websites Native speakers
4.8%
6.1%1.1%
5.8%2.4%
5.1%2.9%
4.7%5.9%
4.0%1.1%
2.9%17.0%
2.3%2.9%
0.8%3.4%
0.5%1.1%
0.1%3.7%
0.1%2.7%
1.2%0.1%
0.1%1.0%
For a number of countries, education and learning programmes that do not meet local language requirements will not be effective. Even when translated with language tools, key messaging may not translate culturally to meet local business customs, practices and expectations.
Even in countries where English is widely spoken, local content still has value. For instance, the Bangla language used in Bangladesh has direct ties to the origin story of the country and brings with it a sense of pride, driving a desire to access content in Bangla.xcvii
Investing in local language content for everything from basic digital literacy programs through to technology and tools for transformation provides an opportunity to develop, access and engage a broader, more diverse, local labour market that has previously been untapped.
Case study: Preserving the Balinese languageIn Indonesia, a program developed jointly with a team of linguists has empowered students to learn global technology content in their native language through an online dictionary and encyclopedia (BASAbaliwiki) that can be edited by members of the local community.xcviii The aim is to help to promote Balinese, a minority language in Indonesia, spoken by about a million speakers.
Case study: Facebook training digital citizens in the global eraIn 2019, Facebook created its We Think Digital online education portal, which aims to train 1 million people across eight APAC countries by 2020 in digital and critical-thinking skills in their local languages. By addressing topics that instil knowledge about the internet, address safety issues, develop critical-thinking skills, and offer insights into digital discourse, this platform not only brings key skills but also promotes greater cultural understanding across communities.
The availability of local language content online varies significantly across countries. Figure 4.9 shows how countries at different stages can improve the availability of local language content.
Figure 4.9: Key principles for making local language content more available online by stage of preparedness journey
Source: Deloitte (2021).
Make free translation software available to residents to allow them to translate websites into their native language.
Translate text
Produce digital content in the national languages of the country, to help encourage greater engagement.
Produce national digital content
Make locally produced digital content available in local languages and dialects.
Produce digital content targeting local languages and dialects
BeginnerIntermediate
Advanced

The Future of Work is Now: Is APAC Ready? | Autodesk Foundation
37
Appendix A: Impact Index
The Impact Index includes 11 unique measures to assess the impact of automation across two pillars. The two pillars cover the likelihood of automation by industry and the extent of disadvantage experienced by workers within that industry, which affects their capacity to transition to other sectors.
The Impact Index can be aggregated at the industry or country level. The overall impact score is determined by the average of the two pillars mentioned previously, across industries or countries.
Results at the industry level are shown in the table below. Industries are based on the international standard industrial classification of all economic activities (ISIC). Aggregated industry results reflect the average score by industry for the 12 countries included in the analysis.
Country results are constructed by taking the scores by industry by country, and weighting by employment.
At the industry level, the average impact score was 48%. Construction received the highest impact score at 52%, while education received the lowest (41%).
Table A.1: Breakdown of Impact Index results
IndustryLikelihood of
automationExtent of
disadvantage Impact score
Agriculture; forestry and fishing 50% 56% 53%
Mining and quarrying 53% 50% 52%
Manufacturing 52% 49% 51%
Electricity; gas, steam and air conditioning supply 49% 47% 48%
Water supply; sewerage, waste management and remediation activities 51% 49% 50%
Construction 54% 50% 52%
Wholesale and retail trade; repair of motor vehicles and motorcycles 45% 51% 48%
Transportation and storage 53% 50% 52%
Financial and insurance activities 43% 45% 44%
Public administration and defence; compulsory social security 44% 45% 44%
Education 37% 45% 41%
Human health and social work activities 41% 47% 44%
Source: Deloitte (2021).
Likelihood of automationAs mentioned above, the Impact Index comprises two pillars. The first pillar relates to the likelihood of automation by industry, which is associated with greater impact.
This pillar, in turn, is made up of three equally weighted sub-pillars, and seven unique indicators. These are detailed in the subsections below.
The indicators included within the Impact Index vary in terms of units and scale. To consolidate these indicators into a single measure, each indicator was allocated a maximum and minimum score. These scores were used to transform the data so that each followed a consistent scale, ranging between 0% and 100%. A score of 100% indicates the country/industry is extremely likely to be automated, while a score of 0% indicates the country/industry is not at all likely to be automated.
All data within this pillar has been drawn from the O*NET database,xcix which provides information about tasks completed by workers at the occupational level. For results at the industry level, this data has been transformed based on the occupational breakdown of industries by country using data from the International Labour Organisation.

The Future of Work is Now: Is APAC Ready? | Autodesk FoundationThe Future of Work is Now: Is APAC Ready? | Autodesk Foundation
38 39
Routineness scores This sub-pillar builds on the work of Autor and Acemoglu (2010) and Deloitte Access Economics’ Building the Lucky Country 7 to categorise occupations based on their level routineness.c Higher levels of routineness are associated with a greater likelihood of automation in the future given the repetitive nature of tasks.
Specific variables from O*NET are utilised to understand the frequency of repeated tasks within a specific occupation. These are shown below.
Table A.2: Indicators in the routineness sub-pillar
Source: Deloitte (2021).
Indicator Description
Maximum score (higher likelihood of automation)
Minimum score (lower likelihood of automation)
Sub-pillar weighting Source
Spend time making repetitive motions
A higher degree of repetitiveness is associated with a higher likelihood of automation.
100% 0% 50% O*NETci
Importance of repeating the same tasks
More importance on repetition is associated with a higher likelihood of automation.
100% 0% 50% O*NETcii
Cognitive scoresThis sub-pillar also draws on the work of Autor and Acemoglu (2010) and Deloitte Access Economics’ Building the Lucky Country 7 to understand the cognitive aspects of each role. Higher cognitive scores are associated with a lower risk of automation given the difficulty in automating non-repetitive tasks.
O*NET data is again used to help quantify this metric, with the measures in the table below forming the base of the sub-pillar.
Table A.3: Indicators in the cognitive sub-pillar
Source: Deloitte (2021).
Indicator Description
Maximum score (higher likelihood of automation)
Minimum score (lower likelihood of automation)
Sub-pillar weighting Source
Thinking creatively More time spent thinking creatively is associated with a lower likelihood of automation.
0% 100% 33.3% O*NETciii
Structured versus unstructured work
A higher degree of structured work is associated with a higher likelihood of automation.
100% 0% 33.3% O*NETciv
Analysing data/information
A higher proportion of time spent analysing data/information is associated with a lower likelihood of automation.
0% 100% 33.3% O*NETcv
Use of technologyThe use of technology sub-pillar aggregates two different measures using data from O*NET, each weighted equally. This is detailed in the table below.
Table A.4: Indicators in the use of technology sub-pillar
Source: Deloitte (2021).
Indicator Description
Maximum score (higher likelihood of automation)
Minimum score (lower likelihood of automation)
Sub-pillar weighting Source
Level of interactions with computers
The level of interaction with computers is negatively correlated with the likelihood of automation.
0% 100% 50% O*NETcvi
Degree of automation
A higher level of automation increases the likelihood of automation.
100% 0% 50% O*NETcvii
Extent of disadvantageThe second pillar in the Impact Index relates to the extent of disadvantage, containing five equally weighted sub-pillars and five unique measures. These measures include the wages, educational level, age, transferability of skills of the workers and size of the informal workforce, as shown in the table below. These inputs are designed to capture how easily a worker in an industry could find work in another occupation within that industry or to another industry altogether, if their current role was automated.
Consistent with the previous sub-pillar, the indicators included within this index vary in terms of units and scale. To consolidate these indicators into a single measure, each indicator was allocated a maximum and minimum score. A score of 0% indicates workers within that particular country/industry are relatively more advantaged, while a score of 100% indicates workers are extremely disadvantaged.
It is noted that in certain instances across these indicators there is missing data for particular industries/countries. For these indicators, alternative data sources were used where possible. Where alternative data was not available, data was imputed based on input from subject matter experts and a desktop review of related literature.
Sub-pillar/indicator Description
Maximum score (highest disadvantage)
Minimum score (lowest disadvantage)
Sub-pillar weighting Source
Wages This indicator looks at the mean nominal earnings of employees by sex and occupation. Higher average wages are associated with lower disadvantage.
Varies by country, based on minimum wage data2
10x the minimum wage by country
20% ILOcviii
Education This indicator is focused on educational attainment and literacy scores, by occupation. Skill levels were mapped to ISCO-08 major groups based on the ISCO conceptual framework.
Higher levels of education are associated with lower disadvantage.
0% 100% 20% OECD datacvix
2 See box below for further detail on how wages have been scored across countries.

The Future of Work is Now: Is APAC Ready? | Autodesk FoundationThe Future of Work is Now: Is APAC Ready? | Autodesk Foundation
40 41
Sub-pillar/indicator Description
Maximum score (highest disadvantage)
Minimum score (lowest disadvantage)
Sub-pillar weighting Source
Age Age by occupation. This measure considers the proportion of workers that were employed under the age of 25 and over the age of 60.
A larger proportion of very young or very old workers are associated with higher disadvantage. Very young workers may struggle to find employment in new roles without the relevant experience or training. Similarly, older workers may struggle to transition to new roles if employers expect they will retire soon.
100% 0% 20% United Nations datacx
Transferability of skills
This measure considers the degree of skills similarity across occupations. A higher degree of skills similarities is associated with a greater ability to transition to new roles and lower disadvantage.
0% 100% 20% O*NETcxi
Informal workforce
This measure looks at the proportion of the economy that is employed informally. A higher proportion of individuals employed informally is associated with higher levels of disadvantage.
100% 0% 20% ILOcxii
A note on wagesAcross indicators, the maximum and minimum scores are set based on what is potentially achievable in terms of the level of disadvantage across industries and countries. These scores do not vary across countries. This enables comparisons to be drawn across countries, following a consistent baseline.
However, due to differences in exchange rates across countries, setting the maximum and minimum scores for wages is challenging.
As such, scores for wages only have been measured relative to the minimum wage within countries. Specifically, the minimum score has been set at the minimum wage within each country, and the maximum score is equal to ten times the minimum wage.
Unlike the other indicators, this means the scoring for wages will vary by country.
Source: Deloitte (2021).
Appendix B: Measuring preparedness
Preparedness is measured within a country by analysing 19 unique indicators, covering the ability of countries to capitalise on automation, and help disadvantaged workers.
Each of these pillars can be broken down further into various sub-pillars. A country’s ability to capitalise on automation takes into the account the business and innovation environment, and education level of workers. A country’s ability to protect disadvantaged workers is determined by its labour-force structures and the availability of welfare. Further detail on the sub-pillars are provided in the sections below.
The scores for each country for each pillar of the preparedness index are shown in the table below. A score of 100% indicates a country is extremely well prepared, while a score of 0% indicates the country is not at all prepared. The overall preparedness score is determined by taking the average across the two pillars.
The preparedness score was 55% on average for the countries included in the analysis. Australia received the highest score at 72%, while Pakistan received the lowest (40%).
Table B.1: Breakdown of preparedness results
Industry Preparedness score Capitalise on automation score Help disadvantaged workers score
Singapore 70% 71% 69%
Australia 72% 69% 76%
Japan 69% 65% 73%
Korea 66% 65% 66%
Thailand 61% 54% 68%
Philippines 56% 56% 56%
Indonesia 54% 53% 54%
Vietnam 50% 48% 52%
India 44% 47% 41%
Myanmar 40% 44% 36%
Bangladesh 41% 38% 44%
Pakistan 40% 44% 36%
Source: Deloitte (2021).
3 The interpretation is analogous for the two sub-pillars i.e. countries extremely well positioned to capitalise on automation or help disadvantaged workers would receive a score of 100%.

The Future of Work is Now: Is APAC Ready? | Autodesk FoundationThe Future of Work is Now: Is APAC Ready? | Autodesk Foundation
42 43
Capitalise on automation The capitalise on automation pillar is one of two pillars that help to measure preparedness. It captures the readiness of countries to take advantage of the coming wave of automation.
It is made up of 12 indicators spanning three sub-pillars, as shown in the table below. Where possible, data has been sourced from international databases, to help ensure consistency in
cross-country analysis. Where there is missing data, values have been imputed based on input from subject matter experts and broad desktop research.
The indicators used to measure preparedness vary in terms of units and scale. To consolidate these indicators into a single measure, each indicator was allocated a maximum and minimum score. These scores were used to transform the data so that each followed a consistent scale, ranging between 0% and 100%. A score of 100% indicates the country is extremely well prepared to capitalise on automation, while a score of 0% indicates the country is not at all prepared.
Further detail on the indicators and the weighting used to aggregate scores within each sub-pillar are detailed in the sub-sections below.
Business environment The business environment sub-pillar captures the ease of doing business in a particular country. More flexible business conditions places businesses in a better position to adapt and capitalise on new technologies. It includes the following three indicators, which each make-up one-third of this sub-pillar.
Table B.2: Indicators in the business environment sub-pillar
Source: Deloitte (2021).
Indicator Description
Maximum score (higher likelihood of automation)
Minimum score (lower likelihood of automation)
Sub-pillar weighting Source
Time to start a business
The number of days required to start a business. A lower number of days indicates a higher level of preparedness.
0 50 33.3% World Bankcxiii
International trade barriers
An index which ranks countries on their use of tariffs and service restrictions. Lower barriers are associated with higher preparedness.
1 10 33.3% International trade barriers indexcxiv
Legal framework’s adaptability to digital business models
The speed at which the legal framework within a country adapts to digital business models. A higher score indicates faster speed in adaptation.
100 0 33.3% WEFcxv
Table B.3: Indicators in the innovation environment sub-pillar
Source: Deloitte (2021).
Indicator Description
Maximum score (higher likelihood of automation)
Minimum score (lower likelihood of automation)
Sub-pillar weighting Source
Intellectual property protection
The extent to which intellectual property is protected within a country. A higher score indicates greater protection.
100 0 16.6% WEFcxvi
R&D expenditure The ratio of expenditure on research and development within a country, as a proportion of GDP. A higher ratio implies a higher level of technology investment.
6 0 16.6% World Bankcxvii
Internet users The adoption and productive use of the Internet across countries, based on the four categories of availability, affordability, relevance and readiness. A higher score indicates a stronger environment for Internet use.
100 0 16.6% EIUcxviii
Female share of management positions
A higher proportion indicates greater female representation in leadership positions.
50 0 16.6% ILOcxix
Digital skills among active population
The extent to which the active population in a country possesses sufficient digital skills such as computer skills or coding. A higher score indicates a more digitally proficient population.
100 0 16.6% WEFcxx
Companies embracing disruptive ideas
The extent to which companies embrace risky or disruptive business ideas in a country. A higher level indicates greater openness to innovation.
100 0 16.6% WEFcxxi
Innovation environment The innovation environment sub-pillar provides an indication of the level of innovation occurring in a particular region and the level of engagement with new technologies. A greater degree of innovation is expected to assist countries capitalise on automation. It includes six indicators, as detailed below.
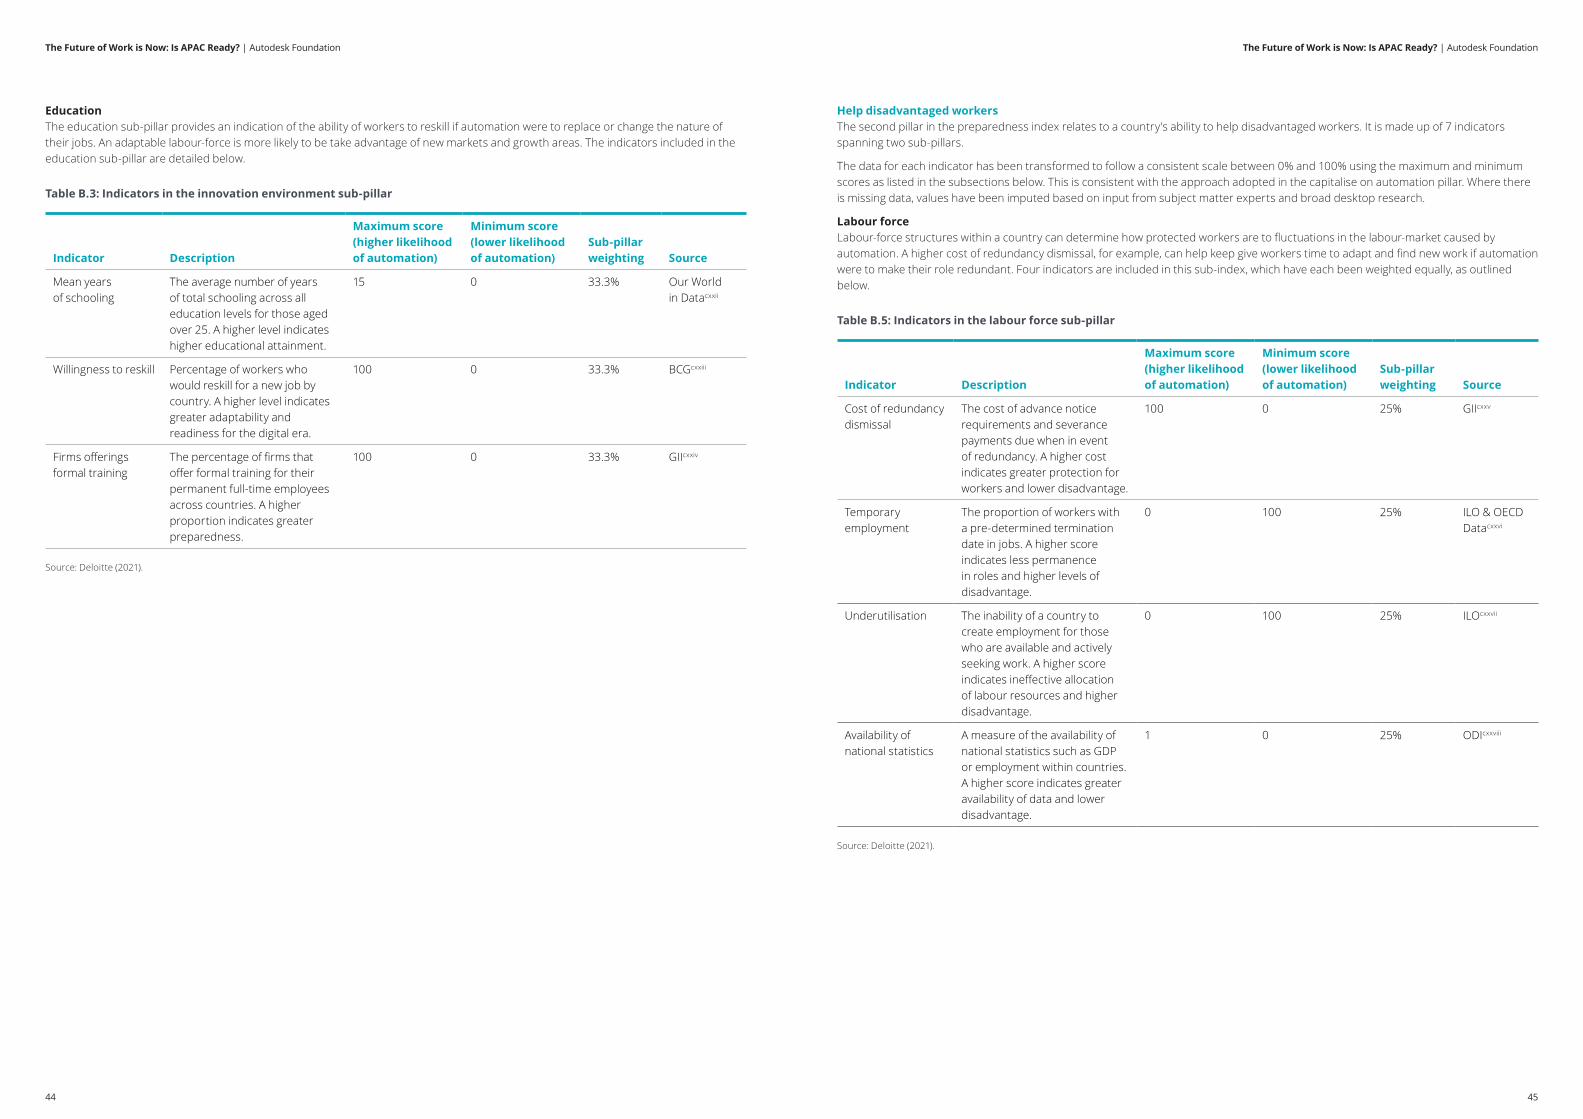
The Future of Work is Now: Is APAC Ready? | Autodesk FoundationThe Future of Work is Now: Is APAC Ready? | Autodesk Foundation
44 45
Table B.3: Indicators in the innovation environment sub-pillar
Indicator Description
Maximum score (higher likelihood of automation)
Minimum score (lower likelihood of automation)
Sub-pillar weighting Source
Mean years of schooling
The average number of years of total schooling across all education levels for those aged over 25. A higher level indicates higher educational attainment.
15 0 33.3% Our World in Datacxxii
Willingness to reskill Percentage of workers who would reskill for a new job by country. A higher level indicates greater adaptability and readiness for the digital era.
100 0 33.3% BCGcxxiii
Firms offerings formal training
The percentage of firms that offer formal training for their permanent full-time employees across countries. A higher proportion indicates greater preparedness.
100 0 33.3% GIIcxxiv
EducationThe education sub-pillar provides an indication of the ability of workers to reskill if automation were to replace or change the nature of their jobs. An adaptable labour-force is more likely to be take advantage of new markets and growth areas. The indicators included in the education sub-pillar are detailed below.
Source: Deloitte (2021).
Help disadvantaged workers The second pillar in the preparedness index relates to a country’s ability to help disadvantaged workers. It is made up of 7 indicators spanning two sub-pillars.
The data for each indicator has been transformed to follow a consistent scale between 0% and 100% using the maximum and minimum scores as listed in the subsections below. This is consistent with the approach adopted in the capitalise on automation pillar. Where there is missing data, values have been imputed based on input from subject matter experts and broad desktop research.
Labour force Labour-force structures within a country can determine how protected workers are to fluctuations in the labour-market caused by automation. A higher cost of redundancy dismissal, for example, can help keep give workers time to adapt and find new work if automation were to make their role redundant. Four indicators are included in this sub-index, which have each been weighted equally, as outlined below.
Table B.5: Indicators in the labour force sub-pillar
Source: Deloitte (2021).
Indicator Description
Maximum score (higher likelihood of automation)
Minimum score (lower likelihood of automation)
Sub-pillar weighting Source
Cost of redundancy dismissal
The cost of advance notice requirements and severance payments due when in event of redundancy. A higher cost indicates greater protection for workers and lower disadvantage.
100 0 25% GIIcxxv
Temporary employment
The proportion of workers with a pre-determined termination date in jobs. A higher score indicates less permanence in roles and higher levels of disadvantage.
0 100 25% ILO & OECD Datacxxvi
Underutilisation The inability of a country to create employment for those who are available and actively seeking work. A higher score indicates ineffective allocation of labour resources and higher disadvantage.
0 100 25% ILOcxxvii
Availability of national statistics
A measure of the availability of national statistics such as GDP or employment within countries. A higher score indicates greater availability of data and lower disadvantage.
1 0 25% ODIcxxviii

The Future of Work is Now: Is APAC Ready? | Autodesk FoundationThe Future of Work is Now: Is APAC Ready? | Autodesk Foundation
46 47
Welfare The availability of welfare in countries is also a relevant consideration. Welfare can help provide disadvantaged workers with a safety net if their job was lost due to automation, giving them time to find new work or reskill in a new area. The indicators included in this sub-index are shown below.
Source: Deloitte (2021).
Table B.6: Indicators in the welfare sub-pillar
Indicator Description
Maximum score (higher likelihood of automation)
Minimum score (lower likelihood of automation)
Sub-pillar weighting Source
Domestic government health expenditure
Health expenditure as a proportion of general government expenditure. A higher level indicates greater government spending on health and lower disadvantage.
100 0 33.3% WHOcxxix
Social capital A measure of the generosity, trust, and E-participation within a country. A greater level indicates a more cohesive and integrated community and lower disadvantage.
100 0 33.3% WEFcxxx
Proportion of population covered by social protection floors
The proportion of the population within a country covered by at least one social protection benefit. A higher level indicates greater social welfare and lower disadvantage.
100 0 33.3% ILOcxxxi
Appendix C: Current programs
There are already a range of initiatives in place across various countries and jurisdictions to address the potential impact of automation. The below table highlights some illustrative examples, which range in their scale and actors targeted.
Program Description Relevant opportunity area
BASAbaliWiki A Balinese-Indonesian-English online dictionary developed by Transparent Language and the Balinese Department of Communication. It aims to promote Balinese in Indonesia and help communities preserve their native language.
Access and inclusion
Benazir Income Support Program
A program introduced by the Pakistan Government to distribute unconditional cash transfers to impoverished women in the country in order to alleviate poverty and improve living standards.
Access and inclusion
Enabling Boat Program
A joint initiative between Microsoft Vietnam and local stakeholders to help Vietnamese youth in remote coastal towns and fishing villages gain access to digital learning facilities.
Skills and learning
FLEX Experiences An AI-powered talent marketplace developed by Unilever and powered by Gloat. It aims to match employees with opportunities in a transparent manner.
Skills and learning
Grab for Good A social impact program developed by Grab to bridge the technology skills gap in Southeast Asia by providing upskilling and digital services.
Skills and learning
Korea Academic Credit Bank System
An education system which allows students to pool credits they have earned from various sources and count these towards one degree.
Foresight and mindset
Maharashtra Employment Guarantee Scheme
A state sponsored program to alleviate poverty and support low-income households by providing unskilled manual labour job opportunities to all job seekers in Maharashtra, India.
Access and inclusion
ReGeneration An international initiative to support mid-career workers who are displaced due to automation or who are returning to the workforce.
Skills and learning
Project Sangam A collaboration between Microsoft and LinkedIn in India to deliver targeted training to functionaries and officers.
Skills and learning
Punjab Skills Development Fund
A joint initiative by the UK Department for International Development and the Punjab Government. It aims to address the low skills trap in Pakistan, particularly those for women, by providing skills and vocational training.
Skills and learning
SABER Workforce Development Program
A World Bank initiative to collect and analyse data on education policies across countries in order to share these with the international community and improve skill mobility.
Foresight and mindset
Schneider Open Talent Marketplace
A platform created by Schneider Electric through the use of AI technology to help match staff with potential opportunities and reduce turnover.
Skills and learning
Skills and Employability Program
A joint initiative between the ILO and the Japanese Government to promote the sharing of resources and technical expertise across countries in APAC.
Foresight and mindset
SkillsFuture Campaign An upskilling campaign in Singapore which provides funding to help employees develop their careers and discover new passions.
Foresight and mindset
We Think Digital An online education program created by Facebook to train individuals across APAC in digital and critical-thinking skills in their local languages.
Access and inclusion
Source: Deloitte (2021).
The Future of Work is Now: Is APAC Ready? | Autodesk FoundationThe Future of Work is Now: Is APAC Ready? | Autodesk Foundation
48 49
Endnotes
i. International Labour Organization, Asia-Pacific Employment and Social Outlook 2018: Advancing decent work for sustainable development (2018) <https://www.ilo.org/wcmsp5/groups/public/---asia/---ro-bangkok/---sro-bangkok/documents/publication/wcms_649885.pdf>.
ii. International Labour Oragnization, World Employment Social Outlook (Trends 2018) <https://www.ilo.org/wcmsp5/groups/public/---dgreports/---dcomm/---publ/documents/publication/wcms_615594.pdf>.
‘Safety and health at work in Asia and the Pacific’, International Labour Organization (2020) <https://www.ilo.org/asia/areas/safety-and-health-at-work/lang--en/index.htm#:~:text=Every%20year%20more%20than%201.1,ethnic%20minorities%20are%20often%20involved>.
iii. ‘How Manufacturing Automation Can Reduce Workplace Injuries and Improve Morale’, Universal Robots (13 June 2019) <https://www.universal-robots.com/blog/how-manufacturing-automation-can-reduce-workplace-injuries-and-improve-morale/>.
iv. Autodesk Foundation, Autodesk Foundation Impact Brief Series: Future of Work (2019) <https://damassets.autodesk.net/content/dam/org/assets/2019/autodesk-report-future-of-work.pdf>.
v. International Federation of Robotics, IFR Press Conference (Frankfurt, 24 September 2020) <https://ifr.org/downloads/press2018/Presentation_WR_2020.pdf>.
vi. Data obtained from:
‘Artificial intelligence revenue in APAC to surpass US$29bn in 2024, says GlobalData’, GlobalData (14 April 2020) <https://www.globaldata.com/artificial-intelligence-revenue-in-apac-to-surpass-us29bn-in-2024-says-globaldata/#:~:text=An%20analysis%20of%20GlobalData’s%20Market,26.8%25%20between%202019%20and%202024>.
And
‘Global artificial intelligence platform market will be worth $52bn by 2024’, GlobalData (12 October 2020) <https://www.globaldata.com/global-artificial-intelligence-platform-market-will-worth-52bn-2024/>.
vii. Fenergo, Banking SOS: How Technology Can Save Commercial and Business Banks from the Brink (Industry Trends Report, 2019/2020) <https://www.fenergo.com/report/how-technology-can-save-commercial-and-business-banks-from-the-brink/>.
viii. ‘Individuals using the Internet (% of population)’, World Bank (2020) <https://data.worldbank.org/indicator/IT.NET.USER.ZS >.
ix. Forrester, The Future of Work – A Pandemic Spotlight (report commissioned by UiPath, 2020) <https://www.uipath.com/resources/automation-analyst-reports/pandemic-impacting-future-of-work-forrester-report>.
x. McKinsey Global Institute, A future that works: Automation, employment and productivity ( January 2017). <https://www.mckinsey.com/~/media/mckinsey/featured%20insights/Digital%20Disruption/Harnessing%20automation%20for%20a%20future%20that%20works/MGI-A-future-that-works-Executive-summary.ashx>.
xi. Deloitte Access Economics, Operating in the new normal (September 2020) <https://www2.deloitte.com/au/en/pages/economics/articles/operating-new-normal.html>.
xii. ‘What is automation?’, IBM (2020). <https://www.ibm.com/topics/automation>.
xiii. ‘TCS Deploys AI-Powered Software to Enable Safe Return to Work for its Employees’, Tata Consultancy Services (22 September 2020) <https://www.tcs.com/tcs-deploys-ai-powered-software-to-enable-safe-return-to-work-for-its-employees>.
xiv. IBM, Bendigo and Adelaide Bank, accessed 16 February 2021, <https://www.ibm.com/case-studies/bendigo-and-adelaide-bank-1>
xv. Oliver Gierz, ‘Cobots maximize return on investment’, Automation (22 July,2020) <https://www.automation.com/en-us/articles/july-2020/cobots-maximize-return-on-investment>.
xvi. Bruce Anderson, ‘These Are the Fastest Growing Jobs Around the World’, LinkedIn Talent Blog (10 December 2019) <https://business.linkedin.com/talent-solutions/blog/trends-and-research/2019/fastest-growing-jobs-2019>.
xvii. Ranges obtained from:
McKinsey Global Institute, A future that works: Automation, employment and productivity ( January 2017). <https://www.mckinsey.com/~/media/mckinsey/featured%20insights/Digital%20Disruption/Harnessing%20automation%20for%20a%20future%20that%20works/MGI-A-future-that-works-Executive-summary.ashx>.
And
Carl B.C. Frey and Michael A.M. Osborne, ‘The future of employment: How susceptible are jobs to computerisation?’, (2013) University of Oxford <https://www.oxfordmartin.ox.ac.uk/downloads/academic/The_Future_of_Employment.pdf>.
xviii. International Labour Organisation, Asia-Pacific Employment and Social Outlook 2018 (2018) <https://www.ilo.org/wcmsp5/groups/public/---asia/---ro-bangkok/---sro-bangkok/documents/publication/wcms_649885.pdf>.
xix. Stuart Frye, ‘Future Focused: Udacity and AT&T Join Forces to Train Workers for the Jobs of Tomorrow’ Udacity (13 September 2018) <https://blog.udacity.com/2018/09/udacity-and-att-join-forces-to-train-workers-for-the-jobs-of-tomorrow.html>.
xx. Nicole Lewis, ‘Implementing AI Technology for HR’, Society for Human Resource Management (9 January 2020) <https://www.shrm.org/resourcesandtools/hr-topics/technology/pages/implementing-ai-technology-hr.aspx>.
xxi. World Economic Forum, The future of jobs report 2020 (2020) <https://www.weforum.org/reports/the-future-of-jobs-report-2020>.
xxii. Australian Department of Jobs and Small Business, Australian Jobs 2019 (2020) <https://docs.employment.gov.au/system/files/doc/other/australianjobs2019.pdf>.
xxiii. ‘Tapping into the potential of IoT in utilities’, Allerin (2019) <https://www.allerin.com/blog/tapping-into-the-potential-of-iot-in-utilities>.
xxiv. Jake Bryant et al, ‘How artificial intelligence will impact K-12 teachers’, McKinsey & Company (14 January 2020) <https://www.mckinsey.com/industries/public-and-social-sector/our-insights/how-artificial-intelligence-will-impact-k-12-teachers>.
xxv. Martha Henriques, ‘The ageing crisis threatening farming’, BBC (2019) <https://www.bbc.com/future/bespoke/follow-the-food/the-ageing-crisis-threatening-farming/>.
xxvi. Nabil Tahir, ‘Turning agriculture around with the power of AI’, The Tribune (online, 12 December 2020) <https://tribune.com.pk/story/2275710/turning-agriculture-around-with-the-power-of-ai>.
xxvii. Anmol M. Dua, ‘Artificial Intelligence in Indian Agriculture’, Bhajan Global Impact Foundation (2020) <http://bhajanfoundation.org/knowledge/artificial-intelligence-in-indian-agriculture/#:~:text=It%20is%20estimated%20that%20AI,2025%20(Maher%2C%202018).>.
xxviii. Dan Robinson, ‘How autonomous technology could make mining safer, cheaper and more valuable’, NS Energy (31 October 2019) <https://www.nsenergybusiness.com/features/autonomous-mining-technology-zyfra/>.
xxix. McKinsey & Company, Reinventing Construction: A Route to Higher Productivity (February 2017) <https://www.mckinsey.com/~/media/McKinsey/Industries/Capital%20Projects%20and%20Infrastructure/Our%20Insights/Reinventing%20construction%20through%20a%20productivity%20revolution/MGI-Reinventing-Construction-Executive-summary.pdf>.
xxx. ‘BIM Benefits: What are the benefits of BIM?’ Autodesk (2020) <https://www.autodesk.com/solutions/bim/benefits-of-bim>.
xxxi. Ashutosh Dekhne et al, ‘Automation in logistics: Big opportunity, bigger uncertainty’, McKinsey and Company (24 April 2019) <https://www.mckinsey.com/industries/travel-logistics-and-transport-infrastructure/our-insights/automation-in-logistics-big-opportunity-bigger-uncertainty>.
xxxii. ‘A.T. Kearney: Top 20 e-commerce markets of the globe’, Consultancy.UK (5 May 2015) <https://www.consultancy.uk/news/1947/at-kearney-top-20-ecommerce-markets-of-the-globe>.
xxxiii. ‘Autonomous Vehicle Adoption Study – BCG’, Boston Consulting Group (2020) <https://www.bcg.com/en-au/industries/automotive/autonomous-vehicle-adoption-study>.
xxxiv. World Economic Forum (in collaboration with Accenture), The New Production Workforce: Responding to Shifting Labour Demands ( January 2018) <http://www3.weforum.org/docs/WEF_White_Paper_The_New_Production_Workforce.pdf>.
xxxv. Deloitte University Press, Industry 4.0 and the digital twin: Manufacturing meets its match (2017) <https://www2.deloitte.com/content/dam/Deloitte/cn/Documents/cip/deloitte-cn-cip-industry-4-0-digital-twin-technology-en-171215.pdf>.
xxxvi. ‘Overview: What is AutoCAD?’, Autodesk (2020) <https://www.autodesk.com.au/products/autocad/overview?plc=ACDIST&term=1-YEAR&support=ADVANCED&quantity=1>.
xxxvii. World Economic Forum, The Future of Jobs Report 2020 (October 2020) <http://www3.weforum.org/docs/WEF_Future_of_Jobs_2020.pdf>.

The Future of Work is Now: Is APAC Ready? | Autodesk FoundationThe Future of Work is Now: Is APAC Ready? | Autodesk Foundation
50 51
xxxviii. International Telecommunications Union, Economic contribution of broadband, digitization and ICT regulation: Econometric modelling for Asia-Pacific (2019) <https://www.itu.int/pub/D-PREF-EF.BDT_AP-2019>.
xxxix. Deloitte Access Economics, The economic impact of improving schooling quality (commissioned by the Australian Department of Education and Training, November 2016) <https://docs.education.gov.au/system/files/doc/other/ecoimpactschoolquality.pdf>.
xl. Anh Ngoc Mai et al, ‘The lasting effects of innovation on firm profitability: panel evidence from a transitional economy’ (2019) 31(1) Economic Research-Ekonomska Istraživanja 3417.
xli. World Economic Forum, Do unemployment benefits help people find better jobs? (2015) <https://www.weforum.org/agenda/2015/07/do-unemployment-benefits-help-people-find-better-jobs/>
xlii. ‘Career Transition Assistance’, Australian Department of Education, Skills and Employment (8 September 2020) <https://www.employment.gov.au/career-transition-assistance>.
xliii. ‘About SkillsFuture’, SkillsFuture (2020) <https://www.skillsfuture.sg/AboutSkillsFuture>.
xliv. Michael A. Cusumano, ‘Manufacturing Innovation: Lessons from the Japanese Auto Industry’, MIT Sloan Management Review (online, fall 1988) <https://sloanreview.mit.edu/article/manufacturing-innovation-lessons-from-the-japanese-auto-industry/>.
xlv. Sam Kim, ‘South Korea’s Robots Are Both Friends and Job Killers’, Bloomberg (11 November 2019) <https://www.bloomberg.com/graphics/2019-new-economy-drivers-and-disrupters/south-korea.html>.
xlvi. Nuurrianti Jalli, ‘Lack of internet access in Southeast Asia poses challenges for students to study online amid COVID-19 pandemic’, The Conversation (online, 17 March 2020) <https://theconversation.com/lack-of-internet-access-in-southeast-asia-poses-challenges-for-students-to-study-online-amid-covid-19-pandemic-133787>.
xlvii. ‘Estimates and projections of labour market indicators’, International Labour Organization (2020) <https://www.ilo.org/empelm/projects/WCMS_114246/lang--en/index.htm>.
xlviii. Jae-Hee Chang & Phu Huynh, ‘ASEAN in Transformation: The Future of Jobs At Risk of Automation’, International Labour Organization ( July 2016) <https://www.ilo.org/wcmsp5/groups/public/---ed_dialogue/---act_emp/documents/publication/wcms_579554.pdf>.
xlix. Nuurrianti Jalli, ‘Lack of internet access in Southeast Asia poses challenges for students to study online amid COVID-19 pandemic’, The Conversation (online, 17 March 2020) <https://theconversation.com/lack-of-internet-access-in-southeast-asia-poses-challenges-for-students-to-study-online-amid-covid-19-pandemic-133787>.
l. Jae-Hee Chang & Phu Huynh, ‘ASEAN in Transformation: The Future of Jobs At Risk of Automation’, International Labour Organization ( July 2016) <https://www.ilo.org/wcmsp5/groups/public/---ed_dialogue/---act_emp/documents/publication/wcms_579554.pdf>.
li. ‘Is automation a threat for RMG workers in Bangladesh?’, Global Times (15 October 2019) <https://www.globaltimes.cn/content/1166912.shtml>.
lii. Thomas Bernhardt et al, ‘Myanmar labour issues from the perspective of enterprises: Findings from a survey of food processing and garment manufacturing enterprises’, International Labour Organization (2017) <https://www.ilo.org/wcmsp5/groups/public/---asia/---ro-bangkok/---ilo-yangon/documents/publication/wcms_546641.pdf>.
liii. International Labour Organization, Mapping Social Protection Systems in Pakistan, (2019) <https://www.ilo.org/wcmsp5/groups/public/---asia/---ro-bangkok/---ilo-islamabad/documents/publication/wcms_737630.pdf>.
liv. Autodesk Foundation, Autodesk Foundation Impact Brief Series: Future of Work (2019) <https://damassets.autodesk.net/content/dam/org/assets/2019/autodesk-report-future-of-work.pdf>.
lv. ‘Four ways the cloud is creating, not eliminating, jobs’, Microsoft News Centre (12 June 2018) <https://news.microsoft.com/en-xm/2018/06/12/four-ways-the-cloud-is-creating-not-eliminating-jobs/>.
lvi. ‘Philippines BPO sector remains competitive with voice and value-added services’, Oxford Business Group (2020) <https://oxfordbusinessgroup.com/overview/people-power-skilled-voice-and-other-value-added-services-outsourcing-powerhouse-attracting>.
lvii. ‘Skills Development’, World Bank (10 October 2017) <https://www.worldbank.org/en/topic/skillsdevelopment#2>.
lviii. ‘ILO/Regional Skills Programme/Japan Skills Development in Asia and the Pacific’, International Labour Organization (2020) <https://www.ilo.org/asia/projects/WCMS_098077/lang--en/index.htm>.
lix. Unicef, Developing skills in youth to succeed in an evolving south Asian economy: a case study on Pakistan, (2019) <https://www.unicef.org/rosa/media/4566/file/Pakistan_Youth_Skills_Case_Study%20.pdf>.
lx. Michael Schrage et al, ‘Opportunity Marketplaces: Aligning Workforce Investment and Value Creation in the Digital Enterprise’, MIT Sloan Management Review (in collaboration with Deloitte, 28 April 2020) <https://sloanreview.mit.edu/projects/opportunity-marketplaces/>.
lxi. Ina Gantcheva, Activating the internal talent marketplace: Accelerate workforce resilience, agility and capability, and impact the future of work’, Deloitte (18 September 2020) <https://www2.deloitte.com/us/en/insights/focus/technology-and-the-future-of-work/internal-talent-marketplace.html>.
lxii. ]Ibid.
lxiii. ‘Unilever launches new AI-powered talent marketplace’, Unilever (24 June 2019) <https://www.unilever.com/news/press-releases/2019/unilever-launches-ai-powered-talent-marketplace.html>.
lxiv. World Economic Forum, The future of jobs report 2020 (2020) <https://www.weforum.org/reports/the-future-of-jobs-report-2020>.
lxv. Deloitte Insights, Deloitte Global Human Capital Trends 2020 (May 2020) <https://www2.deloitte.com/au/en/pages/human-capital/articles/human-capital-trends.html>.
lxvi. Pankaj C. Patel et al, ‘County-level job automation risk and health: Evidence from the United States’ (2018) Social science and medicine 54.
lxvii. Deloitte Access Economics, Operating in the new normal (September 2020) <https://www2.deloitte.com/au/en/pages/economics/articles/operating-new-normal.html>.
lxviii. ‘Malaysia: Blueprint on Enculturation of Lifelong Learning for Malaysia: 2020, issued in 2011’, UNESCO Institute for Lifelong Learning (2020) <https://uil.unesco.org/document/malaysia-blueprint-enculturation-lifelong-learning-malaysia-2020-issued-2011>.
lxix. Alex Usher, ‘The Korean Academic Credit Bank: A Model for Credit Transfer in North America?’, Higher Education Strategy Associates (Intelligence Brief 8, August 2014) <https://higheredstrategy.com/wp-content/uploads/2014/08/Intelligence-Brief-8-Korea-Aug-17.pdf>.
lxx. ‘Most use SkillsFuture credits for work training, but those on ‘leisure’ courses will not be judged: Ong Ye Kung’, Todayonline (2020) <https://www.todayonline.com/singapore/budget-2020-most-use-skillsfuture-credits-work-training-those-doing-leisure-courses-will>.
lxxi. ‘Training indicators’, Ministry of Manpower (2020) <https://stats.mom.gov.sg/Pages/Training-Participation-Rate-of-Economically-Active-Residents.aspx>.
lxxii. ‘Most use SkillsFuture credits for work training, but those on ‘leisure’ courses will not be judged: Ong Ye Kung’, Todayonline (2020) <https://www.todayonline.com/singapore/budget-2020-most-use-skillsfuture-credits-work-training-those-doing-leisure-courses-will>.
lxxiii. Deloitte, Flipping the narrative toward a brighter future of work (2019) <https://www2.deloitte.com/content/dam/Deloitte/us/Documents/human-capital/us-human-capital-flipping-the-narrative-toward-brighter-future-of-work.pdf>.
lxxiv. Ibid.
lxxv. ‘Project Sangam: enabling skilling at scale for a better tomorrow’, Microsoft (2019) <https://news.microsoft.com/en-in/features/project-sangam-skilling-anil-bhansali/>.
lxxvi. Generation, Annual Report 2019 (August 2020) <https://www.generation.org/wp-content/uploads/2020/08/GenerationAR2019-FINAL.pdf>.
lxxvii. ‘Understanding the Effect of Skills Training on Women’s Economic Opportunities in Pakistan’, IDRC (n.d.) <https://www.idrc.ca/en/project/understanding-effect-skills-training-womens-economic-opportunities-pakistan>.
lxxviii. Unicef, Developing skills in youth to succeed in an evolving south Asian economy: a case study on Pakistan, (2019) <https://www.unicef.org/rosa/media/4566/file/Pakistan_Youth_Skills_Case_Study%20.pdf>.
lxxix. ‘Microsoft’s Project Sangam accelerates India’s Swachh Bharat Mission’, Microsoft (2020) <https://news.microsoft.com/en-in/microsoft-project-sangam-swacch-bharat-mission/>.
lxxx. ‘Grab sets 2025 goals to use tech for good in Southeast Asia’, Grab (24 September 2019) <https://www.grab.com/sg/press/others/grab-sets-2025-goals-to-use-tech-for-good-in-southeast-asia/>.
lxxxi. Hoang Anh, ‘Enabling Boat: ICT training to empower coastal youth’, Vietnam Investment Review (23 June 2017) <https://www.vir.com.vn/enabling-boat-ict-training-to-empower-coastal-youth-50132.html>.
lxxxii. United Nations Economic and Social Commission for Asia and the Pacific, Social protection policy guides: Why we need social protection (2018), <https://www.unescap.org/resources/policy-guide-why-we-need-social-protection>.
lxxxiii. Ibid.

The Future of Work is Now: Is APAC Ready? | Autodesk FoundationThe Future of Work is Now: Is APAC Ready? | Autodesk Foundation
52 53
lxxxiv. United Nations Economic and Social Commission for Asia and the Pacific, Time for Equality: The Role of Social Protection in Reducing Inequalities in Asia and the Pacific (2015). <https://www.unescap.org/sites/default/files/SDD%20Time%20for%20Equality%20report_final.pdf>.
lxxxv. Mathers, N. & Slater, R. ‘Social protection and growth: research synthesis’ (2014) Australian Government, Department of Foreign Affairs and Trade.
lxxxvi. Shah, A. & Mehta, A. ‘Experience of the Maharashtra Employment Guarantee Scheme: are there lessons for NREGS?’ (2008) Chronic Poverty Research Centre.
lxxxvii. Kabeer, N. ‘Safety nets and opportunity ladders: Addressing vulnerability and enhancing productivity in South Asia’ (2002), Overseas Development Institute.
lxxxviii. Devereux, S. ‘Social protection for the poor: lessons from recent international experience’ (2002), Institute of Development studies working series.
lxxxix. Kabeer, N. ‘Safety nets and opportunity ladders: Addressing vulnerability and enhancing productivity in South Asia’ (2002), Overseas Development Institute.
xc. International Labour Organization, World social protection report 2017-19: Universal social protection to achieve the Sustainable Development Goals (2017) <https://www.ilo.org/wcmsp5/groups/public/---dgreports/---dcomm/---publ/documents/publication/wcms_604882.pdf>.
xci. ‘The role of SMEs in Asia’s Economic Growth’, SME Finance forum (2020) <https://www.smefinanceforum.org/post/the-role-of-smes-in-asias-economic-growth>.
xcii. Marieme Chouki et al, ‘Barriers to Information Technology Adoption Within Small and Medium Enterprises: A Systematic Literature Review’ (2020) 17(1) International Journal of Innovation and Technology Management.
xciii. ‘Are ASEAN’s internet speeds world class?’, The ASEAN Post (online, 15 May 2019) <https://theaseanpost.com/article/are-aseans-internet-speeds-world-class>.
xciv. ‘Helping SMEs Go Digital’, Infocomm Media Development Authority (Annex, 6 November 2020) <https://www.imda.gov.sg/-/media/Imda/Files/Programme/SMEs-Go-Digital/SMEsGD-Factsheet.pdf?la=en>.
xcv. Alita Sharon, ‘Thai gov introduces tax perks to help SMEs go digital’, OpenGov Asia (online, 16 August 2019) <https://opengovasia.com/thai-gov-introduces-tax-perks-to-help-smes-go-digital/>.
xcvi. Deloitte, Flipping the narrative toward a brighter future of work (2019) <https://www2.deloitte.com/content/dam/Deloitte/us/Documents/human-capital/us-human-capital-flipping-the-narrative-toward-brighter-future-of-work.pdf>.
xcvii. ‘Mobile internet usage challenges in Asia – awareness, literacy and local content’, GSMA (2015) <https://www.gsma.com/mobilefordevelopment/wp-content/uploads/2015/07/150709-asia-local-content-final.pdf>.
xcviii. ‘Can we bridge the digital language divide’, Transparent Language (4 November 2016) <https://medium.com/@TransparentLanguage/can-we-bridge-the-digital-language-divide-35188387596b>.
xcix. O*NET OnLine (17 November 2020) <https://www.onetonline.org/>.
c. Daron Acemoglu and David Autor, ‘Skills, Tasks, and Technologies: Implications for Employment and Earnings’, National Bureau of Economic Research Working Paper 16082 ( June 2010) <https://www.nber.org/papers/w16082>.
Deloitte Access Economics, The Path to prosperity: Why the future of work is human (Building the Lucky Country 7, 2019) <https://www2.deloitte.com/au/en/pages/building-lucky-country/topics/building-lucky-country.html>.
ci. ‘Work Context – Spend Time Making Repetitive Motions’, O*NET OnLine (17 November 2020) <https://www.onetonline.org/find/descriptor/result/4.C.2.d.1.i>.
cii. ‘Work Context – Importance of Repeating Same Tasks’, O*NET OnLine (17 November 2020) <https://www.onetonline.org/find/descriptor/result/4.C.3.b.7>.
ciii. ‘Work Activities – Thinking Creatively’, O*NET OnLine (17 November 2020) <https://www.onetonline.org/find/descriptor/result/4.A.2.b.2>.
civ. ‘Work Context – Structured versus Unstructured Work’, O*NET OnLine (17 November 2020) <https://www.onetonline.org/find/descriptor/result/4.C.3.b.8>.
cv. ‘Work Activities – Analyzing Data or Information’, O*NET OnLine (17 November 2020) <https://www.onetonline.org/find/descriptor/result/4.A.2.a.4>.
cvi. ‘Work Activities – Interacting With Computers’, O*NET OnLine (17 November 2020) <https://www.onetonline.org/find/descriptor/result/4.A.3.b.1>.
cvii. ‘Work Context – Degree of Automation’, O*NET OnLine (17 November 2020) <https://www.onetonline.org/find/descriptor/result/4.C.3.b.2>.
cviii. ‘Statistics on wages’, ILOSTAT (2020) <https://ilostat.ilo.org/topics/wages/>.
cix. ‘Education’, OECD Data (2020) <https://data.oecd.org/education.htm>.
cx. ‘Employed population by occupation, age and sex’, UNdata (19 August 2020) <http://data.un.org/Data.aspx?d=POP&f=tableCode:322>.
cxi. Analysis by Deloitte Access Economics using O*NET data.
cxii. ‘Statistics on wages’, ILOSTAT (2020) <https://ilostat.ilo.org/topics/wages/>.
cxiii. ‘Time required to start a business (days)’, World Bank (2020) <https://data.worldbank.org/indicator/IC.REG.DURS>.
cxiv. Property Rights Alliance (2019), International Trade Barrier Index, <https://www.tradebarrierindex.org/>.
cxv. ‘The Global Competitiveness Report 2017-2018’ (2017) World Economic Forum (Insight Report, 2017) <http://www3.weforum.org/docs/GCR2017-2018/05FullReport/TheGlobalCompetitivenessReport2017%E2%80%932018.pdf>.
cxvi. Ibid.
cxvii. ‘Research and development expenditure (% of GDP)’, World Bank (2020) <https://data.worldbank.org/indicator/GB.XPD.RSDV.GD.ZS>.
cxviii. Economist Intelligence Unit, The Inclusive Internet Index 2020 (commissioned by Facebook, 2020) <https://theinclusiveinternet.eiu.com/>.
cxix. ‘Labour statistics on women’, ILOSTAT (2020) <https://ilostat.ilo.org/topics/women/>.
cxx. ‘The Global Competitiveness Report 2017-2018’ (2017) World Economic Forum (Insight Report, 2017) <http://www3.weforum.org/docs/GCR2017-2018/05FullReport/TheGlobalCompetitivenessReport2017%E2%80%932018.pdf>.
cxxi. Ibid.
cxxii. ‘Mean years of schooling, 2017’, Our World in Data (2017) <https://ourworldindata.org/grapher/mean-years-of-schooling-1>.
cxxiii. Orsolya Kovacs-Ondrejkovic et al, ‘Decoding Global Trends in Upskilling and Reskilling’, Boston Consulting Group (5 November 2019) <https://www.bcg.com/en-au/publications/2019/decoding-global-trends-upskilling-reskilling>.
cxxiv. ‘Global Innovation Index 2020: Who Will Finance Innovation?’ Global Innovation Index (Edition 13, 2020) <https://www.globalinnovationindex.org/Home>.
cxxv. Ibid.
cxxvi. ‘Employment Statistics’, ILOSTAT (2020) <https://ilostat.ilo.org/topics/employment/>.
‘Temporary Employment’, OECD Data (2020) <https://data.oecd.org/emp/temporary-employment.htm>.
cxxvii. ‘Statistics on unemployment and supplementary measures of labour underutilization’, ILOSTAT (2020) <https://ilostat.ilo.org/topics/unemployment-and-labour-underutilization/>.
cxxviii. ‘National Statistics’, Global Open Data Index (2020) <https://index.okfn.org/dataset/statistics/>.
cxxix. ‘Domestic general government health expenditure (GGHE-D) as percentage of general government expenditure (GGE) (%)’, World Health Organization (2020) <https://www.who.int/data/gho/data/indicators/indicator-details/GHO/domestic-general-government-health-expenditure-(gghe-d)-as-percentage-of-general-government-expenditure-(gge)-(-)>.
cxxx. ‘The Global Competitiveness Report 2017-2018’, World Economic Forum (Insight Report, 2017) <http://www3.weforum.org/docs/GCR2017-2018/05FullReport/TheGlobalCompetitivenessReport2017%E2%80%932018.pdf>.
cxxxi. ‘Statistics on social protection’, ILOSTAT (2020) <https://ilostat.ilo.org/topics/social-protection/>.

The Future of Work is Now: Is APAC Ready? | Autodesk FoundationThe Future of Work is Now: Is APAC Ready? | Autodesk Foundation
54 55
Contacts
David RumbensPartner [email protected]
Nicole Scoble-Williams Partner [email protected]
John O’Mahony [email protected]
Jessica Mizrahi Associate Director
Nick Hull [email protected]
Harry Murphy Cruise [email protected]
Siti Nur Durrah [email protected]
Rhiannon Yetsenga [email protected]
David Yohei [email protected]
Angela ZhaResearcher
Limitation of our work
General use restrictionThis report is prepared solely for the use of Autodesk Foundation. This report is not intended to and should not be used or relied upon by anyone else and we accept no duty of care to any other person or entity. The report has been prepared for the purpose of identifying industries/countries where greater automation may create risks for some worker cohorts, and opportunity areas to consider in addressing these risks. You should not refer to or use our name or the advice for any other purpose.

Deloitte refers to one or more of Deloitte Touche Tohmatsu Limited (“DTTL”), its global network of member firms, and their related entities. DTTL (also referred to as “Deloitte Global”) and each of its member firms and their affiliated entities are legally separate and independent entities. DTTL does not provide services to clients. Please see www.deloitte.com/about to learn more.
Deloitte is a leading global provider of audit and assurance, consulting, financial advisory, risk advisory, tax and related services. Our network of member firms in more than 150 countries and territories serves four out of five Fortune Global 500®companies. Learn how Deloitte’s approximately 286,000 people make an impact that matters at www.deloitte.com.
About Deloitte Asia Pacific Deloitte Asia Pacific Limited is a company limited by guarantee and a member firm of DTTL. Members of Deloitte Asia Pacific Limited and their related entities provide services in Australia, Brunei Darussalam, Cambodia, East Timor, Federated States of Micronesia, Guam, Indonesia, Japan, Laos, Malaysia, Mongolia, Myanmar, New Zealand, Palau, Papua New Guinea, Singapore, Thailand, The Marshall Islands, The Northern Mariana Islands, The People’s Republic of China (incl. Hong Kong SAR and Macau SAR), The Philippines and Vietnam, in each of which operations are conducted by separate and independent legal entities.
About Deloitte Australia In Australia, the Deloitte Network member is the Australian partnership of Deloitte Touche Tohmatsu. As one of Australia’s leading professional services firms. Deloitte Touche Tohmatsu and its affiliates provide audit, tax, consulting, and financial advisory services through approximately 8000 people across the country. Focused on the creation of value and growth, and known as an employer of choice for innovative human resources programs, we are dedicated to helping our clients and our people excel. For more information, please visit our web site at https://www2.deloitte.com/au/en.html.
Liability limited by a scheme approved under Professional Standards Legislation.
Member of Deloitte Asia Pacific Limited and the Deloitte Network.
© 2021 Deloitte Access Economics. Deloitte Touche Tohmatsu.
Designed by CoRe Creative Services. RITM0579823.